Exhibit 99.1

Management’s Discussion and Analysis
For the Three and Six Months Ended June 30, 2017
TSX: MPVD |NASDAQ: MPVD
MOUNTAIN PROVINCE DIAMONDS INC.
MANAGEMENT’S DISCUSSION AND ANALYSIS
FOR THE THREE AND SIX MONTHS ENDED JUNE 30, 2017
| TABLE OF CONTENTS | Page |
| Second Quarter 2017 Highlights | 3 |
| Company Overview | 5 |
| Gahcho Kué Diamond Mine | 6 |
| Non-IFRS Measures | 11 |
| Results of Operations | 12 |
| Financial Review | 12 |
| Summary of Quarterly Results | 13 |
| Earnings from Mine Operations, Costs and Expenses | 15 |
| Income and Resource Taxes | 15 |
| Financial Position and Liquidity | 15 |
| Off-Balance Sheet Arrangements | 17 |
| Significant Accounting Policies Adopted in the Period | 17 |
| Significant Accounting Judgments, Estimates and Assumptions | 19 |
| Standards and Amendments to Existing Standards | 20 |
| Related Party Transactions | 20 |
| Contractual Obligations | 22 |
| Other MD&A Analysis Requirements | 22 |
| Disclosure of Outstanding Share Data | 23 |
| Controls and Procedures | 23 |
| Cautionary Note Regarding Forward-Looking Statements | 24 |
This Management’s Discussion and Analysis (“MD&A”) of August 9, 2017 provides a review of the financial performance of Mountain Province Diamonds Inc. (the “Company” or “Mountain Province” or “MPV”) and should be read in conjunction with the MD&A for the year ended December 31, 2016, the unaudited condensed consolidated interim financial statements and the notes thereto for the three and six months ended June 30, 2017 and the audited consolidated statements for the year ended December 31, 2016. The following MD&A has been approved by the Board of Directors.
The unaudited condensed consolidated interim financial statements of the Company were prepared in accordance
with IAS 34 - Interim Financial Reporting. Except as disclosed in the statements, the interim financial statements follow the same accounting policies and methods of computation as compared with the most recent annual financial statements for the year ended December 31, 2016, which were prepared in accordance with International Financial Reporting Standards (“IFRS”) as issued by the International Accounting Standards Board (“IASB”). Accordingly, the interim financial statements should be read in conjunction with the Company’s most recent annual financial statements.
All amounts are expressed in thousands of Canadian dollars, except share and per share amounts, unless otherwise noted.
Technical information included in this MD&A regarding the Company’s mineral property has been reviewed by Carl Verley, a Director of the Company and a Qualified Person as defined by National Instrument 43-101 - Standards of Disclosure for Mineral Properties (“NI 43-101”).
| Page 2 |
Additional information, related to the Company is available on SEDAR at http://sedar.com/ and on EDGAR at http://www.sec.gov/edgar.shtml.
HIGHLIGHTS
| • | The Gahcho Kué Diamond Mine (“GK Mine”) declared commercial production on March 1, 2017 having achieved more than 70% of nameplate capacity of 8,226 tonnes per day over the proceeding 30-day period. |
| • | Mining of overburden, waste rock and ore in the 5034 open pit for the six months ended June 30, 2017 was approximately 16.1 million tonnes. Ore mined in the first six months totalled 1,551,000, with approximately 395,600 tonnes of ore stockpiled at period-end on a 100% basis. |
| • | For the six months ended June 30, 2017, the GK Mine treated approximately 1,258,600 tonnes of ore through the process plant and recovered approximately 2,481,200 carats on a 100% basis for an average grade of approximately 1.97 carats/tonne. This recovered grade is approximately 20% above budget for the six months ended June 30, 2017. It remains unclear at this time to what extent this positive grade variance will be sustainable. The Company’s attributable share of diamond production for the three months ended June 30, 2017 was approximately 790,900 carats and 1,215,800 carats for the six months ended June 30, 2017. Production in the second quarter was 86% higher than the first quarter. |
| • | In the six months ended June 30, 2017, the Company conducted five sales through its diamond broker based in Antwerp, Belgium for a total of approximately 892,000 carats, which included fancies and specials. Proceeds of approximately US$71.5 million or an average of US$80 per carat were received. |
| • | Gem and near-gem diamonds for the six months ended June 30, 2017 contributed approximately 96% of the diamond sales proceeds at an average price of US$128 per carat. The remaining 4% of proceeds came from industrial diamonds at an average price of US$7 per carat. Gem and near-gem diamonds represented approximately 60% of sales by volume to June 30, 2017. |
| • | Subsequent to quarter end, on July 20, 2017, the Company closed its sixth and largest sale to date at an average realized price of US$72 per carat. Certain of the fancies and specials from this assortment were accelerated and sold in the fifth sale in June. If the value of these diamonds were included in the sixth sale assortment, the average realized price would have been US$87 per carat. The fifth sale assortment would have therefore been reduced to US$75 per carat. This sixth sale confirmed the continued strong market interest in the Gahcho Kué production with 10.6 bids received per parcel and 83% of winning bidders repeat customers. |
| • | Participation at the Company’s sales has steadily increased in recent months. Bids per parcel (approx. 120 parcels per sale) increased from an average of 8.1 in January to 10.4 in June. There is a high level of market interest and competition for Gahcho Kué diamonds with an average of 100 companies bidding each sale. |
| Page 3 |
| • | The Company has increased 2017 production guidance on a 100% basis to 5.5 million carats recovered (2.7 million carats on a 49% basis) from 4.4 million carats previously (2.2 million carats on a 49% basis) and also increased guidance on carats sold to 2.4 million carats from 2.0 million previously. |
| • | The Company maintains the price guidance announced on April 25, 2017, of approximately US$70 to US$90 per carat as the expected realized diamond price for the remainder of 2017. |
| • | The ore stockpile inventory on hand on a 100% basis at June 30, 2017 was approximately 395,600 tonnes or approximately 671,848 carats at an estimated 1.7 carats per tonne. The cost of ore stockpile is $7.9 million. |
| • | At June 30, 2017, the Company had drawn US$357 million of the US$370 million Loan Facility. Commencing on March 31, 2017, the Company was subject to maintaining a cash call reserve account balance based upon certain budgeted expenditures for the GK Mine which will vary over the term of the Loan Facility. Approximately US$27.9 million was originally required to be deposited in the cash call reserve account on March 31, 2017. On March 27, 2017, the Company received a waiver deferring the requirement to fund the cash call reserve account to May 31, 2017. On May 31, 2017, the Company received an additional waiver extension to August 31, 2017. As conditions of the waiver, certain information must be furnished to the lenders by August 31, 2017 including: an updated financial model and life of mine plan; a diamond pricing valuation comparison between production to date and historic samples from April 2011 to be prepared by the lender’s independent diamond consultant; and a reconciliation of cumulative diamond production including a statistical comparison of total diamond carats, size and quality. Failure to comply with the requirements of the waiver constitute an event of default. Management expects to furnish the lenders with the requested information, and discussions with the lenders are in progress regarding amendments to the structure of the Loan Facility. However, the Company also expects to require a further waiver before any such revisions can be completed. There are no assurances the lenders will accommodate further waivers or the restructuring that the Company seeks. If the Company is unable to fully fund the required reserve accounts, or is unable to comply with other financial covenants, and is not successful in obtaining suitable waivers or amendments, it would result in an event of default, and the Loan Facility outstanding balance would become payable on demand. To mitigate against this, management may seek alternative sources of financing. These conditions, until such time as they are resolved, indicate the existence of a material uncertainty that results in substantial doubt as to the Company’s ability to continue as a going concern. The financial statements do not include the adjustments to the amounts and classification of assets and liabilities that would be necessary should the Company be unable to continue as a going concern. These adjustments may be material. |
| Page 4 |
The following table summarizes key operating highlights for the period ended June 30, 2017.
| Three months ended | Three months ended | Six months ended | Six months ended | |||||||||||||||
| June 30, 2017 | June 30, 2016 | June 30, 2017 | June 30, 2016 | |||||||||||||||
| GK operating data | ||||||||||||||||||
| Mining | ||||||||||||||||||
| *Ore tonnes mined | kilo tonnes | 940 | – | 1,551 | – | |||||||||||||
| *Waste tonnes mined | kilo tonnes | 7,449 | – | 14,508 | – | |||||||||||||
| *Total tonnes mined | kilo tonnes | 8,389 | – | 16,059 | – | |||||||||||||
| *Ore in stockpile | kilo tonnes | 396 | – | 396 | – | |||||||||||||
| Processing | ||||||||||||||||||
| *Ore tonnes processed | kilo tonnes | 767 | – | 1,259 | – | |||||||||||||
| *Average plant throughput | tonnes per day | 8,618 | – | 6,840 | – | |||||||||||||
| *Average diamond recovery | carats per tonne | 2.10 | – | 1.97 | – | |||||||||||||
| *Diamonds produced | 000's carats | 1,614 | – | 2,481 | – | |||||||||||||
| Approximate diamonds produced - Mountain Province | 000's carats | 791 | – | 1,216 | – | |||||||||||||
| Sales | ||||||||||||||||||
| Approximate diamonds sold - Mountain Province | 000's carats | 469 | – | 885 | – | |||||||||||||
| Average diamond sales price per carat | US | $ | 87 | $ | – | $ | 80 | $ | – | |||||||||
| * at 100% interest in the GK Mine | ||||||||||||||||||
COMPANY OVERVIEW
Mountain Province is a Canadian-based resource company listed on the Toronto Stock Exchange and NASDAQ under the symbol ‘MPVD’. The Company’s registered office and its principal place of business is 161 Bay Street, Suite 1410, P.O. Box 216, Toronto, ON, Canada, M5J 2S1. The Company through its wholly owned subsidiaries 2435572 Ontario Inc. and 2435386 Ontario Inc., holds a 49% interest in the GK Mine, located in the Northwest Territories of Canada. De Beers Canada Inc. (“De Beers” or the “Operator”) holds the remaining 51% interest. The Joint Arrangement between the Company and De Beers is governed by the 2009 amended and restated Joint Venture Agreement. The Company’s primary asset is its 49% interest in the GK Mine.
Physical construction of the GK Mine was substantially completed at June 30, 2016 and the commissioning of the plant took place during July 2016. Ramp-up to commercial production commenced on August 1, 2016 and commercial production was declared on March 1, 2017 after the GK mine achieved approximately 70% of nameplate capacity of 8,226 tonnes per day over a 30-day period.
Under the Gahcho Kué Joint Venture Agreement discussed below, commercial production for sunk cost repayment purposes is based on the first day after 30 days (excluding maintenance days) of achieving and maintaining 70% of designed production capacity. The $10 million sunk cost repayment on reaching commercial production was paid on March 31, 2017. The remaining principal balance of $24.4 million plus accumulated interest of $23.3 million is included in the sunk cost payable on the condensed consolidated interim balance sheet, and is payable on September 1, 2018. For royalty purposes for the Government of the Northwest Territories, commercial production is based on the first day after 90 days of achieving 60% of designed production capacity, which was achieved on December 23, 2016.
The Company’s strategy is to mine and sell its 49% share of rough diamonds at the highest price on the day of the close of the auction. Inventory generally will not be held for speculative purposes, though the sale of certain diamonds may be accelerated or deferred in the short term for tactical marketing purposes. Mountain Province’s long-term view of the rough diamond market remains positive, based on the outlook for a tightening rough diamond supply and growing demand, particularly in developing markets such as China and India, resulting in real, long term price growth.
| Page 5 |
During the six months ended June 30, 2017, the Company held five of ten sales expected to take place in Antwerp during 2017. Sales are held approximately every five weeks during the year.
Revenue from diamond sales is recognized when the performance obligations are completed. Under the Company’s sales terms, the performance obligations are completed when payment has been received for diamonds by the Company or the Company’s agent and diamonds are delivered to the buyer by the Company or the Company’s agent.
GAHCHO KUÉ DIAMOND MINE
Gahcho Kué Joint Venture Agreement
The GK Mine is located in the Northwest Territories, about 300 kilometers northeast of Yellowknife. The mine covers approximately 10,353 acres, and encompasses four mining leases (numbers 4341, 4199, 4200, and 4201) held in trust by the Operator. The Project hosts four primary kimberlite bodies - 5034, Hearne, Tuzo and Tesla. The four main kimberlite bodies are within two kilometers of each other.
The GK Mine is an unincorporated Joint Arrangement between De Beers (51%) and Mountain Province (49%) through its wholly owned subsidiaries. On October 2, 2014, Mountain Province assigned its 49% interest to its wholly-owned subsidiary 2435386 Ontario Inc. to the same extent as if 2435386 Ontario Inc. had been the original party to the Joint Venture Agreement. The Company accounts for the mine as a joint operation in accordance with International Financial Reporting Standard 11, Joint Arrangements. Mountain Province through its subsidiaries holds an undivided 49% ownership interest in the assets, liabilities and expenses of the GK Mine.
Under provisions of the 2009 agreement The Company will repay De Beers $59 million (representing 49% of the agreed sum of $120 million) plus interest compounded on the outstanding amounts in settlement of the Company’s share of the agreed historic sunk costs.
To date the Company has paid $34.6 million of historic sunk costs.
Amounts remaining to be paid is the balance of approximately $24.4 million plus accumulated interest due September 1, 2018. At June 30, 2017, accumulated interest is approximately $23.3 million plus the principal balance of $24.4 million is included in payable to De Beers Canada on the condensed consolidated interim balance sheet. Accumulated interest is being calculated at the prevailing LIBOR rate plus 5%.
2435386 Ontario Inc. has agreed that the Company’s marketing rights under the 2009 Agreement may be diluted if the Company defaults on the remaining repayments described above, if and when such payments become due.
The GK Mine has been successfully constructed and commissioned, and the Company has funded its 49% share of these costs. The underlying value and recoverability of the amounts shown in the consolidated financial statements for the Company’s Mineral Properties is dependent upon having access to necessary working capital and future profitable production.
Between 2014 and 2016, the Company and De Beers signed agreements allowing the Operator to utilize De Beers’ credit facilities to issue reclamation and restoration security deposits to the federal and territorial governments. In accordance with these agreements, the Company agreed to a 3% fee annually for their share of the letters of credit issued. As at June 30, 2017, the Company’s share of the letters of credit issued were $23,419 (December 31, 2016 - $23,419).
| Page 6 |
Gahcho Kué Capital Program
For the period, January 1, 2017 to February 28, 2017, the date immediately preceding the declaration of commercial production, funding of approximately $24.9 million (excluding management fee) was requested by the Operator. Included in this amount are ramp-up operating costs, working capital and the remaining original capital related costs. The Company funded from the Loan Facility approximately $12.5 million representing its proportionate share.
Gahcho Kué Production Forecast
Management expects that the GK mine will produce in excess of 5 million carats for the year ended December 2017 and the Company expects to receive in excess of 2.5 million carats, being its 49% share of production.
During 2017, the Company expects to sell at least 2.3 million carats of diamonds, including pre-commercial production sales.
These production and sales expectations represent an increase from prior guidance of 2.2 million attributable carats of production and 2.0 million carats sold due to favourable production trends experienced during the second quarter of 2017 as the conveyor issues experienced earlier have been overcome and recovered carats per tonne has been higher than planned in certain portion of the 5034 pit. The increased performance is expected to carry through to the second half of 2017.
Diamond Outlook
With the impact of India’s Q4 2016 demonetization policy largely abated, and following on from Q1 2017’s early signs of a recovery, Q2 2017 saw a continued strengthening in rough diamond demand. Categories hardest hit by demonetization, including smalls, near gem, industrials and browns, have largely recovered.
The positive signs out of Asia following the March Hong Kong show continued into Q2 2017, especially in lower value “commercial” polished categories. China-based retailer Chow Tai Fook posted year-on-year positive gains compared with 2016, further signaling a return to stability in the Chinese retail market.
The recovery of watch industry exports continued its positive trend in June. The value of products crossing the Swiss border stood at 1.7 billion Swiss francs, 5.3% higher than in June 2016. It is expected this positive trend will continue to support demand for higher colour and quality small rough and polished diamonds.
Results from June’s JCK Las Vegas show were mixed with reports that the larger US retailers’ buying activity was relatively quiet, or at least delayed, until later in the year. Smaller independents’ results were varied. Post-show reports indicated that polished prices were largely maintained.
Within the context of mediocre polished demand in the US and flat polished prices during Q2 2017, concerns persist that price gains seen in the rough market during the first half of this year are not being met with commensurate increases in polished prices. This places further pressure on the already thin margins being reported from the cutting centres. Delayed buying from US retailers will force manufacturers and wholesalers to carry stock for longer periods and could compound this issue.
| Page 7 |
In this year’s lead-up to the rough diamond sector’s traditional August summer break, the expected slowing of demand was tinged with slightly more trepidation than usual following reports of some bankruptcies in the cutting centres.
More importance than usual is now placed on upcoming results from the September Hong Kong show and US retail buying in Q3 2017.
The Company maintains its price guidance for 2017 of US$70-US$90 per carat sold.
Gahcho Kué Diamond Mine Update
Construction and Development Update
As at June 30, 2017, procurement for the construction of the mine was 100% complete. During the quarter ended June 30, 2017, the close-out of the various procurement packages from Q1 - 2017 were completed.
The mine operator, De Beers Canada, has advised that for geotechnical reasons a push-back of the east wall of the 5034 pit is required, and initial work on that push-back has now commenced. While the operator has not yet determined the full cost impact, it is expected that it will be spread over the next three years. Further information will be provided once the determination has been completed; similar work may be required on the Hearne pit.
During the prior winter, extreme cold conditions affected the mine’s conveyor systems which resulted in downtime and lowered throughput. Work has commenced on this project and is expected to be completed by the end of Q1 2018. De Beers and the Company have approved a capital project totalling $23 million on a 100% basis to install enclosures on two conveyors as well as to install dust collection systems at the primary crusher and plant feed bin.
Mining
For the three months ended June 30, 2017, on a 100% basis, a total of 8.4 million tonnes of overburden, waste rock and ore had been extracted from the 5034 open pit, compared to a plan of approximately 9.1 million tonnes (92% of plan). For the six months ended June 30, 2017, on a 100% basis a total of 16.1 million tonnes of overburden, waste rock and ore had been extracted from the 5034 open pit, compared to a plan of approximately 17.7 million tonnes (91% of plan).
During the three and six months ended June 30, 2017, a total of 940,000 tonnes and 1,551,000 tonnes of ore have been delivered to the stockpile compared to a plan of 740,000 tonnes (127%) and 1,530,000 tonnes (101%). For the three and six months ended June 30, 2017, 767,000 tonnes and 1,259,000 tonnes of kimberlite ore was processed with 1,614,000 carats (100% basis) and 2,481,000 carats being recovered at a grade of 2.10 and 1.97 carats per tonne for the three and six months ended June 30, 2017, respectively.
At June 30, 2017, there was approximately 396,000 tonnes (100% basis) of stockpiled ore or approximately 671,848 carats on a 100% basis. Sufficient ore is available in the 5034 pit to meet the planned process throughput rate.
At June 30, 2017, the GK Mine had 912,220 carats on a 100% basis in rough diamond inventory at the GK Mine and at the Diavik Diamond Mines Inc. (‘DDMI’) sorting facility based in Yellowknife. The Company had 300,350 carats on hand plus its 49% share of the 912,220 carats or 444,100 carats for a total of 744,450 carats available for sale inventory.
Diamond Sales
The Company undertook five sales of diamonds during the first half 2017 through its broker in Antwerp, Belgium, and a sixth sale was completed in July. Although the GK Mine declared commercial production on March 1st, revenues and costs from four out of five sales to date have been recorded against the mine construction costs rather than as revenue on the Company’s statement of comprehensive income (loss) as those diamonds sold were all recovered prior to the mine declaring commercial production.
| Page 8 |
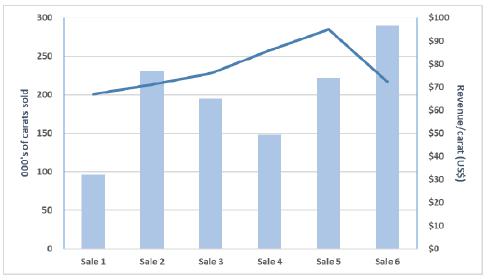
The following table summarizes the results of each sale:
| 000's of carats sold | Gross proceeds (US$) | Revenue/carat (US$) | ||||||||||
| Sale 1(1) | 96 | $ | 6,423 | $ | 67 | |||||||
| Sale 2 | 231 | $ | 16,484 | $ | 71 | |||||||
| Sale 3(2) | 195 | $ | 14,794 | $ | 76 | |||||||
| Total Q1(3) | 522 | $ | 37,701 | $ | 72 | |||||||
| 000's of carats sold | Gross proceeds (US$) | Revenue/carat (US$) | ||||||||||
| Sale 4(4) | 148 | $ | 12,729 | $ | 86 | |||||||
| Sale 5(5) | 222 | $ | 21,118 | $ | 95 | |||||||
| Total Q2 | 370 | $ | 33,847 | $ | 91 | |||||||
| Total year to date | 892 | $ | 71,548 | $ | 80 | |||||||
| 000's of carats sold | Gross proceeds (US$) | Revenue/carat (US$) | ||||||||||
| Sale 6 | 290 | $ | 20,952 | $ | 72 | |||||||
| Total Q3 | 290 | $ | 20,952 | $ | 72 | |||||||
(1) Assuming the diamonds withdrawn were sold in sale 1 instead of sale 2.
(2) Although the diamond sale closed on March 29, 2017, US$13.7 million of the proceeds reflecting the sale of 194,000 carats was received during the first week of April.
(3) Although 522,000 carats were sold, in accordance with IFRS only 416,000 carats could be recognizedas sales proceedsin the quarter. The remaining 106,000 carats have been recognized subsequent to the quarter end. The portion ofsales proceedsrelated to the 106,000 carats is approximately US$7.1 million of the US$37.7 million above.
(4) Sold carats were produced in the period before declaration of commercial production, therefore were recorded against the property, plant and equipment in accordance with IFRS.
(5) Sale 5 represents the first sale of diamonds produced after the declaration of commercial production on March 1, 2017, therefore have been recorded as revenue on the statement of comprehensive income (loss). Although 222,000 carats were sold, in accordance with IFRS only 215,000 carats could be recognized as sales proceeds in the quarter. The remaining 7,000 carats have been recognized subsequent to the quarter end. The portion of sales proceeds related to the 7,000 carats is approximately US$0.2 million of the US$21.1 million above.
(6) A selection of fancies and specials from the assortment slated for Sale 6 were accelerated and sold in Sale 5. Adjusting for the effects of this acceleration, the revenue per carat for Sale 5 would have been US$75 and for Sale 6 would have been US$87.
| Page 9 |
To more meaningfully relate prices realized at sale events to production results, the Company provides the following table:
| Production Period | Inception to end of year 2016 | Q1 2017 | April 2017 | May 2017 | June 2017 | July 2017 | YTD Total 2017 | |||||||||||||||||||||
| Sale in which goods were primarily sold | 1 & 2 | 3 to 5 | 6 | N/A** | N/A** | N/A** | ||||||||||||||||||||||
| Tonnes processed (100%) (000's) | 515 | 492 | 201 | 276 | 289 | 314 | 1,573 | |||||||||||||||||||||
| Recovered grade (carats per tonne) | 1.64 | 1.76 | 2.27 | 2.09 | 2.00 | 2.13 | 2.00 | |||||||||||||||||||||
| Carats recovered (100%) (000's) | 847 | 867 | 457 | 579 | 578 | 669 | 3,150 | |||||||||||||||||||||
| Carats recovered (49%) (000's) | 415 | 425 | 224 | 284 | 283 | 328 | 1,544 | |||||||||||||||||||||
| Price per carat in US$, run of mine basis*** | $ | 67 | $ | 79 | $ | 78 | N/A** | N/A** | N/A** | |||||||||||||||||||
| Attributed value per tonne in CAD* | $ | 143 | $ | 188 | $ | 225 | N/A** | N/A** | N/A** | |||||||||||||||||||
*Attributed value per tonne has been determined based on realized sales results, with accelerated or deferred goods adjusted to their period production, reflecting only the Company’s 49% share of all diamonds including fancies and specials. Attributed value per tonne in CAD is not clearly defined under IFRS. Please refer to Non-IFRS measures section.
**Not applicable as goods from this production period have not yet been sold.
*** Price per carat in US$, run of mine basis is not clearly defined under IFRS. Please refer to Non-IFRS measures section.
The following table summarizes the revenue composition for the five sales above:
| % Volume | % Value | Sale price per carat (US$/ct) | ||||||||||
| Gem/ Near gem | 59 | % | 96 | % | 128 | |||||||
| Industrial/ Boart | 41 | % | 4 | % | 7 | |||||||
The Company has generally experienced an increase in diamond prices with each sale to June 2017 which can be attributed to a somewhat strengthening rough diamond market through the first half of the year as well as the effects of positive experience gained by diamond cutters and polishers in polishing GK Mine diamonds.
As previously reported, a significant proportion of diamonds sold to date, including much of the higher quality colourless diamonds, have exhibited varying degrees of fluorescence. As per industry norms, these continue to be discounted by the market compared to non-fluorescent diamonds.
The Company maintains the revenue guidance issued April 25, 2017, for the remainder of the year of between US$70 and US$90 per carat which accounts for these factors and a normalization of our realized prices compared to market conditions.
Sales and earnings analysis for the three and six months ended June 30, 2017 are as follows:
| Three months ended | Three months ended | Six months ended | Six months ended | |||||||||||||||||
| (in millions of Canadian dollars, except where otherwise noted) | June 30, 2017 | June 30, 2016 | June 30, 2017 | June 30, 2016 | ||||||||||||||||
| Sales | $ | 27,648 | – | 27,648 | – | |||||||||||||||
| Carats sold | 000's carats | 215 | – | 215 | – | |||||||||||||||
| Average price per carat sold | $/carat | 129 | – | 129 | – | |||||||||||||||
| Cost of sales per carat* | $/carat | 75 | 75 | |||||||||||||||||
| Earnings from mine operations per carat | $ | 54 | – | 54 | – | |||||||||||||||
| Earnings from mine operations | % | 42 | % | – | 42 | % | – | |||||||||||||
| Selling, general and administrative expenses | $ | 4,116 | 1,204 | 7,544 | 2,372 | |||||||||||||||
| Operating income (loss) | $ | 7,663 | (1,204 | ) | 4,235 | (2,372 | ) | |||||||||||||
This chart only comprises of data from Sale 5 since these diamonds relate to diamonds produced after the declaration of commercial production on March 1, 2017.
*This cost of sales per carat includes the cost of acquiring 51% of the fancies and specials which have been sold, after having been won in a tendering process with De Beers.
| Page 10 |
NON-IFRS MEASURES
The MD&A refers to the terms “Price per carat in US$, run of mine basis” and “Attributed value per tonne in CAD” both non-IFRS performance measures, in order to provide investors with information about the measures used by management to monitor performance. These measures are intended to provide additional information and should not be considered in isolation or as a substitute for measures of performance prepared in accordance with IFRS.
Price per carat in US$, run of mine basis, and attributed value per tonne in CAD are used by management to analyze the sales lot based on date of production rather than sales date. Differences can be attributed to the hold back or accumulation of diamonds, the expediting of certain diamonds produced into an earlier sales batch, and the inclusion in revenue under IFRS of proceeds from the sale of De Beers’ 51% of fancies and specials won by the Company under the tender process, described as adjustments for stock movements and holdbacks.
The following table provides a reconciliation of price per carat in US$, run of mine basis, to the amounts included in property, plant and equipment on the condensed consolidated interim balance sheets, and the sales reported on the condensed consolidated interim statements of comprehensive income (loss), as applicable:
| Sales per carat (expressed in 000's, except per carat amounts) | Sales 1 & 2* | Sales 3 & 4* | Sale 5** | Sale 6*** | ||||||||||||
| Sales | $ | 30,431 | $ | 37,062 | $ | 27,648 | $ | 26,500 | ||||||||
| Less: effects of foreign exchange spot translations | $ | (7,524 | ) | $ | (9,577 | ) | $ | (6,765 | ) | $ | (5,318 | ) | ||||
| Sales in $US | $ | 22,907 | $ | 27,485 | $ | 20,883 | $ | 21,182 | ||||||||
| Carats sold | 327 | 343 | 215 | 297 | ||||||||||||
| Sales per carat, $US | $ | 70 | $ | 80 | $ | 97 | $ | 71 | ||||||||
| Reconciliation of date of sale to date recovered from processing plant (expressed in 000's) | Sales 1 & 2* | Sales 3 & 4* | Sale 5** | Sale 6*** | Total | |||||||||||||||
| Carats recovered through processing plant | ||||||||||||||||||||
| Inception to end of period 2016 | 327 | 88 | – | – | 415 | |||||||||||||||
| Three month period ended March 31, 2017**** | – | 255 | 163 | 7 | 425 | |||||||||||||||
| One month period ended April 30, 2017**** | – | – | 52 | 172 | 224 | |||||||||||||||
| Sales in $US adjusted for date recovered from processing plant | ||||||||||||||||||||
| Inception to end of period 2016 | $ | 22,907 | $ | 4,898 | $ | – | $ | – | $ | 27,805 | ||||||||||
| Three month period ended March 31, 2017 | $ | – | $ | 22,587 | $ | 11,179 | $ | – | $ | 33,766 | ||||||||||
| One month period ended April 30, 2017 | $ | – | $ | – | $ | 9,704 | $ | 7,768 | $ | 17,472 | ||||||||||
| Production period (expressed in 000's, except per carat amounts) | Inception to end of 2016 | Q1 2017 | April 2017 | May 2017 | June 2017 | |||||||||||||||
| Carats recovered through processing plant | 415 | 425 | 224 | N/A*** | N/A*** | |||||||||||||||
| Sales in $US, date recovered through processing plant | $ | 27,805 | $ | 33,766 | $ | 17,472 | N/A*** | N/A*** | ||||||||||||
| Price per carat in $US, run of mine basis | $ | 67 | $ | 79 | $ | 78 | N/A*** | N/A*** | ||||||||||||
*Total revenue for sales 1 to 4 equates to the amounts included in property, plant and equipment on the condensed consolidated interim balance sheets.
**As presented in the condensed consolidated interim statements of comprehensive income (loss).
***Sale occurred subsequent to the quarter end, which will be reported in Q3 2017 financial report.
****During Sale 6, approximately 290K of carats were sold, of which approximately 172k were processed in the one-month period ended April 30, 2017, and 7k in the period ended March 31, 2017. The remainder were processed during May 2017.
| Page 11 |
The following table provides a reconciliation of the attributed value per tonne in CAD to the amounts included in property, plant and equipment on the condensed consolidated interim balance sheets, and the sales reported on the condensed consolidated interim statements of comprehensive income (loss):
| Production period (expressed in 000's, except per carat amounts) | Inception to end of 2016 | Q1 2017 | April 2017 | May 2017 | June 2017 | |||||||||||||||
| Carats recovered through processing plant | 415 | 425 | 224 | N/A*** | N/A*** | |||||||||||||||
| Average grade processed through processing plant | 1.64 | 1.76 | 2.27 | N/A*** | N/A*** | |||||||||||||||
| Tonnes processed through processing plant | 253 | 241 | 99 | N/A*** | N/A*** | |||||||||||||||
| Sales in $US, date recovered through processing plant | $ | 27,805 | $ | 33,766 | $ | 17,472 | N/A*** | N/A*** | ||||||||||||
| Add back effects of foreign exchange spot translations | $ | 8,381 | $ | 11,632 | $ | 4,731 | N/A*** | N/A*** | ||||||||||||
| Sales in $, date recovered through processing plant | $ | 36,186 | $ | 45,398 | $ | 22,203 | N/A*** | N/A*** | ||||||||||||
| Attributed value per tonne in CAD**** | $ | 143 | $ | 188 | $ | 225 | N/A*** | N/A*** | ||||||||||||
*Total revenue for sales 1 to 4 equates to amounts included in property, plant and equipment on the condensed consolidated interim balance sheets.
**As presented in the condensed consolidated interim statements of comprehensive income (loss).
***Sale occurred subsequent to the quarter end, which will be reported in Q3 2017 financial report.
****Attributed value per tonne in CAD is calculated as ‘Sales in $, date recovered through processing plant’ divided by ‘Tonnes processed through plant.’
Results of operations
The Company has funded its share of the remaining costs, associated fees, operating costs during the build-up to commercial production, which was declared on March 1, 2017. The Company, as discussed above, has held five sales of diamonds during the six months ended June 30, 2017 and expects to conduct another five sales during 2017 or approximately every five weeks generating cash by selling its 49% share of the diamonds produced at the GK Mine.
FINANCIAL REVIEW
Three and six months ended June 30, 2017 compared to the three and six months ended June 30, 2016, expressed in thousands of Canadian dollars.
For the three months ended June 30, 2017, the Company recorded a net income of $7,554 or $0.05 earnings per share compared to net loss $352 or $0.00 loss per share for the same period in 2016. For the six months ended June 30, 2017, the Company recorded a net income of $5,410 or $0.03 earnings per share compared to $18,491 net income or $0.12 earnings per share for the same period in 2016. One significant change was earnings from mine operations of $11,779 in the three and six months ended June 30, 2017 compared to $nil for the same period in 2016. The main reason for the significant decrease in net income for the three and six months ended June 30, 2017 was the $19,909 foreign exchange gain, compared to $15,489 in the current period.
Quarterly financial information for the past eight quarters is shown in Table 1.
| Page 12 |
SUMMARY OF QUARTERLY RESULTS
| Table 1 - Quarterly Financial Data | ||||||||||||||||
| Expressed in thousands of Canadian dollars | ||||||||||||||||
| Three months ended | ||||||||||||||||
| June 30 | March 31 | December 31 | September 30 | |||||||||||||
| 2017 | 2017 | 2016 | 2016 | |||||||||||||
| $ | $ | $ | $ | |||||||||||||
| Earnings and Cash Flow | ||||||||||||||||
| Sales | 27,648 | – | – | – | ||||||||||||
| Operating expenses | (19,985 | ) | (3,428 | ) | (2,479 | ) | (1,426 | ) | ||||||||
| Net income (loss) for the period | 7,554 | (2,144 | ) | (8,305 | ) | (5,387 | ) | |||||||||
| Basic and diluted earnings (loss) per share | 0.05 | (0.01 | ) | (0.05 | ) | (0.03 | ) | |||||||||
| Cash flow used in operating activities | (15,737 | ) | (27,239 | ) | 1,911 | (4,296 | ) | |||||||||
| Cash flow used in investing activities | 18,217 | 7,596 | (63,276 | ) | (16,404 | ) | ||||||||||
| Cash flow used in financing activities | (8,826 | ) | 30,974 | 36,527 | 32,539 | |||||||||||
| Balance Sheet | ||||||||||||||||
| Total assets | 857,320 | 873,753 | 783,762 | 752,825 | ||||||||||||
| Three months ended | ||||||||||||||||
| June 30 | March 31 | December 31 | September 30 | |||||||||||||
| 2016 | 2016 | 2015 | 2015 | |||||||||||||
| $ | $ | $ | $ | |||||||||||||
| Earnings and Cash Flow | ||||||||||||||||
| Operating expenses | (1,204 | ) | (1,168 | ) | (2,368 | ) | (677 | ) | ||||||||
| Net income (loss) for the period | (352 | ) | 18,843 | (10,248 | ) | (26,590 | ) | |||||||||
| Basic and diluted earnings (loss) per share | (0.00 | ) | 0.12 | (0.06 | ) | (0.17 | ) | |||||||||
| Cash flow used in operating activities | (13,972 | ) | (1,654 | ) | (1,592 | ) | (369 | ) | ||||||||
| Cash flow used in investing activities | (36,689 | ) | (89,198 | ) | (57,622 | ) | (23,496 | ) | ||||||||
| Cash flow used in financing activities | 59,271 | 92,870 | 36,316 | 32,485 | ||||||||||||
| Balance Sheet | ||||||||||||||||
| Total assets | 732,959 | 693,923 | 582,848 | 553,299 | ||||||||||||
| Page 13 |
EARNINGS FROM MINE OPERATIONS, COSTS AND EXPENSES
The earnings from mine operations, costs and expenses, expressed in thousands of Canadian dollars for the three and six months ended June 30, 2017 compared to the three and six months ended June 30, 2016 are comparable except for the following:
Earnings from mine operations
Earnings from mine operations for the three and six months ended June 30, 2017 was $11,779. Diamond sales for the period were $27,648. Production costs and depreciation and depletion related to diamonds sold were $6,969 and $5,094, respectively. The cost to acquire the fancies and specials diamonds sold was $3,806.
Selling, general and administrative expenses
Selling, general and administrative expenses for the three and six months ended June 30, 2017, respectively, were $4,116 and $7,544 compared to $1,204 and $2,372 for the same period in 2016. The significant expenses included in these amounts for the three and six months ended June 30, 2017, respectively, were $1,459 and $3,125 relating to selling and marketing, $1,246 and 1,686 related to consulting fees and payroll, and $365 and $773 relating to share-based payment expense. Selling and marketing expenses were incurred in 2017 due to the Company holding its first five sales. Consulting fees and payroll related expenses have significantly increased from $596 to $1,686, due to the transition in executive leadership during the period, and the associated costs of severance and transition.
Net finance income (expenses)
Net finance income (expenses) for the three and six months ended June 30, 2017, respectively, were ($11,376) and ($15,139) compared to $49 and $110 for the same period in 2016. Included in these amounts for the three months and six months ended June 30, 2017, respectively, were ($11,442) and ($15,281) relating to finance costs, ($140) and ($280) relating to accretion expense on decommissioning liability and $206 and $422 relating to interest income. Finance costs has increased for the three and six months ended June 30, 2017 due to interest expense incurred on the Loan Facility for the months of March to June 2017 being expensed after the declaration of commercial production. The increase in accretion expense on decommissioning liability is due to a higher decommissioning liability balance. The decrease in interest income is as a result of a lower average balance in the restricted accounts.
Derivative gains (losses)
Derivative gains (losses) for the three and six months ended June 30, 2017, respectively, were ($15) and $780 compared ($625) and $799 for the same period in 2016. For the six months ended June 30, 2017, the overall derivative gain is attributed to the relative strengthening of the LIBOR rate, which has resulted in a derivative gain on the interest rate swap contracts. The overall derivative gains for the six months ended June 30, 2016, related to the foreign currency forward strip contracts.
| Page 14 |
Foreign exchange gains
Foreign exchange gains for the three and six months ended June 30, 2017, respectively, were $11,260 and $15,489 compared to $1,406 and $19,909 for the same period in 2016. The foreign exchange gains for the three and six months ended June 30, 2017 were a result of the Canadian dollar strengthening relative to the U.S. dollar and the translation of the Loan Facility, net of U.S. dollar cash balances, to Canadian dollar at the spot rate at the period end. At June 30, 2017, the spot exchange rate was 1.2964/US$1 compared to $1.3427/US$1 at December 31, 2016. The foreign exchange gains for the three months ended June 30, 2016 were also a result of the Canadian dollar strengthening relative to the U.S. dollar and the translation of the Loan Facility and U.S. dollar cash balances to Canadian dollar at the spot rate at the period end. At June 30, 2017, the spot exchange rate was 1.2964/US$1, compared to $1.3299/US$1, at March 31, 2017. At June 30, 2016, the spot exchange rate was 1.2917/US$1 compared to $1.384/US$1 at December 31, 2015.
INCOME AND RESOURCE TAXES
The Company is subject to income and mining taxes in Canada with the statutory income tax rate at 26.5%.
No deferred tax asset has been recorded in the financial statements as a result of the uncertainty associated with the ultimate realization of these tax assets.
The Company is subject to assessment by Canadian authorities, which may interpret tax legislation in a manner different from the Company. These differences may affect the final amount or the timing of the payment of taxes. When such differences arise, the Company makes provision for such items based on management’s best estimate of the final outcome of these matters.
FINANCIAL POSITION AND LIQUIDITY
The development of the GK Mine is complete and commercial production was declared on March 1, 2017. The underlying value and recoverability of the amounts shown as “Property, Plant and Equipment” are dependent upon future profitable production and proceeds from disposition of the Company’s mineral properties. Failure to meet the obligations for the Company’s share in the GK Mine may lead to dilution of the interest in the GK Mine and may require the Company to impair costs capitalized to date. As discussed above, the Company arranged the necessary equity and Loan Facility to fund its share of the construction and commissioning costs of the GK Mine. The Company held its first sales of diamonds in January, February, March, April and June 2017 and will conduct sales approximately every five weeks thereafter.
Under the terms of the Company’s Loan Facility Agreement, the Company will be subject to funding of reserve accounts and certain financial covenants as discussed in Note 9 of the financial statements. The Loan Facility Agreement also contains material adverse effect clauses. In the absence of amendments or receipt of waivers, non-compliance with reserve funding requirements or other financial covenants, or the occurrence of a material adverse effect event, would be an event of default under the terms of the Loan Facility Agreement.
Commencing on March 31, 2017, the Company is subject to maintaining a cash call reserve account balance based upon certain budgeted amounts which will vary over the term of the Loan Facility. Approximately US$27.9 million was originally required to be deposited in the cash call reserve account on March 31, 2017. On March 27, 2017, the Company received a waiver deferring the requirement to fund the cash call reserve account to May 31, 2017. On May 31, 2017, the Company received an additional waiver extension to August 31, 2017. As conditions of the waiver, certain information must be furnished to the lenders by August 31, 2017 including: an updated financial model and life of mine plan; a diamond pricing valuation comparison between production to date and historic samples from April 2011 to be prepared by the lender’s independent diamond consultant; and a reconciliation of cumulative diamond production including a statistical comparison of total diamond carats, size and quality. The failure to comply with any of the requirements of the waiver constitutes an event of default.
| Page 15 |
Under the terms of the Loan Facility Agreement, the Company is also required to fund reserve accounts (Note 9 of the financial statements). The table below describes the initial funding of minimum reserve balance requirements by quarter:
| September 30, 2017 | December 31, 2017 | March 31, 2018 | June 30, 2018 | Total | ||||||||||||||||||||
| Cash call reserve account* | US | $ | 27,900 | $ | – | – | – | $ | 27,900 | |||||||||||||||
| Sunk cost reserve account** | 43,000 | – | – | – | 43,000 | |||||||||||||||||||
| Debt service reserve account | 57,100 | 32,700 | – | – | 89,800 | |||||||||||||||||||
| Environment reclamation reserve account | – | 18,200 | 14,400 | – | 32,600 | |||||||||||||||||||
| US | $ | 128,000 | $ | 50,900 | $ | 14,400 | $ | – | $ | 193,300 | ||||||||||||||
*The amount was to be funded by March 31, 2017. On March 27, 2017, the lenders provided a waiver indicating the amount was to be funded by May 31, 2017. On May 31, 2017, the Company received an additional waiver extension to August 31, 2017.
** The sunk cost reserve account is to be funded by September 1, 2017.
Cash call reserve account minimum balance represents the cash calls expected to be paid to the Operator in the next three months.
Sunk cost reserve account minimum balance represents the total expected sunk cost payments to the Operator as described in note 8 of the financial statements.
Debt service reserve account minimum balance represents the principal and interest payments on the loan facility expected to be paid to the lenders in the next nine months.
Environment reclamation reserve account minimum balance represents the Company’s share of all letters of credit issued and expected to be issued in the next nine months to any Government agency pursuant to any environmental or social permit.
At September 30, 2017, the Company can use the remaining balance available in the restricted cost overrun account (Note 7 of the financial statements) to fund a portion of the above reserve accounts. Based on the delay in achieving commercial production and current market prices in the diamond industry, management believes the Company will not be able to comply with the requirement to fully fund these reserve accounts and may not comply with the other financial covenants in the Loan Facility.
The Company is in active discussion with the lenders to restructure the requirements under the Loan Facility. Management expects the Company will seek additional waivers or amendments from the lenders as to the timing and amount of all of these funding requirements. There are no assurances the lenders will accommodate further waivers or amendments the Company will seek. If the Company is unable to fully fund the required reserve accounts, or is unable to comply with other financial covenants, and is not successful in obtaining suitable waivers or amendments, or a material adverse event occurs, it would result in an event of default, and the Loan Facility outstanding balance would become payable on demand. Further, management may seek alternative sources of financing, however, there are no guarantees that the Company may be able to obtain a suitable financing. These conditions indicate the existence of a material uncertainty that results in substantial doubt as to the Company’s ability to continue as a going concern. The financial statements do not include the adjustments to the amounts and classification of assets and liabilities that would be necessary should the Company be unable to continue as a going concern. These adjustments may be material.
In accordance with the waiver from the lenders, the Company paid a US$6.5 million quarterly interest payment during the period from operating cash flows, rather than from the Loan Facility.
Cash flow used in operating activities, including change in non-cash working capital for the six months ended June 30, 2017 were ($42,976) compared to ($15,627) for the same period in 2016. The increase in cash used is mainly as a result of the increase in inventories totalling approximately ($54,658). Included in the cash used in inventories of ($54,658) is ($21,436) used for supplies inventories, with the remainder being attributed to the increase of ore stockpile and rough diamonds.
Investing activities for the six months ended June 30, 2017 were $25,813 compared to ($125,888) for the same period in 2016. For the six months ended June 30, 2017, the outflow for the purchase of equipment and the expenditures directly related to the development of the GK Mine and other commissioned assets were $31,025 compared to $105,097 for the same period in 2016. Capitalized interest paid for the six months ended June 30, 2017 was $5,451 compared to $10,760 for the same period in 2016. Cash used for investing activities for the six months ended June 30, 2017 include $31,025 in property, plant and equipment, $5,451 for capitalized interest paid and $5,626 in restricted cash, offset by $67,493 in pre-production sales and $422 of interest income. Included in the $31,025 cash used in property, plant and equipment is the production and processing costs related to the pre-commercial production diamonds, which were sold and generated the $67,493 in pre-production sales.
| Page 16 |
Financing activities for the six months ended June 30, 2017 were $22,148 compared to $152,141 for the same period in 2016. Cash flows from financing activities for the six months ended June 30, 2017, related to cash draws of US$25 million or approximately $32.4 million Canadian dollar equivalent from January 1, 2017 to June 30, 2017 from the Loan Facility, net of financing costs of approximately $11.8 million and proceeds from option exercises of $1,577. For the six months ended June 30, 2016, financing activities related to cash draws of US$120 million or approximately $153.7 million Canadian dollar equivalent from January 1, 2016 to June 30, 2016 from the Loan Facility, net of financing costs of approximately $1.9 million and proceeds from option exercises of $357.
Off-Balance Sheet Arrangements
The Company has no off-balance sheet arrangements.
SIGNIFICANT ACCOUNTING POLICIES ADOPTED IN THE PERIOD
Effective March 1, 2017, upon declaring commercial production, the Company transitioned from accounting for certain costs as a development stage company to accounting for certain costs as an operating company. The significant financial reporting changes were as follows: the capitalized costs of the GK Mine were transferred from assets under construction to the relevant asset categories; assets began to be depreciated or depleted consistent with the Company’s accounting policies; capitalization of borrowing costs to assets under construction ceased; capitalization of pre-commercial production operating costs ceased; and mine operating results are recorded in the statement of comprehensive income (loss).
The new accounting policies adopted in the period, are as follows:
(a) Property, plant and equipment
Upon entering commercial production stage, capitalized costs associated with the acquisition of the mineral property or the development of the mine, are amortized using the various methods based in the asset categories as follows:
| Corporate assets | two to seven years, straight line |
| Vehicles | three to five years, straight line |
| Production and related equipment | three to ten years or life of mine*, straight line or units of production method |
| General infrastructure | life of mine*, straight line |
| Earthmoving equipment | estimated hours |
| Mineral properties | units of production over proven and probable resources |
| Assets under construction | not depreciated until ready for use |
| *Life of mine is estimated at approximately 12 years. | |
(b) Inventories
Inventories are recorded at the lower of cost and net realizable values. Net realizable value is the estimated selling price in the ordinary course of business, less estimated costs of completion. An impairment adjustment is made when the carrying amount is higher than the net realizable value.
| Page 17 |
Rough diamonds classified as finished goods comprise diamonds that have been subject to the sorting process. Cost is determined on a weighted average cost basis including production costs and value-added processing activity. As outlined in the joint venture agreement between the Company and De Beers Canada, fancies and special diamonds produced at the GK mine are subject to a bid process. Upon a successful bid by the Company, the fancies and specials diamonds will be included in inventories and 51% of the bid amount will be paid to De Beers and capitalized to the cost of inventory. Cost for fancies and specials diamonds is determined on a weighted average cost basis including production costs and value-added processing activity plus the direct cost of acquiring the fancies and specials diamonds from De Beers.
Stockpiled ore represents coarse ore that has been extracted from the mine and is available for future processing. Stockpiled ore value is based on the costs incurred in bringing ore to the stockpile. Costs are added to the stockpiled ore based on current mining costs per tonne and are removed at the average cost per tonne of ore in the stockpile.
Supplies inventory are consumable materials which are measured at the lower of weighted average cost and net realizable value.
(c) Capitalized stripping costs
In open pit mining operations, it is necessary to remove overburden and other waste materials to access ore from which minerals can be extracted economically. The process of mining overburden and waste materials is referred to as stripping. Stripping costs incurred in order to provide initial access to the ore body (referred to as pre-production stripping) are capitalized as mine development costs. These amounts were capitalized under assets under construction.
It may be also required to remove waste materials and to incur stripping costs during the production phase of the mine. The Company recognizes a stripping activity asset if all of the below conditions are met:
| • | It is probable that the future economic benefit (improved access to the component of the ore body) associated with the stripping activity will flow to the Company. |
| • | The Company can identify the component of the ore body for which access has been improved. |
| • | The costs relating to the stripping activity associated with that component can be measured reliably. |
The Company measures the stripping activity at cost based on an accumulation of costs incurred to perform the stripping activity that improves access to the identified component of ore, plus an allocation of directly attributable costs.
After initial recognition, the stripping activity asset is carried at cost less depreciation and impairment losses in the same way as the existing asset of which it is a part.
The stripping activity asset is depreciated over the expected useful life of the identified components of the ore body that becomes more accessible as a result of the stripping activity using the units of production method.
| Page 18 |
(d) Revenue
The Company early adopted IFRS 15, Revenue from Contracts with Customers, effective January 1, 2017.
The Company utilizes a sales agent to facilitate the sale of rough and/or fancies and specials diamonds to the end-customer. The Company recognizes revenue when consideration has been received by the Company’s sales agent, which represents the completion of the performance obligation of the Company.
As outlined in the joint venture agreement between the Company and De Beers Canada, fancies and specials diamonds produced at the GK mine are subject to a bid process. When De Beers is the successful bidder, the Company recognizes 49% of the bid price as revenue at the completion of the bid process, as De Beers receives the fancies and specials diamonds.
(e) Statement of cash flows
In January 2016, the IASB issued an amendment to International Accounting Standard 7 (“IAS 7”), Statement of Cash Flows. The amended standard introduced additional disclosure requirements for liabilities arising from financing activities. The amendment is effective for annual periods beginning on or after January 1, 2017. The adoption of the amendment to IAS 7 did not have an effect on the condensed consolidated interim financial statements for the current period.
SIGNIFICANT ACCOUNTING JUDGMENTS, ESTIMATES AND ASSUMPTIONS
The preparation of the Company’s consolidated financial statements requires management to make judgments and/or estimates that affect the reported amounts of assets and liabilities at the date of the financial statements and reported amounts of expenses during the reporting period. These judgements and estimates are continuously evaluated and are based on management’s experience and knowledge of the relevant facts and circumstances. Actual results may differ from the estimates. The key areas where judgements, estimates and assumptions have been made are summarized below.
i) Significant judgments in applying accounting policies
The areas which require management to make significant judgments in applying the Company’s accounting policies are:
a) Impairment analysis - mineral properties
As required under IAS 36 - Impairment of Assets, the Company reviews its mineral properties for impairment based on results to date and when events and changes in circumstances indicate that the carrying value of the assets may not be recoverable. The Company is required to make certain judgments in assessing indicators of impairment. The Company’s assessment is that as at June 30, 2017 no indicator of an impairment in the carrying value of its mineral properties had occurred.
b) Commencement of commercial production
There are a number of quantitative and qualitative measures the Company considers when determining if conditions exist for the transition from pre-commercial production to commencement of commercial production of an operating mine, which include:
| • | all major capital expenditures have been completed to bring the mine to the condition necessary for it to be capable of operating in the manner intended by management; |
| • | mineral recoveries are at or near expected production levels; |
| • | the ability to sustain ongoing production of ore; and |
| • | the ability to operate the plant as intended. |
The list of measures is not exhaustive and management takes into account the surrounding circumstances before making any specific decision, which required significant judgment.
| Page 19 |
ii) Significant accounting estimates and assumptions
The areas which require management to make significant estimates and assumptions in determining carrying values include, but are not limited to:
Mineral reserves and resources
Mineral reserve and resource estimates include numerous uncertainties and depend heavily on geological interpretations and statistical inferences drawn from drilling and other data, and require estimates of the future price for the commodity and future cost of operations. The mineral reserve and resources are subject to uncertainty and actual results may vary from these estimates. Results from drilling, testing and production, as well as material changes in commodity prices and operating costs subsequent to the date of the estimate, may justify revision of such estimates. Changes in the proven and probable mineral reserves or measured and indicated and inferred mineral resources estimates may impact the carrying value of the properties. This will also impact the carrying value of the decommissioning and restoration liability and future depletion charges.
STANDARDS AND AMENDMENTS TO EXISTING STANDARDS
At the date of authorization of the interim financial statements, certain new standards and amendments to existing standards have been published but are not yet effective, and have not been adopted early by the Company. The Company anticipates that all of the relevant standards will be adopted by the Company in the first period beginning after the effective date of the standard. Information on new standards and amendments that are expected to be relevant to the Company’s financial statements is provided below.
Share-based payments
In June 2016, the IASB issued amendments to International Financial Reporting Standard 2, Share-based Payment (“IFRS 2”). IFRS 2 is effective for periods beginning on or after January 1, 2018 and is to be applied prospectively. The amendments clarify the classification and measurement of share-based payment transactions. Management is currently assessing the impact of the amendment to IFRS 2 on the consolidated financial statements.
Financial instruments
In July 2014, the IASB issued the final version of International Financial Reporting Standard 9, Financial Instruments (“IFRS 9”), bringing together the classification and measurement, impairment and hedge accounting phases of the IASB’s project to replace IAS 39 Financial Instruments: Recognition and Measurement. The mandatory effective date of IFRS 9 is annual periods beginning on or after January 1, 2018, with early adoption permitted. We are currently assessing the impact of adopting IFRS 9 on the consolidated financial statements along with timing of adoption of IFRS 9.
Leases
On January 13, 2016, the IASB issued International Financial Reporting Standard 16, Leases (“IFRS 16”). The new standard will replace existing lease guidance in IFRS and related interpretations, and requires companies to bring most leases on-balance sheet. The new standard is effective for annual periods beginning on or after January 1, 2019. The Company is currently assessing the impact of IFRS 16.
RELATED PARTY TRANSACTIONS
The Company’s related parties include the Operator of the GK Mine, Dermot Desmond, Bottin (a corporation controlled by Dermot Desmond), key management and their close family members, and the Company’s directors. Dermot Desmond, indirectly through Bottin, is a beneficial owner of greater than 10% of the Company’s shares. Kennady Diamonds Inc. (“Kennady Diamonds”) is also a related party since the Company and Kennady Diamonds have common members of key management. International Investment and Underwriting (“IIU”) is also a related party since it is controlled by Mr. Dermot Desmond.
| Page 20 |
Related party transactions are recorded at their exchange amount, being the amount agreed to by the parties. Outstanding balances are settled in cash.
The Company had the following transactions and balances with its related parties including key management personnel and the Company’s directors, Dermot Desmond, Bottin, the Operator of the GK Mine, and Kennady Diamonds. The transactions with key management personnel are in the nature of remuneration. The transactions with the Operator of the GK Mine relate to the funding of the Company’s interest in the GK Mine for the current year’s expenditures, capital additions, management fee, and pre-production sales related to the 49% share of fancies and special diamonds. The transactions with Kennady Diamonds are for a monthly management fee charged by the Company and reimbursement of expenses paid on behalf of Kennady Diamonds. The transactions with IIU are for the director fees and travel expenses of the Chairman of the Company.
The balances as at June 30, 2017 and December 31, 2016 were as follows:
| June 30, | December 31, | |||||||
| 2017 | 2016 | |||||||
| Payable to the Operator of the GK Mine* | $ | 182 | $ | 926 | ||||
| Payable to De Beers Canada Inc. for sunk cost repayment | 47,721 | – | ||||||
| Payable to International Investment and Underwriting | 25 | 53 | ||||||
| Payable to key management personnel | 578 | 3 | ||||||
*included in accounts payable and accrued liabilities
The transactions for the three and six months ended June 30, 2017 and 2016 were as follows:
| Three months ended | Three months ended | Six months ended | Six months ended | |||||||||||||
| June 30, 2017 | June 30, 2016 | June 30, 2017 | June 30, 2016 | |||||||||||||
| The total of the transactions: | ||||||||||||||||
| Kennady Diamonds | $ | 22 | $ | 22 | $ | 45 | $ | 45 | ||||||||
| International Investment and Underwriting | 12 | 10 | 25 | 20 | ||||||||||||
| Remuneration to key management personnel | 1,420 | 203 | 2,145 | 483 | ||||||||||||
| Sunk cost repayment to De Beers Canada Inc. | – | – | 10,000 | – | ||||||||||||
| Pre-production sales to De Beers Canada Inc. | – | – | 1,398 | – | ||||||||||||
| Diamonds purchased from De Beers Canada Inc. | 5,260 | – | 8,524 | – | ||||||||||||
| Finance costs incurred from De Beers Canada Inc. | 714 | – | 1,001 | – | ||||||||||||
| Management fee charged by the Operator of the GK Mine | 1,038 | 748 | 2,076 | 3,113 | ||||||||||||
The remuneration expense of directors and other members of key management personnel for the three and six months ended June 30, 2017 and 2016 were as follows:
| Three months ended | Three months ended | Six months ended | Six months ended | |||||||||||||
| June 30, 2017 | June 30, 2016 | June 30, 2017 | June 30, 2016 | |||||||||||||
| Consulting fees, director fees, bonus and other short-term benefits | $ | 1,164 | $ | 182 | $ | 1,587 | $ | 445 | ||||||||
| Share-based payments | 256 | 21 | 558 | 38 | ||||||||||||
| $ | 1,420 | $ | 203 | $ | 2,145 | $ | 483 | |||||||||
In accordance with International Accounting Standard 24 Related Parties, key management personnel are those persons having authority and responsibility for planning, directing and controlling the activities of the Company directly or indirectly, including any directors (executive and non-executive) of the Company.
| Page 21 |
CONTRACTUAL OBLIGATIONS
The following table summarizes the contractual maturities of the Company’s significant financial liabilities and capital commitments, including contractual obligations:
| Less than | 1 to 3 | 4 to 5 | After 5 | |||||||||||||||||
| 1 Year | Years | Years | Years | Total | ||||||||||||||||
| Operating lease obligations | $ | 231 | $ | 463 | $ | 473 | $ | 434 | $ | 1,601 | ||||||||||
| Gahcho Kué Diamond Mine commitments | 3,760 | – | – | – | 3,760 | |||||||||||||||
| Trade and other payables | 16,338 | – | – | – | 16,338 | |||||||||||||||
| Loan facility - Principal* | 90,618 | 228,209 | 143,988 | – | 462,815 | |||||||||||||||
| Loan facility - Interest | 32,479 | 39,264 | 13,424 | – | 85,167 | |||||||||||||||
| Sunk cost repayment - principal | – | 24,383 | – | – | 24,383 | |||||||||||||||
| Sunk cost repayment - interest | – | 26,501 | – | – | 26,501 | |||||||||||||||
| Interest Rate Swap Contracts: | ||||||||||||||||||||
| Outflows (inflows) | 1,356 | 147 | – | – | 1,503 | |||||||||||||||
| $ | 144,782 | $ | 318,967 | $ | 157,885 | $ | 434 | $ | 622,068 | |||||||||||
*In accordance with the terms of the Loan Facility at March 31, 2017, the Company was subject to maintaining a cash call reserve account balance in the amount of approximately US$27.9 million. As of March 27, 2017, the lenders provided a waiver and the amount was to be funded by May 31, 2017. On May 31, 2017, the Company received an additional waiver extension to August 31, 2017. Under the terms of the Loan Facility Agreement, the Company is also required to fund reserve accounts estimated (Note 9) of US$100.1 million in September 2017, and additional amounts of US$50.9 million at December 31, 2017 At March 31, 2018, an estimated US$14.4 million of additional funding of the reserve accounts will be required.
Other Management Discussion and Analysis Requirements
Risks
Mountain Province’s business of developing and operating mineral resources involves a variety of operational, financial and regulatory risks that are typical in the mining industry. The Company attempts to mitigate these risks and minimize their effect on its financial performance, but there is no guarantee that the Company will be profitable in the future, and investing in the Company’s common shares should be considered speculative.
Mountain Province’s business of developing and operating mineral properties is subject to a variety of risks and uncertainties, including, without limitation:
| • | risk that the development of the mine will not be consistent with the Company’s expectation; |
| • | risks and uncertainties relating to the interpretation of drill results, the geology, grade and continuity of mineral deposits; |
| • | results of initial feasibility, pre-feasibility and feasibility studies, and the possibility that future exploration, development or mining results will not be consistent with the Company's expectations; mining exploration risks, including risks related to accidents, equipment breakdowns or other unanticipated difficulties with or interruptions in production; |
| • | risks related to foreign exchange fluctuations and prices of diamonds; |
| • | risks related to commodity price fluctuations; |
| • | the uncertainty of profitability based upon the Company's history of losses; |
| • | risks related to failure of its joint venture partner; |
| • | risks relating to complying with the covenants in our Loan Facility and the Company’s ability to negotiate further waivers and amendments from the lenders which may be required; |
| • | risk of events of default occurring, under Loan Facility, and not being able to continue as a going concern; |
| • | development and production risks including and particularly risks for weather conducive to the building and use of the Tibbitt to Contwoyto Winter Road; |
| • | risks related to environmental regulation, permitting and liability; |
| • | risks related to legal challenges to operating permits that are approved and/or issued; |
| • | political and regulatory risks associated with mining, exploration and development; |
| • | the ability to develop and operate the Company’s GK Mine on an economic basis and in accordance with applicable timelines; |
| Page 22 |
| • | aboriginal rights and title; |
| • | failure of plant, equipment, processes and transportation services to operate as anticipated; |
| • | possible variations in ore grade or recovery rates, permitting timelines, capital expenditures, reclamation activities, land titles, and social and political developments, and other risks of the mining industry; and |
| • | other risks and uncertainties related to the Company's prospects, properties and business strategy. |
As well, there can be no assurance that any further funding required by the Company will become available to it, and if so, that it will be offered on reasonable terms, or that the Company will be able to secure such funding. Furthermore, there is no assurance that the Company will be able to secure new mineral properties or Projects, or that they can be secured on competitive terms.
Disclosure of Outstanding Share Data
The Company’s common shares are traded on the Toronto Stock Exchange and the NASDAQ under the symbol MPVD.
At August 9, 2017, there were 160,233,833 shares issued, 2,630,000 stock options and 285,000 restricted share units outstanding. There were no warrants outstanding.
There are an unlimited number of common shares without par value authorized to be issued by the Company.
Controls and Procedures
Disclosure Controls and Procedures and internal control over financial reporting
The Company's Chief Executive Officer (“CEO”) and Chief Financial Officer (“CFO”) have evaluated the design of the Company's disclosure controls and procedures and internal controls over financial reporting as of June 30, 2017. The CEO and CFO have concluded that our disclosure controls and procedures were not effective as of June 30, 2017.
For the fiscal year ended December 31, 2016, management identified the following material weaknesses that existed in our internal control over financial reporting.
| • | The design of management’s control in Gahcho Kué Project over the review of manual journal entries was inadequate. Specifically, management did not design controls to ensure that all manual journal entries were independently reviewed and approved for validity, accuracy and completeness. This control deficiency, which is pervasive in nature, did not result in any adjustments, however, there is a reasonable possibility that material misstatements of the consolidated financial statements will not be prevented or detected on a timely basis as a result. |
| • | The design of management’s control in Gahcho Kué Project over payroll changes was inadequate. Specifically, management did not design controls to ensure payroll changes were reviewed for validity, accuracy and completeness. This control deficiency, did not result in any adjustments to payroll costs capitalized to fixed assets in the financial statements, however, there is a reasonable possibility that material misstatements of the consolidated financial statements will not be prevented or detected on a timely basis as a result. |
| • | The design of management’s control in Gahcho Kué Project over supplies inventory was inadequate. Specifically, management did not design controls to ensure the completeness, existence and accuracy of supplies inventory. This control deficiency, resulted in adjustments to increase supplies inventory and decrease assets under construction. This control deficiency results in a reasonable possibility that a material misstatement of the consolidated financial statements would not be prevented or detected on a timely basis. |
| Page 23 |
Remediation activities
Management commenced remediation efforts in the second quarter of Fiscal 2017 related to these material weaknesses. Following management's determination of the material weaknesses, management promptly began taking the following remedial actions:
| • | The Company designed and implemented additional management review controls over payroll changes to ensure validity, accuracy and completeness. |
| • | The Company designed and implemented additional management review controls over supplies inventory to ensure the completeness, existence and accuracy. |
| • | The Company designed and implemented additional management review controls over the manual journal entries to ensure validity, accuracy and completeness. |
Management anticipates that these remedial actions will strengthen the Company's internal control over financial reporting and will, over time, address the material weaknesses that were identified as of December 31, 2016. Because some of these remedial actions will take place on a quarterly basis, their successful implementation may need to be evaluated over several quarters before management is able to conclude that the material weaknesses have been remediated.
Other than the changes to controls noted above, there have been no changes in our internal control over financial reporting during the quarter ended June 30, 2017 that has materially affected, or is reasonably likely to materially affect, our internal control over financial reporting.
CAUTIONARY NOTE ON FORWARD-LOOKING STATEMENTS
Certain of the statements made and information contained herein is “forward-looking information” within the meaning of the Ontario Securities Act. Forward-looking information may include, but is not limited to, statements with respect to the success of exploration activities, future mineral exploration, permitting time lines, requirements for additional capital, sources and uses of funds, the estimation of mineral reserves and mineral resources, the realization of mineral reserve and mineral resource estimates, future remediation and reclamation activities, the timing of activities and the amount of estimated revenues and expenses. Forward-looking information is based on various assumptions including, without limitation, the expectations and beliefs of management, the assumed long-term price of diamonds; that the Company can access financing, appropriate equipment and sufficient labour and that the political environment where the Company operates will continue to support the development and operation of mining projects. Should underlying assumptions prove incorrect, or one or more of the risks and uncertainties described below materialize, actual results may vary materially from those described in forward-looking statements. Accordingly, readers are advised not to place undue reliance on forward-looking statements.
| Page 24 |
Forward-looking information is subject to a variety of risks and uncertainties which could cause actual events or results to differ from those reflected in the forward-looking information, including, without limitation, risks and uncertainties relating to foreign currency fluctuations; risks inherent in mining including environmental hazards, industrial accidents, unusual or unexpected geological formations, ground control problems and flooding; delays or the inability to obtain necessary governmental permits or financing; risks associated with the estimation of mineral resources and reserves and the geology, grade and continuity of mineral deposits; the possibility that future exploration, development or mining results will not be consistent with the Company’s expectations; the potential for and effects of labor disputes or other unanticipated difficulties with or shortages of labor or interruptions in production; failure of plant, equipment or processes to operate as anticipated; actual ore mined varying from estimates of grade, tonnage, dilution and metallurgical and other characteristics; the inherent uncertainty of production and cost estimates and the potential for unexpected costs and expenses, diamond price fluctuations; uncertain political and economic environments; changes in laws or policies, and other risks and uncertainties, including those described under Risk Factors. Historical results of operations and trends that may be inferred from the following discussions and analysis may not necessarily indicate future results from operations. The Company undertakes no obligation to publicly update or review the forward-looking statements whether as a result of new information, future events or otherwise, other than as required under applicable securities laws.
Cautionary Note to U.S. Investors - Information Concerning Preparation of Resource Estimates
This MD&A has been prepared in accordance with the requirements of the securities laws in effect in Canada, which differ from the requirements of United States securities laws. Unless otherwise indicated, all resource and reserve estimates included in this MD&A have been prepared in accordance with NI 43-101 and the Canadian Institute of Mining and Metallurgy Classification System. NI 43-101 is a rule developed by the Canadian Securities Administrators which establishes standards for all public disclosure an issuer makes of scientific and technical information concerning mineral projects.
Canadian standards, including NI 43-101, differ significantly from the requirements of Industry Guide 7 promulgated by the United States Securities and Exchange Commission (“SEC”) under the United States Securities Act of 1933, as amended, and resource and reserve information contained herein may not be comparable to similar information disclosed by U.S. companies. In particular, and without limiting the generality of the foregoing, the term “resource” does not equate to the term “reserves”. Under U.S. standards, mineralization may not be classified as a “reserve” unless the determination has been made that the mineralization could be economically and legally produced or extracted at the time the reserve determination is made. The SEC's disclosure standards under Industry Guide 7 do not define the terms and normally do not permit the inclusion of information concerning “measured mineral resources”, “indicated mineral resources” or “inferred mineral resources” or other descriptions of the amount of mineralization in mineral deposits that do not constitute “reserves” by U.S. standards in documents filed with the SEC. U.S. Investors should also understand that “inferred mineral resources” have a great amount of uncertainty as to their existence and great uncertainty as to their economic and legal feasibility. It cannot be assumed that all or any part of an “inferred mineral resource” will ever be upgraded to a higher category. Under Canadian rules, estimated “inferred mineral resources” may not form the basis of feasibility or pre-feasibility studies except in rare cases. Investors are cautioned not to assume that all or any part of an “inferred mineral resource” exists or is economically or legally mineable.
Disclosure of “contained ounces” (or “contained carats”) in a resource is permitted disclosure under Canadian regulations; however, the SEC normally only permits issuers to report mineralization that does not constitute “reserves” by SEC standards as in place tonnage and grade without reference to unit measures. The requirements of NI 43-101 for identification of “reserves” are also not the same as those of the SEC’s Industry Guide 7, and reserves reported by the Company in compliance with NI 43-101 may not qualify as “reserves” under Industry Guide 7 standards. Accordingly, information concerning mineral deposits set forth herein may not be comparable with information made public by companies that report in accordance with U. S. standards.
| Page 25 |