Exhibit 99.1
![]()
Management’s Discussion and Analysis
For the Three Months Ended March 31, 2020
TSX: MPVD
MOUNTAIN PROVINCE DIAMONDS INC.
MANAGEMENT’S DISCUSSION AND ANALYSIS
FOR THE THREE MONTHS ENDED MARCH 31, 2020
| TABLE OF CONTENTS | Page |
| First Quarter 2020 Highlights | 3 |
| Company Overview | 4 |
| Gahcho Kué Diamond Mine | 5 |
| Gahcho Kué Exploration | 8 |
| Kennady North Project Exploration | 9 |
| Results of Operations | 11 |
| Summary of Quarterly Results | 11 |
| Summary of First Quarter Financial Results | 12 |
| Income and Mining Taxes | 14 |
| Financial Position and Liquidity | 14 |
| Off-Balance Sheet Arrangements | 16 |
| Significant Accounting Policies Adopted in the Current Period | 16 |
| Significant Accounting Judgments, Estimates and Assumptions | 16 |
| Standards and Amendments to Existing Standards | 16 |
| Related Party Transactions | 16 |
| Contractual Obligations | 17 |
| Subsequent Events | 18 |
| Non-IFRS Measures | 18 |
| Other Management Discussion and Analysis Requirements | 19 |
| Disclosure of Outstanding Share Data | 20 |
| Controls and Procedures | 20 |
| Cautionary Note Regarding Forward-Looking Statements | 21 |
This Management’s Discussion and Analysis (“MD&A”) as of May 6, 2020 provides a review of the financial performance of Mountain Province Diamonds Inc. (the “Company” or “Mountain Province” or “MPV”) and should be read in conjunction with the MD&A for the year ended December 31, 2019, the unaudited condensed consolidated interim financial statements and the notes thereto for the three months ended March 31, 2020 and the audited consolidated statements for the year ended December 31, 2019. The following MD&A has been approved by the Board of Directors.
The unaudited condensed consolidated interim financial statements of the Company were prepared in accordance with IAS 34 – Interim Financial Reporting. Except as disclosed in the statements, the interim financial statements follow the same accounting policies and methods of computation as compared with the most recent annual financial statements for the year ended December 31, 2019, which were prepared in accordance with International Financial Reporting Standards (“IFRS”) as issued by the International Accounting Standards Board (“IASB”). Accordingly, the interim financial statements should be read in conjunction with the Company’s most recent annual financial statements.
All amounts are expressed in thousands of Canadian dollars, except share and per share amounts, unless otherwise noted.
The disclosure in this MD&A of scientific and technical information regarding exploration projects on Mountain Province’s mineral properties has been reviewed and approved by Tom McCandless, Ph.D., P.Geo., while that regarding mine development and operations has been reviewed and approved by Keyvan Salehi, P.Eng., MBA, both of whom are Qualified Persons as defined by National Instrument 43-101 - Standards of Disclosure for Mineral Properties (“NI 43-101”).
| Page | 2 |
Additional information, related to the Company is available on SEDAR at http://sedar.com/ and on EDGAR at http://www.sec.gov/edgar.shtml.
HIGHLIGHTS
| · | Cash at March 31, 2020 was $31,945 with net working capital of $103,329; US$50,000 revolving credit facility remains undrawn at March 31, 2020. Cash at December 31, 2019 was $34,751 with net working capital of $99,402. Subsequent to the three months ended March 31, 2020, the Company drew US$25 million from the revolving credit facility in order to maintain liquidity amid the uncertainty surrounding the COVID-19 pandemic. The US$25 million was the maximum amount of the facility that was available at the time. |
| · | Earnings from mine operations for the three months ended March 31, 2020 amounted to $13,627 compared to $10,160 for the same period in 2019. |
· Net loss for the three months ended March 31, 2020 was $40,969 or $0.19 loss per share (basic and diluted) compared net income for the three months period ended of March 31, 2019 of $2,497, or $0.01 earnings per share (basic and diluted). Adjusted EBITDA for those periods were $22,825and$19,728, (Adjusted EBITDA is not defined under IFRS and therefore may not be comparable to similar measures presented by other issuers; refer to the Non-IFRS Measures section).
- The Company conducted two sales in the first quarter of 2020 totaling 659,000 carats and recognized revenue of $65,430 at an average realized value of $99 per carat (US$75) compared to sales in the first quarter of 2019 totaling 644,000 carats and recognized revenue of $60,696 at an average realized value of $94 per carat (US$71). Revenue for the three months ended March 31, 2020 and 2019 included direct sales of fancies and specials made to De Beers Canada Inc. The increase in average realized value per carat is mainly due to the sale of a different mix of goods with better-quality stones sold in Q1 2020 compared to Q1 2019.
- Mining of waste and ore in the 5034, Hearne and Tuzo open pits for the three months ended March 31, 2020 was approximately 6,696,000 tonnes, 2,596,000 tonnes and 65,000 tonnes, respectively, for a total of 9,357,000 tonnes. This represents a 2% decrease in tonnes mined over the comparative period in 2019. Ore mined for the first quarter totaled 1,030,000 tonnes, with approximately 355,000 tonnes of ore stockpile available at quarter end on a 100% basis. For the comparative three months ended March 31, 2019, ore mined totaled 605,000 tonnes, with approximately 295,000 tonnes of ore stockpile on a 100% basis.
· For the three months ended March 31, 2020, the GK Mine treated approximately 903,000 tonnes of ore and recovered approximately 1,655,000 carats on a 100% basis for an average recovered grade of approximately 1.83 carats per tonne (“cpt”). For the comparative three months ended March 31, 2019, the GK Mine treated approximately 871,000 tonnes of ore and recovered approximately 1,585,000 carats on a 100% basis for an average recovered grade of approximately 1.82 cpt. The average grade for the three months ended March 31, 2020, was consistent with the same period in 2019.
| · | Cash costs of production, including capitalized stripping costs, for the three months ended March 31, 2020 were $84 per tonne, and $46 per carat recovered (cash costs of production per tonne and per carat are not defined under IFRS and may not be comparable to similar measures presented by other issuers; refer tothe Non-IFRS Measures section). The cost improvements in Q1 2020 compared to the same period last year are mainly attributable to volumes of ore treated and stockpile management, lower fuel charges and lower maintenance costs. |
| · | The Company successfully completed the 2020 winter ice road supply campaign ahead of schedule in March 2020, which included all required fuel and supplies. The campaign required 1,707 truckloads, and transported 45 million litres of fuel. |
| Page | 3 |
The following table summarizes key operating highlights for the three months ended March 31, 2020 and 2019.
| Three months ended | Three months ended | |||||||||
| March 31, 2020 | March 31, 2019 | |||||||||
| GK operating data | ||||||||||
| Mining | ||||||||||
| *Ore tonnes mined | kilo tonnes | 1,030 | 605 | |||||||
| *Waste tonnes mined | kilo tonnes | 8,327 | 8,923 | |||||||
| *Total tonnes mined | kilo tonnes | 9,357 | 9,528 | |||||||
| *Ore in stockpile | kilo tonnes | 355 | 295 | |||||||
| Processing | ||||||||||
| *Ore tonnes treated | kilo tonnes | 903 | 871 | |||||||
| *Average plant throughput | tonnes per day | 9,505 | 9,467 | |||||||
| *Average diamond recovery | carats per tonne | 1.83 | 1.82 | |||||||
| *Diamonds recovered | 000's carats | 1,655 | 1,585 | |||||||
| Approximate diamonds recovered - Mountain Province | 000's carats | 811 | 777 | |||||||
| Cash costs of production per tonne, net of capitalized stripping ** | $ | 80 | 94 | |||||||
| Cash costs of production per tonne of ore, including capitalized stripping** | $ | 84 | 111 | |||||||
| Cash costs of production per carat recovered, net of capitalized stripping** | $ | 43 | 52 | |||||||
| Cash costs of production per carat recovered, including capitalized stripping** | $ | 46 | 61 | |||||||
| Sales | ||||||||||
| Approximate diamonds sold - Mountain Province*** | 000's carats | 659 | 644 | |||||||
| Average diamond sales price per carat | US | $ | 75 | $ | 71 | |||||
| * at 100% interest in the GK Mine | |||
| **See Non-IFRS Measures section | |||
| ***Includes the sales directly to De Beers for fancies and specials acquired by De Beers through the production split bidding process | |||
COMPANY OVERVIEW
Mountain Province is a Canadian-based resource company listed on the Toronto Stock Exchange under the symbol ‘MPVD’. The Company’s registered office and its principal place of business is 161 Bay Street, Suite 1410, P.O. Box 216, Toronto, ON, Canada, M5J 2S1. The Company, through its wholly owned subsidiaries 2435572 Ontario Inc. and 2435386 Ontario Inc., holds a 49% interest in the Gahcho Kué diamond mine (the “GK Mine”), located in the Northwest Territories of Canada. De Beers Canada Inc. (“De Beers” or the “Operator”) holds the remaining 51% interest. The Joint Arrangement between the Company and De Beers is governed by the 2009 amended and restated Joint Venture Agreement.
The Company’s primary assets are its aforementioned 49% interest in the GK Mine and 100% owned Kennady North Project (“KNP”).
The Company’s strategy is to mine and sell its 49% share of rough diamonds at the highest price on the day of the close of the sale. Despite the impact of the COVID-19 pandemic, the Company’s long-term view of the rough diamond market remains positive, based on the outlook for a tightening rough diamond supply and growing demand, particularly in developing markets such as China and India, resulting in real, long term price growth. The Company also expects to build value through exploration and development of the Kennady North Project which covers properties adjacent to the GK Mine.
During the three months ended March 31, 2020, the Company held two sales in Antwerp.
| Page | 4 |
GAHCHO KUÉ DIAMOND MINE
Gahcho Kué Joint Venture Agreement
The GK Mine is located in the Northwest Territories, approximately 300 kilometers northeast of Yellowknife. The mine covers 10,353 hectares, and encompasses four mining leases (numbers 4341, 4199, 4200, and 4201) held in trust by the Operator. The Project hosts four primary kimberlite bodies – 5034, Hearne, Tuzo and Tesla. The four main kimberlite bodies are within two kilometers of each other.
The GK Mine is an unincorporated Joint Arrangement between De Beers (51%) and Mountain Province (49%) through its wholly owned subsidiaries. The Company accounts for the mine as a joint operation in accordance with International Financial Reporting Standard 11, Joint Arrangements. Mountain Province through its subsidiaries holds an undivided 49% ownership interest in the assets, liabilities and expenses of the GK Mine.
Between 2014 and 2018, the Company and De Beers signed agreements allowing the Operator to utilize De Beers’ credit facilities to issue reclamation and restoration security deposits to the federal and territorial governments. In accordance with these agreements, the Company agreed to a 3% fee annually for their share of the letters of credit issued. As at March 31, 2020, the Company’s share of the letters of credit issued were $23.3 million (December 31, 2019 - $23.3 million).
During the period ended March 31, 2020, the Company and De Beers signed an agreement to reduce the fee from 3% to 0.3%, annually, for their share of the letters of credit issued. Furthermore, on the same day, a resolution was passed by the joint venture management committee to establish a decommissioning fund, where the Company will fund $15 million in 2020, and $10 annually million for four years thereafter until the Company’s 49% share totaling $55 million is fully funded. The targeting funding over time will increase, dependent on future increases to the decommissioning and restoration liability.
Mining and Processing
For the three months ended March 31, 2020, on a 100% basis, a total of 9.4 million tonnes of waste and ore had been extracted from the 5034, Hearne and Tuzo open pits, compared to planned production of approximately 10.1 million tonnes (93% of plan). The lower mining efficiency was as a result of harsher weather conditions than normal and equipment availability issues during the winter months. For the three months ended March 31, 2019, a total of 9.5 million tonnes of waste and ore had been extracted from the 5034 and Hearne open pit, compared to an original plan of approximately 9.8 million tonnes (96% of plan), as a result of harsher weather conditions than normal and higher waste cycle.
Total ore tonnes mined in the three months ended March 31, 2020 were 1,030,000 tonnes compared to 605,000 tonnes for the same periods in 2019. The total ore tonnes mined were higher than the comparative Q1 period, as there was less waste stripping activity to be performed.
For the three months ended March 31, 2020, 903,000 tonnes of kimberlite ore were treated, (compared to an original plan of 879,000 tonnes) with 1,655,000 carats (100% basis) recovered, at a grade of 1.83 carats per tonne. For the three months ended March 31, 2019, 871,000 tonnes of kimberlite ore were treated, with 1,585,000 carats recovered, at a grade of 1.82 carats per tonne. The average grade for the three months ended March 31, 2020, was consistent with the same period in 2019.
| Page | 5 |
The plant treated 903,000 tonnes and produced over 1,655,000 carats in Q1 2020, 4% higher than the same period last year. Full year production guidance remains uncertain at this time, given the challenges of the global pandemic COVID-19. During this unprecedented time, the health and safety of our people, their families, and the communities in which we operate remains our top priority. As a result of that, it could change the original plan of the mining operations as the situation evolves.
At March 31, 2020, there was approximately 355,000 tonnes (100% basis) of stockpiled ore. Sufficient ore is available from the stockpile and 5034 and Hearne pits to meet the planned process throughput rates for 2020.
At March 31, 2020, the GK Mine had 546,231 carats on a 100% basis in rough diamond inventory at the GK Mine and at the sorting facility in Yellowknife. The Company had 788,635 carats within its sale preparation channel plus its share of carats at the GK Mine and sorting facility for a total of 1,055,967 carats in inventory.
Diamond Sales
The Company undertook two sales during the first quarter of 2020 in Antwerp, Belgium. The majority of the Company’s revenue is derived from its sales on the open market, with the remainder attributed to sales of fancies and specials directly to De Beers on such occasions where De Beers has won the periodic fancies and specials bidding process. The average realized value per carat for all sales held in the three months ended March 31, 2020 was US$75 per carat. The average realized value per carat for all sales held for the three months ended March 31, 2019 was US$71 per carat.
The following chart summarizes the sales for the trailing eight quarters:
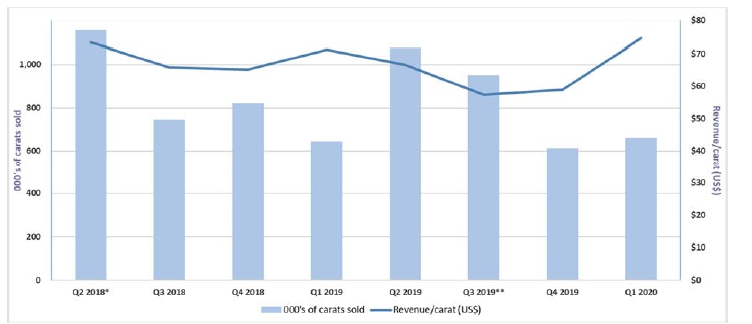
* Although the final sale in this quarter closed on June 22, 2018, the sale of 43,000 carats occurred during the first half of July for IFRS purposes. The amount of revenue recognized for the 43,000 carats was approximately US$8.1 million or $10.7 million.
** Although the final sale in this quarter closed on September 27, 2019, the sale of 159,000 carats occurred during October for IFRS purposes. The amount of revenue recognized in October for the 159,000 carats was approximately US$13.0 million or $17.1 million.
| Page | 6 |
The following table summarizes the results of sales in 2020:
| 000's of carats sold | Gross proceeds (US$ 000's) | Revenue/carat (US$) | ||||||||||||
| Q1 | 659 | $ | 49,220 | $ | 75 | |||||||||
The following table summarizes the results for sales in 2019:
| 000's of carats sold | Gross proceeds (US$ 000's) | Revenue/carat (US$) | ||||||||||||
| Q1 | 644 | $ | 45,810 | $ | 71 | |||||||||
| Q2 | 1,077 | $ | 71,712 | $ | 67 | |||||||||
| Q3(1) | 950 | $ | 54,559 | $ | 57 | |||||||||
| Q4 | 613 | $ | 36,165 | $ | 59 | |||||||||
| Total | 3,284 | $ | 208,246 | $ | 63 | |||||||||
Note: Sales made directly to De Beers are attributed to the closest tender.
(1) Although 950,000 carats were successfully sold, in accordance with IFRS only 791,000 carats could be recognized as sales proceeds in the quarter. The remaining 159,000 carats were recognized in Q4 2019. The amount of revenue recognized for the 159,000 carats was approximately US$13.0 million or $17.1 million.
The Company held two sales during the first quarter of 2020. These sales were well attended by customers, which enabled the Company to maximize revenue and sell 100% of its share of Gahcho Kué production. After three successful years of sales, the Gahcho Kué goods are now firmly established in the market and attract regular and sustained interest from customers.
The Gahcho Kué orebodies and product profiles are complex, producing a broad range of white commercial goods together with a consistent supply of exceptional, high value, gem quality diamonds as well as large volumes of small and brown diamonds. The Gahcho Kué product also exhibits varying degrees of fluorescence for which the Company has attracted specialist customers who are developing strategies to market this characteristic.
The Company’s diamonds have established a strong market and customer base. With the exception of some industrials, the majority of the Company’s diamonds are sold into market segments that cut and polish the rough, with resultant polished destined for the major diamond jewellery markets of the US, India and China.
Having transitioned from an explorer and mine developer into a diamond marketer, the Company is in early stage development of a diamond marketing brand that promotes the unique attributes of our diamonds to support demand through their distribution channels with the potential to reach the consumer level.
Given the complexities of the Gahcho Kué rough diamond product profile and the nature of the Joint Venture’s production splitting process, the mix of diamond categories present in an individual sale may differ. Each sale’s results can and do vary.
2020 Production Outlook
Sentiment in the rough diamond market became slightly more optimistic towards the end of 2019 and remained relatively positive in early 2020 during the first selling cycle of the year. However, the rapid global spread of a novel coronavirus ("COVID-19") has reversed that momentum coincident with the surge in volatility in global capital markets. Though the full extent of the impact of COVID-19 is still unknown at the moment, the Company believes, that like many other businesses, COVID-19 will have a material impact on 2020 sales. At this stage the Company withdraws all guidance metrics while the COVID-19 impacts continue to be assessed on an on-going basis.
The rapid spread of COVID-19 around the globe, and accompanying restrictions on mobility, pose a potential risk and disruption to mine operations. The Company, along with De Beers Canada Inc, in consultation with the Government of the Northwest Territories, have taken all the necessary precautions to ensure the safest working environment possible for all employees and contractors across all working sites and offices. In addition, work from home policies, where applicable, have been implemented. We have halted all long-term, non-core capital and exploration projects to reduce foot traffic and travel to and from site. We have also changed our crew rotation from two weeks to four weeks to further reduce travel. Furthermore, we continue to follow public health guidelines for COVID-19, such as physical distancing protocols to the best of our abilities.
| Page | 7 |
Diamond Outlook
The diamond industry experienced difficult conditions through 2019, particularly in the latter half of the year, for both rough and polished goods as the market struggled to balance demand and supply. Rough diamond sales reduced from the previous year as major producers delivered lower volumes to polished manufacturers in an attempt to balance sales with demand. It was anticipated that this reduction in global rough diamond sales would positively impact the diamond pipeline, and the final months of 2019 and the first of 2020 registered improvements in rough diamond prices. This was boosted by reports of strong retail sales through the Q4 holiday season into January, particularly in the US, the world’s largest market for diamond jewellery.
COVID-19’s emergence and rapid spread through the first months of 2020 shut the emerging recovery down. China’s swift implementation of social distancing and self-isolation measures, necessary to slow the virus’ spread, effectively annulled Chinese New Year jewellery sales. Chinese polished diamond manufacturing capacity was also summarily closed. These events created great uncertainty through the diamond industry as Chinese orders and associated liquidity evaporated overnight.
As the virus continues to ripple across the globe, so does its economic impact. The current, wide-ranging, societal quarantines, in place to try to moderate the public health impact of the pandemic, are having an enormous impact on the physical and financial flows of the global diamond value chain, from rough production, rough sales, polished manufacturing, jewellery manufacturing and retail sales of diamond jewellery. Major trade fairs, including JCK Las Vegas, Hong Kong Gem and Jewellery and Baselworld, have been postponed to later in 2020 or early 2021.
At present it is difficult to predict the full impact the unfolding pandemic will have on the global economy. There are real concerns of sharp drops in GDP, swiftly rising unemployment, continued pressure on financial markets and finite government support programs, factors all contributing to plummeting consumer confidence and a limited desire to purchase luxury items.
However, we are seeing that as China slowly lifts its physical distancing restrictions, there are encouraging early signs of a recovery with many jewellery retail stores re-opening and consumers expressing interest in jewellery, albeit at lower price points.
Gahcho Kué Capital Program
During the three months ended March 31, 2020, stay in business capital items included process plant upgrades, generator upgrades and repairs, and other general infrastructure. All capital additions in the period are considered sustaining capital expenditure, and were largely on budget. Stay in business capital does not include capital stripping.
Gahcho Kué EXPLORATION
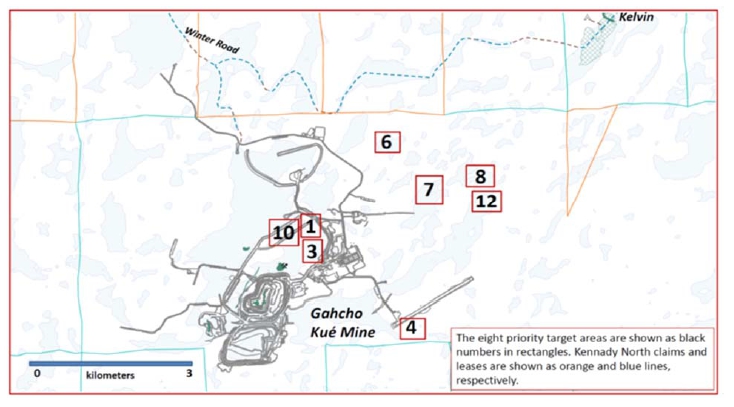
The winter drill program planned for 2,100 meters of core drilling over an eight week period, but the program was greatly reduced due to the COVID-19 pandemic. The program design was the result of a joint review of historical data for the JV lease area. A total of 1,630 line-km of aeromagnetic data, using a superconducting quantum interference device (‘SQUID’) was collected over the lease area in 2018. The SQUID results, as well as older historical mineral, structural, magnetic, EM and gravity data, were reviewed in August 2019 at a joint De Beers/Mountain Province workshop. Thirteen target areas were identified, with some subjected to follow-up ground gravity and OhmMapper resistivity surveys. A total of 116 line-km of ground gravity and 128 line-km of OhmMapper data were collected between October 2019 and February 2020. In a second workshop held in February 2020, eight of the 13 target areas were ranked for drilling, and the winter drilling program started.
Only targets 8 and 12 were drill-tested. Two drillholes were completed on each of the targets for a program total of 549 meters, with no kimberlite encountered. The country rock drill core will be examined to determine whether there are physical properties that explain the geophysical anomalies. The results will be used to reassess the remaining priority target areas, some of which are land-based and could be drilled in a summer program. A location map showing the eight priority target areas is provided below.
| Page | 8 |
KENNADY NORTH PROJECT EXPLORATION
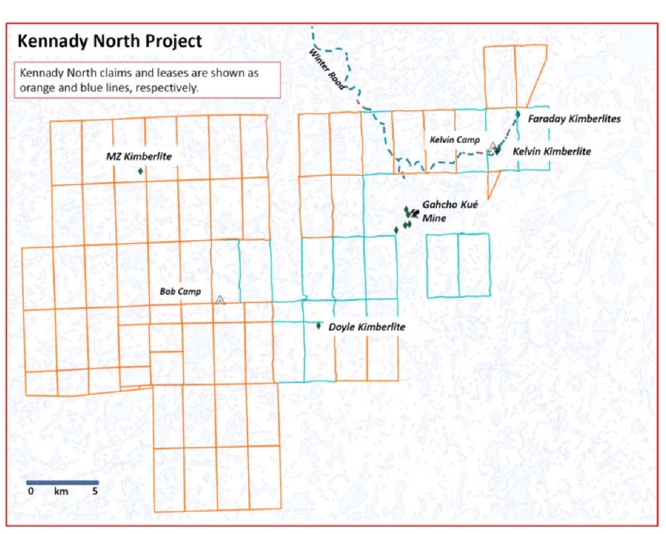
The Kennady North property consists of 22 federal leases and 58 claims covering an area of 67,164 hectares that border the Gahcho Kué Mine on three sides. There are five known kimberlites; Kelvin, Faraday 2, Faraday 1-3, MZ, and Doyle. Significant diamond sampling and drilling programs between 2014 and 2018, resulted in the estimation of resources for the Kelvin and Faraday bodies. The map below shows the location of the Kennady North Project relative to the Gahcho Kué Mine.
| Page | 9 |
The winter program at Kennady North was also terminated early due to the COVID-19 pandemic. The major focus of the winter 2020 program was to conduct geotechnical drilling for the Kelvin and Faraday kimberlites. Two drillholes at Kelvin, and two drillholes each at Faraday 2 and Faraday 1-3 were planned for a total of 1,750 meters. One angled drillhole with a total length of 200 meters was completed through the southeast end of Kelvin, and downhole physical data were collected from the hole.
Several other objectives were achieved in parallel with the drilling geotechnical program. Bathymetry measurements of several smaller lakes for which data were lacking were completed by traditional depth sounding methods. A 43 line-km OhmMapper resistivity survey was completed over a combined indicator-geophysical target located 1.5 kilometers to the east and up-ice of Faraday 2. Just before close of the six-week program, a brief staking program covering 39,000 hectares was conducted for select areas to the east of the project.
In January, the Company engaged Hayward CSR Strategies Inc. (HCSR; Yellowknife, NT) aid in advancing the Kennady North Assets. Dr. April Hayward, Owner and Principal Consultant of HCSR, will represent Kennady Diamonds as Vice President Kennady North Project Sustainable Development. HCSR will lead community relations, and environmental and permitting activities for the Kennady Assets. As with other aspects of the Kennady North Project, these activities have also been curtailed due to the COVID-19 pandemic.
The Kennady Assets include both an Indicated Resource for the Kelvin kimberlite and Inferred Resources for the Faraday kimberlites. Geological model domains for the Kelvin, Faraday 2 and Faraday 1-3 kimberlites were adopted as the resource domains for the estimation of Mineral Resources. The volumes of these domains were combined with estimates of bulk density to derive tonnage estimates. Bulk sampling programs using large diameter RC drilling were conducted to obtain grade and value information. Microdiamond data from drill core were used to forecast grades for the different kimberlite lithologies. Details of the modeling are available in NI 43-101 Compliant Technical Reports (filed in 2016 and 2017 under Kennady Diamonds Inc.) and the NI43-101 Compliant Technical Report filed April 11, 2019 under Mountain Province Diamonds. All reports are available at www.sedar.com. Details for the estimated resources are provided in the table below.
| Page | 10 |
Mineral Resource Estimates for the Kelvin and Faraday Kimberlites (as of February 2019 as referenced in the April 11, 2019 NI43-101 Compliant Technical Report)
| Resource | Classification | Tonnes (Mt) | Carats (Mct) | Grade (cpt) | Value (US$/ct) |
| Kelvin | Indicated | 8.50 | 13.62 | 1.60 | $63 |
| Faraday 2 | Inferred | 2.07 | 5.45 | 2.63 | $140 |
| Faraday 1-3 | Inferred | 1.87 | 1.90 | 1.04 | $75 |
| (1) | Mineral Resources are reported at a bottom cut-off of 1.0mm. Incidental diamonds are not incorporated into grade calculations. |
| (2) | Mineral Resources are not Mineral Reserves and do not have demonstrated economic viability. |
Results of operations
The Company, as discussed above, held two diamond sales during the three months ended March 31, 2020.
Quarterly financial information for the past eight quarters is shown in Table 1.
SUMMARY OF QUARTERLY RESULTS
| Table 1 - Quarterly Financial Data | ||||||||||||||||
| Expressed in thousands of Canadian dollars | ||||||||||||||||
| Three months ended | ||||||||||||||||
| March 31 | December 31 | September 30 | June 30 | |||||||||||||
| 2020 | 2019 | 2019 | 2019 | |||||||||||||
| Earnings and Cash Flow | ||||||||||||||||
| Number of sales | 2 | 2 | 3 | 3 | ||||||||||||
| Sales | $ | 65,430 | 65,032 | 54,832 | 95,774 | |||||||||||
| Impairment loss on property, plant and equipment | $ | — | (115,753 | ) | — | — | ||||||||||
| Operating income (loss) | $ | 7,502 | (118,104 | ) | (11,149 | ) | 12,762 | |||||||||
| Net (loss) income for the period | $ | (40,969 | ) | (115,725 | ) | (25,785 | ) | 10,255 | ||||||||
| Basic and diluted (loss) earnings per share | $ | (0.19 | ) | (0.55 | ) | (0.12 | ) | 0.05 | ||||||||
| Adjusted EBITDA* | $ | 22,825 | 17,648 | 10,583 | 39,096 | |||||||||||
| Cash flow provided by (used in) operating activities | $ | 1,176 | 28,307 | 13,858 | 46,079 | |||||||||||
| Cash flow provided by (used in) investing activities | $ | (5,166 | ) | (5,327 | ) | (2,012 | ) | (9,915 | ) | |||||||
| Cash flow provided by (used in) financing activities | $ | (349 | ) | (16,388 | ) | (13,839 | ) | (17,019 | ) | |||||||
| Balance Sheet | ||||||||||||||||
| Total assets | $ | 842,332 | 822,695 | 953,325 | 973,606 | |||||||||||
*Adjusted EBITDA is not defined under IFRS and therefore may not be comparable to similar measures presented by other issuers; refer to the Non-IFRS Measures section.
| Page | 11 |
| Three months ended | ||||||||||||||||
| March 31 | December 31 | September 30 | June 30 | |||||||||||||
| 2019 | 2018 | 2018 | 2018 | |||||||||||||
| Earnings and Cash Flow | ||||||||||||||||
| Number of sales | 2 | 3 | 2 | 3 | ||||||||||||
| Sales | $ | 60,696 | 70,477 | 74,852 | 99,075 | |||||||||||
| Operating income | $ | 3,639 | 7,144 | 19,952 | 11,187 | |||||||||||
| Net income (loss) for the period | $ | 2,497 | (30,204 | ) | 17,483 | (6,280 | ) | |||||||||
| Basic and diluted (loss) earnings per share | $ | 0.01 | (0.15 | ) | 0.08 | (0.03 | ) | |||||||||
| Adjusted EBITDA* | $ | 19,728 | 26,512 | 37,948 | 41,062 | |||||||||||
| Cash flow provided by (used in) operating activities | $ | (8,880 | ) | 41,818 | 33,319 | 59,007 | ||||||||||
| Cash flow provided by (used in) investing activities | $ | (10,320 | ) | (14,915 | ) | (10,175 | ) | (38,485 | ) | |||||||
| Cash flow provided by (used in) financing activities | $ | (233 | ) | (23,398 | ) | (29,017 | ) | (15,535 | ) | |||||||
| Balance Sheet | ||||||||||||||||
| Total assets | $ | 993,390 | 979,877 | 969,245 | 974,816 | |||||||||||
*Adjusted EBITDA is not defined under IFRS and therefore may not be comparable to similar measures presented by other issuers; refer to the Non-IFRS Measures section.
The Company holds ten sales per year in Antwerp, Belgium, and has typically alternated between two and three sales per quarter over the past two years. For the three months ended March 31, 2020, the Company experienced the impact of the global pandemic of COVID-19, and as a result was forced to halt previously scheduled sales, and therefore was unable to complete the scheduled third sale of the quarter. Despite the third sale not being complete, the Company experienced strong sales and operating income for the three months ended March 31, 2020. Typically, quarters with three sales have resulted in higher overall sales and operating income levels. The eighth sale of the period in 2019 closed successfully on September 27, 2019, 950,000 carats were sold, however, in accordance with IFRS only 791,000 carats could be recognized as sales proceeds in the quarter. The remaining 159,000 carats were recognized in Q4 2019. The amount of revenue recognized in Q4 for the 159,000 carats was approximately US$13.0 million or $17.1 million. Both the three months ended September 30, 2019 and December 31, 2019 resulted as an operating loss due to lower realized diamond prices. The lower prices realized year-on-year are affected by three factors; the source of the diamonds from varying parts of the orebody (mostly lower value areas of Hearne and SWC Kimberlites in 2019 versus 5034 in 2018), lower quality material processed during Q2 and Q3 2019, and the overall sentiment in the rough diamond market and associated pressure on prices of lower quality and smaller stones. The operating income in the three months ended June 30, 2019 is consistent with the same period in 2018. The operating income of $7,144 in the three months ended December 31, 2018 is lower than a typical three sale quarter as a result of product mix and a lower than expected volume of carats sold due to timing in the sales distribution channel.
summary of first Quarter Financial Results
Three months ended March 31, 2020 compared to the three months ended March 31, 2019, expressed in thousands of Canadian dollars.
For the three months ended March 31, 2020, the Company recorded net loss of $40,969 or $0.19 loss per share compared to a net income of $2,497 or $0.01 earnings per share for the same period in 2019. The significant increase in the net loss for the three months ended March 31, 2020 compared to the same period in 2019 can largely be attributed to the foreign exchange losses, which has shifted from foreign exchange gains of $8,647 in 2019 to foreign exchange losses of $30,812 in 2020. The foreign exchange losses for the three months ended March 31, 2020 were as a result of the Canadian dollar weakening relative to the U.S. dollar and the translation of the secured notes payable, net of U.S. dollar cash balances, to Canadian dollars. The opposite trend existed in 2019.
Earnings from mine operations
Earnings from mine operations for the three months ended March 31, 2020 was $13,627 compared to $10,160 for the same period in 2019. For the three months ended March 31, 2020, diamond sales related to 659,000 carats were $65,430. The average diamond sales value per carat was approximately US$75. For the three months ended March 31, 2019, diamond sales related to 644,000 carats were $60,696. The average diamond sales value per carat was approximately US$71. The higher prices realized compared to the same period in 2019 were affected by the source of the diamonds from varying parts of the orebody, the overall sentiment in the rough diamond market improving prior to the COVID-19 pandemic effects. The overall increase in sales can also partially be attributed to a higher volume and quality of fancies and specials included in the product mix, relative to the same period in 2019. Production costs (net of capitalized stripping costs) related to diamonds sold for the three months ended March 31, 2020 were $30,614; depreciation and depletion on the GK Mine commissioned assets related to diamonds sold for the three months ended March 31, 2020, were $14,703; and the cost of acquired diamonds for the three months ended March 31, 2020 were $6,486, which had been previously paid to De Beers when winning the periodic fancies and specials bids. Resultant earnings from mine operations for the three months ended March 31, 2020 was $13,627. Production costs (net of capitalized stripping costs) related to diamonds sold for the three months ended March 31, 2019 were $28,786; depreciation and depletion on the GK Mine commissioned assets related to diamonds sold for the three months ended March 31, 2019 were $15,799; and the cost of acquired diamonds for the three months ended March 31, 2019 were $5,951. The slight increase in production costs for the three months ended March 31, 2020, over the same period in 2019, is mainly due to the slightly higher quantity of carats being sold.
| Page | 12 |
Selling, general and administrative expenses
Selling, general and administrative expenses for the three months ended March 31, 2020, were $3,637 compared to $2,899 for the same period in 2019. The main expenses included in these amounts for the three months ended March 31, 2020 were $1,528 relating to selling and marketing, $516 related to consulting fees and payroll, $291 relating to share-based payment expense, and $578 related to professional fees. The main expenses included in these amounts for the three months ended March 31, 2019 were $1,292 relating to selling and marketing, $649 related to consulting fees and payroll, $219 relating to share-based payment expense, and $220 related to professional fees. The increase in overall selling, general and administrative costs can mainly be attributed to higher selling and marketing expenses focused on branding efforts, as well as an increase to the professional fees. The professional fees increase can be attributed to the completion of technical reports for 43-101 purposes, as well as additional diamond valuation engagements, that did not occur in the same period for 2019.
Exploration and evaluation expenses
Exploration and evaluation expenses for the three months ended March 31, 2020, were $2,488 compared to $3,622 for the same period in 2019. Exploration and evaluation expenses have decreased for the three months ended March 31, 2020 compared to the same period in 2019 as targeted exploration was budgeted to be cash flow conscious. Of the $2,488 total exploration and evaluation expenses incurred in the three months ended March 31, 2020, $737 is related to the Company’s 49% share of the exploration and evaluation expenses on the GK Mine, while the remaining $1,751 related to those spent on the KNP. Of the $3,622 total exploration and evaluation expenses incurred in the three months ended March 31, 2019, $1,159 is related to the Company’s 49% share of the exploration and evaluation expenses on the GK Mine, while the remaining $2,463 related to those spent on the KNP.
Net finance expenses
Net finance expenses for the three months ended March 31, 2020, were $10,287 compared to $9,788 for the same period in 2019. Included in the amount for the three months ended March 31, 2020, were $10,024 relating to finance costs, $355 relating to accretion expense on decommissioning liability and $92 relating to interest income. Included in the amount for the three months ended March 31, 2019, were $9,599 relating to finance costs, $299 relating to accretion expense on decommissioning liability and $110 relating to interest income. Finance costs were slightly higher compared to the same period in 2019 as the majority relates to interest expense over the secured notes payable. Although there have been further secured notes repurchases since March 31, 2019, that decrease in interest expense has been offset by a significantly higher foreign exchange rate on the US denominated interest expenses.
| Page | 13 |
Foreign exchange (losses) gains
Foreign exchange losses for the three months ended March 31, 2020 were $30,812 compared to foreign exchange gains of $8,647 for the same period in 2019. The foreign exchange losses for the three months ended March 31, 2020 were as a result of the Canadian dollar weakening relative to the U.S. dollar and the translation of the secured notes payable, net of U.S. dollar cash balances, to Canadian dollars at the spot rate at the three months ended March 31, 2020. The spot rate at March 31, 2020 was $1.4062/US$1 compared to $1.2978/US$1 at December 31, 2019. The opposite trends existed in the three months ended March 31, 2019.
INCOME AND MINING TAXES
The Company is subject to income and mining taxes in Canada with the statutory income tax rate at 26.5%.
No deferred tax asset has been recorded in the financial statements as a result of the uncertainty associated with the ultimate realization of these tax assets.
The Company is subject to assessment by Canadian authorities, which may interpret tax legislation in a manner different from the Company. These differences may affect the final amount or the timing of the payment of taxes. When such differences arise, the Company makes provision for such items based on management’s best estimate of the final outcome of these matters.
The Company’s current tax expenses are associated with mining royalty taxes in the Northwest Territories. There are no other current tax expenses for income tax purposes, as there are significant losses carried forward that are available to offset current taxable income.
FINANCIAL POSITION AND LIQUIDITY
The Company originally funded its share of the construction and commissioning costs of the GK Mine through a combination of equity and a project lending facility (the previous “Loan Facility”). In December 2017, the Company terminated its previous Loan Facility through the issuance of US$330 million in second lien secured notes payable. Concurrent with the closing of the secured notes payable, the Company entered into a US$50 million first lien revolving credit facility (the “RCF”) with Scotiabank and Nedbank Ltd. in order to maintain a liquidity cushion for general corporate purposes. The RCF has a term of three years.
The RCF is subject to a quarterly commitment fee between 0.9625% and 1.2375%, depending on certain leverage ratio calculations at the time. Upon drawing on the RCF, an interest rate of LIBOR plus 2.5% to 4.5% per annum is charged for the number of days the funds are outstanding, based on certain leverage ratio calculations at the time. As at March 31, 2020, the RCF remained undrawn. The RCF is subject to several financial covenants, in order to remain available. The following financial covenants are calculated on a quarterly basis, of which the first three are required to be met, in order for the RCF to remain available:
- Total leverage ratio of less than or equal to 4.50:1 calculated as total debt divided by EBITDA, up to and including March 31, 2020; 5:1 from April 1, 2020 up to and including June 30, 2020; and 4.25 thereafter until the maturity date.
- A ratio of EBITDA to interest expense no less than 2.25:1; and
- A tangible net worth that is no less than 75% of the tangible net worth as reflected in the September 30, 2017 financial statements provided to the administrative agent as a condition precedent to closing, plus 50% of the positive net income for each subsequent quarter date.
- The Company shall not make any distributions other than regularly scheduled payments of interest and principal related to the secured notes payable.
The Company is in compliance with all financial covenants in order for US$25 million to remain available as at March 31, 2020.
The Company is limited to draw the RCF to a maximum of US$25 million until June 30, 2020. If the total leverage ratio is below 4.25:1 from July 1, 2020 onward, the full US$50 million facility would remain available.
| Page | 14 |
The indenture governing the secured notes payable contains certain restrictive covenants that limit the Company’s ability to, among other things, incur additional indebtedness, make certain dividend payments and other restricted payments, and create certain liens, in each case subject to certain exceptions. The restrictive covenant on the Company’s ability to pay potential future dividends relates to a fixed charge coverage ratio of no less than 2:1. The fixed charge coverage ratio is calculated as EBITDA over interest expense. Subject to certain limitations and exceptions, the amount of the restricted payments, which include dividends and share buybacks, is limited to a maximum dollar threshold, which is calculated at an opening basket of US$10 million plus 50% of the historical consolidated net income, subject to certain adjustments, reported from the quarter of issuance and up to the most recently available financial statements at the time of such restricted payment, plus an amount not to exceed the greater of US$15 million and 2% of total assets as defined in the indenture.
The Company’s condensed consolidated interim financial statements have been prepared using the going concern basis of preparation which assumes that the Company will realize its assets and settle its liabilities in the normal course of business.
Amid the COVID-19 pandemic, the Company may face liquidity challenges primarily resulting from the deferral of the periodic normal sales carried out in Antwerp, Belgium. While the Company continues to carry out direct sales on a limited basis, the risk of decreased sales volumes, particularly in the months of June and July 2020, along with the negative impact on realized diamond prices will significantly reduce 2020 expected revenues as compared to the 2020 revenues the Company expected prior to the onset of the COVID-19 pandemic. As of the date of approval of the financial statements, the Company has drawn US$25 million from its US$50 million revolving credit facility agreement (“RCF”). The Company is subject to certain financial covenants on its outstanding senior secured notes and RCF which each include cross-covenant default terms. The uncertainty that the COVID-19 pandemic has caused over potential diamond sales in the near-term, particularly in June and July 2020, along with these financial covenants discussed, may result in an event of default under the terms of these debt instruments.
Management expects the Company will seek additional waivers or amendments from the lenders as to the financial covenants included. There are no assurances the lenders will provide further waivers or future amendments the Company may seek. If the Company is unable to comply with the financial covenants, and is not successful in obtaining suitable waivers or amendments, it would result in an event of default, and the outstanding balances could become payable on demand. Further, management may seek alternative sources of financing, however, such alternative sources of financing may not be available or at terms acceptable to the Company. These conditions indicate the existence of a material uncertainty that results in substantial doubt as to the Company’s ability to continue as a going concern. These financial statements do not include the adjustments to the amounts and classification of assets and liabilities that would be necessary should the Company be unable to continue as a going concern. These adjustments may be material.
Cash flows provided by operating activities, including changes in non-cash working capital for the three months ended March 31, 2020, were $1,176 compared to ($8,880), for the same period in 2019. The increase in cash provided for the three months ended March 31, 2020 was a result of the increased earnings from mine operations of $13,627 compared to $10,160 for the same period in 2019. The increase can also partially be attributable to the decrease in cash used to build up inventory, as well as the deferral of certain items in accounts payable, which have resulted in more cash. Although the net loss for the three months ended March 31, 2020 was $40,969 significant areas which were non-cash items included foreign exchange losses of $30,812, depreciation and depletion of $14,758, and share-based payment expense of $291.
Cash flows used in investing activities for the three months ended March 31, 2020, were $5,166 compared to $10,320 for the same period in 2019. For the three months ended March 31, 2020, the outflow for the purchase of property, plant and equipment were $5,258 compared to $10,430 for the same period in 2019. For the three months ended March 31, 2020, the amount of cash used in the acquisition of property, plant and equipment was offset by $92 of interest income, compared to $110 for the same period in 2019. The decrease of cash used in investing activities during the three months ended March 31, 2020, compared to the same period in 2019, can be attributed to the decrease in stay-in-business capital expenditures and stripping activity in the current period.
Cash flows used in financing activities for the three months ended March 31, 2020, were $349 compared to $233 for the same period in 2019. Cash flows used in financing activities for the three months ended March 31, 2020, related to stand-by charges on the RCF and the payment of lease liabilities. Under the terms of the secured notes payable, interest payments occur semi-annually, and as such will result in the June and December quarters having significantly higher cash outflows under financing activities. Cash flows from financing activities for the three months ended March 31, 2019 also related to stand-by charges on the RCF and the payment of lease liabilities.
| Page | 15 |
Off-Balance Sheet Arrangements
The Company has no off-balance sheet arrangements.
SIGNIFICANT ACCOUNTING POLICIES ADOPTED IN THE CURRENT PERIOD
Significant accounting policies adopted in the current year are disclosed in Note 3 of the financial statements.
SIGNIFICANT ACCOUNTING JUDGMENTS, ESTIMATES AND ASSUMPTIONS
Significant accounting judgments, estimates and assumptions are disclosed in Note 4 of the financial statements.
STANDARDS AND AMENDMENTS TO EXISTING STANDARDS
There are currently no new standards and amendments to existing standards.
RELATED PARTY TRANSACTIONS
The Company’s related parties include the Operator of the GK Mine, Dermot Desmond and Vertigol Unlimited Company (“Vertigol”) (corporations ultimately beneficially owned by Dermot Desmond), key management and their close family members, and the Company’s directors. International Investment and Underwriting Unlimited (“IIU”) is also a related party since it is ultimately beneficially owned by Mr. Dermot Desmond.
Related party transactions are recorded at their exchange amount, being the amount agreed to by the parties.
The Company had the following transactions and balances with its related parties including key management personnel including the Company’s directors, Dermot Desmond, Vertigol, IIU and the Operator of the GK Mine. The transactions with key management personnel are in the nature of remuneration. The transactions with the Operator of the GK Mine relate to the funding of the Company’s interest in the GK Mine for the current year’s expenditures, capital additions, management fee, and production sales related to the 49% share of fancies and special diamonds. The transactions with IIU are for the director fees and travel expenses of the Chairman of the Company.
Between 2014 and 2018, the Company and De Beers signed agreements allowing De Beers (“the Operator”) to utilize De Beers’ credit facilities to issue reclamation and restoration security deposits to the federal and territorial governments. In accordance with these agreements, the Company agreed to a 3% fee annually for their share of the letters of credit issued. As at March 31, 2020, the Company’s share of the letters of credit issued were $23.3 million (December 31, 2019 - $23.3 million).
During the period ended March 31, 2020, the Company and De Beers signed an agreement to reduce the fee from 3% to 0.3%, annually, for their share of the letters of credit issued. Furthermore, on the same day, a resolution was passed by the joint venture management committee to establish a decommissioning fund, where the Company will fund $15 million in 2020, and $10 million annually for four years thereafter until the Company’s 49% share totaling $55 million is fully funded. The targeting funding over time will increase, dependent on future increases to the decommissioning and restoration liability.
Failure to meet the obligations for cash calls to fund the Company’s share in the GK Mine may lead to dilution of the interest in the GK Mine.
| Page | 16 |
The balances as at March 31, 2020 and December 31, 2019 were as follows:
| March 31, | December 31, | |||||||
| 2020 | 2019 | |||||||
| Payable De Beers Canada Inc. as the operator of the GK Mine* | $ | 11,436 | $ | 12,316 | ||||
| Payable to De Beers Canada Inc. for interest on letters of credit | 477 | 353 | ||||||
| Payable to De Beers Canada Inc. for exploration and evaluation | 1,179 | — | ||||||
| Payable to International Investment and Underwriting | 23 | — | ||||||
| Payable to key management personnel | 175 | 567 | ||||||
*included in accounts payable and accrued liabilities
The transactions for the three months ended March 31, 2020 and 2019 were as follows:
| Three months ended | Three months ended | |||||||
| March 31, 2020 | March 31, 2019 | |||||||
| The total of the transactions: | ||||||||
| International Investment and Underwriting | $ | 23 | $ | 13 | ||||
| Remuneration to key management personnel | 524 | 677 | ||||||
| Diamonds sold to De Beers Canada Inc. | 5,551 | 2,875 | ||||||
| Diamonds purchased from De Beers Canada Inc. | 2,737 | 5,158 | ||||||
| Finance costs incurred from De Beers Canada Inc. | 124 | 172 | ||||||
| Management fee charged by the Operator of the GK Mine | 1,092 | 1,038 | ||||||
The remuneration expense of directors and other members of key management personnel for the three months ended March 31, 2020 and 2019 were as follows:
| Three months ended | Three months ended | |||||||
| March 31, 2020 | March 31, 2019 | |||||||
| Consulting fees, payroll, director fees, bonus and other short-term benefits | $ | 377 | $ | 518 | ||||
| Share-based payments | 170 | 172 | ||||||
| $ | 547 | $ | 690 | |||||
In accordance with International Accounting Standard 24 Related Parties, key management personnel are those persons having authority and responsibility for planning, directing and controlling the activities of the Company directly or indirectly, including any directors (executive and non-executive) of the Company.
CONTRACTUAL OBLIGATIONS
The following table summarizes the contractual maturities of the Company’s significant financial liabilities and capital commitments, including contractual obligations:
| Less than | 1 to 3 | 4 to 5 | After 5 | |||||||||||||||||
| 1 Year | Years | Years | Years | Total | ||||||||||||||||
| Gahcho Kué Diamond Mine commitments | $ | 3,536 | $ | — | $ | — | $ | — | $ | 3,536 | ||||||||||
| Gahcho Kué Diamond Mine decommissioning fund | 15,000 | 20,000 | 20,000 | — | 55,000 | |||||||||||||||
| Revolving credit facility stand by charges | 616 | — | — | — | 616 | |||||||||||||||
| Notes payable - Principal | — | 421,776 | — | — | 421,776 | |||||||||||||||
| Notes payable - Interest | 34,304 | 68,421 | — | — | 102,725 | |||||||||||||||
| Forward Exchange Contracts: | ||||||||||||||||||||
| (Inflows) | (80,536 | ) | (28,390 | ) | — | — | (108,926 | ) | ||||||||||||
| Outflows | 84,372 | 28,124 | — | — | 112,496 | |||||||||||||||
| $ | 57,292 | $ | 509,931 | $ | 20,000 | $ | — | $ | 587,223 | |||||||||||
| Page | 17 |
Subsequent events
Subsequent to the three months ended March 31, 2020, the Company drew US$25 million from the revolving credit facility in order to maintain liquidity during the challenges faced by COVID-19.
NON-IFRS MEASURES
The MD&A refers to the terms “Cash costs of production per tonne of ore processed” and “Cash costs of production per carat recovered”, both including and net of capitalized stripping costs and “Adjusted Earnings Before Interest, Taxes Depreciation and Amortization (Adjusted EBITDA)”. Each of these is a non-IFRS performance measure and is referenced in order to provide investors with information about the measures used by management to monitor performance. These measures are intended to provide additional information and should not be considered in isolation or as a substitute for measures of performance prepared in accordance with IFRS. They do not have any standardized meaning under IFRS and therefore may not be comparable to similar measures presented by other issuers.
Cash costs of production per tonne of ore processed and cash costs of production per carat recovered are used by management to analyze the actual cash costs associated with processing the ore, and for each recovered carat. Differences from production costs reported within cost of sales are attributed to the amount of production cost included in ore stockpile and rough diamond inventories.
Adjusted EBITDA is used by management to analyze the operational cash flows of the Company, as compared to the net income for accounting purposes. It is also a measure which is defined in the secured notes payable documents. Adjusted EBITDA margin is used by management to analyze the operational margin % on cash flows of the Company.
The following table provides a reconciliation of the Adjusted EBITDA and Adjusted EBITDA margin with the net income on the consolidated statements of comprehensive (loss) income:
| Three months ended | Three months ended | |||||||
| March 31, 2020 | March 31, 2019 | |||||||
| Net (loss) income for the period | $ | (40,969 | ) | $ | 2,497 | |||
| Add/deduct: | ||||||||
| Non-cash depreciation and depletion | 14,703 | 15,799 | ||||||
| Share-based payment expense | 291 | 219 | ||||||
| Net finance expenses | 10,287 | 9,788 | ||||||
| Derivative losses (gains) | 5,928 | (401 | ) | |||||
| Current and deferred income taxes | 1,444 | 402 | ||||||
| Unrealized foreign exchange losses (gains) | 31,141 | (8,576 | ) | |||||
| Adjusted earnings before interest, taxes, depreciation and depletion (Adjusted EBITDA) | $ | 22,825 | $ | 19,728 | ||||
| Sales | 65,430 | 60,696 | ||||||
| Adjusted EBITDA margin | 35 | % | 33 | % | ||||
| Page | 18 |
The following table provides a reconciliation of the cash costs of production per tonne of ore processed and per carat recovered and the production costs reported within cost of sales on the consolidated statements of comprehensive (loss) income:
| Three months ended | Three months ended | |||||||||||
| (in thousands of Canadian dollars, except where otherwise noted) | March 31, 2020 | March 31, 2019 | ||||||||||
| Cost of sales production costs | $ | 30,614 | 28,786 | |||||||||
| Timing differences due to inventory and other non-cash adjustments | $ | 4,655 | 11,305 | |||||||||
| Cash cost of production of ore processed, net of capitalized stripping | $ | 35,269 | 40,091 | |||||||||
| Cash costs of production of ore processed, including capitalized stripping | $ | 37,081 | 47,381 | |||||||||
| Tonnes processed | kilo tonnes | 442 | 427 | |||||||||
| Carats recovered | 000's carats | 811 | 777 | |||||||||
| Cash costs of production per tonne of ore, net of capitalized stripping | $ | 80 | 94 | |||||||||
| Cash costs of production per tonne of ore, including capitalized stripping | $ | 84 | 111 | |||||||||
| Cash costs of production per carat recovered, net of capitalized stripping | $ | 43 | 52 | |||||||||
| Cash costs of production per carat recovered, including capitalized stripping | $ | 46 | 61 | |||||||||
Other Management Discussion and Analysis Requirements
Risks
Mountain Province’s business of developing and operating mineral resources involves a variety of operational, financial and regulatory risks that are typical in the mining industry. The Company attempts to mitigate these risks and minimize their effect on its financial performance, but there is no guarantee that the Company will be profitable in the future, and investing in the Company’s common shares should be considered speculative.
Mountain Province’s business of developing and operating mineral properties is subject to a variety of risks and uncertainties, including, without limitation:
| § | risk that COVID-19 continues to spread and materially impedes operations and/or the ability of the Company to sell and distribute diamonds; |
| § | risk of COVID-19 affecting commodity prices and demand of diamond inventory, future sales and increased market volatility; |
| § | risk that the production from the mine will not be consistent with the Company’s expectation; |
| § | risk that production and operating costs are not within the Company’s estimates; |
| § | risk of lack of operating history and new mining operation; |
| § | risks and uncertainties relating to the interpretation of drill results, the geology, grade and continuity of mineral deposits; |
| § | results of initial feasibility, pre-feasibility and feasibility studies, and the possibility that future exploration, development or mining results will not be consistent with the Company's expectations; mining exploration risks, including risks related to accidents, equipment breakdowns or other unanticipated difficulties with or interruptions in production; |
| § | the potential for delays in exploration activities or the completion of studies; |
| § | risks related to the inherent uncertainty of exploration and cost estimates and the potential for unexpected costs and expenses; |
| § | risks related to foreign exchange fluctuations, prices of diamond, and emergence of laboratory grown diamonds; |
| § | risks related to challenges in the diamond market causing the sale of all diamond inventory to be sold below cost; |
| § | risks related to commodity price fluctuations; |
| § | the uncertainty of profitability based upon the Company's lack of operating history; |
| § | risks related to failure of its joint venture partner; |
| Page | 19 |
| § | risks relating to complying with the covenants in our revolver credit facility; |
| § | development and production risks including and particularly risks for weather conducive to the building and use of the Tibbitt to Contwoyto Winter Road; |
| § | risks related to environmental regulation, permitting and liability; |
| § | risks related to legal challenges to operating permits that are approved and/or issued; |
| § | political and regulatory risks associated with mining, exploration and development; |
| § | the ability to operate the Company’s GK Mine on an economic basis; |
| § | aboriginal rights and title; |
| § | failure of plant, equipment, processes and transportation services to operate as anticipated; |
| § | possible variations in ore grade or recovery rates, permitting timelines, capital expenditures, reclamation activities, land titles, and social and political developments, and other risks of the mining industry; and |
| § | other risks and uncertainties related to the Company's prospects, properties and business strategy. |
As well, there can be no assurance that any further funding required by the Company will become available to it, and if so, that it will be offered on reasonable terms, or that the Company will be able to secure such funding. Furthermore, there is no assurance that the Company will be able to secure new mineral properties or Projects, or that they can be secured on competitive terms.
Disclosure of Outstanding Share Data
The Company’s common shares are traded on the Toronto Stock Exchange under the symbol MPVD.
At May 6, 2020, there were 210,392,473 shares issued, 2,933,335 stock options and 1,065,000 restricted share units outstanding. There were no warrants outstanding.
There are an unlimited number of common shares without par value authorized to be issued by the Company.
Controls and Procedures
Disclosure Controls and Procedures and internal control over financial reporting
As of March 31, 2020, we carried out an evaluation under the supervision and with the participation of our management, including our chief executive officer (CEO) and chief financial officer (CFO), of the effectiveness of our disclosure controls and procedures. There are inherent limitations to the effectiveness of any system of disclosure controls and procedures, including the possibility of human error and the circumvention or overriding of the controls and procedures. Accordingly, even effective disclosure controls and procedures can only provide reasonable assurance of achieving their control objectives. Based upon that evaluation and as of March 31, 2020, the CEO and CFO concluded that:
·the disclosure controls and procedures were designed effectively to provide reasonable assurance that information required to be disclosed in the reports we file and submit under applicable securities laws is recorded, processed, summarized and reported as and when required;
·such information is accumulated and communicated to our management, including our CEO and CFO, as appropriate to allow timely decisions regarding required disclosure.
There has been no change in our internal control over financial reporting during the quarter ended March 31, 2020 that has materially affected, or is reasonably likely to materially affect, our internal control over financial reporting.
| Page | 20 |
CAUTIONARY NOTE ON FORWARD-LOOKING STATEMENTS
This MD&A contains certain “forward-looking statements” and “forward-looking information” under applicable Canadian and United States securities laws concerning the business, operations and financial performance and condition of Mountain Province Diamonds Inc. Forward-looking statements and forward-looking information include, but are not limited to, statements with respect to operational hazards, including possible disruption due to pandemic such as COVID-19, its impact on travel, self-isolation protocols and business and operations, estimated production and mine life of the project of Mountain Province; the realization of mineral reserve estimates; the timing and amount of estimated future production; costs of production; the future price of diamonds; the estimation of mineral reserves and resources; the ability to manage debt; capital expenditures; the ability to obtain permits for operations; liquidity; tax rates; and currency exchange rate fluctuations. Except for statements of historical fact relating to Mountain Province, certain information contained herein constitutes forward-looking statements. Forward-looking statements are frequently characterized by words such as “anticipates,” “may,” “can,” “plans,” “believes,” “estimates,” “expects,” “projects,” “targets,” “intends,” “likely,” “will,” “should,” “to be”, “potential” and other similar words, or statements that certain events or conditions “may”, “should” or “will” occur. Forward-looking statements are based on the opinions and estimates of management at the date the statements are made, and are based on a number of assumptions and subject to a variety of risks and uncertainties and other factors that could cause actual events or results to differ materially from those projected in the forward-looking statements. Many of these assumptions are based on factors and events that are not within the control of Mountain Province and there is no assurance they will prove to be correct.
Factors that could cause actual results to vary materially from results anticipated by such forward-looking statements include the development of operation hazards which could arise in relation to COVID-19, including, but not limited to protocols which may be adopted to reduce the spread of COVID-19 and any impact of such protocols on Mountain Province's business and operations, variations in ore grade or recovery rates, changes in market conditions, changes in project parameters, mine sequencing; production rates; cash flow; risks relating to the availability and timeliness of permitting and governmental approvals; supply of, and demand for, diamonds; fluctuating commodity prices and currency exchange rates, the possibility of project cost overruns or unanticipated costs and expenses, labour disputes and other risks of the mining industry, failure of plant, equipment or processes to operate as anticipated.
These factors are discussed in greater detail in this MD&A and in Mountain Province's most recent Annual Information Form filed on SEDAR, which also provide additional general assumptions in connection with these statements. Mountain Province cautions that the foregoing list of important factors is not exhaustive. Investors and others who base themselves on forward-looking statements should carefully consider the above factors as well as the uncertainties they represent and the risk they entail. Mountain Province believes that the expectations reflected in those forward-looking statements are reasonable, but no assurance can be given that these expectations will prove to be correct and such forward-looking statements included in this MD&A should not be unduly relied upon. These statements speak only as of the date of this MD&A.
Although Mountain Province has attempted to identify important factors that could cause actual actions, events or results to differ materially from those described in forward-looking statements, there may be other factors that cause actions, events or results not to be anticipated, estimated or intended. There can be no assurance that forward-looking statements will prove to be accurate, as actual results and future events could differ materially from those anticipated in such statements. Mountain Province undertakes no obligation to update forward-looking statements if circumstances or management’s estimates or opinions should change except as required by applicable securities laws. The reader is cautioned not to place undue reliance on forward-looking statements. Statements concerning mineral reserve and resource estimates may also be deemed to constitute forward-looking statements to the extent they involve estimates of the mineralization that will be encountered as the property is developed.
Further, Mountain Province may make changes to its business plans that could affect its results. The principal assets of Mountain Province are administered pursuant to a joint venture under which Mountain Province is not the operator. Mountain Province is exposed to actions taken or omissions made by the operator within its prerogative and/or determinations made by the joint venture under its terms. Such actions or omissions may impact the future performance of Mountain Province. Under its current note and revolving credit facilities Mountain Province is subject to certain limitations on its ability to pay dividends on common stock. The declaration of dividends is at the discretion of Mountain Province’s Board of Directors, subject to the limitations under the Company’s debt facilities, and will depend on Mountain Province’s financial results, cash requirements, future prospects, and other factors deemed relevant by the Board.
| Page | 21 |
Cautionary Note to U.S. Investors – Information Concerning Preparation of Resource Estimates
This MD&A has been prepared in accordance with the requirements of the securities laws in effect in Canada, which differ from the requirements of United States securities laws. Unless otherwise indicated, all resource and reserve estimates included in this MD&A have been prepared in accordance with NI 43-101 and the Canadian Institute of Mining and Metallurgy Classification System. NI 43-101 is a rule developed by the Canadian Securities Administrators which establishes standards for all public disclosure an issuer makes of scientific and technical information concerning mineral projects.
Canadian standards, including NI 43-101, differ significantly from the requirements of Industry Guide 7 (“Guide 7”) promulgated by the United States Securities and Exchange Commission (“SEC”) under the United States Securities Act of 1933, as amended, and resource and reserve information contained herein may not be comparable to similar information disclosed by U.S. companies pursuant to Guide 7. In particular, and without limiting the generality of the foregoing, the term “resource” does not equate to the term “reserves”. Under Guide 7, mineralization may not be classified as a “reserve” unless the determination has been made that the mineralization could be economically and legally produced or extracted at the time the reserve determination is made. The SEC's disclosure standards under Industry Guide 7 do not define the terms and normally do not permit the inclusion of information concerning “measured mineral resources”, “indicated mineral resources” or “inferred mineral resources” or other descriptions of the amount of mineralization in mineral deposits that do not constitute “reserves” by Guide 7 standards in documents filed with the SEC pursuant to Guide 7. U.S. Investors should also understand that “inferred mineral resources” have a great amount of uncertainty as to their existence and great uncertainty as to their economic and legal feasibility. It cannot be assumed that all or any part of an “inferred mineral resource” will ever be upgraded to a higher category. Under Canadian rules, estimated “inferred mineral resources” may not form the basis of feasibility or pre-feasibility studies except in rare cases. Investors are cautioned not to assume that all or any part of an “inferred mineral resource” exists or is economically or legally mineable.
Disclosure of “contained ounces” (or “contained carats”) in a resource is permitted disclosure under Canadian regulations; however, the Guide 7 normally only permits issuers to report mineralization that does not constitute “reserves” by Guide 7 standards as in place tonnage and grade without reference to unit measures. The requirements of NI 43-101 for identification of “reserves” are also not the same as those of the Guide 7, and reserves reported by the Company in compliance with NI 43-101 may not qualify as “reserves” under Guide 7 standards. Accordingly, information concerning mineral deposits set forth herein may not be comparable with information made public by companies that report in accordance with Guide 7.
| Page | 22 |