Exhibit 99.1

Management’s Discussion and Analysis
For the Three and Six Months Ended June 30, 2020
TSX: MPVD
1
MOUNTAIN PROVINCE DIAMONDS INC.
MANAGEMENT’S DISCUSSION AND ANALYSIS
FOR THE THREE AND SIX MONTHS ENDED JUNE 30, 2020
| TABLE OF CONTENTS | Page | |
| Second Quarter 2020 Highlights | 3 | |
| Company Overview | 4 | |
| Gahcho Kué Diamond Mine | 4 | |
| Gahcho Kué Exploration | 9 | |
| Kennady North Project Exploration | 10 | |
| Results of Operations | 11 | |
| Summary of Quarterly Results | 12 | |
| Summary of Second Quarter Financial Results | 13 | |
| Income and Mining Taxes | 14 | |
| Financial Position and Liquidity | 15 | |
| Off-Balance Sheet Arrangements | 17 | |
| Significant Accounting Policies Adopted in the Current Period | 17 | |
| Significant Accounting Judgments, Estimates and Assumptions | 17 | |
| Standards and Amendments to Existing Standards | 18 | |
| Related Party Transactions | 18 | |
| Contractual Obligations | 19 | |
| Subsequent Events | 19 | |
| Non-IFRS Measures | 19 | |
| Other Management Discussion and Analysis Requirements | 21 | |
| Disclosure of Outstanding Share Data | 22 | |
| Controls and Procedures | 22 | |
| Cautionary Note Regarding Forward-Looking Statements | 23 |
This Management’s Discussion and Analysis (“MD&A”) as of August 5, 2020 provides a review of the financial performance of Mountain Province Diamonds Inc. (the “Company” or “Mountain Province” or “MPV”) and should be read in conjunction with the MD&A for the year ended December 31, 2019, the unaudited condensed consolidated interim financial statements and the notes thereto for the three and six months ended June 30, 2020 and the audited consolidated statements for the year ended December 31, 2019. The following MD&A has been approved by the Board of Directors.
The unaudited condensed consolidated interim financial statements of the Company were prepared in accordance
with IAS 34 – Interim Financial Reporting. Except as disclosed in the statements, the interim financial statements follow the same accounting policies and methods of computation as compared with the most recent annual financial statements for the year ended December 31, 2019, which were prepared in accordance with International Financial Reporting Standards (“IFRS”) as issued by the International Accounting Standards Board (“IASB”). Accordingly, the interim financial statements should be read in conjunction with the Company’s most recent annual financial statements.
All amounts are expressed in thousands of Canadian dollars, except share and per share amounts, unless otherwise noted.
The disclosure in this MD&A of scientific and technical information regarding exploration projects on Mountain Province’s mineral properties has been reviewed and approved by Tom McCandless, Ph.D., P.Geo., while that regarding mine development and operations has been reviewed and approved by Keyvan Salehi, P.Eng., MBA, both of whom are Qualified Persons as defined by National Instrument 43-101 - Standards of Disclosure for Mineral Properties (“NI 43-101”).
Page | 2
Additional information, related to the Company is available on SEDAR at http://sedar.com/ and on EDGAR at http://www.sec.gov/edgar.shtml.
HIGHLIGHTS
| · | Cash at June 30, 2020 was $16,777 with a negative net working capital of $330,782. Cash at December 31, 2019 was $34,751 with net working capital of $99,402. During the three months ended June 30, 2020, the Company drew US$25 million from the revolving credit facility (“RCF”) in order to maintain liquidity amid the challenges of the COVID-19 pandemic. Subsequent to the three and six months ended June 30, 2020, the Company entered into an executed waiver agreement (the “Waiver”) which resulted in a reduction in the size of the facility from US$50 million to US$25 million, and waived all covenant calculations as at June 30, 2020. For further details please refer to Note 9 of the financial statements. |
| · | Loss from mine operations for the three and six months ended June 30, 2020, respectively, amounted to $35,760 and $22,133 compared to earnings from mine operations of $17,799 and $27,959 for the same periods in 2019. |
| · | Net loss for the three and six months ended June 30, 2020, respectively, was $26,762 and $67,731 or $0.13 and $0.32 loss per share (basic and diluted) compared to net income for the three and six months period ended of June 30, 2019 of $10,255 and $12,752, or $0.05 and $0.06 earnings per share (basic and diluted). Adjusted EBITDA for those periods was negative $23,894 and negative $1,069 compared to $39,096 and $58,824, respectively (Adjusted EBITDA is not defined under IFRS and therefore may not be comparable to similar measures presented by other issuers; refer to the Non-IFRS Measures section). |
| · | During the three and six months period ended June 30, 2020, the Company entered into an agreement to sell US$50 million of diamonds to Dunebridge Worldwide Ltd. The first sale for US$22.56 million occurred on June 11, 2020. |
| · | In the second quarter of 2020, the Company sold 757,000 carats and recognized revenue of $34,020 at an average realized value of $45 per carat (US$33) compared to sales in the second quarter of 2019 totaling 1,077,000 carats and recognized revenue of $95,774 at an average realized value of $89 per carat (US$67). The initial sale in Q2 2020 did not reflect a normal, run of mine mix as they contained a lower proportion of larger, higher value diamonds which were accelerated into earlier sales to maximize revenue in Q1 2020. Further, diamonds larger than 10.8 carats recovered during the quarter were not included in any sales. |
| · | Mining of waste and ore in the 5034, Hearne and Tuzo open pits for the six months ended June 30, 2020 was approximately 11,435,000 tonnes, 4,605,000 tonnes and 153,000 tonnes, respectively, for a total of 16,193,000 tonnes. This represents a 21% decrease in tonnes mined over the comparative period in 2019. Ore mined for the first half of the year totaled 1,557,000 tonnes, with approximately 96,000 tonnes of ore stockpile available at quarter end on a 100% basis. For the comparative six months ended June 30, 2019, ore mined totaled 1,352,000 tonnes, with approximately 160,000 tonnes of ore stockpile on a 100% basis. |
| · | For the six months ended June 30, 2020, the GK Mine treated approximately 1,689,000 tonnes of ore and recovered approximately 3,202,000 carats on a 100% basis for an average recovered grade of approximately 1.90 carats per tonne (“cpt”). For the comparative six months ended June 30, 2019, the GK Mine treated approximately 1,753,000 tonnes of ore and recovered approximately 3,315,000 carats on a 100% basis for an average recovered grade of approximately 1.89 cpt. The average grade for the six months ended June 30, 2020, was consistent with the same period in 2019. |
Page | 3
| · | Cash costs of production, including capitalized stripping costs, for the three months ended June 30, 2020 were $125 per tonne, and $63 per carat recovered. Cash cost of production, including capitalized stripping costs, for the six months ended June 30, 2020 were $103 per tonne and $54 per carat recovered (cash costs of production per tonne and per carat are not defined under IFRS and may not be comparable to similar measures presented by other issuers; refer to the Non-IFRS Measures section). The cost improvements in the six months period ended June 30, 2020 compared to the same period last year are mainly attributable to volumes of ore treated and stockpile management, lower fuel charges and lower maintenance costs. |
| · | On June 18, 2020, the Company provided revised guidance for 2020 for the Gahcho Kué Mine (see 2020 Production Outlook section below). |
The following table summarizes key operating highlights for the three and six months ended June 30, 2020 and 2019.
| Three months ended | Three months ended | Six months ended | Six months ended | |||||||||||||||
| June 30, 2020 | June 30, 2019 | June 30, 2020 | June 30, 2019 | |||||||||||||||
| GK operating data | ||||||||||||||||||
| Mining | ||||||||||||||||||
| *Ore tonnes mined | kilo tonnes | 527 | 747 | 1,557 | 1,352 | |||||||||||||
| *Waste tonnes mined | kilo tonnes | 6,309 | 10,118 | 14,636 | 19,041 | |||||||||||||
| *Total tonnes mined | kilo tonnes | 6,836 | 10,865 | 16,193 | 20,393 | |||||||||||||
| *Ore in stockpile | kilo tonnes | 96 | 160 | 96 | 160 | |||||||||||||
| Processing | ||||||||||||||||||
| *Ore tonnes treated | kilo tonnes | 786 | 882 | 1,689 | 1,753 | |||||||||||||
| *Average plant throughput | tonnes per day | 8,733 | 9,800 | 9,130 | 9,632 | |||||||||||||
| *Average plant grade | carats per tonne | 1.97 | 1.96 | 1.90 | 1.89 | |||||||||||||
| *Diamonds recovered | 000's carats | 1,547 | 1,730 | 3,202 | 3,315 | |||||||||||||
| Approximate diamonds recovered - Mountain Province | 000's carats | 758 | 848 | 1,569 | 1,624 | |||||||||||||
| Cash costs of production per tonne, net of capitalized stripping ** | $ | 105 | 86 | 92 | 90 | |||||||||||||
| Cash costs of production per tonne of ore, including capitalized stripping** | $ | 125 | 106 | 103 | 109 | |||||||||||||
| Cash costs of production per carat recovered, net of capitalized stripping** | $ | 53 | 44 | 48 | 48 | |||||||||||||
| Cash costs of production per carat recovered, including capitalized stripping** | $ | 63 | 54 | 54 | 57 | |||||||||||||
| Sales | ||||||||||||||||||
| Approximate diamonds sold - Mountain Province*** | 000's carats | 757 | 1,077 | 1,416 | 1,721 | |||||||||||||
| Average diamond sales price per carat | US | $ | 33 | $ | 67 | $ | 52 | $ | 68 | |||||||||
COMPANY OVERVIEW
Mountain Province is a Canadian-based resource company listed on the Toronto Stock Exchange under the symbol ‘MPVD’. The Company’s registered office and its principal place of business is 161 Bay Street, Suite 1410, P.O. Box 216, Toronto, ON, Canada, M5J 2S1. The Company, through its wholly owned subsidiaries 2435572 Ontario Inc. and 2435386 Ontario Inc., holds a 49% interest in the Gahcho Kué diamond mine (the “GK Mine”), located in the Northwest Territories of Canada. De Beers Canada Inc. (“De Beers” or the “Operator”) holds the remaining 51% interest. The Joint Arrangement between the Company and De Beers is governed by the 2009 amended and restated Joint Venture Agreement.
The Company’s primary assets are its aforementioned 49% interest in the GK Mine and 100% owned Kennady North Project (“KNP”).
The Company’s strategy is to mine and sell its 49% share of rough diamonds at the highest price on the day of the close of the sale. Despite the impact of the COVID-19 pandemic, the Company’s long-term view of the rough diamond market remains positive, based on the outlook for a tightening rough diamond supply and growing demand, particularly in developing markets such as China and India, resulting in real, long term price growth. The Company also expects to build value through further exploration and development of the Kennady North Project which covers properties adjacent to the GK Mine.
GAHCHO KUÉ DIAMOND MINE
Gahcho Kué Joint Venture Agreement
The GK Mine is located in the Northwest Territories, approximately 300 kilometers northeast of Yellowknife. The mine covers 10,353 hectares, and encompasses four mining leases (numbers 4341, 4199, 4200, and 4201) held in trust by the Operator. The Project hosts four primary kimberlite bodies – 5034, Hearne, Tuzo and Tesla. The four main kimberlite bodies are within two kilometers of each other.
Page | 4
The GK Mine is an unincorporated Joint Arrangement between De Beers (51%) and Mountain Province (49%) through its wholly owned subsidiaries. The Company accounts for the mine as a joint operation in accordance with International Financial Reporting Standard 11, Joint Arrangements. Mountain Province through its subsidiaries holds an undivided 49% ownership interest in the assets, liabilities and expenses of the GK Mine.
Between 2014 and 2018, the Company and De Beers signed agreements allowing the Operator to utilize De Beers’ credit facilities to issue reclamation and restoration security deposits to the federal and territorial governments. In accordance with these agreements, the Company agreed to a 3% fee annually for their share of the letters of credit issued. As at June 30, 2020, the Company’s share of the letters of credit issued were $23.3 million (December 31, 2019 - $23.3 million).
During the period ended June 30, 2020, the Company and De Beers signed an agreement to reduce the fee from 3% to 0.3%, annually, for their share of the letters of credit issued. Furthermore, on the same day, a resolution was passed by the joint venture management committee to establish a decommissioning fund, where the Company will fund $15 million in 2020, and $10 annually million for four years thereafter until the Company’s 49% share totaling $55 million is fully funded. The targeting funding over time will increase, dependent on future increases to the decommissioning and restoration liability.
Mining and Processing
For the three and six months ended June 30, 2020, on a 100% basis, a total of 6.8 million and 16.2 million tonnes of waste and ore had been extracted from the 5034, Hearne and Tuzo open pits, compared to the original three and six months ended June 30, 2020 planned production of approximately 11.1 million and 21.2 million tonnes, respectively (62% and 76% of plan respectively). The lower mining efficiency was as a result of the mining changes implemented to reduce costs amid the COVID-19 pandemic as well as personnel shortages which were particularly acute from March to May 2020. For the three and six months ended June 30, 2019, a total of 10.9 million and 20.4 million tonnes of waste and ore had been extracted from the 5034 and Hearne open pit, compared to an original plan of approximately 12.0 million and 22.5 million tonnes, respectively (91% and 91% of plan respectively), as a result of harsher weather conditions than normal and higher waste cycle.
Total ore tonnes mined in the three and six months ended June 30, 2020 were 527,000 tonnes and 1,557,000 tonnes compared to 747,000 tonnes and 1,352,000 tonnes for the same periods in 2019. The total ore tonnes mined were higher than the comparative Q2 period due to revised scheduling and ore availability.
For the three and six months ended June 30, 2020, 786,000 tonnes and 1,689,000 tonnes of kimberlite ore were treated (compared to an original plan of 833,000 tonnes and 1,712,000 tonnes), with 1,547,000 carats and 3,202,000 carats (100% basis) recovered, at a grade of 1.97 carats per tonne and 1.90 carats per tonne respectively. For the three and six months ended June 30, 2019, 882,000 tonnes and 1,753,000 tonnes of kimberlite ore were treated, with 1,730,000 carats and 3,315,000 carats recovered, at a grade of 1.96 carats per tonne and 1.89 carats per tonne respectively. The average grade for the three and six months ended June 30, 2020, was consistent with the same period in 2019.
The plant treated 786,000 tonnes and produced over 1,547,000 carats in Q2 2020, 11% lower than the same period last year due mainly to ore availability and planned scheduling due to COVID-19 pandemic.
At June 30, 2020, there was approximately 96,000 tonnes (100% basis) of stockpiled ore. Sufficient ore is available from the stockpile and 5034 and Hearne pits to meet the planned process throughput rates for 2020.
At June 30, 2020, the GK Mine had 941,246 carats on a 100% basis in rough diamond inventory at the GK Mine and at the sorting facility in Yellowknife. The Company had 595,375 carats within its sale preparation channel plus its share of carats at the GK Mine and sorting facility for a total of 1,056,693 carats in inventory. The Company recorded a $17 million write-down to reduce the carrying value of rough diamond inventory and ore stockpile inventory held at June 30, 2020 as described in note 6 to the financial statements.
Page | 5
Diamond Sales
The Company undertook two sales during the first quarter of 2020 in Antwerp, Belgium and one sale to Dunebridge Worldwide Ltd. (“Dunebridge”) in the second quarter of 2020 (Please refer to note 16 of the financial statements). The majority of the Company’s revenue prior to COVID-19 was derived from its sales on the open market, with the remainder attributed to sales of fancies and specials directly to De Beers. The average realized value per carat for all sales held in the six months ended June 30, 2020 was US$52 per carat. The average realized value per carat for all sales held for the six months ended June 30, 2019 was US$68 per carat.
The following chart summarizes the sales for the trailing eight quarters:

*Although the final sale in this quarter closed on September 27, 2019, the sale of 159,000 carats occurred during October for IFRS purposes. The amount of revenue recognized in October for the 159,000 carats was approximately US$13.0 million or $17.1 million.
Page | 6
The following table summarizes the results of sales in 2020:
| 000's of carats sold | Gross proceeds (US$ 000's) | Revenue/carat (US$) | |||
| Q1 | 659 | $ 49,220 | $ 75 | ||
| Q2 | 757 | $ 25,003 | $ 33 | ||
| Total | 1,416 | $ 74,223 | $ 52 |
The following table summarizes the results for sales in 2019:
| 000's of carats sold | Gross proceeds (US$ 000's) | Revenue/carat (US$) | |||
| Q1 | 644 | $ 45,810 | $ 71 | ||
| Q2 | 1,077 | $ 71,712 | $ 67 | ||
| Q3(1) | 950 | $ 54,559 | $ 57 | ||
| Q4 | 613 | $ 36,165 | $ 59 | ||
| Total | 3,284 | $ 208,246 | $ 63 |
Note: Sales made directly to De Beers are attributed to the closest sale.
(1) Although 950,000 carats were successfully sold, in accordance with IFRS only 791,000 carats could be recognized as sales proceeds in the quarter. The remaining 159,000 carats were recognized in Q4 2019. The amount of revenue recognized for the 159,000 carats was approximately US$13.0 million or $17.1 million.
During the period ended June 30, 2020, the Company entered into an agreement to sell US$50 million of diamonds to Dunebridge Worldwide Ltd. (Please refer to note 16 of the financial statements). The first sale for US$22.56 million occurred on June 11, 2020.
The transaction with Dunebridge will permit the Company to sell its run of mine diamonds (below 10.8 carats) at the estimated prevailing market price at the time of each sale. The transaction will also allow the Company to participate, after fees and expenses in a portion of any increase in the value of the diamonds realized by Dunebridge upon its future sale of the diamonds to a third party.
After three successful years of sales, the Gahcho Kué goods are firmly established in the market. The Company held two sales during the first quarter of 2020 that were well attended by customers and enabled the Company to maximize revenue and sell 100% of its share of Gahcho Kué production prior to the COVID-19 pandemic. The Company has not held a regular sale since February of 2020 due to COVID-19.
The Gahcho Kué orebodies and product profiles are complex, producing a broad range of white commercial goods together with a consistent supply of exceptional, high value, gem quality diamonds as well as large volumes of small and brown diamonds. The Gahcho Kué product also exhibits varying degrees of fluorescence for which the Company has attracted specialist customers who are developing strategies to market this characteristic.
The Company’s diamonds have established a strong market and customer base. With the exception of some industrials, the majority of the Company’s diamonds are sold into market segments that cut and polish the rough, with resultant polished destined for the major diamond jewellery markets of the US, India and China.
Having transitioned from an explorer and mine developer into a diamond marketer, the Company is in early stage development of a diamond marketing brand that promotes the unique attributes of our diamonds to support demand through their distribution channels with the potential to reach the consumer level.
Given the complexities of the Gahcho Kué rough diamond product profile and the nature of the Joint Venture’s production splitting process, the mix of diamond categories present in an individual sale may differ. Each sale’s results can and do vary.
Page | 7
2020 Production Outlook
The Company withdrew its original guidance for 2020 in March due to the impact of the COVID-19 pandemic. On June 18, 2020, the Company provided revised guidance for 2020.
2020 Revised Guidance: (all figures quoted on a 100% basis)
• 37 – 39 million total tonnes mined (ore and waste), adjusted from previous guidance of 42 – 43 million tonnes
• 3.3 – 3.4 million ore tonnes mined, unchanged from previous guidance
• 3.3 – 3.4 million ore tonnes treated, unchanged from previous guidance
• 6.3 – 6.4 million carats recovered, adjusted from previous guidance of 6.75 – 6.95 million carats
• All in cash costs of $100 - $110 per tonne treated, adjusted from previous guidance of $105 – $115 per tonne treated
• All in cash costs of $50 – $55 per carat recovered, unchanged from previous guidance
• Sustaining Capital Expenditure of $21 million, in comparison to $26.5 million of Capital Expenditure previously forecast.
The revised production guidance reflects the challenges of COVID-19 pandemic and the impact on operations and logistics at the Gahcho Kué Mine, and the necessity to implement changes to operating policies and procedures to minimize the risk of infection. These changes included protecting the workforce by isolating vulnerable employees, implementing travel restrictions to and from the mine, revising health and safety protocols, including on site self-isolation, social distancing, and ongoing testing of all employees. The new operating parameters have impacted the ability to utilize the mining fleet at full capacity, which has had a direct impact on the 2020 mine plan.
The carats recovered forecast for 2020 has been reduced due to lower recovered grades than modelled in small local sections of the Hearne and 5034 kimberlite orebodies, and necessary changes to the mining sequence as a result of COVID-19 related workforce reductions. This has resulted in partial deferral of higher-grade ore blocks into 2021. Despite all these challenges, and considering an ongoing global epidemic, the Company and its JV Partner De Beers Canada Inc. are pleased that the Gahcho Kué Mine continues to operate.
The rapid spread of COVID-19 around the globe, and accompanying restrictions on mobility, pose a potential risk and disruption to mine operations. The Company, along with De Beers Canada Inc, in consultation with the Government of the Northwest Territories, have taken all the necessary precautions to ensure the safest working environment possible for all employees and contractors across all working sites and offices. In addition, work from home policies, where applicable, have been implemented. We have halted all long-term, non-core capital and exploration projects to reduce foot traffic and travel to and from site. We have also changed our crew to further reduce frequency of travel. Furthermore, we continue to follow public health guidelines for COVID-19, such as physical distancing protocols to the best of our abilities.
Diamond Outlook
Sentiment in the rough diamond market became slightly more optimistic towards the end of 2019 and remained relatively positive during the first selling cycle of 2020. However, the rapid global spread of COVID-19 has reversed that momentum coincident with the surge in volatility in global economies and capital markets. Though the full extent of the impact of COVID-19 is still unknown at the moment, the Company believes, that like many other businesses, COVID-19 will have a material impact on 2020 sales.
The sweeping global public health measures and travel restrictions and resultant economic turmoil of the COVID-19 pandemic continue to have an enormous impact on the physical and financial flows of the global diamond value chain. Rough diamond production, rough diamond sales, polished diamond manufacturing, jewellery manufacturing and retail sales of diamond jewellery have all been severely impacted.
In January, China’s swift implementation of social distancing and self-isolation measures effectively annulled Chinese New Year jewellery sales and Chinese polished diamond manufacturing capacity closed. These events created great uncertainty through the diamond industry as Chinese orders and associated liquidity evaporated overnight.
Page | 8
After the global lockdown started in mid-March, the rough diamond market was at a virtual standstill for three months. Some rough diamond producers conducted a small number of heavily discounted sales during the second quarter in Antwerp, Belgium. Market reports indicate some of these sales achieved prices on a like-for-like basis as much as 30% below a pre-COVID baseline.
After a closure of several months, activity has slowly resumed in India’s polished diamond manufacturing hub, the world’s largest. Some factories in smaller cutting centres are now operating at limited capacity. However, the country’s rising incidence of coronavirus cases is hampering a more robust re-opening, as is the extension, to the end of July, of India’s voluntary rough import ban designed to restrict the volume of rough entering the country. Polishing factories are believed to have approximately two months of rough stock. Ultimately the measures introduced will help to reduce the polish imbalance and return the pipeline to a more balanced state which will be good for the industry.
2020 production guidance from the major diamond producers has been revised down. Several smaller producers have severely curtailed production or put their mines on indefinite care and maintenance. Customers contracted to purchase from the majors have been offered the flexibility to defer their purchases until later in the year. Most independent producers that can afford to are either holding stock and or opting to temporarily halt production until market conditions and demand levels improve.
A number of small to medium-size producers held sales in June which provided insight into current rough market prices. While some specific product segments saw small price improvements, overall rough market prices remain depressed. While it is certain 2020 rough sales will be significantly down on previous years, it is too early to speculate when normal sales levels will return. The industry is anticipating improved levels of rough market activity after the European summer.
Consumer demand for diamonds is showing encouraging signs of resilience through the pandemic. While revenue will inevitably be down year on year, larger retailers in the US and China are reporting healthy levels of in-store and online sales as levels of trading gradually increase. In June, Chow Tai Fook noted signs of recovery in mainland China with its retail sales down only 3% in April-May. Tiffany & Co. reported “robust recovery” in mainland China, with retail sales up 30% year on year in April and 90% in May.
The Company maintains a positive long-term outlook for its Gahcho Kué diamonds. Rough diamond supply is expected to be significantly curtailed, which has in the past supported price recovery. With the expected closure of the Argyle mine at the end of this year, an increase in demand for cheaper goods is anticipated in 2021. Due to lower absolute price points, cheaper goods have historically been used as a cheaper input for opening up factories and could see an associated increase in demand in the medium term. In the past, these demand increases have been accompanied by increases in price.
Gahcho Kué Capital Program
During the six months ended June 30, 2020, stay in business capital items included process plant upgrades, generator upgrades and repairs, and other general infrastructure. All capital additions in the period are considered sustaining capital expenditure, and were largely on budget. Stay in business capital does not include capital waste stripping.
Gahcho KuÉ EXPLORATION
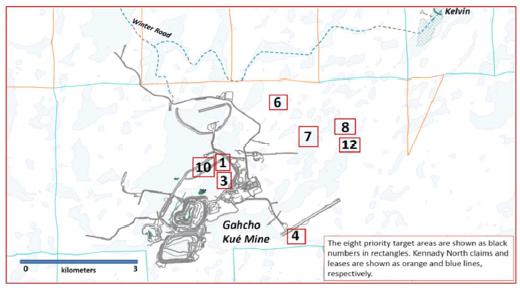
Exploration for the past six months included a winter program of geophysical exploration that prioritized 13 targets, of which only two were drill-tested as the program was shortened due to the COVID-19 pandemic. Two drillholes were completed each on targets 8 and 12 for a program total of 549 meters, with no kimberlite encountered. The drilling results are being used to reassess the remaining priority target areas, which are shown on the map below. Further details of the winter program are available in the Company news release of June 18, 2020.
Page | 9
KENNADY NORTH PROJECT EXPLORATION
The Kennady North Project includes 22 federal leases and 97 claims covering an area of 106,202 hectares that surround the Gahcho Kué Mine on all sides. The project area has increased by 60% due to staking conducted in April 2020 over areas east of the property and the Gahcho Kué Mine. Kennady North has five known kimberlites; Kelvin, Faraday 2, Faraday 1-3, MZ, and Doyle. Significant diamond sampling and drilling programs between 2014 and 2018, resulted in the estimation of resources for the Kelvin and Faraday bodies. The map below shows the location of the claims, leases, and kimberlites relative to the Gahcho Kué Mine.
Winter geotechnical drilling at Kennady North was also terminated early due to the COVID-19 pandemic, with only one drillhole completed through the southeast end of Kelvin. Downhole physical data collected along the length of the 200m drillhole will be used to advance the modeling of the Kelvin kimberlite. Related data for the modeling included bathymetry surveys over several of the smaller lakes near the kimberlites. A brief exploration OhmMapper resistivity survey was also completed over a combined indicator-geophysical target located 1.5 kilometers to the east and up-ice of Faraday 2.
In January, the Company engaged Hayward CSR Strategies Inc. (HCSR; Yellowknife, NT) to aid in advancing the Kennady North Assets. Dr. April Hayward, Vice President Kennady North Project Sustainable Development, oversaw a program of fish connectivity and hydrology data collection during the June freshet period. The program was conducted in combination with similar work at Gahcho Kué in order to optimize sharing of personnel and equipment. Kennady has also reached out to local indigenous communities to provide updates on the project and offer the possibility of continuing to meet regularly by virtual means during the COVID-19 lockdown.
Page | 10

The Kennady Assets include both an Indicated Resource for the Kelvin kimberlite and Inferred Resources for the Faraday kimberlites. Geological model domains for the Kelvin, Faraday 2 and Faraday 1-3 kimberlites were adopted as the resource domains for the estimation of Mineral Resources. The volumes of these domains were combined with estimates of bulk density to derive tonnage estimates. Bulk sampling programs using large diameter RC drilling were conducted to obtain grade and value information. Microdiamond data from drill core were used to forecast grades for the different kimberlite lithologies. Details of the modeling are available in NI 43-101 Compliant Technical Reports (filed in 2016 and 2017 under Kennady Diamonds Inc.) and the NI43-101 Compliant Technical Report filed April 11, 2019 under Mountain Province Diamonds. All reports are available at www.sedar.com. Details for the estimated resources are provided in the table below.
Mineral Resource Estimates for the Kelvin and Faraday Kimberlites (as of February 2019 as referenced in the April 11, 2019 NI43-101 Compliant Technical Report)
| Resource | Classification | Tonnes (Mt) | Carats (Mct) | Grade (cpt) | Value (US$/ct) |
| Kelvin | Indicated | 8.50 | 13.62 | 1.60 | $63 |
| Faraday 2 | Inferred | 2.07 | 5.45 | 2.63 | $140 |
| Faraday 1-3 | Inferred | 1.87 | 1.90 | 1.04 | $75 |
| (1) | Mineral Resources are reported at a bottom cut-off of 1.0mm. Incidental diamonds are not incorporated into grade calculations. |
| (2) | Mineral Resources are not Mineral Reserves and do not have demonstrated economic viability. |
Results of operations
The Company, as discussed above, held three diamond sales during the six months ended June 30, 2020.
Page | 11
Quarterly financial information for the past eight quarters is shown in Table 1.
SUMMARY OF QUARTERLY RESULTS
| Table 1 - Quarterly Financial Data Expressed in thousands of Canadian dollars | |||||
| Three months ended | |||||
| June 30 | March 31 | December 31 | September 30 | ||
| 2020 | 2020 | 2019 | 2019 | ||
| Earnings and Cash Flow | |||||
| Number of sales | 1 | 2 | 2 | 3 | |
| Sales | $ | 34,020 | 65,430 | 65,032 | 54,832 |
| Impairment loss on property, plant and equipment | $ | - | - | (115,753) | - |
| Operating (loss) income | $ | (35,760) | 7,502 | (118,104) | (11,149) |
| Net (loss) income for the period | $ | (26,762) | (40,969) | (115,725) | (25,785) |
| Basic and diluted (loss) earnings per share | $ | (0.13) | (0.19) | (0.55) | (0.12) |
| Adjusted EBITDA* | $ | (23,894) | 22,825 | 17,648 | 10,583 |
| Cash flow provided by (used in) operating activities | $ | (21,941) | 1,176 | 28,307 | 13,858 |
| Cash flow provided by (used in) investing activities | $ | (10,452) | (5,166) | (5,327) | (2,012) |
| Cash flow provided by (used in) financing activities | $ | 17,462 | (349) | (16,388) | (13,839) |
| Balance Sheet | |||||
| Total assets | $ | 795,789 | 842,332 | 822,695 | 953,325 |
*Adjusted EBITDA is not defined under IFRS and therefore may not be comparable to similar measures presented by other issuers; refer to the Non-IFRS Measures section.
| Three months ended | |||||
| June 30 | March 31 | December 31 | September 30 | ||
| 2019 | 2019 | 2018 | 2018 | ||
| Earnings and Cash Flow | |||||
| Number of sales | 3 | 2 | 3 | 2 | |
| Sales | $ | 95,774 | 60,696 | 70,477 | 74,852 |
| Operating income | $ | 12,762 | 3,639 | 7,144 | 19,952 |
| Net income (loss) for the period | $ | 10,255 | 2,497 | (30,204) | 17,483 |
| Basic and diluted (loss) earnings per share | $ | 0.05 | 0.01 | (0.15) | 0.08 |
| Adjusted EBITDA* | $ | 39,096 | 19,728 | 26,512 | 37,948 |
| Cash flow provided by (used in) operating activities | $ | 46,079 | (8,880) | 41,818 | 33,319 |
| Cash flow provided by (used in) investing activities | $ | (9,915) | (10,320) | (14,915) | (10,175) |
| Cash flow provided by (used in) financing activities | $ | (17,019) | (233) | (23,398) | (29,017) |
| Balance Sheet | |||||
| Total assets | $ | 973,606 | 993,390 | 979,877 | 969,245 |
*Adjusted EBITDA is not defined under IFRS and therefore may not be comparable to similar measures presented by other issuers; refer to the Non-IFRS Measures section.
The Company typically holds ten sales per year in Antwerp, Belgium, and has typically alternated between two and three sales per quarter over the past two years. During the three months ended June 30, 2020, the Company was not able to carry out its formal sales process in Antwerp, due to the COVID-19 pandemic, and as a result held one sale to Dunebridge. As a result of the pandemic, the demand for diamonds had been significantly reduced in the period, and the Company’s average realized sales price was much lower than previous quarters, resulting in a loss from mine operations, and operating and net loss. For the three months ended March 31, 2020, the Company began to experience the impact of the global pandemic of COVID-19 and in March halted the previously scheduled sale that was in progress. Despite the third sale not being complete, the Company experienced strong sales and operating income for the three months ended March 31, 2020. Typically, quarters with three sales have resulted in higher overall sales and operating income levels. Both the three months ended September 30, 2019 and December 31, 2019 resulted in an operating loss due to lower realized diamond prices. The lower prices realized year-on-year were affected by three factors; the source of the diamonds from varying parts of the orebody (mostly lower value areas of Hearne and SWC Kimberlites in 2019 versus 5034 in 2018), lower quality material processed during Q2 and Q3 2019, and the overall sentiment in the rough diamond market and associated pressure on prices of lower quality and smaller stones. The operating income in the three months ended June 30, 2019 is consistent with the same period in 2018. The operating income of $7,144 in the three months ended December 31, 2018 is lower than a typical three sale quarter as a result of product mix and a lower than expected volume of carats sold due to timing in the sales distribution channel.
Page | 12
summary of SECOND Quarter Financial Results
Three and six months ended June 30, 2020 compared to the three and six months ended June 30, 2019, expressed in thousands of Canadian dollars.
For the three months ended June 30, 2020, the Company recorded a net loss of $26,762 or $0.13 loss per share compared to a net income of $10,255 or $0.05 earnings per share for the same period in 2019. For the six months ended June 30, 2020, the Company recorded net loss of $67,731 or $0.32 loss per share compared to net income of $12,752 or $0.06 earnings per share for the same period in 2019. The significant increase in the net loss for the three and six months ended June 30, 2020 compared to the same periods in 2019 can largely be attributed to the loss from mine operations. See below for the explanations for loss from mine operations.
(Loss) earnings from mine operations
Loss from mine operations for the three and six months ended June 30, 2020, were $35,760 and $22,133 compared to earnings from mine operations of $17,799 and $27,959 for the same periods in 2019. For the three months ended June 30, 2020, the Company sold 757,000 carats for proceeds of $34,020 with diamond sales value per carat of US$33 (2019 – 1,077,000 carats for $95,774 at US$67 per carat). The majority of these diamonds were sold to Dunebridge Worldwide Ltd (Please refer to note 16 of the financial statements). For the six months ended June 30, 2020, the Company sold 1,416,000 carats for proceeds of $99,450 (2019 – 1,721,000 carats for $156,470 at US$68 per carat). The significantly lower prices realized compared to the same periods in 2019 were affected by the overall sentiment and demand in the rough diamond market as a result of the COVID-19 pandemic.
Production costs (net of capitalized stripping costs) related to diamonds sold for the three and six months ended June 30, 2020 were $54,019 and $84,633; depreciation and depletion on the GK Mine commissioned assets related to diamonds sold for the three and six months ended June 30, 2020, were $15,761 and $30,464; and the cost of acquired diamonds for the three and six months ended June 30, 2020 were $nil and $6,486, which had been previously paid to De Beers when winning the periodic fancies and specials bids. Resultant loss from mine operations for the three and six months ended June 30, 2020 were $35,760 and $22,133. Production costs (net of capitalized stripping costs) related to diamonds sold for the three and six months ended June 30, 2019 were $48,706 and $77,492; depreciation and depletion on the GK Mine commissioned assets related to diamonds sold for the three and six months ended June 30, 2019 were $26,592 and $42,391; and the cost of acquired diamonds for the three and six months ended June 30, 2019 were $2,677 and $8,628. The significant increase in production costs for the three and six months ended June 30, 2020, over the same period in 2019, is primarily due to the net realizable value adjustment of $17 million that was recognized against the value of rough diamond inventory and ore stockpile which was included in production costs. The write-down is included in the cost of sales in the statement of comprehensive (loss) income.
Selling, general and administrative expenses
Selling, general and administrative expenses for the three and six months ended June 30, 2020, were $2,650 and $6,287 compared to $3,141 and $6,040 for the same periods in 2019. The main expenses included in these amounts for the three and six months ended June 30, 2020 were $591 and $2,119 relating to selling and marketing, $414 and $930 related to consulting fees and payroll, $276 and $567 relating to share-based payment expense, and $966 and $1,544 related to professional fees. The main expenses included in these amounts for the three and six months ended June 30, 2019 were $1,658 and $2,950 relating to selling and marketing, $416 and $1,065 related to consulting fees and payroll, $263 and $482 relating to share-based payment expense, and $237 and $457 related to professional fees. The increase in overall selling, general and administrative costs can mainly be attributed to an increase to the professional fees, offset by a reduction in selling and marketing expenses. The professional fees increase can be attributed to the completion of technical reports for 43-101 purposes, additional diamond valuation engagements, and significantly more legal fees and other professional fees related to the Dunebridge sales agreement, and the revolving credit facility amendments and waivers. The reduction of selling and marketing expenses can be attributed to the pause of the formal sales process in Antwerp.
Page | 13
Exploration and evaluation expenses
Exploration and evaluation expenses for the three and six months ended June 30, 2020, were $548 and $3,036 compared to $1,896 and $5,518 for the same periods in 2019. Exploration and evaluation expenses have decreased for the three and six months ended June 30, 2020 compared to the same periods in 2019 as targeted exploration was budgeted to be cash flow conscious. Furthermore, at the onset of the COVID-19 pandemic exploration activities were curtailed in order to conserve cash in the near-term. Of the $3,036 total exploration and evaluation expenses incurred in the six months ended June 30, 2020, $912 is related to the Company’s 49% share of the exploration and evaluation expenses on the GK Mine, while the remaining $2,124 related to those spent on the KNP. Of the $5,518 total exploration and evaluation expenses incurred in the six months ended June 30, 2019, $2,054 is related to the Company’s 49% share of the exploration and evaluation expenses on the GK Mine, while the remaining $3,464 related to those spent on the KNP.
Net finance expenses
Net finance expenses for the three and six months ended June 30, 2020, were $9,983 and $20,270 compared to $9,584 and $19,372 for the same periods in 2019. Included in the amount for the three and six months ended June 30, 2020, were $9,662 and $19,686 relating to finance costs, $354 and $709 relating to accretion expense on decommissioning liability and $33 and $125 relating to interest income. Included in the amount for the three and six months ended June 30, 2019, were $9,432 and $19,031, respectively, relating to finance costs, $299 and $598 relating to accretion expense on decommissioning liability and $147 and $257 relating to interest income. Finance costs were slightly higher compared to the same period in 2019 as the majority relates to interest expense over the secured notes payable, as well as the additional interest expense incurred on the US$25 million drawdown from the RCF during the period. Although there have been further secured notes repurchases since June 30, 2019, that decrease in interest expense has been offset by a significantly higher foreign exchange rate on the US denominated interest expenses.
Foreign exchange gains (losses)
Foreign exchange gains for the three months ended June 30, 2020 were $13,405 and foreign exchange losses for the six months ended June 30, 2020 were $17,407 compared to foreign exchange gains of $7,535 and $16,182 for the same periods in 2019. The foreign exchange gains for the three months ended June 30, 2020 were as a result of the Canadian dollar strengthening relative to the US dollar on the translation of the secured notes payable and revolving credit facility, net of US dollar cash balances. The foreign exchange losses for the six months ended June 30, 2020 were as a result of the Canadian dollar weakening relative to the US dollar on the translation of the secured notes payable and revolving credit facility, net of US dollar cash balances. The spot rate at June 30, 2020 was $1.3576/US$1 compared to $1.4062/US$1 at March 31, 2020 and to $1.2978/US$1 at December 31, 2019. The Company experienced the Canadian dollar strengthening relative to the US dollar on the translation of the secured notes payable, net of US dollar cash balances, in the three and six months ended June 30, 2019.
INCOME AND MINING TAXES
The Company is subject to income and mining taxes in Canada with the statutory income tax rate at 26.5%.
No deferred tax asset has been recorded in the financial statements as a result of the uncertainty associated with the ultimate realization of these tax assets.
The Company is subject to assessment by Canadian authorities, which may interpret tax legislation in a manner different from the Company. These differences may affect the final amount or the timing of the payment of taxes. When such differences arise, the Company makes provision for such items based on management’s best estimate of the final outcome of these matters.
Page | 14
The Company’s current tax expenses are associated with mining royalty taxes in the Northwest Territories. There are no other current tax expenses for income tax purposes, as there are significant losses carried forward that are available to offset current taxable income.
FINANCIAL POSITION AND LIQUIDITY
The Company originally funded its share of the construction and commissioning costs of the GK Mine through a combination of equity and a project lending facility (the previous “Loan Facility”). In December 2017, the Company terminated its previous Loan Facility through the issuance of US$330 million in second lien secured notes payable. Concurrent with the closing of the secured notes payable, the Company entered into a US$50 million first lien revolving credit facility with Scotiabank and Nedbank Ltd. in order to maintain a liquidity cushion for general corporate purposes. The RCF has a term of three years.
As at June 30, 2020, the Company was not in compliance with the Revolving Credit Facility (“RCF”) financial covenants, resulting in a breach of provision under the terms of the secured notes payable. At the end of the reporting period, the Company does not have an unconditional right to defer its settlement of the secured notes payable for at least twelve months and has classified the liability as current.
As a result of the Waiver being obtained within 30 days after the RCF event of default, the acceleration of the secured notes payable was automatically annulled and the secured notes were subsequently reclassified to long-term on July 3, 2020.
The RCF is subject to a quarterly commitment fee between 0.9625% and 1.2375%, depending on certain leverage ratio calculations at the time. Upon drawing on the RCF, an interest rate of LIBOR plus 2.5% to 4.5% per annum is charged for the number of days the funds are outstanding, based on certain leverage ratio calculations at the time.
As at June 30, 2020, the Company had drawn US$25 million from the RCF in order to maintain the liquidity of the business during the challenges faced by COVID-19. The RCF was subject to several financial covenants, in order to remain available. The following financial covenants are calculated on a quarterly basis, of which the first three are required to be met, in order for the RCF to remain available:
- Total leverage ratio of less than or equal to 4.50:1 calculated as total debt divided by EBITDA, up to and including March 31, 2020; 5:1 from April 1, 2020 up to and including June 30, 2020; and 4.25 thereafter until the maturity date. EBITDA in the RCF is defined as net earnings, plus, but only to the extent deducted in calculating net earnings (i) interest, (ii) income taxes, (iii) depreciation, non-cash expenses and losses, and (iv) amortization, excluding however any unusual items.
- A ratio of EBITDA to interest expense no less than 2.25:1
- A tangible net worth that is no less than 75% of the tangible net worth as reflected in the September 30, 2017 financial statements provided to the administrative agent as a condition precedent to closing, plus 50% of the positive net income for each subsequent quarter date.
| · | The Company shall not make any distributions other than regularly scheduled payments of interest and principal related to the secured notes payable. |
| · | From June 11, 2020 onward, the Company must maintain a minimum cash balance of the next four cash calls to the operator of the GK Mine. |
As at June 30, 2020, the Company has an obligation for US$25 million or $33.9 million Canadian dollar equivalent from the RCF (December 31, 2019 -US$nil or $nil).
Subsequent to June 30, 2020, the Company entered into a waiver agreement related to the RCF. The Waiver exempts the Company from compliance with financial covenants including the total leverage ratio, EBITDA to interest expense ratio and total net worth tests that it would otherwise have had to satisfy as of June 30, 2020. The Waiver also removes the Company's covenant to maintain a minimum cash balance, described above. In exchange, the Company has agreed to a reduction in the size of the revolving credit facility to US$25 million from US$50 million and the imposition of additional covenants and restrictions. These covenants and restrictions include:
Page | 15
| · | weekly reporting, a covenant with respect to the sale of diamonds and limitations on the payment of bonuses and incentive payments, |
| · | the incurring of indebtedness, |
| · | the dispositions of assets, and |
| · | the incurring of liens. |
Moreover, the Company under the waiver is required to maintain certain performance metrics with respect to net cash flows and expenditures. The performance metrics and weekly reporting requirements are as follows:
| · | the actual net cash flows of the Company for the preceding two-week period or the cumulative period to not be less than eighty percent (80%) of budgeted net cash flows of the Company for the preceding two week period or the cumulative period, as applicable; or |
| · | the actual line item disbursement amount for the preceding two-week period or the cumulative period to not be greater than one hundred twenty percent (120%) of the budgeted line item disbursement amount for the applicable line item for such preceding two-week period or the cumulative period, as applicable. |
The Company must also repay the US$25 million by September 30, 2020, rather than the original maturity date of December 15, 2020. The Waiver contains customary representations and warranties and events of default.
The Company’s condensed consolidated interim financial statements have been prepared using the going concern basis of preparation which assumes that the Company will realize its assets and settle its liabilities in the normal course of business.
The Company experienced operating losses of $38.9 million and $31.4 million for the three and six months ended June 30, 2020 and negative cash flows from operations of $21.9 million and $20.8 million for the same periods. As at June 30, 2020, the Company had a working capital deficit of $330.8 million (December 31, 2019 – working capital of $99.4 million). As of June 30, 2020, in accordance with IAS 1, the Company reclassified the senior secured notes amounting to $398.5 million to current from long-term (see additional discussion below in connection with the subsequent reclassification of the senior secured notes back to the long term on July 3, 2020).
Amid the COVID-19 pandemic, the Company is experiencing liquidity challenges primarily resulting from the deferral of the periodic normal diamond sales carried out in Antwerp, Belgium. While the Company continues to carry out direct sales of diamonds on a limited basis, as well as through an executed contract to sell up to US$50 million of diamonds with Dunebridge (Note 16 of the financial statements), the risk of decreased sales volumes, particularly in the second half of 2020, along with the negative impact on realized diamond prices will significantly reduce 2020 revenues as compared to the 2020 revenues the Company expected prior to the onset of the COVID-19 pandemic. During the three month period ended June 30, 2020, the Company drew US$25 million from its revolving credit facility agreement. The Company is subject to certain financial covenants on its outstanding senior secured notes and RCF, each of which include cross-covenant default terms. As at June 30, 2020, the Company was not in compliance with the RCF financial covenants resulting in a start of a 30 day “cure” period as provided in the indenture agreement for the senior secured notes. On July 3, 2020, the Company obtained an executed waiver agreement to exempt the Company from the covenants in the RCF, resulting in the RCF covenant violations being cured in relation to the senior secured notes as of the same date. In accordance with IFRS, the Company does not have an unconditional right to defer its settlement of the secured notes payable for at least twelve months from June 30, 2020 without obtaining a “cure” to the RCF covenant violations. As such the Company has classified the senior secured notes as a current liability as at June 30, 2020. As a result of the Waiver which was effective on July 3, 2020, cure of the RCF financial covenants resulted in the secured notes payable subsequently being reclassified to long-term on July 3, 2020. In exchange for the Waiver, the Company has agreed to a reduction in the size of the revolving credit facility to US$25 million from US$50 million and the imposition of additional covenants as noted in Note 9 and an acceleration of the maturity date of the outstanding US$25 million to September 30, 2020 from the original maturity date of December 15, 2020, in addition to certain other requirements. The uncertainty that the COVID-19 pandemic has caused over potential diamond sales in the near-term, particularly in the second half of 2020, along with these additional covenants and the need to repay the RCF by September 30, 2020, may result in a future additional event of default under the terms of these debt instruments.
Page | 16
Management may seek alternative sources of financing, however, such alternative sources of financing may not be available or at terms acceptable to the Company. The above conditions related to the diamond industry, the Company’s operations and the Company’s current financing constraints indicate the existence of material uncertainties that results in substantial doubt as to the Company’s ability to continue as a going concern. These financial statements do not include the adjustments to the amounts and classification of assets and liabilities that would be necessary should the Company be unable to continue as a going concern. These adjustments may be material.
Cash flows provided by operating activities, including changes in non-cash working capital for the three and six months ended June 30, 2020, were $21,941 and $20,765 compared cash flows provided of $46,079 and $37,199, for the same periods in 2019. The decrease in cash provided for the three and six months ended June 30, 2020 was a result of the loss from mine operations of $35,760 and $22,133 compared to earnings from mine operations of $17,799 and $27,959 for the same period in 2019. The significant loss from mine operations can be attributed to the direct effects of the COVID-19 pandemic over the demand for diamonds, and as a result, realized diamond prices.
Cash flows used in investing activities for the three and six months ended June 30, 2020, were $10,452 and $15,618 compared to $9,915 and $20,235 for the same periods in 2019. For the three and six months ended June 30, 2020, the outflow for the purchase of property, plant and equipment were $10,485 and $15,743 compared to $10,062 and $20,492 for the same periods in 2019. For the three and six months ended June 30, 2020, the amount of cash used in the acquisition of property, plant and equipment was offset by $33 and $125 of interest income, compared to $147 and $257 for the same period in 2019. The increase of cash used in investing activities during the three months ended June 30, 2020, compared to the same period in 2019, can be attributed to the increased stripping activity in the current period, along with lower interest income as a result of reduced interest rates and lower average cash on hand. The decrease of cash used in investing activities during the six months ended June 30, 2020, compared to the same period in 2019, can be attributed to the decrease in overall stay-in-business capital expenditures.
Cash flows provided by financing activities for the three and six months ended June 30, 2020, were $17,462 and $17,113 compared to cash used of $17,019 and $17,252 for the same periods in 2019. Cash flows provided by financing activities for the three and six months ended June 30, 2020, related to the inflow from the US$25 million drawdown of the RCF ($35,093 Canadian dollar equivalent) offset by interest and stand-by charges on the RCF, the payment of lease liabilities and the payment of the interest on the secured notes payable. Under the terms of the secured notes payable, interest payments occur semi-annually, and as such will typically result in the June and December quarters having significantly higher cash outflows under financing activities. As a result of the RCF drawdown of US$25 million, the June 30, 2020 period resulted in a cash inflow. Cash flows used in financing activities for the three and six months ended June 30, 2019 related to stand-by charges on the RCF, the payment of lease liabilities and the payment of the interest on the secured notes payable.
Off-Balance Sheet Arrangements
The Company has no off-balance sheet arrangements.
SIGNIFICANT ACCOUNTING POLICIES ADOPTED IN THE CURRENT PERIOD
Significant accounting policies adopted in the current year are disclosed in Note 3 of the financial statements.
SIGNIFICANT ACCOUNTING JUDGMENTS, ESTIMATES AND ASSUMPTIONS
Significant accounting judgments, estimates and assumptions are disclosed in Note 4 of the financial statements.
Page | 17
STANDARDS AND AMENDMENTS TO EXISTING STANDARDS
Standards and amendments to existing standards to existing standards are disclosed in Note 4 of the financial statements.
RELATED PARTY TRANSACTIONS
The Company’s related parties include the Operator of the GK Mine, Dermot Desmond, Dunebridge Worldwide Ltd. (“Dunebridge”) and Vertigol Unlimited Company (“Vertigol”) (corporations ultimately beneficially owned by Dermot Desmond), key management and their close family members, and the Company’s directors. Dermot Desmond, indirectly through Vertigol, is the ultimate beneficial owner of greater than 10% of the Company’s shares. Underwriting Unlimited (“IIU”) is also a related party since it is ultimately beneficially owned by Dermot Desmond.
Related party transactions are recorded at their exchange amount, being the amount agreed to by the parties.
The Company had the following transactions and balances with its related parties including key management personnel including the Company’s directors, Dermot Desmond, Dunebridge, Vertigol, IIU and the Operator of the GK Mine. The transactions with key management personnel are in the nature of remuneration. The transactions with the Operator of the GK Mine relate to the funding of the Company’s interest in the GK Mine for the current year’s expenditures, capital additions, management fee, and production sales related to the 49% share of fancies and special diamonds. The transactions with IIU are for the director fees of the Chairman of the Company.
During the period ended June 30, 2020, the Company entered into an agreement to sell up to US$50 million of diamonds to Dunebridge. The agreement permits the Company to sell its run of mine diamonds (below 10.8 carats) at the estimated prevailing market price at the time of each sale. The transaction also allows the Company to participate, after fees and expenses in a portion of any increase in the value of diamonds realized by Dunebridge upon its future sale of diamonds to a third party. The fees calculated per each sale are fixed at 10% of the value of each future Dunebridge sale for the first year and 10% per year pro-rated for years 2 and 3. The expenses relate to any future sale costs. Once all fees and expenses have been deducted any surplus will be share equally between Dunebridge and the Company. The purchase price has been determined using the Company’s price book, adjusted for the estimated current underlying market conditions. As at June 30, 2020, approximately US$22.6 million of run of mine diamonds have been sold, with approximately US$27.4 million remaining in the agreement.
Between 2014 and 2018, the Company and De Beers signed agreements allowing De Beers (“the Operator”) to utilize De Beers’ credit facilities to issue reclamation and restoration security deposits to the federal and territorial governments. In accordance with these agreements, the Company agreed to a 3% fee annually for their share of the letters of credit issued. As at June 30, 2020, the Company’s share of the letters of credit issued were $23.3 million (December 31, 2019 - $23.3 million).
During the period ended June 30, 2020, the Company and De Beers signed an agreement to reduce the fee from 3% to 0.3%, annually, for their share of the letters of credit issued. Furthermore, on the same day, a resolution was passed by the joint venture management committee to establish a decommissioning fund, where the Company will fund $15 million in 2020, and $10 million each year for four years thereafter until the Company’s 49% share totaling $55 million is fully funded. The targeting funding over time will increase, dependent on future increases to the decommissioning and restoration liability.
Failure to meet the obligations for cash calls to fund the Company’s share in the GK Mine may lead to dilution of the interest in the GK Mine.
Page | 18
The balances as at June 30, 2020 and December 31, 2019 were as follows:
| June 30, | December 31, | ||
| 2020 | 2019 | ||
| Payable De Beers Canada Inc. as the operator of the GK Mine* | $ 245 | $ 12,316 | |
| Payable to De Beers Canada Inc. for interest on letters of credit | 494 | 353 | |
| Payable to De Beers Canada Inc. for exploration and evaluation | 481 | - | |
| Payable to key management personnel | 158 | 567 | |
*included in accounts payable and accrued liabilities
The transactions for the three and six months ended June 30, 2020 and 2019 were as follows:
| Three months ended | Three months ended | Six months ended | Six months ended | |||
| June 30, 2020 | June 30, 2019 | June 30, 2020 | June 30, 2019 | |||
| The total of the transactions: | ||||||
| International Investment and Underwriting | $ (23) | $ 12 | $ - | $ 25 | ||
| Remuneration to key management personnel | 477 | 489 | 1,001 | 1,166 | ||
| Diamonds sold to Dunebridge Worldwide Ltd. | 30,576 | - | 30,576 | - | ||
| Diamonds sold to De Beers Canada Inc. | - | 7,277 | 5,551 | 10,152 | ||
| Diamonds purchased from De Beers Canada Inc. | - | 124 | 2,737 | 5,282 | ||
| Finance costs incurred from De Beers Canada Inc. | 18 | 175 | 142 | 347 | ||
| Management fee charged by the Operator of the GK Mine | 1,092 | 1,038 | 2,184 | 2,076 |
The remuneration expense of directors and other members of key management personnel for the three and six months ended June 30, 2020 and 2019 were as follows:
| Three months ended | Three months ended | Six months ended | Six months ended | |
| June 30, 2020 | June 30, 2019 | June 30, 2020 | June 30, 2019 | |
| Consulting fees, payroll, director fees, bonus and other short-term benefits | $ 298 | $ 290 | $ 675 | $ 808 |
| Share-based payments | 156 | 211 | 326 | 383 |
| $ 454 | $ 501 | $ 1,001 | $ 1,191 |
In accordance with International Accounting Standard 24 Related Parties, key management personnel are those persons having authority and responsibility for planning, directing and controlling the activities of the Company directly or indirectly, including any directors (executive and non-executive) of the Company.
CONTRACTUAL OBLIGATIONS
The following table summarizes the contractual maturities of the Company’s significant financial liabilities and capital commitments, including contractual obligations:
| Less than | 1 to 3 | 4 to 5 | After 5 | ||
| 1 Year | Years | Years | Years | Total | |
| Gahcho Kué Diamond Mine commitments | $ 2,128 | $ - | $ - | $ - | $ 2,128 |
| Gahcho Kué Diamond Mine decommissioning fund | 25,000 | 20,000 | 10,000 | - | 55,000 |
| Revolving credit facility stand by charges | 193 | - | - | - | 193 |
| Revolving credit facility - Principal | 33,940 | - | - | - | 33,940 |
| Revolving credit facility - Interest | 398 | - | - | - | 398 |
| Notes payable - Principal | 407,199 | - | - | - | 407,199 |
| Forward Exchange Contracts: | |||||
| (Inflows) | (82,215) | (7,050) | - | - | (89,265) |
| Outflows | 81,456 | 6,788 | - | - | 88,244 |
| $ 468,099 | $ 19,738 | $ 10,000 | $ - | $ 497,837 |
Subsequent to the three and six months ended June 30, 2020, the Company entered into a waiver agreement related to the RCF (Note 9 of the financial statements). As a result of the Waiver being obained within 30 days after the RCF event of default, the acceleration of the secured notes payable was automatically annulled and the secured notes payable were subsequently reclassified to long-term on July 3, 2020. On July 3, 2020, the interest commitments on the secured notes payable are $33,028 for less than one year and $49,588 for 1 to 3 years.
Page | 19
Subsequent events
Subsequent to June 30, 2020, the Company entered into a waiver agreement related to the RCF. As at June 30, 2020, the Company was not in compliance with the RCF financial covenants resulting in a start of the 30 day “cure” period as provided in the indenture agreement for the senior secured note, at the end of which would result in a breach of the cross-covenant default terms of the senior secured noted. On July 3, 2020, the Company obtained an executed waiver agreement to exempt the Company from the covenants in the RCF, resulting in the RCF covenant violations being cured in relation to the senior secured notes as of the same date. In accordance with IFRS, as the Company does not have an unconditional right to defer its settlement of the secured notes payable for at least twelve months from June 30, 2020 without obtaining a “cure” to the RCF covenant violations, the Company has classified the senior secured notes as a current liability as at June 30, 2020. The Waiver exempts the Company from compliance with financial covenants including the total leverage ratio, EBITDA to interest expense ratio and total net worth tests that it would otherwise have had to satisfy as of June 30, 2020. The Waiver also removes the Borrower's covenant to maintain a minimum cash balance. In exchange, the Company has agreed to a reduction in the size of the revolving credit facility to US$25 million from US$50 million and the imposition of additional covenants as described in note 9 of the financial statements. In addition, the Borrower is required to demonstrate progress by August 31, 2020 to be able to enter into a binding financing commitment by September 30, 2020 in order to repay the revolving credit facility. The Waiver contains customary representations and warranties and events of default.
NON-IFRS MEASURES
The MD&A refers to the terms “Cash costs of production per tonne of ore processed” and “Cash costs of production per carat recovered”, both including and net of capitalized stripping costs and “Adjusted Earnings Before Interest, Taxes Depreciation and Amortization (Adjusted EBITDA)”. Each of these is a non-IFRS performance measure and is referenced in order to provide investors with information about the measures used by management to monitor performance. These measures are intended to provide additional information and should not be considered in isolation or as a substitute for measures of performance prepared in accordance with IFRS. They do not have any standardized meaning under IFRS and therefore may not be comparable to similar measures presented by other issuers.
Cash costs of production per tonne of ore processed and cash costs of production per carat recovered are used by management to analyze the actual cash costs associated with processing the ore, and for each recovered carat. Differences from production costs reported within cost of sales are attributed to the amount of production cost included in ore stockpile and rough diamond inventories.
Adjusted EBITDA is used by management to analyze the operational cash flows of the Company, as compared to the net income for accounting purposes. It is also a measure which is defined in the secured notes payable documents. Adjusted EBITDA margin is used by management to analyze the operational margin % on cash flows of the Company.
The following table provides a reconciliation of the Adjusted EBITDA and Adjusted EBITDA margin with the net income on the consolidated statements of comprehensive (loss) income:
| Three months ended | Three months ended | Six months ended | Six months ended | |||||||||||||
| June 30, 2020 | June 30, 2019 | June 30, 2020 | June 30, 2019 | |||||||||||||
| Net (loss) income for the period | $ | (26,762 | ) | $ | 10,255 | $ | (67,731 | ) | $ | 12,752 | ||||||
| Add/deduct: | ||||||||||||||||
| Non-cash depreciation and depletion | 15,761 | 26,592 | 30,464 | 42,391 | ||||||||||||
| Share-based payment expense | 276 | 263 | 567 | 482 | ||||||||||||
| Net finance expenses | 9,983 | 9,584 | 20,270 | 19,372 | ||||||||||||
| Derivative gains | (7,330 | ) | (610 | ) | (1,402 | ) | (1,011 | ) | ||||||||
| Current and deferred income taxes | (1,444 | ) | 1,068 | — | 1,470 | |||||||||||
| Unrealized foreign exchange (gains) losses | (14,378 | ) | (8,056 | ) | 16,763 | (16,632 | ) | |||||||||
| Adjusted earnings before interest, taxes, depreciation and depletion (Adjusted EBITDA) | $ | (23,894 | ) | $ | 39,096 | $ | (1,069 | ) | $ | 58,824 | ||||||
| Sales | 34,020 | 95,774 | 99,450 | 156,470 | ||||||||||||
| Adjusted EBITDA margin | -70 | % | 41 | % | -1 | % | 38 | % | ||||||||
Page | 20
The following table provides a reconciliation of the cash costs of production per tonne of ore processed and per carat recovered and the production costs reported within cost of sales on the consolidated statements of comprehensive (loss) income:
| Three months ended | Three months ended | Six months ended | Six months ended | ||
| (in thousands of Canadian dollars, except where otherwise noted) | June 30, 2020 | June 30, 2019 | June 30, 2020 | June 30, 2019 | |
| Cost of sales production costs | $ | 54,019 | 48,706 | 84,633 | 77,492 |
| Timing differences due to inventory and other non-cash adjustments | $ | (13,546) | (11,351) | (8,891) | (46) |
| Cash cost of production of ore processed, net of capitalized stripping | $ | 40,473 | 37,355 | 75,742 | 77,446 |
| Cash costs of production of ore processed, including capitalized stripping | $ | 47,956 | 45,988 | 85,037 | 93,369 |
| Tonnes processed | kilo tonnes | 385 | 432 | 828 | 859 |
| Carats recovered | 000's carats | 758 | 848 | 1,569 | 1,624 |
| Cash costs of production per tonne of ore, net of capitalized stripping | $ | 105 | 86 | 92 | 90 |
| Cash costs of production per tonne of ore, including capitalized stripping | $ | 125 | 106 | 103 | 109 |
| Cash costs of production per carat recovered, net of capitalized stripping | $ | 53 | 44 | 48 | 48 |
| Cash costs of production per carat recovered, including capitalized stripping | $ | 63 | 54 | 54 | 57 |
Other Management Discussion and Analysis Requirements
Risks
Mountain Province’s business of developing and operating mineral resources involves a variety of operational, financial and regulatory risks that are typical in the mining industry. The Company attempts to mitigate these risks and minimize their effect on its financial performance, but there is no guarantee that the Company will be profitable in the future, and investing in the Company’s common shares should be considered speculative.
Mountain Province’s business of developing and operating mineral properties is subject to a variety of risks and uncertainties, including, without limitation:
| § | risk that COVID-19 continues to spread and materially impedes operations and/or the ability of the Company to sell and distribute diamonds; |
| § | risk of COVID-19 affecting commodity prices and demand of diamond inventory, future sales and increased market volatility; |
| § | risk that the production from the mine will not be consistent with the Company’s expectation; |
| § | risk that production and operating costs are not within the Company’s estimates; |
| § | risks and uncertainties relating to the interpretation of drill results, the geology, grade and continuity of mineral deposits; |
| § | results of initial feasibility, pre-feasibility and feasibility studies, and the possibility that future exploration, development or mining results will not be consistent with the Company's expectations; mining exploration risks, including risks related to accidents, equipment breakdowns or other unanticipated difficulties with or interruptions in production; |
| § | the potential for delays in exploration activities or the completion of studies; |
| § | risks related to the inherent uncertainty of exploration and cost estimates and the potential for unexpected costs and expenses; |
| § | risks related to foreign exchange fluctuations, prices of diamond, and emergence of laboratory grown diamonds; |
| § | risks related to challenges in the diamond market causing the sale of all diamond inventory to be sold below cost; |
| § | risks related to commodity price fluctuations; |
| § | risks related to failure of its joint venture partner; |
| § | risks relating to complying with the covenants in our revolver credit facility; |
| § | development and production risks including and particularly risks for weather conducive to the building and use of the Tibbitt to Contwoyto Winter Road; |
| § | risks related to environmental regulation, permitting and liability; |
| § | risks related to legal challenges to operating permits that are approved and/or issued; |
Page | 21
| § | political and regulatory risks associated with mining, exploration and development; |
| § | the ability to operate the Company’s GK Mine on an economic basis; |
| § | aboriginal rights and title; |
| § | failure of plant, equipment, processes and transportation services to operate as anticipated; |
| § | possible variations in ore grade or recovery rates, permitting timelines, capital expenditures, reclamation activities, land titles, and social and political developments, and other risks of the mining industry; and |
| § | other risks and uncertainties related to the Company's prospects, properties and business strategy. |
As well, there can be no assurance that any further funding required by the Company will become available to it, and if so, that it will be offered on reasonable terms, or that the Company will be able to secure such funding. Furthermore, there is no assurance that the Company will be able to secure new mineral properties or Projects, or that they can be secured on competitive terms.
Disclosure of Outstanding Share Data
The Company’s common shares are traded on the Toronto Stock Exchange under the symbol MPVD.
At August 5, 2020, there were 210,417,473 shares issued, 2,933,335 stock options and 1,000,000 restricted share units outstanding. There were no warrants outstanding.
There are an unlimited number of common shares without par value authorized to be issued by the Company.
Controls and Procedures
Disclosure Controls and Procedures and internal control over financial reporting
As of June 30, 2020, we carried out an evaluation under the supervision and with the participation of our management, including our chief executive officer (CEO) and chief financial officer (CFO), of the effectiveness of our disclosure controls and procedures. There are inherent limitations to the effectiveness of any system of disclosure controls and procedures, including the possibility of human error and the circumvention or overriding of the controls and procedures. Accordingly, even effective disclosure controls and procedures can only provide reasonable assurance of achieving their control objectives. Based upon that evaluation and as of June 30, 2020, the CEO and CFO concluded that:
· the disclosure controls and procedures were designed effectively to provide reasonable assurance that information required to be disclosed in the reports we file and submit under applicable securities laws is recorded, processed, summarized and reported as and when required;
· such information is accumulated and communicated to our management, including our CEO and CFO, as appropriate to allow timely decisions regarding required disclosure.
There has been no change in our internal control over financial reporting during the quarter ended June 30, 2020 that has materially affected, or is reasonably likely to materially affect, our internal control over financial reporting.
Page | 22
CAUTIONARY NOTE ON FORWARD-LOOKING STATEMENTS
This MD&A contains certain “forward-looking statements” and “forward-looking information” under applicable Canadian and United States securities laws concerning the business, operations and financial performance and condition of Mountain Province Diamonds Inc. Forward-looking statements and forward-looking information include, but are not limited to, statements with respect to operational hazards, including possible disruption due to pandemic such as COVID-19, its impact on travel, self-isolation protocols and business and operations, estimated production and mine life of the project of Mountain Province; the realization of mineral reserve estimates; the timing and amount of estimated future production; costs of production; the future price of diamonds; the estimation of mineral reserves and resources; the ability to manage debt; capital expenditures; the ability to obtain permits for operations; liquidity; tax rates; and currency exchange rate fluctuations. Except for statements of historical fact relating to Mountain Province, certain information contained herein constitutes forward-looking statements. Forward-looking statements are frequently characterized by words such as “anticipates,” “may,” “can,” “plans,” “believes,” “estimates,” “expects,” “projects,” “targets,” “intends,” “likely,” “will,” “should,” “to be”, “potential” and other similar words, or statements that certain events or conditions “may”, “should” or “will” occur. Forward-looking statements are based on the opinions and estimates of management at the date the statements are made, and are based on a number of assumptions and subject to a variety of risks and uncertainties and other factors that could cause actual events or results to differ materially from those projected in the forward-looking statements. Many of these assumptions are based on factors and events that are not within the control of Mountain Province and there is no assurance they will prove to be correct.
Factors that could cause actual results to vary materially from results anticipated by such forward-looking statements include the development of operation hazards which could arise in relation to COVID-19, including, but not limited to protocols which may be adopted to reduce the spread of COVID-19 and any impact of such protocols on Mountain Province's business and operations, variations in ore grade or recovery rates, changes in market conditions, changes in project parameters, mine sequencing; production rates; cash flow; risks relating to the availability and timeliness of permitting and governmental approvals; supply of, and demand for, diamonds; fluctuating commodity prices and currency exchange rates, the possibility of project cost overruns or unanticipated costs and expenses, labour disputes and other risks of the mining industry, failure of plant, equipment or processes to operate as anticipated.
These factors are discussed in greater detail in this MD&A and in Mountain Province's most recent Annual Information Form filed on SEDAR, which also provide additional general assumptions in connection with these statements. Mountain Province cautions that the foregoing list of important factors is not exhaustive. Investors and others who base themselves on forward-looking statements should carefully consider the above factors as well as the uncertainties they represent and the risk they entail. Mountain Province believes that the expectations reflected in those forward-looking statements are reasonable, but no assurance can be given that these expectations will prove to be correct and such forward-looking statements included in this MD&A should not be unduly relied upon. These statements speak only as of the date of this MD&A.
Although Mountain Province has attempted to identify important factors that could cause actual actions, events or results to differ materially from those described in forward-looking statements, there may be other factors that cause actions, events or results not to be anticipated, estimated or intended. There can be no assurance that forward-looking statements will prove to be accurate, as actual results and future events could differ materially from those anticipated in such statements. Mountain Province undertakes no obligation to update forward-looking statements if circumstances or management’s estimates or opinions should change except as required by applicable securities laws. The reader is cautioned not to place undue reliance on forward-looking statements. Statements concerning mineral reserve and resource estimates may also be deemed to constitute forward-looking statements to the extent they involve estimates of the mineralization that will be encountered as the property is developed.
Further, Mountain Province may make changes to its business plans that could affect its results. The principal assets of Mountain Province are administered pursuant to a joint venture under which Mountain Province is not the operator. Mountain Province is exposed to actions taken or omissions made by the operator within its prerogative and/or determinations made by the joint venture under its terms. Such actions or omissions may impact the future performance of Mountain Province. Under its current note and revolving credit facilities Mountain Province is subject to certain limitations on its ability to pay dividends on common stock. The declaration of dividends is at the discretion of Mountain Province’s Board of Directors, subject to the limitations under the Company’s debt facilities, and will depend on Mountain Province’s financial results, cash requirements, future prospects, and other factors deemed relevant by the Board.
Page | 23
Cautionary Note to US Investors – Information Concerning Preparation of Resource Estimates
This MD&A has been prepared in accordance with the requirements of the securities laws in effect in Canada, which differ from the requirements of United States securities laws. Unless otherwise indicated, all resource and reserve estimates included in this MD&A have been prepared in accordance with NI 43-101 and the Canadian Institute of Mining and Metallurgy Classification System. NI 43-101 is a rule developed by the Canadian Securities Administrators which establishes standards for all public disclosure an issuer makes of scientific and technical information concerning mineral projects.
Canadian standards, including NI 43-101, differ significantly from the requirements of Industry Guide 7 (“Guide 7”) promulgated by the United States Securities and Exchange Commission (“SEC”) under the United States Securities Act of 1933, as amended, and resource and reserve information contained herein may not be comparable to similar information disclosed by US companies pursuant to Guide 7. In particular, and without limiting the generality of the foregoing, the term “resource” does not equate to the term “reserves”. Under Guide 7, mineralization may not be classified as a “reserve” unless the determination has been made that the mineralization could be economically and legally produced or extracted at the time the reserve determination is made. The SEC's disclosure standards under Industry Guide 7 do not define the terms and normally do not permit the inclusion of information concerning “measured mineral resources”, “indicated mineral resources” or “inferred mineral resources” or other descriptions of the amount of mineralization in mineral deposits that do not constitute “reserves” by Guide 7 standards in documents filed with the SEC pursuant to Guide 7. US Investors should also understand that “inferred mineral resources” have a great amount of uncertainty as to their existence and great uncertainty as to their economic and legal feasibility. It cannot be assumed that all or any part of an “inferred mineral resource” will ever be upgraded to a higher category. Under Canadian rules, estimated “inferred mineral resources” may not form the basis of feasibility or pre-feasibility studies except in rare cases. Investors are cautioned not to assume that all or any part of an “inferred mineral resource” exists or is economically or legally mineable.
Disclosure of “contained ounces” (or “contained carats”) in a resource is permitted disclosure under Canadian regulations; however, the Guide 7 normally only permits issuers to report mineralization that does not constitute “reserves” by Guide 7 standards as in place tonnage and grade without reference to unit measures. The requirements of NI 43-101 for identification of “reserves” are also not the same as those of the Guide 7, and reserves reported by the Company in compliance with NI 43-101 may not qualify as “reserves” under Guide 7 standards. Accordingly, information concerning mineral deposits set forth herein may not be comparable with information made public by companies that report in accordance with Guide 7.
Page | 24