Exhibit 99.1
![]()
Management’s Discussion and Analysis
For the Three Months Ended March 31, 2022
TSX: MPVD
| Page | 1 |
MOUNTAIN PROVINCE DIAMONDS INC.
MANAGEMENT’S DISCUSSION AND ANALYSIS
FOR THE THREE MONTHS ENDED MARCH 31, 2022
| TABLE OF CONTENTS | Page |
| First Quarter 2022 Highlights | 3 |
| Company Overview | 4 |
| Gahcho Kué Diamond Mine | 4 |
| 2022 Production Outlook | 7 |
| Gahcho Kué Exploration | 7 |
| Kennady North Project Exploration | 7 |
| Results of Operations | 13 |
| Summary of Quarterly Results | 13 |
| Summary of First Quarter Financial Results | 14 |
| Income and Mining Taxes | 16 |
| Financial Position and Liquidity | 16 |
| Off-Balance Sheet Arrangements | 17 |
| Significant Accounting Policies Adopted in the Current Period | 17 |
| Significant Accounting Judgments, Estimates and Assumptions | 17 |
| Standards and Amendments to Existing Standards | 17 |
| Related Party Transactions | 17 |
| Contractual Obligations | 19 |
| Non-IFRS Measures | 19 |
| Subsequent Events | 20 |
| Other Management Discussion and Analysis Requirements | 21 |
| Disclosure of Outstanding Share Data | 22 |
| Controls and Procedures | 22 |
| Cautionary Note Regarding Forward-Looking Statements | 23 |
This Management’s Discussion and Analysis (“MD&A”) as of May 3, 2022 provides a review of the financial performance of Mountain Province Diamonds Inc. (the “Company” or “Mountain Province” or “MPV”) and should be read in conjunction with the annual information form and MD&A for the year ended December 31, 2021, the unaudited condensed consolidated interim financial statements for the three months ended March 31, 2022 and the audited consolidated statements for the year ended December 31, 2021. The following MD&A has been approved by the Board of Directors.
The unaudited condensed consolidated interim financial statements (“financials statements”) of the Company were prepared in accordance with IAS 34 - Interim Financial Reporting. Except as disclosed in the statements, the interim financial statements follow the same accounting policies and methods of computation as compared with the most recent annual financial statements for the year ended December 31, 2021, which were prepared in accordance with International Financial Reporting Standards (“IFRS”) as issued by the International Accounting Standards Board (“IASB”). Accordingly, the interim financial statements should be read in conjunction with the Company’s most recent annual financial statements.
All amounts are expressed in thousands of Canadian dollars, except share and per share amounts, unless otherwise noted.
The disclosure in this MD&A of scientific and technical information regarding exploration projects on Mountain Province’s mineral properties has been reviewed and approved by Tom McCandless, Ph.D., P.Geo., while that regarding mine development and operations has been reviewed and approved by Matthew MacPhail, P.Eng., MBA, both of whom are Qualified Persons as defined by National Instrument 43-101 - Standards of Disclosure for Mineral Properties (“NI 43-101”).
| Page | 2 |
Additional information, related to the Company is available on SEDAR at http://sedar.com/ and on EDGAR at http://www.sec.gov/edgar.shtml.
HIGHLIGHTS
| • | Earnings from mine operations for the three months ended March 31, 2022, amounted to $42,815 compared to $13,736 for the same period in 2021. |
| • | Net income for the three months ended March 31, 2022 was $24,327 or $0.12 basic earnings per share and $0.11 diluted earnings per share compared to $7,312 or $0.03 earnings per share (basic and diluted) for the prior comparative period. Adjusted EBITDA for these periods was $44,585 compared to $19,178 (Adjusted EBITDA is not defined under IFRS and therefore may not be comparable to similar measures presented by other issuers; refer to the Non-IFRS Measures section). |
| • | Cash at March 31, 2022 was $17,425 with net working capital deficit of $261,204, reflecting secured notes payable, categorized as current debt. Cash at December 31, 2021 was $25,000 with net working capital deficit of $275,691. |
| • | In the first quarter of 2022, the Company sold 507,000 carats and recognized revenue of $84,653 at an average realized value of $167 per carat (US$132) compared to sales in the first quarter of 2021 totaling 603,000 carats and recognized revenue of $54,224 at an average realized value of $90 per carat (US$71). |
| • | Cash costs of production, including capitalized stripping costs, for the three months ended March 31, 2022 were $122 per tonne of ore treated, and $73 per carat recovered compared to $139 per tonne of ore treated, and $62 per carat recovered for the same period in 2021 (cash costs of production per tonne and per carat are not defined under IFRS and may not be comparable to similar measures presented by other issuers; refer to the Non-IFRS Measures section). The costs per tonne for the three months ended March 31, 2022 compared to the same period last year have decreased as a result of lower tonnes processed in Q1 2021 due to the impact of COVID-19 and the unplanned operational stand-down in February 2021. The increase in cost per carat recovered reflects the reduction in average grade per tonne treated at 1.67 carats per tonne, for the three months ended March 31, 2022, compared to 2.22 carats per tonne treated, for the three months ended March 31, 2021. |
| • | Mining of waste and ore combined in the 5034, Hearne and Tuzo open pits for the three months March 31, 2022 was approximately 4,294,000 tonnes, 1,637,000 tonnes and 2,237,000 tonnes, respectively, for a total of 8,168,000 tonnes. This represents a 46% increase in tonnes mined over the comparative period in 2021, mainly due to the unplanned operational stand-down in February 2021 to limit the spread of COVID-19, as well as manpower availability issues and a higher-than-average incidence of extreme weather events. Ore mined for the three months March 31, 2022 totaled 1,019,000 tonnes, with approximately 1,059,000 tonnes of ore stockpile available at period end, an increase of 311,000 tonnes during the quarter. For the comparative three months ended March 31, 2021, ore mined totaled 515,000 tonnes, with approximately 158,000 tonnes of ore stockpile. |
| • | For the three months ended March 31, 2022, the GK Mine treated approximately 708,000 tonnes of ore and recovered approximately 1,185,000 carats on a 100% basis for an average recovered grade of approximately 1.67 carats per tonne (“cpt”). For the comparative three months ended March 31, 2021, the GK Mine treated approximately 626,000 tonnes of ore and recovered approximately 1,392,000 carats on a 100% basis for an average recovered grade of approximately 2.22 cpt. This grade reduction is as expected and consistent with the planned grade for carats per tonne of ore mined. |
| Page | 3 |
The following table summarizes key operating highlights for the three months ended March 31, 2022 and 2021.
| Three months ended | Three months ended | ||
| March 31, 2022 | March 31, 2021 | ||
| GK operating data | |||
| Mining | |||
| *Ore tonnes mined | kilo tonnes | 1,019 | 515 |
| *Waste tonnes mined | kilo tonnes | 7,149 | 5,090 |
| *Total tonnes mined | kilo tonnes | 8,168 | 5,605 |
| *Ore in stockpile | kilo tonnes | 1,059 | 158 |
| Processing | |||
| *Ore tonnes treated | kilo tonnes | 708 | 626 |
| *Average plant throughput | tonnes per day | 7,867 | 6,731 |
| *Average plant grade | carats per tonne | 1.67 | 2.22 |
| *Diamonds recovered | 000's carats | 1,185 | 1,392 |
| Approximate diamonds recovered - Mountain Province | 000's carats | 581 | 682 |
| Cash costs of production per tonne of ore, net of capitalized stripping ** | $ | 93 | 119 |
| Cash costs of production per tonne of ore, including capitalized stripping** | $ | 122 | 139 |
| Cash costs of production per carat recovered, net of capitalized stripping** | $ | 56 | 53 |
| Cash costs of production per carat recovered, including capitalized stripping** | $ | 73 | 62 |
| Sales | |||
| Approximate diamonds sold - Mountain Province*** | 000's carats | 507 | 603 |
| Average diamond sales price per carat | US | $ 132 | $ 71 |
| * at 100% interest in the GK Mine |
| **See Non-IFRS Measures section |
| ***Includes the sales directly to De Beers for fancies and specials acquired by De Beers through the production split bidding process |
COMPANY OVERVIEW
Mountain Province is a Canadian-based resource company listed on the Toronto Stock Exchange under the symbol ‘MPVD’. The Company’s registered office and its principal place of business is 161 Bay Street, Suite 1410, P.O. Box 216, Toronto, ON, Canada, M5J 2S1. The Company, through its wholly owned subsidiaries 2435572 Ontario Inc. and 2435386 Ontario Inc., holds a 49% interest in the Gahcho Kué diamond mine (the “GK Mine”), located in the Northwest Territories of Canada. De Beers Canada Inc. (“De Beers” or the “Operator”) holds the remaining 51% interest. The Joint Arrangement between the Company and De Beers is governed by the 2009 amended and restated Joint Venture Agreement.
The Company’s primary assets are its 49% interest in the GK Mine and 100% owned Kennady North Project (“KNP” or “Kennady North”). The Company predominantly sells it’s 49% share of diamond production in Antwerp, Belgium.
GAHCHO KUÉ DIAMOND MINE
Gahcho Kué Joint Venture Agreement
The GK Mine is in the Northwest Territories, approximately 300 kilometers northeast of Yellowknife. The mine covers 5,216 hectares held in trust by the Operator. The Project hosts four primary kimberlite bodies - 5034, Hearne, Tuzo and Tesla. The four main kimberlite bodies are within two kilometers of each other.
The GK Mine is an unincorporated Joint Arrangement between De Beers (51%) and Mountain Province (49%) through its wholly owned subsidiaries. The Company accounts for the mine as a joint operation in accordance with IFRS 11, Joint Arrangements. Mountain Province through its subsidiaries holds an undivided 49% ownership interest in the assets, liabilities and expenses of the GK Mine.
| Page | 4 |
Between 2014 and 2020, the Company and De Beers signed agreements allowing the Operator to utilize De Beers’ credit facilities to issue reclamation and restoration security deposits to the federal and territorial governments. In accordance with these agreements, the Company agreed to a 3% fee annually for their share of the letters of credit issued. In 2020, the Company and De Beers signed an agreement to reduce the fee from 3% to 0.3%, annually, for their share of the letters of credit issued. As at March 31, 2022, the Company’s share of the letters of credit issued were $44.1 million (2020 - $44.1 million).
In 2020, a resolution was passed by the joint venture management committee to establish a decommissioning fund, where the Company will fund $15 million in 2020, and $10 million each year for four years thereafter until the Company’s 49% share totaling $55 million is fully funded. The target funding over time will increase, dependent on future increases to the decommissioning and restoration liability. During the three months ended March 31, 2022, the Company funded $Nil (December 31, 2021 - $10 million) into the decommissioning fund, which is presented as restricted cash on the balance sheet.
Mining and Processing
For the three months ended March 31, 2022, on a 100% basis, a total of 8.2 million tonnes of waste and ore respectively was extracted from the 5034, Hearne and Tuzo open pits. For the three months ended March 31, 2021, a total of 5.6 million tonnes of waste and ore respectively was extracted from the 5034 and Hearne open pits. The lower mining efficiency was as a result of the unplanned operational stand-down in February 2021 due to measures taken to limit the spread of COVID-19 at Gahcho Kué.
Total ore tonnes mined in the three months ended March 31, 2022 were 1,019,000 tonnes compared to 515,000 tonnes for the same period in 2021. The total ore tonnes mined for the three months ended March 31, 2022 were higher than the comparative period as a result of the unplanned operational stand-down in February 2021 due to measures taken to limit the spread of COVID-19 at Gahcho Kué.
For the three months ended March 31, 2022, 708,000 tonnes of kimberlite ore were treated, with 1,185,000 carats (100% basis) recovered, at a grade of 1.67 carats per tonne. For the three months ended March 31, 2021, 626,000 tonnes of kimberlite ore were treated, with 1,392,000 carats recovered, at a grade of 2.22 carats per tonne. The grade for Q1 2022 was lower than Q1 2021 inline with planned mine sequencing.
At March 31, 2022, the GK Mine had 416,120 carats on a 100% basis in rough diamond inventory at the GK Mine and at the sorting facility in Yellowknife. The Company had 549,754 carats within its sale preparation channel plus its share of the aforementioned carats at the GK Mine and sorting facility for a total of 752,229 carats in inventory.
Diamond Sales
After five years of sales, the Gahcho Kué diamonds are firmly established in the rough diamond market. The Gahcho Kué ore bodies and product profiles are complex, producing a broad range of white commercial goods together with a consistent supply of exceptional, high value, gem quality diamonds as well as large volumes of small and brown diamonds. The Gahcho Kué product also exhibits varying degrees of fluorescence for which the Company has attracted specialist customers who are developing strategies to market this characteristic.
The Company’s diamonds have established a strong market presence and customer base. Except for some industrial, non-gem quality diamonds, the majority of the Company’s diamonds are sold into market segments that cut and polish the rough, with resultant polished destined for the major diamond jewellery markets of the US, India and China. Having transitioned from an explorer and mine developer into a diamond marketer, the Company is in early-stage development of a diamond marketing brand. Although somewhat delayed by the COVID-19 pandemic, the brand will promote the unique attributes of our diamonds and support demand through their distribution channels, with potential to reach the consumer level.
Given the variety across the Gahcho Kué rough diamond profile and the variability of the mining plan through the period, the mix of diamond categories may differ from sale to sale.
| Page | 5 |
The Company undertook two sales in Antwerp, Belgium during the first quarter of 2022. Most of the Company’s revenue is derived from open market sales, with the remainder attributed to sales of fancies and specials directly to De Beers on such occasions where De Beers has won the periodic fancies and specials bidding process. The average realized value per carat for all sales held in the three months ended March 31, 2022 was US$132 per carat. The average realized value per carat for all sales held for the three months ended March 31, 2021 was US$71 per carat.
The volume of carats sold in Q1 2022 (which historically, is a low sale period compared to Q2, Q3, Q4 2021) are approximately 96,000 less than the comparable Q1 period for Q1 2021. This is in line with the plan used to inform revised guidance, and reflects the disruption to the process plant in Q1 (which is now resolved), and results in the large ore stockpile at the quarter end.
The following chart summarizes the sales for the trailing eight quarters:

The following table summarizes the results of sales in 2022:
| 000's of carats sold | Revenue (US$ 000's) | Revenue/carat (US$) | |||
| Q1 | 507 | $ 66,693 | $ 132 |
The following table summarizes the results for sales in 2021:
| 000's of carats sold | Revenue (US$ 000's) | Revenue/carat (US$) | |||
| Q1 | 603 | $ 42,725 | $ 71 | ||
| Q2 | 719 | $ 52,570 | $ 73 | ||
| Q3 | 1,027 | $ 74,094 | $ 72 | ||
| Q4 | 809 | $ 67,623 | $ 84 | ||
| Total | 3,158 | $ 237,012 | $ 75 |
| Page | 6 |
Gahcho Kué Capital Program
During the three months ended March 31, 2022, stay in business capital was $3.8 million compared to $4.5 million. Capital expenditures included generator repairs, haul trucks under construction and investments in other general infrastructure. All capital additions in the period are considered sustaining capital expenditure, and were largely on budget. Stay in business capital does not include capital waste stripping. Sustaining capital expenditure is a non IFRS measure and is defined as those expenditures required to sustain the current operation.
2022 Production Outlook
The Company is reiterating its production and cost guidance for 2022, as described below (all figures reported on a 100% basis).
• 35 - 40 million total tonnes mined (ore and waste)
• 3.75 - 4.30 million ore tonnes mined
• 3.35 - 3.60 million ore tonnes treated
• 6.2 - 6.4 million carats recovered
• Production costs of $131 - $137 per tonne treated
• Production costs of $71 - $76 per carat recovered
• Sustaining Capital Expenditure of approximately $11 million
Diamond Outlook
Global rough diamond output remained steady in 2021 with major producers reporting low inventories. Rough prices across all product segments strengthened through the year as demand exceeded supply. Demand for lower price-point rough, notably small, brown, and cheaper white assortments, rose in H2 2021 as manufacturers of these goods sought replacement supply for the high-volume Argyle goods from the now-closed mine. Demand for rough on the open market was very high by the year end as major producers streamlined their distribution models and customer portfolios for 2022. The Company experienced strong demand in the market for its unique profile Canadian origin diamonds during the first two sales of 2022 with an overall average of $167 per carat (US$132).
All diamond industry sectors saw a positive start in 2022, with steady rough output, low producer inventories, high manufacturer and consumer demand, and rapid restocking by buyers after a busy holiday season. This led to rapid, exceptional rough diamond price increases in January and February.
However, by the end of Q1, the invasion of Ukraine had a destabilizing impact on rough market confidence. Further, the effects of China’s new round of COVID-19 restrictions and inflation impacting global consumer diamond jewellery spending, remain unclear.
Rough output remains steady but recent sanctions against Russia extend to ALROSA, which produces 28% of rough diamonds globally. These measures could potentially boost prices for non-Russian based rough diamond production and bring positive attention to diamond producers with provenance that have positive socio-economic and environmental records.
Gahcho Kué EXPLORATION
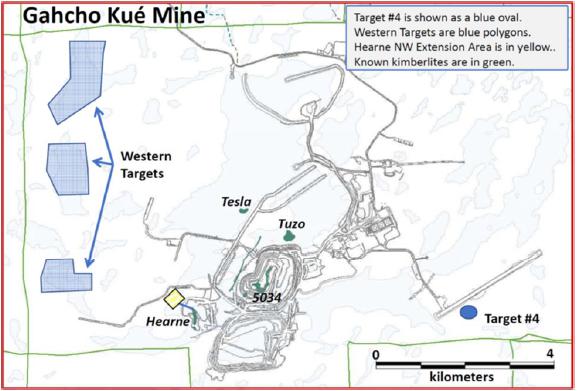
The Gahcho Kué Joint Venture with De Beers Canada covers 5,216 hectares of mining leases that includes the Gahcho Kué Mine. Exploration within the GKJV has focused on near-mine and brownfield discoveries that can extend the life of the mine. In early 2020 a geophysical program prioritized 13 targets, of which eight were selected for drill-testing. Five targets were drill-tested with no significant kimberlite intersected. Two were eliminated from drilling based on follow-up ground geophysics. Target #4 was drill tested in March 2022. Two drillholes (223.81 meters total) were completed on Target #4 with no kimberlite intersected.
In November 2021 a previously unknown extension of kimberlite was exposed in the northwest face of the Hearne open pit. Electromagnetic profiles run over the kimberlite exposed in the pit floor, along the ramp above the extension, and just outside of the pit suggested that the kimberlite extension was trending west-northwest. Four drillholes were completed to test for kimberlite immediately northwest of the exposed extension, and three intersected kimberlite.
| Page | 7 |
More comprehensive ground gravity and electromagnetic surveys conducted northwest of the Hearne pit further supported a northwest extension. A single drillhole roughly 250 meters west-northwest of the drill-confirmed geology did not intersect kimberlite (MPV-22-574C). Details of the drill results for the Hearne Extension are provided in the table below.
| Drill Hole | Azimuth | Inclination | Kimberlite Intersect1 (m) | End of Hole (m) | |||
| From | To | Length1 | |||||
| Hearne Extension | |||||||
| MPV-22-568C | 355 | -58 | 85.42 | 170.54 | 85.12 | 201.04 | |
| 170.71 | 170.75 | 0.04 | |||||
| MPV-22-569C | 35 | -45 | 82.51 | 120.30 | 37.79 | 184.00 | |
| 122.43 | 154.00 | 31.57 | |||||
| MPV-22-570C | 255 | -45 | 36.84 | 89.80 | 52.96 | 130.00 | |
| MPV-22-571C | 195 | -55 | - 2 | - 2 | - 2 | 294.00 | |
| MPV-22-574C | 95 | -55 | - 2 | - 2 | - 2 | 250.00 | |
1Intersects are not true thicknesses. 2No kimberlite intersected
In early 2021 a desk-top study of structural features was combined with 3D differential modeling of susceptibility, gravity and conductivity data to generate additional target areas of interest on the Gahcho Kué Joint Venture leases.Western Target AOI are located 2-3 kilometers west and northwest of the known Gahcho Kué kimberlites. Ground gravity surveys completed over these AOI were reviewed by the joint venture and two were selected as a priority for drill-testing. A ground resistivity survey (‘ARRT’ see description below) was conducted over the highest priority AOI and collars were selected for drill-testing with results expected in Q2 of 2022.
| Page | 8 |
The map image below shows the location of Target #4, the Hearne Extension and the Western Target AOI.
KENNADY NORTH PROJECT EXPLORATION
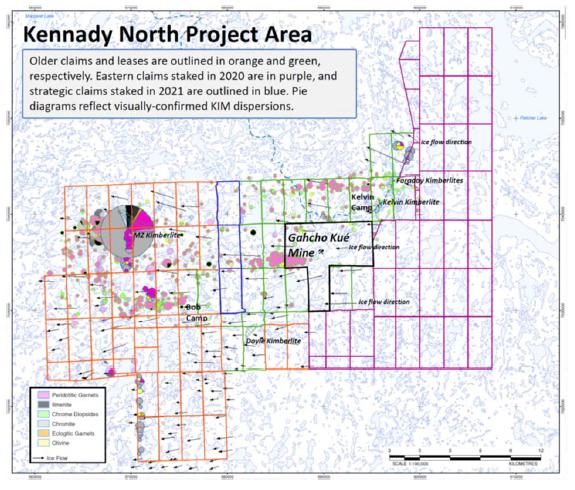
The Kennady North Project includes 22 federal leases and 97 claims covering an area of over 107,000 hectares that surround the Gahcho Kué Mine on all sides. Kennady North has five known kimberlites; Kelvin, Faraday 2, Faraday 1-3, MZ, and Doyle. Significant diamond sampling and drilling programs between 2014 and 2018 resulted in the estimation of resources for the Kelvin and Faraday bodies.
The Project was expanded with staking of the eastern claims in early 2020. In October 2021, three strategic claims were staked near the center of the project area. The claim, lease, and kimberlite locations relative to Gahcho Kué are shown in the map image below.
| Page | 9 |
A detailed glacial geology study completed on the eastern claims was used to guide a 2021 till sampling program over the project area. A total of 327 samples were collected over the eastern claims, with preliminary results for 27 samples visually noting the presence of pyrope, olivine and chromite. These visual observations are awaiting analytical confirmation which will take place in Q2 of 2022.
An additional 298 till samples were also collected from the western Kennady claims. A minerals incentive program (MIP) award was received from the Government of Northwest Territories to help offset the till sampling and processing costs for both sampling programs. Results for the remainder of the samples is expected to be complete by Q3 2022.
A new geophysical tool developed by Aurora Geoscience (Yellowknife, NT) was tested over a large area of interest between the Kelvin and Faraday kimberlites in winter 2021. The Aurora Rapid Reactance Tomography (ARRT) instrument provides greater resolution and depth resistivity data over potential kimberlite targets. The North and South Anomaly were immediately identified in the test, and a minerals incentive program (MIP) award was received from the Government of Northwest Territories to support the drilling of these anomalies. As at the end of Q1 2022, three drillholes (419.7 meters total) were completed on the South Anomaly with hypabyssal kimberlite intersected in each drillhole.
| Page | 10 |
Additional drilling is planned for Q2 at the South Anomaly and drilling of the North Anomaly will begin in Q2. A summary of the Q1 drilling results is provided in the table below.
| Drill Hole | Azimuth | Inclination | Kimberlite Intersect1 (m) | End of Hole (m) | |||||||||
| From | To | Length1 | |||||||||||
| South Anomaly | |||||||||||||
| KDI-22-001 | 307 | -46 | 109.00 | 113.13 | 4.13 | 163.00 | |||||||
| KDI-22-002 | 294 | -65 | 84.19 | 90.06 | 5.87 | 114.70 | |||||||
| KDI-22-003 | 49 | -45 | 115.02 | 121.98 | 6.96 | 142.00 | |||||||
1Intersects are not true thicknesses.
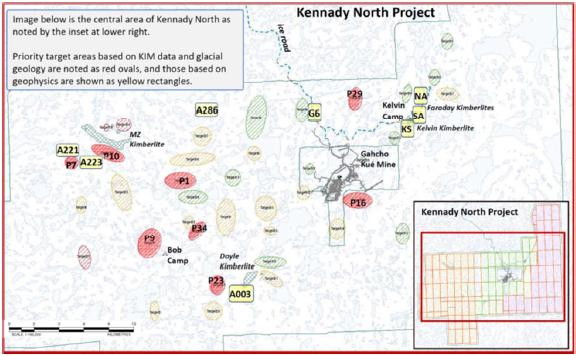
An in-house exploration workshop held in December 2021 prioritized eight target areas of interest (‘AOI”) that were previously identified using glacial geology and kimberlite indicator data. The eight AOI were selected for follow-up ground geophysics (including ARRT) with drilling planned for winter 2022. At a second in-house workshop several historical geophysical AOI were reviewed with six AOI selected for follow-up drilling in winter 2022. A third collaborative workshop with the Gahcho Kué exploration team was held in February 2022, and the fourteen AOI were prioritized in order of receiving follow-up ground geophysics followed by drilling. A map of image showing the fourteen AOI relative to known kimberlites is provided below.
| Page | 11 |
Following on the success of the workshops, a winter 2022 exploration program was implemented in Q1 at Kennady North. The program includes up to 6,000 meters of drilling, along with ARRT, ground gravity, and ground and airborne magnetics/EM. As at the end of Q1, roughly half of the geophysical work was completed, with the remainder to be done in early Q2. Drilling will focus on lake-based targets during the winter program, with helicopter-supported drilling of the land-based targets later in the year.
Environmental activities in Q1 focused on planning the summer baseline data collection program for water quality, hydrology, groundwater, and fish studies. Static and kinetic geochemical analysis of kimberlite and country rock also continued through Q1. Community engagement activities focused on upcoming environmental data collection and permitting activities. The Kennady North Project Advanced Exploration Permit was successfully extended for an additional two years.
The Kennady assets include both an Indicated Resource for the Kelvin kimberlite and Inferred Resources for the Faraday kimberlites. Geological model domains for the Kelvin, Faraday 2 and Faraday 1-3 kimberlites were adopted as the resource domains for the estimation of Mineral Resources. The volumes of these domains were combined with estimates of bulk density to derive tonnage estimates. Bulk sampling programs using large diameter RC drilling were conducted to obtain grade and value information. Microdiamond data from drill core were used to forecast grades for the different kimberlite lithologies. Details of the modeling are available in NI 43-101 Compliant Technical Reports (filed in 2016 and 2017 under Kennady Diamonds Inc.) and the NI43-101 Compliant Technical Report filed April 11, 2019 under Mountain Province Diamonds. All reports are available on SEDAR and on the Company website. Details for the estimated resources are provided in the table below.
Mineral Resource Estimates for the Kelvin and Faraday Kimberlites (as of February 2019 as referenced in the April 11, 2019 NI43-101 Compliant Technical Report)
| Resource | Classification | Tonnes (Mt) | Carats (Mct) | Grade (cpt) | Value (US$/ct) |
| Kelvin | Indicated | 8.50 | 13.62 | 1.60 | $63 |
| Faraday 2 | Inferred | 2.07 | 5.45 | 2.63 | $140 |
| Faraday 1-3 | Inferred | 1.87 | 1.90 | 1.04 | $75 |
| (1) | Mineral Resources are reported at a bottom cut-off of 1.0mm. Incidental diamonds are not incorporated into grade calculations. |
| (2) | Mineral Resources are not Mineral Reserves and do not have demonstrated economic viability. |
| Page | 12 |
Results of operations
The Company, as discussed above, held two diamond sales during the three months ended March 31, 2022.
SUMMARY OF QUARTERLY RESULTS
| Table 1 - Quarterly Financial Data | |||||
| Expressed in thousands of Canadian dollars | |||||
| Three months ended | |||||
| March 31 | Dectember 31 | September 30 | June 30 | ||
| 2022 | 2021 | 2021 | 2021 | ||
| Earnings and Cash Flow | |||||
| Number of sales | 2 | 2 | 2 | 2 | |
| Sales | $ | 84,653 | 85,144 | 94,208 | 75,147 |
| Impairment reversal on property, plant and equipment | $ | - | 240,593 | - | - |
| Operating income | $ | 35,018 | 265,491 | 30,137 | 28,756 |
| Net income for the period | $ | 24,327 | 237,619 | 8,764 | 22,472 |
| Basic earnings per share | $ | 0.12 | 1.13 | 0.04 | 0.11 |
| Diluted earnings per share | $ | 0.11 | 1.13 | 0.04 | 0.11 |
| Adjusted EBITDA* | $ | 44,585 | 37,091 | 41,171 | 37,874 |
| Cash flow provided by (used in) operating activities | $ | 7,008 | 48,012 | 51,905 | 22,465 |
| Cash flow provided by (used in) investing activities | $ | (14,387) | (26,476) | (8,849) | (7,803) |
| Cash flow provided by (used in) financing activities | $ | (394) | (41,014) | (33,545) | 5,471 |
| Balance Sheet | |||||
| Total assets | $ | 935,753 | 877,497 | 624,288 | 632,728 |
*Adjusted EBITDA is not defined under IFRS and therefore may not be comparable to similar measures presented by other issuers; refer to the Non-IFRS Measures section.
| Three months ended | |||||
| March 31 | December 31 | September 30 | June 30 | ||
| 2021 | 2020 | 2020 | 2020 | ||
| Earnings and Cash Flow | |||||
| Number of sales | 2 | 2 | 3 | 1 | |
| Sales | $ | 54,224 | 80,206 | 47,337 | 34,020 |
| Impairment loss on property, plant and equipment | $ | - | (217,366) | - | - |
| Operating (loss) income | $ | 10,532 | (198,643) | (5,712) | (38,958) |
| Net loss for the period | $ | 7,312 | (189,166) | (6,532) | (26,762) |
| Basic and diluted loss per share | $ | 0.03 | (0.90) | (0.03) | (0.13) |
| Adjusted EBITDA* | $ | 19,178 | 37,220 | 15,300 | (23,894) |
| Cash flow provided by (used in) operating activities | $ | (9,804) | 51,396 | 21,117 | �� (21,941) |
| Cash flow provided by (used in) investing activities | $ | (10,615) | (22,302) | (15,766) | (10,452) |
| Cash flow provided by (used in) financing activities | $ | (706) | (16,531) | 1,427 | 17,462 |
| Balance Sheet | |||||
| Total assets | $ | 613,723 | 595,329 | 793,919 | 795,789 |
*Adjusted EBITDA is not defined under IFRS and therefore may not be comparable to similar measures presented by other issuers; refer to the Non-IFRS Measures section.
The Company typically holds between eight to ten sales per year in Antwerp, Belgium, and had typically alternated between two and three sales per quarter since the start of commercial production. The COVID-19 pandemic caused a significant postponement and altering of the regular sales schedule in 2020 and 2021.
| Page | 13 |
During the three months ended March 31, 2022, the Company sold 507,000 carats and recognized revenue of $84,653 at an average realized value of $167 per carat (US$132) over two sales in Antwerp, Belgium. The Company had operating income of $35,018 (not defined under IFRS and may not be comparable to similar measures presented by other issuers).
During the three months ended December 31, 2021, the Company sold 809,000 carats and recognized revenue of $85,144 at an average realized value of $94 per carat (US$84) over two sales. Before considering the effects of the impairment reversal on property plant and equipment in the three months ended December 31, 2021, the operating income was $24,898.
During the three months ended September 30, 2021, the Company sold 1,027,000 carats and recognized revenue of $94,208 at an average realized value of $92 per carat (US$72) over two sales. The Company had operating income of $30,137.
During the three months ended June 30, 2021, the Company held two formal sales resulting in the sale of 719,000 carats and recognized revenue of $64,748 at an average realized value of $90 per carat (US$73). This total does not include any upside profit related to the Dunebridge diamonds. During the three months ended June 30, 2021, all of the original diamonds sold to Dunebridge in 2020 have been sold by Dunebridge to third parties. Included in the diamond sales of $75,147 for the three months ended June 30, 2021, is $10,399 of upside proceeds related to the Dunebridge agreement (See related party transactions section below). The Company had operating income of $28,756.
During the three months ended March 31, 2021, the Company held two formal sales resulting in the Company selling 603,000 carats and recognized revenue of $54,224 at an average realized value of $90 per carat (US$71). The Company had operating income of $10,532.
During the three months ended December 31, 2020, the Company held two formal sales including, on October 30, 2020, its largest open market sale to date of $45.7 million (US$34.3 million) resulting in an average realized value of $81 per carat (US$61 per carat). Before considering the effects of the impairment loss on property plant and equipment in the three months ended December 31, 2020, the operating income was $18,723.
During the three months ended September 30, 2020, the Company held one formal sale, and completed two sales to Dunebridge at a time when the lingering effects of COVID-19 continued to put pressure across the diamond industry.
During the three months ended June 30, 2020, the Company was not able to carry out its formal sales process in Antwerp, due to the COVID-19 pandemic, and as a result completed one sale to Dunebridge (see financial statement note 16). Due to the pandemic, the demand for diamonds had been significantly reduced in the period, and the Company’s average realized sales price was much lower than previous quarters, resulting in a loss from mine operations, and operating and net loss.
summary of FiRsT Quarter Financial Results
Three months ended March 31, 2022 compared to the three months ended March 31, 2021, expressed in thousands of Canadian dollars.
For the three months ended March 31, 2022, the Company recorded a net income of $24,327 or $0.12 basic earnings per share and $0.11 diluted earnings per share compared to a net income of $7,312 or $0.03 earnings per share (basic and diluted) for the same period in 2021. The significant increase in the net income from the three months ended March 31, 2022 compared to the same period in 2021, is largely attributed to higher realized diamond prices in 2022.
| Page | 14 |
Earnings from mine operations
Earnings from mine operations for the three months ended March 31, 2022, were $42,815 compared $13,736 for the same period in 2021. For the three months ended March 31, 2022, the Company sold 507,000 carats for proceeds of $84,653 with diamond sales value per carat of US$132 (three months ended March 31, 2021 - 603,000 carats for $54,224 at US$71 per carat). The prices realized in the first quarter of 2022 exemplify continued improved sentiment and demand in the rough diamond market recovering from the peak of the COVID-19 pandemic effects, amplified by volatility due to speculation as to whether trade embargoes imposed on Russia, could disrupt continuity of supply from Alrosa.
Production costs (excluding capitalized stripping costs) related to diamonds sold for the three months ended March 31, 2022 were $27,120; depreciation and depletion on the GK Mine commissioned assets related to the three months ended March 31, 2022, were $8,894; and the cost of acquired diamonds for the three months ended March 31, 2022 were $5,824, which had been previously paid to De Beers when winning the periodic fancies and specials bids. Resultant earnings from mine operations for the three months ended March 31, 2022 were $42,815. Included in production costs, for the three months ended March 31, 2022 are the Company’s 49% costs specifically arising related to COVID-19 of $2.3 million, comprising of testing, screening services and cost of isolation facilities. Production costs (excluding capitalized stripping costs) related to the three months ended March 31, 2021 were $27,151 and; depreciation and depletion on the GK Mine commissioned assets related to the three months ended March 31, 2021 were $8,463; and the cost of acquired diamonds for the three months ended March 31, 2021 were $4,874. The production costs for the three months ended March 31, 2022, over the same period in 2021, are lower due to less carats sold.
Selling, general and administrative expenses
Selling, general and administrative expenses for the three months ended March 31, 2022, were $3,994 compared to $2,609 for the same period in 2021. The main expenses included in these amounts for the three months ended March 31, 2022 were $1,141 relating to selling and marketing, $1,159 related to consulting fees and payroll, $444 related to share-based payment expenses, $483 related to professional fees and $300 relating to office and administration. The main expenses for the three months ended March 31, 2021 were $1,197 relating to selling and marketing, $440 related to consulting fees and payroll, $179 relating to share-based payment expenses, $272 related to professional fees and $214 related to office and administration. The increase in overall selling, general and administrative costs for the three months ended March 31, 2022, compared to the same period in 2021, can mainly be attributed to an increase in consulting and payroll fees. The payroll increase reflects the appointment of the Chief Sustainability Officer plus an office administration support post along with a payout to the former CFO of the Company. Additionally, a consultant is providing work to support the senior management team. The share-based payment expense also increased compare to prior period as more stock options and RSUs were granted compared to prior period.
Exploration and evaluation expenses
Exploration and evaluation expenses for the three months ended March 31, 2022, were $3,803 compared to $595 for the same period in 2021, which were curtailed in order to conserve cash given the impact of COVID 19 on the business. Of the $3,803 total exploration and evaluation expenses incurred in the three months ended March 31, 2022, $363 is related to the Company’s 49% share of the exploration and evaluation expenses on the GK Mine, while the remaining $3,440 is related to activity on the KNP. Of the $595 total exploration and evaluation expenses incurred in the three months ended March 31, 2021, $181 is related to the Company’s 49% share of the exploration and evaluation expenses on the GK Mine, while the remaining $414 related to activity on the KNP.
Net finance expenses
Net finance expenses for the three months ended March 31, 2022, were $9,152 compared to $9,056 for the same period in 2021. Included in the amount for the three months ended March 31, 2022, were $8,898 relating to finance costs, $323 relating to accretion expense on decommissioning liability and $69 relating to interest income. Included in the amount for the three months ended March 31, 2021, were $8,973 relating to finance costs, $120 relating to accretion expense on decommissioning liability and $37 relating to interest income.
| Page | 15 |
Foreign exchange gains
Foreign exchange gains for the three months ended March 31, 2022, were $4,248 compared to $5,047 for the three months ended March 31, 2021. The foreign exchange gains for the three months ended March 31, 2022 were mainly a result of the Canadian dollar strengthening relative to the US dollar and impacting the translation of the secured notes payable, net of US dollar cash balances. The spot rate on March 31, 2022 was $1.2505/US$1 compared to $1.2637/US$1 at December 31, 2021.
Deferred income taxes
Deferred income taxes for the three months ended March 31, 2022 were $4,270 compared to $Nil for the same period in 2021. A deferred tax liability was established for the first time at the 2021, year end and the deferred tax charged equalled the establishment of the liability. For the three months ended March 31, 2022, the deferred tax liability and corresponding expense increased in anticipation of utilizing tax pools to offset the production income generated in the quarter.
INCOME AND MINING TAXES
The Company is subject to income and mining taxes in Canada with the statutory income tax rate at 26.5%.
No deferred tax asset has been recorded in the financial statements because of the uncertainty associated with the ultimate realization of these tax assets.
The Company is subject to assessment by Canadian authorities, which may interpret tax legislation in a manner different from the Company. These differences may affect the final amount or the timing of the payment of taxes. When such differences arise, the Company makes provision for such items based on management’s best estimate of the outcome of these matters.
The Company’s current tax expenses are associated with mining royalty taxes in the Northwest Territories. There are no other current tax expenses for income tax purposes, as there are significant losses carried forward that are available to offset current taxable income.
FINANCIAL POSITION AND LIQUIDITY
On September 30, 2020, the Company entered into a revolving credit facility with Dunebridge Worldwide Ltd. (Financial Statements Note 10)
On March 28, 2022, the Company executed a credit facility with Dunebridge, for US$50 million (Financial Statements Note 11).
These condensed consolidated interim financial statements have been prepared using the going concern basis of preparation which assumes that the Company will realize its assets and settle its liabilities in the normal course of business.
As of March 31, 2022, the Company faces liquidity challenges as a result of the Senior Secured Notes maturing on December 15, 2022 with a principal amount outstanding of $375,075. The Company does not currently have sufficient cash flows expected from operations available to discharge the Senior Secured Notes amount when they come due. The Company will need to obtain additional financing in the future and/or seek to renegotiate with the holders of the Senior Secured Notes to extend the maturity dates or amend the underlying payment terms. However, there is no guarantee that such financing will be available, or at terms acceptable to the Company, or that holders of the Senior Secured Notes would be willing to renegotiate the amounts in a manner necessary to enable the Company to satisfy its obligations.
The above conditions related to the Company’s Senior Secured Notes and long-term operational financing needs represent material uncertainties that result in substantial doubt as to the Company’s ability to continue as a going concern. These consolidated financial statements do not include the adjustments to the amounts and classification of assets and liabilities that would be necessary should the Company be unable to continue as a going concern. These adjustments may be material.
| Page | 16 |
Failure to meet the obligations for cash calls to fund the Company’s share of expenditures at the GK Mine may lead to De Beers Canada Inc. enforcing its remedies under the JV Agreement, which could result in, amongst other things the dilution of Mountain Province’s interest in the GK Mine, and at certain dilution levels trigger cross-default clauses within the Senior Secured Notes.
Cash flows provided by operating activities, including changes in non-cash working capital for the three months ended March 31, 2022, were $7,008 compared to cash flows used of $9,804 for the same period in 2021. The cash generated from the operating activities for the three months ended March 31, 2022 was significantly higher compared to the same period in 2021 as a result of the strong earnings from mine operations and the increase in accounts payable balance in line with significant deliveries on the winter road during the first quarter of 2022.
Cash flows used in investing activities for the three months ended March 31, 2022, were $14,387 compared to $10,615 for the same period in 2021. For the three months ended March 31, 2022, the outflows for the purchase of property, plant and equipment were $14,409 compared to $10,625 for the same period in 2021. For the three months ended March 31, 2022, the outflow for restricted cash was $47 compared to $27, which relates to the interest earned on the decommissioning fund of the GK Mine. For the three months ended March 31, 2022, the amount of cash used in the acquisition of property, plant and equipment and restricted cash was offset by $69 and of interest income, compared to $37 for the same period in 2021. The increase of cash used in investing activities during the three months ended March 31, 2022, compared to the same period in 2021, can be attributed to the increased stripping activity in the current period.
Cash flows used in financing activities for the three months ended March 31, 2022, were $394 compared to cash flows used of $706 for the same period in 2021. Cash flows used in financing activities for the three months ended March 31, 2022, relate to the cash provided by the Dunebridge RCF, offset by the full repayment of Dunebridge RCF, the payment of lease liabilities and the payment of deferred financing costs on the Dunebridge Junior Credit Facility and the interest on the Dunebridge RCF. Cash flows provided by financing activities for the three months ended March 31, 2021 related to the interest on the Dunebridge RCF and the payment of lease liabilities.
OFF-BALANCE SHEET ARRANGEMENTS
The Company has no off-balance sheet arrangements.
SIGNIFICANT ACCOUNTING POLICIES ADOPTED IN THE CURRENT PERIOD
There was one significant accounting policy adopted in the current period disclosed in Note 3 of the financial statements.
SIGNIFICANT ACCOUNTING JUDGMENTS, ESTIMATES AND ASSUMPTIONS
Significant accounting estimates and assumptions are disclosed in Note 4 of the financial statements.
STANDARDS AND AMENDMENTS TO EXISTING STANDARDS
There is currently one new standard disclosed in Note 3 of the financial statements.
RELATED PARTY TRANSACTIONS
The Company’s related parties include the Operator of the GK Mine, Dermot Desmond, Dunebridge and Vertigol Unlimited Company (“Vertigol”) (corporations ultimately beneficially owned by Dermot Desmond), key management and their close family members, and the Company’s directors. Dermot Desmond, indirectly through Vertigol, is the ultimate beneficial owner of greater than 10% of the Company’s shares. International Investment and Underwriting (“IIU”) is also a related party since it is ultimately beneficially owned by Dermot Desmond.
| Page | 17 |
Related party transactions are recorded at their exchange amount, being the amount agreed to by the parties.
The Company had the following transactions and balances with its related parties including key management personnel including the Company’s directors, Dermot Desmond, Dunebridge, Vertigol, IIU and the Operator of the GK Mine. The transactions with key management personnel are in the nature of remuneration. The transactions with the Operator of the GK Mine relate to the funding of the Company’s interest in the GK Mine for the current year’s expenditures, capital additions, management fee, and production sales related to the 49% share of fancies and special diamonds. The transactions with IIU are for the director fees of the Chairman of the Company.
On March 28, 2022, the Company executed a credit facility with Dunebridge, for US$50 million (Note 11).
On September 24, 2021, the Dunebridge RCF was extended to March 31, 2022 and an upfront 2% extension fee of US$500 was paid. The extension of the Dunebridge RCF was subject to the Term Facility (below) being repaid in full and terminated. The Dunebridge RCF continues to carry an interest rate of 5% per annum. On September 29, 2021, the Company made a partial repayment of US$5 million, and in the fourth quarter of 2021, the Company fully repaid the Dunebridge RCF for the remainder US$20 million. During the period ended March 31, 2022, the Company drew and repaid US$5M from the Dunebridge RCF for funding operations. The Dunebridge RCF was terminated prior to the quarter ended March 31, 2022.
Between 2014 and 2020, the Company and De Beers signed agreements allowing De Beers (“the Operator”) to utilize De Beers’ credit facilities to issue reclamation and restoration security deposits to the federal and territorial governments. In accordance with these agreements, the Company agreed to a 3% fee annually for their share of the letters of credit issued. As at March 31, 2022, the Company’s share of the letters of credit issued were $44.1 million (December 31, 2021 - $44.1 million).
In 2020, the Company and De Beers signed an agreement to reduce the fee from 3% to 0.3%, annually, for their share of the letters of credit issued. Furthermore, a resolution was passed by the joint venture management committee to establish a decommissioning fund, where the Company will fund $15 million in 2020, and $10 million each year for four years thereafter until the Company’s 49% share totaling $55 million is fully funded. The target funding can change over time, dependent on future changes to the decommissioning and restoration liability and returns on decommissioning fund investments. During the three months ended March 31, 2022, the Company funded $Nil (December 31, 2021 - $10 million) into the decommissioning fund, which is presented as restricted cash on the balance sheet.
Failure to meet the obligations for cash calls to fund the Company’s share in the GK Mine may lead to De Beers enforcing its remedies under the JV Agreement, which could result in, amongst other things the dilution of Mountain Province’s interest in the GK Mine, and at certain dilution levels trigger cross-default clauses within the Senior Notes.
The balances as at March 31, 2022 and December 31, 2021 were as follows:
| March 31, | December 31, | |||||||
| 2022 | 2021 | |||||||
| Payable De Beers Canada Inc. as the operator of the GK Mine* | $ | 4,508 | $ | 2,732 | ||||
| Payable to De Beers Canada Inc. for interest on letters of credit | 33 | 99 | ||||||
| Payable to key management personnel | 49 | 67 | ||||||
*Included in accounts payable and accrued liabilities
| Page | 18 |
The transactions for the three months ended March 31, 2022 and 2021 were as follows:
| Three months ended | Three months ended | ||
| March 31, 2022 | March 31, 2021 | ||
| The total of the transactions: | |||
| International Investment and Underwriting | $ 30 | $ 30 | |
| Remuneration to key management personnel | 944 | 490 | |
| Diamonds sold to De Beers Canada Inc. | - | 2,273 | |
| Diamonds purchased from De Beers Canada Inc. | 6,540 | 1,249 | |
| Finance costs incurred from De Beers Canada Inc. | 33 | 36 | |
| Finance costs incurred from Dunebridge Worldwide Ltd. | 28 | 495 | |
| Management fee charged by the Operator of the GK Mine | 833 | 1,191 |
The remuneration expense of directors and other members of key management personnel for the three months ended March 31, 2022 and 2021 were as follows:
| Three months ended | Three months ended | |
| March 31, 2022 | March 31, 2021 | |
| Consulting fees, payroll, director fees, bonus and other short-term benefits | $ 704 | $ 422 |
| Share-based payments | 270 | 98 |
| $ 974 | $ 520 |
Key management personnel are those persons having authority and responsibility for planning, directing and controlling the activities of the Company directly or indirectly, including any directors (executive and non-executive) of the Company.
CONTRACTUAL OBLIGATIONS
The following table summarizes the contractual maturities of the Company’s significant financial liabilities and capital commitments, including contractual obligations:
| Less than | 1 to 3 | 4 to 5 | After 5 | ||
| 1 Year | Years | Years | Years | Total | |
| Gahcho Kué Diamond Mine commitments | $ 3,299 | $ - | $ - | $ - | $ 3,299 |
| Gahcho Kué Diamond Mine decommissioning fund | 10,000 | 20,000 | - | - | 30,000 |
| Notes payable - Principal | 375,075 | - | - | - | 375,075 |
| Notes payable - Interest | 30,006 | �� - | - | - | 30,006 |
| $ 418,380 | $ 20,000 | $ - | $ - | $ 438,380 |
NON-IFRS MEASURES
The MD&A refers to the terms “Cash costs of production per tonne of ore processed” and “Cash costs of production per carat recovered”, both including and net of capitalized stripping costs and “Adjusted Earnings Before Interest, Taxes Depreciation and Amortization (Adjusted EBITDA)” and “Adjusted EBITDA Margin”. Each of these is a non-IFRS performance measure and is referenced in order to provide investors with information about the measures used by management to monitor performance. These measures are intended to provide additional information and should not be considered in isolation or as a substitute for measures of performance prepared in accordance with IFRS. They do not have any standardized meaning under IFRS and therefore may not be comparable to similar measures presented by other issuers.
Cash costs of production per tonne of ore processed and cash costs of production per carat recovered are used by management to analyze the actual cash costs associated with processing the ore, and for each recovered carat. Differences from production costs reported within cost of sales are attributed to the amount of production cost included in ore stockpile and rough diamond inventories.
| Page | 19 |
Adjusted EBITDA is used by management to analyze the operational cash flows of the Company, as compared to the net income for accounting purposes. It is also a measure which is defined in the secured notes payable documents. Adjusted EBITDA margin is used by management to analyze the operational margin % on cash flows of the Company.
The following table provides a reconciliation of the Adjusted EBITDA and Adjusted EBITDA margin with the net income on the consolidated statements of comprehensive income:
| Three months ended | Three months ended | |
| March 31, 2022 | March 31, 2021 | |
| Net income for the period | $ 24,327 | $ 7,312 |
| Add/deduct: | ||
| Non-cash depreciation and depletion | 8,948 | 8,463 |
| Share-based payment expense | 444 | 179 |
| Fair value loss of warrants | 1,525 | - |
| Net finance expenses | 9,140 | 9,056 |
| Derivative gains | 77 | (789) |
| Deferred income taxes | 4,270 | - |
| Unrealized foreign exchange gains | (4,146) | (5,043) |
| Adjusted earnings before interest, taxes, depreciation and depletion (Adjusted EBITDA) | $ 44,585 | $ 19,178 |
| Sales | 84,653 | 54,224 |
| Adjusted EBITDA margin | 53% | 35% |
The following table provides a reconciliation of the cash costs of production per tonne of ore processed and per carat recovered and the production costs reported within cost of sales on the consolidated statements of comprehensive income:
| Three months ended | Three months ended | ||
| (in thousands of Canadian dollars, except where otherwise noted) | March 31, 2022 | March 31, 2021 | |
| Cost of sales production costs | $ | 27,120 | 27,151 |
| Timing differences due to inventory and other non-cash adjustments | $ | 5,150 | 9,321 |
| Cash cost of production of ore processed, net of capitalized stripping | $ | 32,270 | 36,472 |
| Cash costs of production of ore processed, including capitalized stripping | $ | 42,154 | 42,590 |
| Tonnes processed | kilo tonnes | 347 | 307 |
| Carats recovered | 000's carats | 581 | 682 |
| Cash costs of production per tonne of ore, net of capitalized stripping | $ | 93 | 119 |
| Cash costs of production per tonne of ore, including capitalized stripping | $ | 122 | 139 |
| Cash costs of production per carat recovered, net of capitalized stripping | $ | 56 | 53 |
| Cash costs of production per carat recovered, including capitalized stripping | $ | 73 | 62 |
subSequent eventS
Subsequent to the period ended March 31, 2022, the Company drew US$10 million from the Dunebridge JCF.
Subsequent to the three months ended March 31, 2022, the Company entered into an agreement with Scotiabank to cancel the remaining foreign currency of US$32 million put option contracts at strike price 1.28 and 1.25 and exchanged for new foreign currency swing collar contracts of US$60 million at a strike price of 1.26 with settlement dates from May 2022 to December 2022. On settlement date, if the spot rate exceeds 1.33, the Company will settle at a strike price of 1.27 if the spot rate is between 1.26 to 1.33, there is no obligatory settlement. No cash was exchanged on the transaction date and the fair value of the old contract was priced into the new contracts.
| Page | 20 |
Other Management Discussion and Analysis Requirements
Risks
Mountain Province’s business of developing and operating mineral resources involves a variety of operational, financial and regulatory risks that are typical in the mining industry. The Company attempts to mitigate these risks and minimize their effect on its financial performance, but there is no guarantee that the Company will be profitable in the future, and investing in the Company’s common shares should be considered speculative.
Mountain Province’s business of developing and operating mineral properties is subject to a variety of risks and uncertainties, including, without limitation:
| • | risk that the COVID-19 pandemic continues and materially impedes operations and/or the ability of the Company to sell and distribute diamonds; |
| • | risk of COVID-19 affecting commodity prices and demand for diamond inventory, future sales and increased market volatility; |
| • | risk that the production from the mine will not be consistent with the Company’s expectation; |
| • | risk that production and operating costs are not within the Company’s estimates; |
| • | risk that financing required to manage liquidity can be obtained with acceptable terms; |
| • | risk that the Senior Secured Notes will be refinanced with acceptable terms and that the holders of the notes are willing to negotiate with the Company;. |
| • | risks and uncertainties relating to the interpretation of drill results, the geology, grade and continuity of mineral deposits; |
| • | results of initial feasibility, pre-feasibility and feasibility studies, and the possibility that future exploration, development or mining results will not be consistent with the Company's expectations; mining exploration risks, including risks related to accidents, equipment breakdowns or other unanticipated difficulties with or interruptions in production; |
| • | the potential for delays in exploration activities or the completion of studies; |
| • | risks related to the inherent uncertainty of exploration and cost estimates and the potential for unexpected costs and expenses; |
| • | risks related to foreign exchange fluctuations, prices of diamonds, and continued growth in demand for laboratory grown diamonds; |
| • | risks related to challenges in the diamond market causing the sale of some or all of the diamond inventory to be sold below cost; |
| • | risks related to commodity price fluctuations; |
| • | risks related to failure of its joint venture partner; |
| • | risks relating to complying with the covenants in our revolver credit facility; |
| • | development and production risks including and particularly risks for weather conducive to the building and use of the Tibbitt to Contwoyto Winter Road upon which the GK Mine is reliant upon for the cost-effective annual resupply of key inventory including fuel and explosives, the effects of climate change may limit or make impossible the building of the Winter Road; |
| • | risks related to environmental regulation, permitting and liability; |
| • | risks related to legal challenges to operating permits that are approved and/or issued; |
| • | political and regulatory risks associated with mining, exploration and development; |
| • | the ability to operate the Company’s GK Mine on an economically profitable basis; |
| • | aboriginal rights and title; |
| • | failure of plant, equipment, processes and transportation services to operate as anticipated; |
| • | possible variations in ore grade or recovery rates, permitting timelines, capital expenditures, reclamation activities, land titles, and social and political developments, and other risks of the mining industry; and |
| • | other risks and uncertainties related to the Company's prospects, properties and business strategy. |
As well, there can be no assurance that any further funding required by the Company will become available to it, and if so, that it will be offered on reasonable terms, or that the Company will be able to secure such funding. Furthermore, there is no assurance that the Company will be able to secure new mineral properties or Projects, or that they can be secured on competitive terms.
| Page | 21 |
Disclosure of Outstanding Share Data
The Company’s common shares are traded on the Toronto Stock Exchange under the symbol MPVD.
At May 3, 2022, there were 210,909,141 shares issued, 7,881,043 stock options and 2,357,493 restricted share units outstanding. There were 41,000,000 warrants outstanding as at May 3, 2022.
There are an unlimited number of common shares without par value authorized to be issued by the Company.
Controls and Procedures
Disclosure Controls and Procedures and internal control over financial reporting
Management is responsible for the design, implementation and operating effectiveness of internal control over financial reporting. Under the supervision of the Chief Executive Officer and Chief Financial Officer, management evaluated the effectiveness of the Company’s internal control over financial reporting as of March 31, 2022. In making the assessment, management used the criteria set forth in Internal Control - Integrated Framework (2013), issued by the Committee of Sponsoring Organizations of the Treadway Commission. Based on a review of internal control procedures at the end of the period covered by this MD&A, management determined internal control over financial reporting was appropriately designed as at March 31, 2022.
There were no changes in the Company’s internal control over financial reporting that occurred during the quarter ended March 31, 2022 that have materially affected, or are reasonably likely to materially affect, the Company’s internal control over financial reporting.
Management is also responsible for the design and effectiveness of disclosure controls and procedures. The Company’s Chief Executive Officer and Chief Financial Officer have each evaluated the effectiveness of the Company’s disclosure controls and procedures as at March 31, 2022 and have concluded that these disclosure controls and procedures were appropriately designed.
The Company’s management, including the Chief Executive Officer and Chief Financial Officer, believe that internal controls over financial reporting and disclosure controls and procedures, no matter how well designed and operated, have inherent limitations. Therefore, even those systems determined to be properly designed and effective can provide only reasonable assurance that the objectives of the control system are met.
| Page | 22 |
CAUTIONARY NOTE ON FORWARD-LOOKING STATEMENTS
This MD&A contains certain “forward-looking statements” and “forward-looking information” under applicable Canadian and United States securities laws concerning the business, operations and financial performance and condition of Mountain Province Diamonds Inc. Forward-looking statements and forward-looking information include, but are not limited to, statements with respect to the future financial or operating performance of the Company; operational hazards, including possible disruption due to pandemic such as COVID-19, its impact on travel, self-isolation protocols and business, operations and prospects; estimated production and mine life of the project of Mountain Province; the realization of mineral resource estimates; the timing and amount of estimated future production; costs of production; the future price of diamonds; the estimation of mineral reserves and resources; the ability to manage debt; capital and operating expenditures; use of proceeds from financings; the ability to obtain permits or approvals for operations; liquidity and requirements for additional capital; government regulation of mining operations; environmental risks; reclamation expenses; title disputes or claims; limitations of insurance coverage; tax rates; and currency exchange rate fluctuations. Except for statements of historical fact relating to Mountain Province, certain information contained herein constitutes forward-looking statements. Forward-looking statements are frequently characterized by words such as “anticipates,” “may,” “can,” “plans,” “believes,” “estimates,” “expects,” “projects,” “targets,” “intends,” “likely,” “will,” “should,” “to be,” “potential,” “budget,” “scheduled,” “forecasts” and other similar words and variations of such words (including negative variations), or statements that certain events or conditions “may,” “should,” "could," "would," "might" or “will” occur. Forward-looking statements are based on the opinions and estimates of management at the time such statements are made, and, by their nature, are based on a number of assumptions and subject to a variety of inherent risks and uncertainties and other factors that could cause actual events or results to differ materially from those projected in the forward-looking statements. Many of these assumptions are based on factors and events that are not within the control of Mountain Province and are difficult to predict, and there is no assurance they will prove to be correct.
Factors that could cause actual results to vary materially from results anticipated by such forward-looking statements include the development of operation hazards that could arise in relation to COVID-19, including, but not limited to protocols which may be adopted to reduce the spread of COVID-19 and any impact of such protocols on Mountain Province's business, operations and prospects; variations in ore grade or recovery rates; changes in market conditions; the global economic climate; changes in project parameters; mine sequencing; production rates and estimates; dependence on the Gahcho Kué diamond mine; cash flow; risks relating to financing requirements; insurance risks; failure by the Company to maintain its obligations under its debt facilities; risks relating to the availability and timeliness of permitting and governmental approvals; regulatory and licensing risks; environmental and climate risks; supply of, and demand for, diamonds; fluctuating commodity prices and currency exchange rates; the possibility of project cost overruns or unanticipated costs and expenses; the availability of skilled personnel and contractors; labour disputes and other risks of the mining industry; and failure of plant, equipment or processes to operate as anticipated.
These and other factors are discussed in greater detail in this MD&A and in Mountain Province's most recent Annual Information Form filed on SEDAR, which also provides additional general assumptions in connection with these statements. Mountain Province cautions that the foregoing list of important factors is not exhaustive. Investors and others who base themselves on forward-looking statements should carefully consider the above factors as well as the uncertainties they represent and the risk they entail. Mountain Province believes that the expectations reflected in those forward-looking statements are reasonable, but no assurance can be given that these expectations will prove to be correct and such forward-looking statements included in this MD&A should not be unduly relied upon.
Although Mountain Province has attempted to identify important factors that could cause actual actions, events or results to differ materially from those described in forward-looking statements, there may be other factors that cause actions, events or results not to be anticipated, estimated or intended. There can be no assurance that forward-looking statements will prove to be accurate, as actual results and future events could differ materially from those anticipated in such statements. The forward-looking statements and forward-looking information contained herein is given as of the date of this MD&A, and Mountain Province undertakes no obligation to update forward-looking statements, whether as a result of new information, future events or results or if circumstances or management’s estimates or opinions should change, except as required by applicable securities laws. The reader is cautioned not to place undue reliance on forward-looking statements. Statements concerning mineral reserve and resource estimates may also be deemed to constitute forward-looking statements to the extent they involve estimates of the mineralization that will be encountered as the property is developed. Mineral resources are not mineral reserves and do not have demonstrated economic viability.
| Page | 23 |
Further, Mountain Province may make changes to its business plans that could affect its results. The principal assets of Mountain Province are administered pursuant to a joint venture under which Mountain Province is not the operator. Mountain Province is exposed to actions taken or omissions made by the operator within its prerogative and/or determinations made by the joint venture under its terms. Such actions or omissions may impact the future performance of Mountain Province. Under its current notes and credit facilities, Mountain Province is subject to certain limitations on its ability to pay dividends on common shares. The declaration of dividends is at the discretion of Mountain Province’s Board of Directors, subject to the limitations under the Company’s debt facilities, and will depend on Mountain Province’s financial results, cash requirements, future prospects, and other factors deemed relevant by the Board.
Cautionary Note to US Investors - Information Concerning Preparation of Resource Estimates
This MD&A has been prepared in accordance with the requirements of the securities laws in effect in Canada, which differ from the requirements of United States securities laws. Unless otherwise indicated, all resource and reserve estimates included in this MD&A have been prepared in accordance with NI 43-101 and the Canadian Institute of Mining and Metallurgy Classification System. NI 43-101 is a rule developed by the Canadian Securities Administrators which establishes standards for all public disclosure an issuer makes of scientific and technical information concerning mineral projects. As such, the information included herein concerning mineral properties, mineralization and estimates of mineral reserves and mineral resources is not comparable to similar information made public by U.S. companies subject to the reporting and disclosure requirements of the United States Securities and Exchange Commission.
| Page | 24 |