
PINNACLE DATA SYSTEMS, INC.
2005 ANNUAL REPORT TO
SHAREHOLDERS
PINNACLE DATA SYSTEMS, INC.
2005 ANNUAL REPORT
CONTENTS
To Our Shareholders,
I am pleased to report that 2005 marked the third consecutive year of 30% or greater sales growth and the fourth consecutive year of increased earnings. These results reflect successful completion of our first acquisition, new customers in key markets, and further expansion of our products and services. All of this was accomplished as a result of the commitment and extraordinary efforts of our employees.
Key 2005 Objectives
Throughout 2005, we were focused on accomplishing three strategic objectives:
| | • | | Grow sales and the number of customers across the six industries we serve: |
| | • | | Computer and computer peripheral |
| | • | | Expand services and capabilities to capture a broader base within the targeted industry segments. |
| | • | | Develop a team and operating methodology capable of growing the organization. |
By all measures we accomplished or exceeded our goals during 2005.
Sales and Customer Growth
2005 Customer and Revenue Mix
Dollars in millions
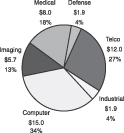
In many ways 2005 was a break-out year for PDSi. Our sales rose to a record $44.6 million and profitability increased for the fourth consecutive year. This was attributable to a significant increase in the number of Fortune global 500 and Fortune 500 customers we serve by providing products and/or services. These customers totaled 19 at year-end 2005, nearly double the number for the previous year. Additionally, we increased our penetration in key markets and achieved an improved mix among the industries we serve compared to 2004. Our customers represent some of the world’s largest and most successful companies and are a solid fit for PDSi’s expanded technology and services portfolio. Approximately three-fourths of our 2005 revenue was generated from products and one-fourth from services.
Acquisition
In August 2005 we completed our first acquisition. Based close to Los Angeles, California, GNP Computers, Inc. is a great fit with PDSi’s business and enabled us to expand our presence in key markets. Due to the commitment of our employees the entire transaction was completed in 41 days following execution of the letter of intent. Importantly, the acquisition was accretive to our earnings for the second half of 2005.
1
PDSi’s growth strategy includes both organic growth and growth through acquisitions. We see a significant opportunity in the embedded computer services industry to consolidate high quality niche players and better serve the growing demand for out-sourced design, manufacturing and support services from original equipment manufacturers across several vertical markets. This acquisition increased our global marketing presence to cover North America, Europe and Asia. PDSi now has sales offices in Boston, Columbus, Dallas, Los Angeles, San Francisco, The Netherlands (through partner Kender-Thijssen) and Singapore.
Our acquisition criteria are well-defined and we plan to maintain a disciplined approach as future opportunities are considered. We will continue to pursue companies that are consistent with our business goals as well as financial capabilities and can add measurable value to PDSi’s long-term performance.
Transition to Professional Services Company
Previously, we have discussed PDSi’s product lifecycle solutions to Original Equipment Manufacturers in select markets. This business model has a foundation of technical service and support programs, which provides resources for the development and sale of high-potential engineered computer solutions for specific customers and niche-industry applications. Our value proposition includes this unique portfolio of services and products, which are utilized to serve our customers’ product lifecycle needs. The entire portfolio is bundled to meet specific customer needs, which offers increased value to customers through a unified program management process supported by a strong information management infrastructure.
Following an in-depth strategic planning process during 2005, we began to develop plans to position PDSi toward becoming a global professional services company. This significant transition, known as Fulcrum, will draw upon PDSi’s established strengths and capabilities, and will also redefine how we conduct our business in the future. Our goal is to collaborate with the world’s leading OEM’s by managing critical business activities required to successfully deploy information technology. PDSi’s existing customer relationships provide a solid foundation to pursue these efforts and are expected to provide additional benefits as we implement this strategy beginning in the second half of 2006.
Looking Ahead
On March 13, 2006, we announced key changes to the Company’s executive management team, which were effective immediately. First, Mike Sayre was elected Chief Executive Officer and President of the Company. Previously, he served as the Company’s Executive Vice President and Chief Financial Officer. I will continue to serve as Chairman of the Board of Directors and was elected Chief Technology and Innovation Officer of the Company. In this new position, my responsibilities include maintaining active oversight of developments in the Company’s key markets as well as current and emerging technology applications, especially as they apply to PDSi’s customers.
PDSi is poised to realize further benefits as we continue to implement our focused growth strategy. For 2006, we have established five strategic objectives:
| | • | | Launch our Fulcrum initiative, which will enable us to manage our customer’s critical business activities seamlessly by linking together the product life-cycle services we offer, thus creating a compelling solution for the Original Equipment Manufacturers. |
| | • | | Continue expanding our global footprint by developing a sales and operating presence in Europe, the Middle East and Africa (EMEA) and the Pacific Rim. |
| | • | | Increase penetration of services revenue within our strategic accounts by focusing on management solutions. |
| | • | | Expand our portfolio of standard platforms with an emphasis on Advanced Telecommunications Architecture® (ATCA) solutions, which we introduced earlier this year. ATCA is a platform to serve the emerging market for telecommunications equipment designed with an efficient blade-computer standard and this market is expected to grow rapidly over the next few years. |
| | • | | Execute a long-term financial strategy that provides funding for PDSi’s capital needs. |
2
We are excited about PDSi’s future growth potential and our ability to capture increased market share in the global services market. Investments directed toward scalability and infrastructure over the last two years, coupled with planned investments for this year, will be key drivers in propelling PDSi to the next level of performance.
Thank you for your interest, investment in PDSi and continued support. We are proud of the contributions from our network of customers, technology partners and key suppliers, as well as our employees and Board of Directors for their dedication and hard work. The Board of Directors and management remain focused on achieving increased shareholder value. Our Annual Shareholder meeting will be on May 5, 2006. We hope you will join us.
Respectfully,
|
|
/s/ John D. Bair __________________________________________ |
John D. Bair Chairman of the Board and Chief |
Technology and Innovation Officer |
3
THE COMPANY
Pinnacle Data Systems, Inc. is located at 6600 Port Road, Groveport, Ohio 43125. We provide product lifecycle service solutions to Original Equipment Manufacturers (“OEMs”) in the medical, telecommunications, defense, imaging and computer equipment industries, among others. We offer a full range of computer and computer-related product development and manufacturing services to increase product speed to market and engineered product life, and to provide service and support to units in the field through comprehensive product lifecycle management programs encompassing depot repair, advanced exchange, contact center support and end-of-life control. For the fiscal year ended December 31, 2005, our operations are reported in two business segments: Product and Service.
Product
Our products are custom-engineered to meet specific customer or niche-industry requirements that generally cannot be met by an off-the-shelf solution. They are sold to OEMs and then typically resold to end-users as components of the OEMs’ final products. Our products are usually developed as a result of us helping OEMs design, engineer, manufacture, assemble, modify, and/or integrate computer systems or components to fit their specific application needs. Many of our products are based on the high performance computer processing technologies of Sun Microsystems, Inc. (“Sun”), Intel Corporation (“Intel”) and Advanced Micro Devices, Inc. (“AMD”), three of world’s leading producers of computer components and systems. We combine their products and other vendor off-the-shelf computer components or peripherals with technologies that we engineer and develop, such as customized circuit boards, enclosures, power supplies and other engineered components and software. By leveraging our expertise and experience in engineering and integrating our internally developed products with Sun, Intel, AMD and other vendors’ technologies, we are able to offer product solutions with minimal product design and engineering costs to our customers.
Our end-of-life product management service allows our customers to maximize their investment in technology by providing continued support for products no longer in production or supported by the original manufacturer. This allows our customers to eliminate or delay the engineering, software development and re-certification charges required to integrate new technology into their products. For example, when a computer board manufacturer stops manufacturing a particular board, its OEM customers are left with few alternative sources for the boards they need to continue building or repairing their products. We can provide the boards, purchased from a number of available sources, either new or refurbished, or we can redesign a new board with the same form, fit and function with components that are readily available at the time.
We are a SunSoft Master Distributor authorized to provide our customers with the right to use Solaris, Sun Microsystem’s UNIX operating system and we are a member of the Sun Partner Advantage Program. We are an authorized Intel Product Dealer and have earned Intel Channel Partner Premier Member status for our distinct level of competency with Intel technologies. We are an authorized AMD Gold Solution Provider. We are an authorized HP Business Development Partner. We are also licensed by Microsoft to distribute embedded Microsoft operating systems.
Service
We offer complete service and support for several OEMs’ products, as well as our own, including testing, repair, inventory and logistics management services. Depot repair and testing services are provided for advanced technology systems, printed circuit board assemblies, and other computer peripherals and components, where the suspect non-functioning equipment is sent to our designated depot location for testing and repair, if required. We also manage “advanced-exchange” repair programs. Our highest volume testing and repair is performed on complex printed circuit boards, systems and electro-mechanical data storage devices for Sun, Lucent Technologies, Hewlett-Packard Company, and Silicon Graphics, Inc. (SGI), and on standard PC configurations for a large home-based computer learning program. For our largest OEM customers, we maintain and share online information management systems that seamlessly connect our companies.
4
We consider our Product and Service segments to be complementary. New product development keeps our engineers and service technicians on the forefront of technologies being sold that generate new service opportunities. Our services provide a competitive advantage in selling our products since the entire infrastructure is already in place to provide high quality service and support before and after the sale.
FIVE YEAR SELECTED FINANCIAL INFORMATION
(in thousands, except earnings per share)
| | | | | | | | | | | | | | | | | | | | | | |
| | | 2005 | | | 2004 | | | 2003 | | | 2002 | | | 2001 | |
FINANCIAL RESULTS | | | | | | | | | | | | | | | | | | | | | | |
| | | | | | |
Sales | | Total | | $ | 44,606 | | | $ | 34,397 | | | $ | 22,884 | | | $ | 15,674 | | | $ | 22,672 | |
| | Products | | | 34,444 | | | | 28,351 | | | | 15,595 | | | | 8,367 | | | | 18,261 | |
| | Services | | | 10,162 | | | | 6,046 | | | | 7,289 | | | | 7,307 | | | | 4,411 | |
| | | | | | |
Gross profit | | Total | | $ | 10,547 | | | $ | 8,015 | | | $ | 6,038 | | | $ | 4,609 | | | $ | 4,420 | |
| | Products | | | 4,289 | | | | 5,698 | | | | 3,594 | | | | 1,610 | | | | 3,419 | |
| | Services | | | 6,258 | | | | 2,317 | | | | 2,444 | | | | 2,999 | | | | 1,001 | |
| | | | | | |
Gross profit margin % | | Total | | | 23.6 | % | | | 23.3 | % | | | 26.4 | % | | | 29.4 | % | | | 19.5 | % |
| | Products | | | 12.5 | % | | | 20.1 | % | | | 23.0 | % | | | 19.2 | % | | | 18.7 | % |
| | Services | | | 61.6 | % | | | 38.3 | % | | | 33.5 | % | | | 41.0 | % | | | 22.7 | % |
| | | | | | |
Operating expenses | | | | $ | 8,739 | | | $ | 6,616 | | | $ | 5,147 | | | $ | 4,500 | | | $ | 5,191 | |
Income (loss) from operations | | | | $ | 1,808 | | | $ | 1,399 | | | $ | 891 | | | $ | 109 | | | $ | (771 | ) |
Interest expense | | | | $ | 289 | | | $ | 113 | | | $ | 85 | | | $ | 128 | | | $ | 351 | |
Net income (loss) | | | | $ | 937 | | | $ | 884 | | | $ | 473 | | | $ | (19 | ) | | $ | (690 | ) |
Basic earnings (loss) per share | | | | $ | 0.16 | | | $ | 0.16 | | | $ | 0.09 | | | $ | (— | ) | | $ | (0.13 | ) |
Diluted earnings (loss) per share | | | | $ | 0.15 | | | $ | 0.14 | | | $ | 0.08 | | | $ | (— | ) | | $ | (0.13 | ) |
| | | | | | |
FINANCIAL POSITION | | | | | | | | | | | | | | | | | | | | | | |
Current assets | | | | $ | 23,529 | | | $ | 9,381 | | | $ | 7,787 | | | $ | 5,683 | | | $ | 7,709 | |
Net fixed assets | | | | $ | 782 | | | $ | 971 | | | $ | 1,086 | | | $ | 1,334 | | | $ | 1,446 | |
Current liabilities | | | | $ | 17,664 | | | $ | 5,219 | | | $ | 4,813 | | | $ | 3,418 | | | $ | 5,564 | |
Long-term liabilities | | | | $ | 63 | | | $ | 101 | | | $ | 55 | | | $ | 93 | | | $ | 98 | |
Stockholders’ equity | | | | $ | 6,692 | | | $ | 5,055 | | | $ | 4,036 | | | $ | 3,552 | | | $ | 3,546 | |
| | | | | | |
Current ratio | | | | | 1.3 | | | | 1.8 | | | | 1.6 | | | | 1.7 | | | | 1.4 | |
Long-term debt to equity ratio | | | | | 0.0 | | | | 0.0 | | | | 0.0 | | | | 0.0 | | | | 0.1 | |
Return on equity | | | | | 16.1 | % | | | 19.4 | % | | | 12.5 | % | | | (0.5 | )% | | | (18.0 | )% |
5
MANAGEMENT’S DISCUSSION AND ANALYSIS OR
PLAN OF OPERATION
The following discussion should be read in conjunction with the Financial Statements and Notes contained herein.
This annual report, including the following sections, contains forward-looking statements within the meaning of Section 27A of the Securities Act of 1933 and Section 21E of the Securities Exchange Act of 1934, including, but not limited to, statements regarding the Company achieving its financial growth and profitability goals, or its sales, earnings and profitability expectations for the first quarter and year of 2006. The words “believe,” “expect,” “anticipate,” “estimate,” “project,” “should,” “intend,” “plan” or “planning” and similar expressions identify forward-looking statements that speak only as of the date thereof. Investors are cautioned that such statements involve risks and uncertainties that could cause actual results to differ materially from historical or anticipated results due to many factors.These factors include changes in general economic conditions, changes in the specific markets for our products and services, adverse business conditions, changes in customer order patterns, increased competition, changes in our business or our relationship with major technology partners or significant customers, pricing pressures, lack of adequate financing to take advantage of business opportunities that may arise, lack of success in technological advancements, risks associated with our new business practices, processes and information systems, and other factors, including those discussed under “Risk Factors” on page 11 of this report.
OVERVIEW
Pinnacle Data Systems, Inc. (“PDSi,” the “Company” or “we”) provides product lifecycle service solutions to Original Equipment Manufacturers (“OEMs”) in the medical, telecommunications, defense, imaging, industrial and computer equipment markets, among others. We offer a full range of computer and computer-related product development and manufacturing services to increase product speed to market and engineered product life, and to provide service and support to units in the field through comprehensive product lifecycle management programs encompassing depot repair, advanced exchange, contact center support and end-of-life control.
Our business strategy is to collaborate with the world’s leading OEMs by managing the critical business activities required to successfully deploy information technology (“IT”) solutions. Our approach includes redefining the outsourced IT solution for OEMs that embed information technologies by offering comprehensive, global and information-laden solutions to fill critical supply-chain, engineering and logistics needs, and differentiating our offerings from other market choices through tangible value propositions based on collaborative execution and business intelligence deliverables. Unlike contract manufacturers, PDSi is skilled at offering hybrid solutions using commercially available technologies combined with proprietary implementations. Unlike distributors, PDSi is technology agnostic and capable of complex engineering programs. Unlike technology providers, PDSi has focused solutions specific to OEMs, not enterprises. Unlike logistics firms, PDSi brings quantitative technical knowledge and engineered platforms to its custom solution development process. We intend to develop a new brand category to address needs of OEMs, consolidate weaker niche players through acquisition, establish a professional services model to parallel that established in the enterprise space and provide its offerings in international markets.
On August 12, 2005, we entered into an asset purchase agreement with GNP Computers, Inc. (GNP) and GNP’s principal shareholder, in which we acquired all of the assets and certain liabilities of GNP. The assets totaled approximately $8.7 million, of which $8.3 million was receivables and inventory. Thus far, the acquisition has been accretive by our retaining over 20 customers with similar profiles and expansion opportunities as our existing business, the former GNP’s sales office and production facility in suburban Los Angeles, California, an expanded international presence with an Asia-based sales office, additional customers in Asia and Europe, an expanded product line including telecommunications platforms and application-specific
6
devices, and additional technical and engineering expertise and capabilities. None of the acquired customers were under contractual obligation to GNP to meet minimum order quantities before the acquisition and they are not under any of those kind of obligations with us today. They could stop placing orders at any time. The liabilities assumed upon the acquisition consisted of a $2.3 million asset-based line of credit, payables and other accrued liabilities of approximately $6.4 million, which included transaction fees for both parties. Simultaneously with the acquisition, we paid off the asset-based line of credit. In order to facilitate the acquisition, on August 9, 2005, we increased our asset-based line of credit with KeyBank NA to $11 million from $6 million. The market value of the assets was essentially equal to the total of the assumed liabilities and capitalized transaction expenses. As a result, no goodwill or other intangibles were recognized and recorded on the transaction and no long term debt was assumed or incurred. The results of the operations of the California operation subsequent to August 15, 2005 are included in our statement of income.
As a result of the acquisition and the expected organic growth of the combined organizations, we anticipate another record sales year in 2006. Further integration of the two businesses and infrastructure development for growth in the future will occur simultaneously throughout the year. We plan to spend up to $1 million in information technology and systems in 2006 to integrate the businesses and build a platform for future growth, with about half of that amount being capitalized as fixed assets. We will continue evaluating viable acquisition opportunities that meet our established criteria, including strategic fit and projected accretive performance in less than a year. However, we are not currently planning any additional acquisitions before the second half of 2006.
The following discussions and analyses are for the year ended December 31, 2005 compared to the year ended December 31, 2004.
SALES
Sales for 2005 and 2004 were as follows:
| | | | | | | | |
| | | Year | | % Change | |
| | | 2005 | | 2004 | |
| | | ($ thousands) | | | |
Total company | | $ | 44,606 | | 34,397 | | 30 | % |
Product | | | 34,444 | | 28,351 | | 21 | % |
Service | | | 10,162 | | 6,046 | | 68 | % |
The increase in product sales for 2005 to a record total was due to increased shipments to medical, telecommunications and defense customers, which more than offset lower shipments to imaging and industrial control customers. The increases in both product and service (mostly test and repair) sales resulted from both the acquisition of GNP Computers and from organic growth in the second half of the year. We anticipate record sales in 2006, starting with strong year-over-year sales in the first quarter.
For 2005, we had three customers that generated revenues of approximately $5.8 million, $5.5 million, and $4.4 million or 13%, 12%, and 10% respectively, of total revenue. In the statements of income, approximately 3% of the revenues from these customers is included in service sales and 97% is included in product sales. In addition, these customers represented 20%, 6%, and 17%, respectively, of accounts receivable at December 31, 2005. This degree of revenue concentration is lower than in recent years and is the result of the growth of the number of active customers both before the acquisition and as a result of the acquisition. While we continually seek new opportunities within our existing customers, we also expect our growth to come from new customers, including international customers, leading to additional customer diversification over time.
7
GROSS PROFIT
Gross profits for 2005 and 2004 were as follows:
| | | | | | | | | |
| | | Year | | % Change | |
| | | 2005 | | 2004 | |
| | | ($ thousands) | | | |
Total company | | $ | 10,547 | | $ | 8,015 | | 32 | % |
Product | | | 4,289 | | | 5,698 | | -25 | % |
Service | | | 6,258 | | | 2,317 | | 170 | % |
The gross profits margin percentage for 2005 and 2004 were as follows:
| | | | | | |
| | | Year | |
| | | 2005 | | | 2004 | |
Total company | | 24 | % | | 23 | % |
Product | | 12 | % | | 20 | % |
Service | | 62 | % | | 38 | % |
The decrease in gross profit dollars and percentage on product sales in 2005 was due to sales mix as we implemented first-time programs with large medical, imaging and network equipment customers during the year. The volume in these programs and the resulting increases in operating efficiency and gross profit contribute significantly to bottom line profitability.
The increase in the gross profit dollars and percentage for service sales in 2005 was attributable to the organic growth in service sales as well as the addition of acquired customer programs. The increase in sales volume led to a significant increase in operating leverage compared to 2004, resulting in the higher margins.
OPERATING AND INTEREST EXPENSES
Operating expenses include selling, general and administrative (SG&A) expenses. Operating and interest expenses for 2005 and 2004 were as follows:
| | | | | | | | | |
| | | Year | | % Change | |
| | | 2005 | | 2004 | |
| | | ($ thousands) | | | |
SG&A expense | | $ | 8,739 | | $ | 6,616 | | 32 | % |
Interest expense | | | 289 | | | 113 | | 156 | % |
| | | | | | | | | |
Total expense | | | 9,028 | | | 6,729 | | 34 | % |
| | | | | | | | | |
The increase in operating expenses in 2005 resulted primarily from the acquired operations along with planned increases in sales and marketing activities. The 32% increase in operating expenses was comparable to the 30% increase in sales. Operating expenses were 20% of sales in 2005, compared to 19% in 2004.
When recording the acquisition of GNP Computers in August 2005, we recorded various estimates of potential liabilities. In the fourth quarter of 2005, after further research and analysis and consultation with outside experts, we reduced the assumed liabilities from the acquisition by approximately $300,000. The reduction of the accruals resulted in a reduction of SG&A expenses of the same amount in the fourth quarter of 2005.
In 2005, an increased use of the credit line due to higher levels of receivables and inventory related to the acquired operations combined with higher interest rates resulting in higher interest expense compared to 2004. The average daily balance on the line of credit increased to $4.4 million in 2005 from $2.6 million in 2004. Interest rates paid on the line of credit ranged from 5.25% to 7.25% in 2005, and from 4.00% to 5.25% in 2004.
8
INCOME TAXES AND NET INCOME
The effective tax rate used for 2005 was 38%, compared to 31% in 2004, reflecting a decrease in foreign sales and the use of the extra-territorial income tax incentive.
Income before taxes, income taxes and net income for 2005 and 2004 were as follows:
| | | | | | |
| | | Year |
| | | 2005 | | 2004 |
| | | ($ thousands) |
Income before income taxes | | $ | 1,519 | | $ | 1,286 |
Income tax expense | | | 582 | | | 402 |
| | | | | | |
Net income | | | 937 | | | 884 |
| | | | | | |
Earnings per share for 2005 and 2004 were as follows:
| | | | | | |
| | | Year |
| | | 2005 | | 2004 |
EPS: | | | | | | |
Basic | | $ | 0.16 | | $ | 0.16 |
Fully diluted | | $ | 0.15 | | $ | 0.14 |
Weighted average number of shares outstanding: | | | | | | |
Basic | | | 5,867,986 | | | 5,572,811 |
Fully diluted | | | 6,284,439 | | | 6,121,675 |
The increase in net income in 2005 resulted from the increase in service sales, due partly to the acquired operations and partly due to organic growth, and from the higher percentage of services sales to overall sales in 2005, compared to 2004.
LIQUIDITY AND CAPITAL RESOURCES
A summary of changes in current assets for 2005 and 2004 follows:
| | | | | | | | | |
| | | 12/31/05 | | 12/31/04 | | % Change | |
| | | ($ thousands) | | | |
Accounts receivable | | $ | 12,556 | | $ | 4,398 | | 185 | % |
Inventory | | | 9,233 | | | 4,080 | | 126 | % |
Other current assets | | | 1,740 | | | 903 | | 93 | % |
| | | | | | | | | |
Total | | | 23,529 | | | 9,381 | | 151 | % |
| | | | | | | | | |
A summary of changes in current liabilities for 2005 and 2004 follows:
| | | | | | | | | |
| | | 12/31/05 | | 12/31/04 | | % Change | |
| | | ($ thousands) | | | |
Line of credit | | $ | 9,336 | | $ | 2,525 | | 270 | % |
Accounts payable | | | 6,122 | | | 2,177 | | 181 | % |
Other current liab. | | | 2,206 | | | 517 | | 327 | % |
| | | | | | | | | |
Total | | | 17,664 | | | 5,219 | | 238 | % |
| | | | | | | | | |
During 2005, $4.8 million of cash was used by operating activities. Net income before depreciation, provision for doubtful accounts, inventory reserves, and provision for deferred taxes was $1.3 million. Cash was
9
used for an increase in accounts receivable of $4.3 million, for an increase in inventory of $1 million and for reductions in accounts payable of $1 million and in accrued expenses of $174,000. The increase in accounts receivable reflects the higher revenue level of the fourth quarter of 2005 ($7.5 million in December) compared to the fourth quarter of 2004 ($3.1 million in December).
In 2005, we used $243,000 of cash to purchase equipment, including computers and software. We also assumed $125,000 of cash balances in the acquisition.
We drew an additional $6.8 million on the line of credit to fund operations, fixed asset purchases and the acquisition.
The line of credit, which is our primary source of operational and non-operational funding, is maintained with KeyBank National Association (KeyBank) and is a revolving credit facility collateralized by a “Blanket Lien” on all of our assets. The amount available under the line of credit is subject to borrowing base restrictions and other financial covenants as outlined in the agreement. Additionally, the agreement restricts the payment of cash dividends that would cause violations of the loan covenants.
The aforementioned borrowing base on the line of credit is calculated as 85% of eligible accounts receivable and 50% of inventory value, net of reserves. The line has an overall limit of $11 million as well as a sub-limit of $5.5 million that can be collateralized by inventory. That calculation represents the maximum amount that can be drawn on the line of credit.
In anticipation of our acquisition of GNP, on August 9, 2005, the terms of the bank line of credit with KeyBank were amended to reflect our near term borrowing needs and our credit risk as rated by KeyBank. The amount available under the line was increased to $11 million from $6 million and is due and renewable by May 15, 2007. The balance on the line of credit at December 31, 2005 was $9,336,000. The borrowing base calculation on that date was the maximum $11 million, resulting in an unused capacity of $1.7 million. To accommodate the additional debt assumed in the GNP acquisition, on December 29, 2005, Total Debt to Tangible Net Worth Ratio loan covenant on the line of credit was increased to a maximum of 3.0 to 1.0 from 2.0 to 1.0. The covenant maximum will become 2.5 to 1.0 for the quarter ending June 30, 2006. The Company was in compliance with the revised covenant on December 31, 2005.
Additional financing may be needed to support the future growth plans of the company. We have begun execution of an acquisition strategy that may be financed by the issuance of additional common or preferred stock that has been previously authorized by the shareholders. Those shares may be issued by approval of the Board of Directors. Acquisitions may also be financed with additional debt. Acquisitions being evaluated provide services similar to our that are, or can be made, accretive in a short period of time; that bring large OEM customer relationships with potential additional business for the combined company (that neither company might get on their own); and that bring resources, in terms of people, processes and/or systems, that increase the scalability of the combined businesses.
OFF-BALANCE SHEET ARRANGEMENTS
We have no off-balance sheet arrangements with any obligation under a guarantee contract, or a retained or contingent interest in assets or similar arrangement that serves as credit, liquidity or market risk support for such assets, or any other obligation, including a contingent obligation, under a contract that would be accounted for as a derivative instrument.
At any given point in time in the normal course of business, we have numerous outstanding purchase orders with our vendors to purchase inventory for use in the products that we sell to our customers or to use in performing repair services for our customers. Such orders are not recorded as liabilities in our balance sheet until the material is typically placed on a common carrier. We have no minimum purchase quantity requirements with any of our vendors.
10
CRITICAL ACCOUNTING POLICIES
The preparation of financial statements and related disclosures in conformity with accounting principles generally accepted in the United States requires management to make judgments, assumptions and estimates that affect the amounts reported in the Financial Statements and accompanying notes. Note 1 to the Financial Statements in the Annual Report on our Form 10-KSB for the year ended December 31, 2005 describes the significant accounting policies and methods used in the preparation of the Financial Statements. Estimates are used for, but not limited to, the accounting for allowance for doubtful accounts and inventory reserves. Actual results could differ from these estimates. The following critical accounting policies are impacted significantly by judgments, assumptions and estimates used in the preparation of the Financial Statements.
For product sales, we recognize revenue upon transference of the title to the products to the customer. For repair sales, we recognize revenue upon completion of the repair work and either shipment of the item back to the customer or, in the programs in which we also manage the customer’s inventory on our site, when we return the repaired item to the customer’s finished goods inventory. For some repair and maintenance programs, the customer pays a flat fee that covers multiple fiscal periods. In those instances, we recognize revenue over the fiscal periods covered by the billing on a pro-rata basis. Our inventory and logistics management programs are billed monthly in the month in which the services are being provided, with revenue recognized upon billing. For non-recurring engineering projects, we recognize revenue on a percentage-of-completion basis.
The allowance for doubtful accounts is based on our assessment of the collectibility of specific customer accounts and the aging of the accounts receivable. If there is a deterioration of a major customer’s credit worthiness or actual defaults are higher than our historical experience, our estimates of the recoverability of amounts due to us could be adversely affected.
Inventory purchases and commitments are based upon future demand forecasts. If there is a sudden and significant decrease in demand for our products or there is a higher risk of inventory obsolescence because of rapidly changing technology and customer requirements, we may be required to increase our inventory allowances and our gross margin would be adversely affected.
Various estimates were used in recording the acquisition of the assets and assumption of the liabilities of GNP Computers, Inc. Exact amounts of future payments for items such as GNP taxes, interest and penalties, and for professional fees are not yet known, but are contractually capped in the Asset Purchase Agreement of August 12, 2005. The exact amounts actually paid may be different from the estimates used in recording the transaction. Approximately $300,000 of estimated assumed liabilities were reduced in the fourth quarter of 2005, and included as a reduction of SG&A expenses of that amount in that quarter.
RISK FACTORS
Investors should carefully consider the risks described below before making an investment decision. The risks and uncertainties described below are not the only ones facing the Company. Additional risks not presently known to us or that we currently believe are immaterial may also impair our business operations. If any of the following risks actually occurs, our business, financial condition or operating results could be seriously impaired. This section should be read in conjunction with the Financial Statements and Notes thereto, and Management’s Discussion and Analysis or Plan of Operation contained in this report.
If we are unable to compete effectively with existing or new competitors, the loss of our competitive position could result in price reductions, fewer customer orders, reduced revenues, reduced margins, reduced levels of profitability, and loss of market share. If we are unable to manage our inventory, will not be able to satisfy customer demand. Our reliance on one or a few suppliers for inventory components could delay shipments and increase our costs. Our future operating results depend on our ability to purchase a sufficient amount of components to meet the demands of our customers. Since we may order components from suppliers in advance of receipt of customer orders for our products that include these components, we could face a material inventory
11
risk. Our products may have quality issues that could adversely affect our sales and reputation. We are dependent on significant customers, as noted in the “SALES” section above.
We depend on key employees and face competition in hiring and retaining qualified employees. Recent and proposed regulations related to equity compensation could adversely affect our ability to attract and retain key personnel.
We expect our quarterly revenues, cash flows and operating results to fluctuate due to the large size and timing of some orders that can materially affect our financial statements from quarter to quarter, either obscuring or presenting trends that do or do not exist. In addition, our quarterly sales have historically reflected a pattern in which a disproportionate percentage of such quarter’s total sales occur in the last month and weeks and days of the quarter. This pattern also makes prediction of revenues, earnings and working capital for each financial period especially difficult and uncertain and increases the risk of unanticipated variations in quarterly results and financial condition.
Our stock price, like that of other technology companies, can be volatile. Our stock price can be affected by many factors such as quarterly increases or decreases in our earnings, speculation in the investment community about our financial condition or results of operations, technological developments, or the loss of key management or technical personnel.
12
REPORT OF INDEPENDENT REGISTERED PUBLIC ACCOUNTING FIRM
To the Board of Directors and Stockholders
Pinnacle Data Systems, Inc. (dba PDSi)
Groveport, Ohio
We have audited the accompanying balance sheet of Pinnacle Data Systems, Inc. (the “Company”) as of December 31, 2005 and the related statements of income, stockholders’ equity, and cash flows for the year then ended. These financial statements are the responsibility of the Company’s management. Our responsibility is to express an opinion on the financial statements based on our audit. The financial statements of the Company for the year ended December 31, 2004 were audited by another independent registered public accounting firm whose report, dated February 15, 2005, expressed an unqualified opinion on those statements.
We conducted our audit in accordance with the standards of the Public Company Accounting Oversight Board (United States). Those standards require that we plan and perform the audit to obtain reasonable assurance about whether the financial statements are free of material misstatement. An audit includes consideration of internal control over financial reporting as a basis for designing audit procedures that are appropriate in the circumstances, but not for the purpose of expressing an opinion on the effectiveness of the Company’s internal control over financial reporting. Accordingly, we express no such opinion. An audit also includes examining, on a test basis, evidence supporting the amounts and disclosures in the financial statement, assessing the accounting principles used and significant estimates made by management, as well as evaluating the overall financial statement presentation. We believe that our audit provides a reasonable basis for our opinion.
In our opinion, such financial statements present fairly, in all material respects, the financial position of the Company at December 31, 2005, and the results of its operations and its cash flows for the year then ended in conformity with accounting principles generally accepted in the United States of America.
Columbus, Ohio
March 13, 2006
13
PINNACLE DATA SYSTEMS, INC.
(DBA PDSi)
BALANCE SHEETS
December 31, 2005 and 2004
ASSETS
| | | | | | |
| | | 2005 | | 2004 |
CURRENT ASSETS | | | | | | |
Cash | | $ | 485,566 | | $ | 15,068 |
Accounts receivable, net of allowance for doubtful accounts of $70,000 and $20,000, respectively | | | 12,555,814 | | | 4,398,251 |
Inventory | | | 9,232,778 | | | 4,080,202 |
Other prepaid expenses | | | 421,273 | | | 239,720 |
Refundable income taxes | | | — | | | 171,248 |
Deferred income taxes | | | 833,000 | | | 477,000 |
| | | | | | |
| | | 23,528,431 | | | 9,381,489 |
| | | | | | |
| | |
PROPERTY AND EQUIPMENT | | | | | | |
Leasehold improvements | | | 328,777 | | | 309,920 |
Furniture and fixtures | | | 389,744 | | | 382,935 |
Computer equipment and related software | | | 2,714,901 | | | 2,481,919 |
Shop equipment | | | 598,999 | | | 568,223 |
| | | | | | |
| | | 4,032,421 | | | 3,742,997 |
Less accumulated depreciation and amortization | | | 3,250,391 | | | 2,772,203 |
| | | | | | |
| | | 782,030 | | | 970,794 |
| | | | | | |
| | |
OTHER ASSETS | | | 108,568 | | | 22,566 |
| | | | | | |
| | |
| | $ | 24,419,029 | | $ | 10,374,849 |
| | | | | | |
The accompanying notes are an integral part of these financial statements.
14
PINNACLE DATA SYSTEMS, INC.
(DBA PDSi)
BALANCE SHEETS
December 31, 2005 and 2004
LIABILITIES AND STOCKHOLDERS’ EQUITY
| | | | | | |
| | | 2005 | | 2004 |
CURRENT LIABILITIES | | | | | | |
Line of credit | | $ | 9,335,940 | | $ | 2,525,020 |
Accounts payable | | | 6,122,181 | | | 2,176,746 |
Accrued expenses: | | | | | | |
Wages, payroll taxes and benefits | | | 977,808 | | | 295,681 |
Income taxes | | | 366,216 | | | — |
Other | | | 652,630 | | | 207,398 |
| | | | | | |
Unearned revenue | | | 209,288 | | | 13,822 |
| | | | | | |
| | | 17,664,063 | | | 5,218,667 |
| | |
LONG-TERM LIABILITIES | | | | | | |
Deferred income taxes | | | 63,000 | | | 101,000 |
| | | | | | |
| | | 17,727,063 | | | 5,319,667 |
| | | | | | |
| | |
COMMITMENTS AND CONTINGENCIES | | | — | | | — |
| | | | | | |
| | |
STOCKHOLDERS’ EQUITY | | | | | | |
Preferred stock; no par value; 4,000,000 shares authorized; no shares issued or outstanding | | | — | | | — |
Common stock; no par value; 25,000,000 shares authorized; 5,985,356 and 5,628,806 shares issued and outstanding, respectively | | | 2,755,030 | | | 2,266,482 |
Additional paid-in capital | | | 754,137 | | | 543,095 |
Retained earnings | | | 3,182,799 | | | 2,245,605 |
| | | | | | |
| | | 6,691,966 | | | 5,055,182 |
| | | | | | |
| | |
| | $ | 24,419,029 | | $ | 10,374,849 |
| | | | | | |
The accompanying notes are an integral part of these financial statements.
15
PINNACLE DATA SYSTEMS, INC.
(DBA PDSi)
STATEMENTS OF INCOME
Years Ended December 31, 2005 and 2004
| | | | | | |
| | | 2005 | | 2004 |
SALES | | | | | | |
Product sales | | $ | 34,444,161 | | $ | 28,351,007 |
Service sales | | | 10,161,957 | | | 6,046,483 |
| | | | | | |
| | | 44,606,118 | | | 34,397,490 |
| | | | | | |
COST OF SALES | | | | | | |
Product sales | | | 30,155,023 | | | 22,652,817 |
Service sales | | | 3,904,291 | | | 3,730,144 |
| | | | | | |
| | | 34,059,314 | | | 26,382,961 |
| | | | | | |
| | |
GROSS PROFIT | | | 10,546,804 | | | 8,014,529 |
| | |
OPERATING EXPENSES | | | 8,738,730 | | | 6,615,741 |
| | | | | | |
| | |
INCOME FROM OPERATIONS | | | 1,808,074 | | | 1,398,788 |
| | | | | | |
| | |
OTHER EXPENSE | | | | | | |
Interest expense | | | 288,880 | | | 112,637 |
| | | | | | |
| | |
INCOME BEFORE INCOME TAXES | | | 1,519,194 | | | 1,286,151 |
| | |
INCOME TAX EXPENSE | | | 582,000 | | | 402,000 |
| | | | | | |
| | |
NET INCOME | | $ | 937,194 | | $ | 884,151 |
| | | | | | |
| | |
BASIC EARNINGS PER COMMON SHARE | | $ | 0.16 | | $ | 0.16 |
| | | | | | |
DILUTED EARNINGS PER COMMON SHARE | | $ | 0.15 | | $ | 0.14 |
| | | | | | |
The accompanying notes are an integral part of these financial statements.
16
PINNACLE DATA SYSTEMS, INC.
(DBA PDSi)
STATEMENTS OF CHANGES IN STOCKHOLDERS’ EQUITY
Years Ended December 31, 2005 and 2004
| | | | | | | | | | | | | | | |
| | | Common Stock | | Additional
Paid-In
Capital | | Retained
Earnings | | Total
Stockholders’
Equity |
| | | Outstanding
Shares | | | Amount | | | |
BALANCE—December 31, 2003 | | 5,539,796 | | | $ | 2,172,281 | | $ | 502,095 | | $ | 1,361,454 | | $ | 4,035,830 |
| | | | | |
Options and warrants exercised | | 93,000 | | | | 94,201 | | | — | | | — | | | 94,201 |
| | | | | |
Treasury stock redeemed | | (3,990 | ) | | | — | | | — | | | — | | | — |
| | | | | |
Tax benefits from employee stock option plan | | — | | | | — | | | 41,000 | | | — | | | 41,000 |
| | | | | |
Net income | | — | | | | — | | | — | | | 884,151 | | | 884,151 |
| | | | | | | | | | | | | | | |
| | | | | |
BALANCE—December 31, 2004 | | 5,628,806 | | | | 2,266,482 | | | 543,095 | | | 2,245,605 | | | 5,055,182 |
| | | | | | | | | | | | | | | |
| | | | | |
Options and warrants exercised | | 356,550 | | | | 488,548 | | | — | | | — | | | 488,548 |
| | | | | |
Tax benefits from employee stock option plan | | — | | | | — | | | 211,042 | | | — | | | 211,042 |
| | | | | |
Net income | | — | | | | — | | | — | | | 937,194 | | | 937,194 |
| | | | | | | | | | | | | | | |
| | | | | |
BALANCE—December 31, 2005 | | 5,985,356 | | | $ | 2,755,030 | | $ | 754,137 | | $ | 3,182,799 | | $ | 6,691,966 |
| | | | | | | | | | | | | | | |
The accompanying notes are an integral part of these financial statements.
17
PINNACLE DATA SYSTEMS, INC.
(DBA PDSi)
STATEMENTS OF CASH FLOWS
Years Ended December 31, 2005 and 2004
| | | | | | | | |
| | | 2005 | | | 2004 | |
CASH FLOWS FROM OPERATING ACTIVITIES | | | | | | | | |
Net income | | $ | 937,194 | | | $ | 884,151 | |
| | | | | | | | |
Adjustments to reconcile net income to net cash used in operating activities: | | | | | | | | |
Depreciation and amortization | | | 485,209 | | | | 554,226 | |
Provision for doubtful accounts | | | 10,000 | | | | — | |
Inventory reserves | | | 271,020 | | | | 271,610 | |
Provision for deferred taxes | | | (394,000 | ) | | | (3,000 | ) |
Loss on disposal of property and equipment | | | 2,002 | | | | 1,620 | |
(Increase)/decrease in assets: | | | | | | | | |
Accounts receivable | | | (4,349,199 | ) | | | 728,381 | |
Inventory | | | (970,215 | ) | | | (2,404,650 | ) |
Prepaid expenses and other assets | | | (6,432 | ) | | | (44,231 | ) |
Refundable income taxes | | | 382,290 | | | | (130,248 | ) |
Increase/(decrease) in liabilities: | | | | | | | | |
Accounts payable | | | (1,016,379 | ) | | | (3,467 | ) |
Accrued expenses and taxes | | | (174,083 | ) | | | 37,440 | |
Unearned revenues | | | 17,077 | | | | 13,822 | |
| | | | | | | | |
Total adjustments | | | (5,742,710 | ) | | | (978,497 | ) |
| | | | | | | | |
Net cash used in operating activities | | | (4,805,516 | ) | | | (94,346 | ) |
| | | | | | | | |
| | |
CASH FLOWS FROM INVESTING ACTIVITIES | | | | | | | | |
Purchases of property and equipment | | | (242,744 | ) | | | (344,465 | ) |
Cash assumed in acquisition | | | 124,518 | | | | — | |
Proceeds from sale of property and equipment | | | — | | | | 165 | |
| | | | | | | | |
Net cash used in investing activities | | | (118,226 | ) | | | (344,300 | ) |
| | | | | | | | |
| | |
CASH FLOWS FROM FINANCING ACTIVITIES | | | | | | | | |
Net change in line of credit | | | 6,810,920 | | | | 38,454 | |
Payment of debt assumed in acquisition | | | (2,281,457 | ) | | | — | |
Outstanding checks in excess of funds on deposit | | | 381,759 | | | | 314,514 | |
Principal payments on capital lease obligation | | | (5,530 | ) | | | (5,452 | ) |
Proceeds from stock options exercised | | | 488,548 | | | | 94,201 | |
| | | | | | | | |
Net cash provided by financing activities | | | 5,394,240 | | | | 441,717 | |
| | | | | | | | |
The accompanying notes are an integral part of these financial statements.
18
PINNACLE DATA SYSTEMS, INC.
(DBA PDSi)
STATEMENTS OF CASH FLOWS (CONTINUED)
Years Ended December 31, 2005 and 2004
| | | | | | |
| | | 2005 | | 2004 |
INCREASE IN CASH | | | 470,498 | | | 3,071 |
| | |
CASH—Beginning of year | | | 15,068 | | | 11,997 |
| | | | | | |
| | |
CASH—End of year | | $ | 485,566 | | $ | 15,068 |
| | | | | | |
| | |
SUPPLEMENTAL DISCLOSURE OF CASH FLOW INFORMATION | | | | | | |
Interest paid | | $ | 253,361 | | $ | 104,151 |
| | | | | | |
Income taxes paid, net of refunds | | $ | 227,493 | | $ | 481,438 |
| | | | | | |
| | |
SUPPLEMENTAL DISCLOSURE OF NONCASH INVESTING AND FINANCING TRANSACTIONS | | | | | | |
Inventory capitalized as computer equipment | | $ | 2,216 | | $ | 76,272 |
| | | | | | |
Equipment acquired through capital lease | | $ | — | | $ | 10,981 |
| | | | | | |
Income tax benefit from employee stock option plan credited to Additional paid-in-capital | | $ | 211,042 | | $ | 41,000 |
| | | | | | |
Assets and liabilities assumed in acquisition: | | | | | | |
Accounts receivable | | $ | 3,818,364 | | | |
Inventory | | | 4,455,597 | | | |
Prepaid expenses | | | 104,523 | | | |
Computer equipment | | | 53,087 | | | |
Other assets | | | 157,000 | | | |
| | | | | | |
Total assets | | $ | 8,588,571 | | | |
| | |
Accounts payable | | $ | 4,580,055 | | | |
Wages, payroll taxes and benefits | | | 563,626 | | | |
Other accrued expenses | | | 1,109,562 | | | |
Unearned revenue | | | 178,389 | | | |
Other debt | | | 2,281,457 | | | |
| | | | | | |
Total liabilities | | $ | 8,713,089 | | | |
| | | | | | |
The accompanying notes are an integral part of these financial statements.
19
NOTES TO FINANCIAL STATEMENTS
Note 1. | Summary of Significant Accounting Policies |
| | A. | Nature of Business—Pinnacle Data Systems, Inc. (dba PDSi) (the “Company”) provides product lifecycle service solutions to Original Equipment Manufacturers (OEMs) in the medical, telecommunications, defense, imaging, industrial and computer equipment markets, among others. PDSi offer a full range of computer and computer-related product development and manufacturing services to increase product speed to market and engineered product life, and to provide service and support to units in the field through comprehensive product lifecycle management programs encompassing depot repair, advanced exchange, contact center support and end-of-life control. |
Effective August 15, 2005, the Company acquired all the assets and certain liabilities of GNP Computers, Inc. (GNP). The former GNP operations are in the process of being fully integrated as part of the Company. The acquired operations also include computer design, manufacturing, and lifecycle management for OEMs in a broad range of industries. The financial results of the acquired operations from the date of the acquisition are included in the financial results reported for the Company.
| | B. | Use of Estimates—The preparation of financial statements in conformity with accounting principles generally accepted in the United States of America requires management to make estimates and assumptions that affect the reported amounts of assets and liabilities at the date of the financial statements and the reported amounts of revenues and expenses during the reporting period. Actual results could differ from those estimates. |
| | C. | Concentration of Credit Risk—Financial instruments, which potentially subject the Company to a concentration of credit risk, principally consist of accounts receivable. The Company grants credit to its customers, which are varied in terms of size, geographic location and financial strength. Customer payment terms typically range from 30 to 60 days. Customer balances are continually monitored to minimize the risk of loss. The allowance for doubtful accounts was $70,000 and $20,000 as of December 31, 2005 and 2004, respectively. The increase in the allowance in 2005 reflects the increase in accounts receivable resulting from the acquisition of GNP Computers. The allowance is based upon management’s review of delinquent accounts and an assessment of the Company’s historical evidence of collections. Bad debt expense of $0 and $30,000 was recognized for the years ended December 31, 2005 and 2004, respectively. |
The Company’s cash balances, which are in excess of federally insured levels, are maintained at large regional financial institutions. The Company continually monitors its balances to minimize the risk of loss for these balances.
For 2005, the Company had three customers that generated revenues of approximately $5.8 million, $5.5 million, and $4.4 million or 13%, 12%, and 10% respectively, of total revenue. In the statements of income, approximately 3% of the revenues from these customers is included in service sales and 97% is included in product sales. In addition, these customers represented 20%, 6%, and 17%, respectively, of accounts receivable at December 31, 2005.
For 2004, the Company had three customers that generated revenues of approximately $5.7 million, $5.7 million, and $3.9 million or 17%, 17%, and 11% respectively, of total revenue. In the statements of income, approximately 2% of the revenues from these customers is included in service sales and 98% is included in product sales. In addition, these customers represented 15%, 10%, and 3%, respectively, of accounts receivable at December 31, 2004.
| | D. | Revenue Recognition—For product sales, the Company recognizes revenue upon transference of the title to the products to the customer. For repair sales, the Company recognizes revenue upon completion of the repair work and either shipment of the item back to the customer or, in the |
20
| | programs in which the Company also manages the customer’s inventory on our site, when the repaired item is returned to the customer’s finished goods inventory. For some repair and maintenance programs, the customer pays a flat fee that covers multiple fiscal periods. In those instances, the Company recognizes revenue over the fiscal periods covered by the billing on a pro-rata basis. The inventory and logistics management programs are billed monthly in the month in which the services are being provided, with revenue recognized upon billing. For non-recurring engineering projects, the Company recognizes revenue on a percentage-of-completion basis. |
| | E. | Inventories—Inventories are valued at average cost, not in excess of market. |
Inventory at December 31, 2005 and 2004 was comprised of the following (net of inventory reserves):
| | | | | | |
| | | 2005 | | 2004 |
Component parts (raw materials) | | $ | 6,848,665 | | $ | 3,362,924 |
Work-in-process | | | 1,075,489 | | | 369,937 |
Finished goods | | | 1,308,624 | | | 347,341 |
| | | | | | |
| | $ | 9,232,778 | | $ | 4,080,202 |
| | | | | | |
The carrying values of component parts and finished goods represent average cost or management’s estimate of its net realizable value. Such value is based on forecasts of product orders and repair/trade-in activity in the ensuing years. Such forecasts are based on historical information, known and anticipated customer contracts, and management’s expertise in computer hardware life cycles. Should demand for the Company’s products and repair/trade-in hardware prove to be significantly less than anticipated, the ultimate realizable value of such products could be substantially less than the amount shown in the balance sheet. At December 31, 2005 and 2004, the Company provided reserves of approximately $2.7 million and $1 million, respectively, to reduce the carrying value of inventory for estimated obsolescence and other loss of value.
| | F. | Statement of Cash Flows—For purposes of the statement of cash flows, the Company considers all short-term instruments purchased with a maturity of three months or less to be cash equivalents. There were no cash equivalents at December 31, 2005 or 2004. |
| | G. | Property and Equipment—Property and equipment are recorded at cost. Depreciation and amortization are provided on the straight-line method for financial reporting purposes over the estimated useful lives of the respective assets. Expenditures for maintenance and repairs are charged to operations as incurred, while expenditures for additions and improvements are capitalized. Furniture and fixtures, computer equipment and related software, and shop equipment are depreciated over useful lives ranging from 3 to 7 years. Leasehold improvements are being amortized over the shorter of useful life or remaining lease term. Technology licenses are amortized over their terms. Depreciation and amortization expense approximated $485,000 and $554,000 for the years ended December 31, 2005 and 2004, respectively. |
Annually, or more frequently if events or changes in circumstances occur, a determination is made by management to ascertain whether property and equipment have been impaired based on the sum of expected future undiscounted cash flows from operating activities. If the estimated net cash flows are less than the carrying amount of such assets, the Company will recognize an impairment loss in an amount necessary to write down the assets to a fair value.
| | H. | Advertising—All of the Company’s advertising costs are of the nondirect-response type. The Company expenses all advertising costs as incurred or at the time the advertising takes place. The Company incurred approximately $93,000 and $83,000 in advertising costs in 2005 and 2004, respectively. |
21
| | I. | Life Insurance—The Company has purchased, and is the beneficiary, of three term life insurance policies on key employees of the Company. The total amount of coverage at December 31, 2005 was $11.5 million. |
| | J. | Stock-Based Compensation—In December 2004, the FASB issued SFAS No. 123 (Revised), Shared Based Payment. SFAS No. 123(R) replaces SFAS No. 123, Accounting for Stock Based Compensation, and supercedes APB Opinion No. 25, Accounting for Stock Issued to Employees. SFAS No. 123 (R) requires compensation costs related to share-based payment transactions to be recognized in the financial statements. Compensation costs will be recognized over the vesting period of the award. SFAS No. 123(R) is effective as of the beginning of the first annual reporting period that begins after June 15, 2005. SFAS No. 123 (R) provides several options regarding its adoption. The Company used the intrinsic value-based method through 2005. Beginning in 2006, the Company will change to the fair value-based method as required by SFAS No 123(R) issued in December 2004. |
On November 10, 2005, and effective November 17, 2005, the Board of Directors approved the acceleration of vesting of unvested stock options previously awarded to employees and officers of the Company under various stock option plans. As a result of this action, options to purchase approximately 1,186,000 shares of common stock that would otherwise have vested over the next one to four years became fully vested.
The decision to accelerate the vesting of these options is considered to be in the best interest of stockholders, and was made primarily to reduce non-cash compensation expense that would have been recorded in future periods following our application of FAS 123R. Because of the acceleration of the vesting period of such options, it is anticipated the Company’s non-cash compensation expense related to these options will be reduced by approximately $890,000 (pre-tax) over fiscal years 2006 through 2009, based on estimated value calculations using the Black-Scholes methodology.
Pro forma information regarding net income and earnings per share for 2005 and prior is required by SFAS No. 123, and has been determined as if the Company had accounted for its employee stock options under the fair value method of that Statement. The Company utilized the intrinsic value-based method for accounting for employee stock options or similar equity instruments in 2005 and prior; therefore, the Company did not recorded any compensation cost in the statements of income for stock-based employee compensation awards.
For purposes of pro forma disclosures, the estimated fair value of the options is amortized to expense over the options’ vesting period. The Company’s pro forma income and earnings per share are as follows for the year ended:
| | | | | | | |
| | | 2005 | | | 2004 |
Net income—as reported | | $ | 937,194 | | | $ | 884,151 |
Stock-based employee compensation expense—pro forma | | | 1,523,438 | | | | 337,311 |
| | | | | | | |
Net income—pro forma | | $ | (586,244 | ) | | $ | 546,840 |
Basic earnings per common share-as reported | | $ | .16 | | | $ | .16 |
Diluted earnings per common share-as reported | | | .15 | | | | .14 |
Basic earnings per common share-pro forma | | $ | (0.10 | ) | | $ | .10 |
Diluted earnings per common share-pro forma | | | (0.10 | ) | | | .09 |
Weighted-average fair value of options granted during the year | | $ | 2.08 | | | $ | 1.97 |
| | K. | Research and Development—Research and development costs are charged to operations when incurred. The Company incurred no research and development expense in 2005 that was not billed to its customers. The amount of research and development expense charged to operations in 2004 was immaterial. |
22
| | L. | Product Warranty Policy—The Company provides a limited warranty for defects in material or workmanship on its products and its repair services. The warranty periods currently in effect range from one to two years. The warranty involves repairing or replacing any defective component returned within the warranty period. The warranty is limited to the original customer. The historical warranty cost of material has been nominal, as most components used in the Company’s products are also warranted by the component supplier. The additional reserve accrued in 2005 resulted from the acquisition of GNP Computers. |
The following summarizes the Company’s warranty liability for years ended December 31, 2005 and 2004:
| | | | | | | | |
| | | 2005 | | | 2004 | |
Beginning balance | | $ | 19,000 | | | $ | 21,000 | |
Additions to balance | | | 75,000 | | | | 10,000 | |
Reductions to balance | | | (0 | ) | | | (12,000 | ) |
| | | | | | | | |
Ending balance | | $ | 94,000 | | | $ | 19,000 | |
| | | | | | | | |
| | M. | RECENTLY ISSUED FINANCIAL ACCOUNTING STANDARDS—In December 2004, the FASB issued SFAS No. 123 (Revised), Shared Based Payment. SFAS No. 123(R) replaces SFAS No. 123, Accounting for Stock Based Compensation, and supercedes APB Opinion No. 25, Accounting for Stock Issued to Employees. SFAS No. 123(R) requires compensation costs related to share-based payment transactions to be recognized in the financial statements. Compensation costs will be recognized over the vesting period of the award. SFAS No. 123 is effective as of the beginning of the first interim or annual reporting period that begins after December 15, 2005. The impact of SFAS No. 123(R) is to record the additional compensation expenses on the financial statements that is currently disclosed in Note 1.J. As noted in Section J. above, the Company has accelerated the vesting period of all of its outstanding stock options. Therefore, the Company will not record any expense in 2006 and beyond for any options outstanding as of December 31, 2005. |
At December 31, 2005, the Company has a bank line of credit with an available limit of $11 million and bearing monthly interest payments at prime, which was 7.25% at December 31, 2005. The Company was obligated for funds drawn against this line of credit in the amount of $9.3 million and $2.5 million at December 31, 2005 and 2004, respectively.
The line is payable on demand and is collateralized by a “Blanket Lien” on all assets of the Company. The amount available under the line of credit is subject to borrowing base restrictions as outlined in the agreement. In anticipation of its acquisition of GNP Computers, on August 9, 2005, the terms of the bank line of credit with KeyBank were amended to reflect the Company’s near term borrowing needs and the Company’s credit risk as rated by KeyBank. The amount available under the line was increased to $11 million from $6 million and is due and renewable by May 15, 2007. The borrowing base calculation on December 31, 2005 was the maximum $11 million, resulting in an unused capacity at December 31, 2005 of approximately $1.7 million. To accommodate the additional debt assumed in the GNP acquisition, on December 29, 2005, the total debt to tangible net worth ratio loan covenant on the line of credit was increased to a maximum of 3.0 to 1.0 from 2.0 to 1.0. The covenant maximum will become 2.5 to 1.0 for the quarter ending June 30, 2006. The Company was in compliance with the revised covenant on December 31, 2005. The Company was in compliance with all loan covenants on both December 31, 2005 and 2004.
23
Note 3. | Stock Options and Warrants |
The Company adopted the Pinnacle Data Systems, Inc., 1995 Stock Option Plan on December 19, 1995 (the “1995 Plan). On May 5, 2005, the shareholders approved and the Company adopted the 2005 Equity Incentive Plan (the “2005 Plan”), which replaced the 1995 Plan. Under both plans, any employee who is granted a discretionary option upon vesting, may purchase Company common stock over a ten-year period, at the fair market value at time of grant. (If the grantee owns more than 10% of the Company’s stock at the time of the grant, the purchase price shall be at least 110% of the fair market value and the options expire five years from the date of grant.) The aggregate number of common shares of the Company, which could be granted under the 2005 Plan at its inception, was 2,000,000 shares, in addition to 386,250 shares available for issuance at the expiration of the 1995 Plan. In addition, the number of common shares of the Company that can be granted under the 2005 Plan automatically increases on the last day of each fiscal year beginning in 2005 equal to the lessor of (a) 5% of the Company’s total outstanding shares on such date, or (b) a lesser amount determined by the Company’s Board of Directors. For 2005, the increase was 299,268, 5% of the outstanding shares on December 31, 2005. Under the 2005 Plan, 1,713,018 shares were reserved for future grants at December 31, 2005. Incentive options available under the 2005 Plan must be granted by May 5, 2015.
On March 22, 2000, the Company adopted the Pinnacle Data Systems, Inc., 2000 Director Stock Option Plan (Director Plan), which was subsequently approved by the shareholders on June 24, 2000. Under the Director Plan, 500,000 shares are reserved for issuance to Directors who are not employees of the Company (Outside Director). Any Outside Director who has been granted a discretionary option may upon vesting, purchase Company common stock over a ten-year period, at the fair market value at time of grant. Before the adoption of the Director Plan, previous issuance of stock options to Outside Directors was made by entering into individual stock option agreements. Under the 2000 Director Stock Option Plan, 236,000 shares were reserved for future grants at December 31, 2005.
Although the Board of Directors has the authority to set other terms, in 2005 and prior the options granted were generally exercisable one year from the date of grant. In 2006 and going forward, the options granted will generally be exercisable in three to five years from the date of grant.
On November 10, 2005, and effective November 17, 2005, the Board of Directors approved the acceleration of vesting of unvested stock options previously awarded to employees and officers of the Company under various stock option plans. As a result of this action, options to purchase approximately 1,186,000 shares of common stock that would otherwise have vested over the next one to four years became fully vested.
The decision to accelerate the vesting of these options, is considered to be in the best interest of stockholders, and was made primarily to reduce non-cash compensation expense that would have been recorded in future periods following our application of FAS 123R. Because of the acceleration of the vesting period of such options, it is anticipated the Company’s non-cash compensation expense related to these options will be reduced by approximately $890,000 (pre-tax) over fiscal years 2006 through 2009, based on estimated value calculations using the Black-Scholes methodology.
Pro forma information regarding net income and earnings per share for 2005 and prior is required by SFAS No. 123, and has been determined as if the Company had accounted for its employee stock options under the fair value method of that Statement. The Company utilized the intrinsic value-based method for accounting for employee stock options or similar equity instruments in 2005 and prior; therefore, the Company did not recorded any compensation cost in the statements of income for stock-based employee compensation awards.
24
The following table is a summary of option activity:
| | | | | | | | | | |
Stock Option Plan | | 2005 | | 2004 |
| | | Number of
Options | | Weighted
Average
Exercise
Price | | Number of
Options | | Weighted
Average
Exercise
Price |
Employee Stock Option Agreements | | | | | | | | | | |
Outstanding, beginning of year | | 1,256,950 | | $ | 2.02 | | 1,170,500 | | $ | 1.92 |
Granted | | 1,023,500 | | | 3.02 | | 211,500 | | | 2.28 |
Exercised | | 222,550 | | | 1.20 | | 73,000 | | | 0.90 |
Forfeited | | 49,000 | | | 3.80 | | 52,050 | | | 2.24 |
| | | | | | | | | | |
Outstanding, end of year | | 2,008,900 | | $ | 2.57 | | 1,256,950 | | $ | 2.02 |
| | | | | | | | | | |
Exercise price range of options outstanding | | $0.75 to $5.25 | | $0.63 to $5.25 |
Director Stock Option Agreements | | | | | | | | | | |
Outstanding, beginning of year | | 270,000 | | $ | 1.90 | | 290,000 | | $ | 1.88 |
Granted | | — | | | — | | 20,000 | | | 2.63 |
Exercised | | 134,000 | | | 1.49 | | 20,000 | | | 2.35 |
Forfeited | | 26,000 | | | 3.88 | | 20,000 | | | 1.82 |
| | | | | | | | | | |
Outstanding, end of year | | 110,000 | | $ | 1.94 | | 270,000 | | $ | 1.90 |
| | | | | | | | | | |
Exercise price range of options outstanding | | $0.75 to $3.88 | | $0.75 to $3.88 |
The following table summarizes information concerning outstanding and exercisable options at December 31, 2005:
| | | | | | | | |
| | | Options Outstanding |
Range of Exercise Price | | Number
Outstanding | | Weighted-average
Remaining Contractual
Life (in years) | | Weighted-average
Exercise Price
Per Share |
$0.75-1.03 | | 314,350 | | | 2.39 | | $ | 0.84 |
$1.85-2.70 | | 633,050 | | | 6.53 | | | 2.27 |
$2.90-4.26 | | 1,168,500 | | | 8.85 | | | 3.13 |
$4.69-5.25 | | 3,000 | | | 4.79 | | | 4.88 |
| | | | | | | | |
Total | | 2,118,900 | | | 7.19 | | $ | 2.54 |
| | | | | | | | |
| | |
| | | Options Exercisable | | |
Range of Exercise Price | | Number
Exercisable | | Weighted-average
Exercise Price
Per Share | | |
$0.75-1.03 | | 314,350 | | $ | 0.84 | | | |
$1.85-2.70 | | 633,050 | | | 2.27 | | | |
$2.90-4.26 | | 1,168,500 | | | 3.13 | | | |
$4.69-5.25 | | 3,000 | | | 4.88 | | | |
| | | | | | | | |
Total | | 2,118,900 | | $ | 2.54 | | | |
| | | | | | | | |
At December 31, 2004, 1,319,450 outstanding options were exercisable. The weighted-average exercise price for outstanding options was $2.00 at December 31, 2004.
The options outstanding at December 31, 2005 are exercisable through periods ranging from January 2006 through September 2015. Of the 1,023,500 options granted in 2005, 51,000 were granted under the 1995 plan, and 972,500 were granted under the 2005 plan.
25
The fair value of each option grant disclosed in Note 1.J. is estimated on the grant date using the Black-Scholes option pricing model with the following weighted average assumptions for the year ended:
| | | | | | |
| | | 2005 | | | 2004 | |
Risk-free interest rate | | 4.22 | % | | 4.3 | % |
Dividend yield | | 0 | % | | 0 | % |
Volatility factor | | 71.46 | % | | 88.61 | % |
Weighted average expected life in years | | 8 | | | 9 | |
The Black-Scholes option pricing model was developed for use in estimating the fair value of traded options that have no vesting restrictions and are fully transferable. In addition, option pricing models require input of highly subjective assumptions including the expected stock price volatility. The Company uses projected volatility rates that are based upon historical volatility rates trended into the future. Because the Company’s stock options have characteristics significantly different from those traded options, and because changes in the subjective input assumptions can materially affect the fair value estimate, in management’s opinion, the existing models do not necessarily provide an accurate measure of the fair value of the Company’s options.
The Company leases its two operating facilities under operating leases that expire in 2009 and 2010. The Company has an option to extend the lease for its headquarters an additional five years beyond the expiration date in 2009.
Minimum future lease payments under the operating leases as of December 31, 2005 are as follows:
| | | |
2006 | | | 1,661,164 |
2007 | | | 1,666,244 |
2008 | | | 1,715,918 |
2009 | | | 1,323,108 |
2010 | | | 98,784 |
| | | |
| | $ | 6,465,218 |
| | | |
Total rent charged to operations for operating leases and other month-to-month rental obligations for the years ended December 31, 2005 and 2004 amounted to $1,210,691 and $689,576, respectively. Both facility leases contain annual escalators intended to cover inflationary costs over the life of the lease.
Note 5. | Profit Sharing and 401(k) Savings Plan |
The Company maintains a qualified cash or deferred compensation plan under section 401(k) of the Internal Revenue Code. The plan covers all employees with three months of service. Under the plan, employees may elect to defer a portion of their salary, subject to Internal Revenue Code limits.
The Company, at its discretion, may match up to 25% of employee contributions up to 6% of wages deferred with an annual maximum contribution of $3,500 per employee. The Company made matching contributions of $69,846 and $32,045 for 2005 and 2004, respectively.
26
Deferred income taxes arise from temporary differences resulting from income and expense items reported for financial accounting and tax reporting purposes in different periods. Deferred taxes are classified as current or long-term, depending on the classification of the assets and liabilities to which they relate. Deferred taxes arising from temporary differences that are not related to an asset or liability are classified as current or long-term depending on the periods in which the temporary differences are expected to reverse.
Net deferred tax assets in the accompanying balance sheets include the following components:
| | | | | | |
| | | 2005 | | 2004 |
Assets | | | | | | |
Accrued vacation | | $ | 45,000 | | $ | — |
Inventory reserves | | | 540,000 | | | 411,000 |
Allowance for doubtful accounts | | | 28,000 | | | 8,000 |
Uniform capitalization | | | 125,000 | | | 51,000 |
Severance accrual | | | 32,000 | | | — |
Warranty accrual | | | 38,000 | | | 7,000 |
Other accruals from acquisition | | | 25,000 | | | — |
| | | | | | |
| | $ | 833,000 | | $ | 477,000 |
| | | | | | |
Liabilities | | | | | | |
Depreciation | | $ | 63,000 | | $ | 101,000 |
| | | | | | |
| | $ | 63,000 | | $ | 101,000 |
| | | | | | |
The components of the tax expense for the years ended December 31, were as follows:
| | | | | | | | |
| | | 2005 | | | 2004 | |
Current: | | | | | | | | |
Federal | | $ | 738,000 | | | $ | 341,000 | |
State and local | | | 238,000 | | | | 64,000 | |
| | | | | | | | |
| | | 976,000 | | | | 405,000 | |
| | | | | | | | |
Deferred: | | | | | | | | |
Federal | | | (332,000 | ) | | | — | |
State and local | | | (62,000 | ) | | | (3,000 | ) |
| | | | | | | | |
| | | (394,000 | ) | | | (3,000 | ) |
| | | | | | | | |
Total | | $ | 582,000 | | | $ | 402,000 | |
| | | | | | | | |
The following sets forth the differences between the provision for income taxes computed at the federal statutory rate of 34% and that reported for financial statement purposes:
| | | | | | | | |
| | | 2005 | | | 2004 | |
Income tax provision at statutory rate | | $ | 517,000 | | | $ | 437,000 | |
Add: | | | | | | | | |
Tax effect of permanent differences | | | (13,000 | ) | | | (49,000 | ) |
State income taxes, net of federal income tax provision | | | 116,000 | | | | 40,000 | |
Other | | | (38,000 | ) | | | (26,000 | ) |
| | | | | | | | |
Total income tax provision | | $ | 582,000 | | | $ | 402,000 | |
| | | | | | | | |
27
Note 7. | Earnings Per Common and Common Equivalent Share |
Earnings per common and common equivalent share were computed by dividing net earnings by the weighted average number of shares of common stock outstanding during the year.
| | | | | | | | |
| | | For the Year Ended 2005 |
| | | Income (Numerator) | | Shares (Denominator) | | Per-Share Amount |
Basic EPS | | | | | | | | |
Income available to common stockholders | | $ | 937,194 | | 5,867,986 | | $ | 0.16 |
Effect of Dilutive Securities | | | | | | | | |
Options | | | 0 | | 416,453 | | | |
| | | | | | | | |
Diluted EPS | | | | | | | | |
Income available to common stockholders and assumed conversions | | $ | 937,194 | | 6,284,439 | | $ | 0.15 |
| | | | | | | | |
| |
| | | For the Year Ended 2004 |
| | | Income
(Numerator) | | Shares
(Denominator) | | Per-Share
Amount |
Basic EPS | | | | | | | | |
Income available to common stockholders | | $ | 884,151 | | 5,572,811 | | $ | 0.16 |
Effect of Dilutive Securities | | | | | | | | |
Options | | | 0 | | 548,864 | | | |
| | | | | | | | |
Diluted EPS | | | | | | | | |
Income available to common stockholders and assumed conversions | | $ | 884,151 | | 6,121,675 | | $ | 0.14 |
| | | | | | | | |
The number of anti-dilutive options for December 31, 2005 and 2004 were 853,000 and 223,100, respectively.
Note 8. | Operating Segments |
The Company’s reportable segments are Product and Service and are described in Item 1 of the Company’s Form 10KSB, including a discussion of principle markets and distribution. The “Other” column listed below reflects working groups of the Company that are not allocated to segments, such as engineering, finance, human resources, quality systems, and executive management. These items primarily represent assets and expenses for various administrative functions within the Company. The Company evaluates performance based on operating earnings of the product and service segments and its coverage of the other administrative expenses of the Company.
Segment information for the years ended December 31, 2005 and 2004, was as follows:
| | | | | | | | | | | | | |
| | | 2005 |
| | | Product | | Service | | Other | | | Total |
Sales | | $ | 34,444,161 | | $ | 10,161,957 | | $ | — | | | $ | 44,606,118 |
Gross profit | | | 4,289,138 | | | 6,257,666 | | | — | | | | 10,546,804 |
Operating earnings (loss) | | | 367,032 | | | 5,104,540 | | | (3,663,498 | ) | | | 1,808,074 |
Depreciation and amortization | | | 221,215 | | | 90,994 | | | 173,000 | | | | 485,209 |
Interest expense | | | — | | | — | | | 288,880 | | | | 288,880 |
Total assets | | | 19,712,960 | | | 2,120,864 | | | 2,585,205 | | | | 24,419,029 |
Capital expenditures | | | 70,515 | | | 35,006 | | | 139,439 | | | | 244,960 |
28
| | | | | | | | | | | | | |
| | | 2004 |
| | | Product | | Service | | Other | | | Total |
Sales | | $ | 28,351,007 | | $ | 6,046,483 | | $ | — | | | $ | 34,397,490 |
Gross profit | | | 5,698,190 | | | 2,316,339 | | | — | | | | 8,014,529 |
Operating earnings (loss) | | | 2,759,841 | | | 1,336,882 | | | (2,697,935 | ) | | | 1,398,788 |
Depreciation and amortization | | | 261,570 | | | 126,722 | | | 165,934 | | | | 554,226 |
Interest expense | | | — | | | — | | | 112,637 | | | | 112,637 |
Total assets | | | 6,311,306 | | | 1,928,303 | | | 2,135,240 | | | | 10,374,849 |
Capital expenditures | | | 171,832 | | | 211,468 | | | 37,437 | | | | 420,737 |
Note 9. | Pro-forma Combined Statement of Operations |
On August 12, 2005, the Company entered into an asset purchase agreement with GNP Computers, Inc. (GNP) and GNP’s principal shareholder, in which the Company acquired all of the assets and certain liabilities of GNP. The assets totaled approximately $8.7 million, of which $8.3 million was receivables and inventory. Thus far, the acquisition has been accretive by our retaining over 20 customers with similar profiles and expansion opportunities as our existing business, the former GNP’s sales office and production facility in suburban Los Angeles, California, an expanded international presence with an Asia-based sales office, additional customers in Asia and Europe, an expanded product line including telecommunications platforms and application-specific devices, and additional technical and engineering expertise and capabilities. None of the acquired customers were under contractual obligation to GNP to meet minimum order quantities before the acquisition and they are not under any of those kind of obligations with the Company now. They could stop placing orders at any time. The liabilities assumed upon the acquisition consisted of a $2.3 million asset-based line of credit, payables and other accrued liabilities of approximately $6.4 million, which included transaction fees for both parties. Simultaneously with the acquisition, the Company paid off the asset-based line of credit. In order to facilitate the acquisition, on August 9, 2005, the Company increased the asset-based line of credit with KeyBank NA to $11 million from $6 million. The market value of the assets was essentially equal to the total of the assumed liabilities and capitalized transaction expenses. As a result, no goodwill was recorded on the transaction and no long term debt was assumed or incurred. The results of the operations of the California operation subsequent to August 15, 2005 are included in our statements of income.
When recording the acquisition of GNP Computers in August 2005, the Company recorded various estimates of potential liabilities. In the fourth quarter of 2005, after further research and analysis and consultation with outside experts, the Company reduced the assumed liabilities from the acquisition by approximately $300,000. The reduction of the accruals resulted in a reduction of SG&A expenses of the same amount in the fourth quarter of 2005.
The pro forma data is presented for informational purposes only and may not necessarily reflect future results of operations or what the results of operations would have been had Pinnacle Data Systems, Inc. (the Company) and GNP Computers, Inc. (GNP) been operating as combined entities for the periods presented.
The accompanying unaudited pro forma combined statements of operations are based on the historical financial statements of the Company and GNP after giving effect to its acquisition by the Company. The Company completed the acquisition of substantially all of the assets and certain liabilities of GNP on August 15, 2005.
29
The unaudited pro forma combined statements of operations for the years ended December 31, 2005 and 2004 are presented as if the acquisition of GNP had occurred on January 1, 2004.
| | | | | | | | | | | | | | | |
| | | Year Ended December 1, 2005 | |
| | | Pinnacle | | GNP | | | Pro Forma
Adjustments | | | Pro
Forma | |
| | | ($ thousands except earnings per share) | |
Sales | | $ | 44,606 | | $ | 14,949 | | | $ | (3 | )a | | $ | 59,553 | |
Net income | | | 937 | | | (2,378 | ) | | | 139 | b | | | (1,302 | ) |
Diluted earnings per common share | | $ | 0.15 | | | | | | | | | | $ | (0.22 | ) |
| | | | | | | | | | | | | | | |
| |
| | | Year Ended December 31, 2004 | |
| | | Pinnacle | | GNP | | | Pro Forma
Adjustments | | | Pro
Forma | |
| | | ($ thousands except earnings per share) | |
Sales | | $ | 34,397 | | $ | 21,121 | | | $ | (12 | )a | | $ | 55,507 | |
Net income | | | 884 | | | (5,101 | ) | | | 653 | b | | | (3,564 | ) |
Diluted earnings per common share | | $ | 0.14 | | | | | | | | | | $ | (0.64 | ) |
| | | | | | | | | | | | | | | |
Pro Forma Adjustments to the Combined Statements of Operations:
| | (a) | Sales—Eliminates sales that occurred between the Company and GNP. |
| | (b) | Operating expenses—decrease in depreciation expense as a result of purchase accounting and elimination of gross profit on sales that occurred between the Company and GNP. |
On March 13, 2006, the Company announced the appointment by the Board of Directors of Michael R. Sayre to the position of Chief Executive Officer and President of the Company effective March 13, 2006. Mr. Sayre previously was the Company’s Executive Vice President and Chief Financial Officer. Mr. Sayre has remained a member of the Board of Directors. The Board also appointed John D. Bair to the new position of Chief Technology and Innovation Officer. Mr. Bair previously was Chief Executive Officer. Mr. Bair has remained Chairman of the Board of Directors. The Company also announced the resignation of Christopher L. Winslow from the Board of Directors and from the position of President and Chief Operating Officer.
30
MARKET FOR COMMON EQUITY AND RELATED STOCKHOLDER MATTERS
(a) | Market Information. Since September 7, 2000, the Company’s common stock has traded on the American Stock Exchange under the stock symbol “PNS.” Set forth below is the range of high and low sales prices of the common shares on the American Stock Exchange during 2005 and 2004. |
| | | | | | |
| | | Range of Sales
Prices |
| | | High | | Low |
Fiscal Year 2005 | | | | | | |
Fourth quarter (ended December 31) | | $ | 3.20 | | $ | 2.60 |
Third quarter (ended September 30) | | | 3.28 | | | 2.70 |
Second quarter (ended June 30) | | | 3.25 | | | 2.65 |
First quarter (ended March 31) | | | 3.34 | | | 2.78 |
Fiscal Year 2004 | | | | | | |
Fourth quarter (ended December 31) | | $ | 3.50 | | $ | 1.90 |
Third quarter (ended September 30) | | | 4.54 | | | 2.00 |
Second quarter (ended June 30) | | | 5.00 | | | 2.21 |
First quarter (ended March 31) | | | 3.23 | | | 1.85 |
(b) | Holders. On March 6, 2006, there were 89 holders of record of the Shares. Most of the Shares not held by officers and directors are held in street name. |
(c) | Dividends. During the past five years, the Company has not paid cash dividends. Payments of dividends are within the discretion of our board of directors. |
31
CORPORATE INFORMATION
| | | | |
Corporate Officers | | Board of Directors | | Stock Symbol |
| | |
John D. Bair Chairman and Chief Technology and Innovation Officer Michael R. Sayre President, Chief Executive Officer, Interim Chief Financial Officer, and Treasurer Laura Palko Secretary Corporate Office Pinnacle Data Systems, Inc. 6600 Port Road Groveport, OH 43125 Tel: 800.882.8282 Tel: 614.748.1150 Fax: 614.748.1209 www.pinnacle.com | | John D. Bair Chairman and Chief Technology and Innovation Officer Carl J. Aschinger, Jr. Chairman and Chief Executive Officer Columbus Show Case Company Hugh C. Cathey Principal Columbus Capital Partners Thomas M. O’Leary Director of Manufacturing Development Lucent Technologies (retired) Michael R. Sayre Chief Executive Officer and President Pinnacle Data Systems, Inc. | | PNS Listed on the American Stock Exchange Transfer Agent and Registrar Computershare Investor Services Shareholder Services 2 North LaSalle Street Chicago, IL 60602 Independent Registered Public
Accounting Firm Hausser + Taylor, LLC 191 West Nationwide Blvd., Suite 400 Columbus, OH 43215 Legal Counsel Schottenstein, Zox & Dunn Co., L.P.A. 250 West Street Columbus, OH 43215 |
| | |
| | |
| | |
| | |
| | |
| | |
| | |
| | |
| | |
| | |
| | |
| | |
| | |
| | |
| | |
| | |
| | |
| | |
| | |
| | |
| | |
| | |
| | |
| | |
| | |
| | |
| | |
Shareholders may receive a copy of the Company’s 2005 Annual Report on Form 10-KSB without charge by writing to:
Investor Relations
Pinnacle Data Systems, Inc.
6600 Port Road
Groveport, OH 43125