UNITED STATES
SECURITIES AND EXCHANGE COMMISSION
Washington, D.C. 20549
FORM N-CSR
CERTIFIED SHAREHOLDER REPORT
OF
REGISTERED MANAGEMENT INVESTMENT COMPANIES
| Investment Company Act file number: | 811-07443 | |
Name of Registrant: | Vanguard Whitehall Funds | |
Address of Registrant: | P.O. Box 2600 | |
| Valley Forge, PA 19482 | ||
Name and address of agent for service: | Heidi Stam, Esquire | |
| P.O. Box 876 | ||
| Valley Forge, PA 19482 | ||
Registrant’s telephone number, including area code: (610) 669-1000 | ||
Date of fiscal year end: October 31 | ||
Date of reporting period: November 1, 2013 – April 30, 2014 | ||
Item 1: Reports to Shareholders | ||
![]()
Semiannual Report | April 30, 2014
Vanguard International Explorer™ Fund

Vanguard’s Principles for Investing Success
We want to give you the best chance of investment success. These principles,
grounded in Vanguard’s research and experience, can put you on the right path.
Goals. Create clear, appropriate investment goals.
Balance. Develop a suitable asset allocation using broadly diversified funds.
Cost. Minimize cost.
Discipline. Maintain perspective and long-term discipline.
A single theme unites these principles: Focus on the things you can control.
We believe there is no wiser course for any investor.
| Contents | |
| Your Fund’s Total Returns. | 1 |
| Chairman’s Letter. | 2 |
| Advisors’ Report. | 6 |
| Fund Profile. | 10 |
| Performance Summary. | 12 |
| Financial Statements. | 13 |
| About Your Fund’s Expenses. | 29 |
| Glossary. | 31 |
Please note: The opinions expressed in this report are just that—informed opinions. They should not be considered promises or advice.
Also, please keep in mind that the information and opinions cover the period through the date on the front of this report. Of course, the
risks of investing in your fund are spelled out in the prospectus.
See the Glossary for definitions of investment terms used in this report.
About the cover: The ship’s wheel represents leadership and guidance, essential qualities in navigating difficult seas.
This one is a replica based on an 18th-century British vessel. The HMSVanguard, another ship of that era, served as the
flagship for British Admiral Horatio Nelson when he defeated a French fleet at the Battle of the Nile.
Your Fund’s Total Returns
| Six Months Ended April 30, 2014 | |
| Total | |
| Returns | |
| Vanguard International Explorer Fund | 7.38% |
| S&P EPAC SmallCap Index | 6.33 |
| International Small-Cap Funds Average | 5.13 |
| International Small-Cap Funds Average: Derived from data provided by Lipper, a Thomson Reuters Company. | |
| Your Fund’s Performance at a Glance | ||||
| October 31, 2013, Through April 30, 2014 | ||||
| Distributions Per Share | ||||
| Starting | Ending | Income | Capital | |
| Share Price | Share Price | Dividends | Gains | |
| Vanguard International Explorer Fund | $18.50 | $19.10 | $0.420 | $0.288 |
1

Chairman’s Letter
Dear Shareholder,
For the six months ended April 30, 2014, Vanguard International Explorer Fund returned 7.38%. This result outdistanced that of its benchmark, the S&P EPAC SmallCap Index, and the average return of its international small-capitalization fund peers.
International stocks returned less than the overall U.S. market for the period, but unlike in the United States, small-cap stocks abroad outperformed those of larger companies. The fund posted positive results in nine of ten market sectors, with industrial stocks leading the way.
Recent progress was sporadic, but stocks continued to climb
For the half year ended April 30, U.S. stocks returned almost 8%, notwithstanding the patches of turbulence the market has encountered in 2014. Technology stocks, for example, turned in a rocky performance amid concerns about pricey valuations. Weak economic data from China and the conflict in Ukraine also unsettled investors.
International stocks, in aggregate, returned nearly 3%, with the developed markets of Europe faring the best. The developed markets of the Pacific region and emerging markets, where China’s weakness was felt most, declined.
Global economic and political shifts are, of course, as inevitable as they are unpredictable. Broad diversification remains the best way to manage the
2
risks they pose to your portfolio. As Joe Davis, our chief economist, noted recently, “Having a broader portfolio tends to moderate those individual issues, and that’s always, I think, a valuable starting point for investors.”
Despite low yields, the bond market experienced a surprising rally
Bonds continued to emerge from the struggles that marked much of 2013, when the market was roiled by the prospect that the Federal Reserve would reduce its stimulative bond-buying. In January, however, when the reduction actually began, investors seemed to take the news in stride.
The broad U.S. taxable bond market returned 1.74% for the six months. The yield of the 10-year Treasury note ended April 30 at 2.69%, up from 2.54% on October 31 but down from nearly 3% on December 31. (Bond prices and yields move in opposite directions.)
Municipal bonds returned 4.08%. Money market funds and savings accounts posted paltry returns as the Fed’s target for short-term interest rates remained at 0%–0.25%.
International bond markets (as measured by the Barclays Global Aggregate Index ex USD) returned 2.33%.
| Market Barometer | |||
| Total Returns | |||
| Periods Ended April 30, 2014 | |||
| Six | One | Five Years | |
| Months | Year | (Annualized) | |
| Stocks | |||
| Russell 1000 Index (Large-caps) | 8.25% | 20.81% | 19.52% |
| Russell 2000 Index (Small-caps) | 3.08 | 20.50 | 19.84 |
| Russell 3000 Index (Broad U.S. market) | 7.83 | 20.78 | 19.54 |
| FTSE All-World ex US Index (International) | 2.84 | 9.77 | 13.22 |
| Bonds | |||
| Barclays U.S. Aggregate Bond Index (Broad taxable market) | 1.74% | -0.26% | 4.88% |
| Barclays Municipal Bond Index (Broad tax-exempt market) | 4.08 | 0.50 | 5.54 |
| Citigroup Three-Month U.S. Treasury Bill Index | 0.00 | 0.04 | 0.08 |
| CPI | |||
| Consumer Price Index | 1.51% | 1.95% | 2.14% |
3
Strength in Europe helped offset weaker results elsewhere
International Explorer’s two advisors oversee a broadly diversified portfolio of more than 300 stocks in about 30 countries. A majority of the fund’s assets are invested in Europe. That market gained modestly, with smaller companies doing particularly well as investors anticipated an emergence from the region’s second recession since the 2008–2009 financial crisis. The advisors took advantage of this optimism to register notable results in Italy, Germany, France, and the Netherlands. These selections helped boost the fund’s European returns to about 12%, just ahead of the index’s results.
The fund’s competition against the unmanaged benchmark was also aided by solid picks in the Pacific region. Although stocks of smaller companies there retreated as a group by a few percentage points, the advisors’ holdings, led by those in Japan and Hong Kong, enabled the fund’s Pacific portfolio to hold steady.
The advisors were less successful in emerging markets, where their selections gained little ground. Underperformance was particularly pronounced in China and Brazil.
| Expense Ratios | ||
| Your Fund Compared With Its Peer Group | ||
| Peer Group | ||
| Fund | Average | |
| International Explorer Fund | 0.36% | 1.51% |
The fund expense ratio shown is from the prospectus dated February 25, 2014, and represents estimated costs for the current fiscal year. For the six months ended April 30, 2014, the fund’s annualized expense ratio was 0.39%. The peer-group expense ratio is derived from data provided by Lipper, a Thomson Reuters Company, and captures information through year-end 2013.
Peer group: International Small-Cap Funds.
4
Among sectors, industrial and information technology companies delivered profitable results. Consumer-oriented holdings also outpaced their index counterparts, particularly in the Pacific region. The fund’s financial stocks lagged, however, especially in Europe. The region’s small-cap financial sector rose 13% in the index, but the advisors’ holdings underperformed by about 4 percentage points. An underweighting of the industry also hurt.
Currency fluctuations always influence returns for U.S. investors sending money abroad. The euro and British pound gained value versus the U.S. dollar for the period, helping returns for U.S. investors. On the other hand, the Japanese yen weakened against the dollar, reducing returns for fund shareholders.
You can find more information about the International Explorer Fund’s performance and positioning in the Advisors’ Report that follows this letter.
Balancing investors’ ‘home bias’ and the benefits of diversification
Many investors have a natural tendency to focus on companies close to home. But this “home bias” can lead to missed opportunities to diversify a portfolio internationally.
Stocks of companies based outside the United States account for about half the global equity market. Vanguard’s analysis of more than four decades of data shows that, on average, adding such stocks to a U.S. portfolio would have reduced the volatility of returns. This benefit has generally persisted even as economies and markets have become more integrated.
International stocks offer exposure to a wider array of economic and market forces, producing returns that can vary from those of U.S. stocks—which helps to reduce volatility risk. Of course, the impact of diversification changes over time as returns, volatility levels, and correlations between foreign and domestic stocks change.
Deciding how much to allocate to international stocks depends on your view regarding the short-term and long-term trade-offs. These include potential exposure to currency fluctuations and generally higher transaction and investment costs. Vanguard suggests that allocating 20% of your equity holdings to non-U.S. stocks may be a reasonable starting point. (You can read more in Global Equities: Balancing Home Bias and Diversification, available at vanguard.com/research.)
As always, thank you for investing with Vanguard.
Sincerely,

F. William McNabb III
Chairman and Chief Executive Officer
May 14, 2014
5
Advisors’ Report
For the six months ended April 30, 2014, Vanguard International Explorer Fund returned 7.38%. Your fund is managed by two independent advisors, a strategy that enhances its diversification by providing exposure to distinct yet complementary investment approaches. It is not uncommon for different advisors to have different views about individual securities or the broader investment environment.
The advisors, the amount and percentage of fund assets each manages, and brief descriptions of their investment strategies are presented in the table below. The advisors have also prepared a discussion of the investment environment that existed during the year and of how their portfolio positioning reflects this assessment. These comments were prepared on May 22, 2014.
| Vanguard International Explorer Fund Investment Advisors | |||
| Fund Assets Managed | |||
| Investment Advisor | % | $ Million | Investment Strategy |
| Schroder Investment | 83 | 2,193 | The advisor employs a fundamental investment |
| Management North America Inc. | approach that considers macroeconomic factors while | ||
| focusing primarily on company-specific factors, | |||
| including a company’s potential for long-term growth, | |||
| financial condition, quality of management, and | |||
| sensitivity to cyclical factors. The advisor also | |||
| considers the relative value of a company’s securities | |||
| compared with those of other companies and the | |||
| market as a whole. | |||
| Wellington Management | 14 | 366 | The advisor employs a traditional, bottom-up approach |
| Company, LLP | that is opportunistic in nature, relying on global and | ||
| regional research resources to identify both | |||
| growth-oriented and neglected or misunderstood | |||
| companies. | |||
| Cash Investments | 3 | 91 | These short-term reserves are invested by Vanguard in |
| equity index products to simulate investment in stocks. | |||
| Each advisor also may maintain a modest cash | |||
| position. | |||
6
Schroder Investment Management
North America Inc.
Portfolio Manager:
Matthew F. Dobbs
Head of Global Small Companies
International small-company equities made further progress over the period, with the S&P EPAC SmallCap Index returning 6.33%. That outpaced the results of larger-cap equities, as the S&P EPAC Large/MidCap Index returned 4.02%.
Aided by currency gains, Europe continued to outperform. Continental European small-caps rose amid generally improving economic expectations and leading indicators, as well as broadly accommodating monetary conditions. Peripheral markets were supported by some contraction in yield spreads across the core countries and growing evidence of economic recovery. Returns were good, with smaller companies ahead of larger peers in every sector except energy.
The United Kingdom also did well, though small-company returns there merely matched those of large-caps as relatively modest large-cap valuations attracted inflows.
Asian and emerging-market returns were muted, with Japan down despite strong earnings momentum and ongoing monetary stimulation. Countervailing factors there included anticipation of an April increase in the national sales tax and disappointment at the glacial pace of structural reform.
The most significant boost to relative returns came from stock selection in Japan, particularly among industrials (Asahi Diamond, Yushin Precision, Obara Group), with lesser contributions from materials (Kureha, Nihon Parkerizing) and consumer cyclicals such as Koito Manufacturing and Nifco. Although a number of our financial holdings did poorly (Sumitomo Real Estate, Tokai Tokyo Financial), their impact was more than offset by the portfolio’s low exposure to the sector.
In the United Kingdom, solid returns came from industrials (Ashtead Group, DCC, Ricardo), consumer cyclicals (Sports Direct), and information technology (CSR, Domino Printing). Elsewhere in Europe, industrial holdings also stood out, most notably Italian civil engineering group Maire Tecnimont and Groupe Eurotunnel. Other areas of strength included information technology (RIB Software, XING) and materials (Borregaard). Consumer cyclicals, where German retailer Tom Tailor has struggled to integrate an acquisition, and financials disappointed.
Although our portion of the fund eked out a positive return in the Pacific region (excluding Japan) and in emerging markets, neither matched its corresponding return in the broader benchmark. Successes included port operator Gujarat Pipavav and specialist finance company Shriram Transport Finance in India and Matahari Department Store in Indonesia. In developed Asian markets, exporters such as Techtronic and Johnson Electric performed well.
7
We experienced contrasting fortunes with New Zealand telecom operator Chorus (hurt by unfavorable regulatory developments), India’s Idea Cellular (affected by spectrum auctions), and Chinese auto distributor and retailer Baoxin Auto (hindered by a slowing economy).
We continue to concentrate on companies offering relatively visible growth and sustainable returns with stronger-than-average balance sheets and focused, shareholder-friendly management. Although market movements have naturally occasioned some changes in the portfolio’s European exposure, the extent has been fairly modest. In continental Europe particularly, although a number of holdings reached our assessment of fair value (and therefore were sold), we have found a good flow of attractive new investment opportunities across a range of markets and sectors. However, we have reduced exposure to the United Kingdom in favor of adding to emerging markets (primarily India) and to a lesser extent Japan.
Wellington Management Company, llp
Portfolio Manager:
Simon H. Thomas
Senior Vice President and
Equity Portfolio Manager
Despite geopolitical tensions involving Ukraine, concerns about a slowdown in China’s economic growth, and tepid growth in Europe, international equities moved higher during the period. Investors took solace in comments by the European Central Bank and China’s government suggesting that stimulus measures might be ramped up. They were further emboldened by signs of expansionary traction in Japan, continued evidence of a Eurozone recovery, solid U.S. corporate earnings, and robust merger and acquisition activity.
Our portion of the fund was restrained by stock selection in the financial, materials, and consumer discretionary sectors. Sector allocation, largely as a result of our bottom-up stock selection process, was also modestly negative. By region, our underweighting of Asia helped relative performance. This was more than offset by our overweight position in Japan and underweight allocation to Europe, both of which detracted.
The largest relative laggards included Mothercare, Yamato, and Sanrio. Mother-care, a U.K.-based retailer of baby clothing and educational toys, reported lower-than-expected earnings. Underlying factors included gross margin pressure in its U.K. business and lower traffic as a result of unseasonable weather in Russia and the Middle East, both important regions for the company. We developed concerns about management’s communication with shareholders and sold our position.
After a period of strong performance, shares of Japan-based steel manufacturer Yamato fell despite earnings results that were in line with expectations.
The company has benefited from the construction industry recovery in the United States and the Middle East, which
8
we expect will continue. We used recent price weakness as an opportunity to add to our position.
Shares of Sanrio, a Japan-based character product company known for its Hello Kitty brand, declined when its president’s likely successor passed away suddenly, generating concerns about management uncertainty. We sold the stock because we believe these difficulties might impede the company’s ability to execute its restructuring plan.
Top contributors to relative performance included Groupe Fnac, USG People, and Azimut. Groupe Fnac, a leading French retailer of consumer electronics, CDs, DVDs, books, and video games, rose following strong earnings results in the fourth quarter of 2013. We sold the stock as it approached our price target.
Netherlands-based temporary-employment company USG People advanced thanks to an uptick in employment in Europe. In addition, USG is in a better position after selling a business in which it had endured losses and lacked critical scale. We still hold the position.
Milan-based asset management firm Azimut outperformed on news of potential merger and acquisition activity and continued improvement in fundamentals, as well as the overall strengthening of Italy’s economic climate. We sold the stock because it reached our price target.
Relative to the benchmark, at the end of the period we were most overweighted in industrials, health care, and energy and most underweighted in information technology, consumer staples, and utilities. By region, we were most overweighted in Japan and most underweighted in Europe.
After the past year’s strong market performance, it is important to be cautious about companies whose share prices have risen dramatically but for which growth has not yet materialized. Stocks with high valuations can be severely punished in the event of disappointment. On the other hand, because our investment process leads to a bias toward high quality, an ongoing market rally could become a challenge as we reach a point in the cycle that could benefit lower-quality companies.
9
International Explorer Fund
Fund Profile
As of April 30, 2014
| Portfolio Characteristics | |||
| MSCI | |||
| S&P | AC | ||
| EPAC | World | ||
| SmallCap | Index ex | ||
| Fund | Index | USA | |
| Number of Stocks | 324 | 3,224 | 1,812 |
| Median Market Cap | $2.1B | $2.2B | $35.5B |
| Price/Earnings Ratio | 18.8x | 21.7x | 16.4x |
| Price/Book Ratio | 1.8x | 1.5x | 1.7x |
| Return on Equity | 11.0% | 9.8% | 14.6% |
| Earnings Growth | |||
| Rate | 11.8% | 9.0% | 9.4% |
| Dividend Yield | 2.0% | 2.2% | 2.9% |
| Turnover Rate | |||
| (Annualized) | 46% | — | — |
| Ticker Symbol | VINEX | — | — |
| Expense Ratio1 | 0.36% | — | — |
| Short-Term Reserves | 2.8% | — | — |
| Sector Diversification (% of equity exposure) | |||
| MSCI | |||
| S&P | AC | ||
| EPAC | World | ||
| SmallCap | Index ex | ||
| Fund | Index | USA | |
| Consumer Discretionary | 19.0% | 17.1% | 10.5% |
| Consumer Staples | 5.4 | 5.9 | 10.0 |
| Energy | 3.4 | 2.6 | 9.5 |
| Financials | 19.0 | 22.3 | 26.6 |
| Health Care | 8.3 | 6.2 | 8.2 |
| Industrials | 23.8 | 24.0 | 11.1 |
| Information Technology | 7.0 | 9.0 | 6.6 |
| Materials | 10.3 | 9.4 | 8.7 |
| Telecommunication | |||
| Services | 2.5 | 1.3 | 5.3 |
| Utilities | 1.3 | 2.2 | 3.5 |
| Volatility Measures | ||
| MSCI | ||
| S&P | AC | |
| EPAC | World | |
| SmallCap | Index ex | |
| Index | USA | |
| R-Squared | 0.97 | 0.93 |
| Beta | 0.99 | 0.97 |
| These measures show the degree and timing of the fund’s fluctuations compared with the indexes over 36 months. | ||
| Ten Largest Holdings (% of total net assets) | ||
| Delta Lloyd NV | Life & Health | |
| Insurance | 1.4% | |
| Freenet AG | Wireless | |
| Telecommunication | ||
| Services | 1.3 | |
| Helvetia Holding AG | Multi-line Insurance | 1.3 |
| Smurfit Kappa Group plc Paper Packaging | 1.2 | |
| Glanbia plc | Packaged Foods & | |
| Meats | 1.1 | |
| Storebrand ASA | Life & Health | |
| Insurance | 1.1 | |
| Groupe Eurotunnel SA | Highways & | |
| Railtracks | 1.1 | |
| Borregaard ASA | Specialty Chemicals | 1.1 |
| Andritz AG | Industrial Machinery | 1.1 |
| Techtronic Industries Co. Household | ||
| Appliances | 1.0 | |
| Top Ten | 11.7% | |
| The holdings listed exclude any temporary cash investments and equity index products. | ||
Allocation by Region (% of equity exposure)
1 The expense ratio shown is from the prospectus dated February 25, 2014, and represents estimated costs for the current fiscal year. For the six
months ended April 30, 2014, the annualized expense ratio was 0.39%.
10
International Explorer Fund
| Market Diversification (% of equity exposure) | |||
| S&P | MSCI | ||
| EPAC | AC World | ||
| SmallCap | Index ex | ||
| Fund | Index | USA | |
| Europe | |||
| United Kingdom | 18.0% | 20.2% | 15.7% |
| Germany | 7.8 | 8.2 | 6.8 |
| Ireland | 5.6 | 0.2 | 0.2 |
| Italy | 4.9 | 2.7 | 1.9 |
| France | 4.6 | 8.7 | 7.6 |
| Switzerland | 4.5 | 8.5 | 6.7 |
| Denmark | 3.7 | 1.5 | 1.0 |
| Sweden | 3.3 | 3.1 | 2.3 |
| Norway | 2.5 | 0.9 | 0.6 |
| Netherlands | 1.6 | 1.8 | 1.9 |
| Austria | 1.5 | 0.3 | 0.2 |
| Other | 1.4 | 5.9 | 4.3 |
| Subtotal | 59.4% | 62.0% | 49.2% |
| Pacific | |||
| Japan | 20.8% | 19.3% | 13.7% |
| Australia | 5.3 | 6.0 | 5.7 |
| South Korea | 2.3 | 4.3 | 3.3 |
| Singapore | 1.9 | 1.5 | 1.1 |
| Hong Kong | 1.7 | 2.0 | 2.0 |
| Other | 0.5 | 0.2 | 0.1 |
| Subtotal | 32.5% | 33.3% | 25.9% |
| Emerging Markets | |||
| India | 3.1% | 0.0% | 1.4% |
| Taiwan | 1.2 | 0.0 | 2.5 |
| Other | 3.7 | 0.6 | 13.2 |
| Subtotal | 8.0% | 0.6% | 17.1% |
| North America | 0.1% | 0.1% | 7.4% |
| Middle East | 0.0% | 0.5% | 0.4% |
| Other | 0.0% | 3.5% | 0.0% |
11
International Explorer Fund
Performance Summary
All of the returns in this report represent past performance, which is not a guarantee of future results that may be achieved by the fund. (Current performance may be lower or higher than the performance data cited. For performance data current to the most recent month-end, visit our website at vanguard.com/performance.) Note, too, that both investment returns and principal value can fluctuate widely, so an investor’s shares, when sold, could be worth more or less than their original cost. The returns shown do not reflect taxes that a shareholder would pay on fund distributions or on the sale of fund shares.
Fiscal-Year Total Returns (%): October 31, 2003, Through April 30, 2014
Average Annual Total Returns: Periods Ended March 31, 2014
This table presents returns through the latest calendar quarter—rather than through the end of the fiscal period.
Securities and Exchange Commission rules require that we provide this information.
| Inception | One | Five | Ten | |
| Date | Year | Years | Years | |
| International Explorer Fund | 11/4/1996 | 27.57% | 20.56% | 9.33% |
See Financial Highlights for dividend and capital gains information.
12
International Explorer Fund
Financial Statements (unaudited)
Statement of Net Assets
As of April 30, 2014
The fund reports a complete list of its holdings in regulatory filings four times in each fiscal year, at the quarter-ends. For the second and fourth fiscal quarters, the lists appear in the fund’s semiannual and annual reports to shareholders. For the first and third fiscal quarters, the fund files the lists with the Securities and Exchange Commission on Form N-Q. Shareholders can look up the fund’s Forms N-Q on the SEC’s website at sec.gov. Forms N-Q may also be reviewed and copied at the SEC’s Public Reference Room (see the back cover of this report for further information).
| Market | |||
| Value | |||
| Shares | ($000) | ||
| Common Stocks (93.4%)1 | |||
| Australia (4.3%) | |||
| Computershare Ltd. | 1,514,826 | 17,461 | |
| Mirvac Group | 10,014,243 | 16,342 | |
| Iluka Resources Ltd. | 1,921,351 | 15,962 | |
| Amcor Ltd. | 1,617,810 | 15,526 | |
| Ansell Ltd. | 812,971 | 13,691 | |
| Incitec Pivot Ltd. | 3,205,064 | 8,603 | |
| * | Recall Holdings Ltd. | 1,113,498 | 4,705 |
| SAI Global Ltd. | 916,972 | 3,644 | |
| PanAust Ltd. | 2,114,958 | 3,181 | |
| * | Transpacific Industries | ||
| Group Ltd. | 2,805,103 | 2,917 | |
| Tox Free Solutions Ltd. | 840,513 | 2,707 | |
| Nufarm Ltd. | 587,529 | 2,273 | |
| Seek Ltd. | 136,719 | 2,141 | |
| Domino’s Pizza | |||
| Enterprises Ltd. | 108,033 | 1,993 | |
| Challenger Ltd. | 206,254 | 1,357 | |
| * | Karoon Gas Australia Ltd. | 396,057 | 910 |
| 113,413 | |||
| Austria (1.5%) | |||
| Andritz AG | 458,923 | 28,508 | |
| Kapsch TrafficCom AG | 85,000 | 4,718 | |
| Schoeller-Bleckmann | |||
| Oilfield Equipment AG | 31,974 | 4,065 | |
| *,^ | Mayr Melnhof Karton AG | 9,000 | 1,146 |
| Zumtobel AG | 47,147 | 980 | |
| Rosenbauer | |||
| International AG | 411 | 39 | |
| 39,456 | |||
| Belgium (0.4%) | |||
| D’ieteren SA/NV | 80,033 | 3,703 | |
| Cie d’Entreprises CFE | 29,268 | 3,225 | |
| Ackermans & | |||
| van Haaren NV | 19,509 | 2,523 | |
| 9,451 | |||
| Brazil (0.5%) | |||
| BR Properties SA | 1,412,388 | 11,281 | |
| Magazine Luiza SA | 726,800 | 2,487 | |
| 13,768 | |||
| Canada (0.1%) | |||
| Pacific Rubiales | |||
| Energy Corp. | 99,500 | 1,624 | |
| * | Niko Resources Ltd. | 6,173 | 12 |
| 1,636 | |||
| China (1.2%) | |||
| ^ | Baoxin Auto Group Ltd. | 9,677,000 | 7,330 |
| Shenzhou International | |||
| Group Holdings Ltd. | 2,005,000 | 6,918 | |
| Dah Chong Hong | |||
| Holdings Ltd. | 10,202,000 | 6,493 | |
| Yuexiu Transport | |||
| Infrastructure Ltd. | 10,012,000 | 5,125 | |
| * | WuXi PharmaTech | ||
| Cayman Inc. ADR | 79,649 | 2,708 | |
| Shanghai Fosun | |||
| Pharmaceutical Group | |||
| Co. Ltd. | 535,000 | 1,816 | |
| Minth Group Ltd. | 334,000 | 526 | |
| Haitian International | |||
| Holdings Ltd. | 4,000 | 8 | |
| 30,924 | |||
| Denmark (3.6%) | |||
| * | Jyske Bank A/S | 430,000 | 23,641 |
| * | Auriga Industries Class B | 575,000 | 21,295 |
| GN Store Nord A/S | 725,000 | 17,515 | |
| * | Matas A/S | 630,646 | 17,297 |
| * | OW Bunker A/S | 240,000 | 7,896 |
| DSV A/S | 120,778 | 4,034 | |
| H Lundbeck A/S | 137,452 | 4,006 | |
| 95,684 | |||
| Finland (0.4%) | |||
| * | Sanitec Corp. | 600,000 | 6,916 |
| Vaisala Oyj | 100,000 | 3,254 | |
| Tikkurila Oyj | 58,083 | 1,442 | |
| 11,612 | |||
13
International Explorer Fund
| Market | |||
| Value | |||
| Shares | ($000) | ||
| France (4.1%) | |||
| Groupe Eurotunnel SA | 2,150,000 | 28,864 | |
| * | Korian-Medica | 454,545 | 17,062 |
| Eurofins Scientific SE | 50,000 | 13,885 | |
| Rubis SCA | 190,000 | 13,529 | |
| Naturex | 72,960 | 6,404 | |
| Lectra | 600,000 | 6,323 | |
| * | Montupet | 73,000 | 6,042 |
| Imerys SA | 58,464 | 5,134 | |
| Saft Groupe SA | 115,000 | 4,090 | |
| Wendel SA | 19,640 | 2,961 | |
| Eurazeo SA | 33,796 | 2,849 | |
| * | Inside Secure SA | 412,288 | 2,083 |
| 109,226 | |||
| Germany (7.2%) | |||
| Freenet AG | 1,000,000 | 34,634 | |
| MTU Aero Engines AG | 280,000 | 26,400 | |
| XING AG | 160,000 | 20,500 | |
| * | Tom Tailor Holding AG | 890,000 | 17,312 |
| Sartorius AG | |||
| Preference Shares | 120,000 | 15,627 | |
| Tipp24 SE | 190,000 | 13,709 | |
| SAF-Holland SA | 846,810 | 12,670 | |
| Delticom AG | 219,948 | 10,473 | |
| RIB Software AG | 550,000 | 8,588 | |
| CTS Eventim AG | 115,000 | 7,325 | |
| * | SHW AG | 100,000 | 6,002 |
| * | Suss Microtec AG | 611,000 | 5,938 |
| Grenkeleasing AG | 40,882 | 4,283 | |
| ^ | Rheinmetall AG | 46,887 | 3,124 |
| ElringKlinger AG | 44,994 | 1,817 | |
| DMG MORI SEIKI AG | 45,834 | 1,444 | |
| ^ | STRATEC Biomedical AG | 24,362 | 1,116 |
| 190,962 | |||
| Hong Kong (1.7%) | |||
| Techtronic Industries Co. | 8,419,500 | 26,901 | |
| Johnson Electric | |||
| Holdings Ltd. | 9,890,500 | 9,460 | |
| Yue Yuen Industrial | |||
| Holdings Ltd. | 2,613,500 | 8,097 | |
| 44,458 | |||
| India (3.0%) | |||
| Idea Cellular Ltd. | 9,629,587 | 21,528 | |
| * | Gujarat Pipavav Port Ltd. | 15,036,675 | 20,589 |
| Cipla Ltd. | 1,920,427 | 12,673 | |
| Shriram Transport | |||
| Finance Co. Ltd. | 720,522 | 8,792 | |
| Apollo Hospitals | |||
| Enterprise Ltd. | 470,010 | 6,981 | |
| Multi Commodity | |||
| Exchange of India Ltd. | 509,658 | 4,509 | |
| McLeod Russel India Ltd. | 883,951 | 3,955 | |
| 79,027 | |||
| Indonesia (0.5%) | |||
| * | Matahari Department | ||
| Store Tbk PT | 6,467,100 | 8,403 | |
| Ciputra Property Tbk PT | 73,359,500 | 4,618 | |
| Gajah Tunggal Tbk PT | 5,602,800 | 930 | |
| 13,951 | |||
| Ireland (5.4%) | |||
| Smurfit Kappa Group plc | 1,400,000 | 31,189 | |
| Glanbia plc | 2,000,000 | 29,870 | |
| Paddy Power plc | 250,000 | 19,289 | |
| Grafton Group plc | 1,500,000 | 14,754 | |
| * | Dalata Hotel Group plc | 2,956,507 | 11,936 |
| FBD Holdings plc | 422,053 | 10,184 | |
| IFG Group plc | 3,312,005 | 7,869 | |
| Irish Continental | |||
| Group plc | 160,000 | 6,419 | |
| * | Origin Enterprises PLC | 530,000 | 5,733 |
| * | Irish Residential | ||
| Properties REIT plc | 3,302,682 | 4,720 | |
| 141,963 | |||
| Italy (4.6%) | |||
| Maire Tecnimont SPA | 7,000,000 | 25,534 | |
| * | Sorin SPA | 7,000,000 | 21,367 |
| Amplifon SPA | 2,882,260 | 18,822 | |
| Prysmian SPA | 579,722 | 15,099 | |
| * | Banca Popolare dell’Emilia | ||
| Romagna SC | 1,300,000 | 14,985 | |
| Credito Emiliano SPA | 1,000,000 | 10,251 | |
| ^ | Beni Stabili SPA | 3,828,368 | 3,422 |
| * | Anima Holding SPA | 467,000 | 2,754 |
| MARR SPA | 125,000 | 2,421 | |
| DiaSorin SPA | 48,355 | 1,995 | |
| Ei Towers SPA | 31,914 | 1,816 | |
| Immobiliare Grande | |||
| Distribuzione | 930,022 | 1,728 | |
| Banca Generali SPA | 43,959 | 1,384 | |
| Salvatore Ferragamo SPA | 30,081 | 953 | |
| 122,531 | |||
| Japan (18.7%) | |||
| NEC Networks & System | |||
| Integration Corp. | 699,300 | 14,774 | |
| Nitta Corp. | 710,900 | 14,604 | |
| Eagle Industry Co. Ltd. | 889,300 | 14,076 | |
| Kureha Corp. | 2,964,000 | 14,016 | |
| Koito Manufacturing | |||
| Co. Ltd. | 643,600 | 13,998 | |
| ^ | Kuroda Electric Co. Ltd. | 854,300 | 13,725 |
| Tokai Tokyo Financial | |||
| Holdings Inc. | 1,969,200 | 13,230 | |
| Arcs Co. Ltd. | 657,900 | 13,199 | |
| Aica Kogyo Co. Ltd. | 599,300 | 12,533 | |
| Tsuruha Holdings Inc. | 123,500 | 12,430 | |
| Nihon Parkerizing Co. Ltd. | 567,300 | 12,365 | |
| JSP Corp. | 811,300 | 12,183 | |
14
International Explorer Fund
| Market | |||
| Value | |||
| Shares | ($000) | ||
| Trusco Nakayama Corp. | 531,900 | 11,987 | |
| Asahi Diamond | |||
| Industrial Co. Ltd. | 858,800 | 11,622 | |
| Kissei Pharmaceutical | |||
| Co. Ltd. | 486,500 | 11,393 | |
| Plenus Co. Ltd. | 471,300 | 10,756 | |
| Mitsui Sugar Co. Ltd. | 2,579,000 | 10,701 | |
| Musashi Seimitsu | |||
| Industry Co. Ltd. | 477,400 | 10,535 | |
| Daibiru Corp. | 1,050,100 | 10,479 | |
| Hitachi | |||
| High-Technologies Corp. | 457,400 | 10,463 | |
| Lintec Corp. | 510,300 | 9,489 | |
| Nabtesco Corp. | 432,800 | 9,343 | |
| Nippon Densetsu | |||
| Kogyo Co. Ltd. | 606,000 | 8,993 | |
| Nippon Soda Co. Ltd. | 1,568,000 | 8,712 | |
| Sumitomo Real | |||
| Estate Sales Co. Ltd. | 263,500 | 7,903 | |
| Hitachi Transport | |||
| System Ltd. | 502,700 | 7,714 | |
| Ai Holdings Corp. | 481,200 | 7,677 | |
| ^ | Yushin Precision | ||
| Equipment Co. Ltd. | 257,300 | 7,427 | |
| Takasago | |||
| International Corp. | 1,511,000 | 7,387 | |
| Glory Ltd. | 271,000 | 7,011 | |
| Unipres Corp. | 352,600 | 6,813 | |
| ^ | Modec Inc. | 301,500 | 6,681 |
| Obara Group Inc. | 165,400 | 6,214 | |
| Nichi-iko Pharmaceutical | |||
| Co. Ltd. | 395,700 | 6,138 | |
| Tsutsumi Jewelry Co. Ltd. | 265,500 | 6,019 | |
| ^ | OBIC Business | ||
| Consultants Ltd. | 166,100 | 5,382 | |
| SCSK Corp. | 198,100 | 5,240 | |
| Mitsubishi UFJ Lease & | |||
| Finance Co. Ltd. | 1,007,000 | 4,968 | |
| Hoshizaki Electric Co. Ltd. | 107,000 | 4,330 | |
| Shinsei Bank Ltd. | 2,183,000 | 4,256 | |
| ^ | Zuiko Corp. | 76,400 | 4,254 |
| Yamato Kogyo Co. Ltd. | 136,100 | 3,925 | |
| ^ | Message Co. Ltd. | 114,600 | 3,678 |
| Zenkoku Hosho Co. Ltd. | 158,600 | 3,552 | |
| GLP J-Reit | 3,534 | 3,488 | |
| CyberAgent Inc. | 82,200 | 3,394 | |
| Hitachi Metals Ltd. | 244,000 | 3,313 | |
| Asahi Intecc Co. Ltd. | 90,500 | 3,312 | |
| Nippon Shinyaku Co. Ltd. | 187,000 | 3,294 | |
| Amada Co. Ltd. | 449,000 | 3,247 | |
| IHI Corp. | 772,000 | 3,078 | |
| Icom Inc. | 130,500 | 3,004 | |
| Nikkiso Co. Ltd. | 265,200 | 2,972 | |
| Denyo Co. Ltd. | 198,700 | 2,961 | |
| Yokogawa Electric Corp. | 212,100 | 2,900 |
| Kumiai Chemical | ||||
| Industry Co. Ltd. | 413,000 | 2,808 | ||
| THK Co. Ltd. | 128,000 | 2,705 | ||
| Aeon Mall Co. Ltd. | 111,180 | 2,651 | ||
| Iida Group | ||||
| Holdings Co. Ltd. | 169,500 | 2,529 | ||
| * | Joyful Honda Co. Ltd. | 66,020 | 2,441 | |
| Mitsubishi Gas | ||||
| Chemical Co. Inc. | 420,000 | 2,425 | ||
| Nihon Nohyaku Co. Ltd. | 188,500 | 2,349 | ||
| ^ | Tokyo Tomin Bank Ltd. | 220,500 | 2,288 | |
| IBJ Leasing Co. Ltd. | 98,600 | 2,256 | ||
| Shionogi & Co. Ltd. | 127,600 | 2,237 | ||
| Kakaku.com Inc. | 155,300 | 2,216 | ||
| ^ | Ferrotec Corp. | 410,500 | 2,214 | |
| Makino Milling | ||||
| Machine Co. Ltd. | 297,000 | 2,211 | ||
| Tenma Corp. | 163,200 | 2,133 | ||
| ^ | Jamco Corp. | 106,800 | 1,912 | |
| DMG Mori Seiki Co. Ltd. | 151,600 | 1,891 | ||
| Japan Petroleum | ||||
| Exploration Co. | 49,600 | 1,846 | ||
| Nafco Co. Ltd. | 121,200 | 1,803 | ||
| ^ | Yumeshin Holdings | |||
| Co. Ltd. | 200,100 | 1,717 | ||
| Sanwa Holdings Corp. | 277,000 | 1,692 | ||
| ^ | Internet Initiative Japan Inc. | 70,800 | 1,643 | |
| Nippon Thompson Co. Ltd. | 349,000 | 1,591 | ||
| Nippon Shokubai Co. Ltd. | 124,000 | 1,431 | ||
| Jaccs Co. Ltd. | 322,000 | 1,429 | ||
| Shizuoka Gas Co. Ltd. | 201,700 | 1,214 | ||
| Digital Garage Inc. | 72,100 | 1,055 | ||
| Matsui Securities Co. Ltd. | 108,900 | 1,003 | ||
| ^ | Pocket Card Co. Ltd. | 148,200 | 971 | |
| Ichiyoshi Securities Co. Ltd. | 79,100 | 943 | ||
| Yaskawa Electric Corp. | 77,100 | 869 | ||
| Nifco Inc. | 27,200 | 760 | ||
| ^ | Fujikura Kasei Co. Ltd. | 99,600 | 544 | |
| 494,915 | ||||
| Luxembourg (0.4%) | ||||
| Samsonite | ||||
| International SA | 1,494,600 | 4,749 | ||
| * | Reinet Investments SCA | 168,093 | 3,803 | |
| *,2 | O’Key Group SA GDR | 178,049 | 1,572 | |
| 10,124 | ||||
| Malaysia (0.3%) | ||||
| Bursa Malaysia Bhd. | 3,336,100 | 7,759 | ||
| Mexico (0.1%) | ||||
| Fibra Uno | ||||
| Administracion SA de CV | 553,600 | 1,809 | ||
| Grupo Sanborns | ||||
| SAB de CV | 881,000 | 1,446 | ||
| 3,255 | ||||
15
International Explorer Fund
| Market | |||
| Value | |||
| Shares | ($000) | ||
| Netherlands (1.5%) | |||
| Delta Lloyd NV | 1,400,000 | 36,846 | |
| USG People NV | 215,037 | 3,720 | |
| 40,566 | |||
| New Zealand (0.5%) | |||
| Fletcher Building Ltd. | 1,475,159 | 12,544 | |
| Norway (2.5%) | |||
| * | Storebrand ASA | 5,300,000 | 29,751 |
| Borregaard ASA | 4,134,522 | 28,737 | |
| Kongsberg Gruppen AS | 206,468 | 4,846 | |
| Petroleum | |||
| Geo-Services ASA | 136,215 | 1,645 | |
| 64,979 | |||
| Philippines (0.2%) | |||
| * | Robinsons Retail | ||
| Holdings Inc. | 3,105,740 | 4,674 | |
| Singapore (1.8%) | |||
| UOL Group Ltd. | 2,322,000 | 11,922 | |
| Mapletree Industrial Trust | 9,634,880 | 11,087 | |
| First Resources Ltd. | 4,598,000 | 9,443 | |
| * | Vard Holdings Ltd. | 8,494,000 | 6,562 |
| Jardine Cycle & | |||
| Carriage Ltd. | 150,000 | 5,625 | |
| Noble Group Ltd. | 2,741,000 | 2,822 | |
| Indofood Agri | |||
| Resources Ltd. | 1,424,000 | 1,213 | |
| 48,674 | |||
| South Korea (2.2%) | |||
| Hankook Tire Co. Ltd. | 408,362 | 23,692 | |
| ^ | Halla Visteon Climate | ||
| Control Corp. | 363,090 | 15,193 | |
| ^ | Sung Kwang Bend Co. Ltd. | 386,521 | 9,065 |
| BS Financial Group Inc. | 318,270 | 4,873 | |
| Green Cross Corp. | 21,596 | 2,669 | |
| CJ O Shopping Co. Ltd. | 6,559 | 2,319 | |
| Lotte Chemical Corp. | 7,355 | 1,164 | |
| 58,975 | |||
| Sweden (3.2%) | |||
| ^ | Intrum Justitia AB | 900,000 | 26,092 |
| Loomis AB Class B | 900,000 | 24,550 | |
| Byggmax Group AB | 1,700,000 | 14,243 | |
| * | Bufab Holding AB | 957,582 | 9,425 |
| Opus Group AB | 2,577,981 | 5,056 | |
| * | Concentric AB | 162,260 | 2,296 |
| Haldex AB | 158,439 | 2,032 | |
| * | Seamless Distribution AB | 350,000 | 1,763 |
| 85,457 | |||
| Switzerland (4.3%) | |||
| Helvetia Holding AG | 67,000 | 33,396 | |
| Clariant AG | 720,000 | 14,198 | |
| Orior AG | 200,000 | 12,924 | |
| ^ | EFG International AG | 900,000 | 11,404 |
| Kuoni Reisen Holding AG | 23,008 | 10,161 | |
| Gategroup Holding AG | 182,057 | 5,673 | |
| Schweizerische | |||
| National-Versicherungs- | |||
| Gesellschaft AG | 78,000 | 5,405 | |
| * | Interroll Holding AG | 8,495 | 5,285 |
| * | Dufry AG | 25,922 | 4,290 |
| Ascom Holding AG | 205,470 | 3,822 | |
| Partners Group Holding AG 12,974 | 3,553 | ||
| ^ | Tecan Group AG | 26,289 | 3,288 |
| OC Oerlikon Corp. AG | 98,377 | 1,567 | |
| 114,966 | |||
| Taiwan (1.1%) | |||
| Giant Manufacturing | |||
| Co. Ltd. | 2,374,000 | 18,588 | |
| CTCI Corp. | 3,710,000 | 5,925 | |
| Chroma ATE Inc. | 1,851,000 | 4,774 | |
| Yungtay Engineering | |||
| Co. Ltd. | 369,000 | 1,089 | |
| 30,376 | |||
| Thailand (0.6%) | |||
| Hemaraj Land and | |||
| Development PCL | 78,955,100 | 8,879 | |
| LPN Development PCL | 12,974,800 | 7,031 | |
| 15,910 | |||
| United Arab Emirates (0.3%) | |||
| * | Lamprell plc | 3,000,000 | 7,780 |
| United Kingdom (17.2%) | |||
| Grainger plc | 4,915,405 | 17,738 | |
| Telecom Plus plc | 560,000 | 14,660 | |
| WS Atkins plc | 675,000 | 14,640 | |
| DCC plc | 275,000 | 14,101 | |
| IG Group Holdings plc | 1,266,131 | 13,616 | |
| Millennium & Copthorne | |||
| Hotels plc | 1,400,000 | 13,143 | |
| Dechra | |||
| Pharmaceuticals plc | 1,100,000 | 12,814 | |
| Ashtead Group plc | 850,000 | 12,594 | |
| Kier Group plc | 422,352 | 11,871 | |
| Elementis plc | 2,521,590 | 11,837 | |
| CSR plc | 1,200,000 | 11,660 | |
| Premier Oil plc | 2,000,000 | 11,452 | |
| * | Persimmon plc | 500,000 | 11,096 |
| Inchcape plc | 1,000,000 | 10,863 | |
| * | Kennedy Wilson Europe | ||
| Real Estate plc | 622,900 | 10,728 | |
| Berendsen plc | 600,000 | 10,486 | |
| Daily Mail & General | |||
| Trust plc | 760,000 | 10,476 | |
| Ricardo plc | 875,000 | 10,019 | |
| Berkeley Group | |||
| Holdings plc | 255,144 | 9,900 | |
| John Wood Group plc | 725,000 | 9,613 | |
16
International Explorer Fund
| Market | |||
| Value | |||
| Shares | ($000) | ||
| Photo-Me | |||
| International plc | 3,750,000 | 8,547 | |
| London Stock | |||
| Exchange Group plc | 275,000 | 8,428 | |
| Soco International plc | 1,100,000 | 8,040 | |
| Senior plc | 1,650,000 | 7,974 | |
| Spirit Pub Co. plc | 5,998,575 | 7,953 | |
| Domino Printing | |||
| Sciences plc | 600,000 | 7,859 | |
| Investec plc | 880,454 | 7,769 | |
| * | EnQuest plc | 3,250,000 | 7,543 |
| N Brown Group plc | 862,917 | 7,479 | |
| * | Findel plc | 1,600,365 | 7,306 |
| SIG plc | 2,250,000 | 7,292 | |
| QinetiQ Group plc | 2,000,000 | 7,126 | |
| A.G.BARR plc | 642,521 | 6,714 | |
| Bodycote plc | 525,000 | 6,478 | |
| Halma plc | 675,000 | 6,413 | |
| * | Pets at Home Group plc | 1,701,219 | 6,398 |
| * | LMS Capital plc | 4,144,854 | 5,793 |
| Micro Focus | |||
| International plc | 415,384 | 5,448 | |
| Devro plc | 1,400,000 | 4,998 | |
| * | Just Retirement | ||
| Group plc | 1,771,468 | 4,885 | |
| Eco Animal Health | |||
| Group plc | 1,608,166 | 4,749 | |
| Mears Group plc | 521,866 | 4,423 | |
| Direct Line Insurance | |||
| Group plc | 983,727 | 4,162 | |
| Tyman plc | 830,336 | 4,010 | |
| Hays plc | 1,557,723 | 3,974 | |
| Booker Group plc | 1,524,268 | 3,792 | |
| TalkTalk Telecom | |||
| Group plc | 750,250 | 3,636 | |
| Hansteen Holdings plc | 2,048,033 | 3,566 | |
| James Fisher & Sons plc | 152,787 | 3,332 | |
| Savills plc | 322,988 | 3,272 | |
| Informa plc | 376,186 | 3,072 | |
| Crest Nicholson | |||
| Holdings plc | 500,287 | 2,944 | |
| De La Rue plc | 186,540 | 2,585 | |
| Michael Page | |||
| International plc | 324,038 | 2,574 | |
| Hunting plc | 169,196 | 2,422 | |
| Henderson Group plc | 550,186 | 2,338 | |
| Keller Group plc | 131,533 | 2,219 | |
| Domino’s Pizza Group plc | 236,687 | 2,057 | |
| Big Yellow Group plc | 228,862 | 1,989 | |
| * | Thomas Cook Group plc | 601,867 | 1,779 |
| Unite Group plc | 231,255 | 1,651 | |
| Howden Joinery | |||
| Group plc | 297,245 | 1,636 |
| Ultra Electronics | ||||
| Holdings plc | 48,095 | 1,379 | ||
| * | Ophir Energy plc | 292,577 | 1,303 | |
| AZ Electronic | ||||
| Materials SA | 180,811 | 1,231 | ||
| Redrow plc | 236,337 | 1,144 | ||
| Chemring Group plc | 226,153 | 856 | ||
| * | Pinnacle Staffing | |||
| Group plc | 673,983 | — | ||
| 455,845 | ||||
| Total Common Stocks | ||||
| (Cost $1,926,567) | 2,474,861 | |||
| Temporary Cash Investments (8.2%)1 | ||||
| Money Market Fund (7.8%) | ||||
| 3,4 | Vanguard Market | |||
| Liquidity Fund, | ||||
| 0.124% | 205,885,653 | 205,886 | ||
| Face | ||||
| Amount | ||||
| ($000) | ||||
| Repurchase Agreement (0.2%) | ||||
| Goldman Sachs & Co. | ||||
| 0.050%, 5/1/14 (Dated | ||||
| 4/30/14, Repurchase | ||||
| Value $4,900,000, | ||||
| collateralized by Federal | ||||
| National Mortgage Assn. | ||||
| 3.000%–9.000%, | ||||
| 3/1/15–11/1/43, and | ||||
| Federal Home Loan | ||||
| Mortgage Corp. | ||||
| 2.500%–11.500%, | ||||
| 7/1/14–12/1/42, with a | ||||
| value of $4,998,000) | 4,900 | 4,900 | ||
| U.S. Government and Agency Obligations (0.2%) | ||||
| 5,6 | Federal Home Loan | |||
| Bank Discount Notes, | ||||
| 0.110%, 7/16/14 | 2,500 | 2,499 | ||
| 5,6 | Federal Home Loan | |||
| Bank Discount Notes, | ||||
| 0.090%, 8/6/14 | 800 | 800 | ||
| 6,7 | Freddie Mac Discount | |||
| Notes, 0.105%, 6/18/14 | 1,700 | 1,700 | ||
| 4,999 | ||||
| Total Temporary Cash Investments | ||||
| (Cost $215,785) | 215,785 | |||
| Total Investments (101.6%) | ||||
| (Cost $2,142,352) | 2,690,646 | |||
17
International Explorer Fund
| Market | |
| Value | |
| ($000) | |
| Other Assets and Liabilities (-1.6%) | |
| Other Assets | 32,502 |
| Liabilities4 | (73,634) |
| (41,132) | |
| Net Assets (100%) | |
| Applicable to 138,682,946 outstanding | |
| $.001 par value shares of beneficial | |
| interest (unlimited authorization) | 2,649,514 |
| Net Asset Value Per Share | $19.10 |
| At April 30, 2014, net assets consisted of: | |
| Amount | |
| ($000) | |
| Paid-in Capital | 2,013,292 |
| Overdistributed Net Investment Income | (11,176) |
| Accumulated Net Realized Gains | 98,076 |
| Unrealized Appreciation (Depreciation) | |
| Investment Securities | 548,294 |
| Futures Contracts | 395 |
| Forward Currency Contracts | 538 |
| Foreign Currencies | 95 |
| Net Assets | 2,649,514 |
See Note A in Notes to Financial Statements.
* Non-income-producing security.
^ Includes partial security positions on loan to broker-dealers. The total value of securities on loan is $55,314,000.
1 The fund invests a portion of its cash reserves in equity markets through the use of index futures contracts. After giving effect to futures
investments, the fund’s effective common stock and temporary cash investment positions represent 96.5% and 5.1%, respectively, of
net assets.
2 Security exempt from registration under Rule 144A of the Securities Act of 1933. Such securities may be sold in transactions exempt from
registration, normally to qualified institutional buyers. At April 30, 2014, the value of this security represented 0.1% of net assets.
3 Affiliated money market fund available only to Vanguard funds and certain trusts and accounts managed by Vanguard. Rate shown is
the 7-day yield.
4 Includes $59,687,000 of collateral received for securities on loan.
5 The issuer operates under a congressional charter; its securities are generally neither guaranteed by the U.S. Treasury nor backed by the
full faith and credit of the U.S. government.
6 Securities with a value of $3,899,000 have been segregated as initial margin for open futures contracts.
7 The issuer was placed under federal conservatorship in September 2008; since that time, its daily operations have been managed by the
Federal Housing Finance Agency and it receives capital from the U.S. Treasury, as needed to maintain a positive net worth, in exchange
for senior preferred stock.
ADR—American Depositary Receipt.
GDR—Global Depositary Receipt.
REIT—Real Estate Investment Trust.
See accompanying Notes, which are an integral part of the Financial Statements.
18
International Explorer Fund
Statement of Operations
| Six Months Ended | |
| April 30, 2014 | |
| ($000) | |
| Investment Income | |
| Income | |
| Dividends1 | 21,408 |
| Interest2 | 91 |
| Securities Lending | 460 |
| Total Income | 21,959 |
| Expenses | |
| Investment Advisory Fees—Note B | |
| Basic Fee | 2,521 |
| Performance Adjustment | (195) |
| The Vanguard Group—Note C | |
| Management and Administrative | 1,940 |
| Marketing and Distribution | 203 |
| Custodian Fees | 269 |
| Shareholders’ Reports | 12 |
| Trustees’ Fees and Expenses | 2 |
| Total Expenses | 4,752 |
| Net Investment Income | 17,207 |
| Realized Net Gain (Loss) | |
| Investment Securities Sold | 101,449 |
| Futures Contracts | 1,277 |
| Foreign Currencies and Forward Currency Contracts | (471) |
| Realized Net Gain (Loss) | 102,255 |
| Change in Unrealized Appreciation (Depreciation) | |
| Investment Securities | 57,520 |
| Futures Contracts | (2,480) |
| Foreign Currencies and Forward Currency Contracts | (218) |
| Change in Unrealized Appreciation (Depreciation) | 54,822 |
| Net Increase (Decrease) in Net Assets Resulting from Operations | 174,284 |
| 1 Dividends are net of foreign withholding taxes of $1,482,000. | |
| 2 Interest income from an affiliated company of the fund was $86,000. | |
See accompanying Notes, which are an integral part of the Financial Statements.
19
International Explorer Fund
Statement of Changes in Net Assets
| Six Months Ended | Year Ended | |
| April 30, | October 31, | |
| 2014 | 2013 | |
| ($000) | ($000) | |
| Increase (Decrease) in Net Assets | ||
| Operations | ||
| Net Investment Income | 17,207 | 40,193 |
| Realized Net Gain (Loss) | 102,255 | 61,956 |
| Change in Unrealized Appreciation (Depreciation) | 54,822 | 440,763 |
| Net Increase (Decrease) in Net Assets Resulting from Operations | 174,284 | 542,912 |
| Distributions | ||
| Net Investment Income | (52,360) | (50,302) |
| Realized Capital Gain1 | (35,904) | — |
| Total Distributions | (88,264) | (50,302) |
| Capital Share Transactions | ||
| Issued | 374,790 | 358,438 |
| Issued in Lieu of Cash Distributions | 81,125 | 45,856 |
| Redeemed | (173,791) | (434,054) |
| Net Increase (Decrease) from Capital Share Transactions | 282,124 | (29,760) |
| Total Increase (Decrease) | 368,144 | 462,850 |
| Net Assets | ||
| Beginning of Period | 2,281,370 | 1,818,520 |
| End of Period2 | 2,649,514 | 2,281,370 |
| 1 Includes fiscal 2014 short-term gain distributions totaling $17,079,000. Short-term gain distributions are treated as ordinary income dividends for tax purposes. | ||
| 2 Net Assets—End of Period includes undistributed (overdistributed) net investment income of ($11,176,000) and $22,380,000. | ||
See accompanying Notes, which are an integral part of the Financial Statements.
20
International Explorer Fund
Financial Highlights
| Six Months | ||||||
| Ended | ||||||
| For a Share Outstanding | April 30, | Year Ended October 31, | ||||
| Throughout Each Period | 2014 | 2013 | 2012 | 2011 | 2010 | 2009 |
| Net Asset Value, Beginning of Period | $18.50 | $14.50 | $14.41 | $15.81 | $13.55 | $9.52 |
| Investment Operations | ||||||
| Net Investment Income | .146 | .327 | .362 | .322 | .237 | .238 |
| Net Realized and Unrealized Gain (Loss) | ||||||
| on Investments | 1.162 | 4.078 | .287 | (1.498) | 2.225 | 4.148 |
| Total from Investment Operations | 1.308 | 4.405 | .649 | (1.176) | 2.462 | 4.386 |
| Distributions | ||||||
| Dividends from Net Investment Income | (. 420) | (. 405) | (. 346) | (. 224) | (. 202) | (. 356) |
| Distributions from Realized Capital Gains | (.288) | — | (.213) | — | — | — |
| Total Distributions | (.708) | (. 405) | (. 559) | (. 224) | (. 202) | (. 356) |
| Net Asset Value, End of Period | $19.10 | $18.50 | $14.50 | $14.41 | $15.81 | $13.55 |
| Total Return1 | 7.38% | 31.13% | 5.02% | -7.60% | 18.38% | 47.88% |
| Ratios/Supplemental Data | ||||||
| Net Assets, End of Period (Millions) | $2,650 | $2,281 | $1,819 | $2,187 | $2,436 | $1,911 |
| Ratio of Total Expenses to | ||||||
| Average Net Assets2 | 0.39% | 0.36% | 0.43% | 0.42% | 0.39% | 0.45% |
| Ratio of Net Investment Income to | ||||||
| Average Net Assets | 1.42% | 2.03% | 2.35% | 1.93% | 1.67% | 2.10% |
| Portfolio Turnover Rate | 46% | 36% | 28% | 43% | 51% | 52% |
The expense ratio, net income ratio, and turnover rate for the current period have been annualized.
1 Total returns do not include transaction or account service fees that may have applied in the periods shown. Fund prospectuses provide
information about any applicable transaction and account service fees.
2 Includes performance-based investment advisory fee increases (decreases) of (0.02%), (0.05%), 0.02%, 0.03%, 0.00%, and 0.00%.
See accompanying Notes, which are an integral part of the Financial Statements.
21
International Explorer Fund
Notes to Financial Statements
Vanguard International Explorer Fund is registered under the Investment Company Act of 1940 as an open-end investment company, or mutual fund. The fund invests in securities of foreign issuers, which may subject it to investment risks not normally associated with investing in securities of United States corporations.
A. The following significant accounting policies conform to generally accepted accounting principles for U.S. investment companies. The fund consistently follows such policies in preparing its financial statements.
1. Security Valuation: Securities are valued as of the close of trading on the New York Stock Exchange (generally 4 p.m., Eastern time) on the valuation date. Equity securities are valued at the latest quoted sales prices or official closing prices taken from the primary market in which each security trades; such securities not traded on the valuation date are valued at the mean of the latest quoted bid and asked prices. Securities for which market quotations are not readily available, or whose values have been affected by events occurring before the fund’s pricing time but after the close of the securities’ primary markets, are valued at their fair values calculated according to procedures adopted by the board of trustees. These procedures include obtaining quotations from an independent pricing service, monitoring news to identify significant market- or security-specific events, and evaluating changes in the values of foreign market proxies (for example, ADRs, futures contracts, or exchange-traded funds), between the time the foreign markets close and the fund’s pricing time. When fair-value pricing is employed, the prices of securities used by a fund to calculate its net asset value may differ from quoted or published prices for the same securities. Investments in Vanguard Market Liquidity Fund are valued at that fund’s net asset value. Temporary cash investments acquired over 60 days to maturity are valued using the latest bid prices or using valuations based on a matrix system (which considers such factors as security prices, yields, maturities, and ratings), both as furnished by independent pricing services. Other temporary cash investments are valued at amortized cost, which approximates market value.
2. Foreign Currency: Securities and other assets and liabilities denominated in foreign currencies are translated into U.S. dollars using exchange rates obtained from an independent third party as of the fund’s pricing time on the valuation date. Realized gains (losses) and unrealized appreciation (depreciation) on investment securities include the effects of changes in exchange rates since the securities were purchased, combined with the effects of changes in security prices. Fluctuations in the value of other assets and liabilities resulting from changes in exchange rates are recorded as unrealized foreign currency gains (losses) until the assets or liabilities are settled in cash, at which time they are recorded as realized foreign currency gains (losses).
3. Futures and Forward Currency Contracts: The fund uses index futures contracts to a limited extent, with the objective of maintaining full exposure to the stock market while maintaining liquidity. The fund may purchase or sell futures contracts to achieve a desired level of investment, whether to accommodate portfolio turnover or cash flows from capital share transactions. The primary risks associated with the use of futures contracts are imperfect correlation between changes in market values of stocks held by the fund and the prices of futures contracts, and the possibility of an illiquid market. Counterparty risk involving futures is mitigated because a regulated clearinghouse is the counterparty instead of the clearing broker. To further mitigate counterparty risk, the fund trades futures contracts on an exchange, monitors the financial strength of its clearing brokers and clearinghouse, and has entered into clearing agreements with its clearing brokers. The clearinghouse imposes initial margin requirements to secure the fund’s performance and requires daily settlement of variation margin representing changes in the market value of each contract.
22
International Explorer Fund
The fund enters into forward currency contracts to provide the appropriate currency exposure related to any open futures contracts or to protect the value of securities and related receivables and payables against changes in foreign exchange rates. The fund’s risks in using these contracts include movement in the values of the foreign currencies relative to the U.S. dollar and the ability of the counterparties to fulfill their obligations under the contracts. The fund mitigates its counterparty risk by entering into forward currency contracts only with a diverse group of prequalified counterparties, monitoring their financial strength, entering into master netting arrangements with its counterparties, and requiring its counterparties to transfer collateral as security for their performance. The master netting arrangements provide that, in the event of a counterparty’s default (including bankruptcy), the fund may terminate the forward currency contracts, determine the net amount owed by either party in accordance with its master netting arrangements, and sell or retain any collateral held up to the net amount owed to the fund under the master netting arrangements. The forward currency contracts contain provisions whereby a counterparty may terminate open contracts if the fund’s net assets decline below a certain level, triggering a payment by the fund if the fund is in a net liability position at the time of the termination. The payment amount would be reduced by any collateral the fund has pledged.
Any assets pledged as collateral for open contracts are noted in the Statement of Net Assets. The value of collateral received or pledged is compared daily to the value of the forward currency contracts exposure with each counterparty, and any difference, if in excess of a specified minimum transfer amount, is adjusted and settled within two business days.
Futures contracts are valued at their quoted daily settlement prices. Forward currency contracts are valued at their quoted daily prices obtained from an independent third party, adjusted for currency risk based on the expiration date of each contract. The aggregate notional amounts of the contracts are not recorded in the Statement of Net Assets. Fluctuations in the value of the contracts are recorded in the Statement of Net Assets as an asset (liability) and in the Statement of Operations as unrealized appreciation (depreciation) until the contracts are closed, when they are recorded as realized gains (losses) on futures or forward currency contracts.
During the six months ended April 30, 2014, the fund’s average investments in long and short futures contracts represented 4% and 0% of net assets, respectively, based on quarterly average aggregate settlement values. The fund’s average investment in forward currency contracts represented 3% of net assets, based on quarterly average notional amounts.
4. Repurchase Agreements: The fund enters into repurchase agreements with institutional counter-parties. Securities pledged as collateral to the fund under repurchase agreements are held by a custodian bank until the agreements mature. Each agreement requires that the market value of the collateral be sufficient to cover payments of interest and principal. The fund further mitigates its counterparty risk by entering into repurchase agreements only with a diverse group of prequalified counterparties, monitoring their financial strength, and entering into master repurchase agreements with its counterparties. The master repurchase agreements provide that, in the event of a counterparty’s default (including bankruptcy), the fund may terminate any repurchase agreements with that counterparty, determine the net amount owed, and sell or retain the collateral up to the net amount owed to the fund. Such action may be subject to legal proceedings, which may delay or limit the disposition of collateral.
23
International Explorer Fund
5. Federal Income Taxes: The fund intends to continue to qualify as a regulated investment company and distribute all of its taxable income. Management has analyzed the fund’s tax positions taken for all open federal income tax years (October 31, 2010–2013), and for the period ended April 30, 2014, and has concluded that no provision for federal income tax is required in the fund’s financial statements.
6. Distributions: Distributions to shareholders are recorded on the ex-dividend date.
7. Securities Lending: To earn additional income, the fund lends its securities to qualified institutional borrowers. Security loans are required to be secured at all times by collateral in an amount at least equal to the market value of securities loaned. Daily market fluctuations could cause the value of loaned securities to be more or less than the value of the collateral received. When this occurs, the collateral is adjusted and settled on the next business day. The fund further mitigates its counterparty risk by entering into securities lending transactions only with a diverse group of prequalified counterparties, monitoring their financial strength, and entering into master securities lending agreements with its counterparties. The master securities lending agreements provide that, in the event of a counterparty’s default (including bankruptcy), the fund may terminate any loans with that borrower, determine the net amount owed, and sell or retain the collateral up to the net amount owed to the fund; however, such actions may be subject to legal proceedings. While collateral mitigates counterparty risk, in the absence of a default the fund may experience delays and costs in recovering the securities loaned. The fund invests cash collateral received in Vanguard Market Liquidity Fund, and records a liability in the Statement of Net Assets for the return of the collateral, during the period the securities are on loan. Securities lending income represents fees charged to borrowers plus income earned on invested cash collateral, less expenses associated with the loan.
8. Credit Facility: The fund and certain other funds managed by The Vanguard Group participate in a $2.89 billion committed credit facility provided by a syndicate of lenders pursuant to a credit agreement that may be renewed annually; each fund is individually liable for its borrowings, if any, under the credit facility. Borrowings may be utilized for temporary and emergency purposes, and are subject to the fund’s regulatory and contractual borrowing restrictions. The participating funds are charged administrative fees and an annual commitment fee of 0.06% of the undrawn amount of the facility; these fees are allocated to the funds based on a method approved by the fund’s board of trustees and included in Management and Administrative expenses on the fund’s Statement of Operations. Any borrowings under this facility bear interest at a rate equal to the higher of the federal funds rate or LIBOR reference rate plus an agreed-upon spread.
The fund had no borrowings outstanding at April 30, 2014, or at any time during the period then ended.
9. Other: Dividend income is recorded on the ex-dividend date. Interest income includes income distributions received from Vanguard Market Liquidity Fund and is accrued daily. Premiums and discounts on debt securities purchased are amortized and accreted, respectively, to interest income over the lives of the respective securities. Security transactions are accounted for on the date securities are bought or sold. Costs used to determine realized gains (losses) on the sale of investment securities are those of the specific securities sold.
24
International Explorer Fund
B. Schroder Investment Management North America Inc. and Wellington Management Company, LLP, each provide investment advisory services to a portion of the fund for a fee calculated at an annual percentage rate of average net assets managed by the advisor. The basic fees of Schroder Investment Management North America Inc. and Wellington Management Company, LLP, are subject to quarterly adjustments based on performance for the preceding three years relative to the S&P EPAC SmallCap Index.
The Vanguard Group manages the cash reserves of the fund on an at-cost basis.
For the six months ended April 30, 2014, the aggregate investment advisory fee represented an effective annual basic rate of 0.21% of the fund’s average net assets, before a decrease of $195,000 (0.02%) based on performance.
C. The Vanguard Group furnishes at cost corporate management, administrative, marketing, and distribution services. The costs of such services are allocated to the fund based on methods approved by the board of trustees. The fund has committed to provide up to 0.40% of its net assets in capital contributions to Vanguard. At April 30, 2014, the fund had contributed capital of $280,000 to Vanguard (included in Other Assets), representing 0.01% of the fund’s net assets and 0.11% of Vanguard’s capitalization. The fund’s trustees and officers are also directors and officers of Vanguard.
D. Various inputs may be used to determine the value of the fund’s investments. These inputs are summarized in three broad levels for financial statement purposes. The inputs or methodologies used to value securities are not necessarily an indication of the risk associated with investing in those securities.
Level 1—Quoted prices in active markets for identical securities.
Level 2—Other significant observable inputs (including quoted prices for similar securities, interest rates, prepayment speeds, credit risk, etc.).
Level 3—Significant unobservable inputs (including the fund’s own assumptions used to determine the fair value of investments).
The following table summarizes the market value of the fund’s investments as of April 30, 2014, based on the inputs used to value them:
| Level 1 | Level 2 | Level 3 | |
| Investments | ($000) | ($000) | ($000) |
| Common Stocks | 21,367 | 2,453,494 | — |
| Temporary Cash Investments | 205,886 | 9,899 | — |
| Futures Contracts—Liabilities1 | (213) | — | — |
| Forward Currency Contracts—Assets | — | 634 | — |
| Forward Currency Contracts—Liabilities | — | (96) | — |
| Total | 227,040 | 2,463,931 | — |
| 1 Represents variation margin on the last day of the reporting period. | |||
25
International Explorer Fund
E. At April 30, 2014, the fair values of derivatives were reflected in the Statement of Net Assets as follows:
| Foreign | |||
| Equity | Exchange | ||
| Contracts | Contracts | Total | |
| Statement of Net Assets Caption | ($000) | ($000) | ($000) |
| Other Assets | — | 634 | 634 |
| Liabilities | (213) | (96) | (309) |
Realized net gain (loss) and the change in unrealized appreciation (depreciation) on derivatives for the six months ended April 30, 2014, were:
| Foreign | |||
| Equity | Exchange | ||
| Contracts | Contracts | Total | |
| Realized Net Gain (Loss) on Derivatives | ($000) | ($000) | ($000) |
| Futures Contracts | 1,277 | — | 1,277 |
| Forward Currency Contracts | — | (106) | (106) |
| Realized Net Gain (Loss) on Derivatives | 1,277 | (106) | 1,171 |
| Change in Unrealized Appreciation (Depreciation) on Derivatives | |||
| Futures Contracts | (2,480) | — | (2,480) |
| Forward Currency Contracts | — | (284) | (284) |
| Change in Unrealized Appreciation (Depreciation) on Derivatives | (2,480) | (284) | (2,764) |
At April 30, 2014, the aggregate settlement value of open futures contracts and the related unrealized appreciation (depreciation) were:
| ($000) | ||||
| Aggregate | ||||
| Number of | Settlement | Unrealized | ||
| Long (Short) | Value | Appreciation | ||
| Futures Contracts | Expiration | Contracts | Long (Short) | (Depreciation) |
| Topix Index | June 2014 | 276 | 31,220 | (806) |
| Dow Jones EURO STOXX 50 Index | June 2014 | 525 | 22,894 | 802 |
| S&P ASX 200 Index | June 2014 | 176 | 22,296 | 299 |
| FTSE 100 Index | June 2014 | 45 | 5,125 | 100 |
| 395 | ||||
Unrealized appreciation (depreciation) on open Dow Jones EURO STOXX 50 Index and FTSE 100 Index futures contracts are required to be treated as realized gain (loss) for tax purposes.
26
International Explorer Fund
At April 30, 2014, the fund had open forward currency contracts to receive and deliver currencies as follows. Unrealized appreciation (depreciation) on open forward currency contracts is treated as realized gain (loss) for tax purposes.
| Unrealized | ||||||
| Contract | Appreciation | |||||
| Settlement | Contract Amount (000) | (Depreciation) | ||||
| Counterparty | Date | Receive | Deliver | ($000) | ||
| Brown Brothers Harriman & Co. | 6/17/14 | JPY | 2,367,736 | USD | 22,984 | 183 |
| Brown Brothers Harriman & Co. | 6/24/14 | AUD | 17,742 | USD | 16,213 | 206 |
| Brown Brothers Harriman & Co. | 6/25/14 | EUR | 8,614 | USD | 11,912 | 38 |
| Brown Brothers Harriman & Co. | 6/25/14 | EUR | 6,334 | USD | 8,807 | (20) |
| Brown Brothers Harriman & Co. | 6/25/14 | GBP | 5,185 | USD | 8,649 | 102 |
| UBS AG | 6/17/14 | JPY | 605,929 | USD | 5,964 | (36) |
| Brown Brothers Harriman & Co. | 6/17/14 | JPY | 417,240 | USD | 4,095 | (13) |
| UBS AG | 6/25/14 | EUR | 2,916 | USD | 4,059 | (15) |
| UBS AG | 6/24/14 | AUD | 3,751 | USD | 3,391 | 81 |
| Brown Brothers Harriman & Co. | 6/24/14 | AUD | 2,308 | USD | 2,148 | (12) |
| UBS AG | 6/25/14 | GBP | 909 | USD | 1,509 | 24 |
| 538 | ||||||
AUD—Australian dollar.
EUR—Euro.
GBP—British pound.
JPY—Japanese yen.
USD—U.S. dollar.
At April 30, 2014, Brown Brothers Harriman & Co. had deposited in segregated accounts cash of $760,000 in connection with amounts due to the fund for open forward currency contracts.
F. Distributions are determined on a tax basis and may differ from net investment income and realized capital gains for financial reporting purposes. Differences may be permanent or temporary. Permanent differences are reclassified among capital accounts in the financial statements to reflect their tax character. Temporary differences arise when certain items of income, expense, gain, or loss are recognized in different periods for financial statement and tax purposes; such differences are primarily atrributed to the tax treatment of unrealized appreciation on passive foreign investment companies. These differences will reverse at some time in the future. Differences in classification may also result from the treatment of short-term gains as ordinary income for tax purposes. The fund’s tax-basis capital gains and losses are determined only at the end of each fiscal year.
During the six months ended April 30, 2014, the fund realized net foreign currency losses of $365,000, which decreased distributable net income for tax purposes; accordingly, such losses have been reclassified from accumulated net realized gains to overdistributed net investment income. Certain of the fund’s investments are in securities considered to be passive foreign investment companies, for which any unrealized appreciation and/or realized gains are required to be included in distributable net investment income for tax purposes. During the six months ended April 30, 2014, the fund realized gains on the sale of passive foreign investment companies of $1,962,000, which have been
27
International Explorer Fund
included in current and prior periods’ taxable income; accordingly, such gains have been reclassified from accumulated net realized gains to overdistributed net investment income. Passive foreign investment companies had unrealized appreciation of $22,926,000 at April 30, 2014.
At April 30, 2014, the cost of investment securities for tax purposes was $2,165,278,000. Net unrealized appreciation of investment securities for tax purposes was $525,368,000, consisting of unrealized gains of $582,076,000 on securities that had risen in value since their purchase and $56,708,000 in unrealized losses on securities that had fallen in value since their purchase.
G. During the six months ended April 30, 2014, the fund purchased $740,927,000 of investment securities and sold $528,013,000 of investment securities, other than temporary cash investments.
H. Capital shares issued and redeemed were:
| Six Months Ended | Year Ended | |
| April 30, 2014 | October 31, 2013 | |
| Shares | Shares | |
| (000) | (000) | |
| Issued | 20,173 | 22,030 |
| Issued in Lieu of Cash Distributions | 4,589 | 3,141 |
| Redeemed | (9,379) | (27,321) |
| Net Increase (Decrease) in Shares Outstanding | 15,383 | (2,150) |
I. Management has determined that no material events or transactions occurred subsequent to April 30, 2014, that would require recognition or disclosure in these financial statements.
28
About Your Fund’s Expenses
As a shareholder of the fund, you incur ongoing costs, which include costs for portfolio management, administrative services, and shareholder reports (like this one), among others. Operating expenses, which are deducted from a fund’s gross income, directly reduce the investment return of the fund.
A fund’s expenses are expressed as a percentage of its average net assets. This figure is known as the expense ratio. The following examples are intended to help you understand the ongoing costs (in dollars) of investing in your fund and to compare these costs with those of other mutual funds. The examples are based on an investment of $1,000 made at the beginning of the period shown and held for the entire period.
The accompanying table illustrates your fund’s costs in two ways:
• Based on actual fund return. This section helps you to estimate the actual expenses that you paid over the period. The ”Ending Account Value“ shown is derived from the fund‘s actual return, and the third column shows the dollar amount that would have been paid by an investor who started with $1,000 in the fund. You may use the information here, together with the amount you invested, to estimate the expenses that you paid over the period.
To do so, simply divide your account value by $1,000 (for example, an $8,600 account value divided by $1,000 = 8.6), then multiply the result by the number given for your fund under the heading ”Expenses Paid During Period.“
• Based on hypothetical 5% yearly return. This section is intended to help you compare your fund‘s costs with those of other mutual funds. It assumes that the fund had a yearly return of 5% before expenses, but that the expense ratio is unchanged. In this case—because the return used is not the fund’s actual return—the results do not apply to your investment. The example is useful in making comparisons because the Securities and Exchange Commission requires all mutual funds to calculate expenses based on a 5% return. You can assess your fund’s costs by comparing this hypothetical example with the hypothetical examples that appear in shareholder reports of other funds.
Note that the expenses shown in the table are meant to highlight and help you compare ongoing costs only and do not reflect transaction costs incurred by the fund for buying and selling securities. Further, the expenses do not include any purchase, redemption, or account service fees described in the fund prospectus. If such fees were applied to your account, your costs would be higher. Your fund does not carry a “sales load.”
The calculations assume no shares were bought or sold during the period. Your actual costs may have been higher or lower, depending on the amount of your investment and the timing of any purchases or redemptions.
You can find more information about the fund’s expenses, including annual expense ratios, in the Financial Statements section of this report. For additional information on operating expenses and other shareholder costs, please refer to your fund’s current prospectus.
29
| Six Months Ended April 30, 2014 | |||
| Beginning | Ending | Expenses | |
| Account Value | Account Value | Paid During | |
| International Explorer Fund | 10/31/2013 | 4/30/2014 | Period |
| Based on Actual Fund Return | $1,000.00 | $1,073.78 | $2.01 |
| Based on Hypothetical 5% Yearly Return | 1,000.00 | 1,022.86 | 1.96 |
The calculations are based on expenses incurred in the most recent six-month period. The fund’s annualized six-month expense ratio for that
period is 0.39%. The dollar amounts shown as “Expenses Paid” are equal to the annualized expense ratio multiplied by the average account
value over the period, multiplied by the number of days in the most recent six-month period, then divided by the number of days in the most
recent 12-month period.
30
Glossary
Beta. A measure of the magnitude of a fund’s past share-price fluctuations in relation to the ups and downs of a given market index. The index is assigned a beta of 1.00. Compared with a given index, a fund with a beta of 1.20 typically would have seen its share price rise or fall by 12% when the index rose or fell by 10%. For this report, beta is based on returns over the past 36 months for both the fund and the index. Note that a fund’s beta should be reviewed in conjunction with its R-squared (see definition). The lower the R-squared, the less correlation there is between the fund and the index, and the less reliable beta is as an indicator of volatility.
Dividend Yield. Dividend income earned by stocks, expressed as a percentage of the aggregate market value (or of net asset value, for a fund). The yield is determined by dividing the amount of the annual dividends by the aggregate value (or net asset value) at the end of the period. For a fund, the dividend yield is based solely on stock holdings and does not include any income produced by other investments.
Earnings Growth Rate. The average annual rate of growth in earnings over the past five years for the stocks now in a fund.
Equity Exposure. A measure that reflects a fund’s investments in stocks and stock futures. Any holdings in short-term reserves are excluded.
Expense Ratio. A fund’s total annual operating expenses expressed as a percentage of the fund’s average net assets. The expense ratio includes management and administrative expenses, but does not include the transaction costs of buying and selling portfolio securities.
Inception Date. The date on which the assets of a fund (or one of its share classes) are first invested in accordance with the fund’s investment objective. For funds with a subscription period, the inception date is the day after that period ends. Investment performance is measured from the inception date.
Median Market Cap. An indicator of the size of companies in which a fund invests; the midpoint of market capitalization (market price x shares outstanding) of a fund’s stocks, weighted by the proportion of the fund’s assets invested in each stock. Stocks representing half of the fund’s assets have market capitalizations above the median, and the rest are below it.
Price/Book Ratio. The share price of a stock divided by its net worth, or book value, per share. For a fund, the weighted average price/book ratio of the stocks it holds.
Price/Earnings Ratio. The ratio of a stock’s current price to its per-share earnings over the past year. For a fund, the weighted average P/E of the stocks it holds. P/E is an indicator of market expectations about corporate prospects; the higher the P/E, the greater the expectations for a company’s future growth.
R-Squared. A measure of how much of a fund’s past returns can be explained by the returns from the market in general, as measured by a given index. If a fund’s total returns were precisely synchronized with an index’s returns, its R-squared would be 1.00. If the fund’s returns bore no relationship to the index’s returns, its R-squared would be 0. For this report, R-squared is based on returns over the past 36 months for both the fund and the index.
31
Return on Equity. The annual average rate of return generated by a company during the past five years for each dollar of shareholder’s equity (net income divided by shareholder’s equity). For a fund, the weighted average return on equity for the companies whose stocks it holds.
Short-Term Reserves. The percentage of a fund invested in highly liquid, short-term securities that can be readily converted to cash.
Turnover Rate. An indication of the fund’s trading activity. Funds with high turnover rates incur higher transaction costs and may be more likely to distribute capital gains (which may be taxable to investors). The turnover rate excludes in-kind transactions, which have minimal impact on costs.
32
This page intentionally left blank.
This page intentionally left blank.
This page intentionally left blank.
The People Who Govern Your Fund
The trustees of your mutual fund are there to see that the fund is operated and managed in your best interests since, as a shareholder, you are a part owner of the fund. Your fund’s trustees also serve on the board of directors of The Vanguard Group, Inc., which is owned by the Vanguard funds and provides services to them on an at-cost basis.
A majority of Vanguard’s board members are independent, meaning that they have no affiliation with Vanguard or the funds they oversee, apart from the sizable personal investments they have made as private individuals. The independent board members have distinguished backgrounds in business, academia, and public service. Each of the trustees and executive officers oversees 178 Vanguard funds.
The following table provides information for each trustee and executive officer of the fund. More information about the trustees is in the Statement of Additional Information, which can be obtained, without charge, by contacting Vanguard at 800-662-7447, or online at vanguard.com.
| InterestedTrustee1 | and Delphi Automotive LLP (automotive components); |
| Senior Advisor at New Mountain Capital. | |
| F. William McNabb III | |
| Born 1957. Trustee Since July 2009. Chairman of the | Amy Gutmann |
| Board. Principal Occupation(s) During the Past Five | Born 1949. Trustee Since June 2006. Principal |
| Years: Chairman of the Board of The Vanguard Group, | Occupation(s) During the Past Five Years: President of |
| Inc., and of each of the investment companies served | the University of Pennsylvania; Christopher H. Browne |
| by The Vanguard Group, since January 2010; Director | Distinguished Professor of Political Science, School of |
| of The Vanguard Group since 2008; Chief Executive | Arts and Sciences, and Professor of Communication, |
| Officer and President of The Vanguard Group, and of | Annenberg School for Communication, with secondary |
| each of the investment companies served by The | faculty appointments in the Department of Philosophy, |
| Vanguard Group, since 2008; Director of Vanguard | School of Arts and Sciences, and at the Graduate |
| Marketing Corporation; Managing Director of The | School of Education, University of Pennsylvania; |
| Vanguard Group (1995–2008). | Trustee of the National Constitution Center; Chair |
| of the Presidential Commission for the Study of | |
| Bioethical Issues. | |
| IndependentTrustees | |
| JoAnn Heffernan Heisen | |
| Emerson U. Fullwood | Born 1950. Trustee Since July 1998. Principal |
| Born 1948. Trustee Since January 2008. Principal | Occupation(s) During the Past Five Years: Corporate |
| Occupation(s) During the Past Five Years: Executive | Vice President and Chief Global Diversity Officer |
| Chief Staff and Marketing Officer for North America | (retired 2008) and Member of the Executive |
| and Corporate Vice President (retired 2008) of Xerox | Committee (1997–2008) of Johnson & Johnson |
| Corporation (document management products and | (pharmaceuticals/medical devices/consumer |
| services); Executive in Residence and 2009–2010 | products); Director of Skytop Lodge Corporation |
| Distinguished Minett Professor at the Rochester | (hotels), the University Medical Center at Princeton, |
| Institute of Technology; Director of SPX Corporation | the Robert Wood Johnson Foundation, and the Center |
| (multi-industry manufacturing), the United Way of | for Talent Innovation; Member of the Advisory Board |
| Rochester, Amerigroup Corporation (managed health | of the Maxwell School of Citizenship and Public Affairs |
| care), the University of Rochester Medical Center, | at Syracuse University. |
| Monroe Community College Foundation, and North | |
| Carolina A&T University. | F. Joseph Loughrey |
| Born 1949. Trustee Since October 2009. Principal | |
| Rajiv L. Gupta | Occupation(s) During the Past Five Years: President |
| Born 1945. Trustee Since December 2001.2 | and Chief Operating Officer (retired 2009) of Cummins |
| Principal Occupation(s) During the Past Five Years: | Inc. (industrial machinery); Chairman of the Board |
| Chairman and Chief Executive Officer (retired 2009) | of Hillenbrand, Inc. (specialized consumer services), |
| and President (2006–2008) of Rohm and Haas Co. | and of Oxfam America; Director of SKF AB (industrial |
| (chemicals); Director of Tyco International, Ltd. | machinery), Hyster-Yale Materials Handling, Inc. |
| (diversified manufacturing and services), Hewlett- | (forklift trucks), the Lumina Foundation for Education, |
| Packard Co. (electronic computer manufacturing), |
| and the V Foundation for Cancer Research; Member | Executive Officers | |
| of the Advisory Council for the College of Arts and | ||
| Letters and of the Advisory Board to the Kellogg | Glenn Booraem | |
| Institute for International Studies, both at the | Born 1967. Controller Since July 2010. Principal | |
| University of Notre Dame. | Occupation(s) During the Past Five Years: Principal | |
| of The Vanguard Group, Inc.; Controller of each of | ||
| Mark Loughridge | the investment companies served by The Vanguard | |
| Born 1953. Trustee Since March 2012. Principal | Group; Assistant Controller of each of the investment | |
| Occupation(s) During the Past Five Years: Senior Vice | companies served by The Vanguard Group (2001–2010). | |
| President and Chief Financial Officer (retired 2013) | ||
| at IBM (information technology services); Fiduciary | Thomas J. Higgins | |
| Member of IBM’s Retirement Plan Committee (2004– | Born 1957. Chief Financial Officer Since September | |
| 2013); Member of the Council on Chicago Booth. | 2008. Principal Occupation(s) During the Past Five | |
| Years: Principal of The Vanguard Group, Inc.; Chief | ||
| Scott C. Malpass | Financial Officer of each of the investment companies | |
| Born 1962. Trustee Since March 2012. Principal | served by The Vanguard Group; Treasurer of each of | |
| Occupation(s) During the Past Five Years: Chief | the investment companies served by The Vanguard | |
| Investment Officer and Vice President at the University | Group (1998–2008). | |
| of Notre Dame; Assistant Professor of Finance at the | ||
| Mendoza College of Business at Notre Dame; Member | Kathryn J. Hyatt | |
| of the Notre Dame 403(b) Investment Committee; | Born 1955. Treasurer Since November 2008. Principal | |
| Board Member of TIFF Advisory Services, Inc. | Occupation(s) During the Past Five Years: Principal of | |
| (investment advisor); Member of the Investment | The Vanguard Group, Inc.; Treasurer of each of the | |
| Advisory Committees of the Financial Industry | investment companies served by The Vanguard | |
| Regulatory Authority (FINRA) and of Major League | Group; Assistant Treasurer of each of the investment | |
| Baseball. | companies served by The Vanguard Group (1988–2008). | |
| André F. Perold | Heidi Stam | |
| Born 1952. Trustee Since December 2004. Principal | Born 1956. Secretary Since July 2005. Principal | |
| Occupation(s) During the Past Five Years: George | Occupation(s) During the Past Five Years: Managing | |
| Gund Professor of Finance and Banking, Emeritus | Director of The Vanguard Group, Inc.; General Counsel | |
| at the Harvard Business School (retired 2011); | of The Vanguard Group; Secretary of The Vanguard | |
| Chief Investment Officer and Managing Partner of | Group and of each of the investment companies | |
| HighVista Strategies LLC (private investment firm); | served by The Vanguard Group; Director and Senior | |
| Director of Rand Merchant Bank; Overseer of the | Vice President of Vanguard Marketing Corporation. | |
| Museum of Fine Arts Boston. | ||
| Vanguard Senior ManagementTeam | ||
| Alfred M. Rankin, Jr. | ||
| Born 1941. Trustee Since January 1993. Principal | Mortimer J. Buckley | Chris D. McIsaac |
| Occupation(s) During the Past Five Years: Chairman, | Kathleen C. Gubanich | Michael S. Miller |
| President, and Chief Executive Officer of NACCO | Paul A. Heller | James M. Norris |
| Industries, Inc. (housewares/lignite), and of Hyster- | Martha G. King | Glenn W. Reed |
| Yale Materials Handling, Inc. (forklift trucks); Chairman | John T. Marcante | |
| of the Board of University Hospitals of Cleveland. | ||
| Peter F. Volanakis | Chairman Emeritus and Senior Advisor | |
| Born 1955. Trustee Since July 2009. Principal | ||
| Occupation(s) During the Past Five Years: President | John J. Brennan | |
| and Chief Operating Officer (retired 2010) of Corning | Chairman, 1996–2009 | |
| Incorporated (communications equipment); Trustee of | Chief Executive Officer and President, 1996–2008 | |
| Colby-Sawyer College; Member of the Advisory Board | ||
| of the Norris Cotton Cancer Center and of the Advisory | Founder | |
| Board of the Parthenon Group (strategy consulting). | ||
| John C. Bogle | ||
| Chairman and Chief Executive Officer, 1974–1996 | ||
1 Mr. McNabb is considered an “interested person,” as defined in the Investment Company Act of 1940, because he is an officer of the
Vanguard funds.
2 December 2002 for Vanguard Equity Income Fund, the Vanguard Municipal Bond Funds, and the Vanguard State Tax-Exempt Funds.
 | |
| P.O. Box 2600 | |
| Valley Forge, PA 19482-2600 | |
| Connect with Vanguard® > vanguard.com | |
| Fund Information > 800-662-7447 | |
| Direct Investor Account Services > 800-662-2739 | |
| Institutional Investor Services > 800-523-1036 | |
| Text Telephone for People | |
| With Hearing Impairment > 800-749-7273 | |
| This material may be used in conjunction | |
| with the offering of shares of any Vanguard | |
| fund only if preceded or accompanied by | |
| the fund’s current prospectus. | |
| All comparative mutual fund data are from Lipper, a | |
| Thomson Reuters Company, or Morningstar, Inc., unless | |
| otherwise noted. | |
| You can obtain a free copy of Vanguard’s proxy voting | |
| guidelines by visiting vanguard.com/proxyreporting or by | |
| calling Vanguard at 800-662-2739. The guidelines are | |
| also available from the SEC’s website, sec.gov. In | |
| addition, you may obtain a free report on how your fund | |
| voted the proxies for securities it owned during the 12 | |
| months ended June 30. To get the report, visit either | |
| vanguard.com/proxyreporting or sec.gov. | |
| You can review and copy information about your fund at | |
| the SEC’s Public Reference Room in Washington, D.C. To | |
| find out more about this public service, call the SEC at | |
| 202-551-8090. Information about your fund is also | |
| available on the SEC’s website, and you can receive | |
| copies of this information, for a fee, by sending a | |
| request in either of two ways: via e-mail addressed to | |
| publicinfo@sec.gov or via regular mail addressed to the | |
| Public Reference Section, Securities and Exchange | |
| Commission, Washington, DC 20549-1520. | |
| © 2014 The Vanguard Group, Inc. | |
| All rights reserved. | |
| Vanguard Marketing Corporation, Distributor. | |
| Q1262 062014 | |
![]()
Semiannual Report | April 30, 2014
Vanguard Mid-Cap Growth Fund
Vanguard’s Principles for Investing Success
We want to give you the best chance of investment success. These principles,
grounded in Vanguard’s research and experience, can put you on the right path.
Goals. Create clear, appropriate investment goals.
Balance. Develop a suitable asset allocation using broadly diversified funds.
Cost. Minimize cost.
Discipline. Maintain perspective and long-term discipline.
A single theme unites these principles: Focus on the things you can control.
We believe there is no wiser course for any investor.
| Contents | |
| Your Fund’s Total Returns. | 1 |
| Chairman’s Letter. | 2 |
| Advisors’ Report. | 7 |
| Fund Profile. | 11 |
| Performance Summary. | 12 |
| Financial Statements. | 13 |
| About Your Fund’s Expenses. | 23 |
| Trustees Approve Advisory Arrangements. | 25 |
| Glossary. | 27 |
Please note: The opinions expressed in this report are just that—informed opinions. They should not be considered promises or advice.
Also, please keep in mind that the information and opinions cover the period through the date on the front of this report. Of course, the
risks of investing in your fund are spelled out in the prospectus.
See the Glossary for definitions of investment terms used in this report.
About the cover: The ship’s wheel represents leadership and guidance, essential qualities in navigating difficult seas.
This one is a replica based on an 18th-century British vessel. The HMSVanguard, another ship of that era, served as the
flagship for British Admiral Horatio Nelson when he defeated a French fleet at the Battle of the Nile.
Your Fund’s Total Returns
| Six Months Ended April 30, 2014 | |
| Total | |
| Returns | |
| Vanguard Mid-Cap Growth Fund | 4.83% |
| Russell Midcap Growth Index | 6.04 |
| Mid-Cap Growth Funds Average | 3.28 |
| Mid-Cap Growth Funds Average: Derived from data provided by Lipper, a Thomson Reuters Company. | |
| Your Fund’s Performance at a Glance | ||||
| October 31, 2013, Through April 30, 2014 | ||||
| Distributions Per Share | ||||
| Starting | Ending | Income | Capital | |
| Share Price | Share Price | Dividends | Gains | |
| Vanguard Mid-Cap Growth Fund | $25.72 | $24.40 | $0.007 | $2.492 |
1

Chairman’s Letter
Dear Shareholder,
The advance of mid-capitalization growth stocks slowed considerably in the six months ended April 30, 2014. Indexes that track these stocks notched single-digit increases, modest compared with the double-digit gains of the previous six months.
Against this backdrop, Vanguard Mid-Cap Growth Fund returned 4.83% for the fiscal half year. This was ahead of the average return of peer funds but behind the performance of the fund’s benchmark, the Russell Midcap Growth Index.
The stocks of companies in a range of industries from food products to semiconductors helped the fund’s performance. Disappointments among health care stocks hurt results.
Please note that one of the fund’s advisors, Chartwell Investment Partners, is now a subsidiary of TriState Capital Bank. There is no change to Chartwell’s investment approach, and Edward Antoian and John Heffern continue to manage Chartwell’s portion of the fund. Chartwell has advised Mid-Cap Growth Fund since 2006.
Recent progress has been sporadic, but stocks continued their climb
For the half year ended April 30, U.S. stocks returned almost 8%, notwithstanding the patches of turbulence the market has encountered in 2014. Technology stocks, for example, turned in a rocky performance amid concerns about pricey valuations. Poor economic data from China and the conflict in Ukraine also unsettled investors.
2
Global economic and political shifts are, of course, as inevitable as they are unpredictable. Broad diversification remains the best way to manage the risks they pose to your portfolio. As Joe Davis, our chief economist, noted recently, “Having a broader portfolio tends to moderate those individual issues and that’s always, I think, a valuable starting point for investors.”
International stocks, in aggregate, returned nearly 3%, with the developed markets of Europe faring best. The developed markets of the Pacific region and emerging markets, where China’s weakness was felt most, had negative returns.
Despite low yields, the bond market experienced a surprising rally
Bonds continued to emerge from the struggles that marked much of 2013,
when the market was roiled by worries about the prospect of the Federal Reserve reducing its stimulative bond-buying.
In January, however, when the reduction actually began, investors seemed to take the news in stride.
The broad U.S. taxable bond market returned 1.74%. The yield of the 10-year Treasury note ended the six months at 2.69%, up from 2.54% on October 31 but down from nearly 3% on December 31. (Bond prices and yields move in opposite directions.)
Municipal bonds returned 4.08% for the six months. Money market and savings accounts posted paltry returns as the Fed’s target for short-term interest rates remained at 0%–0.25%.
| Market Barometer | |||
| Total Returns | |||
| Periods Ended April 30, 2014 | |||
| Six | One | Five Years | |
| Months | Year | (Annualized) | |
| Stocks | |||
| Russell 1000 Index (Large-caps) | 8.25% | 20.81% | 19.52% |
| Russell 2000 Index (Small-caps) | 3.08 | 20.50 | 19.84 |
| Russell 3000 Index (Broad U.S. market) | 7.83 | 20.78 | 19.54 |
| FTSE All-World ex US Index (International) | 2.84 | 9.77 | 13.22 |
| Bonds | |||
| Barclays U.S. Aggregate Bond Index (Broad taxable market) | 1.74% | -0.26% | 4.88% |
| Barclays Municipal Bond Index (Broad tax-exempt market) | 4.08 | 0.50 | 5.54 |
| Citigroup Three-Month U.S. Treasury Bill Index | 0.00 | 0.04 | 0.08 |
| CPI | |||
| Consumer Price Index | 1.51% | 1.95% | 2.14% |
3
International bond markets (as measured by the Barclays Global Aggregate Index ex USD) returned 2.33%.
As winds shift, the fund’s advisors stay true to their growth strategies
Value stocks outshone their growth counterparts in the six-month period, presenting a challenge for your fund, which, of course, pursues growth-style investing. For much of 2013, growth stocks, especially those of certain biotechnology, internet, and social media companies, notched robust advances. But the arrival of 2014 seemed to mark a shift in investors’ preferences, perhaps prompted by concerns that those high-flying biotech and tech stocks had gotten too expensive.
Value stocks tend to sell at relatively low prices in relation to their earnings or book value, reflecting the lower sales and earnings growth prospects of the underlying companies. Growth stocks, by contrast, typically have higher valuations because the issuing companies are expected to expand their businesses more quickly.
For the six months ended April 30, the Russell Midcap Growth Index returned 6.04%, compared with 9.69% for the Russell Midcap Value Index.
Value and growth stocks tend to alternate market leadership over time, and that will naturally affect your fund’s standing relative to the broad market indexes typically quoted
| Expense Ratios | ||
| Your Fund Compared With Its Peer Group | ||
| Peer Group | ||
| Fund | Average | |
| Mid-Cap Growth Fund | 0.51% | 1.30% |
The fund expense ratio shown is from the prospectus dated February 25, 2014, and represents estimated costs for the current fiscal year. For
the six months ended April 30, 2014, the fund’s annualized expense ratio was 0.46%. The peer-group expense ratio is derived from data
provided by Lipper, a Thomson Reuters Company, and captures information through year-end 2013.
Peer group: Mid-Cap Growth Funds.
4
in investment commentary. (You can read more about the performance of growth versus value stocks in the box below.)
But these shifting winds don’t alter the strategies of the Mid-Cap Growth Fund’s advisors. Both Chartwell Investment
Partners and William Blair & Company are committed to investing primarily in mid-size companies that they believe have stronger-than-average earnings and revenue growth prospects.
| Growth stocks versus value stocks: A case for both |
| Growth and value stocks typically take turns outperforming each other. The chart here |
| shows how they have switched off during the past 20 years in leading or lagging a broad |
| market average. |
| These two styles of investing are typically considered complementary—when growth is |
| performing well, value typically isn’t, and vice versa. Very generally speaking, growth stocks |
| represent companies that are expected to expand their businesses at a rapid pace, while |
| value stocks typically represent more established, slower-growing companies. |
| Which does better in the long run? Neither. Vanguard research has shown that there is no |
| significant long-term difference in the risk/reward characteristics of growth and value stocks. |
| But, because their performance can vary considerably over shorter time periods, a truly |
| diversified portfolio should have exposure to both. |
| Rolling 12-month return differences, 1994–2013 |

| Note: “Rolling” means here that 12-month returns were calculated from the start of each month in the 20-year period ended |
| December 31, 2013. |
| Source: Vanguard. |
5
For the six months, the fund had some striking pockets of strength, such as the food products industry, which was buoyed by investors’ hopes about an expanded market opportunity.
The fund also had success in the financial sector. Banks seemed to benefit from reduced debt, increased deposits, and improved lending conditions. Asset managers and insurance firms appeared to get a lift from the generally favorable investing climate.
In the technology sector, the fund’s returns were, on the whole, fairly modest, with the notable exception of shares of semiconductor companies. These stocks did well amid strong sales for the chip makers.
The fund had its share of stumbles, especially in the health care arena, where stocks of certain companies were hard hit by earnings disappointments. Please read the Advisors’ Report that follows this letter for more information about the fund’s performance and portfolio positioning.
Taking just a slice of the market can add risk to your portfolio
Like other Vanguard funds that are devoted to particular market-capitalization ranges, Vanguard Mid-Cap Growth Fund offers you a low-cost way to gain exposure to a specific segment of the market. These funds can do important work for an investor—by filling a gap in a portfolio, for example.
But keep in mind that by choosing just a slice of the market-cap pie, you’re also choosing to take on additional risk. Investors who depart from a market-proportional approach by overweighting a certain segment are exposing themselves to more volatility by reducing their portfolio’s level of diversification.
As I mentioned earlier, diversification is a powerful strategy for managing risk. Vanguard generally counsels that investors get exposure to large-, mid-, and small-cap stocks in a way that approximates the U.S. market to help ensure that their portfolio stays diversified.
As we say in Vanguard’s Principles for Investing Success, “Leadership among market segments changes constantly and rapidly, so investors must diversify both to mitigate losses and to participate in gains.” (You can read more about our investment principles at vanguard.com/research.)
You can achieve a balanced market-cap representation through a total stock fund, or you can assemble segment-specific funds in way that mirrors the overall market. Either way, appropriate diversification should remain paramount.
As always, thank you for investing with Vanguard.
Sincerely,

F. William McNabb III
Chairman and Chief Executive Officer
May 14, 2014
6
Advisors’ Report
During the six months ended April 30, 2014, Vanguard Mid-Cap Growth Fund returned 4.83%. Your fund is managed by two independent advisors, a strategy that enhances the fund’s diversification by providing exposure to distinct yet complementary investment approaches. It’s not uncommon for different advisors to have different views about individual securities or the broader investment environment.
The advisors, the percentage of fund assets each manages, and brief descriptions of their investment strategies are presented in the table below. The advisors have also prepared a discussion of the investment environment that existed during the period and of how their portfolio positioning reflects this assessment. These comments were prepared on May 20, 2014.
Chartwell Investment Partners, Inc.
Portfolio Managers:
Edward N. Antoian, CFA, CPA,
Managing Partner
John A. Heffern, Managing Partner and
Senior Portfolio Manager
In the six months ended April 30, the financial markets shrugged off the impact of adverse weather and geopolitical tensions to advance. Investor confidence in the strength and stability of the economy was supported by the Federal Reserve’s decision to keep tapering its monthly bond-buying program. The market continued to focus on and reward companies that met or exceeded investor expectations.
| Vanguard Mid-Cap Growth Fund Investment Advisors | |||
| Fund Assets Managed | |||
| Investment Advisor | % | $ Million | Investment Strategy |
| Chartwell Investment Partners, | 49 | 1,506 | Uses a bottom-up, fundamental, research-driven |
| Inc. | stock-selection strategy focusing on companies with | ||
| sustainable growth, strong management teams, | |||
| competitive positions, and outstanding product and | |||
| service offerings. These companies should continually | |||
| demonstrate growth in earnings per share. | |||
| William Blair & Company, L.L.C. | 48 | 1,458 | Uses a fundamental investment approach in pursuit of |
| superior long-term investment results from | |||
| growth-oriented companies with leadership positions | |||
| and strong market presence. | |||
| Cash Investments | 3 | 93 | These short-term reserves are invested by Vanguard in |
| equity index products to simulate investment in stocks. | |||
| Each advisor may also maintain a modest cash | |||
| position. | |||
7
Accordingly, we are navigating these uncertain times with a portfolio focused on mid-cap companies demonstrating above-average growth potential supported by good products and expanding markets. This approach leads to portfolio decisions that steadfastly reflect our bias toward quality, leadership, defensible margins, and a pattern of successful execution around growth-oriented business models.
Stock selection boosted returns in our top-performing sectors: technology, consumer services, and financial services. NXP Semiconductors, a broad-based maker of industrial and mixed-signal semiconductors, reported above-average seasonal results and issued strong guidance that propelled the stock higher.
Avago Technologies, an analog semiconductor provider, is in the midst of several good product cycles in the mobile handset, data center, and industrial markets. Increasing radio frequency filter content in premium smartphones, new content on the iPhone, and greater optical demand have generated better-than-expected earnings. The late-December acquisition of semiconductor designer LSI will also contribute to revenue in 2015 and beyond.
MGM Resorts International operates and owns casinos and resorts, primarily in the United States and China. Strong fourth-quarter results were driven by MGM China and ongoing improvement in the firm’s Las Vegas properties. Convention activity
remains solid, and management expects this trend to continue. Basic-apparel company Hanesbrands gained from strong execution in core business segments, a potentially profitable acquisition, favorable capital allocation, and a 50% dividend increase.
Investments in two financial services companies also boosted the portfolio. Shareholders in Lazard, a global financial advisory and asset management firm, benefit from a straightforward operating model under which revenue growth can generate operating leverage and cash flow. Recent earnings reports and appealing capital allocations show the company is executing efficiently and is well-positioned for any improvement in global mergers-and-acquisitions activity.
Financial guarantor Assured Guaranty continues to heal from the global economic recession. Underwriting activity remains at a low ebb, but the company’s shares trade below book value and management has committed to repurchasing shares, which will add value over time.
Another good performer was United Rentals, which provides rental equipment to construction and industrial companies. The stock rose after a solid quarter, driven by volume and pricing gains. Keurig Green Mountain, a provider of personal beverage systems, advanced after the announcement of a ten-year partnership with Coca-Cola to develop its Keurig Cold platform. Keurig will be the exclusive partner for the
8
production and sale of Coca-Cola branded, single-serve, pod-based cold beverages, and Coca-Cola will own 10% of the company. This is a significant long-term growth opportunity.
Alaska Air Group, which includes Alaska Airlines and Horizon Air Industries, benefited from superior free cash flow compared to its peers, enabling it to generate better-than-expected shareholder returns.
The sectors detracting the most from performance were health care and energy. Leading pharmaceutical company Zoetis serves the production and companion animal market. Its stock retreated when the company lowered full-year earnings guidance after experiencing drought-impacted lower revenue growth and gross margin deterioration. Top pharmacy benefit manager Catamaran lowered its 2014 earnings guidance as questions about service quality affected its stock.
Denbury Resources, an independent exploration and production operator, has significant reserves. Its stock fell after the company announced plans to return capital to shareholders that did not include conversion to a master limited partnership. Gas-leveraged exploration and production company Cabot reacted in sympathy with a higher-than-forecast decline in natural gas pricing differentials. However, the company is expected to increase production by 40% to 50% in 2014.
William Blair & Company, L.L.C.
Portfolio Managers:
Robert C. Lanphier, Principal
David Ricci, CFA, Principal
U.S. mid-cap growth stocks, as determined by the Russell Midcap Growth Index, returned 6.04% during the six months ended April 30, 2014.
Although generally positive, the market environment over the period was somewhat volatile. After closing 2013 with strong returns, the market pulled back in late January. Weaker-than-expected economic data in the United States and China, global political tensions, and concerns regarding emerging markets’ growth prospects rattled investors.
The rapid recovery in February was supported by better-than-expected corporate earnings, a U.S. debt ceiling resolution, and increasingly transparent Federal Reserve policy. However, Fed comments surrounding the future trajectory of interest rates prompted a style rotation in mid-March. The market turned away from higher-growth companies toward cheaper stocks with lower growth prospects. This dynamic persisted through April.
Our challenges during the period stemmed from a combination of stock selection and style issues. The market’s preference for cheaper stocks, particularly
9
in March and April, hampered performance, as our portfolio typically underweights companies with lower valuations. In the information technology sector, our usual underweighting of semiconductors and overweighting of software and services also worked against us, as did stock selection. Notable detractors within the sector included Guidewire Software, Neustar, and Genpact.
From a stock perspective, the largest individual detractor was Lululemon Athletica. Business momentum disappointed investors, partly because of product availability issues and aggressive promotions by competitors.
Keurig Green Mountain (consumer staples) was our top contributor. The primary driver of its performance over the period was the announcement of a ten-year agreement with Coca-Cola to bring Coke’s global brand portfolio to the forthcoming Keurig Cold at-home beverage system. We view the deal favorably because of the access it provides to Coke’s vast product portfolio and powerful global distribution network, the nonexclusive deal terms, and the size of the global soft-drink market opportunity.
Stock selection in financials was also beneficial, with our position in LPL Financial Holdings helping notably. Other strong performers included O’Reilly Automotive (consumer discretionary) and Akamai Technologies (information technology).
March 2014 marked the five-year anniversary of the current bull market, which has been driven by a rebound in corporate profitability and considerable expansion in U.S. equity valuation multiples. With limited opportunity for further multiple expansion, future equity performance will be largely dependent on earnings growth. Thus far in the cycle, the dominant driver of earnings growth has been higher profit margins achieved through cost containment; going forward, revenue growth will be critical.
Our focus remains on identifying high-quality companies whose stocks trade at attractive valuations relative to the expected growth and consistency of their businesses. Despite disappointing relative performance in recent periods, we believe the portfolio remains well-suited to add value over the long term.
After the market’s impressive five-year run, we would expect equity returns to moderate to more sustainable levels. At the same time, we do not expect the market’s current preference for lower valuations to continue, as such periods historically have been short-lived. A normalization of these factors, together with improved stock selection, should allow us to return to our long history of adding value for our clients.
10
Mid-Cap Growth Fund
Fund Profile
As of April 30, 2014
| Portfolio Characteristics | |||
| DJ | |||
| U.S. | |||
| Russell | Total | ||
| Midcap | Market | ||
| Growth | FA | ||
| Fund | Index | Index | |
| Number of Stocks | 117 | 508 | 3,664 |
| Median Market Cap | $7.5B | $11.6B | $47.3B |
| Price/Earnings Ratio | 26.2x | 26.0x | 19.7x |
| Price/Book Ratio | 3.9x | 4.8x | 2.6x |
| Return on Equity | 15.9% | 19.2% | 17.4% |
| Earnings Growth | |||
| Rate | 20.7% | 16.8% | 12.4% |
| Dividend Yield | 0.6% | 1.1% | 1.9% |
| Foreign Holdings | 1.7% | 0.0% | 0.0% |
| Turnover Rate | |||
| (Annualized) | 84% | — | — |
| Ticker Symbol | VMGRX | — | — |
| Expense Ratio1 | 0.51% | — | — |
| 30-Day SEC Yield | 0.09% | — | — |
| Short-Term Reserves | 1.9% | — | — |
| Sector Diversification (% of equity exposure) | |||
| DJ | |||
| U.S. | |||
| Russell | Total | ||
| Midcap | Market | ||
| Growth | FA | ||
| Fund | Index | Index | |
| Consumer | |||
| Discretionary | 20.0% | 24.2% | 12.6% |
| Consumer Staples | 4.6 | 8.3 | 8.6 |
| Energy | 3.3 | 6.9 | 9.9 |
| Financials | 10.5 | 9.0 | 17.3 |
| Health Care | 16.6 | 13.4 | 12.8 |
| Industrials | 18.6 | 15.4 | 11.6 |
| Information | |||
| Technology | 21.7 | 15.7 | 17.9 |
| Materials | 2.4 | 6.0 | 3.9 |
| Telecommunication | |||
| Services | 2.2 | 0.7 | 2.2 |
| Utilities | 0.1 | 0.4 | 3.2 |
| Volatility Measures | ||
| Russell | DJ | |
| Midcap | U.S. Total | |
| Growth | Market | |
| Index | FA Index | |
| R-Squared | 0.96 | 0.90 |
| Beta | 0.94 | 1.06 |
| These measures show the degree and timing of the fund’s fluctuations compared with the indexes over 36 months. | ||
| Ten Largest Holdings (% of total net assets) | ||
| SBA Communications | Wireless | |
| Corp. | Telecommunication | |
| Services | 2.1% | |
| Vantiv Inc. | Data Processing & | |
| Outsourced Services | 1.8 | |
| Perrigo Co. plc | Pharmaceuticals | 1.7 |
| Keurig Green Mountain | Packaged Foods & | |
| Inc. | Meats | 1.5 |
| MGM Resorts | ||
| International | Casinos & Gaming | 1.5 |
| F5 Networks Inc. | Communications | |
| Equipment | 1.5 | |
| Gartner Inc. | IT Consulting & | |
| Other Services | 1.4 | |
| Thermo Fisher Scientific | Life Sciences Tools & | |
| Inc. | Services | 1.4 |
| Intercontinental- | ||
| Exchange Group Inc. | Specialized Finance | 1.4 |
| O'Reilly Automotive Inc. | Automotive Retail | 1.4 |
| Top Ten | 15.7% | |
| The holdings listed exclude any temporary cash investments and equity index products. | ||
Investment Focus
![]()
1 The expense ratio shown is from the prospectus dated February 25, 2014, and represents estimated costs for the current fiscal year. For the six
months ended April 30, 2014, the annualized expense ratio was 0.46%.
11
Mid-Cap Growth Fund
Performance Summary
All of the returns in this report represent past performance, which is not a guarantee of future results that may be achieved by the fund. (Current performance may be lower or higher than the performance data cited. For performance data current to the most recent month-end, visit our website at vanguard.com/performance.) Note, too, that both investment returns and principal value can fluctuate widely, so an investor’s shares, when sold, could be worth more or less than their original cost. The returns shown do not reflect taxes that a shareholder would pay on fund distributions or on the sale of fund shares.
Fiscal-Year Total Returns (%): October 31, 2003, Through April 30, 2014
Average Annual Total Returns: Periods Ended March 31, 2014
This table presents returns through the latest calendar quarter—rather than through the end of the fiscal period.
Securities and Exchange Commission rules require that we provide this information.
| Inception | One | Five | Ten | |
| Date | Year | Years | Years | |
| Mid-Cap Growth Fund | 12/31/1997 | 22.29% | 22.99% | 9.69% |
See Financial Highlights for dividend and capital gains information.
12
Mid-Cap Growth Fund
Financial Statements (unaudited)
Statement of Net Assets
As of April 30, 2014
The fund reports a complete list of its holdings in regulatory filings four times in each fiscal year, at the quarter-ends. For the second and fourth fiscal quarters, the lists appear in the fund’s semiannual and annual reports to shareholders. For the first and third fiscal quarters, the fund files the lists with the Securities and Exchange Commission on Form N-Q. Shareholders can look up the fund’s Forms N-Q on the SEC’s website at sec.gov. Forms N-Q may also be reviewed and copied at the SEC’s Public Reference Room (see the back cover of this report for further information).
| Market | ||||
| Value | ||||
| Shares | ($000) | |||
| Common Stocks (95.0%)1 | ||||
| Consumer Discretionary (19.1%) | ||||
| * | MGM Resorts | |||
| International | 1,828,150 | 46,124 | ||
| * | O’Reilly Automotive Inc. | 282,100 | 41,974 | |
| Six Flags Entertainment | ||||
| Corp. | 895,355 | 35,940 | ||
| Dick’s Sporting Goods Inc. | 670,825 | 35,326 | ||
| * | Dollar General Corp. | 614,826 | 34,701 | |
| Williams-Sonoma Inc. | 473,033 | 29,716 | ||
| Brunswick Corp. | 680,425 | 27,346 | ||
| Advance Auto Parts Inc. | 219,800 | 26,659 | ||
| Harley-Davidson Inc. | 356,600 | 26,367 | ||
| Lennar Corp. Class A | 678,820 | 26,196 | ||
| Cheesecake Factory Inc. | 570,250 | 25,598 | ||
| Hanesbrands Inc. | 307,395 | 25,234 | ||
| Carter’s Inc. | 341,225 | 25,135 | ||
| * | Fossil Group Inc. | 225,300 | 24,028 | |
| VF Corp. | 381,380 | 23,298 | ||
| * | Norwegian Cruise Line | |||
| Holdings Ltd. | 639,150 | 20,945 | ||
| Wyndham Worldwide Corp. | 281,000 | 20,046 | ||
| Ralph Lauren Corp. | ||||
| Class A | 118,865 | 17,993 | ||
| Interpublic Group of | ||||
| Cos. Inc. | 998,580 | 17,395 | ||
| Tractor Supply Co. | 233,675 | 15,712 | ||
| *,^ | Lululemon Athletica Inc. | 322,200 | 14,799 | |
| * | Chipotle Mexican Grill Inc. | |||
| Class A | 28,900 | 14,407 | ||
| BorgWarner Inc. | 101,704 | 6,320 | ||
| Tiffany & Co. | 24,400 | 2,135 | ||
| 583,394 | ||||
| Consumer Staples (4.4%) | ||||
| Keurig Green Mountain Inc. | 505,337 | 47,340 | ||
| Mead Johnson Nutrition Co. | 381,200 | 33,645 | ||
| Church & Dwight Co. Inc. | 460,500 | 31,779 | ||
| * | Hain Celestial Group Inc. | 258,831 | 22,264 | |
| 135,028 | ||||
| Energy (3.1%) | |||
| Cabot Oil & Gas Corp. | 568,980 | 22,350 | |
| Range Resources Corp. | 240,200 | 21,726 | |
| * | FMC Technologies Inc. | 353,900 | 20,066 |
| * | Whiting Petroleum Corp. | 242,700 | 17,892 |
| Helmerich & Payne Inc. | 104,833 | 11,390 | |
| 93,424 | |||
| Financials (9.6%) | |||
| IntercontinentalExchange | |||
| Group Inc. | 205,985 | 42,112 | |
| * | Affiliated Managers Group | ||
| Inc. | 176,590 | 35,000 | |
| Synovus Financial Corp. | 9,135,605 | 29,325 | |
| * | E*TRADE Financial Corp. | 1,204,888 | 27,050 |
| Assured Guaranty Ltd. | 1,046,450 | 25,021 | |
| Lazard Ltd. Class A | 515,735 | 24,265 | |
| LPL Financial Holdings Inc. | 481,114 | 22,781 | |
| SEI Investments Co. | 661,725 | 21,427 | |
| * | Signature Bank | 156,684 | 18,617 |
| Invesco Ltd. | 526,758 | 18,547 | |
| * | Portfolio Recovery | ||
| Associates Inc. | 262,700 | 15,013 | |
| PrivateBancorp Inc. | 530,825 | 14,635 | |
| 293,793 | |||
| Health Care (15.9%) | |||
| Perrigo Co. plc | 362,275 | 52,479 | |
| Thermo Fisher Scientific | |||
| Inc. | 375,825 | 42,844 | |
| * | BioMarin Pharmaceutical | ||
| Inc. | 681,070 | 39,659 | |
| * | IDEXX Laboratories Inc. | 302,294 | 38,222 |
| * | Actavis plc | 151,775 | 31,012 |
| * | Sirona Dental Systems Inc. | 405,200 | 30,479 |
| * | Cerner Corp. | 509,675 | 26,146 |
| * | Catamaran Corp. | 675,250 | 25,491 |
| * | Salix Pharmaceuticals Ltd. | 206,725 | 22,740 |
| * | HMS Holdings Corp. | 1,404,178 | 22,706 |
| HealthSouth Corp. | 645,131 | 22,347 | |
| Techne Corp. | 220,300 | 19,675 | |
13
Mid-Cap Growth Fund
| Market | |||
| Value | |||
| Shares | ($000) | ||
| * | ICON plc | 499,275 | 19,357 |
| * | Covance Inc. | 215,350 | 19,011 |
| * | Medivation Inc. | 305,200 | 18,376 |
| * | Alexion Pharmaceuticals | ||
| Inc. | 103,350 | 16,350 | |
| * | Bruker Corp. | 722,775 | 14,932 |
| * | Mettler-Toledo | ||
| International Inc. | 59,895 | 13,963 | |
| * | Align Technology Inc. | 220,300 | 11,101 |
| 486,890 | |||
| Industrials (17.7%) | |||
| Equifax Inc. | 576,665 | 40,834 | |
| * | Stericycle Inc. | 330,590 | 38,494 |
| * | Old Dominion Freight Line | ||
| Inc. | 626,400 | 37,979 | |
| Alaska Air Group Inc. | 377,775 | 35,541 | |
| * | United Rentals Inc. | 323,570 | 30,360 |
| Fortune Brands Home & | |||
| Security Inc. | 723,800 | 28,843 | |
| Fastenal Co. | 552,635 | 27,676 | |
| * | B/E Aerospace Inc. | 288,755 | 25,344 |
| * | Hertz Global Holdings Inc. | 880,300 | 25,062 |
| TransDigm Group Inc. | 138,900 | 24,706 | |
| * | Jacobs Engineering Group | ||
| Inc. | 420,900 | 24,286 | |
| Flowserve Corp. | 326,040 | 23,817 | |
| Nordson Corp. | 313,475 | 23,307 | |
| AMETEK Inc. | 433,700 | 22,865 | |
| * | IHS Inc. Class A | 183,875 | 22,181 |
| Waste Connections Inc. | 488,890 | 21,834 | |
| * | Genesee & Wyoming Inc. | ||
| Class A | 189,170 | 18,730 | |
| * | WESCO International Inc. | 213,229 | 18,717 |
| Manpowergroup Inc. | 229,200 | 18,643 | |
| * | Verisk Analytics Inc. | ||
| Class A | 244,460 | 14,689 | |
| JB Hunt Transport | |||
| Services Inc. | 108,500 | 8,257 | |
| Hubbell Inc. Class B | 64,900 | 7,640 | |
| 539,805 | |||
| Information Technology (20.6%) | |||
| * | Vantiv Inc. Class A | 1,752,712 | 53,896 |
| * | F5 Networks Inc. | 430,250 | 45,249 |
| * | Gartner Inc. | 625,785 | 43,142 |
| * | NXP Semiconductor NV | 569,950 | 33,980 |
| * | PTC Inc. | 881,155 | 31,167 |
| * | Red Hat Inc. | 589,500 | 28,679 |
| * | Akamai Technologies Inc. | 515,700 | 27,368 |
| * | Cognizant Technology | ||
| Solutions Corp. Class A | 552,120 | 26,449 | |
| FactSet Research Systems | |||
| Inc. | 246,200 | 26,220 | |
| * | Trimble Navigation Ltd. | 670,030 | 25,749 |
| * | Informatica Corp. | 708,725 | 25,124 |
| * | SolarWinds Inc. | 588,800 | 23,740 | |
| * | Genpact Ltd. | 1,351,790 | 22,791 | |
| * | ANSYS Inc. | 292,072 | 22,288 | |
| * | Pandora Media Inc. | 915,100 | 21,432 | |
| * | Guidewire Software Inc. | 565,700 | 21,361 | |
| * | CoStar Group Inc. | 125,779 | 20,237 | |
| *,^ | IPG Photonics Corp. | 305,200 | 19,725 | |
| * | FleetCor Technologies Inc. | 159,798 | 18,238 | |
| * | NCR Corp. | 539,275 | 16,453 | |
| Amphenol Corp. Class A | 169,800 | 16,191 | ||
| Avago Technologies Ltd. | ||||
| Class A | 249,450 | 15,840 | ||
| * | NeuStar Inc. Class A | 470,827 | 12,110 | |
| * | Fortinet Inc. | 532,675 | 11,708 | |
| * | Electronics For Imaging Inc. | 242,900 | 9,179 | |
| *,^ | 3D Systems Corp. | 151,900 | 7,191 | |
| * | Finisar Corp. | 187,245 | 4,897 | |
| 630,404 | ||||
| Materials (2.2%) | ||||
| Airgas Inc. | 300,912 | 31,975 | ||
| Cytec Industries Inc. | 277,400 | 26,442 | ||
| International Flavors & | ||||
| Fragrances Inc. | 76,878 | 7,574 | ||
| 65,991 | ||||
| Other (0.3%) | ||||
| 2 | Vanguard Mid-Cap Growth | |||
| ETF | 100,223 | 9,081 | ||
| Telecommunication Services (2.1%) | ||||
| * | SBA Communications | |||
| Corp. Class A | 729,925 | 65,518 | ||
| Total Common Stocks | ||||
| (Cost $2,370,389) | 2,903,328 | |||
| Temporary Cash Investments (5.1%)1 | ||||
| Money Market Fund (4.9%) | ||||
| 3,4 | Vanguard Market | |||
| Liquidity Fund, | ||||
| 0.124% | 150,761,008 | 150,761 | ||
| Face | ||||
| Amount | ||||
| ($000) | ||||
| U.S. Government and Agency Obligations (0.2%) | ||||
| 5,6 | Federal Home Loan | |||
| Bank Discount Notes, | ||||
| 0.075%, 6/6/14 | 600 | 600 | ||
| 5,6 | Federal Home Loan | |||
| Bank Discount Notes, | ||||
| 0.075%, 6/24/14 | 400 | 400 | ||
| 5,6 | Federal Home Loan | |||
| Bank Discount Notes, | ||||
| 0.090%, 7/16/14 | 3,100 | 3,099 | ||
14
Mid-Cap Growth Fund
| Face | Market | |
| Amount | Value | |
| ($000) | ($000) | |
| 5 Federal Home Loan | ||
| Bank Discount Notes, | ||
| 0.055%, 7/30/14 | 1,000 | 1,000 |
| 5,099 | ||
| Total Temporary Cash Investments | ||
| (Cost $155,860) | 155,860 | |
| Total Investments (100.1%) | ||
| (Cost $2,526,249) | 3,059,188 | |
| Other Assets and Liabilities (-0.1%) | ||
| Other Assets | 72,234 | |
| Liabilities4 | (74,894) | |
| (2,660) | ||
| Net Assets (100%) | ||
| Applicable to 125,246,266 outstanding | ||
| $.001 par value shares of beneficial | ||
| interest (unlimited authorization) | 3,056,528 | |
| Net Asset Value Per Share | $24.40 | |
| At April 30, 2014, net assets consisted of: | |
| Amount | |
| ($000) | |
| Paid-in Capital | 2,277,322 |
| Overdistributed Net Investment Income | (1,955) |
| Accumulated Net Realized Gains | 249,022 |
| Unrealized Appreciation (Depreciation) | |
| Investment Securities | 532,939 |
| Futures Contracts | (800) |
| Net Assets | 3,056,528 |
See Note A in Notes to Financial Statements.
* Non-income-producing security.
^ Includes partial security positions on loan to broker-dealers. The total value of securities on loan is $12,094,000.
1 The fund invests a portion of its cash reserves in equity markets through the use of index futures contracts. After giving effect to
futures investments, the fund’s effective common stock and temporary cash investment positions represent 97.8% and 2.3%, respectively,
of net assets.
2 Considered an affiliated company of the fund as the issuer is another member of The Vanguard Group.
3 Affiliated money market fund available only to Vanguard funds and certain trusts and accounts managed by Vanguard. Rate shown is the
7-day yield.
4 Includes $12,248,000 of collateral received for securities on loan.
5 The issuer operates under a congressional charter; its securities are generally neither guaranteed by the U.S. Treasury nor backed by the
full faith and credit of the U.S. government.
6 Securities with a value of $3,599,000 have been segregated as initial margin for open futures contracts.
See accompanying Notes, which are an integral part of the Financial Statements.
15
Mid-Cap Growth Fund
Statement of Operations
| Six Months Ended | |
| April 30, 2014 | |
| ($000) | |
| Investment Income | |
| Income | |
| Dividends1 | 8,357 |
| Interest1 | 90 |
| Securities Lending | 220 |
| Total Income | 8,667 |
| Expenses | |
| Investment Advisory Fees—Note B | |
| Basic Fee | 3,085 |
| Performance Adjustment | (225) |
| The Vanguard Group—Note C | |
| Management and Administrative | 3,727 |
| Marketing and Distribution | 315 |
| Custodian Fees | 20 |
| Shareholders’ Reports | 9 |
| Trustees’ Fees and Expenses | 3 |
| Total Expenses | 6,934 |
| Expenses Paid Indirectly | (149) |
| Net Expenses | 6,785 |
| Net Investment Income | 1,882 |
| Realized Net Gain (Loss) | |
| Investment Securities Sold1 | 245,099 |
| Futures Contracts | 8,329 |
| Realized Net Gain (Loss) | 253,428 |
| Change in Unrealized Appreciation (Depreciation) | |
| Investment Securities | (113,582) |
| Futures Contracts | (4,555) |
| Change in Unrealized Appreciation (Depreciation) | (118,137) |
| Net Increase (Decrease) in Net Assets Resulting from Operations | 137,173 |
| 1 Dividend income, interest income, and realized net gain (loss) from affiliated companies of the fund were $1,000, $88,000, and $0, respectively. | |
See accompanying Notes, which are an integral part of the Financial Statements.
16
Mid-Cap Growth Fund
Statement of Changes in Net Assets
| Six Months Ended | Year Ended | |
| April 30, | October 31, | |
| 2014 | 2013 | |
| ($000) | ($000) | |
| Increase (Decrease) in Net Assets | ||
| Operations | ||
| Net Investment Income | 1,882 | 4,714 |
| Realized Net Gain (Loss) | 253,428 | 297,724 |
| Change in Unrealized Appreciation (Depreciation) | (118,137) | 353,334 |
| Net Increase (Decrease) in Net Assets Resulting from Operations | 137,173 | 655,772 |
| Distributions | ||
| Net Investment Income | (782) | (7,620) |
| Realized Capital Gain1 | (278,523) | (118,662) |
| Total Distributions | (279,305) | (126,282) |
| Capital Share Transactions | ||
| Issued | 351,198 | 533,350 |
| Issued in Lieu of Cash Distributions | 271,687 | 122,777 |
| Redeemed | (260,819) | (478,266) |
| Net Increase (Decrease) from Capital Share Transactions | 362,066 | 177,861 |
| Total Increase (Decrease) | 219,934 | 707,351 |
| Net Assets | ||
| Beginning of Period | 2,836,594 | 2,129,243 |
| End of Period2 | 3,056,528 | 2,836,594 |
| 1 Includes fiscal 2014 and 2013 short-term gain distributions totaling $86,619,000 and $32,409,000, respectively. Short-term gain distributions | ||
| are treated as ordinary income dividends for tax purposes. | ||
| 2 Net Assets—End of Period includes undistributed (overdistributed) net investment income of ($1,955,000) and ($3,055,000). | ||
See accompanying Notes, which are an integral part of the Financial Statements.
17
Mid-Cap Growth Fund
Financial Highlights
| Six Months | ||||||
| Ended | ||||||
| For a Share Outstanding | April 30, | Year Ended October 31, | ||||
| Throughout Each Period | 2014 | 2013 | 2012 | 2011 | 2010 | 2009 |
| Net Asset Value, Beginning of Period | $25.72 | $20.95 | $19.40 | $17.54 | $13.86 | $11.82 |
| Investment Operations | ||||||
| Net Investment Income | .019 | .048 | .041 | .0401 | .001 | .0212 |
| Net Realized and Unrealized Gain (Loss) | ||||||
| on Investments | 1.160 | 5.965 | 1.892 | 1.840 | 3.697 | 2.059 |
| Total from Investment Operations | 1.179 | 6.013 | 1.933 | 1.880 | 3.698 | 2.080 |
| Distributions | ||||||
| Dividends from Net Investment Income | (. 007) | (. 075) | (. 030) | (. 020) | (. 018) | (. 040) |
| Distributions from Realized Capital Gains | (2.492) | (1.168) | (.353) | — | — | — |
| Total Distributions | (2.499) | (1.243) | (.383) | (.020) | (.018) | (.040) |
| Net Asset Value, End of Period | $24.40 | $25.72 | $20.95 | $19.40 | $17.54 | $13.86 |
| Total Return3 | 4.83% | 30.32% | 10.24% | 10.72% | 26.70% | 17.70% |
| Ratios/Supplemental Data | ||||||
| Net Assets, End of Period (Millions) | $3,057 | $2,837 | $2,129 | $1,804 | $1,562 | $1,229 |
| Ratio of Total Expenses to | ||||||
| Average Net Assets4 | 0.46% | 0.51% | 0.54% | 0.53% | 0.51% | 0.60% |
| Ratio of Net Investment Income to | ||||||
| Average Net Assets | 0.13% | 0.19% | 0.19% | 0.20%1 | 0.00% | 0.16%2 |
| Portfolio Turnover Rate | 84% | 83% | 97% | 127% | 88% | 125% |
The expense ratio, net income ratio, and turnover rate for the current period have been annualized.
1 Net investment income per share and the ratio of net investment income to average net assets include $.02 and 0.11%, respectively,
resulting from a special dividend from VeriSign Inc. in December 2010.
2 Net investment income per share and the ratio of net investment income to average net assets include $.02 and 0.19%, respectively,
resulting from a special dividend from TransDigm Group Inc. in October 2009.
3 Total returns do not include account service fees that may have applied in the periods shown. Fund prospectuses provide information about
any applicable account service fees.
4 Includes performance-based investment advisory fee increases (decreases) of (0.02%), 0.02%, 0.04%, 0.01%, (0.01%) and 0.02%.
See accompanying Notes, which are an integral part of the Financial Statements.
18
Mid-Cap Growth Fund
Notes to Financial Statements
Vanguard Mid-Cap Growth Fund is registered under the Investment Company Act of 1940 as an open-end investment company, or mutual fund.
A. The following significant accounting policies conform to generally accepted accounting principles for U.S. investment companies. The fund consistently follows such policies in preparing its financial statements.
1. Security Valuation: Securities are valued as of the close of trading on the New York Stock Exchange (generally 4 p.m., Eastern time) on the valuation date. Equity securities are valued at the latest quoted sales prices or official closing prices taken from the primary market in which each security trades; such securities not traded on the valuation date are valued at the mean of the latest quoted bid and asked prices. Securities for which market quotations are not readily available, or whose values have been materially affected by events occurring before the fund’s pricing time but after the close of the securities’ primary markets, are valued by methods deemed by the board of trustees to represent fair value. Investments in Vanguard Market Liquidity Fund are valued at that fund’s net asset value. Temporary cash investments acquired over 60 days to maturity are valued using the latest bid prices or using valuations based on a matrix system (which considers such factors as security prices, yields, maturities, and ratings), both as furnished by independent pricing services. Other temporary cash investments are valued at amortized cost, which approximates market value.
2. Futures Contracts: The fund uses index futures contracts to a limited extent, with the objective of maintaining full exposure to the stock market while maintaining liquidity. The fund may purchase or sell futures contracts to achieve a desired level of investment, whether to accommodate portfolio turnover or cash flows from capital share transactions. The primary risks associated with the use of futures contracts are imperfect correlation between changes in market values of stocks held by the fund and the prices of futures contracts, and the possibility of an illiquid market. Counterparty risk involving futures is mitigated because a regulated clearinghouse is the counterparty instead of the clearing broker. To further mitigate counterparty risk, the fund trades futures contracts on an exchange, monitors the financial strength of its clearing brokers and clearinghouse, and has entered into clearing agreements with its clearing brokers. The clearinghouse imposes initial margin requirements to secure the fund’s performance and requires daily settlement of variation margin representing changes in the market value of each contract.
Futures contracts are valued at their quoted daily settlement prices. The aggregate notional amounts of the contracts are not recorded in the Statement of Net Assets. Fluctuations in the value of the contracts are recorded in the Statement of Net Assets as an asset (liability) and in the Statement of Operations as unrealized appreciation (depreciation) until the contracts are closed, when they are recorded as realized futures gains (losses).
During the six months ended April 30, 2014, the fund’s average investments in long and short futures contracts represented 3% and 0% of net assets, respectively, based on quarterly average aggregate settlement values.
3. Federal Income Taxes: The fund intends to continue to qualify as a regulated investment company and distribute all of its taxable income. Management has analyzed the fund’s tax positions taken for all open federal income tax years (October 31, 2010–2013), and for the period ended April 30, 2014, and has concluded that no provision for federal income tax is required in the fund’s financial statements.
19
Mid-Cap Growth Fund
4. Distributions: Distributions to shareholders are recorded on the ex-dividend date.
5. Securities Lending: To earn additional income, the fund lends its securities to qualified institutional borrowers. Security loans are required to be secured at all times by collateral in an amount at least equal to the market value of securities loaned. Daily market fluctuations could cause the value of loaned securities to be more or less than the value of the collateral received. When this occurs, the collateral is adjusted and settled on the next business day. The fund further mitigates its counterparty risk by entering into securities lending transactions only with a diverse group of prequalified counterparties, monitoring their financial strength, and entering into master securities lending agreements with its counterparties. The master securities lending agreements provide that, in the event of a counterparty’s default (including bankruptcy), the fund may terminate any loans with that borrower, determine the net amount owed, and sell or retain the collateral up to the net amount owed to the fund; however, such actions may be subject to legal proceedings. While collateral mitigates counterparty risk, in the absence of a default the fund may experience delays and costs in recovering the securities loaned. The fund invests cash collateral received in Vanguard Market Liquidity Fund, and records a liability in the Statement of Net Assets for the return of the collateral, during the period the securities are on loan. Securities lending income represents fees charged to borrowers plus income earned on invested cash collateral, less expenses associated with the loan.
6. Credit Facility: The fund and certain other funds managed by The Vanguard Group participate in a $2.89 billion committed credit facility provided by a syndicate of lenders pursuant to a credit agreement that may be renewed annually; each fund is individually liable for its borrowings, if any, under the credit facility. Borrowings may be utilized for temporary and emergency purposes, and are subject to the fund’s regulatory and contractual borrowing restrictions. The participating funds are charged administrative fees and an annual commitment fee of 0.06% of the undrawn amount of the facility; these fees are allocated to the funds based on a method approved by the fund’s board of trustees and included in Management and Administrative expenses on the fund’s Statement of Operations. Any borrowings under this facility bear interest at a rate equal to the higher of the federal funds rate or LIBOR reference rate plus an agreed-upon spread.
The fund had no borrowings outstanding at April 30, 2014, or at any time during the period then ended.
7. Other: Dividend income is recorded on the ex-dividend date. Interest income includes income distributions received from Vanguard Market Liquidity Fund and is accrued daily. Premiums and discounts on debt securities purchased are amortized and accreted, respectively, to interest income over the lives of the respective securities. Security transactions are accounted for on the date securities are bought or sold. Costs used to determine realized gains (losses) on the sale of investment securities are those of the specific securities sold.
B. Chartwell Investment Partners, Inc., and William Blair & Company, L.L.C., each provide investment advisory services to a portion of the fund for a fee calculated at an annual percentage rate of average net assets managed by the advisor. The basic fee of Chartwell Investment Partners, Inc., is subject to quarterly adjustments based on performance for the preceding three years relative to the Russell Midcap Growth Index. The basic fee of William Blair & Company, L.L.C., is subject to quarterly adjustments based on performance for the preceding five years relative to the Russell MidCap Growth Index.
20
Mid-Cap Growth Fund
The Vanguard Group manages the cash reserves of the fund on an at-cost basis.
For the six months ended April 30, 2014, the aggregate investment advisory fee represented an effective annual basic rate of 0.21% of the fund’s average net assets, before a decrease of $225,000 (0.02%) based on performance.
C. The Vanguard Group furnishes at cost corporate management, administrative, marketing, and distribution services. The costs of such services are allocated to the fund based on methods approved by the board of trustees. The fund has committed to provide up to 0.40% of its net assets in capital contributions to Vanguard. At April 30, 2014, the fund had contributed capital of $334,000 to Vanguard (included in Other Assets), representing 0.01% of the fund’s net assets and 0.13% of Vanguard’s capitalization. The fund’s trustees and officers are also directors and officers of Vanguard.
D. The fund has asked its investment advisors to direct certain security trades, subject to obtaining the best price and execution, to brokers who have agreed to rebate to the fund part of the commissions generated. Such rebates are used solely to reduce the fund’s management and administrative expenses. For the six months ended April 30, 2014, these arrangements reduced the fund’s expenses by $149,000 (an annual rate of 0.01% of average net assets).
E. Various inputs may be used to determine the value of the fund’s investments. These inputs are summarized in three broad levels for financial statement purposes. The inputs or methodologies used to value securities are not necessarily an indication of the risk associated with investing in those securities.
Level 1—Quoted prices in active markets for identical securities.
Level 2—Other significant observable inputs (including quoted prices for similar securities, interest rates, prepayment speeds, credit risk, etc.).
Level 3—Significant unobservable inputs (including the fund’s own assumptions used to determine the fair value of investments).
The following table summarizes the market value of the fund’s investments as of April 30, 2014, based on the inputs used to value them:
| Level 1 | Level 2 | Level 3 | |
| Investments | ($000) | ($000) | ($000) |
| Common Stocks | 2,903,328 | — | — |
| Temporary Cash Investments | 150,761 | 5,099 | — |
| Futures Contracts—Assets1 | 487 | — | — |
| Futures Contracts—Liabilities1 | (1) | — | — |
| Total | 3,054,575 | 5,099 | — |
| 1 Represents variation margin on the last day of the reporting period. | |||
21
Mid-Cap Growth Fund
F. At April 30, 2014, the aggregate settlement value of open futures contracts and the related unrealized appreciation (depreciation) were:
| ($000) | ||||
| Aggregate | ||||
| Number of | Settlement | Unrealized | ||
| Long (Short) | Value | Appreciation | ||
| Futures Contracts | Expiration | Contracts | Long (Short) | (Depreciation) |
| E-mini S&P Midcap 400 Index | June 2014 | 617 | 83,486 | (799) |
| S&P 500 Index | June 2014 | 30 | 2,817 | (1) |
| (800) | ||||
Unrealized appreciation (depreciation) on open futures contracts is required to be treated as realized gain (loss) for tax purposes.
G. Distributions are determined on a tax basis and may differ from net investment income and realized capital gains for financial reporting purposes. Differences may be permanent or temporary. Permanent differences are reclassified among capital accounts in the financial statements to reflect their tax character. Temporary differences arise when certain items of income, expense, gain, or loss are recognized in different periods for financial statement and tax purposes. These differences will reverse at some time in the future. Differences in classification may also result from the treatment of short-term gains as ordinary income for tax purposes. The fund’s tax-basis capital gains and losses are determined only at the end of each fiscal year.
At April 30, 2014, the cost of investment securities for tax purposes was $2,526,249,000. Net unrealized appreciation of investment securities for tax purposes was $532,939,000 consisting of unrealized gains of $595,044,000 on securities that had risen in value since their purchase and $62,105,000 in unrealized losses on securities that had fallen in value since their purchase.
H. During the six months ended April 30, 2014, the fund purchased $1,296,808 of investment securities and sold $1,219,211,000 of investment securities, other than temporary cash investments.
I. Capital shares issued and redeemed were:
| Six Months Ended | Year Ended | |
| April 30, 2014 | October 31, 2013 | |
| Shares | Shares | |
| (000) | (000) | |
| Issued | 14,044 | 23,286 |
| Issued in Lieu of Cash Distributions | 11,415 | 6,078 |
| Redeemed | (10,519) | (20,687) |
| Net Increase (Decrease) in Shares Outstanding | 14,940 | 8,677 |
J. Management has determined that no material events or transactions occurred subsequent to April 30, 2014, that would require recognition or disclosure in these financial statements.
22
About Your Fund’s Expenses
As a shareholder of the fund, you incur ongoing costs, which include costs for portfolio management, administrative services, and shareholder reports (like this one), among others. Operating expenses, which are deducted from a fund’s gross income, directly reduce the investment return of the fund.
A fund’s expenses are expressed as a percentage of its average net assets. This figure is known as the expense ratio. The following examples are intended to help you understand the ongoing costs (in dollars) of investing in your fund and to compare these costs with those of other mutual funds. The examples are based on an investment of $1,000 made at the beginning of the period shown and held for the entire period.
The accompanying table illustrates your fund’s costs in two ways:
• Based on actual fund return. This section helps you to estimate the actual expenses that you paid over the period. The ”Ending Account Value“ shown is derived from the fund‘s actual return, and the third column shows the dollar amount that would have been paid by an investor who started with $1,000 in the fund. You may use the information here, together with the amount you invested, to estimate the expenses that you paid over the period.
To do so, simply divide your account value by $1,000 (for example, an $8,600 account value divided by $1,000 = 8.6), then multiply the result by the number given for your fund under the heading ”Expenses Paid During Period.“
• Based on hypothetical 5% yearly return. This section is intended to help you compare your fund‘s costs with those of other mutual funds. It assumes that the fund had a yearly return of 5% before expenses, but that the expense ratio is unchanged. In this case—because the return used is not the fund’s actual return—the results do not apply to your investment. The example is useful in making comparisons because the Securities and Exchange Commission requires all mutual funds to calculate expenses based on a 5% return. You can assess your fund’s costs by comparing this hypothetical example with the hypothetical examples that appear in shareholder reports of other funds.
Note that the expenses shown in the table are meant to highlight and help you compare ongoing costs only and do not reflect transaction costs incurred by the fund for buying and selling securities. Further, the expenses do not include any purchase, redemption, or account service fees described in the fund prospectus. If such fees were applied to your account, your costs would be higher. Your fund does not carry a “sales load.”
The calculations assume no shares were bought or sold during the period. Your actual costs may have been higher or lower, depending on the amount of your investment and the timing of any purchases or redemptions.
You can find more information about the fund’s expenses, including annual expense ratios, in the Financial Statements section of this report. For additional information on operating expenses and other shareholder costs, please refer to your fund’s current prospectus.
23
| Six Months Ended April 30, 2014 | |||
| Beginning | Ending | Expenses | |
| Account Value | Account Value | Paid During | |
| Mid-Cap Growth Fund | 10/31/2013 | 4/30/2014 | Period |
| Based on Actual Fund Return | $1,000.00 | $1,048.29 | $2.34 |
| Based on Hypothetical 5% Yearly Return | 1,000.00 | 1,022.51 | 2.31 |
The calculations are based on expenses incurred in the most recent six-month period. The fund’s annualized six-month expense ratio for that
period is 0.46%. The dollar amounts shown as “Expenses Paid” are equal to the annualized expense ratio multiplied by the average account
value over the period, multiplied by the number of days in the most recent six-month period, then divided by the number of days in the most
recent 12-month period.
24
Trustees Approve Advisory Arrangements
The board of trustees of Vanguard Mid-Cap Growth Fund has renewed the fund’s investment advisory arrangements with Chartwell Investment Partners (Chartwell) and William Blair & Company, L.L.C. (William Blair & Company). In addition, the board approved a new advisory agreement with Chartwell for the reasons described below.
In March 2014, Chartwell was acquired by TriState Capital Holdings, Inc. (TriState Capital). The acquisition resulted in what is legally referred to as a change in control of Chartwell. This change constituted an “assignment” under the Investment Company Act of 1940 and triggered the automatic termination of Chartwell’s former advisory agreement with the fund. The board of trustees approved a new advisory agreement to allow for an uninterrupted advisory relationship between Chartwell and the fund. The new agreement is identical in all material respects to the former agreement with Chartwell except for the date of the agreement and a change to the Chartwell entity name from Chartwell Investment Partners, L.P., to Chartwell Investment Partners, Inc.
The board determined that renewing and approving the fund’s advisory arrangements was in the best interests of the fund and its shareholders.
The board based its decisions upon an evaluation of each advisor’s investment staff, portfolio management process, and performance. The trustees considered the factors discussed below, among others. However, no single factor determined whether the board approved the arrangements. Rather, it was the totality of the circumstances that drove the board’s decision.
Nature, extent, and quality of services
The board considered the quality of the fund’s investment management services, and took into account the organizational depth and stability of each advisor. The board noted the following:
Chartwell. Chartwell, founded in 1997, is a wholly owned subsidiary of TriState Capital. The firm has expertise in small- and mid-cap equity management and employs a fundamental bottom-up strategy in seeking companies with superior growth potential that are trading at reasonable valuations. Chartwell uses a team approach to managing assets. The team invests in companies that have demonstrated strong earnings-per-share growth and have achieved strong competitive positions while serving a meaningful customer base. The team will invest opportunistically when stocks are attractively valued, yet it will concentrate holdings in those companies best positioned for rapid growth, all with an intermediate-term time horizon in mind. Chartwell has advised a portion of the fund since 2006.
William Blair & Company. Founded in 1935, William Blair & Company is an independently owned, full-service investment firm. The firm’s investment process relies on thorough in-depth fundamental analysis. Based on this process, the advisor invests in companies that it believes are high quality and have sustainable, above-average growth. In selecting stocks, the advisor considers a company’s leadership position within the market it serves, the quality of its products or services, its return on equity, its accounting policies, and the quality of the management team. William Blair & Company has advised a portion of the fund since 2006.
The board concluded that each advisor’s experience, stability, depth, and performance, among other factors, warranted continuation of the advisory arrangements.
25
Investment performance
The board considered the fund’s performance since 2006 (when the advisors began managing the fund), including any periods of outperformance or underperformance relative to a benchmark index and peer group. The board concluded that the performance was such that the advisory arrangements should continue. Information about the fund’s most recent performance can be found in the Performance Summary section of this report.
Cost
The board concluded that the fund’s expense ratio was well below the average expense ratio charged by funds in its peer group and that the fund’s advisory fee rate was also well below the peer-group average. Information about the fund’s expenses appears in the About Your Fund’s Expenses section of this report as well as in the Financial Statements section, which also includes information about the fund’s advisory fee rate.
The board did not consider profitability of Chartwell or William Blair & Company in determining whether to approve the advisory fees, because the firms are independent of Vanguard and the advisory fees are the result of arm’s-length negotiations.
The benefit of economies of scale
The board concluded that the fund’s shareholders benefit from economies of scale because of breakpoints in the advisory fee schedules for Chartwell and William Blair & Company. The breakpoints reduce the effective rate of the fees as the fund’s assets managed by each advisor increase.
The board will consider whether to renew the advisory arrangements again after a one-year period.
26
Glossary
30-Day SEC Yield. A fund’s 30-day SEC yield is derived using a formula specified by the U.S. Securities and Exchange Commission. Under the formula, data related to the fund’s security holdings in the previous 30 days are used to calculate the fund’s hypothetical net income for that period, which is then annualized and divided by the fund’s estimated average net assets over the calculation period. For the purposes of this calculation, a security’s income is based on its current market yield to maturity (for bonds), its actual income (for asset-backed securities), or its projected dividend yield (for stocks). Because the SEC yield represents hypothetical annualized income, it will differ—at times significantly—from the fund’s actual experience. As a result, the fund’s income distributions may be higher or lower than implied by the SEC yield.
Beta. A measure of the magnitude of a fund’s past share-price fluctuations in relation to the ups and downs of a given market index. The index is assigned a beta of 1.00. Compared with a given index, a fund with a beta of 1.20 typically would have seen its share price rise or fall by 12% when the index rose or fell by 10%. For this report, beta is based on returns over the past 36 months for both the fund and the index. Note that a fund’s beta should be reviewed in conjunction with its R-squared (see definition). The lower the R-squared, the less correlation there is between the fund and the index, and the less reliable beta is as an indicator of volatility.
Dividend Yield. Dividend income earned by stocks, expressed as a percentage of the aggregate market value (or of net asset value, for a fund). The yield is determined by dividing the amount of the annual dividends by the aggregate value (or net asset value) at the end of the period. For a fund, the dividend yield is based solely on stock holdings and does not include any income produced by other investments.
Earnings Growth Rate. The average annual rate of growth in earnings over the past five years for the stocks now in a fund.
Equity Exposure. A measure that reflects a fund’s investments in stocks and stock futures. Any holdings in short-term reserves are excluded.
Expense Ratio. A fund’s total annual operating expenses expressed as a percentage of the fund’s average net assets. The expense ratio includes management and administrative expenses, but does not include the transaction costs of buying and selling portfolio securities.
Foreign Holdings. The percentage of a fund represented by securities or depositary receipts of companies based outside the United States.
Inception Date. The date on which the assets of a fund (or one of its share classes) are first invested in accordance with the fund’s investment objective. For funds with a subscription period, the inception date is the day after that period ends. Investment performance is measured from the inception date.
Median Market Cap. An indicator of the size of companies in which a fund invests; the midpoint of market capitalization (market price x shares outstanding) of a fund’s stocks, weighted by the proportion of the fund’s assets invested in each stock. Stocks representing half of the fund’s assets have market capitalizations above the median, and the rest are below it.
Price/Book Ratio. The share price of a stock divided by its net worth, or book value, per share. For a fund, the weighted average price/book ratio of the stocks it holds.
27
Price/Earnings Ratio. The ratio of a stock’s current price to its per-share earnings over the past year. For a fund, the weighted average P/E of the stocks it holds. P/E is an indicator of market expectations about corporate prospects; the higher the P/E, the greater the expectations for a company’s future growth.
R-Squared. A measure of how much of a fund’s past returns can be explained by the returns from the market in general, as measured by a given index. If a fund’s total returns were precisely synchronized with an index’s returns, its R-squared would be 1.00. If the fund’s returns bore no relationship to the index’s returns, its R-squared would be 0. For this report, R-squared is based on returns over the past 36 months for both the fund and the index.
Return on Equity. The annual average rate of return generated by a company during the past five years for each dollar of shareholder’s equity (net income divided by shareholder’s equity). For a fund, the weighted average return on equity for the companies whose stocks it holds.
Short-Term Reserves. The percentage of a fund invested in highly liquid, short-term securities that can be readily converted to cash.
Turnover Rate. An indication of the fund’s trading activity. Funds with high turnover rates incur higher transaction costs and may be more likely to distribute capital gains (which may be taxable to investors). The turnover rate excludes in-kind transactions, which have minimal impact on costs.
28
This page intentionally left blank.
This page intentionally left blank.
This page intentionally left blank.
The People Who Govern Your Fund
The trustees of your mutual fund are there to see that the fund is operated and managed in your best interests since, as a shareholder, you are a part owner of the fund. Your fund’s trustees also serve on the board of directors of The Vanguard Group, Inc., which is owned by the Vanguard funds and provides services to them on an at-cost basis.
A majority of Vanguard’s board members are independent, meaning that they have no affiliation with Vanguard or the funds they oversee, apart from the sizable personal investments they have made as private individuals. The independent board members have distinguished backgrounds in business, academia, and public service. Each of the trustees and executive officers oversees 178 Vanguard funds.
The following table provides information for each trustee and executive officer of the fund. More information about the trustees is in the Statement of Additional Information, which can be obtained, without charge, by contacting Vanguard at 800-662-7447, or online at vanguard.com.
| InterestedTrustee1 | and Delphi Automotive LLP (automotive components); |
| Senior Advisor at New Mountain Capital. | |
| F. William McNabb III | |
| Born 1957. Trustee Since July 2009. Chairman of the | Amy Gutmann |
| Board. Principal Occupation(s) During the Past Five | Born 1949. Trustee Since June 2006. Principal |
| Years: Chairman of the Board of The Vanguard Group, | Occupation(s) During the Past Five Years: President of |
| Inc., and of each of the investment companies served | the University of Pennsylvania; Christopher H. Browne |
| by The Vanguard Group, since January 2010; Director | Distinguished Professor of Political Science, School of |
| of The Vanguard Group since 2008; Chief Executive | Arts and Sciences, and Professor of Communication, |
| Officer and President of The Vanguard Group, and of | Annenberg School for Communication, with secondary |
| each of the investment companies served by The | faculty appointments in the Department of Philosophy, |
| Vanguard Group, since 2008; Director of Vanguard | School of Arts and Sciences, and at the Graduate |
| Marketing Corporation; Managing Director of The | School of Education, University of Pennsylvania; |
| Vanguard Group (1995–2008). | Trustee of the National Constitution Center; Chair |
| of the Presidential Commission for the Study of | |
| Bioethical Issues. | |
| IndependentTrustees | |
| JoAnn Heffernan Heisen | |
| Emerson U. Fullwood | Born 1950. Trustee Since July 1998. Principal |
| Born 1948. Trustee Since January 2008. Principal | Occupation(s) During the Past Five Years: Corporate |
| Occupation(s) During the Past Five Years: Executive | Vice President and Chief Global Diversity Officer |
| Chief Staff and Marketing Officer for North America | (retired 2008) and Member of the Executive |
| and Corporate Vice President (retired 2008) of Xerox | Committee (1997–2008) of Johnson & Johnson |
| Corporation (document management products and | (pharmaceuticals/medical devices/consumer |
| services); Executive in Residence and 2009–2010 | products); Director of Skytop Lodge Corporation |
| Distinguished Minett Professor at the Rochester | (hotels), the University Medical Center at Princeton, |
| Institute of Technology; Director of SPX Corporation | the Robert Wood Johnson Foundation, and the Center |
| (multi-industry manufacturing), the United Way of | for Talent Innovation; Member of the Advisory Board |
| Rochester, Amerigroup Corporation (managed health | of the Maxwell School of Citizenship and Public Affairs |
| care), the University of Rochester Medical Center, | at Syracuse University. |
| Monroe Community College Foundation, and North | |
| Carolina A&T University. | F. Joseph Loughrey |
| Born 1949. Trustee Since October 2009. Principal | |
| Rajiv L. Gupta | Occupation(s) During the Past Five Years: President |
| Born 1945. Trustee Since December 2001.2 | and Chief Operating Officer (retired 2009) of Cummins |
| Principal Occupation(s) During the Past Five Years: | Inc. (industrial machinery); Chairman of the Board |
| Chairman and Chief Executive Officer (retired 2009) | of Hillenbrand, Inc. (specialized consumer services), |
| and President (2006–2008) of Rohm and Haas Co. | and of Oxfam America; Director of SKF AB (industrial |
| (chemicals); Director of Tyco International, Ltd. | machinery), Hyster-Yale Materials Handling, Inc. |
| (diversified manufacturing and services), Hewlett- | (forklift trucks), the Lumina Foundation for Education, |
| Packard Co. (electronic computer manufacturing), |
| and the V Foundation for Cancer Research; Member | Executive Officers | |
| of the Advisory Council for the College of Arts and | ||
| Letters and of the Advisory Board to the Kellogg | Glenn Booraem | |
| Institute for International Studies, both at the | Born 1967. Controller Since July 2010. Principal | |
| University of Notre Dame. | Occupation(s) During the Past Five Years: Principal | |
| of The Vanguard Group, Inc.; Controller of each of | ||
| Mark Loughridge | the investment companies served by The Vanguard | |
| Born 1953. Trustee Since March 2012. Principal | Group; Assistant Controller of each of the investment | |
| Occupation(s) During the Past Five Years: Senior Vice | companies served by The Vanguard Group (2001–2010). | |
| President and Chief Financial Officer (retired 2013) | ||
| at IBM (information technology services); Fiduciary | Thomas J. Higgins | |
| Member of IBM’s Retirement Plan Committee (2004– | Born 1957. Chief Financial Officer Since September | |
| 2013); Member of the Council on Chicago Booth. | 2008. Principal Occupation(s) During the Past Five | |
| Years: Principal of The Vanguard Group, Inc.; Chief | ||
| Scott C. Malpass | Financial Officer of each of the investment companies | |
| Born 1962. Trustee Since March 2012. Principal | served by The Vanguard Group; Treasurer of each of | |
| Occupation(s) During the Past Five Years: Chief | the investment companies served by The Vanguard | |
| Investment Officer and Vice President at the University | Group (1998–2008). | |
| of Notre Dame; Assistant Professor of Finance at the | ||
| Mendoza College of Business at Notre Dame; Member | Kathryn J. Hyatt | |
| of the Notre Dame 403(b) Investment Committee; | Born 1955. Treasurer Since November 2008. Principal | |
| Board Member of TIFF Advisory Services, Inc. | Occupation(s) During the Past Five Years: Principal of | |
| (investment advisor); Member of the Investment | The Vanguard Group, Inc.; Treasurer of each of the | |
| Advisory Committees of the Financial Industry | investment companies served by The Vanguard | |
| Regulatory Authority (FINRA) and of Major League | Group; Assistant Treasurer of each of the investment | |
| Baseball. | companies served by The Vanguard Group (1988–2008). | |
| André F. Perold | Heidi Stam | |
| Born 1952. Trustee Since December 2004. Principal | Born 1956. Secretary Since July 2005. Principal | |
| Occupation(s) During the Past Five Years: George | Occupation(s) During the Past Five Years: Managing | |
| Gund Professor of Finance and Banking, Emeritus | Director of The Vanguard Group, Inc.; General Counsel | |
| at the Harvard Business School (retired 2011); | of The Vanguard Group; Secretary of The Vanguard | |
| Chief Investment Officer and Managing Partner of | Group and of each of the investment companies | |
| HighVista Strategies LLC (private investment firm); | served by The Vanguard Group; Director and Senior | |
| Director of Rand Merchant Bank; Overseer of the | Vice President of Vanguard Marketing Corporation. | |
| Museum of Fine Arts Boston. | ||
| Vanguard Senior ManagementTeam | ||
| Alfred M. Rankin, Jr. | ||
| Born 1941. Trustee Since January 1993. Principal | Mortimer J. Buckley | Chris D. McIsaac |
| Occupation(s) During the Past Five Years: Chairman, | Kathleen C. Gubanich | Michael S. Miller |
| President, and Chief Executive Officer of NACCO | Paul A. Heller | James M. Norris |
| Industries, Inc. (housewares/lignite), and of Hyster- | Martha G. King | Glenn W. Reed |
| Yale Materials Handling, Inc. (forklift trucks); Chairman | John T. Marcante | |
| of the Board of University Hospitals of Cleveland. | ||
| Peter F. Volanakis | Chairman Emeritus and Senior Advisor | |
| Born 1955. Trustee Since July 2009. Principal | ||
| Occupation(s) During the Past Five Years: President | John J. Brennan | |
| and Chief Operating Officer (retired 2010) of Corning | Chairman, 1996–2009 | |
| Incorporated (communications equipment); Trustee of | Chief Executive Officer and President, 1996–2008 | |
| Colby-Sawyer College; Member of the Advisory Board | ||
| of the Norris Cotton Cancer Center and of the Advisory | Founder | |
| Board of the Parthenon Group (strategy consulting). | ||
| John C. Bogle | ||
| Chairman and Chief Executive Officer, 1974–1996 | ||
1 Mr. McNabb is considered an “interested person,” as defined in the Investment Company Act of 1940, because he is an officer of the
Vanguard funds.
2 December 2002 for Vanguard Equity Income Fund, the Vanguard Municipal Bond Funds, and the Vanguard State Tax-Exempt Funds.
 | ||
| P.O. Box 2600 | ||
| Valley Forge, PA 19482-2600 | ||
| Connect with Vanguard® > vanguard.com | ||
| Fund Information > 800-662-7447 | CFA® is a trademark owned by CFA Institute. | |
| Direct Investor Account Services > 800-662-2739 | ||
| Institutional Investor Services > 800-523-1036 | ||
| Text Telephone for People | ||
| With Hearing Impairment > 800-749-7273 | ||
| This material may be used in conjunction | ||
| with the offering of shares of any Vanguard | ||
| fund only if preceded or accompanied by | ||
| the fund’s current prospectus. | ||
| All comparative mutual fund data are from Lipper, a | ||
| Thomson Reuters Company, or Morningstar, Inc., unless | ||
| otherwise noted. | ||
| You can obtain a free copy of Vanguard’s proxy voting | ||
| guidelines by visiting vanguard.com/proxyreporting or by | ||
| calling Vanguard at 800-662-2739. The guidelines are | ||
| also available from the SEC’s website, sec.gov. In | ||
| addition, you may obtain a free report on how your fund | ||
| voted the proxies for securities it owned during the 12 | ||
| months ended June 30. To get the report, visit either | ||
| vanguard.com/proxyreporting or sec.gov. | ||
| You can review and copy information about your fund at | ||
| the SEC’s Public Reference Room in Washington, D.C. To | ||
| find out more about this public service, call the SEC at | ||
| 202-551-8090. Information about your fund is also | ||
| available on the SEC’s website, and you can receive | ||
| copies of this information, for a fee, by sending a | ||
| request in either of two ways: via e-mail addressed to | ||
| publicinfo@sec.gov or via regular mail addressed to the | ||
| Public Reference Section, Securities and Exchange | ||
| Commission, Washington, DC 20549-1520. | ||
| © 2014 The Vanguard Group, Inc. | ||
| All rights reserved. | ||
| Vanguard Marketing Corporation, Distributor. | ||
| Q3012 062014 | ||
![]()
Semiannual Report | April 30, 2014
Vanguard High Dividend Yield Index Fund

Vanguard’s Principles for Investing Success
We want to give you the best chance of investment success. These principles,
grounded in Vanguard’s research and experience, can put you on the right path.
Goals. Create clear, appropriate investment goals.
Balance. Develop a suitable asset allocation using broadly diversified funds.
Cost. Minimize cost.
Discipline. Maintain perspective and long-term discipline.
A single theme unites these principles: Focus on the things you can control.
We believe there is no wiser course for any investor.
| Contents | |
| Your Fund’s Total Returns. | 1 |
| Chairman’s Letter. | 2 |
| Fund Profile. | 7 |
| Performance Summary. | 9 |
| Financial Statements. | 10 |
| About Your Fund’s Expenses. | 24 |
| Trustees Approve Advisory Arrangement. | 26 |
| Glossary. | 27 |
Please note: The opinions expressed in this report are just that—informed opinions. They should not be considered promises or advice.
Also, please keep in mind that the information and opinions cover the period through the date on the front of this report. Of course, the
risks of investing in your fund are spelled out in the prospectus.
See the Glossary for definitions of investment terms used in this report.
About the cover: The ship’s wheel represents leadership and guidance, essential qualities in navigating difficult seas.
This one is a replica based on an 18th-century British vessel. The HMSVanguard, another ship of that era, served as the
flagship for British Admiral Horatio Nelson when he defeated a French fleet at the Battle of the Nile.
Your Fund’s Total Returns
| Six Months Ended April 30, 2014 | |
| Total | |
| Returns | |
| Vanguard High Dividend Yield Index Fund | |
| Investor Shares | 8.72% |
| ETF Shares | |
| Market Price | 8.68 |
| Net Asset Value | 8.76 |
| FTSE High Dividend Yield Index | 8.80 |
| Equity Income Funds Average | 7.54 |
Equity Income Funds Average: Derived from data provided by Lipper, a Thomson Reuters Company.
The Vanguard ETF® Shares shown are traded on the NYSE Arca exchange and are available only through brokers. The table provides ETF
returns based on both the NYSE Arca market price and the net asset value for a share. U.S. Pat. Nos. 6,879,964; 7,337,138; 7,720,749;
7,925,573; 8,090,646; and 8,417,623.
For the ETF Shares, the market price is determined by the midpoint of the bid-offer spread as of the closing time of the New York Stock
Exchange (generally 4 p.m., Eastern time). The net asset value is also determined as of the NYSE closing time. For more information about
how the ETF Shares' market prices have compared with their net asset value, visit vanguard.com, select your ETF, and then select the Price
and Performance tab. The ETF premium/discount analysis there shows the percentages of days on which the ETF Shares' market price was
above or below the NAV.
Your Fund’s Performance at a Glance
October 31, 2013, Through April 30, 2014
| Distributions Per Share | ||||
| Starting | Ending | Income | Capital | |
| Share Price | Share Price | Dividends | Gains | |
| Vanguard High Dividend Yield Index Fund | ||||
| Investor Shares | $23.83 | $25.53 | $0.360 | $0.000 |
| ETF Shares | 60.16 | 64.45 | 0.933 | 0.000 |
1

Chairman’s Letter
Dear Shareholder,
For the six months ended April 30, 2014, Vanguard High Dividend Yield Index Fund returned 8.72% for Investor Shares and 8.76% for ETF Shares based on net asset value. The fund met its objective of closely tracking the performance of its target, the FTSE High Dividend Yield Index. The fund’s return was a bit better than that of the broad U.S. stock market and the average return of its peers.
At the period’s close, the 30-day SEC yield of the fund’s Investor Shares was 2.92%, compared with the 1.74% yield of the broad stock market as measured by Investor Shares of Vanguard Total Stock Market Index Fund.
The fund posted positive results in nine of ten market sectors. Technology stocks were the leading contributor to returns.
Recent progress has been sporadic, but stocks continued their climb
For the half year ended April 30, U.S. stocks returned almost 8%, notwithstanding the patches of turbulence the market has encountered in 2014. Technology stocks, for example, turned in a rocky performance amid concerns about pricey valuations. Poor economic data from China and the conflict in Ukraine also unsettled investors.
Global economic and political shifts are, of course, as inevitable as they are unpredictable. Broad diversification remains the best way of managing the risks they pose to your portfolio. As Joe Davis, our chief economist, noted recently, “Having a
2
broader portfolio tends to moderate those individual issues and that’s always, I think, a valuable starting point for investors.”
International stocks, in aggregate, returned nearly 3%, with the developed markets of Europe faring the best. The developed markets of the Pacific region and emerging markets, where China’s weakness was felt most, had negative returns.
Despite low yields, the bond market experienced a surprising rally
Bonds continued to emerge from the struggles that marked much of 2013, when the market was roiled by worries about the prospect of the Federal Reserve reducing its stimulative bond-buying. In January, however, when the Fed actually started to trim purchases, investors seemed to take the news in stride.
The broad U.S. taxable bond market returned 1.74%. The yield of the 10-year Treasury note ended the six months at 2.69%, up from 2.54% on October 31 but down from nearly 3% on December 31. (Bond prices and yields move in opposite directions.)
Municipal bonds returned 4.08% for the six months. Money market and savings accounts posted paltry returns as the Fed’s target for short-term interest rates remained at 0%–0.25%.
| Market Barometer | |||
| Total Returns | |||
| Periods Ended April 30, 2014 | |||
| Six | One | Five Years | |
| Months | Year | (Annualized) | |
| Stocks | |||
| Russell 1000 Index (Large-caps) | 8.25% | 20.81% | 19.52% |
| Russell 2000 Index (Small-caps) | 3.08 | 20.50 | 19.84 |
| Russell 3000 Index (Broad U.S. market) | 7.83 | 20.78 | 19.54 |
| FTSE All-World ex US Index (International) | 2.84 | 9.77 | 13.22 |
| Bonds | |||
| Barclays U.S. Aggregate Bond Index (Broad taxable market) | 1.74% | -0.26% | 4.88% |
| Barclays Municipal Bond Index (Broad tax-exempt market) | 4.08 | 0.50 | 5.54 |
| Citigroup Three-Month U.S. Treasury Bill Index | 0.00 | 0.04 | 0.08 |
| CPI | |||
| Consumer Price Index | 1.51% | 1.95% | 2.14% |
3
International bond markets (as measured by the Barclays Global Aggregate Index ex USD) returned 2.33%.
Technology provided robust returns and took on a larger presence
Technology turned in the best performance among the fund’s ten sectors, returning about 15%. The sector, which encompasses hardware and software makers and computer service companies, became the fund’s largest by market value primarily because Apple was included in the index following the March reconstitution.
(You can read more about the index’s construction and maintenance in the accompanying box.)
The next-best performing sector was utilities, long a dividend-paying mainstay, which returned about 13%. Another relatively small sector, basic materials, was the third-best performer, returning about 12%. Three larger sectors, health care (+11%), oil and gas (+10%), and financials (+9%), performed better than the fund overall.
On the lower end of the return spectrum were industrials (+8%), consumer services (+6%), consumer goods (+3%), and telecommunications (–1%). The two consumer-related sectors were hindered by tepid holiday sales, and by severe winter weather that crimped sales overall across much of the United States.
| Expense Ratios | |||
| Your Fund Compared With Its Peer Group | |||
| Investor | ETF | Peer Group | |
| Shares | Shares | Average | |
| High Dividend Yield Index Fund | 0.19% | 0.10% | 1.22% |
The fund expense ratios shown are from the prospectus dated February 25, 2014, and represent estimated costs for the current fiscal year.
For the six months ended April 30, 2014, the fund’s annualized expense ratios were 0.18% for Investor Shares and 0.10% for ETF Shares. The
peer-group expense ratio is derived from data provided by Lipper, a Thomson Reuters Company, and captures information through year-end
2013.
Peer group: Equity Income Funds.
4
| What’s inside your fund’s benchmark index? | ||
| As an investor in an index fund, you can better understand your investment by knowing how | ||
| the fund’s benchmark index is put together. Your fund’s benchmark, the FTSE High Dividend | ||
| Yield Index, included 390 stocks as of March 31, 2014. But how were those stocks selected? | ||
| In this case, FTSE Group, the index provider, starts with stocks from the FTSE US Total | ||
| Market Index series. Real estate investment trusts (REITs), whose income generally does | ||
| not qualify for favorable tax treatment, are removed, as are stocks that do not pay a dividend. | ||
| The remaining stocks are ranked by forecasted annual dividend yield, and FTSE uses this group | ||
| of stocks to build the index. FTSE selects the highest forecasted dividend payers, cutting off | ||
| the list once the companies included represent 50% of the cumulative market capitalization | ||
| of the group’s publicly traded shares. After the constituents are determined, their weightings | ||
| in the benchmark are determined by each stock’s current market cap. | ||
| The focus on above-average current dividends means that the composition of the index— | ||
| and hence of your fund—differs significantly from that of the broad U.S. stock market. | ||
| In addition, the exposure to technology, which has historically been lower than in the broad | ||
| market, increased recently by about 6 percentage points to almost 16% after the FTSE | ||
| benchmark’s most recent reconstitution in March 2014. (The index is rebalanced twice a | ||
| year.) After the March rebalancing, Apple became the index’s largest weight at almost 6%. | ||
| In July 2012, Apple paid its first dividend in nearly two decades. Since then, the company | ||
| has distributed a dividend every quarter and as of March 31 had a dividend yield of 2.20%. | ||
| Another notable sector is financials, which historically has been a large source of dividends. | ||
| Since the financial crisis in 2008–2009, some financial companies have reduced or eliminated | ||
| their dividend payouts and have retained those earnings to strengthen their balance sheets. | ||
| How your fund’s index compares with a broad U.S. stock index | ||
| FTSE High Dividend | ||
| Equity sector | Yield Index | CRSP US Total Market Index |
| Basic materials | 3.7% | 3.1% |
| Consumer goods | 13.5 | 9.9 |
| Consumer services | 6.3 | 13.2 |
| Financials | 12.9 | 18.7 |
| Health care | 11.4 | 12.2 |
| Industrials | 12.4 | 13.2 |
| Oil & gas | 11.4 | 9.1 |
| Technology | 15.7 | 15.2 |
| Telecommunications | 5.1 | 2.2 |
| Utilities | 7.6 | 3.2 |
| Notes: Sector categories are based on the Industry Classification Benchmark system. Percentages are as of March 31, 2014. | ||
| Source: Vanguard. | ||
5
Taking only a slice of the market can add risk to your portfolio
Like other Vanguard funds devoted to segments of the market, Vanguard High Dividend Yield Index Fund offers you a low-cost, transparent way to gain exposure to a particular group of stocks. These funds can do important work for an investor—filling in a gap in a portfolio, for example.
But keep in mind that by choosing just a slice of the market, you’re also choosing to take on additional risk. Investors who depart from a market-proportional approach by overweighting a certain segment of the market are exposing themselves to more volatility by reducing their portfolio’s diversification.
Diversification is, of course, a powerful strategy for managing risk. Vanguard generally counsels that investors get exposure to large-, mid-, and small-capitalization stocks in a way that approximates the U.S. stock market, because this approach helps ensure that they stay diversified.
As we say in Vanguard’s Principles for Investing Success: “Leadership among market segments changes constantly and rapidly, so investors must diversify both to mitigate losses and to participate in gains.” (You can read more about our investment principles at vanguard.com/research.)
You can achieve balanced market-cap representation through a total-market stock fund, or you can assemble segment-specific funds in a way that mirrors the overall market. Either way, appropriate diversification should remain paramount.
As always, thank you for investing with Vanguard.
Sincerely,

F. William McNabb III
Chairman and Chief Executive Officer
May 13, 2014
6
High Dividend Yield Index Fund
Fund Profile
As of April 30, 2014
| Share-Class Characteristics | ||
| Investor | ETF | |
| Shares | Shares | |
| Ticker Symbol | VHDYX | VYM |
| Expense Ratio1 | 0.19% | 0.10% |
| 30-Day SEC Yield | 2.92% | 3.00% |
| Portfolio Characteristics | |||
| DJ | |||
| U.S. | |||
| FTSE High | Total | ||
| Dividend | Market | ||
| Yield | FA | ||
| Fund | Index | Index | |
| Number of Stocks | 391 | 390 | 3,664 |
| Median Market Cap | $132.7B | $132.7B | $47.3B |
| Price/Earnings Ratio | 16.2x | 16.2x | 19.7x |
| Price/Book Ratio | 2.6x | 2.6x | 2.6x |
| Return on Equity | 21.0% | 21.0% | 17.4% |
| Earnings Growth | |||
| Rate | 10.3% | 10.3% | 12.4% |
| Dividend Yield | 3.1% | 3.1% | 1.9% |
| Foreign Holdings | 0.0% | 0.0% | 0.0% |
| Turnover Rate | |||
| (Annualized) | 13% | — | — |
| Short-Term Reserves | 0.0% | — | — |
| Volatility Measures | ||
| FTSE High | DJ | |
| Dividend | U.S. Total | |
| Yield | Market | |
| Index | FA Index | |
| R-Squared | 1.00 | 0.84 |
| Beta | 1.00 | 0.73 |
| These measures show the degree and timing of the fund’s fluctuations compared with the indexes over 36 months. | ||
| Ten Largest Holdings (% of total net assets) | ||
| Apple Inc. | Computer Hardware | 6.4% |
| Exxon Mobil Corp. | Integrated Oil & Gas | 5.4 |
| Microsoft Corp. | Software | 3.7 |
| Johnson & Johnson | Pharmaceuticals | 3.4 |
| General Electric Co. | Diversified Industrials | 3.3 |
| Wells Fargo & Co. | Banks | 3.2 |
| Chevron Corp. | Integrated Oil & Gas | 2.9 |
| Procter & Gamble Co. | Nondurable | |
| Household Products | 2.7 | |
| JPMorgan Chase & Co. | Banks | 2.6 |
| Pfizer Inc. | Pharmaceuticals | 2.4 |
| Top Ten | 36.0% | |
| The holdings listed exclude any temporary cash investments and equity index products. | ||
Investment Focus
1 The expense ratios shown are from the prospectus dated February 25, 2014, and represent estimated costs for the current fiscal year. For the six months ended April 30, 2014, the annualized expense ratios were 0.18% for Investor Shares and 0.10% for ETF Shares.
7
High Dividend Yield Index Fund
| Sector Diversification (% of equity exposure) | |||
| DJ | |||
| U.S. | |||
| FTSE High | Total | ||
| Dividend | Market | ||
| Yield | FA | ||
| Fund | Index | Index | |
| Basic Materials | 3.7% | 3.7% | 3.1% |
| Consumer Goods | 13.6 | 13.6 | 10.1 |
| Consumer Services | 6.2 | 6.2 | 12.9 |
| Financials | 12.3 | 12.3 | 18.3 |
| Health Care | 11.3 | 11.3 | 12.1 |
| Industrials | 12.4 | 12.4 | 13.2 |
| Oil & Gas | 11.7 | 11.7 | 9.7 |
| Technology | 16.0 | 16.0 | 14.9 |
| Telecommunications | 5.0 | 5.0 | 2.4 |
| Utilities | 7.8 | 7.8 | 3.3 |
8
High Dividend Yield Index Fund
Performance Summary
All of the returns in this report represent past performance, which is not a guarantee of future results that may be achieved by the fund. (Current performance may be lower or higher than the performance data cited. For performance data current to the most recent month-end, visit our website at vanguard.com/performance.) Note, too, that both investment returns and principal value can fluctuate widely, so an investor’s shares, when sold, could be worth more or less than their original cost. The returns shown do not reflect taxes that a shareholder would pay on fund distributions or on the sale of fund shares.
Fiscal-Year Total Returns (%): November 16, 2006, Through April 30, 2014
Average Annual Total Returns: Periods Ended March 31, 2014
This table presents returns through the latest calendar quarter—rather than through the end of the fiscal period.
Securities and Exchange Commission rules require that we provide this information.
| Inception | One | Five | Since | |
| Date | Year | Years | Inception | |
| Investor Shares | 11/16/2006 | 18.56% | 21.63% | 6.18% |
| ETF Shares | 11/10/2006 | |||
| Market Price | 18.67 | 21.80 | 6.42 | |
| Net Asset Value | 18.65 | 21.76 | 6.42 |
See Financial Highlights for dividend and capital gains information.
9
High Dividend Yield Index Fund
Financial Statements (unaudited)
Statement of Net Assets
As of April 30, 2014
The fund reports a complete list of its holdings in regulatory filings four times in each fiscal year, at the quarter-ends. For the second and fourth fiscal quarters, the lists appear in the fund’s semiannual and annual reports to shareholders. For the first and third fiscal quarters, the fund files the lists with the Securities and Exchange Commission on Form N-Q. Shareholders can look up the fund’s Forms N-Q on the SEC’s website at sec.gov. Forms N-Q may also be reviewed and copied at the SEC’s Public Reference Room (see the back cover of this report for further information).
| Market | |||
| Value | |||
| Shares | ($000) | ||
| Common Stocks (99.7%)1 | |||
| Basic Materials (3.7%) | |||
| EI du Pont de Nemours | |||
| & Co. | 1,260,425 | 84,852 | |
| Dow Chemical Co. | 1,659,705 | 82,819 | |
| LyondellBasell Industries | |||
| NV Class A | 629,639 | 58,242 | |
| Freeport-McMoRan | |||
| Copper & Gold Inc. | 1,423,428 | 48,923 | |
| Air Products & | |||
| Chemicals Inc. | 290,320 | 34,118 | |
| International Paper Co. | 601,865 | 28,077 | |
| Nucor Corp. | 434,106 | 22,465 | |
| Newmont Mining Corp. | 671,906 | 16,683 | |
| RPM International Inc. | 181,985 | 7,763 | |
| Avery Dennison Corp. | 132,515 | 6,448 | |
| Huntsman Corp. | 220,330 | 5,519 | |
| Steel Dynamics Inc. | 285,748 | 5,221 | |
| Compass Minerals | |||
| International Inc. | 45,578 | 4,175 | |
| ^ | Cliffs Natural | ||
| Resources Inc. | 209,739 | 3,717 | |
| Olin Corp. | 104,947 | 2,949 | |
| Commercial Metals Co. | 142,788 | 2,742 | |
| Tronox Ltd. Class A | 85,455 | 2,094 | |
| Innophos Holdings Inc. | 29,660 | 1,674 | |
| A Schulman Inc. | 40,050 | 1,439 | |
| Koppers Holdings Inc. | 24,107 | 1,029 | |
| 420,949 | |||
| Consumer Goods (13.6%) | |||
| Procter & Gamble Co. | 3,727,629 | 307,716 | |
| Coca-Cola Co. | 5,802,281 | 236,675 | |
| Philip Morris | |||
| International Inc. | 2,173,874 | 185,714 | |
| PepsiCo Inc. | 2,087,852 | 179,326 | |
| Altria Group Inc. | 2,756,293 | 110,555 | |
| Ford Motor Co. | 5,281,840 | 85,302 | |
| Kimberly-Clark Corp. | 522,249 | 58,622 | |
| Kraft Foods Group Inc. | 807,398 | 45,909 |
| General Mills Inc. | 856,545 | 45,414 |
| Lorillard Inc. | 496,797 | 29,520 |
| Reynolds American Inc. | 426,869 | 24,088 |
| Kellogg Co. | 337,819 | 22,576 |
| Genuine Parts Co. | 213,365 | 18,588 |
| Stanley Black & Decker Inc. | 212,919 | 18,288 |
| Mattel Inc. | 464,248 | 18,205 |
| ConAgra Foods Inc. | 578,573 | 17,652 |
| Coach Inc. | 380,497 | 16,989 |
| Clorox Co. | 177,937 | 16,139 |
| Dr Pepper Snapple | ||
| Group Inc. | 270,434 | 14,987 |
| Autoliv Inc. | 130,730 | 13,332 |
| Campbell Soup Co. | 249,011 | 11,327 |
| Molson Coors Brewing | ||
| Co. Class B | 184,093 | 11,040 |
| Hasbro Inc. | 159,180 | 8,796 |
| Ingredion Inc. | 92,977 | 6,550 |
| Leggett & Platt Inc. | 191,203 | 6,283 |
| Tupperware Brands Corp. | 63,194 | 5,366 |
| Flowers Foods Inc. | 239,143 | 4,907 |
| Scotts Miracle-Gro | ||
| Co. Class A | 49,041 | 3,002 |
| B&G Foods Inc. | 72,252 | 2,370 |
| HNI Corp. | 58,956 | 2,077 |
| Cosan Ltd. | 170,329 | 2,066 |
| Steelcase Inc. Class A | 125,183 | 2,063 |
| Vector Group Ltd. | 92,610 | 1,973 |
| Universal Corp. | 31,602 | 1,724 |
| Schweitzer-Mauduit | ||
| International Inc. | 39,360 | 1,718 |
| Snyders-Lance Inc. | 62,207 | 1,652 |
| MDC Holdings Inc. | 49,739 | 1,373 |
| Knoll Inc. | 57,260 | 1,042 |
| Superior Industries | ||
| International Inc. | 30,443 | 644 |
| National Presto Industries Inc. | 6,985 | 505 |
| 1,542,075 |
10
High Dividend Yield Index Fund
| Market | ||
| Value | ||
| Shares | ($000) | |
| Consumer Services (6.2%) | ||
| Wal-Mart Stores Inc. | 2,224,395 | 177,307 |
| McDonald’s Corp. | 1,357,499 | 137,623 |
| Time Warner Cable Inc. | 381,130 | 53,915 |
| Target Corp. | 865,565 | 53,449 |
| Las Vegas Sands Corp. | 557,216 | 44,092 |
| Sysco Corp. | 797,685 | 29,060 |
| Omnicom Group Inc. | 354,433 | 23,988 |
| Wynn Resorts Ltd. | 111,615 | 22,757 |
| Carnival Corp. | 571,295 | 22,458 |
| Kohl’s Corp. | 273,007 | 14,958 |
| Staples Inc. | 896,207 | 11,203 |
| Safeway Inc. | 315,755 | 10,755 |
| H&R Block Inc. | 371,719 | 10,564 |
| Best Buy Co. Inc. | 379,808 | 9,848 |
| Darden Restaurants Inc. | 177,851 | 8,841 |
| Gannett Co. Inc. | 313,861 | 8,528 |
| GameStop Corp. Class A | 158,842 | 6,303 |
| KAR Auction Services Inc. | 187,599 | 5,587 |
| Six Flags Entertainment | ||
| Corp. | 130,598 | 5,242 |
| Cablevision Systems Corp. | ||
| Class A | 256,599 | 4,285 |
| Cinemark Holdings Inc. | 143,152 | 4,240 |
| International Game | ||
| Technology | 337,628 | 4,237 |
| Cracker Barrel Old Country | ||
| Store Inc. | 30,349 | 2,875 |
| American Eagle | ||
| Outfitters Inc. | 248,415 | 2,872 |
| Hillenbrand Inc. | 85,726 | 2,606 |
| Guess? Inc. | 87,787 | 2,362 |
| Meredith Corp. | 49,581 | 2,185 |
| Rent-A-Center Inc. | 73,440 | 2,145 |
| Regal Entertainment | ||
| Group Class A | 110,857 | 2,084 |
| DineEquity Inc. | 23,748 | 1,800 |
| Bob Evans Farms Inc. | 36,084 | 1,691 |
| ^ Arcos Dorados Holdings | ||
| Inc. Class A | 176,507 | 1,608 |
| Copa Holdings SA Class A | 11,382 | 1,540 |
| Buckle Inc. | 32,656 | 1,535 |
| National CineMedia Inc. | 82,163 | 1,248 |
| Cato Corp. Class A | 32,020 | 912 |
| Weis Markets Inc. | 17,249 | 795 |
| CTC Media Inc. | 82,146 | 712 |
| Stage Stores Inc. | 34,878 | 669 |
| Harte-Hanks Inc. | 54,518 | 438 |
| Speedway Motorsports Inc. | 19,304 | 351 |
| Schawk Inc. Class A | 14,333 | 287 |
| 699,955 | ||
| Financials (12.2%) | ||
| Wells Fargo & Co. | 7,253,154 | 360,047 |
| JPMorgan Chase & Co. | 5,210,790 | 291,700 |
| PNC Financial Services | ||
| Group Inc. | 728,940 | 61,260 |
| BlackRock Inc. | 174,386 | 52,490 |
| Prudential Financial Inc. | 636,362 | 51,342 |
| ACE Ltd. | 465,059 | 47,585 |
| Travelers Cos. Inc. | 484,824 | 43,915 |
| Aflac Inc. | 604,891 | 37,939 |
| Marsh & McLennan | ||
| Cos. Inc. | 756,104 | 37,283 |
| BB&T Corp. | 965,380 | 36,038 |
| CME Group Inc. | 432,516 | 30,445 |
| Fifth Third Bancorp | 1,172,339 | 24,162 |
| Invesco Ltd. | 593,729 | 20,905 |
| M&T Bank Corp. | 156,861 | 19,139 |
| Principal Financial | ||
| Group Inc. | 404,538 | 18,949 |
| SLM Corp. | 587,681 | 15,133 |
| Western Union Co. | 763,795 | 12,121 |
| Fidelity National Financial | ||
| Inc. Class A | 376,400 | 12,113 |
| Huntington | ||
| Bancshares Inc. | 1,150,954 | 10,543 |
| Willis Group Holdings plc | 243,909 | 9,998 |
| Arthur J Gallagher & Co. | 215,372 | 9,696 |
| Cincinnati Financial Corp. | 194,427 | 9,476 |
| New York Community | ||
| Bancorp Inc. | 579,054 | 8,923 |
| PartnerRe Ltd. | 70,761 | 7,458 |
| Lazard Ltd. Class A | 140,681 | 6,619 |
| Axis Capital Holdings Ltd. | 144,466 | 6,609 |
| People’s United | ||
| Financial Inc. | 425,548 | 6,077 |
| Cullen/Frost Bankers Inc. | 71,672 | 5,476 |
| Old Republic International | ||
| Corp. | 329,786 | 5,461 |
| PacWest Bancorp | 132,313 | 5,209 |
| FirstMerit Corp. | 222,776 | 4,320 |
| BankUnited Inc. | 127,362 | 4,202 |
| First Niagara Financial | ||
| Group Inc. | 462,387 | 4,124 |
| Validus Holdings Ltd. | 104,863 | 3,887 |
| ProAssurance Corp. | 84,180 | 3,823 |
| Hancock Holding Co. | 112,427 | 3,792 |
| Umpqua Holdings Corp. | 216,255 | 3,596 |
| Federated Investors Inc. | ||
| Class B | 124,033 | 3,540 |
| Hanover Insurance | ||
| Group Inc. | 60,310 | 3,525 |
| Bank of Hawaii Corp. | 59,156 | 3,264 |
| Fulton Financial Corp. | 267,561 | 3,262 |
| Janus Capital Group Inc. | 258,484 | 3,135 |
| Endurance Specialty | ||
| Holdings Ltd. | 56,565 | 2,875 |
| FNB Corp. | 215,081 | 2,676 |
| Glacier Bancorp Inc. | 102,010 | 2,618 |
| Valley National Bancorp | 260,140 | 2,607 |
| Susquehanna | ||
| Bancshares Inc. | 246,409 | 2,553 |
11
High Dividend Yield Index Fund
| Market | |||
| Value | |||
| Shares | ($000) | ||
| Capitol Federal Financial Inc. | 199,544 | 2,403 | |
| United Bankshares Inc. | 79,879 | 2,336 | |
| Iberiabank Corp. | 33,494 | 2,107 | |
| Kemper Corp. | 53,187 | 2,096 | |
| Home Loan Servicing | |||
| Solutions Ltd. | 93,810 | 2,078 | |
| Old National Bancorp. | 139,610 | 1,971 | |
| Trustmark Corp. | 83,987 | 1,921 | |
| Community Bank | |||
| System Inc. | 50,140 | 1,865 | |
| BOK Financial Corp. | 28,122 | 1,840 | |
| Mercury General Corp. | 37,828 | 1,810 | |
| Greenhill & Co. Inc. | 35,938 | 1,802 | |
| CVB Financial Corp. | 121,018 | 1,750 | |
| Westamerica | |||
| Bancorporation | 33,592 | 1,707 | |
| Northwest Bancshares Inc. | 127,705 | 1,697 | |
| Horace Mann Educators | |||
| Corp. | 54,958 | 1,653 | |
| National Penn | |||
| Bancshares Inc. | 155,474 | 1,519 | |
| CNA Financial Corp. | 36,910 | 1,511 | |
| Provident Financial | |||
| Services Inc. | 78,842 | 1,370 | |
| Boston Private Financial | |||
| Holdings Inc. | 108,650 | 1,359 | |
| NBT Bancorp Inc. | 59,396 | 1,345 | |
| American National | |||
| Insurance Co. | 11,699 | 1,315 | |
| First Financial Bancorp | 78,122 | 1,265 | |
| Park National Corp. | 16,657 | 1,208 | |
| * | Blackhawk Network | ||
| Holdings Inc. Class B | 51,668 | 1,190 | |
| Renasant Corp. | 42,743 | 1,163 | |
| WesBanco Inc. | 38,206 | 1,155 | |
| Chemical Financial Corp. | 40,575 | 1,139 | |
| Safety Insurance Group Inc. | 20,852 | 1,120 | |
| Independent Bank Corp. | 29,498 | 1,095 | |
| BGC Partners Inc. Class A | 149,175 | 1,070 | |
| First Commonwealth | |||
| Financial Corp. | 116,817 | 1,003 | |
| Oritani Financial Corp. | 61,979 | 919 | |
| City Holding Co. | 20,198 | 868 | |
| Brookline Bancorp Inc. | 94,781 | 861 | |
| Maiden Holdings Ltd. | 72,715 | 858 | |
| S&T Bancorp Inc. | 36,869 | 858 | |
| United Fire Group Inc. | 29,482 | 820 | |
| Sandy Spring Bancorp Inc. | 33,091 | 796 | |
| TrustCo Bank Corp. NY | 119,686 | 791 | |
| Simmons First National | |||
| Corp. Class A | 21,733 | 786 | |
| Flushing Financial Corp. | 39,159 | 753 | |
| Tompkins Financial Corp. | 14,233 | 671 | |
| Bancfirst Corp. | 11,347 | 661 | |
| Washington Trust | |||
| Bancorp Inc. | 19,108 | 653 |
| Dime Community | ||
| Bancshares Inc. | 39,532 | 644 |
| Community Trust | ||
| Bancorp Inc. | 16,829 | 620 |
| 1st Source Corp. | 19,953 | 588 |
| Stock Yards Bancorp Inc. | 17,394 | 513 |
| First Financial Corp. | 14,038 | 449 |
| GFI Group Inc. | 89,147 | 332 |
| Republic Bancorp Inc. | ||
| Class A | 12,974 | 312 |
| Baldwin & Lyons Inc. | 9,084 | 236 |
| IntercontinentalExchange | ||
| Group Inc. | 34 | 7 |
| 1,384,769 | ||
| Health Care (11.2%) | ||
| Johnson & Johnson | 3,766,045 | 381,463 |
| Pfizer Inc. | 8,753,202 | 273,800 |
| Merck & Co. Inc. | 4,013,090 | 235,006 |
| Bristol-Myers Squibb Co. | 2,263,735 | 113,390 |
| AbbVie Inc. | 2,156,312 | 112,301 |
| Eli Lilly & Co. | 1,384,615 | 81,831 |
| Baxter International Inc. | 743,267 | 54,102 |
| Quest Diagnostics Inc. | 199,387 | 11,152 |
| Healthcare Services | ||
| Group Inc. | 95,774 | 2,787 |
| Owens & Minor Inc. | 81,701 | 2,740 |
| PDL BioPharma Inc. | 220,217 | 1,870 |
| Meridian Bioscience Inc. | 55,939 | 1,117 |
| 1,271,559 | ||
| Industrials (12.4%) | ||
| General Electric Co. | 13,758,829 | 369,975 |
| 3M Co. | 909,632 | 126,521 |
| Boeing Co. | 927,739 | 119,697 |
| United Parcel Service Inc. | ||
| Class B | 981,606 | 96,688 |
| Caterpillar Inc. | 872,701 | 91,983 |
| Lockheed Martin Corp. | 443,754 | 72,838 |
| Emerson Electric Co. | 965,443 | 65,824 |
| Automatic Data | ||
| Processing Inc. | 660,261 | 51,474 |
| General Dynamics Corp. | 445,920 | 48,806 |
| Eaton Corp. plc | 648,210 | 47,086 |
| Raytheon Co. | 431,351 | 41,185 |
| Norfolk Southern Corp. | 423,674 | 40,050 |
| PACCAR Inc. | 484,850 | 31,021 |
| Waste Management Inc. | 640,570 | 28,473 |
| Xerox Corp. | 1,628,879 | 19,693 |
| Paychex Inc. | 448,660 | 18,758 |
| Republic Services Inc. | ||
| Class A | 410,616 | 14,408 |
| CH Robinson | ||
| Worldwide Inc. | 203,537 | 11,988 |
| MeadWestvaco Corp. | 239,132 | 9,343 |
| Packaging Corp. of America | 135,093 | 9,001 |
| ADT Corp. | 251,100 | 7,593 |
| Iron Mountain Inc. | 230,095 | 6,544 |
12
High Dividend Yield Index Fund
| Market | ||
| Value | ||
| Shares | ($000) | |
| Broadridge Financial | ||
| Solutions Inc. | 163,430 | 6,266 |
| Bemis Co. Inc. | 139,607 | 5,618 |
| Sonoco Products Co. | 130,170 | 5,478 |
| RR Donnelley & Sons Co. | 268,479 | 4,725 |
| Macquarie Infrastructure | ||
| Co. LLC | 75,433 | 4,339 |
| National Instruments Corp. | 132,649 | 3,623 |
| GATX Corp. | 53,001 | 3,478 |
| Teekay Corp. | 55,845 | 3,133 |
| Covanta Holding Corp. | 145,476 | 2,684 |
| Harsco Corp. | 110,288 | 2,639 |
| MSA Safety Inc. | 42,612 | 2,248 |
| ABM Industries Inc. | 73,723 | 1,997 |
| TAL International Group Inc. 46,578 | 1,965 | |
| Greif Inc. Class A | 34,804 | 1,886 |
| Sturm Ruger & Co. Inc. | 26,326 | 1,694 |
| Aircastle Ltd. | 91,360 | 1,605 |
| Brady Corp. Class A | 59,038 | 1,523 |
| Ship Finance | ||
| International Ltd. | 80,065 | 1,412 |
| Seaspan Corp. Class A | 64,222 | 1,385 |
| Matson Inc. | 54,089 | 1,281 |
| Otter Tail Corp. | 43,002 | 1,260 |
| Textainer Group | ||
| Holdings Ltd. | 28,874 | 1,135 |
| Acacia Research Corp. | 68,072 | 1,092 |
| Schnitzer Steel | ||
| Industries Inc. | 35,368 | 993 |
| ManTech International Corp. | ||
| Class A | 32,452 | 968 |
| AVX Corp. | 71,866 | 959 |
| Nordic American | ||
| Tankers Ltd. | 110,736 | 956 |
| McGrath RentCorp | 28,278 | 893 |
| Navios Maritime | ||
| Holdings Inc. | 98,505 | 775 |
| Daktronics Inc. | 58,516 | 762 |
| American Science & | ||
| Engineering Inc. | 11,273 | 758 |
| Landauer Inc. | 12,684 | 548 |
| Ennis Inc. | 35,094 | 525 |
| Electro Rent Corp. | 26,756 | 432 |
| 1,399,984 | ||
| Oil & Gas (11.7%) | ||
| Exxon Mobil Corp. | 5,925,851 | 606,866 |
| Chevron Corp. | 2,618,071 | 328,620 |
| ConocoPhillips | 1,665,610 | 123,771 |
| Occidental | ||
| Petroleum Corp. | 1,089,911 | 104,359 |
| Williams Cos. Inc. | 934,058 | 39,389 |
| Kinder Morgan Inc. | 909,121 | 29,692 |
| Ensco plc Class A | 320,130 | 16,151 |
| Helmerich & Payne Inc. | 140,045 | 15,216 |
| HollyFrontier Corp. | 273,979 | 14,409 |
| Noble Corp. plc | 345,890 | 10,657 |
| OGE Energy Corp. | 269,088 | 10,045 | |
| ^ | Diamond Offshore | ||
| Drilling Inc. | 94,681 | 5,171 | |
| Targa Resources Corp. | 38,278 | 4,134 | |
| PBF Energy Inc. Class A | 95,614 | 2,943 | |
| Western Refining Inc. | 65,114 | 2,832 | |
| ^ | EXCO Resources Inc. | 276,791 | 1,758 |
| Delek US Holdings Inc. | 49,453 | 1,582 | |
| CVR Energy Inc. | 23,749 | 1,167 | |
| W&T Offshore Inc. | 40,700 | 781 | |
| Gulfmark Offshore Inc. | 8,011 | 361 | |
| 1,319,904 | |||
| Technology (15.9%) | |||
| Apple Inc. | 1,223,211 | 721,804 | |
| Microsoft Corp. | 10,280,861 | 415,347 | |
| Intel Corp. | 6,851,321 | 182,862 | |
| Cisco Systems Inc. | 7,064,291 | 163,256 | |
| Texas Instruments Inc. | 1,486,925 | 67,581 | |
| Corning Inc. | 1,909,317 | 39,924 | |
| Applied Materials Inc. | 1,645,939 | 31,372 | |
| Seagate Technology plc | 429,158 | 22,565 | |
| Analog Devices Inc. | 429,608 | 22,034 | |
| Symantec Corp. | 951,167 | 19,290 | |
| KLA-Tencor Corp. | 227,411 | 14,552 | |
| Linear Technology Corp. | 323,422 | 14,392 | |
| CA Inc. | 460,388 | 13,876 | |
| Microchip Technology Inc. | 273,196 | 12,988 | |
| Maxim Integrated | |||
| Products Inc. | 390,848 | 12,679 | |
| Harris Corp. | 146,721 | 10,787 | |
| Garmin Ltd. | 150,200 | 8,576 | |
| Pitney Bowes Inc. | 273,801 | 7,338 | |
| Lexmark International Inc. | |||
| Class A | 86,296 | 3,711 | |
| Leidos Holdings Inc. | 96,951 | 3,610 | |
| Diebold Inc. | 87,254 | 3,282 | |
| j2 Global Inc. | 63,453 | 2,942 | |
| Compuware Corp. | 267,554 | 2,772 | |
| Cypress Semiconductor | |||
| Corp. | 210,876 | 1,997 | |
| Intersil Corp. Class A | 144,148 | 1,779 | |
| Computer Programs & | |||
| Systems Inc. | 14,319 | 904 | |
| Quality Systems Inc. | 60,028 | 887 | |
| Brooks Automation Inc. | 83,826 | 857 | |
| Comtech | |||
| Telecommunications Corp. | 21,687 | 688 | |
| Epiq Systems Inc. | 38,380 | 491 | |
| 1,805,143 | |||
| Telecommunications (5.0%) | |||
| Verizon | |||
| Communications Inc. | 5,665,827 | 264,764 | |
| AT&T Inc. | 7,166,671 | 255,850 | |
| CenturyLink Inc. | 792,736 | 27,674 | |
| Frontier Communications | |||
| Corp. | 1,355,848 | 8,067 | |
13
High Dividend Yield Index Fund
| Market | ||
| Value | ||
| Shares | ($000) | |
| Windstream Holdings Inc. | 806,886 | 7,319 |
| Consolidated | ||
| Communications | ||
| Holdings Inc. | 54,657 | 1,089 |
| EarthLink Holdings Corp. | 112,024 | 382 |
| NTELOS Holdings Corp. | 22,676 | 313 |
| 565,458 | ||
| Utilities (7.8%) | ||
| Duke Energy Corp. | 968,227 | 72,123 |
| NextEra Energy Inc. | 596,831 | 59,594 |
| Dominion Resources Inc. | 792,257 | 57,470 |
| Southern Co. | 1,209,269 | 55,421 |
| Exelon Corp. | 1,174,778 | 41,152 |
| Spectra Energy Corp. | 913,441 | 36,273 |
| American Electric Power | ||
| Co. Inc. | 667,625 | 35,925 |
| Sempra Energy | 333,687 | 32,905 |
| PPL Corp. | 866,431 | 28,887 |
| PG&E Corp. | 627,727 | 28,612 |
| Public Service Enterprise | ||
| Group Inc. | 697,547 | 28,579 |
| Edison International | 446,926 | 25,278 |
| Consolidated Edison Inc. | 398,231 | 23,109 |
| Xcel Energy Inc. | 681,566 | 21,722 |
| Northeast Utilities | 428,764 | 20,263 |
| FirstEnergy Corp. | 573,180 | 19,345 |
| DTE Energy Co. | 242,345 | 18,937 |
| ONEOK Inc. | 280,481 | 17,732 |
| Entergy Corp. | 244,299 | 17,712 |
| NiSource Inc. | 424,626 | 15,422 |
| Wisconsin Energy Corp. | 312,098 | 15,131 |
| CenterPoint Energy Inc. | 585,773 | 14,504 |
| Ameren Corp. | 331,303 | 13,686 |
| American Water Works | ||
| Co. Inc. | 241,891 | 11,013 |
| CMS Energy Corp. | 363,308 | 11,012 |
| SCANA Corp. | 171,983 | 9,232 |
| Pepco Holdings Inc. | 340,094 | 9,101 |
| Alliant Energy Corp. | 151,137 | 8,838 |
| Pinnacle West Capital Corp. | 150,213 | 8,404 |
| AGL Resources Inc. | 151,307 | 8,171 |
| UGI Corp. | 156,120 | 7,289 |
| Atmos Energy Corp. | 135,815 | 6,932 |
| Integrys Energy Group Inc. | 108,525 | 6,650 |
| Westar Energy Inc. Class A | 172,996 | 6,207 |
| Questar Corp. | 241,181 | 5,856 |
| Great Plains Energy Inc. | 200,129 | 5,369 |
| TECO Energy Inc. | 298,316 | 5,358 |
| Aqua America Inc. | 196,259 | 4,924 |
| Vectren Corp. | 112,043 | 4,546 |
| Cleco Corp. | 82,761 | 4,349 |
| IDACORP Inc. | 68,419 | 3,841 |
| Piedmont Natural Gas | ||
| Co. Inc. | 106,560 | 3,814 |
| Portland General Electric Co. | 106,019 | 3,548 |
| Black Hills Corp. | 60,889 | 3,516 |
| Southwest Gas Corp. | 63,453 | 3,491 | ||
| UNS Energy Corp. | 56,562 | 3,397 | ||
| Hawaiian Electric | ||||
| Industries Inc. | 134,995 | 3,239 | ||
| PNM Resources Inc. | 109,272 | 3,025 | ||
| ALLETE Inc. | 57,378 | 2,970 | ||
| New Jersey Resources Corp. | 57,831 | 2,876 | ||
| WGL Holdings Inc. | 71,009 | 2,825 | ||
| UIL Holdings Corp. | 75,940 | 2,789 | ||
| Avista Corp. | 82,075 | 2,639 | ||
| NorthWestern Corp. | 52,823 | 2,556 | ||
| South Jersey Industries Inc. | 43,902 | 2,522 | ||
| El Paso Electric Co. | 55,371 | 2,094 | ||
| Laclede Group Inc. | 42,306 | 2,006 | ||
| MGE Energy Inc. | 46,871 | 1,791 | ||
| Northwest Natural Gas Co. | 36,621 | 1,621 | ||
| American States Water Co. | 52,371 | 1,590 | ||
| California Water Service | ||||
| Group | 64,390 | 1,449 | ||
| Empire District Electric Co. | 58,408 | 1,420 | ||
| SJW Corp. | 22,362 | 609 | ||
| 882,661 | ||||
| Total Common Stocks | ||||
| (Cost $9,098,086) | 11,292,457 | |||
| Temporary Cash Investments (0.4%)1 | ||||
| Money Market Fund (0.4%) | ||||
| 2,3 | Vanguard Market Liquidity | |||
| Fund, 0.124% | 46,686,609 | 46,687 | ||
| Face | ||||
| Amount | ||||
| ($000) | ||||
| U.S. Government and Agency Obligations (0.0%) | ||||
| 4,5 | Federal Home Loan | |||
| Bank Discount Notes, | ||||
| 0.120%, 5/28/14 | 800 | 800 | ||
| 4,5 | Federal Home Loan | |||
| Bank Discount Notes, | ||||
| 0.077%, 6/13/14 | 700 | 700 | ||
| 4,5 | Federal Home Loan | |||
| Bank Discount Notes, | ||||
| 0.110%, 7/30/14 | 400 | 400 | ||
| 1,900 | ||||
| Total Temporary Cash Investments | ||||
| (Cost $48,586) | 48,587 | |||
| Total Investments (100.1%) | ||||
| (Cost $9,146,672) | 11,341,044 | |||
| Other Assets and Liabilities (-0.1%) | ||||
| Other Assets | 28,957 | |||
| Liabilities3 | (38,377) | |||
| (9,420) | ||||
| Net Assets (100%) | 11,331,624 | |||
14
High Dividend Yield Index Fund
| At April 30, 2014, net assets consisted of: | |
| Amount | |
| ($000) | |
| Paid-in Capital | 9,149,630 |
| Undistributed Net Investment Income | 25,493 |
| Accumulated Net Realized Losses | (38,354) |
| Unrealized Appreciation (Depreciation) | |
| Investment Securities | 2,194,372 |
| Futures Contracts | 483 |
| Net Assets | 11,331,624 |
| Investor Shares—Net Assets | |
| Applicable to 135,163,778 outstanding | |
| $.001 par value shares of beneficial | |
| interest (unlimited authorization) | 3,450,312 |
| Net Asset Value Per Share— | |
| Investor Shares | $25.53 |
| ETF Shares—Net Assets | |
| Applicable to 122,287,156 outstanding | |
| $.001 par value shares of beneficial | |
| interest (unlimited authorization) | 7,881,312 |
| Net Asset Value Per Share— | |
| ETF Shares | $64.45 |
See Note A in Notes to Financial Statements.
^ Includes partial security positions on loan to broker-dealers. The total value of securities on loan is $4,367,000.
* Non-income-producing security.
1 The fund invests a portion of its cash reserves in equity markets through the use of index futures contracts. After giving effect to futures
investments, the fund’s effective common stock and temporary cash investment positions represent 100.0% and 0.1%, respectively, of
net assets.
2 Affiliated money market fund available only to Vanguard funds and certain trusts and accounts managed by Vanguard. Rate shown is the
7-day yield.
3 Includes $4,542,000 of collateral received for securities on loan.
4 The issuer operates under a congressional charter; its securities are generally neither guaranteed by the U.S. Treasury nor backed by the
full faith and credit of the U.S. government.
5 Securities with a value of $1,700,000 have been segregated as initial margin for open futures contracts.
See accompanying Notes, which are an integral part of the Financial Statements.
15
High Dividend Yield Index Fund
Statement of Operations
| Six Months Ended | |
| April 30, 2014 | |
| ($000) | |
| Investment Income | |
| Income | |
| Dividends | 164,850 |
| Interest1 | 17 |
| Securities Lending | 24 |
| Total Income | 164,891 |
| Expenses | |
| The Vanguard Group—Note B | |
| Investment Advisory Services | 605 |
| Management and Administrative—Investor Shares | 2,334 |
| Management and Administrative—ETF Shares | 2,199 |
| Marketing and Distribution—Investor Shares | 281 |
| Marketing and Distribution—ETF Shares | 753 |
| Custodian Fees | 119 |
| Shareholders’ Reports—Investor Shares | 15 |
| Shareholders’ Reports—ETF Shares | 161 |
| Trustees’ Fees and Expenses | 3 |
| Total Expenses | 6,470 |
| Net Investment Income | 158,421 |
| Realized Net Gain (Loss) | |
| Investment Securities Sold | 255,489 |
| Futures Contracts | 3,447 |
| Realized Net Gain (Loss) | 258,936 |
| Change in Unrealized Appreciation (Depreciation) | |
| Investment Securities | 479,236 |
| Futures Contracts | (243) |
| Change in Unrealized Appreciation (Depreciation) | 478,993 |
| Net Increase (Decrease) in Net Assets Resulting from Operations | 896,350 |
| 1 Interest income from an affiliated company of the fund was $16,000. | |
See accompanying Notes, which are an integral part of the Financial Statements.
16
High Dividend Yield Index Fund
Statement of Changes in Net Assets
| Six Months Ended | Year Ended | |
| April 30, | October 31, | |
| 2014 | 2013 | |
| ($000) | ($000) | |
| Increase (Decrease) in Net Assets | ||
| Operations | ||
| Net Investment Income | 158,421 | 250,716 |
| Realized Net Gain (Loss) | 258,936 | 390,351 |
| Change in Unrealized Appreciation (Depreciation) | 478,993 | 1,046,139 |
| Net Increase (Decrease) in Net Assets Resulting from Operations | 896,350 | 1,687,206 |
| Distributions | ||
| Net Investment Income | ||
| Investor Shares | (46,571) | (69,438) |
| ETF Shares | (110,783) | (171,585) |
| Realized Capital Gain | ||
| Investor Shares | — | — |
| ETF Shares | — | — |
| Total Distributions | (157,354) | (241,023) |
| Capital Share Transactions | ||
| Investor Shares | 207,953 | 1,003,585 |
| ETF Shares | 447,651 | 1,688,115 |
| Net Increase (Decrease) from Capital Share Transactions | 655,604 | 2,691,700 |
| Total Increase (Decrease) | 1,394,600 | 4,137,883 |
| Net Assets | ||
| Beginning of Period | 9,937,024 | 5,799,141 |
| End of Period1 | 11,331,624 | 9,937,024 |
| 1 Net Assets—End of Period includes undistributed net investment income of $25,493,000 and $24,426,000. | ||
See accompanying Notes, which are an integral part of the Financial Statements.
17
High Dividend Yield Index Fund
Financial Highlights
| Investor Shares | ||||||
| Six Months | ||||||
| Ended | ||||||
| For a Share Outstanding | April 30, | Year Ended October 31, | ||||
| Throughout Each Period | 2014 | 2013 | 2012 | 2011 | 2010 | 2009 |
| Net Asset Value, Beginning of Period | $23.83 | $19.76 | $17.30 | $15.94 | $14.15 | $14.20 |
| Investment Operations | ||||||
| Net Investment Income | .359 | .667 | .579 | .489 | .415 | .4681 |
| Net Realized and Unrealized Gain (Loss) | ||||||
| on Investments | 1.701 | 4.063 | 2.446 | 1.355 | 1.792 | (.070) |
| Total from Investment Operations | 2.060 | 4.730 | 3.025 | 1.844 | 2.207 | .398 |
| Distributions | ||||||
| Dividends from Net Investment Income | (.360) | (.660) | (.565) | (.484) | (.417) | (.448) |
| Distributions from Realized Capital Gains | — | — | — | — | — | — |
| Total Distributions | (.360) | (.660) | (.565) | (.484) | (.417) | (.448) |
| Net Asset Value, End of Period | $25.53 | $23.83 | $19.76 | $17.30 | $15.94 | $14.15 |
| Total Return 2 | 8.72% | 24.35% | 17.69% | 11.70% | 15.79% | 3.27% |
| Ratios/Supplemental Data | ||||||
| Net Assets, End of Period (Millions) | $3,450 | $3,019 | $1,596 | $761 | $296 | $155 |
| Ratio of Total Expenses to | ||||||
| Average Net Assets | 0.18% | 0.19% | 0.20% | 0.25% | 0.30% | 0.35% |
| Ratio of Net Investment Income to | ||||||
| Average Net Assets | 2.99% | 3.10% | 3.22% | 3.04% | 2.86% | 3.63% |
| Portfolio Turnover Rate3 | 13% | 13% | 11% | 16% | 34% | 20% |
The expense ratio, net income ratio, and turnover rate for the current period have been annualized.
1 Calculated based on average shares outstanding.
2 Total returns do not include account service fees that may have applied in the periods shown. Fund prospectuses provide information about
any applicable account service fees.
3 Excludes the value of portfolio securities received or delivered as a result of in-kind purchases or redemptions of the fund’s capital shares,
including ETF Creation Units.
See accompanying Notes, which are an integral part of the Financial Statements.
18
High Dividend Yield Index Fund
Financial Highlights
| ETF Shares | ||||||
| Six Months | ||||||
| Ended | ||||||
| For a Share Outstanding | April 30, | Year Ended October 31, | ||||
| Throughout Each Period | 2014 | 2013 | 2012 | 2011 | 2010 | 2009 |
| Net Asset Value, Beginning of Period | $60.16 | $49.89 | $43.68 | $40.22 | $35.70 | $35.84 |
| Investment Operations | ||||||
| Net Investment Income | .930 | 1.732 | 1.506 | 1.283 | 1.092 | 1.2351 |
| Net Realized and Unrealized Gain (Loss) | ||||||
| on Investments | 4.293 | 10.247 | 6.180 | 3.442 | 4.527 | (.198) |
| Total from Investment Operations | 5.223 | 11.979 | 7.686 | 4.725 | 5.619 | 1.037 |
| Distributions | ||||||
| Dividends from Net Investment Income | (.933) | (1.709) | (1.476) | (1.265) | (1.099) | (1.177) |
| Distributions from Realized Capital Gains | — | — | — | — | — | — |
| Total Distributions | (.933) | (1.709) | (1.476) | (1.265) | (1.099) | (1.177) |
| Net Asset Value, End of Period | $64.45 | $60.16 | $49.89 | $43.68 | $40.22 | $35.70 |
| Total Return | 8.76% | 24.43% | 17.80% | 11.88% | 15.93% | 3.38% |
| Ratios/Supplemental Data | ||||||
| Net Assets, End of Period (Millions) | $7,881 | $6,918 | $4,203 | $1,984 | $884 | $430 |
| Ratio of Total Expenses to | ||||||
| Average Net Assets | 0.10% | 0.10% | 0.10% | 0.13% | 0.18% | 0.20% |
| Ratio of Net Investment Income to | ||||||
| Average Net Assets | 3.07% | 3.19% | 3.32% | 3.16% | 2.98% | 3.78% |
| Portfolio Turnover Rate2 | 13% | 13% | 11% | 16% | 34% | 20% |
The expense ratio, net income ratio, and turnover rate for the current period have been annualized.
1 Calculated based on average shares outstanding.
2 Excludes the value of portfolio securities received or delivered as a result of in-kind purchases or redemptions of the fund’s capital shares,
including ETF Creation Units.
See accompanying Notes, which are an integral part of the Financial Statements.
19
High Dividend Yield Index Fund
Notes to Financial Statements
Vanguard High Dividend Yield Index Fund is registered under the Investment Company Act of 1940 as an open-end investment company, or mutual fund. The fund offers two classes of shares: Investor Shares and ETF Shares. Investor Shares are available to any investor who meets the fund’s minimum purchase requirements. ETF Shares are listed for trading on NYSE Arca; they can be purchased and sold through a broker.
A. The following significant accounting policies conform to generally accepted accounting principles for U.S. investment companies. The fund consistently follows such policies in preparing its financial statements.
1. Security Valuation: Securities are valued as of the close of trading on the New York Stock Exchange (generally 4 p.m., Eastern time) on the valuation date. Equity securities are valued at the latest quoted sales prices or official closing prices taken from the primary market in which each security trades; such securities not traded on the valuation date are valued at the mean of the latest quoted bid and asked prices. Securities for which market quotations are not readily available, or whose values have been materially affected by events occurring before the fund’s pricing time but after the close of the securities’ primary markets, are valued by methods deemed by the board of trustees to represent fair value. Investments in Vanguard Market Liquidity Fund are valued at that fund’s net asset value. Temporary cash investments acquired over 60 days to maturity are valued using the latest bid prices or using valuations based on a matrix system (which considers such factors as security prices, yields, maturities, and ratings), both as furnished by independent pricing services. Other temporary cash investments are valued at amortized cost, which approximates market value.
2. Futures Contracts: The fund uses index futures contracts to a limited extent, with the objectives of maintaining full exposure to the stock market, enhancing returns, maintaining liquidity, and minimizing transaction costs. The fund may purchase futures contracts to immediately invest incoming cash in the market, or sell futures in response to cash outflows, thereby simulating a fully invested position in the underlying index while maintaining a cash balance for liquidity. The fund may seek to enhance returns by using futures contracts instead of the underlying securities when futures are believed to be priced more attractively than the underlying securities. The primary risks associated with the use of futures contracts are imperfect correlation between changes in market values of stocks held by the fund and the prices of futures contracts, and the possibility of an illiquid market. Counterparty risk involving futures is mitigated because a regulated clearinghouse is the counterparty instead of the clearing broker. To further mitigate counterparty risk, the fund trades futures contracts on an exchange, monitors the financial strength of its clearing brokers and clearinghouse, and has entered into clearing agreements with its clearing brokers. The clearinghouse imposes initial margin requirements to secure the fund performance and requires daily settlement of variation margin representing changes in the market value of each contract.
Futures contracts are valued at their quoted daily settlement prices. The aggregate notional amounts of the contracts are not recorded in the Statement of Net Assets. Fluctuations in the value of the contracts are recorded in the Statement of Net Assets as an asset (liability) and in the Statement of Operations as unrealized appreciation (depreciation) until the contracts are closed, when they are recorded as realized futures gains (losses).
During the six months ended April 30, 2014, the fund’s average investments in long and short futures contracts represented less than 1% and 0% of net assets, respectively, based on quarterly average aggregate settlement values.
20
High Dividend Yield Index Fund
3. Federal Income Taxes: The fund intends to continue to qualify as a regulated investment company and distribute all of its taxable income. Management has analyzed the fund’s tax positions taken for all open federal income tax years (October 31, 2010–2013), and for the period ended April 30, 2014, and has concluded that no provision for federal income tax is required in the fund’s financial statements.
4. Distributions: Distributions to shareholders are recorded on the ex-dividend date.
5. Securities Lending: To earn additional income, the fund lends its securities to qualified institutional borrowers. Security loans are required to be secured at all times by collateral in an amount at least equal to the market value of securities loaned. Daily market fluctuations could cause the value of loaned securities to be more or less than the value of the collateral received. When this occurs, the collateral is adjusted and settled on the next business day. The fund further mitigates its counterparty risk by entering into securities lending transactions only with a diverse group of prequalified counterparties, monitoring their financial strength, and entering into master securities lending agreements with its counterparties. The master securities lending agreements provide that, in the event of a counterparty’s default (including bankruptcy), the fund may terminate any loans with that borrower, determine the net amount owed, and sell or retain the collateral up to the net amount owed to the fund; however, such actions may be subject to legal proceedings. While collateral mitigates counterparty risk, in the absence of a default the fund may experience delays and costs in recovering the securities loaned. The fund invests cash collateral received in Vanguard Market Liquidity Fund, and records a liability in the Statement of Net Assets for the return of the collateral, during the period the securities are on loan. Securities lending income represents fees charged to borrowers plus income earned on invested cash collateral, less expenses associated with the loan.
6. Credit Facility: The fund and certain other funds managed by The Vanguard Group participate in a $2.89 billion committed credit facility provided by a syndicate of lenders pursuant to a credit agreement that may be renewed annually; each fund is individually liable for its borrowings, if any, under the credit facility. Borrowings may be utilized for temporary and emergency purposes, and are subject to the fund’s regulatory and contractual borrowing restrictions. The participating funds are charged administrative fees and an annual commitment fee of 0.06% of the undrawn amount of the facility; these fees are allocated to the funds based on a method approved by the fund’s board of trustees and included in Management and Administrative expenses on the fund’s Statement of Operations. Any borrowings under this facility bear interest at a rate equal to the higher of the federal funds rate or LIBOR reference rate plus an agreed-upon spread.
The fund had no borrowings outstanding at April 30, 2014, or at any time during the period then ended.
7. Other: Dividend income is recorded on the ex-dividend date. Interest income includes income distributions received from Vanguard Market Liquidity Fund and is accrued daily. Premiums and discounts on debt securities purchased are amortized and accreted, respectively, to interest income over the lives of the respective securities. Security transactions are accounted for on the date securities are bought or sold. Costs used to determine realized gains (losses) on the sale of investment securities are those of the specific securities sold.
Each class of shares has equal rights as to assets and earnings, except that each class separately bears certain class-specific expenses related to maintenance of shareholder accounts (included in Management and Administrative expenses) and shareholder reporting. Marketing and distribution expenses are allocated to each class of shares based on a method approved by the board of trustees. Income, other non-class-specific expenses, and gains and losses on investments are allocated to each class of shares based on its relative net assets.
21
High Dividend Yield Index Fund
B. The Vanguard Group furnishes at cost investment advisory, corporate management, administrative, marketing, and distribution services. The costs of such services are allocated to the fund based on methods approved by the board of trustees. The fund has committed to provide up to 0.40% of its net assets in capital contributions to Vanguard. At April 30, 2014, the fund had contributed capital of $1,162,000 to Vanguard (included in Other Assets), representing 0.01% of the fund’s net assets and 0.46% of Vanguard’s capitalization. The fund’s trustees and officers are also directors and officers of Vanguard.
C. Various inputs may be used to determine the value of the fund’s investments. These inputs are summarized in three broad levels for financial statement purposes. The inputs or methodologies used to value securities are not necessarily an indication of the risk associated with investing in those securities.
Level 1—Quoted prices in active markets for identical securities.
Level 2—Other significant observable inputs (including quoted prices for similar securities, interest rates, prepayment speeds, credit risk, etc.).
Level 3—Significant unobservable inputs (including the fund’s own assumptions used to determine the fair value of investments).
The following table summarizes the market value of the fund’s investments as of April 30, 2014, based on the inputs used to value them:
| Level 1 | Level 2 | Level 3 | |
| Investments | ($000) | ($000) | ($000) |
| Common Stocks | 11,292,457 | — | — |
| Temporary Cash Investments | 46,687 | 1,900 | — |
| Futures Contracts—Assets1 | 119 | — | — |
| Futures Contracts—Liabilities1 | (1) | — | — |
| Total | 11,339,262 | 1,900 | — |
| 1 Represents variation margin on the last day of the reporting period. | |||
D. At April 30, 2014, the aggregate settlement value of open futures contracts and the related unrealized appreciation (depreciation) were:
| ($000) | ||||
| Aggregate | ||||
| Number of | Settlement | Unrealized | ||
| Long (Short) | Value | Appreciation | ||
| Futures Contracts | Expiration | Contracts | Long (Short) | (Depreciation) |
| E-mini S&P 500 Index | June 2014 | 421 | 39,530 | 483 |
Unrealized appreciation (depreciation) on open futures contracts is required to be treated as realized gain (loss) for tax purposes.
E. Distributions are determined on a tax basis and may differ from net investment income and realized capital gains for financial reporting purposes. Differences may be permanent or temporary. Permanent differences are reclassified among capital accounts in the financial statements to reflect their tax character. Temporary differences arise when certain items of income, expense, gain, or loss
22
High Dividend Yield Index Fund
are recognized in different periods for financial statement and tax purposes. These differences will reverse at some time in the future. Differences in classification may also result from the treatment of short-term gains as ordinary income for tax purposes.
During the six months ended April 30, 2014, the fund realized $278,233,000 of net capital gains resulting from in-kind redemptions—in which shareholders exchanged fund shares for securities held by the fund rather than for cash. Because such gains are not taxable to the fund, and are not distributed to shareholders, they have been reclassified from accumulated net realized losses to paid-in capital.
The fund’s tax-basis capital gains and losses are determined only at the end of each fiscal year. For tax purposes, at October 31, 2013, the fund had available capital losses totaling $18,315,000 to offset future net capital gains through October 31, 2018. The fund will use these capital losses to offset net taxable capital gains, if any, realized during the year ending October 31, 2014; should the fund realize net capital losses for the year, the losses will be added to the loss carryforward balance above.
At April 30, 2014, the cost of investment securities for tax purposes was $9,147,435,000. Net unrealized appreciation of investment securities for tax purposes was $2,193,609,000, consisting of unrealized gains of $2,228,098,000 on securities that had risen in value since their purchase and $34,489,000 in unrealized losses on securities that had fallen in value since their purchase.
F. During the six months ended April 30, 2014, the fund purchased $2,700,112,000 of investment securities and sold $2,056,082,000 of investment securities, other than temporary cash investments. Purchases and sales include $1,112,823,000 and $815,519,000, respectively, in connection with in-kind purchases and redemptions of the fund’s capital shares.
G. Capital share transactions for each class of shares were:
| Six Months Ended | Year Ended | |||
| April 30, 2014 | October 31, 2013 | |||
| Amount | Shares | Amount | Shares | |
| ($000) | (000) | ($000) | (000) | |
| Investor Shares | ||||
| Issued | 507,235 | 20,714 | 1,501,318 | 68,725 |
| Issued in Lieu of Cash Distributions | 38,026 | 1,559 | 56,426 | 2,604 |
| Redeemed | (337,308) | (13,815) | (554,159) | (25,363) |
| Net Increase (Decrease)—Investor Shares | 207,953 | 8,458 | 1,003,585 | 45,966 |
| ETF Shares | ||||
| Issued | 1,273,488 | 20,595 | 3,045,335 | 55,835 |
| Issued in Lieu of Cash Distributions | — | — | — | — |
| Redeemed | (825,837) | (13,300) | (1,357,220) | (25,100) |
| Net Increase (Decrease)—ETF Shares | 447,651 | 7,295 | 1,688,115 | 30,735 |
H. Management has determined that no material events or transactions occurred subsequent to April 30, 2014, that would require recognition or disclosure in these financial statements.
23
About Your Fund’s Expenses
As a shareholder of the fund, you incur ongoing costs, which include costs for portfolio management, administrative services, and shareholder reports (like this one), among others. Operating expenses, which are deducted from a fund’s gross income, directly reduce the investment return of the fund.
A fund’s expenses are expressed as a percentage of its average net assets. This figure is known as the expense ratio. The following examples are intended to help you understand the ongoing costs (in dollars) of investing in your fund and to compare these costs with those of other mutual funds. The examples are based on an investment of $1,000 made at the beginning of the period shown and held for the entire period.
The accompanying table illustrates your fund’s costs in two ways:
• Based on actual fund return. This section helps you to estimate the actual expenses that you paid over the period. The ”Ending Account Value“ shown is derived from the fund‘s actual return, and the third column shows the dollar amount that would have been paid by an investor who started with $1,000 in the fund. You may use the information here, together with the amount you invested, to estimate the expenses that you paid over the period.
To do so, simply divide your account value by $1,000 (for example, an $8,600 account value divided by $1,000 = 8.6), then multiply the result by the number given for your fund under the heading ”Expenses Paid During Period.“
• Based on hypothetical 5% yearly return. This section is intended to help you compare your fund‘s costs with those of other mutual funds. It assumes that the fund had a yearly return of 5% before expenses, but that the expense ratio is unchanged. In this case—because the return used is not the fund’s actual return—the results do not apply to your investment. The example is useful in making comparisons because the Securities and Exchange Commission requires all mutual funds to calculate expenses based on a 5% return. You can assess your fund’s costs by comparing this hypothetical example with the hypothetical examples that appear in shareholder reports of other funds.
Note that the expenses shown in the table are meant to highlight and help you compare ongoing costs only and do not reflect transaction costs incurred by the fund for buying and selling securities. Further, the expenses do not include any purchase, redemption, or account service fees described in the fund prospectus. If such fees were applied to your account, your costs would be higher. Your fund does not carry a “sales load.”
The calculations assume no shares were bought or sold during the period. Your actual costs may have been higher or lower, depending on the amount of your investment and the timing of any purchases or redemptions.
You can find more information about the fund’s expenses, including annual expense ratios, in the Financial Statements section of this report. For additional information on operating expenses and other shareholder costs, please refer to your fund’s current prospectus.
24
| Six Months Ended April 30, 2014 | |||
| Beginning | Ending | Expenses | |
| Account Value | Account Value | Paid During | |
| High Dividend Yield Index Fund | 10/31/2013 | 4/30/2014 | Period |
| Based on Actual Fund Return | |||
| Investor Shares | $1,000.00 | $1,087.21 | $0.93 |
| ETF Shares | 1,000.00 | 1,087.57 | 0.52 |
| Based on Hypothetical 5% Yearly Return | |||
| Investor Shares | $1,000.00 | $1,023.90 | $0.90 |
| ETF Shares | 1,000.00 | 1,024.30 | 0.50 |
The calculations are based on expenses incurred in the most recent six-month period. The fund’s annualized six-month expense ratios for that
period are 0.18% for Investor Shares and 0.10% for ETF Shares. The dollar amounts shown as “Expenses Paid” are equal to the annualized
expense ratio multiplied by the average account value over the period, multiplied by the number of days in the most recent six-month period,
then divided by the number of days in the most recent 12-month period.
25
Trustees Approve Advisory Arrangement
The board of trustees of Vanguard High Dividend Yield Index Fund has renewed the fund’s investment advisory arrangement with The Vanguard Group Inc. (Vanguard). Vanguard—through its Equity Investment Group—serves as the investment advisor for the fund. The board determined that continuing the fund’s internalized management structure was in the best interests of the fund and its shareholders.
The board based its decision upon an evaluation of the advisor’s investment staff, portfolio management process, and performance. The trustees considered the factors discussed below, among others. However, no single factor determined whether the board approved the arrangement. Rather, it was the totality of the circumstances that drove the board’s decision.
Nature, extent, and quality of services
The board considered the quality of the fund’s investment management services since the fund’s inception in 2006, and took into account the organizational depth and stability of the advisor. The board noted that Vanguard has been managing investments for more than three decades. The Equity Investment Group adheres to a sound, disciplined investment management process; the team has considerable experience, stability, and depth.
The board concluded that Vanguard’s experience, stability, depth, and performance, among other factors, warranted continuation of the advisory arrangement.
Investment performance
The board considered the fund’s performance since its inception, including any periods of outperformance or underperformance relative to a target index and peer group. The board concluded that the performance was such that the advisory arrangement should continue. Information about the fund’s most recent performance can be found in the Performance Summary section of this report.
Cost
The board concluded that the fund’s expense ratio was well below the average expense ratio charged by funds in its peer group and that the fund’s advisory fee rate was also well below its peer-group average. Information about the fund’s expenses appears in the About Your Fund’s Expenses section of this report as well as in the Financial Statements section.
The board does not conduct a profitability analysis of Vanguard because of Vanguard’s unique “at-cost” structure. Unlike most other mutual fund management companies, Vanguard is owned by the funds it oversees, and produces “profits” only in the form of reduced expenses for fund shareholders.
The benefit of economies of scale
The board concluded that the fund’s at-cost arrangement with Vanguard ensures that the fund will realize economies of scale as it grows, with the cost to shareholders declining as the fund’s assets increase.
The board will consider whether to renew the advisory arrangement again after a one-year period.
26
Glossary
30-Day SEC Yield. A fund’s 30-day SEC yield is derived using a formula specified by the U.S. Securities and Exchange Commission. Under the formula, data related to the fund’s security holdings in the previous 30 days are used to calculate the fund’s hypothetical net income for that period, which is then annualized and divided by the fund’s estimated average net assets over the calculation period. For the purposes of this calculation, a security’s income is based on its current market yield to maturity (for bonds), its actual income (for asset-backed securities), or its projected dividend yield (for stocks). Because the SEC yield represents hypothetical annualized income, it will differ—at times significantly—from the fund’s actual experience. As a result, the fund’s income distributions may be higher or lower than implied by the SEC yield.
Beta. A measure of the magnitude of a fund’s past share-price fluctuations in relation to the ups and downs of a given market index. The index is assigned a beta of 1.00. Compared with a given index, a fund with a beta of 1.20 typically would have seen its share price rise or fall by 12% when the index rose or fell by 10%. For this report, beta is based on returns over the past 36 months for both the fund and the index. Note that a fund’s beta should be reviewed in conjunction with its R-squared (see definition). The lower the R-squared, the less correlation there is between the fund and the index, and the less reliable beta is as an indicator of volatility.
Dividend Yield. Dividend income earned by stocks, expressed as a percentage of the aggregate market value (or of net asset value, for a fund). The yield is determined by dividing the amount of the annual dividends by the aggregate value (or net asset value) at the end of the period. For a fund, the dividend yield is based solely on stock holdings and does not include any income produced by other investments.
Earnings Growth Rate. The average annual rate of growth in earnings over the past five years for the stocks now in a fund.
Equity Exposure. A measure that reflects a fund’s investments in stocks and stock futures. Any holdings in short-term reserves are excluded.
Expense Ratio. A fund’s total annual operating expenses expressed as a percentage of the fund’s average net assets. The expense ratio includes management and administrative expenses, but does not include the transaction costs of buying and selling portfolio securities.
Foreign Holdings. The percentage of a fund represented by securities or depositary receipts of companies based outside the United States.
Inception Date. The date on which the assets of a fund (or one of its share classes) are first invested in accordance with the fund’s investment objective. For funds with a subscription period, the inception date is the day after that period ends. Investment performance is measured from the inception date.
Median Market Cap. An indicator of the size of companies in which a fund invests; the midpoint of market capitalization (market price x shares outstanding) of a fund’s stocks, weighted by the proportion of the fund’s assets invested in each stock. Stocks representing half of the fund’s assets have market capitalizations above the median, and the rest are below it.
Price/Book Ratio. The share price of a stock divided by its net worth, or book value, per share. For a fund, the weighted average price/book ratio of the stocks it holds.
27
Price/Earnings Ratio. The ratio of a stock’s current price to its per-share earnings over the past year. For a fund, the weighted average P/E of the stocks it holds. P/E is an indicator of market expectations about corporate prospects; the higher the P/E, the greater the expectations for a company’s future growth.
R-Squared. A measure of how much of a fund’s past returns can be explained by the returns from the market in general, as measured by a given index. If a fund’s total returns were precisely synchronized with an index’s returns, its R-squared would be 1.00. If the fund’s returns bore no relationship to the index’s returns, its R-squared would be 0. For this report, R-squared is based on returns over the past 36 months for both the fund and the index.
Return on Equity. The annual average rate of return generated by a company during the past five years for each dollar of shareholder’s equity (net income divided by shareholder’s equity). For a fund, the weighted average return on equity for the companies whose stocks it holds.
Short-Term Reserves. The percentage of a fund invested in highly liquid, short-term securities that can be readily converted to cash.
Turnover Rate. An indication of the fund’s trading activity. Funds with high turnover rates incur higher transaction costs and may be more likely to distribute capital gains (which may be taxable to investors). The turnover rate excludes in-kind transactions, which have minimal impact on costs.
28
This page intentionally left blank.
This page intentionally left blank.
This page intentionally left blank.
The People Who Govern Your Fund
The trustees of your mutual fund are there to see that the fund is operated and managed in your best interests since, as a shareholder, you are a part owner of the fund. Your fund’s trustees also serve on the board of directors of The Vanguard Group, Inc., which is owned by the Vanguard funds and provides services to them on an at-cost basis.
A majority of Vanguard’s board members are independent, meaning that they have no affiliation with Vanguard or the funds they oversee, apart from the sizable personal investments they have made as private individuals. The independent board members have distinguished backgrounds in business, academia, and public service. Each of the trustees and executive officers oversees 178 Vanguard funds.
The following table provides information for each trustee and executive officer of the fund. More information about the trustees is in the Statement of Additional Information, which can be obtained, without charge, by contacting Vanguard at 800-662-7447, or online at vanguard.com.
| InterestedTrustee1 | and Delphi Automotive LLP (automotive components); |
| Senior Advisor at New Mountain Capital. | |
| F. William McNabb III | |
| Born 1957. Trustee Since July 2009. Chairman of the | Amy Gutmann |
| Board. Principal Occupation(s) During the Past Five | Born 1949. Trustee Since June 2006. Principal |
| Years: Chairman of the Board of The Vanguard Group, | Occupation(s) During the Past Five Years: President of |
| Inc., and of each of the investment companies served | the University of Pennsylvania; Christopher H. Browne |
| by The Vanguard Group, since January 2010; Director | Distinguished Professor of Political Science, School of |
| of The Vanguard Group since 2008; Chief Executive | Arts and Sciences, and Professor of Communication, |
| Officer and President of The Vanguard Group, and of | Annenberg School for Communication, with secondary |
| each of the investment companies served by The | faculty appointments in the Department of Philosophy, |
| Vanguard Group, since 2008; Director of Vanguard | School of Arts and Sciences, and at the Graduate |
| Marketing Corporation; Managing Director of The | School of Education, University of Pennsylvania; |
| Vanguard Group (1995–2008). | Trustee of the National Constitution Center; Chair |
| of the Presidential Commission for the Study of | |
| Bioethical Issues. | |
| IndependentTrustees | |
| JoAnn Heffernan Heisen | |
| Emerson U. Fullwood | Born 1950. Trustee Since July 1998. Principal |
| Born 1948. Trustee Since January 2008. Principal | Occupation(s) During the Past Five Years: Corporate |
| Occupation(s) During the Past Five Years: Executive | Vice President and Chief Global Diversity Officer |
| Chief Staff and Marketing Officer for North America | (retired 2008) and Member of the Executive |
| and Corporate Vice President (retired 2008) of Xerox | Committee (1997–2008) of Johnson & Johnson |
| Corporation (document management products and | (pharmaceuticals/medical devices/consumer |
| services); Executive in Residence and 2009–2010 | products); Director of Skytop Lodge Corporation |
| Distinguished Minett Professor at the Rochester | (hotels), the University Medical Center at Princeton, |
| Institute of Technology; Director of SPX Corporation | the Robert Wood Johnson Foundation, and the Center |
| (multi-industry manufacturing), the United Way of | for Talent Innovation; Member of the Advisory Board |
| Rochester, Amerigroup Corporation (managed health | of the Maxwell School of Citizenship and Public Affairs |
| care), the University of Rochester Medical Center, | at Syracuse University. |
| Monroe Community College Foundation, and North | |
| Carolina A&T University. | F. Joseph Loughrey |
| Born 1949. Trustee Since October 2009. Principal | |
| Rajiv L. Gupta | Occupation(s) During the Past Five Years: President |
| Born 1945. Trustee Since December 2001.2 | and Chief Operating Officer (retired 2009) of Cummins |
| Principal Occupation(s) During the Past Five Years: | Inc. (industrial machinery); Chairman of the Board |
| Chairman and Chief Executive Officer (retired 2009) | of Hillenbrand, Inc. (specialized consumer services), |
| and President (2006–2008) of Rohm and Haas Co. | and of Oxfam America; Director of SKF AB (industrial |
| (chemicals); Director of Tyco International, Ltd. | machinery), Hyster-Yale Materials Handling, Inc. |
| (diversified manufacturing and services), Hewlett- | (forklift trucks), the Lumina Foundation for Education, |
| Packard Co. (electronic computer manufacturing), | |
| and the V Foundation for Cancer Research; Member | Executive Officers | |
| of the Advisory Council for the College of Arts and | ||
| Letters and of the Advisory Board to the Kellogg | Glenn Booraem | |
| Institute for International Studies, both at the | Born 1967. Controller Since July 2010. Principal | |
| University of Notre Dame. | Occupation(s) During the Past Five Years: Principal | |
| of The Vanguard Group, Inc.; Controller of each of | ||
| Mark Loughridge | the investment companies served by The Vanguard | |
| Born 1953. Trustee Since March 2012. Principal | Group; Assistant Controller of each of the investment | |
| Occupation(s) During the Past Five Years: Senior Vice | companies served by The Vanguard Group (2001–2010). | |
| President and Chief Financial Officer (retired 2013) | ||
| at IBM (information technology services); Fiduciary | Thomas J. Higgins | |
| Member of IBM’s Retirement Plan Committee (2004– | Born 1957. Chief Financial Officer Since September | |
| 2013); Member of the Council on Chicago Booth. | 2008. Principal Occupation(s) During the Past Five | |
| Years: Principal of The Vanguard Group, Inc.; Chief | ||
| Scott C. Malpass | Financial Officer of each of the investment companies | |
| Born 1962. Trustee Since March 2012. Principal | served by The Vanguard Group; Treasurer of each of | |
| Occupation(s) During the Past Five Years: Chief | the investment companies served by The Vanguard | |
| Investment Officer and Vice President at the University | Group (1998–2008). | |
| of Notre Dame; Assistant Professor of Finance at the | ||
| Mendoza College of Business at Notre Dame; Member | Kathryn J. Hyatt | |
| of the Notre Dame 403(b) Investment Committee; | Born 1955. Treasurer Since November 2008. Principal | |
| Board Member of TIFF Advisory Services, Inc. | Occupation(s) During the Past Five Years: Principal of | |
| (investment advisor); Member of the Investment | The Vanguard Group, Inc.; Treasurer of each of the | |
| Advisory Committees of the Financial Industry | investment companies served by The Vanguard | |
| Regulatory Authority (FINRA) and of Major League | Group; Assistant Treasurer of each of the investment | |
| Baseball. | companies served by The Vanguard Group (1988–2008). | |
| André F. Perold | Heidi Stam | |
| Born 1952. Trustee Since December 2004. Principal | Born 1956. Secretary Since July 2005. Principal | |
| Occupation(s) During the Past Five Years: George | Occupation(s) During the Past Five Years: Managing | |
| Gund Professor of Finance and Banking, Emeritus | Director of The Vanguard Group, Inc.; General Counsel | |
| at the Harvard Business School (retired 2011); | of The Vanguard Group; Secretary of The Vanguard | |
| Chief Investment Officer and Managing Partner of | Group and of each of the investment companies | |
| HighVista Strategies LLC (private investment firm); | served by The Vanguard Group; Director and Senior | |
| Director of Rand Merchant Bank; Overseer of the | Vice President of Vanguard Marketing Corporation. | |
| Museum of Fine Arts Boston. | ||
| Vanguard Senior ManagementTeam | ||
| Alfred M. Rankin, Jr. | ||
| Born 1941. Trustee Since January 1993. Principal | Mortimer J. Buckley | Chris D. McIsaac |
| Occupation(s) During the Past Five Years: Chairman, | Kathleen C. Gubanich | Michael S. Miller |
| President, and Chief Executive Officer of NACCO | Paul A. Heller | James M. Norris |
| Industries, Inc. (housewares/lignite), and of Hyster- | Martha G. King | Glenn W. Reed |
| Yale Materials Handling, Inc. (forklift trucks); Chairman | John T. Marcante | |
| of the Board of University Hospitals of Cleveland. | ||
| Peter F. Volanakis | Chairman Emeritus and Senior Advisor | |
| Born 1955. Trustee Since July 2009. Principal | ||
| Occupation(s) During the Past Five Years: President | John J. Brennan | |
| and Chief Operating Officer (retired 2010) of Corning | Chairman, 1996–2009 | |
| Incorporated (communications equipment); Trustee of | Chief Executive Officer and President, 1996–2008 | |
| Colby-Sawyer College; Member of the Advisory Board | ||
| of the Norris Cotton Cancer Center and of the Advisory | Founder | |
| Board of the Parthenon Group (strategy consulting). | ||
| John C. Bogle | ||
| Chairman and Chief Executive Officer, 1974–1996 | ||
1 Mr. McNabb is considered an “interested person,” as defined in the Investment Company Act of 1940, because he is an officer of the
Vanguard funds.
2 December 2002 for Vanguard Equity Income Fund, the Vanguard Municipal Bond Funds, and the Vanguard State Tax-Exempt Funds.
 | |
| Connect with Vanguard® > vanguard.com | |
| Fund Information > 800-662-7447 | All rights in a FTSE index (the “Index”) vest in FTSE |
| Direct Investor Account Services > 800-662-2739 | International Limited (“FTSE”). “FTSE®” is a trademark |
| of London Stock Exchange Group companies and is | |
| Institutional Investor Services > 800-523-1036 | used by FTSE under licence. The Vanguard Fund(s) (the |
| Text Telephone for People | “Product”) has been developed solely by Vanguard. The |
| With Hearing Impairment > 800-749-7273 | Index is calculated by FTSE or its agent. FTSE and its |
| licensors are not connected to and do not sponsor, | |
| This material may be used in conjunction | advise, recommend, endorse or promote the Product |
| with the offering of shares of any Vanguard | and do not accept any liability whatsoever to any |
| fund only if preceded or accompanied by | person arising out of (a) the use of, reliance on or any |
| error in the Index or (b) investment in or operation of | |
| the fund’s current prospectus. | the Product. FTSE makes no claim, prediction, warranty |
| All comparative mutual fund data are from Lipper, a | or representation either as to the results to be obtained |
| Thomson Reuters Company, or Morningstar, Inc., unless | from the Product or the suitability of the Index for the |
| otherwise noted. | purpose to which it is being put by Vanguard. |
| You can obtain a free copy of Vanguard’s proxy voting | |
| guidelines by visiting vanguard.com/proxyreporting or by | |
| calling Vanguard at 800-662-2739. The guidelines are | |
| also available from the SEC’s website, sec.gov. In | |
| addition, you may obtain a free report on how your fund | |
| voted the proxies for securities it owned during the 12 | |
| months ended June 30. To get the report, visit either | |
| vanguard.com/proxyreporting or sec.gov. | |
| You can review and copy information about your fund at | |
| the SEC’s Public Reference Room in Washington, D.C. To | |
| find out more about this public service, call the SEC at | |
| 202-551-8090. Information about your fund is also | |
| available on the SEC’s website, and you can receive | |
| copies of this information, for a fee, by sending a | |
| request in either of two ways: via e-mail addressed to | |
| publicinfo@sec.gov or via regular mail addressed to the | |
| Public Reference Section, Securities and Exchange | |
| Commission, Washington, DC 20549-1520. | |
| © 2014 The Vanguard Group, Inc. | |
| All rights reserved. | |
| Vanguard Marketing Corporation, Distributor. | |
| Q6232 062014 | |
![]()
Semiannual Report | April 30, 2014
Vanguard Selected Value Fund

Vanguard’s Principles for Investing Success
We want to give you the best chance of investment success. These principles,
grounded in Vanguard’s research and experience, can put you on the right path.
Goals. Create clear, appropriate investment goals.
Balance. Develop a suitable asset allocation using broadly diversified funds.
Cost. Minimize cost.
Discipline. Maintain perspective and long-term discipline.
A single theme unites these principles: Focus on the things you can control.
We believe there is no wiser course for any investor.
| Contents | |
| Your Fund’s Total Returns. | 1 |
| Chairman’s Letter. | 2 |
| Advisors’ Report. | 8 |
| Fund Profile. | 12 |
| Performance Summary. | 13 |
| Financial Statements. | 14 |
| About Your Fund’s Expenses. | 24 |
| Trustees Approve Advisory Arrangements. | 26 |
| Glossary. | 28 |
Please note: The opinions expressed in this report are just that—informed opinions. They should not be considered promises or advice.
Also, please keep in mind that the information and opinions cover the period through the date on the front of this report. Of course, the
risks of investing in your fund are spelled out in the prospectus.
See the Glossary for definitions of investment terms used in this report.
About the cover: The ship’s wheel represents leadership and guidance, essential qualities in navigating difficult seas.
This one is a replica based on an 18th-century British vessel. The HMSVanguard, another ship of that era, served as the
flagship for British Admiral Horatio Nelson when he defeated a French fleet at the Battle of the Nile.
Your Fund’s Total Returns
| Six Months Ended April 30, 2014 | |
| Total | |
| Returns | |
| Vanguard Selected Value Fund | 7.78% |
| Russell Midcap Value Index | 9.69 |
| Mid-Cap Value Funds Average | 7.95 |
| Mid-Cap Value Funds Average: Derived from data provided by Lipper, a Thomson Reuters Company. | |
| Your Fund’s Performance at a Glance | ||||
| October 31, 2013, Through April 30, 2014 | ||||
| Distributions Per Share | ||||
| Starting | Ending | Income | Capital | |
| Share Price | Share Price | Dividends | Gains | |
| Vanguard Selected Value Fund | $28.07 | $28.63 | $0.330 | $1.220 |
1

Chairman’s Letter
Dear Shareholder,
Mid-capitalization value stocks were among the market’s standouts over the six-month period ended April 30, 2014, as investors spurned several market segments that appeared overpriced. Against this backdrop, Selected Value returned almost 8% for the half year, a commendable result on the surface but nearly 2 percentage points behind its benchmark, the Russell Midcap Value Index. The fund also slightly trailed the average return of its peers; financial and materials stocks and its cash position detracted from relative performance.
On a separate note, in March, we announced a new investment advisory arrangement for the fund, with Pzena Investment Management joining Barrow, Hanley, Mewhinney & Strauss and Donald Smith & Co. on the management team. Pzena will be allocated a portion of new cash flow over time after initially managing part of the fund’s cash position.
I’d also like to express my appreciation to James P. Barrow, the founder of Barrow, Hanley, Mewhinney & Strauss, who is marking his 15th anniversary as a lead portfolio manager for the Selected Value Fund. Jim is an industry icon and has served Vanguard well for a good portion of his 52-year career.
Recent progress has been sporadic, but stocks continued their climb
For the half year ended April 30, U.S. stocks returned almost 8%, notwithstanding the patches of turbulence the market has
2
encountered in 2014. Technology stocks, for example, turned in a rocky performance amid concerns about pricey valuations. Poor economic data from China and the conflict in Ukraine also unsettled investors.
Global economic and political developments are, of course, as inevitable as they are unpredictable. Broad diversification remains the best way of managing the risks they pose to your portfolio. As Joe Davis, our chief economist, noted recently, “Having a broader portfolio tends to moderate those individual issues and that’s always, I think, a valuable starting point for investors.”
International stocks, in aggregate, returned nearly 3%, with the developed markets of Europe faring the best. The developed markets of the Pacific region and emerging markets, where China’s weakness was felt most, had negative returns.
Despite low yields, the bond market experienced a surprising rally
Bonds continued to emerge from the struggles that marked much of 2013, when the market was roiled by worries about the prospect of the Federal Reserve reducing its stimulative bond-buying. In January, however, when the reduction actually began, investors seemed to take the news in stride.
The broad U.S. taxable bond market returned 1.74%. The yield of the 10-year Treasury note ended the six months at 2.69%, up from 2.54% on October 31
| Market Barometer | |||
| Total Returns | |||
| Periods Ended April 30, 2014 | |||
| Six | One | Five Years | |
| Months | Year | (Annualized) | |
| Stocks | |||
| Russell 1000 Index (Large-caps) | 8.25% | 20.81% | 19.52% |
| Russell 2000 Index (Small-caps) | 3.08 | 20.50 | 19.84 |
| Russell 3000 Index (Broad U.S. market) | 7.83 | 20.78 | 19.54 |
| FTSE All-World ex US Index (International) | 2.84 | 9.77 | 13.22 |
| Bonds | |||
| Barclays U.S. Aggregate Bond Index (Broad taxable market) | 1.74% | -0.26% | 4.88% |
| Barclays Municipal Bond Index (Broad tax-exempt market) | 4.08 | 0.50 | 5.54 |
| Citigroup Three-Month U.S. Treasury Bill Index | 0.00 | 0.04 | 0.08 |
| CPI | |||
| Consumer Price Index | 1.51% | 1.95% | 2.14% |
3
but down from nearly 3% on December 31. (Bond prices and yields move in opposite directions.)
Municipal bonds returned 4.08%. Money market and savings accounts posted paltry returns as the Fed’s target for short-term interest rates remained at 0%–0.25%.
International bond markets (as measured by the Barclays Global Aggregate Index ex USD) returned 2.33%.
The fund’s distinctive portfolio can diverge from the benchmark
Although the Selected Value Fund’s three advisors take different investment approaches and bring diversity of thought to the management of the fund, they’re united in several important ways. Each has a mid-cap value focus, and each invests for the long term by emphasizing company fundamentals and serious research.
Over its 18-year history, the fund traced a fairly jagged path—albeit one that ultimately tilted upward. A distinctive portfolio and low turnover rate have translated into periods of outperformance but inevitable underperformance, too. Some of the peaks wouldn’t have been possible without the valleys, as the advisors’ patience and conviction can lead to higher returns.
The fund’s limited holdings have also been a recipe for divergence from the benchmark index. Over the last year, since Pzena joined the advisory team, the number of
| Expense Ratios | ||
| Your Fund Compared With Its Peer Group | ||
| Peer Group | ||
| Fund | Average | |
| Selected Value Fund | 0.44% | 1.30% |
The fund expense ratio shown is from the prospectus dated March 31, 2014, and represents estimated costs for the current fiscal year. For
the six months ended April 30, 2014, the fund’s annualized expense ratio was 0.43%. The peer-group expense ratio is derived from data
provided by Lipper, a Thomson Reuters Company, and captures information through year-end 2013.
Peer group: Mid-Cap Value Funds.
4
stocks in the portfolio has risen from fewer than 70 to about 120. That’s still far fewer than the more than 500 included in the benchmark.
The financial sector, the fund’s largest by far over the period, was also its biggest disappointment. Regional banks accounted for most of the subpar performance. Two
| Growth stocks versus value stocks: A case for both |
| Growth and value stocks typically take turns outperforming each other. The chart here |
| shows how they have switched off during the past 20 years in leading or lagging a broad |
| market average. |
| These two styles of investing are typically considered complementary—when growth is |
| performing well, value typically isn’t, and vice versa. Very generally speaking, growth stocks |
| represent companies that are expected to expand their businesses at a rapid pace, while |
| value stocks typically represent more established, slower-growing companies. |
| Which does better in the long run? Neither. Vanguard research has shown that there is no |
| significant long-term difference in the risk/reward characteristics of growth and value stocks. |
| But, because their performance can vary considerably over shorter time periods, a truly |
| diversified portfolio should have exposure to both. |
| Rolling 12-month return differences, 1994–2013 |

| Note: “Rolling” means here that 12-month returns were calculated from the start of each month in the 20-year period ended |
| December 31, 2013. |
| Source: Vanguard. |
5
of these banks suffered double-digit losses related to growing pains from strategy changes. In addition, the fund did not hold a number of banks that had more impressive earnings and balance sheets.
Of Selected Value’s nine sectors, only materials registered a decline. Materials stocks in the fund returned –6%, while their benchmark counterparts returned 9%. Although materials is one of the fund’s smallest sectors, its negative outcome still affected the fund’s overall results. An environment of price volatility for gold and other precious metals played a role here, as the fund’s holdings of companies engaged in the exploration and mining of such metals dragged down returns.
The advisors’ decision to keep about 8% of fund assets in cash, on average, also hurt. (The advisors have the flexibility to hold cash when they cannot find attractive stocks that meet their strict valuation criteria.)
But Selected Value wasn’t without its successes. The industrials sector, the fund’s second largest, added the most to results. Sizable returns in the airline and airline leasing industry offset weakness in construction and engineering. Consolidation boosted the airlines, which raised prices as demand grew and capacity dropped.
The consumer discretionary sector was another source of strength as the fund’s apparel and automobile components companies excelled. Lower cotton prices helped the former; the overall recovery of the auto market helped the latter.
You can find more information on the fund’s positioning and performance during the fiscal year in the Advisors’ Report that follows this letter.
Taking just a slice of the market can add risk to your portfolio
Like other Vanguard funds that are devoted to a particular investment style, Selected Value offers you a low-cost way to gain exposure to a specific segment of the market. Such funds can do important work within a portfolio by providing access to a large but distinct part of the broader market.
But keep in mind that no matter how important that part is or how well-regarded the fund, such an investment isn’t like owning the broad stock market. By choosing just a slice of that vast pie, you’re also choosing to take on additional risk. Investors overweighting a single segment are exposing themselves to more volatility by reducing their portfolio’s diversification.
Diversification is, of course, a powerful strategy for managing risk, and Vanguard generally counsels that investors have exposure to growth and value as well as large-, mid-, and small-cap stocks, in a proportion that approximates the U.S. market.
You can achieve broad market diversification through a total stock fund or by assembling segment-specific funds to mirror the overall market. Either way, appropriate diversification should remain paramount.
6
As we say in our Principles for Investing Success, “Leadership among market segments changes constantly and rapidly, so investors must diversify both to mitigate losses and to participate in gains.” (You can read more about our investment principles at vanguard.com/research.)
As always, thank you for investing with Vanguard.
Sincerely,

F. William McNabb III
Chairman and Chief Executive Officer
May 15, 2014
7
Advisors’ Report
For the six months ended April 30, 2014, Vanguard Selected Value Fund returned 7.78%. Your fund is managed by three independent advisors. This provides exposure to distinct yet complementary investment approaches, enhancing the fund’s diversification. It is not uncommon for different advisors to have different views about individual securities or the broader investment environment.
The advisors, the percentage and amount of fund assets each manages, and a brief description of their investment strategies are presented in the table below. The advisors have also prepared a discussion of the investment environment that existed during the fiscal period and of how portfolio positioning reflects this assessment. These comments were prepared on May 21, 2014.
| Vanguard Selected Value Fund Investment Advisors | |||
| Fund Assets Managed | |||
| Investment Advisor | % | $ Million | Investment Strategy |
| Barrow, Hanley, Mewhinney & | 69 | 6,146 | Conducts fundamental research on individual stocks |
| Strauss, LLC | exhibiting traditional value characteristics: | ||
| price/earnings and price/book ratios below the market | |||
| average and dividend yields above the market average. | |||
| Donald Smith & Co., Inc. | 24 | 2,095 | Conducts fundamental research on the lowest |
| price-to-tangible-book-value companies. Research | |||
| focuses on underlying quality of book value and assets, | |||
| and on long-term earnings potential. | |||
| Pzena Investment Management, | 5 | 405 | Uses a fundamental, bottom-up, deep-value-oriented |
| LLC | investment strategy. Seeks to buy good businesses at | ||
| low prices, focusing exclusively on companies that are | |||
| underperforming their historically demonstrated | |||
| earnings power. | |||
| Cash Investments | 2 | 257 | These short-term reserves are invested by Vanguard in |
| equity index products to simulate investment in stocks. | |||
| Each advisor may also maintain a modest cash | |||
| position. | |||
8
Barrow, Hanley, Mewhinney &
Strauss, LLC
Portfolio Managers:
James P. Barrow,
Executive Director
Mark Giambrone,
Managing Director
The markets performed positively in the six months ended April 30. The period had two distinct parts. As last year drew to a close, the economy and the stock market continued their strong momentum and interest rates moved slowly higher. But as 2014 began, exceptionally bad weather and geopolitical issues created doubt about the economic recovery and drove interest rates lower.
Although we had good returns for the period, we have built the portfolio with companies that benefit from a modestly improving economy and rising interest rates. Therefore, the early part of 2014 created a drag on our performance that we expect will rectify as the year goes on. We have already seen positive economic data, and although many companies had a weak first quarter, the markets improved as April approached. We are maintaining the portfolio’s position to take advantage of a modest and consistent growth in the U.S. economy and an eventual rise in interest rates.
Accordingly, we are meaningfully overweighted in consumer discretionary, health care, and industrial stocks, and our largest weighting is in financials. We are
underweighted in information technology, utilities, materials, and REITs. We believe traditional yield plays such as utilities and REITs have had substantial runs during a long period of low interest rates and have very little room for valuation upside or meaningfully higher yield. Additionally, we see considerable risk to these valuation levels should interest rates rise.
Donald Smith & Co., Inc.
Portfolio Managers:
Donald G. Smith,
Chief Investment Officer
Richard L. Greenberg, CFA,
Senior Vice President
The portfolio at the end of April continued to meet our criteria of holding a concentrated selection of stocks with low price-to-tangible book value and attractive long-term earnings potential. It currently sells at 123% of tangible book value and 9.6 times our estimate of “normalized” earnings. In contrast, the Standard & Poor’s 500 Index sells at about 523% of tangible book value and 17.9 times normalized earnings.
The “equity only” return of the portfolio was even higher than the total account return as cash restrained performance in a strongly rising market. AerCap (+105.7%) led the gains. Its agreement to purchase International Lease Finance Corporation from AIG at a substantial discount to book value and net asset value is an attractive deal. Earnings per share could double to more than $5 after the two companies are integrated.
9
The portfolio’s largest holding, Micron Technology, rose 47.7% as investors noted the improved industry dynamics that resulted from consolidation. Micron’s purchase of ELPIDA at only 30% of its underlying asset value has proven very accretive.
Airline stocks Southwest (+40.4%), Air France (+37.5%), and JetBlue (+11.5%) have benefited from the oligopolistic pricing structure that arose after the three major airline mergers. The top four competitors now control more than 85% of capacity. Other standouts included Valero (+38.9%), Royal Caribbean (+26.4%), and Exelon (+22.7%).
Precious metal stocks Yamana Gold (–24.7%) and Coeur Mining (–29.1%) were the only double-digit losers. Both have suffered from the decline in precious metal prices, poor operating performance, and questionable acquisitions.
Our positions in American National, Yamana Gold, Celestica, WPX Energy, and XL Group grew, while our positions in CNA Financial, Dillard’s, Ingram Micro, Southwest Airlines, and Royal Caribbean shrank.
We added two new names to the portfolio. We established a small position in New Gold, our third precious metal holding. A low-cost producer with four operating mines and three growth projects in geographically secure countries (Canada, United States, Australia, Mexico, and Chile), the company has positive earnings and cash flow at currently depressed prices. In a higher-price environment, it could earn more than 75 cents per share. We purchased the stock at less than seven times potential earnings and a discount to tangible book value.
Our second addition was Noble Corporation, an offshore drilling contractor with a fleet of drill ships, semisubmersibles, and jack-up rigs. It is completing a multiyear upgrade program next year, after which earnings and cash flow are expected to rise. The substantial free cash generated should be returned to shareholders through higher dividends and stock buybacks.
Our two largest industry weightings are insurance (18.3%) and technology (18.3%). The insurance companies sell, on average, below tangible book value. Some are wisely engaging in aggressive stock buyback programs. The largest holding remains Micron Technology, discussed above. Airlines/aircraft leasing companies total 14.6% of the portfolio; energy companies (primarily natural gas-sensitive), 11.1%.
Pzena Investment Management, LLC
Portfolio Managers:
Richard S. Pzena, Founder,
Chief Executive Officer, and
Co-Chief Investment Officer
Manoj Tandon, Principal,
Co-Director of Research
Eli Rabinowich, Principal
For the period March 31, 2014 (our portfolio’s inception), through April 30, 2014, results were restrained by weak returns from holdings in the technology and materials and processing sectors.
10
Avnet was our top detractor; the company missed on earnings because of lower-than-expected revenue and industry margins. Masco was also a weak performer, reporting earnings below expectations as a result of margin weakness in multiple segments.
Energy and producer durables contributed most, led by holdings of Superior Energy Services and Parker Hannifin. Superior Energy, a leading oil services company, is poised to continue its strong performance through expansion of U.S. exploration. Parker Hannifin, a manufacturer of motion and control technologies and systems, showed solid organic sales increases for a second quarter of growth in a row. The staples sector was up strongly, and it was also one of the portfolio’s top contributors.
Our portfolio is positioned in a number of high-quality but discounted cyclical stocks, with significant exposure to the attractively valued technology, consumer discretionary, and producer durables sectors. We also hold companies in the insurance sector that are experiencing healthy profitability and trading at historically low valuations. High-dividend-paying firms with less cyclical earnings profiles (such as utilities, REITs, and pharmaceuticals) outperformed recently on the back of falling rates. However, because they trade at premium valuations they have little representation among our deep-value holdings. We expect the portfolio to benefit as this valuation gap normalizes over time.
11
Selected Value Fund
Fund Profile
As of April 30, 2014
| Portfolio Characteristics | |||
| DJ | |||
| U.S. | |||
| Russell | Total | ||
| Midcap | Market | ||
| Value | FA | ||
| Fund | Index | Index | |
| Number of Stocks | 120 | 540 | 3,664 |
| Median Market Cap | $11.4B | $10.0B | $47.3B |
| Price/Earnings Ratio | 15.4x | 20.8x | 19.7x |
| Price/Book Ratio | 1.7x | 1.8x | 2.6x |
| Return on Equity | 12.5% | 9.8% | 17.4% |
| Earnings Growth | |||
| Rate | 4.9% | 8.4% | 12.4% |
| Dividend Yield | 2.1% | 2.0% | 1.9% |
| Foreign Holdings | 5.5% | 0.0% | 0.0% |
| Turnover Rate | |||
| (Annualized) | 21% | — | — |
| Ticker Symbol | VASVX | — | — |
| Expense Ratio1 | 0.44% | — | — |
| 30-Day SEC Yield | 1.48% | — | — |
| Short-Term Reserves | 8.3% | — | — |
| Sector Diversification (% of equity exposure) | |||
| DJ | |||
| U.S. | |||
| Russell | Total | ||
| Midcap | Market | ||
| Value | FA | ||
| Fund | Index | Index | |
| Consumer | |||
| Discretionary | 10.9% | 8.5% | 12.6% |
| Consumer Staples | 4.0 | 2.9 | 8.6 |
| Energy | 10.0 | 7.5 | 9.9 |
| Financials | 29.2 | 31.9 | 17.3 |
| Health Care | 9.3 | 8.5 | 12.8 |
| Industrials | 19.4 | 11.7 | 11.6 |
| Information | |||
| Technology | 10.2 | 10.7 | 17.9 |
| Materials | 3.6 | 5.3 | 3.9 |
| Telecommunication | |||
| Services | 0.0 | 0.7 | 2.2 |
| Utilities | 3.4 | 12.3 | 3.2 |
| Volatility Measures | ||
| Russell | DJ | |
| Midcap | U.S. Total | |
| Value | Market | |
| Index | FA Index | |
| R-Squared | 0.94 | 0.95 |
| Beta | 0.93 | 1.01 |
| These measures show the degree and timing of the fund’s fluctuations compared with the indexes over 36 months. | ||
| Ten Largest Holdings (% of total net assets) | ||
| Micron Technology Inc. | Semiconductors | 2.9% |
| Omnicare Inc. | Health Care Services | 2.3 |
| Delphi Automotive plc | Auto Parts & | |
| Equipment | 2.2 | |
| Hanesbrands Inc. | Apparel, Accessories | |
| & Luxury Goods | 2.2 | |
| Host Hotels & Resorts | ||
| Inc. | Specialized REITs | 2.2 |
| Joy Global Inc. | Construction & Farm | |
| Machinery & Heavy | ||
| Trucks | 2.2 | |
| Stanley Black & Decker | ||
| Inc. | Industrial Machinery | 2.1 |
| Cardinal Health Inc. | Health Care | |
| Distributors | 2.1 | |
| Discover Financial | ||
| Services | Consumer Finance | 2.1 |
| Murphy Oil Corp. | Oil & Gas Exploration | |
| & Production | 2.0 | |
| Top Ten | 22.3% | |
| The holdings listed exclude any temporary cash investments and equity index products. | ||
Investment Focus

1 The expense ratio shown is from the prospectus dated March 31, 2014, and represents estimated costs for the current fiscal year. For the six
months ended April 30, 2014, the annualized expense ratio was 0.43%.
12
Selected Value Fund
Performance Summary
All of the returns in this report represent past performance, which is not a guarantee of future results that may be achieved by the fund. (Current performance may be lower or higher than the performance data cited. For performance data current to the most recent month-end, visit our website at vanguard.com/performance.) Note, too, that both investment returns and principal value can fluctuate widely, so an investor’s shares, when sold, could be worth more or less than their original cost. The returns shown do not reflect taxes that a shareholder would pay on fund distributions or on the sale of fund shares.
Fiscal-Year Total Returns (%): October 31, 2003, Through April 30, 2014
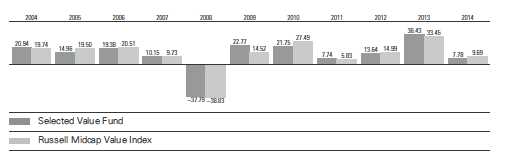
Average Annual Total Returns: Periods Ended March 31, 2014
This table presents returns through the latest calendar quarter—rather than through the end of the fiscal period.
Securities and Exchange Commission rules require that we provide this information.
| Inception | One | Five | Ten | |
| Date | Year | Years | Years | |
| Selected Value Fund | 2/15/1996 | 28.91% | 24.67% | 10.33% |
See Financial Highlights for dividend and capital gains information.
13
Selected Value Fund
Financial Statements (unaudited)
Statement of Net Assets
As of April 30, 2014
The fund reports a complete list of its holdings in regulatory filings four times in each fiscal year, at the quarter-ends. For the second and fourth fiscal quarters, the lists appear in the fund’s semiannual and annual reports to shareholders. For the first and third fiscal quarters, the fund files the lists with the Securities and Exchange Commission on Form N-Q. Shareholders can look up the fund’s Forms N-Q on the SEC’s website at sec.gov. Forms N-Q may also be reviewed and copied at the SEC’s Public Reference Room (see the back cover of this report for further information).
| Market | |||
| Value | |||
| Shares | ($000) | ||
| Common Stocks (89.0%)1 | |||
| Consumer Discretionary (9.7%) | |||
| Delphi Automotive plc | 2,976,500 | 198,949 | |
| Hanesbrands Inc. | 2,421,300 | 198,764 | |
| Royal Caribbean | |||
| Cruises Ltd. | 3,289,525 | 174,772 | |
| L Brands Inc. | 2,599,200 | 140,877 | |
| * | Murphy USA Inc. | 1,414,300 | 60,108 |
| Dillard’s Inc. Class A | 249,521 | 24,436 | |
| Interpublic Group of | |||
| Cos. Inc. | 732,775 | 12,765 | |
| * | News Corp. Class A | 721,250 | 12,276 |
| Staples Inc. | 672,275 | 8,403 | |
| * | TRW Automotive | ||
| Holdings Corp. | 101,265 | 8,137 | |
| Omnicom Group Inc. | 119,500 | 8,088 | |
| Kohl’s Corp. | 74,275 | 4,069 | |
| Dana Holding Corp. | 179,125 | 3,792 | |
| International Game | |||
| Technology | 292,825 | 3,675 | |
| 859,111 | |||
| Consumer Staples (3.4%) | |||
| Reynolds American Inc. | 2,734,200 | 154,291 | |
| Lorillard Inc. | 2,492,500 | 148,104 | |
| Kellogg Co. | 60,550 | 4,047 | |
| 306,442 | |||
| Energy (8.9%) | |||
| Murphy Oil Corp. | 2,962,625 | 187,919 | |
| * | WPX Energy Inc. | 6,469,194 | 137,665 |
| Helmerich & Payne Inc. | 1,239,800 | 134,704 | |
| ^ | Seadrill Ltd. | 3,689,300 | 129,937 |
| ^ | Golar LNG Ltd. | 1,734,847 | 76,680 |
| Noble Corp. plc | 1,933,979 | 59,586 | |
| Nabors Industries Ltd. | 835,000 | 21,309 | |
| Valero Energy Corp. | 237,000 | 13,549 | |
| Superior Energy | |||
| Services Inc. | 383,325 | 12,619 | |
| Baker Hughes Inc. | 125,500 | 8,773 | |
| * | Rowan Cos. plc Class A | 197,575 | 6,109 |
| *,^ | Overseas Shipholding | ||
| Group Inc. | 472,900 | 2,696 | |
| 791,546 | |||
| Financials (26.1%) | |||
| Host Hotels & | |||
| Resorts Inc. | 9,118,800 | 195,598 | |
| Discover Financial | |||
| Services | 3,296,000 | 184,246 | |
| Fifth Third Bancorp | 8,366,650 | 172,437 | |
| Capital One | |||
| Financial Corp. | 2,261,600 | 167,132 | |
| CIT Group Inc. | 3,684,400 | 158,613 | |
| Ameriprise Financial Inc. | 1,346,800 | 150,343 | |
| New York Community | |||
| Bancorp Inc. | 9,681,700 | 149,195 | |
| XL Group plc Class A | 4,654,876 | 145,930 | |
| * | Genworth Financial Inc. | ||
| Class A | 7,528,817 | 134,389 | |
| SLM Corp. | 4,618,000 | 118,914 | |
| People’s United | |||
| Financial Inc. | 7,696,800 | 109,910 | |
| Willis Group Holdings plc | 2,616,900 | 107,267 | |
| First Niagara Financial | |||
| Group Inc. | 11,362,000 | 101,349 | |
| CNA Financial Corp. | 2,165,344 | 88,671 | |
| Corporate Office | |||
| Properties Trust | 2,881,600 | 77,083 | |
| Unum Group | 1,990,890 | 66,137 | |
| Everest Re Group Ltd. | 383,337 | 60,579 | |
| American National | |||
| Insurance Co. | 254,722 | 28,633 | |
| Hospitality Properties Trust | 276,800 | 8,318 | |
| Assurant Inc. | 123,370 | 8,316 | |
| * | Voya Financial Inc. | 228,540 | 8,088 |
| Axis Capital Holdings Ltd. | 172,225 | 7,879 | |
| Legg Mason Inc. | 137,575 | 6,451 | |
14
Selected Value Fund
| Market | |||
| Value | |||
| Shares | ($000) | ||
| Invesco Ltd. | 174,975 | 6,161 | |
| Validus Holdings Ltd. | 160,000 | 5,931 | |
| Endurance Specialty | |||
| Holdings Ltd. | 84,375 | 4,288 | |
| Hartford Financial | |||
| Services Group Inc. | 119,425 | 4,284 | |
| Symetra Financial Corp. | 205,400 | 4,244 | |
| PartnerRe Ltd. | 39,600 | 4,174 | |
| KeyCorp | 301,700 | 4,115 | |
| RenaissanceRe | |||
| Holdings Ltd. | 40,525 | 4,102 | |
| Allstate Corp. | 71,925 | 4,096 | |
| Progressive Corp. | 168,075 | 4,076 | |
| Primerica Inc. | 88,809 | 4,076 | |
| Synovus Financial Corp. | 1,246,550 | 4,001 | |
| Webster Financial Corp. | 132,650 | 3,998 | |
| EPR Properties | 74,325 | 3,985 | |
| Comerica Inc. | 82,425 | 3,976 | |
| Regions Financial Corp. | 391,000 | 3,965 | |
| 2,324,950 | |||
| Health Care (8.2%) | |||
| Omnicare Inc. | 3,448,200 | 204,375 | |
| Cardinal Health Inc. | 2,690,400 | 187,010 | |
| Cigna Corp. | 2,143,050 | 171,530 | |
| St. Jude Medical Inc. | 2,331,700 | 147,993 | |
| Becton Dickinson and Co. | 71,525 | 8,084 | |
| Aetna Inc. | 56,150 | 4,012 | |
| * | Laboratory Corp. of | ||
| America Holdings | 31,650 | 3,124 | |
| Quest Diagnostics Inc. | 27,325 | 1,528 | |
| 727,656 | |||
| Industrials (17.3%) | |||
| Joy Global Inc. | 3,192,000 | 192,733 | |
| Stanley Black & | |||
| Decker Inc. | 2,177,800 | 187,051 | |
| Eaton Corp. plc | 2,338,800 | 169,891 | |
| SPX Corp. | 1,489,000 | 151,640 | |
| Pentair Ltd. | 1,988,400 | 147,718 | |
| Owens Corning | 3,050,652 | 124,619 | |
| KBR Inc. | 4,637,975 | 117,665 | |
| * | Air France-KLM ADR | 7,473,685 | 107,621 |
| * | AerCap Holdings NV | 2,322,811 | 96,931 |
| Xylem Inc. | 1,742,700 | 65,508 | |
| * | JetBlue Airways Corp. | 7,389,729 | 58,416 |
| Southwest Airlines Co. | 1,800,370 | 43,515 | |
| L-3 Communications | |||
| Holdings Inc. | 282,515 | 32,594 | |
| Parker Hannifin Corp. | 83,450 | 10,588 | |
| Terex Corp. | 195,800 | 8,476 | |
| URS Corp. | 169,325 | 7,979 | |
| * | AECOM Technology Corp. | 185,875 | 6,026 |
| Masco Corp. | 279,375 | 5,613 | |
| Con-way Inc. | 100,575 | 4,272 | |
| Regal-Beloit Corp. | 55,225 | 4,127 | |
| 1,542,983 | |||
| Information Technology (8.9%) | ||||
| * | Micron Technology Inc. | 10,000,000 | 261,200 | |
| Total System | ||||
| Services Inc. | 5,576,278 | 177,158 | ||
| CA Inc. | 5,432,800 | 163,745 | ||
| * | Ingram Micro Inc. | 3,672,066 | 98,999 | |
| * | Celestica Inc. | 2,167,602 | 24,060 | |
| Avnet Inc. | 310,122 | 13,376 | ||
| * | Flextronics | |||
| International Ltd. | 1,313,825 | 11,811 | ||
| * | Arrow Electronics Inc. | 206,750 | 11,733 | |
| * | ON Semiconductor Corp. | 830,175 | 7,812 | |
| Corning Inc. | 292,675 | 6,120 | ||
| Jabil Circuit Inc. | 346,175 | 5,975 | ||
| * | Tech Data Corp. | 65,234 | 4,077 | |
| Western Digital Corp. | 45,075 | 3,972 | ||
| 790,038 | ||||
| Materials (3.2%) | ||||
| Rockwood Holdings Inc. | 1,920,787 | 136,472 | ||
| Yamana Gold Inc. | 16,260,246 | 121,627 | ||
| * | New Gold Inc. | 2,646,670 | 13,418 | |
| * | Coeur Mining Inc. | 825,000 | 7,144 | |
| Ashland Inc. | 41,850 | 4,043 | ||
| 282,704 | ||||
| Other (0.3%) | ||||
| ^,2 | Vanguard Mid-Cap | |||
| Value ETF | 334,800 | 27,845 | ||
| Utilities (3.0%) | ||||
| Xcel Energy Inc. | 2,043,880 | 65,138 | ||
| CenterPoint Energy Inc. | 2,595,717 | 64,270 | ||
| Pinnacle West | ||||
| Capital Corp. | 1,112,800 | 62,261 | ||
| Exelon Corp. | 1,280,153 | 44,844 | ||
| NRG Energy Inc. | 796,234 | 26,053 | ||
| FirstEnergy Corp. | 170,875 | 5,767 | ||
| 268,333 | ||||
| Total Common Stocks | ||||
| (Cost $5,665,676) | 7,921,608 | |||
| Temporary Cash Investments (11.2%)1 | ||||
| Money Market Fund (11.0%) | ||||
| 3,4 | Vanguard Market | |||
| Liquidity Fund, | ||||
| 0.124% | 980,199,352 | 980,199 | ||
15
Selected Value Fund
| Face | Market | ||
| Amount | Value | ||
| ($000) | ($000) | ||
| U.S. Government and Agency Obligations (0.2%) | |||
| 5 | Fannie Mae Discount Notes, | ||
| 0.080%, 5/14/14 | 2,100 | 2,100 | |
| 5,6 | Fannie Mae Discount Notes, | ||
| 0.085%, 7/14/14 | 1,000 | 1,000 | |
| 7 | Federal Home Loan Bank | ||
| Discount Notes, | |||
| 0.073%, 5/2/14 | 2,400 | 2,400 | |
| 6,7 | Federal Home Loan Bank | ||
| Discount Notes, | |||
| 0.075%, 5/21/14 | 6,700 | 6,700 | |
| 6,7 | Federal Home Loan Bank | ||
| Discount Notes, | |||
| 0.080%, 6/6/14 | 2,000 | 2,000 | |
| 6,7 | Federal Home Loan Bank | ||
| Discount Notes, | |||
| 0.090%, 7/16/14 | 2,100 | 2,099 | |
| 6,7 | Federal Home Loan Bank | ||
| Discount Notes, | |||
| 0.080%, 7/18/14 | 1,500 | 1,500 | |
| 6,7 | Federal Home Loan Bank | ||
| Discount Notes, | |||
| 0.110%, 7/30/14 | 1,100 | 1,100 | |
| 18,899 | |||
| Total Temporary Cash Investments | |||
| (Cost $999,098) | 999,098 | ||
| Total Investments (100.2%) | |||
| (Cost $6,664,774) | 8,920,706 | ||
| Market | |
| Value | |
| ($000) | |
| Other Assets and Liabilities (-0.2%) | |
| Other Assets | 47,793 |
| Liabilities4 | (65,428) |
| (17,635) | |
| Net Assets (100%) | |
| Applicable to 311,003,245 outstanding | |
| $.001 par value shares of beneficial | |
| interest (unlimited authorization) | 8,903,071 |
| Net Asset Value Per Share | $28.63 |
| At April 30, 2014, net assets consisted of: | |
| Amount | |
| ($000) | |
| Paid-in Capital | 6,372,965 |
| Undistributed Net Investment Income | 30,434 |
| Accumulated Net Realized Gains | 244,763 |
| Unrealized Appreciation (Depreciation) | |
| Investment Securities | 2,255,932 |
| Futures Contracts | (1,023) |
| Net Assets | 8,903,071 |
See Note A in Notes to Financial Statements.
* Non-income-producing security.
^ Includes partial security positions on loan to broker-dealers. The total value of securities on loan is $32,941,000.
1 The fund invests a portion of its cash reserves in equity markets through the use of index futures contracts. After giving effect to futures
investments, the fund’s effective common stock and temporary cash investment positions represent 91.5% and 8.7%, respectively, of
net assets.
2 Considered an affiliated company of the fund as the issuer is another member of The Vanguard Group.
3 Affiliated money market fund available only to Vanguard funds and certain trusts and accounts managed by Vanguard. Rate shown is the
7-day yield.
4 Includes $34,007,000 of collateral received for securities on loan.
5 The issuer was placed under federal conservatorship in September 2008; since that time, its daily operations have been managed by the
Federal Housing Finance Agency and it receives capital from the U.S. Treasury, as needed to maintain a positive net worth, in exchange
for senior preferred stock.
6 Securities with a value of $11,299,000 have been segregated as initial margin for open futures contracts.
7 The issuer operates under a congressional charter; its securities are generally neither guaranteed by the U.S. Treasury nor backed by the
full faith and credit of the U.S. government.
ADR—American Depositary Receipt.
See accompanying Notes, which are an integral part of the Financial Statements.
16
Selected Value Fund
Statement of Operations
| Six Months Ended | |
| April 30, 2014 | |
| ($000) | |
| Investment Income | |
| Income | |
| Dividends1,2 | 76,393 |
| Interest2 | 587 |
| Securities Lending | 296 |
| Total Income | 77,276 |
| Expenses | |
| Investment Advisory Fees—Note B | |
| Basic Fee | 8,398 |
| Performance Adjustment | 1,053 |
| The Vanguard Group—Note C | |
| Management and Administrative | 6,763 |
| Marketing and Distribution | 767 |
| Custodian Fees | 42 |
| Shareholders’ Reports | 37 |
| Trustees’ Fees and Expenses | 6 |
| Total Expenses | 17,066 |
| Expenses Paid Indirectly | (417) |
| Net Expenses | 16,649 |
| Net Investment Income | 60,627 |
| Realized Net Gain (Loss) | |
| Investment Securities Sold2 | 230,701 |
| Futures Contracts | 30,300 |
| Realized Net Gain (Loss) | 261,001 |
| Change in Unrealized Appreciation (Depreciation) | |
| Investment Securities | 268,361 |
| Futures Contracts | (10,285) |
| Change in Unrealized Appreciation (Depreciation) | 258,076 |
| Net Increase (Decrease) in Net Assets Resulting from Operations | 579,704 |
| 1 Dividends are net of foreign withholding taxes of $215,000. | |
| 2 Dividend income, interest income, and realized net gain (loss) from affiliated companies of the fund were $477,000, $576,000, and $1,126,000, respectively. | |
See accompanying Notes, which are an integral part of the Financial Statements.
17
Selected Value Fund
Statement of Changes in Net Assets
| Six Months Ended | Year Ended | |
| April 30, | October 31, | |
| 2014 | 2013 | |
| ($000) | ($000) | |
| Increase (Decrease) in Net Assets | ||
| Operations | ||
| Net Investment Income | 60,627 | 91,650 |
| Realized Net Gain (Loss) | 261,001 | 384,477 |
| Change in Unrealized Appreciation (Depreciation) | 258,076 | 1,206,948 |
| Net Increase (Decrease) in Net Assets Resulting from Operations | 579,704 | 1,683,075 |
| Distributions | ||
| Net Investment Income | (86,230) | (90,598) |
| Realized Capital Gain | (318,790) | — |
| Total Distributions | (405,020) | (90,598) |
| Capital Share Transactions | ||
| Issued | 1,903,870 | 1,708,267 |
| Issued in Lieu of Cash Distributions | 371,698 | 81,500 |
| Redeemed | (565,748) | (700,802) |
| Net Increase (Decrease) from Capital Share Transactions | 1,709,820 | 1,088,965 |
| Total Increase (Decrease) | 1,884,504 | 2,681,442 |
| Net Assets | ||
| Beginning of Period | 7,018,567 | 4,337,125 |
| End of Period1 | 8,903,071 | 7,018,567 |
| 1 Net Assets—End of Period includes undistributed net investment income of $30,434,000 and $56,037,000. | ||
See accompanying Notes, which are an integral part of the Financial Statements.
18
Selected Value Fund
Financial Highlights
| Six Months | ||||||
| Ended | ||||||
| For a Share Outstanding | April 30, | Year Ended October 31, | ||||
| Throughout Each Period | 2014 | 2013 | 2012 | 2011 | 2010 | 2009 |
| Net Asset Value, Beginning of Period | $28.07 | $21.01 | $18.81 | $17.73 | $14.78 | $12.48 |
| Investment Operations | ||||||
| Net Investment Income | .204 | .395 | .405 | .334 | .250 | .254 |
| Net Realized and Unrealized Gain (Loss) | ||||||
| on Investments | 1.906 | 7.105 | 2.122 | 1.037 | 2.941 | 2.463 |
| Total from Investment Operations | 2.110 | 7.500 | 2.527 | 1.371 | 3.191 | 2.717 |
| Distributions | ||||||
| Dividends from Net Investment Income | (. 330) | (. 440) | (. 327) | (. 291) | (. 241) | (. 417) |
| Distributions from Realized Capital Gains | (1.220) | — | — | — | — | — |
| Total Distributions | (1.550) | (. 440) | (. 327) | (. 291) | (. 241) | (. 417) |
| Net Asset Value, End of Period | $28.63 | $28.07 | $21.01 | $18.81 | $17.73 | $14.78 |
| Total Return1 | 7.78% | 36.43% | 13.64% | 7.74% | 21.75% | 22.77% |
| Ratios/Supplemental Data | ||||||
| Net Assets, End of Period (Millions) | $8,903 | $7,019 | $4,337 | $3,956 | $3,639 | $2,851 |
| Ratio of Total Expenses to | ||||||
| Average Net Assets2 | 0.43% | 0.43% | 0.38% | 0.45% | 0.47% | 0.52% |
| Ratio of Net Investment Income to | ||||||
| Average Net Assets | 1.51% | 1.70% | 2.00% | 1.74% | 1.52% | 1.93% |
| Portfolio Turnover Rate | 21% | 27% | 18% | 25% | 22% | 30% |
The expense ratio, net income ratio, and turnover rate for the current period have been annualized.
1 Total returns do not include transaction or account service fees that may have applied in the periods shown. Fund prospectuses provide
information about any applicable transaction and account service fees.
2 Includes performance-based investment advisory fee increases (decreases) of 0.03%, 0.02%, (0.03%), 0.04%, 0.05%, and 0.05%.
See accompanying Notes, which are an integral part of the Financial Statements.
19
Selected Value Fund
Notes to Financial Statements
Vanguard Selected Value Fund is registered under the Investment Company Act of 1940 as an open-end investment company, or mutual fund.
A. The following significant accounting policies conform to generally accepted accounting principles for U.S. investment companies. The fund consistently follows such policies in preparing its financial statements.
1. Security Valuation: Securities are valued as of the close of trading on the New York Stock Exchange (generally 4 p.m., Eastern time) on the valuation date. Equity securities are valued at the latest quoted sales prices or official closing prices taken from the primary market in which each security trades; such securities not traded on the valuation date are valued at the mean of the latest quoted bid and asked prices. Securities for which market quotations are not readily available, or whose values have been affected by events occurring before the fund’s pricing time but after the close of the securities’ primary markets, are valued at their fair values calculated according to procedures adopted by the board of trustees. These procedures include obtaining quotations from an independent pricing service, monitoring news to identify significant market- or security-specific events, and evaluating changes in the values of foreign market proxies (for example, ADRs, futures contracts, or exchange-traded funds), between the time the foreign markets close and the fund’s pricing time. When fair-value pricing is employed, the prices of securities used by a fund to calculate its net asset value may differ from quoted or published prices for the same securities. Investments in Vanguard Market Liquidity Fund are valued at that fund’s net asset value. Temporary cash investments acquired over 60 days to maturity are valued using the latest bid prices or using valuations based on a matrix system (which considers such factors as security prices, yields, maturities, and ratings), both as furnished by independent pricing services. Other temporary cash investments are valued at amortized cost, which approximates market value.
2. Futures Contracts: The fund uses index futures contracts to a limited extent, with the objective of maintaining full exposure to the stock market while maintaining liquidity. The fund may purchase or sell futures contracts to achieve a desired level of investment, whether to accommodate portfolio turnover or cash flows from capital share transactions. The primary risks associated with the use of futures contracts are imperfect correlation between changes in market values of stocks held by the fund and the prices of futures contracts, and the possibility of an illiquid market. Counterparty risk involving futures is mitigated because a regulated clearinghouse is the counterparty instead of the clearing broker. To further mitigate counterparty risk, the fund trades futures contracts on an exchange, monitors the financial strength of its clearing brokers and clearinghouse, and has entered into clearing agreements with its clearing brokers. The clearinghouse imposes initial margin requirements to secure the fund’s performance and requires daily settlement of variation margin representing changes in the market value of each contract.
Futures contracts are valued at their quoted daily settlement prices. The aggregate notional amounts of the contracts are not recorded in the Statement of Net Assets. Fluctuations in the value of the contracts are recorded in the Statement of Net Assets as an asset (liability) and in the Statement of Operations as unrealized appreciation (depreciation) until the contracts are closed, when they are recorded as realized futures gains (losses).
During the six months ended April 30, 2014, the fund’s average investments in long and short futures contracts represented 4% and 0% of net assets, respectively, based on quarterly average aggregate settlement values.
20
Selected Value Fund
3. Federal Income Taxes: The fund intends to continue to qualify as a regulated investment company and distribute all of its taxable income. Management has analyzed the fund’s tax positions taken for all open federal income tax years (October 31, 2010–2013), and for the period ended April 30, 2014, and has concluded that no provision for federal income tax is required in the fund’s financial statements. 4. Distributions: Distributions to shareholders are recorded on the ex-dividend date.
5. Securities Lending: To earn additional income, the fund lends its securities to qualified institutional borrowers. Security loans are required to be secured at all times by collateral in an amount at least equal to the market value of securities loaned. Daily market fluctuations could cause the value of loaned securities to be more or less than the value of the collateral received. When this occurs, the collateral is adjusted and settled on the next business day. The fund further mitigates its counterparty risk by entering into securities lending transactions only with a diverse group of prequalified counter-parties, monitoring their financial strength, and entering into master securities lending agreements with its counterparties. The master securities lending agreements provide that, in the event of a counterparty’s default (including bankruptcy), the fund may terminate any loans with that borrower, determine the net amount owed, and sell or retain the collateral up to the net amount owed to the fund; however, such actions may be subject to legal proceedings. While collateral mitigates counterparty risk, in the absence of a default the fund may experience delays and costs in recovering the securities loaned. The fund invests cash collateral received in Vanguard Market Liquidity Fund, and records a liability in the Statement of Net Assets for the return of the collateral, during the period the securities are on loan. Securities lending income represents fees charged to borrowers plus income earned on invested cash collateral, less expenses associated with the loan.
6. Credit Facility: The fund and certain other funds managed by The Vanguard Group participate in a $2.89 billion committed credit facility provided by a syndicate of lenders pursuant to a credit agreement that may be renewed annually; each fund is individually liable for its borrowings, if any, under the credit facility. Borrowings may be utilized for temporary and emergency purposes, and are subject to the fund’s regulatory and contractual borrowing restrictions. The participating funds are charged administrative fees and an annual commitment fee of 0.06% of the undrawn amount of the facility; these fees are allocated to the funds based on a method approved by the fund’s board of trustees and included in Management and Administrative expenses on the fund’s Statement of Operations. Any borrowings under this facility bear interest at a rate equal to the higher of the federal funds rate or LIBOR reference rate plus an agreed-upon spread.
The fund had no borrowings outstanding at April 30, 2014, or at any time during the period then ended.
7. Other: Dividend income is recorded on the ex-dividend date. Interest income includes income distributions received from Vanguard Market Liquidity Fund and is accrued daily. Premiums and discounts on debt securities purchased are amortized and accreted, respectively, to interest income over the lives of the respective securities. Security transactions are accounted for on the date securities are bought or sold. Costs used to determine realized gains (losses) on the sale of investment securities are those of the specific securities sold.
B. Barrow, Hanley, Mewhinney & Strauss, LLC, Donald Smith & Co., Inc., and beginning March 2014, Pzena Investment Management, LLC, each provide investment advisory services to a portion of the fund for a fee calculated at an annual percentage rate of average net assets managed by the advisor. The basic fee of Barrow, Hanley, Mewhinney & Strauss, LLC, is subject to quarterly adjustments based on
21
Selected Value Fund
performance for the preceding three years relative to the Russell Midcap Value Index. The basic fee of Donald Smith & Co., Inc., is subject to quarterly adjustments based on performance for the preceding five years relative to the MSCI Investable Market 2500 Index. In accordance with the advisory contract entered into with Pzena Investment Management, LLC, beginning February 1, 2015, the investment advisory fee will be subject to quarterly adjustments based on performance since April 30, 2014, relative to the Russell Midcap Value Index.
The Vanguard Group manages the cash reserves of the fund on an at-cost basis.
For the six months ended April 30, 2014, the aggregate investment advisory fee represented an effective annual basic rate of 0.21% of the fund’s average net assets, before an increase of $1,053,000 (0.03%) based on performance.
C. The Vanguard Group furnishes at cost corporate management, administrative, marketing, and distribution services. The costs of such services are allocated to the fund based on methods approved by the board of trustees. The fund has committed to provide up to 0.40% of its net assets in capital contributions to Vanguard. At April 30, 2014, the fund had contributed capital of $903,000 to Vanguard (included in Other Assets), representing 0.01% of the fund’s net assets and 0.36% of Vanguard’s capitalization. The fund’s trustees and officers are also directors and officers of Vanguard.
D. The fund has asked its investment advisors to direct certain security trades, subject to obtaining the best price and execution, to brokers who have agreed to rebate to the fund part of the commissions generated. Such rebates are used solely to reduce the fund’s management and administrative expenses. For the six months ended April 30, 2014, these arrangements reduced the fund’s expenses by $417,000 (an annual rate of 0.00% of average net assets).
E. Various inputs may be used to determine the value of the fund’s investments. These inputs are summarized in three broad levels for financial statement purposes. The inputs or methodologies used to value securities are not necessarily an indication of the risk associated with investing in those securities.
Level 1—Quoted prices in active markets for identical securities.
Level 2—Other significant observable inputs (including quoted prices for similar securities, interest rates, prepayment speeds, credit risk, etc.).
Level 3—Significant unobservable inputs (including the fund’s own assumptions used to determine the fair value of investments).
The following table summarizes the market value of the fund’s investments as of April 30, 2014, based on the inputs used to value them:
| Level 1 | Level 2 | Level 3 | |
| Investments | ($000) | ($000) | ($000) |
| Common Stocks | 7,921,608 | — | — |
| Temporary Cash Investments | 980,199 | 18,899 | — |
| Futures Contracts—Assets1 | 1,063 | — | — |
| Total | 8,902,870 | 18,899 | — |
| 1 Represents variation margin on the last day of the reporting period. | |||
22
Selected Value Fund
F. At April 30, 2014, the aggregate settlement value of open futures contracts and the related unrealized appreciation (depreciation) were:
| ($000) | ||||
| Aggregate | ||||
| Number of | Settlement | Unrealized | ||
| Long (Short) | Value | Appreciation | ||
| Futures Contracts | Expiration | Contracts | Long (Short) | (Depreciation) |
| E-mini S&P 500 Index | June 2014 | 1,176 | 110,421 | 976 |
| E-mini S&P MidCap 400 Index | June 2014 | 742 | 100,400 | (1,320) |
| E-mini Russell 2000 Index | June 2014 | 162 | 18,202 | (679) |
| (1,023) | ||||
Unrealized appreciation (depreciation) on open futures contracts is required to be treated as realized gain (loss) for tax purposes.
G. Distributions are determined on a tax basis and may differ from net investment income and realized capital gains for financial reporting purposes. Differences may be permanent or temporary. Permanent differences are reclassified among capital accounts in the financial statements to reflect their tax character. Temporary differences arise when certain items of income, expense, gain, or loss are recognized in different periods for financial statement and tax purposes. These differences will reverse at some time in the future. Differences in classification may also result from the treatment of short-term gains as ordinary income for tax purposes. The fund’s tax-basis capital gains and losses are determined only at the end of each fiscal year.
At April 30, 2014, the cost of investment securities for tax purposes was $6,664,774,000. Net unrealized appreciation of investment securities for tax purposes was $2,255,932,000, consisting of unrealized gains of $2,394,074,000 on securities that had risen in value since their purchase and $138,142,000 in unrealized losses on securities that had fallen in value since their purchase.
H. During the six months ended April 30, 2014, the fund purchased $2,024,877,000 of investment securities and sold $778,540,000 of investment securities, other than temporary cash investments.
I. Capital shares issued and redeemed were:
| Six Months Ended | Year Ended | |
| April 30, 2014 | October 31, 2013 | |
| Shares | Shares | |
| (000) | (000) | |
| Issued | 67,500 | 68,780 |
| Issued in Lieu of Cash Distributions | 13,610 | 3,922 |
| Redeemed | (20,101) | (29,178) |
| Net Increase (Decrease) in Shares Outstanding | 61,009 | 43,524 |
J. Management has determined that no material events or transactions occurred subsequent to April 30, 2014, that would require recognition or disclosure in these financial statements.
23
About Your Fund’s Expenses
As a shareholder of the fund, you incur ongoing costs, which include costs for portfolio management, administrative services, and shareholder reports (like this one), among others. Operating expenses, which are deducted from a fund’s gross income, directly reduce the investment return of the fund.
A fund’s expenses are expressed as a percentage of its average net assets. This figure is known as the expense ratio. The following examples are intended to help you understand the ongoing costs (in dollars) of investing in your fund and to compare these costs with those of other mutual funds. The examples are based on an investment of $1,000 made at the beginning of the period shown and held for the entire period.
The accompanying table illustrates your fund’s costs in two ways:
• Based on actual fund return. This section helps you to estimate the actual expenses that you paid over the period. The ”Ending Account Value“ shown is derived from the fund‘s actual return, and the third column shows the dollar amount that would have been paid by an investor who started with $1,000 in the fund. You may use the information here, together with the amount you invested, to estimate the expenses that you paid over the period.
To do so, simply divide your account value by $1,000 (for example, an $8,600 account value divided by $1,000 = 8.6), then multiply the result by the number given for your fund under the heading ”Expenses Paid During Period.“
• Based on hypothetical 5% yearly return. This section is intended to help you compare your fund‘s costs with those of other mutual funds. It assumes that the fund had a yearly return of 5% before expenses, but that the expense ratio is unchanged. In this case—because the return used is not the fund’s actual return—the results do not apply to your investment. The example is useful in making comparisons because the Securities and Exchange Commission requires all mutual funds to calculate expenses based on a 5% return. You can assess your fund’s costs by comparing this hypothetical example with the hypothetical examples that appear in shareholder reports of other funds.
Note that the expenses shown in the table are meant to highlight and help you compare ongoing costs only and do not reflect transaction costs incurred by the fund for buying and selling securities. Further, the expenses do not include any purchase, redemption, or account service fees described in the fund prospectus. If such fees were applied to your account, your costs would be higher. Your fund does not carry a “sales load.”
The calculations assume no shares were bought or sold during the period. Your actual costs may have been higher or lower, depending on the amount of your investment and the timing of any purchases or redemptions.
You can find more information about the fund’s expenses, including annual expense ratios, in the Financial Statements section of this report. For additional information on operating expenses and other shareholder costs, please refer to your fund’s current prospectus.
24
| Six Months Ended April 30, 2014 | |||
| Beginning | Ending | Expenses | |
| Account Value | Account Value | Paid During | |
| Selected Value Fund | 10/31/2013 | 4/30/2014 | Period |
| Based on Actual Fund Return | $1,000.00 | $1,077.84 | $2.22 |
| Based on Hypothetical 5% Yearly Return | 1,000.00 | 1,022.66 | 2.16 |
The calculations are based on expenses incurred in the most recent six-month period. The fund’s annualized six-month expense ratio for that
period is 0.43%. The dollar amounts shown as “Expenses Paid” are equal to the annualized expense ratio multiplied by the average account
value over the period, multiplied by the number of days in the most recent six-month period, then divided by the number of days in the most
recent 12-month period.
25
Trustees Approve Advisory Arrangements
The board of trustees of Vanguard Selected Value Fund has renewed the fund’s investment advisory arrangements with Barrow, Hanley, Mewhinney & Strauss, LLC (Barrow Hanley), and Donald Smith & Co., Inc. (Donald Smith & Co.). The board also added Pzena Investment Management Group, LLC (Pzena), to the fund’s investment advisory team effective March 2014. Please see the Notice to Shareholders for more information regarding the board’s approval of the advisor. The board determined that approving and renewing the advisory arrangements was in the best interests of the fund and its shareholders.
The board based its decision upon an evaluation of each advisor’s investment staff, portfolio management process, and performance. The trustees considered the factors discussed below, among others. However, no single factor determined whether the board approved the arrangements. Rather, it was the totality of the circumstances that drove the board’s decision.
Nature, extent, and quality of services
The board considered the quality of the fund’s investment management services over both the short and long term, and took into account the organizational depth and stability of each advisor. The board noted the following:
Barrow Hanley. Founded in 1979, Barrow Hanley is known for its commitment to value investing. A subsidiary of Old Mutual Asset Managers, Barrow Hanley remains independently managed. Using a combination of in-depth fundamental research and valuation forecasts, the firm seeks stocks offering strong fundamentals and price appreciation potential, with below-average price/earnings ratios and price/book-value ratios, and above-average current yields. Barrow Hanley has advised the fund since its inception in 1996.
Donald Smith & Co. Founded in 1983, Donald Smith & Co. is a deep-value-oriented firm that manages large-, mid-, and small-cap value portfolios and employs a strictly bottom-up approach. The portfolio managers invest in out-of-favor companies selling at discounts to tangible book value. The firm looks for companies in the bottom decile of price-to-tangible-book ratios that have a positive outlook for earnings potential over the next two to four years. Donald Smith & Co. has managed a portion of the fund since 2005.
Pzena. Founded in 1995, Pzena is a global investment management firm that employs a deep value investment approach. Pzena seeks to buy good businesses at low prices, focusing exclusively on companies that are underperforming their historically demonstrated earnings power. Pzena conducts intensive fundamental research, buying companies only when the problems are judged to be temporary, management has a viable strategy to generate earnings recovery, and there is meaningful downside protection in case earnings do not recover. Pzena has advised a portion of the fund since March 2014.
The board concluded that each advisor’s experience, stability, depth, and performance, among other factors, warranted approval and continuation of the advisory arrangements.
Investment performance
The board considered the short- and long-term performance of the fund and each advisor, including any periods of outperformance or underperformance relative to a benchmark index and peer group. The board concluded that the performance was such that the advisory arrangements should continue. Information about the fund’s most recent performance can be found in the Performance Summary section of this report.
26
Cost
The board concluded that the fund’s expense ratio was well below the average expense ratio charged by funds in its peer group and that the fund’s advisory fee rate was also well below the peer-group average. Information about the fund’s expenses appears in the About Your Fund’s Expenses section of this report as well as in the Financial Statements section, which also includes information about the fund’s advisory fee rate.
The board did not consider profitability of Barrow Hanley, Donald Smith & Co., or Pzena in determining whether to approve the advisory fees, because the firms are independent of Vanguard and the advisory fees are the result of arm’s-length negotiations.
The benefit of economies of scale
The board concluded that the fund’s shareholders benefit from economies of scale because of breakpoints in the advisory fee schedules for Barrow Hanley, Donald Smith & Co., and Pzena. The breakpoints reduce the effective rate of the fees as the fund’s assets managed by each advisor increase.
The board will consider whether to renew the advisory agreements again after a one-year period.
27
Glossary
30-Day SEC Yield. A fund’s 30-day SEC yield is derived using a formula specified by the U.S. Securities and Exchange Commission. Under the formula, data related to the fund’s security holdings in the previous 30 days are used to calculate the fund’s hypothetical net income for that period, which is then annualized and divided by the fund’s estimated average net assets over the calculation period. For the purposes of this calculation, a security’s income is based on its current market yield to maturity (for bonds), its actual income (for asset-backed securities), or its projected dividend yield (for stocks). Because the SEC yield represents hypothetical annualized income, it will differ—at times significantly—from the fund’s actual experience. As a result, the fund’s income distributions may be higher or lower than implied by the SEC yield.
Beta. A measure of the magnitude of a fund’s past share-price fluctuations in relation to the ups and downs of a given market index. The index is assigned a beta of 1.00. Compared with a given index, a fund with a beta of 1.20 typically would have seen its share price rise or fall by 12% when the index rose or fell by 10%. For this report, beta is based on returns over the past 36 months for both the fund and the index. Note that a fund’s beta should be reviewed in conjunction with its R-squared (see definition). The lower the R-squared, the less correlation there is between the fund and the index, and the less reliable beta is as an indicator of volatility.
Dividend Yield. Dividend income earned by stocks, expressed as a percentage of the aggregate market value (or of net asset value, for a fund). The yield is determined by dividing the amount of the annual dividends by the aggregate value (or net asset value) at the end of the period. For a fund, the dividend yield is based solely on stock holdings and does not include any income produced by other investments.
Earnings Growth Rate. The average annual rate of growth in earnings over the past five years for the stocks now in a fund.
Equity Exposure. A measure that reflects a fund’s investments in stocks and stock futures. Any holdings in short-term reserves are excluded.
Expense Ratio. A fund’s total annual operating expenses expressed as a percentage of the fund’s average net assets. The expense ratio includes management and administrative expenses, but does not include the transaction costs of buying and selling portfolio securities.
Foreign Holdings. The percentage of a fund represented by securities or depositary receipts of companies based outside the United States.
Inception Date. The date on which the assets of a fund (or one of its share classes) are first invested in accordance with the fund’s investment objective. For funds with a subscription period, the inception date is the day after that period ends. Investment performance is measured from the inception date.
Median Market Cap. An indicator of the size of companies in which a fund invests; the midpoint of market capitalization (market price x shares outstanding) of a fund’s stocks, weighted by the proportion of the fund’s assets invested in each stock. Stocks representing half of the fund’s assets have market capitalizations above the median, and the rest are below it.
Price/Book Ratio. The share price of a stock divided by its net worth, or book value, per share. For a fund, the weighted average price/book ratio of the stocks it holds.
28
Price/Earnings Ratio. The ratio of a stock’s current price to its per-share earnings over the past year. For a fund, the weighted average P/E of the stocks it holds. P/E is an indicator of market expectations about corporate prospects; the higher the P/E, the greater the expectations for a company’s future growth.
R-Squared. A measure of how much of a fund’s past returns can be explained by the returns from the market in general, as measured by a given index. If a fund’s total returns were precisely synchronized with an index’s returns, its R-squared would be 1.00. If the fund’s returns bore no relationship to the index’s returns, its R-squared would be 0. For this report, R-squared is based on returns over the past 36 months for both the fund and the index.
Return on Equity. The annual average rate of return generated by a company during the past five years for each dollar of shareholder’s equity (net income divided by shareholder’s equity). For a fund, the weighted average return on equity for the companies whose stocks it holds.
Short-Term Reserves. The percentage of a fund invested in highly liquid, short-term securities that can be readily converted to cash.
Turnover Rate. An indication of the fund’s trading activity. Funds with high turnover rates incur higher transaction costs and may be more likely to distribute capital gains (which may be taxable to investors). The turnover rate excludes in-kind transactions, which have minimal impact on costs.
29
This page intentionally left blank.
This page intentionally left blank.
The People Who Govern Your Fund
The trustees of your mutual fund are there to see that the fund is operated and managed in your best interests since, as a shareholder, you are a part owner of the fund. Your fund’s trustees also serve on the board of directors of The Vanguard Group, Inc., which is owned by the Vanguard funds and provides services to them on an at-cost basis.
A majority of Vanguard’s board members are independent, meaning that they have no affiliation with Vanguard or the funds they oversee, apart from the sizable personal investments they have made as private individuals. The independent board members have distinguished backgrounds in business, academia, and public service. Each of the trustees and executive officers oversees 178 Vanguard funds.
The following table provides information for each trustee and executive officer of the fund. More information about the trustees is in the Statement of Additional Information, which can be obtained, without charge, by contacting Vanguard at 800-662-7447, or online at vanguard.com.
| InterestedTrustee1 | and Delphi Automotive LLP (automotive components); |
| Senior Advisor at New Mountain Capital. | |
| F. William McNabb III | |
| Born 1957. Trustee Since July 2009. Chairman of the | Amy Gutmann |
| Board. Principal Occupation(s) During the Past Five | Born 1949. Trustee Since June 2006. Principal |
| Years: Chairman of the Board of The Vanguard Group, | Occupation(s) During the Past Five Years: President of |
| Inc., and of each of the investment companies served | the University of Pennsylvania; Christopher H. Browne |
| by The Vanguard Group, since January 2010; Director | Distinguished Professor of Political Science, School of |
| of The Vanguard Group since 2008; Chief Executive | Arts and Sciences, and Professor of Communication, |
| Officer and President of The Vanguard Group, and of | Annenberg School for Communication, with secondary |
| each of the investment companies served by The | faculty appointments in the Department of Philosophy, |
| Vanguard Group, since 2008; Director of Vanguard | School of Arts and Sciences, and at the Graduate |
| Marketing Corporation; Managing Director of The | School of Education, University of Pennsylvania; |
| Vanguard Group (1995–2008). | Trustee of the National Constitution Center; Chair |
| of the Presidential Commission for the Study of | |
| Bioethical Issues. | |
| IndependentTrustees | |
| JoAnn Heffernan Heisen | |
| Emerson U. Fullwood | Born 1950. Trustee Since July 1998. Principal |
| Born 1948. Trustee Since January 2008. Principal | Occupation(s) During the Past Five Years: Corporate |
| Occupation(s) During the Past Five Years: Executive | Vice President and Chief Global Diversity Officer |
| Chief Staff and Marketing Officer for North America | (retired 2008) and Member of the Executive |
| and Corporate Vice President (retired 2008) of Xerox | Committee (1997–2008) of Johnson & Johnson |
| Corporation (document management products and | (pharmaceuticals/medical devices/consumer |
| services); Executive in Residence and 2009–2010 | products); Director of Skytop Lodge Corporation |
| Distinguished Minett Professor at the Rochester | (hotels), the University Medical Center at Princeton, |
| Institute of Technology; Director of SPX Corporation | the Robert Wood Johnson Foundation, and the Center |
| (multi-industry manufacturing), the United Way of | for Talent Innovation; Member of the Advisory Board |
| Rochester, Amerigroup Corporation (managed health | of the Maxwell School of Citizenship and Public Affairs |
| care), the University of Rochester Medical Center, | at Syracuse University. |
| Monroe Community College Foundation, and North | |
| Carolina A&T University. | F. Joseph Loughrey |
| Born 1949. Trustee Since October 2009. Principal | |
| Rajiv L. Gupta | Occupation(s) During the Past Five Years: President |
| Born 1945. Trustee Since December 2001.2 | and Chief Operating Officer (retired 2009) of Cummins |
| Principal Occupation(s) During the Past Five Years: | Inc. (industrial machinery); Chairman of the Board |
| Chairman and Chief Executive Officer (retired 2009) | of Hillenbrand, Inc. (specialized consumer services), |
| and President (2006–2008) of Rohm and Haas Co. | and of Oxfam America; Director of SKF AB (industrial |
| (chemicals); Director of Tyco International, Ltd. | machinery), Hyster-Yale Materials Handling, Inc. |
| (diversified manufacturing and services), Hewlett- | (forklift trucks), the Lumina Foundation for Education, |
| Packard Co. (electronic computer manufacturing), |
| and the V Foundation for Cancer Research; Member | Executive Officers | |
| of the Advisory Council for the College of Arts and | ||
| Letters and of the Advisory Board to the Kellogg | Glenn Booraem | |
| Institute for International Studies, both at the | Born 1967. Controller Since July 2010. Principal | |
| University of Notre Dame. | Occupation(s) During the Past Five Years: Principal | |
| of The Vanguard Group, Inc.; Controller of each of | ||
| Mark Loughridge | the investment companies served by The Vanguard | |
| Born 1953. Trustee Since March 2012. Principal | Group; Assistant Controller of each of the investment | |
| Occupation(s) During the Past Five Years: Senior Vice | companies served by The Vanguard Group (2001–2010). | |
| President and Chief Financial Officer (retired 2013) | ||
| at IBM (information technology services); Fiduciary | Thomas J. Higgins | |
| Member of IBM’s Retirement Plan Committee (2004– | Born 1957. Chief Financial Officer Since September | |
| 2013); Member of the Council on Chicago Booth. | 2008. Principal Occupation(s) During the Past Five | |
| Years: Principal of The Vanguard Group, Inc.; Chief | ||
| Scott C. Malpass | Financial Officer of each of the investment companies | |
| Born 1962. Trustee Since March 2012. Principal | served by The Vanguard Group; Treasurer of each of | |
| Occupation(s) During the Past Five Years: Chief | the investment companies served by The Vanguard | |
| Investment Officer and Vice President at the University | Group (1998–2008). | |
| of Notre Dame; Assistant Professor of Finance at the | ||
| Mendoza College of Business at Notre Dame; Member | Kathryn J. Hyatt | |
| of the Notre Dame 403(b) Investment Committee; | Born 1955. Treasurer Since November 2008. Principal | |
| Board Member of TIFF Advisory Services, Inc. | Occupation(s) During the Past Five Years: Principal of | |
| (investment advisor); Member of the Investment | The Vanguard Group, Inc.; Treasurer of each of the | |
| Advisory Committees of the Financial Industry | investment companies served by The Vanguard | |
| Regulatory Authority (FINRA) and of Major League | Group; Assistant Treasurer of each of the investment | |
| Baseball. | companies served by The Vanguard Group (1988–2008). | |
| André F. Perold | Heidi Stam | |
| Born 1952. Trustee Since December 2004. Principal | Born 1956. Secretary Since July 2005. Principal | |
| Occupation(s) During the Past Five Years: George | Occupation(s) During the Past Five Years: Managing | |
| Gund Professor of Finance and Banking, Emeritus | Director of The Vanguard Group, Inc.; General Counsel | |
| at the Harvard Business School (retired 2011); | of The Vanguard Group; Secretary of The Vanguard | |
| Chief Investment Officer and Managing Partner of | Group and of each of the investment companies | |
| HighVista Strategies LLC (private investment firm); | served by The Vanguard Group; Director and Senior | |
| Director of Rand Merchant Bank; Overseer of the | Vice President of Vanguard Marketing Corporation. | |
| Museum of Fine Arts Boston. | ||
| Vanguard Senior ManagementTeam | ||
| Alfred M. Rankin, Jr. | ||
| Born 1941. Trustee Since January 1993. Principal | Mortimer J. Buckley | Chris D. McIsaac |
| Occupation(s) During the Past Five Years: Chairman, | Kathleen C. Gubanich | Michael S. Miller |
| President, and Chief Executive Officer of NACCO | Paul A. Heller | James M. Norris |
| Industries, Inc. (housewares/lignite), and of Hyster- | Martha G. King | Glenn W. Reed |
| Yale Materials Handling, Inc. (forklift trucks); Chairman | John T. Marcante | |
| of the Board of University Hospitals of Cleveland. | ||
| Peter F. Volanakis | Chairman Emeritus and Senior Advisor | |
| Born 1955. Trustee Since July 2009. Principal | ||
| Occupation(s) During the Past Five Years: President | John J. Brennan | |
| and Chief Operating Officer (retired 2010) of Corning | Chairman, 1996–2009 | |
| Incorporated (communications equipment); Trustee of | Chief Executive Officer and President, 1996–2008 | |
| Colby-Sawyer College; Member of the Advisory Board | ||
| of the Norris Cotton Cancer Center and of the Advisory | Founder | |
| Board of the Parthenon Group (strategy consulting). | ||
| John C. Bogle | ||
| Chairman and Chief Executive Officer, 1974–1996 | ||
1 Mr. McNabb is considered an “interested person,” as defined in the Investment Company Act of 1940, because he is an officer of the
Vanguard funds.
2 December 2002 for Vanguard Equity Income Fund, the Vanguard Municipal Bond Funds, and the Vanguard State Tax-Exempt Funds.
 | ||
| P.O. Box 2600 | ||
| Valley Forge, PA 19482-2600 | ||
| Connect with Vanguard® > vanguard.com | ||
| Fund Information > 800-662-7447 | CFA® is a trademark owned by CFA Institute. | |
| Direct Investor Account Services > 800-662-2739 | ||
| Institutional Investor Services > 800-523-1036 | ||
| Text Telephone for People | ||
| With Hearing Impairment > 800-749-7273 | ||
| This material may be used in conjunction | ||
| with the offering of shares of any Vanguard | ||
| fund only if preceded or accompanied by | ||
| the fund’s current prospectus. | ||
| All comparative mutual fund data are from Lipper, a | ||
| Thomson Reuters Company, or Morningstar, Inc., unless | ||
| otherwise noted. | ||
| You can obtain a free copy of Vanguard’s proxy voting | ||
| guidelines by visiting vanguard.com/proxyreporting or by | ||
| calling Vanguard at 800-662-2739. The guidelines are | ||
| also available from the SEC’s website, sec.gov. In | ||
| addition, you may obtain a free report on how your fund | ||
| voted the proxies for securities it owned during the 12 | ||
| months ended June 30. To get the report, visit either | ||
| vanguard.com/proxyreporting or sec.gov. | ||
| You can review and copy information about your fund at | ||
| the SEC’s Public Reference Room in Washington, D.C. To | ||
| find out more about this public service, call the SEC at | ||
| 202-551-8090. Information about your fund is also | ||
| available on the SEC’s website, and you can receive | ||
| copies of this information, for a fee, by sending a | ||
| request in either of two ways: via e-mail addressed to | ||
| publicinfo@sec.gov or via regular mail addressed to the | ||
| Public Reference Section, Securities and Exchange | ||
| Commission, Washington, DC 20549-1520. | ||
| © 2014 The Vanguard Group, Inc. | ||
| All rights reserved. | ||
| Vanguard Marketing Corporation, Distributor. | ||
| Q9342 062014 | ||
![]()
Semiannual Report | April 30, 2014
Vanguard Global Minimum Volatility Fund

Vanguard’s Principles for Investing Success
We want to give you the best chance of investment success. These principles,
grounded in Vanguard’s research and experience, can put you on the right path.
Goals. Create clear, appropriate investment goals.
Balance. Develop a suitable asset allocation using broadly diversified funds.
Cost. Minimize cost.
Discipline. Maintain perspective and long-term discipline.
A single theme unites these principles: Focus on the things you can control.
We believe there is no wiser course for any investor.
| Contents | |
| Your Fund’s Total Returns. | 1 |
| Chairman’s Letter. | 2 |
| Advisor’s Report. | 8 |
| Fund Profile. | 11 |
| Performance Summary. | 13 |
| Financial Statements. | 14 |
| Trustees Approve Advisory Arrangement. | 30 |
| Glossary. | 31 |
Please note: The opinions expressed in this report are just that—informed opinions. They should not be considered promises or advice.
Also, please keep in mind that the information and opinions cover the period through the date on the front of this report. Of course, the
risks of investing in your fund are spelled out in the prospectus.
See the Glossary for definitions of investment terms used in this report.
About the cover: The ship’s wheel represents leadership and guidance, essential qualities in navigating difficult seas.
This one is a replica based on an 18th-century British vessel. The HMSVanguard, another ship of that era, served as the
flagship for British Admiral Horatio Nelson when he defeated a French fleet at the Battle of the Nile.
Your Fund’s Total Returns
| Period Ended April 30, 2014 | |
| Returns | |
| Since Inception | |
| Vanguard Global Minimum Volatility Fund | |
| Investor Shares (Inception: 12/12/2013) | 6.75% |
| Admiral™ Shares (Inception: 12/12/2013) | 6.75 |
| FTSE Global All Cap Index (USD Hedged) | 5.80 |
| Global Funds Average | 4.48 |
| Global Funds Average: Derived from data provided by Lipper, a Thomson Reuters Company. | |
| Benchmark returns are calculated from the start of the reporting period or from the earliest share-class inception date. | |
| Your Fund’s Performance at a Glance | ||||
| Inception Through April 30, 2014 | ||||
| Distributions Per Share | ||||
| Starting | Ending | Income | Capital | |
| Share Price | Share Price | Dividends | Gains | |
| Vanguard Global Minimum Volatility Fund | ||||
| Investor Shares | $10.00 | $10.65 | $0.024 | $0.000 |
| Admiral Shares | 20.00 | 21.30 | 0.048 | 0.000 |
1

Chairman’s Letter
Dear Shareholder,
I am pleased to present the first shareholder report for Vanguard Global Minimum Volatility Fund. We launched this fund to give investors global equity exposure with a relatively smoother ride than they would experience by investing in the global stock market as a whole.
From its inception on December 12, 2013, through April 30, 2014, the fund delivered annualized daily volatility of 7.6%, well below the 9.5% annualized daily volatility of its benchmark, the FTSE Global All Cap Index (USD Hedged). As explained in the box that appears later in my letter, we measure volatility using a statistic called standard deviation, and we use that statistic to determine a ratio referred to as the fund’s risk-adjusted return.
Vanguard Global Minimum Volatility Fund’s total return for the partial half year was 6.75% for both Investor and Admiral Shares, ahead of the 5.80% return of its benchmark and the 4.48% average return of its global fund peers. However, as in comparisons with the benchmark index, your fund’s return relative to the peer-group average tells only part of the story. The vast majority of the funds in the peer group don’t follow an investment strategy that is focused on reducing volatility.
2
Although 4½ months is too short a period to draw conclusions, we’re encouraged that the fund’s performance is consistent with our expectations. The fund’s risk-adjusted return for the period—its return divided by its standard deviation—was 0.88, which was better than the 0.61 risk-adjusted return of its index.
This report includes an overview of the financial markets during the full six months of the fund’s partial fiscal half year, followed by a brief discussion of the fund’s investment strategy.
Recent progress has been sporadic, but stocks continued their climb
For the half year ended April 30, U.S. stocks returned almost 8%, notwithstanding the patches of turbulence the market has encountered in 2014. Technology stocks, for example, turned in a rocky performance amid concerns about pricey valuations. Poor economic data from China and the conflict in Ukraine also unsettled investors.
International stocks, in aggregate, returned nearly 3%, with the developed markets of Europe faring the best. The developed markets of the Pacific region and emerging markets, where China’s weakness was felt most, had negative returns.
Global economic and political developments, of course, are as inevitable as they are unpredictable. Broad diversification remains the best way of managing the risks they pose to your portfolio. As Joe Davis, our chief economist, noted recently,
| Market Barometer | |||
| Total Returns | |||
| Periods Ended April 30, 2014 | |||
| Six | One | Five Years | |
| Months | Year | (Annualized) | |
| Stocks | |||
| Russell 1000 Index (Large-caps) | 8.25% | 20.81% | 19.52% |
| Russell 2000 Index (Small-caps) | 3.08 | 20.50 | 19.84 |
| Russell 3000 Index (Broad U.S. market) | 7.83 | 20.78 | 19.54 |
| FTSE All-World ex US Index (International) | 2.84 | 9.77 | 13.22 |
| Bonds | |||
| Barclays U.S. Aggregate Bond Index (Broad taxable market) | 1.74% | -0.26% | 4.88% |
| Barclays Municipal Bond Index (Broad tax-exempt market) | 4.08 | 0.50 | 5.54 |
| Citigroup Three-Month U.S. Treasury Bill Index | 0.00 | 0.04 | 0.08 |
| CPI | |||
| Consumer Price Index | 1.51% | 1.95% | 2.14% |
3
“Having a broader portfolio tends to moderate those individual issues, and that’s always, I think, a valuable starting point for investors.”
Despite low yields, the bond market experienced a surprising rally
Bonds continued to emerge from the struggles that marked much of 2013, when the market was roiled by worries about the prospect of the Federal Reserve reducing its stimulative bond-buying. In January, however, when the Fed actually started to trim purchases, investors seemed to take the news in stride.
The broad U.S. taxable bond market returned 1.74% for the six months. The yield of the 10-year Treasury note ended at 2.69% in April, up from 2.54% on October 31 but down from nearly 3% on December 31. (Bond prices and yields move in opposite directions.)
Municipal bonds returned 4.08%. Money market funds and savings accounts posted paltry returns as the Fed’s target for short-term interest rates remained at 0%–0.25%.
International bond markets (as measured by the Barclays Global Aggregate Index ex USD, unhedged for currency exposure) returned 2.33%.
Seeking global equity exposure with more muted ups and downs
Investing is all about the trade-off between risk and return. Vanguard Global Minimum Volatility Fund is designed to address
| Expense Ratios | |||
| Your Fund Compared With Its Peer Group | |||
| Investor | Admiral | Peer Group | |
| Shares | Shares | Average | |
| Global Minimum Volatility Fund | 0.30% | 0.20% | 1.44% |
The fund expense ratios shown are from the prospectus dated December 12, 2013, and represent estimated costs for the current fiscal period.
For the period from inception through April 30, 2014, the fund’s annualized expense ratios were 0.30% for Investor Shares and 0.20% for
Admiral Shares. The peer-group expense ratio is derived from data provided by Lipper, a Thomson Reuters Company, and captures information
through year-end 2013.
Peer group: Global Funds.
4
that trade-off for investors who want to participate in the long-term potential of global stocks but who may have less appetite for the often bumpy ride along the way.
Our research leads us to expect that, on average, a minimum volatility fund may outperform the overall global market in sharp downturns (while still experiencing losses) and trail the market in strong bull markets. Of course, because the fund is expected to have a lower level of risk than the global equity market, you should not expect it to outperform the market over the long run.
Vanguard Equity Investment Group (EIG) uses quantitative models to evaluate all the stocks that make up the FTSE Global All Cap Index (USD Hedged)—representing about 7,400 companies in nearly 50 developed and emerging countries—and selects about 200 to 300 for the fund. Your advisor’s selection process includes estimates of expected returns and cross-correlations between securities. (EIG’s use of correlation measures, which assess how securities move, up or down, in relation to each other, sets your fund apart from those that follow a “low volatility” strategy that focuses only on historical volatility.) Over time, the advisor expects to invest about
| What will “success” look like? |
| Vanguard Global Minimum Volatility Fund is unique among all the equity mutual funds we offer. |
| Unlike with active stock funds that seek to deliver higher returns than their benchmarks, the |
| objective of this fund is to minimize the variability of fund returns relative to the broad global |
| stock market while satisfying a set of constraints on portfolio characteristics such as liquidity |
| and concentration. |
| Of course, delivering strong returns relative to a market benchmark index is still a desirable |
| outcome. But this fund will be a long-term “success” if its returns over time and across market |
| cycles are less variable than those of its benchmark index. By “less variable,” we mean that its |
| returns fluctuate less, up or down, from its average return. |
| The statistic we use to evaluate the variability of your fund’s annual rate of return is standard |
| deviation. Standard deviation serves as a snapshot of the fund’s historical volatility by |
| measuring the degree to which its return varies from its average return. We use the standard |
| deviation to determine the fund’s risk-adjusted return, which is its return divided by the |
| standard deviation, and compare it with the same ratio for the market. The fund will provide |
| strong value to investors if the ratio of its return to standard deviation, or its risk-adjusted |
| return, is above that of the market. |
| Vanguard always counsels investors to evaluate performance over a long time horizon. That’s |
| especially important for this fund, whose ability to achieve returns that are meaningfully less |
| volatile than the market depends in part on the level of market volatility. |
5
half the fund’s assets in the stocks of U.S. companies and half in those of foreign companies.
Because this is an actively managed fund, you can expect that country and sector weightings will differ from those of the benchmark index. The advisor imposes a set of constraints to control the amount of exposure to any single country or industry. This helps to ensure portfolio diversification and liquidity, or the ability to readily trade into and out of holdings.
For U.S.-based investors, owning stocks in foreign markets involves the risk of unfavorable changes in exchange rates between foreign currencies and the U.S. dollar. Consistent with the objective of minimizing volatility, EIG uses currency contracts to try to manage such risk.
For more on EIG’s quantitative investment strategy and process, please see the Advisor’s Report that follows this letter.
Balancing investors’ ‘home bias’ and the benefits of diversification
Many investors have a natural tendency to focus on companies close to home. But this “home bias” can lead to missed opportunities to diversify a portfolio internationally.
Stocks of companies based outside the United States account for about half of the global equity market. Vanguard’s analysis of more than four decades of data shows that, on average, adding such stocks to a U.S. portfolio would have reduced the volatility of returns. This benefit has generally persisted even as economies and markets have become more integrated.
International stocks offer exposure to a wider array of economic and market forces, producing returns that can vary from those of U.S. stocks—which helps to reduce volatility risk. Of course, the impact of diversification changes over time as returns, volatilities, and correlations between foreign and domestic stocks change.
Deciding how much to allocate to international stocks depends on your view regarding the short-term and long-term trade-offs. These include potential exposure to currency fluctuations and generally higher transaction and investment costs. Within Vanguard Global Minimum Volatility Fund, the mix of U.S. and non-U.S. stocks is determined for you by the investment advisor, and—as I noted—the advisor seeks to hedge currency exposure. When it comes to your total investment portfolio, Vanguard
6
suggests that allocating 20% of your equity holdings to non-U.S. stocks may be a reasonable starting point. (You can read more in Global Equities: Balancing Home Bias and Diversification, available at vanguard.com/research.)
As always, thank you for investing with Vanguard.
Sincerely,

F. William McNabb III
Chairman and Chief Executive Officer
May 19, 2014
7
Advisor’s Report
We are pleased to present the first Advisor’s Report for Vanguard Global Minimum Volatility Fund, which opened for investment on December 12, 2013. The fund posted encouraging results for the partial fiscal half year ended April 30, 2014, with a total return of 6.75% and an annualized daily volatility of 7.6%.
By comparison, its benchmark, the FTSE Global All Cap Index (USD Hedged), returned 5.80% with an annualized daily volatility of 9.5%. (Just a bit of math: To get the annualized daily volatility, we calculate the standard deviation of daily returns, and then multiply it by the square root of 252, generally the number of trading days in a year.)
Investment objective and strategy
Our objective is to create a portfolio that has broad equity exposure with less volatility than the global equity market. Over the performance period, the fund’s volatility was about 20% less than that of its benchmark, on average.
While we recognize that equity-like returns are also an important outcome of an investment in this fund, it should be pointed out that achieving a total return higher than the benchmark’s is not an explicit objective of our approach. With this in mind, it is reasonable to expect the fund to outperform on a relative basis in many down markets while still experiencing losses, and to underperform in some strong bull markets.
Over the long term, we think an acceptable comparative performance measure for the fund is its risk-adjusted return. This metric can be calculated by dividing the portfolio’s total return for the period by the annualized standard deviation of daily returns. For this partial fiscal period, which is admittedly a relatively short time for comparison, the risk-adjusted return was 0.88, compared with 0.61 for the benchmark.
It’s important to note that we do not target a specific volatility level. Rather, we seek to provide an equity fund that has lower absolute risk than the broad global market. Thus, when the broad global equity market is experiencing spikes in volatility, you should expect this fund’s volatility to rise as well—just not by the same magnitude.
To construct a portfolio to meet our objective, we incorporate quantitative models that evaluate historical volatilities and correlations for all of the securities in the fund’s benchmark in an attempt to estimate expected volatilities and correlations. This approach allows us to make appropriate trade-offs involving risk and diversification, while not relying solely on volatility estimates. We also apply constraints to reduce stock, sector, and country concentration risk. We believe that these constraints, which allow for broader diversification and liquidity, reduce unnecessarily high risk exposures without having a significant impact on our ability to reduce overall volatility. In the end, we
8
construct a portfolio of approximately 200 to 300 stocks from the universe of about 7,400 in the FTSE index.
Currency risk is an exposure that deserves specific mention. We recognize that owning companies in foreign markets involves the risk of movements in foreign currency exchange rates relative to the U.S. dollar. To minimize this risk, we use currency forwards to hedge out much of this exposure.
The investment environment
Over the last six months, the Federal Reserve announced several reductions in its stimulative bond-buying program (known as quantitative easing), effective beginning in January. In testimony before Congress, Fed Chairwoman Janet Yellen suggested that the tapering of the purchases was likely to continue despite weather-related softness in recent economic data. There were no major fiscal surprises during the period, and without new policy stimulus (even with the reductions), the economy seemed to be improving: The Institute for Supply Management Manufacturing Index, a closely watched measure of the manufacturing sector, has consistently been above the baseline of 50, pointing to expansion. GDP growth has been in the range of 2% to 4%, in line with historical averages.
Globally, market participants have kept a nervous eye on the tensions in Ukraine, which led the ruble to decline more than 8%. In addition, China has seen its growth rate decelerate as its economy shifts toward a greater emphasis on consumption and a correspondingly smaller focus on investment. In turn, Latin America has struggled because of weaker demand from China.
The uncertainty triggered by these international developments has pushed up equity market volatility. This can be seen by looking at rolling 20-day volatility levels for a broad global benchmark such as the FTSE Global All Cap Index, which is unhedged and susceptible to the impact of currency fluctuations. After starting the year at relatively low levels (8.7%), the index’s volatility spiked to 13.3% in mid-February—closer to historic norms���and had settled in at 9.1% at the end of the fiscal period.
The fund’s successes and shortfalls
Throughout these changes in the level of equity market volatility, our strategy succeeded in meeting its lower-volatility objective as the fund benefited from a variety of exposures and diversification strategies.
9
We had greater weightings than the index did in less volatile sectors such as utilities and consumer staples and had smaller weightings in two of the benchmark’s more volatile sectors, information technology and consumer discretionary. The fund did have some overweight exposures in the more volatile health care sector. In addition, some of our positions in the materials sector were more volatile than average, which modestly held back our results.
We had overweight positions in some of the benchmark’s less volatile countries, including Hong Kong, Canada, and the United Kingdom. Underweight positions in more volatile countries, such as China and France, also helped.
Our approach to portfolio construction has paid off so far in terms of both volatility reduction and relative performance. We are confident in our ability to produce lower volatility results over the long term. When it comes to total return, however, we caution that the minimum volatility approach (as with any active strategy) may produce returns that deviate from the benchmark and has the potential for wide variations at times. With that in mind,
we see this fund appealing to investors who are looking for broadly diversified exposure to the equity asset class, with lower average volatility over time than the market, and are willing to accept the risks of using an active-investment approach. We look forward to the remainder of the fiscal year and thank you for your investment.
Portfolio Managers:
James D. Troyer, CFA, Principal
James P. Stetler, Principal
Michael R. Roach, CFA
Vanguard Equity Investment Group
May 19, 2014
10
Global Minimum Volatility Fund
Fund Profile
As of April 30, 2014
| Share-Class Characteristics | ||
| Investor | Admiral | |
| Shares | Shares | |
| Ticker Symbol | VMVFX | VMNVX |
| Expense Ratio1 | 0.30% | 0.20% |
| Portfolio Characteristics | ||
| FTSE Global | ||
| All Cap Index | ||
| Fund | (USD Hedged) | |
| Number of Stocks | 241 | 7,434 |
| Median Market Cap | $7.5B | $34.7B |
| Price/Earnings Ratio | 20.5x | 18.1x |
| Price/Book Ratio | 2.1x | 2.0x |
| Return on Equity | 15.7% | 15.7% |
| Earnings Growth | ||
| Rate | 8.3% | 10.9% |
| Dividend Yield | 3.0% | 2.4% |
| Short-Term Reserves | 0.0% | — |
| Sector Diversification (% of equity exposure) | ||
| FTSE Global | ||
| All Cap Index | ||
| Fund (USD Hedged) | ||
| Consumer Discretionary | 16.5% | 11.9% |
| Consumer Staples | 12.4 | 9.1 |
| Energy | 4.4 | 9.4 |
| Financials | 16.7 | 21.7 |
| Health Care | 13.1 | 10.2 |
| Industrials | 11.2 | 11.9 |
| Information Technology | 7.0 | 12.5 |
| Materials | 2.1 | 6.5 |
| Telecommunication Services | 8.0 | 3.5 |
| Utilities | 8.6 | 3.3 |
| Ten Largest Holdings (% of total net assets) | ||
| Chunghwa Telecom Co. | Electronic | |
| Ltd. | Components | 1.5% |
| Clorox Co. | Household Products | 1.4 |
| BCE Inc. | Integrated | |
| Telecommunication | ||
| Services | 1.4 | |
| Capitol Federal Financial | Thrifts & Mortgage | |
| Inc. | Finance | 1.4 |
| Amdocs Ltd. | It Consulting & Other | |
| Services | 1.4 | |
| Markel Corp. | Property & Casualty | |
| Insurance | 1.4 | |
| National Grid plc | Multi-Utilities | 1.4 |
| Allergan Inc. | Pharmaceuticals | 1.3 |
| British American | ||
| Tobacco plc | Tobacco | 1.3 |
| Hudson Pacific | ||
| Properties Inc. | Office Reits | 1.3 |
| Top Ten | 13.8% | |
Allocation by Region (% of equity exposure)
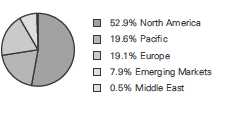
1 The expense ratios shown are from the prospectus dated December 12, 2013, and represent estimated costs for the current fiscal period. For the
period from inception through April 30, 2014, the annualized expense ratios were 0.30% for Investor Shares and 0.20% for Admiral Shares.
11
Global Minimum Volatility Fund
| Market Diversification (% of equity exposure) | ||
| FTSE | ||
| Global | ||
| All Cap | ||
| Index | ||
| (USD | ||
| Fund | Hedged) | |
| Europe | ||
| United Kingdom | 9.1% | 8.0% |
| Switzerland | 3.0 | 3.2 |
| Germany | 2.1 | 3.2 |
| Italy | 1.2 | 1.0 |
| Other | 3.7 | 9.1 |
| Subtotal | 19.1% | 24.5% |
| Pacific | ||
| Australia | 5.7% | 2.9% |
| Japan | 4.8 | 7.3 |
| Hong Kong | 4.7 | 1.2 |
| South Korea | 3.2 | 1.6 |
| Singapore | 1.2 | 0.6 |
| Other | 0.0 | 0.1 |
| Subtotal | 19.6% | 13.7% |
| Emerging Markets | ||
| Taiwan | 2.6% | 1.4% |
| India | 1.7 | 0.8 |
| Brazil | 1.5 | 1.1 |
| Mexico | 0.9 | 0.5 |
| Other | 1.2 | 5.0 |
| Subtotal | 7.9% | 8.8% |
| North America | ||
| United States | 45.6% | 49.1% |
| Canada | 7.3 | 3.7 |
| Subtotal | 52.9% | 52.8% |
| Middle East | 0.5% | 0.2% |
12
Global Minimum Volatility Fund
Performance Summary
All of the returns in this report represent past performance, which is not a guarantee of future results that may be achieved by the fund. (Current performance may be lower or higher than the performance data cited. For performance data current to the most recent month-end, visit our website at vanguard.com/performance.) Note, too, that both investment returns and principal value can fluctuate widely, so an investor’s shares, when sold, could be worth more or less than their original cost. The returns shown do not reflect taxes that a shareholder would pay on fund distributions or on the sale of fund shares.
Fiscal-Period Total Returns (%): December 12, 2013, Through April 30, 2014
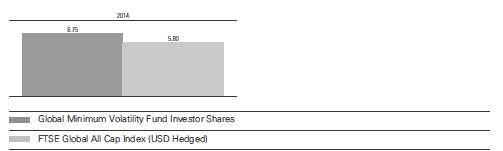
Total Returns: Periods Ended March 31, 2014
This table presents returns through the latest calendar quarter—rather than through the end of the fiscal period.
Securities and Exchange Commission rules require that we provide this information.
| Inception | Since | |
| Date | Inception | |
| Investor Shares | 12/12/2013 | 5.85% |
| Admiral Shares | 12/12/2013 | 5.90 |
See Financial Highlights for dividend and capital gains information.
13
Global Minimum Volatility Fund
Financial Statements (unaudited)
Statement of Net Assets
As of April 30, 2014
The fund reports a complete list of its holdings in regulatory filings four times in each fiscal year, at the quarter-ends. For the second and fourth fiscal quarters, the lists appear in the fund’s semiannual and annual reports to shareholders. For the first and third fiscal quarters, the fund files the lists with the Securities and Exchange Commission on Form N-Q. Shareholders can look up the fund’s Forms N-Q on the SEC’s website at sec.gov. Forms N-Q may also be reviewed and copied at the SEC’s Public Reference Room (see the back cover of this report for further information).
| Market | ||
| Value | ||
| Shares | ($000) | |
| Common Stocks (99.3%)1 | ||
| Australia (5.7%) | ||
| Telstra Corp. Ltd. | 1,005,791 | 4,890 |
| Wesfarmers Ltd. | 106,728 | 4,248 |
| Transurban Group | 623,726 | 4,213 |
| BWP Trust | 1,339,993 | 3,116 |
| Woodside Petroleum Ltd. | 32,208 | 1,224 |
| ASX Ltd. | 24,578 | 813 |
| Abacus Property Group | 326,832 | 742 |
| Charter Hall Retail REIT | 169,755 | 610 |
| DUET Group | 267,212 | 540 |
| Sigma Pharmaceuticals | ||
| Ltd. | 317,664 | 215 |
| Premier Investments Ltd. | 22,186 | 205 |
| Amcom | ||
| Telecommunications Ltd. | 95,223 | 186 |
| Tatts Group Ltd. | 59,000 | 166 |
| 21,168 | ||
| Belgium (0.8%) | ||
| Sofina SA | 13,289 | 1,595 |
| Elia System Operator | ||
| SA/NV | 23,212 | 1,231 |
| Cofinimmo | 2,602 | 319 |
| 3,145 | ||
| Brazil (1.5%) | ||
| Ultrapar Participacoes | ||
| SA ADR | 75,500 | 1,879 |
| Embraer SA ADR | 46,400 | 1,596 |
| CPFL Energia SA ADR | 94,300 | 1,580 |
| Telefonica Brasil SA ADR | 10,000 | 212 |
| Banco Santander Brasil | ||
| SA ADR | 28,500 | 190 |
| Cia Brasileira de | ||
| Distribuicao Grupo Pao | ||
| de Acucar ADR | 3,200 | 152 |
| BRF SA ADR | 4,900 | 111 |
| 5,720 |
| Canada (7.2%) | |||
| BCE Inc. | 121,400 | 5,405 | |
| ^ | Bell Aliant Inc. | 186,900 | 4,604 |
| Toronto-Dominion Bank | 85,000 | 4,089 | |
| ^ | Emera Inc. | 123,750 | 3,828 |
| Fortis Inc. | 58,800 | 1,727 | |
| Aimia Inc. | 78,000 | 1,256 | |
| Cineplex Inc. | 28,000 | 1,055 | |
| Canadian Oil Sands Ltd. | 45,000 | 976 | |
| ^ | Parkland Fuel Corp. | 51,000 | 945 |
| ^ | Veresen Inc. | 62,800 | 929 |
| Corus Entertainment Inc. | |||
| Class B | 38,000 | 854 | |
| Manitoba Telecom Services | |||
| Inc. | 22,400 | 619 | |
| Gibson Energy Inc. | 17,900 | 478 | |
| ^ | Extendicare Inc. | 29,800 | 183 |
| Canadian Tire Corp. Ltd. | |||
| Class A | 1,500 | 147 | |
| 27,095 | |||
| Chile (0.3%) | |||
| Cia Cervecerias Unidas | |||
| SA ADR | 27,600 | 651 | |
| Enersis SA ADR | 32,700 | 526 | |
| 1,177 | |||
| Denmark (0.6%) | |||
| TDC A/S | 234,302 | 2,200 | |
| France (0.4%) | |||
| BioMerieux | 7,524 | 822 | |
| Sodexo | 5,000 | 539 | |
| Orpea | 2,015 | 147 | |
| 1,508 | |||
| Germany (2.1%) | |||
| Fielmann AG | 23,476 | 3,176 | |
| Fresenius Medical Care | |||
| AG & Co. KGaA | 37,230 | 2,565 | |
| Rhoen Klinikum AG | 67,805 | 2,190 | |
| 7,931 | |||
14
Global Minimum Volatility Fund
| Market | |||
| Value | |||
| Shares | ($000) | ||
| Hong Kong (4.7%) | |||
| CLP Holdings Ltd. | 581,000 | 4,645 | |
| Yuexiu REIT | 6,176,000 | 2,919 | |
| Hopewell Highway | |||
| Infrastructure Ltd. | 3,210,500 | 1,566 | |
| Television Broadcasts Ltd. | 200,500 | 1,253 | |
| Chow Tai Fook Jewellery | |||
| Group Ltd. | 862,400 | 1,211 | |
| Hang Seng Bank Ltd. | 71,800 | 1,172 | |
| Uni-President China | |||
| Holdings Ltd. | 1,199,000 | 993 | |
| Tingyi Cayman Islands | |||
| Holding Corp. | 318,000 | 885 | |
| Towngas China Co. Ltd. | 763,000 | 871 | |
| VTech Holdings Ltd. | 56,600 | 781 | |
| Sun Art Retail Group Ltd. | 378,250 | 493 | |
| Microport Scientific Corp. | 492,000 | 334 | |
| Road King Infrastructure | |||
| Ltd. | 201,000 | 185 | |
| Prosperity REIT | 547,000 | 162 | |
| 17,470 | |||
| India (1.7%) | |||
| Dr Reddy’s Laboratories | |||
| Ltd. ADR | 76,500 | 3,448 | |
| Infosys Ltd. ADR | 29,600 | 1,590 | |
| 2 | Reliance Industries Ltd. | ||
| GDR | 33,228 | 1,032 | |
| Wipro Ltd. ADR | 26,800 | 320 | |
| 6,390 | |||
| Ireland (0.2%) | |||
| Kerry Group plc Class A | 7,616 | 601 | |
| Israel (0.5%) | |||
| Paz Oil Co. Ltd. | 5,534 | 865 | |
| Cellcom Israel Ltd. | |||
| (Registered) | 30,678 | 389 | |
| Ituran Location and | |||
| Control Ltd. | 11,095 | 267 | |
| Delek Automotive | |||
| Systems Ltd. | 16,618 | 168 | |
| Reit 1 Ltd. | 41,599 | 109 | |
| 1,798 | |||
| Italy (1.2%) | |||
| Parmalat SPA | 1,249,262 | 4,340 | |
| Japan (4.7%) | |||
| ^ | Kagome Co. Ltd. | 225,700 | 3,819 |
| MOS Food Services Inc. | 57,100 | 1,138 | |
| Kappa Create Holdings | |||
| Co. Ltd. | 94,500 | 911 | |
| TonenGeneral Sekiyu KK | 94,000 | 888 | |
| Studio Alice Co. Ltd. | 61,900 | 861 | |
| Fujiya Co. Ltd. | 368,000 | 673 | |
| Earth Chemical Co. Ltd. | 18,600 | 665 | |
| Ringer Hut Co. Ltd. | 44,500 | 661 | |
| Dunlop Sports Co. Ltd. | 50,500 | 615 | |
| Kisoji Co. Ltd. | 32,100 | 579 | |
| Matsuya Foods Co. Ltd. | 31,600 | 568 | |
| Senshukai Co. Ltd. | 62,500 | 532 | |
| Aozora Bank Ltd. | 170,000 | 506 | |
| Sakata Seed Corp. | 33,300 | 465 | |
| KEY Coffee Inc. | 29,700 | 458 | |
| ^ | Keiyo Co. Ltd. | 91,000 | 419 |
| Nitto Kohki Co. Ltd. | 18,200 | 331 | |
| Ministop Co. Ltd. | 20,700 | 314 | |
| Kasumi Co. Ltd. | 42,200 | 298 | |
| Atom Corp. | 58,100 | 296 | |
| Sagami Chain Co. Ltd. | 32,000 | 290 | |
| Morinaga & Co. Ltd. | 128,000 | 282 | |
| Kourakuen Corp. | 19,000 | 245 | |
| ST Corp. | 25,200 | 244 | |
| Rock Field Co. Ltd. | 13,500 | 241 | |
| Daisyo Corp. | 18,000 | 212 | |
| Toho Co. Ltd. | 51,000 | 184 | |
| Hioki EE Corp. | 11,600 | 183 | |
| Takihyo Co. Ltd. | 43,000 | 171 | |
| Saizeriya Co. Ltd. | 13,500 | 155 | |
| Taisei Lamick Co. Ltd. | 5,800 | 141 | |
| Itochu-Shokuhin Co. Ltd. | 4,100 | 138 | |
| Kyoto Kimono Yuzen Co. | |||
| Ltd. | 13,300 | 132 | |
| Daidoh Ltd. | 5,800 | 35 | |
| 17,650 | |||
| Mexico (0.9%) | |||
| Grupo Aeroportuario del | |||
| Pacifico SAB de CV ADR | 58,800 | 3,546 | |
| Netherlands (0.7%) | |||
| ^ | Wolters Kluwer NV | 93,129 | 2,596 |
| Norway (0.6%) | |||
| Statoil ASA | 70,538 | 2,150 | |
| Russia (0.9%) | |||
| MMC Norilsk Nickel OJSC | |||
| ADR | 112,478 | 2,034 | |
| Surgutneftegas OAO ADR | 164,355 | 1,165 | |
| 3,199 | |||
| Singapore (1.1%) | |||
| Singapore Airlines Ltd. | 242,000 | 2,006 | |
| DBS Group Holdings Ltd. | 141,000 | 1,910 | |
| Singapore Post Ltd. | 344,000 | 389 | |
| 4,305 | |||
| South Korea (3.2%) | |||
| S-Oil Corp. | 57,862 | 3,386 | |
| Bukwang Pharmaceutical | |||
| Co. Ltd. | 84,010 | 1,185 | |
| * | Asiana Airlines Inc. | 245,280 | 1,170 |
15
Global Minimum Volatility Fund
| Market | |||
| Value• | |||
| Shares | ($000) | ||
| POSCO | 3,284 | 970 | |
| Hyundai Greenfood Co. Ltd. | 48,910 | 822 | |
| POSCO ADR | 9,000 | 662 | |
| Macquarie Korea | |||
| Infrastructure Fund | 106,880 | 662 | |
| POSCO Chemtech Co. Ltd. | 3,960 | 572 | |
| * | SK Broadband Co. Ltd. | 117,075 | 486 |
| Daum Communications | |||
| Corp. | 4,596 | 334 | |
| Green Cross Holdings Corp. | 23,940 | 330 | |
| Kwang Dong | |||
| Pharmaceutical Co. Ltd. | 29,770 | 266 | |
| Samsung Techwin Co. Ltd. | 4,700 | 264 | |
| Samsung Securities Co. Ltd. | 6,000 | 229 | |
| MegaStudy Co. Ltd. | 3,000 | 203 | |
| SK Gas Ltd. | 2,079 | 191 | |
| NH Investment & | |||
| Securities Co. Ltd. | 27,990 | 182 | |
| Namyang Dairy Products | |||
| Co. Ltd. | 189 | 168 | |
| 12,082 | |||
| Sweden (0.4%) | |||
| Skanska AB Class B | 39,777 | 913 | |
| Axfood AB | 11,163 | 595 | |
| 1,508 | |||
| Switzerland (3.0%) | |||
| Kaba Holding AG Class B | 5,720 | 2,755 | |
| Novartis AG | 26,699 | 2,321 | |
| Swisscom AG | 2,938 | 1,787 | |
| Allreal Holding AG | 9,242 | 1,303 | |
| Alpiq Holding AG | 10,599 | 1,301 | |
| Siegfried Holding AG | 5,310 | 995 | |
| Lindt & Spruengli AG | 106 | 516 | |
| Helvetia Holding AG | 218 | 109 | |
| 11,087 | |||
| Taiwan (2.6%) | |||
| ^,3 | Chunghwa Telecom Co. | ||
| Ltd. ADR | 175,900 | 5,522 | |
| Siliconware Precision | |||
| Industries Co. ADR | 199,100 | 1,477 | |
| Taiwan Semiconductor | |||
| Manufacturing Co. Ltd. | |||
| ADR | 70,100 | 1,409 | |
| United Microelectronics | |||
| Corp. ADR | 592,600 | 1,292 | |
| 9,700 | |||
| United Kingdom (9.0%) | |||
| National Grid plc | 356,213 | 5,063 | |
| British American Tobacco | |||
| plc | 86,820 | 5,013 | |
| AstraZeneca plc | 62,759 | 4,954 | |
| Next plc | 43,192 | 4,765 | |
| Smith & Nephew plc | 276,219 | 4,307 | |
| GlaxoSmithKline plc | 113,376 | 3,133 | |
| DCC plc | 51,973 | 2,665 | |
| Reed Elsevier plc | 105,062 | 1,549 | |
| UK Commercial Property | |||
| Trust Ltd. | 884,670 | 1,211 | |
| BP plc | 50,000 | 422 | |
| * | BTG plc | 41,765 | 376 |
| Inmarsat plc | 30,220 | 372 | |
| 33,830 | |||
| United States (45.3%) | |||
| Consumer Discretionary (3.0%) | |||
| McDonald’s Corp. | 35,400 | 3,589 | |
| John Wiley & Sons Inc. | |||
| Class A | 30,300 | 1,741 | |
| Interval Leisure Group Inc. | 51,400 | 1,325 | |
| Service Corp. International | 50,400 | 946 | |
| Home Depot Inc. | 11,700 | 930 | |
| Matthews International | |||
| Corp. Class A | 22,400 | 904 | |
| Fred’s Inc. Class A | 29,900 | 545 | |
| * | Madison Square Garden | ||
| Co. Class A | 8,500 | 464 | |
| HSN Inc. | 7,500 | 435 | |
| Cato Corp. Class A | 8,900 | 253 | |
| 11,132 | |||
| Consumer Staples (6.6%) | |||
| Clorox Co. | 59,600 | 5,406 | |
| Altria Group Inc. | 120,500 | 4,833 | |
| Church & Dwight Co. Inc. | 59,900 | 4,134 | |
| 3,4 | Wal-Mart Stores Inc. | 39,750 | 3,169 |
| Vector Group Ltd. | 103,700 | 2,209 | |
| Philip Morris International | |||
| Inc. | 20,500 | 1,751 | |
| J&J Snack Foods Corp. | 13,100 | 1,226 | |
| Coca-Cola Co. | 29,400 | 1,199 | |
| Reynolds American Inc. | 16,200 | 914 | |
| 24,841 | |||
| Energy (1.4%) | |||
| Cosan Ltd. | 221,600 | 2,688 | |
| Chevron Corp. | 21,400 | 2,686 | |
| 5,374 | |||
| Financials (10.9%) | |||
| Capitol Federal Financial | |||
| Inc. | 436,700 | 5,258 | |
| * | Markel Corp. | 8,100 | 5,070 |
| 3 | Hudson Pacific Properties | ||
| Inc. | 210,500 | 4,957 | |
| Colony Financial Inc. | 225,000 | 4,894 | |
| Starwood Property Trust | |||
| Inc. | 153,600 | 3,694 | |
| Oritani Financial Corp. | 199,700 | 2,962 | |
| * | TFS Financial Corp. | 175,700 | 2,353 |
| Marsh & McLennan Cos. | |||
| Inc. | 38,000 | 1,874 | |
16
Global Minimum Volatility Fund
| Market | |||
| Value• | |||
| Shares | ($000) | ||
| Home Loan Servicing | |||
| Solutions Ltd. | 73,300 | 1,624 | |
| * | Beneficial Mutual Bancorp | ||
| Inc. | 122,900 | 1,603 | |
| F&C Commercial Property | |||
| Trust Ltd. | 537,029 | 1,084 | |
| * | Starwood Waypoint | ||
| Residential Trust | 30,720 | 835 | |
| Investors Real Estate Trust | 82,500 | 719 | |
| Crown Castle International | |||
| Corp. | 8,800 | 640 | |
| Northwest Bancshares Inc. | 41,800 | 555 | |
| Urstadt Biddle Properties | |||
| Inc. Class A | 26,500 | 541 | |
| Brookline Bancorp Inc. | 58,100 | 527 | |
| Two Harbors Investment | |||
| Corp. | 49,000 | 509 | |
| Acadia Realty Trust | 15,600 | 423 | |
| Universal Health Realty | |||
| Income Trust | 8,800 | 373 | |
| Dime Community | |||
| Bancshares Inc. | 20,000 | 326 | |
| 40,821 | |||
| Health Care (7.0%) | |||
| Allergan Inc. | 30,400 | 5,041 | |
| Merck & Co. Inc. | 59,600 | 3,490 | |
| Johnson & Johnson | 32,500 | 3,292 | |
| Patterson Cos. Inc. | 71,500 | 2,910 | |
| * | Henry Schein Inc. | 21,700 | 2,479 |
| AmerisourceBergen Corp. | |||
| Class A | 32,700 | 2,131 | |
| * | Haemonetics Corp. | 66,600 | 2,022 |
| Omnicare Inc. | 31,700 | 1,879 | |
| * | Amsurg Corp. Class A | 33,200 | 1,438 |
| Landauer Inc. | 16,300 | 705 | |
| Owens & Minor Inc. | 16,300 | 547 | |
| * | ICU Medical Inc. | 2,900 | 162 |
| * | LHC Group Inc. | 7,000 | 145 |
| 26,241 | |||
| Industrials (5.2%) | |||
| 4 | United Parcel Service Inc. | ||
| Class B | 48,900 | 4,817 | |
| Rollins Inc. | 153,400 | 4,614 | |
| General Dynamics Corp. | 25,900 | 2,835 | |
| 3M Co. | 16,300 | 2,267 | |
| National Presto Industries | |||
| Inc. | 24,000 | 1,734 | |
| Danaher Corp. | 20,100 | 1,475 | |
| Carlisle Cos. Inc. | 15,700 | 1,291 | |
| Illinois Tool Works Inc. | 4,700 | 401 | |
| 19,434 | |||
| Information Technology (7.2%) | ||||
| Amdocs Ltd. | 112,300 | 5,225 | ||
| Jack Henry & Associates | ||||
| Inc. | 77,200 | 4,258 | ||
| 4 | Motorola Solutions Inc. | 48,800 | 3,103 | |
| Comtech | ||||
| Telecommunications Corp. | 84,300 | 2,676 | ||
| QUALCOMM Inc. | 33,700 | 2,653 | ||
| Paychex Inc. | 57,800 | 2,417 | ||
| * | VeriSign Inc. | 50,100 | 2,364 | |
| * | CACI International Inc. | |||
| Class A | 24,600 | 1,713 | ||
| Amphenol Corp. Class A | 12,100 | 1,154 | ||
| FactSet Research Systems | ||||
| Inc. | 8,900 | 948 | ||
| Intuit Inc. | 7,300 | 553 | ||
| 27,064 | ||||
| Materials (0.9%) | ||||
| Sigma-Aldrich Corp. | 21,400 | 2,059 | ||
| Compass Minerals | ||||
| International Inc. | 12,200 | 1,117 | ||
| 3,176 | ||||
| Telecommunication Services (0.8%) | ||||
| AT&T Inc. | 57,300 | 2,046 | ||
| * | tw telecom inc Class A | 32,100 | 985 | |
| 3,031 | ||||
| Utilities (2.3%) | ||||
| Southern Co. | 54,500 | 2,498 | ||
| Empire District Electric Co. | 97,500 | 2,371 | ||
| NorthWestern Corp. | 27,300 | 1,321 | ||
| Duke Energy Corp. | 17,400 | 1,296 | ||
| Northeast Utilities | 24,000 | 1,134 | ||
| 8,620 | ||||
| 169,734 | ||||
| Total Common Stocks | ||||
| (Cost $355,733) | 371,930 | |||
| Temporary Cash Investment (4.7%)1 | ||||
| Money Market Fund (4.7%) | ||||
| 5,6 | Vanguard Market | |||
| Liquidity Fund, 0.124% | ||||
| (Cost $17,546) | 17,546,368 | 17,546 | ||
| Total Investments (104.0%) | ||||
| (Cost $373,279) | 389,476 | |||
| Other Assets and Liabilities (-4.0%) | ||||
| Other Assets | 6,149 | |||
| Liabilities6 | (21,184) | |||
| (15,035) | ||||
| Net Assets (100%) | 374,441 | |||
17
Global Minimum Volatility Fund
| At April 30, 2014, net assets consisted of: | |
| Amount | |
| ($000) | |
| Paid-in Capital | 354,975 |
| Undistributed Net Investment Income | 3,674 |
| Accumulated Net Realized Gains | 1,358 |
| Unrealized Appreciation (Depreciation) | |
| Investment Securities | 16,197 |
| Futures Contracts | 56 |
| Forward Currency Contracts | (1,891) |
| Foreign Currencies | 72 |
| Net Assets | 374,441 |
| Investor Shares—Net Assets | |
| Applicable to 30,112,679 outstanding | |
| $.001 par value shares of beneficial | |
| interest (unlimited authorization) | 320,570 |
| Net Asset Value Per Share— | |
| Investor Shares | $10.65 |
| Admiral Shares—Net Assets | |
| Applicable to 2,529,218 outstanding | |
| $.001 par value shares of beneficial | |
| interest (unlimited authorization) | 53,871 |
| Net Asset Value Per Share— | |
| Admiral Shares | $21.30 |
See Note A in Notes to Financial Statements.
^ Includes partial security positions on loan to broker-dealers. The total value of securities on loan is $15,247,000.
* Non-income-producing security.
1 The fund invests a portion of its cash reserves in equity markets through the use of index futures contracts. After giving effect to futures
investments, the fund’s effective common stock and temporary cash investment positions represent 99.7% and 4.3%, respectively,
of net assets.
2 Security exempt from registration under Rule 144A of the Securities Act of 1933. Such securities may be sold in transactions exempt
from registration, normally to qualified institutional buyers. At April 30, 2014, the value of this security represented 0.3% of net assets.
3 Securities with a value of $381,000 have been segregated as initial margin for open futures contracts.
4 Securities with a value of $2,692,000 have been segregated as collateral for open forward currency contracts.
5 Affiliated money market fund available only to Vanguard funds and certain trusts and accounts managed by Vanguard. Rate shown is
the 7-day yield.
6 Includes $16,128,000 of collateral received for securities on loan.
ADR—American Depositary Receipt.
GDR—Global Depositary Receipt.
REIT—Real Estate Investment Trust.
See accompanying Notes, which are an integral part of the Financial Statements.
18
Global Minimum Volatility Fund
Statement of Operations
| December 12, 20131 to | |
| April 30, 2014 | |
| ($000) | |
| Investment Income | |
| Income | |
| Dividends2 | 4,806 |
| Interest3 | 4 |
| Securities Lending | 32 |
| Total Income | 4,842 |
| Expenses | |
| The Vanguard Group—Note B | |
| Investment Advisory Services | 45 |
| Management and Administrative—Investor Shares | 247 |
| Management and Administrative—Admiral Shares | 15 |
| Marketing and Distribution—Investor Shares | 9 |
| Marketing and Distribution—Admiral Shares | 1 |
| Custodian Fees | 47 |
| Shareholders’ Reports—Investor Shares | 2 |
| Shareholders’ Reports—Admiral Shares | 1 |
| Total Expenses | 367 |
| Net Investment Income | 4,475 |
| Realized Net Gain (Loss) | |
| Investment Securities Sold | 2,157 |
| Futures Contracts | 97 |
| Foreign Currencies and Forward Currency Contracts | (967) |
| Realized Net Gain (Loss) | 1,287 |
| Change in Unrealized Appreciation (Depreciation) | |
| Investment Securities | 16,197 |
| Futures Contracts | 56 |
| Foreign Currencies and Forward Currency Contracts | (1,819) |
| Change in Unrealized Appreciation (Depreciation) | 14,434 |
| Net Increase (Decrease) in Net Assets Resulting from Operations | 20,196 |
1 Inception.
2 Dividends are net of foreign withholding taxes of $195,000.
3 Interest income from an affiliated company of the fund was $4,000.
See accompanying Notes, which are an integral part of the Financial Statements.
19
Global Minimum Volatility Fund
Statement of Changes in Net Assets
| December 12, 20131 to | |
| April 30, 2014 | |
| ($000) | |
| Increase (Decrease) in Net Assets | |
| Operations | |
| Net Investment Income | 4,475 |
| Realized Net Gain (Loss) | 1,287 |
| Change in Unrealized Appreciation (Depreciation) | 14,434 |
| Net Increase (Decrease) in Net Assets Resulting from Operations | 20,196 |
| Distributions | |
| Net Investment Income | |
| Investor Shares | (703) |
| Admiral Shares | (27) |
| Realized Capital Gain | |
| Investor Shares | — |
| Admiral Shares | — |
| Total Distributions | (730) |
| Capital Share Transactions | |
| Investor Shares | 302,712 |
| Admiral Shares | 52,263 |
| Net Increase (Decrease) from Capital Share Transactions | 354,975 |
| Total Increase (Decrease) | 374,441 |
| Net Assets | |
| Beginning of Period | — |
| End of Period2 | 374,441 |
| 1 Inception. | |
| 2 Net Assets—End of Period includes undistributed net investment income of $3,674,000. | |
See accompanying Notes, which are an integral part of the Financial Statements.
20
Global Minimum Volatility Fund
Financial Highlights
| Investor Shares | |
| December 12, 20131 to | |
| For a Share Outstanding Throughout the Period | April 30, 2014 |
| Net Asset Value, Beginning of Period | $10.00 |
| Investment Operations | |
| Net Investment Income | .130 |
| Net Realized and Unrealized Gain (Loss) on Investments | .544 |
| Total from Investment Operations | .674 |
| Distributions | |
| Dividends from Net Investment Income | (.024) |
| Distributions from Realized Capital Gains | — |
| Total Distributions | (. 024) |
| Net Asset Value, End of Period | $10.65 |
| Total Return2 | 6.75% |
| Ratios/Supplemental Data | |
| Net Assets, End of Period (Millions) | $321 |
| Ratio of Total Expenses to Average Net Assets | 0.30% |
| Ratio of Net Investment Income to Average Net Assets | 3.55% |
| Portfolio Turnover Rate | 48% |
The expense ratio, net income ratio, and turnover rate for the current period have been annualized.
1 Inception.
2 Total returns do not include account service fees that may have applied in the period shown. Fund prospectuses provide information about
any applicable account service fees.
See accompanying Notes, which are an integral part of the Financial Statements.
21
Global Minimum Volatility Fund
Financial Highlights
| Admiral Shares | |
| December 12, 20131 to | |
| For a Share Outstanding Throughout the Period | April 30, 2014 |
| Net Asset Value, Beginning of Period | $20.00 |
| Investment Operations | |
| Net Investment Income | . 269 |
| Net Realized and Unrealized Gain (Loss) on Investments | 1.079 |
| Total from Investment Operations | 1.348 |
| Distributions | |
| Dividends from Net Investment Income | (.048) |
| Distributions from Realized Capital Gains | — |
| Total Distributions | (. 048) |
| Net Asset Value, End of Period | $21.30 |
| Total Return2 | 6.75% |
| Ratios/Supplemental Data | |
| Net Assets, End of Period (Millions) | $54 |
| Ratio of Total Expenses to Average Net Assets | 0.20% |
| Ratio of Net Investment Income to Average Net Assets | 3.65% |
| Portfolio Turnover Rate | 48% |
The expense ratio, net income ratio, and turnover rate for the current period have been annualized.
1 Inception.
2 Total returns do not include account service fees that may have applied in the period shown. Fund prospectuses provide information about
any applicable account service fees.
See accompanying Notes, which are an integral part of the Financial Statements.
22
Global Minimum Volatility Fund
Notes to Financial Statements
Vanguard Global Minimum Volatility Fund is registered under the Investment Company Act of 1940 as an open-end investment company, or mutual fund. The fund invests in securities of foreign issuers, which may subject it to investment risks not normally associated with investing in securities of U.S. corporations. To minimize the currency risk and volatility associated with investment in securities denominated in currencies other than the U.S. dollar, the fund attempts to hedge its currency exposure. The fund offers two classes of shares: Investor Shares and Admiral Shares. Investor Shares are available to any investor who meets the fund’s minimum purchase requirements. Admiral Shares are designed for investors who meet certain administrative, service, and account-size criteria.
A. The following significant accounting policies conform to generally accepted accounting principles for U.S. investment companies. The fund consistently follows such policies in preparing its financial statements.
1. Security Valuation: Securities are valued as of the close of trading on the New York Stock Exchange (generally 4 p.m., Eastern time) on the valuation date. Equity securities are valued at the latest quoted sales prices or official closing prices taken from the primary market in which each security trades; such securities not traded on the valuation date are valued at the mean of the latest quoted bid and asked prices. Securities for which market quotations are not readily available, or whose values have been affected by events occurring before the fund’s pricing time but after the close of the securities’ primary markets, are valued at their fair values calculated according to procedures adopted by the board of trustees. These procedures include obtaining quotations from an independent pricing service, monitoring news to identify significant market- or security-specific events, and evaluating changes in the values of foreign market proxies (for example, ADRs, futures contracts, or exchange-traded funds), between the time the foreign markets close and the fund’s pricing time. When fair-value pricing is employed, the prices of securities used by a fund to calculate its net asset value may differ from quoted or published prices for the same securities. Investments in Vanguard Market Liquidity Fund are valued at that fund’s net asset value.
2. Foreign Currency: Securities and other assets and liabilities denominated in foreign currencies are translated into U.S. dollars using exchange rates obtained from an independent third party as of the fund’s pricing time on the valuation date. Realized gains (losses) and unrealized appreciation (depreciation) on investment securities include the effects of changes in exchange rates since the securities were purchased, combined with the effects of changes in security prices. Fluctuations in the value of other assets and liabilities resulting from changes in exchange rates are recorded as unrealized foreign currency gains (losses) until the assets or liabilities are settled in cash, at which time they are recorded as realized foreign currency gains (losses).
3. Futures and Forward Currency Contracts: The fund uses index futures contracts to a limited extent, with the objective of maintaining full exposure to the stock market while maintaining liquidity. The fund may purchase or sell futures contracts to achieve a desired level of investment, whether to accommodate portfolio turnover or cash flows from capital share transactions. The primary risks associated with the use of futures contracts are imperfect correlation between changes in market values of stocks held by the fund and the prices of futures contracts, and the possibility of an illiquid market. Counterparty risk involving futures is mitigated because a regulated clearinghouse is the counterparty instead of the clearing broker. To further mitigate counterparty risk, the fund trades futures contracts on an exchange, monitors the financial strength of its clearing brokers and clearing-house, and has entered into clearing agreements with its clearing brokers. The clearinghouse imposes initial margin requirements to secure the fund’s performance and requires daily settlement of variation margin representing changes in the market value of each contract.
23
Global Minimum Volatility Fund
The fund enters into forward currency contracts to protect the value of securities and related receivables and payables against changes in future foreign exchange rates. The fund’s risks in using these contracts include movement in the values of the foreign currencies relative to the U.S. dollar and the ability of the counterparties to fulfill their obligations under the contracts. The fund mitigates its counterparty risk by entering into forward currency contracts only with a diverse group of prequalified counterparties, monitoring their financial strength, entering into master netting arrangements with its counterparties, and requiring its counterparties to transfer collateral as security for their performance. The master netting arrangements provide that, in the event of a counterparty’s default (including bankruptcy), the fund may terminate the forward currency contracts, determine the net amount owed by either party in accordance with its master netting arrangements, and sell or retain any collateral held up to the net amount owed to the fund under the master netting arrangements. The forward currency contracts contain provisions whereby a counterparty may terminate open contracts if the fund’s net assets decline below a certain level, triggering a payment by the fund if the fund is in a net liability position at the time of the termination. The payment amount would be reduced by any collateral the fund has pledged. Any assets pledged as collateral for open contracts are noted in the Statement of Net Assets. The value of collateral received or pledged is compared daily to the value of the forward currency contracts exposure with each counterparty, and any difference, if in excess of a specified minimum transfer amount, is adjusted and settled within two business days.
Futures contracts are valued at their quoted daily settlement prices. Forward currency contracts are valued at their quoted daily prices obtained from an independent third party, adjusted for currency risk based on the expiration date of each contract. The aggregate notional amounts of the contracts are not recorded in the Statement of Net Assets. Fluctuations in the value of the contracts are recorded in the Statement of Net Assets as an asset (liability) and in the Statement of Operations as unrealized appreciation (depreciation) until the contracts are closed, when they are recorded as realized gains (losses) on futures or forward currency contracts.
During the period ended April 30, 2014, the fund’s average investments in long and short futures contracts represented less than 1% and 0% of net assets, respectively, based on quarterly average aggregate settlement values. The fund’s average investment in forward currency contracts represented 48% of net assets, based on quarterly average notional amounts.
4. Federal Income Taxes: The fund intends to qualify as a regulated investment company and distribute all of its taxable income. Management has analyzed the fund’s tax positions taken for its open federal income tax period ended April 30, 2014, and has concluded that no provision for federal income tax is required in the fund’s financial statements.
5. Distributions: Distributions to shareholders are recorded on the ex-dividend date.
6. Securities Lending: To earn additional income, the fund lends its securities to qualified institutional borrowers. Security loans are required to be secured at all times by collateral in an amount at least equal to the market value of securities loaned. Daily market fluctuations could cause the value of loaned securities to be more or less than the value of the collateral received. When this occurs, the collateral is adjusted and settled on the next business day. The fund further mitigates its counterparty
24
Global Minimum Volatility Fund
risk by entering into securities lending transactions only with a diverse group of prequalified counter-parties, monitoring their financial strength, and entering into master securities lending agreements with its counterparties. The master securities lending agreements provide that, in the event of a counterparty’s default (including bankruptcy), the fund may terminate any loans with that borrower, determine the net amount owed, and sell or retain the collateral up to the net amount owed to the fund; however, such actions may be subject to legal proceedings. While collateral mitigates counter-party risk, in the absence of a default the fund may experience delays and costs in recovering the securities loaned. The fund invests cash collateral received in Vanguard Market Liquidity Fund, and records a liability in the Statement of Net Assets for the return of the collateral, during the period the securities are on loan. Securities lending income represents fees charged to borrowers plus income earned on invested cash collateral, less expenses associated with the loan.
7. Credit Facility: The fund and certain other funds managed by The Vanguard Group participate in a $2.89 billion committed credit facility provided by a syndicate of lenders pursuant to a credit agreement that may be renewed annually; each fund is individually liable for its borrowings, if any, under the credit facility. Borrowings may be utilized for temporary and emergency purposes, and are subject to the fund’s regulatory and contractual borrowing restrictions. The participating funds are charged administrative fees and an annual commitment fee of 0.06% of the undrawn amount of the facility; these fees are allocated to the funds based on a method approved by the fund’s board of trustees and included in Management and Administrative expenses on the fund’s Statement of Operations. Any borrowings under this facility bear interest at a rate equal to the higher of the federal funds rate or LIBOR reference rate plus an agreed-upon spread.
The fund had no borrowings outstanding at April 30, 2014, or at any time during the period then ended.
8. Other: Dividend income is recorded on the ex-dividend date. Interest income includes income distributions received from Vanguard Market Liquidity Fund and is accrued daily. Security transactions are accounted for on the date securities are bought or sold. Costs used to determine realized gains (losses) on the sale of investment securities are those of the specific securities sold.
Each class of shares has equal rights as to assets and earnings, except that each class separately bears certain class-specific expenses related to maintenance of shareholder accounts (included in Management and Administrative expenses) and shareholder reporting. Marketing and distribution expenses are allocated to each class of shares based on a method approved by the board of trustees. Income, other non-class-specific expenses, and gains and losses on investments are allocated to each class of shares based on its relative net assets.
B. The Vanguard Group furnishes at cost investment advisory, corporate management, administrative, marketing, and distribution services. The costs of such services are allocated to the fund based on methods approved by the board of trustees. The fund has committed to provide up to 0.40% of its net assets in capital contributions to Vanguard. At April 30, 2014, the fund had contributed capital of $38,000 to Vanguard (included in Other Assets), representing 0.01% of the fund’s net assets and 0.02% of Vanguard’s capitalization. The fund’s trustees and officers are also directors and officers of Vanguard.
25
Global Minimum Volatility Fund
C. Various inputs may be used to determine the value of the fund’s investments. These inputs are summarized in three broad levels for financial statement purposes. The inputs or methodologies used to value securities are not necessarily an indication of the risk associated with investing in those securities.
Level 1—Quoted prices in active markets for identical securities.
Level 2—Other significant observable inputs (including quoted prices for similar securities, interest rates, prepayment speeds, credit risk, etc.).
Level 3—Significant unobservable inputs (including the fund’s own assumptions used to determine the fair value of investments).
The following table summarizes the market value of the fund’s investments as of April 30, 2014, based on the inputs used to value them:
| Level 1 | Level 2 | Level 3 | |
| Investments | ($000) | ($000) | ($000) |
| Common Stocks—International | 53,258 | 144,725 | 4,213 |
| Common Stocks—United States | 168,650 | 1,084 | — |
| Temporary Cash Investments | 17,546 | — | — |
| Futures Contracts—Assets1 | 4 | — | — |
| Futures Contracts—Liabilities1 | (1) | — | — |
| Forward Currency Contracts—Assets | — | 514 | — |
| Forward Currency Contracts—Liabilities | — | (2,405) | — |
| Total | 239,457 | 143,918 | 4,213 |
| 1 Represents variation margin on the last day of the reporting period. | |||
D. At April 30, 2014, the fair values of derivatives were reflected in the Statement of Net Assets as follows:
| Foreign | |||
| Equity | Exchange | ||
| Contracts | Contracts | Total | |
| Statement of Net Assets Caption | ($000) | ($000) | ($000) |
| Other Assets | 4 | 514 | 518 |
| Liabilities | (1) | (2,405) | (2,406) |
26
Global Minimum Volatility Fund
Realized net gain (loss) and the change in unrealized appreciation (depreciation) on derivatives for the period ended April 30, 2014, were:
| Foreign | |||
| Equity | Exchange | ||
| Contracts | Contracts | Total | |
| Realized Net Gain (Loss) on Derivatives | ($000) | ($000) | ($000) |
| Futures Contracts | 97 | — | 97 |
| Forward Currency Contracts | — | (896) | (896) |
| Realized Net Gain (Loss) on Derivatives | 97 | (896) | (799) |
| Change in Unrealized Appreciation (Depreciation) on Derivatives | |||
| Futures Contracts | 56 | — | 56 |
| Forward Currency Contracts | — | (1,891) | (1,891) |
| Change in Unrealized Appreciation (Depreciation) on Derivatives | 56 | (1,891) | (1,835) |
At April 30, 2014, the aggregate settlement value of open futures contracts and the related unrealized appreciation (depreciation) were:
| ($000) | ||||
| Aggregate | ||||
| Number of | Settlement | Unrealized | ||
| Long (Short) | Value | Appreciation | ||
| Futures Contracts | Expiration | Contracts | Long (Short) | (Depreciation) |
| E-mini S&P 500 Index | June 2014 | 11 | 1,033 | 9 |
| S&P ASX 200 Index | June 2014 | 1 | 127 | 10 |
| FTSE 100 Index | June 2014 | 1 | 114 | 11 |
| Topix Index | June 2014 | 1 | 113 | 1 |
| mini MSCI Emerging Markets Index | June 2014 | 2 | 99 | 6 |
| Dow Jones EURO STOXX 50 Index | June 2014 | 2 | 87 | 19 |
| 56 | ||||
Unrealized appreciation (depreciation) on open E-mini S&P 500 Index, FTSE 100 Index, mini MSCI Emerging Markets Index, and Dow Jones EURO STOXX 50 Index futures contracts are required to be treated as realized gain (loss) for tax purposes.
27
Global Minimum Volatility Fund
At April, 30, 2014, the fund had open forward currency contracts to receive and deliver currencies as follows. Unrealized appreciation (depreciation) on open forward currency contracts is treated as realized gain (loss) for tax purposes.
| Unrealized | ||||||
| Contract | Appreciation | |||||
| Settlement | Contract Amount (000) | (Depreciation) | ||||
| Counterparty | Date | Receive | Deliver | ($000) | ||
| Credit Suisse International | 7/2/14 | USD | 34,283 | GBP | 20,674 | (606) |
| Credit Suisse International | 7/2/14 | USD | 25,745 | CAD | 28,734 | (430) |
| Credit Suisse International | 7/2/14 | USD | 21,347 | EUR | 15,330 | 82 |
| Credit Suisse International | 7/2/14 | USD | 18,002 | AUD | 19,862 | (368) |
| Credit Suisse International | 7/2/14 | USD | 17,307 | JPY | 1,754,003 | 144 |
| Credit Suisse International | 7/2/14 | USD | 11,585 | KRW | 12,477,906 | (450) |
| Credit Suisse International | 7/2/14 | USD | 11,241 | CHF | 9,811 | 88 |
| Credit Suisse International | 7/2/14 | USD | 9,230 | TWD | 280,879 | (87) |
| Credit Suisse International | 7/2/14 | USD | 6,016 | INR | 374,820 | (112) |
| Credit Suisse International | 7/2/14 | USD | 5,333 | BRL | 12,695 | (253) |
| Credit Suisse International | 7/2/14 | USD | 3,409 | MXN | 45,124 | (22) |
| Credit Suisse International | 7/2/14 | USD | 2,466 | RUB | 91,107 | (48) |
| Credit Suisse International | 7/2/14 | USD | 2,135 | AUD | 2,290 | 16 |
| Credit Suisse International | 7/2/14 | USD | 2,056 | NOK | 12,295 | (7) |
| Credit Suisse International | 7/2/14 | USD | 1,727 | ILS | 5,981 | (1) |
| Credit Suisse International | 7/2/14 | USD | 1,531 | SEK | 9,717 | 39 |
| Credit Suisse International | 7/2/14 | USD | 992 | CLP | 571,080 | (13) |
| Credit Suisse International | 7/2/14 | USD | 884 | RUB | 26,790 | 145 |
| Credit Suisse International | 7/2/14 | USD | 837 | EUR | 610 | (8) |
| (1,891) | ||||||
AUD—Australian dollar.
BRL—Brazilian real.
CAD—Canadian dollar.
CHF—Swiss franc.
CLP—Chilean peso.
EUR—Euro.
GBP—British pound.
ILS—Israeli shekel.
INR—Indian rupee.
JPY—Japanese yen.
KRW—Korean won.
MXN—Mexican peso.
NOK—Norwegian krone.
RUB—Russian ruble.
SEK—Swedish krona.
TWD—Taiwanese dollar.
USD—U.S. dollar.
28
Global Minimum Volatility Fund
E. Distributions are determined on a tax basis and may differ from net investment income and realized capital gains for financial reporting purposes. Differences may be permanent or temporary. Permanent differences are reclassified among capital accounts in the financial statements to reflect their tax character. Temporary differences arise when certain items of income, expense, gain, or loss are recognized in different periods for financial statement and tax purposes. These differences will reverse at some time in the future. Differences in classification may also result from the treatment of short-term gains as ordinary income for tax purposes. The fund’s tax-basis capital gains and losses are determined only at the end of each fiscal year.
During the period ended April 30, 2014, the fund realized net foreign currency losses of $71,000, which decreased distributable net income for tax purposes; accordingly, such losses have been reclassified from accumulated net realized gains to undistributed net investment income.
At April 30, 2014, the cost of investment securities for tax purposes was $373,279,000. Net unrealized appreciation of investment securities for tax purposes was $16,197,000, consisting of unrealized gains of $22,826,000 on securities that had risen in value since their purchase and $6,629,000 in unrealized losses on securities that had fallen in value since their purchase.
F. During the period ended April 30, 2014, the fund purchased $428,066,000 of investment securities and sold $75,332,000 of investment securities, other than temporary cash investments.
G. Capital share transactions for each class of shares were:
| December 12, 20131 to | ||
| April 30, 2014 | ||
| Amount | Shares | |
| ($000) | (000) | |
| Investor Shares | ||
| Issued | 320,419 | 31,837 |
| Issued in Lieu of Cash Distributions | 702 | 69 |
| Redeemed | (18,409) | (1,793) |
| Net Increase (Decrease)—Investor Shares | 302,712 | 30,113 |
| Admiral Shares | ||
| Issued | 59,521 | 2,879 |
| Issued in Lieu of Cash Distributions | 26 | 1 |
| Redeemed | (7,284) | (351) |
| Net Increase (Decrease) —Admiral Shares | 52,263 | 2,529 |
| 1 Inception. | ||
At April 30, 2014, Vanguard Managed Payout Fund was the record or beneficial owner of 80% of the fund’s net assets. If the shareholder were to redeem its investment in the fund, the redemption might result in an increase in the fund’s expense ratio, cause the fund to incur higher transaction costs, or lead to the realization of taxable capital gains.
H. Management has determined that no material events or transactions occurred subsequent to April 30, 2014, that would require recognition or disclosure in these financial statements.
29
Trustees Approve Advisory Arrangement
The board of trustees approved the launch of Vanguard Global Minimum Volatility Fund with an internalized management structure whereby The Vanguard Group, Inc. (Vanguard)—through its Equity Investment Group—would provide investment advisory services to the fund at cost. The board determined that the investment advisory arrangement with Vanguard was in the best interests of the fund and its prospective shareholders.
The board based its decision upon an evaluation of the advisor’s investment staff, portfolio management process, and performance. The trustees considered the factors discussed below, among others. However, no single factor determined whether the board approved the arrangement. Rather, it was the totality of the circumstances that drove the board’s decision.
Nature, extent, and quality of services
The board considered the quality of the investment management services to be provided to the fund and took into account the organizational depth and stability of the advisor. The board noted that Vanguard has been managing investments for more than three decades. The Equity Investment Group adheres to a sound, disciplined investment management process; the team has considerable experience, stability, and depth.
The board concluded that Vanguard’s experience, stability, depth, and performance, among other factors, warranted approval of the advisory arrangement.
Investment performance
The board could not consider the performance of the fund because it was newly launched. However, the board determined that, in its management of other Vanguard active funds, the Equity Investment Group has a track record of consistent performance and disciplined investment processes. Information about the fund’s performance since inception can be found in the Performance Summary section of this report.
Cost
The board considered the cost of services to be provided and concluded that the fund’s expense ratio would be below the average expense ratio charged by funds in its peer group.
The board did not conduct a profitability analysis of Vanguard, because of Vanguard’s unique “at-cost” structure. Unlike most other mutual fund management companies, Vanguard is owned by the funds it oversees, and produces “profits” only in the form of reduced expenses for fund shareholders.
The benefit of economies of scale
The board concluded that the fund’s at-cost arrangement with Vanguard ensures that the fund will realize economies of scale as it grows, with the cost to shareholders declining as fund assets increase.
The board will consider whether to renew the advisory arrangement again after a one-year period.
30
Glossary
Beta. A measure of the magnitude of a fund’s past share-price fluctuations in relation to the ups and downs of a given market index. The index is assigned a beta of 1.00. Compared with a given index, a fund with a beta of 1.20 typically would have seen its share price rise or fall by 12% when the index rose or fell by 10%. For this report, beta is based on returns over the past 36 months for both the fund and the index. Note that a fund’s beta should be reviewed in conjunction with its R-squared (see definition). The lower the R-squared, the less correlation there is between the fund and the index, and the less reliable beta is as an indicator of volatility.
Dividend Yield. Dividend income earned by stocks, expressed as a percentage of the aggregate market value (or of net asset value, for a fund). The yield is determined by dividing the amount of the annual dividends by the aggregate value (or net asset value) at the end of the period. For a fund, the dividend yield is based solely on stock holdings and does not include any income produced by other investments.
Earnings Growth Rate. The average annual rate of growth in earnings over the past five years for the stocks now in a fund.
Equity Exposure. A measure that reflects a fund’s investments in stocks and stock futures. Any holdings in short-term reserves are excluded.
Expense Ratio. A fund’s total annual operating expenses expressed as a percentage of the fund’s average net assets. The expense ratio includes management and administrative expenses, but does not include the transaction costs of buying and selling portfolio securities.
Inception Date. The date on which the assets of a fund (or one of its share classes) are first invested in accordance with the fund’s investment objective. For funds with a subscription period, the inception date is the day after that period ends. Investment performance is measured from the inception date.
Median Market Cap. An indicator of the size of companies in which a fund invests; the midpoint of market capitalization (market price x shares outstanding) of a fund’s stocks, weighted by the proportion of the fund’s assets invested in each stock. Stocks representing half of the fund’s assets have market capitalizations above the median, and the rest are below it.
Price/Book Ratio. The share price of a stock divided by its net worth, or book value, per share. For a fund, the weighted average price/book ratio of the stocks it holds.
Price/Earnings Ratio. The ratio of a stock’s current price to its per-share earnings over the past year. For a fund, the weighted average P/E of the stocks it holds. P/E is an indicator of market expectations about corporate prospects; the higher the P/E, the greater the expectations for a company’s future growth.
R-Squared. A measure of how much of a fund’s past returns can be explained by the returns from the market in general, as measured by a given index. If a fund’s total returns were precisely synchronized with an index’s returns, its R-squared would be 1.00. If the fund’s returns bore no relationship to the index’s returns, its R-squared would be 0. For this report, R-squared is based on returns over the past 36 months for both the fund and the index.
31
Return on Equity. The annual average rate of return generated by a company during the past five years for each dollar of shareholder’s equity (net income divided by shareholder’s equity). For a fund, the weighted average return on equity for the companies whose stocks it holds.
Short-Term Reserves. The percentage of a fund invested in highly liquid, short-term securities that can be readily converted to cash.
Turnover Rate. An indication of the fund’s trading activity. Funds with high turnover rates incur higher transaction costs and may be more likely to distribute capital gains (which may be taxable to investors). The turnover rate excludes in-kind transactions, which have minimal impact on costs.
32
This page intentionally left blank.
This page intentionally left blank.
This page intentionally left blank.
The People Who Govern Your Fund
The trustees of your mutual fund are there to see that the fund is operated and managed in your best interests since, as a shareholder, you are a part owner of the fund. Your fund’s trustees also serve on the board of directors of The Vanguard Group, Inc., which is owned by the Vanguard funds and provides services to them on an at-cost basis.
A majority of Vanguard’s board members are independent, meaning that they have no affiliation with Vanguard or the funds they oversee, apart from the sizable personal investments they have made as private individuals. The independent board members have distinguished backgrounds in business, academia, and public service. Each of the trustees and executive officers oversees 178 Vanguard funds.
The following table provides information for each trustee and executive officer of the fund. More information about the trustees is in the Statement of Additional Information, which can be obtained, without charge, by contacting Vanguard at 800-662-7447, or online at vanguard.com.
| InterestedTrustee1 | and Delphi Automotive LLP (automotive components); |
| Senior Advisor at New Mountain Capital. | |
| F. William McNabb III | |
| Born 1957. Trustee Since July 2009. Chairman of the | Amy Gutmann |
| Board. Principal Occupation(s) During the Past Five | Born 1949. Trustee Since June 2006. Principal |
| Years: Chairman of the Board of The Vanguard Group, | Occupation(s) During the Past Five Years: President of |
| Inc., and of each of the investment companies served | the University of Pennsylvania; Christopher H. Browne |
| by The Vanguard Group, since January 2010; Director | Distinguished Professor of Political Science, School of |
| of The Vanguard Group since 2008; Chief Executive | Arts and Sciences, and Professor of Communication, |
| Officer and President of The Vanguard Group, and of | Annenberg School for Communication, with secondary |
| each of the investment companies served by The | faculty appointments in the Department of Philosophy, |
| Vanguard Group, since 2008; Director of Vanguard | School of Arts and Sciences, and at the Graduate |
| Marketing Corporation; Managing Director of The | School of Education, University of Pennsylvania; |
| Vanguard Group (1995–2008). | Trustee of the National Constitution Center; Chair |
| of the Presidential Commission for the Study of | |
| Bioethical Issues. | |
| IndependentTrustees | |
| JoAnn Heffernan Heisen | |
| Emerson U. Fullwood | Born 1950. Trustee Since July 1998. Principal |
| Born 1948. Trustee Since January 2008. Principal | Occupation(s) During the Past Five Years: Corporate |
| Occupation(s) During the Past Five Years: Executive | Vice President and Chief Global Diversity Officer |
| Chief Staff and Marketing Officer for North America | (retired 2008) and Member of the Executive |
| and Corporate Vice President (retired 2008) of Xerox | Committee (1997–2008) of Johnson & Johnson |
| Corporation (document management products and | (pharmaceuticals/medical devices/consumer |
| services); Executive in Residence and 2009–2010 | products); Director of Skytop Lodge Corporation |
| Distinguished Minett Professor at the Rochester | (hotels), the University Medical Center at Princeton, |
| Institute of Technology; Director of SPX Corporation | the Robert Wood Johnson Foundation, and the Center |
| (multi-industry manufacturing), the United Way of | for Talent Innovation; Member of the Advisory Board |
| Rochester, Amerigroup Corporation (managed health | of the Maxwell School of Citizenship and Public Affairs |
| care), the University of Rochester Medical Center, | at Syracuse University. |
| Monroe Community College Foundation, and North | |
| Carolina A&T University. | F. Joseph Loughrey |
| Born 1949. Trustee Since October 2009. Principal | |
| Rajiv L. Gupta | Occupation(s) During the Past Five Years: President |
| Born 1945. Trustee Since December 2001.2 | and Chief Operating Officer (retired 2009) of Cummins |
| Principal Occupation(s) During the Past Five Years: | Inc. (industrial machinery); Chairman of the Board |
| Chairman and Chief Executive Officer (retired 2009) | of Hillenbrand, Inc. (specialized consumer services), |
| and President (2006–2008) of Rohm and Haas Co. | and of Oxfam America; Director of SKF AB (industrial |
| (chemicals); Director of Tyco International, Ltd. | machinery), Hyster-Yale Materials Handling, Inc. |
| (diversified manufacturing and services), Hewlett- | (forklift trucks), the Lumina Foundation for Education, |
| Packard Co. (electronic computer manufacturing), |
| and the V Foundation for Cancer Research; Member | Executive Officers | |
| of the Advisory Council for the College of Arts and | ||
| Letters and of the Advisory Board to the Kellogg | Glenn Booraem | |
| Institute for International Studies, both at the | Born 1967. Controller Since July 2010. Principal | |
| University of Notre Dame. | Occupation(s) During the Past Five Years: Principal | |
| of The Vanguard Group, Inc.; Controller of each of | ||
| Mark Loughridge | the investment companies served by The Vanguard | |
| Born 1953. Trustee Since March 2012. Principal | Group; Assistant Controller of each of the investment | |
| Occupation(s) During the Past Five Years: Senior Vice | companies served by The Vanguard Group (2001–2010). | |
| President and Chief Financial Officer (retired 2013) | ||
| at IBM (information technology services); Fiduciary | Thomas J. Higgins | |
| Member of IBM’s Retirement Plan Committee (2004– | Born 1957. Chief Financial Officer Since September | |
| 2013); Member of the Council on Chicago Booth. | 2008. Principal Occupation(s) During the Past Five | |
| Years: Principal of The Vanguard Group, Inc.; Chief | ||
| Scott C. Malpass | Financial Officer of each of the investment companies | |
| Born 1962. Trustee Since March 2012. Principal | served by The Vanguard Group; Treasurer of each of | |
| Occupation(s) During the Past Five Years: Chief | the investment companies served by The Vanguard | |
| Investment Officer and Vice President at the University | Group (1998–2008). | |
| of Notre Dame; Assistant Professor of Finance at the | ||
| Mendoza College of Business at Notre Dame; Member | Kathryn J. Hyatt | |
| of the Notre Dame 403(b) Investment Committee; | Born 1955. Treasurer Since November 2008. Principal | |
| Board Member of TIFF Advisory Services, Inc. | Occupation(s) During the Past Five Years: Principal of | |
| (investment advisor); Member of the Investment | The Vanguard Group, Inc.; Treasurer of each of the | |
| Advisory Committees of the Financial Industry | investment companies served by The Vanguard | |
| Regulatory Authority (FINRA) and of Major League | Group; Assistant Treasurer of each of the investment | |
| Baseball. | companies served by The Vanguard Group (1988–2008). | |
| André F. Perold | Heidi Stam | |
| Born 1952. Trustee Since December 2004. Principal | Born 1956. Secretary Since July 2005. Principal | |
| Occupation(s) During the Past Five Years: George | Occupation(s) During the Past Five Years: Managing | |
| Gund Professor of Finance and Banking, Emeritus | Director of The Vanguard Group, Inc.; General Counsel | |
| at the Harvard Business School (retired 2011); | of The Vanguard Group; Secretary of The Vanguard | |
| Chief Investment Officer and Managing Partner of | Group and of each of the investment companies | |
| HighVista Strategies LLC (private investment firm); | served by The Vanguard Group; Director and Senior | |
| Director of Rand Merchant Bank; Overseer of the | Vice President of Vanguard Marketing Corporation. | |
| Museum of Fine Arts Boston. | ||
| Vanguard Senior ManagementTeam | ||
| Alfred M. Rankin, Jr. | ||
| Born 1941. Trustee Since January 1993. Principal | Mortimer J. Buckley | Chris D. McIsaac |
| Occupation(s) During the Past Five Years: Chairman, | Kathleen C. Gubanich | Michael S. Miller |
| President, and Chief Executive Officer of NACCO | Paul A. Heller | James M. Norris |
| Industries, Inc. (housewares/lignite), and of Hyster- | Martha G. King | Glenn W. Reed |
| Yale Materials Handling, Inc. (forklift trucks); Chairman | John T. Marcante | |
| of the Board of University Hospitals of Cleveland. | ||
| Peter F. Volanakis | Chairman Emeritus and Senior Advisor | |
| Born 1955. Trustee Since July 2009. Principal | ||
| Occupation(s) During the Past Five Years: President | John J. Brennan | |
| and Chief Operating Officer (retired 2010) of Corning | Chairman, 1996–2009 | |
| Incorporated (communications equipment); Trustee of | Chief Executive Officer and President, 1996–2008 | |
| Colby-Sawyer College; Member of the Advisory Board | ||
| of the Norris Cotton Cancer Center and of the Advisory | Founder | |
| Board of the Parthenon Group (strategy consulting). | ||
| John C. Bogle | ||
| Chairman and Chief Executive Officer, 1974–1996 | ||
1 Mr. McNabb is considered an “interested person,” as defined in the Investment Company Act of 1940, because he is an officer of the
Vanguard funds.
2 December 2002 for Vanguard Equity Income Fund, the Vanguard Municipal Bond Funds, and the Vanguard State Tax-Exempt Funds.
 | ||
| P.O. Box 2600 | ||
| Valley Forge, PA 19482-2600 | ||
| Connect with Vanguard® > vanguard.com | ||
| Fund Information > 800-662-7447 | CFA® is a trademark owned by CFA Institute. | |
| Direct Investor Account Services > 800-662-2739 | ||
| Institutional Investor Services > 800-523-1036 | ||
| Text Telephone for People | ||
| With Hearing Impairment > 800-749-7273 | ||
| This material may be used in conjunction | ||
| with the offering of shares of any Vanguard | ||
| fund only if preceded or accompanied by | ||
| the fund’s current prospectus. | ||
| All comparative mutual fund data are from Lipper, a | ||
| Thomson Reuters Company, or Morningstar, Inc., unless | ||
| otherwise noted. | ||
| You can obtain a free copy of Vanguard’s proxy voting | ||
| guidelines by visiting vanguard.com/proxyreporting or by | ||
| calling Vanguard at 800-662-2739. The guidelines are | ||
| also available from the SEC’s website, sec.gov. In | ||
| addition, you may obtain a free report on how your fund | ||
| voted the proxies for securities it owned during the 12 | ||
| months ended June 30. To get the report, visit either | ||
| vanguard.com/proxyreporting or sec.gov. | ||
| You can review and copy information about your fund at | ||
| the SEC’s Public Reference Room in Washington, D.C. To | ||
| find out more about this public service, call the SEC at | ||
| 202-551-8090. Information about your fund is also | ||
| available on the SEC’s website, and you can receive | ||
| copies of this information, for a fee, by sending a | ||
| request in either of two ways: via e-mail addressed to | ||
| publicinfo@sec.gov or via regular mail addressed to the | ||
| Public Reference Section, Securities and Exchange | ||
| Commission, Washington, DC 20549-1520. | ||
| © 2014 The Vanguard Group, Inc. | ||
| All rights reserved. | ||
| Vanguard Marketing Corporation, Distributor. | ||
| Q11942 062014 | ||
![]()
Semiannual Report | April 30, 2014
Vanguard Emerging Markets
Government Bond Index Fund

Vanguard’s Principles for Investing Success
We want to give you the best chance of investment success. These principles, grounded in Vanguard’s research and experience, can put you on the right path.
Goals. Create clear, appropriate investment goals.
Balance. Develop a suitable asset allocation using broadly diversified funds. Cost. Minimize cost.
Discipline. Maintain perspective and long-term discipline.
A single theme unites these principles: Focus on the things you can control.
We believe there is no wiser course for any investor.
| Contents | |
| Your Fund’s Total Returns. | 1 |
| Chairman’s Letter. | 2 |
| Fund Profile. | 7 |
| Performance Summary. | 9 |
| Financial Statements. | 10 |
| About Your Fund’s Expenses. | 37 |
| Trustees Approve Advisory Arrangement. | 39 |
| Glossary. | 40 |
Please note: The opinions expressed in this report are just that—informed opinions. They should not be considered promises or advice.
Also, please keep in mind that the information and opinions cover the period through the date on the front of this report. Of course, the
risks of investing in your fund are spelled out in the prospectus.
See the Glossary for definitions of investment terms used in this report.
About the cover: The ship’s wheel represents leadership and guidance, essential qualities in navigating difficult seas.
This one is a replica based on an 18th-century British vessel. The HMSVanguard, another ship of that era, served as the
flagship for British Admiral Horatio Nelson when he defeated a French fleet at the Battle of the Nile.
Your Fund’s Total Returns
| Six Months Ended April 30, 2014 | ||||
| 30-Day SEC | Income | Capital | Total | |
| Yield | Returns | Returns | Returns | |
| Vanguard Emerging Markets Government Bond Index Fund | ||||
| Investor Shares | 4.50% | 2.18% | 0.62% | 2.80% |
| Admiral™ Shares | 4.65 | 2.27 | 0.56 | 2.83 |
| ETF Shares | 4.65 | |||
| Market Price | 2.89 | |||
| Net Asset Value | 2.84 | |||
| Barclays USD Emerging Markets Government RIC Capped Index | 3.02 | |||
| Emerging Markets Hard Currency Debt Funds Average | 1.73 |
Emerging Markets Hard Currency Debt Funds Average: Derived from data provided by Lipper, a Thomson Reuters Company.
Admiral Shares carry lower expenses and are available to investors who meet certain account-balance requirements. The Vanguard ETF®
Shares shown are traded on the Nasdaq exchange and are available only through brokers. The table provides ETF returns based on both the
Nasdaq market price and the net asset value for a share. U.S. Pat. Nos. 6,879,964; 7,337,138; 7,720,749; 7,925,573; 8,090,646; and 8,417,623.
For the ETF Shares, the market price is determined by the midpoint of the bid-offer spread as of the closing time of the New York Stock
Exchange (generally 4 p.m., Eastern time). The net asset value is also determined as of the NYSE closing time. For more information about
how the ETF Shares' market prices have compared with their net asset value, visit vanguard.com, select your ETF, and then select the Price
and Performance tab. The ETF premium/discount analysis there shows the percentages of days on which the ETF Shares' market price was
above or below the NAV.
Your Fund’s Performance at a Glance
October 31, 2013, Through April 30, 2014
| Distributions Per Share | ||||
| Starting | Ending | Income | Capital | |
| Share Price | Share Price | Dividends | Gains | |
| Vanguard Emerging Markets Government | ||||
| Bond Index Fund | ||||
| Investor Shares | $9.74 | $9.80 | $0.207 | $0.000 |
| Admiral Shares | 19.48 | 19.59 | 0.430 | 0.000 |
| ETF Shares | 77.71 | 78.15 | 1.705 | 0.000 |
1

Chairman’s Letter
Dear Shareholder,
Global bond markets found their footing during the six months ended April 30, 2014. And the emerging market bonds in which your fund invests were some of the stronger performers.
Vanguard Emerging Markets Government Bond Index Fund returned 2.80% for Investor Shares for the half year, and about the same for Admiral and ETF Shares. In addition to earning interest income, the fund’s holdings increased modestly in price.
The fund accomplished its investment objective of closely tracking its benchmark index: The Barclays USD Emerging Markets Government RIC Capped Index, which of course incurs no expenses, returned 3.02%. This close index tracking, for a fund that is shy of its one-year anniversary, is a tribute to the skill and experience of Vanguard Fixed Income Group, the fund’s advisor.
Your fund’s return outpaced the average return of its peer category, emerging markets hard currency debt funds, by more than a full percentage point—a notable lead in the bond arena, and one that underscores the benefit of Vanguard’s focus on low costs. (A “hard currency” is one that is issued by an economically and politically stable country and is widely used around the world as payment for goods and services.)
As I noted in your fund’s first shareholder report last year, Barclays constructs and manages the fund’s custom index with caps, or limits, on certain holdings. The
2
intent is to comply with Internal Revenue Service diversification standards for regulated investment companies, or RICs, which include mutual funds. In seeking to track the index, the advisor uses a sampling strategy, holding a range of securities that in total approximate the index’s key risk factors and characteristics, such as average duration and credit ratings. Sampling is a common practice for bond index funds because it can be very difficult and potentially costly to own all the bonds in an index.
The fund’s 30-day SEC yield for Investor Shares was 4.50% at the end of April, up slightly from 4.29% last October and more than double the yield of the broad U.S. bond market (as measured by Vanguard Total Bond Market Index Fund)—reflecting the higher risk of emerging market debt.
Despite low yields, the bond market experienced a surprising rally
Overall, bonds continued to emerge from the struggles that marked much of 2013, when many markets were roiled by worries about the prospect of the Federal Reserve reducing its stimulative bond-buying. Such concerns hit developing countries especially hard, because their capital markets have been bolstered by significant cash inflows under the Fed’s easy-money policy. In January, however, when the Fed actually started to trim purchases, investors seemed to take the news in stride.
| Market Barometer | |||
| Total Returns | |||
| Periods Ended April 30, 2014 | |||
| Six | One | Five Years | |
| Months | Year | (Annualized) | |
| Bonds | |||
| Barclays U.S. Aggregate Bond Index (Broad taxable | |||
| market) | 1.74% | -0.26% | 4.88% |
| Barclays Municipal Bond Index (Broad tax-exempt market) | 4.08 | 0.50 | 5.54 |
| Citigroup Three-Month U.S. Treasury Bill Index | 0.00 | 0.04 | 0.08 |
| Stocks | |||
| Russell 1000 Index (Large-caps) | 8.25% | 20.81% | 19.52% |
| Russell 2000 Index (Small-caps) | 3.08 | 20.50 | 19.84 |
| Russell 3000 Index (Broad U.S. market) | 7.83 | 20.78 | 19.54 |
| FTSE All-World ex US Index (International) | 2.84 | 9.77 | 13.22 |
| CPI | |||
| Consumer Price Index | 1.51% | 1.95% | 2.14% |
3
Outside the United States, bond markets (as measured by the Barclays Global Aggregate Index ex USD, unhedged for currency exposure) returned 2.33% for the six months ended April 30.
The broad U.S. taxable bond market lagged international bonds, returning 1.74%. The yield of the 10-year Treasury note ended at 2.69% in April, up from 2.54% on October 31 but down from nearly 3% on December 31. (Bond prices and yields move in opposite directions.) Municipal bonds returned 4.08%. Money market funds and savings accounts posted paltry returns as the Fed’s target for short-term interest rates remained at 0%–0.25%.
Global stocks continued to climb, despite some recent choppiness
International stocks, in aggregate, returned nearly 3% for the half year, with the developed markets of Europe faring best. The developed markets of the Pacific region and emerging markets declined. Investors were unsettled by the conflict in Ukraine and weak economic data from China—where efforts to reposition the economy have significant implications for trade with countries around the globe.
U.S. stocks returned almost 8%, notwithstanding the patches of turbulence the market has encountered in 2014. Technology stocks, for example, turned in a rocky performance amid concerns about pricey valuations.
| Expense Ratios | ||||
| Your Fund Compared With Its Peer Group | ||||
| Investor | Admiral | ETF | Peer Group | |
| Shares | Shares | Shares | Average | |
| Emerging Markets Government Bond | ||||
| Index Fund | 0.49% | 0.34% | 0.35% | 1.21% |
The fund expense ratios shown are from the prospectus dated February 25, 2014, and represent estimated costs for the current fiscal year.
For the six months ended April 30, 2014, the fund’s annualized expense ratios were 0.49% for Investor Shares, 0.34% for Admiral Shares, and
0.34% for ETF Shares. The peer-group expense ratio is derived from data provided by Lipper, a Thomson Reuters Company, and captures
information through year-end 2013.
Peer group: Emerging Markets Hard Currency Debt Funds.
4
Global economic and political shifts are as inevitable as they are unpredictable. Broad diversification across stock and bond markets remains the best way of managing the risks they pose to your portfolio. As Joe Davis, our chief economist, noted recently, “Having a broader portfolio tends to moderate those individual issues and that’s always, I think, a valuable starting point for investors.”
A solid first half overall, even with a few setbacks
Returns were positive across almost all the emerging markets in your fund’s target index. Because of their sheer size, however, the two largest emerging markets tend to be major drivers of performance. And between these markets—in Russia and Brazil—results diverged notably.
Amid significant geopolitical and economic turmoil, Russian sovereign U.S. dollar-denominated bonds returned about –5%. Investors were concerned not only about the tense relationship between Russia and Ukraine but also about the potential economic impact of sanctions imposed on Russian businesses and officials. (In April, a major credit rating agency downgraded Russian sovereign debt to the lowest investment-grade category.) Ukrainian bonds, which make up only about 2% of the market value of the index, held up better, dipping slightly into negative territory.
It was a different story in Brazil, which returned more than 3% in the index. Investors have been attracted to Brazilian bond yields that are higher than those offered in some other large emerging markets. (This spring, one of the major credit rating agencies downgraded Brazil’s bonds, citing weaker economic growth; the country’s debt remains investment-grade.)
Other Central and South American markets were some of the standouts in the period Argentina, representing only about 1% of the index, returned about 14%. The government has taken steps to steady its finances, including raising interest rates—while issues related to Argentina’s debt default in 2001 remain unresolved. Smaller markets such as Belize and Honduras posted returns of about 15% and 25%, respectively—an indication of the wide variability (and typically high volatility) of returns in small slices of the global marketplace.
In emerging markets overall, longer-maturity bonds generally outperformed shorter-term bonds. This isn’t surprising: U.S. Treasury bonds serve as a reference point for pricing not only corporate and other bonds issued in the United States but also international bonds. During the six months, as shorter-term rates rose in the United States—and even higher short-term rates next year seemed increasingly likely—longer-maturity bonds outperformed.
5
Global bonds can help diversify interest rate risk
As the Fed further trims its bond-buying program, we’re likely to see more headlines about the prospect of higher interest rates and lower bond prices. But the latest media speculation is never a sound basis for changing your portfolio’s long-term allocation to bonds, which serve to moderate the much higher volatility of stocks.
Investors can nevertheless limit their exposure to U.S. interest rate risk by shifting some of their portfolio’s bond allocation into international bonds that are hedged for foreign currency risk—or are issued in U.S. dollars, such as the bonds in this fund.
Using nearly three decades’ worth of data from periods when interest rates rose, Vanguard has found that adding international bonds can effectively diversify an investor’s portfolio of local bonds—regardless of the investor’s home country. Much of this benefit arises because the interest rate movements of various markets can cancel one another out to some extent, leading to more stable returns.
Of course, there’s no guarantee that such trends will continue, and diversification doesn’t prevent losses. But it’s unlikely that all interest rates across the globe would increase at the same time or by the same magnitude. (You can read more in Fearful of Rising Interest Rates? Consider a More Global Bond Portfolio, available at vanguard.com/research.)
This strategy of global diversification is simple and straightforward and can make sense in any rate environment. And unlike changes in interest rates, such a strategy is under your control. Keep in mind, however, that the emerging market government bonds that your fund invests in represent only a very small slice of the total international market, so you may want to consider other bonds as well to round out your portfolio.
As always, thank you for investing with Vanguard.
Sincerely,

F. William McNabb III
Chairman and Chief Executive Officer
May 19, 2014
6
Emerging Markets Government Bond Index Fund
Fund Profile
As of April 30, 2014
| Share-Class Characteristics | |||
| Investor | Admiral | ETF | |
| Shares | Shares | Shares | |
| Ticker Symbol | VGOVX | VGAVX | VWOB |
| Expense Ratio1 | 0.49% | 0.34% | 0.35% |
| 30-Day SEC Yield | 4.50% | 4.65% | 4.65% |
| Financial Attributes | ||
| Barclays USD | ||
| Emerging Mkts | ||
| Government | ||
| Fund | RIC Capped Idx | |
| Number of Bonds | 631 | 667 |
| Yield to Maturity | ||
| (before expenses) | 5.0% | 5.1% |
| Average Coupon | 5.8% | 5.9% |
| Average Duration | 6.7 years | 6.5 years |
| Average Effective | ||
| Maturity | 10.4 years | 10.2 years |
| Short-Term | ||
| Reserves | 0.9% | — |
| Sector Diversification (% of portfolio) | |
| Foreign Government | 99.7% |
| Other | 0.3 |
The agency and mortgage-backed securities sectors may include issues from government-sponsored enterprises; such issues are
generally not backed by the full faith and credit of the U.S. government.
| Distribution by Effective Maturity | |
| (% of portfolio) | |
| Under 1 Year | 0.3% |
| 1 - 3 Years | 13.1 |
| 3 - 5 Years | 16.4 |
| 5 - 10 Years | 43.4 |
| 10 - 20 Years | 10.4 |
| 20 - 30 Years | 14.4 |
| Over 30 Years | 2.0 |
| Distribution by Credit Quality (% of portfolio) | |
| Aaa | 0.3% |
| Aa | 8.1 |
| A | 11.5 |
| Baa | 57.9 |
| Less Than Baa | 22.2 |
| For information about these ratings, see the Glossary entry for Credit Quality. | |
1 The expense ratios shown are from the prospectus dated February 25, 2014, and represent estimated costs for the current fiscal year. For the six
months ended April 30, 2014, the annualized expense ratios were 0.49% for Investor Shares, 0.34% for Admiral Shares, and 0.34% for ETF Shares.
7
Emerging Markets Government Bond Index Fund
| Market Diversification (% of portfolio) | |
| Fund | |
| Emerging Markets | |
| Brazil | 10.9% |
| Russia | 8.6 |
| Mexico | 8.5 |
| China | 6.6 |
| Turkey | 5.9 |
| Indonesia | 5.4 |
| United Arab Emirates | 5.4 |
| Venezuela | 5.3 |
| Philippines | 3.2 |
| Colombia | 2.8 |
| Lebanon | 2.2 |
| Hungary | 2.0 |
| Poland | 1.9 |
| Chile | 1.7 |
| South Africa | 1.7 |
| India | 1.7 |
| Peru | 1.5 |
| Malaysia | 1.3 |
| Croatia | 1.1 |
| Argentina | 1.1 |
| Other | 19.9 |
| Subtotal | 98.7% |
| North America | |
| United States | 0.3% |
| Other | |
| Panama | 1.0% |
8
Emerging Markets Government Bond Index Fund
Performance Summary
All of the returns in this report represent past performance, which is not a guarantee of future results that may be achieved by the fund. (Current performance may be lower or higher than the performance data cited. For performance data current to the most recent month-end, visit our website at vanguard.com/performance.) Note, too, that both investment returns and principal value can fluctuate widely, so an investor’s shares, when sold, could be worth more or less than their original cost. The returns shown do not reflect taxes that a shareholder would pay on fund distributions or on the sale of fund shares.
Fiscal-Year Total Returns (%): May 31, 2013, Through April 30, 2014
| Barclays USD | ||||
| Emerging Mkts | ||||
| Government | ||||
| Investor Shares | RIC Capped Idx | |||
| Fiscal Year | Income Returns | Capital Returns | Total Returns | Total Returns |
| 2013 | 1.51% | -2.89% | -1.38% | -1.30% |
| 2014 | 2.18 | 0.62 | 2.80 | 3.02 |
| Note: For 2014, performance data reflect the six months ended April 30, 2014. | ||||
Total Returns: Periods Ended March 31, 2014
This table presents returns through the latest calendar quarter—rather than through the end of the fiscal period.
Securities and Exchange Commission rules require that we provide this information.
| Since Inception | ||||
| Inception Date | Income | Capital | Total | |
| Investor Shares | 5/31/2013 | 3.31% | -3.09% | 0.22% |
| Fee-Adjusted Returns | -0.53 | |||
| Admiral Shares | 5/31/2013 | 3.43 | -3.14 | 0.29 |
| Fee-Adjusted Returns | -0.46 | |||
| ETF Shares | 5/31/2013 | |||
| Market Price | 1.27 | |||
| Net Asset Value | 0.26 |
Vanguard fund returns are adjusted to reflect the 0.75% fee on purchases of fund shares. The fee does not apply to the ETF Shares. The Fiscal-Year Total Returns table is not adjusted for fees.
See Financial Highlights for dividend and capital gains information.
9
Emerging Markets Government Bond Index Fund
Financial Statements (unaudited)
Statement of Net Assets
As of April 30, 2014
The fund reports a complete list of its holdings in regulatory filings four times in each fiscal year, at the quarter-ends. For the second and fourth fiscal quarters, the lists appear in the fund’s semiannual and annual reports to shareholders. For the first and third fiscal quarters, the fund files the lists with the Securities and Exchange Commission on Form N-Q. Shareholders can look up the fund’s Forms N-Q on the SEC’s website at sec.gov. Forms N-Q may also be reviewed and copied at the SEC’s Public Reference Room (see the back cover of this report for further information).
| Face | Market | |||
| Maturity | Amount | Value | ||
| Coupon | Date | ($000) | ($000) | |
| Angola (0.1%) | ||||
| Sovereign Bond (U.S. Dollar-Denominated) (0.1%) | ||||
| 1 Republic of Angola Via Northern Lights III BV | 7.000% | 8/16/19 | 250 | 272 |
| Total Angola (Cost $267) | 272 | |||
| Argentina (1.0%) | ||||
| Sovereign Bonds (U.S. Dollar-Denominated) (1.0%) | ||||
| 1 Provincia de Buenos Aires | 10.875% | 1/26/21 | 100 | 91 |
| Provincia de Buenos Aires | 11.750% | 10/5/15 | 300 | 291 |
| Provincia de Cordoba | 12.375% | 8/17/17 | 100 | 95 |
| 1 Republic of Argentina | 2.500% | 12/31/38 | 1,447 | 615 |
| Republic of Argentina | 8.280% | 12/31/33 | 516 | 412 |
| Republic of Argentina | 8.280% | 12/31/33 | 1,192 | 962 |
| Republic of Argentina | 8.750% | 6/2/17 | 200 | 186 |
| Total Argentina (Cost $2,322) | 2,652 | |||
| Armenia (0.1%) | ||||
| Sovereign Bond (U.S. Dollar-Denominated) (0.1%) | ||||
| 2 Republic of Armenia | 6.000% | 9/30/20 | 200 | 205 |
| Total Armenia (Cost $198) | 205 | |||
| Azerbaijan (0.3%) | ||||
| Sovereign Bonds (U.S. Dollar-Denominated) (0.3%) | ||||
| 2 Republic of Azerbaijan | 4.750% | 3/18/24 | 400 | 404 |
| State Oil Co. of the Azerbaijan Republic | 4.750% | 3/13/23 | 200 | 190 |
| State Oil Co. of the Azerbaijan Republic | 5.450% | 2/9/17 | 200 | 211 |
| Total Azerbaijan (Cost $796) | 805 | |||
| Bahrain (0.7%) | ||||
| Sovereign Bonds (U.S. Dollar-Denominated) (0.7%) | ||||
| Bahrain Mumtalakat Holding Co. BSC | 5.000% | 6/30/15 | 150 | 155 |
| 2 Kingdom of Bahrain | 5.500% | 3/31/20 | 350 | 380 |
| 2 Kingdom of Bahrain | 6.125% | 7/5/22 | 600 | 659 |
| 2 Kingdom of Bahrain | 6.125% | 8/1/23 | 150 | 164 |
| Kingdom of Bahrain | 6.273% | 11/22/18 | 350 | 401 |
| Total Bahrain (Cost $1,689) | 1,759 |
10
Emerging Markets Government Bond Index Fund
| Face | Market | |||
| Maturity | Amount | Value | ||
| Coupon | Date | ($000) | ($000) | |
| Belarus (0.2%) | ||||
| Sovereign Bonds (U.S. Dollar-Denominated) (0.2%) | ||||
| Republic of Belarus | 8.750% | 8/3/15 | 358 | 361 |
| Republic of Belarus | 8.950% | 1/26/18 | 200 | 201 |
| Total Belarus (Cost $566) | 562 | |||
| Belize (0.0%) | ||||
| Sovereign Bond (U.S. Dollar-Denominated) (0.0%) | ||||
| 1 Belize | 5.000% | 2/20/38 | 100 | 69 |
| Total Belize (Cost $61) | 69 | |||
| Bermuda (0.1%) | ||||
| Sovereign Bonds (U.S. Dollar-Denominated) (0.1%) | ||||
| 2 Bermuda | 4.854% | 2/6/24 | 150 | 154 |
| 2 Bermuda | 5.603% | 7/20/20 | 100 | 111 |
| Total Bermuda (Cost $257) | 265 | |||
| Bolivia (0.1%) | ||||
| Sovereign Bond (U.S. Dollar-Denominated) (0.1%) | ||||
| Plurinational State of Bolivia | 4.875% | 10/29/22 | 200 | 199 |
| Total Bolivia (Cost $183) | 199 | |||
| Brazil (10.2%) | ||||
| Sovereign Bonds (U.S. Dollar-Denominated) (10.2%) | ||||
| Banco do Brasil SA | 3.875% | 1/23/17 | 94 | 97 |
| Banco do Brasil SA | 3.875% | 10/10/22 | 475 | 441 |
| Banco do Brasil SA | 5.375% | 1/15/21 | 275 | 280 |
| Banco do Brasil SA | 5.875% | 1/26/22 | 600 | 614 |
| Banco do Brasil SA | 5.875% | 1/19/23 | 250 | 254 |
| Banco do Brasil SA | 6.000% | 1/22/20 | 100 | 109 |
| 1 Banco do Brasil SA | 8.500% | 10/29/49 | 350 | 402 |
| Banco Nacional de Desenvolvimento | ||||
| Economico e Social | 3.375% | 9/26/16 | 200 | 204 |
| 2 Banco Nacional de Desenvolvimento | ||||
| Economico e Social | 3.375% | 9/26/16 | 150 | 153 |
| 2 Banco Nacional de Desenvolvimento | ||||
| Economico e Social | 4.000% | 4/14/19 | 250 | 250 |
| 2 Banco Nacional de Desenvolvimento | ||||
| Economico e Social | 5.500% | 7/12/20 | 100 | 107 |
| 2 Banco Nacional de Desenvolvimento | ||||
| Economico e Social | 5.750% | 9/26/23 | 200 | 208 |
| Banco Nacional de Desenvolvimento | ||||
| Economico e Social | 6.369% | 6/16/18 | 425 | 471 |
| Banco Nacional de Desenvolvimento | ||||
| Economico e Social | 6.500% | 6/10/19 | 400 | 448 |
| Caixa Economica Federal | 2.375% | 11/6/17 | 325 | 312 |
| Caixa Economica Federal | 3.500% | 11/7/22 | 150 | 132 |
| Caixa Economica Federal | 4.500% | 10/3/18 | 150 | 153 |
| 2 Caixa Economica Federal | 4.500% | 10/3/18 | 200 | 204 |
| Centrais Eletricas Brasileiras SA | 5.750% | 10/27/21 | 400 | 402 |
| Centrais Eletricas Brasileiras SA | 6.875% | 7/30/19 | 200 | 217 |
| Federative Republic of Brazil | 4.250% | 1/7/25 | 1,425 | 1,420 |
| Federative Republic of Brazil | 4.875% | 1/22/21 | 956 | 1,035 |
| Federative Republic of Brazil | 5.625% | 1/7/41 | 600 | 627 |
| Federative Republic of Brazil | 5.875% | 1/15/19 | 430 | 490 |
| Federative Republic of Brazil | 6.000% | 1/17/17 | 800 | 890 |
11
Emerging Markets Government Bond Index Fund
| Face | Market | |||
| Maturity | Amount | Value | ||
| Coupon | Date | ($000) | ($000) | |
| Federative Republic of Brazil | 7.125% | 1/20/37 | 990 | 1,217 |
| 1 Federative Republic of Brazil | 8.000% | 1/15/18 | 311 | 348 |
| Federative Republic of Brazil | 8.250% | 1/20/34 | 725 | 982 |
| Federative Republic of Brazil | 8.750% | 2/4/25 | 350 | 480 |
| Federative Republic of Brazil | 8.875% | 10/14/19 | 175 | 228 |
| Federative Republic of Brazil | 8.875% | 4/15/24 | 150 | 206 |
| Federative Republic of Brazil | 8.875% | 4/15/24 | 307 | 422 |
| Federative Republic of Brazil | 10.125% | 5/15/27 | 430 | 663 |
| 1 Federative Republic of Brazil | 11.000% | 8/17/40 | 100 | 113 |
| Federative Republic of Brazil | 12.250% | 3/6/30 | 150 | 261 |
| 3 Petrobras Global Finance BV | 1.855% | 5/20/16 | 350 | 348 |
| Petrobras Global Finance BV | 2.000% | 5/20/16 | 100 | 100 |
| 3 Petrobras Global Finance BV | 2.366% | 1/15/19 | 150 | 149 |
| 3 Petrobras Global Finance BV | 2.593% | 3/17/17 | 200 | 201 |
| Petrobras Global Finance BV | 4.375% | 5/20/23 | 1,225 | 1,143 |
| Petrobras Global Finance BV | 4.875% | 3/17/20 | 900 | 913 |
| Petrobras Global Finance BV | 5.625% | 5/20/43 | 450 | 392 |
| Petrobras Global Finance BV | 6.250% | 3/17/24 | 900 | 943 |
| Petrobras Global Finance BV | 7.250% | 3/17/44 | 200 | 214 |
| Petrobras International Finance Co. | 3.500% | 2/6/17 | 200 | 205 |
| Petrobras International Finance Co. | 3.875% | 1/27/16 | 1,300 | 1,340 |
| Petrobras International Finance Co. | 5.375% | 1/27/21 | 1,260 | 1,289 |
| Petrobras International Finance Co. | 5.750% | 1/20/20 | 700 | 738 |
| Petrobras International Finance Co. | 5.875% | 3/1/18 | 1,200 | 1,297 |
| Petrobras International Finance Co. | 6.125% | 10/6/16 | 300 | 325 |
| Petrobras International Finance Co. | 6.750% | 1/27/41 | 627 | 637 |
| Petrobras International Finance Co. | 6.875% | 1/20/40 | 490 | 504 |
| Petrobras International Finance Co. | 7.875% | 3/15/19 | 600 | 695 |
| Petrobras International Finance Co. | 8.375% | 12/10/18 | 350 | 413 |
| Total Brazil (Cost $26,457) | 26,686 | |||
| Chile (1.7%) | ||||
| Sovereign Bonds (U.S. Dollar-Denominated) (1.7%) | ||||
| 2 Banco del Estado de Chile | 2.000% | 11/9/17 | 200 | 199 |
| 2 Banco del Estado de Chile | 3.875% | 2/8/22 | 200 | 199 |
| 2 Banco del Estado de Chile | 4.125% | 10/7/20 | 200 | 207 |
| Corp. Nacional del Cobre de Chile | 3.000% | 7/17/22 | 200 | 189 |
| 2 Corp. Nacional del Cobre de Chile | 6.150% | 10/24/36 | 200 | 226 |
| 2 Corp. Nacional del Cobre de Chile | 3.000% | 7/17/22 | 475 | 451 |
| 2 Corp. Nacional del Cobre de Chile | 3.875% | 11/3/21 | 400 | 404 |
| 2 Corp. Nacional del Cobre de Chile | 4.250% | 7/17/42 | 50 | 44 |
| Corp. Nacional del Cobre de Chile | 4.500% | 8/13/23 | 200 | 208 |
| 2 Corp. Nacional del Cobre de Chile | 4.500% | 8/13/23 | 150 | 157 |
| 2 Corp. Nacional del Cobre de Chile | 5.625% | 9/21/35 | 300 | 316 |
| 2 Corp. Nacional del Cobre de Chile | 5.625% | 10/18/43 | 200 | 212 |
| 2 Empresa de Transporte de Pasajeros Metro SA | 4.750% | 2/4/24 | 200 | 209 |
| 2 Empresa Nacional del Petroleo | 4.750% | 12/6/21 | 200 | 206 |
| 2 Empresa Nacional del Petroleo | 5.250% | 8/10/20 | 200 | 212 |
| Republic of Chile | 2.250% | 10/30/22 | 200 | 185 |
| Republic of Chile | 3.250% | 9/14/21 | 350 | 354 |
| Republic of Chile | 3.625% | 10/30/42 | 150 | 127 |
| Republic of Chile | 3.875% | 8/5/20 | 250 | 266 |
| Total Chile (Cost $4,273) | 4,371 |
12
Emerging Markets Government Bond Index Fund
| Face | Market | ||||
| Maturity | Amount | Value | |||
| Coupon | Date | ($000) | ($000) | ||
| China (6.1%) | |||||
| Sovereign Bonds (U.S. Dollar-Denominated) (5.9%) | |||||
| Amber Circle Funding Ltd. | 2.000% | 12/4/17 | 200 | 198 | |
| Amber Circle Funding Ltd. | 3.250% | 12/4/22 | 400 | 372 | |
| BOC Aviation Pte Ltd. | 2.875% | 10/10/17 | 300 | 297 | |
| China Development Bank Corp. | 5.000% | 10/15/15 | 200 | 211 | |
| 2 | China Resources Gas Group Ltd. | 4.500% | 4/5/22 | 200 | 201 |
| 2 | China Resources Land Ltd. | 4.625% | 5/19/16 | 200 | 208 |
| CNOOC Curtis Funding No 1 pty Ltd. | 4.500% | 10/3/23 | 350 | 359 | |
| 2 | CNOOC Curtis Funding No 1 Pty Ltd. | 4.500% | 10/3/23 | 300 | 307 |
| 2 | CNOOC Finance 2011 Ltd. | 4.250% | 1/26/21 | 338 | 350 |
| 2 | CNOOC Finance 2012 Ltd. | 3.875% | 5/2/22 | 475 | 469 |
| 2 | CNOOC Finance 2012 Ltd. | 5.000% | 5/2/42 | 200 | 204 |
| CNOOC Finance 2013 Ltd. | 1.125% | 5/9/16 | 50 | 50 | |
| CNOOC Finance 2013 Ltd. | 1.750% | 5/9/18 | 200 | 196 | |
| CNOOC Finance 2013 Ltd. | 3.000% | 5/9/23 | 500 | 457 | |
| CNOOC Finance 2013 Ltd. | 4.250% | 5/9/43 | 200 | 177 | |
| CNOOC Nexen Finance 2014 ULC | 1.625% | 4/30/17 | 300 | 300 | |
| CNOOC Nexen Finance 2014 ULC | 4.250% | 4/30/24 | 900 | 899 | |
| CNPC General Capital Ltd. | 1.450% | 4/16/16 | 250 | 250 | |
| 2 | CNPC General Capital Ltd. | 2.750% | 4/19/17 | 200 | 205 |
| CNPC General Capital Ltd. | 3.400% | 4/16/23 | 250 | 237 | |
| 2 | CNPC General Capital Ltd. | 3.950% | 4/19/22 | 200 | 199 |
| 2 | CNPC HK Overseas Capital Ltd. | 3.125% | 4/28/16 | 400 | 413 |
| 2 | CNPC HK Overseas Capital Ltd. | 5.950% | 4/28/41 | 200 | 230 |
| 2 | COSL Finance BVI Ltd. | 3.250% | 9/6/22 | 550 | 509 |
| 2 | Export-Import Bank of China | 4.875% | 7/21/15 | 200 | 209 |
| 2 | Franshion Development Ltd. | 6.750% | 4/15/21 | 200 | 205 |
| MCC Holding Hong Kong Corp. Ltd. | 4.875% | 7/29/16 | 200 | 202 | |
| Nexen Energy ULC | 5.875% | 3/10/35 | 308 | 342 | |
| Nexen Energy ULC | 6.400% | 5/15/37 | 425 | 491 | |
| Nexen Energy ULC | 7.875% | 3/15/32 | 100 | 134 | |
| Prosperous Ray Ltd. | 3.000% | 11/12/18 | 400 | 397 | |
| 1,2 | Sinochem Global Capital Co. Ltd. | 5.000% | 12/29/49 | 200 | 199 |
| 2 | Sinochem Offshore Capital Co. Ltd. | 3.250% | 4/29/19 | 200 | 200 |
| 2 | Sinochem Overseas Capital Co. Ltd. | 4.500% | 11/12/20 | 275 | 286 |
| 2 | Sinochem Overseas Capital Co. Ltd. | 6.300% | 11/12/40 | 250 | 273 |
| Sinopec Capital 2013 Ltd. | 1.250% | 4/24/16 | 200 | 200 | |
| Sinopec Capital 2013 Ltd. | 3.125% | 4/24/23 | 400 | 370 | |
| 2 | Sinopec Capital 2013 Ltd. | 3.125% | 4/24/23 | 400 | 370 |
| 2 | Sinopec Group Overseas Development 2012 Ltd. | 3.900% | 5/17/22 | 600 | 597 |
| 2 | Sinopec Group Overseas Development 2012 Ltd. | 4.875% | 5/17/42 | 100 | 98 |
| Sinopec Group Overseas Development 2013 Ltd. | 4.375% | 10/17/23 | 525 | 535 | |
| 2 | Sinopec Group Overseas Development 2014 Ltd. | 1.750% | 4/10/17 | 1,200 | 1,196 |
| 2 | Sinopec Group Overseas Development 2014 Ltd. | 2.750% | 4/10/19 | 400 | 397 |
| 2 | Sinopec Group Overseas Development 2014 Ltd. | 4.375% | 4/10/24 | 500 | 503 |
| 2 | State Grid Overseas Investment 2013 Ltd. | 1.750% | 5/22/18 | 200 | 195 |
| State Grid Overseas Investment 2013 Ltd. | 3.125% | 5/22/23 | 350 | 330 | |
| 2 | State Grid Overseas Investment 2014 Ltd. | 2.750% | 5/7/19 | 700 | 697 |
| 2 | State Grid Overseas Investment 2014 Ltd. | 4.850% | 5/7/44 | 350 | 346 |
| Total China (Cost $16,017) | 16,070 | ||||
13
Emerging Markets Government Bond Index Fund
| Face | Market | |||
| Maturity | Amount | Value | ||
| Coupon | Date | ($000) | ($000) | |
| Colombia (2.6%) | ||||
| Sovereign Bonds (U.S. Dollar-Denominated) (2.6%) | ||||
| Ecopetrol SA | 4.250% | 9/18/18 | 35 | 37 |
| Ecopetrol SA | 5.875% | 9/18/23 | 265 | 291 |
| Ecopetrol SA | 7.375% | 9/18/43 | 300 | 359 |
| Ecopetrol SA | 7.625% | 7/23/19 | 425 | 513 |
| 1 Republic of Colombia | 2.625% | 3/15/23 | 675 | 619 |
| Republic of Colombia | 4.000% | 2/26/24 | 200 | 203 |
| Republic of Colombia | 4.375% | 7/12/21 | 400 | 424 |
| 1 Republic of Colombia | 5.625% | 2/26/44 | 400 | 431 |
| Republic of Colombia | 6.125% | 1/18/41 | 1,000 | 1,148 |
| Republic of Colombia | 7.375% | 1/27/17 | 900 | 1,034 |
| Republic of Colombia | 7.375% | 3/18/19 | 500 | 605 |
| Republic of Colombia | 7.375% | 9/18/37 | 550 | 719 |
| Republic of Colombia | 8.125% | 5/21/24 | 350 | 462 |
| Total Colombia (Cost $6,680) | 6,845 | |||
| Costa Rica (0.6%) | ||||
| Sovereign Bonds (U.S. Dollar-Denominated) (0.6%) | ||||
| Banco Nacional de Costa Rica | 4.875% | 11/1/18 | 200 | 199 |
| 2 Banco Nacional de Costa Rica | 4.875% | 11/1/18 | 200 | 199 |
| Instituto Costarricense de Electricidad | 6.375% | 5/15/43 | 200 | 165 |
| Instituto Costarricense de Electricidad | 6.950% | 11/10/21 | 200 | 210 |
| Republic of Costa Rica | 4.250% | 1/26/23 | 400 | 368 |
| Republic of Costa Rica | 4.375% | 4/30/25 | 200 | 178 |
| 2 Republic of Costa Rica | 7.000% | 4/4/44 | 200 | 199 |
| Total Costa Rica (Cost $1,542) | 1,518 | |||
| Cote D’Ivoire (0.2%) | ||||
| Sovereign Bond (U.S. Dollar-Denominated) (0.2%) | ||||
| 1 Republic of Ivory Coast | 5.750% | 12/31/32 | 595 | 562 |
| Total Cote D’Ivoire (Cost $545) | 562 | |||
| Croatia (1.1%) | ||||
| Sovereign Bonds (U.S. Dollar-Denominated) (1.1%) | ||||
| Republic of Croatia | 5.500% | 4/4/23 | 500 | 506 |
| 2 Republic of Croatia | 6.000% | 1/26/24 | 300 | 313 |
| Republic of Croatia | 6.000% | 1/26/24 | 435 | 454 |
| Republic of Croatia | 6.250% | 4/27/17 | 200 | 215 |
| Republic of Croatia | 6.375% | 3/24/21 | 350 | 377 |
| Republic of Croatia | 6.625% | 7/14/20 | 440 | 481 |
| Republic of Croatia | 6.750% | 11/5/19 | 400 | 440 |
| Total Croatia (Cost $2,726) | 2,786 | |||
| Dominican Republic (0.5%) | ||||
| Sovereign Bonds (U.S. Dollar-Denominated) (0.5%) | ||||
| 1 Dominican Republic | 5.875% | 4/18/24 | 300 | 301 |
| Dominican Republic | 6.600% | 1/28/24 | 250 | 261 |
| 2 Dominican Republic | 7.450% | 4/30/44 | 300 | 302 |
| 1 Dominican Republic | 7.500% | 5/6/21 | 350 | 391 |
| 1 Dominican Republic | 9.040% | 1/23/18 | 87 | 96 |
| Total Dominican Republic (Cost $1,328) | 1,351 |
14
Emerging Markets Government Bond Index Fund
| Face | Market | |||
| Maturity | Amount | Value | ||
| Coupon | Date | ($000) | ($000) | |
| Ecuador (0.1%) | ||||
| Sovereign Bond (U.S. Dollar-Denominated) (0.1%) | ||||
| Republic of Ecuador | 9.375% | 12/15/15 | 350 | 374 |
| Total Ecuador (Cost $367) | 374 | |||
| Egypt (0.3%) | ||||
| Sovereign Bonds (U.S. Dollar-Denominated) (0.3%) | ||||
| African Export-Import Bank | 3.875% | 6/4/18 | 250 | 251 |
| Arab Republic of Egypt | 5.750% | 4/29/20 | 362 | 370 |
| Nile Finance Ltd. | 5.250% | 8/5/15 | 100 | 101 |
| Total Egypt (Cost $683) | 722 | |||
| El Salvador (0.5%) | ||||
| Sovereign Bonds (U.S. Dollar-Denominated) (0.5%) | ||||
| Republic of El Salvador | 5.875% | 1/30/25 | 200 | 195 |
| Republic of El Salvador | 7.375% | 12/1/19 | 200 | 224 |
| Republic of El Salvador | 7.625% | 2/1/41 | 150 | 155 |
| Republic of El Salvador | 7.650% | 6/15/35 | 260 | 271 |
| Republic of El Salvador | 7.750% | 1/24/23 | 300 | 336 |
| Republic of El Salvador | 8.250% | 4/10/32 | 100 | 112 |
| Total El Salvador (Cost $1,274) | 1,293 | |||
| Gabon (0.2%) | ||||
| Sovereign Bonds (U.S. Dollar-Denominated) (0.2%) | ||||
| 1,2 Gabonese Republic | 6.375% | 12/12/24 | 400 | 429 |
| Gabonese Republic | 8.200% | 12/12/17 | 100 | 114 |
| Total Gabon (Cost $523) | 543 | |||
| Georgia (0.1%) | ||||
| Sovereign Bond (U.S. Dollar-Denominated) (0.1%) | ||||
| Republic of Georgia | 6.875% | 4/12/21 | 200 | 215 |
| Total Georgia (Cost $226) | 215 | |||
| Ghana (0.1%) | ||||
| Sovereign Bonds (U.S. Dollar-Denominated) (0.1%) | ||||
| 2 Republic of Ghana | 7.875% | 8/7/23 | 200 | 186 |
| Republic of Ghana | 8.500% | 10/4/17 | 200 | 205 |
| Total Ghana (Cost $416) | 391 | |||
| Guatemala (0.2%) | ||||
| Sovereign Bonds (U.S. Dollar-Denominated) (0.2%) | ||||
| Republic of Guatemala | 4.875% | 2/13/28 | 200 | 196 |
| Republic of Guatemala | 5.750% | 6/6/22 | 200 | 217 |
| Total Guatemala (Cost $401) | 413 | |||
| Honduras (0.1%) | ||||
| Sovereign Bond (U.S. Dollar-Denominated) (0.1%) | ||||
| 1 Republic of Honduras | 7.500% | 3/15/24 | 200 | 199 |
| Total Honduras (Cost $170) | 199 | |||
| Hungary (1.9%) | ||||
| Sovereign Bonds (U.S. Dollar-Denominated) (1.9%) | ||||
| 2,4 MFB Magyar Fejlesztesi Bank Zrt | 6.250% | 10/21/20 | 200 | 216 |
| Republic of Hungary | 4.000% | 3/25/19 | 600 | 604 |
| Republic of Hungary | 4.125% | 2/19/18 | 716 | 738 |
15
Emerging Markets Government Bond Index Fund
| Face | Market | |||
| Maturity | Amount | Value | ||
| Coupon | Date | ($000) | ($000) | |
| Republic of Hungary | 5.375% | 2/21/23 | 562 | 585 |
| Republic of Hungary | 5.375% | 3/25/24 | 700 | 722 |
| Republic of Hungary | 5.750% | 11/22/23 | 200 | 209 |
| Republic of Hungary | 6.250% | 1/29/20 | 400 | 443 |
| Republic of Hungary | 6.375% | 3/29/21 | 810 | 900 |
| Republic of Hungary | 7.625% | 3/29/41 | 530 | 634 |
| Total Hungary (Cost $4,861) | 5,051 | |||
| India (1.4%) | ||||
| Sovereign Bonds (U.S. Dollar-Denominated) (1.4%) | ||||
| Bank of India | 3.625% | 9/21/18 | 350 | 346 |
| Bank of India | 4.750% | 9/30/15 | 225 | 233 |
| Bharat Petroleum Corp. Ltd. | 4.625% | 10/25/22 | 200 | 194 |
| Export-Import Bank of India | 4.000% | 1/14/23 | 400 | 375 |
| IDBI Bank Ltd. | 3.750% | 1/25/19 | 200 | 194 |
| IDBI Bank Ltd. | 4.375% | 3/26/18 | 200 | 203 |
| Indian Oil Corp. Ltd. | 5.625% | 8/2/21 | 200 | 208 |
| Indian Overseas Bank | 5.000% | 10/19/16 | 200 | 210 |
| NTPC Ltd. | 5.625% | 7/14/21 | 200 | 209 |
| Power Grid Corp. of India Ltd. | 3.875% | 1/17/23 | 200 | 181 |
| Rural Electrification Corp. Ltd. | 4.250% | 1/25/16 | 300 | 308 |
| State Bank of India | 4.125% | 8/1/17 | 850 | 879 |
| Syndicate Bank | 4.750% | 11/6/16 | 250 | 261 |
| Total India (Cost $3,766) | 3,801 | |||
| Indonesia (5.2%) | ||||
| Sovereign Bonds (U.S. Dollar-Denominated) (5.2%) | ||||
| Lembaga Pembiayaan Ekspor Indonesia | 3.750% | 4/26/17 | 300 | 306 |
| Majapahit Holding BV | 7.750% | 1/20/20 | 775 | 892 |
| Majapahit Holding BV | 7.875% | 6/29/37 | 100 | 111 |
| Majapahit Holding BV | 8.000% | 8/7/19 | 100 | 116 |
| 2 Pertamina Persero PT | 4.300% | 5/20/23 | 655 | 596 |
| Pertamina Persero PT | 4.875% | 5/3/22 | 350 | 338 |
| Pertamina Persero PT | 5.250% | 5/23/21 | 200 | 201 |
| 2 Pertamina Persero PT | 5.625% | 5/20/43 | 200 | 170 |
| 2 Pertamina Persero PT | 6.000% | 5/3/42 | 200 | 178 |
| Pertamina Persero PT | 6.500% | 5/27/41 | 400 | 381 |
| Perusahaan Listrik Negara PT | 5.250% | 10/24/42 | 200 | 164 |
| Perusahaan Listrik Negara PT | 5.500% | 11/22/21 | 300 | 305 |
| 2 Perusahaan Penerbit SBSN Indonesia | 6.125% | 3/15/19 | 200 | 221 |
| Republic of Indonesia | 3.300% | 11/21/22 | 228 | 205 |
| Republic of Indonesia | 3.375% | 4/15/23 | 200 | 181 |
| Republic of Indonesia | 3.750% | 4/25/22 | 850 | 807 |
| Republic of Indonesia | 4.000% | 11/21/18 | 200 | 206 |
| Republic of Indonesia | 4.625% | 4/15/43 | 375 | 315 |
| Republic of Indonesia | 4.875% | 5/5/21 | 500 | 517 |
| Republic of Indonesia | 5.250% | 1/17/42 | 500 | 460 |
| Republic of Indonesia | 5.375% | 10/17/23 | 200 | 209 |
| 2 Republic of Indonesia | 5.875% | 3/13/20 | 350 | 383 |
| Republic of Indonesia | 5.875% | 3/13/20 | 600 | 658 |
| Republic of Indonesia | 5.875% | 1/15/24 | 250 | 271 |
| 2 Republic of Indonesia | 5.875% | 1/15/24 | 200 | 217 |
| Republic of Indonesia | 6.125% | 3/15/19 | 400 | 441 |
| Republic of Indonesia | 6.625% | 2/17/37 | 818 | 885 |
| 2 Republic of Indonesia | 6.750% | 1/15/44 | 450 | 500 |
16
Emerging Markets Government Bond Index Fund
| Face | Market | |||
| Maturity | Amount | Value | ||
| Coupon | Date | ($000) | ($000) | |
| Republic of Indonesia | 6.750% | 1/15/44 | 600 | 668 |
| Republic of Indonesia | 6.875% | 3/9/17 | 300 | 339 |
| Republic of Indonesia | 6.875% | 1/17/18 | 1,026 | 1,167 |
| Republic of Indonesia | 7.750% | 1/17/38 | 275 | 334 |
| Republic of Indonesia | 8.500% | 10/12/35 | 250 | 325 |
| Republic of Indonesia | 11.625% | 3/4/19 | 400 | 541 |
| Total Indonesia (Cost $13,422) | 13,608 | |||
| Iraq (0.2%) | ||||
| Sovereign Bond (U.S. Dollar-Denominated) (0.2%) | ||||
| Republic of Iraq | 5.800% | 1/15/28 | 560 | 500 |
| Total Iraq (Cost $485) | 500 | |||
| Jamaica (0.1%) | ||||
| Sovereign Bonds (U.S. Dollar-Denominated) (0.1%) | ||||
| 1 Jamaica | 8.000% | 6/24/19 | 250 | 264 |
| 1 Jamaica | 8.000% | 3/15/39 | 125 | 119 |
| Total Jamaica (Cost $355) | 383 | |||
| Jordan (0.1%) | ||||
| Sovereign Bond (U.S. Dollar-Denominated) (0.1%) | ||||
| Hashemite Kingdom of Jordan | 3.875% | 11/12/15 | 200 | 200 |
| Total Jordan (Cost $200) | 200 | |||
| Kazakhstan (1.5%) | ||||
| Sovereign Bonds (U.S. Dollar-Denominated) (1.5%) | ||||
| Development Bank of Kazakhstan JSC | 4.125% | 12/10/22 | 400 | 362 |
| Intergas Finance BV | 6.375% | 5/14/17 | 150 | 159 |
| 2 KazAgro National Management Holding JSC | 4.625% | 5/24/23 | 200 | 186 |
| Kazakhstan Temir Zholy Finance BV | 6.950% | 7/10/42 | 400 | 410 |
| Kazatomprom Natsionalnaya Atomnaya | ||||
| Kompaniya AO | 6.250% | 5/20/15 | 200 | 207 |
| KazMunayGas National Co. JSC | 4.400% | 4/30/23 | 425 | 403 |
| KazMunayGas National Co. JSC | 5.750% | 4/30/43 | 200 | 182 |
| 2 KazMunayGas National Co. JSC | 5.750% | 4/30/43 | 425 | 384 |
| KazMunayGas National Co. JSC | 6.375% | 4/9/21 | 350 | 381 |
| KazMunayGas National Co. JSC | 7.000% | 5/5/20 | 200 | 225 |
| KazMunayGas National Co. JSC | 9.125% | 7/2/18 | 825 | 985 |
| Total Kazakhstan (Cost $3,897) | 3,884 | |||
| Latvia (0.3%) | ||||
| Sovereign Bonds (U.S. Dollar-Denominated) (0.3%) | ||||
| Republic of Latvia | 2.750% | 1/12/20 | 300 | 291 |
| Republic of Latvia | 5.250% | 2/22/17 | 280 | 304 |
| Republic of Latvia | 5.250% | 6/16/21 | 200 | 220 |
| Total Latvia (Cost $804) | 815 | |||
| Lebanon (2.1%) | ||||
| Sovereign Bonds (U.S. Dollar-Denominated) (2.1%) | ||||
| Republic of Lebanon | 4.750% | 11/2/16 | 100 | 101 |
| Republic of Lebanon | 5.150% | 6/12/18 | 50 | 50 |
| Republic of Lebanon | 5.150% | 11/12/18 | 300 | 298 |
| Republic of Lebanon | 5.450% | 11/28/19 | 350 | 346 |
| Republic of Lebanon | 5.500% | 4/23/19 | 50 | 50 |
| Republic of Lebanon | 6.000% | 5/20/19 | 150 | 153 |
17
Emerging Markets Government Bond Index Fund
| Face | Market | ||||
| Maturity | Amount | Value | |||
| Coupon | Date | ($000) | ($000) | ||
| Republic of Lebanon | 6.000% | 1/27/23 | 400 | 390 | |
| Republic of Lebanon | 6.100% | 10/4/22 | 550 | 544 | |
| Republic of Lebanon | 6.250% | 6/12/25 | 100 | 98 | |
| Republic of Lebanon | 6.375% | 3/9/20 | 580 | 597 | |
| Republic of Lebanon | 6.600% | 11/27/26 | 250 | 248 | |
| Republic of Lebanon | 6.750% | 11/29/27 | 375 | 376 | |
| Republic of Lebanon | 8.250% | 4/12/21 | 700 | 789 | |
| Republic of Lebanon | 8.500% | 8/6/15 | 350 | 372 | |
| Republic of Lebanon | 8.500% | 1/19/16 | 600 | 646 | |
| Republic of Lebanon | 9.000% | 3/20/17 | 400 | 446 | |
| Total Lebanon (Cost $5,450) | 5,504 | ||||
| Lithuania (0.7%) | |||||
| Sovereign Bonds (U.S. Dollar-Denominated) (0.7%) | |||||
| Republic of Lithuania | 5.125% | 9/14/17 | 200 | 219 | |
| Republic of Lithuania | 6.125% | 3/9/21 | 375 | 432 | |
| Republic of Lithuania | 6.625% | 2/1/22 | 440 | 524 | |
| Republic of Lithuania | 7.375% | 2/11/20 | 563 | 682 | |
| Total Lithuania (Cost $1,835) | 1,857 | ||||
| Malaysia (1.6%) | |||||
| Sovereign Bonds (U.S. Dollar-Denominated) (1.6%) | |||||
| Export-Import Bank of Malaysia Bhd. | 2.875% | 12/14/17 | 200 | 207 | |
| 2 | Federation of Malaysia | 2.991% | 7/6/16 | 625 | 650 |
| 2 | Federation of Malaysia | 4.646% | 7/6/21 | 250 | 270 |
| 1 | Malayan Banking Berhad | 3.250% | 9/20/22 | 400 | 398 |
| 2,5 | Penerbangan Malaysia Bhd. | 5.625% | 3/15/16 | 300 | 324 |
| Petroliam Nasional Bhd. | 7.625% | 10/15/26 | 100 | 133 | |
| 2 | Petroliam Nasional Bhd. | 7.750% | 8/15/15 | 250 | 271 |
| 2 | Petronas Capital Ltd. | 5.250% | 8/12/19 | 748 | 836 |
| Petronas Capital Ltd. | 5.250% | 8/12/19 | 216 | 242 | |
| Petronas Capital Ltd. | 7.875% | 5/22/22 | 200 | 260 | |
| Sarawak International Inc. | 5.500% | 8/3/15 | 200 | 210 | |
| SSG Resources Ltd. | 4.250% | 10/4/22 | 400 | 395 | |
| Total Malaysia (Cost $4,168) | 4,196 | ||||
| Mexico (8.3%) | |||||
| Sovereign Bonds (U.S. Dollar-Denominated) (8.3%) | |||||
| Comision Federal de Electricidad | 4.875% | 5/26/21 | 250 | 263 | |
| Comision Federal de Electricidad | 4.875% | 1/15/24 | 200 | 206 | |
| 2 | Comision Federal de Electricidad | 4.875% | 1/15/24 | 200 | 207 |
| Comision Federal de Electricidad | 5.750% | 2/14/42 | 200 | 200 | |
| Pemex Project Funding Master Trust | 5.750% | 3/1/18 | 775 | 860 | |
| Pemex Project Funding Master Trust | 6.625% | 6/15/35 | 790 | 888 | |
| Petroleos Mexicanos | 3.500% | 7/18/18 | 400 | 411 | |
| Petroleos Mexicanos | 3.500% | 1/30/23 | 650 | 616 | |
| Petroleos Mexicanos | 4.875% | 1/24/22 | 950 | 999 | |
| Petroleos Mexicanos | 4.875% | 1/18/24 | 550 | 570 | |
| 2 | Petroleos Mexicanos | 4.875% | 1/18/24 | 100 | 104 |
| Petroleos Mexicanos | 5.500% | 1/21/21 | 850 | 933 | |
| Petroleos Mexicanos | 5.500% | 6/27/44 | 680 | 667 | |
| Petroleos Mexicanos | 6.000% | 3/5/20 | 200 | 225 | |
| 2 | Petroleos Mexicanos | 6.375% | 1/23/45 | 1,000 | 1,097 |
| Petroleos Mexicanos | 6.500% | 6/2/41 | 720 | 796 | |
| Petroleos Mexicanos | 8.000% | 5/3/19 | 590 | 719 | |
18
Emerging Markets Government Bond Index Fund
| Face | Market | ||||
| Maturity | Amount | Value• | |||
| Coupon | Date | ($000) | ($000) | ||
| United Mexican States | 3.500% | 1/21/21 | 450 | 459 | |
| United Mexican States | 3.625% | 3/15/22 | 892 | 904 | |
| United Mexican States | 4.000% | 10/2/23 | 1,425 | 1,465 | |
| United Mexican States | 4.750% | 3/8/44 | 1,370 | 1,331 | |
| United Mexican States | 5.125% | 1/15/20 | 780 | 872 | |
| United Mexican States | 5.550% | 1/21/45 | 950 | 1,036 | |
| United Mexican States | 5.625% | 1/15/17 | 1,380 | 1,538 | |
| United Mexican States | 5.750% | 10/12/10 | 750 | 756 | |
| United Mexican States | 5.950% | 3/19/19 | 325 | 378 | |
| United Mexican States | 6.050% | 1/11/40 | 864 | 1,002 | |
| United Mexican States | 6.750% | 9/27/34 | 785 | 979 | |
| United Mexican States | 7.500% | 4/8/33 | 200 | 267 | |
| United Mexican States | 8.000% | 9/24/22 | 150 | 192 | |
| United Mexican States | 8.300% | 8/15/31 | 200 | 285 | |
| United Mexican States | 11.375% | 9/15/16 | 325 | 405 | |
| Total Mexico (Cost $21,176) | 21,630 | ||||
| Mongolia (0.1%) | |||||
| Sovereign Bonds (U.S. Dollar-Denominated) (0.1%) | |||||
| 6 | Development Bank of Mongolia LLC | 5.750% | 3/21/17 | 200 | 188 |
| Mongolia | 5.125% | 12/5/22 | 250 | 211 | |
| Total Mongolia (Cost $426) | 399 | ||||
| Morocco (0.4%) | |||||
| Sovereign Bonds (U.S. Dollar-Denominated) (0.4%) | |||||
| Kingdom of Morocco | 4.250% | 12/11/22 | 250 | 242 | |
| Kingdom of Morocco | 5.500% | 12/11/42 | 425 | 398 | |
| 2 | OCP SA | 5.625% | 4/25/24 | 300 | 301 |
| Total Morocco (Cost $907) | 941 | ||||
| Mozambique (0.1%) | |||||
| Sovereign Bond (U.S. Dollar-Denominated) (0.1%) | |||||
| 1,7 | Mozambique EMATUM Finance 2020 BV | 6.305% | 9/11/20 | 400 | 386 |
| Total Mozambique (Cost $381) | 386 | ||||
| Namibia (0.1%) | |||||
| Sovereign Bond (U.S. Dollar-Denominated) (0.1%) | |||||
| Republic of Namibia | 5.500% | 11/3/21 | 200 | 210 | |
| Total Namibia (Cost $206) | 210 | ||||
| Nigeria (0.2%) | |||||
| Sovereign Bonds (U.S. Dollar-Denominated) (0.2%) | |||||
| 2 | Federal Republic of Nigeria | 5.125% | 7/12/18 | 200 | 205 |
| Federal Republic of Nigeria | 6.750% | 1/28/21 | 250 | 272 | |
| Total Nigeria (Cost $463) | 477 | ||||
| Pakistan (0.3%) | |||||
| Sovereign Bonds (U.S. Dollar-Denominated) (0.3%) | |||||
| Islamic Republic of Pakistan | 6.875% | 6/1/17 | 175 | 178 | |
| 2 | Islamic Republic of Pakistan | 7.250% | 4/15/19 | 400 | 401 |
| 2 | Islamic Republic of Pakistan | 8.250% | 4/15/24 | 250 | 248 |
| Total Pakistan (Cost $818) | 827 | ||||
19
Emerging Markets Government Bond Index Fund
| Face | Market | |||
| Maturity | Amount | Value | ||
| Coupon | Date | ($000) | ($000) | |
| Panama (0.9%) | ||||
| Sovereign Bonds (U.S. Dollar-Denominated) (0.9%) | ||||
| 1 Republic of Panama | 4.300% | 4/29/53 | 200 | 168 |
| Republic of Panama | 5.200% | 1/30/20 | 450 | 499 |
| 1 Republic of Panama | 6.700% | 1/26/36 | 816 | 984 |
| Republic of Panama | 7.125% | 1/29/26 | 100 | 125 |
| Republic of Panama | 8.875% | 9/30/27 | 275 | 386 |
| Republic of Panama | 9.375% | 4/1/29 | 225 | 325 |
| Total Panama (Cost $2,466) | 2,487 | |||
| Paraguay (0.1%) | ||||
| Sovereign Bonds (U.S. Dollar-Denominated) (0.1%) | ||||
| Republic of Paraguay | 4.625% | 1/25/23 | 200 | 198 |
| Total Paraguay (Cost $200) | 198 | |||
| Peru (1.4%) | ||||
| Sovereign Bonds (U.S. Dollar-Denominated) (1.4%) | ||||
| Corp Financiera de Desarrollo SA | 4.750% | 2/8/22 | 200 | 204 |
| Fondo MIVIVIENDA SA | 3.500% | 1/31/23 | 100 | 93 |
| Republic of Peru | 5.625% | 11/18/50 | 100 | 110 |
| 1 Republic of Peru | 6.550% | 3/14/37 | 909 | 1,120 |
| Republic of Peru | 7.125% | 3/30/19 | 250 | 304 |
| Republic of Peru | 7.350% | 7/21/25 | 465 | 607 |
| Republic of Peru | 8.375% | 5/3/16 | 250 | 285 |
| Republic of Peru | 8.750% | 11/21/33 | 660 | 996 |
| Total Peru (Cost $3,674) | 3,719 | |||
| Philippines (3.1%) | ||||
| sovereign bonds (u.s. dollar-denominated) (3.1%) | ||||
| 8 power sector assets & liabilities | ||||
| management corp. | 6.875% | 11/2/16 | 100 | 112 |
| 8 power sector assets & liabilities | ||||
| management corp. | 7.250% | 5/27/19 | 264 | 317 |
| 8 power sector assets & liabilities | ||||
| management corp. | 7.390% | 12/2/24 | 300 | 380 |
| Republic of Philippines | 4.000% | 1/15/21 | 650 | 684 |
| Republic of Philippines | 4.200% | 1/21/24 | 200 | 208 |
| Republic of Philippines | 5.000% | 1/13/37 | 600 | 661 |
| Republic of Philippines | 5.500% | 3/30/26 | 550 | 624 |
| Republic of Philippines | 6.375% | 1/15/32 | 500 | 616 |
| Republic of Philippines | 6.375% | 10/23/34 | 700 | 876 |
| Republic of Philippines | 6.500% | 1/20/20 | 250 | 298 |
| Republic of Philippines | 7.750% | 1/14/31 | 650 | 896 |
| Republic of Philippines | 8.375% | 6/17/19 | 405 | 515 |
| Republic of Philippines | 9.375% | 1/18/17 | 200 | 242 |
| Republic of Philippines | 9.500% | 2/2/30 | 625 | 977 |
| Republic of Philippines | 9.875% | 1/15/19 | 250 | 331 |
| Republic of Philippines | 10.625% | 3/16/25 | 300 | 470 |
| Total Philippines (Cost $8,117) | 8,207 | |||
| Poland (1.9%) | ||||
| Sovereign Bonds (U.S. Dollar-Denominated) (1.9%) | ||||
| Republic of Poland | 3.000% | 3/17/23 | 900 | 846 |
| Republic of Poland | 3.875% | 7/16/15 | 625 | 649 |
| Republic of Poland | 4.000% | 1/22/24 | 200 | 202 |
20
Emerging Markets Government Bond Index Fund
| Face | Market | ||||
| Maturity | Amount | Value | |||
| Coupon | Date | ($000) | ($000) | ||
| Republic of Poland | 5.000% | 10/19/15 | 200 | 213 | |
| Republic of Poland | 5.000% | 3/23/22 | 900 | 980 | |
| Republic of Poland | 5.125% | 4/21/21 | 825 | 914 | |
| Republic of Poland | 6.375% | 7/15/19 | 925 | 1,087 | |
| Total Poland (Cost $4,877) | 4,891 | ||||
| Qatar (4.3%) | |||||
| Sovereign Bonds (U.S. Dollar-Denominated) (4.3%) | |||||
| 1,2 | Nakilat Inc. | 6.067% | 12/31/33 | 400 | 426 |
| Ooredoo Tamweel Ltd. | 3.039% | 12/3/18 | 225 | 228 | |
| 2,9 | Qatari Diar Finance QSC | 3.500% | 7/21/15 | 215 | 221 |
| 2,9 | Qatari Diar Finance QSC | 5.000% | 7/21/20 | 825 | 918 |
| QNB Finance Ltd. | 2.125% | 2/14/18 | 200 | 198 | |
| QNB Finance Ltd. | 2.750% | 10/31/18 | 400 | 401 | |
| QNB Finance Ltd. | 2.875% | 4/29/20 | 400 | 392 | |
| QNB Finance Ltd. | 3.125% | 11/16/15 | 400 | 412 | |
| QNB Finance Ltd. | 3.375% | 2/22/17 | 400 | 416 | |
| 2 | Qtel International Finance Ltd. | 3.250% | 2/21/23 | 150 | 141 |
| 2 | Qtel International Finance Ltd. | 3.375% | 10/14/16 | 305 | 319 |
| 2 | Qtel International Finance Ltd. | 3.875% | 1/31/28 | 650 | 596 |
| 2 | Qtel International Finance Ltd. | 4.750% | 2/16/21 | 500 | 539 |
| 2 | Qtel International Finance Ltd. | 5.000% | 10/19/25 | 200 | 207 |
| 1,2 | Ras Laffan Liquefied Natural Gas Co. Ltd. II | 5.298% | 9/30/20 | 333 | 359 |
| 1,2 | Ras Laffan Liquefied Natural Gas Co. Ltd. III | 5.838% | 9/30/27 | 270 | 292 |
| 2 | Ras Laffan Liquefied Natural Gas Co. Ltd. III | 6.750% | 9/30/19 | 250 | 297 |
| 9 | State of Qatar | 2.099% | 1/18/18 | 700 | 705 |
| 2 | State of Qatar | 3.125% | 1/20/17 | 775 | 816 |
| 9 | State of Qatar | 3.241% | 1/18/23 | 725 | 726 |
| 2 | State of Qatar | 4.500% | 1/20/22 | 400 | 435 |
| 2 | State of Qatar | 5.250% | 1/20/20 | 757 | 860 |
| 2 | State of Qatar | 5.750% | 1/20/42 | 400 | 441 |
| 2 | State of Qatar | 6.400% | 1/20/40 | 200 | 238 |
| 2 | State of Qatar | 6.550% | 4/9/19 | 250 | 301 |
| 2 | State of Qatar | 9.750% | 6/15/30 | 250 | 394 |
| Total Qatar (Cost $11,231) | 11,278 | ||||
| Romania (0.8%) | |||||
| Sovereign Bonds (U.S. Dollar-Denominated) (0.8%) | |||||
| Republic of Romania | 4.375% | 8/22/23 | 626 | 633 | |
| 2 | Republic of Romania | 4.875% | 1/22/24 | 100 | 104 |
| 2 | Republic of Romania | 6.125% | 1/22/44 | 300 | 330 |
| Republic of Romania | 6.750% | 2/7/22 | 850 | 1,007 | |
| Total Romania (Cost $1,994) | 2,074 | ||||
| Russia (10.9%) | |||||
| Sovereign Bonds (U.S. Dollar-Denominated) (10.6%) | |||||
| AK Transneft OJSC Via TransCapitalInvest Ltd. | 8.700% | 8/7/18 | 220 | 255 | |
| Gazprom Neft OAO Via GPN Capital SA | 4.375% | 9/19/22 | 400 | 331 | |
| Gazprom Neft OAO Via GPN Capital SA | 6.000% | 11/27/23 | 250 | 225 | |
| 2 | Gazprom Neft OAO Via GPN Capital SA | 6.000% | 11/27/23 | 200 | 184 |
| Gazprom OAO Via Gaz Capital SA | 3.850% | 2/6/20 | 378 | 341 | |
| Gazprom OAO Via Gaz Capital SA | 4.950% | 5/23/16 | 500 | 505 | |
| Gazprom OAO Via Gaz Capital SA | 4.950% | 7/19/22 | 550 | 496 | |
| Gazprom OAO Via Gaz Capital SA | 4.950% | 2/6/28 | 450 | 368 | |
| Gazprom OAO Via Gaz Capital SA | 5.092% | 11/29/15 | 200 | 203 | |
| Gazprom OAO Via Gaz Capital SA | 5.999% | 1/23/21 | 200 | 196 | |
21
Emerging Markets Government Bond Index Fund
| Face | Market | |||
| Maturity | Amount | Value | ||
| Coupon | Date | ($000) | ($000) | |
| Gazprom OAO Via Gaz Capital SA | 6.212% | 11/22/16 | 325 | 338 |
| Gazprom OAO Via Gaz Capital SA | 6.510% | 3/7/22 | 325 | 322 |
| Gazprom OAO Via Gaz Capital SA | 7.288% | 8/16/37 | 250 | 245 |
| Gazprom OAO Via Gaz Capital SA | 8.146% | 4/11/18 | 250 | 275 |
| Gazprom OAO Via Gaz Capital SA | 8.625% | 4/28/34 | 275 | 303 |
| Gazprom OAO Via Gaz Capital SA | 9.250% | 4/23/19 | 500 | 573 |
| Gazprombank OJSC Via GPB | ||||
| Eurobond Finance plc | 5.625% | 5/17/17 | 400 | 394 |
| Gazprombank OJSC Via GPB | ||||
| Eurobond Finance plc | 6.500% | 9/23/15 | 345 | 346 |
| Gazprombank OJSC Via GPB | ||||
| Eurobond Finance plc | 7.250% | 5/3/19 | 200 | 195 |
| Rosneft Finance SA | 7.250% | 2/2/20 | 200 | 212 |
| Rosneft Finance SA | 7.500% | 7/18/16 | 250 | 265 |
| 2 Rosneft Finance SA | 7.875% | 3/13/18 | 100 | 107 |
| Rosneft Finance SA | 7.875% | 3/13/18 | 400 | 432 |
| Rosneft Oil Co. via Rosneft | ||||
| International Finance Ltd. | 3.149% | 3/6/17 | 400 | 380 |
| Rosneft Oil Co. via Rosneft | ||||
| International Finance Ltd. | 4.199% | 3/6/22 | 527 | 441 |
| 2 Russian Agricultural Bank OJSC | ||||
| Via RSHB Capital SA | 5.100% | 7/25/18 | 100 | 93 |
| Russian Agricultural Bank OJSC Via RSHB | ||||
| Capital SA | 5.100% | 7/25/18 | 400 | 376 |
| Russian Agricultural Bank OJSC | ||||
| Via RSHB Capital SA | 5.298% | 12/27/17 | 318 | 301 |
| 1 Russian Agricultural Bank OJSC | ||||
| Via RSHB Capital SA | 6.000% | 6/3/21 | 200 | 188 |
| Russian Agricultural Bank OJSC | ||||
| Via RSHB Capital SA | 6.299% | 5/15/17 | 200 | 198 |
| Russian Agricultural Bank OJSC | ||||
| Via RSHB Capital SA | 7.750% | 5/29/18 | 200 | 205 |
| Russian Federation | 3.250% | 4/4/17 | 400 | 404 |
| 2 Russian Federation | 3.500% | 1/16/19 | 300 | 292 |
| Russian Federation | 3.500% | 1/16/19 | 400 | 389 |
| 2 Russian Federation | 4.500% | 4/4/22 | 500 | 475 |
| Russian Federation | 4.500% | 4/4/22 | 200 | 190 |
| 2 Russian Federation | 4.875% | 9/16/23 | 200 | 191 |
| Russian Federation | 4.875% | 9/16/23 | 600 | 570 |
| Russian Federation | 5.000% | 4/29/20 | 1,300 | 1,313 |
| Russian Federation | 5.625% | 4/4/42 | 1,000 | 913 |
| Russian Federation | 5.875% | 9/16/43 | 600 | 558 |
| 1 Russian Federation | 7.500% | 3/31/30 | 4,076 | 4,544 |
| Russian Federation | 11.000% | 7/24/18 | 925 | 1,187 |
| Russian Federation | 12.750% | 6/24/28 | 375 | 599 |
| Russian Railways via RZD Capital plc | 5.700% | 4/5/22 | 400 | 380 |
| Russian Railways via RZD Capital plc | 5.739% | 4/3/17 | 350 | 360 |
| Sberbank of Russia Via SB Capital SA | 4.950% | 2/7/17 | 300 | 298 |
| Sberbank of Russia Via SB Capital SA | 5.125% | 10/29/22 | 524 | 449 |
| Sberbank of Russia Via SB Capital SA | 5.180% | 6/28/19 | 450 | 441 |
| 2 Sberbank of Russia Via SB Capital SA | 5.250% | 5/23/23 | 150 | 130 |
| Sberbank of Russia Via SB Capital SA | 5.400% | 3/24/17 | 450 | 451 |
| Sberbank of Russia Via SB Capital SA | 5.499% | 7/7/15 | 350 | 359 |
| Sberbank of Russia Via SB Capital SA | 5.717% | 6/16/21 | 200 | 193 |
| Sberbank of Russia Via SB Capital SA | 6.125% | 2/7/22 | 200 | 195 |
22
Emerging Markets Government Bond Index Fund
| Face | Market | |||
| Maturity | Amount | Value | ||
| Coupon | Date | ($000) | ($000) | |
| SCF Capital Ltd. | 5.375% | 10/27/17 | 200 | 186 |
| Vnesheconombank Via VEB Finance PLC | 5.375% | 2/13/17 | 300 | 298 |
| 2 Vnesheconombank Via VEB Finance PLC | 5.942% | 11/21/23 | 200 | 176 |
| Vnesheconombank Via VEB Finance PLC | 6.025% | 7/5/22 | 425 | 388 |
| Vnesheconombank Via VEB Finance PLC | 6.800% | 11/22/25 | 400 | 367 |
| Vnesheconombank Via VEB Finance PLC | 6.902% | 7/9/20 | 650 | 637 |
| VTB Bank OJSC Via VTB Capital SA | 6.000% | 4/12/17 | 525 | 520 |
| VTB Bank OJSC Via VTB Capital SA | 6.250% | 6/30/35 | 100 | 101 |
| VTB Bank OJSC Via VTB Capital SA | 6.315% | 2/22/18 | 200 | 199 |
| VTB Bank OJSC Via VTB Capital SA | 6.551% | 10/13/20 | 350 | 344 |
| VTB Bank OJSC Via VTB Capital SA | 6.875% | 5/29/18 | 425 | 425 |
| VTB Bank OJSC Via VTB Capital SA | 6.950% | 10/17/22 | 575 | 552 |
| Total Russia (Cost $30,398) | 28,367 | |||
| Saudi Arabia (1.0%) | ||||
| Sovereign Bonds (U.S. Dollar-Denominated) (1.0%) | ||||
| SABIC Capital I BV | 3.000% | 11/2/15 | 200 | 206 |
| SABIC Capital II BV | 2.625% | 10/3/18 | 400 | 402 |
| Saudi Electricity Global Sukuk Co. | 4.211% | 4/3/22 | 200 | 207 |
| Saudi Electricity Global Sukuk Co. 2 | 3.473% | 4/8/23 | 550 | 538 |
| Saudi Electricity Global Sukuk Co. 2 | 5.060% | 4/8/43 | 200 | 191 |
| 2 Saudi Electricity Global Sukuk Co. 3 | 4.000% | 4/8/24 | 650 | 656 |
| 2 Saudi Electricity Global Sukuk Co. 3 | 5.500% | 4/8/44 | 300 | 307 |
| Total Saudi Arabia (Cost $2,501) | 2,507 | |||
| Senegal (0.1%) | ||||
| Sovereign Bond (U.S. Dollar-Denominated) (0.1%) | ||||
| Republic of Senegal | 8.750% | 5/13/21 | 200 | 228 |
| Total Senegal (Cost $221) | 228 | |||
| Serbia, Republic Of (0.6%) | ||||
| Sovereign Bonds (U.S. Dollar-Denominated) (0.6%) | ||||
| Republic of Serbia | 4.875% | 2/25/20 | 500 | 497 |
| Republic of Serbia | 5.250% | 11/21/17 | 400 | 413 |
| Republic of Serbia | 5.875% | 12/3/18 | 200 | 210 |
| 2 Republic of Serbia | 5.875% | 12/3/18 | 200 | 211 |
| Republic of Serbia | 7.250% | 9/28/21 | 200 | 223 |
| Total Serbia, Republic Of (Cost $1,521) | 1,554 | |||
| South Africa (1.6%) | ||||
| Sovereign Bonds (U.S. Dollar-Denominated) (1.6%) | ||||
| Eskom Holdings SOC Ltd. | 5.750% | 1/26/21 | 650 | 669 |
| Eskom Holdings SOC Ltd. | 6.750% | 8/6/23 | 200 | 214 |
| Republic of South Africa | 4.665% | 1/17/24 | 650 | 657 |
| Republic of South Africa | 5.500% | 3/9/20 | 585 | 636 |
| Republic of South Africa | 5.875% | 5/30/22 | 425 | 471 |
| Republic of South Africa | 5.875% | 9/16/25 | 450 | 493 |
| Republic of South Africa | 6.250% | 3/8/41 | 125 | 141 |
| Republic of South Africa | 6.875% | 5/27/19 | 475 | 549 |
| 2 Transnet SOC Ltd. | 4.000% | 7/26/22 | 200 | 186 |
| Transnet SOC Ltd. | 4.500% | 2/10/16 | 200 | 209 |
| Total South Africa (Cost $4,139) | 4,225 |
23
Emerging Markets Government Bond Index Fund
| Face | Market | ||||
| Maturity | Amount | Value | |||
| Coupon | Date | ($000) | ($000) | ||
| Sri Lanka (0.8%) | |||||
| Sovereign Bonds (U.S. Dollar-Denominated) (0.8%) | |||||
| Bank of Ceylon | 5.325% | 4/16/18 | 200 | 198 | |
| Bank of Ceylon | 6.875% | 5/3/17 | 250 | 261 | |
| 2 | Democratic Socialist Republic of Sri Lanka | 5.125% | 4/11/19 | 250 | 251 |
| Democratic Socialist Republic of Sri Lanka | 5.875% | 7/25/22 | 400 | 400 | |
| 2 | Democratic Socialist Republic of Sri Lanka | 6.000% | 1/14/19 | 200 | 209 |
| Democratic Socialist Republic of Sri Lanka | 6.250% | 10/4/20 | 432 | 450 | |
| National Savings Bank | 8.875% | 9/18/18 | 200 | 222 | |
| Total Sri Lanka (Cost $1,937) | 1,991 | ||||
| Thailand (0.1%) | |||||
| Sovereign Bonds (U.S. Dollar-Denominated) (0.1%) | |||||
| PTT PCL | 4.500% | 10/25/42 | 200 | 166 | |
| PTT Public Co. Ltd. | 3.375% | 10/25/22 | 225 | 210 | |
| Total Thailand (Cost $388) | 376 | ||||
| Trinidad And Tobago (0.2%) | |||||
| Sovereign Bonds (U.S. Dollar-Denominated) (0.2%) | |||||
| 1 | Petroleum Co. of Trinidad & Tobago Ltd. | 6.000% | 5/8/22 | 71 | 77 |
| 2 | Petroleum Co. of Trinidad & Tobago Ltd. | 9.750% | 8/14/19 | 150 | 190 |
| 2 | Republic of Trinidad & Tobago | 4.375% | 1/16/24 | 200 | 213 |
| Total Trinidad And Tobago (Cost $463) | 480 | ||||
| Turkey (5.8%) | |||||
| Sovereign Bonds (U.S. Dollar-Denominated) (5.8%) | |||||
| Export Credit Bank of Turkey | 5.875% | 4/24/19 | 200 | 210 | |
| Hazine Mustesarligi Varlik Kiralama AS | 4.557% | 10/10/18 | 250 | 259 | |
| 10 | Republic of Turkey | 2.803% | 3/26/18 | 450 | 439 |
| Republic of Turkey | 3.250% | 3/23/23 | 451 | 406 | |
| 2 | Republic of Turkey | 4.557% | 10/10/18 | 150 | 154 |
| Republic of Turkey | 4.875% | 4/16/43 | 700 | 637 | |
| Republic of Turkey | 5.125% | 3/25/22 | 525 | 546 | |
| Republic of Turkey | 5.625% | 3/30/21 | 901 | 970 | |
| Republic of Turkey | 5.750% | 3/22/24 | 800 | 855 | |
| Republic of Turkey | 6.000% | 1/14/41 | 800 | 829 | |
| Republic of Turkey | 6.250% | 9/26/22 | 504 | 561 | |
| Republic of Turkey | 6.625% | 2/17/45 | 350 | 390 | |
| Republic of Turkey | 6.750% | 4/3/18 | 987 | 1,107 | |
| Republic of Turkey | 6.750% | 5/30/40 | 590 | 667 | |
| Republic of Turkey | 6.875% | 3/17/36 | 930 | 1,067 | |
| Republic of Turkey | 7.000% | 9/26/16 | 700 | 773 | |
| Republic of Turkey | 7.000% | 3/11/19 | 350 | 400 | |
| Republic of Turkey | 7.000% | 6/5/20 | 630 | 726 | |
| Republic of Turkey | 7.250% | 3/5/38 | 150 | 180 | |
| Republic of Turkey | 7.375% | 2/5/25 | 900 | 1,074 | |
| Republic of Turkey | 7.500% | 7/14/17 | 450 | 511 | |
| Republic of Turkey | 7.500% | 11/7/19 | 350 | 411 | |
| Republic of Turkey | 8.000% | 2/14/34 | 400 | 513 | |
| Republic of Turkey | 11.875% | 1/15/30 | 275 | 459 | |
| Turkiye Halk Bankasi AS | 3.875% | 2/5/20 | 400 | 370 | |
| Turkiye Vakiflar Bankasi Tao | 3.750% | 4/15/18 | 200 | 193 | |
| Turkiye Vakiflar Bankasi Tao | 5.750% | 4/24/17 | 200 | 209 | |
| Turkiye Vakiflar Bankasi Tao | 6.000% | 11/1/22 | 200 | 187 | |
| Total Turkey (Cost $14,943) | 15,103 | ||||
24
Emerging Markets Government Bond Index Fund
| Face | Market | ||||
| Maturity | Amount | Value | |||
| Coupon | Date | ($000) | ($000) | ||
| Ukraine (1.6%) | |||||
| Sovereign Bonds (U.S. Dollar-Denominated) (1.6%) | |||||
| 11 | Financing of Infrastructural | ||||
| Projects State Enterprise | 7.400% | 4/20/18 | 200 | 164 | |
| 11 | Financing of Infrastructural | ||||
| Projects State Enterprise | 8.375% | 11/3/17 | 100 | 84 | |
| 11 | Financing of Infrastructural | ||||
| Projects State Enterprise | 9.000% | 12/7/17 | 200 | 168 | |
| Oschadbank Via SSB #1 plc | 8.875% | 3/20/18 | 200 | 154 | |
| Ukraine | 6.250% | 6/17/16 | 400 | 338 | |
| Ukraine | 6.580% | 11/21/16 | 515 | 434 | |
| Ukraine | 6.750% | 11/14/17 | 200 | 172 | |
| Ukraine | 6.875% | 9/23/15 | 300 | 268 | |
| Ukraine | 7.500% | 4/17/23 | 200 | 169 | |
| Ukraine | 7.750% | 9/23/20 | 498 | 418 | |
| Ukraine | 7.800% | 11/28/22 | 600 | 505 | |
| Ukraine | 7.950% | 2/23/21 | 450 | 378 | |
| Ukraine | 9.250% | 7/24/17 | 750 | 673 | |
| Ukreximbank Via Biz Finance plc | 8.750% | 1/22/18 | 200 | 154 | |
| Total Ukraine (Cost $4,565) | 4,079 | ||||
| United Arab Emirates (5.0%) | |||||
| Sovereign Bonds (U.S. Dollar-Denominated) (4.9%) | |||||
| 2 | Abu Dhabi National Energy Co. | 2.500% | 1/12/18 | 400 | 405 |
| 2 | Abu Dhabi National Energy Co. | 3.625% | 1/12/23 | 600 | 593 |
| 2 | Abu Dhabi National Energy Co. | 4.125% | 3/13/17 | 400 | 426 |
| 2 | Abu Dhabi National Energy Co. | 5.875% | 10/27/16 | 385 | 427 |
| 2 | Abu Dhabi National Energy Co. | 5.875% | 12/13/21 | 200 | 231 |
| 2 | Abu Dhabi National Energy Co. | 6.250% | 9/16/19 | 275 | 323 |
| 2 | Abu Dhabi National Energy Co. | 6.500% | 10/27/36 | 100 | 119 |
| 3 | ADCB Finance Cayman Ltd. | 1.529% | 1/9/17 | 200 | 201 |
| ADCB Finance Cayman Ltd. | 2.500% | 3/6/18 | 200 | 200 | |
| ADCB Finance Cayman Ltd. | 4.500% | 3/6/23 | 425 | 427 | |
| DEWA Sukuk 2013 Ltd. | 3.000% | 3/5/18 | 300 | 303 | |
| 2 | Dolphin Energy Ltd. | 5.500% | 12/15/21 | 420 | 474 |
| 1,2 | Dolphin Energy Ltd. | 5.888% | 6/15/19 | 66 | 74 |
| 2 | DP World Ltd. | 6.850% | 7/2/37 | 400 | 437 |
| 2 | DP World Sukuk Ltd. | 6.250% | 7/2/17 | 670 | 744 |
| Dubai DOF Sukuk Ltd. | 6.450% | 5/2/22 | 200 | 237 | |
| 2 | Dubai Electricity & Water Authority | 6.375% | 10/21/16 | 100 | 111 |
| 2 | Dubai Electricity & Water Authority | 7.375% | 10/21/20 | 450 | 543 |
| 2 | Emirate of Abu Dhabi | 6.750% | 4/8/19 | 525 | 638 |
| Emirate of Dubai United Arab Emirates | 3.875% | 1/30/23 | 200 | 196 | |
| Emirate of Dubai United Arab Emirates | 4.900% | 5/2/17 | 200 | 216 | |
| Emirate of Dubai United Arab Emirates | 5.250% | 1/30/43 | 200 | 183 | |
| Emirate of Dubai United Arab Emirates | 6.700% | 10/5/15 | 200 | 215 | |
| Emirate of Dubai United Arab Emirates | 7.750% | 10/5/20 | 100 | 125 | |
| 1,2 | Emirates Airline | 4.500% | 2/6/25 | 160 | 154 |
| Emirates Airline | 5.125% | 6/8/16 | 300 | 315 | |
| Emirates NBD PJSC | 4.625% | 3/28/17 | 425 | 450 | |
| IPIC GMTN Ltd. | 1.750% | 11/30/15 | 450 | 455 | |
| 2 | IPIC GMTN Ltd. | 3.125% | 11/15/15 | 100 | 103 |
| 2 | IPIC GMTN Ltd. | 3.750% | 3/1/17 | 445 | 472 |
| 2 | IPIC GMTN Ltd. | 5.000% | 11/15/20 | 500 | 551 |
| 2 | IPIC GMTN Ltd. | 5.500% | 3/1/22 | 310 | 350 |
| 2 | IPIC GMTN Ltd. | 6.875% | 11/1/41 | 200 | 258 |
25
Emerging Markets Government Bond Index Fund
| Face | Market | ||||
| Maturity | Amount | Value | |||
| Coupon | Date | ($000) | ($000) | ||
| Jafz Sukuk Ltd. | 7.000% | 6/19/19 | 200 | 229 | |
| 2 | MDC-GMTN B.V. | 3.750% | 4/20/16 | 200 | 211 |
| 2 | MDC-GMTN B.V. | 5.500% | 4/20/21 | 200 | 228 |
| 2 | MDC-GMTN B.V. | 7.625% | 5/6/19 | 200 | 250 |
| National Bank of Abu Dhabi PJSC | 3.000% | 8/13/19 | 200 | 201 | |
| National Bank of Abu Dhabi PJSC | 3.250% | 3/27/17 | 200 | 208 | |
| RAK Capital | 3.297% | 10/21/18 | 200 | 206 | |
| 1 | Ruwais Power Co. PJSC | 6.000% | 8/31/36 | 200 | 220 |
| Union National Bank PJSC | 3.875% | 11/10/16 | 200 | 210 | |
| 1,2 | Waha Aerospace BV | 3.925% | 7/28/20 | 85 | 90 |
| Total United Arab Emirates (Cost $12,828) | 13,009 | ||||
| United States (0.0%) | |||||
| U.S. Government and Agency Obligations (0.0%) | |||||
| United States Treasury Note/Bond | 1.375% | 1/31/20 | 25 | 24 | |
| United States Treasury Note/Bond | 3.750% | 8/15/41 | 5 | 5 | |
| United States Treasury Note/Bond | 5.500% | 8/15/28 | 5 | 7 | |
| Total United States (Cost $36) | 36 | ||||
| Uruguay (0.8%) | |||||
| Sovereign Bonds (U.S. Dollar-Denominated) (0.8%) | |||||
| 1 | Oriental Republic of Uruguay | 4.125% | 11/20/45 | 350 | 291 |
| 1 | Oriental Republic of Uruguay | 4.500% | 8/14/24 | 596 | 614 |
| 1 | Oriental Republic of Uruguay | 7.625% | 3/21/36 | 300 | 392 |
| Oriental Republic of Uruguay | 7.875% | 1/15/33 | 150 | 199 | |
| 1 | Oriental Republic of Uruguay | 8.000% | 11/18/22 | 375 | 478 |
| Total Uruguay (Cost $1,931) | 1,974 | ||||
| Venezuela (5.2%) | |||||
| Sovereign Bonds (U.S. Dollar-Denominated) (5.2%) | |||||
| Bolivarian Republic of Venezuela | 5.750% | 2/26/16 | 490 | 449 | |
| Bolivarian Republic of Venezuela | 6.000% | 12/9/20 | 400 | 291 | |
| Bolivarian Republic of Venezuela | 7.000% | 12/1/18 | 250 | 208 | |
| Bolivarian Republic of Venezuela | 7.000% | 3/31/38 | 550 | 374 | |
| Bolivarian Republic of Venezuela | 7.650% | 4/21/25 | 300 | 224 | |
| Bolivarian Republic of Venezuela | 7.750% | 10/13/19 | 700 | 576 | |
| Bolivarian Republic of Venezuela | 8.250% | 10/13/24 | 634 | 488 | |
| Bolivarian Republic of Venezuela | 9.000% | 5/7/23 | 825 | 679 | |
| Bolivarian Republic of Venezuela | 9.250% | 9/15/27 | 1,175 | 972 | |
| Bolivarian Republic of Venezuela | 9.250% | 5/7/28 | 440 | 350 | |
| Bolivarian Republic of Venezuela | 9.375% | 1/13/34 | 450 | 360 | |
| Bolivarian Republic of Venezuela | 11.750% | 10/21/26 | 675 | 626 | |
| 1 | Bolivarian Republic of Venezuela | 11.950% | 8/5/31 | 1,335 | 1,235 |
| 1 | Bolivarian Republic of Venezuela | 12.750% | 8/23/22 | 725 | 721 |
| Bolivarian Republic of Venezuela | 13.625% | 8/15/18 | 300 | 316 | |
| Petroleos de Venezuela SA | 5.250% | 4/12/17 | 850 | 680 | |
| Petroleos de Venezuela SA | 5.375% | 4/12/27 | 750 | 437 | |
| Petroleos de Venezuela SA | 5.500% | 4/12/37 | 400 | 226 | |
| 1 | Petroleos de Venezuela SA | 6.000% | 11/15/26 | 1,550 | 928 |
| 1 | Petroleos de Venezuela SA | 8.500% | 11/2/17 | 1,600 | 1,440 |
| 1 | Petroleos de Venezuela SA | 9.000% | 11/17/21 | 938 | 766 |
| 1 | Petroleos de Venezuela SA | 9.750% | 5/17/35 | 725 | 555 |
| 1 | Petroleos de Venezuela SA | 12.750% | 2/17/22 | 805 | 781 |
| Total Venezuela (Cost $13,609) | 13,682 | ||||
26
Emerging Markets Government Bond Index Fund
| Face | Market | |||
| Maturity | Amount | Value | ||
| Coupon | Date | ($000) | ($000) | |
| Vietnam (0.2%) | ||||
| Sovereign Bonds (U.S. Dollar-Denominated) (0.2%) | ||||
| Socialist Republic of Vietnam | 6.750% | 1/29/20 | 274 | 308 |
| Socialist Republic of Vietnam | 6.875% | 1/15/16 | 100 | 108 |
| Total Vietnam (Cost $401) | 416 | |||
| Zambia (0.2%) | ||||
| Sovereign Bonds (U.S. Dollar-Denominated) (0.2%) | ||||
| Republic of Zambia | 5.375% | 9/20/22 | 200 | 177 |
| 2 Republic of Zambia | 8.500% | 4/14/24 | 250 | 261 |
| Total Zambia (Cost $437) | 438 | |||
| Temporary Cash Investments (0.9%) | ||||
| Time Deposits (0.1%) | ||||
| United States Dollar Time Deposits | 0.000% | 8/1/50 | 289 | 289 |
| Shares | ||||
| Money Market Fund (0.8%) | ||||
| 12 Vanguard Market Liquidity Fund | 0.124% | 2,014,845 | 2,015 | |
| Total Temporary Cash Investments (Cost $2,304) | 2,304 | |||
| Total Investments (99.3%) (Cost $258,768) | 259,419 | |||
| Other Assets and Liabilities (0.7%) | ||||
| Other Assets | 7,488 | |||
| Liabilities | (5,765) | |||
| 1,723 | ||||
| Net Assets (100%) | 261,142 | |||
27
Emerging Markets Government Bond Index Fund
| At April 30, 2014, net assets consisted of: | |
| Amount | |
| ($000) | |
| Paid-in Capital | 260,407 |
| Undistributed Net Investment Income | 577 |
| Accumulated Net Realized Losses | (493) |
| Unrealized Appreciation (Depreciation) | 651 |
| Net Assets | 261,142 |
| Investor Shares—Net Assets | |
| Applicable to 624,582 outstanding $.001 par value shares of | |
| beneficial interest (unlimited authorization) | 6,118 |
| Net Asset Value Per Share—Investor Shares | $9.80 |
| Admiral Shares—Net Assets | |
| Applicable to 4,633,424 outstanding $.001 par value shares of | |
| beneficial interest (unlimited authorization) | 90,773 |
| Net Asset Value Per Share—Admiral Shares | $19.59 |
| ETF Shares—Net Assets | |
| Applicable to 2,101,668 outstanding $.001 par value shares of | |
| beneficial interest (unlimited authorization) | 164,251 |
| Net Asset Value Per Share—ETF Shares | $78.15 |
See Note A in Notes to Financial Statements.
1 The average or expected maturity is shorter than the final maturity shown because of the possibility of interim principal payments and
prepayments or the possibility of the issue being called.
2 Security exempt from registration under Rule 144A of the Securities Act of 1933. Such securities may be sold in transactions exempt from
registration, normally to qualified institutional buyers. At April 30, 2014, the aggregate value of these securities was $45,432,000,
representing 17.4% of net assets.
3 Adjustable-rate security.
4 Guaranteed by the Republic of Hungary.
5 Guaranteed by the Federation of Malaysia.
6 Guaranteed by the Government of Mongolia.
7 Guaranteed by the Republic of Mozambique.
8 Guaranteed by the Republic of the Philippines.
9 Guaranteed by the State of Qatar.
10 Guaranteed by the Republic of Turkey.
11 Guaranteed by the Govenment of the Ukraine.
12 Affiliated money market fund available only to Vanguard funds and certain trusts and accounts managed by Vanguard. Rate shown is
the 7-day yield.
See accompanying Notes, which are an integral part of the Financial Statements.
28
Emerging Markets Government Bond Index Fund
Statement of Operations
| Six Months Ended | |
| April 30, 2014 | |
| ($000) | |
| Investment Income | |
| Income | |
| Interest1,2 | 4,939 |
| Total Income | 4,939 |
| Expenses | |
| The Vanguard Group—Note B | |
| Investment Advisory Services | 2 |
| Management and Administrative—Investor Shares | 8 |
| Management and Administrative—Admiral Shares | 115 |
| Management and Administrative—ETF Shares | 184 |
| Marketing and Distribution—Investor Shares | — |
| Marketing and Distribution—Admiral Shares | 5 |
| Marketing and Distribution—ETF Shares | 12 |
| Custodian Fees | 9 |
| Shareholders’ Reports—Investor Shares | 5 |
| Shareholders�� Reports—Admiral Shares | — |
| Shareholders’ Reports—ETF Shares | 2 |
| Total Expenses | 342 |
| Net Investment Income | 4,597 |
| Realized Net Gain (Loss) on Investment Securities Sold | (304) |
| Change in Unrealized Appreciation (Depreciation) of Investment Securities | 2,943 |
| Net Increase (Decrease) in Net Assets Resulting from Operations | 7,236 |
| 1 Interest income from an affiliated company of the fund was $1,000. | |
| 2 Interest income is net of foreign withholding taxes of $36,000. | |
See accompanying Notes, which are an integral part of the Financial Statements.
29
Emerging Markets Government Bond Index Fund
Statement of Changes in Net Assets
| Six Months Ended | May 14, 20131 | |
| April 30, | to October 31, | |
| 2014 | 2013 | |
| ($000) | ($000) | |
| Increase (Decrease) in Net Assets | ||
| Operations | ||
| Net Investment Income | 4,597 | 1,937 |
| Realized Net Gain (Loss) | (304) | (189) |
| Change in Unrealized Appreciation (Depreciation) | 2,943 | (2,292) |
| Net Increase (Decrease) in Net Assets Resulting from Operations | 7,236 | (544) |
| Distributions | ||
| Net Investment Income | ||
| Investor Shares | (109) | (50) |
| Admiral Shares | (1,689) | (685) |
| ETF Shares | (2,531) | (893) |
| Realized Capital Gain | ||
| Investor Shares | — | — |
| Admiral Shares | — | — |
| ETF Shares | — | — |
| Total Distributions | (4,329) | (1,628) |
| Capital Share Transactions | ||
| Investor Shares | 1,857 | 4,229 |
| Admiral Shares | 34,832 | 55,480 |
| ETF Shares | 76,793 | 87,216 |
| Net Increase (Decrease) from Capital Share Transactions | 113,482 | 146,925 |
| Total Increase (Decrease) | 116,389 | 144,753 |
| Net Assets | ||
| Beginning of Period | 144,753 | — |
| End of Period2 | 261,142 | 144,753 |
| 1 Commencement of subscription period for the fund. | ||
| 2 Net Assets—End of Period includes undistributed net investment income of $577,000 and $309,000. | ||
See accompanying Notes, which are an integral part of the Financial Statements.
30
Emerging Markets Government Bond Index Fund
Financial Highlights
| Investor Shares | ||
| Six Months | May 14, | |
| Ended | 20131 to | |
| April 30, | October 31, | |
| For a Share Outstanding Throughout Each Period | 2014 | 2013 |
| Net Asset Value, Beginning of Period | $9.74 | $10.00 |
| Investment Operations | ||
| Net Investment Income | . 207 | .149 |
| Net Realized and Unrealized Gain (Loss) on Investments2 | .060 | (.261) |
| Total from Investment Operations | .267 | (.112) |
| Distributions | ||
| Dividends from Net Investment Income | (.207) | (.148) |
| Distributions from Realized Capital Gains | — | — |
| Total Distributions | (. 207) | (.148) |
| Net Asset Value, End of Period | $9.80 | $9.74 |
| Total Return3 | 2.80% | -1.38% |
| Ratios/Supplemental Data | ||
| Net Assets, End of Period (Millions) | $6 | $4 |
| Ratio of Total Expenses to Average Net Assets | 0.49% | 0.49%4 |
| Ratio of Net Investment Income to Average Net Assets | 4.50% | 3.81%4 |
| Portfolio Turnover Rate 5 | 98% | 38% |
The expense ratio, net income ratio, and turnover rate for the current period have been annualized.
1 Subscription period for the fund was May 14, 2013, to May 30, 2013, during which time all assets were held in money market instruments.
Performance measurement began May 31, 2013, at a net asset value of $10.03.
2 Includes increases from purchase fees of $.00, and $.03.
3 Total returns do not include transaction or account service fees that may have applied in the periods shown. Fund prospectuses provide
information about any applicable transaction and account service fees.
4 Annualized.
5 Excludes the value of portfolio securities received or delivered as a result of in-kind purchases or redemptions of the fund’s capital shares,
including ETF Creation Units.
See accompanying Notes, which are an integral part of the Financial Statements.
31
Emerging Markets Government Bond Index Fund
Financial Highlights
| Admiral Shares | ||
| Six Months | May 14, | |
| Ended | 20131 to | |
| April 30, | October 31, | |
| For a Share Outstanding Throughout Each Period | 2014 | 2013 |
| Net Asset Value, Beginning of Period | $19.48 | $20.00 |
| Investment Operations | ||
| Net Investment Income | . 428 | . 309 |
| Net Realized and Unrealized Gain (Loss) on Investments2 | .112 | (.522) |
| Total from Investment Operations | .540 | (.213) |
| Distributions | ||
| Dividends from Net Investment Income | (.430) | (.307) |
| Distributions from Realized Capital Gains | — | — |
| Total Distributions | (. 430) | (. 307) |
| Net Asset Value, End of Period | $19.59 | $19.48 |
| Total Return3 | 2.83% | -1.37% |
| Ratios/Supplemental Data | ||
| Net Assets, End of Period (Millions) | $91 | $55 |
| Ratio of Total Expenses to Average Net Assets | 0.34% | 0.34%4 |
| Ratio of Net Investment Income to Average Net Assets | 4.65% | 3.96%4 |
| Portfolio Turnover Rate 5 | 98% | 38% |
The expense ratio, net income ratio, and turnover rate for the current period have been annualized.
1 Subscription period for the fund was May 14, 2013, to May 30, 2013, during which time all assets were held in money market instruments.
Performance measurement began May 31, 2013, at a net asset value of $20.07.
2 Includes increases from purchase fees of $.00, and $.06.
3 Total returns do not include transaction or account service fees that may have applied in the periods shown. Fund prospectuses provide
information about any applicable transaction and account service fees.
4 Annualized.
5 Excludes the value of portfolio securities received or delivered as a result of in-kind purchases or redemptions of the fund’s capital shares,
including ETF Creation Units.
See accompanying Notes, which are an integral part of the Financial Statements.
32
Emerging Markets Government Bond Index Fund
Financial Highlights
| ETF Shares | ||
| Six Months | May 31, | |
| Ended | 20131 to | |
| April 30, | October 31, | |
| For a Share Outstanding Throughout Each Period | 2014 | 2013 |
| Net Asset Value, Beginning of Period | $77.71 | $79.52 |
| Investment Operations | ||
| Net Investment Income | 1.702 | 1.217 |
| Net Realized and Unrealized Gain (Loss) on Investments2 | .443 | (2.086) |
| Total from Investment Operations | 2.145 | (.869) |
| Distributions | ||
| Dividends from Net Investment Income | (1.705) | (.941) |
| Distributions from Realized Capital Gains | — | — |
| Total Distributions | (1.705) | (.941) |
| Net Asset Value, End of Period | $78.15 | $77.71 |
| Total Return | 2.84% | -1.39% |
| Ratios/Supplemental Data | ||
| Net Assets, End of Period (Millions) | $164 | $85 |
| Ratio of Total Expenses to Average Net Assets | 0.34% | 0.35%3 |
| Ratio of Net Investment Income to Average Net Assets | 4.65% | 3.95%3 |
| Portfolio Turnover Rate 4 | 98% | 38% |
The expense ratio, net income ratio, and turnover rate for the current period have been annualized.
1 Inception.
2 Includes increases from purchase fees of $.02, and $.30.
3 Annualized.
4 Excludes the value of portfolio securities received or delivered as a result of in-kind purchases or redemptions of the fund’s capital shares,
including ETF Creation Units.
See accompanying Notes, which are an integral part of the Financial Statements.
33
Emerging Markets Government Bond Index Fund
Notes to Financial Statements
Vanguard Emerging Markets Government Bond Index Fund is registered under the Investment Company Act of 1940 as an open-end investment company, or mutual fund. The fund invests in securities of foreign issuers, which may subject it to investment risks not normally associated with investing in securities of U.S. corporations. The fund offers four classes of shares: Investor Shares, Admiral Shares, Institutional Shares, and ETF Shares. Investor Shares are available to any investor who meets the fund’s minimum purchase requirements. Admiral Shares and Institutional Shares are designed for investors who meet certain administrative, service, and account-size criteria. The fund has not issued any Institutional Shares through April 30, 2014. ETF Shares are listed for trading on Nasdaq; they can be purchased and sold through a broker.
A. The following significant accounting policies conform to generally accepted accounting principles for U.S. investment companies. The fund consistently follows such policies in preparing its financial statements.
1. Security Valuation: Securities are valued as of the close of trading on the New York Stock Exchange (generally 4 p.m., Eastern time) on the valuation date. Bonds, and temporary cash investments acquired over 60 days to maturity, are valued using the latest bid prices or using valuations based on a matrix system (which considers such factors as security prices, yields, maturities, and ratings), both as furnished by independent pricing services. Investments in Vanguard Market Liquidity Fund are valued at that fund’s net asset value. Other temporary cash investments are valued at amortized cost, which approximates market value. Securities for which market quotations are not readily available, or whose values have been affected by events occurring before the fund’s pricing time but after the close of the securities’ primary markets, are valued at their fair values calculated according to procedures adopted by the board of trustees. These procedures include obtaining quotations from an independent pricing service, monitoring news to identify significant market- or security-specific events, and evaluating changes in the values of foreign market proxies (for example, ADRs, futures contracts, or exchange-traded funds), between the time the foreign markets close and the fund’s pricing time. When fair-value pricing is employed, the prices of securities used by a fund to calculate its net asset value may differ from quoted or published prices for the same securities.
2. Federal Income Taxes: The fund intends to qualify as a regulated investment company and distribute all of its taxable income. Management has analyzed the fund’s tax positions taken for its open federal income tax period ended October 31, 2013, and for the period ended April 30, 2014, and has concluded that no provision for federal income tax is required in the fund’s financial statements.
3. Distributions: Distributions to shareholders are recorded on the ex-dividend date.
4. Credit Facility: The fund and certain other funds managed by The Vanguard Group participate in a $2.89 billion committed credit facility provided by a syndicate of lenders pursuant to a credit agreement that may be renewed annually; each fund is individually liable for its borrowings, if any, under the credit facility. Borrowings may be utilized for temporary and emergency purposes, and are subject to the fund’s regulatory and contractual borrowing restrictions. The participating funds are charged administrative fees and an annual commitment fee of 0.06% of the undrawn amount of the facility; these fees are allocated to the funds based on a method approved by the fund’s board of trustees and included in Management and Administrative expenses on the fund’s Statement of Operations. Any borrowings under this facility bear interest at a rate equal to the higher of the federal funds rate or LIBOR reference rate plus an agreed-upon spread.
The fund had no borrowings outstanding at April 30, 2014, or at any time during the period then ended.
34
Emerging Markets Government Bond Index Fund
5. Other: Interest income includes income distributions received from Vanguard Market Liquidity Fund and is accrued daily. Premiums and discounts on debt securities purchased are amortized and accreted, respectively, to interest income over the lives of the respective securities. Security transactions are accounted for on the date securities are bought or sold. Costs used to determine realized gains (losses) on the sale of investment securities are those of the specific securities sold. Fees, if any, assessed on purchases of capital shares are credited to paid-in capital.
Each class of shares has equal rights as to assets and earnings, except that each class separately bears certain class-specific expenses related to maintenance of shareholder accounts (included in Management and Administrative expenses) and shareholder reporting. Marketing and distribution expenses are allocated to each class of shares based on a method approved by the board of trustees. Income, other non-class-specific expenses, and gains and losses on investments are allocated to each class of shares based on its relative net assets.
B. The Vanguard Group furnishes at cost investment advisory, corporate management, administrative, marketing, and distribution services. The costs of such services are allocated to the fund based on methods approved by the board of trustees. The fund has committed to provide up to 0.40% of its net assets in capital contributions to Vanguard. At April 30, 2014, the fund had contributed capital of $26,000 to Vanguard (included in Other Assets), representing 0.01% of the fund’s net assets and 0.01% of Vanguard’s capitalization. The fund’s trustees and officers are also directors and officers of Vanguard.
C. Various inputs may be used to determine the value of the fund’s investments. These inputs are summarized in three broad levels for financial statement purposes. The inputs or methodologies used to value securities are not necessarily an indication of the risk associated with investing in those securities.
Level 1—Quoted prices in active markets for identical securities.
Level 2—Other significant observable inputs (including quoted prices for similar securities, interest rates, prepayment speeds, credit risk, etc.).
Level 3—Significant unobservable inputs (including the fund’s own assumptions used to determine the fair value of investments).
The following table summarizes the market value of the fund’s investments as of April 30, 2014, based on the inputs used to value them:
| Level 1 | Level 2 | Level 3 | |
| Investments | ($000) | ($000) | ($000) |
| U.S. Government and Agency Obligations | — | 36 | — |
| Sovereign Bonds | — | 257,079 | — |
| Temporary Cash Investments | 2,015 | 289 | — |
| Total | 2,015 | 257,404 | — |
D. Distributions are determined on a tax basis and may differ from net investment income and realized capital gains for financial reporting purposes. Differences may be permanent or temporary. Permanent differences are reclassified among capital accounts in the financial statements to reflect their tax character. Temporary differences arise when certain items of income, expense, gain, or loss are recognized in different periods for financial statement and tax purposes. These differences will reverse at some time in the future. Differences in classification may also result from the treatment of short-term gains as ordinary income for tax purposes.
35
Emerging Markets Government Bond Index Fund
The fund’s tax-basis capital gains and losses are determined only at the end of each fiscal year. For tax purposes, at October 31, 2013, the fund had available capital losses totaling $179,000 to offset future net capital gains. The fund will use these capital losses to offset net taxable capital gains, if any, realized during the year ending October 31, 2014; should the fund realize net capital losses for the year, the losses will be added to the loss carryforward balance above.
At April 30, 2014, the cost of investment securities for tax purposes was $258,768,000. Net unrealized appreciation of investment securities for tax purposes was $651,000, consisting of unrealized gains of $4,607,000 on securities that had risen in value since their purchase and $3,956,000 in unrealized losses on securities that had fallen in value since their purchase.
E. During the six months ended April 30, 2014, the fund purchased $195,754,000 of investment securities and sold $83,430,000 of investment securities, other than U.S. government securities and temporary cash investments. Purchases and sales of U.S. government securities were $11,242,000 and $11,861,000, respectively. Total purchases and sales include $59,372,000 and $0, respectively, in connection with in-kind purchases and redemptions of the fund’s capital shares.
F. Capital share transactions for each class of shares were:
| Six Months Ended | Period Ended | |||
| April 30, 2014 | October 31, 2013 | |||
| Amount | Shares | Amount | Shares | |
| ($000) | (000) | ($000) | (000) | |
| Investor Shares1 | ||||
| Issued 2 | 3,416 | 354 | 5,058 | 519 |
| Issued in Lieu of Cash Distributions | 102 | 11 | 47 | 5 |
| Redeemed | (1,661) | (173) | (876) | (91) |
| Net Increase (Decrease)—Investor Shares | 1,857 | 192 | 4,229 | 433 |
| Admiral Shares1 | ||||
| Issued 2 | 41,924 | 2,176 | 59,924 | 3,057 |
| Issued in Lieu of Cash Distributions | 1,420 | 74 | 632 | 33 |
| Redeemed | (8,512) | (443) | (5,076) | (264) |
| Net Increase (Decrease)—Admiral Shares | 34,832 | 1,807 | 55,480 | 2,826 |
| ETF Shares3 | ||||
| Issued 2 | 76,793 | 1,002 | 87,216 | 1,100 |
| Issued in Lieu of Cash Distributions | — | — | — | — |
| Redeemed | — | — | — | — |
| Net Increase (Decrease)—ETF Shares | 76,793 | 1,002 | 87,216 | 1,100 |
1 Commencement of subscription period for the fund was May 14, 2013.
2 Includes purchase fees for fiscal 2014 and 2013 of $59,000 and $482,000, respectively (fund totals).
3 Inception date was May 31, 2013.
G. Management has determined that no material events or transactions occurred subsequent to April 30, 2014, that would require recognition or disclosure in these financial statements.
36
About Your Fund’s Expenses
As a shareholder of the fund, you incur ongoing costs, which include costs for portfolio management, administrative services, and shareholder reports (like this one), among others. Operating expenses, which are deducted from a fund’s gross income, directly reduce the investment return of the fund.
A fund’s expenses are expressed as a percentage of its average net assets. This figure is known as the expense ratio. The following examples are intended to help you understand the ongoing costs (in dollars) of investing in your fund and to compare these costs with those of other mutual funds. The examples are based on an investment of $1,000 made at the beginning of the period shown and held for the entire period.
The accompanying table illustrates your fund’s costs in two ways:
• Based on actual fund return. This section helps you to estimate the actual expenses that you paid over the period. The ”Ending Account Value“ shown is derived from the fund‘s actual return, and the third column shows the dollar amount that would have been paid by an investor who started with $1,000 in the fund. You may use the information here, together with the amount you invested, to estimate the expenses that you paid over the period.
To do so, simply divide your account value by $1,000 (for example, an $8,600 account value divided by $1,000 = 8.6), then multiply the result by the number given for your fund under the heading ”Expenses Paid During Period.“
• Based on hypothetical 5% yearly return. This section is intended to help you compare your fund‘s costs with those of other mutual funds. It assumes that the fund had a yearly return of 5% before expenses, but that the expense ratio is unchanged. In this case—because the return used is not the fund’s actual return—the results do not apply to your investment. The example is useful in making comparisons because the Securities and Exchange Commission requires all mutual funds to calculate expenses based on a 5% return. You can assess your fund’s costs by comparing this hypothetical example with the hypothetical examples that appear in shareholder reports of other funds.
Note that the expenses shown in the table are meant to highlight and help you compare ongoing costs only and do not reflect transaction costs incurred by the fund for buying and selling securities. Further, the expenses do not include any purchase, redemption, or account service fees described in the fund prospectus. If such fees were applied to your account, your costs would be higher. Your fund does not carry a “sales load.”
The calculations assume no shares were bought or sold during the period. Your actual costs may have been higher or lower, depending on the amount of your investment and the timing of any purchases or redemptions.
You can find more information about the fund’s expenses, including annual expense ratios, in the Financial Statements section of this report. For additional information on operating expenses and other shareholder costs, please refer to your fund’s current prospectus.
37
| Six Months Ended April 30, 2014 | |||
| Beginning | Ending | Expenses | |
| Account Value | Account Value | Paid During | |
| Emerging Markets Government Bond Index Fund | 10/31/2013 | 4/30/2014 | Period |
| Based on Actual Fund Return | |||
| Investor Shares | $1,000.00 | $1,028.01 | $2.46 |
| Admiral Shares | 1,000.00 | 1,028.34 | 1.71 |
| ETF Shares | 1,000.00 | 1,028.35 | 1.71 |
| Based on Hypothetical 5% Yearly Return | |||
| Investor Shares | $1,000.00 | $1,022.36 | $2.46 |
| Admiral Shares | 1,000.00 | 1,023.11 | 1.71 |
| ETF Shares | 1,000.00 | 1,023.11 | 1.71 |
The calculations are based on expenses incurred in the most recent six-month period. The fund’s annualized six-month expense ratios for that
period are 0.49% for Investor Shares, 0.34% for Admiral Shares, and 0.34% for ETF Shares. The dollar amounts shown as “Expenses Paid”
are equal to the annualized expense ratio multiplied by the average account value over the period, multiplied by the number of days in the
most recent six-month period, then divided by the number of days in the most recent 12-month period.
38
Trustees Approve Advisory Arrangement
The board of trustees of Vanguard Emerging Markets Government Bond Index Fund has renewed the fund’s investment advisory arrangement with The Vanguard Group, Inc. (Vanguard). Vanguard—through its Fixed Income Group—serves as the investment advisor for the fund. The board determined that continuing the fund’s internalized management structure was in the best interests of the fund and its shareholders.
The board based its decision upon an evaluation of the advisor’s investment staff, portfolio management process, and performance. The trustees considered the factors discussed below, among others. However, no single factor determined whether the board approved the arrangement. Rather, it was the totality of the circumstances that drove the board’s decision.
Nature, extent, and quality of services
The board considered the quality of the investment management services provided to the fund since its inception in 2013, and took into account the organizational depth and stability of the advisor. The board noted that Vanguard has been managing investments for more than three decades. The Fixed Income Group adheres to a sound, disciplined investment management process; the team has considerable experience, stability, and depth.
The board concluded that Vanguard’s experience, stability, depth, and performance, among other factors, warranted continuation of the advisory arrangement.
Investment performance
The board considered the performance of the fund since its inception, including any periods of outperformance or underperformance relative to a target index and peer group. The board concluded that the performance was such that the advisory arrangement should continue. Information about the fund’s performance since inception can be found in the Performance Summary section of this report.
Cost
The board concluded that the fund’s expense ratio was well below the average expense ratio charged by funds in its peer group and that the fund’s advisory fee rate was also well below its peer-group average. Information about the fund’s expense ratio appears in the About Your Fund’s Expenses section of this report as well as in the Financial Statements section.
The board did not conduct a profitability analysis of Vanguard, because of Vanguard’s unique “at-cost” structure. Unlike most other mutual fund management companies, Vanguard is owned by the funds it oversees, and produces “profits” only in the form of reduced expenses for fund shareholders.
The benefit of economies of scale
The board concluded that the fund’s at-cost arrangement with Vanguard ensures that the fund will realize economies of scale as it grows, with the cost to shareholders declining as fund assets increase.
The board will consider whether to renew the advisory arrangement again after a one-year period.
39
Glossary
30-Day SEC Yield. A fund’s 30-day SEC yield is derived using a formula specified by the U.S. Securities and Exchange Commission. Under the formula, data related to the fund’s security holdings in the previous 30 days are used to calculate the fund’s hypothetical net income for that period, which is then annualized and divided by the fund’s estimated average net assets over the calculation period. For the purposes of this calculation, a security’s income is based on its current market yield to maturity (for bonds), its actual income (for asset-backed securities), or its projected dividend yield (for stocks). Because the SEC yield represents hypothetical annualized income, it will differ—at times significantly—from the fund’s actual experience. As a result, the fund’s income distributions may be higher or lower than implied by the SEC yield.
Average Coupon. The average interest rate paid on the fixed income securities held by a fund. It is expressed as a percentage of face value.
Average Duration. An estimate of how much the value of the bonds held by a fund will fluctuate in response to a change in interest rates. To see how the value could change, multiply the average duration by the change in rates. If interest rates rise by 1 percentage point, the value of the bonds in a fund with an average duration of five years would decline by about 5%. If rates decrease by a percentage point, the value would rise by 5%.
Average Effective Maturity. The average length of time until fixed income securities held by a fund reach maturity and are repaid, taking into consideration the possibility that the issuer may call the bond before its maturity date. The figure reflects the proportion of fund assets represented by each security; it also reflects any futures contracts held. In general, the longer the average effective maturity, the more a fund’s share price will fluctuate in response to changes in market interest rates.
Credit Quality. Credit-quality ratings are measured on a scale that generally ranges from AAA (highest) to D (lowest). “Not Rated” is used to classify securities for which a rating is not available. U.S. Treasury, U.S. Agency, and U.S. Agency mortgage-backed securities appear under “U.S. Government.” Credit-quality ratings are obtained from Barclays using ratings generally derived from Moody’s, Fitch, and S&P. When ratings from all three agencies are used, the median rating is shown. When ratings from two of the agencies are used, the lower rating is shown.
Expense Ratio. A fund’s total annual operating expenses expressed as a percentage of the fund’s average net assets. The expense ratio includes management and administrative expenses, but does not include the transaction costs of buying and selling portfolio securities.
Inception Date. The date on which the assets of a fund (or one of its share classes) are first invested in accordance with the fund’s investment objective. For funds with a subscription period, the inception date is the day after that period ends. Investment performance is measured from the inception date.
Short-Term Reserves. The percentage of a fund invested in highly liquid, short-term securities that can be readily converted to cash.
Yield to Maturity. The rate of return an investor would receive if the fixed income securities held by a fund were held to their maturity dates.
40
This page intentionally left blank.
This page intentionally left blank.
This page intentionally left blank.
The People Who Govern Your Fund
The trustees of your mutual fund are there to see that the fund is operated and managed in your best interests since, as a shareholder, you are a part owner of the fund. Your fund’s trustees also serve on the board of directors of The Vanguard Group, Inc., which is owned by the Vanguard funds and provides services to them on an at-cost basis.
A majority of Vanguard’s board members are independent, meaning that they have no affiliation with Vanguard or the funds they oversee, apart from the sizable personal investments they have made as private individuals. The independent board members have distinguished backgrounds in business, academia, and public service. Each of the trustees and executive officers oversees 178 Vanguard funds.
The following table provides information for each trustee and executive officer of the fund. More information about the trustees is in the Statement of Additional Information, which can be obtained, without charge, by contacting Vanguard at 800-662-7447, or online at vanguard.com.
| InterestedTrustee1 | and Delphi Automotive LLP (automotive components); |
| Senior Advisor at New Mountain Capital. | |
| F. William McNabb III | |
| Born 1957. Trustee Since July 2009. Chairman of the | Amy Gutmann |
| Board. Principal Occupation(s) During the Past Five | Born 1949. Trustee Since June 2006. Principal |
| Years: Chairman of the Board of The Vanguard Group, | Occupation(s) During the Past Five Years: President of |
| Inc., and of each of the investment companies served | the University of Pennsylvania; Christopher H. Browne |
| by The Vanguard Group, since January 2010; Director | Distinguished Professor of Political Science, School of |
| of The Vanguard Group since 2008; Chief Executive | Arts and Sciences, and Professor of Communication, |
| Officer and President of The Vanguard Group, and of | Annenberg School for Communication, with secondary |
| each of the investment companies served by The | faculty appointments in the Department of Philosophy, |
| Vanguard Group, since 2008; Director of Vanguard | School of Arts and Sciences, and at the Graduate |
| Marketing Corporation; Managing Director of The | School of Education, University of Pennsylvania; |
| Vanguard Group (1995–2008). | Trustee of the National Constitution Center; Chair |
| of the Presidential Commission for the Study of | |
| Bioethical Issues. | |
| IndependentTrustees | |
| JoAnn Heffernan Heisen | |
| Emerson U. Fullwood | Born 1950. Trustee Since July 1998. Principal |
| Born 1948. Trustee Since January 2008. Principal | Occupation(s) During the Past Five Years: Corporate |
| Occupation(s) During the Past Five Years: Executive | Vice President and Chief Global Diversity Officer |
| Chief Staff and Marketing Officer for North America | (retired 2008) and Member of the Executive |
| and Corporate Vice President (retired 2008) of Xerox | Committee (1997–2008) of Johnson & Johnson |
| Corporation (document management products and | (pharmaceuticals/medical devices/consumer |
| services); Executive in Residence and 2009–2010 | products); Director of Skytop Lodge Corporation |
| Distinguished Minett Professor at the Rochester | (hotels), the University Medical Center at Princeton, |
| Institute of Technology; Director of SPX Corporation | the Robert Wood Johnson Foundation, and the Center |
| (multi-industry manufacturing), the United Way of | for Talent Innovation; Member of the Advisory Board |
| Rochester, Amerigroup Corporation (managed health | of the Maxwell School of Citizenship and Public Affairs |
| care), the University of Rochester Medical Center, | at Syracuse University. |
| Monroe Community College Foundation, and North | |
| Carolina A&T University. | F. Joseph Loughrey |
| Born 1949. Trustee Since October 2009. Principal | |
| Rajiv L. Gupta | Occupation(s) During the Past Five Years: President |
| Born 1945. Trustee Since December 2001.2 | and Chief Operating Officer (retired 2009) of Cummins |
| Principal Occupation(s) During the Past Five Years: | Inc. (industrial machinery); Chairman of the Board |
| Chairman and Chief Executive Officer (retired 2009) | of Hillenbrand, Inc. (specialized consumer services), |
| and President (2006–2008) of Rohm and Haas Co. | and of Oxfam America; Director of SKF AB (industrial |
| (chemicals); Director of Tyco International, Ltd. | machinery), Hyster-Yale Materials Handling, Inc. |
| (diversified manufacturing and services), Hewlett- | (forklift trucks), the Lumina Foundation for Education, |
| Packard Co. (electronic computer manufacturing), | |
| and the V Foundation for Cancer Research; Member | Executive Officers | |
| of the Advisory Council for the College of Arts and | ||
| Letters and of the Advisory Board to the Kellogg | Glenn Booraem | |
| Institute for International Studies, both at the | Born 1967. Controller Since July 2010. Principal | |
| University of Notre Dame. | Occupation(s) During the Past Five Years: Principal | |
| of The Vanguard Group, Inc.; Controller of each of | ||
| Mark Loughridge | the investment companies served by The Vanguard | |
| Born 1953. Trustee Since March 2012. Principal | Group; Assistant Controller of each of the investment | |
| Occupation(s) During the Past Five Years: Senior Vice | companies served by The Vanguard Group (2001–2010). | |
| President and Chief Financial Officer (retired 2013) | ||
| at IBM (information technology services); Fiduciary | Thomas J. Higgins | |
| Member of IBM’s Retirement Plan Committee (2004– | Born 1957. Chief Financial Officer Since September | |
| 2013); Member of the Council on Chicago Booth. | 2008. Principal Occupation(s) During the Past Five | |
| Years: Principal of The Vanguard Group, Inc.; Chief | ||
| Scott C. Malpass | Financial Officer of each of the investment companies | |
| Born 1962. Trustee Since March 2012. Principal | served by The Vanguard Group; Treasurer of each of | |
| Occupation(s) During the Past Five Years: Chief | the investment companies served by The Vanguard | |
| Investment Officer and Vice President at the University | Group (1998–2008). | |
| of Notre Dame; Assistant Professor of Finance at the | ||
| Mendoza College of Business at Notre Dame; Member | Kathryn J. Hyatt | |
| of the Notre Dame 403(b) Investment Committee; | Born 1955. Treasurer Since November 2008. Principal | |
| Board Member of TIFF Advisory Services, Inc. | Occupation(s) During the Past Five Years: Principal of | |
| (investment advisor); Member of the Investment | The Vanguard Group, Inc.; Treasurer of each of the | |
| Advisory Committees of the Financial Industry | investment companies served by The Vanguard | |
| Regulatory Authority (FINRA) and of Major League | Group; Assistant Treasurer of each of the investment | |
| Baseball. | companies served by The Vanguard Group (1988–2008). | |
| André F. Perold | Heidi Stam | |
| Born 1952. Trustee Since December 2004. Principal | Born 1956. Secretary Since July 2005. Principal | |
| Occupation(s) During the Past Five Years: George | Occupation(s) During the Past Five Years: Managing | |
| Gund Professor of Finance and Banking, Emeritus | Director of The Vanguard Group, Inc.; General Counsel | |
| at the Harvard Business School (retired 2011); | of The Vanguard Group; Secretary of The Vanguard | |
| Chief Investment Officer and Managing Partner of | Group and of each of the investment companies | |
| HighVista Strategies LLC (private investment firm); | served by The Vanguard Group; Director and Senior | |
| Director of Rand Merchant Bank; Overseer of the | Vice President of Vanguard Marketing Corporation. | |
| Museum of Fine Arts Boston. | ||
| Vanguard Senior ManagementTeam | ||
| Alfred M. Rankin, Jr. | ||
| Born 1941. Trustee Since January 1993. Principal | Mortimer J. Buckley | Chris D. McIsaac |
| Occupation(s) During the Past Five Years: Chairman, | Kathleen C. Gubanich | Michael S. Miller |
| President, and Chief Executive Officer of NACCO | Paul A. Heller | James M. Norris |
| Industries, Inc. (housewares/lignite), and of Hyster- | Martha G. King | Glenn W. Reed |
| Yale Materials Handling, Inc. (forklift trucks); Chairman | John T. Marcante | |
| of the Board of University Hospitals of Cleveland. | ||
| Peter F. Volanakis | Chairman Emeritus and Senior Advisor | |
| Born 1955. Trustee Since July 2009. Principal | ||
| Occupation(s) During the Past Five Years: President | John J. Brennan | |
| and Chief Operating Officer (retired 2010) of Corning | Chairman, 1996–2009 | |
| Incorporated (communications equipment); Trustee of | Chief Executive Officer and President, 1996–2008 | |
| Colby-Sawyer College; Member of the Advisory Board | ||
| of the Norris Cotton Cancer Center and of the Advisory | Founder | |
| Board of the Parthenon Group (strategy consulting). | ||
| John C. Bogle | ||
| Chairman and Chief Executive Officer, 1974–1996 | ||
1 Mr. McNabb is considered an “interested person,” as defined in the Investment Company Act of 1940, because he is an officer of the
Vanguard funds.
2 December 2002 for Vanguard Equity Income Fund, the Vanguard Municipal Bond Funds, and the Vanguard State Tax-Exempt Funds.
 | |
| P.O. Box 2600 | |
| Valley Forge, PA 19482-2600 | |
| Connect with Vanguard® > vanguard.com | |
| Fund Information > 800-662-7447 | |
| Direct Investor Account Services > 800-662-2739 | |
| Institutional Investor Services > 800-523-1036 | |
| Text Telephone for People | |
| With Hearing Impairment > 800-749-7273 | |
| This material may be used in conjunction | |
| with the offering of shares of any Vanguard | |
| fund only if preceded or accompanied by | |
| the fund’s current prospectus. | |
| All comparative mutual fund data are from Lipper, a | |
| Thomson Reuters Company, or Morningstar, Inc., unless | |
| otherwise noted. | |
| You can obtain a free copy of Vanguard’s proxy voting | |
| guidelines by visiting vanguard.com/proxyreporting or by | |
| calling Vanguard at 800-662-2739. The guidelines are | |
| also available from the SEC’s website, sec.gov. In | |
| addition, you may obtain a free report on how your fund | |
| voted the proxies for securities it owned during the 12 | |
| months ended June 30. To get the report, visit either | |
| vanguard.com/proxyreporting or sec.gov. | |
| You can review and copy information about your fund at | |
| the SEC’s Public Reference Room in Washington, D.C. To | |
| find out more about this public service, call the SEC at | |
| 202-551-8090. Information about your fund is also | |
| available on the SEC’s website, and you can receive | |
| copies of this information, for a fee, by sending a | |
| request in either of two ways: via e-mail addressed to | |
| publicinfo@sec.gov or via regular mail addressed to the | |
| Public Reference Section, Securities and Exchange | |
| Commission, Washington, DC 20549-1520. | |
| © 2014 The Vanguard Group, Inc. | |
| All rights reserved. | |
| Vanguard Marketing Corporation, Distributor. | |
| Q11202 062014 | |
Item 2: Code of Ethics.
Not Applicable.
Item 3:
Not Applicable.
Item 4: Principal Accountant Fees and Services.
Not. Applicable.
Item 5: Audit Committee of Listed Registrants.
Not Applicable.
Item 6: Investments.
Not Applicable.
Item 7: Disclosure of Proxy Voting Policies and Procedures for Closed-End Management
Investment Companies.
Not Applicable.
Item 8: Portfolio Managers of Closed-End Management Investment Companies.
Not Applicable.
Item 9: Purchase of Equity Securities by Closed-End Management Investment Company and
Affiliated Purchasers.
Not Applicable.
Item 10: Submission of Matters to a Vote of Security Holders.
Not Applicable.
Item 11: Controls and Procedures.
(a) Disclosure Controls and Procedures. The Principal Executive and Financial Officers concluded that the Registrant’s Disclosure Controls and Procedures are effective based on their evaluation of the Disclosure Controls and Procedures as of a date within 90 days of the filing date of this report.
(b) Internal Control Over Financial Reporting. There were no significant changes in Registrant’s Internal Control Over Financial Reporting or in other factors that could significantly affect this control subsequent to the date of the evaluation, including any corrective actions with regard to significant deficiencies and material weaknesses.
Item 12: Exhibits.
(a) Certifications.
Pursuant to the requirements of the Securities Exchange Act of 1934 and the Investment Company Act of 1940, the registrant has duly caused this report to be signed on its behalf by the undersigned, thereunto duly authorized.
| VANGUARD WHITEHALL FUNDS | |
| BY: | /s/ F. WILLIAM MCNABB III* |
| F. WILLIAM MCNABB III | |
| CHIEF EXECUTIVE OFFICER | |
| Date: June 19, 2014 | |
Pursuant to the requirements of the Securities Exchange Act of 1934 and the Investment Company Act of 1940, this report has been signed below by the following persons on behalf of the registrant and in the capacities and on the dates indicated.
| VANGUARD WHITEHALL FUNDS | |
BY: | /s/ F. WILLIAM MCNABB III* |
| F. WILLIAM MCNABB III | |
| CHIEF EXECUTIVE OFFICER | |
Date: June 19, 2014 | |
| VANGUARD WHITEHALL FUNDS |
BY: | /s/ THOMAS J. HIGGINS* |
| THOMAS J. HIGGINS | |
| CHIEF FINANCIAL OFFICER | |
Date: June 19, 2014 | |
* By: /s/ Heidi Stam
Heidi Stam, pursuant to a Power of Attorney filed on April 22, 2014 see file Number
2-17620, Incorporated by Reference.