UNITED STATES
SECURITIES AND EXCHANGE COMMISSION
Washington, D.C. 20549
FORM N-CSR
CERTIFIED SHAREHOLDER REPORT
OF
REGISTERED MANAGEMENT INVESTMENT COMPANIES
Investment Company Act file number: 811-07443
Name of Registrant: Vanguard Whitehall Funds
Address of Registrant:
P.O. Box 2600
Valley Forge, PA 19482
Name and address of agent for service:
Anne E. Robinson, Esquire
P.O. Box 876
Valley Forge, PA 19482
Registrant’s telephone number, including area code: (610) 669-1000
Date of fiscal year end: October 31
Date of reporting period: November 1, 2017—April 30, 2018
Item 1: Reports to Shareholders
| Semiannual Report | April 30, 2018 |
| Vanguard Selected Value Fund |
Vanguard’s Principles for Investing Success
We want to give you the best chance of investment success. These principles, grounded in Vanguard’s research and experience, can put you on the right path.
Goals. Create clear, appropriate investment goals.
Balance. Develop a suitable asset allocation using broadly diversified funds. Cost. Minimize cost.
Discipline. Maintain perspective and long-term discipline.
A single theme unites these principles: Focus on the things you can control. We believe there is no wiser course for any investor.
| Contents | |
| Your Fund’s Performance at a Glance. | 1 |
| CEO’s Perspective. | 2 |
| Advisors’ Report. | 4 |
| Results of Proxy Voting. | 8 |
| Fund Profile. | 9 |
| Performance Summary. | 10 |
| Financial Statements. | 11 |
| About Your Fund’s Expenses. | 23 |
| Trustees Approve Advisory Arrangements. | 25 |
| Glossary. | 27 |
Please note: The opinions expressed in this report are just that—informed opinions. They should not be considered promises or advice. Also, please keep in mind that the information and opinions cover the period through the date on the front of this report. Of course, the risks of investing in your fund are spelled out in the prospectus.
See the Glossary for definitions of investment terms used in this report.
About the cover: Nautical images have been part of Vanguard’s rich heritage since its start in 1975. For an incoming ship, a lighthouse offers a beacon and safe path to shore. You can similarly depend on Vanguard to put you first––and light the way––as you strive to meet your financial goals. Our client focus and low costs, stemming from our unique ownership structure, assure that your interests are paramount.
Your Fund’s Performance at a Glance
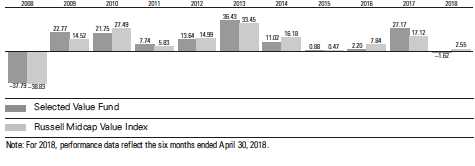
• For the six months ended April 30, 2018, Vanguard Selected Value Fund returned –1.62%, behind the 2.55% return of its benchmark, the Russell Midcap Value Index, and the 2.65% average return of its mid-capitalization value fund peers.
• Value stocks trailed their growth counterparts for the period, while large- and small-cap stocks recorded generally similar returns.
• Each of the fund’s three advisors invests in the stocks of mid-cap companies they consider undervalued by the marketplace with solid prospects for recovery.
• Selected Value recorded negative returns in seven of the ten industry sectors it held investments in, and the fund trailed its benchmark counterparts in all ten sectors. Industrials, information technology, and health care detracted most from relative performance.
• Financials and energy contributed the most to the fund’s absolute returns, although the advisors’ stock holdings in those sectors weren’t advantageous.
| Total Returns: Six Months Ended April 30, 2018 | ||
| Total | ||
| Returns | ||
| Vanguard Selected Value Fund | -1.62% | |
| Russell Midcap Value Index | 2.55 | |
| Mid-Cap Value Funds Average | 2.65 | |
| Mid-Cap Value Funds Average: Derived from data provided by Lipper, a Thomson Reuters Company. | ||
| Expense Ratios | ||
| Your Fund Compared With Its Peer Group | ||
| Peer Group | ||
| Fund | Average | |
| Selected Value Fund | 0.39% | 1.15% |
The fund expense ratio shown is from the prospectus dated February 22, 2018, and represents estimated costs for the current fiscal year. For the six months ended April 30, 2018, the fund’s annualized expense ratio was 0.40%. The peer-group expense ratio is derived from data provided by Lipper, a Thomson Reuters Company, and captures information through year-end 2017.
Peer group: Mid-Cap Value Funds.
1
CEO’s Perspective

Tim Buckley
President and Chief Executive Officer
Dear Shareholder,
I feel extremely fortunate to have the chance to lead a company filled with people who come to work every day passionate about Vanguard’s core purpose: to take a stand for all investors, to treat them fairly, and to give them the best chance for investment success.
When I joined Vanguard in 1991, I found a mission-driven team focused on improving lives—helping people retire more comfortably, put their children through college, and achieve financial security. I also found a company with purpose in an industry ripe for improvement.
It was clear, even early in my career, that the cards were stacked against most investors. Hidden fees, performance-chasing, and poor advice were relentlessly eroding investors’ dreams.
We knew Vanguard could be different and, as a result, could make a real difference. We have lowered the costs of investing for our shareholders significantly. And we’re proud of the performance of our funds.
Vanguard is built for Vanguard investors—we focus solely on you, our fund shareholders. Everything we do is designed to give our clients the best chance for investment success. In my role as CEO, I’ll keep this priority
2
front and center. We’re proud of what we’ve achieved, but we’re even more excited about what’s to come.
Steady, time-tested guidance
Our guidance for investors, as always, is to stay the course, tune out the hyperbolic headlines, and focus on your goals and what you can control, such as costs and how much you save. This time-tested advice has served our clients well over the decades.
Regardless of how the markets perform in the short term, I’m incredibly optimistic about the future for our investors. We have a dedicated team serving you, and we will never stop striving to make Vanguard the best place for you to invest through our high-quality funds and services, advice and guidance to help you meet your financial goals, and an experience that makes you feel good about entrusting us with your hard-earned savings.
Thank you for your continued loyalty.
Sincerely,

Mortimer J. Buckley
President and Chief Executive Officer
May 16, 2018
| Market Barometer | |||
| Total Returns | |||
| Periods Ended April 30, 2018 | |||
| Six | One | Five Years | |
| Months | Year | (Annualized) | |
| Stocks | |||
| Russell 1000 Index (Large-caps) | 3.83% | 13.17% | 12.84% |
| Russell 2000 Index (Small-caps) | 3.27 | 11.54 | 11.74 |
| Russell 3000 Index (Broad U.S. market) | 3.79 | 13.05 | 12.75 |
| FTSE All-World ex US Index (International) | 3.72 | 15.84 | 5.85 |
| Bonds | |||
| Bloomberg Barclays U.S. Aggregate Bond Index | |||
| (Broad taxable market) | -1.87% | -0.32% | 1.47% |
| Bloomberg Barclays Municipal Bond Index | |||
| (Broad tax-exempt market) | -0.97 | 1.56 | 2.44 |
| Citigroup Three-Month U.S. Treasury Bill Index | 0.67 | 1.16 | 0.32 |
| CPI | |||
| Consumer Price Index | 1.57% | 2.46% | 1.50% |
3
Advisors’ Report
For the six months ended April 30, 2018, Vanguard Selected Value Fund returned –1.62%. Your fund is managed by three independent advisors. This provides exposure to distinct yet complementary investment approaches, enhancing the fund’s diversification. It is not uncommon for different advisors to have different views about individual securities or the broader investment environment.
The advisors, the percentage and amount of fund assets each manages, and a brief description of their investment strategies are presented in the table below. The advisors have also prepared a discussion of the investment environment that existed during the fiscal period and of how portfolio positioning reflects this assessment. These comments were prepared on May 17, 2018.
Barrow, Hanley, Mewhinney & Strauss, LLC
Portfolio Managers:
James P. Barrow,
Executive Director
Mark Giambrone,
Managing Director
Over the six months, we saw a resumption of significant volatility created by uncertainties over geopolitics, interest rates, and economic growth. In periods like this, we still believe in focusing on longer-term
| Vanguard Selected Value Fund Investment Advisors | |||
| Fund Assets Managed | |||
| Investment Advisor | % | $ Million | Investment Strategy |
| Barrow, Hanley, Mewhinney & | 57 | 5,883 | Conducts fundamental research on individual |
| Strauss, LLC | stocks exhibiting traditional value | ||
| characteristics: price/earnings and price/book | |||
| ratios below the market average and dividend | |||
| yields above the market average. | |||
| Pzena Investment Management, | 23 | 2,348 | Uses a fundamental, bottom-up, |
| LLC | deep-value-oriented investment strategy. Seeks | ||
| to buy good businesses at low prices, focusing | |||
| exclusively on companies that are | |||
| underperforming their historically demonstrated | |||
| earnings power. | |||
| Donald Smith & Co., Inc. | 18 | 1,873 | Conducts fundamental research on the lowest |
| price-to-tangible book value companies. | |||
| Research focuses on underlying quality of book | |||
| value and assets, and on long-term earnings | |||
| potential. | |||
| Cash Investments | 2 | 181 | These short-term reserves are invested by |
| Vanguard in equity index products to simulate | |||
| investment in stocks. Each advisor may also | |||
| maintain a cash position. | |||
4
investment horizons and company fundamentals and try to take advantage of opportunities created by the volatility.
To this end, we still believe we are in a period of positive economic growth, modestly rising rates, and occasional political uncertainties. Therefore, we remain positioned to benefit from this outlook. It has led us to underweight areas of the market that tend to be more defensive but that should not hold up in a rising-rate environment with already stretched valuations. These areas are real estate, utilities, consumer staples, and telecommunication services, sometimes referred to as “the rust stocks.” This does lead us to be overweight in areas that will benefit from this environment, such as financials, consumer discretionary, materials, information technology, and industrials.
Markets appear to be priced for robust earnings growth, continued high profit margins, and the expected enactment of pro-growth policies. We believe that we are positioned appropriately to take advantage of value in the market and that we are past the point of maximum uncertainty, and we expect our performance to continue to recover and benefit from such an environment.
Furthermore, we believe that the most recent environment––a highly correlated, macro-driven bull market now in its eighth year––is turning in favor of differentiated stock selection and that our active management will reap the benefits.
Pzena Investment Management, LLC
Portfolio Managers:
Richard Pzena, Managing Principal and Co-Chief Investment Officer John Flynn, Principal Ben Silver, CFA, CPA, Principal
U.S. equity markets continued their long bull market advance, though volatility in the period’s second half caused by rising interest rates and rumblings of a trade war muted the strong returns of the first half. Positions in financials and consumer discretionary drove our portion of the fund.
Financial holdings benefited from improving economic growth, the new tax law, and deregulation. This sector also showed strength across industries––as with Voya Financial, a life insurer; Regions Financial and Comerica, both regional banks; and Axis Capital, a property and casualty insurer. HPE, the server and networking products business spun out of Hewlett Packard, advanced amid strong earnings, robust sales growth, improved expectations, and plans to return $7 billion to shareholders over the next two years.
The main detractors were JELD-WEN (windows and doors) and Terex (cranes). JELD-WEN’s weakness derived from concerns over labor inflation and housing affordability in light of lower tax incentives and higher interest rates. Terex fell, along with the entire machinery industry, amid fears of margin pressure and greater competitive threats because of potential
5
steel tariffs imposed by the administration. We view the problems as temporary and continue to believe in the company’s value proposition.
A broadening opportunity set led us to trim holdings in financials and information technology, allowing us to add several new holdings in consumer discretionary, health care, and industrials. Two examples are MEDNAX and Carlisle Companies. Despite a long history of stable margins, MEDNAX—the leading provider of neonatal physician services—has seen earnings drop recently because of a lower number of births, an adverse payer mix, and cyclical wage inflation; we expect these factors to be offset by management actions and normalization in births.
Carlisle is an industrial conglomerate with strong positions in commercial roofing, aerospace components, and other businesses. Higher input costs and a challenging technology transition for in-flight entertainment systems have pressured earnings. The company is well-positioned to navigate these challenges and return to normal profitability. We sold our holdings in Lamar Advertising, Hilton Worldwide, and Validus Holdings (which was bought by AIG) as they approached fair value.
In a market that appears expensive, the spread in valuations between the cheapest and costliest stocks is among the widest in 50 years, leaving a broad set of opportunities for the portfolio. We are finding the best ones in financials, industrials, IT, and more recently health care.
Donald Smith & Co., Inc.
Portfolio Managers: Donald G. Smith, President and Chief Investment Officer
Richard L. Greenberg, CFA, Senior Portfolio Manager and Director of Research
The portfolio at the end of April continues to meet our criteria of owning a concentrated set of low price-to-tangible book value stocks with attractive long-term earnings potential. The portfolio currently sells at 113% of tangible book value and 8.2 times our estimate of “normalized” earnings. In contrast, the S&P 500 Index sells at 961% of tangible book value and 15.8 times normalized earnings.
Energy and information technology holdings were the top contributors, while financials and precious metals holdings were mixed. Homebuilders and airline/aircraft leasing companies largely detracted from performance. The biggest contributor was Micron Technology—also the largest holding in the portfolio—as it continued the appreciation it experienced in 2017 on good earnings and solid guidance amid strong memory-product prices.
WPX Energy was up more recently, catching up to the rise in oil prices that has taken place since mid-2017. XL Group rose significantly on the news that AXA had agreed to acquire it at $57.60 per share to create “the number one global property and casualty commercial lines insurer.” This also lifted the property and casualty insurance group more broadly and benefited Axis Capital.
6
Offsetting this was Air France, which has struggled with a union strike over pay. But even amid that uncertainty, Air France-KLM is still solidly profitable, and the recent resignation of the airline’s CEO may be a catalyst for both sides to eventually reach agreement. Insurance company Unum Group declined amid market worries about its exposure to long-term care liabilities. Aircraft leasing company AerCap also declined slightly, but we continue to like its capital deployment approach (that is, share buybacks), and air traffic remains strong.
We added to our holdings in Air France-KLM, Aspen Insurance, Axis Capital, IAMGOLD, and Taylor Morrison, while trimming our exposure in CNA Financial, JetBlue, Kinross Gold, Micron, Toll Brothers, Unum Group, WPX Energy, and XL Group. We sold out of our holdings in News Corp.
We initiated two new positions: Gold Fields and Sanmina. Gold Fields is a substantial gold producer that trades at a discount because of market concerns about its historically troubled South Deep mine in South Africa, but the company’s valuation is compelling even ignoring this mine, which can be viewed as a “free option.” Sanmina, an electronics manufacturing services supplier, differentiates itself with a low-volume/high-mix, high-value-added strategy; a vertically integrated model; and a high-margin components business.
Our largest industry weightings are airlines and aircraft leasing, precious metals, insurance, and technology.
7
Results of Proxy Voting
At a special meeting of shareholders on November 15, 2017, fund shareholders approved the following proposals:
Proposal 1—Elect trustees for the fund.*
The individuals listed in the table below were elected as trustees for the fund. All trustees with the exception of Ms. Mulligan, Ms. Raskin, and Mr. Buckley (each of whom already serves as a director of The Vanguard Group, Inc.) served as trustees to the funds prior to the shareholder meeting.
| Percentage | |||
| Trustee | For | Withheld | For |
| Mortimer J. Buckley | 860,548,560 | 28,473,629 | 96.8% |
| Emerson U. Fullwood | 859,625,511 | 29,396,677 | 96.7% |
| Amy Gutmann | 859,439,842 | 29,582,347 | 96.7% |
| JoAnn Heffernan Heisen | 860,336,031 | 28,686,158 | 96.8% |
| F. Joseph Loughrey | 860,411,988 | 28,610,200 | 96.8% |
| Mark Loughridge | 860,924,717 | 28,097,471 | 96.8% |
| Scott C. Malpass | 859,842,339 | 29,179,849 | 96.7% |
| F. William McNabb III | 859,460,373 | 29,561,815 | 96.7% |
| Deanna Mulligan | 860,984,342 | 28,037,846 | 96.8% |
| André F. Perold | 850,692,197 | 38,329,992 | 95.7% |
| Sarah Bloom Raskin | 860,331,311 | 28,690,878 | 96.8% |
| Peter F. Volanakis | 860,652,393 | 28,369,796 | 96.8% |
| * Results are for all funds within the same trust. |
Proposal 3—Approve a manager-of-managers arrangement with wholly owned subsidiaries of Vanguard.
This arrangement enables Vanguard or the fund to enter into and materially amend investment advisory arrangements with wholly owned subsidiaries of Vanguard, subject to the approval of the fund’s board of trustees and any conditions imposed by the Securities and Exchange Commission (SEC), while avoiding the costs and delays associated with obtaining future shareholder approval. The ability of the fund to operate in this manner is contingent upon the SEC’s approval of a pending application for an order of exemption.
| Broker | Percentage | ||||
| Vanguard Fund | For | Abstain | Against | Non-Votes | For |
| Selected Value Fund | 151,178,502 | 6,836,844 | 9,360,357 | 32,091,283 | 75.8% |
8
| Selected Value Fund | |||
| Fund Profile | |||
| As of April 30, 2018 | |||
| Portfolio Characteristics | |||
| Russell | DJ | ||
| Midcap | U.S. Total | ||
| Value | Market | ||
| Fund | Index | FA Index | |
| Number of Stocks | 118 | 581 | 3,752 |
| Median Market Cap | $9.2B | $12.9B | $66.1B |
| Price/Earnings Ratio | 15.2x | 17.2x | 20.5x |
| Price/Book Ratio | 1.6x | 1.9x | 2.9x |
| Return on Equity | 11.2% | 9.7% | 15.0% |
| Earnings Growth | |||
| Rate | 8.7% | 7.1% | 8.4% |
| Dividend Yield | 1.9% | 2.2% | 1.8% |
| Foreign Holdings | 13.1% | 0.0% | 0.0% |
| Turnover Rate | |||
| (Annualized) | 32% | — | — |
| Ticker Symbol | VASVX | — | — |
| Expense Ratio1 | 0.39% | — | — |
| 30-Day SEC Yield | 1.56% | — | — |
| Short-Term Reserves | 2.5% | — | — |
| Sector Diversification (% of equity exposure) | |||
| Russell | DJ | ||
| Midcap | U.S. Total | ||
| Value | Market | ||
| Fund | Index | FA Index | |
| Consumer Discretionary | 15.3% | 11.6% | 13.1% |
| Consumer Staples | 1.8 | 3.8 | 6.3 |
| Energy | 8.4 | 8.9 | 6.0 |
| Financials | 26.5 | 21.0 | 15.1 |
| Health Care | 6.0 | 6.3 | 13.6 |
| Industrials | 17.4 | 11.6 | 10.5 |
| Information Technology | 10.6 | 6.5 | 23.8 |
| Materials | 6.9 | 5.5 | 3.3 |
| Real Estate | 2.4 | 13.7 | 3.7 |
| Telecommunication | |||
| Services | 0.0 | 0.6 | 1.7 |
| Utilities | 4.7 | 10.5 | 2.9 |
Sector categories are based on the Global Industry Classification Standard (“GICS”), except for the “Other” category (if applicable), which includes securities that have not been provided a GICS classification as of the effective reporting period.
| Volatility Measures | ||
| Russell | DJ | |
| Midcap | U.S. Total | |
| Value | Market | |
| Index | FA Index | |
| R-Squared | 0.87 | 0.80 |
| Beta | 1.05 | 1.04 |
These measures show the degree and timing of the fund’s fluctuations compared with the indexes over 36 months.
| Ten Largest Holdings (% of total net assets) | ||
| Micron Technology Inc. | Semiconductors | 2.5% |
| Willis Towers Watson | ||
| plc | Insurance Brokers | 2.3 |
| Axis Capital Holdings | Property & Casualty | |
| Ltd. | Insurance | 2.3 |
| AerCap Holdings NV | Trading Companies & | |
| Distributors | 2.3 | |
| KeyCorp | Regional Banks | 2.2 |
| Cigna Corp. | Managed Health | |
| Care | 2.1 | |
| Cardinal Health Inc. | Health Care | |
| Distributors | 2.0 | |
| Fifth Third Bancorp | Regional Banks | 2.0 |
| Spirit AeroSystems | Aerospace & | |
| Holdings Inc. | Defense | 1.8 |
| Dollar General Corp. | General Merchandise | |
| Stores | 1.8 | |
| Top Ten | 21.3% | |
The holdings listed exclude any temporary cash investments and equity index products.
![]()
1 The expense ratio shown is from the prospectus dated February 22, 2018, and represents estimated costs for the current fiscal year. For the six months ended April 30, 2018, the annualized expense ratio was 0.40%.
9
Selected Value Fund
Performance Summary
All of the returns in this report represent past performance, which is not a guarantee of future results that may be achieved by the fund. (Current performance may be lower or higher than the performance data cited. For performance data current to the most recent month-end, visit our website at vanguard.com/performance.) Note, too, that both investment returns and principal value can fluctuate widely, so an investor’s shares, when sold, could be worth more or less than their original cost. The returns shown do not reflect taxes that a shareholder would pay on fund distributions or on the sale of fund shares.
Fiscal-Year Total Returns (%): October 31, 2007, Through April 30, 2018
Average Annual Total Returns: Periods Ended March 31, 2018
This table presents returns through the latest calendar quarter—rather than through the end of the fiscal period.
Securities and Exchange Commission rules require that we provide this information.
| Inception | One | Five | Ten | |
| Date | Year | Years | Years | |
| Selected Value Fund | 2/15/1996 | 8.08% | 11.43% | 10.32% |
See Financial Highlights for dividend and capital gains information.
10
Selected Value Fund
Financial Statements (unaudited)
Statement of Net Assets
As of April 30, 2018
The fund reports a complete list of its holdings in regulatory filings four times in each fiscal year, at the quarter-ends. For the second and fourth fiscal quarters, the lists appear in the fund’s semiannual and annual reports to shareholders. For the first and third fiscal quarters, the fund files the lists with the Securities and Exchange Commission on Form N-Q. Shareholders can look up the fund’s Forms N-Q on the SEC’s website at sec.gov. Forms N-Q may also be reviewed and copied at the SEC’s Public Reference Room (see the back cover of this report for further information).
| Market | |||
| Value• | |||
| Shares | ($000) | ||
| Common Stocks (96.1%)1 | |||
| Consumer Discretionary (14.8%) | |||
| Dollar General Corp. | 1,918,700 | 185,212 | |
| * | Norwegian Cruise | ||
| Line Holdings Ltd. | 3,109,240 | 166,251 | |
| Advance Auto Parts | |||
| Inc. | 1,363,090 | 156,006 | |
| Royal Caribbean | |||
| Cruises Ltd. | 1,433,294 | 155,068 | |
| Whirlpool Corp. | 951,300 | 147,404 | |
| * | Taylor Morrison | ||
| Home Corp. Class A | 3,989,443 | 94,789 | |
| ^ | Hanesbrands Inc. | 5,128,952 | 94,732 |
| Adient plc | 1,539,400 | 94,350 | |
| Meredith Corp. | 1,632,944 | 84,587 | |
| L Brands Inc. | 2,236,648 | 78,081 | |
| Omnicom Group Inc. | 991,174 | 73,010 | |
| *,^,2SeaWorld | |||
| Entertainment Inc. | 4,467,400 | 67,413 | |
| Interpublic Group of | |||
| Cos. Inc. | 2,741,799 | 64,679 | |
| News Corp. Class A | 2,158,265 | 34,489 | |
| Newell Brands Inc. | 695,447 | 19,215 | |
| Toll Brothers Inc. | 98,920 | 4,170 | |
| 1,519,456 | |||
| Consumer Staples (1.6%) | |||
| Coca-Cola European | |||
| Partners plc | 3,754,923 | 147,193 | |
| Kellogg Co. | 337,425 | 19,874 | |
| 167,067 | |||
| Energy (8.2%) | |||
| ^ | Vermilion Energy Inc. | 5,440,500 | 183,943 |
| Devon Energy Corp. | 5,015,600 | 182,217 | |
| 2 | Golar LNG Ltd. | 5,342,908 | 171,774 |
| Murphy Oil Corp. | 2,425,940 | 73,045 | |
| TechnipFMC plc | 1,648,322 | 54,329 | |
| * | WPX Energy Inc. | 2,638,779 | 45,097 |
| Cenovus Energy Inc. | 4,261,811 | 42,746 | |
| Market | |||
| Value• | |||
| Shares | ($000) | ||
| *,^ | Chesapeake Energy | ||
| Corp. | 8,129,600 | 24,145 | |
| * | Noble Corp. plc | 3,160,316 | 14,759 |
| * | Rowan Cos. plc | ||
| Class A | 996,725 | 14,393 | |
| Nabors Industries | |||
| Ltd. | 1,741,181 | 13,250 | |
| * | Superior Energy | ||
| Services Inc. | 1,120,132 | 12,019 | |
| Baker Hughes a GE Co. | 170,476 | 6,156 | |
| 837,873 | |||
| Financials (25.6%) | |||
| Willis Towers Watson | |||
| plc | 1,625,664 | 241,427 | |
| Axis Capital Holdings | |||
| Ltd. | 4,002,615 | 234,954 | |
| KeyCorp | 11,103,225 | 221,176 | |
| Fifth Third Bancorp | 6,122,850 | 203,095 | |
| Capital One Financial | |||
| Corp. | 1,585,600 | 143,687 | |
| New York Community | |||
| Bancorp Inc. | 11,309,500 | 134,357 | |
| FNB Corp. | 9,396,300 | 122,152 | |
| Navient Corp. | 7,622,347 | 101,072 | |
| Everest Re Group Ltd. | 401,462 | 93,408 | |
| FNF Group | 2,489,000 | 91,670 | |
| CNA Financial Corp. | 1,796,069 | 90,630 | |
| Voya Financial Inc. | 1,605,205 | 84,032 | |
| Regions Financial | |||
| Corp. | 4,105,725 | 76,777 | |
| Unum Group | 1,575,194 | 76,208 | |
| Discover Financial | |||
| Services | 1,026,400 | 73,131 | |
| Valley National | |||
| Bancorp | 5,308,100 | 66,617 | |
| Leucadia National | |||
| Corp. | 2,562,295 | 61,598 | |
| Aspen Insurance | |||
| Holdings Ltd. | 1,242,911 | 52,762 | |
11
Selected Value Fund
| Market | |||
| Value• | |||
| Shares | ($000) | ||
| Element Fleet | |||
| Management Corp. | 12,459,100 | 47,063 | |
| * | SLM Corp. | 3,960,300 | 45,464 |
| Invesco Ltd. | 1,501,950 | 43,511 | |
| Franklin Resources | |||
| Inc. | 1,287,762 | 43,320 | |
| XL Group Ltd. | 765,553 | 42,557 | |
| Hanover Insurance | |||
| Group Inc. | 340,945 | 39,158 | |
| Webster Financial | |||
| Corp. | 619,497 | 37,288 | |
| Allstate Corp. | 374,140 | 36,598 | |
| Legg Mason Inc. | 639,775 | 25,399 | |
| Torchmark Corp. | 279,434 | 24,238 | |
| Hartford Financial | |||
| Services Group Inc. | 424,208 | 22,839 | |
| Comerica Inc. | 240,292 | 22,727 | |
| MFA Financial Inc. | 2,274,657 | 17,105 | |
| Synovus Financial | |||
| Corp. | 253,611 | 13,256 | |
| * | Genworth Financial | ||
| Inc. Class A | 2,224,850 | 6,141 | |
| 2,635,417 | |||
| Health Care (5.6%) | |||
| Cigna Corp. | 1,249,445 | 214,679 | |
| Cardinal Health Inc. | 3,284,755 | 210,783 | |
| * | Mylan NV | 2,077,324 | 80,517 |
| * | MEDNAX Inc. | 1,150,225 | 52,807 |
| McKesson Corp. | 122,713 | 19,169 | |
| 577,955 | |||
| Industrials (16.8%) | |||
| * | AerCap Holdings NV | 4,443,188 | 231,623 |
| Spirit AeroSystems | |||
| Holdings Inc. Class A | 2,350,107 | 188,878 | |
| Stanley Black & | |||
| Decker Inc. | 1,262,500 | 178,757 | |
| Owens Corning | 2,282,802 | 149,501 | |
| Johnson Controls | |||
| International plc | 4,103,364 | 138,981 | |
| * | Air France-KLM ADR | 13,938,085 | 136,593 |
| Ryder System Inc. | 1,706,421 | 115,064 | |
| Nielsen Holdings plc | 3,350,400 | 105,370 | |
| * | JetBlue Airways Corp. | 4,453,257 | 85,458 |
| Dover Corp. | 664,325 | 61,583 | |
| Carlisle Cos. Inc. | 571,327 | 61,549 | |
| * | JELD-WEN Holding | ||
| Inc. | 1,989,993 | 55,939 | |
| Terex Corp. | 1,176,904 | 42,981 | |
| Actuant Corp. Class A | 1,717,514 | 40,447 | |
| * | AECOM | 1,101,235 | 37,927 |
| Snap-on Inc. | 236,708 | 34,382 | |
| * | Avis Budget Group Inc. | 692,631 | 34,223 |
| KBR Inc. | 1,837,216 | 30,663 | |
| 1,729,919 | |||
| Market | |||
| Value• | |||
| Shares | ($000) | ||
| Information Technology (9.9%) | |||
| * | Micron Technology | ||
| Inc. | 5,622,700 | 258,532 | |
| Microchip Technology | |||
| Inc. | 2,211,000 | 184,972 | |
| Versum Materials Inc. | 3,791,401 | 133,382 | |
| Total System Services | |||
| Inc. | 1,276,936 | 107,339 | |
| Avnet Inc. | 2,333,189 | 91,531 | |
| Hewlett Packard | |||
| Enterprise Co. | 3,220,553 | 54,910 | |
| * | Anixter International | ||
| Inc. | 695,257 | 40,951 | |
| Genpact Ltd. | 1,016,327 | 32,411 | |
| * | Flex Ltd. | 1,991,393 | 25,888 |
| * | Celestica Inc. | 2,081,919 | 23,942 |
| * | Arrow Electronics Inc. | 304,204 | 22,736 |
| Jabil Inc. | 711,890 | 18,936 | |
| HP Inc. | 710,967 | 15,279 | |
| Micro Focus | |||
| International plc ADR | 432,661 | 7,494 | |
| * | Sanmina Corp. | 41,500 | 1,224 |
| 1,019,527 | |||
| Materials (6.7%) | |||
| * | Axalta Coating | ||
| Systems Ltd. | 5,409,900 | 167,166 | |
| * | Kinross Gold Corp. | 36,321,300 | 140,927 |
| Yamana Gold Inc. | 38,000,000 | 109,060 | |
| * | IAMGOLD Corp. | 14,347,457 | 78,337 |
| Celanese Corp. | |||
| Class A | 680,346 | 73,933 | |
| ^ | CRH plc ADR | 1,654,199 | 58,492 |
| Gold Fields Ltd. ADR | 12,725,000 | 48,610 | |
| *,2 | Brio Gold Inc. | 7,361,783 | 14,793 |
| 691,318 | |||
| Real Estate (2.3%) | |||
| 2 | MGM Growth | ||
| Properties LLC | |||
| Class A | 5,331,698 | 149,128 | |
| GEO Group Inc. | 1,606,450 | 36,145 | |
| Realogy Holdings | |||
| Corp. | 1,286,639 | 31,921 | |
| Hospitality Properties | |||
| Trust | 583,800 | 14,525 | |
| 231,719 | |||
| Utilities (4.6%) | |||
| Xcel Energy Inc. | 3,952,196 | 185,121 | |
| Pinnacle West | |||
| Capital Corp. | 2,282,360 | 183,730 | |
| Edison International | 1,181,254 | 77,396 | |
| Avangrid Inc. | 445,533 | 23,484 | |
| 469,731 | |||
| Total Common Stocks | |||
| (Cost $7,734,237) | 9,879,982 | ||
12
| Selected Value Fund | |||
| Market | |||
| Value• | |||
| Shares | ($000) | ||
| Temporary Cash Investments (6.3%)1 | |||
| Money Market Fund (6.2%) | |||
| 3,4 | Vanguard Market | ||
| Liquidity Fund, | |||
| 1.886% | 6,427,009 | 642,701 | |
| Face | |||
| Amount | |||
| ($000) | |||
| U. S. Government and Agency Obligations (0.1%) | |||
| 5 | United States Treasury Bill, | ||
| 1.602%, 5/24/18 | 7,000 | 6,993 | |
| 5 | United States Treasury Bill, | ||
| 1.497%–1.633%, 6/14/18 | 1,200 | 1,197 | |
| 5 | United States Treasury Bill, | ||
| 1.509%, 6/21/18 | 800 | 798 | |
| 5 | United States Treasury Bill, | ||
| 1.541%, 6/28/18 | 130 | 130 | |
| 5 | United States Treasury Bill, | ||
| 1.934%, 10/11/18 | 1,300 | 1,288 | |
| 10,406 | |||
| Total Temporary Cash Investments | |||
| (Cost $653,074) | 653,107 | ||
| Total Investments (102.4%) | |||
| (Cost $8,387,311) | 10,533,089 | ||
| Other Assets and Liabilities (-2.4%) | |||
| Other Assets | 31,790 | ||
| Liabilities 4 | (280,016) | ||
| (248,226) | |||
| Net Assets (100%) | |||
| Applicable to 346,856,976 outstanding | |||
| $.001 par value shares of beneficial | |||
| interest (unlimited authorization) | 10,284,863 | ||
| Net Asset Value Per Share | $29.65 | ||
| Amount | |
| ($000) | |
| Statement of Assets and Liabilities | |
| Assets | |
| Investments in Securities, at Value | |
| Unaffiliated Issuers | 9,487,280 |
| Affiliated Issuers | 1,045,809 |
| Total Investments in Securities | 10,533,089 |
| Investment in Vanguard | 566 |
| Receivables for Investment | |
| Securities Sold | 20,133 |
| Receivables for Accrued Income | 6,483 |
| Receivables for Capital Shares Issued | 4,608 |
| Total Assets | 10,564,879 |
| Liabilities | |
| Payables for Investment Securities | |
| Purchased | 40,964 |
| Collateral for Securities on Loan | 208,075 |
| Payables to Investment Advisor | 5,699 |
| Payables for Capital | |
| Shares Redeemed | 12,753 |
| Payables to Vanguard | 10,789 |
| Variation Margin Payable— | |
| Futures Contracts | 1,712 |
| Other Liabilities | 24 |
| Total Liabilities | 280,016 |
| Net Assets | 10,284,863 |
13
Selected Value Fund
| At April 30, 2018, net assets consisted of: | |
| Amount | |
| ($000) | |
| Paid-in Capital | 7,678,361 |
| Undistributed Net Investment Income | 39,941 |
| Accumulated Net Realized Gains | 429,430 |
| Unrealized Appreciation (Depreciation) | |
| Investment Securities | 2,145,778 |
| Futures Contracts | (8,647) |
| Net Assets | 10,284,863 |
• See Note A in Notes to Financial Statements.
* Non-income-producing security.
^ Includes partial security positions on loan to broker-dealers. The total value of securities on loan is $200,692,000.
1 The fund invests a portion of its cash reserves in equity markets through the use of index futures contracts. After giving effect to futures investments, the fund’s effective common stock and temporary cash investment positions represent 97.9% and 4.5%, respectively, of net assets.
2 Considered an affiliated company of the fund as the fund owns more than 5% of the outstanding voting securities of such company.
3 Affiliated money market fund available only to Vanguard funds and certain trusts and accounts managed by Vanguard. Rate shown is the 7-day yield.
4 Includes $208,075,000 of collateral received for securities on loan.
5 Securities with a value of $9,311,000 have been segregated as initial margin for open futures contracts.
ADR—American Depositary Receipt.
| Derivative Financial Instruments Outstanding as of Period End | ||||
| Futures Contracts | ||||
| ($000) | ||||
| Value and | ||||
| Number of | Unrealized | |||
| Long (Short) | Notional | Appreciation | ||
| Expiration | Contracts | Amount | (Depreciation) | |
| Long Futures Contracts | ||||
| E-mini S&P 500 Index | June 2018 | 1,419 | 187,805 | (8,647) |
Unrealized appreciation (depreciation) on open futures contracts is required to be treated as realized gain (loss) for tax purposes.
See accompanying Notes, which are an integral part of the Financial Statements.
14
| Selected Value Fund | |
| Statement of Operations | |
| Six Months Ended | |
| April 30, 2018 | |
| ($000) | |
| Investment Income | |
| Income | |
| Dividends—Unaffiliated Issuers1 | 96,077 |
| Dividends—Affiliated Issuers | 526 |
| Interest—Unaffiliated Issuers | 64 |
| Interest—Affiliated Issuers | 4,313 |
| Securities Lending—Net | 534 |
| Total Income | 101,514 |
| Expenses | |
| Investment Advisory Fees—Note B | |
| Basic Fee | 11,537 |
| Performance Adjustment | 534 |
| The Vanguard Group—Note C | |
| Management and Administrative | 8,016 |
| Marketing and Distribution | 865 |
| Custodian Fees | 62 |
| Shareholders’ Reports and Proxy | 124 |
| Trustees’ Fees and Expenses | 8 |
| Total Expenses | 21,146 |
| Expenses Paid Indirectly | (84) |
| Net Expenses | 21,062 |
| Net Investment Income | 80,452 |
| Realized Net Gain (Loss) | |
| Investment Securities Sold—Unaffiliated Issuers | 420,112 |
| Investment Securities Sold—Affiliated Issuers | (113) |
| Futures Contracts | 14,599 |
| Foreign Currencies | 18 |
| Realized Net Gain (Loss) | 434,616 |
| Change in Unrealized Appreciation (Depreciation) | |
| Investment Securities—Unaffiliated Issuers | (752,852) |
| Investment Securities—Affiliated Issuers | 82,704 |
| Futures Contracts | (10,732) |
| Change in Unrealized Appreciation (Depreciation) | (680,880) |
| Net Increase (Decrease) in Net Assets Resulting from Operations | (165,812) |
| 1 Dividends are net of foreign withholding taxes of $1,197,000. | |
See accompanying Notes, which are an integral part of the Financial Statements.
15
| Selected Value Fund | ||
| Statement of Changes in Net Assets | ||
| Six Months Ended | Year Ended | |
| April 30, | October 31, | |
| 2018 | 2017 | |
| ($000) | ($000) | |
| Increase (Decrease) in Net Assets | ||
| Operations | ||
| Net Investment Income | 80,452 | 147,219 |
| Realized Net Gain (Loss) | 434,616 | 910,522 |
| Change in Unrealized Appreciation (Depreciation) | (680,880) | 1,284,821 |
| Net Increase (Decrease) in Net Assets Resulting from Operations | (165,812) | 2,342,562 |
| Distributions | ||
| Net Investment Income | (135,374) | (160,953) |
| Realized Capital Gain1 | (859,146) | (259,949) |
| Total Distributions | (994,520) | (420,902) |
| Capital Share Transactions | ||
| Issued | 892,716 | 1,344,907 |
| Issued in Lieu of Cash Distributions | 917,398 | 390,140 |
| Redeemed | (939,339) | (1,883,953) |
| Net Increase (Decrease) from Capital Share Transactions | 870,775 | (148,906) |
| Total Increase (Decrease) | (289,557) | 1,772,754 |
| Net Assets | ||
| Beginning of Period | 10,574,420 | 8,801,666 |
| End of Period2 | 10,284,863 | 10,574,420 |
1 Includes fiscal 2018 and 2017 short-term gain distributions totaling $74,529,000 and $0, respectively. Short-term gain distributions
are treated as ordinary income dividends for tax purposes.
2 Net Assets—End of Period includes undistributed (overdistributed) net investment income of $39,941,000 and $94,845,000.
See accompanying Notes, which are an integral part of the Financial Statements.
16
| Selected Value Fund | ||||||
| Financial Highlights | ||||||
| Six Months | ||||||
| Ended | ||||||
| For a Share Outstanding | April 30, | Year Ended October 31, | ||||
| Throughout Each Period | 2018 | 2017 | 2016 | 2015 | 2014 | 2013 |
| Net Asset Value, Beginning of Period | $33.15 | $27.24 | $28.15 | $29.49 | $28.07 | $21.01 |
| Investment Operations | ||||||
| Net Investment Income | . 2361 | .4491 | .5271 | .478 | .415 | . 395 |
| Net Realized and Unrealized Gain (Loss) | ||||||
| on Investments | (.626) | 6.760 | .030 | (.245) | 2.555 | 7.105 |
| Total from Investment Operations | (.390) | 7.209 | .557 | .233 | 2.970 | 7.500 |
| Distributions | ||||||
| Dividends from Net Investment Income | (. 423) | (. 501) | (. 443) | (. 404) | (. 330) | (. 440) |
| Distributions from Realized Capital Gains | (2.687) | (.798) | (1.024) | (1.169) | (1.220) | — |
| Total Distributions | (3.110) | (1.299) | (1.467) | (1.573) | (1.550) | (.440) |
| Net Asset Value, End of Period | $29.65 | $33.15 | $27.24 | $28.15 | $29.49 | $28.07 |
| Total Return2 | -1.62% | 27.17% | 2.20% | 0.88% | 11.02% | 36.43% |
| Ratios/Supplemental Data | ||||||
| Net Assets, End of Period (Millions) | $10,285 | $10,574 | $8,802 | $9,663 | $10,153 | $7,019 |
| Ratio of Total Expenses to | ||||||
| Average Net Assets3 | 0.40% | 0.39% | 0.35% | 0.39% | 0.41% | 0.43% |
| Ratio of Net Investment Income to | ||||||
| Average Net Assets | 1.50% | 1.47% | 2.00% | 1.62% | 1.53% | 1.70% |
| Portfolio Turnover Rate | 32% | 22% | 27% | 24% | 18% | 27% |
The expense ratio, net investment income ratio, and turnover rate for the current period have been annualized.
1 Calculated based on average shares outstanding.
2 Total returns do not include account service fees that may have applied in the periods shown. Fund prospectuses provide
information about any applicable account service fees.
3 Includes performance-based investment advisory fee increases (decreases) of 0.01%, 0.00%, (0.04)%, (0.02%), 0.01%, and 0.02%.
See accompanying Notes, which are an integral part of the Financial Statements.
17
Selected Value Fund
Notes to Financial Statements
Vanguard Selected Value Fund is registered under the Investment Company Act of 1940 as an open-end investment company, or mutual fund.
A. The following significant accounting policies conform to generally accepted accounting principles for U.S. investment companies. The fund consistently follows such policies in preparing its financial statements.
1. Security Valuation: Securities are valued as of the close of trading on the New York Stock Exchange (generally 4 p.m., Eastern time) on the valuation date. Equity securities are valued at the latest quoted sales prices or official closing prices taken from the primary market in which each security trades; such securities not traded on the valuation date are valued at the mean of the latest quoted bid and asked prices. Securities for which market quotations are not readily available, or whose values have been affected by events occurring before the fund’s pricing time but after the close of the securities’ primary markets, are valued at their fair values calculated according to procedures adopted by the board of trustees. These procedures include obtaining quotations from an independent pricing service, monitoring news to identify significant market- or security-specific events, and evaluating changes in the values of foreign market proxies (for example, ADRs, futures contracts, or exchange-traded funds), between the time the foreign markets close and the fund’s pricing time. When fair-value pricing is employed, the prices of securities used by a fund to calculate its net asset value may differ from quoted or published prices for the same securities. Investments in Vanguard Market Liquidity Fund are valued at that fund’s net asset value. Temporary cash investments are valued using the latest bid prices or using valuations based on a matrix system (which considers such factors as security prices, yields, maturities, and ratings), both as furnished by independent pricing services.
2. Foreign Currency: Securities and other assets and liabilities denominated in foreign currencies are translated into U.S. dollars using exchange rates obtained from an independent third party as of the fund’s pricing time on the valuation date. Realized gains (losses) and unrealized appreciation (depreciation) on investment securities include the effects of changes in exchange rates since the securities were purchased, combined with the effects of changes in security prices. Fluctuations in the value of other assets and liabilities resulting from changes in exchange rates are recorded as unrealized foreign currency gains (losses) until the assets or liabilities are settled in cash, at which time they are recorded as realized foreign currency gains (losses).
3. Futures Contracts: The fund uses index futures contracts to a limited extent, with the objective of maintaining full exposure to the stock market while maintaining liquidity. The fund may purchase or sell futures contracts to achieve a desired level of investment, whether to accommodate portfolio turnover or cash flows from capital share transactions. The primary risks associated with the use of futures contracts are imperfect correlation between changes in market values of stocks held by the fund and the prices of futures contracts, and the possibility of an illiquid market. Counterparty risk involving futures is mitigated because a regulated clearinghouse is the counterparty instead of the clearing broker. To further mitigate counterparty risk, the fund trades futures contracts on an exchange, monitors the financial strength of its clearing brokers and clearinghouse, and has entered into clearing agreements with its clearing brokers. The clearinghouse imposes initial margin requirements to secure the fund’s performance and requires daily settlement of variation margin representing changes in the market value of each contract.
18
Selected Value Fund
Futures contracts are valued at their quoted daily settlement prices. The notional amounts of the contracts are not recorded in the Statement of Net Assets. Fluctuations in the value of the contracts are recorded in the Statement of Assets and Liabilities as an asset (liability) and in the Statement of Operations as unrealized appreciation (depreciation) until the contracts are closed, when they are recorded as realized futures gains (losses).
During the six months ended April 30, 2018, the fund’s average investments in long and short futures contracts represented 2% and 0% of net assets, respectively, based on the average of the notional amounts at each quarter-end during the period.
4. Federal Income Taxes: The fund intends to continue to qualify as a regulated investment company and distribute all of its taxable income. Management has analyzed the fund’s tax positions taken for all open federal income tax years (October 31, 2014–2017), and for the period ended April 30, 2018, and has concluded that no provision for federal income tax is required in the fund’s financial statements.
5. Distributions: Distributions to shareholders are recorded on the ex-dividend date.
6. Securities Lending: To earn additional income, the fund lends its securities to qualified institutional borrowers. Security loans are subject to termination by the fund at any time, and are required to be secured at all times by collateral in an amount at least equal to the market value of securities loaned. Daily market fluctuations could cause the value of loaned securities to be more or less than the value of the collateral received. When this occurs, the collateral is adjusted and settled before the opening of the market on the next business day. The fund further mitigates its counterparty risk by entering into securities lending transactions only with a diverse group of prequalified counterparties, monitoring their financial strength, and entering into master securities lending agreements with its counterparties. The master securities lending agreements provide that, in the event of a counterparty’s default (including bankruptcy), the fund may terminate any loans with that borrower, determine the net amount owed, and sell or retain the collateral up to the net amount owed to the fund; however, such actions may be subject to legal proceedings. While collateral mitigates counterparty risk, in the event of a default, the fund may experience delays and costs in recovering the securities loaned. The fund invests cash collateral received in Vanguard Market Liquidity Fund, and records a liability in the Statement of Assets and Liabilities for the return of the collateral, during the period the securities are on loan. Securities lending income represents fees charged to borrowers plus income earned on invested cash collateral, less expenses associated with the loan. During the term of the loan, the fund is entitled to all distributions made on or in respect of the loaned securities.
7. Credit Facility: The fund and certain other funds managed by The Vanguard Group (“Vanguard”) participate in a $3.1 billion committed credit facility provided by a syndicate of lenders pursuant to a credit agreement that may be renewed annually; each fund is individually liable for its borrowings, if any, under the credit facility. Borrowings may be utilized for temporary and emergency purposes, and are subject to the fund’s regulatory and contractual borrowing restrictions. The participating funds are charged administrative fees and an annual commitment fee of 0.10% of the undrawn amount of the facility; these fees are allocated to the funds based on a method approved by the fund’s board of trustees and included in Management and Administrative expenses on the fund’s Statement of Operations. Any borrowings under this facility bear interest at a rate based upon the higher of the one-month London Interbank Offered Rate, federal funds effective rate, or overnight bank funding rate plus an agreed-upon spread.
The fund had no borrowings outstanding at April 30, 2018, or at any time during the period then ended.
19
Selected Value Fund
8. Other: Dividend income is recorded on the ex-dividend date. Interest income includes income distributions received from Vanguard Market Liquidity Fund and is accrued daily. Premiums and discounts on debt securities purchased are amortized and accreted, respectively, to interest income over the lives of the respective securities. Security transactions are accounted for on the date securities are bought or sold. Costs used to determine realized gains (losses) on the sale of investment securities are those of the specific securities sold.
B. The investment advisory firms Barrow, Hanley, Mewhinney & Strauss, LLC, Pzena Investment Management, LLC, and Donald Smith & Co., Inc., each provide investment advisory services to a portion of the fund for a fee calculated at an annual percentage rate of average net assets managed by the advisor. The basic fee of Barrow, Hanley, Mewhinney & Strauss, LLC, and Pzena Investment Management, LLC, are subject to quarterly adjustments based on performance relative to the Russell Midcap Value Index for the preceding three years. The basic fee of Donald Smith & Co., Inc., is subject to quarterly adjustments based on performance relative to the MSCI Investable Market 2500 Index for the preceding five years.
Vanguard manages the cash reserves of the fund as described below.
For the six months ended April 30, 2018, the aggregate investment advisory fee represented an effective annual basic rate of 0.22% of the fund’s average net assets, before a net increase of $534,000 (0.01%) based on performance.
C. In accordance with the terms of a Funds’ Service Agreement (the “FSA”) between Vanguard and the fund, Vanguard furnishes to the fund corporate management, administrative, marketing, distribution, and cash management services at Vanguard’s cost of operations (as defined by the FSA). These costs of operations are allocated to the fund based on methods and guidelines approved by the board of trustees. Vanguard does not require reimbursement in the current period for certain costs of operations (such as deferred compensation/benefits and risk/insurance costs); the fund’s liability for these costs of operations is included in Payables to Vanguard on the Statement of Assets and Liabilities. All other costs of operations payable to Vanguard are generally settled twice a month.
Upon the request of Vanguard, the fund may invest up to 0.40% of its net assets as capital in Vanguard. At April 30, 2018, the fund had contributed to Vanguard capital in the amount of $566,000, representing 0.01% of the fund’s net assets and 0.23% of Vanguard’s capitalization. The fund’s trustees and officers are also directors and employees, respectively, of Vanguard.
D. The fund has asked its investment advisors to direct certain security trades, subject to obtaining the best price and execution, to brokers who have agreed to rebate to the fund part of the commissions generated. Such rebates are used solely to reduce the fund’s management and administrative expenses. The fund’s custodian bank has also agreed to reduce its fees when the fund maintains cash on deposit in the non-interest-bearing custody account. For the six months ended April 30, 2018, these arrangements reduced the fund’s management and administrative expenses by $72,000 and custodian fees by $12,000. The total expense reduction represented an effective annual rate of 0.00% of the fund’s average net assets.
20
Selected Value Fund
E. Various inputs may be used to determine the value of the fund’s investments. These inputs are summarized in three broad levels for financial statement purposes. The inputs or methodologies used to value securities are not necessarily an indication of the risk associated with investing in those securities.
Level 1—Quoted prices in active markets for identical securities.
Level 2—Other significant observable inputs (including quoted prices for similar securities, interest rates, prepayment speeds, credit risk, etc.).
Level 3—Significant unobservable inputs (including the fund’s own assumptions used to determine the fair value of investments). Any investments valued with significant unobservable inputs are noted on the Statement of Net Assets.
The following table summarizes the market value of the fund’s investments as of April 30, 2018, based on the inputs used to value them:
| Level 1 | Level 2 | Level 3 | |
| Investments | ($000) | ($000) | ($000) |
| Common Stocks | 9,879,982 | — | — |
| Temporary Cash Investments | 642,701 | 10,406 | — |
| Futures Contracts—Liabilities1 | (1,712) | — | — |
| Total | 10,520,971 | 10,406 | — |
| 1 Represents variation margin on the last day of the reporting period. |
F. Distributions are determined on a tax basis and may differ from net investment income and realized capital gains for financial reporting purposes. Differences may be permanent or temporary. Permanent differences are reclassified among capital accounts in the financial statements to reflect their tax character. Temporary differences arise when certain items of income, expense, gain, or loss are recognized in different periods for financial statement and tax purposes. These differences will reverse at some time in the future. Differences in classification may also result from the treatment of short-term gains as ordinary income for tax purposes. The fund’s tax-basis capital gains and losses are determined only at the end of each fiscal year.
At April 30, 2018, the cost of investment securities for tax purposes was $8,387,311,000. Net unrealized appreciation of investment securities for tax purposes was $2,145,778,000, consisting of unrealized gains of $2,742,874,000 on securities that had risen in value since their purchase and $597,096,000 in unrealized losses on securities that had fallen in value since their purchase.
G. During the six months ended April 30, 2018, the fund purchased $1,857,118,000 of investment securities and sold $1,617,674,000 of investment securities, other than temporary cash investments.
21
| Selected Value Fund | ||
| H. Capital shares issued and redeemed were: | ||
| Six Months Ended | Year Ended | |
| April 30, 2018 | October 31, 2017 | |
| Shares | Shares | |
| (000) | (000) | |
| Issued | 28,268 | 44,024 |
| Issued in Lieu of Cash Distributions | 29,479 | 13,370 |
| Redeemed | (29,905) | (61,444) |
| Net Increase (Decrease) in Shares Outstanding | 27,842 | (4,050) |
I. Certain of the fund’s investments are in companies that are considered to be affiliated companies of the fund because the fund owns more than 5% of the outstanding voting securities of the company or the issuer is another member of The Vanguard Group. Transactions during the period in securities of these companies were as follows:
| Current Period Transactions | ||||||||
| Oct. 31, | Proceeds | Realized | April 30, | |||||
| 2017 | from | Net | Change in | Capital Gain | 2018 | |||
| Market | Purchases | Securities | Gain | Unrealized | Distributions | Market | ||
| Value | at Cost | Sold | (Loss) | App. (Dep.) | Income | Received | Value | |
| ($000) | ($000) | ($000) | ($000) | ($000) | ($000) | ($000) | ($000) | |
| Brio Gold Inc. | 10,157 | — | — | — | 4,636 | — | — | 14,793 |
| Golar LNG Ltd. | 112,896 | — | — | — | 58,878 | 526 | — | 171,774 |
| MGM Growth | ||||||||
| Properties LLC | ||||||||
| Class A | — | 146,119 | — | — | 3,009 | — | — | 149,128 |
| SeaWorld | ||||||||
| Entertainment Inc. | NA1 | — | — | — | 16,127 | — | — | 67,413 |
| Vanguard Market | ||||||||
| Liquidity Fund | 755,485 | NA 2 | NA 2 | (113) | 54 | 4,313 | — | 642,701 |
| Total | 878,538 | (113) | 82,704 | 4,839 | — | 1,045,809 | ||
1 Not applicable—at October 31, 2017, the issuer was not an affiliated company of the fund. 2 Not applicable—purchases and sales are for temporary cash investment purposes.
J. Management has determined that no material events or transactions occurred subsequent to April 30, 2018, that would require recognition or disclosure in these financial statements.
22
About Your Fund’s Expenses
As a shareholder of the fund, you incur ongoing costs, which include costs for portfolio management, administrative services, and shareholder reports (like this one), among others. Operating expenses, which are deducted from a fund’s gross income, directly reduce the investment return of the fund.
A fund’s expenses are expressed as a percentage of its average net assets. This figure is known as the expense ratio. The following examples are intended to help you understand the ongoing costs (in dollars) of investing in your fund and to compare these costs with those of other mutual funds. The examples are based on an investment of $1,000 made at the beginning of the period shown and held for the entire period.
The accompanying table illustrates your fund’s costs in two ways:
• Based on actual fund return. This section helps you to estimate the actual expenses that you paid over the period. The ”Ending Account Value“ shown is derived from the fund‘s actual return, and the third column shows the dollar amount that would have been paid by an investor who started with $1,000 in the fund. You may use the information here, together with the amount you invested, to estimate the expenses that you paid over the period.
To do so, simply divide your account value by $1,000 (for example, an $8,600 account value divided by $1,000 = 8.6), then multiply the result by the number given for your fund under the heading ”Expenses Paid During Period.“
• Based on hypothetical 5% yearly return. This section is intended to help you compare your fund‘s costs with those of other mutual funds. It assumes that the fund had a yearly return of 5% before expenses, but that the expense ratio is unchanged. In this case—because the return used is not the fund’s actual return—the results do not apply to your investment. The example is useful in making comparisons because the Securities and Exchange Commission requires all mutual funds to calculate expenses based on a 5% return. You can assess your fund’s costs by comparing this hypothetical example with the hypothetical examples that appear in shareholder reports of other funds.
Note that the expenses shown in the table are meant to highlight and help you compare ongoing costs only and do not reflect transaction costs incurred by the fund for buying and selling securities. Further, the expenses do not include any purchase, redemption, or account service fees described in the fund prospectus. If such fees were applied to your account, your costs would be higher. Your fund does not carry a “sales load.”
The calculations assume no shares were bought or sold during the period. Your actual costs may have been higher or lower, depending on the amount of your investment and the timing of any purchases or redemptions.
You can find more information about the fund’s expenses, including annual expense ratios, in the Financial Statements section of this report. For additional information on operating expenses and other shareholder costs, please refer to your fund’s current prospectus.
23
| Six Months Ended April 30, 2018 | |||
| Beginning | Ending | Expenses | |
| Account Value | Account Value | Paid During | |
| Selected Value Fund | 10/31/2017 | 4/30/2018 | Period |
| Based on Actual Fund Return | $1,000.00 | $983.82 | $1.97 |
| Based on Hypothetical 5% Yearly Return | 1,000.00 | 1,022.81 | 2.01 |
The calculations are based on expenses incurred in the most recent six-month period. The fund’s annualized six-month expense ratio for that period is 0.40%. The dollar amounts shown as “Expenses Paid” are equal to the annualized expense ratio multiplied by the average account value over the period, multiplied by the number of days in the most recent six-month period, then divided by the number of days in the most recent 12-month period (181/365).
24
Trustees Approve Advisory Arrangements
The board of trustees of Vanguard Selected Value Fund has renewed the fund’s investment advisory arrangements with Barrow, Hanley, Mewhinney & Strauss, LLC (Barrow Hanley), Donald Smith & Co., Inc. (Donald Smith & Co.), and Pzena Investment Management, LLC (Pzena). The board determined that renewing the advisory arrangements was in the best interests of the fund and its shareholders.
The board based its decision upon an evaluation of each advisor’s investment staff, portfolio management process, and performance. This evaluation included information provided to the board by Vanguard’s Portfolio Review Department, which is responsible for fund and advisor oversight and product management. The Portfolio Review Department met regularly with the advisors and made monthly presentations to the board during the fiscal year that directed the board’s focus to relevant information and topics.
The board, or an investment committee made up of board members, also received information throughout the year during advisor presentations. For each advisor presentation, the board was provided with letters and reports that included information about, among other things, the advisory firm and the advisor’s assessment of the investment environment, portfolio performance, and portfolio characteristics.
In addition, the board received monthly reports, which included a Market and Economic Report, a Fund Dashboard Monthly Summary, and a Fund Performance Report.
Prior to their meeting, the trustees were provided with a memo and materials that summarized the information they received over the course of the year. They also considered the factors discussed below, among others. However, no single factor determined whether the board approved the arrangements. Rather, it was the totality of the circumstances that drove the board’s decision.
Nature, extent, and quality of services
The board reviewed the quality of the fund’s investment management services over both the short and long term, and took into account the organizational depth and stability of each advisor. The board considered the following:
Barrow Hanley. Founded in 1979, Barrow Hanley is known for its commitment to value investing. A subsidiary of Old Mutual Asset Managers, Barrow Hanley remains independently managed. Using fundamental research, Barrow Hanley seeks to make long-term investments in quality or improving businesses that are undervalued because of short-term disappointments. The advisor seeks to construct a portfolio with strict adherence to valuation factors, with below-average price/ earnings and price/book value ratios, and above-average current yields. Barrow Hanley has advised the fund since its inception in 1996.
Donald Smith & Co. Founded in 1983, Donald Smith & Co. is a deep-value-oriented firm that manages large-, mid-, and small-capitalization value portfolios. Donald Smith & Co. employs a strictly bottom-up approach, focusing on companies in the bottom decile of price-to-tangible-book value in the benchmark. The advisor uses fundamental analysis to invest in those companies that it considers to be inexpensive relative to their estimate of normalized earnings power and to have solid balance sheets and asset quality. Donald Smith & Co. has managed a portion of the fund since 2005.
25
Pzena. Founded in 1995, Pzena is a global investment management firm that employs a deep value investment approach. Pzena uses in-depth fundamental research to identify companies that are temporarily underperforming their long-term earnings power. Companies are purchased when Pzena judges that: (1) the company’s problems are temporary; (2) management has a viable strategy to generate recovery; and (3) there is meaningful downside protection in case the earnings recovery does not materialize. Pzena has managed a portion of the fund since 2014.
The board concluded that each advisor’s experience, stability, depth, and performance, among other factors, warranted continuation of the advisory arrangements.
Investment performance
The board considered the short- and long-term performance of the fund and each advisor, including any periods of outperformance or underperformance compared with a relevant benchmark index and peer group. The board concluded that the performance was such that the advisory arrangements should continue. Information about the fund’s most recent performance can be found in the Performance Summary section of this report.
Cost
The board concluded that the fund’s expense ratio was well below the average expense ratio charged by funds in its peer group and that the fund’s advisory fee rate was also well below the peer-group average. Information about the fund’s expense ratio appears in the About Your Fund’s Expenses section of this report as well as in the Financial Statements section, which also includes information about the fund’s advisory fee rate.
The board did not consider the profitability of Barrow Hanley, Donald Smith & Co., or Pzena in determining whether to approve the advisory fees, because the firms are independent of Vanguard and the advisory fees are the result of arm’s-length negotiations.
The benefit of economies of scale
The board concluded that the fund’s shareholders benefit from economies of scale because of breakpoints in the advisory fee schedules for Barrow Hanley, Donald Smith & Co., and Pzena. The breakpoints reduce the effective rate of the fees as the fund’s assets managed by each advisor increase.
The board will consider whether to renew the advisory arrangements again after a one-year period.
26
Glossary
30-Day SEC Yield. A fund’s 30-day SEC yield is derived using a formula specified by the U.S. Securities and Exchange Commission. Under the formula, data related to the fund’s security holdings in the previous 30 days are used to calculate the fund’s hypothetical net income for that period, which is then annualized and divided by the fund’s estimated average net assets over the calculation period. For the purposes of this calculation, a security’s income is based on its current market yield to maturity (for bonds), its actual income (for asset-backed securities), or its projected dividend yield (for stocks). Because the SEC yield represents hypothetical annualized income, it will differ—at times significantly—from the fund’s actual experience. As a result, the fund’s income distributions may be higher or lower than implied by the SEC yield.
Beta. A measure of the magnitude of a fund’s past share-price fluctuations in relation to the ups and downs of a given market index. The index is assigned a beta of 1.00. Compared with a given index, a fund with a beta of 1.20 typically would have seen its share price rise or fall by 12% when the index rose or fell by 10%. For this report, beta is based on returns over the past 36 months for both the fund and the index. Note that a fund’s beta should be reviewed in conjunction with its R-squared (see definition). The lower the R-squared, the less correlation there is between the fund and the index, and the less reliable beta is as an indicator of volatility.
Dividend Yield. Dividend income earned by stocks, expressed as a percentage of the aggregate market value (or of net asset value, for a fund). The yield is determined by dividing the amount of the annual dividends by the aggregate value (or net asset value) at the end of the period. For a fund, the dividend yield is based solely on stock holdings and does not include any income produced by other investments.
Earnings Growth Rate. The average annual rate of growth in earnings over the past five years for the stocks now in a fund.
Equity Exposure. A measure that reflects a fund’s investments in stocks and stock futures. Any holdings in short-term reserves are excluded.
Expense Ratio. A fund’s total annual operating expenses expressed as a percentage of the fund’s average net assets. The expense ratio includes management and administrative expenses, but does not include the transaction costs of buying and selling portfolio securities.
Foreign Holdings. The percentage of a fund represented by securities or depositary receipts of companies based outside the United States.
Inception Date. The date on which the assets of a fund (or one of its share classes) are first invested in accordance with the fund’s investment objective. For funds with a subscription period, the inception date is the day after that period ends. Investment performance is measured from the inception date.
Median Market Cap. An indicator of the size of companies in which a fund invests; the midpoint of market capitalization (market price x shares outstanding) of a fund’s stocks, weighted by the proportion of the fund’s assets invested in each stock. Stocks representing half of the fund’s assets have market capitalizations above the median, and the rest are below it.
Price/Book Ratio. The share price of a stock divided by its net worth, or book value, per share.
For a fund, the weighted average price/book ratio of the stocks it holds.
27
Price/Earnings Ratio. The ratio of a stock’s current price to its per-share earnings over the past year. For a fund, the weighted average P/E of the stocks it holds. P/E is an indicator of market expectations about corporate prospects; the higher the P/E, the greater the expectations for a company’s future growth.
R-Squared. A measure of how much of a fund’s past returns can be explained by the returns from the market in general, as measured by a given index. If a fund’s total returns were precisely synchronized with an index’s returns, its R-squared would be 1.00. If the fund’s returns bore no relationship to the index’s returns, its R-squared would be 0. For this report, R-squared is based on returns over the past 36 months for both the fund and the index.
Return on Equity. The annual average rate of return generated by a company during the past five years for each dollar of shareholder’s equity (net income divided by shareholder’s equity). For a fund, the weighted average return on equity for the companies whose stocks it holds.
Short-Term Reserves. The percentage of a fund invested in highly liquid, short-term securities that can be readily converted to cash.
Turnover Rate. An indication of the fund’s trading activity. Funds with high turnover rates incur higher transaction costs and may be more likely to distribute capital gains (which may be taxable to investors). The turnover rate excludes in-kind transactions, which have minimal impact on costs.
28
The Global Industry Classification Standard (“GICS”) was developed by and is the exclusive property and a service mark of MSCI Inc. (“MSCI”) and Standard and Poor’s, a division of McGraw-Hill Companies, Inc. (“S&P”), and is licensed for use by Vanguard. Neither MSCI, S&P nor any third party involved in making or compiling the GICS or any GICS classification makes any express or implied warranties or representations with respect to such standard or classification (or the results to be obtained by the use thereof), and all such parties hereby expressly disclaim all warranties of originality, accuracy, completeness, merchantability or fitness for a particular purpose with respect to any such standard or classification. Without limiting any of the foregoing, in no event shall MSCI, S&P, any of its affiliates or any third party involved in making or compiling the GICS or any GICS classification have any liability for any direct, indirect, special, punitive, consequential or any other damages (including lost profits) even if notified of the possibility of such damages.
29
This page intentionally left blank.
The People Who Govern Your Fund
The trustees of your mutual fund are there to see that the fund is operated and managed in your best interests since, as a shareholder, you are a part owner of the fund. Your fund’s trustees also serve on the board of directors of The Vanguard Group, Inc., which is owned by the Vanguard funds and provides services to them on an at-cost basis.
A majority of Vanguard’s board members are independent, meaning that they have no affiliation with Vanguard or the funds they oversee, apart from the sizable personal investments they have made as private individuals. The independent board members have distinguished backgrounds in business, academia, and public service. Each of the trustees and executive officers oversees 208 Vanguard funds.
Information for each trustee and executive officer of the fund appears below. The mailing address of the trustees and officers is P.O. Box 876, Valley Forge, PA 19482. More information about the trustees is in the Statement of Additional Information, which can be obtained, without charge, by contacting Vanguard at 800-662-7447, or online at vanguard.com.
Interested Trustees1
F. William McNabb III
Born in 1957. Trustee since July 2009. Principal occupation(s) during the past five years and other experience: chairman of the board (January 2010–present) of Vanguard and of each of the investment companies served by Vanguard, trustee (2009–present) of each of the investment companies served by Vanguard, and director (2008–present) of Vanguard. Chief executive officer and president (2008–2017) of Vanguard and each of the investment companies served by Vanguard, managing director (1995–2008) of Vanguard, and director (1997–2018) of Vanguard Marketing Corporation. Director (2018–present) of UnitedHealth Group.
Mortimer J. Buckley
Born in 1969. Trustee since January 2018. Principal occupation(s) during the past five years and other experience: chief executive officer (January 2018–present) of Vanguard; chief executive officer, president, and trustee (January 2018–present) of each of the investment companies served by Vanguard; president and director (2017–present) of Vanguard; and president (February 2018–present) of Vanguard Marketing Corporation. Chief investment officer (2013–2017), managing director (2002–2017), head of the Retail Investor Group (2006–2012), and chief information officer (2001–2006) of Vanguard. Chairman of the board (2011–2017) of the Children’s Hospital of Philadelphia.
Independent Trustees
Emerson U. Fullwood
Born in 1948. Trustee since January 2008. Principal occupation(s) during the past five years and other experience: executive chief staff and marketing officer for North America and corporate vice president (retired 2008) of Xerox Corporation (document management products and services). Former president of the Worldwide Channels Group, Latin America, and Worldwide Customer Service and executive chief staff officer of Developing Markets of Xerox. Executive in residence and 2009–2010 Distinguished Minett Professor at the Rochester Institute of Technology. Lead director of SPX FLOW, Inc. (multi-industry manufacturing). Director of the University of Rochester Medical Center, the Monroe Community College Foundation, the United Way of Rochester, North Carolina A&T University, and Roberts Wesleyan College. Trustee of the University of Rochester.
Amy Gutmann
Born in 1949. Trustee since June 2006. Principal occupation(s) during the past five years and other experience: president (2004–present) of the University of Pennsylvania. Christopher H. Browne Distinguished Professor of Political Science, School of Arts and Sciences, and professor of communication, Annenberg School for Communication, with secondary faculty appointments in the Department of Philosophy, School of Arts and Sciences, and at the Graduate School of Education, University of Pennsylvania. Trustee of the National Constitution Center.
1 Mr. McNabb and Mr. Buckley are considered “interested persons,” as defined in the Investment Company Act of 1940, because they are officers of the Vanguard funds.
JoAnn Heffernan Heisen
Born in 1950. Trustee since July 1998. Principal occupation(s) during the past five years and other experience: corporate vice president of Johnson & Johnson (pharmaceuticals/medical devices/consumer products) and member of its executive committee (1997–2008). Chief global diversity officer (retired 2008), vice president and chief information officer (1997–2006), controller (1995–1997), treasurer (1991–1995), and assistant treasurer (1989–1991) of Johnson & Johnson. Director of Skytop Lodge Corporation (hotels) and the Robert Wood Johnson Foundation. Member of the advisory board of the Institute for Women’s Leadership at Rutgers University.
F. Joseph Loughrey
Born in 1949. Trustee since October 2009. Principal occupation(s) during the past five years and other experience: president and chief operating officer (retired 2009) and vice chairman of the board (2008–2009) of Cummins Inc. (industrial machinery). Chairman of the board of Hillenbrand, Inc. (specialized consumer services), Oxfam America, and the Lumina Foundation for Education. Director of the V Foundation for Cancer Research. Member of the advisory council for the College of Arts and Letters and chair of the advisory board to the Kellogg Institute for International Studies, both at the University of Notre Dame.
Mark Loughridge
Born in 1953. Trustee since March 2012. Principal occupation(s) during the past five years and other experience: senior vice president and chief financial officer (retired 2013) of IBM (information technology services). Fiduciary member of IBM’s Retirement Plan Committee (2004–2013), senior vice president and general manager (2002–2004) of IBM Global Financing, vice president and controller (1998–2002) of IBM, and a variety of other prior management roles at IBM. Member of the Council on Chicago Booth.
Scott C. Malpass
Born in 1962. Trustee since March 2012. Principal occupation(s) during the past five years and other experience: chief investment officer (1989–present) and vice president (1996–present) of the University of Notre Dame. Assistant professor of finance at the Mendoza College of Business, University of Notre Dame, and member of the Notre Dame 403(b) Investment Committee. Chairman of the board of TIFF Advisory Services, Inc. Member of the board of Catholic Investment Services, Inc. (investment advisors), the board of advisors for Spruceview Capital Partners, and the board of superintendence of the Institute for the Works of Religion.
Deanna Mulligan
Born in 1963. Trustee since January 2018. Principal occupation(s) during the past five years and other experience: president (2010–present) and chief executive officer (2011–present) of The Guardian Life Insurance Company of America. Chief operating officer (2010–2011) and executive vice president (2008–2010) of Individual Life and Disability of The Guardian Life Insurance Company of America. Member of the board of The Guardian Life Insurance Company of America, the American Council of Life Insurers, the Partnership for New York City (business leadership), and the Committee Encouraging Corporate Philanthropy. Trustee of the Economic Club of New York and the Bruce Museum (arts and science). Member of the Advisory Council for the Stanford Graduate School of Business.
André F. Perold
Born in 1952. Trustee since December 2004. Principal occupation(s) during the past five years and other experience: George Gund Professor of Finance and Banking, Emeritus at the Harvard Business School (retired 2011). Chief investment officer and co-managing partner of HighVista Strategies LLC (private investment firm). Overseer of the Museum of Fine Arts Boston.
Sarah Bloom Raskin
Born in 1961. Trustee since January 2018. Principal occupation(s) during the past five years and other experience: deputy secretary (2014–2017) of the United States Department of the Treasury. Governor (2010–2014) of the Federal Reserve Board. Commissioner (2007–2010) of financial regulation for the State of Maryland. Member of the board of directors (2012–2014) of Neighborhood Reinvestment Corporation. Director of i(x) Investments, LLC.
Peter F. Volanakis
Born in 1955. Trustee since July 2009. Principal occupation(s) during the past five years and other experience: president and chief operating officer (retired 2010) of Corning Incorporated (communications equipment) and director of Corning Incorporated (2000–2010) and Dow Corning (2001–2010). Director (2012) of SPX Corporation (multi-industry manufacturing). Overseer of the Amos Tuck School of Business Administration, Dartmouth College (2001–2013). Chairman of the board of trustees of Colby-Sawyer College. Member of the Board of Hypertherm Inc. (industrial cutting systems, software, and consumables).
Executive Officers
Glenn Booraem
Born in 1967. Principal occupation(s) during the past five years and other experience: principal of Vanguard. Investment stewardship officer (2017–present), treasurer (2015–2017), controller (2010–2015), and assistant controller (2001–2010) of each of the investment companies served by Vanguard.
Christine M. Buchanan
Born in 1970. Principal occupation(s) during the past five years and other experience: principal of Vanguard and global head of Fund Administration at Vanguard. Treasurer (2017–present) of each of the investment companies served by Vanguard. Partner (2005–2017) at KPMG LLP (audit, tax, and advisory services).
Brian Dvorak
Born in 1973. Principal occupation(s) during the past five years and other experience: principal of Vanguard. Chief compliance officer (2017–present) of Vanguard and each of the investment companies served by Vanguard. Assistant vice president (2017–present) of Vanguard Marketing Corporation. Vice president and director of Enterprise Risk Management (2011–2013) at Oppenheimer Funds, Inc.
Thomas J. Higgins
Born in 1957. Principal occupation(s) during the past five years and other experience: principal of Vanguard. Chief financial officer (2008–present) and treasurer (1998–2008) of each of the investment companies served by Vanguard.
Peter Mahoney
Born in 1974. Principal occupation(s) during the past five years and other experience: principal of Vanguard. Controller (2015–present) of each of the investment companies served by Vanguard. Head of International Fund Services (2008–2014) at Vanguard.
Anne E. Robinson
Born in 1970. Principal occupation(s) during the past five years and other experience: general counsel (2016–present) of Vanguard. Secretary (2016–present) of Vanguard and of each of the investment companies served by Vanguard. Managing director (2016–present) of Vanguard. Director and senior vice president (2016–2018) of Vanguard Marketing Corporation. Managing director and general counsel of Global Cards and Consumer Services (2014–2016) at Citigroup. Counsel (2003–2014) at American Express.
Michael Rollings
Born in 1963. Principal occupation(s) during the past five years and other experience: finance director (2017–present) and treasurer (2017) of each of the investment companies served by Vanguard. Managing director (2016–present) of Vanguard. Chief financial officer (2016–present) of Vanguard. Director (2016–present) of Vanguard Marketing Corporation. Executive vice president and chief financial officer (2006–2016) of MassMutual Financial Group.
| Vanguard Senior Management Team | |
| Mortimer J. Buckley | James M. Norris |
| Gregory Davis | Thomas M. Rampulla |
| John James | Karin A. Risi |
| Martha G. King | Anne E. Robinson |
| John T. Marcante | Michael Rollings |
| Chris D. McIsaac | |
| Chairman Emeritus and Senior Advisor | |
| John J. Brennan | |
| Chairman, 1996–2009 | |
| Chief Executive Officer and President, 1996–2008 | |
| Founder | |
| John C. Bogle | |
| Chairman and Chief Executive Officer, 1974–1996 | |
 | |
| P.O. Box 2600 Valley Forge, PA 19482-2600 | |
| |
| Fund Information > 800-662-7447 | Source for Bloomberg Barclays indexes: Bloomberg |
| Direct Investor Account Services > 800-662-2739 | Index Services Limited. Copyright 2018, Bloomberg. All |
| Institutional Investor Services > 800-523-1036 | rights reserved. |
| Text Telephone for People | |
| Who Are Deaf or Hard of Hearing > 800-749-7273 | CFA® is a registered trademark owned by CFA Institute. |
| This material may be used in conjunction | |
| with the offering of shares of any Vanguard | |
| fund only if preceded or accompanied by | |
| the fund’s current prospectus. | |
| All comparative mutual fund data are from Lipper, a | |
| Thomson Reuters Company, or Morningstar, Inc., unless | |
| otherwise noted. | |
| You can obtain a free copy of Vanguard’s proxy voting | |
| guidelines by visiting vanguard.com/proxyreporting or by | |
| calling Vanguard at 800-662-2739. The guidelines are | |
| also available from the SEC’s website, sec.gov. In | |
| addition, you may obtain a free report on how your fund | |
| voted the proxies for securities it owned during the 12 | |
| months ended June 30. To get the report, visit either | |
| vanguard.com/proxyreporting or sec.gov. | |
| You can review and copy information about your fund at | |
| the SEC’s Public Reference Room in Washington, D.C. To | |
| find out more about this public service, call the SEC at | |
| 202-551-8090. Information about your fund is also | |
| available on the SEC’s website, and you can receive | |
| copies of this information, for a fee, by sending a | |
| request in either of two ways: via email addressed to | |
| publicinfo@sec.gov or via regular mail addressed to the | |
| Public Reference Section, Securities and Exchange | |
| Commission, Washington, DC 20549-1520. | |
| © 2018 The Vanguard Group, Inc. | |
| All rights reserved. | |
| Vanguard Marketing Corporation, Distributor. | |
| Q9342 062018 | |
| Semiannual Report | April 30, 2018 |
| Vanguard Mid-Cap Growth Fund |
Vanguard’s Principles for Investing Success
We want to give you the best chance of investment success. These principles, grounded in Vanguard’s research and experience, can put you on the right path.
Goals. Create clear, appropriate investment goals.
Balance. Develop a suitable asset allocation using broadly diversified funds. Cost. Minimize cost.
Discipline. Maintain perspective and long-term discipline.
A single theme unites these principles: Focus on the things you can control. We believe there is no wiser course for any investor.
| Contents | |
| Your Fund’s Performance at a Glance. | 1 |
| CEO’s Perspective. | 2 |
| Advisors’ Report. | 4 |
| Results of Proxy Voting. | 8 |
| Fund Profile. | 9 |
| Performance Summary. | 10 |
| Financial Statements. | 11 |
| About Your Fund’s Expenses. | 22 |
| Trustees Approve Advisory Arrangements. | 24 |
| Glossary. | 26 |
Please note: The opinions expressed in this report are just that—informed opinions. They should not be considered promises or advice. Also, please keep in mind that the information and opinions cover the period through the date on the front of this report. Of course, the risks of investing in your fund are spelled out in the prospectus.
See the Glossary for definitions of investment terms used in this report.
About the cover: Nautical images have been part of Vanguard’s rich heritage since its start in 1975. For an incoming ship, a lighthouse offers a beacon and safe path to shore. You can similarly depend on Vanguard to put you first––and light the way––as you strive to meet your financial goals. Our client focus and low costs, stemming from our unique ownership structure, assure that your interests are paramount.
Your Fund’s Performance at a Glance
• For the six months ended April 30, 2018, Vanguard Mid-Cap Growth Fund returned 7.58%. It surpassed its benchmark, the Russell Midcap Growth Index, and the average return of its mid-capitalization growth fund peers.
• Stocks advanced as the period opened, supported by improving economic data, solid corporate earnings, and new tax reform legislation. But as the half year progressed, investors’ inflation fears increased, causing stocks to decline.
• Value stocks trailed their growth counterparts, while large-cap stocks outpaced their small-cap peers.
• The industrial, health care, and energy sectors helped drive relative performance.
• Consumer staples and consumer discretionary stocks were among the biggest detractors from relative performance.
| Total Returns: Six Months Ended April 30, 2018 | ||
| Total | ||
| Returns | ||
| Vanguard Mid-Cap Growth Fund | 7.58% | |
| Russell Midcap Growth Index | 5.16 | |
| Mid-Cap Growth Funds Average | 5.54 | |
| Mid-Cap Growth Funds Average: Derived from data provided by Lipper, a Thomson Reuters Company. | ||
| Expense Ratios | ||
| Your Fund Compared With Its Peer Group | ||
| Peer Group | ||
| Fund | Average | |
| Mid-Cap Growth Fund | 0.36% | 1.21% |
The fund expense ratio shown is from the prospectus dated February 22, 2018, and represents estimated costs for the current fiscal year. For the six months ended April 30, 2018, the fund’s annualized expense ratio was 0.36%. The peer-group expense ratio is derived from data provided by Lipper, a Thomson Reuters Company, and captures information through year-end 2017.
Peer group: Mid-Cap Growth Funds.
1
CEO’s Perspective

Tim Buckley
President and Chief Executive Officer
Dear Shareholder,
I feel extremely fortunate to have the chance to lead a company filled with people who come to work every day passionate about Vanguard’s core purpose: to take a stand for all investors, to treat them fairly, and to give them the best chance for investment success.
When I joined Vanguard in 1991, I found a mission-driven team focused on improving lives—helping people retire more comfortably, put their children through college, and achieve financial security. I also found a company with purpose in an industry ripe for improvement.
It was clear, even early in my career, that the cards were stacked against most investors. Hidden fees, performance-chasing, and poor advice were relentlessly eroding investors’ dreams.
We knew Vanguard could be different and, as a result, could make a real difference. We have lowered the costs of investing for our shareholders significantly. And we’re proud of the performance of our funds.
Vanguard is built for Vanguard investors—we focus solely on you, our fund shareholders. Everything we do is designed to give our clients the best chance for investment success. In my role as CEO, I’ll keep this priority
2
front and center. We’re proud of what we’ve achieved, but we’re even more excited about what’s to come.
Steady, time-tested guidance
Our guidance for investors, as always, is to stay the course, tune out the hyperbolic headlines, and focus on your goals and what you can control, such as costs and how much you save. This time-tested advice has served our clients well over the decades.
Regardless of how the markets perform in the short term, I’m incredibly optimistic about the future for our investors. We have a dedicated team serving you, and we will never stop striving to make
Vanguard the best place for you to invest through our high-quality funds and services, advice and guidance to help you meet your financial goals, and an experience that makes you feel good about entrusting us with your hard-earned savings.
Thank you for your continued loyalty.
Sincerely,

Mortimer J. Buckley
President and Chief Executive Officer
May 16, 2018
| Market Barometer | |||
| Total Returns | |||
| Periods Ended April 30, 2018 | |||
| Six | One | Five Years | |
| Months | Year | (Annualized) | |
| Stocks | |||
| Russell 1000 Index (Large-caps) | 3.83% | 13.17% | 12.84% |
| Russell 2000 Index (Small-caps) | 3.27 | 11.54 | 11.74 |
| Russell 3000 Index (Broad U.S. market) | 3.79 | 13.05 | 12.75 |
| FTSE All-World ex US Index (International) | 3.72 | 15.84 | 5.85 |
| Bonds | |||
| Bloomberg Barclays U.S. Aggregate Bond Index | |||
| (Broad taxable market) | -1.87% | -0.32% | 1.47% |
| Bloomberg Barclays Municipal Bond Index | |||
| (Broad tax-exempt market) | -0.97 | 1.56 | 2.44 |
| Citigroup Three-Month U.S. Treasury Bill Index | 0.67 | 1.16 | 0.32 |
| CPI | |||
| Consumer Price Index | 1.57% | 2.46% | 1.50% |
3
Advisors’ Report
For the six months ended April 30, 2018, Vanguard Mid-Cap Growth Fund returned 7.58%. It outpaced its benchmark, the Russell Midcap Growth Index, and the average return of its mid-capitalization growth peer funds.
Your fund is managed by two independent advisors, a strategy that enhances the fund’s diversification by providing exposure to distinct yet complementary investment approaches. It’s not uncommon for different advisors to have different views about individual securities or the broader investment environment.
The fund’s advisors, the percentage of fund assets each manages, and brief descriptions of their investment strategies are presented in the table that follows. The advisors have also prepared a discussion of the investment environment that existed during the six-month period and of how their portfolio positioning reflects this assessment. These comments were prepared on May 11, 2018.
| Vanguard Mid-Cap Growth Fund Investment Advisors | |||
| Fund Assets Managed | |||
| Investment Advisor | % | $ Million | Investment Strategy |
| RS Investments | 49 | 2,073 | RS Investments, a Victory Capital investment |
| franchise, employs both fundamental analysis | |||
| and quantitative screening in seeking to identify | |||
| companies that the investment team believes | |||
| will produce sustainable earnings growth over a | |||
| multiyear horizon. Investment candidates | |||
| typically exhibit some or all of the following key | |||
| criteria: strong organic revenue growth, | |||
| expanding margins and profitability, innovative | |||
| products or services, defensible competitive | |||
| advantages, growing market share, and | |||
| experienced management teams. | |||
| William Blair Investment | 48 | 2,047 | Uses a fundamental investment approach in |
| Management, LLC | pursuit of superior long-term investment results | ||
| from growth-oriented companies with | |||
| leadership positions and strong market | |||
| presence. | |||
| Cash Investments | 3 | 127 | These short-term reserves are invested by |
| Vanguard in equity index products to simulate | |||
| investment in stocks. Each advisor may also | |||
| maintain a modest cash position. | |||
4
RS Investments
Portfolio Managers:
D. Scott Tracy, CFA, Chief Investment Officer
Stephen J. Bishop
Melissa Chadwick-Dunn
Christopher W. Clark, CFA
U.S. equity markets were positive but mixed for the half year ended April 30, 2018. Mid-cap growth stocks, as measured by the Russell Midcap Growth Index, outperformed value-oriented mid-caps, as measured by the Russell Midcap Value Index. Underlying fundamentals were strong. Earnings were higher than expected for all styles and market caps, driven by strong economic growth, the largest corporate tax cuts in decades, and solid execution.
However, the six-month time frame was really a tale of two very different periods. The Russell Midcap Growth Index returned almost 10% for the three months ended January 31. An uptick in volatility arrived in February, driven in part by increased expectations for interest rate hikes under new Federal Reserve Chairman Jerome Powell. Other factors included uncertainty surrounding trade policy following the threat of tariffs and the potential for a trade war with China.
Markets also grew concerned about the possibility of increased regulation for some of the largest technology companies after it emerged that they may have been
collecting more user data than previously thought. This resulted in negative performance for the Russell Midcap Growth Index for the three months ended April 30.
Sector returns for our portion of the portfolio were mixed. Stock selection in information technology, consumer staples, consumer discretionary, and real estate weighed on returns. But selection in health care, industrials, materials, energy, and financials was positive.
The underperformance in information technology was led by software and services holding Euronet Worldwide. Euronet provides electronic payment and transaction processing solutions for financial institutions, retailers, service providers, and individual consumers.
We purchased the stock because of the high barriers to entry in each of the company’s three core segments (ATM, ePay, and money transfer), its strong management team, and the opportunity it had to expand its profit margins through expense management. It declined following concerns that the European Union would effectively cap ATM charges for customers traveling abroad. Although this would affect the company’s future earnings, we felt the reaction was overblown based on the likely timeline of the regulation’s implementation (2023) and the relative size of the business. As a result, we continue to hold Euronet.
5
Health care was the top-performing sector, led by pharmaceutical and biotechnology stocks and life-sciences holding bluebird bio. Bluebird has focused on developing gene therapies that target “orphan diseases,” conditions that affect small, underserved but high-need populations. The company’s technology uses an HIV-1 virus, lentivirus, to modify genes and correct a patient’s abnormal stem cells. These cells are then reintroduced into a patient’s bone marrow via transplant, where they produce properly functioning daughter cells to correct the disorder. In late 2017, bluebird bio shared strong results for its ongoing Phase 1 therapy study in late-stage, relapsed multiple myeloma. We believe the company is in the early stages of its potential, and we continue to hold the position.
William Blair Investment Management, LLC
Portfolio Managers: Robert C. Lanphier, Partner David Ricci, CFA, Partner Dan Crowe, CFA, Partner
The equity market as measured by the Russell Midcap Growth Index advanced from November to January, supported by improving economic data and solid corporate earnings growth. Further bolstering investor optimism was the reduction of the U.S. corporate statutory tax rate in December.
However, the market weakened and volatility spiked after inflationary fears arose in late January as the future ramifications of a tight labor market weighed on investors’ minds. Companies generally reported strong financial results and economic data was mostly positive for the first half of the period, but the Russell Midcap Growth Index posted declines from February to April.
Our performance was driven by a combination of strong stock selection and our investment style. After trailing modestly in the first half of the period, our strategy added significant value beginning in February when the market turned negative. As investors digested the inflation-related cost pressures on businesses, our higher and more sustainable growth bias, which leads us to companies with value-added products and services and flexible pricing, was helpful.
Stock selection was strong in most sectors. The top contributors were industrials, including Copart and Verisk Analytics; health care, including ABIOMED; and information technology, including Red Hat. The best performer was Copart, an auction platform for salvage vehicles. It benefited from higher volumes of newer and more expensive cars as insurers chose to scrap vehicles sooner because of the rising cost of repairs. This was a key component of our investment thesis.
6
Shares of Red Hat, an open-source software provider, advanced on strong demand for Red Hat Linux and the company’s cloud-based solutions. We believe the firm will continue to benefit from the massive shift in enterprise IT architectures to Linux-based operating systems, for which it provides support, services, and other products.
Domino’s Pizza was also among the period’s standouts, but in aggregate, stock selection in the consumer discretionary sector detracted from results. Notable laggards included Newell Brands, CarMax, and Mohawk Industries.
Newell Brands, a diversified consumer and commercial products company, underperformed in part because of a challenging retail environment. Its 2016 acquisition of Jarden also proved to be more complex than anticipated. Other large detractors included Ball and Coherent.
Ball provides metal packaging for beverages, foods, and household products. Its share price weakness was primarily due to a drop in North American beverage can sales in late 2017 as hurricanes resulted in lost production.
Looking forward, we continue to focus on identifying quality growth businesses at attractive valuations. The economic recovery following the global financial crisis began almost nine years ago, and we are entering a period of unprecedented late-cycle fiscal stimulus. Although the effect of this stimulus remains to be seen, we believe it is in our clients’ best interest for us to concentrate on bottom-up, fundamental analysis. We believe purchasing companies with durable growth drivers that are underappreciated by other investors will allow us to outperform in a variety of economic scenarios and over the long term.
7
Results of Proxy Voting
At a special meeting of shareholders on November 15, 2017, fund shareholders approved the following proposals:
Proposal 1—Elect trustees for the fund.*
The individuals listed in the table below were elected as trustees for the fund. All trustees with the exception of Ms. Mulligan, Ms. Raskin, and Mr. Buckley (each of whom already serves as a director of The Vanguard Group, Inc.) served as trustees to the funds prior to the shareholder meeting.
| Percentage | |||
| Trustee | For | Withheld | For |
| Mortimer J. Buckley | 860,548,560 | 28,473,629 | 96.8% |
| Emerson U. Fullwood | 859,625,511 | 29,396,677 | 96.7% |
| Amy Gutmann | 859,439,842 | 29,582,347 | 96.7% |
| JoAnn Heffernan Heisen | 860,336,031 | 28,686,158 | 96.8% |
| F. Joseph Loughrey | 860,411,988 | 28,610,200 | 96.8% |
| Mark Loughridge | 860,924,717 | 28,097,471 | 96.8% |
| Scott C. Malpass | 859,842,339 | 29,179,849 | 96.7% |
| F. William McNabb III | 859,460,373 | 29,561,815 | 96.7% |
| Deanna Mulligan | 860,984,342 | 28,037,846 | 96.8% |
| André F. Perold | 850,692,197 | 38,329,992 | 95.7% |
| Sarah Bloom Raskin | 860,331,311 | 28,690,878 | 96.8% |
| Peter F. Volanakis | 860,652,393 | 28,369,796 | 96.8% |
| * Results are for all funds within the same trust. |
Proposal 3—Approve a manager-of-managers arrangement with wholly owned subsidiaries of Vanguard.
This arrangement enables Vanguard or the fund to enter into and materially amend investment advisory arrangements with wholly owned subsidiaries of Vanguard, subject to the approval of the fund’s board of trustees and any conditions imposed by the Securities and Exchange Commission (SEC), while avoiding the costs and delays associated with obtaining future shareholder approval. The ability of the fund to operate in this manner is contingent upon the SEC’s approval of a pending application for an order of exemption.
| Broker | Percentage | ||||
| Vanguard Fund | For | Abstain | Against | Non-Votes | For |
| Mid-Cap Growth Fund | 85,223,787 | 4,027,034 | 2,856,741 | 12,340,861 | 81.6% |
8
Mid-Cap Growth Fund
Fund Profile
As of April 30, 2018
| Portfolio Characteristics | |||
| Russell | DJ | ||
| Midcap | U.S. Total | ||
| Growth | Market | ||
| Fund | Index | FA Index | |
| Number of Stocks | 111 | 420 | 3,752 |
| Median Market Cap | $12.0B | $14.4B | $66.1B |
| Price/Earnings Ratio | 30.1x | 25.6x | 20.5x |
| Price/Book Ratio | 5.0x | 5.3x | 2.9x |
| Return on Equity | 15.6% | 19.0% | 15.0% |
| Earnings Growth | |||
| Rate | 18.7% | 13.2% | 8.4% |
| Dividend Yield | 0.6% | 1.0% | 1.8% |
| Foreign Holdings | 0.9% | 0.0% | 0.0% |
| Turnover Rate | |||
| (Annualized) | 70% | — | — |
| Ticker Symbol | VMGRX | — | — |
| Expense Ratio1 | 0.36% | — | — |
| 30-Day SEC Yield | 0.40% | — | — |
| Short-Term Reserves | 2.3% | — | — |
Sector Diversification (% of equity exposure)
| Russell | DJ | ||
| Midcap | U.S. Total | ||
| Growth | Market | ||
| Fund | Index | FA Index | |
| Consumer | |||
| Discretionary | 17.5% | 17.4% | 13.1% |
| Consumer Staples | 2.4 | 4.0 | 6.3 |
| Energy | 2.8 | 2.5 | 6.0 |
| Financials | 8.6 | 7.5 | 15.1 |
| Health Care | 15.4 | 13.1 | 13.6 |
| Industrials | 18.7 | 17.2 | 10.5 |
| Information | |||
| Technology | 28.6 | 29.0 | 23.8 |
| Materials | 4.8 | 5.8 | 3.3 |
| Real Estate | 1.1 | 3.2 | 3.7 |
| Telecommunication | |||
| Services | 0.0 | 0.2 | 1.7 |
| Utilities | 0.1 | 0.1 | 2.9 |
Sector categories are based on the Global Industry Classification Standard (“GICS”), except for the “Other” category (if applicable), which includes securities that have not been provided a GICS classification as of the effective reporting period.
| Volatility Measures | ||
| Russell | DJ | |
| Midcap | U.S. Total | |
| Growth | Market | |
| Index | FA Index | |
| R-Squared | 0.93 | 0.85 |
| Beta | 0.97 | 0.99 |
| These measures show the degree and timing of the fund’s | ||
| fluctuations compared with the indexes over 36 months. | ||
Ten Largest Holdings (% of total net assets)
| Progressive Corp. | Property & Casualty | |
| Insurance | 2.5% | |
| Vail Resorts Inc. | Leisure Facilities | 2.0 |
| Worldpay Inc. | Data Processing & | |
| Outsourced Services | 1.9 | |
| Ultimate Software Group | ||
| Inc. | Application Software | 1.9 |
| BWX Technologies Inc. | Aerospace & | |
| Defense | 1.9 | |
| Red Hat Inc. | Systems Software | 1.9 |
| Ulta Beauty Inc. | Specialty Stores | 1.7 |
| East West Bancorp Inc. | Regional Banks | 1.7 |
| Copart Inc. | Diversified Support | |
| Services | 1.7 | |
| Six Flags Entertainment | ||
| Corp. | Leisure Facilities | 1.7 |
| Top Ten | 18.9% |
The holdings listed exclude any temporary cash investments and equity index products.
Investment Focus
1 The expense ratio shown is from the prospectus dated February 22, 2018, and represents estimated costs for the current fiscal year. For the six months ended April 30, 2018, the annualized expense ratio was 0.36%.
9
Mid-Cap Growth Fund
Performance Summary
All of the returns in this report represent past performance, which is not a guarantee of future results that may be achieved by the fund. (Current performance may be lower or higher than the performance data cited. For performance data current to the most recent month-end, visit our website at vanguard.com/performance.) Note, too, that both investment returns and principal value can fluctuate widely, so an investor’s shares, when sold, could be worth more or less than their original cost. The returns shown do not reflect taxes that a shareholder would pay on fund distributions or on the sale of fund shares.
Fiscal-Year Total Returns (%): October 31, 2007, Through April 30, 2018
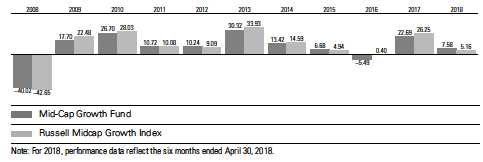
Average Annual Total Returns: Periods Ended March 31, 2018
This table presents returns through the latest calendar quarter—rather than through the end of the fiscal period.
Securities and Exchange Commission rules require that we provide this information.
| Inception | One | Five | Ten | |
| Date | Year | Years | Years | |
| Mid-Cap Growth Fund | 12/31/1997 | 19.64% | 11.27% | 9.93% |
See Financial Highlights for dividend and capital gains information.
10
Mid-Cap Growth Fund
Financial Statements (unaudited)
Statement of Net Assets
As of April 30, 2018
The fund reports a complete list of its holdings in regulatory filings four times in each fiscal year, at the quarter-ends. For the second and fourth fiscal quarters, the lists appear in the fund’s semiannual and annual reports to shareholders. For the first and third fiscal quarters, the fund files the lists with the Securities and Exchange Commission on Form N-Q. Shareholders can look up the fund’s Forms N-Q on the SEC’s website at sec.gov. Forms N-Q may also be reviewed and copied at the SEC’s Public Reference Room (see the back cover of this report for further information).
| Market | |||
| Value• | |||
| Shares | ($000) | ||
| Common Stocks (95.6%)1 | |||
| Consumer Discretionary (16.8%) | |||
| Vail Resorts Inc. | 365,292 | 83,765 | |
| * | Ulta Beauty Inc. | 295,462 | 74,134 |
| Six Flags | |||
| Entertainment Corp. | 1,112,932 | 70,382 | |
| Ross Stores Inc. | 787,800 | 63,694 | |
| Domino’s Pizza Inc. | 183,700 | 44,406 | |
| Tiffany & Co. | 407,540 | 41,907 | |
| Hilton Worldwide | |||
| Holdings Inc. | 521,150 | 41,087 | |
| Wendy’s Co. | 2,450,025 | 41,013 | |
| * | Live Nation | ||
| Entertainment Inc. | 988,000 | 38,996 | |
| * | CarMax Inc. | 542,600 | 33,913 |
| * | Burlington Stores Inc. | 228,587 | 31,054 |
| * | Norwegian Cruise | ||
| Line Holdings Ltd. | 570,900 | 30,526 | |
| * | Dollar Tree Inc. | 306,030 | 29,345 |
| * | Mohawk Industries Inc. | 94,500 | 19,834 |
| Aptiv plc | 225,500 | 19,073 | |
| Yum China Holdings | |||
| Inc. | 419,670 | 17,945 | |
| Brunswick Corp. | 279,373 | 16,729 | |
| * | TopBuild Corp. | 187,230 | 14,922 |
| 712,725 | |||
| Consumer Staples (2.2%) | |||
| Pinnacle Foods Inc. | 851,780 | 51,447 | |
| Ingredion Inc. | 166,670 | 20,182 | |
| Conagra Brands Inc. | 540,300 | 20,029 | |
| 91,658 | |||
| Energy (2.6%) | |||
| * | Concho Resources Inc. | 295,047 | 46,384 |
| * | Parsley Energy Inc. | ||
| Class A | 1,185,600 | 35,604 | |
| * | Diamondback Energy | ||
| Inc. | 223,621 | 28,724 | |
| 110,712 | |||
| Financials (8.0%) | |||
| Progressive Corp. | 1,729,500 | 104,272 | |
| East West Bancorp | |||
| Inc. | 1,070,540 | 71,319 | |
| * | Western Alliance | ||
| Bancorp | 662,306 | 39,063 | |
| Cboe Global Markets | |||
| Inc. | 263,200 | 28,104 | |
| * | SVB Financial Group | 84,690 | 25,374 |
| MSCI Inc. Class A | 139,600 | 20,916 | |
| Intercontinental | |||
| Exchange Inc. | 252,717 | 18,312 | |
| * | LendingTree Inc. | 76,110 | 18,145 |
| Ameriprise Financial | |||
| Inc. | 116,710 | 16,364 | |
| 341,869 | |||
| Health Care (14.8%) | |||
| Zoetis Inc. | 706,000 | 58,937 | |
| * | Illumina Inc. | 226,770 | 54,636 |
| * | Veeva Systems Inc. | ||
| Class A | 540,712 | 37,920 | |
| * | Centene Corp. | 333,487 | 36,210 |
| * | WellCare Health | ||
| Plans Inc. | 169,820 | 34,840 | |
| Encompass Health | |||
| Corp. | 541,500 | 32,934 | |
| * | ABIOMED Inc. | 104,700 | 31,510 |
| * | Align Technology Inc. | 123,144 | 30,768 |
| Teleflex Inc. | 108,400 | 29,038 | |
| * | Bluebird Bio Inc. | 159,330 | 27,110 |
| * | Charles River | ||
| Laboratories | |||
| International Inc. | 258,600 | 26,944 | |
| Cooper Cos. Inc. | 105,969 | 24,236 | |
| * | Intuitive Surgical Inc. | 53,737 | 23,686 |
| * | Exact Sciences Corp. | 472,910 | 23,650 |
| West Pharmaceutical | |||
| Services Inc. | 266,979 | 23,550 | |
11
| Mid-Cap Growth Fund | |||
| Market | |||
| Value• | |||
| Shares | ($000) | ||
| * | Edwards Lifesciences | ||
| Corp. | 173,162 | 22,054 | |
| * | Neurocrine | ||
| Biosciences Inc. | 263,470 | 21,362 | |
| * | BioMarin | ||
| Pharmaceutical Inc. | 247,662 | 20,682 | |
| * | IDEXX Laboratories | ||
| Inc. | 103,200 | 20,071 | |
| * | Mettler-Toledo | ||
| International Inc. | 32,200 | 18,030 | |
| * | BeiGene Ltd. ADR | 94,830 | 16,081 |
| * | Sage Therapeutics Inc. | 103,570 | 14,906 |
| 629,155 | |||
| Industrials (18.0%) | |||
| BWX Technologies Inc. | 1,175,051 | 79,668 | |
| * | Copart Inc. | 1,382,300 | 70,608 |
| * | Verisk Analytics Inc. | ||
| Class A | 641,700 | 68,309 | |
| * | CoStar Group Inc. | 179,647 | 65,869 |
| Equifax Inc. | 413,565 | 46,340 | |
| * | Middleby Corp. | 357,800 | 45,026 |
| Knight-Swift | |||
| Transportation | |||
| Holdings Inc. | 1,150,520 | 44,882 | |
| Fortive Corp. | 554,100 | 38,959 | |
| Xylem Inc. | 492,200 | 35,881 | |
| Hexcel Corp. | 532,370 | 35,387 | |
| Wabtec Corp. | 376,700 | 33,455 | |
| Parker-Hannifin Corp. | 196,710 | 32,382 | |
| * | United Rentals Inc. | 174,470 | 26,170 |
| * | TransUnion | 398,317 | 25,855 |
| * | Gardner Denver | ||
| Holdings Inc. | 815,620 | 25,798 | |
| Roper Technologies | |||
| Inc. | 93,050 | 24,583 | |
| * | Teledyne Technologies | ||
| Inc. | 130,880 | 24,486 | |
| * | XPO Logistics Inc. | 210,910 | 20,492 |
| AO Smith Corp. | 300,310 | 18,424 | |
| 762,574 | |||
| Information Technology (27.4%) | |||
| * | Worldpay Inc. Class A | 1,016,329 | 82,546 |
| * | Ultimate Software | ||
| Group Inc. | 341,470 | 81,926 | |
| * | Red Hat Inc. | 483,340 | 78,813 |
| * | GoDaddy Inc. Class A | 1,061,139 | 68,507 |
| Microchip Technology | |||
| Inc. | 769,682 | 64,392 | |
| * | WEX Inc. | 378,150 | 61,230 |
| Global Payments Inc. | 532,027 | 60,146 | |
| * | Black Knight Inc. | 1,189,378 | 57,863 |
| Booz Allen Hamilton | |||
| Holding Corp. Class A | 1,208,133 | 47,878 | |
| * | Euronet Worldwide Inc. | 605,461 | 47,293 |
| Marvell Technology | |||
| Group Ltd. | 2,051,560 | 41,154 | |
| * | Guidewire Software | ||
| Inc. | 455,400 | 38,536 | |
| * | ServiceNow Inc. | 220,140 | 36,574 |
| Lam Research Corp. | 195,538 | 36,186 | |
| * | Take-Two Interactive | ||
| Software Inc. | 358,970 | 35,793 | |
| Maxim Integrated | |||
| Products Inc. | 633,030 | 34,500 | |
| LogMeIn Inc. | 297,200 | 32,751 | |
| * | Akamai Technologies | ||
| Inc. | 418,600 | 29,993 | |
| * | Tyler Technologies Inc. | 128,600 | 28,153 |
| TE Connectivity Ltd. | 270,200 | 24,791 | |
| * | Wix.com Ltd. | 290,210 | 23,870 |
| * | Yelp Inc. Class A | 510,690 | 22,904 |
| Analog Devices Inc. | 258,300 | 22,563 | |
| Activision Blizzard Inc. | 324,042 | 21,500 | |
| j2 Global Inc. | 259,300 | 20,583 | |
| * | Trimble Inc. | 589,060 | 20,382 |
| Western Digital Corp. | 168,080 | 13,243 | |
| Dropbox Inc. Class A | 405,552 | 12,211 | |
| * | Square Inc. | 192,490 | 9,113 |
| * | Coherent Inc. | 48,100 | 8,091 |
| 1,163,485 | |||
| Materials (4.6%) | |||
| Ball Corp. | 1,427,200 | 57,217 | |
| Vulcan Materials Co. | 317,400 | 35,450 | |
| Celanese Corp. | |||
| Class A | 316,000 | 34,340 | |
| Chemours Co. | 556,730 | 26,951 | |
| Steel Dynamics Inc. | 459,320 | 20,582 | |
| * | Axalta Coating | ||
| Systems Ltd. | 641,800 | 19,832 | |
| 194,372 | |||
| Other (0.3%) | |||
| 2 | Vanguard Mid-Cap | ||
| Growth ETF | 100,223 | 12,881 | |
| Real Estate (0.9%) | |||
| * | SBA Communications | ||
| Corp. Class A | 252,500 | 40,458 | |
| Total Common Stocks | |||
| (Cost $3,178,982) | 4,059,889 | ||
12
| Mid-Cap Growth Fund | |||
| Market | |||
| Value• | |||
| Shares | ($000) | ||
| Temporary Cash Investments (4.9%)1 | |||
| Money Market Fund (4.7%) | |||
| 3 | Vanguard Market | ||
| Liquidity Fund, | |||
| 1.886% | 1,988,464 | 198,846 | |
| Face | |||
| Amount | |||
| ($000) | |||
| U. S. Government and Agency Obligations (0.2%) | |||
| 4 | United States Treasury Bill, | ||
| 1.398%, 5/3/18 | 1,300 | 1,300 | |
| 4 | United States Treasury Bill, | ||
| 1.446%, 5/31/18 | 2,610 | 2,607 | |
| 4 | United States Treasury Bill, | ||
| 1.509%, 6/21/18 | 750 | 748 | |
| 4 | United States Treasury Bill, | ||
| 1.941%, 9/27/18 | 500 | 496 | |
| 4 | United States Treasury Bill, | ||
| 1.887%–1.946%, 10/4/18 | 5,500 | 5,454 | |
| 10,605 | |||
| Total Temporary Cash Investments | |||
| (Cost $209,411) | 209,451 | ||
| Total Investments (100.5%) | |||
| (Cost $3,388,393) | 4,269,340 | ||
| Other Assets and Liabilities (-0.5%) | |||
| Other Assets | 115,976 | ||
| Liabilities 4 | (138,705) | ||
| (22,729) | |||
| Net Assets (100%) | |||
| Applicable to 154,095,564 outstanding | |||
| $.001 par value shares of beneficial | |||
| interest (unlimited authorization) | 4,246,611 | ||
| Net Asset Value Per Share | $27.56 | ||
| Amount | |
| ($000) | |
| Statement of Assets and Liabilities | |
| Assets | |
| Investments in Securities, at Value | |
| Unaffiliated Issuers | 4,057,613 |
| Affiliated Issuers | 211,727 |
| Total Investments in Securities | 4,269,340 |
| Investment in Vanguard | 235 |
| Receivables for Investment | |
| Securities Sold | 99,013 |
| Receivables for Accrued Income | 1,079 |
| Receivables for Capital Shares Issued | 5,191 |
| Other Assets | 10,458 |
| Total Assets | 4,385,316 |
| Liabilities | |
| Payables for Investment | |
| Securities Purchased | 45,785 |
| Payables to Investment Advisor | 1,727 |
| Payables for Capital Shares Redeemed | 83,591 |
| Payables to Vanguard | 5,010 |
| Variation Margin Payable— | |
| Futures Contracts | 2,592 |
| Total Liabilities | 138,705 |
| Net Assets | 4,246,611 |
| At April 30, 2018, net assets consisted of: | |
| Amount | |
| ($000) | |
| Paid-in Capital | 3,076,333 |
| Undistributed Net Investment Income | 1,081 |
| Accumulated Net Realized Gains | 288,912 |
| Unrealized Appreciation (Depreciation) | |
| Investment Securities | 880,947 |
| Futures Contracts | (662) |
| Net Assets | 4,246,611 |
• See Note A in Notes to Financial Statements.
* Non-income-producing security.
1 The fund invests a portion of its cash reserves in equity markets through the use of index futures contracts. After giving effect to futures investments, the fund’s effective common stock and temporary cash investment positions represent 98.2% and 2.3%, respectively, of net assets.
2 Considered an affiliated company of the fund as the issuer is another member of The Vanguard Group.
3 Affiliated money market fund available only to Vanguard funds and certain trusts and accounts managed by Vanguard. Rate shown is the 7-day yield.
4 Securities with a value of $5,588,000 and cash of $2,711,000 have been segregated as initial margin for open futures contracts.
ADR—American Depositary Receipt.
13
| Mid-Cap Growth Fund | ||||
| Derivative Financial Instruments Outstanding as of Period End | ||||
| Futures Contracts | ||||
| ($000) | ||||
| Value and | ||||
| Number of | Unrealized | |||
| Long (Short) | Notional | Appreciation | ||
| Expiration | Contracts | Amount | (Depreciation) | |
| Long Futures Contracts | ||||
| E-mini S&P 500 Index | June 2018 | 494 | 65,381 | (567) |
| E-mini S&P Mid-Cap 400 Index | June 2018 | 253 | 47,364 | (95) |
| (662) | ||||
Unrealized appreciation (depreciation) on open futures contracts is required to be treated as realized gain (loss) for tax purposes.
See accompanying Notes, which are an integral part of the Financial Statements.
14
| Mid-Cap Growth Fund | |
| Statement of Operations | |
| Six Months Ended | |
| April 30, 2018 | |
| ($000) | |
| Investment Income | |
| Income | |
| Dividends—Unaffiliated Issuers | 15,969 |
| Dividends—Affiliated Issuers | 46 |
| Interest—Unaffiliated Issuers | 30 |
| Interest—Affiliated Issuers | 1,201 |
| Securities Lending—Net | 23 |
| Total Income | 17,269 |
| Expenses | |
| Investment Advisory Fees—Note B | |
| Basic Fee | 4,327 |
| Performance Adjustment | (1,012) |
| The Vanguard Group—Note C | |
| Management and Administrative | 4,088 |
| Marketing and Distribution | 360 |
| Custodian Fees | 26 |
| Shareholders’ Reports and Proxy | 49 |
| Trustees’ Fees and Expenses | 4 |
| Total Expenses | 7,842 |
| Expenses Paid Indirectly | (100) |
| Net Expenses | 7,742 |
| Net Investment Income | 9,527 |
| Realized Net Gain (Loss) | |
| Investment Securities Sold—Unaffiliated Issuers | 289,487 |
| Investment Securities Sold—Affiliated Issuers | (43) |
| Futures Contracts | 2,381 |
| Realized Net Gain (Loss) | 291,825 |
| Change in Unrealized Appreciation (Depreciation) | |
| Investment Securities—Unaffiliated Issuers | 15,999 |
| Investment Securities—Affiliated Issuers | 430 |
| Futures Contracts | (3,107) |
| Change in Unrealized Appreciation (Depreciation) | 13,322 |
| Net Increase (Decrease) in Net Assets Resulting from Operations | 314,674 |
See accompanying Notes, which are an integral part of the Financial Statements.
15
| Mid-Cap Growth Fund | ||
| Statement of Changes in Net Assets | ||
| Six Months Ended | Year Ended | |
| April 30, | October 31, | |
| 2018 | 2017 | |
| ($000) | ($000) | |
| Increase (Decrease) in Net Assets | ||
| Operations | ||
| Net Investment Income | 9,527 | 15,976 |
| Realized Net Gain (Loss) | 291,825 | 334,086 |
| Change in Unrealized Appreciation (Depreciation) | 13,322 | 492,259 |
| Net Increase (Decrease) in Net Assets Resulting from Operations | 314,674 | 842,321 |
| Distributions | ||
| Net Investment Income | (14,941) | (27,123) |
| Realized Capital Gain | (130,422) | — |
| Total Distributions | (145,363) | (27,123) |
| Capital Share Transactions | ||
| Issued | 367,658 | 471,816 |
| Issued in Lieu of Cash Distributions | 140,921 | 26,277 |
| Redeemed | (670,961) | (1,053,660) |
| Net Increase (Decrease) from Capital Share Transactions | (162,382) | (555,567) |
| Total Increase (Decrease) | 6,929 | 259,631 |
| Net Assets | ||
| Beginning of Period | 4,239,682 | 3,980,051 |
| End of Period1 | 4,246,611 | 4,239,682 |
1 Net Assets—End of Period includes undistributed (overdistributed) net investment income of $1,081,000 and $6,495,000.
See accompanying Notes, which are an integral part of the Financial Statements.
16
| Mid-Cap Growth Fund | ||||||
| Financial Highlights | ||||||
| Six Months | ||||||
| Ended | ||||||
| For a Share Outstanding | April 30, | Year Ended October 31, | ||||
| Throughout Each Period | 2018 | 2017 | 2016 | 2015 | 2014 | 2013 |
| Net Asset Value, Beginning of Period | $26.51 | $21.75 | $24.88 | $26.40 | $25.72 | $20.95 |
| Investment Operations | ||||||
| Net Investment Income | . 0601 | .0931 | .1472 | .064 3 | .045 | .048 |
| Net Realized and Unrealized Gain (Loss) | ||||||
| on Investments | 1.913 | 4.817 | (1.437) | 1.625 | 3.134 | 5.965 |
| Total from Investment Operations | 1.973 | 4.910 | (1.290) | 1.689 | 3.179 | 6.013 |
| Distributions | ||||||
| Dividends from Net Investment Income | (. 095) | (.150) | (. 070) | (. 038) | (. 007) | (. 075) |
| Distributions from Realized Capital Gains | (.828) | — | (1.770) | (3.171) | (2.492) | (1.168) |
| Total Distributions | (.923) | (.150) | (1.840) | (3.209) | (2.499) | (1.243) |
| Net Asset Value, End of Period | $27.56 | $26.51 | $21.75 | $24.88 | $26.40 | $25.72 |
| Total Return4 | 7.58% | 22.69% | -5.49% | 6.68% | 13.42% | 30.32% |
| Ratios/Supplemental Data | ||||||
| Net Assets, End of Period (Millions) | $4,247 | $4,240 | $3,980 | $4,317 | $3,319 | $2,837 |
| Ratio of Total Expenses to | ||||||
| Average Net Assets5 | 0.36% | 0.36% | 0.36% | 0.43% | 0.46% | 0.51% |
| Ratio of Net Investment Income to | ||||||
| Average Net Assets | 0.44% | 0.39% | 0.64%2 | 0.25%3 | 0.16% | 0.19% |
| Portfolio Turnover Rate | 70% | 118% | 91% | 93% | 82% | 83% |
The expense ratio, net investment income ratio, and turnover rate for the current period have been annualized.
1 Calculated based on average shares outstanding.
2 Net investment income per share and the ratio of net investment income to average net assets include $.018 and 0.08%, respectively, resulting from a special dividend from TransDigm Group in October 2016.
3 Net investment income per share and the ratio of net investment income to average net assets include $.006 and 0.03%, respectively, resulting from a special dividend from Lazard Ltd. in February 2015.
4 Total returns do not include account service fees that may have applied in the periods shown. Fund prospectuses provide information about any applicable account service fees.
5 Includes performance-based investment advisory fee increases (decreases) of (0.05%), (0.05%), (0.04%), (0.01%), (0.02%), and 0.02%.
See accompanying Notes, which are an integral part of the Financial Statements.
17
Mid-Cap Growth Fund
Notes to Financial Statements
Vanguard Mid-Cap Growth Fund is registered under the Investment Company Act of 1940 as an open-end investment company, or mutual fund.
A. The following significant accounting policies conform to generally accepted accounting principles for U.S. investment companies. The fund consistently follows such policies in preparing its financial statements.
1. Security Valuation: Securities are valued as of the close of trading on the New York Stock Exchange (generally 4 p.m., Eastern time) on the valuation date. Equity securities are valued at the latest quoted sales prices or official closing prices taken from the primary market in which each security trades; such securities not traded on the valuation date are valued at the mean of the latest quoted bid and asked prices. Securities for which market quotations are not readily available, or whose values have been materially affected by events occurring before the fund’s pricing time but after the close of the securities’ primary markets, are valued by methods deemed by the board of trustees to represent fair value. Investments in Vanguard Market Liquidity Fund are valued at that fund’s net asset value. Temporary cash investments are valued using the latest bid prices or using valuations based on a matrix system (which considers such factors as security prices, yields, maturities, and ratings), both as furnished by independent pricing services.
2. Futures Contracts: The fund uses index futures contracts to a limited extent, with the objective of maintaining full exposure to the stock market while maintaining liquidity. The fund may purchase or sell futures contracts to achieve a desired level of investment, whether to accommodate portfolio turnover or cash flows from capital share transactions. The primary risks associated with the use of futures contracts are imperfect correlation between changes in market values of stocks held by the fund and the prices of futures contracts, and the possibility of an illiquid market. Counterparty risk involving futures is mitigated because a regulated clearinghouse is the counterparty instead of the clearing broker. To further mitigate counterparty risk, the fund trades futures contracts on an exchange, monitors the financial strength of its clearing brokers and clearinghouse, and has entered into clearing agreements with its clearing brokers. The clearinghouse imposes initial margin requirements to secure the fund’s performance and requires daily settlement of variation margin representing changes in the market value of each contract.
Futures contracts are valued at their quoted daily settlement prices. The notional amounts of the contracts are not recorded in the Statement of Net Assets. Fluctuations in the value of the contracts are recorded in the Statement of Assets and Liabilities as an asset (liability) and in the Statement of Operations as unrealized appreciation (depreciation) until the contracts are closed, when they are recorded as realized futures gains (losses).
During the six months ended April 30, 2018, the fund’s average investments in long and short futures contracts represented 2% and 0% of net assets, respectively, based on the average of the notional amounts at each quarter-end during the period.
3. Federal Income Taxes: The fund intends to continue to qualify as a regulated investment company and distribute all of its taxable income. Management has analyzed the fund’s tax positions taken for all open federal income tax years (October 31, 2014–2017), and for the period ended April 30, 2018, and has concluded that no provision for federal income tax is required in the fund’s financial statements.
4. Distributions: Distributions to shareholders are recorded on the ex-dividend date.
18
Mid-Cap Growth Fund
5. Securities Lending: To earn additional income, the fund lends its securities to qualified institutional borrowers. Security loans are subject to termination by the fund at any time, and are required to be secured at all times by collateral in an amount at least equal to the market value of securities loaned. Daily market fluctuations could cause the value of loaned securities to be more or less than the value of the collateral received. When this occurs, the collateral is adjusted and settled before the opening of the market on the next business day. The fund further mitigates its counterparty risk by entering into securities lending transactions only with a diverse group of prequalified counterparties, monitoring their financial strength, and entering into master securities lending agreements with its counterparties. The master securities lending agreements provide that, in the event of a counterparty’s default (including bankruptcy), the fund may terminate any loans with that borrower, determine the net amount owed, and sell or retain the collateral up to the net amount owed to the fund; however, such actions may be subject to legal proceedings. While collateral mitigates counterparty risk, in the event of a default, the fund may experience delays and costs in recovering the securities loaned. The fund invests cash collateral received in Vanguard Market Liquidity Fund, and records a liability in the Statement of Assets and Liabilities for the return of the collateral, during the period the securities are on loan. Securities lending income represents fees charged to borrowers plus income earned on invested cash collateral, less expenses associated with the loan. During the term of the loan, the fund is entitled to all distributions made on or in respect of the loaned securities.
6. Credit Facility: The fund and certain other funds managed by The Vanguard Group (“Vanguard”) participate in a $3.1 billion committed credit facility provided by a syndicate of lenders pursuant to a credit agreement that may be renewed annually; each fund is individually liable for its borrowings, if any, under the credit facility. Borrowings may be utilized for temporary and emergency purposes, and are subject to the fund’s regulatory and contractual borrowing restrictions. The participating funds are charged administrative fees and an annual commitment fee of 0.10% of the undrawn amount of the facility; these fees are allocated to the funds based on a method approved by the fund’s board of trustees and included in Management and Administrative expenses on the fund’s Statement of Operations. Any borrowings under this facility bear interest at a rate based upon the higher of the one-month London Interbank Offered Rate, federal funds effective rate, or overnight bank funding rate plus an agreed-upon spread.
The fund had no borrowings outstanding at April 30, 2018, or at any time during the period then ended.
7. Other: Dividend income is recorded on the ex-dividend date. Interest income includes income distributions received from Vanguard Market Liquidity Fund and is accrued daily. Premiums and discounts on debt securities purchased are amortized and accreted, respectively, to interest income over the lives of the respective securities. Security transactions are accounted for on the date securities are bought or sold. Costs used to determine realized gains (losses) on the sale of investment securities are those of the specific securities sold.
B. The investment advisory firms Victory Capital Management Inc., through its RS Investments franchise, and William Blair Investment Management, LLC, each provide investment advisory services to a portion of the fund for a fee calculated at an annual percentage rate of average net assets managed by the advisor. The basic fee of RS Investments is subject to quarterly adjustments based on performance relative to the Russell Midcap Growth Index since January 31, 2017. The basic fee of William Blair Investment Management, LLC, is subject to quarterly adjustments based on performance relative to the Russell Midcap Growth Index for the preceding five years.
19
Mid-Cap Growth Fund
Vanguard manages the cash reserves of the fund as described below.
For the six months ended April 30, 2018, the aggregate investment advisory fee represented an effective annual basic rate of 0.20% of the fund’s average net assets, before a decrease of $1,012,000 (0.05%) based on performance.
C. In accordance with the terms of a Funds’ Service Agreement (the “FSA”) between Vanguard and the fund, Vanguard furnishes to the fund corporate management, administrative, marketing, distribution, and cash management services at Vanguard’s cost of operations (as defined by the FSA). These costs of operations are allocated to the fund based on methods and guidelines approved by the board of trustees. Vanguard does not require reimbursement in the current period for certain costs of operations (such as deferred compensation/benefits and risk/insurance costs); the fund’s liability for these costs of operations is included in Payables to Vanguard on the Statement of Assets and Liabilities. All other costs of operations payable to Vanguard are generally settled twice a month.
Upon the request of Vanguard, the fund may invest up to 0.40% of its net assets as capital in Vanguard. At April 30, 2018, the fund had contributed to Vanguard capital in the amount of $235,000, representing 0.01% of the fund’s net assets and 0.09% of Vanguard’s capitalization. The fund’s trustees and officers are also directors and employees, respectively, of Vanguard.
D. The fund has asked its investment advisors to direct certain security trades, subject to obtaining the best price and execution, to brokers who have agreed to rebate to the fund part of the commissions generated. Such rebates are used solely to reduce the fund’s management and administrative expenses. For the six months ended April 30, 2018, these arrangements reduced the fund’s expenses by $100,000 (an annual rate of 0.00% of average net assets).
E. Various inputs may be used to determine the value of the fund’s investments. These inputs are summarized in three broad levels for financial statement purposes. The inputs or methodologies used to value securities are not necessarily an indication of the risk associated with investing in those securities.
Level 1—Quoted prices in active markets for identical securities.
Level 2—Other significant observable inputs (including quoted prices for similar securities, interest rates, prepayment speeds, credit risk, etc.).
Level 3—Significant unobservable inputs (including the fund’s own assumptions used to determine the fair value of investments). Any investments valued with significant unobservable inputs are noted on the Statement of Net Assets.
The following table summarizes the market value of the fund’s investments as of April 30, 2018, based on the inputs used to value them:
| Level 1 | Level 2 | Level 3 | |
| Investments | ($000) | ($000) | ($000) |
| Common Stocks | 4,059,889 | — | — |
| Temporary Cash Investments | 198,846 | 10,605 | — |
| Futures Contracts—Liabilities1 | (2,592) | — | — |
| Total | 4,256,143 | 10,605 | — |
| 1 Represents variation margin on the last day of the reporting period. |
20
Mid-Cap Growth Fund
F. Distributions are determined on a tax basis and may differ from net investment income and realized capital gains for financial reporting purposes. Differences may be permanent or temporary. Permanent differences are reclassified among capital accounts in the financial statements to reflect their tax character. Temporary differences arise when certain items of income, expense, gain, or loss are recognized in different periods for financial statement and tax purposes. These differences will reverse at some time in the future. Differences in classification may also result from the treatment of short-term gains as ordinary income for tax purposes. The fund’s tax-basis capital gains and losses are determined only at the end of the fiscal year.
At April 30, 2018, the cost of investment securities for tax purposes was $3,388,393,000. Net unrealized appreciation of investment securities for tax purposes was $880,947,000, consisting of unrealized gains of $928,889,000 on securities that had risen in value since their purchase and $47,942,000 in unrealized losses on securities that had fallen in value since their purchase.
G. During the six months ended April 30, 2018, the fund purchased $1,449,333,000 of investment securities and sold $1,775,915,000 of investment securities, other than temporary cash investments.
| H. Capital shares issued and redeemed were: | ||
| Six Months Ended | Year Ended | |
| April 30, 2018 | October 31, 2017 | |
| Shares | Shares | |
| (000) | (000) | |
| Issued | 13,425 | 19,783 |
| Issued in Lieu of Cash Distributions | 5,324 | 1,160 |
| Redeemed | (24,580) | (43,995) |
| Net Increase (Decrease) in Shares Outstanding | (5,831) | (23,052) |
| I. Transactions during the period in investments where the issuer is another member of | ||||||||
| The Vanguard Group were as follows: | ||||||||
| Current Period Transactions | ||||||||
| Oct. 31, | Proceeds Realized | April 30, | ||||||
| 2017 | from | Net | Change in | Capital Gain | 2018 | |||
| Market | Purchases | Securities | Gain | Unrealized | Distributions | Market | ||
| Value | at Cost | Sold | (Loss) | App. (Dep.) | Income | Received | Value | |
| ($000) | ($000) | ($000) | ($000) | ($000) | ($000) | ($000) | ($000) | |
| Vanguard Market | ||||||||
| Liquidity Fund | 213,537 | NA1 | NA1 | (43) | 23 | 1,201 | — | 198,846 |
| Vanguard Mid-Cap | ||||||||
| Growth ETF | 12,474 | — | — | — | 407 | 46 | — | 12,881 |
| Total | 226,011 | — | — | (43) | 430 | 1,247 | — | 211,727 |
1 Not applicable—purchases and sales are for temporary cash investment purposes.
J. Management has determined that no material events or transactions occurred subsequent to April 30, 2018, that would require recognition or disclosure in these financial statements.
21
About Your Fund’s Expenses
As a shareholder of the fund, you incur ongoing costs, which include costs for portfolio management, administrative services, and shareholder reports (like this one), among others. Operating expenses, which are deducted from a fund’s gross income, directly reduce the investment return of the fund.
A fund’s expenses are expressed as a percentage of its average net assets. This figure is known as the expense ratio. The following examples are intended to help you understand the ongoing costs (in dollars) of investing in your fund and to compare these costs with those of other mutual funds. The examples are based on an investment of $1,000 made at the beginning of the period shown and held for the entire period.
The accompanying table illustrates your fund’s costs in two ways:
• Based on actual fund return. This section helps you to estimate the actual expenses that you paid over the period. The ”Ending Account Value“ shown is derived from the fund‘s actual return, and the third column shows the dollar amount that would have been paid by an investor who started with $1,000 in the fund. You may use the information here, together with the amount you invested, to estimate the expenses that you paid over the period.
To do so, simply divide your account value by $1,000 (for example, an $8,600 account value divided by $1,000 = 8.6), then multiply the result by the number given for your fund under the heading ”Expenses Paid During Period.“
• Based on hypothetical 5% yearly return. This section is intended to help you compare your fund‘s costs with those of other mutual funds. It assumes that the fund had a yearly return of 5% before expenses, but that the expense ratio is unchanged. In this case—because the return used is not the fund’s actual return—the results do not apply to your investment. The example is useful in making comparisons because the Securities and Exchange Commission requires all mutual funds to calculate expenses based on a 5% return. You can assess your fund’s costs by comparing this hypothetical example with the hypothetical examples that appear in shareholder reports of other funds.
Note that the expenses shown in the table are meant to highlight and help you compare ongoing costs only and do not reflect transaction costs incurred by the fund for buying and selling securities. Further, the expenses do not include any purchase, redemption, or account service fees described in the fund prospectus. If such fees were applied to your account, your costs would be higher. Your fund does not carry a “sales load.”
The calculations assume no shares were bought or sold during the period. Your actual costs may have been higher or lower, depending on the amount of your investment and the timing of any purchases or redemptions.
You can find more information about the fund’s expenses, including annual expense ratios, in the Financial Statements section of this report. For additional information on operating expenses and other shareholder costs, please refer to your fund’s current prospectus.
22
| Six Months Ended April 30, 2018 | |||
| Beginning | Ending | Expenses | |
| Account Value | Account Value | Paid During | |
| Mid-Cap Growth Fund | 10/31/2017 | 4/30/2018 | Period |
| Based on Actual Fund Return | $1,000.00 | $1,075.83 | $1.85 |
| Based on Hypothetical 5% Yearly Return | 1,000.00 | 1,023.01 | 1.81 |
The calculations are based on expenses incurred in the most recent six-month period. The fund’s annualized six-month expense ratio for that period is 0.36%. The dollar amounts shown as “Expenses Paid” are equal to the annualized expense ratio multiplied by the average account value over the period, multiplied by the number of days in the most recent six-month period, then divided by the number of days in the most recent 12-month period (181/365).
23
Trustees Approve Advisory Arrangements
The board of trustees of Vanguard Mid-Cap Growth Fund has renewed the fund’s investment advisory arrangements with Victory Capital Management Inc. (Victory Capital) and William Blair & Company, L.L.C. (William Blair & Company). The board determined that renewing the fund’s advisory arrangements was in the best interests of the fund and its shareholders.
The board based its decisions upon an evaluation of each advisor’s investment staff, portfolio management process, and performance. This evaluation included information provided to the board by Vanguard’s Portfolio Review Department, which is responsible for fund and advisor oversight and product management. The Portfolio Review Department met regularly with the advisors and made monthly presentations to the board during the fiscal year that directed the board’s focus to relevant information and topics.
The board, or an investment committee made up of board members, also received information throughout the year during advisor presentations. For each advisor presentation, the board was provided with letters and reports that included information about, among other things, the advisory firm and the advisor’s assessment of the investment environment, portfolio performance, and portfolio characteristics.
In addition, the board received monthly reports, which included a Market and Economic Report, a Fund Dashboard Monthly Summary, and a Fund Performance Report.
Prior to their meeting, the trustees were provided with a memo and materials that summarized the information they received over the course of the year. They also considered the factors discussed below, among others. However, no single factor determined whether the board approved the arrangements. Rather, it was the totality of the circumstances that drove the board’s decision.
Nature, extent, and quality of services
The board reviewed the quality of the fund’s investment management services over both the short and long term and took into account the organizational depth and stability of each advisor. The board considered the following:
Victory Capital. Victory Capital, a wholly owned subsidiary of Victory Capital Holdings, Inc., is a multi-boutique asset manager. It is comprised of multiple investment teams, referred to as investment franchises, each of which uses an independent approach to investing. RS Investments, founded in 1986, is the franchise responsible for the day-to-day management of a portion of Mid-Cap Growth Fund. RS Investments uses fundamental research to identify companies with sustainable growth trajectories. Risk management is integrated into the team’s process to mitigate the negative impact of any position. Victory Capital, through its RS Investments franchise, has managed a portion of the fund since 2016.
William Blair & Company. Founded in 1935, William Blair & Company is an independently owned, full-service investment firm. It uses in-depth fundamental research to identify quality growth companies that can sustain an above-average growth rate for a longer period than the market expects. The team focuses on businesses with durable franchises, sustainable competitive advantages and business models, solid balance sheets, high returns on invested capital, and quality management teams. The team also analyzes relative valuation in comparison with historical averages, the market, and industry peers. William Blair & Company has managed a portion of the fund since 2006.
The board concluded that the advisors’ experience, stability, depth, and performance, among other factors, warranted continuation of the advisory arrangements.
24
Investment performance
The board considered the short- and long-term performance of the fund and each advisor, including any periods of outperformance or underperformance compared with a relevant benchmark index and peer group. The board concluded that the performance was such that the advisory arrangements should continue. Information about the fund’s most recent performance can be found in the Performance Summary section of this report.
Cost
The board concluded that the fund’s expense ratio was well below the average expense ratio charged by funds in its peer group and that the fund’s advisory fee rate was also well below the peer-group average. Information about the fund’s expense ratio appears in the About Your Fund’s Expenses section of this report as well as in the Financial Statements section, which also includes information about the fund’s advisory fee rate.
The board did not consider the profitability of Victory Capital or William Blair & Company in determining whether to approve the advisory fees because the firms are independent of Vanguard and the advisory fees are the result of arm’s-length negotiations.
The benefit of economies of scale
The board concluded that the fund’s shareholders benefit from economies of scale because of breakpoints in the advisory fee schedules for Victory Capital and William Blair & Company. The breakpoints reduce the effective rate of the fees as the fund’s assets managed by each advisor increase.
The board will consider whether to renew the advisory arrangements again after a one-year period.
25
Glossary
30-Day SEC Yield. A fund’s 30-day SEC yield is derived using a formula specified by the U.S. Securities and Exchange Commission. Under the formula, data related to the fund’s security holdings in the previous 30 days are used to calculate the fund’s hypothetical net income for that period, which is then annualized and divided by the fund’s estimated average net assets over the calculation period. For the purposes of this calculation, a security’s income is based on its current market yield to maturity (for bonds), its actual income (for asset-backed securities), or its projected dividend yield (for stocks). Because the SEC yield represents hypothetical annualized income, it will differ—at times significantly—from the fund’s actual experience. As a result, the fund’s income distributions may be higher or lower than implied by the SEC yield.
Beta. A measure of the magnitude of a fund’s past share-price fluctuations in relation to the ups and downs of a given market index. The index is assigned a beta of 1.00. Compared with a given index, a fund with a beta of 1.20 typically would have seen its share price rise or fall by 12% when the index rose or fell by 10%. For this report, beta is based on returns over the past 36 months for both the fund and the index. Note that a fund’s beta should be reviewed in conjunction with its R-squared (see definition). The lower the R-squared, the less correlation there is between the fund and the index, and the less reliable beta is as an indicator of volatility.
Dividend Yield. Dividend income earned by stocks, expressed as a percentage of the aggregate market value (or of net asset value, for a fund). The yield is determined by dividing the amount of the annual dividends by the aggregate value (or net asset value) at the end of the period. For a fund, the dividend yield is based solely on stock holdings and does not include any income produced by other investments.
Earnings Growth Rate. The average annual rate of growth in earnings over the past five years for the stocks now in a fund.
Equity Exposure. A measure that reflects a fund’s investments in stocks and stock futures. Any holdings in short-term reserves are excluded.
Expense Ratio. A fund’s total annual operating expenses expressed as a percentage of the fund’s average net assets. The expense ratio includes management and administrative expenses, but does not include the transaction costs of buying and selling portfolio securities.
Foreign Holdings. The percentage of a fund represented by securities or depositary receipts of companies based outside the United States.
Inception Date. The date on which the assets of a fund (or one of its share classes) are first invested in accordance with the fund’s investment objective. For funds with a subscription period, the inception date is the day after that period ends. Investment performance is measured from the inception date.
Median Market Cap. An indicator of the size of companies in which a fund invests; the midpoint of market capitalization (market price x shares outstanding) of a fund’s stocks, weighted by the proportion of the fund’s assets invested in each stock. Stocks representing half of the fund’s assets have market capitalizations above the median, and the rest are below it.
Price/Book Ratio. The share price of a stock divided by its net worth, or book value, per share.
For a fund, the weighted average price/book ratio of the stocks it holds.
26
Price/Earnings Ratio. The ratio of a stock’s current price to its per-share earnings over the past year. For a fund, the weighted average P/E of the stocks it holds. P/E is an indicator of market expectations about corporate prospects; the higher the P/E, the greater the expectations for a company’s future growth.
R-Squared. A measure of how much of a fund’s past returns can be explained by the returns from the market in general, as measured by a given index. If a fund’s total returns were precisely synchronized with an index’s returns, its R-squared would be 1.00. If the fund’s returns bore no relationship to the index’s returns, its R-squared would be 0. For this report, R-squared is based on returns over the past 36 months for both the fund and the index.
Return on Equity. The annual average rate of return generated by a company during the past five years for each dollar of shareholder’s equity (net income divided by shareholder’s equity). For a fund, the weighted average return on equity for the companies whose stocks it holds.
Short-Term Reserves. The percentage of a fund invested in highly liquid, short-term securities that can be readily converted to cash.
Turnover Rate. An indication of the fund’s trading activity. Funds with high turnover rates incur higher transaction costs and may be more likely to distribute capital gains (which may be taxable to investors). The turnover rate excludes in-kind transactions, which have minimal impact on costs.
27
The Global Industry Classification Standard (“GICS”) was developed by and is the exclusive property and a service mark of MSCI Inc. (“MSCI”) and Standard and Poor’s, a division of McGraw-Hill Companies, Inc. (“S&P”), and is licensed for use by Vanguard. Neither MSCI, S&P nor any third party involved in making or compiling the GICS or any GICS classification makes any express or implied warranties or representations with respect to such standard or classification (or the results to be obtained by the use thereof), and all such parties hereby expressly disclaim all warranties of originality, accuracy, completeness, merchantability or fitness for a particular purpose with respect to any such standard or classification. Without limiting any of the foregoing, in no event shall MSCI, S&P, any of its affiliates or any third party involved in making or compiling the GICS or any GICS classification have any liability for any direct, indirect, special, punitive, consequential or any other damages (including lost profits) even if notified of the possibility of such damages.
28
This page intentionally left blank.
This page intentionally left blank.
The People Who Govern Your Fund
The trustees of your mutual fund are there to see that the fund is operated and managed in your best interests since, as a shareholder, you are a part owner of the fund. Your fund’s trustees also serve on the board of directors of The Vanguard Group, Inc., which is owned by the Vanguard funds and provides services to them on an at-cost basis.
A majority of Vanguard’s board members are independent, meaning that they have no affiliation with Vanguard or the funds they oversee, apart from the sizable personal investments they have made as private individuals. The independent board members have distinguished backgrounds in business, academia, and public service. Each of the trustees and executive officers oversees 208 Vanguard funds.
Information for each trustee and executive officer of the fund appears below. The mailing address of the trustees and officers is P.O. Box 876, Valley Forge, PA 19482. More information about the trustees is in the Statement of Additional Information, which can be obtained, without charge, by contacting Vanguard at 800-662-7447, or online at vanguard.com.
Interested Trustees1
F. William McNabb III
Born in 1957. Trustee since July 2009. Principal occupation(s) during the past five years and other experience: chairman of the board (January 2010–present) of Vanguard and of each of the investment companies served by Vanguard, trustee (2009–present) of each of the investment companies served by Vanguard, and director (2008–present) of Vanguard. Chief executive officer and president (2008–2017) of Vanguard and each of the investment companies served by Vanguard, managing director (1995–2008) of Vanguard, and director (1997–2018) of Vanguard Marketing Corporation. Director (2018–present) of UnitedHealth Group.
Mortimer J. Buckley
Born in 1969. Trustee since January 2018. Principal occupation(s) during the past five years and other experience: chief executive officer (January 2018–present) of Vanguard; chief executive officer, president, and trustee (January 2018–present) of each of the investment companies served by Vanguard; president and director (2017–present) of Vanguard; and president (February 2018–present) of Vanguard Marketing Corporation. Chief investment officer (2013–2017), managing director (2002–2017), head of the Retail Investor Group (2006–2012), and chief information officer (2001–2006) of Vanguard. Chairman of the board (2011–2017) of the Children’s Hospital of Philadelphia.
Independent Trustees
Emerson U. Fullwood
Born in 1948. Trustee since January 2008. Principal occupation(s) during the past five years and other experience: executive chief staff and marketing officer for North America and corporate vice president (retired 2008) of Xerox Corporation (document management products and services). Former president of the Worldwide Channels Group, Latin America, and Worldwide Customer Service and executive chief staff officer of Developing Markets of Xerox. Executive in residence and 2009–2010 Distinguished Minett Professor at the Rochester Institute of Technology. Lead director of SPX FLOW, Inc. (multi-industry manufacturing). Director of the University of Rochester Medical Center, the Monroe Community College Foundation, the United Way of Rochester, North Carolina A&T University, and Roberts Wesleyan College. Trustee of the University of Rochester.
Amy Gutmann
Born in 1949. Trustee since June 2006. Principal occupation(s) during the past five years and other experience: president (2004–present) of the University of Pennsylvania. Christopher H. Browne Distinguished Professor of Political Science, School of Arts and Sciences, and professor of communication, Annenberg School for Communication, with secondary faculty appointments in the Department of Philosophy, School of Arts and Sciences, and at the Graduate School of Education, University of Pennsylvania. Trustee of the National Constitution Center.
1 Mr. McNabb and Mr. Buckley are considered “interested persons,” as defined in the Investment Company Act of 1940, because they are officers of the Vanguard funds.
JoAnn Heffernan Heisen
Born in 1950. Trustee since July 1998. Principal occupation(s) during the past five years and other experience: corporate vice president of Johnson & Johnson (pharmaceuticals/medical devices/consumer products) and member of its executive committee (1997–2008). Chief global diversity officer (retired 2008), vice president and chief information officer (1997–2006), controller (1995–1997), treasurer (1991–1995), and assistant treasurer (1989–1991) of Johnson & Johnson. Director of Skytop Lodge Corporation (hotels) and the Robert Wood Johnson Foundation. Member of the advisory board of the Institute for Women’s Leadership at Rutgers University.
F. Joseph Loughrey
Born in 1949. Trustee since October 2009. Principal occupation(s) during the past five years and other experience: president and chief operating officer (retired 2009) and vice chairman of the board (2008–2009) of Cummins Inc. (industrial machinery). Chairman of the board of Hillenbrand, Inc. (specialized consumer services), Oxfam America, and the Lumina Foundation for Education. Director of the V Foundation for Cancer Research. Member of the advisory council for the College of Arts and Letters and chair of the advisory board to the Kellogg Institute for International Studies, both at the University of Notre Dame.
Mark Loughridge
Born in 1953. Trustee since March 2012. Principal occupation(s) during the past five years and other experience: senior vice president and chief financial officer (retired 2013) of IBM (information technology services). Fiduciary member of IBM’s Retirement Plan Committee (2004–2013), senior vice president and general manager (2002–2004) of IBM Global Financing, vice president and controller (1998–2002) of IBM, and a variety of other prior management roles at IBM. Member of the Council on Chicago Booth.
Scott C. Malpass
Born in 1962. Trustee since March 2012. Principal occupation(s) during the past five years and other experience: chief investment officer (1989–present) and vice president (1996–present) of the University of Notre Dame. Assistant professor of finance at the Mendoza College of Business, University of Notre Dame, and member of the Notre Dame 403(b) Investment Committee. Chairman of the board of TIFF Advisory Services, Inc. Member of the board of Catholic Investment Services, Inc. (investment advisors), the board of advisors for Spruceview Capital Partners, and the board of superintendence of the Institute for the Works of Religion.
Deanna Mulligan
Born in 1963. Trustee since January 2018. Principal occupation(s) during the past five years and other experience: president (2010–present) and chief executive officer (2011–present) of The Guardian Life Insurance Company of America. Chief operating officer (2010–2011) and executive vice president (2008–2010) of Individual Life and Disability of The Guardian Life Insurance Company of America. Member of the board of The Guardian Life Insurance Company of America, the American Council of Life Insurers, the Partnership for New York City (business leadership), and the Committee Encouraging Corporate Philanthropy. Trustee of the Economic Club of New York and the Bruce Museum (arts and science). Member of the Advisory Council for the Stanford Graduate School of Business.
André F. Perold
Born in 1952. Trustee since December 2004. Principal occupation(s) during the past five years and other experience: George Gund Professor of Finance and Banking, Emeritus at the Harvard Business School (retired 2011). Chief investment officer and co-managing partner of HighVista Strategies LLC (private investment firm). Overseer of the Museum of Fine Arts Boston.
Sarah Bloom Raskin
Born in 1961. Trustee since January 2018. Principal occupation(s) during the past five years and other experience: deputy secretary (2014–2017) of the United States Department of the Treasury. Governor (2010–2014) of the Federal Reserve Board. Commissioner (2007–2010) of financial regulation for the State of Maryland. Member of the board of directors (2012–2014) of Neighborhood Reinvestment Corporation. Director of i(x) Investments, LLC.
Peter F. Volanakis
Born in 1955. Trustee since July 2009. Principal occupation(s) during the past five years and other experience: president and chief operating officer (retired 2010) of Corning Incorporated (communications equipment) and director of Corning Incorporated (2000–2010) and Dow Corning (2001–2010). Director (2012) of SPX Corporation (multi-industry manufacturing). Overseer of the Amos Tuck School of Business Administration, Dartmouth College (2001–2013). Chairman of the board of trustees of Colby-Sawyer College. Member of the Board of Hypertherm Inc. (industrial cutting systems, software, and consumables).
Executive Officers
Glenn Booraem
Born in 1967. Principal occupation(s) during the past five years and other experience: principal of Vanguard. Investment stewardship officer (2017–present), treasurer (2015–2017), controller (2010–2015), and assistant controller (2001–2010) of each of the investment companies served by Vanguard.
Christine M. Buchanan
Born in 1970. Principal occupation(s) during the past five years and other experience: principal of Vanguard and global head of Fund Administration at Vanguard. Treasurer (2017–present) of each of the investment companies served by Vanguard. Partner (2005–2017) at KPMG LLP (audit, tax, and advisory services).
Brian Dvorak
Born in 1973. Principal occupation(s) during the past five years and other experience: principal of Vanguard. Chief compliance officer (2017–present) of Vanguard and each of the investment companies served by Vanguard. Assistant vice president (2017–present) of Vanguard Marketing Corporation. Vice president and director of Enterprise Risk Management (2011–2013) at Oppenheimer Funds, Inc.
Thomas J. Higgins
Born in 1957. Principal occupation(s) during the past five years and other experience: principal of Vanguard. Chief financial officer (2008–present) and treasurer (1998–2008) of each of the investment companies served by Vanguard.
Peter Mahoney
Born in 1974. Principal occupation(s) during the past five years and other experience: principal of Vanguard. Controller (2015–present) of each of the investment companies served by Vanguard. Head of International Fund Services (2008–2014) at Vanguard.
Anne E. Robinson
Born in 1970. Principal occupation(s) during the past five years and other experience: general counsel (2016–present) of Vanguard. Secretary (2016–present) of Vanguard and of each of the investment companies served by Vanguard. Managing director (2016–present) of Vanguard. Director and senior vice president (2016–2018) of Vanguard Marketing Corporation. Managing director and general counsel of Global Cards and Consumer Services (2014–2016) at Citigroup. Counsel (2003–2014) at American Express.
Michael Rollings
Born in 1963. Principal occupation(s) during the past five years and other experience: finance director (2017–present) and treasurer (2017) of each of the investment companies served by Vanguard. Managing director (2016–present) of Vanguard. Chief financial officer (2016–present) of Vanguard. Director (2016–present) of Vanguard Marketing Corporation. Executive vice president and chief financial officer (2006–2016) of MassMutual Financial Group.
| Vanguard Senior Management Team | |
| Mortimer J. Buckley | James M. Norris |
| Gregory Davis | Thomas M. Rampulla |
| John James | Karin A. Risi |
| Martha G. King | Anne E. Robinson |
| John T. Marcante | Michael Rollings |
| Chris D. McIsaac | |
| Chairman Emeritus and Senior Advisor | |
| John J. Brennan | |
| Chairman, 1996–2009 | |
| Chief Executive Officer and President, 1996–2008 | |
| Founder | |
| John C. Bogle | |
| Chairman and Chief Executive Officer, 1974–1996 | |
 | |
| P.O. Box 2600 | |
Connect with Vanguard® > vanguard.com | Valley Forge, PA 19482-2600 |
| Fund Information > 800-662-7447 | Source for Bloomberg Barclays indexes: Bloomberg |
| Direct Investor Account Services > 800-662-2739 | Index Services Limited. Copyright 2018, Bloomberg. All |
| Institutional Investor Services > 800-523-1036 | rights reserved. |
| Text Telephone for People | |
| Who Are Deaf or Hard of Hearing > 800-749-7273 | CFA® is a registered trademark owned by CFA Institute. |
| This material may be used in conjunction | |
| with the offering of shares of any Vanguard | |
| fund only if preceded or accompanied by | |
| the fund’s current prospectus. | |
| All comparative mutual fund data are from Lipper, a | |
| Thomson Reuters Company, or Morningstar, Inc., unless | |
| otherwise noted. | |
| You can obtain a free copy of Vanguard’s proxy voting | |
| guidelines by visiting vanguard.com/proxyreporting or by | |
| calling Vanguard at 800-662-2739. The guidelines are | |
| also available from the SEC’s website, sec.gov. In | |
| addition, you may obtain a free report on how your fund | |
| voted the proxies for securities it owned during the 12 | |
| months ended June 30. To get the report, visit either | |
| vanguard.com/proxyreporting or sec.gov. | |
| You can review and copy information about your fund at | |
| the SEC’s Public Reference Room in Washington, D.C. To | |
| find out more about this public service, call the SEC at | |
| 202-551-8090. Information about your fund is also | |
| available on the SEC’s website, and you can receive | |
| copies of this information, for a fee, by sending a | |
| request in either of two ways: via email addressed to | |
| publicinfo@sec.gov or via regular mail addressed to the | |
| Public Reference Section, Securities and Exchange | |
| Commission, Washington, DC 20549-1520. | |
| © 2018 The Vanguard Group, Inc. | |
| All rights reserved. | |
| Vanguard Marketing Corporation, Distributor. | |
| Q3012 062018 | |
| Semiannual Report | April 30, 2018 |
| Vanguard International Explorer™ Fund |
Vanguard’s Principles for Investing Success
We want to give you the best chance of investment success. These
principles, grounded in Vanguard’s research and experience, can put you on
the right path.
Goals. Create clear, appropriate investment goals.
Balance. Develop a suitable asset allocation using broadly diversified funds.
Cost. Minimize cost.
Discipline. Maintain perspective and long-term discipline.
A single theme unites these principles: Focus on the things you can control.
We believe there is no wiser course for any investor.
| Contents | |
| Your Fund’s Performance at a Glance. | 1 |
| CEO’s Perspective. | 2 |
| Advisors’ Report. | 4 |
| Results of Proxy Voting. | 9 |
| Fund Profile. | 11 |
| Performance Summary. | 13 |
| Financial Statements. | 14 |
| About Your Fund’s Expenses. | 33 |
| Glossary. | 35 |
Please note: The opinions expressed in this report are just that—informed opinions. They should not be considered promises or advice. Also, please keep in mind that the information and opinions cover the period through the date on the front of this report. Of course, the risks of investing in your fund are spelled out in the prospectus.
See the Glossary for definitions of investment terms used in this report.
About the cover: Nautical images have been part of Vanguard’s rich heritage since its start in 1975. For an incoming ship, a lighthouse offers a beacon and safe path to shore. You can similarly depend on Vanguard to put you first––and light the way––as you strive to meet your financial goals. Our client focus and low costs, stemming from our unique ownership structure, assure that your interests are paramount.
Your Fund’s Performance at a Glance
• For the six months ended April 30, 2018, Vanguard International Explorer Fund returned 4.49%. It trailed the 5.58% return of its benchmark, the S&P EPAC SmallCap Index, and nearly equaled the 4.53% average return of its peers.
• The fund’s advisors invest in smaller companies—mostly from the developed regions of Europe and the Pacific—that they believe have strong long-term growth prospects.
• Relative to its benchmark, the fund’s underperformance stemmed from its allocation across regions. An overweighted exposure to emerging markets detracted most. Stock selection was broadly muted; strong selection in emerging markets was mostly overriden by negative selection in European and Pacific stocks.
• From a sector standpoint, the fund lagged its benchmark in six of eleven sectors.
Negative positioning in five sectors hindered performance most. Security selection modestly detracted from relative performance; weak selection in industrials more than offset positive selection in consumer discretionary stocks.
| Total Returns: Six Months Ended April 30, 2018 | ||
| Total | ||
| Returns | ||
| Vanguard International Explorer Fund | 4.49% | |
| S&P EPAC SmallCap Index | 5.58 | |
| International Small-Cap Funds Average | 4.53 | |
| International Small-Cap Funds Average: Derived from data provided by Lipper, a Thomson Reuters Company. | ||
| Expense Ratios | ||
| Your Fund Compared With Its Peer Group | ||
| Peer Group | ||
| Fund | Average | |
| International Explorer Fund | 0.38% | 1.52% |
The fund expense ratio shown is from the prospectus dated February 22, 2018, and represents estimated costs for the current fiscal year. For the six months ended April 30, 2018, the fund’s annualized expense ratio was 0.41%. The peer-group expense ratio is derived from data provided by Lipper, a Thomson Reuters Company, and captures information through year-end 2017.
Peer group: International Small-Cap Funds.
1
CEO’s Perspective

Tim Buckley
President and Chief Executive Officer
Dear Shareholder,
I feel extremely fortunate to have the chance to lead a company filled with people who come to work every day passionate about Vanguard’s core purpose: to take a stand for all investors, to treat them fairly, and to give them the best chance for investment success.
When I joined Vanguard in 1991, I found a mission-driven team focused on improving lives—helping people retire more comfortably, put their children through college, and achieve financial security. I also found a company with purpose in an industry ripe for improvement.
It was clear, even early in my career, that the cards were stacked against most investors. Hidden fees, performance-chasing, and poor advice were relentlessly eroding investors’ dreams.
We knew Vanguard could be different and, as a result, could make a real difference. We have lowered the costs of investing for our shareholders significantly. And we’re proud of the performance of our funds.
Vanguard is built for Vanguard investors—we focus solely on you, our fund shareholders. Everything we do is designed to give our clients the best chance for investment success. In my role as CEO, I’ll keep this priority
2
front and center. We’re proud of what we’ve achieved, but we’re even more excited about what’s to come.
Steady, time-tested guidance
Our guidance for investors, as always, is to stay the course, tune out the hyperbolic headlines, and focus on your goals and what you can control, such as costs and how much you save. This time-tested advice has served our clients well over the decades.
Regardless of how the markets perform in the short term, I’m incredibly optimistic about the future for our investors. We have a dedicated team serving you, and we will never stop striving to make Vanguard the best place for you to invest through our high-quality funds and services, advice and guidance to help you meet your financial goals, and an experience that makes you feel good about entrusting us with your hard-earned savings.
Thank you for your continued loyalty.
Sincerely,

Mortimer J. Buckley
President and Chief Executive Officer
May 16, 2018
| Market Barometer | |||
| Total Returns | |||
| Periods Ended April 30, 2018 | |||
| Six | One | Five Years | |
| Months | Year | (Annualized) | |
| Stocks | |||
| Russell 1000 Index (Large-caps) | 3.83% | 13.17% | 12.84% |
| Russell 2000 Index (Small-caps) | 3.27 | 11.54 | 11.74 |
| Russell 3000 Index (Broad U.S. market) | 3.79 | 13.05 | 12.75 |
| FTSE All-World ex US Index (International) | 3.72 | 15.84 | 5.85 |
| Bonds | |||
| Bloomberg Barclays U.S. Aggregate Bond Index | |||
| (Broad taxable market) | -1.87% | -0.32% | 1.47% |
| Bloomberg Barclays Municipal Bond Index | |||
| (Broad tax-exempt market) | -0.97 | 1.56 | 2.44 |
| Citigroup Three-Month U.S. Treasury Bill Index | 0.67 | 1.16 | 0.32 |
| CPI | |||
| Consumer Price Index | 1.57% | 2.46% | 1.50% |
3
Advisors’ Report
For the six months ended April 30, 2018, Vanguard International Explorer Fund returned 4.49%. Your fund is managed by three independent advisors, a strategy that enhances its diversification by providing exposure to distinct yet complementary investment approaches. It is not uncommon for different advisors to have different views about individual securities or the broader investment environment.
The advisors, the amount and percentage of fund assets each manages, and brief descriptions of their investment strategies are presented in the table below. The advisors have also prepared a discussion of the investment environment that existed during the year and of how their portfolio positioning reflected that assessment. These comments were prepared on May 23, 2018.
Vanguard International Explorer Fund Investment Advisors
| Fund Assets Managed | |||
| Investment Advisor | % | $ Million | Investment Strategy |
| Schroder Investment | 57 | 2,630 | The advisor employs a fundamental investment |
| Management North America Inc. | approach that considers macroeconomic | ||
| factors while focusing primarily on | |||
| company-specific factors, including a | |||
| company’s potential for long-term growth, | |||
| financial condition, quality of management, and | |||
| sensitivity to cyclical factors. The advisor also | |||
| considers the relative value of a company’s | |||
| securities compared with those of other | |||
| companies and the market as a whole. | |||
| Wellington Management | 25 | 1,143 | The advisor employs a traditional, bottom-up |
| Company LLP | approach that is opportunistic in nature, relying | ||
| on global and regional research resources to | |||
| �� | identify both growth-oriented and neglected or | ||
| misunderstood companies. | |||
| TimesSquare Capital | 14 | 642 | The advisor employs a quality growth |
| Management, LLC | philosophy that is based on the premise that a | ||
| skilled research team—emphasizing | |||
| management quality, superior business models, | |||
| and valuation—contributes to a diversified | |||
| portfolio that will generate superior | |||
| risk-adjusted returns over the long term. | |||
| Cash Investments | 4 | 162 | These short-term reserves are invested by |
| Vanguard in equity index products to simulate | |||
| investment in stocks. Each advisor also may | |||
| maintain a modest cash position. | |||
4
Schroder Investment Management North America Inc.
Portfolio Manager: Matthew F. Dobbs, Head of Global Small Companies
International small-company stocks gained over the period despite a degree of volatility in the latter months. Uncertainty arose from concerns about less uniformly positive leading indicators of economic activity (particularly in Europe), the course of interest rates, and rising trade tensions. The annual corporate results season revealed good progress but provided few positive surprises following generally optimistic expectations.
Smaller companies outpaced their larger peers for the six months. Their performance was aided in continental Europe and Japan by their more domestic focus because of firmness in both the euro and the yen versus the U.S. dollar.
Strong stock selection in Japan was offset by shortfalls in the United Kingdom and somewhat muted returns from the portfolio’s emerging-market holdings. The biggest single detractor in the United Kingdom was Micro Focus International, which disclosed very disappointing progress after the integration of a sizable acquisition and the departure of key management. Retailers including Superdry and Dunelm had smaller negative impacts.
Although emerging-market holdings were positive overall, they generally lagged the returns of developed markets. One notable detractor was L.P.N. Development, a Thai real estate developer.
Stock selection in Japan was most positive in the information technology sector, including Digital Garage, Kakaku.com, and OBIC Business Consultants. Other contributors included the specialty chemical group Kureha; POLA Orbis, on new product momentum; and Tokai Tokyo Financial, reflecting strong results and a hike in shareholder returns. The auto parts sector was generally weak because of concern over global auto sales and a stronger yen.
Although small-capitalization valuations are within comfortable ranges, they have substantially outperformed large-caps for an extended period. They are now at the upper end of their narrow range versus large-caps that has persisted for the last 15 years. We are agnostic as to whether small-caps in aggregate can continue to grow faster than their larger peers. We believe the best policy is to remain focused on good-quality companies with superior characteristics and relatively visible earnings growth. Strong balance sheets will be key if interest rates are really on the rise.
5
Wellington Management Company llp
Portfolio Manager:
Simon H. Thomas, Senior Managing Director and Equity Portfolio Manager
International small-cap equities returned 5.58% (as measured by the S&P EPAC SmallCap Index) amid a sharp correction in global markets and a large spike in volatility. This was initially triggered by concerns about escalating U.S. inflation risks. Fears of a global trade war further unsettled the markets after U.S. President Donald Trump imposed stiff tariffs on steel and aluminum. He then announced plans to implement tariffs on Chinese imports and enacted tighter restrictions on acquisitions and technology transfers.
Our portion of the fund benefited from stock selection in health care, energy, industrials, and telecommunication services. However, positive results were offset by weaker selection in information technology, financials, consumer staples, and materials. At a regional level, selection in Japan and continental Europe, particularly Switzerland, detracted from relative returns, while selection in China, the United Kingdom, and Asia excluding Japan contributed positively. An underweighted exposure to Europe, especially Sweden and Switzerland, also helped.
The largest detractors from relative performance during the period included ams AG, Toyo Tire & Rubber, and OVS. Austria-based ams AG is the market
leader in analog sensor chips and is part of Apple’s supply chain. The company missed first-quarter earnings and reported poor topline guidance for the second quarter. Additionally, weak iPhone X sales at the end of 2017 led to a sell-off of many of Apple’s supply-chain stocks. We maintained our position because we believe that the market underappreciates the company’s ability to improve returns on capital. It has room to expand beyond its role as a supplier to Apple through exposure to Chinese competitors and increasing market share with existing customers.
Japan-based Toyo Tire & Rubber’s stock sold off in November and again later in the period following weak earnings and 2018 guidance. The company took higher-than-expected extraordinary losses for the recall of earthquake shock absorbers in the fourth quarter of 2017. We view the core business favorably and think the market is taking a short-term stance that ignores opportunities for margin expansion and increased market share.
The stock price of Italian apparel retailer OVS declined relative to the European sector in part because of the struggling apparel industry. Italy’s political problems also detracted from the overall market’s attractiveness. We believe the company will grow sales and margins as it integrates a well-conceived acquisition of Switzerland-based retail firm Charles Voegele and expands its reach in Italy and Europe. We continue to hold the stock.
6
Top contributors to relative performance included China-based BeiGene, Norway-based Kongsberg, and Australia-based Toxfree Solutions. BeiGene, a leading biotechnology company that develops cancer drugs for global markets, is executing well and has several ongoing registrational trials. Its stock was up 72% in the first quarter after rallying 225% in 2017. We have trimmed our position into strength as it has approached the upper end of our market-cap range.
Kongsberg delivers technology systems and solutions to clients in the oil and gas, merchant marine, defense, and aerospace industries. The company benefited from a number of large contracts over the period—one from the U.S. army in December and two related to the production of F-35 joint strike fighter aircraft in February. In March, it signed a cooperation agreement with Qatar for long-term technology development programs.
Toxfree is a waste management and industrial services provider. During the period, Cleanaway Waste Management, an Australian competitor, announced its acquisition of the company for a 21% premium. Toxfree has been in the portfolio since the end of 2012, and this event provided a great opportunity to exit the position.
At the end of the period, we were most overweighted in the industrial and health care sectors relative to the benchmark. We were most underweighted in real estate and information technology. On a regional basis, Japan was our greatest overweight, and we were most underweighted in emerging markets, Europe, and Asia excluding Japan. We continue to look for high-quality companies that have been neglected by the market and offer attractive investment opportunities.
TimesSquare Capital Management, LLC
Portfolio Manager: Magnus S. Larsson, Director and Head of International Equities
The last six months have been characterized by a heightened focus on the changing rates regime, inflation, increased market volatility, and mounting concerns about global trade wars. Despite various headwinds, global economic growth remains synchronized and supportive for earnings growth. On a relative basis, contributions were strongest from our holdings in Japan and Europe, while the Asia-Pacific region excluding Japan detracted. Consumer discretionary and industrials were our strongest sectors.
7
Asia-Pacific weakness resulted from stock selection in Australia. IPH, a provider of intellectual property management services, experienced softer patent filing in Australia and New Zealand and weaker-than-expected contributions from its acquisitions. Challenger, an Australian provider of annuities and fixed income products, retreated because of uncertainty over new Department of Social Services rules that could temporarily hinder annuity sales.
In Europe, U.K. funeral services provider Dignity detracted when its lower price strategy for “simple” funerals implied cannibalization of core, higher-margin “traditional” services. Shares of RPC, a leader in the design and manufacturing of rigid plastic packaging, weakened in light of uncertainties about management’s ability to deliver strong short-term results.
Our top performers hailed from Japan and Italy. In Japan, discount store operator Don Quijote bought a 40% stake in Uny, giving it easy access to premier location sites for its large-format stores. The company is well-positioned to continue its outstanding record of 20 years of uninterrupted growth.
Nihon M&A Center is a boutique advisory firm specializing in merger and acquisition intermediary services for small to midsize companies and a structural beneficiary of Japan’s aging/retiring population. Shares moved higher on the company’s strengthening pipeline of deals. Horiba, a leading manufacturer of measuring instruments, experienced strong sales of automotive emissions analyzers and robust demand from global semiconductor production equipment manufacturers.
In Italy, FinecoBank, an online financial services firm, benefited from the wealth management and financial technology needs shaping the Italian banking industry. Amplifon, a global specialty retailer for hearing aids, gained from the structural growth and adoption of its products.
Our strong valuation discipline enabled the portfolio to profit from some of its strongest contributors, particularly in Italy and Japan. As bottom-up active investors, we continue to seek opportunities that stand apart from broad market movements with companies capable of sustained stable growth in most environments.
8
Results of Proxy Voting
At a special meeting of shareholders on November 15, 2017, fund shareholders approved the following proposals:
Proposal 1—Elect trustees for the fund.*
The individuals listed in the table below were elected as trustees for the fund. All trustees with the exception of Ms. Mulligan, Ms. Raskin, and Mr. Buckley (each of whom already serves as a director of The Vanguard Group, Inc.) served as trustees to the funds prior to the shareholder meeting.
| Percentage | |||
| Trustee | For | Withheld | For |
| Mortimer J. Buckley | 860,548,560 | 28,473,629 | 96.8% |
| Emerson U. Fullwood | 859,625,511 | 29,396,677 | 96.7% |
| Amy Gutmann | 859,439,842 | 29,582,347 | 96.7% |
| JoAnn Heffernan Heisen | 860,336,031 | 28,686,158 | 96.8% |
| F. Joseph Loughrey | 860,411,988 | 28,610,200 | 96.8% |
| Mark Loughridge | 860,924,717 | 28,097,471 | 96.8% |
| Scott C. Malpass | 859,842,339 | 29,179,849 | 96.7% |
| F. William McNabb III | 859,460,373 | 29,561,815 | 96.7% |
| Deanna Mulligan | 860,984,342 | 28,037,846 | 96.8% |
| André F. Perold | 850,692,197 | 38,329,992 | 95.7% |
| Sarah Bloom Raskin | 860,331,311 | 28,690,878 | 96.8% |
| Peter F. Volanakis | 860,652,393 | 28,369,796 | 96.8% |
| * Results are for all funds within the same trust. |
Proposal 3—Approve a manager-of-managers arrangement with wholly owned subsidiaries of Vanguard.
This arrangement enables Vanguard or the fund to enter into and materially amend investment advisory arrangements with wholly owned subsidiaries of Vanguard, subject to the approval of the fund’s board of trustees and any conditions imposed by the Securities and Exchange Commission (SEC), while avoiding the costs and delays associated with obtaining future shareholder approval. The ability of the fund to operate in this manner is contingent upon the SEC’s approval of a pending application for an order of exemption.
| Broker | Percentage | ||||
| Vanguard Fund | For | Abstain | Against | Non-Votes | For |
| International Explorer Fund | 101,482,399 | 4,232,824 | 5,784,083 | 18,567,516 | 78.0% |
9
Fund shareholders did not approve the following proposal:
Proposal 7—Institute transparent procedures to avoid holding investments in companies that, in management’s judgment, substantially contribute to genocide or crimes against humanity, the most egregious violations of human rights. Such procedures may include time-limited engagement with problem companies if management believes that their behavior can be changed.
The trustees recommended a vote against the proposal for the following reasons: (1) Vanguard is fully compliant with all applicable U.S. laws and regulations that prohibit the investment in any company owned or controlled by the government of Sudan; (2) the addition of further investment constraints is not in fund shareholders’ best interests if those constraints are unrelated to a fund’s stated investment objective, policies, and strategies; and (3) divestment is an ineffective means to implement social change, as it often puts the shares into the hands of another owner with no direct impact to the company’s capitalization.
| Broker | Percentage | ||||
| Vanguard Fund | For | Abstain | Against | Non-Votes | For |
| International Explorer Fund | 24,448,244 | 7,419,379 | 79,621,027 | 18,578,170 | 18.8% |
10
International Explorer Fund
Fund Profile
As of April 30, 2018
| Portfolio Characteristics | |||
| MSCI | |||
| S&P | AC | ||
| EPAC | World | ||
| SmallCap Index ex | |||
| Fund | Index | USA | |
| Number of Stocks | 358 | 3,552 | 1,862 |
| Median Market Cap | $2.9B | $2.1B | $36.0B |
| Price/Earnings Ratio | 18.7x | 15.7x | 14.6x |
| Price/Book Ratio | 2.1x | 1.6x | 1.7x |
| Return on Equity | 12.3% | 9.9% | 12.6% |
| Earnings Growth | |||
| Rate | 16.5% | 12.7% | 9.6% |
| Dividend Yield | 1.8% | 2.2% | 2.8% |
| Turnover Rate | |||
| (Annualized) | 33% | — | — |
| Ticker Symbol | VINEX | — | — |
| Expense Ratio1 | 0.38% | — | — |
| Short-Term Reserves | 3.1% | — | — |
| Sector Diversification (% of equity exposure) | |||
| MSCI | |||
| S&P | AC | ||
| EPAC | World | ||
| SmallCap | Index | ||
| Fund | Index | ex USA | |
| Consumer Discretionary 20.2% | 15.7% | 11.4% | |
| Consumer Staples | 3.7 | 5.7 | 9.3 |
| Energy | 1.4 | 2.4 | 7.1 |
| Financials | 10.7 | 11.0 | 23.0 |
| Health Care | 7.7 | 8.7 | 7.6 |
| Industrials | 28.7 | 22.6 | 11.8 |
| Information Technology 12.2 | 12.1 | 11.5 | |
| Materials | 10.4 | 9.6 | 8.1 |
| Other | 0.7 | 0.0 | 0.0 |
| Real Estate | 3.5 | 9.2 | 3.2 |
| Telecommunication | |||
| Services | 0.4 | 1.1 | 4.0 |
| Utilities | 0.4 | 1.9 | 3.0 |
Sector categories are based on the Global Industry Classification Standard (“GICS”), except for the “Other” category (if applicable), which includes securities that have not been provided a GICS classification as of the effective reporting period.
| Volatility Measures | ||
| MSCI | ||
| S&P | AC | |
| EPAC | World | |
| SmallCap | Index ex | |
| Index | USA | |
| R-Squared | 0.94 | 0.78 |
| Beta | 0.97 | 0.85 |
These measures show the degree and timing of the fund’s fluctuations compared with the indexes over 36 months.
| Ten Largest Holdings (% of total net assets) | ||
| Anima Holding SPA | Asset Management | |
| & Custody Banks | 1.1% | |
| Nippon Shinyaku Co. | ||
| Ltd. | Pharmaceuticals | 1.0 |
| Dalata Hotel Group plc | Hotels, Resorts & | |
| Cruise Lines | 1.0 | |
| Yoox Net-A-Porter Group Internet & Direct | ||
| SPA | Marketing Retail | 0.8 |
| Tokai Tokyo Financial | Investment Banking | |
| Holdings Inc. | & Brokerage | 0.8 |
| Ubisoft Entertainment | Home Entertainment | |
| SA | Software | 0.7 |
| Altran Technologies SA | IT Consulting & | |
| Other Services | 0.7 | |
| OCI NV | Fertilizer & | |
| Agricultural | ||
| Chemicals | 0.7 | |
| Helvetia Holding AG | Multi-line Insurance | 0.7 |
| Cerved Information | ||
| Solutions SPA | Specialized Finance | 0.7 |
| Top Ten | 8.2% | |
The holdings listed exclude any temporary cash investments and equity index products.
Allocation by Region (% of equity exposure)

1 The expense ratio shown is from the prospectus dated February 22, 2018, and represents estimated costs for the current fiscal year. For the six months ended April 30, 2018, the annualized expense ratio was 0.41%.
11
International Explorer Fund
| Market Diversification (% of equity exposure) | |||
| S&P | MSCI | ||
| EPAC | AC World | ||
| SmallCap | Index ex | ||
| Fund | Index | USA | |
| Europe | |||
| United | |||
| Kingdom | 15.1% | 16.4% | 12.2% |
| Italy | 7.2 | 2.6 | 1.8 |
| France | 6.8 | 8.8 | 7.7 |
| Germany | 5.0 | 8.9 | 6.7 |
| Netherlands | 4.3 | 2.3 | 2.5 |
| Switzerland | 4.2 | 7.2 | 5.2 |
| Ireland | 3.2 | 0.0 | 0.3 |
| Sweden | 2.5 | 2.9 | 1.8 |
| Spain | 2.2 | 3.1 | 2.2 |
| Finland | 1.6 | 0.9 | 0.7 |
| Austria | 1.5 | 0.2 | 0.2 |
| Denmark | 1.2 | 1.5 | 1.2 |
| Other | 1.7 | 2.3 | 1.4 |
| Subtotal | 56.5% | 57.1% | 43.9% |
| Pacific | |||
| Japan | 27.0% | 28.8% | 16.7% |
| Australia | 4.6 | 6.5 | 4.5 |
| South Korea | 2.1 | 4.5 | 3.9 |
| Hong Kong | 1.1 | 0.0 | 2.5 |
| Other | 0.6 | 1.3 | 1.1 |
| Subtotal | 35.4% | 41.1% | 28.7% |
| Emerging | |||
| Markets | |||
| China | 2.1% | 0.8% | 7.5% |
| India | 2.1 | 0.1 | 2.1 |
| Taiwan | 1.2 | 0.0 | 2.8 |
| Other | 0.9 | 0.0 | 8.4 |
| Subtotal | 6.3% | 0.9% | 20.8% |
| North America | |||
| Other | 0.9% | 0.2% | 6.2% |
| Middle East | 0.3% | 0.6% | 0.3% |
| Other | 0.6% | 0.1% | 0.1% |
"Other" represents securities that are not classified by the fund's benchmark index.
12
International Explorer Fund
Performance Summary
All of the returns in this report represent past performance, which is not a guarantee of future results that may be achieved by the fund. (Current performance may be lower or higher than the performance data cited. For performance data current to the most recent month-end, visit our website at vanguard.com/performance.) Note, too, that both investment returns and principal value can fluctuate widely, so an investor’s shares, when sold, could be worth more or less than their original cost. The returns shown do not reflect taxes that a shareholder would pay on fund distributions or on the sale of fund shares.
Fiscal-Year Total Returns (%): October 31, 2007, Through April 30, 2018

Average Annual Total Returns: Periods Ended March 31, 2018
This table presents returns through the latest calendar quarter—rather than through the end of the fiscal period.
Securities and Exchange Commission rules require that we provide this information.
| Inception | One | Five | Ten | |
| Date | Year | Years | Years | |
| International Explorer Fund | 11/4/1996 | 26.53% | 12.07% | 6.47% |
See Financial Highlights for dividend and capital gains information.
13
International Explorer Fund
Financial Statements (unaudited)
Statement of Net Assets
As of April 30, 2018
The fund reports a complete list of its holdings in regulatory filings four times in each fiscal year, at the quarter-ends. For the second and fourth fiscal quarters, the lists appear in the fund’s semiannual and annual reports to shareholders. For the first and third fiscal quarters, the fund files the lists with the Securities and Exchange Commission on Form N-Q. Shareholders can look up the fund’s Forms N-Q on the SEC’s website at sec.gov. Forms N-Q may also be reviewed and copied at the SEC’s Public Reference Room (see the back cover of this report for further information).
| Market | |||
| Value• | |||
| Shares | ($000) | ||
| Common Stocks (93.7%)1 | |||
| Australia (4.2%) | |||
| Iluka Resources Ltd. | 1,947,456 | 17,097 | |
| Computershare Ltd. | 1,149,920 | 14,629 | |
| Link Administration | |||
| Holdings Ltd. | 2,203,580 | 13,712 | |
| Steadfast Group Ltd. | 5,339,300 | 10,994 | |
| ^ | oOh!media Ltd. | 2,966,606 | 10,833 |
| ALS Ltd. | 1,776,068 | 10,365 | |
| ^ | Domino’s Pizza | ||
| Enterprises Ltd. | 326,913 | 10,349 | |
| SEEK Ltd. | 707,821 | 10,296 | |
| Bingo Industries Ltd. | 4,996,752 | 9,888 | |
| Ansell Ltd. | 443,360 | 8,662 | |
| * | Netwealth Group Ltd. | 1,469,551 | 7,914 |
| Nufarm Ltd. | 1,140,761 | 7,797 | |
| Monadelphous Group | |||
| Ltd. | 586,491 | 7,094 | |
| Challenger Ltd. | 864,000 | 6,985 | |
| Incitec Pivot Ltd. | 2,439,068 | 6,941 | |
| * | NRW Holdings Ltd. | 7,189,801 | 6,893 |
| Mirvac Group | 3,590,948 | 6,026 | |
| Estia Health Ltd. | 2,109,977 | 5,623 | |
| IPH Ltd. | 1,794,100 | 4,920 | |
| Domain Holdings | |||
| Australia Ltd. | 1,930,853 | 4,477 | |
| SpeedCast | |||
| International Ltd. | 932,200 | 4,140 | |
| Cleanaway Waste | |||
| Management Ltd. | 3,477,417 | 4,130 | |
| ^,* | Karoon Gas Australia | ||
| Ltd. | 1,374,635 | 1,305 | |
| 191,070 | |||
| Austria (1.4%) | |||
| Lenzing AG | 241,362 | 28,087 | |
| Wienerberger AG | 484,939 | 12,219 | |
| ANDRITZ AG | 157,718 | 8,478 | |
| Market | |||
| Value• | |||
| Shares | ($000) | ||
| * | Schoeller-Bleckmann | ||
| Oilfield Equipment AG | 62,926 | 7,779 | |
| ^ | Porr AG | 167,220 | 5,951 |
| Palfinger AG | 62,000 | 2,325 | |
| 64,839 | |||
| Belgium (0.6%) | |||
| Cie d’Entreprises CFE | 69,281 | 8,721 | |
| Euronav NV | 1,051,287 | 8,483 | |
| Ontex Group NV | 258,478 | 6,625 | |
| * | Galapagos NV | 52,470 | 4,701 |
| 28,530 | |||
| Brazil (0.0%) | |||
| 2 | Ser Educacional SA | 429,800 | 2,037 |
| China (2.0%) | |||
| Shenzhou International | |||
| Group Holdings Ltd. | 2,297,000 | 25,075 | |
| * | Vipshop Holdings Ltd. | ||
| ADR | 1,178,116 | 18,237 | |
| * | SINA Corp. | 187,121 | 17,877 |
| New Oriental Education | |||
| & Technology Group | |||
| Inc. ADR | 143,765 | 12,916 | |
| *,2 | Crystal International | ||
| Group Ltd. | 6,799,500 | 7,876 | |
| Tarena International | |||
| Inc. ADR | 529,794 | 5,356 | |
| Haitian International | |||
| Holdings Ltd. | 1,807,000 | 4,809 | |
| 92,146 | |||
| Denmark (1.2%) | |||
| FLSmidth & Co. A/S | 400,000 | 24,707 | |
| SimCorp A/S | 169,500 | 12,289 | |
| Topdanmark A/S | 190,300 | 8,950 | |
| * | Ambu A/S Class B | 300,000 | 6,957 |
| *,3 | OW Bunker A/S | 1,000,000 | — |
| 52,903 | |||
14
International Explorer Fund
| Market | |||
| Value• | |||
| Shares | ($000) | ||
| Finland (1.5%) | |||
| Huhtamaki Oyj | 750,000 | 30,506 | |
| Amer Sports Oyj | 875,000 | 26,766 | |
| * | Outotec Oyj | 705,689 | 6,419 |
| Metso Oyj | 139,221 | 4,948 | |
| 68,639 | |||
| France (6.3%) | |||
| * | Ubisoft Entertainment | ||
| SA | 350,000 | 33,442 | |
| ^ | Altran Technologies SA | 2,086,455 | 32,206 |
| Nexity SA | 500,000 | 31,265 | |
| SPIE SA | 1,375,000 | 31,112 | |
| Teleperformance | 155,000 | 24,909 | |
| 2 | Maisons du Monde SA | 426,719 | 17,340 |
| Elis SA | 700,000 | 16,742 | |
| * | ID Logistics Group | 80,632 | 14,383 |
| L’Occitane International | |||
| SA | 7,127,250 | 13,239 | |
| Kaufman & Broad SA | 250,000 | 13,171 | |
| *,2 | SMCP SA | 500,000 | 12,736 |
| * | Marie Brizard Wine & | ||
| Spirits SA | 950,000 | 9,160 | |
| Imerys SA | 88,285 | 8,058 | |
| Albioma SA | 286,970 | 7,096 | |
| * | Virbac SA | 38,634 | 6,034 |
| * | SOITEC | 63,366 | 5,153 |
| Orpea | 35,500 | 4,549 | |
| LISI | 104,300 | 3,845 | |
| ^,* | Innate Pharma SA | 341,522 | 2,613 |
| 287,053 | |||
| Germany (4.6%) | |||
| Duerr AG | 250,000 | 24,811 | |
| Grand City Properties | |||
| SA | 875,000 | 21,081 | |
| *,2 | Befesa SA | 400,000 | 20,174 |
| RIB Software SE | 629,700 | 16,687 | |
| Wacker Chemie AG | 87,500 | 15,724 | |
| XING SE | 46,250 | 14,336 | |
| * | Senvion SA | 1,000,000 | 13,077 |
| * | Stemmer Imaging AG | 300,000 | 12,734 |
| *,2 | Aumann AG | 195,975 | 11,809 |
| SAF-Holland SA | 575,438 | 10,715 | |
| ^ | STRATEC Biomedical | ||
| AG | 112,609 | 10,269 | |
| CTS Eventim AG & | |||
| Co. KGaA | 166,100 | 7,768 | |
| Stabilus SA | 84,800 | 7,623 | |
| Nemetschek SE | 55,800 | 6,687 | |
| Zeal Network SE | 150,000 | 4,843 | |
| GRENKE AG | 28,900 | 3,407 | |
| KION Group AG | 35,000 | 2,918 | |
| *,2 | windeln.de SE | 1,125,000 | 2,491 |
| Norma Group SE | 30,200 | 2,214 | |
| 209,368 | |||
| Hong Kong (1.1%) | |||
| Techtronic Industries | |||
| Co. Ltd. | 4,439,500 | 26,008 | |
| Cathay Pacific Airways | |||
| Ltd. | 5,811,386 | 9,331 | |
| Value Partners Group | |||
| Ltd. | 8,958,000 | 8,473 | |
| Johnson Electric | |||
| Holdings Ltd. | 1,773,625 | 6,175 | |
| Microport Scientific | |||
| Corp. | 124,000 | 144 | |
| 50,131 | |||
| India (2.0%) | |||
| Apollo Hospitals | |||
| Enterprise Ltd. | 962,758 | 15,708 | |
| Container Corp. Of | |||
| India Ltd. | 770,877 | 15,016 | |
| Gujarat Pipavav Port | |||
| Ltd. | 6,724,221 | 14,873 | |
| Zee Entertainment | |||
| Enterprises Ltd. | 1,446,958 | 12,720 | |
| Dewan Housing | |||
| Finance Corp. Ltd. | 1,311,100 | 12,506 | |
| Edelweiss Financial | |||
| Services Ltd. | 2,049,100 | 8,731 | |
| Indiabulls Housing | |||
| Finance Ltd. | 444,200 | 8,657 | |
| Multi Commodity | |||
| Exchange of India Ltd. | 205,558 | 2,389 | |
| 90,600 | |||
| Indonesia (0.0%) | |||
| Tower Bersama | |||
| Infrastructure Tbk PT | 2,870,600 | 1,143 | |
| Ireland (3.1%) | |||
| * | Dalata Hotel Group plc | 5,620,300 | 44,741 |
| Kingspan Group plc | 625,000 | 28,293 | |
| Smurfit Kappa | |||
| Group plc | 650,000 | 27,709 | |
| Glanbia plc | 750,000 | 12,668 | |
| Irish Continental | |||
| Group plc | 1,620,200 | 10,976 | |
| Irish Residential | |||
| Properties REIT plc | 6,500,000 | 10,672 | |
| Origin Enterprises plc | 1,075,000 | 6,926 | |
| 141,985 | |||
| Israel (0.3%) | |||
| Frutarom Industries | |||
| Ltd. | 135,000 | 12,905 | |
| Italy (6.9%) | |||
| 2 | Anima Holding SPA | 7,016,793 | 50,346 |
| * | Yoox Net-A-Porter | ||
| Group SPA | 825,000 | 37,748 | |
15
International Explorer Fund
| Market | |||
| Value• | |||
| Shares | ($000) | ||
| Cerved Information | |||
| Solutions SPA | 2,591,873 | 31,364 | |
| ^ | Maire Tecnimont SPA | 4,125,000 | 20,966 |
| Interpump Group SPA | 658,817 | 20,929 | |
| Amplifon SPA | 1,088,800 | 20,340 | |
| ^ | Salvatore Ferragamo | ||
| SPA | 510,890 | 15,096 | |
| Autogrill SPA | 1,171,250 | 14,927 | |
| PRADA SPA | 2,463,100 | 12,497 | |
| Brunello Cucinelli SPA | 316,516 | 10,513 | |
| FinecoBank Banca | |||
| Fineco SPA | 815,900 | 9,716 | |
| DiaSorin SPA | 100,801 | 9,498 | |
| *,2 | Gima TT SPA | 453,681 | 9,051 |
| Credito Emiliano SPA | 950,000 | 8,355 | |
| *,2 | doBank SPA | 509,037 | 7,704 |
| Buzzi Unicem SPA | 297,382 | 7,509 | |
| 2 | Banca Sistema SPA | 2,300,000 | 6,317 |
| Moncler SPA | 132,500 | 5,972 | |
| Tamburi Investment | |||
| Partners SPA | 663,800 | 4,911 | |
| Datalogic SPA | 144,100 | 4,592 | |
| 2 | Infrastrutture Wireless | ||
| Italiane SPA | 496,451 | 3,996 | |
| 2 | OVS SPA | 785,882 | 3,338 |
| Tamburi Investment | |||
| Partners SPA Warrants | |||
| Expire 06/30/2020 | 120,400 | 222 | |
| 315,907 | |||
| Japan (25.1%) | |||
| Nippon Shinyaku Co. | |||
| Ltd. | 636,170 | 47,367 | |
| Tokai Tokyo Financial | |||
| Holdings Inc. | 4,931,100 | 35,718 | |
| Koito Manufacturing | |||
| Co. Ltd. | 435,300 | 29,132 | |
| Kureha Corp. | 420,600 | 28,560 | |
| Glory Ltd. | 829,100 | 28,510 | |
| Tsuruha Holdings Inc. | 185,300 | 26,598 | |
| Hitachi Transport | |||
| System Ltd. | 983,800 | 26,348 | |
| Kakaku.com Inc. | 1,285,100 | 24,500 | |
| Zenkoku Hosho Co. | |||
| Ltd. | 564,755 | 23,306 | |
| Ai Holdings Corp. | 845,500 | 22,564 | |
| Horiba Ltd. | 299,700 | 21,774 | |
| Nifco Inc. | 617,200 | 21,670 | |
| Musashi Seimitsu | |||
| Industry Co. Ltd. | 590,500 | 20,688 | |
| Digital Garage Inc. | 618,500 | 20,544 | |
| Aica Kogyo Co. Ltd. | 544,900 | 20,488 | |
| Nitta Corp. | 485,100 | 18,442 | |
| Trusco Nakayama Corp. | 682,800 | 17,926 | |
| Sumitomo Forestry Co. | ||
| Ltd. | 1,078,900 | 17,878 |
| Sugi Holdings Co. Ltd. | 294,900 | 17,169 |
| DMG Mori Co. Ltd. | 899,900 | 16,814 |
| Nishi-Nippon Financial | ||
| Holdings Inc. | 1,381,300 | 16,587 |
| Nippon Densetsu | ||
| Kogyo Co. Ltd. | 807,600 | 16,576 |
| Nabtesco Corp. | 447,800 | 16,148 |
| Izumi Co. Ltd. | 242,000 | 15,980 |
| ABC-Mart Inc. | 242,100 | 15,955 |
| Kobe Steel Ltd. | 1,509,500 | 15,528 |
| Arcs Co. Ltd. | 563,500 | 15,436 |
| SCSK Corp. | 354,700 | 15,180 |
| Ferrotec Holdings Corp. | 673,700 | 14,989 |
| Lintec Corp. | 499,400 | 14,452 |
| JSP Corp. | 439,100 | 14,212 |
| Daikyonishikawa Corp. | 732,800 | 13,171 |
| Daifuku Co. Ltd. | 244,700 | 13,081 |
| Shinmaywa Industries | ||
| Ltd. | 1,164,600 | 13,052 |
| Asahi Intecc Co. Ltd. | 371,640 | 12,963 |
| en-japan Inc. | 274,200 | 12,818 |
| Unipres Corp. | 509,300 | 11,992 |
| Kyudenko Corp. | 256,330 | 11,977 |
| Miura Co. Ltd. | 392,800 | 11,928 |
| IHI Corp. | 357,424 | 11,683 |
| Taiheiyo Cement Corp. | 307,200 | 11,600 |
| Persol Holdings Co. Ltd. | 479,700 | 11,403 |
| Japan Lifeline Co. Ltd. | 387,400 | 11,349 |
| OBIC Business | ||
| Consultants Co. Ltd. | 155,400 | 11,335 |
| Kawasaki Heavy | ||
| Industries Ltd. | 331,394 | 11,079 |
| Ezaki Glico Co. Ltd. | 194,400 | 10,472 |
| TechnoPro Holdings | ||
| Inc. | 172,600 | 10,042 |
| Ichigo Inc. | 2,238,330 | 9,968 |
| Sanwa Holdings Corp. | 765,290 | 9,827 |
| IDOM Inc. | 1,307,000 | 9,443 |
| Toyo Tire & Rubber | ||
| Co. Ltd. | 552,400 | 9,403 |
| Iriso Electronics Co. | ||
| Ltd. | 142,600 | 9,033 |
| EPS Holdings Inc. | 430,700 | 8,775 |
| Kissei Pharmaceutical | ||
| Co. Ltd. | 307,100 | 8,664 |
| Nippon Yusen KK | 403,900 | 8,591 |
| Obara Group Inc. | 144,600 | 8,544 |
| Eagle Industry Co. | ||
| Ltd. | 471,000 | 8,494 |
| Itoham Yonekyu | ||
| Holdings Inc. | 910,700 | 8,271 |
| TPR Co. Ltd. | 272,400 | 8,252 |
16
| International Explorer Fund | |||
| Market | |||
| Value• | |||
| Shares | ($000) | ||
| JGC Corp. | 330,900 | 8,110 | |
| Nihon Parkerizing Co. | |||
| Ltd. | 511,900 | 8,104 | |
| Dip Corp. | 331,900 | 8,048 | |
| Tokyo Ohka Kogyo Co. | |||
| Ltd. | 225,180 | 7,911 | |
| Tokyo Steel | |||
| Manufacturing Co. Ltd. | 945,800 | 7,893 | |
| Benefit One Inc. | 336,500 | 7,869 | |
| NEC Networks & System | |||
| Integration Corp. | 285,400 | 7,467 | |
| Open House Co. Ltd. | 133,500 | 7,432 | |
| H2O Retailing Corp. | 381,700 | 7,183 | |
| Takara Leben Co. Ltd. | 1,673,200 | 7,089 | |
| Fukushima Industries | |||
| Corp. | 147,000 | 6,816 | |
| Daibiru Corp. | 571,100 | 6,809 | |
| ^ | Jamco Corp. | 295,000 | 6,788 |
| Disco Corp. | 38,000 | 6,661 | |
| Tokyo Seimitsu Co. Ltd. | 168,100 | 6,385 | |
| Kumiai Chemical | |||
| Industry Co. Ltd. | 967,400 | 6,140 | |
| Don Quijote Holdings | |||
| Co. Ltd. | 113,700 | 6,121 | |
| San-In Godo Bank Ltd. | 624,800 | 5,874 | |
| Ain Holdings Inc. | 87,500 | 5,828 | |
| Pola Orbis Holdings Inc. | 132,100 | 5,763 | |
| Skylark Co. Ltd. | 370,900 | 5,456 | |
| Aruhi Corp. | 403,600 | 5,420 | |
| Kenedix Inc. | 903,900 | 5,221 | |
| KH Neochem Co. Ltd. | 168,400 | 5,093 | |
| Furukawa Electric Co. | |||
| Ltd. | 99,400 | 4,885 | |
| Hitachi Metals Ltd. | 410,800 | 4,695 | |
| Alps Electric Co. Ltd. | 182,090 | 4,022 | |
| Hiroshima Bank Ltd. | 428,300 | 3,259 | |
| Kanto Denka Kogyo Co. | |||
| Ltd. | 350,200 | 3,247 | |
| Tokyo TY Financial | |||
| Group Inc. | 120,045 | 3,168 | |
| Warabeya Nichiyo | |||
| Holdings Co. Ltd. | 114,600 | 2,909 | |
| Tsutsumi Jewelry Co. | |||
| Ltd. | 137,700 | 2,586 | |
| Nihon M&A Center Inc. | 88,300 | 2,577 | |
| Yushin Precision | |||
| Equipment Co. Ltd. | 117,600 | 1,671 | |
| Yokogawa Bridge | |||
| Holdings Corp. | 15,200 | 331 | |
| 1,149,080 | |||
| Malaysia (0.2%) | |||
| AirAsia Group Bhd. | 10,178,100 | 9,943 | |
| Market | |||
| Value• | |||
| Shares | ($000) | ||
| Mexico (0.3%) | |||
| Grupo Aeroportuario | |||
| del Pacifico SAB de | |||
| CV Class B | 1,021,243 | 10,623 | |
| Banregio Grupo | |||
| Financiero SAB de CV | 667,400 | 4,264 | |
| 14,887 | |||
| Netherlands (4.1%) | |||
| ^,* | OCI NV | 1,350,000 | 32,038 |
| AMG Advanced | |||
| Metallurgical Group | |||
| NV | 606,965 | 28,361 | |
| TKH Group NV | 425,000 | 26,866 | |
| SIF Holding NV | 975,000 | 22,005 | |
| ^,* | Fugro NV | 1,175,000 | 18,582 |
| Van Lanschot | |||
| Kempen NV | 550,000 | 16,990 | |
| *,2 | Basic-Fit NV | 525,000 | 15,775 |
| IMCD NV | 235,377 | 14,484 | |
| 2 | Philips Lighting NV | 325,000 | 9,884 |
| Beter Bed Holding NV | 286,640 | 2,879 | |
| 187,864 | |||
| New Zealand (0.3%) | |||
| Fletcher Building Ltd. | 2,542,263 | 11,260 | |
| Fisher & Paykel | |||
| Healthcare Corp. Ltd. | 452,500 | 4,047 | |
| 15,307 | |||
| Norway (0.9%) | |||
| * | Kongsberg Gruppen | ||
| ASA | 993,319 | 24,318 | |
| *,2 | Elkem ASA | 3,200,000 | 12,645 |
| Tomra Systems ASA | 325,000 | 6,029 | |
| 42,992 | |||
| Other (0.7%) | |||
| 4 | Vanguard FTSE All | ||
| World ex-US | |||
| Small-Cap ETF | 249,010 | 29,784 | |
| Singapore (0.2%) | |||
| First Resources Ltd. | 5,709,600 | 7,260 | |
| South Africa (0.2%) | |||
| Reinet Investments | |||
| SCA | 369,347 | 6,839 | |
| South Korea (2.0%) | |||
| NCSoft Corp. | 81,722 | 27,391 | |
| Medy-Tox Inc. | 27,725 | 18,019 | |
| S-1 Corp. | 110,958 | 10,175 | |
| ^,2 | Netmarble Corp. | 70,436 | 9,649 |
| Mando Corp. | 44,140 | 9,339 | |
| Samsung Securities | |||
| Co. Ltd. | 188,430 | 6,481 | |
17
International Explorer Fund
| Market | |||
| Value• | |||
| Shares | ($000) | ||
| Nexen Tire Corp. | 554,547 | 6,250 | |
| * | Korea Aerospace | ||
| Industries Ltd. | 127,782 | 5,135 | |
| 92,439 | |||
| Spain (2.0%) | |||
| *,2 | Unicaja Banco SA | 11,000,000 | 19,951 |
| CIE Automotive SA | 491,400 | 18,369 | |
| Prosegur Cia de | |||
| Seguridad SA | 2,221,700 | 16,794 | |
| *,2 | Aedas Homes SAU | 400,000 | 14,301 |
| Melia Hotels | |||
| International SA | 949,646 | 14,120 | |
| Bolsas y Mercados | |||
| Espanoles SHMSF | |||
| SA | 110,300 | 3,866 | |
| Viscofan SA | 43,800 | 2,903 | |
| Naturhouse Health | |||
| SAU | 591,220 | 2,707 | |
| 93,011 | |||
| Sweden (2.4%) | |||
| 2 | Bravida Holding AB | 3,400,000 | 24,350 |
| Loomis AB Class B | 641,115 | 23,347 | |
| *,2 | Ahlsell AB | 2,500,000 | 14,928 |
| Modern Times Group | |||
| MTG AB Class B | 353,900 | 13,909 | |
| ^ | Intrum Justitia AB | 425,000 | 11,278 |
| * | Concentric AB | 523,836 | 8,553 |
| 2 | Coor Service | ||
| Management | |||
| Holding AB | 769,558 | 5,330 | |
| Avanza Bank Holding | |||
| AB | 73,600 | 3,460 | |
| ^,2 | Alimak Group AB | 193,100 | 2,856 |
| 2 | Hoist Finance AB | 307,000 | 2,713 |
| 110,724 | |||
| Switzerland (4.0%) | |||
| ^ | Helvetia Holding AG | 53,750 | 31,928 |
| OC Oerlikon Corp. AG | 1,904,764 | 30,751 | |
| Ascom Holding AG | 1,011,600 | 20,240 | |
| Logitech International | |||
| SA | 500,000 | 18,472 | |
| ^,* | Dufry AG | 100,990 | 14,284 |
| ^ | u-blox Holding AG | 73,907 | 13,504 |
| Interroll Holding AG | 7,000 | 11,597 | |
| ^ | COSMO | ||
| Pharmaceuticals NV | 75,000 | 10,940 | |
| Daetwyler Holding AG | 40,400 | 7,706 | |
| ^ | Comet Holding AG | 55,000 | 7,208 |
| ams AG | 86,899 | 7,167 | |
| Tecan Group AG | 26,971 | 5,930 | |
| *,2 | Galenica AG | 97,537 | 5,244 |
| 184,971 | |||
| Market | |||
| Value• | |||
| Shares | ($000) | ||
| Taiwan (1.1%) | |||
| Chroma ATE Inc. | 3,591,900 | 18,061 | |
| Giant Manufacturing | |||
| Co. Ltd. | 1,785,000 | 9,066 | |
| Gourmet Master | |||
| Co. Ltd. | 723,030 | 8,331 | |
| CTCI Corp. | 4,336,000 | 7,304 | |
| Nien Made Enterprise | |||
| Co. Ltd. | 722,000 | 6,413 | |
| 49,175 | |||
| Thailand (0.1%) | |||
| LPN Development | |||
| PCL | 14,565,300 | 4,607 | |
| United Arab Emirates (0.0%) | |||
| * | Lamprell plc | 1,250,000 | 1,590 |
| United Kingdom (14.1%) | |||
| B&M European Value | |||
| Retail SA | 4,087,286 | 22,777 | |
| Dechra | |||
| Pharmaceuticals plc | 580,000 | 21,785 | |
| Elementis plc | 5,457,482 | 21,258 | |
| Grainger plc | 4,842,605 | 20,856 | |
| Restaurant Group plc | 4,487,482 | 18,743 | |
| * | SSP Group plc | 1,935,483 | 17,320 |
| Bodycote plc | 1,313,958 | 16,177 | |
| DCC plc | 159,000 | 15,262 | |
| 2 | Auto Trader Group plc | 3,114,718 | 15,135 |
| Cineworld Group plc | 4,200,000 | 14,994 | |
| RPC Group plc | 1,374,100 | 14,910 | |
| Keller Group plc | 1,017,143 | 14,540 | |
| Melrose Industries plc | 4,243,600 | 13,307 | |
| Rentokil Initial plc | 3,042,486 | 12,836 | |
| Cranswick plc | 321,363 | 12,827 | |
| Abcam plc | 751,175 | 12,593 | |
| IG Group Holdings plc | 1,100,000 | 12,560 | |
| Hikma Pharmaceuticals | |||
| plc | 693,725 | 12,232 | |
| HomeServe plc | 1,200,000 | 12,197 | |
| Tyman plc | 2,795,486 | 12,124 | |
| Howden Joinery | |||
| Group plc | 1,850,000 | 12,108 | |
| * | Rhi Magnesita NV | 197,609 | 11,807 |
| Superdry plc | 560,000 | 11,569 | |
| UDG Healthcare plc | 914,300 | 11,487 | |
| Redrow plc | 1,300,000 | 11,202 | |
| Genus plc | 321,188 | 11,108 | |
| Polypipe Group plc | 2,080,975 | 10,937 | |
| Ted Baker plc | 298,100 | 10,921 | |
| Coats Group plc | 10,000,000 | 10,879 | |
| Ultra Electronics | |||
| Holdings plc | 536,502 | 10,384 | |
18
International Explorer Fund
| Market | |||
| Value• | |||
| Shares | ($000) | ||
| Eco Animal Health | |||
| Group plc | 1,200,000 | 9,583 | |
| QinetiQ Group plc | 3,000,000 | 9,484 | |
| Dunelm Group plc | 1,195,500 | 9,274 | |
| * | Hunting plc | 818,811 | 9,049 |
| Hill & Smith | |||
| Holdings plc | 488,053 | 8,907 | |
| Halma plc | 520,000 | 8,725 | |
| Sanne Group plc | 1,018,616 | 8,710 | |
| Lancashire Holdings | |||
| Ltd. | 1,040,282 | 8,525 | |
| Kier Group plc | 575,507 | 8,492 | |
| Volution Group plc | 2,978,915 | 8,075 | |
| Hays plc | 3,249,962 | 8,009 | |
| Northgate plc | 1,560,000 | 7,965 | |
| Telecom Plus plc | 535,193 | 7,924 | |
| Consort Medical plc | 478,735 | 7,893 | |
| Electrocomponents | |||
| plc | 917,700 | 7,672 | |
| * | Cairn Homes plc | 3,516,310 | 7,625 |
| Investec plc | 931,000 | 7,365 | |
| Pets at Home Group | |||
| plc | 3,500,000 | 7,353 | |
| Segro plc | 812,281 | 7,208 | |
| Photo-Me | |||
| International plc | 2,938,810 | 6,444 | |
| Rotork plc | 1,363,000 | 6,147 | |
| 2 | ConvaTec Group plc | 2,047,040 | 6,094 |
| Just Group plc | 3,100,000 | 5,992 | |
| Diploma plc | 358,500 | 5,915 | |
| 2 | Ibstock plc | 1,430,876 | 5,850 |
| LondonMetric | |||
| Property plc | 2,050,000 | 5,364 | |
| Jupiter Fund | |||
| Management plc | 846,200 | 5,292 | |
| Micro Focus | |||
| International plc | 190,000 | 3,276 | |
| James Fisher & | |||
| Sons plc | 141,368 | 3,249 | |
| Soco International plc | 1,700,000 | 2,460 | |
| Clarkson plc | 73,000 | 2,427 | |
| * | Rhi Magnesita NV | ||
| (Vienna Shares) | 12,201 | 719 | |
| 643,902 | |||
| United States (0.8%) | |||
| Samsonite | |||
| International SA | 4,002,800 | 18,055 | |
| * | BeiGene Ltd. ADR | 34,379 | 5,830 |
| * | iQIYI Inc. ADR | 750,605 | 13,534 |
| 37,419 | |||
| Total Common Stocks | |||
| (Cost $3,393,843) | 4,291,050 | ||
| Temporary Cash Investments (8.3%)1 | |||
| Money Market Fund (7.2%) | |||
| 5,6 Vanguard Market | |||
| Liquidity Fund, | |||
| 1.886% | 3,261,605 | 326,161 | |
| Face | |||
| Amount | |||
| ($000) | |||
| Repurchase Agreement (0.8%) | |||
| Goldman Sachs & Co. | |||
| 1.710%, 5/1/18 (Dated | |||
| 04/30/18, Repurchase | |||
| Value $37,702,000 | |||
| collateralized by Federal | |||
| National Mortgage Assoc. | |||
| 3.000%–5.000%, | |||
| 03/01/30–02/01/48, | |||
| with a purchase value | |||
| of $38,454,000) | 37,700 | 37,700 | |
| U. S. Government and Agency Obligations (0.3%) | |||
| United States Treasury Bill, | |||
| 1.462%, 5/17/18 | 4,400 | 4,397 | |
| 7 United States Treasury Bill, | |||
| 1.475%–1.509%, 6/21/18 | 9,400 | 9,377 | |
| 13,774 | |||
| Total Temporary Cash Investments | |||
| (Cost $377,611) | 377,635 | ||
| Total Investments (102.0%) | |||
| (Cost $3,771,454) | 4,668,685 | ||
| Other Assets and Liabilities (-2.0%) | |||
| Other Assets 8 | 56,477 | ||
| Liabilities 6 | (147,870) | ||
| (91,393) | |||
| Net Assets (100%) | |||
| Applicable to 213,204,572 outstanding | |||
| $.001 par value shares of beneficial | |||
| interest (unlimited authorization) | 4,577,292 | ||
| Net Asset Value Per Share | $21.47 | ||
19
| International Explorer Fund | |
| Amount | |
| ($000) | |
| Statement of Assets and Liabilities | |
| Assets | |
| Investments in Securities, at Value | |
| Unaffiliated Issuers | 4,312,740 |
| Affiliated Issuers | 355,945 |
| Total Investments in Securities | 4,668,685 |
| Investment in Vanguard | 244 |
| Receivables for Investment | |
| Securities Sold | 22,490 |
| Receivables for Accrued Income | 17,451 |
| Receivables for Capital Shares Issued | 4,415 |
| Variation Margin Receivable— | |
| Futures Contracts | 264 |
| Unrealized Appreciation— | |
| Forward Currency Contracts | 2,541 |
| Other Assets 8 | 9,072 |
| Total Assets | 4,725,162 |
| Liabilities | |
| Payables for Investment Securities | |
| Purchased | 22,103 |
| Collateral for Securities on Loan | 108,815 |
| Payables to Investment Advisor | 2,351 |
| Payables for Capital Shares Redeemed | 4,494 |
| Payables to Vanguard | 4,445 |
| Variation Margin Payable— | |
| Futures Contracts | 5 |
| Unrealized Depreciation— | |
| Forward Currency Contracts | 5,605 |
| Other Liabilities | 52 |
| Total Liabilities | 147,870 |
| Net Assets | 4,577,292 |
| At April 30, 2018, net assets consisted of: | |
| Amount | |
| ($000) | |
| Paid-in Capital | 3,547,498 |
| Overdistributed Net Investment Income | (12,716) |
| Accumulated Net Realized Gains | 143,963 |
| Unrealized Appreciation (Depreciation) | |
| Investment Securities | 897,231 |
| Futures Contracts | 4,749 |
| Forward Currency Contracts | (3,064) |
| Foreign Currencies | (369) |
| Net Assets | 4,577,292 |
• See Note A in Notes to Financial Statements.
^ Includes partial security positions on loan to broker-dealers.
The total value of securities on loan is $102,788,000.
* Non-income-producing security.
1 The fund invests a portion of its cash reserves in equity markets through the use of index futures contracts. After giving effect to futures investments, the fund’s effective common stock and temporary cash investment positions represent 96.5% and 5.5%, respectively, of net assets.
2 Security exempt from registration under Rule 144A of the Securities Act of 1933. Such securities may be sold in transactions exempt from registration, normally to qualified institutional buyers. At April 30, 2018, the aggregate value of these securities was $317,883,000, representing 6.9% of net assets.
3 Security value determined using significant unobservable inputs.
4 Considered an affiliated company of the fund as the issuer is another member of The Vanguard Group.
5 Affiliated money market fund available only to Vanguard funds and certain trusts and accounts managed by Vanguard. Rate shown is the 7-day yield.
6 Includes $108,815,000 of collateral received for securities on loan.
7 Securities with a value of $6,145,000 have been segregated as initial margin for open futures contracts.
8 Cash of $2,530,000 has been segregated as collateral for open forward currency contracts.
ADR—American Depositary Receipt.
REIT—Real Estate Investment Trust.
20
| International Explorer Fund | �� | |||
| Derivative Financial Instruments Outstanding as of Period End | ||||
| Futures Contracts | ||||
| ($000) | ||||
| Value and | ||||
| Number of | Unrealized | |||
| Long (Short) | Notional | Appreciation | ||
| Expiration | Contracts | Amount | (Depreciation) | |
| Long Futures Contracts | ||||
| Topix Index | June 2018 | 280 | 45,534 | 1,757 |
| Dow Jones EURO STOXX 50 Index | June 2018 | 889 | 37,314 | 1,367 |
| FTSE 100 Index | June 2018 | 288 | 29,592 | 1,348 |
| S&P ASX 200 Index | June 2018 | 129 | 14,524 | 277 |
| 4,749 | ||||
Unrealized appreciation (depreciation) on open futures contracts, except for Topix Index and S&P ASX 200 Index, is required to be treated as realized gain (loss) for tax purposes. Unrealized appreciation (depreciation) for Topix Index and S&P ASX 200 Index futures contracts is generally treated the same for financial reporting and tax purposes.
| Forward Currency Contracts | ||||||
| Unrealized | ||||||
| Contract | Appreciation | |||||
| Contract Amount (000) | ||||||
| Settlement | (Depreciation) | |||||
| Counterparty | Date | Receive | Deliver | ($000) | ||
| UBS AG | 6/20/18 | EUR | 33,357 | USD | 41,524 | (1,082) |
| Goldman Sachs International | 6/12/18 | JPY | 4,324,693 | USD | 41,038 | (1,357) |
| Barclays Bank plc | 6/20/18 | GBP | 18,669 | USD | 26,136 | (369) |
| Citibank, N.A. | 6/20/18 | EUR | 20,529 | USD | 25,398 | (506) |
| JPMorgan Chase Bank, N.A. | 6/12/18 | JPY | 2,486,250 | USD | 23,292 | (479) |
| Toronto-Dominion Bank | 6/26/18 | AUD | 14,926 | USD | 11,771 | (532) |
| Credit Suisse International | 6/20/18 | GBP | 6,446 | USD | 9,190 | (293) |
| BNP Paribas | 6/12/18 | JPY | 843,250 | USD | 7,988 | (250) |
| Bank of America, N.A. | 6/20/18 | GBP | 3,874 | USD | 5,499 | (153) |
| Citibank, N.A. | 6/12/18 | JPY | 583,770 | USD | 5,353 | 3 |
| BNP Paribas | 6/26/18 | AUD | 5,730 | USD | 4,394 | (81) |
| Goldman Sachs International | 6/20/18 | GBP | 2,425 | USD | 3,388 | (41) |
| Citibank, N.A. | 6/12/18 | JPY | 339,580 | USD | 3,226 | (111) |
| JPMorgan Chase Bank, N.A. | 6/26/18 | AUD | 4,108 | USD | 3,176 | (83) |
| Citibank, N.A. | 6/26/18 | AUD | 3,491 | USD | 2,715 | (87) |
| Citibank, N.A. | 6/20/18 | GBP | 1,748 | USD | 2,465 | (52) |
| BNP Paribas | 6/20/18 | EUR | 1,639 | USD | 2,046 | (58) |
| HSBC Bank USA, N.A. | 6/20/18 | GBP | 1,234 | USD | 1,734 | (31) |
| UBS AG | 6/26/18 | AUD | 2,154 | USD | 1,661 | (40) |
21
| International Explorer Fund | ||||||
| Forward Currency Contracts (continued) | ||||||
| Unrealized | ||||||
| Contract | Appreciation | |||||
| Settlement | Contract Amount (000) | (Depreciation) | ||||
| Counterparty | Date | Receive | Deliver | ($000) | ||
| BNP Paribas | 6/12/18 | USD | 21,437 | JPY | 2,263,025 | 674 |
| JPMorgan Chase Bank, N.A. | 6/12/18 | USD | 15,059 | JPY | 1,588,840 | 483 |
| JPMorgan Chase Bank, N.A. | 6/20/18 | USD | 31,647 | EUR | 25,479 | 753 |
| JPMorgan Chase Bank, N.A. | 6/26/18 | USD | 8,917 | AUD | 11,392 | 338 |
| Bank of America, N.A. | 6/20/18 | USD | 11,241 | GBP | 8,032 | 154 |
| JPMorgan Chase Bank, N.A. | 6/20/18 | USD | 8,005 | GBP | 5,701 | 136 |
| (3,064) | ||||||
| AUD—Australian dollar. | ||||||
| EUR—Euro. | ||||||
| GBP—British pound. | ||||||
| JPY—Japanese yen. | ||||||
| USD—U.S. dollar. | ||||||
Unrealized appreciation (depreciation) on open forward currency contracts is treated as realized gain (loss) for tax purposes.
See accompanying Notes, which are an integral part of the Financial Statements.
22
| International Explorer Fund | |
| Statement of Operations | |
| Six Months Ended | |
| April 30, 2018 | |
| ($000) | |
| Investment Income | |
| Income | |
| Dividends—Unaffiliated Issuers1 | 41,664 |
| Dividends—Affiliated Issuers | 509 |
| Interest—Unaffiliated Issuers | 290 |
| Interest—Affiliated Issuers | 1,348 |
| Securities Lending—Net | 1,436 |
| Total Income | 45,247 |
| Expenses | |
| Investment Advisory Fees—Note B | |
| Basic Fee | 4,672 |
| Performance Adjustment | 64 |
| The Vanguard Group—Note C | |
| Management and Administrative | 3,371 |
| Marketing and Distribution | 373 |
| Custodian Fees | 282 |
| Shareholders’ Reports and Proxy | 65 |
| Trustees’ Fees and Expenses | 3 |
| Total Expenses | 8,830 |
| Net Investment Income | 36,417 |
| Realized Net Gain (Loss) | |
| Investment Securities Sold—Unaffiliated Issuers | 155,069 |
| Investment Securities Sold—Affiliated Issuers | (53) |
| Futures Contracts | (1,697) |
| Forward Currency Contracts | 2,667 |
| Foreign Currencies | (476) |
| Realized Net Gain (Loss) | 155,510 |
| Change in Unrealized Appreciation (Depreciation) | |
| Investment Securities—Unaffiliated Issuers | (15,969) |
| Investment Securities—Affiliated Issuers | 780 |
| Futures Contracts | 1,354 |
| Forward Currency Contracts | (918) |
| Foreign Currencies | 345 |
| Change in Unrealized Appreciation (Depreciation) | (14,408) |
| Net Increase (Decrease) in Net Assets Resulting from Operations | 177,519 |
| 1 Dividends are net of foreign withholding taxes of $3,283,000. | |
| See accompanying Notes, which are an integral part of the Financial Statements. | |
23
| International Explorer Fund | ||
| Statement of Changes in Net Assets | ||
| Six Months Ended | Year Ended | |
| April 30, | October 31, | |
| 2018 | 2017 | |
| ($000) | ($000) | |
| Increase (Decrease) in Net Assets | ||
| Operations | ||
| Net Investment Income | 36,417 | 56,421 |
| Realized Net Gain (Loss) | 155,510 | 201,076 |
| Change in Unrealized Appreciation (Depreciation) | (14,408) | 648,383 |
| Net Increase (Decrease) in Net Assets Resulting from Operations | 177,519 | 905,880 |
| Distributions | ||
| Net Investment Income | (83,340) | (52,250) |
| Realized Capital Gain1 | (167,556) | — |
| Total Distributions | (250,896) | (52,250) |
| Capital Share Transactions | ||
| Issued | 815,272 | 810,710 |
| Issued in Lieu of Cash Distributions | 228,661 | 47,014 |
| Redeemed | (373,328) | (559,993) |
| Net Increase (Decrease) from Capital Share Transactions | 670,605 | 297,731 |
| Total Increase (Decrease) | 597,228 | 1,151,361 |
| Net Assets | ||
| Beginning of Period | 3,980,064 | 2,828,703 |
| End of Period2 | 4,577,292 | 3,980,064 |
1 Includes fiscal 2018 and 2017 short- term gain distributions totaling $38,075,000 and $0, respectively. Short-term gain distributions
are treated as ordinary income dividends for tax purposes.
2 Net Assets—End of Period includes undistributed (overdistributed) net investment income of ($12,716,000) and $25,159,000.
See accompanying Notes, which are an integral part of the Financial Statements.
24
| International Explorer Fund | ||||||
| Financial Highlights | ||||||
| Six Months | ||||||
| Ended | ||||||
| For a Share Outstanding | April 30, | Year Ended October 31, | ||||
| Throughout Each Period | 2018 | 2017 | 2016 | 2015 | 2014 | 2013 |
| Net Asset Value, Beginning of Period | $21.87 | $16.82 | $17.76 | $18.26 | $18.50 | $14.50 |
| Investment Operations | ||||||
| Net Investment Income | .1821 | . 3331 | .318 | .287 | .335 | .327 |
| Net Realized and Unrealized Gain (Loss) | ||||||
| on Investments | .765 | 5.035 | (.334) | .635 | .133 | 4.078 |
| Total from Investment Operations | .947 | 5.368 | (.016) | .922 | .468 | 4.405 |
| Distributions | ||||||
| Dividends from Net Investment Income | (. 447) | (. 318) | (. 263) | (. 326) | (. 420) | (. 405) |
| Distributions from Realized Capital Gains | (.900) | — | (.661) | (1.096) | (.288) | — |
| Total Distributions | (1.347) | (.318) | (.924) | (1.422) | (.708) | (.405) |
| Net Asset Value, End of Period | $21.47 | $21.87 | $16.82 | $17.76 | $18.26 | $18.50 |
| Total Return2 | 4.49% | 32.58% | -0.06% | 5.65% | 2.66% | 31.13% |
| Ratios/Supplemental Data | ||||||
| Net Assets, End of Period (Millions) | $4,577 | $3,980 | $2,829 | $2,887 | $2,598 | $2,281 |
| Ratio of Total Expenses to | ||||||
| Average Net Assets3 | 0.41% | 0.38% | 0.41% | 0.42% | 0.40% | 0.36% |
| Ratio of Net Investment Income to | ||||||
| Average Net Assets | 1.67% | 1.68% | 1.83% | 1.53% | 1.69% | 2.03% |
| Portfolio Turnover Rate | 33% | 43% | 37% | 42% | 39% | 36% |
The expense ratio, net investment income ratio, and turnover rate for the current period have been annualized.
1 Calculated based on average shares outstanding.
2 Total returns do not include account service fees that may have applied in the periods shown. Fund prospectuses provide information
about any applicable account service fees.
3 Includes performance-based investment advisory fee increases (decreases) of 0.00%, (0.01%), 0.00%, 0.00%, 0.00%, and (0.05%).
See accompanying Notes, which are an integral part of the Financial Statements.
25
International Explorer Fund
Notes to Financial Statements
Vanguard International Explorer Fund is registered under the Investment Company Act of 1940 as an open-end investment company, or mutual fund.
The fund invests in securities of foreign issuers, which may subject it to investment risks not normally associated with investing in securities of U.S. corporations. Further, at April 30, 2018, the fund had a concentration of its investments in securities issued in Japan, and the performance of such investments may be impacted by the country’s social, political, and economic conditions.
A. The following significant accounting policies conform to generally accepted accounting principles for U.S. investment companies. The fund consistently follows such policies in preparing its financial statements.
1. Security Valuation: Securities are valued as of the close of trading on the New York Stock Exchange (generally 4 p.m., Eastern time) on the valuation date. Equity securities are valued at the latest quoted sales prices or official closing prices taken from the primary market in which each security trades; such securities not traded on the valuation date are valued at the mean of the latest quoted bid and asked prices. Securities for which market quotations are not readily available, or whose values have been affected by events occurring before the fund’s pricing time but after the close of the securities’ primary markets, are valued at their fair values calculated according to procedures adopted by the board of trustees. These procedures include obtaining quotations from an independent pricing service, monitoring news to identify significant market- or security-specific events, and evaluating changes in the values of foreign market proxies (for example, ADRs, futures contracts, or exchange-traded funds), between the time the foreign markets close and the fund’s pricing time. When fair-value pricing is employed, the prices of securities used by a fund to calculate its net asset value may differ from quoted or published prices for the same securities. Investments in Vanguard Market Liquidity Fund are valued at that fund’s net asset value. Temporary cash investments are valued using the latest bid prices or using valuations based on a matrix system (which considers such factors as security prices, yields, maturities, and ratings), both as furnished by independent pricing services.
2. Foreign Currency: Securities and other assets and liabilities denominated in foreign currencies are translated into U.S. dollars using exchange rates obtained from an independent third party as of the fund’s pricing time on the valuation date. Realized gains (losses) and unrealized appreciation (depreciation) on investment securities include the effects of changes in exchange rates since the securities were purchased, combined with the effects of changes in security prices. Fluctuations in the value of other assets and liabilities resulting from changes in exchange rates are recorded as unrealized foreign currency gains (losses) until the assets or liabilities are settled in cash, at which time they are recorded as realized foreign currency gains (losses).
3. Futures and Forward Currency Contracts: The fund uses index futures contracts to a limited extent, with the objective of maintaining full exposure to the stock market while maintaining liquidity. The fund may purchase or sell futures contracts to achieve a desired level of investment, whether to accommodate portfolio turnover or cash flows from capital share transactions. The primary risks associated with the use of futures contracts are imperfect correlation between changes in market values of stocks held by the fund and the prices of futures contracts, and the possibility of an illiquid market. Counterparty risk involving futures is mitigated because a regulated clearinghouse is the counterparty instead of the clearing broker. To further mitigate counterparty risk, the fund trades futures contracts on an exchange, monitors the financial strength of its clearing brokers and clearinghouse, and has entered into clearing agreements with its clearing brokers. The clearinghouse imposes initial margin requirements to secure the fund’s performance and requires daily settlement of variation margin representing changes in the market value of each contract.
26
International Explorer Fund
The fund enters into forward currency contracts to provide the appropriate currency exposure related to any open futures contracts or to protect the value of securities and related receivables and payables against changes in foreign exchange rates. The fund’s risks in using these contracts include movement in the values of the foreign currencies relative to the U.S. dollar and the ability of the counterparties to fulfill their obligations under the contracts. The fund mitigates its counterparty risk by entering into forward currency contracts only with a diverse group of prequalified counterparties, monitoring their financial strength, entering into master netting arrangements with its counterparties, and requiring its counterparties to transfer collateral as security for their performance. In the absence of a default, the collateral pledged or received by the fund cannot be repledged, resold, or rehypothecated. The master netting arrangements provide that, in the event of a counterparty’s default (including bankruptcy), the fund may terminate the forward currency contracts, determine the net amount owed by either party in accordance with its master netting arrangements, and sell or retain any collateral held up to the net amount owed to the fund under the master netting arrangements. The forward currency contracts contain provisions whereby a counterparty may terminate open contracts if the fund’s net assets decline below a certain level, triggering a payment by the fund if the fund is in a net liability position at the time of the termination. The payment amount would be reduced by any collateral the fund has pledged. Any assets pledged as collateral for open contracts are noted in the Statement of Net Assets.
The value of collateral received or pledged is compared daily to the value of the forward currency contracts exposure with each counterparty, and any difference, if in excess of a specified minimum transfer amount, is adjusted and settled within two business days.
Futures contracts are valued at their quoted daily settlement prices. Forward currency contracts are valued at their quoted daily prices obtained from an independent third party, adjusted for currency risk based on the expiration date of each contract. The notional amounts of the contracts are not recorded in the Statement of Net Assets. Fluctuations in the value of the contracts are recorded in the Statement of Assets and Liabilities as an asset (liability) and in the Statement of Operations as unrealized appreciation (depreciation) until the contracts are closed, when they are recorded as realized gains (losses) on futures or forward currency contracts.
During the six months ended April 30, 2018, the fund’s average investments in long and short futures contracts represented 2% and 0% of net assets, respectively, based on the average of the notional amounts at each quarter-end during the period. The fund’s average investment in forward currency contracts represented 8% of net assets, based on the average of the notional amounts at each quarter-end during the period.
4. Repurchase Agreements: The fund enters into repurchase agreements with institutional counterparties. Securities pledged as collateral to the fund under repurchase agreements are held by a custodian bank until the agreements mature, and in the absence of a default, such collateral cannot be repledged, resold, or rehypothecated. Each agreement requires that the market value of the collateral be sufficient to cover payments of interest and principal. The fund further mitigates its counterparty risk by entering into repurchase agreements only with a diverse group of prequalified counterparties, monitoring their financial strength, and entering into master repurchase agreements with its counterparties. The master repurchase agreements provide that, in the event of a counterparty’s default (including bankruptcy), the fund may terminate any repurchase agreements with that counterparty, determine the net amount owed, and sell or retain the collateral up to the net amount owed to the fund. Such action may be subject to legal proceedings, which may delay or limit the disposition of collateral.
27
International Explorer Fund
5. Federal Income Taxes: The fund intends to continue to qualify as a regulated investment company and distribute all of its taxable income. Management has analyzed the fund’s tax positions taken for all open federal income tax years (October 31, 2014–2017), and for the period ended April 30, 2018, and has concluded that no provision for federal income tax is required in the fund’s financial statements.
6. Distributions: Distributions to shareholders are recorded on the ex-dividend date.
7. Securities Lending: To earn additional income, the fund lends its securities to qualified institutional borrowers. Security loans are subject to termination by the fund at any time, and are required to be secured at all times by collateral in an amount at least equal to the market value of securities loaned. Daily market fluctuations could cause the value of loaned securities to be more or less than the value of the collateral received. When this occurs, the collateral is adjusted and settled before the opening of the market on the next business day. The fund further mitigates its counterparty risk by entering into securities lending transactions only with a diverse group of prequalified counterparties, monitoring their financial strength, and entering into master securities lending agreements with its counterparties. The master securities lending agreements provide that, in the event of a counterparty’s default (including bankruptcy), the fund may terminate any loans with that borrower, determine the net amount owed, and sell or retain the collateral up to the net amount owed to the fund; however, such actions may be subject to legal proceedings. While collateral mitigates counterparty risk, in the event of a default, the fund may experience delays and costs in recovering the securities loaned. The fund invests cash collateral received in Vanguard Market Liquidity Fund, and records a liability in the Statement of Assets and Liabilities for the return of the collateral, during the period the securities are on loan. Securities lending income represents fees charged to borrowers plus income earned on invested cash collateral, less expenses associated with the loan. During the term of the loan, the fund is entitled to all distributions made on or in respect of the loaned securities.
8. Credit Facility: The fund and certain other funds managed by The Vanguard Group (“Vanguard”) participate in a $3.1 billion committed credit facility provided by a syndicate of lenders pursuant to a credit agreement that may be renewed annually; each fund is individually liable for its borrowings, if any, under the credit facility. Borrowings may be utilized for temporary and emergency purposes, and are subject to the fund’s regulatory and contractual borrowing restrictions. The participating funds are charged administrative fees and an annual commitment fee of 0.10% of the undrawn amount of the facility; these fees are allocated to the funds based on a method approved by the fund’s board of trustees and included in Management and Administrative expenses on the fund’s Statement of Operations. Any borrowings under this facility bear interest at a rate based upon the higher of the one-month London Interbank Offered Rate, federal funds effective rate, or overnight bank funding rate plus an agreed-upon spread.
The fund had no borrowings outstanding at April 30, 2018, or at any time during the period then ended.
9. Other: Dividend income is recorded on the ex-dividend date. Interest income includes income distributions received from Vanguard Market Liquidity Fund and is accrued daily. Premiums and discounts on debt securities purchased are amortized and accreted, respectively, to interest income over the lives of the respective securities. Security transactions are accounted for on the date securities are bought or sold. Costs used to determine realized gains (losses) on the sale of investment securities are those of the specific securities sold.
28
International Explorer Fund
Taxes on foreign dividends and capital gains have been provided for in accordance with the fund’s understanding of the applicable countries’ tax rules and rates. Foreign capital gains tax is accrued daily based upon net unrealized gains. The fund has filed tax reclaims for previously withheld taxes on dividends earned in certain European Union countries. These filings are subject to various administrative and judicial proceedings within these countries. Such tax reclaims received during the year, if any, are included in dividend income. No other amounts for additional tax reclaims are reflected in the financial statements due to the uncertainty as to the ultimate resolution of proceedings, the likelihood of receipt of these reclaims, and the potential timing of payment.
B. The investment advisory firms Schroder Investment Management North America Inc., Wellington Management Company LLP, and TimesSquare Capital Management, LLC, each provide investment advisory services to a portion of the fund for a fee calculated at an annual percentage rate of average net assets managed by the advisor. The basic fee of Schroder Investment Management North America Inc. and Wellington Management Company LLP is subject to quarterly adjustments based on performance relative to the S&P EPAC SmallCap Index for the preceding three years. In accordance with the advisory contract entered into with TimesSquare Capital Management, LLC, beginning November 1, 2018, the investment advisory fee will be subject to quarterly adjustments based on performance relative to the S&P EPAC SmallCap Index since October 31, 2017.
Vanguard manages the cash reserves of the fund as described below.
For the six months ended April 30, 2018, the aggregate investment advisory fee represented an effective annual basic rate of 0.22% of the fund’s average net assets, before an increase of $64,000 (0.00%) based on performance.
C. In accordance with the terms of a Funds’ Service Agreement (the “FSA”) between Vanguard and the fund, Vanguard furnishes to the fund corporate management, administrative, marketing, distribution, and cash management services at Vanguard’s cost of operations (as defined by the FSA). These costs of operations are allocated to the fund based on methods and guidelines approved by the board of trustees. Vanguard does not require reimbursement in the current period for certain costs of operations (such as deferred compensation/benefits and risk/insurance costs); the fund’s liability for these costs of operations is included in Payables to Vanguard on the Statement of Assets and Liabilities. All other costs of operations payable to Vanguard are generally settled twice a month.
Upon the request of Vanguard, the fund may invest up to 0.40% of its net assets as capital in Vanguard. At April 30, 2018, the fund had contributed to Vanguard capital in the amount of $244,000, representing 0.01% of the fund’s net assets and 0.10% of Vanguard’s capitalization. The fund’s trustees and officers are also directors and employees, respectively, of Vanguard.
29
International Explorer Fund
D. Various inputs may be used to determine the value of the fund’s investments. These inputs are summarized in three broad levels for financial statement purposes. The inputs or methodologies used to value securities are not necessarily an indication of the risk associated with investing in those securities.
Level 1—Quoted prices in active markets for identical securities.
Level 2—Other significant observable inputs (including quoted prices for similar securities, interest rates, prepayment speeds, credit risk, etc.).
Level 3—Significant unobservable inputs (including the fund’s own assumptions used to determine the fair value of investments). Any investments valued with significant unobservable inputs are noted on the Statement of Net Assets.
The following table summarizes the market value of the fund’s investments as of April 30, 2018, based on the inputs used to value them:
| Level 1 | Level 2 | Level 3 | |
| Investments | ($000) | ($000) | ($000) |
| Common Stocks | 116,194 | 4,174,856 | — |
| Temporary Cash Investments | 326,161 | 51,474 | — |
| Futures Contracts—Assets1 | 264 | — | — |
| Futures Contracts—Liabilities1 | (5) | — | — |
| Forward Currency Contracts—Assets | — | 2,541 | — |
| Forward Currency Contracts—Liabilities | — | (5,605) | — |
| Total | 442,614 | 4,223,266 | — |
| 1 Represents variation margin on the last day of the reporting period. |
E. At April 30, 2018, the fair values of derivatives were reflected in the Statement of Assets and Liabilities as follows:
| Foreign | |||
| Equity | Exchange | ||
| Contracts | Contracts | Total | |
| Statement of Assets and Liabilities Caption | ($000) | ($000) | ($000) |
| Variation Margin Receivable—Futures Contracts | 264 | — | 264 |
| Unrealized Appreciation—Forward Currency Contracts | — | 2,541 | 2,541 |
| Total Assets | 264 | 2,541 | 2,805 |
| Variation Margin Payable—Futures Contracts | (5) | — | (5) |
| Unrealized Depreciation—Forward Currency Contracts | — | (5,605) | (5,605) |
| Total Liabilities | (5) | (5,605) | (5,610) |
30
International Explorer Fund
Realized net gain (loss) and the change in unrealized appreciation (depreciation) on derivatives for the six months ended April 30, 2018, were:
| Foreign | |||
| Equity | Exchange | ||
| Contracts | Contracts | Total | |
| Realized Net Gain (Loss) on Derivatives | ($000) | ($000) | ($000) |
| Futures Contracts | (1,697) | — | (1,697) |
| Forward Currency Contracts | — | 2,667 | 2,667 |
| Realized Net Gain (Loss) on Derivatives | (1,697) | 2,667 | 970 |
| Change in Unrealized Appreciation (Depreciation) on Derivatives | |||
| Futures Contracts | 1,354 | — | 1,354 |
| Forward Currency Contracts | — | (918) | (918) |
| Change in Unrealized Appreciation (Depreciation) on Derivatives | 1,354 | (918) | 436 |
F. Distributions are determined on a tax basis and may differ from net investment income and realized capital gains for financial reporting purposes. Differences may be permanent or temporary. Permanent differences are reclassified among capital accounts in the financial statements to reflect their tax character. Temporary differences arise when certain items of income, expense, gain, or loss are recognized in different periods for financial statement and tax purposes. These differences will reverse at some time in the future. Differences in classification may also result from the treatment of short-term gains as ordinary income for tax purposes. The fund’s tax-basis capital gains and losses are determined only at the end of each fiscal year.
Certain of the fund’s investments are in securities considered to be passive foreign investment companies, for which any unrealized appreciation and/or realized gains are required to be included in distributable net investment income for tax purposes. During the six months ended April 30, 2018, the fund realized gains on the sale of passive foreign investment companies of $9,578,000, which have been included in current and prior periods’ taxable income; accordingly, such gains have been reclassified from accumulated net realized gains to overdistributed net investment income. Passive foreign investment companies had unrealized appreciation of $37,461,000 at April 30, 2018.
At April 30, 2018, the cost of investment securities for tax purposes was $3,808,915,000. Net unrealized appreciation of investment securities for tax purposes was $859,770,000, consisting of unrealized gains of $1,024,868,000 on securities that had risen in value since their purchase and $165,098,000 in unrealized losses on securities that had fallen in value since their purchase.
G. During the six months ended April 30, 2018, the fund purchased $1,120,447,000 of investment securities and sold $684,102,000 of investment securities, other than temporary cash investments.
31
| International Explorer Fund | ||
| H. Capital shares issued and redeemed were: | ||
| Six Months Ended | Year Ended | |
| April 30, 2018 | October 31, 2017 | |
| Shares | Shares | |
| (000) | (000) | |
| Issued | 37,557 | 41,710 |
| Issued in Lieu of Cash Distributions | 10,930 | 2,904 |
| Redeemed | (17,259) | (30,798) |
| Net Increase (Decrease) in Shares Outstanding | 31,228 | 13,816 |
I. Transactions during the period in investments where the issuer is another member of The Vanguard Group were as follows:
| Current Period Transactions | ||||||||
| Oct. 31, | Proceeds | Realized | April 30, | |||||
| 2017 | from | Net | Change in | Capital Gain | 2018 | |||
| Market | Purchases | Securities | Gain | Unrealized | Distributions | Market | ||
| Value | at Cost | Sold | (Loss) | App. (Dep.) | Income | Received | Value | |
| ($000) | ($000) | ($000) | ($000) | ($000) | ($000) | ($000) | ($000) | |
| Vanguard FTSE All | ||||||||
| World ex-US | ||||||||
| Small-Cap ETF | 29,042 | — | — | — | 742 | 509 | — | 29,784 |
| Vanguard Market | ||||||||
| Liquidity Fund | 348,467 | NA1 | NA1 | (53) | 38 | 1,348 | — | 326,161 |
| Total | 377,509 | (53) | 780 | 1,857 | — | 355,945 | ||
1 Not applicable—purchases and sales are for temporary cash investment purposes.
J. Management has determined that no material events or transactions occurred subsequent to April 30, 2018, that would require recognition or disclosure in these financial statements.
32
About Your Fund’s Expenses
As a shareholder of the fund, you incur ongoing costs, which include costs for portfolio management, administrative services, and shareholder reports (like this one), among others. Operating expenses, which are deducted from a fund’s gross income, directly reduce the investment return of the fund.
A fund’s expenses are expressed as a percentage of its average net assets. This figure is known as the expense ratio. The following examples are intended to help you understand the ongoing costs (in dollars) of investing in your fund and to compare these costs with those of other mutual funds. The examples are based on an investment of $1,000 made at the beginning of the period shown and held for the entire period.
The accompanying table illustrates your fund’s costs in two ways:
• Based on actual fund return. This section helps you to estimate the actual expenses that you paid over the period. The ”Ending Account Value“ shown is derived from the fund‘s actual return, and the third column shows the dollar amount that would have been paid by an investor who started with $1,000 in the fund. You may use the information here, together with the amount you invested, to estimate the expenses that you paid over the period.
To do so, simply divide your account value by $1,000 (for example, an $8,600 account value divided by $1,000 = 8.6), then multiply the result by the number given for your fund under the heading ”Expenses Paid During Period.“
• Based on hypothetical 5% yearly return. This section is intended to help you compare your fund‘s costs with those of other mutual funds. It assumes that the fund had a yearly return of 5% before expenses, but that the expense ratio is unchanged. In this case—because the return used is not the fund’s actual return—the results do not apply to your investment. The example is useful in making comparisons because the Securities and Exchange Commission requires all mutual funds to calculate expenses based on a 5% return. You can assess your fund’s costs by comparing this hypothetical example with the hypothetical examples that appear in shareholder reports of other funds.
Note that the expenses shown in the table are meant to highlight and help you compare ongoing costs only and do not reflect transaction costs incurred by the fund for buying and selling securities. Further, the expenses do not include any purchase, redemption, or account service fees described in the fund prospectus. If such fees were applied to your account, your costs would be higher. Your fund does not carry a “sales load.”
The calculations assume no shares were bought or sold during the period. Your actual costs may have been higher or lower, depending on the amount of your investment and the timing of any purchases or redemptions.
You can find more information about the fund’s expenses, including annual expense ratios, in the Financial Statements section of this report. For additional information on operating expenses and other shareholder costs, please refer to your fund’s current prospectus.
33
| Six Months Ended April 30, 2018 | |||
| Beginning | Ending | Expenses | |
| Account Value | Account Value | Paid During | |
| International Explorer Fund | 10/31/2017 | 4/30/2018 | Period |
| Based on Actual Fund Return | $1,000.00 | $1,044.92 | $2.08 |
| Based on Hypothetical 5% Yearly Return | 1,000.00 | 1,022.76 | 2.06 |
The calculations are based on expenses incurred in the most recent six-month period. The fund’s annualized six-month expense ratio for that period is 0.41%. The dollar amounts shown as “Expenses Paid” are equal to the annualized expense ratio multiplied by the average account value over the period, multiplied by the number of days in the most recent six-month period, then divided by the number of days in the most recent 12-month period (181/365).
34
Glossary
Beta. A measure of the magnitude of a fund’s past share-price fluctuations in relation to the ups and downs of a given market index. The index is assigned a beta of 1.00. Compared with a given index, a fund with a beta of 1.20 typically would have seen its share price rise or fall by 12% when the index rose or fell by 10%. For this report, beta is based on returns over the past 36 months for both the fund and the index. Note that a fund’s beta should be reviewed in conjunction with its R-squared (see definition). The lower the R-squared, the less correlation there is between the fund and the index, and the less reliable beta is as an indicator of volatility.
Dividend Yield. Dividend income earned by stocks, expressed as a percentage of the aggregate market value (or of net asset value, for a fund). The yield is determined by dividing the amount of the annual dividends by the aggregate value (or net asset value) at the end of the period. For a fund, the dividend yield is based solely on stock holdings and does not include any income produced by other investments.
Earnings Growth Rate. The average annual rate of growth in earnings over the past five years for the stocks now in a fund.
Equity Exposure. A measure that reflects a fund’s investments in stocks and stock futures. Any holdings in short-term reserves are excluded.
Expense Ratio. A fund’s total annual operating expenses expressed as a percentage of the fund’s average net assets. The expense ratio includes management and administrative expenses, but does not include the transaction costs of buying and selling portfolio securities.
Inception Date. The date on which the assets of a fund (or one of its share classes) are first invested in accordance with the fund’s investment objective. For funds with a subscription period, the inception date is the day after that period ends. Investment performance is measured from the inception date.
Median Market Cap. An indicator of the size of companies in which a fund invests; the midpoint of market capitalization (market price x shares outstanding) of a fund’s stocks, weighted by the proportion of the fund’s assets invested in each stock. Stocks representing half of the fund’s assets have market capitalizations above the median, and the rest are below it.
Price/Book Ratio. The share price of a stock divided by its net worth, or book value, per share. For a fund, the weighted average price/book ratio of the stocks it holds.
Price/Earnings Ratio. The ratio of a stock’s current price to its per-share earnings over the past year. For a fund, the weighted average P/E of the stocks it holds. P/E is an indicator of market expectations about corporate prospects; the higher the P/E, the greater the expectations for a company’s future growth.
R-Squared. A measure of how much of a fund’s past returns can be explained by the returns from the market in general, as measured by a given index. If a fund’s total returns were precisely synchronized with an index’s returns, its R-squared would be 1.00. If the fund’s returns bore no relationship to the index’s returns, its R-squared would be 0. For this report, R-squared is based on returns over the past 36 months for both the fund and the index.
35
Return on Equity. The annual average rate of return generated by a company during the past five years for each dollar of shareholder’s equity (net income divided by shareholder’s equity). For a fund, the weighted average return on equity for the companies whose stocks it holds.
Short-Term Reserves. The percentage of a fund invested in highly liquid, short-term securities that can be readily converted to cash.
Turnover Rate. An indication of the fund’s trading activity. Funds with high turnover rates incur higher transaction costs and may be more likely to distribute capital gains (which may be taxable to investors). The turnover rate excludes in-kind transactions, which have minimal impact on costs.
36
The Global Industry Classification Standard (“GICS”) was developed by and is the exclusive property and a service mark of MSCI Inc. (“MSCI”) and Standard and Poor’s, a division of McGraw-Hill Companies, Inc. (“S&P”), and is licensed for use by Vanguard. Neither MSCI, S&P nor any third party involved in making or compiling the GICS or any GICS classification makes any express or implied warranties or representations with respect to such standard or classification (or the results to be obtained by the use thereof), and all such parties hereby expressly disclaim all warranties of originality, accuracy, completeness, merchantability or fitness for a particular purpose with respect to any such standard or classification. Without limiting any of the foregoing, in no event shall MSCI, S&P, any of its affiliates or any third party involved in making or compiling the GICS or any GICS classification have any liability for any direct, indirect, special, punitive, consequential or any other damages (including lost profits) even if notified of the possibility of such damages.
37
This page intentionally left blank.
The People Who Govern Your Fund
The trustees of your mutual fund are there to see that the fund is operated and managed in your best interests since, as a shareholder, you are a part owner of the fund. Your fund’s trustees also serve on the board of directors of The Vanguard Group, Inc., which is owned by the Vanguard funds and provides services to them on an at-cost basis.
A majority of Vanguard’s board members are independent, meaning that they have no affiliation with Vanguard or the funds they oversee, apart from the sizable personal investments they have made as private individuals. The independent board members have distinguished backgrounds in business, academia, and public service. Each of the trustees and executive officers oversees 208 Vanguard funds.
Information for each trustee and executive officer of the fund appears below. The mailing address of the trustees and officers is P.O. Box 876, Valley Forge, PA 19482. More information about the trustees is in the Statement of Additional Information, which can be obtained, without charge, by contacting Vanguard at 800-662-7447, or online at vanguard.com.
Interested Trustees1
F. William McNabb III
Born in 1957. Trustee since July 2009. Principal occupation(s) during the past five years and other experience: chairman of the board (January 2010–present) of Vanguard and of each of the investment companies served by Vanguard, trustee (2009–present) of each of the investment companies served by Vanguard, and director (2008–present) of Vanguard. Chief executive officer and president (2008–2017) of Vanguard and each of the investment companies served by Vanguard, managing director (1995–2008) of Vanguard, and director (1997–2018) of Vanguard Marketing Corporation. Director (2018–present) of UnitedHealth Group.
Mortimer J. Buckley
Born in 1969. Trustee since January 2018. Principal occupation(s) during the past five years and other experience: chief executive officer (January 2018–present) of Vanguard; chief executive officer, president, and trustee (January 2018–present) of each of the investment companies served by Vanguard; president and director (2017–present) of Vanguard; and president (February 2018–present) of Vanguard Marketing Corporation. Chief investment officer (2013–2017), managing director (2002–2017), head of the Retail Investor Group (2006–2012), and chief information officer (2001–2006) of Vanguard. Chairman of the board (2011–2017) of the Children’s Hospital of Philadelphia.
Independent Trustees
Emerson U. Fullwood
Born in 1948. Trustee since January 2008. Principal occupation(s) during the past five years and other experience: executive chief staff and marketing officer for North America and corporate vice president (retired 2008) of Xerox Corporation (document management products and services). Former president of the Worldwide Channels Group, Latin America, and Worldwide Customer Service and executive chief staff officer of Developing Markets of Xerox. Executive in residence and 2009–2010 Distinguished Minett Professor at the Rochester Institute of Technology. Lead director of SPX FLOW, Inc. (multi-industry manufacturing). Director of the University of Rochester Medical Center, the Monroe Community College Foundation, the United Way of Rochester, North Carolina A&T University, and Roberts Wesleyan College. Trustee of the University of Rochester.
Amy Gutmann
Born in 1949. Trustee since June 2006. Principal occupation(s) during the past five years and other experience: president (2004–present) of the University of Pennsylvania. Christopher H. Browne Distinguished Professor of Political Science, School of Arts and Sciences, and professor of communication, Annenberg School for Communication, with secondary faculty appointments in the Department of Philosophy, School of Arts and Sciences, and at the Graduate School of Education, University of Pennsylvania. Trustee of the National Constitution Center.
1 Mr. McNabb and Mr. Buckley are considered “interested persons,” as defined in the Investment Company Act of 1940, because they are officers of the Vanguard funds.
JoAnn Heffernan Heisen
Born in 1950. Trustee since July 1998. Principal occupation(s) during the past five years and other experience: corporate vice president of Johnson & Johnson (pharmaceuticals/medical devices/consumer products) and member of its executive committee (1997–2008). Chief global diversity officer (retired 2008), vice president and chief information officer (1997–2006), controller (1995–1997), treasurer (1991–1995), and assistant treasurer (1989–1991) of Johnson & Johnson. Director of Skytop Lodge Corporation (hotels) and the Robert Wood Johnson Foundation. Member of the advisory board of the Institute for Women’s Leadership at Rutgers University.
F. Joseph Loughrey
Born in 1949. Trustee since October 2009. Principal occupation(s) during the past five years and other experience: president and chief operating officer (retired 2009) and vice chairman of the board (2008–2009) of Cummins Inc. (industrial machinery). Chairman of the board of Hillenbrand, Inc. (specialized consumer services), Oxfam America, and the Lumina Foundation for Education. Director of the V Foundation for Cancer Research. Member of the advisory council for the College of Arts and Letters and chair of the advisory board to the Kellogg Institute for International Studies, both at the University of Notre Dame.
Mark Loughridge
Born in 1953. Trustee since March 2012. Principal occupation(s) during the past five years and other experience: senior vice president and chief financial officer (retired 2013) of IBM (information technology services). Fiduciary member of IBM’s Retirement Plan Committee (2004–2013), senior vice president and general manager (2002–2004) of IBM Global Financing, vice president and controller (1998–2002) of IBM, and a variety of other prior management roles at IBM. Member of the Council on Chicago Booth.
Scott C. Malpass
Born in 1962. Trustee since March 2012. Principal occupation(s) during the past five years and other experience: chief investment officer (1989–present) and vice president (1996–present) of the University of Notre Dame. Assistant professor of finance at the Mendoza College of Business, University of Notre Dame, and member of the Notre Dame 403(b) Investment Committee. Chairman of the board of TIFF Advisory Services, Inc. Member of the board of Catholic Investment Services, Inc. (investment advisors), the board of advisors for Spruceview Capital Partners, and the board of superintendence of the Institute for the Works of Religion.
Deanna Mulligan
Born in 1963. Trustee since January 2018. Principal occupation(s) during the past five years and other experience: president (2010–present) and chief executive officer (2011–present) of The Guardian Life Insurance Company of America. Chief operating officer (2010–2011) and executive vice president (2008–2010) of Individual Life and Disability of The Guardian Life Insurance Company of America. Member of the board of The Guardian Life Insurance Company of America, the American Council of Life Insurers, the Partnership for New York City (business leadership), and the Committee Encouraging Corporate Philanthropy. Trustee of the Economic Club of New York and the Bruce Museum (arts and science). Member of the Advisory Council for the Stanford Graduate School of Business.
André F. Perold
Born in 1952. Trustee since December 2004. Principal occupation(s) during the past five years and other experience: George Gund Professor of Finance and Banking, Emeritus at the Harvard Business School (retired 2011). Chief investment officer and co-managing partner of HighVista Strategies LLC (private investment firm). Overseer of the Museum of Fine Arts Boston.
Sarah Bloom Raskin
Born in 1961. Trustee since January 2018. Principal occupation(s) during the past five years and other experience: deputy secretary (2014–2017) of the United States Department of the Treasury. Governor (2010–2014) of the Federal Reserve Board. Commissioner (2007–2010) of financial regulation for the State of Maryland. Member of the board of directors (2012–2014) of Neighborhood Reinvestment Corporation. Director of i(x) Investments, LLC.
Peter F. Volanakis
Born in 1955. Trustee since July 2009. Principal occupation(s) during the past five years and other experience: president and chief operating officer (retired 2010) of Corning Incorporated (communications equipment) and director of Corning Incorporated (2000–2010) and Dow Corning (2001–2010). Director (2012) of SPX Corporation (multi-industry manufacturing). Overseer of the Amos Tuck School of Business Administration, Dartmouth College (2001–2013). Chairman of the board of trustees of Colby-Sawyer College. Member of the Board of Hypertherm Inc. (industrial cutting systems, software, and consumables).
Executive Officers
Glenn Booraem
Born in 1967. Principal occupation(s) during the past five years and other experience: principal of Vanguard. Investment stewardship officer (2017–present), treasurer (2015–2017), controller (2010–2015), and assistant controller (2001–2010) of each of the investment companies served by Vanguard.
Christine M. Buchanan
Born in 1970. Principal occupation(s) during the past five years and other experience: principal of Vanguard and global head of Fund Administration at Vanguard. Treasurer (2017–present) of each of the investment companies served by Vanguard. Partner (2005–2017) at KPMG LLP (audit, tax, and advisory services).
Brian Dvorak
Born in 1973. Principal occupation(s) during the past five years and other experience: principal of Vanguard. Chief compliance officer (2017–present) of Vanguard and each of the investment companies served by Vanguard. Assistant vice president (2017–present) of Vanguard Marketing Corporation. Vice president and director of Enterprise Risk Management (2011–2013) at Oppenheimer Funds, Inc.
Thomas J. Higgins
Born in 1957. Principal occupation(s) during the past five years and other experience: principal of Vanguard. Chief financial officer (2008–present) and treasurer (1998–2008) of each of the investment companies served by Vanguard.
Peter Mahoney
Born in 1974. Principal occupation(s) during the past five years and other experience: principal of Vanguard. Controller (2015–present) of each of the investment companies served by Vanguard. Head of International Fund Services (2008–2014) at Vanguard.
Anne E. Robinson
Born in 1970. Principal occupation(s) during the past five years and other experience: general counsel (2016–present) of Vanguard. Secretary (2016–present) of Vanguard and of each of the investment companies served by Vanguard. Managing director (2016–present) of Vanguard. Director and senior vice president (2016–2018) of Vanguard Marketing Corporation. Managing director and general counsel of Global Cards and Consumer Services (2014–2016) at Citigroup. Counsel (2003–2014) at American Express.
Michael Rollings
Born in 1963. Principal occupation(s) during the past five years and other experience: finance director (2017–present) and treasurer (2017) of each of the investment companies served by Vanguard. Managing director (2016–present) of Vanguard. Chief financial officer (2016–present) of Vanguard. Director (2016–present) of Vanguard Marketing Corporation. Executive vice president and chief financial officer (2006–2016) of MassMutual Financial Group.
| Vanguard Senior Management Team | |
| Mortimer J. Buckley | James M. Norris |
| Gregory Davis | Thomas M. Rampulla |
| John James | Karin A. Risi |
| Martha G. King | Anne E. Robinson |
| John T. Marcante | Michael Rollings |
| Chris D. McIsaac | |
| Chairman Emeritus and Senior Advisor | |
| John J. Brennan | |
| Chairman, 1996–2009 | |
| Chief Executive Officer and President, 1996–2008 | |
| Founder | |
| John C. Bogle | |
| Chairman and Chief Executive Officer, 1974–1996 | |
 | |
P.O. Box 2600 | |
Connect with Vanguard® > vanguard.com | |
| Fund Information > 800-662-7447 | Source for Bloomberg Barclays indexes: Bloomberg |
| Direct Investor Account Services > 800-662-2739 | Index Services Limited. Copyright 2018, Bloomberg. All |
| Institutional Investor Services > 800-523-1036 | rights reserved. |
| Text Telephone for People | |
| Who Are Deaf or Hard of Hearing > 800-749-7273 | |
| This material may be used in conjunction | |
| with the offering of shares of any Vanguard | |
| fund only if preceded or accompanied by | |
| the fund’s current prospectus. | |
| All comparative mutual fund data are from Lipper, a | |
| Thomson Reuters Company, or Morningstar, Inc., unless | |
| otherwise noted. | |
| You can obtain a free copy of Vanguard’s proxy voting | |
| guidelines by visiting vanguard.com/proxyreporting or by | |
| calling Vanguard at 800-662-2739. The guidelines are | |
| also available from the SEC’s website, sec.gov. In | |
| addition, you may obtain a free report on how your fund | |
| voted the proxies for securities it owned during the 12 | |
| months ended June 30. To get the report, visit either | |
| vanguard.com/proxyreporting or sec.gov. | |
| You can review and copy information about your fund at | |
| the SEC’s Public Reference Room in Washington, D.C. To | |
| find out more about this public service, call the SEC at | |
| 202-551-8090. Information about your fund is also | |
| available on the SEC’s website, and you can receive | |
| copies of this information, for a fee, by sending a | |
| request in either of two ways: via email addressed to | |
| publicinfo@sec.gov or via regular mail addressed to the | |
| Public Reference Section, Securities and Exchange | |
| Commission, Washington, DC 20549-1520. | |
| © 2018 The Vanguard Group, Inc. | |
| All rights reserved. | |
| Vanguard Marketing Corporation, Distributor. | |
| Q1262 062018 | |
| Semiannual Report | April 30, 2018 |
| Vanguard High Dividend Yield Index Fund |
Vanguard’s Principles for Investing Success
We want to give you the best chance of investment success. These principles, grounded in Vanguard’s research and experience, can put you on the right path.
Goals. Create clear, appropriate investment goals.
Balance. Develop a suitable asset allocation using broadly diversified funds. Cost. Minimize cost.
Discipline. Maintain perspective and long-term discipline.
A single theme unites these principles: Focus on the things you can control. We believe there is no wiser course for any investor.
| Contents | |
| Your Fund’s Performance at a Glance. | 1 |
| CEO’s Perspective. | 3 |
| Results of Proxy Voting. | 5 |
| Fund Profile. | 7 |
| Performance Summary. | 9 |
| Financial Statements. | 10 |
| About Your Fund’s Expenses. | 25 |
| Trustees Approve Advisory Arrangement. | 27 |
| Glossary. | 29 |
Please note: The opinions expressed in this report are just that—informed opinions. They should not be considered promises or advice. Also, please keep in mind that the information and opinions cover the period through the date on the front of this report. Of course, the risks of investing in your fund are spelled out in the prospectus.
See the Glossary for definitions of investment terms used in this report.
About the cover: Nautical images have been part of Vanguard’s rich heritage since its start in 1975. For an incoming ship, a lighthouse offers a beacon and safe path to shore. You can similarly depend on Vanguard to put you first––and light the way––as you strive to meet your financial goals. Our client focus and low costs, stemming from our unique ownership structure, assure that your interests are paramount.
Your Fund’s Performance at a Glance
• For the six months ended April 30, 2018, Vanguard High Dividend Yield Index Fund returned 1.60% for Investor Shares. That performance was in line with the 1.70% return of its expense-free benchmark. The average return of its peer group was 2.07%.
• Stocks continued to climb through late January amid robust global economic momentum, then slumped because of concerns about inflation, geopolitical tensions, and trade protectionism.
• Because U.S. companies that are committed to paying larger-than-average dividends fell harder than the broad U.S. stock market, they underperformed for the six months.
• The fund posted positive results in five of ten industry sectors. Technology stood out, with a return of about 13%. Consumer services and oil and gas also performed well. Consumer goods, utilities, and basic materials lagged.
| Total Returns: Six Months Ended April 30, 2018 | |
| Total | |
| Returns | |
| Vanguard High Dividend Yield Index Fund | |
| Investor Shares | 1.60% |
| ETF Shares | |
| Market Price | 1.66 |
| Net Asset Value | 1.63 |
| FTSE High Dividend Yield Index | 1.70 |
| Equity Income Funds Average | 2.07 |
Equity Income Funds Average: Derived from data provided by Lipper, a Thomson Reuters Company.
The Vanguard ETF® Shares shown are traded on the NYSE Arca exchange and are available only through brokers. The table provides ETF returns based on both the NYSE Arca market price and the net asset value for a share. U.S. Pat. Nos. 6,879,964; 7,337,138; 7,720,749; 7,925,573; 8,090,646; and 8,417,623.
For the ETF Shares, the market price is determined by the midpoint of the bid-offer spread as of the closing time of the New York Stock Exchange (generally 4 p.m., Eastern time). The net asset value is also determined as of the NYSE closing time. For more information about how the ETF Shares' market prices have compared with their net asset value, visit vanguard.com, select your ETF, and then select the Price and Performance tab. The ETF premium/discount analysis there shows the percentages of days on which the ETF Shares' market price was above or below the NAV.
1
| Expense Ratios | |||
| Your Fund Compared With Its Peer Group | |||
| Investor | ETF | Peer Group | |
| Shares | Shares | Average | |
| High Dividend Yield Index Fund | 0.15% | 0.08% | 1.15% |
The fund expense ratios shown are from the prospectus dated February 22, 2018, and represent estimated costs for the current fiscal year. For the six months ended April 30, 2018, the fund’s annualized expense ratios were 0.15% for Investor Shares and 0.08% for ETF Shares. The peer-group expense ratio is derived from data provided by Lipper, a Thomson Reuters Company, and captures information through year-end 2017.
Peer group: Equity Income Funds.
2
CEO’s Perspective

Tim Buckley
President and Chief Executive Officer
Dear Shareholder,
I feel extremely fortunate to have the chance to lead a company filled with people who come to work every day passionate about Vanguard’s core purpose: to take a stand for all investors, to treat them fairly, and to give them the best chance for investment success.
When I joined Vanguard in 1991, I found a mission-driven team focused on improving lives—helping people retire more comfortably, put their children through college, and achieve financial security. I also found a company with purpose in an industry ripe for improvement.
It was clear, even early in my career, that the cards were stacked against most investors. Hidden fees, performance-chasing, and poor advice were relentlessly eroding investors’ dreams.
We knew Vanguard could be different and, as a result, could make a real difference. We have lowered the costs of investing for our shareholders significantly. And we’re proud of the performance of our funds.
Vanguard is built for Vanguard investors—we focus solely on you, our fund shareholders. Everything we do is designed to give our clients the best chance for investment success. In my role as CEO, I’ll keep this priority
3
front and center. We’re proud of what we’ve achieved, but we’re even more excited about what’s to come.
Steady, time-tested guidance
Our guidance for investors, as always, is to stay the course, tune out the hyperbolic headlines, and focus on your goals and what you can control, such as costs and how much you save. This time-tested advice has served our clients well over the decades.
Regardless of how the markets perform in the short term, I’m incredibly optimistic about the future for our investors. We have a dedicated team serving you, and we will never stop striving to make
Vanguard the best place for you to invest through our high-quality funds and services, advice and guidance to help you meet your financial goals, and an experience that makes you feel good about entrusting us with your hard-earned savings.
Thank you for your continued loyalty.
Sincerely,

Mortimer J. Buckley
President and Chief Executive Officer May 16, 2018
| Market Barometer | |||
| Total Returns | |||
| Periods Ended April 30, 2018 | |||
| Six | One | Five Years | |
| Months | Year | (Annualized) | |
| Stocks | |||
| Russell 1000 Index (Large-caps) | 3.83% | 13.17% | 12.84% |
| Russell 2000 Index (Small-caps) | 3.27 | 11.54 | 11.74 |
| Russell 3000 Index (Broad U.S. market) | 3.79 | 13.05 | 12.75 |
| FTSE All-World ex US Index (International) | 3.72 | 15.84 | 5.85 |
| Bonds | |||
| Bloomberg Barclays U.S. Aggregate Bond Index | |||
| (Broad taxable market) | -1.87% | -0.32% | 1.47% |
| Bloomberg Barclays Municipal Bond Index | |||
| (Broad tax-exempt market) | -0.97 | 1.56 | 2.44 |
| Citigroup Three-Month U.S. Treasury Bill Index | 0.67 | 1.16 | 0.32 |
| CPI | |||
| Consumer Price Index | 1.57% | 2.46% | 1.50% |
4
Results of Proxy Voting
At a meeting of shareholders on November 15, 2017, fund shareholders approved the following proposals:
Proposal 1—Elect trustees for the fund.*
The individuals listed in the table below were elected as trustees for the fund. All trustees with the exception of Ms. Mulligan, Ms. Raskin, and Mr. Buckley (each of whom already serves as a director of The Vanguard Group, Inc.) served as trustees to the funds prior to the shareholder meeting.
| Percentage | |||
| Trustee | For | Withheld | For |
| Mortimer J. Buckley | 860,548,560 | 28,473,629 | 96.8% |
| Emerson U. Fullwood | 859,625,511 | 29,396,677 | 96.7% |
| Amy Gutmann | 859,439,842 | 29,582,347 | 96.7% |
| JoAnn Heffernan Heisen | 860,336,031 | 28,686,158 | 96.8% |
| F. Joseph Loughrey | 860,411,988 | 28,610,200 | 96.8% |
| Mark Loughridge | 860,924,717 | 28,097,471 | 96.8% |
| Scott C. Malpass | 859,842,339 | 29,179,849 | 96.7% |
| F. William McNabb III | 859,460,373 | 29,561,815 | 96.7% |
| Deanna Mulligan | 860,984,342 | 28,037,846 | 96.8% |
| André F. Perold | 850,692,197 | 38,329,992 | 95.7% |
| Sarah Bloom Raskin | 860,331,311 | 28,690,878 | 96.8% |
| Peter F. Volanakis | 860,652,393 | 28,369,796 | 96.8% |
| * Results are for all funds within the same trust. |
Proposal 2—Approve a manager-of-managers arrangement with third-party investment advisors.
This arrangement enables the fund to enter into and materially amend investment advisory arrangements with third-party investment advisors, subject to the approval of the fund’s board of trustees and certain conditions imposed by the Securities and Exchange Commission, while avoiding the costs and delays associated with obtaining future shareholder approval.
| Broker | Percentage | ||||
| Vanguard Fund | For | Abstain | Against | Non-Votes | For |
| High Dividend Yield | |||||
| Index Fund | 235,114,216 | 11,363,723 | 13,448,970 | 73,079,165 | 70.6% |
5
Proposal 3—Approve a manager-of-managers arrangement with wholly owned subsidiaries of Vanguard.
This arrangement enables Vanguard or the fund to enter into and materially amend investment advisory arrangements with wholly owned subsidiaries of Vanguard, subject to the approval of the fund’s board of trustees and any conditions imposed by the Securities and Exchange Commission (SEC), while avoiding the costs and delays associated with obtaining future shareholder approval. The ability of the fund to operate in this manner is contingent upon the SEC’s approval of a pending application for an order of exemption.
| Broker | Percentage | ||||
| Vanguard Fund | For | Abstain | Against | Non-Votes | For |
| High Dividend Yield | |||||
| Index Fund | 236,984,039 | 10,777,443 | 12,165,428 | 73,079,165 | 71.2% |
6
High Dividend Yield Index Fund
Fund Profile
As of April 30, 2018
| Share-Class Characteristics | ||
| Investor | ETF | |
| Shares | Shares | |
| Ticker Symbol | VHDYX | VYM |
| Expense Ratio1 | 0.15% | 0.08% |
| 30-Day SEC Yield | 3.02% | 3.09% |
| Portfolio Characteristics | |||
| FTSE High | DJ | ||
| Dividend | U.S. Total | ||
| Yield | Market | ||
| Fund | Index | FA Index | |
| Number of Stocks | 380 | 378 | 3,752 |
| Median Market | |||
| Cap | $127.5B | $127.5B | $66.1B |
| Price/Earnings | |||
| Ratio | 18.4x | 18.4x | 20.5x |
| Price/Book Ratio | 2.7x | 2.7x | 2.9x |
| Return on Equity | 16.2% | 16.2% | 15.0% |
| Earnings Growth | |||
| Rate | 1.7% | 1.7% | 8.4% |
| Dividend Yield | 3.1% | 3.1% | 1.8% |
| Foreign Holdings | 0.0% | 0.0% | 0.0% |
| Turnover Rate | |||
| (Annualized) | 2% | — | — |
| Short-Term | |||
| Reserves | -0.1% | — | — |
| Volatility Measures | ||
| FTSE High | DJ | |
| Dividend | U.S. Total | |
| Yield | Market | |
| Index | FA Index | |
| R-Squared | 1.00 | 0.90 |
| Beta | 1.00 | 0.88 |
These measures show the degree and timing of the fund’s fluctuations compared with the indexes over 36 months.
| Ten Largest Holdings (% of total net assets) | ||
| Microsoft Corp. | Software | 7.2% |
| JPMorgan Chase & Co. | Banks | 3.8 |
| Johnson & Johnson | Pharmaceuticals | 3.5 |
| Exxon Mobil Corp. | Integrated Oil & Gas | 3.4 |
| Intel Corp. | Semiconductors | 2.5 |
| Chevron Corp. | Intergrated Oil & Gas | 2.4 |
| Wells Fargo & Co. | Banks | 2.4 |
| Cisco Systems Inc. | Telecommunications | |
| Equipment | 2.2 | |
| Pfizer Inc. | Pharmaceuticals | 2.2 |
| Verizon Communications Fixed Line | ||
| Inc. | Telecommunications | 2.1 |
| Top Ten | 31.7% | |
The holdings listed exclude any temporary cash investments and equity index products.
Investment Focus
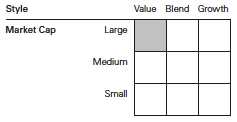
1 The expense ratios shown are from the prospectus dated February 22, 2018, and represent estimated costs for the current fiscal year. For the six months ended April 30, 2018, the annualized expense ratios were 0.15% for Investor Shares and 0.08% for ETF Shares.
7
High Dividend Yield Index Fund
| Sector Diversification (% of equity exposure) | |||
| FTSE High | DJ | ||
| Dividend | U.S. Total | ||
| Yield | Market | ||
| Fund | Index | FA Index | |
| Basic Materials | 3.8% | 3.8% | 2.5% |
| Consumer Goods | 11.7 | 11.7 | 8.2 |
| Consumer Services | 6.1 | 6.1 | 13.4 |
| Financials | 14.1 | 14.1 | 20.4 |
| Health Care | 12.9 | 12.9 | 12.5 |
| Industrials | 12.5 | 12.5 | 12.9 |
| Oil & Gas | 10.1 | 10.1 | 6.0 |
| Technology | 16.9 | 16.9 | 19.5 |
| Telecommunications | 4.4 | 4.4 | 1.7 |
| Utilities | 7.5 | 7.5 | 2.9 |
Sector categories are based on the Industry Classification Benchmark (“ICB”), except for the “Other” category (if applicable), which includes securities that have not been provided an ICB classification as of the effective reporting period.
8
High Dividend Yield Index Fund
Performance Summary
All of the returns in this report represent past performance, which is not a guarantee of future results that may be achieved by the fund. (Current performance may be lower or higher than the performance data cited. For performance data current to the most recent month-end, visit our website at vanguard.com/performance.) Note, too, that both investment returns and principal value can fluctuate widely, so an investor’s shares, when sold, could be worth more or less than their original cost. The returns shown do not reflect taxes that a shareholder would pay on fund distributions or on the sale of fund shares.
Fiscal-Year Total Returns (%): October 31, 2007, Through April 30, 2018
Average Annual Total Returns: Periods Ended March 31, 2018
This table presents returns through the latest calendar quarter—rather than through the end of the fiscal period.
Securities and Exchange Commission rules require that we provide this information.
| Inception | One | Five | Ten | |
| Date | Year | Years | Years | |
| Investor Shares | 11/16/2006 | 9.40% | 11.79% | 9.01% |
| ETF Shares | 11/10/2006 | |||
| Market Price | 9.50 | 11.87 | 9.13 | |
| Net Asset Value | 9.46 | 11.86 | 9.12 |
See Financial Highlights for dividend and capital gains information.
9
High Dividend Yield Index Fund
Financial Statements (unaudited)
Statement of Net Assets
As of April 30, 2018
The fund reports a complete list of its holdings in regulatory filings four times in each fiscal year, at the quarter-ends. For the second and fourth fiscal quarters, the lists appear in the fund’s semiannual and annual reports to shareholders. For the first and third fiscal quarters, the fund files the lists with the Securities and Exchange Commission on Form N-Q. Shareholders can look up the fund’s Forms N-Q on the SEC’s website at sec.gov. Forms N-Q may also be reviewed and copied at the SEC’s Public Reference Room (see the back cover of this report for further information).
| Market | |||
| Value• | |||
| Shares | ($000) | ||
| Common Stocks (99.6%)1 | |||
| Basic Materials (3.8%) | |||
| DowDuPont Inc. | 6,781,223 | 428,844 | |
| Praxair Inc. | 829,217 | 126,472 | |
| Air Products & | |||
| Chemicals Inc. | 620,783 | 100,747 | |
| LyondellBasell Industries | |||
| NV Class A | 942,240 | 99,623 | |
| International Paper Co. | 1,194,904 | 61,609 | |
| Nucor Corp. | 926,724 | 57,105 | |
| Mosaic Co. | 1,020,802 | 27,511 | |
| Avery Dennison Corp. | 256,156 | 26,848 | |
| CF Industries Holdings Inc. | 675,692 | 26,217 | |
| RPM International Inc. | 380,927 | 18,399 | |
| Reliance Steel & | |||
| Aluminum Co. | 205,924 | 18,105 | |
| Huntsman Corp. | 580,407 | 17,279 | |
| Olin Corp. | 479,673 | 14,481 | |
| Scotts Miracle-Gro Co. | 121,794 | 10,180 | |
| Domtar Corp. | 180,921 | 7,942 | |
| Commercial Metals Co. | 331,602 | 6,967 | |
| Compass Minerals | |||
| International Inc. | 97,025 | 6,530 | |
| A Schulman Inc. | 81,938 | 3,515 | |
| Rayonier Advanced | |||
| Materials Inc. | 143,111 | 3,063 | |
| * | Ferroglobe plc | 225,247 | 2,545 |
| Innophos Holdings Inc. | 54,433 | 2,252 | |
| *,2 | Ferroglobe R&W Trust | 166,085 | — |
| 1,066,234 | |||
| Consumer Goods (11.7%) | |||
| Procter & Gamble Co. | 7,335,480 | 530,649 | |
| Coca-Cola Co. | 11,167,659 | 482,555 | |
| PepsiCo Inc. | 4,151,771 | 419,080 | |
| Philip Morris | |||
| International Inc. | 4,510,570 | 369,867 | |
| Altria Group Inc. | 5,548,122 | 311,305 | |
| General Motors Co. | 3,807,489 | 139,887 | |
| Market | |||
| Value• | |||
| Shares | ($000) | ||
| Ford Motor Co. | 11,313,127 | 127,160 | |
| Kimberly-Clark Corp. | 1,016,091 | 105,206 | |
| Kraft Heinz Co. | 1,745,667 | 98,421 | |
| VF Corp. | 944,681 | 76,396 | |
| Archer-Daniels-Midland | |||
| Co. | 1,600,740 | 72,642 | |
| General Mills Inc. | 1,650,227 | 72,181 | |
| Tapestry Inc. | 826,106 | 44,420 | |
| Clorox Co. | 374,390 | 43,879 | |
| Kellogg Co. | 708,100 | 41,707 | |
| Conagra Brands Inc. | 1,107,080 | 41,039 | |
| Genuine Parts Co. | 417,417 | 36,866 | |
| Bunge Ltd. | 406,669 | 29,374 | |
| Hasbro Inc. | 329,176 | 28,997 | |
| Coty Inc. Class A | 1,360,450 | 23,604 | |
| Pinnacle Foods Inc. | 344,458 | 20,805 | |
| Coca-Cola European | |||
| Partners plc | 529,446 | 20,754 | |
| Harley-Davidson Inc. | 487,948 | 20,069 | |
| Hanesbrands Inc. | 1,040,534 | 19,219 | |
| Polaris Industries Inc. | 170,580 | 17,880 | |
| Ralph Lauren Corp. | |||
| Class A | 160,430 | 17,623 | |
| Leggett & Platt Inc. | 384,845 | 15,606 | |
| ^ | Mattel Inc. | 993,994 | 14,711 |
| Flowers Foods Inc. | 510,879 | 11,551 | |
| Nu Skin Enterprises Inc. | |||
| Class A | 150,090 | 10,679 | |
| Tupperware Brands Corp. | 145,339 | 6,476 | |
| Vector Group Ltd. | 280,882 | 5,477 | |
| B&G Foods Inc. | 189,310 | 4,307 | |
| HNI Corp. | 123,992 | 4,140 | |
| MDC Holdings Inc. | 133,273 | 3,866 | |
| Cosan Ltd. | 374,716 | 3,777 | |
| Schweitzer-Mauduit | |||
| International Inc. | 87,696 | 3,423 | |
| Universal Corp. | 71,465 | 3,362 | |
| Steelcase Inc. Class A | 242,810 | 3,217 | |
| Knoll Inc. | 143,121 | 2,729 |

| High Dividend Yield Index Fund | |||
| Market | |||
| Value• | |||
| Shares | ($000) | ||
| Briggs & Stratton Corp. | 119,119 | 2,148 | |
| Ethan Allen Interiors Inc. | 69,669 | 1,536 | |
| ^ | National Presto Industries | ||
| Inc. | 13,953 | 1,336 | |
| 3,309,926 | |||
| Consumer Services (6.0%) | |||
| McDonald’s Corp. | 2,319,331 | 388,349 | |
| Walmart Inc. | 4,172,673 | 369,115 | |
| Target Corp. | 1,580,105 | 114,716 | |
| Sysco Corp. | 1,396,073 | 87,310 | |
| Las Vegas Sands Corp. | 1,047,250 | 76,795 | |
| Carnival Corp. | 1,181,423 | 74,501 | |
| Best Buy Co. Inc. | 727,566 | 55,681 | |
| Omnicom Group Inc. | 671,013 | 49,427 | |
| Wynn Resorts Ltd. | 231,693 | 43,139 | |
| Darden Restaurants Inc. | 362,403 | 33,653 | |
| Wyndham Worldwide | |||
| Corp. | 287,547 | 32,841 | |
| Nielsen Holdings plc | 1,035,723 | 32,573 | |
| Kohl’s Corp. | 487,300 | 30,271 | |
| Macy’s Inc. | 884,167 | 27,471 | |
| Interpublic Group of | |||
| Cos. Inc. | 1,122,929 | 26,490 | |
| L Brands Inc. | 698,752 | 24,393 | |
| KAR Auction Services Inc. | 393,311 | 20,448 | |
| Gap Inc. | 675,133 | 19,741 | |
| Nordstrom Inc. | 338,221 | 17,100 | |
| H&R Block Inc. | 599,017 | 16,563 | |
| Six Flags Entertainment | |||
| Corp. | 192,529 | 12,175 | |
| Cinemark Holdings Inc. | 308,231 | 12,073 | |
| Williams-Sonoma Inc. | 242,485 | 11,591 | |
| Extended Stay America | |||
| Inc. | 558,252 | 10,931 | |
| ILG Inc. | 305,380 | 10,423 | |
| American Eagle Outfitters | |||
| Inc. | 472,977 | 9,781 | |
| Cracker Barrel Old Country | |||
| Store Inc. | 55,567 | 9,146 | |
| International Game | |||
| Technology plc | 312,062 | 8,822 | |
| Tribune Media Co. | |||
| Class A | 230,333 | 8,704 | |
| John Wiley & Sons Inc. | |||
| Class A | 128,198 | 8,455 | |
| Hillenbrand Inc. | 181,017 | 8,390 | |
| TEGNA Inc. | 619,046 | 6,543 | |
| Meredith Corp. | 114,893 | 5,951 | |
| Brinker International Inc. | 133,908 | 5,837 | |
| Abercrombie & Fitch Co. | 199,220 | 5,104 | |
| Tailored Brands Inc. | 145,851 | 4,602 | |
| DSW Inc. Class A | 188,075 | 4,194 | |
| Guess? Inc. | 177,568 | 4,136 | |
| Dine Brands Global Inc. | 49,567 | 3,933 | |
| GameStop Corp. Class A | 286,993 | 3,917 | |
| Chico’s FAS Inc. | 364,508 | 3,620 | |
| Gannett Co. Inc. | 329,402 | 3,185 | |
| Copa Holdings SA | |||
| Class A | 22,515 | 2,638 | |
| New Media Investment | |||
| Group Inc. | 146,138 | 2,423 | |
| Buckle Inc. | 81,151 | 1,870 | |
| ^ | Rent-A-Center Inc. | 135,399 | 1,369 |
| Weis Markets Inc. | 27,057 | 1,245 | |
| National CineMedia Inc. | 174,964 | 1,001 | |
| Barnes & Noble Inc. | 179,632 | 997 | |
| Speedway Motorsports Inc. 38,201 | 674 | ||
| 1,714,307 | |||
| Financials (14.0%) | |||
| JPMorgan Chase & Co. | 10,039,588 | 1,092,106 | |
| Wells Fargo & Co. | 12,864,536 | 668,441 | |
| BlackRock Inc. | 361,120 | 188,324 | |
| Chubb Ltd. | 1,351,280 | 183,328 | |
| CME Group Inc. | 984,137 | 155,179 | |
| Prudential Financial Inc. | 1,231,129 | 130,894 | |
| MetLife Inc. | 2,627,207 | 125,239 | |
| BB&T Corp. | 2,288,398 | 120,827 | |
| Travelers Cos. Inc. | 787,634 | 103,653 | |
| Aflac Inc. | 2,213,938 | 100,889 | |
| T. Rowe Price Group Inc. | 683,092 | 77,750 | |
| Fifth Third Bancorp | 2,014,722 | 66,828 | |
| KeyCorp | 3,107,380 | 61,899 | |
| Regions Financial Corp. | 3,288,722 | 61,499 | |
| Ameriprise Financial Inc. | 428,630 | 60,098 | |
| Huntington Bancshares | |||
| Inc. | 3,088,616 | 46,051 | |
| Principal Financial Group | |||
| Inc. | 772,832 | 45,767 | |
| Arthur J Gallagher & Co. | 521,319 | 36,487 | |
| Invesco Ltd. | 1,167,967 | 33,836 | |
| Cincinnati Financial Corp. | 445,826 | 31,359 | |
| FNF Group | 759,270 | 27,964 | |
| Western Union Co. | 1,331,499 | 26,297 | |
| PacWest Bancorp | 367,563 | 18,834 | |
| Cullen/Frost Bankers Inc. | 163,991 | 18,769 | |
| Lazard Ltd. Class A | 340,821 | 18,548 | |
| People’s United Financial | |||
| Inc. | 996,106 | 18,219 | |
| Eaton Vance Corp. | 329,121 | 17,901 | |
| Janus Henderson Group | |||
| plc | 560,514 | 17,707 | |
| New York Community | |||
| Bancorp Inc. | 1,379,583 | 16,389 | |
| First American Financial | |||
| Corp. | 313,192 | 16,007 | |
| LPL Financial Holdings Inc. 255,922 | 15,501 | ||
| Validus Holdings Ltd. | 223,456 | 15,144 | |
| Umpqua Holdings Corp. | 641,289 | 15,109 | |
11
| High Dividend Yield Index Fund | ||
| Market | ||
| Value• | ||
| Shares | ($000) | |
| Old Republic International | ||
| Corp. | 705,009 | 14,382 |
| Axis Capital Holdings Ltd. | 237,290 | 13,929 |
| FNB Corp. | 938,504 | 12,201 |
| BankUnited Inc. | 300,614 | 11,907 |
| Hancock Holding Co. | 242,012 | 11,822 |
| Chemical Financial Corp. | 202,802 | 11,132 |
| Bank of Hawaii Corp. | 123,068 | 10,364 |
| Navient Corp. | 756,013 | 10,025 |
| United Bankshares Inc. | 288,281 | 9,787 |
| Valley National Bancorp | 742,910 | 9,324 |
| BGC Partners Inc. Class A | 680,896 | 9,097 |
| First Financial Bancorp | 275,984 | 8,542 |
| Glacier Bancorp Inc. | 227,043 | 8,407 |
| Columbia Banking System | ||
| Inc. | 209,081 | 8,407 |
| Fulton Financial Corp. | 490,783 | 8,294 |
| Community Bank System | ||
| Inc. | 140,554 | 7,906 |
| Kemper Corp. | 114,096 | 7,702 |
| BOK Financial Corp. | 72,436 | 7,293 |
| Federated Investors Inc. | ||
| Class B | 274,426 | 7,264 |
| ProAssurance Corp. | 151,749 | 7,178 |
| RLI Corp. | 111,342 | 7,046 |
| Old National Bancorp | 386,461 | 6,647 |
| Kennedy-Wilson Holdings | ||
| Inc. | 349,233 | 6,618 |
| CVB Financial Corp. | 295,882 | 6,554 |
| Hope Bancorp Inc. | 376,615 | 6,512 |
| Trustmark Corp. | 193,695 | 6,065 |
| WesBanco Inc. | 121,237 | 5,310 |
| Horace Mann Educators | ||
| Corp. | 117,514 | 5,253 |
| Waddell & Reed Financial | ||
| Inc. Class A | 230,897 | 4,673 |
| Provident Financial | ||
| Services Inc. | 178,263 | 4,656 |
| Northwest Bancshares Inc. | 272,369 | 4,521 |
| Capitol Federal Financial | ||
| Inc. | 362,292 | 4,518 |
| NBT Bancorp Inc. | 123,242 | 4,503 |
| Artisan Partners Asset | ||
| Management Inc. Class A | 134,101 | 4,311 |
| S&T Bancorp Inc. | 99,969 | 4,267 |
| First Hawaiian Inc. | 153,115 | 4,218 |
| First Commonwealth | ||
| Financial Corp. | 274,205 | 4,151 |
| Westamerica | ||
| Bancorporation | 73,146 | 4,082 |
| CNA Financial Corp. | 77,515 | 3,911 |
| Boston Private Financial | ||
| Holdings Inc. | 237,030 | 3,804 |
| Mercury General Corp. | 80,415 | 3,677 |
| HFF Inc. Class A | 104,225 | 3,662 | |
| Sandy Spring Bancorp Inc. | 91,925 | 3,643 | |
| Brookline Bancorp Inc. | 218,683 | 3,630 | |
| WisdomTree Investments | |||
| Inc. | 335,743 | 3,549 | |
| NRG Yield Inc. | 192,275 | 3,423 | |
| Safety Insurance Group Inc. | 41,278 | 3,302 | |
| AmTrust Financial Services | |||
| Inc. | 255,226 | 3,290 | |
| City Holding Co. | 42,334 | 3,030 | |
| American National | |||
| Insurance Co. | 21,410 | 2,584 | |
| Cohen & Steers Inc. | 60,998 | 2,446 | |
| TFS Financial Corp. | 156,441 | 2,333 | |
| TrustCo Bank Corp. NY | 269,468 | 2,304 | |
| FBL Financial Group Inc. | |||
| Class A | 28,923 | 2,249 | |
| Community Trust Bancorp | |||
| Inc. | 45,318 | 2,175 | |
| Flushing Financial Corp. | 80,159 | 2,077 | |
| Oritani Financial Corp. | 115,778 | 1,771 | |
| Dime Community | |||
| Bancshares Inc. | 88,945 | 1,757 | |
| NRG Yield Inc. Class A | 96,621 | 1,702 | |
| Maiden Holdings Ltd. | 219,005 | 1,675 | |
| Greenhill & Co. Inc. | 69,725 | 1,415 | |
| First Financial Corp. | 28,258 | 1,208 | |
| Republic Bancorp Inc. | |||
| Class A | 27,797 | 1,172 | |
| Fairfax Financial Holdings | |||
| Ltd. | 46 | 26 | |
| 3,987,526 | |||
| Health Care (12.9%) | |||
| Johnson & Johnson | 7,838,220 | 991,457 | |
| Pfizer Inc. | 17,192,516 | 629,418 | |
| Merck & Co. Inc. | 7,957,373 | 468,451 | |
| AbbVie Inc. | 4,628,419 | 446,874 | |
| Amgen Inc. | 2,094,451 | 365,440 | |
| Gilead Sciences Inc. | 3,779,248 | 272,975 | |
| Bristol-Myers Squibb | |||
| Co. | 4,786,590 | 249,525 | |
| Eli Lilly & Co. | 2,837,799 | 230,060 | |
| Owens & Minor Inc. | 174,656 | 2,838 | |
| * | Kindred Healthcare Inc. | 255,653 | 2,275 |
| Meridian Bioscience Inc. | 120,095 | 1,753 | |
| 3,661,066 | |||
| Industrials (12.4%) | |||
| Boeing Co. | 1,618,297 | 539,799 | |
| General Electric Co. | 25,262,251 | 355,440 | |
| 3M Co. | 1,685,153 | 327,577 | |
| Caterpillar Inc. | 1,649,975 | 238,190 | |
| Lockheed Martin Corp. | 718,140 | 230,408 | |
| United Parcel Service | |||
| Inc. Class B | 2,004,449 | 227,505 | |
12
| High Dividend Yield Index Fund | ||
| Market | ||
| Value• | ||
| Shares | ($000) | |
| Raytheon Co. | 845,674 | 173,312 |
| Automatic Data | ||
| Processing Inc. | 1,300,120 | 153,518 |
| Deere & Co. | 938,467 | 127,003 |
| Emerson Electric Co. | 1,837,737 | 122,044 |
| Norfolk Southern Corp. | 823,787 | 118,189 |
| Waste Management Inc. | 1,260,762 | 102,487 |
| Eaton Corp. plc | 1,277,779 | 95,872 |
| Johnson Controls | ||
| International plc | 2,681,888 | 90,836 |
| Cummins Inc. | 454,715 | 72,691 |
| PACCAR Inc. | 994,990 | 63,351 |
| Paychex Inc. | 933,031 | 56,514 |
| TransDigm Group Inc. | 140,231 | 44,954 |
| WestRock Co. | 728,232 | 43,082 |
| Republic Services Inc. | ||
| Class A | 653,268 | 42,253 |
| Fastenal Co. | 838,967 | 41,940 |
| CH Robinson Worldwide | ||
| Inc. | 401,977 | 36,994 |
| Packaging Corp. of | ||
| America | 271,721 | 31,435 |
| Xerox Corp. | 665,392 | 20,927 |
| MDU Resources Group | ||
| Inc. | 562,839 | 15,855 |
| Watsco Inc. | 87,290 | 14,614 |
| Sonoco Products Co. | 283,245 | 14,547 |
| National Instruments Corp. | 308,120 | 12,599 |
| Ryder System Inc. | 151,889 | 10,242 |
| Macquarie Infrastructure | ||
| Corp. | 231,699 | 8,781 |
| Timken Co. | 201,924 | 8,632 |
| Kennametal Inc. | 236,682 | 8,627 |
| GATX Corp. | 109,132 | 7,120 |
| Mobile Mini Inc. | 125,930 | 5,289 |
| Covanta Holding Corp. | 345,655 | 5,150 |
| Brady Corp. Class A | 135,074 | 4,917 |
| Otter Tail Corp. | 111,889 | 4,906 |
| ManTech International | ||
| Corp. Class A | 76,029 | 4,493 |
| Greif Inc. Class A | 73,463 | 4,299 |
| General Cable Corp. | 144,517 | 4,285 |
| Triton International Ltd. | 136,507 | 4,233 |
| McGrath RentCorp | 68,234 | 4,021 |
| Greenbrier Cos. Inc. | 80,032 | 3,509 |
| H&E Equipment Services | ||
| Inc. | 92,125 | 2,980 |
| Aircastle Ltd. | 143,593 | 2,814 |
| Sturm Ruger & Co. Inc. | 48,656 | 2,688 |
| Ship Finance International | ||
| Ltd. | 181,172 | 2,582 |
| Schnitzer Steel Industries | ||
| Inc. | 78,829 | 2,322 |
| Scorpio Tankers Inc. | 775,106 | 2,062 |
| Market | |||
| Value• | |||
| Shares | ($000) | ||
| GasLog Ltd. | 116,258 | 1,959 | |
| AVX Corp. | 131,547 | 1,942 | |
| RR Donnelley & Sons Co. | 201,285 | 1,701 | |
| Teekay Corp. | 180,879 | 1,595 | |
| Myers Industries Inc. | 65,709 | 1,531 | |
| Seaspan Corp. Class A | 164,968 | 1,269 | |
| ^ | Frontline Ltd. | 222,074 | 962 |
| American Railcar | |||
| Industries Inc. | 23,704 | 900 | |
| 3,529,747 | |||
| Oil & Gas (10.1%) | |||
| Exxon Mobil Corp. | 12,323,468 | 958,150 | |
| Chevron Corp. | 5,493,911 | 687,343 | |
| ConocoPhillips | 3,423,258 | 224,223 | |
| Occidental Petroleum | |||
| Corp. | 2,218,592 | 171,408 | |
| Valero Energy Corp. | 1,269,825 | 140,862 | |
| Phillips 66 | 1,231,835 | 137,116 | |
| Marathon Petroleum | |||
| Corp. | 1,407,709 | 105,452 | |
| Kinder Morgan Inc. | 5,521,901 | 87,356 | |
| ONEOK Inc. | 1,120,460 | 67,474 | |
| Andeavor | 452,732 | 62,622 | |
| Williams Cos. Inc. | 2,402,810 | 61,824 | |
| HollyFrontier Corp. | 512,960 | 31,132 | |
| Targa Resources Corp. | 614,646 | 28,870 | |
| Helmerich & Payne Inc. | 307,105 | 21,359 | |
| OGE Energy Corp. | 579,446 | 19,046 | |
| Murphy Oil Corp. | 471,953 | 14,211 | |
| PBF Energy Inc. Class A | 319,760 | 12,256 | |
| Delek US Holdings Inc. | 230,276 | 10,908 | |
| Oceaneering | |||
| International Inc. | 284,194 | 6,036 | |
| SemGroup Corp. Class A | 191,051 | 4,805 | |
| Archrock Inc. | 384,793 | 4,156 | |
| Pattern Energy Group | |||
| Inc. Class A | 226,713 | 4,122 | |
| CVR Energy Inc. | 44,331 | 1,529 | |
| ^ | Frank’s International NV | 142,816 | 998 |
| 2,863,258 | |||
| Technology (16.9%) | |||
| Microsoft Corp. | 21,801,241 | 2,038,852 | |
| Intel Corp. | 13,700,216 | 707,205 | |
| Cisco Systems Inc. | 14,405,466 | 638,018 | |
| International Business | |||
| Machines Corp. | 2,460,416 | 356,662 | |
| Texas Instruments Inc. | 2,845,876 | 288,657 | |
| QUALCOMM Inc. | 4,295,051 | 219,090 | |
| HP Inc. | 4,781,314 | 102,750 | |
| Analog Devices Inc. | 1,078,417 | 94,200 | |
| Western Digital Corp. | 859,943 | 67,755 | |
| Seagate Technology plc | 821,742 | 47,571 | |
| Xilinx Inc. | 739,253 | 47,490 | |
| KLA-Tencor Corp. | 454,974 | 46,289 | |
13
| High Dividend Yield Index Fund | |||
| Market | |||
| Value• | |||
| Shares | ($000) | ||
| Maxim Integrated | |||
| Products Inc. | 815,406 | 44,440 | |
| CA Inc. | 914,039 | 31,808 | |
| Garmin Ltd. | 349,530 | 20,507 | |
| Cypress Semiconductor | |||
| Corp. | 964,040 | 14,056 | |
| Cogent Communications | |||
| Holdings Inc. | 121,261 | 5,717 | |
| Pitney Bowes Inc. | 539,045 | 5,509 | |
| TiVo Corp. | 345,373 | 4,887 | |
| NIC Inc. | 184,641 | 2,742 | |
| 4,784,205 | |||
| Telecommunications (4.3%) | |||
| Verizon Communications | |||
| Inc. | 11,977,581 | 591,094 | |
| AT&T Inc. | 17,881,019 | 584,709 | |
| CenturyLink Inc. | 2,789,854 | 51,836 | |
| Consolidated | |||
| Communications | |||
| Holdings Inc. | 188,578 | 2,131 | |
| ^ | Frontier Communications | ||
| Corp. | 226,197 | 1,877 | |
| 1,231,647 | |||
| Utilities (7.5%) | |||
| NextEra Energy Inc. | 1,359,364 | 222,813 | |
| Duke Energy Corp. | 2,037,299 | 163,310 | |
| Southern Co. | 2,894,226 | 133,482 | |
| Dominion Energy Inc. | 1,863,821 | 124,056 | |
| Exelon Corp. | 2,787,957 | 110,626 | |
| American Electric Power | |||
| Co. Inc. | 1,432,156 | 100,222 | |
| Sempra Energy | 729,183 | 81,523 | |
| Public Service Enterprise | |||
| Group Inc. | 1,468,363 | 76,575 | |
| Consolidated Edison Inc. | 903,126 | 72,368 | |
| Xcel Energy Inc. | 1,478,090 | 69,234 | |
| PG&E Corp. | 1,484,366 | 68,429 | |
| Edison International | 921,414 | 60,371 | |
| WEC Energy Group Inc. | 918,267 | 59,026 | |
| PPL Corp. | 1,973,898 | 57,440 | |
| Eversource Energy | 919,842 | 55,421 | |
| DTE Energy Co. | 520,117 | 54,820 | |
| FirstEnergy Corp. | 1,288,259 | 44,316 | |
| Entergy Corp. | 521,571 | 42,555 | |
| Ameren Corp. | 703,752 | 41,254 | |
| CMS Energy Corp. | 810,118 | 38,230 | |
| CenterPoint Energy Inc. | 1,250,758 | 31,682 | |
| Alliant Energy Corp. | 673,937 | 28,946 | |
| Atmos Energy Corp. | 316,805 | 27,527 | |
| Pinnacle West Capital | |||
| Corp. | 321,791 | 25,904 | |
| UGI Corp. | 504,177 | 24,397 | |
| NiSource Inc. | 976,325 | 23,813 | |
| AES Corp. | 1,914,931 | 23,439 | |
| Westar Energy Inc. | ||
| Class A | 411,052 | 22,271 |
| Great Plains Energy Inc. | 623,836 | 20,418 |
| Aqua America Inc. | 517,765 | 18,199 |
| Vectren Corp. | 240,526 | 16,902 |
| SCANA Corp. | 381,209 | 14,017 |
| IDACORP Inc. | 145,226 | 13,506 |
| WGL Holdings Inc. | 148,078 | 12,601 |
| ALLETE Inc. | 146,733 | 11,212 |
| National Fuel Gas Co. | 216,865 | 11,136 |
| Portland General Electric | ||
| Co. | 256,116 | 10,880 |
| Hawaiian Electric | ||
| Industries Inc. | 312,172 | 10,829 |
| ONE Gas Inc. | 150,976 | 10,526 |
| New Jersey Resources | ||
| Corp. | 254,412 | 10,520 |
| Southwest Gas Holdings | ||
| Inc. | 136,287 | 9,948 |
| Spire Inc. | 136,418 | 9,843 |
| Avista Corp. | 185,540 | 9,622 |
| PNM Resources Inc. | 229,054 | 9,082 |
| Black Hills Corp. | 154,221 | 8,741 |
| Avangrid Inc. | 164,092 | 8,649 |
| NorthWestern Corp. | 141,996 | 7,801 |
| South Jersey Industries | ||
| Inc. | 231,260 | 7,146 |
| El Paso Electric Co. | 116,241 | 5,934 |
| Northwest Natural Gas Co. | 83,593 | 5,124 |
| Atlantica Yield plc | 50,284 | 1,010 |
| 2,127,696 | ||
| Total Common Stocks | ||
| (Cost $23,435,383) | 28,275,612 | |
| Temporary Cash Investments (0.3%)1 | ||
| Money Market Fund (0.3%) | ||
| 3,4 Vanguard Market | ||
| Liquidity Fund, | ||
| 1.886% | 788,210 | 78,821 |
| Face | ||
| Amount | ||
| ($000) | ||
| U. S. Government and Agency Obligations (0.0%) | ||
| 5 United States Treasury Bill, | ||
| 1.370%–1.462%, 5/17/18 | 8,000 | 7,994 |
| Total Temporary Cash Investments | ||
| (Cost $86,810) | 86,815 | |
| Total Investments (99.9%) | ||
| (Cost $23,522,193) | 28,362,427 | |
14
| High Dividend Yield Index Fund | |
| Amount | |
| ($000) | |
| Other Assets and Liabilities (0.1%) | |
| Other Assets | |
| Investment in Vanguard | 1,529 |
| Receivables for Accrued Income | 39,489 |
| Receivables for Capital Shares Issued | 5,258 |
| Other Assets | 38 |
| Total Other Assets | 46,314 |
| Liabilities | |
| Payables for Investment Securities | |
| Purchased | (2,057) |
| Collateral for Securities on Loan | (5,474) |
| Payables for Capital Shares Redeemed | (4,604) |
| Payables to Vanguard | (7,505) |
| Variation Margin Payable—Futures Contracts (1,049) | |
| Total Liabilities | (20,689) |
| Net Assets (100%) | 28,388,052 |
| At April 30, 2018, net assets consisted of: | |
| Amount | |
| ($000) | |
| Paid-in Capital | 23,813,789 |
| Undistributed Net Investment Income | 46,607 |
| Accumulated Net Realized Losses | (308,382) |
| Unrealized Appreciation (Depreciation) | |
| Investment Securities | 4,840,234 |
| Futures Contracts | (4,196) |
| Net Assets | 28,388,052 |
| Investor Shares—Net Assets | |
| Applicable to 240,978,540 outstanding | |
| $.001 par value shares of beneficial | |
| interest (unlimited authorization) | 7,882,989 |
| Net Asset Value Per Share— | |
| Investor Shares | $32.71 |
| Amount | |
| ($000) | |
| ETF Shares—Net Assets | |
| Applicable to 248,337,117 outstanding | |
| $.001 par value shares of beneficial | |
| interest (unlimited authorization) | 20,505,063 |
| Net Asset Value Per Share— | |
| ETF Shares | $82.57 |
• See Note A in Notes to Financial Statements.
* Non-income-producing security.
^ Includes partial security positions on loan to broker-dealers. The total value of securities on loan is $5,034,000.
1 The fund invests a portion of its cash reserves in equity markets through the use of index futures contracts. After giving effect to futures investments, the fund’s effective common stock and temporary cash investment positions represent 100.0% and -0.1%, respectively, of net assets.
2 Security value determined using significant unobservable inputs.
3 Affiliated money market fund available only to Vanguard funds and certain trusts and accounts managed by Vanguard. Rate shown is the 7-day yield.
4 Includes $5,474,000 of collateral received for securities on loan.
5 Securities with a value of $5,278,000 have been segregated as initial margin for open futures contracts.
15
| High Dividend Yield Index Fund | ||||
| Derivative Financial Instruments Outstanding as of Period End | ||||
| Futures Contracts | ||||
| ($000) | ||||
| Value and | ||||
| Number of | Unrealized | |||
| Long (Short) | Notional | Appreciation | ||
| Expiration | Contracts | Amount | (Depreciation) | |
| Long Futures Contracts | ||||
| E-mini S&P 500 Index | June 2018 | 860 | 113,821 | (4,196) |
Unrealized appreciation (depreciation) on open futures contracts is required to be treated as realized gain (loss) for tax purposes.
See accompanying Notes, which are an integral part of the Financial Statements.
16
| High Dividend Yield Index Fund | |
| Statement of Operations | |
| Six Months Ended | |
| April 30, 2018 | |
| ($000) | |
| Investment Income | |
| Income | |
| Dividends | 435,161 |
| Interest1 | 574 |
| Securities Lending—Net | 468 |
| Total Income | 436,203 |
| Expenses | |
| The Vanguard Group—Note B | |
| Investment Advisory Services | 1,572 |
| Management and Administrative—Investor Shares | 4,632 |
| Management and Administrative—ETF Shares | 6,079 |
| Marketing and Distribution—Investor Shares | 720 |
| Marketing and Distribution—ETF Shares | 507 |
| Custodian Fees | 329 |
| Shareholders’ Reports and Proxy—Investor Shares | 61 |
| Shareholders’ Reports and Proxy—ETF Shares | 331 |
| Trustees’ Fees and Expenses | 10 |
| Total Expenses | 14,241 |
| Net Investment Income | 421,962 |
| Realized Net Gain (Loss) | |
| Investment Securities Sold1 | 522,469 |
| Futures Contracts | (1,451) |
| Realized Net Gain (Loss) | 521,018 |
| Change in Unrealized Appreciation (Depreciation) | |
| Investment Securities1 | (465,012) |
| Futures Contracts | (6,039) |
| Change in Unrealized Appreciation (Depreciation) | (471,051) |
| Net Increase (Decrease) in Net Assets Resulting from Operations | 471,929 |
1 Interest income, realized net gain (loss), and change in unrealized appreciation (depreciation) from an affiliated company of the fund were $513,000, ($22,000), and $10,000, respectively. Purchases and sales are for temporary cash investment purposes.
See accompanying Notes, which are an integral part of the Financial Statements.
17
| High Dividend Yield Index Fund | ||
| Statement of Changes in Net Assets | ||
| Six Months Ended | Year Ended | |
| April 30, | October 31, | |
| 2018 | 2017 | |
| ($000) | ($000) | |
| Increase (Decrease) in Net Assets | ||
| Operations | ||
| Net Investment Income | 421,962 | 763,919 |
| Realized Net Gain (Loss) | 521,018 | 853,945 |
| Change in Unrealized Appreciation (Depreciation) | (471,051) | 2,723,767 |
| Net Increase (Decrease) in Net Assets Resulting from Operations | 471,929 | 4,341,631 |
| Distributions | ||
| Net Investment Income | ||
| Investor Shares | (114,494) | (210,236) |
| ETF Shares | (310,777) | (567,866) |
| Realized Capital Gain | ||
| Investor Shares | — | — |
| ETF Shares | — | — |
| Total Distributions | (425,271) | (778,102) |
| Capital Share Transactions | ||
| Investor Shares | 293,174 | 718,901 |
| ETF Shares | 447,975 | 1,941,695 |
| Net Increase (Decrease) from Capital Share Transactions | 741,149 | 2,660,596 |
| Total Increase (Decrease) | 787,807 | 6,224,125 |
| Net Assets | ||
| Beginning of Period | 27,600,245 | 21,376,120 |
| End of Period1 | 28,388,052 | 27,600,245 |
1 Net Assets—End of Period includes undistributed (overdistributed) net investment income of $46,607,000 and $49,916,000.
See accompanying Notes, which are an integral part of the Financial Statements.
18
| High Dividend Yield Index Fund | ||||||
| Financial Highlights | ||||||
| Investor Shares | ||||||
| Six Months | ||||||
| Ended | ||||||
| For a Share Outstanding | April 30, | Year Ended October 31, | ||||
| Throughout Each Period | 2018 | 2017 | 2016 | 2015 | 2014 | 2013 |
| Net Asset Value, Beginning of Period | $32.67 | $28.20 | $26.89 | $26.98 | $23.83 | $19.76 |
| Investment Operations | ||||||
| Net Investment Income | . 4821 | .9271 | .854 | .815 | .727 | .667 |
| Net Realized and Unrealized Gain (Loss) | ||||||
| on Investments | .042 | 4.472 | 1.286 | (.088) | 3.147 | 4.063 |
| Total from Investment Operations | .524 | 5.399 | 2.140 | .727 | 3.874 | 4.730 |
| Distributions | ||||||
| Dividends from Net Investment Income | (. 484) | (. 929) | (. 830) | (. 817) | (.724) | (. 660) |
| Distributions from Realized Capital Gains | — | — | — | — | — | — |
| Total Distributions | (. 484) | (. 929) | (. 830) | (. 817) | (.724) | (. 660) |
| Net Asset Value, End of Period | $32.71 | $32.67 | $28.20 | $26.89 | $26.98 | $23.83 |
| Total Return2 | 1.60% | 19.37% | 8.11% | 2.78% | 16.48% | 24.35% |
| Ratios/Supplemental Data | ||||||
| Net Assets, End of Period (Millions) | $7,883 | $7,590 | $5,879 | $4,368 | $4,066 | $3,019 |
| Ratio of Total Expenses to | ||||||
| Average Net Assets | 0.15% | 0.15% | 0.15% | 0.16% | 0.18% | 0.19% |
| Ratio of Net Investment Income to | ||||||
| Average Net Assets | 2.85% | 3.00% | 3.19% | 3.06% | 2.92% | 3.10% |
| Portfolio Turnover Rate 3 | 2% | 9% | 7% | 11% | 12% | 13% |
The expense ratio, net investment income ratio, and turnover rate for the current period have been annualized.
1 Calculated based on average shares outstanding.
2 Total returns do not include account service fees that may have applied in the periods shown. Fund prospectuses provide information about any applicable account service fees.
3 Excludes the value of portfolio securities received or delivered as a result of in-kind purchases or redemptions of the fund’s capital shares, including ETF Creation Units.
See accompanying Notes, which are an integral part of the Financial Statements.
19
| High Dividend Yield Index Fund | ||||||
| Financial Highlights | ||||||
| ETF Shares | ||||||
| Six Months | ||||||
| Ended | ||||||
| For a Share Outstanding | April 30, | Year Ended October 31, | ||||
| Throughout Each Period | 2018 | 2017 | 2016 | 2015 | 2014 | 2013 |
| Net Asset Value, Beginning of Period | $82.46 | $71.19 | $67.88 | $68.11 | $60.16 | $49.89 |
| Investment Operations | ||||||
| Net Investment Income | 1.2481 | 2.3941 | 2.203 | 2.104 | 1.885 | 1.732 |
| Net Realized and Unrealized Gain (Loss) | ||||||
| on Investments | .114 | 11.301 | 3.245 | (.222) | 7.943 | 10.247 |
| Total from Investment Operations | 1.362 | 13.695 | 5.448 | 1.882 | 9.828 | 11.979 |
| Distributions | ||||||
| Dividends from Net Investment Income | (1.252) | (2.425) | (2.138) | (2.112) | (1.878) | (1.709) |
| Distributions from Realized Capital Gains | — | — | — | — | — | — |
| Total Distributions | (1.252) | (2.425) | (2.138) | (2.112) | (1.878) | (1.709) |
| Net Asset Value, End of Period | $82.57 | $82.46 | $71.19 | $67.88 | $68.11 | $60.16 |
| Total Return | 1.63% | 19.46% | 8.18% | 2.84% | 16.56% | 24.43% |
| Ratios/Supplemental Data | ||||||
| Net Assets, End of Period (Millions) | $20,505 | $20,010 | $15,497 | $11,214 | $9,782 | $6,918 |
| Ratio of Total Expenses to | ||||||
| Average Net Assets | 0.08% | 0.08% | 0.08% | 0.09% | 0.10% | 0.10% |
| Ratio of Net Investment Income to | ||||||
| Average Net Assets | 2.92% | 3.07% | 3.26% | 3.13% | 3.00% | 3.19% |
| Portfolio Turnover Rate2 | 2% | 9% | 7% | 11% | 12% | 13% |
The expense ratio, net investment income ratio, and turnover rate for the current period have been annualized.
1 Calculated based on average shares outstanding.
2 Excludes the value of portfolio securities received or delivered as a result of in-kind purchases or redemptions of the fund’s capital shares, including ETF Creation Units.
See accompanying Notes, which are an integral part of the Financial Statements.
20
High Dividend Yield Index Fund
Notes to Financial Statements
Vanguard High Dividend Yield Index Fund is registered under the Investment Company Act of 1940 as an open-end investment company, or mutual fund. The fund offers two classes of shares: Investor Shares and ETF Shares. Investor Shares are available to any investor who meets the fund’s minimum purchase requirements. ETF Shares are listed for trading on NYSE Arca; they can be purchased and sold through a broker.
A. The following significant accounting policies conform to generally accepted accounting principles for U.S. investment companies. The fund consistently follows such policies in preparing its financial statements.
1. Security Valuation: Securities are valued as of the close of trading on the New York Stock Exchange (generally 4 p.m., Eastern time) on the valuation date. Equity securities are valued at the latest quoted sales prices or official closing prices taken from the primary market in which each security trades; such securities not traded on the valuation date are valued at the mean of the latest quoted bid and asked prices. Securities for which market quotations are not readily available, or whose values have been materially affected by events occurring before the fund’s pricing time but after the close of the securities’ primary markets, are valued by methods deemed by the board of trustees to represent fair value. Investments in Vanguard Market Liquidity Fund are valued at that fund’s net asset value. Temporary cash investments are valued using the latest bid prices or using valuations based on a matrix system (which considers such factors as security prices, yields, maturities, and ratings), both as furnished by independent pricing services.
2. Futures Contracts: The fund uses index futures contracts to a limited extent, with the objectives of maintaining full exposure to the stock market, maintaining liquidity, and minimizing transaction costs. The fund may purchase futures contracts to immediately invest incoming cash in the market, or sell futures in response to cash outflows, thereby simulating a fully invested position in the underlying index while maintaining a cash balance for liquidity. The primary risks associated with the use of futures contracts are imperfect correlation between changes in market values of stocks held by the fund and the prices of futures contracts, and the possibility of an illiquid market. Counterparty risk involving futures is mitigated because a regulated clearinghouse is the counterparty instead of the clearing broker. To further mitigate counterparty risk, the fund trades futures contracts on an exchange, monitors the financial strength of its clearing brokers and clearinghouse, and has entered into clearing agreements with its clearing brokers. The clearinghouse imposes initial margin requirements to secure the fund’s performance and requires daily settlement of variation margin representing changes in the market value of each contract.
Futures contracts are valued at their quoted daily settlement prices. The notional amounts of the contracts are not recorded in the Statement of Net Assets. Fluctuations in the value of the contracts are recorded in the Statement of Net Assets as an asset (liability) and in the Statement of Operations as unrealized appreciation (depreciation) until the contracts are closed, when they are recorded as realized futures gains (losses).
During the six months ended April 30, 2018, the fund’s average investments in long and short futures contracts represented less than 1% and 0% of net assets, respectively, based on the average of the notional amounts at each quarter-end during the period.
3. Federal Income Taxes: The fund intends to continue to qualify as a regulated investment company and distribute all of its taxable income. Management has analyzed the fund’s tax positions taken for all open federal income tax years (October 31, 2014–2017), and for the period ended April 30, 2018, and has concluded that no provision for federal income tax is required in the fund’s financial statements.
21
High Dividend Yield Index Fund
4. Distributions: Distributions to shareholders are recorded on the ex-dividend date.
5. Securities Lending: To earn additional income, the fund lends its securities to qualified institutional borrowers. Security loans are subject to termination by the fund at any time, and are required to be secured at all times by collateral in an amount at least equal to the market value of securities loaned. Daily market fluctuations could cause the value of loaned securities to be more or less than the value of the collateral received. When this occurs, the collateral is adjusted and settled before the opening of the market on the next business day. The fund further mitigates its counterparty risk by entering into securities lending transactions only with a diverse group of prequalified counterparties, monitoring their financial strength, and entering into master securities lending agreements with its counterparties. The master securities lending agreements provide that, in the event of a counterparty’s default (including bankruptcy), the fund may terminate any loans with that borrower, determine the net amount owed, and sell or retain the collateral up to the net amount owed to the fund; however, such actions may be subject to legal proceedings. While collateral mitigates counterparty risk, in the event of a default, the fund may experience delays and costs in recovering the securities loaned. The fund invests cash collateral received in Vanguard Market Liquidity Fund, and records a liability in the Statement of Net Assets for the return of the collateral, during the period the securities are on loan. Securities lending income represents fees charged to borrowers plus income earned on invested cash collateral, less expenses associated with the loan. During the term of the loan, the fund is entitled to all distributions made on or in respect of the loaned securities.
6. Credit Facility: The fund and certain other funds managed by The Vanguard Group (“Vanguard”) participate in a $3.1 billion committed credit facility provided by a syndicate of lenders pursuant to a credit agreement that may be renewed annually; each fund is individually liable for its borrowings, if any, under the credit facility. Borrowings may be utilized for temporary and emergency purposes, and are subject to the fund’s regulatory and contractual borrowing restrictions. The participating funds are charged administrative fees and an annual commitment fee of 0.10% of the undrawn amount of the facility; these fees are allocated to the funds based on a method approved by the fund’s board of trustees and included in Management and Administrative expenses on the fund’s Statement of Operations. Any borrowings under this facility bear interest at a rate based upon the higher of the one-month London Interbank Offered Rate, federal funds effective rate, or overnight bank funding rate plus an agreed-upon spread.
The fund had no borrowings outstanding at April 30, 2018, or at any time during the period then ended.
7. Other: Dividend income is recorded on the ex-dividend date. Interest income includes income distributions received from Vanguard Market Liquidity Fund and is accrued daily. Premiums and discounts on debt securities purchased are amortized and accreted, respectively, to interest income over the lives of the respective securities. Security transactions are accounted for on the date securities are bought or sold. Costs used to determine realized gains (losses) on the sale of investment securities are those of the specific securities sold.
Each class of shares has equal rights as to assets and earnings, except that each class separately bears certain class-specific expenses related to maintenance of shareholder accounts (included in Management and Administrative expenses), shareholder reporting, and the proxy. Marketing and distribution expenses are allocated to each class of shares based on a method approved by the board of trustees. Income, other non-class-specific expenses, and gains and losses on investments are allocated to each class of shares based on its relative net assets.
22
High Dividend Yield Index Fund
B. In accordance with the terms of a Funds’ Service Agreement (the “FSA”) between Vanguard and the fund, Vanguard furnishes to the fund investment advisory, corporate management, administrative, marketing, and distribution services at Vanguard’s cost of operations (as defined by the FSA). These costs of operations are allocated to the fund based on methods and guidelines approved by the board of trustees. Vanguard does not require reimbursement in the current period for certain costs of operations (such as deferred compensation/benefits and risk/insurance costs); the fund’s liability for these costs of operations is included in Payables to Vanguard on the Statement of Net Assets. All other costs of operations payable to Vanguard are generally settled twice a month.
Upon the request of Vanguard, the fund may invest up to 0.40% of its net assets as capital in Vanguard. At April 30, 2018, the fund had contributed to Vanguard capital in the amount of $1,529,000, representing 0.01% of the fund’s net assets and 0.61% of Vanguard’s capitalization. The fund’s trustees and officers are also directors and employees, respectively, of Vanguard.
C. Various inputs may be used to determine the value of the fund’s investments. These inputs are summarized in three broad levels for financial statement purposes. The inputs or methodologies used to value securities are not necessarily an indication of the risk associated with investing in those securities.
Level 1—Quoted prices in active markets for identical securities.
Level 2—Other significant observable inputs (including quoted prices for similar securities, interest rates, prepayment speeds, credit risk, etc.).
Level 3—Significant unobservable inputs (including the fund’s own assumptions used to determine the fair value of investments). Any investments valued with significant unobservable inputs are noted on the Statement of Net Assets.
The following table summarizes the market value of the fund’s investments as of April 30, 2018, based on the inputs used to value them:
| Level 1 | Level 2 | Level 3 | |
| Investments | ($000) | ($000) | ($000) |
| Common Stocks | 28,275,612 | — | — |
| Temporary Cash Investments | 78,821 | 7,994 | — |
| Futures Contracts—Liabilities1 | (1,049) | — | — |
| Total | 28,353,384 | 7,994 | — |
| 1 Represents variation margin on the last day of the reporting period. |
D. Distributions are determined on a tax basis and may differ from net investment income and realized capital gains for financial reporting purposes. Differences may be permanent or temporary. Permanent differences are reclassified among capital accounts in the financial statements to reflect their tax character. Temporary differences arise when certain items of income, expense, gain, or loss are recognized in different periods for financial statement and tax purposes. These differences will reverse at some time in the future. Differences in classification may also result from the treatment of short-term gains as ordinary income for tax purposes.
23
High Dividend Yield Index Fund
During the six months ended April 30, 2018, the fund realized $554,082,000 of net capital gains resulting from in-kind redemptions—in which shareholders exchanged fund shares for securities held by the fund rather than for cash. Because such gains are not taxable to the fund, and are not distributed to shareholders, they have been reclassified from accumulated net realized losses to paid-in capital.
The fund’s tax-basis capital gains and losses are determined only at the end of each fiscal year. For tax purposes, at October 31, 2017, the fund had available capital losses totaling $273,476,000 to offset future net capital gains. Of this amount, $18,315,000 is subject to expiration on October 31, 2018. Capital losses of $255,161,000 realized beginning in fiscal 2012 may be carried forward indefinitely under the Regulated Investment Company Modernization Act of 2010, but must be used before any expiring loss carryforwards. The fund will use these capital losses to offset net taxable capital gains, if any, realized during the year ending October 31, 2018; should the fund realize net capital losses for the year, the losses will be added to the loss carryforward balance above.
At April 30, 2018, the cost of investment securities for tax purposes was $23,523,080,000. Net unrealized appreciation of investment securities for tax purposes was $4,839,347,000, consisting of unrealized gains of $5,828,961,000 on securities that had risen in value since their purchase and $989,614,000 in unrealized losses on securities that had fallen in value since their purchase.
E. During the six months ended April 30, 2018, the fund purchased $2,628,549,000 of investment securities and sold $1,929,313,000 of investment securities, other than temporary cash investments. Purchases and sales include $1,865,896,000 and $1,683,655,000, respectively, in connection with in-kind purchases and redemptions of the fund’s capital shares.
| F. Capital share transactions for each class of shares were: | ||||
| Six Months Ended | Year Ended | |||
| April 30, 2018 | October 31, 2017 | |||
| Amount | Shares | Amount | Shares | |
| ($000) | (000) | ($000) | (000) | |
| Investor Shares | ||||
| Issued | 1,010,886 | 29,862 | 2,032,133 | 66,558 |
| Issued in Lieu of Cash Distributions | 91,082 | 2,773 | 169,270 | 5,467 |
| Redeemed | (808,794) | (23,995) | (1,482,502) | (48,193) |
| Net Increase (Decrease)—Investor Shares | 293,174 | 8,640 | 718,901 | 23,832 |
| ETF Shares | ||||
| Issued | 2,136,750 | 25,390 | 4,601,220 | 59,187 |
| Issued in Lieu of Cash Distributions | — | — | — | — |
| Redeemed | (1,688,775) | (19,725) | (2,659,525) | (34,200) |
| Net Increase (Decrease)—ETF Shares | 447,975 | 5,665 | 1,941,695 | 24,987 |
G. Management has determined that no material events or transactions occurred subsequent to April 30, 2018, that would require recognition or disclosure in these financial statements.
24
About Your Fund’s Expenses
As a shareholder of the fund, you incur ongoing costs, which include costs for portfolio management, administrative services, and shareholder reports (like this one), among others. Operating expenses, which are deducted from a fund’s gross income, directly reduce the investment return of the fund.
A fund’s expenses are expressed as a percentage of its average net assets. This figure is known as the expense ratio. The following examples are intended to help you understand the ongoing costs (in dollars) of investing in your fund and to compare these costs with those of other mutual funds. The examples are based on an investment of $1,000 made at the beginning of the period shown and held for the entire period.
The accompanying table illustrates your fund’s costs in two ways:
• Based on actual fund return. This section helps you to estimate the actual expenses that you paid over the period. The ”Ending Account Value“ shown is derived from the fund‘s actual return, and the third column shows the dollar amount that would have been paid by an investor who started with $1,000 in the fund. You may use the information here, together with the amount you invested, to estimate the expenses that you paid over the period.
To do so, simply divide your account value by $1,000 (for example, an $8,600 account value divided by $1,000 = 8.6), then multiply the result by the number given for your fund under the heading ”Expenses Paid During Period.“
• Based on hypothetical 5% yearly return. This section is intended to help you compare your fund‘s costs with those of other mutual funds. It assumes that the fund had a yearly return of 5% before expenses, but that the expense ratio is unchanged. In this case—because the return used is not the fund’s actual return—the results do not apply to your investment. The example is useful in making comparisons because the Securities and Exchange Commission requires all mutual funds to calculate expenses based on a 5% return. You can assess your fund’s costs by comparing this hypothetical example with the hypothetical examples that appear in shareholder reports of other funds.
Note that the expenses shown in the table are meant to highlight and help you compare ongoing costs only and do not reflect transaction costs incurred by the fund for buying and selling securities. Further, the expenses do not include any purchase, redemption, or account service fees described in the fund prospectus. If such fees were applied to your account, your costs would be higher. Your fund does not carry a “sales load.”
The calculations assume no shares were bought or sold during the period. Your actual costs may have been higher or lower, depending on the amount of your investment and the timing of any purchases or redemptions.
You can find more information about the fund’s expenses, including annual expense ratios, in the Financial Statements section of this report. For additional information on operating expenses and other shareholder costs, please refer to your fund’s current prospectus.
25
| Six Months Ended April 30, 2018 | |||
| Beginning | Ending | Expenses | |
| Account Value | Account Value | Paid During | |
| High Dividend Yield Index Fund | 10/31/2017 | 4/30/2018 | Period |
| Based on Actual Fund Return | |||
| Investor Shares | $1,000.00 | $1,016.03 | $0.75 |
| ETF Shares | 1,000.00 | 1,016.31 | 0.40 |
| Based on Hypothetical 5% Yearly Return | |||
| Investor Shares | $1,000.00 | $1,024.05 | $0.75 |
| ETF Shares | 1,000.00 | 1,024.40 | 0.40 |
The calculations are based on expenses incurred in the most recent six-month period. The fund’s annualized six-month expense ratios for that period are 0.15% for Investor Shares and 0.08% for ETF Shares. The dollar amounts shown as “Expenses Paid” are equal to the annualized expense ratio multiplied by the average account value over the period, multiplied by the number of days in the most recent six-month period, then divided by the number of days in the most recent 12-month period (181/365).
26
Trustees Approve Advisory Arrangement
The board of trustees of Vanguard High Dividend Yield Index Fund has renewed the fund’s investment advisory arrangement with The Vanguard Group, Inc. (Vanguard), through its Equity Index Group. The board determined that continuing the fund’s internalized management structure was in the best interests of the fund and its shareholders.
The board based its decision upon an evaluation of the advisor’s investment staff, portfolio management process, and performance. This evaluation included information provided to the board by Vanguard’s Portfolio Review Department, which is responsible for fund and advisor oversight and product management. The Portfolio Review Department met regularly with the advisor and made monthly presentations to the board during the fiscal year that directed the board’s focus to relevant information and topics.
The board, or an investment committee made up of board members, also received information throughout the year during advisor presentations. For each advisor presentation, the board was provided with letters and reports that included information about, among other things, the advisory firm and the advisor’s assessment of the investment environment, portfolio performance, and portfolio characteristics.
In addition, the board received monthly reports, which included a Market and Economic Report, a Fund Dashboard Monthly Summary, and a Fund Performance Report.
Prior to their meeting, the trustees were provided with a memo and materials that summarized the information they received over the course of the year. They also considered the factors discussed below, among others. However, no single factor determined whether the board approved the arrangement. Rather, it was the totality of the circumstances that drove the board’s decision.
Nature, extent, and quality of services
The board reviewed the quality of the fund’s investment management services over both the short and long term, and took into account the organizational depth and stability of the advisor. The board considered that Vanguard has been managing investments for more than three decades. The Equity Index Group adheres to a sound, disciplined investment management process; the team has considerable experience, stability, and depth.
The board concluded that Vanguard’s experience, stability, depth, and performance, among other factors, warranted continuation of the advisory arrangement.
Investment performance
The board considered the short- and long-term performance of the fund, including any periods of outperformance or underperformance compared with its target index and peer group. The board concluded that the performance was such that the advisory arrangement should continue. Information about the fund’s most recent performance can be found in the Performance Summary section of this report.
Cost
The board concluded that the fund’s expense ratio was well below the average expense ratio charged by funds in its peer group and that the fund’s advisory expenses were also well below the peer-group average. Information about the fund’s expenses appears in the About Your Fund’s Expenses section of this report as well as in the Financial Statements section.
27
The board does not conduct a profitability analysis of Vanguard because of Vanguard’s unique “at-cost” structure. Unlike most other mutual fund management companies, Vanguard is owned by the funds it oversees and produces “profits” only in the form of reduced expenses for fund shareholders.
The benefit of economies of scale
The board concluded that the fund’s at-cost arrangement with Vanguard ensures that the fund will realize economies of scale as it grows, with the cost to shareholders declining as the fund’s assets increase.
The board will consider whether to renew the advisory arrangement again after a one-year period.
28
Glossary
30-Day SEC Yield. A fund’s 30-day SEC yield is derived using a formula specified by the U.S. Securities and Exchange Commission. Under the formula, data related to the fund’s security holdings in the previous 30 days are used to calculate the fund’s hypothetical net income for that period, which is then annualized and divided by the fund’s estimated average net assets over the calculation period. For the purposes of this calculation, a security’s income is based on its current market yield to maturity (for bonds), its actual income (for asset-backed securities), or its projected dividend yield (for stocks). Because the SEC yield represents hypothetical annualized income, it will differ—at times significantly—from the fund’s actual experience. As a result, the fund’s income distributions may be higher or lower than implied by the SEC yield.
Beta. A measure of the magnitude of a fund’s past share-price fluctuations in relation to the ups and downs of a given market index. The index is assigned a beta of 1.00. Compared with a given index, a fund with a beta of 1.20 typically would have seen its share price rise or fall by 12% when the index rose or fell by 10%. For this report, beta is based on returns over the past 36 months for both the fund and the index. Note that a fund’s beta should be reviewed in conjunction with its R-squared (see definition). The lower the R-squared, the less correlation there is between the fund and the index, and the less reliable beta is as an indicator of volatility.
Dividend Yield. Dividend income earned by stocks, expressed as a percentage of the aggregate market value (or of net asset value, for a fund). The yield is determined by dividing the amount of the annual dividends by the aggregate value (or net asset value) at the end of the period. For a fund, the dividend yield is based solely on stock holdings and does not include any income produced by other investments.
Earnings Growth Rate. The average annual rate of growth in earnings over the past five years for the stocks now in a fund.
Equity Exposure. A measure that reflects a fund’s investments in stocks and stock futures. Any holdings in short-term reserves are excluded.
Expense Ratio. A fund’s total annual operating expenses expressed as a percentage of the fund’s average net assets. The expense ratio includes management and administrative expenses, but does not include the transaction costs of buying and selling portfolio securities.
Foreign Holdings. The percentage of a fund represented by securities or depositary receipts of companies based outside the United States.
Inception Date. The date on which the assets of a fund (or one of its share classes) are first invested in accordance with the fund’s investment objective. For funds with a subscription period, the inception date is the day after that period ends. Investment performance is measured from the inception date.
Median Market Cap. An indicator of the size of companies in which a fund invests; the midpoint of market capitalization (market price x shares outstanding) of a fund’s stocks, weighted by the proportion of the fund’s assets invested in each stock. Stocks representing half of the fund’s assets have market capitalizations above the median, and the rest are below it.
Price/Book Ratio. The share price of a stock divided by its net worth, or book value, per share.
For a fund, the weighted average price/book ratio of the stocks it holds.
29
Price/Earnings Ratio. The ratio of a stock’s current price to its per-share earnings over the past year. For a fund, the weighted average P/E of the stocks it holds. P/E is an indicator of market expectations about corporate prospects; the higher the P/E, the greater the expectations for a company’s future growth.
R-Squared. A measure of how much of a fund’s past returns can be explained by the returns from the market in general, as measured by a given index. If a fund’s total returns were precisely synchronized with an index’s returns, its R-squared would be 1.00. If the fund’s returns bore no relationship to the index’s returns, its R-squared would be 0. For this report, R-squared is based on returns over the past 36 months for both the fund and the index.
Return on Equity. The annual average rate of return generated by a company during the past five years for each dollar of shareholder’s equity (net income divided by shareholder’s equity). For a fund, the weighted average return on equity for the companies whose stocks it holds.
Short-Term Reserves. The percentage of a fund invested in highly liquid, short-term securities that can be readily converted to cash.
Turnover Rate. An indication of the fund’s trading activity. Funds with high turnover rates incur higher transaction costs and may be more likely to distribute capital gains (which may be taxable to investors). The turnover rate excludes in-kind transactions, which have minimal impact on costs.
30
The People Who Govern Your Fund
The trustees of your mutual fund are there to see that the fund is operated and managed in your best interests since, as a shareholder, you are a part owner of the fund. Your fund’s trustees also serve on the board of directors of The Vanguard Group, Inc., which is owned by the Vanguard funds and provides services to them on an at-cost basis.
A majority of Vanguard’s board members are independent, meaning that they have no affiliation with Vanguard or the funds they oversee, apart from the sizable personal investments they have made as private individuals. The independent board members have distinguished backgrounds in business, academia, and public service. Each of the trustees and executive officers oversees 208 Vanguard funds.
Information for each trustee and executive officer of the fund appears below. The mailing address of the trustees and officers is P.O. Box 876, Valley Forge, PA 19482. More information about the trustees is in the Statement of Additional Information, which can be obtained, without charge, by contacting Vanguard at 800-662-7447, or online at vanguard.com.
Interested Trustees1
F. William McNabb III
Born in 1957. Trustee since July 2009. Principal occupation(s) during the past five years and other experience: chairman of the board (January 2010–present) of Vanguard and of each of the investment companies served by Vanguard, trustee (2009–present) of each of the investment companies served by Vanguard, and director (2008–present) of Vanguard. Chief executive officer and president (2008–2017) of Vanguard and each of the investment companies served by Vanguard, managing director (1995–2008) of Vanguard, and director (1997–2018) of Vanguard Marketing Corporation. Director (2018–present) of UnitedHealth Group.
Mortimer J. Buckley
Born in 1969. Trustee since January 2018. Principal occupation(s) during the past five years and other experience: chief executive officer (January 2018–present) of Vanguard; chief executive officer, president, and trustee (January 2018–present) of each of the investment companies served by Vanguard; president and director (2017–present) of Vanguard; and president (February 2018–present) of Vanguard Marketing Corporation. Chief investment officer (2013–2017), managing director (2002–2017), head of the Retail Investor Group (2006–2012), and chief information officer (2001–2006) of Vanguard. Chairman of the board (2011–2017) of the Children’s Hospital of Philadelphia.
Independent Trustees
Emerson U. Fullwood
Born in 1948. Trustee since January 2008. Principal occupation(s) during the past five years and other experience: executive chief staff and marketing officer for North America and corporate vice president (retired 2008) of Xerox Corporation (document management products and services). Former president of the Worldwide Channels Group, Latin America, and Worldwide Customer Service and executive chief staff officer of Developing Markets of Xerox. Executive in residence and 2009–2010 Distinguished Minett Professor at the Rochester Institute of Technology. Lead director of SPX FLOW, Inc. (multi-industry manufacturing). Director of the University of Rochester Medical Center, the Monroe Community College Foundation, the United Way of Rochester, North Carolina A&T University, and Roberts Wesleyan College. Trustee of the University of Rochester.
Amy Gutmann
Born in 1949. Trustee since June 2006. Principal occupation(s) during the past five years and other experience: president (2004–present) of the University of Pennsylvania. Christopher H. Browne Distinguished Professor of Political Science, School of Arts and Sciences, and professor of communication, Annenberg School for Communication, with secondary faculty appointments in the Department of Philosophy, School of Arts and Sciences, and at the Graduate School of Education, University of Pennsylvania. Trustee of the National Constitution Center.
1 Mr. McNabb and Mr. Buckley are considered “interested persons,” as defined in the Investment Company Act of 1940, because they are officers of the Vanguard funds.
JoAnn Heffernan Heisen
Born in 1950. Trustee since July 1998. Principal occupation(s) during the past five years and other experience: corporate vice president of Johnson & Johnson (pharmaceuticals/medical devices/consumer products) and member of its executive committee (1997–2008). Chief global diversity officer (retired 2008), vice president and chief information officer (1997–2006), controller (1995–1997), treasurer (1991–1995), and assistant treasurer (1989–1991) of Johnson & Johnson. Director of Skytop Lodge Corporation (hotels) and the Robert Wood Johnson Foundation. Member of the advisory board of the Institute for Women’s Leadership at Rutgers University.
F. Joseph Loughrey
Born in 1949. Trustee since October 2009. Principal occupation(s) during the past five years and other experience: president and chief operating officer (retired 2009) and vice chairman of the board (2008–2009) of Cummins Inc. (industrial machinery). Chairman of the board of Hillenbrand, Inc. (specialized consumer services), Oxfam America, and the Lumina Foundation for Education. Director of the V Foundation for Cancer Research. Member of the advisory council for the College of Arts and Letters and chair of the advisory board to the Kellogg Institute for International Studies, both at the University of Notre Dame.
Mark Loughridge
Born in 1953. Trustee since March 2012. Principal occupation(s) during the past five years and other experience: senior vice president and chief financial officer (retired 2013) of IBM (information technology services). Fiduciary member of IBM’s Retirement Plan Committee (2004–2013), senior vice president and general manager (2002–2004) of IBM Global Financing, vice president and controller (1998–2002) of IBM, and a variety of other prior management roles at IBM. Member of the Council on Chicago Booth.
Scott C. Malpass
Born in 1962. Trustee since March 2012. Principal occupation(s) during the past five years and other experience: chief investment officer (1989–present) and vice president (1996–present) of the University of Notre Dame. Assistant professor of finance at the Mendoza College of Business, University of Notre Dame, and member of the Notre Dame 403(b) Investment Committee. Chairman of the board of TIFF Advisory Services, Inc. Member of the board of Catholic Investment Services, Inc. (investment advisors), the board of advisors for Spruceview Capital Partners, and the board of superintendence of the Institute for the Works of Religion.
Deanna Mulligan
Born in 1963. Trustee since January 2018. Principal occupation(s) during the past five years and other experience: president (2010–present) and chief executive officer (2011–present) of The Guardian Life Insurance Company of America. Chief operating officer (2010–2011) and executive vice president (2008–2010) of Individual Life and Disability of The Guardian Life Insurance Company of America. Member of the board of The Guardian Life Insurance Company of America, the American Council of Life Insurers, the Partnership for New York City (business leadership), and the Committee Encouraging Corporate Philanthropy. Trustee of the Economic Club of New York and the Bruce Museum (arts and science). Member of the Advisory Council for the Stanford Graduate School of Business.
André F. Perold
Born in 1952. Trustee since December 2004. Principal occupation(s) during the past five years and other experience: George Gund Professor of Finance and Banking, Emeritus at the Harvard Business School (retired 2011). Chief investment officer and co-managing partner of HighVista Strategies LLC (private investment firm). Overseer of the Museum of Fine Arts Boston.
Sarah Bloom Raskin
Born in 1961. Trustee since January 2018. Principal occupation(s) during the past five years and other experience: deputy secretary (2014–2017) of the United States Department of the Treasury. Governor (2010–2014) of the Federal Reserve Board. Commissioner (2007–2010) of financial regulation for the State of Maryland. Member of the board of directors (2012–2014) of Neighborhood Reinvestment Corporation. Director of i(x) Investments, LLC.
Peter F. Volanakis
Born in 1955. Trustee since July 2009. Principal occupation(s) during the past five years and other experience: president and chief operating officer (retired 2010) of Corning Incorporated (communications equipment) and director of Corning Incorporated (2000–2010) and Dow Corning (2001–2010). Director (2012) of SPX Corporation (multi-industry manufacturing). Overseer of the Amos Tuck School of Business Administration, Dartmouth College (2001–2013). Chairman of the board of trustees of Colby-Sawyer College. Member of the Board of Hypertherm Inc. (industrial cutting systems, software, and consumables).
Executive Officers
Glenn Booraem
Born in 1967. Principal occupation(s) during the past five years and other experience: principal of Vanguard. Investment stewardship officer (2017–present), treasurer (2015–2017), controller (2010–2015), and assistant controller (2001–2010) of each of the investment companies served by Vanguard.
Christine M. Buchanan
Born in 1970. Principal occupation(s) during the past five years and other experience: principal of Vanguard and global head of Fund Administration at Vanguard. Treasurer (2017–present) of each of the investment companies served by Vanguard. Partner (2005–2017) at KPMG LLP (audit, tax, and advisory services).
Brian Dvorak
Born in 1973. Principal occupation(s) during the past five years and other experience: principal of Vanguard. Chief compliance officer (2017–present) of Vanguard and each of the investment companies served by Vanguard. Assistant vice president (2017–present) of Vanguard Marketing Corporation. Vice president and director of Enterprise Risk Management (2011–2013) at Oppenheimer Funds, Inc.
Thomas J. Higgins
Born in 1957. Principal occupation(s) during the past five years and other experience: principal of Vanguard. Chief financial officer (2008–present) and treasurer (1998–2008) of each of the investment companies served by Vanguard.
Peter Mahoney
Born in 1974. Principal occupation(s) during the past five years and other experience: principal of Vanguard. Controller (2015–present) of each of the investment companies served by Vanguard. Head of International Fund Services (2008–2014) at Vanguard.
Anne E. Robinson
Born in 1970. Principal occupation(s) during the past five years and other experience: general counsel (2016–present) of Vanguard. Secretary (2016–present) of Vanguard and of each of the investment companies served by Vanguard. Managing director (2016–present) of Vanguard. Director and senior vice president (2016–2018) of Vanguard Marketing Corporation. Managing director and general counsel of Global Cards and Consumer Services (2014–2016) at Citigroup. Counsel (2003–2014) at American Express.
Michael Rollings
Born in 1963. Principal occupation(s) during the past five years and other experience: finance director (2017–present) and treasurer (2017) of each of the investment companies served by Vanguard. Managing director (2016–present) of Vanguard. Chief financial officer (2016–present) of Vanguard. Director (2016–present) of Vanguard Marketing Corporation. Executive vice president and chief financial officer (2006–2016) of MassMutual Financial Group.
| Vanguard Senior Management Team | |
| Mortimer J. Buckley | James M. Norris |
| Gregory Davis | Thomas M. Rampulla |
| John James | Karin A. Risi |
| Martha G. King | Anne E. Robinson |
| John T. Marcante | Michael Rollings |
| Chris D. McIsaac | |
| Chairman Emeritus and Senior Advisor | |
| John J. Brennan | |
| Chairman, 1996–2009 | |
| Chief Executive Officer and President, 1996–2008 | |
| Founder | |
| John C. Bogle | |
| Chairman and Chief Executive Officer, 1974–1996 | |
 | |
P.O. Box 2600 | |
Connect with Vanguard® > vanguard.com | |
| Fund Information > 800-662-7447 | Source for Bloomberg Barclays indexes: Bloomberg |
| Direct Investor Account Services > 800-662-2739 | Index Services Limited. Copyright 2018, Bloomberg. All |
| Institutional Investor Services > 800-523-1036 | rights reserved. |
| Text Telephone for People | |
| Who Are Deaf or Hard of Hearing > 800-749-7273 | London Stock Exchange Group companies include FTSE |
| International Limited (”FTSE”), Frank Russell Company | |
| (”Russell”), MTS Next Limited (”MTS”), and FTSE TMX | |
| Global Debt Capital Markets Inc. (”FTSE TMX”). All | |
| This material may be used in conjunction | rights reserved. ”FTSE®”, ”Russell®”, ”MTS®”, ”FTSE |
| with the offering of shares of any Vanguard | TMX®” and ”FTSE Russell” and other service marks |
| fund only if preceded or accompanied by | and trademarks related to the FTSE or Russell indexes |
| the fund’s current prospectus. | are trademarks of the London Stock Exchange Group |
| companies and are used by FTSE, MTS, FTSE TMX and | |
| All comparative mutual fund data are from Lipper, a | Russell under licence. All information is provided for |
| Thomson Reuters Company, or Morningstar, Inc., unless | information purposes only. No responsibility or liability |
| otherwise noted. | can be accepted by the London Stock Exchange Group |
| You can obtain a free copy of Vanguard’s proxy voting | companies nor its licensors for any errors or for any |
| guidelines by visiting vanguard.com/proxyreporting or by | loss from use of this publication. Neither the London |
| calling Vanguard at 800-662-2739. The guidelines are | Stock Exchange Group companies nor any of its |
| also available from the SEC’s website, sec.gov. In | licensors make any claim, prediction, warranty or |
| addition, you may obtain a free report on how your fund | representation whatsoever, expressly or impliedly, |
| voted the proxies for securities it owned during the 12 | either as to the results to be obtained from the use of |
| months ended June 30. To get the report, visit either | the FTSE Indexes or the fitness or suitability of the |
| vanguard.com/proxyreporting or sec.gov. | Indexes for any particular purpose to which they might |
| be put. | |
| You can review and copy information about your fund at | |
| the SEC’s Public Reference Room in Washington, D.C. To | |
| find out more about this public service, call the SEC at | |
| 202-551-8090. Information about your fund is also | |
| available on the SEC’s website, and you can receive | |
| copies of this information, for a fee, by sending a | |
| request in either of two ways: via email addressed to | |
| publicinfo@sec.gov or via regular mail addressed to the | |
| Public Reference Section, Securities and Exchange | |
| Commission, Washington, DC 20549-1520. | |
| © 2018 The Vanguard Group, Inc. | |
| All rights reserved. | |
| Vanguard Marketing Corporation, Distributor. | |
| Q6232 062018 | |
| Semiannual Report | April 30, 2018 |
| Vanguard Emerging Markets |
| Government Bond Index Fund |
Vanguard’s Principles for Investing Success
We want to give you the best chance of investment success. These
principles, grounded in Vanguard’s research and experience, can put you on
the right path.
Goals. Create clear, appropriate investment goals.
Balance. Develop a suitable asset allocation using broadly diversified funds.
Cost. Minimize cost.
Discipline. Maintain perspective and long-term discipline.
A single theme unites these principles: Focus on the things you can control.
We believe there is no wiser course for any investor.
| Contents | |
| Your Fund’s Performance at a Glance. | 1 |
| CEO’s Perspective. | 3 |
| Results of Proxy Voting. | 5 |
| Fund Profile. | 7 |
| Performance Summary. | 9 |
| Financial Statements. | 10 |
| About Your Fund’s Expenses. | 49 |
| Trustees Approve Advisory Arrangement. | 51 |
| Glossary. | 53 |
Please note: The opinions expressed in this report are just that—informed opinions. They should not be considered promises or advice. Also, please keep in mind that the information and opinions cover the period through the date on the front of this report. Of course, the risks of investing in your fund are spelled out in the prospectus.
See the Glossary for definitions of investment terms used in this report.
About the cover: Nautical images have been part of Vanguard’s rich heritage since its start in 1975. For an incoming ship, a lighthouse offers a beacon and safe path to shore. You can similarly depend on Vanguard to put you first––and light the way––as you strive to meet your financial goals. Our client focus and low costs, stemming from our unique ownership structure, assure that your interests are paramount.
Your Fund’s Performance at a Glance
• For the six months ended April 30, 2018, Vanguard Emerging Markets Government Bond Index Fund returned –2.69% for Investor Shares. That was in line with the performance of its benchmark (–2.46%) after taking the cost of running the fund into account. The fund’s peer group had an average return of –1.04%.
• The period was marked by rising interest rates and an upswing in volatility, which seemed to result from an accumulation of concerns. Among them were the prospect of an upturn in inflation, a more aggressive pace of monetary tightening, and a flare-up in global trade tensions. Emerging-market bonds repriced significantly in February, and yield spreads with U.S. Treasuries ended the fiscal half year a little wider.
• Among the larger constituents in the index, South Africa outperformed significantly as reform momentum accelerated. So did Brazil, which pulled out of recession. Laggards included Indonesia, Argentina, Saudi Arabia, and Venezuela.
| Total Returns: Six Months Ended April 30, 2018 | ||||
| 30-Day SEC | Income | Capital | Total | |
| Yield | Returns | Returns | Returns | |
| Vanguard Emerging Markets Government Bond Index Fund | ||||
| Investor Shares | 4.37% | 1.95% | -4.64% | -2.69% |
| ETF Shares | 4.54 | |||
| Market Price | -2.76 | |||
| Net Asset Value | -2.59 | |||
| Admiral™ Shares | 4.54 | 2.04 | -4.64 | -2.60 |
| Institutional Shares | 4.57 | 2.06 | -4.62 | -2.56 |
| Bloomberg Barclays USD Emerging Markets Government | ||||
| RIC Capped Index | -2.46 | |||
| Emerging Markets Hard Currency Debt Funds Average | -1.04 |
Emerging Markets Hard Currency Debt Funds Average: Derived from data provided by Lipper, a Thomson Reuters Company.
Admiral Shares carry lower expenses and are available to investors who meet certain account-balance requirements. The Vanguard ETF® Shares shown are traded on the Nasdaq exchange and are available only through brokers. The table provides ETF returns based on both the Nasdaq market price and the net asset value for a share. U.S. Pat. Nos. 6,879,964; 7,337,138; 7,720,749; 7,925,573; 8,090,646; and 8,417,623.
For the ETF Shares, the market price is determined by the midpoint of the bid-offer spread as of the closing time of the New York Stock Exchange (generally 4 p.m., Eastern time). The net asset value is also determined as of the NYSE closing time. For more information about how the ETF Shares' market prices have compared with their net asset value, visit vanguard.com, select your ETF, and then select the Price and Performance tab. The ETF premium/discount analysis there shows the percentages of days on which the ETF Shares' market price was above or below the NAV.
1
| Expense Ratios | |||||
| Your Fund Compared With Its Peer Group | |||||
| Investor | ETF | Admiral | Institutional | Peer Group | |
| Shares | Shares | Shares | Shares | Average | |
| Emerging Markets Government Bond Index | |||||
| Fund | 0.49% | 0.32% | 0.32% | 0.29% | 1.13% |
The fund expense ratios shown are from the prospectus dated February 22, 2018, and represent estimated costs for the current fiscal year. For the six months ended April 30, 2018, the fund’s annualized expense ratios were 0.49% for Investor Shares, 0.32% for ETF Shares, 0.32% for Admiral Shares, and 0.29% for Institutional Shares. The peer-group expense ratio is derived from data provided by Lipper, a Thomson Reuters Company, and captures information through year-end 2017.
Peer group: Emerging Markets Hard Currency Debt Funds.
2
CEO’s Perspective

Tim Buckley
President and Chief Executive Officer
Dear Shareholder,
I feel extremely fortunate to have the chance to lead a company filled with people who come to work every day passionate about Vanguard’s core purpose: to take a stand for all investors, to treat them fairly, and to give them the best chance for investment success.
When I joined Vanguard in 1991, I found a mission-driven team focused on improving lives—helping people retire more comfortably, put their children through college, and achieve financial security. I also found a company with purpose in an industry ripe for improvement.
It was clear, even early in my career, that the cards were stacked against most investors. Hidden fees, performance-chasing, and poor advice were relentlessly eroding investors’ dreams.
We knew Vanguard could be different and, as a result, could make a real difference. We have lowered the costs of investing for our shareholders significantly. And we’re proud of the performance of our funds.
Vanguard is built for Vanguard investors—we focus solely on you, our fund shareholders. Everything we do is designed to give our clients the best chance for investment success. In my role as CEO, I’ll keep this priority
3
front and center. We’re proud of what we’ve achieved, but we’re even more excited about what’s to come.
Steady, time-tested guidance
Our guidance for investors, as always, is to stay the course, tune out the hyperbolic headlines, and focus on your goals and what you can control, such as costs and how much you save. This time-tested advice has served our clients well over the decades.
Regardless of how the markets perform in the short term, I’m incredibly optimistic about the future for our investors. We have a dedicated team serving you, and we will never stop striving to make
Vanguard the best place for you to invest through our high-quality funds and services, advice and guidance to help you meet your financial goals, and an experience that makes you feel good about entrusting us with your hard-earned savings.
Thank you for your continued loyalty.
Sincerely,

Mortimer J. Buckley
President and Chief Executive Officer
May 16, 2018
| Market Barometer | |||
| Total Returns | |||
| Periods Ended April 30, 2018 | |||
| Six | One | Five Years | |
| Months | Year | (Annualized) | |
| Stocks | |||
| Russell 1000 Index (Large-caps) | 3.83% | 13.17% | 12.84% |
| Russell 2000 Index (Small-caps) | 3.27 | 11.54 | 11.74 |
| Russell 3000 Index (Broad U.S. market) | 3.79 | 13.05 | 12.75 |
| FTSE All-World ex US Index (International) | 3.72 | 15.84 | 5.85 |
| Bonds | |||
| Bloomberg Barclays U.S. Aggregate Bond Index | |||
| (Broad taxable market) | -1.87% | -0.32% | 1.47% |
| Bloomberg Barclays Municipal Bond Index | |||
| (Broad tax-exempt market) | -0.97 | 1.56 | 2.44 |
| Citigroup Three-Month U.S. Treasury Bill Index | 0.67 | 1.16 | 0.32 |
| CPI | |||
| Consumer Price Index | 1.57% | 2.46% | 1.50% |
4
Results of Proxy Voting
At a special meeting of shareholders on November 15, 2017, fund shareholders approved the following proposals:
Proposal 1—Elect trustees for the fund.*
The individuals listed in the table below were elected as trustees for the fund. All trustees with the exception of Ms. Mulligan, Ms. Raskin, and Mr. Buckley (each of whom already serves as a director of The Vanguard Group, Inc.) served as trustees to the funds prior to the shareholder meeting.
| Percentage | |||
| Trustee | For | Withheld | For |
| Mortimer J. Buckley | 860,548,560 | 28,473,629 | 96.8% |
| Emerson U. Fullwood | 859,625,511 | 29,396,677 | 96.7% |
| Amy Gutmann | 859,439,842 | 29,582,347 | 96.7% |
| JoAnn Heffernan Heisen | 860,336,031 | 28,686,158 | 96.8% |
| F. Joseph Loughrey | 860,411,988 | 28,610,200 | 96.8% |
| Mark Loughridge | 860,924,717 | 28,097,471 | 96.8% |
| Scott C. Malpass | 859,842,339 | 29,179,849 | 96.7% |
| F. William McNabb III | 859,460,373 | 29,561,815 | 96.7% |
| Deanna Mulligan | 860,984,342 | 28,037,846 | 96.8% |
| André F. Perold | 850,692,197 | 38,329,992 | 95.7% |
| Sarah Bloom Raskin | 860,331,311 | 28,690,878 | 96.8% |
| Peter F. Volanakis | 860,652,393 | 28,369,796 | 96.8% |
| * Results are for all funds within the same trust. |
Proposal 2—Approve a manager-of-managers arrangement with third-party investment advisors.
This arrangement enables the fund to enter into and materially amend investment advisory arrangements with third-party investment advisors, subject to the approval of the fund’s board of trustees and certain conditions imposed by the Securities and Exchange Commission, while avoiding the costs and delays associated with obtaining future shareholder approval.
| Broker | Percentage | ||||
| Vanguard Fund | For | Abstain | Against | Non-Votes | For |
| Emerging Markets Government | |||||
| Bond Index Fund | 16,758,206 | 608,780 | 919,293 | 3,646,164 | 76.4% |
5
Proposal 3—Approve a manager-of-managers arrangement with wholly owned subsidiaries of Vanguard.
This arrangement enables Vanguard or the fund to enter into and materially amend investment advisory arrangements with wholly owned subsidiaries of Vanguard, subject to the approval of the fund’s board of trustees and any conditions imposed by the Securities and Exchange Commission (SEC), while avoiding the costs and delays associated with obtaining future shareholder approval. The ability of the fund to operate in this manner is contingent upon the SEC’s approval of a pending application for an order of exemption.
| Broker | Percentage | ||||
| Vanguard Fund | For | Abstain | Against | Non-Votes | For |
| Emerging Markets Government | |||||
| Bond Index Fund | 16,736,340 | 549,473 | 1,000,466 | 3,646,164 | 76.3% |
6
Emerging Markets Government Bond Index Fund
Fund Profile
As of April 30, 2018
| Share-Class Characteristics | ||||
| Investor | Admiral | Institutional | ||
| Shares | ETF Shares | Shares | Shares | |
| Ticker Symbol | VGOVX | VWOB | VGAVX | VGIVX |
| Expense Ratio1 | 0.49% | 0.32% | 0.32% | 0.29% |
| 30-Day SEC Yield | 4.37% | 4.54% | 4.54% | 4.57% |
| Financial Attributes | ||
| Bloomberg | ||
| Barclays USD | ||
| Emerging Mkts | ||
| Government | ||
| Fund | RIC Capped Idx | |
| Number of Bonds | 1,042 | 1,126 |
| Yield to Maturity (before | ||
| expenses) | 5.3% | 5.3% |
| Average Coupon | 5.3% | 5.3% |
| Average Duration | 6.4 years | 6.3 years |
| Average Effective | ||
| Maturity | 10.2 years | 10.4 years |
| Short-Term Reserves | 0.7% | — |
| Sector Diversification (% of portfolio) | ||
| Foreign | 100.0% | |
| Volatility Measures | |
| Bloomberg | |
| Barclays USD | |
| Emerging Mkts | |
| Government | |
| RIC Capped Idx | |
| R-Squared | 1.00 |
| Beta | 1.02 |
These measures show the degree and timing of the fund’s fluctuations compared with the index over 36 months.
| Distribution by Credit Quality (% of portfolio) | |
| Aaa | 0.2% |
| Aa | 5.2 |
| A | 20.9 |
| Baa | 37.6 |
| Less Than Baa | 36.1 |
Credit-quality ratings are obtained from Barclays and are from Moody's, Fitch, and S&P. When ratings from all three agencies are used, the median rating is shown. When ratings from two of the agencies are used, the lower rating for each issue is shown. "Not Rated" is used to classify securities for which a rating is not available. For more information about these ratings, see the Glossary entry for Credit Quality.
| Distribution by Effective Maturity | |
| (% of portfolio) | |
| Under 1 Year | 0.4% |
| 1 - 3 Years | 18.4 |
| 3 - 5 Years | 19.4 |
| 5 - 10 Years | 35.9 |
| 10 - 20 Years | 8.5 |
| 20 - 30 Years | 16.0 |
| Over 30 Years | 1.4 |
1 The expense ratios shown are from the prospectus dated February 22, 2018, and represent estimated costs for the current fiscal year. For the six months ended April 30, 2018, the annualized expense ratios were 0.49% for Investor Shares, 0.32% for ETF Shares, 0.32% for Admiral Shares, and 0.29% for Institutional Shares.
7
Emerging Markets Government Bond Index Fund
| Market Diversification (% of portfolio exposure) | |
| Fund | |
| Emerging Markets | |
| China | 16.9% |
| Mexico | 7.9 |
| Brazil | 6.5 |
| Indonesia | 5.5 |
| United Arab Emirates | 4.8 |
| Russia | 4.7 |
| Turkey | 4.4 |
| Argentina | 4.4 |
| Saudi Arabia | 3.8 |
| Qatar | 3.2 |
| Colombia | 2.5 |
| Philippines | 2.2 |
| Lebanon | 1.6 |
| Malaysia | 1.6 |
| South Africa | 1.6 |
| Chile | 1.5 |
| Kazakhstan | 1.5 |
| Egypt | 1.4 |
| India | 1.4 |
| Oman | 1.3 |
| Ukraine | 1.3 |
| Panama | 1.2 |
| Bahrain | 1.1 |
| Ecuador | 1.1 |
| Hungary | 1.1 |
| Peru | 1.1 |
| Dominican Republic | 1.0 |
| Poland | 1.0 |
| Uruguay | 1.0 |
| Other | 11.4 |
| Total | 100.0% |
8
Emerging Markets Government Bond Index Fund
Performance Summary
All of the returns in this report represent past performance, which is not a guarantee of future results that may be achieved by the fund. (Current performance may be lower or higher than the performance data cited. For performance data current to the most recent month-end, visit our website at vanguard.com/performance.) Note, too, that both investment returns and principal value can fluctuate widely, so an investor’s shares, when sold, could be worth more or less than their original cost. The returns shown do not reflect taxes that a shareholder would pay on fund distributions or on the sale of fund shares.
| Fiscal-Year Total Returns (%): May 31, 2013, Through April 30, 2018 | ||||
| Bloomberg | ||||
| Barclays USD | ||||
| Emerging Mkts | ||||
| Government | ||||
| Investor Shares | RIC Capped Idx | |||
| Fiscal Year | Income Returns | Capital Returns | Total Returns | Total Returns |
| 2013 | 1.51% | -2.89% | -1.38% | -1.39% |
| 2014 | 4.46 | 2.16 | 6.62 | 7.00 |
| 2015 | 4.36 | -4.52 | -0.16 | -0.08 |
| 2016 | 4.97 | 5.68 | 10.65 | 11.05 |
| 2017 | 4.66 | 0.80 | 5.46 | 5.74 |
| 2018 | 1.95 | -4.64 | -2.69 | -2.46 |
| Note: For 2018, performance data reflect the six months ended April 30, 2018. | ||||
Average Annual Total Returns: Periods Ended March 31, 2018
This table presents returns through the latest calendar quarter—rather than through the end of the fiscal period.
Securities and Exchange Commission rules require that we provide this information.
| Since Inception | |||||
| Inception Date | One Year | Income | Capital | Total | |
| Investor Shares | 5/31/2013 | 2.74% | 4.44% | -0.50% | 3.94% |
| Fee-Adjusted Returns | 1.97 | 3.78 | |||
| ETF Shares | 5/31/2013 | ||||
| Market Price | 2.92 | 4.22 | |||
| Net Asset Value | 2.89 | 4.09 | |||
| Admiral Shares | 5/31/2013 | 2.90 | 4.61 | -0.50 | 4.11 |
| Fee-Adjusted Returns | 2.13 | 3.95 | |||
| Institutional Shares | 2/11/20151 | 2.92 | 4.88 | 0.73 | 5.61 |
| Fee-Adjusted Returns | 2.15 | 5.36 |
1 Institutional Shares were first issued on November 25, 2014, and were redeemed shortly thereafter. Institutional Shares were next issued on February 11, 2015. The total return shown is based on the period beginning February 11, 2015.
Vanguard fund returns are adjusted to reflect the 0.75% fee on purchases of fund shares. The fee does not apply to the ETF Shares. The Fiscal-Year Total Returns table is not adjusted for fees.
See Financial Highlights for dividend and capital gains information.
9
Emerging Markets Government Bond Index Fund
Financial Statements (unaudited)
Statement of Net Assets
As of April 30, 2018
The fund reports a complete list of its holdings in regulatory filings four times in each fiscal year, at the quarter-ends. For the second and fourth fiscal quarters, the lists appear in the fund’s semiannual and annual reports to shareholders. For the first and third fiscal quarters, the fund files the lists with the Securities and Exchange Commission on Form N-Q. Shareholders can look up the fund’s Forms N-Q on the SEC’s website at sec.gov. Forms N-Q may also be reviewed and copied at the SEC’s Public Reference Room (see the back cover of this report for further information).
| Face | Market | ||||
| Maturity | Amount | Value • | |||
| Coupon | Date | ($000) | ($000) | ||
| Angola (0.1%) | |||||
| Sovereign Bond (0.1%) | |||||
| Republic of Angola | 9.500% | 11/12/25 | 1,400 | 1,574 | |
| Total Angola (Cost $1,415) | 1,574 | ||||
| Argentina (4.3%) | |||||
| Corporate Bond (0.0%) | |||||
| Pampa Energia SA | 7.375% | 7/21/23 | 500 | 520 | |
| 520 | |||||
| Sovereign Bonds (4.3%) | |||||
| Argentine Republic | 6.875% | 4/22/21 | 4,525 | 4,751 | |
| Argentine Republic | 5.625% | 1/26/22 | 3,000 | 3,023 | |
| Argentine Republic | 4.625% | 1/11/23 | 1,300 | 1,245 | |
| Argentine Republic | 7.500% | 4/22/26 | 6,070 | 6,364 | |
| Argentine Republic | 6.875% | 1/26/27 | 4,200 | 4,185 | |
| Argentine Republic | 5.875% | 1/11/28 | 3,850 | 3,526 | |
| Argentine Republic | 6.625% | 7/6/28 | 150 | 145 | |
| Argentine Republic | 8.280% | 12/31/33 | 1,012 | 1,058 | |
| Argentine Republic | 8.280% | 12/31/33 | 3,854 | 4,134 | |
| Argentine Republic | 7.125% | 7/6/36 | 2,615 | 2,494 | |
| Argentine Republic | 2.500% | 12/31/38 | 6,844 | 4,457 | |
| Argentine Republic | 7.625% | 4/22/46 | 3,900 | 3,777 | |
| Argentine Republic | 6.875% | 1/11/48 | 2,600 | 2,314 | |
| 1 | City of Buenos Aires | 8.950% | 2/19/21 | 200 | 213 |
| 1 | City of Buenos Aires | 7.500% | 6/1/27 | 250 | 258 |
| 1,2 | City of Buenos Aires | 7.500% | 6/1/27 | 1,000 | 1,033 |
| 1 | Provincia de Buenos Aires | 10.875% | 1/26/21 | 1,500 | 1,641 |
| 1 | Provincia de Buenos Aires | 9.950% | 6/9/21 | 600 | 665 |
| 1,2 | Provincia de Buenos Aires | 9.950% | 6/9/21 | 650 | 720 |
| 1 | Provincia de Buenos Aires | 9.125% | 3/16/24 | 1,000 | 1,108 |
| 1 | Provincia de Buenos Aires | 7.875% | 6/15/27 | 2,000 | 2,035 |
| Provincia de Cordoba | 7.125% | 6/10/21 | 300 | 313 | |
| 2 | Provincia de Cordoba | 7.125% | 8/1/27 | 550 | 532 |
| 1 | Provincia de Mondoza | 8.375% | 5/19/24 | 400 | 422 |
| 1 | Provincia del Chubut | 7.750% | 7/26/26 | 500 | 470 |
| YPF SA | 8.500% | 3/23/21 | 1,200 | 1,303 | |
10
| Emerging Markets Government Bond Index Fund | |||||
| Face | Market | ||||
| Maturity | Amount | Value • | |||
| Coupon | Date | ($000) | ($000) | ||
| 1 | YPF SA | 8.750% | 4/4/24 | 1,345 | 1,482 |
| YPF SA | 8.500% | 7/28/25 | 1,675 | 1,829 | |
| 2 | YPF SA | 7.000% | 12/15/47 | 1,025 | 907 |
| 56,404 | |||||
| Total Argentina (Cost $56,528) | 56,924 | ||||
| Armenia (0.1%) | |||||
| Sovereign Bonds (0.1%) | |||||
| 2 | Republic of Armenia | 6.000% | 9/30/20 | 200 | 204 |
| Republic of Armenia | 6.000% | 9/30/20 | 200 | 204 | |
| Republic of Armenia | 7.150% | 3/26/25 | 500 | 537 | |
| Total Armenia (Cost $924) | 945 | ||||
| Azerbaijan (0.5%) | |||||
| Sovereign Bonds (0.5%) | |||||
| 2 | Republic of Azerbaijan | 4.750% | 3/18/24 | 400 | 398 |
| Republic of Azerbaijan | 4.750% | 3/18/24 | 800 | 796 | |
| 1,2 | Republic of Azerbaijan | 3.500% | 9/1/32 | 1,100 | 903 |
| 3 | Southern Gas Corridor CJSC | 6.875% | 3/24/26 | 2,000 | 2,187 |
| State Oil Co. of the Azerbaijan Republic | 4.750% | 3/13/23 | 1,700 | 1,693 | |
| State Oil Co. of the Azerbaijan Republic | 6.950% | 3/18/30 | 200 | 215 | |
| Total Azerbaijan (Cost $6,148) | 6,192 | ||||
| Bahamas (0.1%) | |||||
| Sovereign Bond (0.1%) | |||||
| 1,2 | Commonwealth of the Bahamas | 6.000% | 11/21/28 | 850 | 877 |
| Total Bahamas (Cost $850) | 877 | ||||
| Bahrain (1.1%) | |||||
| Sovereign Bonds (1.1%) | |||||
| Bahrain Mumtalakat Holding Co. BSC | 4.000% | 11/25/21 | 250 | 236 | |
| Batelco International Finance No. 1 Ltd. | 4.250% | 5/1/20 | 400 | 390 | |
| CBB International Sukuk Co. SPC | 5.624% | 2/12/24 | 1,000 | 971 | |
| 2 | Kingdom of Bahrain | 5.500% | 3/31/20 | 1,900 | 1,900 |
| Kingdom of Bahrain | 5.875% | 1/26/21 | 200 | 201 | |
| 2 | Kingdom of Bahrain | 6.125% | 7/5/22 | 1,200 | 1,204 |
| 2 | Kingdom of Bahrain | 6.125% | 8/1/23 | 150 | 150 |
| Kingdom of Bahrain | 6.125% | 8/1/23 | 625 | 623 | |
| Kingdom of Bahrain | 7.000% | 1/26/26 | 1,300 | 1,289 | |
| 2 | Kingdom of Bahrain | 7.000% | 1/26/26 | 2,200 | 2,181 |
| Kingdom of Bahrain | 7.000% | 10/12/28 | 2,200 | 2,097 | |
| 2 | Kingdom of Bahrain | 6.750% | 9/20/29 | 800 | 739 |
| Kingdom of Bahrain | 6.000% | 9/19/44 | 400 | 321 | |
| 2 | Kingdom of Bahrain | 6.000% | 9/19/44 | 1,050 | 843 |
| 2 | Oil and Gas Holding Co. BSCC | 7.500% | 10/25/27 | 1,000 | 975 |
| Total Bahrain (Cost $14,932) | 14,120 | ||||
| Belarus (0.1%) | |||||
| Sovereign Bonds (0.1%) | |||||
| Republic of Belarus | 6.875% | 2/28/23 | 800 | 838 | |
| Republic of Belarus | 7.625% | 6/29/27 | 600 | 645 | |
| Total Belarus (Cost $1,492) | 1,483 | ||||
11
| Emerging Markets Government Bond Index Fund | |||||
| Face | Market | ||||
| Maturity | Amount | Value • | |||
| Coupon | Date | ($000) | ($000) | ||
| Belize (0.0%) | |||||
| Sovereign Bond (0.0%) | |||||
| Belize | 4.938% | 2/20/34 | 450 | 268 | |
| Total Belize (Cost $305) | 268 | ||||
| Bermuda (0.1%) | |||||
| Sovereign Bonds (0.1%) | |||||
| 2 | Bermuda | 4.854% | 2/6/24 | 400 | 419 |
| Bermuda | 4.854% | 2/6/24 | 400 | 417 | |
| 1 | Bermuda | 3.717% | 1/25/27 | 950 | 913 |
| Total Bermuda (Cost $1,771) | 1,749 | ||||
| Bolivia (0.1%) | |||||
| Sovereign Bonds (0.1%) | |||||
| Plurinational State of Bolivia | 5.950% | 8/22/23 | 600 | 639 | |
| 1,2 | Plurinational State of Bolivia | 4.500% | 3/20/28 | 1,000 | 933 |
| Total Bolivia (Cost $1,640) | 1,572 | ||||
| Brazil (6.3%) | |||||
| Sovereign Bonds (6.3%) | |||||
| Banco do Brasil SA | 6.000% | 1/22/20 | 695 | 723 | |
| Banco do Brasil SA | 5.375% | 1/15/21 | 375 | 384 | |
| Banco do Brasil SA | 5.875% | 1/26/22 | 1,875 | 1,919 | |
| Banco do Brasil SA | 3.875% | 10/10/22 | 1,726 | 1,661 | |
| Banco do Brasil SA | 5.875% | 1/19/23 | 850 | 874 | |
| 2 | Banco do Brasil SA | 4.875% | 4/19/23 | 800 | 795 |
| Banco do Brasil SA | 8.500% | 10/29/49 | 425 | 462 | |
| Banco Nacional de Desenvolvimento | |||||
| Economico e Social | 6.500% | 6/10/19 | 950 | 981 | |
| 2 | Banco Nacional de Desenvolvimento | ||||
| Economico e Social | 5.500% | 7/12/20 | 400 | 413 | |
| Banco Nacional de Desenvolvimento | |||||
| Economico e Social | 5.500% | 7/12/20 | 200 | 206 | |
| 2 | Banco Nacional de Desenvolvimento | ||||
| Economico e Social | 4.750% | 5/9/24 | 1,300 | 1,280 | |
| Banco Nacional de Desenvolvimento | |||||
| Economico e Social | 4.750% | 5/9/24 | 700 | 690 | |
| Caixa Economica Federal | 4.250% | 5/13/19 | 1,950 | 1,965 | |
| Caixa Economica Federal | 3.500% | 11/7/22 | 150 | 141 | |
| Cemig Geracao e Transmissao SA | 9.250% | 12/5/24 | 600 | 649 | |
| Centrais Eletricas Brasileiras SA | 6.875% | 7/30/19 | 900 | 930 | |
| Centrais Eletricas Brasileiras SA | 5.750% | 10/27/21 | 1,600 | 1,632 | |
| Federative Republic of Brazil | 8.875% | 10/14/19 | 175 | 189 | |
| Federative Republic of Brazil | 4.875% | 1/22/21 | 3,326 | 3,430 | |
| Federative Republic of Brazil | 2.625% | 1/5/23 | 2,761 | 2,599 | |
| Federative Republic of Brazil | 8.875% | 4/15/24 | 707 | 885 | |
| Federative Republic of Brazil | 4.250% | 1/7/25 | 4,472 | 4,416 | |
| Federative Republic of Brazil | 8.750% | 2/4/25 | 350 | 439 | |
| Federative Republic of Brazil | 6.000% | 4/7/26 | 450 | 488 | |
| Federative Republic of Brazil | 10.125% | 5/15/27 | 966 | 1,343 | |
| 1 | Federative Republic of Brazil | 4.625% | 1/13/28 | 2,610 | 2,514 |
| Federative Republic of Brazil | 8.250% | 1/20/34 | 1,425 | 1,771 | |
| Federative Republic of Brazil | 7.125% | 1/20/37 | 2,665 | 3,045 | |
| Federative Republic of Brazil | 5.625% | 1/7/41 | 2,226 | 2,126 | |
12
| Emerging Markets Government Bond Index Fund | ||||
| Face | Market | |||
| Maturity | Amount | Value • | ||
| Coupon | Date | ($000) | ($000) | |
| Federative Republic of Brazil | 5.000% | 1/27/45 | 3,561 | 3,080 |
| Federative Republic of Brazil | 5.625% | 2/21/47 | 2,200 | 2,068 |
| Petrobras Global Finance BV | 8.375% | 5/23/21 | 2,940 | 3,315 |
| Petrobras Global Finance BV | 6.125% | 1/17/22 | 500 | 528 |
| Petrobras Global Finance BV | 4.375% | 5/20/23 | 4,200 | 4,090 |
| Petrobras Global Finance BV | 6.250% | 3/17/24 | 1,325 | 1,391 |
| 2 Petrobras Global Finance BV | 5.299% | 1/27/25 | 1,859 | 1,826 |
| Petrobras Global Finance BV | 8.750% | 5/23/26 | 4,708 | 5,497 |
| Petrobras Global Finance BV | 7.375% | 1/17/27 | 4,270 | 4,569 |
| Petrobras Global Finance BV | 5.999% | 1/27/28 | 550 | 538 |
| 2 Petrobras Global Finance BV | 5.999% | 1/27/28 | 6,058 | 5,907 |
| Petrobras Global Finance BV | 5.750% | 2/1/29 | 1,800 | 1,710 |
| Petrobras Global Finance BV | 5.625% | 5/20/43 | 600 | 501 |
| Petrobras Global Finance BV | 7.250% | 3/17/44 | 910 | 901 |
| Petrobras Global Finance BV | 6.850% | 6/5/15 | 2,375 | 2,203 |
| Petrobras International Finance Co. SA | 5.375% | 1/27/21 | 1,517 | 1,572 |
| Petrobras International Finance Co. SA | 6.875% | 1/20/40 | 2,415 | 2,318 |
| Petrobras International Finance Co. SA | 6.750% | 1/27/41 | 2,277 | 2,163 |
| Total Brazil (Cost $79,709) | 83,127 | |||
| Cameroon (0.0%) | ||||
| Sovereign Bond (0.0%) | ||||
| 1 Republic of Cameroon | 9.500% | 11/19/25 | 500 | 575 |
| Total Cameroon (Cost $493) | 575 | |||
| Chile (1.5%) | ||||
| Sovereign Bonds (1.5%) | ||||
| 2 Banco del Estado de Chile | 4.125% | 10/7/20 | 400 | 407 |
| 2 Banco del Estado de Chile | 2.668% | 1/8/21 | 400 | 389 |
| 2 Banco del Estado de Chile | 3.875% | 2/8/22 | 725 | 727 |
| 2 Corp. Nacional del Cobre de Chile | 3.875% | 11/3/21 | 600 | 606 |
| Corp. Nacional del Cobre de Chile | 3.000% | 7/17/22 | 350 | 339 |
| 2 Corp. Nacional del Cobre de Chile | 3.000% | 7/17/22 | 650 | 631 |
| Corp. Nacional del Cobre de Chile | 4.500% | 8/13/23 | 675 | 691 |
| 2 Corp. Nacional del Cobre de Chile | 4.500% | 8/13/23 | 150 | 154 |
| Corp. Nacional del Cobre de Chile | 4.500% | 9/16/25 | 1,100 | 1,122 |
| 2 Corp. Nacional del Cobre de Chile | 3.625% | 8/1/27 | 800 | 762 |
| Corp. Nacional del Cobre de Chile | 3.625% | 8/1/27 | 1,100 | 1,045 |
| 2 Corp. Nacional del Cobre de Chile | 5.625% | 9/21/35 | 300 | 336 |
| 2 Corp. Nacional del Cobre de Chile | 6.150% | 10/24/36 | 100 | 118 |
| 2 Corp. Nacional del Cobre de Chile | 4.250% | 7/17/42 | 400 | 379 |
| 2 Corp. Nacional del Cobre de Chile | 5.625% | 10/18/43 | 200 | 227 |
| Corp. Nacional del Cobre de Chile | 5.625% | 10/18/43 | 700 | 795 |
| Corp. Nacional del Cobre de Chile | 4.875% | 11/4/44 | 900 | 928 |
| 2 Corp. Nacional del Cobre de Chile | 4.875% | 11/4/44 | 400 | 413 |
| Corp. Nacional del Cobre de Chile | 4.500% | 8/1/47 | 1,450 | 1,415 |
| 2 Empresa de Transporte de Pasajeros | ||||
| Metro SA | 4.750% | 2/4/24 | 200 | 206 |
| 2 Empresa de Transporte de Pasajeros | ||||
| Metro SA | 5.000% | 1/25/47 | 400 | 406 |
| 2 Empresa Nacional del Petroleo | 4.750% | 12/6/21 | 536 | 549 |
| Empresa Nacional del Petroleo | 4.375% | 10/30/24 | 500 | 502 |
| 2 Empresa Nacional del Petroleo | 4.500% | 9/14/47 | 1,000 | 917 |
| Republic of Chile | 3.875% | 8/5/20 | 500 | 509 |
13
| Emerging Markets Government Bond Index Fund | ||||
| Face | Market | |||
| Maturity | Amount | Value • | ||
| Coupon | Date | ($000) | ($000) | |
| Republic of Chile | 3.125% | 3/27/25 | 1,050 | 1,020 |
| Republic of Chile | 3.125% | 1/21/26 | 1,090 | 1,049 |
| 1 Republic of Chile | 3.240% | 2/6/28 | 2,150 | 2,054 |
| Republic of Chile | 3.860% | 6/21/47 | 1,150 | 1,078 |
| Total Chile (Cost $19,859) | 19,774 | |||
| China (16.5%) | ||||
| Corporate Bonds (0.2%) | ||||
| Azure Nova International Finance Ltd. | 2.250% | 11/1/19 | 1,400 | 1,370 |
| 2 China Southern Power Grid International | ||||
| Finance BVI Co. Ltd. | 2.750% | 5/8/22 | 1,000 | 965 |
| 2,335 | ||||
| Sovereign Bonds (16.3%) | ||||
| ABCL Glory Capital Ltd. | 2.500% | 6/21/21 | 1,500 | 1,450 |
| Agricultural Bank of China Ltd. | 2.750% | 5/21/20 | 250 | 246 |
| Agricultural Bank of China Ltd. | 2.750% | 10/20/20 | 200 | 197 |
| Amber Circle Funding Ltd. | 3.250% | 12/4/22 | 1,950 | 1,908 |
| Avi Funding Co. Ltd. | 2.850% | 9/16/20 | 300 | 295 |
| 2 Avi Funding Co. Ltd. | 2.850% | 9/16/20 | 400 | 394 |
| Avi Funding Co. Ltd. | 3.800% | 9/16/25 | 1,000 | 977 |
| Bank of China Ltd. | 1.875% | 7/12/19 | 1,000 | 984 |
| 4 Bank of China Ltd. | 2.603% | 2/14/20 | 1,150 | 1,151 |
| 4 Bank of China Ltd. | 2.581% | 5/11/20 | 600 | 600 |
| Bank of China Ltd. | 2.875% | 6/30/20 | 2,800 | 2,768 |
| Bank of China Ltd. | 2.375% | 3/1/21 | 750 | 726 |
| Bank of China Ltd. | 2.250% | 7/12/21 | 700 | 671 |
| 2 Bank of China Ltd. | 5.000% | 11/13/24 | 1,000 | 1,024 |
| Bank of China Ltd. | 5.000% | 11/13/24 | 2,200 | 2,252 |
| Bank of China Ltd. | 3.875% | 6/30/25 | 775 | 767 |
| Beijing State-Owned Assets Management | ||||
| Hong Kong Co. Ltd. | 4.125% | 5/26/25 | 1,000 | 972 |
| Bluestar Finance Holdings Ltd. | 3.125% | 9/30/19 | 1,000 | 990 |
| Bluestar Finance Holdings Ltd. | 4.375% | 6/11/20 | 200 | 201 |
| Bluestar Finance Holdings Ltd. | 3.500% | 9/30/21 | 300 | 292 |
| Bluestar Finance Holdings Ltd. | 4.375% | 12/29/49 | 700 | 700 |
| BOC Aviation Ltd. | 3.000% | 3/30/20 | 1,000 | 990 |
| 2 BOC Aviation Ltd. | 2.375% | 9/15/21 | 900 | 861 |
| BOC Aviation Ltd. | 2.375% | 9/15/21 | 450 | 430 |
| BOC Aviation Ltd. | 4.375% | 5/2/23 | 500 | 502 |
| BOC Aviation Ltd. | 3.875% | 4/27/26 | 800 | 762 |
| CCBL Cayman 1 Corp. Ltd. | 2.750% | 5/31/21 | 450 | 435 |
| CCBL Cayman Corp. Ltd. | 3.250% | 7/28/20 | 300 | 296 |
| CCCI Treasure Ltd. | 3.500% | 12/29/49 | 1,100 | 1,079 |
| CGNPC International Ltd. | 4.000% | 5/19/25 | 500 | 491 |
| Chalco Hong Kong Investment Co. Ltd. | 4.250% | 12/31/49 | 450 | 437 |
| Charming Light Investments Ltd. | 3.750% | 9/3/19 | 1,910 | 1,910 |
| Charming Light Investments Ltd. | 2.375% | 8/30/21 | 400 | 380 |
| Charming Light Investments Ltd. | 4.375% | 12/21/27 | 950 | 890 |
| China Cinda Finance 2014 Ltd. | 4.000% | 5/14/19 | 900 | 903 |
| China Cinda Finance 2014 Ltd. | 5.625% | 5/14/24 | 800 | 840 |
| China Cinda Finance 2015 I Ltd. | 3.125% | 4/23/20 | 2,200 | 2,169 |
| China Cinda Finance 2015 I Ltd. | 4.250% | 4/23/25 | 1,900 | 1,850 |
| China Cinda Finance 2017 I Ltd. | 3.650% | 3/9/22 | 300 | 295 |
| China Cinda Finance 2017 I Ltd. | 4.400% | 3/9/27 | 2,400 | 2,292 |
14
| Emerging Markets Government Bond Index Fund | ||||
| Face | Market | |||
| Maturity | Amount | Value • | ||
| Coupon | Date | ($000) | ($000) | |
| China Clean Energy Development Ltd. | 4.000% | 11/5/25 | 1,000 | 979 |
| China Construction Bank Asia Corp. Ltd. | 3.250% | 7/2/19 | 2,800 | 2,798 |
| 1 China Construction Bank Asia Corp. Ltd. | 4.250% | 8/20/24 | 700 | 702 |
| 4 China Construction Bank Corp. | 2.754% | 5/31/20 | 1,000 | 1,001 |
| 4 China Construction Bank Corp. | 2.825% | 12/4/20 | 475 | 476 |
| 1 China Construction Bank Corp. | 3.875% | 5/13/25 | 2,225 | 2,214 |
| China Development Bank Corp. | 1.625% | 6/22/19 | 200 | 197 |
| 4 China Development Bank Corp. | 2.575% | 3/6/20 | 200 | 200 |
| China Development Bank Corp. | 2.500% | 10/9/20 | 2,500 | 2,451 |
| China Development Bank Corp. | 2.125% | 6/1/21 | 2,150 | 2,068 |
| China Development Bank Corp. | 2.625% | 1/24/22 | 2,100 | 2,033 |
| 4 China Development Bank Corp. | 2.725% | 3/6/22 | 1,300 | 1,299 |
| China Development Bank Corp. | 3.375% | 1/24/27 | 200 | 191 |
| China Development Bank Corp. | 4.000% | 1/24/37 | 645 | 626 |
| China Great Wall International Holdings III Ltd. | 2.250% | 10/27/19 | 200 | 196 |
| China Great Wall International Holdings III Ltd. | 2.625% | 10/27/21 | 200 | 191 |
| China Great Wall International Holdings III Ltd. | 3.125% | 8/31/22 | 2,400 | 2,292 |
| China Great Wall International Holdings III Ltd. | 3.875% | 8/31/27 | 450 | 413 |
| 1 China Life Insurance Co. Ltd. | 4.000% | 7/3/75 | 1,000 | 984 |
| China Overseas Finance Cayman II Ltd. | 5.500% | 11/10/20 | 1,800 | 1,876 |
| China Overseas Finance Cayman III Ltd. | 5.375% | 10/29/23 | 1,300 | 1,361 |
| China Overseas Finance Cayman III Ltd. | 6.375% | 10/29/43 | 450 | 542 |
| China Overseas Finance Cayman V Ltd. | 3.950% | 11/15/22 | 1,350 | 1,336 |
| China Overseas Finance Cayman VI Ltd. | 5.950% | 5/8/24 | 200 | 215 |
| 2 China Resources Gas Group Ltd. | 4.500% | 4/5/22 | 400 | 408 |
| China Resources Land Ltd. | 6.000% | 2/27/24 | 400 | 434 |
| China Shenhua Overseas Capital Co. Ltd. | 3.125% | 1/20/20 | 850 | 843 |
| China Shenhua Overseas Capital Co. Ltd. | 3.875% | 1/20/25 | 600 | 589 |
| Chinalco Capital Holdings Ltd. | 4.000% | 8/25/21 | 1,300 | 1,258 |
| CITIC Ltd. | 6.375% | 4/10/20 | 1,000 | 1,048 |
| CITIC Ltd. | 6.625% | 4/15/21 | 400 | 430 |
| CITIC Ltd. | 2.800% | 12/14/21 | 300 | 288 |
| CITIC Ltd. | 3.125% | 2/28/22 | 200 | 194 |
| CITIC Ltd. | 6.800% | 1/17/23 | 1,700 | 1,884 |
| CITIC Ltd. | 3.700% | 6/14/26 | 500 | 465 |
| CITIC Ltd. | 3.875% | 2/28/27 | 750 | 702 |
| CITIC Securities Finance MTN Co. Ltd. | 3.500% | 10/30/19 | 1,450 | 1,445 |
| CNAC HK Finbridge Co. Ltd. | 3.500% | 7/19/22 | 2,600 | 2,507 |
| CNAC HK Finbridge Co. Ltd. | 4.125% | 7/19/27 | 1,950 | 1,801 |
| CNOOC Curtis Funding No 1 Pty Ltd. | 4.500% | 10/3/23 | 2,520 | 2,578 |
| 2 CNOOC Curtis Funding No 1 Pty Ltd. | 4.500% | 10/3/23 | 300 | 307 |
| 2 CNOOC Finance 2011 Ltd. | 4.250% | 1/26/21 | 1,888 | 1,924 |
| 2 CNOOC Finance 2011 Ltd. | 5.750% | 1/26/41 | 200 | 232 |
| 2 CNOOC Finance 2012 Ltd. | 3.875% | 5/2/22 | 1,200 | 1,202 |
| 2 CNOOC Finance 2012 Ltd. | 5.000% | 5/2/42 | 200 | 212 |
| CNOOC Finance 2013 Ltd. | 3.000% | 5/9/23 | 1,050 | 1,007 |
| CNOOC Finance 2013 Ltd. | 4.250% | 5/9/43 | 800 | 762 |
| CNOOC Finance 2015 Australia Pty Ltd. | 2.625% | 5/5/20 | 1,850 | 1,822 |
| CNOOC Finance 2015 USA LLC | 3.500% | 5/5/25 | 1,300 | 1,245 |
| CNOOC Nexen Finance 2014 ULC | 4.250% | 4/30/24 | 2,160 | 2,174 |
| CNOOC Nexen Finance 2014 ULC | 4.875% | 4/30/44 | 900 | 938 |
| 2 CNPC General Capital Ltd. | 2.750% | 5/14/19 | 200 | 199 |
| CNPC General Capital Ltd. | 2.750% | 5/14/19 | 450 | 448 |
| CNPC General Capital Ltd. | 2.700% | 11/25/19 | 1,000 | 991 |
15
| Emerging Markets Government Bond Index Fund | ||||
| Face | Market | |||
| Maturity | Amount | Value • | ||
| Coupon | Date | ($000) | ($000) | |
| 2 CNPC General Capital Ltd. | 3.950% | 4/19/22 | 700 | 706 |
| CNPC General Capital Ltd. | 3.400% | 4/16/23 | 250 | 245 |
| 2 CNPC HK Overseas Capital Ltd. | 4.500% | 4/28/21 | 1,225 | 1,261 |
| 2 CNPC HK Overseas Capital Ltd. | 5.950% | 4/28/41 | 400 | 478 |
| CNRC Capitale Ltd. | 3.900% | 12/31/49 | 1,500 | 1,438 |
| COSCO Finance 2011 Ltd. | 4.000% | 12/3/22 | 1,050 | 1,050 |
| 2 COSL Finance BVI Ltd. | 3.250% | 9/6/22 | 550 | 529 |
| COSL Singapore Capital Ltd. | 3.500% | 7/30/20 | 1,200 | 1,193 |
| COSL Singapore Capital Ltd. | 4.500% | 7/30/25 | 500 | 494 |
| CRCC Yupeng Ltd. | 3.950% | 2/28/49 | 300 | 299 |
| CRCC Yuxiang Ltd. | 3.500% | 5/16/23 | 950 | 925 |
| Dianjian Haixing Ltd. | 4.050% | 10/29/49 | 200 | 199 |
| 2 Export-Import Bank of China | 2.500% | 7/31/19 | 200 | 199 |
| Export-Import Bank of China | 2.500% | 7/31/19 | 1,960 | 1,946 |
| Export-Import Bank of China | 2.000% | 4/26/21 | 300 | 288 |
| Export-Import Bank of China | 2.625% | 3/14/22 | 2,400 | 2,319 |
| Export-Import Bank of China | 2.750% | 11/28/22 | 700 | 675 |
| Export-Import Bank of China | 3.625% | 7/31/24 | 500 | 491 |
| Export-Import Bank of China | 2.875% | 4/26/26 | 1,850 | 1,702 |
| Export-Import Bank of China | 3.375% | 3/14/27 | 500 | 471 |
| Export-Import Bank of China | 4.000% | 11/28/47 | 700 | 650 |
| Franshion Brilliant Ltd. | 5.750% | 12/31/49 | 500 | 490 |
| 2 Franshion Development Ltd. | 6.750% | 4/15/21 | 500 | 534 |
| Huarong Finance 2017 Co. Ltd. | 3.375% | 1/24/20 | 300 | 297 |
| Huarong Finance 2017 Co. Ltd. | 3.750% | 4/27/22 | 700 | 687 |
| 4 Huarong Finance 2017 Co. Ltd. | 4.216% | 4/27/22 | 1,200 | 1,232 |
| Huarong Finance 2017 Co. Ltd. | 4.750% | 4/27/27 | 2,050 | 1,978 |
| Huarong Finance Co. Ltd. | 4.000% | 7/17/19 | 1,550 | 1,553 |
| Huarong Finance II Co. Ltd. | 2.875% | 11/19/18 | 1,600 | 1,594 |
| Huarong Finance II Co. Ltd. | 2.875% | 11/22/19 | 1,500 | 1,477 |
| Huarong Finance II Co. Ltd. | 4.500% | 1/16/20 | 1,450 | 1,461 |
| Huarong Finance II Co. Ltd. | 3.750% | 11/19/20 | 550 | 546 |
| Huarong Finance II Co. Ltd. | 3.250% | 6/3/21 | 1,250 | 1,218 |
| Huarong Finance II Co. Ltd. | 3.625% | 11/22/21 | 1,400 | 1,375 |
| Huarong Finance II Co. Ltd. | 5.500% | 1/16/25 | 1,600 | 1,643 |
| Huarong Finance II Co. Ltd. | 5.000% | 11/19/25 | 600 | 596 |
| Huarong Finance II Co. Ltd. | 4.625% | 6/3/26 | 1,250 | 1,203 |
| Huarong Finance II Co. Ltd. | 4.875% | 11/22/26 | 1,200 | 1,171 |
| Huarong Finance II Co. Ltd. | 2.875% | 12/31/49 | 1,200 | 1,117 |
| 2 ICBCIL Finance Co. Ltd. | 2.375% | 5/19/19 | 700 | 691 |
| ICBCIL Finance Co. Ltd. | 2.125% | 9/29/19 | 800 | 783 |
| ICBCIL Finance Co. Ltd. | 3.250% | 3/17/20 | 1,000 | 990 |
| ICBCIL Finance Co. Ltd. | 3.000% | 4/5/20 | 500 | 493 |
| ICBCIL Finance Co. Ltd. | 3.200% | 11/10/20 | 700 | 690 |
| 2 ICBCIL Finance Co. Ltd. | 2.750% | 5/19/21 | 600 | 580 |
| ICBCIL Finance Co. Ltd. | 2.750% | 5/19/21 | 1,450 | 1,401 |
| ICBCIL Finance Co. Ltd. | 2.500% | 9/29/21 | 1,000 | 953 |
| Industrial & Commercial Bank of China | ||||
| Asia Ltd. | 5.125% | 11/30/20 | 950 | 979 |
| Industrial & Commercial Bank of China Ltd. | 2.000% | 5/10/19 | 1,825 | 1,802 |
| Industrial & Commercial Bank of China Ltd. | 1.875% | 8/11/19 | 200 | 196 |
| Industrial & Commercial Bank of China Ltd. | 3.231% | 11/13/19 | 1,300 | 1,297 |
| 4 Industrial & Commercial Bank of China Ltd. | 3.129% | 4/24/20 | 1,950 | 1,951 |
| Industrial & Commercial Bank of China Ltd. | 2.905% | 11/13/20 | 1,300 | 1,279 |
| Industrial & Commercial Bank of China Ltd. | 2.635% | 5/26/21 | 1,700 | 1,652 |
16
| Emerging Markets Government Bond Index Fund | ||||
| Face | Market | |||
| Maturity | Amount | Value • | ||
| Coupon | Date | ($000) | ($000) | |
| Industrial & Commercial Bank of China Ltd. | 2.452% | 10/20/21 | 350 | 336 |
| 4 Industrial & Commercial Bank of China Ltd. | 3.309% | 4/24/22 | 1,400 | 1,405 |
| Industrial & Commercial Bank of China Ltd. | 2.957% | 11/8/22 | 250 | 241 |
| Industrial & Commercial Bank of China Ltd. | 4.875% | 9/21/25 | 2,750 | 2,781 |
| Industrial & Commercial Bank of China Ltd. | 3.538% | 11/8/27 | 250 | 235 |
| Inventive Global Investments Ltd. | 2.375% | 12/7/19 | 1,200 | 1,181 |
| King Power Capital Ltd. | 5.625% | 11/3/24 | 500 | 532 |
| Kunlun Energy Co. Ltd. | 2.875% | 5/13/20 | 600 | 592 |
| Kunlun Energy Co. Ltd. | 3.750% | 5/13/25 | 350 | 342 |
| Minmetals Bounteous Finance BVI Ltd. | 3.500% | 7/30/20 | 300 | 298 |
| Minmetals Bounteous Finance BVI Ltd. | 4.750% | 7/30/25 | 600 | 600 |
| Minmetals Bounteous Finance BVI Ltd. | 4.200% | 7/27/26 | 850 | 816 |
| Nexen Energy ULC | 7.875% | 3/15/32 | 475 | 636 |
| Nexen Energy ULC | 5.875% | 3/10/35 | 808 | 930 |
| Nexen Energy ULC | 6.400% | 5/15/37 | 920 | 1,117 |
| Nexen Energy ULC | 7.500% | 7/30/39 | 775 | 1,064 |
| Prosperous Ray Ltd. | 4.625% | 11/12/23 | 550 | 565 |
| Rongshi International Finance Ltd. | 2.875% | 5/4/22 | 500 | 482 |
| Rongshi International Finance Ltd. | 3.625% | 5/4/27 | 500 | 475 |
| Shanghai Electric Group Global Investment | ||||
| Ltd. | 3.000% | 8/14/19 | 300 | 298 |
| Shanghai Electric Power Finance Ltd. | 3.625% | 8/11/20 | 1,100 | 1,093 |
| Sino-Ocean Land Treasure Finance I Ltd. | 4.625% | 7/30/19 | 1,300 | 1,309 |
| Sino-Ocean Land Treasure Finance I Ltd. | 6.000% | 7/30/24 | 350 | 368 |
| Sino-Ocean Land Treasure Finance II Ltd. | 4.450% | 2/4/20 | 1,100 | 1,103 |
| Sino-Ocean Land Treasure Finance II Ltd. | 5.950% | 2/4/27 | 250 | 263 |
| Sino-Ocean Land Treasure III Ltd. | 4.900% | 12/31/49 | 600 | 552 |
| 2 Sinochem Global Capital Co. Ltd. | 5.000% | 12/29/49 | 200 | 201 |
| 2 Sinochem Overseas Capital Co. Ltd. | 4.500% | 11/12/20 | 1,375 | 1,401 |
| Sinochem Overseas Capital Co. Ltd. | 4.500% | 11/12/20 | 200 | 204 |
| 2 Sinochem Overseas Capital Co. Ltd. | 6.300% | 11/12/40 | 450 | 550 |
| Sinopec Capital 2013 Ltd. | 3.125% | 4/24/23 | 1,500 | 1,441 |
| 2 Sinopec Capital 2013 Ltd. | 3.125% | 4/24/23 | 400 | 384 |
| Sinopec Capital 2013 Ltd. | 4.250% | 4/24/43 | 200 | 190 |
| 2 Sinopec Group Overseas Development | ||||
| 2012 Ltd. | 3.900% | 5/17/22 | 1,619 | 1,624 |
| Sinopec Group Overseas Development | ||||
| 2012 Ltd. | 3.900% | 5/17/22 | 707 | 709 |
| 2 Sinopec Group Overseas Development | ||||
| 2012 Ltd. | 4.875% | 5/17/42 | 975 | 1,017 |
| Sinopec Group Overseas Development | ||||
| 2013 Ltd. | 4.375% | 10/17/23 | 1,825 | 1,861 |
| Sinopec Group Overseas Development | ||||
| 2013 Ltd. | 5.375% | 10/17/43 | 200 | 223 |
| Sinopec Group Overseas Development | ||||
| 2014 Ltd. | 4.375% | 4/10/24 | 2,000 | 2,032 |
| Sinopec Group Overseas Development | ||||
| 2015 Ltd. | 2.500% | 4/28/20 | 5,650 | 5,554 |
| Sinopec Group Overseas Development | ||||
| 2015 Ltd. | 3.250% | 4/28/25 | 1,900 | 1,794 |
| Sinopec Group Overseas Development | ||||
| 2015 Ltd. | 4.100% | 4/28/45 | 800 | 740 |
| Sinopec Group Overseas Development | ||||
| 2016 Ltd. | 2.125% | 5/3/19 | 710 | 703 |
17
| Emerging Markets Government Bond Index Fund | ||||
| Face | Market | |||
| Maturity | Amount | Value • | ||
| Coupon | Date | ($000) | ($000) | |
| Sinopec Group Overseas Development | ||||
| 2016 Ltd. | 2.750% | 5/3/21 | 400 | 392 |
| Sinopec Group Overseas Development | ||||
| 2016 Ltd. | 2.000% | 9/29/21 | 700 | 667 |
| Sinopec Group Overseas Development | ||||
| 2016 Ltd. | 3.500% | 5/3/26 | 1,000 | 952 |
| Sinopec Group Overseas Development | ||||
| 2017 Ltd. | 2.375% | 4/12/20 | 700 | 687 |
| 2 Sinopec Group Overseas Development | ||||
| 2017 Ltd. | 3.000% | 4/12/22 | 700 | 679 |
| 2 Sinopec Group Overseas Development | ||||
| 2017 Ltd. | 3.625% | 4/12/27 | 800 | 766 |
| Sinopec Group Overseas Development | ||||
| 2017 Ltd. | 3.625% | 4/12/27 | 600 | 573 |
| 2 Sinopec Group Overseas Development | ||||
| 2017 Ltd. | 3.250% | 9/13/27 | 1,000 | 926 |
| 2 Sinopec Group Overseas Development | ||||
| 2017 Ltd. | 4.000% | 9/13/47 | 200 | 181 |
| Skysea International Capital Management | 4.875% | 12/7/21 | 1,900 | 1,976 |
| State Elite Global Ltd. | 3.125% | 1/20/20 | 1,000 | 993 |
| State Grid Overseas Investment 2013 Ltd. | 3.125% | 5/22/23 | 1,410 | 1,369 |
| 2 State Grid Overseas Investment 2013 Ltd. | 4.375% | 5/22/43 | 200 | 202 |
| 2 State Grid Overseas Investment 2014 Ltd. | 2.750% | 5/7/19 | 1,000 | 996 |
| State Grid Overseas Investment 2014 Ltd. | 2.750% | 5/7/19 | 1,670 | 1,664 |
| 2 State Grid Overseas Investment 2014 Ltd. | 4.125% | 5/7/24 | 200 | 203 |
| State Grid Overseas Investment 2014 Ltd. | 4.125% | 5/7/24 | 2,270 | 2,300 |
| 2 State Grid Overseas Investment 2014 Ltd. | 4.850% | 5/7/44 | 350 | 380 |
| State Grid Overseas Investment 2014 Ltd. | 4.850% | 5/7/44 | 400 | 435 |
| 2 State Grid Overseas Investment 2016 Ltd. | 2.750% | 5/4/22 | 600 | 580 |
| State Grid Overseas Investment 2016 Ltd. | 2.750% | 5/4/22 | 600 | 580 |
| State Grid Overseas Investment 2016 Ltd. | 3.750% | 5/2/23 | 1,000 | 1,001 |
| State Grid Overseas Investment 2016 Ltd. | 2.875% | 5/18/26 | 700 | 643 |
| 2 State Grid Overseas Investment 2016 Ltd. | 3.500% | 5/4/27 | 1,200 | 1,141 |
| State Grid Overseas Investment 2016 Ltd. | 3.500% | 5/4/27 | 1,000 | 951 |
| 2 State Grid Overseas Investment 2016 Ltd. | 4.000% | 5/4/47 | 900 | 855 |
| Three Gorges Finance I Cayman Islands Ltd. | 2.300% | 6/2/21 | 400 | 387 |
| Three Gorges Finance I Cayman Islands Ltd. | 3.700% | 6/10/25 | 900 | 882 |
| Three Gorges Finance I Cayman Islands Ltd. | 3.150% | 6/2/26 | 2,300 | 2,139 |
| Tsinghua Unic Ltd. | 4.750% | 1/31/21 | 850 | 829 |
| Tsinghua Unic Ltd. | 5.375% | 1/31/23 | 700 | 677 |
| 215,070 | ||||
| Total China (Cost $222,316) | 217,405 | |||
| Colombia (2.4%) | ||||
| Sovereign Bonds (2.4%) | ||||
| Ecopetrol SA | 7.625% | 7/23/19 | 725 | 765 |
| Ecopetrol SA | 5.875% | 9/18/23 | 1,635 | 1,743 |
| Ecopetrol SA | 4.125% | 1/16/25 | 1,150 | 1,111 |
| Ecopetrol SA | 5.375% | 6/26/26 | 1,970 | 2,032 |
| Ecopetrol SA | 7.375% | 9/18/43 | 1,193 | 1,363 |
| Ecopetrol SA | 5.875% | 5/28/45 | 1,530 | 1,478 |
| Empresas Publicas de Medellin ESP | 7.625% | 7/29/19 | 300 | 316 |
| Oleoducto Central SA | 4.000% | 5/7/21 | 400 | 399 |
| Republic of Colombia | 11.750% | 2/25/20 | 390 | 448 |
| Republic of Colombia | 4.375% | 7/12/21 | 2,534 | 2,602 |
18
| Emerging Markets Government Bond Index Fund | ||||
| Face | Market | |||
| Maturity | Amount | Value • | ||
| Coupon | Date | ($000) | ($000) | |
| 1 Republic of Colombia | 2.625% | 3/15/23 | 1,610 | 1,524 |
| Republic of Colombia | 4.000% | 2/26/24 | 1,595 | 1,594 |
| Republic of Colombia | 8.125% | 5/21/24 | 690 | 839 |
| 1 Republic of Colombia | 4.500% | 1/28/26 | 2,100 | 2,137 |
| 1 Republic of Colombia | 3.875% | 4/25/27 | 2,450 | 2,366 |
| Republic of Colombia | 7.375% | 9/18/37 | 1,090 | 1,381 |
| Republic of Colombia | 6.125% | 1/18/41 | 1,107 | 1,249 |
| 1 Republic of Colombia | 5.625% | 2/26/44 | 1,984 | 2,119 |
| 1 Republic of Colombia | 5.000% | 6/15/45 | 5,550 | 5,495 |
| Transportadora de Gas Internacional SA ESP | 5.700% | 3/20/22 | 600 | 611 |
| Total Colombia (Cost $31,258) | 31,572 | |||
| Costa Rica (0.4%) | ||||
| Sovereign Bonds (0.4%) | ||||
| 2 Banco Nacional de Costa Rica | 5.875% | 4/25/21 | 1,000 | 1,039 |
| Banco Nacional de Costa Rica | 6.250% | 11/1/23 | 200 | 207 |
| Instituto Costarricense de Electricidad | 6.950% | 11/10/21 | 475 | 505 |
| Instituto Costarricense de Electricidad | 6.375% | 5/15/43 | 200 | 173 |
| Republic of Costa Rica | 4.250% | 1/26/23 | 1,132 | 1,084 |
| Republic of Costa Rica | 5.625% | 4/30/43 | 600 | 519 |
| Republic of Costa Rica | 7.000% | 4/4/44 | 1,000 | 997 |
| Republic of Costa Rica | 7.158% | 3/12/45 | 1,200 | 1,215 |
| Total Costa Rica (Cost $5,680) | 5,739 | |||
| Cote d’Ivoire (0.4%) | ||||
| Sovereign Bonds (0.4%) | ||||
| 1 Republic of Cote d’Ivoire | 6.375% | 3/3/28 | 1,300 | 1,308 |
| Republic of Cote d’Ivoire | 5.750% | 12/31/32 | 1,346 | 1,288 |
| 2 Republic of Cote d’Ivoire | 5.750% | 12/31/32 | 1,418 | 1,356 |
| 1 Republic of Cote d’Ivoire | 6.125% | 6/15/33 | 800 | 756 |
| Total Cote d’Ivoire (Cost $4,726) | 4,708 | |||
| Croatia (0.7%) | ||||
| Sovereign Bonds (0.7%) | ||||
| Hrvatska Elektroprivreda | 5.875% | 10/23/22 | 500 | 532 |
| Republic of Croatia | 6.750% | 11/5/19 | 1,222 | 1,282 |
| Republic of Croatia | 6.625% | 7/14/20 | 1,794 | 1,912 |
| Republic of Croatia | 6.375% | 3/24/21 | 1,900 | 2,037 |
| Republic of Croatia | 5.500% | 4/4/23 | 1,200 | 1,272 |
| Republic of Croatia | 6.000% | 1/26/24 | 1,435 | 1,563 |
| Total Croatia (Cost $8,420) | 8,598 | |||
| Dominican Republic (1.0%) | ||||
| Sovereign Bonds (1.0%) | ||||
| 1 Dominican Republic | 7.500% | 5/6/21 | 1,602 | 1,693 |
| Dominican Republic | 6.600% | 1/28/24 | 875 | 929 |
| 1 Dominican Republic | 5.875% | 4/18/24 | 750 | 775 |
| Dominican Republic | 5.500% | 1/27/25 | 1,860 | 1,866 |
| Dominican Republic | 6.875% | 1/29/26 | 2,345 | 2,530 |
| Dominican Republic | 5.950% | 1/25/27 | 100 | 102 |
| Dominican Republic | 7.450% | 4/30/44 | 450 | 493 |
| 1 Dominican Republic | 6.850% | 1/27/45 | 1,819 | 1,882 |
| 2 Dominican Republic | 6.850% | 1/27/45 | 1,170 | 1,205 |
| 2 Dominican Republic | 6.500% | 2/15/48 | 1,250 | 1,244 |
| Total Dominican Republic (Cost $12,766) | 12,719 | |||
19
| Emerging Markets Government Bond Index Fund | |||||
| Face | Market | ||||
| Maturity | Amount | Value • | |||
| Coupon | Date | ($000) | ($000) | ||
| Ecuador (1.1%) | |||||
| Sovereign Bonds (1.1%) | |||||
| Republic of Ecuador | 10.500% | 3/24/20 | 1,500 | 1,546 | |
| Republic of Ecuador | 10.750% | 3/28/22 | 1,900 | 2,006 | |
| Republic of Ecuador | 8.750% | 6/2/23 | 900 | 880 | |
| Republic of Ecuador | 7.950% | 6/20/24 | 1,950 | 1,830 | |
| Republic of Ecuador | 9.650% | 12/13/26 | 1,550 | 1,524 | |
| 2 | Republic of Ecuador | 9.625% | 6/2/27 | 770 | 755 |
| Republic of Ecuador | 9.625% | 6/2/27 | 200 | 196 | |
| 2 | Republic of Ecuador | 7.875% | 1/23/28 | 6,000 | 5,325 |
| Total Ecuador (Cost $14,827) | 14,062 | ||||
| Egypt (1.3%) | |||||
| Sovereign Bonds (1.3%) | |||||
| Arab Republic of Egypt | 5.750% | 4/29/20 | 912 | 934 | |
| Arab Republic of Egypt | 6.125% | 1/31/22 | 2,700 | 2,770 | |
| 2 | Arab Republic of Egypt | 5.577% | 2/21/23 | 1,200 | 1,205 |
| Arab Republic of Egypt | 5.875% | 6/11/25 | 3,175 | 3,119 | |
| Arab Republic of Egypt | 7.500% | 1/31/27 | 1,700 | 1,795 | |
| 2 | Arab Republic of Egypt | 6.588% | 2/21/28 | 3,000 | 2,976 |
| Arab Republic of Egypt | 6.875% | 4/30/40 | 500 | 476 | |
| Arab Republic of Egypt | 8.500% | 1/31/47 | 1,950 | 2,089 | |
| 2 | Arab Republic of Egypt | 7.903% | 2/21/48 | 1,200 | 1,218 |
| Total Egypt (Cost $16,460) | 16,582 | ||||
| El Salvador (0.5%) | |||||
| Sovereign Bonds (0.5%) | |||||
| Republic of El Salvador | 7.375% | 12/1/19 | 1,045 | 1,084 | |
| Republic of El Salvador | 7.750% | 1/24/23 | 1,035 | 1,114 | |
| Republic of El Salvador | 5.875% | 1/30/25 | 300 | 294 | |
| Republic of El Salvador | 6.375% | 1/18/27 | 669 | 661 | |
| 2 | Republic of El Salvador | 6.375% | 1/18/27 | 300 | 296 |
| 2 | Republic of El Salvador | 8.625% | 2/28/29 | 150 | 171 |
| Republic of El Salvador | 8.250% | 4/10/32 | 604 | 668 | |
| Republic of El Salvador | 7.650% | 6/15/35 | 1,490 | 1,552 | |
| Republic of El Salvador | 7.625% | 2/1/41 | 568 | 592 | |
| Total El Salvador (Cost $6,111) | 6,432 | ||||
| Ethiopia (0.1%) | |||||
| Sovereign Bond (0.1%) | |||||
| Federal Democratic Republic of Ethiopia | 6.625% | 12/11/24 | 1,150 | 1,161 | |
| Total Ethiopia (Cost $1,118) | 1,161 | ||||
| Gabon (0.2%) | |||||
| Sovereign Bonds (0.2%) | |||||
| 1,2 | Gabonese Republic | 6.375% | 12/12/24 | 400 | 390 |
| 1 | Gabonese Republic | 6.375% | 12/12/24 | 1,586 | 1,545 |
| Gabonese Republic | 6.950% | 6/16/25 | 200 | 199 | |
| Total Gabon (Cost $2,161) | 2,134 | ||||
| Georgia (0.1%) | |||||
| Sovereign Bonds (0.1%) | |||||
| Georgian Railway JSC | 7.750% | 7/11/22 | 900 | 965 | |
| Republic of Georgia | 6.875% | 4/12/21 | 400 | 430 | |
| Total Georgia (Cost $1,391) | 1,395 | ||||
20
| Emerging Markets Government Bond Index Fund | |||||
| Face | Market | ||||
| Maturity | Amount | Value • | |||
| Coupon | Date | ($000) | ($000) | ||
| Ghana (0.3%) | |||||
| Sovereign Bonds (0.3%) | |||||
| 1 | Republic of Ghana | 9.250% | 9/15/22 | 500 | 568 |
| 2 | Republic of Ghana | 7.875% | 8/7/23 | 400 | 435 |
| 1,2 | Republic of Ghana | 8.125% | 1/18/26 | 300 | 320 |
| 1 | Republic of Ghana | 8.125% | 1/18/26 | 1,270 | 1,356 |
| 1 | Republic of Ghana | 10.750% | 10/14/30 | 1,000 | 1,293 |
| Total Ghana (Cost $3,464) | 3,972 | ||||
| Guatemala (0.2%) | |||||
| Sovereign Bonds (0.2%) | |||||
| Republic of Guatemala | 5.750% | 6/6/22 | 700 | 737 | |
| Republic of Guatemala | 4.500% | 5/3/26 | 1,300 | 1,271 | |
| Republic of Guatemala | 4.875% | 2/13/28 | 600 | 591 | |
| Total Guatemala (Cost $2,629) | 2,599 | ||||
| Honduras (0.1%) | |||||
| Sovereign Bonds (0.1%) | |||||
| Republic of Honduras | 8.750% | 12/16/20 | 700 | 765 | |
| 1 | Republic of Honduras | 7.500% | 3/15/24 | 200 | 217 |
| Republic of Honduras | 6.250% | 1/19/27 | 800 | 827 | |
| Total Honduras (Cost $1,729) | 1,809 | ||||
| Hungary (1.0%) | |||||
| Sovereign Bonds (1.0%) | |||||
| MFB Magyar Fejlesztesi Bank Zrt | 6.250% | 10/21/20 | 200 | 213 | |
| 2,5 | MFB Magyar Fejlesztesi Bank Zrt | 6.250% | 10/21/20 | 1,100 | 1,173 |
| Republic of Hungary | 6.250% | 1/29/20 | 1,565 | 1,643 | |
| Republic of Hungary | 6.375% | 3/29/21 | 3,497 | 3,768 | |
| Republic of Hungary | 5.375% | 2/21/23 | 1,812 | 1,941 | |
| Republic of Hungary | 5.750% | 11/22/23 | 1,470 | 1,606 | |
| Republic of Hungary | 5.375% | 3/25/24 | 1,125 | 1,211 | |
| Republic of Hungary | 7.625% | 3/29/41 | 1,450 | 2,042 | |
| Total Hungary (Cost $13,546) | 13,597 | ||||
| India (1.4%) | |||||
| Sovereign Bonds (1.4%) | |||||
| Bank of Baroda | 4.875% | 7/23/19 | 975 | 989 | |
| Bank of India | 3.125% | 5/6/20 | 400 | 392 | |
| Bank of India | 6.250% | 2/16/21 | 900 | 947 | |
| Bharat Petroleum Corp. Ltd. | 4.625% | 10/25/22 | 400 | 408 | |
| Bharat Petroleum Corp. Ltd. | 4.000% | 5/8/25 | 400 | 386 | |
| BPRL International Singapore Pte Ltd. | 4.375% | 1/18/27 | 550 | 533 | |
| Export-Import Bank of India | 3.875% | 10/2/19 | 500 | 503 | |
| Export-Import Bank of India | 2.750% | 4/1/20 | 600 | 591 | |
| Export-Import Bank of India | 2.750% | 8/12/20 | 200 | 196 | |
| Export-Import Bank of India | 3.125% | 7/20/21 | 700 | 686 | |
| Export-Import Bank of India | 4.000% | 1/14/23 | 600 | 598 | |
| Export-Import Bank of India | 3.375% | 8/5/26 | 1,900 | 1,761 | |
| 2 | Export-Import Bank of India | 3.875% | 2/1/28 | 1,400 | 1,331 |
| Indian Oil Corp. Ltd. | 5.625% | 8/2/21 | 500 | 526 | |
| Indian Oil Corp. Ltd. | 5.750% | 8/1/23 | 400 | 427 | |
21
| Emerging Markets Government Bond Index Fund | ||||
| Face | Market | |||
| Maturity | Amount | Value • | ||
| Coupon | Date | ($000) | ($000) | |
| NTPC Ltd. | 5.625% | 7/14/21 | 400 | 421 |
| NTPC Ltd. | 4.750% | 10/3/22 | 450 | 462 |
| NTPC Ltd. | 4.375% | 11/26/24 | 400 | 401 |
| NTPC Ltd. | 4.250% | 2/26/26 | 450 | 441 |
| Oil India International Pte Ltd. | 4.000% | 4/21/27 | 800 | 752 |
| Oil India Ltd. | 5.375% | 4/17/24 | 450 | 471 |
| ONGC Videsh Ltd. | 3.250% | 7/15/19 | 900 | 897 |
| ONGC Videsh Ltd. | 3.750% | 5/7/23 | 700 | 686 |
| ONGC Videsh Ltd. | 4.625% | 7/15/24 | 900 | 912 |
| Power Grid Corp. of India Ltd. | 3.875% | 1/17/23 | 600 | 592 |
| 4 State Bank of India | 3.275% | 4/6/20 | 1,150 | 1,151 |
| State Bank of India | 3.250% | 1/24/22 | 700 | 681 |
| 2 State Bank of India | 4.875% | 4/17/24 | 400 | 412 |
| Total India (Cost $18,960) | 18,553 | |||
| Indonesia (5.4%) | ||||
| Sovereign Bonds (5.4%) | ||||
| Majapahit Holding BV | 8.000% | 8/7/19 | 350 | 372 |
| Majapahit Holding BV | 7.750% | 1/20/20 | 2,625 | 2,809 |
| Majapahit Holding BV | 7.875% | 6/29/37 | 400 | 514 |
| 2 Pelabuhan Indonesia II PT | 4.250% | 5/5/25 | 300 | 292 |
| Pelabuhan Indonesia II PT | 4.250% | 5/5/25 | 1,150 | 1,121 |
| Pelabuhan Indonesia II PT | 5.375% | 5/5/45 | 500 | 476 |
| 2 Pelabuhan Indonesia III PT | 4.875% | 10/1/24 | 200 | 200 |
| Pertamina Persero PT | 5.250% | 5/23/21 | 450 | 467 |
| Pertamina Persero PT | 4.875% | 5/3/22 | 1,950 | 1,999 |
| 2 Pertamina Persero PT | 4.300% | 5/20/23 | 430 | 430 |
| Pertamina Persero PT | 4.300% | 5/20/23 | 1,100 | 1,101 |
| Pertamina Persero PT | 6.500% | 5/27/41 | 200 | 222 |
| 2 Pertamina Persero PT | 6.000% | 5/3/42 | 750 | 786 |
| Pertamina Persero PT | 6.000% | 5/3/42 | 1,450 | 1,522 |
| 2 Pertamina Persero PT | 5.625% | 5/20/43 | 200 | 199 |
| Pertamina Persero PT | 5.625% | 5/20/43 | 1,425 | 1,418 |
| Pertamina Persero PT | 6.450% | 5/30/44 | 1,300 | 1,440 |
| 2 Perusahaan Gas Negara Persero Tbk PT | 5.125% | 5/16/24 | 400 | 409 |
| Perusahaan Gas Negara Persero Tbk PT | 5.125% | 5/16/24 | 800 | 820 |
| Perusahaan Listrik Negara PT | 5.500% | 11/22/21 | 1,000 | 1,046 |
| 2 Perusahaan Listrik Negara PT | 4.125% | 5/15/27 | 1,450 | 1,363 |
| Perusahaan Listrik Negara PT | 5.250% | 10/24/42 | 500 | 476 |
| 2 Perusahaan Listrik Negara PT | 5.250% | 10/24/42 | 300 | 285 |
| Perusahaan Penerbit SBSN Indonesia III | 3.300% | 11/21/22 | 378 | 368 |
| 2 Perusahaan Penerbit SBSN Indonesia III | 3.750% | 3/1/23 | 800 | 788 |
| Perusahaan Penerbit SBSN Indonesia III | 4.350% | 9/10/24 | 2,250 | 2,267 |
| 2 Perusahaan Penerbit SBSN Indonesia III | 4.350% | 9/10/24 | 600 | 605 |
| 6 Perusahaan Penerbit SBSN Indonesia III | 4.325% | 5/28/25 | 1,200 | 1,197 |
| Perusahaan Penerbit SBSN Indonesia III | 4.550% | 3/29/26 | 1,250 | 1,258 |
| 6 Perusahaan Penerbit SBSN Indonesia III | 4.150% | 3/29/27 | 1,500 | 1,459 |
| 2 Perusahaan Penerbit SBSN Indonesia III | 4.400% | 3/1/28 | 1,000 | 987 |
| Republic of Indonesia | 5.875% | 3/13/20 | 1,210 | 1,269 |
| 2 Republic of Indonesia | 5.875% | 3/13/20 | 350 | 367 |
| Republic of Indonesia | 4.875% | 5/5/21 | 4,200 | 4,350 |
| Republic of Indonesia | 3.700% | 1/8/22 | 1,500 | 1,496 |
22
| Emerging Markets Government Bond Index Fund | ||||
| Face | Market | |||
| Maturity | Amount | Value • | ||
| Coupon | Date | ($000) | ($000) | |
| Republic of Indonesia | 3.375% | 4/15/23 | 1,900 | 1,848 |
| Republic of Indonesia | 5.375% | 10/17/23 | 1,359 | 1,448 |
| Republic of Indonesia | 5.875% | 1/15/24 | 2,650 | 2,879 |
| Republic of Indonesia | 4.125% | 1/15/25 | 1,575 | 1,569 |
| 2 Republic of Indonesia | 4.125% | 1/15/25 | 200 | 199 |
| Republic of Indonesia | 4.750% | 1/8/26 | 2,400 | 2,476 |
| Republic of Indonesia | 4.350% | 1/8/27 | 1,100 | 1,101 |
| 2 Republic of Indonesia | 3.850% | 7/18/27 | 1,000 | 965 |
| Republic of Indonesia | 3.850% | 7/18/27 | 500 | 482 |
| Republic of Indonesia | 4.100% | 4/24/28 | 900 | 876 |
| Republic of Indonesia | 8.500% | 10/12/35 | 1,840 | 2,578 |
| Republic of Indonesia | 6.625% | 2/17/37 | 2,637 | 3,140 |
| Republic of Indonesia | 7.750% | 1/17/38 | 1,863 | 2,485 |
| Republic of Indonesia | 5.250% | 1/17/42 | 1,750 | 1,809 |
| Republic of Indonesia | 4.625% | 4/15/43 | 2,175 | 2,081 |
| Republic of Indonesia | 6.750% | 1/15/44 | 1,850 | 2,291 |
| 2 Republic of Indonesia | 6.750% | 1/15/44 | 100 | 124 |
| Republic of Indonesia | 5.125% | 1/15/45 | 3,619 | 3,668 |
| Republic of Indonesia | 5.950% | 1/8/46 | 200 | 227 |
| Republic of Indonesia | 5.250% | 1/8/47 | 2,000 | 2,067 |
| Republic of Indonesia | 4.750% | 7/18/47 | 600 | 582 |
| Total Indonesia (Cost $70,926) | 71,073 | |||
| Iraq (0.3%) | ||||
| Sovereign Bonds (0.3%) | ||||
| 2 Republic of Iraq | 6.752% | 3/9/23 | 1,250 | 1,247 |
| Republic of Iraq | 6.752% | 3/9/23 | 950 | 948 |
| 1 Republic of Iraq | 5.800% | 1/15/28 | 1,445 | 1,362 |
| Total Iraq (Cost $3,486) | 3,557 | |||
| Jamaica (0.4%) | ||||
| Sovereign Bonds (0.4%) | ||||
| 1 Jamaica | 7.625% | 7/9/25 | 450 | 520 |
| Jamaica | 6.750% | 4/28/28 | 2,050 | 2,270 |
| 1 Jamaica | 8.000% | 3/15/39 | 648 | 767 |
| Jamaica | 7.875% | 7/28/45 | 950 | 1,120 |
| Total Jamaica (Cost $4,325) | 4,677 | |||
| Jordan (0.2%) | ||||
| Sovereign Bonds (0.2%) | ||||
| Hashemite Kingdom of Jordan | 6.125% | 1/29/26 | 850 | 832 |
| Hashemite Kingdom of Jordan | 5.750% | 1/31/27 | 1,200 | 1,139 |
| 2 Hashemite Kingdom of Jordan | 7.375% | 10/10/47 | 1,000 | 975 |
| Total Jordan (Cost $3,108) | 2,946 | |||
| Kazakhstan (1.8%) | ||||
| Sovereign Bonds (1.8%) | ||||
| Development Bank of Kazakhstan JSC | 4.125% | 12/10/22 | 1,500 | 1,494 |
| KazAgro National Management Holding JSC | 4.625% | 5/24/23 | 850 | 830 |
| Kazakhstan Temir Zholy Finance BV | 6.950% | 7/10/42 | 1,000 | 1,093 |
| KazMunayGas National Co. JSC | 7.000% | 5/5/20 | 1,920 | 2,054 |
| KazMunayGas National Co. JSC | 6.375% | 4/9/21 | 1,399 | 1,497 |
| 2 KazMunayGas National Co. JSC | 3.875% | 4/19/22 | 4,000 | 3,950 |
23
| Emerging Markets Government Bond Index Fund | ||||
| Face | Market | |||
| Maturity | Amount | Value • | ||
| Coupon | Date | ($000) | ($000) | |
| 2 KazMunayGas National Co. JSC | 4.750% | 4/24/25 | 1,000 | 996 |
| 2 KazMunayGas National Co. JSC | 4.750% | 4/19/27 | 400 | 394 |
| 2 KazMunayGas National Co. JSC | 5.375% | 4/24/30 | 500 | 499 |
| KazMunayGas National Co. JSC | 5.750% | 4/30/43 | 350 | 370 |
| KazMunayGas National Co. JSC | 5.750% | 4/19/47 | 2,300 | 2,197 |
| 2 KazMunayGas National Co. JSC | 5.750% | 4/19/47 | 200 | 190 |
| 2 KazMunayGas National Co. JSC | 6.375% | 10/24/48 | 1,100 | 1,122 |
| Republic of Kazakhstan | 3.875% | 10/14/24 | 1,700 | 1,704 |
| Republic of Kazakhstan | 5.125% | 7/21/25 | 2,300 | 2,450 |
| Republic of Kazakhstan | 4.875% | 10/14/44 | 1,100 | 1,079 |
| 2 Republic of Kazakhstan | 4.875% | 10/14/44 | 400 | 393 |
| Republic of Kazakhstan | 6.500% | 7/21/45 | 1,000 | 1,192 |
| Total Kazakhstan (Cost $22,855) | 23,504 | |||
| Kenya (0.3%) | ||||
| Sovereign Bonds (0.3%) | ||||
| Republic of Kenya | 5.875% | 6/24/19 | 300 | 304 |
| 2 Republic of Kenya | 5.875% | 6/24/19 | 200 | 203 |
| 2 Republic of Kenya | 6.875% | 6/24/24 | 200 | 207 |
| Republic of Kenya | 6.875% | 6/24/24 | 1,925 | 1,992 |
| 2 Republic of Kenya | 7.250% | 2/28/28 | 800 | 825 |
| 2 Republic of Kenya | 8.250% | 2/28/48 | 1,000 | 1,033 |
| Total Kenya (Cost $4,444) | 4,564 | |||
| Kuwait (0.7%) | ||||
| Sovereign Bonds (0.7%) | ||||
| Equate Petrochemical BV | 3.000% | 3/3/22 | 900 | 859 |
| Equate Petrochemical BV | 4.250% | 11/3/26 | 1,350 | 1,312 |
| State of Kuwait | 2.750% | 3/20/22 | 3,125 | 3,028 |
| State of Kuwait | 3.500% | 3/20/27 | 4,300 | 4,132 |
| Total Kuwait (Cost $9,637) | 9,331 | |||
| Lebanon (1.5%) | ||||
| Sovereign Bonds (1.5%) | ||||
| Republic of Lebanon | 6.000% | 5/20/19 | 450 | 449 |
| Republic of Lebanon | 5.450% | 11/28/19 | 925 | 911 |
| Republic of Lebanon | 6.375% | 3/9/20 | 2,341 | 2,334 |
| Republic of Lebanon | 5.800% | 4/14/20 | 1,100 | 1,078 |
| Republic of Lebanon | 8.250% | 4/12/21 | 1,728 | 1,767 |
| Republic of Lebanon | 6.100% | 10/4/22 | 2,214 | 2,105 |
| Republic of Lebanon | 6.000% | 1/27/23 | 1,385 | 1,306 |
| Republic of Lebanon | 6.650% | 4/22/24 | 1,791 | 1,693 |
| Republic of Lebanon | 6.200% | 2/26/25 | 300 | 274 |
| Republic of Lebanon | 6.250% | 6/12/25 | 400 | 364 |
| Republic of Lebanon | 6.600% | 11/27/26 | 1,975 | 1,780 |
| Republic of Lebanon | 6.750% | 11/29/27 | 961 | 864 |
| Republic of Lebanon | 6.650% | 11/3/28 | 850 | 750 |
| Republic of Lebanon | 6.850% | 5/25/29 | 800 | 708 |
| Republic of Lebanon | 6.650% | 2/26/30 | 1,050 | 915 |
| Republic of Lebanon | 7.000% | 3/23/32 | 400 | 354 |
| Republic of Lebanon | 7.050% | 11/2/35 | 500 | 437 |
| Republic of Lebanon | 7.250% | 3/23/37 | 2,250 | 1,995 |
| Total Lebanon (Cost $21,531) | 20,084 | |||
24
| Emerging Markets Government Bond Index Fund | ||||
| Face | Market | |||
| Maturity | Amount | Value • | ||
| Coupon | Date | ($000) | ($000) | |
| Malaysia (1.6%) | ||||
| Sovereign Bonds (1.6%) | ||||
| 1MDB Global Investments Ltd. | 4.400% | 3/9/23 | 2,700 | 2,551 |
| Axiata SPV2 Bhd. | 3.466% | 11/19/20 | 350 | 349 |
| Axiata SPV2 Bhd. | 4.357% | 3/24/26 | 1,350 | 1,350 |
| Cagamas Global plc | 2.745% | 12/10/19 | 500 | 496 |
| Danga Capital Bhd. | 3.035% | 3/1/21 | 400 | 393 |
| 1 Malayan Banking Bhd. | 3.905% | 10/29/26 | 700 | 692 |
| Malaysia Sovereign Sukuk Bhd. | 3.043% | 4/22/25 | 900 | 870 |
| Malaysia Sovereign Sukuk Bhd. | 4.236% | 4/22/45 | 550 | 555 |
| Malaysia Sukuk Global Bhd. | 3.179% | 4/27/26 | 1,100 | 1,061 |
| Malaysia Sukuk Global Bhd. | 4.080% | 4/27/46 | 450 | 441 |
| Petroliam Nasional Bhd. | 7.625% | 10/15/26 | 185 | 231 |
| Petronas Capital Ltd. | 5.250% | 8/12/19 | 1,137 | 1,167 |
| 2 Petronas Capital Ltd. | 5.250% | 8/12/19 | 1,323 | 1,358 |
| Petronas Capital Ltd. | 3.125% | 3/18/22 | 400 | 394 |
| 2 Petronas Capital Ltd. | 7.875% | 5/22/22 | 1,150 | 1,329 |
| Petronas Capital Ltd. | 3.500% | 3/18/25 | 2,550 | 2,479 |
| Petronas Capital Ltd. | 4.500% | 3/18/45 | 1,250 | 1,276 |
| Petronas Global Sukuk Ltd. | 2.707% | 3/18/20 | 1,950 | 1,929 |
| SSG Resources Ltd. | 4.250% | 10/4/22 | 700 | 703 |
| 2 Wakala Global Sukuk Bhd. | 4.646% | 7/6/21 | 750 | 784 |
| Total Malaysia (Cost $20,653) | 20,408 | |||
| Mexico (7.8%) | ||||
| Sovereign Bonds (7.8%) | ||||
| Banco Nacional de Comercio Exterior SNC | 4.375% | 10/14/25 | 900 | 894 |
| 1 Banco Nacional de Comercio Exterior SNC | 3.800% | 8/11/26 | 700 | 683 |
| Comision Federal de Electricidad | 4.875% | 5/26/21 | 1,450 | 1,486 |
| Comision Federal de Electricidad | 4.875% | 1/15/24 | 600 | 613 |
| 2 Comision Federal de Electricidad | 4.875% | 1/15/24 | 700 | 716 |
| 2 Comision Federal de Electricidad | 4.750% | 2/23/27 | 1,000 | 994 |
| Comision Federal de Electricidad | 5.750% | 2/14/42 | 700 | 717 |
| 2 Comision Federal de Electricidad | 6.125% | 6/16/45 | 200 | 216 |
| 2 Mexico City Airport Trust | 4.250% | 10/31/26 | 1,600 | 1,494 |
| Mexico City Airport Trust | 5.500% | 10/31/46 | 200 | 178 |
| Mexico City Airport Trust | 5.500% | 7/31/47 | 2,900 | 2,577 |
| 2 Mexico City Airport Trust | 5.500% | 7/31/47 | 1,000 | 889 |
| Petroleos Mexicanos | 8.000% | 5/3/19 | 760 | 795 |
| Petroleos Mexicanos | 6.000% | 3/5/20 | 1,019 | 1,059 |
| Petroleos Mexicanos | 5.500% | 1/21/21 | 3,939 | 4,082 |
| Petroleos Mexicanos | 6.375% | 2/4/21 | 2,670 | 2,821 |
| Petroleos Mexicanos | 4.875% | 1/24/22 | 1,575 | 1,602 |
| Petroleos Mexicanos | 5.375% | 3/13/22 | 375 | 388 |
| Petroleos Mexicanos | 3.500% | 1/30/23 | 2,095 | 1,978 |
| Petroleos Mexicanos | 4.625% | 9/21/23 | 2,343 | 2,304 |
| Petroleos Mexicanos | 4.875% | 1/18/24 | 1,469 | 1,459 |
| Petroleos Mexicanos | 4.250% | 1/15/25 | 1,460 | 1,382 |
| Petroleos Mexicanos | 4.500% | 1/23/26 | 1,700 | 1,604 |
| Petroleos Mexicanos | 6.875% | 8/4/26 | 4,030 | 4,322 |
| Petroleos Mexicanos | 6.500% | 3/13/27 | 5,520 | 5,707 |
| 2 Petroleos Mexicanos | 5.350% | 2/12/28 | 300 | 286 |
| Petroleos Mexicanos | 6.625% | 6/15/35 | 2,697 | 2,680 |
| Petroleos Mexicanos | 6.500% | 6/2/41 | 2,920 | 2,794 |
25
| Emerging Markets Government Bond Index Fund | |||||
| Face | Market | ||||
| Maturity | Amount | Value • | |||
| Coupon | Date | ($000) | ($000) | ||
| Petroleos Mexicanos | 5.500% | 6/27/44 | 3,311 | 2,792 | |
| Petroleos Mexicanos | 6.375% | 1/23/45 | 1,060 | 983 | |
| Petroleos Mexicanos | 5.625% | 1/23/46 | 2,747 | 2,327 | |
| Petroleos Mexicanos | 6.750% | 9/21/47 | 6,959 | 6,712 | |
| 2 | Petroleos Mexicanos | 6.350% | 2/12/48 | 665 | 608 |
| 1 | Poinsettia Finance Ltd. | 6.625% | 6/17/31 | 500 | 509 |
| United Mexican States | 3.500% | 1/21/21 | 200 | 203 | |
| United Mexican States | 3.625% | 3/15/22 | 4,157 | 4,173 | |
| United Mexican States | 4.000% | 10/2/23 | 4,041 | 4,083 | |
| United Mexican States | 3.600% | 1/30/25 | 3,499 | 3,393 | |
| United Mexican States | 4.125% | 1/21/26 | 2,300 | 2,289 | |
| United Mexican States | 4.150% | 3/28/27 | 3,000 | 2,956 | |
| United Mexican States | 3.750% | 1/11/28 | 2,830 | 2,667 | |
| United Mexican States | 7.500% | 4/8/33 | 1,125 | 1,440 | |
| United Mexican States | 6.750% | 9/27/34 | 1,449 | 1,753 | |
| United Mexican States | 6.050% | 1/11/40 | 3,979 | 4,377 | |
| United Mexican States | 4.750% | 3/8/44 | 6,750 | 6,315 | |
| United Mexican States | 4.600% | 1/23/46 | 3,130 | 2,855 | |
| United Mexican States | 4.350% | 1/15/47 | 2,000 | 1,765 | |
| United Mexican States | 4.600% | 2/10/48 | 200 | 185 | |
| United Mexican States | 5.750% | 10/12/10 | 2,950 | 2,906 | |
| Total Mexico (Cost $105,547) | 102,011 | ||||
| Mongolia (0.3%) | |||||
| Sovereign Bonds (0.3%) | |||||
| Mongolia | 5.125% | 12/5/22 | 1,850 | 1,778 | |
| 2 | Mongolia | 5.625% | 5/1/23 | 1,000 | 970 |
| 2,7 | Trade & Development Bank of Mongolia LLC | 9.375% | 5/19/20 | 200 | 214 |
| 7 | Trade & Development Bank of Mongolia LLC | 9.375% | 5/19/20 | 400 | 427 |
| Total Mongolia (Cost $3,327) | 3,389 | ||||
| Morocco (0.4%) | |||||
| Sovereign Bonds (0.4%) | |||||
| Kingdom of Morocco | 4.250% | 12/11/22 | 1,450 | 1,456 | |
| Kingdom of Morocco | 5.500% | 12/11/42 | 725 | 753 | |
| OCP SA | 5.625% | 4/25/24 | 1,300 | 1,339 | |
| 2 | OCP SA | 4.500% | 10/22/25 | 450 | 432 |
| OCP SA | 4.500% | 10/22/25 | 950 | 912 | |
| OCP SA | 6.875% | 4/25/44 | 300 | 325 | |
| 2 | OCP SA | 6.875% | 4/25/44 | 200 | 216 |
| Total Morocco (Cost $5,428) | 5,433 | ||||
| Mozambique (0.0%) | |||||
| Sovereign Bond (0.0%) | |||||
| Republic of Mozambique | 10.500% | 1/18/23 | 644 | 537 | |
| Total Mozambique (Cost $557) | 537 | ||||
| Namibia (0.1%) | |||||
| Sovereign Bonds (0.1%) | |||||
| Republic of Namibia | 5.500% | 11/3/21 | 500 | 513 | |
| Republic of Namibia | 5.250% | 10/29/25 | 700 | 687 | |
| Total Namibia (Cost $1,227) | 1,200 | ||||
26
| Emerging Markets Government Bond Index Fund | |||||
| Face | Market | ||||
| Maturity | Amount | Value • | |||
| Coupon | Date | ($000) | ($000) | ||
| Nigeria (0.6%) | |||||
| Sovereign Bonds (0.6%) | |||||
| Federal Republic of Nigeria | 6.750% | 1/28/21 | 250 | 263 | |
| Federal Republic of Nigeria | 6.375% | 7/12/23 | 600 | 625 | |
| Federal Republic of Nigeria | 6.500% | 11/28/27 | 1,000 | 1,007 | |
| 2 | Federal Republic of Nigeria | 7.143% | 2/23/30 | 1,000 | 1,028 |
| 2 | Federal Republic of Nigeria | 7.875% | 2/16/32 | 1,200 | 1,293 |
| 2 | Federal Republic of Nigeria | 7.696% | 2/23/38 | 2,175 | 2,251 |
| Federal Republic of Nigeria | 7.625% | 11/28/47 | 1,000 | 1,006 | |
| Total Nigeria (Cost $7,318) | 7,473 | ||||
| Oman (1.3%) | |||||
| Sovereign Bonds (1.3%) | |||||
| Lamar Funding Ltd. | 3.958% | 5/7/25 | 1,500 | 1,323 | |
| 2 | Oman Government International Bond | 5.625% | 1/17/28 | 1,800 | 1,720 |
| OmGrid Funding Ltd. | 5.196% | 5/16/27 | 500 | 467 | |
| Sultanate of Oman | 3.625% | 6/15/21 | 1,400 | 1,354 | |
| 2 | Sultanate of Oman | 3.625% | 6/15/21 | 1,300 | 1,256 |
| 2 | Sultanate of Oman | 4.125% | 1/17/23 | 750 | 714 |
| Sultanate of Oman | 4.750% | 6/15/26 | 1,900 | 1,767 | |
| 2 | Sultanate of Oman | 4.750% | 6/15/26 | 1,800 | 1,677 |
| Sultanate of Oman | 5.375% | 3/8/27 | 2,000 | 1,903 | |
| Sultanate of Oman | 5.625% | 1/17/28 | 200 | 191 | |
| Sultanate of Oman | 6.500% | 3/8/47 | 2,115 | 1,953 | |
| 2 | Sultanate of Oman | 6.750% | 1/17/48 | 2,500 | 2,349 |
| Total Oman (Cost $17,822) | 16,674 | ||||
| Pakistan (0.4%) | |||||
| Sovereign Bonds (0.4%) | |||||
| Islamic Republic of Pakistan | 6.750% | 12/3/19 | 600 | 612 | |
| 2 | Islamic Republic of Pakistan | 8.250% | 4/15/24 | 250 | 260 |
| Islamic Republic of Pakistan | 8.250% | 4/15/24 | 1,350 | 1,404 | |
| Islamic Republic of Pakistan | 8.250% | 9/30/25 | 450 | 466 | |
| 2 | Islamic Republic of Pakistan | 6.875% | 12/5/27 | 1,800 | 1,690 |
| Third Pakistan International Sukuk Co. Ltd. | 5.500% | 10/13/21 | 500 | 492 | |
| Third Pakistan International Sukuk Co. Ltd. | 5.625% | 12/5/22 | 200 | 193 | |
| Total Pakistan (Cost $5,246) | 5,117 | ||||
| Panama (1.2%) | |||||
| Sovereign Bonds (1.2%) | |||||
| 1,2 | Aeropuerto Internacional de Tocumen SA | 5.625% | 5/18/36 | 1,000 | 1,056 |
| Republic of Panama | 5.200% | 1/30/20 | 1,223 | 1,270 | |
| 1 | Republic of Panama | 4.000% | 9/22/24 | 400 | 404 |
| 1 | Republic of Panama | 3.750% | 3/16/25 | 1,400 | 1,389 |
| Republic of Panama | 7.125% | 1/29/26 | 1,125 | 1,348 | |
| Republic of Panama | 8.875% | 9/30/27 | 1,285 | 1,746 | |
| 1 | Republic of Panama | 3.875% | 3/17/28 | 1,000 | 984 |
| Republic of Panama | 9.375% | 4/1/29 | 2,100 | 2,987 | |
27
| Emerging Markets Government Bond Index Fund | ||||
| Face | Market | |||
| Maturity | Amount | Value • | ||
| Coupon | Date | ($000) | ($000) | |
| 1 Republic of Panama | 6.700% | 1/26/36 | 1,962 | 2,430 |
| 1 Republic of Panama | 4.500% | 4/16/50 | 1,000 | 979 |
| 1 Republic of Panama | 4.300% | 4/29/53 | 600 | 563 |
| Total Panama (Cost $15,299) | 15,156 | |||
| Paraguay (0.2%) | ||||
| Sovereign Bonds (0.2%) | ||||
| Republic of Paraguay | 4.625% | 1/25/23 | 800 | 813 |
| Republic of Paraguay | 4.700% | 3/27/27 | 1,000 | 986 |
| 2 Republic of Paraguay | 5.600% | 3/13/48 | 600 | 598 |
| Republic of Paraguay | 6.100% | 8/11/44 | 650 | 682 |
| Total Paraguay (Cost $3,071) | 3,079 | |||
| Peru (1.1%) | ||||
| Sovereign Bonds (1.1%) | ||||
| 2 Corp. Financiera de Desarrollo SA | 3.250% | 7/15/19 | 250 | 250 |
| Corp. Financiera de Desarrollo SA | 3.250% | 7/15/19 | 1,200 | 1,196 |
| Corp. Financiera de Desarrollo SA | 4.750% | 2/8/22 | 200 | 204 |
| Fondo MIVIVIENDA SA | 3.500% | 1/31/23 | 650 | 633 |
| 2 Petroleos del Peru SA | 5.625% | 6/19/47 | 1,850 | 1,795 |
| Republic of Peru | 7.350% | 7/21/25 | 600 | 738 |
| Republic of Peru | 4.125% | 8/25/27 | 1,947 | 1,990 |
| Republic of Peru | 8.750% | 11/21/33 | 1,822 | 2,676 |
| 1 Republic of Peru | 6.550% | 3/14/37 | 1,836 | 2,308 |
| Republic of Peru | 5.625% | 11/18/50 | 2,157 | 2,522 |
| Total Peru (Cost $14,378) | 14,312 | |||
| Philippines (2.1%) | ||||
| Sovereign Bonds (2.1%) | ||||
| 8 Power Sector Assets & Liabilities | ||||
| Management Corp. | 7.250% | 5/27/19 | 1,264 | 1,317 |
| 8 Power Sector Assets & Liabilities | ||||
| Management Corp. | 7.390% | 12/2/24 | 1,650 | 1,976 |
| Republic of the Philippines | 8.375% | 6/17/19 | 1,091 | 1,158 |
| Republic of the Philippines | 6.500% | 1/20/20 | 150 | 159 |
| Republic of the Philippines | 4.000% | 1/15/21 | 1,310 | 1,339 |
| Republic of the Philippines | 4.200% | 1/21/24 | 1,564 | 1,617 |
| Republic of the Philippines | 10.625% | 3/16/25 | 1,134 | 1,615 |
| Republic of the Philippines | 5.500% | 3/30/26 | 1,850 | 2,067 |
| Republic of the Philippines | 3.000% | 2/1/28 | 200 | 188 |
| Republic of the Philippines | 9.500% | 2/2/30 | 1,623 | 2,406 |
| Republic of the Philippines | 7.750% | 1/14/31 | 2,454 | 3,304 |
| Republic of the Philippines | 6.375% | 1/15/32 | 1,200 | 1,470 |
| Republic of the Philippines | 6.375% | 10/23/34 | 1,695 | 2,127 |
| Republic of the Philippines | 5.000% | 1/13/37 | 2,080 | 2,291 |
| Republic of the Philippines | 3.950% | 1/20/40 | 1,950 | 1,896 |
| Republic of the Philippines | 3.700% | 3/1/41 | 1,450 | 1,358 |
| Republic of the Philippines | 3.700% | 2/2/42 | 1,590 | 1,483 |
| Total Philippines (Cost $28,746) | 27,771 | |||
28
| Emerging Markets Government Bond Index Fund | |||||
| Face | Market | ||||
| Maturity | Amount | Value • | |||
| Coupon | Date | ($000) | ($000) | ||
| Poland (1.0%) | |||||
| Sovereign Bonds (1.0%) | |||||
| Republic of Poland | 6.375% | 7/15/19 | 2,561 | 2,670 | |
| Republic of Poland | 5.125% | 4/21/21 | 2,060 | 2,176 | |
| Republic of Poland | 5.000% | 3/23/22 | 3,334 | 3,538 | |
| Republic of Poland | 3.000% | 3/17/23 | 675 | 664 | |
| Republic of Poland | 4.000% | 1/22/24 | 1,878 | 1,925 | |
| Republic of Poland | 3.250% | 4/6/26 | 2,000 | 1,948 | |
| Total Poland (Cost $13,056) | 12,921 | ||||
| Qatar (3.2%) | |||||
| Sovereign Bonds (3.2%) | |||||
| 1,2 | Nakilat Inc. | 6.067% | 12/31/33 | 700 | 781 |
| 2 | Ooredoo International Finance Ltd. | 7.875% | 6/10/19 | 550 | 577 |
| 2 | Ooredoo International Finance Ltd. | 4.750% | 2/16/21 | 500 | 512 |
| 2 | Ooredoo International Finance Ltd. | 3.250% | 2/21/23 | 1,050 | 1,004 |
| 2 | Ooredoo International Finance Ltd. | 5.000% | 10/19/25 | 900 | 920 |
| 2 | Ooredoo International Finance Ltd. | 3.750% | 6/22/26 | 250 | 236 |
| 2 | Ooredoo International Finance Ltd. | 3.875% | 1/31/28 | 1,750 | 1,650 |
| 2 | Qatari Diar Finance QSC | 5.000% | 7/21/20 | 2,480 | 2,552 |
| QNB Finance Ltd. | 2.875% | 4/29/20 | 2,500 | 2,461 | |
| 2 | Ras Laffan Liquefied Natural Gas Co. Ltd. III | 6.750% | 9/30/19 | 950 | 991 |
| 1,2 | Ras Laffan Liquefied Natural Gas Co. Ltd. III | 5.838% | 9/30/27 | 1,020 | 1,095 |
| 1,2 | Ras Laffan Liquefied Natural Gas Co. Ltd. III | 6.332% | 9/30/27 | 500 | 548 |
| 2 | State of Qatar | 5.250% | 1/20/20 | 2,007 | 2,068 |
| State of Qatar | 5.250% | 1/20/20 | 600 | 618 | |
| State of Qatar | 2.375% | 6/2/21 | 4,900 | 4,722 | |
| 2 | State of Qatar | 4.500% | 1/20/22 | 1,050 | 1,077 |
| State of Qatar | 3.241% | 1/18/23 | 475 | 462 | |
| 2 | State of Qatar | 3.875% | 4/23/23 | 1,000 | 996 |
| State of Qatar | 3.250% | 6/2/26 | 4,300 | 4,014 | |
| 2 | State of Qatar | 4.500% | 4/23/28 | 3,000 | 2,998 |
| 2 | State of Qatar | 9.750% | 6/15/30 | 750 | 1,100 |
| State of Qatar | 9.750% | 6/15/30 | 325 | 477 | |
| 2 | State of Qatar | 6.400% | 1/20/40 | 500 | 591 |
| State of Qatar | 6.400% | 1/20/40 | 1,028 | 1,213 | |
| 2 | State of Qatar | 5.750% | 1/20/42 | 316 | 348 |
| State of Qatar | 5.750% | 1/20/42 | 650 | 715 | |
| State of Qatar | 4.625% | 6/2/46 | 1,450 | 1,363 | |
| 2 | State of Qatar | 5.103% | 4/23/48 | 5,535 | 5,490 |
| Total Qatar (Cost $42,608) | 41,579 | ||||
| Romania (0.5%) | |||||
| Sovereign Bonds (0.5%) | |||||
| Republic of Romania | 6.750% | 2/7/22 | 2,682 | 2,948 | |
| Republic of Romania | 4.375% | 8/22/23 | 1,404 | 1,424 | |
| 2 | Republic of Romania | 4.875% | 1/22/24 | 100 | 104 |
| Republic of Romania | 4.875% | 1/22/24 | 470 | 488 | |
| 2 | Republic of Romania | 6.125% | 1/22/44 | 200 | 232 |
| Republic of Romania | 6.125% | 1/22/44 | 820 | 952 | |
| Total Romania (Cost $6,259) | 6,148 | ||||
29
| Emerging Markets Government Bond Index Fund | ||||
| Face | Market | |||
| Maturity | Amount | Value • | ||
| Coupon | Date | ($000) | ($000) | |
| Russia (4.8%) | ||||
| Sovereign Bonds (4.8%) | ||||
| Gazprom Neft OAO Via GPN Capital SA | 4.375% | 9/19/22 | 1,000 | 981 |
| Gazprom Neft OAO Via GPN Capital SA | 6.000% | 11/27/23 | 1,750 | 1,822 |
| 2 Gazprom Neft OAO Via GPN Capital SA | 6.000% | 11/27/23 | 200 | 209 |
| Gazprom OAO Via Gaz Capital SA | 3.850% | 2/6/20 | 678 | 673 |
| Gazprom OAO Via Gaz Capital SA | 5.999% | 1/23/21 | 1,700 | 1,761 |
| Gazprom OAO Via Gaz Capital SA | 6.510% | 3/7/22 | 1,000 | 1,061 |
| Gazprom OAO Via Gaz Capital SA | 4.950% | 7/19/22 | 350 | 353 |
| Gazprom OAO Via Gaz Capital SA | 4.950% | 3/23/27 | 200 | 197 |
| Gazprom OAO Via Gaz Capital SA | 4.950% | 2/6/28 | 650 | 640 |
| Gazprom OAO Via Gaz Capital SA | 8.625% | 4/28/34 | 725 | 919 |
| Gazprom OAO Via Gaz Capital SA | 7.288% | 8/16/37 | 1,375 | 1,582 |
| 2 Gazprom OAO Via Gaz Capital SA | 7.288% | 8/16/37 | 100 | 115 |
| Gazprombank OJSC Via GPB Eurobond | ||||
| Finance plc | 7.250% | 5/3/19 | 200 | 202 |
| Gazprombank OJSC Via GPB Eurobond | ||||
| Finance plc | 4.960% | 9/5/19 | 1,100 | 1,101 |
| GTLK Europe DAC | 5.950% | 7/19/21 | 1,000 | 1,001 |
| Rosneft Finance SA | 7.250% | 2/2/20 | 200 | 207 |
| Rosneft Oil Co. Via Rosneft International | ||||
| Finance Ltd. | 4.199% | 3/6/22 | 1,727 | 1,686 |
| Russian Federation | 5.000% | 4/29/20 | 2,800 | 2,862 |
| Russian Federation | 4.500% | 4/4/22 | 3,800 | 3,857 |
| 2 Russian Federation | 4.875% | 9/16/23 | 450 | 466 |
| Russian Federation | 4.875% | 9/16/23 | 4,800 | 4,969 |
| Russian Federation | 4.750% | 5/27/26 | 3,000 | 3,043 |
| 2 Russian Federation | 4.250% | 6/23/27 | 200 | 195 |
| Russian Federation | 4.250% | 6/23/27 | 2,200 | 2,146 |
| Russian Federation | 12.750% | 6/24/28 | 1,235 | 1,995 |
| 1 Russian Federation | 7.500% | 3/31/30 | 1,074 | 1,198 |
| Russian Federation | 5.625% | 4/4/42 | 4,400 | 4,614 |
| Russian Federation | 5.875% | 9/16/43 | 600 | 649 |
| 2 Russian Federation | 5.250% | 6/23/47 | 4,600 | 4,457 |
| Russian Federation | 5.250% | 6/23/47 | 2,400 | 2,325 |
| Russian Railways Via RZD Capital plc | 5.700% | 4/5/22 | 1,550 | 1,604 |
| Russian Railways Via RZD Capital plc | 4.375% | 3/1/24 | 600 | 589 |
| Sberbank of Russia Via SB Capital SA | 5.180% | 6/28/19 | 750 | 757 |
| Sberbank of Russia Via SB Capital SA | 5.717% | 6/16/21 | 2,000 | 2,053 |
| Sberbank of Russia Via SB Capital SA | 6.125% | 2/7/22 | 2,300 | 2,395 |
| Sberbank of Russia Via SB Capital SA | 5.125% | 10/29/22 | 224 | 222 |
| SCF Capital Designated Activity Co. | 5.375% | 6/16/23 | 400 | 394 |
| Vnesheconombank Via VEB Finance plc | 6.902% | 7/9/20 | 1,350 | 1,402 |
| Vnesheconombank Via VEB Finance plc | 6.025% | 7/5/22 | 1,225 | 1,267 |
| 2 Vnesheconombank Via VEB Finance plc | 5.942% | 11/21/23 | 200 | 208 |
| Vnesheconombank Via VEB Finance plc | 5.942% | 11/21/23 | 1,125 | 1,166 |
| Vnesheconombank Via VEB Finance plc | 6.800% | 11/22/25 | 1,275 | 1,379 |
| VTB Bank OJSC Via VTB Capital SA | 6.551% | 10/13/20 | 550 | 574 |
| VTB Bank OJSC Via VTB Capital SA | 6.950% | 10/17/22 | 1,925 | 1,979 |
| Total Russia (Cost $62,361) | 63,275 | |||
30
| Emerging Markets Government Bond Index Fund | |||||
| Face | Market | ||||
| Maturity | Amount | Value • | |||
| Coupon | Date | ($000) | ($000) | ||
| Saudi Arabia (3.8%) | |||||
| Sovereign Bonds (3.8%) | |||||
| 2 | Kingdom of Saudi Arabia | 2.375% | 10/26/21 | 3,400 | 3,260 |
| Kingdom of Saudi Arabia | 2.375% | 10/26/21 | 1,500 | 1,437 | |
| Kingdom of Saudi Arabia | 2.875% | 3/4/23 | 400 | 382 | |
| 2 | Kingdom of Saudi Arabia | 2.875% | 3/4/23 | 2,400 | 2,296 |
| 2 | Kingdom of Saudi Arabia | 4.000% | 4/17/25 | 4,000 | 3,947 |
| 2 | Kingdom of Saudi Arabia | 3.250% | 10/26/26 | 5,050 | 4,663 |
| Kingdom of Saudi Arabia | 3.625% | 3/4/28 | 1,900 | 1,777 | |
| 2 | Kingdom of Saudi Arabia | 3.625% | 3/4/28 | 3,000 | 2,811 |
| 2 | Kingdom of Saudi Arabia | 4.500% | 4/17/30 | 2,400 | 2,369 |
| Kingdom of Saudi Arabia | 4.500% | 10/26/46 | 6,185 | 5,594 | |
| Kingdom of Saudi Arabia | 4.625% | 10/4/47 | 2,650 | 2,424 | |
| 2 | Kingdom of Saudi Arabia | 4.625% | 10/4/47 | 1,900 | 1,740 |
| 2 | Kingdom of Saudi Arabia | 5.000% | 4/17/49 | 3,100 | 2,979 |
| 2 | KSA Sukuk Ltd. | 2.894% | 4/20/22 | 2,800 | 2,700 |
| KSA Sukuk Ltd. | 2.894% | 4/20/22 | 1,300 | 1,252 | |
| 9 | KSA Sukuk Ltd. | 3.628% | 4/20/27 | 4,300 | 4,069 |
| Saudi Electricity Global Sukuk Co. | 4.211% | 4/3/22 | 625 | 632 | |
| Saudi Electricity Global Sukuk Co. 2 | 3.473% | 4/8/23 | 1,050 | 1,023 | |
| Saudi Electricity Global Sukuk Co. 2 | 5.060% | 4/8/43 | 700 | 674 | |
| 2 | Saudi Electricity Global Sukuk Co. 3 | 4.000% | 4/8/24 | 650 | 644 |
| Saudi Electricity Global Sukuk Co. 3 | 4.000% | 4/8/24 | 1,950 | 1,931 | |
| 2 | Saudi Electricity Global Sukuk Co. 3 | 5.500% | 4/8/44 | 300 | 304 |
| Saudi Electricity Global Sukuk Co. 3 | 5.500% | 4/8/44 | 500 | 505 | |
| Total Saudi Arabia (Cost $51,764) | 49,413 | ||||
| Senegal (0.2%) | |||||
| Sovereign Bonds (0.2%) | |||||
| Republic of Senegal | 8.750% | 5/13/21 | 500 | 557 | |
| Republic of Senegal | 6.250% | 7/30/24 | 200 | 205 | |
| 1 | Republic of Senegal | 6.250% | 5/23/33 | 1,000 | 963 |
| 1,2 | Republic of Senegal | 6.750% | 3/13/48 | 800 | 759 |
| Total Senegal (Cost $2,554) | 2,484 | ||||
| Serbia, Republic Of (0.2%) | |||||
| Sovereign Bonds (0.2%) | |||||
| Republic of Serbia | 4.875% | 2/25/20 | 1,100 | 1,119 | |
| Republic of Serbia | 7.250% | 9/28/21 | 1,950 | 2,153 | |
| Total Serbia, Republic Of (Cost $3,215) | 3,272 | ||||
| South Africa (1.5%) | |||||
| Sovereign Bonds (1.5%) | |||||
| Eskom Holdings SOC Ltd. | 5.750% | 1/26/21 | 2,000 | 1,996 | |
| Eskom Holdings SOC Ltd. | 6.750% | 8/6/23 | 930 | 940 | |
| 2 | Eskom Holdings SOC Ltd. | 7.125% | 2/11/25 | 200 | 205 |
| Eskom Holdings SOC Ltd. | 7.125% | 2/11/25 | 300 | 306 | |
| Republic of South Africa | 6.875% | 5/27/19 | 500 | 518 | |
| Republic of South Africa | 5.500% | 3/9/20 | 3,175 | 3,286 | |
| Republic of South Africa | 5.875% | 5/30/22 | 1,071 | 1,141 | |
| Republic of South Africa | 4.665% | 1/17/24 | 1,700 | 1,691 | |
| Republic of South Africa | 5.875% | 9/16/25 | 2,200 | 2,307 | |
| Republic of South Africa | 4.850% | 9/27/27 | 200 | 194 | |
| Republic of South Africa | 4.300% | 10/12/28 | 2,750 | 2,523 | |
31
| Emerging Markets Government Bond Index Fund | |||||
| Face | Market | ||||
| Maturity | Amount | Value • | |||
| Coupon | Date | ($000) | ($000) | ||
| Republic of South Africa | 6.250% | 3/8/41 | 743 | 774 | |
| Republic of South Africa | 5.375% | 7/24/44 | 1,000 | 931 | |
| Republic of South Africa | 5.000% | 10/12/46 | 950 | 838 | |
| Republic of South Africa | 5.650% | 9/27/47 | 1,500 | 1,438 | |
| 2 | Transnet SOC Ltd. | 4.000% | 7/26/22 | 1,025 | 996 |
| ZAR Sovereign Capital Fund Propriety Ltd. | 3.903% | 6/24/20 | 200 | 201 | |
| Total South Africa (Cost $20,795) | 20,285 | ||||
| Sri Lanka (0.6%) | |||||
| Sovereign Bonds (0.6%) | |||||
| Democratic Socialist Republic of Sri Lanka | 6.250% | 10/4/20 | 1,132 | 1,168 | |
| Democratic Socialist Republic of Sri Lanka | 6.250% | 7/27/21 | 1,700 | 1,750 | |
| 2 | Democratic Socialist Republic of Sri Lanka | 5.750% | 4/18/23 | 1,400 | 1,403 |
| Democratic Socialist Republic of Sri Lanka | 6.125% | 6/3/25 | 700 | 689 | |
| Democratic Socialist Republic of Sri Lanka | 6.850% | 11/3/25 | 700 | 715 | |
| Democratic Socialist Republic of Sri Lanka | 6.825% | 7/18/26 | 1,200 | 1,215 | |
| Democratic Socialist Republic of Sri Lanka | 6.200% | 5/11/27 | 600 | 579 | |
| 2 | Democratic Socialist Republic of Sri Lanka | 6.750% | 4/18/28 | 1,050 | 1,045 |
| Total Sri Lanka (Cost $8,545) | 8,564 | ||||
| Supranational (0.2%) | |||||
| Sovereign Bonds (0.2%) | |||||
| 2 | Africa Finance Corp. | 4.375% | 4/29/20 | 750 | 751 |
| 2 | Africa Finance Corp. | 3.875% | 4/13/24 | 500 | 477 |
| African Export-Import Bank | 4.750% | 7/29/19 | 400 | 403 | |
| African Export-Import Bank | 4.000% | 5/24/21 | 900 | 892 | |
| African Export-Import Bank | 4.125% | 6/20/24 | 750 | 725 | |
| Total Supranational (Cost $3,337) | 3,248 | ||||
| Suriname (0.0%) | |||||
| Sovereign Bond (0.0%) | |||||
| 1 | Republic of Suriname | 9.250% | 10/26/26 | 300 | 306 |
| Total Suriname (Cost $308) | 306 | ||||
| Thailand (0.1%) | |||||
| Sovereign Bonds (0.1%) | |||||
| 1 | Krung Thai Bank PCL | 5.200% | 12/26/24 | 650 | 660 |
| PTT Public Co. Ltd. | 4.500% | 10/25/42 | 400 | 391 | |
| Total Thailand (Cost $1,028) | 1,051 | ||||
| Trinidad and Tobago (0.2%) | |||||
| Sovereign Bonds (0.2%) | |||||
| 2 | Petroleum Co. of Trinidad & Tobago Ltd. | 9.750% | 8/14/19 | 700 | 737 |
| 2 | Republic of Trinidad & Tobago | 4.375% | 1/16/24 | 400 | 407 |
| Republic of Trinidad & Tobago | 4.500% | 8/4/26 | 1,300 | 1,294 | |
| Total Trinidad and Tobago (Cost $2,431) | 2,438 | ||||
| Tunisia (0.1%) | |||||
| Sovereign Bond (0.1%) | |||||
| Banque Centrale de Tunisie SA | 5.750% | 1/30/25 | 1,900 | 1,759 | |
| Total Tunisia (Cost $1,824) | 1,759 | ||||
32
| Emerging Markets Government Bond Index Fund | ||||
| Face | Market | |||
| Maturity | Amount | Value • | ||
| Coupon | Date | ($000) | ($000) | |
| Turkey (4.4%) | ||||
| Sovereign Bonds (4.4%) | ||||
| 2 Export Credit Bank of Turkey | 5.375% | 2/8/21 | 500 | 502 |
| 2 Export Credit Bank of Turkey | 5.000% | 9/23/21 | 400 | 394 |
| 2 Export Credit Bank of Turkey | 4.250% | 9/18/22 | 500 | 473 |
| Hazine Mustesarligi Varlik Kiralama AS | 4.251% | 6/8/21 | 1,250 | 1,240 |
| Hazine Mustesarligi Varlik Kiralama AS | 5.004% | 4/6/23 | 500 | 499 |
| 2 Hazine Mustesarligi Varlik Kiralama AS | 4.489% | 11/25/24 | 800 | 773 |
| Republic of Turkey | 7.500% | 11/7/19 | 1,216 | 1,282 |
| Republic of Turkey | 7.000% | 6/5/20 | 2,530 | 2,673 |
| Republic of Turkey | 5.625% | 3/30/21 | 1,901 | 1,960 |
| Republic of Turkey | 5.125% | 3/25/22 | 1,925 | 1,947 |
| Republic of Turkey | 6.250% | 9/26/22 | 2,354 | 2,478 |
| Republic of Turkey | 3.250% | 3/23/23 | 1,801 | 1,664 |
| Republic of Turkey | 5.750% | 3/22/24 | 2,550 | 2,588 |
| Republic of Turkey | 7.375% | 2/5/25 | 2,600 | 2,850 |
| Republic of Turkey | 4.250% | 4/14/26 | 2,750 | 2,487 |
| Republic of Turkey | 4.875% | 10/9/26 | 3,300 | 3,081 |
| Republic of Turkey | 6.000% | 3/25/27 | 2,950 | 2,961 |
| Republic of Turkey | 5.125% | 2/17/28 | 900 | 843 |
| Republic of Turkey | 6.125% | 10/24/28 | 900 | 898 |
| Republic of Turkey | 8.000% | 2/14/34 | 1,840 | 2,114 |
| Republic of Turkey | 6.875% | 3/17/36 | 3,198 | 3,286 |
| Republic of Turkey | 6.750% | 5/30/40 | 2,410 | 2,422 |
| Republic of Turkey | 6.000% | 1/14/41 | 3,580 | 3,294 |
| Republic of Turkey | 4.875% | 4/16/43 | 3,719 | 2,957 |
| Republic of Turkey | 6.625% | 2/17/45 | 850 | 829 |
| Republic of Turkey | 5.750% | 5/11/47 | 4,550 | 3,976 |
| 2 TC Ziraat Bankasi AS | 4.250% | 7/3/19 | 200 | 199 |
| 2 TC Ziraat Bankasi AS | 4.750% | 4/29/21 | 800 | 781 |
| TC Ziraat Bankasi AS | 5.125% | 5/3/22 | 900 | 875 |
| Turkiye Halk Bankasi AS | 4.750% | 6/4/19 | 400 | 392 |
| 2 Turkiye Halk Bankasi AS | 4.750% | 6/4/19 | 250 | 246 |
| Turkiye Halk Bankasi AS | 3.875% | 2/5/20 | 800 | 748 |
| 2 Turkiye Halk Bankasi AS | 3.875% | 2/5/20 | 400 | 375 |
| Turkiye Halk Bankasi AS | 4.750% | 2/11/21 | 700 | 655 |
| Turkiye Halk Bankasi AS | 5.000% | 7/13/21 | 200 | 189 |
| 2 Turkiye Halk Bankasi AS | 5.000% | 7/13/21 | 500 | 473 |
| 2 Turkiye Vakiflar Bankasi TAO | 5.625% | 5/30/22 | 500 | 490 |
| Turkiye Vakiflar Bankasi TAO | 6.000% | 11/1/22 | 200 | 193 |
| 1 Turkiye Vakiflar Bankasi TAO | 6.875% | 2/3/25 | 200 | 200 |
| 1 Turkiye Vakiflar Bankasi TAO | 8.000% | 11/1/27 | 1,000 | 1,015 |
| Total Turkey (Cost $60,271) | 57,302 | |||
| Ukraine (1.3%) | ||||
| Sovereign Bonds (1.3%) | ||||
| Oschadbank Via SSB #1 plc | 9.625% | 3/20/25 | 1,000 | 1,039 |
| 2 Oschadbank Via SSB #1 plc | 9.625% | 3/20/25 | 200 | 208 |
| Ukraine | 7.750% | 9/1/19 | 1,400 | 1,447 |
| Ukraine | 7.750% | 9/1/20 | 600 | 623 |
| 2 Ukraine | 7.750% | 9/1/20 | 378 | 393 |
| 2 Ukraine | 7.750% | 9/1/21 | 907 | 938 |
| Ukraine | 7.750% | 9/1/22 | 1,200 | 1,225 |
| Ukraine | 7.750% | 9/1/23 | 1,900 | 1,916 |
| Ukraine | 7.750% | 9/1/24 | 1,750 | 1,747 |
33
| Emerging Markets Government Bond Index Fund | |||||
| Face | Market | ||||
| Maturity | Amount | Value • | |||
| Coupon | Date | ($000) | ($000) | ||
| Ukraine | 7.750% | 9/1/25 | 250 | 248 | |
| Ukraine | 7.750% | 9/1/26 | 2,000 | 1,968 | |
| Ukraine | 7.750% | 9/1/27 | 800 | 784 | |
| 1,2 | Ukraine | 7.375% | 9/25/32 | 2,900 | 2,679 |
| 1 | Ukraine Government International Bond | 7.375% | 9/25/32 | 250 | 230 |
| 1,2 | Ukraine Railways via Shortline plc | 9.875% | 9/15/21 | 200 | 208 |
| 1 | Ukreximbank Via Biz Finance plc | 9.625% | 4/27/22 | 300 | 311 |
| 1 | Ukreximbank Via Biz Finance plc | 9.750% | 1/22/25 | 700 | 732 |
| 1,2 | Ukreximbank Via Biz Finance plc | 9.750% | 1/22/25 | 200 | 209 |
| Total Ukraine (Cost $16,291) | 16,905 | ||||
| United Arab Emirates (4.7%) | |||||
| Sovereign Bonds (4.7%) | |||||
| 2 | Abu Dhabi Crude Oil Pipeline LLC | 3.650% | 11/2/29 | 800 | 746 |
| 1,2 | Abu Dhabi Crude Oil Pipeline LLC | 4.600% | 11/2/47 | 2,050 | 1,931 |
| 2 | Abu Dhabi National Energy Co. PJSC | 6.250% | 9/16/19 | 275 | 285 |
| Abu Dhabi National Energy Co. PJSC | 3.625% | 6/22/21 | 1,450 | 1,439 | |
| 2 | Abu Dhabi National Energy Co. PJSC | 5.875% | 12/13/21 | 200 | 213 |
| Abu Dhabi National Energy Co. PJSC | 3.625% | 1/12/23 | 200 | 195 | |
| 2 | Abu Dhabi National Energy Co. PJSC | 3.625% | 1/12/23 | 2,500 | 2,439 |
| Abu Dhabi National Energy Co. PJSC | 3.875% | 5/6/24 | 650 | 635 | |
| 2 | Abu Dhabi National Energy Co. PJSC | 4.375% | 6/22/26 | 1,000 | 978 |
| 2 | Abu Dhabi National Energy Co. PJSC | 4.875% | 4/23/30 | 800 | 794 |
| 2 | Abu Dhabi National Energy Co. PJSC | 6.500% | 10/27/36 | 425 | 495 |
| ADCB Finance Cayman Ltd. | 2.625% | 3/10/20 | 2,000 | 1,965 | |
| ADCB Finance Cayman Ltd. | 4.500% | 3/6/23 | 425 | 424 | |
| 2 | DAE Funding LLC | 4.000% | 8/1/20 | 515 | 511 |
| 2 | DAE Funding LLC | 4.500% | 8/1/22 | 800 | 772 |
| 2 | DAE Funding LLC | 5.000% | 8/1/24 | 1,000 | 963 |
| 1,2 | Dolphin Energy Ltd. | 5.888% | 6/15/19 | 350 | 356 |
| 2 | Dolphin Energy Ltd. | 5.500% | 12/15/21 | 820 | 867 |
| DP World Crescent Ltd. | 3.908% | 5/31/23 | 1,000 | 992 | |
| DP World Ltd. | 3.250% | 5/18/20 | 1,250 | 1,244 | |
| 2 | DP World Ltd. | 6.850% | 7/2/37 | 1,240 | 1,477 |
| Dubai DOF Sukuk Ltd. | 6.450% | 5/2/22 | 200 | 219 | |
| 2 | Dubai Electricity & Water Authority | 7.375% | 10/21/20 | 1,975 | 2,156 |
| Emirate of Abu Dhabi | 2.125% | 5/3/21 | 2,065 | 1,995 | |
| Emirate of Abu Dhabi | 2.500% | 10/11/22 | 400 | 382 | |
| 2 | Emirate of Abu Dhabi | 2.500% | 10/11/22 | 500 | 478 |
| Emirate of Abu Dhabi | 3.125% | 5/3/26 | 2,107 | 1,986 | |
| 2 | Emirate of Abu Dhabi | 3.125% | 5/3/26 | 1,400 | 1,320 |
| Emirate of Abu Dhabi | 3.125% | 10/11/27 | 600 | 555 | |
| 2 | Emirate of Abu Dhabi | 3.125% | 10/11/27 | 4,250 | 3,938 |
| Emirate of Abu Dhabi | 4.125% | 10/11/47 | 500 | 457 | |
| 2 | Emirate of Abu Dhabi | 4.125% | 10/11/47 | 3,800 | 3,472 |
| Emirate of Dubai | 7.750% | 10/5/20 | 1,200 | 1,320 | |
| Emirate of Dubai | 3.875% | 1/30/23 | 1,100 | 1,095 | |
| Emirate of Dubai | 5.250% | 1/30/43 | 200 | 190 | |
| 1,2 | Emirates Airline | 4.500% | 2/6/25 | 907 | 896 |
| Emirates NBD PJSC | 3.250% | 11/19/19 | 935 | 934 | |
| Emirates Telecommunications Group Co. | |||||
| PJSC | 2.375% | 6/18/19 | 800 | 793 | |
| Emirates Telecommunications Group Co. | |||||
| PJSC | 3.500% | 6/18/24 | 300 | 295 | |
| First Abu Dhabi Bank PJSC | 3.000% | 8/13/19 | 1,300 | 1,298 | |
34
| Emerging Markets Government Bond Index Fund | |||||
| Face | Market | ||||
| Maturity | Amount | Value • | |||
| Coupon | Date | ($000) | ($000) | ||
| First Abu Dhabi Bank PJSC | 2.250% | 2/11/20 | 1,475 | 1,444 | |
| ICD Sukuk Co. Ltd. | 3.508% | 5/21/20 | 250 | 248 | |
| ICD Sukuk Co. Ltd. | 5.000% | 2/1/27 | 1,100 | 1,097 | |
| IPIC GMTN Ltd. | 5.000% | 11/15/20 | 250 | 260 | |
| 2 | IPIC GMTN Ltd. | 5.000% | 11/15/20 | 1,400 | 1,455 |
| 2 | IPIC GMTN Ltd. | 5.500% | 3/1/22 | 1,710 | 1,820 |
| 2 | IPIC GMTN Ltd. | 6.875% | 11/1/41 | 800 | 1,021 |
| Jafz Sukuk Ltd. | 7.000% | 6/19/19 | 400 | 416 | |
| 2 | MDC-GMTN BV | 7.625% | 5/6/19 | 500 | 522 |
| 2 | MDC-GMTN BV | 5.500% | 4/20/21 | 450 | 475 |
| 2 | MDC-GMTN BV | 3.250% | 4/28/22 | 200 | 197 |
| MDC-GMTN BV | 3.250% | 4/28/22 | 500 | 491 | |
| MDC-GMTN BV | 2.750% | 5/11/23 | 250 | 237 | |
| MDC-GMTN BV | 3.000% | 4/19/24 | 1,600 | 1,517 | |
| 1 | Medjool Ltd. | 3.875% | 3/19/23 | 189 | 187 |
| Noor Sukuk Co. Ltd. | 2.788% | 4/28/20 | 350 | 344 | |
| 2 | NOVA Chemicals Corp. | 5.250% | 8/1/23 | 900 | 902 |
| 2 | NOVA Chemicals Corp. | 4.875% | 6/1/24 | 1,000 | 966 |
| 2 | NOVA Chemicals Corp. | 5.250% | 6/1/27 | 1,400 | 1,344 |
| RAK Capital | 3.094% | 3/31/25 | 700 | 660 | |
| RAKFunding Cayman Ltd. | 3.250% | 6/24/19 | 950 | 948 | |
| 1 | Ruwais Power Co. PJSC | 6.000% | 8/31/36 | 600 | 665 |
| Sharjah Sukuk Ltd. | 3.764% | 9/17/24 | 400 | 397 | |
| 1,2 | Waha Aerospace BV | 3.925% | 7/28/20 | 370 | 372 |
| Total United Arab Emirates (Cost $63,485) | 61,485 | ||||
| Uruguay (0.9%) | |||||
| Sovereign Bonds (0.9%) | |||||
| 1 | Oriental Republic of Uruguay | 8.000% | 11/18/22 | 548 | 628 |
| 1 | Oriental Republic of Uruguay | 4.500% | 8/14/24 | 1,689 | 1,737 |
| 1 | Oriental Republic of Uruguay | 4.375% | 10/27/27 | 2,205 | 2,222 |
| Oriental Republic of Uruguay | 7.875% | 1/15/33 | 546 | 714 | |
| 1 | Oriental Republic of Uruguay | 7.625% | 3/21/36 | 1,276 | 1,657 |
| 1 | Oriental Republic of Uruguay | 4.125% | 11/20/45 | 850 | 755 |
| 1 | Oriental Republic of Uruguay | 5.100% | 6/18/50 | 3,975 | 3,910 |
| 1 | Oriental Republic of Uruguay | 4.975% | 4/20/55 | 850 | 812 |
| Total Uruguay (Cost $12,349) | 12,435 | ||||
| Venezuela (0.8%) | |||||
| Sovereign Bonds (0.8%) | |||||
| 10 | Bolivarian Republic of Venezuela | 7.750% | 10/13/19 | 2,656 | 770 |
| 10 | Bolivarian Republic of Venezuela | 6.000% | 12/9/20 | 1,156 | 325 |
| 1,10 Bolivarian Republic of Venezuela | 12.750% | 8/23/22 | 3,355 | 1,040 | |
| 10 | Bolivarian Republic of Venezuela | 9.000% | 5/7/23 | 1,432 | 408 |
| 10 | Bolivarian Republic of Venezuela | 8.250% | 10/13/24 | 2,829 | 805 |
| 10 | Bolivarian Republic of Venezuela | 7.650% | 4/21/25 | 2,000 | 566 |
| 10 | Bolivarian Republic of Venezuela | 11.750% | 10/21/26 | 2,227 | 691 |
| 10 | Bolivarian Republic of Venezuela | 9.250% | 9/15/27 | 3,226 | 1,000 |
| 10 | Bolivarian Republic of Venezuela | 9.250% | 5/7/28 | 640 | 182 |
| 1,10 Bolivarian Republic of Venezuela | 11.950% | 8/5/31 | 4,429 | 1,373 | |
| 10 | Bolivarian Republic of Venezuela | 9.375% | 1/13/34 | 1,900 | 627 |
| 10 | Bolivarian Republic of Venezuela | 7.000% | 3/31/38 | 1,375 | 402 |
35
| Emerging Markets Government Bond Index Fund | |||||
| Face | Market | ||||
| Maturity | Amount | Value • | |||
| Coupon | Date | ($000) | ($000) | ||
| 2 | Citgo Holding Inc. | 10.750% | 2/15/20 | 1,400 | 1,482 |
| 2 | CITGO Petroleum Corp. | 6.250% | 8/15/22 | 535 | 535 |
| CITGO Petroleum Corp. | 6.250% | 8/15/22 | 100 | 100 | |
| Total Venezuela (Cost $16,693) | 10,306 | ||||
| Vietnam (0.2%) | |||||
| Sovereign Bonds (0.2%) | |||||
| Socialist Republic of Vietnam | 6.750% | 1/29/20 | 709 | 745 | |
| Socialist Republic of Vietnam | 4.800% | 11/19/24 | 1,275 | 1,295 | |
| Total Vietnam (Cost $2,045) | 2,040 | ||||
| Zambia (0.2%) | |||||
| Sovereign Bonds (0.2%) | |||||
| Republic of Zambia | 5.375% | 9/20/22 | 725 | 666 | |
| 2 | Republic of Zambia | 8.500% | 4/14/24 | 450 | 455 |
| Republic of Zambia | 8.500% | 4/14/24 | 1,000 | 1,009 | |
| 1 | Republic of Zambia | 8.970% | 7/30/27 | 1,100 | 1,107 |
| Total Zambia (Cost $3,132) | 3,237 | ||||
| Temporary Cash Investments (0.7%) | |||||
| Time Deposits (0.0%) | |||||
| Brown Brothers Harriman & Co. | 1.450% | 5/1/18 | 14 | 14 | |
| Shares | |||||
| Money Market Fund (0.7%) | |||||
| 11 | Vanguard Market Liquidity Fund | 1.886% | 87,612 | 8,761 | |
| Total Temporary Cash Investments (Cost $8,775) | 8,775 | ||||
| Total Investments (99.3%) (Cost $1,325,685) | 1,303,741 | ||||
| Amount | |||||
| ($000) | |||||
| Other Assets and Liabilities (0.7%) | |||||
| Other Assets | |||||
| Investment in Vanguard | 72 | ||||
| Receivables for Investment Securities Sold | 21,310 | ||||
| Receivables for Accrued Income | 15,776 | ||||
| Receivables for Capital Shares Issued | 253 | ||||
| Variation Margin Receivable—Futures Contracts | 2 | ||||
| Other Assets12 | 119 | ||||
| Total Other Assets | 37,532 | ||||
| Liabilities | |||||
| Payables for Investment Securities Purchased | (26,315) | ||||
| Payables for Capital Shares Redeemed | (434) | ||||
| Payables for Distributions | (170) | ||||
| Payables to Vanguard | (422) | ||||
| Variation Margin Payable—Futures Contracts | (25) | ||||
| Other Liabilities | (910) | ||||
| Total Liabilities | (28,276) | ||||
| Net Assets (100%) | 1,312,997 | ||||
36
| Emerging Markets Government Bond Index Fund | |
| At April 30, 2018, net assets consisted of: | |
| Amount | |
| ($000) | |
| Paid-in Capital | 1,338,099 |
| Undistributed Net Investment Income | 2,993 |
| Accumulated Net Realized Losses | (6,160) |
| Unrealized Appreciation (Depreciation) | |
| Investment Securities | (21,944) |
| Futures Contracts | 9 |
| Net Assets | 1,312,997 |
| Investor Shares—Net Assets | |
| Applicable to 1,314,957 outstanding $.001 par value shares of | |
| beneficial interest (unlimited authorization) | 12,691 |
| Net Asset Value Per Share—Investor Shares | $9.65 |
| ETF Shares—Net Assets | |
| Applicable to 13,114,015 outstanding $.001 par value shares of | |
| beneficial interest (unlimited authorization) | 1,008,892 |
| Net Asset Value Per Share—ETF Shares | $76.93 |
| Admiral Shares—Net Assets | |
| Applicable to 14,080,543 outstanding $.001 par value shares of | |
| beneficial interest (unlimited authorization) | 271,802 |
| Net Asset Value Per Share—Admiral Shares | $19.30 |
| Institutional Shares—Net Assets | |
| Applicable to 633,339 outstanding $.001 par value shares of | |
| beneficial interest (unlimited authorization) | 19,612 |
| Net Asset Value Per Share—Institutional Shares | $30.97 |
• See Note A in Notes to Financial Statements.
1 The average or expected maturity is shorter than the final maturity shown because of the possibility of interim principal payments
and prepayments or the possibility of the issue being called.
2 Security exempt from registration under Rule 144A of the Securities Act of 1933. Such securities may be sold in transactions
exempt from registration, normally to qualified institutional buyers. At April 30, 2018, the aggregate value of these securities
was $238,472,000, representing 18.2% of net assets.
3 Guaranteed by the Republic of Azerbaijan.
4 Adjustable-rate security based upon 3-month USD LIBOR plus spread.
5 Guaranteed by the Republic of Hungary.
6 Guaranteed by the Republic of Indonesia.
7 Guaranteed by the Government of Mongolia.
8 Guaranteed by the Republic of the Philippines.
9 Guaranteed by the Kingdom of Saudi Arabia.
10 Non-income-producing security—security in default.
11 Affiliated money market fund available only to Vanguard funds and certain trusts and accounts managed by Vanguard. Rate shown
is the 7-day yield.
12 Cash of $119,000 has been segregated as initial margin for open futures contracts.
37
| Emerging Markets Government Bond Index Fund | ||||
| Derivative Financial Instruments Outstanding as of Period End | ||||
| Futures Contracts | ||||
| ($000) | ||||
| Value and | ||||
| Number of | Unrealized | |||
| Long (Short) | Notional | Appreciation | ||
| Expiration | Contracts | Amount | (Depreciation) | |
| Long Futures Contracts | ||||
| 2-Year U. S. Treasury Note | June 2018 | 40 | 8,482 | — |
| 5-Year U. S. Treasury Note | June 2018 | 28 | 3,178 | 1 |
| 10-Year U.S. Treasury Note | June 2018 | 10 | 1,196 | — |
| Ultra 10-Year U.S. Treasury Note | June 2018 | 6 | 767 | — |
| 30-Year U.S. Treasury Bond | June 2018 | 1 | 144 | (3) |
| (2) | ||||
| Short Futures Contracts | ||||
| Ultra Long U.S. Treasury Bond | June 2018 | (10) | (1,571) | 11 |
| 9 | ||||
Unrealized appreciation (depreciation) on open futures contracts is required to be treated as realized gain (loss) for tax purposes.
See accompanying Notes, which are an integral part of the Financial Statements.
38
| Emerging Markets Government Bond Index Fund | |
| Statement of Operations | |
| Six Months Ended | |
| April 30, 2018 | |
| ($000) | |
| Investment Income | |
| Income | |
| Interest1 | 29,801 |
| Total Income | 29,801 |
| Expenses | |
| The Vanguard Group—Note B | |
| Investment Advisory Services | 22 |
| Management and Administrative—Investor Shares | 23 |
| Management and Administrative—ETF Shares | 1,491 |
| Management and Administrative—Admiral Shares | 422 |
| Management and Administrative—Institutional Shares | 28 |
| Marketing and Distribution—Investor Shares | 1 |
| Marketing and Distribution—ETF Shares | 29 |
| Marketing and Distribution—Admiral Shares | 11 |
| Marketing and Distribution—Institutional Shares | — |
| Custodian Fees | 34 |
| Shareholders’ Reports and Proxy—Investor Shares | 6 |
| Shareholders’ Reports and Proxy—ETF Shares | 25 |
| Shareholders’ Reports and Proxy—Admiral Shares | 4 |
| Shareholders’ Reports and Proxy—Institutional Shares | — |
| Trustees’ Fees and Expenses | 1 |
| Total Expenses | 2,097 |
| Net Investment Income | 27,704 |
| Realized Net Gain (Loss) | |
| Investment Securities Sold1 | (2,590) |
| Futures Contracts | 21 |
| Realized Net Gain (Loss) | (2,569) |
| Change in Unrealized Appreciation (Depreciation) | |
| Investment Securities1 | (59,907) |
| Futures Contracts | 9 |
| Change in Unrealized Appreciation (Depreciation) | (59,898) |
| Net Increase (Decrease) in Net Assets Resulting from Operations | (34,763) |
1 Interest income, realized net gain (loss), and change in unrealized appreciation (depreciation) from an affiliated company of the fund were $38,000, $1,000, and $1,000, respectively. Purchases and sales are for temporary cash investment purposes.
See accompanying Notes, which are an integral part of the Financial Statements.
39
| Emerging Markets Government Bond Index Fund | ||
| Statement of Changes in Net Assets | ||
| Six Months Ended | Year Ended | |
| April 30, | October 31, | |
| 2018 | 2017 | |
| ($000) | ($000) | |
| Increase (Decrease) in Net Assets | ||
| Operations | ||
| Net Investment Income | 27,704 | 57,245 |
| Realized Net Gain (Loss) | (2,569) | 6,795 |
| Change in Unrealized Appreciation (Depreciation) | (59,898) | 4,599 |
| Net Increase (Decrease) in Net Assets Resulting from Operations | (34,763) | 68,639 |
| Distributions | ||
| Net Investment Income | ||
| Investor Shares | (260) | (597) |
| ETF Shares | (21,891) | (44,292) |
| Admiral Shares | (6,006) | (10,905) |
| Institutional Shares | (425) | (933) |
| Realized Capital Gain | ||
| Investor Shares | — | — |
| ETF Shares | — | — |
| Admiral Shares | — | — |
| Institutional Shares | — | — |
| Total Distributions | (28,582) | (56,727) |
| Capital Share Transactions | ||
| Investor Shares | 466 | 890 |
| ETF Shares | 55,072 | 118,819 |
| Admiral Shares | (2,370) | 94,634 |
| Institutional Shares | 430 | (1,051) |
| Net Increase (Decrease) from Capital Share Transactions | 53,598 | 213,292 |
| Total Increase (Decrease) | (9,747) | 225,204 |
| Net Assets | ||
| Beginning of Period | 1,322,744 | 1,097,540 |
| End of Period1 | 1,312,997 | 1,322,744 |
1 Net Assets—End of Period includes undistributed (overdistributed) net investment income of $2,993,000 and $3,871,000.
See accompanying Notes, which are an integral part of the Financial Statements.
40
| Emerging Markets Government Bond Index Fund | ||||||
| Financial Highlights | ||||||
| Investor Shares | ||||||
| Six Months | May 14, | |||||
| Ended | 20131 to | |||||
| For a Share Outstanding | April 30, | Year Ended October 31, | Oct. 31, | |||
| Throughout Each Period | 2018 | 2017 | 2016 | 2015 | 2014 | 2013 |
| Net Asset Value, Beginning of Period | $10.12 | $10.04 | $9.50 | $9.95 | $9.74 | $10.00 |
| Investment Operations | ||||||
| Net Investment Income | . 2012 | .450 2 | .454 | .427 | .417 | .149 |
| Net Realized and Unrealized Gain (Loss) | ||||||
| on Investments 3 | (. 469) | . 082 | . 533 | (. 447) | . 213 | (. 261) |
| Total from Investment Operations | (. 268) | . 532 | . 987 | (. 020) | . 630 | (.112) |
| Distributions | ||||||
| Dividends from Net Investment Income | (. 202) | (. 452) | (. 447) | (. 430) | (. 420) | (.148) |
| Distributions from Realized Capital Gains | — | — | — | — | — | — |
| Total Distributions | (. 202) | (. 452) | (. 447) | (. 430) | (. 420) | (.148) |
| Net Asset Value, End of Period | $9.65 | $10.12 | $10.04 | $9.50 | $9.95 | $9.74 |
| Total Return4 | -2.69% | 5.46% | 10.65% | -0.16% | 6.62% | -1.38% |
| Ratios/Supplemental Data | ||||||
| Net Assets, End of Period (Millions) | $13 | $13 | $12 | $9 | $7 | $4 |
| Ratio of Total Expenses to | ||||||
| Average Net Assets | 0.49% | 0.49% | 0.49% | 0.49% | 0.49% | 0.49%5 |
| Ratio of Net Investment Income to | ||||||
| Average Net Assets | 4.08% | 4.50% | 4.72% | 4.52% | 4.35% | 3.81%5 |
| Portfolio Turnover Rate 6 | 26% | 19% | 24% | 20% | 27% | 38% |
The expense ratio, net investment income ratio, and turnover rate for the current period have been annualized.
1 Subscription period for the fund was May 14, 2013, to May 30, 2013, during which time all assets were held in money market
instruments. Performance measurement began May 31, 2013, at a net asset value of $10.03.
2 Calculated based on average shares outstanding.
3 Includes increases from purchase fees of $.00, $.01, $.01, $.01, $.00, and $.03.
4 Total returns do not include transaction or account service fees that may have applied in the periods shown. Fund prospectuses provide
information about any applicable transaction and account service fees.
5 Annualized.
6 Excludes the value of portfolio securities received or delivered as a result of in-kind purchases or redemptions of the fund’s capital
shares, including ETF Creation Units.
See accompanying Notes, which are an integral part of the Financial Statements.
41
| Emerging Markets Government Bond Index Fund | ||||||
| Financial Highlights | ||||||
| ETF Shares | ||||||
| Six Months | May 31, | |||||
| Ended | 20131 to | |||||
| For a Share Outstanding | April 30, | Year Ended October 31, | Oct. 31, | |||
| Throughout Each Period | 2018 | 2017 | 2016 | 2015 | 2014 | 2013 |
| Net Asset Value, Beginning of Period | $80.73 | $80.11 | $75.81 | $79.40 | $77.71 | $79.52 |
| Investment Operations | ||||||
| Net Investment Income | 1.663 2 | 3.713 2 | 3.753 | 3.516 | 3.429 | 1.217 |
| Net Realized and Unrealized Gain (Loss) | ||||||
| on Investments 3 | (3.720) | .589 | 4.228 | (3.556) | 1.700 | (2.086) |
| Total from Investment Operations | (2.057) | 4.302 | 7.981 | (.040) | 5.129 | (.869) |
| Distributions | ||||||
| Dividends from Net Investment Income | (1.743) | (3.682) | (3.681) | (3.550) | (3.439) | (.941) |
| Distributions from Realized Capital Gains | — | — | — | — | — | — |
| Total Distributions | (1.743) | (3.682) | (3.681) | (3.550) | (3.439) | (.941) |
| Net Asset Value, End of Period | $76.93 | $80.73 | $80.11 | $75.81 | $79.40 | $77.71 |
| Total Return | -2.59% | 5.56% | 10.84% | -0.01% | 6.79% | -1.39% |
| Ratios/Supplemental Data | ||||||
| Net Assets, End of Period (Millions) | $1,009 | $1,002 | $874 | $501 | $222 | $85 |
| Ratio of Total Expenses to | ||||||
| Average Net Assets | 0.32% | 0.32% | 0.32% | 0.34% | 0.34% | 0.35%4 |
| Ratio of Net Investment Income to | ||||||
| Average Net Assets | 4.25% | 4.67% | 4.89% | 4.67% | 4.50% | 3.95%4 |
| Portfolio Turnover Rate 5 | 26% | 19% | 24% | 20% | 27% | 38% |
The expense ratio, net investment income ratio, and turnover rate for the current period have been annualized.
1 Inception.
2 Calculated based on average shares outstanding.
3 Includes increases from purchase fees of $.02, $.07, $.04, $.06, $.01, and $.30.
4 Annualized.
5 Excludes the value of portfolio securities received or delivered as a result of in-kind purchases or redemptions of the fund’s capital
shares, including ETF Creation Units.
See accompanying Notes, which are an integral part of the Financial Statements.
42
| Emerging Markets Government Bond Index Fund | ||||||
| Financial Highlights | ||||||
| Admiral Shares | ||||||
| Six Months | May 14, | |||||
| Ended | 20131 to | |||||
| For a Share Outstanding | April 30, | Year Ended October 31, | Oct. 31, | |||
| Throughout Each Period | 2018 | 2017 | 2016 | 2015 | 2014 | 2013 |
| Net Asset Value, Beginning of Period | $20.24 | $20.09 | $19.00 | $19.90 | $19.48 | $20.00 |
| Investment Operations | ||||||
| Net Investment Income | . 419 2 | .9342 | .941 | .885 | .863 | . 309 |
| Net Realized and Unrealized Gain (Loss) | ||||||
| on Investments 3 | (. 938) | .150 | 1.076 | (. 894) | . 427 | (. 522) |
| Total from Investment Operations | (.519) | 1.084 | 2.017 | (.009) | 1.290 | (.213) |
| Distributions | ||||||
| Dividends from Net Investment Income | (. 421) | (. 934) | (. 927) | (. 891) | (. 870) | (. 307) |
| Distributions from Realized Capital Gains | — | — | — | — | — | — |
| Total Distributions | (. 421) | (. 934) | (. 927) | (. 891) | (. 870) | (. 307) |
| Net Asset Value, End of Period | $19.30 | $20.24 | $20.09 | $19.00 | $19.90 | $19.48 |
| Total Return4 | -2.60% | 5.57% | 10.89% | 0% | 6.78% | -1.37% |
| Ratios/Supplemental Data | ||||||
| Net Assets, End of Period (Millions) | $272 | $288 | $191 | $131 | $118 | $55 |
| Ratio of Total Expenses to | ||||||
| Average Net Assets | 0.32% | 0.32% | 0.32% | 0.33% | 0.34% | 0.34%5 |
| Ratio of Net Investment Income to | ||||||
| Average Net Assets | 4.25% | 4.67% | 4.89% | 4.68% | 4.50% | 3.96%5 |
| Portfolio Turnover Rate 6 | 26% | 19% | 24% | 20% | 27% | 38% |
| The expense ratio, net investment income ratio, and turnover rate for the current period have been annualized. |
| 1 Subscription period for the fund was May 14, 2013, to May 30, 2013, during which time all assets were held in money market |
| instruments. Performance measurement began May 31, 2013, at a net asset value of $20.07. |
| 2 Calculated based on average shares outstanding. |
| 3 Includes increases from purchase fees of $.01, $.02, $.01, $.02, $.00, and $.06. |
| 4 Total returns do not include transaction or account service fees that may have applied in the periods shown. Fund prospectuses provide |
| information about any applicable transaction and account service fees. |
| 5 Annualized. |
| 6 Excludes the value of portfolio securities received or delivered as a result of in-kind purchases or redemptions of the fund’s capital |
| shares, including ETF Creation Units. |
See accompanying Notes, which are an integral part of the Financial Statements.
43
| Emerging Markets Government Bond Index Fund | |||||
| Financial Highlights | |||||
| Institutional Shares | |||||
| Six Months | Feb. 11, | Nov. 25, | |||
| Ended | Year Ended | 20151 to | 20141 to | ||
| For a Share Outstanding | April 30, | October 31, | Oct. 31, | Dec. 18, | |
| Throughout Each Period | 2018 | 2017 | 2016 | 2015 | 2014 |
| Net Asset Value, Beginning of Period | $32.47 | $32.24 | $30.50 | $30.72 | $31.53 |
| Investment Operations | |||||
| Net Investment Income | . 676 2 | 1.5082 | 1.521 | 1.019 | .108 |
| Net Realized and Unrealized Gain (Loss) | |||||
| on Investments 3 | (1.497) | .238 | 1.715 | (.159) | (1.240) |
| Total from Investment Operations | (.821) | 1.746 | 3.236 | .860 | (1.132) |
| Distributions | |||||
| Dividends from Net Investment Income | (.679) | (1.516) | (1.496) | (1.080) | (.108) |
| Distributions from Realized Capital Gains | — | — | — | — | — |
| Total Distributions | (.679) | (1.516) | (1.496) | (1.080) | (.108) |
| Net Asset Value, End of Period | $30.97 | $32.47 | $32.24 | $30.50 | $30.29 |
| Total Return4 | -2.56% | 5.59% | 10.89% | 2.82% | -3.60% |
| Ratios/Supplemental Data | |||||
| Net Assets, End of Period (Millions) | $20 | $20 | $21 | $10 | $0 |
| Ratio of Total Expenses to Average Net Assets | 0.29% | 0.29% | 0.29% | 0.29% | 0.30% |
| Ratio of Net Investment Income to | |||||
| Average Net Assets | 4.28% | 4.70% | 4.92% | 4.75% | 4.72% |
| Portfolio Turnover Rate 5 | 26% | 19% | 24% | 20%6 | 20%6 |
The expense ratio, net investment income ratio, and turnover rate for the current period have been annualized.
1 The class commenced operations on November 25, 2014. On December 18, 2014, all outstanding shares were redeemed and the net
asset value represents the per share amount at which such shares were redeemed. On February 11, 2015, the class recommenced
operations. The expense ratio and net income ratio for the periods shown have been annualized.
2 Calculated based on average shares outstanding.
3 Includes increases from purchase fees of $.01 for 2018, $.03 for 2017, $.02 for 2016, and $.04 in aggregate for periods prior to
November 1, 2015.
4 Total returns do not include transaction fees that may have applied in the periods shown. Fund prospectuses provide information about
any applicable transaction fees.
5 Excludes the value of portfolio securities received or delivered as a result of in-kind purchases or redemptions of the fund’s capital
shares, including ETF Creation Units.
6 Reflects the fund’s portfolio turnover for the fiscal year ended October 31, 2015.
See accompanying Notes, which are an integral part of the Financial Statements.
44
Emerging Markets Government Bond Index Fund
Notes to Financial Statements
Vanguard Emerging Markets Government Bond Index Fund is registered under the Investment Company Act of 1940 as an open-end investment company, or mutual fund. The fund invests in securities of foreign issuers, which may subject it to investment risks not normally associated with investing in securities of U.S. corporations. The fund offers four classes of shares: Investor Shares, ETF Shares, Admiral Shares, and Institutional Shares. Investor Shares are available to any investor who meets the fund’s minimum purchase requirements. ETF Shares are listed for trading on Nasdaq; they can be purchased and sold through a broker. Admiral Shares and Institutional Shares are designed for investors who meet certain administrative, service, and account-size criteria.
A. The following significant accounting policies conform to generally accepted accounting principles for U.S. investment companies. The fund consistently follows such policies in preparing its financial statements.
1. Security Valuation: Securities are valued as of the close of trading on the New York Stock Exchange (generally 4 p.m., Eastern time) on the valuation date. Bonds and temporary cash investments are valued using the latest bid prices or using valuations based on a matrix system (which considers such factors as security prices, yields, maturities, and ratings), both as furnished by independent pricing services. Investments in Vanguard Market Liquidity Fund are valued at that fund’s net asset value. Securities for which market quotations are not readily available, or whose values have been affected by events occurring before the fund’s pricing time but after the close of the securities’ primary markets, are valued at their fair values calculated according to procedures adopted by the board of trustees. These procedures include obtaining quotations from an independent pricing service, monitoring news to identify significant market- or security-specific events, and evaluating changes in the values of foreign market proxies (for example, ADRs, futures contracts, or exchange-traded funds), between the time the foreign markets close and the fund’s pricing time. When fair-value pricing is employed, the prices of securities used by a fund to calculate its net asset value may differ from quoted or published prices for the same securities.
2. Futures Contracts: The fund uses futures contracts to invest in fixed income asset classes with greater efficiency and lower cost than is possible through direct investment, to add value when these instruments are attractively priced, or to adjust sensitivity to changes in interest rates. The primary risks associated with the use of futures contracts are imperfect correlation between changes in market values of bonds held by the fund and the prices of futures contracts, and the possibility of an illiquid market. Counterparty risk involving futures is mitigated because a regulated clearinghouse is the counterparty instead of the clearing broker. To further mitigate counterparty risk, the fund trades futures contracts on an exchange, monitors the financial strength of its clearing brokers and clearinghouse, and has entered into clearing agreements with its clearing brokers. The clearinghouse imposes initial margin requirements to secure the fund’s performance and requires daily settlement of variation margin representing changes in the market value of each contract.
Futures contracts are valued at their quoted daily settlement prices. The notional amounts of the contracts are not recorded in the Statement of Net Assets. Fluctuations in the value of the contracts are recorded in the Statement of Net Assets as an asset (liability) and in the Statement of Operations as unrealized appreciation (depreciation) until the contracts are closed, when they are recorded as realized futures gains (losses).
During the six months ended April 30, 2018, the fund’s average investments in long and short futures contracts each represented less than 1% of net assets, based on the average of the notional amounts at each quarter-end during the period.
45
Emerging Markets Government Bond Index Fund
3. Federal Income Taxes: The fund intends to continue to qualify as a regulated investment company and distribute all of its taxable income. Management has analyzed the fund’s tax positions taken for all open federal income tax years (October 31, 2014–2017), and for the period ended April 30, 2018, and has concluded that no provision for federal income tax is required in the fund’s financial statements.
4. Distributions: Distributions to shareholders are recorded on the ex-dividend date.
5. Credit Facility: The fund and certain other funds managed by The Vanguard Group (“Vanguard”) participate in a $3.1 billion committed credit facility provided by a syndicate of lenders pursuant to a credit agreement that may be renewed annually; each fund is individually liable for its borrowings, if any, under the credit facility. Borrowings may be utilized for temporary and emergency purposes, and are subject to the fund’s regulatory and contractual borrowing restrictions. The participating funds are charged administrative fees and an annual commitment fee of 0.10% of the undrawn amount of the facility; these fees are allocated to the funds based on a method approved by the fund’s board of trustees and included in Management and Administrative expenses on the fund’s Statement of Operations. Any borrowings under this facility bear interest at a rate based upon the higher of the one-month London Interbank Offered Rate, federal funds effective rate, or overnight bank funding rate plus an agreed-upon spread.
The fund had no borrowings outstanding at April 30, 2018, or at any time during the period then ended.
6. Other: Interest income includes income distributions received from Vanguard Market Liquidity Fund and is accrued daily. Premiums and discounts on debt securities purchased are amortized and accreted, respectively, to interest income over the lives of the respective securities. Security transactions are accounted for on the date securities are bought or sold. Costs used to determine realized gains (losses) on the sale of investment securities are those of the specific securities sold. Fees assessed on capital share transactions are credited to paid-in capital.
Each class of shares has equal rights as to assets and earnings, except that each class separately bears certain class-specific expenses related to maintenance of shareholder accounts (included in Management and Administrative expenses), shareholder reporting, and the proxy. Marketing and distribution expenses are allocated to each class of shares based on a method approved by the board of trustees. Income, other non-class-specific expenses, and gains and losses on investments are allocated to each class of shares based on its relative net assets.
B. In accordance with the terms of a Funds’ Service Agreement (the “FSA”) between Vanguard and the fund, Vanguard furnishes to the fund investment advisory, corporate management, administrative, marketing, and distribution services at Vanguard’s cost of operations (as defined by the FSA). These costs of operations are allocated to the fund based on methods and guidelines approved by the board of trustees. Vanguard does not require reimbursement in the current period for certain costs of operations (such as deferred compensation/benefits and risk/insurance costs); the fund’s liability for these costs of operations is included in Payables to Vanguard on the Statement of Net Assets. All other costs of operations payable to Vanguard are generally settled twice a month.
Upon the request of Vanguard, the fund may invest up to 0.40% of its net assets as capital in Vanguard. At April 30, 2018, the fund had contributed to Vanguard capital in the amount of $72,000, representing 0.01% of the fund’s net assets and 0.03% of Vanguard’s capitalization. The fund’s trustees and officers are also directors and employees, respectively, of Vanguard.
46
Emerging Markets Government Bond Index Fund
C. Various inputs may be used to determine the value of the fund’s investments. These inputs are summarized in three broad levels for financial statement purposes. The inputs or methodologies used to value securities are not necessarily an indication of the risk associated with investing in those securities.
Level 1—Quoted prices in active markets for identical securities.
Level 2—Other significant observable inputs (including quoted prices for similar securities, interest rates, prepayment speeds, credit risk, etc.).
Level 3—Significant unobservable inputs (including the fund’s own assumptions used to determine the fair value of investments). Any investments valued with significant unobservable inputs are noted on the Statement of Net Assets.
The following table summarizes the market value of the fund’s investments as of April 30, 2018, based on the inputs used to value them:
| Level 1 | Level 2 | Level 3 | |
| Investments | ($000) | ($000) | ($000) |
| Corporate Bonds | — | 2,855 | — |
| Sovereign Bonds | — | 1,292,111 | — |
| Temporary Cash Investments | 8,761 | 14 | — |
| Futures Contracts—Assets1 | 2 | — | — |
| Futures Contracts—Liabilities1 | (25) | — | — |
| Total | 8,738 | 1,294,980 | — |
| 1 Represents variation margin on the last day of the reporting period. |
D. Distributions are determined on a tax basis and may differ from net investment income and realized capital gains for financial reporting purposes. Differences may be permanent or temporary. Permanent differences are reclassified among capital accounts in the financial statements to reflect their tax character. Temporary differences arise when certain items of income, expense, gain, or loss are recognized in different periods for financial statement and tax purposes. These differences will reverse at some time in the future. Differences in classification may also result from the treatment of short-term gains as ordinary income for tax purposes.
During the six months ended April 30, 2018, the fund realized $1,157,000 of net capital gains resulting from in-kind redemptions—in which shareholders exchanged fund shares for securities held by the fund rather than for cash. Because such gains are not taxable to the fund, and are not distributed to shareholders, they have been reclassified from accumulated net realized losses to paid-in capital.
The fund’s tax-basis capital gains and losses are determined only at the end of each fiscal year. For tax purposes, at October 31, 2017, the fund had available capital losses totaling $2,355,000 that may be carried forward indefinitely to offset future net capital gains. The fund will use these capital losses to offset net taxable capital gains, if any, realized during the year ending October 31, 2018; should the fund realize net capital losses for the year, the losses will be added to the loss carryforward balance above.
47
Emerging Markets Government Bond Index Fund
At April 30, 2018, the cost of investment securities for tax purposes was $1,325,763,000. Net unrealized depreciation of investment securities for tax purposes was $22,022,000, consisting of unrealized gains of $15,550,000 on securities that had risen in value since their purchase and $37,572,000 in unrealized losses on securities that had fallen in value since their purchase.
E. During the six months ended April 30, 2018, the fund purchased $217,747,000 of investment securities and sold $165,906,000 of investment securities, other than U.S. government securities and temporary cash investments. Purchases and sales of U.S. government securities were $26,587,000 and $26,559,000, respectively. Total purchases and sales include $64,172,000 and $23,559,000, respectively, in connection with in-kind purchases and redemptions of the fund’s capital shares.
| F. Capital share transactions for each class of shares were: | ||||
| Six Months Ended | Year Ended | |||
| April 30, 2018 | October 31, 2017 | |||
| Amount | Shares | Amount | Shares | |
| ($000) | (000) | ($000) | (000) | |
| Investor Shares | ||||
| Issued1 | 3,618 | 363 | 8,929 | 892 |
| Issued in Lieu of Cash Distributions | 211 | 21 | 502 | 50 |
| Redeemed | (3,363) | (337) | (8,541) | (850) |
| Net Increase (Decrease)—Investor Shares | 466 | 47 | 890 | 92 |
| ETF Shares | ||||
| Issued1 | 79,101 | 1,000 | 206,684 | 2,608 |
| Issued in Lieu of Cash Distributions | — | — | — | — |
| Redeemed | (24,029) | (300) | (87,865) | (1,100) |
| Net Increase (Decrease)—ETF Shares | 55,072 | 700 | 118,819 | 1,508 |
| Admiral Shares | ||||
| Issued1 | 43,172 | 2,158 | 130,192 | 6,486 |
| Issued in Lieu of Cash Distributions | 5,017 | 253 | 9,143 | 457 |
| Redeemed | (50,559) | (2,536) | (44,701) | (2,245) |
| Net Increase (Decrease)—Admiral Shares | (2,370) | (125) | 94,634 | 4,698 |
| Institutional Shares | ||||
| Issued1 | — | — | — | — |
| Issued in Lieu of Cash Distributions | 430 | 13 | 949 | 29 |
| Redeemed | — | — | (2,000) | (64) |
| Net Increase (Decrease) —Institutional Shares | 430 | 13 | (1,051) | (35) |
1 Includes purchase fees for fiscal 2018 and 2017 of $339,000 and $1,024,000, respectively (fund totals).
G. Management has determined that no material events or transactions occurred subsequent to April 30, 2018, that would require recognition or disclosure in these financial statements.
48
About Your Fund’s Expenses
As a shareholder of the fund, you incur ongoing costs, which include costs for portfolio management, administrative services, and shareholder reports (like this one), among others. Operating expenses, which are deducted from a fund’s gross income, directly reduce the investment return of the fund.
A fund’s expenses are expressed as a percentage of its average net assets. This figure is known as the expense ratio. The following examples are intended to help you understand the ongoing costs (in dollars) of investing in your fund and to compare these costs with those of other mutual funds. The examples are based on an investment of $1,000 made at the beginning of the period shown and held for the entire period.
The accompanying table illustrates your fund’s costs in two ways:
• Based on actual fund return. This section helps you to estimate the actual expenses that you paid over the period. The ”Ending Account Value“ shown is derived from the fund‘s actual return, and the third column shows the dollar amount that would have been paid by an investor who started with $1,000 in the fund. You may use the information here, together with the amount you invested, to estimate the expenses that you paid over the period.
To do so, simply divide your account value by $1,000 (for example, an $8,600 account value divided by $1,000 = 8.6), then multiply the result by the number given for your fund under the heading ”Expenses Paid During Period.“
• Based on hypothetical 5% yearly return. This section is intended to help you compare your fund‘s costs with those of other mutual funds. It assumes that the fund had a yearly return of 5% before expenses, but that the expense ratio is unchanged. In this case—because the return used is not the fund’s actual return—the results do not apply to your investment. The example is useful in making comparisons because the Securities and Exchange Commission requires all mutual funds to calculate expenses based on a 5% return. You can assess your fund’s costs by comparing this hypothetical example with the hypothetical examples that appear in shareholder reports of other funds.
Note that the expenses shown in the table are meant to highlight and help you compare ongoing costs only and do not reflect transaction costs incurred by the fund for buying and selling securities. Further, the expenses do not include any purchase, redemption, or account service fees described in the fund prospectus. If such fees were applied to your account, your costs would be higher. Your fund does not carry a “sales load.”
The calculations assume no shares were bought or sold during the period. Your actual costs may have been higher or lower, depending on the amount of your investment and the timing of any purchases or redemptions.
You can find more information about the fund’s expenses, including annual expense ratios, in the Financial Statements section of this report. For additional information on operating expenses and other shareholder costs, please refer to your fund’s current prospectus.
49
| Six Months Ended April 30, 2018 | |||
| Beginning | Ending | Expenses | |
| Account Value | Account Value | Paid During | |
| Emerging Markets Government Bond Index | 10/31/2017 | 4/30/2018 | Period |
| Based on Actual Fund Return | |||
| Investor Shares | $1,000.00 | $973.14 | $2.40 |
| ETF Shares | 1,000.00 | 974.07 | 1.57 |
| Admiral Shares | 1,000.00 | 974.01 | 1.57 |
| Institutional Shares | 1,000.00 | 974.39 | 1.42 |
| Based on Hypothetical 5% Yearly Return | |||
| Investor Shares | $1,000.00 | $1,022.36 | $2.46 |
| ETF Shares | 1,000.00 | 1,023.21 | 1.61 |
| Admiral Shares | 1,000.00 | 1,023.21 | 1.61 |
| Institutional Shares | 1,000.00 | 1,023.36 | 1.45 |
The calculations are based on expenses incurred in the most recent six-month period. The fund’s annualized six-month expense ratios for that period are 0.49% for Investor Shares, 0.32% for ETF Shares, 0.32% for Admiral Shares, and 0.29% for Institutional Shares. The dollar amounts shown as “Expenses Paid” are equal to the annualized expense ratio multiplied by the average account value over the period, multiplied by the number of days in the most recent six-month period, then divided by the number of days in the most recent 12-month period (181/365).
50
Trustees Approve Advisory Arrangement
The board of trustees of Vanguard Emerging Markets Government Bond Index Fund has renewed the fund’s investment advisory arrangement with The Vanguard Group, Inc. (Vanguard), through its Fixed Income Group. The board determined that continuing the fund’s internalized management structure was in the best interests of the fund and its shareholders.
The board based its decision upon an evaluation of the advisor’s investment staff, portfolio management process, and performance. This evaluation included information provided to the board by Vanguard’s Portfolio Review Department, which is responsible for fund and advisor oversight and product management. The Portfolio Review Department met regularly with the advisor and made monthly presentations to the board during the fiscal year that directed the board’s focus to relevant information and topics.
The board, or an investment committee made up of board members, also received information throughout the year during advisor presentations. For each advisor presentation, the board was provided with letters and reports that included information about, among other things, the advisory firm and the advisor’s assessment of the investment environment, portfolio performance, and portfolio characteristics.
In addition, the board received monthly reports, which included a Market and Economic Report, a Fund Dashboard Monthly Summary, and a Fund Performance Report.
Prior to their meeting, the trustees were provided with a memo and materials that summarized the information they received over the course of the year. They also considered the factors discussed below, among others. However, no single factor determined whether the board approved the arrangement. Rather, it was the totality of the circumstances that drove the board’s decision.
Nature, extent, and quality of services
The board reviewed the quality of the investment management services provided to the fund since its inception in 2013, and took into account the organizational depth and stability of the advisor. The board considered that Vanguard has been managing investments for more than three decades. The Fixed Income Group adheres to a sound, disciplined investment management process; the team has considerable experience, stability, and depth.
The board concluded that Vanguard’s experience, stability, depth, and performance, among other factors, warranted continuation of the advisory arrangement.
Investment performance
The board considered the performance of the fund since its inception, including any periods of outperformance or underperformance compared with its target index and peer group. The board concluded that the performance was such that the advisory arrangement should continue. Information about the fund’s performance can be found in the Performance Summary section of this report.
51
Cost
The board concluded that the fund’s expense ratio was well below the average expense ratio charged by funds in its peer group and that the fund’s advisory expenses were also below the peer-group average. Information about the fund’s expenses appears in the About Your Fund’s Expenses section of this report as well as in the Financial Statements section.
The board does not conduct a profitability analysis of Vanguard because of Vanguard’s unique “at-cost” structure. Unlike most other mutual fund management companies, Vanguard is owned by the funds it oversees and produces “profits” only in the form of reduced expenses for fund shareholders.
The benefit of economies of scale
The board concluded that the fund’s at-cost arrangement with Vanguard ensures that the fund will realize economies of scale as it grows, with the cost to shareholders declining as fund assets increase.
The board will consider whether to renew the advisory arrangement again after a one-year period.
52
Glossary
30-Day SEC Yield. A fund’s 30-day SEC yield is derived using a formula specified by the U.S. Securities and Exchange Commission. Under the formula, data related to the fund’s security holdings in the previous 30 days are used to calculate the fund’s hypothetical net income for that period, which is then annualized and divided by the fund’s estimated average net assets over the calculation period. For the purposes of this calculation, a security’s income is based on its current market yield to maturity (for bonds), its actual income (for asset-backed securities), or its projected dividend yield (for stocks). Because the SEC yield represents hypothetical annualized income, it will differ—at times significantly—from the fund’s actual experience. As a result, the fund’s income distributions may be higher or lower than implied by the SEC yield.
Average Coupon. The average interest rate paid on the fixed income securities held by a fund. It is expressed as a percentage of face value.
Average Duration. An estimate of how much the value of the bonds held by a fund will fluctuate in response to a change in interest rates. To see how the value could change, multiply the average duration by the change in rates. If interest rates rise by 1 percentage point, the value of the bonds in a fund with an average duration of five years would decline by about 5%. If rates decrease by a percentage point, the value would rise by 5%.
Average Effective Maturity. The average length of time until fixed income securities held by a fund reach maturity and are repaid, taking into consideration the possibility that the issuer may call the bond before its maturity date. The figure reflects the proportion of fund assets represented by each security; it also reflects any futures contracts held. In general, the longer the average effective maturity, the more a fund’s share price will fluctuate in response to changes in market interest rates.
Beta. A measure of the magnitude of a fund’s past share-price fluctuations in relation to the ups and downs of a given market index. The index is assigned a beta of 1.00. Compared with a given index, a fund with a beta of 1.20 typically would have seen its share price rise or fall by 12% when the index rose or fell by 10%. For this report, beta is based on returns over the past 36 months for both the fund and the index. Note that a fund’s beta should be reviewed in conjunction with its R-squared (see definition). The lower the R-squared, the less correlation there is between the fund and the index, and the less reliable beta is as an indicator of volatility.
Credit Quality. Credit-quality ratings are measured on a scale that generally ranges from AAA (highest) to D (lowest). U.S. Treasury, U.S. Agency, and U.S. Agency mortgage-backed securities appear under “U.S. Government.” Credit-quality ratings are obtained from Barclays and are from Moody’s, Fitch, and S&P. When ratings from all three agencies are used, the median rating is shown. When ratings from two of the agencies are used, the lower rating for each issue is shown. “Not Rated” is used to classify securities for which a rating is not available.
Expense Ratio. A fund’s total annual operating expenses expressed as a percentage of the fund’s average net assets. The expense ratio includes management and administrative expenses, but does not include the transaction costs of buying and selling portfolio securities.
Inception Date. The date on which the assets of a fund (or one of its share classes) are first invested in accordance with the fund’s investment objective. For funds with a subscription period, the inception date is the day after that period ends. Investment performance is measured from the inception date.
53
R-Squared. A measure of how much of a fund’s past returns can be explained by the returns from the market in general, as measured by a given index. If a fund’s total returns were precisely synchronized with an index’s returns, its R-squared would be 1.00. If the fund’s returns bore no relationship to the index’s returns, its R-squared would be 0. For this report, R-squared is based on returns over the past 36 months for both the fund and the index.
Short-Term Reserves. The percentage of a fund invested in highly liquid, short-term securities that can be readily converted to cash.
Yield to Maturity. The rate of return an investor would receive if the fixed income securities held by a fund were held to their maturity dates.
54
BLOOMBERG is a trademark and service mark of Bloomberg Finance L.P. BARCLAYS is a trademark and service mark of Barclays Bank Plc, used under license. Bloomberg Finance L.P. and its affiliates, including Bloomberg Index Services Limited (BISL) (collectively, Bloomberg), or Bloomberg’s licensors, own all proprietary rights in the Bloomberg Barclays USD Emerging Markets Government RIC Capped Index (Index or Bloomberg Barclays Index).
Neither Barclays Bank Plc, Barclays Capital Inc., or any affiliate (collectively Barclays) or Bloomberg is the issuer or producer of the Emerging Markets Government Bond Index Fund and neither Bloomberg nor Barclays has any responsibilities, obligations or duties to investors in the Emerging Markets Government Bond Index Fund. The Index is licensed for use by The Vanguard Group, Inc. (Vanguard) as the sponsor of the Emerging Markets Government Bond Index Fund. Bloomberg and Barclays’ only relationship with Vanguard in respect of the Index is the licensing of the Index, which is determined, composed and calculated by BISL, or any successor thereto, without regard to the Issuer or the Emerging Markets Government Bond Index Fund or the owners of the Emerging Markets Government Bond Index Fund.
Additionally, Vanguard may for itself execute transaction(s) with Barclays in or relating to the Index in connection with the Emerging Markets Government Bond Index Fund. Investors acquire the Emerging Markets Government Bond Index Fund from Vanguard and investors neither acquire any interest in the Index nor enter into any relationship of any kind whatsoever with Bloomberg or Barclays upon making an investment in the Emerging Markets Government Bond Index Fund. The Emerging Markets Government Bond Index Fund is not sponsored, endorsed, sold or promoted by Bloomberg or Barclays. Neither Bloomberg nor Barclays makes any representation or warranty, express or implied regarding the advisability of investing in the Emerging Markets Government Bond Index Fund or the advisability of investing in securities generally or the ability of the Index to track corresponding or relative market performance. Neither Bloomberg nor Barclays has passed on the legality or suitability of the Emerging Markets Government Bond Index Fund with respect to any person or entity. Neither Bloomberg nor Barclays is responsible for and has not participated in the determination of the timing of, prices at, or quantities of the Emerging Markets Government Bond Index Fund to be issued. Neither Bloomberg nor Barclays has any obligation to take the needs of the Issuer or the owners of the Emerging Markets Government Bond Index Fund or any other third party into consideration in determining, composing or calculating the Index. Neither Bloomberg nor Barclays has any obligation or liability in connection with administration, marketing or trading of the Emerging Markets Government Bond Index Fund.
55
The licensing agreement between Bloomberg and Barclays is solely for the benefit of Bloomberg and Barclays and not for the benefit of the owners of the Emerging Markets Government Bond Index Fund, investors or other third parties. In addition, the licensing agreement between Vanguard and Bloomberg is solely for the benefit of Vanguard and Bloomberg and not for the benefit of the owners of the Emerging Markets Government Bond Index Fund, investors or other third parties.
NEITHER BLOOMBERG NOR BARCLAYS SHALL HAVE ANY LIABILITY TO THE ISSUER, INVESTORS OR TO OTHER THIRD PARTIES FOR THE QUALITY, ACCURACY AND/OR COMPLETENESS OF THE BLOOMBERG BARCLAYS INDEX OR ANY DATA INCLUDED THEREIN OR FOR INTERRUPTIONS IN THE DELIVERY OF THE BLOOMBERG BARCLAYS INDEX. NEITHER BLOOMBERG NOR BARCLAYS MAKES ANY WARRANTY, EXPRESS OR IMPLIED, AS TO RESULTS TO BE OBTAINED BY THE ISSUER, THE INVESTORS OR ANY OTHER PERSON OR ENTITY FROM THE USE OF THE BLOOMBERG BARCLAYS INDEX OR ANY DATA INCLUDED THEREIN. NEITHER BLOOMBERG NOR BARCLAYS MAKES ANY EXPRESS OR IMPLIED WARRANTIES, AND EACH HEREBY EXPRESSLY DISCLAIMS ALL WARRANTIES OF MERCHANTABILITY OR FITNESS FOR A PARTICULAR PURPOSE OR USE WITH RESPECT TO THE BLOOMBERG BARCLAYS INDEX OR ANY DATA INCLUDED THEREIN. BLOOMBERG RESERVES THE RIGHT TO CHANGE THE METHODS OF CALCULATION OR PUBLICATION, OR
TO CEASE THE CALCULATION OR PUBLICATION OF THE BLOOMBERG BARCLAYS INDEX, AND NEITHER BLOOMBERG NOR BARCLAYS SHALL BE LIABLE FOR ANY MISCALCULATION OF OR ANY INCORRECT, DELAYED OR INTERRUPTED PUBLICATION WITH RESPECT TO THE BLOOMBERG BARCLAYS INDEX. NEITHER BLOOMBERG NOR BARCLAYS SHALL BE LIABLE FOR ANY DAMAGES, INCLUDING, WITHOUT LIMITATION, ANY SPECIAL, INDIRECT OR CONSEQUENTIAL DAMAGES, OR ANY LOST PROFITS AND EVEN IF ADVISED OF THE POSSIBILITY OF SUCH, RESULTING FROM THE USE OF THE BLOOMBERG BARCLAYS INDEX OR ANY DATA INCLUDED THEREIN OR WITH RESPECT TO THE EMERGING MARKETS GOVERNMENT BOND INDEX FUND.
None of the information supplied by Bloomberg or Barclays and used in this publication may be reproduced in any manner without the prior written permission of both Bloomberg and Barclays Capital, the investment banking division of Barclays Bank Plc. Barclays Bank Plc is registered in England No. 1026167. Registered office 1 Churchill Place London E14 5HP.
© 2018 Bloomberg. Used with Permission.
Source: Bloomberg Index Services Limited. Copyright 2018, Bloomberg. All rights reserved.
56
This page intentionally left blank.
This page intentionally left blank.
The People Who Govern Your Fund
The trustees of your mutual fund are there to see that the fund is operated and managed in your best interests since, as a shareholder, you are a part owner of the fund. Your fund’s trustees also serve on the board of directors of The Vanguard Group, Inc., which is owned by the Vanguard funds and provides services to them on an at-cost basis.
A majority of Vanguard’s board members are independent, meaning that they have no affiliation with Vanguard or the funds they oversee, apart from the sizable personal investments they have made as private individuals. The independent board members have distinguished backgrounds in business, academia, and public service. Each of the trustees and executive officers oversees 208 Vanguard funds.
Information for each trustee and executive officer of the fund appears below. The mailing address of the trustees and officers is P.O. Box 876, Valley Forge, PA 19482. More information about the trustees is in the Statement of Additional Information, which can be obtained, without charge, by contacting Vanguard at 800-662-7447, or online at vanguard.com.
Interested Trustees1
F. William McNabb III
Born in 1957. Trustee since July 2009. Principal occupation(s) during the past five years and other experience: chairman of the board (January 2010–present) of Vanguard and of each of the investment companies served by Vanguard, trustee (2009–present) of each of the investment companies served by Vanguard, and director (2008–present) of Vanguard. Chief executive officer and president (2008–2017) of Vanguard and each of the investment companies served by Vanguard, managing director (1995–2008) of Vanguard, and director (1997–2018) of Vanguard Marketing Corporation. Director (2018–present) of UnitedHealth Group.
Mortimer J. Buckley
Born in 1969. Trustee since January 2018. Principal occupation(s) during the past five years and other experience: chief executive officer (January 2018–present) of Vanguard; chief executive officer, president, and trustee (January 2018–present) of each of the investment companies served by Vanguard; president and director (2017–present) of Vanguard; and president (February 2018–present) of Vanguard Marketing Corporation. Chief investment officer (2013–2017), managing director (2002–2017), head of the Retail Investor Group (2006–2012), and chief information officer (2001–2006) of Vanguard. Chairman of the board (2011–2017) of the Children’s Hospital of Philadelphia.
Independent Trustees
Emerson U. Fullwood
Born in 1948. Trustee since January 2008. Principal occupation(s) during the past five years and other experience: executive chief staff and marketing officer for North America and corporate vice president (retired 2008) of Xerox Corporation (document management products and services). Former president of the Worldwide Channels Group, Latin America, and Worldwide Customer Service and executive chief staff officer of Developing Markets of Xerox. Executive in residence and 2009–2010 Distinguished Minett Professor at the Rochester Institute of Technology. Lead director of SPX FLOW, Inc. (multi-industry manufacturing). Director of the University of Rochester Medical Center, the Monroe Community College Foundation, the United Way of Rochester, North Carolina A&T University, and Roberts Wesleyan College. Trustee of the University of Rochester.
Amy Gutmann
Born in 1949. Trustee since June 2006. Principal occupation(s) during the past five years and other experience: president (2004–present) of the University of Pennsylvania. Christopher H. Browne Distinguished Professor of Political Science, School of Arts and Sciences, and professor of communication, Annenberg School for Communication, with secondary faculty appointments in the Department of Philosophy, School of Arts and Sciences, and at the Graduate School of Education, University of Pennsylvania. Trustee of the National Constitution Center.
1 Mr. McNabb and Mr. Buckley are considered “interested persons,” as defined in the Investment Company Act of 1940, because they are officers of the Vanguard funds.
JoAnn Heffernan Heisen
Born in 1950. Trustee since July 1998. Principal occupation(s) during the past five years and other experience: corporate vice president of Johnson & Johnson (pharmaceuticals/medical devices/consumer products) and member of its executive committee (1997–2008). Chief global diversity officer (retired 2008), vice president and chief information officer (1997–2006), controller (1995–1997), treasurer (1991–1995), and assistant treasurer (1989–1991) of Johnson & Johnson. Director of Skytop Lodge Corporation (hotels) and the Robert Wood Johnson Foundation. Member of the advisory board of the Institute for Women’s Leadership at Rutgers University.
F. Joseph Loughrey
Born in 1949. Trustee since October 2009. Principal occupation(s) during the past five years and other experience: president and chief operating officer (retired 2009) and vice chairman of the board (2008–2009) of Cummins Inc. (industrial machinery). Chairman of the board of Hillenbrand, Inc. (specialized consumer services), Oxfam America, and the Lumina Foundation for Education. Director of the V Foundation for Cancer Research. Member of the advisory council for the College of Arts and Letters and chair of the advisory board to the Kellogg Institute for International Studies, both at the University of Notre Dame.
Mark Loughridge
Born in 1953. Trustee since March 2012. Principal occupation(s) during the past five years and other experience: senior vice president and chief financial officer (retired 2013) of IBM (information technology services). Fiduciary member of IBM’s Retirement Plan Committee (2004–2013), senior vice president and general manager (2002–2004) of IBM Global Financing, vice president and controller (1998–2002) of IBM, and a variety of other prior management roles at IBM. Member of the Council on Chicago Booth.
Scott C. Malpass
Born in 1962. Trustee since March 2012. Principal occupation(s) during the past five years and other experience: chief investment officer (1989–present) and vice president (1996–present) of the University of Notre Dame. Assistant professor of finance at the Mendoza College of Business, University of Notre Dame, and member of the Notre Dame 403(b) Investment Committee. Chairman of the board of TIFF Advisory Services, Inc. Member of the board of Catholic Investment Services, Inc. (investment advisors), the board of advisors for Spruceview Capital Partners, and the board of superintendence of the Institute for the Works of Religion.
Deanna Mulligan
Born in 1963. Trustee since January 2018. Principal occupation(s) during the past five years and other experience: president (2010–present) and chief executive officer (2011–present) of The Guardian Life Insurance Company of America. Chief operating officer (2010–2011) and executive vice president (2008–2010) of Individual Life and Disability of The Guardian Life Insurance Company of America. Member of the board of The Guardian Life Insurance Company of America, the American Council of Life Insurers, the Partnership for New York City (business leadership), and the Committee Encouraging Corporate Philanthropy. Trustee of the Economic Club of New York and the Bruce Museum (arts and science). Member of the Advisory Council for the Stanford Graduate School of Business.
André F. Perold
Born in 1952. Trustee since December 2004. Principal occupation(s) during the past five years and other experience: George Gund Professor of Finance and Banking, Emeritus at the Harvard Business School (retired 2011). Chief investment officer and co-managing partner of HighVista Strategies LLC (private investment firm). Overseer of the Museum of Fine Arts Boston.
Sarah Bloom Raskin
Born in 1961. Trustee since January 2018. Principal occupation(s) during the past five years and other experience: deputy secretary (2014–2017) of the United States Department of the Treasury. Governor (2010–2014) of the Federal Reserve Board. Commissioner (2007–2010) of financial regulation for the State of Maryland. Member of the board of directors (2012–2014) of Neighborhood Reinvestment Corporation. Director of i(x) Investments, LLC.
Peter F. Volanakis
Born in 1955. Trustee since July 2009. Principal occupation(s) during the past five years and other experience: president and chief operating officer (retired 2010) of Corning Incorporated (communications equipment) and director of Corning Incorporated (2000–2010) and Dow Corning (2001–2010). Director (2012) of SPX Corporation (multi-industry manufacturing). Overseer of the Amos Tuck School of Business Administration, Dartmouth College (2001–2013). Chairman of the board of trustees of Colby-Sawyer College. Member of the Board of Hypertherm Inc. (industrial cutting systems, software, and consumables).
Executive Officers
Glenn Booraem
Born in 1967. Principal occupation(s) during the past five years and other experience: principal of Vanguard. Investment stewardship officer (2017–present), treasurer (2015–2017), controller (2010–2015), and assistant controller (2001–2010) of each of the investment companies served by Vanguard.
Christine M. Buchanan
Born in 1970. Principal occupation(s) during the past five years and other experience: principal of Vanguard and global head of Fund Administration at Vanguard. Treasurer (2017–present) of each of the investment companies served by Vanguard. Partner (2005–2017) at KPMG LLP (audit, tax, and advisory services).
Brian Dvorak
Born in 1973. Principal occupation(s) during the past five years and other experience: principal of Vanguard. Chief compliance officer (2017–present) of Vanguard and each of the investment companies served by Vanguard. Assistant vice president (2017–present) of Vanguard Marketing Corporation. Vice president and director of Enterprise Risk Management (2011–2013) at Oppenheimer Funds, Inc.
Thomas J. Higgins
Born in 1957. Principal occupation(s) during the past five years and other experience: principal of Vanguard. Chief financial officer (2008–present) and treasurer (1998–2008) of each of the investment companies served by Vanguard.
Peter Mahoney
Born in 1974. Principal occupation(s) during the past five years and other experience: principal of Vanguard. Controller (2015–present) of each of the investment companies served by Vanguard. Head of International Fund Services (2008–2014) at Vanguard.
Anne E. Robinson
Born in 1970. Principal occupation(s) during the past five years and other experience: general counsel (2016–present) of Vanguard. Secretary (2016–present) of Vanguard and of each of the investment companies served by Vanguard. Managing director (2016–present) of Vanguard. Director and senior vice president (2016–2018) of Vanguard Marketing Corporation. Managing director and general counsel of Global Cards and Consumer Services (2014–2016) at Citigroup. Counsel (2003–2014) at American Express.
Michael Rollings
Born in 1963. Principal occupation(s) during the past five years and other experience: finance director (2017–present) and treasurer (2017) of each of the investment companies served by Vanguard. Managing director (2016–present) of Vanguard. Chief financial officer (2016–present) of Vanguard. Director (2016–present) of Vanguard Marketing Corporation. Executive vice president and chief financial officer (2006–2016) of MassMutual Financial Group.
| Vanguard Senior Management Team | |
| Mortimer J. Buckley | James M. Norris |
| Gregory Davis | Thomas M. Rampulla |
| John James | Karin A. Risi |
| Martha G. King | Anne E. Robinson |
| John T. Marcante | Michael Rollings |
| Chris D. McIsaac | |
| Chairman Emeritus and Senior Advisor | |
| John J. Brennan | |
| Chairman, 1996–2009 | |
| Chief Executive Officer and President, 1996–2008 | |
| Founder | |
| John C. Bogle | |
| Chairman and Chief Executive Officer, 1974–1996 | |
 | |
P.O. Box 2600 | |
Connect with Vanguard® > vanguard.com | |
| Fund Information > 800-662-7447 | |
| Direct Investor Account Services > 800-662-2739 | |
| Institutional Investor Services > 800-523-1036 | |
| Text Telephone for People | |
| Who Are Deaf or Hard of Hearing > 800-749-7273 | |
| This material may be used in conjunction | |
| with the offering of shares of any Vanguard | |
| fund only if preceded or accompanied by | |
| the fund’s current prospectus. | |
| All comparative mutual fund data are from Lipper, a | |
| Thomson Reuters Company, or Morningstar, Inc., unless | |
| otherwise noted. | |
| You can obtain a free copy of Vanguard’s proxy voting | |
| guidelines by visiting vanguard.com/proxyreporting or by | |
| calling Vanguard at 800-662-2739. The guidelines are | |
| also available from the SEC’s website, sec.gov. In | |
| addition, you may obtain a free report on how your fund | |
| voted the proxies for securities it owned during the 12 | |
| months ended June 30. To get the report, visit either | |
| vanguard.com/proxyreporting or sec.gov. | |
| You can review and copy information about your fund at | |
| the SEC’s Public Reference Room in Washington, D.C. To | |
| find out more about this public service, call the SEC at | |
| 202-551-8090. Information about your fund is also | |
| available on the SEC’s website, and you can receive | |
| copies of this information, for a fee, by sending a | |
| request in either of two ways: via email addressed to | |
| publicinfo@sec.gov or via regular mail addressed to the | |
| Public Reference Section, Securities and Exchange | |
| Commission, Washington, DC 20549-1520. | |
| © 2018 The Vanguard Group, Inc. | |
| All rights reserved. | |
| Vanguard Marketing Corporation, Distributor. | |
| Q11202 062018 | |
| Semiannual Report | April 30, 2018 |
| Vanguard Global Minimum Volatility Fund |
Vanguard’s Principles for Investing Success
We want to give you the best chance of investment success. These
principles, grounded in Vanguard’s research and experience, can put you on
the right path.
Goals. Create clear, appropriate investment goals.
Balance. Develop a suitable asset allocation using broadly diversified funds.
Cost. Minimize cost.
Discipline. Maintain perspective and long-term discipline.
A single theme unites these principles: Focus on the things you can control.
We believe there is no wiser course for any investor.
| Contents | |
| Your Fund’s Performance at a Glance. | 1 |
| CEO’s Perspective. | 2 |
| Advisor’s Report. | 4 |
| Results of Proxy Voting. | 7 |
| Fund Profile. | 8 |
| Performance Summary. | 10 |
| Financial Statements. | 11 |
| About Your Fund’s Expenses. | 31 |
| Trustees Approve Advisory Arrangement. | 33 |
| Glossary. | 35 |
Please note: The opinions expressed in this report are just that—informed opinions. They should not be considered promises or advice. Also, please keep in mind that the information and opinions cover the period through the date on the front of this report. Of course, the risks of investing in your fund are spelled out in the prospectus.
See the Glossary for definitions of investment terms used in this report.
About the cover: Nautical images have been part of Vanguard’s rich heritage since its start in 1975. For an incoming ship, a lighthouse offers a beacon and safe path to shore. You can similarly depend on Vanguard to put you first––and light the way––as you strive to meet your financial goals. Our client focus and low costs, stemming from our unique ownership structure, assure that your interests are paramount.
Your Fund’s Performance at a Glance
• Vanguard Global Minimum Volatility Fund returned about 2% for the six months ended April 30, 2018, trailing its benchmark, the FTSE Global All Cap Index (USD Hedged), by about a percentage point.
• The fund’s objective is to create a portfolio that has broad equity exposure with less volatility than the global equity market. Over the period, the fund produced lower weekly volatility but also a lower risk-adjusted return than its benchmark. (We calculate weekly volatility and risk-adjusted return using standard deviation, as we discuss in the Advisor’s Report.)
• Our positions in industrials, information technology, health care, and consumer staples aided relative performance. Energy, utilities, and consumer discretionary were the biggest relative detractors.
• Overweight allocations to North America and the developed markets of the Pacific region helped lower volatility, as did our underweight position in emerging markets.
| Total Returns: Six Months Ended April 30, 2018 | |
| Total | |
| Returns | |
| Vanguard Global Minimum Volatility Fund | |
| Investor Shares | 2.00% |
| Admiral™ Shares | 2.08 |
| FTSE Global All Cap Index (USD Hedged) | 3.05 |
| Global Funds Average | 3.30 |
| Global Funds Average: Derived from data provided by Lipper, a Thomson Reuters Company. | |
| Admiral Shares carry lower expenses and are available to investors who meet certain account-balance requirements. |
| Expense Ratios | |||
| Your Fund Compared With Its Peer Group | |||
| Investor | Admiral | Peer Group | |
| Shares | Shares | Average | |
| Global Minimum Volatility Fund | 0.25% | 0.17% | 1.18% |
The fund expense ratios shown are from the prospectus dated February 22, 2018, and represent estimated costs for the current fiscal period. For the six months ended April 30, 2018, the fund’s annualized expense ratios were 0.25% for Investor Shares and 0.17% for Admiral Shares. The peer-group expense ratio is derived from data provided by Lipper, a Thomson Reuters Company, and captures information through year-end 2017.
Peer group: Global Funds.

CEO’s Perspective

Tim Buckley
President and Chief Executive Officer
Dear Shareholder,
I feel extremely fortunate to have the chance to lead a company filled with people who come to work every day passionate about Vanguard’s core purpose: to take a stand for all investors, to treat them fairly, and to give them the best chance for investment success.
When I joined Vanguard in 1991, I found a mission-driven team focused on improving lives—helping people retire more comfortably, put their children through college, and achieve financial security. I also found a company with purpose in an industry ripe for improvement.
It was clear, even early in my career, that the cards were stacked against most investors. Hidden fees, performance-chasing, and poor advice were relentlessly eroding investors’ dreams.
We knew Vanguard could be different and, as a result, could make a real difference. We have lowered the costs of investing for our shareholders significantly. And we’re proud of the performance of our funds.
Vanguard is built for Vanguard investors—we focus solely on you, our fund shareholders. Everything we do is designed to give our clients the best chance for investment success. In my role as CEO, I’ll keep this priority
2
front and center. We’re proud of what we’ve achieved, but we’re even more excited about what’s to come.
Steady, time-tested guidance
Our guidance for investors, as always, is to stay the course, tune out the hyperbolic headlines, and focus on your goals and what you can control, such as costs and how much you save. This time-tested advice has served our clients well over the decades.
Regardless of how the markets perform in the short term, I’m incredibly optimistic about the future for our investors. We have a dedicated team serving you, and we will never stop striving to make Vanguard the best place for you to invest through our high-quality funds and services, advice and guidance to help you meet your financial goals, and an experience that makes you feel good about entrusting us with your hard-earned savings.
Thank you for your continued loyalty.
Sincerely,

Mortimer J. Buckley
President and Chief Executive Officer
May 16, 2018
| Market Barometer | |||
| Total Returns | |||
| Periods Ended April 30, 2018 | |||
| Six | One | Five Years | |
| Months | Year | (Annualized) | |
| Stocks | |||
| Russell 1000 Index (Large-caps) | 3.83% | 13.17% | 12.84% |
| Russell 2000 Index (Small-caps) | 3.27 | 11.54 | 11.74 |
| Russell 3000 Index (Broad U.S. market) | 3.79 | 13.05 | 12.75 |
| FTSE All-World ex US Index (International) | 3.72 | 15.84 | 5.85 |
| Bonds | |||
| Bloomberg Barclays U.S. Aggregate Bond Index | |||
| (Broad taxable market) | -1.87% | -0.32% | 1.47% |
| Bloomberg Barclays Municipal Bond Index | |||
| (Broad tax-exempt market) | -0.97 | 1.56 | 2.44 |
| Citigroup Three-Month U.S. Treasury Bill Index | 0.67 | 1.16 | 0.32 |
| CPI | |||
| Consumer Price Index | 1.57% | 2.46% | 1.50% |
3
Advisor’s Report
For the six months ended April 30, 2018, Vanguard Global Minimum Volatility Fund returned 2.00% for Investor Shares and 2.08% for Admiral Shares, with an annualized weekly volatility of 11.63%. Its benchmark, the FTSE Global All Cap Index (USD Hedged), returned 3.05%, with an annualized weekly volatility of 14.48%. (To get the annualized weekly volatility, we calculate the standard deviation of weekly returns and multiply it by the square root of 52, the number of weeks in a year.)
Investment objective
Our objective is to create a portfolio that has broad equity exposure with less volatility than the global equity market. We achieved this over the performance period, as the fund’s weekly volatility averaged 19.68% less than that of its benchmark.
It is important to mention, as we have in the past, that we do not target a specific volatility level. Rather, we seek to provide an equity fund that has lower absolute risk than the broad global market. Thus, when the broad global equity market is experiencing periods of low volatility, you should expect this fund’s volatility to be much closer to the volatility level of its benchmark.
We recognize that equity-like returns are also an important outcome of an investment in this fund, but achieving a total return higher than the benchmark’s is not our objective. Although our research leads us to expect that, on average, a minimum
volatility fund may outperform the overall global market in sharp downturns (while still experiencing losses), the fund should be expected to trail in strong bull markets. With that in mind, because the fund is expected to have a lower level of risk than the global equity market, you should not expect it to outperform the market over the long run.
We think an acceptable comparative performance measure for the fund over the long term is its risk-adjusted return. This can be calculated by dividing the portfolio’s total return for the period by the annualized standard deviation of weekly returns. We view six months to be a relatively short time, but for the semiannual period, the risk-adjusted return was 0.17, compared with 0.21 for the benchmark. Over a longer period—since the fund’s inception on December 12, 2013—its risk-adjusted return was 1.23, compared with 0.88 for the benchmark.
Investment strategy
In building our portfolio, we use quantitative models that evaluate a variety of factors that drive a stock’s volatility. These fundamental drivers include risk factors such as growth, value, dividend yields, size, volatility, and liquidity. In addition, our portfolio construction process includes estimates of each stock’s correlation—or how its factors move in relation to one another. This approach
4
allows us to make appropriate risk/ diversification trade-offs, while not relying solely on volatility estimates.
Our process also approaches currency exposure and its impact on a portfolio in a specific manner. We recognize that owning companies in foreign markets involves the risk of movements in foreign currency exchange rates relative to the U.S. dollar. Because of this, an optimization process that focuses solely on volatilities tied to an investor’s home currency will tend to overweight exposures to that currency. We aim to avoid such currency-specific exposures by focusing on equity volatilities and correlations measured in local currency terms. Then we use currency forward contracts to hedge the resulting exposure for U.S. investors. We believe this process can further reduce the volatility of the portfolio overall in the long run.
Finally, when constructing the portfolio, we apply constraints to reduce stock, sector, and country concentration risk. We find that these constraints, which allow for broader diversification and liquidity, reduce unnecessarily high risk exposures without significantly affecting our ability to reduce overall volatility. Drawing from the universe of about 7,700 stocks in the FTSE index, we construct a portfolio of about 400–450 stocks.
The investment environment
The period opened with global equities posting positive returns. In the United States, encouraging economic fundamentals, tax-law changes, and low inflation boosted investor sentiment. The European economy continued on a path of broad improvement, including record-high employment and manufacturing activity and elevated consumer confidence. Developed markets in the Pacific region also rallied, helped by economic and business activity in Japan and Singapore.
As 2018 began, global economic momentum remained positive against a backdrop of rising volatility and a hawkish tone from the major central banks. In the United States, companies began to respond to the new tax law, and strong earnings announcements moved the Standard & Poor’s 500 Index to a record high at the end of January. Equities in the developed markets of Europe and the Pacific region also rose, fueled by improvement in macroeconomic fundamentals.
February brought a sudden change in market sentiment, and investors saw volatility return after an unusually long period of calm. From a macroeconomic perspective, it seems the markets finally realized that the U.S. tax cuts and large government spending package posed upside risks to inflation and could speed up the Federal Reserve’s timetable for raising the target interest rate. (This is on top of pro-growth deregulation.) Against
5
a backdrop of strong economic fundamentals, these stimulus efforts spurred some of the spike in volatility, as inflation and interest-rate concerns grew.
The fund’s successes and shortfalls
In addition, the benefits of our strategy become even clearer when you seek to remove some of the noise caused by short-term reversals in daily and weekly returns, which can increase volatility levels, and focus on a longer return horizon such as monthly returns. For example, since inception, the fund has delivered a 30.95% reduction in the annualized volatility of monthly returns relative to its benchmark.
Despite a challenging environment over the six months, our strategy of holding stocks that have lower correlations with one another provided diversification benefits. On average, we were overweighted in less volatile sectors—such as consumer staples, telecommunication services, and utilities—and underweighted in two of the
benchmark’s more volatile industry groups, energy and financials. Our overweight allocations to the North American and Pacific regions helped lower volatility, as did our underweight positions in energy and information technology markets.
We expect our approach to portfolio construction to pay off in reduced volatility over the long run. With this in mind, we find that focusing on the long-term, risk-adjusted returns of the portfolio relative to the benchmark realigns expectations with the fund’s objective. We thank you for your investment and look forward to serving our investors in the future.
Portfolio Managers: Anatoly Shtekhman, CFA
Felix Xu, CFA
Vanguard Quantitative Equity Group
May 21, 2018
6
Results of Proxy Voting
At a special meeting of shareholders on November 15, 2017, fund shareholders approved the following proposals:
Proposal 1—Elect trustees for the fund.*
The individuals listed in the table below were elected as trustees for the fund. All trustees with the exception of Ms. Mulligan, Ms. Raskin, and Mr. Buckley (each of whom already serves as a director of The Vanguard Group, Inc.) served as trustees to the funds prior to the shareholder meeting.
| Percentage | |||
| Trustee | For | Withheld | For |
| Mortimer J. Buckley | 860,548,560 | 28,473,629 | 96.8% |
| Emerson U. Fullwood | 859,625,511 | 29,396,677 | 96.7% |
| Amy Gutmann | 859,439,842 | 29,582,347 | 96.7% |
| JoAnn Heffernan Heisen | 860,336,031 | 28,686,158 | 96.8% |
| F. Joseph Loughrey | 860,411,988 | 28,610,200 | 96.8% |
| Mark Loughridge | 860,924,717 | 28,097,471 | 96.8% |
| Scott C. Malpass | 859,842,339 | 29,179,849 | 96.7% |
| F. William McNabb III | 859,460,373 | 29,561,815 | 96.7% |
| Deanna Mulligan | 860,984,342 | 28,037,846 | 96.8% |
| André F. Perold | 850,692,197 | 38,329,992 | 95.7% |
| Sarah Bloom Raskin | 860,331,311 | 28,690,878 | 96.8% |
| Peter F. Volanakis | 860,652,393 | 28,369,796 | 96.8% |
| * Results are for all funds within the same trust. |
Proposal 3—Approve a manager-of-managers arrangement with wholly owned subsidiaries of Vanguard.
This arrangement enables Vanguard or the fund to enter into and materially amend investment advisory arrangements with wholly owned subsidiaries of Vanguard, subject to the approval of the fund’s board of trustees and any conditions imposed by the Securities and Exchange Commission (SEC), while avoiding the costs and delays associated with obtaining future shareholder approval. The ability of the fund to operate in this manner is contingent upon the SEC’s approval of a pending application for an order of exemption.
| Broker | Percentage | ||||
| Vanguard Fund | For | Abstain | Against | Non-Votes | For |
| Global Minimum Volatility | |||||
| Fund | 56,929,876 | 3,309,485 | 2,706,921 | 18,700,866 | 69.7% |
7
Global Minimum Volatility Fund
Fund Profile
As of April 30, 2018
| Share-Class Characteristics | ||
| Investor | Admiral | |
| Shares | Shares | |
| Ticker Symbol | VMVFX | VMNVX |
| Expense Ratio1 | 0.25% | 0.17% |
| Portfolio Characteristics | ||
| FTSE Global | ||
| All Cap Index | ||
| Fund | (USD Hedged) | |
| Number of Stocks | 410 | 7,847 |
| Median Market Cap | $10.6B | $42.4B |
| Price/Earnings Ratio | 20.1x | 17.0x |
| Price/Book Ratio | 2.3x | 2.2x |
| Return on Equity | 12.9% | 13.5% |
| Earnings Growth | ||
| Rate | 8.0% | 9.2% |
| Dividend Yield | 2.8% | 2.3% |
| Turnover Rate | ||
| (Annualized) | 29% | — |
| Short-Term Reserves | -1.1% | — |
| Sector Diversification (% of equity exposure) | ||
| FTSE Global | ||
| All Cap Index | ||
| Fund | (USD Hedged) | |
| Consumer Discretionary | 11.0% | 12.5% |
| Consumer Staples | 12.2 | 7.6 |
| Energy | 1.5 | 6.4 |
| Financials | 14.8 | 18.2 |
| Health Care | 10.8 | 10.7 |
| Industrials | 10.4 | 11.6 |
| Information Technology | 13.4 | 17.8 |
| Materials | 3.9 | 5.8 |
| Real Estate | 8.0 | 3.8 |
| Telecommunication Services | 7.0 | 2.6 |
| Utilities | 7.0 | 3.0 |
Sector categories are based on the Global Industry Classification Standard (“GICS”), except for the “Other” category (if applicable), which includes securities that have not been provided a GICS classification as of the effective reporting period.
| Volatility Measures | |
| FTSE Global | |
| All Cap Index | |
| (USD Hedged) | |
| R-Squared | 0.68 |
| Beta | 0.54 |
These measures show the degree and timing of the fund’s fluctuations compared with the index over 36 months.
| Ten Largest Holdings (% of total net assets) | ||
| Starwood Property Trust | ||
| Inc. | Mortgage REITs | 1.6% |
| Amdocs Ltd. | IT Consulting & | |
| Other Services | 1.5 | |
| Jack Henry & Associates Data Processing & | ||
| Inc. | Outsourced Services | 1.5 |
| Broadridge Financial | Data Processing & | |
| Solutions Inc. | Outsourced Services | 1.4 |
| HDFC Bank Ltd. | Diversified Banks | 1.4 |
| Waste Management Inc. Environmental & | ||
| Facilities Services | 1.3 | |
| Expeditors International | Air Freight & | |
| of Washington Inc. | Logistics | 1.3 |
| Quest Diagnostics Inc. | Health Care Services | 1.2 |
| Dollarama Inc. | General Merchandise | |
| Stores | 1.1 | |
| Fidelity National | Data Processing & | |
| Information Services Inc. Outsourced Services | 1.1 | |
| Top Ten | 13.4% | |
The holdings listed exclude any temporary cash investments and equity index products.
Allocation by Region (% of equity exposure)
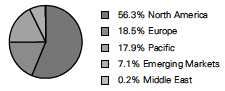
1 The expense ratios shown are from the prospectus dated February 22, 2018, and represent estimated costs for the current fiscal period. For the six months ended April 30, 2018, the annualized expense ratios were 0.25% for Investor Shares and 0.17% for Admiral Shares.
8
Global Minimum Volatility Fund
| Market Diversification (% of equity exposure) | ||
| FTSE Global | ||
| All Cap | ||
| Index | ||
| (USD | ||
| Fund | Hedged) | |
| Europe | ||
| United Kingdom | 6.2% | 6.0% |
| Switzerland | 4.4 | 2.4 |
| Germany | 2.3 | 3.0 |
| France | 1.4 | 3.2 |
| Sweden | 1.3 | 1.0 |
| Other | 2.9 | 5.1 |
| Subtotal | 18.5% | 20.7% |
| Pacific | ||
| Japan | 7.5% | 8.5% |
| Australia | 4.3 | 2.3 |
| South Korea | 2.6 | 1.9 |
| Hong Kong | 2.5 | 1.2 |
| Other | 1.0 | 0.7 |
| Subtotal | 17.9% | 14.6% |
| Emerging Markets | ||
| India | 2.0% | 1.2% |
| Brazil | 1.5 | 0.9 |
| Taiwan | 1.4 | 1.5 |
| China | 1.1 | 3.2 |
| Other | 1.1 | 3.2 |
| Subtotal | 7.1% | 10.0% |
| North America | ||
| United States | 50.6% | 51.5% |
| Canada | 5.7 | 3.0 |
| Subtotal | 56.3% | 54.5% |
| Middle East | 0.2% | 0.2% |
9
Global Minimum Volatility Fund
Performance Summary
All of the returns in this report represent past performance, which is not a guarantee of future results that may be achieved by the fund. (Current performance may be lower or higher than the performance data cited. For performance data current to the most recent month-end, visit our website at vanguard.com/performance.) Note, too, that both investment returns and principal value can fluctuate widely, so an investor’s shares, when sold, could be worth more or less than their original cost. The returns shown do not reflect taxes that a shareholder would pay on fund distributions or on the sale of fund shares.
Fiscal-Year Total Returns (%): December 12, 2013, Through April 30, 2018
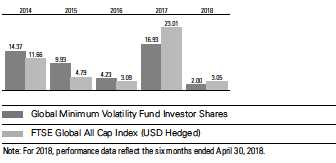
Average Annual Total Returns: Periods Ended March 31, 2018
This table presents returns through the latest calendar quarter—rather than through the end of the fiscal period.
Securities and Exchange Commission rules require that we provide this information.
| Inception | One | Since | |
| Date | Year | Inception | |
| Investor Shares | 12/12/2013 | 9.40% | 10.74% |
| Admiral Shares | 12/12/2013 | 9.53 | 10.83 |
See Financial Highlights for dividend and capital gains information.
10
Global Minimum Volatility Fund
Financial Statements (unaudited)
Statement of Net Assets
As of April 30, 2018
The fund reports a complete list of its holdings in regulatory filings four times in each fiscal year, at the quarter-ends. For the second and fourth fiscal quarters, the lists appear in the fund’s semiannual and annual reports to shareholders. For the first and third fiscal quarters, the fund files the lists with the Securities and Exchange Commission on Form N-Q. Shareholders can look up the fund’s Forms N-Q on the SEC’s website at sec.gov. Forms N-Q may also be reviewed and copied at the SEC’s Public Reference Room (see the back cover of this report for further information).
| Market | ||
| Value• | ||
| Shares | ($000) | |
| Common Stocks (98.1%)1 | ||
| Australia (4.2%) | ||
| AGL Energy Ltd. | 983,833 | 16,034 |
| Wesfarmers Ltd. | 367,202 | 12,081 |
| Cochlear Ltd. | 70,913 | 10,320 |
| Sonic Healthcare Ltd. | 513,781 | 9,109 |
| Woolworths Group Ltd. | 391,019 | 8,178 |
| Transurban Group | 787,070 | 6,858 |
| Stockland | 2,204,185 | 6,852 |
| ASX Ltd. | 141,615 | 6,226 |
| Caltex Australia Ltd. | 206,011 | 4,791 |
| Woodside Petroleum | ||
| Ltd. | 113,275 | 2,745 |
| GPT Group | 514,397 | 1,865 |
| Amcor Ltd. | 176,247 | 1,816 |
| AMP Ltd. | 553,612 | 1,676 |
| JB Hi-Fi Ltd. | 75,108 | 1,448 |
| Coca-Cola Amatil Ltd. | 195,045 | 1,361 |
| Computershare Ltd. | 97,458 | 1,240 |
| Crown Resorts Ltd. | 120,123 | 1,166 |
| Challenger Ltd. | 115,999 | 938 |
| BWP Trust | 383,701 | 902 |
| Goodman Group | 119,454 | 813 |
| Ramsay Health Care Ltd. | 12,064 | 587 |
| Charter Hall Retail REIT | 191,055 | 566 |
| 97,572 | ||
| Austria (0.1%) | ||
| voestalpine AG | 50,217 | 2,649 |
| Belgium (0.5%) | ||
| Colruyt SA | 126,301 | 7,107 |
| Elia System Operator SA | 23,212 | 1,466 |
| Sofina SA | 6,290 | 1,098 |
| Cofinimmo SA | 5,474 | 727 |
| Ackermans & van Haaren | ||
| NV | 2,298 | 415 |
| 10,813 | ||
| Brazil (1.5%) | |||
| Telefonica Brasil SA ADR | 966,926 | 13,653 | |
| Ambev SA ADR | 1,870,822 | 12,385 | |
| Ultrapar Participacoes | |||
| SA ADR | 283,674 | 4,913 | |
| TIM Participacoes SA | |||
| ADR | 117,950 | 2,683 | |
| 33,634 | |||
| Canada (5.7%) | |||
| ^ | Dollarama Inc. | 228,372 | 26,289 |
| BCE Inc. | 464,284 | 19,704 | |
| ^ | Emera Inc. | 608,272 | 18,945 |
| TELUS Corp. | 519,828 | 18,603 | |
| Canadian Tire Corp. Ltd. | |||
| Class A | 81,280 | 11,077 | |
| Shaw Communications | |||
| Inc. Class B | 508,080 | 10,443 | |
| Intact Financial Corp. | 95,668 | 7,294 | |
| ^ | Bank of Montreal | 78,683 | 5,976 |
| Pembina Pipeline Corp. | 108,535 | 3,456 | |
| National Bank of Canada | 60,737 | 2,885 | |
| * | CGI Group Inc. Class A | 42,164 | 2,443 |
| Metro Inc. | 38,536 | 1,223 | |
| Fortis Inc. | 34,129 | 1,146 | |
| 2 | Hydro One Ltd. | 53,573 | 851 |
| Power Corp. of Canada | 17,850 | 424 | |
| 130,759 | |||
| Chile (0.2%) | |||
| Enel Americas SA ADR | 157,624 | 1,789 | |
| Enel Chile SA ADR | 152,793 | 951 | |
| Cia Cervecerias Unidas | |||
| SA ADR | 30,786 | 850 | |
| Banco Santander Chile | |||
| ADR | 20,561 | 679 | |
| 4,269 | |||
11
Global Minimum Volatility Fund
| Market | |||
| Value• | |||
| Shares | ($000) | ||
| China (1.1%) | |||
| China Mobile Ltd. ADR | 479,851 | 22,774 | |
| * | Ctrip.com International | ||
| Ltd. ADR | 78,082 | 3,193 | |
| 25,967 | |||
| Denmark (0.4%) | |||
| Coloplast A/S Class B | 36,733 | 3,112 | |
| Carlsberg A/S Class B | 18,343 | 2,051 | |
| * | William Demant Holding | ||
| A/S | 51,625 | 2,012 | |
| Jyske Bank A/S | 19,159 | 1,147 | |
| H Lundbeck A/S | 17,814 | 1,032 | |
| 9,354 | |||
| Finland (0.2%) | |||
| Elisa Oyj | 64,997 | 2,873 | |
| Fortum Oyj | 68,278 | 1,571 | |
| Nokian Renkaat Oyj | 22,391 | 896 | |
| 5,340 | |||
| France (1.4%) | |||
| Hermes International | 20,184 | 13,052 | |
| Thales SA | 58,591 | 7,427 | |
| Dassault Systemes SE | 41,243 | 5,345 | |
| Accor SA | 73,498 | 4,154 | |
| Sodexo SA | 15,825 | 1,567 | |
| Alstom SA | 31,989 | 1,457 | |
| 33,002 | |||
| Germany (2.3%) | |||
| Deutsche Post AG | 356,181 | 15,460 | |
| Merck KGaA | 50,401 | 4,924 | |
| MTU Aero Engines AG | 27,951 | 4,808 | |
| HUGO BOSS AG | 47,154 | 4,421 | |
| Fielmann AG | 43,608 | 3,581 | |
| Axel Springer SE | 38,553 | 3,158 | |
| Henkel AG & Co. KGaA | |||
| Preference Shares | 24,216 | 3,077 | |
| *,2 | Scout24 AG | 57,520 | 2,973 |
| Aareal Bank AG | 32,422 | 1,622 | |
| Beiersdorf AG | 13,977 | 1,581 | |
| RHOEN-KLINIKUM AG | 44,814 | 1,465 | |
| Freenet AG | 43,292 | 1,374 | |
| Wirecard AG | 9,580 | 1,296 | |
| adidas AG | 5,021 | 1,234 | |
| Rheinmetall AG | 6,494 | 849 | |
| Aurubis AG | 8,146 | 728 | |
| 52,551 | |||
| Hong Kong (2.4%) | |||
| CLP Holdings Ltd. | 2,269,350 | 23,565 | |
| Hang Seng Bank Ltd. | 424,500 | 10,753 | |
| Power Assets Holdings | |||
| Ltd. | 1,206,000 | 8,974 | |
| Yuexiu REIT | 5,326,000 | 3,555 | |
| Want Want China | |||
| Holdings Ltd. | 3,487,000 | 3,081 | |
| Chow Tai Fook Jewellery | |||
| Group Ltd. | 1,969,600 | 2,539 | |
| CK Infrastructure | |||
| Holdings Ltd. | 217,500 | 1,717 | |
| China Mengniu Dairy | |||
| Co. Ltd. | 482,000 | 1,554 | |
| MTR Corp. Ltd. | 104,500 | 587 | |
| 56,325 | |||
| India (2.0%) | |||
| HDFC Bank Ltd. ADR | 331,939 | 31,803 | |
| Infosys Ltd. ADR | 424,978 | 7,509 | |
| Dr Reddy’s Laboratories | |||
| Ltd. ADR | 160,635 | 5,190 | |
| 2 | Reliance Industries Ltd. | ||
| GDR | 26,708 | 769 | |
| 45,271 | |||
| Indonesia (0.3%) | |||
| Telekomunikasi Indonesia | |||
| Persero Tbk PT ADR | 286,923 | 7,819 | |
| Ireland (0.1%) | |||
| Kerry Group plc Class A | 22,787 | 2,323 | |
| Israel (0.2%) | |||
| Bank Hapoalim BM | 679,226 | 4,639 | |
| Paz Oil Co. Ltd. | 5,690 | 828 | |
| 5,467 | |||
| Italy (0.4%) | |||
| Mediobanca Banca di | |||
| Credito Finanziario SPA | 312,781 | 3,790 | |
| Moncler SPA | 59,053 | 2,662 | |
| Terna Rete Elettrica | |||
| Nazionale SPA | 409,786 | 2,460 | |
| Recordati SPA | 23,219 | 828 | |
| 9,740 | |||
| Japan (7.4%) | |||
| Daiichi Sankyo Co. Ltd. | 347,800 | 11,904 | |
| Otsuka Holdings Co. Ltd. | 208,000 | 10,875 | |
| Canon Inc. | 286,700 | 9,862 | |
| NEC Corp. | 345,300 | 9,465 | |
| Mitsubishi Tanabe Pharma | |||
| Corp. | 477,100 | 9,062 | |
| Kagome Co. Ltd. | 230,700 | 8,318 | |
| NTT DOCOMO Inc. | 284,100 | 7,339 | |
| Japan Tobacco Inc. | 251,500 | 6,761 | |
| Sawai Pharmaceutical | |||
| Co. Ltd. | 154,500 | 6,677 | |
| ^ | Yamada Denki Co. Ltd. | 1,133,700 | 5,930 |
| Skylark Co. Ltd. | 403,000 | 5,928 | |
| Seven & i Holdings Co. | |||
| Ltd. | 108,700 | 4,789 | |
| Toyo Suisan Kaisha Ltd. | 101,400 | 3,992 | |
| ABC-Mart Inc. | 57,300 | 3,776 | |
12
| Global Minimum Volatility Fund | |||
| Market | |||
| Value• | |||
| Shares | ($000) | ||
| Taisho Pharmaceutical | |||
| Holdings Co. Ltd. | 37,700 | 3,606 | |
| Toho Co. Ltd. | 107,900 | 3,599 | |
| Chugoku Electric Power | |||
| Co. Inc. | 285,200 | 3,568 | |
| Sumitomo Dainippon | |||
| Pharma Co. Ltd. | 185,900 | 3,381 | |
| Nitori Holdings Co. Ltd. | 18,800 | 3,170 | |
| Ryohin Keikaku Co. Ltd. | 8,700 | 2,976 | |
| Sankyo Co. Ltd. | 81,700 | 2,864 | |
| Japan Airlines Co. Ltd. | 72,100 | 2,845 | |
| Eisai Co. Ltd. | 41,900 | 2,810 | |
| Unicharm Corp. | 93,400 | 2,626 | |
| K’s Holdings Corp. | 180,400 | 2,602 | |
| Chugai Pharmaceutical | |||
| Co. Ltd. | 45,800 | 2,415 | |
| Shimamura Co. Ltd. | 19,500 | 2,269 | |
| Nissin Foods Holdings | |||
| Co. Ltd. | 27,800 | 2,047 | |
| MOS Food Services Inc. | 60,500 | 1,833 | |
| Pigeon Corp. | 37,600 | 1,763 | |
| Nisshin Seifun Group Inc. | 77,500 | 1,694 | |
| Takashimaya Co. Ltd. | 196,000 | 1,683 | |
| Lawson Inc. | 24,900 | 1,645 | |
| Takeda Pharmaceutical | |||
| Co. Ltd. | 38,200 | 1,609 | |
| Rohto Pharmaceutical | |||
| Co. Ltd. | 51,000 | 1,485 | |
| Hisamitsu Pharmaceutical | |||
| Co. Inc. | 17,100 | 1,329 | |
| NH Foods Ltd. | 29,000 | 1,267 | |
| Ajinomoto Co. Inc. | 65,000 | 1,191 | |
| Kura Corp. | 15,800 | 1,135 | |
| Tsumura & Co. | 27,900 | 1,012 | |
| Isetan Mitsukoshi | |||
| Holdings Ltd. | 83,100 | 925 | |
| Kamigumi Co. Ltd. | 36,000 | 810 | |
| Nichirei Corp. | 26,800 | 776 | |
| Bic Camera Inc. | 45,200 | 741 | |
| Earth Corp. | 13,200 | 693 | |
| Studio Alice Co. Ltd. | 28,500 | 640 | |
| Benesse Holdings Inc. | 17,500 | 637 | |
| Yoshinoya Holdings Co. | |||
| Ltd. | 31,400 | 583 | |
| ^ | UACJ Corp. | 20,900 | 545 |
| Nippon Television | |||
| Holdings Inc. | 28,000 | 491 | |
| 169,943 | |||
| Mexico (0.6%) | |||
| Fomento Economico | |||
| Mexicano SAB de CV | |||
| ADR | 121,291 | 11,724 | |
| Grupo Televisa SAB ADR | 92,350 | 1,655 | |
| 13,379 | |||
| Netherlands (0.2%) | |||
| Koninklijke Ahold | |||
| Delhaize NV | 186,124 | 4,490 | |
| New Zealand (0.1%) | |||
| Spark New Zealand Ltd. | 1,236,367 | 3,002 | |
| Norway (0.4%) | |||
| ^ | Orkla ASA | 925,762 | 8,568 |
| Telenor ASA | 33,367 | 739 | |
| 9,307 | |||
| Singapore (0.9%) | |||
| Oversea-Chinese Banking | |||
| Corp. Ltd. | 934,748 | 9,655 | |
| United Overseas Bank | |||
| Ltd. | 306,300 | 6,936 | |
| Singapore | |||
| Telecommunications | |||
| Ltd. | 1,339,900 | 3,544 | |
| Singapore Exchange Ltd. | 121,900 | 707 | |
| Singapore Airlines Ltd. | 79,940 | 652 | |
| 21,494 | |||
| South Korea (2.5%) | |||
| Korea Zinc Co. Ltd. | 34,802 | 14,085 | |
| KT Corp. | 510,114 | 12,970 | |
| SK Telecom Co. Ltd. | 29,049 | 6,207 | |
| KT&G Corp. | 59,300 | 5,423 | |
| S-Oil Corp. | 43,154 | 4,426 | |
| Woori Bank | 205,992 | 3,075 | |
| GS Holdings Corp. | 51,116 | 2,926 | |
| Maeil Dairies Co. Ltd. | 33,866 | 2,525 | |
| Samsung Fire & Marine | |||
| Insurance Co. Ltd. | 8,447 | 2,109 | |
| Yuhan Corp. | 5,881 | 1,256 | |
| Kangwon Land Inc. | 42,410 | 1,144 | |
| POSCO | 2,941 | 1,013 | |
| Macquarie Korea | |||
| Infrastructure Fund | 106,880 | 895 | |
| Hyundai Department | |||
| Store Co. Ltd. | 6,499 | 627 | |
| 58,681 | |||
| Spain (0.6%) | |||
| ^ | Merlin Properties Socimi | ||
| SA | 489,764 | 7,557 | |
| Endesa SA | 56,688 | 1,322 | |
| Bankinter SA | 118,040 | 1,234 | |
| Red Electrica Corp. SA | 50,985 | 1,062 | |
| Viscofan SA | 15,824 | 1,049 | |
| Ebro Foods SA | 17,809 | 429 | |
| 12,653 | |||
13
| Global Minimum Volatility Fund | |||
| Market | |||
| Value• | |||
| Shares | ($000) | ||
| Sweden (1.3%) | |||
| Swedish Match AB | 418,420 | 18,770 | |
| Essity AB Class B | 174,354 | 4,423 | |
| Tele2 AB | 225,278 | 2,920 | |
| Telia Co. AB | 450,547 | 2,218 | |
| ^ | ICA Gruppen AB | 61,545 | 1,911 |
| 30,242 | |||
| Switzerland (4.4%) | |||
| Swisscom AG | 49,515 | 23,749 | |
| Sonova Holding AG | 113,003 | 18,622 | |
| Kuehne & Nagel | |||
| International AG | 108,640 | 16,915 | |
| Logitech International SA | 301,217 | 11,128 | |
| Baloise Holding AG | 54,703 | 8,671 | |
| Straumann Holding AG | 8,978 | 6,095 | |
| Partners Group Holding AG | 7,766 | 5,664 | |
| Swiss Prime Site AG | 35,518 | 3,328 | |
| Flughafen Zurich AG | 12,226 | 2,553 | |
| dormakaba Holding AG | 2,472 | 1,912 | |
| * | Allreal Holding AG | 9,242 | 1,519 |
| Siegfried Holding AG | 2,483 | 863 | |
| 101,019 | |||
| Taiwan (1.4%) | |||
| Taiwan Semiconductor | |||
| Manufacturing Co. Ltd. | |||
| ADR | 564,770 | 21,715 | |
| Chunghwa Telecom Co. | |||
| Ltd. ADR | 217,730 | 8,272 | |
| United Microelectronics | |||
| Corp. ADR | 995,508 | 2,658 | |
| 32,645 | |||
| United Kingdom (6.2%) | |||
| GlaxoSmithKline plc | 1,263,425 | 25,341 | |
| Coca-Cola HBC AG | 364,790 | 12,221 | |
| RSA Insurance Group plc | 936,499 | 8,450 | |
| Smith & Nephew plc | 436,406 | 8,358 | |
| B&M European Value | |||
| Retail SA | 1,492,336 | 8,316 | |
| Informa plc | 795,753 | 8,079 | |
| Royal Dutch Shell plc | |||
| Class B | 220,000 | 7,854 | |
| Reckitt Benckiser Group | |||
| plc | 77,636 | 6,090 | |
| Compass Group plc | 273,047 | 5,858 | |
| Rightmove plc | 87,748 | 5,503 | |
| Tate & Lyle plc | 565,549 | 4,467 | |
| Segro plc | 453,522 | 4,024 | |
| Wm Morrison | |||
| Supermarkets plc | 1,011,409 | 3,373 | |
| DS Smith plc | 395,029 | 2,830 | |
| Legal & General | |||
| Group plc | 733,700 | 2,717 | |
| 2 | Merlin Entertainments | ||
| plc | 532,359 | 2,693 | |
| InterContinental Hotels | |||
| Group plc | 41,783 | 2,636 | |
| UDG Healthcare plc | 205,596 | 2,583 | |
| British Land Co. plc | 279,007 | 2,577 | |
| WH Smith plc | 82,727 | 2,217 | |
| Inchcape plc | 208,142 | 2,079 | |
| Antofagasta plc | 136,063 | 1,818 | |
| Croda International plc | 25,289 | 1,547 | |
| SSE plc | 79,867 | 1,516 | |
| * | Indivior plc | 234,263 | 1,451 |
| National Grid plc | 115,115 | 1,332 | |
| DCC plc | 12,780 | 1,227 | |
| UK Commercial Property | |||
| Trust Ltd. | 899,207 | 1,105 | |
| F&C Commercial Property | |||
| Trust Ltd. | 434,498 | 877 | |
| St. James’s Place plc | 54,849 | 854 | |
| Schroders plc | 18,169 | 822 | |
| Meggitt plc | 126,346 | 819 | |
| * | BTG plc | 65,423 | 613 |
| Saga plc | 229,498 | 428 | |
| 142,675 | |||
| United States (49.1%) | |||
| Consumer Discretionary (3.5%) | |||
| Service Corp. International | 405,563 | 14,807 | |
| Yum China Holdings Inc. | 311,563 | 13,323 | |
| * | Madison Square Garden | ||
| Co. Class A | 31,561 | 7,670 | |
| * | Grand Canyon Education | ||
| Inc. | 63,539 | 6,607 | |
| Aramark | 134,505 | 5,029 | |
| Pool Corp. | 35,136 | 4,877 | |
| Churchill Downs Inc. | 16,038 | 4,404 | |
| * | Bright Horizons Family | ||
| Solutions Inc. | 43,619 | 4,139 | |
| John Wiley & Sons Inc. | |||
| Class A | 60,106 | 3,964 | |
| Cable One Inc. | 5,265 | 3,344 | |
| Hyatt Hotels Corp. Class A | 30,985 | 2,382 | |
| Vail Resorts Inc. | 8,163 | 1,872 | |
| TJX Cos. Inc. | 20,744 | 1,760 | |
| * | ServiceMaster Global | ||
| Holdings Inc. | 34,612 | 1,751 | |
| Graham Holdings Co. | |||
| Class B | 2,838 | 1,712 | |
| Ross Stores Inc. | 13,840 | 1,119 | |
| Choice Hotels International | |||
| Inc. | 13,846 | 1,108 | |
| * | Liberty Broadband Corp. | 6,912 | 490 |
| 80,358 | |||
| Consumer Staples (4.2%) | |||
| Church & Dwight Co. Inc. | 554,649 | 25,625 | |
| Clorox Co. | 165,989 | 19,454 | |
| Vector Group Ltd. | 702,230 | 13,693 | |
| Colgate-Palmolive Co. | 146,189 | 9,536 | |
14
| Global Minimum Volatility Fund | |||
| Market | |||
| Value• | |||
| Shares | ($000) | ||
| Coca-Cola Co. | 164,700 | 7,117 | |
| Kimberly-Clark Corp. | 66,329 | 6,868 | |
| Procter & Gamble Co. | 73,366 | 5,307 | |
| Lancaster Colony Corp. | 30,812 | 3,870 | |
| Hershey Co. | 33,995 | 3,125 | |
| Sysco Corp. | 11,659 | 729 | |
| J&J Snack Foods Corp. | 4,400 | 605 | |
| McCormick & Co. Inc. | 5,400 | 569 | |
| Ingredion Inc. | 4,200 | 508 | |
| 97,006 | |||
| Financials (8.7%) | |||
| Starwood Property Trust | |||
| Inc. | 1,774,982 | 37,204 | |
| Blackstone Mortgage | |||
| Trust Inc. Class A | 775,462 | 23,923 | |
| RenaissanceRe Holdings | |||
| Ltd. | 151,830 | 20,655 | |
| Washington Federal Inc. | 448,631 | 14,244 | |
| Apollo Commercial Real | |||
| Estate Finance Inc. | 749,446 | 13,505 | |
| Brown & Brown Inc. | 452,400 | 12,319 | |
| Arthur J Gallagher & Co. | 107,283 | 7,509 | |
| Torchmark Corp. | 83,653 | 7,256 | |
| Beneficial Bancorp Inc. | 400,982 | 6,355 | |
| ProAssurance Corp. | 132,894 | 6,286 | |
| Capitol Federal Financial | |||
| Inc. | 455,900 | 5,685 | |
| Marsh & McLennan Cos. | |||
| Inc. | 61,079 | 4,978 | |
| Two Harbors Investment | |||
| Corp. | 289,704 | 4,421 | |
| White Mountains | |||
| Insurance Group Ltd. | 4,296 | 3,717 | |
| TFS Financial Corp. | 219,700 | 3,276 | |
| Oritani Financial Corp. | 206,400 | 3,158 | |
| MFA Financial Inc. | 418,444 | 3,147 | |
| AGNC Investment Corp. | 160,500 | 3,037 | |
| * | Arch Capital Group Ltd. | 36,803 | 2,949 |
| Cullen/Frost Bankers Inc. | 23,820 | 2,726 | |
| American Financial Group | |||
| Inc. | 23,331 | 2,641 | |
| Northwest Bancshares Inc. | 128,863 | 2,139 | |
| Capstead Mortgage Corp. | 241,849 | 2,128 | |
| Commerce Bancshares Inc. | 23,630 | 1,501 | |
| Axis Capital Holdings Ltd. | 25,360 | 1,489 | |
| Aon plc | 8,713 | 1,241 | |
| Granite Point Mortgage | |||
| Trust Inc. | 54,907 | 914 | |
| Bank of Hawaii Corp. | 10,760 | 906 | |
| FirstCash Inc. | 6,644 | 576 | |
| Safety Insurance Group Inc. 6,600 | 528 | ||
| New Residential | |||
| Investment Corp. | 24,950 | 436 | |
| CYS Investments Inc. | 54,368 | 390 | |
| 201,239 | |||
| Health Care (3.6%) | |||
| Quest Diagnostics Inc. | 263,686 | 26,685 | |
| Chemed Corp. | 61,006 | 18,803 | |
| * | Premier Inc. Class A | 218,212 | 7,199 |
| Zoetis Inc. | 74,312 | 6,203 | |
| Pfizer Inc. | 166,073 | 6,080 | |
| * | Henry Schein Inc. | 76,733 | 5,832 |
| Danaher Corp. | 36,900 | 3,702 | |
| STERIS plc | 29,223 | 2,762 | |
| * | Laboratory Corp. of | ||
| America Holdings | 14,634 | 2,499 | |
| * | Varian Medical Systems | ||
| Inc. | 20,456 | 2,364 | |
| West Pharmaceutical | |||
| Services Inc. | 14,204 | 1,253 | |
| * | WellCare Health Plans Inc. | 5,254 | 1,078 |
| 84,460 | |||
| Industrials (7.4%) | |||
| Waste Management Inc. | 366,593 | 29,800 | |
| Expeditors International | |||
| of Washington Inc. | 457,904 | 29,242 | |
| Harris Corp. | 108,243 | 16,931 | |
| L3 Technologies Inc. | 80,761 | 15,820 | |
| Republic Services Inc. | |||
| Class A | 244,137 | 15,791 | |
| BWX Technologies Inc. | 207,463 | 14,066 | |
| Rollins Inc. | 208,778 | 10,130 | |
| Northrop Grumman Corp. | 29,701 | 9,565 | |
| Carlisle Cos. Inc. | 51,603 | 5,559 | |
| General Dynamics Corp. | 20,100 | 4,046 | |
| Lockheed Martin Corp. | 11,992 | 3,848 | |
| Cintas Corp. | 22,330 | 3,803 | |
| * | Teledyne Technologies Inc. | 17,400 | 3,255 |
| * | Copart Inc. | 62,217 | 3,178 |
| * | CoStar Group Inc. | 6,309 | 2,313 |
| National Presto Industries | |||
| Inc. | 17,011 | 1,629 | |
| Raytheon Co. | 4,852 | 994 | |
| UniFirst Corp. | 5,821 | 935 | |
| 170,905 | |||
| Information Technology (9.5%) | |||
| Amdocs Ltd. | 524,225 | 35,254 | |
| Jack Henry & Associates | |||
| Inc. | 289,996 | 34,649 | |
| Broadridge Financial | |||
| Solutions Inc. | 311,353 | 33,380 | |
| Fidelity National | |||
| Information Services Inc. | 272,519 | 25,881 | |
| Paychex Inc. | 288,625 | 17,482 | |
| MAXIMUS Inc. | 147,505 | 9,976 | |
| Automatic Data | |||
| Processing Inc. | 60,455 | 7,139 | |
| Genpact Ltd. | 219,592 | 7,003 | |
| Amphenol Corp. Class A | 82,408 | 6,898 | |
| Total System Services Inc. | 73,312 | 6,163 | |
15
| Global Minimum Volatility Fund | |||
| Market | |||
| Value• | |||
| Shares | ($000) | ||
| * | Tyler Technologies Inc. | 27,278 | 5,972 |
| * | Synopsys Inc. | 67,688 | 5,788 |
| * | ANSYS Inc. | 35,199 | 5,690 |
| * | Fiserv Inc. | 58,250 | 4,128 |
| Dolby Laboratories Inc. | |||
| Class A | 50,032 | 2,993 | |
| FLIR Systems Inc. | 44,302 | 2,372 | |
| * | Gartner Inc. | 19,049 | 2,310 |
| * | Check Point Software | ||
| Technologies Ltd. | 23,274 | 2,246 | |
| * | EPAM Systems Inc. | 15,136 | 1,731 |
| * | ExlService Holdings Inc. | 19,412 | 1,122 |
| National Instruments Corp. | 19,000 | 777 | |
| * | IAC/InterActiveCorp | 4,541 | 736 |
| * | Itron Inc. | 7,521 | 492 |
| 220,182 | |||
| Materials (2.7%) | |||
| AptarGroup Inc. | 258,655 | 24,184 | |
| Kaiser Aluminum Corp. | 151,369 | 14,916 | |
| Sonoco Products Co. | 186,390 | 9,573 | |
| Avery Dennison Corp. | 64,931 | 6,805 | |
| Compass Minerals | |||
| International Inc. | 75,877 | 5,107 | |
| Bemis Co. Inc. | 27,103 | 1,173 | |
| Silgan Holdings Inc. | 33,250 | 933 | |
| 62,691 | |||
| Real Estate (6.4%) | |||
| * | Equity Commonwealth | 602,417 | 18,669 |
| Mid-America Apartment | |||
| Communities Inc. | 138,614 | 12,678 | |
| Rayonier Inc. | 322,137 | 11,980 | |
| Highwoods Properties Inc. | 259,667 | 11,431 | |
| PS Business Parks Inc. | 79,867 | 9,207 | |
| Apple Hospitality REIT Inc. | 417,177 | 7,505 | |
| Lamar Advertising Co. | |||
| Class A | 116,889 | 7,447 | |
| 3 | Hudson Pacific Properties | ||
| Inc. | 162,097 | 5,328 | |
| UDR Inc. | 125,196 | 4,526 | |
| EastGroup Properties Inc. | 46,848 | 4,206 | |
| Crown Castle International | |||
| Corp. | 39,788 | 4,013 | |
| Equity LifeStyle Properties | |||
| Inc. | 42,469 | 3,787 | |
| First Industrial Realty Trust | |||
| Inc. | 109,280 | 3,400 | |
| STAG Industrial Inc. | 137,785 | 3,385 | |
| Camden Property Trust | 37,810 | 3,229 | |
| Piedmont Office Realty | |||
| Trust Inc. Class A | 161,294 | 2,890 | |
| National Health Investors | |||
| Inc. | 37,412 | 2,554 | |
| Gaming and Leisure | ||
| Properties Inc. | 70,920 | 2,430 |
| WP Carey Inc. | 37,029 | 2,364 |
| Cousins Properties Inc. | 262,880 | 2,337 |
| Empire State Realty Trust | ||
| Inc. | 131,989 | 2,299 |
| American Homes 4 Rent | ||
| Class A | 113,183 | 2,286 |
| Life Storage Inc. | 23,189 | 2,051 |
| Sun Communities Inc. | 21,244 | 1,994 |
| Weyerhaeuser Co. | 49,320 | 1,814 |
| AvalonBay Communities | ||
| Inc. | 10,754 | 1,753 |
| Rexford Industrial Realty | ||
| Inc. | 56,488 | 1,726 |
| Healthcare Realty Trust Inc. | 59,674 | 1,661 |
| Healthcare Trust of | ||
| America Inc. Class A | 61,219 | 1,530 |
| Douglas Emmett Inc. | 39,067 | 1,456 |
| Duke Realty Corp. | 50,390 | 1,366 |
| Liberty Property Trust | 19,512 | 816 |
| Urstadt Biddle Properties | ||
| Inc. Class A | 40,998 | 815 |
| Medical Properties Trust | ||
| Inc. | 61,031 | 780 |
| Alexandria Real Estate | ||
| Equities Inc. | 5,878 | 732 |
| Universal Health Realty | ||
| Income Trust | 8,800 | 527 |
| 146,972 | ||
| Utilities (3.1%) | ||
| IDACORP Inc. | 193,596 | 18,004 |
| ALLETE Inc. | 118,610 | 9,063 |
| NorthWestern Corp. | 142,089 | 7,806 |
| Portland General Electric | ||
| Co. | 163,848 | 6,960 |
| Southern Co. | 133,667 | 6,165 |
| Hawaiian Electric | ||
| Industries Inc. | 176,183 | 6,112 |
| MDU Resources Group | ||
| Inc. | 197,247 | 5,556 |
| OGE Energy Corp. | 127,612 | 4,195 |
| Pinnacle West Capital | ||
| Corp. | 37,117 | 2,988 |
| Ameren Corp. | 36,454 | 2,137 |
| Westar Energy Inc. | ||
| Class A | 21,457 | 1,163 |
| NiSource Inc. | 41,407 | 1,010 |
| 71,159 | ||
| 1,134,972 | ||
| Total Common Stocks | ||
| (Cost $1,987,475) | 2,267,357 |
16
| Global Minimum Volatility Fund | |||
| Market | |||
| Value• | |||
| Shares | ($000) | ||
| Temporary Cash Investments (1.9%)1 | |||
| Money Market Fund (1.8%) | |||
| 4,5 | Vanguard Market | ||
| Liquidity Fund, 1.886% | 417,803 | 41,780 | |
| Face | |||
| Amount | |||
| ($000) | |||
| U. S. Government and Agency Obligations (0.1%) | |||
| 3 | United States Treasury | ||
| Bill, 1.461%, 5/3/18 | 900 | 900 | |
| 3 | United States Treasury | ||
| Bill, 1.941%, 9/27/18 | 500 | 496 | |
| United States Treasury | |||
| Bill, 1.946%, 10/4/18 | 750 | 744 | |
| 2,140 | |||
| Total Temporary Cash Investments | |||
| (Cost $43,917) | 43,920 | ||
| Total Investments (100.0%) | |||
| (Cost $2,031,392) | 2,311,277 | ||
| Amount | |||
| ($000) | |||
| Other Assets and Liabilities (0.0%) | |||
| Other Assets | |||
| Investment in Vanguard | 126 | ||
| Receivables for Investment Securities Sold | 25,060 | ||
| Receivables for Accrued Income | 5,544 | ||
| Receivables for Capital Shares Issued | 4,012 | ||
| Variation Margin Receivable— | |||
| Futures Contracts | 7 | ||
| Unrealized Appreciation— | |||
| Forwards Contracts | 24,748 | ||
| Other Assets | 1,059 | ||
| Total Other Assets | 60,556 | ||
| Liabilities | |||
| Payables for Investment Securities | |||
| Purchased | (744) | ||
| Collateral for Securities on Loan | (41,775) | ||
| Payables for Capital Shares Redeemed | (1,200) | ||
| Payables to Vanguard | (581) | ||
| Variation Margin Payable—Futures Contracts | (177) | ||
| Unrealized Depreciation—Forwards Contracts | (345) | ||
| Other Liabilities | (14,847) | ||
| Total Liabilities | (59,669) | ||
| Net Assets (100%) | 2,312,164 | ||
| At April 30, 2018, net assets consisted of: | |
| Amount | |
| ($000) | |
| Paid-in Capital | 1,975,572 |
| Undistributed Net Investment Income | 14,362 |
| Accumulated Net Realized Gains | 18,090 |
| Unrealized Appreciation (Depreciation) | |
| Investment Securities | 279,885 |
| Futures Contracts | (79) |
| Forward Currency Contracts | 24,403 |
| Foreign Currencies | (69) |
| Net Assets | 2,312,164 |
| Investor Shares—Net Assets | |
| Applicable to 38,329,698 outstanding | |
| $.001 par value shares of beneficial | |
| interest (unlimited authorization) | 518,749 |
| Net Asset Value Per Share— | |
| Investor Shares | $13.53 |
| Admiral Shares—Net Assets | |
| Applicable to 66,211,646 outstanding | |
| $.001 par value shares of beneficial | |
| interest (unlimited authorization) | 1,793,415 |
| Net Asset Value Per Share— | |
| Admiral Shares | $27.09 |
• See Note A in Notes to Financial Statements.
^ Includes partial security positions on loan to broker-dealers.
The total value of securities on loan is $33,408,000.
* Non-income-producing security.
1 The fund invests a portion of its cash reserves in equity
markets through the use of index futures contracts. After
giving effect to futures investments, the fund’s effective
common stock and temporary cash investment positions
represent 99.3% and 0.7%, respectively, of net assets.
2 Security exempt from registration under Rule 144A of the
Securities Act of 1933. Such securities may be sold in
transactions exempt from registration, normally to qualified
institutional buyers. At April 30, 2018, the aggregate value of
these securities was $7,286,000, representing 0.3% of
net assets.
3 Securities with a value of $1,794,000 have been segregated
as initial margin for open futures contracts.
4 Affiliated money market fund available only to Vanguard funds
and certain trusts and accounts managed by Vanguard. Rate
shown is the 7-day yield.
5 Includes $41,775,000 of collateral received for securities
on loan.
ADR—American Depositary Receipt.
GDR—Global Depositary Receipt.
REIT—Real Estate Investment Trust.
17
| Global Minimum Volatility Fund | ||||
| Derivative Financial Instruments Outstanding as of Period End | ||||
| Futures Contracts | ||||
| ($000) | ||||
| Value and | ||||
| Number of | Unrealized | |||
| Long (Short) | Notional | Appreciation | ||
| Expiration | Contracts | Amount | (Depreciation) | |
| Long Futures Contracts | ||||
| E-mini S&P 500 Index | June 2018 | 180 | 23,823 | (227) |
| Topix Index | June 2018 | 7 | 1,138 | 57 |
| S&P ASX 200 Index | June 2018 | 7 | 788 | (12) |
| FTSE 100 Index | June 2018 | 7 | 719 | 23 |
| Dow Jones EURO STOXX 50 Index | June 2018 | 17 | 714 | 80 |
| (79) | ||||
Unrealized appreciation (depreciation) on open futures contracts, except for Topix Index and S&P ASX 200 Index, is required to be treated as realized gain (loss) for tax purposes. Unrealized appreciation (depreciation) for Topix and S&P ASX 200 Index futures contracts is generally treated the same for financial reporting and tax purposes.
| Forward Currency Contracts | ||||||
| Unrealized | ||||||
| Contract | Appreciation | |||||
| Settlement | Contract Amount (000) | (Depreciation) | ||||
| Counterparty | Date | Receive | Deliver | ($000) | ||
| Deutsche Bank AG | 5/15/18 | RUB | 818,055 | USD | 13,216 | (250) |
| Credit Suisse International | 5/15/18 | JPY | 640,400 | USD | 5,872 | (8) |
| Toronto-Dominion Bank | 5/15/18 | USD | 179,401 | JPY | 19,156,296 | 3,988 |
| Toronto-Dominion Bank | 5/15/18 | USD | 136,019 | GBP | 95,909 | 3,885 |
| Toronto-Dominion Bank | 5/15/18 | USD | 133,321 | CAD | 168,747 | 1,851 |
| Deutsche Bank AG | 5/15/18 | USD | 109,688 | EUR | 88,636 | 2,529 |
| Credit Suisse International | 5/15/18 | USD | 99,673 | CHF | 94,980 | 3,703 |
| Toronto-Dominion Bank | 5/15/18 | USD | 98,581 | AUD | 127,490 | 2,598 |
| BNP Paribas | 5/15/18 | USD | 77,603 | HKD | 608,332 | 62 |
| BNP Paribas | 5/15/18 | USD | 59,744 | KRW | 63,656,334 | 121 |
| Deutsche Bank AG | 5/15/18 | USD | 46,002 | INR | 2,998,138 | 1,158 |
| BNP Paribas | 5/15/18 | USD | 35,418 | TWD | 1,031,796 | 509 |
| Goldman Sachs International | 5/15/18 | USD | 34,702 | BRL | 119,153 | 741 |
| Toronto-Dominion Bank | 5/15/18 | USD | 31,585 | SEK | 261,852 | 1,647 |
| Credit Suisse International | 5/15/18 | USD | 26,267 | EUR | 21,408 | 386 |
| Credit Suisse International | 5/15/18 | USD | 20,536 | SGD | 26,885 | 255 |
| Toronto-Dominion Bank | 5/15/18 | USD | 12,900 | MXN | 237,430 | 237 |
| Deutsche Bank AG | 5/15/18 | USD | 12,886 | RUB | 818,055 | (79) |
| Toronto-Dominion Bank | 5/15/18 | USD | 10,793 | NOK | 84,212 | 290 |
| Deutsche Bank AG | 5/15/18 | USD | 7,730 | IDR | 106,494,443 | 88 |
18
| Global Minimum Volatility Fund | ||||||
| Forward Currency Contracts (continued) | ||||||
| Unrealized | ||||||
| Contract | Appreciation | |||||
| Settlement | Contract Amount (000) | (Depreciation) | ||||
| Counterparty | Date | Receive | Deliver | ($000) | ||
| Toronto-Dominion Bank | 5/15/18 | USD | 6,865 | DKK | 41,295 | 164 |
| Deutsche Bank AG | 5/15/18 | USD | 5,937 | GBP | 4,315 | (8) |
| Goldman Sachs International | 5/15/18 | USD | 5,558 | ILS | 19,438 | 152 |
| Deutsche Bank AG | 5/15/18 | USD | 5,139 | CHF | 5,080 | 6 |
| Deutsche Bank AG | 5/15/18 | USD | 5,073 | GBP | 3,577 | 145 |
| Toronto-Dominion Bank | 5/15/18 | USD | 4,416 | CLP | 2,663,285 | 74 |
| Goldman Sachs International | 5/15/18 | USD | 3,098 | NZD | 4,213 | 134 |
| Goldman Sachs International | 5/15/18 | USD | 1,014 | JPY | 108,278 | 23 |
| Goldman Sachs International | 5/15/18 | USD | 546 | HKD | 4,281 | — |
| Goldman Sachs International | 5/15/18 | USD | 87 | AUD | 112 | 2 |
| 24,403 | ||||||
AUD—Australian dollar.
BRL—Brazilian real.
CAD—Canadian dollar.
CHF—Swissfranc.
CLP—Chilean peso.
DKK—Danish krone.
EUR—Euro.
GBP—Britishpound.
HKD—Hong Kong dollar.
IDR—Indonesian rupiah.
ILS—Israeli shekel.
INR—Indian rupee.
JPY—Japaneseyen.
KRW—Koreanwon.
MXN—Mexican peso.
NOK—Norwegian krone.
NZD—New Zealand dollar.
RUB—Russianruble.
SEK—Swedishkrona.
SGD—Singapore dollar.
TWD—Taiwanese dollar.
USD—U.S.dollar.
Unrealized appreciation (depreciation) on open forward currency contracts, except for Hong Kong dollar, Taiwanese dollar, Singapore dollar, Indonesian rupiah, and Danish krone contracts is treated as realized gain (loss) for tax purposes.
At April 30, 2018, the counterparties had deposited in segregated accounts securities and cash with a value of $21,879,000 in connection with open forward currency contracts.
See accompanying Notes, which are an integral part of the Financial Statements.
19
| Global Minimum Volatility Fund | |
| Statement of Operations | |
| Six Months Ended | |
| April 30, 2018 | |
| ($000) | |
| Investment Income | |
| Income | |
| Dividends1 | 31,934 |
| Interest 2 | 87 |
| Securities Lending—Net | 177 |
| Total Income | 32,198 |
| Expenses | |
| The Vanguard Group—Note B | |
| Investment Advisory Services | 593 |
| Management and Administrative—Investor Shares | 438 |
| Management and Administrative—Admiral Shares | 895 |
| Marketing and Distribution—Investor Shares | 55 |
| Marketing and Distribution—Admiral Shares | 72 |
| Custodian Fees | 92 |
| Shareholders’ Reports and Proxy—Investor Shares | 9 |
| Shareholders’ Reports and Proxy—Admiral Shares | 16 |
| Trustees’ Fees and Expenses | 1 |
| Total Expenses | 2,171 |
| Net Investment Income | 30,027 |
| Realized Net Gain (Loss) | |
| Investment Securities Sold 2 | 57,116 |
| Futures Contracts | 20 |
| Forward Currency Contracts | (25,731) |
| Foreign Currencies | 87 |
| Realized Net Gain (Loss) | 31,492 |
| Change in Unrealized Appreciation (Depreciation) | |
| Investment Securities 2 | (33,613) |
| Futures Contracts | (268) |
| Forward Currency Contracts | 18,883 |
| Foreign Currencies | (13) |
| Change in Unrealized Appreciation (Depreciation) | (15,011) |
| Net Increase (Decrease) in Net Assets Resulting from Operations | 46,508 |
1 Dividends are net of foreign withholding taxes of $1,587,000.
2 Interest income, realized net gain (loss), and change in unrealized appreciation (depreciation) from an affiliated company of the fund
were $80,000, ($7,000), and $3,000 respectively. Purchases and sales are for temporary cash investment purposes.
See accompanying Notes, which are an integral part of the Financial Statements.
20
| Global Minimum Volatility Fund | ||
| Statement of Changes in Net Assets | ||
| Six Months Ended | Year Ended | |
| April 30, | October 31, | |
| 2018 | 2017 | |
| ($000) | ($000) | |
| Increase (Decrease) in Net Assets | ||
| Operations | ||
| Net Investment Income | 30,027 | 48,457 |
| Realized Net Gain (Loss) | 31,492 | 7,873 |
| Change in Unrealized Appreciation (Depreciation) | (15,011) | 229,772 |
| Net Increase (Decrease) in Net Assets Resulting from Operations | 46,508 | 286,102 |
| Distributions | ||
| Net Investment Income | ||
| Investor Shares | (12,387) | (11,274) |
| Admiral Shares | (40,756) | (32,305) |
| Realized Capital Gain | ||
| Investor Shares | — | — |
| Admiral Shares | — | — |
| Total Distributions | (53,143) | (43,579) |
| Capital Share Transactions | ||
| Investor Shares | (18,560) | 57,675 |
| Admiral Shares | 98,843 | 367,340 |
| Net Increase (Decrease) from Capital Share Transactions | 80,283 | 425,015 |
| Total Increase (Decrease) | 73,648 | 667,538 |
| Net Assets | ||
| Beginning of Period | 2,238,516 | 1,570,978 |
| End of Period1 | 2,312,164 | 2,238,516 |
1 Net Assets—End of Period includes undistributed (overdistributed) net investment income of $14,362,000 and $37,391,000.
See accompanying Notes, which are an integral part of the Financial Statements.
21
| Global Minimum Volatility Fund | |||||
| Financial Highlights | |||||
| Investor Shares | |||||
| Six Months | Dec.12, | ||||
| Ended | 20131 to | ||||
| April 30, | Year Ended October 31, | Oct. 31, | |||
| For a Share Outstanding Throughout Each Period | 2018 | 2017 | 2016 | 2015 | 2014 |
| Net Asset Value, Beginning of Period | $13.57 | $11.92 | $11.81 | $11.41 | $10.00 |
| Investment Operations | |||||
| Net Investment Income | .170 2 | .3242 | .293 | .2882 | .262 |
| Net Realized and Unrealized Gain (Loss) | |||||
| on Investments | .102 | 1.650 | .181 | .795 | 1.172 |
| Total from Investment Operations | .272 | 1.974 | .474 | 1.083 | 1.434 |
| Distributions | |||||
| Dividends from Net Investment Income | (. 312) | (. 324) | (. 205) | (. 280) | (. 024) |
| Distributions from Realized Capital Gains | — | — | (.159) | (.403) | — |
| Total Distributions | (. 312) | (. 324) | (. 364) | (. 683) | (. 024) |
| Net Asset Value, End of Period | $13.53 | $13.57 | $11.92 | $11.81 | $11.41 |
| Total Return3 | 2.00% | 16.93% | 4.23% | 9.93% | 14.37% |
| Ratios/Supplemental Data | |||||
| Net Assets, End of Period (Millions) | $519 | $539 | $419 | $451 | $360 |
| Ratio of Total Expenses to Average Net Assets | 0.25% | 0.25% | 0.25% | 0.27% | 0.30%4 |
| Ratio of Net Investment Income to | |||||
| Average Net Assets | 2.44% | 2.54% | 2.63% | 2.52% | 3.18%4 |
| Portfolio Turnover Rate | 29% | 37% | 58% | 57% | 49% |
The expense ratio, net investment income ratio, and turnover rate for the current period have been annualized.
1 Inception.
2 Calculated based on average shares outstanding.
3 Total returns do not include account service fees that may have applied in the periods shown. Fund prospectuses provide information
about any applicable account service fees.
4 Annualized.
See accompanying Notes, which are an integral part of the Financial Statements.
22
| Global Minimum Volatility Fund | |||||
| Financial Highlights | |||||
| Admiral Shares | |||||
| Six Months | Dec.12, | ||||
| Ended | 20131 to | ||||
| April 30, | Year Ended October 31, | Oct. 31, | |||
| For a Share Outstanding Throughout Each Period | 2018 | 2017 | 2016 | 2015 | 2014 |
| Net Asset Value, Beginning of Period | $27.15 | $23.86 | $23.62 | $22.83 | $20.00 |
| Investment Operations | |||||
| Net Investment Income | . 353 2 | .668 2 | .608 | .605 2 | .546 |
| Net Realized and Unrealized Gain (Loss) | |||||
| on Investments | .212 | 3.295 | .377 | 1.576 | 2.332 |
| Total from Investment Operations | .565 | 3.963 | .985 | 2.181 | 2.878 |
| Distributions | |||||
| Dividends from Net Investment Income | (. 625) | (. 673) | (. 427) | (. 585) | (. 048) |
| Distributions from Realized Capital Gains | — | — | (.318) | (.806) | — |
| Total Distributions | (. 625) | (. 673) | (.745) | (1.391) | (. 048) |
| Net Asset Value, End of Period | $27.09 | $27.15 | $23.86 | $23.62 | $22.83 |
| Total Return3 | 2.08% | 16.99% | 4.39% | 10.00% | 14.42% |
| Ratios/Supplemental Data | |||||
| Net Assets, End of Period (Millions) | $1,793 | $1,699 | $1,152 | $757 | $115 |
| Ratio of Total Expenses to Average Net Assets | 0.17% | 0.17% | 0.17% | 0.21% | 0.20%4 |
| Ratio of Net Investment Income to | |||||
| Average Net Assets | 2.52% | 2.62% | 2.71% | 2.58% | 3.28%4 |
| Portfolio Turnover Rate | 29% | 37% | 58% | 57% | 49% |
The expense ratio, net investment income ratio, and turnover rate for the current period have been annualized.
1 Inception.
2 Calculated based on average shares outstanding.
3 Total returns do not include account service fees that may have applied in the periods shown. Fund prospectuses provide information
about any applicable account service fees.
4 Annualized.
See accompanying Notes, which are an integral part of the Financial Statements.
23
Global Minimum Volatility Fund
Notes to Financial Statements
Vanguard Global Minimum Volatility Fund is registered under the Investment Company Act of 1940 as an open-end investment company, or mutual fund. The fund invests in securities of foreign issuers, which may subject it to investment risks not normally associated with investing in securities of U.S. corporations. To minimize the currency risk and volatility associated with investment in securities denominated in currencies other than the U.S. dollar, the fund attempts to hedge its currency exposure. The fund offers two classes of shares: Investor Shares and Admiral Shares. Investor Shares are available to any investor who meets the fund’s minimum purchase requirements. Admiral Shares are designed for investors who meet certain administrative, service, and account-size criteria.
A. The following significant accounting policies conform to generally accepted accounting principles for U.S. investment companies. The fund consistently follows such policies in preparing its financial statements.
1. Security Valuation: Securities are valued as of the close of trading on the New York Stock Exchange (generally 4 p.m., Eastern time) on the valuation date. Equity securities are valued at the latest quoted sales prices or official closing prices taken from the primary market in which each security trades; such securities not traded on the valuation date are valued at the mean of the latest quoted bid and asked prices. Securities for which market quotations are not readily available, or whose values have been affected by events occurring before the fund’s pricing time but after the close of the securities’ primary markets, are valued at their fair values calculated according to procedures adopted by the board of trustees. These procedures include obtaining quotations from an independent pricing service, monitoring news to identify significant market- or security-specific events, and evaluating changes in the values of foreign market proxies (for example, ADRs, futures contracts, or exchange-traded funds), between the time the foreign markets close and the fund’s pricing time. When fair-value pricing is employed, the prices of securities used by a fund to calculate its net asset value may differ from quoted or published prices for the same securities. Investments in Vanguard Market Liquidity Fund are valued at that fund’s net asset value. Temporary cash investments are valued using the latest bid prices or using valuations based on a matrix system (which considers such factors as security prices, yields, maturities, and ratings), both as furnished by independent pricing services.
2. Foreign Currency: Securities and other assets and liabilities denominated in foreign currencies are translated into U.S. dollars using exchange rates obtained from an independent third party as of the fund’s pricing time on the valuation date. Realized gains (losses) and unrealized appreciation (depreciation) on investment securities include the effects of changes in exchange rates since the securities were purchased, combined with the effects of changes in security prices. Fluctuations in the value of other assets and liabilities resulting from changes in exchange rates are recorded as unrealized foreign currency gains (losses) until the assets or liabilities are settled in cash, at which time they are recorded as realized foreign currency gains (losses).
3. Futures and Forward Currency Contracts: The fund uses index futures contracts to a limited extent, with the objective of maintaining full exposure to the stock market while maintaining liquidity. The fund may purchase or sell futures contracts to achieve a desired level of investment, whether to accommodate portfolio turnover or cash flows from capital share transactions. The primary risks associated with the use of futures contracts are imperfect correlation between changes in market values of stocks held by the fund and the prices of futures contracts, and the possibility of an illiquid market. Counterparty risk involving futures is mitigated because a regulated clearinghouse is the counterparty instead of the clearing broker. To further mitigate counterparty
24
Global Minimum Volatility Fund
risk, the fund trades futures contracts on an exchange, monitors the financial strength of its clearing brokers and clearinghouse, and has entered into clearing agreements with its clearing brokers. The clearinghouse imposes initial margin requirements to secure the fund’s performance and requires daily settlement of variation margin representing changes in the market value of each contract.
The fund enters into forward currency contracts to protect the value of securities and related receivables and payables against changes in future foreign exchange rates. The fund’s risks in using these contracts include movement in the values of the foreign currencies relative to the U.S. dollar and the ability of the counterparties to fulfill their obligations under the contracts. The fund mitigates its counterparty risk by entering into forward currency contracts only with a diverse group of prequalified counterparties, monitoring their financial strength, entering into master netting arrangements with its counterparties, and requiring its counterparties to transfer collateral as security for their performance. In the absence of a default, the collateral pledged or received by the fund cannot be repledged, resold, or rehypothecated. The master netting arrangements provide that, in the event of a counterparty’s default (including bankruptcy), the fund may terminate the forward currency contracts, determine the net amount owed by either party in accordance with its master netting arrangements, and sell or retain any collateral held up to the net amount owed to the fund under the master netting arrangements. The forward currency contracts contain provisions whereby a counterparty may terminate open contracts if the fund’s net assets decline below a certain level, triggering a payment by the fund if the fund is in a net liability position at the time of the termination. The payment amount would be reduced by any collateral the fund has pledged. Any assets pledged as collateral for open contracts are noted in the Statement of Net Assets.
The value of collateral received or pledged is compared daily to the value of the forward currency contracts exposure with each counterparty, and any difference, if in excess of a specified minimum transfer amount, is adjusted and settled within two business days.
Futures contracts are valued at their quoted daily settlement prices. Forward currency contracts are valued at their quoted daily prices obtained from an independent third party, adjusted for currency risk based on the expiration date of each contract. The notional amounts of the contracts are not recorded in the Statement of Net Assets. Fluctuations in the value of the contracts are recorded in the Statement of Net Assets as an asset (liability) and in the Statement of Operations as unrealized appreciation (depreciation) until the contracts are closed, when they are recorded as realized gains (losses) on futures or forward currency contracts.
During the six months ended April 30, 2018, the fund’s average investments in long and short futures contracts represented less than 1% and 0% of net assets, respectively, based on the average of aggregate settlement values at each quarter-end during the period. The fund’s average investment in forward currency contracts represented 48% of net assets, based on the average of notional amounts at each quarter-end during the period.
4. Federal Income Taxes: The fund intends to continue to qualify as a regulated investment company and distribute all of its taxable income. Management has analyzed the fund’s tax positions taken for all open federal income tax years (October 31, 2014–2017), and for the period ended April 30, 2018, and has concluded that no provision for federal income tax is required in the fund’s financial statements.
5. Distributions: Distributions to shareholders are recorded on the ex-dividend date.
25
Global Minimum Volatility Fund
6. Securities Lending: To earn additional income, the fund lends its securities to qualified institutional borrowers. Security loans are subject to termination by the fund at any time, and are required to be secured at all times by collateral in an amount at least equal to the market value of securities loaned. Daily market fluctuations could cause the value of loaned securities to be more or less than the value of the collateral received. When this occurs, the collateral is adjusted and settled before the opening of the market on the next business day. The fund further mitigates its counterparty risk by entering into securities lending transactions only with a diverse group of prequalified counterparties, monitoring their financial strength, and entering into master securities lending agreements with its counterparties. The master securities lending agreements provide that, in the event of a counterparty’s default (including bankruptcy), the fund may terminate any loans with that borrower, determine the net amount owed, and sell or retain the collateral up to the net amount owed to the fund; however, such actions may be subject to legal proceedings. While collateral mitigates counterparty risk, in the event of a default, the fund may experience delays and costs in recovering the securities loaned. The fund invests cash collateral received in Vanguard Market Liquidity Fund, and records a liability in the Statement of Net Assets for the return of the collateral, during the period the securities are on loan. Securities lending income represents fees charged to borrowers plus income earned on invested cash collateral, less expenses associated with the loan. During the term of the loan, the fund is entitled to all distributions made on or in respect of the loaned securities.
7. Credit Facility: The fund and certain other funds managed by The Vanguard Group (“Vanguard”) participate in a $3.1 billion committed credit facility provided by a syndicate of lenders pursuant to a credit agreement that may be renewed annually; each fund is individually liable for its borrowings, if any, under the credit facility. Borrowings may be utilized for temporary and emergency purposes, and are subject to the fund’s regulatory and contractual borrowing restrictions. The participating funds are charged administrative fees and an annual commitment fee of 0.10% of the undrawn amount of the facility; these fees are allocated to the funds based on a method approved by the fund’s board of trustees and included in Management and Administrative expenses on the fund’s Statement of Operations. Any borrowings under this facility bear interest at a rate based upon the higher of the one-month London Interbank Offered Rate, federal funds effective rate, or overnight bank funding rate plus an agreed-upon spread.
The fund had no borrowings outstanding at April 30, 2018, or at any time during the period then ended.
8. Other: Dividend income is recorded on the ex-dividend date. Interest income includes income distributions received from Vanguard Market Liquidity Fund and is accrued daily. Premiums and discounts on debt securities purchased are amortized and accreted, respectively, to interest income over the lives of the respective securities. Security transactions are accounted for on the date securities are bought or sold. Costs used to determine realized gains (losses) on the sale of investment securities are those of the specific securities sold.
Each class of shares has equal rights as to assets and earnings, except that each class separately bears certain class-specific expenses related to maintenance of shareholder accounts (included in Management and Administrative expenses), shareholder reporting, and the proxy. Marketing and distribution expenses are allocated to each class of shares based on a method approved by the board of trustees. Income, other non-class-specific expenses, and gains and losses on investments are allocated to each class of shares based on its relative net assets.
26
Global Minimum Volatility Fund
B. In accordance with the terms of a Funds’ Service Agreement (the “FSA”) between Vanguard and the fund, Vanguard furnishes to the fund investment advisory, corporate management, administrative, marketing, and distribution services at Vanguard’s cost of operations (as defined by the FSA). These costs of operations are allocated to the fund based on methods and guidelines approved by the board of trustees. Vanguard does not require reimbursement in the current period for certain costs of operations (such as deferred compensation/benefits and risk/insurance costs); the fund’s liability for these costs of operations is included in Payables to Vanguard on the Statement of Net Assets. All other costs of operations payable to Vanguard are generally settled twice a month.
Upon the request of Vanguard, the fund may invest up to 0.40% of its net assets as capital in Vanguard. At April 30, 2018, the fund had contributed to Vanguard capital in the amount of $126,000, representing 0.01% of the fund’s net assets and 0.05% of Vanguard’s capitalization. The fund’s trustees and officers are also directors and employees, respectively, of Vanguard.
C. Various inputs may be used to determine the value of the fund’s investments. These inputs are summarized in three broad levels for financial statement purposes. The inputs or methodologies used to value securities are not necessarily an indication of the risk associated with investing in those securities.
Level 1—Quoted prices in active markets for identical securities.
Level 2—Other significant observable inputs (including quoted prices for similar securities, interest rates, prepayment speeds, credit risk, etc.).
Level 3—Significant unobservable inputs (including the fund’s own assumptions used to determine the fair value of investments). Any investments valued with significant unobservable inputs are noted on the Statement of Net Assets.
The following table summarizes the market value of the fund’s investments as of April 30, 2018, based on the inputs used to value them:
| Level 1 | Level 2 | Level 3 | |
| Investments | ($000) | ($000) | ($000) |
| Common Stocks—International | 293,587 | 838,798 | — |
| Common Stocks—United States | 1,134,972 | — | — |
| Temporary Cash Investments | 41,780 | 2,140 | — |
| Futures Contracts—Assets1 | 7 | — | — |
| Futures Contracts—Liabilities1 | (177) | — | — |
| Forward Currency Contracts—Assets | — | 24,748 | — |
| Forward Currency Contracts—Liabilities | — | (345) | — |
| Total | 1,470,169 | 865,341 | — |
| 1 Represents variation margin on the last day of the reporting period. |
27
Global Minimum Volatility Fund
D. At April 30, 2018, the fair values of derivatives were reflected in the Statement of Net Assets as follows:
| Foreign | |||
| Equity | Exchange | ||
| Contracts | Contracts | Total | |
| Statement of Assets and Liabilities Caption | ($000) | ($000) | ($000) |
| Variation Margin Receivable—Futures Contracts | 7 | — | 7 |
| Unrealized Appreciation—Forwards Contracts | — | 24,748 | 24,748 |
| Total Assets | 7 | 24,748 | 24,755 |
| Variation Margin Payable—Futures Contracts | (177) | — | (177) |
| Unrealized Depreciation—Forwards Contracts | — | (345) | (345) |
| Total Liabilities | (177) | (345) | (522) |
Realized net gain (loss) and the change in unrealized appreciation (depreciation) on derivatives for the six months ended April 30, 2018, were:
| Foreign | |||
| Equity | Exchange | ||
| Contracts | Contracts | Total | |
| Realized Net Gain (Loss) on Derivatives | ($000) | ($000) | ($000) |
| Futures Contracts | 20 | — | 20 |
| Forward Currency Contracts | — | (25,731) | (25,731) |
| Realized Net Gain (Loss) on Derivatives | 20 | (25,731) | (25,711) |
| Change in Unrealized Appreciation (Depreciation) on Derivatives | |||
| Futures Contracts | (268) | — | (268) |
| Forward Currency Contracts | — | 18,883 | 18,883 |
| Change in Unrealized Appreciation (Depreciation) on Derivatives | (268) | 18,883 | 18,615 |
28
Global Minimum Volatility Fund
The following table summarizes the fund’s derivative assets and liabilities by counterparty for derivatives subject to arrangements that provide for offsetting assets and liabilities. Exchange traded derivatives are listed separately.
| Assets | Liabilities | Amounts Not Offset in the | Net | |||
| Reflected in | Reflected in | Net Amount | Statement of Net Assets | Exposure3 | ||
| Statement of | Statement of | Receivable | Collateral | Collateral | (Not Less | |
| Net Assets1 | Net Assets1 | (Payable) | Pledged 2 | Received 2 | Than $0) | |
| ($000) | ($000) | ($000) | ($000) | ($000) | ($000) | |
| Forwards Subject to Offsetting | ||||||
| Arrangements, by Counterparty | ||||||
| BNP Paribas | 692 | — | 692 | — | 1,227 | — |
| Credit Suisse International | 4,344 | (8) | 4,336 | — | 3,900 | 436 |
| Deutsche Bank AG | 3,926 | (337) | 3,589 | — | 3,280 | 309 |
| Goldman Sachs International | 1,052 | — | 1,052 | — | 620 | 432 |
| Toronto-Dominion Bank | 14,734 | — | 14,734 | — | 12,852 | 1,882 |
| Exchange Traded Futures | ||||||
| Contracts | 7 | (177) | (170) | 1,794 | — | — |
| Total | 24,755 | (522) | 24,233 | 1,794 | 21,879 | 3,059 |
1 Absent an event of default or early termination, derivative assets and liabilities are presented gross and not offset in the
Statement of Net Assets.
2 Securities or other assets pledged as collateral are noted in the Statement of Net Assets. Securities or other assets received as
collateral are held in a segregated account and not included in the fund’s security holdings in the Statement of Net Assets.
3 Net Exposure represents the net amount receivable from the counterparty in the event of default. Counterparties may not
exchange collateral if amount is below a specified minimum transfer amount.
E. Distributions are determined on a tax basis and may differ from net investment income and realized capital gains for financial reporting purposes. Differences may be permanent or temporary. Permanent differences are reclassified among capital accounts in the financial statements to reflect their tax character. Temporary differences arise when certain items of income, expense, gain, or loss are recognized in different periods for financial statement and tax purposes. These differences will reverse at some time in the future. Differences in classification may also result from the treatment of short-term gains as ordinary income for tax purposes.
The fund’s tax-basis capital gains and losses are determined only at the end of each fiscal year. For tax purposes, at October 31, 2017, the fund had available capital losses totaling $7,155,000 that may be carried forward indefinitely to offset future net capital gains. The fund will use these capital losses to offset net taxable capital gains, if any, realized during the year ending October 31, 2018; should the fund realize net capital losses for the year, the losses will be added to the loss carryforward balance above.
29
Global Minimum Volatility Fund
At April 30, 2018, the cost of investment securities for tax purposes was $2,034,506,000. Net unrealized appreciation of investment securities for tax purposes was $276,771,000, consisting of unrealized gains of $330,541,000 on securities that had risen in value since their purchase and $53,770,000 in unrealized losses on securities that had fallen in value since their purchase.
F. During the six months ended April 30, 2018, the fund purchased $356,508,000 of investment securities and sold $336,928,000 of investment securities, other than temporary cash investments.
| G. Capital share transactions for each class of shares were: | ||||
| Six Months Ended | Year Ended | |||
| April 30, 2018 | October 31, 2017 | |||
| Amount | Shares | Amount | Shares | |
| ($000) | (000) | ($000) | (000) | |
| Investor Shares | ||||
| Issued | 70,514 | 5,194 | 195,539 | 15,366 |
| Issued in Lieu of Cash Distributions | 11,552 | 854 | 10,598 | 886 |
| Redeemed | (100,626) | (7,440) | (148,462) | (11,703) |
| Net Increase (Decrease)—Investor Shares | (18,560) | (1,392) | 57,675 | 4,549 |
| Admiral Shares | ||||
| Issued | 372,924 | 13,791 | 705,355 | 27,658 |
| Issued in Lieu of Cash Distributions | 35,011 | 1,294 | 28,030 | 1,172 |
| Redeemed | (309,092) | (11,454) | (366,045) | (14,509) |
| Net Increase (Decrease)—Admiral Shares | 98,843 | 3,631 | 367,340 | 14,321 |
H. Management has determined that no material events or transactions occurred subsequent to April 30, 2018, that would require recognition or disclosure in these financial statements.
30
About Your Fund’s Expenses
As a shareholder of the fund, you incur ongoing costs, which include costs for portfolio management, administrative services, and shareholder reports (like this one), among others. Operating expenses, which are deducted from a fund’s gross income, directly reduce the investment return of the fund.
A fund’s expenses are expressed as a percentage of its average net assets. This figure is known as the expense ratio. The following examples are intended to help you understand the ongoing costs (in dollars) of investing in your fund and to compare these costs with those of other mutual funds. The examples are based on an investment of $1,000 made at the beginning of the period shown and held for the entire period.
The accompanying table illustrates your fund’s costs in two ways:
• Based on actual fund return. This section helps you to estimate the actual expenses that you paid over the period. The ”Ending Account Value“ shown is derived from the fund‘s actual return, and the third column shows the dollar amount that would have been paid by an investor who started with $1,000 in the fund. You may use the information here, together with the amount you invested, to estimate the expenses that you paid over the period.
To do so, simply divide your account value by $1,000 (for example, an $8,600 account value divided by $1,000 = 8.6), then multiply the result by the number given for your fund under the heading ”Expenses Paid During Period.“
• Based on hypothetical 5% yearly return. This section is intended to help you compare your fund‘s costs with those of other mutual funds. It assumes that the fund had a yearly return of 5% before expenses, but that the expense ratio is unchanged. In this case—because the return used is not the fund’s actual return—the results do not apply to your investment. The example is useful in making comparisons because the Securities and Exchange Commission requires all mutual funds to calculate expenses based on a 5% return. You can assess your fund’s costs by comparing this hypothetical example with the hypothetical examples that appear in shareholder reports of other funds.
Note that the expenses shown in the table are meant to highlight and help you compare ongoing costs only and do not reflect transaction costs incurred by the fund for buying and selling securities. Further, the expenses do not include any purchase, redemption, or account service fees described in the fund prospectus. If such fees were applied to your account, your costs would be higher. Your fund does not carry a “sales load.”
The calculations assume no shares were bought or sold during the period. Your actual costs may have been higher or lower, depending on the amount of your investment and the timing of any purchases or redemptions.
You can find more information about the fund’s expenses, including annual expense ratios, in the Financial Statements section of this report. For additional information on operating expenses and other shareholder costs, please refer to your fund’s current prospectus.
31
| Six Months Ended April 30, 2018 | |||
| Beginning | Ending | Expenses | |
| Account Value | Account Value | Paid During | |
| Global Minimum Volatility Fund | 10/31/2017 | 4/30/2018 | Period |
| Based on Actual Fund Return | |||
| Investor Shares | $1,000.00 | $1,020.04 | $1.25 |
| Admiral Shares | 1,000.00 | 1,020.84 | 0.85 |
| Based on Hypothetical 5% Yearly Return | |||
| Investor Shares | $1,000.00 | $1,023.55 | $1.25 |
| Admiral Shares | 1,000.00 | 1,023.95 | 0.85 |
The calculations are based on expenses incurred in the most recent six-month period. The fund’s annualized six-month expense ratios for that period are 0.25% for Investor Shares and 0.17% for Admiral Shares. The dollar amounts shown as “Expenses Paid” are equal to the annualized expense ratio multiplied by the average account value over the period, multiplied by the number of days in the most recent six-month period, then divided by the number of days in the most recent 12-month period (181/365).
32
Trustees Approve Advisory Arrangement
The board of trustees of Vanguard Global Minimum Volatility Fund has renewed the fund’s investment advisory arrangement with The Vanguard Group, Inc. (Vanguard), through its Quantitative Equity Group. The board determined that continuing the fund’s internalized management structure was in the best interests of the fund and its shareholders.
The board based its decision upon an evaluation of the advisor’s investment staff, portfolio management process, and performance. This evaluation included information provided to the board by Vanguard’s Portfolio Review Department, which is responsible for fund and advisor oversight and product management. The Portfolio Review Department met regularly with the advisor and made monthly presentations to the board during the fiscal year that directed the board’s focus to relevant information and topics.
The board, or an investment committee made up of board members, also received information throughout the year during advisor presentations. For each advisor presentation, the board was provided with letters and reports that included information about, among other things, the advisory firm and the advisor’s assessment of the investment environment, portfolio performance, and portfolio characteristics.
In addition, the board received monthly reports, which included a Market and Economic Report, a Fund Dashboard Monthly Summary, and a Fund Performance Report.
Prior to their meeting, the trustees were provided with a memo and materials that summarized the information they received over the course of the year. They also considered the factors discussed below, among others. However, no single factor determined whether the board approved the arrangement. Rather, it was the totality of the circumstances that drove the board’s decision.
Nature, extent, and quality of services
The board reviewed the quality of the investment management services provided to the fund since its inception in 2013, and took into account the organizational depth and stability of the advisor. The board considered that Vanguard has been managing investments for more than three decades. The Quantitative Equity Group adheres to a sound, disciplined investment management process; the team has considerable experience, stability, and depth.
The board concluded that Vanguard’s experience, stability, depth, and performance, among other factors, warranted continuation of the advisory arrangement.
Investment performance
The board considered the performance of the fund since its inception, including any periods of outperformance or underperformance compared with a relevant benchmark and peer group. The board concluded that the performance was such that the advisory arrangement should continue. Information about the fund’s performance can be found in the Performance Summary section of this report.
33
Cost
The board concluded that the fund’s expense ratio was well below the average expense ratio charged by funds in its peer group and that the fund’s advisory expenses were also well below the peer-group average. Information about the fund’s expenses appears in the About Your Fund’s Expenses section of this report as well as in the Financial Statements section.
The board does not conduct a profitability analysis of Vanguard because of Vanguard’s unique “at-cost” structure. Unlike most other mutual fund management companies, Vanguard is owned by the funds it oversees and produces “profits” only in the form of reduced expenses for fund shareholders.
The benefit of economies of scale
The board concluded that the fund’s at-cost arrangement with Vanguard ensures that the fund will realize economies of scale as it grows, with the cost to shareholders declining as fund assets increase.
The board will consider whether to renew the advisory arrangement again after a one-year period.
34
Glossary
Beta. A measure of the magnitude of a fund’s past share-price fluctuations in relation to the ups and downs of a given market index. The index is assigned a beta of 1.00. Compared with a given index, a fund with a beta of 1.20 typically would have seen its share price rise or fall by 12% when the index rose or fell by 10%. For this report, beta is based on returns over the past 36 months for both the fund and the index. Note that a fund’s beta should be reviewed in conjunction with its R-squared (see definition). The lower the R-squared, the less correlation there is between the fund and the index, and the less reliable beta is as an indicator of volatility.
Dividend Yield. Dividend income earned by stocks, expressed as a percentage of the aggregate market value (or of net asset value, for a fund). The yield is determined by dividing the amount of the annual dividends by the aggregate value (or net asset value) at the end of the period. For a fund, the dividend yield is based solely on stock holdings and does not include any income produced by other investments.
Earnings Growth Rate. The average annual rate of growth in earnings over the past five years for the stocks now in a fund.
Equity Exposure. A measure that reflects a fund’s investments in stocks and stock futures. Any holdings in short-term reserves are excluded.
Expense Ratio. A fund’s total annual operating expenses expressed as a percentage of the fund’s average net assets. The expense ratio includes management and administrative expenses, but does not include the transaction costs of buying and selling portfolio securities.
Inception Date. The date on which the assets of a fund (or one of its share classes) are first invested in accordance with the fund’s investment objective. For funds with a subscription period, the inception date is the day after that period ends. Investment performance is measured from the inception date.
Median Market Cap. An indicator of the size of companies in which a fund invests; the midpoint of market capitalization (market price x shares outstanding) of a fund’s stocks, weighted by the proportion of the fund’s assets invested in each stock. Stocks representing half of the fund’s assets have market capitalizations above the median, and the rest are below it.
Price/Book Ratio. The share price of a stock divided by its net worth, or book value, per share. For a fund, the weighted average price/book ratio of the stocks it holds.
Price/Earnings Ratio. The ratio of a stock’s current price to its per-share earnings over the past year. For a fund, the weighted average P/E of the stocks it holds. P/E is an indicator of market expectations about corporate prospects; the higher the P/E, the greater the expectations for a company’s future growth.
R-Squared. A measure of how much of a fund’s past returns can be explained by the returns from the market in general, as measured by a given index. If a fund’s total returns were precisely synchronized with an index’s returns, its R-squared would be 1.00. If the fund’s returns bore no relationship to the index’s returns, its R-squared would be 0. For this report, R-squared is based on returns over the past 36 months for both the fund and the index.
35
Return on Equity. The annual average rate of return generated by a company during the past five years for each dollar of shareholder’s equity (net income divided by shareholder’s equity). For a fund, the weighted average return on equity for the companies whose stocks it holds.
Short-Term Reserves. The percentage of a fund invested in highly liquid, short-term securities that can be readily converted to cash.
Turnover Rate. An indication of the fund’s trading activity. Funds with high turnover rates incur higher transaction costs and may be more likely to distribute capital gains (which may be taxable to investors). The turnover rate excludes in-kind transactions, which have minimal impact on costs.
36
The Global Industry Classification Standard (“GICS”) was developed by and is the exclusive property and a service mark of MSCI Inc. (“MSCI”) and Standard and Poor’s, a division of McGraw-Hill Companies, Inc. (“S&P”), and is licensed for use by Vanguard. Neither MSCI, S&P nor any third party involved in making or compiling the GICS or any GICS classification makes any express or implied warranties or representations with respect to such standard or classification (or the results to be obtained by the use thereof), and all such parties hereby expressly disclaim all warranties of originality, accuracy, completeness, merchantability or fitness for a particular purpose with respect to any such standard or classification. Without limiting any of the foregoing, in no event shall MSCI, S&P, any of its affiliates or any third party involved in making or compiling the GICS or any GICS classification have any liability for any direct, indirect, special, punitive, consequential or any other damages (including lost profits) even if notified of the possibility of such damages.
37
This page intentionally left blank.
The People Who Govern Your Fund
The trustees of your mutual fund are there to see that the fund is operated and managed in your best interests since, as a shareholder, you are a part owner of the fund. Your fund’s trustees also serve on the board of directors of The Vanguard Group, Inc., which is owned by the Vanguard funds and provides services to them on an at-cost basis.
A majority of Vanguard’s board members are independent, meaning that they have no affiliation with Vanguard or the funds they oversee, apart from the sizable personal investments they have made as private individuals. The independent board members have distinguished backgrounds in business, academia, and public service. Each of the trustees and executive officers oversees 208 Vanguard funds.
Information for each trustee and executive officer of the fund appears below. The mailing address of the trustees and officers is P.O. Box 876, Valley Forge, PA 19482. More information about the trustees is in the Statement of Additional Information, which can be obtained, without charge, by contacting Vanguard at 800-662-7447, or online at vanguard.com.
Interested Trustees1
F. William McNabb III
Born in 1957. Trustee since July 2009. Principal occupation(s) during the past five years and other experience: chairman of the board (January 2010–present) of Vanguard and of each of the investment companies served by Vanguard, trustee (2009–present) of each of the investment companies served by Vanguard, and director (2008–present) of Vanguard. Chief executive officer and president (2008–2017) of Vanguard and each of the investment companies served by Vanguard, managing director (1995–2008) of Vanguard, and director (1997–2018) of Vanguard Marketing Corporation. Director (2018–present) of UnitedHealth Group.
Mortimer J. Buckley
Born in 1969. Trustee since January 2018. Principal occupation(s) during the past five years and other experience: chief executive officer (January 2018–present) of Vanguard; chief executive officer, president, and trustee (January 2018–present) of each of the investment companies served by Vanguard; president and director (2017–present) of Vanguard; and president (February 2018–present) of Vanguard Marketing Corporation. Chief investment officer (2013–2017), managing director (2002–2017), head of the Retail Investor Group (2006–2012), and chief information officer (2001–2006) of Vanguard. Chairman of the board (2011–2017) of the Children’s Hospital of Philadelphia.
Independent Trustees
Emerson U. Fullwood
Born in 1948. Trustee since January 2008. Principal occupation(s) during the past five years and other experience: executive chief staff and marketing officer for North America and corporate vice president (retired 2008) of Xerox Corporation (document management products and services). Former president of the Worldwide Channels Group, Latin America, and Worldwide Customer Service and executive chief staff officer of Developing Markets of Xerox. Executive in residence and 2009–2010 Distinguished Minett Professor at the Rochester Institute of Technology. Lead director of SPX FLOW, Inc. (multi-industry manufacturing). Director of the University of Rochester Medical Center, the Monroe Community College Foundation, the United Way of Rochester, North Carolina A&T University, and Roberts Wesleyan College. Trustee of the University of Rochester.
Amy Gutmann
Born in 1949. Trustee since June 2006. Principal occupation(s) during the past five years and other experience: president (2004–present) of the University of Pennsylvania. Christopher H. Browne Distinguished Professor of Political Science, School of Arts and Sciences, and professor of communication, Annenberg School for Communication, with secondary faculty appointments in the Department of Philosophy, School of Arts and Sciences, and at the Graduate School of Education, University of Pennsylvania. Trustee of the National Constitution Center.
1 Mr. McNabb and Mr. Buckley are considered “interested persons,” as defined in the Investment Company Act of 1940, because they are officers of the Vanguard funds.
JoAnn Heffernan Heisen
Born in 1950. Trustee since July 1998. Principal occupation(s) during the past five years and other experience: corporate vice president of Johnson & Johnson (pharmaceuticals/medical devices/consumer products) and member of its executive committee (1997–2008). Chief global diversity officer (retired 2008), vice president and chief information officer (1997–2006), controller (1995–1997), treasurer (1991–1995), and assistant treasurer (1989–1991) of Johnson & Johnson. Director of Skytop Lodge Corporation (hotels) and the Robert Wood Johnson Foundation. Member of the advisory board of the Institute for Women’s Leadership at Rutgers University.
F. Joseph Loughrey
Born in 1949. Trustee since October 2009. Principal occupation(s) during the past five years and other experience: president and chief operating officer (retired 2009) and vice chairman of the board (2008–2009) of Cummins Inc. (industrial machinery). Chairman of the board of Hillenbrand, Inc. (specialized consumer services), Oxfam America, and the Lumina Foundation for Education. Director of the V Foundation for Cancer Research. Member of the advisory council for the College of Arts and Letters and chair of the advisory board to the Kellogg Institute for International Studies, both at the University of Notre Dame.
Mark Loughridge
Born in 1953. Trustee since March 2012. Principal occupation(s) during the past five years and other experience: senior vice president and chief financial officer (retired 2013) of IBM (information technology services). Fiduciary member of IBM’s Retirement Plan Committee (2004–2013), senior vice president and general manager (2002–2004) of IBM Global Financing, vice president and controller (1998–2002) of IBM, and a variety of other prior management roles at IBM. Member of the Council on Chicago Booth.
Scott C. Malpass
Born in 1962. Trustee since March 2012. Principal occupation(s) during the past five years and other experience: chief investment officer (1989–present) and vice president (1996–present) of the University of Notre Dame. Assistant professor of finance at the Mendoza College of Business, University of Notre Dame, and member of the Notre Dame 403(b) Investment Committee. Chairman of the board of TIFF Advisory Services, Inc. Member of the board of Catholic Investment Services, Inc. (investment advisors), the board of advisors for Spruceview Capital Partners, and the board of superintendence of the Institute for the Works of Religion.
Deanna Mulligan
Born in 1963. Trustee since January 2018. Principal occupation(s) during the past five years and other experience: president (2010–present) and chief executive officer (2011–present) of The Guardian Life Insurance Company of America. Chief operating officer (2010–2011) and executive vice president (2008–2010) of Individual Life and Disability of The Guardian Life Insurance Company of America. Member of the board of The Guardian Life Insurance Company of America, the American Council of Life Insurers, the Partnership for New York City (business leadership), and the Committee Encouraging Corporate Philanthropy. Trustee of the Economic Club of New York and the Bruce Museum (arts and science). Member of the Advisory Council for the Stanford Graduate School of Business.
André F. Perold
Born in 1952. Trustee since December 2004. Principal occupation(s) during the past five years and other experience: George Gund Professor of Finance and Banking, Emeritus at the Harvard Business School (retired 2011). Chief investment officer and co-managing partner of HighVista Strategies LLC (private investment firm). Overseer of the Museum of Fine Arts Boston.
Sarah Bloom Raskin
Born in 1961. Trustee since January 2018. Principal occupation(s) during the past five years and other experience: deputy secretary (2014–2017) of the United States Department of the Treasury. Governor (2010–2014) of the Federal Reserve Board. Commissioner (2007–2010) of financial regulation for the State of Maryland. Member of the board of directors (2012–2014) of Neighborhood Reinvestment Corporation. Director of i(x) Investments, LLC.
Peter F. Volanakis
Born in 1955. Trustee since July 2009. Principal occupation(s) during the past five years and other experience: president and chief operating officer (retired 2010) of Corning Incorporated (communications equipment) and director of Corning Incorporated (2000–2010) and Dow Corning (2001–2010). Director (2012) of SPX Corporation (multi-industry manufacturing). Overseer of the Amos Tuck School of Business Administration, Dartmouth College (2001–2013). Chairman of the board of trustees of Colby-Sawyer College. Member of the Board of Hypertherm Inc. (industrial cutting systems, software, and consumables).
Executive Officers
Glenn Booraem
Born in 1967. Principal occupation(s) during the past five years and other experience: principal of Vanguard. Investment stewardship officer (2017–present), treasurer (2015–2017), controller (2010–2015), and assistant controller (2001–2010) of each of the investment companies served by Vanguard.
Christine M. Buchanan
Born in 1970. Principal occupation(s) during the past five years and other experience: principal of Vanguard and global head of Fund Administration at Vanguard. Treasurer (2017–present) of each of the investment companies served by Vanguard. Partner (2005–2017) at KPMG LLP (audit, tax, and advisory services).
Brian Dvorak
Born in 1973. Principal occupation(s) during the past five years and other experience: principal of Vanguard. Chief compliance officer (2017–present) of Vanguard and each of the investment companies served by Vanguard. Assistant vice president (2017–present) of Vanguard Marketing Corporation. Vice president and director of Enterprise Risk Management (2011–2013) at Oppenheimer Funds, Inc.
Thomas J. Higgins
Born in 1957. Principal occupation(s) during the past five years and other experience: principal of Vanguard. Chief financial officer (2008–present) and treasurer (1998–2008) of each of the investment companies served by Vanguard.
Peter Mahoney
Born in 1974. Principal occupation(s) during the past five years and other experience: principal of Vanguard. Controller (2015–present) of each of the investment companies served by Vanguard. Head of International Fund Services (2008–2014) at Vanguard.
Anne E. Robinson
Born in 1970. Principal occupation(s) during the past five years and other experience: general counsel (2016–present) of Vanguard. Secretary (2016–present) of Vanguard and of each of the investment companies served by Vanguard. Managing director (2016–present) of Vanguard. Director and senior vice president (2016–2018) of Vanguard Marketing Corporation. Managing director and general counsel of Global Cards and Consumer Services (2014–2016) at Citigroup. Counsel (2003–2014) at American Express.
Michael Rollings
Born in 1963. Principal occupation(s) during the past five years and other experience: finance director (2017–present) and treasurer (2017) of each of the investment companies served by Vanguard. Managing director (2016–present) of Vanguard. Chief financial officer (2016–present) of Vanguard. Director (2016–present) of Vanguard Marketing Corporation. Executive vice president and chief financial officer (2006–2016) of MassMutual Financial Group.
| Vanguard Senior Management Team | |
| Mortimer J. Buckley | James M. Norris |
| Gregory Davis | Thomas M. Rampulla |
| John James | Karin A. Risi |
| Martha G. King | Anne E. Robinson |
| John T. Marcante | Michael Rollings |
| Chris D. McIsaac | |
| Chairman Emeritus and Senior Advisor | |
| John J. Brennan | |
| Chairman, 1996–2009 | |
| Chief Executive Officer and President, 1996–2008 | |
| Founder | |
| John C. Bogle | |
| Chairman and Chief Executive Officer, 1974–1996 | |
 | |
P.O. Box 2600 | |
Connect with Vanguard® > vanguard.com | |
| Fund Information > 800-662-7447 | Source for Bloomberg Barclays indexes: Bloomberg |
| Direct Investor Account Services > 800-662-2739 | Index Services Limited. Copyright 2018, Bloomberg. All |
| Institutional Investor Services > 800-523-1036 | rights reserved. |
| Text Telephone for People | |
| Who Are Deaf or Hard of Hearing > 800-749-7273 | CFA® is a registered trademark owned by CFA Institute |
| This material may be used in conjunction | |
| with the offering of shares of any Vanguard | |
| fund only if preceded or accompanied by | |
| the fund’s current prospectus. | |
| All comparative mutual fund data are from Lipper, a | |
| Thomson Reuters Company, or Morningstar, Inc., unless | |
| otherwise noted. | |
| You can obtain a free copy of Vanguard’s proxy voting | |
| guidelines by visiting vanguard.com/proxyreporting or by | |
| calling Vanguard at 800-662-2739. The guidelines are | |
| also available from the SEC’s website, sec.gov. In | |
| addition, you may obtain a free report on how your fund | |
| voted the proxies for securities it owned during the 12 | |
| months ended June 30. To get the report, visit either | |
| vanguard.com/proxyreporting or sec.gov. | |
| You can review and copy information about your fund at | |
| the SEC’s Public Reference Room in Washington, D.C. To | |
| find out more about this public service, call the SEC at | |
| 202-551-8090. Information about your fund is also | |
| available on the SEC’s website, and you can receive | |
| copies of this information, for a fee, by sending a | |
| request in either of two ways: via email addressed to | |
| publicinfo@sec.gov or via regular mail addressed to the | |
| Public Reference Section, Securities and Exchange | |
| Commission, Washington, DC 20549-1520. | |
| © 2018 The Vanguard Group, Inc. | |
| All rights reserved. | |
| Vanguard Marketing Corporation, Distributor. | |
| Q11942 062018 | |
Item 2: Code of Ethics.
Not Applicable.
Item 3: Audit Committee Financial Expert.
Not Applicable.
Item 4: Principal Accountant Fees and Services.
(a) Audit Fees.
Not Applicable.
Item 5: Audit Committee of Listed Registrants.
Not Applicable.
Item 6: Investments.
Not Applicable.
Item 7: Disclosure of Proxy Voting Policies and Procedures for Closed-End Management Investment Companies.
Not Applicable.
Item 8: Portfolio Managers of Closed-End Management Investment Companies.
Not Applicable.
Item 9: Purchase of Equity Securities by Closed-End Management Investment Company and Affiliated Purchasers.
Not Applicable.
Item 10: Submission of Matters to a Vote of Security Holders.
Not Applicable.
Item 11: Controls and Procedures.
(a) Disclosure Controls and Procedures. The Principal Executive and Financial Officers concluded
that the Registrant’s Disclosure Controls and Procedures are effective based on their evaluation of the
Disclosure Controls and Procedures as of a date within 90 days of the filing date of this report.
(b) Internal Control Over Financial Reporting. There were no significant changes in Registrant’s
Internal Control Over Financial Reporting or in other factors that could significantly affect this control
subsequent to the date of the evaluation, including any corrective actions with regard to significant deficiencies
and material weaknesses.
Item 12: Disclosure of Securities Lending Activities for Closed-End Management
Investment Companies.
Not Applicable.
Item 13: Exhibits.
(a) Certifications.
Pursuant to the requirements of the Securities Exchange Act of 1934 and the Investment Company Act of
1940, the registrant has duly caused this report to be signed on its behalf by the undersigned, thereunto duly
authorized.
| VANGUARD WHITEHALL FUNDS | |
| By: | /s/ MORTIMER J. BUCKLEY* |
| MORTIMER J. BUCKLEY | |
| CHIEF EXECUTIVE OFFICER | |
| Date: June 14, 2018 | |
Pursuant to the requirements of the Securities Exchange Act of 1934 and the Investment Company Act of 1940, this report has been signed below by the following persons on behalf of the registrant and in the capacities and on the dates indicated.
| VANGUARD WHITEHALL FUNDS | |
| By: | /s/ MORTIMER J. BUCKLEY* |
| MORTIMER J. BUCKLEY | |
| CHIEF EXECUTIVE OFFICER | |
| Date: June 14, 2018 | |
| VANGUARD WHITEHALL FUNDS | |
| By: | /s/ THOMAS J. HIGGINS* |
| THOMAS J. HIGGINS | |
| CHIEF FINANCIAL OFFICER | |
| Date: June 14, 2018 | |
* By: /s/ Anne E. Robinson
Anne E. Robinson, pursuant to a Power of Attorney filed on January 18, 2018; see file Number 33-32216,
Incorporated by Reference.