Exhibit 99.1
OceanFirst Financial Corp.
John R. Garbarino, Chairman, President & CEO
Michael J. Fitzpatrick, Executive Vice President & CFO
INVESTOR PRESENTATION
SEPTEMBER 27, 2005
NASDAQ: OCFC 1
OceanFirst Financial Corp.
This presentation contains certain forward-looking statements which are based on certain assumptions and describe future plans, strategies and expectations of the Company. These forward-looking statements are generally identified by use of the words “believe”, “expect”, “intend”, “anticipate”, “estimate”, “project”, or similar expressions. The Company’s ability to predict results or the actual effect of future plans or strategies is inherently uncertain. Factors which could have a material adverse effect on the operations of the Company and the subsidiaries include, but are not limited to, changes in interest rates, general economic conditions, legislative/regulatory changes, monetary and fiscal policies of the U.S. Government, including policies of the U.S. Treasury and the Federal Reserve Board, the quality or composition of the loan or investment portfolios, demand for loan products, deposit flows, competition, demand for financial services in the Company’s market area and accounting principles and guidelines. These risks and uncertainties should be considered in evaluating forward-looking statements and undue reliance should not be placed on such statements. The Company does not undertake – and specifically disclaims any obligation – to publicly release the result of any revisions which may be made to any forward-looking statements to reflect events or circumstances after the date of such statements or to reflect the occurrence of anticipated or unanticipated events.
NASDAQ: OCFC 2
OceanFirst Financial Today
Holding company for the 103 year old financial services firm serving the community banking needs of the attractive Central New Jersey Shore growth market between the major metropolitan areas of New York City and Philadelphia
$2.0 Billion in Assets – 18 OceanFirst Bank branches and 2 satellite loan production offices (lpo) within a tightly defined market area
Columbia Home Loans, LLC. (CHL) – wholly owned mortgage banking subsidiary headquartered in Westchester County, New York with offices in the greater NYC metropolitan area
Transitioning the Bank’s balance sheet to reduce a historical over-reliance on CD funding and residential mortgage portfolio lending
Responding to the Compliance & Risk Management challenges of the day
Growing revenue and non-interest income through balance sheet expansion and composition change, maturity of new business lines and continual product line expansion
NASDAQ: OCFC 3
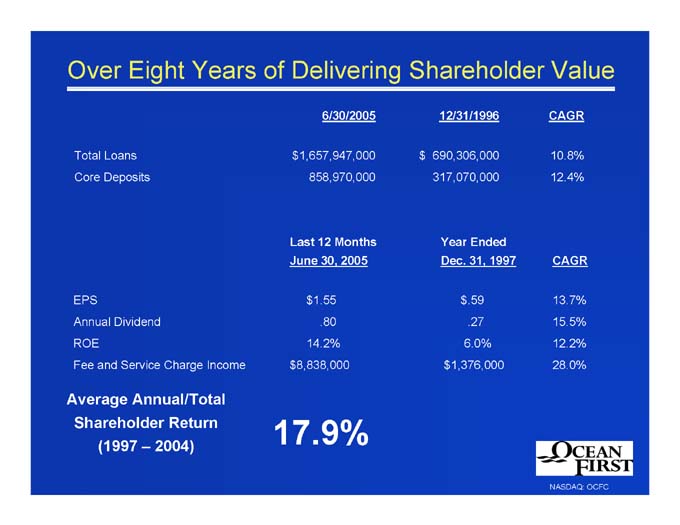
Over Eight Years of Delivering Shareholder Value
6/30/2005 12/31/1996 CAGR
Total Loans $1,657,947,000 $ 690,306,000 10.8%
Core Deposits 858,970,000 317,070,000 12.4%
Last 12 Months Year Ended
June 30, 2005 Dec. 31, 1997 CAGR
EPS $1.55 $.59 13.7%
Annual Dividend .80 .27 15.5%
ROE 14.2% 6.0% 12.2%
Fee and Service Charge Income $8,838,000 $1,376,000 28.0%
Average Annual/Total
Shareholder Return
(1997 – 2004)
17.9%
NASDAQ: OCFC 4
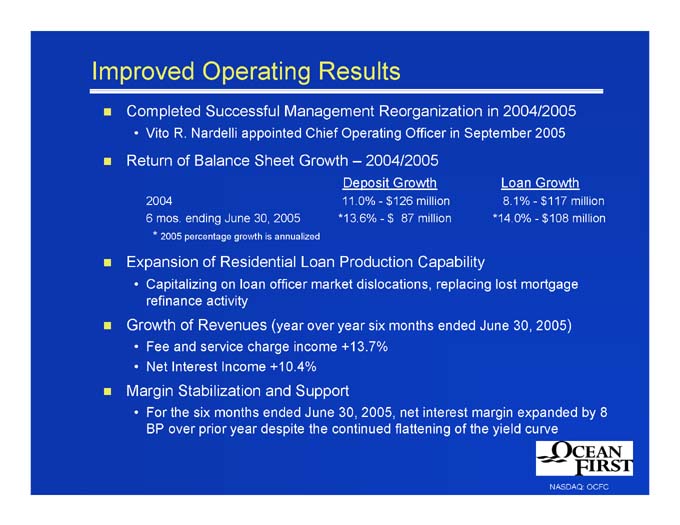
Improved Operating Results
Completed Successful Management Reorganization in 2004/2005
Vito R. Nardelli appointed Chief Operating Officer in September 2005
Return of Balance Sheet Growth – 2004/2005
Deposit Growth Loan Growth
2004 11.0% - $126 million 8.1% - $117 million
6 mos. ending June 30, 2005 *13.6% - $ 87 million *14.0% - $108 million
* 2005 percentage growth is annualized
Expansion of Residential Loan Production Capability
Capitalizing on loan officer market dislocations, replacing lost mortgage refinance activity
Growth of Revenues (year over year six months ended June 30, 2005)
Fee and service charge income +13.7%
Net Interest Income +10.4%
Margin Stabilization and Support
For the six months ended June 30, 2005, net interest margin expanded by 8 BP over prior year despite the continued flattening of the yield curve
NASDAQ: OCFC 5
Business Plan 2005 – 2007
Return to double-digit EPS growth rates
Focus on disciplined de novo branch and core account development to drive asset/revenue growth
Market commercial lending services to local businesses, further improving the loan portfolio mix
Grow non-interest income as the primary driver of top-line revenue through the maturation of recent initiatives
Improve operating efficiency through revenue enhancement and expense control
Deliver all financial services within the Bank’s defined market under the strong sales, service and credit cultures
Capitalizing on the unique advantage of being the local community service minded alternative to mega-banks
NASDAQ: OCFC 6
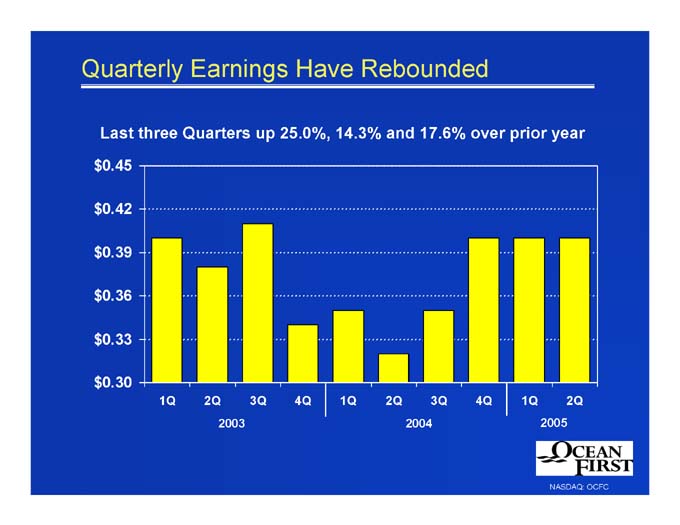
Quarterly Earnings Have Rebounded
Last three Quarters up 25.0%, 14.3% and 17.6% over prior year
$0.45
$0.42
$0.39
$0.36
$0.33
$0.30
1Q
4Q
3Q
2Q
1Q
4Q
3Q
2Q
1Q
2Q
2004
2003
2005
NASDAQ: OCFC 7
Retail Branch In-Market Growth
18 Branches in tightly defined market
provide significant presence, market share
Successful de novo branching and core deposit generation
From 1996 through 2Q ‘05, 10 branches were opened with an average core deposit mix of 73%
Additional current branch activity in our growth market
Freehold branch opened March 2005
Whiting branch to be relocated to a more convenient, prominent location (1Q ‘06)
New Little Egg Harbor branch scheduled to open (2Q ‘06)
New Wall branch scheduled to open 1Q ‘07
NASDAQ: OCFC 8
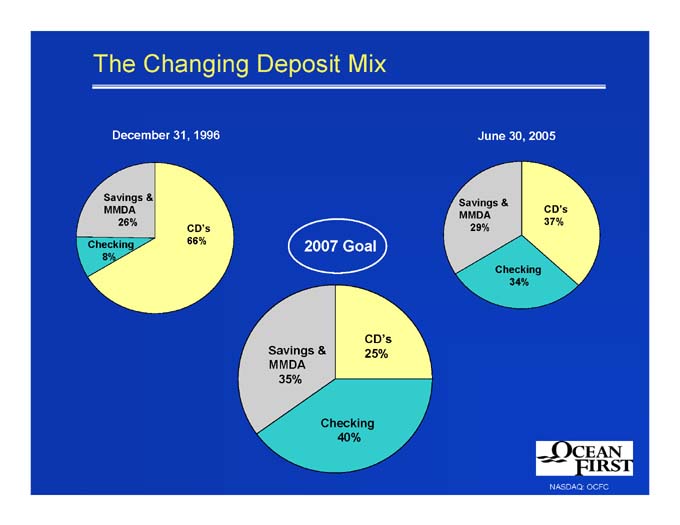
The Changing Deposit Mix
June 30, 2005
December 31, 1996
Savings &
MMDA
29%
Savings &
MMDA
26%
CD’s
37%
CD’s
66%
Checking
8%
2007 Goal
Checking
34%
CD’s
25%
Savings &
MMDA
35%
Checking
40%
NASDAQ: OCFC 9
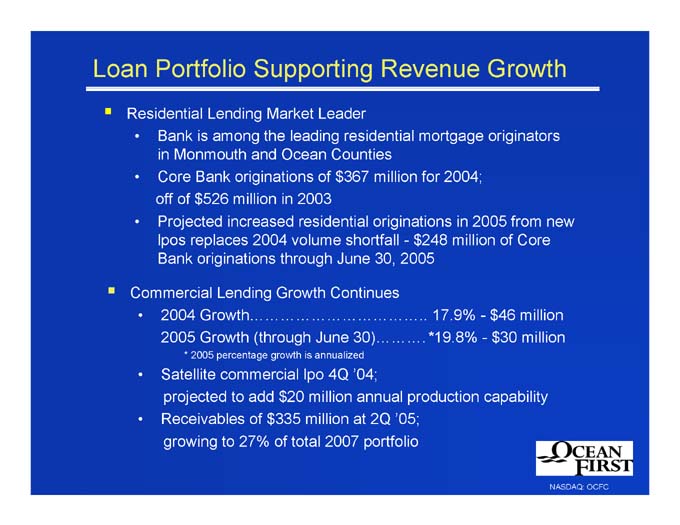
Loan Portfolio Supporting Revenue Growth
Residential Lending Market Leader
Bank is among the leading residential mortgage originators in Monmouth and Ocean Counties
Core Bank originations of $367 million for 2004;
off of $526 million in 2003
Projected increased residential originations in 2005 from new lpos replaces 2004 volume shortfall - $248 million of Core Bank originations through June 30, 2005
Commercial Lending Growth Continues
2004 Growth 17.9% - $46 million
2005 Growth (through June 30) *19.8% - $30 million
* 2005 percentage growth is annualized
Satellite commercial lpo 4Q ‘04;
projected to add $20 million annual production capability
Receivables of $335 million at 2Q ’05;
growing to 27% of total 2007 portfolio
NASDAQ: OCFC 10
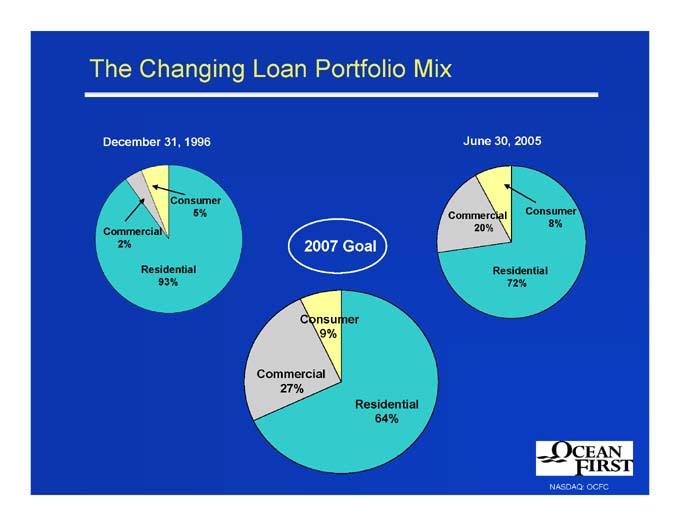
The Changing Loan Portfolio Mix
December 31, 1996
June 30, 2005
Consumer
5%
Commercial
20%
Consumer
8%
Commercial
2%
2007 Goal
Residential
72%
Residential
93%
Consumer
9%
Commercial
27%
Residential
64%
NASDAQ: OCFC 11
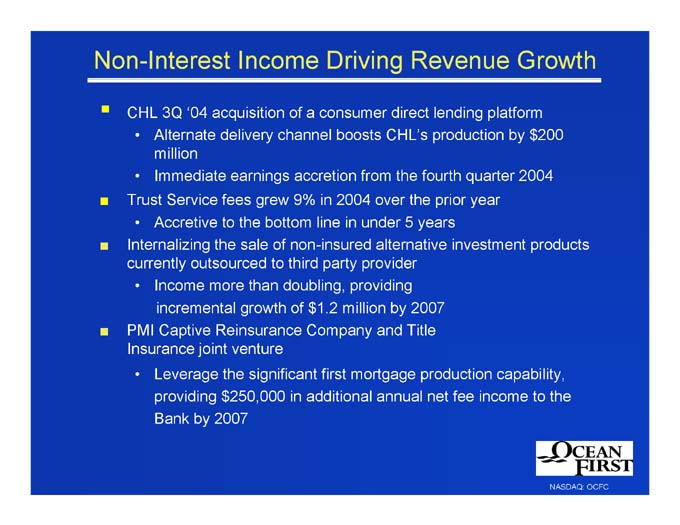
Non-Interest Income Driving Revenue Growth
CHL 3Q ‘04 acquisition of a consumer direct lending platform
Alternate delivery channel boosts CHL’s production by $200 million
Immediate earnings accretion from the fourth quarter 2004
Trust Service fees grew 9% in 2004 over the prior year
Accretive to the bottom line in under 5 years
Internalizing the sale of non-insured alternative investment products currently outsourced to third party provider
Income more than doubling, providing
incremental growth of $1.2 million by 2007
PMI Captive Reinsurance Company and Title Insurance joint venture
Leverage the significant first mortgage production capability, providing $250,000 in additional annual net fee income to the Bank by 2007
NASDAQ: OCFC 12
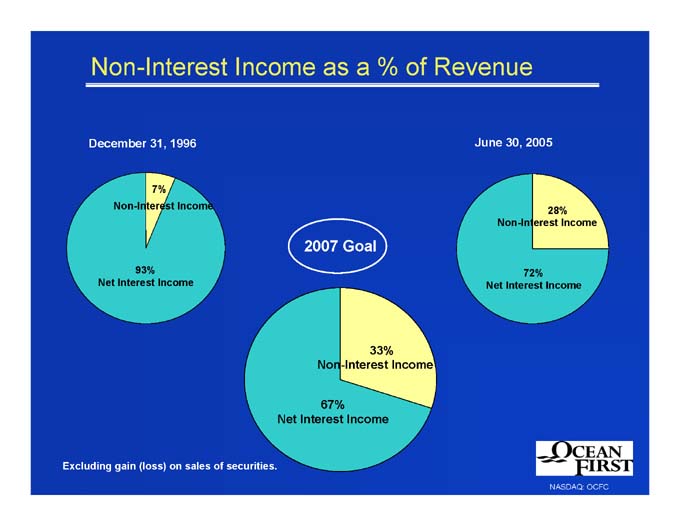
Non-Interest Income as a % of Revenue
December 31, 1996
June 30, 2005
7%
Non-Interest Income
28%
Non-Interest Income
2007 Goal
72%
Net Interest Income
93%
Net Interest Income
33%
Non-Interest Income
67%
Net Interest Income
Excluding gain (loss) on sales of securities.
NASDAQ: OCFC 13
Capital Management
Successfully delivering on our 1996 IPO Business Plan
Historical
First mutual thrift conversion to include a charitable foundation
Repurchase of 16.0 million shares, 59% of shares originally issued
Eleventh repurchase program for 10% of outstanding shares
100% stock dividend – 5/98; 50% stock dividend – 5/02
Quarterly cash dividend increases totaling 200% since the initial dividend in 1997
Current attractive yield – 3.5%
Wholesale leverage strategy managed to transition from investment securities to loans providing additional net interest income with manageable interest rate risk
Effective leverage of core capital from 20.8% in 1996 to 6.8% at June 30, 2005, without ill conceived acquisitions or market-dilutive geographic expansion
NASDAQ: OCFC 14
Capital Management (cont’d)
Continuing to drive value
Prospective
OceanFirst Foundation performing as expected – without bottom-line dilution
Capital leveraged appropriately
Continued share repurchases and aggressive cash dividend payout ratios
Balance sheet expansion driven by commercial loan and core deposit growth
Raise Tier 2 debt capital, as necessary, to support growth and share repurchases
$5 million of subordinated debt issued in August 2005
NASDAQ: OCFC 15
Building Additional Shareholder Value
In the long run, we think the following factors undoubtedly create value for the long term OCFC investor
EPS Growth
Restore double digit EPS growth for 2005-2007 periods
Balance Sheet & Revenue Expansion
Grow the balance sheet in excess of 6% annually
Increase total revenue minimum of 7% each year
Prudent Capital Management
Targeting desired capital levels of 6.5% – 7.25%
Continued repurchase program funded through debt issuance
Healthy cash dividend payout ratio
NASDAQ: OCFC 16
Building Additional Shareholder Value (cont’d.)
Effective Risk Management
Chief Risk Officer directing Enterprise-wide Risk
Management
Net charge-offs amounted to approximately 3 basis points of
average net loans from 1997 through 2004
Interest Rate Risk controlled in transitional environment
Franchise Value Enhancement
Successful community banking in a most attractive
Central Jersey Shore market
CHL initiatives in the opportunity-rich New York
metropolitan area
NASDAQ: OCFC 17
Thank you for your interest in
OceanFirst
Financial Corp.
NASDAQ: OCFC 18