 Investor Presentation July 2015 OceanFirst Financial Corp. Exhibit 99.1 |
 OceanFirst Financial Corp. Forward Looking Statements: This presentation contains certain forward-looking statements within the meaning of the Private Securities Reform Act of 1995 which are based on certain assumptions and describe future plans, strategies and expectations of the Company. These forward-looking statements are generally identified by use of the words "believe," "expect," "intend," "anticipate," "estimate," "project," "will," "should," "may," "view," "opportunity," "potential," or similar expressions or expressions of confidence. The Company's ability to predict results or the actual effect of future plans or strategies is inherently uncertain. Factors which could have a material adverse effect on the operations of the Company and its subsidiaries include, but are not limited to, changes in interest rates, general economic conditions, levels of unemployment in the Bank’s lending area, real estate market values in the Bank’s lending area, future natural disasters and increases to flood insurance premiums, the level of prepayments on loans and mortgage-backed securities, legislative/ regulatory changes, monetary and fiscal policies of the U.S. Government including policies of the U.S. Treasury and the Board of Governors of the Federal Reserve System, the quality or composition of the loan or investment portfolios, demand for loan products, deposit flows, competition, demand for financial services in the Company's market area and accounting principles and guidelines. These risks and uncertainties are further discussed in the Company’s Annual Report on Form 10-K for the year ended December 31, 2014 and subsequent securities filings and should be considered in evaluating forward- looking statements and undue reliance should not be placed on such statements. The Company does not undertake, and specifically disclaims any obligation, to publicly release the result of any revisions which may be made to any forward-looking statements to reflect events or circumstances after the date of such statements or to reflect the occurrence of anticipated or unanticipated events. 2 |
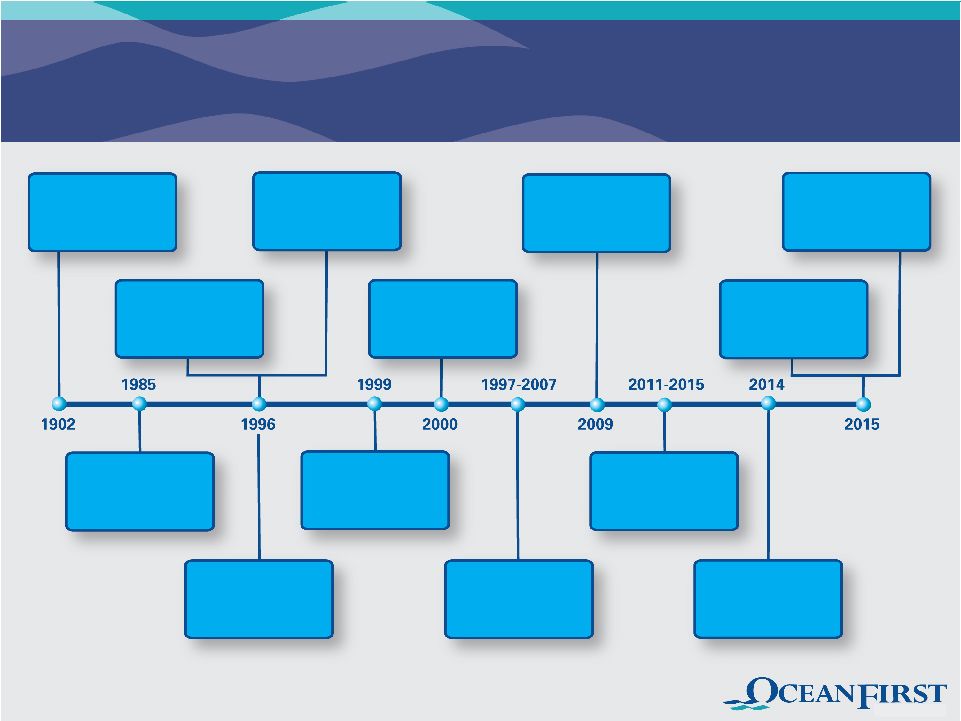 OceanFirst Milestones – 113 Years of Growth 3 Established Trust and Asset Management Founded, Point Pleasant, NJ Established Commercial Lending Rebuilt Capital To 9.5% Through Secondary Stock Offering IPO To Mutual Depositors Repurchased 62% Of Original IPO shares OceanFirst Foundation Passes $25 million In Cumulative Grants Branch Expansion Into Middlesex County Branch Expansion Into Monmouth County Resumed Share Repurchases – Current Authorization: 358,458 Shares Created OceanFirst Foundation Colonial American Bank Acquired* Open LPO In Mercer County To Serve The Broader Central Jersey Market * Closing scheduled for July 31, 2015 |
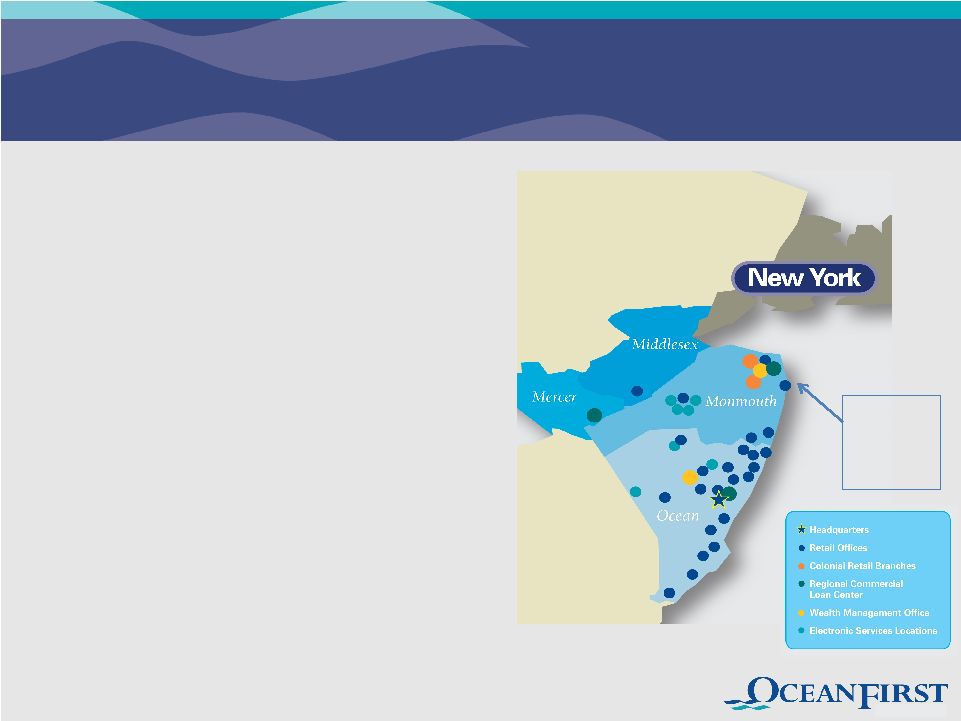
 Serving Central New Jersey Market • Community Bank serving the Central Jersey market - $2.4 billion in assets and 24 branch offices (25 th branch opening in third quarter 2015) • Targeting growth opportunities in Monmouth, Mercer and Middlesex Counties • Market Cap $306 million 30 million people, or approximately 10% of the total U.S. population, reside within a 2-hour drive* *Includes New York – Newark NY-NJ-PA-CT CSA and Philadelphia – Reading – Camden CSA. 4 |
 Experienced Leadership Name Position # of Years at OCFC # of Years In Banking Previous Experience Christopher D. Maher President, Chief Executive Officer 2 27 Patriot National Bancorp; Dime Community Bancshares Michael J. Fitzpatrick Executive Vice President, Chief Financial Officer 23 34 KPMG Joseph R. Iantosca Executive Vice President, Chief Administrative Officer 11 37 BISYS Banking Solutions; Newtrend LLC; Brooklyn Federal Savings Joseph J. Lebel III Executive Vice President, Chief Lending Officer 9 31 Wachovia Bank N.A.; First Fidelity • Substantial insider ownership of 27.3% – aligned with shareholders’ interests OceanFirst Bank ESOP 10.0% Directors & Senior Executive Officers 10.6% (Chairman 5.9%) Director and Proxy Officer Stock Ownership Guidelines OceanFirst Foundation 6.7% As of March 10, 2015 proxy date. 5 |
 Deep Bench of Experienced Executives Name Position # of Years at OCFC # of Years In Banking Previous Experience Craig C. Spengeman Executive Vice President, Director of Wealth Management 1 38 PGB Trust and Investments (Division of Peapack-Gladstone Bank) Margaret Lanning First Senior Vice President, Chief Credit Officer - 36 Wells Fargo Bank, N.A.; Wachovia Bank Steven J. Tsimbinos First Senior Vice President, General Counsel 5 21 Thacher Proffit & Wood; Lowenstein Sandler PC Gary S. Hett Senior Vice President, Director of Human Resources 3 42 Patriot National Bancorp; Dime Community Bancshares Gayle S. Hoffman Senior Vice President, Internal Audit Director 1 17 Rumson-Fair Haven Bank & Trust; First State Bank; KPMG David R. Howard Senior Vice President, Chief Risk Officer 2 25 Guggenheim Partners; Financial Guaranty Insurance Company 6 |
 Our Strategy • Currently positioned as the leading Community Bank in Central New Jersey • Expanding into Monmouth, Mercer and Middlesex Counties Developing the franchise Growing revenue Creating additional value for shareholders • Strategically focused on revenue growth in commercial lending, wealth management, and bankcard services Guarding credit quality in ALL business cycles Growing diversified streams of non-interest income to decrease reliance on Net Interest Margin (NIM) • Creating attractive profile to encourage roll-up opportunities presented by local community banks lacking the scale or desire to remain independent 7 |
 Significant Primary Market Deposit Share Competing Favorably Against Banking Behemoths # of Dep. In Mkt. Mkt. Shr. Rank Institution Branches ($000) (%) Ocean County, NJ 1 TD Bank, National Association (Canada) 22 2,541,705 17.45 2 Hudson City Bancorp Inc. (NJ) (1) 14 2,212,695 15.19 3 Wells Fargo Bank NA (CA) 26 2,203,005 15.13 4 OceanFirst Financial Corp. (NJ) 19 1,480,885 10.17 5 Banco Santander S.A. (Spain) 21 1,368,640 9.40 6 Bank of America Corp. (NC) 17 1,267,176 8.70 Total For Institutions In Market 188 14,563,013 (1) Pending acquisition by M&T Bank (NY) Source: FDIC Summary of Deposits, June 30, 2014 8 |
 Strategic Deposit Composition Transition 0% 20% 40% 60% 80% 100% Dec 1996 Dec 2009 Jun 2015 Time Deposits Time Deposits MMDA & Savings MMDA & Savings MMDA & Savings Interest Checking Interest Checking Interest Checking Non-Interest Checking Non- Interest Checking WAR 0.05% WAR 1.40% Time Deposits* *Time deposits duration of 19 months WAR 0.09% Total Cost of Deposits 0.22% 9 88% Transaction Deposits |
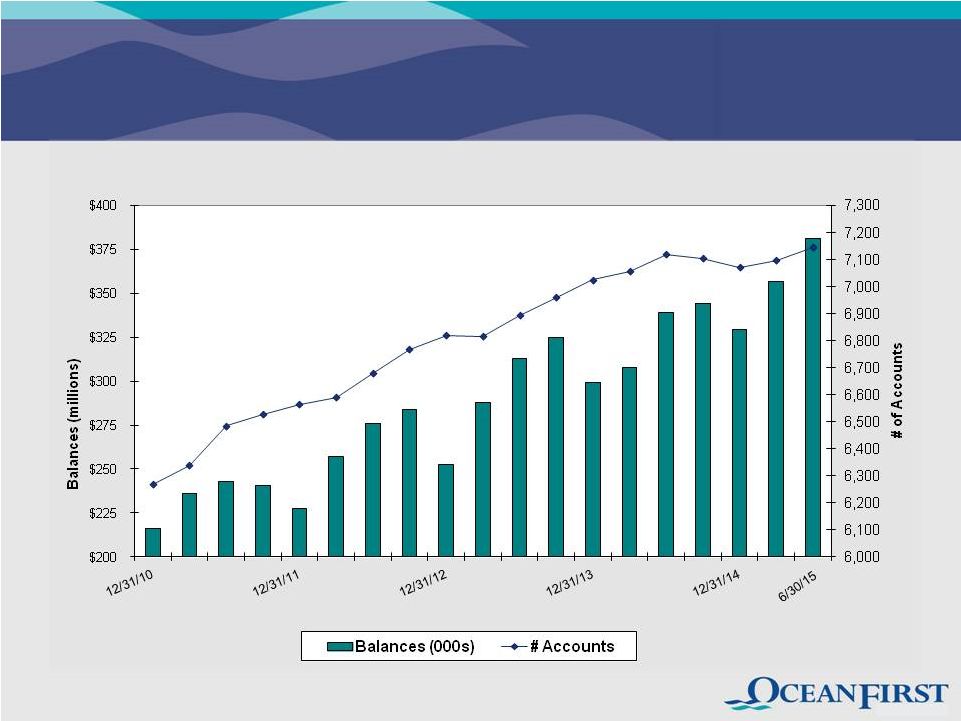 Strategic Focus on Commercial Lending Drives Business Checking 10 |
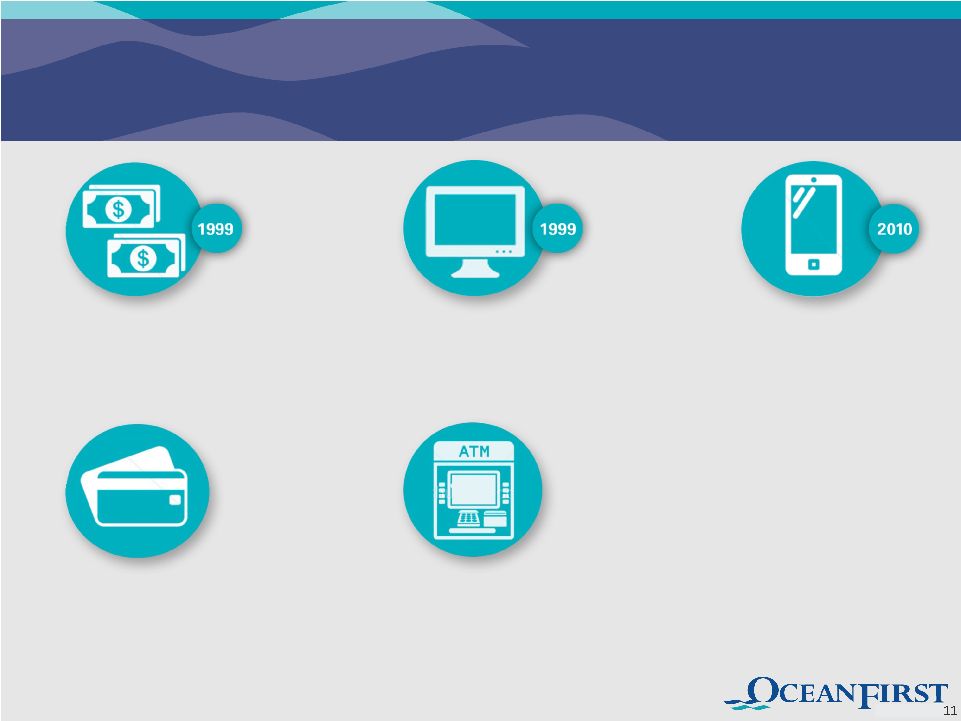 Full Suite of Technology and Delivery Systems Mobile Banking Added mobile deposit capture in 2013 and TouchID in April 2015. More than 14,000 depositors use mobile, text or smart phone apps monthly. Online Banking & Bill Pay In 2014, 42% of depositors used online banking and an average of 34,000 bills were paid with online bill pay service each month. Check Card Over 6 million transactions processed in 2014, Rewards program promotes usage. ATM & Interactive Teller (ITM) Invested $900,000 to upgrade ATM Fleet to intelligent terminals in 2014; self-service deposits more than doubled. First ITM deployed in 2014 with 5 more to be added in 2015. Corporate Cash Management Added Remote Deposit Capture (RDC) in 2007. In 2014, 88 clients processed over 600,000 checks using RDC. Pending Enhancements • Apple Watch • Apple Pay • EMV Check Cards • Instant Issue Check Cards • Card Valet – a mobile card management app |
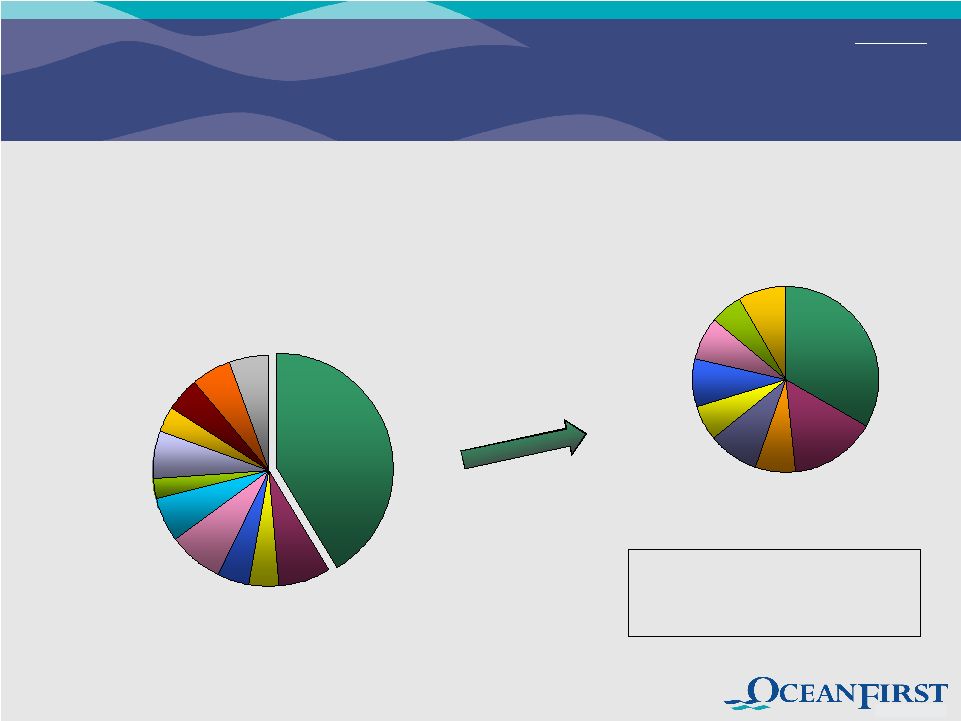
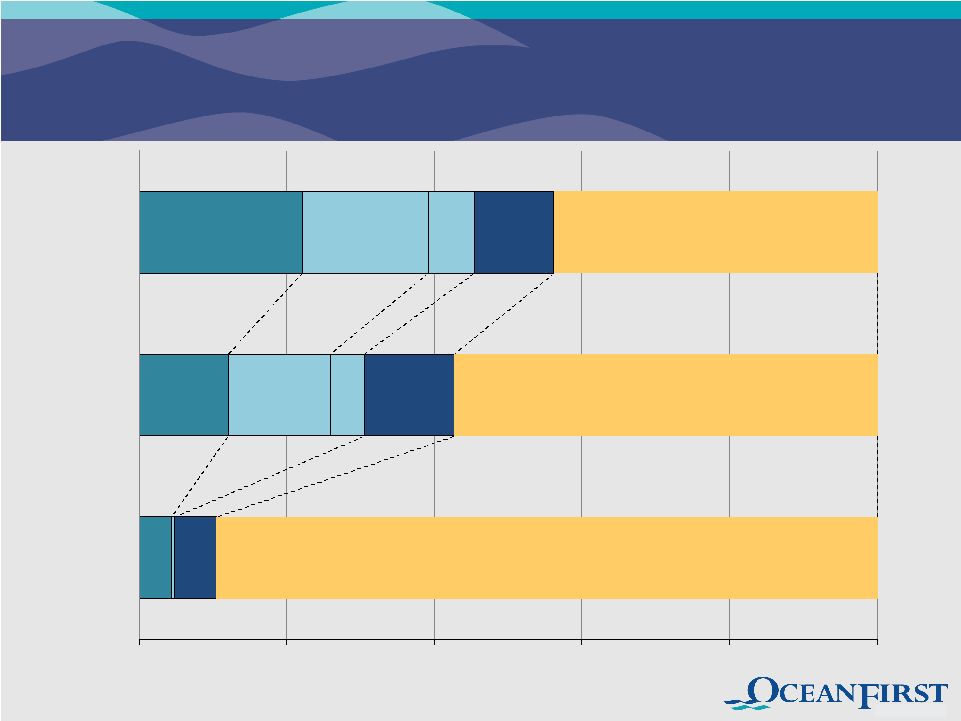 Strategic Loan Composition Transition 0% 20% 40% 60% 80% 100% Dec 1996 Dec 2009 Jun 2015 Residential R.E. (57.4%) Residential R.E. (89.6%) Residential R.E. Investment CRE Investment CRE Investment CRE Consumer & Other Consumer & Other Consumer & Other C&I Owner- Occupied CRE Owner- Occupied CRE C&I (1) (1) Commercial loan (CRE and C&I) duration of 2.7 years. (43.9%) 12 |
 Credit Underwriting Remains Conservative: Commercial Loan Production 2014 and 2015 (Dollars in thousands) 2014 Total Commercial Loan Originations First Half 2015 Total Commercial Loan Originations Total Portfolio at June 30, 2015 Amount $243,858 $121,473 $809,515 Weighted average rate 4.14% 4.13% 4.34% Weighted average debt service coverage 2.0X 1.96X 2.00X Weighted average loan-to-value (CRE only) 56% 64% 55% Weighted average risk rating (1) 4.3 4.3 4.5 Deposit contribution $35,727 $26,464 $198,475 Cash management (% utilizing) 35% (1) Risk rating is on a scale from 1 (best) to 9 (worst). A rating of 4.5 represents an equivalent S&P rating of BBB. 13 |
 Highlights – Second Quarter 2015 • Received required regulatory and stockholder approvals relating to the pending acquisition of Colonial American Bank. The transaction is scheduled to close on July 31, 2015. • Grew commercial loan portfolio $34.3 million, 17.7% annualized A new commercial lending team located in Mercer County, New Jersey, began operations in the first quarter The Bank’s conservative credit culture was further enhanced with addition of a highly experienced Chief Credit Officer • Expanded funding sources to support loan growth Opened new branch office in Long Branch, NJ at Pier Village An additional branch in Jackson Township, Ocean County, to open in third quarter • Earnings per share of $0.31, 9.3% ROE & 0.86% ROA Excluding non-recurring merger related expenses, earnings per share was $0.32 Net interest margin relatively stable at 3.23% Expense discipline led to reductions in operating expenses of 3.0%, as compared to the same prior year quarter • Tangible common equity of 9.3% of assets • Common stock repurchase plan in place to strategically manage capital levels 14 |
 Highlights – Risk Management Over the past year through June 30, 2015: • Interest Rate Risk Management Extended $60 million of FHLB advances into 3 – 5 year terms $57 million of retail checking migrated to non-interest bearing Core deposits (1) are 88.1% of total deposits, a significant hedge against a rising rate environment • Asset Quality Improvements Non-performing loans decreased by 49%, or $19.8 million, to $20.9 million at June 30, 2015 Credit metrics improved as non-performing loans as a percent of total loans receivable decreased to 1.16% from 2.44%, and Allowance for Loan Losses as a percent of total non-performing loans increased to 79.1% from 51.4% (1) Core deposits are all deposits except time deposits. 15 |
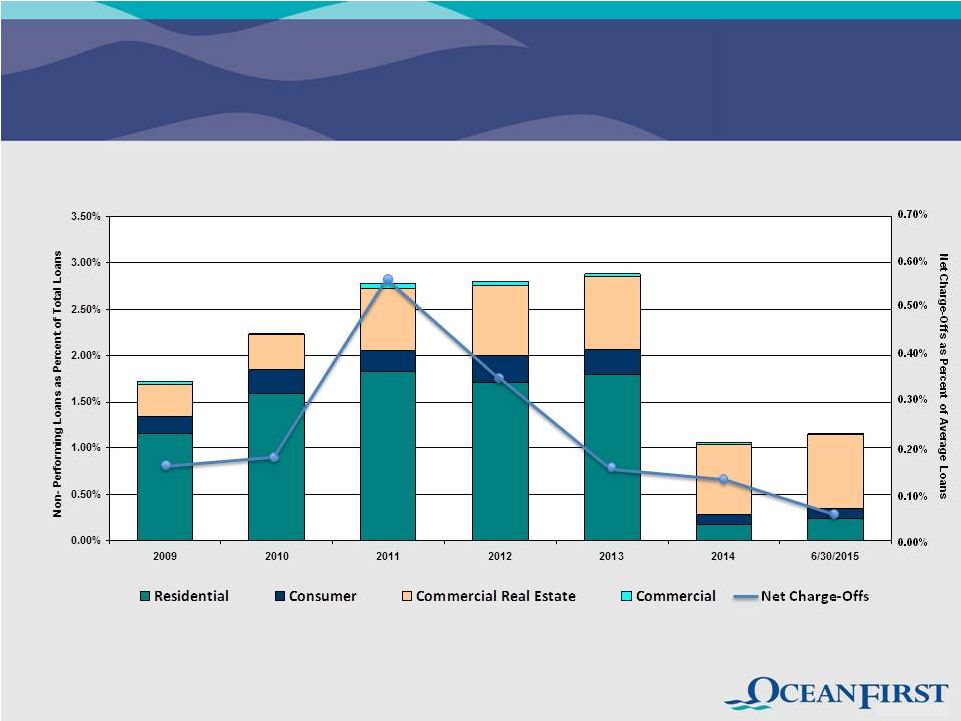 Credit Metrics Reflect Conservative Culture Data as of December 31, unless otherwise indicated. Net charge-off ratio for 2014 excludes charge-off related to bulk sale of non-performing residential and consumer mortgage loans. Including this charge-off, the ratio is 0.45%. Ratio for 2015 is annualized. 16 |
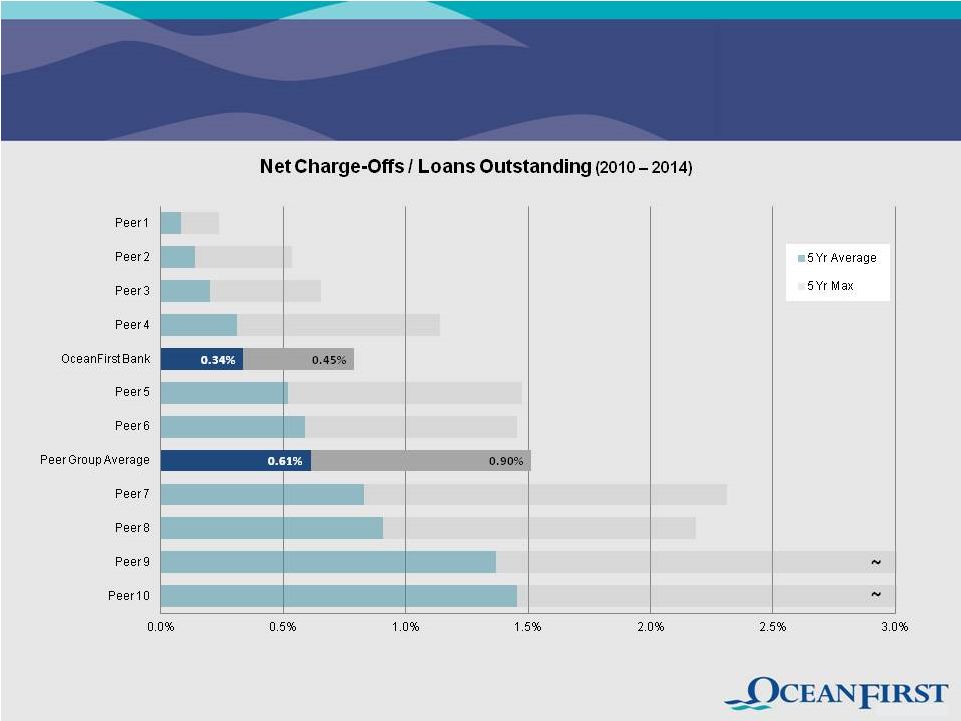 Peer group contains: BMTC, DCOM, FLIC, HUVL, LBAI, ORIT, PGC, SUBK, UVSP, WSFS. (FFIC excluded due to lack of data during full time period). Source: FDIC Statistics on Depository Institutions. OceanFirst Charge-Offs Are 44% Below Peer Average 17 |
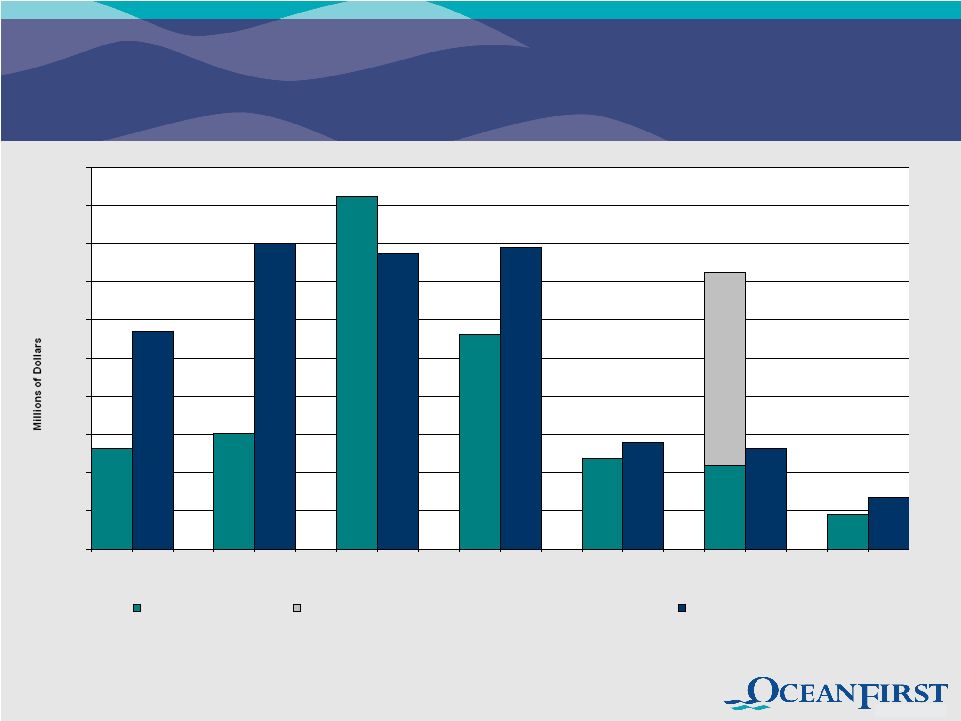 Prudently Provisioning for Credit Costs $0 $1 $2 $3 $4 $5 $6 $7 $8 $9 $10 Net Charge-Offs Net Charge-Offs Attributable to Bulk Sale of NPL's Provision for Loan Losses (1) Higher 2011 charge-offs were due to a change in charge-off policy to recognize the charge-off when the loan is deemed uncollectible rather than when the foreclosure process is complete. 12/31/09 12/31/10 12/31/11 (1) 12/31/12 12/31/13 12/31/14 6/30/15 18 Annualized |
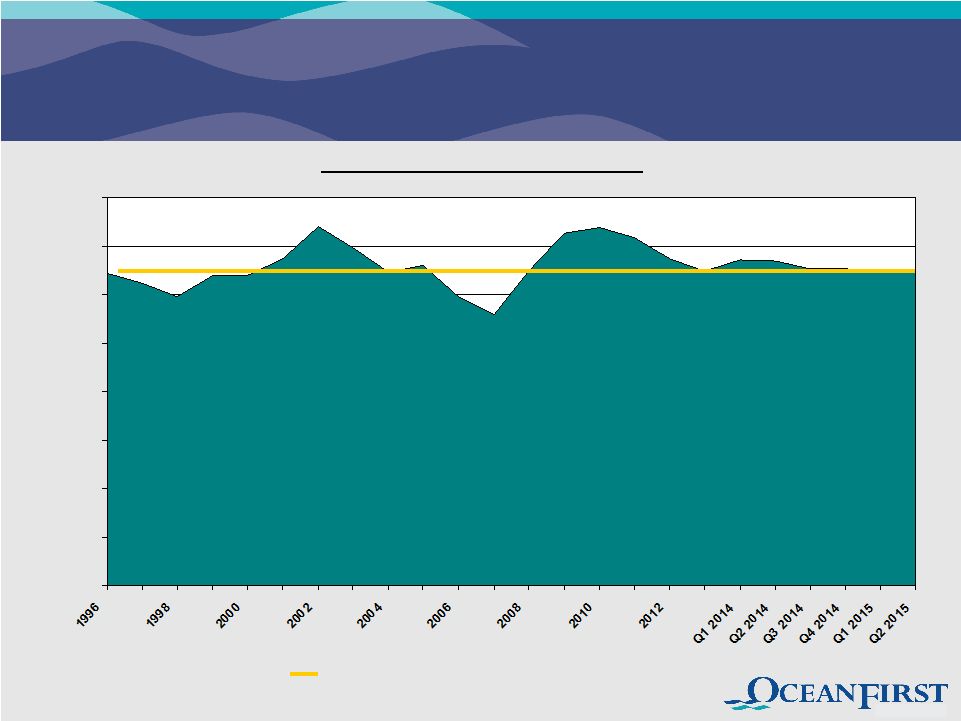 Net Interest Margin Stabilized at Historical Levels 0.00% 0.50% 1.00% 1.50% 2.00% 2.50% 3.00% 3.50% 4.00% Quarterly Trend Historical Average Net Interest Margin (3.28%) 19 |
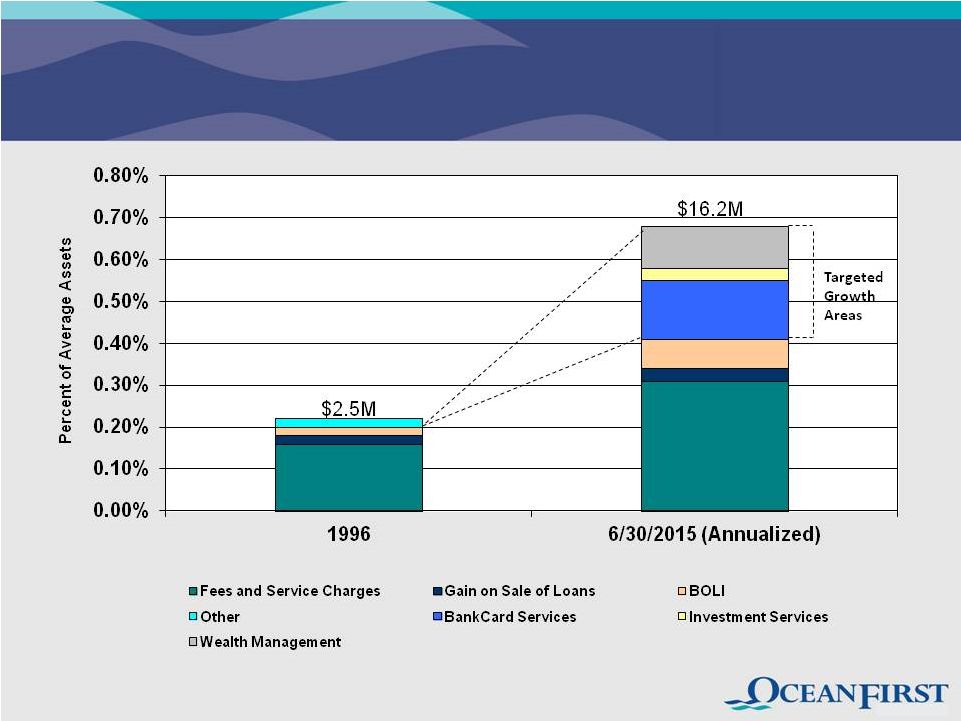 Diversified Streams of Non-Interest Income Non-Interest Income excludes gain/loss from other real estate operations, gain on sale of securities and gain on sale of loan servicing. 20 |
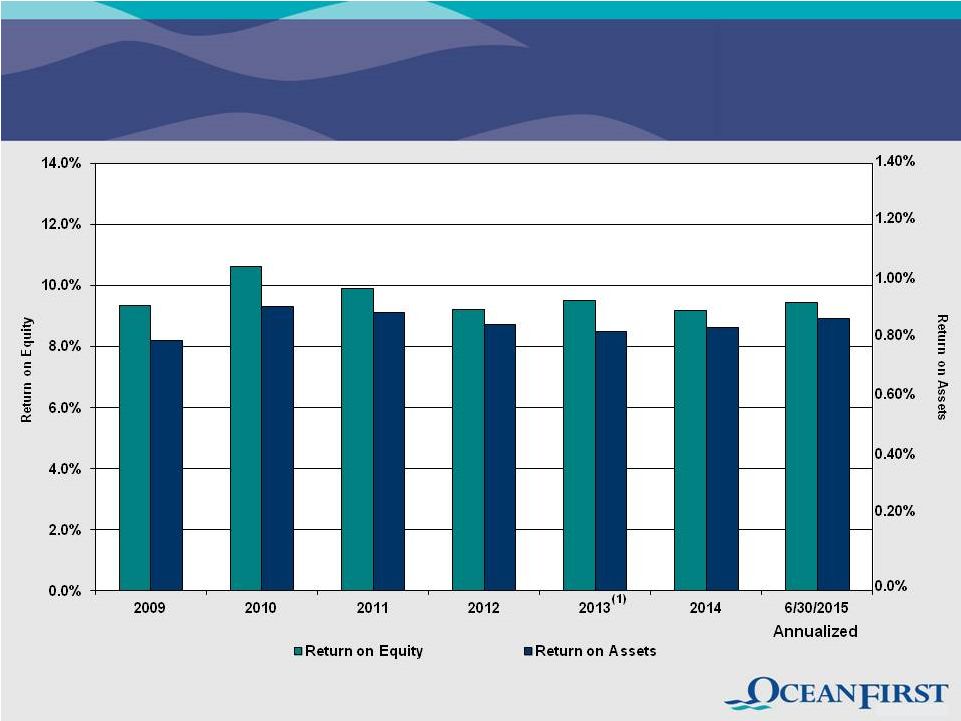 Generating Consistent Attractive Returns (1) Excludes after-tax impact of $3.1 million in non-recurring charges related to strategic advance restructuring and branch consolidation. 21 |
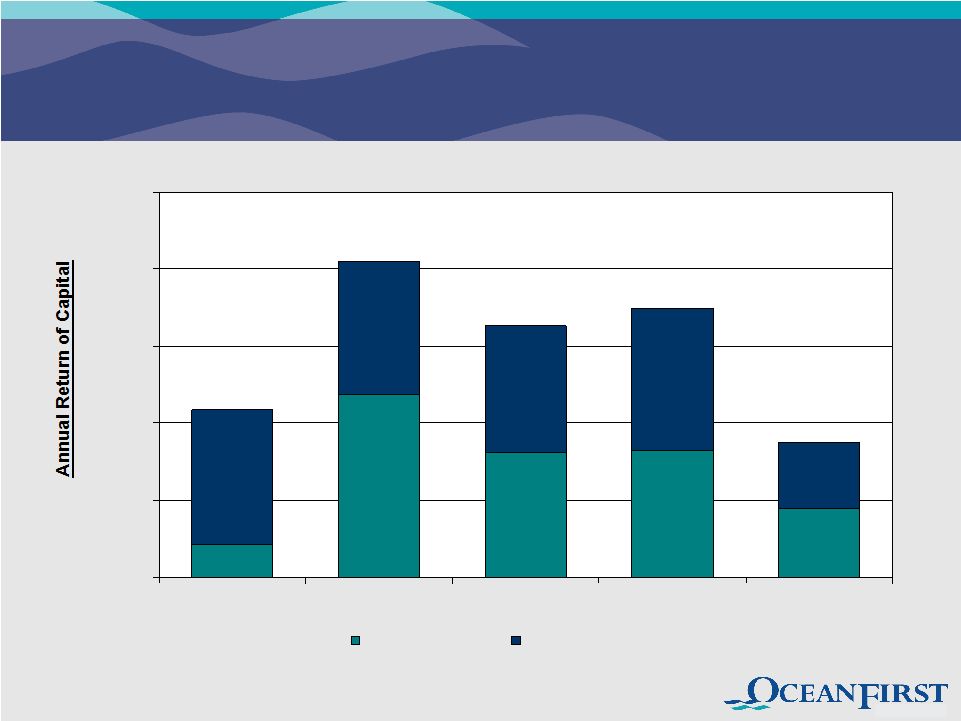 Prudently Managing Excess Capital in Near Term $0.0 $5.0 $10.0 $15.0 $20.0 $25.0 2011 2012 2013 2014 6/30/15 Stock Repurchases Cash Dividends Notes: Stock Repurchases – $15.19 Average Cost per Share. Quarterly dividend rate increased by $0.01, or 8.3%, in October 2014. (Six Months) 22 |
 Growing Revenue and Building Shareholder Value • Target growth in broader central New Jersey market – increasing share In early 2015, added new commercial lending team located in Mercer County Commercial loans increase at double digit percentage growth rate for eight consecutive quarters Superstorm Sandy recovery continuing to provide market opportunity Continuing Strategic Execution Sold most non-performing residential/consumer mortgage loans in third quarter of 2014; $500,000 in annual cost savings FHLB Advances restructured in fourth quarter 2013; duration extended to 3.1 years Repositioning retail distribution and residential lending, reinvesting cost saves to support growth • Control operating expenses while investing in revenue producing growth opportunities Operating expenses decreased 3.0% for the quarter ended June 30, 2015, as compared to the same prior year period • Opportunistic roll-up of local community banks with operating scale concerns Strategic, in-market, acquisition of Colonial American Bank expands branch footprint in demographically attractive markets; accretive to EPS in 2016 with negligible book value dilution Management depth and infrastructure currently in place able to support significantly larger scale 23 |
 Colonial American Bank Acquisition Supports Retail Expansion in High Value Communities • 100% Stock deal, valued at $11.3 million • In-Market acquisition supports growth objective in towns of Middletown and Shrewsbury, NJ • Favorable financial terms (adjusted for DTA realization of $2 million) • Price/Tangible Book Value of 96% • Price/Core Deposit Premium of (0.6%) • Price/2016 Est. EPS w/Cost Savings of 8X • OCFC book value dilution < 2% ($0.01 per share) • Modest execution risk with conservative assumptions • Cost saves of 35%, fully realized in 2016 • Tangible book value earnback under 24 months • Strong pro-forma capital position of 9.2% TCE, 9.5% Leverage • Effective execution • Announcement – February 25 • OCC Approval - June 17 • Shareholder Approval - July 9 • Closing – July 31 Note: All metrics as of announcement date – February 25, 2015 24 |
 Why OCFC…? • Fundamental franchise value • Superior deposit profile • Conservative credit culture • Consistent commercial loan and deposit growth • Solid financial performance • Strong balance sheet and capital base • Seasoned and effective management team • Substantial insider ownership – aligned with shareholders’ interests • Fully capable of executing on 5-year growth plan 25 |
 Attractive Valuation Metrics Valuation Price / Tang. Book Value 140% 162% Price / LQA EPS 14.3x 16.0 x Price / Estimated EPS 14.2x 14.9x Core Deposit Premium 5.0% 9.1% Cash Dividend Yield 2.8% 2.8% OCFC Peers (1) 1) Peers include: BMTC, DCOM, FFIC, FLIC, LBAI, ORIT, PGC, SUBK, UVSP and WSFS Note: Financial data as of the most recent period available; market data as of July 22, 2015. Source: Sandler O’Neill 26 |
 Appendix 27 |
 Market Demographics Ocean Monmouth Middlesex Mercer National Number of Offices 19 4 1 % of OceanFirst Deposits 86.2 10.9 2.9 Market Rank 4 17 35 Market Share (%) 10.2 0.9 0.2 Population 583,000 628,000 831,000 369,000 Projected 2014-2019 Population Growth (%) 1.4 — 3.0 1.2 3.5 Median Household Income ($) 58,000 81,000 75,000 74,000 52,000 Projected 2014-2019 Median Household Income Growth (%) 2.6 3.1 3.5 5.6 4.6 Deposit and demographic data as of June 30, 2014. Source: SNL Financial APPENDIX 1 28 |
 Commercial Portfolio Metrics APPENDIX 2 Commercial Real Estate (CRE) Total portfolio $698.3 million % of Total Loan Portfolio 38.7% Average size of CRE loans $896,000 Largest CRE loan $20.1 million Current Pipeline $41.5 million Weighted Average Yield 4.35% Weighted Average Repricing Term 5.9 years Commercial Loans Total portfolio $111.2 million % of Total Loan Portfolio 6.2% Average size of commercial loans $363,000 Largest commercial loan (total exposure) $10.0 million Current Pipeline $17.1 million Weighted Average Yield 3.82% Weighted Average Repricing Term 2.4 years 29 |
 Commercial Portfolio Segmentation APPENDIX 2 (Cont’d) Total Commercial Loan Exposure by Industry Classification Real Estate Investment, 41.4% Arts/Entertainment/ Recreation, 6.6% Other Services, 2.7% Retail Trade, 4.2% Public Administration, 5.6% Miscellaneous, 5.5% Manufacturing, 3.7% Educational Services, 4.7% Accommodations/ Food Services, 6.3% Healthcare, 7.6% Wholesale Trade, 4.5% Construction, 7.2% Real Estate Investment by Property Classification Office, 33.4% Commercial Development, 6.1% Shopping Center, 8.3% Retail Store, 7.4% Multi-Family, 5.7% Miscellaneous, 8.2% Single Purpose, 9.0% Industrial/ Warehouse, 14.9% Residential Development, 7.0% Diversified portfolio provides protection against industry- specific credit events. As of June 30, 2015. 30 |
 Residential Portfolio Metrics APPENDIX 3 Residential Real Estate Total Portfolio $785.8 million % of Total Loan Portfolio 43.9% Average size of mortgage loans $195,000 % of loans for second homes 11.0% Portfolio weighted average loan-to-value ratio (using original or most recent appraisal) - Loans originated during 2015 56% 60% Portfolio average FICO score - Loans originated during 2015 752 757 % of loans outside the New York/New Jersey market 3.3% % of loans outside Ocean/Monmouth Counties 26.3% % of loans exceeding agency conforming amounts 45.9% As of June 30, 2015, unless otherwise noted. 31 Note: Within the total loan portfolio, only 32 loans are in Atlantic County, NJ, totaling $13.6 million, or 0.8%. |