 Investor Presentation November 2016 OceanFirst Financial Corp. Exhibit 99.1 |
 OceanFirst Financial Corp. Forward-Looking Statements In addition to historical information, this news release contains certain forward-looking statements within the meaning of the Private Securities Litigation Reform Act of 1995 which are based on certain assumptions and describe future plans, strategies and expectations of the Company. These forward-looking statements are generally identified by use of the words "believe," "expect," "intend," "anticipate," "estimate," "project," "will," "should," "may," "view," "opportunity," "potential," or similar expressions or expressions of confidence. The Company's ability to predict results or the actual effect of future plans or strategies is inherently uncertain. Factors which could have a material adverse effect on the operations of the Company and its subsidiaries include, but are not limited to: changes in interest rates, general economic conditions, levels of unemployment in the Bank’s lending area, real estate market values in the Bank’s lending area, future natural disasters and increases to flood insurance premiums, the level of prepayments on loans and mortgage-backed securities, legislative/regulatory changes, monetary and fiscal policies of the U.S. Government including policies of the U.S. Treasury and the Board of Governors of the Federal Reserve System, the quality or composition of the loan or investment portfolios, demand for loan products, deposit flows, competition, demand for financial services in the Company's market area and accounting principles and guidelines. These risks and uncertainties are further discussed in the Company’s Annual Report on Form 10-K for the year ended December 31, 2015 and subsequent securities filings and should be considered in evaluating forward-looking statements and undue reliance should not be placed on such statements. The Company does not undertake, and specifically disclaims any obligation, to publicly release the result of any revisions which may be made to any forward-looking statements to reflect events or circumstances after the date of such statements or to reflect the occurrence of anticipated or unanticipated events. 2 |
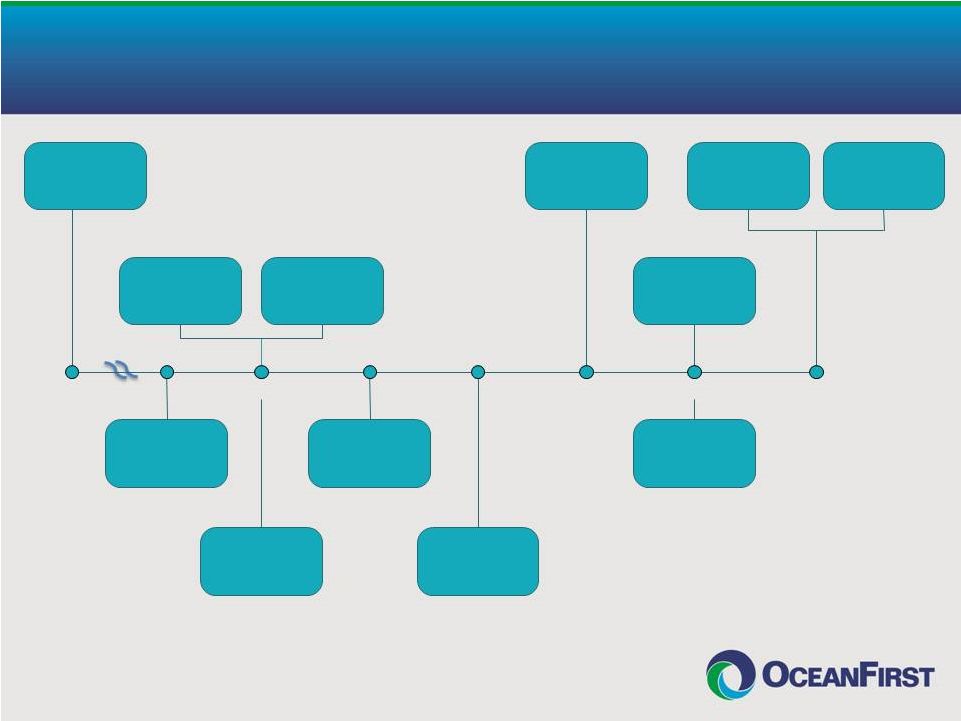 OceanFirst Milestones – 114 Years of Growth 3 *Announced regulatory approvals with plans for legal closing 11/30/2016. Founded, Point Pleasant, NJ Branch Expansion Into Middlesex County 1902 1985 IPO To Mutual Depositors 1996 Established Commercial Lending Created OceanFirst Foundation Established Trust and Asset Management 2000 2014 2015 Colonial American Bank Acquired Commercial LPO Expansion into Mercer County Branch Expansion Into Monmouth County 1999 Cape Bancorp Acquired 2016 Announced Merger Agreement with Ocean Shore Holding Co.* OceanFirst Foundation Exceeds $25 Million In Cumulative Grants |
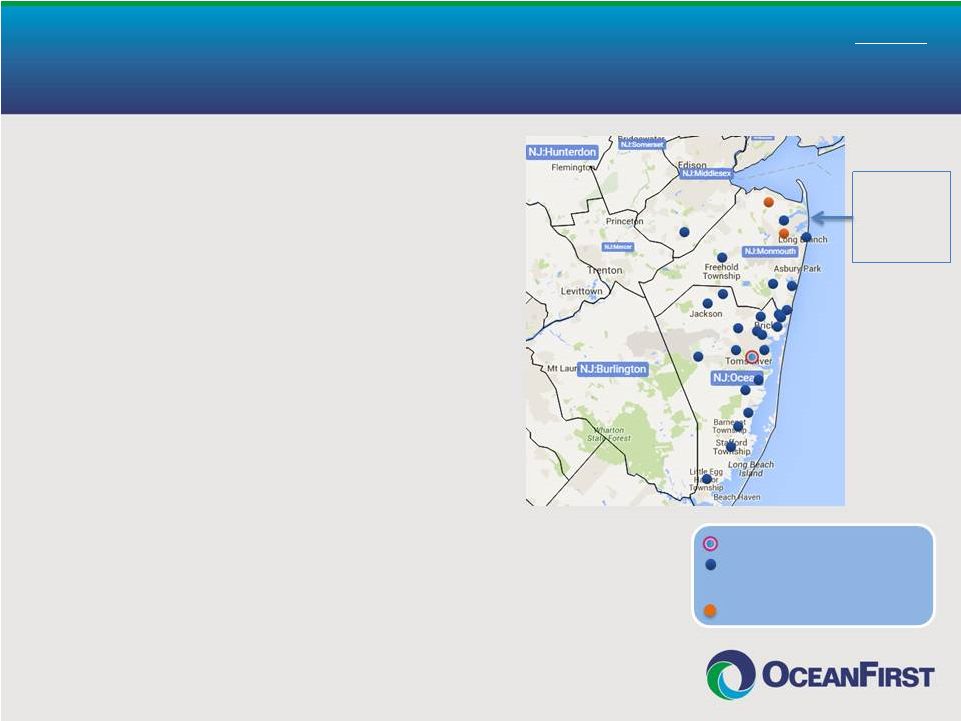
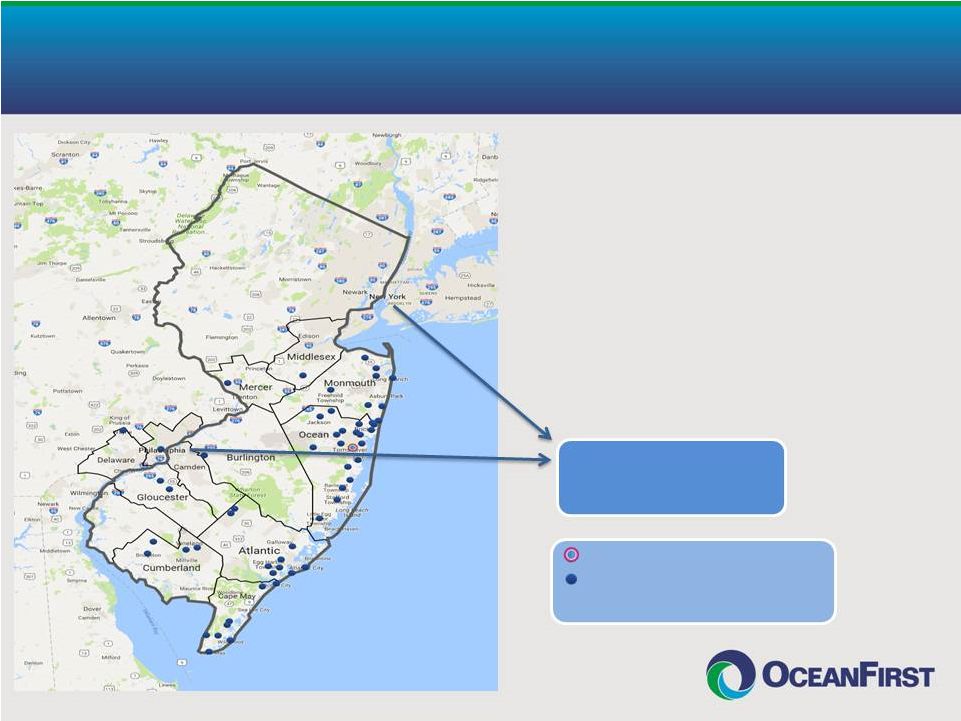 Serving Central and Southern New Jersey Markets • OceanFirst is the largest Bank headquartered in Central and Southern New Jersey • $4.2 billion in assets • 50 branch offices • Market Cap $530 million • Average Daily Share Volume of 80,000 OceanFirst Headquarters OceanFirst Retail Branches, Commercial Loan Production Offices, and Wealth Management Office 30 million people, or approximately 10% of the total U.S. population, reside within a 2-hour drive* and 7.3 million reside in market area** 4 *Includes New York – Newark NY-NJ-PA-CT CSA and Philadelphia – Reading – Camden CSA. **Refer to Appendix 2 for market area. |
 OceanFirst Loan Portfolio Diversification by Geography Atlantic City is 1.2% of the OceanFirst loan portfolio Least Concentration Highest Concentration 5 |
 Experienced Leadership Name Position # of Years at OCFC # of Years In Banking Previous Experience Christopher D. Maher President, Chief Executive Officer 3 28 Patriot National Bancorp; Dime Community Bancshares Michael J. Fitzpatrick Executive Vice President, Chief Financial Officer 24 35 KPMG Joseph R. Iantosca Executive Vice President, Chief Administrative Officer 12 38 BISYS Banking Solutions; Newtrend LLC; Brooklyn Federal Savings Joseph J. Lebel III Executive Vice President, Chief Lending Officer 10 32 Wachovia Bank N.A.; First Fidelity Mark C. Foley President, Southern Division 37 Bank of Boston; Patriot National Bank; Naugatuck Valley Savings and Loan • Substantial insider ownership of 19.4% – aligned with shareholders’ interests OceanFirst Bank ESOP 6.2% Directors & Senior Executive Officers 8.0% Director and Proxy Officer Stock Ownership Guidelines OceanFirst Foundation 5.2% From April 26, 2016 Proxy Statement, adjusted for Cape Bancorp acquisition on May 2, 2016. 6 - |
 Deep Bench of Experienced Executives 7 Name Position # of Years at OCFC # of Years In Banking Previous Experience Steven J. Tsimbinos Executive Vice President, General Counsel 6 22 Thacher Proffit & Wood; Lowenstein Sandler PC David R. Howard First Senior Vice President, Chief Risk Officer 3 26 Guggenheim Partners; GE Capital Margaret Lanning First Senior Vice President, Chief Credit Officer 1 38 Wells Fargo Bank, N.A.; Wachovia Bank Gary S. Hett Senior Vice President, Director of Human Resources 3 43 Patriot National Bancorp; Dime Community Bancshares Angela Ho Senior Vice President, Principal Accounting Officer - 10 Northfield Bank; Signature Bank; KPMG |
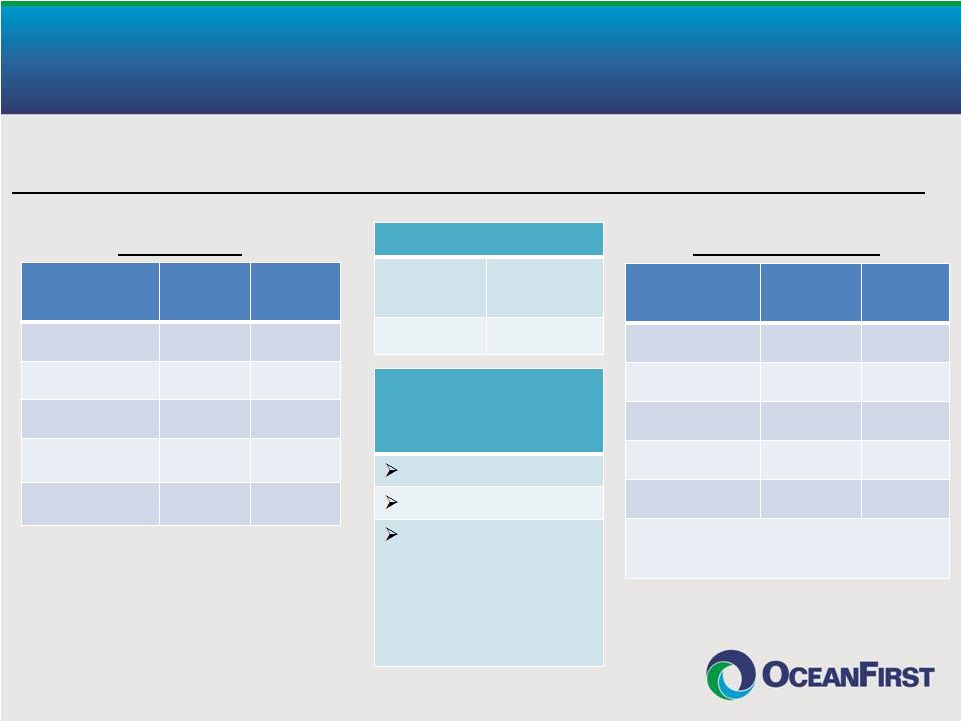
 Strategic Focus 8 I. Organic Commercial Loan and Core Deposit Growth • Grew commercial loans (excluding acquired loans) from $533 million at December 31, 2012 to $922 million at September 30, 2016, 15.7% CAGR • Grew low cost core deposits (excluding acquired deposits) from $1,493 million (0.15% cost) at December 31, 2012 to $1,803.5 million (0.13% cost) at September 30, 2016 II. Opportunistic Acquisitions of Local Community Banks Target Closing Date Transaction Value Total Assets Colonial American Bank July 31, 2015 $ 12 million $ 142 million Cape Bancorp May 2, 2016 $196 million $1,518 million Ocean Shore Holding Co. November 30, 2016 (pending) $146 million $1,097 million Weighted average (1) : Price/Tangible Book Value 135%; Core Deposit Premium 4.5% (1) At time of announcement. |
 Strategic Focus (Continued) 9 III. Conservative Risk Management • Credit Risk Reduced non-performing loans from $43.4 million (2.8% of loans) at December 31, 2012 to $16.5 million (0.54% of loans) at September 30, 2016 Strong credit culture – no non-performing commercial loans originated in the past five years • Interest Rate Risk Grew non-interest bearing deposits (excluding acquisitions) by $65 million in 2016, or 26% annualized; core deposits (all deposits except time deposits) are 85.8% of total deposits at September 30, 2016 • Regulatory/Compliance Risk Regulatory approvals received for three acquisitions in a timely manner Outstanding CRA rating received October 2015 Total Shareholder Return December 31, 2012 to October 31, 2016 – 67%, 14.3% CAGR |
 Highlights – 2016 10 • Completed the acquisition of Cape Bancorp on May 2, 2016, which added $1.5 billion to assets, $1.2 billion to loans, and $1.2 billion to deposits Added highly experienced banking executive as Southern Division President to maintain local decision-making and strong oversight • Announced Ocean Shore Holding Co. acquisition (NASDAQ: OSHC) on July 13, 2016, valued at approximately $146 million; received regulatory approval on October 27, 2016; closing expected November 30, 2016 Third Quarter • Increased quarterly dividend 15%, from $0.13 per share to $0.15 per share • Core EPS of $0.40 (1) , a 25% increase from $0.32 (1) in Q3 2015 11.9% ROTE (1) & 1.00% ROA (1) Net interest margin was 3.56% in Q3 2016, an increase from 3.24% in Q3 2015 • Strong deposit funding with an annualized third quarter growth rate of 14.8%, a loan to deposit ratio of 91.1% and an average cost of deposits of just 0.25% • Completed successful integration of Cape’s core systems providing for realization of additional cost savings entering the first quarter of 2017 • Reduced credit risk through the sale of high risk loans, including the entire SBA portfolio (1) Amounts and ratios exclude merger related expenses |
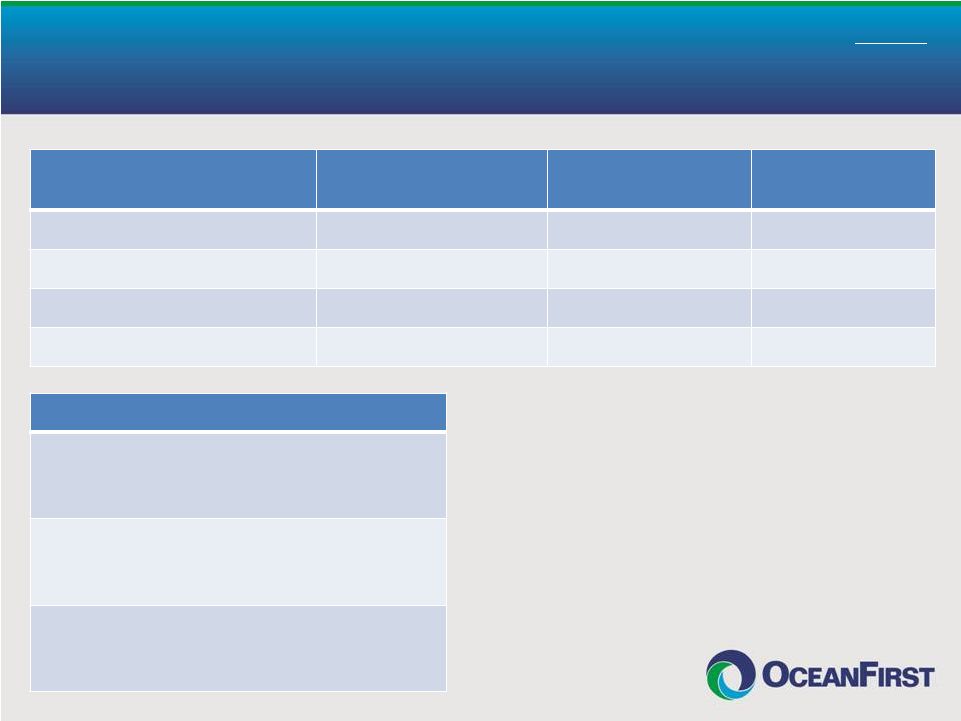
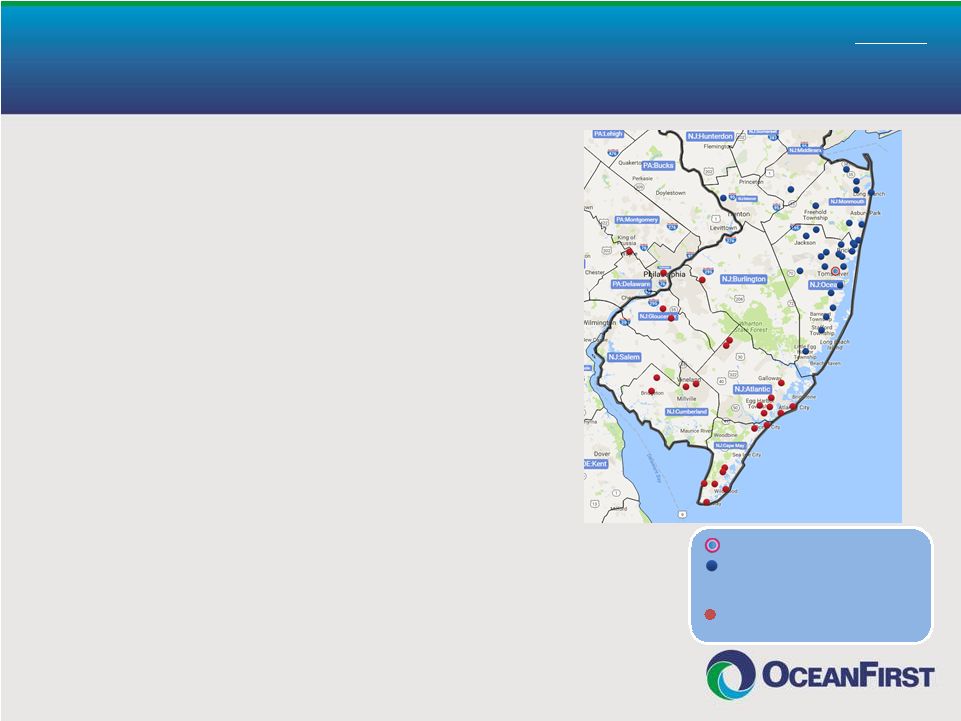
 11 Branch Map 1 Valuation metrics as of announcement date, July 13, 2016. 2 Financial highlights as of or for the quarter ended September 30, 2016. Overview of Ocean Shore Holding Co. Acquisition Transaction Summary Financial Highlights Total Assets ($M) $1,097 ROAA 0.64% Loans, Net ($M) $793 ROE 5.91% Total Deposits ($M) $857 NIM 3.24% TCE/ TA 10.4% Yield on Loans 4.06% Leverage Ratio 10.6% Cost of Deposits 0.31% Total RBC Ratio 21.5% Efficiency 68% - OCFC Branches - OSHC Branches • Valued at $146 million – 80% stock, 20% cash Price/TBV – 132% Core deposit premium – 4.9% • Regulatory approvals received October 27, 2016 • Financially compelling: Over 5% accretive to EPS in 2018 in addition to double digit earnings accretion from Cape Earnback of 3.7 years IRR of approximately 20% 1 2 |
 Favorable Competitive Position Competing Favorably Against Banking Behemoths and Local Community Banks Source: FDIC Summary of Deposits, June 30, 2016 Note: Market area is defined as counties in Central and Southern New Jersey Institution # of Branches Dep. In Mkt. ($000) TD Bank (Canada) 132 18,749,018 PNC Bank (PA) 143 17,002,556 Wells Fargo (CA) 145 15,802,079 Bank of America (NC) 123 14,604,095 Santander Bank (Spain) 81 6,103,973 OceanFirst Bank # of Branches Dep. In Mkt. ($000) 50 3,222,405 Institution # of Branches Dep. In Mkt. ($000) Sun 31 1,659,983 Manasquan 8 870,556 Ocean Shore* 11 817,290 First Choice 5 693,069 Sturdy Savings 13 668,769 *OCFC announced acquisition on July 13, 2016 and a target closing on November 30, 2016, refer to page 11. OceanFirst Competitive Position Responsive Flexible Capable • Lending Limit • Technology • Trust • Cash Management • Consumer & Commercial Mega Banks Community Banks 12 |
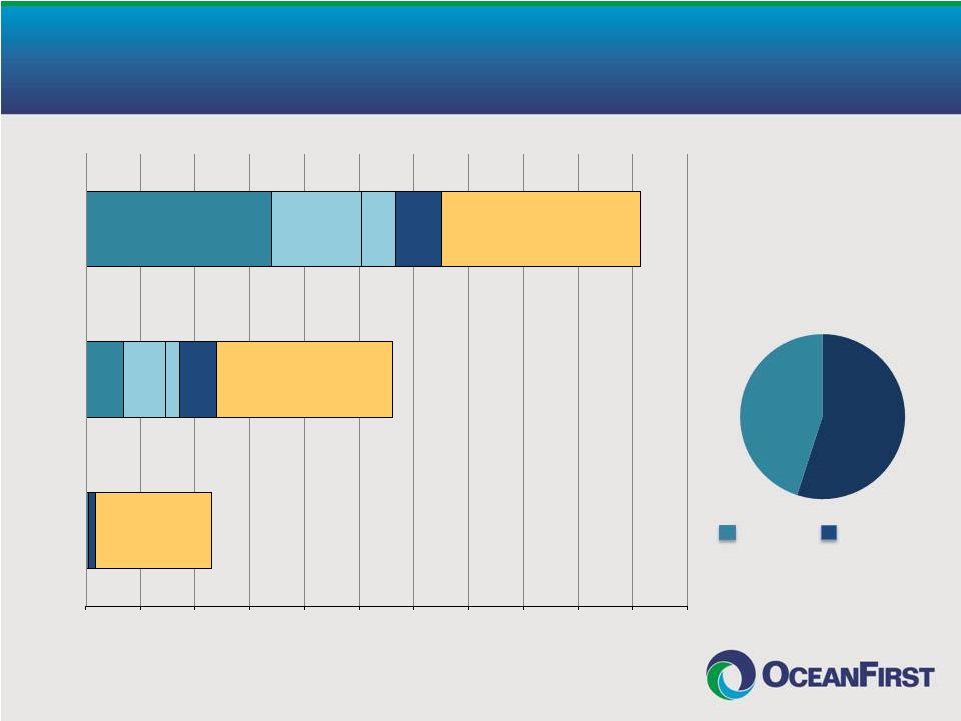
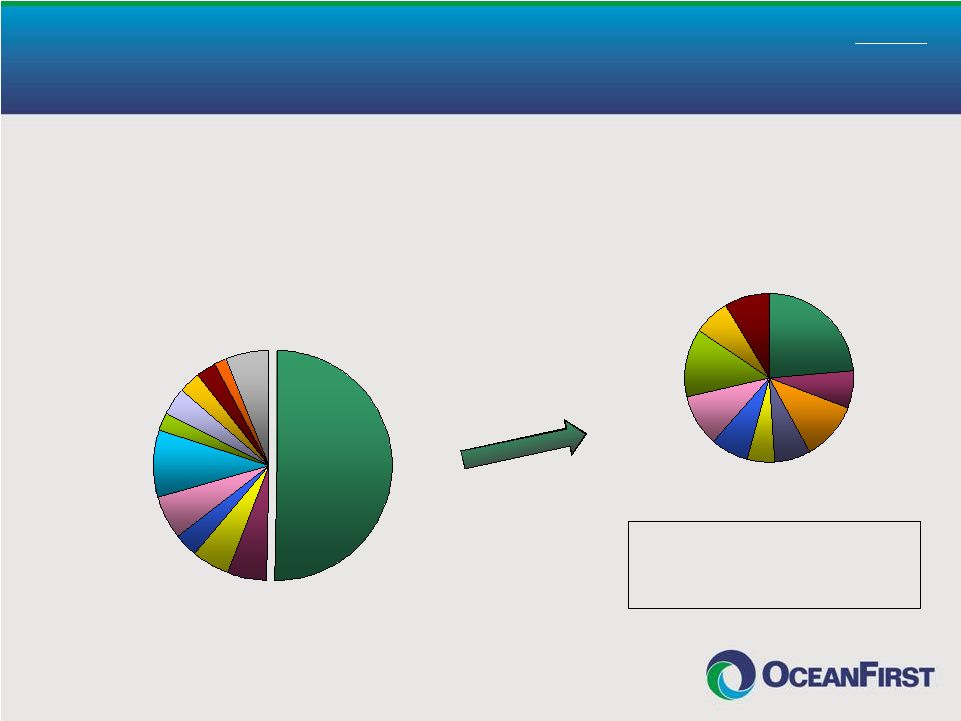
 Strategic Deposit Composition Transition Consumer Commercial Total Cost of Deposits 0.27% 13 0 300 600 900 1,200 1,500 1,800 2,100 2,400 2,700 3,000 3,300 Dec 1996 Dec 2010 Sept 2016 (In Millions) Non- Interest Checking Interest Checking WAR 0.16% MMDA & Savings WAR 0.13% Time Deposits WAR 1.15% Non- Interest Checking Interest Checking MMDA & Savings Time Deposits MMDA & Savings Time Deposits 46% 54% September 30, 2016 Deposits by Customer Segment |
 Strategic Focus on Commercial Lending Drives Business Deposits Note: Amounts include repurchase agreements classified as borrowings but offered to local business relationships 14 6,000 7,000 8,000 9,000 10,000 11,000 12,000 13,000 14,000 $- $100 $200 $300 $400 $500 $600 $700 $800 Balances (000s) # Accounts |
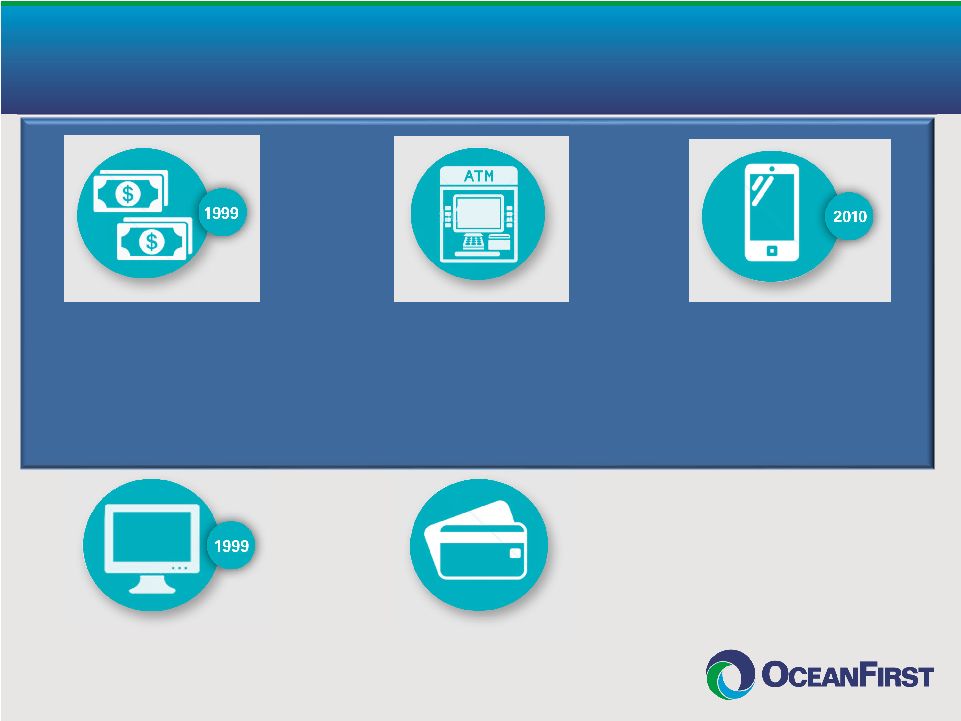 Online Banking & Bill Pay In 2015, 40% of depositors used online banking and an average of 49,000 bills were paid with online bill pay service each month. Check Card Over 11.6 million transactions processed in 2015. Rewards program promotes usage. Launched Card Valet, a personalized mobile card management app, in 2015. Full Suite of Technology and Delivery Systems 15 Deposits made by customers via self-service options in June 2016 total $127 million ($1.5 billion annualized). Corporate Cash Management Added Remote Deposit Capture (RDC) in 2007. In 2015, 297 clients processed over 875,000 checks using RDC. ATM & Interactive Teller (ITM) Fleet of intelligent ATM terminals provide technology for continually growing self- service deposit option. First ITM deployed in 2014 with more added in 2015 and 2016. Mobile Banking Consistently adopting mobile- centric options. Currently offering TouchID, Apple Watch, and Apple Pay. |
 Strategic Loan Composition Transition Investment CRE(A) Investment CRE(A) Owner- Occupied CRE Owner- Occupied CRE C&I C&I Consumer (Home Equity) Residential Real Estate Residential Real Estate Residential Real Estate 0 300 600 900 1,200 1,500 1,800 2,100 2,400 2,700 3,000 3,300 Dec 1996 Dec 2010 Sept 2016 (In Millions) Note (A): Investment CRE as a percent of risk-based capital is 254% at September 30, 2016. Consumer Commercial 16 56% 44% September 30, 2016 Loans by Customer Segment Consumer (Home Equity) |
 Credit Underwriting Remains Conservative: Commercial Loan Production 2015 and 2016 (Dollars in thousands) Commercial Loan Originations Year Nine Months Ended Ended December 31, 2015 September 30, 2016 Commercial Loan Portfolio at September 30, 2016 Amount $264,385 $180,858 $1,693,489 Weighted average rate 4.16% 4.13% 4.37% Weighted average debt service coverage 2.0X 2.4X 1.9X Weighted average loan-to-value (CRE only) 55% 65% 56% Weighted average risk rating (1) 4.5 4.4 4.5 Deposit contribution $92,367 $4,877 $213,970 Cash management (% utilizing) (excluding Cape portfolio) 43% (1) Risk rating is on a scale from 1 (best) to 9 (worst). A rating of 4.5 represents an equivalent S&P rating of BBB. 17 |
 OceanFirst Maintains Conservative CRE Portfolio Relative to Peers Domestic CRE Loans (Construction, Multifamily & Other Nonfarm Non-residential) to Total Risk Based Capital. Supervisory guideline is 300% of TRBC. Peers include: AROW, BMTC, DCOM, FFIC, FISI, FLIC, LBAI, NFBK, ORIT, PGC, SCNB, UVSP and WSFS. Source: BankRegData.com 18 0 200 400 600 800 1,000 1,200 Peer 1 Peer 2 Peer 3 Peer 4 OceanFirst Bank Peer 5 Peer 6 Peer 7 Peer Group Average Peer 8 Peer 9 Peer 10 Peer 11 Peer 12 Peer 13 (%) CRE to Total Risk Based Capital September 30, 2016 9/30/2016 9/30/2014 391 1012 254 |
 Highlights – Risk Management 2016 • Interest Rate Risk Management $65 million increase in non-interest bearing deposits (excluding the addition of Cape deposits) which represent 15.4% of total deposits Core deposits (1) are 85.8% of total deposits, a significant hedge against a rising rate environment Slight asset sensitive balance sheet, positioned for rising interest rate environment o Approximately $250 million of excess liquidity in interest-bearing deposits at September 30, 2016; available for investment in future quarters • Credit Risk Management Sold three loan pools with high risk characteristics - residential mortgage – 63 loans, $8.7 million; SBA – 72 loans, $10.0 million; commercial – 58 loans, $22.4 million Currently re-grading the Cape loan portfolio using OceanFirst Bank’s risk rating scale (1) Core deposits are all deposits except time deposits. 19 |
 Effective Interest Rate Risk Management Duration Rate Characteristics All asset categories managed with limited duration At September 30, 2016 20 |
 Term Borrowings Extended as Interest Rate Hedge 0.00 10.00 20.00 30.00 40.00 50.00 60.00 70.00 80.00 90.00 2016 2017 2018 2019 2020 2021 Maturity Periods TOTAL $251.0MM 1.75% AVG. COST At September 30, 2016 21 |
 0.00% 0.20% 0.40% 0.60% 0.80% 1.00% 0.00% 0.50% 1.00% 1.50% 2.00% 2.50% 3.00% 3.50% 2011 2012 2013 2014 2015 9/30/2016 Residential Consumer Commercial Real Estate Commercial Net Charge-Offs 2.80% 2.88% 1.06% 0.91% 0.54% Credit Metrics Reflect Conservative Culture (1) Net charge-off ratio for 2014 excludes charge-off related to bulk sale of non-performing residential and consumer mortgage loans. Including this charge-off, the ratio is 0.45%. Ratio for 2016 is annualized. Half of the net charge-offs relate to the sale of three high risk loan pools No non-performing commercial loans were originated within the past 5 years (1) 22 2.77% |
 Charged-off loans and lease financing receivables debited to the allowance for loan and lease losses divided by average loans outstanding. Peers include: AROW, BMTC, DCOM, FFIC, FISI, FLIC, LBAI, NFBK, ORIT, PGC, SCNB, UVSP and WSFS. Source: BankRegData.com OceanFirst Average Charge-Offs Since 2011 Are 14% Below Peer Average 23 0.36% 0.31% 3.93% 0.48% 0.0% 0.5% 1.0% 1.5% 2.0% 2.5% 3.0% Peer 13 Peer 12 Peer 11 Peer 10 Peer 9 Peer Group Average Peer 8 OceanFirst Bank Peer 7 Peer 6 Peer 5 Peer 4 Peer 3 Peer 2 Peer 1 Average Maximum Charge-Offs / Average Loans Outstanding YE 2011 – 3Q16 |
 Net Interest Margin Expanded Net Interest Margin to Outperform both Historical Level and Peer Group Historical Average (1996 – 2015) Net Interest Margin (3.28%) Q3 consolidated NIM at 3.56% includes 17 BP of net accretable yield from purchase accounting adjustments and prepayment fees OceanFirst Bank: 6 consecutive quarters of expansion Peers: 9 consecutive quarters of decline prior to 9/30/16 24 3.15 3.25 3.35 3.45 3.55 3.65 OceanFirst Bank Peers 3.56 3.28 |
 Diversified Streams of Non-Interest Income 0.00% 0.10% 0.20% 0.30% 0.40% 0.50% 0.60% 0.70% 0.80% 1996 9/30/16 (Annualized) Fees and Service Charges Gain on Sale of Loans BOLI BankCard Services Wealth Management/Investment Services Other $2.5M $19.9M Targeted Growth Areas Non-Interest Income excludes gain/loss from other real estate operations and loss on sale of securities. 25 |
 Generating Consistent Attractive Returns 7.0% 8.0% 9.0% 10.0% 11.0% 12.0% 13.0% 2009 2010 2011 2012 2013 2014 2015 9/30/16 Annualized 0.70% 0.80% 0.90% 1.00% 1.10% Return on Tangible Equity Return on Assets (1) (2) (2) 26 10.6% 0.94% Q3 2016 Core (2) ROA – 1.00% ROTE – 11.90% (1) For 2013, excludes after-tax impact of $3.1 million in non-recurring charges related to strategic advance restructuring and branch consolidation. (2) For 2015 and 2016, excludes merger related expenses. For 2016, also excludes Federal Home Loan Bank prepayment fee and loss on sale of investment securities. |
 Accelerating EPS Growth 27 (1) For 2013, excludes after-tax impact of $3.1 million in non-recurring charges related to strategic advance restructuring and branch consolidation. (2) For 2015 and 2016, excludes merger related expenses. For 2016, also excludes Federal Home Loan Bank prepayment fee and loss on sale of investment securities. 2016 (2) (Annualized) |
 Prudently Managing Excess Capital in Near Term Notes: Stock Repurchases – $15.32 Average Cost per Share. In Q4 2015 and 2016, stock repurchases suspended as capital was allocated to Cape Bancorp acquisition. 28 Increased Quarterly Dividend by 15%, from $0.13 per share to $0.15 per share |
 Why OCFC…? • Fundamental franchise value • Preeminent community bank in Central and Southern New Jersey • Superior deposit profile • Significant commercial loan growth since December 2012; current focus on recent portfolio integrations • Conservative credit culture • Solid financial performance • Consistent attractive returns • Strong balance sheet and capital base • Seasoned and effective management team • Substantial insider ownership – aligned with shareholders’ interests • Fully capable of executing on 5-year growth plan 29 |
 Attractive Valuation Metrics Valuation Price / Tang. Book Value 163% 183% Price / LQA EPS 15.6x 17.2x Price / Estimated 2016 EPS 15.0x 16.8x Price / 2017 Estimated EPS 13.5x 14.9x Core Deposit Premium 7.0% 11.1% Cash Dividend Yield 2.7% 2.6% OCFC Peers (1) 1) Peers include: AROW, BMTC, DCOM, FFIC, FISI, FLIC, LBAI, NFBK, ORIT, PGC, UVSP and WSFS Note: Financial data as of the most recent period available; market data as of November 10, 2016; OCFC stock price of $21.87. Source: Sandler O’Neill 30 |
 Appendix 31 |
 OceanFirst Financial Corp. – Analyst Coverage APPENDIX 1 Company Analyst Recommendation Price Target Keefe Bruyette & Woods Collyn Gilbert Outperform $23.00 Sandler O’Neill & Partners Frank Schiraldi Buy $22.00 Piper Jaffray Matt Breese Overweight $22.00 FIG Partners David Bishop Outperform $23.00 Investor Relations Contacts Christopher D. Maher President and Chief Executive Officer 732-240-4500 Ext. 7504 cmaher@oceanfirst.com Michael Fitzpatrick Executive Vice President and Chief Financial Officer 732-240-4500 Ext. 7506 mfitzpatrick@oceanfirst.com Jill Hewitt Senior Vice President/Investor Relations Officer 732-240-4500 Ext. 7513 jhewitt@oceanfirst.com 32 |
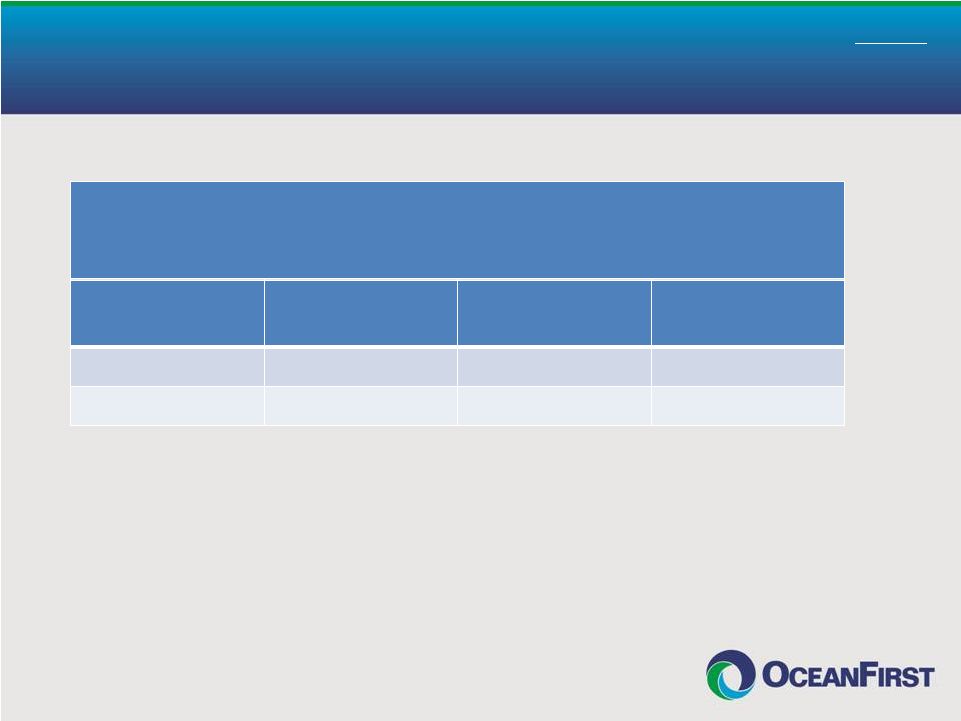
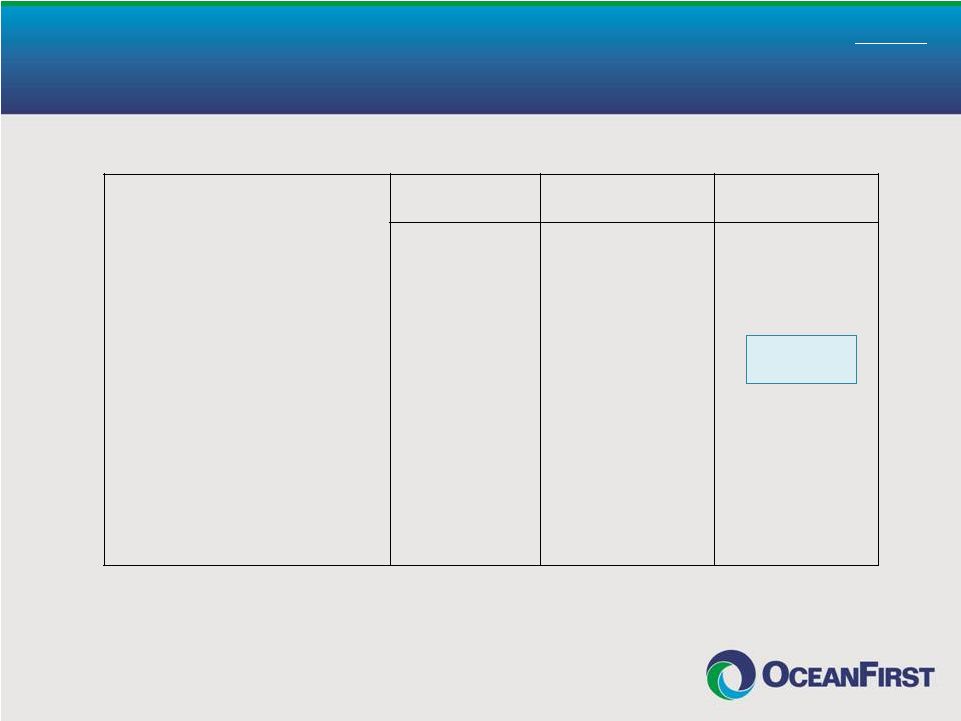 Market Demographics Central New Jersey (1) Southern New Jersey (2) Philadelphia Metro (3) Total Bank Offices in Market 864 508 848 Total Bank Deposits in Market $87.3 billion $38.0 billion $93.7 billion Number of OceanFirst Offices 28 22 % of OceanFirst Deposits 62 38 Market Rank 11 8 Market Share (%) 2.3 3.2 Population 2,442,000 1,838,000 3,029,000 Projected 2017-2022 Population Growth (%) 7.0 2.6 4.5 Deposit and demographic data as of June 30, 2016. Source: SNL Financial Notes: 1 – Includes Monmouth, Ocean, Middlesex and Mercer counties, New Jersey 2 – Includes Burlington, Atlantic, Cape May, Camden, Gloucester, Salem and Cumberland counties, New Jersey 3 – Includes Philadelphia, Bucks and Montgomery counties, Pennsylvania APPENDIX 2 Expansion opportunity 33 |
 Commercial Portfolio Metrics APPENDIX 3 Commercial Real Estate (CRE) Owner-Occupied Investor Total $ 493.2 million 1,014.7 million $1,507.9 million % of Total Loan Portfolio 49.6% Average Size of CRE Loans $764,000 Largest CRE Loan $16.6 million Pipeline as of September 30, 2016 $42.4 million Weighted Average Yield 4.17% Weighted Average Repricing Term 4.9 years Commercial Loans (C&I) Total Portfolio $185.6 million % of Total Loan Portfolio 6.1% Average Size of Commercial Loans $299,000 Largest Commercial Loan $12.0 million Pipeline as of September 30, 2016 $15.5 million Weighted Average Yield 4.24% Weighted Average Repricing Term 3.7 years Note: The maximum loan exposure to a single borrower, including CRE and C&I loans, was $22.4 million. Legal lending limit of $52 million in loans to one borrower. 34 |
 Commercial Portfolio Segmentation APPENDIX 3 (Cont’d) Total Commercial Loan Exposure by Industry Classification Arts/Entertainment/ Recreation, 4.1% Real Estate Investment, 50.3% Other Services, 2.3% Retail Trade, 5.1% Public Administration, 1.7% Miscellaneous, 6.1% Manufacturing, 3.0% Educational Services, 2.7% Accommodations/ Food Services, 9.6% Healthcare, 6.1% Wholesale Trade, 3.4% Construction, 5.6% Real Estate Investment by Property Classification Residential Development, 11.1% Industrial/ Warehouse, 7.2% Single Purpose, 6.9% Miscellaneous, 8.7% Motel, 6.9% Multi-Family, 12.9% Retail Store, 10.0% Shopping Center, 7.4% Development, 5.3% Office, 23.6% Diversified portfolio provides protection against industry- specific credit events. As of September 30, 2016. 35 |
 Residential Portfolio Metrics APPENDIX 4 Residential Real Estate Total Portfolio $1,096.5 million % of Total Loan Portfolio 36.1% Average size of mortgage loans $198,000 % of loans for second homes 12.2% Portfolio weighted average loan-to-value ratio (using original or most recent appraisal) - Loans originated during 2016 55% 62% Portfolio average FICO score - Loans originated during 2016 752 760 % of loans outside the New York/New Jersey market 3.3% As of September 30, 2016, unless otherwise noted. 36 |
 Colonial American Bank Acquisition • 100% Stock deal, valued at $11.9 million • In-Market acquisition supports growth objective in towns of Middletown and Shrewsbury, NJ • Favorable financial terms (adjusted for DTA realization of $2.3 million) • Price/Tangible Book Value of 104% o Transaction neutral to OCFC book value • Price/Core Deposit Premium of 0.4% • Modest execution risk with conservative assumptions • Expected cost saves of 35%, fully realized in 2016 • Gross credit mark of $2.9 million, 2.4% of loans • Effective execution (2015) • Announcement – February 25 • Regulatory Approvals - June 17 (68 days following application) • Shareholder Approval - July 9 • Closing – July 31 • Systems Integration – October 17 (72 days following legal closing) APPENDIX 5 Supports Retail Expansion in High Value Communities 37 OceanFirst Headquarters OceanFirst Retail Branches, Commercial Loan Production Offices, and Wealth Management Office Colonial American Retail Branches |
 Cape Bancorp Acquisition • Creates the preeminent New Jersey based community banking franchise operating throughout central and southern New Jersey • 85% stock and 15% cash, valued at $195 million • Favorable financial terms • Price/Tangible Book Value of 139% • Price/Core Deposit Premium of 4.4% • Expected accretion to GAAP EPS of 17% in 2017 • Expected tangible book value dilution of 7.2%, projected earnback of approximately 3.3 years using the cross-over method and 3.8 years on a simple tangible book value earnback calculation • Modest execution risk with conservative assumptions • Expected cost saves of 33%, fully realized by end of 2016 • Expected one-time, pre-tax transaction expenses of $15.5 million • Gross credit mark of $25.5 million, 2.3% of loans • Effective execution (2016) • Announcement – January 5 • Regulatory Approvals – March 28 (52 days following application) • Shareholder Approvals – April 25 • Closing – May 2 • Systems Integration – completed October 15 APPENDIX 6 38 OceanFirst Headquarters OceanFirst Retail Branches, Commercial Loan Production Offices, and Wealth Management Office Cape Bank Retail Branches and Commercial Loan Offices |
 39 APPENDIX 7 Atlantic City Exposure Number of Loans Amount (000’s) Percent of Total Assets Atlantic City 93 $ 36,529 0.9% Atlantic County 1,134 238,620 5.7% OceanFirst Bank (including Cape Bank) October 31, 2016 |
 Serving Our Communities • Recovering from Superstorm Sandy – Construction Financing 2013 – 2015 funded 287 loans = $117.2 million • OceanFirst Foundation As of September 30, 2016, over $30.6 million has been granted to organizations serving the Bank’s market Provided $500,000 in grants dedicated to assisting our neighbors after Superstorm Sandy hit the Jersey Shore in 2012 First foundation established during a mutual conversion to IPO (July 1996) Completed merger of Cape Foundation into OceanFirst Foundation for combined assets of $25.5 million at September 30, 2016 APPENDIX 8 40 |
 Client Comments APPENDIX 9 CHEFS INTERNATIONAL INC. Robert Cooper – President “The relationship with OceanFirst goes back before my tenure, and I was the true benefactor of that successful affiliation. Whether we request a simple letter of credit or a complicated loan, OceanFirst listens to our needs and makes it happen. It’s that simple. OceanFirst knows how to make it happen.” NATIONWIDE IMAGING SERVICES INC. Robert Manetta – CEO “OceanFirst understands what I need to maintain and grow my business. They have been a banking partner that responds quickly and has always been there when I need them.” WOODHAVEN LUMBER & MILLWORK INC. Alan Robinson & David Robinson – Owners “Our relationship with OceanFirst goes back many years – through good economic times and tough ones. Even during the Great Recession, the bank stood by us, understood our needs and helped us reach the other side. Our OceanFirst relationship has contributed significantly to the growth and success of our business.” ROBEN MFG. CO., INC. Gary R. Huhn – Chief Operating Officer and President “For years, Roben Mfg. has relied on OceanFirst Bank’s expertise for recommending banking solutions that best serve our business. OceanFirst has enabled us to meet increased demands and triple our growth from a $3 million a year business into a $9 million a year business serving the chemical, petrochemical, pharmaceutical & food industries globally. We look forward to continuing this partnership with OceanFirst through the expansion of our manufacturing facility in 2016 and beyond.” 41 |