
1
Exhibit 99
PG&E Corporation:
Creating A Sustainable Future
Investor Package
42nd Edison Electric Institute Financial Conference
Orlando, Florida
November 5-6, 2007

2
This presentation contains forward-looking statements regarding management’s guidance for PG&E Corporation’s 2007 and 2008 earnings per share from operations, targeted average annual
growth rate for earnings per share from operations, as well as management’s projections regarding Pacific Gas and Electric Company’s (Utility) capital expenditures, rate base, future electricity
resources, and potential investments in transmission, generation and renewable energy resources. These statements are based on current expectations and various assumptions which
management believes are reasonable, including that substantial capital investments are made in the Utility business over the 2007-2011 period, Utility rate base averages $16.9 billion in 2007
and $18.7 billion in 2008, that the Utility earns at least its authorized rate of return on equity, that the U
tility’s ratemaking capital structure is maintained at 52 percent equity, and that the Utility
is successful in implementing its initiatives to become more efficient and reduce costs. These statements and assumptions are necessarily subject to various risks and uncertainties, the
realization or resolution of which are outside of management's control. Actual results may differ materially. Factors that could cause actual results to differ materially include:
•The Utility’s ability to timely recover costs through rates;
•the outcome of regulatory proceedings, including ratemaking proceedings pending at the California Public Utilities Commission (CPUC) and the Federal Energy Regulatory
Commission;
•the adequacy and price of electricity and natural gas supplies, and the ability of the Utility to manage and respond to the volatility of the electricity and natural gas markets;
•the effect of weather, storms, earthquakes, fires, floods, disease, other natural disasters, explosions, accidents, mechanical breakdowns, acts of terrorism, and other events or hazards
that could affect the Utility’s facilities and operations, its customers, and third parties on which the Utility relies;
•the potential impacts of climate change on the Utility’s electricity and natural gas business;
•changes in customer demand for electricity and natural gas resulting from unanticipated population growth or decline, general economic and financial market conditions, changes in
technology including the development of alternative energy sources, or other reasons;
•operating performance of the Utility’s Diablo Canyon nuclear generating facilities (Diablo Canyon), the occurrence of unplanned outages at Diablo Canyon, or the temporary or
permanent cessation of operations at Diablo Canyon;
•the ability of the Utility to recognize benefits from its initiatives to improve its business processes and customer service;
•whether the Utility’s planned capital investment projects are completed within authorized cost amounts;
•the impact of changes in federal or state laws, or their interpretation, on energy policy and the regulation of utilities and their holding companies;
•the impact of changing wholesale electric or gas market rules, including the California Independent System Operator’s new rules to restructure the California wholesale electricity
market;
•how the CPUC administers the conditions imposed on PG&E Corporation when it became the Utility’s holding company;
•the extent to which PG&E Corporation or the Utility incur costs and liabilities in connection with pending litigation that are not recoverable through rates, from third parties, or through
insurance recoveries;
•the ability of PG&E Corporation and/or the Utility to access capital markets and other sources of credit;
•the impact of environmental laws and regulations and the costs of compliance and remediation;
•the effect of municipalization, direct access, community choice aggregation, or other forms of bypass, and
•other risks and factors disclosed in PG&E Corporation’s SEC reports.
Cautionary Statement Regarding
Forward-Looking Information

3
Key Takeaways From Today’s Discussion
PG&E is:
•      A strong utility holding, delivering 1st quartile
      earnings growth in a positive regulatory
      environment
•      Innovating in our core business to create
      competitive advantage
•Creating a sustainable future for California
4
We act with integrity and communicate honestly and openly.
We are passionate about meeting our customers’ needs
and delivering for our shareholders.
We are accountable for all of our own actions: these include
safety, protecting the environment, and supporting our communities.
We work together as a team and are committed to excellence and innovation.
We respect each other and celebrate our diversity.
The
leading
utility in the
United States
Delighted Customers
Energized Employees
Rewarded Shareholders
Our values
Operational excellence
Transformation
Our strategies
Our goals
Our vision
PG&E Vision
5
Business Unit | 2006 Rate Base ($B) |
Electric and gas distribution (CPUC) | $10.3 |
Electric generation (CPUC) | $1.8 |
Gas transmission (CPUC) | $1.5 |
Electric transmission (FERC) | $2.3 |
PCG Total Business | $15.9 |
Pacific Gas and Electric Company (PG&E)
•$12.5 B in Revenues
•$34.8 B in Assets
•5.1 MM Electric/4.2 MM Gas Customers
•$17 B+ Market Capitalization

6
Core Business Investment Opportunities
•Electric and gas distribution
-Advanced metering technology
•Electric transmission
-System reliability and generation substitutes
-Growth to reach renewable resources
•Natural gas transmission and storage
•Electric resource requirements
-Energy efficiency
-Conventional generation
-Renewables
7
∗Reg G reconciliation to GAAP for 2006 EPS from Operations and 2007 and 2008 EPS Guidance
available in Appendix and at www.pgecorp.com
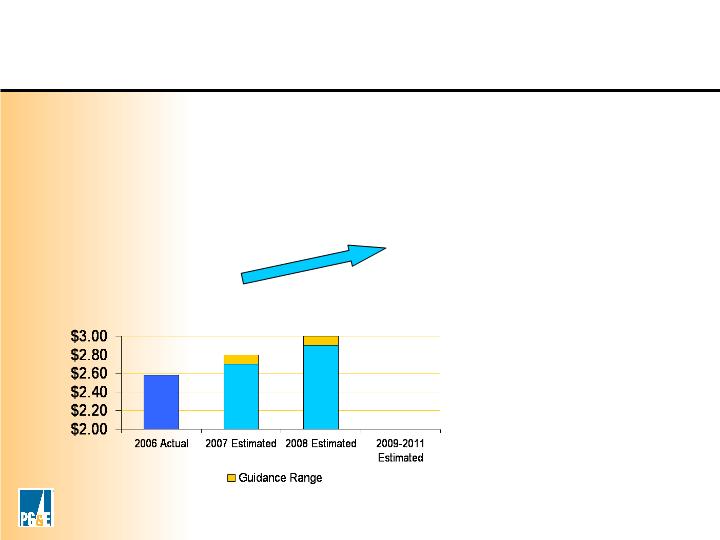
EPS from Operations*
EPS Guidance
EPS from Operations*: 2007 guidance of $2.70-$2.80 per share (upper half)
                                     2008 guidance of $2.90-$3.00 per share
Targeted Growth Rate: 8%
    Assumes success in cost saving efforts
    Energy efficiency incentives and broader operational savings may be needed
    Review of 3-year operating plan underway
    Update planned for Q1 2008
8%

8
Investment Driver | Cap Ex | Notable Projects |
Common Plant | ~$1.3 Billion | •Building Investment •Technology Infrastructure •General Use Fleet |
Electric and Gas Transmission | ~$3.8 Billion | •Central California Clean Energy Transmission Line ( formerly Midway-Gregg) •Line Upgrades for Renewables •McDonald Island Gas Storage Pipeline |
Generation | ~$2.9 Billion | •Gateway Generating Station •Humboldt Power Plant •Colusa Power Plant •DCPP Steam Generator Replacement |
Distribution | ~$6.2 Billion | •Distribution maintenance and upgrades •New Customer Connections •AMI |
2007-2011 Estimated CapEx totals more than $14 B* (~$2.8 B/yr.)
* CapEx projections for 2007-2011 last affirmed in October 2007. CapEx projections for 2008-2012 currently in development.
Capital Expenditures Drive Core Growth

9
State Energy Policy Supports Business Strategy
PG&E’s resource investment strategy is aligned with
California’s Energy Action Plan “preferred loading order”:
1.Energy Efficiency
2.Demand Response
3.Renewable Resources
4.Distributed Generation
5.Conventional Resources
10
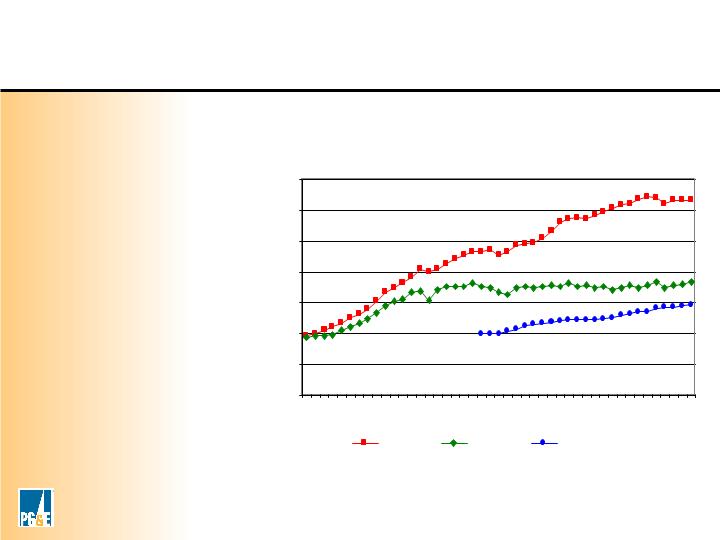
Source: California Energy Commission
EE is California’s Least-Cost Resource
-
2,000
4,000
6,000
8,000
10,000
12,000
14,000
1960
1965
1970
1975
1980
1985
1990
1995
2000
kWh
US
CA
Western Europe
Per Capita Energy Usage - California, US and Europe
Resource Type | 2006 Cost (kWh)* |
Energy Efficiency | $.025 |
Diablo Canyon | $.039 |
Utility, Irrigation Districts, Other Wholesale | $.048 |
QFs and Renewables | $.084 |
DWR | $.085 |
* Costs represent 2006 average price per kilowatt hour
11
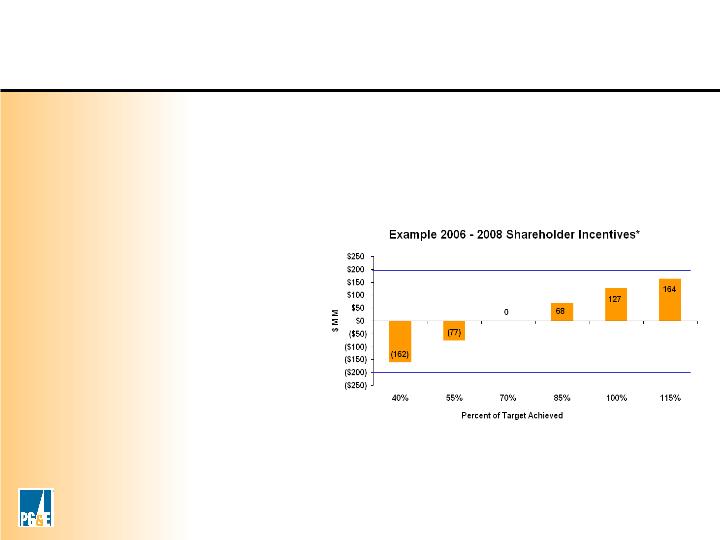
*All amounts are pre-tax and cumulative for the three-year cycle
$180 MM Cap
($180) MM Cap
Constructive Policy with Measurement/ Evaluation Issues to be Resolved
Energy Efficiency Decision
•Symmetrical “risk/reward” mechanism
with $180 MM cap
•Effective for 2006-2008 and 2009-
2011 EE program cycles
•Currently discussing measurement
and evaluation issues with CPUC
•Joint petition to resolve technical
issues filed October 31, 2007
12
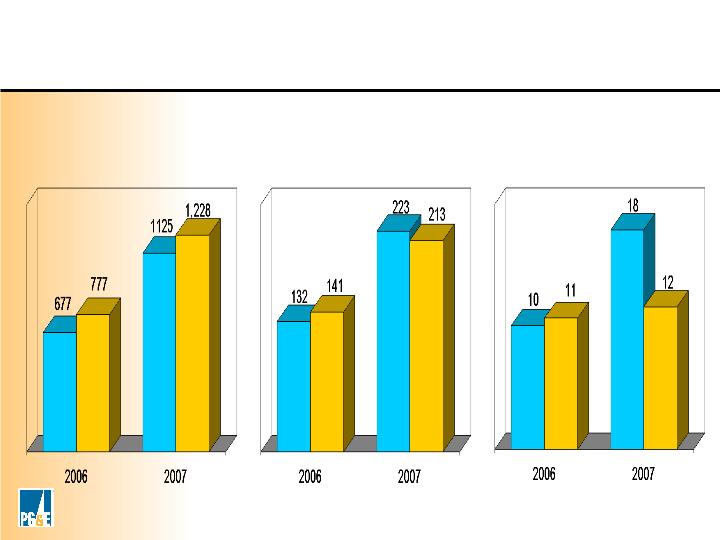
Energy Efficiency Savings: Goals and Achievements*
*Energy Efficiency goals are annual; YTD is through 9/30/07
GWh
MW
Therms
Goal
Goal
Goal
Goal
Goal
Goal
Year
End
YTD
YTD
YTD
Year
End
Year
End
PG&E’s Recent Energy Efficiency Performance

13
*SmartMeterTM Program Upgrade subject to results of bid evaluation, successful field testing, and obtaining any necessary CPUC approval.
SmartMeter is a trademark of SmartSynch, Inc. and is used by permission.
2008 and beyond
2007
July 2007:
RFP Issued
Q4 2007 - Q2 2008:
Field Testing
Aug 2007:
Bids Submitted
Q4 2011:
Initial deployment complete
Approximate timeline for SmartMeter Program Upgrade*
2011
•RFP Responses received
•Two vendors selected for initial pilot tests
•Next Step: CPUC approval (possible deployment as early as 2009)
SmartMeterTM Project Upgrade Timeline
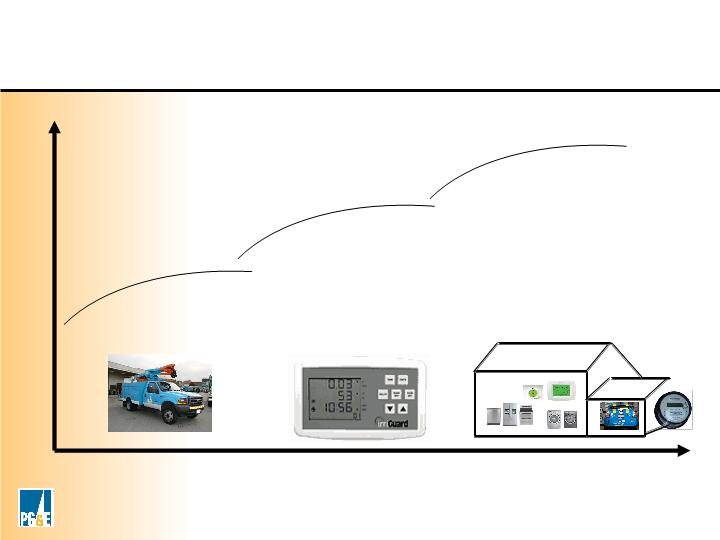
14
Today
Near-Term
Future
•Smart Meters
•HAN Energy
Management
•PHEV
SmartCharge
•Vehicle to Grid
•Distributed storage and
generation
2007
20??
•Electric Field Vehicles
Innovating for the Future: Smart Energy Web
15
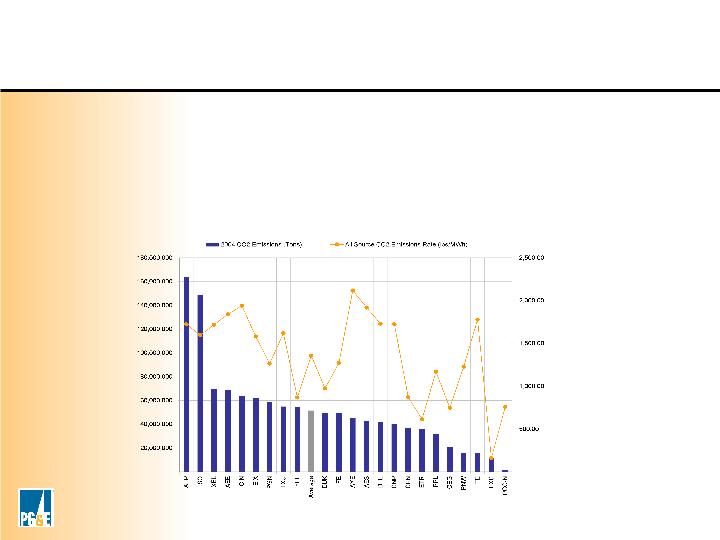
2004 CO2 Emissions and Emission Rates*
*Source: Innovest, based on most recent data available
PG&E’s Stance on Climate Change
•Global climate change is serious and requires immediate action
•Energy sector is among the largest contributors to U.S. GHG emissions
•PG&E has an obligation to find solutions to global climate change

16
Changing Legislative Environment for GHG
Recent Legislative Action:
•California global warming legislation enacted in 2006
•Comprehensive federal legislation expected in 2 to 4 years
•Pending near-term “energy independence” measures
-Federal energy efficiency standards
-Favorable tax treatment for renewable generation and AMI technology
-Federal renewable portfolio standard
-Support for clean fuels development (Plug-in Hybrids, Electric and Natural Gas Vehicles)
PG&E Supports:
•Mandatory market-based approach
•Encouraging early action toward goals before full regulatory implementation
•Recognition of prior actions
•Pursuit of all cost-effective reductions in greenhouse gases
•International cooperation

17
Year Signed | Project | Max GWh/yr | Technology |
Pre 2002 | Various Projects | ~7500** | Various |
2002 | Calpine Geysers 13 & 20 | 722 | Geothermal |
2002 | Wheelabrator #4 | 25 | Biomass |
2003 | CBEA Projects (3) | 305 | Biomass |
2004 | Big Valley Lumber | 41 | Biomass |
2004 | Diablo Winds | 65 | Wind |
2005 | FPL Energy-Montezuma Winds | 102 | Wind |
2005 | Buena Vista Energy LLC | 108 | Wind |
2005 | Pacific Renewable Energy | 280 | Wind |
2005 | Shiloh 1 Wind Project LLC | 225 | Wind |
2006 | Military Pass Rd. | 840 | Geothermal |
2006 | HFI Silvan | 142 | Biomass |
2006 | Liberty Biofuels | 70 | Biofuels |
2006 | Bottle Rock USRG | 385 | Geothermal |
2006 | IAE Truckhaven | 366 | Geothermal |
2006 | Global Common - Chowchilla | 72 | Biomass |
Year Signed | Project | Max GWh/yr | Technology |
2006 | Global Common - El Nido | 72 | Biomass |
2006 | Newberry | 840 | Geothermal |
2006 | Calpine Geysers | 922 | Geothermal |
2006 | Tunnel Hydro | 2.1 | Hydro |
2006 | Buckeye Hydro | 1.4 | Hydro |
2006 | Eden Vale Dairy | 1.3 | Biogas |
2006 | Microgy | TBD | Biogas |
2006 | Bio_Energy LLC | TBD | Biogas |
2006 | Palco | 36 | Biomass |
2007 | Solel | 1388 | Solar Thermal |
2007 | Western GeoPower | 212 | Geothermal |
2007 | PPM-Klondike | 265 | Wind |
2007 | CalRenew | 9 | PV |
2007 | Green Volts | 5 | PV |
18% of Projected 2010 Load Currently Signed*
*Based on contracts signed through August 2007
** Average delivered energy over multiple years: pre-RPS baseline
PG&E’s Renewable Contracts Signed
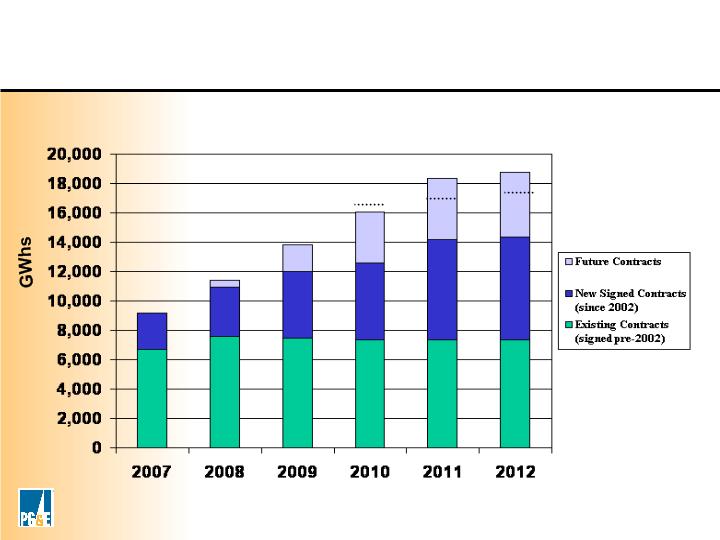
18
Year
18%
15%
12%
19%
Expected Deliveries From Contracts
20%
20%
Renewable Portfolio Standard Target is 20% by 2010*
* See Appendix for further description of RPS requirements
PG&E’s RPS Compliance Outlook

19
PCG Value Summary
•    PG&E is a core utility holding with a record of delivering
    strong earnings growth in a constructive regulatory
    environment.
•    Technology innovation and a clean energy portfolio are
     key parts of our overall strategy.
•    We believe our actions will ensure the success of our
    shareholders and improve the communities we serve.

20
Conference Notes

21
Appendix

22
* Earnings per share from operations is a non-GAAP measure.  This non-GAAP measure is used
  because it allows investors to compare the core underlying financial performance from one period to
  another, exclusive of items that do not reflect the normal course of operations
2006
2006 EPS - Reg G Reconciliation
EPS on an Earnings from Operations Basis* $2.57
Items Impacting Comparability:
Scheduling Coordinator Cost Recovery 0.21
Environmental Remediation Liability (0.05)
Recovery of Interest on PX Liability 0.08
Severance Costs (0.05)
EPS on a GAAP Basis $2.76

23
EPS Guidance - Reg G Reconciliation
 2007
                                                                                 Low             High
EPS Guidance on an Earnings from Operations Basis*              $2.70              $2.80
Estimated Items Impacting Comparability                                    0.00                0.00
EPS Guidance on a GAAP Basis                                              $2.70              $2.80
2008
                                                                               Low             High
EPS Guidance on an Earnings from Operations Basis* $2.90 $3.00
Estimated Items Impacting Comparability 0.00 0.00
EPS Guidance on a GAAP Basis $2.90 $3.00
* Earnings per share from operations is a non-GAAP measure.  This non-GAAP measure is used because it allows investors
   to compare the core underlying financial performance from one period to another, exclusive of items that do not reflect the
   normal course of operations.
24
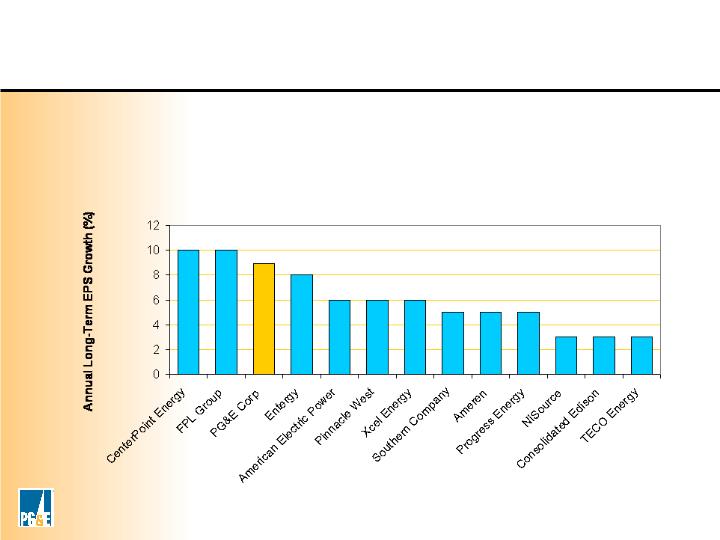
Consensus of analyst estimates of EPS growth:
Source: Thomson IBIS long-term EPS Growth Consensus Estimate Median October 30, 2007
EPS Growth - Comparator Group
PG&E targets 1st quartile growth in a constructive regulatory
environment

25
Market | Example Initiatives |
High Tech | Data Center Efficiency |
Residential New Construction | New Solar Homes Partnership |
Agricultural and Food Processing | Bio-Energy Recovery Systems |
Schools and Colleges | University Research Center Efficiency |
Large Commercial | “More-than-a-Million” Retro-commissioning Program |
Other Programs, including mass market and third-party programs | Compact Fluorescent Bulbs, Appliances and Air Conditioning Equipment, Enhancements to New Buildings, etc. |
Energy Efficiency Target Markets and Initiatives

26
Mandate | •Deliveries of 20% of load from eligible renewables by 2010. Large hydro (>30 MW) doesn’t qualify. |
Purpose | •Fuel Diversity •GHG Reduction •Economic Development |
Penalty | •$50/MWhr, up to $25 million per year |
Exceptions | 1)Contract failure 2)Insufficient public goods funds 3)Insufficient offers 4)Lack of transmission |
Flexible Compliance | •Allows shortfalls to be made up within following three years. |
California’s RPS Program
27
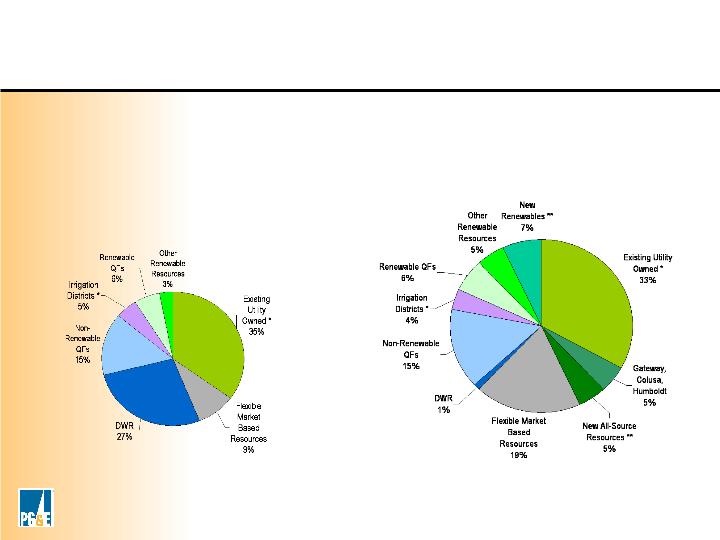
*Over  20% of total retail sales expected to be eligible renewable resources coming from
   utility-owned, QFs, Irrigation Districts, and other sources.
** May include utility-owned resources
* Approximately 13% of total retail sales expected to be eligible renewable resources
  coming from utility-owned, QFs, Irrigation Districts and other sources.
2007 Projected Sources of Energy
85,500 GWh
2012 Projected Sources of Energy
89,900 GWh
•Energy efficiency expected to meet half of future load growth
•Growth in renewable resources and resources with operating flexibility
•Growth in utility ownership
Long-Term Electricity Resources
28
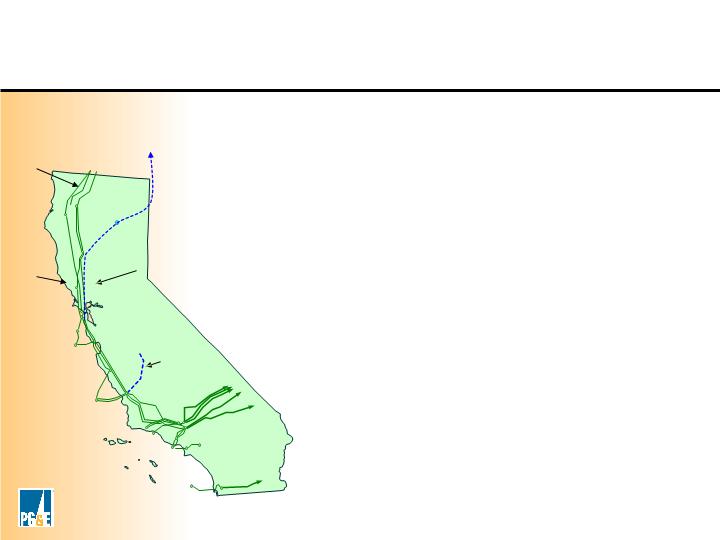
Transmission Line | Project / Estimated Total Cost |
Central California Clean Energy Transmission Line | Proposed 500 KV line improving reliability and increasing access to renewables / $800 MM |
Vaca Dixon - Contra Costa Upgrade | 230 kV path adding access to wind energy / $23 MM |
California - Oregon Upgrade | Replacing substation / switchyard equipment to increase MW rating / $30 MM |
Lakeville Sonoma Transmission Line | Adding reliability and capacity to Napa and Sonoma / $27 MM |
B.C. Renewable Line (possible) | Proposed to bring British Columbia renewable resource energy to CA / $4-6B |
California Oregon Upgrade
B.C.Renewable
        Line
Wind
Lakeville Sonoma
Central California
Clean Energy Line
 Vaca Dixon Contra
        Costa Upgrade
New Transmission: Reliability and Renewables