UBS Natural Gas,
Electric Power and Coal
Conference
March 5, 2009
Conference
March 5, 2009

2
This presentation contains management’s guidance for PG&E Corporation’s 2009, 2010 and 2011 earnings per share from operations, projections of Pacific
Gas and Electric Company’s (Utility) capital expenditures, rate base and rate base growth, and projections of PG&E Corporation’s and the Utility’s financing
needs. These statements and projections, as well as the underlying assumptions, are forward-looking statements that are based on current expectations
which management believes are reasonable. These statements and assumptions are necessarily subject to various risks and uncertainties, the realization or
resolution of which may be outside of management's control. Actual results may differ materially. Factors that could cause actual results to differ materially
include:
• the Utility’s ability to manage capital expenditures and its operating and maintenance expenses within authorized levels;
• the outcome of pending and future regulatory proceedings and whether the Utility is able to timely recover its costs through rates;
• the adequacy and price of electricity and natural gas supplies, and the ability of the Utility to manage and respond to the volatility of the electricity and natural gas markets,
including the ability of the Utility and its counterparties to post or return collateral;
including the ability of the Utility and its counterparties to post or return collateral;
• the effect of weather, storms, earthquakes, fires, floods, disease, other natural disasters, explosions, accidents, mechanical breakdowns, acts of terrorism, and other events or
hazards on the Utility’s facilities and operations, its customers, and third parties on which the Utility relies;
hazards on the Utility’s facilities and operations, its customers, and third parties on which the Utility relies;
• the potential impacts of climate change on the Utility’s electricity and natural gas businesses;
• changes in customer demand for electricity and natural gas resulting from unanticipated population growth or decline, general economic and financial market conditions,
changes in technology, including the development of alternative energy sources, or other reasons;
changes in technology, including the development of alternative energy sources, or other reasons;
• operating performance of Diablo Canyon, the availability of nuclear fuel, the occurrence of unplanned outages at Diablo Canyon or the temporary or permanent cessation of
operations at Diablo Canyon;
operations at Diablo Canyon;
• whether the Utility can maintain the cost savings it has recognized from operating efficiencies it has achieved and identify and successfully implement additional sustainable
cost-saving measures;
cost-saving measures;
• whether the Utility incurs substantial expense to improve the safety and reliability of its electric and natural gas systems;
• whether the Utility achieves the California Public Utilities Commission’s (CPUC) energy efficiency targets and recognizes any incentives the Utility may earn in a timely manner;
• the impact of changes in federal or state laws, or their interpretation, on energy policy and the regulation of utilities and their holding companies;
• the impact of changing wholesale electric or gas market rules, including new rules of the California Independent System Operator (CAISO) to restructure the California
wholesale electricity market;
wholesale electricity market;
• how the CPUC administers the conditions imposed on PG&E Corporation when it became the Utility’s holding company;
• the extent to which PG&E Corporation or the Utility incurs costs and liabilities in connection with litigation that are not recoverable through rates, from insurance, or from other
third parties;
third parties;
• the ability of PG&E Corporation, the Utility, and counterparties, to access capital markets and other sources of credit in a timely manner on acceptable terms, especially given
the recent deteriorating conditions in the economy and financial markets;
the recent deteriorating conditions in the economy and financial markets;
• the impact of environmental laws and regulations and the costs of compliance and remediation;
• the effect of municipalization, direct access, community choice aggregation, or other forms of bypass;
• the impact of changes in federal or state tax laws, policies, or regulations; and
• other factors and risks discussed in PG&E Corporation’s and the Utility’s 2008 Annual Report on Form 10-K and other reports filed with the Securities and Exchange
Commission.
Commission.
Cautionary Language Regarding Forward-Looking
Statements
Statements

3
PCG Investment Case
• PCG is focused on better service to our customers,
which is the foundation of our growth:
which is the foundation of our growth:
• Substantial CapEx Program
• Manageable financing requirements
• Decoupled revenues
• Pass-through of procurement costs
• 11.45% weighted ROE on 52% equity
• Low carbon footprint
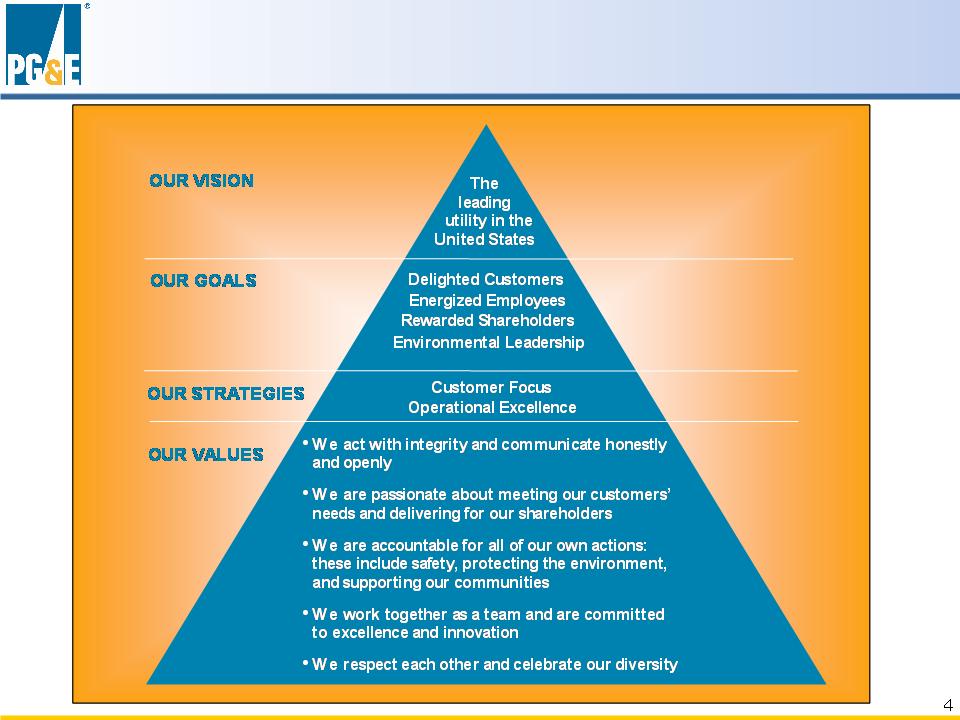
Vision and Values

5
2009 Business Priorities
• Improve reliability
• Improve safety and human performance
• Deliver on budget, on plan, and on purpose
• Drive customer satisfaction
• Champion effective regulatory and legislative policies

6
PG&E Financial Strategy
• Achieve solid, sustained EPS growth
• Actively manage cash flow
• Maintain opportunistic financing approach
7
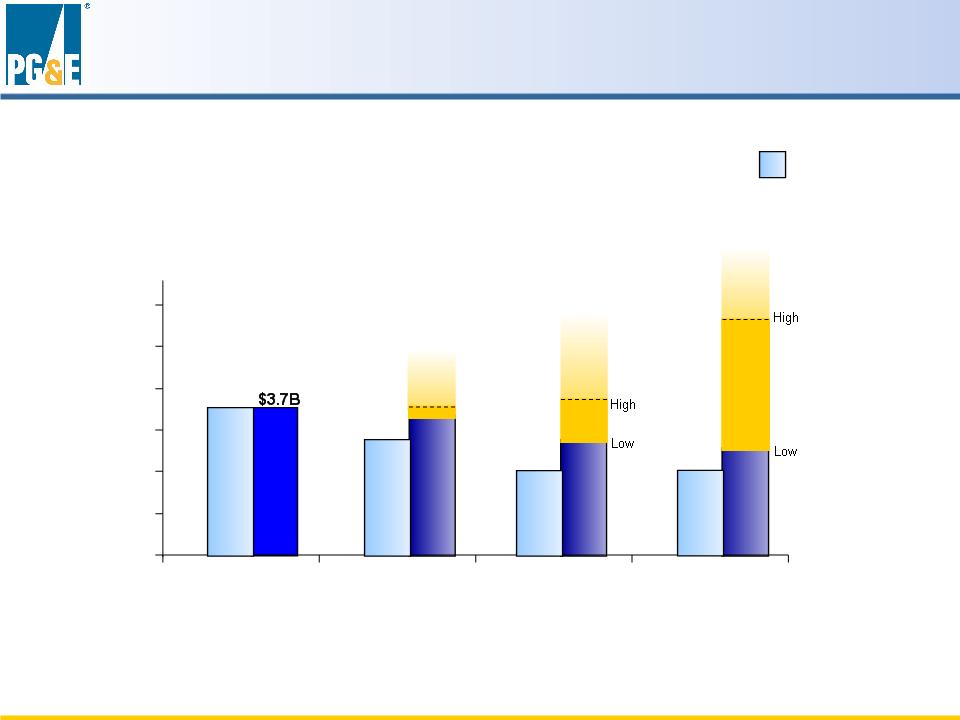
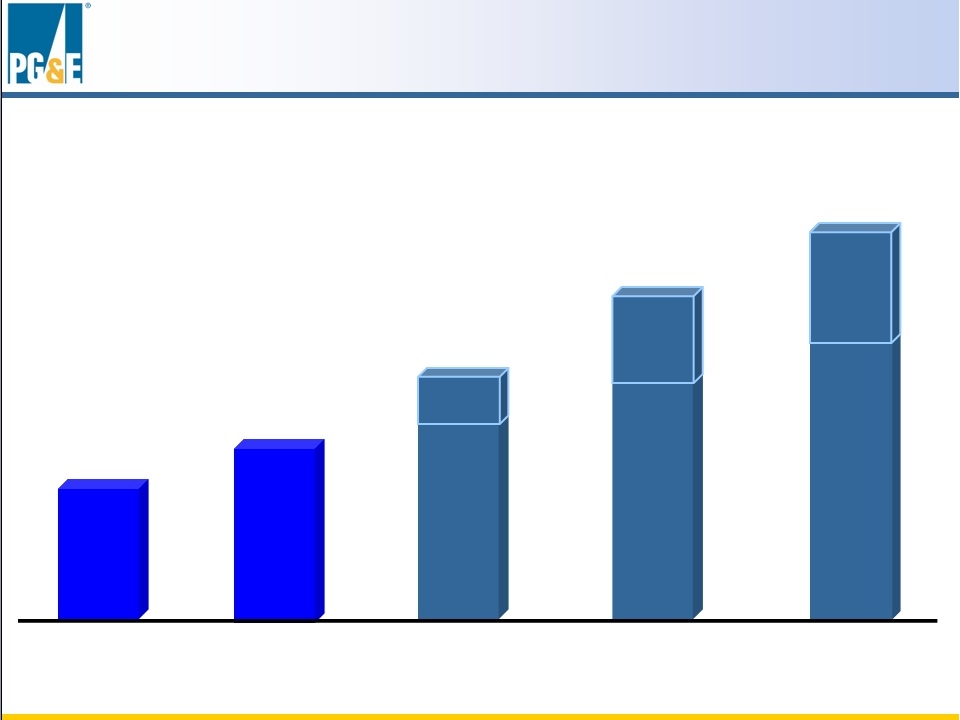
Capital Expenditure Outlook
Low Case $3.6B
Low Case $3.6B
High Case $3.7B
High Case $3.7B
Low Case $3.4B
Low Case $3.4B
High Case $3.8B
High Case $3.8B
Low Case $3.3B
Low Case $3.3B
High Case $4.8B
High Case $4.8B
2.0
2.5
3.0
3.5
4.0
4.5
5.0
2008
2009
2010
2011
$ B
Low
Low
High
High
Prior Forecast
Prior Forecast
CapEx Outlook
Prior vs. Current Forecast
Prior vs. Current Forecast
CapEx Outlook
Prior vs. Current Forecast
Prior vs. Current Forecast
$3.3B
$3.3B
$3.0B
$3.0B
$3.0B
$3.0B
$3.7B
$3.7B
Actual

8
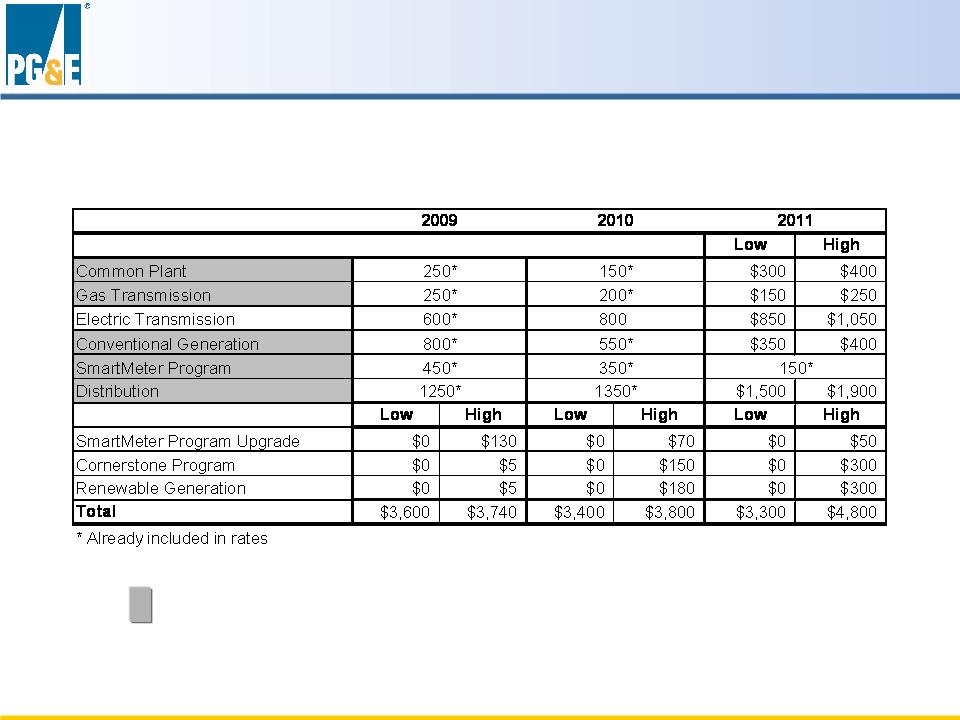
Capital Expenditure Outlook
2009 | 2010 | 2011 | |
Low Case | Total CapEx of $3.6B • Includes: • CPUC Basic CapEx of $3.0B • Elec. Trans. CapEx of $600MM • Does not include: • SmartMeter Program Upgrade • Cornerstone Program • Renewable Generation • BC Transmission / Pacific Connector Gas Pipeline | Total CapEx of $3.4B • Includes: • CPUC Basic CapEx of $2.6B • Elec. Trans. CapEx of $800MM • Does not include: • SmartMeter Program Upgrade • Cornerstone Program • Renewable Generation • BC Transmission / Pacific Connector Gas Pipeline • | Total CapEx of $3.3B • Includes: • CPUC Basic CapEx of $2.45B • Elec. Trans. CapEx of $850MM • Does not include: • SmartMeter Program Upgrade • Cornerstone Program • Renewable Generation • BC Transmission / Pacific Connector Gas Pipeline • |
High Case | Total CapEx of $3.7B • Includes: • CPUC Basic CapEx of $3.0B • Elec. Trans. CapEx of $600MM • SmartMeter Program Upgrade • Cornerstone Program • Renewable Generation •Does not include: • BC Transmission / Pacific Connector Gas Pipeline | Total CapEx of $3.8B • Includes: • CPUC Basic CapEx of $2.6B • Elec. Trans. CapEx of $800MM • SmartMeter Program Upgrade • Cornerstone Program • Renewable Generation • Does not include: • BC Transmission / Pacific Connector Gas Pipeline | Total CapEx of $4.8B • Includes: • CPUC Basic CapEx of $3.1B • Elec. Trans. CapEx of $1.0B • SmartMeter Program Upgrade • Cornerstone Program • Renewable Generation • Does not include: • BC Transmission / Pacific Connector Gas Pipeline |
Spending Included in Low Case and High Case
Spending Included in Low Case and High Case
9
CapEx Low and High Cases
- 2011 GRC Category Capital Expenditures
- 2011 GRC Category Capital Expenditures
Capital Expenditure Forecast ($MM)
Capital Expenditure Forecast ($MM)

10
Generation
• Prior RFO Shortfalls
• RFO for 2006-2016 issued April 2008 for 800-1200 MW
• Additional renewable generation investment opportunities
Electric Transmission & Gas Pipelines
• Additional transmission to reach renewable generation
• B.C. Transmission Line
• Pacific Connector Gas Pipeline
Additional Capital Opportunities
11
* Projected 2008-2011 rate base is not adjusted for the impact of the carrying cost credit that primarily results from the second series of the Energy
Recovery Bonds. Earnings will be reduced by an amount equal to the deferred tax balance associated with the Energy Recovery Bonds regulatory
asset, multiplied by the Utility's equity ratio and by its equity return. This rate base offset carrying cost declines to zero when the taxes are fully paid in
2012.
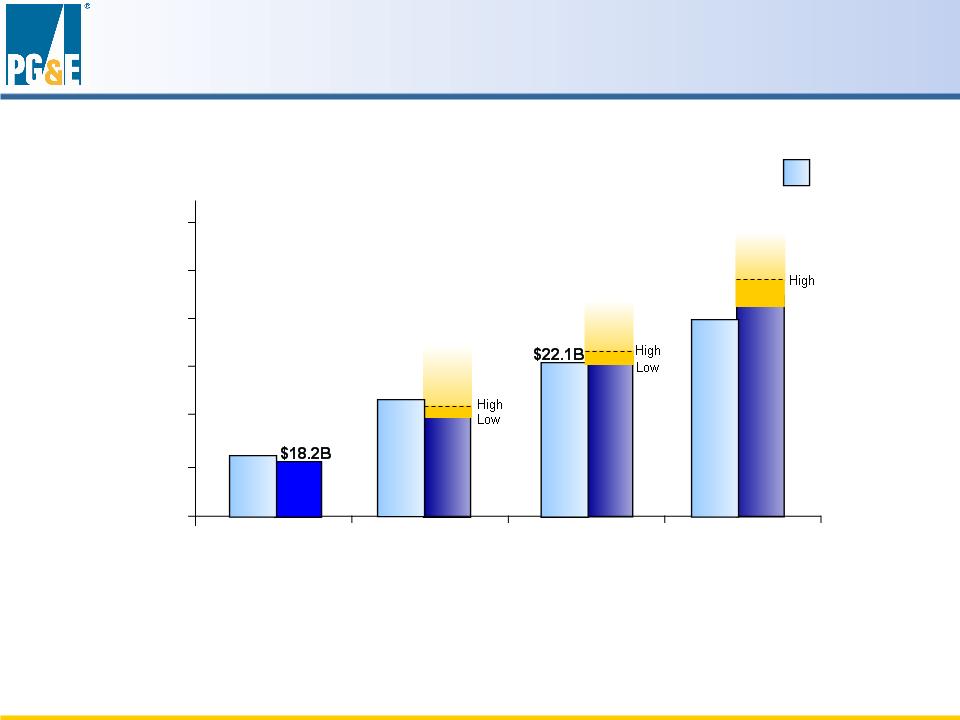
Weighted Average Annual Rate Base*
16.0
18.0
20.0
22.0
24.0
26.0
28.0
2008
2009
2010
2011
$ B
Rate Base Growth
Low
Low
Low Case $20.1B
Low Case $20.1B
High Case $20.3B
High Case $20.3B
Low Case $22.1B
Low Case $22.1B
High Case $22.4B
High Case $22.4B
Low Case $24.3B
Low Case $24.3B
High Case $25.4B
High Case $25.4B
$20.4B
$20.4B
Prior Forecast
Prior Forecast
$23.9B
$23.9B
$18.3B
$18.3B
Actual
12
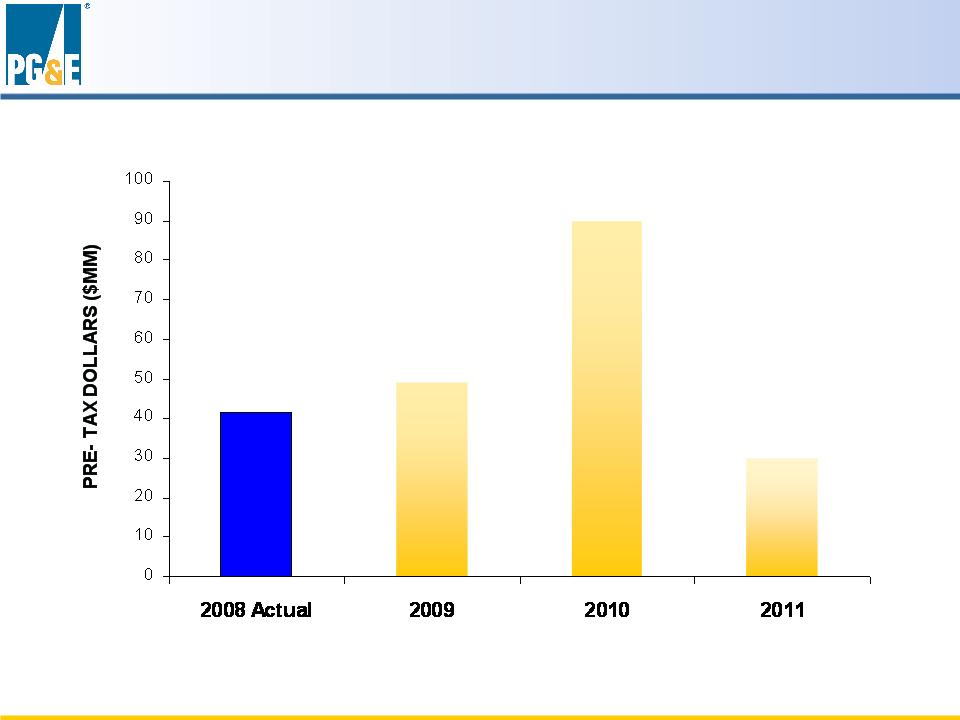
Energy Efficiency Incentive Opportunities
$41.5MM
$41.5MM
13
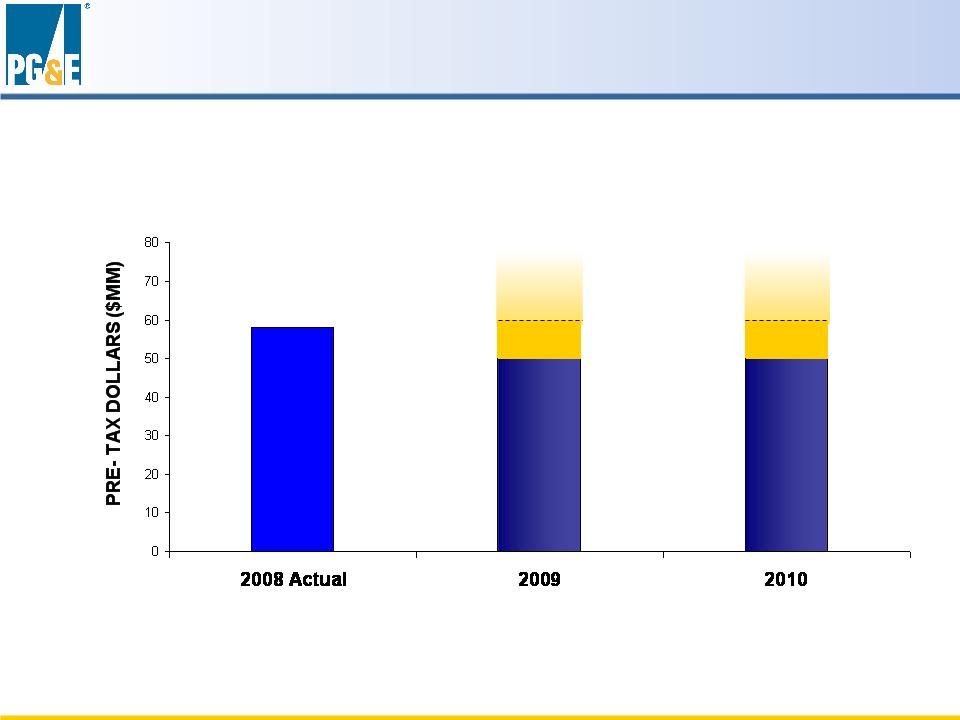
Operational Changes and Efficiencies
Low
Low
High
High
Low
Low
High
High
Low Case $50MM
Low Case $50MM
High Case $60MM
High Case $60MM
Low Case $50MM
Low Case $50MM
High Case $60MM
High Case $60MM
$58MM
$58MM
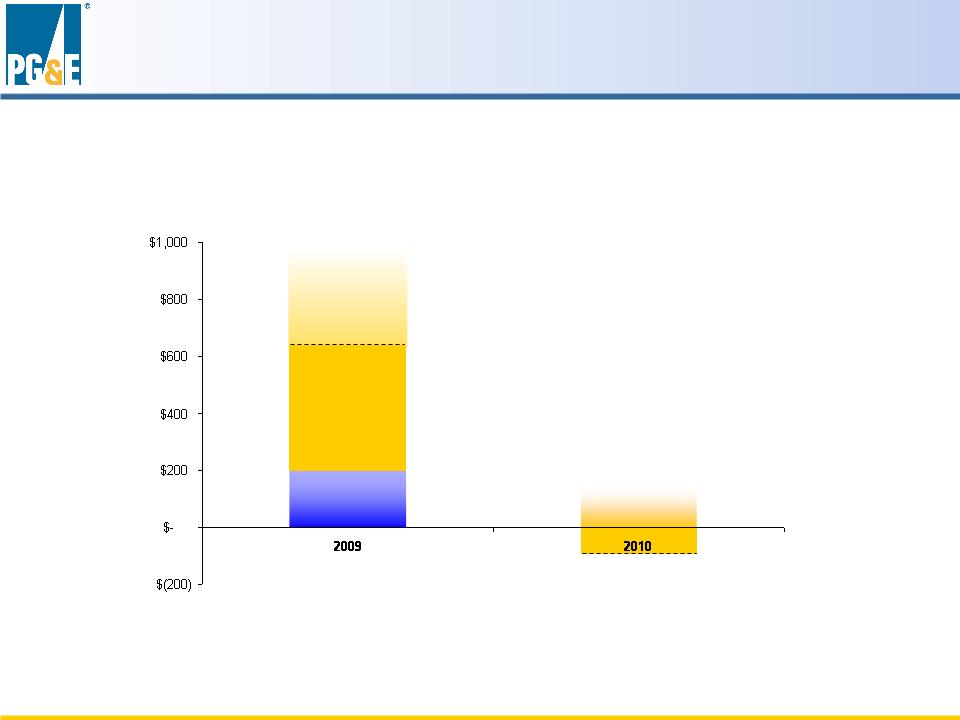
Impact to Cash Flow from Tax
Low
Low
High
High
Low
Low
High
High
Low Case $200M
High Case $640M
Low Case ($90M)
High Case ($90M)
14
15
2011
2007
Actual
Actual
EPS Guidance
$3.85
2008
Actual
Actual
2009
2010
$2.78
$2.95
$3.65
Low
High
Low
High
Low
High
$3.50
$3.35
$3.25
$3.15
Earnings per Share from Operations
16
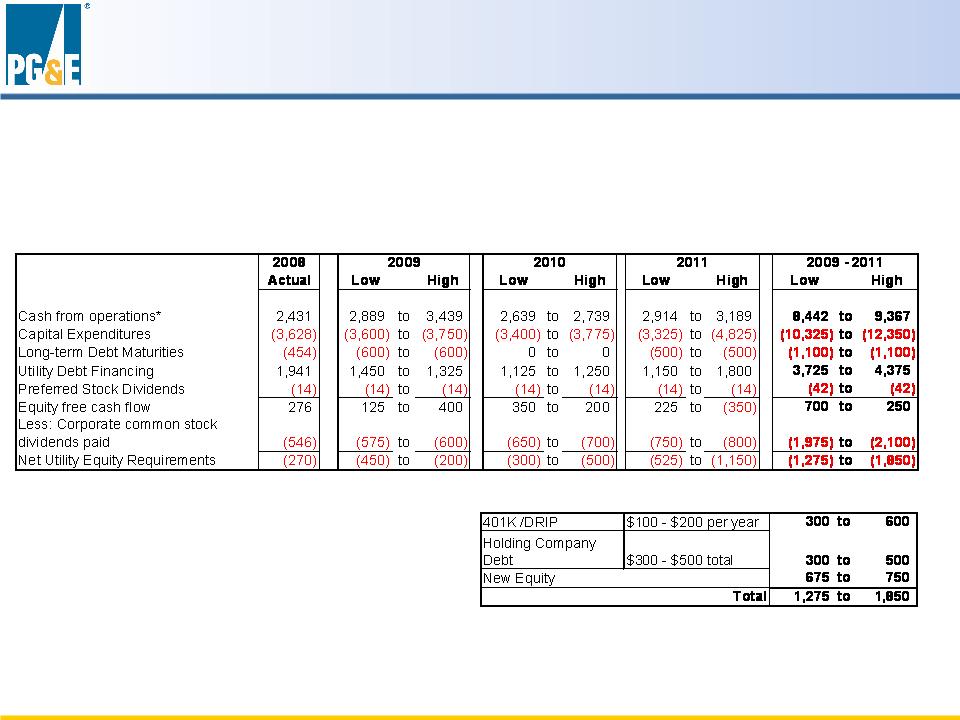
Cash Flow and Equity Needs
Financing Needs 2009 - 2011 ($MM)
Financing Needs 2009 - 2011 ($MM)
Projected Sources of Equity
Projected Sources of Equity
2009 - - 2011
2009 - - 2011
* Excludes cash from Energy Recovery Bond revenues |
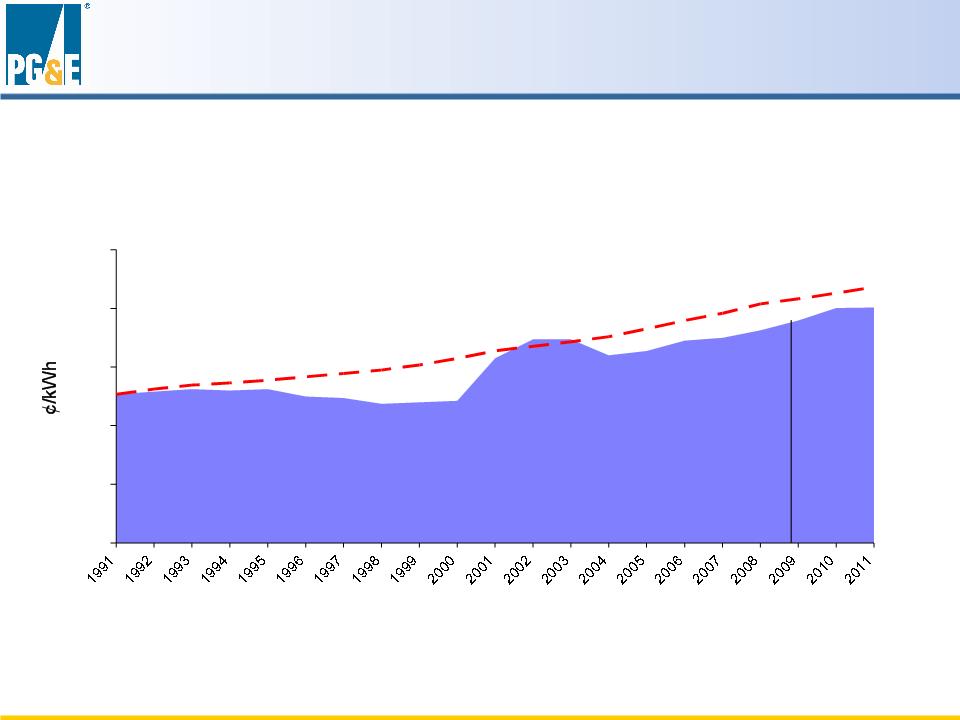
Bundled System Average Electric Rate
0.0
4.0
8.0
12.0
16.0
20.0
14.4¢
Bundled
CPI
17
Electric Rate Forecast
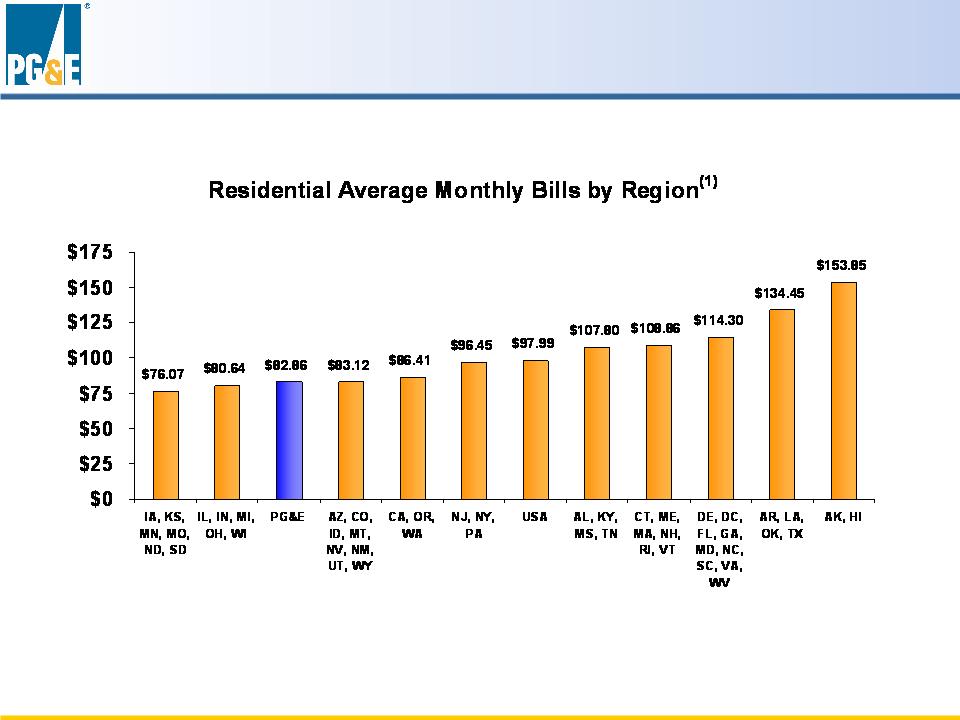
Residential Electric Bills
(1) Edison Electric Institute, Statistical Yearbook, Year 2007 (latest data available).
18
19
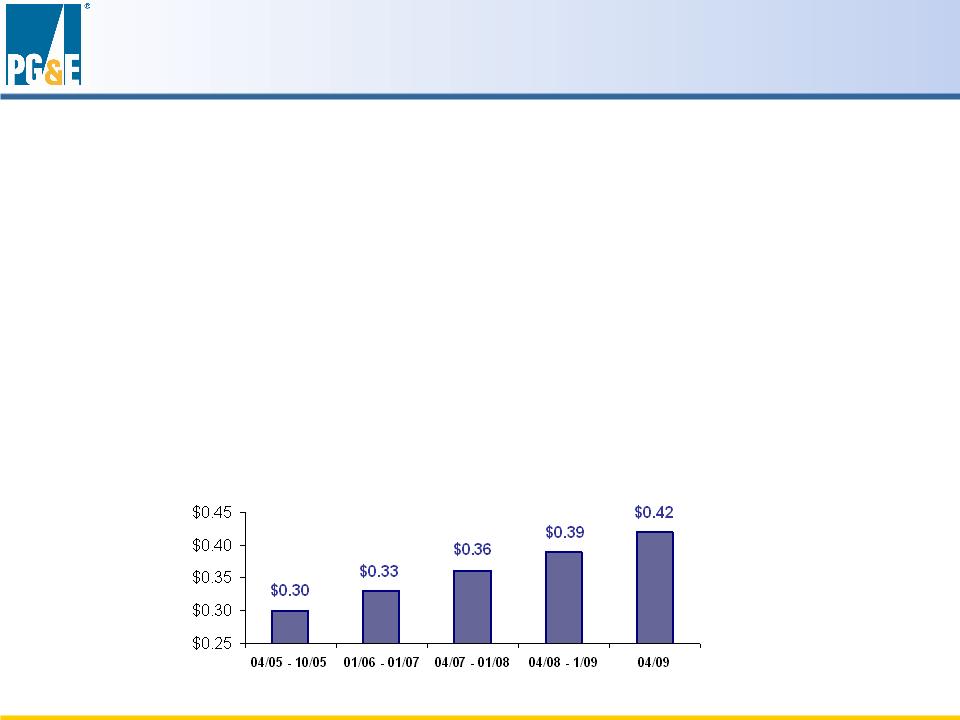
• Sustainable, comparable dividend
• Payout ratio range of 50% - 70%
• Dividend growth in line with EPS growth.
Dividend Policy
Historical Quarterly Dividends per Share

20
Financial Assumptions 2009-2011
GUIDANCE REFLECTS:
• Capital expenditures consistent with low and high case ranges
• CPUC authorized ROE of at least 11.35% and Utility earns at least
12% on FERC projected rate base
12% on FERC projected rate base
• Ratemaking capital structure maintained at 52% equity
• CEE incentives, operational changes and efficiencies and tax cash
flow consistent with low and high case ranges
flow consistent with low and high case ranges
• Current conditions for debt and equity markets
• Resolution of FERC generator claims in 2009-2011 results in
financing needs
financing needs
PG&E Ownership of Renewables
Proposed Solar PV Program
• Up to 250 MW of Utility-owned PV generation
• Up to 250 MW of standard-offer PV PPAs
22
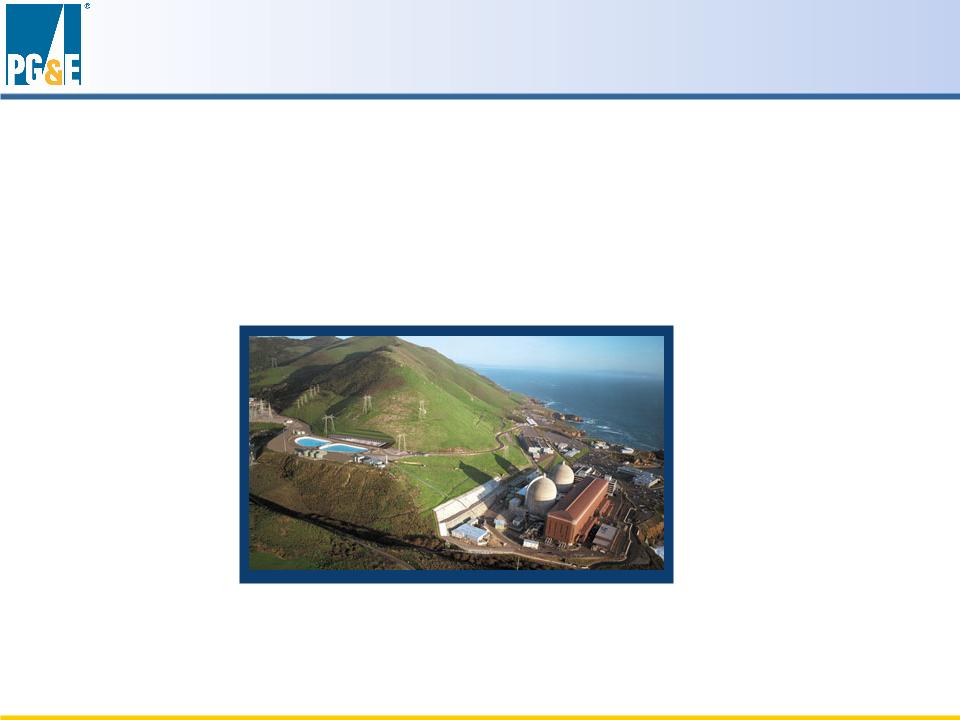
Diablo Canyon Steam Generator Replacement
• $700 Million approved capital investment
• Unit 2 replacement completed in 69 days in 2008
• Unit 1 replacement began January 25, 2009

23
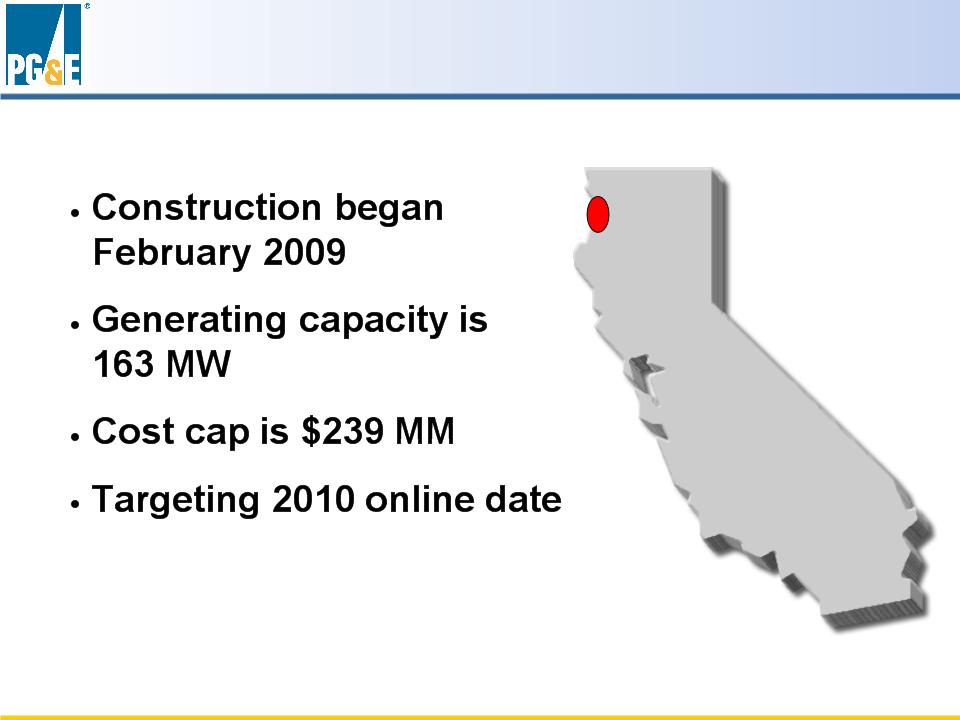
Colusa
Colusa Generating Station
24
Humboldt
Humboldt Bay Project
25
Category | 2009 | 2010 | 2011 |
System Expansion/Congestion Relief | $230M | $400M | $590M |
Maintenance and Replacement | $280M | $290M | $310M |
Automation Technology Expansion | $70M | $90M | $110M |
New Generation Interconnection | $20M | $20M | $40M |
Total | $600M | $800M | $1050M |
Transmission Investments
*All numbers are approximate
26
• $1.2 - $1.5 Billion annual investment
• Infrastructure main spend categories:
• Substations
• Poles and Maintenance
• New Customer Connects
• Capacity and Reliability
Distribution Investments
27
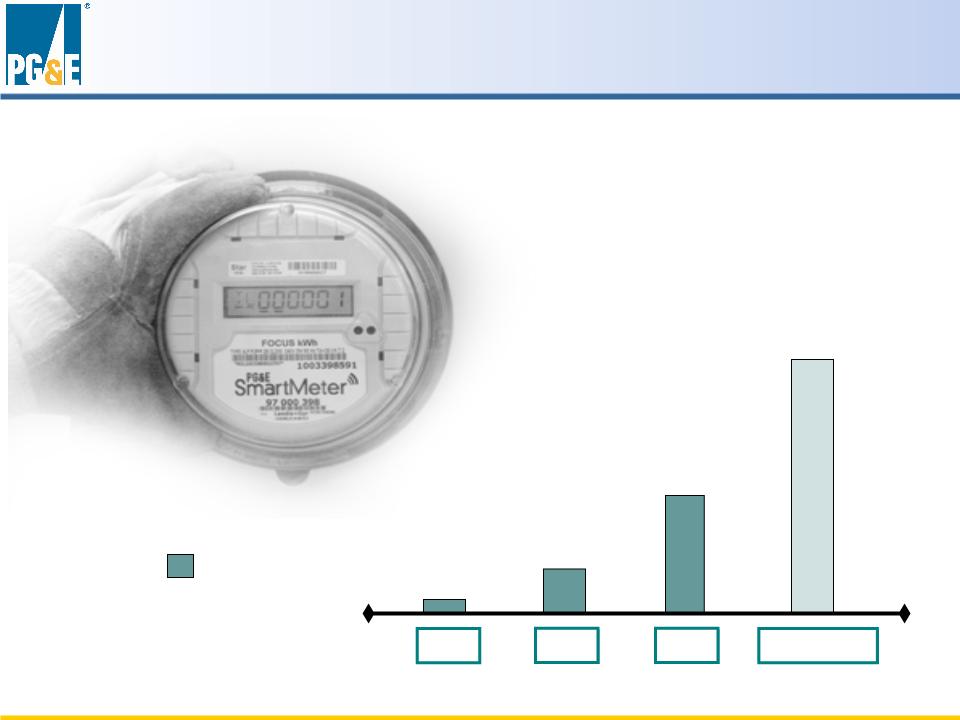
SmartMeterTM
Cumulative Meters Installed
Cumulative Meters Installed
1.7 million
1.7 million
1,656
1,656
2006
273,000
273,000
2007
2008
2009 PLAN
4.5 million
4.5 million
• Installation of meters continues
• Awaiting CPUC approval for Upgrade

28
PCG Investment Case
• PCG is focused on better service to our customers,
which is the foundation of our growth:
which is the foundation of our growth:
• Substantial CapEx Program
• Manageable financing requirements
• Decoupled revenues
• Pass-through of procurement costs
• 11.45% weighted ROE on 52% equity
• Low carbon footprint

* Earnings per share from operations is a non-GAAP measure. This non-GAAP measure is used because it allows
investors to compare the core underlying financial performance from one period to another, exclusive of items that do not
reflect the normal course of operations.
investors to compare the core underlying financial performance from one period to another, exclusive of items that do not
reflect the normal course of operations.
** Items impacting comparability reconcile earnings from operations with consolidated net income as reported in accordance
with GAAP. For the three and twelve months ended December 31, 2008, PG&E Corporation recognized $257 million of
net income resulting from a settlement of tax audits for tax years 2001 through 2004. Of this amount, $154 million was
related to PG&E Corporation’s former subsidiary, National Energy & Gas Transmission, Inc., and was recorded as income
from discontinued operations
EPS on an Earnings from Operations Basis* | $2.95 |
Items Impacting Comparability** | 0.68 |
EPS on a GAAP Basis | $3.63 |
2008
30
2008 EPS - Reg G Reconciliation
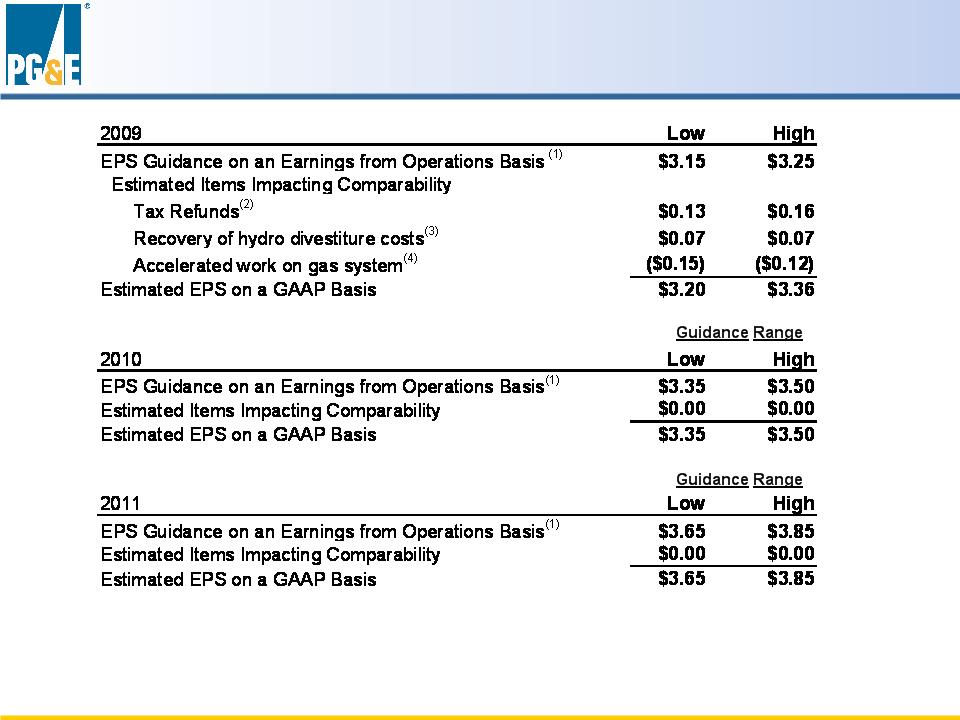
(1) Earnings per share from operations is a non-GAAP measure. This non-GAAP measure is used because it allows investors to compare the core underlying financial performance from one period to another, exclusive of items that do not reflect the normal course of operations. (2) Tentative agreement to resolve federal tax refund claims related to tax years 1998 and 1999. (3) Anticipated recovery of costs incurred in connection with efforts to determine the market value of hydroelectric generation facilities. (4) Forecasted cost to accelerate the performance of system-wide gas integrity surveys and remedial work. |
Guidance Range
Reg G reconciliation also provided on the PG&E Corporation website: www.pge-corp.com
31
EPS Guidance - Reg G Reconciliation