Banc of America Merrill Lynch Commercial Mortgage
Filed: 29 Jan 13, 12:00am
| FREE WRITING PROSPECTUS | ||
| FILED PURSUANT TO RULE 433 | ||
| REGISTRATION FILE NO.: 333-177707-01 | ||
 |  |
BofA MERRILL LYNCH | MORGAN STANLEY |
Co-Lead Bookrunning Manager | Co-Lead Bookrunning Manager |
| This is not a research report and was not prepared by the BofA Merrill Lynch or Morgan Stanley research departments. It was prepared by BofA Merrill Lynch and Morgan Stanley sales, trading, banking or other non-research personnel. This Term Sheet was not intended or written to be used, and it cannot be used by any taxpayer, for the purpose of avoiding penalties that may be imposed on the taxpayer under U.S. federal tax laws. Each taxpayer should seek advice based on the taxpayer’s particular circumstances from an independent tax advisor. Please see additional important information and qualifications at the end of this Term Sheet. |
This is not a research report and was not prepared by the Morgan Stanley or BofA Merrill Lynch research departments. It was prepared by Morgan Stanley and BofA Merrill Lynch sales, trading, banking or other non-research personnel. This Term Sheet was not intended or written to be used, and it cannot be used by any taxpayer, for the purpose of avoiding penalties that may be imposed on the taxpayer under U.S. federal tax laws. Each taxpayer should seek advice based on the taxpayer’s particular circumstances from an independent tax advisor. Please see additional important information and qualifications at the end of this Term Sheet. |
| MSBAM 2013-C8 | Issue Characteristics |
| Class | Expect Ratings (Fitch/KBRA/S&P)(1) | Approximate Initial Certificate Balance or Notional Amount(2)(3) | Approximate Initial Credit Support(4) | Pass-Through Rate Description(5) | Expected Weighted Average Life (Years)(6) | Principal Window (Months)(6) | Certificate Principal UW NOI Debt Yield(7) | Certificate Principal to Value Ratio(8) | ||||||
| Class A-1 | AAA(sf)/AAA(sf)/AAA(sf) | $75,700,000 | 30.000% | Fixed | 2.69 | 1-59 | 17.1% | 40.0% | ||||||
| Class A-2 | AAA(sf)/AAA(sf)/AAA(sf) | $145,900,000 | 30.000% | Fixed | 4.95 | 59-60 | 17.1% | 40.0% | ||||||
| Class A-SB | AAA(sf)/AAA(sf)/AAA(sf) | $98,964,000 | 30.000% | Fixed | 7.32 | 60-116 | 17.1% | 40.0% | ||||||
| Class A-3 | AAA(sf)/AAA(sf)/AAA(sf) | $140,000,000 | 30.000% | Fixed | 9.71 | 116-117 | 17.1% | 40.0% | ||||||
| Class A-4 | AAA(sf)/AAA(sf)/AAA(sf) | $335,996,000 | 30.000% | Fixed | 9.83 | 117-119 | 17.1% | 40.0% | ||||||
| Class X-A | AAA(sf)/AAA(sf)/AAA(sf) | $904,665,000 | NAP | Variable(10) | NAP | NAP | NAP | NAP | ||||||
Class A-S(9) | AAA(sf)/AAA(sf)/AAA(sf) | $108,105,000 | 20.500% | (5) | 9.90 | 119-119 | 15.1% | 45.5% | ||||||
Class B(9) | AA-(sf)/AA-(sf)/AA-(sf) | $68,276,000 | 14.500% | (5) | 9.92 | 119-120 | 14.0% | 48.9% | ||||||
Class PST(9) | A-(sf)/A-(sf)/A-(sf) | $219,054,000 | 10.750% | (5) | 9.98 | 119-120 | 13.4% | 51.1% | ||||||
Class C(9) | A-(sf)/A-(sf)/A-(sf) | $42,673,000 | 10.750% | (5) | 9.98 | 120-120 | 13.4% | 51.1% |
| Class | Expect Ratings (Fitch/KBRA/S&P)(1) | Approximate Initial Certificate Balance or Notional Amount(2)(3) | Approximate Initial Credit Support(4) | Pass-Through Rate Description(5) | Expected Weighted Average Life (Years)(6) | Principal Window (Months)(6) | Certificate Principal UW NOI Debt Yield(7) | Certificate Principal to Value Ratio(8) | ||||||
| Class X-B | AA-(sf)/AAA(sf)/AA-(sf) | $68,276,000 | NAP | Variable(10) | NAP | NAP | NAP | NAP | ||||||
| Class D | BBB-(sf)/BBB-(sf)/BBB-(sf) | $48,363,000 | 6.500% | (5) | 9.98 | 120-120 | 12.8% | 53.5% | ||||||
| Class E | BB(sf)/BB(sf)/BB(sf) | $19,914,000 | 4.750% | (5) | 9.98 | 120-120 | 12.6% | 54.5% | ||||||
| Class F | B(sf)/B+(sf)/BB-(sf) | $12,802,000 | 3.625% | (5) | 9.98 | 120-120 | 12.5% | 55.1% | ||||||
| Class G | NR/NR/B(sf) | $21,336,000 | 1.750% | (5) | 9.98 | 120-120 | 12.2% | 56.2% | ||||||
| Class H | NR/NR/NR | $19,914,694 | 0.000% | (5) | 9.98 | 120-120 | 12.0% | 57.2% |
| (1) | Ratings shown are those of Fitch, Inc., Kroll Bond Rating Agency, Inc. and Standard & Poor’s Ratings Services, a Standard & Poor’s Financial Services LLC Business. Certain nationally recognized statistical rating organizations that were not hired by the depositor may use information they receive pursuant to Rule 17g-5 under the Securities Exchange Act of 1934, as amended, or otherwise to rate the certificates. There can be no assurance as to what ratings a non-hired nationally recognized statistical rating organization would assign. See “RISK FACTORS—Risks Related to the Offered Certificates—Ratings of the Offered Certificates Do Not Represent Any Assessment of the Yield to Maturity That a Certificateholder May Experience and Such Ratings May Be Reviewed, Revised, Suspended, Downgraded, Qualified or Withdrawn By the Applicable Rating Agency” and “RATINGS” in the other free writing prospectus, dated January 29, 2013 (the “Free Writing Prospectus”) to which the prospectus dated January 29, 2013 (the “Prospectus”) is attached as Exhibit A. Capitalized terms used but not defined herein have the meanings assigned to such terms in the Free Writing Prospectus. |
| (2) | The certificate principal balances and notional amounts are approximate and on the closing date may vary by up to 5%. Mortgage loans may be removed from or added to the mortgage pool prior to the closing date within the same maximum permitted variance. Any reduction or increase in the aggregate principal balance of mortgage loans within these parameters will result in changes to the initial certificate principal balance or notional amount of each class of certificates and to the other statistical data contained herein and in the Free Writing Prospectus. |
| (3) | The Class X-A and Class X-B Certificates will not have certificate principal balances and will not be entitled to receive distributions of principal. Interest will accrue on the Class X-A and Class X-B Certificates at their respective pass-through rates based upon their respective notional amounts. The notional amount of the Class X-A Certificates will equal the aggregate certificate principal balance of the Class A-1, Class A-2, Class A-SB, Class A-3, Class A-4 and Class A-S Certificates outstanding from time to time (without regard to any exchange of Class A-S, Class B and Class C Certificates for Class PST Certificates). The notional amount of the Class X-B Certificates will equal the certificate principal balance of the Class B Certificates outstanding from time to time (without regard to any exchange of Class A-S, Class B and Class C Certificates for Class PST Certificates). |
| (4) | The percentages indicated under the column “Approximate Initial Credit Support” with respect to the Class A-1, Class A-2, Class A-SB, Class A-3 and Class A-4 Certificates represent the approximate credit support for the Class A-1, Class A-2, Class A-SB, Class A-3 and Class A-4 Certificates in the aggregate. The percentage indicated under the column “Approximate Initial Credit Support” with respect to the Class C Certificates and the Class PST Certificates represents the approximate credit support for the Class C trust component which will have an initial outstanding certificate balance on the closing date of $42,673,000. |
| (5) | The Class A-1, Class A-2, Class A-SB, Class A-3, Class A-4, Class A-S, Class B, Class C, Class D, Class E, Class F, Class G and Class H Certificates will, at all times, accrue interest at a per annum rate equal to (i) a fixed rate, (ii) a fixed rate subject to a cap equal to the weighted average of the net interest rates on the mortgage loans (in each case adjusted, if necessary, to accrue on the basis of a 360-day year consisting of twelve (12) 30-day months) or (iii) a rate equal to the weighted average of the net interest rates on the mortgage loans (in each case adjusted, if necessary, to accrue on the basis of a 360-day year consisting of twelve (12) 30-day months) less a specified percentage, which percentage may be zero. The Class PST Certificates will not have a pass-through rate, but will be entitled to receive the sum of the interest distributable on the Class PST Components. The pass-through rate for the Class A-S Certificates, the Class A-S trust component and the Class PST Component A-S will, at all times, be the same. The pass-through rate for the Class B Certificates, the Class B trust component and the Class PST Component B will, at all times, be the same. The pass-through rate for the Class C Certificates, the Class C trust component and the Class PST Component C will, at all times, be the same. |
| (6) | The principal window is expressed in months following the closing date and reflects the period during which distributions of principal would be received under the assumptions set forth in the following sentence. The expected weighted average life and principal window figures set forth above are based on the following assumptions, among others: (i) no defaults or subsequent losses on the mortgage loans; (ii) no extensions of maturity dates of mortgage loans that do not have “anticipated repayment dates”; (iii) payment in full on the stated maturity date or, in the case of each mortgage loan having an anticipated repayment date, on the anticipated repayment date; and (iv) no prepayments of the mortgage loans prior to maturity or, in the case of a mortgage loan having an anticipated repayment date, prior to such anticipated repayment date. See the structuring assumptions set forth under “YIELD, PREPAYMENT AND MATURITY CONSIDERATIONS—Weighted Average Life” in the Free Writing Prospectus. |
This is not a research report and was not prepared by the BofA Merrill Lynch or Morgan Stanley research departments. Please see additional important information and qualifications at the end of this Term Sheet. |
| MSBAM 2013-C8 | Issue Characteristics |
| (7) | Certificate Principal UW NOI Debt Yield for any class of principal balance certificates (other than the Exchangeable Certificates) is calculated as the product of (a) the weighted average UW NOI Debt Yield for the mortgage pool, multiplied by (b) a fraction, the numerator of which is the total initial principal balance of all the principal balance certificates (other than the Exchangeable Certificates) and the trust components, and the denominator of which is the total initial principal balance of the subject class of principal balance certificates and all other classes of principal balance certificates (other than the Exchangeable Certificates and the trust components), if any, that are senior to such class. The Certificate Principal UW NOI Debt Yields of the Class A-1, Class A-2, Class A-SB, Class A-3 and Class A-4 Certificates are calculated in the aggregate for those classes as if they were a single class. Certificate Principal UW NOI Debt Yield for the Class A-S, Class B and Class C Certificates is calculated as the product of (a) the weighted average UW NOI Debt Yield for the mortgage pool, multiplied by (b) a fraction, the numerator of which is the total initial principal balance of all the principal balance certificates (other than the Exchangeable Certificates) and the trust components, and the denominator of which is the total initial principal balance of the Class A-S trust component, the Class B trust component or the Class C trust component, as applicable, and all other classes of principal balance certificates (other than the Exchangeable Certificates) and the trust components that are senior to such class. The Certificate Principal UW NOI Debt Yield of the Class PST Certificates is equal to the Certificate Principal UW NOI Debt Yield for the Class C Certificates. |
| (8) | Certificate Principal to Value Ratio for any class of principal balance certificates (other than the Exchangeable Certificates) is calculated as the product of (a) the weighted average Cut-off Date LTV Ratio of the mortgage pool, multiplied by (b) a fraction, the numerator of which is the total initial principal balance of the subject class of principal balance certificates and all other classes of principal balance certificates (other than the Exchangeable Certificates) and the trust components, if any, that are senior to such class, and the denominator of which is the total initial principal balance of all the principal balance certificates (other than the Exchangeable Certificates) and the trust components. The Certificate Principal to Value Ratios of the Class A-1, Class A-2, Class A-SB, Class A-3 and Class A-4 Certificates are calculated in the aggregate for those classes as if they were a single class. Certificate Principal to Value Ratio for the Class A-S, Class B and Class C Certificates is calculated as the product of (a) the weighted average Cut-off Date LTV Ratio of the mortgage pool, multiplied by (b) a fraction, the numerator of which is the total initial principal balance of the Class A-S trust component, the Class B trust component or the Class C trust component, as applicable, and all other classes of principal balance certificates (other than the Exchangeable Certificates) and the trust components that are senior to such class, and denominator of which is the total initial principal balance of all the principal balance certificates (other than the Exchangeable Certificates) and the trust components. The Certificate Principal to Value Ratio of the Class PST Certificates is equal to the Certificate Principal to Value Ratio of the Class C Certificates. |
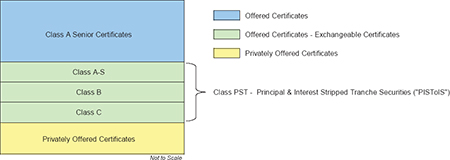
| (9) | The Class A-S, Class B, Class PST and Class C Certificates are “Exchangeable Certificates”. On the closing date, the upper-tier REMIC of the issuing entity will issue the Class A-S, Class B and Class C trust components (each a “trust component”) which will have outstanding principal balances on the closing dates of $108,105,000, $68,276,000 and $42,673,000, respectively. The trust components will be held in a grantor trust for the benefit of the holders of the Class A-S, Class B, Class PST and Class C Certificates. The Class A-S, Class B, Class PST and Class C Certificates will, at all times, represent undivided beneficial ownership interests in a grantor trust that will hold those trust components. Each class of the Class A-S, Class B and Class C Certificates will, at all times, represent an undivided beneficial ownership interest in a percentage of the outstanding certificate principal balance of the trust component with the same alphabetical class designation. The Class PST Certificates will, at all times, represent an undivided beneficial ownership interest in the remaining percentages of the outstanding certificate principal balances of the Class A-S, Class B and Class C trust components and which portions of those trust components are referred to in this Term Sheet as the Class PST Component A-S, Class PST Component B and Class PST Component C (collectively, the “Class PST Components”). Following any exchange of Class A-S, Class B and Class C Certificates for Class PST Certificates or any exchange of Class PST Certificates for Class A-S, Class B and Class C Certificates as described in the Free Writing Prospectus, the percentage interest of the outstanding certificate principal balances of the Class A-S, Class B and Class C trust component that is represented by the Class A-S, Class B, Class PST and Class C Certificates will be increased or decreased accordingly. The initial certificate principal balance of each of the Class A-S, Class B and Class C Certificates shown in the table represents the maximum certificate principal balance of such class without giving effect to any exchange. The initial certificate principal balance of the Class PST Certificates is equal to the aggregate of the initial certificate principal balance of the Class A-S, Class B and Class C Certificates and represents the maximum certificate principal balance of the Class PST Certificates that could be issued in an exchange. The certificate principal balances of the Class A-S, Class B and Class C Certificates to be issued on the closing date will be reduced, in required proportions, by an amount equal to the certificate principal balance of the Class PST Certificates issued on the closing date. Distributions and allocations of payments and losses with respect to the Exchangeable Certificates are described in this Term Sheet under “Allocations and Distributions on the Class A-S, Class B, Class PST and Class C Certificates” and under “DESCRIPTION OF THE OFFERED CERTIFICATES—Distributions” in the Free Writing Prospectus. The maximum certificate principal balance of the Class PST Certificates is set forth in the table but is not included in the certificate principal balance of the certificates set forth on the cover page of this Term Sheet or on the top of the cover page of the Free Writing Prospectus. |
| (10) | The pass-through rate on the Class X-A Certificates will generally be equal to the excess, if any, of (a) the weighted average of the net interest rates on the mortgage loans (in each case adjusted, if necessary, to accrue on the basis of a 360-day year consisting of twelve (12) 30-day months), over (b) the weighted average of the pass-through rates of the Class A-1, Class A-2, Class A-SB, Class A-3, Class A-4 and Class A-S Certificates (without regard to any exchange of Class A-S, Class B and Class C Certificates for Class PST Certificates) as described in the Free Writing Prospectus. The pass-through rate on the Class X-B Certificates will generally be equal to the excess, if any, of (a) the weighted average of the net interest rates on the mortgage loans (in each case adjusted, if necessary, to accrue on the basis of a 360-day year consisting of twelve (12) 30-day months), over (b) the pass-through rate of the Class B Certificates (without regard to any exchange of Class A-S, Class B and Class C Certificates for Class PST Certificates) as described in the Free Writing Prospectus. |
| (11) | Not offered pursuant to the Prospectus, the Free Writing Prospectus or this Term Sheet. Information provided in this Term Sheet regarding the characteristics of these certificates is provided only to enhance your understanding of the offered certificates. The privately offered certificates also include the Class R Certificates, which do not have a certificate principal balance, notional amount, pass-through rate, rating or rated final distribution date, and which are not shown in the chart. |
This is not a research report and was not prepared by the BofA Merrill Lynch or Morgan Stanley research departments. Please see additional important information and qualifications at the end of this Term Sheet. |
| MSBAM 2013-C8 | Issue Characteristics |
| Offered Certificates: | $1,015,614,000 (approximate) monthly pay, multi-class, commercial mortgage pass-through certificates, consisting of nine principal balance classes (Class A-1, Class A-2, Class A-SB, Class A-3, Class A-4, Class A-S, Class B, Class PST and Class C Certificates) and one interest only class (Class X-A Certificates), offered pursuant to a registration statement filed with the SEC (File Number 333-177707) |
| Co-Lead Bookrunning Managers: | Merrill Lynch, Pierce, Fenner & Smith Incorporated and Morgan Stanley & Co. LLC |
| Mortgage Loan Sellers: | Bank of America, National Association and Morgan Stanley Mortgage Capital Holdings LLC |
| Rating Agencies: | Fitch, Inc., Kroll Bond Rating Agency, Inc. and Standard & Poor’s Ratings Services, a Standard & Poor’s Financial Services LLC business |
| Master Servicer: | Wells Fargo Bank, National Association |
| Special Servicer: | NS Servicing II LLC |
| Trustee: | U.S. Bank National Association |
| Certificate Administrator/ Certificate Registrar/ Custodian: | Wells Fargo Bank, National Association |
| Trust Advisor: | Situs Holdings, LLC |
| Initial Controlling Class Representative: | Northstar Realty Finance Corp. |
| Cut-off Date: | February 1, 2013. For purposes of the information contained in this term sheet (this “Term Sheet”), scheduled payments due in February 2013 with respect to mortgage loans not having payment dates on the first day of each month have been deemed received on February 1, 2013, not the actual day on which such scheduled payments were due. |
| Expected Pricing Date: | Week of February 1, 2013 |
| Expected Closing Date: | On or about February 21, 2013 |
| Determination Dates: | The 11th calendar day of each month (if the 11th calendar day is not a business day, the next succeeding business day), commencing in March 2013 |
| Distribution Dates: | The 4th business day following the Determination Date in each month, commencing in March 2013 |
| Rated Final Distribution Date: | The Distribution Date in December 2048 |
| Interest Accrual Period: | Preceding calendar month |
| Payment Structure: | Sequential pay |
| Tax Treatment: | REMIC, except that the Class A-S, Class B, Class PST and Class C Certificates will evidence an interest in a grantor trust |
| Optional Termination: | 1.00% clean-up call |
| Minimum Denominations: | $10,000 for each class of Offered Certificates (other than Class X-A) and integral multiples of $1 in excess of $10,000. The Class X-A Certificates will be initially offered and sold in minimum denominations of $100,000 and integral multiples of $1 in excess of $100,000 |
| Settlement Terms: | DTC, Euroclear and Clearstream |
| Legal/Regulatory Status: | Each Class of Offered Certificates is expected to be eligible for exemptive relief under ERISA. No class of certificates is SMMEA eligible. |
| Analytics: | The certificate administrator is expected to make available all distribution date statements, CREFC reports and supplemental notices received by it to certain modeling financial services (i.e., BlackRock Financial Management, Inc., Bloomberg, L.P., Intex Solutions, Inc., Markit, CMBS.com, Inc. and Trepp, LLC). |
| Bloomberg Ticker: | MSBAM 2013-C8 <MTGE><GO> |
| Risk Factors: | THE CERTIFICATES INVOLVE CERTAIN RISKS AND MAY NOT BE SUITABLE FOR ALL INVESTORS. SEE THE “RISK FACTORS” SECTION OF THE FREE WRITING PROSPECTUS AND THE “RISK FACTORS” SECTION OF THE PROSPECTUS. |
This is not a research report and was not prepared by the BofA Merrill Lynch or Morgan Stanley research departments. Please see additional important information and qualifications at the end of this Term Sheet. |
| MSBAM 2013-C8 | Structural Overview |
| Accrual: | Each class of Offered Certificates will accrue interest on a 30/360 basis. |
| Amount and Order of Distributions: | On each distribution date, certificateholders will be entitled to receive distributions of interest and principal from funds received with respect to the mortgage loans and available for distribution. Funds available for distribution on the certificates will be net of excess interest, excess liquidation proceeds and specified trust expenses, including all advance reimbursements (with interest) and all servicing fees and expenses, certificate administrator fees (including trustee fees and custodian fees) and expenses, and trust advisor fees and expenses as set forth below. Distributions to certificateholders on each distribution date will be in an amount equal to the interest and principal entitlement of each class, subject to: (i) payment of the respective interest entitlement for any other class of certificates bearing an earlier alphanumeric designation (except (x) in respect of the distribution of interest among the Class A-1, Class A-2, Class A-SB, Class A-3, Class A-4, Class X-A and Class X-B Certificates, which will have the same senior priority and be distributed pro rata and (y) in respect of the distribution of interest among the Class A-S, Class B, Class PST and Class C Certificates as described below under “Allocations and Distributions on the Class A-S, Class B, Class PST and Class C Certificates”); (ii) if applicable, payment of the respective principal entitlement for the distribution date to the outstanding classes of principal balance certificate, first, to the Class A-SB Certificates, until the principal balance of such class has been reduced to the planned principal balance for the related distribution date set forth on Appendix VII to the Free Writing Prospectus, then, to the Class A-1, Class A-2, Class A-3, Class A-4 and Class A-SB Certificates, in that order, until the principal balance of each such class has been reduced to zero (and, if the principal balance of each class of principal balance certificates other than the Class A-1, Class A-2, Class A-SB, Class A-3 and Class A-4 Certificates has been reduced to zero as a result of the allocation of mortgage loan losses or trust advisor expenses to those certificates, or if the aggregate appraisal reduction equals or exceeds the aggregate principal balance of the Class A-S through Class H Certificates (including the Class PST Certificates), then on a pro rata basis among the holders of the Class A-1, Class A-2, Class A-SB, Class A-3 and Class A-4 Certificates), then, to the Class A-S, Class B, Class PST and Class C Certificates as described below under “Allocations and Distributions on the Class A-S, Class B, Class PST and Class C Certificates” until the principal balance of each such class has been reduced to zero, and then to the Class D, Class E, Class F, Class G and Class H Certificates, in that order, until the principal balance of each such class has been reduced to zero; and (iii) the allocation of trust advisor expenses, (a) first, to reduce payments of interest on the Class D Certificates, the Class C trust component and the Class B trust component in that order, (b) second, to reduce payments of principal on the Class D Certificates, the Class C trust component, the Class B trust component and the Class A-S trust component in that order, and (c) third, to reduce payments of principal on the Class A-1, Class A-2, Class A-SB, Class A-3 and Class A-4 Certificates on a pro rata basis. No trust advisor expenses (other than the trust advisor fee) will be allocated to or otherwise borne by the Control Eligible Certificates. As a result, none of the classes of Control Eligible Certificates will provide protection to the more senior classes of certificates for the purposes of allocating losses based on trust advisor expenses. Trust advisor expenses allocated to the Class A-S trust component, the Class B trust component and the Class C trust component will be allocated to the Class A-S, Class B, Class PST and Class C Certificates as described below under “Allocations and Distributions on the Class A-S, Class B, Class PST and Class C Certificates”. |
| Interest and Principal Entitlements: | Interest distributable on any class of certificates (other than the Exchangeable Certificates and the Class R Certificates) or trust component on any distribution date, with various adjustments described under “DESCRIPTION OF THE OFFERED CERTIFICATES—Distributions” in the Free Writing Prospectus, represents all unpaid interest accrued with respect to that class of certificates or trust component through the end of the interest accrual period that corresponds to that distribution date. Interest accrues with respect to the interest-bearing certificates and the trust components (and correspondingly on the Exchangeable Certificates) on the basis of a 360-day year consisting of twelve (12) 30-day months. Interest accrues with respect to each interest-bearing certificate and each trust component during each interest accrual period at the applicable pass-through rate for, and on the principal balance or notional amount, as applicable, of that certificate or trust component outstanding immediately prior to, the distribution date that corresponds to that interest accrual period. However, as described in “DESCRIPTION OF THE OFFERED CERTIFICATES—Distributions” in the Free Writing Prospectus, there are circumstances relating to the timing of prepayments in which the interest entitlement with respect to any certificate or trust component for a distribution date could be less than one full month’s interest at the pass-through rate on the certificate’s or trust component’s principal balance or notional amount. In addition, the right of the master servicer, the special servicer and the trustee to reimbursement for payment of advances (with interest thereon), and the rights of such parties and of the certificate administrator, the custodian and, subject to certain limitations, the trust advisor to the payments of compensation and reimbursement of certain costs and expenses will be prior to a certificateholder’s right to receive distributions of principal or interest. In addition, the right of the trust advisor to receive reimbursement of trust advisor expenses will be prior to the right of the holders of the Class B, Class PST, Class C and Class D Certificates to receive payments of interest, and to the holders of the Class A-1, Class A-2, Class A-SB, Class A-3, Class A-4, Class A-S, Class B, Class PST, Class C, Class D and Class E Certificates to receive payments of principal. The amount of principal available to be distributed on the classes entitled to principal on a particular |
This is not a research report and was not prepared by the BofA Merrill Lynch or Morgan Stanley research departments. Please see additional important information and qualifications at the end of this Term Sheet. |
| MSBAM 2013-C8 | Structural Overview |
| distribution date will, in general, be equal to the sum of: (i) the principal portion of all scheduled payments, other than balloon payments, to the extent received during the related collection period or advanced by the master servicer or other party (in accordance with the pooling and servicing agreement) in respect of such distribution date; (ii) all principal prepayments and the principal portion of balloon payments received during the related collection period; (iii) the principal portion of other collections on the mortgage loans received during the related collection period, for example liquidation proceeds, condemnation proceeds, insurance proceeds and income on other “real estate owned” (“REO”); and (iv) the principal portion of proceeds of mortgage loan repurchases received during the related collection period; subject, to certain adjustments described in the Free Writing Prospectus relating to the payment or reimbursement of nonrecoverable advances, workout-delayed reimbursement amounts and trust advisor expenses, and exclusive of any late collections of principal received during the related collection period for which there is an outstanding advance. The Class R, Class X-A and Class X-B Certificates will not be entitled to principal distributions. | |
| Allocations and Distributions on the Class A-S, Class B, Class PST and Class C Certificates: | On the closing date, the upper-tier REMIC of the issuing entity will issue the Class A-S, Class B and Class C trust components (each a “trust component”) which will have outstanding principal balances on the closing date of $108,105,000, $68,276,000 and $42,673,000, respectively. The trust components will be held in a grantor trust for the benefit of the holders of the Class A-S, Class B, Class PST and Class C Certificates. The Class A-S, Class B, Class PST and Class C Certificates will, at all times, represent undivided beneficial ownership interests in a grantor trust that will hold those trust components. Each class of the Class A-S, Class B and Class C Certificates will, at all times, represent an undivided beneficial ownership interest in a percentage of the outstanding principal balance of the trust component with the same alphabetical class designation. The Class PST Certificates will, at all times, represent an undivided beneficial ownership interest in the remaining percentages of the outstanding principal balances of the Class A-S, Class B and Class C trust components and which percentage interests are referred to in this Term Sheet as the “Class PST Component A-S, Class PST Component B and Class PST Component C” (collectively, the “Class PST Components”). Interest, principal, prepayment premiums, yield maintenance charges and voting rights that are allocated to the Class A-S, Class B or Class C trust component will be distributed or allocated, as applicable, as between the Class A-S, Class B or Class C Certificates, as applicable, on the one hand, and Class PST Component A-S, Class PST Component B or Class PST Component C, as applicable (and correspondingly, the Class PST Certificates), on the other hand, pro rata, based on their respective percentage interests in the Class A-S, Class B or Class C trust component, as applicable. In addition, any losses (including, without limitation, as a result of trust advisor expenses) or collateral support deficit that are allocated to the Class A-S, Class B or Class C trust component will correspondingly be allocated as between the Class A-S, Class B or Class C Certificates, as applicable, on the one hand, and Class PST Component A-S, Class PST Component B or Class PST Component C, as applicable (and correspondingly, the Class PST Certificates), on the other hand, pro rata, based on their respective percentage interests in the Class A-S, Class B or Class C trust component, as applicable. For a complete description of the allocations and distributions with respect to the Class A-S trust component, the Class B trust component and the Class C trust component (and correspondingly the Class A-S, Class B, Class PST and Class C Certificates and the Class PST Component A-S, Class PST Component B and Class PST Component C), see “DESCRIPTION OF THE OFFERED CERTIFICATES” in the Free Writing Prospectus. See “MATERIAL FEDERAL INCOME TAX CONSEQUENCES” in the Free Writing Prospectus for a discussion of the tax treatment of the Exchangeable Certificates. |
| Exchanging Certificates through Combination and Recombination: | If you own Class A-S, Class B and Class C Certificates, you will be able to exchange them for a proportionate interest in the Class PST Certificates, and vice versa, as described in the Free Writing Prospectus. You can exchange your Exchangeable Certificates by notifying the certificate administrator. If Exchangeable Certificates are outstanding and held by certificateholders, those certificates will receive principal and interest that would otherwise have been payable on the same proportion of certificates exchanged therefor if those certificates were outstanding and held by certificateholders. Any such allocations of principal and interest as between classes of Exchangeable Certificates will have no effect on the principal or interest entitlements of any other class of certificates. The Free Writing Prospectus describes the available combinations of Exchangeable Certificates eligible for exchange. |
| Servicing and Administration Fees: | The master servicer and special servicer are entitled to a master servicing fee and a special servicing fee, respectively, payable from general collections on the mortgage loans. The master servicing fee for each distribution date is calculated based on the outstanding principal balance of each mortgage loan and REO mortgage loan at the master servicing fee rate, which will be 0.02% per annum for each mortgage loan (other than any non-serviced mortgage loan for which the master servicing fee rate will be 0.01% per annum). The special servicing fee for each distribution date is calculated based on the outstanding principal balance of each mortgage loan that is a specially serviced mortgage loan or as to which the related mortgaged property has become an REO property at the special servicing fee rate, which will be approximately 0.25% per annum. Any primary servicing fee or sub-servicing fee will be paid by the master servicer or special servicer, as applicable, out of the fees described above. The master servicer and special servicer are also entitled to additional fees and amounts, including, without limitation, income on the amounts held in permitted investments. The special servicer will also be entitled to (i) liquidation fees generally equal to 1.0% of liquidation proceeds in respect of a specially serviced mortgage loan or REO property and (ii) workout fees generally equal to 1.0% of interest and principal payments made in respect of a rehabilitated mortgage loan, subject to a cap with respect to each such fee of $1,000,000 with respect to any mortgage loan or REO property and subject to certain adjustments and exceptions as described in the Free Writing Prospectus under “SERVICING OF THE MORTGAGE LOANS—The Special Servicer—Special Servicer Compensation”. The trust advisor will be entitled to the trust advisor fee for each distribution date, calculated based on the outstanding principal balance of each mortgage loan (other than any non-serviced mortgage loan) at the trust |
This is not a research report and was not prepared by the BofA Merrill Lynch or Morgan Stanley research departments. Please see additional important information and qualifications at the end of this Term Sheet. |
| MSBAM 2013-C8 | Structural Overview |
advisor fee rate, which will equal 0.00125% per annum. The certificate administrator fee for each distribution date is calculated on the outstanding principal balance of each mortgage loan at the certificate administrator fee rate, which will equal 0.0039% per annum. The certificate administrator fee is payable out of general collections on the mortgage loans. Each of the trustee fee and custodian fee for each distribution date is a portion of the certificate administrator fee. Each of the master servicing fee, the special servicing fee, the trust advisor fee and the certificate administrator fee will be calculated on the same interest accrual basis as is interest on the related mortgage loan and will be prorated for any partial period. The administrative fee rate will be the sum of the master servicing fee rate, the trust advisor fee rate and the certificate administrator fee rate, and is set forth for each mortgage loan on Appendix I to the Free Writing Prospectus. |
| Prepayment Premiums/Yield Maintenance Charges: | On any distribution date, prepayment premiums or yield maintenance charges collected in respect of each mortgage loan during the related collection period will be distributed by the certificate administrator on the classes of certificates or trust components as follows: to each class of principal balance certificates (other than the Class E, Class F, Class G and Class H Certificates) and, without duplication, the trust components then entitled to distributions of principal on such distribution date, an amount equal to the product of (a) a fraction, the numerator of which is the amount distributed as principal to that class or trust component on that distribution date, and the denominator of which is the total amount distributed as principal to all classes of principal balance certificates and, without duplication, trust components on that distribution date, (b) the Base Interest Fraction for the related principal prepayment and that class or trust component and (c) the amount of the prepayment premium or yield maintenance charge collected in respect of such principal prepayment during the one month period ending on the related determination date. Any prepayment premiums or yield maintenance charges relating to the mortgage loans collected during the related collection period and remaining after those distributions described above (as to the applicable distribution date, the “Class X YM Distribution Amount”) will be distributed to the holders of the Class X Certificates, as follows: first, to holders of the Class X-A Certificates in an amount equal to the product of (a) a fraction, the numerator of which is the total amount of principal distributed with respect to the Class A-1, Class A-2, Class A-SB, Class A-3 and Class A-4 Certificates and the Class A-S trust component on the applicable distribution date, and the denominator of which is the total principal distributed with respect to the principal balance certificates on the applicable distribution date, multiplied by (b) the Class X YM Distribution Amount for the applicable distribution date; and second, to the holders of the Class X-B Certificates in an amount equal to the portion of the Class X YM Distribution Amount remaining after the distributions to the holders of the Class X-A Certificates. Distributions of prepayment premiums and yield maintenance charges made on the Class A-S trust component, the Class B trust component and the Class C trust component will be distributed to the Class A-S, Class B and Class C Certificates and the Class PST Components (and correspondingly the Class PST Certificates) as described above in “Allocations and Distributions on the Class A-S, Class B, Class PST and Class C Certificates”. No prepayment premiums or yield maintenance charges will be distributed to holders of the Class E, Class F, Class G or Class H Certificates or the Class R Certificates. The “Base Interest Fraction”, with respect to any principal prepayment of any mortgage loan that provides for payment of a prepayment premium or yield maintenance charge, and with respect to any class of principal balance certificates (other than the Exchangeable Certificates) or trust component, is a fraction (A) whose numerator is the greater of (x) zero and (y) the difference between (i) the pass-through rate on that class of certificates or trust component, as applicable, and (ii) the applicable discount rate and (B) whose denominator is the difference between (i) the mortgage interest rate on the related mortgage loan and (ii) the applicable discount rate; provided, that under no circumstances will the Base Interest Fraction be greater than one. If the discount rate referred to above is greater than or equal to the mortgage interest rate on the related mortgage loan, then the Base Interest Fraction will equal zero; provided, however, that if the discount rate referred to above is greater than or equal to the mortgage interest rate on the related mortgage loan, but is less than the pass-through rate on the subject class of certificates or trust component, then the Base Interest Fraction will be equal to 1.0. Consistent with the foregoing, the Base Interest Fraction is equal to: |
| (Pass-Through Rate – Discount Rate) | |||
| (Mortgage Rate – Discount Rate) |
| Servicing Advances: | Other than with regard to any non-serviced mortgage loan and subject to a recoverability determination described in the Free Writing Prospectus, the master servicer and/or the trustee may make servicing advances to pay delinquent real estate taxes, insurance premiums and similar expenses necessary to protect, lease, manage and maintain the mortgaged property, to maintain the lien on the mortgaged property or to enforce the mortgage loan documents. In addition, the special servicer may, but is not required to, make servicing advances on an emergency basis. |
Collateral Support Deficits: | On each distribution date, immediately following the distributions made to the certificateholders on that date, the certificate administrator will be required to calculate the amount, if any, by which (1) the aggregate stated principal balance of the mortgage loans, including any mortgage loans as to which the related mortgaged properties have become REO properties, expected to be outstanding immediately following that distribution date, is less than (2) the aggregate principal balance of the principal balance certificates after giving effect to distributions of principal on that distribution date and the allocation of any excess trust advisor expenses to reduce the principal balances of the principal balance certificates that are not Control Eligible Certificates on that distribution date (any such deficit, a “Collateral Support Deficit”). On each distribution date, the certificate administrator will be required to allocate any Collateral Support Deficit |
This is not a research report and was not prepared by the BofA Merrill Lynch or Morgan Stanley research departments. Please see additional important information and qualifications at the end of this Term Sheet. |
| MSBAM 2013-C8 | Structural Overview |
| to the respective classes of principal balance certificates (other than the Exchangeable Certificates) and trust components in the following order: to the Class H Certificates, the Class G Certificates, the Class F Certificates, the Class E Certificates, the Class D Certificates, the Class C trust component, the Class B trust component, and the Class A-S trust component, in that order, in each case in respect of and until the remaining principal balance of that class of certificates or trust components has been reduced to zero. Following the reduction of the principal balances of all such classes of subordinate certificates to zero, the certificate administrator will be required to allocate the Collateral Support Deficit to the Class A-1, Class A-2, Class A-SB, Class A-3 and Class A-4 Certificates, pro rata (based upon their respective principal balances), until the remaining principal balances of those classes of certificates have been reduced to zero. Any Collateral Support Deficit allocated to a class of certificates will be allocated to the respective certificates of such class in proportion to the Percentage Interests evidenced by the respective certificates. Any Collateral Support Deficit allocated to the Class A-S, Class B and Class C trust components will, in turn, be allocated to the Class A-S, Class B, Class PST and Class C Certificates as described above in “Allocations and Distributions on the Class A-S, Class B, Class PST and Class C Certificates”. | |
| Appraisal Reductions: | The occurrence of certain adverse events affecting a mortgage loan (other than any non-serviced mortgage loan) (“Appraisal Events”) will require the special servicer to obtain a new appraisal or other valuation of the related mortgaged property. In general, if the principal amount of a mortgage loan plus all other amounts due under the mortgage loan and interest on advances made with respect to the mortgage loan exceeds 90% of the value of the mortgaged property determined by an appraisal or other valuation, an appraisal reduction may be created in the amount of the excess as described in the Free Writing Prospectus. Notwithstanding the foregoing, if an appraisal is required to be obtained in accordance with the pooling and servicing agreement but is not obtained within one hundred twenty (120) days following the applicable Appraisal Event, then, until such appraisal is obtained and solely for purposes of determining the amounts of P&I advances, the appraisal reduction will equal 25% of the stated principal balance of the related mortgage loan; provided that, upon receipt of an appraisal, the appraisal reduction for such mortgage loan will be recalculated generally in accordance with the preceding sentence. Notwithstanding the foregoing, any appraisal reduction in respect of any non-serviced mortgage loan generally will be calculated in accordance with the related non-serviced mortgage loan pooling and servicing agreement, which calculations are generally similar to those provided for in the pooling and servicing agreement for this transaction. The non-serviced mortgage loan included in this pool is the Chrysler East Building Mortgage Loan. If an appraisal reduction exists for any mortgage loan, the interest portion of the amount required to be advanced on that mortgage loan will be reduced in the same proportion that the appraisal reduction bears to the stated principal balance of that mortgage loan. This will reduce the funds available to pay interest on the certificates or trust components, as applicable, then outstanding. If any mortgage loan is part of an A/B whole loan or loan pair, any appraisal reduction will be calculated in respect of such A/B whole loan or loan pair taken as a whole. With respect to an A/B whole loan, any such appraisal reduction will be allocated first to the related B note and then to the related A note. With respect to a loan pair, any such appraisal reduction will be allocated between the mortgage loan and the related companion loan on a pro rata basis by unpaid principal balance. There are no mortgage loans that are part of an A/B whole loan included in this mortgage pool. The loan pair related to this mortgage pool is the Boston Park Plaza Loan Pair. For a discussion of how Appraisal Reductions are calculated and allocated, see “DESCRIPTION OF THE OFFERED CERTIFICATES—Appraisal Reductions” in the Free Writing Prospectus. |
| Loan Pairs: | The mortgaged property identified on Appendix I to the Free Writing Prospectus as Boston Park Plaza secures a mortgage loan (the “Boston Park Plaza Mortgage Loan”) with an outstanding principal balance as of the Cut–off Date of $95,000,000, representing approximately 8.3% of the initial pool balance, and is secured on a pari passu basis with a serviced companion loan that has an outstanding principal balance as of the Cut-off Date of $25,000,000 and is not part of the mortgage pool and is currently held by Bank of America, National Association. The Boston Park Plaza Mortgage Loan and the related serviced companion loan are pari passu in right of payment and collectively are referred to herein as the “Boston Park Plaza Loan Pair”. The Boston Park Plaza serviced companion loan may be sold or further divided at any time (subject to compliance with the terms of the related intercreditor agreement). The Boston Park Plaza Loan Pair will be serviced pursuant to the pooling and servicing agreement related to this transaction and the related intercreditor agreement. For additional information regarding the Boston Park Plaza Loan Pair, see “DESCRIPTION OF THE MORTGAGE POOL—The A/B Whole Loans and the Loan Pairs—The Boston Park Plaza Loan Pair” in the Free Writing Prospectus. |
| Non-Serviced Mortgage Loans: | The mortgaged property identified on APPENDIX I to the Free Writing Prospectus as the Chrysler East Building secures a mortgage loan (the “Chrysler East Building Mortgage Loan”) with an outstanding principal balance as of the Cut–off Date of $100,000,000, representing approximately 8.8% of the initial pool balance, and is secured on a pari passu basis with another mortgage loan (the “Chrysler East Building Non-Serviced Companion Loan”) that has an aggregate outstanding principal balance as of the Cut-off Date of $165,000,000 and is not part of the mortgage pool and is currently held by the Morgan Stanley Bank of America Merrill Lynch Trust 2013-C7. The Chrysler East Building Mortgage Loan and the Chrysler East Building Non-Serviced Companion Loan are pari passu in right of payment. The Chrysler East Building Mortgage Loan is a “non-serviced mortgage loan” and the Chrysler East Building Non-Serviced Companion Loan is a “non-serviced companion loan”. The Chrysler East Building Mortgage Loan and the Chrysler East Building Non-Serviced Companion Loan are currently being serviced pursuant to the pooling and servicing agreement related to the Morgan Stanley Bank |
This is not a research report and was not prepared by the BofA Merrill Lynch or Morgan Stanley research departments. Please see additional important information and qualifications at the end of this Term Sheet. |
| MSBAM 2013-C8 | Structural Overview |
| of America Merrill Lynch Trust 2013-C7 and the related intercreditor agreement. For additional information regarding the Chrysler East Building Mortgage Loan and the Chrysler East Building Non-Serviced Companion Loan, see “DESCRIPTION OF THE MORTGAGE POOL—Non-Serviced Mortgage Loans—The Chrysler East Building Mortgage Loan” in the Free Writing Prospectus. | |
| Control Rights: | Subject to the limitations described below under “A/B Whole Loan, Loan Pair and Non-Serviced Mortgage Loan Control Rights” in respect of any A/B whole loans, loan pairs or non-serviced mortgage loans, during any Subordinate Control Period, the controlling class representative will have certain consent and consultation rights under the pooling and servicing agreement with respect to certain major decisions and other matters (including with respect to the Boston Park Plaza Loan Pair) but not with respect to the Chrysler East Building Mortgage Loan and the Chrysler East Building Non-Serviced Companion Loan. A “Subordinate Control Period” means any period when the aggregate principal balance of the Class E Certificates (taking into account the application of appraisal reductions to notionally reduce the aggregate principal balance of such class) is at least 25% of the initial aggregate principal balance of that class. During any Collective Consultation Period, the controlling class representative will not have any consent rights, but the controlling class representative and the trust advisor will each have certain non-binding consultation rights under the pooling and servicing agreement with respect to certain major decisions and other matters. A “Collective Consultation Period” means any period when both (i) the aggregate principal balance of the Class E Certificates (taking into account the application of appraisal reductions to notionally reduce the aggregate principal balance of such class), is less than 25% of the initial aggregate principal balance of the Class E Certificates and (ii) the aggregate principal balance of that class (without regard to any appraisal reductions allocable to such class), is at least 25% of the initial aggregate principal balance of that class. During any Senior Consultation Period, the controlling class representative will not have any consent or consultation rights, except with respect to any rights expressly set forth in the pooling and servicing agreement, and the trust advisor will retain certain non-binding consultation rights under the pooling and servicing agreement with respect to certain major decisions and other matters. A “Senior Consultation Period” means a period when the aggregate principal balance of the Class E Certificates (without regard to any appraisal reductions allocable to such class) is less than 25% of the initial aggregate principal balance of that class. See “SERVICING OF THE MORTGAGE LOANS—The Controlling Class Representative” in the Free Writing Prospectus. |
A/B Whole Loan, Loan Pair and Non-Serviced Mortgage Loan Control Rights: | If any mortgage loan is part of an A/B whole loan or loan pair or is a non-serviced mortgage loan, the controlling class representative’s consent and/or consultation rights with respect thereto may be limited as described in the Free Writing Prospectus. There are no mortgage loans that are part of an A/B whole loan included in the mortgage pool. The controlling class representative under the pooling and servicing agreement related to the Morgan Stanley Bank of America Merrill Lynch Trust 2013-C7 will be the controlling holder of The Chrysler East Building Mortgage Loan and The Chrysler East Building Non-Serviced Companion Loan and, subject to the terms of that pooling and servicing agreement, will generally have consent rights with respect to certain major decisions and other matters related to The Chrysler East Building Mortgage Loan and The Chrysler East Building Non-Serviced Companion Loan. The controlling class representative under the pooling and servicing agreement for this transaction will only have certain consultation rights with respect to certain major decisions and other matters related to The Chrysler East Building Mortgage Loan and The Chrysler East Building Non-Serviced Companion Loan. The holder of the Boston Park Plaza serviced companion loan will have certain consultation rights under the pooling and servicing agreement with respect to certain major decisions and other matters related to the Boston Park Plaza Loan Pair. See “RISK FACTORS—Realization on a Mortgage Loan That Is Part of an A/B Whole Loan or Loan Pair May Be Adversely Affected by the Rights of the Related Directing Holder”, “DESCRIPTION OF THE MORTGAGE POOL —The A/B Whole Loans and the Loan Pairs” and “DESCRIPTION OF THE MORTGAGE POOL —Non-Serviced Mortgage Loans” in the Free Writing Prospectus. |
| Control Eligible Certificates: | The “Control Eligible Certificates” will be the Class E, Class F, Class G and Class H Certificates. |
| Controlling Class Representative/ Controlling Class: | The controlling class representative will be the representative appointed by more than 50% of the Controlling Class (by principal balance). The “Controlling Class” will be the most subordinate class of Control Eligible Certificates then outstanding that has an aggregate principal balance (taking into account the application of any appraisal reductions to notionally reduce the aggregate principal balance of such class) at least equal to 25% of the initial aggregate principal balance of such class; provided that if no class of Control Eligible Certificates has an aggregate principal balance (taking into account the application of any appraisal reductions to notionally reduce the aggregate principal balance of such class) at least equal to 25% of the initial aggregate principal balance of such class, then the Controlling Class will be the most senior class of Control Eligible Certificates. A summary of the consent and consultation rights of the controlling class representative, and the limitations thereon, is set forth above under “Control Rights”. The Controlling Class on the closing date will be the Class H Certificates. The initial controlling class representative will be Northstar Realty Finance Corp. |
| Appraised-Out Class: | Any class of Control Eligible Certificates, the aggregate principal balance of which (taking into account the application of any appraisal reductions to notionally reduce the aggregate principal balance of such class) has been reduced to less than 25% of its initial aggregate principal balance, is referred to as an “Appraised-Out |
This is not a research report and was not prepared by the BofA Merrill Lynch or Morgan Stanley research departments. Please see additional important information and qualifications at the end of this Term Sheet. |
| MSBAM 2013-C8 | Structural Overview |
| Class”. | |
| Appraisal Remedy: | The holders of the majority (by principal balance) of an Appraised-Out Class will have the right, at their sole expense, to present to the special servicer a second appraisal for any mortgage loan (generally other than with respect to any non-serviced mortgage loan) for which an Appraisal Event has occurred prepared by an MAI appraiser on an “as-is” basis acceptable to the special servicer in accordance with the Servicing Standard. Upon receipt of such second appraisal, the special servicer will be required to determine, in accordance with the Servicing Standard, whether, based on its assessment of such second appraisal, any recalculation of the applicable appraisal reduction is warranted and, if so warranted, will recalculate such appraisal reduction based upon such second appraisal. If required by any such recalculation, any applicable Appraised-Out Class will have its related principal balance notionally restored to the extent required by such recalculation of the appraisal reduction, and there will be a redetermination of whether a Subordinate Control Period, a Collective Consultation Period or a Senior Consultation Period is then in effect. However, until an Appraised-Out Class is restored as the Controlling Class, the next most senior class of Control Eligible Certificates that is not an Appraised-Out Class (or, if all classes of Control Eligible Certificates are Appraised-Out Classes, the most senior class of Control Eligible Certificates), if any, will be the Controlling Class. The right of any Appraised-Out Class to present a second appraisal of any mortgage loan for which an Appraisal Event has occurred is limited to one appraisal with respect to each mortgaged property relating to the affected mortgage loan, subject to certain exceptions regarding a material change in circumstance. |
| Sale of Defaulted Loans and REO Properties: | The special servicer will be required to solicit offers for defaulted mortgage loans and accept the first (and, if multiple bids are contemporaneously received, the highest) cash bid from any person that constitutes a fair price for the defaulted mortgage loan, determined as described in “SERVICING OF THE MORTGAGE LOANS—Sale of Defaulted Mortgage Loans and REO Properties—Sale of Defaulted Mortgage Loans” in the Free Writing Prospectus, unless the special servicer determines, in accordance with the Servicing Standard, that rejection of such offer would be in the best interests of the certificateholders (as a collective whole), subject to (i) with respect to any mortgage loan that is part of an A/B whole loan or loan pair or any non-serviced mortgage loan or any mortgage loan with existing mezzanine debt, to the extent set forth in the related intercreditor agreement, the right of the holder of the related debt held outside the issuing entity to purchase the related mortgage loan and (ii) any consent or consultation rights of the controlling class representative and/or, with respect to any mortgage loan that is part of an A/B whole loan or loan pair or any non-serviced mortgage loan, the holder of the related B note, companion loan or non-serviced companion loan, respectively, to the extent set forth in the related intercreditor agreement. See “DESCRIPTION OF THE MORTGAGE POOL—The A/B Whole Loans and the Loan Pairs” and “DESCRIPTION OF THE MORTGAGE POOL—Non-Serviced Mortgage Loans” in the Free Writing Prospectus. If title to any REO property is acquired by the issuing entity in respect of any specially serviced mortgage loan, the special servicer is required to use its reasonable best efforts to sell the REO property for cash as soon as practicable consistent with the requirement to maximize proceeds for all certificateholders (and, with respect to a serviced companion loan or a B note, for the certificateholders and the holders of such loans, as a collective whole) but in no event later than three (3) years after the end of the year in which it was acquired, and in any event prior to the rated final distribution date or earlier to the extent necessary to comply with REMIC provisions, unless (i) the trustee or the special servicer has been granted an extension of time by the IRS or is permitted under the REMIC provisions to continue to hold such REO property during the period in which an application for an extension is pending or (ii) the special servicer receives an opinion of counsel that holding such REO property beyond the period specified above will not result in the imposition of taxes on “prohibited transactions” under the REMIC provisions or cause any REMIC to fail to qualify as a REMIC; provided, that in no event may the issuing entity hold any REO property beyond the end of the sixth (6th) calendar year following the end of the year of such REO property’s acquisition. If the special servicer is unable to sell such REO property for cash within such time period (as it may be extended as described above), the special servicer will be required, after consultation with the controlling class representative during any Subordinate Control Period and any Collective Consultation Period and, in the case of a sale of any REO property relating to an A/B whole loan or loan pair, the related directing holder to the extent set forth in the related intercreditor agreement, to auction the REO property to the highest bidder (which may be the special servicer or another Interested Person) in accordance with the Servicing Standard. See “SERVICING OF THE MORTGAGE LOANS—Sale of Defaulted Mortgage Loans and REO Properties—Sale of REO Properties” and “DESCRIPTION OF THE MORTGAGE POOL—The A/B Whole Loans and the Loan Pairs” in the Free Writing Prospectus. |
| Appointment and Termination of Special Servicer Without Cause: | The controlling class representative will appoint the initial special servicer. During any Subordinate Control Period, the special servicer may be replaced at any time by the controlling class representative. During any Collective Consultation Period and any Senior Consultation Period, the special servicer will be subject to termination without cause if certificateholders evidencing not less than 25% of voting rights request a vote of certificateholders to replace the special servicer. The certificate administrator would present the proposal to all certificateholders and replacement would be conditioned on receipt, within one hundred eighty (180) days thereafter, of approval of the termination from holders of 75% of the voting rights of the certificates. The holders initiating such vote will be responsible for the fees and expenses of the issuing entity in connection with the replacement. During any Senior Consultation Period, if the trust advisor determines that the special servicer is not performing its duties in accordance with the Servicing Standard, the trust advisor will have the right to recommend the replacement of the special servicer. The trust advisor’s recommendation to replace the special servicer must be confirmed by an affirmative vote of holders of a majority of the voting rights of the principal balance certificates. |
This is not a research report and was not prepared by the BofA Merrill Lynch or Morgan Stanley research departments. Please see additional important information and qualifications at the end of this Term Sheet. |
| MSBAM 2013-C8 | Structural Overview |
For purposes of the voting rights described above, the Class A-S, Class B, Class PST and Class C Certificates will be allocated voting rights in accordance with their respective percentage interests in the applicable Class A-S, Class B and Class C trust components as described in the Free Writing Prospectus. In addition, if any mortgage loan is part of an A/B whole loan or loan pair or is a non-serviced mortgage loan, to the extent set forth in the related intercreditor agreement, the related directing holder may have the right to replace the special servicer, with respect to the related A/B whole loan or loan pair or non-serviced mortgage loan to the extent set forth in the related intercreditor agreement. See “DESCRIPTION OF THE MORTGAGE POOL—The A/B Whole Loans and the Loan Pairs” and “DESCRIPTION OF THE MORTGAGE POOL—Non-Serviced Mortgage Loans” in the Free Writing Prospectus. There are no mortgage loans that are part of an A/B whole loan included in the mortgage pool. | |
| Servicing Standard: | Each of the master servicer and the special servicer is obligated to service and administer the mortgage loans (and, if applicable, the related B notes and serviced companion loans but not any non-serviced mortgage loans) for which it is responsible pursuant to the pooling and servicing agreement on behalf of the issuing entity and in the best interests of and for the benefit of the certificateholders (and, with respect to any mortgage loan that is part of an A/B whole loan or loan pair, the holder of the related B note or serviced companion loan, as applicable) as a collective whole (as determined by the master servicer or the special servicer, as the case may be, in its good faith and reasonable judgment), in accordance with applicable law, the terms of the pooling and servicing agreement, the terms of the respective mortgage loans and, if applicable, any related intercreditor agreement and, to the extent consistent with the foregoing, further as follows. |
| ● | With the same care, skill and diligence as is normal and usual in its general mortgage servicing and REO property management activities on behalf of third parties or on behalf of itself, whichever is higher, with respect to mortgage loans and REO properties that are comparable to those for which it is responsible under the pooling and servicing agreement; | |
| ● | With a view to the timely collection of all scheduled payments of principal and interest under the mortgage loans and any related B note or serviced companion loan or, if a mortgage loan or the related B note or serviced companion loan comes into and continues in default and with respect to the special servicer, if, in the good faith and reasonable judgment of the special servicer, no satisfactory arrangements can be made for the collection of the delinquent payments, the maximization of the recovery of principal and interest on such mortgage loan to the certificateholders (as a collective whole) (or in the case of any A/B whole loan or loan pair, the maximization of recovery thereon of principal and interest to the certificateholders and the holder of the related B note (taking into account the subordinate nature of any such B note) or serviced companion loan, as applicable, all taken as a collective whole) on a net present value basis; and | |
| ● | Without regard to various specified circumstances that could give rise to conflicts of interest. |
Defaulted Mortgage Loan Waterfall: | Amounts received by the issuing entity in respect of defaulted mortgage loans in connection with liquidation of any mortgage loan, net of unreimbursed advances and interest thereon, servicing compensation, and other amounts payable or reimbursable therefrom, will be applied so that amounts allocated as a recovery of accrued and unpaid interest will not, in the first instance, include any amount by which the interest portion of P&I advances previously made was reduced as a result of appraisal reductions. After the adjusted interest amount is so allocated, any remaining net proceeds will be allocated to pay principal on the mortgage loan until the unpaid principal amount of the mortgage loan has been reduced to zero. Any remaining proceeds would then be allocated as a recovery of accrued and unpaid interest corresponding to the amount by which the interest portion of P&I advances previously made was reduced as a result of appraisal reductions. |
| Trust Advisor: | Situs Holdings, LLC, a Delaware limited liability company, will act as the trust advisor. The trust advisor will be required to promptly review all information available to certain privileged persons on the certificate administrator’s website related to any specially serviced mortgage loan or REO property and each asset status report with respect to specially serviced mortgage loans (provided that during any Subordinate Control Period, the trust advisor may only review final asset status reports). During any Collective Consultation Period and any Senior Consultation Period, within sixty (60) days after the end of each calendar year during which any mortgage loan was a specially serviced mortgage loan or any mortgaged property was an REO property, the trust advisor will be required to meet with representatives of the special servicer to review certain operational practices of the special servicer related to specially serviced mortgage loans and REO properties. In addition, during any Collective Consultation Period and any Senior Consultation Period, based on (i) the trust advisor’s annual meeting with the special servicer and (ii) the trust advisor’s review of any asset status reports and other information delivered to the trust advisor by the special servicer and any other information available to certain privileged persons on the certificate administrator’s website, the trust advisor will be required to prepare an annual report to be provided to the certificate administrator (and to be made available through the certificate administrator’s website) setting forth its assessment of the special servicer’s performance of its duties under the pooling and servicing agreement during the prior calendar year on a platform-level basis with respect to the resolution and liquidation of specially serviced mortgage loans and REO properties. No such annual report will be required to be prepared or delivered with respect to any calendar year during which no annual meeting has occurred or any calendar year during which no asset status reports have been prepared in connection with a specially serviced mortgage loan or REO property. Furthermore, during any Collective Consultation Period and any Senior Consultation Period, the special |
This is not a research report and was not prepared by the BofA Merrill Lynch or Morgan Stanley research departments. Please see additional important information and qualifications at the end of this Term Sheet. |
| MSBAM 2013-C8 | Structural Overview |
servicer will be required to consult (on a non-binding basis) the trust advisor in connection with certain major decisions involving any serviced mortgage loan, A/B whole loan, loan pair or any related REO property to the extent described in this Term Sheet, the Free Writing Prospectus and the pooling and servicing agreement; provided that, with respect to matters relating to any A/B whole loan, loan pair or any serviced mortgage loan, the special servicer will only be required to consult the trust advisor with regard to such matters after the holder of the related B note or serviced companion loan, as applicable, is no longer the directing holder with respect to such A/B whole loan or loan pair pursuant to the terms of the applicable intercreditor agreement. The Trust Advisor will have no consultation rights with respect to any non-serviced mortgage loan or any related non-serviced companion loan. During any Subordinate Control Period, there will be no annual meeting or annual report, the trust advisor will not be permitted to consult or consent with regard to any particular servicing actions, and the trust advisor will not distribute any report based on its review or otherwise opine on the activities of the special servicer with respect to any transaction. | |
| Trust Advisor Expenses: | The trust advisor will be entitled, on each distribution date, to reimbursement for any trust advisor expenses, including unreimbursed indemnification amounts and other expenses (other than trust advisor fees) payable to the trust advisor pursuant to the terms of the pooling and servicing agreement. No trust advisor expenses will be allocated to or otherwise borne by the Control Eligible Certificates, and all trust advisor expenses will be allocated to reduce amounts due and owing to certain classes of the non-Control Eligible Certificates as described in the Free Writing Prospectus and above in this Term Sheet. |
| Termination and Replacement of Trust Advisor: | If the holders of at least 25% of the voting rights of the certificates request a vote to terminate and/or replace the trust advisor, then the holders of at least 75% of the voting rights of the certificates may either (i) terminate all rights and obligations of the trust advisor under the pooling and servicing agreement and replace the trust advisor, or (ii) terminate all rights and obligations of the trust advisor and not appoint a replacement trust advisor, until such time as the holders of at least 75% of the voting rights of the certificates agree to the appointment of a replacement trust advisor. During any Subordinate Control Period and any Collective Consultation Period, the controlling class representative will have the right to consent, such consent not to be unreasonably withheld, to any replacement trust advisor; provided, that such consent will be deemed granted if no objection is made within ten business days following the controlling class representative’s receipt of the request for consent. Any such consent will be required to be solicited from the controlling class representative before any related vote. For purposes of the voting rights described above, the Class A-S, Class B, Class PST, and Class C Certificates will be allocated voting rights in accordance with their respective percentage interests in the applicable Class A-S, Class B and Class C trust components as described in the Free Writing Prospectus. See “SERVICING OF THE MORTGAGE LOANS—The Trust Advisor—Termination of the Trust Advisor Without Cause” in the Free Writing Prospectus. |
| Deal Website: | The certificate administrator will be required to maintain a deal website which will include, among other items, (i) distribution date statements, (ii) CREFC reports, (iii) summaries of final asset status reports, (iv) inspection reports, (v) appraisals, (vi) various special notices described in the Free Writing Prospectus, (vii) the “Investor Q&A Forum” and (viii) a voluntary “Investor Registry”. Investors may access the deal website following execution of an investor certification as described in the Free Writing Prospectus. |
This is not a research report and was not prepared by the BofA Merrill Lynch or Morgan Stanley research departments. Please see additional important information and qualifications at the end of this Term Sheet. |
| MSBAM 2013-C8 | Collateral Overview |
| Mortgage Loan Sellers | No. of Mortgage Loans | No. of Mortgaged Properties | Aggregate Cut-off Date Balance | % of Pool(1) | |||
| Bank of America, National Association | 44 | 51 | $828,812,884 | 72.8% | |||
| Morgan Stanley Mortgage Capital Holdings LLC | 10 | 11 | $309,130,811 | 27.2% | |||
| Total: | 54 | 62 | $1,137,943,695 | 100.0% |
| Aggregate Cut-off Date Balance: | $1,137,943,695 |
| Number of Mortgage Loans: | 54 |
| Average Cut-off Date Balance per Mortgage Loan: | $21,073,031 |
| Number of Mortgaged Properties: | 62 |
| Average Cut-off Date Balance per Mortgaged Property: | $18,353,931 |
| Weighted Average Mortgage Rate: | 4.197% |
| % of Pool Secured by Five Largest Mortgage Loans: | 39.3% |
| % of Pool Secured by Ten Largest Mortgage Loans: | 59.5% |
| % of Pool Secured by ARD Loans: | 0.0% |
| Weighted Average Original Term to Maturity (months): | 111 |
| Weighted Average Remaining Term to Maturity (months): | 110 |
| Weighted Average Seasoning (months): | 1 |
| % of Pool Secured by Single Tenant Mortgaged Properties: | 1.0% |
% of Pool with Pari Passu Mortgage Debt: | 17.1% |
| % of Pool with Subordinate Mortgage Debt: | 6.7% |
| % of Pool with Mezzanine Debt: | 13.7% |
| Weighted Average UW NOI DSCR: | 2.19x |
| Weighted Average UW NOI Debt Yield: | 12.0% |
| Weighted Average UW NCF DSCR: | 2.00x |
| Weighted Average UW NCF Debt Yield: | 10.8% |
| Weighted Average Cut-off Date LTV Ratio: | 57.2% |
| Weighted Average LTV Ratio at Maturity: | 48.7% |
| (1) | Unless otherwise indicated, all references to “% of Pool” in this Term Sheet reflect a percentage of the aggregate principal balance of the mortgage pool as of the Cut-off Date, after application of all payments of principal due during or prior to February 2013. |
| (2) | With respect to the Chrysler East Building Mortgage Loan and the Boston Park Plaza Mortgage Loan, unless otherwise indicated, all LTV, DSCR, Debt Yield and Cut-off Date Balance PSF/Room calculations include the related pari passu companion loan. With respect to the Wanamaker Building Mortgage Loan, unless otherwise indicated, all LTV, DSCR, Debt Yield and Cut-off Date Balance PSF/Room calculations do not include the related subordinate secured indebtedness. |
This is not a research report and was not prepared by the BofA Merrill Lynch or Morgan Stanley research departments. Please see additional important information and qualifications at the end of this Term Sheet. |
| MSBAM 2013-C8 | Collateral Overview |
| Amortization | |
| Weighted Average Original Amortization Term (months): | 353 |
| Weighted Average Remaining Amortization Term (months): | 352 |
| % of Pool Amortizing Balloon: | 61.0% |
| % of Pool Fully Amortizing: | 0.0% |
| % of Pool Interest Only followed by Amortizing Balloon: | 19.8% |
| % of Pool Interest Only through Maturity: | 19.2% |
| % of Pool with Hard Lockboxes: | 76.2% |
| % of Pool with Soft Lockboxes: | 12.2% |
| % of Pool with Springing Lockboxes: | 7.9% |
| % of Pool with No Lockboxes: | 3.8% |
| % of Pool Requiring Tax Reserves: | 83.3% |
| % of Pool Requiring Insurance Reserves: | 15.0% |
| % of Pool Requiring Replacement Reserves: | 73.9% |
% of Pool Requiring TI/LC Reserves(1): | 39.9% |
| % of Pool with lockout period, followed by defeasance until open period: | 67.9% |
| % of Pool with lockout period, followed by the greater of a prepayment premium and yield maintenance until open period: | 13.9% |
| % of Pool with the greater of a prepayment premium and yield maintenance, followed by defeasance or the greater of a prepayment premium and yield maintenance until open period: | 8.8% |
| % of Pool with greater of a prepayment premium or yield maintenance until open period: | 8.3% |
| % of Pool with lockout period, followed by the greater of a prepayment premium and yield maintenance, followed by defeasance or the greater of a prepayment premium and yield maintenance until open period: | 1.0% |
| (1) | Based only on mortgage loans secured by retail, office, mixed use and industrial properties. |
This is not a research report and was not prepared by the BofA Merrill Lynch or Morgan Stanley research departments. Please see additional important information and qualifications at the end of this Term Sheet. |
| MSBAM 2013-C8 | Characteristics of the Mortgage Loans |
| Top 10 Mortgage Loans | ||||||||||||||||||||||||||
Loan No. | Mortgage Loan Seller | Property Name | City | State | Property Type | Cut-off Date Balance | % of Pool | SF/Rooms | Cut-off Date Balance PSF/Room | UW NCF DSCR | UW NOI Debt Yield | Cut-off Date LTV Ratio | LTV Ratio at Maturity | |||||||||||||
| 1 | BANA | The Crossings Premium Outlets | Tannersville | PA | Retail | $115,000,000 | 10.1% | 411,223 | 280 | 2.26x | 12.8% | 47.9% | 40.9% | |||||||||||||
| 2 | MSMCH | Chrysler East Building(1) | New York | NY | Office | $100,000,000 | 8.8% | 745,201 | 356 | 1.99x | 9.1% | 54.1% | 54.1% | |||||||||||||
| 3 | BANA | Boston Park Plaza(2) | Boston | MA | Hospitality | $95,000,000 | 8.3% | 941 | 127,524 | 1.98x | 14.1% | 45.5% | 41.6% | |||||||||||||
| 4 | MSMCH | Wanamaker Building | Philadelphia | PA | Office | $76,500,000 | 6.7% | 965,577 | 79 | 1.91x | 13.4% | 56.3% | 44.5% | |||||||||||||
| 5 | MSMCH | Hyatt Regency Hill Country Resort and Spa | San Antonio | TX | Hospitality | $61,000,000 | 5.4% | 500 | 122,000 | 1.48x | 13.1% | 45.9% | 43.4% | |||||||||||||
| 6 | BANA | Storage Post Portfolio | Various | NY | Self Storage | $54,400,000 | 4.8% | 478,620 | 114 | 3.13x | 12.0% | 45.7% | 45.7% | |||||||||||||
| 7 | BANA | Carolina Premium Outlets | Smithfield | NC | Retail | $50,346,450 | 4.4% | 439,009 | 115 | 3.04x | 17.2% | 41.1% | 32.1% | |||||||||||||
| 8 | BANA | Broadcasting Square Shopping Center | Wyomissing | PA | Retail | $50,000,000 | 4.4% | 487,330 | 103 | 3.50x | 14.1% | 50.3% | 50.3% | |||||||||||||
| 9 | BANA | Kingsgate Center | Lubbock | TX | Mixed Use | $38,949,222 | 3.4% | 240,749 | 162 | 1.49x | 9.4% | 74.9% | 59.9% | |||||||||||||
| 10 | BANA | Embassy Suites – Fort Lauderdale | Fort Lauderdale | FL | Hospitality | $36,336,958 | 3.2% | 361 | 100,656 | 1.74x | 13.1% | 58.6% | 48.4% | |||||||||||||
| Total / Wtd. Avg. | $677,532,631 | 59.5% | 2.22x | 12.7% | 50.9% | 45.5% | ||||||||||||||||||||
| (1) | The Chrysler East Building Mortgage Loan is a non-serviced mortgage loan that is part of a $265,000,000 pari passu loan combination evidenced by three pari passu promissory notes. The entire loan combination is serviced under the pooling and servicing agreement governing the MSBAM 2013-C7 securitization. Two such pari passu notes (Notes A-1 and A-3) with an aggregate outstanding principal balance as of the Cut-off Date of $165,000,000 evidence the related pari passu non-serviced companion loan and are not included in the Issuing Entity. The note that is included in the Issuing Entity (Note A-2) has an outstanding balance as of the Cut-Off Date of $100,000,000. Unless otherwise indicated, all LTV, DSCR, Debt Yield and Cut-off Date Balance PSF/Room calculations include the related pari passu companion loan. |
| (2) | The Boston Park Plaza Mortgage Loan is part of a $120,000,000 pari passu loan pair evidenced by two pari passu promissory notes. One such note (Note A-2) with an aggregate outstanding principal balance as of the Cut-off Date of $25,000,000 evidences the related pari passu Serviced Companion Loan and is not included in the Issuing Entity. The entire loan pair will be serviced under the pooling and servicing agreement for this transaction (MSBAM 2013-C8). The note that is included in the Issuing Entity (Note A-1) has an outstanding balance as of the Cut-off Date of $95,000,000. Unless otherwise indicated, all LTV, DSCR, Debt Yield and Cut-off Date Balance PSF/Room calculations include the related pari passu companion loan. |
| This is not a research report and was not prepared by the BofA Merrill Lynch or Morgan Stanley research departments. Please see additional important information and qualifications at the end of this Term Sheet. |
| MSBAM 2013-C8 | Characteristics of the Mortgage Loans |
Mortgage Loans with Pari Passu Companion Loans | ||||||||||||||||||||||||
Loan No. | Mortgage Loan Seller | Property Name | Mortgage Loan Cut-off Date Balance | Companion Loan Cut-off Date Balance | Loan Combination Cut-off Date Balance | Controlling Pooling & Servicing Agreement | Master Servicer | Special Servicer | Voting Rights | Total Debt UW NCF DSCR | Total Debt UW NOI Debt Yield | Total Debt Cut-off Date LTV Ratio | ||||||||||||
| 2 | MSMCH | Chrysler East Building(1) | $100,000,000 | $165,000,000 | $265,000,000 | MSBAM 2013-C7 | Midland | Midland | MSBAM 2013-C7 | 1.99x | 9.1% | 54.1% | ||||||||||||
| 3 | BANA | Boston Park Plaza(1) | $95,000,000 | $25,000,000 | $120,000,000 | MSBAM 2013-C8 | Wells Fargo | NS Servicing II LLC | MSBAM 2013-C8 | 1.44x | 11.2% | 56.8% | ||||||||||||
| Mortgage Loans with Subordinate Mortgage Debt | ||||||||||||||||||||||
Loan No. | Mortgage Loan Seller | Property Name | Mortgage Loan Cut-off Date Balance | Cut-off Date Balance PSF/Room | Subordinate Debt Cut-off Date Balance | UW NCF DSCR | UW NOI Debt Yield | Cut-off Date LTV Ratio | Total Debt UW NCF DSCR | Total Debt UW NOI Debt Yield | Total Debt Cut-off Date LTV Ratio | |||||||||||
| 4 | MSMCH | Wanamaker Building(2) | $76,500,000 | $79.23 | $6,873,221 | 1.91x | 13.4% | 56.3% | 1.43x | 12.3% | 61.3% | |||||||||||
| Mortgage Loans with Mezzanine Debt | ||||||||||||||||||||||
Loan No. | Mortgage Loan Seller | Property Name | Mortgage Loan Cut-off Date Balance | Cut-off Date Balance PSF/Room | Mezzanine Debt Cut-off Date Balance | UW NCF DSCR | UW NOI Debt Yield | Cut-off Date LTV Ratio | Total Debt UW NCF DSCR | Total Debt UW NOI Debt Yield | Total Debt Cut-off Date LTV Ratio | |||||||||||
| 3 | BANA | Boston Park Plaza(3) | $95,000,000 | $127,523.91 | $30,000,000 | 1.98x | 14.1% | 45.5% | 1.44x | 11.2% | 56.8% | |||||||||||
| 5 | MSMCH | Hyatt Regency Hill Country Resort and Spa(4) | $61,000,000 | $122,000.00 | $5,442,609 | 1.48x | 13.1% | 45.9% | 0.80x | 8.9% | 67.3% | |||||||||||
| (1) | With respect to the Chrysler East Building Mortgage Loan and the Boston Park Plaza Mortgage Loan, unless otherwise indicated, all LTV, DSCR, Debt Yield and Cut-off Date Balance PSF/Room calculations include the related pari passu companion loan. |
| (2) | With respect to the Wanamaker Building Mortgage Loan, unless otherwise indicated, all LTV, DSCR, Debt Yield and Cut-off Date Balance PSF/Room calculations do not include the related subordinate secured indebtedness. |
| (3) | With respect to the Boston Park Plaza Mortgage Loan, mezzanine financing in the amount of $30,000,000 is in place. The Boston Park Plaza Mezzanine Loan has a interest rate of LIBOR plus 7.75% per annum and a maturity date of February 1, 2018. |
| (4) | With respect to the Hyatt Regency Hill Country Resort and Spa Mortgage Loan, mezzanine financing in the current amount of $5,442,609 is in place. The mezzanine lender has committed to fund a total of $28,500,000 to finance a portion of budged renovation and expansion costs. This full funding is expected by the third quarter of 2013. There are no Total Debt UW NCF DSCR, NOI Debt Yield or LTV Ratio constraints on additional mezzanine loan fundings. The Total Debt UW NCF DSCR (based on payments of principal and interest), Total Debt UW NOI Debt Yield and Total Debt Cut-off Date LTV Ratio calculations above are based on the fully advanced mezzanine principal loan amount of $28,500,000. The Hyatt Regency Hill Country Resort and Spa Mezzanine Loan has a current interest rate of 12.25% per annum and a current maturity date of January 1, 2016. There are two, 12-month mezzanine loan extension options. The interest rate during the first extension option will be equal to the interest rate during the initial 3-year mezzanine loan term if the NCF debt yield equals or exceeds 11.0%. If not, the interest rate will adjust to 13.25% per annum. The interest rate during the second extension option will be equal to the interest rate during the first extension period if the NCF debt yield equals or exceeds 11.5%. If not, the interest rate will adjust by one percent over the interest rate during the first extension period. |
| This is not a research report and was not prepared by the BofA Merrill Lynch or Morgan Stanley research departments. Please see additional important information and qualifications at the end of this Term Sheet. |
| MSBAM 2013-C8 | Characteristics of the Mortgage Loans |
Prior Securitization History(1) | |||||||||||||||||||||||||||
Loan No. | Mortgage Loan Seller | Property Name | City | State | Property Type | Cut-off Date Balance | % of Pool | SF/Units/ Rooms/Pads | Loan PSF/Units/ Rooms/ Pads | UW NCF DSCR | UW NOI Debt Yield | Cut-off Date LTV Ratio | LTV Ratio at Maturity | Prior Securitization | |||||||||||||
| 1 | BANA | The Crossings Premium Outlets | Tannersville | PA | Retail | $115,000,000 | 10.1% | 411,223 | $280 | 2.26x | 12.8% | 47.9% | 40.9% | CSFB 2003-C3 | |||||||||||||
| 2 | MSMCH | Chrysler East Building(2) | New York | NY | Office | $100,000,000 | 8.8% | 745,201 | $356 | 1.99x | 9.1% | 54.1% | 54.1% | HVBMC 2003-FL1A | |||||||||||||
| 4 | MSMCH | Wanamaker Building | Philadelphia | PA | Office | $76,500,000 | 6.7% | 965,577 | $79 | 1.91x | 13.4% | 56.3% | 44.5% | CSFB 2003-C4 | |||||||||||||
| 6.2 | BANA | Storage Post - Bruckner(3) | Bronx | NY | Self Storage | $10,000,000 | 0.9% | 89,386 | $112 | NAV | NAV | 45.7% | 45.7% | LBUBS 2004-C6 | |||||||||||||
| 6.6 | BANA | Storage Post - New Rochelle(3) | New Rochelle | NY | Self Storage | $4,500,000 | 0.4% | 42,155 | $107 | NAV | NAV | 45.7% | 45.7% | LBUBS 2004-C6 | |||||||||||||
| 7 | BANA | Carolina Premium Outlets | Smithfield | NC | Retail | $50,346,450 | 4.4% | 439,009 | $115 | 3.04x | 17.2% | 41.1% | 32.1% | NASC 1998-D6; CSMC 2007-C3 | |||||||||||||
| 8 | BANA | Broadcasting Square Shopping Center | Wyomissing | PA | Retail | $50,000,000 | 4.4% | 487,330 | $103 | 3.50x | 14.1% | 50.3% | 50.3% | LBUBS 2003-C3 | |||||||||||||
| 11 | BANA | Fair Lakes Center | Fairfax | VA | Retail | $35,954,154 | 3.2% | 116,427 | $309 | 1.48x | 9.2% | 64.8% | 52.0% | BACM 2006-3 | |||||||||||||
| 14.1 | BANA | 2200 Whitney Avenue(3) | Hamden | CT | Office | $14,469,212 | 1.3% | 82,062 | $176 | NAV | NAV | 68.9% | 55.6% | MLCFC 2006-2 | |||||||||||||
| 14.2 | BANA | 2080 Whitney Avenue(3) | Hamden | CT | Office | $9,301,565 | 0.8% | 52,288 | $178 | NAV | NAV | 68.9% | 55.6% | GECMC 2001-1 | |||||||||||||
| 15 | MSMCH | 11451 Katy Freeway | Houston | TX | Office | $22,869,000 | 2.0% | 117,261 | $195 | 1.47x | 9.7% | 70.3% | 58.0% | LBUBS 2006-C1 | |||||||||||||
| 16 | BANA | Anderson Mall | Anderson | SC | Retail | $20,806,491 | 1.8% | 316,561 | $66 | 1.89x | 14.1% | 61.2% | 45.4% | JPMCC 2002-C3 | |||||||||||||
| 20 | BANA | 58-66 East Fordham Road | Bronx | NY | Retail | $14,500,000 | 1.3% | 25,001 | $580 | 1.41x | 8.2% | 71.4% | 57.0% | JPMCC 2003-C1 | |||||||||||||
| 27 | BANA | Lee’s Hill II | Fredericksburg | VA | Office | $11,160,871 | 1.0% | 152,254 | $73 | 1.60x | 11.4% | 74.9% | 60.2% | JPMCC 2005-CB12 | |||||||||||||
| 28 | BANA | Landmark Industrial Portfolio | West Palm Beach | FL | Industrial | $10,209,526 | 0.9% | 194,105 | $53 | 1.84x | 12.2% | 69.0% | 55.5% | MSDWC 2003- TOP9; PNCMA 2001-C1 | |||||||||||||
| 29 | BANA | North Loop Plaza | Austin | TX | Retail | $10,159,321 | 0.9% | 64,410 | $158 | 1.53x | 9.6% | 74.7% | 60.1% | MSDWC 2003-HQ2 | |||||||||||||
| 31 | BANA | Security Self Storage - Delray Beach, FL | Delray Beach | FL | Self Storage | $8,700,000 | 0.8% | 122,235 | $71 | 1.86x | 11.5% | 71.9% | 58.2% | GECMC 2003-C2 | |||||||||||||
| 32 | BANA | Terrace View Estates | Brooklyn | MD | Manufactured Housing | $8,339,229 | 0.7% | 162 | $51,477 | 1.50x | 8.8% | 73.2% | 58.6% | JPMCC 2003-C1 | |||||||||||||
| 33 | BANA | Shops at Fox River | Grand Chute | WI | Retail | $8,071,703 | 0.7% | 70,075 | $115 | 1.54x | 10.6% | 72.7% | 59.7% | JPMCC 2006-LDP8 | |||||||||||||
| 37 | BANA | Parham One Shopping Center | Richmond | VA | Retail | $6,600,000 | 0.6% | 79,085 | $83 | 1.44x | 11.2% | 68.8% | 53.5% | FUNBC 2000-C2 | |||||||||||||
| 39 | BANA | Anchor Self Storage | Paramount | CA | Self Storage | $6,483,773 | 0.6% | 119,722 | $54 | 1.93x | 11.8% | 59.8% | 48.2% | BACM 2004-3 | |||||||||||||
| 46 | BANA | Highland Commons | Austin | TX | Retail | $5,243,266 | 0.5% | 39,739 | $132 | 1.53x | 9.6% | 73.8% | 59.2% | GSMS 1996-PL | |||||||||||||
| 48 | BANA | Access Self Storage - Clark, NJ | Clark | NJ | Self Storage | $5,047,354 | 0.4% | 79,339 | $64 | 2.07x | 15.7% | 40.4% | 25.1% | JPMCC 2002-C2 | |||||||||||||
| 51 | BANA | Alden Village Estates MHC | Alden | NY | Manufactured Housing | $3,450,000 | 0.3% | 150 | $23,000 | 1.72x | 11.4% | 66.2% | 54.5% | FNA 2000-M2 | |||||||||||||
| 54 | BANA | Pioneer Village MHC | Horseheads | NY | Manufactured Housing | $2,167,542 | 0.2% | 87 | $24,914 | 1.53x | 9.8% | 74.0% | 60.5% | JPMCC 2002-C2; MSC 1997-HF1 | |||||||||||||
| Total / Wtd. Avg. | $609,879,457 | 53.6% | |||||||||||||||||||||||||
| (1) | Includes mortgaged properties securing mortgage loans for which the most recent prior financing of all or a significant portion of such property was included in a securitization. The table above describes the most recent securitization with respect to the mortgaged property securing the related mortgage loan, based on information provided by the related borrower or obtained through searches of a third-party database. The information has not otherwise been confirmed by the mortgage loan sellers. |
| (2) | With respect to the Chrysler East Building Mortgage Loan, unless otherwise indicated, all LTV, DSCR, Debt Yield and Cut-off Date Balance PSF/Room calculations include the related pari passu companion loan. |
| (3) | With respect to the Storage Post Portfolio and Hamden Medical Office Portfolio, all calculations are property specific and do not reflect the Storage Post Portfolio and Hamden Medical Office Portfolio as a whole. |
| This is not a research report and was not prepared by the BofA Merrill Lynch or Morgan Stanley research departments. Please see additional important information and qualifications at the end of this Term Sheet. |
| MSBAM 2013-C8 | Characteristics of the Mortgage Loans |
| Class A-2 ($145,900,000) | ||||||||||||||||||||||||||||||||
Loan No. | Mortgage Loan Seller | Property Name | State | Property Type | Cut-off Date Balance | % of Pool | Balance at Maturity | % of Class A-2 Certificate Principal Balance | SF/ Rooms | Cut-off Date Balance PSF/Room | UW NCF DSCR | UW NOI Debt Yield | Cut-off Date LTV Ratio | LTV Ratio at Maturity | Rem. IO Period (mos.) | Rem. Term to Maturity (mos.) | ||||||||||||||||
| 3 | BANA | Boston Park Plaza(2) | MA | Hospitality | $95,000,000 | 8.3% | $86,935,066 | 59.6% | 941 | $127,523.91 | 1.98x | 14.1% | 45.5% | 41.6% | 0 | 60 | ||||||||||||||||
| 5 | MSMCH | Hyatt Regency Hill Country Resort and Spa | TX | Hospitality | $61,000,000 | 5.4% | $57,764,274 | 39.6% | 500 | $122,000.00 | 1.48x | 13.1% | 45.9% | 43.4% | 11 | 59 | ||||||||||||||||
| Total / Wtd. Avg. | $156,000,000 | 13.7% | $144,699,340 | 99.2% | 1.78x | 13.7% | 45.7% | 42.3% | 4 | 60 | ||||||||||||||||||||||
| (1) | The table above reflects the mortgage loans whose balloon payments will be applied to pay down the Class A-2 Certificates, assuming (i) that none of the mortgage loans experience prepayments, defaults or losses; (ii) there are no extensions of maturity dates; and (iii) each mortgage loan is paid in full on its stated maturity date or, in the case of the mortgage loan with an anticipated repayment date, on such anticipated repayment date. The table above is otherwise based on the Structuring Assumptions set forth under “Yield, Prepayment and Maturity Considerations” in the Free Writing Prospectus. |
| (2) | With respect to the Boston Park Plaza Mortgage Loan, unless otherwise indicated, all LTV, DSCR, Debt Yield and Cut-off Date Balance PSF/Room calculations include the related pari passu companion loan. |
| This is not a research report and was not prepared by the BofA Merrill Lynch or Morgan Stanley research departments. Please see additional important information and qualifications at the end of this Term Sheet. |
| MSBAM 2013-C8 | Characteristics of the Mortgage Loans |
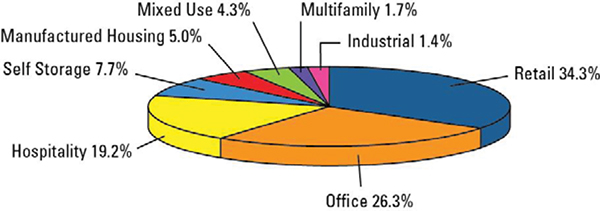
Property Type Distribution(1)(2) | ||||||||||||||||
| Property Type | Number of Mortgaged Properties | �� | Aggregate Cut-off Date Balance | % of Pool | Wtd. Avg. Mortgage Rate | Wtd. Avg. UW NCF DSCR | Wtd. Avg. UW NOI Debt Yield | Wtd. Avg. Cut-off Date LTV Ratio | Wtd. Avg. LTV Ratio at Maturity | |||||||
| Retail | 17 | $390,752,834 | 34.3% | 3.806% | 2.31x | 12.7% | 54.0% | 45.1% | ||||||||
| Anchored | 9 | $296,004,808 | 26.0% | 3.644% | 2.54x | 13.4% | 50.7% | 43.3% | ||||||||
| Shadow Anchored | 3 | $46,967,576 | 4.1% | 4.280% | 1.50x | 9.7% | 66.3% | 53.0% | ||||||||
| Regional Mall | 1 | $20,806,491 | 1.8% | 4.612% | 1.89x | 14.1% | 61.2% | 45.4% | ||||||||
| Unanchored | 2 | $15,998,226 | 1.4% | 4.108% | 1.39x | 8.2% | 69.3% | 55.4% | ||||||||
| Free-Standing | 2 | $10,975,733 | 1.0% | 4.200% | 1.70x | 10.1% | 56.9% | 45.8% | ||||||||
| Office | 11 | $298,994,354 | 26.3% | 4.171% | 1.76x | 10.5% | 61.8% | 53.7% | ||||||||
| CBD | 2 | $176,500,000 | 15.5% | 4.102% | 1.96x | 11.0% | 55.1% | 49.9% | ||||||||
| Suburban | 5 | $87,084,870 | 7.7% | 4.241% | 1.49x | 10.2% | 73.0% | 60.5% | ||||||||
| Medical | 4 | $35,409,484 | 3.1% | 4.345% | 1.44x | 9.4% | 68.2% | 55.9% | ||||||||
| Hospitality | 6 | $218,261,074 | 19.2% | 4.840% | 1.82x | 13.9% | 49.6% | 43.6% | ||||||||
| Full Service | 3 | $192,336,958 | 16.9% | 4.882% | 1.78x | 13.6% | 48.1% | 43.5% | ||||||||
| Limited Service | 3 | $25,924,116 | 2.3% | 4.527% | 2.12x | 16.1% | 60.3% | 44.4% | ||||||||
| Self Storage | 11 | $88,041,857 | 7.7% | 4.011% | 2.62x | 12.0% | 51.9% | 46.2% | ||||||||
| Manufactured Housing | 9 | $57,223,557 | 5.0% | 4.694% | 1.50x | 9.6% | 70.8% | 57.5% | ||||||||
| Mixed Use | 3 | $49,286,258 | 4.3% | 4.226% | 1.45x | 9.2% | 72.0% | 57.5% | ||||||||
| Office/Retail | 2 | $43,743,546 | 3.8% | 4.146 % | 1.46x | 9.2% | 72.1% | 57.7% | ||||||||
| Multifamily/Retail | 1 | $5,542,711 | 0.5% | 4.862% | 1.33x | 9.2% | 71.1% | 56.0% | ||||||||
| Multifamily | 3 | $19,794,090 | 1.7% | 4.410% | 1.56x | 10.4% | 74.2% | 57.9% | ||||||||
| Garden | 2 | $14,252,873 | 1.3% | 4.239% | 1.66x | 10.7% | 74.9% | 59.4% | ||||||||
| Student Housing | 1 | $5,541,217 | 0.5% | 4.850% | 1.32x | 9.5% | 72.4% | 54.1% | ||||||||
| Industrial Flex | 2 | $15,589,671 | 1.4% | 4.323% | 1.80x | 12.1% | 69.2% | 55.9% | ||||||||
| Total / Wtd. Avg. | 62 | $1,137,943,695 | 100.0% | 4.197% | 2.00x | 12.0% | 57.2% | 48.7% | ||||||||
| (1) | All numerical information concerning the mortgage loans is approximate. All weighted average information regarding the mortgage loans reflects the weighting of the mortgage loans based on their outstanding principal balances as of the Cut-off Date. State and Property Type tables reflect allocated loan amounts in the case of mortgage loans secured by multiple properties. The sum of numbers and percentages in columns may not match the “Total” due to rounding. Additionally, LTV ratios and DSCR are calculated for mortgage loans without regard to any additional indebtedness that may be incurred at a future date. |
| (2) | With respect to the Chrysler East Building Mortgage Loan and the Boston Park Plaza Mortgage Loan, unless otherwise indicated, all LTV, DSCR, Debt Yield and Cut-off Date Balance PSF/Room calculations include the related pari passu companion loan. With respect to the Wanamaker Building Mortgage Loan, unless otherwise indicated, all LTV, DSCR, Debt Yield and Cut-off Date Balance PSF/Room calculations do not include the related subordinate secured indebtedness. |
| This is not a research report and was not prepared by the BofA Merrill Lynch or Morgan Stanley research departments. Please see additional important information and qualifications at the end of this Term Sheet. |
| MSBAM 2013-C8 | Characteristics of the Mortgage Loans |
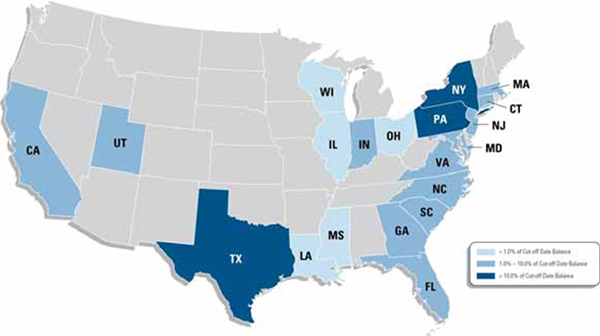
Geographic Distribution(1)(2) | ||||||||||||||||
| State | Number of Mortgaged Properties | Aggregate Cut-off Date Balance | % of Pool | Wtd. Avg. Mortgage Rate | Wtd. Avg. UW NCF DSCR | Wtd. Avg. UW NOI Debt Yield | Wtd. Avg. Cut-off Date LTV Ratio | Wtd. Avg. LTV Ratio at Maturity | ||||||||
| Pennsylvania | 3 | $241,500,000 | 21.2% | 3.603% | 2.41x | 13.3% | 51.1% | 44.0% | ||||||||
| New York | 12 | $187,087,634 | 16.4% | 4.186% | 2.23x | 9.9% | 54.7% | 52.3% | ||||||||
| Texas | 7 | $156,875,954 | 13.8% | 4.710% | 1.49x | 11.1% | 62.7% | 53.3% | ||||||||
| Massachusetts | 1 | $95,000,000 | 8.3% | 4.402% | 1.98x | 14.1% | 45.5% | 41.6% | ||||||||
| Virginia | 4 | $74,269,588 | 6.5% | 4.442% | 1.47x | 9.6% | 68.2% | 55.0% | ||||||||
| Florida | 5 | $65,016,075 | 5.7% | 4.730% | 1.75x | 12.4% | 63.8% | 52.0% | ||||||||
| North Carolina | 3 | $59,830,546 | 5.3% | 3.571% | 2.81x | 16.1% | 45.2% | 35.7% | ||||||||
| California | 5 | $53,946,596 | 4.7% | 4.386% | 1.61x | 10.9% | 70.3% | 56.2% | ||||||||
California – Southern(3) | 4 | $29,746,596 | 2.6% | 4.347% | 1.70x | 11.5% | 66.8% | 53.0% | ||||||||
California – Northern(3) | 1 | $24,200,000 | 2.1% | 4.435% | 1.50x | 10.2% | 74.5% | 60.2% | ||||||||
| New Jersey | 4 | $50,184,535 | 4.4% | 4.045% | 2.34x | 12.7% | 53.6% | 43.2% | ||||||||
| Connecticut | 4 | $30,063,327 | 2.6% | 4.402% | 1.38x | 9.0% | 64.8% | 52.3% | ||||||||
| South Carolina | 2 | $25,219,914 | 2.2% | 4.520% | 1.87x | 13.6% | 63.6% | 47.9% | ||||||||
| Utah | 1 | $18,184,068 | 1.6% | 4.100% | 1.69x | 11.9% | 56.3% | 41.0% | ||||||||
| Georgia | 3 | $16,813,278 | 1.5% | 4.086% | 1.77x | 11.2% | 70.8% | 55.5% | ||||||||
| Indiana | 1 | $15,579,999 | 1.4% | 4.169% | 1.46x | 9.5% | 72.1% | 62.8% | ||||||||
| Maryland | 2 | $12,479,740 | 1.1% | 4.399% | 1.47x | 9.0% | 73.7% | 59.5% | ||||||||
| Mississippi | 1 | $8,900,000 | 0.8% | 4.530% | 1.74x | 13.0% | 63.1% | 46.5% | ||||||||
| Wisconsin | 1 | $8,071,703 | 0.7% | 4.793% | 1.54x | 10.6% | 72.7% | 59.7% | ||||||||
| Illinois | 1 | $7,979,520 | 0.7% | 4.185% | 1.58x | 9.3% | 59.5% | 47.9% | ||||||||
| Ohio | 1 | $5,541,217 | 0.5% | 4.850% | 1.32x | 9.5% | 72.4% | 54.1% | ||||||||
| Louisiana | 1 | $5,400,000 | 0.5% | 4.759% | 3.45x | 27.3% | 33.1% | 24.6% | ||||||||
| Total / Wtd. Avg. | 62 | $1,137,943,695 | 100.0% | 4.197% | 2.00x | 12.0% | 57.2% | 48.7% | ||||||||
| (1) | All numerical information concerning the mortgage loans is approximate. All weighted average information regarding the mortgage loans reflects the weighting of the mortgage loans based on their outstanding principal balances as of the Cut-off Date. State and Property Type tables reflect allocated loan amounts in the case of mortgage loans secured by multiple properties. The sum of numbers and percentages in columns may not match the “Total” due to rounding. Additionally, LTV ratios and DSCR are calculated for mortgage loans without regard to any additional indebtedness that may be incurred at a future date. |
| (2) | With respect to the Boston Park Plaza Mortgage Loan and the Chrysler East Building Mortgage Loan, unless otherwise indicated, all LTV, DSCR, Debt Yield and Cut-off Date Balance PSF/Room calculations include the related pari passu companion loan. With respect to the Wanamaker Building Mortgage Loan, unless otherwise indicated, all LTV, DSCR, Debt Yield and Cut-off Date Balance PSF/Room calculations do not include the related subordinate secured indebtedness. |
| (3) | “California-Northern” includes zip codes above 93600, and “California-Southern” includes zip codes at or below 93600. |
| This is not a research report and was not prepared by the BofA Merrill Lynch or Morgan Stanley research departments. Please see additional important information and qualifications at the end of this Term Sheet. |
| MSBAM 2013-C8 | Collateral Statistics |
Collateral Statistics(1)(2) | ||||||||||||||||
| Cut-off Date Balance ($) | Mortgage Rate (%) | Cut-off Date LTV Ratio (%) | ||||||||||||||
| No. of | Aggregate | No. of | Aggregate | No. of | Aggregate | |||||||||||
| Mortgage | Cut-off Date | % of | Mortgage | Cut-off Date | % of | Mortgage | Cut-off Date | % of | ||||||||
| Loans | Balance ($) | Pool | Loans | Balance ($) | Pool | Loans | Balance ($) | Pool | ||||||||
| 2,167,542 - 10,000,000 | 27 | 156,806,347 | 13.8 | 3.364 - 4.000 | 7 | 385,246,450 | 33.9 | 33.1 - 40.0 | 1 | 5,400,000 | 0.5 | |||||
| 10,000,001 - 20,000,000 | 10 | 130,449,732 | 11.5 | 4.001 - 4.500 | 28 | 529,227,997 | 46.5 | 40.1 - 50.0 | 8 | 401,086,354 | 35.2 | |||||
| 20,000,001 - 30,000,000 | 6 | 137,200,832 | 12.1 | 4.501 - 5.000 | 18 | 162,469,248 | 14.3 | 50.1 - 60.0 | 10 | 309,674,160 | 27.2 | |||||
| 30,000,001 - 40,000,000 | 3 | 111,240,334 | 9.8 | 5.001 - 5.590 | 1 | 61,000,000 | 5.4 | 60.1 - 70.0 | 12 | 154,205,842 | 13.6 | |||||
| 40,000,001 - 50,000,000 | 1 | 50,000,000 | 4.4 | Total: | 54 | $1,137,943,695 | 100.0 | % | 70.1 - 76.8 | 23 | 267,577,339 | 23.5 | ||||
| 50,000,001 - 60,000,000 | 2 | 104,746,450 | 9.2 | Min: 3.364% | Max: 5.590% | Wtd Avg: 4.197% | Total: | 54 | $1,137,943,695 | 100.0 | % | |||||
| 60,000,001 - 70,000,000 | 1 | 61,000,000 | 5.4 | Original Term to Maturity (mos.) | Min: 33.1% | Max: 76.8% | Wtd Avg: 57.2% | |||||||||
| 70,000,001 - 80,000,000 | 1 | 76,500,000 | 6.7 | No. of | Aggregate | LTV Ratio at Maturity (%) | ||||||||||
| 90,000,001 - 100,000,000 | 2 | 195,000,000 | 17.1 | Mortgage | Cut-off Date | % of | No. of | Aggregate | ||||||||
| 100,000,001 - 115,000,000 | 1 | 115,000,000 | 10.1 | Loans | Balance ($) | Pool | Mortgage | Cut-off Date | % of | |||||||
| Total: | 54 | $1,137,943,695 | 100.0 | % | 60 | 2 | 156,000,000 | 13.7 | Loans | Balance ($) | Pool | |||||
| Min: $2,167,542 | Max: $115,000,000 | Avg: $21,073,031 | 84 | 2 | 20,218,706 | 1.8 | 24.6 - 30.0 | 2 | 10,447,354 | 0.9 | ||||||
| State | 120 | 50 | 961,724,989 | 84.5 | 30.1 - 40.0 | 3 | 62,776,181 | 5.5 | ||||||||
| No. of | Aggregate | Total: | 54 | $1,137,943,695 | 100.0 | % | 40.1 - 50.0 | 16 | 550,139,512 | 48.3 | ||||||
| Mortgaged | Cut-off Date | % of | Min: 60 | Max: 120 | Wtd Avg: 111 | 50.1 - 60.0 | 23 | 408,625,309 | 35.9 | |||||||
| Properties | Balance ($) | Pool | Remaining Term to Maturity (mos.) | 60.1 - 62.8 | 10 | 105,955,338 | 9.3 | |||||||||
| Pennsylvania | 3 | 241,500,000 | 21.2 | No. of | Aggregate | Total: | 54 | $1,137,943,695 | 100.0 | % | ||||||
| New York | 12 | 187,087,634 | 16.4 | Mortgage | Cut-off Date | % of | Min: 24.6% | Max: 62.8% | Wtd Avg: 48.7% | |||||||
| Texas | 7 | 156,875,954 | 13.8 | Loans | Balance ($) | Pool | UW DSCR (x) | |||||||||
| Massachusetts | 1 | 95,000,000 | 8.3 | 59 - 79 | 2 | 156,000,000 | 13.7 | No. of | Aggregate | |||||||
| Virginia | 4 | 74,269,588 | 6.5 | 80 - 109 | 2 | 20,218,706 | 1.8 | Mortgage | Cut-off Date | % of | ||||||
| Florida | 5 | 65,016,075 | 5.7 | 110 - 120 | 50 | 961,724,989 | 84.5 | Loans | Balance ($) | Pool | ||||||
| North Carolina | 3 | 59,830,546 | 5.3 | Total: | 54 | $1,137,943,695 | 100.0 | % | 1.24 - 1.30 | 1 | 6,292,550 | 0.6 | ||||
| California | 5 | 53,946,596 | 4.7 | Min: 59 | Max: 120 | Wtd Avg: 110 | 1.31 - 1.40 | 3 | 31,638,492 | 2.8 | ||||||
| 4 | 29,746,596 | 2.6 | Original Amortization Term (mos.) | 1.41 - 1.50 | 15 | 289,693,156 | 25.5 | |||||||||
| 1 | 24,200,000 | 2.1 | No. of | Aggregate | 1.51 - 1.60 | 9 | 58,054,153 | 5.1 | ||||||||
| New Jersey | 4 | 50,184,535 | 4.4 | Mortgage | Cut-off Date | % of | 1.61 - 1.70 | 4 | 62,214,447 | 5.5 | ||||||
| Connecticut | 4 | 30,063,327 | 2.6 | Loans | Balance ($) | Pool | 1.71 - 1.80 | 6 | 70,104,641 | 6.2 | ||||||
| South Carolina | 2 | 25,219,914 | 2.2 | Interest Only | 4 | 218,400,000 | 19.2 | 1.81 - 1.90 | 3 | 39,716,018 | 3.5 | |||||
| Utah | 1 | 18,184,068 | 1.6 | 240 | 2 | 11,184,535 | 1.0 | 1.91 - 2.00 | 4 | 277,983,773 | 24.4 | |||||
| Georgia | 3 | 16,813,278 | 1.5 | 300 | 9 | 84,608,382 | 7.4 | 2.01 - 2.10 | 3 | 13,100,014 | 1.2 | |||||
| Indiana | 1 | 15,579,999 | 1.4 | 330 | 1 | 5,542,711 | 0.5 | 2.11 - 2.50 | 1 | 115,000,000 | 10.1 | |||||
| Maryland | 2 | 12,479,740 | 1.1 | 360 | 38 | 818,208,067 | 71.9 | 2.51 - 3.96 | 5 | 174,146,450 | 15.3 | |||||
| Mississippi | 1 | 8,900,000 | 0.8 | Total: | 54 | $1,137,943,695 | 100.0 | % | Total: | 54 | $1,137,943,695 | 100.0 | % | |||
| Wisconsin | 1 | 8,071,703 | 0.7 | Non-Zero Min: 240 | Max: 360 | Non-Zero Wtd Avg: 353 | Min: 1.24x | Max: 3.96x | Wtd Avg: 2.00x | |||||||
| Illinois | 1 | 7,979,520 | 0.7 | Remaining Amortization Term (mos.) | UW NOI Debt Yield (%) | |||||||||||
| Ohio | 1 | 5,541,217 | 0.5 | No. of | Aggregate | No. of | Aggregate | |||||||||
| Louisiana | 1 | 5,400,000 | 0.5 | Mortgage | Cut-off Date | % of | Mortgage | Cut-off Date | % of | |||||||
| Total: | 62 | $1,137,943,695 | 100.0 | % | Loans | Balance ($) | Pool | Loans | Balance ($) | Pool | ||||||
| Property Type | Interest Only | 4 | 218,400,000 | 19.2 | 8.0 | 1 | 6,292,550 | 0.6 | ||||||||
| No. of | Aggregate | 236 - 300 | 11 | 95,792,916 | 8.4 | 8.1 - 8.5 | 1 | 14,500,000 | 1.3 | |||||||
| Mortgaged | Cut-off Date | % of | 301 - 350 | 1 | 5,542,711 | 0.5 | 8.6 - 9.0 | 2 | 28,893,793 | 2.5 | ||||||
| Properties | Balance ($) | Pool | 351 - 360 | 38 | 818,208,067 | 71.9 | 9.1 - 10.0 | 17 | 303,051,212 | 26.6 | ||||||
| Retail | 17 | 390,752,834 | 34.3 | Total: | 54 | $1,137,943,695 | 100.0 | % | 10.1 - 10.5 | 4 | 68,230,380 | 6.0 | ||||
| Anchored | 9 | 296,004,808 | 26.0 | Non-Zero Min: 236 | Max: 360 | Non-Zero Wtd Avg: 352 | 10.6 - 11.0 | 3 | 25,760,125 | 2.3 | ||||||
| Shadow Anchored | 3 | 46,967,576 | 4.1 | 11.1 - 11.5 | 4 | 29,910,871 | 2.6 | |||||||||
| Regional Mall | 1 | 20,806,491 | 1.8 | 11.6 - 12.0 | 4 | 84,447,985 | 7.4 | |||||||||
| Unanchored | 2 | 15,998,226 | 1.4 | 12.1 - 12.5 | 4 | 21,838,962 | 1.9 | |||||||||
| Free-Standing | 2 | 10,975,733 | 1.0 | 12.6 - 13.0 | 2 | 123,900,000 | 10.9 | |||||||||
| Office | 11 | 298,994,354 | 26.3 | 13.1 - 13.5 | 5 | 190,517,522 | 16.7 | |||||||||
| CBD | 2 | 176,500,000 | 15.5 | 14.1 - 14.5 | 3 | 165,806,491 | 14.6 | |||||||||
| Suburban | 5 | 87,084,870 | 7.7 | 15.1 – 27.3 | 4 | 74,793,804 | 6.6 | |||||||||
| Medical | 4 | 35,409,484 | 3.1 | Total: | 54 | $1,137,943,695 | 100.0 | % | ||||||||
| Hospitality | 6 | 218,261,074 | 19.2 | Min: 8.0% | Max: 27.3% | Wtd Avg: 12.0% | ||||||||||
| Full Service | 3 | 192,336,958 | 16.9 | |||||||||||||
| Limited Service | 3 | 25,924,116 | 2.3 | |||||||||||||
| Self Storage | 11 | 88,041,857 | 7.7 | |||||||||||||
| Manufactured Housing | 9 | 57,223,557 | 5.0 | |||||||||||||
| Mixed Use | 3 | 49,286,258 | 4.3 | |||||||||||||
| Office/Retail | 2 | 43,743,546 | 3.8 | |||||||||||||
| Multifamily/Retail | 1 | 5,542,711 | 0.5 | |||||||||||||
| Multifamily | 3 | 19,794,090 | 1.7 | |||||||||||||
| Garden | 2 | 14,252,873 | 1.3 | |||||||||||||
| Student Housing | 1 | 5,541,217 | 0.5 | |||||||||||||
| Flex Industrial | 2 | 15,589,671 | 1.4 | |||||||||||||
| Total: | 62 | $1,137,943,695 | 100.0 | % | ||||||||||||
| (1) | All numerical information concerning the mortgage loans is approximate. All weighted average information regarding the mortgage loans reflects the weighting of the mortgage loans based on their outstanding principal balances as of the Cut-off Date. State and Property Type tables reflect allocated loan amounts in the case of mortgage loans secured by multiple properties. The sum of numbers and percentages in columns may not match the “Total” due to rounding. Additionally, LTV ratios and DSCR are calculated for mortgage loans without regard to any additional indebtedness that may be incurred at a future date. |
| (2) | With respect to the Chrysler East Building Mortgage Loan and the Boston Park Plaza Mortgage Loan, unless otherwise indicated, all LTV, DSCR, Debt Yield and Cut-Off Date Balance PSF/Room calculations include the related pari passu companion loan. With respect to the Wanamaker Building Mortgage Loan, unless otherwise indicated, all LTV, DSCR, Debt Yield and Cut-off Date Balance PSF/Room calculations do not include the related subordinate secured indebtedness. |
| (3) | “California-Northern” includes zip codes above 93600, and “California-Southern” includes zip codes at or below 93600. |
| This is not a research report and was not prepared by the BofA Merrill Lynch or Morgan Stanley or research departments. Please see additional important information and qualifications at the end of this Term Sheet. | |
MSBAM 2013-C8 | Collateral Statistics |
| Prepayment Restrictions | February 2013 | February 2014 | February 2015 | February 2016 | February 2017 |
| Locked Out | 82.9% | 82.3% | 69.9% | 62.3% | 62.2% |
| Yield Maintenance Total | 17.1% | 17.7% | 30.1% | 24.0% | 24.2% |
| Open | 0.0% | 0.0% | 0.0% | 13.6% | 13.6% |
| TOTAL | 100.0% | 100.0% | 100.0% | 100.0% | 100.0% |
| Pool Balance Outstanding | $1,137,943,695 | $1,125,788,748 | $1,111,831,863 | $1,096,697,968 | $1,079,159,417 |
| % Initial Pool Balance | 100.0% | 98.9% | 97.7% | 96.4% | 94.8% |
| Prepayment Restrictions | February 2018 | February 2019 | February 2020 | February 2021 | February 2022 |
| Locked Out | 71.8% | 71.5% | 71.2% | 70.9% | 70.6% |
| Yield Maintenance Total | 28.2% | 28.5% | 28.8% | 29.1% | 29.4% |
| Open | 0.0% | 0.0% | 0.0% | 0.0% | 0.0% |
| TOTAL | 100.0% | 100.0% | 100.0% | 100.0% | 100.0% |
| Pool Balance Outstanding | $916,340,624 | $899,962,056 | $865,320,064 | $848,043,625 | $829,955,622 |
| % Initial Pool Balance | 80.5% | 79.1% | 76.0% | 74.5% | 72.9% |
| (1) | The analysis is based on Structuring Assumptions and a 0% CPR as discussed in the Free Writing Prospectus. |
| (2) | See description of Yield Maintenance under “Description of the Offered Certificates—Distributions of Prepayment Premiums and Yield Maintenance Charges” in the Free Writing Prospectus. |
| (3) | Mortgage loans modeled as Yield Maintenance include mortgage loans characterized by YM0.5, YM1, DEF/YM0.5 and DEF/YM1 on Appendix I to the Free Writing Prospectus. |
(4) | Totals may not add due to rounding. |
| This is not a research report and was not prepared by the BofA Merrill Lynch or Morgan Stanley research departments. Please see additional important information and qualifications at the end of this Term Sheet. |
| This is not a research report and was not prepared by the BofA Merrill Lynch or Morgan Stanley research departments. Please see additional important information and qualifications at the end of this Term Sheet. |
MSBAM 2013-C8 | The Crossings Premium Outlets |
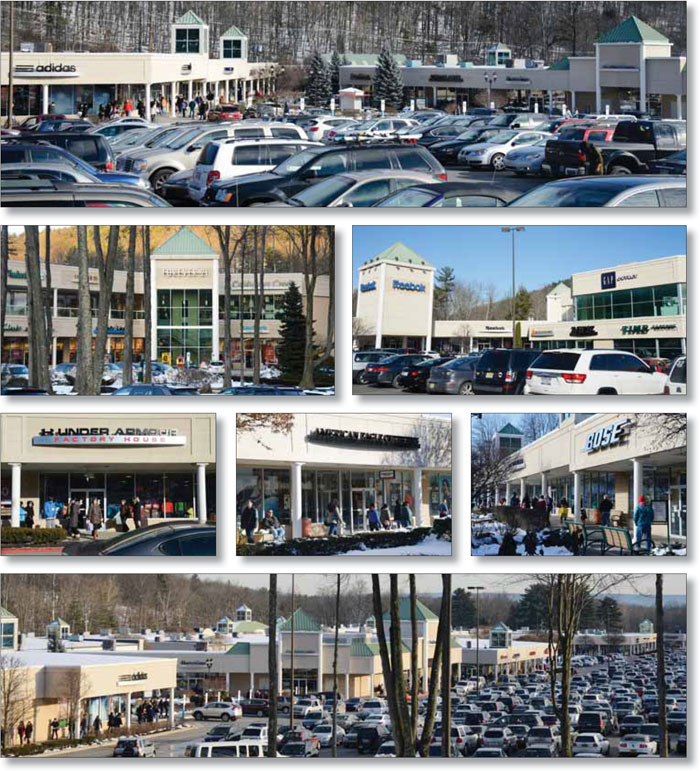
| This is not a research report and was not prepared by the BofA Merrill Lynch or Morgan Stanley research departments. Please see additional important information and qualifications at the end of this Term Sheet. |
MSBAM 2013-C8 | The Crossings Premium Outlets |
| This is not a research report and was not prepared by the BofA Merrill Lynch or Morgan Stanley research departments. Please see additional important information and qualifications at the end of this Term Sheet. |
MSBAM 2013-C8 | The Crossings Premium Outlets |

| This is not a research report and was not prepared by the BofA Merrill Lynch or Morgan Stanley research departments. Please see additional important information and qualifications at the end of this Term Sheet. |
MSBAM 2013-C8 | The Crossings Premium Outlets |
| Mortgage Loan No. 1 – The Crossings Premium Outlets |
| Mortgage Loan Information | Mortgaged Property Information | |||||
| Mortgage Loan Seller: | BANA | Single Asset / Portfolio: | Single Asset | |||
| Credit Assessment (Fitch/KBRA/S&P): | NR/BBB-/BBB- | Property Address: | 1000 Route 611 Tannersville, PA 18372 | |||
| Original Balance: | $115,000,000 | General Property Type: | Retail | |||
| Cut-off Date Balance: | $115,000,000 | Detailed Property Type: | Anchored | |||
| % of Initial Pool Balance: | 10.1% | Net Rentable Area: | 411,223 SF | |||
| Loan Purpose: | Refinance | Cut-off Date Balance Per Unit/SF: | $280 | |||
| Borrower Name(s): | Chelsea Pocono Finance, LLC | Balloon Balance Per Unit/SF: | $239 | |||
| Sponsor(s): | Simon Property Group, L.P. | Year Built / Year Renovated: | 1991 / 2005 | |||
| Mortgage Rate: | 3.41400% | Title Vesting: | Fee | |||
| Note Date: | 11/14/2012 | Property Manager: | Simon Management Associates, LLC | |||
| First Payment Date: | 1/1/2013 | Underwriting and Financial Information | ||||
| Anticipated Repayment Date: | NAP | UW Revenues: | $20,623,103 | |||
| Maturity Date: | 12/1/2022 | UW Expenses: | $5,931,211 | |||
| IO Period: | 36 months | UW NOI: | $14,691,891 | |||
| Original Term to Maturity: | 120 months | UW NCF: | $13,870,653 | |||
| Seasoning: | 2 months | UW NOI DSCR: | 2.40x | |||
| Original Amortization Term: | 360 months | UW NCF DSCR: | 2.26x | |||
| Loan Amortization Type: | Partial IO | UW NOI Debt Yield: | 12.8% | |||
| Interest Accrual Basis: | Actual/360 | UW NCF Debt Yield: | 12.1% | |||
| Prepayment Provisions: | LO (26); DEF (87); O (7) | UW NCF Debt Yield at Maturity: | 14.1% | |||
| Lockbox / Cash Management: | Hard / Springing | Most Recent NOI (As of): | $15,480,567 (6/30/2012 TTM) | |||
| Pari Passu Mortgage Debt: | None | 2nd Most Recent NOI (As of): | $15,299,489 (12/31/2011) | |||
| Subordinate Mortgage Debt: | None | 3rd Most Recent NOI (As of): | $14,210,129 (12/31/2010) | |||
| Mezzanine Debt: | None | Appraised Value: | $240,000,000 | |||
| Appraisal As-of Date: | 10/23/2012 | |||||
| Cut-off Date LTV Ratio: | 47.9% | |||||
| LTV Ratio at Maturity: | 40.9% | |||||
Reserves(1) | Occupancy Rate (As of): | 100.0% (11/5/2012) | ||||
| Type | Initial | Monthly | Cap | 2nd Most Recent Occupancy (As of): | 100.0% (12/31/2011) | |
RE Tax(2): | $0 | Springing | NAP | 3rd Most Recent Occupancy (As of): | 100.0% (12/31/2010) | |
Insurance(2): | $0 | Springing | NAP | 4th Most Recent Occupancy (As of): | 99.3% (12/31/2009) | |
Recurring Replacements(2): | $0 | Springing | $324,000 | 5th Most Recent Occupancy (As of): | 100.0% (12/31/2008) | |
TI/LC(2): | $0 | Springing | $2,088,000 | 6th Most Recent Occupancy (As of): | 100.0% (12/31/2007) | |
| (1) | See “—Escrows and Reserves” below for further discussion of reserve requirements. |
| (2) | During a Reserve Period, The Crossings Premium Outlets Borrower is required to escrow for taxes, insurance, replacement reserves and TI/LC reserves as described under “—Escrows and Reserves” below. |
| This is not a research report and was not prepared by the BofA Merrill Lynch or Morgan Stanley research departments. Please see additional important information and qualifications at the end of this Term Sheet. |
MSBAM 2013-C8 | The Crossings Premium Outlets |
| This is not a research report and was not prepared by the BofA Merrill Lynch or Morgan Stanley research departments. Please see additional important information and qualifications at the end of this Term Sheet. |
MSBAM 2013-C8 | The Crossings Premium Outlets |
Tenant Summary(1) | |||||||||||||||||||
| Tenant Name | Tenant SF | Approx. % of SF | Annualized Underwritten Base Rent ($) | % of Total Annualized Underwritten Base Rent | Annualized Underwritten Base Rent ($ Per NRSF) (2) | Lease Expiration | TTM 8/12 Sales PSF | Occupancy Cost as a % of Sales | |||||||||||
Forever 21(3) | 14,326 | 3% | $131,878 | 0% | $0.00 | 9/30/2015 | $286 | 5.6% | |||||||||||
| Gap Outlet | 13,100 | 3% | $242,350 | 2% | $18.50 | 11/30/2012(4) | $526 | 5.0% | |||||||||||
| Nike Factory Store | 11,744 | 3% | $317,088 | 2% | $27.00 | 10/31/2016 | $633 | 5.6% | |||||||||||
| Reebok/Rockport Outlet | 11,700 | 3% | $204,750 | 1% | $17.50 | 9/30/2014 | $260 | 10.0% | |||||||||||
| American Eagle Outfitters | 9,514 | 2% | $361,532 | 2% | $38.00 | 1/31/2023 | $623 | 8.9% | |||||||||||
| Polo Ralph Lauren | 9,415 | 2% | $112,500 | 1% | $11.95 | 1/31/2015 | $831 | 2.5% | |||||||||||
| Banana Republic Factory | 8,492 | 2% | $243,866 | 2% | $28.72 | 6/30/2015 | $562 | 6.5% | |||||||||||
| Tommy Hilfiger | 7,699 | 2% | $317,199 | 2% | $41.20 | 7/31/2022 | $466 | 12.5% | |||||||||||
| Adidas | 7,360 | 2% | $341,283 | 2% | $46.37 | 1/31/2018 | $460 | 12.2% | |||||||||||
| Coach | 7,200 | 2% | $252,000 | 2% | $35.00 | 1/31/2020 | $2,366 | 3.6% | |||||||||||
| Subtotal / Wtd. Avg. | 100,550 | 24% | $2,392,568 | 16% | $23.79 | ||||||||||||||
| Other Tenants | 310,673 | 76% | $12,255,019 | 84% | $39.45 | ||||||||||||||
| Vacant Space | 0 | 0% | $0 | 0% | $0.00 | ||||||||||||||
| Total / Wtd. Avg. | 411,223 | 100% | $14,647,587 | 100% | $35.62 | ||||||||||||||
| (1) | Information is based on the underwritten rent roll. |
| (2) | Total Annualized Underwritten Base Rent ($ per NRSF) excludes vacant space. |
| (3) | Forever 21 pays percent in lieu of rent based on 3% of sales. |
| (4) | Gap Outlet is negotiating a potential long term renewal. Gap is currently paying their contractual rent on a month-to-month basis. |
Lease Rollover Schedule(1)(2) | |||||||||||||||||
| Year | # of Leases Rolling | SF Rolling | Average Underwritten Base Rent PSF Rolling(3) | Approx. % of Total SF Rolling | Approx. Cumulative % of SF Rolling | Total Underwritten Base Rent Rolling | Approx. % of Total Base Rent Rolling | Approx. Cumulative % of Total Base Rent Rolling | |||||||||
| MTM | 5 | 19,065 | $22.29 | 5% | 5% | $424,899 | 3% | 3% | |||||||||
| 2013 | 8 | 24,141 | $42.49 | 6% | 11% | $1,025,641 | 7% | 10% | |||||||||
| 2014 | 16 | 66,064 | $37.44 | 16% | 27% | $2,473,614 | 17% | 27% | |||||||||
| 2015 | 13 | 62,560 | $22.18 | 15% | 42% | $1,387,379 | 9% | 36% | |||||||||
| 2016 | 17 | 69,148 | $38.54 | 17% | 59% | $2,665,143 | 18% | 54% | |||||||||
| 2017 | 10 | 26,246 | $37.54 | 6% | 65% | $985,402 | 7% | 61% | |||||||||
| 2018 | 8 | 29,532 | $41.21 | 7% | 72% | $1,217,124 | 8% | 69% | |||||||||
| 2019 | 6 | 19,860 | $40.65 | 5% | 77% | $807,265 | 6% | 75% | |||||||||
| 2020 | 8 | 31,596 | $40.88 | 8% | 85% | $1,291,735 | 9% | 84% | |||||||||
| 2021 | 6 | 11,617 | $37.08 | 3% | 88% | $430,796 | 3% | 87% | |||||||||
| 2022 | 9 | 41,880 | $37.66 | 10% | 98% | $1,577,057 | 11% | 98% | |||||||||
| 2023 & Beyond | 1 | 9,514 | $38.00 | 2% | 100% | $361,532 | 2% | 100% | |||||||||
| Vacant | 0 | 0 | $0.00 | 0% | 100% | $0 | 0% | 100% | |||||||||
| Total / Wtd. Avg. | 107 | 411,223 | $35.62 | 100% | $14,647,587 | 100% | |||||||||||
| (1) | The information in the lease rollover schedule is based on the underwritten rent roll. |
| (2) | Certain tenants may have lease termination options that are exercisable prior to the originally stated expiration date of the subject lease and that are not considered in the lease rollover schedule. |
| (3) | Average Underwritten Base Rent PSF Rolling excludes vacant space. |
| This is not a research report and was not prepared by the BofA Merrill Lynch or Morgan Stanley research departments. Please see additional important information and qualifications at the end of this Term Sheet. |
MSBAM 2013-C8 | The Crossings Premium Outlets |
| Competitive Property Summary | |||||||
| Property | Location | Year Built/ Renovated | Total GLA | Proximity | Occupancy | Major Tenants | |
Liberty Village Premium Outlets | 1 Church Street Flemington, NJ | 1981/2002 | 117,000 | 67 Miles | 100.0% | Famous Footwear, Toys R Us, Polo Ralph Lauren, Tommy Hilfiger | |
Philadelphia Premium Outlets | 18 W Lightcap Road Sanatoga, PA | 2007/2008 | 549,067 | 73 Miles | 100.0% | Last Call by Nieman Marcus, Lane Bryant, Gap Outlet, Tommy Hilfiger | |
| VF Outlet Village | 801 Hill Avenue Reading, PA | 1970/1996 | 500,000 | 82 Miles | 100.0% | VF Factory Outlet, Tommy Hilfiger, Reebok Factory, Factory Brand Shoes | |
Woodbury Common Premium Outlets | 498 Red Apple Court Central Valley, NY | 1985/1998 | 844,734 | 92 Miles | 100.0% | Last Call by Nieman Marcus, Off 5th, Banana Republic, Polo Ralph Lauren | |
| Cash Flow Analysis | ||||||||||||
| 2009 | 2010 | 2011 | 6/30/2012 TTM | UW | UW PSF | |||||||
| Base Rental Income | $12,331,176 | $12,915,198 | $13,585,005 | $13,672,709 | $14,647,587 | $35.62 | ||||||
| Percentage Rent | $761,555 | $1,031,714 | $873,813 | $965,559 | $963,119 | $2.34 | ||||||
Expense Reimbursements(1) | $5,154,589 | $5,478,285 | $2,797,065 | $2,991,774 | $5,715,624 | $13.90 | ||||||
| Other Income | $86,246 | $115,137 | $118,535 | $103,925 | $123,394 | $0.30 | ||||||
| Less Vacancy & Credit Loss | ($73,956) | ($5,811) | $34,336 | $66,627 | ($1,066,317) | 5.00% | ||||||
| Effective Gross Income | $18,507,826 | $19,759,805 | $17,672,290 | $18,069,647 | $20,623,103 | $50.15 | ||||||
Total Operating Expenses(1) | $5,440,884 | $5,549,676 | $2,372,801 | $2,589,080 | $5,931,211 | $14.42 | ||||||
| Net Operating Income | $13,066,942 | $14,210,129 | $15,299,489 | $15,480,567(2) | $14,691,891 | $35.73 | ||||||
| TI/LC | $0 | $0 | $0 | $0 | $659,259 | $1.60 | ||||||
| Capital Expenditures | $0 | $0 | $0 | $0 | $161,979 | $0.39 | ||||||
| Net Cash Flow | $13,066,942 | $14,210,129 | $15,299,489 | $15,480,567 | $13,870,653 | $33.73 | ||||||
| Occupancy % | 100.0% | 100.0% | 100.0% | 100.0% | 95.0% | |||||||
| NOI DSCR | 2.13x | 2.32x | 2.50x | 2.53x | 2.40x | |||||||
| NCF DSCR | 2.13x | 2.32x | 2.50x | 2.53x | 2.26x | |||||||
| NOI Debt Yield | 11.4% | 12.4% | 13.3% | 13.5% | 12.8% | |||||||
| NCF Debt Yield | 11.4% | 12.4% | 13.3% | 13.5% | 12.1% | |||||||
Average Annual Rent PSF(3) | $29.99 | $31.41 | $33.04 | $33.25 | $35.62 | |||||||
| (1) | Expense reimbursements and Total Operating Expenses were lower in 2011 and 6/30/2012 TTM due to prior year tax adjustments, which are not reflected in the UW. |
| (2) | The Crossings Premium Outlets sponsor reported trailing twelve months ended September 30, 2012 NOI of $15,298,483 at The Crossings Premium Outlet Property. |
| (3) | Average Annual Rent PSF is based on historical financials and end of year property occupancy rates. |
| This is not a research report and was not prepared by the BofA Merrill Lynch or Morgan Stanley research departments. Please see additional important information and qualifications at the end of this Term Sheet. |
MSBAM 2013-C8 | The Crossings Premium Outlets |
| This is not a research report and was not prepared by the BofA Merrill Lynch or Morgan Stanley research departments. Please see additional important information and qualifications at the end of this Term Sheet. |
| MSBAM 2013-C8 | Chrysler East Building |
| Mortgage Loan No. 2 – Chrysler East Building |
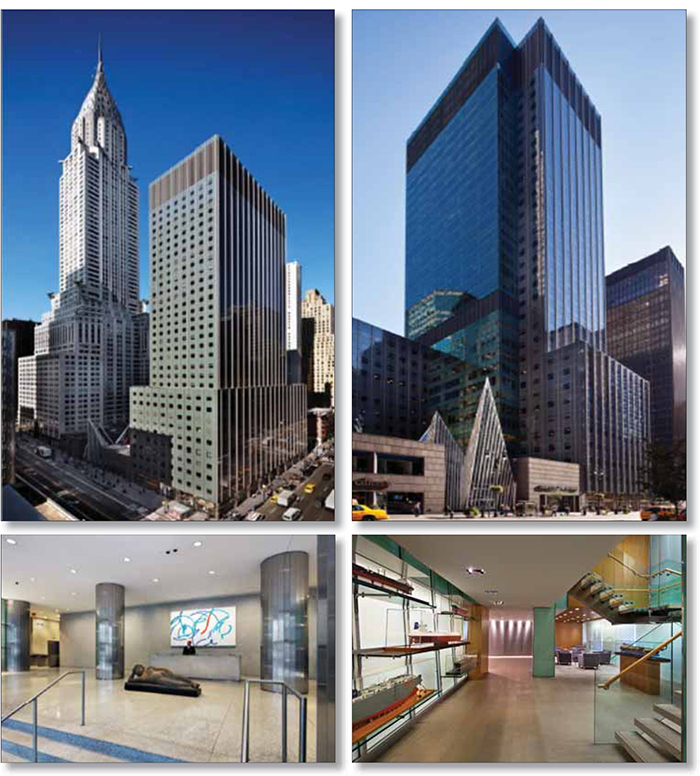
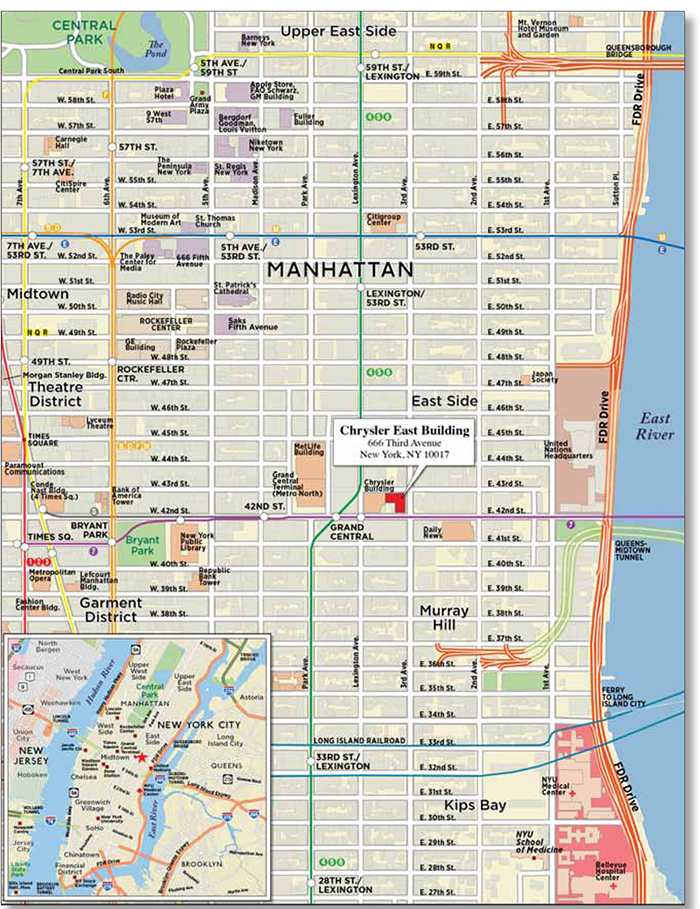
| This is not a research report and was not prepared by the BofA Merrill Lynch or Morgan Stanley research departments. Please see additional important information and qualifications at the end of this Term Sheet. |
| MSBAM 2013-C8 | Chrysler East Building |
Mortgage Loan No. 2 – Chrysler East Building |
| Mortgage Loan Information | Mortgaged Property Information | |||||||||
| Mortgage Loan Seller: | MSMCH | Single Asset / Portfolio: | Single Asset | |||||||
| Credit Assessment (Fitch/KBRA/S&P): | NR/NR/NR | Property Address: | 666 Third Avenue New York, NY 10017 | |||||||
Original Balance(1): | $100,000,000 | |||||||||
Cut-off Date Balance(1): | $100,000,000 | General Property Type: | Office | |||||||
| % of Initial Pool Balance: | 8.8% | Detailed Property Type: | CBD | |||||||
Loan Purpose(2): | Acquisition | Net Rentable Area: | 745,201 SF | |||||||
| Borrower Name(s): | Chrysler East Building, L.L.C. | Cut-off Date Balance Per Unit/SF(1): | $356 | |||||||
Sponsor(2): | Tishman Speyer Properties | Balloon Balance Per Unit/SF(1): | $356 | |||||||
| Mortgage Rate: | 4.31000% | Year Built / Year Renovated: | 1952 / 2000 | |||||||
| Note Date: | 11/1/2012 | Title Vesting: | Fee | |||||||
| First Payment Date: | 12/7/2012 | Property Manager: | Tishman Speyer Properties, L.P. | |||||||
Anticipated Repayment Date: | NAP | Underwriting and Financial Information | ||||||||
| Maturity Date: | 11/7/2022 | UW Revenues: | $47,484,343 | |||||||
| IO Period: | 120 months | UW Expenses: | $23,461,792 | |||||||
| Original Term to Maturity: | 120 months | UW NOI: | $24,022,551 | |||||||
| Seasoning: | 3 months | UW NCF: | $23,003,850 | |||||||
| Original Amortization Term: | NAP | UW NOI DSCR(1): | 2.07x | |||||||
| Loan Amortization Type: | Full IO | UW NCF DSCR(1): | 1.99x | |||||||
| Interest Accrual Basis: | Actual/360 | UW NOI Debt Yield(1): | 9.1% | |||||||
| Prepayment Provisions: | YM0.5 (27); DEF/YM0.5 (89); O (4) | UW NCF Debt Yield(1): | 8.7% | |||||||
| Lockbox / Cash Management: | Hard / In Place | UW NCF Debt Yield at Maturity(1): | 8.7% | |||||||
| Pari Passu Mortgage Debt: | $165,000,000 | Most Recent NOI (As of): | $23,059,925 (10/31/2012 TTM) | |||||||
| Subordinate Mortgage Debt: | None | 2nd Most Recent NOI (As of): | $18,685,199 (12/31/2011) | |||||||
| Mezzanine Debt: | None | 3rd Most Recent NOI (As of): | $19,836,165 (12/31/2010) | |||||||
Reserves(3) | Appraised Value: | $490,000,000 | ||||||||
| Type | Initial | Monthly | Cap | Appraisal As-of Date: | 10/1/2012 | |||||
RE Tax: | $0 | $945,207 | NAP | Cut-off Date LTV Ratio(1): | 54.1% | |||||
| Insurance: | $0 | Springing | NAP | LTV Ratio at Maturity(1): | 54.1% | |||||
| Recurring Replacements: | $0 | $15,573 | NAP | Occupancy Rate: | 96.3% (10/15/2012) | |||||
| TI/LC: | $10,000,000 | $93,438 | NAP | 2nd Most Recent Occupancy (As of): | 92.2% (12/31/2011) | |||||
3rd Most Recent Occupancy (As of): | 87.4% (12/31/2010) | |||||||||
4th Most Recent Occupancy (As of): | 99.1% (12/31/2009) | |||||||||
5th Most Recent Occupancy (As of): | 99.5% (12/31/2008) | |||||||||
6th Most Recent Occupancy (As of): | 99.8% (12/31/2007) | |||||||||
| (1) | The Chrysler East Building Mortgage Loan is part of a loan combination evidenced by three pari passu notes with an aggregate original principal balance of $265,000,000. The Cut-off Date Principal Balance per SF, LTV, DSCR, Balloon Balance Per SF, Debt Yield and LTV Ratio at Maturity figures presented above are based on the entire $265,000,000 Chrysler East Building loan combination. |
| (2) | Tishman Speyer Properties related entities have held an interest in the property ownership since 1998. |
| (3) | See “—Escrows and Reserves” below for further discussion of reserve requirements. The reserves are available to the entire $265,000,000 Chrysler East Building loan combination. |
| This is not a research report and was not prepared by the BofA Merrill Lynch or Morgan Stanley research departments. Please see additional important information and qualifications at the end of this Term Sheet. |
| MSBAM 2013-C8 | Chrysler East Building |
| This is not a research report and was not prepared by the BofA Merrill Lynch or Morgan Stanley research departments. Please see additional important information and qualifications at the end of this Term Sheet. |
| MSBAM 2013-C8 | Chrysler East Building |
| Tenant Summary | ||||||||||||
| Tenant Name | Credit Rating (Fitch/ Moody’s/ S&P)(1) | Tenant SF | Approx. % of SF | Annualized Underwritten Base Rent | % of Total Annualized Underwritten Base Rent | Annualized Underwritten Base Rent (PSF) | Lease Expiration | |||||
| Major Tenants | ||||||||||||
Credit Agricole(2) | A+/A2/A | 140,369 | 19% | $7,321,903 | 18% | $52.16 | 5/31/2015 | |||||
| Mintz, Levin, Cohn, Ferris | NR/NR/NR | 84,466 | 11% | $4,234,790 | 10% | $50.14 | 12/31/2022 | |||||
| Grant Thornton | NR/NR/NR | 62,648 | 8% | $3,320,344 | 8% | $53.00 | 11/30/2014 | |||||
Overseas Shipholding(3) | NR/NR/NR | 60,318 | 8% | $2,834,946 | 7% | $47.00 | 12/31/2020 | |||||
| APG Asset Management | NR/NR/NR | 51,179 | 7% | $3,562,949 | 9% | $69.62 | 12/31/2020 | |||||
| European Union | AAA/Aaa/AAA | 45,397 | 6% | $2,851,668 | 7% | $62.82 | 2/29/2028 | |||||
| Dutch Consulate | AAA/Aaa/AAA | 36,976 | 5% | $2,189,888 | 5% | $59.22 | 5/31/2015 & 3/31/2027(4) | |||||
| Jackson Lewis LLP | NR/NR/NR | 36,764 | 5% | $2,159,885 | 5% | $58.75 | 8/31/2024 | |||||
| American Century Investment Management | NR/NR/NR | 36,532 | 5% | $2,128,386 | 5% | $58.26 | 1/31/2021 | |||||
| Simpson Thatcher & Bartlett LLP | NR/NR/NR | 36,092 | 5% | $2,490,348 | 6% | $69.00 | 10/31/2018 | |||||
| Subtotal / Wtd. Avg. | 590,741 | 79% | $33,095,106 | 81% | $56.02 | |||||||
| Other Tenants | 126,595 | 17% | $7,918,662 | 19% | $62.55 | |||||||
| Vacant Space | 27,865 | 4% | $0 | 0% | $0.00 | |||||||
| Total / Wtd. Avg. | 745,201 | 100% | $41,013,769 | 100% | $57.18(5) | |||||||
| (1) | Certain ratings may be those of the parent company whether or not the parent guarantees the lease. The Dutch Consulate rating reflects the sovereign rating for the Netherlands. |
| (2) | Credit Agricole subleases all of its leased space to five subtenants at various base rental rates currently averaging approximately $48.46 PSF. The subleases all expire on the same date as the Credit Agricole primary lease. |
| (3) | Overseas Shipholding Group, Inc., a tenant at the Chrysler East Building Property under a lease dated 11/23/2004, and certain of its affiliates, are currently debtors in a Chapter 11 bankruptcy filing dated November 15, 2012. No representation can be made regarding the future status of the related tenant’s occupancy or ability to meet its contractual lease obligations, or whether such contractual lease obligations will be modified or terminated as a result of the bankruptcy process. The tenant’s current contractual base rent and recoveries are included in the underwritten cash flow. |
| (4) | 3,019 SF expire on 5/31/2015 and 33,957 SF expire on 3/31/2027. |
| (5) | Total Annualized Underwritten Base Rent (PSF) excludes vacant space and includes $782,419 of averaged rent steps associated with certain tenants that occur within those tenants’ lease terms. Those tenants include American Century Investment Management, APG Asset Management, the Dutch Consulate, the European Union and Wells Fargo Bank. |
| This is not a research report and was not prepared by the BofA Merrill Lynch or Morgan Stanley research departments. Please see additional important information and qualifications at the end of this Term Sheet. |
| MSBAM 2013-C8 | Chrysler East Building |
Lease Rollover Schedule(1)(2) | ||||||||
| Year | # of Leases Rolling | SF Rolling | Average Underwritten Base Rent PSF Rolling(3) | Approx. % of Total SF Rolling | Approx. Cumulative % of SF Rolling | Total Underwritten Base Rent Rolling | Approx. % of Total Base Rent Rolling | Approx. Cumulative % of Total Base Rent Rolling |
| MTM | 0 | 0 | $0.00 | 0% | 0% | $0 | 0% | 0% |
| 2012 | 1 | 101 | $61.49 | 0% | 0% | $6,210 | 0% | 0% |
| 2013 | 1 | 50 | $50.00 | 0% | 0% | $2,500 | 0% | 0% |
| 2014 | 7 | 72,214 | $54.29 | 10% | 10% | $3,920,341 | 10% | 10% |
| 2015 | 15 | 164,432 | $52.59 | 22% | 32% | $8,647,524 | 21% | 31% |
| 2016 | 1 | 4,786 | $58.00 | 1% | 32% | $277,588 | 1% | 31% |
| 2017 | 2 | 9,243 | $143.83 | 1% | 34% | $1,329,450 | 3% | 35% |
| 2018 | 1 | 36,092 | $69.00 | 5% | 39% | $2,490,348 | 6% | 41% |
| 2019 | 2 | 14,334 | $48.26 | 2% | 40% | $691,688 | 2% | 42% |
| 2020 | 7 | 113,267 | $56.71 | 15% | 56% | $6,422,835 | 16% | 58% |
| 2021 | 4 | 80,881 | $55.32 | 11% | 66% | $4,474,321 | 11% | 69% |
| 2022 | 8 | 84,466 | $50.14 | 11% | 78% | $4,234,790 | 10% | 79% |
| 2023 | 0 | 0 | $0.00 | 0% | 78% | $0 | 0% | 79% |
| 2024 | 2 | 36,764 | $58.75 | 5% | 83% | $2,159,885 | 5% | 85% |
| 2025 & Beyond | 8 | 100,706 | $63.12 | 14% | 96% | $6,356,289 | 15% | 100% |
| Vacant | 7 | 27,865 | $0.00 | 4% | 100% | $0 | 0% | 100% |
| Total / Wtd. Avg. | 66 | 745,201 | $57.18 | 100% | $41,013,769 | 100% | ||
| (1) | The information in the lease rollover schedule is based on the underwritten rent roll. |
| (2) | Certain tenants may have lease termination options that are exercisable prior to the originally stated expiration date of the subject lease and that are not considered in the lease rollover schedule. |
| (3) | Average Underwritten Base Rent PSF Rolling excludes vacant space and includes $782,419 of averaged rent steps associated with certain tenants that occur within those tenants’ lease terms. Those tenants include American Century Investment Management, APG Asset Management, the Dutch Consulate, the European Union and Wells Fargo Bank. |
| Primary Competitor Property Summary | |||||||
| Property | NRA | Direct Available SF | Sublease Available SF | % Occupied (Direct) | % Occupied (Total) | Low | High |
| 730 Third Avenue | 407,000 | 0 | 0 | 100.0% | 100.0% | N/A | N/A |
| 767 Third Avenue | 275,000 | 31,943 | 41,800 | 88.4% | 73.2% | $55.00 | $62.00 |
| 780 Third Avenue | 484,005 | 60,880 | 0 | 87.4% | 87.4% | $57.00 | $75.00 |
| 875 Third Avenue | 662,588 | 13,343 | 10,383 | 98.0% | 96.4% | $62.00 | $62.00 |
| 90 Park Avenue | 785,000 | 25,897 | 10,578 | 96.7% | 95.4% | $60.00 | $75.00 |
| 99 Park Avenue | 480,000 | 31,689 | 0 | 93.4% | 93.4% | $52.00 | $62.00 |
| 100 Park Avenue | 825,815 | 26,896 | 0 | 96.7% | 96.7% | $88.00 | $88.00 |
| 485 Lexington Avenue | 733,173 | 13,882 | 43,307 | 98.1% | 92.2% | $55.00 | $55.00 |
| Total | 4,652,581 | 204,530 | 106,068 | ||||
| Wtd. / Avg. | 581,573 | 25,566 | 13,259 | 95.6% | 93.3% | $52.00 | $88.00 |
| This is not a research report and was not prepared by the BofA Merrill Lynch or Morgan Stanley research departments. Please see additional important information and qualifications at the end of this Term Sheet. |
| MSBAM 2013-C8 | Chrysler East Building |
| Cash Flow Analysis | ||||||||||||
| 2009 | 2010 | 2011 | 10/31/2012 TTM | UW | UW PSF | |||||||
Gross Potential Rent(1) | $37,132,946 | $32,700,242 | $33,365,253 | $37,513,340 | $41,013,769 | $55.04 | ||||||
| Total Reimbursements | $6,657,072 | $5,222,643 | $2,970,332 | $3,681,147 | $5,712,615 | $7.67 | ||||||
| Other Income | $4,004,484 | $3,078,486 | $4,130,271 | $3,309,215 | $757,959 | $1.02 | ||||||
| Less Vacancy & MTM Loss | $0 | $0 | $0 | $0 | $0 | $0 | ||||||
| Effective Gross Income | $47,794,502 | $41,001,371 | $40,465,856 | $44,503,702 | $47,484,343 | $63.72 | ||||||
| Total Expenses | $19,845,224 | $21,165,206 | $21,780,657 | $21,443,777 | $23,461,792 | $31.48 | ||||||
| Net Operating Income | $27,949,278 | $19,836,165 | $18,685,199 | $23,059,925 | $24,022,551 | $32.24 | ||||||
| TI/LC | $0 | $0 | $0 | $0 | $1,832,400 | $2.46 | ||||||
| Capital Expenditures | $0 | $0 | $0 | $0 | $186,300 | $0.25 | ||||||
Initial TI/LC Reserve Credit(2) | $0 | $0 | $0 | $0 | ($1,000,000) | ($1.34) | ||||||
| Net Cash Flow | $27,949,278 | $19,836,165 | $18,685,199 | $23,059,925 | $23,003,850 | $30.87 | ||||||
| Occupancy % | 99.1% | 87.4% | 92.2% | 96.3% | 96.3% | |||||||
| NOI DSCR | 2.41x | 1.71x | 1.61x | 1.99x | 2.07x | |||||||
| NCF DSCR | 2.41x | 1.71x | 1.61x | 1.99x | 1.99x | |||||||
| NOI Debt Yield | 10.5% | 7.5% | 7.1% | 8.7% | 9.1% | |||||||
| NCF Debt Yield | 10.5% | 7.5% | 7.1% | 8.7% | 8.7% | |||||||
Average Annual Rent PSF(3) | $50.28 | $50.21 | $48.56 | $52.27 | $57.18 | |||||||
| (1) | Historical and Underwritten Gross Potential Rent (“GPR”) is net of vacancy. Underwritten GPR includes contractual rents steps totaling $75,622 through June 1, 2013. Underwritten GPR also includes $782,419 of averaged rent steps associated with certain tenants that occur within those tenants’ lease terms. Those tenants include American Century Investment Management, APG Asset Management, the Dutch Consulate, the European Union and Wells Fargo Bank. |
| (2) | The borrower deposited $10,000,000 into the TI/LC reserve account at loan closing. This reserve is utilized as an offset to the underwritten TI/LC expenses over the ten year loan term at $1,000,000 per year. See “—Escrows and Reserves” below for further details. |
| (3) | Average Annual Rent PSF is based on historical financials and end of year occupancy rates. Vacant space is excluded from the calculation. The Underwritten Average Annual Rent PSF includes certain contractual rent steps and average lease term rental rates for certain tenants as described in note 1 above. |
| This is not a research report and was not prepared by the BofA Merrill Lynch or Morgan Stanley research departments. Please see additional important information and qualifications at the end of this Term Sheet. |
| MSBAM 2013-C8 | Chrysler East Building |
| This is not a research report and was not prepared by the BofA Merrill Lynch or Morgan Stanley research departments. Please see additional important information and qualifications at the end of this Term Sheet. |
| This is not a research report and was not prepared by the BofA Merrill Lynch or Morgan Stanley research departments. Please see additional important information and qualifications at the end of this Term Sheet. |
| MSBAM 2013-C8 | Boston Park Plaza |
| Mortgage Loan No. 3 – Boston Park Plaza |

| This is not a research report and was not prepared by the BofA Merrill Lynch or Morgan Stanley research departments. Please see additional important information and qualifications at the end of this Term Sheet. |
| MSBAM 2013-C8 | Boston Park Plaza |
| Mortgage Loan No. 3 – Boston Park Plaza |
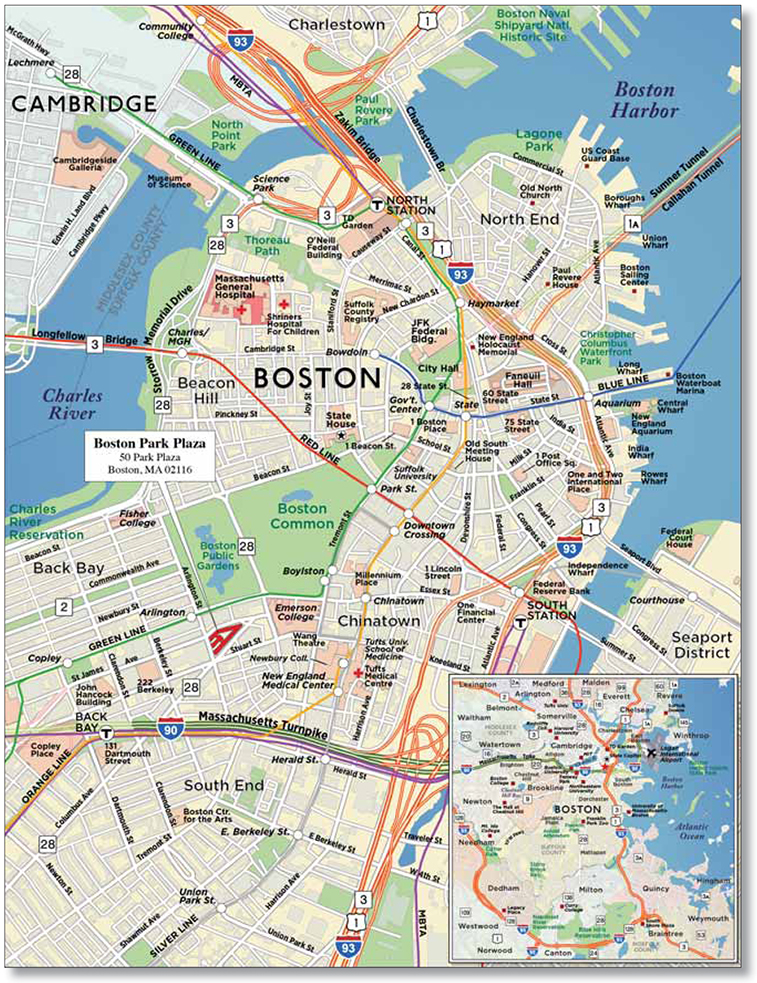
| This is not a research report and was not prepared by the BofA Merrill Lynch or Morgan Stanley research departments. Please see additional important information and qualifications at the end of this Term Sheet. |
| MSBAM 2013-C8 | Boston Park Plaza |
| Mortgage Loan No. 3 – Boston Park Plaza |
| Mortgage Loan Information | Mortgaged Property Information | |||||
| Mortgage Loan Seller: | BANA | Single Asset / Portfolio: | Single Asset | |||
| Credit Assessment (Fitch/KBRA/S&P): | NR/NR/NR | Property Address: | 50 Park Plaza Boston, MA 02116 | |||
Original Balance(1): | $95,000,000 | General Property Type: | Hospitality | |||
Cut-off Date Balance(1): | $95,000,000 | Detailed Property Type: | Full Service | |||
| % of Initial Pool Balance: | 8.3% | Number of Rooms: | 941 Rooms | |||
| Loan Purpose: | Refinance | Cut-off Date Balance Per Room: | $127,524 | |||
| Borrower Name(s): | RP/HH Park Plaza, Limited Partnership | Balloon Balance Per Room: | $92,386 | |||
| Sponsor(s): | Rockpoint Real Estate Fund III, L.P.; Highgate, L.P. | Year Built / Year Renovated: | 1927 / 2012 | |||
| Mortgage Rate: | 4.40200% | Title Vesting: | Fee | |||
| Note Date: | 1/22/2013 | Property Manager: | Highgate Hotels, L.P. | |||
| First Payment Date: | 3/1/2013 | |||||
| Anticipated Repayment Date: | NAP | Underwriting and Financial Information | ||||
| Maturity Date: | 2/1/2018 | UW Revenues: | $65,307,626 | |||
| IO Period: | None | UW Expenses: | $48,445,148 | |||
| Original Term to Maturity: | 60 months | UW NOI: | $16,862,478 | |||
| Seasoning: | 0 months | UW NCF: | $14,250,173 | |||
| Original Amortization Term: | 360 months | UW NOI DSCR(1): | 2.34x | |||
| Loan Amortization Type: | Amortizing | UW NCF DSCR(1): | 1.98x | |||
| Interest Accrual Basis: | Actual/360 | UW NOI Debt Yield(1): | 14.1% | |||
| Prepayment Provisions: | YM1 (35); O (25) | UW NCF Debt Yield(1): | 11.9% | |||
| Lockbox / Cash Management: | Hard / In Place | UW NCF Debt Yield at Maturity(1): | 13.0% | |||
| Pari Passu Mortgage Debt: | $25,000,000 | Most Recent NOI (As of)(1): | $17,697,397 (9/30/2012 TTM) | |||
| Subordinate Mortgage Debt: | None | 2nd Most Recent NOI (As of)(1): | $11,051,144 (12/31/2011) | |||
Mezzanine Debt(2): | In Place ($30,000,000) and Permitted | 3rd Most Recent NOI (As of)(1): | $4,220,000 (12/31/2010) | |||
| Preferred Equity: | Permitted | |||||
Reserves(3) | Appraised Value: | $264,000,000 | ||||
| Type | Initial | Monthly | Cap | Appraisal As-of Date: | 12/4/2012 | |
| RE Tax: | $833,337 | $416,668 | NAP | Cut-off Date LTV Ratio(1): | 45.5% | |
| Insurance: | $0 | Springing | NAP | LTV Ratio at Maturity (1): | 41.6% | |
| Deferred Maintenance: | $2,040,735 | $0 | NAP | Occupancy Rate (As of): | 85.4% (9/30/2012) | |
| FF&E: | $0 | $275,556 | NAP | 2nd Most Recent Occupancy (As of): | 80.8% (12/31/2011) | |
Other(4): | $4,656,621 | $0 | $4,500,000 | 3rd Most Recent Occupancy (As of): | 74.8% (12/31/2010) | |
| (1) | The Boston Park Plaza Mortgage Loan is part of the Boston Park Plaza Loan Pair evidenced by two pari passu notes with an aggregate Original Balance of $120,000,000. The Cut-off Date Balance per Room/SF, LTV, DSCR, Balloon Balance per Room/SF, Debt Yield and LTV Ratio at Maturity figures presented above are based on the entire $120,000,000 Boston Park Plaza Loan Pair. |
| (2) | The LTV, Debt Yield and DSCR for the Boston Park Plaza Mortgage, inclusive of mezzanine debt, is 56.8%, 9.5% and 1.44x, respectively. |
| (3) | See “—Escrows and Reserves” below for further discussion of reserve requirements. |
| (4) | The Boston Park Plaza Borrower is required to deposit $3,500,000 related to a seasonality reserve and $1,156,621 related to a room split reserve as described under “—Escrows and Reserves” below. |
| This is not a research report and was not prepared by the BofA Merrill Lynch or Morgan Stanley research departments. Please see additional important information and qualifications at the end of this Term Sheet. |
| MSBAM 2013-C8 | Boston Park Plaza |
| The Boston Park Plaza and Market Historical Occupancy, ADR, RevPAR | |||||||||
| Competitive Set | Boston Park Plaza | Penetration Factor | |||||||
Year (October TTM) | Occupancy | ADR | RevPAR | Occupancy | ADR | RevPAR | Occupancy | ADR | RevPAR |
| 2010 | 76.2% | $201.62 | $153.71 | 74.3% | $153.26 | $113.85 | 97.4% | 76.0% | 74.1% |
| 2011 | 75.0% | $200.40 | $150.31 | 78.6% | $156.65 | $123.17 | 104.8% | 78.2% | 81.9% |
| 2012 | 77.2% | $215.81 | $166.67 | 86.0% | $168.06 | $144.60 | 111.4% | 77.9% | 86.8% |
| This is not a research report and was not prepared by the BofA Merrill Lynch or Morgan Stanley research departments. Please see additional important information and qualifications at the end of this Term Sheet. |
| MSBAM 2013-C8 | Boston Park Plaza |
| Competitive Property Summary | |||||||
| Property | Rooms | Commercial % | Meeting & Group % | Leisure % | 2012E Occupancy | 2012E ADR | 2012E RevPAR |
| Hilton Boston Back Bay | 390 | 35% | 30% | 35% | 87% | $214 | $186 |
| Marriott Boston Copley Place | 1,145 | 25% | 40% | 35% | 79% | $210 | $166 |
| Sheraton Boston | 1,220 | 30% | 40% | 30% | 73% | $202 | $147 |
| Westin Copley Place | 803 | 30% | 40% | 30% | 78% | $245 | $191 |
| Total / Wtd. Avg. | 3,558 | 29% | 39% | 32% | 78% | $216 | $167 |
| Cash Flow Analysis | ||||||||||||||
| 2010 | 2011 | 9/30/2012 TTM | UW | UW per Room | ||||||||||
| Occupancy | 74.8% | 80.8% | 85.4% | 85.4% | ||||||||||
| ADR | $153.75 | $156.20 | $167.69 | $167.69 | ||||||||||
| RevPAR | $115.07 | $126.19 | $143.14 | $143.14 | ||||||||||
| Total Revenue | $56,066,000 | $61,512,662 | $66,015,283 | $65,307,626 | $69,402 | |||||||||
| Total Departmental Expenses | $27,879,000 | $27,205,175 | $25,022,908 | $24,983,941 | $26,550 | |||||||||
| Gross Operating Profit | $28,187,000 | $34,307,487 | $40,992,375 | $40,323,685 | $42,852 | |||||||||
| Total Undistributed Expenses | $17,119,000 | $16,720,085 | $16,583,408 | $16,583,408 | $17,623 | |||||||||
| Profit Before Fixed Charges | $11,068,000 | $17,587,402 | $24,408,967 | $23,740,277 | $25,229 | |||||||||
| Rent and Other Expense | $84,000 | $92,538 | $94,364 | $94,364 | $100 | |||||||||
| Total Fixed Charges | $6,764,000 | $6,443,720 | $6,617,206 | $6,783,435 | $7,209 | |||||||||
| Net Operating Income | $4,220,000 | $11,051,144 | $17,697,397 | $16,862,478 | $17,920 | |||||||||
| Replacement Reserves | $2,243,000 | $2,460,506 | $2,640,611 | $2,612,305 | $2,776 | |||||||||
| Net Cash Flow | $1,977,000 | $8,590,638 | $15,056,786 | $14,250,173 | $15,144 | |||||||||
| NOI DSCR | 0.74x | 1.94x | 3.10x | 2.95x | ||||||||||
| NCF DSCR | 0.35x | 1.50x | 2.64x | 2.50x | ||||||||||
| NOI Debt Yield | 3.5% | 9.2% | 14.7% | 14.1% | ||||||||||
| NCF Debt Yield | 1.6% | 7.2% | 12.5% | 11.9% | ||||||||||
| This is not a research report and was not prepared by the BofA Merrill Lynch or Morgan Stanley research departments. Please see additional important information and qualifications at the end of this Term Sheet. |
| MSBAM 2013-C8 | Boston Park Plaza |
| This is not a research report and was not prepared by the BofA Merrill Lynch or Morgan Stanley research departments. Please see additional important information and qualifications at the end of this Term Sheet. |
| MSBAM 2013-C8 | Wanamaker Building |
| Mortgage Loan No. 4 – Wanamaker Building |

| This is not a research report and was not prepared by the BofA Merrill Lynch or Morgan Stanley research departments. Please see additional important information and qualifications at the end of this Term Sheet. |
| MSBAM 2013-C8 | Wanamaker Building |
| Mortgage Loan No. 4 – Wanamaker Building |

| This is not a research report and was not prepared by the BofA Merrill Lynch or Morgan Stanley research departments. Please see additional important information and qualifications at the end of this Term Sheet. |
| MSBAM 2013-C8 | Wanamaker Building |
| Mortgage Loan No. 4 – Wanamaker Building |
| Mortgage Loan Information | Mortgaged Property Information | |||||
| Mortgage Loan Seller: | MSMCH | Single Asset / Portfolio: | Single Asset | |||
| Credit Assessment (Fitch/KBRA/S&P): | NR/NR/BBB- | Property Address: | Philadelphia, PA 19107 | |||
| Original Balance: | $76,500,000 | |||||
| Cut-off Date Balance: | $76,500,000 | General Property Type: | Office | |||
| % of Initial Pool Balance: | 6.7% | Detailed Property Type: | CBD | |||
| Loan Purpose: | Refinance | Net Rentable Area: | 965,577 SF | |||
| Borrower Name(s): | Wanamaker Office Lease, LP | Cut-off Date Balance Unit/SF: | $79 | |||
| Sponsor(s): | Behringer Harvard REIT I, Inc.; Amerimar Enterprises, Inc. | Balloon Balance Unit/SF: | $63 | |||
| Year Built / Year Renovated: | 1904-1911 / 1989 | |||||
| Mortgage Rate: | 3.83000% | Title Vesting(3): | Fee | |||
| Note Date: | 1/14/2013 | Property Manager: | IPC/Amerimar Wanamaker Management Co., LLC | |||
| First Payment Date: | 3/7/2013 | |||||
Anticipated Repayment Date: | NAP | Underwriting and Financial Information(4) | ||||
| Maturity Date: | 2/7/2023 | UW Revenues: | $21,779,715 | |||
| IO Period: | None | UW Expenses: | $11,548,199 | |||
| Original Term to Maturity: | 120 months | UW NOI: | $10,231,517 | |||
| Seasoning: | 0 months | UW NCF: | $8,193,465 | |||
| Original Amortization Term: | 360 months | UW NOI DSCR: | 2.38x | |||
| Loan Amortization Type: | Amortizing | UW NCF DSCR: | 1.91x | |||
| Interest Accrual Basis: | Actual/360 | UW NOI Debt Yield: | 13.4% | |||
| Prepayment Provisions: | LO (24); DEF (92); O (4) | UW NCF Debt Yield: | 10.7% | |||
| Lockbox / Cash Management: | Hard / In Place | UW NCF Debt Yield at Maturity: | 13.5% | |||
| Pari Passu Mortgage Debt: | None | Most Recent NOI (As of): | $11,552,038 (11/30/2012 TTM) | |||
| Subordinate Mortgage Debt: | $6,873,221 | 2nd Most Recent NOI (As of): | $11,122,095 (12/31/2011) | |||
| Mezzanine Debt: | None | 3rd Most Recent NOI (As of): | $11,505,659 (12/31/2010) | |||
Reserves(1) | Appraised Value: | $136,000,000 | ||||
| Type | Initial | Monthly | Cap | Appraisal As-of Date: | 12/3/2012 | |
| RE Tax: | $0 | $252,933 | NAP | Cut-off Date LTV Ratio: | 56.3% | |
| Insurance: | $0 | Springing | NAP | LTV Ratio at Maturity: | 44.5% | |
| Recurring Replacements: | $0 | $100,581 | NAP | Occupancy Rate (As of): | 96.6% (11/1/2012) | |
TI/LC(2): | $1,700,000 | $100,581 | NAP | 2nd Most Recent Occupancy (As of): | 99.2% (12/31/2011) | |
3rd Most Recent Occupancy (As of): | 99.0% (12/31/2010 ) | |||||
| (1) | See “—Escrows and Reserves” below for further discussion of reserve requirements. |
| (2) | There is currently an excess cash flow sweep in place to collect certain outstanding TI/LC obligations of the Wanamaker Building Borrower up to $7,542,667 (inclusive of the initial TI/LC reserve). At such time the $7,542,667 amount for outstanding TI/LC obligations is fully reserved, or the obligation to so reserve is waived or reduced and the reduced amount is fully reserved, the normalized monthly collection of $100,581 will begin. |
| (3) | The Wanamaker Building Borrower has pledged its leasehold interest as security for the Wanamaker Building Mortgage Loan. In addition, the fee owner has pledged its interest in the Wanamaker Building Property as collateral for the Wanamaker Building Mortgage Loan. See “—The Mortgaged Property” below for further details. |
| (4) | Unless otherwise indicated, all LTV, DSCR, Debt Yield and Cut-off Date Balance PSF/Unit calculations do not include the related subordinate secured indebtedness described below under “-Additional Secured Indebtedness (not including trade payables)”. |
| This is not a research report and was not prepared by the BofA Merrill Lynch or Morgan Stanley research departments. Please see additional important information and qualifications at the end of this Term Sheet. |
| MSBAM 2013-C8 | Wanamaker Building |
| This is not a research report and was not prepared by the BofA Merrill Lynch or Morgan Stanley research departments. Please see additional important information and qualifications at the end of this Term Sheet. |
| MSBAM 2013-C8 | Wanamaker Building |
| Tenant Summary | ||||||||||||
| Tenant Name | Credit Rating (Fitch/ Moody’s/ S&P)(1) | Tenant SF | Approx. % of SF | Annualized Underwritten Base Rent | % of Total Annualized Underwritten Base Rent | Annualized Underwritten Base Rent (PSF) | Lease Expiration | |||||
| Major Tenants | ||||||||||||
| GSA | AAA/Aaa/AA+ | 282,044 | 29% | $5,771,745 | 30% | $20.46 | 8/31/2020; 11/30/2022; 9/30/2021(2) | |||||
| Children’s Hospital of Philadelphia | NR/Aa2/AA | 252,631 | 26% | $5,368,409 | 27% | $21.25(3) | 6/30/2027 | |||||
| Digitas | NR/Baa2/BBB+ | 73,417 | 8% | $1,725,300 | 9% | $23.50 | 12/31/2020 | |||||
| United Healthcare | A-/A3/A | 61,948 | 6% | $1,372,148 | 7% | $22.15 | 8/31/2019 | |||||
| Subtotal / Wtd. Avg. | 670,040 | 69% | $14,237,601 | 73% | $21.25 | |||||||
| Other Tenants | 262,642 | 27% | $5,285,748 | 27% | $20.13 | |||||||
| Vacant Space | 32,895 | 3% | $0 | 0% | $0.00 | |||||||
| Total / Wtd. Avg. | 965,577 | 100% | $19,523,349 | 100% | $20.93(4) | |||||||
| (1) | Certain ratings may be those of the parent company whether or not the parent guarantees the lease. The ratings for Children’s Hospital of Philadelphia, which is not directly rated, reference the tenant’s current long term debt obligation ratings. |
| (2) | The GSA tenant leases space under separate leases with different lease expiration dates. See the “Major Tenants” section above for details on lease expiration dates. |
| (3) | The Children’s Hospital of Philadelphia annualized underwritten base rent includes $568,420 of averaged rent steps over the tenant’s lease term. |
| (4) | Total Annualized Underwritten Base Rent PSF excludes vacant space. |
Lease Rollover Schedule(1)(2) | ||||||||
| Year | # of Leases Rolling | SF Rolling | Average Underwritten Base Rent PSF Rolling(3) | Approx. % of Total SF Rolling | Approx. Cumulative % of SF Rolling | Total Underwritten Base Rent Rolling | Approx. % of Total Base Rent Rolling | Approx. Cumulative % of Total Base Rent Rolling |
| 2013 | 1 | 3,688 | $20.50 | 0% | 0% | $75,604 | 0% | 0% |
| 2014 | 6 | 48,852 | $21.34 | 5% | 5% | $1,042,360 | 5% | 6% |
| 2015 | 3 | 19,372 | $19.74 | 2% | 7% | $382,320 | 2% | 8% |
| 2016 | 2 | 13,422 | $15.12 | 1% | 9% | $202,890 | 1% | 9% |
| 2017 | 0 | 0 | $0.00 | 0% | 9% | $0 | 0% | 9% |
| 2018 | 3 | 75,866 | $22.51 | 8% | 17% | $1,707,464 | 9% | 17% |
| 2019 | 4 | 106,217 | $18.75 | 11% | 28% | $1,991,684 | 10% | 28% |
| 2020 | 9 | 199,020 | $22.71 | 21% | 48% | $4,519,966 | 23% | 51% |
| 2021 | 4 | 71,544 | $19.18 | 7% | 56% | $1,372,197 | 7% | 58% |
| 2022 | 3 | 137,033 | $20.10 | 14% | 70% | $2,754,698 | 14% | 72% |
| 2023 | 0 | 0 | $0.00 | 0% | 70% | $0 | 0% | 72% |
| 2024 | 0 | 0 | $0.00 | 0% | 70% | $0 | 0% | 72% |
| 2025 | 0 | 0 | $0.00 | 0% | 70% | $0 | 0% | 72% |
| 2026 & Beyond | 8 | 257,668 | $21.25 | 27% | 97% | $5,474,165 | 28% | 100% |
| Vacant | 0 | 32,895 | $0.00 | 3% | 100% | $0 | 0% | 100% |
| Total / Wtd. Avg. | 43 | 965,577 | $22.93(3) | 100% | $19,523,349 | 100% | ||
| (1) | The information in the lease rollover schedule is based on the underwritten rent roll. |
| (2) | Certain tenants may have lease termination options that are exercisable prior to the originally stated expiration date of the subject lease and that are not considered in the lease rollover schedule. |
| (3) | Average Underwritten Base Rent PSF Rolling excludes vacant space and includes $568,420 of underwritten averaged rent steps associated with the Children’s Hospital of Philadelphia tenant. |
| This is not a research report and was not prepared by the BofA Merrill Lynch or Morgan Stanley research departments. Please see additional important information and qualifications at the end of this Term Sheet. |
| MSBAM 2013-C8 | Wanamaker Building |
| Primary Competitor Property Summary | ||||||
| Property | Rentable Area (SF) | Occupancy | Year Built/ Renovated | Class | Asking Rent | |
| 801 Market Street | 927,931 | 87.8% | 1931/ 2002 | A- | $22.50 + E | |
| Aramark Tower, 1101 Market Street | 689,123 | 96.2% | 1984 | A | $25.00 + E | |
| Public Ledger Building, 600 Chestnut Street | 533,945 | 93.8% | 1927/ 2007 | A- | $24.00 + E | |
The Curtis Center, 126 South 6th Street | 885,786 | 89.6% | 1909/ 2007 | A | $27.00 + E | |
| 833 Chestnut Street | 677,413 | 84.5% | 1926/ 2000 | A- | $23.00 + E | |
| One South Broad Street | 464,800 | 92.9% | 1932 | B+ | $23.00 FS | |
| The Widener Building, 1327-1341 Chestnut Street | 456,650 | 88.0% | 1915 | A-/ B+ | $20.00 - $22.00 + E | |
| Total / Wtd. Avg. | 4,635,648 | 90.1% | ||||
| Cash Flow Analysis | |||||||||||
| 2010 | 2011 | 11/30/2012 TTM | UW | UW PSF | |||||||
Gross Potential Rent(1) | $20,441,091 | $20,784,782 | $21,052,880 | $19,523,349 | $20.22 | ||||||
| Total Reimbursements | $1,113,498 | $943,793 | $714,745 | $966,740 | $1.00 | ||||||
Parking Lease Income(2) | $0 | $0 | $0 | $1,879,744 | $1.95 | ||||||
Other Income(3) | $1,407,018 | $979,279 | $1,805,373 | $266,275 | $0.28 | ||||||
| Less Vacancy & Abatements | ($809,487) | ($633,125) | ($1,054,808) | ($856,393) | ($0.89) | ||||||
| Effective Gross Income | $22,152,120 | $22,074,728 | $22,518,190 | $21,779,715 | $22.56 | ||||||
| Total Expenses | $10,646,461 | $10,952,633 | $10,966,152 | $11,548,199 | $11.96 | ||||||
| Net Operating Income | $11,505,659 | $11,122,095 | $11,552,038 | $10,231,517 | $10.60 | ||||||
| TI/LC | $0 | $0 | $0 | $1,748,378 | $1.81 | ||||||
| Capital Expenditures | $0 | $0 | $0 | $289,673 | $0.30 | ||||||
| Net Cash Flow | $11,505,659 | $11,122,095 | $11,552,038 | $8,193,465 | $8.49 | ||||||
| Occupancy % | 99.0% | 99.2% | 96.6% | 92.7% | |||||||
| NOI DSCR | 2.68x | 2.59x | 2.69x | 2.38x | |||||||
| NCF DSCR | 2.68x | 2.59x | 2.69x | 1.91x | |||||||
| NOI Debt Yield | 15.0% | 14.5% | 15.1% | 13.4% | |||||||
| NCF Debt Yield | 15.0% | 14.5% | 15.1% | 10.7% | |||||||
| (1) | Historical and Underwritten Gross Potential Rent (“GPR”) are net of actual vacancy. Underwritten GPR includes contractual rents steps totaling $568,420 associated with the Children’s Hospital of Philadelphia tenant. |
| (2) | Historical GPR includes income from the parking operator lease. For underwriting purposes, the parking income is shown as an individual line item. |
| (3) | Historical Other Income includes certain borrower accounting adjustments for future rent steps. |
| This is not a research report and was not prepared by the BofA Merrill Lynch or Morgan Stanley research departments. Please see additional important information and qualifications at the end of this Term Sheet. |
| MSBAM 2013-C8 | Wanamaker Building |
| This is not a research report and was not prepared by the BofA Merrill Lynch or Morgan Stanley research departments. Please see additional important information and qualifications at the end of this Term Sheet. |
| This is not a research report and was not prepared by the BofA Merrill Lynch or Morgan Stanley research departments. Please see additional important information and qualifications at the end of this Term Sheet. |
| MSBAM 2013-C8 | Hyatt Regency Hill Country Resort and Spa |

| This is not a research report and was not prepared by the BofA Merrill Lynch or Morgan Stanley research departments. Please see additional important information and qualifications at the end of this Term Sheet. |
| MSBAM 2013-C8 | Hyatt Regency Hill Country Resort and Spa |
| This is not a research report and was not prepared by the BofA Merrill Lynch or Morgan Stanley research departments. Please see additional important information and qualifications at the end of this Term Sheet. |
| MSBAM 2013-C8 | Hyatt Regency Hill Country Resort and Spa |
| Mortgage Loan No. 5 – Hyatt Regency Hill Country Resort and Spa |
| Mortgage Loan Information | Mortgaged Property Information | |||||
| Mortgage Loan Seller: | MSMCH | Single Asset / Portfolio: | Single Asset | |||
| Credit Assessment (Fitch/KBRA/S&P): | NR/NR/NR | Property Address: | 9800 Hyatt Resort Drive San Antonio, TX 78251 | |||
| Original Balance: | $61,000,000 | |||||
| Cut-off Date Balance: | $61,000,000 | General Property Type: | Hospitality | |||
| % of Initial Pool Balance: | 5.4% | Detailed Property Type: | Full Service | |||
| Loan Purpose: | Refinance | Number of Rooms: | 500 Rooms | |||
| Borrower Name(s): | SARLP-Resort Owner, LLC | Cut-off Date Balance Per Room: | $122,000 | |||
| Sponsor(s): | Woodbine Holdings, Ltd. | Balloon Balance Per Room: | $115,529 | |||
| Mortgage Rate: | 5.59000% | Year Built / Year Renovated(3): | 1992 / 2001; 2005; 2012-2013 | |||
| Note Date: | 12/31/2012 | Title Vesting(4): | Fee/Leasehold | |||
| First Payment Date: | 2/1/2013 | Property Manager: | Hyatt Corporation | |||
| Anticipated Repayment Date: | NAP | |||||
| Maturity Date: | 1/1/2018 | Underwriting and Financial Information | ||||
| IO Period: | 12 months | UW Revenues: | $43,965,549 | |||
| Original Term to Maturity: | 60 months | UW Expenses: | $36,002,057 | |||
| Seasoning: | 1 month | UW NOI: | $7,963,492 | |||
| Original Amortization Term: | 360 months | UW NCF: | $6,204,870 | |||
| Loan Amortization Type: | Partial IO | UW NOI DSCR: | 1.90x | |||
| Interest Accrual Basis: | Actual/360 | UW NCF DSCR: | 1.48x | |||
| Prepayment Provisions: | LO (25); DEF (10); O (25) | UW NOI Debt Yield: | 13.1% | |||
| Lockbox / Cash Management: | Soft / In Place | UW NCF Debt Yield: | 10.2% | |||
| Pari Passu Mortgage Debt: | None | UW NCF Debt Yield at Maturity: | 10.7% | |||
| Subordinate Mortgage Debt: | None | Most Recent NOI (As of): | $7,923,681(11/30/2012 TTM) | |||
Mezzanine Debt(1): | $5,442,609 (Permitted up to $28,500,000) | 2nd Most Recent NOI (As of): | $8,667,249 (12/31/2011) | |||
| 3rd Most Recent NOI (As of): | $7,106,992 (12/31/2010) | |||||
Reserves(2) | Appraised Value(5): | $133,000,000 | ||||
| Type: | Initial | Monthly | Cap | Appraisal As-of Date: | 12/1/2012 | |
| RE Tax: | $0 | $199,763 | NAP | Cut-off Date LTV Ratio: | 45.9% | |
| Insurance: | $0 | Springing | NAP | LTV Ratio at Maturity: | 43.4% | |
| FF&E: | $0 | $183,186 | NAP | Occupancy Rate (As of): | 62.8% (11/30/2012 TTM) | |
2nd Most Recent Occupancy (As of): | 62.3% (12/31/2011 TTM) | |||||
3rd Most Recent Occupancy (As of): | 55.0% (12/31/2010 TTM) | |||||
| (1) | Mezzanine financing funded in stages to finance property renovation costs to a maximum of $28,500,000 is permitted. See “—Mezzanine Loan and Preferred Equity” below for further discussion of in place and future mezzanine financing. |
| (2) | See “—Escrows and Reserves” below for further discussion of reserve requirements. |
| (3) | See “—The Mortgaged Property” below for further discussion of a current renovation program. |
| (4) | A portion of an on-site golf course is subject to a ground lease expiring on 4/1/2102, with annual ground rent of $1.00, plus certain additional rent. |
| (5) | The Appraised Value is an “as is” value, not considering the on-going renovation program. |
| This is not a research report and was not prepared by the BofA Merrill Lynch or Morgan Stanley research departments. Please see additional important information and qualifications at the end of this Term Sheet. |
| MSBAM 2013-C8 | Hyatt Regency Hill Country Resort and Spa |
| Primary Competitor Property Summary | ||||||||||||
| Property | Rooms | Location | Distance | Date Opened | Meeting Space (SF) | Golf Course | ||||||
| Barton Creek Resort & Spa | 303 | Austin, Texas | 103 miles northeast | 1988 | 30,859 | 72 holes, Championship | ||||||
| Hilton San Antonio Hill Country Hotel & Spa | 227 | San Antonio, Texas | 0.8 miles northwest | 2002 | 13,830 | None | ||||||
| Westin La Cantera Hill Country Resort | 508 | San Antonio, Texas | 13 miles northeast | 1999 | 39,000 | 36 holes, Championship | ||||||
| JW Marriott San Antonio Hill Country Resort & Spa | 1,002 | San Antonio, Texas | 30 miles northeast | 2010 | 120,700 | 36 holes, Championship | ||||||
| Hyatt Regency Lost Pines Resort & Spa | 491 | Lost Pines, Texas | 110 miles northeast | 2006 | 34,156 | 18 holes, Wolfdancer Golf Club | ||||||
| Total: | 2,531 | |||||||||||
| Source: Appraisal. |
| This is not a research report and was not prepared by the BofA Merrill Lynch or Morgan Stanley research departments. Please see additional important information and qualifications at the end of this Term Sheet. |
| MSBAM 2013-C8 | Hyatt Regency Hill Country Resort and Spa |
| Cash Flow Analysis | |||||||||
| 2010 | 2011 | 11/30/2012 TTM | UW | UW per Room | |||||
| Occupancy % | 55.0% | 62.3% | 62.8% | 62.8% | |||||
| ADR | $194.79 | $194.00 | $194.52 | $194.52 | |||||
| RevPAR | $107.17 | $120.93 | $122.11 | $122.11 | |||||
| Room Revenue | $19,558,361 | $22,068,924 | $22,346,838 | $22,346,838 | $44,694 | ||||
| Food & Beverage Revenue | $14,908,539 | $17,947,192 | $16,482,546 | $16,482,546 | $32,965 | ||||
| Other Income | $4,770,653 | $5,337,936 | $5,136,165 | $5,136,165 | $10,272 | ||||
| Less Vacancy & Credit Loss | $0 | $0 | $0 | $0 | $0 | ||||
| Total Revenue | $39,237,553 | $45,354,052 | $43,965,549 | $43,965,549 | $87,931 | ||||
| Total Expenses | $32,130,561 | $36,686,803 | $36,041,868 | $36,002,057 | $72,004 | ||||
| Net Operating Income | $7,106,992 | $8,667,249 | $7,923,681 | $7,963,492 | $15,927 | ||||
| FF&E | $1,961,840 | $2,267,654 | $2,198,236 | $1,758,622 | $3,517 | ||||
| Net Cash Flow | $5,145,152 | $6,399,595 | $5,725,445 | $6,204,870 | $12,410 | ||||
| NOI DSCR | 1.69x | 2.06x | 1.89x | 1.90x | |||||
| NCF DSCR | 1.23x | 1.52x | 1.36x | 1.48x | |||||
| NOI Debt Yield | 11.7% | 14.2% | 13.0% | 13.1% | |||||
| NCF Debt Yield | 8.4% | 10.5% | 9.4% | 10.2% | |||||
| This is not a research report and was not prepared by the BofA Merrill Lynch or Morgan Stanley research departments. Please see additional important information and qualifications at the end of this Term Sheet. |
| MSBAM 2013-C8 | Hyatt Regency Hill Country Resort and Spa |
| This is not a research report and was not prepared by the BofA Merrill Lynch or Morgan Stanley research departments. Please see additional important information and qualifications at the end of this Term Sheet. |
| MSBAM 2013-C8 | Storage Post Portfolio |
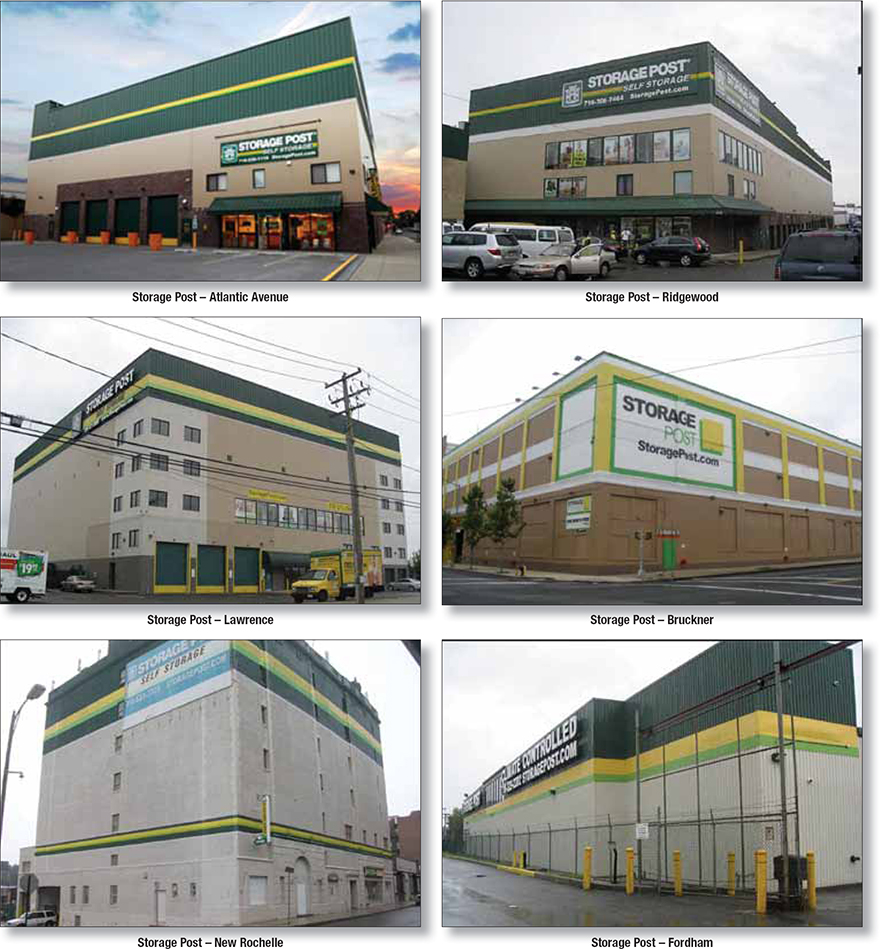
| This is not a research report and was not prepared by the BofA Merrill Lynch or Morgan Stanley research departments. Please see additional important information and qualifications at the end of this Term Sheet. |
| MSBAM 2013-C8 | Storage Post Portfolio |
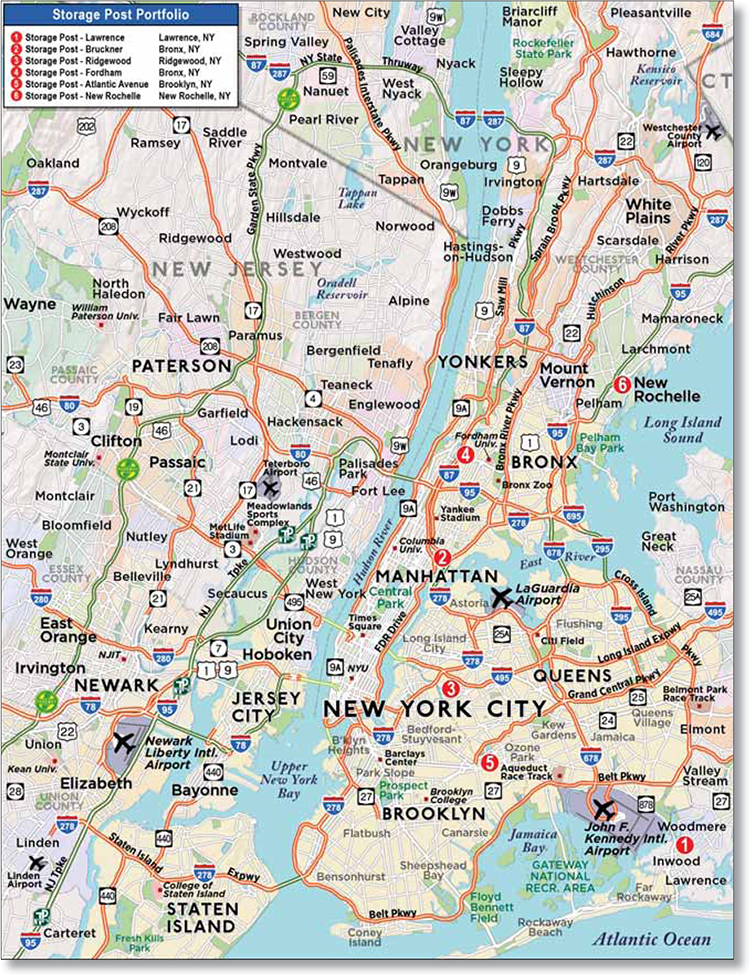
| This is not a research report and was not prepared by the BofA Merrill Lynch or Morgan Stanley research departments. Please see additional important information and qualifications at the end of this Term Sheet. |
| MSBAM 2013-C8 | Storage Post Portfolio |
| Mortgage Loan No. 6 – Storage Post Portfolio |
| Mortgage Loan Information | Mortgaged Property Information | |||||
| Mortgage Loan Seller: | BANA | Single Asset / Portfolio: | Portfolio | |||
| Credit Assessment (Fitch/KBRA/S&P): | NR/NR/BBB- | Property Address(3): | Various | |||
| Original Balance: | $54,400,000 | General Property Type: | Self Storage | |||
| Cut-off Date Balance: | $54,400,000 | Detailed Property Type: | Self Storage | |||
| % of Initial Pool Balance: | 4.8% | Net Rentable Area: | 478,620 SF | |||
| Loan Purpose: | Acquisition | Cut-off Date Balance Per Unit/SF: | $114 | |||
| Borrower Name(s): | SP HHF Sub B LLC | Balloon Balance Per Unit/SF: | $114 | |||
| Sponsor: | Storage Post HHF Venture, LLC | Year Built / Year Renovated(3): | Various | |||
| Mortgage Rate: | 3.75500% | Title Vesting: | Fee | |||
| Note Date: | 12/20/2012 | Property Manager: | Self Storage Management LLC | |||
| First Payment Date: | 2/1/2013 | |||||
| Anticipated Repayment Date: | NAP | Underwriting and Financial Information | ||||
| Maturity Date: | 1/1/2023 | UW Revenues: | $11,123,903 | |||
| IO Period: | 120 months | UW Expenses: | $4,602,097 | |||
| Original Term to Maturity: | 120 months | UW NOI: | $6,521,806 | |||
| Seasoning: | 1 month | UW NCF: | $6,473,944 | |||
| Original Amortization Term: | NAP | UW NOI DSCR: | 3.15x | |||
| Loan Amortization Type: | Full IO | UW NCF DSCR: | 3.13x | |||
| Interest Accrual Basis: | Actual/360 | UW NOI Debt Yield: | 12.0% | |||
| Prepayment Provisions: | LO (25); YM1 (91); O (4) | UW NCF Debt Yield: | 11.9% | |||
| Lockbox / Cash Management: | Hard / Springing | UW NCF Debt Yield at Maturity: | 11.9% | |||
| Pari Passu Mortgage Debt: | None | Most Recent NOI (As of): | $6,743,333 (12/31/2012) | |||
| Subordinate Mortgage Debt: | None | 2nd Most Recent NOI (As of): | $4,994,283 (12/31/2011) | |||
| Mezzanine Debt: | None | 3rd Most Recent NOI (As of): | $3,522,183 (12/31/2010) | |||
Reserves(1) | Appraised Value: | $119,000,000 | ||||
| Type | Initial | Monthly | Cap | Appraisal As-of Date: | 11/29/2012 | |
| RE Tax: | $217,818 | $113,001 | NAP | Cut-off Date LTV Ratio: | 45.7% | |
| Insurance: | $0 | Springing | NAP | LTV Ratio at Maturity: | 45.7% | |
| Recurring Replacements: | $0 | $3,989 | NAP | Occupancy Rate (As of): | 95.3% (12/5/2012) | |
Other (2): | $723,152 | $0 | NAP | 2nd Most Recent Occupancy (As of): | 86.3% (12/31/2011) | |
3rd Most Recent Occupancy (As of): | 73.6% (12/31/2010) | |||||
| (1) | See “—Escrows and Reserves” below for further discussion of reserve requirements. |
| (2) | The other initial reserve is for an environmental reserve related to the Storage Post – Atlantic Avenue Property and a renovation reserve related to the Storage Post – Bruckner Property as described under “—Escrows and Reserves” below. |
| (3) | See property summary table. |
| This is not a research report and was not prepared by the BofA Merrill Lynch or Morgan Stanley research departments. Please see additional important information and qualifications at the end of this Term Sheet. |
| MSBAM 2013-C8 | Storage Post Portfolio |
| Property Summary | ||||||||||||||||||
| Property | Location | Title Vesting | Allocated Cut-off Date Loan Amount | % of Allocated Loan Amount | Appraised Value | Year Built / Renovated | Percent Leased | Units | SF | |||||||||
| Storage Post – Lawrence | Lawrence, NY | Fee | $12,000,000 | 22% | $26,400,000 | 2006 / NAP | 99.6% | 1,261 | 97,743 | |||||||||
| Storage Post – Bruckner | Bronx, NY | Fee | $10,000,000 | 18% | $21,400,000 | 1924 / 2000 | 92.6% | 1,645 | 89,386 | |||||||||
| Storage Post – Ridgewood | Ridgewood, NY | Fee | $9,600,000 | 18% | $21,300,000 | 2009 / NAP | 95.9% | 1,186 | 88,120 | |||||||||
| Storage Post – Fordham | Bronx, NY | Fee | $9,200,000 | 17% | $20,100,000 | 2003 / NAP | 92.6% | 1,370 | 85,755 | |||||||||
| Storage Post – Atlantic Avenue | Brooklyn, NY | Fee | $9,100,000 | 17% | $19,900,000 | 1964; 2009 / NAP | 97.9% | 1,145 | 75,461 | |||||||||
| Storage Post – New Rochelle | New Rochelle, NY | Fee | $4,500,000 | 8% | $9,900,000 | 1927 / 2000 | 91.0% | 698 | 42,155 | |||||||||
| Total / Wtd. Avg. | $54,400,000 | 100% | $119,000,000 | 95.3% | 7,305 | 478,620 | ||||||||||||
| Market Summary | |||||
| Property | Location | Population (2012) | Appraiser’s Competitive Set Occupancy Rate | ||
| 1-Mile Radius | 3-Mile Radius | 5-Mile Radius | |||
| Storage Post - Fordham | Bronx, NY | 232,666 | 1,102,000 | 2,093,175 | 92.6% |
| Storage Post - Ridgewood | Ridgewood, NY | 74,998 | 936,561 | 3,133,425 | 85.2% |
| Storage Post - Lawrence | Lawrence, NY | 14,055 | 188,100 | 528,430 | 90.8% |
| Storage Post - New Rochelle | New Rochelle, NY | 45,582 | 165,939 | NAP | 91.4% |
| Storage Post - Bruckner | Bronx, NY | 98,856 | 1,214,036 | 2,823,554 | 89.8% |
| Storage Post - Atlantic Avenue | Brooklyn, NY | 120,878 | 825,653 | 2,283,878 | 92.0% |
| Source: Appraisals. |
| This is not a research report and was not prepared by the BofA Merrill Lynch or Morgan Stanley research departments. Please see additional important information and qualifications at the end of this Term Sheet. |
| MSBAM 2013-C8 | Storage Post Portfolio |
| Cash Flow Analysis | ||||||||||
| 2010 | 2011 | 10/31/2012 TTM | UW | UW PSF | ||||||
| Rental Income | $8,124,479 | $9,725,779 | $10,984,710 | $12,040,361 | $25.16 | |||||
| Vacancy | $0 | $0 | $0 | ($1,766,522) | 14.7% | |||||
| Concessions/Other | ($959,768) | ($875,401) | ($710,871) | $0 | $0.00 | |||||
| Other Income | $354,760 | $440,799 | $850,064 | $850,064 | $1.78 | |||||
| Effective Gross Income | $7,519,471 | $9,291,177 | $11,123,903 | $11,123,903 | $23.24 | |||||
| Total Operating Expense | $3,997,287 | $4,296,893 | $4,380,570 | $4,602,097 | $9.62 | |||||
| Net Operating Income | $3,522,183 | $4,994,283 | $6,743,333 | $6,521,806 | $13.63 | |||||
| Capital Expenditures | $0 | $0 | $0 | $47,862 | $0.10 | |||||
| Net Cash Flow | $3,522,183 | $4,994,283 | $6,743,333 | $6,473,944 | $13.53 | |||||
| Occupancy % | 73.6% | 86.3% | 93.5% | 85.3% | ||||||
| NOI DSCR | 1.70x | 2.41x | 3.26x | 3.15x | ||||||
| NCF DSCR | 1.70x | 2.41x | 3.26x | 3.13x | ||||||
| NOI Debt Yield | 6.5% | 9.2% | 12.4% | 12.0% | ||||||
| NCF Debt Yield | 6.5% | 9.2% | 12.4% | 11.9% | ||||||
| This is not a research report and was not prepared by the BofA Merrill Lynch or Morgan Stanley research departments. Please see additional important information and qualifications at the end of this Term Sheet. |
| This is not a research report and was not prepared by the BofA Merrill Lynch or Morgan Stanley research departments. Please see additional important information and qualifications at the end of this Term Sheet. |
MSBAM 2013-C8 | Carolina Premium Outlets |
Mortgage Loan No. 7 – Carolina Premium Outlets |
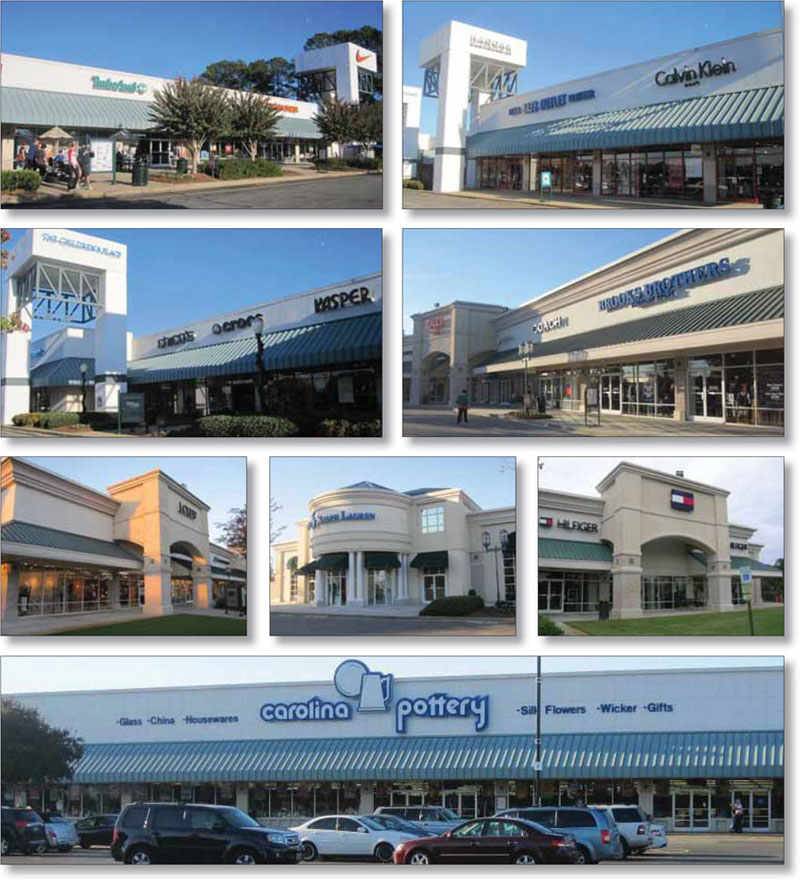
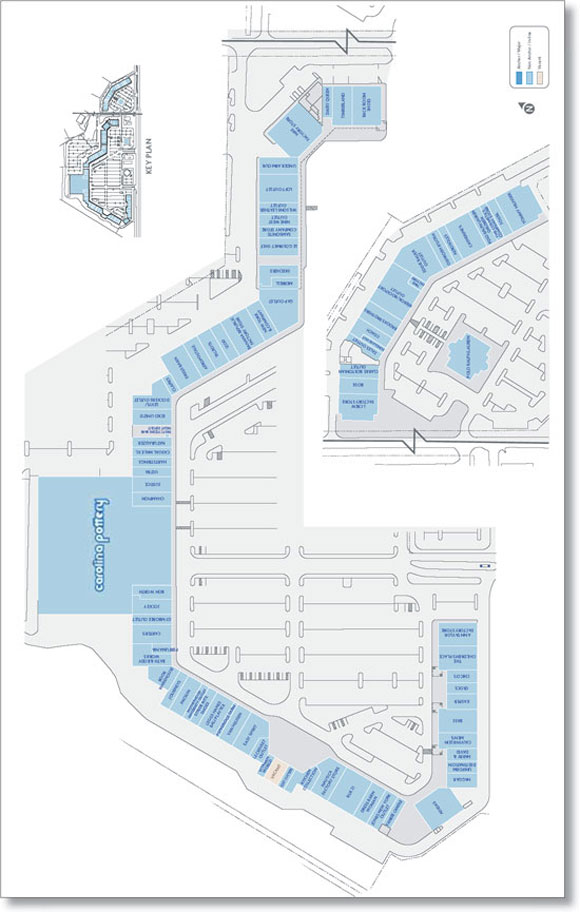
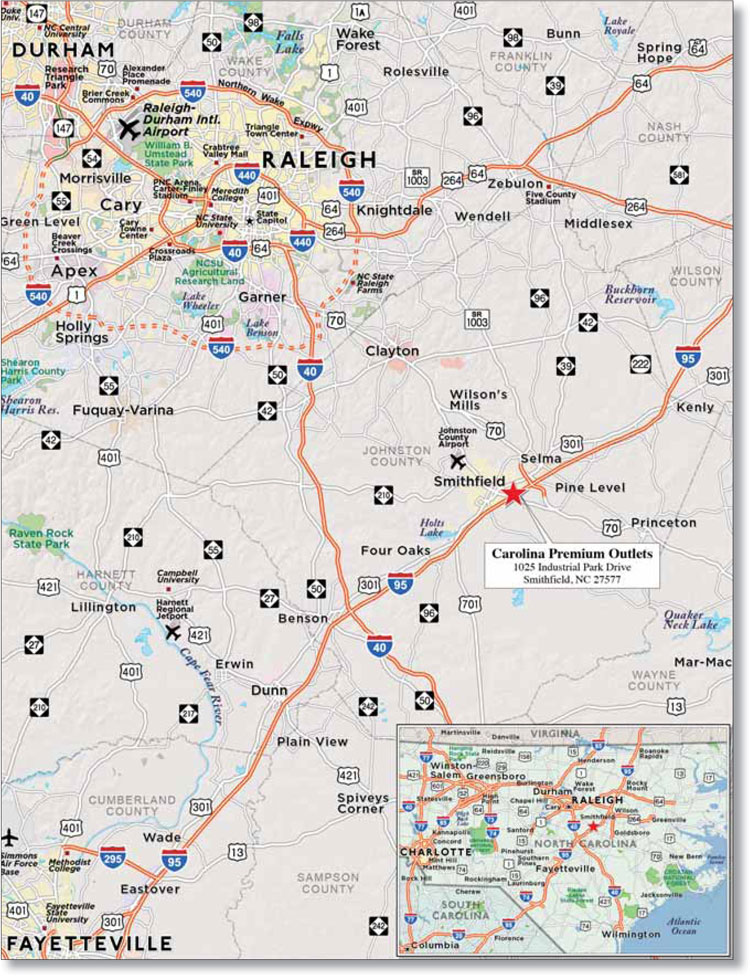
| This is not a research report and was not prepared by the BofA Merrill Lynch or Morgan Stanley research departments. Please see additional important information and qualifications at the end of this Term Sheet. |
MSBAM 2013-C8 | Carolina Premium Outlets |
| Mortgage Loan No. 7 – Carolina Premium Outlets |
| Mortgage Loan Information | Mortgaged Property Information | |||||
| Mortgage Loan Seller: | BANA | Single Asset / Portfolio: | Single Asset | |||
| Credit Assessment (Fitch/KBRA/S&P): | BBB-/AA/AA | Property Address: | 1025 Industrial Park Drive | |||
| Original Balance: | $50,500,000 | Smithfield, NC 27577 | ||||
| Cut-off Date Balance: | $50,346,450 | General Property Type: | Retail | |||
| % of Initial Pool Balance: | 4.4% | Detailed Property Type: | Anchored | |||
| Loan Purpose: | Refinance | Net Rentable Area: | 439,009 SF | |||
| Borrower Name(s): | Carolina Premium Outlets, LLC | Cut-off Date Balance Per Unit/SF: | $115 | |||
| Sponsor: | Simon Property Group, L.P. | Balloon Balance Per Unit/SF: | $89 | |||
| Mortgage Rate: | 3.36400% | Year Built / Year Renovated: | 1987 / NAP | |||
| Note Date: | 11/14/2012 | Title Vesting: | Fee | |||
| First Payment Date: | 1/1/2013 | Property Manager: | Simon Management Associates, LLC | |||
| Anticipated Repayment Date: | NAP | Underwriting and Financial Information | ||||
| Maturity Date: | 12/1/2022 | UW Revenues: | $11,746,692 | |||
| IO Period: | None | UW Expenses: | $3,070,640 | |||
| Original Term to Maturity: | 120 months | UW NOI: | $8,676,053 | |||
| Seasoning: | 2 months | UW NCF: | $8,138,526 | |||
| Original Amortization Term: | 360 months | UW NOI DSCR: | 3.24x | |||
| Loan Amortization Type: | Amortizing | UW NCF DSCR: | 3.04x | |||
| Interest Accrual Basis: | Actual/360 | UW NOI Debt Yield: | 17.2% | |||
| Prepayment Provisions: | LO (26); DEF (87); O (7) | UW NCF Debt Yield: | 16.2% | |||
| Lockbox / Cash Management: | Hard / Springing | UW NCF Debt Yield at Maturity: | 20.7% | |||
| Pari Passu Mortgage Debt: | None | Most Recent NOI (As of): | $8,482,030 (6/30/2012 TTM) | |||
| Subordinate Mortgage Debt: | None | 2nd Most Recent NOI (As of): | $8,325,073 (12/31/2011) | |||
| Mezzanine Debt: | None | 3rd Most Recent NOI (As of): | $7,907,744 (12/31/2010) | |||
Reserves(1) | Appraised Value: | $122,500,000 | ||||
| Type | Initial | Monthly | Cap | Appraisal As-of Date: | 10/24/2012 | |
| RE Tax: | $0 | Springing | NAP | Cut-off Date LTV Ratio: | 41.1% | |
| Insurance: | $0 | Springing | NAP | LTV Ratio at Maturity: | 32.1% | |
| Recurring Replacements: | $0 | Springing | $72,000 | Occupancy Rate (As of): | 100.0% (11/5/2012) | |
| TI/LC: | $0 | Springing | $1,314,000 | 2nd Most Recent Occupancy (As of): | 99.5% (12/31/2011) | |
| Carolina Pottery Reserve: | $0 | Springing | $2,000,000 | 3rd Most Recent Occupancy (As of): | 100.0% (12/31/2010) | |
| (1) | See “—Escrows and Reserves” below for further discussion of reserve requirements. |
| This is not a research report and was not prepared by the BofA Merrill Lynch or Morgan Stanley research departments. Please see additional important information and qualifications at the end of this Term Sheet. |
MSBAM 2013-C8 | Carolina Premium Outlets |
| This is not a research report and was not prepared by the BofA Merrill Lynch or Morgan Stanley research departments. Please see additional important information and qualifications at the end of this Term Sheet. |
MSBAM 2013-C8 | Carolina Premium Outlets |
| Tenant Summary | |||||||||||||||||||
| Tenant Name | Credit Rating (Fitch/KBRA/S&P)(1) | Tenant SF(2) | Approx .. % of SF | Annualized Underwritten Base Rent ($) | % of Total Annualized Underwritten Base Rent | Annualized Underwritten Base Rent ($ Per NRSF)(3) | Lease Expiration | TTM 8/12 Sales PSF | UW Occupancy Cost as % of Sales | ||||||||||
| Major Tenants | |||||||||||||||||||
| Carolina Pottery | NR / NR / NR | 104,000 | 24% | $468,000 | 6% | $4.50 | 12/31/2013 | NAV | 0.0% | ||||||||||
| Nike Factory Store | NR / A1 / A+ | 11,284 | 3% | $157,976 | 2% | $14.00 | 11/30/2018 | $631 | 3.5% | ||||||||||
| Reebok/Rockport Outlet | NR / NR / NR | 10,520 | 2% | $195,462 | 2% | $18.58 | 10/31/2019 | $194 | 14.8% | ||||||||||
| Tommy Hilfiger | NR / Ba3 / BB+ | 9,004 | 2% | $225,100 | 3% | $25.00 | 1/31/2020 | $257 | 9.7% | ||||||||||
| Polo Ralph Lauren | NR / A3 / A- | 8,606 | 2% | $86,067 | 1% | $10.00 | 10/31/2014 | $688 | 2.5% | ||||||||||
| Gap Outlet | BBB- / Baa3 / BB+ | 8,456 | 2% | $285,539 | 3% | $33.77 | 7/31/2014 | $451 | 7.3% | ||||||||||
| Eddie Bauer Outlet | NR / NR / NR | 8,369 | 2% | $129,301 | 2% | $15.45 | 1/31/2017 | $151 | 20.4% | ||||||||||
| Adidas | NR / NR / NR | 8,008 | 2% | $232,087 | 3% | $28.98 | 1/31/2018 | $296 | 12.0% | ||||||||||
| Rack Room Shoes | NR / NR / NR | 7,573 | 2% | $188,265 | 2% | $24.86 | 1/31/2017 | $438 | 8.2% | ||||||||||
| Banana Republic Factory | BBB- / Baa3 / BB+ | 7,500 | 2% | $127,500 | 2% | $17.00 | 7/31/2014 | $471 | 4.5% | ||||||||||
| Subtotal / Wtd. Avg. | 183,320 | 42% | $2,095,297 | 25% | $19.21 | ||||||||||||||
| Other Tenants | 253,289 | 58% | $6,345,963 | 75% | $25.05 | ||||||||||||||
| Vacant Space | 2,400 | 1% | $0 | 0% | $0.00 | ||||||||||||||
| Total / Wtd. Avg. | 439,009 | 100% | $8,441,260 | 100% | $19.33 | ||||||||||||||
| (1) | Certain ratings are those of the parent company whether or not the parent guarantees the lease. |
| (2) | Information is based on the underwritten rent roll. |
| (3) | Total Annualized Underwritten Base Rent ($ per NSRF) excludes vacant space. |
| This is not a research report and was not prepared by the BofA Merrill Lynch or Morgan Stanley research departments. Please see additional important information and qualifications at the end of this Term Sheet. |
MSBAM 2013-C8 | Carolina Premium Outlets |
Lease Rollover Schedule(1)(2) | |||||||||||||||
| Year | # of Leases Rolling | SF Rolling | Average Underwritten Base Rent PSF Rolling(3) | Approx. % of Total SF Rolling | Approx. Cumulative % of SF Rolling | Total Underwritten Base Rent Rolling | Approx. % of Total Base Rent Rolling | Approx. Cumulative % of Total Base Rent Rolling | |||||||
| MTM | 1 | 1,000 | $0.00 | 0% | 0% | $0 | 0% | 0% | |||||||
| 2013 | 19 | 152,277 | $10.66 | 35% | 35% | $1,623,833 | 19% | 19% | |||||||
| 2014 | 10 | 47,296 | $21.90 | 11% | 46% | $1,035,761 | 12% | 32% | |||||||
| 2015 | 6 | 21,329 | $21.83 | 5% | 51% | $465,551 | 6% | 37% | |||||||
| 2016 | 13 | 39,669 | $26.42 | 9% | 60% | $1,048,129 | 12% | 49% | |||||||
| 2017 | 8 | 36,866 | $22.66 | 8% | 68% | $835,478 | 10% | 59% | |||||||
| 2018 | 6 | 30,707 | $23.07 | 7% | 75% | $708,526 | 8% | 68% | |||||||
| 2019 | 3 | 18,120 | $22.17 | 4% | 79% | $401,775 | 5% | 72% | |||||||
| 2020 | 5 | 23,823 | $27.88 | 5% | 85% | $664,146 | 8% | 80% | |||||||
| 2021 | 6 | 28,771 | $24.75 | 7% | 91% | $712,159 | 8% | 89% | |||||||
| 2022 | 5 | 29,033 | $25.39 | 7% | 98% | $737,234 | 9% | 98% | |||||||
| 2023 & Beyond | 2 | 7,718 | $27.04 | 2% | 99% | $208,668 | 2% | 100% | |||||||
| Vacant | 0 | 2,400 | $0.00 | 1% | 100% | $0 | 0% | ||||||||
| Total / Wtd. Avg. | 84 | 439,009 | $19.33 | 100% | $8,441,260 | 100% | |||||||||
| (1) | The information in the lease rollover schedule is based on the underwritten rent roll. |
| (2) | Certain tenants may have lease termination options that are exercisable prior to the originally stated expiration date of the subject lease and that are not considered in the lease rollover schedule. |
| (3) | Average Base Rent PSF Rolling excludes vacant space. |
| Competitive Property Summary | ||||||||||
Property | City | State | Competition | Center Type | Total GLA | Occupancy | Proximity | |||
| Tanger Factory Outlet | Mebane | NC | Primary | Outlet Center | 318,990 | 100.0% | 66 miles | |||
| Berkeley Mall | Goldsboro | NC | Secondary | Regional Center | 446,818 | 91.0% | 23 miles | |||
| Wilson Mall | Wilson | NC | Secondary | Regional Center | 471,880 | 64.0% | 26 miles | |||
| Cary Towne Center | Cary | NC | Secondary | Super-Regional | 1,014,155 | 96.0% | 31 miles | |||
| Triangle Center | Raleigh | NC | Secondary | Super-Regional | 1,261,125 | 95.0% | 28 miles | |||
| Crabtree Valley Mall | Raleigh | NC | Secondary | Super-Regional | 1,480,043 | 100.0% | 31 miles | |||
| The Streets at Southpoint | Durham | NC | Secondary | Super-Regional | 1,326,000 | 98.0% | 44 miles | |||
| Cross Creek Mall | Fayetteville | NC | Secondary | Super-Regional | 1,001,345 | 99.0% | 47 miles | |||
| This is not a research report and was not prepared by the BofA Merrill Lynch or Morgan Stanley research departments. Please see additional important information and qualifications at the end of this Term Sheet. |
MSBAM 2013-C8 | Carolina Premium Outlets |
| Cash Flow Analysis | ||||||||||||
| 2009 | 2010 | 2011 | 6/30/2012 TTM | UW | UW PSF | |||||||
| Gross Potential Rent | $7,020,386 | $7,536,230 | $7,828,838 | $8,176,913 | $8,507,260 | $19.38 | ||||||
| Percentage Rent | $579,001 | $714,882 | $427,885 | $442,497 | $441,366 | $1.01 | ||||||
| Total Reimbursements | $2,456,277 | $2,162,463 | $3,011,443 | $3,079,740 | $3,216,294 | $7.33 | ||||||
| Other Income | $156,833 | $156,258 | $158,073 | $164,678 | $158,073 | $0.36 | ||||||
| Temporary Tenants | $56,683 | $27,066 | $31,946 | $46,649 | $31,946 | $0.07 | ||||||
| Less Vacancy & Credit Loss | ($82,873) | $59,605 | ($9,952) | $9,816 | ($608,246) | (5.00%) | ||||||
| Effective Gross Income | $10,186,307 | $10,656,504 | $11,448,233 | $11,920,293 | $11,746,692 | $26.76 | ||||||
| Total Operating Expenses | $2,992,353 | $2,748,760 | $3,123,160 | $3,438,263 | $3,070,640 | $6.99 | ||||||
| Net Operating Income | $7,193,954 | $7,907,744 | $8,325,073 | $8,482,030 | $8,676,053 | $19.76 | ||||||
| TI/LC | $0 | $0 | $0 | $0 | $471,674 | $1.07 | ||||||
| Capital Expenditures | $0 | $0 | $0 | $0 | $65,851 | $0.15 | ||||||
| Net Cash Flow | $7,193,954 | $7,907,744 | $8,325,073 | $8,482,030 | $8,138,526 | $18.54 | ||||||
| Occupancy % | 99.1% | 100.0% | 100.0% | 99.5% | 95.0% | |||||||
| NOI DSCR | 2.69x | 2.96x | 3.11x | 3.17x | 3.24x | |||||||
| NCF DSCR | 2.69x | 2.96x | 3.11x | 3.17x | 3.04x | |||||||
| NOI Debt Yield | 14.3% | 15.7% | 16.5% | 16.8% | 17.2% | |||||||
| NCF Debt Yield | 14.3% | 15.7% | 16.5% | 16.8% | 16.2% | |||||||
| This is not a research report and was not prepared by the BofA Merrill Lynch or Morgan Stanley research departments. Please see additional important information and qualifications at the end of this Term Sheet. |
| MSBAM 2013-C8 | Broadcasting Square Shopping Center |
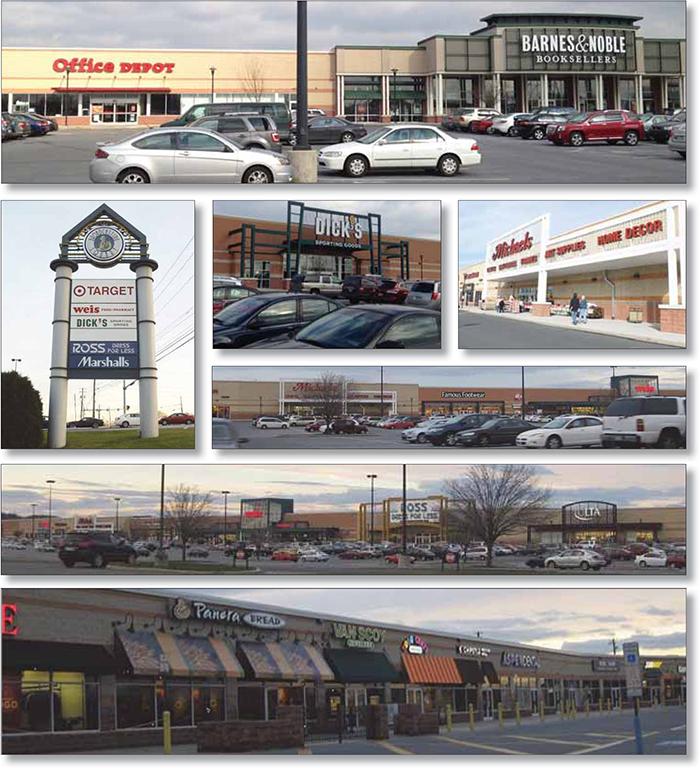
This is not a research report and was not prepared by the BofA Merrill Lynch or Morgan Stanley research departments. Please see additional important information and qualifications at the end of this Term Sheet. |
| MSBAM 2013-C8 | Broadcasting Square Shopping Center |
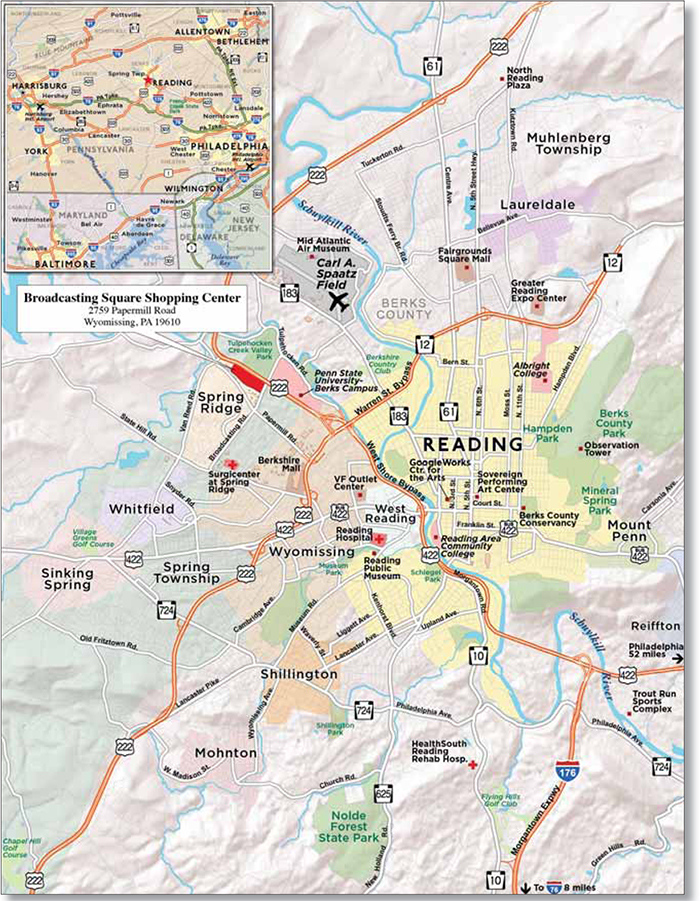
This is not a research report and was not prepared by the BofA Merrill Lynch or Morgan Stanley research departments. Please see additional important information and qualifications at the end of this Term Sheet. |
| MSBAM 2013-C8 | Broadcasting Square Shopping Center |
| Mortgage Loan No. 8 – Broadcasting Square Shopping Center |
| Mortgage Loan Information | Mortgaged Property Information | ||||||
| Mortgage Loan Seller: | BANA | Single Asset / Portfolio: | Single Asset | ||||
| Credit Assessment (Fitch/KBRA/S&P): | NR/BBB-/A- | Property Address: | 2759 Papermill Road | ||||
| Original Balance: | $50,000,000 | Wyomissing, PA 19610 | |||||
| Cut-off Date Balance: | $50,000,000 | General Property Type: | Retail | ||||
| % of Initial Pool Balance: | 4.4% | Detailed Property Type: | Anchored | ||||
| Loan Purpose: | Refinance | Net Rentable Area: | 487,330 SF | ||||
| Borrower Name(s): | Spring Ridge L.P. and GH Spring Ridge Associates, L.P. | Cut-off Date Balance Per Unit/SF: | $103 | ||||
| Sponsor(s): | 1994 Louise B. Grass Trust; Martin L. Grass Irrevocable Trust U/A 1/1/2003; Estate of Alex Grass | Balloon Balance Per Unit/SF: | $103 | ||||
| Mortgage Rate: | 3.69200% | Year Built / Year Renovated: | 2000 / NAP | ||||
| Note Date: | 1/11/2013 | Title Vesting: | Fee | ||||
| First Payment Date: | 3/1/2013 | Property Manager: | S Ridge Management, LLC | ||||
| Anticipated Repayment Date: | NAP | Underwriting and Financial Information | |||||
| Maturity Date: | 2/1/2023 | UW Revenues: | $9,734,181 | ||||
| IO Period: | 120 months | UW Expenses: | $2,688,488 | ||||
| Original Term to Maturity: | 120 months | UW NOI: | $7,045,693 | ||||
| Seasoning: | 0 months | UW NCF: | $6,543,976 | ||||
| Original Amortization Term: | 0 months | UW NOI DSCR: | 3.76x | ||||
| Loan Amortization Type: | Full IO | UW NCF DSCR: | 3.50x | ||||
| Interest Accrual Basis: | Actual/360 | UW NOI Debt Yield: | 14.1% | ||||
| Prepayment Provisions: | LO (24); DEF (92); O (4) | UW NCF Debt Yield: | 13.1% | ||||
| Lockbox / Cash Management: | Hard / In Place | UW NCF Debt Yield at Maturity: | 13.1% | ||||
| Pari Passu Mortgage Debt: | None | Most Recent NOI (As of): | $6,690,746 (12/31/2011) | ||||
| Subordinate Mortgage Debt: | None | 2nd Most Recent NOI (As of): | $6,488,871 (12/31/2010) | ||||
| Mezzanine Debt: | None | 3rd Most Recent NOI (As of): | $6,856,217 (12/31/2009) | ||||
Reserves(1) | Appraised Value: | $99,500,000 | |||||
| Type | Initial | Monthly | Cap | Appraisal As-of Date: | 12/11/2012 | ||
| RE Tax: | $980,774 | $119,480 | NAP | Cut-off Date LTV Ratio: | 50.3% | ||
| Insurance: | $17,626 | $8,813 | NAP | LTV Ratio at Maturity: | 50.3% | ||
Recurring Replacements(2): | $0 | Springing | NAP | Occupancy Rate (As of): | 99.7% (12/12/2012) | ||
TI/LC(2): | $0 | Springing | NAP | 2nd Most Recent Occupancy (As of): | 98.4% (12/31/2011) | ||
3rd Most Recent Occupancy (As of): | 97.3% (12/31/2010) | ||||||
| (1) | See “—Escrows and Reserves” below for further discussion of reserve requirements. |
| (2) | During a Reserve Deposit Period (as defined below), the Broadcasting Square Shopping Center Borrower is required to escrow for Replacement and TI/LC reserves as described under “—Escrows and Reserves” below. |
This is not a research report and was not prepared by the BofA Merrill Lynch or Morgan Stanley research departments. Please see additional important information and qualifications at the end of this Term Sheet. |
| MSBAM 2013-C8 | Broadcasting Square Shopping Center |
This is not a research report and was not prepared by the BofA Merrill Lynch or Morgan Stanley research departments. Please see additional important information and qualifications at the end of this Term Sheet. |
| MSBAM 2013-C8 | Broadcasting Square Shopping Center |
| Tenant Summary | ||||||||||||||||||
| Tenant Name | Credit Rating (Fitch/Moody’s/S&P)(1) | Tenant SF(2) | Approx. % of SF | Annualized Underwritten Base Rent ($) | % of Total Annualized Underwritten Base Rent | Annualized Underwritten Base Rent ($ Per NRSF)(3) | Lease Expiration | 2011 Sales PSF | Occupancy Cost as a % of Sales | |||||||||
| Weiss Markets Inc. | NR / NR / NR | 52,976 | 11% | $646,600 | 8% | $12.21 | 9/30/2020 | N/A | N/A | |||||||||
| Dick’s Sporting Goods | NR / NR/ NR | 45,101 | 9% | $495,000 | 6% | $10.98 | 1/31/2016 | $292 | 5.3% | |||||||||
| Babies R Us | B- / B3 / B | 30,555 | 6% | $294,112 | 4% | $9.63 | 1/31/2017 | N/A | N/A | |||||||||
| Bed Bath & Beyond | NR / NR / BBB+ | 30,066 | 6% | $377,028 | 5% | $12.54 | 1/31/2016 | N/A | N/A | |||||||||
| Marshalls | NR / NR / NR | 30,000 | 6% | $352,500 | 4% | $11.75 | 1/31/2018 | $278 | 5.9% | |||||||||
| Ross | NR / NR / BBB+ | 29,828 | 6% | $398,800 | 5% | $13.37 | 1/31/2017 | $268 | 6.7% | |||||||||
| Barnes & Noble | NR / NR / NR | 24,107 | 5% | $265,177 | 3% | $11.00 | 1/31/2017 | N/A | N/A | |||||||||
Michael’s | NR / B3 / B | 23,929 | 5% | $275,184 | 3% | $11.50 | 3/31/2017 | $178 | 9.1% | |||||||||
| Office Depot | NR / Caa1 / B- | 19,653 | 4% | $297,153 | 4% | $15.12 | 10/31/2015 | $124 | 16.0% | |||||||||
| Petco | NR / Caa1 / B | 16,510 | 3% | $315,638 | 4% | $19.12 | 5/31/2017 | $220 | 10.8% | |||||||||
| Subtotal / Wtd. Avg. | 302,725 | 62% | $3,717,192 | 47% | $12.28 | |||||||||||||
| Other Tenants | 182,925 | 38% | $4,266,498 | 53% | $23.32 | |||||||||||||
| Vacant Space | 1,680 | 0% | $0 | 0% | $0.00 | |||||||||||||
| Total / Wtd. Avg. | 487,330 | 100% | $7,983,691 | 100% | $16.44 | |||||||||||||
| (1) | Certain ratings are those of the parent company whether or not the parent guarantees the lease. |
| (2) | Information is based on the underwritten rent roll. |
| (3) | Total Annualized Underwritten Base Rent ($ per NRSF) excludes vacant space. |
Lease Rollover Schedule(1)(2) | |||||||||||||||
| Year | # of Leases Rolling | SF Rolling | Average Underwritten Base Rent per SF Rolling(3) | Approx. % of Total SF Rolling | Approx. Cumulative % of SF Rolling | Total Underwritten Base Rent Rolling | Approx. % of Total Base Rent Rolling | Approx. Cumulative % of Total Base Rent Rolling | |||||||
| 2013 | 2 | 12,210 | $22.21 | 3% | 3% | $271,150 | 3% | 3% | |||||||
| 2014 | 5 | 12,922 | $29.56 | 3% | 5% | $381,977 | 5% | 8% | |||||||
| 2015 | 5 | 37,646 | $17.76 | 8% | 13% | $668,585 | 8% | 17% | |||||||
| 2016 | 5 | 101,659 | $13.89 | 21% | 34% | $1,412,044 | 18% | 34% | |||||||
| 2017 | 19 | 191,118 | $16.07 | 39% | 73% | $3,071,195 | 38% | 73% | |||||||
| 2018 | 3 | 41,351 | $14.93 | 8% | 81% | $617,210 | 8% | 80% | |||||||
| 2019 | 1 | 8,066 | $19.84 | 2% | 83% | $160,029 | 2% | 82% | |||||||
| 2020 | 3 | 58,286 | $13.70 | 12% | 95% | $798,473 | 10% | 92% | |||||||
| 2021 | 2 | 8,370 | $29.01 | 2% | 97% | $242,843 | 3% | 95% | |||||||
| 2022 | 1 | 6,800 | $25.00 | 1% | 98% | $170,000 | 2% | 98% | |||||||
| 2023 & Beyond | 2 | 7,222 | $26.33 | 1% | 100% | $190,184 | 2% | 100% | |||||||
| Vacant | 0 | 1,680 | $0.00 | 0% | 100% | $0 | 0% | 100% | |||||||
| Total / Wtd. Avg. | 48 | 487,330 | $16.44 | 100% | $7,983,691 | 100% | |||||||||
| (1) | The information in the lease rollover schedule is based on the underwritten rent roll. |
| (2) | Certain tenants may have lease termination options that are exercisable prior to the originally stated expiration date of the subject lease and that are not considered in the lease rollover schedule. |
| (3) | Average Underwritten Base Rent PSF Rolling excludes vacant space. |
This is not a research report and was not prepared by the BofA Merrill Lynch or Morgan Stanley research departments. Please see additional important information and qualifications at the end of this Term Sheet. |
| MSBAM 2013-C8 | Broadcasting Square Shopping Center |
| Market Summary | ||||
| Property | Location | Total GLA | Occupancy | Major Tenant(s) |
| Wood Mill Commons | Woodland Road Reading, PA | 123,536 | 100.0% | Old Navy |
| Berkshire Square | Berkshire Blvd Wyomissing, PA | 297,966 | 92.0% | Walmart; Staples; PetSmart; Redners Market |
| Springtowne Shopping Center | Shillington Road Reading, PA | 278,140 | 95.7% | Great Clips Hair Cut Salon; Sleepy’s Sinking Springs |
| Berkshire Mall West | State Hill Road Reading, PA | 118,175 | 95.7% | American Eagle Outfitters’ Bath & Body Works; Gap; Zales |
| Shillington Plaza | Parkside Ave Reading, PA | 152,151 | 86.2% | Amelia’s Grocery; Kmart |
| Cash Flow Analysis | |||||||||||||||
| 2009 | 2010 | 2011 | UW | UW PSF | |||||||||||
| Gross Potential Rental Income | $7,144,756 | $7,073,544 | $7,170,247 | $8,025,691 | $16.47 | ||||||||||
| Expense Reimbursements | $2,009,687 | $2,135,001 | $2,233,418 | $2,219,763 | $4.55 | ||||||||||
| Other Income | $5,577 | $6,126 | $4,078 | $1,000 | $0.00 | ||||||||||
| Less Vacancy & Credit Loss | $0 | $0 | $0 | ($512,273) | 5.00% | ||||||||||
| Effective Gross Income | $9,160,020 | $9,214,671 | $9,407,743 | $9,734,181 | $19.97 | ||||||||||
| Total Operating Expenses | $2,303,803 | $2,725,800 | $2,716,997 | $2,688,488 | $5.52 | ||||||||||
| Net Operating Income | $6,856,217 | $6,488,871 | $6,690,746 | $7,045,693 | $14.46 | ||||||||||
| TI/LC | $0 | $0 | $40,100 | $379,884 | $0.78 | ||||||||||
| Capital Expenditures | $0 | $0 | $0 | $121,833 | $0.25 | ||||||||||
| Net Cash Flow | $6,856,217 | $6,488,871 | $6,650,646 | $6,543,976 | $13.43 | ||||||||||
| Occupancy % | 98.5% | 97.3% | 98.4% | 95.0% | |||||||||||
| NOI DSCR | 3.66x | 3.47x | 3.57x | 3.76x | |||||||||||
| NCF DSCR | 3.66x | 3.47x | 3.55x | 3.50x | |||||||||||
| NOI Debt Yield | 13.7% | 13.0% | 13.4% | 14.1% | |||||||||||
| NCF Debt Yield | 13.7% | 13.0% | 13.3% | 13.1% | |||||||||||
This is not a research report and was not prepared by the BofA Merrill Lynch or Morgan Stanley research departments. Please see additional important information and qualifications at the end of this Term Sheet. |
| MSBAM 2013-C8 | Broadcasting Square Shopping Center |
This is not a research report and was not prepared by the BofA Merrill Lynch or Morgan Stanley research departments. Please see additional important information and qualifications at the end of this Term Sheet. |
This is not a research report and was not prepared by the BofA Merrill Lynch or Morgan Stanley research departments. Please see additional important information and qualifications at the end of this Term Sheet. |
| MSBAM 2013-C8 | Kingsgate Center |
| Mortgage Loan No. 9 – Kingsgate Center |
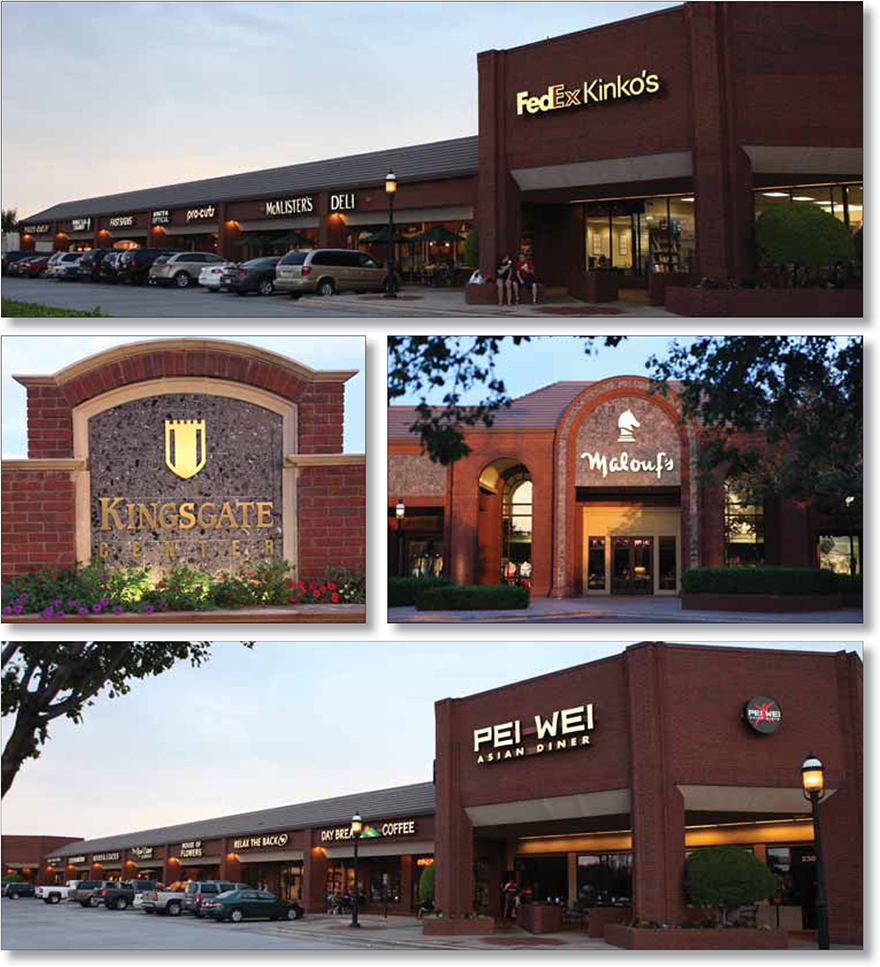
| This is not a research report and was not prepared by the BofA Merrill Lynch or Morgan Stanley research departments. Please see additional important information and qualifications at the end of this Term Sheet. |
| MSBAM 2013-C8 | Kingsgate Center |
| Mortgage Loan No. 9 – Kingsgate Center |

| This is not a research report and was not prepared by the BofA Merrill Lynch or Morgan Stanley research departments. Please see additional important information and qualifications at the end of this Term Sheet. |
| MSBAM 2013-C8 | Kingsgate Center |
| Mortgage Loan No. 9 – Kingsgate Center |
| Mortgage Loan Information | Mortgaged Property Information | |||||
| Mortgage Loan Seller: | BANA | Single Asset / Portfolio: | Single Asset | |||
| Credit Assessment (Fitch/KBRA/S&P): | NR/NR/NR | Property Address: | 4210 82nd Street and 8201 Quaker Avenue | |||
| Original Balance: | $39,000,000 | Lubbock, TX 79423 and 79424 | ||||
| Cut-off Date Balance: | $38,949,222 | General Property Type: | Mixed Use | |||
| % of Initial Pool Balance: | 3.4% | Detailed Property Type: | Office / Retail | |||
| Loan Purpose: | Refinance | Net Rentable Area: | 240,749 SF | |||
| Borrower Name(s): | KG South 2012, LLC and KG North 2012, LLC | Cut-off Date Balance Per Unit/SF: | $162 | |||
| Sponsor(s): | G. Randall Andrews ; Robert G. Muzyka, Jr. | Balloon Balance Per Unit/SF: | $129 | |||
| Mortgage Rate: | 4.09800% | Year Built / Year Renovated: | 1986; 1989 / NAP | |||
| Note Date: | 12/24/2012 | Title Vesting: | Fee | |||
| First Payment Date: | 2/1/2013 | Property Manager: | GRACO Real Estate Development, Inc. | |||
| Anticipated Repayment Date: | NAP | Underwriting and Financial Information | ||||
| Maturity Date: | 1/1/2023 | UW Revenues: | $5,178,164 | |||
| IO Period: | None | UW Expenses: | $1,522,582 | |||
| Original Term to Maturity: | 120 months | UW NOI: | $3,655,582 | |||
| Seasoning: | 1 month | UW NCF: | $3,363,183 | |||
| Original Amortization Term: | 360 months | UW NOI DSCR: | 1.62x | |||
| Loan Amortization Type: | Amortizing | UW NCF DSCR: | 1.49x | |||
| Interest Accrual Basis: | Actual/360 | UW NOI Debt Yield: | 9.4% | |||
| Prepayment Provisions: | LO (25); DEF (91); O (4) | UW NCF Debt Yield: | 8.6% | |||
| Lockbox / Cash Management: | Soft / Springing | UW NCF Debt Yield at Maturity: | 10.8% | |||
| Pari Passu Mortgage Debt: | None | Most Recent NOI (As of): | $3,621,750 (10/31/2012 TTM) | |||
| Subordinate Mortgage Debt: | None | 2nd Most Recent NOI (As of): | $3,329,026 (12/31/2011) | |||
| Mezzanine Debt: | None | 3rd Most Recent NOI (As of): | $3,046,877 (12/31/2010) | |||
Reserves(1) | Appraised Value: | $52,000,000 | ||||
| Type | Initial | Monthly | Cap | Appraisal As-of Date: | 11/26/2012 | |
| RE Tax: | $0 | $33,906 | NAP | Cut-off Date LTV Ratio: | 74.9% | |
| Insurance: | $0 | Springing | NAP | LTV Ratio at Maturity: | 59.9% | |
| Recurring Replacement: | $100,000 | $4,012 | $309,000 | Occupancy Rate (As of): | 96.9% (12/12/2012) | |
| TI/LC: | $0 | $15,050 | $650,000 | 2nd Most Recent Occupancy (As of): | 94.2% (12/31/2011) | |
Other(2): | $155,000 | $0 | NAP | 3rd Most Recent Occupancy (As of): | 95.9% (12/31/2010) | |
| (1) | See “—Escrows and Reserves” below for further discussion of reserve requirements. |
| (2) | The Kingsgate Center Borrower deposited $80,000 at closing for tenant allowances related to Americas Best Contacts & Eyeglasses and $75,000 for an environmental reserve as described under ”—Escrows and Reserves” below. |
| This is not a research report and was not prepared by the BofA Merrill Lynch or Morgan Stanley research departments. Please see additional important information and qualifications at the end of this Term Sheet. |
| MSBAM 2013-C8 | Kingsgate Center |
| This is not a research report and was not prepared by the BofA Merrill Lynch or Morgan Stanley research departments. Please see additional important information and qualifications at the end of this Term Sheet. |
| MSBAM 2013-C8 | Kingsgate Center |
| Tenant Summary | |||||||||
| Tenant Name | Property | Tenant SF(1) | Approx. % of SF | Annualized Underwritten Base Rent ($) | % of Total Annualized Underwritten Base Rent | Annualized Underwritten Base Rent ($ Per NRSF) | Lease Expiration | TTM 12/12 Sales PSF | Occupancy Cost as a % of Sales |
| Sprouts Farmers Market | Retail | 30,074 | 12% | $250,000 | 6% | $8.31 | 10/31/2025 | $314 | 4.0% |
| Malouf’s | Retail | 20,000 | 8% | $140,000 | 3% | $7.00 | 3/31/2014 | $223 | 5.3% |
| Suddenlink Communication | Office | 11,080 | 5% | $160,660 | 4% | $14.50 | 3/31/2015 | N/A | N/A |
| Fox & Hound | Retail | 10,642 | 4% | $115,195 | 3% | $10.82 | 11/30/2013 | $157 | 10.4% |
| Allen L Adkins | Office | 10,174 | 4% | $183,132 | 4% | $18.00 | 2/28/2013 | N/A | N/A |
| Banana Republic | Retail | 6,098 | 3% | $115,862 | 3% | $19.00 | 6/30/2013 | $231 | 10.4% |
| Talbot’s | Retail | 6,036 | 3% | $126,756 | 3% | $21.00 | 1/31/2016 | $261 | 10.4% |
| Hayashi Hibachi (Pad) | Retail | 6,000 | 2% | $156,000 | 4% | $26.00 | 3/31/2019 | $344 | 9.8% |
| Chico’s | Retail | 5,120 | 2% | $130,560 | 3% | $25.50 | 1/31/2017 | $526 | 5.8% |
| Coldwater Creek | Retail | 5,120 | 2% | $146,995 | 4% | $28.71 | 11/30/2015 | $316 | 10.7% |
| Subtotal / Wtd. Avg. | 110,344 | 46% | $1,525,160 | 37% | $13.82 | ||||
| Other Tenants | 121,964 | 51% | $2,550,827 | 63% | $20.91 | ||||
| Vacant Space | 8,441 | 4% | $0 | 0% | $0.00 | ||||
| Total / Wtd. Avg. | 240,749 | 100% | $4,075,987 | 100% | $17.55 (2) | ||||
| Total Office SF | 41,198 | 17% | $738,447 | 18% | $17.92 | ||||
| Total Retail SF | 191,110 | 79% | $3,337,540 | 82% | $17.46 | ||||
| (1) | Information is based on the underwritten rent roll. |
| (2) | Total Annualized Underwritten Base Rent ($ per NRSF) excludes vacant space. |
Lease Rollover Schedule(1)(2) | ||||||||
| Year | # of Leases Rolling | SF Rolling | Average Underwritten Base Rent per SF Rolling(3) | Approx. % of Total SF Rolling | Approx. Cumulative % of SF Rolling | Total Underwritten Base Rent Rolling | Approx. % of Total Base Rent Rolling | Approx. Cumulative % of Total Base Rent Rolling |
| 2013 | 10 | 51,427 | $17.55 | 21% | 21% | $902,305 | 22% | 22% |
| 2014 | 13 | 44,310 | $15.65 | 18% | 40% | $693,343 | 17% | 39% |
| 2015 | 7 | 25,407 | $19.18 | 11% | 50% | $487,249 | 12% | 51% |
| 2016 | 7 | 23,384 | $19.78 | 10% | 60% | $462,560 | 11% | 62% |
| 2017 | 6 | 15,425 | $20.66 | 6% | 66% | $318,693 | 8% | 70% |
| 2018 | 3 | 13,149 | $23.06 | 5% | 72% | $303,217 | 7% | 78% |
| 2019 | 1 | 6,000 | $26.00 | 2% | 74% | $156,000 | 4% | 82% |
| 2020 | 2 | 3,977 | $16.60 | 2% | 76% | $66,002 | 2% | 83% |
| 2021 | 2 | 5,497 | $24.44 | 2% | 78% | $134,328 | 3% | 86% |
| 2022 | 2 | 5,421 | $21.14 | 2% | 81% | $114,603 | 3% | 89% |
| 2023 & Beyond | 3 | 38,311 | $11.42 | 16% | 96% | $437,688 | 11% | 100% |
| Vacant | 0 | 8,441 | $0.00 | 4% | 100% | $0 | 0% | 100% |
| Total / Wtd. Avg. | 56 | 240,749 | $17.55 | 100% | $4,075,987 | 100% | ||
| (1) | The information in the lease rollover schedule is based on the underwritten rent roll. |
| (2) | Certain tenants may have lease termination options that are exercisable prior to the originally stated expiration date of the subject lease and that are not considered in the lease rollover schedule. |
| (3) | Average Underwritten Base Rent PSF Rolling excludes vacant space. |
| This is not a research report and was not prepared by the BofA Merrill Lynch or Morgan Stanley research departments. Please see additional important information and qualifications at the end of this Term Sheet. |
| MSBAM 2013-C8 | Kingsgate Center |
| Competitive Property Summary – Retail | ||||||
| Property | Location | Year Built/ Renovated | Total GLA | Occupancy | Wtd. Avg. NNN Rents ($/SF/YR): | Proximity |
| The Commons at Northpark | Midland, Texas | 2012/NAP | 63,437 | 52.0% | $20.44 | 100 Miles |
Lakeridge Commons | Lubbock, Texas | 2006/NAP | 24,805 | 95.0% | $20.14 | 1.15 Miles |
The Village | Lubbock, Texas | 1983/NAP | 42,000 | 100.0% | $15.50 | 0.1 Miles |
| University Park Village | Fort Worth, Texas | 1986/NAP | 173,220 | 100.0% | $35.88 | 270 Miles |
Inwood Village | Dallas, Texas | 1949/Various | 235,666 | 97.0% | $22.50 | 300 Miles |
Total / Wtd. Avg. | 539,128 | 93.0% | $25.90 | |||
| Competitive Property Summary – Office | |||||
| Property | Location | Year Built/ Renovated | Total GLA | Occupancy | Quoted Rents |
Lubbock Lakeview | Lubbock, Texas | 1976/NAP | 30,568 | 100% | $19.00 |
84th & Oxford | Lubbock, Texas | 1987/NAP | 10,418 | 87% | $15.00 |
Pyramid Plaza | Lubbock, Texas | 1981/NAP | 94,606 | 93% | $16.25 |
4747 S. Loop 289 | Lubbock, Texas | 1983/NAP | 31,260 | 94% | $16.00 |
| Total / Wtd. Avg. | 166,852 | 94.1% | $16.63 | ||
| This is not a research report and was not prepared by the BofA Merrill Lynch or Morgan Stanley research departments. Please see additional important information and qualifications at the end of this Term Sheet. |
| MSBAM 2013-C8 | Kingsgate Center |
| Cash Flow Analysis | ||||||||||||||
| 2010 | 2011 | 10/31/2012 TTM | UW | UW PSF | ||||||||||
| Gross Potential Rental Income | $3,422,852 | $3,763,545 | $3,944,111 | $4,246,818 | $17.64 | |||||||||
| Percentage Rent | $66,916 | $68,710 | $61,307 | $58,215 | $0.24 | |||||||||
| Expense Reimbursements | $867,433 | $944,988 | $989,405 | $1,151,880 | $4.78 | |||||||||
| Other Income | $64,244 | $8,027 | $26,838 | $26,838 | $0.11 | |||||||||
| Less Vacancy & Credit Loss | $0 | $0 | $0 | ($305,587) | 5.60% | |||||||||
| Effective Gross Income | $4,421,445 | $4,785,270 | $5,021,661 | $5,178,164 | $21.51 | |||||||||
Total Operating Expenses | $1,374,568 | $1,456,244 | $1,399,911 | $1,522,582 | $6.32 | |||||||||
| Net Operating Income | $3,046,877 | $3,329,026 | $3,621,750 | $3,655,582 | $15.18 | |||||||||
| TI/LC | $0 | $0 | $0 | $244,249 | $1.01 | |||||||||
| Capital Expenditures | $0 | $0 | $0 | $48,150 | $0.20 | |||||||||
| Net Cash Flow | $3,046,877 | $3,329,026 | $3,621,750 | $3,363,183 | $13.97 | |||||||||
| Occupancy % | 95.9% | 94.2% | 96.9%(1) | 94.4% | ||||||||||
| NOI DSCR | 1.35x | 1.47x | 1.60x | 1.62x | ||||||||||
| NCF DSCR | 1.35x | 1.47x | 1.60x | 1.49x | ||||||||||
| NOI Debt Yield | 7.8% | 8.5% | 9.3% | 9.4% | ||||||||||
| NCF Debt Yield | 7.8% | 8.5% | 9.3% | 8.6% | ||||||||||
| (1) | Occupancy as of December 12, 2012. |
| This is not a research report and was not prepared by the BofA Merrill Lynch or Morgan Stanley research departments. Please see additional important information and qualifications at the end of this Term Sheet. |
| This is not a research report and was not prepared by the BofA Merrill Lynch or Morgan Stanley research departments. Please see additional important information and qualifications at the end of this Term Sheet. |
| MSBAM 2013-C8 | Embassy Suites – Fort Lauderdale |
| Mortgage Loan No. 10 – Embassy Suites – Fort Lauderdale |
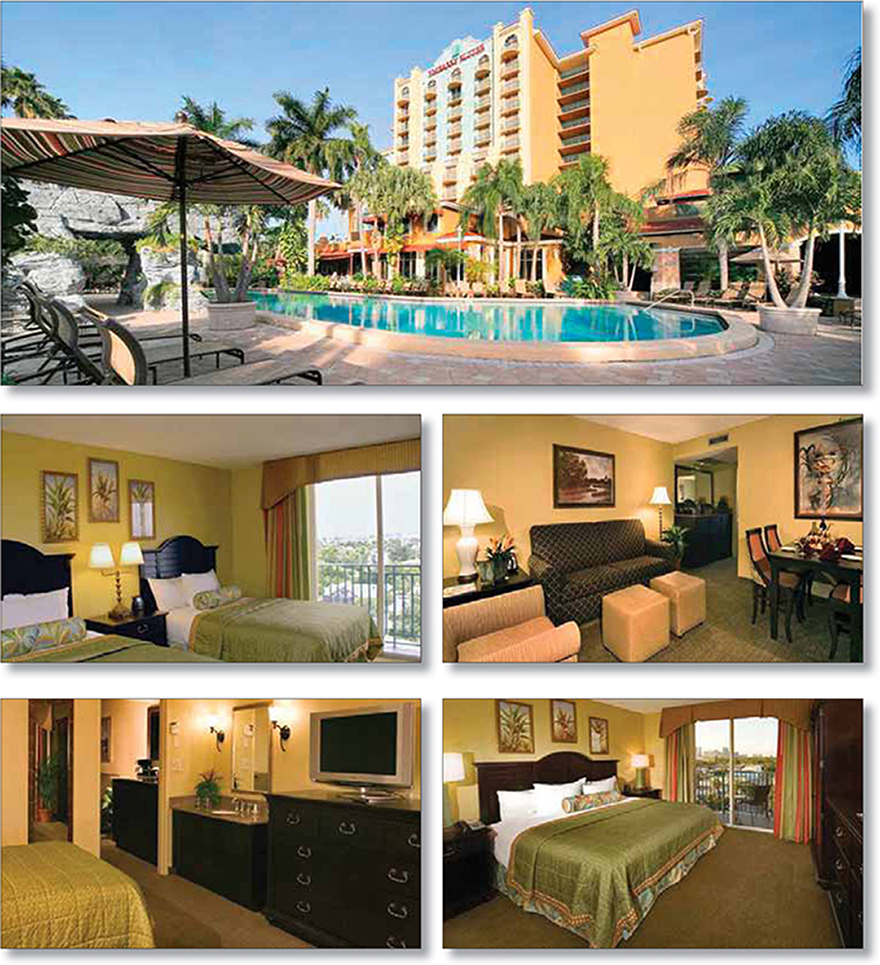
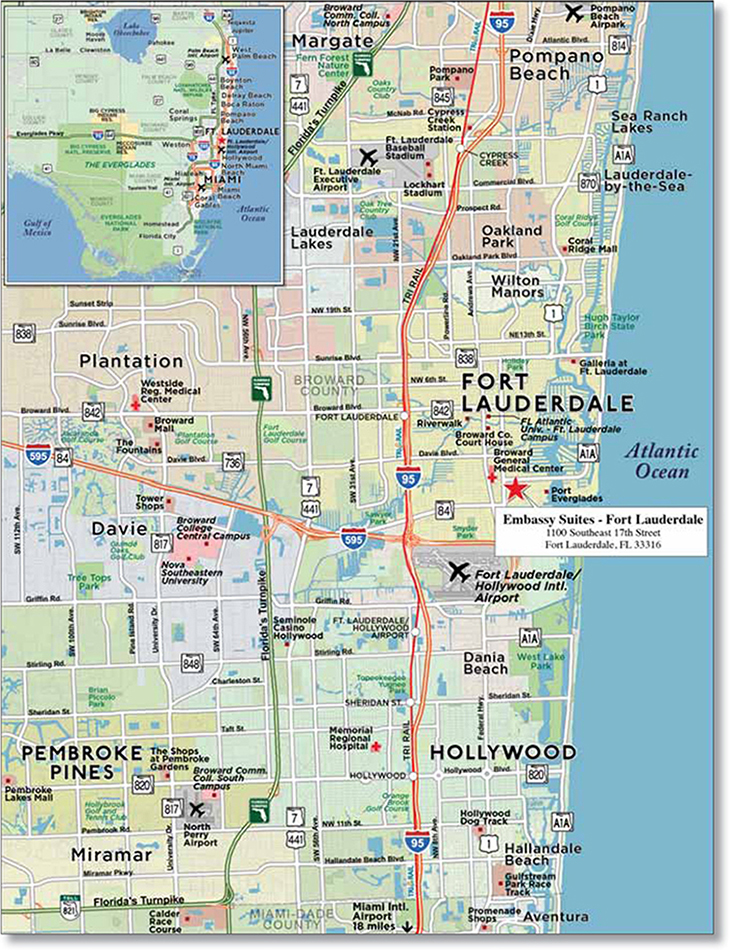
| Mortgage Loan Information | Mortgaged Property Information | |||||
| Mortgage Loan Seller: | BANA | Single Asset / Portfolio: | Single Asset | |||
| Credit Assessment (Fitch/KBRA/S&P): | NR/NR/NR | Property Address: | 1100 Southeast 17th Street Fort Lauderdale, FL 33316 | |||
| Original Balance: | $36,500,000 | General Property Type: | Hospitality | |||
| Cut-off Date Balance: | $36,336,958 | Detailed Property Type: | Full Service | |||
| % of Initial Pool Balance: | 3.2% | Number of Rooms: | 361 Rooms | |||
| Loan Purpose: | Refinance | Cut-off Date Balance Per Room: | $100,656 | |||
| Borrower Name(s): | Ft. Lauderdale ES Hotel, L.L.C.; Ft. Lauderdale ES Leasing, L.L.C. | Balloon Balance Per Room: | $83,178 | |||
| Sponsor(s): | FelCor Lodging Limited Partnership | Year Built / Year Renovated: | 1987 / 2007 | |||
| Mortgage Rate: | 4.95000% | Title Vesting: | Fee | |||
| Note Date: | 9/28/2012 | Property Manager: | Embassy Suites Management LLC | |||
| First Payment Date: | 11/1/2012 | Underwriting and Financial Information | ||||
| Anticipated Repayment Date: | NAP | UW Revenues: | $17,501,041 | |||
| Maturity Date: | 10/1/2022 | UW Expenses: | $12,726,521 | |||
| IO Period: | None | UW NOI: | $4,774,520 | |||
| Original Term to Maturity: | 120 months | UW NCF: | $4,074,478 | |||
| Seasoning: | 4 months | UW NOI DSCR: | 2.04x | |||
| Original Amortization Term: | 360 months | UW NCF DSCR: | 1.74x | |||
| Loan Amortization Type: | Amortizing | UW NOI Debt Yield: | 13.1% | |||
| Interest Accrual Basis: | Actual/360 | UW NCF Debt Yield: | 11.2% | |||
| Prepayment Provisions: | LO (25); YM1 (92); O (3) | UW NCF Debt Yield at Maturity: | 13.6% | |||
| Lockbox / Cash Management: | Soft / Springing | Most Recent NOI (As of): | $5,144,565 (10/31/2012 TTM) | |||
| Pari Passu Mortgage Debt: | None | 2nd Most Recent NOI (As of): | $4,938,106 (12/31/2011) | |||
| Subordinate Mortgage Debt: | None | 3rd Most Recent NOI (As of): | $5,850,293 (12/31/2010) | |||
| Mezzanine Debt: | Future | Appraised Value: | $62,000,000 | |||
Reserves(1) | Appraisal As-of Date: | 8/1/2012 | ||||
| Type | Initial | Monthly | Cap | Cut-off Date LTV Ratio: | 58.6% | |
| RE Tax: | $896,513 | $81,501 | NAP | LTV Ratio at Maturity: | 48.4% | |
| Insurance: | $0 | Springing | NAP | Occupancy Rate (As of): | 79.0% (10/31/2012) | |
| FF&E: | $0 | Springing | NAP | 2nd Most Recent Occupancy (As of): | 78.6% (12/31/2011) | |
3rd Most Recent Occupancy (As of): | 76.6% (12/31/2010) | |||||
| (1) | See “—Escrows and Reserves” below for further discussion of reserve requirements. |
| This is not a research report and was not prepared by the BofA Merrill Lynch or Morgan Stanley research departments. Please see additional important information and qualifications at the end of this Term Sheet. |
| MSBAM 2013-C8 | Embassy Suites – Fort Lauderdale |
| The Embassy Suites and Market Historical Occupancy, ADR, RevPAR | |||||||||
| Competitive Set | Embassy Suites | Penetration Factor | |||||||
| Year | Occupancy | ADR | RevPAR | Occupancy | ADR | RevPAR | Occupancy | ADR | RevPAR |
| 2010 | 67.5% | $117.32 | $79.16 | 77.1% | $146.14 | $113.55 | 115.2% | 124.6% | 143.4% |
| 2011 | 70.7% | $117.36 | $82.99 | 77.9% | $135.11 | $105.22 | 110.1% | 115.1% | 126.8% |
| TTM 11/30/2012 | 75.9% | $120.61 | $91.60 | 79.3% | $138.31 | $109.68 | 104.4% | 114.7% | 119.7% |
| Competitive Property Summary | |||||||||
| Property | Rooms | Commercial % | Meeting & Group % | Leisure % | 2011E Occupancy | 2011E ADR | 2011E RevPAR | ||
| Embassy Suites – Fort Lauderdale | 361 | 35% | 30% | 35% | 78% | $135 | $105 | ||
| Sheraton Fort Lauderdale Airport | 250 | 60% | 25% | 15% | 71% | $100 | $71 | ||
| Hilton Fort Lauderdale Airport | 388 | 60% | 25% | 15% | 70% | $100 | $70 | ||
| Riverside Hotel | 214 | 30% | 45% | 25% | 62% | $110 | $68 | ||
| Renaissance Fort Lauderdale Cruise Port | 236 | 25% | 25% | 50% | 89% | $112 | $100 | ||
| Hyatt Place Fort Lauderdale 17th Street | 126 | 55% | 10% | 35% | 72% | $100 | $72 | ||
| Hyatt Regency Pier 66 | 384 | 20% | 40% | 40% | 67% | $135 | $90 | ||
| Sheraton Fort Lauderdale Beach Resort | 487 | 15% | 20% | 65% | 75% | $140 | $105 | ||
| Hilton Fort Lauderdale Marina | 589 | 20% | 40% | 40% | 75% | $135 | $101 | ||
| Total / Wtd. Avg. | 3,035 | 32% | 30% | 38% | 73% | $123 | $91 | ||
| This is not a research report and was not prepared by the BofA Merrill Lynch or Morgan Stanley research departments. Please see additional important information and qualifications at the end of this Term Sheet. |
| MSBAM 2013-C8 | Embassy Suites – Fort Lauderdale |
| Cash Flow Analysis | ||||||||||||||
| 2010 | 2011 | 10/31/2012 TTM | UW | UW per Room | ||||||||||
| Occupancy | 76.6% | 78.6% | 79.0% | 79.0% | ||||||||||
| Average Daily Rate | $145.53 | $134.09 | $138.47 | $138.47 | ||||||||||
| RevPAR | $111.44 | $105.36 | $109.45 | $109.45 | ||||||||||
| Total Revenue | $17,809,617 | $16,913,743 | $17,541,033 | $17,501,041 | $48,479 | |||||||||
| Total Departmental Expenses | $5,679,019 | $5,759,768 | $5,995,443 | $5,984,667 | $16,578 | |||||||||
| Gross Operating Profit | $12,130,598 | $11,153,975 | $11,545,589 | $11,516,374 | $31,901 | |||||||||
| Total Undistributed Expenses | $4,639,639 | $4,587,016 | $4,746,583 | $4,745,484 | $13,145 | |||||||||
| Profit before Fixed Charges | $7,490,959 | $6,566,959 | $6,799,006 | $6,770,890 | $18,756 | |||||||||
| Total Fixed Charges | $1,640,666 | $1,628,853 | $1,654,441 | $1,996,370 | $5,530 | |||||||||
| Net Operating Income | $5,850,293 | $4,938,106 | $5,144,565 | $4,774,520 | $13,226 | |||||||||
| Replacement Reserves | $720,235 | $673,903 | $701,641 | $700,042 | $1,939 | |||||||||
| Net Cash Flow | $5,130,058 | $4,264,203 | $4,442,924 | $4,074,478 | $11,287 | |||||||||
| NOI DSCR | 2.50x | 2.11x | 2.20x | 2.04x | ||||||||||
| NCF DSCR | 2.19x | 1.82x | 1.90x | 1.74x | ||||||||||
| NOI Debt Yield | 16.0% | 13.5% | 14.1% | 13.1% | ||||||||||
| NCF Debt Yield | 14.1% | 11.7% | 12.2% | 11.2% | ||||||||||
| This is not a research report and was not prepared by the BofA Merrill Lynch or Morgan Stanley research departments. Please see additional important information and qualifications at the end of this Term Sheet. |
| This is not a research report and was not prepared by the BofA Merrill Lynch or Morgan Stanley research departments. Please see additional important information and qualifications at the end of this Term Sheet. |
| MSBAM 2013-C8 | Fair Lakes Center |
| Mortgage Loan No. 11 – Fair Lakes Center |
| Mortgage Loan Information | Mortgaged Property Information | |||||
| Mortgage Loan Seller: | BANA | Single Asset / Portfolio: | Single Asset | |||
| Credit Assessment (Fitch/KBRA/S&P): | NR/NR/NR | Property Address: | 12997 Fair Lakes Parkway | |||
| Original Balance: | $36,000,000 | Fairfax, VA 22033 | ||||
| Cut-off Date Balance: | $35,954,154 | General Property Type: | Retail | |||
| % of Initial Pool Balance: | 3.2% | Detailed Property Type: | Shadow Anchored | |||
| Loan Purpose: | Refinance | Net Rentable Area: | 116,427 SF | |||
| Borrower Name(s): | Fair Lakes Center Associates II LC | Cut-off Date Balance Per Unit/SF: | $309 | |||
| Sponsor(s): | Milton V. Peterson; Peterson Family Group | Balloon Balance Per Unit/SF: | $248 | |||
| Mortgage Rate: | 4.20000% | Year Built / Year Renovated: | 1993 / NAP | |||
| Note Date: | 12/11/2012 | Title Vesting: | Fee | |||
| First Payment Date: | 2/1/2013 | Property Manager: | Peterson Management L.C. | |||
| Anticipated Repayment Date: | NAP | Underwriting and Financial Information | ||||
| Maturity Date: | 1/1/2023 | UW Revenues: | $4,268,177 | |||
| IO Period: | None | UW Expenses: | $966,845 | |||
| Original Term to Maturity: | 120 months | UW NOI: | $3,301,332 | |||
| Seasoning: | 1 month | UW NCF: | $3,122,368 | |||
| Original Amortization Term: | 360 months | UW NOI DSCR: | 1.56x | |||
| Loan Amortization Type: | Amortizing | UW NCF DSCR: | 1.48x | |||
| Interest Accrual Basis: | Actual/360 | UW NOI Debt Yield: | 9.2% | |||
| Prepayment Provisions: | LO (25); DEF (91); O (4) | UW NCF Debt Yield: | 8.7% | |||
| Lockbox / Cash Management: | Hard / Springing | UW NCF Debt Yield at Maturity: | 10.8% | |||
| Pari Passu Mortgage Debt: | None | Most Recent NOI (As of): | $3,385,982 (12/31/2011) | |||
| Subordinate Mortgage Debt: | None | 2nd Most Recent NOI (As of): | $3,331,067 (12/31/2010) | |||
| Mezzanine Debt: | None | 3rd Most Recent NOI (As of): | $2,915,798 (12/31/2009) | |||
| Appraised Value: | $55,500,000 | |||||
| Reserves | Appraisal As-of Date: | 10/15/2012 | ||||
| Type | Initial | Monthly | Cap | Cut-off Date LTV Ratio: | 64.8% | |
| RE Tax: | $84,640 | $42,320 | NAP | LTV Ratio at Maturity: | 52.0% | |
| Insurance: | $0 | Springing | NAP | Occupancy Rate (As of): | 100.0% (10/31/2012) | |
| Recurring Replacements: | $500,000 | $1,455 | NAP | 2nd Most Recent Occupancy (As of): | 100.0% (12/31/2011) | |
| TI/LC: | $24,968 | $12,128 | $450,000 | 3rd Most Recent Occupancy (As of): | 96.4% (12/31/2010) | |
| This is not a research report and was not prepared by the BofA Merrill Lynch or Morgan Stanley research departments. Please see additional important information and qualifications at the end of this Term Sheet. |
| MSBAM 2013-C8 | The Atrium at Fashion Center |
| Mortgage Loan No. 12 – The Atrium at Fashion Center |
| Mortgage Loan Information | Mortgaged Property Information | |||||
| Mortgage Loan Seller: | BANA | Single Asset / Portfolio: | Single Asset | |||
| Credit Assessment (Fitch/KBRA/S&P): | NR/NR/NR | Property Address: | 34 East Ridgewood Avenue Paramus, NJ 07652 | |||
| Original Balance: | $25,000,000 | General Property Type: | Retail | |||
| Cut-off Date Balance: | $25,000,000 | Detailed Property Type: | Anchored | |||
| % of Initial Pool Balance: | 2.2% | Net Rentable Area: | 173,073 SF | |||
| Loan Purpose: | Refinance | Cut-off Date Balance Per Unit/SF: | $144 | |||
| Borrower Name(s): | KMO-361 (Paramus) LLC | Balloon Balance Per Unit/SF: | $115 | |||
| Sponsor(s): | Morton Olshan | Year Built / Year Renovated: | 1968 / 2011 | |||
| Mortgage Rate: | 3.99100% | Title Vesting: | Fee | |||
| Note Date: | 1/9/2013 | Property Manager: | Mall Properties, Inc. | |||
| First Payment Date: | 3/1/2013 | Underwriting and Financial Information | ||||
| Anticipated Repayment Date: | NAP | UW Revenues: | $3,613,471 | |||
| Maturity Date: | 2/1/2023 | UW Expenses: | $1,083,784 | |||
| IO Period: | None | UW NOI: | $2,529,687 | |||
| Original Term to Maturity: | 120 months | UW NCF: | $2,403,218 | |||
| Seasoning: | 0 months | UW NOI DSCR: | 1.77x | |||
| Original Amortization Term: | 360 months | UW NCF DSCR: | 1.68x | |||
| Loan Amortization Type: | Amortizing | UW NOI Debt Yield: | 10.1% | |||
| Interest Accrual Basis: | Actual/360 | UW NCF Debt Yield: | 9.6% | |||
| Prepayment Provisions: | LO (24); DEF (92); O (4) | UW NCF Debt Yield at Maturity: | 12.1% | |||
| Lockbox / Cash Management: | Hard / Springing | Most Recent NOI (As of): | $1,940,166 (12/31/2011) | |||
| Pari Passu Mortgage Debt: | None | 2nd Most Recent NOI (As of): | $1,968,945 (12/31/2010) | |||
| Subordinate Mortgage Debt: | None | 3rd Most Recent NOI (As of): | $1,975,566 (12/31/2009) | |||
| Mezzanine Debt: | None | Appraised Value: | $40,400,000 | |||
| Reserves | Appraisal As-of Date: | 11/28/2012 | ||||
| Type | Initial | Monthly | Cap | Cut-off Date LTV Ratio: | 61.9% | |
| RE Tax: | $42,149 | $42,149 | NAP | LTV Ratio at Maturity: | 49.3% | |
| Insurance: | $0 | Springing | NAP | Occupancy Rate (As of): | 100.0% (1/3/2013) | |
| Recurring Replacements: | $0 | $2,163 | $35,000 | |||
TI/LC(1): | $0 | Springing | $1,000,000 | |||
| (1) | Upon the TI/LC reserve trigger event, The Atrium at Fashion Center borrower is required to deposit monthly the lesser of (a) $83,333 and (b) excess cash flow after debt service. A TI/LC reserve trigger event commences upon the first to occur of the following if any Specified Tenants (defined below): (i) enters bankruptcy or (ii) goes dark, vacates, ceases to occupy or discontinues its operations prior to an ownership change nine months before lease expiration. “Specified Tenant” means (i) The TJX Operating Companies, Inc., (ii) Bed Bath & Beyond of Fashion Center, Inc., (iii) Bed Bath & Beyond Inc., (iv) Buy Buy Baby Inc. and (v) any other lessee(s) of the Specified Tenant Space (or any portion thereof). |
| This is not a research report and was not prepared by the BofA Merrill Lynch or Morgan Stanley research departments. Please see additional important information and qualifications at the end of this Term Sheet. |
| MSBAM 2013-C8 | Mather Corporate Center |
| Mortgage Loan No. 13 – Mather Corporate Center |
| Mortgage Loan Information | Mortgaged Property Information | |||||
| Mortgage Loan Seller: | BANA | Single Asset / Portfolio: | Single Asset | |||
| Credit Assessment (Fitch/KBRA/S&P): | NR/NR/NR | Property Address: | 10370 & 10390 Peter A. McCuen Boulevard Rancho Cordova, CA 95655 | |||
| Original Balance: | $24,200,000 | General Property Type: | Office | |||
| Cut-off Date Balance: | $24,200,000 | Detailed Property Type: | Suburban | |||
| % of Initial Pool Balance: | 2.1% | Net Rentable Area: | 174,445 SF | |||
| Loan Purpose: | Refinance | Cut-off Date Balance Per Unit/SF: | $139 | |||
| Borrower Name(s): | Mather Development Partners IV, L.P. | Balloon Balance Per Unit/SF: | $112 | |||
| Sponsor(s): | Marc Sussman; Mark Friedman; David Nystrom | Year Built / Year Renovated: | 2008 / NAP | |||
| Mortgage Rate: | 4.43500% | Title Vesting: | Fee | |||
| Note Date: | 1/24/2013 | Property Manager: | McCuen Properties | |||
| First Payment Date: | 3/1/2013 | Underwriting and Financial Information | ||||
| Anticipated Repayment Date: | NAP | UW Revenues: | $3,510,019 | |||
| Maturity Date: | 2/1/2023 | UW Expenses: | $1,050,283 | |||
| IO Period: | None | UW NOI: | $2,459,736 | |||
| Original Term to Maturity: | 120 months | UW NCF: | $2,197,345 | |||
| Seasoning: | 0 months | UW NOI DSCR: | 1.68x | |||
| Original Amortization Term: | 360 months | UW NCF DSCR: | 1.50x | |||
| Loan Amortization Type: | Amortizing | UW NOI Debt Yield: | 10.2% | |||
| Interest Accrual Basis: | Actual/360 | UW NCF Debt Yield: | 9.1% | |||
| Prepayment Provisions: | LO (36); YM1 (80); O (4) | UW NCF Debt Yield at Maturity: | 11.2% | |||
| Lockbox / Cash Management: | Hard / Springing | Most Recent NOI (As of): | $1,465,519 (12/31/2011) | |||
| Pari Passu Mortgage Debt: | None | 2nd Most Recent NOI (As of): | $3,779,513 (12/31/2010) | |||
| Subordinate Mortgage Debt: | None | 3rd Most Recent NOI (As of): | $3,582,533 (12/31/2009) | |||
| Mezzanine Debt: | None | Appraised Value: | $32,500,000 | |||
| Reserves | Appraisal As-of Date: | 9/26/2012 | ||||
| Type | Initial | Monthly | Cap | Cut-off Date LTV Ratio: | 74.5% | |
| RE Tax: | $100,427 | $25,107 | NAP | LTV Ratio at Maturity: | 60.2% | |
| Insurance: | $0 | Springing | NAP | Occupancy Rate (As of): | 100.0% (9/30/2012) | |
| Recurring Replacements: | $0 | $3,634 | NAP | |||
| TI/LC: | $0 | $6,250 | $250,000 | |||
| This is not a research report and was not prepared by the BofA Merrill Lynch or Morgan Stanley research departments. Please see additional important information and qualifications at the end of this Term Sheet. |
MSBAM 2013-C8 | Hamden Medical Office Portfolio |
| Mortgage Loan No. 14 – Hamden Medical Office Portfolio |
| Mortgage Loan Information | Mortgaged Property Information | |||||
| Mortgage Loan Seller: | BANA | Single Asset / Portfolio: | Portfolio | |||
| Credit Assessment (Fitch/KBRA/S&P): | NR/NR/NR | Property Address: | 2080 & 2200 Whitney Avenue Hamden, CT 06518 | |||
| Original Balance: | $23,800,000 | General Property Type: | Office | |||
| Cut-off Date Balance: | $23,770,777 | Detailed Property Type: | Medical | |||
| % of Initial Pool Balance: | 2.1% | Net Rentable Area: | 134,350 SF | |||
| Loan Purpose: | Acquisition | Cut-off Date Balance Per Unit/SF: | $177 | |||
| Borrower Name(s): | 2080 Real Estate, LLC & 2200 Real Estate, LLC | Balloon Balance Per Unit/SF: | $143 | |||
| Sponsor(s): | Stephen P. Lawrence | Year Built / Year Renovated: | 1969/1972; 1997/2008 | |||
| Mortgage Rate: | 4.36625% | Title Vesting: | Fee | |||
| Note Date: | 12/20/2012 | Property Manager: | Investment Capital Management, LLC and MKR, Inc. | |||
| First Payment Date: | 2/1/2013 | Underwriting and Financial Information | ||||
| Anticipated Repayment Date: | NAP | UW Revenues: | $4,189,976 | |||
| Maturity Date: | 1/1/2023 | UW Expenses: | $1,974,288 | |||
| IO Period: | None | UW NOI: | $2,215,688 | |||
| Original Term to Maturity: | 120 months | UW NCF: | $2,022,192 | |||
| Seasoning: | 1 month | UW NOI DSCR: | 1.56x | |||
| Original Amortization Term: | 360 months | UW NCF DSCR: | 1.42x | |||
| Loan Amortization Type: | Amortizing | UW NOI Debt Yield: | 9.3% | |||
| Interest Accrual Basis: | Actual/360 | UW NCF Debt Yield: | 8.5% | |||
| Prepayment Provisions: | LO (25); DEF (91); O (4) | UW NCF Debt Yield at Maturity: | 10.5% | |||
| Lockbox / Cash Management: | Hard / In Place | Most Recent NOI (As of): | $2,467,887 (8/31/2012 TTM) | |||
| Pari Passu Mortgage Debt: | None | 2nd Most Recent NOI (As of): | $2,383,497 (12/31/2011) | |||
| Subordinate Mortgage Debt: | None | 3rd Most Recent NOI (As of): | $2,430,024 (12/31/2010) | |||
| Mezzanine Debt: | None | Appraised Value: | $34,500,000 | |||
| Reserves | Appraisal As-of Date: | 10/18/2012 | ||||
| Type | Initial | Monthly | Cap | Cut-off Date LTV Ratio: | 68.9% | |
| RE Tax: | $42,107 | $42,107 | NAP | LTV Ratio at Maturity: | 55.6% | |
| Insurance: | $0 | Springing | NAP | Occupancy Rate (As of): | 100.0% (12/18/2012) | |
| Recurring Replacements: | $120,000 | $2,799 | NAP | |||
| TI/LC: | $420,000 | $0 | NAP | |||
| This is not a research report and was not prepared by the BofA Merrill Lynch or Morgan Stanley research departments. Please see additional important information and qualifications at the end of this Term Sheet. |
| MSBAM 2013-C8 | 11451 Katy Freeway |
| Mortgage Loan No. 15 – 11451 Katy Freeway |
| Mortgage Loan Information | Mortgaged Property Information | |||||
Mortgage Loan Seller: | MSMCH | Single Asset / Portfolio: | Single Asset | |||
| Credit Assessment (Fitch/KBRA/S&P): | NR/NR/NR | Property Address: | 11451 Katy Freeway Houston, TX 77079 | |||
| Original Balance: | $22,869,000 | |||||
| Cut-off Date Balance: | $22,869,000 | General Property Type: | Office | |||
| % of Initial Pool Balance: | 2.0% | Detailed Property Type: | Suburban | |||
| Loan Purpose: | Acquisition | Net Rentable Area: | ||||
| Borrower Name(s): | Katy Freeway Investors, LP | Cut-off Date Balance Per Unit/SF: | $195 | |||
| Sponsor(s): | Timothy Horan, Jr. | Balloon Balance Per Unit/SF: | $161 | |||
| Mortgage Rate: | 4.20000% | Year Built / Year Renovated: | 1999 / NAP | |||
| Note Date: | 12/28/2012 | Title Vesting: | Fee | |||
| First Payment Date: | 2/1/2013 | Property Manager: | Amherst Management L.C. | |||
| Anticipated Repayment Date: | NAP | Underwriting and Financial Information | ||||
| Maturity Date: | 1/1/2023 | UW Revenues: | $3,778,857 | |||
| IO Period: | 12 months | UW Expenses: | $1,568,742 | |||
| Original Term to Maturity: | 120 months | UW NOI: | $2,210,115 | |||
| Seasoning: | 1 month | UW NCF: | $1,969,226 | |||
| Original Amortization Term: | 360 months | UW NOI DSCR: | 1.65x | |||
| Loan Amortization Type: | Partial IO | UW NCF DSCR: | 1.47x | |||
| Interest Accrual Basis: | Actual/360 | UW NOI Debt Yield: | 9.7% | |||
| Prepayment Provisions: | LO (25); DEF (91); O (4) | UW NCF Debt Yield: | 8.6% | |||
| Lockbox / Cash Management: | Hard / Springing | UW NCF Debt Yield at Maturity: | 10.4% | |||
| Pari Passu Mortgage Debt: | None | Most Recent NOI (As of): | ||||
| Subordinate Mortgage Debt: | None | 2nd Most Recent NOI (As of): | ||||
| Mezzanine Debt: | None | 3rd Most Recent NOI (As of): | ||||
| Reserves | Appraised Value: | $32,550,000 | ||||
| Type | Initial | Monthly | Cap | Appraisal As-of Date: | 11/20/2012 | |
| RE Tax: | $0 | $22,500 | Cut-off Date LTV Ratio: | 70.3% | ||
| Insurance: | $0 | LTV Ratio at Maturity: | 58.0% | |||
| Recurring Replacements: | $0 | NAP | Occupancy Rate (As of): | |||
TI/LC(1): | $0 | 2nd Most Recent Occupancy (As of): | ||||
3rd Most Recent Occupancy (As of): | ||||||
| (1) | The monthly TI/LC escrow is $33,333 for the first 12 months, and $16,667 thereafter. |
| This is not a research report and was not prepared by the BofA Merrill Lynch or Morgan Stanley research departments. Please see additional important information and qualifications at the end of this Term Sheet. |
| MSBAM 2013-C8 | Anderson Mall |
| Mortgage Loan No. 16 – Anderson Mall |
| Mortgage Loan Information | Mortgaged Property Information | |||||
| Mortgage Loan Seller: | BANA | Single Asset / Portfolio: | Single Asset | |||
| Credit Assessment (Fitch/KBRA/S&P): | NR/NR/NR | Property Address: | 3131 North Main Street Anderson, SC 29621 | |||
| Original Balance: | $20,875,544 | General Property Type: | Retail | |||
| Cut-off Date Balance: | $20,806,491 | Detailed Property Type: | Regional Mall | |||
| % of Initial Pool Balance: | 1.8% | Net Rentable Area: | 316,561 SF | |||
| Loan Purpose: | Refinance | Cut-off Date Balance Per Unit/SF: | $66 | |||
| Borrower Name(s): | SPG Anderson Mall, LLC | Balloon Balance Per Unit/SF: | $49 | |||
| Sponsor(s): | Simon Property Group, L.P. | Year Built / Year Renovated: | 1972 / 2008 | |||
| Mortgage Rate: | 4.61200% | Title Vesting: | Fee | |||
| Note Date: | 11/20/2012 | Property Manager: | Simon Management Associates, LLC | |||
| First Payment Date: | 1/1/2013 | Underwriting and Financial Information | ||||
| Anticipated Repayment Date: | NAP | UW Revenues: | $5,617,429 | |||
| Maturity Date: | 12/1/2022 | UW Expenses: | $2,685,984 | |||
| IO Period: | None | UW NOI: | $2,931,445 | |||
| Original Term to Maturity | 120 months | UW NCF: | $2,656,295 | |||
| Seasoning: | 2 months | UW NOI DSCR: | 2.08x | |||
| Original Amortization Term: | 300 months | UW NCF DSCR: | 1.89x | |||
| Loan Amortization Type: | Amortizing | UW NOI Debt Yield: | 14.1% | |||
| Interest Accrual Basis: | Actual/360 | UW NCF Debt Yield: | 12.8% | |||
| Prepayment Provisions: | LO (26); DEF (87); O (7) | UW NCF Debt Yield at Maturity: | 17.2% | |||
| Lockbox / Cash Management: | Hard / Springing | Most Recent NOI (As of): | $2,894,579 (10/31/2012 TTM) | |||
| Pari Passu Mortgage Debt: | None | 2nd Most Recent NOI (As of): | $3,005,756 (12/31/2011) | |||
| Subordinate Mortgage Debt: | None | 3rd Most Recent NOI (As of): | $3,366,419 (12/31/2010) | |||
| Mezzanine Debt: | None | Appraised Value: | $34,000,000 | |||
| Reserves | Appraisal As-of Date: | 5/1/2012 | ||||
| Type | Initial | Monthly | Cap | Cut-off Date LTV Ratio: | 61.2% | |
| RE Tax: | $410,392 | $58,627 | NAP | LTV Ratio at Maturity: | 45.4% | |
| Insurance: | $0 | Springing | NAP | Occupancy Rate (As of): | 87.2% (6/4/2012) | |
| Recurring Replacements: | $0 | Springing | $221,620 | 2nd Most Recent Occupancy (As of): | 85.1% (12/31/2011) | |
| TI/LC: | $0 | Springing | $617,370 | 3rd Most Recent Occupancy (As of): | 89.0% (12/31/2010) | |
| J.C. Penney Reserve | $0 | Springing | $500,000(1 ) | |||
| (1) | Upon the occurrence of a J.C. Penney Store trigger event, excess cash (up to a cap of $500,000) will be deposited into the J.C. Penny Reserve Account to escrow for costs incurred if (a) J.C. Penney fails to give notice of its election to renew the J.C. Penney Lease, or (ii) if J.C. Penney “goes dark”, vacates, ceases to occupy or discontinues its operations at the J.C. Penney Premises. |
| This is not a research report and was not prepared by the BofA Merrill Lynch or Morgan Stanley research departments. Please see additional important information and qualifications at the end of this Term Sheet. |
| MSBAM 2013-C8 | Warwick Estates MHC |
| Mortgage Loan No. 17 – Warwick Estates MHC |
| Mortgage Loan Information | Mortgaged Property Information | |||||
| Mortgage Loan Seller: | BANA | Single Asset / Portfolio: | Single Asset | |||
| Credit Assessment (Fitch/KBRA/S&P): | NR/NR/NR | Property Address: | 12095 Jefferson Avenue Newport News, VA 23606 | |||
| Original Balance: | $20,600,000 | General Property Type: | Manufactured Housing | |||
| Cut-off Date Balance: | $20,554,564 | Detailed Property Type: | Manufactured Housing | |||
| % of Initial Pool Balance: | 1.8% | Number of Pads: | 581 Pads | |||
| Loan Purpose: | Refinance | Cut-off Date Balance Per Pad: | $35,378 | |||
| Borrower Name(s): | Warwick Mobile Home Park, LLC | Balloon Balance Per Pad: | $29,073 | |||
| Sponsor(s): | John A. Franklin | Year Built / Year Renovated: | 1980 / NAP | |||
| Mortgage Rate: | 4.85000% | Title Vesting: | Fee | |||
| Note Date: | 11/15/2012 | Property Manager: | Franklin Investment, LLC | |||
| First Payment Date: | 1/1/2013 | Underwriting and Financial Information | ||||
| Anticipated Repayment Date: | NAP | UW Revenues: | $2,854,142 | |||
| Maturity Date: | 12/1/2022 | UW Expenses: | $1,018,376 | |||
| IO Period: | None | UW NOI: | $1,835,766 | |||
| Original Term to Maturity: | 120 months | UW NCF: | $1,815,431 | |||
| Seasoning: | 2 months | UW NOI DSCR: | 1.41x | |||
| Original Amortization Term: | 360 months | UW NCF DSCR: | 1.39x | |||
| Loan Amortization Type: | Amortizing | UW NOI Debt Yield: | 8.9% | |||
| Interest Accrual Basis: | Actual/360 | UW NCF Debt Yield: | 8.8% | |||
| Prepayment Provisions: | LO (26); DEF (91); O (3) | UW NCF Debt Yield at Maturity: | 10.7% | |||
| Lockbox / Cash Management: | Hard / Springing | Most Recent NOI (As of): | $1,865,115 (9/30/2012 TTM) | |||
| Pari Passu Mortgage Debt: | None | 2nd Most Recent NOI (As of): | $1,848,238 (12/31/2011) | |||
| Subordinate Mortgage Debt: | None | 3rd Most Recent NOI (As of): | $1,626,186 (12/31/2010) | |||
| Mezzanine Debt: | None | Appraised Value: | $29,200,000 | |||
| Reserves | Appraisal As-of Date: | 8/29/2012 | ||||
| Type | Initial | Monthly | Cap | Cut-off Date LTV Ratio: | 70.4% | |
| RE Tax: | $19,579 | $19,579 | NAP | LTV Ratio at Maturity: | 57.8% | |
| Insurance: | $0 | Springing | NAP | Occupancy Rate (As of): | 89.5% (9/30/2012) | |
| Recurring Replacements: | $0 | $1,695 | NAP | |||
| Deferred Maintenance: | $18,375 | $0 | NAP | |||
| This is not a research report and was not prepared by the BofA Merrill Lynch or Morgan Stanley research departments. Please see additional important information and qualifications at the end of this Term Sheet. |
| MSBAM 2013-C8 | Riverdale |
| Mortgage Loan No. 18 – Riverdale |
| Mortgage Loan Information | Mortgaged Property Information | |||||
| Mortgage Loan Seller: | BANA | Single Asset / Portfolio: | Single Asset | |||
| Credit Assessment (Fitch/KBRA/S&P): | NR/NR/NR | Property Address: | 4177 Riverdale Road Riverdale, UT 84405 | |||
| Original Balance: | $18,250,000 | General Property Type: | Retail | |||
| Cut-off Date Balance: | $18,184,068 | Detailed Property Type: | Anchored | |||
| % of Initial Pool Balance: | 1.6% | Net Rentable Area: | 243,762 SF | |||
| Loan Purpose: | Refinance | Cut-off Date Balance Per Unit/SF: | $75 | |||
| Borrower Name(s): | Riverdale Center Owner, L.C. | Balloon Balance Per Unit/SF: | $54 | |||
| Sponsor(s): | The Boyer Company, L.C.; Gardner Property Holdings, L.C. | Year Built / Year Renovated: | 2001 / NAP | |||
| Mortgage Rate: | 4.10000% | Title Vesting: | Fee / Leasehold | |||
| Note Date: | 11/21/2012 | Property Manager: | The Boyer Company, L.C. | |||
| First Payment Date: | 1/1/2013 | Underwriting and Financial Information | ||||
| Anticipated Repayment Date: | NAP | UW Revenues: | $2,913,699 | |||
| Maturity Date: | 12/1/2022 | UW Expenses: | $752,764 | |||
| IO Period: | None | UW NOI: | $2,160,935 | |||
| Original Term to Maturity: | 120 months | UW NCF: | $1,976,028 | |||
| Seasoning: | 2 months | UW NOI DSCR: | 1.85x | |||
| Original Amortization Term: | 300 months | UW NCF DSCR: | 1.69x | |||
| Loan Amortization Type: | Amortizing | UW NOI Debt Yield: | 11.9% | |||
| Interest Accrual Basis: | Actual/360 | UW NCF Debt Yield: | 10.9% | |||
| Prepayment Provisions: | LO (26); DEF (90); O (4) | UW NCF Debt Yield at Maturity: | 14.9% | |||
| Lockbox / Cash Management: | None / NAP | Most Recent NOI (As of): | $2,449,748 (8/31/2012 TTM) | |||
| Pari Passu Mortgage Debt: | None | 2nd Most Recent NOI (As of): | $2,445,129 (12/31/2011) | |||
| Subordinate Mortgage Debt: | None | 3rd Most Recent NOI (As of): | $2,326,861 (12/31/2010) | |||
| Mezzanine Debt: | None | Appraised Value: | $32,300,000 | |||
| Reserves | Appraisal As-of Date: | 10/11/2012 | ||||
| Type | Initial | Monthly | Cap | Cut-off Date LTV Ratio: | 56.3% | |
| RE Tax: | $47,886 | $23,943 | NAP | LTV Ratio at Maturity: | 41.0% | |
| Insurance: | $0 | Springing | NAP | Occupancy Rate (As of): | 91.5% (11/8/2012) | |
| Recurring Replacements: | $0 | $4,063 | NAP | 2nd Most Recent Occupancy (As of): | 91.0% (12/31/2011) | |
| TI/LC: | $500,000 | $16,667(1) | $1,000,000(2) | 3rd Most Recent Occupancy (As of): | 91.0% (12/31/2010) | |
(1) | A monthly reserve amount of $16,667, is required until the Best Buy Leasing Condition has occurred, thereafter, $8,333 |
| (2) | $1,000,000 until the Best Buy Leasing Condition has occurred, and thereafter, $500,000. |
| This is not a research report and was not prepared by the BofA Merrill Lynch or Morgan Stanley research departments. Please see additional important information and qualifications at the end of this Term Sheet. |
| MSBAM 2013-C8 | One Concourse |
Mortgage Loan No. 19 – One Concourse |
| Mortgage Loan Information | Mortgaged Property Information | |||||
| Mortgage Loan Seller: | BANA | Single Asset / Portfolio: | Single Asset | |||
| Credit Assessment (Fitch/KBRA/S&P): | NR/NR/NR | Property Address: | 9998 Crosspoint Boulevard Fishers, IN 46256 | |||
| Original Balance: | $15,600,000 | General Property Type: | Office | |||
| Cut-off Date Balance: | $15,579,999 | Detailed Property Type: | Suburban | |||
| % of Initial Pool Balance: | 1.4% | Net Rentable Area: | 110,167 SF | |||
| Loan Purpose: | Refinance | Cut-off Date Balance Per Unit/SF: | $141 | |||
| Borrower Name(s): | E-L Crosspoint Building 1 Delaware, LLC | Balloon Balance Per Unit/SF: | $123 | |||
| Sponsor(s): | John L. Edgeworth; Thomas P. Laskey, Jr. | Year Built / Year Renovated: | 2009 / NAP | |||
| Mortgage Rate: | 4.16900% | Title Vesting: | Fee | |||
| Note Date: | 12/31/2012 | Property Manager: | Edgeworth-Laskey Property Management, LLC | |||
| First Payment Date: | 2/1/2013 | Underwriting and Financial Information | ||||
| Anticipated Repayment Date: | NAP | UW Revenues: | $2,112,111 | |||
| Maturity Date: | 1/1/2020 | UW Expenses: | $627,223 | |||
| IO Period: | None | UW NOI: | $1,484,888 | |||
| Original Term to Maturity: | 84 months | UW NCF: | $1,330,294 | |||
| Seasoning: | 1 month | UW NOI DSCR: | 1.63x | |||
| Original Amortization Term: | 360 months | UW NCF DSCR: | 1.46x | |||
| Loan Amortization Type: | Amortizing | UW NOI Debt Yield: | 9.5% | |||
| Interest Accrual Basis: | Actual/360 | UW NCF Debt Yield: | 8.5% | |||
| Prepayment Provisions: | LO (25); DEF (55); O (4) | UW NCF Debt Yield at Maturity: | 9.8% | |||
| Lockbox / Cash Management: | Hard / In Place | Most Recent NOI (As of): | $72,316 (12/31/2011) | |||
| Pari Passu Mortgage Debt: | None | 2nd Most Recent NOI (As of): | $53,562 (12/31/2010) | |||
| Subordinate Mortgage Debt: | None | 3rd Most Recent NOI (As of): | NAP | |||
| Mezzanine Debt: | None | Appraised Value: | $21,600,000 | |||
| Reserves | Appraisal As-of Date: | 12/1/2012 | ||||
| Type | Initial | Monthly | Cap | Cut-off Date LTV Ratio: | 72.1% | |
| RE Tax: | $67,890 | $22,630 | NAP | LTV Ratio at Maturity: | 62.8% | |
| Insurance: | $0 | Springing | NAP | Occupancy Rate (As of): | 95.4% (12/6/2012) | |
| Recurring Replacements: | $0 | $1,836 | NAP | |||
| TI/LC: | $0 | $11,047 | $600,000 | |||
| This is not a research report and was not prepared by the BofA Merrill Lynch or Morgan Stanley research departments. Please see additional important information and qualifications at the end of this Term Sheet. |
| MSBAM 2013-C8 | 58-66 East Fordham Road |
| Mortgage Loan No. 20 – 58-66 East Fordham Road |
| Mortgage Loan Information | Mortgaged Property Information | |||||
| Mortgage Loan Seller: | BANA | Single Asset / Portfolio: | Single Asset | |||
| Credit Assessment (Fitch/KBRA/S&P): | NR/NR/NR | Property Address: | 58-66 East Fordham Road Bronx, NY 10468 | |||
| Original Balance: | $14,500,000 | General Property Type: | Retail | |||
| Cut-off Date Balance: | $14,500,000 | Detailed Property Type: | Unanchored | |||
| % of Initial Pool Balance: | 1.3% | Net Rentable Area: | 25,001 SF | |||
| Loan Purpose: | Refinance | Cut-off Date Balance Per Unit/SF: | $580 | |||
| Borrower Name(s): | 58-66 East Fordham LLC | Balloon Balance Per Unit/SF: | $463 | |||
| Sponsor(s): | Bob Roberts | Year Built / Year Renovated: | 1931 / NAP | |||
| Mortgage Rate: | 4.06350% | Title Vesting: | Fee | |||
| Note Date: | 1/2/2013 | Property Manager: | Roberts Equities Group, Inc. | |||
| First Payment Date: | 3/1/2013 | Underwriting and Financial Information | ||||
| Anticipated Repayment Date: | NAP | UW Revenues: | $1,588,061 | |||
| Maturity Date: | 2/1/2023 | UW Expenses: | $394,491 | |||
| IO Period: | None | UW NOI: | $1,193,570 | |||
| Original Term to Maturity: | 120 months | UW NCF: | $1,180,570 | |||
| Seasoning: | 0 months | UW NOI DSCR: | 1.43x | |||
| Original Amortization Term: | 360 months | UW NCF DSCR: | 1.41x | |||
| Loan Amortization Type: | Amortizing | UW NOI Debt Yield: | 8.2% | |||
| Interest Accrual Basis: | Actual/360 | UW NCF Debt Yield: | 8.1% | |||
| Prepayment Provisions: | LO (24); DEF (91); O (5) | UW NCF Debt Yield at Maturity: | 10.2% | |||
| Lockbox / Cash Management: | Springing / Springing | Most Recent NOI (As of): | $933,531 (12/31/2011 TTM) | |||
| Pari Passu Mortgage Debt: | None | 2nd Most Recent NOI (As of): | $959,491 (12/31/2010) | |||
| Subordinate Mortgage Debt: | None | 3rd Most Recent NOI (As of): | $561,652 (12/31/2009) | |||
| Mezzanine Debt: | None | Appraised Value: | $20,300,000 | |||
| Reserves | Appraisal As-of Date: | 12/6/2012 | ||||
| Type | Initial | Monthly | Cap | Cut-off Date LTV Ratio: | 71.4% | |
| RE Tax: | $25,004 | $25,004 | NAP | LTV Ratio at Maturity: | 57.0% | |
| Insurance: | $0 | Springing | NAP | Occupancy Rate (As of): | 100.0% (12/12/2012) | |
| Recurring Replacements: | $0 | $208 | NAP | 2nd Most Recent Occupancy (As of): | 100.0% (12/31/2011) | |
| TI/LC: | $0 | $0 | NAP | 3rd Most Recent Occupancy (As of): | 100.0% (12/31/2010) | |
| This is not a research report and was not prepared by the BofA Merrill Lynch or Morgan Stanley research departments. Please see additional important information and qualifications at the end of this Term Sheet. |
| MSBAM 2013-C8 |