Banc of America Merrill Lynch Commercial Mortgage
Filed: 29 Jul 13, 12:00am
| FREE WRITING PROSPECTUS | ||
| FILED PURSUANT TO RULE 433 | ||
| REGISTRATION FILE NO.: 333-177707-02 | ||
 |  |
| BofA MERRILL LYNCH | MORGAN STANLEY |
| Co-Lead Bookrunning Manager | Co-Lead Bookrunning Manager |
| CIBC World Markets | |
| Co-Manager | |
| This is not a research report and was not prepared by the Underwriters’ research departments. It was prepared by the Underwriters’ sales, trading, banking or other non-research personnel. This Term Sheet was not intended or written to be used, and it cannot be used by any taxpayer, for the purpose of avoiding penalties that may be imposed on the taxpayer under U.S. federal tax laws. Each taxpayer should seek advice based on the taxpayer’s particular circumstances from an independent tax advisor. Please see additional important information and qualifications at the end of this Term Sheet. |
| This is not a research report and was not prepared by the Underwriters’ research departments. It was prepared by the Underwriters’ sales, trading, banking or other non-research personnel. This Term Sheet was not intended or written to be used, and it cannot be used by any taxpayer, for the purpose of avoiding penalties that may be imposed on the taxpayer under U.S. federal tax laws. Each taxpayer should seek advice based on the taxpayer’s particular circumstances from an independent tax advisor. Please see additional important information and qualifications at the end of this Term Sheet. |
| MSBAM 2013-C11 | Structural Overview |
| Class | Expected Ratings (Fitch/Moody’s/Morningstar)(1) | Approximate Initial Certificate Balance or Notional Amount(2)(3) | Approximate Initial Credit Support(4) | Pass-Through Rate Description(5) | Expected Weighted Average Life (Years)(6) | Principal Window (Months)(6) | Certificate Principal UW NOI Debt Yield(7) | Certificate Principal to Value Ratio(8) |
| Class A-1 | AAA(sf)/Aaa(sf)/AAA | $53,000,000 | 30.000% | (5) | 2.72 | 1-57 | 17.5% | 43.8% |
| Class A-2 | AAA(sf)/Aaa(sf)/AAA | $142,000,000 | 30.000% | (5) | 4.98 | 57-60 | 17.5% | 43.8% |
| Class A-AB | AAA(sf)/Aaa(sf)/AAA | $72,980,000 | 30.000% | (5) | 7.45 | 60-116 | 17.5% | 43.8% |
| Class A-3 | AAA(sf)/Aaa(sf)/AAA | $125,000,000 | 30.000% | (5) | 9.72 | 116-117 | 17.5% | 43.8% |
| Class A-4 | AAA(sf)/Aaa(sf)/AAA | $206,448,000 | 30.000% | (5) | 9.87 | 117-119 | 17.5% | 43.8% |
| Class X-A | AAA(sf)/Aaa(sf)/AAA | $648,667,000 | NAP | Variable(10) | NAP | NAP | NAP | NAP |
Class A-S(9) | AAA(sf)/Aaa(sf)/AAA | $49,239,000 | 24.250% | (5) | 9.92 | 119-119 | 16.2% | 47.4% |
Class B(9) | AA-(sf)/Aa3(sf)/AA+ | $61,013,000 | 17.125% | (5) | 9.92 | 119-119 | 14.8% | 51.9% |
Class PST(9) | A-(sf)/A3(sf)/A+ | $144,505,000 | 13.125% | (5) | 9.92 | 119-119 | 14.1% | 54.4% |
Class C(9) | A-(sf)/A3(sf)/A+ | $34,253,000 | 13.125% | (5) | 9.92 | 119-119 | 14.1% | 54.4% |
| Class | Expected Ratings (Fitch/Moody’s/Morningstar)(1) | Approximate Initial Certificate Balance or Notional Amount(2)(3) | Approximate Initial Credit Support(4) | Pass-Through Rate Description(5) | Expected Weighted Average Life (Years)(6) | Principal Window (Months)(6) | Certificate Principal UW NOI Debt Yield(7) | Certificate Principal to Value Ratio(8) |
| Class X-B | NR/NR/AAA | $55,661,746 | NAP | Variable(10) | NAP | NAP | NAP | NAP |
| Class D | BBB-(sf)/Baa3(sf)/BBB+ | $38,535,000 | 8.625% | (5) | 9.97 | 119-120 | 13.4% | 57.2% |
| Class E | BBB-(sf)/Ba2(sf)/BBB | $9,634,000 | 7.500% | (5) | 10.00 | 120-120 | 13.3% | 57.9% |
| Class F | BB+(sf)/Ba2(sf)/BBB- | $8,563,000 | 6.500% | (5) | 10.00 | 120-120 | 13.1% | 58.5% |
| Class G | B(sf)/B2(sf)/BB- | $20,338,000 | 4.125% | (5) | 10.00 | 120-120 | 12.8% | 60.0% |
| Class H | NR/NR/B | $10,747,000 | 2.870% | (5) | 10.00 | 120-120 | 12.6% | 60.8% |
| Class J | NR/NR/NR | $24,576,746 | 0.000% | (5) | 10.00 | 120-120 | 12.3% | 62.6% |
| (1) | Ratings shown are those of Fitch Ratings, Inc., Moody’s Investors Service, Inc. and Morningstar Credit Ratings, LLC. Certain nationally recognized statistical rating organizations that were not hired by the depositor may use information they receive pursuant to Rule 17g-5 under the Securities Exchange Act of 1934, as amended, or otherwise to rate the certificates. There can be no assurance as to what ratings a non-hired nationally recognized statistical rating organization would assign. See “RISK FACTORS—Risks Related to the Offered Certificates—Ratings of the Offered Certificates Do Not Represent Any Assessment of the Yield to Maturity That a Certificateholder May Experience and Such Ratings May Be Reviewed, Revised, Suspended, Downgraded, Qualified or Withdrawn By the Applicable Rating Agency” and “RATINGS” in the other free writing prospectus, dated July 29, 2013 (the “Free Writing Prospectus”) to which the prospectus dated July 29, 2013 (the “Prospectus”) is attached as Exhibit A. Capitalized terms used but not defined herein have the meanings assigned to such terms in the Free Writing Prospectus. |
| (2) | The certificate principal balances and notional amounts are approximate and on the closing date may vary by up to 5%. Mortgage loans may be removed from or added to the mortgage pool prior to the closing date within the same maximum permitted variance. Any reduction or increase in the aggregate principal balance of mortgage loans within these parameters will result in changes to the initial certificate principal balance or notional amount of each class of certificates and to the other statistical data contained herein and in the Free Writing Prospectus. |
| (3) | The Class X-A and Class X-B Certificates will not have certificate principal balances and will not be entitled to receive distributions of principal. Interest will accrue on the Class X-A and Class X-B Certificates at their respective pass-through rates based upon their respective notional amounts. The notional amount of the Class X-A Certificates will equal the aggregate principal balance of the Class A-1, Class A-2, Class A-AB, Class A-3 and Class A-4 Certificates and the Class A-S trust component, in each case, outstanding from time to time (without regard to any exchange of Class A-S, Class B and Class C Certificates for Class PST Certificates). The notional amount of the Class X-B Certificates will equal the aggregate principal balance of the Class G, Class H and Class J Certificates outstanding from time to time. |
| (4) | The percentages indicated under the column “Approximate Initial Credit Support” with respect to the Class A-1, Class A-2, Class A-AB, Class A-3 and Class A-4 Certificates represent the approximate initial credit support for the Class A-1, Class A-2, Class A-AB, Class A-3 and Class A-4 Certificates in the aggregate. The percentage indicated under the column “Approximate Initial Credit Support” with respect to the Class C Certificates and the Class PST Certificates represents the approximate initial credit support for the Class C trust component. |
| (5) | Each class of principal balance certificates (other than the Class PST Certificates and each trust component) will, at all times, accrue interest at a per annum rate equal to (i) a fixed rate, (ii) a fixed rate subject to a cap equal to the weighted average of the net interest rates on the mortgage loans (in each case adjusted, if necessary, to accrue on the basis of a 360-day year consisting of twelve (12) 30-day months) or (iii) a rate equal to the weighted average of the net interest rates on the mortgage loans (in each case adjusted, if necessary, to accrue on the basis of a 360-day year consisting of twelve (12) 30-day months) less a specified percentage, which percentage may be zero. The Class PST Certificates will not have a pass-through rate, but will be entitled to receive the sum of the interest distributable on its percentage interests in the Class A-S, Class B and Class C trust components. The distribution of interest to the Class PST Certificates on each distribution date is expected to be in an amount that would produce an effective pass-through rate equal to the weighted average of the pass-through rates of the Class A-S, Class B and Class C trust components. The pass-through rates for the Class A-S Certificates, the Class A-S trust component and the Class PST Component A-S will, at all times, be the same. The pass-through rates for the Class B Certificates, the Class B trust component and the Class PST Component B will, at all times, be the same. The pass-through rates for the Class C Certificates, the Class C trust component and the Class PST Component C will, at all times, be the same. |
| (6) | The principal window is expressed in months following the closing date and reflects the period during which distributions of principal would be received under the assumptions set forth in the following sentence. The expected weighted average life and principal window figures set forth above are based on the following assumptions, among others: (i) no defaults or subsequent losses on the mortgage loans; (ii) no extensions of maturity dates of mortgage loans that do not have “anticipated repayment dates”; (iii) payment in full on the stated maturity date or, in the case of each mortgage loan having an anticipated repayment date, on the anticipated repayment date; and (iv) no prepayments of the mortgage loans prior to maturity or, in the case of a mortgage loan having an anticipated repayment date, |
| This is not a research report and was not prepared by the Underwriters’ research departments. Please see additional important information and qualifications at the end of this Term Sheet. |
| MSBAM 2013-C11 | Structural Overview |
| prior to such anticipated repayment date. See the structuring assumptions set forth under “YIELD, PREPAYMENT AND MATURITY CONSIDERATIONS—Weighted Average Life” in the Free Writing Prospectus. |
| (7) | Certificate Principal UW NOI Debt Yield for any class of principal balance certificates (other than the Exchangeable Certificates) is calculated as the product of (a) the weighted average UW NOI Debt Yield for the mortgage pool, multiplied by (b) a fraction, the numerator of which is the total initial principal balance of all the principal balance certificates (other than the Exchangeable Certificates) and the trust components, and the denominator of which is the total initial principal balance of the subject class of principal balance certificates and all other classes of principal balance certificates (other than the Exchangeable Certificates), if any, that are senior to such class. The Certificate Principal UW NOI Debt Yields of the Class A-1, Class A-2, Class A-AB, Class A-3 and Class A-4 Certificates are calculated in the aggregate for those classes as if they were a single class. Certificate Principal UW NOI Debt Yield for the Class A-S, Class B and Class C Certificates is calculated as the product of (a) the weighted average UW NOI Debt Yield for the mortgage pool, multiplied by (b) a fraction, the numerator of which is the total initial principal balance of all the principal balance certificates (other than the Exchangeable Certificates) and the trust components, and the denominator of which is the total initial principal balance of the Class A-S trust component, the Class B trust component or the Class C trust component, as applicable, and all other classes of principal balance certificates (other than the Exchangeable Certificates) and the trust components that are senior to such class. The Certificate Principal UW NOI Debt Yield of the Class PST Certificates is equal to the Certificate Principal UW NOI Debt Yield for the Class C Certificates. |
| (8) | Certificate Principal to Value Ratio for any class of principal balance certificates (other than the Exchangeable Certificates) is calculated as the product of (a) the weighted average Cut-off Date LTV Ratio of the mortgage pool, multiplied by (b) a fraction, the numerator of which is the total initial principal balance of the subject class of principal balance certificates and all other classes of principal balance certificates (other than the Exchangeable Certificates) and the trust components, if any, that are senior to such class, and the denominator of which is the total initial principal balance of all the principal balance certificates (other than the Exchangeable Certificates) and the trust components. The Certificate Principal to Value Ratios of the Class A-1, Class A-2, Class A-AB, Class A-3 and Class A-4 Certificates are calculated in the aggregate for those classes as if they were a single class. Certificate Principal to Value Ratio for the Class A-S, Class B and Class C Certificates is calculated as the product of (a) the weighted average Cut-off Date LTV Ratio of the mortgage pool, multiplied by (b) a fraction, the numerator of which is the total initial principal balance of the Class A-S trust component, the Class B trust component or the Class C trust component, as applicable, and all other classes of principal balance certificates (other than the Exchangeable Certificates) and the trust components that are senior to such class, and denominator of which is the total initial principal balance of all the principal balance certificates (other than the Exchangeable Certificates) and the trust components. The Certificate Principal to Value Ratio of the Class PST Certificates is equal to the Certificate Principal to Value Ratio of the Class C Certificates. |
| (9) | The Class A-S, Class B, Class PST and Class C Certificates are “Exchangeable Certificates”. On the closing date, the upper-tier REMIC of the issuing entity will issue the Class A-S, Class B and Class C trust components (each a, “trust component”), which will have outstanding principal balances on the closing date of $49,239,000, $61,013,000 and $34,253,000, respectively. The trust components will be held in a grantor trust for the benefit of the holders of the Class A-S, Class B, Class PST and Class C Certificates. The Class A-S, Class B, Class PST and Class C Certificates will, at all times, represent undivided beneficial ownership interests in the grantor trust that will hold those trust components, and each class of the Class A-S, Class B and Class C Certificates will, at all times, represent an undivided beneficial ownership interest in a percentage of the outstanding principal balance of the trust component with the same alphabetical class designation. The Class PST Certificates will, at all times, represent an undivided beneficial ownership interest in the remaining percentages of the outstanding principal balances of the Class A-S, Class B and Class C trust components and which portions of those trust components are referred to in this Term Sheet as the Class PST Component A-S, Class PST Component B and Class PST Component C (collectively, the “Class PST Components”). Following any exchange of Class A-S, Class B and Class C Certificates for Class PST Certificates or any exchange of Class PST Certificates for Class A-S, Class B and Class C Certificates as described in the Free Writing Prospectus, the percentage interest of the outstanding certificate principal balances of the Class A-S, Class B and Class C trust components that is represented by the Class A-S, Class B, Class PST and Class C Certificates will be increased or decreased accordingly. The initial certificate principal balance of each of the Class A-S, Class B and Class C Certificates shown in the table represents the maximum certificate principal balance of such class without giving effect to any exchange. The initial certificate principal balance of the Class PST Certificates is equal to the aggregate of the initial certificate principal balance of the Class A-S, Class B and Class C Certificates and represents the maximum certificate principal balance of the Class PST Certificates that could be issued in an exchange. The certificate principal balances of the Class A-S, Class B and Class C Certificates to be issued on the closing date will be reduced, in required proportions, by an amount equal to the certificate principal balance of the Class PST Certificates issued on the closing date. Distributions and allocations of payments and losses with respect to the Exchangeable Certificates are described in this Term Sheet under “Allocations and Distributions on the Class A-S, Class B, Class PST and Class C Certificates” and under “DESCRIPTION OF THE OFFERED CERTIFICATES—Distributions” in the Free Writing Prospectus. The maximum certificate principal balance of the Class PST Certificates is set forth in the table but is not included in the certificate principal balance of the certificates set forth on the cover page of this Term Sheet or on the top of the cover page of the Free Writing Prospectus. |
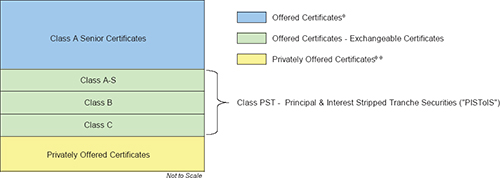
| * | For purposes of the foregoing chart, the Class A Senior Certificates includes the Class X-A Certificates, which are also offered certificates, in regards to payments of interest. |
** | For purposes of the foregoing chart, the Class A Senior Certificates includes the Class X-B Certificates, which are privately offered certificates, in regards to payments of interest. |
| (10) | The pass-through rate on the Class X-A Certificates will generally be equal to the excess, if any, of (i) the weighted average of the net interest rates on the mortgage loans (in each case adjusted, if necessary, to accrue on the basis of a 360-day year consisting of twelve (12) 30-day months), over (ii) the weighted average of the pass-through rates of the Class A-1, Class A-2, Class A-AB, Class A-3 and Class A-4 Certificates and the Class A-S trust component (without regard to any exchange of Class A-S, Class B and Class C Certificates for Class PST Certificates) as described in the Free Writing Prospectus. The pass-through rate on the Class X-B Certificates will generally be equal to the excess, if any, of (a) the weighted average of the net interest rates on the mortgage loans (in each case adjusted, if necessary, to accrue on the basis of a 360-day year consisting of twelve (12) 30-day months), over (b) the weighted average of the pass-through rates of the Class G, Class H and Class J Certificates. |
| (11) | Not offered pursuant to the Prospectus, the Free Writing Prospectus or this Term Sheet. Information provided in this Term Sheet regarding the characteristics of these certificates is provided only to enhance your understanding of the offered certificates. The privately offered certificates also include the Class R Certificates, which do not have a certificate principal balance, notional amount, pass-through rate, rating or rated final distribution date, and which are not shown in the chart. |
| This is not a research report and was not prepared by the Underwriters’ research departments. Please see additional important information and qualifications at the end of this Term Sheet. |
| MSBAM 2013-C11 | Structural Overview |
| Offered Certificates: | $743,933,000 (approximate) monthly pay, multi-class, commercial mortgage pass-through certificates, consisting of nine principal balance classes (Class A-1, Class A-2, Class A-AB, Class A-3, Class A-4, Class A-S, Class B, Class PST and Class C Certificates) and one interest only class (Class X-A Certificates), offered pursuant to a registration statement filed with the SEC (File Number 333-177707) |
| Co-Lead Bookrunning Managers: | Merrill Lynch, Pierce, Fenner & Smith Incorporated and Morgan Stanley & Co. LLC |
| Co-Manager: | CIBC World Markets Corp. |
| Mortgage Loan Sellers: | Bank of America, National Association, Morgan Stanley Mortgage Capital Holdings LLC and CIBC Inc. |
| Rating Agencies: | Fitch Ratings, Inc., Moody’s Investors Service, Inc. and Morningstar Credit Ratings, LLC |
| Master Servicer: | Wells Fargo Bank, National Association |
| Special Servicer: | Midland Loan Services, a Division of PNC Bank, National Association |
| Trustee: | Deutsche Bank Trust Company Americas |
Certificate Administrator/Certificate Registrar/Custodian: | Wells Fargo Bank, National Association |
| Trust Advisor: | Situs Holdings, LLC |
Initial Controlling Class Representative: | BlackRock Financial Management Inc. |
| Cut-off Date: | August 1, 2013. For purposes of the information contained in this term sheet (this “Term Sheet”), scheduled payments due in August 2013 with respect to mortgage loans not having payment dates on the first day of each month have been deemed received on August 1, 2013, not the actual day on which such scheduled payments were due. |
| Expected Pricing Date: | Week of July 29, 2013 |
| Expected Closing Date: | On or about August 15, 2013 |
| Determination Dates: | The 11th calendar day of each month (if the 11th calendar day is not a business day, the next succeeding business day), commencing in September 2013 |
| Distribution Dates: | The 4th business day following the Determination Date in each month, commencing in September 2013 |
| Rated Final Distribution Date: | The Distribution Date in August 2046 |
| Interest Accrual Period: | Preceding calendar month |
| Payment Structure: | Sequential pay |
| Tax Treatment: | REMIC, except that the Class A-S, Class B, Class PST and Class C Certificates will evidence an interest in a grantor trust |
| Optional Termination: | 1.00% clean-up call |
| Minimum Denominations: | $10,000 for each class of Offered Certificates (other than Class X-A) and integral multiples of $1 in excess of $10,000. The Class X-A Certificates will be initially offered and sold in minimum denominations of $100,000 and integral multiples of $1 in excess of $100,000 |
| Settlement Terms: | DTC, Euroclear and Clearstream |
| Legal/Regulatory Status: | Each Class of Offered Certificates is expected to be eligible for exemptive relief under ERISA. No class of certificates is SMMEA eligible. |
| Analytics: | The certificate administrator is expected to make available all distribution date statements, CREFC reports and supplemental notices received by it to certain modeling financial services (i.e., BlackRock Financial Management, Inc., Bloomberg, L.P., Intex Solutions, Inc., Markit, CMBS.com, Inc. and Trepp, LLC). |
| Bloomberg Ticker: | MSBAM 2013-C11 <MTGE><GO> |
| Risk Factors: | THE CERTIFICATES INVOLVE CERTAIN RISKS AND MAY NOT BE SUITABLE FOR ALL INVESTORS. SEE THE “RISK FACTORS” SECTION OF THE FREE WRITING PROSPECTUS AND THE “RISK FACTORS” SECTION OF THE PROSPECTUS. |
| This is not a research report and was not prepared by the Underwriters’ research departments. Please see additional important information and qualifications at the end of this Term Sheet. |
| MSBAM 2013-C11 | Structural Overview |
| Accrual: | Each class of Offered Certificates will accrue interest on a 30/360 basis. |
| Amount and Order of Distributions: | On each distribution date, certificateholders will be entitled to receive distributions of interest and principal from funds received with respect to the mortgage loans and available for distribution. Funds available for distribution on the certificates will be net of excess interest, excess liquidation proceeds and specified trust expenses, including, without limitation, all advance reimbursements (with interest) and all servicing fees and expenses, certificate administrator fees (including trustee fees and custodian fees) and expenses, special servicing compensation and trust advisor fees and expenses as set forth below. Distributions to certificateholders on each distribution date out of payments (or advances in lieu thereof) and other collections on the mortgage loans will be in an amount equal to each class’ interest and principal entitlement, subject to: (i) payment of the respective interest entitlement for any other class of certificates bearing an earlier alphanumeric designation (except (x) in respect of the distribution of interest among the Class A-1, Class A-2, Class A-AB, Class A-3, Class A-4, Class X-A and Class X-B Certificates, which will have the same senior priority and be distributed pro rata and (y) in respect of the distribution of interest among the Class A-S, Class B, Class PST and Class C Certificates as described below under “Allocations and Distributions on the Class A-S, Class B, Class PST and Class C Certificates”); (ii) if applicable, payment of the respective principal entitlement for the distribution date to the outstanding classes of principal balance certificates, first, to the Class A-AB Certificates, until the principal balance of such class has been reduced to the planned principal balance for the related distribution date set forth on Appendix VII to the Free Writing Prospectus, then, to the Class A-1, Class A-2, Class A-3 and Class A-4 Class A-AB Certificates, in that order, until the principal balance of each such class has been reduced to zero (and, if the principal balance of each class of principal balance certificates other than the Class A-1, Class A-2, Class A-AB, Class A-3 and Class A-4 Certificates has been reduced to zero as a result of the allocation of mortgage loan losses or trust advisor expenses to those certificates, or if the aggregate appraisal reduction equals or exceeds the aggregate principal balance of the Class A-S through Class J Certificates (including the Class PST Certificates), then on a pro rata basis among the holders of the Class A-1, Class A-2, Class A-AB, Class A-3 and Class A-4 Certificates), then, to the Class A-S, Class B, Class PST and Class C Certificates as described below under “Allocations and Distributions on the Class A-S, Class B, Class PST and Class C Certificates” until the principal balance of each such class has been reduced to zero, and then to the Class D, Class E, Class F, Class G, Class H and Class J Certificates, in that order, until the principal balance of each such class has been reduced to zero; and (iii) the allocation of trust advisor expenses, (a) first, to reduce payments of interest on the Class F Certificates, Class E Certificates, the Class D Certificates, the Class C trust component and the Class B trust component in that order, (b) second, to reduce payments of principal on the Class F Certificates, Class E Certificates, the Class D Certificates, the Class C trust component, the Class B trust component and the Class A-S trust component in that order, and (c) third, to reduce payments of principal on the Class A-1, Class A-2, Class A-AB, Class A-3 and Class A-4 Certificates on a pro rata basis. No trust advisor expenses (other than the trust advisor fee) will be allocated to or otherwise borne by the Control Eligible Certificates. As a result, none of the classes of Control Eligible Certificates will provide protection to the more senior classes of certificates for the purposes of allocating losses based on trust advisor expenses. Trust advisor expenses allocated to the Class A-S trust component, the Class B trust component and the Class C trust component will be allocated to the Class A-S, Class B, Class PST and Class C Certificates as described below under “Allocations and Distributions on the Class A-S, Class B, Class PST and Class C Certificates”. |
| Interest and Principal Entitlements: | Interest distributable on any class of certificates (other than the Exchangeable Certificates and the Class R Certificates) or trust component on any distribution date, with various adjustments described under “DESCRIPTION OF THE OFFERED CERTIFICATES—Distributions” in the Free Writing Prospectus, represents all unpaid interest accrued with respect to that class of certificates or trust component through the end of the interest accrual period that corresponds to that distribution date. Interest accrues with respect to the interest-bearing certificates and the trust components (and correspondingly on the Exchangeable Certificates) on the basis of a 360-day year consisting of twelve (12) 30-day months. Interest accrues with respect to each interest-bearing certificate and each trust component during each interest accrual period at the applicable pass-through rate for, and on the principal balance or notional amount, as applicable, of that certificate or trust component outstanding immediately prior to, the distribution date that corresponds to that interest accrual period. However, as described in “DESCRIPTION OF THE OFFERED CERTIFICATES—Distributions” in the Free Writing Prospectus, there are circumstances relating to the timing of prepayments in which the interest entitlement with respect to any certificate or trust component for a distribution date could be less than one full month’s interest at the pass-through rate on the certificate’s or trust component’s principal balance or notional amount. In addition, certain specified trust fund expenses, the right of the master servicer, the special servicer and the trustee to reimbursement for payment of advances (with interest thereon), and the rights of such parties and of the certificate administrator, the custodian and, subject to certain limitations, the trust advisor to the payments of compensation and reimbursement of certain costs and expenses will be prior to a certificateholder’s right to receive distributions of principal or interest. In addition, the right of the trust advisor to receive reimbursement of trust advisor expenses will be prior to the right of the holders of the Class B, Class PST, Class C, Class D, Class E and Class F Certificates to receive payments of interest, and to the holders of the Class A-1, Class A-2, Class A-AB, Class A-3, Class A-4, Class A-S, Class B, Class PST, Class |
| This is not a research report and was not prepared by the Underwriters’ research departments. Please see additional important information and qualifications at the end of this Term Sheet. |
| MSBAM 2013-C11 | Structural Overview |
C, Class D, Class E and Class F Certificates to receive payments of principal. The amount of principal available to be distributed on the classes entitled to principal on a particular distribution date will, in general, be equal to the sum of: (i) the principal portion of all scheduled payments, other than balloon payments, to the extent received during the related collection period or advanced by the master servicer or other party (in accordance with the pooling and servicing agreement) in respect of such distribution date; (ii) all principal prepayments and the principal portion of balloon payments received during the related collection period; (iii) the principal portion of other collections on the mortgage loans received during the related collection period, for example liquidation proceeds, condemnation proceeds, insurance proceeds and income on other “real estate owned” (“REO”); and (iv) the principal portion of proceeds of mortgage loan repurchases received during the related collection period; subject, to certain adjustments described in the Free Writing Prospectus relating to the payment or reimbursement of nonrecoverable advances, workout-delayed reimbursement amounts and trust advisor expenses, and exclusive of any late collections of principal received during the related collection period for which there is an outstanding advance. The Class R, Class X-A and Class X-B Certificates will not be entitled to principal distributions. | |
| Allocations and Distributions on the Class A-S, Class B, Class PST and Class C Certificates: | On the closing date, the upper-tier REMIC of the issuing entity will issue the Class A-S, Class B and Class C trust components (each a “trust component”) which will have outstanding principal balances on the closing date of $49,239,000, $61,013,000 and $34,253,000, respectively. The trust components will be held in a grantor trust for the benefit of the holders of the Class A-S, Class B, Class PST and Class C Certificates. The Class A-S, Class B, Class PST and Class C Certificates will, at all times, represent undivided beneficial ownership interests in a grantor trust that will hold those trust components. Each class of the Class A-S, Class B and Class C Certificates will, at all times, represent an undivided beneficial ownership interest in a percentage of the outstanding principal balance of the trust component with the same alphabetical class designation. The Class PST Certificates will, at all times, represent an undivided beneficial ownership interest in the remaining percentages of the outstanding principal balances of the Class A-S, Class B and Class C trust components and which percentage interests are referred to in this Term Sheet as the “Class PST Component A-S, Class PST Component B and Class PST Component C” (collectively, the “Class PST Components”). Interest, principal, prepayment premiums, yield maintenance charges and voting rights that are allocated to the Class A-S, Class B or Class C trust component will be distributed or allocated, as applicable, as between the Class A-S, Class B or Class C Certificates, as applicable, on the one hand, and Class PST Component A-S, Class PST Component B or Class PST Component C, as applicable (and correspondingly, the Class PST Certificates), on the other hand, pro rata, based on their respective percentage interests in the Class A-S, Class B or Class C trust component, as applicable. In addition, any losses (including, without limitation, as a result of trust advisor expenses) or collateral support deficit that are allocated to the Class A-S, Class B or Class C trust component will correspondingly be allocated as between the Class A-S, Class B or Class C Certificates, as applicable, on the one hand, and Class PST Component A-S, Class PST Component B or Class PST Component C, as applicable (and correspondingly, the Class PST Certificates), on the other hand, pro rata, based on their respective percentage interests in the Class A-S, Class B or Class C trust component, as applicable. For a complete description of the allocations and distributions with respect to the Class A-S trust component, the Class B trust component and the Class C trust component (and correspondingly the Class A-S, Class B, Class PST and Class C Certificates and the Class PST Component A-S, Class PST Component B and Class PST Component C), see “DESCRIPTION OF THE OFFERED CERTIFICATES” in the Free Writing Prospectus. See “MATERIAL FEDERAL INCOME TAX CONSEQUENCES” in the Free Writing Prospectus for a discussion of the tax treatment of the Exchangeable Certificates. |
| Exchanges of Exchangeable Certificates: | If you own Class A-S, Class B and Class C Certificates, you will be able to exchange them for a proportionate interest in the Class PST Certificates, and vice versa, as described in the Free Writing Prospectus. You can exchange your Exchangeable Certificates by notifying the certificate administrator. If Exchangeable Certificates are outstanding and held by certificateholders, those certificates will receive principal and interest that would otherwise have been payable on the same proportion of certificates exchanged therefor if those certificates were outstanding and held by certificateholders. Any such allocations of principal and interest as between classes of Exchangeable Certificates will have no effect on the principal or interest entitlements of any other class of certificates. The Free Writing Prospectus describes the available combinations of Exchangeable Certificates eligible for exchange. |
| Special Servicing Fees: | The special servicer is entitled to a special servicing fee payable from general collections on the mortgage loans. The special servicing fee for each distribution date is calculated based on the outstanding principal balance of each mortgage loan that is a specially serviced mortgage loan or as to which the related mortgaged property has become an REO property at the special servicing fee rate, which will be approximately 0.25% per annum. Any primary servicing fee or sub-servicing fee will be paid by the special servicer out of the fees described above. The special servicer is also entitled to additional fees and amounts, including, without limitation, income on the amounts held in permitted investments. The special servicer will also be entitled to (i) liquidation fees generally equal to 1.0% of liquidation proceeds in respect of a specially serviced mortgage loan or REO property and (ii) workout fees generally equal to 1.0% of interest and principal payments made in respect of a rehabilitated mortgage loan, subject to a cap with respect to each such fee of $1,000,000 with respect to any mortgage loan or REO property and subject to certain adjustments and exceptions as described in the Free Writing Prospectus under “SERVICING OF THE MORTGAGE LOANS—The Special Servicer—Special Servicer Compensation.” With respect to any non-serviced mortgage loan, the related special servicer under the related other pooling and servicing agreement pursuant to which such mortgage loan is being serviced will be entitled to similar compensation as that described above with respect to such non-serviced mortgage loan under such other |
| This is not a research report and was not prepared by the Underwriters’ research departments. Please see additional important information and qualifications at the end of this Term Sheet. |
| MSBAM 2013-C11 | Structural Overview |
| pooling and servicing agreement as further described in the Free Writing Prospectus. | |||
| Prepayment Premiums/Yield Maintenance Charges: | On any distribution date, prepayment premiums or yield maintenance charges collected in respect of each mortgage loan during the related collection period will be distributed by the certificate administrator on the classes of certificates or trust components as follows: to each class of principal balance certificates (other than the Class G, Class H and Class J Certificates) and, without duplication, the trust components then entitled to distributions of principal on such distribution date, an amount equal to the product of (a) a fraction, the numerator of which is the amount distributed as principal to that class or trust component on that distribution date, and the denominator of which is the total amount distributed as principal to all classes of principal balance certificates and, without duplication, trust components on that distribution date, (b) the Base Interest Fraction for the related principal prepayment and that class or trust component and (c) the amount of the prepayment premium or yield maintenance charge collected in respect of such principal prepayment during the one month period ending on the related determination date. Any prepayment premiums or yield maintenance charges relating to the mortgage loans collected during the related collection period and remaining after those distributions described above (as to the applicable distribution date, the “Class X YM Distribution Amount”) will be distributed to the holders of the Class X Certificates, as follows: first, to holders of the Class X-A Certificates in an amount equal to the product of (a) a fraction, the numerator of which is the total amount of principal distributed with respect to the Class A-1, Class A-2, Class A-AB, Class A-3 and Class A-4 Certificates and the Class A-S trust component on the applicable distribution date, and the denominator of which is the total principal distributed with respect to the principal balance certificates on the applicable distribution date, multiplied by (b) the Class X YM Distribution Amount for the applicable distribution date; and second, to the holders of the Class X-B Certificates in an amount equal to the portion of the Class X YM Distribution Amount remaining after the distributions to the holders of the Class X-A Certificates. Distributions of prepayment premiums and yield maintenance charges made on the Class A-S trust component, the Class B trust component and the Class C trust component will be distributed to the Class A-S, Class B and Class C Certificates and the Class PST Components (and correspondingly the Class PST Certificates) as described above in “Allocations and Distributions on the Class A-S, Class B, Class PST and Class C Certificates”. No prepayment premiums or yield maintenance charges will be distributed to holders of the Class G, Class H or Class J Certificates or the Class R Certificates. The “Base Interest Fraction”, with respect to any principal prepayment of any mortgage loan that provides for payment of a prepayment premium or yield maintenance charge, and with respect to any class of principal balance certificates (other than the Exchangeable Certificates) or trust component, is a fraction (A) whose numerator is the greater of (x) zero and (y) the difference between (i) the pass-through rate on that class of certificates or trust component, as applicable, and (ii) the applicable discount rate and (B) whose denominator is the difference between (i) the mortgage interest rate on the related mortgage loan and (ii) the applicable discount rate; provided, that under no circumstances will the Base Interest Fraction be greater than one. If the discount rate referred to above is greater than or equal to the mortgage interest rate on the related mortgage loan, then the Base Interest Fraction will equal zero; provided, however, that if the discount rate referred to above is greater than or equal to the mortgage interest rate on the related mortgage loan, but is less than the pass-through rate on the subject class of certificates or trust component, then the Base Interest Fraction will be equal to 1.0. Consistent with the foregoing, the Base Interest Fraction is equal to: | ||
| (Pass-Through Rate – Discount Rate) | |||
| (Mortgage Rate – Discount Rate) | |||
| Servicing Advances: | Other than with regard to any non-serviced mortgage loan and subject to a recoverability determination described in the Free Writing Prospectus, the master servicer and/or the trustee may make servicing advances to pay delinquent real estate taxes, insurance premiums and similar expenses necessary to protect, lease, manage and maintain the mortgaged property, to maintain the lien on the mortgaged property or to enforce the mortgage loan documents. In addition, the special servicer may, but is not required to, make servicing advances on an emergency basis. | ||
Collateral Support Deficits: | On each distribution date, immediately following the distributions made to the certificateholders on that date, the certificate administrator will be required to calculate the amount, if any, by which (1) the aggregate stated principal balance of the mortgage loans, including any mortgage loans as to which the related mortgaged properties have become REO properties, expected to be outstanding immediately following that distribution date, is less than (2) the aggregate principal balance of the principal balance certificates after giving effect to distributions of principal on that distribution date and the allocation of any excess trust advisor expenses to reduce the principal balances of the principal balance certificates that are not Control Eligible Certificates on that distribution date (any such deficit, a “Collateral Support Deficit”). On each distribution date, the certificate administrator will be required to allocate any Collateral Support Deficit to the respective classes of principal balance certificates (other than the Exchangeable Certificates) and trust components in the following order: to the Class J Certificates, the Class H Certificates, the Class G Certificates, the Class F Certificates, the Class E Certificates, the Class D Certificates, the Class C trust component, the Class B trust component, and the Class A-S trust component, in that order, in each case in respect of and until the remaining principal balance of that class of certificates or trust components has been reduced to zero. Following the reduction of the principal balances of all such classes of subordinate certificates to zero, the certificate administrator will be required to allocate the Collateral Support Deficit to the Class A-1, Class A-2, Class A-AB, Class A-3 and Class A-4 Certificates, pro rata (based upon their respective principal balances), until the remaining principal balances of those classes of certificates have been reduced to zero. Any Collateral Support Deficit allocated to a class of certificates will be allocated to the respective certificates of such class in proportion to the Percentage Interests evidenced by the respective certificates. | ||
| This is not a research report and was not prepared by the Underwriters’ research departments. Please see additional important information and qualifications at the end of this Term Sheet. |
| MSBAM 2013-C11 | Structural Overview |
Any Collateral Support Deficit allocated to the Class A-S, Class B and Class C trust components will, in turn, be allocated to the Class A-S, Class B, Class PST and Class C Certificates as described above in “Allocations and Distributions on the Class A-S, Class B, Class PST and Class C Certificates”. | |||
| Appraisal Reductions: | The occurrence of certain adverse events affecting a mortgage loan (other than any non-serviced mortgage loan and the Marriott Chicago River North Hotel Mortgage Loan on or after the securitization of its companion loan (such date, the “Marriott Chicago River North Hotel Companion Loan Securitization Date”)) (“Appraisal Events”) will require the special servicer to obtain a new appraisal or other valuation of the related mortgaged property. In general, if the principal amount of a mortgage loan plus all other amounts due under the mortgage loan and interest on advances made with respect to the mortgage loan exceeds 90% of the value of the mortgaged property determined by an appraisal or other valuation, an appraisal reduction may be created in the amount of the excess as described in the Free Writing Prospectus. Notwithstanding the foregoing, if an appraisal is required to be obtained in accordance with the pooling and servicing agreement but is not obtained within one hundred twenty (120) days following the applicable Appraisal Event, then, until such appraisal is obtained and solely for purposes of determining the amounts of P&I advances, the appraisal reduction will equal 25% of the stated principal balance of the related mortgage loan; provided that, upon receipt of an appraisal, the appraisal reduction for such mortgage loan will be recalculated generally in accordance with the preceding sentence. Notwithstanding the foregoing, any appraisal reduction in respect of any non-serviced mortgage loan and, after Marriott Chicago River North Hotel Companion Loan Securitization Date, the Marriott Chicago River North Hotel Mortgage Loan generally will be calculated in accordance with the related non-serviced mortgage loan pooling and servicing agreement or, with respect to the Marriott Chicago River North Hotel Mortgage Loan, the pooling and servicing agreement entered into in connection with the securitization of Marriott Chicago River North Hotel companion loan (“Marriott Chicago River North Hotel PSA”), which calculations are, or with respect to Marriott Chicago River North Hotel Mortgage Loan are expected to be, generally similar to those provided for in the pooling and servicing agreement for this transaction. If an appraisal reduction exists for or is allocable to any mortgage loan, the interest portion of the amount required to be advanced on that mortgage loan will be reduced in the same proportion that the appraisal reduction bears to the stated principal balance of that mortgage loan. This will reduce the funds available to pay interest on the certificates or trust components, as applicable, then outstanding. If any mortgage loan is part of an A/B whole loan or loan pair, any appraisal reduction will be calculated in respect of such A/B whole loan or loan pair taken as a whole. With respect to an A/B whole loan, any such appraisal reduction will be allocated first to the related B note and then to the related A note. With respect to a loan pair or non-serviced loan combination, any such appraisal reduction will be allocated between the mortgage loan and the related serviced companion loan or non-serviced companion loan, respectively, on a pro rata basis by unpaid principal balance. There are no mortgage loans that are part of an A/B whole loan included in this mortgage pool. The loan pairs related to this mortgage pool, as of the closing date, are the Westfield Countryside Loan Pair, The Mall at Tuttle Crossing Loan Pair and the Marriott Chicago River North Hotel Loan Pair. On and after the date on which the Marriott Chicago River North Hotel Companion Loan is included in a securitization trust (the “Marriott Chicago River North Hotel Companion Loan Securitization Date”), the Marriott Chicago River North Hotel Mortgage Loan and the Marriott Chicago River North Hotel Companion Loan, collectively, will be a Non-Serviced Loan Combination. The non-serviced mortgage loan included in this pool is the Southdale Center Mortgage Loan. There are no mortgage loans that are part of an A/B whole loan included in this mortgage pool. For a discussion of how Appraisal Reductions are calculated and allocated, see “DESCRIPTION OF THE OFFERED CERTIFICATES—Appraisal Reductions” in the Free Writing Prospectus. | ||
| Loan Pairs: | The mortgaged property identified on Appendix I to the Free Writing Prospectus as Westfield Countryside secures a mortgage loan (the “Westfield Countryside Mortgage Loan”) with an outstanding principal balance as of the Cut–off Date of $100,000,000, representing approximately 11.7% of the initial pool balance, and is secured on a pari passu basis with a serviced companion loan that has an outstanding principal balance as of the Cut-off Date of $55,000,000 and is not part of the mortgage pool and is currently held by Morgan Stanley Mortgage Capital Holdings LLC. The Westfield Countryside Mortgage Loan and the related serviced companion loan are pari passu in right of payment and collectively are referred to herein as the “Westfield Countryside Loan Pair”. The Westfield Countryside serviced companion loan may be sold or further divided at any time (subject to the terms of the related intercreditor agreement). The Westfield Countryside Loan Pair will be serviced pursuant to the pooling and servicing agreement related to this transaction and the related intercreditor agreement. For additional information regarding the Westfield Countryside Loan Pair, see “DESCRIPTION OF THE MORTGAGE POOL—The A/B Whole Loans and the Loan Pairs—The Westfield Countryside Loan Pair” in the Free Writing Prospectus. The mortgaged property identified on Appendix I to the Free Writing Prospectus as The Mall at Tuttle Crossing secures a mortgage loan (“The Mall at Tuttle Crossing Mortgage Loan”) with an outstanding principal balance as of the Cut–off Date of $95,000,000, representing approximately 11.1% of the initial pool balance, and is secured on a pari passu basis with a serviced companion loan that has an outstanding principal balance as of the Cut-off Date of $30,000,000 and is not part of the mortgage pool and is currently included in the MSBAM 2013-C10 securitization. The Mall at Tuttle Crossing Mortgage Loan and the related serviced companion loan are pari passu in right of payment and collectively are referred to herein as “The Mall at Tuttle Crossing Loan Pair”. The Mall at Tuttle Crossing Loan Pair will be serviced pursuant to the pooling and servicing agreement related | ||
| This is not a research report and was not prepared by the Underwriters’ research departments. Please see additional important information and qualifications at the end of this Term Sheet. |
| MSBAM 2013-C11 | Structural Overview |
| to this transaction and the related intercreditor agreement. For additional information regarding The Mall at Tuttle Crossing Loan Pair, see “DESCRIPTION OF THE MORTGAGE POOL—The A/B Whole Loans and the Loan Pairs—The Mall at Tuttle Crossing Loan Pair” in the Free Writing Prospectus. The mortgaged property identified on APPENDIX I to the Free Writing Prospectus as the Marriott Chicago River North Hotel secures a mortgage loan (the “Marriott Chicago River North Hotel Mortgaged Loan”) with an outstanding principal balance as of the Cut–off Date of $55,000,000, representing approximately 6.4% of the initial pool balance, and is secured on a pari passu basis with another mortgage loan (the “Marriott Chicago River North Hotel Companion Loan”) that has an outstanding principal balance as of the Cut-off Date of $65,000,000 and is not part of the mortgage pool and is currently held by Bank of America, National Association. The Marriott Chicago River North Hotel Mortgage Loan and the Marriott Chicago River North Hotel Companion Loan are pari passu in right of payment. The Marriott Chicago River North Hotel Companion Loan may be sold or further divided at any time (subject to compliance with the terms of the related intercreditor agreement). From and after the closing date, but prior to the Marriott Chicago River North Hotel Companion Loan Securitization Date, the Marriott Chicago River North Hotel Loan Pair will be serviced pursuant to the pooling and servicing agreement related to this transaction and the related intercreditor agreement, and are collectively referred to herein, prior to the Marriott Chicago River North Hotel Companion Loan Securitization Date, as the “Marriott Chicago River North Hotel Loan Pair”. From and after the Marriott Chicago River North Hotel Companion Loan Securitization Date, the Marriott Chicago River North Hotel Mortgage Loan and the Marriott Chicago River North Hotel Companion Loan will be serviced pursuant to the terms of the pooling and servicing agreement entered into in connection with the securitization of the Marriott Chicago River North Hotel Companion Loan and the related intercreditor agreement. For additional information regarding the Marriott Chicago River North Hotel Loan Pair, see “DESCRIPTION OF THE MORTGAGE POOL—The A/B Whole Loans and the Loan Pairs—The Marriott Chicago River North Hotel Loan Pair” in the Free Writing Prospectus. | |||
| Non-Serviced Mortgage Loans: | The mortgaged property identified on APPENDIX I to the Free Writing Prospectus as Southdale Center secures a mortgage loan (the “Southdale Center Mortgage Loan”) with an outstanding principal balance as of the Cut–off Date of $55,000,000, representing approximately 6.4% of the initial pool balance, and is secured on a pari passu basis with another mortgage loan (the “Southdale Center Non-Serviced Companion Loan”) that has an outstanding principal balance as of the Cut-off Date of $100,000,000 and is not part of the mortgage pool and is currently held by the Morgan Stanley Bank of America Merrill Lynch Trust 2013-C10. The Southdale Center Mortgage Loan and the Southdale Center Non-Serviced Companion Loan are pari passu in right of payment and collectively are referred to herein as the “Southdale Center Non-Serviced Loan Combination”. The Southdale Center Mortgage Loan is a “non-serviced mortgage loan” and the Southdale Center Non-Serviced Companion Loan is a “non-serviced companion loan”. The Southdale Center Mortgage Loan and the Southdale Center Non-Serviced Companion Loan are currently being serviced pursuant to the pooling and servicing agreement related to the Morgan Stanley Bank of America Merrill Lynch Trust 2013-C10 and the related intercreditor agreement. Accordingly, in the case of such non-serviced mortgage loan and non-serviced companion loan, various servicing actions described in this Term Sheet are actually being performed by the master servicer and/or special servicer under, and in accordance with, the MSBAM 2013-C10 pooling and servicing agreement. For additional information regarding the Southdale Center Non-Serviced Loan Combination, see “DESCRIPTION OF THE MORTGAGE POOL—Non-Serviced Mortgage Loans—The Southdale Center Loan Combination” in the Free Writing Prospectus From and after the Marriott Chicago River North Hotel Companion Loan Securitization Date, the Marriott Chicago River North Hotel Mortgage Loan will be a “non-serviced mortgage loan” and the Marriott Chicago River North Hotel Companion Loan will be a “non-serviced companion loan”. For additional information regarding the Marriott Chicago River North Hotel Loan Pair, see “DESCRIPTION OF THE MORTGAGE POOL—The A/B Whole Loans and the Loan Pairs—The Marriott Chicago River North Hotel Loan Pair” in the Free Writing Prospectus. | ||
| Control Rights: | Subject to the limitations described below under “A/B Whole Loan, Loan Pair and Non-Serviced Mortgage Loan Control Rights” in respect of any A/B whole loans, loan pairs or non-serviced mortgage loans, during any Subordinate Control Period, the controlling class representative will have certain consent and consultation rights under the pooling and servicing agreement with respect to certain major decisions and other matters (including with respect to The Mall at Tuttle Crossing Loan Pair and the Westfield Countryside Loan Pair) but not with respect to the Southdale Center Non-Serviced Loan Combination or the Marriott Chicago River North Hotel Loan Pair. A “Subordinate Control Period” means any period when the aggregate principal balance of the Class G Certificates (taking into account the application of appraisal reductions to notionally reduce the aggregate principal balance of such class) is at least 25% of the initial aggregate principal balance of that class. During any Collective Consultation Period, the controlling class representative will not have any consent rights, but the controlling class representative and the trust advisor will each have certain non-binding consultation rights under the pooling and servicing agreement with respect to certain major decisions and other matters. A “Collective Consultation Period” means any period when both (i) the aggregate principal balance of the Class G Certificates (taking into account the application of appraisal reductions to notionally reduce the aggregate principal balance of such class), is less than 25% of the initial aggregate principal | ||
| This is not a research report and was not prepared by the Underwriters’ research departments. Please see additional important information and qualifications at the end of this Term Sheet. |
| MSBAM 2013-C11 | Structural Overview |
| balance of the Class G Certificates and (ii) the aggregate principal balance of that class (without regard to any appraisal reductions allocable to such class), is at least 25% of the initial aggregate principal balance of that class. During any Senior Consultation Period, the controlling class representative will not have any consent or consultation rights, except with respect to any rights expressly set forth in the pooling and servicing agreement, and the trust advisor will retain certain non-binding consultation rights under the pooling and servicing agreement with respect to certain major decisions and other matters. A “Senior Consultation Period” means a period when the aggregate principal balance of the Class G Certificates (without regard to any appraisal reductions allocable to such class) is less than 25% of the initial aggregate principal balance of that class. See “SERVICING OF THE MORTGAGE LOANS—The Controlling Class Representative” in the Free Writing Prospectus. | |||
A/B Whole Loan, Loan Pair and Non-Serviced Mortgage Loan Control Rights: | If any mortgage loan is part of an A/B whole loan or loan pair or is a non-serviced mortgage loan, the controlling class representative’s consent and/or consultation rights with respect thereto may be limited as described in the Free Writing Prospectus. There are no mortgage loans that are part of an A/B whole loan included in the mortgage pool. The controlling class representative under the pooling and servicing agreement related to the Morgan Stanley Bank of America Merrill Lynch Trust 2013-C10 will be the controlling holder of the Southdale Center Mortgage Loan and the Southdale Center Non-Serviced Companion Loan and, subject to the terms of that pooling and servicing agreement, will generally have consent rights with respect to certain major decisions and other matters related to Southdale Center Mortgage Loan and the Southdale Center Non-Serviced Companion Loan. The controlling class representative under the pooling and servicing agreement for this transaction will only have certain consultation rights with respect to certain major decisions and other matters related to Southdale Center Mortgage Loan and the Southdale Center Non-Serviced Companion Loan. The holder of the Westfield Countryside serviced companion loan and The Mall at Tuttle Crossing serviced companion loan will have certain consultation rights under the pooling and servicing agreement with respect to certain major decisions and other matters related to the Westfield Countryside Loan Pair and The Mall at Tuttle Crossing Loan Pair. Prior to the Marriott Chicago River North Hotel Companion Securitization Date, the controlling holder of the Marriott Chicago River North Hotel Loan Pair will be the holder of the Marriott Chicago River North Hotel Companion Loan and on or after Marriott Chicago River North Hotel Companion Loan Securitization Date, the controlling class representative under the related pooling and servicing agreement will be the controlling holder of the Marriott Chicago River North Hotel Loan Pair. See “RISK FACTORS—Realization on a Mortgage Loan That Is Part of an A/B Whole Loan or Loan Pair May Be Adversely Affected by the Rights of the Related Directing Holder”, “DESCRIPTION OF THE MORTGAGE POOL—The A/B Whole Loans and the Loan Pairs” and “DESCRIPTION OF THE MORTGAGE POOL—Non-Serviced Loan Combinations” in the Free Writing Prospectus. | ||
| Control Eligible Certificates: | The “Control Eligible Certificates” will be the Class G, Class H and Class J Certificates. | ||
| Controlling Class Representative/ Controlling Class: | The controlling class representative will be the representative appointed by more than 50% of the Controlling Class (by principal balance). The “Controlling Class” will be the most subordinate class of Control Eligible Certificates then outstanding that has an aggregate principal balance (taking into account the application of any appraisal reductions to notionally reduce the aggregate principal balance of such class) at least equal to 25% of the initial aggregate principal balance of such class; provided that if no class of Control Eligible Certificates has an aggregate principal balance (taking into account the application of any appraisal reductions to notionally reduce the aggregate principal balance of such class) at least equal to 25% of the initial aggregate principal balance of such class, then the Controlling Class will be the most senior class of Control Eligible Certificates. A summary of the consent and consultation rights of the controlling class representative, and the limitations thereon, is set forth above under “Control Rights”. The Controlling Class on the closing date will be the Class J Certificates. The initial controlling class representative is expected to be BlackRock Financial Management, Inc. | ||
| Appraised-Out Class: | Any class of Control Eligible Certificates, the aggregate principal balance of which (taking into account the application of any appraisal reductions to notionally reduce the aggregate principal balance of such class) has been reduced to less than 25% of its initial aggregate principal balance, is referred to as an “Appraised-Out Class”. | ||
| Appraisal Remedy: | The holders of the majority (by principal balance) of an Appraised-Out Class will have the right, at their sole expense, to present to the special servicer a second appraisal for any mortgage loan (generally other than with respect to any non-serviced mortgage loan and the Marriott Chicago River North Hotel Mortgage Loan following the Marriott Chicago River North Hotel Companion Loan Securitization Date) for which an Appraisal Event has occurred prepared by an MAI appraiser on an “as-is” basis acceptable to the special servicer in accordance with the Servicing Standard. Upon receipt of such second appraisal, the special servicer will be required to determine, in accordance with the Servicing Standard, whether, based on its assessment of such second appraisal, any recalculation of the applicable appraisal reduction is warranted and, if so warranted, will recalculate such appraisal reduction based upon such second appraisal. If required by any such recalculation, any applicable Appraised-Out Class will have its related principal balance notionally restored to the extent required by such recalculation of the appraisal reduction, and there will be a redetermination of whether a Subordinate Control Period, a Collective Consultation Period or a Senior Consultation Period is then in effect. However, until an Appraised-Out Class is restored as the Controlling Class, the next most senior class of Control Eligible Certificates that is not an Appraised-Out Class (or, if all classes of Control Eligible Certificates | ||
| This is not a research report and was not prepared by the Underwriters’ research departments. Please see additional important information and qualifications at the end of this Term Sheet. |
| MSBAM 2013-C11 | Structural Overview |
are Appraised-Out Classes, the most senior class of Control Eligible Certificates), if any, will be the Controlling Class. The right of any Appraised-Out Class to present a second appraisal of any mortgage loan for which an Appraisal Event has occurred is limited to one appraisal with respect to each mortgaged property relating to the affected mortgage loan, subject to certain exceptions regarding a material change in circumstance. No Certificateholders of an Appraised-Out Class will have appraisal remedies in respect of a non-serviced mortgage loan or, following the Marriott Chicago River North Hotel Companion Loan Securitization Date, the Marriott Chicago River North Hotel Mortgage Loan under the pooling and servicing agreement for this transaction. | |||
| Sale of Defaulted Loans and REO Properties: | The special servicer will be required to solicit offers for defaulted mortgage loans and accept the first (and, if multiple bids are contemporaneously received, the highest) cash bid from any person that constitutes a fair price for the defaulted mortgage loan, determined as described in “SERVICING OF THE MORTGAGE LOANS—Sale of Defaulted Mortgage Loans and REO Properties—Sale of Defaulted Mortgage Loans” in the Free Writing Prospectus, unless the special servicer determines, in accordance with the Servicing Standard, that rejection of such offer would be in the best interests of the certificateholders (as a collective whole), subject to (i) with respect to any mortgage loan that is part of an A/B whole loan or loan pair or any non-serviced mortgage loan or any mortgage loan with existing mezzanine debt, to the extent set forth in the related intercreditor agreement, the right (if any) of the holder of the related debt held outside the issuing entity to purchase the related mortgage loan and (ii) any consent or consultation rights of the controlling class representative and/or, with respect to any mortgage loan that is part of an A/B whole loan or loan pair or any non-serviced mortgage loan or, following the Marriott Chicago River North Hotel Companion Loan Securitization Date, the Marriott Chicago River North Hotel Mortgage Loan, the holder of the related B note or companion loan, respectively, to the extent set forth in the related intercreditor agreement. If the special servicer determines to sell any mortgage loan that is part of a loan pair or the Marriott Chicago River North Hotel Mortgage Loan prior to the Marriott Chicago River North Hotel Companion Loan Securitization Date, it will be required to sell the entire loan pair as one whole loan subject to, and in accordance with, the terms of the related intercreditor agreement. If the special servicer under any pooling and servicing agreement related to a non-serviced mortgage loan or the Marriott Chicago River North Hotel Mortgage Loan following the Marriott Chicago River North Hotel Companion Loan Securitization Date determines to sell any related companion loan, such special servicer may also be required to sell that mortgage loan and the related companion loan as one whole loan subject to, and in accordance with, the terms of the related other pooling and servicing agreement and related intercreditor agreement. See “DESCRIPTION OF THE MORTGAGE POOL—The A/B Whole Loans and the Loan Pairs” and “DESCRIPTION OF THE MORTGAGE POOL—The Non-Serviced Loan Combinations” in the Free Writing Prospectus. If title to any REO property is acquired by the issuing entity in respect of any specially serviced mortgage loan, the special servicer is required to use its reasonable best efforts to sell the REO property for cash as soon as practicable consistent with the requirement to maximize proceeds for all certificateholders (and, with respect to a serviced companion loan or a B note, for the certificateholders and the holders of such loans, as a collective whole) but in no event later than three (3) years after the end of the year in which it was acquired, and in any event prior to the rated final distribution date or earlier to the extent necessary to comply with REMIC provisions; provided that such period may be extended under certain circumstances as described in the Free Writing Prospectus. If the special servicer is unable to sell such REO property for cash within such time period (as it may be extended as described in the Free Writing Prospectus), the special servicer will be required, after consultation with the controlling class representative during any Subordinate Control Period and any Collective Consultation Period and, in the case of a sale of any REO property relating to an A/B whole loan or loan pair, the related directing holder to the extent set forth in the related intercreditor agreement, to auction the REO property to the highest bidder (which may be the special servicer or another Interested Person) in accordance with the Servicing Standard. See “SERVICING OF THE MORTGAGE LOANS—Sale of Defaulted Mortgage Loans and REO Properties—Sale of REO Properties” and “DESCRIPTION OF THE MORTGAGE POOL—The A/B Whole Loans and the Loan Pairs” in the Free Writing Prospectus. | ||
| Appointment and Termination of Special Servicer Without Cause: | The controlling class representative will appoint the initial special servicer (but not with respect to the Marriott Chicago River North Hotel Mortgage Loan or any non-serviced mortgage loan). During any Subordinate Control Period, the special servicer (other than with respect to the Marriott Chicago River North Hotel Mortgage Loan or any non-serviced mortgage loan) may be replaced at any time by the controlling class representative. During any Collective Consultation Period and any Senior Consultation Period, the special servicer (other than with respect to the Marriott Chicago River North Hotel Mortgage Loan or any non-serviced mortgage loan) will be subject to termination without cause if certificateholders evidencing not less than 25% of voting rights request a vote of certificateholders to replace the special servicer. The certificate administrator would present the proposal to all certificateholders and replacement would be conditioned on receipt, within one hundred eighty (180) days thereafter, of approval of the termination from holders of 75% of the voting rights of the certificates. The holders initiating such vote will be responsible for the fees and expenses of the issuing entity in connection with the replacement. During any Senior Consultation Period, if the trust advisor determines that the special servicer is not performing its duties in accordance with the Servicing Standard, the trust advisor will have the right to recommend the replacement of the special servicer. The trust advisor’s recommendation to replace the special servicer must be confirmed by an affirmative vote of holders of a majority of the voting rights of the principal balance certificates. For purposes of the voting rights described above, the Class A-S, Class B, Class PST and Class C Certificates will be allocated voting rights in accordance with their respective percentage interests in the applicable Class A-S, Class B and Class C trust components as described in the Free Writing Prospectus. | ||
| This is not a research report and was not prepared by the Underwriters’ research departments. Please see additional important information and qualifications at the end of this Term Sheet. |
| MSBAM 2013-C11 | Structural Overview |
In addition, if any mortgage loan is part of an A/B whole loan or loan pair or is a non-serviced mortgage loan, to the extent set forth in the related intercreditor agreement, the related directing holder may have the right to replace the special servicer, with respect to the related A/B whole loan or loan pair or non-serviced mortgage loan to the extent set forth in the related intercreditor agreement. See “DESCRIPTION OF THE MORTGAGE POOL—The A/B Whole Loans and the Loan Pairs” and “DESCRIPTION OF THE MORTGAGE POOL—Non-Serviced Loan Combinations” in the Free Writing Prospectus. There are no mortgage loans that are part of an A/B whole loan included in the mortgage pool. | |||
| Servicing Standard: | Each of the master servicer and the special servicer is obligated to service and administer the mortgage loans (and, if applicable, the related B notes and serviced companion loans but not any non-serviced mortgage loans or, following the Marriott Chicago River North Hotel Companion Loan Securitization Date, the Marriott Chicago River North Hotel Mortgage Loan) in accordance with the definition of the “Servicing Standard” described in the Free Writing Prospectus and the terms of the pooling and servicing agreement. | ||
Defaulted Mortgage Loan Waterfall: | Amounts received by the issuing entity in respect of defaulted mortgage loans in connection with liquidation of any mortgage loan, net of unreimbursed advances and interest thereon, servicing compensation, and other amounts payable or reimbursable therefrom, will be applied so that amounts allocated as a recovery of accrued and unpaid interest will not, in the first instance, include any amount by which the interest portion of P&I advances previously made was reduced as a result of appraisal reductions. After the adjusted interest amount is so allocated, any remaining net proceeds will be allocated to pay principal on the mortgage loan until the unpaid principal amount of the mortgage loan has been reduced to zero. Any remaining proceeds would then be allocated as a recovery of accrued and unpaid interest corresponding to the amount by which the interest portion of P&I advances previously made was reduced as a result of appraisal reductions. | ||
| Trust Advisor: | Situs Holdings, LLC, a Delaware limited liability company, will act as the trust advisor. The trust advisor will be required to promptly review all information available to certain privileged persons on the certificate administrator’s website related to any specially serviced mortgage loan or REO property and each asset status report with respect to specially serviced mortgage loans (provided that during any Subordinate Control Period, the trust advisor may only review final asset status reports). During any Collective Consultation Period and any Senior Consultation Period, within sixty (60) days after the end of each calendar year during which any mortgage loan was a specially serviced mortgage loan or any mortgaged property was an REO property, the trust advisor will be required to meet with representatives of the special servicer to review certain operational practices of the special servicer related to specially serviced mortgage loans and REO properties. In addition, during any Collective Consultation Period and any Senior Consultation Period, based on (i) the trust advisor’s annual meeting with the special servicer and (ii) the trust advisor’s review of any asset status reports and other information delivered to the trust advisor by the special servicer and any other information available to certain privileged persons on the certificate administrator’s website, the trust advisor will be required to prepare an annual report to be provided to the certificate administrator (and to be made available through the certificate administrator’s website) setting forth its assessment of the special servicer’s performance of its duties under the pooling and servicing agreement during the prior calendar year on a platform-level basis with respect to the resolution and liquidation of specially serviced mortgage loans and REO properties. No such annual report will be required to be prepared or delivered with respect to any calendar year during which no annual meeting has occurred or any calendar year during which no asset status reports have been prepared in connection with a specially serviced mortgage loan or REO property. Furthermore, during any Collective Consultation Period and any Senior Consultation Period, the special servicer will be required to consult (on a non-binding basis) the trust advisor in connection with certain major decisions involving any serviced mortgage loan, A/B whole loan, loan pair or any related REO property to the extent described in this Term Sheet, the Free Writing Prospectus and as set forth in the pooling and servicing agreement; provided that, with respect to matters relating to any A/B whole loan or loan pair, the special servicer will only be required to consult the trust advisor with regard to such matters if the holder of the related B note or serviced companion loan, as applicable, is no longer the directing holder with respect to such A/B whole loan or loan pair pursuant to the terms of the applicable intercreditor agreement. The trust advisor will have no consultation rights with respect to any non-serviced mortgage loan or any related non-serviced companion loan or the Marriott Chicago River North Hotel Mortgage Loan Pair. During any Subordinate Control Period, there will be no annual meeting between the trust advisor and the special servicer or annual report prepared by the trust advisor, the trust advisor will not be permitted to consult or consent with regard to any particular servicing actions, and the trust advisor will not distribute any report based on any review of the special servicer’s actions or otherwise opine on the actions of the special servicer with respect to any transaction. | ||
| Trust Advisor Expenses: | The trust advisor will be entitled, on each distribution date, to reimbursement for any trust advisor expenses, including unreimbursed indemnification amounts and other expenses (other than trust advisor fees) payable to the trust advisor pursuant to the terms of the pooling and servicing agreement. No trust advisor expenses will be allocated to or otherwise borne by the Control Eligible Certificates, and all trust advisor expenses will be allocated to reduce amounts due and owing to certain classes of the non-Control Eligible Certificates as described in the Free Writing Prospectus and above in this Term Sheet. | ||
| Termination and Replacement of Trust Advisor: | If the holders of at least 25% of the voting rights of the certificates request a vote to terminate and/or replace the trust advisor, then the holders of at least 75% of the voting rights of the certificates may either (i) terminate all rights and obligations of the trust advisor under the pooling and servicing agreement and replace the trust advisor, or (ii) terminate all rights and obligations of the trust advisor and not appoint a replacement trust | ||
| This is not a research report and was not prepared by the Underwriters’ research departments. Please see additional important information and qualifications at the end of this Term Sheet. |
| MSBAM 2013-C11 | Structural Overview |
advisor, until such time as the holders of at least 75% of the voting rights of the certificates agree to the appointment of a replacement trust advisor. During any Subordinate Control Period and any Collective Consultation Period, the controlling class representative will have the right to consent, such consent not to be unreasonably withheld, to any replacement trust advisor; provided, that such consent will be deemed granted if no objection is made within ten business days following the controlling class representative’s receipt of the request for consent. Any such consent will be required to be solicited from the controlling class representative before any related vote. For purposes of the voting rights described above, the Class A-S, Class B, Class PST and Class C Certificates will be allocated voting rights in accordance with their respective percentage interests in the applicable Class A-S, Class B and Class C trust components as described in the Free Writing Prospectus. See “SERVICING OF THE MORTGAGE LOANS—The Trust Advisor—Termination of the Trust Advisor Without Cause” in the Free Writing Prospectus. | |||
| Deal Website: | The certificate administrator will be required to maintain a deal website which will include, among other items, (i) distribution date statements, (ii) CREFC reports, (iii) summaries of final asset status reports, (iv) inspection reports, (v) appraisals, (vi) various special notices described in the Free Writing Prospectus, (vii) the “Investor Q&A Forum” and (viii) a voluntary “Investor Registry”. Investors may access the deal website following execution of an investor certification as described in the Free Writing Prospectus. | ||
| This is not a research report and was not prepared by the Underwriters’ research departments. Please see additional important information and qualifications at the end of this Term Sheet. |
| MSBAM 2013-C11 | Collateral Overview |
| Mortgage Loan Sellers | No. of Mortgage Loans | No. of Mortgaged Properties | Aggregate Cut-off Date Balance | % of Pool(1) |
| Bank of America, National Association | 25 | 59 | $513,615,464 | 60.0% |
| Morgan Stanley Mortgage Capital Holdings LLC | 9 | 9 | $276,111,283 | 32.2% |
| CIBC Inc. | 4 | 4 | $66,600,000 | 7.8% |
| Total: | 38 | 72 | $856,326,747 | 100.0% |
| Aggregate Cut-off Date Balance: | $856,326,747 |
| Number of Mortgage Loans: | 38 |
| Average Cut-off Date Balance per Mortgage Loan: | $22,534,914 |
| Number of Mortgaged Properties: | 72 |
| Average Cut-off Date Balance per Mortgaged Property: | $11,893,427 |
| Weighted Average Mortgage Rate: | 4.446% |
| % of Pool Secured by Five Largest Mortgage Loans: | 45.5% |
| % of Pool Secured by Ten Largest Mortgage Loans: | 67.0% |
| % of Pool Secured by ARD Loans: | 0.0% |
| Weighted Average Original Term to Maturity (months): | 109 |
| Weighted Average Remaining Term to Maturity (months): | 108 |
| Weighted Average Seasoning (months): | 1 |
| % of Pool Secured by Single Tenant Mortgaged Properties: | 1.3% |
% of Pool with Pari Passu Mortgage Debt: | 35.6% |
| % of Pool with Subordinate Mortgage Debt: | 0.0% |
| % of Pool with Mezzanine Debt: | 0.0% |
| Weighted Average UW NOI DSCR: | 2.00x |
| Weighted Average UW NOI Debt Yield: | 12.3% |
| Weighted Average UW NCF DSCR: | 1.81x |
| Weighted Average UW NCF Debt Yield: | 11.1% |
| Weighted Average Cut-off Date LTV Ratio: | 62.6% |
| Weighted Average LTV Ratio at Maturity: | 53.1% |
| (1) | Unless otherwise indicated, all references to “% of Pool” in this Term Sheet reflect a percentage of the aggregate principal balance of the mortgage pool as of the Cut-off Date, after application of all payments of principal due during or prior to August 2013. |
| (2) | With respect to the Westfield Countryside Mortgage Loan, The Mall at Tuttle Crossing Mortgage Loan, the Southdale Center Mortgage Loan and the Marriott Chicago River North Hotel Mortgage Loan, unless otherwise indicated, all LTV, DSCR and Debt Yield calculations include the related pari passu companion loan. |
| This is not a research report and was not prepared by the Underwriters’ research departments. Please see additional important information and qualifications at the end of this Term Sheet. |
| MSBAM 2013-C11 | Collateral Overview |
Amortization | |
| Weighted Average Original Amortization Term (months): | 350 |
| Weighted Average Remaining Amortization Term (months): | 349 |
| % of Pool Amortizing Balloon: | 53.5% |
| % of Pool Fully Amortizing: | 0.0% |
| % of Pool Interest Only followed by Amortizing Balloon: | 46.5% |
| % of Pool Interest Only through Maturity: | 0.0% |
| % of Pool with Hard Lockboxes: | 68.6% |
| % of Pool with Soft Lockboxes: | 14.6% |
| % of Pool with Springing Lockboxes: | 14.1% |
| % of Pool with No Lockboxes: | 2.8% |
| % of Pool Requiring Tax Reserves: | 70.6% |
| % of Pool Requiring Insurance Reserves: | 23.3% |
| % of Pool Requiring Replacement Reserves: | 64.7% |
% of Pool Requiring TI/LC Reserves(1): | 44.5% |
| % of Pool with lockout period, followed by defeasance until open period: | 79.4% |
| % of Pool with lockout period, followed by defeasance or the greater of a prepayment premium and yield maintenance until open period: | 16.6% |
| % of Pool with lockout period, followed by the greater of a prepayment premium and yield maintenance until open period: | 4.0% |
| (1) | Based only on mortgage loans secured by retail, office, mixed use and industrial properties. |
| This is not a research report and was not prepared by the Underwriters’ research departments. Please see additional important information and qualifications at the end of this Term Sheet. |
| MSBAM 2013-C11 | Characteristics of the Mortgage Loans |
| Top 10 Mortgage Loans | |||||||||||||
Loan No. | Mortgage Loan Seller | Property Name | City | State | Property Type | Cut-off Date Balance | % of Pool | SF/Units/ Rooms | Cut-off Date Balance PSF/Unit/Room | UW NCF DSCR | UW NOI Debt Yield | Cut-off Date LTV Ratio | LTV Ratio at Maturity |
| 1 | MSMCH | Westfield Countryside(1) | Clearwater | FL | Retail | $100,000,000 | 11.7% | 464,836 | $333 | 1.66x | 10.1% | 57.4% | 52.1% |
| 2 | BANA | The Mall at Tuttle Crossing(2) | Dublin | OH | Retail | $95,000,000 | 11.1% | 385,057 | $325 | 2.34x | 13.3% | 52.1% | 44.7% |
| 3 | BANA | Matrix Corporate Center | Danbury | CT | Office | $85,000,000 | 9.9% | 1,046,701 | $81 | 1.69x | 12.5% | 67.5% | 61.9% |
| 4 | MSMCH | Southdale Center(3) | Edina | MN | Retail | $55,000,000 | 6.4% | 634,880 | $244 | 1.52x | 9.1% | 61.8% | 51.9% |
| 5 | BANA | Marriott Chicago River North Hotel(4) | Chicago | IL | Hospitality | $55,000,000 | 6.4% | 523 | $229,446 | 1.50x | 11.8% | 62.8% | 47.5% |
| 6 | CIBC Inc. | Bridgewater Campus | Bridgewater | NJ | Mixed Use | $43,500,000 | 5.1% | 446,649 | $97 | 1.42x | 9.9% | 68.5% | 58.7% |
| 7 | MSMCH | Hilton Waterfront Beach Resort | Huntington Beach | CA | Hospitality | $42,500,000 | 5.0% | 290 | $146,552 | 1.54x | 12.7% | 51.8% | 48.8% |
| 8 | BANA | 1600 Lexington Ave. - Rochester, NY | Rochester | NY | Industrial | $40,154,101 | 4.7% | 1,755,500 | $23 | 1.45x | 11.2% | 74.9% | 61.2% |
| 9 | BANA | Beverly Garland Hotel | North Hollywood | CA | Hospitality | $29,969,490 | 3.5% | 255 | $117,527 | 1.76x | 13.7% | 57.7% | 47.9% |
| 10 | BANA | Paddock Club | Jacksonville | FL | Multifamily | $27,360,000 | 3.2% | 440 | $62,182 | 1.32x | 8.4% | 76.6% | 68.7% |
| Total / Wtd. Avg. | $573,483,592 | 67.0% | 1.69x | 11.4% | 61.5% | 53.3% | |||||||
| (1) | The Westfield Countryside Mortgage Loan is part of a $155,000,000 pari passu loan pair evidenced by ten pari passu promissory notes. The Westfield Countryside Mortgage Loan is evidenced by five such pari passu notes (Notes A-1-1, A-2-1, A-3-1, B-1-1 and B-2-1) with an aggregate outstanding principal balance as of the Cut-off Date of $100,000,000. The entire loan pair will be serviced under the pooling and servicing agreement for this transaction (MSBAM 2013-C11). The pari passu notes not included in the Issuing Entity (Notes A-1-2, A-2-2, A-3-2, B-1-2 and B-2-2) evidence the related companion loan, which has an aggregate outstanding principal balance as of the Cut-off Date of $55,000,000. Unless otherwise indicated, all Cut-off Date Balance PSF/Unit/Room, DSCR, Debt Yield and LTV calculations include the related pari passu companion loan. |
| (2) | The Mall at Tuttle Crossing Mortgage Loan is part of a $125,000,000 pari passu loan pair evidenced by two pari passu promissory notes. The Mall at Tuttle Crossing Mortgage Loan is evidenced by a pari passu note (Note A-2) with an outstanding principal balance as of the Cut-off Date of $95,000,000. The entire loan pair will be serviced under the pooling and servicing agreement for this transaction (MSBAM 2013-C11). The pari passu note that is not included in the Issuing Entity (Note A-1) evidences the related companion loan, which has an outstanding balance as of the Cut-off Date of $30,000,000. Unless otherwise indicated, all Cut-off Date Balance PSF/Unit/Room, DSCR, Debt Yield and LTV calculations include the related pari passu companion loan. |
| (3) | The Southdale Center Mortgage Loan is part of a $155,000,000 pari passu non-serviced loan combination evidenced by two pari passu promissory notes. The Southdale Center Mortgage Loan is evidenced by one such pari passu note (Note A-2) with an outstanding principal balance as of the Cut-off Date of $55,000,000. The entire non-serviced loan combination will be serviced under the pooling and servicing agreement for a previous transaction (MSBAM 2013-C10). The pari passu note not included in the Issuing Entity (Note A-1) evidences the related companion loan, which has an outstanding balance as of the Cut-off Date of $100,000,000. Unless otherwise indicated, all Cut-off Date Balance PSF/Unit/Room, DSCR, Debt Yield and LTV calculations include the related pari passu companion loan. |
| (4) | The Marriott Chicago River North Hotel Mortgage Loan is part of a $120,000,000 pari passu loan pair evidenced by two pari passu promissory notes. The Marriott Chicago River North Hotel Mortgage Loan is evidenced by one such pari passu note (Note A-1) with an outstanding principal balance as of the Cut-off Date of $55,000,000. The entire loan pair will be serviced under the pooling and servicing agreement for this transaction until the related pari passu companion loan is securitized at which point the entire loan pair will be serviced under the pooling and servicing agreement for that future transaction. The pari passu note not included in the Issuing Entity (Note A-2) evidences the related companion loan, which has an outstanding balance as of the Cut-off Date of $65,000,000. Unless otherwise indicated, all Cut-off Date Balance PSF/Unit/Room, DSCR, Debt Yield and LTV calculations include the related pari passu companion loan. |
| This is not a research report and was not prepared by the Underwriters’ research departments. Please see additional important information and qualifications at the end of this Term Sheet. |
| MSBAM 2013-C11 | Characteristics of the Mortgage Loans |
Mortgage Loans with Pari Passu Companion Loans | ||||||||||||
Loan No. | Mortgage Loan Seller | Property Name | Mortgage Loan Cut-off Date Balance | Companion Loan Cut-off Date Balance | Loan Combination Cut-off Date Balance | Controlling Pooling and Servicing Agreement | Master Servicer | Special Servicer | Voting Rights | Total Debt UW NCF DSCR | Total Debt UW NOI Debt Yield | Total Debt Cut-off Date LTV Ratio |
| 1 | MSMCH | Westfield Countryside | $100,000,000 | $55,000,000 | $155,000,000 | MSBAM 2013-C11 | Wells Fargo | Midland | MSBAM 2013-C11 | 1.66x | 10.1% | 57.4% |
| 2 | BANA | The Mall at Tuttle Crossing | $95,000,000 | $30,000,000 | $125,000,000 | MSBAM 2013-C11 | Wells Fargo | Midland | MSBAM 2013-C11 | 2.34x | 13.3% | 52.1% |
| 4 | MSMCH | Southdale Center | $55,000,000 | $100,000,000 | $155,000,000 | MSBAM 2013-C10 | Midland | Midland | MSBAM 2013-C10 | 1.52x | 9.1% | 61.8% |
| 5 | BANA | Marriott Chicago River North Hotel | $55,000,000 | $65,000,000 | $120,000,000 | (1) | Wells Fargo(1) | Midland(1) | (1) | 1.50x | 11.8% | 62.8% |
| (1) | Upon any securitization of the Marriott Chicago River North Hotel Companion Loan, servicing of the Marriott Chicago River North Hotel Mortgage Loan will be governed by the pooling and servicing agreement to be entered into in connection with that securitization, and the representative of the controlling class under that pooling and servicing agreement will have certain consent rights regarding servicing of the Marriott Chicago River North Hotel Loan Pair and the master servicer and the special servicer under that pooling and servicing agreement may not be Wells Fargo or Midland. |
| This is not a research report and was not prepared by the Underwriters’ research departments. Please see additional important information and qualifications at the end of this Term Sheet. |
| MSBAM 2013-C11 | Characteristics of the Mortgage Loans |
Prior Securitization History(1) | ||||||||||||||
Loan No. | Mortgage Loan Seller | Property Name | City | State | Property Type | Cut-off Date Balance | % of Pool | SF/Units/ Rooms/ Pads | Cut-off Date Balance PSF/Unit/ Room/Pad | UW NCF DSCR | UW NOI Debt Yield | Cut-off Date LTV Ratio | LTV Ratio at Maturity | Prior Securitization |
| 2 | BANA | The Mall at Tuttle Crossing(2) | Dublin | OH | Retail | $95,000,000 | 11.1% | 385,057 | $325 | 2.34x | 13.3% | 52.1% | 44.7% | MSBAM 2013-C10 |
| 4 | MSMCH | Southdale Center(2) | Edina | MN | Retail | $55,000,000 | 6.4% | 634,880 | $244 | 1.52x | 9.1% | 61.8% | 51.9% | MSBAM 2013-C10 |
| 6 | CIBC Inc. | Bridgewater Campus | Bridgewater | NJ | Mixed Use | $43,500,000 | 5.1% | 446,649 | $97 | 1.42x | 9.9% | 68.5% | 58.7% | COMM 2010-C1 |
| 7 | MSMCH | Hilton Waterfront Beach Resort | Huntington Beach | CA | Hospitality | $42,500,000 | 5.0% | 290 | $146,552 | 1.54x | 12.7% | 51.8% | 48.8% | CD 2006-CD3 |
| 9 | BANA | Beverly Garland Hotel | North Hollywood | CA | Hospitality | $29,969,490 | 3.5% | 255 | $117,527 | 1.76x | 13.7% | 57.7% | 47.9% | CGCMT 2006-C4 |
| 11.01 | BANA | ADG Pool 6 - Manor Hill(3) | Eden | WI | Manufactured Housing | $3,420,832 | 0.4% | 147 | $23,271 | 1.52x | 9.4% | 75.3% | 61.0% | WBCMT 2005-C16; MEZZ 2004-C2 |
| 11.02 | BANA | ADG Pool 6 - Lake Onalaska(3) | Onalaska | WI | Manufactured Housing | $2,796,593 | 0.3% | 124 | $22,553 | 1.52x | 9.4% | 75.3% | 61.0% | WBCMT 2005-C16; MEZZ 2004-C2 |
| 11.03 | BANA | ADG Pool 6 - Shorecrest Pointe(3) | Kenosha | WI | Manufactured Housing | $2,596,836 | 0.3% | 81 | $32,060 | 1.52x | 9.4% | 75.3% | 61.0% | WBCMT 2004-C15; MEZZ 2004-C2 |
| 11.04 | BANA | ADG Pool 6 - Camelot Acres(3) | Rice Lake | WI | Manufactured Housing | $2,451,513 | 0.3% | 135 | $18,159 | 1.52x | 9.4% | 75.3% | 61.0% | WBCMT 2005-C16; MEZZ 2004-C2 |
| 11.05 | BANA | ADG Pool 6 - The Maples(3) | Wisconsin Rapids | WI | Manufactured Housing | $1,722,901 | 0.2% | 125 | $13,783 | 1.52x | 9.4% | 75.3% | 61.0% | WBCMT 2005-C16; MEZZ 2004-C2 |
| 11.06 | BANA | ADG Pool 6 - Parkview Terrace(3) | Marinette | WI | Manufactured Housing | $1,872,718 | 0.2% | 130 | $14,406 | 1.52x | 9.4% | 75.3% | 61.0% | WBCMT 2005-C16; MEZZ 2004-C2 |
| 11.07 | BANA | ADG Pool 6 - River View Manor(3) | Amery | WI | Manufactured Housing | $1,865,228 | 0.2% | 78 | $23,913 | 1.52x | 9.4% | 75.3% | 61.0% | WBCMT 2004-C15; MEZZ 2004-C2 |
| 11.10 | BANA | ADG Pool 6 - Oak Manor(3) | Waupaca | WI | Manufactured Housing | $1,423,266 | 0.2% | 90 | $15,814 | 1.52x | 9.4% | 75.3% | 61.0% | WBCMT 2004-C15; MEZZ 2004-C2 |
| 11.12 | BANA | ADG Pool 6 - Foxx Glen(3) | Marinette | WI | Manufactured Housing | $973,814 | 0.1% | 76 | $12,813 | 1.52x | 9.4% | 75.3% | 61.0% | WBCMT 2004-C15; MEZZ 2004-C2 |
| 11.15 | BANA | ADG Pool 6 - Indianhead Manor(3) | Chippewa Falls | WI | Manufactured Housing | $576,797 | 0.1% | 61 | $9,456 | 1.52x | 9.4% | 75.3% | 61.0% | WBCMT 2004-C15; MEZZ 2004-C2 |
| 11.16 | BANA | ADG Pool 6 - Markesan(3) | Markesan | WI | Manufactured Housing | $419,489 | 0.0% | 22 | $19,068 | 1.52x | 9.4% | 75.3% | 61.0% | WBCMT 2004-C15; MEZZ 2004-C2 |
| 12.01 | BANA | ADG Pool 4 - Skyview Terrace(3) | East Troy | WI | Manufactured Housing | $4,097,508 | 0.5% | 109 | $37,592 | 1.55x | 9.6% | 74.2% | 60.0% | WBCMT 2004-C15; MEZZ 2004-C2 |
| 12.02 | BANA | ADG Pool 4 - Country Crossing(3) | Appleton | WI | Manufactured Housing | $3,310,966 | 0.4% | 127 | $26,071 | 1.55x | 9.6% | 74.2% | 60.0% | WBCMT 2005-C16; MEZZ 2004-C2 |
| 12.03 | BANA | ADG Pool 4 - Birch Terrace(3) | Menomonie | WI | Manufactured Housing | $2,816,569 | 0.3% | 191 | $14,746 | 1.55x | 9.6% | 74.2% | 60.0% | WBCMT 2005-C16; MEZZ 2004-C2 |
| 12.06 | BANA | ADG Pool 4 - Meadowview Place(3) | Janesville | WI | Manufactured Housing | $2,292,207 | 0.3% | 116 | $19,760 | 1.55x | 9.6% | 74.2% | 60.0% | WBCMT 2004-C15; MEZZ 2004-C2 |
| 12.08 | BANA | ADG Pool 4 - Park Ridge(3) | Iron Mountain | MI | Manufactured Housing | $1,550,611 | 0.2% | 89 | $17,423 | 1.55x | 9.6% | 74.2% | 60.0% | WBCMT 2004-C15; MEZZ 2004-C2 |
| 12.10 | BANA | ADG Pool 4 - Falls View(3) | Fall River | WI | Manufactured Housing | $823,996 | 0.1% | 59 | $13,966 | 1.55x | 9.6% | 74.2% | 60.0% | WBCMT 2004-C15; MEZZ 2004-C2 |
| 12.12 | BANA | ADG Pool 4 - Lake Bluff(3) | Kewaunee | WI | Manufactured Housing | $312,619 | 0.0% | 25 | $12,505 | 1.55x | 9.6% | 74.2% | 60.0% | WBCMT 2004-C15; MEZZ 2004-C2 |
| 12.13 | BANA | ADG Pool 4 - Forest Glen(3) | Marinette | WI | Manufactured Housing | $194,763 | 0.0% | 16 | $12,173 | 1.55x | 9.6% | 74.2% | 60.0% | WBCMT 2004-C15; MEZZ 2004-C2 |
| 13 | MSMCH | University Towers Cooperative | Brooklyn | NY | Multifamily | $19,952,715 | 2.3% | 549 | $36,344 | 7.59x | 47.5% | 10.9% | 7.2% | JPMCC 2001-C1 |
| 22 | BANA | Hilton Garden Inn Tampa East | Tampa | FL | Hospitality | $9,584,009 | 1.1% | 152 | $63,053 | 1.57x | 12.5% | 76.7% | 68.0% | GSMS 2006-GG6 |
| 25.01 | BANA | ADG Pool 1 - Evergreen Estates(3) | Faribault | MN | Manufactured Housing | $3,256,033 | 0.4% | 161 | $20,224 | 1.52x | 9.5% | 70.6% | 57.1% | WBCMT 2005-C16; MEZZ 2004-C2 |
| 25.02 | BANA | ADG Pool 1 - Cloverleaf(3) | St. Cloud | MN | Manufactured Housing | $2,586,848 | 0.3% | 164 | $15,773 | 1.52x | 9.5% | 70.6% | 57.1% | WBCMT 2005-C16; MEZZ 2004-C2 |
| This is not a research report and was not prepared by the Underwriters’ research departments. Please see additional important information and qualifications at the end of this Term Sheet. |
| MSBAM 2013-C11 | Characteristics of the Mortgage Loans |
Prior Securitization History(1) | ||||||||||||||
Loan No. | Mortgage Loan Seller | Property Name | City | State | Property Type | Cut-off Date Balance | % of Pool | SF/Units/ Rooms/ Pads | Cut-off Date Balance PSF/Unit/ Room/Pad | UW NCF DSCR | UW NOI Debt Yield | Cut-off Date LTV Ratio | LTV Ratio at Maturity | Prior Securitization |
| 25.03 | BANA | ADG Pool 1 - Maplewood(3) | Lake City | MN | Manufactured Housing | $1,248,479 | 0.1% | 74 | $16,871 | 1.52x | 9.5% | 70.6% | 57.1% | WBCMT 2005-C16; MEZZ 2004-C2 |
| 25.05 | BANA | ADG Pool 1 - Shamrock(3) | Albany | MN | Manufactured Housing | $499,392 | 0.1% | 31 | $16,109 | 1.52x | 9.5% | 70.6% | 57.1% | WBCMT 2005-C16; MEZZ 2004-C2 |
| 26 | BANA | Heathwood Village | Heath | OH | Multifamily | $7,721,611 | 0.9% | 304 | $25,400 | 1.90x | 13.3% | 69.6% | 57.2% | FNA 2012-M11 |
| 29 | BANA | ADG Pool 3 (Lannon Estates) | Lannon | WI | Manufactured Housing | $6,891,604 | 0.8% | 161 | $42,805 | 1.58x | 9.6% | 73.7% | 59.6% | WBCMT 2004-C15 |
| 33 | MSMCH | 1303 Ocala | Tallahassee | FL | Multifamily | $5,378,663 | 0.6% | 340 | $15,820 | 1.52x | 9.9% | 69.4% | 63.6% | COMM 2000-C1 |
| 34 | BANA | Autumn Sunrise Apartments | Corpus Christi | TX | Multifamily | $4,494,627 | 0.5% | 142 | $31,652 | 1.87x | 12.4% | 74.9% | 60.8% | JPMCC 2004-CB8 |
| Total / Wtd. Avg. | $363,102,697 | 42.4% | ||||||||||||
| (1) | Includes mortgaged properties securing mortgage loans for which the most recent prior financing of all or a significant portion of such property was included in a securitization. The table above describes the most recent securitization with respect to the mortgaged property securing the related mortgage loan, based on information provided by the related borrower or obtained through searches of a third-party database. The information has not otherwise been confirmed by the mortgage loan sellers. |
| (2) | With respect to The Mall at Tuttle Crossing Mortgage Loan and the Southdale Center Mortgage Loan, unless otherwise indicated, all Cut-off Date Balance PSF/Unit/Room/Pad LTV, DSCR and Debt Yield calculations include the related pari passu companion loan. |
| (3) | The ADG Pool 1 Mortgage Loan, the ADG Pool 4 Mortgage Loan and the ADG Pool 6 Mortgage Loan are secured by multiple properties. For the purpose of the statistical information set forth above, a portion of the aggregate Cut-off Date Balance for each loan has been allocated to each mortgaged property based on the respective appraised values and/or UW NCF, and all Loan PSF/Unit/Room/Pad, DSCR, Debt Yield and LTV calculations are shown on an aggregate loan basis. |
| This is not a research report and was not prepared by the Underwriters’ research departments. Please see additional important information and qualifications at the end of this Term Sheet. |
| MSBAM 2013-C11 | Characteristics of the Mortgage Loans |
| Class A-2 ($142,000,000) | ||||||||||||||||
Loan No. | Mortgage Loan Seller | Property Name | State | Property Type | Cut-off Date Balance | % of Pool | Balance at Maturity | % of Class A-2 Certificate Principal Balance | SF/ Units/ Rooms | Cut-off Date Balance PSF/Unit/ Room | UW NCF DSCR | UW NOI Debt Yield | Cut-off Date LTV Ratio | LTV Ratio at Maturity | Rem. IO Period (mos.) | Rem. Term to Maturity (mos.) |
| 3 | BANA | Matrix Corporate Center | CT | Office | $85,000,000 | 9.9% | $78,044,974 | 55.0% | 1,046,701 | $81 | 1.69x | 12.5% | 67.5% | 61.9% | 0 | 60 |
| 7 | MSMCH | Hilton Waterfront Beach Resort | CA | Hospitality | $42,500,000 | 5.0% | $40,039,995 | 28.2% | 290 | $146,552 | 1.54x | 12.7% | 51.8% | 48.8% | 11 | 60 |
| 21 | BANA | Hilton Garden Inn Tampa East | FL | Hospitality | $9,584,009 | 1.1% | $8,498,092 | 6.0% | 152 | $63,053 | 1.57x | 12.5% | 76.7% | 68.0% | 0 | 59 |
| 27 | BANA | Hampton Inn – Burlington, NC | NC | Hospitality | $7,500,000 | 0.9% | $6,913,799 | 4.9% | 92 | $81,522 | 1.99x | 14.0% | 69.4% | 64.0% | 0 | 60 |
| 32 | MSMCH | 1303 Ocala | FL | Multifamily | $5,378,663 | 0.6% | $4,926,546 | 3.5% | 340 | $15,820 | 1.52x | 9.9% | 69.4% | 63.6% | 0 | 57 |
| Total / Wtd. Avg. | $149,962,672 | 17.5% | $138,423,405 | 97.5% | 1.65x | 12.5% | 63.8% | 58.8% | 3 | 60 | ||||||
| (1) | The table above reflects the mortgage loans whose balloon payments will be applied to pay down the Class A-2 Certificates, assuming (i) that none of the mortgage loans experience prepayments, defaults or losses; (ii) there are no extensions of maturity dates; and (iii) each mortgage loan is paid in full on its stated maturity date. The table above is otherwise based on the Structuring Assumptions set forth under “YIELD, PREPAYMENT AND MATURITY CONSIDERATIONS” in the Free Writing Prospectus. |
| This is not a research report and was not prepared by the Underwriters’ research departments. Please see additional important information and qualifications at the end of this Term Sheet. |
| MSBAM 2013-C11 | Characteristics of the Mortgage Loans |
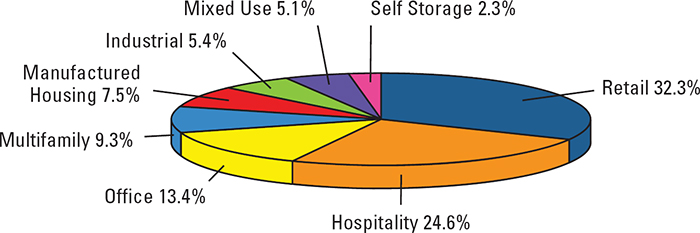
Property Type Distribution(1)(2) | ||||||||
| Property Type | Number of Mortgaged Properties | Aggregate Cut-off Date Balance | % of Pool | Wtd. Avg. Mortgage Rate | Wtd. Avg. UW NCF DSCR | Wtd. Avg. UW NOI Debt Yield | Wtd. Avg. Cut-off Date LTV Ratio | Wtd. Avg. LTV Ratio at Maturity |
| Retail | 8 | $276,938,428 | 32.3% | 3.866% | 1.85x | 11.0% | 57.3% | 49.6% |
| Regional Mall | 3 | $250,000,000 | 29.2% | 3.765% | 1.89x | 11.1% | 56.3% | 49.2% |
| Anchored | 2 | $13,882,231 | 1.6% | 4.426% | 1.56x | 10.3% | 64.6% | 51.6% |
| Single Tenant | 1 | $9,000,000 | 1.1% | 5.130% | 1.43x | 9.9% | 69.8% | 57.7% |
| Unanchored | 2 | $4,056,197 | 0.5% | 5.410% | 1.35x | 10.4% | 64.9% | 49.5% |
| Hospitality | 11 | $210,631,766 | 24.6% | 5.083% | 1.64x | 13.1% | 60.8% | 49.5% |
| Full Service | 4 | $74,614,522 | 8.7% | 4.930% | 1.77x | 13.8% | 62.6% | 52.2% |
| Extended Stay | 1 | $55,000,000 | 6.4% | 5.200% | 1.50x | 11.8% | 62.8% | 47.5% |
| Resort | 1 | $42,500,000 | 5.0% | 5.240% | 1.54x | 12.7% | 51.8% | 48.8% |
| Limited Service | 5 | $38,517,244 | 4.5% | 5.042% | 1.68x | 14.0% | 64.6% | 47.8% |
| Office | 3 | $114,700,000 | 13.4% | 4.695% | 1.60x | 11.7% | 68.5% | 61.5% |
| Suburban | 1 | $85,000,000 | 9.9% | 4.610% | 1.69x | 12.5% | 67.5% | 61.9% |
| Urban | 1 | $17,500,000 | 2.0% | 4.960% | 1.39x | 9.9% | 72.9% | 60.0% |
| Medical | 1 | $12,200,000 | 1.4% | 4.910% | 1.28x | 9.0% | 69.7% | 60.3% |
| Multifamily | 6 | $79,777,616 | 9.3% | 4.169% | 2.99x | 19.0% | 59.4% | 51.8% |
| Garden | 3 | $46,724,627 | 5.5% | 4.453% | 1.37x | 8.7% | 77.3% | 68.6% |
| Cooperative | 1 | $19,952,715 | 2.3% | 3.210% | 7.59x | 47.5% | 10.9% | 7.2% |
| Garden/Townhouse | 1 | $7,721,611 | 0.9% | 4.910% | 1.90x | 13.3% | 69.6% | 57.2% |
| Student Housing | 1 | $5,378,663 | 0.6% | 4.200% | 1.52x | 9.9% | 69.4% | 63.6% |
| Manufactured Housing | 35 | $64,628,263 | 7.5% | 4.407% | 1.54x | 9.5% | 74.1% | 60.0% |
| Industrial | 2 | $46,154,101 | 5.4% | 4.684% | 1.59x | 12.0% | 70.1% | 57.3% |
| Warehouse Distribution | 1 | $40,154,101 | 4.7% | 4.690% | 1.45x | 11.2% | 74.9% | 61.2% |
| Manufacturing | 1 | $6,000,000 | 0.7% | 4.645% | 2.56x | 17.3% | 38.2% | 31.1% |
| Mixed Use | 1 | $43,500,000 | 5.1% | 4.550% | 1.42x | 9.9% | 68.5% | 58.7% |
| Office / Flex | 1 | $43,500,000 | 5.1% | 4.550% | 1.42x | 9.9% | 68.5% | 58.7% |
| Self Storage | 6 | $19,996,573 | 2.3% | 4.772% | 1.78x | 11.8% | 64.9% | 52.8% |
| Total / Wtd. Avg. | 72 | $856,326,747 | 100.0% | 4.446% | 1.81x | 12.3% | 62.6% | 53.1% |
| (1) | All numerical information concerning the mortgage loans is approximate. All weighted average information regarding the mortgage loans reflects the weighting of the mortgage loans based on their outstanding principal balances as of the Cut-off Date. State and Property Type tables reflect allocated loan amounts in the case of mortgage loans secured by multiple properties. The sum of numbers and percentages in columns may not match the “Total” due to rounding. Additionally, LTV ratios and DSCR are calculated for mortgage loans without regard to any additional indebtedness that may be incurred at a future date. |
| (2) | With respect to the Westfield Countryside Mortgage Loan, The Mall at Tuttle Crossing Mortgage Loan, the Southdale Center Mortgage Loan and the Marriott Chicago River North Hotel Mortgage Loan, unless otherwise indicated, all LTV, DSCR and Debt Yield calculations include the related pari passu companion loan. |
| This is not a research report and was not prepared by the Underwriters’ research departments. Please see additional important information and qualifications at the end of this Term Sheet. |
| MSBAM 2013-C11 | Characteristics of the Mortgage Loans |
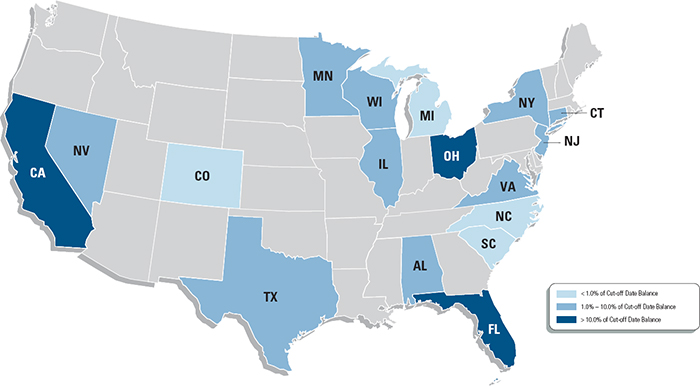
Geographic Distribution(1)(2) | ||||||||
| State | Number of Mortgaged Properties | Aggregate Cut-off Date Balance | % of Pool | Wtd. Avg. Mortgage Rate | Wtd. Avg. UW NCF DSCR | Wtd. Avg. UW NOI Debt Yield | Wtd. Avg. Cut-off Date LTV Ratio | Wtd. Avg. LTV Ratio at Maturity |
| Florida | 7 | $176,303,790 | 20.6% | 4.204% | 1.62x | 10.5% | 62.7% | 55.8% |
| California | 5 | $108,169,490 | 12.6% | 5.109% | 1.60x | 12.4% | 58.1% | 50.7% |
California – Northern(3) | 0 | $0 | 0.0% | 0.000% | 0.00x | 0.0% | 0.0% | 0.0% |
California – Southern(3) | 5 | $108,169,490 | 12.6% | 5.109% | 1.60x | 12.4% | 58.1% | 50.7% |
| Ohio | 2 | $102,721,611 | 12.0% | 3.665% | 2.30x | 13.3% | 53.4% | 45.6% |
| Connecticut | 1 | $85,000,000 | 9.9% | 4.610% | 1.69x | 12.5% | 67.5% | 61.9% |
| Minnesota | 6 | $63,339,839 | 7.4% | 3.918% | 1.52x | 9.2% | 62.9% | 52.6% |
| New York | 2 | $60,106,816 | 7.0% | 4.199% | 3.49x | 23.3% | 53.7% | 43.3% |
| Illinois | 1 | $55,000,000 | 6.4% | 5.200% | 1.50x | 11.8% | 62.8% | 47.5% |
| Wisconsin | 28 | $53,756,508 | 6.3% | 4.407% | 1.54x | 9.5% | 74.7% | 60.4% |
| New Jersey | 1 | $43,500,000 | 5.1% | 4.550% | 1.42x | 9.9% | 68.5% | 58.7% |
| Texas | 9 | $41,766,589 | 4.9% | 4.868% | 1.48x | 11.0% | 70.9% | 57.3% |
| Virginia | 1 | $17,579,905 | 2.1% | 4.690% | 1.79x | 13.3% | 68.1% | 55.6% |
| Alabama | 1 | $13,180,493 | 1.5% | 4.890% | 1.67x | 14.7% | 64.8% | 41.0% |
| Nevada | 1 | $11,985,343 | 1.4% | 4.390% | 1.59x | 10.4% | 63.9% | 51.7% |
| South Carolina | 1 | $8,100,000 | 0.9% | 5.300% | 1.51x | 11.3% | 66.9% | 55.7% |
| North Carolina | 1 | $7,500,000 | 0.9% | 4.870% | 1.99x | 14.0% | 69.4% | 64.0% |
| Michigan | 4 | $6,531,915 | 0.8% | 4.810% | 1.88x | 13.5% | 63.3% | 49.2% |
| Colorado | 1 | $1,784,447 | 0.2% | 5.410% | 1.35x | 10.4% | 64.9% | 49.5% |
| Total / Wtd. Avg. | 72 | $856,326,747 | 100.0% | 4.446% | 1.81x | 12.3% | 62.6% | 53.1% |
| (1) | All numerical information concerning the mortgage loans is approximate. All weighted average information regarding the mortgage loans reflects the weighting of the mortgage loans based on their outstanding principal balances as of the Cut-off Date. State and Property Type tables reflect allocated loan amounts in the case of mortgage loans secured by multiple properties. The sum of numbers and percentages in columns may not match the “Total” due to rounding. Additionally, LTV ratios and DSCR are calculated for mortgage loans without regard to any additional indebtedness that may be incurred at a future date. |
| (2) | With respect to the Westfield Countryside Mortgage Loan, The Mall at Tuttle Crossing Mortgage Loan, the Southdale Center Mortgage Loan and the Marriott Chicago River North Hotel Mortgage Loan, unless otherwise indicated, all LTV, DSCR, and Debt Yield calculations include the related pari passu companion loan. |
| (3) | “California – Northern” includes zip codes above 93600, and “California – Southern” includes zip codes at or below 93600. |
| This is not a research report and was not prepared by the Underwriters’ research departments. Please see additional important information and qualifications at the end of this Term Sheet. |
| MSBAM 2013-C11 | Collateral Statistics |
Collateral Statistics(1)(2) | |||||||||||||
| Cut-off Date Balance ($) | Mortgage Rate (%) | Cut-off Date LTV Ratio (%) | |||||||||||
| No. of | Aggregate | No. of | Aggregate | No. of | Aggregate | ||||||||
| Mortgage | Cut-off Date | % of | Mortgage | Cut-off Date | % of | Mortgage | Cut-off Date | % of | |||||
| Loans | Balance ($) | Pool | Loans | Balance ($) | Pool | Loans | Balance ($) | Pool | |||||
| 1,896,888 - 10,000,000 | 18 | 108,696,762 | 12.7 | 3.210 - 4.000 | 5 | 277,452,715 | 32.4 | 10.9 - 20.0 | 1 | 19,952,715 | 2.3 | ||
| 10,000,001 - 20,000,000 | 8 | 124,749,573 | 14.6 | 4.001 - 4.500 | 9 | 128,716,896 | 15.0 | 30.1 - 40.0 | 1 | 6,000,000 | 0.7 | ||
| 20,000,001 - 30,000,000 | 4 | 106,726,310 | 12.5 | 4.501 - 5.000 | 13 | 279,298,124 | 32.6 | 50.1 - 60.0 | 7 | 292,687,359 | 34.2 | ||
| 40,000,001 - 50,000,000 | 3 | 126,154,101 | 14.7 | 5.001 - 5.630 | 11 | 170,859,012 | 20.0 | 60.1 - 70.0 | 18 | 353,095,673 | 41.2 | ||
| 50,000,001 - 60,000,000 | 2 | 110,000,000 | 12.8 | Total: | 38 | $856,326,747 | 100.0% | 70.1 - 79.1 | 11 | 184,591,000 | 21.6 | ||
| 80,000,001 - 90,000,000 | 1 | 85,000,000 | 9.9 | Min: 3.210% | Max: 5.630% | Wtd Avg: 4.446% | Total: | 38 | $856,326,747 | 100.0% | |||
| 90,000,001 - 100,000,000 | 2 | 195,000,000 | 22.8 | Min: 10.9% | Max: 79.1% | Wtd Avg: 62.6% | |||||||
| Total: | 38 | $856,326,747 | 100.0% | Original Term to Maturity (mos.) | |||||||||
| Min: $1,896,888 | Max: $100,000,000 | Avg: $22,534,914 | LTV Ratio at Maturity (%) | ||||||||||
| No. of | Aggregate | ||||||||||||
| State | Mortgage | Cut-off Date | % of | No. of | Aggregate | ||||||||
| Loans | Balance ($) | Pool | Mortgage | Cut-off Date | % of | ||||||||
| No. of | Aggregate | 60 | 5 | 149,962,672 | 17.5 | Loans | Balance ($) | Pool | |||||
| Mortgaged | Cut-off Date | % of | 120 | 33 | 706,364,075 | 82.5 | 7.2 - 10.0 | 1 | 19,952,715 | 2.3 | |||
| Properties | Balance ($) | Pool | Total: | 38 | $856,326,747 | 100.0% | 20.1 - 30.0 | 1 | 3,736,751 | 0.4 | |||
| Florida | 7 | 176,303,790 | 20.6 | Min: 60 | Max: 120 | Wtd Avg: 109 | 30.1 - 40.0 | 1 | 6,000,000 | 0.7 | |||
| California | 5 | 108,169,490 | 12.6 | 40.1 - 50.0 | 9 | 267,187,298 | 31.2 | ||||||
California – Northern(3) | 0 | 0 | 0.0 | Remaining Term to Maturity (mos.) | 50.1 - 60.0 | 16 | 327,282,803 | 38.2 | |||||
California – Southern(3) | 5 | 108,169,490 | 12.6 | 60.1 - 70.0 | 9 | 217,297,180 | 25.4 | ||||||
| Ohio | 2 | 102,721,611 | 12.0 | No. of | Aggregate | 70.1 - 70.9 | 1 | 14,870,000 | 1.7 | ||||
| Connecticut | 1 | 85,000,000 | 9.9 | Mortgage | Cut-off Date | % of | Total: | 38 | $856,326,747 | 100.0% | |||
| Minnesota | 6 | 63,339,839 | 7.4 | Loans | Balance ($) | Pool | Min: 7.2% | Max: 70.9% | Wtd Avg: 53.1% | ||||
| New York | 2 | 60,106,816 | 7.0 | 57 - 79 | 5 | 149,962,672 | 17.5 | ||||||
| Illinois | 1 | 55,000,000 | 6.4 | 116 - 118 | 4 | 257,500,000 | 30.1 | UW DSCR (x) | |||||
| Wisconsin | 28 | 53,756,508 | 6.3 | 119 - 120 | 29 | 448,864,075 | 52.4 | ||||||
| New Jersey | 1 | 43,500,000 | 5.1 | Total: | 38 | $856,326,747 | 100.0% | No. of | Aggregate | ||||
| Texas | 9 | 41,766,589 | 4.9 | Min: 57 | Max: 120 | Wtd Avg: 108 | Mortgage | Cut-off Date | % of | ||||
| Virginia | 1 | 17,579,905 | 2.1 | Loans | Balance ($) | Pool | |||||||
| Alabama | 1 | 13,180,493 | 1.5 | Original Amortization Term (mos.) | 1.28 - 1.30 | 2 | 27,070,000 | 3.2 | |||||
| Nevada | 1 | 11,985,343 | 1.4 | 1.31 - 1.40 | 5 | 54,549,836 | 6.4 | ||||||
| South Carolina | 1 | 8,100,000 | 0.9 | No. of | Aggregate | 1.41 - 1.50 | 5 | 150,150,675 | 17.5 | ||||
| North Carolina | 1 | 7,500,000 | 0.9 | Mortgage | Cut-off Date | % of | 1.51 - 1.60 | 11 | 203,176,277 | 23.7 | |||
| Michigan | 4 | 6,531,915 | 0.8 | Loans | Balance ($) | Pool | 1.61 - 1.70 | 3 | 198,180,493 | 23.1 | |||
| Colorado | 1 | 1,784,447 | 0.2 | 180 | 1 | 3,736,751 | 0.4 | 1.71 - 1.80 | 3 | 53,549,395 | 6.3 | ||
| Total: | 72 | $856,326,747 | 100.0% | 240 | 1 | 13,180,493 | 1.5 | 1.81 - 1.90 | 4 | 37,197,356 | 4.3 | ||
| 276 | 1 | 19,952,715 | 2.3 | 1.91 - 2.00 | 1 | 7,500,000 | 0.9 | ||||||
| Property Type | 300 | 7 | 83,033,667 | 9.7 | 2.01 - 2.10 | 1 | 4,000,000 | 0.5 | |||||
| 360 | 28 | 736,423,121 | 86.0 | 2.11 - 2.50 | 1 | 95,000,000 | 11.1 | ||||||
| No. of | Aggregate | Total: | 38 | $856,326,747 | 100.0% | 2.51 - 7.59 | 2 | 25,952,715 | 3.0 | ||||
| Mortgaged | Cut-off Date | % of | Min: 180 | Max: 360 | Wtd Avg: 350 | Total: | 38 | $856,326,747 | 100.0% | ||||
| Properties | Balance ($) | Pool | Min: 1.28x | Max: 7.59x | Wtd Avg: 1.81x | ||||||||
| Retail | 8 | 276,938,428 | 32.3 | Remaining Amortization Term (mos.) | |||||||||
| Regional Mall | 3 | 250,000,000 | 29.2 | UW NOI Debt Yield (%) | |||||||||
| Anchored | 2 | 13,882,231 | 1.6 | No. of | Aggregate | ||||||||
| Single Tenant | 1 | 9,000,000 | 1.1 | Mortgage | Cut-off Date | % of | No. of | Aggregate | |||||
| Unanchored | 2 | 4,056,197 | 0.5 | Loans | Balance ($) | Pool | Mortgage | Cut-off Date | % of | ||||
| Hospitality | 11 | 210,631,766 | 24.6 | 179 - 230 | 1 | 3,736,751 | 0.4 | Loans | Balance ($) | Pool | |||
| Full Service | 4 | 74,614,522 | 8.7 | 231 - 300 | 9 | 116,166,874 | 13.6 | 8.3 - 8.5 | 2 | 42,230,000 | 4.9 | ||
| Extended Stay | 1 | 55,000,000 | 6.4 | 351 - 360 | 28 | 736,423,121 | 86.0 | 8.6 - 9.0 | 1 | 12,200,000 | 1.4 | ||
| Resort | 1 | 42,500,000 | 5.0 | Total: | 38 | $856,326,747 | 100.0% | 9.1 - 9.5 | 4 | 90,862,507 | 10.6 | ||
| Limited Service | 5 | 38,517,244 | 4.5 | Min: 179 | Max: 360 | Wtd Avg: 349 | 9.6 - 10.0 | 6 | 106,041,306 | 12.4 | |||
| Office | 3 | 114,700,000 | 13.4 | 10.1 - 10.5 | 4 | 122,041,540 | 14.3 | ||||||
| Suburban | 1 | 85,000,000 | 9.9 | 10.6 - 11.0 | 1 | 7,500,000 | 0.9 | ||||||
| Urban | 1 | 17,500,000 | 2.0 | 11.1 - 11.5 | 2 | 48,254,101 | 5.6 | ||||||
| Medical | 1 | 12,200,000 | 1.4 | 11.6 - 12.0 | 2 | 57,496,573 | 6.7 | ||||||
| Multifamily | 6 | 79,777,616 | 9.3 | 12.1 - 12.5 | 3 | 99,078,636 | 11.6 | ||||||
| Garden | 3 | 46,724,627 | 5.5 | 12.6 - 13.0 | 1 | 42,500,000 | 5.0 | ||||||
| Cooperative | 1 | 19,952,715 | 2.3 | 13.1 - 13.5 | 3 | 120,301,516 | 14.0 | ||||||
| Garden/Townhouse | 1 | 7,721,611 | 0.9 | 13.6 - 14.0 | 2 | 37,469,490 | 4.4 | ||||||
| Student Housing | 1 | 5,378,663 | 0.6 | 14.6 - 15.0 | 2 | 19,180,493 | 2.2 | ||||||
| Manufactured Housing | 35 | 64,628,263 | 7.5 | 15.1 - 47.5 | 5 | 51,170,584 | 6.0 | ||||||
| Industrial | 2 | 46,154,101 | 5.4 | Total: | 38 | $856,326,747 | 100.0% | ||||||
| Warehouse Distribution | 1 | 40,154,101 | 4.7 | Min: 8.3% | Max: 47.5% | Wtd Avg: 12.3% | |||||||
| Manufacturing | 1 | 6,000,000 | 0.7 | ||||||||||
| Mixed Use | 1 | 43,500,000 | 5.1 | ||||||||||
| Office / Flex | 1 | 43,500,000 | 5.1 | ||||||||||
| Self Storage | 6 | 19,996,573 | 2.3 | ||||||||||
| Total: | 72 | $856,326,747 | 100.0% | ||||||||||
| (1) | All numerical information concerning the mortgage loans is approximate. All weighted average information regarding the mortgage loans reflects the weighting of the mortgage loans based on their outstanding principal balances as of the Cut-off Date. State and Property Type tables reflect allocated loan amounts in the case of mortgage loans secured by multiple properties. The sum of numbers and percentages in columns may not match the “Total” due to rounding. Additionally, LTV ratios and DSCR are calculated for mortgage loans without regard to any additional indebtedness that may be incurred at a future date. |
| (2) | With respect to the Westfield Countryside Mortgage Loan, The Mall at Tuttle Crossing Mortgage Loan, the Southdale Center Mortgage Loan and the Marriott Chicago River North Hotel Mortgage Loan, unless otherwise indicated, all LTV, DSCR and Debt Yield calculations include the related pari passu companion loan. |
| (3) | “California-Northern” includes zip codes above 93600, and “California-Southern” includes zip codes at or below 93600. |
| This is not a research report and was not prepared by the Underwriters’ research departments. Please see additional important information and qualifications at the end of this Term Sheet. |
| MSBAM 2013-C11 | Collateral Statistics |
| Prepayment Restrictions |
| Prepayment Restrictions | August 2013 | August 2014 | August 2015 | August 2016 | August 2017 |
| Locked Out | 100.0% | 100.0% | 0.0% | 0.0% | 0.0% |
| Yield Maintenance Total | 0.0% | 0.0% | 20.8% | 21.0% | 21.2% |
| Open | 0.0% | 0.0% | 0.0% | 5.0% | 5.0% |
| TOTAL | 100.0% | 100.0% | 100.0% | 100.0% | 100.0% |
| Pool Balance Outstanding | $856,326,747 | $848,454,589 | $839,285,200 | $827,773,694 | $814,254,157 |
| % Initial Pool Balance | 100.0% | 99.1% | 98.0% | 96.7% | 95.1% |
| Prepayment Restrictions | August 2018 | August 2019 | August 2020 | August 2021 | August 2022 |
| Locked Out | 0.0% | 0.0% | 0.0% | 0.0% | 0.0% |
| Yield Maintenance Total | 24.5% | 24.6% | 24.6% | 24.7% | 24.8% |
| Open | 0.0% | 0.0% | 0.0% | 0.0% | 0.0% |
| TOTAL | 100.0% | 100.0% | 100.0% | 100.0% | 100.0% |
| Pool Balance Outstanding | $661,057,302 | $646,706,393 | $631,783,562 | $616,104,386 | $599,712,798 |
| % Initial Pool Balance | 77.2% | 75.5% | 73.8% | 71.9% | 70.0% |
| (1) | The analysis is based on Structuring Assumptions and a 0% CPR as discussed in the Free Writing Prospectus. |
| (2) | See description of Yield Maintenance under “DESCRIPTION OF THE OFFERED CERTIFICATES—Distributions of Prepayment Premiums and Yield Maintenance Charges” in the Free Writing Prospectus. |
| (3) | Mortgage loans modeled as Yield Maintenance include mortgage loans characterized by YM1 and DEF/YM1 on Appendix I to the Free Writing Prospectus. |
This is not a research report and was not prepared by the Underwriters’ research departments. Please see additional important information and qualifications at the end of this Term Sheet. |
This is not a research report and was not prepared by the Underwriters’ research departments. Please see additional important information and qualifications at the end of this Term Sheet. |
| MSBAM 2013-C11 | Westfield Countryside |
| Mortgage Loan No. 1 – Westfield Countryside |
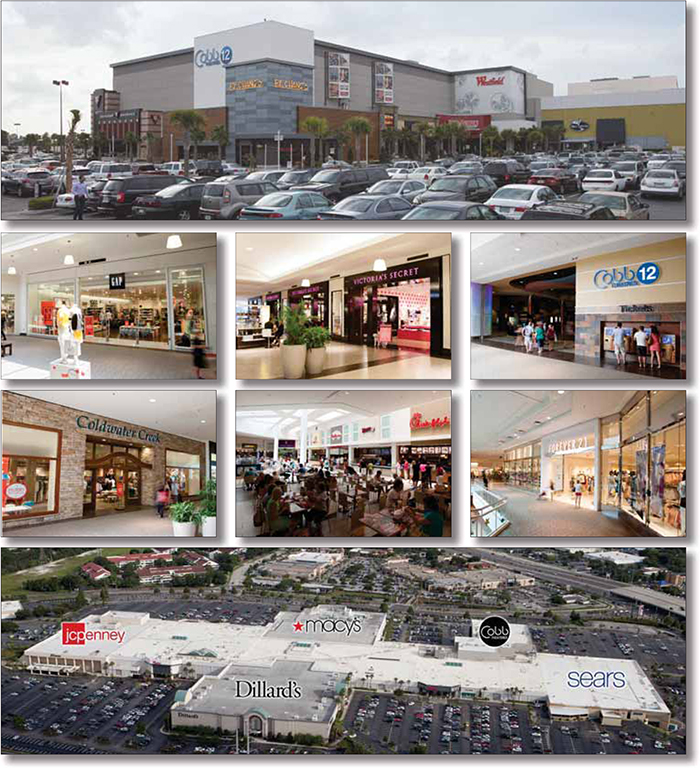
This is not a research report and was not prepared by the Underwriters’ research departments. Please see additional important information and qualifications at the end of this Term Sheet. |
| MSBAM 2013-C11 | Westfield Countryside |
| Mortgage Loan No. 1 – Westfield Countryside |
This is not a research report and was not prepared by the Underwriters’ research departments. Please see additional important information and qualifications at the end of this Term Sheet. |
| MSBAM 2013-C11 | Westfield Countryside |
| Mortgage Loan No. 1 – Westfield Countryside |
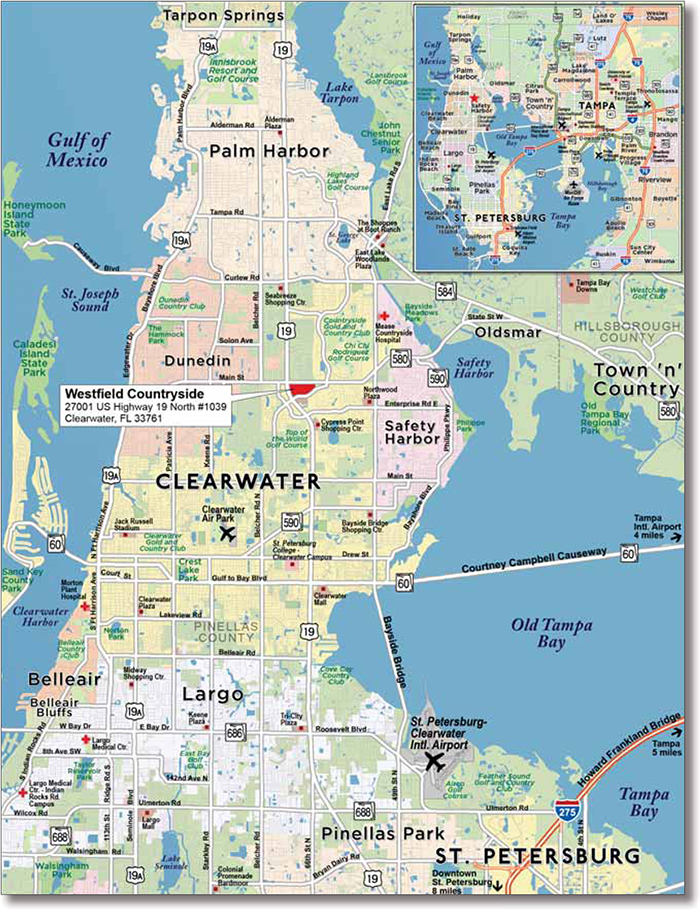
This is not a research report and was not prepared by the Underwriters’ research departments. Please see additional important information and qualifications at the end of this Term Sheet. |
| MSBAM 2013-C11 | Westfield Countryside |
| Mortgage Loan No. 1 – Westfield Countryside |
| Mortgage Loan Information | Mortgaged Property Information | ||||||
| Mortgage Loan Seller: | MSMCH | Single Asset/ Portfolio: | |||||
Credit Assessment: (Fitch/Moody’s/Morningstar) | NR/NR/NR | Property Address: | Clearwater, FL 33761 | ||||
Original Balance(1): | General Property Type: | ||||||
Cut-off Date Balance(1): | Detailed Property Type: | ||||||
| % of Initial Pool Balance: | 11.7% | Net Rentable Area(4): | |||||
Loan Purpose(2): | Cut-off Date Balance Per Unit/SF(1): | ||||||
| Borrower Name(s): | Balloon/ARD Balance Per Unit/SF(1): | ||||||
| Sponsor(s): | Year Built / Year Renovated: | ||||||
| Mortgage Rate: | Title Vesting: | ||||||
| Note Date: | Property Manager: | ||||||
| First Payment Date: | |||||||
| Anticipated Repayment Date: | Underwriting and Financial Information | ||||||
| Maturity Date: | UW Revenues: | ||||||
| IO Period: | UW Expenses: | ||||||
| Original Term to Maturity or ARD: | UW NOI: | ||||||
| Seasoning: | UW NCF: | ||||||
| Original Amortization Term: | UW NOI DSCR(1): | ||||||
| Loan Amortization Type: | UW NCF DSCR(1): | ||||||
| Interest Accrual Basis: | UW NOI Debt Yield(1): | ||||||
| Prepayment Provisions: | UW NCF Debt Yield(1): | ||||||
| Lockbox/Cash Management: | UW NCF Debt Yield at Maturity(1): | ||||||
Pari Passu Mortgage Debt(1): | Most Recent NOI (As of): | ||||||
| Subordinate Mortgage Debt: | 2nd Most Recent NOI (As of): | ||||||
| Mezzanine Debt: | 3rd Most Recent NOI (As of): | ||||||
Reserves(3) | Appraised Value: | ||||||
| Type | Initial | Monthly | Cap | Appraisal As-of Date: | |||
| RE Tax: | Springing | NAP | Cut-off Date LTV Ratio(1): | ||||
| Insurance: | Springing | NAP | LTV Ratio at Maturity/ARD(1): | ||||
| Recurring Replacements: | Springing | $92,880 | Occupancy Rate (As of): | ||||
| TI/LC: | Springing | $464,398 | 2nd Most Recent Occupancy (As of): | ||||
3rd Most Recent Occupancy (As of): | |||||||
4th Most Recent Occupancy (As of): | |||||||
5th Most Recent Occupancy (As of): | 88.6% (12/31/2009) | ||||||
6th Most Recent Occupancy (As of): | 88.6% (12/31/2008) | ||||||
| (1) | The Westfield Countryside Mortgage Loan is part of the Westfield Countryside Loan Pair evidenced by multiple pari passu notes with an aggregate original principal balance of $155,000,000. The Cut-off Date Balance Per Unit/SF, Balloon/ARD Balance Per Unit/SF, UW NOI DSCR, UW NCF DSCR, UW NOI Debt Yield, UW NCF Debt Yield, UW NCF Debt Yield at Maturity, Cut-off Date LTV Ratio and LTV Ratio at Maturity/ARD numbers presented above are based on the entire $155,000,000 Westfield Countryside Loan Pair balance. |
| (2) | The proceeds of the Westfield Countryside Loan Pair were used to partially finance a joint venture purchase of 6 regional malls. An affiliate or affiliates of Westfield America, Inc., one of the current loan sponsors, previously owned a majority interest in the Westfield Countryside Property. |
| (3) | See “—Escrows and Reserves” below for further discussion of reserve requirements. The reserves, if any, are applicable to the entire Westfield Countryside Loan Pair. |
| (4) | The Net Rentable Area includes improvements owned by the Westfield Countryside Borrower and excludes four non-collateral anchor tenant stores totaling approximately 795,151 SF, which are tenant owned. |
This is not a research report and was not prepared by the Underwriters’ research departments. Please see additional important information and qualifications at the end of this Term Sheet. |
| MSBAM 2013-C11 | Westfield Countryside |
This is not a research report and was not prepared by the Underwriters’ research departments. Please see additional important information and qualifications at the end of this Term Sheet. |
| MSBAM 2013-C11 | Westfield Countryside |
Tenant Summary | |||||||||||
| Tenant Name | Credit Rating (Fitch/Moody’s/S&P)(1) | Tenant NRSF | Approximate % of NRSF(2) | Annual Underwritten Base Rent | % of Total Annual UW Rent | Total Annual Underwritten Base Rent (PSF)(3) | Lease Expiration(4) | TTM May 2013 Sales PSF/ Screen(5) | UW Occupancy Cost as a % of Sales | ||
| Non-Collateral Anchors | |||||||||||
| Sears | CCC/B3/CCC+ | 220,833 | NAP | NAP | NAP | NAP | 9/06/2030 | $103 | NAP | ||
| Macy’s | BBB/Baa3/BBB | 214,965 | NAP | NAP | NAP | NAP | 7/23/2030 | $202 | NAP | ||
| Dillard’s | BBB-/Ba3/BB+ | 209,214 | NAP | NAP | NAP | NAP | 3/30/2031 | $128 | NAP | ||
| J.C. Penney | B-/Caa1/CCC+ | 150,139 | NAP | NAP | NAP | NAP | 1/20/2031 | $121 | NAP | ||
| Subtotal / Wtd. Avg. | 795,151 | ||||||||||
| Tenants > 10,000 SF | |||||||||||
| Cobb Theaters | NR/NR/NR | 53,729 | 12% | $1,682,389 | 11% | $31.31 | 12/31/2026 | $587,583 | 23.9% | ||
| XXI Forever | NR/NR/NR | 20,000 | 4% | $574,464 | 4% | $28.72 | 1/31/2023 | $210 | 12.7% | ||
| L.A. Fitness | NR/NR/NR | 18,466 | 4% | $203,126 | 1% | $11.00 | 3/31/2018 | $52 | 30.0% | ||
| Victoria’s Secret | NR/NR/NR | 12,411 | 3% | $372,330 | 3% | $30.00 | 1/31/2018 | $542 | 10.1% | ||
| Gap/Gap Body | BBB-/Baa3/BBB- | 11,168 | 2% | $223,360 | 2% | $20.00 | 1/31/2017 | $199 | 24.3% | ||
| Subtotal / Wtd. Avg. | 115,774 | 25% | $3,055,669 | 21% | $26.39 | ||||||
| Other Tenants | 310,282 | 67% | $11,751,680 | 79% | $37.87 | $404 | 17.4% | ||||
| Vacant Space | 38,780 | 8% | $0 | 0% | $0.00 | ||||||
| Total | 464,836 | 100% | $14,807,349 | 100% | $34.75 | ||||||
| (1) | Certain ratings are those of the parent company whether or not the parent guarantees the lease. |
| (2) | Approximate % of NRSF is based on total collateral NRSF of 464,836 SF. It does not include the Sears, Macy’s, Dillard’s or J.C. Penney stores, which are not collateral for the Westfield Countryside Mortgage Loan. |
| (3) | Total Annual Underwritten Base Rent (PSF) excludes vacant space. |
| (4) | The lease expiration dates for Sears, Macy’s, Dillard’s and J.C. Penney represent the current reciprocal easement agreement expiration dates for each respective store. These anchor stores are not collateral for the Westfield Countryside Mortgage Loan. |
| (5) | The Sears, Macy’s, Dillard’s and J.C. Penney stores do not report sales for this location. The above Sales PSF attributed to these non-collateral stores are based only on estimates by Westfield for the 2012 calendar year. TTM May 2013 Sales PSF attributed to “Other Tenants” includes only 177,728 SF of comparable in-line and 2,613 SF of comparable food court tenants. (Non-comparable in-line, food court and kiosk tenants are excluded from this calculation.) Excluding the comparable food court tenants, which had TTM average sales of $887 PSF, the average sales PSF for comparable in-line tenants was approximately $396. |
This is not a research report and was not prepared by the Underwriters’ research departments. Please see additional important information and qualifications at the end of this Term Sheet. |
| MSBAM 2013-C11 | Westfield Countryside |
Lease Rollover Schedule(1)(2) | |||||||||
| Year | # of Leases Rolling | SF Rolling | Average Underwritten Base Rent PSF Rolling(3) | Approx. % of Total SF Rolling | Approx. Cumulative % of SF Rolling | Total Underwritten Base Rent Rolling | Approx. % of Total Base Rent Rolling | Approx. Cumulative % of Total Base Rent Rolling | |
| MTM | 0 | 0 | $0.00 | 0% | 0% | $0 | 0% | 0% | |
| 2013 | 3 | 2,532 | $73.42 | 1% | 1% | $185,896 | 1% | 1% | |
| 2014 | 27 | 47,501 | $36.98 | 10% | 11% | $1,756,727 | 12% | 13% | |
| 2015 | 13 | 19,525 | $46.64 | 4% | 15% | $910,640 | 6% | 19% | |
| 2016 | 24 | 55,306 | $39.38 | 12% | 27% | $2,178,065 | 15% | 35% | |
| 2017 | 14 | 22,655 | $46.92 | 5% | 32% | $1,062,962 | 7% | 42% | |
| 2018 | 24 | 77,274 | $29.46 | 17% | 49% | $2,276,371 | 15% | 57% | |
| 2019 | 9 | 25,179 | $30.55 | 5% | 54% | $769,170 | 5% | 62% | |
| 2020 | 8 | 16,754 | $48.04 | 4% | 58% | $804,836 | 5% | 67% | |
| 2021 | 5 | 13,940 | $32.60 | 3% | 61% | $454,406 | 3% | 70% | |
| 2022 | 8 | 22,096 | $33.87 | 5% | 66% | $748,402 | 5% | 75% | |
| 2023 | 10 | 49,345 | $27.58 | 11% | 77% | $1,360,903 | 9% | 85% | |
| 2024 | 1 | 3,500 | $10.00 | 1% | 78% | $35,000 | 0% | 85% | |
| 2025 | 0 | 0 | $0.00 | 0% | 78% | $0 | 0% | 85% | |
| 2026 & Beyond | 3 | 70,449 | $32.14 | 15% | 92% | $2,263,969 | 15% | 100% | |
| Vacant | 17 | 38,780 | $0.00 | 8% | 100% | $0 | 0% | 100% | |
| Total / Wtd. Avg. | 166 | 464,836 | $34.75 | 100% | $14,807,349 | 100% | |||
| (1) | The information in the lease rollover schedule is based on the underwritten rent roll. |
| (2) | Certain tenants may have lease termination options that are exercisable prior to the originally stated expiration date of the subject lease and that are not considered in the lease rollover schedule. |
| (3) | Average Underwritten Base Rent PSF Rolling excludes vacant space. |
This is not a research report and was not prepared by the Underwriters’ research departments. Please see additional important information and qualifications at the end of this Term Sheet. |
| MSBAM 2013-C11 | Westfield Countryside |
| Competitive Property Summary | ||||||||||
| Property | Center Type | Year Built | Year Renovated | Total GLA (SF) | Anchor Tenants | Inline Avg. Rent PSF | Sales PSF | Occupancy | Proximity | |
Citrus Park (Primary Competition) NEQ Sheldon Rd. & Citrus Park Dr., Tampa | Super-Regional | 1999 | 2004 | 1,143,377 | Dillard’s JC Penney Macy’s Sears Dick’s Sporting Goods | $30.62 | $370 | 88% | 10.2 miles NE | |
International Plaza (Primary Competitor) 2223 N Westshore Boulevard Tampa | Super-Regional | 2001 | 2005 | 1,174,565 | Dillard’s Neiman Marcus Nordstrom Forever XXI | $49.00 | $500 | 95% | 14.3 miles SE | |
Westshore Plaza (Primary Competitor) 250 Westshore Plaza Tampa | Super-Regional | 1967 | 2001 | 1,036,322 | JC Penney Macy’s Saks Fifth Avenue Sears | $29.00 | $375 | 93% | 14.4 miles SE | |
Tyrone Square (Secondary Competitor) 1050 58th St. N St. Petersburg | Super-Regional | 1972 | 1998 | 1,124,606 | Dillard’s JC Penney Macy’s Sears | $28.00 | $350 | 91% | 15.6 miles S | |
This is not a research report and was not prepared by the Underwriters’ research departments. Please see additional important information and qualifications at the end of this Term Sheet. |
| MSBAM 2013-C11 | Westfield Countryside |
| Cash Flow Analysis | ||||||||||||
| 2009 | 2010 | 2011 | 2012 | UW | UW PSF | |||||||
Base Rent(1) | $11,651,000 | $10,261,000 | $10,004,000 | $12,335,000 | $14,807,349 | $31.85 | ||||||
| Overage Rent | $52,000 | $71,000 | $128,000 | $182,000 | $235,225 | $0.51 | ||||||
Other Income(2) | $3,426,000 | $2,913,000 | $2,723,000 | $3,135,000 | $1,511,000 | $3.25 | ||||||
| Total Recoveries | $8,157,000 | $7,800,000 | $8,669,000 | $9,114,000 | $10,117,000 | $21.76 | ||||||
Mark to Market(3) | $0 | $0 | $0 | $0 | ($1,346,538) | ($2.90) | ||||||
| Less Vacancy & Credit Loss | ($119,000) | $27,000 | ($1,000) | ($71,000) | $0 | $0 | ||||||
| Effective Gross Income | $23,167,000 | $21,072,000 | $21,523,000 | $24,695,000 | $25,324,035 | $54.48 | ||||||
| Total Operating Expenses | $7,891,000 | $7,618,000 | $8,139,000 | $8,935,000 | $9,698,281 | $20.86 | ||||||
| Net Operating Income | $15,276,000 | $13,454,000 | $13,384,000 | $15,760,000(4) | $15,625,754 | $33.62 | ||||||
| TI/LC | $0 | $0 | $0 | $0 | $946,604 | $2.04 | ||||||
| Capital Expenditures | $0 | $0 | $0 | $0 | $92,967 | $0.20 | ||||||
| Net Cash Flow | $15,276,000 | $13,454,000 | $13,384,000 | $15,760,000 | $14,586,182 | $31.38 | ||||||
| Occupancy % | 88.6% | 89.5% | 84.4% | 82.4% | 91.7% | |||||||
| NOI DSCR | 1.74x | 1.53x | 1.52x | 1.79x | 1.78x | |||||||
| NCF DSCR | 1.74x | 1.53x | 1.52x | 1.79x | 1.66x | |||||||
| NOI Debt Yield | 9.9% | 8.7% | 8.6% | 10.2% | 10.1% | |||||||
| NCF Debt Yield | 9.9% | 8.7% | 8.6% | 10.2% | 9.4% | |||||||
Average Annual Rent PSF(5) | $31.99 | $27.87 | $28.84 | $32.20 | $34.75 | |||||||
| (1) | Historical and Underwritten Base Rent includes actual property vacancy. Underwritten Base Rent includes approximately $250,047 of contractual rent increases through December 31, 2013. In 2011, 2012 and 2013, a new theater and 5 restaurants were added to the Westfield Countryside Property, which account for approximately $2,828,519 of total additional underwritten base rents, plus associated recoveries. |
| (2) | Underwritten Other Income includes specialty leasing, partnership marketing and additional income. |
| (3) | Inline tenants with occupancy costs exceeding 20% are marked down to a 20% occupancy cost total rental rate. |
| (4) | The Westfield Countryside sponsor reported trailing twelve months ended April 30, 2013 NOI of $16,066,085 at the Westfield Countryside Property. |
| (5) | Average Annual Rent PSF is based on historical financials and end of year occupancy rates. Vacant space is excluded from the calculation. The Underwritten Average Annual Rent PSF includes certain contractual rent steps as described in note 1 above. The assumed SF for the calculation is approximately 411,107 (the current SF less the recently constructed Cobb Theater space, which lease began on December 16, 2011) for the years 2009, 2010 and 2011 and 464,836 SF for 2012 and the underwritten period, net of vacancy. |
This is not a research report and was not prepared by the Underwriters’ research departments. Please see additional important information and qualifications at the end of this Term Sheet. |
| MSBAM 2013-C11 | Westfield Countryside |
This is not a research report and was not prepared by the Underwriters’ research departments. Please see additional important information and qualifications at the end of this Term Sheet. |
| MSBAM 2013-C11 | The Mall at Tuttle Crossing |
| Mortgage Loan No. 2 – The Mall at Tuttle Crossing |
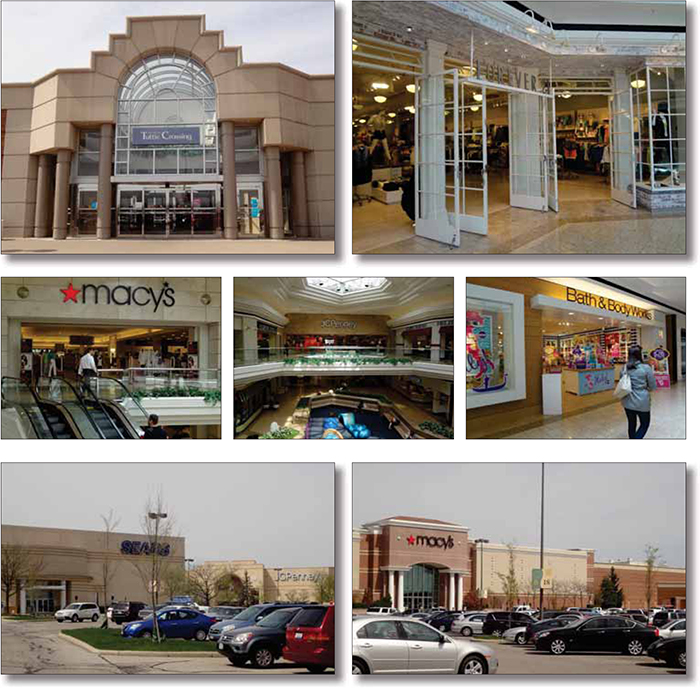
This is not a research report and was not prepared by the Underwriters’ research departments. Please see additional important information and qualifications at the end of this Term Sheet. |
| MSBAM 2013-C11 | The Mall at Tuttle Crossing |
| Mortgage Loan No. 2 – The Mall at Tuttle Crossing |
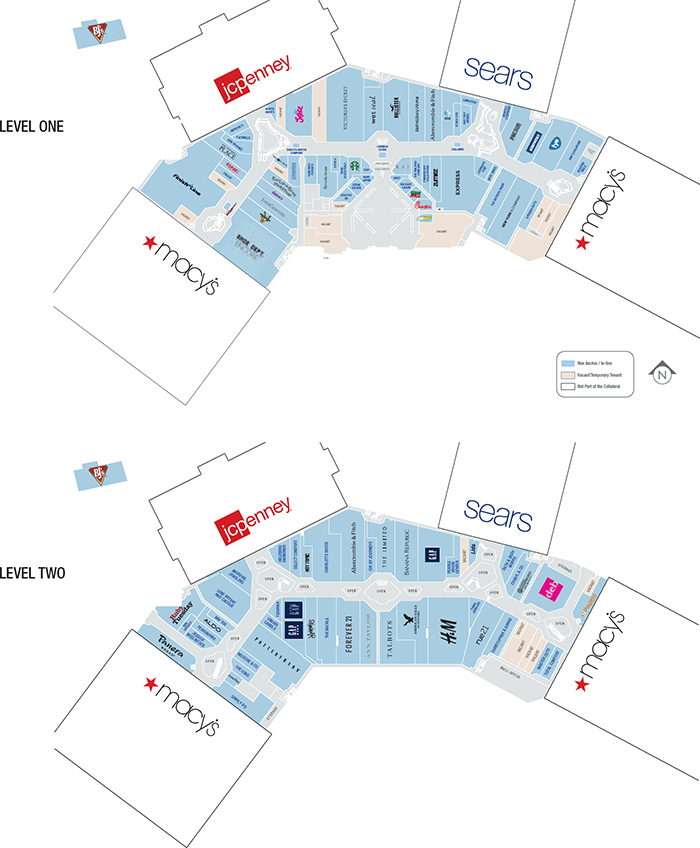
This is not a research report and was not prepared by the Underwriters’ research departments. Please see additional important information and qualifications at the end of this Term Sheet. |
| MSBAM 2013-C11 | The Mall at Tuttle Crossing |
| Mortgage Loan No. 2 – The Mall at Tuttle Crossing |
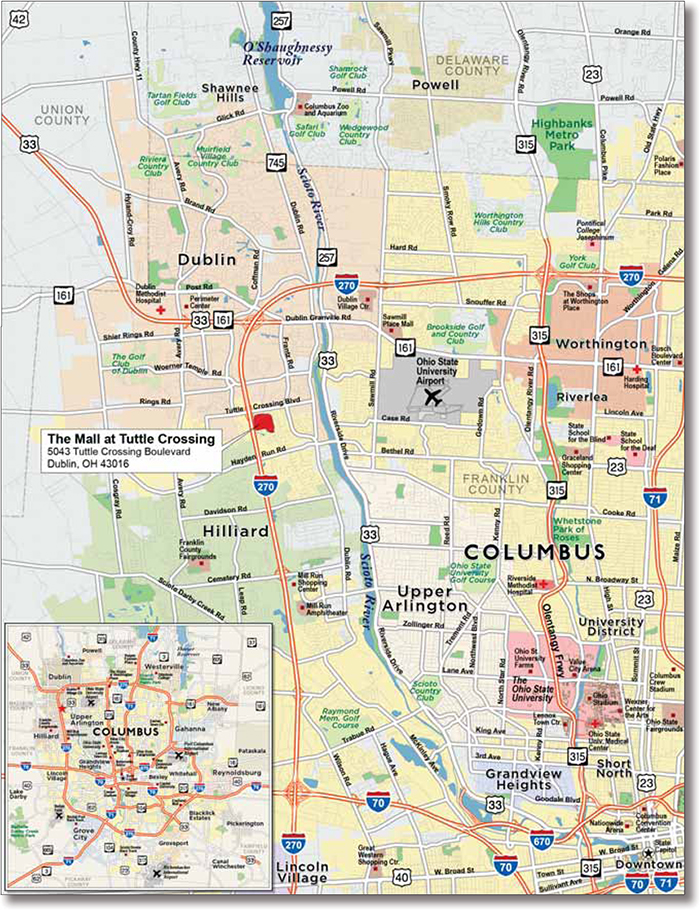
This is not a research report and was not prepared by the Underwriters’ research departments. Please see additional important information and qualifications at the end of this Term Sheet. |
| MSBAM 2013-C11 | The Mall at Tuttle Crossing |
| Mortgage Loan No. 2 – The Mall at Tuttle Crossing |
| Mortgage Loan Information | Mortgaged Property Information | ||||||
| Mortgage Loan Seller: | BANA | Single Asset / Portfolio: | Single Asset | ||||
Credit Assessment: (Fitch/Moody’s/Morningstar) | NR/NR/NR | Property Address: | 5043 Tuttle Crossing Boulevard Dublin, OH 43016 | ||||
Original Balance(1): | $95,000,000 | General Property Type: | Retail | ||||
Cut-off Date Balance(1): | $95,000,000 | Detailed Property Type: | Regional Mall | ||||
% of Initial Pool Balance(1): | 11.1% | Net Rentable Area: | 385,057 SF | ||||
| Loan Purpose: | Refinance | Cut-off Date Balance Per Unit/SF(1): | $325 | ||||
| Borrower Name(s): | Mall at Tuttle Crossing, LLC | Balloon / ARD Balance Per Unit/SF(1): | $278 | ||||
| Sponsor(s): | Simon Property Group, L.P. | Year Built / Year Renovated: | 1997 / NAP | ||||
| Mortgage Rate: | 3.564% | Title Vesting: | Fee | ||||
| Note Date: | 4/30/2013 | Property Manager: | Simon Management Associates II, LLC | ||||
| First Payment Date: | 6/1/2013 | ||||||
| Anticipated Repayment Date: | NAP | Underwriting and Financial Information | |||||
| Maturity Date: | 5/1/2023 | UW Revenues: | $23,570,293 | ||||
| IO Period: | 36 months | UW Expenses: | $6,971,755 | ||||
| Original Term to Maturity or ARD: | 120 months | UW NOI: | $16,598,538 | ||||
| Seasoning: | 3 months | UW NCF: | $15,855,851 | ||||
| Original Amortization Term: | 360 months | UW NOI DSCR: | 2.44x | ||||
| Loan Amortization Type: | Partial IO | UW NCF DSCR: | 2.34x | ||||
| Interest Accrual Basis: | Actual/360 | UW NOI Debt Yield(1): | 13.3% | ||||
| Prepayment Provisions: | LO (27); DEF (89); O (4) | UW NCF Debt Yield(1): | 12.7% | ||||
| Lockbox / Cash Management: | Hard / Springing | UW NCF Debt Yield at Maturity(1): | 14.8% | ||||
Pari Passu Mortgage Debt(1): | $30,000,000 | Most Recent NOI (As of): | $17,782,813 (12/31/2012) | ||||
| Subordinate Mortgage Debt: | None | 2nd Most Recent NOI (As of): | $17,922,943 (12/31/2011) | ||||
| Mezzanine Debt: | None | 3rd Most Recent NOI (As of): | $18,221,729 (12/31/2010) | ||||
Reserves(2) | Appraised Value: | $240,000,000 | |||||
| Type | Initial | Monthly | Cap | Appraisal As-of Date: | 4/18/2013 | ||
| RE Tax: | $0 | Springing | NAP | Cut-off Date LTV Ratio(1): | 52.1% | ||
| Insurance: | $0 | Springing | NAP | LTV Ratio at Maturity/ARD(1): | 44.7% | ||
| Recurring Replacements: | $0 | Springing | $323,448 | Occupancy Rate (As of): | 94.9% (4/9/2013) | ||
| TI/LC: | $0 | Springing | $752,628 | 2nd Most Recent Occupancy (As of): | 96.1% (12/31/2012) | ||
3rd Most Recent Occupancy (As of): | 94.9% (12/31/2011) | ||||||
4th Most Recent Occupancy (As of): | 98.3% (12/31/2010) | ||||||
5th Most Recent Occupancy (As of): | 97.4% (12/31/2009) | ||||||
| (1) | The Mall at Tuttle Crossing Mortgage Loan is part of The Mall at Tuttle Crossing Loan Pair evidenced by two pari passu notes with an aggregate original principal balance of $125,000,000. The Cut-off Date Balance Per Unit/SF, Balloon/ARD Balance Per Unit/SF, UW NOI DSCR, UW NCF DSCR, UW NOI Debt Yield, UW NCF Debt Yield, UW NCF Debt Yield at Maturity, Cut-off Date LTV Ratio and LTV Ratio at Maturity/ARD numbers presented above are based on the entire $125,000,000 The Mall at Tuttle Crossing Loan Pair balance. |
| (2) | See “—Escrows and Reserves” below for further discussion of reserve requirements. |
This is not a research report and was not prepared by the Underwriters’ research departments. Please see additional important information and qualifications at the end of this Term Sheet. |
| MSBAM 2013-C11 | The Mall at Tuttle Crossing |
This is not a research report and was not prepared by the Underwriters’ research departments. Please see additional important information and qualifications at the end of this Term Sheet. |
| MSBAM 2013-C11 | The Mall at Tuttle Crossing |
Tenant Summary(1) | ||||||||||
| Tenant Name | Credit Rating (Fitch/Moody’s /S&P)(2) | Tenant SF | Approx. % of Collateral SF | Annualized Underwritten Base Rent ($) | % of Total Annualized Underwritten Base Rent | Annualized Underwritten Base Rent ($ Per NRSF)(3) | Lease Expiration | 2012 Sales PSF | Occupancy Cost as a % of Sales | |
| Non-collateral Anchors | ||||||||||
| J.C. Penney | B- / Caa1 / CCC+ | 149,000 | ||||||||
| Sears | B / B2 / CCC+ | 149,000 | ||||||||
| Macy’s | BBB / Baa3 / BBB | 223,568 | ||||||||
| Macy’s | BBB / Baa3 / BBB | 222,560 | ||||||||
| Subtotal | 744,128 | |||||||||
| Major Tenants | ||||||||||
| The Finish Line | NR / NR / NR | 20,600 | 5% | $535,600 | 4% | $26.00 | 6/30/2014 | $306 | 14.9% | |
| Victoria’s Secret | NR / NR / NR | 11,987 | 3% | $491,467 | 3% | $41.00 | 1/31/2018 | $654 | 10.1% | |
| Shoe Dept. Encore | NR / NR / NR | 13,613 | 4% | $200,000 | 1% | $14.69 | 5/31/2023 | N/A | N/A | |
| H&M | NR / NR / NR | 11,882 | 3% | $230,000 | 2% | $19.36 | 1/31/2015 | $223 | 9.7% | |
| Pottery Barn | NR / NR / NR | 10,000 | 3% | $159,000 | 1% | $15.90 | 1/31/2016 | $265 | 9.4% | |
| Subtotal / Wtd. Avg. | 68,082 | 18% | $1,616,067 | 11% | $23.74 | |||||
| Other Tenants | 273,565 | 71% | $12,713,806 | 89% | $46.47 | $367 | 17.0% | |||
| Vacant Space | 43,410 | 11% | $0 | 0% | $0.00 | |||||
| Collateral – Total / Wtd. Avg. | 385,057 | 100% | $14,329,873 | 100% | $41.94 | |||||
| Whole Property – Total | 1,129,185 | |||||||||
| (1) | Information is based on the underwritten rent roll. |
| (2) | Certain ratings are those of the parent company whether or not the parent guarantees the lease. |
| (3) | Total Annualized Underwritten Base Rent ($ per NRSF) excludes vacant space. |
Lease Rollover Schedule(1)(2) | ||||||||
| Year | # of Leases Rolling | SF Rolling | Avg. Underwritten Base Rent PSF Rolling(3) | Approx. % of Total SF Rolling | Approx. Cumulative % of SF Rolling | Total Underwritten Base Rent Rolling | Approx. % of Total Base Rent Rolling | Approx. Cumulative % of Total Base Rent Rolling |
| 2013 | 3 | 6,415 | $41.32 | 2% | 2% | $265,042 | 2% | 2% |
| 2014 | 19 | 68,136 | $35.54 | 18% | 19% | $2,421,782 | 17% | 19% |
| 2015 | 18 | 43,469 | $39.63 | 11% | 31% | $1,722,758 | 12% | 31% |
| 2016 | 12 | 39,490 | $37.19 | 10% | 41% | $1,468,482 | 10% | 41% |
| 2017 | 16 | 40,395 | $52.88 | 10% | 51% | $2,136,049 | 15% | 56% |
| 2018 | 17 | 66,044 | $47.90 | 17% | 69% | $3,163,248 | 22% | 78% |
| 2019 | 6 | 16,082 | $51.32 | 4% | 73% | $825,322 | 6% | 84% |
| 2020 | 2 | 2,119 | $50.85 | 1% | 73% | $107,743 | 1% | 85% |
| 2021 | 2 | 8,823 | $54.82 | 2% | 76% | $483,676 | 3% | 88% |
| 2022 | 5 | 9,935 | $71.45 | 3% | 78% | $709,832 | 5% | 93% |
| 2023 & Beyond | 7 | 40,739 | $25.18 | 11% | 89% | $1,025,939 | 7% | 100% |
| Vacant | 0 | 43,410 | $0.00 | 11% | 100% | $0 | 0% | 100% |
| Total / Wtd. Avg. | 107 | 385,057 | $41.94 | 100% | $14,329,873 | 100% | ||
| (1) | Information is based on the underwritten rent roll. |
| (2) | Certain tenants may have lease termination options that are exercisable prior to the originally stated expiration date of the subject lease and that are not considered in the lease rollover schedule. |
| (3) | Weighted Average Underwritten Base Rent PSF Rolling excludes vacant space. |
This is not a research report and was not prepared by the Underwriters’ research departments. Please see additional important information and qualifications at the end of this Term Sheet. |
| MSBAM 2013-C11 | The Mall at Tuttle Crossing |
Competitive Property Summary | ||||||||
| Property | Address | Distance to Subject | Year Built / Renovated | Total GLA (SF) | Anchor Tenants | Occupancy | Sales PSF | |
| Polaris Fashion Place | 1500 Polaris Parkway Columbus, OH | 9.0 miles NE | 2001 / N/A | 1,579,931 | J.C. Penney, Von Maur, Macy’s, Saks 5th Avenue, Sears | 90% | $500 | |
| Easton Town Center | 160 Easton Town Center Columbus, OH | 15.0 miles E | 1999 / 2004 | 1,421,923 | Barnes & Noble’s, Crate & Barrel, Macy’s, Nordstrom | 95% | $400 | |
| Eastland Mall | 2740 South Hamilton Road Columbus, OH | 18.0 miles SE | 1968 / 2005 | 999,189 | J.C. Penney, Macy’s, Sears | 52% | $268 | |
| Source: Appraisal. |
This is not a research report and was not prepared by the Underwriters’ research departments. Please see additional important information and qualifications at the end of this Term Sheet. |
| MSBAM 2013-C11 | The Mall at Tuttle Crossing |
| Cash Flow Analysis | |||||||||||
| 2010 | 2011 | 2012 | UW | UW PSF | |||||||
| Gross Potential Rental Income | $14,108,997 | $14,034,565 | $13,827,162 | $16,209,716 | $42.10 | ||||||
| Adjustments to Contracted Rent | $0 | $0 | $0 | ($1,854,441) | ($4.82) | ||||||
| Percentage Rent | $57,372 | $90,050 | $158,809 | $53,000 | $0.14 | ||||||
| Expense Reimbursements | $9,205,972 | $9,055,482 | $8,975,483 | $10,301,507 | $26.75 | ||||||
| Temporary Tenants | $1,754,016 | $1,724,017 | $1,815,381 | $1,782,292 | $4.63 | ||||||
| Other Income | $270,427 | $297,433 | $144,015 | $202,717 | $0.53 | ||||||
| Less Vacancy & Credit Loss | $162,231 | ($106,456) | ($34,511) | ($3,124,498) | (12.64%) | ||||||
| Effective Gross Income | $25,559,015 | $25,095,091 | $24,886,339 | $23,570,293 | $61.21 | ||||||
| Total Operating Expenses | $7,337,286 | $7,172,148 | $7,103,526 | $6,971,755 | $18.11 | ||||||
| Net Operating Income | $18,221,729 | $17,922,943 | $17,782,813(1) | $16,598,538 | $43.11 | ||||||
| TI/LC | $0 | $0 | $0 | $580,963 | $1.51 | ||||||
| Capital Expenditures | $0 | $0 | $0 | $161,724 | $0.42 | ||||||
| Net Cash Flow | $18,221,729 | $17,922,943 | $17,782,813 | $15,855,851 | $41.18 | ||||||
| Occupancy % | 98.3% | 94.9% | 96.1% | 94.9%(2) | |||||||
| NOI DSCR | 3.53x | 3.47x | 3.45x | 3.22x | |||||||
| NCF DSCR | 3.53x | 3.47x | 3.45x | 3.07x | |||||||
| NOI Debt Yield | 19.2% | 18.9% | 18.7% | 17.5% | |||||||
| NCF Debt Yield | 19.2% | 18.9% | 18.7% | 16.7% | |||||||
Average Annual Rent PSF(3) | $36.64 | $36.45 | $35.91 | ||||||||
| (1) | The Mall at Tuttle Crossing Mortgage Loan sponsor reported trailing twelve months ended June 30, 2013 NOI of $17,606,668 at The Mall at Tuttle Crossing Property. |
| (2) | Occupancy as of April 9, 2013. |
| (3) | Average Annual Rent PSF is based on historical financials and end of year property occupancy rates. |
This is not a research report and was not prepared by the Underwriters’ research departments. Please see additional important information and qualifications at the end of this Term Sheet. |
| MSBAM 2013-C11 | The Mall at Tuttle Crossing |
This is not a research report and was not prepared by the Underwriters’ research departments. Please see additional important information and qualifications at the end of this Term Sheet. |
This is not a research report and was not prepared by the Underwriters’ research departments. Please see additional important information and qualifications at the end of this Term Sheet. |
| MSBAM 2013-C11 | Matrix Corporate Center |
| Mortgage Loan No. 3 – Matrix Corporate Center |

| This is not a research report and was not prepared by the Underwriters’ research departments. Please see additional important information and qualifications at the end of this Term Sheet. |
| MSBAM 2013-C11 | Matrix Corporate Center |
| Mortgage Loan No. 3 – Matrix Corporate Center |
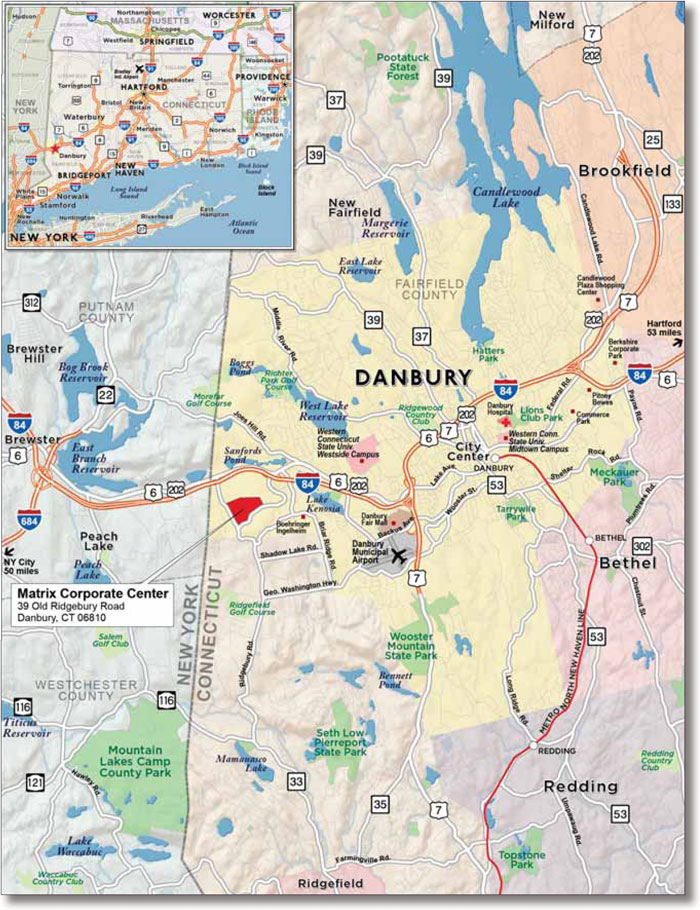
| This is not a research report and was not prepared by the Underwriters’ research departments. Please see additional important information and qualifications at the end of this Term Sheet. |
| MSBAM 2013-C11 | Matrix Corporate Center |
| Mortgage Loan No. 3 – Matrix Corporate Center |
| Mortgage Loan Information | Mortgaged Property Information | ||||||
| Mortgage Loan Seller: | BANA | Single Asset / Portfolio: | Single Asset | ||||
Credit Assessment: (Fitch/Moody’s/Morningstar) | NR/NR/NR | Property Address: | 39 Old Ridgebury Road Danbury, CT 06810 | ||||
| Original Balance: | $85,000,000 | General Property Type: | Office | ||||
| Cut-off Date Balance: | $85,000,000 | Detailed Property Type: | Suburban | ||||
| % of Initial Pool Balance: | 9.9% | Net Rentable Area: | 1,046,701 SF | ||||
| Loan Purpose: | Refinance | Cut-off Date Balance Per Unit/SF: | $81 | ||||
| Borrower Name(s): | Gera Danbury LLC | Balloon / ARD Balance Per Unit/SF: | $75 | ||||
| Sponsor(s): | Glen Nelson | Year Built / Year Renovated: | 1978 / 2010 | ||||
| Mortgage Rate: | 4.610% | Title Vesting: | Fee | ||||
| Note Date: | 7/16/2013 | Property Manager: | Matrix Equities, Inc. | ||||
| First Payment Date: | 9/1/2013 | ||||||
| Anticipated Repayment Date: | NAP | Underwriting and Financial Information | |||||
| Maturity Date: | 8/1/2018 | UW Revenues: | $17,825,567 | ||||
| IO Period: | None | UW Expenses: | $7,210,184 | ||||
| Original Term to Maturity or ARD: | 60 months | UW NOI: | $10,615,383 | ||||
| Seasoning: | 0 months | UW NCF: | $8,847,446 | ||||
| Original Amortization Term: | 360 months | UW NOI DSCR: | 2.03x | ||||
| Loan Amortization Type: | Amortizing | UW NCF DSCR: | 1.69x | ||||
| Interest Accrual Basis: | Actual/360 | UW NOI Debt Yield: | 12.5% | ||||
| Prepayment Provisions: | LO (24); DEF (33); O (3) | UW NCF Debt Yield: | 10.4% | ||||
| Lockbox / Cash Management: | Hard / Springing | UW NCF Debt Yield at Maturity: | 11.3% | ||||
| Pari Passu Mortgage Debt: | None | Most Recent NOI (As of): | $10,194,133 (12/31/2012) | ||||
| Subordinate Mortgage Debt: | None | 2nd Most Recent NOI (As of): | $9,680,433 (12/31/2011) | ||||
| Mezzanine Debt: | Future | 3rd Most Recent NOI (As of): | $7,370,924 (12/31/2010) | ||||
Reserves(1) | Appraised Value: | $126,000,000 | |||||
| Type | Initial | Monthly | Cap | Appraisal As-of Date: | 6/26/2013 | ||
| RE Tax: | $222,993 | $111,497 | NAP | Cut-off Date LTV Ratio: | 67.5% | ||
| Insurance: | $0 | Springing | NAP | LTV Ratio at Maturity/ARD: | 61.9% | ||
| Recurring Replacements: | $2,685,000 | $35,000 | NAP | Occupancy Rate (As of): | 72.1% (6/6/2013) | ||
| TI/LC: | $5,000,000 | $130,851 | NAP | 2nd Most Recent Occupancy (As of): | 67.9% (12/31/2012) | ||
| Deferred Maintenance: | $198,214 | $0 | NAP | 3rd Most Recent Occupancy (As of): | 67.8% (12/31/2011) | ||
Other(2): | $3,675,000 | $0 | NAP | ||||
| (1) | See “—Escrows and Reserves” below for further discussion of reserve requirements. |
| (2) | The Matrix Corporate Center Borrower deposited $2,100,000 at closing for tenant improvements and leasing commission related to Praxair, $1,500,000 for a leasing holdback reserve and $75,000 for an environmental reserve as described under “—Escrows and Reserves” below. |
| This is not a research report and was not prepared by the Underwriters’ research departments. Please see additional important information and qualifications at the end of this Term Sheet. |
| MSBAM 2013-C11 | Matrix Corporate Center |
| This is not a research report and was not prepared by the Underwriters’ research departments. Please see additional important information and qualifications at the end of this Term Sheet. |
| MSBAM 2013-C11 | Matrix Corporate Center |
Tenant Summary(1) | |||||||
| Tenant Name | Credit Rating (Fitch/Moody’s /S&P)(2) | Tenant S) | Approx. % of Collateral SF | Annualized Underwritten Base Rent ($) | % of Total Annualized Underwritten Base Rent | Annualized Underwritten Base Rent ($ Per NRSF)(3) | Lease Expiration |
| Major Tenants | |||||||
| Boehringer Ingelheim | NR / NR / NR | 327,095 | 31% | $7,523,185 | 46% | $23.00 | 12/31/2022 |
| Praxair | NR / A2 / A | 203,284 | 19% | $4,030,657 | 25% | $19.83 | 12/31/2016 |
| Guideposts | NR / NR / NR | 54,186 | 5% | $1,065,838 | 7% | $19.67 | 6/30/2021 |
| General Motors | BB+ / Ba1 / BB+ | 26,874 | 3% | $606,102 | 4% | $22.55 | 2/28/2018 |
| Odyssey Logistics | NR / NR / NR | 22,661 | 2% | $408,300 | 3% | $18.02 | 2/28/2018 |
| Subtotal / Wtd. Avg. | 634,100 | 61% | $13,634,082 | 84% | $21.50 | ||
| Other Tenants | 122,437 | 12% | $2,678,121 | 16% | $21.87 | ||
| Vacant Space | 290,164 | 28% | $0 | 0% | $0.00 | ||
| Collateral – Total / Wtd. Avg. | 1,046,701 | 100% | $16,312,203 | 100% | $21.56 | ||
| (1) | Information is based on the underwritten rent roll. |
| (2) | Certain ratings are those of the parent company whether or not the parent guarantees the lease. |
| (3) | Total Annualized Underwritten Base Rent ($ per NRSF) excludes vacant space. |
Lease Rollover Schedule(1)(2) | ||||||||
| Year | # of Leases Rolling | SF Rolling | Avg. Underwritten Base Rent PSF Rolling(3) | Approx. % of Total SF Rolling | Approx. Cumulative % of SF Rolling | Total Underwritten Base Rent Rolling | Approx. % of Total Base Rent Rolling | Approx. Cumulative % of Total Base Rent Rolling |
| MTM | 8 | 23,309 | $21.81 | 2% | 2% | $508,295 | 3% | 3% |
| 2013 | 0 | 0 | $0.00 | 0% | 2% | $0 | 0% | 3% |
| 2014 | 4 | 15,959 | $13.99 | 2% | 4% | $223,250 | 1% | 4% |
| 2015 | 1 | 12,500 | $20.73 | 1% | 5% | $259,126 | 2% | 6% |
| 2016 | 9 | 234,965 | $20.40 | 22% | 27% | $4,792,927 | 29% | 35% |
| 2017 | 0 | 0 | $0.00 | 0% | 27% | $0 | 0% | 35% |
| 2018 | 4 | 49,535 | $20.48 | 5% | 32% | $1,014,402 | 6% | 42% |
| 2019 | 1 | 6,500 | $22.66 | 1% | 33% | $147,290 | 1% | 43% |
| 2020 | 1 | 4,143 | $22.81 | 0% | 33% | $94,500 | 1% | 43% |
| 2021 | 3 | 54,186 | $19.67 | 5% | 38% | $1,065,838 | 7% | 50% |
| 2022 | 1 | 327,095 | $23.00 | 31% | 70% | $7,523,185 | 46% | 96% |
| 2023 & Beyond | 2 | 28,345 | $24.11 | 3% | 72% | $683,390 | 4% | 100% |
| Vacant | 0 | 290,164 | $0.00 | 28% | 100% | $0 | 0% | 100% |
| Total / Wtd. Avg. | 34 | 1,046,701 | $21.56 | 100% | $16,312,203 | 100% | ||
| (1) | Information is based on the underwritten rent roll. |
| (2) | Certain tenants may have lease termination options that are exercisable prior to the originally stated expiration date of the subject lease and that are not considered in the lease rollover schedule. |
| (3) | Weighted Average Underwritten Base Rent PSF Rolling excludes vacant space. |
| This is not a research report and was not prepared by the Underwriters’ research departments. Please see additional important information and qualifications at the end of this Term Sheet. |
| MSBAM 2013-C11 | Matrix Corporate Center |
Summary of Comparable Office Rentals | ||||||||||
| Property Name and Location | Year Built | Occ. | NRA (SF) | Tenant Name | Lease Area (SF) | Lease Date | Lease Term | Base Rent (PSF) | Improvements (PSF) | Escalations |
Lee Farm Corporate Center 83 Wooster Heights, Danbury, CT | 1988 | 73% | 213,446 | GE Capital – Renewal ClearStructure – Renewal IMS Health Navigators Group | 66,633 6,354 25,000 3,400 | Nov-12 Mar-12 Sep-11 Jun-11 | 3.0 Yrs. 5.5 Yrs. 5.0 Yrs. 5.3 Yrs. | $22.15 $21.75 $22.50 $22.00 | $0.00 $0.00 $35.00 $0.00 | 3%/yr $0.50/yr None $0.50/yr |
AAA Motor Club 93 Lake ext., Danbury, CT | 2002 | 71% | 39,500 | Wells Fargo & Company | 15,156 | May-12 | 5.0 Yrs. | $20.50 | $30.00 | $0.50/yr |
44 Old Ridgebury 44 Old Ridgebury, Danbury, CT | 1989 | 40% | 126,107 | Armored Auto Group Fox Rehab RMI Direct Marketing | 18,819 725 10,605 | Dec-12 Dec-12 Dec-11 | 7.0 Yrs. 1.8 Yrs. 7.3 Yrs. | $20.00 $23.50 $18.00 | $30.00 $0.00 $30.00 | No None $0.50/yr |
One Plaza West 100 Mill Plain Road, Danbury, CT | 1982 | 82% | 89,705 | Sportography Metro Energy Solutions Energy USA | 3,881 6,549 5,896 | Mar-12 Jun-09 May-08 | 5.0 Yrs. 8.2 Yrs. 5.0 Yrs. | $22.00 $21.50 $23.00 | $0.00 $0.00 $5.00 | None 0 0 |
| Source: Appraisal. |
| This is not a research report and was not prepared by the Underwriters’ research departments. Please see additional important information and qualifications at the end of this Term Sheet. |
| MSBAM 2013-C11 | Matrix Corporate Center |
| Cash Flow Analysis | ||||||||||
| 2010 | 2011 | 2012 | UW | UW PSF | ||||||
| Gross Potential Rental Income | $15,474,938 | $15,044,043 | $15,567,503 | $22,967,727 | $21.94 | |||||
| Expense Reimbursements | $0 | $1,449,691 | $1,620,755 | $1,358,465 | $1.30 | |||||
| Other Income | $261,836 | $899,549 | $202,054 | $230,000 | $0.22 | |||||
| Less Vacancy & Credit Loss | $0 | $0 | $0 | ($6,730,625) | (29.30%) | |||||
| Effective Gross Income | $15,736,774 | $17,393,283 | $17,390,312 | $17,825,567 | $17.03 | |||||
| Total Operating Expenses | $8,365,850 | $7,712,850 | $7,196,179 | $7,210,184 | $6.89 | |||||
| Net Operating Income | $7,370,924 | $9,680,433 | $10,194,133 | $10,615,383 | $10.14 | |||||
| TI/LC | $0 | $0 | $0 | $1,558,575 | $1.49 | |||||
| Capital Expenditures | $0 | $0 | $0 | $209,362 | $0.20 | |||||
| Net Cash Flow | $7,370,924 | $9,680,433 | $10,194,133 | $8,847,446 | $8.45 | |||||
| Occupancy % | 63.3% | 67.8% | 67.9% | 72.1%(1) | ||||||
| NOI DSCR | 1.41x | 1.85x | 1.95x | 2.03x | ||||||
| NCF DSCR | 1.41x | 1.85x | 1.95x | 1.69x | ||||||
| NOI Debt Yield | 8.7% | 11.4% | 12.0% | 12.5% | ||||||
| NCF Debt Yield | 8.7% | 11.4% | 12.0% | 10.4% | ||||||
| (1) | Occupancy as of June 6, 2013. |
| This is not a research report and was not prepared by the Underwriters’ research departments. Please see additional important information and qualifications at the end of this Term Sheet. |
| MSBAM 2013-C11 | Matrix Corporate Center |
| This is not a research report and was not prepared by the Underwriters’ research departments. Please see additional important information and qualifications at the end of this Term Sheet. |
| MSBAM 2013-C11 | Southdale Center |
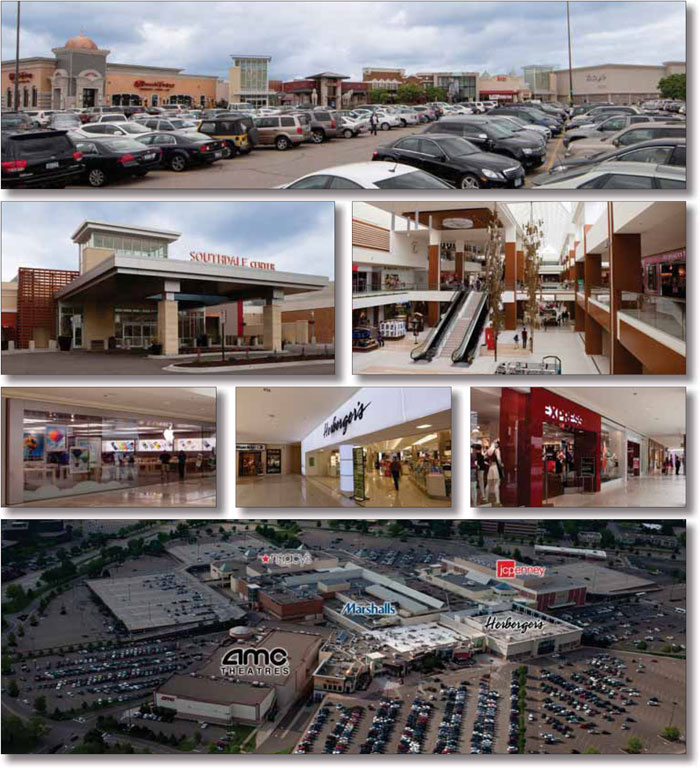
| This is not a research report and was not prepared by the Underwriters’ research departments. Please see additional important information and qualifications at the end of this Term Sheet. |
| MSBAM 2013-C11 | Southdale Center |
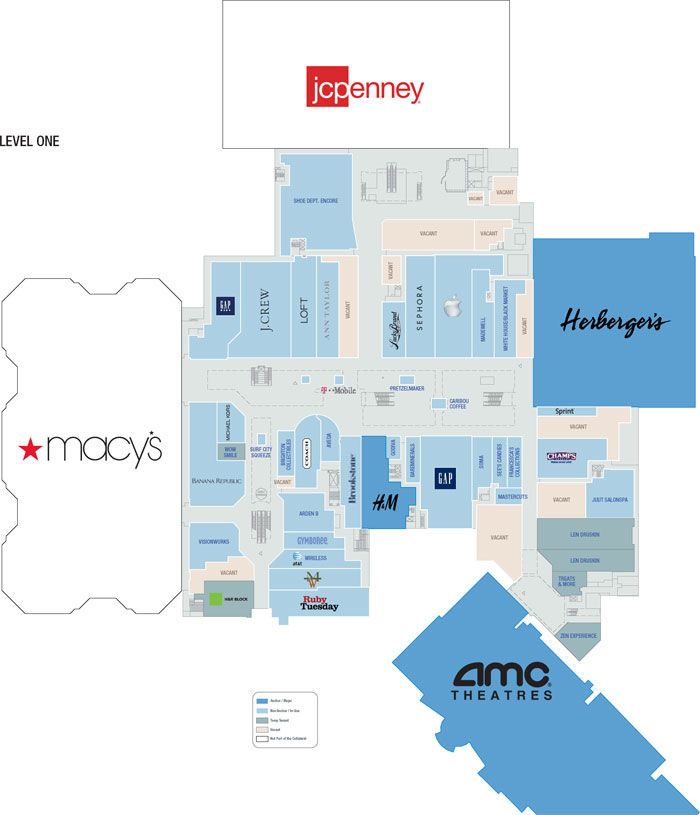
| This is not a research report and was not prepared by the Underwriters’ research departments. Please see additional important information and qualifications at the end of this Term Sheet. |
| MSBAM 2013-C11 | Southdale Center |
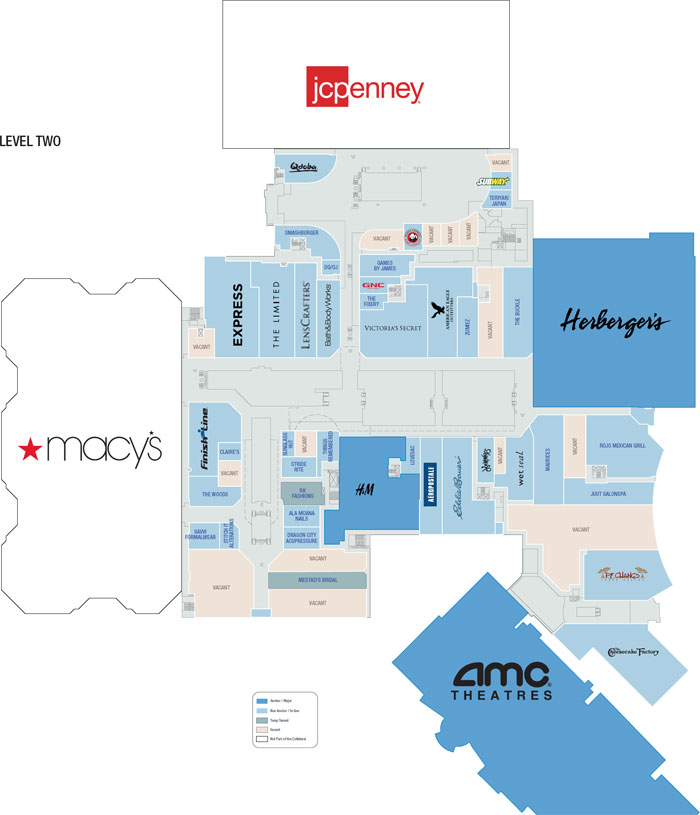
| This is not a research report and was not prepared by the Underwriters’ research departments. Please see additional important information and qualifications at the end of this Term Sheet. |
| MSBAM 2013-C11 | Southdale Center |
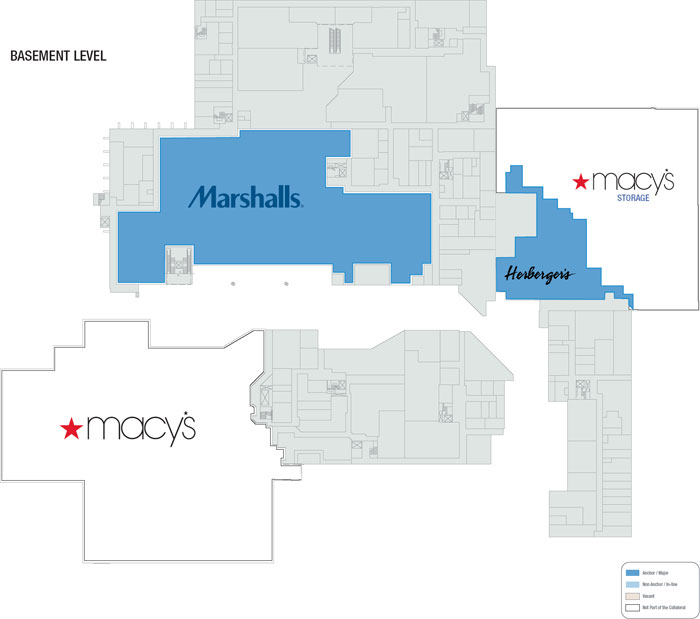
| This is not a research report and was not prepared by the Underwriters’ research departments. Please see additional important information and qualifications at the end of this Term Sheet. |
| MSBAM 2013-C11 | Southdale Center |
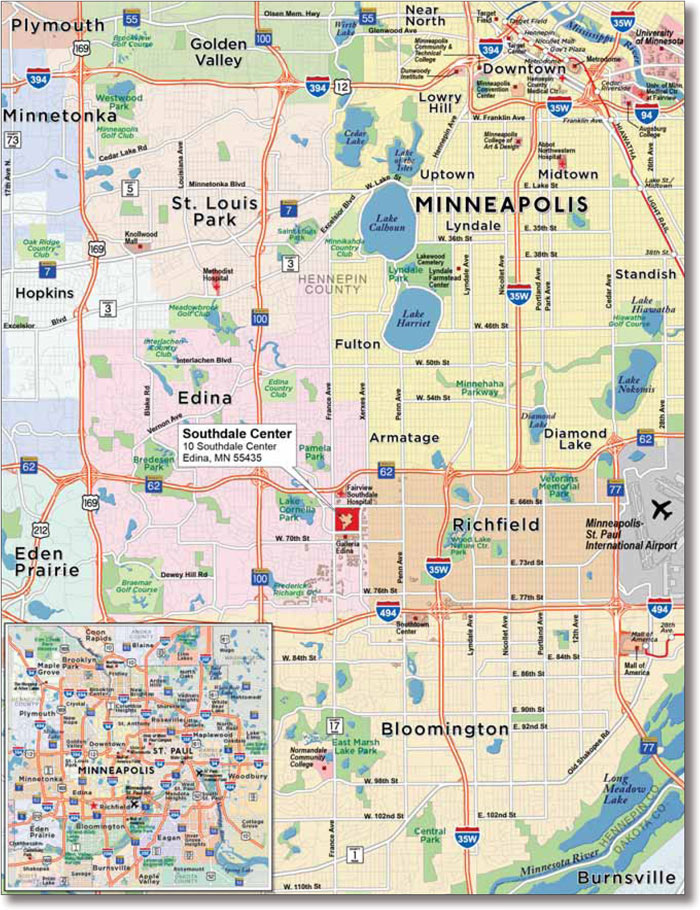
| This is not a research report and was not prepared by the Underwriters’ research departments. Please see additional important information and qualifications at the end of this Term Sheet. |
| MSBAM 2013-C11 | Southdale Center |
| Mortgage Loan No. 4 – Southdale Center |
| Mortgage Loan Information | Mortgaged Property Information | ||||||
| Mortgage Loan Seller: | MSMCH | Single Asset/Portfolio: | Single Asset | ||||
Credit Assessment: (Fitch/Moody’s/Morningstar) | NR/NR/NR | Property Address: | 10 Southdale Center Edina, MN 55435 | ||||
Original Balance(1): | $55,000,000 | General Property Type: | Retail | ||||
Cut-off Date Balance(1): | $55,000,000 | Detailed Property Type: | Regional Mall | ||||
% of Initial Pool Balance(1): | 6.4% | Net Rentable Area(3): | 634,880 SF | ||||
| Loan Purpose: | Refinance | Cut-off Date Balance Per Unit/SF(1): | $244 | ||||
| Borrower Name(s): | Southdale Center, LLC | Balloon/ARD Balance Per Unit/SF(1): | $205 | ||||
| Sponsor(s): | Simon Property Group, L.P. | Year Built / Year Renovated: | 1956 / 2012 | ||||
| Mortgage Rate: | 3.844% | Title Vesting: | Fee | ||||
| Note Date: | 3/14/2013 | Property Manager: | Simon Management Associates II, LLC | ||||
| First Payment Date: | 5/1/2013 | ||||||
| Anticipated Repayment Date: | NAP | Underwriting and Financial Information | |||||
| Maturity Date: | 4/1/2023 | UW Revenues: | $24,361,986 | ||||
| IO Period: | 24 months | UW Expenses: | $10,187,479 | ||||
| Original Term to Maturity or ARD: | 120 months | UW NOI: | $14,174,507 | ||||
| Seasoning: | 4 months | UW NCF: | $13,272,884 | ||||
| Original Amortization Term: | 360 months | UW NOI DSCR(1): | 1.63x | ||||
| Loan Amortization Type: | Partial IO | UW NCF DSCR(1): | 1.52x | ||||
| Interest Accrual Basis: | Actual/360 | UW NOI Debt Yield(1): | 9.1% | ||||
| Prepayment Provisions: | LO (28); DEF (85); O (7) | UW NCF Debt Yield(1): | 8.6% | ||||
| Lockbox / Cash Management: | Hard / Springing | UW NCF Debt Yield at Maturity(1): | 10.2% | ||||
Pari Passu Mortgage Debt(1): | $100,000,000 | Most Recent NOI (As of): | $15,019,892 (3/31/2013 TTM) | ||||
| Subordinate Mortgage Debt: | None | 2nd Most Recent NOI (As of): | $14,692,683 (12/31/2012) | ||||
| Mezzanine Debt: | None | 3rd Most Recent NOI (As of): | $15,937,141 (12/31/2011) | ||||
Reserves(2) | Appraised Value: | $251,000,000 | |||||
| Type | Initial | Monthly | Cap | Appraisal As-of Date: | 2/25/2013 | ||
| RE Tax: | $0 | Springing | NAP | Cut-off Date LTV Ratio(1): | 61.8% | ||
| Insurance: | $0 | Springing | NAP | LTV Ratio at Maturity/ARD(1): | 51.9% | ||
| Recurring Replacements: | $0 | Springing | $254,352 | Occupancy Rate (As of): | 87.9% (4/4/2013) | ||
| TI/LC: | $2,662,332 | Springing | $1,271,766 | 2nd Most Recent Occupancy (As of): | 81.1% (12/31/2012) | ||
3rd Most Recent Occupancy (As of): | 80.2% (12/31/2011) | ||||||
4th Most Recent Occupancy (As of): | 89.2% (12/31/2010) | ||||||
| (1) | The Southdale Center Mortgage Loan is part of the Southdale Center Loan Combination evidenced by two pari passu notes with an aggregate original principal balance of $155,000,000. The Cut-off Date Balance Per Unit/SF, Balloon/ARD Balance Per Unit/SF, UW NOI DSCR, UW NCF DSCR, UW NOI Debt Yield, UW NCF Debt Yield, UW NCF Debt Yield at Maturity, and Cut-off Date LTV Ratio and LTV Ratio at Maturity/ARD numbers presented above are based on the entire $155,000,000 Southdale Center Loan Combination balance. |
| (2) | See “—Escrows and Reserves” below for further discussion of reserve requirements. The reserves are applicable to the entire Southdale Center Loan Combination. The TI/LC Reserve is currently in the form of a Simon Property Group, L.P. guaranty. |
| (3) | The Net Rentable Area includes improvements owned by the borrower and excludes two non-collateral anchor tenant stores totaling approximately 594,697 SF, which are tenant-owned. |
| This is not a research report and was not prepared by the Underwriters’ research departments. Please see additional important information and qualifications at the end of this Term Sheet. |
| MSBAM 2013-C11 | Southdale Center |
| This is not a research report and was not prepared by the Underwriters’ research departments. Please see additional important information and qualifications at the end of this Term Sheet. |
| MSBAM 2013-C11 | Southdale Center |
| Tenant Summary | |||||||||
| Tenant Name | Credit Rating (Fitch/Moody’s/ S&P)(1) | Tenant NRSF | Approx .. % of NRSF(2) | Annual Underwritten Base Rent | % of Total Annual Underwritten Rent | Total Annual Underwritten Base Rent (PSF)(3) | Lease Expiration(4) | TTM February 2013 Sales PSF/ Screen(5) | UW Occupancy Cost as a % of Sales |
| Anchor Tenants | |||||||||
| Herberger’s | NR/Caa2/B- | 143,608 | 23% | $845,000 | 6% | $5.88 | 1/31/2027 | $111 | 5.6% |
| Marshall’s | NR/A3/A | 43,533 | 7% | $489,996 | 4% | $11.26 | 1/31/2014 | $205 | 15.7% |
| Subtotal/Wtd. Avg. | 187,141 | 29% | $1,334,996 | 10% | $7.13 | ||||
| Non-Collateral Anchors | |||||||||
| Macy’s | BBB/Baa3/BBB | 346,795 | NAP | NAP | NAP | NAP | 12/31/209920 | $203 | NAP |
| JC Penney | B-/Caa1/CCC+ | 247,902 | NAP | NAP | NAP | NAP | 2/28/2017 | $73 | NAP |
| Subtotal/Wtd. Avg. | 594,697 | ||||||||
| Major Non-Anchor Tenants | |||||||||
| AMC | B/B2/B | 80,927 | 13% | $2,007,000 | 15% | $24.80 | 12/31/2021 | $678,875 | 25.9% |
| H&M | NR/NR/NR | 19,374 | 3% | $835,133 | 6% | $43.11 | 1/31/2020 | $252 | 18.4% |
| Subtotal/Wtd. Avg. | 100,301 | 16% | $2,842,133 | 22% | $28.34 | ||||
| Other Tenants | 270,620 | 43% | $8,956,067 | 68% | $33.09 | ||||
| Vacant Space | 76,818 | 12% | $0 | 0% | $0.00 | ||||
| Total | 634,880 | $13,133,196 | $23.53 | ||||||
| (1) | Certain ratings are those of the parent company whether or not the parent guarantees the lease. |
| (2) | Approximate % of NRSF is based on total collateral NRSF of 634,880 SF. It does not include the Macy’s or JC Penney stores, which are not collateral for the Southdale Center Mortgage Loan. |
| (3) | Total Annual Underwritten Base Rent (PSF) excludes vacant space. |
| (4) | The lease expiration dates for Macy’s and JC Penney represent the current reciprocal easement agreement expiration dates for each respective store. These anchor stores are not collateral for the Southdale Center Mortgage Loan. |
| (5) | The Macy’s and JC Penney stores do not report sales for this location. The above TTM February 2013 Sales PSF attributed to these non-collateral stores are based only on estimates by SPG. |
| This is not a research report and was not prepared by the Underwriters’ research departments. Please see additional important information and qualifications at the end of this Term Sheet. |
| MSBAM 2013-C11 | Southdale Center |
Lease Rollover Schedule(1)(2) | ||||||||
| Year | # of Leases Rolling | SF Rolling | Average Underwritten Base Rent PSF Rolling(3) | Approx. % of Total SF Rolling | Approx. Cumulative % of SF Rolling | Total Underwritten Base Rent Rolling | Approx. % of Total Base Rent Rolling | Approx. Cumulative % of Total Base Rent Rolling |
| MTM | 13 | 37,284 | $15.85 | 6% | 6% | $590,884 | 4% | 4% |
| 2013 | 0 | 0 | $0.00 | 0% | 6% | $0.00 | 0% | 4% |
| 2014 | 11 | 66,884 | $20.96 | 11% | 16% | $1,402,104 | 11% | 15% |
| 2015 | 12 | 37,070 | $33.84 | 6% | 22% | $1,254,436 | 10% | 25% |
| 2016 | 3 | 16,671 | $39.10 | 3% | 25% | $651,853 | 5% | 30% |
| 2017 | 3 | 10,252 | $30.80 | 2% | 26% | $315,749 | 2% | 32% |
| 2018 | 5 | 12,644 | $58.73 | 2% | 28% | $742,641 | 6% | 38% |
| 2019 | 2 | 2,197 | $34.18 | 0% | 29% | $75,085 | 1% | 38% |
| 2020 | 3 | 23,468 | $46.08 | 4% | 33% | $1,081,437 | 8% | 47% |
| 2021 | 3 | 86,208 | $26.32 | 14% | 46% | $2,268,767 | 17% | 64% |
| 2022 | 13 | 33,118 | $35.82 | 5% | 51% | $1,186,354 | 9% | 73% |
| 2023 | 15 | 72,198 | $30.69 | 11% | 63% | $2,215,416 | 17% | 90% |
| 2024 | 3 | 16,460 | $30.59 | 3% | 65% | $503,470 | 4% | 94% |
| 2025 | 0 | 0 | $0.00 | 0% | 65% | $0 | 0% | 94% |
| 2026 & Beyond | 1 | 143,608 | $5.88 | 23% | 88% | $845,000 | 6% | 100% |
| Vacant | 29 | 76,818 | $0.00 | 12% | 100% | $0.00 | 0% | 100% |
| Total/Wtd. Avg. | 116 | 634,880 | $23.53 | 100% | $13,133,196 | 100% | ||
| (1) | The information in the lease rollover schedule is based on the underwritten rent roll. |
| (2) | Certain tenants may have lease termination options that are exercisable prior to the originally stated expiration date of the subject lease and that are not considered in the lease rollover schedule. |
| (3) | Average Base Rent PSF Rolling excludes vacant space. |
Competitive Property Summary | ||||||||
| Property | Center Type | Year Built | Year Renovated | Total GLA (SF) | Anchor Tenants | Sales PSF | Occupancy | Proximity |
| Galleria (Primary) | Regional | 1974 | 1992 | 631,675 | Gabbert’s Furniture | $550 | 95% | 0.1 miles south |
| Mall of America (Primary) | Super-Regional | 1992 | 2003 | 2,769,954 | Bloomingdale’s, Macy’s, Nordstrom, Sears, AMC Cinema | $550 | 97% | 4.5 miles southeast |
| Eden Prairie Center (Primary) | Super-Regional | 1976 | 2002 | 1,287,436 | JC Penney, Von Maur, Kohl’s, Sears, Target, AMC Cinema | $300 | 99% | 5.3 miles southwest |
| Ridgedale Center (Primary) | Regional | 1974 | 2009 | 1,039,752 | Macy’s, JC Penney, Sears | $500 | 97% | 8.0 miles northwest |
| Southtown Shopping Center (Secondary) | Community | 1959 | 1990 | 420,558 | Herberger’s, Bed Bath & Beyond, Toys R Us, Dress Barn | NAV | 99% | 1.8 miles southeast |
| Burnsville Center (Secondary) | Super-Regional | 1977 | 2001 | 1,216,980 | Macy’s, Sears, JC Penney, Becker Furniture World, Dick’s Sporting Goods | $335 | 99% | 9.5 miles south |
| Knollwood Mall (Secondary) | Community | 1955 | 2005 | 464,619 | Cub Foods, Kohl’s, TJ Maxx | $270 | 95% | 5.0 miles northwest |
| This is not a research report and was not prepared by the Underwriters’ research departments. Please see additional important information and qualifications at the end of this Term Sheet. |
| MSBAM 2013-C11 | Southdale Center |
Cash Flow Analysis | ||||||||||||
| 2010 | 2011 | 2012 | TTM 3/31/2013 | UW | UW PSF | |||||||
Base Rent(1) | $14,956,515 | $14,180,927 | $13,313,681 | $13,163,032 | $13,133,196 | $20.69 | ||||||
| Temporary Tenant Rents | $1,296,958 | $1,203,193 | $1,250,935 | $1,246,448 | $1,041,000 | $1.64 | ||||||
| Other and Overage Rent | $447,569 | $440,771 | $425,320 | $405,927 | $290,000 | $0.46 | ||||||
| Total Recoveries | $10,607,425 | $10,070,823 | $9,180,527 | $9,435,460 | $10,325,000 | $16.26 | ||||||
Other Income(2) | $422,167 | $402,189 | $405,486 | $425,156 | $476,000 | $0.75 | ||||||
Less Vacancy & Credit Loss(3) | $98,692 | $79,360 | ($250,258) | ($201,547) | ($903,210) | ($1.42) | ||||||
| Effective Gross Income | $27,829,326 | $26,377,263 | $24,325,691 | $24,474,476 | $24,361,986 | $38.37 | ||||||
| Total Operating Expenses | $11,197,941 | $10,440,122 | $9,633,008 | $9,454,584 | $10,187,479 | $16.05 | ||||||
| Net Operating Income | $16,631,385 | $15,937,141 | $14,692,683 | $15,019,892 | $14,174,507 | $22.33 | ||||||
| TI/LC | $0 | $0 | $0 | $0 | $774,647 | $1.22 | ||||||
| Capital Expenditures | $0 | $0 | $0 | $0 | $126,976 | $0.20 | ||||||
| Net Cash Flow | $16,631,385 | $15,937,141 | $14,692,683 | $15,019,892 | $13,272,884 | $20.91 | ||||||
| Occupancy % | 89.2% | 80.2% | 81.1% | 87.9% | 87.9% | |||||||
| NOI DSCR | 1.91x | 1.83x | 1.69x | 1.72x | 1.63x | |||||||
| NCF DSCR | 1.91x | 1.83x | 1.69x | 1.72x | 1.52x | |||||||
| NOI Debt Yield | 10.7% | 10.3% | 9.5% | 9.7% | 9.1% | |||||||
| NCF Debt Yield | 10.7% | 10.3% | 9.5% | 9.7% | 8.6% | |||||||
| (1) | Historical and Underwritten Base Rent includes actual property vacancy. Underwritten Base Rent includes approximately $208,315 of contractual rent increases through July 1, 2013. |
| (2) | Underwritten Other Income includes miscellaneous income. |
| (3) | The underwritten Vacancy and Credit Loss represents the total “mark to market” adjustments applied to underwritten total rent and an $115,107 vacancy adjustment above actual vacancy. Generally, tenants that demonstrate a greater than 20% total occupancy cost are marked down to a total rent equivalent to an approximately 20% occupancy cost. The total “mark to market” adjustment is $788,103. In 2010 and 2011 certain historical bad debt allowances were collected in excess of losses creating a net positive number for the category. |
| This is not a research report and was not prepared by the Underwriters’ research departments. Please see additional important information and qualifications at the end of this Term Sheet. |
| MSBAM 2013-C11 | Southdale Center |
| This is not a research report and was not prepared by the Underwriters’ research departments. Please see additional important information and qualifications at the end of this Term Sheet. |
| This is not a research report and was not prepared by the Underwriters’ research departments. Please see additional important information and qualifications at the end of this Term Sheet. |
| MSBAM 2013-C11 | Marriott Chicago River North Hotel |
Mortgage Loan No. 5 – Marriott Chicago River North Hotel |
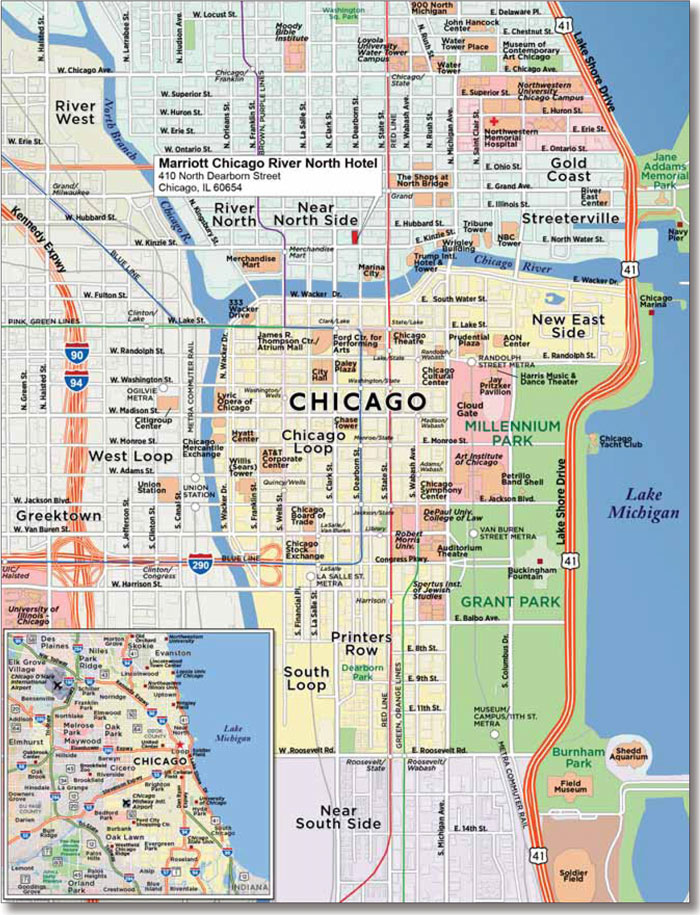
| Mortgage Loan Information | Mortgaged Property Information | ||||||
| Mortgage Loan Seller: | BANA | Single Asset/Portfolio: | Single Asset | ||||
Credit Assessment: (Fitch/Moody’s/Morningstar) | NR/NR/NR | Property Address: | 410 North Dearborn Street Chicago, IL 60654 | ||||
Original Balance(1): | $55,000,000 | General Property Type: | Hospitality | ||||
Cut-off Date Balance(1): | $55,000,000 | Detailed Property Type: | Extended Stay | ||||
% of Initial Pool Balance(1): | 6.4% | Number of Rooms: | 523 Rooms | ||||
| Loan Purpose: | Refinance | Cut-off Date Balance Per Room: | $229,446 | ||||
| Borrower Name(s): | Dearkin RES (DE) LLC | Balloon/ARD Balance Per Room: | $173,380 | ||||
| Sponsor(s): | River North Historic District Holdings, LLC; White Lodging Services Corporation | Year Built / Year Renovated: | 2008 / NAP | ||||
| Mortgage Rate: | 5.200% | Title Vesting: | Fee and Leasehold | ||||
| Note Date: | 7/18/2013 | Property Manager: | White Lodging Services Corporation | ||||
| First Payment Date: | 9/1/2013 | ||||||
| Anticipated Repayment Date: | NAP | Underwriting and Financial Information | |||||
| Maturity Date: | 8/1/2023 | UW Revenues: | $30,160,936 | ||||
| IO Period: | None | UW Expenses: | $16,024,333 | ||||
| Original Term to Maturity or ARD: | 120 months | UW NOI: | $14,136,603 | ||||
| Seasoning: | 0 months | UW NCF: | $12,858,889 | ||||
| Original Amortization Term: | 300 months | UW NOI DSCR(1): | 1.65x | ||||
| Loan Amortization Type: | Amortizing | UW NCF DSCR(1): | 1.50x | ||||
| Interest Accrual Basis: | Actual/360 | UW NOI Debt Yield(1): | 11.8% | ||||
| Prepayment Provisions: | LO (24); DEF (92); O (4) | UW NCF Debt Yield(1): | 10.7% | ||||
| Lockbox / Cash Management: | Soft / In Place | UW NCF Debt Yield at Maturity(1): | 14.2% | ||||
Pari Passu Mortgage Debt(1): | $65,000,000 | Most Recent NOI (As of): | $13,907,698 (4/30/2013 TTM) | ||||
| Subordinate Mortgage Debt: | None | 2nd Most Recent NOI (As of): | $13,680,244 (12/31/2012) | ||||
| Mezzanine Debt: | None | 3rd Most Recent NOI (As of): | $11,062,273 (12/31/2011) | ||||
Reserves(2) | Appraised Value: | $191,000,000 | |||||
| Type | Initial | Monthly | Cap | Appraisal As-of Date: | 5/1/2013 | ||
| RE Tax: | $163,834 | $163,834 | NAP | Cut-off Date LTV Ratio(1): | 62.8% | ||
| Insurance: | $0 | Springing | NAP | LTV Ratio at Maturity/ARD(1): | 47.5% | ||
| FF&E: | $0 | $100,536 | NAP | Occupancy Rate (As of): | 84.7% (4/30/2013) | ||
| Other: | $1,610,000 | $3,750 | $1,610,000 | 2nd Most Recent Occupancy (As of): | 84.1% (12/31/2012) | ||
3rd Most Recent Occupancy (As of): | 77.7% (12/31/2011) | ||||||
| (1) | The Marriott Chicago River North Hotel Mortgage Loan is part of the Marriott Chicago River North Hotel Loan Pair evidenced by two pari passu notes with an aggregate original principal balance of $120,000,000. The Cut-off Date Balance Per Room, Balloon/ARD Balance Per Room, UW NOI DSCR, UW NCF DSCR, UW NOI Debt Yield, UW NCF Debt Yield, UW NCF Debt Yield at Maturity, Cut-off Date LTV Ratio and LTV Ratio at Maturity/ARD numbers presented above are based on the entire $120,000,000 Marriott Chicago River North Hotel Loan Pair balance. |
| (2) | See “—Escrows and Reserves” below for further discussion of reserve requirements. See also ““—Lockbox and Cash Management” below for further discussion of the lockbox and cash management provisions. |
| This is not a research report and was not prepared by the Underwriters’ research departments. Please see additional important information and qualifications at the end of this Term Sheet. |
| MSBAM 2013-C11 | Marriott Chicago River North Hotel |
Residence Inn and Market Historical Occupancy, ADR, RevPAR | |||||||||
Competitive Set | Residence Inn | Penetration Factor | |||||||
| Year | Occupancy | ADR | RevPAR | Occupancy | ADR | RevPAR | Occupancy | ADR | RevPAR |
| 2011 | 78.1% | $158.14 | $123.47 | 78.5% | $168.11 | $131.91 | 100.5% | 106.3% | 106.8% |
| 2012 | 82.1% | $165.96 | $136.20 | 84.6% | $176.74 | $149.49 | 103.1% | 106.5% | 109.8% |
| TTM 4/30/2013 | 83.0% | $166.66 | $138.38 | 84.0% | $181.51 | $152.42 | 101.1% | 108.9% | 110.1% |
SpringHill Suites and Market Historical Occupancy, ADR, RevPAR | |||||||||
| Competitive Set | SpringHill Suites | Penetration Factor | |||||||
| Year | Occupancy | ADR | RevPAR | Occupancy | ADR | RevPAR | Occupancy | ADR | RevPAR |
| 2011 | 79.0% | $157.10 | $124.06 | 76.9% | $162.51 | $124.90 | 97.3% | 103.4% | 100.7% |
| 2012 | 83.4% | $165.30 | $137.81 | 83.5% | $171.36 | $143.13 | 100.2% | 103.7% | 103.9% |
| TTM 4/30/2013 | 84.3% | $166.73 | $140.56 | 83.9% | $173.21 | $145.27 | 99.5% | 103.9% | 103.4% |
| This is not a research report and was not prepared by the Underwriters’ research departments. Please see additional important information and qualifications at the end of this Term Sheet. |
| MSBAM 2013-C11 | Marriott Chicago River North Hotel |
Competitive Property Summary | |||||||||
| Property | Rooms | Commercial % | Meeting & Group % | Leisure % | Extended Stay % | 2012E Occupancy | 2012E ADR | 2012E RevPAR | |
| Residence Inn and SpringHill Suites | 523 | 25% | 7% | 30% | 38% | 84.3% | $174.16 | $146.82 | |
| Courtyard Chicago Downtown River North | 337 | 40% | 15% | 40% | 5% | 80.0% | $162.00 | $129.60 | |
| Hampton Inn Suites Chicago Downtown | 230 | 45% | 10% | 40% | 5% | 75.0% | $152.00 | $114.00 | |
| Hilton Garden Inn Chicago Magnificent Mile | 357 | 40% | 15% | 40% | 5% | 88.0% | $178.00 | $156.64 | |
| Fairfield Inn & Suites Chicago Downtown | 185 | 35% | 5% | 50% | 10% | 83.0% | $168.00 | $139.44 | |
| Four Points Chicago Magnificent Mile | 226 | 35% | 15% | 45% | 5% | 79.0% | $160.00 | $126.40 | |
| Hampton Inn Chicago Theatre District | 135 | 40% | 5% | 50% | 5% | 89.0% | $180.00 | $160.20 | |
| Total/Wtd. Avg. | 1,993 | 37% | 10% | 42% | 10% | 82.8% | $168.90 | $139.78 | |
Cash Flow Analysis | |||||||||||
| 2011 | 2012 | TTM 4/30/2013 | UW | UW per Room | |||||||
| Occupancy | 77.7% | 84.1% | 84.7% | 84.7% | |||||||
| Average Daily Rate | $165.43 | $174.16 | $175.96 | $175.96 | |||||||
| REVPAR | $128.52 | $146.42 | $148.97 | $148.97 | |||||||
| Rooms Revenue | $24,533,865 | $28,026,362 | $28,436,021 | $28,436,021 | $54,371 | ||||||
| Food & Beverage Revenue | $55,915 | $70,326 | $95,195 | $95,195 | $182 | ||||||
| Other Income | $1,344,701 | $1,591,286 | $1,629,720 | $1,629,720 | $3,116 | ||||||
| Total Revenue | $25,934,481 | $29,687,974 | $30,160,936 | $30,160,936 | $57,669 | ||||||
| Total Expenses | $14,872,208 | $16,007,730 | $16,253,238 | $16,024,333 | $30,639 | ||||||
| Net Operating Income | $11,062,273 | $13,680,244 | $13,907,698 | $14,136,603 | $27,030 | ||||||
| FF&E | $1,037,380 | $1,484,399 | $1,508,047 | $1,206,437 | $2,307 | ||||||
| Ground Lease Payment | $48,074 | $62,199 | $69,740 | $71,277 | $136 | ||||||
| Net Cash Flow | $9,976,819 | $12,133,646 | $12,329,911 | $12,858,889 | $24,587 | ||||||
| NOI DSCR | 1.29x | 1.59x | 1.62x | 1.65x | |||||||
| NCF DSCR | 1.16x | 1.41x | 1.44x | 1.50x | |||||||
| NOI Debt Yield | 9.2% | 11.4% | 11.6% | 11.8% | |||||||
| NCF Debt Yield | 8.3% | 10.1% | 10.3% | 10.7% | |||||||
| This is not a research report and was not prepared by the Underwriters’ research departments. Please see additional important information and qualifications at the end of this Term Sheet. |
| MSBAM 2013-C11 | Marriott Chicago River North Hotel |
| This is not a research report and was not prepared by the Underwriters’ research departments. Please see additional important information and qualifications at the end of this Term Sheet. |
| MSBAM 2013-C11 | Bridgewater Campus |
| This is not a research report and was not prepared by the Underwriters’ research departments. Please see additional important information and qualifications at the end of this Term Sheet. |
| MSBAM 2013-C11 | Bridgewater Campus |
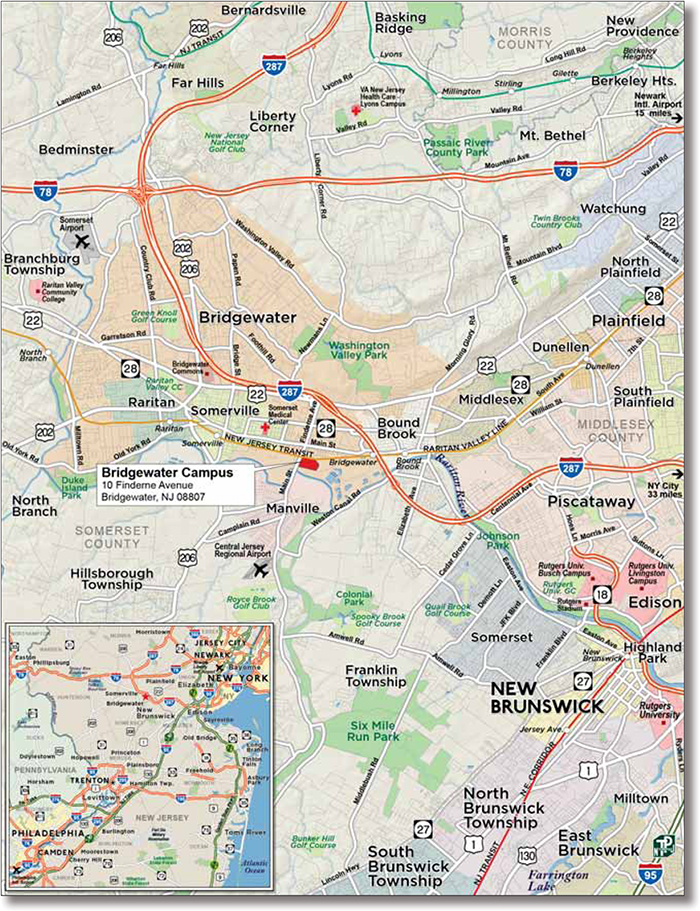
| This is not a research report and was not prepared by the Underwriters’ research departments. Please see additional important information and qualifications at the end of this Term Sheet. |
| MSBAM 2013-C11 | Bridgewater Campus |
| Mortgage Loan No. 6 – Bridgewater Campus |
| Mortgage Loan Information | Mortgaged Property Information | ||||||
| Mortgage Loan Seller: | CIBC Inc. | Single Asset / Portfolio: | Single Asset | ||||
Credit Assessment: (Fitch/Moody’s/Morningstar) | NR/NR/NR | Property Address: | 10 Finderne Avenue Bridgewater, NJ 08807 | ||||
| Original Balance: | $43,500,000 | General Property Type: | Mixed Use | ||||
| Cut-off Date Balance: | $43,500,000 | Detailed Property Type: | Office / Flex | ||||
| % of Initial Pool Balance: | 5.1% | Net Rentable Area: | 446,649 SF | ||||
| Loan Purpose: | Refinance | Cut-off Date Balance Per Unit/SF: | $97 | ||||
| Borrower Name(s): | Denver Road, LLC | Balloon Balance Per Unit/SF: | $83 | ||||
| Sponsor: | Yeheskel Frankel, Menashe Frankel | Year Built / Year Renovated: | 1956-2002 / 2009, 2011, 2012 | ||||
| Mortgage Rate: | 4.55% | Title Vesting: | Fee | ||||
| Note Date: | 6/17/2013 | Property Manager: | Linque Management Company, Inc. | ||||
| First Payment Date: | 8/1/2013 | ||||||
| Anticipated Repayment Date: | NAP | Underwriting and Financial Information | |||||
| Maturity Date: | 7/1/2023 | UW Revenues: | $10,196,163 | ||||
| IO Period: | 24 months | UW Expenses: | $5,889,327 | ||||
| Original Term to Maturity or ARD: | 120 months | UW NOI: | $4,306,837 | ||||
| Seasoning: | 1 month | UW NCF: | $3,770,858 | ||||
| Original Amortization Term: | 360 months | UW NOI DSCR: | 1.62x | ||||
| Loan Amortization Type: | Partial IO | UW NCF DSCR: | 1.42x | ||||
| Interest Accrual Basis: | Actual/360 | UW NOI Debt Yield: | 9.9% | ||||
| Prepayment Provisions: | LO (25); DEF (91); O (4) | UW NCF Debt Yield: | 8.7% | ||||
| Lockbox/Cash Management: | Hard / Springing | UW NCF Debt Yield at Maturity: | 10.1% | ||||
| Pari Passu Mortgage Debt: | None | Most Recent NOI (As of): | $4,432,787 (12/31/2012) | ||||
| Subordinate Mortgage Debt: | None | 2nd Most Recent NOI (As of): | $4,059,677 (12/31/2011) | ||||
| Mezzanine Debt: | None | 3rd Most Recent NOI (As of): | NAV | ||||
Reserves(1) | Appraised Value: | $63,500,000 | |||||
| Type | Initial | Monthly | Cap | Appraisal As-of Date: | 4/4/2013 | ||
| RE Tax: | $131,075 | $43,692 | NAP | Cut-off Date LTV Ratio: | 68.5% | ||
| Insurance: | $109,511 | $8,590 | NAP | LTV Ratio at Maturity: | 58.7% | ||
| Recurring Replacements: | $0 | $18,775 | NAP | Occupancy Rate: | 91.4% (4/30/2013) | ||
| TI/LC: | $0 | $27,916 | NAP | 2nd Most Recent Occupancy (As of): | 92.8% (12/31/2012) | ||
Other(2): | $222,738 | $0 | NAP | 3rd Most Recent Occupancy (As of): | 82.4% (12/31/2011) | ||
| (1) | See “—Escrows and Reserves” below for further discussion of reserve requirements. |
| (2) | Environmental Reserve related to the remediation and maintenance of (1) the fill material that was imported from unknown off-site sources(s) to increase the elevation of the land surface beneath the eastern portion of the parking lot south of Building 3, which was expanded eastward in the late 1980s or early 1990s; and (2) an area of historic fill of approximately 1-1.5 acres in the southeastern corner of the Property, as shown on the State of New Jersey Historic Fill maps. |
| This is not a research report and was not prepared by the Underwriters’ research departments. Please see additional important information and qualifications at the end of this Term Sheet. |
| MSBAM 2013-C11 | Bridgewater Campus |
| Tenant Summary | |||||||
| Tenant Name | Credit Rating (Fitch/Moody’s/S&P)(1) | Tenant SF | Approximate % of SF | Annualized Underwritten Base Rent | % of Total Annualized Underwritten Base Rent | Annualized Underwritten Base Rent (PSF) | Lease Expiration |
| Henkel Corporation | A/A2/A | 188,411 | 42% | $2,292,204 | 45% | $12.17 | 7/31/2023 |
| Ingredion | BBB/Baa2/BBB | 163,066 | 37% | $1,914,634 | 38% | $11.74 | 6/30/2024 |
| Akzo Nobel | BBB+/Baa1/BBB+ | 47,834 | 11% | $680,892 | 13% | $14.23 | 6/30/2019 |
| Obanta | NAP/NAP/NAP | 8,760 | 2% | $157,680 | 3% | $18.00 | 2/28/2015 |
| Vacant Space | 38,578 | 9% | $0 | $0 | $0 | ||
| Total / Wtd. Avg. | 446,649 | 100% | $5,045,410 | 100% | $12.36(2) | ||
| (1) | Certain ratings may be those of the parent company whether or not the parent guarantees the lease. |
| (2) | Total Annualized Underwritten Base Rent PSF excludes vacant space. |
| This is not a research report and was not prepared by the Underwriters’ research departments. Please see additional important information and qualifications at the end of this Term Sheet. |
| MSBAM 2013-C11 | Bridgewater Campus |
Lease Rollover Schedule(1) | ||||||||
| Year | # of Leases Rolling | SF Rolling | Average Underwritten Base Rent PSF Rolling(2) | Approx. % of Total SF Rolling | Approx. Cumulative % of SF Rolling | Total Underwritten Base Rent Rolling | Approx. % of Total Base Rent Rolling | Approx. Cumulative % of Total Base Rent Rolling |
| MTM | 0 | 0 | $0 | 0% | 0% | $0 | 0% | 0% |
| 2013 | 0 | 0 | $0 | 0% | 0% | $0 | 0% | 0% |
| 2014 | 0 | 0 | $0 | 0% | 0% | $0 | 0% | 0% |
| 2015 | 1 | 8,760 | $18.00 | 2% | 2% | $157,680 | 3% | 3% |
| 2016 | 0 | 0 | $0 | 0% | 2% | $0 | 0% | 3% |
| 2017 | 0 | 0 | $0 | 0% | 2% | $0 | 0% | 3% |
| 2018 | 0 | 0 | $0 | 0% | 2% | $0 | 0% | 3% |
| 2019 | 1 | 47,834 | $14.23 | 11% | 13% | $680,892 | 13% | 17% |
| 2020 | 0 | 0 | $0 | 0% | 13% | $0 | 0% | 17% |
| 2021 | 0 | 0 | $0 | 0% | 13% | $0 | 0% | 17% |
| 2022 | 0 | 0 | $0 | 0% | 13% | $0 | 0% | 17% |
| 2023 | 1 | 188,411 | $12.25 | 42% | 55% | $2,292,204 | 45% | 62% |
| 2024 | 1 | 163,066 | $11.74 | 37% | 91% | $1,914,634 | 38% | 100% |
| 2025 | 0 | 0 | $0 | 0% | 91% | $0 | 0% | 100% |
| 2026 & Beyond | 0 | 0 | $0 | 0% | 91% | $0 | 0% | 100% |
| Vacant | 0 | 38,578 | $0.00 | 9% | 100% | $0 | 0% | 100% |
| Total / Wtd. Avg. | 4 | 446,649 | $12.36 | 100% | 100% | $5,045,410 | 100% | 100% |
| (1) | The information in the lease rollover schedule is based on the underwritten rent roll. |
| (2) | Average Underwritten Base Rent PSF Rolling excludes vacant space. |
| This is not a research report and was not prepared by the Underwriters’ research departments. Please see additional important information and qualifications at the end of this Term Sheet. |
| MSBAM 2013-C11 | Bridgewater Campus |
Cash Flow Analysis | ||||||||
| 2011 | 2012 | UW | UW PSF | |||||
Gross Potential Rent(1) | $4,701,278 | $4,882,314 | $5,546,924 | $12.42 | ||||
| Total Reimbursements | $5,284,327 | $5,179,995 | $5,762,682 | $12.90 | ||||
| Other Income | $10,812 | $49,317 | $10,000 | $0.02 | ||||
| Vacancy | ($19,710) | ($19,937) | ($1,123,443) | ($2.52) | ||||
| Effective Gross Income | $9,976,707 | $10,091,690 | $10,196,163 | $22.83 | ||||
| Total Expenses | $5,917,030 | $5,658,902 | $5,889,327 | $13.19 | ||||
| Net Operating Income | $4,059,677 | $4,432,787 | $4,306,837 | $9.64 | ||||
| TI/LC | $0 | $0 | $334,987 | $0.75 | ||||
| Capital Expenditures | $0 | $0 | $200,992 | $0.45 | ||||
| Net Cash Flow | $4,059,677 | $4,432,787 | $3,770,858 | $8.44 | ||||
| Occupancy % | 82.4% | 92.8% | 90.2% | |||||
| NOI DSCR | 1.53x | 1.67x | 1.62x | |||||
| NCF DSCR | 1.53x | 1.67x | 1.42x | |||||
| NOI Debt Yield | 9.3% | 10.2% | 9.9% | |||||
| NCF Debt Yield | 9.3% | 10.2% | 8.7% | |||||
| (1) | Gross Potential Rent based on actual leases with average rents over the remaining term for investment grade tenants. |
| (i) | commence upon the occurrence of an event of default and continue until the event of default is cured, |
| (ii) | commence upon the occurrence of a Henkel Corporation Cash Management Period. A “Henkel Corporation Cash Management Period” means a period commencing upon the first to occur of (i) Henkel Corporation being in monetary or material non-monetary default under the Henkel Corporation lease beyond all notice and cure periods under the Henke Corporation l lease, (ii) Henkel Corporation failing to be in actual, physical possession of the Henkel Corporation space, failing to be conducting its business during customary office hours in all of the Henkel Corporation space and/or “going dark” in the Henkel Corporation space, (iii) Henkel Corporation giving notice that it is terminating or canceling its lease for all or any material portion of the Henkel Corporation space, (iv) any termination or cancellation of the Henkel Corporation lease and/or the Henkel Corporation lease failing to otherwise be in full force and effect, and (v) the Henkel Corporation lease extension deadline (June 17, 2022) unless on or prior to the Henkel Corporation lease extension deadline (June 17, 2012) the Bridgewater Campus Borrower and Henkel Corporation have entered into the Henkel Corporation lease extension. |
Property Management. The Bridgewater Campus Property is managed by Linque Management Company, Inc., which is located in New Jersey. |
| This is not a research report and was not prepared by the Underwriters’ research departments. Please see additional important information and qualifications at the end of this Term Sheet. |
| MSBAM 2013-C11 | Bridgewater Campus |
| This is not a research report and was not prepared by the Underwriters’ research departments. Please see additional important information and qualifications at the end of this Term Sheet. |
| This is not a research report and was not prepared by the Underwriters’ research departments. Please see additional important information and qualifications at the end of this Term Sheet. |
| MSBAM 2013-C11 | Hilton Waterfront Beach Resort |
| This is not a research report and was not prepared by the Underwriters’ research departments. Please see additional important information and qualifications at the end of this Term Sheet. |
| MSBAM 2013-C11 | Hilton Waterfront Beach Resort |
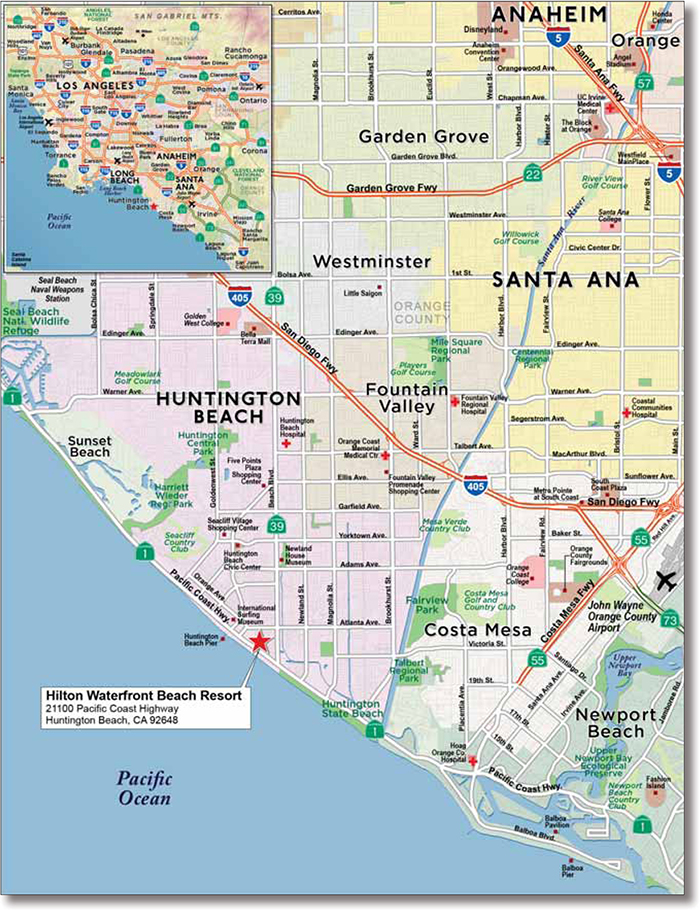
| This is not a research report and was not prepared by the Underwriters’ research departments. Please see additional important information and qualifications at the end of this Term Sheet. |
| MSBAM 2013-C11 | Hilton Waterfront Beach Resort |
| Mortgage Loan No. 7 – Hilton Waterfront Beach Resort |
| Mortgage Loan Information | Mortgaged Property Information | ||||||
| Mortgage Loan Seller: | MSMCH | Single Asset/ Portfolio: | Single Asset | ||||
Credit Assessment: (Fitch/Moody’s/Morningstar) | NR/NR/NR | Property Address: | 21100 Pacific Coast Highway | ||||
| Original Balance: | $42,500,000 | General Property Type: | Hospitality | ||||
| Cut-off Date Balance: | $42,500,000 | Detailed Property Type: | Resort | ||||
| % of Initial Pool Balance: | 5.0% | Number of Rooms: | 290 | ||||
| Loan Purpose: | Refinance | Cut-off Date Balance Per Unit/SF: | $146,552 | ||||
| Borrower Name(s): | The Waterfront Hotel, LLC | Balloon/ARD Balance Per Unit/SF: | $138,250 | ||||
| Sponsor(s): | Waterfront Development, Inc. | Year Built / Year Renovated: | 1990 / 2012 | ||||
| Mortgage Rate: | 5.240% | Title Vesting: | Leasehold | ||||
| Note Date: | 7/19/2013 | Property Manager: | Mayer Hospitality Group, LLC | ||||
| First Payment Date: | 9/1/2013 | ||||||
| Anticipated Repayment Date: | NAP | Underwriting and Financial Information | |||||
| Maturity Date: | 8/1/2018 | UW Revenues: | $26,758,860 | ||||
| IO Period: | 12 months | UW Expenses: | $21,349,260 | ||||
| Original Term to Maturity or ARD: | 60 months | UW NOI: | $5,409,600 | ||||
| Seasoning: | 0 months | UW NCF: | $4,339,246 | ||||
| Original Amortization Term: | 360 months | UW NOI DSCR: | 1.92x | ||||
| Loan Amortization Type: | Partial IO | UW NCF DSCR: | 1.54x | ||||
| Interest Accrual Basis: | Actual/360 | UW NOI Debt Yield: | 12.7% | ||||
| Prepayment Provisions: | LO (24); DEF (12); O (24) | UW NCF Debt Yield: | 10.2% | ||||
| Lockbox/Cash Management: | Hard / Springing | UW NCF Debt Yield at Maturity: | 10.8% | ||||
| Pari Passu Mortgage Debt: | None | Most Recent NOI (As of): | $5,316,986 (5/31/2013 TTM) | ||||
| Subordinate Mortgage Debt: | None | 2nd Most Recent NOI (As of): | $5,651,601 (12/31/2012) | ||||
| Mezzanine Debt: | None | 3rd Most Recent NOI (As of): | $5,123,111 (12/31/2011) | ||||
Reserves(1) | Appraised Value: | $82,100,000 | |||||
| Type | Initial | Monthly | Cap | Appraisal As-of Date: | 6/10/2013 | ||
| RE Tax: | $195,479 | $48,870 | NAP | Cut-off Date LTV Ratio: | 51.8% | ||
| Insurance: | $88,611 | $29,537 | NAP | LTV Ratio at Maturity/ARD: | 48.8% | ||
| Recurring Replacements: | $0 | $89,196 | NAP | Occupancy Rate (As of): | 74.9% (5/31/2013) | ||
| Deferred Maintenance: | $0 | $0 | NAP | 2nd Most Recent Occupancy (As of): | 76.1% (12/31/2012) | ||
| Ground Rent: | $49,374 | $37,639 | NAP | 3rd Most Recent Occupancy (As of): | 74.9% (12/31/2011) | ||
| (1) | See “—Escrows and Reserves” below for further discussion of reserve requirements. |
| This is not a research report and was not prepared by the Underwriters’ research departments. Please see additional important information and qualifications at the end of this Term Sheet. |
| MSBAM 2013-C11 | Hilton Waterfront Beach Resort |
| The Hilton Waterfront Beach Resort Market Historical Occupancy, ADR, RevPAR | |||||||||
| Competitive Set | Hilton Waterfront Beach Resort | Penetration Factor | |||||||
| Year | Occupancy | ADR | RevPAR | Occupancy | ADR | RevPAR | Occupancy | ADR | RevPAR |
| 2011 | 71.8% | $183.20 | $131.62 | 74.0% | $200.62 | $148.48 | 103.0% | 109.5% | 112.8% |
| 2012 | 74.1% | $190.78 | $141.41 | 75.2% | $212.38 | $159.84 | 101.5% | 111.3% | 113.0% |
| TTM 5/31/2013 | 72.7% | $195.74 | $142.24 | 74.2% | $217.22 | $161.13 | 102.1% | 111.0% | 113.3% |
| This is not a research report and was not prepared by the Underwriters’ research departments. Please see additional important information and qualifications at the end of this Term Sheet. |
| MSBAM 2013-C11 | Hilton Waterfront Beach Resort |
Primary Competitive Hotels | ||||
| Property | Rooms | Year Built | Year Renovated | Distance from subject |
| Hilton Waterfront Beach Resort | 290 | 1990 | 2012 | NAP |
| Hyatt Regency Resort & Spa Huntington Beach | 517 | 2003 | 2012 | Adjacent |
| Shorebreak Hotel Huntington Beach | 157 | 2009 | NAP | 1 mile NW |
| Hyatt Regency Newport Beach | 407 | 1963 | 2013 | 7 miles SE |
| Newport Beach Marriott Hotel & Spa | 532 | 1975 | 2009 | 8 miles SE |
| The Island Hotel | 295 | 1986 | 2009 | 8 miles SE |
| Balboa Bay Resort | 160 | 2003 | NAP | 8 miles E |
| Laguna Cliffs Marriott Resort and Spa | 378 | 1987 | 2010 | 22 miles SE |
Cash Flow Analysis | ||||||||||||||
| 2009 | 2010 | 2011 | 2012 | TTM 5/31/2013 | UW | UW per Room | ||||||||
| Occupancy | 68.6% | 75.3% | 74.9% | 76.1% | 74.9% | 74.9% | ||||||||
| ADR | $187.22 | $187.83 | $197.71 | $208.96 | $212.85 | $212.85 | ||||||||
| RevPAR | $126.53 | $139.35 | $146.34 | $157.28 | $157.91 | $157.91 | ||||||||
| Rooms Revenue | $13,393,550 | $14,750,177 | $15,490,520 | $16,693,376 | $16,714,537 | $16,714,537 | $57,636 | |||||||
| Food & Beverage | $6,991,554 | $7,477,610 | $8,627,446 | $8,731,762 | $8,284,980 | $8,284,980 | $28,569 | |||||||
| Other Income | $1,679,975 | $1,496,720 | $1,590,862 | $1,679,681 | $1,759,343 | $1,759,343 | $6,067 | |||||||
| Total Revenue | $22,065,079 | $23,724,507 | $25,708,828 | $27,104,819 | $26,758,860 | $26,758,860 | $92,272 | |||||||
| Total Expenses | $18,366,152 | $19,691,732 | $20,585,717 | $21,453,218 | $21,441,874 | $21,349,260 | $73,618 | |||||||
| NOI | $3,698,927 | $4,032,775 | $5,123,111 | $5,651,601 | $5,316,986 | $5,409,600 | $18,654 | |||||||
| FF&E | $1,165,411 | $957,525 | $932,674 | $1,008,103 | $1,070,354 | $1,070,354 | $3,691 | |||||||
| NCF | $2,533,516 | $3,075,250 | $4,190,437 | $4,643,498 | $4,246,632 | $4,339,246 | $14,963 | |||||||
| NOI DSCR | 1.31x | 1.43x | 1.82x | 2.01x | 1.89x | 1.92x | ||||||||
| NCF DSCR | 0.90x | 1.09x | 1.49x | 1.65x | 1.51x | 1.54x | ||||||||
| NOI Debt Yield | 8.7% | 9.5% | 12.1% | 13.3% | 12.5% | 12.7% | ||||||||
| NCF Debt Yield | 6.0% | 7.2% | 9.9% | 10.9% | 10.0% | 10.2% | ||||||||
| This is not a research report and was not prepared by the Underwriters’ research departments. Please see additional important information and qualifications at the end of this Term Sheet. |
| MSBAM 2013-C11 | Hilton Waterfront Beach Resort |
| This is not a research report and was not prepared by the Underwriters’ research departments. Please see additional important information and qualifications at the end of this Term Sheet. |
| MSBAM 2013-C11 | 1600 Lexington Ave. – Rochester, NY |
| This is not a research report and was not prepared by the Underwriters’ research departments. Please see additional important information and qualifications at the end of this Term Sheet. |
| MSBAM 2013-C11 | 1600 Lexington Ave. – Rochester, NY |
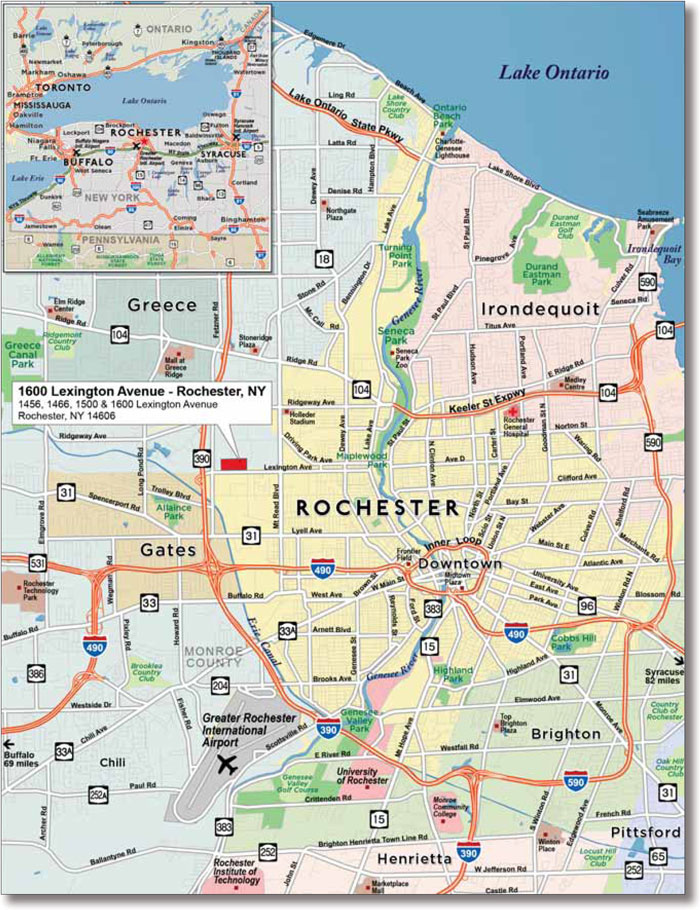
| This is not a research report and was not prepared by the Underwriters’ research departments. Please see additional important information and qualifications at the end of this Term Sheet. |
| MSBAM 2013-C11 | 1600 Lexington Ave. – Rochester, NY |
| Mortgage Loan No. 8 – 1600 Lexington Ave. – Rochester, NY |
| Mortgage Loan Information | Mortgaged Property Information | |||||
| Mortgage Loan Seller: | BANA | Single Asset / Portfolio: | Single Asset | |||
Credit Assessment: (Fitch/Moody’s/Morningstar) | NR/NR/NR | Property Address: | 1456, 1466, 1500 & 1600 Lexington Avenue | |||
| Original Balance: | $40,200,000 | Rochester, NY 14606 | ||||
| Cut-off Date Balance: | $40,154,101 | General Property Type: | Industrial | |||
| % of Initial Pool Balance: | 4.7% | Detailed Property Type: | Warehouse Distribution | |||
| Loan Purpose: | Refinance | Net Rentable Area: | 1,755,500 SF | |||
| Borrower Name(s): | Acquest South Park, LLC | Cut-off Date Balance Per Unit/SF: | $23 | |||
| Sponsor(s): | William L. Huntress | Balloon/ARD Balance Per Unit/SF: | $19 | |||
| Mortgage Rate: | 4.690% | Year Built / Year Renovated: | 1968 / NAP | |||
| Note Date: | 6/18/2013 | Title Vesting: | Fee | |||
| First Payment Date: | 8/1/2013 | Property Manager: | Acquest Holdings, Inc. | |||
| Anticipated Repayment Date: | None | Underwriting and Financial Information | ||||
| Maturity Date: | 7/1/2023 | UW Revenues: | $7,502,201 | |||
| IO Period: | 0 months | UW Expenses: | $3,000,528 | |||
| Original Term to Maturity or ARD: | 120 months | UW NOI: | $4,501,673 | |||
| Seasoning: | 1 month | UW NCF: | $3,617,408 | |||
| Original Amortization Term: | 360 months | UW NOI DSCR: | 1.80x | |||
| Loan Amortization Type: | Amortizing | UW NCF DSCR: | 1.45x | |||
| Interest Accrual Basis: | Actual/360 | UW NOI Debt Yield: | 11.2% | |||
| Prepayment Provisions: | LO (25); DEF (91); O (4) | UW NCF Debt Yield: | 9.0% | |||
| Lockbox / Cash Management: | Hard / Springing | UW NCF Debt Yield at Maturity: | 11.0% | |||
| Pari Passu Mortgage Debt: | None | Most Recent NOI (As of): | $3,089,650 (12/31/2012) | |||
| Subordinate Mortgage Debt: | None | 2nd Most Recent NOI (As of): | $1,810,019 (12/31/2011) | |||
| Mezzanine Debt: | None | 3rd Most Recent NOI (As of): | $379,058 (12/31/2010) | |||
Reserves(1) | Appraised Value: | $53,600,000 | ||||
| Type | Initial | Monthly | Cap | Appraisal As-of Date: | 3/15/2013 | |
| RE Tax: | $401,347 | $46,340 | NAP | Cut-off Date LTV Ratio: | 74.9% | |
| Insurance: | $0 | Springing | NAP | LTV Ratio at Maturity/ARD: | 61.2% | |
| Recurring Replacement: | $700,000 | $29,258 | NAP | Occupancy Rate (As of): | 87.1% (6/4/2013) | |
| TI/LC: | $0 | $44,430 | $2,665,825 | 2nd Most Recent Occupancy (As of): | 87.0% (12/31/2012) | |
| Deferred Maintenance: | $37,500 | $0 | NAP | 3rd Most Recent Occupancy (As of): | 70.0% (12/31/2011) | |
| (1) | See “—Escrows and Reserves” below for further discussion of reserve requirements. |
| This is not a research report and was not prepared by the Underwriters’ research departments. Please see additional important information and qualifications at the end of this Term Sheet. |
| MSBAM 2013-C11 | 1600 Lexington Ave. – Rochester, NY |
| This is not a research report and was not prepared by the Underwriters’ research departments. Please see additional important information and qualifications at the end of this Term Sheet. |
| MSBAM 2013-C11 | 1600 Lexington Ave. – Rochester, NY |
Tenant Summary(1) | |||||||
| Tenant Name | Credit Rating (Fitch/Moody’s/S&P)(2) | Tenant SF | % of SF | Annual Underwritten Base Rent ($) | % of Total Annual Underwritten Base Rent | Annual Underwritten Base Rent ($ Per NRSF) | Lease Expiration |
| High Falls Operating Co, LLC | NR / NR / NR | 360,365 | 21% | $850,461 | 17% | $2.36 | 2/29/2016 |
| Carestream Health | NR / B2 / B | 183,545 | 10% | $1,156,334 | 23% | $6.30 | 12/31/2015 |
| Optimation Technology, Inc. | NR / NR / NR | 175,714 | 10% | $541,398 | 11% | $3.08 | 2/28/2019 |
| Kingsbury Corporation | NR / NR / NR | 166,500 | 9% | $524,475 | 10% | $3.15 | 8/31/2019 |
| Carta USA, LLC | NR / NR / NR | 145,360 | 8% | $331,421 | 7% | $2.28 | 1/31/2014 |
| PrimeSource, Inc. | NR / NR / NR | 90,286 | 5% | $288,915 | 6% | $3.20 | 10/31/2020 |
| Carroll Tire Co. | NR / NR / NR | 70,000 | 4% | $206,500 | 4% | $2.95 | 4/30/2023 |
| Warehouse & Distributive Mgmt | NR / NR / NR | 48,650 | 3% | $132,815 | 3% | $2.73 | 11/30/2014 |
| ABVI - Goodwill | NR / NR / NR | 47,825 | 3% | $131,519 | 3% | $2.75 | 3/31/2014 |
| Jamestown Container Corp | NR / NR / NR | 40,000 | 2% | $94,800 | 2% | $2.37 | 7/31/2017 |
| Subtotal / Wtd. Avg. | 1,328,245 | 76% | $4,258,637 | 84% | $3.21 | ||
| Other Tenants | 200,196 | 11% | $809,078 | 16% | $4.04 | ||
| Vacant Space | 227,059 | 13% | $0 | 0% | $0.00 | ||
| Total / Wtd. Avg. | 1,755,500 | 100% | $5,067,715 | 100% | $3.32 (3) | ||
| (1) | Information is based on the underwritten rent roll. |
| (2) | Certain ratings are those of the parent company whether or not the parent guarantees the lease. |
| (3) | Weighted Average Annualized Underwritten Base Rent ($ per NRSF) excludes vacant space. |
Lease Rollover Schedule(1)(2) | ||||||||
| Year | # of Leases Rolling | SF Rolling | Avg. Underwritten Base Rent PSF Rolling(3) | Approx. % of Total SF Rolling | Approx. Cumulative % of SF Rolling | Total Underwritten Base Rent Rolling | Approx. % of Total Base Rent Rolling | Approx. Cumulative % of Total Base Rent Rolling |
| MTM | 4 | 26,499 | $4.02 | 2% | 2% | $106,531 | 2% | 2% |
| 2013 | 0 | 0 | $0.00 | 0% | 2% | $0 | 0% | 2% |
| 2014 | 7 | 285,270 | $2.72 | 16% | 18% | $774,823 | 15% | 17% |
| 2015 | 2 | 198,545 | $6.03 | 11% | 29% | $1,197,584 | 24% | 41% |
| 2016 | 4 | 417,215 | $2.42 | 24% | 53% | $1,009,389 | 20% | 61% |
| 2017 | 2 | 66,250 | $3.00 | 4% | 57% | $198,488 | 4% | 65% |
| 2018 | 0 | 0 | $0.00 | 0% | 57% | $0 | 0% | 65% |
| 2019 | 4 | 342,214 | $3.11 | 19% | 76% | $1,065,873 | 21% | 86% |
| 2020 | 2 | 106,836 | $3.09 | 6% | 82% | $330,290 | 7% | 92% |
| 2021 | 0 | 0 | $0.00 | 0% | 82% | $0 | 0% | 92% |
| 2022 | 2 | 15,612 | $11.42 | 1% | 83% | $178,239 | 4% | 96% |
| 2023 | 1 | 70,000 | $2.95 | 4% | 87% | $206,500 | 4% | 100% |
| Vacant | 0 | 227,059 | $0.00 | 13% | 100% | $0 | 0% | 100% |
| Total / Wtd. Avg. | 28 | 1,755,500 | $3.32 | 100% | $5,067,715 | 100% | ||
| (1) | The information in the lease rollover schedule is based on the underwritten rent roll. |
| (2) | Certain tenants may have lease termination options that are exercisable prior to the originally stated expiration date of the subject lease and that are not considered in the lease rollover schedule. |
| (3) | Average Underwritten Base Rent PSF Rolling excludes vacant space. |
| This is not a research report and was not prepared by the Underwriters’ research departments. Please see additional important information and qualifications at the end of this Term Sheet. |
| MSBAM 2013-C11 | 1600 Lexington Ave. – Rochester, NY |
Competitive Property Summary | ||||||||
| Property Name and Location | Year Built | GBA (SF) | Clear Height | Major Tenant Name(s) | Lease Area (SF) | Lease Date(s) | Lease Term(s) | Base Rent(s) |
| Former Westinghouse Facility | 1952 | 860,000 | 22’ | Crown Tank | 59,662 | Feb-12 | 5.0 Yrs. | $2.81 PSF |
| 200 Westinghouse Circle, | Southern Tier Logistics | 120,000 | Nov-11 | 1.0 Yrs. | $2.65 PSF | |||
| Horseheads, NY | ISCO Industries | 9,600 | Oct-11 | 1.0 Yrs. | $4.83 PSF | |||
| Schweizer Aircraft | 43,200 | Sep-11 | 3.0 Yrs. | $4.68 PSF | ||||
| 8 Northeastern Industrial Park, | 1963 | 192,000 | 16’ – 21’6” | McGrann Paper Co. | 65,135 | Jan-11 | 4.0 Yrs. | $2.50 PSF |
| Guilderland, NY | ||||||||
| Rochester Tech Park, | 1966 | 3,259,823 | 10’ – 30’ | ITT | 111,322 | Jun-12 | 10.0 Yrs. | $3.75 PSF |
| Gates, NY | Southern Wine | 6,524 | Mar-11 | 5.0 Yrs. | $3.50 PSF | |||
| Solid Cell | 4,861 | Mar-11 | 5.0 Yrs. | $4.00 PSF | ||||
| Surplus Switching | 15,000 | Mar-11 | 5.0 Yrs. | $4.00 PSF | ||||
| 1100 & 1200 Lee Road, | 1980 | 800,000 | NAP | C&M Forwarding | 424,414 | Sep-10 | 3.5 Yrs. | $1.85 PSF |
| Greece, NY | ||||||||
| 215 Commerce Drive, | 1967 | 83,000 | 30’ | Monroe FTZ | 20,600 | Jun-10 | NAP | $2.91 PSF |
| Henrietta, NY | ||||||||
| This is not a research report and was not prepared by the Underwriters’ research departments. Please see additional important information and qualifications at the end of this Term Sheet. |
| MSBAM 2013-C11 | 1600 Lexington Ave. – Rochester, NY |
Cash Flow Analysis | ||||||||||
| 2010 | 2011 | 2012 | UW | UW PSF | ||||||
| Gross Potential Rental Income | $2,402,469 | $3,104,691 | $3,928,839 | $5,748,892 | $3.27 | |||||
| Expense Reimbursements | $1,033,818 | $1,702,823 | $2,132,330 | $2,847,411 | $1.62 | |||||
| Other Income | $3,448 | $40,395 | $63,137 | $38,696 | $0.02 | |||||
| Less Vacancy & Credit Loss | $0 | $0 | $0 | ($1,132,798) | 64.5% | |||||
| Effective Gross Income | $3,439,735 | $4,847,909 | $6,124,306 | $7,502,201 | $4.27 | |||||
| Total Operating Expenses | $3,060,677 | $3,037,890 | $3,034,656 | $3,000,528 | $1.71 | |||||
| Net Operating Income | $379,058 | $1,810,019 | $3,089,650 | $4,501,673 | $2.56 | |||||
| TI/LC | $0 | $0 | $0 | $533,165 | $0.30 | |||||
| Capital Expenditures | $81,273 | $36,762 | $0 | $351,100 | $0.20 | |||||
| Net Cash Flow | $297,785 | $1,773,257 | $3,089,650 | $3,617,408 | $2.06 | |||||
| Occupancy % | 52.0% | 70.0% | 87.0% | 87.1%(1) | ||||||
| NOI DSCR | 0.15x | 0.72x | 1.24x | 1.80x | ||||||
| NCF DSCR | 0.12x | 0.71x | 1.24x | 1.45x | ||||||
| NOI Debt Yield | 0.9% | 4.5% | 7.7% | 11.2% | ||||||
| NCF Debt Yield | 0.7% | 4.4% | 7.7% | 9.0% | ||||||
| (1) | Occupancy as of June 4, 2013. |
| This is not a research report and was not prepared by the Underwriters’ research departments. Please see additional important information and qualifications at the end of this Term Sheet. |
| This is not a research report and was not prepared by the Underwriters’ research departments. Please see additional important information and qualifications at the end of this Term Sheet. |
| MSBAM 2013-C11 | Beverly Garland Hotel |

| This is not a research report and was not prepared by the Underwriters’ research departments. Please see additional important information and qualifications at the end of this Term Sheet. |
| MSBAM 2013-C11 | Beverly Garland Hotel |
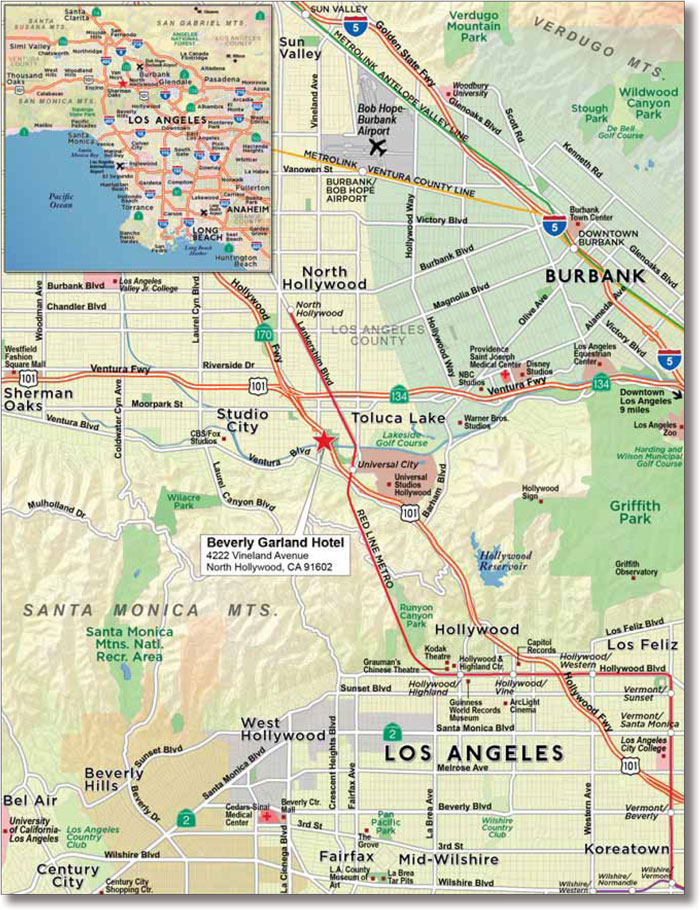
| This is not a research report and was not prepared by the Underwriters’ research departments. Please see additional important information and qualifications at the end of this Term Sheet. |
| MSBAM 2013-C11 | Beverly Garland Hotel |
| Mortgage Loan No. 9 – Beverly Garland Hotel |
| Mortgage Loan Information | Mortgaged Property Information | ||||||
| Mortgage Loan Seller: | BANA | Single Asset/Portfolio: | Single Asset | ||||
Credit Assessment: (Fitch/Moody’s/Morningstar) | NR/NR/NR | Property Address: | 4222 Vineland Avenue North Hollywood, CA 91602 | ||||
| Original Balance: | $30,000,000 | General Property Type: | Hospitality | ||||
| Cut-off Date Balance: | $29,969,490 | Detailed Property Type: | Full Service | ||||
| % of Initial Pool Balance: | 3.5% | Number of Rooms: | 255 Rooms | ||||
| Loan Purpose: | Refinance | Cut-off Date Balance Per Unit/SF: | $117,527 | ||||
| Borrower Name(s): | Rio Vista Development Company | Balloon/ARD Balance Per Unit/SF: | $97,530 | ||||
| Sponsor(s): | James Crank | Year Built / Year Renovated: | 1971 / 2012 | ||||
| Mortgage Rate: | 5.185% | Title Vesting: | Fee and Leasehold | ||||
| Note Date: | 6/27/2013 | Property Manager: | Marcus Hotels, Inc. | ||||
| First Payment Date: | 8/1/2013 | ||||||
| Anticipated Repayment Date: | NAP | Underwriting and Financial Information | |||||
| Maturity Date: | 7/1/2023 | UW Revenues: | $15,060,498 | ||||
| IO Period: | None | UW Expenses: | $10,966,752 | ||||
| Original Term to Maturity or ARD: | 120 months | UW NOI: | $4,093,746 | ||||
| Seasoning: | 1 month | UW NCF: | $3,463,874 | ||||
| Original Amortization Term: | 360 months | UW NOI DSCR: | 2.07x | ||||
| Loan Amortization Type: | Amortizing | UW NCF DSCR: | 1.76x | ||||
| Interest Accrual Basis: | Actual/360 | UW NOI Debt Yield: | 13.7% | ||||
| Prepayment Provisions: | LO (25); DEF (88); O (7) | UW NCF Debt Yield: | 11.6% | ||||
| Lockbox / Cash Management: | Hard / Springing | UW NCF Debt Yield at Maturity: | 13.9% | ||||
| Pari Passu Mortgage Debt: | None | Most Recent NOI (As of): | $4,330,394 (4/30/2013 TTM) | ||||
| Subordinate Mortgage Debt: | None | Second Most Recent NOI (As of): | $4,243,320 (12/31/2012) | ||||
| Mezzanine Debt: | Future | Third Most Recent NOI (As of): | $4,107,347 (12/31/2011) | ||||
Reserves(1) | Appraised Value(2): | $51,900,000 | |||||
| Type | Initial | Monthly | Cap | Appraisal As-of Date: | 6/13/2013 | ||
| RE Tax: | $96,128 | $16,021 | NAP | Cut-off Date LTV Ratio(2): | 57.7% | ||
| Insurance: | $0 | Springing | NAP | LTV Ratio at Maturity/ARD: | 47.9% | ||
| FF&E: | $12,700,000 | $25,101 | NAP | Occupancy Rate (As of): | 85.8% (4/30/2013) | ||
| Deferred Maintenance: | $0 | $0 | NAP | 2nd Most Recent Occupancy (As of): | 84.7% (12/31/2012) | ||
3rd Most Recent Occupancy (As of): | 82.7% (12/31/2011) | ||||||
| (1) | See “—Escrows and Reserves” below for further discussion of reserve requirements. |
| (2) | The Beverly Garland Hotel Mortgage Loan has a “when stabilized” value as of June 1, 2016 of $75,000,000 that results in a Cut-off Date LTV Ratio of 40.0%. |
| This is not a research report and was not prepared by the Underwriters’ research departments. Please see additional important information and qualifications at the end of this Term Sheet. |
| MSBAM 2013-C11 | Beverly Garland Hotel |
| Beverly Garland Hotel and Market Historical Occupancy, ADR, RevPAR | |||||||||
| Competitive Set | Beverly Garland Hotel | Penetration Factor | |||||||
| Year | Occupancy | ADR | RevPAR | Occupancy | ADR | RevPAR | Occupancy | ADR | RevPAR |
| 2011 | 76.5% | $147.34 | $112.65 | 82.8% | $127.28 | $105.33 | 108.2% | 86.4% | 93.5% |
| 2012 | 79.5% | $155.11 | $123.33 | 84.6% | $139.17 | $117.79 | 106.4% | 89.7% | 95.5% |
| TTM 5/31/2013 | 80.8% | $157.95 | $127.57 | 86.8% | $143.14 | $124.17 | 107.4% | 90.6% | 97.3% |
Competitive Property Summary | |||||||
| Property | Rooms | Commercial % | Meeting & Group % | Leisure % | 2012E Occupancy | 2012E ADR | 2012E RevPAR |
| Beverly Garland Hotel | 255 | 20% | 15% | 65% | 84.9% | $139.13 | $118.13 |
| Hilton Los Angeles Universal City | 482 | 40% | 25% | 35% | 84.0% | $173.00 | $145.32 |
| Hotel Amarano Burbank | 132 | 50% | 10% | 40% | 76.0% | $186.00 | $141.36 |
| Marriott Los Angeles Burbank Airport | 488 | 50% | 30% | 20% | 80.0% | $135.00 | $108.00 |
| Sheraton Universal City | 449 | 35% | 25% | 40% | 76.0% | $163.00 | $123.88 |
| Sportsmens Lodge | 190 | 40% | 30% | 30% | 75.0% | $118.00 | $88.50 |
| Total/Wtd. Avg. | 1,996 | 39% | 24% | 36% | 80.0% | $152.88 | $122.23 |
| This is not a research report and was not prepared by the Underwriters’ research departments. Please see additional important information and qualifications at the end of this Term Sheet. |
| MSBAM 2013-C11 | Beverly Garland Hotel |
| Cash Flow Analysis | |||||||||||
| 2011 | 2012 | TTM 4/30/2013 | UW | UW per Room | |||||||
| Occupancy | 82.7% | 84.7% | 85.8% | 80.0% | |||||||
| Average Daily Rate | $127.27 | $139.13 | $142.22 | $142.22 | |||||||
| REVPAR | $105.27 | $117.80 | $122.08 | $113.78 | |||||||
| Rooms Revenue | $9,797,753 | $10,994,503 | $11,362,364 | $10,589,684 | $41,528 | ||||||
| Food & Beverage Revenue | $2,604,283 | $2,795,258 | $2,882,486 | $2,882,486 | $11,304 | ||||||
| Other Income | $1,537,286 | $1,637,128 | $1,588,328 | $1,588,328 | $6,229 | ||||||
| Total Revenue | $13,939,323 | $15,426,889 | $15,833,178 | $15,060,498 | $59,061 | ||||||
| Total Expenses | $9,831,976 | $11,183,569 | $11,502,784 | $10,966,752 | $43,007 | ||||||
| Net Operating Income | $4,107,347 | $4,243,320 | $4,330,394 | $4,093,746 | $16,054 | ||||||
| FF&E | $557,764 | $617,095 | $633,351 | $602,420 | $2,362 | ||||||
| Ground Lease Payment | $27,453 | $27,453 | $27,453 | $27,453 | $108 | ||||||
| Net Cash Flow | $3,522,130 | $3,598,773 | $3,669,590 | $4,436,874 | $13,584 | ||||||
| NOI DSCR | 2.08x | 2.15x | 2.19x | 2.07x | |||||||
| NCF DSCR | 1.78x | 1.82x | 1.86x | 1.76x | |||||||
| NOI Debt Yield | 13.7% | 14.2% | 14.4% | 13.7% | |||||||
| NCF Debt Yield | 11.8% | 12.0% | 12.2% | 11.6% | |||||||
| This is not a research report and was not prepared by the Underwriters’ research departments. Please see additional important information and qualifications at the end of this Term Sheet. |
| MSBAM 2013-C11 | Beverly Garland Hotel |
| This is not a research report and was not prepared by the Underwriters’ research departments. Please see additional important information and qualifications at the end of this Term Sheet. |
| MSBAM 2013-C11 | Paddock Club |
| Mortgage Loan No. 10 – Paddock Club |
| This is not a research report and was not prepared by the Underwriters’ research departments. Please see additional important information and qualifications at the end of this Term Sheet. |
| MSBAM 2013-C11 | Paddock Club |
| Mortgage Loan No. 10 – Paddock Club |
| This is not a research report and was not prepared by the Underwriters’ research departments. Please see additional important information and qualifications at the end of this Term Sheet. |
| MSBAM 2013-C11 | Paddock Club |
| Mortgage Loan No. 10 – Paddock Club |
| Mortgage Loan Information | Mortgaged Property Information | ||||||
| Mortgage Loan Seller: | BANA | Single Asset / Portfolio: | Single Asset | ||||
Credit Assessment: (Fitch/Moody’s/Morningstar) | NR/NR/NR | Property Address: | 7925 Merrill Road Jacksonville, FL 32277 | ||||
| Original Balance: | $27,360,000 | General Property Type: | Multifamily | ||||
| Cut-off Date Balance: | $27,360,000 | Detailed Property Type: | Garden | ||||
| % of Initial Pool Balance: | 3.2% | Number of Units: | 440 Units | ||||
| Loan Purpose: | Acquisition | Cut-off Date Balance Per Unit/SF: | $62,182 | ||||
| Borrower Name(s): | Arium St. Johns, LLC | Balloon / ARD Balance Per Unit/SF: | $55,744 | ||||
| Sponsor(s): | Darren W. DeVore and | Year Built / Year Renovated: | 1989 / 2013 | ||||
| Michael Patrick Carroll | Title Vesting: | Fee | |||||
| Mortgage Rate: | 4.449% | Property Manager: | Carroll Management Group, LLC | ||||
| Note Date: | 6/20/2013 | Underwriting and Financial Information | |||||
| First Payment Date: | 8/1/2013 | UW Revenues: | $4,410,872 | ||||
| Anticipated Repayment Date: | NAP | UW Expenses: | $2,114,807 | ||||
| Maturity Date: | 7/1/2023 | UW NOI: | $2,296,065 | ||||
| IO Period: | 48 months | UW NCF: | $2,186,065 | ||||
| Original Term to Maturity or ARD: | 120 months | UW NOI DSCR: | 1.39x | ||||
| Seasoning: | 1 month | UW NCF DSCR: | 1.32x | ||||
| Original Amortization Term: | 360 months | UW NOI Debt Yield: | 8.4% | ||||
| Loan Amortization Type: | Partial IO | UW NCF Debt Yield: | 8.0% | ||||
| Interest Accrual Basis: | Actual/360 | UW NCF Debt Yield at Maturity: | 8.9% | ||||
| Prepayment Provisions: | LO (25); YM1/DEF (91); O (4) | Most Recent NOI (As of): | $2,436,485 (4/30/2013 TTM) | ||||
| Lockbox / Cash Management: | Soft / Springing | 2nd Most Recent NOI (As of): | $2,387,476 (12/31/2012) | ||||
| Pari Passu Mortgage Debt: | None | 3rd Most Recent NOI (As of): | $2,543,432 (12/31/2011) | ||||
| Subordinate Mortgage Debt: | None | Appraised Value: | $35,700,000 | ||||
| Mezzanine Debt: | None | Appraisal As-of Date: | 5/31/2013 | ||||
Reserves(1) | Cut-off Date LTV Ratio: | 76.6% | |||||
| Type | Initial | Monthly | Cap | LTV Ratio at Maturity/ARD: | 68.7% | ||
| RE Tax: | $226,116 | $45,223 | NAP | Occupancy Rate (As of): | 95.7% (6/10/2013) | ||
| Insurance: | $0 | Springing | NAP | 2nd Most Recent Occupancy (As of): | 90.4% (12/31/2012) | ||
| Deferred Maintenance: | $39,325 | NAP | NAP | 3rd Most Recent Occupancy (As of): | 92.8% (12/31/2011) | ||
| Recurring Replacements: | $1,730,000 | $9,167 | NAP | ||||
| (1) | See “—Escrows and Reserves” below for further discussion of reserve requirements. |
| This is not a research report and was not prepared by the Underwriters’ research departments. Please see additional important information and qualifications at the end of this Term Sheet. |
| MSBAM 2013-C11 | Paddock Club |
| Paddock Club Property Unit Mix | |||||||
| Unit Type | Number of Units | Occupied Units | Occupancy | Average Unit Size (SF) | Average Monthly Rental Rate(1) | Average Monthly Rental Rate PSF | |
| 1 BR – 1 BA | 96 | 92 | 95.8% | 783 | $670 | $0.86 | |
| 2 BR – 1 BA | 104 | 98 | 94.2% | 1,100 | $813 | $0.74 | |
| 2 BR – 2 BA | 144 | 141 | 97.9% | 1,102 | $824 | $0.75 | |
| 3 BR – 2 BA | 96 | 90 | 93.8% | 1,360 | $959 | $0.71 | |
| Total/Wtd. Avg. | 440 | 421 | 95.7% | 1,087 | $817 | $0.75 | |
| (1) | Average Monthly Rental Rate is for occupied units only. |
| This is not a research report and was not prepared by the Underwriters’ research departments. Please see additional important information and qualifications at the end of this Term Sheet. |
| MSBAM 2013-C11 | Paddock Club |
| Competitive Property Summary | ||||
| Property | Unit Type | Size | Rent Per Month | Rent PSF |
| The Villas at Dames Point Crossing | 1BD/1BA 1BD/1BA Loft 2BD/2BA 2BD/2BA Loft | 844 1,099 1,127 1,382 | $849.00 $929.00 $989.00 $1,069.00 | $1.01 $0.85 $0.88 $0.77 |
| Madison Spring Woods | 1BD/1BA 1BD/1BA 1BD/1BA 2BD/1BA 2BD/2BA 2BD/2BA | 500 600 700 900 1,000 1,100 | 634.00 – $741.00 $655.00 – $798.00 $711.00 – $855.00 $913.00 – $928.00 $954.00 – $1,095.00 $1,067.00 – $1,096.00 | $1.27 – $1.48 $1.09 – $1.33 $1.02 – $1.22 $1.01 – $1.03 $0.95 – $1.10 $0.97 – $1.00 |
| The Canopy | 1BD/1BA 1BD/1BA 1BD/1BA 2BD/1BA 2BD/2BA 2BD/2BA 3BD/2BA | 629 766 788 915 1,100 1,138 1,338 | $786.00 $866.00 $876.00 $946.00 $1,076.00 $1,096.00 $1,162.00 | $1.25 $1.13 $1.11 $1.03 $0.98 $0.96 $0.87 |
| Colonnade at Regency | 1BD/1BA 1BD/1BA 1BD/1BA Loft 2BD/2BA 1BD/1BA Loft 2BD/2BA 3BD/2BA 2BD/2BA 3BD/2BA 2BD/2BA Loft | 836 964 1,038 1,136 1,165 1,256 1,269 1,338 1,397 1,465 | $850.00 – $900.00 $875.00 $985.00 $975.00 – $999.00 $900.00 $999.00 – $1,025.00 $1,200.00 $1,100.00 $1,329.00 $1,200.00 – $1,250.00 | $1.02 – $1.08 $0.91 $0.95 $0.86 – $0.88 $0.77 $0.80 – $0.82 $0.95 $0.82 $0.95 $0.82 – $0.85 |
| Bella Terraza Apartments | 1BD/1BA 1BD/1BA 2BD/1BA 2BD/2BA 2BD/2BA 2BD/1.5BA 2BD/1.5BA 3BD/2BA 3BD/2BA 3BD/2BA 3BD/2.5BA | 710 880 1,050 1,050 1,110 1,150 1,170 1,300 1,330 1,400 1,510 | $750.00 $790.00 $880.00 $935.00 $935.00 $935.00 $965.00 $1,045.00 $1,085.00 $1,099.00 $1,155.00 | $1.06 $0.90 $0.84 $0.89 $0.84 $0.81 $0.82 $0.80 $0.82 $0.79 $0.76 |
| This is not a research report and was not prepared by the Underwriters’ research departments. Please see additional important information and qualifications at the end of this Term Sheet. |
| MSBAM 2013-C11 | Paddock Club |
Cash Flow Analysis(1) | |||||||||||
| 2010 | 2011 | 2012 | UW | UW Per Unit | |||||||
| Gross Potential Rent | $4,287,643 | $4,247,717 | $4,345,525 | $4,315,584 | $9,808.15 | ||||||
| Other Income | $444,470 | $448,842 | $408,775 | $416,692 | $947.03 | ||||||
| Less Vacancy & Credit Loss | ($363,678) | ($304,263) | ($417,819) | ($321,404) | (7.45%) | ||||||
| Effective Gross Income | $4,368,435 | $4,392,296 | $4,336,481 | $4,410,872 | $10,024.71 | ||||||
| Total Operating Expenses | $1,756,174 | $1,848,864 | $1,949,005 | $2,114,807 | $4,806.38 | ||||||
| Net Operating Income | $2,612,261 | $2,543,432 | $2,387,476 | $2,296,065 | $5,218.33 | ||||||
| TI/LC | $0 | $0 | $0 | $0 | $0.00 | ||||||
| Capital Expenditures | $0 | $0 | $0 | $110,000 | $250.00 | ||||||
| Net Cash Flow | $2,612,261 | $2,543,432 | $2,387,476 | $2,186,065 | $4,968.33 | ||||||
| Occupancy % | 91.5% | 92.8% | 90.4% | 92.6% | |||||||
| NOI DSCR | 1.58x | 1.54x | 1.44x | 1.39x | |||||||
| NCF DSCR | 1.58x | 1.54x | 1.44x | 1.32x | |||||||
| NOI Debt Yield | 9.5% | 9.3% | 8.7% | 8.4% | |||||||
| NCF Debt Yield | 9.5% | 9.3% | 8.7% | 8.0% | |||||||
| (1) | Information is based on the underwritten rent roll. |
| This is not a research report and was not prepared by the Underwriters’ research departments. Please see additional important information and qualifications at the end of this Term Sheet. |
| MSBAM 2013-C11 | ADG Pool 6 |
| Mortgage Loan No. 11 – ADG Pool 6 |
| Mortgage Loan Information | Mortgaged Property Information | ||||||
| Mortgage Loan Seller: | BANA | Single Asset / Portfolio: | Portfolio | ||||
Credit Assessment: (Fitch/Moody’s/Morningstar) | NR/NR/NR | Property Address(1): | Various | ||||
| Original Balance: | $25,657,000 | General Property Type: | Manufactured Housing | ||||
| Cut-off Date Balance: | $25,625,780 | Detailed Property Type: | Manufactured Housing | ||||
| % of Initial Pool Balance: | 3.0% | Number of Pads(1): | 1,379 Pads | ||||
| Loan Purpose: | Refinance | Cut-off Date Balance Per Unit/SF: | $18,583 | ||||
| Borrower Name(s): | Plover Pointe Associates, LLC; Oakwood Associates, LLC; Northern Development Group, LLC | Balloon / ARD Balance Per Unit/SF: | $15,032 | ||||
| Sponsor(s): | Bruce Arbit; Jerry Benjamin; M. Nicol Padway; James Reitzner | Year Built / Year Renovated(1): | Various / Various | ||||
| Mortgage Rate: | 4.407% | Title Vesting: | Fee | ||||
| Note Date: | 6/11/2013 | Property Manager: | Asset Development Group, Inc. | ||||
| First Payment Date: | 8/1/2013 | ||||||
| Anticipated Repayment Date: | NAP | Underwriting and Financial Information | |||||
| Maturity Date: | 7/1/2023 | UW Revenues: | $3,995,652 | ||||
| IO Period: | 0 months | UW Expenses: | $1,574,621 | ||||
| Original Term to Maturity or ARD: | 120 months | UW NOI: | $2,421,031 | ||||
| Seasoning: | 1 month | UW NCF: | $2,352,081 | ||||
| Original Amortization Term: | 360 months | UW NOI DSCR: | 1.57x | ||||
| Loan Amortization Type: | Amortizing | UW NCF DSCR: | 1.52x | ||||
| Interest Accrual Basis: | Actual/360 | UW NOI Debt Yield: | 9.4% | ||||
| Prepayment Provisions: | LO (25); DEF (91); O (4) | UW NCF Debt Yield: | 9.2% | ||||
| Lockbox / Cash Management: | Springing / Springing | UW NCF Debt Yield at Maturity: | 11.3% | ||||
| Pari Passu Mortgage Debt: | None | Most Recent NOI (As of): | $2,418,415 (3/31/2013 TTM) | ||||
| Subordinate Mortgage Debt: | None | 2nd Most Recent NOI (As of): | $2,494,122(12/31/2012) | ||||
| Mezzanine Debt: | None | 3rd Most Recent NOI (As of): | $2,258,643 (12/31/2011) | ||||
| Reserves | Appraised Value(1): | $34,010,000 | |||||
| Type | Initial | Monthly | Cap | Appraisal As-of Date(1): | Various | ||
| RE Tax: | $29,924 | $29,924 | NAP | Cut-off Date LTV Ratio: | 75.3% | ||
| Insurance: | $0 | Springing | NAP | LTV Ratio at Maturity/ARD: | 61.0% | ||
| Deferred Maintenance: | $283,744 | $0 | NAP | Occupancy Rate (As of)(1): | 86.8% (6/5/2013) | ||
| Recurring Replacements: | $0 | $5,746 | NAP | 2nd Most Recent Occupancy (As of): | 83.9% (12/31/2012) | ||
3rd Most Recent Occupancy (As of): | 82.6% (12/31/2011) | ||||||
| (1) | Individual property details are shown on the table below. |
| This is not a research report and was not prepared by the Underwriters’ research departments. Please see additional important information and qualifications at the end of this Term Sheet. |
| MSBAM 2013-C11 | ADG Pool 6 |
| ADG Pool 6 Property Overview | ||||||||||||||||||||||||||||
| Property/Location | Address | City/State | Allocated Loan Amount | % of Allocated Loan Amount | No. of Units | Year Built | Year Reno-vated | Appraised Value | Appraised Value as of Date | % Leased as of 6/5/13 | ||||||||||||||||||
| Manor Hill | 63 Manor Hill Drive | Eden, WI | $3,425,000 | 13.3% | 147 | 1970 | NAP | $4,400,000 | 4/26/2013 | 89.8% | ||||||||||||||||||
| Lake Onalaska | 1004 Second Avenue North | Onalaska, WI | $2,800,000 | 10.9% | 124 | 1960 | 1990 | $3,600,000 | 5/3/2013 | 94.4% | ||||||||||||||||||
| Shorecrest Pointe | 8743 Sheridan Road | Kenosha, WI | $2,600,000 | 10.1% | 81 | 1960 | 1994 | $3,340,000 | 4/26/2013 | 97.5% | ||||||||||||||||||
| Camelot Acres | 32 Camelot Lane #26 | Rice Lake, WI | $2,454,500 | 9.6% | 135 | 1970 | NAP | $3,000,000 | 5/3/2013 | 83.0% | ||||||||||||||||||
| The Maples | 4610 8th Street South | Wisconsin Rapids, WI | $1,725,000 | 6.7% | 125 | 1985 | 1990 | $2,800,000 | 5/3/2013 | 68.0% | ||||||||||||||||||
| Parkview Terrace | 2430 Mary Street | Marinette, WI | $1,875,000 | 7.3% | 130 | 1965 | 1985 | $2,500,000 | 4/26/2013 | 96.9% | ||||||||||||||||||
| River View Manor | 640 Meadow Street | Amery, WI | $1,867,500 | 7.3% | 78 | 1970 | NAP | $2,490,000 | 5/3/2013 | 94.9% | ||||||||||||||||||
| Balsam Lake | 113 Tilltag Drive #1 | Balsam Lake, WI | $1,612,500 | 6.3% | 81 | 1970 | NAP | $2,150,000 | 5/3/2013 | 87.7% | ||||||||||||||||||
| Plover Pointe Manor | 4101 Hoover Avenue South | Plover, WI | $1,455,000 | 5.7% | 62 | 1986 | NAP | $1,940,000 | 5/3/2013 | 93.6% | ||||||||||||||||||
| Oak Manor | 600 Oak Street | Waupaca, WI | $1,425,000 | 5.6% | 90 | 1972 | 1990 | $1,900,000 | 5/3/2013 | 80.0% | ||||||||||||||||||
| Oakwood Terrace | W10445 Highway 16 West | Portage, WI | $1,245,000 | 4.9% | 66 | 1965 | NAP | $1,660,000 | 4/26/2013 | 90.9% | ||||||||||||||||||
| Foxx Glen | 3920 Hall Ave | Marinette, WI | $975,000 | 3.8% | 76 | 1970 | NAP | $1,300,000 | 4/26/2013 | 88.2% | ||||||||||||||||||
| Willow Grove | 211 East Willow Drive | Spencer, WI | $ 600,000 | 2.3% | 49 | 1972 | 2005 | $800,000 | 5/3/2013 | 77.6% | ||||||||||||||||||
| Kountry Squire | 2155 Highway X | Mosinee, WI | $600,000 | 2.3% | 52 | 1986 | NAP | $800,000 | 4/26/2013 | 74.5% | ||||||||||||||||||
| Indianhead Manor | 815 Park Avenue | Chippewa Falls, WI | $577,500 | 2.3% | 61 | 1960 | 1990 | $770,000 | 5/3/2013 | 73.3% | ||||||||||||||||||
| Markesan | 531 West John Street | Markesan, WI | $420,000 | 1.6% | 22 | 1970 | NAP | $560,000 | 4/26/2013 | 100.0% | ||||||||||||||||||
| Total | $25,657,000 | 100% | 1,379 | $34,010,000 | ||||||||||||||||||||||||
| This is not a research report and was not prepared by the Underwriters’ research departments. Please see additional important information and qualifications at the end of this Term Sheet. |
| MSBAM 2013-C11 | ADG Pool 4 |
| Mortgage Loan No. 12 – ADG Pool 4 |
| Mortgage Loan Information | Mortgaged Property Information | ||||||
| Mortgage Loan Seller: | BANA | Single Asset / Portfolio: | Portfolio | ||||
Credit Assessment: (Fitch/Moody’s/Morningstar) | NR/NR/NR | Property Address(1): | Various | ||||
Original Balance(1): | $23,800,000 | General Property Type: | Manufactured Housing | ||||
| Cut-off Date Balance: | $23,771,039 | Detailed Property Type: | Manufactured Housing | ||||
| % of Initial Pool Balance: | 2.8% | Number of Pads(1): | 1,220 Pads | ||||
| Loan Purpose: | Refinance | Cut-off Date Balance Per Unit/SF: | $19,484 | ||||
Borrower Name(s)(2): | Blackhawk Development Group, LLC, Key Development Group, LLC, Meadows Development Group, LLC, Strategic Development Group, L.L.C., Marquette Development Group, LLC | Balloon / ARD Balance Per Unit/SF: | $15,762 | ||||
| Sponsor(s): | Bruce Arbit; Jerry Benjamin; M. Nicol Padway; James Reitzner | Year Built / Year Renovated(1): | Various / Various | ||||
| Mortgage Rate: | 4.407% | Title Vesting: | Fee | ||||
| Note Date: | 6/11/2013 | Property Manager: | Asset Development Group, Inc. | ||||
| First Payment Date: | 8/1/2013 | ||||||
| Anticipated Repayment Date: | NAP | Underwriting and Financial Information | |||||
| Maturity Date: | 7/1/2023 | UW Revenues: | $3,982,451 | ||||
| IO Period: | 0 months | UW Expenses: | $1,701,211 | ||||
| Original Term to Maturity or ARD: | 120 months | UW NOI: | $2,281,240 | ||||
| Seasoning: | 1 month | UW NCF: | $2,220,240 | ||||
| Original Amortization Term: | 360 months | UW NOI DSCR: | 1.59x | ||||
| Loan Amortization Type: | Amortizing | UW NCF DSCR: | 1.55x | ||||
| Interest Accrual Basis: | Actual/360 | UW NOI Debt Yield: | 9.6% | ||||
| Prepayment Provisions: | LO (25); DEF (91); O (4) | UW NCF Debt Yield: | 9.3% | ||||
| Lockbox / Cash Management: | Springing / Springing | UW NCF Debt Yield at Maturity: | 11.5% | ||||
| Pari Passu Mortgage Debt: | None | Most Recent NOI (As of): | $2,368,385 (3/31/2013 TTM) | ||||
Subordinate Mortgage Debt(2): | None | 2nd Most Recent NOI (As of): | $2,348,517(12/31/2012) | ||||
| Mezzanine Debt: | None | 3rd Most Recent NOI (As of): | $2,191,603 (12/31/2011) | ||||
| Reserves | Appraised Value(1): | $32,030,000 | |||||
| Type | Initial | Monthly | Cap | Appraisal As-of Date(1): | Various | ||
| RE Tax: | $50,818 | $25,409 | NAP | Cut-off Date LTV Ratio: | 74.2% | ||
| Insurance: | $0 | Springing | NAP | LTV Ratio at Maturity/ARD: | 60.0% | ||
| Deferred Maintenance: | $220,517 | $0 | NAP | Occupancy Rate (As of): | 88.8% (6/5/2013) | ||
| Recurring Replacements: | $0 | $4,925 | NAP | 2nd Most Recent Occupancy (As of): | 83.1% (12/31/2012) | ||
Environmental Reserve(3): | $10,000 | $0 | NAP | 3rd Most Recent Occupancy (As of): | 78.6% (12/31/2011) | ||
| (1) | Individual property details are shown on the table below. |
| (2) | The ADG Pool 4 borrower is an obligor with respect to additional debt in the amount of $1,100,000; however, such debt is unsecured, the related sponsor has assumed such debt and there is a recourse carve-out with respect to such debt in the ADG Pool 4 mortgage loan agreement. |
| (3) | The ADG Pool 4 borrower deposited $10,000 at loan origination related to an environmental reserve for water testing and filtration. The reserve will be released upon satisfactory closure of the issue. |
| This is not a research report and was not prepared by the Underwriters’ research departments. Please see additional important information and qualifications at the end of this Term Sheet. |
| MSBAM 2013-C11 | ADG Pool 4 |
ADG Pool 4 Property Overview | ||||||||||
| Property/Location | Address | City/State | Allocated Loan Amount | % of Allocated Loan Amount | No. of Units | Year Built | Year Reno- vated | Appraised Value | Appraised Value as of Date | % Leased as of 6/5/13 |
Skyview Terrace | 2742 Main Street | East Troy, WI | $4,102,500 | 17.2% | 109 | 1965 | 1970 | $5,470,000 | 4/26/2013 | 99.1% |
Country Crossing | W 6150 County BB | Appleton, WI | $3,315,000 | 13.9% | 127 | 1985 | NAP | $4,140,000 | 5/3/2013 | 95.3% |
Birch Terrace | N 4795 State Road 25 | Menomonie, WI | $2,820,000 | 11.8% | 191 | 1965 | 1982 | $4,000,000 | 5/3/2013 | 77.5% |
Lakeland | 855 East Lake Street | Lake Mills, WI | $2,209,500 | 9.3% | 122 | 1970 | 2001 | $3,250,000 | 4/26/2013 | 96.4% |
Cardinal Crest | 1006 21st Street | Brodhead, WI | $2,400,000 | 10.1% | 109 | 1970 | NAP | $3,200,000 | 4/26/2013 | 92.7% |
Meadowview Place | 2400 Johnson Street | Janesville, WI | $2,295,000 | 9.6% | 116 | 1965 | 2000 | $3,060,000 | 4/26/2013 | 80.2% |
| Harbor Lights | 902 Happy Valley Lane #90 | Menasha, WI | $2,175,000 | 9.1% | 95 | 1985 | NAP | $2,900,000 | 5/3/2013 | 91.6% |
| Park Ridge | 1300 Michigan Avenue | Iron Mountain, MI | $1,552,500 | 6.5% | 89 | 1970 | NAP | $2,070,000 | 4/26/2013 | 94.4% |
Pioneer Village | 777 Pioneer Road | Marquette, MI | $982,500 | 4.1% | 90 | 1980 | NAP | $1,310,000 | 4/26/2013 | 98.9% |
Falls View | 601 North Main Street | Fall River, WI | $825,000 | 3.5% | 59 | 1960 | NAP | $1,100,000 | 4/26/2013 | 76.3% |
| Northview Estates | 2nd Street & Roosevelt Street | Fennimore, WI | $615,000 | 2.6% | 72 | 1965 | NAP | $820,000 | 5/3/2013 | 72.2% |
Lake Bluff | 927 Miller Street | Kewaunee, WI | $313,000 | 1.3% | 25 | 1950 | NAP | $450,000 | 5/3/2013 | 88.0% |
Forest Glen | 1450 Myrtle Street | Marinette, WI | $195,000 | 0.8% | 16 | 1970 | NAP | $260,000 | 4/26/2013 | 100.0% |
| Total | $23,800,000 | 100.0% | 1,220 | $32,030,000 | ||||||
| This is not a research report and was not prepared by the Underwriters’ research departments. Please see additional important information and qualifications at the end of this Term Sheet. |
| MSBAM 2013-C11 | University Towers Cooperative |
| Mortgage Loan No. 13 – University Towers Cooperative |
| Mortgage Loan Information | Mortgaged Property Information | ||||||
| Mortgage Loan Seller: | MSMCH | Single Asset/ Portfolio: | Single Asset | ||||
Credit Assessment: (Fitch/Moody’s/Morningstar) | AAA/Aaa/AAA | Property Address: | 175, 191 Willoughby Street and 122 Ashland Place Brooklyn, NY 11201 | ||||
| Original Balance: | $20,000,000 | General Property Type: | Multifamily | ||||
| Cut-off Date Balance: | $19,952,715 | Detailed Property Type: | Cooperative | ||||
| % of Initial Pool Balance: | 2.3% | Number of Units: | 549 Units | ||||
| Loan Purpose: | Refinance | Cut-off Date Balance Per Unit/SF: | $36,344 | ||||
| Borrower Name(s): | University Towers Apartment Corp. | Balloon/ARD Balance Per Unit/SF: | $24,096 | ||||
| Sponsor(s): | University Towers Apartment Corp. | Year Built / Year Renovated: | 1957, 1958, 1959 / NAP | ||||
| Mortgage Rate: | 3.210% | Title Vesting: | Fee | ||||
| Note Date: | 6/27/2013 | Property Manager: | Cooper Square Realty, Inc. | ||||
| First Payment Date: | 8/1/2013 | Underwriting and Financial Information | |||||
| Anticipated Repayment Date: | NAP | UW Revenues(2): | $14,951,712 | ||||
| Maturity Date: | 7/1/2023 | UW Expenses(2): | $5,471,017 | ||||
| IO Period: | None | UW NOI(2): | $9,480,695 | ||||
| Original Term to Maturity or ARD: | 120 months | UW NCF(2): | $9,342,195 | ||||
| Seasoning: | 1 month | UW NOI DSCR(2): | 7.70x | ||||
| Original Amortization Term: | 276 months | UW NCF DSCR(2): | 7.59x | ||||
| Loan Amortization Type: | Amortizing | UW NOI Debt Yield(2): | 47.5% | ||||
| Interest Accrual Basis: | Actual/360 | UW NCF Debt Yield(2): | 46.8% | ||||
| Prepayment Provisions: | LO (23); YM1 (93); O (4) | UW NCF Debt Yield at Maturity(2): | 70.6% | ||||
| Lockbox/Cash Management: | NAP / NAP | Most Recent NOI (As of): | $1,216,407 (04/30/2013 TTM) | ||||
| Pari Passu Mortgage Debt: | None | 2nd Most Recent NOI (As of): | $1,020,190 (12/31/2012) | ||||
Subordinate Mortgage Debt(1): | Permitted | 3rd Most Recent NOI (As of): | $978,889 (12/31/2011) | ||||
| Mezzanine Debt: | None | Appraised Value: | $183,500,000 | ||||
| Reserves | Appraisal As-of Date: | 6/4/2013 | |||||
| Type | Initial | Monthly | Cap | Cut-off Date LTV Ratio: | 10.9% | ||
| RE Tax: | $0 | $95,051 | NAP | LTV Ratio at Maturity/ARD: | 7.2% | ||
| Insurance: | $16,283 | $16,283 | NAP | Occupancy Rate (As of): | 97.7% (4/30/2013) | ||
2nd Most Recent Occupancy (As of): | NAP | ||||||
3rd Most Recent Occupancy (As of): | NAP | ||||||
| (1) | The University Towers Cooperative borrower is permitted to obtain additional financing secured by the University Towers Cooperative property, including a revolving or term line of credit, subject to lender’s consent and the following conditions, among others: (i) no event of default, (ii) the LTV of the combined first and second loans not to exceed 35%, as determined by lender, and (iii) the second lender executes lender’s standard subordination agreement. |
| (2) | The University Towers Cooperative property is a cooperatively owned residential property. The above underwritten figures are based on an estimate of cash flow assuming market rental rates applied to each apartment type and estimated apartment rental expenses. |
| This is not a research report and was not prepared by the Underwriters’ research departments. Please see additional important information and qualifications at the end of this Term Sheet. |
| MSBAM 2013-C11 | Wyndham - Virginia Beach |
| Mortgage Loan No. 14 – Wyndham - Virginia Beach |
| Mortgage Loan Information | Mortgaged Property Information | ||||||
| Mortgage Loan Seller: | MSMCH | Single Asset/ Portfolio: | Single Asset | ||||
Credit Assessment: (Fitch/Moody’s/Morningstar) | NR/NR/NR | Property Address: | 5700 Atlantic Avenue Virginia Beach, VA 23451 | ||||
| Original Balance: | $17,600,000 | General Property Type: | Hospitality | ||||
| Cut-off Date Balance: | $17,579,905 | Detailed Property Type: | Full Service | ||||
| % of Initial Pool Balance: | 2.1% | Number of Rooms: | 244 Rooms | ||||
| Loan Purpose: | Refinance | Cut-off Date Balance Per Unit/SF: | $72,049 | ||||
| Borrower Name(s): | Mariner Associates, L.P | Balloon/ARD Balance Per Unit/SF: | $58,840 | ||||
| Sponsor(s): | Harmony Investments, Inc | Year Built / Year Renovated: | 1939,1962,1972, 1985, 1999 / 2007 | ||||
| Mortgage Rate: | 4.690% | Title Vesting: | Fee | ||||
| Note Date: | 6/4/2013 | Property Manager: | Harmony Hospitality, Inc. | ||||
| First Payment Date: | 8/1/2013 | ||||||
| Anticipated Repayment Date: | NAP | Underwriting and Financial Information | |||||
| Maturity Date: | 7/1/2023 | UW Revenues: | $9,579,016 | ||||
| IO Period: | None | UW Expenses: | $7,239,843 | ||||
| Original Term to Maturity or ARD: | 120 months | UW NOI: | $2,339,173 | ||||
| Seasoning: | 1 month | UW NCF: | $1,956,013 | ||||
| Original Amortization Term: | 360 months | UW NOI DSCR: | 2.14x | ||||
| Loan Amortization Type: | Amortizing | UW NCF DSCR: | 1.79x | ||||
| Interest Accrual Basis: | Actual/360 | UW NOI Debt Yield: | 13.3% | ||||
| Prepayment Provisions: | LO (25); DEF (91); O (4) | UW NCF Debt Yield: | 11.1% | ||||
| Lockbox/Cash Management: | Soft / Springing | UW NCF Debt Yield at Maturity: | 13.6% | ||||
| Pari Passu Mortgage Debt: | None | Most Recent NOI (As of): | $2,339,386 (4/30/2013 TTM) | ||||
Subordinate Mortgage Debt(1): | $666,665 | 2nd Most Recent NOI (As of): | $2,493,486 (12/31/2012) | ||||
| Mezzanine Debt: | None | 3rd Most Recent NOI (As of): | $1,783,422 (12/31/2011) | ||||
| Reserves | Appraised Value: | $25,800,000 | |||||
| Type | Initial | Monthly | Cap | Appraisal As-of Date: | 5/2/2013 | ||
| RE Tax: | $92,650 | $19,302 | NAP | Cut-off Date LTV Ratio: | 68.1% | ||
| Insurance: | $85,669 | $17,848 | NAP | LTV Ratio at Maturity/ARD: | 55.6% | ||
| Recurring Replacements: | $153,264 | $31,930 | NAP | Occupancy Rate (As of): | 53.1% (4/30/2013) | ||
| Deferred Maintenance: | $21,600 | $0 | NAP | 2nd Most Recent Occupancy (As of): | 54.9% (12/31/2012) | ||
Other(2): | $965,000 | $0 | NAP | 3rd Most Recent Occupancy (As of): | 54.5% (12/31/2011) | ||
| Seasonality Escrow | $273,524 | $45,587 | NAP | ||||
| (1) | The subordinate debt is the amount outstanding of a non-interest bearing loan by Wyndham Hotels and Resorts, LLC to the borrower, which is forgiven in part each year the franchise agreement is in place and is scheduled to be extinguished by the end of the current Wyndham franchise agreement provided the borrower is not in default under the franchise agreement. In the event of a borrower default under the franchise agreement, the remaining principal must be repaid within 10 days thereafter and the loan will bear interest at the lesser of 18% and the highest legal rate. The debt is unsecured. |
| (2) | The Other Escrow consists of a $965,000 planned capital improvement escrow. Peak demand for the mortgaged property is May to September, and a seasonality escrow is in place. |
| This is not a research report and was not prepared by the Underwriters’ research departments. Please see additional important information and qualifications at the end of this Term Sheet. |
| MSBAM 2013-C11 | Gateway I Office Building |
Mortgage Loan No. 15 – Gateway I Office Building |
| Mortgage Loan Information | Mortgaged Property Information | ||||||
| Mortgage Loan Seller: | MSMCH | Single Asset/ Portfolio: | Single Asset | ||||
Credit Assessment: (Fitch/Moody’s/Morningstar) | NR/NR/NR | Property Address: | 303 H Street Chula Vista, CA 91910 | ||||
| Original Balance: | $17,500,000 | General Property Type: | Office | ||||
| Cut-off Date Balance: | $17,500,000 | Detailed Property Type: | Urban | ||||
| % of Initial Pool Balance: | 2.0% | Net Rentable Area: | |||||
| Loan Purpose: | Acquisition | Cut-off Date Balance Per Unit/SF: | $173 | ||||
| Borrower Name(s): | Bear Garden Investments LLC | Balloon/ARD Balance Per Unit/SF: | $143 | ||||
| Sponsor(s): | James Vincent Pleri; Faye Roslyn Kevlen | Year Built / Year Renovated: | 2002 / NAP | ||||
| Mortgage Rate: | 4.960% | Title Vesting: | Fee | ||||
| Note Date: | 7/24/2013 | Property Manager: | Mountain West Real Estate, Inc. | ||||
| First Payment Date: | 9/1/2013 | ||||||
| Anticipated Repayment Date: | NAP | Underwriting and Financial Information | |||||
| Maturity Date: | 8/1/2023 | UW Revenues: | $2,467,710 | ||||
| IO Period: | None | UW Expenses: | $727,950 | ||||
| Original Term to Maturity or ARD: | 120 months | UW NOI: | $1,739,760 | ||||
| Seasoning: | 0 months | UW NCF: | $1,558,066 | ||||
| Original Amortization Term: | 360 months | UW NOI DSCR: | 1.55x | ||||
| Loan Amortization Type: | Amortizing | UW NCF DSCR: | 1.39x | ||||
| Interest Accrual Basis: | Actual/360 | UW NOI Debt Yield: | 9.9% | ||||
| Prepayment Provisions: | LO (24); DEF (92); O (4) | UW NCF Debt Yield: | 8.9% | ||||
| Lockbox/Cash Management: | Hard / Springing | UW NCF Debt Yield at Maturity: | 10.8% | ||||
| Pari Passu Mortgage Debt: | None | Most Recent NOI (As of): | |||||
| Subordinate Mortgage Debt: | None | 2nd Most Recent NOI (As of): | |||||
| Mezzanine Debt: | None | 3rd Most Recent NOI (As of): | |||||
| Reserves | Appraised Value: | $24,000,000 | |||||
| Type | Initial | Monthly | Cap | Appraisal As-of Date: | 4/19/2013 | ||
| RE Tax: | $112,176 | Cut-off Date LTV Ratio: | 72.9% | ||||
| Insurance: | $4,568 | LTV Ratio at Maturity/ARD: | 60.0% | ||||
| Recurring Replacements: | $0 | Occupancy Rate (As of): | |||||
| TI/LC: | $250,000 | 2nd Most Recent Occupancy (As of): | |||||
3rd Most Recent Occupancy (As of): | 51.0% (12/31/2011) | ||||||
| This is not a research report and was not prepared by the Underwriters’ research departments. Please see additional important information and qualifications at the end of this Term Sheet. |
| MSBAM 2013-C11 | Marriott Jacksonville |
Mortgage Loan No. 16 – Marriott Jacksonville |
| Mortgage Loan Information | Mortgaged Property Information | ||||||
| Mortgage Loan Seller: | BANA | Single Asset / Portfolio: | Single Asset | ||||
Credit Assessment: (Fitch/Moody’s/Morningstar) | NAP | Property Address: | 4670 Salisbury Road Jacksonville, FL 32256 | ||||
| Original Balance: | $17,500,000 | General Property Type: | Hospitality | ||||
| Cut-off Date Balance: | $17,481,118 | Detailed Property Type: | Full Service | ||||
| % of Initial Pool Balance: | 2.0% | Number of Rooms: | 255 Rooms | ||||
| Loan Purpose: | Refinance | Cut-off Date Balance Per Room: | $68,553 | ||||
| Borrower Name(s): | CP Jacksonville, LLC | Balloon / ARD Balance Per Room: | $56,437 | ||||
| Sponsor(s): | Columbia Sussex Corporation; Sussex Holdings, LLC | Year Built / Year Renovated: | 1986 / 2006 | ||||
| Mortgage Rate: | 4.935% | Title Vesting: | Leasehold | ||||
| Note Date: | 6/20/2013 | Property Manager: | Columbia Sussex Management, LLC | ||||
| First Payment Date: | 8/1/2013 | ||||||
| Anticipated Repayment Date: | NAP | Underwriting and Financial Information | |||||
| Maturity Date: | 7/1/2023 | UW Revenues: | $10,338,558 | ||||
| IO Period: | 0 months | UW Expenses: | $7,691,430 | ||||
| Original Term to Maturity or ARD: | 120 months | UW NOI: | $2,647,128 | ||||
| Seasoning: | 1 month | UW NCF: | $2,130,200 | ||||
| Original Amortization Term: | 360 months | UW NOI DSCR: | 2.37x | ||||
| Loan Amortization Type: | Amortizing | UW NCF DSCR: | 1.90x | ||||
| Interest Accrual Basis: | Actual/360 | UW NOI Debt Yield: | 15.1% | ||||
| Prepayment Provisions: | LO (25); DEF (92); O (3) | UW NCF Debt Yield: | 12.2% | ||||
| Lockbox / Cash Management: | Hard / Springing | UW NCF Debt Yield at Maturity: | 14.8% | ||||
| Pari Passu Mortgage Debt: | None | Most Recent NOI (As of): | $2,766,892 (4/30/2013 TTM) | ||||
| Subordinate Mortgage Debt: | None | 2nd Most Recent NOI (As of): | $2,468,240 (12/31/2012) | ||||
| Mezzanine Debt: | None | 3rd Most Recent NOI (As of): | $2,190,805 (12/31/2011) | ||||
| Reserves | Appraised Value: | $30,300,000 | |||||
| Type | Initial | Monthly | Cap | Appraisal As-of Date: | 5/1/2013 | ||
| RE Tax: | $263,445 | $29,272 | NAP | Cut-off Date LTV Ratio: | 57.7% | ||
| Insurance: | $0 | Springing | NAP | LTV Ratio at Maturity/ARD: | 47.5% | ||
| Immediate Repairs: | $204,501 | $0 | NAP | Occupancy Rate (As of): | 64.5% (4/30/2013) | ||
Recurring Replacements(1): | $0 | Springing | $2,550,000 | 2nd Most Recent Occupancy (As of): | 61.3% (12/31/2012) | ||
Ground Rent Reserve(2): | $3,044,732 | $0 | NAP | 3rd Most Recent Occupancy (As of): | 58.8% (12/31/2011) | ||
| (1) | Beginning January 1, 2016, the Marriott Jacksonville borrower is required to deposit monthly all excess cash related to a PIP reserve in anticipation of the November 2018 franchise agreement renewal. |
| (2) | The Marriott Jacksonville borrower deposited upfront all remaining ground rent payments and the $2,250,000 fee interest purchase price. |
| This is not a research report and was not prepared by the Underwriters’ research departments. Please see additional important information and qualifications at the end of this Term Sheet. |
| MSBAM 2013-C11 | Limestone Ranch |
Mortgage Loan No. 17 – Limestone Ranch |
| Mortgage Loan Information | Mortgaged Property Information | ||||||
| Mortgage Loan Seller: | BANA | Single Asset / Portfolio: | Single Asset | ||||
Credit Assessment: (Fitch/Moody’s/Morningstar) | NR/NR/NR | Property Address: | 12655 Crossroads Park Drive Houston, TX 77065 | ||||
| Original Balance: | $14,870,000 | General Property Type: | Multifamily | ||||
| Cut-off Date Balance: | $14,870,000 | Detailed Property Type: | Garden | ||||
| % of Initial Pool Balance: | 1.7% | Number of Units: | 256 Units | ||||
| Loan Purpose: | Acquisition | Cut-off Date Balance Per Unit/SF: | $58,086 | ||||
| Borrower Name(s): | Arium Crossroads, LLC | Balloon / ARD Balance Per Unit/SF: | $52,073 | ||||
| Sponsor(s): | Darren W. DeVore and | Year Built / Year Renovated: | 1998 / NAP | ||||
| Michael Patrick Carroll | Title Vesting: | Fee | |||||
| Mortgage Rate: | 4.449% | Property Manager: | Carroll Management Group, LLC | ||||
| Note Date: | 6/20/2013 | Underwriting and Financial Information | |||||
| First Payment Date: | 8/1/2013 | UW Revenues: | $2,545,506 | ||||
| Anticipated Repayment Date: | NAP | UW Expenses: | $1,313,228 | ||||
| Maturity Date: | 7/1/2023 | UW NOI: | $1,232,278 | ||||
| IO Period: | 48 months | UW NCF: | $1,168,278 | ||||
| Original Term to Maturity or ARD: | 120 months | UW NOI DSCR: | 1.37x | ||||
| Seasoning: | 1 month | UW NCF DSCR: | 1.30x | ||||
| Original Amortization Term: | 360 months | UW NOI Debt Yield: | 8.3% | ||||
| Loan Amortization Type: | Partial IO | UW NCF Debt Yield: | 7.9% | ||||
| Interest Accrual Basis: | Actual/360 | UW NCF Debt Yield at Maturity: | 8.8% | ||||
| Prepayment Provisions: | LO (25); YM1/DEF (91); O (4) | Most Recent NOI (As of): | $1,232,674 (4/30/2013 TTM) | ||||
| Lockbox / Cash Management: | Soft / Springing | 2nd Most Recent NOI (As of): | $1,200,078 (12/31/2012) | ||||
| Pari Passu Mortgage Debt: | None | 3rd Most Recent NOI (As of): | $1,088,985 (12/31/2011) | ||||
| Subordinate Mortgage Debt: | None | Appraised Value: | $18,800,000 | ||||
| Mezzanine Debt: | None | Appraisal As-of Date: | 5/28/2013 | ||||
| Reserves | Cut-off Date LTV Ratio: | 79.1% | |||||
| Type | Initial | Monthly | Cap | LTV Ratio at Maturity/ARD: | 70.9% | ||
| RE Tax: | $284,398 | $40,628 | NAP | Occupancy Rate (As of): | 95.3% (6/13/2013) | ||
| Insurance: | $0 | Springing | NAP | 2nd Most Recent Occupancy (As of): | 88.0% (12/31/2012) | ||
| Deferred Maintenance: | $22,000 | $0 | NAP | 3rd Most Recent Occupancy (As of): | 88.7% (12/31/2011) | ||
| Recurring Replacements: | $822,988 | $5,333 | NAP | ||||
| This is not a research report and was not prepared by the Underwriters’ research departments. Please see additional important information and qualifications at the end of this Term Sheet. |
| MSBAM 2013-C11 | Hilton Garden Inn Tuscaloosa |
| Mortgage Loan No. 18 – Hilton Garden Inn Tuscaloosa |
| Mortgage Loan Information | Mortgaged Property Information | ||||||
| Mortgage Loan Seller: | BANA | Single Asset / Portfolio: | Single Asset | ||||
Credit Assessment: (Fitch/Moody’s/Morningstar) | NAP | Property Address: | 800 Hollywood Boulevard Tuscaloosa, AL 35405 | ||||
| Original Balance: | $13,211,250 | General Property Type: | Hospitality | ||||
| Cut-off Date Balance: | $13,180,493 | Detailed Property Type: | Limited Service | ||||
| % of Initial Pool Balance: | 1.5% | Number of Rooms: | 122 Rooms | ||||
| Loan Purpose: | Refinance | Cut-off Date Balance Per Room: | $108,037 | ||||
| Borrower Name(s): | Gopinath, LLC | Balloon / ARD Balance Per Room: | $68,372 | ||||
| Sponsor(s): | Chiman S. Patel; Vimu C. Patel | Year Built / Year Renovated: | 2007 / NAP | ||||
| Mortgage Rate: | 4.890% | Title Vesting: | Leasehold | ||||
| Note Date: | 6/14/2013 | Property Manager: | Kana Hotels, Inc. | ||||
| First Payment Date: | 8/1/2013 | ||||||
| Anticipated Repayment Date: | NAP | Underwriting and Financial Information | |||||
| Maturity Date: | 7/1/2023 | UW Revenues: | $4,512,526 | ||||
| IO Period: | 0 months | UW Expenses: | $2,574,917 | ||||
| Original Term to Maturity or ARD: | 120 months | UW NOI: | $1,937,610 | ||||
| Seasoning: | 1 month | UW NCF: | $1,735,994 | ||||
| Original Amortization Term: | 240 months | UW NOI DSCR: | 1.87x | ||||
| Loan Amortization Type: | Amortizing | UW NCF DSCR: | 1.67x | ||||
| Interest Accrual Basis: | Actual/360 | UW NOI Debt Yield: | 14.7% | ||||
| Prepayment Provisions: | LO (25); DEF (91); O (4) | UW NCF Debt Yield: | 13.2% | ||||
| Lockbox / Cash Management: | Hard / In-Place | UW NCF Debt Yield at Maturity: | 20.8% | ||||
| Pari Passu Mortgage Debt: | None | Most Recent NOI (As of): | $2,046,503 (4/30/2013 TTM) | ||||
| Subordinate Mortgage Debt: | None | 2nd Most Recent NOI (As of): | $1,929,694 (12/31/2012) | ||||
| Mezzanine Debt: | None | 3rd Most Recent NOI (As of): | $1,989,536 (12/31/2011) | ||||
| Reserves | Appraised Value: | $20,325,000 | |||||
| Type | Initial | Monthly | Cap | Appraisal As-of Date: | 4/19/2013 | ||
| RE Tax: | $50,175 | $6,272 | NAP | Cut-off Date LTV Ratio: | 64.8% | ||
| Insurance: | $0 | Springing | NAP | LTV Ratio at Maturity/ARD: | 41.0% | ||
| Deferred Maintenance: | $75,000 | $0 | NAP | Occupancy Rate (As of): | 76.1% (4/30/2013) | ||
| Recurring Replacements: | $0 | $15,042 | NAP | 2nd Most Recent Occupancy (As of): | 76.9% (12/31/2012) | ||
Other(1): | $0 | Springing | NAP | 3rd Most Recent Occupancy (As of): | 80.2% (12/31/2011) | ||
| (1) | On date any PIP imposed by Franchisor, the Hilton Garden Inn Tuscaloosa borrower is required to deposit monthly 125% of required PIP related to a PIP reserve. |
| This is not a research report and was not prepared by the Underwriters’ research departments. Please see additional important information and qualifications at the end of this Term Sheet. |
| MSBAM 2013-C11 | Woodbridge Square Medical |
| Mortgage Loan No. 19 – Woodbridge Square Medical |
| Mortgage Loan Information | Mortgaged Property Information | ||||||
| Mortgage Loan Seller: | MSMCH | Single Asset/ Portfolio: | Single Asset | ||||
Credit Assessment: (Fitch/Moody’s/Morningstar) | NR/NR/NR | Property Address: | 4980 Barranca Parkway Irvine, CA 92604 | ||||
| Original Balance: | $12,200,000 | General Property Type: | Office | ||||
| Cut-off Date Balance: | $12,200,000 | Detailed Property Type: | Medical | ||||
| % of Initial Pool Balance: | 1.4% | Net Rentable Area: | 36,660 SF | ||||
| Loan Purpose: | Refinance | Cut-off Date Balance Per Unit/SF: | $333 | ||||
| Borrower Name(s): | Woodbridge Medical Plaza I, LLC | Balloon/ARD Balance Per Unit/SF: | $288 | ||||
| Sponsor(s): | Richard E. Boureston | Year Built / Year Renovated: | 2005 / NAP | ||||
| Mortgage Rate: | 4.910% | Title Vesting: | Fee | ||||
| Note Date: | 7/15/2013 | Property Manager: | Pacific Coast Commercial Real Estate, Inc. | ||||
| First Payment Date: | 9/1/2013 | ||||||
| Anticipated Repayment Date: | NAP | Underwriting and Financial Information | |||||
| Maturity Date: | 8/1/2023 | UW Revenues: | $1,524,365 | ||||
| IO Period: | 24 months | UW Expenses: | $425,431 | ||||
| Original Term to Maturity or ARD: | 120 months | UW NOI: | $1,098,934 | ||||
| Seasoning: | 0 months | UW NCF: | $997,753 | ||||
| Original Amortization Term: | 360 months | UW NOI DSCR: | 1.41x | ||||
| Loan Amortization Type: | Partial IO | UW NCF DSCR: | 1.28x | ||||
| Interest Accrual Basis: | Actual/360 | UW NOI Debt Yield: | 9.0% | ||||
| Prepayment Provisions: | LO (24); DEF (92); O (4) | UW NCF Debt Yield: | 8.2% | ||||
| Lockbox / Cash Management: | Hard / Springing | UW NCF Debt Yield at Maturity: | 9.5% | ||||
| Pari Passu Mortgage Debt: | None | Most Recent NOI (As of): | $1,054,050 (12/31/2012) | ||||
| Subordinate Mortgage Debt: | None | 2nd Most Recent NOI (As of): | $1,010,471 (12/31/2011) | ||||
| Mezzanine Debt: | None | 3rd Most Recent NOI (As of): | $930,418 (12/31/2010) | ||||
| Reserves | Appraised Value: | $17,500,000 | |||||
| Type | Initial | Monthly | Cap | Appraisal As-of Date: | 5/29/2013 | ||
| RE Tax: | $31,549 | $6,310 | NAP | Cut-off Date LTV Ratio: | 69.7% | ||
| Insurance: | $5,258 | $584 | NAP | LTV Ratio at Maturity/ARD: | 60.3% | ||
| Recurring Replacements: | $0 | $611 | NAP | Occupancy Rate (As of): | 100.0% (5/17/2013) | ||
| TI/LC: | $0 | $6,416 | $230,958 | 2nd Most Recent Occupancy (As of): | 93.4% (12/31/2012) | ||
| Deferred Maintenance: | $13,239 | $0 | NAP | 3rd Most Recent Occupancy (As of): | |||
| This is not a research report and was not prepared by the Underwriters’ research departments. Please see additional important information and qualifications at the end of this Term Sheet. |
| MSBAM 2013-C11 | Spring Oaks Shopping Center |
| Mortgage Loan No. 20 – Spring Oaks Shopping Center |
| Mortgage Loan Information | Mortgaged Property Information | ||||||
| Mortgage Loan Seller: | BANA | Single Asset / Portfolio: | Single Asset | ||||
Credit Assessment: (Fitch/Moody’s/Morningstar) | NR/NR/NR | Property Address: | 4711-4825 Spring Mountain Road Las Vegas, NV 89102 | ||||
| Original Balance: | $12,000,000 | General Property Type: | Retail | ||||
| Cut-off Date Balance: | $11,985,343 | Detailed Property Type: | Anchored | ||||
| % of Initial Pool Balance: | 1.4% | Net Rentable Area: | 125,150 SF | ||||
| Loan Purpose: | Refinance | Cut-off Date Balance Per Unit/SF: | $96 | ||||
| Borrower Name: | Spring Oaks Shopping Center, LLC | Balloon / ARD Balance Per Unit/SF: | $77 | ||||
| Sponsor: | Jeff Damavandi | Year Built / Year Renovated: | 1977 / 2012 | ||||
| Mortgage Rate: | 4.390% | Title Vesting: | Fee | ||||
| Note Date: | 6/6/2013 | Property Manager: | Damavandi Capital, LLC | ||||
| First Payment Date: | 8/1/2013 | ||||||
| Anticipated Repayment Date: | NAP | Underwriting and Financial Information | |||||
| Maturity Date: | 7/1/2023 | UW Revenues: | $1,578,317 | ||||
| IO Period: | 0 months | UW Expenses: | $331,257 | ||||
Original Term to Maturity or ARD: | 120 months | UW NOI: | $1,247,060 | ||||
| Seasoning: | 1 month | UW NCF: | $1,146,017 | ||||
| Original Amortization Term: | 360 months | UW NOI DSCR: | 1.73x | ||||
| Loan Amortization Type: | Amortizing | UW NCF DSCR: | 1.59x | ||||
| Interest Accrual Basis: | Actual/360 | UW NOI Debt Yield: | 10.4% | ||||
| Prepayment Provisions: | LO (25); DEF (91); O (4) | UW NCF Debt Yield: | 9.6% | ||||
| Lockbox / Cash Management: | Hard / In Place | UW NCF Debt Yield at Maturity: | 11.8% | ||||
| Pari passu Mortgage Debt: | None | Most Recent NOI (As of): | $1,208,174 (12/31/2012) | ||||
| Subordinate Mortgage Debt: | None | 2nd Most Recent NOI (As of): | $1,342,635 (12/31/2011) | ||||
| Mezzanine Debt: | None | 3rd Most Recent NOI (As of): | $1,085,127(12/31/2010) | ||||
| Reserves | Appraised Value: | $18,750,000 | |||||
| Type | Initial | Monthly | Cap | Appraisal As-of Date: | 4/15/2013 | ||
| RE Tax: | $30,496 | $7,624 | NAP | Cut-off Date LTV Ratio: | 63.9% | ||
| Insurance: | $0 | Springing | NAP | LTV Ratio at Maturity/ARD: | 51.7% | ||
| Recurring Replacements: | $0 | $1,564 | NAP | Occupancy Rate (As of): | 97.2% (5/20/2013) | ||
| TI/LC Reserve: | $131,426 | $4,000 | NAP | 2nd Most Recent Occupancy (As of): | 100% (12/31/2012) | ||
3rd Most Recent Occupancy (As of): | 100% (12/31/2011) | ||||||
| This is not a research report and was not prepared by the Underwriters’ research departments. Please see additional important information and qualifications at the end of this Term Sheet. |
| MSBAM 2013-C11 |