Banc of America Merrill Lynch Commercial Mortgage
Filed: 8 Sep 15, 12:00am
| FREE WRITING PROSPECTUS | ||
| FILED PURSUANT TO RULE 433 | ||
| REGISTRATION FILE NO.: 333-201743-01 | ||
September 8, 2015
FREE WRITING PROSPECTUS
STRUCTURAL AND COLLATERAL TERM SHEET
$757,280,331
(Approximate Total Mortgage Pool Balance)
$703,324,000
(Approximate Offered Certificates)
BACM 2015-UBS7 |
Banc of America Merrill Lynch Commercial Mortgage Inc.
Depositor
UBS Real Estate Securities Inc.
Bank of America, National Association
Sponsors and Mortgage Loan Sellers
| BofA Merrill Lynch | UBS Securities LLC | |
| Joint Bookrunning Managers and Co-Lead Managers | ||
| Drexel Hamilton | ||
Co-Manager | ||
The depositor has filed a registration statement (including the prospectus) with the SEC (File No. 333-201743) for the offering to which this communication relates. Before you invest, you should read the prospectus in the registration statement and other documents the depositor has filed with the SEC for more complete information about the depositor, the issuing entity and this offering. You may get these documents for free by visiting EDGAR on the SEC website at www.sec.gov. Alternatively, the depositor, Merrill Lynch, Pierce, Fenner & Smith Incorporated, UBS Securities LLC or any other underwriter, or any dealer participating in this offering will arrange to send you the prospectus if you request it by calling toll-free 1-800-294-1322 or by email to the following address:dg.Prospectus_Requests@baml.com. The offered certificates referred to in these materials, and the asset pool backing them, are subject to modification or revision (including the possibility that one or more classes of certificates may be split, combined or eliminated at any time prior to issuance or availability of a final prospectus) and are offered on a “when, as and if issued” basis. You understand that, when you are considering the purchase of these certificates, a contract of sale will come into being no sooner than the date on which the relevant class has been priced and we have verified the allocation of certificates to be made to you; any “indications of interest” expressed by you, and any “soft circles” generated by us, will not create binding contractual obligations for you or us.
STATEMENT REGARDING THIS FREE WRITING PROSPECTUS
Nothing in this document constitutes an offer of securities for sale in any jurisdiction where the offer or sale is not permitted. The information contained herein is preliminary as of the date hereof, supersedes any such information previously delivered to you and will be superseded by any such information subsequently delivered and ultimately by the final prospectus relating to the securities. These materials are subject to change, completion, supplement or amendment from time to time.
STATEMENT REGARDING CERTAIN ESTIMATES AND OTHER INFORMATION
This free writing prospectus contains certain forward-looking statements. If and when included in this free writing prospectus, the words “expects”, “intends”, “anticipates”, “estimates” and analogous expressions and all statements that are not historical facts, including statements about our beliefs or expectations, are intended to identify forward-looking statements. Any forward-looking statements are made subject to risks and uncertainties which could cause actual results to differ materially from those stated. Those risks and uncertainties include, among other things, declines in general economic and business conditions, increased competition, changes in demographics, changes in political and social conditions, regulatory initiatives and changes in customer preferences, many of which are beyond our control and the control of any other person or entity related to this offering. The forward-looking statements made in this free writing prospectus are made as of the date stated on the cover. We have no obligation to update or revise any forward-looking statement.
“Bank of America Merrill Lynch” is the marketing name for the global banking and global markets businesses of Bank of America Corporation. Lending, derivatives, and other commercial banking activities are performed globally by banking affiliates of Bank of America Corporation, including Bank of America, N.A., member FDIC. Securities, strategic advisory, and other investment banking activities are performed globally by investment banking affiliates of Bank of America Corporation, including, in the United States, Merrill Lynch, Pierce, Fenner & Smith Incorporated, which is a registered broker-dealer and member of FINRA and SIPC, and, in other jurisdictions, locally registered entities.
IMPORTANT NOTICE REGARDING THE OFFERED CERTIFICATES
The certificates to be backed in part by the assets described herein, and such assets, are subject to modification, revision and other changes any time prior to issuance or availability of a final prospectus, such certificates are offered on a “when, as and if issued” basis. Prospective investors should understand that, when considering the purchase of such certificates, a contract of sale will come into being no sooner than the date on which the relevant class of certificates has been priced and the underwriters have confirmed the allocation of certificates to be made to investors; any “indications of interest” expressed by any prospective investor, and any “soft circles” generated by the underwriters, will not create binding contractual obligations for such prospective investors, on the one hand, or the underwriters, the depositor or any of their respective agents or affiliates, on the other hand.
As a result of the foregoing, a prospective investor may commit to purchase certificates that have characteristics (including with respect to the underlying assets) that may change, and each prospective investor is advised that all or a portion of the certificates referred to in these materials may be issued without all or certain of the characteristics (including with respect to the underlying assets) described in these materials. The underwriters’ obligation to sell certificates to any prospective investor is conditioned on the certificates and the transaction having the characteristics described in these materials. If the underwriters determine that a condition is not satisfied in any material respect, such prospective investor will be notified, and neither the depositor nor the underwriters will have any obligation to such prospective investor to deliver any portion of the certificates which such prospective investor has committed to purchase, and there will be no liability between the underwriters, the depositor or any of their respective agents or affiliates, on the one hand, and such prospective investor, on the other hand, as a consequence of the non-delivery.
Each prospective investor has requested that the underwriters provide to such prospective investor information in connection with such prospective investor’s consideration of the purchase of the certificates to be backed in part by the assets described in these materials. These materials are being provided to each prospective investor for informative purposes only in response to such prospective investor’s specific request. The underwriters described in these materials may from time to time perform investment banking services for, or solicit investment banking business from, any company named in these materials. The underwriters and/or their affiliates or respective employees may from time to time have a long or short position in any security or contract discussed in these materials.
The information contained herein supersedes any previous such information delivered to any prospective investor and will be superseded by information delivered to such prospective investor prior to the time of sale.
IMPORTANT NOTICE RELATING TO AUTOMATICALLY-GENERATED EMAIL DISCLAIMERS
Any legends, disclaimers or other notices that may appear at the bottom of any email communication to which this free writing prospectus is attached relating to (1) these materials not constituting an offer (or a solicitation of an offer), (2) no representation that these materials are accurate or complete and may not be updated or (3) these materials possibly being confidential, are not applicable to these materials and should be disregarded. Such legends, disclaimers or other notices have been automatically generated as a result of these materials having been sent via Bloomberg or another system.
BACM 2015-UBS7
Capitalized terms used but not defined herein have the meanings assigned to them in the other free writing prospectus expected to be dated September 8, 2015, relating to the offered certificates (hereinafter referred to as the “Free Writing Prospectus”).
| KEY FEATURES OF SECURITIZATION | |||
| Offering Terms: | |||
| Joint Bookrunners & Co-Lead Managers: | Merrill Lynch, Pierce, Fenner & Smith Incorporated UBS Securities LLC | ||
| Co-Manager: | Drexel Hamilton, LLC | ||
| Mortgage Loan Sellers: | UBS Real Estate Securities Inc. (“UBSRES”) (83.7%) and Bank of America, National Association (“BANA”) (16.3%). | ||
| Master Servicer: | Midland Loan Services, a Division of PNC Bank, National Association | ||
| Trust Advisor: | Pentalpha Surveillance LLC | ||
| Special Servicer: | LNR Partners, LLC | ||
| Trustee: | U.S. Bank National Association | ||
| Certificate Administrator: | U.S. Bank National Association | ||
| Rating Agencies: | Fitch Ratings, Inc., Kroll Bond Rating Agency, Inc., Moody’s Investors Service, Inc. and Morningstar Credit Ratings, LLC | ||
| Determination Date: | The 11th day of each month, or if such 11th day is not a business day, the succeeding business day, commencing in October 2015. | ||
| Distribution Date: | 4th business day following the Determination Date in each month, commencing in October 2015. | ||
| Cut-off Date: | September 1, 2015. For purposes of the information contained in this Term Sheet, scheduled payments due in September 2015 with respect to mortgage loans not having payment dates on the first day of each month have been deemed received on September 1, 2015, not the actual day or days on which such scheduled payments were due. Unless otherwise noted, all mortgage loan statistics are based on the outstanding principal balances as of the Cut-off Date. | ||
| Settlement Date: | On or about September 24, 2015 | ||
| Settlement Terms: | DTC, Euroclear and Clearstream, same day funds, with accrued interest. | ||
| ERISA Eligible: | All of the Offered Certificates are expected to be ERISA eligible. | ||
| SMMEA Eligible: | None of the Offered Certificates will be SMMEA eligible. | ||
| Day Count: | 30/360 | ||
| Tax Treatment: | REMIC | ||
| Rated Final Distribution Date: | September 2048 | ||
| Minimum Denominations: | $10,000 (or $100,000 with respect to the Class X-A, Class X-B and Class X-D Certificates) and in each case in multiples of $1 thereafter. | ||
| Clean-up Call: | 1.0% | ||
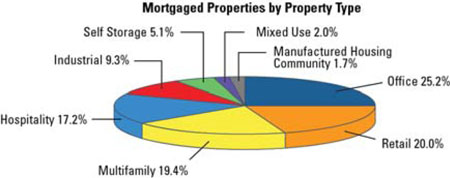
Distribution of Collateral by Property Type |
THE INFORMATION IN THIS STRUCTURAL AND COLLATERAL TERM SHEET IS NOT COMPLETE AND MAY BE AMENDED PRIOR TO THE TIME OF SALE. THIS TERM SHEET IS NOT AN OFFER TO SELL THESE SECURITIES AND IT IS NOT A SOLICITATION OF AN OFFER TO BUY THESE SECURITIES IN ANY JURISDICTION WHERE THE OFFER OR SALE IS NOT PERMITTED.
| 3 |
BACM 2015-UBS7
|
| TRANSACTION HIGHLIGHTS |
Mortgage Loan Sellers | Number of Mortgage Loans | Number of Mortgaged Properties | Aggregate Cut-off Date Balance | % of Outstanding Pool Balance | ||
| UBS Real Estate Securities Inc. | 33 | 48 | $634,123,331 | 83.7% | ||
| Bank of America, National Association | 9 | 9 | $123,157,000 | 16.3% | ||
| Total: | 42 | 57 | $757,280,331 | 100.0% | ||
Pooled Collateral Facts: | ||||||
| Initial Outstanding Pool Balance: | $757,280,331 | |||||
| Number of Mortgage Loans: | 42 | |||||
| Number of Mortgaged Properties: | 57 | |||||
| Average Mortgage Loan Cut-off Date Balance: | $18,030,484 | |||||
| Average Mortgaged Property Cut-off Date Balance: | $13,285,620 | |||||
| Weighted Average Mortgage Rate: | 4.3803% | |||||
| Weighted Average Mortgage Loan Original Term to Maturity Date or ARD (months): | 120 | |||||
| Weighted Average Mortgage Loan Remaining Term to Maturity Date or ARD (months): | 119 | |||||
| Weighted Average Mortgage Loan Seasoning (months): | 1 | |||||
| % of Mortgaged Properties Leased to a Single Tenant: | 16.1% | |||||
Credit Statistics(1): | ||||||
| Weighted Average Mortgage Loan U/W NCF DSCR: | 1.85x | |||||
| Weighted Average Mortgage Loan Cut-off Date LTV(2)(3): | 59.2% | |||||
| Weighted Average Mortgage Loan Maturity Date or ARD LTV(2): | 51.6% | |||||
| Weighted Average U/W NOI Debt Yield(3): | 11.0% | |||||
Amortization Overview: | ||||||
| % Mortgage Loans with Amortization through Maturity Date or ARD: | 39.6% | |||||
| % Mortgage Loans which pay Interest Only through Maturity Date or ARD: | 32.1% | |||||
| % Mortgage Loans which pay Interest Only followed by Amortization through Maturity Date or ARD: | 28.3% | |||||
| Weighted Average Remaining Amortization Term (months)(4): | 338 | |||||
Loan Structural Features: | ||||||
| % Mortgage Loans with Upfront or Ongoing Tax Reserves: | 77.3% | |||||
| % Mortgage Loans with Upfront or Ongoing Replacement Reserves(5): | 65.2% | |||||
| % Mortgage Loans with Upfront or Ongoing Insurance Reserves: | 56.0% | |||||
| % Mortgage Loans with Upfront or Ongoing TI/LC Reserves(6): | 40.0% | |||||
| % Mortgage Loans with Upfront Engineering Reserves: | 34.1% | |||||
| % Mortgage Loans with Upfront or Ongoing Other Reserves: | 43.9% | |||||
| % Mortgage Loans with In Place Hard Lockboxes: | 53.2% | |||||
| % Mortgage Loans with Cash Traps Triggered at DSCR Levels ≥ 1.05x: | 89.2% | |||||
| % Mortgage Loans with Cash Traps Triggered only based on Loan Specific Debt Yield: | 5.9% | |||||
| % Mortgage Loans with Defeasance Only After a Lockout Period and Prior to an Open Period: | 76.4% | |||||
| % Mortgage Loans with Prepayment with a Yield Maintenance Charge Only After a Lockout Period and Prior to an Open Period: | 17.0% | |||||
| % Mortgage Loans with Prepayment with a YM Charge Prior to an Open Period: | 5.9% | |||||
| % Mortgage Loans with YM Charge Only After a Lockout Period and YM Charge or Defeasance Only after a Yield Maintenance Period and Prior to an Open Period: | 0.7% | |||||
| (1) | With respect to the Charles River Plaza North Mortgage Loan, the 261 Fifth Avenue Mortgage Loan, The Mall of New Hampshire Mortgage Loan, the 200 Helen Street Mortgage Loan, the WPC Department Store Portfolio Mortgage Loan and the Aviare Place Apartments Mortgage Loan, the LTV, DSCR and debt yield calculations include the relatedpari passu companion loan(s) but exclude the related subordinate companion loan, if applicable. |
| (2) | With respect to the Preferred Freezer – Lynden, WA Mortgage Loan, representing 3.3% of the initial outstanding principal balance as of the Cut-off Date, the Cut-off Date LTV and Maturity Date or ARD LTV have in certain cases been calculated based on the “as stabilized” value. For additional information, see the footnotes to APPENDIX I in the Free Writing Prospectus. |
| (3) | With respect to the Lockport Square Mortgage Loan, representing approximately 0.6% of the initial outstanding pool balance as of the Cut-off Date, the loan-to-value ratio and the debt yield for such mortgage loan has been calculated based on the mortgage loan balance net of a holdback reserve or an earnout reserve. For additional information, see the definitions of “Cut-off Date Loan-to-Value Ratio” and “Cut-off Date U/W NOI Debt Yield” in “Description of the Mortgage Pool—Additional Mortgage Loan Information” in the Free Writing Prospectus. |
| (4) | Excludes mortgage loans that are interest only for the full loan term or through a related anticipated repayment date. |
| (5) | Includes FF&E Reserves. |
| (6) | Represents the percent of the allocated initial outstanding principal balance of retail, office, industrial and mixed use properties only. |
THE INFORMATION IN THIS STRUCTURAL AND COLLATERAL TERM SHEET IS NOT COMPLETE AND MAY BE AMENDED PRIOR TO THE TIME OF SALE. THIS TERM SHEET IS NOT AN OFFER TO SELL THESE SECURITIES AND IT IS NOT A SOLICITATION OF AN OFFER TO BUY THESE SECURITIES IN ANY JURISDICTION WHERE THE OFFER OR SALE IS NOT PERMITTED.
| 4 |
BACM 2015-UBS7
|
| STRUCTURE OVERVIEW |
OFFERED CERTIFICATES
| Class(1) | Ratings(2) (Fitch/KBRA/Moody’s/Morningstar) | Initial Certificate Principal Balance or Notional Amount(3) | Initial Subordination | Expected Weighted Average Life (years)(4) | Principal Window (months)(4) | Certificate Principal to Value Ratio(5) | Underwritten NOI Debt Yield(6) |
| Class A-1 | AAAsf/AAA(sf)/Aaa(sf)/AAA | $38,700,000 | 30.000%(7) | 2.80 | 1-60 | 41.4% | 15.7% |
| Class A-SB | AAAsf/AAA(sf)/Aaa(sf)/AAA | $62,400,000 | 30.000%(7) | 7.61 | 60-117 | 41.4% | 15.7% |
| Class A-3 | AAAsf/AAA(sf)/Aaa(sf)/AAA | $200,000,000 | 30.000%(7) | 9.85 | 117-119 | 41.4% | 15.7% |
| Class A-4 | AAAsf/AAA(sf)/Aaa(sf)/AAA | $228,996,000 | 30.000%(7) | 9.94 | 119-120 | 41.4% | 15.7% |
| Class X-A(8) | AAAsf/AAA(sf)/Aaa(sf)/AAA | $530,096,000(9) | N/A | N/A | N/A | N/A | N/A |
| Class X-B(8) | AAAsf/AAA(sf)/Aa2(sf)/AAA | $50,170,000(9) | N/A | N/A | N/A | N/A | N/A |
| Class X-D(8) | BBB-sf/BBB-(sf)/NR/AAA | $39,879,000(9) | N/A | N/A | N/A | N/A | N/A |
| Class A-S | AAAsf/AAA(sf)/Aa2(sf)/AAA | $50,170,000 | 23.375% | 9.98 | 120-120 | 45.4% | 14.4% |
| Class B | AA-sf/AA-(sf)/NR/AA- | $50,169,000 | 16.750% | 9.98 | 120-120 | 49.3% | 13.2% |
| Class C | A-sf/A-(sf)/NR/A- | $33,010,000 | 12.391% | 9.98 | 120-120 | 51.9% | 12.6% |
| Class D | BBB-sf/BBB-(sf)/NR/BBB- | $39,879,000 | 7.125% | 9.98 | 120-120 | 55.0% | 11.8% |
NON-OFFERED CERTIFICATES(10)
| Class(1) | Ratings(2) (Fitch/KBRA/Moody’s/Morningstar) | Initial Certificate Principal Balance or Notional Amount(3) | Initial Subordination | Expected Weighted Average Life (years)(4) | Principal Window (months)(4) | Certificate Principal to Value Ratio(5) | Underwritten NOI Debt Yield(6) |
| Class X-E(8) | BB-sf/BB(sf)/NR/AAA | $17,038,000(9) | N/A | N/A | N/A | N/A | N/A |
| Class X-FG(8) | NR/NR/NR/AAA | $15,146,000(9) | N/A | N/A | N/A | N/A | N/A |
| Class X-NR(8) | NR/NR/NR/AAA | $21,772,331(9) | N/A | N/A | N/A | N/A | N/A |
| Class E | BB-sf/BB(sf)/NR/BB- | $17,038,000 | 4.875% | 9.98 | 120-120 | 56.3% | 11.6% |
| Class F | B-sf/B+(sf)/NR/B | $7,573,000 | 3.875% | 9.98 | 120-120 | 56.9% | 11.4% |
| Class G | NR/B-(sf)/NR/B- | $7,573,000 | 2.875% | 9.98 | 120-120 | 57.5% | 11.3% |
| Class H | NR/NR/NR/NR | $21,772,331 | 0.000% | 9.98 | 120-120 | 59.2% | 11.0% |
Please see footnotes on following page.
THE INFORMATION IN THIS STRUCTURAL AND COLLATERAL TERM SHEET IS NOT COMPLETE AND MAY BE AMENDED PRIOR TO THE TIME OF SALE. THIS TERM SHEET IS NOT AN OFFER TO SELL THESE SECURITIES AND IT IS NOT A SOLICITATION OF AN OFFER TO BUY THESE SECURITIES IN ANY JURISDICTION WHERE THE OFFER OR SALE IS NOT PERMITTED.
| 5 |
BACM 2015-UBS7
|
| STRUCTURE OVERVIEW |
| (1) | Theper annum pass-through rates applicable to the Class A-1, Class A-SB, Class A-3, Class A-4, Class A-S, Class B, Class C, Class D, Class E, Class F, Class G and Class H Certificates will equal one of: (i) a fixed rate, (ii) a fixed rate subject to a cap equal to the weighted average of the net interest rates on the mortgage loans (in each case adjusted, if necessary, to accrue on the basis of a 360-day year consisting of twelve 30-day months) or (iii) a rate equal to the weighted average of the net interest rates on the mortgage loans (in each case adjusted, if necessary, to accrue on the basis of a 360-day year consisting of twelve (30-day months) less a specified percentage, which percentage may be zero. |
| (2) | Ratings shown are those of Fitch Ratings, Inc. (“Fitch”), Kroll Bond Rating Agency, Inc. (“KBRA”), Moody’s Investors Service, Inc. (“Moody’s) and Morningstar Credit Ratings, LLC (“Morningstar”). Certain nationally recognized statistical rating organizations that were not hired by the depositor may use information they receive pursuant to Rule 17g-5 under the Securities Exchange Act of 1934, as amended, or otherwise to rate the certificates. There can be no assurance as to what ratings a non-hired nationally recognized statistical rating organization would assign. See “Risk Factors—Risks Related to the Offered Certificates—Ratings of the Offered Certificates Do Not Represent Any Assessment of the Yield to Maturity That a Certificateholder May Experience and Such Ratings May Be Reviewed, Revised, Suspended, Downgraded, Qualified or Withdrawn By the Applicable Rating Agency” and “Ratings” in the Free Writing Prospectus. Fitch, KBRA and Moody’s have informed us that the “sf” designation in their ratings represents an identifier for structured finance product ratings. |
| (3) | Approximate; subject to a permitted variance of plus or minus 5% on the Settlement Date. In addition, the notional amounts of the Class X-A, Class X-B, Class X-D, Class X-E, Class X-FG and Class X-NR Certificates may vary depending upon the final pricing of the classes of principal balance certificates and whose certificate principal balances comprise such notional amounts and, if as a result of such pricing the pass-through rate of the Class X-A, Class X-B, Class X-D, Class X-E, Class X-FG and Class X-NR Certificates, as applicable, would be equal to zero, such class of certificates will not be issued on the Settlement Date of this securitization. |
| (4) | The principal window is expressed in months following the Settlement Date and reflects the period during which distributions of principal would be received under the assumptions set forth in the following sentence. The expected weighted average life and principal window figures set forth above are based on the following assumptions, among others: (i) no defaults or subsequent losses on the mortgage loans; (ii) no extensions of maturity dates of the mortgage loans; (iii) payment in full on the stated maturity date or, in the case of any mortgage loan having an anticipated repayment date, on the anticipated repayment date; and (iv) no prepayments of the mortgage loans prior to maturity or, in the case of a mortgage loan having an anticipated repayment date, prior to such anticipated repayment date. See the structuring assumptions set forth under “Yield, Prepayment and Maturity Considerations—Weighted Average Life” in the Free Writing Prospectus. |
| (5) | “Certificate Principal to Value Ratio” for any class of principal balance certificates is calculated as the product of (a) the weighted average Cut-off Date LTV Ratio of the mortgage pool, multiplied by (b) a fraction, the numerator of which is the total initial certificate principal balance of the subject class of principal balance certificates and all other classes of principal balance certificates that are senior to such class, and the denominator of which is the total initial certificate principal balance of all the principal balance certificates. The Certificate Principal to Value Ratios of the Class A-1, Class A-SB, Class A-3 and Class A-4 Certificates are calculated in the aggregate for those classes as if they were a single class. |
| (6) | “Underwritten NOI Debt Yield” for any class of principal balance certificates is calculated as the product of (a) the weighted average UW NOI Debt Yield for the mortgage pool, multiplied by (b) a fraction, the numerator of which is the total initial certificate principal balance of all the principal balance certificates, and the denominator of which is the total initial certificate principal balance of the subject class of principal balance certificates and all other classes of principal balance certificates, if any, that are senior to such class. The Underwritten NOI Debt Yields of the Class A-1, Class A-SB, Class A-3 and Class A-4 Certificates are calculated in the aggregate for those classes as if they were a single class. |
| (7) | The initial subordination levels for the Class A-1, Class A-SB, Class A-3 and Class A-4 Certificates represent the approximate credit support for the Class A-1, Class A-SB, Class A-3 and Class A-4 Certificates in the aggregate. |
| (8) | As further described in the Free Writing Prospectus, the pass-through rate on the Class X-A Certificates will generally be equal to the excess, if any, of (a) the weighted average of the net interest rates on the mortgage loans (in each case adjusted, if necessary, to accrue on the basis of a 360-day year consisting of twelve 30-day months), over (b) the weighted average of the pass-through rates of the Class A-1, Class A-SB, Class A-3 and Class A-4 Certificates as described in the Free Writing Prospectus. The pass-through rate on the Class X-B Certificates will generally be equal to the excess, if any, of (a) the weighted average of the net interest rates on the mortgage loans (in each case adjusted, if necessary, to accrue on the basis of a 360-day year consisting of twelve 30-day months), over (b) the pass-through rate of the Class A-S Certificates as described in the Free Writing Prospectus. The pass-through rate on the Class X-D Certificates will generally be equal to the excess, if any, of (a) the weighted average of the net interest rates on the mortgage loans (in each case adjusted, if necessary, to accrue on the basis of a 360-day year consisting of twelve 30-day months), over (b) the pass-through rate of the Class DCertificates as described in the Free Writing Prospectus. The pass-through rate on the Class X-E Certificates will generally be equal to the excess, if any, of (a) the weighted average of the net interest rates on the mortgage loans (in each case adjusted, if necessary, to accrue on the basis of a 360-day year consisting of twelve 30-day months), over (b) the pass-through rate of the Class E Certificates as described in the Free Writing Prospectus. The pass-through rate on the Class X-FG Certificates will generally be equal to the excess, if any, of (a) the weighted average of the net interest rates on the mortgage loans (in each case adjusted, if necessary, to accrue on the basis of a 360-day year consisting of twelve 30-day months), over (b) the weighted average of the pass-through rates of the Class F and Class G Certificates as described in the Free Writing Prospectus. The pass-through rate on the Class X-NR Certificates will generally be equal to the excess, if any, of (a) the weighted average of the net interest rates on the mortgage loans (in each case adjusted, if necessary, to accrue on the basis of a 360-day year consisting of twelve 30-day months), over (b) the pass-through rate of the Class H Certificates as described in the Free Writing Prospectus. |
| (9) | The Class X-A, Class X-B, Class X-D, Class X-E, Class X-FG and Class X-NR Certificates (collectively, the “Class X Certificates”) will not have certificate principal balances and will not be entitled to receive distributions of principal. Interest will accrue on the Class X-A, Class X-B, Class X-D, Class X-E, Class X-FG and Class X-NR Certificates at their respective pass-through rates based upon their respective notional amounts. The notional amount of the Class X-A Certificates will be equal to the aggregate certificate principal balances of the Class A-1, Class A-SB, Class A-3 and Class A-4 Certificates outstanding from time to time. The notional amount of the Class X-B Certificates will be equal to the certificate principal balance of the Class A-S Certificates outstanding from time to time. The notional amount of the Class X-D Certificates will be equal to the certificate principal balance of the Class D Certificates outstanding from time to time. The notional amount of the Class X-E Certificates will be equal to the certificate principal balance of the Class E Certificates outstanding from time to time.The notional amount of the Class X-FG Certificates will be equal to the aggregate certificate principal balances of the Class F and Class G Certificates outstanding from time to time. The notional amount of the Class X-NR Certificates will be equal to the certificate principal balance of the Class H Certificates outstanding from time to time. |
| (10) | Not offered pursuant to the Free Writing Prospectus or this Term Sheet. Information provided in this Term Sheet regarding the characteristics of these certificates is provided only to enhance your understanding of the offered certificates. The privately offered certificates also include the Class V and Class R Certificates, which will not have a certificate principal balance, notional amount, pass-through rate, rating or rated final distribution date, and which are not shown in the chart. The Class V Certificates will represent a beneficial ownership interest held through the grantor trust in certain excess interest in respect of mortgage loans having anticipated repayment dates, if any. The Class R Certificates will represent the beneficial ownership of the residual interest in each of the real estate mortgage investment conduits, as further described in the Free Writing Prospectus. |
THE INFORMATION IN THIS STRUCTURAL AND COLLATERAL TERM SHEET IS NOT COMPLETE AND MAY BE AMENDED PRIOR TO THE TIME OF SALE. THIS TERM SHEET IS NOT AN OFFER TO SELL THESE SECURITIES AND IT IS NOT A SOLICITATION OF AN OFFER TO BUY THESE SECURITIES IN ANY JURISDICTION WHERE THE OFFER OR SALE IS NOT PERMITTED.
| 6 |
BACM 2015-UBS7
|
| STRUCTURE OVERVIEW |
| Principal Distributions: | Payments in respect of principal of the certificates will be distributed,first, to the Class A-SB Certificates, until the certificate principal balance of such class is reduced to the planned principal balance for the related Distribution Date set forth on APPENDIX VII to the Free Writing Prospectus,then, to the Class A-1, Class A-3, Class A-4, Class A-SB, Class A-S, Class B, Class C, Class D, Class E, Class F, Class G and Class H Certificates, in that order, until the certificate principal balance of each such class is reduced to zero. Notwithstanding the foregoing, if the aggregate certificate principal balances of the Class A-S, Class B, Class C, Class D, Class E, Class F, Class G and Class H Certificates have been reduced to zero as a result of the allocation of mortgage loan losses or trust advisor expenses to those certificates, or if the aggregate appraisal reduction equals or exceeds the aggregate certificate principal balances of the Class A-S through Class H Certificates, distributions in respect of principal of the certificates will be distributed,first, to the Class A-1, Class A-SB, Class A-3 and Class A-4 Certificates, on apro rata basis, based on the certificate principal balance of each such class,then, to the extent of any recoveries on realized losses, to the Class A-S, Class B, Class C, Class D, Class E, Class F, Class G and Class H Certificates, in that order, in each case until the certificate principal balance of each such class is reduced to zero (or previously allocated realized losses have been fully reimbursed).
The Class X Certificates will not be entitled to receive distributions of principal; however, (i) the notional amount of the Class X-A Certificates will be reduced by the aggregate amount of principal distributions and realized losses allocated to the Class A-1, Class A-SB, Class A-3 and Class A-4 Certificates; (ii) the notional amount of the Class X-B Certificates will be reduced by the aggregate amount of principal distributions and realized losses allocated to the Class A-S Certificates; (iii) the notional amount of the Class X-D Certificates will be reduced by the principal distributions and realized losses allocated to the Class D Certificates; (iv) the notional amount of the Class X-E Certificates will be reduced by the principal distributions and realized losses allocated to the Class E Certificates; (v) the notional amount of the Class X-FG Certificates will be reduced by the aggregate amount of principal distributions and realized losses allocated to the Class F and Class G Certificates; and (vi) the notional amount of the Class X-NR Certificates will be reduced by the principal distributions and realized losses allocated to the Class H Certificates.
| |||
| Interest Distributions: | On each Distribution Date, interest accrued for each class of the certificates at the applicable pass-through rate will be distributed in the following order of priority, to the extent of available funds:first, to the Class A-1, Class A-SB, Class A-3, Class A-4, Class X-A, Class X-B, Class X-D, Class X-E, Class X-FG and Class X-NR Certificates, on apro rata basis, based on the accrued and unpaid interest on each such class andthen, to the Class A-S, Class B, Class C, Class D, Class E, Class F, Class G and Class H Certificates, in that order, in each case until the interest payable to each such class is paid in full.
Theper annum pass-through rates applicable to the Class A-1, Class A-SB, Class A-3, Class A-4, Class A-S, Class B, Class C, Class D, Class E, Class F, Class G and Class H Certificates for each Distribution Date will equal one of: (i) a fixed rate, (ii) a fixed rate subject to a cap equal to the weighted average of the net interest rates on the mortgage loans (in each case adjusted, if necessary, to accrue on the basis of a 360-day year consisting of twelve 30-day months) or (iii) a rate equal to the weighted average of the net interest rates on the mortgage loans (in each case adjusted, if necessary, to accrue on the basis of a 360-day year consisting of twelve 30-day months) less a specified percentage, which percentage may be zero.
As further described in the Free Writing Prospectus, theper annumpass-through rate on the Class X-A Certificates will generally be equal to the excess, if any, of (a) the weighted average of the net interest rates on the mortgage loans (in each case adjusted, if necessary, to accrue on the basis of a 360-day year consisting of twelve 30-day months), over (b) the weighted average of the pass-through rates of the Class A-1, Class A-SB, Class A-3 and Class A-4 Certificates as described in the Free Writing Prospectus. Theper annum pass-through rate on the Class X-B Certificates will generally be equal to the excess, if any, of (a) the weighted average of the net interest rates on the mortgage loans (in each case adjusted, if necessary, to accrue on the basis of a 360-day year consisting of twelve 30-day months), over (b) the pass-through rate of the Class A-S Certificates as described in the Free Writing Prospectus. Theper annumpass-through rate on the Class X-D Certificates will generally be equal to the excess, if any, of (a) the weighted average of the net interest rates on the mortgage loans (in each case adjusted, if necessary, to accrue on the basis of a 360-day year consisting of | |||
THE INFORMATION IN THIS STRUCTURAL AND COLLATERAL TERM SHEET IS NOT COMPLETE AND MAY BE AMENDED PRIOR TO THE TIME OF SALE. THIS TERM SHEET IS NOT AN OFFER TO SELL THESE SECURITIES AND IT IS NOT A SOLICITATION OF AN OFFER TO BUY THESE SECURITIES IN ANY JURISDICTION WHERE THE OFFER OR SALE IS NOT PERMITTED.
| 7 |
BACM 2015-UBS7
|
| STRUCTURE OVERVIEW |
| twelve 30-day months), over (b) the pass-through rate of the Class D Certificates as described in the Free Writing Prospectus. Theper annumpass-through rate on the Class X-E Certificates will generally be equal to the excess, if any, of (a) the weighted average of the net interest rates on the mortgage loans (in each case adjusted, if necessary, to accrue on the basis of a 360-day year consisting of twelve 30-day months), over (b) the pass-through rate of the Class E Certificates as described in the Free Writing Prospectus. Theper annumpass-through rate on the Class X-FG Certificates will generally be equal to the excess, if any, of (a) the weighted average of the net interest rates on the mortgage loans (in each case adjusted, if necessary, to accrue on the basis of a 360-day year consisting of twelve 30-day months), over (b) the weighted average of the pass-through rates of the Class F and Class G Certificates as described in the Free Writing Prospectus. Theper annum pass-through rate on the Class X-NR Certificates will generally be equal to the excess, if any, of (a) the weighted average of the net interest rates on the mortgage loans (in each case adjusted, if necessary, to accrue on the basis of a 360-day year consisting of twelve 30-day months), over (b) the pass-through rate of the Class H Certificates as described in the Free Writing Prospectus. | ||||
| Trust Advisor Expenses: | Trust Advisor expenses will be allocated, (i)first, to reduce payments of interest on the Class D, Class C and Class B Certificates, in that order, (ii)second, to reduce payments of principal on the Class D, Class C, Class B and Class A-S Certificates, in that order, and (iii)third, to reduce payments of principal on the Class A-1, Class A-SB, Class A-3 and Class A-4 Certificates on apro rata basis.
No Trust Advisor expenses (other than the Trust Advisor fee) will be allocated to or otherwise borne by the Control Eligible Certificates. As a result, no class of Control Eligible Certificates will provide protection to the more senior classes of certificates for the purposes of allocating losses based on Trust Advisor expenses. See “Servicing of the Mortgage Loans—The Trust Advisor” and “Description of the Offered Certificates—Distributions—Allocation of Trust Advisor Expenses” in the Free Writing Prospectus.
| |||
| Prepayment Interest Shortfalls: | Prepayment interest shortfalls will be allocatedpro rata based on interest entitlements, in reduction of the interest otherwise payable with respect to each of the interest-bearing classes of certificates.
| |||
| Realized Loss Allocation: | Realized losses will be allocated to each class of certificates entitled to principal in reverse alphanumeric order starting with Class H through and including Class A-S and then to Class A-1, Class A-SB, Class A-3 and Class A-4 Certificates on apro ratabasis based on the certificate principal balance of each such class. The notional amount of any class of Class X Certificates will be reduced by the aggregate amount of realized losses allocated to certificates that are components of the notional amount of such class of Class X Certificates.
| |||
Prepayment Premiums:
| On any Distribution Date, prepayment premiums or yield maintenance charges collected in respect of each mortgage loan during the related collection period will be distributed by the Certificate Administrator on the classes of certificates as follows: to Class A-1, Class A-SB, Class A-3, Class A-4, Class A-S, Class B, Class C and Class D Certificates then entitled to distributions of principal on such Distribution Date, an amount equal to the product of (a) a fraction, the numerator of which is the amount distributed as principal to that class on that Distribution Date, and the denominator of which is the total amount distributed as principal to all classes of principal balance certificates on that Distribution Date, (b) the Base Interest Fraction for the related principal prepayment and that class and (c) the amount of the prepayment premium or yield maintenance charge collected in respect of such principal prepayment during the one month period ending on the related determination date. Any prepayment premiums or yield maintenance charges relating to the mortgage loans collected during the related collection period and remaining after those distributions described above (as to the applicable Distribution Date, the “Class X YM Distribution Amount”) will be distributed to the holders of the Class X Certificates, as follows:first, to holders of the Class X-A Certificates in an amount equal to the product of (a) a fraction, the numerator of which is the total amount of principal distributed on the applicable Distribution Date with respect to the class(es) of principal balance certificates whose Certificate Principal Balances comprise the Notional Amount of such Class of Class X Certificates, and the denominator of which is the total amount of principal distributed on the applicable distribution date with respect to the principal balance certificates, multiplied by (b) the Class X YM Distribution Amount for the applicable distribution date;second, to holders of the Class X B Certificates in an amount equal to the product of (a) a fraction, the numerator of which is the total amount of principal distributed on the applicable distribution date with respect
| |||
THE INFORMATION IN THIS STRUCTURAL AND COLLATERAL TERM SHEET IS NOT COMPLETE AND MAY BE AMENDED PRIOR TO THE TIME OF SALE. THIS TERM SHEET IS NOT AN OFFER TO SELL THESE SECURITIES AND IT IS NOT A SOLICITATION OF AN OFFER TO BUY THESE SECURITIES IN ANY JURISDICTION WHERE THE OFFER OR SALE IS NOT PERMITTED.
| 8 |
BACM 2015-UBS7
|
| STRUCTURE OVERVIEW |
| to the Class(es) of principal balance certificates whose Certificate Principal Balances comprise the Notional Amount of such Class of Class X Certificates, and the denominator of which is the total amount of principal distributed on the applicable distribution date with respect to the principal balance certificates, multiplied by (b) the Class X YM Distribution Amount for the applicable distribution date;third, to holders of the Class X-D Certificates in an amount equal to the product of (a) a fraction, the numerator of which is the total amount of principal distributed on the applicable distribution date with respect to the Class(es) of principal balance certificates whose Certificate Principal Balances comprise the Notional Amount of such Class of Class X Certificates, and the denominator of which is the total amount of principal distributed on the applicable distribution date with respect to the principal balance certificates, multiplied by (b) the Class X YM Distribution Amount for the applicable distribution date;fourth, to holders of the Class X-E Certificates in an amount equal to the product of (a) a fraction, the numerator of which is the total amount of principal distributed on the applicable distribution date with respect to the Class(es) of principal balance certificates whose Certificate Principal Balances comprise the Notional Amount of such Class of Class X Certificates, and the denominator of which is the total amount of principal distributed on the applicable distribution date with respect to the principal balance certificates, multiplied by (b) the Class X YM Distribution Amount for the applicable distribution date;fifth, to holders of the Class X-FG Certificates in an amount equal to the product of (a) a fraction, the numerator of which is the total amount of principal distributed on the applicable distribution date with respect to the Class(es) of principal balance certificates whose Certificate Principal Balances comprise the Notional Amount of such Class of Class X Certificates, and the denominator of which is the total amount of principal distributed on the applicable distribution date with respect to the principal balance certificates, multiplied by (b) the Class X YM Distribution Amount for the applicable distribution date; andsixth, to the holders of the Class X-NR Certificates in an amount equal to the portion of the Class X YM Distribution Amount remaining after the distributions to the holders of the Class X-A, Class X-B, Class X-D, Class X-E and Class X-FG Certificates.
The “Base Interest Fraction”, with respect to any principal prepayment of any mortgage loan that provides for payment of a prepayment premium or yield maintenance charge, and with respect to any class of principal balance certificates (other than the Control Eligible Certificates), is a fraction (A) whose numerator is the greater of (x) zero and (y) the difference between (i) the pass-through rate on that class of certificates and (ii) the applicable discount rate and (B) whose denominator is the difference between (i) the mortgage interest rate on the related mortgage loan and (ii) the applicable discount rate; provided that under no circumstances will the Base Interest Fraction be greater than one. If the discount rate referred to above is greater than or equal to the mortgage interest rate on the related mortgage loan, then the Base Interest Fraction will equal zero; provided that if the discount rate referred to above is greater than or equal to the mortgage interest rate on the related mortgage loan, but is less than the pass-through rate on the subject class of certificates, then the Base Interest Fraction shall be equal to 1.0.
Consistent with the foregoing, the Base Interest Fraction is equal to: | |||
| (Pass-Through Rate - Discount Rate) | ||||
| (Mortgage Rate - Discount Rate) | ||||
Collateral Support Deficits:
| On each Distribution Date, immediately following the distributions made to the certificateholders on that date, the Certificate Administrator will be required to calculate the amount, if any, by which (1) the aggregate stated principal balance of pool of the mortgage loans, including any mortgage loans as to which the related mortgaged properties have become REO properties, expected to be outstanding immediately following that Distribution Date, is less than (2) the aggregate principal balance of the principal balance certificates after giving effect to distributions of principal on that Distribution Date and the allocation of any excess trust advisor expenses to reduce the principal balances of the principal balance certificates that are not Control Eligible Certificates on that Distribution Date (any such deficit, a “Collateral Support Deficit”).
On each Distribution Date, the Certificate Administrator will be required to allocate any Collateral Support Deficit to the respective classes of principal balance certificates in the following order: to the Class H, Class G, Class F, Class E, Class D, Class C, Class B and Class A-S Certificates, in that order, in each case in reduction of and until the remaining
| |||
THE INFORMATION IN THIS STRUCTURAL AND COLLATERAL TERM SHEET IS NOT COMPLETE AND MAY BE AMENDED PRIOR TO THE TIME OF SALE. THIS TERM SHEET IS NOT AN OFFER TO SELL THESE SECURITIES AND IT IS NOT A SOLICITATION OF AN OFFER TO BUY THESE SECURITIES IN ANY JURISDICTION WHERE THE OFFER OR SALE IS NOT PERMITTED.
| 9 |
BACM 2015-UBS7
|
| STRUCTURE OVERVIEW |
principal balance of that class of certificates has been reduced to zero. Following the reduction of the principal balances of all such classes of certificates to zero, the Certificate Administrator will be required to allocate the Collateral Support Deficit to the Class A-1, Class A-SB, Class A-3 and Class A-4 Certificates,pro rata (based upon their respective principal balances), until the remaining principal balances of those classes of certificates have been reduced to zero. Any Collateral Support Deficit allocated to a class of certificates will be allocated to the respective certificates of such class in proportion to the percentage interests evidenced by the respective certificates. | ||||
Split Loans: | Charles River Plaza North
The mortgaged property identified on APPENDIX I to the Free Writing Prospectus as Charles River Plaza North secures a mortgage loan with an outstanding principal balance as of the Cut-off Date of $72,884,027, evidenced by Note A-3-1 (the “Charles River Plaza North Mortgage Loan”), representing approximately 9.6% of the Initial Outstanding Pool Balance, and also secures (i) on apari passu basis (a) two companion loans, evidenced by Note A-1 and Note A-2, with an aggregate outstanding principal balance as of the Cut-off Date of $129,793,473, which were included in the CSAIL 2015-C3 securitization trust and (b) one companion loan, evidenced by Note A-3-2, with an outstanding principal balance as of the Cut-off Date of $7,987,291, which is currently held by UBSRES and is expected to be contributed to a future securitization (clauses (a) and (b), collectively, the “Charles River Plaza North Pari Passu Companion Loans”), and (ii) one subordinate companion loan, evidenced by Note B, with an outstanding principal balance as of the Cut-off Date of $33,945,985, that is generally subordinate in right of payment to the Charles River Plaza North Mortgage Loan and the Charles River Plaza North Pari Passu Companion Loans (the “Charles River Plaza North Subordinate Companion Loan”) and is currently held by a third-party investor (the “Charles River Plaza North Subordinate Companion Loan Holder”). The Charles River Plaza North Mortgage Loan, the Charles River Plaza North Pari Passu Companion Loans and the Charles River Plaza North Subordinate Companion Loan are collectively referred to herein as the “Charles River Plaza North Non-Serviced Loan Combination”.
The Charles River Plaza North Non-Serviced Loan Combination is being serviced pursuant to the CSAIL 2015-C3 pooling and servicing agreement and the related intercreditor agreement. The Charles River Plaza North Subordinate Companion Loan Holder is the initial directing holder of the Charles River North Plaza Non-Serviced Loan Combination until such time as such holder loses its rights as the directing holder as a result of an appraisal reduction or other trigger event (at which point the controlling class representative of the CSAIL 2015-C3 securitization trust would be the directing holder of the Charles River Plaza North Non-Serviced Loan Combination). For additional information regarding the Charles River Plaza North Non-Serviced Loan Combination, see “Description of the Mortgage Pool—The Non-Serviced Loan Combinations—The Charles River Plaza North Non-Serviced Loan Combination” in the Free Writing Prospectus. 261 Fifth Avenue
The mortgaged property identified on APPENDIX I to the Free Writing Prospectus as 261 Fifth Avenue secures a mortgage loan with an outstanding principal balance as of the Cut-off Dateof $70,000,000, evidenced by Note A-2 (the “261 Fifth Avenue Mortgage Loan”), representing approximately 9.2% of the Initial Outstanding Pool Balance, and also secures on apari passu basis one companion loan, evidenced by Note A-1, that has an outstanding principal balance as of the Cut-off Date of $110,000,000 (the “261 Fifth Avenue Pari Passu Companion Loan”) and is currently held by BANA and is expected to be contributed into a future securitization. The 261 Fifth Avenue Mortgage Loan and the 261 Fifth Avenue Pari Passu Companion Loan arepari passu in right of payment and are collectively referred to herein as the “261 Fifth Avenue Loan Pair”.
The 261 Fifth Avenue Loan Pair will be serviced pursuant to the Pooling and Servicing Agreement and the related intercreditor agreement until the securitization of the 261 Fifth Avenue Pari Passu Companion Loan. Upon such securitization, the 261 Fifth Avenue Loan Pair will be serviced pursuant to the pooling and servicing agreement relating to such securitization. For additional information regarding the 261 Fifth Avenue Loan Pair, see “Description of the Mortgage Pool—The A/B Whole Loans and the Loan Pairs—The 261 Fifth Avenue Loan Pair” in the Free Writing Prospectus.
| |||
THE INFORMATION IN THIS STRUCTURAL AND COLLATERAL TERM SHEET IS NOT COMPLETE AND MAY BE AMENDED PRIOR TO THE TIME OF SALE. THIS TERM SHEET IS NOT AN OFFER TO SELL THESE SECURITIES AND IT IS NOT A SOLICITATION OF AN OFFER TO BUY THESE SECURITIES IN ANY JURISDICTION WHERE THE OFFER OR SALE IS NOT PERMITTED.
| 10 |
BACM 2015-UBS7
|
| STRUCTURE OVERVIEW |
Prior to the securitization of the 261 Fifth Avenue Pari Passu Companion Loan, the 261 Fifth Avenue Mortgage Loan and the 261 Fifth Avenue Pari Passu Companion Loan will be a “Loan Pair”. Following the securitization of the 261 Fifth Avenue Pari Passu Companion Loan, the 261 Fifth Avenue Mortgage Loan and the 261 Fifth Avenue Pari Passu Companion Loan will be a “Non-Serviced Loan Combination”.
The Mall of New Hampshire
The mortgaged property identified on APPENDIX I to the Free Writing Prospectus as The Mall of New Hampshire secures a mortgage loan with an outstanding principal balance as of the Cut-off Date of $50,000,000, evidenced by Note A-2 (“The Mall of New Hampshire Mortgage Loan”), representing approximately 6.6% of the Initial Outstanding Pool Balance, and also secures on apari passu basis one companion loan with an outstanding principal balance as of the Cut-off Date of $100,000,000, evidenced by Note A-1 (“The Mall of New Hampshire Pari Passu Companion Loan”), which was included in the CSAIL 2015-C3 securitization trust. The Mall of New Hampshire Mortgage Loan and The Mall of New Hampshire Pari Passu Companion Loan arepari passu in right of payment and are collectively referred to herein as “The Mall of New Hampshire Non-Serviced Loan Combination”. The Mall of New Hampshire Non-Serviced Loan Combination is being serviced pursuant to the CSAIL 2015-C3 pooling and servicing agreement and the related intercreditor agreement. For additional information regarding The Mall of New Hampshire Non-Serviced Loan Combination, see “Description of the Mortgage Pool—The Non-Serviced Loan Combinations—The Mall of New Hampshire Non-Serviced Loan Combination” in the Free Writing Prospectus.
200 Helen Street
The mortgaged property identified on APPENDIX I to the Free Writing Prospectus as 200 Helen Street secures a mortgage loan with an outstanding principal balance as of the Cut-off Date of $41,500,000, evidenced by Note A (the “200 Helen Street Mortgage Loan”), representing approximately 5.5% of the Initial Outstanding Pool Balance, and also secures one subordinate companion loan, evidenced by Note B, with an outstanding principal balance as of the Cut-off Date of $9,936,740 (the “200 Helen Street B Note”) that is generally subordinate in right of payment to the 200 Helen Street Mortgage Loan. The 200 Helen Street B Note is currently held by a third-party investor (the “200 Helen Street B Note Holder”). The 200 Helen Street Mortgage Loan and the 200 Helen Street B Note are collectively referred to herein as the “200 Helen Street A/B Whole Loan”.
The 200 Helen Street A/B Whole Loan will be serviced pursuant to the Pooling and Servicing Agreement and the related intercreditor agreement. The 200 Helen Street B Note Holder is the initial directing holder of the 200 Helen Street A/B Whole Loan until such time as such holder loses its rights as the directing holder as a result of an appraisal reduction or other trigger event (at which point the Controlling Class Representative, during a Subordinate Control Period, would be the directing holder of the 200 Helen Street A/B Whole Loan). For additional information regarding the 200 Helen Street A/B Whole Loan, see “Description of the Mortgage Pool—The Non-Serviced The A/B Whole Loans and the Loan Pairs—The 200 Helen Street A/B Whole Loan” in the Free Writing Prospectus.
WPC Department Store Portfolio
The portfolio of mortgaged properties identified on APPENDIX I to the Free Writing Prospectus as WPC Department Store Portfolio secures a mortgage loan with an outstanding principal balance as of the Cut-off Date of $20,100,000, evidenced by Note A-2 (the “WPC Department Store Portfolio Mortgage Loan”), representing approximately 2.7% of the Initial Outstanding Pool Balance, and also secures on apari passu basis two promissory notes (collectively, the “WPC Department Store Portfolio Pari Passu Companion Loan”) consisting of (i) one promissory note, evidenced by Note A-1, with an outstanding principal balance as of the Cut-off Date of $19,900,000 (the “WPC Department Store Portfolio Controlling Companion Loan”), which is currently held by UBSRES and is expected to be contributed into a future securitization, and (ii) one promissory note, evidenced by Note A-3, with an outstanding principal balance as of the Cut-off Date of $17,170,000, which was included in the CSAIL 2015-C3 securitization trust. The WPC Department Store Portfolio
| ||||
THE INFORMATION IN THIS STRUCTURAL AND COLLATERAL TERM SHEET IS NOT COMPLETE AND MAY BE AMENDED PRIOR TO THE TIME OF SALE. THIS TERM SHEET IS NOT AN OFFER TO SELL THESE SECURITIES AND IT IS NOT A SOLICITATION OF AN OFFER TO BUY THESE SECURITIES IN ANY JURISDICTION WHERE THE OFFER OR SALE IS NOT PERMITTED.
| 11 |
BACM 2015-UBS7
|
| STRUCTURE OVERVIEW |
Mortgage Loan and the WPC Department Store Portfolio Pari Passu Companion Loan arepari passu in right of payment and are collectively referred to herein as the “WPC Department Store Portfolio Loan Pair”.
The WPC Department Store Portfolio Loan Pair will be serviced pursuant to the Pooling and Servicing Agreement and the related intercreditor agreement. For additional information regarding the WPC Department Store Portfolio Loan Pair, see “Description of the Mortgage Pool—The A/B Whole Loans and the Loan Pairs—The WPC Department Store Portfolio Non-Serviced Loan Combination” in the Free Writing Prospectus.
Aviare Place Apartments
The mortgaged property identified on APPENDIX I to the Free Writing Prospectus as Aviare Place Apartments secures a mortgage loan with an outstanding principal balance as of the Cut-off Date of $5,472,000, evidenced by Note A-2 (the “Aviare Place Apartments Mortgage Loan”), representing approximately 0.7% of the Initial Outstanding Pool Balance, and also secures on apari passu basis one companion loan that has an outstanding principal balance as of the Cut-off Date of $20,850,000, evidenced by one promissory note designated as Note A-1 (the “Aviare Place Apartments Pari Passu Companion Loan”), which was included in the MSBAM 2015-C23 securitization trust. The Aviare Place Apartments Mortgage Loan and theAviare Place Apartments Pari Passu Companion Loan arepari passu in right of payment and are collectively referred to herein as the “Aviare Place Apartments Non-Serviced Loan Combination”. The Aviare Place Apartments Non-Serviced Loan Combination is being serviced pursuant to the MSBAM 2015-C23 pooling and servicing agreement and the related intercreditor agreement. For additional information regarding the Aviare Place Apartments Non-Serviced Loan Combination, see “Description of the Mortgage Pool—The Non-Serviced Loan Combinations—Aviare Place Apartments Non-Serviced Loan Combination” in the Free Writing Prospectus. | ||||
| Control Rights and Controlling Class Representative: | Controlling Class Certificateholders will have certain control rights over servicing matters with respect to each mortgage loan (other than Non-Serviced Mortgage Loans and the 261 Fifth Avenue Mortgage Loan after the securitization of the 261 Fifth Avenue Pari Passu Companion Loan) and Loan Pair (other than the 261 Fifth Avenue Loan Pair after the securitization of the 261 Fifth Avenue Pari Passu Companion Loan). The majority owner or appointed representative of the Class of Control Eligible Certificates that is the Controlling Class (such owner or representative, the “Controlling Class Representative”) will be entitled to direct the Special Servicer to take, or refrain from taking, certain actions with respect to a mortgage loan (other than Non-Serviced Mortgage Loans and the 261 Fifth Avenue Mortgage Loan after the securitization of the 261 Fifth Avenue Pari Passu Companion Loan) and Loan Pair (other than the 261 Fifth Avenue Loan Pair after the securitization of the 261 Fifth Avenue Pari Passu Companion Loan). Furthermore, the Controlling Class Representative will also have the right to receive notices and consent to certain material actions that the Master Servicer or the Special Servicer proposes to take with respect to a mortgage loan (other than Non-Serviced Mortgage Loans and the 261 Fifth Avenue Mortgage Loan after the securitization of the 261 Fifth Avenue Pari Passu Companion Loan) or Loan Pair (other than the 261 Fifth Avenue Loan Pair after the securitization of the 261 Fifth Avenue Pari Passu Companion Loan). Provided that the foregoing control rights will be subject to the 200 Helen Street B Note Holder’s control rights under the related intercreditor agreement with respect to the 200 Helen Street B Mortgage Loan.
It is expected thatEllington Management Group, LLC or its affiliate will be the initial Controlling Class Representative with respect to each mortgage loan (other than Non-Serviced Mortgage Loans and the 261 Fifth Avenue Mortgage Loan after the securitization of the 261 Fifth Avenue Pari Passu Companion Loan) and Loan Pair (other than the 261 Fifth Avenue Loan Pair after the securitization of the 261 Fifth Avenue Pari Passu Companion Loan).
For a description of the directing holders for Non-Serviced Loan Combinations and the 261 Fifth Avenue Loan Pair, see“Description of the Mortgage Pool—The Non-Serviced Loan Combinations” and “Servicing of the Mortgage Loans—The Controlling Class Representative” in the Free Writing Prospectus.
| |||
THE INFORMATION IN THIS STRUCTURAL AND COLLATERAL TERM SHEET IS NOT COMPLETE AND MAY BE AMENDED PRIOR TO THE TIME OF SALE. THIS TERM SHEET IS NOT AN OFFER TO SELL THESE SECURITIES AND IT IS NOT A SOLICITATION OF AN OFFER TO BUY THESE SECURITIES IN ANY JURISDICTION WHERE THE OFFER OR SALE IS NOT PERMITTED.
| 12 |
BACM 2015-UBS7
|
| STRUCTURE OVERVIEW |
| Control Eligible Certificates: | Class E, Class F, Class G and Class H Certificates.
| |||
| Controlling Class: | The Controlling Class will be the most subordinate class of Control Eligible Certificates then outstanding that has an aggregate certificate principal balance, as notionally reduced by any Appraisal Reduction Amounts allocable to such class, equal to no less than 25% of the initial certificate principal balance of such class.
The Controlling Class as of the Settlement Date will be the Class H Certificates.
| |||
| Appraised-Out Class: | Any Class of Control Eligible Certificates that has been determined, as a result of Appraisal Reductions allocable to such class, to no longer be the Controlling Class.
| |||
| Remedies Available to Holders of an Appraised-Out Class: |
Holders of the majority of any class of Control Eligible Certificates that is determined at any time of determination to no longer be the Controlling Class as a result of an allocation of an Appraisal Reduction in respect of such Class will have the right, at their sole expense, to require the Special Servicer to order a second appraisal for any mortgage loan (other than Non-Serviced Mortgage Loans and the 261 Fifth Avenue Mortgage Loan and subject to the rights of the 200 Helen Street Note B Holder with respect to the 200 Helen Street Mortgage Loan) for which an Appraisal Event has occurred. Upon receipt of the second appraisal, the Special Servicer will be required to determine, in accordance with the Servicing Standard, whether, based on its assessment of the second appraisal, a recalculation of the Appraisal Reduction is warranted. If warranted, the Special Servicer will direct the Master Servicer to recalculate the Appraisal Reduction based on the second appraisal, and if required by such recalculation, the Special Servicer will reinstate the Appraised-Out Class as the Controlling Class. The holders of an Appraised-Out Class requesting a second appraisal will not be entitled to exercise any rights of the Controlling Class until such time, if any, as the Class is reinstated as the Controlling Class. | |||
| Control Rights: | During any Subordinate Control Period, the Controlling Class Representative will have certain consent and consultation rights under the Pooling and Servicing Agreement with respect to certain major decisions and other matters. A “Subordinate Control Period” means any period when the aggregate principal balance of the Class E Certificates (taking into account the application of any Appraisal Reductions to notionally reduce the aggregate principal balance of such class) is at least 25% of the initial aggregate principal balance of that class.
During any Collective Consultation Period, the Controlling Class Representative will not have any consent rights, but the Controlling Class Representative and the Trust Advisor will each have certain non-binding consultation rights under the Pooling and Servicing Agreement with respect to certain major decisions and other matters;provided, the Trust Advisor’s consultation rights do not apply if the holder of the related serviced B note or serviced companion loan is acting as the directing holder with respect to such A/B whole loan or loan pair.
A “Collective Consultation Period” means any period when both (i) the aggregate principal balance of the Class E Certificates (taking into account the application of any Appraisal Reductions to notionally reduce the aggregate principal balance of such class), is less than 25% of the initial aggregate principal balance of the Class E Certificates and (ii) the aggregate principal balance of that class (without regard to any Appraisal Reductions allocable to such class), is at least 25% of the initial aggregate principal balance of that class.
During any Senior Consultation Period, the Controlling Class Representative will not have any consent or consultation rights, except with respect to any rights expressly set forth in the Pooling and Servicing Agreement, and the Trust Advisor will retain certain non-binding consultation rights under the Pooling and Servicing Agreement with respect to certain major decisions and other matters. A “Senior Consultation Period” means a period when the aggregate principal balance of the Class E Certificates (without regard to any Appraisal Reductions allocable to such class) is less than 25% of the initial aggregate principal balance of that class.
Notwithstanding any of the foregoing to the contrary, the Controlling Class Representative will not have any rights to consent to or direct the special servicer or master servicer with respect to any major decision or any other material action involving (A) a Non-Serviced Loan Combination, (B) the 261 Fifth Avenue Loan Pair for so long as the holder of the relatedpari passucompanion
| |||
| ||||
THE INFORMATION IN THIS STRUCTURAL AND COLLATERAL TERM SHEET IS NOT COMPLETE AND MAY BE AMENDED PRIOR TO THE TIME OF SALE. THIS TERM SHEET IS NOT AN OFFER TO SELL THESE SECURITIES AND IT IS NOT A SOLICITATION OF AN OFFER TO BUY THESE SECURITIES IN ANY JURISDICTION WHERE THE OFFER OR SALE IS NOT PERMITTED.
| 13 |
BACM 2015-UBS7
|
| STRUCTURE OVERVIEW |
| loan is the related controlling note holder under the related intercreditor agreement or (C) the 200 Helen Street A/B Whole Loan prior to such time as the related B note holder loses its rights as the controlling holder as a result of an appraisal reduction or other trigger event under the related intercreditor agreement. See“Description of the Mortgage Pool—The A/B Whole Loans and the Loan Pairs”,“Risk Factors—Risks Related to the Offered Certificates—Realization on a Mortgage Loan That Is Part of an A/B Whole Loan or Loan Pair May Be Adversely Affected by the Rights of the Related Directing Holder”and“Servicing of the Mortgage Loans—The Controlling Class Representative” in the Free Writing Prospectus. The Controlling Class Representative will also not have any consent or consultation rights with respect to any Non-Serviced Mortgage Loan or the 261 Fifth Avenue Mortgage Loan except for the non-binding consultation rights set forth in the related intercreditor agreement. See“Description of the Mortgage Pool—The Non-Serviced Loan Combinations”and“Description of the Mortgage Pool—The A/B Whole Loans and the Loan Pairs” in the Free Writing Prospectus. | ||||
| Appointment and Replacement of Special Servicer: |
The Controlling Class Representative will appoint the initial Special Servicer as of the Settlement Date. During a Subordinate Control Period, the Special Servicer (other than with respect to Non-Serviced Loan Combinations and the 261 Fifth Avenue Loan Pair after the securitization of the 261 Fifth Avenue Pari Passu Companion Loan) may generally be replaced by the Controlling Class Representative (a) for cause at any time and (b) without cause if (i) LNR Partners, LLC or
| |||
its affiliate is no longer the special servicer or (ii) LNR Securities Holdings, LLC or its affiliate owns less than 15% of the then Controlling Class of certificates.
During any Collective Consultation Period or Senior Consultation Period, the Controlling Class Representative will no longer have the right to replace the Special Servicer and such replacement (other than with respect to Non-Serviced Loan Combinations and the 261 Fifth Avenue Loan Pair after the securitization of the 261 Fifth Avenue Pari Passu Companion Loan) will occur based on a vote of holders of all voting eligible classes of certificates as described below. See“Description of the Mortgage Pool—The Non-Serviced Loan Combinations” and“Servicing of the Mortgage Loans”in the Free Writing Prospectus for a description of the special servicer appointment and replacement rights with respect to Non-Serviced Loan Combinations and the 261 Fifth Avenue Loan Pair.
| ||||
| Replacement of Special Servicer by Vote of Certificateholders: |
Other than with respect to Non-Serviced Loan Combinations and the 261 Fifth Avenue Loan Pair (after the securitization of the 261 Fifth Avenue Pari Passu Companion Loan), during any Collective Consultation Period or Senior Consultation Period, upon (i) the written direction of holders of certificates evidencing not less than 25% of the voting rights of all classes of certificates entitled to principal (taking into account the application of Appraisal Reduction amounts to notionally reduce the certificate principal balance of classes to which such Appraisal Reductions are allocable) requesting a vote to replace the Special Servicer with a replacement Special Servicer, (ii) payment by such requesting holders to the Certificate Administrator and/or the trustee of all reasonable fees and expenses to be incurred by the Certificate Administrator and/or the trustee in connection with administering such vote and (iii) delivery by such Holders to each Rating Agency (with a copy to the Certificate Administrator and the Trustee) of a Rating Agency Communication, the Certificate Administrator will be required to promptly provide written notice to all certificateholders of such request by posting such notice on its internet website and by mailing such notice to their addresses appearing in the certificate register. Upon the written direction of the holders of certificates evidencing at least 75% of the aggregate voting rights of all certificates, the Trustee will be required to terminate all of the rights and obligations of the special servicer under the Pooling and Servicing Agreement and appoint the proposed successor special servicer;provided that if that written direction is not provided within 180 days of the initial request for a vote to terminate and replace the Special Servicer, then that written direction will have no force and effect.
In addition, during any Senior Consultation Period, if the Trust Advisor determines that the Special Servicer is not performing its duties in accordance with the Servicing Standard, the Trust Advisor will have the right to recommend the replacement of the Special Servicer (other than with respect to Non-Serviced Loan Combinations and the 261 Fifth Avenue Loan Pair after the securitization of the 261 Fifth Avenue Pari Passu Companion Loan). The Trust Advisor’s recommendation to replace the Special Servicer (other than with respect to Non-
| |||
| ||||
THE INFORMATION IN THIS STRUCTURAL AND COLLATERAL TERM SHEET IS NOT COMPLETE AND MAY BE AMENDED PRIOR TO THE TIME OF SALE. THIS TERM SHEET IS NOT AN OFFER TO SELL THESE SECURITIES AND IT IS NOT A SOLICITATION OF AN OFFER TO BUY THESE SECURITIES IN ANY JURISDICTION WHERE THE OFFER OR SALE IS NOT PERMITTED.
| 14 |
BACM 2015-UBS7
|
| STRUCTURE OVERVIEW |
Serviced Loan Combinations and the 261 Fifth Avenue Loan Pair after the securitization of the 261 Fifth Avenue Pari Passu Companion Loan) must be confirmed by a majority of the voting rights of all classes of certificates entitled to principal (taking into account the application of Appraisal Reduction amounts to notionally reduce the Certificate Balances of classes to which such Appraisal Reduction Amounts are allocable) within 180 days from the time such recommendation is posted to the Certificate Administrator website and is subject to the receipt of written confirmations from each Rating Agency that the appointment of the replacement Special Servicer will not result in a downgrade of the certificates.
See“Description of the Mortgage Pool—The Non-Serviced Loan Combinations”and “Servicing of the Mortgage Loans”in theFree Writing Prospectus for a description of the special servicer appointment and replacement rights with respect to Non-Serviced Loan Combinations and the 261 Fifth Avenue Loan Pair. | ||||
| Cap on Workout and Liquidation Fees: | The workout fees and liquidation fees payable to the Special Servicer under the Pooling and Servicing Agreement will be an amount equal to the lesser of: (1) 1.0% of each collection of interest and principal following a workout or liquidation and (2) $1,000,000 per workout or liquidation. All Modification Fees actually paid to the Special Servicer in connection with a workout or liquidation or in connection with any prior workout or partial liquidation that occurred within the prior 18 months will be deducted from the total workout and/or liquidation feespayable (other than Modification Fees earned while the mortgage loan was not in special servicing). In addition, the total amount of workout and liquidation fees actually payable by the Trust under the Pooling and Servicing Agreement will be capped in the aggregate at $1,000,000 for each related mortgage loan. If a new special servicer begins servicing the related mortgage loan, all amounts paid to the prior special servicer will be disregarded for purposes of calculating the cap. | |||
| Special Servicer Compensation: | The special servicing fee will equal 0.25%per annum of the stated principal balance of the related specially serviced loan or REO property or, if such rate would result in a special servicing fee that would be less than $2,000 in any given month, such higher rate as would result in a special servicing fee equal to $2,000 for such month. The Special Servicer and its affiliates will be prohibited from receiving or retaining any compensation or any other remuneration under the Pooling and Servicing Agreement (including in the form of commissions, brokerage fees, rebates, or as a result of any other fee-sharing arrangement) from any person (including the issuing entity, any borrower, any manager, any guarantor or indemnitor in respect of a mortgage loan or Loan Pair, if any, and any purchaser of any mortgage loan, Serviced Companion Loan or REO Property) in connection with the disposition, workout or foreclosure of any mortgage loan or Loan Pair, the management or disposition of any REO Property, or the performance of any other special servicing duties under the Pooling and Servicing Agreement, other than as expressly permitted in the Pooling and Servicing Agreement and other than commercially reasonable treasury management fees, banking fees, customary title agent fees and insurance commissions or fees received or retained by the Special Servicer or any of its Affiliates in connection with any services performed by such party with respect to any mortgage loan. Subject to certain limited exceptions, the Special Servicer will also be required to report any compensation or other remuneration the Special Servicer or its affiliates have received from any person and such information will be disclosed in the Certificateholders’ monthly distribution date statement.
| |||
| Trust Advisor: | With respect to the mortgage loans (other than with respect to Non-Serviced Loan Combinations and the 261 Fifth Avenue Loan Pair after the securitization of the 261 Fifth Avenue Pari Passu Companion Loan), (A) the Trust Advisor will be required to promptly review all information available to certain privileged persons on the Certificate Administrator’s website related to any specially serviced mortgage loan or REO property and each asset status report with respect to specially serviced mortgage loans (provided, that during any Subordinate Control Period, the Trust Advisor may only review final asset status reports) and (B) during any Collective Consultation Period or Senior Consultation Period, the Trust Advisor will have consultation rights with respect to certain major decisions and will have additional monitoring responsibilities on behalf of the entire trust. The Trust Advisor will be subject to termination if holders of at least 25% of the voting rights request (in connection with termination and replacement relating to the mortgage loans) a vote to terminate and replace the Trust Advisor and such vote is approved by holders of more than 75% of the applicable voting rights that exercise their right to vote. The holders initiating such
| |||
THE INFORMATION IN THIS STRUCTURAL AND COLLATERAL TERM SHEET IS NOT COMPLETE AND MAY BE AMENDED PRIOR TO THE TIME OF SALE. THIS TERM SHEET IS NOT AN OFFER TO SELL THESE SECURITIES AND IT IS NOT A SOLICITATION OF AN OFFER TO BUY THESE SECURITIES IN ANY JURISDICTION WHERE THE OFFER OR SALE IS NOT PERMITTED.
| 15 |
BACM 2015-UBS7
|
| STRUCTURE OVERVIEW |
vote will be responsible for the fees and expenses in connection with the vote and replacement.
The Trust Advisor will not have consultation rights in respect of any Non-Serviced Mortgage Loan, the 261 Fifth Avenue Mortgage Loan or any related REO property.
| ||||
| Liquidated Loan Waterfall: | On liquidation of any mortgage loan, all net liquidation proceeds will be applied so that amounts allocated as a recovery of accrued and unpaid interest will not, in the first instance, include any amount by which the interest portion of P&I Advances previously made was reduced as a result of Appraisal Reductions. After the adjusted interest amount is so allocated, any remaining net liquidation proceeds will be allocated to pay principal on the mortgage loan until the unpaid principal amount of the mortgage loan has been reduced to zero. Any remaining liquidation proceeds would then be allocated as a recovery of accrued and unpaid interest corresponding to the amount by which the interest portion of P&I Advances previously made was reduced as a result of Appraisal Reductions. | |||
THE INFORMATION IN THIS STRUCTURAL AND COLLATERAL TERM SHEET IS NOT COMPLETE AND MAY BE AMENDED PRIOR TO THE TIME OF SALE. THIS TERM SHEET IS NOT AN OFFER TO SELL THESE SECURITIES AND IT IS NOT A SOLICITATION OF AN OFFER TO BUY THESE SECURITIES IN ANY JURISDICTION WHERE THE OFFER OR SALE IS NOT PERMITTED.
| 16 |
BACM 2015-UBS7 |
OVERVIEW OF MORTGAGE POOL CHARACTERISTICS |
Distribution of Cut-off Date Balances(1) |
| Range of Cut-off Date Balances | Number of Mortgage Loans | Aggregate Cut-off Date Balance | % of Initial Pool | Weighted Averages | |||||||
| Mortgage Rate | Stated Remaining Term (Mos.)(2) | U/W NCF DSCR | Cut-off Date LTV Ratio(3)(4) | Maturity Date or ARD LTV(3) | |||||||
| $1,785,000 | - | $7,499,999 | 17 | $65,047,545 | 8.6% | 4.5565% | 118 | 1.95x | 63.3% | 56.7% | |
| $7,500,000 | - | $14,999,999 | 9 | $95,514,268 | 12.6% | 4.6627% | 119 | 1.61x | 68.4% | 58.8% | |
| $15,000,000 | - | $24,999,999 | 6 | $106,300,000 | 14.0% | 4.4269% | 120 | 1.82x | 62.0% | 54.3% | |
| $25,000,000 | - | $49,999,999 | 5 | $175,034,491 | 23.1% | 4.3259% | 119 | 1.75x | 58.8% | 48.0% | |
| $50,000,000 | - | $72,884,027 | 5 | $315,384,027 | 41.6% | 4.2728% | 119 | 1.97x | 54.8% | 49.6% | |
| Total/Weighted Average | 42 | $757,280,331 | 100.0% | 4.3803% | 119 | 1.85x | 59.2% | 51.6% | |||
Distribution of Mortgage Rates(1) |
| Range of Mortgage Rates | Number of Mortgage Loans | Aggregate Cut-off Date Balance | % of Initial Outstanding Pool Balance | Weighted Averages | |||||||
| Mortgage Rate | Stated Remaining Term (Mos.)(2) | U/W NCF DSCR | Cut-off Date LTV Ratio(3)(4) | Maturity Date or ARD LTV(3) | |||||||
| 3.8000% | - | 4.4999% | 23 | $509,510,923 | 67.3% | 4.2247% | 119 | 2.01x | 56.6% | 49.7% | |
| 4.5000% | - | 4.7499% | 9 | $163,500,000 | 21.6% | 4.5895% | 120 | 1.60x | 62.9% | 57.5% | |
| 4.7500% | - | 5.4070% | 10 | $84,269,409 | 11.1% | 4.9149% | 119 | 1.39x | 68.0% | 52.2% | |
| Total/Weighted Average | 42 | $757,280,331 | 100.0% | 4.3803% | 119 | 1.85x | 59.2% | 51.6% | |||
Property Type Distribution(1)(5) |
| Property Type | Number of Mortgaged Properties | Aggregate Date Balance | % of Initial Outstanding Pool Balance | Number of Units/Rooms/Pads/ NRA/Beds | Weighted Averages | ||||||||
Cut-off Date NRA/Beds | Mortgage Rate | Stated Term | Occupancy | U/W NCF DSCR | Cut-off Ratio(3)(4) | Maturity Date or ARD LTV(3) | |||||||
| Office | 4 | $191,190,658 | 25.2% | 952,525 | $457 | 4.1996% | 120 | 99.9% | 1.76x | 51.7% | 43.8% | ||
| CBD | 3 | $187,884,027 | 24.8% | 931,570 | $462 | 4.1823% | 120 | 99.9% | 1.77x | 51.4% | 43.6% | ||
| Medical | 1 | $3,306,631 | 0.4% | 20,955 | $158 | 5.1810% | 119 | 100.0% | 1.33x | 68.9% | 57.0% | ||
| Retail | 22 | $151,585,452 | 20.0% | 1,885,630 | $238 | 4.3843% | 119 | 96.6% | 1.93x | 60.4% | 55.3% | ||
| Anchored(6) | 15 | $117,814,055 | 15.6% | 1,753,532 | $229 | 4.3015% | 119 | 96.9% | 2.04x | 58.5% | 54.3% | ||
| Unanchored | 7 | $33,771,397 | 4.5% | 132,098 | $268 | 4.6733% | 120 | 95.7% | 1.53x | 67.0% | 58.5% | ||
| Multifamily | 10 | $146,857,448 | 19.4% | 2,030 | $134,239 | 4.5885% | 119 | 96.4% | 1.49x | 65.5% | 59.5% | ||
| Hospitality | 4 | $130,508,415 | 17.2% | 924 | $169,847 | 4.3903% | 120 | 78.3% | 2.10x | 59.2% | 45.8% | ||
| Full Service | 3 | $121,434,491 | 16.0% | 804 | $176,888 | 4.3143% | 120 | 79.1% | 2.15x | 58.5% | 45.3% | ||
| Select Service | 1 | $9,073,924 | 1.2% | 120 | $75,616 | 5.4070% | 118 | 67.7% | 1.49x | 69.3% | 52.7% | ||
| Industrial | 3 | $70,388,463 | 9.3% | 1,180,527 | $61 | 4.3507% | 119 | 99.1% | 1.93x | 58.7% | 53.4% | ||
| Self Storage | 11 | $38,945,000 | 5.1% | 716,019 | $65 | 4.4816% | 120 | 91.1% | 2.56x | 57.1% | 54.1% | ||
| Mixed Use | 1 | $14,780,000 | 2.0% | 56,812 | $260 | 4.4560% | 119 | 95.5% | 1.53x | 75.4% | 65.9% | ||
| Manufactured Housing Community | 2 | $13,024,896 | 1.7% | 400 | $32,646 | 4.3061% | 118 | 94.7% | 1.55x | 74.3% | 61.6% | ||
| Total/Weighted Average | 57 | $757,280,331 | 100.0% | 4.3803% | 119 | 94.1% | 1.85x | 59.2% | 51.6% | ||||
Please see footnotes on page 19
THE INFORMATION IN THIS STRUCTURAL AND COLLATERAL TERM SHEET IS NOT COMPLETE AND MAY BE AMENDED PRIOR TO THE TIME OF SALE. THIS TERM SHEET IS NOT AN OFFER TO SELL THESE SECURITIES AND IT IS NOT A SOLICITATION OF AN OFFER TO BUY THESE SECURITIES IN ANY JURISDICTION WHERE THE OFFER OR SALE IS NOT PERMITTED.
| 17 |
BACM 2015-UBS7 |
OVERVIEW OF MORTGAGE POOL CHARACTERISTICS |
Geographic Distribution(1)(5) |
| State/Location | Number of Properties | Aggregate Cut-off Date Balance | % of Initial Outstanding Pool Balance | Weighted Averages | ||||
| Mortgage Rate | Stated Term (Mos.)(2) | U/W NCF DSCR | Cut-off Date LTV Ratio(3)(4) | Maturity Date or ARD LTV(3) | ||||
| California | 13 | $191,085,000 | 25.2% | 4.3452% | 120 | 1.76x | 57.0% | 50.1% |
| Northern(7) | 5 | $128,200,000 | 16.9% | 4.3367% | 120 | 1.75x | 53.9% | 47.3% |
| Southern(7) | 8 | $62,885,000 | 8.3% | 4.3626% | 120 | 1.78x | 63.3% | 55.7% |
| Texas | 8 | $125,637,448 | 16.6% | 4.2656% | 119 | 2.16x | 60.8% | 50.4% |
| New York | 2 | $104,934,491 | 13.9% | 4.5302% | 120 | 1.46x | 62.6% | 55.8% |
| Massachusetts | 1 | $72,884,027 | 9.6% | 4.1902% | 119 | 1.85x | 46.5% | 34.5% |
| New Hampshire | 1 | $50,000,000 | 6.6% | 4.1080% | 118 | 2.52x | 58.6% | 58.6% |
| New Jersey | 1 | $41,500,000 | 5.5% | 4.2845% | 119 | 2.19x | 57.6% | 57.6% |
| Other | 31 | $171,239,365 | 22.6% | 4.5952% | 119 | 1.68x | 64.4% | 55.6% |
| Total/Weighted Average | 57 | $757,280,331 | 100.0% | 4.3803% | 119 | 1.85x | 59.2% | 51.6% |
Distribution of Cut-off Date LTV Ratios(1)(3)(4) |
| Range of Cut-off Date LTV Ratios | Number of Mortgage Loans | Aggregate Cut-off Date Balance | % of Initial Outstanding Pool Balance | Weighted Averages | ||||||
| Mortgage Rate | Stated Remaining Term (Mos.)(2) | U/W NCF DSCR | Cut-off Date LTV Ratio | Maturity Date or ARD LTV | ||||||
| 38.0% | - | 54.9% | 10 | $219,274,714 | 29.0% | 4.2166% | 120 | 2.06x | 48.9% | 41.0% |
| 55.0% | - | 59.9% | 10 | $229,754,766 | 30.3% | 4.2514% | 119 | 2.16x | 57.5% | 51.7% |
| 60.0% | - | 64.9% | 4 | $108,800,000 | 14.4% | 4.4346% | 120 | 1.61x | 61.1% | 59.2% |
| 65.0% | - | 69.9% | 4 | $51,865,046 | 6.8% | 4.8670% | 119 | 1.38x | 67.8% | 50.3% |
| 70.0% | - | 74.9% | 11 | $121,333,807 | 16.0% | 4.6565% | 119 | 1.36x | 72.1% | 61.7% |
| 75.0% | - | 77.4% | 3 | $26,252,000 | 3.5% | 4.4115% | 117 | 1.54x | 75.7% | 65.6% |
| Total/Weighted Average | 42 | $757,280,331 | 100.0% | 4.3803% | 119 | 1.85x | 59.2% | 51.6% | ||
Distribution of Maturity Date or ARD LTV Ratios(1)(3) |
Range of LTV Ratios at Maturity or ARD | Number of Mortgage Loans | Aggregate Cut-off Date Balance | % of Initial Outstanding Pool Balance | Weighted Averages | ||||||
| Mortgage Rate | Stated Remaining Term (Mos.)(2) | U/W NCF DSCR | Cut-off Date LTV Ratio(4) | Maturity Date or ARD LTV | ||||||
| 32.8% | - | 49.9% | 12 | $294,123,284 | 38.8% | 4.2101% | 120 | 2.05x | 52.7% | 40.4% |
| 50.0% | - | 54.9% | 7 | $98,903,073 | 13.1% | 4.6391% | 120 | 1.66x | 57.5% | 53.6% |
| 55.0% | - | 59.9% | 8 | $154,392,079 | 20.4% | 4.3393% | 119 | 2.13x | 60.5% | 57.8% |
| 60.0% | - | 64.9% | 12 | $174,609,896 | 23.1% | 4.5462% | 120 | 1.47x | 66.9% | 61.0% |
| 65.0% | - | 69.9% | 2 | $29,780,000 | 3.9% | 4.4631% | 120 | 1.39x | 73.7% | 66.0% |
| 70.0% | - | 70.6% | 1 | $5,472,000 | 0.7% | 4.2600% | 110 | 1.38x | 77.4% | 70.6% |
| Total/Weighted Average | 42 | $757,280,331 | 100.0% | 4.3803% | 119 | 1.85x | 59.2% | 51.6% | ||
Distribution of Underwritten NCF Debt Service Coverage Ratios(1) |
| Range of Underwritten NCF Debt Service Coverage Ratios | Number of Mortgage Loans | Aggregate Cut-off Date Balance | % of Initial Outstanding Pool Balance | Weighted Averages | ||||||
| Mortgage Rate | Stated Remaining Term (Mos.)(2) | U/W NCF DSCR | Cut-off Date LTV Ratio(3)(4) | Maturity Date or ARD LTV(3) | ||||||
| 1.20x | - | 1.29x | 5 | $60,379,149 | 8.0% | 4.7275% | 119 | 1.27x | 70.1% | 60.8% |
| 1.30x | - | 1.39x | 7 | $96,963,122 | 12.8% | 4.6685% | 119 | 1.35x | 68.4% | 55.6% |
| 1.40x | - | 1.59x | 9 | $140,144,033 | 18.5% | 4.5424% | 120 | 1.52x | 65.0% | 59.4% |
| 1.60x | - | 1.99x | 7 | $190,134,027 | 25.1% | 4.3540% | 119 | 1.78x | 54.2% | 46.5% |
| 2.00x | - | 2.49x | 7 | $180,560,000 | 23.8% | 4.0894% | 120 | 2.20x | 53.4% | 44.7% |
| 2.50x | - | 2.99x | 3 | $63,700,000 | 8.4% | 4.1939% | 118 | 2.53x | 58.4% | 58.4% |
| 3.00x | - | 4.15x | 4 | $25,400,000 | 3.4% | 4.2915% | 120 | 3.32x | 47.1% | 42.9% |
| Total/Weighted Average | 42 | $757,280,331 | 100.0% | 4.3803% | 119 | 1.85x | 59.2% | 51.6% | ||
Please see footnotes on page 19
THE INFORMATION IN THIS STRUCTURAL AND COLLATERAL TERM SHEET IS NOT COMPLETE AND MAY BE AMENDED PRIOR TO THE TIME OF SALE. THIS TERM SHEET IS NOT AN OFFER TO SELL THESE SECURITIES AND IT IS NOT A SOLICITATION OF AN OFFER TO BUY THESE SECURITIES IN ANY JURISDICTION WHERE THE OFFER OR SALE IS NOT PERMITTED.
| 18 |
BACM 2015-UBS7 |
OVERVIEW OF MORTGAGE POOL CHARACTERISTICS |
Original Terms to Maturity or ARD(1)(2) |
| Original Terms to Maturity or ARD | Number of Mortgage Loans | Aggregate Cut-off Date Balance | % of Initial Outstanding Pool Balance | Weighted Averages | ||||
| Mortgage Rate | Stated Remaining Term (Mos.) | U/W NCF DSCR | Cut-off Date LTV Ratio(3)(4) | Maturity Date or ARD LTV(3) | ||||
| 120 | 42 | $757,280,331 | 100.0% | 4.3803% | 119 | 1.85x | 59.2% | 51.6% |
| Total/Weighted Average | 42 | $757,280,331 | 100.0% | 4.3803% | 119 | 1.85x | 59.2% | 51.6% |
Distribution of Remaining Terms to Maturity or ARD(1)(2) |
| Range of Remaining Terms to Maturity or ARD | Number of Mortgage Loans | Aggregate Cut-off Date Balance | % of Initial Outstanding Pool Balance | Weighted Averages | ||||||
| Mortgage Rate | Stated Remaining Term (Mos.) | U/W NCF DSCR | Cut-off Date LTV Ratio(3)(4) | Maturity Date or ARD LTV(3) | ||||||
| 110 | - | 115 | 1 | $5,472,000 | 0.7% | 4.2600% | 110 | 1.38x | 77.4% | 70.6% |
| 116 | - | 118 | 6 | $92,103,073 | 12.2% | 4.3853% | 118 | 2.10x | 61.9% | 57.8% |
| 119 | - | 120 | 35 | $659,705,258 | 87.1% | 4.3806% | 120 | 1.82x | 58.7% | 50.6% |
| Total/Weighted Average | 42 | $757,280,331 | 100.0% | 4.3803% | 119 | 1.85x | 59.2% | 51.6% | ||
Distribution of Underwritten NOI Debt Yields(1)(4) |
| Range of Underwritten NOI Debt Yields | Number of Mortgage Loans | Aggregate Cut-off Date Balance | % of Initial Outstanding Pool Balance | Weighted Averages | ||||||
| Mortgage Rate | Stated Remaining Term (Mos.)(2) | U/W NCF DSCR | Cut-off Date LTV Ratio(3) | Maturity Date or ARD LTV(3) | ||||||
| 7.4% | - | 8.9% | 10 | $233,622,000 | 30.9% | 4.5543% | 120 | 1.48x | 63.5% | 59.3% |
| 9.0% | - | 9.9% | 6 | $37,534,989 | 5.0% | 4.5658% | 119 | 1.47x | 73.7% | 62.3% |
| 10.0% | - | 10.9% | 7 | $117,569,940 | 15.5% | 4.5166% | 119 | 1.74x | 64.2% | 54.9% |
| 11.0% | - | 14.9% | 15 | $345,093,403 | 45.6% | 4.1998% | 119 | 2.08x | 53.8% | 44.8% |
| 15.0% | - | 21.6% | 4 | $23,460,000 | 3.1% | 4.3211% | 120 | 3.26x | 47.8% | 42.5% |
| Total/Weighted Average | 42 | $757,280,331 | 100.0% | 4.3803% | 119 | 1.85x | 59.2% | 51.6% | ||
Amortization Types(1) |
| Amortization Type | Number of Mortgage Loans | Aggregate Cut-off Date Balance | % of Initial Outstanding Pool Balance | Weighted Averages | ||||
| Mortgage Rate | Stated Remaining Term (Mos.)(2) | U/W NCF DSCR | Cut-off Date LTV Ratio(3)(4) | Maturity Date or ARD LTV(3) | ||||
| Interest Only | 11 | $243,200,000 | 32.1% | 4.3629% | 119 | 2.05x | 57.2% | 57.2% |
| Amortizing Balloon | 14 | $227,059,304 | 30.0% | 4.3572% | 120 | 1.86x | 59.2% | 45.6% |
| Interest Only, then Amortizing | 16 | $214,137,000 | 28.3% | 4.4891% | 119 | 1.61x | 65.8% | 57.6% |
| Amortizing Balloon, ARD | 1 | $72,884,027 | 9.6% | 4.1902% | 119 | 1.85x | 46.5% | 34.5% |
| Total/Weighted Average | 42 | $757,280,331 | 100.0% | 4.3803% | 119 | 1.85x | 59.2% | 51.6% |
| (1) | With respect to the LTV, DSCR, debt yield, and Cut-off Date balance per Unit/Room/Pad/NRA/Beds calculations include the relatedpari passu companion loan(s). |
| (2) | In the case of the one mortgage loan, Charles River Plaza North, with an anticipated repayment date, Original Terms to Maturity or ARD and Remaining Terms to Maturity or ARD is through the related anticipated repayment date. |
| (3) | With respect to Preferred Freezer – Lynden, WA mortgage loan, representing approximately 3.3% of the initial outstanding principal balance, the Cut-off Date LTV Ratio and Maturity Date or ARD LTV have in certain cases been calculated based on the “as stabilized” value. For additional information, see the Footnotes to APPENDIX I in the Free Writing Prospectus. |
| (4) | With respect to Lockport Square mortgage loan, representing approximately 0.6% of the initial outstanding pool balance as of the Cut-off Date, the loan-to-value ratio and the debt yield for such mortgage loan has been calculated based on the mortgage loan balance net of a holdback reserve or an earnout reserve. For additional information, see the definitions of “Cut-off Date Loan-to-Value Ratio” and “Cut-off Date U/W NOI Debt Yield” in “Description of the Mortgage Pool—Additional Mortgage Loan Information” in the Free Writing Prospectus. |
| (5) | Reflects allocated loan amount for properties securing multi-property mortgage loans. |
| (6) | Anchored retail includes anchored, single tenant and shadow anchored properties. |
| (7) | Northern California properties have a zip code greater than 93600. Southern California properties have a zip code less than or equal to 93600. |
THE INFORMATION IN THIS STRUCTURAL AND COLLATERAL TERM SHEET IS NOT COMPLETE AND MAY BE AMENDED PRIOR TO THE TIME OF SALE. THIS TERM SHEET IS NOT AN OFFER TO SELL THESE SECURITIES AND IT IS NOT A SOLICITATION OF AN OFFER TO BUY THESE SECURITIES IN ANY JURISDICTION WHERE THE OFFER OR SALE IS NOT PERMITTED.
| 19 |
BACM 2015-UBS7 |
OVERVIEW OF MORTGAGE POOL CHARACTERISTICS |
Ten Largest Mortgage Loans |
Mortgage Loan | Mortgage Loan | City, State | Property Type | Cut-off Date Balance | % of Initial Outstanding Pool Balance | Cut-off Date Balance per Room/NRA(1) | Cut-off Date Ratio(1) | U/W NCF DSCR(1) | U/W NOI Debt Yield(1) |
| Charles River Plaza North | UBSRES | Boston, MA | Office | $72,884,027 | 9.6% | $594 | 46.5% | 1.85x | 11.7% |
| 261 Fifth Avenue | BANA | New York, NY | Office | $70,000,000 | 9.2% | $407 | 60.0% | 1.52x | 7.4% |
| Westin Hotel at the Domain | UBSRES | Austin, TX | Hospitality | $70,000,000 | 9.2% | $205,279 | 56.0% | 2.29x | 14.9% |
| The Panoramic | UBSRES | San Francisco, CA | Multifamily | $52,500,000 | 6.9% | $131,250 | 54.4% | 1.76x | 8.2% |
| The Mall of New Hampshire | UBSRES | Manchester, NH | Retail | $50,000,000 | 6.6% | $370 | 58.6% | 2.52x | 11.1% |
| 651 Brannan Street | UBSRES | San Francisco, CA | Office | $45,000,000 | 5.9% | $333 | 46.0% | 2.02x | 13.5% |
| 200 Helen Street | UBSRES | South Plainfield, NJ | Industrial | $41,500,000 | 5.5% | $52 | 57.6% | 2.19x | 10.2% |
| Holiday Inn JFK | UBSRES | Rosedale, NY | Hospitality | $34,934,491 | 4.6% | $173,803 | 67.7% | 1.35x | 10.6% |
| Pond’s Edge | UBSRES | Delmar, MD | Multifamily | $28,400,000 | 3.8% | $107,576 | 70.3% | 1.29x | 8.2% |
| Preferred Freezer – Lynden, WA | UBSRES | Lynden, WA | Industrial | $25,200,000 | 3.3% | $76 | 58.6% | 1.61x | 11.2% |
| Total/Weighted Average | $490,418,518 | 64.8% | 56.3% | 1.89x | 10.8% |
| (1) | With respect to the Non-Serviced Loan Combinations and the 261 Fifth Avenue Loan Pair, the numerical and statistical information related to the LTV, DSCR, debt yield and Cut-off Date balances per room or sq. ft. includes the related companion loans. |
Pari Passu Companion Loan Summary |
| Mortgage Loan | Mortgage Loan Cut-off Date | Companion Cut-off Date | Non-Serviced Cut-off Date |
Pooling and Servicing | Master Servicer | Special Servicer | Voting Rights |
| Charles River Plaza North | $72,884,027 | $137,780,764(1) | $210,664,791(1) | CSAIL 2015-C3 | Midland | Rialto | CSAIL 2015-C3 |
| 261 Fifth Avenue | $70,000,000 | $110,000,000 | $180,000,000 | BACM 2015-UBS7(2) | Midland(2) | LNR(2) | BACM 2015-UBS7(2) |
| The Mall of New Hampshire | $50,000,000 | $100,000,000 | $150,000,000 | CSAIL 2015-C3 | Midland | Rialto | CSAIL 2015-C3 |
| WPC Department Store Portfolio | $20,100,000 | $37,070,000 | $57,170,000 | BACM 2015-UBS7 | Midland(3) | LNR(3) | BACM 2015-UBS7(3) |
| Aviare Place Apartments | $5,472,000 | $20,850,000 | $26,322,000 | MSBAM 2015-C23 | Wells Fargo | LNR Partners, LLC | MSBAM 2015-C23 |
| * | “Midland” means Midland Loan Services, a Division of PNC Bank, National Association. “Rialto” means Rialto Capital Advisors, LLC. “Wells Fargo” means Wells Fargo Bank, National Association. |
(1) Excludes one mezzanine loan and subordinate B-Note. For additional information, see “Additional Subordinate Debt Summary” below.
(2) The 261 Fifth Avenue Loan Pair will initially be serviced under the Pooling and Servicing Agreement until the securitization of the 261 Fifth Avenue Pari Passu Companion Loan. Following the securitization of the 261 Fifth Avenue Pari Passu Companion Loan, the whole loan will be serviced by the master servicer and the special servicer for such other securitization, in each case pursuant to the pooling and servicing agreement for such other securitization.
| (3) | As of the Settlement Date. Prior to the Settlement Date the WPC Department Store Portfolio is being serviced pursuant to the CSAIL 2015-C3 pooling and servicing agreement by Midland, as master servicer and Rialto, as special servicer. |
Additional Subordinate Debt Summary |
| Mortgage Loan | Mortgage Loan Cut-off Date | Subordinate Debt Cut-off Date Balance | Trust U/W NCF DSCR | Total Debt U/W NCF DSCR(1) | Trust Cut-off Date LTV Ratio | Total Debt Cut-off Date LTV Ratio(1) | Trust U/W NOI Debt Yield | Total Debt U/W NOI Debt Yield(1) | |
| Charles River Plaza North | $72,884,027 | $133,945,985(2) | 1.85x | 1.14x | 46.5% | 76.1% | 11.7% | 8.7% | |
| The Panoramic | $52,500,000 | $12,500,000(3) | 1.76x | 1.29x | 54.4% | 67.4% | 8.2% | 6.6% | |
| 200 Helen Street | $41,500,000 | $9,936,740(4) | 2.19x | 1.28x | 57.6% | 71.4% | 10.2% | 10.2% | |
| Fountains at Andover | $22,050,000 | $3,500,000(3) | 1.32x | 1.14x | 72.5% | 84.0% | 8.6% | 8.4% | |
| (1) | Includes all in-trust notes, Non-Serviced Loan Combinations, Servicing Shift Non-Serviced Loan Combination and additional subordinate debt. |
| (2) | The subordinate debt is comprised of a B-Note of $33,945,985 and a mezzanine loan of $100,000,000. |
| (3) | The subordinate debt is comprised of one or more mezzanine loans. |
| (4) | The subordinate debt is comprised of a B-Note. |
THE INFORMATION IN THIS STRUCTURAL AND COLLATERAL TERM SHEET IS NOT COMPLETE AND MAY BE AMENDED PRIOR TO THE TIME OF SALE. THIS TERM SHEET IS NOT AN OFFER TO SELL THESE SECURITIES AND IT IS NOT A SOLICITATION OF AN OFFER TO BUY THESE SECURITIES IN ANY JURISDICTION WHERE THE OFFER OR SALE IS NOT PERMITTED.
| 20 |
BACM 2015-UBS7 |
OVERVIEW OF MORTGAGE POOL CHARACTERISTICS |
Previous Securitization History |
| Mortgage Loan | Mortgage Loan Seller | City, State | Property Type | Cut-off Date Balance | % of Initial Outstanding Pool Balance | Previous Securitization(s) | ||||
| Charles River Plaza North | UBSRES | Boston, MA | Office | $72,884,027 | 9.6% | CD 2007-CD5, CWCI 2007-C3, CSAIL 2015-C3 | ||||
| 261 Fifth Avenue | BANA | New York, NY | Office | $70,000,000 | 9.2% | MSC 2005-HQ7 | ||||
| The Mall of New Hampshire | UBSRES | Manchester, NH | Retail | $50,000,000 | 6.6% | CSAIL 2015-C3, BSCMS 2000-WF1, MSC 1998-XL2 | ||||
| 200 Helen Street | UBSRES | South Plainfield, NJ | Industrial | $41,500,000 | 5.5% | BACM 2006-1 | ||||
| WPC Department Store Portfolio | UBSRES | Various, Various | Retail | $20,100,000 | 2.7% | CSAIL 2015-C3 | ||||
| Sweetwater Square | UBSRES | National City, CA | Retail | $15,500,000 | 2.0% | BSCMS 2006-PW12 | ||||
| Wichita Falls MF Portfolio | UBSRES | Wichita Falls, TX | Multifamily | $12,985,448 | 1.7% | MSC 2006-IQ12 | ||||
| Regency Plaza | UBSRES | Pleasant Hill, CA | Retail | $9,000,000 | 1.2% | MLMT 2005-CKI1 | ||||
| Aviare Place Apartments | BANA | Midland, TX | Multifamily | $5,472,000 | 0.7% | MSBAM 2015-C23 | ||||
| Somerset Meadows MHC | BANA | Kimball Township, MI | Manufactured Housing Community | $4,950,000 | 0.7% | MLCFC 2007-7 | ||||
| Total | $302,391,475 | 39.9% |
THE INFORMATION IN THIS STRUCTURAL AND COLLATERAL TERM SHEET IS NOT COMPLETE AND MAY BE AMENDED PRIOR TO THE TIME OF SALE. THIS TERM SHEET IS NOT AN OFFER TO SELL THESE SECURITIES AND IT IS NOT A SOLICITATION OF AN OFFER TO BUY THESE SECURITIES IN ANY JURISDICTION WHERE THE OFFER OR SALE IS NOT PERMITTED.
| 21 |
185 Cambridge Street Boston, MA 02114
| Collateral Asset Summary – Loan No. 1 Charles River Plaza North
| Cut-off Date Balance: Cut-off Date LTV: U/W NCF DSCR: U/W NOI Debt Yield: | $72,884,027 46.5% 1.85x 11.7% |
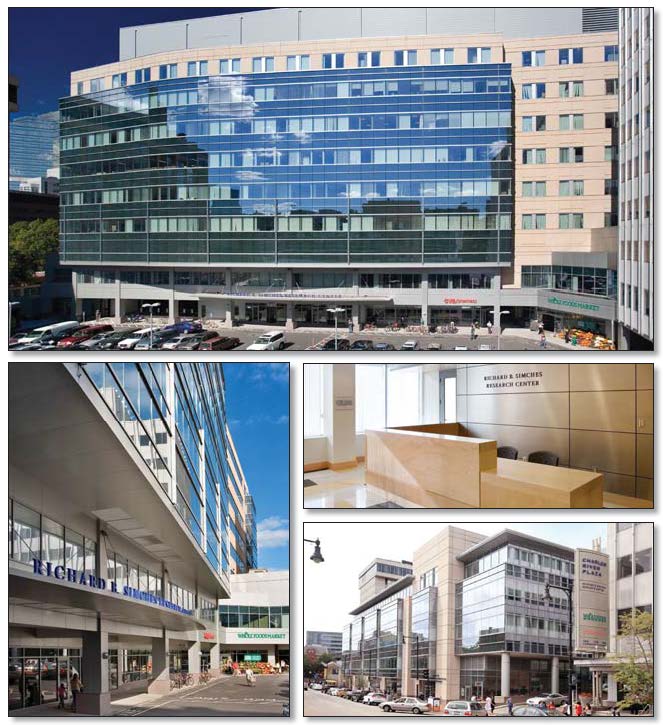 |
| THE INFORMATION IN THIS STRUCTURAL AND COLLATERAL TERM SHEET IS NOT COMPLETE AND MAY BE AMENDED PRIOR TO THE TIME OF SALE. THIS TERM SHEET IS NOT AN OFFER TO SELL THESE SECURITIES AND IT IS NOT A SOLICITATION OF AN OFFER TO BUY THESE SECURITIES IN ANY JURISDICTION WHERE THE OFFER OR SALE IS NOT PERMITTED. |
| 22 |
185 Cambridge Street Boston, MA 02114
| Collateral Asset Summary – Loan No. 1 Charles River Plaza North
| Cut-off Date Balance: Cut-off Date LTV: U/W NCF DSCR: U/W NOI Debt Yield: | $72,884,027 46.5% 1.85x 11.7% |
| Mortgage Loan Information | |
| Loan Seller: | UBSRES |
| Credit Assessment (Fitch/KBRA/Moody’s/Morningstar)(1): | BBB+/BBB-/NR/A- |
| Loan Purpose: | Refinance |
| Sponsors: | Jonathan G. Davis; Paul R. Marcus |
| Borrower: | DMP CR Plaza, LLC |
| Original Balance(2): | $73,000,000 |
| Cut-off Date Balance(2): | $72,884,027 |
| % by Initial UPB: | 9.6% |
| Interest Rate(3)(4): | 4.1902% |
| Payment Date: | 6thof each month |
| First Payment Date: | September 6, 2015 |
| Anticipated Repayment Date(4): | August 6, 2025 |
| Maturity Date: | April 6, 2029 |
| Amortization(5): | 315 months, ARD |
| Additional Debt(2)(6): | $137,780,764Pari PassuDebt; $33,945,985 Subordinate Companion Loan; $100,000,000 Mezzanine Debt |
| Call Protection: | L(25), D(91), O(4) |
| Lockbox / Cash Management: | Hard / Springing |
| Reserves(7) | ||
| Initial | Monthly | |
| Taxes: | $284,052 | $270,526 |
| Insurance: | $16,531 | Springing |
| Replacement: | $0 | Springing |
| TI/LC: | $0 | Springing |
| Major Tenant TI/LC: | $0 | Springing |
| Financial Information(8) | ||||
| Mortgage Loan | Loan Combination | Total Debt | ||
| Cut-off Date Balance / Sq. Ft.: | $594 | $690 | $972 | |
| Balloon Balance / Sq. Ft.(9): | $440 | $511 | $793 | |
| Cut-off Date LTV: | 46.5% | 54.0% | 76.1% | |
| Balloon LTV(9): | 34.5% | 40.0% | 62.1% | |
| Underwritten NOI DSCR: | 1.85x | 1.60x | 1.14x | |
| Underwritten NCF DSCR: | 1.85x | 1.60x | 1.14x | |
| Underwritten NOI Debt Yield: | 11.7% | 10.0% | 7.1% | |
| Underwritten NCF Debt Yield: | 11.7% | 10.0% | 7.1% | |
| Underwritten NOI Debt Yield at Balloon: | 15.7% | 13.5% | 8.7% | |
| Underwritten NCF Debt Yield at Balloon: | 15.7% | 13.5% | 8.7% | |
| Property Information | |
| Single Asset / Portfolio: | Single Asset |
| Property Type: | CBD Office |
| Collateral: | Fee Simple |
| Location: | Boston, MA |
| Year Built / Renovated: | 2005 / NAP |
| Total Sq. Ft.: | 354,594 |
| Property Management: | Davis Marcus Management Inc. |
| Underwritten NOI: | $24,556,135 |
| Underwritten NCF: | $24,556,135 |
| Appraised Value: | $453,100,000 |
| Appraisal Date: | May 29, 2015 |
| Historical NOI | |
| Most Recent NOI: | $23,070,057 (T-12 April 30, 2015) |
| 2014 NOI: | $22,897,637 (December 31, 2014) |
| 2013 NOI: | $22,548,841 (December 31, 2013) |
| 2012 NOI: | $22,140,440 (December 31, 2012) |
| Historical Occupancy | |
| Most Recent Occupancy: | 100.0% (September 6, 2015) |
| 2014 Occupancy: | 100.0% (December 31, 2014) |
| 2013 Occupancy: | 100.0% (December 31, 2013) |
| 2012 Occupancy: | 100.0% (December 31, 2012) |
(1) Fitch, KBRA and Morningstar have confirmed that the Charles River Plaza North Loan has, in the context of its inclusion in the Initial Pool Balance, credit characteristics consistent with an investment grade obligation.
(2) The Cut-off Date Balance of $72,884,027 represents the non-controlling Note A-3-1 of the $210,664,791 Charles River Plaza North Loan Pari Passu Combination that also consists of the controlling Note A-1 and Note A-2 and the non-controlling Note A-3-2. The Charles River Plaza North Loan Combination is evidenced by fourpari passu notes and one subordinate B-Note with a Cut-off Date Balance of $33,945,985. For additional information, see “The Loan” herein.
(3) Represents the average interest rate of 4.1902% from the first payment date after the cut-off date, October 6, 2015, through the 12th payment date following the cut-off date. The interest rate varies according to a fixed interest schedule (“Initial Interest Rate”). See Appendix VIII-A of the Free Writing Prospectus.
(4) The Charles River Plaza North Loan is structured with an anticipated repayment date (“ARD”). In the event that the loan is not paid off on or before the ARD, the borrower is required to make monthly payments to the lender of principal and interest based on a fixed amortization schedule with an average interest rate through the post-ARD term of 3.9340%. Additional interest will accrue at the difference between the Initial Interest Rate and an amount that is the greater of (i) 2.0% plus the interest rate applicable to the interest period immediately preceding the ARD and (ii) 2.0% plus the then current swap spread between the ARD and the final maturity date of April 6, 2029. SeeAppendix VIII-A of the Free Writing Prospectus. Payments of the additional interest will be deferred until the entire principal balance is paid in full.
(5) The Charles River Plaza North Loan Combination is structured with a fixed amortization schedule based on an approximately 315-month amortization period. See Appendix VIII-A of the Free Writing Prospectus.
(6) See “Current Mezzanine or Subordinate Indebtedness” herein.
(7) See “Initial Reserves” and “Ongoing Reserves” herein.
(8) DSCR, LTV, Debt Yield and Balance / Sq. Ft. calculations under the heading “Mortgage Loan” are based on the aggregate amount of the Charles River Plaza North Pari Passu Loan Combination. DSCR, LTV, Debt Yield and Balance / Sq. Ft. calculations under the heading “Loan Combination” are based on the aggregate amount of the Charles River Plaza North Loan Combination (which includes the subordinate B-Note). DSCR, LTV, Debt Yield and Balance / Sq. Ft. calculations under the heading “Total Debt” are based on the aggregate amount of the Charles River Plaza North Loan Combination plus the existing mezzanine loan.
(9) Balloon Balance / Sq. Ft. and Balloon LTV are based on the amortized loan balance as of the ARD. The Charles River Plaza North Pari Passu Loan Combination final maturity date Balance / Sq. Ft. and final maturity date LTV are estimated to be $343.12 and 26.9%, respectively, which are calculated based on the allocation of the scheduled principal amortization and interest payments among the Charles River Plaza North Pari Passu Loan Combination and the Charles River Plaza North Subordinate Companion Loan on apro rata basis in accordance with the principal and interest payment schedule shown inAppendix VIII-A to the Free Writing Prospectus, as well as the application of the projected excess cash flow expected with respect to the Charles River Plaza North Loan Combination during the post-ARD term, first to the Charles River Plaza North Pari Passu Loan Combination, on apro rata andpari passu basis until the Charles River Plaza North Pari Passu Loan Combination is reduced to zero and then to the Charles River Plaza North Subordinate Companion Loan. Such projected excess cash flow takes into account the contractual rent steps set forth in the General Hospital Corporation Lease for the post-ARD term.
| THE INFORMATION IN THIS STRUCTURAL AND COLLATERAL TERM SHEET IS NOT COMPLETE AND MAY BE AMENDED PRIOR TO THE TIME OF SALE. THIS TERM SHEET IS NOT AN OFFER TO SELL THESE SECURITIES AND IT IS NOT A SOLICITATION OF AN OFFER TO BUY THESE SECURITIES IN ANY JURISDICTION WHERE THE OFFER OR SALE IS NOT PERMITTED. |
| 23 |
185 Cambridge Street Boston, MA 02114
| Collateral Asset Summary – Loan No. 1 Charles River Plaza North
| Cut-off Date Balance: Cut-off Date LTV: U/W NCF DSCR: U/W NOI Debt Yield: | $72,884,027 46.5% 1.85x 11.7% |
| Tenant Summary | |||||||
Tenant | Ratings (Fitch/Moody’s/S&P)(1) | Net Rentable Area (Sq. Ft.) | % of Net Rentable Area |
| U/W Base Rent PSF | % of Total U/W Base Rent | Lease Expiration |
| Massachusetts General Hospital | AA/Aa3/AA | 354,594 | 100.0% | $66.11 | 100.0% | 5/4/2029 | |
| (1) | Certain ratings are those of the parent company whether or not the parent company guarantees the lease. |
| Lease Rollover Schedule | ||||||||
| Year | # of Leases Expiring | Total Expiring Sq. Ft. | % of Total Sq. Ft. Expiring | Cumulative Sq. Ft. Expiring | Cumulative % of Sq. Ft. Expiring | Annual U/W Base Rent PSF | % U/W Base Rent Rolling | Cumulative % of U/W Base Rent |
| MTM | 0 | 0 | 0.0% | 0 | 0.0% | $0.00 | 0.0% | 0.0% |
| 2015 | 0 | 0 | 0.0% | 0 | 0.0% | $0.00 | 0.0% | 0.0% |
| 2016 | 0 | 0 | 0.0% | 0 | 0.0% | $0.00 | 0.0% | 0.0% |
| 2017 | 0 | 0 | 0.0% | 0 | 0.0% | $0.00 | 0.0% | 0.0% |
| 2018 | 0 | 0 | 0.0% | 0 | 0.0% | $0.00 | 0.0% | 0.0% |
| 2019 | 0 | 0 | 0.0% | 0 | 0.0% | $0.00 | 0.0% | 0.0% |
| 2020 | 0 | 0 | 0.0% | 0 | 0.0% | $0.00 | 0.0% | 0.0% |
| 2021 | 0 | 0 | 0.0% | 0 | 0.0% | $0.00 | 0.0% | 0.0% |
| 2022 | 0 | 0 | 0.0% | 0 | 0.0% | $0.00 | 0.0% | 0.0% |
| 2023 | 0 | 0 | 0.0% | 0 | 0.0% | $0.00 | 0.0% | 0.0% |
| 2024 | 0 | 0 | 0.0% | 0 | 0.0% | $0.00 | 0.0% | 0.0% |
| 2025 | 0 | 0 | 0.0% | 0 | 0.0% | $0.00 | 0.0% | 0.0% |
| Thereafter | 1 | 354,594 | 100.0% | 354,594 | 100.0% | $66.11 | 100.0% | 100.0% |
| Vacant | NAP | 0 | 0.0% | 354,594 | 100.0% | NAP | NAP | |
| Total / Wtd. Avg. | 1 | 354,594 | 100.0% | $66.11 | 100.0% | |||
The Loan. The Charles River Plaza North loan (the “Charles River Plaza North Loan”) consists of the non-controlling Note A-3-1 with a cut-off date balance of $72,884,027 of a fixed rate loan in the aggregate outstanding principal amount as of the cut-off date of $210,664,791 (the “Charles River Plaza North Pari Passu Loan Combination”) plus a subordinate B-Note in the outstanding principal amount as if the cut-off date of $33,945,985 (the “Charles River Plaza North Subordinate Companion Loan,” and together with the Charles River Plaza North Pari Passu Loan Combination, the “Charles River Plaza North Loan Combination”). The Charles River Plaza North Loan Combination is secured by the borrower’s fee simple interest in a 354,594 sq. ft. medical office condominium located at 185 Cambridge Street in Boston, Massachusetts (the “Charles River Plaza North Property”). The Charles River Plaza North Loan Combination is evidenced by fourpari passu notes and one subordinate B-Note. Only the non-controlling Note A-3-1 with a cut-off date balance of $72,884,027 will be contributed to the BACM 2015-UBS7 mortgage trust. The controlling Note A-1 and Note A-2, with an aggregate original principal balance of $130.0 million, were included in the CSAIL 2015-C3 securitization trust. The non-controlling Note A-3-2, with a cut-off date balance of $7,987,291, is currently held by UBSRES and is expected to be contributed to a future securitized trust. The Charles River Plaza North Subordinate Companion Loan is currently held by a third party investor. Holder of the Charles River Plaza North Subordinate Loan is the initial directing holder of the Charles River Plaza North Loan Combination and will continue as directing holder until such time as such holder loses its rights as the directing holder as a result of an appraisal reduction or other trigger event (an “AB Control Appraisal Event”). Holder of the Charles River Plaza North Subordinate Loan has the right to approve certain major decisions with respect to the Charles River Plaza North Loan Combination and to replace the CSAIL 2015-C3 special servicer with respect to the Charles River Plaza North Loan Combination with or without cause. After an AB control appraisal event with respect to the Charles River Plaza North Subordinate Loan, the holder of Note A-1 will be entitled to exercise all of the rights of directing holder with respect to the Charles River Plaza North Loan Combination (which rights, prior to the occurrence and continuance of a control termination event, will be exercised by the controlling class representative of the CSAIL 2015-C3 securitization trust); however, the holder of Note A-3-1 will be entitled, under certain circumstances, to consult with respect to certain major decisions. The Charles River Plaza North Loan Combination has a 10-year ARD and amortizes on a fixed amortization schedule. The fixed amortization schedule results in an approximately 315-month effective amortization period. If the Charles River Plaza North Loan Combination is not repaid on or prior to the ARD, the final loan maturity is April 6, 2029.
Proceeds of the Charles River Plaza North Loan Combination were used to retire existing debt of $310.0 million, fund upfront reserves of $300,583, pay closing costs of approximately $30.3 million and return equity to the sponsors of approximately $4.4 million. Based on the appraised value of $453.1 million as of May 29, 2015, the Charles River Plaza North Pari Passu Loan Combination cut-off date LTV ratio is 46.5% and the remaining implied equity is approximately $108.1 million.
| THE INFORMATION IN THIS STRUCTURAL AND COLLATERAL TERM SHEET IS NOT COMPLETE AND MAY BE AMENDED PRIOR TO THE TIME OF SALE. THIS TERM SHEET IS NOT AN OFFER TO SELL THESE SECURITIES AND IT IS NOT A SOLICITATION OF AN OFFER TO BUY THESE SECURITIES IN ANY JURISDICTION WHERE THE OFFER OR SALE IS NOT PERMITTED. |
| 24 |
185 Cambridge Street Boston, MA 02114
| Collateral Asset Summary – Loan No. 1 Charles River Plaza North
| Cut-off Date Balance: Cut-off Date LTV: U/W NCF DSCR: U/W NOI Debt Yield: | $72,884,027 46.5% 1.85x 11.7% |
| Loan Combination Summary | ||||
| Original Balance | Cut-off Date Balance | Note Holder | Controlling Piece | |
| Note A-1, Note A-2 | $130,000,000 | $129,793,473 | CSAIL 2015-C3 | Yes |
| Note A-3-1 | $73,000,000 | $72,884,027 | BACM 2015-UBS7 | No |
| Note A-3-2 | $8,000,000 | $7,987,291 | Future Securitization | No |
| B-Note | $34,000,000 | $33,945,985 | Privately Placed | NAP |
| Total | $245,000,000 | $244,610,776 | ||
| Sources and Uses | ||||||
| Sources | Proceeds | % of Total | Uses | Proceeds | % of Total | |
| Loan Amount | $211,000,000 | 061.2% | Loan Payoff | $310,000,000 | 089.9% | |
| Subordinate Note | $34,000,000 | 009.9% | Reserves | $300,583 | 000.1% | |
| Mezzanine Loan | $100,000,000 | 029.0% | Closing Costs | $30,289,569 | 008.8% | |
| Return of Equity | $4,409,848 | 001.3% | ||||
| Total Sources | $345,000,000 | 100.0% | Total Uses | $345,000,000 | 100.0% | |
The Borrower / Sponsor. The borrower, DMP CR Plaza, LLC, is a single purpose Delaware limited liability company structured to be bankruptcy-remote, with two independent directors in its organizational structure. The sponsors of the borrower and the nonrecourse carve-out guarantors are Jonathan G. Davis and Paul R. Marcus.
Jonathan G. Davis is the founder and chief executive officer of The Davis Companies, founded in 1976, and has since invested in over 140 properties representing nearly $3.0 billion of gross asset value across all major property types. The Davis Companies has additionally acquired approximately $550.0 million of commercial real estate loans and securities and developed new constructions of over 2.5 million sq. ft. The Davis Companies currently owns and manages a portfolio of approximately 12 million sq. ft.
Paul R. Marcus founded and leads Marcus Partners, a value-oriented real estate investment firm based in Boston, Massachusetts with a regional office in Norwalk, Connecticut. Mr. Marcus has been involved in, with the ownership of, over 14 million sq. ft. of office, medical office, biomedical, retail and residential projects, 2,000 hotel rooms and numerous mixed-use developments over the course of 30 years.
The Property.The Charles River Plaza North Property is an eight-story medical office condominium located in Boston, Massachusetts, that is part of Charles River Plaza complex, an approximately 640,000 sq. ft. mixed use development complex comprised of laboratory, office, research and retail space along with a 954-car parking facility. The Charles River Plaza North Property, located in Boston’s Beacon Hill neighborhood at 185 Cambridge Street, contains 354,594 sq. ft. of the net rentable area (“NRA”) and 350 designated parking spots. The collateral includes a portion of floor one, the plaza level, a portion of floor two, and the entirety of floors three through eight, as well as the penthouse mechanical portion on the roof level of the Charles River Plaza North Property.
The sponsors developed the property between 2002 and 2005 as a build-to-suit for Massachusetts General Hospital (“MGH”). The property abuts the MGH main campus and is within the MGH extended campus. MGH owns the remaining condominium interest in the Charles River Plaza development complex, and has invested $86.0 million in tenant improvements since 2005 in the Charles River Plaza development complex, of which $50.0 million ($141 PSF) was invested into the Charles River Plaza North Property.
The overall Charles River Plaza development complex is currently 100.0% occupied, and is 83.0% occupied by MGH, 6.3% by Harvard-affiliated Schepens Eye Research, and the remainder by Whole Foods, CVS, Bank of America and other national and local retail tenants. The Charles River Plaza North Property is leased in its entirety through May 2029 to The General Hospital Corporation, the parent company of MGH and a subsidiary of Partners Healthcare (the “General Hospital Corporation Lease”). The General Hospital Corporation Lease is structured as NNN and the tenant has two 10-year renewal options upon lease expiration. The base rent due under the lease is comprised of three components, (i) “Yearly Escalating Rent”, which is $17,197,809per annum until May 4, 2006 and thereafter increases annually based on CPI (subject to a 2% annual cap on such increases), (ii) “Yearly Fixed Rent” of $2,340,312per annum, which ceases to be payable on May 4, 2025, and (iii) a “Design Change Component” of $72,765per annum, which amount will increase by 5% on July 1 of each year. The lease is guaranteed by Partners Healthcare System, Inc. (Moody’s/S&P/Fitch: Aa3/AA/AA).
Tenant.The Charles River Plaza North Property is 100.0% occupied by MGH, which is the third oldest general hospital in the United States, and the largest hospital in New England. Today, MGH operates a 999-bed medical center with an annual research budget of approximately $786.0 million. MGH was ranked number two in the nation and number one in New England for 2014 based on quality of care, patient safety, and reputation, according to U.S. News & World Report. MGH conducts one of the largest hospital-based research programs in the nation, which spans more than 20 clinical departments across the hospital. The research group at MGH is extremely active and was the top National Institute of Health (“NIH”) Funded Independent Hospital in 2014, with over 770 grants awarded for research totaling approximately $350.0 million. MGH is also the original and largest teaching hospital of Harvard Medical School, and
| THE INFORMATION IN THIS STRUCTURAL AND COLLATERAL TERM SHEET IS NOT COMPLETE AND MAY BE AMENDED PRIOR TO THE TIME OF SALE. THIS TERM SHEET IS NOT AN OFFER TO SELL THESE SECURITIES AND IT IS NOT A SOLICITATION OF AN OFFER TO BUY THESE SECURITIES IN ANY JURISDICTION WHERE THE OFFER OR SALE IS NOT PERMITTED. |
| 25 |
185 Cambridge Street Boston, MA 02114
| Collateral Asset Summary – Loan No. 1 Charles River Plaza North
| Cut-off Date Balance: Cut-off Date LTV: U/W NCF DSCR: U/W NOI Debt Yield: | $72,884,027 46.5% 1.85x 11.7% |
nearly all of MGH’s staff physicians serve on the faculty of Harvard Medical School. MGH utilizes the Charles River Plaza North Property as a primary research facility with five distinct research teams: Center for Systems Biology, Center for Human Genetic Research, Center for Regenerative Medicine, Center for Computational and Integrative Biology, and Wellman Center for Photomedicine.
MGH benefits financially from leasing space at the Charles River Plaza North Property due to its use of the space as a research facility. According to the NIH grants policy, the funds received from an NIH grant cannot be used for the acquisition of real property or any capital expenditures to equipment, land or buildings. By leasing the Charles River Plaza North Property, MGH is able to apply the funds received through the NIH grants to its overall research operations, including operating expenses as assessed through a NNN lease. The Charles River Plaza North Property allows for MGH to have its research center adjacent to its campus while allowing operating expenses to be paid for through NIH grants, rather than out of income provided through other means. As MGH’s main campus is adjacent to the Charles River Plaza North Property and MGH owns the other condominium interests in Charles River Plaza development complex, the research and laboratory space offered within the Charles River Plaza North Property is able to accommodate the unique needs of MGH.
Environmental Matters.The Phase I environmental report dated June 16, 2015 recommended no further action at the Charles River Plaza North Property.
The Market. The Charles River Plaza North Property is located along Cambridge Street in Boston’s affluent Beacon Hill neighborhood. The immediate area includes several hotels, including the Holiday Inn and Liberty Hotel. The city’s National Hockey League team, Boston Bruins, and National Basketball Association team, Boston Celtics, both play at the TD Banknorth Garden 0.5 miles from the Charles River Plaza North Property. The Charles River Plaza North Property is at Beacon Hill’s junction with the West End of Boston, which offers a substantial amenity base including numerous shopping, dining, and entertainment opportunities.
The Charles River Plaza North Property is served by many public transportation options with the Massachusetts Bay Transportation Authority Red Line, Blue Line, Orange Line, and Green Line all within walking distance and major roadways accessible by Storrow Drive, Boston’s main throughway. The Red Line’s Charles/MGH station and Blue Line’s Bowdoin station are both within a five minute walk from the Charles River Plaza North Property. The Charles/MGH station is also three stops from South Station, Boston’s transportation hub, offering access to Logan Airport as well as Amtrak service to New York City and Washington D.C.
As the largest city in New England and the capital of Massachusetts, Boston is the economic and cultural “hub” of the region. Since its founding in 1630, Boston has been a gateway city, with industries in business, finance, transportation, communications and public services. Boston is also well-known for its prominent educational institutions, medical facilities, and research centers. This helps Massachusetts attract the second most government research funding of any state in the United States, totaling approximately $3.0 billion in 2014. Combined with industry and university research funding, total research and development funding in the state was $18.4 billion in 2014.
As of August 2014, the unemployment rate within the Boston metropolitan statistical area (“MSA”) was 5.1%, compared to the U.S. average of 6.1%. The Boston MSA has a population of 4.6 million as of the 2010 census, and is one of the most educated workforces in all major metro areas with nearly 43% of its population over the age of 25 having obtained a bachelor’s degree or higher. Boston’s income per capita of $55,200 and median household income of $76,524 are 27% and 48% above the national levels, respectively. Income per capita in Massachusetts has ranked the third highest in the nation for the past several years.
The 2015 estimated population within a one-, three-, and five-mile radius of the Charles River Plaza North Property is 60,085, 437,262, and 963,632, respectively. From 2000 to 2015, the population within a one-, three-, and five-mile radius of the Charles River Plaza North Property has experienced an average annual growth rate of 2.19%, 1.18%, and 0.74%, respectively. The 2015 estimated average household income within a one-, three-, and five-mile radius of the property is $121,196, $89,544, and $83,763, respectively.
According to a market research report, the Charles River Plaza North Property is located in the Boston/Suffolk County office submarket cluster, which contains 158 Class A buildings totaling approximately 57.0 million sq. ft. of office space. The Boston/Suffolk County Class A submarket cluster vacancy rate is 8.5% and the average rental rate is $45.80 PSF in 1Q 2015. All rates reported have been converted into a full service equivalent rental rate. Furthermore, the Boston lab market has experienced a tightening of fundamentals and increased demand as vacancy hit its lowest mark, at 0.7%, with vacancy averaging at 2.7% over the past five years.
| THE INFORMATION IN THIS STRUCTURAL AND COLLATERAL TERM SHEET IS NOT COMPLETE AND MAY BE AMENDED PRIOR TO THE TIME OF SALE. THIS TERM SHEET IS NOT AN OFFER TO SELL THESE SECURITIES AND IT IS NOT A SOLICITATION OF AN OFFER TO BUY THESE SECURITIES IN ANY JURISDICTION WHERE THE OFFER OR SALE IS NOT PERMITTED. |
| 26 |
185 Cambridge Street Boston, MA 02114
| Collateral Asset Summary – Loan No. 1 Charles River Plaza North
| Cut-off Date Balance: Cut-off Date LTV: U/W NCF DSCR: U/W NOI Debt Yield: | $72,884,027 46.5% 1.85x 11.7% |
| Comparable Office Rentals(1) | ||||||
| Name | Charles River Plaza North Property | 300 Third Avenue | 125 Binney Street | 300 Massachusetts Avenue | 610 Main Street North | 1 Joslin Place |
| Building Sq. Ft. | 354,594(2) | 131,547 | 386,097 | 250,000 | 267,855 | 425,000 |
| Year Built | 2005 | 2001 | 2014 | 2014 | 2014 | 2014 |
| Tenant Name | Massachusetts General Hospital | Alnylam Pharma (Renewal) | ARIAD Pharma (Expansion) | Millennium | Pfizer | Dana Farber |
| Rent PSF | $66.11(2) | $59.46 | $70.00 | $74.87 | $79.13 | $77.00 |
| Building Type | Class A | Class A | Class A | Class A | Class A | Class A |
| Lease Type | NNN | NNN | NNN | NNN | NNN | Gross |
| (1) | Source: Appraisal |
| (2) | Based on the rent roll dated September 6, 2015. |
Cash Flow Analysis.
| Cash Flow Analysis | ||||||
| 2012 | 2013 | 2014 | T-12 4/30/2015 | U/W | U/W PSF | |
| Base Rent | $22,077,841 | $22,475,836 | $22,882,190 | $23,018,597 | $25,505,442 | $71.93 |
| Value of Vacant Space | 0 | 0 | 0 | 0 | 0 | 0.00 |
| Gross Potential Rent | $22,077,841 | $22,475,836 | $22,882,190 | $23,018,597 | $25,505,442 | $71.93 |
| Total Recoveries | 3,502,455 | 3,600,214 | 3,649,461 | 3,696,497 | 3,648,910 | 10.29 |
| Total Other Income | 476,832 | 485,841 | 479,088 | 450,516 | 522,475 | 1.47 |
| Less: Vacancy & Credit Loss | 0 | 0 | 0 | 0 | (583,087) | (1.64) |
| Effective Gross Income | $26,057,128 | $26,561,891 | $27,010,739 | $27,165,610 | $29,093,740 | $82.05 |
| Total Operating Expenses | 3,916,688 | 4,013,050 | 4,113,102 | 4,095,553 | 4,537,605 | 12.80 |
| Net Operating Income | $22,140,440 | $22,548,841 | $22,897,637 | $23,070,057 | $24,556,135 | $69.25 |
| TI/LC | 0 | 0 | 0 | 0 | 0 | 0.00 |
| Capital Expenditures | 0 | 0 | 0 | 0 | 0 | 0.00 |
| Net Cash Flow | $22,140,440 | $22,548,841 | $22,897,637 | $23,070,057 | $24,556,135 | $69.25 |
Property Management. The Charles River Plaza North Property is managed by Davis Marcus Management, Inc., an affiliate of the sponsors.
Lockbox / Cash Management. The Charles River Plaza North Loan is structured with a hard lockbox and springing cash management. All rent and other revenue of the property is required to be directly deposited into a sweep account controlled by the lender. Provided no Cash Management Trigger Event Period (as defined herein) is continuing, all funds are required to be remitted to the borrower on each business day. During a Cash Management Trigger Event Period, all funds in the lockbox account will be swept on each business day to a cash management account under the control of the lender and disbursed during each interest period of the loan term in accordance with the loan documents. Any excess, if no Cash Sweep Event Period (as defined herein) is in effect, will be disbursed to the borrower, or if a Cash Sweep Event Period is in effect, held as additional collateral for the Charles River Plaza North Loan.
A “Cash Management Trigger Event Period” will commence upon the occurrence of (i) an event of default on the Charles River Plaza North Loan Combination, (ii) a bankruptcy action of borrower or borrower becoming insolvent, (iii) a bankruptcy action of guarantor or guarantor becoming insolvent, (iv) a bankruptcy action of the affiliated property manager or the affiliated property manager becoming insolvent, (v) the debt service coverage ratio of the Charles River Plaza North Loan Combination falling below 1.05x on a trailing twelve month basis, (vi) an event of default under the mezzanine loan, (vii) a Major Tenant Trigger Event (as defined herein), or (viii) the borrower failing to repay or defease the Charles River Plaza North Loan Combination in full on or before the payment date preceding the ARD. A Cash Management Trigger Event Period will end: (a) with regards to clause (i) above, upon the cure of the event of default; (b) with regards to clause (ii) above, provided the applicable bankruptcy action was involuntary and not solicited or caused to be solicited by borrower, guarantor or any affiliate of borrower or guarantor, upon the applicable bankruptcy action being discharged, stayed or dismissed within 90 days of such filing, and such filing does not materially increase borrower’s monetary obligations and borrower is not in default of its SPE provisions; (c) with regards to clause (iii) above, provided the applicable bankruptcy action was involuntary and not solicited or caused to be solicited by borrower, guarantor or any affiliate of borrower or guarantor, upon the applicable bankruptcy action being discharged, stayed or dismissed within 90 days of such filing, and such filing does not materially increase guarantor’s monetary obligations or materially and adversely affect guarantor’s ability to perform its obligations under the loan documents; (d) with regards to clause (iv) above, if borrower replaces the affiliated manager with a replacement manager meeting certain requirements under the loan agreement, (e) with regards to clause (v) above, the debt service coverage ratio of the Charles
| THE INFORMATION IN THIS STRUCTURAL AND COLLATERAL TERM SHEET IS NOT COMPLETE AND MAY BE AMENDED PRIOR TO THE TIME OF SALE. THIS TERM SHEET IS NOT AN OFFER TO SELL THESE SECURITIES AND IT IS NOT A SOLICITATION OF AN OFFER TO BUY THESE SECURITIES IN ANY JURISDICTION WHERE THE OFFER OR SALE IS NOT PERMITTED. |
| 27 |
185 Cambridge Street Boston, MA 02114
| Collateral Asset Summary – Loan No. 1 Charles River Plaza North
| Cut-off Date Balance: Cut-off Date LTV: U/W NCF DSCR: U/W NOI Debt Yield: | $72,884,027 46.5% 1.85x 11.7% |
River Plaza North Loan Combination is greater than 1.10x based on the trailing twelve month period for two consecutive quarters, (f) with regards to clause (vi) above, a cure or waiver of the event of default under the mezzanine loan, provided that the mezzanine lender has not accelerated the mezzanine loan or commenced a foreclosure action and (g) with regards to clause (vii) above, the Major Tenant Trigger Event is cured.
A “Cash Sweep Event Period” will commence upon the occurrence of (i) an event of default on the Charles River Plaza North Loan Combination or mezzanine loan, (ii) a bankruptcy action involving the borrower or guarantor or the borrower or guarantor has become insolvent, (iii) a bankruptcy action involving property manager or the property manager has become insolvent, (iv) the debt service coverage ratio falling below 1.05x on a trailing twelve month basis, (v) an event of default under the mezzanine loan, or (vi) the borrower failing to repay or defease the Charles River Plaza North Loan Combination on or before the payment date preceding the ARD. A Cash Sweep Event Period will end: (a) with regards to clause (i) above, upon the cure of the event of default; (b) with regards to clause (ii) above, provided the applicable bankruptcy action was involuntary and not solicited, upon the applicable bankruptcy action being discharged, stayed or dismissed; (c) with regards to clause (iii) above, if borrower replaces the affiliated manager with a replacement manager meeting certain requirements under the loan agreement; (d) with regards to clause (iv) above, the debt service coverage ratio being greater than 1.10x based on the trailing twelve month period for two consecutive quarters; (e) with regards to clause (v) above, cure or waiver of the event of default under the mezzanine loan, provided that the mezzanine lender has not accelerated the mezzanine loan or commenced a foreclosure action, and (f) with regards to clause (vi) above, an event of condition has occurred and is continuing, that would cure a Major Tenant Trigger Event.
A “Major Tenant Trigger Event” will commence upon the earlier of (i) a Major Tenant (as defined herein) giving written notice of its intention to terminate or not extend or renew its lease, (ii) if, on or prior to the date that is twelve months prior to the then-applicable expiration date of any Major Tenant’s lease, such Major Tenant fails to extend or renew such lease upon terms and conditions set forth in such Major Tenant’s lease (or otherwise as acceptable to lender), (iii) a Major Tenant fails to notify borrower of its election to extend or renew its lease prior to the date set forth in the lease for exercise of such renewal or extension option, (iv) if an event of default under any Major Tenant’s lease has occurred, (v) a Major Tenant or lease guarantor of a Major Tenant’s lease becomes insolvent or a debtor in any bankruptcy action, (vi) if any Major Tenant’s lease is terminated or no longer in full force or effect, (vii) if any Major Tenant fails to utilize more than 25% of the space demised under its lease for normal business operations, or (viii) the decline in the long term unsecured debt rating of the lease guarantor for General Hospital Corporation’s Lease below “BBB-” or equivalent by any two rating agencies made up of Moody’s, S&P or Fitch (or if only one of such rating agencies rates such lease guarantor, by such rating agency). A Major Tenant Trigger Event will end if, in regards to clause (i), clause (ii) or clause (iii) above, the Major Tenant has entered into a renewal of all of its leased premises in accordance with the requirements of the loan documents or certain re-leasing conditions have been satisfied with respect to the Major Tenant space (or with respect to clause (i) only, the Major Tenant has revoked or rescinded its lease termination), in regards to clause (iv) above, the applicable event of default has been cured, in regards to clause (v) above, the Major Tenant’s lease is affirmed in the applicable bankruptcy and the Major Tenant is paying full unabated rent or, if applicable, the guarantor bankruptcy has been discharged or dismissed with no material adverse effect on guarantor’s ability to perform under the lease guaranty, in regards to clause (vi) above, certain re-leasing conditions have been satisfied with respect to the Major Tenant space, in regards to clause (vii) above, the Major Tenant recommences its operations at the leased premises and utilizes at least 75% of the leased premises with respect to the Major Tenant space or certain re-leasing conditions have been satisfied with respect to the Major Tenant space; in regards to clause (viii) above, the rating is raised so that such rating is no lower than “BBB-” or equivalent by each applicable rating agency; and in the case of a Major Tenant Trigger Event occurring when the General Hospital Corporation’s Lease is not in full force and effect, a debt service ratio for the applicable period (excluding revenues attributable to a lease as to which a Major Tenant Trigger event exists) is equal to or greater than 1.15x based on the trailing twelve month period.
A “Major Tenant” means (i) General Hospital Corporation or (ii) any tenant or replacement tenant or tenants that (together with its affiliates) leases space comprising 20% or more of either (a) the NRA or (b) the total in-place base rent at the Charles River Plaza North Property.
Initial Reserves. At closing, the borrower deposited (i) $284,052 into a tax reserve account and (ii) $16,531 into an insurance reserve account.
Ongoing Reserves. On a monthly basis, the borrower is required to deposit reserves of (i) 1/12 of the estimated annual real estate taxes, which currently equates to $270,526, into a tax reserve account and (ii) 1/12 of the annual insurance premiums, which currently equates to $2,952, into an insurance reserve account (for those insurance policies that are not being provided by tenant or condominium association, as permitted under the loan documents). The requirement for the borrower to make monthly deposits to the insurance escrow will be waived with respect to the portion of insurance premiums relating to (a) policies covering the common area so long as (i) the condominium is not terminated, (ii) the condominium documents are in full force and effect, (iii) the condominium association is maintaining the policies and (iv) the policies comply with all applicable terms and conditions set forth in the loan agreement, and (b) any policy so long as (i) General Hospital Corporation Lease is in full force and effect, and (ii) MGH is carrying the insurance in accordance with all applicable terms and conditions set forth in the loan agreement.
The requirement for the borrower to make monthly deposits of $5,910 to the replacement reserve escrow is waived so long as the following conditions are met: (i) the General Hospital Corporation Lease is in full force and effect, (ii) no Major Tenant Trigger Event has
| THE INFORMATION IN THIS STRUCTURAL AND COLLATERAL TERM SHEET IS NOT COMPLETE AND MAY BE AMENDED PRIOR TO THE TIME OF SALE. THIS TERM SHEET IS NOT AN OFFER TO SELL THESE SECURITIES AND IT IS NOT A SOLICITATION OF AN OFFER TO BUY THESE SECURITIES IN ANY JURISDICTION WHERE THE OFFER OR SALE IS NOT PERMITTED. |
| 28 |
185 Cambridge Street Boston, MA 02114
| Collateral Asset Summary – Loan No. 1 Charles River Plaza North
| Cut-off Date Balance: Cut-off Date LTV: U/W NCF DSCR: U/W NOI Debt Yield: | $72,884,027 46.5% 1.85x 11.7% |
occurred and is continuing, (iii) the General Hospital Corporation is obligated under the General Hospital Corporation Lease to maintain the property in at least the same condition as required under the loan documents, and (iv) the General Hospital Corporation performs such obligations under its lease in a timely manner.
The requirement for the borrower to make monthly deposits of $29,550 to the TI/LC reserve escrow is waived so long as the following conditions are met: (i) the General Hospital Corporation Lease is in full force and effect or (ii) all deposits required to be made to the major tenant TI/LC reserves are being deposited therein as required pursuant to the loan agreement.
The requirement for the borrower to make monthly deposits to the Major Tenant TI/LC reserve escrow is waived so long as no Major Tenant Trigger Event exists. During the existence of a Major Tenant Trigger Event, the borrower is required to deposit an applicable portion of the excess cash flow (which is generally 100%, unless such Major Tenant Trigger Event is caused by a specific downgrade of the General Hospital Corporation Lease’s guarantor, in which event the applicable portion may be 50%-100%, depending on the extent of the downgrade) into the Major Tenant TI/LC reserve escrow.
Current Mezzanine or Subordinate Indebtedness. The Charles River Plaza North Property is also the security for a subordinate B-Note, which has an outstanding principal balance as of the cut-off date of $33,945,985. In addition, a $100.0 million mezzanine loan was provided by Teachers Insurance and Annuity Association of America for the Benefit of the TIAA Real Estate Account. The mezzanine loan is coterminous with the Charles River Plaza North Loan Combination and accrues interest at a fixed rate of 6.0800%per annum. The mezzanine loan has a 10-year ARD and is interest only. Including the mezzanine loan and the subordinate B-Note, the Total Debt Cut-off Date LTV ratio is 76.1%, the Total Debt UW NCF DSCR is 1.14x and the Total Debt UW NOI Debt Yield is 7.1%.
Future Mezzanine or Subordinate Indebtedness Permitted. None.
| THE INFORMATION IN THIS STRUCTURAL AND COLLATERAL TERM SHEET IS NOT COMPLETE AND MAY BE AMENDED PRIOR TO THE TIME OF SALE. THIS TERM SHEET IS NOT AN OFFER TO SELL THESE SECURITIES AND IT IS NOT A SOLICITATION OF AN OFFER TO BUY THESE SECURITIES IN ANY JURISDICTION WHERE THE OFFER OR SALE IS NOT PERMITTED. |
| 29 |
185 Cambridge Street Boston, MA 02114
| Collateral Asset Summary – Loan No. 1 Charles River Plaza North
| Cut-off Date Balance: Cut-off Date LTV: U/W NCF DSCR: U/W NOI Debt Yield: | $72,884,027 46.5% 1.85x 11.7% |
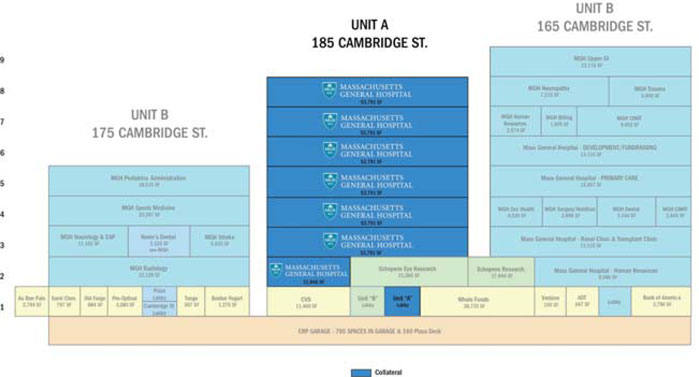 |
| THE INFORMATION IN THIS STRUCTURAL AND COLLATERAL TERM SHEET IS NOT COMPLETE AND MAY BE AMENDED PRIOR TO THE TIME OF SALE. THIS TERM SHEET IS NOT AN OFFER TO SELL THESE SECURITIES AND IT IS NOT A SOLICITATION OF AN OFFER TO BUY THESE SECURITIES IN ANY JURISDICTION WHERE THE OFFER OR SALE IS NOT PERMITTED. |
| 30 |
185 Cambridge Street Boston, MA 02114
| Collateral Asset Summary – Loan No. 1 Charles River Plaza North
| Cut-off Date Balance: Cut-off Date LTV: U/W NCF DSCR: U/W NOI Debt Yield: | $72,884,027 46.5% 1.85x 11.7% |
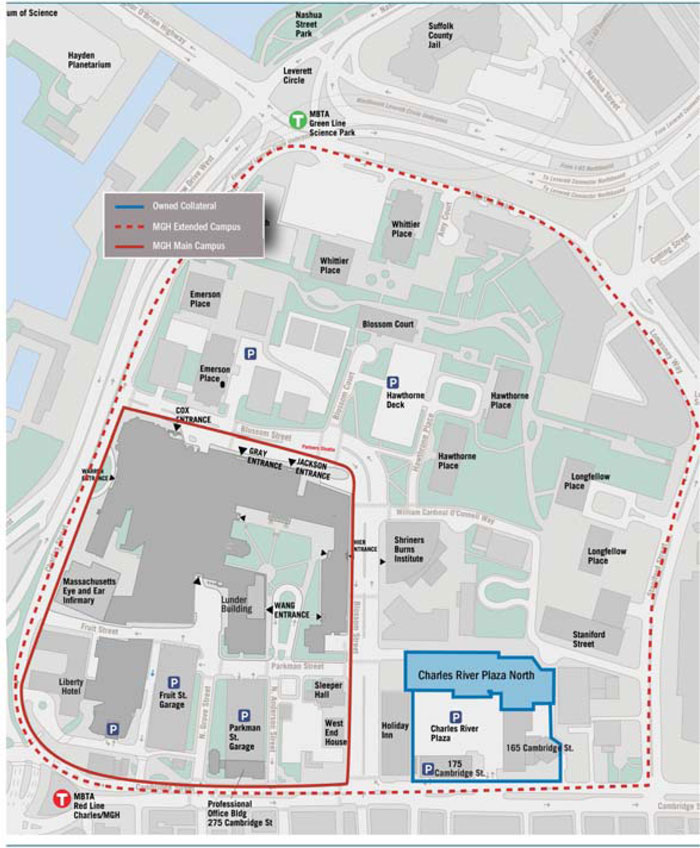 |
| THE INFORMATION IN THIS STRUCTURAL AND COLLATERAL TERM SHEET IS NOT COMPLETE AND MAY BE AMENDED PRIOR TO THE TIME OF SALE. THIS TERM SHEET IS NOT AN OFFER TO SELL THESE SECURITIES AND IT IS NOT A SOLICITATION OF AN OFFER TO BUY THESE SECURITIES IN ANY JURISDICTION WHERE THE OFFER OR SALE IS NOT PERMITTED. |
| 31 |
185 Cambridge Street Boston, MA 02114
| Collateral Asset Summary – Loan No. 1 Charles River Plaza North
| Cut-off Date Balance: Cut-off Date LTV: U/W NCF DSCR: U/W NOI Debt Yield: | $72,884,027 46.5% 1.85x 11.7% |
 |
| THE INFORMATION IN THIS STRUCTURAL AND COLLATERAL TERM SHEET IS NOT COMPLETE AND MAY BE AMENDED PRIOR TO THE TIME OF SALE. THIS TERM SHEET IS NOT AN OFFER TO SELL THESE SECURITIES AND IT IS NOT A SOLICITATION OF AN OFFER TO BUY THESE SECURITIES IN ANY JURISDICTION WHERE THE OFFER OR SALE IS NOT PERMITTED. |
| 32 |
(THIS PAGE INTENTIONALLY LEFT BLANK)
| 33 |
261 Fifth Avenue New York, NY 10016 | Collateral Asset Summary – Loan No. 2 261 Fifth Avenue | Cut-off Date Balance: Cut-off Date LTV: U/W NCF DSCR: U/W NOI Debt Yield: | $70,000,000 60.0% 1.52x 7.4% |
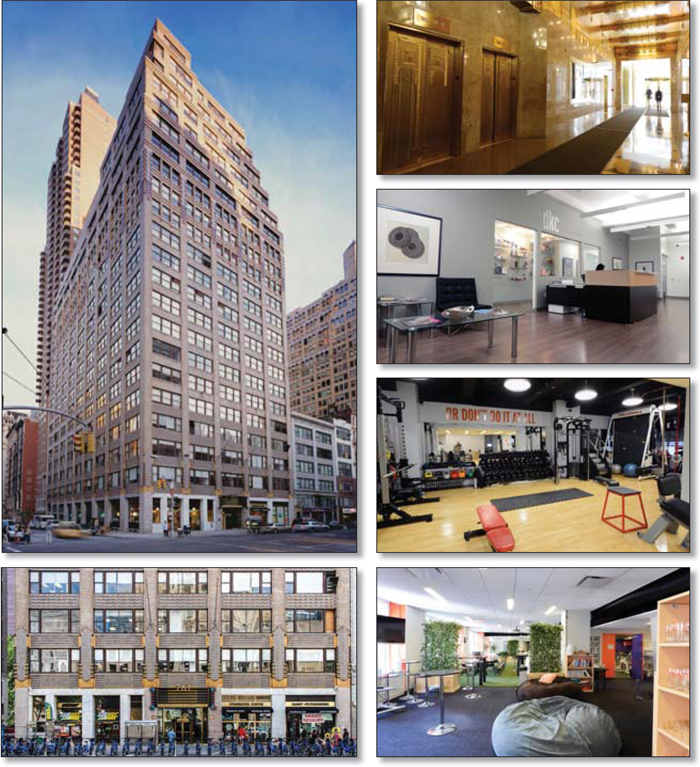
THE INFORMATION IN THIS STRUCTURAL AND COLLATERAL TERM SHEET IS NOT COMPLETE AND MAY BE AMENDED PRIOR TO THE TIME OF SALE. THIS TERM SHEET IS NOT AN OFFER TO SELL THESE SECURITIES AND IT IS NOT A SOLICITATION OF AN OFFER TO BUY THESE SECURITIES IN ANY JURISDICTION WHERE THE OFFER OR SALE IS NOT PERMITTED.
| 34 |
261 Fifth Avenue New York, NY 10016 | Collateral Asset Summary – Loan No. 2 261 Fifth Avenue | Cut-off Date Balance: Cut-off Date LTV: U/W NCF DSCR: U/W NOI Debt Yield: | $70,000,000 60.0% 1.52x 7.4% |
| Mortgage Loan Information | |
| Loan Seller: | BANA |
| Loan Purpose: | Refinance |
| Sponsors: | Jeffrey Feil; Lloyd Goldman |
| Borrowers: | 261 Fifth Avenue TIC Owner LLC; Normandy 261 5th Ave LLC |
| Original Balance(1): | $70,000,000 |
| Cut-off Date Balance(1): | $70,000,000 |
| % by Initial UPB: | 9.2% |
| Interest Rate: | 4.4200% |
| Payment Date: | 1stof each month |
| First Payment Date: | October 1, 2015 |
| Maturity Date: | September 1, 2025 |
| Amortization: | Interest Only |
| Additional Debt(1): | $110,000,000Pari Passu Debt |
| Call Protection: | L(24), D(92), O(4) |
| Lockbox / Cash Management: | Hard / Springing |
| Reserves(2) | ||
| Initial | Monthly | |
| Taxes: | $1,051,424 | $350,475 |
| Insurance: | $0 | Springing |
| Replacement: | $0 | $9,206 |
| TI/LC: | $0 | Springing |
| Free Rent: | $457,936 | NAP |
| Financial Information(3) | ||
| Cut-off Date Balance / Sq. Ft.: | $407 | |
| Balloon Balance / Sq. Ft.: | $407 | |
| Cut-off Date LTV: | 60.0% | |
| Balloon LTV: | 60.0% | |
| Underwritten NOI DSCR: | 1.64x | |
| Underwritten NCF DSCR: | 1.52x | |
| Underwritten NOI Debt Yield: | 7.4% | |
| Underwritten NCF Debt Yield: | 6.8% | |
| Underwritten NOI Debt Yield at Balloon: | 7.4% | |
| Underwritten NCF Debt Yield at Balloon: | 6.8% | |
| Property Information | |
| Single Asset / Portfolio: | Single Asset |
| Property Type: | CBD Office |
| Collateral: | Fee Simple |
| Location: | New York, NY |
| Year Built / Renovated: | 1928 / 2015 |
| Total Sq. Ft.: | 441,922 |
| Property Management: | Jeffrey Management Corp. |
| Underwritten NOI: | $13,235,872 |
| Underwritten NCF: | $12,241,547 |
| Appraised Value: | $300,000,000 |
| Appraisal Date: | July 1, 2015 |
| Historical NOI | |
| Most Recent NOI: | $12,335,215 (December 31, 2014) |
| 2013 NOI: | $10,943,668 (December 31, 2013) |
| 2012 NOI: | $11,213,823 (December 31, 2012) |
| Historical Occupancy | |
| Most Recent Occupancy: | 99.7% (July 31, 2015) |
| 2014 Occupancy: | 99.3% (December 31, 2014) |
| 2013 Occupancy: | 97.8% (December 31, 2013) |
| 2012 Occupancy: | 92.8% (December 31, 2012) |
| (1) | The Original Balance and Cut-off Date Balance of $70.0 million represents the non-controlling Note A-2 of the $180.0 million 261 Fifth Avenue Loan Pair evidenced by twopari passunotes. Thepari passucompanion loan is evidenced by the controlling Note A-1 with an original principal balance of $110.0 million. For additional information on thepari passucompanion loan, see “The Loan” herein. |
| (2) | See “Initial Reserves” and “Ongoing Reserves” herein. |
| (3) | DSCR, LTV, Debt Yield and Balance / Sq. Ft. calculations are based on the aggregate 261 Fifth Avenue Loan Pair. |
THE INFORMATION IN THIS STRUCTURAL AND COLLATERAL TERM SHEET IS NOT COMPLETE AND MAY BE AMENDED PRIOR TO THE TIME OF SALE. THIS TERM SHEET IS NOT AN OFFER TO SELL THESE SECURITIES AND IT IS NOT A SOLICITATION OF AN OFFER TO BUY THESE SECURITIES IN ANY JURISDICTION WHERE THE OFFER OR SALE IS NOT PERMITTED.
| 35 |
261 Fifth Avenue New York, NY 10016 | Collateral Asset Summary – Loan No. 2 261 Fifth Avenue | Cut-off Date Balance: Cut-off Date LTV: U/W NCF DSCR: U/W NOI Debt Yield: | $70,000,000 60.0% 1.52x 7.4% |
| Tenant Summary | |||||||
Tenant | Ratings (Fitch/Moody’s/S&P) | Net Rentable Area (Sq. Ft.) |
% of Net Rentable Area |
| U/W Base Rent PSF | % of Total U/W Base Rent(1) | Lease Expiration |
| Dan Klores Communication(2) | NR/NR/NR | 38,877 | 8.8% | $35.87 | 7.4% | 1/31/2022 | |
| Next Jump Inc | NR/NR/NR | 38,346 | 8.7% | $49.38 | 10.0% | 11/30/2017 | |
| Mistdoda Capital LLC(3) | NR/NR/NR | 38,271 | 8.7% | $46.65 | 9.5% | 10/31/2017 | |
| Richloom Fabrics Group | NR/NR/NR | 28,885 | 6.5% | $37.50 | 5.7% | 12/31/2017 | |
| Total Major Tenants | 144,379 | 32.7% | $42.64 | 32.6% | |||
| Remaining Tenants | 296,023 | 67.0% | $42.92 | 67.4% | |||
| Total Occupied Collateral | 440,402 | 99.7% | $42.83 | 100.0% | |||
| Vacant | 1,520 | 0.3% | |||||
| Total | 441,922 | 100.0% | |||||
| (1) | % of Total U/W Base Rent excludes vacant space. |
| (2) | Dan Klores Communication is entitled to two months of free rent (November and December, 2015) in the total amount of $69,650, which amount was escrowed at closing. |
| (3) | Mistdoda Capital LLC is currently subleasing all of its space through October 31, 2017 (the end of its lease term) to three subtenants: Christine Valmy International School, Inc. (12,757 sq. ft.), The Norwest Company, LLC (12,757 sq. ft.) and Badger & Winters Group, Inc. (12,757 sq. ft.). |
| Lease Rollover Schedule(1)(2) | ||||||||
| Year | # of Leases Expiring(3)(4) | Total Expiring Sq. Ft. | % of Total Sq. Ft. Expiring | Cumulative Sq. Ft. Expiring | Cumulative % of Sq. Ft. Expiring | Annual U/W Base Rent PSF | % U/W Base Rent Rolling | Cumulative % of U/W Base Rent |
| MTM | 0 | 0 | 0.0% | 0 | 0.0% | $0.00 | 0.0% | 0.0% |
| 2015 | 0 | 0 | 0.0% | 0 | 0.0% | $0.00 | 0.0% | 0.0% |
| 2016 | 5 | 22,014 | 5.0% | 22,014 | 5.0% | $45.32 | 5.3% | 5.3% |
| 2017 | 16 | 190,796 | 43.2% | 212,810 | 48.2% | $42.60 | 43.1% | 48.4% |
| 2018 | 3 | 14,051 | 3.2% | 226,861 | 51.3% | $52.22 | 3.9% | 52.3% |
| 2019 | 5 | 26,760 | 6.1% | 253,621 | 57.4% | $48.75 | 6.9% | 59.2% |
| 2020 | 2 | 15,894 | 3.6% | 269,515 | 61.0% | $38.30 | 3.2% | 62.4% |
| 2021 | 8 | 68,470 | 15.5% | 337,985 | 76.5% | $39.42 | 14.3% | 76.7% |
| 2022 | 4 | 75,476 | 17.1% | 413,461 | 93.6% | $38.53 | 15.4% | 92.1% |
| 2023 | 1 | 1,704 | 0.4% | 415,165 | 93.9% | $101.09 | 0.9% | 93.1% |
| 2024 | 1 | 11,030 | 2.5% | 426,195 | 96.4% | $50.00 | 2.9% | 96.0% |
| 2025 | 2 | 9,880 | 2.2% | 436,075 | 98.7% | $52.52 | 2.8% | 98.7% |
| Thereafter | 1 | 4,327 | 1.0% | 440,402 | 99.7% | $55.00 | 1.3% | 100.0% |
| Vacant | NAP | 1,520 | 0.3% | 441,922 | 100.0% | NAP | NAP | |
| Total / Wtd. Avg. | 48 | 441,922 | 100.0% | $42.83 | 100.0% | |||
| (1) | Certain tenants may have lease termination options that may become exercisable prior to the originally stated expiration date of the tenant lease and that are not considered in the lease rollover schedule or the stacking plan. |
| (2) | The rollover schedule includes contractual rent steps through September 2016. |
| (3) | Certain tenants may have multiple co-terminus leases that are consolidated for purposes of this Lease Rollover Schedule. |
| (4) | Mistdoda Capital LLC is currently subleasing all of its space through October 31, 2017 (the end of its lease term) to three subtenants: Christine Valmy International School, Inc. (12,757 sq. ft.), The Norwest Company, LLC (12,757 sq. ft.) and Badger & Winters Group, Inc. (12,757 sq. ft.). The subleases are consolidated for purposes of this Lease Rollover Schedule. |
The Loan. The 261 Fifth Avenue loan (the “261 Fifth Avenue Loan”) is a fixed rate loan secured by the borrowers’ fee simple interest in the 441,922 sq. ft. Class B office building located at 261 Fifth Avenue in New York City, New York (the “261 Fifth Avenue Property”) with an original and cut-off date principal balance of $70.0 million. The 261 Fifth Avenue Loan represents the non-controlling Note A-2 of the $180.0 million whole loan evidenced by twopari passu notes (the “261 Fifth Avenue Loan Pair”). Thepari passu companion loan (the “261 Fifth Avenue Companion Loan”) is evidenced by the controlling Note A-1 with an original principal balance of $110.0 million, and is expected to be contributed to a future securitization trust. The 261 Fifth Avenue Loan has a 10-year term, accrues interest only at a fixed rate equal to 4.4200%per annum (the same rate as the 261 Fifth Avenue Companion Loan), and is entitled to payments on apro rata andpari passu basis with the 261 Fifth Avenue Companion Loan. The holders of the 261 Fifth Avenue Loan and the 261 Fifth Avenue Companion Loan have entered into an agreement among note-holders, which sets forth the allocation of collections of the 261 Fifth Avenue Loan Pair. The 261 Fifth Avenue Loan will be serviced pursuant to the terms of the BACM 2015-UBS7 transaction until the securitization of the 261 Fifth Avenue Companion Loan, at which time the 261 Fifth Avenue Loan Pair will be serviced pursuant to the terms of the pooling and servicing agreement entered into with respect to such future securitization.
THE INFORMATION IN THIS STRUCTURAL AND COLLATERAL TERM SHEET IS NOT COMPLETE AND MAY BE AMENDED PRIOR TO THE TIME OF SALE. THIS TERM SHEET IS NOT AN OFFER TO SELL THESE SECURITIES AND IT IS NOT A SOLICITATION OF AN OFFER TO BUY THESE SECURITIES IN ANY JURISDICTION WHERE THE OFFER OR SALE IS NOT PERMITTED.
| 36 |
261 Fifth Avenue New York, NY 10016 | Collateral Asset Summary – Loan No. 2 261 Fifth Avenue | Cut-off Date Balance: Cut-off Date LTV: U/W NCF DSCR: U/W NOI Debt Yield: | $70,000,000 60.0% 1.52x 7.4% |
Loan proceeds were used to retire existing debt of approximately $141.6 million, fund upfront reserves of approximately $1.5 million and pay closing costs of approximately $2.3 million, giving the borrowers a return of equity of approximately $34.6 million. Based on the appraised value of $300.0 million as of July 1, 2015, the cut-off date LTV ratio for the 261 Fifth Avenue Loan Pair is 60.0%. The most recent prior financing of the 261 Fifth Avenue Property was included in the MSC 2005-HQ7 transaction.
| Loan Combination Summary | ||||
| Original Balance | Cut-off Date Balance | Note Holder | Controlling Piece | |
| Note A-1 | $110,000,000 | $110,000,000 | Future Securitization | Yes |
| Note A-2 | $70,000,000 | $70,000,000 | BACM 2015-UBS7 | No |
| Total | $180,000,000 | $180,000,000 | ||
| Sources and Uses | ||||||
| Sources | Proceeds | % of Total | Uses | Proceeds | % of Total | |
| Loan Amount(1) | $180,000,000 | 100.0% | Loan Payoff | $141,631,767 | 078.7% | |
| Reserves | $1,509,360 | 000.8% | ||||
| Closing Costs | $2,254,035 | 001.3% | ||||
| Return of Equity | $34,604,839 | 019.2% | ||||
| Total Sources | $180,000,000 | 100.0% | Total Uses | $180,000,000 | 100.0% | |
| (1) | The 261 Fifth Avenue Loan of $70.0 million represents the non-controlling Note A-2 of the total $180.0 million 261 Fifth Avenue Loan Pair evidenced by twopari passu notes. Thepari passuserviced companion loan is comprised of the controlling Note A-1 with an original principal balance of $110.0 million. For additional information on thepari passuserviced companion loan, see “The Loan” herein. |
The Borrower / Sponsor. The borrowers are tenants in common, 261 Fifth Avenue TIC Owner LLC and Normandy 261 5th Ave LLC, each a single purpose Delaware limited liability company structured to be bankruptcy-remote, with two independent directors. The sponsors of the borrowers and the nonrecourse carve-out guarantors are Jeffrey Feil and Lloyd Goldman.
Jeffrey Feil is the President and Chief Executive Office of the Feil Organization, Inc, a New York based real estate investment, development and management firm that owns and has developed and managed over 26 million sq. ft. of retail, commercial and industrial properties, over 5,000 residential rental units and hundreds of net leased properties. Mr. Feil is a founding partner of the real estate lending platform RCG Longview, and also serves on the Board of Governors of the New York Real Estate Board and as President of The Feil Family Foundation.
Lloyd Goldman is the President of BLDG Management Co., Inc. and its affiliates, which owns and manages a national real estate portfolio of in excess of 400 properties, including over 7,000 residential units and over 20 million sq. ft. of commercial properties. BLDG Management Co., Inc. and its affiliates employ over 80 people for property management, leasing and support and over 750 people for the operation and maintenance of its properties.
The Property.The 261 Fifth Avenue Property was constructed in 1928 by renowned architect Ely Jacques Kahn and is a designated New York City landmark. The 261 Fifth Avenue Property is a 26-story, Class B office building located at the southeast intersection of Fifth Avenue and East 29th Street in Manhattan’s Midtown South market and consists of 441,922 sq. ft. (427,869 sq. ft. of office space and 14,053 sq. ft. of retail with frontage along both Fifth Avenue and 29th Street). The 261 Fifth Avenue Property is proximate to the Empire State Building, Madison Square Garden, the Flatiron and Madison Square Park and to several mass transit options including the 1, N, R and 6 subway trains (all within two blocks), and additional subway lines, New Jersey Path and Transit trains, Long Island Railroad and Amtrak trains.
The borrowers acquired the 261 Fifth Avenue Property in 2005 and has a current cost basis of $193.2 million. In 2015, the borrowers began a capital improvement and renovation plan that calls for approximately $17.5 million in the 261 Fifth Avenue Property over the next six years. The renovation plans include upgrades to the lobby, façade, mechanicals, common areas, and conversion to a gas boiler.
As of July 31, 2015, the 261 Fifth Avenue Property was 99.7% leased by 44 office and 4 retail tenants. The largest tenants are Dan Klores Communication, Next Jump Inc, Mistdoda Capital LLC and Richloom Fabrics Group, with no other tenant leasing more than 4.4% of sq. ft. or representing more than 4.8% of base rent. The retail spaces are currently occupied by Harounian Rugs International, Den Enterprises Inc (d/b/a Saint-Petersburg), Subway Real Estate Corp and Starbucks Corp. Historical occupancy at the 261 Fifth Avenue Property has averaged 96.6% for the last three years.
Environmental Matters.The Phase I environmental report dated June 13, 2015 recommended the development and implementation of an Asbestos Operation and Maintenance Plan at the 216 Fifth Avenue Property.
THE INFORMATION IN THIS STRUCTURAL AND COLLATERAL TERM SHEET IS NOT COMPLETE AND MAY BE AMENDED PRIOR TO THE TIME OF SALE. THIS TERM SHEET IS NOT AN OFFER TO SELL THESE SECURITIES AND IT IS NOT A SOLICITATION OF AN OFFER TO BUY THESE SECURITIES IN ANY JURISDICTION WHERE THE OFFER OR SALE IS NOT PERMITTED.
| 37 |
261 Fifth Avenue New York, NY 10016 | Collateral Asset Summary – Loan No. 2 261 Fifth Avenue | Cut-off Date Balance: Cut-off Date LTV: U/W NCF DSCR: U/W NOI Debt Yield: | $70,000,000 60.0% 1.52x 7.4% |
Major Tenants.
Dan Klores Communication (38,877 sq. ft., 8.8% of NRA, 7.4% of U/W Base Rent) Dan Klores Communication occupies 38,877 sq. ft. under an initial lease dated June 29, 2010 and expiring January 31, 2022, with one five-year renewal option at fair market rent. Pursuant to the lease, the tenant pays a current base rent of $35.87 PSF and is entitled to two months of rent abatement from November through December, 2015 totaling $69,650. Dan Klores Communication is an independent public relations firm with offices in New York, Los Angeles, Chicago, San Francisco and Washington, D.C. Its clients range from Fortune 100 companies to small startups and individuals.
Next Jump Inc (38,346 sq. ft., 8.7% of NRA, 10.0% of U/W Base Rent) Next Jump Inc occupies 38,346 sq. ft. under a lease dated August 1, 2007 and expiring July 31, 2017. Pursuant to the lease, the tenant pays a current base rent of $47.33 PSF, which will increase to $48.69 PSF by December 2015 and to $50.08 PSF by December 2016. Next Jump Inc is an e-commerce company that manages exclusive perks, benefits, rewards and recognition for over 70% of the Fortune 1000 companies and for its merchant partners reaches a customer network of over 70 million members.
Mistdoda Capital LLC(38,271 sq. ft., 8.7% of NRA, 9.5% of U/W Base Rent) Mistdoda Capital LLC was an entity under the common control of Croscill, Inc., a textile manufacturer. Mistdoda Capital LLC pays a current base rent of $45.30 PSF, which will increase to $46.66 PSF beginning November 2015 and to $48.05 PSF beginning November 2016. Mistdoda Capital LLC currently subleases all of its space through October 31, 2017 (the end of its lease term) to three subtenants: Christine Valmy International School, Inc. (occupying 12,757 sq. ft. under a sublease dated August 27, 2010), The Norwest Company, LLC (occupying 12,757 sq. ft. under a sublease dated December 20, 2010) and Badger & Winters Group, Inc. (occupying 12,757 sq. ft. under a sublease dated June 29, 2010).
Richloom Fabrics Group(28,885 sq. ft., 6.5% of NRA, 5.7% of U/W Base Rent) Richloom Fabrics Group occupies 28,885 sq. ft. under a lease dated January 1999 and expiring December 31, 2017. Pursuant to the lease, the tenant pays a current base rent of $37.50 PSF. Richloom Fabrics Group is a privately held home furnishings company specializing in servicing hospitality clients, furniture manufacturers worldwide, over-the-counter fabric retailers, jobbers, recreational vehicles and outdoor manufacturers.
The Market. The 261 Fifth Avenue Property is located in the Midtown South office market, which includes businesses in the fashion, art, advertising and high-tech industries. The Midtown South office market outperforms other Manhattan office markets with a vacancy rate of 7.0%, which rate has remained under 10% over the past five years. Supply is especially limited for larger blocks of space. During the first quarter of 2015, only four blocks of 100,000 sq. ft. or larger were available. Over the past year, the Midtown South office market’s average asking rent has risen by 5.4%. Midtown South’s Class B office space is the most expensive in its class of any Manhattan office market, at an asking rent of $65.67 PSF. Comparable space in Midtown and Downtown carries an average asking rent of $54.69 PSF and $41.86 PSF, respectively.
The 261 Fifth Avenue Property is located in the Madison/Union Square submarket of the Midtown South office market. During the first quarter of 2015, the Madison/Union Square submarket had a vacancy rate of 7.3%, 1.6% less that the same period last year, and the lowest vacancy since the second quarter of 2013. The submarket had a weighted average Class B office rent of $66.17 PSF. The weighted average underwritten office rent at the 261 Fifth Avenue Property is $42.03 PSF. Class B available space decreased 14.4% during the first quarter of 2015 from the previous quarter. The submarket continued a streak of five consecutive quarters of positive absorption which registered 237,548 sq. ft. in the first quarter of 2015.
THE INFORMATION IN THIS STRUCTURAL AND COLLATERAL TERM SHEET IS NOT COMPLETE AND MAY BE AMENDED PRIOR TO THE TIME OF SALE. THIS TERM SHEET IS NOT AN OFFER TO SELL THESE SECURITIES AND IT IS NOT A SOLICITATION OF AN OFFER TO BUY THESE SECURITIES IN ANY JURISDICTION WHERE THE OFFER OR SALE IS NOT PERMITTED.
| 38 |
261 Fifth Avenue New York, NY 10016 | Collateral Asset Summary – Loan No. 2 261 Fifth Avenue | Cut-off Date Balance: Cut-off Date LTV: U/W NCF DSCR: U/W NOI Debt Yield: | $70,000,000 60.0% 1.52x 7.4% |
The subsequent chart presents the primary competitive properties to the 261 Fifth Avenue Property:
| Competitive Set(1) | |||||
| Name | Asking Rent | Year Built / Renovated | Direct Occupancy | Size (Sq. Ft.) | Stories |
| 261 Fifth Avenue Property | $43(2) | 1928 / 2015 | 99.7%(3) | 441,922(3) | 26 |
| 60 Madison Avenue | $64 - $68 | 1910 | 80.5% | 183,400 | 13 |
| 79 Madison Avenue | $65 | 1925 / 2005 | 86.9% | 216,000 | 17 |
| 105 Madison Avenue | $59 | 1913 | 94.2% | 231,000 | 20 |
| 11 East 26th Street | $68 | 1912 | 94.8% | 230,000 | 21 |
| 345-355 Park Avenue South | N/A | 1912 / 1999 | 100.0% | 240,000 | 12 |
| 360 Park Avenue South | N/A | 1912 | 100.0% | 451,000 | 20 |
| 381 Park Avenue South | $55 | 1910 | 87.8% | 192,000 | 17 |
| 230 Fifth Avenue | N/A | 1915 | 100.0% | 300,000 | 20 |
| Range / Wtd. Avg. / Total(4) | $55 - $68 | 94.5% | 2,043,400 | ||
| (1) | Source: Appraisal |
| (2) | Reflects current weighted average underwritten rent at the 261 Fifth Avenue Property. |
| (3) | Based on the rent roll dated July 31, 2015. |
| (4) | Range / Wtd. Avg. / Total excludes the 261 Fifth Avenue Property. |
Cash Flow Analysis.
| Cash Flow Analysis | |||||
| 2012 | 2013 | 2014 | U/W | U/W PSF | |
| Base Rent(1) | $15,320,343 | $15,372,196 | $16,747,229 | $18,860,856 | $42.68 |
| Value of Vacant Space | 0 | 0 | 0 | 91,200 | 0.21 |
| Gross Potential Rent | $15,320,343 | $15,372,196 | $16,747,229 | $18,952,056 | $42.89 |
| Total Recoveries | 2,192,866 | 2,363,793 | 2,673,153 | 3,090,171 | 6.99 |
| Total Other Income | 129,659 | 70,161 | 134,271 | 129,484 | 0.29 |
| Less: Vacancy(2) | 0 | 0 | 0 | (1,102,111) | (2.49) |
| Effective Gross Income | $17,642,868 | $17,806,150 | $19,554,653 | $21,069,600 | $47.68 |
| Total Operating Expenses | 6,429,045 | 6,862,482 | 7,219,438 | 7,833,728 | 17.73 |
| Net Operating Income | $11,213,823 | $10,943,668 | $12,335,215 | $13,235,872 | $29.95 |
| TI/LC | 0 | 0 | 0 | 883,844 | 2.00 |
| Capital Expenditures | 0 | 0 | 0 | 110,481 | 0.25 |
| Net Cash Flow | $11,213,823 | $10,943,668 | $12,335,215 | $12,241,547 | $27.70 |
| (1) | U/W Base Rent includes $282,648 in contractual step rent through September 2016. |
| (2) | U/W Vacancy represents 5.0% of gross income. |
Property Management. The 261 Fifth Avenue Property is managed by Jeffrey Management Corp., a borrower affiliate.
Lockbox / Cash Management. The 261 Fifth Avenue Loan is structured with a hard lockbox and springing cash management. The borrowers sent tenant direction letters to all tenants instructing them to deposit all rents and other payments into the lockbox account controlled by the lender. During the continuance of a Cash Sweep Period (as defined herein), all funds in the lockbox account are swept daily to a cash management account under the control of the lender and disbursed during each interest period of the loan term in accordance with the loan documents. All funds remaining in the cash management account after the payment of all required monthly debt service and reserve amounts (if any) will be remitted to the borrowers on a daily basis.
A “Cash Sweep Period” will occur upon the debt service coverage ratio falling below 1.30x and will end upon the debt service coverage ratio equaling or exceeding 1.35x for two consecutive calendar quarters.
Initial Reserves. At closing, the borrowers deposited (i) $1,051,424 into a tax reserve account and (ii) $457,936 into the Free Rent Reserve for free rent periods ranging from one to eight months, relating to ten individual tenants.
Ongoing Reserves. On a monthly basis, the borrowers are required to deposit reserves of (i) 1/12 of the estimated annual real estate taxes, which currently equates to $350,475, into a tax reserve account, (ii) 1/12 of the annual insurance premiums (unless the borrowers maintain coverage under a blanket insurance policy) into an insurance reserve account and (iii) $9,206 into a capital expenditure account. Upon the debt service coverage ratio falling below 1.40x until the debt service coverage ratio equaling or
THE INFORMATION IN THIS STRUCTURAL AND COLLATERAL TERM SHEET IS NOT COMPLETE AND MAY BE AMENDED PRIOR TO THE TIME OF SALE. THIS TERM SHEET IS NOT AN OFFER TO SELL THESE SECURITIES AND IT IS NOT A SOLICITATION OF AN OFFER TO BUY THESE SECURITIES IN ANY JURISDICTION WHERE THE OFFER OR SALE IS NOT PERMITTED.
| 39 |
261 Fifth Avenue New York, NY 10016 | Collateral Asset Summary – Loan No. 2 261 Fifth Avenue | Cut-off Date Balance: Cut-off Date LTV: U/W NCF DSCR: U/W NOI Debt Yield: | $70,000,000 60.0% 1.52x 7.4% |
exceeding 1.40x for two consecutive quarters, the borrowers are required to deposit monthly reserves of $73,665 into a TI/LC reserve account.
Current Mezzanine or Subordinate Indebtedness. None.
Future Mezzanine or Subordinate Indebtedness Permitted. None.
THE INFORMATION IN THIS STRUCTURAL AND COLLATERAL TERM SHEET IS NOT COMPLETE AND MAY BE AMENDED PRIOR TO THE TIME OF SALE. THIS TERM SHEET IS NOT AN OFFER TO SELL THESE SECURITIES AND IT IS NOT A SOLICITATION OF AN OFFER TO BUY THESE SECURITIES IN ANY JURISDICTION WHERE THE OFFER OR SALE IS NOT PERMITTED.
| 40 |
261 Fifth Avenue New York, NY 10016 | Collateral Asset Summary – Loan No. 2 261 Fifth Avenue | Cut-off Date Balance: Cut-off Date LTV: U/W NCF DSCR: U/W NOI Debt Yield: | $70,000,000 60.0% 1.52x 7.4% |

THE INFORMATION IN THIS STRUCTURAL AND COLLATERAL TERM SHEET IS NOT COMPLETE AND MAY BE AMENDED PRIOR TO THE TIME OF SALE. THIS TERM SHEET IS NOT AN OFFER TO SELL THESE SECURITIES AND IT IS NOT A SOLICITATION OF AN OFFER TO BUY THESE SECURITIES IN ANY JURISDICTION WHERE THE OFFER OR SALE IS NOT PERMITTED.
| 41 |
261 Fifth Avenue New York, NY 10016 | Collateral Asset Summary – Loan No. 2 261 Fifth Avenue | Cut-off Date Balance: Cut-off Date LTV: U/W NCF DSCR: U/W NOI Debt Yield: | $70,000,000 60.0% 1.52x 7.4% |
THE INFORMATION IN THIS STRUCTURAL AND COLLATERAL TERM SHEET IS NOT COMPLETE AND MAY BE AMENDED PRIOR TO THE TIME OF SALE. THIS TERM SHEET IS NOT AN OFFER TO SELL THESE SECURITIES AND IT IS NOT A SOLICITATION OF AN OFFER TO BUY THESE SECURITIES IN ANY JURISDICTION WHERE THE OFFER OR SALE IS NOT PERMITTED.
| 42 |
(THIS PAGE INTENTIONALLY LEFT BLANK)
| 43 |
11301 Domain Drive Austin, TX 78758 | Collateral Asset Summary – Loan No. 3 Westin Hotel at the Domain | Cut-off Date Balance: Cut-off Date LTV: U/W NCF DSCR: U/W NOI Debt Yield: | $70,000,000 56.0% 2.29x 14.9% |
THE INFORMATION IN THIS STRUCTURAL AND COLLATERAL TERM SHEET IS NOT COMPLETE AND MAY BE AMENDED PRIOR TO THE TIME OF SALE. THIS TERM SHEET IS NOT AN OFFER TO SELL THESE SECURITIES AND IT IS NOT A SOLICITATION OF AN OFFER TO BUY THESE SECURITIES IN ANY JURISDICTION WHERE THE OFFER OR SALE IS NOT PERMITTED.
| 44 |
11301 Domain Drive Austin, TX 78758 | Collateral Asset Summary – Loan No. 3 Westin Hotel at the Domain | Cut-off Date Balance: Cut-off Date LTV: U/W NCF DSCR: U/W NOI Debt Yield: | $70,000,000 56.0% 2.29x 14.9% |
| Mortgage Loan Information | |
| Loan Seller: | UBSRES |
| Loan Purpose: | Refinance |
| Sponsors: | Simon Property Group, L.P.; White Lodging Services Corporation |
| Borrowers: | Domain Hotel Operating Company, LLC; Domain Hotel Company, LLC |
| Original Balance: | $70,000,000 |
| Cut-off Date Balance: | $70,000,000 |
| % by Initial UPB: | 9.2% |
| Interest Rate: | 4.1203% |
| Payment Date: | 1stof each month |
| First Payment Date: | October 1, 2015 |
| Maturity Date: | September 1, 2025 |
| Amortization: | 360 months |
| Additional Debt: | None |
| Call Protection: | L(24), D(89), O(7) |
| Lockbox / Cash Management: | Soft / Springing |
| Reserves(1) | ||
| Initial | Monthly | |
| Taxes: | $0 | Springing |
| Insurance: | $0 | Springing |
| FF&E: | $0 | Springing |
| Financial Information | ||
| Cut-off Date Balance / Room: | $205,279 | |
| Balloon Balance / Room: | $163,781 | |
| Cut-off Date LTV: | 56.0% | |
| Balloon LTV: | 44.7% | |
| Underwritten NOI DSCR: | 2.55x | |
| Underwritten NCF DSCR: | 2.29x | |
| Underwritten NOI Debt Yield: | 14.9% | |
| Underwritten NCF Debt Yield: | 13.3% | |
| Underwritten NOI Debt Yield at Balloon: | 18.6% | |
| Underwritten NCF Debt Yield at Balloon: | 16.7% | |
| Property Information | ||
| Single Asset / Portfolio: | Single Asset | |
| Property Type: | Full Service Hospitality | |
| Collateral: | Fee Simple | |
| Location: | Austin, TX | |
| Year Built / Renovated: | 2010 / NAP | |
| Total Rooms: | 341 | |
| Property Management: | White Lodging Services Corporation | |
| Underwritten NOI: | $10,395,452 | |
| Underwritten NCF: | $9,317,873 | |
| Appraised Value: | $125,000,000 | |
| Appraisal Date: | July 14, 2015 | |
| Historical NOI | ||
| Most Recent NOI: | $10,046,816 (T-12 June 30, 2015) | |
| 2014 NOI: | $9,638,643 (December 31, 2014) | |
| 2013 NOI: | $8,438,566 (December 31, 2013) | |
| 2012 NOI: | $7,198,276 (December 31, 2012) | |
| Historical Occupancy | ||
| Most Recent Occupancy: | 75.1% (June 30, 2015) | |
| 2014 Occupancy: | 75.9% (December 31, 2014) | |
| 2013 Occupancy: | 77.3% (December 31, 2013) | |
| 2012 Occupancy: | 73.0% (December 31, 2012) | |
| (1) | See “Initial Reserves” and “Ongoing Reserves” herein. |
THE INFORMATION IN THIS STRUCTURAL AND COLLATERAL TERM SHEET IS NOT COMPLETE AND MAY BE AMENDED PRIOR TO THE TIME OF SALE. THIS TERM SHEET IS NOT AN OFFER TO SELL THESE SECURITIES AND IT IS NOT A SOLICITATION OF AN OFFER TO BUY THESE SECURITIES IN ANY JURISDICTION WHERE THE OFFER OR SALE IS NOT PERMITTED.
| 45 |
11301 Domain Drive Austin, TX 78758 | Collateral Asset Summary – Loan No. 3 Westin Hotel at the Domain | Cut-off Date Balance: Cut-off Date LTV: U/W NCF DSCR: U/W NOI Debt Yield: | $70,000,000 56.0% 2.29x 14.9% |
Historical Occupancy, ADR, RevPAR(1) | |||||||||
| Westin Hotel at the Domain Property | Competitive Set | Penetration Factor | |||||||
| Year | Occupancy | ADR | RevPAR | Occupancy | ADR | RevPAR | Occupancy | ADR | RevPAR |
| 2011 | 70.4% | $152.33 | $107.20 | 67.3% | $130.98 | $88.12 | 104.6% | 116.3% | 121.7% |
| 2012 | 73.0% | $168.79 | $123.26 | 69.9% | $138.47 | $96.74 | 104.5% | 121.9% | 127.4% |
| 2013 | 77.3% | $183.03 | $141.54 | 70.5% | $149.65 | $105.47 | 109.7% | 122.3% | 134.2% |
| 2014 | 75.9% | $196.53 | $149.10 | 72.8% | $157.55 | $114.77 | 104.1% | 124.7% | 129.9% |
| T-12 May 2015 | 75.1% | $199.68 | $149.92 | 72.1% | $162.09 | $116.94 | 104.1% | 123.2% | 128.2% |
| (1) | Source: Hospitality research report |
The Loan. The Westin Hotel at the Domain loan (the “Westin Hotel at the Domain Loan”) is a fixed rate loan secured by the borrowers’ fee simple interest in a 341-room, full service hotel located at 11301 Domain Drive in Austin, Texas (the “Westin Hotel at the Domain Property”) with an original principal balance of $70.0 million. The Westin Hotel at the Domain Loan has a 10-year term and amortizes on a 30-year schedule. The Westin Hotel at the Domain Loan accrues interest at a fixed rate equal to 4.1203%per annum and has a cut-off date balance of $70.0 million. The Westin Hotel at the Domain Loan proceeds were used to retire existing debt of approximately $45.1 million, pay closing costs of $628,816, and return equity to the sponsors of approximately $24.3 million. Based on the appraised value of $125.0 million as of July 14, 2015, the cut-off date LTV ratio is 56.0% and the remaining implied equity is $55.0 million.
| Sources and Uses | ||||||
| Sources | Proceeds | % of Total | Uses | Proceeds | % of Total | |
| Loan Amount | $70,000,000 | 100.0% | Loan Payoff | $45,089,612 | 064.4% | |
| Closing Costs | $628,816 | 000.9% | ||||
| Return of Equity | $24,281,572 | 034.7% | ||||
| Total Sources | $70,000,000 | 100.0% | Total Uses | $70,000,000 | 100.0% | |
The Borrower / Sponsor. The borrowers, Domain Hotel Operating Company, LLC and Domain Hotel Company, LLC, are single purpose Delaware limited liability companies structured to be bankruptcy-remote, with two independent directors for each of the borrowers in its organizational structure. The sponsors of the borrowers are Simon Property Group, L.P. (“Simon”) and White Lodging Services Corporation (“White Lodging”).
Simon is a publicly traded self-administered and self-managed real estate investment trust (NYSE: SPG) focused on retail property ownership and management. Simon is one of the largest publicly traded owner, operator and developer of retail assets in the United States. As of December 31, 2014, Simon operated 207 income producing properties in the United States, consisting of 109 malls, 68 outlet centers, 13 mills, three community centers, and 14 other retail properties located in 37 states and Puerto Rico.
White Lodging is a hospitality company with over 163 premium branded, full service and select service hotels across 20 states with over 30 restaurants, totaling more than $1 billion in revenue. Since 1985, White Lodging has developed and managed over 120 premium branded hotels, representing more than $2.5 billion in investment value. White Lodging has partnerships with Starwood, Marriott International, Global Hyatt, and Hilton. Over the last three years White Lodging has added six Starwood branded-properties and eight Hyatt-branded properties to its portfolio, including hotels under development.
For so long as Simon and/or White Lodging are the guarantors, the recourse liability of the guarantors will be limited to matters that relate to voluntary or collusive involuntary bankruptcy, voluntary liens or transfers in violation of the loan documents, and the failure to replace a terminated franchise agreement with an acceptable replacement franchise agreement and to matters arising under the environmental indemnity.
The Property. The Westin Hotel at the Domain Property is an eight-story, 341 room full service hotel constructed in 2010 on a 5.6 acre site with 377 parking spaces. Of the 341 rooms, 201 are king rooms, 132 are double rooms and eight are suites. In-room amenities include a 37” flat screen television, high speed internet, iHome docking station, complimentary daily newspaper, desk and ergonomic chair, microwave and a refrigerator. Certain rooms are WestinWORKOUT® rooms, which in addition to the traditional room layout, feature a treadmill, DVD player, workout DVDs, adjustable dumbbells and other fitness equipment in the guest room. Upon request, the Westin Hotel at the Domain Property also provides pet amenities including a dog bed, bowl and mat.
The Westin Hotel at the Domain Property amenities include a heated outdoor pool and whirlpool, 17,000 sq. ft. of meeting and pre-function space including an 8,000 sq. ft. ball room, a 24-hour business center and a 24-hour gym. The meetings spaces can be separated by up to 17 different rooms, with a variety of configurations. The 8,000 sq. ft. Primrose ballroom features 18’ ceilings, adjustable lighting, chandeliers and classic décor and can accommodate up to 800 guests. The smaller Wine Room, which can accommodate up to 20 guests, features a wine cooler storage, display cases, as well as decorative shelving featuring local and
THE INFORMATION IN THIS STRUCTURAL AND COLLATERAL TERM SHEET IS NOT COMPLETE AND MAY BE AMENDED PRIOR TO THE TIME OF SALE. THIS TERM SHEET IS NOT AN OFFER TO SELL THESE SECURITIES AND IT IS NOT A SOLICITATION OF AN OFFER TO BUY THESE SECURITIES IN ANY JURISDICTION WHERE THE OFFER OR SALE IS NOT PERMITTED.
| 46 |
11301 Domain Drive Austin, TX 78758 | Collateral Asset Summary – Loan No. 3 Westin Hotel at the Domain | Cut-off Date Balance: Cut-off Date LTV: U/W NCF DSCR: U/W NOI Debt Yield: | $70,000,000 56.0% 2.29x 14.9% |
artisanal cookbooks. Meeting and wedding amenities include specialized coordinators, catering, teleconferencing equipment, video-conferencing equipment and audiovisual equipment. The 24-hour fitness center at the Westin Hotel at the Domain Property features state-of-the-art machines, flat-screen TVs, complimentary towel service as well as a gear lending service, which provides athletic shoes and apparel for guests. Dining options at the hotel include Urban - An American Grill, as well as the Urban Lounge, which offers wine, beers, cocktails and snacks. The hotel also offers access to the Domain Spa Réveil, a luxury spa with women’s and men’s Turkish steam baths, a sanctuary lounge, couples’ suite and in-room treatments as well as a number of other spa services.
The Westin Hotel at the Domain Property received the Conde Nast Reader’s Choice Awards: Best in the World Top 200 Hotels in 2011, the year after it was developed. It is currently rated 4 diamonds by AAA and 4 stars by Northstar. The Westin Hotel at the Domain Property is also rated 4.5 stars out of 5 on Tripadvisor, and has received the Tripadvisor certificate of excellence.
Environmental Matters. The Phase I environmental report dated July 21, 2015 recommended no further action at the Westin Hotel at the Domain Property.
The Market. The Westin Hotel at the Domain Property is located within the central portion of a multi-phased development of high-density business, retail and residential properties (“The Domain”) approximately 10.0 miles northwest of the Austin central business district (“CBD”). The Domain is operated by Simon Property Group and located in the high-tech corridor of northwest Austin. The Domain also offers more than 800 residential units and over 1.25 million sq. ft. of class A office space. The first phase of The Domain opened in 2007 and includes 700,000 sq. ft. of restaurants, office space, upscale retail stores, and apartments. The Domain Mall is anchored by Neiman Marcus, Macy’s, Dillard’s and Dick’s Sporting Goods. Other retailers include Apple, Barneys New York CO-OP, Burberry, and a Microsoft store. In January of 2014, Whole Foods opened a 63,000 sq. ft. store approximately half a mile from the Domain Mall and the Westin Hotel at the Domain Property. Phase II opened in spring 2008 and added an additional 350,000 sq. ft. of retail space, restaurants, apartments, a theater, and other entertainment options including a music venue that hosts live bands on weekends and food trucks. Once phase III is completed, expected in Fall 2016, the 304-acre development will be comprised of over 5,000 residential units, 1.8 million sq. ft. of retail space and 3.5 million sq. ft. of office space. Nordstrom’s plans to occupy a 149,000 sq. ft. store in Phase III and is expected to open in Fall 2016, and Saks Fifth Avenue has signed a letter of intent for Phase III.
The Westin Hotel at the Domain Property is located in Austin, Texas, approximately 10 miles northwest of the Austin CBD. As of January 2015, the City of Austin’s unemployment rate was 3.4%, which is lower than both the national and the state unemployment rates, as of May 2015, of 6.1% and 4.1%, respectively. Located in Travis County, the Westin Hotel at the Domain Property is part of the Austin-Round Rock metropolitan statistical area (“Austin-Round MSA”). The Austin-Round MSA has an estimated 2015 population of approximately 1.9 million, making it the fourth largest MSA in Texas.
Austin has become a major high-tech industry city and was recently ranked the No. 1 city for tech businesses globally by the Savills World Research in 2015 over San Francisco and 10 other cities. The area has more than 91,000 people working for approximately 3,700 technology firms. Samsung Electronics announced a $4.0 billion expansion at their Austin facility at the end of 2012, which increased their total investment in Austin to $15 billon. The IBM Corp. campus with 6,000 employees is located within The Domain and the Apple campus is less than five minutes away from the Westin Hotel at the Domain Property with 2,500 employees, as well as divisions from Emerson, Cisco, and AT&T. Dell Inc.’s headquarters with 12,000 employees is located within 10 minutes from The Domain.
Austin is the State Capital of Texas, and is home to the University of Texas - Austin, the fifth-largest single-campus enrollment in the nation with 24,000 faculty and staff employed by the university. The Austin area also has numerous tourist attractions; many of which are centered around the city’s vibrant live music scene with more music venues per capita than any other city in the U.S. The area has drawn a number of music festivals including the Austin City Limits Music Festival and South by Southwest (“SXSW”). Austin City Limits is the longest running music program on American television. The success of the television series has led to the annual Austin City Limits Music Festival, which takes place over two three-day weekends. The area also holds SXSW, with over 2,000 performers and bands playing in more than 100 different venues, which generated an economic impact of approximately $315.3 million in 2014.
The market mix with respect to the Westin Hotel at the Domain Property consists of 27.0% group, 45.0% corporate, and 28.0% leisure. The corporate demand is primarily related to the concentration of Class A office space in northwest Austin, with over 15.0 million sq. ft., including corporations such as IBM Inc., Apple, Dell Inc., Emerson, Cisco, AT&T, and National Instrument. The leisure demand is generated by SXSW, Formula One, University of Texas, sporting events, and weddings. The group demand is primarily related to corporate meetings, training seminars for businesses and government, and social and sports groups.
THE INFORMATION IN THIS STRUCTURAL AND COLLATERAL TERM SHEET IS NOT COMPLETE AND MAY BE AMENDED PRIOR TO THE TIME OF SALE. THIS TERM SHEET IS NOT AN OFFER TO SELL THESE SECURITIES AND IT IS NOT A SOLICITATION OF AN OFFER TO BUY THESE SECURITIES IN ANY JURISDICTION WHERE THE OFFER OR SALE IS NOT PERMITTED.
| 47 |
11301 Domain Drive Austin, TX 78758 | Collateral Asset Summary – Loan No. 3 Westin Hotel at the Domain | Cut-off Date Balance: Cut-off Date LTV: U/W NCF DSCR: U/W NOI Debt Yield: | $70,000,000 56.0% 2.29x 14.9% |
The subsequent chart presents the primary competitive properties to the Westin Hotel at the Domain Property:
| Primary Competitive Set(1) | ||||||
| Property | # of Rooms | Year Opened | Meeting Space (Sq. Ft.) | Occupancy(2) | ADR(2) | RevPAR(2) |
| Westin Hotel at the Domain Property | 341(3) | 2010 | 17,000 | 75.1%(3) | $201.88(3) | $151.58(3) |
| Holiday Inn Austin Northwest Arboretum Area | 194 | 1984 | 2,640 | 71.0% | $110.00 | $78.10 |
| Renaissance Austin Hotel | 492 | 1986 | 65,000 | 74.0% | $185.00 | $136.90 |
| Sheraton Hotel Austin at the Capitol | 363 | 1986 | 9,602 | 74.0% | $185.00 | $136.90 |
| Embassy Suites Austin Arboretum | 150 | 1998 | 2,000 | 78.0% | $175.00 | $136.50 |
| Marriott Austin North | 295 | 2001 | 14,905 | 73.0% | $150.00 | $109.50 |
| Aloft Hotel Austin at the Domain | 140 | 2009 | 1,634 | 78.0% | $185.00 | $144.30 |
| Total / Wtd. Avg.(4) | 1,634 | 74.2% | $155.80 | $125.57 | ||
| (1) | Source: Appraisal |
| (2) | Competitive Set Occupancy, ADR and RevPAR represent mid-year 2015 estimates from the appraiser. |
| (3) | Source: Historical operating statements. Based on trailing twelve months ending June 30, 2015. |
| (4) | Total / Wtd. Avg. excludes the Westin Hotel at the Domain Property. |
Cash Flow Analysis.
| Cash Flow Analysis | ||||||
| 2012 | 2013 | 2014 | T-12 6/30/2015 | U/W | U/W per Room | |
| Occupancy | 73.0% | 77.3% | 75.9% | 75.1% | 75.1% | |
| ADR | $168.85 | $183.68 | $197.80 | $201.88 | $201.88 | |
| RevPAR | $123.26 | $141.98 | $150.07 | $151.58 | $151.58 | |
| Room Revenue | $15,383,560 | $17,672,008 | $18,678,155 | $18,865,927 | $18,865,927 | $55,325 |
| F&B Revenue | 5,420,035 | 6,622,497 | 7,133,720 | 7,709,455 | 7,709,455 | 22,608 |
| Other Revenue | 350,066 | 286,549 | 361,209 | 364,079 | 364,079 | 1,068 |
| Total Revenue | $21,153,661 | $24,581,054 | $26,173,084 | $26,939,461 | $26,939,461 | $79,001 |
| Operating Expenses | 5,573,624 | 6,555,592 | 6,550,642 | 6,647,844 | 6,647,844 | 19,495 |
| Undistributed Expenses | 6,853,940 | 7,791,611 | 8,206,641 | 8,335,241 | 7,748,015 | 22,721 |
| Gross Operating Profit | $8,726,097 | $10,233,851 | $11,415,801 | $11,956,376 | $12,543,602 | $36,785 |
| Total Fixed Charges | 1,527,821 | 1,795,285 | 1,777,158 | 1,909,560 | 2,148,150 | 6,300 |
| Net Operating Income | $7,198,276 | $8,438,566 | $9,638,643 | $10,046,816 | $10,395,452 | $30,485 |
| FF&E | 0 | 0 | 0 | 60,267 | 1,077,578 | 3,160 |
| Net Cash Flow | $7,198,276 | $8,438,566 | $9,638,643 | $9,986,549 | $9,317,873 | $27,325 |
Property Management. The Westin Hotel at the Domain Property is managed by White Lodging Services Corporation.
Lockbox / Cash Management. The Westin Hotel at the Domain Loan is structured with a soft lockbox and springing cash management. All rent and other revenue of the Westin Hotel at the Domain Property is required to be collected by the borrowers and/or property manager and deposited into a clearing account controlled by the lender once per week. During a Cash Sweep Event Period (as defined herein), all funds in the clearing account will be swept on each business day into a cash management account under the control of the lender and applied toward the payment of debt service and funding of required monthly reserves and approved operating expenses. Any excess, if no Cash Sweep Event Period is in effect, will be disbursed to the borrowers or, if a Cash Sweep Event Period is in effect, held as additional collateral for the loan.
A “Cash Sweep Event Period” will commence upon the occurrence of (i) an event of default, (ii) the bankruptcy or insolvency of the guarantors or property manager or (iii) if the debt service coverage ratio based on the trailing 12 month period falling below 1.15x for two consecutive quarters. A Cash Sweep Event Period will be cured (a) with respect to clause (i) above, upon the cure of such event of default and acceptance of such cure by the lender, (b) with respect to clause (ii) above, upon the replacement of such guarantor or property manager with the qualified guarantor or property manager, and (c) with respect to clause (iii) above, upon the debt service coverage ratio based on the trailing 12 month period being equal to or greater than 1.15x for two consecutive quarters.
Initial Reserves. None.
THE INFORMATION IN THIS STRUCTURAL AND COLLATERAL TERM SHEET IS NOT COMPLETE AND MAY BE AMENDED PRIOR TO THE TIME OF SALE. THIS TERM SHEET IS NOT AN OFFER TO SELL THESE SECURITIES AND IT IS NOT A SOLICITATION OF AN OFFER TO BUY THESE SECURITIES IN ANY JURISDICTION WHERE THE OFFER OR SALE IS NOT PERMITTED.
| 48 |
11301 Domain Drive Austin, TX 78758 | Collateral Asset Summary – Loan No. 3 Westin Hotel at the Domain | Cut-off Date Balance: Cut-off Date LTV: U/W NCF DSCR: U/W NOI Debt Yield: | $70,000,000 56.0% 2.29x 14.9% |
Ongoing Reserves. During a Cash Sweep Event Period on a monthly basis, the borrowers are required to deposit reserves of (i) 1/12 of the estimated annual real estate taxes into a tax reserve account, (ii) unless an acceptable blanket insurance policy is in place, 1/12 of the estimated annual insurance premiums into an insurance reserve account and (iii) 4.0% of monthly gross revenues into a monthly FF&E reserve account.
Current Mezzanine or Subordinate Indebtedness. None.
Future Mezzanine or Subordinate Indebtedness Permitted. None.
Partial Release. The borrowers may make transfers of immaterial or non-income producing portions of the Westin Hotel at the Domain Property, including portions of the ring road, to third parties, affiliates of the borrowers or the government, provided that if immediately following the partial release, the ratio of the unpaid principal balance of the Westin Hotel at the Domain Loan to the value of the remaining Westin Hotel at the Domain Property is greater than 125%, then the borrowers are required to pay down the loan by a qualified amount to satisfy REMIC requirements.
THE INFORMATION IN THIS STRUCTURAL AND COLLATERAL TERM SHEET IS NOT COMPLETE AND MAY BE AMENDED PRIOR TO THE TIME OF SALE. THIS TERM SHEET IS NOT AN OFFER TO SELL THESE SECURITIES AND IT IS NOT A SOLICITATION OF AN OFFER TO BUY THESE SECURITIES IN ANY JURISDICTION WHERE THE OFFER OR SALE IS NOT PERMITTED.
| 49 |
11301 Domain Drive Austin, TX 78758 | Collateral Asset Summary – Loan No. 3 Westin Hotel at the Domain | Cut-off Date Balance: Cut-off Date LTV: U/W NCF DSCR: U/W NOI Debt Yield: | $70,000,000 56.0% 2.29x 14.9% |

THE INFORMATION IN THIS STRUCTURAL AND COLLATERAL TERM SHEET IS NOT COMPLETE AND MAY BE AMENDED PRIOR TO THE TIME OF SALE. THIS TERM SHEET IS NOT AN OFFER TO SELL THESE SECURITIES AND IT IS NOT A SOLICITATION OF AN OFFER TO BUY THESE SECURITIES IN ANY JURISDICTION WHERE THE OFFER OR SALE IS NOT PERMITTED.
| 50 |
(THIS PAGE INTENTIONALLY LEFT BLANK)
| 51 |
1321 Mission Street San Francisco, CA 94103 | Collateral Asset Summary – Loan No. 4 The Panoramic | Cut-off Date Balance: Cut-off Date LTV: U/W NCF DSCR: U/W NOI Debt Yield: | $52,500,000 54.4% 1.76x 8.2% |
 |
| THE INFORMATION IN THIS STRUCTURAL AND COLLATERAL TERM SHEET IS NOT COMPLETE AND MAY BE AMENDED PRIOR TO THE TIME OF SALE. THIS TERM SHEET IS NOT AN OFFER TO SELL THESE SECURITIES AND IT IS NOT A SOLICITATION OF AN OFFER TO BUY THESE SECURITIES IN ANY JURISDICTION WHERE THE OFFER OR SALE IS NOT PERMITTED. |
| 52 |
1321 Mission Street San Francisco, CA 94103 | Collateral Asset Summary – Loan No. 4 The Panoramic | Cut-off Date Balance: Cut-off Date LTV: U/W NCF DSCR: U/W NOI Debt Yield: | $52,500,000 54.4% 1.76x 8.2% |
| Mortgage Loan Information | |
| Loan Seller: | UBSRES |
| Loan Purpose: | Refinance |
| Sponsors: | Patrick C. Kennedy; The Patrick and Julie Kennedy Revocable Trust |
| Borrower: | Mission Smartspace Senior LLC |
| Original Balance: | $52,500,000 |
| Cut-off Date Balance: | $52,500,000 |
| % by Initial UPB: | 6.9% |
| Interest Rate: | 4.55154% |
| Payment Date: | 6thof each month |
| First Payment Date: | October 6, 2015 |
| Maturity Date: | September 6, 2025 |
| Amortization: | Interest Only |
| Additional Debt(1): | $12,500,000 Mezzanine Debt |
| Call Protection: | L(24), YM1(92), O(4) |
| Lockbox / Cash Management: | Hard / Springing |
| Reserves(2) | ||
| Initial | Monthly | |
| Taxes: | $31,770 | $4,814 |
| Insurance: | $24,140 | Springing |
| Replacement: | $1,356,263 | Springing |
| TI/LC: | $0 | $125 |
| Tenant Obligation Funds: | $420,000 | $0 |
| Major Tenant Rollover Funds: | $0 | Springing |
| Financial Information | ||
| Mortgage Loan | Total Debt | |
| Cut-off Date Balance / Bed: | $131,250 | $162,500 |
| Balloon Balance / Bed: | $131,250 | $162,500 |
| Cut-off Date LTV: | 54.4% | 67.4% |
| Balloon LTV: | 54.4% | 67.4% |
| Underwritten NOI DSCR: | 1.78x | 1.30x |
| Underwritten NCF DSCR: | 1.76x | 1.29x |
| Underwritten NOI Debt Yield: | 8.2% | 6.6% |
| Underwritten NCF Debt Yield: | 8.1% | 6.6% |
| Underwritten NOI Debt Yield at Balloon: | 8.2% | 6.6% |
| Underwritten NCF Debt Yield at Balloon: | 8.1% | 6.6% |
| Property Information | |
| Single Asset / Portfolio: | Single Asset |
| Property Type(3): | Student Housing |
| Collateral: | Fee Simple |
| Location: | San Francisco, CA |
| Year Built / Renovated: | 2015 / NAP |
| Total Beds(3): | 400 |
| Property Management: | Panoramic Management, LLC |
| Underwritten NOI: | $4,306,733 |
| Underwritten NCF: | $4,266,733 |
| “As-is” Appraised Value: | $96,430,000 |
| “As-is” Appraisal Date: | July 1, 2015 |
| “As Stabilized” Appraised Value(4): | $96,560,000 |
| “As Stabilized” Appraisal Date(4): | September 1, 2015 |
| Historical NOI(5) | |
| Most Recent NOI: | NAP |
| 2014 NOI: | NAP |
| 2013 NOI: | NAP |
| 2012 NOI: | NAP |
| Historical Occupancy(5) | |
| Most Recent Occupancy: | 100.0% (June 26, 2015) |
| 2014 Occupancy: | NAP |
| 2013 Occupancy: | NAP |
| 2012 Occupancy: | NAP |
| (1) | See “Current Mezzanine or Subordinate Indebtedness” herein. |
| (2) | See “Initial Reserves” and “Ongoing Reserves” herein. |
| (3) | The Panoramic Property also includes 3,003 sq. ft. of street level retail space. |
| (4) | The “As Stabilized” Appraised Value is based on achieving a stabilized occupancy of 97.0%. |
| (5) | The Panoramic Property was built in 2015 and, as such, Historical NOI and Historical Occupancy are not applicable. |
| THE INFORMATION IN THIS STRUCTURAL AND COLLATERAL TERM SHEET IS NOT COMPLETE AND MAY BE AMENDED PRIOR TO THE TIME OF SALE. THIS TERM SHEET IS NOT AN OFFER TO SELL THESE SECURITIES AND IT IS NOT A SOLICITATION OF AN OFFER TO BUY THESE SECURITIES IN ANY JURISDICTION WHERE THE OFFER OR SALE IS NOT PERMITTED. |
| 53 |
1321 Mission Street San Francisco, CA 94103 | Collateral Asset Summary – Loan No. 4 The Panoramic | Cut-off Date Balance: Cut-off Date LTV: U/W NCF DSCR: U/W NOI Debt Yield: | $52,500,000 54.4% 1.76x 8.2% |
| Unit Mix Summary(1) | |||||||
| Unit Type | # of Units | # of Beds per Unit | # of Beds | % of Total Beds | Average Unit Size (Sq. Ft.) | Average Monthly Rental Rate Per Bed | Average Monthly Rental Rate PSF |
| Studio | 120 | 2 | 240 | 60.0% | 274 | $1,264(2). | $4.61 |
| 2 Bedroom | 40 | 4 | 160 | 40.0% | 625 | $1,522 | $2.44 |
| Total / Wtd. Avg. | 160 | 400 | 100.0% | 414 | $1,367 | $3.30 | |
| (1) | Source: Appraisal |
| (2) | The Studio Average Monthly Rental Rate Per Bed for San Francisco Conservatory of Music and California College of the Arts is $1,322 per bed and $1,206 per bed, respectively. |
The Loan.The Panoramic loan (the “Panoramic Loan”) is a fixed rate loan secured by the borrower’s fee simple interest in a 400-bed student housing property located at 1321 Mission Street in San Francisco, California (the “Panoramic Property”) with an original principal balance of $52.5 million. The Panoramic Loan has a 10-year term and is interest only. The Panoramic Loan accrues interest at a fixed rate equal to 4.55154%per annum and has a cut-off date balance of $52.5 million. Panoramic Loan proceeds of $52.5 million, along with $12.5 million in mezzanine financing, were used to retire existing debt of approximately $49.1 million, fund upfront reserves of approximately $1.8 million, pay closing costs of $819,367 and return equity to the sponsors of approximately $13.2 million.Based on the “As-is” appraised value of $96.43 million as of July 1, 2015, the cut-off date LTV ratio is 54.4% and the remaining implied equity is $43.93 million. Based on the “As Stabilized” appraised value of $96.56 million as of September 1, 2015, the “As Stabilized” LTV ratio is 54.4%.
| Sources and Uses | ||||||
| Sources | Proceeds | % of Total | Uses | Proceeds | % of Total | |
| Loan Amount | $52,500,000 | 080.8% | Loan Payoff(1) | $49,128,905 | 075.6% | |
| Mezzanine Loan | $12,500,000 | 019.2% | Reserves | $1,832,172 | 002.8% | |
| Closing Costs | $819,367 | 001.3% | ||||
| Return of Equity | $13,219,557 | 020.3% | ||||
| Total Sources | $65,000,000 | 100.0% | Total Uses | $65,000,000 | 100.0% | |
| (1) | Includes $29,677,655 in senior debt payoff and $19,451,250 in mezzanine debt payoff. |
The Borrower / Sponsor. The borrower, Mission Smartspace Senior LLC, is a single purpose Delaware limited liability company structured to be bankruptcy-remote, with two independent directors in its organizational structure. The sponsors of the borrower and the nonrecourse carve-out guarantors are Patrick C. Kennedy and The Patrick and Julie Kennedy Revocable Trust.
Patrick C. Kennedy is the owner of Panoramic Interests, a development firm that has been building housing, live-work space, and commercial property in San Francisco and Berkeley since 1990. Since 1995, Panoramic Interests has built over 506 units of housing in several mixed-use projects in and around downtown San Francisco and Berkeley. From 2004-2007, Panoramic Interests was the largest private landlord for UC Berkeley students. In April 2007, Panoramic Interests sold its seven building rental portfolio to Equity Residential Apartment REIT of Chicago for $146 million, the largest real estate transaction in Berkeley’s history. Panoramic Interests is now buildingCITYSPACES®, small, stylish, efficient dwellings, in walkable neighborhoods in San Francisco and Berkeley.
The Property. The Panoramic Property is a 400-bed, 160-unit Class A multifamily building master-leased to two colleges as student housing, located at 1321 Mission Street in San Francisco, California. The Panoramic Property was completed in August 2015 and, as of September 2015, all tenants are income producing. The Panoramic Property is an 11-story building totaling 100,603 sq. ft. comprised of 120 two-bed studios, 40 four-bed suites, and 3,003 sq. ft. of street level retail space.
Unit amenities include fully furnished rooms, flat screen TVs, built in desks, Elfa© shelving and closet systems, nine-foot ceilings, bay windows and window seats, polished concrete floors, engineered soundproofing, and daltile countertops. All units include a fully equipped kitchen and bathroom. The fully equipped kitchens in each unit feature a refrigerator, microwave, dishwasher, garbage disposal, sink and a range. Community amenities available to all residents include a landscaped roof deck, numerous common seating areas and lounges on both the ground floor and individual floor levels, bike storage, storage lockers in the basement, a fireplace, ground floor café, restaurant and wine bar, wireless internet throughout the building, coin operated laundry machines on each floor, and a 24-hour security desk with secure key fob access to the building. As of the June 26, 2015 rent roll, the Panoramic Property was 100.0% leased for student housing for the 2015/2016 school year.
The Panoramic Property (other than the street level retail space) is master-leased to two colleges utilizing the space as student housing. California College of the Arts (“CCA”) (Moody’s: Baa2), founded in 1907, offers 21 undergraduate and 13 graduate majors in the areas of fine arts, architecture, design, and writing with approximately 1,950 full-time students across its two campuses located in San Francisco and Oakland, California. CCA has leased floors two through six at the Panoramic Property with a total of 80 units or 48,800 sq. ft., at a rental rate of $2,300 per unit/month or $45.25 PSF. The CCA is leased for an initial term of 10 years through July 2025 with two five-year renewal options. San Francisco Conservatory of Music (“SFCM”), incorporated in 1923, offers classes in many instruments as well as theory, composition and voice to over 412 students. SFCM has leased floors seven through 11 at the Panoramic
| THE INFORMATION IN THIS STRUCTURAL AND COLLATERAL TERM SHEET IS NOT COMPLETE AND MAY BE AMENDED PRIOR TO THE TIME OF SALE. THIS TERM SHEET IS NOT AN OFFER TO SELL THESE SECURITIES AND IT IS NOT A SOLICITATION OF AN OFFER TO BUY THESE SECURITIES IN ANY JURISDICTION WHERE THE OFFER OR SALE IS NOT PERMITTED. |
| 54 |
1321 Mission Street San Francisco, CA 94103 | Collateral Asset Summary – Loan No. 4 The Panoramic | Cut-off Date Balance: Cut-off Date LTV: U/W NCF DSCR: U/W NOI Debt Yield: | $52,500,000 54.4% 1.76x 8.2% |
Property with a total of 80 units or 48,800 sq. ft., at a rental rate of $2,625 per unit/month or $51.64 PSF. The SFCM is leased for an initial term of five years through July 2020 with one five-year renewal option. Each college leases 60 studios and 20 suites for a total of 200 beds per college. The Panoramic Property receives 100% tax abatements for the pro rata portion of the Panoramic Property leased to the two colleges, based on the non-profit status of the two colleges.
The Panoramic Property also features 3,003 sq. ft. of street level retail, which is currently 100.0% leased to two tenants: Coffee Cultures (1,955 sq. ft., 1.9% of the NRA) and Panoramic Leasing Office (1,048 sq. ft., 1.0% of the NRA). Both Coffee Cultures and Panoramic Leasing Office are open and paying rent.
Environmental Matters.The Phase I environmental report dated July 8, 2015 recommended no further action at the Panoramic Property.
The Market. The Panoramic Property is located 1.2 miles from CCA’s main campus and 0.4 miles from the SFCM. Both schools have leased portions of the Panoramic Property to use as student housing. The Panoramic Property is located in a central location in the San Francisco Bay Area. Located one block from the commercial thoroughfare Market Street, the Panoramic Property scores a 96 out of 100 on walkscore.com and is in proximity to numerous restaurants, bars and retail shops. The Panoramic Property is also approximately one mile from the Civic Center Bay Area Rapid Transit (“BART”) station, which connects the Bay Area to the neighborhoods in the south. The new Transbay Transit Center, a $4.5 billion transportation and commercial project that will connect eight Bay Area counties, is underway and scheduled for completion in late 2017. A new station will be built underground at 4th Street and King, just 6 blocks north of the Panoramic Property, connecting the neighborhood to the Transbay Transit Center.
San Francisco’s economy continues to be one of the strongest in the nation, bolstered by technology companies, rising incomes, and an influx of visitors. Unemployment stood at 3.7% as of 1Q 2015, the lowest among California’s major metro areas, and was below the national rate of 5.5% and California’s unemployment rate of 6.7%. The tech industry in the San Francisco office market is one of the strongest nationally and globally. A third party market report stated in February 2015 that tech and creative-sector firms are more focused on securing qualified employees and the space to house them, and less concerned with the cost of leasing and building out the space. Venture-backed startups have become a primary driver of the office market. The tourism industry also continues to be a major driver in the market. In February 2015, the leisure and hospitality sector posted year-over-year job growth of 5.0%. The $100 million cruise ship terminal at Pier 35 brings thousands of cruise ship passengers to city hotels, restaurants and shops. The average number of passengers on cruise ships is 3,345, and those travelers spend an average of $168 per day while in San Francisco.
The estimated 2015 population for the one-, three-, and five-mile radius is 113,363, 488,363, and 804,333, respectively. The 2015 estimated average household income within a one-, three-, and five-mile radius is $71,732, $116,325, and $113,992, respectively.
According to a third party research report, the Panoramic Property is located in the south of market multifamily submarket, which contains a total of 17,821 units, 10,279 units of which are Class A units. As of 1Q 2015, the vacancy rate for Class A properties in the submarket was 12.1%. As of 1Q 2015, the average asking rental rate for Class A properties was $3,518 per unit.
The subsequent chart presents the primary competitive properties to the Panoramic Property:
| Competitive Set(1) | ||||||||
| Name | Distance | Year Built | Occupancy | Total Units | Average Unit Size (Sq. Ft.) | Range of Monthly Rental Rate Per Unit | ||
| Studio | 1 Bedroom | 2 Bedrooms | ||||||
| Panoramic Property | NAP | 2015 | 100.0%(2) | 160 | 414 | $2,750 | NAP | $4,750 |
| Ava 55 Ninth | Adjacent | 2014 | 98.0% | 273 | 834 | $3,515 - $3,520 | $3,990 - $4,115 | $4,400 - $4,650 |
| SOMA Residences | 0.4 miles | 2001 | 98.0% | 278 | 480 | $2,469 - $2,975 | $3,336 - $3,458 | NAP |
| 77 Bluxome Apartments | 1.4 miles | 2007 | 98.0% | 102 | 236 | $2,551 - $2,578 | NAP | NAP |
| Cubix Yerba Buena | 1.2 miles | 2008 | 99.0% | 98 | 282 | $2,300 | NAP | NAP |
| Trinity Place | 0.2 miles | 2009 | 98.0% | 440 | 576 | NAP | $2,624 - $3,479 | NAP |
| Venn on Market | 0.7 miles | 2013 | 96.0% | 99 | 857 | NAP | NAP | $4,375 - $4,925 |
| 38 Dolores | 0.9 miles | 2013 | 96.0% | 81 | 1,330 | NAP | NAP | $6,750 |
| Vara Apartments | 0.8 miles | 2013 | 96.0% | 162 | 820 | $3,175 - $3,495 | NAP | $5,141 - $6,111 |
| (1) | Source: Appraisal |
| (2) | Based on the underwritten rent roll dated June 26, 2015. |
| THE INFORMATION IN THIS STRUCTURAL AND COLLATERAL TERM SHEET IS NOT COMPLETE AND MAY BE AMENDED PRIOR TO THE TIME OF SALE. THIS TERM SHEET IS NOT AN OFFER TO SELL THESE SECURITIES AND IT IS NOT A SOLICITATION OF AN OFFER TO BUY THESE SECURITIES IN ANY JURISDICTION WHERE THE OFFER OR SALE IS NOT PERMITTED. |
| 55 |
1321 Mission Street San Francisco, CA 94103 | Collateral Asset Summary – Loan No. 4 The Panoramic | Cut-off Date Balance: Cut-off Date LTV: U/W NCF DSCR: U/W NOI Debt Yield: | $52,500,000 54.4% 1.76x 8.2% |
Cash Flow Analysis.
| Cash Flow Analysis | ||
| U/W | U/W per Bed | |
| Gross Potential Rent(1) | $5,057,689 | $12,644 |
| Total Recoveries | 25,890 | 65 |
| Total Other Income(2) | 208,259 | 521 |
| Less: Vacancy & Credit Loss(3) | (173,488) | (434) |
| Effective Gross Income | $5,118,351 | $12,796 |
| Total Operating Expenses | 811,618 | 2,029 |
| Net Operating Income | $4,306,733 | $10,767 |
| Capital Expenditures | 40,000 | 100 |
| Net Cash Flow | $4,266,733 | $10,667 |
| (1) | Based on the contractual base rent as per the CCA and SFCM master leases. Includes $209,698 of U/W straight-line rent for investment grade tenant, CCA. Contractual rent increases annual by the consumer price index, estimated at 2%. | |
| (2) | Total Other Income includes laundry and storage locker income. | |
| (3) | U/W Vacancy & Credit Loss represents 3.4% of Gross Potential Rent and Total Recoveries. |
Property Management. The Panoramic Property is managed by Panoramic Management, LLC, an affiliate of the sponsors.
Lockbox / Cash Management. The Panoramic Loan is structured with a hard lockbox and springing cash management. The borrower sent tenant direction letters to all tenants instructing them to deposit all rents and other payments into the lockbox account controlled by the lender. During a Cash Management Trigger Event Period (as defined herein), all funds in the lockbox account will be swept on each business day to a cash management account under the control of the lender and disbursed during each interest period of the loan term in accordance with the Panoramic Loan documents. Any excess, if no Cash Sweep Event Period (as defined herein) is in effect, will be disbursed to the borrower or, if a Cash Sweep Event Period is in effect, held as additional collateral for the Panoramic Loan.
A “Cash Management Trigger Event Period” will commence upon the occurrence of (i) an event of default, (ii) a bankruptcy action involving the borrower, the guarantors or the property manager, (iii) a DSCR Trigger Event (as defined herein), (iv) a Major Tenant Trigger Event (as defined herein), or (v) on indictment for fraud or misappropriation of funds by the borrower, guarantors, or property manager. A Cash Management Trigger Event Period will end: (a) with regards to clause (i) above, upon the cure of the event of default, (b) with regards to clause (ii) above, upon the filing being discharged, stayed or dismissed within 90 days for the borrower or guarantors and 120 days for the property manager and lender determination that such filing does not materially affect the borrower’s, guarantors’ or property manager’s monetary obligations, (c) with regards to clause (iii) above, the DSCR Trigger Event is cured, and (d) with regards to clause (iv) above, the Major Tenant Trigger Event is cured.
A “DSCR Trigger Event” will commence upon the occurrence of (i) prior to August 31, 2016, gross income from operations as of September 1, 2015 and ending the last day of the calendar month immediately preceding the determination date falling below the product of (x) $402,486 and (y) the number of calendar months as of September 1, 2015 and ending the last day of the calendar month immediately preceding the determination date and (ii) on or after August 31, 2016, the debt service coverage ratio falling below 1.20x on a trailing twelve month basis. A DSCR Trigger Event will end: (a) with regards to clause (i) above, prior to August 31, 2016, gross income from operations as of September 1, 2015 and ending the last day of the calendar month immediately preceding the determination date is equal to or greater than the product of (x) $402,486 and (y) the number of calendar months as of September 1, 2015 and ending the last day of the calendar month immediately preceding the determination date and (b) with respect to clause (ii) above, on or after August 31, 2016, the debt service coverage ratio is equal to or greater than 1.20x based on the trailing twelve month period for two consecutive quarters.
A “Cash Sweep Event Period” will commence upon the occurrence of (i) an event of default, (ii) a bankruptcy action involving the borrower, the guarantors or the property manager, or (iii) a DSCR Trigger Event. A Cash Sweep Event Period will end: (a) with regards to clause (i) above, upon the cure of the event of default, (b) with regards to clause (ii) above, upon the filing being discharged, stayed or dismissed within 90 days for the borrower or guarantors and 120 days for the property manager and lender determination that such filing does not materially affect the borrower’s, guarantors’ or property manager’s monetary obligations, and (c) with regards to clause (iii) above, the DSCR Trigger Event is cured.
A “Major Tenant Trigger Event” will commence upon the earlier of (i) if, on or prior to the date that is twelve months prior to the then-applicable expiration date of any Major Tenant’s lease, such Major Tenant fails to extend or renew such lease upon terms and conditions set forth in such Major Tenant’s lease (or otherwise as acceptable to lender), (ii) if an event of default under any Major Tenant’s lease has occurred, (iii) a Major Tenant or lease guarantor of a Major Tenant’s lease becomes insolvent or a debtor in any
| THE INFORMATION IN THIS STRUCTURAL AND COLLATERAL TERM SHEET IS NOT COMPLETE AND MAY BE AMENDED PRIOR TO THE TIME OF SALE. THIS TERM SHEET IS NOT AN OFFER TO SELL THESE SECURITIES AND IT IS NOT A SOLICITATION OF AN OFFER TO BUY THESE SECURITIES IN ANY JURISDICTION WHERE THE OFFER OR SALE IS NOT PERMITTED. |
| 56 |
1321 Mission Street San Francisco, CA 94103 | Collateral Asset Summary – Loan No. 4 The Panoramic | Cut-off Date Balance: Cut-off Date LTV: U/W NCF DSCR: U/W NOI Debt Yield: | $52,500,000 54.4% 1.76x 8.2% |
bankruptcy action, (iv) if any Major Tenant’s lease is terminated or no longer in full force or effect, (v) if a Major Tenant “goes dark”, vacates, ceases to occupy or discontinues its operations at the Panoramic Property, or (vi) the decline in rating of CCAs lease or lease guarantor for CCA below “BBB-” or equivalent by any rating agency made up of Moody’s, S&P, Fitch, DBRS, Inc. or Realpoint LLC. A Major Tenant Trigger Event will end if, in regards to clause (i) above, the Major Tenant has entered into a renewal of all of its leased premises in accordance with the requirements of the loan documents or certain re-leasing conditions have been satisfied with respect to the Major Tenant space, in regards to clause (ii) above, the applicable event of default has been cured, in regards to clause (iii) above, the Major Tenant’s lease is affirmed in the applicable bankruptcy and the Major Tenant is paying full unabated rent or, if applicable, the guarantor bankruptcy has been discharged or dismissed with no material adverse effect on guarantor’s ability to perform under the lease guaranty, in regards to clause (iv) above, certain re-leasing conditions have been satisfied with respect to the Major Tenant space, in regards to clause (v) above, the applicable Major Tenant re-commences its operations at its leased premises, or certain re-leasing conditions have been satisfied with respect to the Major Tenant space and, in regards to clause (vi) above, (a) the rating is raised so that such rating is no lower than “BBB-” or equivalent by each applicable rating agency or (b) an amount equal to an aggregate sum equal to (x) six months of CCAs base rent or (y) nine months of CCAs base rent under the CCA lease as of the date of determination, deposited into the Major Tenant rollover reserve account.
“Major Tenant” means (i) CCA, (ii) SFCM, or (iii) any tenant or replacement that together with its affiliates, leases space comprising either (a) greater than 25% of the total rentable sq. ft. or (b) 25% or more of the total in-place base rent.
Initial Reserves. At closing, the borrower deposited (i) $31,770 into a tax reserve account, (ii) $24,140 into an insurance reserve account, (iii) $1,356,263 into the replacement reserve account and (iv) $420,000 into the Tenant Obligations Funds reserve account.
Ongoing Reserves. On a monthly basis, the borrower is required to deposit reserves of (i) 1/12 of the estimated annual real estate taxes, which currently equates to $4,814 into a tax reserve account, (ii) $3,371 into a replacement reserve account, once the deposit in the replacement reserve falls below the cap of $250,000, (iii) $125 into a TI/LC reserve account, and (iv) any excess cash into a Major Tenant Rollover Funds reserve account upon a Major Tenant Trigger Event. In addition, the borrower is required to deposit 1/12 of the estimated annual insurance premiums into an insurance reserve account if an acceptable blanket policy is no longer in place, which currently equates to $6,705.
Current Mezzanine or Subordinate Indebtedness. In conjunction with the Panoramic Loan, a mezzanine loan (the “Panoramic Mezzanine Loan”) was made in the amount of $12.5 million by SM Core Credit Finance LLC. The Panoramic Mezzanine Loan is coterminous with the Panoramic Loan and accrues interest at a fixed rate of 7.0000%per annum. The Panoramic Mezzanine Loan has a 10-year term and is interest only. Including the mezzanine loan, the Cut-off Date LTV ratio is 67.4%, the UW NCF DSCR is 1.29x and the UW NOI Debt Yield is 6.6%.
Future Mezzanine or Subordinate Indebtedness Permitted. None.
| THE INFORMATION IN THIS STRUCTURAL AND COLLATERAL TERM SHEET IS NOT COMPLETE AND MAY BE AMENDED PRIOR TO THE TIME OF SALE. THIS TERM SHEET IS NOT AN OFFER TO SELL THESE SECURITIES AND IT IS NOT A SOLICITATION OF AN OFFER TO BUY THESE SECURITIES IN ANY JURISDICTION WHERE THE OFFER OR SALE IS NOT PERMITTED. |
| 57 |
1321 Mission Street San Francisco, CA 94103 | Collateral Asset Summary – Loan No. 4 The Panoramic | Cut-off Date Balance: Cut-off Date LTV: U/W NCF DSCR: U/W NOI Debt Yield: | $52,500,000 54.4% 1.76x 8.2% |
| THE INFORMATION IN THIS STRUCTURAL AND COLLATERAL TERM SHEET IS NOT COMPLETE AND MAY BE AMENDED PRIOR TO THE TIME OF SALE. THIS TERM SHEET IS NOT AN OFFER TO SELL THESE SECURITIES AND IT IS NOT A SOLICITATION OF AN OFFER TO BUY THESE SECURITIES IN ANY JURISDICTION WHERE THE OFFER OR SALE IS NOT PERMITTED. |
| 58 |
1321 Mission Street San Francisco, CA 94103 | Collateral Asset Summary – Loan No. 4 The Panoramic | Cut-off Date Balance: Cut-off Date LTV: U/W NCF DSCR: U/W NOI Debt Yield: | $52,500,000 54.4% 1.76x 8.2% |

| THE INFORMATION IN THIS STRUCTURAL AND COLLATERAL TERM SHEET IS NOT COMPLETE AND MAY BE AMENDED PRIOR TO THE TIME OF SALE. THIS TERM SHEET IS NOT AN OFFER TO SELL THESE SECURITIES AND IT IS NOT A SOLICITATION OF AN OFFER TO BUY THESE SECURITIES IN ANY JURISDICTION WHERE THE OFFER OR SALE IS NOT PERMITTED. |
| 59 |
1500 South Willow Street Manchester, NH 03103 | Collateral Asset Summary – Loan No. 5 The Mall of New Hampshire | Cut-off Date Balance: Cut-off Date LTV: U/W NCF DSCR: U/W NOI Debt Yield: | $50,000,000 58.6% 2.52x 11.1% |

THE INFORMATION IN THIS STRUCTURAL AND COLLATERAL TERM SHEET IS NOT COMPLETE AND MAY BE AMENDED PRIOR TO THE TIME OF SALE. THIS TERM SHEET IS NOT AN OFFER TO SELL THESE SECURITIES AND IT IS NOT A SOLICITATION OF AN OFFER TO BUY THESE SECURITIES IN ANY JURISDICTION WHERE THE OFFER OR SALE IS NOT PERMITTED.
| 60 |
1500 South Willow Street Manchester, NH 03103 | Collateral Asset Summary – Loan No. 5 The Mall of New Hampshire | Cut-off Date Balance: Cut-off Date LTV: U/W NCF DSCR: U/W NOI Debt Yield: | $50,000,000 58.6% 2.52x 11.1% |
| Mortgage Loan Information | |
| Loan Seller: | UBSRES |
| Loan Purpose: | Refinance |
| Sponsor: | Mayflower Realty LLC |
| Borrowers: | MNH Mall L.L.C.; Mayflower New Hampshire Best Buy, L.P. |
| Original Balance(1): | $50,000,000 |
| Cut-off Date Balance(1): | $50,000,000 |
| % by Initial UPB: | 6.6% |
| Interest Rate: | 4.1080% |
| Payment Date: | 1stof each month |
| First Payment Date: | August 1, 2015 |
| Maturity Date: | July 1, 2025 |
| Amortization: | Interest Only |
| Additional Debt(1): | $100,000,000Pari Passu Debt |
| Call Protection: | L(26), D(87), O(7) |
| Lockbox / Cash Management: | Hard / Springing |
| Reserves(2) | ||
| Initial | Monthly | |
| Taxes: | $0 | Springing |
| Insurance: | $0 | Springing |
| Replacement: | $0 | Springing |
| TI/LC: | $0 | Springing |
| Financial Information(3) | ||
| Cut-off Date Balance / Sq. Ft.(4): | $370 | |
| Balloon Balance / Sq. Ft.(4): | $370 | |
| Cut-off Date LTV: | 58.6% | |
| Balloon LTV: | 58.6% | |
| Underwritten NOI DSCR: | 2.65x | |
| Underwritten NCF DSCR: | 2.52x | |
| Underwritten NOI Debt Yield: | 11.1% | |
| Underwritten NCF Debt Yield: | 10.5% | |
| Underwritten NOI Debt Yield at Balloon: | 11.1% | |
| Underwritten NCF Debt Yield at Balloon: | 10.5% | |
| Property Information | ||
| Single Asset / Portfolio: | Single Asset | |
| Property Type: | Regional Mall Retail | |
| Collateral: | Fee Simple / Leasehold | |
| Location: | Manchester, NH | |
| Year Built / Renovated: | 1977 / 1998 | |
| Total Sq. Ft.: | 811,573 | |
| Total Collateral Sq. Ft.(5): | 405,723 | |
| Property Management: | Simon Management Associates, LLC | |
| Underwritten NOI: | $16,582,371 | |
| Underwritten NCF: | $15,768,824 | |
| Appraised Value: | $256,000,000 | |
| Appraisal Date: | June 11, 2015 | |
| Historical NOI | ||
| Most Recent NOI: | $16,348,708 (T-12 April 30, 2015) | |
| 2014 NOI(6): | $16,000,861 (December 31, 2014) | |
| 2013 NOI(6): | $16,130,453 (December 31, 2013) | |
| 2012 NOI(6): | $17,086,985 (December 31, 2012) | |
| Historical Occupancy | ||
| Most Recent Occupancy: | 95.5% (June 3, 2015) | |
| 2014 Occupancy: | 96.8% (December 31, 2014) | |
| 2013 Occupancy: | 96.1% (December 31, 2013) | |
| 2012 Occupancy: | 97.5% (December 31, 2012) | |
| (1) | The Original Balance and Cut-off Date Balance of $50.0 million represent the non-controlling Note A-2 of the $150.0 million Mall of New Hampshire Loan Combination evidenced by twopari passu notes. Thepari passucompanion loan is comprised of the controlling Note A-1 with an original principal balance of $100.0 million, which was included in the CSAIL 2015-C3 securitization trust. For additional information on thepari passucompanion loan, see “The Loan” herein. |
| (2) | See “Initial Reserves” and “Ongoing Reserves” herein. |
| (3) | DSCR, LTV, Debt Yield and Balance / Sq. Ft. calculations are based on the aggregate Mall of New Hampshire Loan Combination. |
| (4) | Based on Total Collateral Sq. Ft. of 405,723. |
| (5) | Excludes Macy’s, Sears and J.C. Penney, which own their own land and improvements totaling 405,850 sq. ft. and are not considered part of the collateral. |
| (6) | NOI declined in 2013 and 2014 in a large part because of a decline in “other income” (including specialty leasing tenants). The decrease is a result of shortage of temporary inline space resulting from an increase of new and relocating tenants beginning in late 2013. Additionally, income from local events was exceptionally high in 2012. |
THE INFORMATION IN THIS STRUCTURAL AND COLLATERAL TERM SHEET IS NOT COMPLETE AND MAY BE AMENDED PRIOR TO THE TIME OF SALE. THIS TERM SHEET IS NOT AN OFFER TO SELL THESE SECURITIES AND IT IS NOT A SOLICITATION OF AN OFFER TO BUY THESE SECURITIES IN ANY JURISDICTION WHERE THE OFFER OR SALE IS NOT PERMITTED.
| 61 |
1500 South Willow Street Manchester, NH 03103 | Collateral Asset Summary – Loan No. 5 The Mall of New Hampshire | Cut-off Date Balance: Cut-off Date LTV: U/W NCF DSCR: U/W NOI Debt Yield: | $50,000,000 58.6% 2.52x 11.1% |
| Tenant Summary | ||||||||
| Tenant Mix | Ratings (Fitch/Moody’s/S&P)(1) | Total Sq. Ft. | % of Total Sq. Ft.(2) | Lease Expiration | Annual UW Base Rent PSF(3) | Total Sales (000s)(4) | Sales PSF(4) | Occupancy Cost (% of Sales)(4) |
| Non-Collateral Anchor Tenants(5) | ||||||||
| Macy’s | BBB/Baa2/BBB+ | 165,000 | NAP | NAP | NAP | $27,300 | $165 | NAP |
| Sears | C/Caa3/CCC+ | 139,462 | NAP | NAP | NAP | $18,800 | $135 | NAP |
| J.C. Penney | CCC/Caa1/CCC+ | 101,388 | NAP | NAP | NAP | $9,900 | $98 | NAP |
| Subtotal | 405,850 | |||||||
| Major Tenants | ||||||||
| Best Buy | BB/Baa2/BB | 42,037 | 10.4% | 1/31/2024 | $21.00 | $35,106 | $835 | 3.1% |
| Old Navy | BBB-/Baa3/BBB- | 18,678 | 4.6% | 5/31/2020 | $22.00 | $5,695 | $305 | 10.5% |
| A.C. Moore | NR/NR/NR | 18,479 | 4.6% | 9/16/2016 | $24.20 | $2,815 | $152 | 20.1% |
| The Gap | BBB-/Baa3/BBB- | 17,781 | 4.4% | 1/31/2016 | $30.93 | $1,936 | $109 | 28.4% |
| Olympia Sports | NR/NR/NR | 13,130 | 3.2% | 1/31/2016 | $13.00 | $2,201 | $168 | 21.0% |
| Ulta | NR/NR/NR | 11,979 | 3.0% | 5/31/2021 | $23.10 | $4,510 | $376 | 10.3% |
| American Eagle Outfitter | NR/NR/NR | 11,465 | 2.8% | 1/31/2017 | $38.00 | $3,382 | $295 | 27.4% |
| Apple | NR/Aa1/AA+ | 6,835 | 1.7% | 1/31/2025 | $59.69 | $48,570 | $7,106 | 0.8% |
| Total Major Tenants | 140,384 | 34.6% | $25.52 | $104,215 | $742 | 4.8% | ||
| Other(6) | 247,280 | 60.9% | $44.47 | $77,470 | $407 | 18.3% | ||
| Total Occupied Collateral | 387,664 | 95.5% | ||||||
| Vacant | 18,059 | 4.5% | ||||||
| Total Collateral(6) | 405,723 | 100.0% | ||||||
| (1) | Certain ratings may be those of the parent company whether or not the parent company guarantees the lease. |
| (2) | % of Total Sq. Ft. is based off sq. ft. including the two ground leased parcels, but excluding non-collateral anchor space of 405,850 sq. ft. |
| (3) | Annual UW Base Rent PSF includes contractual rent steps through July 31, 2016. |
| (4) | Total Sales (000s), Sales PSF and Occupancy Cost (% of Sales) represent trailing 12 months ending April 30, 2015 as provided by the sponsor except with respect to Apple, which represents trailing four months ending April 30, 2015 annualized and the Non-Collateral Anchor Tenants, which represent sales as estimated by the sponsor as of December 31, 2014. Total Sales (000s), Sales PSF and Occupancy Cost (% of Sales) only include tenants reporting sales. |
| (5) | The Macy’s, Sears, and J.C. Penney stores do not report sales for this location. The above Sales PSF attributed to the Non-Collateral Anchor Tenants are based only on estimates provided by the sponsor. |
| (6) | Other includes 13,230 sq. ft. occupied by T.G.I. Fridays and Longhorn Steakhouse, which own their improvements on an outparcel ground leased from the borrower. |
| Lease Rollover Schedule(1)(2) | ||||||||
| Year | # of Leases Expiring | Total Expiring Sq. Ft. | % of Total Sq. Ft. Expiring | Cumulative Sq. Ft. Expiring | Cumulative % of Sq. Ft. Expiring | Annual U/W Base Rent PSF | % U/W Base Rent Rolling | Cumulative % of U/W Base Rent |
| MTM | 6 | 12,961 | 3.2% | 12,961 | 3.2% | $51.96 | 4.6% | 4.6% |
| 2015 | 2 | 2,083 | 0.5% | 15,044 | 3.7% | $38.05 | 0.5% | 5.2% |
| 2016 | 19 | 82,721 | 20.4% | 97,765 | 24.1% | $32.47 | 18.4% | 23.6% |
| 2017 | 17 | 41,151 | 10.1% | 138,916 | 34.2% | $46.89 | 13.2% | 36.8% |
| 2018 | 14 | 32,464 | 8.0% | 171,380 | 42.2% | $56.13 | 12.5% | 49.3% |
| 2019 | 10 | 31,371 | 7.7% | 202,751 | 50.0% | $43.40 | 9.3% | 58.7% |
| 2020 | 9 | 40,641 | 10.0% | 243,392 | 60.0% | $30.73 | 8.6% | 67.2% |
| 2021 | 5 | 17,884 | 4.4% | 261,276 | 64.4% | $30.54 | 3.7% | 71.0% |
| 2022 | 5 | 19,459 | 4.8% | 280,735 | 69.2% | $39.19 | 5.2% | 76.2% |
| 2023 | 7 | 14,486 | 3.6% | 295,221 | 72.8% | $46.55 | 4.6% | 80.8% |
| 2024 | 7 | 64,719 | 16.0% | 359,940 | 88.7% | $27.96 | 12.4% | 93.2% |
| 2025 | 4 | 15,803 | 3.9% | 375,743 | 92.6% | $40.23 | 4.4% | 97.6% |
| Thereafter | 2 | 11,921 | 2.9% | 387,664 | 95.5% | $29.27 | 2.4% | 100.0% |
| Vacant | NAP | 18,059 | 4.5% | 405,723 | 100.0% | NAP | NAP | |
| Total / Wtd. Avg. | 107 | 405,723 | 100.0% | $37.60 | 100.0% | |||
| (1) | Certain tenants may have lease termination options related to co-tenancy provisions and sales thresholds that may become exercisable prior to the originally stated expiration date of the tenant lease and that are not considered in the lease rollover schedule or the site plan. |
| (2) | The rollover schedule includes contractual rent steps through July 31, 2016 and is based on total owned collateral of 405,723 sq. ft. |
THE INFORMATION IN THIS STRUCTURAL AND COLLATERAL TERM SHEET IS NOT COMPLETE AND MAY BE AMENDED PRIOR TO THE TIME OF SALE. THIS TERM SHEET IS NOT AN OFFER TO SELL THESE SECURITIES AND IT IS NOT A SOLICITATION OF AN OFFER TO BUY THESE SECURITIES IN ANY JURISDICTION WHERE THE OFFER OR SALE IS NOT PERMITTED.
| 62 |
1500 South Willow Street Manchester, NH 03103 | Collateral Asset Summary – Loan No. 5 The Mall of New Hampshire | Cut-off Date Balance: Cut-off Date LTV: U/W NCF DSCR: U/W NOI Debt Yield: | $50,000,000 58.6% 2.52x 11.1% |
The Loan. The Mall of New Hampshire loan (the “Mall of New Hampshire Loan”) consists of the non-controlling Note A-2 with a cut-off date balance of $50.0 million of a fixed rate whole loan in the aggregate principal amount of $150.0 million (the “Mall of New Hampshire Loan Combination”). The Mall of New Hampshire Loan Combination is secured by the borrower’s fee simple interest in a 392,493 sq. ft. portion and leasehold interest in a 13,230 sq. ft. portion of an 811,573 sq. ft. regional mall located at 1500 South Willow Street in Manchester, New Hampshire (the “Mall of New Hampshire Property”). The Mall of New Hampshire Loan Combination is evidenced by twopari passu notes, Note A-1 and Note A-2. The non-controlling Note A-2 has an outstanding principal balance as of the cut-off date of $50.0 million and is being contributed to the BACM 2015-UBS7 mortgage trust. The controlling Note A-1, with an outstanding principal balance as of the cut-off date of $100.0 million, was securitized in the CSAIL 2015-C3 securitization trust. The Mall of New Hampshire Loan Combination has a 10-year interest only term, and accrues interest at a fixed rate equal to 4.1080%. Proceeds of the Mall of New Hampshire Loan Combination were used to retire existing debt of approximately $124.5 million, pay closing costs of approximately $2.4 million and return equity to the sponsor of approximately $23.2 million. Based on the appraised value of $256.0 million as of June 11, 2015, the cut-off date LTV ratio is 58.6% and the remaining implied equity is $106.0 million.
| Loan Combination Summary | ||||
| Original Balance | Cut-off Date Balance | Note Holder | Controlling Piece | |
| Note A-1 | $100,000,000 | $100,000,000 | CSAIL 2015-C3 | Yes |
| Note A-2 | $50,000,000 | $50,000,000 | BACM 2015-UBS7 | No |
| Total | $150,000,000 | $150,000,000 | ||
| Sources and Uses | ||||||
| Sources | Proceeds | % of Total | Uses | Proceeds | % of Total | |
| Loan Amount | $150,000,000 | 100.0% | Loan Payoff | $124,471,467 | 083.0% | |
| Closing Costs | $2,359,929 | 001.6% | ||||
| Return of Equity | $23,168,605 | 015.4% | ||||
| Total Sources | $150,000,000 | 100.0% | Total Uses | $150,000,000 | 100.0% | |
The Borrower / Sponsor. The borrowers, MNH Mall L.L.C., a New Hampshire limited liability company and Mayflower New Hampshire Best Buy, L.P., a Delaware limited partnership, are each structured to be bankruptcy-remote single purpose entities, with two independent directors in their organizational structure. The borrowers are wholly owned by Mayflower Realty LLC, a Delaware limited liability company. The sponsor of the borrower and the nonrecourse carve-out guarantor is Mayflower Realty LLC, a Delaware limited liability company, an affiliate of Simon Property Group, Inc.
Mayflower Realty LLC was founded in 1999 for the purpose of acquiring interests in retail, office and other related properties. According to Mayflower Realty LLC’s 2014 audited financial statements, Simon Property Group, Inc. holds a 56% interest in the property with Canadian Pension Plan Investment Board holding the remaining 44% interest. Simon Property Group, Inc., is a publicly traded self-administered and self-managed REIT (NYSE: SPG) focused on retail property ownership and management. The company is one of the largest publicly traded owner, operator and developer of retail assets. As of December 31, 2014, the company operated 207 income-producing properties in the United States, consisting of 109 malls, 69 outlet centers, 13 mills, three community centers, and 14 other retail properties located in 37 states and Puerto Rico.
The Property.The Mall of New Hampshire Property is a single level 811,573 sq. ft. (including 405,850 sq. ft. of non-collateral anchor space) enclosed regional mall situated on a 44.95 acre site located in Manchester, New Hampshire. Anchor tenants at the Mall of New Hampshire Property include Macy’s, Sears and J.C. Penney, which are not part of the collateral for The Mall of New Hampshire Loan Combination. The collateral of 405,723 sq. ft. includes two ground leased outparcels, which are leased to T.G.I. Fridays and Longhorn Steakhouse (totaling 3.79 acres). In-line tenants include a diverse mix of nationally recognized retailers such as: Best Buy, Old Navy, The Gap, Ulta, American Eagle Outfitters, Victoria’s Secret, Abercrombie & Fitch, Express, Eastern Mountain Sports, Apple, Hollister Co., Men’s Warehouse and Famous Footwear. As of the June 3, 2015 rent roll, The Mall of New Hampshire was 97.8% occupied including the non-collateral anchor space of 405,850 sq. ft. The Mall of New Hampshire Property was 95.5% occupied based on total owned collateral of 405,723 sq. ft. Based on trailing twelve months ending April 30, 2015, the property’s in line (<10,000 sq. ft.) comparable tenant sales are $409 PSF with an occupancy cost of 18.6%, excluding Apple. Including Apple, whose sales are based on trailing four months ending April 30, 2015 annualized, the Mall of New Hampshire Property’s in-line comparable tenant sales are $661 PSF with an occupancy cost of 11.4%.
Apple recently opened a 6,835 sq. ft. retail location at the Mall of New Hampshire Property in October 2014. Based on trailing six months ending April 30, 2015 annualized, Apple is projected to generate approximately $48.6 million in sales in its first year of operation ($7,106 PSF). The closest Apple retail store to the Mall of New Hampshire Property is approximately 19.9 miles southeast in Salem, New Hampshire. There are only three Apple retail stores in the State of New Hampshire, including The Mall of New Hampshire.
The Mall of New Hampshire Property was built in 1977, with a significant renovation and expansion completed in 1998. The borrowers purchased the Mall of New Hampshire Property in 1999 for $166.0 million and have since invested approximately $9.0 million in capital
THE INFORMATION IN THIS STRUCTURAL AND COLLATERAL TERM SHEET IS NOT COMPLETE AND MAY BE AMENDED PRIOR TO THE TIME OF SALE. THIS TERM SHEET IS NOT AN OFFER TO SELL THESE SECURITIES AND IT IS NOT A SOLICITATION OF AN OFFER TO BUY THESE SECURITIES IN ANY JURISDICTION WHERE THE OFFER OR SALE IS NOT PERMITTED.
| 63 |
1500 South Willow Street Manchester, NH 03103 | Collateral Asset Summary – Loan No. 5 The Mall of New Hampshire | Cut-off Date Balance: Cut-off Date LTV: U/W NCF DSCR: U/W NOI Debt Yield: | $50,000,000 58.6% 2.52x 11.1% |
improvements. The capital improvement expenditures exclude land acquisition costs as well as any development costs associated with the construction of tenant owned improvements on the two occupied ground lease parcels.
| Historical Sales and Occupancy Cost(1) | ||||||
| 2013 | 2014 | T-12 April 2015 | ||||
| Sales PSF | Occupancy Cost % | Sales PSF | Occupancy Cost % | Sales PSF | Occupancy Cost % | |
| Non-Collateral Anchors(2) | $139 | NAP | $138 | NAP | NAV | NAP |
| Majors(3)(4) | $544 | 06.3% | $415 | 08.4% | $417 | 08.3% |
| In-Line/Specialty Stores/Others(5) | $395 | 18.1% | $405 | 19.2% | $409 | 18.6% |
| (1) | Represents comparable tenant sales (tenants with 12 months of reported sales) and occupancy costs as provided by the sponsor. 2013 Sales PSF include only sponsor identified comparable tenant sales. |
| (2) | The Macy’s, Sears, and J.C. Penney stores do not report sales for this location. The above Sales PSF attributed to the Non-Collateral Anchor Tenants are based only on estimates provided by the sponsor. |
| (3) | Majors include tenants occupying between 11,000 and 43,000 SF. As of June 3, 2015, Majors included Best Buy, Old Navy, A.C. Moore, The Gap, Olympia Sports, Ulta and American Eagle Outfitter. |
| (4) | The decrease in Majors Sales PSF from 2013 to 2014 is primarily attributable to a drop in Best Buy sales due to Apple taking occupancy in 2014. As of TTM, Best Buy had Sales PSF of $835 with an occupancy cost of 3.1%. |
| (5) | In-Line/Specialty Stores/Others include comparable tenant sales (tenants with reported sales for 2013, 2014 and TTM) occupying less than 10,000 SF. In Line/Specialty Stores/Others include Longhorn Steakhouse, which owns its improvements on an out parcel ground leased from the borrower and excludes Apple, whose lease commenced in 2014. Including Apple sales as of the trailing four months ending April 30, 2015 annualized, In-Line/Specialty Stores/Others TTM Sales PSF was $661 PSF and TTM Occupancy Cost % was 11.4%. |
Environmental Matters.The Phase I environmental report dated June 8, 2015 recommended no further action at the Mall of New Hampshire Property.
The Market. The Mall of New Hampshire Property’s location draws shoppers across state borders due to sales tax free shopping available in New Hampshire. Manchester has a large concentration of big box retailers, hotels, restaurants and car dealerships. Retailers such as Barnes and Noble, TJ Maxx, Sports Authority, Sam’s Club, Walmart, The Home Depot, Sport’s Authority, Staples and L.L. Bean, among others, are all located in the vicinity of the Mall of New Hampshire Property. There are also several hotels within walking distance, including Courtyard by Marriott, TownePlace Suites and Fairfield Inn Marriott.
The Mall of New Hampshire Property is located on South Willow Street, a major arterial that crosses through the center of Manchester and is the main retail and hospitality corridor in Manchester. South Willow Street provides main access to the property via Interstate 293, a major highway that connects Interstate 93 to the east and US Route 3 to the west. Interstate 93 is approximately 4.1 miles east of the Mall of New Hampshire Property, which is a major north/south highway from Manchester to Boston, approximately 50.0 miles southeast of the Mall of New Hampshire Property. The Mall of New Hampshire Property is served by the Manchester-Boston Regional Airport, which is located approximately 2.9 miles to the southwest, and as of December 2014, served 2.1 million passengers.
The Mall of New Hampshire Property is located in Manchester, Hillsborough County, New Hampshire in the Manchester-Nashua, New Hampshire Metropolitan Statistical Area (“Manchester MSA”). The Manchester MSA is located in the southeast corner of New Hampshire and is part of the Boston-Worcester-Providence, MA-RI-NH-CT Combined Statistical Area (“CSA”), the sixth largest CSA in the United States. According to the appraiser, Hillsborough County had an estimated 2015 population of 403,993, which is projected to increase at a 0.2% annual rate over the next five years, and has an average household income of $71,522, 7.1% higher than the State of New Hampshire. According to the appraisal, the estimated 2015 population within a one-, three-, and five-mile radius of the Mall of New Hampshire Property is 6,229, 66,027, and 129,823, respectively.
The subsequent chart presents the primary competitive properties to the Mall of New Hampshire Property:
| Competitive Set(1) | |||||
| Name | Mall of New Hampshire Property | Pheasant Lane Mall | Mall at Rockingham Park | Northshore Mall | Liberty Tree Mall |
| Distance from Subject | NAP | 22 mi. | 24 mi. | 50 mi. | 50 mi. |
| City, State | Manchester, NH | Nashua, NH | Salem, NH | Peabody, MA | Danvers, MA |
| Property Type | Regional Mall Retail | Regional Mall Retail | Regional Mall Retail | Regional Mall Retail | Regional Mall Retail |
| Year Built / Renovated | 1977 / 1998 | 1986 / 1999 | 1991 / 1993 | 1958 / 1993, 2009 | 1972 / 1999 |
| Total Occupancy | 97.8%(2) | 96.6% | 97.2% | 95.2% | 92.1% |
| Size (Sq. Ft.) | 811,573(2) | 979,338 | 1,025,214 | 1,591,973 | 856,039 |
| Anchors / Major Tenants | Macy’s, Sears, J.C. Penney | Sears, J.C. Penney, Macy’s, Target, Dicks | Sears, J.C. Penney, Macy’s | Nordstrom, Sears, J.C. Penney, Macy’s | Kohl’s, Target, Nordstrom Rack |
| (1) | Source: Appraisal |
| (2) | Based on the rent roll dated June 3, 2015, including non-collateral anchor space of 405,850 sq. ft. |
THE INFORMATION IN THIS STRUCTURAL AND COLLATERAL TERM SHEET IS NOT COMPLETE AND MAY BE AMENDED PRIOR TO THE TIME OF SALE. THIS TERM SHEET IS NOT AN OFFER TO SELL THESE SECURITIES AND IT IS NOT A SOLICITATION OF AN OFFER TO BUY THESE SECURITIES IN ANY JURISDICTION WHERE THE OFFER OR SALE IS NOT PERMITTED.
| 64 |
1500 South Willow Street Manchester, NH 03103 | Collateral Asset Summary – Loan No. 5 The Mall of New Hampshire | Cut-off Date Balance: Cut-off Date LTV: U/W NCF DSCR: U/W NOI Debt Yield: | $50,000,000 58.6% 2.52x 11.1% |
Cash Flow Analysis.
| Cash Flow Analysis | ||||||
| 2012 | 2013 | 2014 | T-12 4/30/2015 | U/W(1) | U/W PSF(2) | |
| Base Rent | $13,787,625 | $13,783,321 | $13,895,849 | $14,171,932 | $14,578,076 | $35.93 |
| Value of Vacant Space | 0 | 0 | 0 | 0 | 977,689 | 2.41 |
| Percentage Rent | 358,898 | 74,162 | 98,347 | 119,006 | 50,002 | 0.12 |
| Gross Potential Rent | $14,146,523 | $13,857,483 | $13,994,196 | $14,290,938 | $15,605,766 | $38.46 |
| Total Recoveries | 9,152,756 | 8,738,435 | 8,873,686 | 8,958,164 | 8,846,000 | 21.80 |
| Total Other Income | 1,768,282 | 1,654,911 | 1,222,457 | 1,220,328 | 1,495,000 | 3.68 |
| Less: Vacancy & Credit Loss | (70,266) | 1,670 | (34,614) | 0 | (1,222,588) | (3.01) |
| Effective Gross Income | $24,997,295 | $24,252,499 | $24,055,725 | $24,469,430 | $24,724,178 | $60.94 |
| Total Operating Expenses | 7,910,310 | 8,122,046 | 8,054,864 | 8,120,722 | 8,141,807 | 20.07 |
| Net Operating Income | $17,086,985 | $16,130,453 | $16,000,861 | $16,348,708 | $16,582,371 | $40.87 |
| TI/LC | 0 | 0 | 0 | 0 | 664,481 | 1.64 |
| Capital Expenditures | 0 | 0 | 0 | 0 | 149,066 | 0.37 |
| Net Cash Flow | $17,086,985 | $16,130,453 | $16,000,861 | $16,348,708 | $15,768,824 | $38.87 |
| (1) | U/W Base Rent includes base rent and rent increases occurring through July 2016 and is based on the June 3, 2015 rent roll. |
| (2) | U/W PSF values are based on total owned collateral of 405,723 sq. ft. |
Property Management. The Mall of New Hampshire Property is managed by Simon Management Associates, LLC, an affiliate of the sponsor.
Lockbox / Cash Management. The Mall of New Hampshire Loan is structured with a hard lockbox and springing cash management. All rent and other revenue of the property is required to be directly deposited into a sweep account controlled by the lender. Provided no Cash Sweep Period (as defined herein) is continuing, all funds are required to be remitted to the borrowers on each Wednesday. During a Cash Sweep Period, all funds in the lockbox account will be swept on a weekly basis to a cash management account under the control of the lender and disbursed during each interest period of the loan term in accordance with the loan documents. Any excess, if no Cash Sweep Period is in effect, will be disbursed to the borrowers, or if a Cash Sweep Period is in effect, held as additional collateral for the loan.
A “Cash Sweep Period” will commence upon the occurrence of (i) an event of default, (ii) a bankruptcy action involving the borrowers, guarantor or the property manager or (iii) the debt service coverage ratio falling below 1.40x for two consecutive quarters. A Cash Sweep Period will end with regards to clause (iii) above when the debt service coverage ratio for the immediately preceding four calendar quarters being equal to or greater than 1.40x for two consecutive quarters.
Initial Reserves. None.
Ongoing Reserves. On a monthly basis, following the occurrence of a Cash Sweep Period, the borrower is required to deposit reserves of (i) 1/12 of the estimated annual real estate taxes into a tax reserve account, (ii) 1/12 of the annual insurance premiums into an insurance reserve account, (iii) $6,762 into a capital expenditure account, subject to a cap of $243,434, and (iv) $28,739 into a TI/LC reserve account, subject to a cap of $689,729.
Current Mezzanine or Subordinate Indebtedness. None.
Future Mezzanine or Subordinate Indebtedness Permitted. None.
Ground Lease. The Mall of New Hampshire Property is partially subject to two separate ground leases. The lessor on the first ground lease is Hannaford Bros. Co. and the ground leased property contains two outparcels leased to T.G.I. Fridays and Longhorn Steakhouse. The lease commenced on June 1, 1984 and expires on May 31, 2019. Upon its expiration, the ground lease contains 12 five-year renewal options with a current annual base ground rent of $83,112, payable monthly, which will be adjusted based on the then current CPI, with no more than a 20.0% increase every five years. The lessor on the second ground lease is Manchester Mall Realty Trust and such property is currently unimproved vacant land. The lease commenced on December 1, 1977 and expires on December 1, 2029. The ground lease has a current annual base ground rent of $27,488, payable monthly, which will be adjusted based on the then current wholesale price index every five years.
THE INFORMATION IN THIS STRUCTURAL AND COLLATERAL TERM SHEET IS NOT COMPLETE AND MAY BE AMENDED PRIOR TO THE TIME OF SALE. THIS TERM SHEET IS NOT AN OFFER TO SELL THESE SECURITIES AND IT IS NOT A SOLICITATION OF AN OFFER TO BUY THESE SECURITIES IN ANY JURISDICTION WHERE THE OFFER OR SALE IS NOT PERMITTED.
| 65 |
1500 South Willow Street Manchester, NH 03103 | Collateral Asset Summary – Loan No. 5 The Mall of New Hampshire | Cut-off Date Balance: Cut-off Date LTV: U/W NCF DSCR: U/W NOI Debt Yield: | $50,000,000 58.6% 2.52x 11.1% |
THE INFORMATION IN THIS STRUCTURAL AND COLLATERAL TERM SHEET IS NOT COMPLETE AND MAY BE AMENDED PRIOR TO THE TIME OF SALE. THIS TERM SHEET IS NOT AN OFFER TO SELL THESE SECURITIES AND IT IS NOT A SOLICITATION OF AN OFFER TO BUY THESE SECURITIES IN ANY JURISDICTION WHERE THE OFFER OR SALE IS NOT PERMITTED.
| 66 |
1500 South Willow Street Manchester, NH 03103 | Collateral Asset Summary – Loan No. 5 The Mall of New Hampshire | Cut-off Date Balance: Cut-off Date LTV: U/W NCF DSCR: U/W NOI Debt Yield: | $50,000,000 58.6% 2.52x 11.1% |
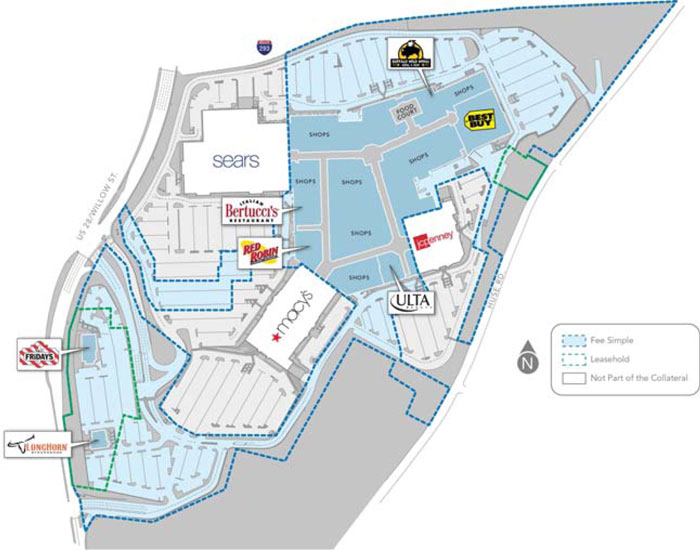
THE INFORMATION IN THIS STRUCTURAL AND COLLATERAL TERM SHEET IS NOT COMPLETE AND MAY BE AMENDED PRIOR TO THE TIME OF SALE. THIS TERM SHEET IS NOT AN OFFER TO SELL THESE SECURITIES AND IT IS NOT A SOLICITATION OF AN OFFER TO BUY THESE SECURITIES IN ANY JURISDICTION WHERE THE OFFER OR SALE IS NOT PERMITTED.
| 67 |
1500 South Willow Street Manchester, NH 03103 | Collateral Asset Summary – Loan No. 5 The Mall of New Hampshire | Cut-off Date Balance: Cut-off Date LTV: U/W NCF DSCR: U/W NOI Debt Yield: | $50,000,000 58.6% 2.52x 11.1% |
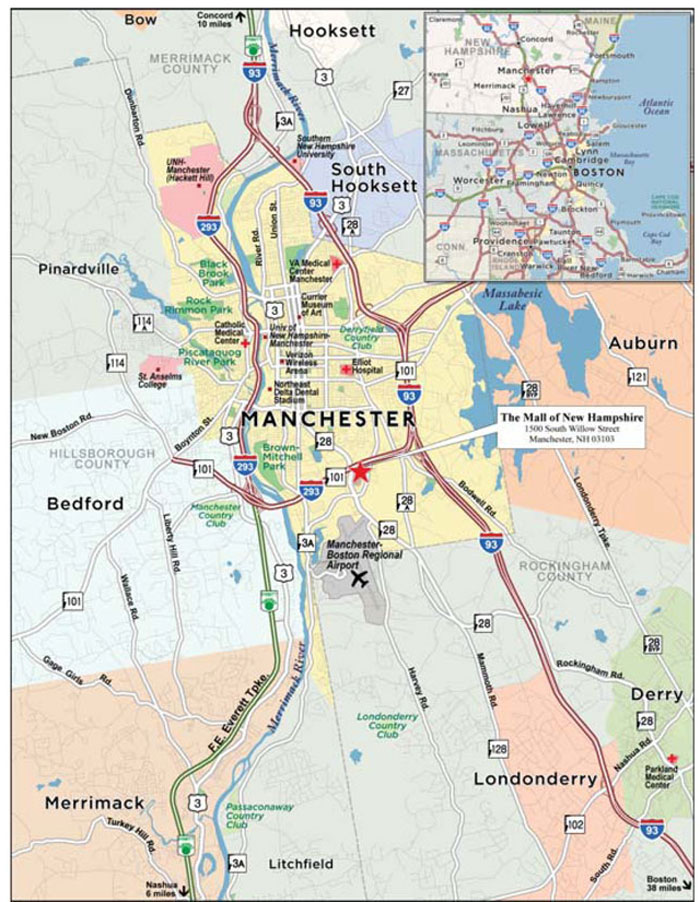
THE INFORMATION IN THIS STRUCTURAL AND COLLATERAL TERM SHEET IS NOT COMPLETE AND MAY BE AMENDED PRIOR TO THE TIME OF SALE. THIS TERM SHEET IS NOT AN OFFER TO SELL THESE SECURITIES AND IT IS NOT A SOLICITATION OF AN OFFER TO BUY THESE SECURITIES IN ANY JURISDICTION WHERE THE OFFER OR SALE IS NOT PERMITTED.
| 68 |
(THIS PAGE INTENTIONALLY LEFT BLANK)
| 69 |
651 Brannan Street San Francisco, CA 94107 | Collateral Asset Summary – Loan No. 6 651 Brannan Street | Cut-off Date Balance: Cut-off Date LTV: U/W NCF DSCR: U/W NOI Debt Yield: | $45,000,000 46.0% 2.02x 13.5% |
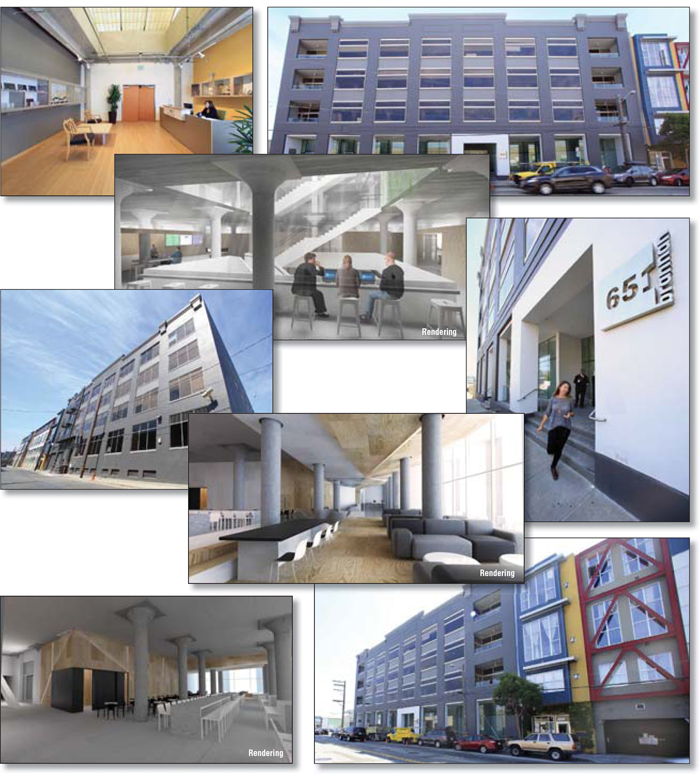
| THE INFORMATION IN THIS STRUCTURAL AND COLLATERAL TERM SHEET IS NOT COMPLETE AND MAY BE AMENDED PRIOR TO THE TIME OF SALE. THIS TERM SHEET IS NOT AN OFFER TO SELL THESE SECURITIES AND IT IS NOT A SOLICITATION OF AN OFFER TO BUY THESE SECURITIES IN ANY JURISDICTION WHERE THE OFFER OR SALE IS NOT PERMITTED. |
| 70 |
651 Brannan Street San Francisco, CA 94107 | Collateral Asset Summary – Loan No. 6 651 Brannan Street | Cut-off Date Balance: Cut-off Date LTV: U/W NCF DSCR: U/W NOI Debt Yield: | $45,000,000 46.0% 2.02x 13.5% |
| Mortgage Loan Information | |
| Loan Seller: | UBSRES |
| Credit Assessment (Fitch/KBRA/Moody’s/Morningstar)(1): | BBB-/BBB-/NR/A |
| Loan Purpose: | Refinance |
| Sponsors: | Inja Kim Wang; Jung T. Wang Family Trust |
| Borrower: | W5 Brannan LLC |
| Original Balance: | $45,000,000 |
| Cut-off Date Balance: | $45,000,000 |
| % by Initial UPB: | 5.9% |
| Interest Rate: | 3.8000% |
| Payment Date: | 6thof each month |
| First Payment Date: | October 6, 2015 |
| Maturity Date: | September 6, 2025 |
| Amortization: | 300 months |
| Additional Debt: | None |
| Call Protection: | YM (116), O(4) |
| Lockbox / Cash Management: | Hard / Springing |
| Reserves(2) | ||
| Initial | Monthly | |
| Taxes: | $65,000 | $10,833 |
| Insurance: | $39,231 | $5,162 |
| Replacement: | $0 | $2,814 |
| TI/LC: | $0 | $39,391 |
| Pinterest TI Allowance Funds: | $3,391,089 | $0 |
| Pinterest Required Work Funds: | $500,000 | $0 |
| Specified Tenant Rollover: | $0 | Springing |
| Financial Information | ||
| Cut-off Date Balance / Sq. Ft.: | $333 | |
| Balloon Balance / Sq. Ft.: | $238 | |
| Cut-off Date LTV(3): | 46.0% | |
| Balloon LTV(3): | 32.8% | |
| Underwritten NOI DSCR: | 2.18x | |
| Underwritten NCF DSCR: | 2.02x | |
| Underwritten NOI Debt Yield: | 13.5% | |
| Underwritten NCF Debt Yield: | 12.5% | |
| Underwritten NOI Debt Yield at Balloon: | 18.9% | |
| Underwritten NCF Debt Yield at Balloon: | 17.5% | |
| Property Information | |
| Single Asset / Portfolio: | Single Asset |
| Property Type: | CBD Office |
| Collateral: | Fee Simple |
| Location: | San Francisco, CA |
| Year Built / Renovated: | 1911 / 2015 |
| Total Sq. Ft.: | 135,054 |
| Property Management: | SOMA Property Management, LLC |
| Underwritten NOI(4): | $6,086,667 |
| Underwritten NCF: | $5,634,668 |
| Appraised Value(3): | $97,900,000 |
| Appraisal Date(3): | June 18, 2015 |
| Historical NOI(4) | |
| Most Recent NOI: | $2,964,447 (T-12 June 30, 2015) |
| 2014 NOI: | $3,449,805 (December 31, 2014) |
| 2013 NOI: | $3,570,813 (December 31, 2013) |
| 2012 NOI: | $2,910,900 (December 31, 2012) |
| Historical Occupancy | |
| Most Recent Occupancy(5): | 100.0% (August 5, 2015) |
| 2014 Occupancy: | 77.7% (December 31, 2014) |
| 2013 Occupancy: | 80.4% (December 31, 2013) |
| 2012 Occupancy: | 98.6% (December 31, 2012) |
| (1) | Fitch, KBRA and Morningstar have confirmed that the 651 Brannan Street Loan has, in the context of its inclusion in the Initial Pool Balance, credit characteristics consistent with an investment grade obligation. |
| (2) | See “Initial Reserves” and “Ongoing Reserves” herein. |
| (3) | Based on an appraised value of $97,900,000 reflecting the fact the lender is reserving the landlord’s contribution to Pinterest’s leasing commissions and tenant improvements. Based on an appraised value excluding the reserves of $92,000,000, the Cut-off Date LTV and Balloon LTV are 48.9% and 34.9%, respectively. |
(4) The increase in Underwritten NOI over Historical NOI is due to recent leasing at the 651 Brannan Street Property. The new lease totaling 101,304 sq. ft. (75.0% of NRA), was recently signed by Pinterest, with a rent commencement date of June 1, 2015. Upon the expiration of the Independent Television Services (ITVS) lease (17,800 sq. ft.), Pinterest will lease an additional 18,809 sq. ft. (including an extra 1,009 sq. ft.) of space on the fourth floor under the same terms as its existing space. For additional information on recent leasing, see “The Property” herein.
| (5) | Includes approximately 101,304 sq. ft. recently leased to Pinterest as occupied space. Pinterest is not yet in occupancy, but has begun paying rent as of June 1, 2015 and is investing approximately $18.9 million in building and tenant improvements. |
| THE INFORMATION IN THIS STRUCTURAL AND COLLATERAL TERM SHEET IS NOT COMPLETE AND MAY BE AMENDED PRIOR TO THE TIME OF SALE. THIS TERM SHEET IS NOT AN OFFER TO SELL THESE SECURITIES AND IT IS NOT A SOLICITATION OF AN OFFER TO BUY THESE SECURITIES IN ANY JURISDICTION WHERE THE OFFER OR SALE IS NOT PERMITTED. |
| 71 |
651 Brannan Street San Francisco, CA 94107 | Collateral Asset Summary – Loan No. 6 651 Brannan Street | Cut-off Date Balance: Cut-off Date LTV: U/W NCF DSCR: U/W NOI Debt Yield: | $45,000,000 46.0% 2.02x 13.5% |
| Tenant Summary | |||||||
Tenant | Ratings (Fitch/Moody’s/S&P) | Net Rentable Area (Sq. Ft.) | % of Net Rentable Area |
| U/W Base Rent PSF | % of Total U/W Base Rent | Lease Expiration |
| Pinterest(1) | NR/NR/NR | 101,304 | 75.0% | $58.71 | 79.7% | 5/31/2022 | |
| Independent Television Services (ITVS) | NR/NR/NR | 17,800 | 13.2% | $29.00 | 6.9% | 11/30/2016 | |
| XO Communications(2) | NR/NR/NR | 15,950 | 11.8% | $60.00 | 12.8% | 11/3/2018 | |
| Total Occupied Collateral | 135,054 | 100.0% | $54.95 | 99.5% | |||
| Other(3) | NAP | NAP | NAP(3) | 0.5% | MTM(3) | ||
| Vacant | 0 | 0.0% | |||||
| Total | 135,054 | 100.0% | |||||
| (1) | Pinterest is not yet in occupancy, but has begun paying rent as of June 1, 2015 and is investing approximately $18.9 million in building and tenant improvements. Pinterest has the right to terminate its lease on or after May 31, 2020 with nine months’ notice with a termination fee of five months’ base rent plus the unamortized portion of the allowance paid by the landlord and the unamortized portion of the leasing commissions paid to the landlord’s or tenant’s broker. In addition, Pinterest has a right of first offer to lease the remaining space on the third floor, currently occupied by XO Communications (15,950 sq. ft.), within 15 days’ notice from landlord. Pinterest has one three-year renewal option remaining. |
| (2) | XO Communications has one five-year renewal option remaining. |
| (3) | Other tenants are licensees in place for XO Communications, Webpass, Time Warner, and Level 3 and therefore have no associated sq. ft., but have a combined total of $38,400 underwritten base rent attributed. All such other leases are MTM. |
| Lease Rollover Schedule(1)(2) | ||||||||
| Year | # of Leases Expiring | Total Expiring Sq. Ft. | % of Total Sq. Ft. Expiring | Cumulative Sq. Ft. Expiring | Cumulative % of Sq. Ft. Expiring | Annual U/W Base Rent PSF | % U/W Base Rent Rolling | Cumulative % of U/W Base Rent |
| MTM(3) | 4 | NAP | NAP | NAP | NAP | NAP | 0.5% | 0.5% |
| 2015 | 0 | 0 | 0.0% | 0 | 0.0% | $0.00 | 0.0% | 0.5% |
| 2016 | 1 | 17,800 | 13.2% | 17,800 | 13.2% | $29.00 | 6.9% | 7.4% |
| 2017 | 0 | 0 | 0.0% | 17,800 | 13.2% | $0.00 | 0.0% | 7.4% |
| 2018 | 1 | 15,950 | 11.8% | 33,750 | 25.0% | $60.00 | 12.8% | 20.3% |
| 2019 | 0 | 0 | 0.0% | 33,750 | 25.0% | $0.00 | 0.0% | 20.3% |
| 2020 | 0 | 0 | 0.0% | 33,750 | 25.0% | $0.00 | 0.0% | 20.3% |
| 2021 | 0 | 0 | 0.0% | 33,750 | 25.0% | $0.00 | 0.0% | 20.3% |
| 2022 | 1 | 101,304 | 75.0% | 135,054 | 100.0% | $58.71 | 79.7% | 100.0% |
| 2023 | 0 | 0 | 0.0% | 135,054 | 100.0% | $0.00 | 0.0% | 100.0% |
| 2024 | 0 | 0 | 0.0% | 135,054 | 100.0% | $0.00 | 0.0% | 100.0% |
| 2025 | 0 | 0 | 0.0% | 135,054 | 100.0% | $0.00 | 0.0% | 100.0% |
| Thereafter | 0 | 0 | 0.0% | 135,054 | 100.0% | $0.00 | 0.0% | 100.0% |
| Vacant | NAP | 0 | 0.0% | 135,054 | 100.0% | NAP | NAP | |
| Total / Wtd. Avg. | 7 | 135,054 | 100.0% | $54.95(4) | 100.0% | |||
| (1) | Certain tenants may have lease termination options that may become exercisable prior to the originally stated expiration date of the tenant lease and that are not considered in the lease rollover schedule. |
| (2) | The rollover schedule includes contractual rent steps through August 1, 2016. |
| (3) | MTM consists of licensees in place for XO Communications, Webpass, Time Warner, and Level 3 and therefore have no associated sq. ft., but have a combined total of $38,400 underwritten base rent attributed. |
| (4) | Total / Wtd. Avg. Annual U/W Base Rent PSF excludes MTM leases. |
The Loan.The 651 Brannan Street loan (the “651 Brannan Street Loan”) is a fixed rate loan secured by the borrower’s fee simple interest in a four-story 135,054 sq. ft. central business district (“CBD”) office building located at 651 Brannan Street in San Francisco, California (the “651 Brannan Street Property”) with an original principal balance of $45.0 million. The 651 Brannan Street Loan has a 10-year term and amortizes on a 25-year schedule. The 651 Brannan Street Loan accrues interest at a fixed rate equal to 3.8000%per annumand has a cut-off date balance of $45.0 million. Proceeds of the 651 Brannan Street Loan were used to refinance existing debt of approximately $17.1 million, fund upfront reserves of approximately $4.0 million, pay closing costs of $227,375, and return equity to the sponsor of approximately $23.7 million. Based on the appraised value of $97.9 million as of June 18, 2015, the cut-off date LTV ratio is 46.0% and the remaining implied equity is $52.9 million.
| THE INFORMATION IN THIS STRUCTURAL AND COLLATERAL TERM SHEET IS NOT COMPLETE AND MAY BE AMENDED PRIOR TO THE TIME OF SALE. THIS TERM SHEET IS NOT AN OFFER TO SELL THESE SECURITIES AND IT IS NOT A SOLICITATION OF AN OFFER TO BUY THESE SECURITIES IN ANY JURISDICTION WHERE THE OFFER OR SALE IS NOT PERMITTED. |
| 72 |
651 Brannan Street San Francisco, CA 94107 | Collateral Asset Summary – Loan No. 6 651 Brannan Street | Cut-off Date Balance: Cut-off Date LTV: U/W NCF DSCR: U/W NOI Debt Yield: | $45,000,000 46.0% 2.02x 13.5% |
| Sources and Uses | ||||||
| Sources | Proceeds | % of Total | Uses | Proceeds | % of Total | |
| Loan Amount | $45,000,000 | 100.0% | Loan Payoff | $17,062,588 | 037.9% | |
| Reserves | $3,995,320 | 008.9% | ||||
| Closing Costs | $227,375 | 000.5% | ||||
| Return of Equity | $23,714,716 | 052.7% | ||||
| Total Sources | $45,000,000 | 100.0% | Total Uses | $45,000,000 | 100.0% | |
The Borrower / Sponsor.The borrower, W5 Brannan LLC, is a single purpose Delaware limited liability company structured to be bankruptcy-remote, with two independent directors in its organizational structure. W5 Brannan LLC is owned 100% by W5-Brannan L.P., a California limited partnership comprised of the Jung T. Wang Family Trust (1% GP interest) and limited partners Jung T. Wang Family Trust (51%), James and Jane Park Family Trust (16%), Walter Charles Wang (16%) and Victor and Melissa Wang Family Trust (16%). The sponsors of the borrower and the nonrecourse carve-out guarantors are Inja Kim Wang and Jung T. Wang Family Trust.
Inja Kim Wang and her husband, Jung T. Wang, co-founded U-Jin Enterprises, Inc., now known as King’s Asian Gourmet, Inc. and subsequently established King’s Kimchi, the No. 1 selling brand of kimchi in the United States. Mr. and Ms. Wang engaged in the import and export of herbal medicines and consumer goods with Korea, New Zealand, China, Japan, and the former USSR, establishing one of the first 25 joint ventures between the United States and the USSR following the opening of the Soviet economy. Ms. Wang has also purchased, managed, financed, leased, and renovated real estate projects since the 1970s, including industrial, retail, residential and commercial office properties. Ms. Wang also co-founded and serves as the Managing Member for Wang Ventures, a family investment partnership through which she has researched and invested in medical device, financial, and technology start-up companies.
The Property.The 651 Brannan Street Property consists of a four-story, 135,054 sq. ft. office building located in the South of Market area (“SOMA”) of San Francisco, California. The 651 Brannan Street Property was built in 1911 and renovated throughout the years with the most recent renovations occurring in 2011 and 2015. Amenities at the 651 Brannan Street Property include a modern lobby with a covered plaza and full height glass walls, a 62-space subterranean parking garage and a three-story high interior atrium with glass ceilings.
The building is currently 100.0% leased to three tenants. The largest tenant, Pinterest, will occupy 101,304 sq. ft. (75.0% of NRA) over a seven-year lease term, and is currently in the process of building out its space with $4.1 million in tenant improvements and $18.9 million of its own money, for a total amount of $23.0 million ($227.04 PSF). Pinterest’s lease commenced on June 1, 2015 and it is expected to take occupancy in November 2015. Pinterest’s space will include amenities such as a kitchen modeled after a food truck that is expected to serve over 2,000 meals a day, all hands meeting areas and training rooms and showers. Other than Pinterest (75.0% of the NRA), no other tenant occupies more than 13.2% of the 651 Brannan Street Property.
In addition to Pinterest’s tenant improvements, the borrower is also investing approximately $2.7 million in capital improvements, which includes HVAC replacements, lobby elevator renovations, façade and lobby upgrades, and sidewalk replacements among others.
The 651 Brannan Street Property is within walking distance to a number of public transportation options and is in close proximity to I-280 and I-80. City buses are available along 7th and Townsend Streets. Commuter train service is available at the Caltrain Depot, located on the corner of 4th and Townsend Streets, 0.4 miles from the 651 Brannan Street Property. The Caltrain connects San Francisco to communities in San Mateo and Santa Clara Counties. The BART regional light rail system runs underneath Market Street approximately one mile north of 651 Brannan Street Property, and connects the CBD to neighborhoods in the south. Regional access to communities to the south of 651 Brannan Street Property is provided by Interstate 280, with the nearest access point approximately two blocks northeast of the 651 Brannan Street Property. Interstate 80 connects with the Bay Bridge providing access to East Bay communities. The nearest access point to I-80 is approximately a quarter mile northeast of the 651 Brannan Street Property.
Environmental Matters.The Phase I environmental report dated June 26, 2015 recommended the development and implementation of an Asbestos Operation and Maintenance Plan at the 651 Brannan Street Property, which is already in place.
Major Tenants.
Pinterest (101,304 sq. ft., 75.0% of NRA, 79.7% of U/W Base Rent) Pinterest is a web and mobile application company launched in 2010, operating a photo sharing virtual clipboard website. It provides a platform allowing users to share and save content to virtual collections called pinboards, including photos, comments, links, and other materials. Pinterest is known as a hub for DIY and craft projects, recipes, fashion, home décor, and health and fitness related information. In March 2015, Pinterest announced it had raised $367 million, giving the online site a valuation of $11 billion with over 70 million users. Pinterest’s lease commenced on June 1, 2015 and it is investing approximately $18.9 million into its space as well as an additional $4.1 million provided by the borrower in tenant improvements. Pinterest is expected to take occupancy at 651 Brannan Street in November 2015. In addition to standard office space, Pinterest’s space will include other amenities such as a kitchen expected to serve over 2,000 meals a day and modeled after a food
| THE INFORMATION IN THIS STRUCTURAL AND COLLATERAL TERM SHEET IS NOT COMPLETE AND MAY BE AMENDED PRIOR TO THE TIME OF SALE. THIS TERM SHEET IS NOT AN OFFER TO SELL THESE SECURITIES AND IT IS NOT A SOLICITATION OF AN OFFER TO BUY THESE SECURITIES IN ANY JURISDICTION WHERE THE OFFER OR SALE IS NOT PERMITTED. |
| 73 |
651 Brannan Street San Francisco, CA 94107 | Collateral Asset Summary – Loan No. 6 651 Brannan Street | Cut-off Date Balance: Cut-off Date LTV: U/W NCF DSCR: U/W NOI Debt Yield: | $45,000,000 46.0% 2.02x 13.5% |
truck, all hands meeting areas and training rooms, showers, and other features that are considered to be desirable to tech tenants in the San Francisco area. Upon expiration of Independent Television Services (ITVS) (“ITVS”) (17,800 sq. ft.), Pinterest will acquire an additional 18,809 sq. ft. (including an extra 1,009 sq. ft.) of space on the fourth floor under the same terms of its existing space. Pinterest is expected to spend an additional approximately $1.15 million to build out the additional space on top of the approximately $752,000 in tenant improvements that will be provided by the borrower for an overall total of $24.9 million invested into the Pinterest space by both Pinterest and the borrower. Pinterest has the right to terminate its lease on or after May 31, 2020 with nine months’ notice with a termination fee of five months’ base rent plus the unamortized portion of the allowance paid by the landlord and the unamortized portion of the leasing commissions paid to the landlord’s or tenant’s broker. In addition, Pinterest has a right of first offer to lease the remaining space on the third floor, currently occupied by XO Communications (15,950 sq. ft.), within 15 days’ notice from landlord. Pinterest also has a right of first offer to purchase the entire 651 Brannan Street Property within 10 days’ notice from landlord of intent to sell. Pinterest will then have 10 days to negotiate the purchase of the 651 Brannan Street Property. Pinterest has a lease expiration date of May 31, 2022 with one three-year renewal option remaining.
ITVS (17,800 sq. ft., 13.2% of NRA, 6.9% of U/W Base Rent) ITVS funds, presents, and promotes award-winning documentaries and dramas on public television and cable, and innovative new media projects on the Internet. ITVS receives core funding from the Corporation for Public Broadcasting. In 1988, Congress passed legislation directing the Corporation for Public Broadcasting to negotiate with a national coalition of independent producer groups to establish ITVS. In 1991, ITVS funded its first wave of independently produced programs for public television. ITVS has been in occupancy at the 651 Brannan Street Property since 2006 and leases 17,800 sq. ft. expiring November 30, 2016 at which time Pinterest will take over the ITVS space.
XO Communications (15,950 sq. ft., 11.8% of NRA, 12.8% of U/W Base Rent) XO Communications is a telecommunications company owned by XO Holdings, Inc. (OTCBB: XOHO). XO Communications owns and operates one of the largest IP and Ethernet networks in the U.S. that customers rely on for private data networking, cloud connectivity, unified communications and voice, Internet access, and managed services for small and medium-sized companies, enterprises, national and government accounts. XO Communications was established in 1996 and serves 85 U.S. markets with over 2,800 employees. XO Communications has spent approximately $8.0 million in improvements and another $10 million in equipment for its space. XO Communications has been in occupancy at the 651 Brannan Street Property since 1998 and leases 15,950 sq. ft. expiring November 3, 2018 with one five-year renewal option remaining.
The Market.The 651 Brannan Street Property is located in the SOMA district of San Francisco, California. Due to its proximity to the San Francisco Bay waterfront and the city’s Financial District, the area has been a stable area catering to service businesses, garment manufacturing, and printing. During the late-1990s the growth of the Internet and Internet-related companies, which preferred this area, supplanted the prior traditional users. In conjunction with the growth in office/R&D uses, demand for residential uses increased. The recent growth in social media related companies has also led to increased demand in the neighborhood.
San Francisco’s economy continues to be one of the strongest in the nation, bolstered by technology companies, rising incomes, and an influx of visitors. Unemployment stood at 3.7% as of 1Q 2015, the lowest among California’s major metro areas, and was below the national unemployment rate of 5.5% and California’s unemployment rate of 6.7%. The tech industry in the San Francisco office market is one of the strongest nationally and globally. A third party market report stated in February 2015 that tech and creative-sector firms are more focused on securing qualified employees and the space to house them, and less concerned with the cost of leasing and building out the space. Venture-backed startups have become the heart of the office market. The tourism industry also continues to be a major driver in the market. In February 2015, the leisure and hospitality sector posted year-over-year job growth of 5.0%. The $100 million cruise ship terminal at Pier 35 brings thousands of cruise ship passengers to the city hotels, restaurants and shops. The average number of passengers on cruise ships is 3,345, and those travelers spend an average of $168 per day while in San Francisco.
According to a third party research report, the estimated 2015 population for the one-, three-, and five-mile radius is 65,853, 442,103, and 732,922, respectively. The 2015 estimated average household income within a one-, three-, and five-mile radius is $102,963, $114,341, and $114,615, respectively. The average annual household income is approximately 48.0% higher than that of the U.S. overall. San Francisco’s 37.5% share of households in the $100,000 plus annual income category far exceeds the 21.3% share across the U.S. The population’s educational breakdown follows a similar pattern to incomes with 43.8% of San Francisco’s population having either a bachelor or a graduate degree, compared to only 28.4% across the U.S.
In an attempt to control commercial development within San Francisco the voters of San Francisco passed Proposition M in 1986, which limits the amount of new office space that can be approved for development in each fiscal year. Under Prop M, the cap limits the amount of office space that can be approved to 950,000 sq. ft. per year, but if less is approved the rest rolls over. In the first quarter of 2015, there were no new construction deliveries. Roughly 4.3 million sq. ft. were under construction in 1Q 2015, with most of it occurring in the South Financial District and pre-leased to tech tenants. The 651 Brannan Street Property is located in the SOMA district of the San Francisco office market. The subject’s submarket is known as Non-CBD West SOMA. As of 1Q 2015, Non-CBD West Soma had an inventory of 851,672 sq. ft. of office space, an overall vacancy rate of 2.9%, no construction completions during the quarter, no YTD net absorption and an overall average rental rate of $43.01 PSF.
| THE INFORMATION IN THIS STRUCTURAL AND COLLATERAL TERM SHEET IS NOT COMPLETE AND MAY BE AMENDED PRIOR TO THE TIME OF SALE. THIS TERM SHEET IS NOT AN OFFER TO SELL THESE SECURITIES AND IT IS NOT A SOLICITATION OF AN OFFER TO BUY THESE SECURITIES IN ANY JURISDICTION WHERE THE OFFER OR SALE IS NOT PERMITTED. |
| 74 |
651 Brannan Street San Francisco, CA 94107 | Collateral Asset Summary – Loan No. 6 651 Brannan Street | Cut-off Date Balance: Cut-off Date LTV: U/W NCF DSCR: U/W NOI Debt Yield: | $45,000,000 46.0% 2.02x 13.5% |
The subsequent chart presents the primary competitive properties to the 651 Brannan Street Property:
| Competitive Set(1) | ||||||
| Property | City, State | Distance | Occupancy | Year Built | Total Building Area (Sq. Ft.) | Class |
| 651 Brannan Street Property | San Francisco, CA | NAP | 100.0%(2) | 1911 | 135,054(2) | B |
| San Francisco Multimedia Center | San Francisco, CA | 0.3 miles | 100.0% | 1908 | 260,000 | A |
| 539 Bryant Street | San Francisco, CA | 0.5 miles | 78.7% | 1912 | 73,130 | B |
| 111 Townsend Street | San Francisco, CA | 0.7 miles | 100.0% | 1911 | 22,483 | B |
| 634 Second Street | San Francisco, CA | 0.7 miles | 100.0% | 1927 | 48,000 | C |
| 600 Townsend Street | San Francisco, CA | 0.4 miles | 100.0% | 1989 | 186,377 | A |
| (1) | Source: Appraisal |
| (2) | Based on the rent roll dated August 5, 2015. |
Cash Flow Analysis.
| Cash Flow Analysis | ||||||
| 2012 | 2013 | 2014 | T-12 6/30/2015 | U/W | U/W PSF | |
| Base Rent(1) | $3,681,995 | $4,197,466 | $4,066,376 | $3,565,055 | $7,247,628 | $53.66 |
| Rent Steps(2) | 0 | 0 | 0 | 0 | 173,130 | 1.28 |
| Gross Potential Rent | $3,681,995 | $4,197,466 | $4,066,376 | $3,565,055 | $7,420,758 | $54.95 |
| Total Recoveries | 69,360 | 168,146 | 382,544 | 496,884 | 430,543 | 3.19 |
| Total Other Income(3) | 171,555 | 229,463 | 196,589 | 145,130 | 177,218 | 1.31 |
| Less: Vacancy(4) | 0 | 0 | (137,291) | (137,291) | (392,565) | (2.91) |
| Effective Gross Income | $3,922,910 | $4,595,074 | $4,508,218 | $4,069,778 | $7,635,953 | $56.54 |
| Total Operating Expenses | 1,012,010 | 1,024,262 | 1,058,413 | 1,105,331 | 1,549,286 | 11.47 |
| Net Operating Income | $2,910,900 | $3,570,813 | $3,449,805 | $2,964,447 | $6,086,667 | $45.07 |
| TI/LC | 0 | 0 | 0 | 0 | 424,988 | 3.15 |
| Capital Expenditures | 0 | 0 | 0 | 0 | 27,011 | 0.20 |
| Net Cash Flow | $2,910,900 | $3,570,813 | $3,449,805 | $2,964,447 | $5,634,668 | $41.72 |
| (1) | Base Rent excludes license fees in place for XO Communications, Webpass, Time Warner, and Level 3. |
| (2) | U/W Rent Steps based on contractual step rent through August 1, 2016. |
| (3) | Total Other Income includes license fees in place for XO Communications, Webpass, Time Warner, and Level 3. |
| (4) | U/W Vacancy represents 5.0% of gross income. |
Property Management.The 651 Brannan Street Property is managed by SOMA Property Management, LLC, a borrower affiliate.
Lockbox / Cash Management.The 651 Brannan Street Loan is structured with a hard lockbox and springing cash management. The borrower was required to send tenant direction letters to all tenants instructing them to deposit all rents and other payments into the lockbox account controlled by the lender. During a Cash Management Trigger Event Period (as defined herein), all funds in the lockbox account will be swept twice a month to a cash management account under the control of the lender and disbursed during each interest period of the 651 Brannan Street Loan term in accordance with the loan documents. Further, during a Cash Sweep Event Period (as defined herein), excess cash flow will be swept into a lender controlled account and held as additional collateral for the 651 Brannan Street Loan.
A “Cash Management Trigger Event Period” will commence upon the occurrence of (i) an event of default, (ii) a bankruptcy action involving a borrower, the guarantors or the property manager, (iii) an indictment for fraud or misappropriation of funds by the borrower, the guarantor or the property manager, (iv) the debt yield falling below 11.0% on a trailing twelve month basis, or (v) a Specified Tenant Trigger Event (as defined herein). A Cash Management Trigger Event Period will end: (a) with regards to clause (i) above, upon the cure or waiver of the event of default by lender; (b) with regards to clause (ii) above, upon the filing being discharged, stayed or dismissed within 60 days for the borrower or guarantors and 120 days for the property manager and lender determination that such filing does not materially affect the borrower’s, guarantors’ or property manager’s monetary obligations; (c) with regards to clause (iii) above, the dismissal of the related indictment or a final judgment that acquits all of the borrower, guarantors or the property manager; (d) with regards to clause (iv) above, the debt yield being equal to or greater than 11.0% based on the trailing twelve month period; and (e) with regards to clause (v) above, when the Specified Tenant Trigger Event is cured in accordance with the loan documents.
A “Cash Sweep Event Period” will commence upon the occurrence of (i) an event of default, (ii) a bankruptcy action involving a borrower, the guarantors or the property manager, (iii) the debt yield falling below 11.0% on a trailing twelve month basis, or (iv) a Specified Tenant Trigger Event. A Cash Sweep Event Period will end: (a) with regards to clause (i) above, upon the cure or waiver of
| THE INFORMATION IN THIS STRUCTURAL AND COLLATERAL TERM SHEET IS NOT COMPLETE AND MAY BE AMENDED PRIOR TO THE TIME OF SALE. THIS TERM SHEET IS NOT AN OFFER TO SELL THESE SECURITIES AND IT IS NOT A SOLICITATION OF AN OFFER TO BUY THESE SECURITIES IN ANY JURISDICTION WHERE THE OFFER OR SALE IS NOT PERMITTED. |
| 75 |
651 Brannan Street San Francisco, CA 94107 | Collateral Asset Summary – Loan No. 6 651 Brannan Street | Cut-off Date Balance: Cut-off Date LTV: U/W NCF DSCR: U/W NOI Debt Yield: | $45,000,000 46.0% 2.02x 13.5% |
the event of default by lender; (b) with regards to clause (ii) above, upon the filing being discharged, stayed or dismissed within 60 days for the borrower or guarantors and 120 days for the property manager and lender determination that such filing does not materially affect the borrower’s, guarantors’ or property manager’s monetary obligations; (c) with regards to clause (iii) above, the debt yield being equal to or greater than 11.0% based on the trailing twelve month period; and (d) with regards to clause (iv) above, when the Specified Tenant Trigger Event is cured in accordance with the loan documents.
A “Specified Tenant Trigger Event” will commence upon (i) a Specified Tenant (as defined herein) exercises a cancellation or termination option, (ii) a Specified Tenant fails to extend or renew its lease on or prior to twelve months before its expiration date, (iii) the Specified Tenant failing to notify the borrower of extending or renewing its lease prior to the date set forth in the lease agreement, (iv) if an event of default under any Specified Tenant lease has occurred, (v) a Specified Tenant or lease guarantor becomes insolvent or a debtor in any bankruptcy action, (vi) if any Specified Tenant lease is terminated or no longer in full force or effect or (vii) if any Specified Tenant fails to be in actual, physical possession of the applicable Specified Tenant space, fails to be open to the public for business during customary hours at the applicable Specified Tenant space and/or “goes dark” in the applicable Specified Tenant space. A Specified Tenant Trigger Event will end if, in regards to clause (i) above, the applicable Specified Tenant has unconditionally revoked or rescinded its exercise of the cancellation or termination option with respect to its lease, has re-affirmed such lease as being in full force and effect and is paying full unabated rent thereunder, or borrower has entered into one or more acceptable replacement leases satisfying certain re-releasing conditions with respect to the Specified Tenant space; in regards to clause (ii) above, the Specified Tenant has entered into a renewal of all of its leased premises in accordance with the requirements of the loan documents or the borrower has entered into one or more acceptable replacement leases satisfying certain re-leasing conditions with respect to the Specified Tenant space; in regards to clause (iii) above, the Specified Tenant has entered into an extension or the borrower has entered into one or more acceptable replacement leases satisfying certain re-leasing conditions with respect to the Specified Tenant space; in regards to clause (iv) above, the applicable event of default has been cured, in regards to clause (v) above, the Specified Tenant lease is affirmed in the applicable bankruptcy, provided that the Specified Tenant is open for business and is paying full unabated rent or, if applicable, the guarantor bankruptcy has been discharged or dismissed with no material adverse effect on guarantor’s ability to perform under the lease guaranty; in regards to clause (vi) above, the borrower has entered into one or more acceptable replacement leases satisfying certain re-leasing conditions with respect to the Specified Tenant space; or, in regards to clause (vii) above, the Specified Tenant is open for business and is paying full unabated rent.
“Specified Tenant” means (i) Pinterest, or (ii) any tenant or replacement that together with its affiliates, leases space comprising either (a) greater than 25% of the total rentable sq. ft. or (b) 25% or more of the total in-place base rent.
Initial Reserves.At closing, the borrower deposited (i) $65,000 into a tax reserve account, (ii) $39,231 into an insurance reserve account, (iii) $3,391,089 into the Pinterest TI Allowance Funds reserve and (iv) $500,000 into the Pinterest Required Work Funds reserve.
Ongoing Reserves.On a monthly basis, the borrower is required to deposit reserves of (i) 1/12 of the estimated annual real estate taxes, which currently equates to $10,833, into a tax reserve account, (ii) 1/12 of the annual insurance premiums, which currently equates to $5,162, into an insurance reserve account, (iii) $2,814 into a replacement reserve account and (iv) $39,391 into a TI/LC reserve account, subject to a cap of $2.0 million. In addition, if a Specified Tenant Trigger Event occurs, all excess cash flow is deposited into the Specified Tenant Rollover reserve account.
Current Mezzanine or Subordinate Indebtedness. None.
Future Mezzanine or Subordinate Indebtedness Permitted. None.
Pinterest Letter of Credit. Pursuant to the Pinterest lease, Pinterest will provide to the borrower a letter of credit in the amount of $4,330,746 as a security deposit and a letter of credit in the amount of $4,052,160 (“Rebuild Letter of Credit”) representing the estimated cost for the borrower to restore the leased premises to its built-out condition as of the date of the Pinterest lease. Pinterest is entitled to a return of the Rebuild Letter of Credit upon satisfaction of certain move in requirements, including Pinterest’s completion of its tenant improvements and initial payment of rent. Upon the borrower delivery of the additional space on the fourth floor, Pinterest is obligated to deliver to the borrower an additional letter of credit as a security deposit for such additional space and a second letter of credit as security for Pinterest’s move in requirements for such additional space. The borrower has agreed, upon the request of the lender, to collaterally assign such letters of credit to the lender, as well as other customary lender protections under the 651 Brannan Street Loan documents.
| THE INFORMATION IN THIS STRUCTURAL AND COLLATERAL TERM SHEET IS NOT COMPLETE AND MAY BE AMENDED PRIOR TO THE TIME OF SALE. THIS TERM SHEET IS NOT AN OFFER TO SELL THESE SECURITIES AND IT IS NOT A SOLICITATION OF AN OFFER TO BUY THESE SECURITIES IN ANY JURISDICTION WHERE THE OFFER OR SALE IS NOT PERMITTED. |
| 76 |
651 Brannan Street San Francisco, CA 94107 | Collateral Asset Summary – Loan No. 6 651 Brannan Street | Cut-off Date Balance: Cut-off Date LTV: U/W NCF DSCR: U/W NOI Debt Yield: | $45,000,000 46.0% 2.02x 13.5% |
| THE INFORMATION IN THIS STRUCTURAL AND COLLATERAL TERM SHEET IS NOT COMPLETE AND MAY BE AMENDED PRIOR TO THE TIME OF SALE. THIS TERM SHEET IS NOT AN OFFER TO SELL THESE SECURITIES AND IT IS NOT A SOLICITATION OF AN OFFER TO BUY THESE SECURITIES IN ANY JURISDICTION WHERE THE OFFER OR SALE IS NOT PERMITTED. |
| 77 |
200 Helen Street South Plainfield, NJ 07080 | Collateral Asset Summary – Loan No. 7 200 Helen Street | Cut-off Date Balance: Cut-off Date LTV: U/W NCF DSCR: U/W NOI Debt Yield: | $41,500,000 57.6% 2.19x 10.2% |
 |
THE INFORMATION IN THIS STRUCTURAL AND COLLATERAL TERM SHEET IS NOT COMPLETE AND MAY BE AMENDED PRIOR TO THE TIME OF SALE. THIS TERM SHEET IS NOT AN OFFER TO SELL THESE SECURITIES AND IT IS NOT A SOLICITATION OF AN OFFER TO BUY THESE SECURITIES IN ANY JURISDICTION WHERE THE OFFER OR SALE IS NOT PERMITTED.
| 78 |
200 Helen Street South Plainfield, NJ 07080 | Collateral Asset Summary – Loan No. 7 200 Helen Street | Cut-off Date Balance: Cut-off Date LTV: U/W NCF DSCR: U/W NOI Debt Yield: | $41,500,000 57.6% 2.19x 10.2% |
| Mortgage Loan Information | |
| Loan Seller: | UBSRES |
| Loan Purpose: | Refinance |
| Sponsor: | Joseph C. Nakash |
| Borrower: | Nakash 200 Helen Street LLC |
| Original Balance(1): | $41,500,000 |
| Cut-off Date Balance(1): | $41,500,000 |
| % by Initial UPB: | 5.5% |
| Interest Rate(2): | 4.2845% |
| Payment Date: | 6thof each month |
| First Payment Date: | September 6, 2015 |
| Maturity Date: | August 6, 2025 |
| Amortization: | Interest Only |
| Additional Debt(1)(3): | $9,936,740 Subordinate Companion Loan |
| Call Protection: | L(25), D(91), O(4) |
| Lockbox / Cash Management: | Hard / In Place |
| Reserves(4) | ||
| Initial | Monthly | |
| Taxes: | $380,394 | $57,635 |
| Insurance: | $16,965 | $3,029 |
| Replacement: | $0 | $6,593 |
| TI/LC: | $0 | $3,536 |
| Required Repairs: | $19,875 | NAP |
| Major Tenant TI/LC: | $0 | Springing |
| Baker’s Express Rollover Funds: | $0 | Springing |
| Financial Information(5) | ||
| Senior Note | Total Debt | |
| Cut-off Date Balance / Sq. Ft.: | $52 | $65 |
| Balloon Balance / Sq. Ft.: | $52 | $53 |
| Cut-off Date LTV: | 57.6% | 71.4% |
| Balloon LTV: | 57.6% | 57.7% |
| Underwritten NOI DSCR: | 2.35x | 1.38x |
| Underwritten NCF DSCR: | 2.19x | 1.28x |
| Underwritten NOI Debt Yield: | 10.2% | 8.2% |
| Underwritten NCF Debt Yield: | 9.5% | 7.7% |
| Underwritten NOI Debt Yield at Balloon: | 10.2% | 10.2% |
| Underwritten NCF Debt Yield at Balloon: | 9.5% | 9.5% |
| Property Information | |
| Single Asset / Portfolio: | Single Asset |
| Property Type: | Warehouse Industrial |
| Collateral: | Fee Simple |
| Location: | South Plainfield, NJ |
| Year Built / Renovated: | 1973 / 1988 |
| Total Sq. Ft.: | 791,150 |
| Property Management: | Self-managed |
| Underwritten NOI: | $4,237,678 |
| Underwritten NCF: | $3,949,250 |
| Appraised Value: | $72,000,000 |
| Appraisal Date: | June 2, 2015 |
| Historical NOI | |
| Most Recent NOI: | $4,674,039 (T-12 May 31, 2015) |
| 2014 NOI: | $4,336,455 (December 31, 2014) |
| 2013 NOI: | $4,466,989 (December 31, 2013) |
| 2012 NOI: | $4,268,663 (December 31, 2012) |
| Historical Occupancy | |
| Most Recent Occupancy: | 98.4% (July 1, 2015) |
| 2014 Occupancy: | 97.0% (December 31, 2014) |
| 2013 Occupancy: | 97.0% (December 31, 2013) |
| 2012 Occupancy: | 92.0% (December 31, 2012) |
| (1) | The Cut-off Date Balance of $41.5 million represent the senior portion of the $51,436,740 200 Helen Street Loan Combination evidenced by the senior note (included in the trust) and a subordinate B-Note with a cut-off date balance of $9,936,740. |
| (2) | The interest rate of 4.2845% represents the interest rate for the 200 Helen Street Loan only. The 200 Helen Street Subordinate Companion Loan accrues interest at an average interest rate of 4.7119% from the first payment date after the cut-off date, October 6, 2015, through the 12th payment date following the cut-off date. The 200 Helen Street Subordinate Companion Loan interest rate varies according to a fixed interest schedule. See Appendix VIII-B of the Free Writing Prospectus. |
| (3) | See “Current Mezzanine or Subordinate Indebtedness” herein. |
| (4) | See “Initial Reserves” and “Ongoing Reserves” herein. |
| (5) | DSCR, LTV, Debt Yield and Balance / Sq. Ft. calculations under the heading “Senior Note” are based on the 200 Helen Street Loan. DSCR, LTV, Debt Yield and Balance / Sq. Ft. calculations under the heading “Total Debt” are based on the 200 Helen Street Loan Combination (which includes the 200 Helen Street Subordinate Companion Loan). The 200 Helen Street Subordinate Companion Loan is structured with a fixed amortization schedule based on a 120-month amortization period. See Appendix VIII-B of the Free Writing Prospectus. |
THE INFORMATION IN THIS STRUCTURAL AND COLLATERAL TERM SHEET IS NOT COMPLETE AND MAY BE AMENDED PRIOR TO THE TIME OF SALE. THIS TERM SHEET IS NOT AN OFFER TO SELL THESE SECURITIES AND IT IS NOT A SOLICITATION OF AN OFFER TO BUY THESE SECURITIES IN ANY JURISDICTION WHERE THE OFFER OR SALE IS NOT PERMITTED.
| 79 |
200 Helen Street South Plainfield, NJ 07080 | Collateral Asset Summary – Loan No. 7 200 Helen Street | Cut-off Date Balance: Cut-off Date LTV: U/W NCF DSCR: U/W NOI Debt Yield: | $41,500,000 57.6% 2.19x 10.2% |
| Tenant Summary | |||||||
Tenant | Ratings (Fitch/Moody’s/S&P)(1) |
Net Rentable Area (Sq. Ft.) | % of Net Rentable Area |
| U/W Base Rent PSF(2) | % of Total U/W Base Rent | Lease Expiration |
| Jordache, Inc.(3) | NR/NR/NR | 579,000 | 73.2% | $5.75 | 74.4% | 6/30/2030 | |
| Baker’s Express | NR/NR/NR | 80,160 | 10.1% | $5.00 | 9.0% | MTM(4) | |
| Prevost Car, Inc.(5) | BBB/Baa2/BBB | 60,000 | 7.6% | $6.42 | 8.6% | 7/31/2024 | |
| Jimmy’s Trucking(6) | NR/NR/NR | 46,990 | 5.9% | $4.78 | 5.0% | 8/17/2017 | |
| GW Labs(7) | NR/NR/NR | 12,500 | 1.6% | $10.87 | 3.0% | 4/30/2019 | |
| Total Occupied Collateral | 778,650 | 98.4% | $5.75 | 100.0% | |||
| Vacant | 12,500 | 1.6% | |||||
| Total | 791,150 | 100.0% | |||||
| (1) | Certain ratings are those of the parent company whether or not the parent company guarantees the lease. |
| (2) | U/W Base Rent PSF includes contractual rent steps through May 2016. |
| (3) | Jordache, Inc. is a borrower affiliated entity and has recently executed a 15-year lease renewal effective July 1, 2015. |
| (4) | Baker’s Express is on a month-to-month basis and is in negotiations with the owner to execute a new lease. |
| (5) | Prevost Car, Inc. has a one-time right to terminate its lease effective July 31, 2019 with written notice no later than 12 months prior to the termination date and a termination fee of $200,000. Prevost Car, Inc. has a continuing right of first offer to lease two directly contiguous spaces (60,000 sq. ft. and 47,000 sq. ft.) upon notification from the landlord that the space(s) have or will become available with notice no later than 15 business days from the date of notification. Prevost Car, Inc. has two five-year renewal options remaining. |
| (6) | Jimmy’s Trucking subleases approximately 32,000 sq. ft. to Champion Pool Distributors Corp. through November 14, 2017 with a current annual rent of approximately $4.49 PSF. Jimmy’s Trucking and subsequently, Champion Pool Distributors Corp., have a right to terminate its lease effective September 20, 2015 with written notice no earlier than six months prior to the termination date and have one five-year renewal option remaining. |
| (7) | GW Labs has a continuing right of first offer to lease the office space (12,500 sq. ft.) directly above its current space with written notice no later than 10 days prior to the date of possession. GW Labs has one three- or five-year renewal option remaining. |
| Lease Rollover Schedule(1)(2) | ||||||||
| Year | # of Leases Expiring | Total Expiring Sq. Ft. | % of Total Sq. Ft. Expiring | Cumulative Sq. Ft. Expiring | Cumulative % of Sq. Ft. Expiring | Annual U/W Base Rent PSF | % U/W Base Rent Rolling | Cumulative % of U/W Base Rent |
| MTM | 1 | 80,160 | 10.1% | 80,160 | 10.1% | $5.00 | 9.0% | 9.0% |
| 2015 | 0 | 0 | 0.0% | 80,160 | 10.1% | $0.00 | 0.0% | 9.0% |
| 2016 | 0 | 0 | 0.0% | 80,160 | 10.1% | $0.00 | 0.0% | 9.0% |
| 2017 | 1 | 46,990 | 5.9% | 127,150 | 16.1% | $4.78 | 5.0% | 14.0% |
| 2018 | 0 | 0 | 0.0% | 127,150 | 16.1% | $0.00 | 0.0% | 14.0% |
| 2019 | 1 | 12,500 | 1.6% | 139,650 | 17.7% | $10.87 | 3.0% | 17.0% |
| 2020 | 0 | 0 | 0.0% | 139,650 | 17.7% | $0.00 | 0.0% | 17.0% |
| 2021 | 0 | 0 | 0.0% | 139,650 | 17.7% | $0.00 | 0.0% | 17.0% |
| 2022 | 0 | 0 | 0.0% | 139,650 | 17.7% | $0.00 | 0.0% | 17.0% |
| 2023 | 0 | 0 | 0.0% | 139,650 | 17.7% | $0.00 | 0.0% | 17.0% |
| 2024 | 1 | 60,000 | 7.6% | 199,650 | 25.2% | $6.42 | 8.6% | 25.6% |
| 2025 | 0 | 0 | 0.0% | 199,650 | 25.2% | $0.00 | 0.0% | 25.6% |
| Thereafter | 1 | 579,000 | 73.2% | 778,650 | 98.4% | $5.75 | 74.4% | 100.0% |
| Vacant | NAP | 12,500 | 1.6% | 791,150 | 100.0% | NAP | NAP | |
| Total / Wtd. Avg. | 5 | 791,150 | 100.0% | $5.75 | 100.0% | |||
| (1) | Certain tenants may have lease termination options that may become exercisable prior to the originally stated expiration date of the tenant lease and that are not considered in the lease rollover schedule. |
| (2) | The rollover schedule includes contractual rent steps through May 2016. |
The Loan.The 200 Helen Street loan (the “200 Helen Street Loan”) represents the senior portion, with a cut-off date balance of $41.5 million, of a fixed rate loan combination that includes a subordinate B-Note in the original principal amount of $10.0 million (the “200 Helen Street Subordinate Companion Loan,” and together with the 200 Helen Street Loan, the “200 Helen Street Loan Combination”). The 200 Helen Street Loan Combination is secured by the borrower’s fee simple interest in a 791,150 sq. ft. industrial warehouse located at 200 Helen Street in South Plainfield, New Jersey (the “200 Helen Street Property”). The 200 Helen Street Loan has a 10-year term and is interest only for the term of the loan. The 200 Helen Street Loan accrues interest at a fixed rate equal to 4.2845%per annumand has a cut-off date balance of $41.5 million. The aggregate cut-off date balance of the 200 Helen Street Loan Combination is approximately $51.4 million. Proceeds of the 200 Helen Street Loan Combination were used to retire existing debt of approximately $30.4 million, fund upfront reserves of $417,234, pay closing costs of $732,609 and return equity to the sponsor of approximately $19.9
THE INFORMATION IN THIS STRUCTURAL AND COLLATERAL TERM SHEET IS NOT COMPLETE AND MAY BE AMENDED PRIOR TO THE TIME OF SALE. THIS TERM SHEET IS NOT AN OFFER TO SELL THESE SECURITIES AND IT IS NOT A SOLICITATION OF AN OFFER TO BUY THESE SECURITIES IN ANY JURISDICTION WHERE THE OFFER OR SALE IS NOT PERMITTED.
| 80 |
200 Helen Street South Plainfield, NJ 07080 | Collateral Asset Summary – Loan No. 7 200 Helen Street | Cut-off Date Balance: Cut-off Date LTV: U/W NCF DSCR: U/W NOI Debt Yield: | $41,500,000 57.6% 2.19x 10.2% |
million. Based on the appraised value of $72.0 million as of June 2, 2015, the 200 Helen Street Loan cut-off date LTV ratio is 57.6% and the remaining implied equity is $20.5 million.
| Sources and Uses | ||||||
| Sources | Proceeds | % of Total | Uses | Proceeds | % of Total | |
| Loan Amount | $41,500,000 | 080.6% | Loan Payoff | $30,401,208 | 059.0% | |
| Subordinate Note | $10,000,000 | 019.4% | Reserves | $417,234 | 000.8% | |
| Closing Costs | $732,609 | 001.4% | ||||
| Return of Equity | $19,948,949 | 038.7% | ||||
| Total Sources | $51,500,000 | 100.0% | Total Uses | $51,500,000 | 100.0% | |
The Borrower / Sponsor.The borrower, Nakash 200 Helen Street LLC, is a single purpose Delaware limited liability company structured to be bankruptcy-remote, with two independent directors in its organizational structure. The borrower is wholly owned by its sole member and manager, Nakash Holding LLC, a Delaware limited liability company. Nakash Holding LLC is owned by managing members, Joseph C. Nakash (0.331%), Avi Nakash (0.331%), and Ralph Nakash (0.331%), along with various other non-managing members, none of which exceeds a 9.578% ownership stake. The sponsor and the nonrecourse carve-out guarantor is Joseph C. Nakash.
Nakash Holding LLC (“Nakash Holdings”) is the private investment office for the Nakash family, which founded and owns Jordache Enterprises, Inc., maker of Jordache jeans. Nakash Holdings manages a multi-billion dollar portfolio of investments with a focus on real estate located in prime locations throughout the world. Its portfolio consists of over $2 billion in retail, office, multifamily and hospitality properties.
Joseph C. Nakash, co-founder and chairman of Jordache Enterprises, Inc., launched the company in 1977. The firm was an early manufacturer of designer jeans. As the Jordache brand grew, the company diversified into several areas and began contract manufacturing for companies such as American Eagle, Abercrombie & Fitch, Gap, and Tommy Hilfiger. Jordache Enterprises, Inc. later began investing in shipping and banking operations, as well as real estate focused in Israel along with worldwide locations. The Nakash family also operates an office in Hong Kong where it manages real estate holdings in Hong Kong, Macau, and China.
Joseph C. Nakash reported total assets of approximately $453.1 million, a net worth of approximately $398.4 million, and liquidity of approximately $20.0 million, according to his personal financial statement dated May 1, 2014. According to its balance sheet dated December 31, 2014, Jordache Enterprises, Inc. reported total assets of approximately $338.5 million, a net worth of approximately $116.2 million, and liquidity of approximately $46.6 million.
The Property.The 200 Helen Street Property is a 791,150 sq. ft. industrial warehouse located in South Plainfield, Middlesex County, New Jersey, approximately 25.5 miles southwest of Newark, New Jersey and 36.5 miles northeast of Trenton, New Jersey. The building was constructed in 1973, renovated in 1988, and consists of one single-story warehouse building with approximately 12,500 sq. ft. of second floor office space on 44.5 acres of land. The 200 Helen Street Property includes 479 parking spaces (0.61 per 1,000 sq. ft.), 87 dock-high doors, 11 drive-in doors, and features 27-foot ceiling heights. Since purchasing the 200 Helen Street Property in August 2005, the sponsor has invested approximately $12.5 million in capital improvements, consisting of solar panel installation, re-roofing work, new rooftop HVAC unit installation and parking lot paving. Since the installation of the solar panels in 2010, utilities decreased 20.5% from 2013 to 2014.
The 200 Helen Street Property is currently 98.4% occupied as of July 1, 2015 by five tenants. The largest tenant, Jordache, Inc. (“Jordache”), is a sponsor-related entity occupying 579,000 sq. ft. (73.2% NRA; 74.4% U/W Base Rent) of space. The tenant currently uses its space as the major regional distribution center due to the building’s access to major highways and ports. Jordache’s lease is guaranteed by Jordache Enterprises, Inc. The second largest tenant, Baker’s Express, has occupied 80,160 sq. ft. (10.1% NRA; 9.0% U/W Base Rent) of space since October 2000 and is currently on a month-to-month lease. The third largest tenant, Prevost Car, Inc., occupies 60,000 sq. ft. (7.6% NRA; 8.6% U/W Base Rent) of space. The tenant is part of the Volvo Group (Fitch/Moody’s/S&P: BBB/Baa2/BBB) and currently uses its space as its only regional service center and parts distribution facility in the Northeast. No other tenant at the 200 Helen Street Property occupies greater than 5.9% of total net rentable area (“NRA”).
The 200 Helen Street Property is located less than one mile from I-287 and five miles from the intersection of I-287 and I-95. I-287 extends for approximately 100 miles and forms an outer loop around the north and west sides of the greater New York area. I-287 connects with I-78 approximately 11.0 miles northwest of the 200 Helen Street Property. I-78 extends west towards Harrisburg, Pennsylvania, where it merges with Interstate 81 and provides access to numerous interstates, which continue towards the western regions of the United States.As the main highway along the East Coast, I-95 extends north through New York and Boston, running from northeast Maine, south through Philadelphia, Baltimore, and Washington D.C. and ending in Miami, Florida.
THE INFORMATION IN THIS STRUCTURAL AND COLLATERAL TERM SHEET IS NOT COMPLETE AND MAY BE AMENDED PRIOR TO THE TIME OF SALE. THIS TERM SHEET IS NOT AN OFFER TO SELL THESE SECURITIES AND IT IS NOT A SOLICITATION OF AN OFFER TO BUY THESE SECURITIES IN ANY JURISDICTION WHERE THE OFFER OR SALE IS NOT PERMITTED.
| 81 |
200 Helen Street South Plainfield, NJ 07080 | Collateral Asset Summary – Loan No. 7 200 Helen Street | Cut-off Date Balance: Cut-off Date LTV: U/W NCF DSCR: U/W NOI Debt Yield: | $41,500,000 57.6% 2.19x 10.2% |
Environmental Matters.The Phase I environmental report dated May 29, 2015 recommended the development and implementation of an Asbestos Operation and Maintenance Plan at the 200 Helen Street Property, which is already in place.
Major Tenant.
Jordache, Inc. (579,000 sq. ft.; 73.2% of NRA; 74.4% of U/W Base Rent) Jordache is a borrower-related entity, owned and its lease is guaranteed by Jordache Enterprises, Inc., a national apparel and jeans company. Jordache Enterprises, Inc. is a privately held conglomerate that designs and manufactures a wide variety of denim, apparel and accessories. Distributed internationally, the brands owned by Jordache Enterprises, Inc. include Jordache, KIKIT, Dittos, Gasoline, LoveLola, GAS, and XOXO. Licensed brands include U.S. Polo Assn. Jordache Enterprises, Inc. also manufactures private label denim for well-known companies, including Gap, Tommy Hilfiger, Levi’s, and Abercrombie & Fitch, among others. As of December 31, 2014, Jordache Enterprises, Inc. had a net worth of approximately $116.2 million. Revenues for 2014 were approximately $341.4 million. Jordache uses its space as one of its two regional distribution centers due to the building’s access to major highways and ports under a recently renewed lease expiring in June 2030. The tenant currently pays a base rental rate of $5.75 PSF NNN.
The Market.The 200 Helen Street Property is situated at the southwest corner of Helen Street and Coolidge Street in the City of South Plainfield, Middlesex County, New Jersey. The 200 Helen Street Property is less than one mile from Interstate 287, which links to I-95, approximately five miles east, providing access to New York City, approximately 34.5 miles northeast of the 200 Helen Street Property. Middlesex County is currently the second most populous county in the state of New Jersey with well over 20,000 firms and Rutgers University, which maintains more than 60 research facilities. There are also more than a hundred Fortune 500 corporations maintaining plants and other facilities in Middlesex County, including Johnson & Johnson. Four of the State University of New Jersey’s main campuses (Rutgers, Cook, Douglas, and Livingston) are located within Middlesex County. The Forrestal Campus of Princeton University can also be found in Middlesex County, with Princeton’s main campus also located nearby.
The estimated 2015 population within a one-, three-, and five-mile radius of the 200 Helen Street Property is 7,891, 99,533, and 332,620, respectively. From 2010 to 2015 the populations within a one-, three-, and five-mile radius of the 200 Helen Street Property have experienced an average annual growth rate of 7.2%, 4.1%, and 2.7%, respectively. The estimated 2015 average household income within a one-, three-, and five-mile radius of the 200 Helen Street Property is $106,316, $108,950, and $101,114, respectively.
According to a market research report, the 200 Helen Street Property is located in the South Plainfield industrial submarket, which contains 307 properties totaling approximately 14.2 million sq. ft. (284 industrial properties and 23 flex properties). The South Plainfield industrial submarket vacancy rate is 2.8% with an average rental rate of $5.50 PSF in 1Q 2015.
The subsequent chart presents the primary competitive properties to the 200 Helen Street Property:
| Competitive Set(1) | |||||||
| Name | 200 Helen Street Property | Main St | Newfield | Mill Rd E | Century Lane | Fieldcrest Ave | Randolphville |
| Building Sq. Ft. | 791,150(2) | 157,500 | 120,000 | 170,000 | 13,000 | 77,975 | 22,500 |
| Year Built | 1973 | 2001 | 1989 | 2001 | 1982 | 1980 | 1971 |
| Tenant Name | Jordache, Inc.(2) | NAV | Model Rectifier Corporation | DSV Solutions | NAV | Wintec | NAV |
| Rent PSF | $5.75(2) | $6.25 | $5.40 | $5.25 | $5.25 | $5.50 | $5.25 |
| Lease Type | NNN | NNN | NNN | NNN | NNN | NNN | NNN |
| Distance from Subject | NAP | 7.3 miles | 5.0 miles | 5.1 miles | 1.3 miles | 4.6 miles | 2.9 miles |
| (1) | Source: Appraisal |
| (2) | Based on the rent roll dated July 1, 2015. |
THE INFORMATION IN THIS STRUCTURAL AND COLLATERAL TERM SHEET IS NOT COMPLETE AND MAY BE AMENDED PRIOR TO THE TIME OF SALE. THIS TERM SHEET IS NOT AN OFFER TO SELL THESE SECURITIES AND IT IS NOT A SOLICITATION OF AN OFFER TO BUY THESE SECURITIES IN ANY JURISDICTION WHERE THE OFFER OR SALE IS NOT PERMITTED.
| 82 |
200 Helen Street South Plainfield, NJ 07080 | Collateral Asset Summary – Loan No. 7 200 Helen Street | Cut-off Date Balance: Cut-off Date LTV: U/W NCF DSCR: U/W NOI Debt Yield: | $41,500,000 57.6% 2.19x 10.2% |
Cash Flow Analysis.
| Cash Flow Analysis | ||||||
| 2012 | 2013 | 2014 | T-12 5/31/2015 | U/W | U/W PSF | |
| Base Rent(1) | $3,878,641 | $4,213,826 | $4,176,733 | $4,347,728 | $4,475,765 | $5.66 |
| Value of Vacant Space | 0 | 0 | 0 | 0 | 137,500 | 0.17 |
| Gross Potential Rent | $3,878,641 | $4,213,826 | $4,176,733 | $4,347,728 | $4,613,265 | $5.83 |
| Total Recoveries | 1,691,174 | 1,632,186 | 1,461,285 | 1,461,060 | 1,347,585 | 1.70 |
| Total Other Income | 42,914 | 48,606 | 31,958 | 24,133 | 41,159 | 0.05 |
| Less: Vacancy(2) | 0 | 0 | 0 | 0 | (298,043) | (0.38) |
| Effective Gross Income | $5,612,729 | $5,894,618 | $5,669,975 | $5,832,920 | $5,703,967 | $7.21 |
| Total Operating Expenses | 1,344,066 | 1,427,630 | 1,333,520 | 1,158,881 | 1,466,289 | 1.85 |
| Net Operating Income | $4,268,663 | $4,466,989 | $4,336,455 | $4,674,039 | $4,237,678 | $5.36 |
| TI/LC | 0 | 0 | 0 | 0 | 209,313 | 0.26 |
| Capital Expenditures | 0 | 0 | 0 | 0 | 79,115 | 0.10 |
| Net Cash Flow | $4,268,663 | $4,466,989 | $4,336,455 | $4,674,039 | $3,949,250 | $4.99 |
| (1) | U/W Base Rent includes base rent and rent increases occurring through May 2016 and is based on the July 1, 2015 rent roll. |
| (2) | U/W Vacancy represents 5.0% of gross income. |
Property Management.The 200 Helen Street Property is self-managed.
Lockbox / Cash Management.The 200 Helen Street Loan Combination is structured with a hard lockbox and in place cash management. The borrower sent tenant direction letters to all tenants instructing them to deposit all rents and other payments into the lockbox account controlled by the lender. All funds in the lockbox account are swept daily to a cash management account under the control of the lender and disbursed during each interest period of the loan term in accordance with the loan documents. Provided no Cash Sweep Event Period (as defined herein), all funds remaining in the cash management account after the payment of all required monthly debt service and reserve amounts will be remitted to the borrower. During a Cash Sweep Event Period caused solely by a Major Tenant Trigger Event (as defined herein), all excess cash flow will be deposited into the major tenant TI/LC reserve account. During a Cash Sweep Event Period caused solely by a Baker’s Express Trigger Event (as defined herein), all excess cash flow will be deposited into the Baker’s Express rollover account capped at $801,600, and during a Cash Sweep Event Period caused by a Cash Sweep Event Period other than a Major Tenant Trigger Event or Baker’s Express Trigger Event, all excess cash flow will be will be held by the lender as additional collateral for the 200 Helen Street Loan Combination.
A “Cash Sweep Event Period” will commence upon the occurrence of (i) an event of default, (ii) any bankruptcy action of borrower, guarantor or property manager, (iii) the debt service coverage ratio, including the 200 Helen Street Subordinate Companion Loan, based on the trailing 12 month period falling below 1.15x, (iv) a Major Tenant Trigger Event, or (v) a Baker’s Express Trigger Event. A Cash Sweep Event Period will end if, (a) with respect to clause (i) above, upon the cure of such event of default and acceptance of such cure by lender, (b) with respect to clause (ii)above, upon the filing being discharged, stayed or dismissed within 30 days for the borrower or guarantor and 120 days for the property manager and lender determination that such filing does not materially affect the borrower’s, guarantor’s or property manager’s monetary obligations, (c) with respect to clause (iii) above, upon the date the debt service coverage ratio, including the 200 Helen Street Subordinate Companion Loan, based on the trailing 12 month period is greater than 1.20x for two consecutive quarters, (d) with respect to clause (iv) above, the cure of a Major Tenant Trigger Event, and (e) with respect to clause (v) above, the cure of a Baker’s Express Trigger Event.
A “Major Tenant Trigger Event” will commence upon the earlier of (i) a Major Tenant or lease guarantor of a Major Tenant’s lease becomes insolvent or a debtor in any bankruptcy action, (ii) a Major Tenant (as defined herein) giving written notice of its intention to terminate or not extend or renew its lease, (iii) if, on or prior to the date that is twelve months prior to the then-applicable expiration date of any Major Tenant’s lease, such Major Tenant fails to extend or renew such lease upon terms and conditions set forth in such Major Tenant’s lease (or otherwise as acceptable to the lender), (iv) a Major Tenant fails to notify borrower of its election to extend or renew its lease prior to the date set forth in the lease for exercise of such renewal or extension option, (v) if an event of default under any Major Tenant’s lease has occurred, (vi) if any Major Tenant’s lease is terminated or no longer in full force or effect or (vii) a Major Tenant “goes dark,” vacates, ceases to occupy or discontinues its operations at the property. A Major Tenant Trigger Event will end if, in regards to clause (i) above, the Major Tenant’s lease is affirmed in the applicable bankruptcy and the Major Tenant is paying full unabated rent or, if applicable, the guarantor bankruptcy has been discharged or dismissed with no material adverse effect on the guarantor’s ability to perform under the lease guaranty, in regards to clause (ii), clause (iii) or clause (iv) above, the Major Tenant has entered into a renewal of all of its leased premises in accordance with the requirements of the loan documents or certain re-leasing conditions have been satisfied with respect to the Major Tenant space (or with respect to clause (ii) only, the Major Tenant has revoked or rescinded its lease termination), in regards to clause (v) above, the applicable event of default has been cured, in regards to clause (vi) above, certain re-leasing conditions have been satisfied with respect to the Major Tenant space and in regards to clause (vii) above,
THE INFORMATION IN THIS STRUCTURAL AND COLLATERAL TERM SHEET IS NOT COMPLETE AND MAY BE AMENDED PRIOR TO THE TIME OF SALE. THIS TERM SHEET IS NOT AN OFFER TO SELL THESE SECURITIES AND IT IS NOT A SOLICITATION OF AN OFFER TO BUY THESE SECURITIES IN ANY JURISDICTION WHERE THE OFFER OR SALE IS NOT PERMITTED.
| 83 |
200 Helen Street South Plainfield, NJ 07080 | Collateral Asset Summary – Loan No. 7 200 Helen Street | Cut-off Date Balance: Cut-off Date LTV: U/W NCF DSCR: U/W NOI Debt Yield: | $41,500,000 57.6% 2.19x 10.2% |
the Major Tenant has provided written notice that they have reopened for business in accordance with the requirements of the loan documents or certain re-leasing conditions have been satisfied with respect to the Major Tenant’s space.
A “Baker’s Express Trigger Event” will commence, for so long as Baker’s Express is not a Major Tenant, upon the earlier of (i) a Baker’s Express or lease guarantor of Baker’s Express’ lease becomes insolvent or a debtor in any bankruptcy action, (ii) Baker’s Express giving written notice of its intention to terminate, (iii) if an event of default under the Baker’s Express lease has occurred, (iv) if Baker’s Express’ lease is terminated or no longer in full force or effect, or (v) Baker’s Express “goes dark,” vacates, ceases to occupy or discontinues its operations at the property. A Baker’s Express Trigger Event will end if, for so long as Baker’s Express is not a Major Tenant, in regards to clause (i) above, Baker’s Express’ lease is affirmed in the applicable bankruptcy and Baker’s Express is paying full unabated rent or, if applicable, the guarantor bankruptcy has been discharged or dismissed with no material adverse effect on the guarantor’s ability to perform under the lease guaranty, in regards to clause (ii) above, Baker’s Express has entered into a renewal of all of its leased premises in accordance with the requirements of the loan documents or certain re-leasing conditions have been satisfied with respect to the Baker’s Express space, in regards to clause (iii) above, the applicable event of default has been cured, and in regards to clause (iv) and (v) above, Baker’s Express has provided written notice that they have re-opened for business in accordance with the requirements of the loan documents or certain re-leasing conditions have been satisfied with respect to the Baker’s Express space.
A “Major Tenant” means (i) Jordache, (ii) any replacement tenant acceptable to the lender pursuant to a replacement lease encumbering all or any portion of the space currently occupied by Jordache, or (iii) any tenant whose lease, either individually or when taken together with any other lease with the same tenant or any affiliate of such tenant, leases space comprising of 10% or more of either (a) the NRA or (b) the gross income from operations at the 200 Helen Street Property. Notwithstanding the foregoing, prior to the execution of a new lease with Baker’s Express or an extension or renewal of its lease, Baker’s Express will not be a Major Tenant pursuant to clause (iii) above provided, however, for so long as Baker’s Express is not deemed a Major Tenant and the Baker’s Express lease will be subject to the terms of the Baker’s Express Trigger Event.
Initial Reserves.At closing, the borrower deposited (i) $380,394 into a tax reserve account, (ii) $16,965 into an insurance reserve account and (iii) $19,875 into a required repairs reserve account.
Ongoing Reserves.On a monthly basis, the borrower is required to deposit reserves of (i) 1/12 of the estimated annual real estate taxes, which currently equates to $57,635, into a tax reserve account, (ii) 1/12 of the annual insurance premiums, which currently equates to $3,029, into an insurance reserve account, (iii) $6,593 into a replacement reserve account, and (iv) $3,536 into a TI/LC reserve account prior to a Jordache Trigger Event (as defined herein), and upon the occurrence of a Jordache Trigger Event, $13,186. In addition, the borrower is required to deposit excess cash flow into (i) a major tenant TI/LC reserve account if a Major Tenant Trigger Event is in effect, (ii) a Baker’s Express rollover funds account if a Baker’s Express Trigger Event is in effect, subject to a cap of $801,600, and (iii) an excess cash flow reserve fund if any Cash Sweep Event Period exists, other than a Major Tenant Trigger Event or a Baker’s Express Trigger Event, is in effect.
A “Jordache Trigger Event” means (i) a Major Tenant Trigger Event relating to Jordache or (ii) the failure of the Jordache lease to be in full force and effect.
Current Mezzanine or Subordinate Indebtedness. The 200 Helen Street Loan Combination includes the 200 Helen Street Subordinate Companion Loan, which has an outstanding principal balance as of the cut-off date of approximately $9.9 million. The 200 Helen Street Subordinate Companion Loan has a 10-year term and fully amortizes over its term. The 200 Helen Street Subordinate Companion Loan accrues interest based on a fixed interest schedule with an average interest rate of 4.7119% from the first payment date after the cut-off date, October 6, 2015, through the 12th payment date following the cut-off date. See Appendix VIII-B of the Free Writing Prospectus for the fixed amortization and interest schedule. Including the 200 Helen Street Subordinate Companion Loan, the Total Debt Cut-off Date LTV ratio is 71.4%, the Total Debt UW NCF DSCR is 1.28x and the Total Debt UW NOI Debt Yield is 8.2%.
Future Mezzanine or Subordinate Indebtedness Permitted. None.
THE INFORMATION IN THIS STRUCTURAL AND COLLATERAL TERM SHEET IS NOT COMPLETE AND MAY BE AMENDED PRIOR TO THE TIME OF SALE. THIS TERM SHEET IS NOT AN OFFER TO SELL THESE SECURITIES AND IT IS NOT A SOLICITATION OF AN OFFER TO BUY THESE SECURITIES IN ANY JURISDICTION WHERE THE OFFER OR SALE IS NOT PERMITTED.
| 84 |
200 Helen Street South Plainfield, NJ 07080 | Collateral Asset Summary – Loan No. 7 200 Helen Street | Cut-off Date Balance: Cut-off Date LTV: U/W NCF DSCR: U/W NOI Debt Yield: | $41,500,000 57.6% 2.19x 10.2% |
 |
THE INFORMATION IN THIS STRUCTURAL AND COLLATERAL TERM SHEET IS NOT COMPLETE AND MAY BE AMENDED PRIOR TO THE TIME OF SALE. THIS TERM SHEET IS NOT AN OFFER TO SELL THESE SECURITIES AND IT IS NOT A SOLICITATION OF AN OFFER TO BUY THESE SECURITIES IN ANY JURISDICTION WHERE THE OFFER OR SALE IS NOT PERMITTED.
| 85 |
154-71 Brookville Boulevard Rosedale, NY 11422 | Collateral Asset Summary – Loan No. 8 Holiday Inn JFK | Cut-off Date Balance: Cut-off Date LTV: U/W NCF DSCR: U/W NOI Debt Yield: | $34,934,491 67.7% 1.35x 10.6% |
THE INFORMATION IN THIS STRUCTURAL AND COLLATERAL TERM SHEET IS NOT COMPLETE AND MAY BE AMENDED PRIOR TO THE TIME OF SALE. THIS TERM SHEET IS NOT AN OFFER TO SELL THESE SECURITIES AND IT IS NOT A SOLICITATION OF AN OFFER TO BUY THESE SECURITIES IN ANY JURISDICTION WHERE THE OFFER OR SALE IS NOT PERMITTED.
| 86 |
154-71 Brookville Boulevard Rosedale, NY 11422 | Collateral Asset Summary – Loan No. 8 Holiday Inn JFK | Cut-off Date Balance: Cut-off Date LTV: U/W NCF DSCR: U/W NOI Debt Yield: | $34,934,491 67.7% 1.35x 10.6% |
| Mortgage Loan Information | |
| Loan Seller: | UBSRES |
| Loan Purpose: | Refinance |
| Sponsor: | Sam Chang |
| Borrower: | Brisam JFK LLC d/b/a Holiday Inn JFK Airport |
| Original Balance: | $35,000,000 |
| Cut-off Date Balance: | $34,934,491 |
| % by Initial UPB: | 4.6% |
| Interest Rate: | 4.7510% |
| Payment Date: | 6thof each month |
| First Payment Date: | September 6, 2015 |
| Maturity Date: | August 6, 2025 |
| Amortization: | 276 months |
| Additional Debt: | None |
| Call Protection: | L(25), D(91), O(4) |
| Lockbox / Cash Management: | Hard / Springing |
| Reserves(1) | ||
| Initial | Monthly | |
| Taxes: | $79,125 | $21,979 |
| Insurance: | $8,928 | $3,434 |
| FF&E: | $0 | At least 1/12 of 4% of prior year’s gross income |
| Required Repairs: | $2,150 | NAP |
| Lien Funds: | $276,094 | $0 |
| PIP Funds: | $0 | Springing |
| Financial Information | ||
| Cut-off Date Balance / Room: | $173,803 | |
| Balloon Balance / Room: | $122,035 | |
| Cut-off Date LTV(2): | 67.7% | |
| Balloon LTV(2): | 47.5% | |
| Underwritten NOI DSCR: | 1.48x | |
| Underwritten NCF DSCR: | 1.35x | |
| Underwritten NOI Debt Yield: | 10.6% | |
| Underwritten NCF Debt Yield: | 9.7% | |
| Underwritten NOI Debt Yield at Balloon: | 15.1% | |
| Underwritten NCF Debt Yield at Balloon: | 13.8% | |
| Property Information | ||
| Single Asset / Portfolio: | Single Asset | |
| Property Type: | Full Service Hospitality | |
| Collateral: | Fee Simple | |
| Location: | Rosedale, NY | |
| Year Built / Renovated: | 2013 / NAP | |
| Total Rooms: | 201 | |
| Property Management: | M&R Hospitality Management Corp. | |
| Underwritten NOI: | $3,714,588 | |
| Underwritten NCF: | $3,374,339 | |
| “As-is” Appraised Value: | $51,600,000 | |
| “As-is” Appraisal Date: | June 30, 2015 | |
| “As Stabilized” Appraised Value(3): | $55,600,000 | |
| “As Stabilized” Appraisal Date(3): | July 1, 2018 | |
| Historical NOI(4) | ||
| Most Recent NOI: | $3,913,140 (T-12 June 30, 2015) | |
| 2014 NOI: | $2,638,686 (December 31, 2014) | |
| 2013 NOI: | NAP | |
| 2012 NOI: | NAP | |
| Historical Occupancy(4) | ||
| Most Recent Occupancy: | 83.1% (June 30, 2015) | |
| 2014 Occupancy: | 69.4% (December 31, 2014) | |
| 2013 Occupancy: | NAP | |
| 2012 Occupancy: | NAP | |
| (1) | See “Initial Reserves” and “Ongoing Reserves” herein. |
| (2) | Based on the “As-is” Appraised Value. Based on the “As Stabilized” Appraised Value, the Cut-off Date LTV and Balloon LTV are 62.8% and 44.1%, respectively. |
| (3) | The “As Stabilized” Appraised Value is based on achieving a stabilized ADR of $156.49 and a stabilized occupancy of 88.0%. |
| (4) | The Holiday Inn JFK Property was opened in December 2013, and as such, 2013 and 2012 Historical NOI and Historical Occupancy are not applicable. |
THE INFORMATION IN THIS STRUCTURAL AND COLLATERAL TERM SHEET IS NOT COMPLETE AND MAY BE AMENDED PRIOR TO THE TIME OF SALE. THIS TERM SHEET IS NOT AN OFFER TO SELL THESE SECURITIES AND IT IS NOT A SOLICITATION OF AN OFFER TO BUY THESE SECURITIES IN ANY JURISDICTION WHERE THE OFFER OR SALE IS NOT PERMITTED.
| 87 |
154-71 Brookville Boulevard Rosedale, NY 11422 | Collateral Asset Summary – Loan No. 8 Holiday Inn JFK | Cut-off Date Balance: Cut-off Date LTV: U/W NCF DSCR: U/W NOI Debt Yield: | $34,934,491 67.7% 1.35x 10.6% |
| Historical Occupancy, ADR, RevPAR(1)(2) | |||||||||
| Holiday Inn JFK Property | Competitive Set | Penetration Factor | |||||||
| Year | Occupancy(3) | ADR(3) | RevPAR(3) | Occupancy | ADR | RevPAR | Occupancy | ADR | RevPAR |
| 2014 | 69.4% | $137.70 | $95.63 | 84.5% | $154.60 | $130.69 | 82.2% | 89.1% | 73.2% |
| T-12 June 2015 | 83.1% | $137.66 | $114.33 | 84.9% | $157.18 | $133.52 | 97.8% | 87.6% | 85.6% |
| (1) | Source: Hospitality research report |
| (2) | The Holiday Inn JFK Property opened in December 2013, and as such, historical occupancy, ADR and RevPAR are unavailable prior to 2014. |
| (3) | Source: Historical operating statements |
The Loan.The Holiday Inn JFK loan (the “Holiday Inn JFK Loan”) is a fixed rate loan secured by the borrower’s fee simple interest in a 201 room, full service hotel located at 154-71 Brookville Boulevard in Rosedale, New York (the “Holiday Inn JFK Property”) with an original principal balance of $35.0 million. The Holiday Inn JFK Loan has a 10-year term and amortizes on a 23-year schedule. The Holiday Inn JFK Loan accrues interest at a fixed rate equal to 4.7510%per annum and has a cut-off date balance of $34,934,491.
The Holiday Inn JFK Loan proceeds were used to retire existing debt of approximately $25.0 million, fund upfront reserves of $366,297, pay closing costs of $750,078, and return equity to the sponsor of approximately $8.8 million. Based on the “As-is” appraised value of $51.6 million as of June 30, 2015, the cut-off date LTV ratio is 67.7% and the remaining implied equity is $16.6 million. Based on the “As Stabilized” appraised value of $55.6 million as of July 1, 2018, the “As Stabilized” LTV ratio is 62.8%.
| Sources and Uses | ||||||
| Sources | Proceeds | % of Total | Uses | Proceeds | % of Total | |
| Loan Amount | $35,000,000 | 100.0% | Loan Payoff | $25,037,979 | 071.5% | |
| Reserves | $366,297 | 001.0% | ||||
| Closing Costs | $750,078 | 002.1% | ||||
| Return of Equity | $8,845,645 | 025.3% | ||||
| Total Sources | $35,000,000 | 100.0% | Total Uses | $35,000,000 | 100.0% | |
The Borrower / Sponsor. The borrower, Brisam JFK LLC d/b/a Holiday Inn JFK Airport, is a single purpose New York limited liability company structured to be bankruptcy-remote, with two independent directors in its organizational structure. The sponsor of the borrower and the nonrecourse carve-out guarantor is Sam Chang.
Sam Chang is the founder, Chairman and CEO of McSam Hotel Group, LLC based in Great Neck, Long Island, New York. Since 1997, Mr. Chang has developed and operated more than 60 properties, including hotels and residential and commercial properties in the New York metropolitan area. Mr. Chang has been approved for franchise licenses by a variety of hotel franchise companies and their affiliates including Hilton Hotel Corporation, InterContinental Hotels Group, Marriott International, Inc., Hyatt Hotels Corporation, Carlson Hotels Worldwide, Starwood Hotels and Resorts Worldwide, Inc., Wyndham Worldwide Corporation, and Choice Hotels International. Mr. Chang was awarded the 2006 and 2012 Developer of the Year by InterContinental Hotels Group. Mr. Chang currently operates 20 properties, has five under construction, and five more under development totaling 4,000 rooms for a variety of national hotel chains.
The Property.The Holiday Inn JFK Property consists of a six-story, 201 room full service hotel built in 2013 and located on the northeastern side of New York’s John F. Kennedy International Airport (“JFK Airport”). Of the 201 rooms, 103 are king rooms, 88 are double/double rooms and 10 are ADA accessible rooms. The Holiday Inn JFK Property amenities include complimentary 24-hour airport shuttle service, approximately 913 sq. ft. of indoor meeting space, a 52-seat restaurant, cocktail lounge, exercise room, business center, dry-cleaning and laundry service and market pantry. Room amenities include a 32” flat screen television, complimentary high speed internet, complimentary Wi-Fi, as well as a workspace area. Room service is also available for breakfast, lunch and dinner. The Holiday Inn JFK Property is situated on a 1.55 acre site with 77 parking spaces.
The market mix for the Holiday Inn JFK Property consists of 36.9% commercial, 36.5% meeting and group and 26.6% leisure. Airline-related demand in the area, local employers and headquarter offices, as well as leisure travelers visiting Manhattan, represent the primary sources of demand for this market. In 2014, airline crews contributed approximately 28,000 room nights at the Holiday Inn JFK Property. Due to the proximity of JFK Airport, the Holiday Inn JFK Property also has a number of local negotiated accounts, including The Port Authority of New York and New Jersey (“Port Authority”), Transportation Security Administration, Federal Aviation Administration, and other airport related businesses.
The land beneath the Holiday Inn JFK Property was acquired by the borrower in 2005 for a purchase price of $6.2 million and the Holiday Inn JFK Property was subsequently constructed with a total development cost of $32.7 million including the purchase price of the land. The Holiday Inn JFK Property was completed and opened in December 2013. In 2014, the Holiday Inn JFK Property’s first full calendar year of operation, the Holiday Inn JFK Property achieved an occupancy of 69.4% compared to T-12 June 2015, where occupancy for the Holiday Inn JFK Property ramped up to 83.1%, an increase of 19.6%.
THE INFORMATION IN THIS STRUCTURAL AND COLLATERAL TERM SHEET IS NOT COMPLETE AND MAY BE AMENDED PRIOR TO THE TIME OF SALE. THIS TERM SHEET IS NOT AN OFFER TO SELL THESE SECURITIES AND IT IS NOT A SOLICITATION OF AN OFFER TO BUY THESE SECURITIES IN ANY JURISDICTION WHERE THE OFFER OR SALE IS NOT PERMITTED.
| 88 |
154-71 Brookville Boulevard Rosedale, NY 11422 | Collateral Asset Summary – Loan No. 8 Holiday Inn JFK | Cut-off Date Balance: Cut-off Date LTV: U/W NCF DSCR: U/W NOI Debt Yield: | $34,934,491 67.7% 1.35x 10.6% |
The Holiday Inn JFK Property currently receives an industrial and commercial abatement program exemption of $757,732 per year, which is phased out over the next 15 years.
The Franchise. The Holiday Inn JFK Property operates under a franchise agreement with Holiday Hospitality Franchising, Inc. (the “Franchisor”) as a Holiday Inn expiring November 26, 2023. The Holiday Inn brand, owned by InterContinental Hotels Group (“IHG”), a leading global hospitality group, has over 100 million guest nights hosted every year globally. As of year-end 2014, there were 770 Holiday Inn Hotels & Resorts (136,280 rooms) in the Americas. The majority of IHG’s upper-midscale, full service hotels feature a restaurant and lounge, an exercise room, business services, and meeting facilities. As of year-end 2014, Holiday Inn hotels operated at an average occupancy level of 65.8%, with an ADR of $107.56, and an average RevPAR of $70.74 in the Americas. The Holiday Inn JFK Property had a year-end 2014 average occupancy level of 69.4%, with an ADR of $137.70, and an average RevPAR of $95.63, a 5.5%, 28.0%, and 35.2% increase, respectively, over Holiday Inn hotels average occupancy level, ADR and average RevPAR.
The debt will be fully recourse to the borrower in the event that (i) any of the following occurs, (a) the franchise agreement will expire, or be cancelled, surrendered or terminated by the borrower, or by reason of any failure of the borrower to perform its obligations in connection therewith, (b) the borrower amends or modifies the franchise agreement, or (c) the borrower takes any action in addition to the foregoing or in the case of clause (i)(a) above, without concurrently entering into a replacement franchise agreement in accordance with the Holiday Inn JFK Loan agreement, or (ii) if, in connection with any transfer of the Holiday Inn JFK Property to the lender in full or partial satisfaction of the debt, the borrower fails to take any lawful action reasonably necessary to effect the transfer of any liquor license or other licenses or permits from the then-current holder thereof to the transferee of the Holiday Inn JFK Property provided that this paragraph shall not apply due to borrower’s insufficient cashflow from the operation of the Holiday Inn JFK Property.
Environmental Matters.The Phase I environmental report dated March 10, 2015 recommended no further action at the Holiday Inn JFK Property.
The Market. The Holiday Inn JFK Property is located 3.5 miles from JFK Airport in Queens County, New York City, New York. New York City is an international center of business and culture, with over eight million residents, and is one of the most populous cities in the nation and the world. New York City is also one of the most popular tourist destinations in the country and is home to the United Nations, the Statue of Liberty and the Empire State Building. The Borough of Queens represents 34.9% of the total area of New York City and offers a variety of tourist attractions, including Citi Field (home of the New York Mets), Flushing Meadows-Corona Park, the Louis Armstrong House Museum, New York Hall of Science and the Queens Botanical Garden. The USTA National Tennis Center, located in Queens, is the home of the U.S. Open. Access to Manhattan is provided via Interstate 678, Interstate 495 and the Midtown Tunnel.
JFK Airport is the nation’s leading international air passenger gateway in the United States and the fifth busiest airport by passenger volume, servicing approximately 53.3 million passengers in 2014. It has eight operating terminals with 125 gates serving over 80 airlines. Since 1947, JFK Airport has been operated by Port Authority who has invested approximately $7 billion into the airport. In 2011, a $1.2 billion redevelopment of Terminal 4 commenced with the first phase completed in May 2013 providing an expanded security area with 16 lanes, improved check-in areas, a 24,000 sq. ft. Sky Club, as well as improved Customs and Border Protection baggage claim and re-check facilities serving both international and domestic passengers. JFK Airport is also one of the world’s leading international air cargo centers and offers nearly four million sq. ft. of modern, state-of-the-art cargo warehouse and office space. The entire air cargo area is designated as a Foreign-Trade-Zone. JFK Airport serves air cargo markets through a strong mix of long-haul, direct and nonstop all-cargo aircraft and wide-body passenger aircraft flights. Approximately 37,000 people are employed at JFK Airport.
The subsequent chart presents the primary competitive properties to the Holiday Inn JFK Property:
| Primary Competitive Set(1) | ||||||
| Property | # of Rooms | Year Opened | Meeting Space (Sq. Ft.) | 2014 Occupancy | 2014 ADR | 2014 RevPAR |
| Holiday Inn JFK Property | 201 | 2013 | 913 | 69.4%(2) | $137.70(2) | $95.63(2) |
| Radisson Hotel JFK Airport(3) | 385 | 1955 | 8,276 | 76.0% | $128.00 | $97.28 |
| Hilton New York JFK Airport | 356 | 1987 | 6,334 | 91.0% | $169.00 | $153.79 |
| Courtyard by Marriott JFK(3) | 166 | 2001 | 900 | 99.0% | $189.00 | $187.11 |
| Hampton Inn JFK Airport(3) | 216 | 2001 | 500 | 79.0% | $147.00 | $116.13 |
| Fairfield Inn by Marriott New York JFK Airport | 110 | 2002 | 100 | 92.0% | $140.00 | $128.80 |
| Holiday Inn Express JFK Airport | 128 | 2002 | N/A | 78.0% | $148.00 | $115.44 |
| Hilton Garden Inn Queens JFK Airport(3) | 192 | 2005 | 1,200 | 90.0% | $150.00 | $135.00 |
| Sheraton Hotel JFK Airport(3) | 150 | 2008 | 2,300 | 86.0% | $175.00 | $150.50 |
| Crowne Plaza JFK Airport New York City | 330 | 2014 | 5,000 | 70.0% | $155.00 | $108.50 |
| Total / Wtd. Avg.(4) | 2,033 | 82.9% | $154.02 | $128.67 | ||
| (1) | Source: Appraisal |
| (2) | Source: Historical operating statements |
| (3) | The above five properties are also included in the hospitality research report. |
| (4) | Total / Wtd. Avg. excludes the Holiday Inn JFK Property. |
THE INFORMATION IN THIS STRUCTURAL AND COLLATERAL TERM SHEET IS NOT COMPLETE AND MAY BE AMENDED PRIOR TO THE TIME OF SALE. THIS TERM SHEET IS NOT AN OFFER TO SELL THESE SECURITIES AND IT IS NOT A SOLICITATION OF AN OFFER TO BUY THESE SECURITIES IN ANY JURISDICTION WHERE THE OFFER OR SALE IS NOT PERMITTED.
| 89 |
154-71 Brookville Boulevard Rosedale, NY 11422 | Collateral Asset Summary – Loan No. 8 Holiday Inn JFK | Cut-off Date Balance: Cut-off Date LTV: U/W NCF DSCR: U/W NOI Debt Yield: | $34,934,491 67.7% 1.35x 10.6% |
Cash Flow Analysis.
| Cash Flow Analysis(1) | ||||
| 2014 | T-12 6/30/2015 | U/W | U/W per Room | |
| Occupancy | 69.4% | 83.1% | 83.1% | |
| ADR | $137.70 | $137.66 | $137.66 | |
| RevPAR | $95.63 | $114.33 | $114.33 | |
| Room Revenue | $7,015,854 | $8,387,760 | $8,387,760 | $41,730 |
| F&B Revenue | 0 | 0 | 0 | 0 |
| Other Revenue | 85,701 | 88,579 | 118,489 | 589 |
| Total Revenue | $7,101,555 | $8,476,339 | $8,506,249 | $42,320 |
| Operating Expenses | 1,947,676 | 2,078,602 | 2,078,602 | 10,341 |
| Undistributed Expenses | 1,997,887 | 2,204,640 | 2,305,178 | 11,469 |
| Gross Operating Profit | $3,155,992 | $4,193,097 | $4,122,469 | $20,510 |
| Total Fixed Charges(2) | 517,306 | 279,957 | 407,881 | 2,029 |
| Net Operating Income | $2,638,686 | $3,913,140 | $3,714,588 | $18,481 |
| FF&E | 141,973 | 213,166 | 340,250 | 1,693 |
| Net Cash Flow | $2,496,714 | $3,699,974 | $3,374,339 | $16,788 |
| (1) | The Holiday Inn JFK Property opened in December 2013, with 2014 representing the first full year of operation. |
| (2) | U/W Total Fixed Charges includes Real Estate Taxes underwritten based on the average taxes under the ICAP exemption over the next 15 years. |
Property Management. The Holiday Inn JFK Property is managed by M&R Hospitality Management Corp., a third party management company. Formed in 1992, M&R Hospitality Management Corp. was initially created as a development company focused on acquiring and building hotels in the New York metropolitan area and beyond. M&R Hospitality Management Corp. currently manages and operates 14 hotels including 12 in New York City, one in Boston and one in St. Maarten, totaling 1,581 rooms. In addition, M&R Hospitality Management Corp. currently has five hotels in New York City under development, totaling 1,045 rooms.
Lockbox / Cash Management. The Holiday Inn JFK Loan is structured with a hard lockbox and springing cash management. All rents and revenues are required to be deposited in a sweep account controlled by the lender within three business days of receipt by the borrower or property manager. All credit card receipts are required to be deposited by credit card processing companies directly into a sweep account controlled by the lender. During the existence of a Cash Management Trigger Event Period (as defined herein), all funds in the sweep account are swept each business day to a cash management account under the control of the lender and applied during each interest period of the loan term to payments of debt service, required reserves, approved operating expenses, and other items required under the loan documents. During the existence of any Cash Sweep Event Period (as defined herein), all funds remaining in the cash management account are required to be held by the lender as additional collateral for the Holiday Inn JFK Loan. If a Cash Sweep Event Period does not exist, but a PIP Trigger Event Period (as defined herein) does, all funds remaining in the cash management account are required to be deposited into a PIP account and disbursed by the lender in accordance with the loan documents. If at any time a Cash Sweep Event Period and PIP Trigger Event Period co-exist, all funds remaining in the cash management account are required to be held and disbursed by the lender in accordance with the loan documents. Provided no Cash Sweep Event Period or PIP Trigger Event Period exist, the remaining cash flow (after application to debt service, required reserves, approved operating expenses, and other items required under the loan documents) will be released to the borrower.
A “Cash Management Trigger Event Period” will commence upon the occurrence of any of the following: (i) an event of default, (ii) a bankruptcy action of the borrower or guarantor, (iii) a bankruptcy action of the affiliated property manager, (iv) if the debt service coverage ratio based on the trailing 12 month period is less than 1.15x, (v) the felony or fraud indictment or misappropriation of funds by the borrower, guarantor, or property manager, or (vi) a PIP Trigger Event Period. A Cash Management Trigger Event Period will end: (a) with regards to clause (i) above, upon the cure of the event of default (provided that lender has not exercised certain remedial rights to accelerate the loan or move to appoint a receiver or commence a foreclosure action); (b) with regards to clause (ii) above, the applicable bankruptcy action was involuntary and not solicited or caused to be solicited by the borrower or guarantor or any affiliate of the borrower or guarantor, upon the applicable bankruptcy action being discharged, stayed or dismissed within 90 days of such filing, and provided that such filing does not materially increase the borrower’s or guarantor’s monetary obligations, as applicable, and with respect to such bankruptcy action of borrower, the borrower is not in violation of its SPE or transfer covenants, and with respect to such bankruptcy action of guarantor, it does not materially and adversely affect guarantor’s ability to perform its obligations under the loan documents to which it is a party; (c) with regards to clause (iii) above, (x) if borrower replaces the affiliated property manager with a replacement property manager meeting certain requirements under the loan agreement and pursuant to a replacement management agreement or (y) upon the applicable involuntary bankruptcy action being discharged, stayed or dismissed within 120 days of such
THE INFORMATION IN THIS STRUCTURAL AND COLLATERAL TERM SHEET IS NOT COMPLETE AND MAY BE AMENDED PRIOR TO THE TIME OF SALE. THIS TERM SHEET IS NOT AN OFFER TO SELL THESE SECURITIES AND IT IS NOT A SOLICITATION OF AN OFFER TO BUY THESE SECURITIES IN ANY JURISDICTION WHERE THE OFFER OR SALE IS NOT PERMITTED.
| 90 |
154-71 Brookville Boulevard Rosedale, NY 11422 | Collateral Asset Summary – Loan No. 8 Holiday Inn JFK | Cut-off Date Balance: Cut-off Date LTV: U/W NCF DSCR: U/W NOI Debt Yield: | $34,934,491 67.7% 1.35x 10.6% |
filing, and provided that such filing does not materially increase the property manager’s monetary obligations or materially affect the property manager’s ability to perform its obligations under the management agreement; (d) with regards to clause (iv) above, the debt service coverage ratio of the Holiday Inn JFK Loan is equal to or greater than 1.20x based on the trailing twelve month period for two consecutive quarters; (e) with regards to clause (v) above, if the borrower replaces the affiliated property manager with a replacement property manager meeting certain requirements under the loan agreement pursuant to a replacement management agreement; and (f) with regards to clause (vi) above, (x) if the borrower replaces the Franchisor with a qualified franchisor meeting certain requirements under the loan agreement pursuant to a replacement franchise agreement, (y) upon the cure of an event of default under the franchise agreement, or (z) upon the applicable involuntary petition against Franchisor being discharged, stayed or dismissed within 120 days of such filing, and provided that such filing does not materially increase the Franchisor’s monetary obligations or materially and adversely affect the Franchisor’s ability to perform its obligations under the franchise agreement.
A “Cash Sweep Event Period” will commence upon the occurrence of any of the following: (i) an event of default, (ii) a bankruptcy action of the borrower, (iii) a bankruptcy action of the guarantor, (iv) a bankruptcy action of the affiliated property manager, or (v) if the debt service coverage ratio based on the trailing 12 month period is less than 1.15x. A Cash Sweep Event Period will end: (a) with regards to clause (i) above, upon the cure of the event of default (provided that lender has not exercised certain remedial rights to accelerate the loan or move to appoint a receiver or commence a foreclosure action); (b) with regards to clause (ii) above, provided the applicable bankruptcy action was involuntary and not solicited or caused to be solicited by borrower, guarantor or any affiliate of borrower or guarantor, upon such bankruptcy action being discharged, stayed or dismissed within 90 days of such filing, and such filing does not materially increase borrower’s monetary obligations and borrower is not in default of its SPE or transfer provisions; (c) with regards to clause (iii) above, provided the applicable bankruptcy action was involuntary and not solicited or caused to be solicited by guarantor or any affiliate of guarantor, upon such bankruptcy action being discharged, stayed or dismissed within 90 days of such filing, and such filing does not materially increase guarantor’s monetary obligations and does not materially and adversely affect guarantor’s ability to perform its obligations under the loan documents to which it is a party; (d) with respect to clause (iv) above, (x) if borrower replaces the affiliated property manager with a replacement property manager meeting certain requirements under the loan agreement pursuant to a replacement management agreement or (y) upon the applicable involuntary bankruptcy action being discharged, stayed or dismissed within 120 days of such filing, and such filing does not materially increase property manager’s monetary obligations or materially and adversely affect property manager’s ability to perform its obligations under the management agreement; and (e) with regards to clause (v) above, the debt service coverage ratio of the Holiday Inn JFK Loan is greater than 1.20x based on the trailing twelve month period for two consecutive quarters.
A “PIP Trigger Event Period” will commence upon the occurrence of (i) Franchisor providing notice of its intention to terminate or not extend or renew the franchise agreement, (ii) an event of default under the franchise agreement, (iii) a bankruptcy action of the Franchisor, or (iv) the date that is 12 months prior to the then applicable franchise agreement expiration date. A PIP Trigger Event Period will end upon the occurrence of: (a) with regards to clauses (i) or (iv) above, the borrower replaces the Franchisor with a qualified franchisor meeting certain requirements under the loan agreement and pursuant to a replacement franchise agreement (provided that no event of default then exists under the replacement franchise agreement); (b) with regards to clause (ii) above, upon the cure of the event of default (provided that no other event of default then exists under the franchise agreement); and (c) with regards to clause (iii) above, upon the applicable involuntary petition against Franchisor being discharged, stayed or dismissed within 120 days of such filing (provided that such filing does not materially increase franchisor’s monetary obligations or materially and adversely affect franchisor’s ability to perform its obligations under the franchise agreement).
Initial Reserves. At closing, the borrower deposited (i) $79,125 into a tax reserve account, (ii) $8,928 into an insurance reserve account, (iii) $2,150 into a required repairs reserve account and (iv) $276,094 into a lien funds account.
Ongoing Reserves. On a monthly basis, the borrower is required to deposit reserves of (i) 1/12 of the estimated annual real estate taxes, which currently equates to $21,979 into a tax reserve account, (ii) 1/12 of the annual insurance premiums, which currently equates to $3,434 into an insurance reserve account, and (iii) the greater of (a) 1/12 of 4.0% of previous year’s gross income from operations and (b) the aggregate amount required under the management and franchise agreement, into a monthly FF&E reserve account, subject to a cap of $2.0 million. Borrower is required to deposit with lender (i) 125% of estimated costs into a PIP reserve to perform work required in the property improvement plan under the franchise agreement upon the Franchisor requiring a property improvement plan or (ii) during a PIP Trigger Event Period, all funds remaining in the cash management account will be held and disbursed by the lender in accordance with the loan documents.
Current Mezzanine or Subordinate Indebtedness. None.
Future Mezzanine or Subordinate Indebtedness Permitted. None.
THE INFORMATION IN THIS STRUCTURAL AND COLLATERAL TERM SHEET IS NOT COMPLETE AND MAY BE AMENDED PRIOR TO THE TIME OF SALE. THIS TERM SHEET IS NOT AN OFFER TO SELL THESE SECURITIES AND IT IS NOT A SOLICITATION OF AN OFFER TO BUY THESE SECURITIES IN ANY JURISDICTION WHERE THE OFFER OR SALE IS NOT PERMITTED.
| 91 |
154-71 Brookville Boulevard Rosedale, NY 11422 | Collateral Asset Summary – Loan No. 8 Holiday Inn JFK | Cut-off Date Balance: Cut-off Date LTV: U/W NCF DSCR: U/W NOI Debt Yield: | $34,934,491 67.7% 1.35x 10.6% |
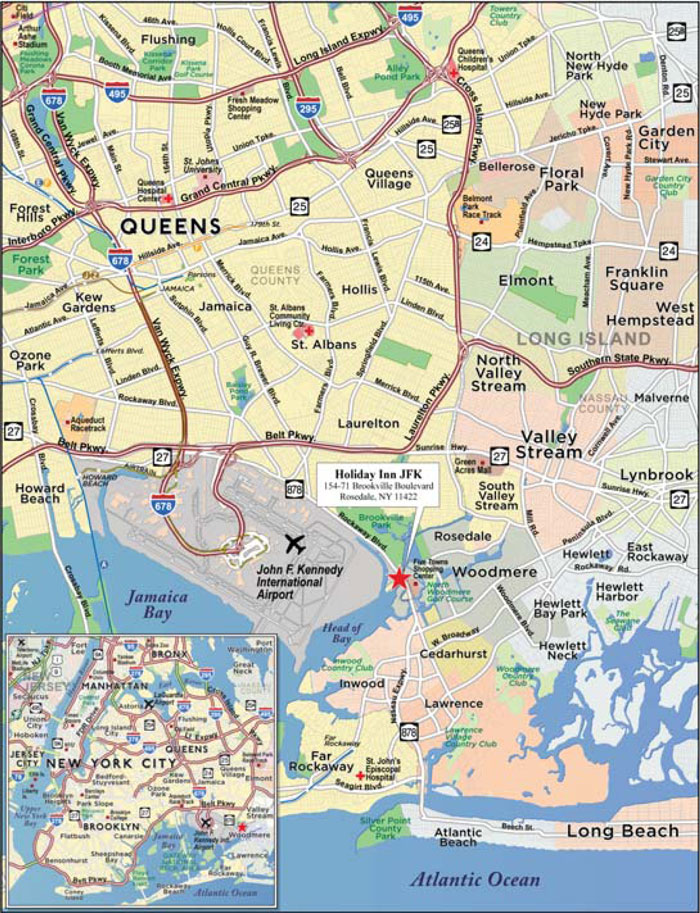
THE INFORMATION IN THIS STRUCTURAL AND COLLATERAL TERM SHEET IS NOT COMPLETE AND MAY BE AMENDED PRIOR TO THE TIME OF SALE. THIS TERM SHEET IS NOT AN OFFER TO SELL THESE SECURITIES AND IT IS NOT A SOLICITATION OF AN OFFER TO BUY THESE SECURITIES IN ANY JURISDICTION WHERE THE OFFER OR SALE IS NOT PERMITTED.
| 92 |
(THIS PAGE INTENTIONALLY LEFT BLANK)
| 93 |
8650 Barbara Ann Way Delmar, MD 21875 | Collateral Asset Summary – Loan No. 9 Pond’s Edge | Cut-off Date Balance: Cut-off Date LTV: U/W NCF DSCR: U/W NOI Debt Yield: | $28,400,000 70.3% 1.29x 8.2% |
THE INFORMATION IN THIS STRUCTURAL AND COLLATERAL TERM SHEET IS NOT COMPLETE AND MAY BE AMENDED PRIOR TO THE TIME OF SALE. THIS TERM SHEET IS NOT AN OFFER TO SELL THESE SECURITIES AND IT IS NOT A SOLICITATION OF AN OFFER TO BUY THESE SECURITIES IN ANY JURISDICTION WHERE THE OFFER OR SALE IS NOT PERMITTED.
| 94 |
8650 Barbara Ann Way Delmar, MD 21875 | Collateral Asset Summary – Loan No. 9 Pond’s Edge | Cut-off Date Balance: Cut-off Date LTV: U/W NCF DSCR: U/W NOI Debt Yield: | $28,400,000 70.3% 1.29x 8.2% |
| Mortgage Loan Information | |
| Loan Seller: | UBSRES |
| Loan Purpose: | Refinance |
| Sponsors: | John Hynansky; Alexandra H. Vadas |
| Borrower: | Pond’s Edge Associates, LLC |
| Original Balance: | $28,400,000 |
| Cut-off Date Balance: | $28,400,000 |
| % by Initial UPB: | 3.8% |
| Interest Rate: | 4.6554% |
| Payment Date: | 6thof each month |
| First Payment Date: | September 6, 2015 |
| Maturity Date: | August 6, 2025 |
| Amortization: | Interest only for first 24 months; 360 months thereafter |
| Additional Debt: | None |
| Call Protection: | L(25), D(91), O(4) |
| Lockbox / Cash Management: | Soft / Springing |
| Reserves(1) | ||
| Initial | Monthly | |
| Taxes: | $0 | $21,483 |
| Insurance: | $60,823 | $10,861 |
| Replacement: | $0 | $5,500 |
| Required Repairs: | $4,375 | NAP |
| Financial Information | ||
| Cut-off Date Balance / Unit: | $107,576 | |
| Balloon Balance / Unit: | $92,257 | |
| Cut-off Date LTV: | 70.3% | |
| Balloon LTV: | 60.3% | |
| Underwritten NOI DSCR(2): | 1.33x | |
| Underwritten NCF DSCR(2): | 1.29x | |
| Underwritten NOI Debt Yield: | 8.2% | |
| Underwritten NCF Debt Yield: | 8.0% | |
| Underwritten NOI Debt Yield at Balloon: | 9.6% | |
| Underwritten NCF Debt Yield at Balloon: | 9.3% | |
| Property Information | |
| Single Asset / Portfolio: | Single Asset |
| Property Type: | Garden Multifamily |
| Collateral: | Fee Simple |
| Location: | Delmar, MD |
| Year Built / Renovated: | 2007 / NAP |
| Total Units: | 264 |
| Property Management: | Winner Group Management, Inc. |
| Underwritten NOI: | $2,337,817 |
| Underwritten NCF: | $2,271,817 |
| Appraised Value: | $40,400,000 |
| Appraisal Date: | June 18, 2015 |
| Historical NOI | |
| Most Recent NOI: | $2,338,921 (T-12 May 31, 2015) |
| 2014 NOI: | $2,543,221 (December 31, 2014) |
| 2013 NOI: | $2,326,490 (December 31, 2013) |
| 2012 NOI: | $2,396,615 (December 31, 2012) |
| Historical Occupancy | |
| Most Recent Occupancy: | 98.1% (June 30, 2015) |
| 2014 Occupancy: | 98.2% (December 31, 2014) |
| 2013 Occupancy: | 98.5% (December 31, 2013) |
| 2012 Occupancy: | 98.9% (December 31, 2012) |
| (1) | See “Initial Reserves” and “Ongoing Reserves” herein. |
| (2) | Based on amortizing debt service payments. Based on the current interest only payments, the Underwritten NOI DSCR and Underwritten NCF DSCR are 1.74x and 1.69x, respectively. |
THE INFORMATION IN THIS STRUCTURAL AND COLLATERAL TERM SHEET IS NOT COMPLETE AND MAY BE AMENDED PRIOR TO THE TIME OF SALE. THIS TERM SHEET IS NOT AN OFFER TO SELL THESE SECURITIES AND IT IS NOT A SOLICITATION OF AN OFFER TO BUY THESE SECURITIES IN ANY JURISDICTION WHERE THE OFFER OR SALE IS NOT PERMITTED.
| 95 |
8650 Barbara Ann Way Delmar, MD 21875 | Collateral Asset Summary – Loan No. 9 Pond’s Edge | Cut-off Date Balance: Cut-off Date LTV: U/W NCF DSCR: U/W NOI Debt Yield: | $28,400,000 70.3% 1.29x 8.2% |
| Unit Mix Summary(1) | |||||||
| Unit Type | # of Units | % of Total | Occupied Units | Occupancy | Average Unit Size (Sq. Ft.) | Average Monthly Rental Rate | Average Monthly Rental Rate PSF |
| 1 Bed / 1 Bath | 30 | 11.4% | 30 | 100.0% | 875 | $1,016 | $1.16 |
| 2 Bed / 2 Bath | 180 | 68.2% | 178 | 98.9% | 1,100 | $1,152 | $1.05 |
| 3 Bed / 2.5 Bath | 30 | 11.4% | 27 | 90.0% | 1,450 | $1,421 | $0.98 |
| 3 Bed / 2.5 Bath Townhouse | 24 | 9.1% | 24 | 100.0% | 1,995 | $1,699 | $0.85 |
| Total / Wtd. Avg. | 264 | 100.0% | 259 | 98.1% | 1,196 | $1,215 | $1.02 |
| (1) | Based on the underwritten rent roll dated June 30, 2015. |
The Loan.The Pond’s Edge loan (the “Pond’s Edge Loan”) is a fixed rate loan secured by the borrower’s fee simple interest in a 264-unit garden-style, multifamily property located at 8650 Barbara Ann Way in Delmar, Maryland (the “Pond’s Edge Property”) with an original principal balance of $28.4 million. The Pond’s Edge Loan has a 10-year term and amortizes on a 30-year schedule after an initial 24-month interest only period. The Pond’s Edge Loan accrues interest at a fixed rate equal to 4.6554%per annum and has a cut-off date balance of $28.4 million. Loan proceeds, along with $170,092 in equity from the sponsors, were used to retire existing debt of approximately $28.2 million, fund upfront reserves of $65,198, and pay closing costs of $324,269.Based on the appraised value of $40.4 million as of June 18, 2015, the cut-off date LTV ratio is 70.3% and the borrower cash equity is approximately $4.4 million.
| Sources and Uses | ||||||
| Sources | Proceeds | % of Total | Uses | Proceeds | % of Total | |
| Loan Amount | $28,400,000 | 099.4% | Loan Payoff | $28,180,626 | 098.6% | |
| Sponsor Equity | $170,092 | 000.6% | Reserves | $65,198 | 000.2% | |
| Closing Costs | $324,269 | 001.1% | ||||
| Total Sources | $28,570,092 | 100.0% | Total Uses | $28,570,092 | 100.0% | |
The Borrower / Sponsor. The borrower, Pond’s Edge Associates, LLC, is a single purpose Delaware limited liability company structured to be bankruptcy-remote, with two independent directors in its organizational structure. The sponsors of the borrower and the nonrecourse carve-out guarantors are John Hynansky and Alexandra H. Vadas.
John Hynansky is the founder and president of Winner Automotive Group, a family-owned and operated company consisting of seven automotive dealerships and three collision centers in Wilmington, Newark and Dover, Delaware. Winner Automotive Group’s sister company, Winner Imports Ukraine, is the official importer for Ford, Jaguar, Land Rover, Volvo and Porsche into Ukraine. Winner Imports Ukraine started in 1992 as the official importer of Ford Motor Co., and now reports net sales in excess of $405 million.
The Property. The Pond’s Edge Property is a 264-unit garden-style multifamily community comprised of 10, two- and three-story buildings, four, three-story townhouse buildings, and one clubhouse/leasing office building located in Delmar, Maryland. The buildings are situated on a 36.49 acre site and were built in 2007. The Pond’s Edge Property includes 456 outdoor parking spaces and 75 garage parking spaces for a total of 531 parking spaces, or 2.01 spaces per unit. The Pond’s Edge Property was 98.1% occupied as of the rent roll dated June 30, 2015.
Unit amenities include private entrances, walk-in closets, washer/dryer, a private deck or balcony and fully equipped kitchens with stainless steel appliances. Kitchen appliances include refrigerators, built-in microwaves, dishwashers and garbage disposals. Most units also feature a fireplace and furnished units are available. Three-bedroom townhouse units include attached garages. Community amenities include a 24-hour fitness center, outdoor swimming pool, BBQ center, clubhouse, storage facilities, leasing office, playground, business center with a computer lab, cappuccino bar, and a dog park. Management also provides on-site maintenance, package service as well as an on-site property manager.
The Centre at Salisbury is an 862,000 sq. ft. regional mall located 2.4 miles from the Pond’s Edge Property. The Centre at Salisbury, anchored by Macy’s, JCPenney, Sears, Dick’s Sporting Goods, Boscov’s, and Regal Cinemas, has over 85 tenants, with numerous national retailers including Victoria’s Secret, Pier One Imports, Express, Foot Locker, Bath & Body Works, and Zales. The Centre at Salisbury also includes multiple restaurants and entertainment destinations including Chick-fil-A, Longhorn Steakhouse, Chuck E. Cheese’s, Jake’s Wayback Burgers, The Greene Turtle, Red Lobster, Ruby Tuesday, and Subway. The Commons shopping center, containing 349,907 sq. ft. of retail space and located 1.5 miles south of the Pond’s Edge Property, is anchored by Home Depot, Target, Michael’s, Best Buy and PetSmart.
Environmental Matters.The Phase I environmental report dated June 29, 2015 recommended no further action at the Pond’s Edge Property.
The Market. The Pond’s Edge Property is located just outside the city of Salisbury, the largest city on the Eastern Shore of Maryland and the county seat of Wicomico County, and is approximately 114 miles southeast of Baltimore, 114 miles southeast of Washington D.C., and 134 miles south of Philadelphia, Pennsylvania. The Peninsula Regional Medical Center, located 5.7 miles southwest of the
THE INFORMATION IN THIS STRUCTURAL AND COLLATERAL TERM SHEET IS NOT COMPLETE AND MAY BE AMENDED PRIOR TO THE TIME OF SALE. THIS TERM SHEET IS NOT AN OFFER TO SELL THESE SECURITIES AND IT IS NOT A SOLICITATION OF AN OFFER TO BUY THESE SECURITIES IN ANY JURISDICTION WHERE THE OFFER OR SALE IS NOT PERMITTED.
| 96 |
8650 Barbara Ann Way Delmar, MD 21875 | Collateral Asset Summary – Loan No. 9 Pond’s Edge | Cut-off Date Balance: Cut-off Date LTV: U/W NCF DSCR: U/W NOI Debt Yield: | $28,400,000 70.3% 1.29x 8.2% |
Pond’s Edge Property, is a 292-bed regional hospital that employs 3,300 people and serves approximately 500,000 patients per year. Perdue Farms, a multi-national poultry corporation, is headquartered in Salisbury with approximately 22,000 employees. Other industries in Salisbury include electronic component manufacturing, pharmaceuticals, shipbuilding, and agriculture. Additional major employers in the area include Salisbury University, Verizon and Pepsi Bottling of Delmarva. The labor market within a 15- and 30-mile radius of Salisbury is 85,000 and 101,000 people, respectively. Salisbury also features Arthur W. Perdue Stadium, Poplar Hill Mansion, Chipman Cultural Center, Ward Museum of Wildfowl Art and the Salisbury Zoological Park.
The Pond’s Edge Property is located half a mile east of U.S. Route 13, which provides access to major cities including Philadelphia, Pennsylvania, Norfolk, Virginia, and Fayetteville, North Carolina, and connects to U.S. Route 50 to the south and U.S. Route 9 to the north. U.S. Route 50 is located approximately 2.8 miles south of the Pond’s Edge Property, running in an east/west direction covering over 3,000 miles, coast to coast. U.S. Route 50 runs through 12 states and provides access to a number of major cities including Washington, D.C., Cincinnati, Ohio, St. Louis, Missouri, Kansas City, Missouri, and Sacramento, California.
The Pond’s Edge Property is located in the Salisbury market. According to a market research report, as of Q1 2015, the vacancy rate for the Salisbury multifamily market was 3.9%, a 0.8% decrease from the previous quarter’s vacancy rate of 4.7%. The Q1 2015 average asking monthly rental rate was $920 per unit, representing a 0.3% decrease from the previous quarter’s monthly rate of $923 per unit.
The subsequent chart presents the primary competitive properties to the Pond’s Edge Property:
| Competitive Set(1) | |||||||
| Name | Pond’s Edge Property | Mill Pond Village | Runaway Bay | Marley Manor | Island Club | Addison Court | Ocean Aisle |
| Distance from Subject | NAP | 2.4 miles | 3.1 miles | 7.5 miles | 5.4 miles | 1.6 miles | 5.4 miles |
| Class | A | A | A | A | A | A | A |
| Total Occupancy | 98.1%(2) | 95.0% | 98.0% | 96.0% | 97.0% | 85.0%(3) | 80.0%(3) |
| No. of Units | 264(2) | 456 | 180 | 276 | 144 | 300 | 96 |
| Avg. Unit Size (Sq. Ft.) | 1,196(2) | 941 | 1,204 | 933 | 860 | 1,169 | 1,303 |
| Avg. Monthly Rental Rate Range | $954 - $1,699(2) | $920 - $1,350 | $1,040 - $1,175 | $1,115 - $1,347 | $759 - $969 | $995 - $1,390 | $1,219 - $1,219 |
| (1) | Source: Appraisal |
| (2) | Based on the underwritten rent roll dated June 30, 2015. |
| (3) | Addison Court and Ocean Aisle properties were built in 2015 and therefore show a lower occupancy compared to the competitive set. |
Cash Flow Analysis.
| Cash Flow Analysis | ||||||
| 2012 | 2013 | 2014 | T-12 5/31/2015 | U/W | U/W per Unit | |
| Gross Potential Rent | $3,793,007 | $3,828,473 | $3,874,723 | $3,891,342 | $3,854,892 | $14,602 |
| Total Recoveries | 0 | 0 | 0 | 0 | 0 | 0 |
| Total Other Income | 339,252 | 314,319 | 346,684 | 363,969 | 363,969 | 1,379 |
| Less: Vacancy & Credit Loss(1) | (605,638) | (599,753) | (600,507) | (657,164) | (554,336) | (2,100) |
| Effective Gross Income | $3,526,621 | $3,543,039 | $3,620,900 | $3,598,147 | $3,664,525 | $13,881 |
| Total Operating Expenses | 1,130,006 | 1,216,550 | 1,077,679 | 1,259,226 | 1,326,708 | 5,025 |
| Net Operating Income | $2,396,615 | $2,326,490 | $2,543,221 | $2,338,921 | $2,337,817 | $8,855 |
| Capital Expenditures | 0 | 0 | 0 | 0 | 66,000 | 250 |
| Net Cash Flow | $2,396,615 | $2,326,490 | $2,543,221 | $2,338,921 | $2,271,817 | $8,605 |
| (1) | U/W Vacancy represents 14.4% of gross income. |
Property Management. The Pond’s Edge Property is managed by Winner Group Management, Inc., an affiliate of the sponsors.
Lockbox / Cash Management. The Pond’s Edge Loan is structured with a soft lockbox and springing cash management. All rent and other revenue of the property is required to be collected by the borrower and/or property manager and deposited into a clearing account controlled by the lender within three business days of receipt. During a Cash Management Trigger Event Period (as defined herein), all funds in the clearing account will be swept on each business day into a cash management account under the control of the lender and applied toward the payment of debt service and funding of required monthly reserves and approved operating expenses. Any excess, if no Cash Sweep Event Period (as defined herein) is in effect, will be disbursed to the borrower or, if a Cash Sweep Event Period is in effect, held as additional collateral for the loan.
THE INFORMATION IN THIS STRUCTURAL AND COLLATERAL TERM SHEET IS NOT COMPLETE AND MAY BE AMENDED PRIOR TO THE TIME OF SALE. THIS TERM SHEET IS NOT AN OFFER TO SELL THESE SECURITIES AND IT IS NOT A SOLICITATION OF AN OFFER TO BUY THESE SECURITIES IN ANY JURISDICTION WHERE THE OFFER OR SALE IS NOT PERMITTED.
| 97 |
8650 Barbara Ann Way Delmar, MD 21875 | Collateral Asset Summary – Loan No. 9 Pond’s Edge | Cut-off Date Balance: Cut-off Date LTV: U/W NCF DSCR: U/W NOI Debt Yield: | $28,400,000 70.3% 1.29x 8.2% |
A “Cash Management Trigger Event Period” will commence upon the occurrence of (i) an event of default, (ii) a bankruptcy action involving a borrower, the guarantors or the property manager, (iii) the debt service coverage ratio falling below 1.15x on a trailing twelve month basis, or (iv) on indictment for fraud or misappropriation of funds by the borrower, guarantors, or property manager. A Cash Management Trigger Event Period will end: (a) with regard to clause (i) above, upon the cure of the event of default; (b) with regard to clause (ii) above, provided the applicable bankruptcy action was involuntary and not solicited, upon the applicable bankruptcy action being discharged, stayed or dismissed; and (c) with regard to clause (iii) above, the debt service coverage ratio being greater than 1.20x based on the trailing twelve month period for two consecutive quarters.
A “Cash Sweep Event Period” will commence upon the occurrence of (i) an event of default, (ii) a bankruptcy action involving a borrower, the guarantors or the property manager, or (iii) the debt service coverage ratio falling below 1.15x on a trailing twelve month basis. A Cash Sweep Event Period will end: (a) with regard to clause (i) above, upon the cure of the event of default; (b) with regard to clause (ii) above, provided the applicable bankruptcy action was involuntary and not solicited, upon the applicable bankruptcy action being discharged, stayed or dismissed; and (c) with regard to clause (iii) above, the debt service coverage ratio being greater than 1.20x based on the trailing twelve month period for two consecutive quarters.
Initial Reserves. At closing, the borrower deposited (i) $60,823 into an insurance reserve account and (ii) $4,375 into the required repairs reserve account.
Ongoing Reserves. On a monthly basis, the borrower is required to deposit reserves of (i) 1/12 of the estimated annual real estate taxes, which currently equates to $21,483 into a tax reserve account, (ii) 1/12 of the annual insurance premiums, which currently equates to $10,861 into an insurance reserve account and (iii) $5,500 into a replacement reserve account, subject to a cap of $198,000.
Current Mezzanine or Subordinate Indebtedness. None.
Future Mezzanine or Subordinate Indebtedness Permitted. None.
THE INFORMATION IN THIS STRUCTURAL AND COLLATERAL TERM SHEET IS NOT COMPLETE AND MAY BE AMENDED PRIOR TO THE TIME OF SALE. THIS TERM SHEET IS NOT AN OFFER TO SELL THESE SECURITIES AND IT IS NOT A SOLICITATION OF AN OFFER TO BUY THESE SECURITIES IN ANY JURISDICTION WHERE THE OFFER OR SALE IS NOT PERMITTED.
| 98 |
8650 Barbara Ann Way Delmar, MD 21875 | Collateral Asset Summary – Loan No. 9 Pond’s Edge | Cut-off Date Balance: Cut-off Date LTV: U/W NCF DSCR: U/W NOI Debt Yield: | $28,400,000 70.3% 1.29x 8.2% |
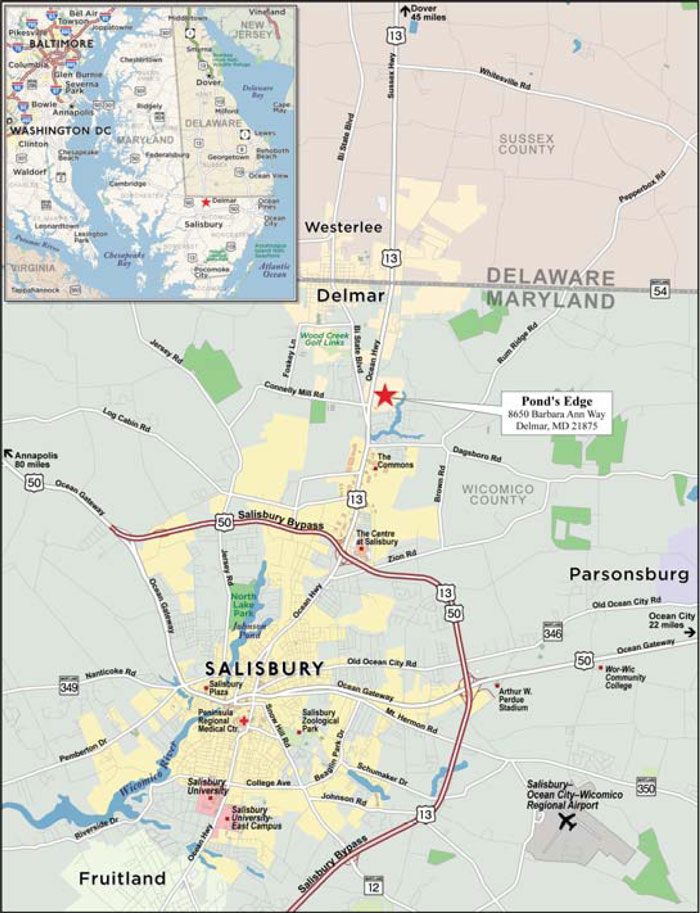
THE INFORMATION IN THIS STRUCTURAL AND COLLATERAL TERM SHEET IS NOT COMPLETE AND MAY BE AMENDED PRIOR TO THE TIME OF SALE. THIS TERM SHEET IS NOT AN OFFER TO SELL THESE SECURITIES AND IT IS NOT A SOLICITATION OF AN OFFER TO BUY THESE SECURITIES IN ANY JURISDICTION WHERE THE OFFER OR SALE IS NOT PERMITTED.
| 99 |
604 Curt Maberry Road Lynden, WA 98264 | Collateral Asset Summary – Loan No. 10 Preferred Freezer - Lynden, WA | Cut-off Date Balance: Cut-off Date LTV: U/W NCF DSCR: U/W NOI Debt Yield: | $25,200,000 58.6% 1.61x 11.2% |

THE INFORMATION IN THIS STRUCTURAL AND COLLATERAL TERM SHEET IS NOT COMPLETE AND MAY BE AMENDED PRIOR TO THE TIME OF SALE. THIS TERM SHEET IS NOT AN OFFER TO SELL THESE SECURITIES AND IT IS NOT A SOLICITATION OF AN OFFER TO BUY THESE SECURITIES IN ANY JURISDICTION WHERE THE OFFER OR SALE IS NOT PERMITTED.
| 100 |
604 Curt Maberry Road Lynden, WA 98264 | Collateral Asset Summary – Loan No. 10 Preferred Freezer - Lynden, WA | Cut-off Date Balance: Cut-off Date LTV: U/W NCF DSCR: U/W NOI Debt Yield: | $25,200,000 58.6% 1.61x 11.2% |
| Mortgage Loan Information | |
| Loan Seller: | UBSRES |
| Loan Purpose: | Refinance |
| Sponsor: | Gary Edwards |
| Borrower: | Chill Build Lynden, LLC |
| Original Balance: | $25,200,000 |
| Cut-off Date Balance: | $25,200,000 |
| % by Initial UPB: | 3.3% |
| Interest Rate: | 4.3727% |
| Payment Date: | 6thof each month |
| First Payment Date: | October 6, 2015 |
| Maturity Date: | September 6, 2025 |
| Amortization: | Interest only for first 24 months; 300 months thereafter |
| Additional Debt: | None |
| Call Protection: | L(24), D(92), O(4) |
| Lockbox / Cash Management: | Springing Hard / Springing |
| Reserves(1) | ||
| Initial | Monthly | |
| Taxes: | $0 | Springing |
| Insurance: | $0 | Springing |
| Replacement: | $0 | Springing |
| TI/LC: | $0 | Springing |
| Free Rent: | $939,043 | $0 |
| Major Tenant Renewal: | $0 | Springing |
| Financial Information | ||
| Cut-off Date Balance / Sq. Ft.: | $76 | |
| Balloon Balance / Sq. Ft.: | $60 | |
| Cut-off Date LTV(2): | 58.6% | |
| Balloon LTV(2): | 46.5% | |
| Underwritten NOI DSCR(3): | 1.71x | |
| Underwritten NCF DSCR(3): | 1.61x | |
| Underwritten NOI Debt Yield: | 11.2% | |
| Underwritten NCF Debt Yield: | 10.6% | |
| Underwritten NOI Debt Yield at Balloon: | 14.2% | |
| Underwritten NCF Debt Yield at Balloon: | 13.3% | |
| Property Information | |
| Single Asset / Portfolio: | Single Asset |
| Property Type: | Warehouse Industrial |
| Collateral: | Fee Simple |
| Location: | Lynden, WA |
| Year Built / Renovated: | 2015 / NAP |
| Total Sq. Ft.: | 331,960 |
| Property Management: | Self-managed |
| Underwritten NOI: | $2,832,969 |
| Underwritten NCF: | $2,667,950 |
| “As-is” Appraised Value(2): | $42,000,000 |
| “As-is” Appraisal Date(2): | August 25, 2015 |
| “As Stabilized” Appraised Value(2): | $43,000,000 |
| “As Stabilized” Appraisal Date(2): | June 1, 2016 |
| Historical NOI(4) | |
| Most Recent NOI: | NAP |
| 2014 NOI: | NAP |
| 2013 NOI: | NAP |
| 2012 NOI: | NAP |
| Historical Occupancy(4) | |
| Most Recent Occupancy(5): | 100.0% (September 6, 2015) |
| 2014 Occupancy: | NAP |
| 2013 Occupancy: | NAP |
| 2012 Occupancy: | NAP |
| (1) | See “Initial Reserves” and “Ongoing Reserves” herein. |
| (2) | Based on the “As Stabilized” Appraised Value. The “As-is” Appraised Value was derived by deducting approximately $900,000 in loss rental income from the “As Stabilized” Appraised Value. As the current value of the loss rental income was escrowed at closing, the Cut-off Date LTV and Balloon LTV were calculated based off of the “As Stabilized” Appraised Value. Based on the “As-is” Appraised Value, the Cut-off Date LTV and Balloon LTV are 60.0% and 47.7%, respectively. |
| (3) | Based on amortizing debt service payments. Based on the current interest only payments, the Underwritten NOI DSCR and Underwritten NCF DSCR are 2.54x and 2.39x, respectively. |
| (4) | The Preferred Freezer Property was built in 2015, and as such, Historical NOI and Historical Occupancy are not available. |
| (5) | Preferred Freezer Services has 100.0% leased the Preferred Freezer Property as of September 1, 2015 and is expected to take occupancy in October 2015. |
THE INFORMATION IN THIS STRUCTURAL AND COLLATERAL TERM SHEET IS NOT COMPLETE AND MAY BE AMENDED PRIOR TO THE TIME OF SALE. THIS TERM SHEET IS NOT AN OFFER TO SELL THESE SECURITIES AND IT IS NOT A SOLICITATION OF AN OFFER TO BUY THESE SECURITIES IN ANY JURISDICTION WHERE THE OFFER OR SALE IS NOT PERMITTED.
| 101 |
604 Curt Maberry Road Lynden, WA 98264 | Collateral Asset Summary – Loan No. 10 Preferred Freezer - Lynden, WA | Cut-off Date Balance: Cut-off Date LTV: U/W NCF DSCR: U/W NOI Debt Yield: | $25,200,000 58.6% 1.61x 11.2% |
| Tenant Summary | |||||||
Tenant | Ratings (Fitch/Moody’s/S&P) | Net Rentable Area (Sq. Ft.) | % of Net Rentable Area |
| U/W Base Rent PSF(1) | % of Total U/W Base Rent | Lease Expiration |
| Preferred Freezer Services(2) | NR/NR/NR | 331,960 | 100.0% | $9.01 | 100.0% | 5/31/2041 | |
| (1) | U/W Base Rent PSF includes contractual rent steps through September 1, 2016. |
| (2) | Preferred Freezer Services has 100.0% leased the Preferred Freezer Property as of September 6, 2015 and is expected to take occupancy in October 2015. Preferred Freezer Services has four five-year renewal options remaining. |
| Lease Rollover Schedule(1) | ||||||||
| Year | # of Leases Expiring | Total Expiring Sq. Ft. | % of Total Sq. Ft. Expiring | Cumulative Sq. Ft. Expiring | Cumulative % of Sq. Ft. Expiring | Annual U/W Base Rent PSF | % U/W Base Rent Rolling | Cumulative % of U/W Base Rent |
| MTM | 0 | 0 | 0.0% | 0 | 0.0% | $0.00 | 0.0% | 0.0% |
| 2015 | 0 | 0 | 0.0% | 0 | 0.0% | $0.00 | 0.0% | 0.0% |
| 2016 | 0 | 0 | 0.0% | 0 | 0.0% | $0.00 | 0.0% | 0.0% |
| 2017 | 0 | 0 | 0.0% | 0 | 0.0% | $0.00 | 0.0% | 0.0% |
| 2018 | 0 | 0 | 0.0% | 0 | 0.0% | $0.00 | 0.0% | 0.0% |
| 2019 | 0 | 0 | 0.0% | 0 | 0.0% | $0.00 | 0.0% | 0.0% |
| 2020 | 0 | 0 | 0.0% | 0 | 0.0% | $0.00 | 0.0% | 0.0% |
| 2021 | 0 | 0 | 0.0% | 0 | 0.0% | $0.00 | 0.0% | 0.0% |
| 2022 | 0 | 0 | 0.0% | 0 | 0.0% | $0.00 | 0.0% | 0.0% |
| 2023 | 0 | 0 | 0.0% | 0 | 0.0% | $0.00 | 0.0% | 0.0% |
| 2024 | 0 | 0 | 0.0% | 0 | 0.0% | $0.00 | 0.0% | 0.0% |
| 2025 | 0 | 0 | 0.0% | 0 | 0.0% | $0.00 | 0.0% | 0.0% |
| Thereafter | 1 | 331,960 | 100.0% | 331,960 | 100.0% | $9.01 | 100.0% | 100.0% |
| Vacant | NAP | 0 | 0.0% | 331,960 | 100.0% | NAP | NAP | |
| Total / Wtd. Avg. | 1 | 331,960 | 100.0% | $9.01 | 100.0% | |||
| (1) | The rollover schedule includes contractual rent steps through September 1, 2016. |
The Loan. The Preferred Freezer - Lynden, WA loan (the “Preferred Freezer Loan”) is a fixed rate loan secured by the borrower’s fee simple interest in a 331,960 sq. ft. industrial warehouse located at 604 Curt Maberry Road in Lynden, Washington (the “Preferred Freezer Property”) with an original principal balance of $25.2 million. The Preferred Freezer Loan has a 10-year term and amortizes on a 25-year schedule after an initial 24-month interest only period. The Preferred Freezer Loan accrues interest at a fixed rate equal to 4.3727% per annum and has a cut-off date balance of $25.2 million. The Preferred Freezer Loan proceeds were used to fund upfront reserves of $939,043, pay closing costs of $313,471 and return equity to the sponsor of approximately $23.9 million. Based on the “As-is” appraised value of $42.0 million as of August 25, 2015, the cut-off date LTV ratio is 60.0%. Based on the sponsor’s cost basis of approximately $34.1 million, there is approximately $10.1 million of borrower’s cash equity. Based on the “As Stabilized” appraised value of $43.0 million as of June 1, 2016, the “As Stabilized” LTV ratio is 58.6%.
| Sources and Uses | ||||||
| Sources | Proceeds | % of Total | Uses | Proceeds | % of Total | |
| Loan Amount | $25,200,000 | 100.0% | Loan Payoff | $0 | 000.0% | |
| Reserves | $939,043 | 003.7% | ||||
| Closing Costs | $313,471 | 001.2% | ||||
| Return of Equity(1) | $23,947,486 | 095.0% | ||||
| Total Sources | $25,200,000 | 100.0% | Total Uses | $25,200,000 | 100.0% | |
| (1) | Based on the sponsor’s cost basis of approximately $34.1 million, there is approximately $10.1 million of borrower’s cash equity. |
The Borrower / Sponsor. The borrower, Chill Build Lynden, LLC, is a single purpose Delaware limited liability company structured to be bankruptcy-remote, with one independent director in its organizational structure. The sponsor of the borrower and the nonrecourse carve-out guarantor is Gary Edwards.
Gary Edwards is the owner of Victory Unlimited Construction, LLC (“Victory Unlimited”), a full service national general contractor established in 2009 in Indianapolis, Indiana. Victory Unlimited specializes in designing and building projects ranging from 10,000 sq. ft. to over 1.5 million sq. ft. Victory Unlimited provides construction services for various types of projects, including industrial, distribution, manufacturing, commercial, and office.
THE INFORMATION IN THIS STRUCTURAL AND COLLATERAL TERM SHEET IS NOT COMPLETE AND MAY BE AMENDED PRIOR TO THE TIME OF SALE. THIS TERM SHEET IS NOT AN OFFER TO SELL THESE SECURITIES AND IT IS NOT A SOLICITATION OF AN OFFER TO BUY THESE SECURITIES IN ANY JURISDICTION WHERE THE OFFER OR SALE IS NOT PERMITTED.
| 102 |
604 Curt Maberry Road Lynden, WA 98264 | Collateral Asset Summary – Loan No. 10 Preferred Freezer - Lynden, WA | Cut-off Date Balance: Cut-off Date LTV: U/W NCF DSCR: U/W NOI Debt Yield: | $25,200,000 58.6% 1.61x 11.2% |
The Property.The Preferred Freezer Property consists of a 331,960 sq. ft. cold storage industrial warehouse facility 100.0% leased to Preferred Freezer Services. Situated on 14.47 acres, the Preferred Freezer Property contains 30,364 sq. ft. of cold dock/cooler area, 292,396 sq. ft. of freezer area, 4,200 sq. ft. of office area and 5,000 sq. ft. of mechanical and electrical areas. The building features clear heights of 18 ft. in the cold dock, 28 ft. in the freezers and 18 dock high doors. Each freezer will be fully automated and will feature conveyors, specialized cranes known as storage and retrieval machines, and pallet moles rather than human-operated equipment typically used in warehouses. The facility will have more than 207 miles of pallet support and satellite rail. In addition, the Preferred Freezer Property will be the first in the U.S. to feature an oxygen reduction system by introducing nitrogen into the freezers as its main fire prevention system.
Acquired in April 2015, the building is expected to be completed in September 2015 with Preferred Freezer Services expected to take occupancy in October 2015. The Preferred Freezer Property currently includes 38 parking spaces via an easement with the adjacent parcel with an additional 5.0 acre parcel adjacent to the property being acquired to develop additional parking including reserved handicap and trailer parking spaces for a total of 176 parking spaces.
The Preferred Freezer Property is 100.0% occupied by Preferred Freezer Services. Founded in 1989, the Chatham, New Jersey-based company has become one of the largest public refrigerated warehouse companies in North America with over 1,300 employees and approximately $200 million in sales. Preferred Freezer Services designs, constructs, and operates state-of-the-art cold storage warehouses throughout the U.S. and Asia. Today, Preferred Freezer Services operates 35 facilities across 11 states with an additional three facilities under development totaling over 200 million cubic feet of warehouse space from coast-to-coast. Preferred Freezer Services also has an international presence with several cold storage warehouses in both China and Vietnam.
The Preferred Freezer Property is near an existing railroad spur, which will be extended to the property. Three rail spurs totaling 6,000 feet of track will be installed on site for rail car staging with an additional 800 feet of track being installed for active loading and unloading of rail cars. The Preferred Freezer Property will have the ability to turn 30 rail cars per day with roughly two billion pounds of frozen products anticipated to go through the property on an annual basis.
Environmental Matters.The Phase I environmental report dated March 26, 2015 recommended no further action at the Preferred Freezer Property.
The Market.The Preferred Freezer Property is located in Lynden, Whatcom County, Washington. The City of Lynden is approximately four miles south of the Canadian border and is one of the most affluent communities in the county, ranking second behind the City of Bellingham, approximately 15.4 miles south of the Preferred Freezer Property. The historic downtown is known for its Dutch-European architectural theme and design. The Preferred Freezer Property is one of the largest commercial projects in all of Whatcom County and is expected to be an important resource for the local farming and fishing communities, which rely on cold storage to freeze their food to maintain quality and freshness. As such, three of the freezers will be subleased to Ocean Spray, an agricultural cooperative of growers of cranberries and grapefruit with over 700 member growers in the U.S., Canada, and Chile.
Primary access to the Preferred Freezer Property is provided by SR-539, a major north-south arterial road connecting the property with Canada to the north, and Interstate 5, 11.3 miles to the south. Interstate 5 connects with the City of Bellingham and Seattle, 102 miles south of the Preferred Freezer Property. The Puget Sound Region and Seattle market has a limited number of cold storage facilities operated by an owner-user or that are single-tenant buildings. According to a market research report, there are only 14 cold storage facilities in King, Snohomish, Pierce, and Thurston counties larger than 30,000 sq. ft., including Seafreeze Cold Storage (645,129 sq. ft.), Versa Cold Building (310,600 sq. ft.) and General Mills (275,000 sq. ft.).
According to a market research report, the Preferred Freezer Property is located in the Whatcom industrial submarket, a tertiary market along the United States/Canadian border, which contains 262 properties totaling approximately 5.2 million sq. ft. The Whatcom industrial submarket vacancy rate is 5.6% with an average rental rate of $6.22 PSF NNN in 1Q 2015.
THE INFORMATION IN THIS STRUCTURAL AND COLLATERAL TERM SHEET IS NOT COMPLETE AND MAY BE AMENDED PRIOR TO THE TIME OF SALE. THIS TERM SHEET IS NOT AN OFFER TO SELL THESE SECURITIES AND IT IS NOT A SOLICITATION OF AN OFFER TO BUY THESE SECURITIES IN ANY JURISDICTION WHERE THE OFFER OR SALE IS NOT PERMITTED.
| 103 |
604 Curt Maberry Road Lynden, WA 98264 | Collateral Asset Summary – Loan No. 10 Preferred Freezer - Lynden, WA | Cut-off Date Balance: Cut-off Date LTV: U/W NCF DSCR: U/W NOI Debt Yield: | $25,200,000 58.6% 1.61x 11.2% |
The subsequent chart presents the primary competitive properties to the Preferred Freezer Property:
| Competitive Set(1) | ||||||
| Name | Preferred Freezer Property | Seattle Food Warehouse | Spokane Street Distribution Center | Springbrook 188 | Levinson Mayo Building | Western Distribution Services Building |
| Building Sq. Ft. | 331,960(2) | 27,263 | 101,101 | 367,991 | 25,828 | 81,100 |
| Year Built | 2015 | 1967 | 1949 | 1963 | 1961 | 1996 |
| Tenant Name | Preferred Freezer Services(2) | Cold Storage Express | Charlie’s Produce | Henningsen Cold Storage | OverSea Casing; Uli’s Sausage | Western Distribution |
| Occupancy | 100.0%(2) | 100.0% | 100.0% | 50.0% | 100.0% | 100.0% |
| Rent PSF | $9.01(2) | $12.48 | $5.64 | $7.80 | $11.52 | $10.08 |
| Lease Type | NNN | NNN | NNN | NNN | NNN | NNN |
| Distance from Subject | NAP | 106 miles | 105 miles | 116 miles | 105 miles | 114 miles |
| (1) | Source: Appraisal |
| (2) | Based on the rent roll dated September 6, 2015. |
Cash Flow Analysis.
| Cash Flow Analysis | ||
| U/W | U/W PSF | |
| Base Rent | $2,989,638 | $9.01 |
| Value of Vacant Space | 0 | 0.00 |
| Gross Potential Rent | $2,989,638 | $9.01 |
| Total Recoveries | 84,664 | 0.26 |
| Total Other Income | 0 | 0.00 |
| Less: Vacancy(1) | (153,715) | (0.46) |
| Effective Gross Income | $2,920,587 | $8.80 |
| Total Operating Expenses | 87,618 | 0.26 |
| Net Operating Income | $2,832,969 | $8.53 |
| TI/LC | 115,226 | 0.35 |
| Capital Expenditures | 49,794 | 0.15 |
| Net Cash Flow | $2,667,950 | $8.04 |
| (1) | U/W Vacancy represents 5.0% of gross income. |
Property Management. The Preferred Freezer Property is self-managed by the tenant.
Lockbox / Cash Management. The Preferred Freezer Loan is structured with a springing hard lockbox and springing cash management. The borrower may continue to collect all rents and will not be required to deposit the rents into a clearing account until a Cash Management Trigger Event (as defined herein) has occurred. Upon the occurrence of the Cash Management Trigger Event, the borrower is required to send tenant direction letters to all tenants instructing them to deposit all rents and other payments into the lockbox account controlled by the lender. All funds in the lockbox account are swept daily to a cash management account under the control of the lender and disbursed during each interest period of the Preferred Freezer Loan term in accordance with the Preferred Freezer Loan documents. Any excess, if no Cash Sweep Event Period (as defined herein) is in effect, will be disbursed to the borrower, or if a Cash Sweep Event Period is in effect, held as additional collateral for the Preferred Freezer Loan.
A “Cash Management Trigger Event” will commence upon the occurrence of (i) a Cash Sweep Event Period that is not a DSCR Trigger Event (as defined herein), (ii) the debt service coverage ratio based on the trailing 12 month period falling below 1.15x (“DSCR Trigger Event”), (iii) a Major Tenant Trigger Event (as defined herein), or (iv) the felony or fraud indictment or misappropriation of funds by the borrower, guarantor, or property manager. A Cash Management Trigger Event will end: (a) with regard to clause (i) above, the cure of a Cash Sweep Event Period, (b) with regard to clause (ii) above, upon the date the debt service coverage ratio based on the trailing 12 month period is greater than 1.20x for two consecutive quarters and (c) with regard to clause (iii) above, the cure of a Major Tenant Trigger Event.
A “Cash Sweep Event Period” will commence upon the occurrence of (i) an event of default, (ii) any bankruptcy action of the borrower, guarantor or property manager, or (iii) the debt service coverage ratio based on the trailing 12 month period, which shall not be prior to June 1, 2017, falling below 1.15x. A Cash Sweep Event Period will end if, (a) with respect to clause (i) above, upon the cure of such event of default and acceptance of such cure by lender, (b) with respect to clause (ii) above, upon the filing being discharged, stayed or dismissed within 60 days for the borrower or guarantor and 120 days for the property manager and lender determination that such filing does not materially affect the borrower’s, guarantor’s or property manager’s monetary obligations, and (c) with respect to clause (iii)
THE INFORMATION IN THIS STRUCTURAL AND COLLATERAL TERM SHEET IS NOT COMPLETE AND MAY BE AMENDED PRIOR TO THE TIME OF SALE. THIS TERM SHEET IS NOT AN OFFER TO SELL THESE SECURITIES AND IT IS NOT A SOLICITATION OF AN OFFER TO BUY THESE SECURITIES IN ANY JURISDICTION WHERE THE OFFER OR SALE IS NOT PERMITTED.
| 104 |
604 Curt Maberry Road Lynden, WA 98264 | Collateral Asset Summary – Loan No. 10 Preferred Freezer - Lynden, WA | Cut-off Date Balance: Cut-off Date LTV: U/W NCF DSCR: U/W NOI Debt Yield: | $25,200,000 58.6% 1.61x 11.2% |
above, upon the date the debt service coverage ratio based on the trailing 12 month period is greater than 1.20x for two consecutive quarters.
A “Major Tenant Trigger Event” will commence upon the earlier of (i) a Major Tenant (as defined herein) giving written notice of its intention to terminate or not extend or renew its lease, (ii) if, on or prior to the date that is twelve months prior to the then-applicable expiration date of any Major Tenant’s lease, such Major Tenant fails to extend or renew such lease upon terms and conditions set forth in such Major Tenant’s lease (or otherwise as acceptable to the lender), (iii) a Major Tenant fails to notify the borrower of its election to extend or renew its lease prior to the date set forth in the lease for exercise of such renewal or extension option, (iv) if an event of default under any Major Tenant’s lease has occurred, (v) a Major Tenant or lease guarantor of a Major Tenant’s lease becomes insolvent or a debtor in any bankruptcy action, or (vi) if any Major Tenant’s lease is terminated or no longer in full force or effect. A Major Tenant Trigger Event will end if, in regards to clause (i), clause (ii) or clause (iii) above, the Major Tenant has entered into a renewal of all of its leased premises in accordance with the requirements of the loan documents or certain re-leasing conditions have been satisfied with respect to the Major Tenant space.
A “Major Tenant” means (i) Preferred Freezer Services, (ii) any tenant or replacement tenant or tenants that (together with its affiliates) leases space comprising 20% or more of either (a) the NRA or (b) the gross income from operations at the Preferred Freezer Property, (iii) any lease that contains an option to purchase all or any portion of the Preferred Freezer Property, (iv) any lease that is with an affiliate of the borrower, guarantor, or property manager as a tenant, (v) any lease that is entered into during any event of default or Cash Sweep Event Period, or (vi) any lease that is entered into with any tenant identified by the lender as a Major Tenant of the Preferred Freezer Property.
Initial Reserves. At closing, the borrower deposited $939,043 into the free rent reserve funds account.
Ongoing Reserves. On a monthly basis, so long as each and all of the Funds Escrow Waiver Conditions Precedent (as defined herein) are met, the borrower is not required to deposit reserves of (i) 1/12 of the estimated annual real estate taxes into a tax reserve account, (ii) 1/12 of the annual insurance premiums into an insurance reserve account, and (iii) $13,832 into a replacement reserve account. The borrower is not required to deposit reserves of $4,150 into a TI/LC reserve account so long as Preferred Freezer Services lease is in full force and effect. In addition, if a Cash Sweep Event Period caused solely by a Major Tenant Trigger Event occurs, all excess cash flow will be deposited into a Major Tenant renewal account.
A “Funds Escrow Waiver Conditions Precedent” will commence upon the occurrence of (i) an event of default, (ii) a Major Tenant Trigger Event, (iii) the Preferred Freezer Services lease is no longer in full force and effect, (iv) an event of default under the Preferred Freezer Services lease, (v) the Preferred Freezer Services lease becomes insolvent or a debtor in any bankruptcy action, or (vi) taxes and other assessments are not paid within 30 days following the last day that payment of such taxes may be made without penalty or, if earlier, 30 days following the date of actual payment, the borrower does not deliver to the lender evidence that all taxes relating to the Preferred Freezer Property have been paid prior to the last day they could have been paid without penalty.
Current Mezzanine or Subordinate Indebtedness. None.
Future Mezzanine or Subordinate Indebtedness Permitted. None.
THE INFORMATION IN THIS STRUCTURAL AND COLLATERAL TERM SHEET IS NOT COMPLETE AND MAY BE AMENDED PRIOR TO THE TIME OF SALE. THIS TERM SHEET IS NOT AN OFFER TO SELL THESE SECURITIES AND IT IS NOT A SOLICITATION OF AN OFFER TO BUY THESE SECURITIES IN ANY JURISDICTION WHERE THE OFFER OR SALE IS NOT PERMITTED.
| 105 |
604 Curt Maberry Road Lynden, WA 98264 | Collateral Asset Summary – Loan No. 10 Preferred Freezer - Lynden, WA | Cut-off Date Balance: Cut-off Date LTV: U/W NCF DSCR: U/W NOI Debt Yield: | $25,200,000 58.6% 1.61x 11.2% |

THE INFORMATION IN THIS STRUCTURAL AND COLLATERAL TERM SHEET IS NOT COMPLETE AND MAY BE AMENDED PRIOR TO THE TIME OF SALE. THIS TERM SHEET IS NOT AN OFFER TO SELL THESE SECURITIES AND IT IS NOT A SOLICITATION OF AN OFFER TO BUY THESE SECURITIES IN ANY JURISDICTION WHERE THE OFFER OR SALE IS NOT PERMITTED.
| 106 |
(THIS PAGE INTENTIONALLY LEFT BLANK)
| 107 |
3200 Todds Road Lexington, KY 40509 | Collateral Asset Summary – Loan No. 11 Fountains at Andover | Cut-off Date Balance: Cut-off Date LTV: U/W NCF DSCR: U/W NOI Debt Yield: | $22,050,000 72.5% 1.32x 8.6% |
| Mortgage Loan Information | |
| Loan Seller: | UBSRES |
| Loan Purpose: | Refinance |
| Sponsors: | John D. Blanchard; Samuel L. Miller |
| Borrowers: | Fountains - Brookfield, L.L.C.; Fountains - WP, L.L.C. |
| Original Balance: | $22,050,000 |
| Cut-off Date Balance: | $22,050,000 |
| % by Initial UPB: | 2.9% |
| Interest Rate: | 4.6826% |
| Payment Date: | 6thof each month |
| First Payment Date: | October 6, 2015 |
| Maturity Date: | September 6, 2025 |
| Amortization: | Interest only for first 24 months; 360 months thereafter |
| Additional Debt(1): | $3,500,000 Mezzanine Debt |
| Call Protection: | L(24), D(92), O(4) |
| Lockbox / Cash Management(2): | Springing Hard / Springing |
| Reserves | ||
| Initial | Monthly | |
| Taxes: | $188,961 | $20,996 |
| Insurance(3): | $0 | Springing |
| Replacement: | $0 | $6,625 |
| Required Repairs: | $99,375 | NAP |
| Financial Information | ||
| Mortgage Loan | Total Debt | |
| Cut-off Date Balance / Unit: | $69,340 | $80,346 |
| Balloon Balance / Unit: | $59,505 | $70,512 |
| Cut-off Date LTV: | 72.5% | 84.0% |
| Balloon LTV: | 62.2% | 73.8% |
| Underwritten NOI DSCR(4): | 1.38x | 1.19x(5) |
| Underwritten NCF DSCR(4): | 1.32x | 1.14x(5) |
| Underwritten NOI Debt Yield: | 8.6% | 7.4% |
| Underwritten NCF Debt Yield: | 8.2% | 7.1% |
| Property Information | |
| Single Asset / Portfolio: | Single Asset |
| Property Type: | Garden Multifamily |
| Collateral: | Fee Simple |
| Location: | Lexington, KY |
| Year Built / Renovated: | 1996 / 2014 |
| Total Units: | 318 |
| Property Management: | B & M Management Company, L.L.C. |
| Underwritten NOI: | $1,889,726 |
| Underwritten NCF: | $1,810,226 |
| Appraised Value: | $30,400,000 |
| Appraisal Date: | May 5, 2015 |
| Historical NOI | |
| Most Recent NOI: | $1,747,535 (T-12 June 30, 2015) |
| 2014 NOI: | $1,729,936 (December 31, 2014) |
| 2013 NOI: | $1,652,577 (December 31, 2013) |
| 2012 NOI: | $1,667,288 (December 31, 2012) |
| Historical Occupancy | |
| Most Recent Occupancy: | 96.5% (August 18, 2015) |
| 2014 Occupancy: | 95.8% (December 31, 2014) |
| 2013 Occupancy: | 94.9% (December 31, 2013) |
| 2012 Occupancy: | 94.7% (December 31, 2012) |
| (1) | A $3.5 million mezzanine loan was funded at closing by RMI - Fountains at Andover LLC. The mezzanine loan is coterminous with the Fountains at Andover loan and accrues interest at a fixed rate of 12.5000%per annum and is interest only for the term of the loan. |
| (2) | A hard lockbox with cash management will be triggered upon (i) an event of default, (ii) any bankruptcy action of the borrowers, mezzanine borrowers, guarantors, or property manager, (iii) if the DSCR is less than 1.05x based on the trailing 12 month period immediately preceding the date of such determination, or (iv) a felony or fraud indictment of the borrowers, guarantors, or property manager. |
| (3) | The borrowers are required to deposit 1/12 of the annual insurance premiums into the insurance reserve account if an acceptable blanket policy is no longer in place. |
| (4) | Based on amortizing debt service payments. Based on the current interest only payments, the Underwritten NOI DSCR and Underwritten NCF DSCR are 1.81x and 1.73x, respectively. |
| (5) | The “Total Debt” Underwritten NOI DSCR and Underwritten NCF DSCR are based on the “Mortgage Loan” amortizing debt service payments and the current pay debt service payments of 6.0000% on the mezzanine loan. |
TRANSACTION HIGHLIGHTS |
| ■ | Property.The Fountains at Andover property is a 318-unit garden-style multifamily community comprised of 16 two- and three-story residential buildings and one clubhouse situated on approximately 18.7 acres. Parking is provided for 545 vehicles or 1.71 spaces per unit. Community amenities include a swimming pool, hot tub, tennis/sports courts, 24-hour fitness center, business center, a gazebo with BBQ grills, car wash area and detached garages. Internet and basic cable are provided to tenants at no additional charge. Unit amenities include a full kitchen, washer and dryer, walk-in closets, linen closet, ceiling fan, and a patio or balcony. As of the August 18, 2015 rent roll, the Fountains at Andover property was 96.5% occupied. |
| ■ | Location.The Fountains at Andover property is located in Lexington, Kentucky, home to several large corporations including, Affiliated Computer Services, Hewlett Packard, United Parcel Service, Tempur-Pedic, and Amazon.com, Inc. and a Jif Peanut Butter plant. The Fountains at Andover property is approximately two miles from Hamburg Place, a retail shopping center with approximately one million sq. ft. of retail space including convenience shopping (Meijer’s supermarket), restaurants, a 16-screen movie theater and big box retailers such as Target, Best Buy, Marshalls, Barnes & Noble and Staples. The area is also known for thoroughbred breeding with over 400 horse farms, and is home to the Kentucky Horse Park, attracting approximately one million visitors per year. |
| ■ | Sponsorship / Management.John D. Blanchard has over 35 years of experience in property management, acquisitions, and dispositions. Mr. Blanchard started B & M Management Company, L.L.C. in 1993 in partnership with Samuel L. Miller. Mr. Blanchard and Mr. Miller have since grown the company to over 9,000 units valued at over $600 million. |
THE INFORMATION IN THIS STRUCTURAL AND COLLATERAL TERM SHEET IS NOT COMPLETE AND MAY BE AMENDED PRIOR TO THE TIME OF SALE. THIS TERM SHEET IS NOT AN OFFER TO SELL THESE SECURITIES AND IT IS NOT A SOLICITATION OF AN OFFER TO BUY THESE SECURITIES IN ANY JURISDICTION WHERE THE OFFER OR SALE IS NOT PERMITTED.
| 108 |
| WI, IL and ND | Collateral Asset Summary – Loan No. 12 WPC Department Store Portfolio
| Cut-off Date Balance: Cut-off Date LTV: U/W NCF DSCR: U/W NOI Debt Yield: | $20,100,000 63.9% 1.76x 11.7% |
| Mortgage Loan Information | |
| Loan Seller: | UBSRES |
| Loan Purpose: | Acquisition |
| Sponsor: | Corporate Property Associates 17 - Global Incorporated |
| Borrower: | BT (Multi) LLC |
| Original Balance(1): | $20,100,000 |
| Cut-off Date Balance(1): | $20,100,000 |
| % by Initial UPB: | 2.7% |
| Interest Rate: | 4.4065% |
| Payment Date: | 6thof each month |
| First Payment Date: | August 6, 2015 |
| Maturity Date: | July 6, 2025 |
| Amortization: | Interest only for first 60 months; 360 months thereafter |
| Additional Debt(1): | $37,070,000Pari Passu Debt |
| Call Protection(2): | L(26), D(87), O(7) |
| Lockbox / Cash Management(3): | Springing Hard / Springing |
| Reserves(4) | ||
| Initial | Monthly | |
| Taxes: | $0 | Springing |
| Insurance: | $0 | Springing |
| Replacement: | $0 | Springing |
| TI/LC: | $0 | Springing |
| Required Repairs: | $512,738 | NAP |
| Financial Information | ||
| Cut-off Date Balance / Sq. Ft.: | $57 | |
| Balloon Balance / Sq. Ft.: | $52 | |
| Cut-off Date LTV: | 63.9% | |
| Balloon LTV: | 58.4% | |
| Underwritten NOI DSCR(5): | 1.94x | |
| Underwritten NCF DSCR(5): | 1.76x | |
| Underwritten NOI Debt Yield: | 11.7% | |
| Underwritten NCF Debt Yield: | 10.6% | |
| Property Information | |
| Single Asset / Portfolio: | Portfolio of 6 properties |
| Property Type: | Single Tenant Retail |
| Collateral: | Fee Simple |
| Location: | WI, IL and ND |
| Year Built / Renovated: | Various |
| Total Sq. Ft.(6): | 1,002,731 |
| Property Management: | Self-managed |
| Underwritten NOI: | $6,664,368 |
| Underwritten NCF: | $6,037,461 |
| Appraised Value: | $89,500,000 |
| Appraisal Date: | Various |
| Historical NOI | |
| Most Recent NOI: | NAV |
| Historical Occupancy(6) | |
| Most Recent Occupancy: | 100.0% (September 6, 2015) |
| (1) | The Original Balance and Cut-off Date Balance represent the controlling Note A-2 of the $57.17 million WPC Department Store Portfolio loan combination, evidenced by threepari passunotes. The non-controlling Note A-3 has an original balance of $17.17 million and is included in the CSAIL 2015-C3 securitized trust and the non-controlling Note A-1 has an original principal balance of $19.9 million and is expected to be contributed to a future securitized trust. |
| (2) | The borrower may obtain the release of a property or properties from the lien of the mortgages after the expiration of the lockout period so long as among other requirements (i) the aggregate allocated loan amounts for the released property or properties does not exceed $28,585,000; (ii) the DSCR and debt yield for the remaining property or properties is not less than the greater of (a) the closing date DSCR and debt yield and (b) DSCR and debt yield immediately prior to such release; (iii) the LTV for the remaining property or properties is not greater than the lesser of (a) the closing date LTV and (b) the LTV immediately prior to such release; and (iv) the release amount must be the greater of (1) the product of the (x) allocated loan amount and (y) release price percentage for each such property and (2) 100% of the net sales proceeds with respect to such property. |
| (3) | Upon a Cash Management Trigger Event (as defined herein), the borrower will be required to establish and maintain a lockbox, and cause all rents to be delivered to the lockbox. All excess cash flow will be swept into a lender controlled account and held as additional collateral for the WPC Department Store Portfolio loan during a “Go Dark Event” (as defined herein) or a “Lease Sweep Event” (as defined herein). A “Cash Management Trigger Event” will be triggered upon (i) an event of default, (ii) an event which results in the borrower no longer being controlled by the guarantor or an affiliate, (iii) a “Springing Reserve Event” (as defined below), (iv) a “Lease Sweep Event” or (v) a “Go Dark Event”. A “Springing Reserve Event” occurs upon (i) an event of default, (ii) material default by the tenant or any replacement tenant, (iii) if the lease is surrendered, cancelled or terminated prior to the current expiration date, (iv) bankruptcy action of the tenant or replacement tenant or (v) after the occurrence of the Springing Reserve Event caused solely by clause (iii), the DSCR falls below 1.40x. A “Lease Sweep Event” occurs upon (i) a material event of default under the lease or (ii) the lease is surrendered, cancelled or terminated prior to its current expiration date. A “Go Dark Event” occurs, with respect to any individual property, (i) if the tenant vacates, abandons or ceases operations at the individual property or (ii) if the subsequent sublease(s) on a dark property expires before July 2024. |
| (4) | Tax, insurance, replacement and TI/LC escrows are required upon a Springing Reserve Event as defined in the loan documents. TI/LC reserves are subject to a Go Dark Cap as defined in the loan documents. |
| (5) | Based on amortizing debt service payments. Based on the current interest only payments, the Underwritten NOI DSCR and Underwritten NCF DSCR are 2.61x and 2.36x, respectively. |
| (6) | A single lease, which covers all properties in the WPC Department Store Portfolio, was signed at closing. |
TRANSACTION HIGHLIGHTS |
| ■ | The Portfolio.The WPC Department Store Portfolio is comprised of six single tenant retail properties totaling 1,002,731 sq. ft., all of which are 100.0% leased and occupied by Bon-Ton stores. The WPC Department Store Portfolio properties are operated under several different brands owned by Bon-Ton, including Boston Store, Carson’s, Herberger’s and Younkers. The WPC Department Store Portfolio properties are located in three states: Wisconsin (76.5% of NRA), Illinois (12.6% of NRA) and North Dakota (10.9% of NRA). |
| ■ | Tenant.At closing, a single, long-term lease was signed. This unitary lease covers all of the WPC Department Store Portfolio properties with a single rent payment. The initial lease term is for 20 years with two 10-year renewal options for a fully extended term of 40 years and no provisions for termination options. Each of the six stores are ranked in the top 25% of the 273 stores in the Bon-Ton chain, and five of the six are ranked in the top 25% in terms of sales PSF. All of the department stores are anchor boxes located within malls operated by the top five national mall operators, including Simon, Macerich Property Management Company, Starwood Capital Group, General Growth Properties and CBL. |
| ■ | Sponsorship.The borrower contributed approximately $29.8 million of cash equity to acquire the WPC Department Store Portfolio properties, representing 35.5% of the total capitalization. The sponsor is Corporate Property Associates 17 – Global Incorporated. Corporate Property Associates 17 – Global Incorporated is a publicly registered non-traded real estate investment trust formed in 2007, to acquire, own, and manage a portfolio of commercial properties leased to a diverse group of companies on a single tenant. The sponsor’s 2014 annual report had total assets of $4.6 billion and reported annual net income of $74.2 million. The sponsor is managed by W. P. Carey Inc. through Carey Asset Management Corp. W. P. Carey Inc. (NYSE: WPC, “WPC”) is a leading global owner and manager of commercial properties net leased to companies on a long-term basis. WPC owns and manages a diversified global investment portfolio of 783 properties with an average occupancy of 98.6%. As of December 31, 2014, WPC had total assets of approximately $8.6 billion. |
THE INFORMATION IN THIS STRUCTURAL AND COLLATERAL TERM SHEET IS NOT COMPLETE AND MAY BE AMENDED PRIOR TO THE TIME OF SALE. THIS TERM SHEET IS NOT AN OFFER TO SELL THESE SECURITIES AND IT IS NOT A SOLICITATION OF AN OFFER TO BUY THESE SECURITIES IN ANY JURISDICTION WHERE THE OFFER OR SALE IS NOT PERMITTED.
| 109 |
3303-3421 Deer Valley Road Antioch, CA 94531
| Collateral Asset Summary – Loan No. 13 Antioch Crossings Shopping Center | Cut-off Date Balance: Cut-off Date LTV: U/W NCF DSCR: U/W NOI Debt Yield: | $17,150,000 59.8% 1.34x 8.8% |
| Mortgage Loan Information | |
| Loan Seller: | UBSRES |
| Loan Purpose: | Refinance |
| Sponsors: | CNA Enterprises, Inc.; Yehochai Schneider |
| Borrower: | Antioch Crossings Retail Center L.P. |
| Original Balance: | $17,150,000 |
| Cut-off Date Balance: | $17,150,000 |
| % by Initial UPB: | 2.3% |
| Interest Rate: | 4.6038% |
| Payment Date: | 6thof each month |
| First Payment Date: | October 6, 2015 |
| Maturity Date: | September 6, 2025 |
| Amortization: | Interest only for first 36 months; 360 months thereafter |
| Additional Debt: | None |
| Call Protection: | L(24), YM1(92), O(4) |
| Lockbox / Cash Management(1): | Springing Hard / Springing |
| Reserves | ||
| Initial | Monthly | |
| Taxes: | $145,008 | $21,971 |
| Insurance: | $8,310 | $1,484 |
| Replacement: | $127,752 | $2,105 |
| TI/LC(2): | $100,000 | $6,250 |
| Required Repairs: | $29,688 | NAP |
| Major Tenant Rollover Funds(3): | $0 | Springing |
| Financial Information | ||
| Cut-off Date Balance / Sq. Ft.: | $136 | |
| Balloon Balance / Sq. Ft.: | $119 | |
| Cut-off Date LTV: | 59.8% | |
| Balloon LTV: | 52.4% | |
| Underwritten NOI DSCR(4): | 1.43x | |
| Underwritten NCF DSCR(4): | 1.34x | |
| Underwritten NOI Debt Yield: | 8.8% | |
| Underwritten NCF Debt Yield: | 8.3% | |
| Property Information | |
| Single Asset / Portfolio: | Single Asset |
| Property Type: | Anchored Retail |
| Collateral: | Fee Simple |
| Location: | Antioch, CA |
| Year Built / Renovated: | 1990 / 2005 |
| Total Sq. Ft.: | 126,308 |
| Property Management: | River Rock Real Estate Group, Inc. |
| Underwritten NOI: | $1,511,236 |
| Underwritten NCF: | $1,416,989 |
| Appraised Value: | $28,700,000 |
| Appraisal Date: | June 26, 2015 |
| Historical NOI | |
| Most Recent NOI: | $1,617,201 (T-12 June 30, 2015) |
| 2014 NOI: | $1,679,473 (December 31, 2014) |
| 2013 NOI: | $1,671,479 (December 31, 2013) |
| 2012 NOI: | $1,577,304 (December 31, 2012) |
| Historical Occupancy | |
| Most Recent Occupancy: | 96.3% (August 19, 2015) |
| 2014 Occupancy: | 97.3% (December 31, 2014) |
| 2013 Occupancy: | 99.0% (December 31, 2013) |
| 2012 Occupancy: | 98.2% (December 31, 2012) |
| (1) | A hard lockbox with cash management will be triggered upon (i) an event of default, (ii) any bankruptcy action of the borrower, guarantors, or property manager, (iii) if the DSCR for the trailing 12 month period falls below 1.15x, (iv) a felony or fraud indictment of the borrower, guarantors, or property manager or (v) a Major Tenant Trigger Event (as defined below). A “Major Tenant Trigger Event” will occur upon (i) the date on which a Major Tenant (as defined below) delivers written notice to terminate or not to renew its lease, (ii) the Major Tenant failing to deliver written notice to extend or renew its lease on the date required for such notice, (iii) any bankruptcy action by a Major Tenant or the guarantor of the Major Tenant’s lease or monetary default by a Major Tenant or (iv) the going dark of the Major Tenant space. A “Major Tenant” is (i) Safeway, (ii) Rite Aid, or (iii) any tenant or replacement tenant under any Major Tenant lease. All excess cash flow will be swept into a lender controlled account and held as additional collateral for the Antioch Crossings Shopping Center loan upon (i) an event of default, (ii) any bankruptcy action of the borrower, guarantors, or property manager, or (iii) if the DSCR for the trailing 12 month period falling below 1.10x. |
| (2) | TI/LC reserves are subject to a cap of $400,000. |
| (3) | Upon the occurrence of a Major Tenant Trigger Event (other than a Major Tenant Trigger Event caused by Rite Aid while the DSCR is greater than 1.30x), all excess cash is required to be deposited into the Major Tenant Rollover Funds reserve subject to a cap of $900,000 for Safeway and $250,000 for Rite Aid. |
| (4) | Based on amortizing debt service payments. Based on the current interest only payments, the Underwritten NOI DSCR and Underwritten NCF DSCR are 1.89x and 1.77x, respectively. |
TRANSACTION HIGHLIGHTS |
| ■ | Tenancy.The property is 96.3% occupied by 19 tenants and has maintained an average occupancy of 96.5% since 2007. The property is anchored by Safeway (41.8% of NRA). Safeway has been in occupancy since 1990 and has eight five-year renewal options remaining. Additional national tenants supporting the Safeway include Rite Aid, Dollar Tree, Sally Beauty Supply, Subway, Sprint, and Safeway Gas. According to public reporting of the store, Safeway has reported increasing sales of approximately $31.3 million ($593 PSF) in 2012, approximately $31.8 million ($601 PSF) in 2013, and approximately $33.3 million ($630 PSF) in 2014 with a 2014 occupancy cost of 2.6%. |
| ■ | Location.The property is located along at the intersection of Deer Valley Road and Hillcrest Avenue with an average daily traffic count of 35,901 vehicles, approximately 2.0 miles north of Lone Tree Way, a major commercial thoroughfare. Lone Tree Way contains national retailers such as Walmart, Staples, Kohl’s, The Home Depot, Trader Joe’s, Michaels, Lowe’s Home Improvement, Bed Bath & Beyond, Barnes & Noble, Cost Plus World Market, Hobby Lobby, PetSmart, Old Navy, JC Penney, and Best Buy. The average daily traffic count at the intersection of Highway 4 and Hillcrest Avenue, approximately 0.6 miles north of the property, is 77,505 vehicles. As of 2015, 174,227 people live within a five-mile radius of the property, an annual growth of 0.53% since 2000, with an average household income of $86,467. The Bay Area Rapid Transit (“BART”) system is currently building a 10-mile extension from the Pittsburg-Bay Point BART station to a new Antioch station located approximately 0.5 miles east of the property scheduled to be completed in 2016. |
| ■ | Sponsorship.CNA Enterprises, Inc. is a real estate investment and advisory firm specializing in direct equity investments on behalf of high net worth individuals, currently operating approximately 6.0 million sq. ft. of commercial real estate. With over 30 years of experience, CNA Enterprises, Inc. specializes in grocery-anchored shopping centers, power centers, and entertainment centers and also invests in office, industrial, and mixed use properties. |
THE INFORMATION IN THIS STRUCTURAL AND COLLATERAL TERM SHEET IS NOT COMPLETE AND MAY BE AMENDED PRIOR TO THE TIME OF SALE. THIS TERM SHEET IS NOT AN OFFER TO SELL THESE SECURITIES AND IT IS NOT A SOLICITATION OF AN OFFER TO BUY THESE SECURITIES IN ANY JURISDICTION WHERE THE OFFER OR SALE IS NOT PERMITTED.
| 110 |
1800 South 2nd Street McAllen, TX 78503 | Collateral Asset Summary – Loan No. 14 DoubleTree McAllen | Cut-off Date Balance: Cut-off Date LTV: U/W NCF DSCR: U/W NOI Debt Yield: | $16,500,000 49.5% 3.22x 21.6% |
| Mortgage Loan Information | |
| Loan Seller: | UBSRES |
| Loan Purpose: | Refinance |
| Sponsors: | 1998 Greenstein Family Trust; Gregory R. Greenstein; Joseph J. Amoroso Family Trust; Joseph J. Amoroso |
| Borrower: | Calmac Suites, Ltd. |
| Original Balance: | $16,500,000 |
| Cut-off Date Balance: | $16,500,000 |
| % by Initial UPB: | 2.2% |
| Interest Rate: | 4.2130% |
| Payment Date: | 6thof each month |
| First Payment Date: | October 6, 2015 |
| Maturity Date: | September 6, 2025 |
| Amortization: | Interest only for first 36 months; 360 months thereafter |
| Additional Debt: | None |
| Call Protection: | L(24), D(92), O(4) |
| Lockbox / Cash Management(1): | Springing Hard / Springing |
| Reserves | ||
| Initial | Monthly | |
| Taxes: | $282,969 | $29,476 |
| Insurance: | $168,150 | $14,496 |
| Replacement(2): | $0 | At least 1/12 of 3% of prior year’s gross income until 9/6/2017, 1/12 of 4% thereafter |
| Required Repairs: | $25,875 | NAP |
| PIP(3): | $2,221,348 | Springing |
| Financial Information | ||
| Cut-off Date Balance / Room: | $62,977 | |
| Balloon Balance / Room: | $54,757 | |
| Cut-off Date LTV: | 49.5% | |
| Balloon LTV: | 43.1% | |
| Underwritten NOI DSCR(4): | 3.67x | |
| Underwritten NCF DSCR(4): | 3.22x | |
| Underwritten NOI Debt Yield: | 21.6% | |
| Underwritten NCF Debt Yield: | 18.9% | |
| Property Information | |
| Single Asset / Portfolio: | Single Asset |
| Property Type: | Full Service Hospitality |
| Collateral: | Fee Simple |
| Location: | McAllen, TX |
| Year Built / Renovated: | 1986 / 2015 |
| Total Rooms: | 262 |
| Property Management: | PHG Hospitality, Ltd. |
| Underwritten NOI: | $3,556,923 |
| Underwritten NCF: | $3,118,350 |
| Appraised Value: | $33,300,000 |
| Appraisal Date: | June 1, 2015 |
| Historical NOI | |
| Most Recent NOI: | $2,884,200 (T-12 June 30, 2015) |
| 2014 NOI: | $3,596,485 (December 31, 2014) |
| 2013 NOI: | $2,962,644 (December 31, 2013) |
| 2012 NOI: | $2,594,384 (December 31, 2012) |
| Historical Occupancy | |
| Most Recent Occupancy: | 87.3% (June 30, 2015) |
| 2014 Occupancy: | 79.7% (December 31, 2014) |
| 2013 Occupancy: | 77.7% (December 31, 2013) |
| 2012 Occupancy: | 74.5% (December 31, 2012) |
| (1) | A hard lockbox with cash management will be triggered upon (i) an event of default, (ii) any bankruptcy action of the borrower, guarantors or property manager, (iii) if the DSCR for the trailing 12 month period falls below 1.30x, (iv) a felony or fraud indictment of the borrower, guarantors, or property manager or (v) a PIP Trigger Event, as defined in the loan documents. All excess cash flow will be swept into a lender controlled account and held as additional collateral for the DoubleTree McAllen loan upon (i) an event of default, (ii) any bankruptcy action of the borrower, guarantors or property manager or (iii) if the DSCR for the trailing 12 month period falls below 1.25x. |
| (2) | The borrower will be required to make monthly deposits equal to the greater of (i) 1/12 of 3.0% of gross income from operations on or prior to September 6, 2017, or 1/12 of 4% of gross income from operations, thereafter, and (ii) any amount required under the management agreement or franchise agreement for FF&E work. This currently equates to $36,548. |
| (3) | Upon the occurrence of a PIP Trigger Event, as defined in the loan documents, and provided no trigger event described in footnote (1) above has occurred, all excess cash flow will be deposited into the PIP reserve. |
| (4) | Based on amortizing debt service payments. Based on the current interest only payments, the Underwritten NOI DSCR and Underwritten NCF DSCR are 5.05x and 4.42x, respectively. |
TRANSACTION HIGHLIGHTS |
| ■ | Property.The DoubleTree McAllen property is a 262-room, full service hotel located in McAllen Texas. Formerly an Embassy Suites hotel, the hotel was converted into a DoubleTree Suites by Hilton on June 1, 2015, following a $6.6 million ($25,276 per room) renovation. The renovation included a complete redesign and update of the lobby, atrium, restaurant, bar, guestrooms, meeting rooms, and indoor pool area. The property is situated on 3.19 acres and includes a parking garage, which together with the surface parking lot, provides 360 parking spaces. Property amenities include indoor swimming and whirlpool, fitness room, Starbucks coffee bar, lobby workstation, market pantry, and vending area. The property features a 130-seat restaurant, 27-seat bar and approximately 6,200 sq. ft. of meeting space. |
| ■ | Location.The DoubleTree McAllen property is located on South 2nd Street, McAllen, Texas, approximately 8.0 miles north of the Mexican border. The property is located approximately 1.0 mile northeast of the McAllen-Miller International Airport with 774,989 passengers recorded in 2014, an 11.1% year-over-year increase. Demand generators in the area include La Plaza Mall (a 1.2 million sq. ft. enclosed regional shopping center anchored by Macy’s, Sears, J.C. Penney, and Dillard’s, located 0.7 miles west), McAllen Medical Center (a 441-bed, full service medical facility, located adjacent to the property), and McAllen Convention Center (featuring 174,000 sq. ft. of convention space with an average of 400,000 attendees annually, located 3.3 miles northwest). |
| ■ | Sponsorship.The sponsors of the borrower are 1998 Greenstein Family Trust, Gregory R. Greenstein, Joseph J. Amoroso Family Trust, and Joseph J. Amoroso. Gregory R. Greenstein is the president of JG Management Co., Inc., a privately held real estate firm specializing in acquisitions, development, and management of retail centers, office and medical buildings, hotels, and various other asset types. JG Management Co., Inc. has been involved in approximately $1 billion in real estate transactions over the last decade and currently manages approximately four million sq. ft. of commercial property.In1976, Joseph J. Amoroso founded Amoroso Companies, a real estate firm specializing in the acquisition, development and management of various asset types including hospitality, commercial and medical office, multifamily, retail and self storage. |
THE INFORMATION IN THIS STRUCTURAL AND COLLATERAL TERM SHEET IS NOT COMPLETE AND MAY BE AMENDED PRIOR TO THE TIME OF SALE. THIS TERM SHEET IS NOT AN OFFER TO SELL THESE SECURITIES AND IT IS NOT A SOLICITATION OF AN OFFER TO BUY THESE SECURITIES IN ANY JURISDICTION WHERE THE OFFER OR SALE IS NOT PERMITTED.
| 111 |
3001-3009 Highland Avenue National City, CA 91950 | Collateral Asset Summary – Loan No. 15 Sweetwater Square | Cut-off Date Balance: Cut-off Date LTV: U/W NCF DSCR: U/W NOI Debt Yield: | $15,500,000 50.5% 2.21x 14.1% |
| Mortgage Loan Information | |
| Loan Seller: | UBSRES |
| Loan Purpose: | Refinance |
| Sponsor: | Frank M. Goldberg |
| Borrower: | Broadway/Sweetwater Square, LLC |
| Original Balance: | $15,500,000 |
| Cut-off Date Balance: | $15,500,000 |
| % by Initial UPB: | 2.0% |
| Interest Rate: | 4.0800% |
| Payment Date: | 6thof each month |
| First Payment Date: | October 6, 2015 |
| Maturity Date: | September 6, 2025 |
| Amortization: | 360 months |
| Additional Debt: | None |
| Call Protection: | L(24), YM1(92), O(4) |
| Lockbox / Cash Management(1): | Springing Hard / Springing |
| Reserves | ||
| Initial | Monthly | |
| Taxes: | $137,294 | $20,802 |
| Insurance: | $19,539 | $1,684 |
| Replacement(2): | $0 | Springing |
| TI/LC(3): | $0 | Springing |
| Required Repairs: | $16,875 | NAP |
| Ground Rent Funds(4): | $5,167 | Springing |
| Major Tenant Funds(5): | $0 | Springing |
| Financial Information | ||
| Cut-off Date Balance / Sq. Ft.: | $121 | |
| Balloon Balance / Sq. Ft.: | $96 | |
| Cut-off Date LTV: | 50.5% | |
| Balloon LTV: | 40.2% | |
| Underwritten NOI DSCR: | 2.44x | |
| Underwritten NCF DSCR: | 2.21x | |
| Underwritten NOI Debt Yield: | 14.1% | |
| Underwritten NCF Debt Yield: | 12.8% | |
| Property Information | |
| Single Asset / Portfolio: | Single Asset |
| Property Type: | Anchored Retail |
| Collateral(6): | Leasehold |
| Location: | National City, CA |
| Year Built / Renovated: | 1974 / NAP |
| Total Sq. Ft.: | 128,419 |
| Property Management: | SEA Property Management Company, AMO |
| Underwritten NOI: | $2,184,787 |
| Underwritten NCF: | $1,978,300 |
| Appraised Value: | $30,700,000 |
| Appraisal Date: | June 5, 2015 |
| Historical NOI | |
| Most Recent NOI: | $2,308,609 (T-12 June 30, 2015) |
| 2014 NOI: | $2,221,904 (December 31, 2014) |
| 2013 NOI: | $2,226,318 (December 31, 2013) |
| 2012 NOI: | $2,001,810 (December 31, 2012) |
| Historical Occupancy | |
| Most Recent Occupancy: | 99.8% (August 1, 2015) |
| 2014 Occupancy: | 100.0% (December 31, 2014) |
| 2013 Occupancy: | 100.0% (December 31, 2013) |
| 2012 Occupancy: | 94.0% (December 31, 2012) |
| (1) | A hard lockbox with cash management will be triggered upon (i) an event of default, (ii) any bankruptcy action of the borrower, guarantor or property manager, (iii) if the DSCR for the trailing 12 month period falls below 1.25x for two consecutive quarters, (iv) a felony or fraud indictment of the borrower, guarantor, or property manager or (v) a Major Tenant Trigger Event, as defined in the loan documents (collectively, a “Cash Management Trigger Event”). All excess cash flow will be swept into a lender controlled account and held as additional collateral for the Sweetwater Square loan upon (i) an event of default, (ii) any bankruptcy action of the borrower, guarantor or property manager or (iii) if the DSCR for the trailing 12 month period falls below 1.25x for two consecutive quarters (collectively, a “Cash Sweep Event Period”). |
| (2) | Upon the occurrence of a Cash Management Trigger Event, the borrower is required to deposit monthly payments of $3,639 into the replacement reserve account. |
| (3) | Upon the occurrence of a Cash Management Trigger Event caused solely by a Cash Sweep Event Period or Major Tenant Trigger Event, as defined in the loan documents, borrower will be required to deposit $8,775 into a TI/LC reserve account. |
| (4) | Upon the occurrence of a Cash Management Trigger Event or a Cash Sweep Event Period, the borrower will be required to deposit $5,167 into the ground rent funds reserve account. |
| (5) | Upon the occurrence of a Major Tenant Trigger Event, as defined in the loan documents, and provided no trigger event described in footnote (1) above has occurred, all excess cash flow will be deposited into a Major Tenant Funds reserve. |
(6) The Sweetwater Square property is subject to a ground lease with Santa Ana Development Corporation, expiring on March 21, 2038 with two 10-year renewal options remaining.
TRANSACTION HIGHLIGHTS |
| ■ | Property.The Sweetwater Square property is a 128,419 sq. ft. retail property that is 99.8% occupied by 20 tenants. Tenants include national and local tenants such as El Super, Rachas, Inc. dba CHUZE, Peter Piper, and H&R Block. El Super, a grocery store chain operating in California, Arizona and Nevada, has occupied 56,802 sq. ft. (44.2% of NRA) since 2010 with its lease expiring in July 2025. Rachas, Inc. dba CHUZE, a fitness center, has occupied 19,788 sq. ft. (15.4% of NRA) since 2011, with its lease expiring in 2021. Rachas, Inc. dba CHUZE has one five-year renewal option remaining. Other than these two tenants, no other tenant occupies more than 9.4% of the NRA or makes up more than 8.3% of underwritten base rent. Tenants at the Sweetwater Square property have been at the center for an average of 9.5 years with five tenants having occupied the center for over 15 years. |
| ■ | Location.The Sweetwater Square property is located in National City, California, approximately 1.2 miles from the “National City Mile of Cars” and 1.6 miles from the Westfield Plaza Bonita Mall. The “National City Mile of Cars” offers over 5,000 cars across 21 brands, all within one mile. The Westfield Plaza Bonita Mall is a 1.04 million sq. ft. regional mall that is 91.0% occupied with sales of $425 PSF. The mall has over 180 stores and restaurants, features a 14-screen movie theater and provides its shoppers with complimentary Wi-Fi and wheelchairs. Other national retails located within a two-mile radius include Toys “R” Us, CVS, Ross Dress for Less, Walmart and Best Buy. The population within a one-, three-, and five-mile radius of the Sweetwater Square property is 22,679, 181,835 and 431,479, respectively. |
| ■ | Sponsorship.Frank M. Goldberg began investing in real estate development and holdings in 1957. SEA Property Management Company, AMO (“SEA”), an affiliate of the borrower, was founded in 1980 and has managed over four million sq. ft. of commercial, retail, residential and industrial real estate properties. Its current portfolio consists of 53 separate properties including 850 residential units and over 1.5 million sq. ft. of commercial, retail, industrial and office properties, two mini-warehouse properties and a 110,000 sq. ft. indoor RV, boat and auto storage facility. |
THE INFORMATION IN THIS STRUCTURAL AND COLLATERAL TERM SHEET IS NOT COMPLETE AND MAY BE AMENDED PRIOR TO THE TIME OF SALE. THIS TERM SHEET IS NOT AN OFFER TO SELL THESE SECURITIES AND IT IS NOT A SOLICITATION OF AN OFFER TO BUY THESE SECURITIES IN ANY JURISDICTION WHERE THE OFFER OR SALE IS NOT PERMITTED.
| 112 |
One or more of Merrill Lynch, Pierce, Fenner & Smith Incorporated (together with its affiliates, “BofA Merrill Lynch”), UBS Securities LLC (together with its affiliates, “UBS Securities LLC”) or Drexel Hamilton, LLC (together with its affiliates, “Drexel” and, collectively with BofA Merrill Lynch and UBS Securities, the “Underwriters”) may deal as principal in or own or act as market maker or liquidity provider for the securities/instruments (or related derivatives) mentioned herein. The trading desk may have accumulated a position in the subject securities/instruments based on the information contained herein. Each of the Underwriters may also perform or seek to perform investment banking services for the issuers of the securities and instruments mentioned herein.
The information contained in this free writing prospectus is subject to change, completion or amendment from time to time, and the information in this free writing prospectus supersedes information in any other communication other than in any other free writing prospectus relating to the securities referred to in this free writing prospectus. This free writing prospectus is not a solicitation to participate in any trading strategy, and is not an offer to sell any security or instrument or a solicitation of an offer to buy or sell any security or instrument in any jurisdiction where the offer, solicitation or sale is not permitted. Unless otherwise set forth in this material, any securities referred to in this material may not have been registered under the U.S. Securities Act of 1933, as amended, and, if not, may not be offered or sold absent an exemption therefrom. Recipients are required to comply with any legal or contractual restrictions on their purchase, holding, sale, exercise of rights or performance of obligations under any securities/instruments transaction.
The securities/instruments discussed in this free writing prospectus may not be suitable for all investors. This free writing prospectus has been prepared for intended distribution to market professionals and institutional investor clients. Other recipients should seek independent investment advice prior to making any investment decision based on this free writing prospectus. This free writing prospectus does not provide individually tailored investment advice or offer tax, regulatory, accounting or legal advice. Prior to entering into any proposed transaction, recipients should determine, in consultation with their own investment, legal, tax, regulatory and accounting advisors, the economic risks and merits, as well as the legal, tax, regulatory and accounting characteristics and consequences, of the transaction. You should consider this free writing prospectus as only a single factor in making an investment decision.
The value of and income from investments may vary because of changes in interest rates, foreign exchange rates, default rates, prepayment rates, securities/instruments prices, market indexes, operational or financial conditions of companies or other factors. There may be time limitations on the exercise of options or other rights in securities/instruments transactions. Past performance is not necessarily a guide to future performance. Estimates of future performance are based on assumptions that may not be realized. Actual events may differ from those assumed and changes to any assumptions may have a material impact on any projections or estimates. Other events not taken into account may occur and may significantly affect the projections or estimates. Certain assumptions may have been made for modeling purposes only to simplify the presentation and/or calculation of any projections or estimates, and the Underwriters do not represent that any such assumptions will reflect actual future events. Accordingly, there can be no assurance that estimated returns or projections will be realized or that actual returns or performance results will not materially differ from those estimated herein. Some of the information contained in this document may be aggregated data of transactions in securities or other financial instruments executed by one or more Underwriters that has been compiled so as not to identify the underlying transactions of any particular customer.
Notwithstanding anything herein to the contrary, the Underwriters and each recipient hereof (and their employees, representatives, and other agents) may disclose to any and all persons, without limitation of any kind from the commencement of discussions, the U.S. federal and state income tax treatment and tax structure of the transaction and all materials of any kind (including opinions or other tax analyses) that are provided to it relating to the tax treatment and tax structure (as such terms are defined in Treasury Regulation 1.6011-4). For this purpose, “tax structure” is limited to facts relevant to the U.S. federal and state income tax treatment of the transaction and does not include information relating to the identity of the parties, their affiliates, agents or advisors. This authorization of tax disclosure is retroactively effective to the commencement of discussions with prospective investors regarding the transactions contemplated herein.
In the United Kingdom, this free writing prospectus is only being distributed to, and is directed only at, persons who (i) have professional experience in matters relating to investments and who qualify as investment professionals in accordance with Article 19(5) of the Financial Services and Markets Act 2000 (Financial Promotion) Order 2005 (the “Order”)), or (ii) are high net worth companies, unincorporated associations, partnerships or trustees in accordance with Article 49(2) of the Order (all such persons together being referred to as “relevant persons”). This free writing prospectus must not be acted on or relied on by persons who are not relevant persons. Any investment or investment activity to which this free writing prospectus relates is available only to relevant persons and will be engaged in only with relevant persons.
THE OFFERED CERTIFICATES HAVE NOT BEEN AND WILL NOT BE REGISTERED UNDER THE FINANCIAL INSTRUMENTS EXCHANGE ACT OF JAPAN (LAW NO. 25 OF 1948, AS AMENDED (THE “FIEL”)), AND EACH OF MERRILL LYNCH, PIERCE, FENNER & SMITH INCORPORATED, UBS SECURITIES LLC AND DREXEL HAMILTON, LLC HAS AGREED THAT IT WILL NOT OFFER OR SELL ANY OFFERED CERTIFICATES, DIRECTLY OR INDIRECTLY, IN JAPAN OR TO, OR FOR THE BENEFIT OF, ANY JAPANESE PERSON, OR TO OTHERS FOR RE-OFFERING OR RESALE, DIRECTLY OR INDIRECTLY, IN JAPAN OR TO ANY JAPANESE PERSON, EXCEPT PURSUANT TO AN EXEMPTION FROM THE REGISTRATION REQUIREMENTS OF, AND OTHERWISE IN COMPLIANCE WITH, THE FIEL AND ANY OTHER APPLICABLE LAWS AND REGULATIONS. FOR THE PURPOSES OF THIS PARAGRAPH, “JAPANESE PERSON” SHALL MEAN ANY PERSON RESIDENT IN JAPAN, INCLUDING ANY CORPORATION OR OTHER ENTITY ORGANIZED UNDER THE LAWS AND REGULATIONS OF JAPAN.
| 113 |