Banc of America Merrill Lynch Commercial Mortgage
Filed: 4 Feb 16, 12:00am
| FREE WRITING PROSPECTUS | ||
| FILED PURSUANT TO RULE 433 | ||
| REGISTRATION FILE NO.: 333-206847-01 | ||
 |  |
Morgan Stanley Bank of America Merrill Lynch Trust 2016-C28
Free Writing Prospectus
Structural and Collateral Term Sheet
$955,648,355
(Approximate Total Mortgage Pool Balance)
$813,496,000
(Approximate Offered Certificates)
Banc of America Merrill Lynch Commercial Mortgage Inc.
as Depositor
Bank of America, National Association
Morgan Stanley Mortgage Capital Holdings LLC
CIBC Inc.
Starwood Mortgage Funding III LLC
as Sponsors and Mortgage Loan Sellers
Commercial Mortgage Pass-Through Certificates
Series 2016-C28
February 4, 2016
| BofA MERRILL LYNCH | MORGAN STANLEY | |
| Co-Lead Bookrunning Manager | Co-Lead Bookrunning Manager | |
CIBC World Markets | Drexel Hamilton | |
| Co-Manager | Co-Manager | |
STATEMENT REGARDING THIS FREE WRITING PROSPECTUS
The depositor has filed a registration statement (including a prospectus) with the SEC (File No. 333-206847) for the offering to which this communication relates. Before you invest, you should read the prospectus in that registration statement and other documents the depositor has filed with the SEC for more complete information about the depositor, the issuing entity and this offering. You may get these documents for free by visiting EDGAR on the SEC web site atwww.sec.gov. Alternatively, the depositor or any underwriter or any dealer participating in the offering will arrange to send you the prospectus if you request it by calling toll free 1-800-294-1322 or by email todg.Prospectus_Requests@baml.com.
| This is not a research report and was not prepared by any Underwriter’s research department. It was prepared by the Underwriters’ sales, trading, banking or other non-research personnel. Please see additional important information and qualifications at the end of this Term Sheet. |
Neither this Term Sheet nor anything contained herein shall form the basis for any contract or commitment whatsoever.The information contained herein is preliminary as of the date hereof.This Term Sheet is subject to change, completion or amendment from time to time.The information contained herein will be superseded by similar information delivered to you as part of the Preliminary Prospectus.The information contained herein supersedes any such information previously delivered.The information contained herein should be reviewed only in conjunction with the entire Preliminary Prospectus.All of the information contained herein is subject to the same limitations and qualifications contained in the Preliminary Prospectus.The information contained herein does not contain all relevant information relating to the underlying mortgage loans or mortgaged properties.Such information is described in the Preliminary Prospectus.The information contained herein will be more fully described in the Preliminary Prospectus.The information contained herein should not be viewed as projections, forecasts, predictions or opinions with respect to value.Prior to making any investment decision, prospective investors are strongly urged to read the Preliminary Prospectus in its entirety.Neither the Securities and Exchange Commission nor any state securities commission has approved or disapproved of these securities or determined if this Term Sheet is truthful or complete.Any representation to the contrary is a criminal offense.
IMPORTANT NOTICE RELATING TO AUTOMATICALLY GENERATED EMAIL DISCLAIMERS
Any legends, disclaimers or other notices that may appear at the bottom of, or attached to, the email communication to which this Term Sheet may have been attached are not applicable to this Term Sheet and should be disregarded. Such legends, disclaimers or other notices have been automatically generated as a result of this Term Sheet having been sent via Bloomberg or another email system.
IMPORTANT NOTICE REGARDING THE CONDITIONS FOR THIS OFFERING OF ASSET-BACKED SECURITIES
THE ASSET-BACKED SECURITIES REFERRED TO IN THIS TERM SHEET ARE BEING OFFERED WHEN, AS AND IF ISSUED. IN PARTICULAR, YOU ARE ADVISED THAT THE ASSET-BACKED SECURITIES, AND THE ASSET POOL BACKING THEM, ARE SUBJECT TO MODIFICATION OR REVISION (INCLUDING, AMONG OTHER THINGS, THE POSSIBILITY THAT ONE OR MORE CLASSES OF SECURITIES MAY BE SPLIT, COMBINED OR ELIMINATED), AT ANY TIME PRIOR TO ISSUANCE OR AVAILABILITY OF A FINAL PROSPECTUS. AS A RESULT, YOU MAY COMMIT TO PURCHASE SECURITIES THAT HAVE CHARACTERISTICS THAT MAY CHANGE, AND YOU ARE ADVISED THAT ALL OR A PORTION OF THE SECURITIES MAY NOT BE ISSUED THAT HAVE THE CHARACTERISTICS DESCRIBED IN THIS TERM SHEET. OUR OBLIGATION TO SELL SECURITIES TO YOU IS CONDITIONED ON THE SECURITIES AND THE UNDERLYING TRANSACTION HAVING THE CHARACTERISTICS DESCRIBED IN THIS TERM SHEET. IF WE DETERMINE THAT THE FOREGOING CONDITION IS NOT SATISFIED IN ANY MATERIAL RESPECT, WE WILL NOTIFY YOU, AND NEITHER THE ISSUING ENTITY NOR ANY UNDERWRITER WILL HAVE ANY OBLIGATION TO YOU TO DELIVER ALL OR ANY PORTION OF THE SECURITIES WHICH YOU HAVE COMMITTED TO PURCHASE, AND THERE WILL BE NO LIABILITY BETWEEN US AS A CONSEQUENCE OF THE NON-DELIVERY.
| This is not a research report and was not prepared by the Underwriters’ research departments. Please see additional important information and qualifications at the end of this Term Sheet. |
| T-1 |
| MSBAM 2016-C28 | Structural Overview |
Offered Certificates
| Class | Expected Ratings (DBRS/Fitch/Moody’s)(1) | Approximate Initial Certificate Balance or Notional Amount(2) | Approximate Initial Credit Support(3) | Pass-Through Rate Description | Expected Weighted Average Life (Years)(5) | Principal Window (Months)(5) | Certificate Principal UW NOI Debt Yield(6) | Certificate Principal to Value Ratio(7) | |||||||||
| A-1 | AAA(sf)/AAAsf/Aaa(sf) | $25,700,000 | 30.000% | (4) | 2.90 | 1-58 | 16.3% | 42.6% | |||||||||
| A-2 | AAA(sf)/AAAsf/Aaa(sf) | $43,800,000 | 30.000% | (4) | 4.85 | 58-60 | 16.3% | 42.6% | |||||||||
| A-SB | AAA(sf)/AAAsf/Aaa(sf) | $59,300,000 | 30.000% | (4) | 6.93 | 60-110 | 16.3% | 42.6% | |||||||||
| A-3 | AAA(sf)/AAAsf/Aaa(sf) | $215,000,000 | 30.000% | (4) | 9.59 | 110-117 | 16.3% | 42.6% | |||||||||
| A-4 | AAA(sf)/AAAsf/Aaa(sf) | $325,154,000 | 30.000% | (4) | 9.81 | 117-119 | 16.3% | 42.6% | |||||||||
| X-A | AAA(sf)/AAAsf/Aaa(sf) | $668,954,000 | (8) | N/A | Variable IO(9) | N/A | N/A | N/A | N/A | ||||||||
| X-B | AAA(sf)/AA-sf/Aa3(sf) | $97,954,000 | (8) | N/A | Variable IO(9) | N/A | N/A | N/A | N/A | ||||||||
| A-S | AAA(sf)/AAAsf/Aa1(sf) | $47,782,000 | 25.000% | (4) | 9.89 | 119-119 | 15.2% | 45.6% | |||||||||
| B | AA(sf)/AA-sf/Aa3(sf) | $50,172,000 | 19.750% | (4) | 9.89 | 119-119 | 14.2% | 48.8% | |||||||||
| C | A(sf)/A-sf/A3(sf) | $46,588,000 | 14.875% | (4) | 9.89 | 119-119 | 13.4% | 51.8% | |||||||||
Privately Offered Certificates(10)
| Class | Expected Ratings (DBRS/Fitch/Moody’s)(1) | Approximate Initial Certificate Balance or Notional Amount(2) | Approximate Initial Credit Support(3) | Pass-Through Rate Description | Expected Weighted Average Life (Years)(5) | Principal Window (Months)(5) | Certificate Principal UW NOI Debt Yield(6) | Certificate Principal to Value Ratio(7) | |||||||||
| X-D | AAA(sf)/BBB-sf/NR | $52,560,000 | (8) | N/A | Variable IO(9) | N/A | N/A | N/A | N/A | ||||||||
| D | BBB(sf)/BBB-sf/NR | $52,560,000 | 9.375% | (4) | 9.89 | 119-119 | 12.6% | 55.1% | |||||||||
| E-1(11)(17)(23) | BBB(sf)/BBsf/NR | $14,335,000 | (12)(18)(24) | 7.875% | (4) | 9.92 | 119-120 | 12.4% | 56.0% | ||||||||
| E-2(11)(17)(23) | BBB(low)(sf)/BB-sf/NR | $14,335,000 | (12)(18)(24) | 6.375% | (4) | 9.97 | 120-120 | 12.2% | 56.9% | ||||||||
| E(11) | BBB(low)(sf)/BB-sf/NR | $28,670,000 | (12) | 6.375% | N/A(13) | 9.95 | 119-120 | 12.2% | 56.9% | ||||||||
| F-1(14)(17)(23) | BB(sf)/NR/NR | $4,778,000 | (1*5)(18)(24) | 5.875% | (4) | 9.97 | 120-120 | 12.1% | 57.2% | ||||||||
| F-2(14)(17)(23) | BB(sf)/NR/NR | $4,778,000 | (15)(18)(24) | 5.375% | (4) | 9.97 | 120-120 | 12.0% | 57.5% | ||||||||
| F(14) | BB(sf)/B-sf/NR | $9,556,000 | (15) | 5.375% | N/A(16) | 9.97 | 120-120 | 12.0% | 57.5% | ||||||||
| EF(17) | BB(sf)/B-sf/NR | $38,226,000 | (18) | 5.375% | N/A(19) | 9.95 | 119-120 | 12.0% | 57.5% | ||||||||
| G-1(20)(23) | B(high)(sf)/NR/NR | $11,348,500 | (21)(24) | 4.188% | (4) | 9.97 | 120-120 | 11.9% | 58.3% | ||||||||
| G-2(20)(23) | B(low)(sf)/NR/NR | $11,348,500 | (21)(24) | 3.000% | (4) | 9.97 | 120-120 | 11.8% | 59.0% | ||||||||
| G(20) | B(low)(sf)/NR/NR | $22,697,000 | (21) | 3.000% | N/A(22) | 9.97 | 120-120 | 11.8% | 59.0% | ||||||||
| EFG(23) | B(low)(sf)/NR/NR | $60,923,000 | (24) | 3.000% | N/A(25) | 9.96 | 119-120 | 11.8% | 59.0% | ||||||||
| H-1(26) | NR/NR/NR | $14,334,677 | (27) | 1.500% | (4) | 11.44 | 120-144 | 11.6% | 59.9% | ||||||||
| H-2(26) | NR/NR/NR | $14,334,677 | (27) | 0.000% | (4) | 11.97 | 144-144 | 11.4% | 60.8% | ||||||||
| H(26) | NR/NR/NR | $28,669,354 | (27) | 0.000% | N/A(28) | 11.71 | 120-144 | 11.4% | 60.8% | ||||||||
| (1) | Ratings shown are those of DBRS, Inc. (“DBRS”), Fitch Ratings, Inc. (“Fitch”) and Moody’s Investors Service, Inc. (“Moody’s”). Certain nationally recognized statistical rating organizations that were not hired by the depositor may use information they receive pursuant to Rule 17g-5 under the Securities Exchange Act of 1934, as amended, or otherwise to rate the certificates. There can be no assurance as to what ratings a non-hired nationally recognized statistical rating organization would assign. See “Risk Factors—Other Risks Relating to the Certificates—Nationally Recognized Statistical Rating Organizations May Assign Different Ratings to the Certificates; Ratings of the Certificates Reflect Only the Views of the Applicable Rating Agencies as of the Dates Such Ratings Were Issued; Ratings May Affect ERISA Eligibility; Ratings May Be Downgraded” and “Ratings” in the Preliminary Prospectus, expected to be dated February 5, 2016 (the “Preliminary Prospectus”). Capitalized terms used but not defined herein have the meanings assigned to such terms in the Preliminary Prospectus. |
| (2) | Approximate, subject to a permitted variance of plus or minus 5%. In addition, the notional amounts of the Class X-A, Class X-B and Class X-D certificates may vary depending upon the final pricing of the classes of principal balance certificates whose certificate balances comprise such notional amounts, and, if as a result of such pricing the pass-through rate of the Class X-A, Class X-B or Class X-D certificates, as applicable, would be equal to zero, such class of certificates will not be issued on the closing date of this securitization. |
| (3) | The approximate initial credit support percentages set forth for the certificates are approximate and, for the Class A-1, Class A-2, Class A-3, Class A-4 and Class A-SB certificates, are represented in the aggregate. The approximate initial credit support percentage set forth for the Class E certificates represents the approximate initial credit support for the underlying Class E-2 trust component. The approximate initial credit support percentage set forth for the Class F certificates represents the approximate initial credit support for the underlying Class F-2 trust component. The approximate initial credit support percentage set forth for the Class EF certificates represents the approximate initial credit support for the underlying Class F-2 trust component. The approximate initial credit support percentage set forth for the Class G certificates represents the approximate initial credit support for the underlying Class G-2 trust component. |
The approximate initial credit support percentage set forth for the Class EFG certificates represents the approximate initial credit support for the underlying Class G-2 trust component. The approximate initial credit support percentage set forth for the Class H certificates represents the approximate initial credit support for the underlying Class H-2 trust component.
| This is not a research report and was not prepared by the Underwriters’ research departments. Please see additional important information and qualifications at the end of this Term Sheet. |
| T-2 |
| MSBAM 2016-C28 | Structural Overview |
| (4) | The pass-through rates for the Class A-1, Class A-2, Class A-SB, Class A-3, Class A-4, Class A-S, Class B, Class C, Class D, Class E-1, Class E-2, Class F-1, Class F-2, Class G-1, Class G-2, Class H-1 and Class H-2 certificates will be one of the following: (i) a fixed rateper annum, (ii) a variable rateper annum equal to the weighted average of the net mortgage interest rates on the mortgage loans for the related distribution date, (iii) a variable rateper annum equal to the lesser of (a) a fixed rate and (b) the weighted average of the net mortgage interest rates on the mortgage loans for the related distribution date or (iv) a variable rateper annum equal to the weighted average of the net mortgage interest rates on the mortgage loans for the related distribution date minus a specified percentage. For purposes of the calculation of the weighted average of the net mortgage interest rates on the mortgage loans for each distribution date, the mortgage interest rates will be adjusted as necessary to a 30/360 basis. |
| (5) | The Expected Weighted Average Life (Years) and Principal Window (Months) during which distributions of principal would be received as set forth in the foregoing table with respect to each class of certificates having a certificate balance are based on the assumptions set forth under “Yield and Maturity Considerations—Weighted Average Life” in the Preliminary Prospectus and on the assumptions that there are no prepayments, modifications or losses in respect of the mortgage loans and that there are no extensions or forbearances of maturity dates or anticipated repayment dates of the mortgage loans. |
| (6) | Certificate Principal UW NOI Debt Yield for any class of principal balance certificates (other than the Exchangeable Certificates and the Exchangeable Combined Certificates) is calculated as the product of (a) the weighted average UW NOI Debt Yield for the mortgage pool, multiplied by (b) a fraction, the numerator of which is the total initial principal balance of all the principal balance certificates (other than the Exchangeable Certificates and the Exchangeable Combined Certificates) and trust components, and the denominator of which is the total initial principal balance of the subject class of principal balance certificates and all other classes of principal balance certificates (other than the Exchangeable Certificates and the Exchangeable Combined Certificates) and trust components, if any, that are senior to such class. The Certificate Principal UW NOI Debt Yields of the Class A-1, Class A-2, Class A-SB, Class A-3 and Class A-4 certificates are calculated in the aggregate for those classes as if they were a single class. |
| Certificate Principal UW NOI Debt Yield for each class of the Class E-1, Class E-2, Class F-1, Class F-2, Class G-1, Class G-2, Class H-1 and Class H-2 certificates is calculated as the product of (a) the weighted average UW NOI Debt Yield for the mortgage pool, multiplied by (b) a fraction, the numerator of which is the total initial principal balance of all the principal balance certificates (other than the Exchangeable Certificates and the Exchangeable Combined Certificates) and trust components, and the denominator of which is the total initial principal balance of the trust component with the same alphanumeric designation and all other classes of principal balance certificates (other than the Exchangeable Certificates and the Exchangeable Combined Certificates) and trust components that are senior to such trust component. The Certificate Principal UW NOI Debt Yield for the Class E certificates is equal to the Certificate Principal UW NOI Debt Yield for the Class E-2 trust component. The Certificate Principal UW NOI Debt Yield for each class of the Class F and Class EF certificates is equal to the Certificate Principal UW NOI Debt Yield for the Class F-2 trust component. The Certificate Principal UW NOI Debt Yield for each class of the Class G and Class EFG certificates is equal to the Certificate Principal UW NOI Debt Yield for the Class G-2 trust component. The Certificate Principal UW NOI Debt Yield for the Class H certificates is equal to the Certificate Principal UW NOI Debt Yield for the Class H-2 trust component. |
| (7) | Certificate Principal to Value Ratio for any class of principal balance certificates (other than the Exchangeable Certificates and the Exchangeable Combined Certificates) is calculated as the product of (a) the weighted average Cut-off Date LTV Ratio of the mortgage pool, multiplied by (b) a fraction, the numerator of which is the total initial certificate balance of the subject class of principal balance certificates and all other classes of principal balance certificates (other than the Exchangeable Certificates and the Exchangeable Combined Certificates) and trust components that are senior to such class, and the denominator of which is the total initial certificate balance of all the principal balance certificates (other than the Exchangeable Certificates and the Exchangeable Combined Certificates) and trust components. The Certificate Principal to Value Ratios of the Class A-1, Class A-2, Class A-SB, Class A-3 and Class A-4 certificates are calculated in the aggregate for those classes as if they were a single class. Certificate Principal to Value Ratio for each class of the Class E-1, Class E-2, Class F-1, Class F-2, Class G-1, Class G-2, Class H-1 and Class H-2 certificates is calculated as the product of (a) the weighted average Cut-off Date LTV Ratio of the mortgage pool, multiplied by (b) a fraction, the numerator of which is the total initial principal balance of the trust component with the same alphanumeric designation and all other classes of principal balance certificates (other than the Exchangeable Certificates and the Exchangeable Combined Certificates) and trust components that are senior to such trust component, and the denominator of which is the total initial principal balance of all the principal balance certificates (other than the Exchangeable Certificates and the Exchangeable Combined Certificates) and trust components. The Certificate Principal to Value Ratio for the Class E certificates is equal to the Certificate Principal to Value Ratio for the Class E-2 trust component. The Certificate Principal to Value Ratio for each class of the Class F and Class EF certificates is equal to the Certificate Principal to Value Ratio for the Class F-2 trust component. The Certificate Principal to Value Ratio for each class of the Class G and Class EFG certificates is equal to the Certificate Principal to Value Ratio for the Class G-2 trust component. The Certificate Principal to Value Ratio for the Class H certificates is equal to the Certificate Principal to Value Ratio for the Class H-2 trust component. |
| (8) | The Class X-A, Class X-B and Class X-D certificates (collectively, the “Class X Certificates”) will not have certificate balances and will not be entitled to receive distributions of principal. Interest will accrue on the Class X-A, Class X-B and Class X-D certificates at their respective pass-through rates based upon their respective notional amounts. The notional amount of the Class X-A certificates will equal the aggregate certificate balance of the Class A-1, Class A-2, Class A-SB, Class A-3 and Class A-4 certificates outstanding from time to time. The notional amount of the Class X-B certificates will equal the aggregate certificate balance of the Class A-S and Class B certificates outstanding from time to time. The notional amount of the Class X-D certificates will equal the certificate balance of the Class D certificates outstanding from time to time. |
| (9) | The pass-through rate for the Class X-A certificates for any distribution date will be aper annum rate equal to the excess, if any, of (a) the weighted average of the net mortgage interest rates on the mortgage loans for the related distribution date, over (b) the weighted average of the pass-through rates on the Class A-1, Class A-2, Class A-SB, Class A-3 and Class A-4 certificates for the related distribution date, weighted on the basis of their respective aggregate certificate balances outstanding immediately prior to that distribution date. The pass-through rate for the Class X-B certificates for any distribution date will be aper annum rate equal to the excess, if any, of (a) the weighted average of the net mortgage interest rates on the mortgage loans for the related distribution date, over (b) the weighted average of the pass-through rates on the Class A-S and Class B certificates for the related distribution date, weighted on the basis of their respective aggregate certificate balances outstanding immediately prior to that distribution date. The pass-through rate for the Class X-D certificates for any distribution date will be aper annum rate equal to the excess, if any, of (a) the weighted average of the net mortgage interest rates on the mortgage loans for the related distribution date, over (b) the pass-through rate on the Class D certificates for the related distribution date. For purposes of the calculation of the weighted average of the net mortgage interest rates on the mortgage loans for each distribution date, the mortgage interest rates will be adjusted as necessary to a 30/360 basis. |
| (10) | Not offered pursuant to the Preliminary Prospectus or this Term Sheet. Information provided in this Term Sheet regarding the characteristics of these certificates is provided only to enhance your understanding of the offered certificates. The privately offered certificates also include the Class V and Class R certificates, which do not have a certificate balance, notional amount, pass-through rate, rating or rated final distribution date, and which are not shown in the chart. The Class V certificates represent a beneficial ownership interest held through the grantor trust in certain excess interest in respect of mortgage loans having anticipated repayment dates, if any. The Class R certificates represent the beneficial ownership of the residual interest in each of the real estate mortgage investment conduits, as further described in the Preliminary Prospectus. |
| (11) | A holder of Class E-1 and Class E-2 certificates may exchange such classes of certificates (on an aggregate basis) for a related amount of Class E certificates, and a holder of Class E certificates may exchange that class for a ratable portion of each class of the Class E-1 and Class E-2 certificates. |
| This is not a research report and was not prepared by the Underwriters’ research departments. Please see additional important information and qualifications at the end of this Term Sheet. |
| T-3 |
| MSBAM 2016-C28 | Structural Overview |
| (12) | On the closing date, the issuing entity will issue the Class E-1 and Class E-2 trust components (collectively, the “Class E Trust Components”), which will have outstanding certificate balances on the closing date of $14,335,000 and $14,335,000, respectively. The Class E-1 and Class E-2 certificates and the Class E certificates will, at all times, represent undivided beneficial ownership interests in a grantor trust that will hold such trust components. Each class of the Class E-1, Class E-2 and Class E certificates will, at all times, represent a beneficial interest in a percentage of the outstanding certificate balance of the Class E-1 and Class E-2 trust components. Following any exchange of Class E-1 and Class E-2 certificates for Class E certificates or any exchange of Class E certificates for Class E-1 and Class E-2 certificates, the percentage interest of the outstanding certificate balances of the Class E-1 and Class E-2 trust components that is represented by the Class E-1 and Class E-2 certificates and the Class E certificates will be increased or decreased accordingly. The initial balance of each class of the Class E-1 and Class E-2 certificates shown in the table above represents the maximum principal balance of such class without giving effect to any issuance of Class E certificates (and assuming no Class EF or Class EFG certificates are issued). The initial certificate balance of the Class E certificates shown in the table above is equal to the aggregate of the maximum initial certificate balances of the Class E-1 and Class E-2 certificates, representing the maximum certificate balance of the Class E certificates that could be issued in an exchange. The principal balance of the Class E-1 and Class E-2 certificates to be issued on the closing date will be reduced, in required proportions, by an amount equal to the principal balance of the Class E certificates issued on the closing date. |
| (13) | The Class E certificates will not have a pass-through rate, but will be entitled to receive the sum of the interest distributable on its percentage interests in the Class E-1 and Class E-2 trust components. The pass-through rates on the Class E-1 and Class E-2 trust components will at all times be the same as the pass-through rates of the Class E-1 and Class E-2 certificates, respectively. Any distribution of interest to the Class E certificates on the first distribution date is expected to be in an amount that would produce an effective pass-through rate equal to the weighted average of the pass-through rates of the Class E-1 and Class E-2 trust components for the first distribution date. |
| (14) | A holder of Class F-1 and Class F-2 certificates may exchange such classes of certificates (on an aggregate basis) for a related amount of Class F certificates, and a holder of Class F certificates may exchange that class for a ratable portion of each class of the Class F-1 and Class F-2 certificates. |
| (15) | On the closing date, the issuing entity will issue the Class F-1 and Class F-2 trust components (collectively, the “Class F Trust Components”), which will have outstanding certificate balances on the closing date of $4,778,000 and $4,778,000, respectively. The Class F-1 and Class F-2 certificates and the Class F certificates will, at all times, represent undivided beneficial ownership interests in a grantor trust that will hold such trust components. Each class of the Class F-1, Class F-2 and Class F certificates will, at all times, represent a beneficial interest in a percentage of the outstanding certificate balance of the Class F-1 and Class F-2 trust components. Following any exchange of Class F-1 and Class F-2 certificates for Class F certificates or any exchange of Class F certificates for Class F-1 and Class F-2 certificates, the percentage interest of the outstanding certificate balances of the Class F-1 and Class F-2 trust components that is represented by the Class F-1 and Class F-2 certificates and the Class F certificates will be increased or decreased accordingly. The initial balance of each class of the Class F-1 and Class F-2 certificates shown in the table above represents the maximum principal balance of such class without giving effect to any issuance of Class F certificates (and assuming no Class EF or Class EFG certificates are issued). The initial certificate balance of the Class F certificates shown in the table above is equal to the aggregate of the maximum initial certificate balances of the Class F-1 and Class F-2 certificates, representing the maximum certificate balance of the Class F certificates that could be issued in an exchange. The principal balance of the Class F-1 and Class F-2 certificates to be issued on the closing date will be reduced, in required proportions, by an amount equal to the principal balance of the Class F certificates issued on the closing date. |
| (16) | The Class F certificates will not have a pass-through rate, but will be entitled to receive the sum of the interest distributable on its percentage interests in the Class F-1 and Class F-2 trust components. The pass-through rates on the Class F-1 and Class F-2 trust components will at all times be the same as the pass-through rates of the Class F-1 and Class F-2 certificates, respectively. Any distribution of interest to the Class F certificates on the first distribution date is expected to be in an amount that would produce an effective pass-through rate equal to the weighted average of the pass-through rates of the Class F-1 and Class F-2 trust components for the first distribution date. |
| (17) | A holder of Class E-1, Class E-2, Class F-1 and Class F-2 certificates may exchange such classes of certificates (on an aggregate basis) for a related amount of Class EF certificates, and a holder of Class EF certificates may exchange that class for a ratable portion of each class of the Class E-1, Class E-2, Class F-1 and Class F-2 certificates. |
| (18) | Each class of the Class E-1, Class E-2, Class F-1, Class F-2 and Class EF certificates will, at all times, represent a beneficial interest in a percentage of the outstanding certificate balance of the Class E-1, Class E-2, Class F-1 and Class F-2 trust components. Following any exchange of Class E-1, Class E-2, Class F-1 and Class F-2 certificates for Class EF certificates or any exchange of Class EF certificates for Class E-1, Class E-2, Class F-1 and Class F-2 certificates, the percentage interest of the outstanding certificate balances of the Class E-1, Class E-2, Class F-1 and Class F-2 trust components that is represented by the Class E-1, Class E-2, Class F-1 and Class F-2 certificates and the Class EF certificates will be increased or decreased accordingly. The initial balance of each class of the Class E-1, Class E-2, Class F-1 and Class F-2 certificates shown in the table above represents the maximum principal balance of such class without giving effect to any issuance of Class EF certificates (and assuming no Class E, Class F or Class EFG certificates are issued). The initial certificate balance of the Class EF certificates shown in the table above is equal to the aggregate of the maximum initial certificate balances of the Class E-1, Class E-2, Class F-1 and Class F-2 certificates, representing the maximum certificate balance of the Class EF certificates that could be issued in an exchange. The principal balance of the Class E-1, Class E-2, Class F-1 and Class F-2 certificates to be issued on the closing date will be reduced, in required proportions, by an amount equal to the principal balance of the Class EF certificates issued on the closing date. |
| (19) | The Class EF certificates will not have a pass-through rate, but will be entitled to receive the sum of the interest distributable on its percentage interests in the Class E-1, Class E-2, Class F-1 and Class F-2 trust components. Any distribution of interest to the Class EF certificates on the first distribution date is expected to be in an amount that would produce an effective pass-through rate equal to the weighted average of the pass-through rates of the Class E-1, Class E-2, Class F-1 and Class F-2 trust components for the first distribution date. |
| (20) | A holder of Class G-1 and Class G-2 certificates may exchange such classes of certificates (on an aggregate basis) for a related amount of Class G certificates, and a holder of Class G certificates may exchange that class for a ratable portion of each class of the Class G-1 and Class G-2 certificates. |
| (21) | On the closing date, the issuing entity will issue the Class G-1 and Class G-2 trust components (collectively, the “Class G Trust Components”), which will have outstanding certificate balances on the closing date of $11,348,500 and $11,348,500, respectively. The Class G-1 and Class G-2 certificates and the Class G certificates will, at all times, represent undivided beneficial ownership interests in a grantor trust that will hold such trust components. Each class of the Class G-1, Class G-2 and Class G certificates will, at all times, represent a beneficial interest in a percentage of the outstanding certificate balance of the Class G-1 and Class G-2 trust components. Following any exchange of Class G-1 and Class G-2 certificates for Class G certificates or any exchange of Class G certificates for Class G-1 and Class G-2 certificates, the percentage interest of the outstanding certificate balances of the Class G-1 and Class G-2 trust components that is represented by the Class G-1 and Class G-2 certificates and the Class G certificates will be increased or decreased accordingly. The initial balance of each class of the Class G-1 and Class G-2 certificates shown in the table above represents the maximum principal balance of such class without giving effect to any issuance of Class G certificates (and assuming no Class EFG certificates are issued). The initial certificate balance of the Class G certificates shown in the table above is equal to the aggregate of the maximum initial certificate balances of the Class G-1 and Class G-2 certificates, representing the maximum certificate balance of the Class G certificates that could be issued in an exchange. The principal balance of the Class G-1 and |
| This is not a research report and was not prepared by the Underwriters’ research departments. Please see additional important information and qualifications at the end of this Term Sheet. |
| T-4 |
| MSBAM 2016-C28 | Structural Overview |
| Class G-2 certificates to be issued on the closing date will be reduced, in required proportions, by an amount equal to the principal balance of the Class G certificates issued on the closing date. |
| (22) | The Class G certificates will not have a pass-through rate, but will be entitled to receive the sum of the interest distributable on its percentage interests in the Class G-1 and Class G-2 trust components. The pass-through rates on the Class G-1 and Class G-2 trust components will at all times be the same as the pass-through rates of the Class G-1 and Class G-2 certificates, respectively. Any distribution of interest to the Class G certificates on the first distribution date is expected to be in an amount that would produce an effective pass-through rate equal to the weighted average of the pass-through rates of the Class G-1 and Class G-2 trust components for the first distribution date. |
| (23) | A holder of Class E-1, Class E-2, Class F-1, Class F-2, Class G-1 and Class G-2 certificates may exchange such classes of certificates (on an aggregate basis) for a related amount of Class EFG certificates, and a holder of Class EFG certificates may exchange that Class EFG for a ratable portion of each class of the Class E-1, Class E-2, Class F-1, Class F-2, Class G-1 and Class G-2 certificates. |
| (24) | Each class of the Class E-1, Class E-2, Class F-1, Class F-2, Class G-1, Class G-2 and Class EFG certificates will, at all times, represent a beneficial interest in a percentage of the outstanding certificate balance of the Class E-1, Class E-2, Class F-1, Class F-2, Class G-1 and Class G-2 trust components. Following any exchange of Class E-1, Class E-2, Class F-1, Class F-2, Class G-1 and Class G-2 certificates for Class EFG certificates or any exchange of Class EFG certificates for Class E-1, Class E-2, Class F-1, Class F-2, Class G-1 and Class G-2 certificates, the percentage interest of the outstanding certificate balances of the Class E-1, Class E-2, Class F-1, Class F-2, Class G-1 and Class G-2 trust components that is represented by the Class E-1, Class E-2, Class F-1, Class F-2, Class G-1 and Class G-2 certificates and the Class EFG certificates will be increased or decreased accordingly. The initial balance of each class of the Class E-1, Class E-2, Class F-1, Class F-2, Class G-1 and Class G-2 certificates shown in the table above represents the maximum principal balance of such class without giving effect to any issuance of Class EFG certificates (and assuming no Class E, Class F, Class EF or Class G certificates are issued). The initial certificate balance of the Class EFG certificates shown in the table above is equal to the aggregate of the maximum initial certificate balances of the Class E-1, Class E-2, Class F-1, Class F-2, Class G-1 and Class G-2 certificates, representing the maximum certificate balance of the Class EFG certificates that could be issued in an exchange. The principal balance of the Class E-1, Class E-2, Class F-1, Class F-2, Class G-1 and Class G-2 certificates to be issued on the closing date will be reduced, in required proportions, by an amount equal to the principal balance of the Class EFG certificates issued on the closing date. |
| (25) | The Class EFG certificates will not have a pass-through rate, but will be entitled to receive the sum of the interest distributable on its percentage interests in the Class E-1, Class E-2, Class F-1, Class F-2, Class G-1 and Class G-2 trust components. Any distribution of interest to the Class EFG certificates on the first distribution date is expected to be in an amount that would produce an effective pass-through rate equal to the weighted average of the pass-through rates of the Class E-1, Class E-2, Class F-1, Class F-2, Class G-1 and Class G-2 trust components for the first distribution date. |
| (26) | A holder of Class H-1 and Class H-2 certificates may exchange such classes of certificates (on an aggregate basis) for a related amount of Class H certificates, and a holder of Class H certificates may exchange that class for a ratable portion of each class of the Class H-1 and Class H-2 certificates. |
| (27) | On the closing date, the issuing entity will issue the Class H-1 and Class H-2 trust components (collectively, the “Class H Trust Components”), which will have outstanding certificate balances on the closing date of $14,334,677 and $14,334,677, respectively. The Class H-1 and Class H-2 certificates and the Class H certificates will, at all times, represent undivided beneficial ownership interests in a grantor trust that will hold such trust components. Each class of the Class H-1, Class H-2 and Class H certificates will, at all times, represent a beneficial interest in a percentage of the outstanding certificate balance of the Class H-1 and Class H-2 trust components. Following any exchange of Class H-1 and Class H-2 certificates for Class H certificates or any exchange of Class H certificates for Class H-1 and Class H-2 certificates, the percentage interest of the outstanding certificate balances of the Class H-1 and Class H-2 trust components that is represented by the Class H-1 and Class H-2 certificates and the Class H certificates will be increased or decreased accordingly. The initial balance of each class of the Class H-1 and Class H-2 certificates shown in the table above represents the maximum principal balance of such class without giving effect to any issuance of Class H certificates. The initial certificate balance of the Class H certificates shown in the table above is equal to the aggregate of the maximum initial certificate balances of the Class H-1 and Class H-2 certificates, representing the maximum certificate balance of the Class H certificates that could be issued in an exchange. The principal balance of the Class H-1 and Class H-2 certificates to be issued on the closing date will be reduced, in required proportions, by an amount equal to the principal balance of the Class H certificates issued on the closing date. |
| (28) | The Class H certificates will not have a pass-through rate, but will be entitled to receive the sum of the interest distributable on its percentage interests in the Class H-1 and Class H-2 trust components. The pass-through rates on the Class H-1 and Class H-2 trust components will at all times be the same as the pass-through rates of the Class H-1 and Class H-2 certificates, respectively. Any distribution of interest to the Class H certificates on the first distribution date is expected to be in an amount that would produce an effective pass-through rate equal to the weighted average of the pass-through rates of the Class H-1 and Class H-2 trust components for the first distribution date. |
| This is not a research report and was not prepared by the Underwriters’ research departments. Please see additional important information and qualifications at the end of this Term Sheet. |
| T-5 |
| MSBAM 2016-C28 | Structural Overview |
| Offered Certificates: | $813,496,000 (approximate) monthly pay, multi-class, commercial mortgage pass-through certificates, consisting of eight principal balance classes (Class A-1, Class A-2, Class A-SB, Class A-3, Class A-4, Class A-S, Class B and Class C) and two interest-only classes (Class X-A and Class X-B) | |
| Co-Lead Bookrunning Managers: | Merrill Lynch, Pierce, Fenner & Smith Incorporated and Morgan Stanley & Co. LLC | |
| Co-Managers: | CIBC World Markets Corp. and Drexel Hamilton, LLC | |
| Mortgage Loan Sellers: | Bank of America, National Association, Morgan Stanley Mortgage Capital Holdings LLC, CIBC Inc. and Starwood Mortgage Funding III LLC | |
| Rating Agencies: | DBRS, Inc., Fitch Ratings, Inc. and Moody’s Investors Service, Inc. | |
| Master Servicer: | Wells Fargo Bank, National Association | |
| Special Servicer: | C-III Asset Management LLC | |
| Certificate Administrator/ Certificate Registrar/Custodian: | Wells Fargo Bank, National Association | |
| Trustee: | Wilmington Trust, National Association | |
| Operating Advisor: | Park Bridge Lender Services LLC | |
| Asset Representations Reviewer: | Park Bridge Lender Services LLC | |
| Initial Directing Certificateholder: | C-III High Yield Real Estate Debt Fund IV Tier Holdings Inc. or an affiliate thereof | |
| Cut-off Date: | The mortgage loans will be considered part of the trust fund as of their respective cut-off dates. The cut-off date with respect to each mortgage loan is the respective due date for the monthly debt service payment that is due in February 2016 (or, in the case of any mortgage loan that has its first due date in March 2016, the date that would have been its due date in February 2016 under the terms of that mortgage loan if a monthly debt service payment were scheduled to be due in that month). | |
| Expected Pricing Date: | Week of February 8, 2016 | |
| Expected Closing Date: | Week of February 22, 2016 | |
| Determination Dates: | The 11th day of each month or, if the 11th day is not a business day, then the business day immediately following such 11th day. | |
| Distribution Dates: | The 4th business day following each determination date. The first distribution date will be in March 2016. | |
| Rated Final Distribution Date: | The distribution date in January 2049 | |
| Interest Accrual Period: | Preceding calendar month | |
| Payment Structure: | Sequential pay | |
| Tax Treatment: | REMIC | |
| Optional Termination: | 1.00% clean-up call | |
| Minimum Denominations: | $10,000 for each class of Offered Certificates (other than Class X-A and Class X-B certificates); $1,000,000 for the Class X-A and Class X-B certificates | |
| Settlement Terms: | DTC, Euroclear and Clearstream | |
| Legal/Regulatory Status: | Each class of Offered Certificates is expected to be eligible for exemptive relief under ERISA. No class of Offered Certificates is SMMEA eligible. | |
| Analytics: | The certificate administrator is expected to make available all distribution date statements, CREFC® reports and supplemental notices received by it to certain modeling financial services as described in the Preliminary Prospectus. | |
| Bloomberg Ticker: | MSBAM 2016-C28 <MTGE><GO> | |
| Risk Factors: | THE CERTIFICATES INVOLVE CERTAIN RISKS AND MAY NOT BE SUITABLE FOR ALL INVESTORS. SEE THE “RISK FACTORS” SECTION OF THE PRELIMINARY PROSPECTUS. |
| This is not a research report and was not prepared by the Underwriters’ research departments. Please see additional important information and qualifications at the end of this Term Sheet. |
| T-6 |
| MSBAM 2016-C28 | Structural Overview |
| Accrual: | Each class of Offered Certificates will accrue interest on a 30/360 basis. | |
| Amount and Order of Distributions: | On each distribution date, funds available for distribution from the mortgage loans, net of (i) specified expenses of the issuing entity, including fees payable to, and costs and expenses reimbursable to, the master servicer, the special servicer, the certificate administrator, the trustee, the operating advisor, the asset representations reviewer and CREFC®, (ii) any yield maintenance charges and prepayment premiums and (iii) any excess interest distributable to the Class V certificates, will be distributed in the following amounts and order of priority:
First, to the Class A-1, Class A-2, Class A-SB, Class A-3, Class A-4, Class X-A, Class X-B and Class X-D certificates, in respect of interest, up to an amount equal to, and pro rata in accordance with, the interest entitlements for those classes;
Second, to the Class A-1, Class A-2, Class A-SB, Class A-3 and Class A-4 certificates as follows, to the extent of funds allocated to principal and available for distribution: (i) (a) first, to principal on the Class A-SB certificates, until the certificate balance of the Class A-SB certificates is reduced to the planned principal balance for the related distribution date set forth in Annex E to the Preliminary Prospectus, (b) second, to principal on the Class A-1 certificates, until the certificate balance of the Class A-1 certificates has been reduced to zero, (c) third, to principal on the Class A-2 certificates, until the certificate balance of the Class A-2 certificates has been reduced to zero, (d) fourth, to principal on the Class A-3 certificates until the certificate balance of the Class A-3 certificates has been reduced to zero, (e) fifth, to principal on the Class A-4 certificates until the certificate balance of the Class A-4 certificates has been reduced to zero, and (f) sixth, to principal on the Class A-SB certificates, until the certificate balance of the Class A-SB certificates has been reduced to zero, or (ii) if the certificate balance of each class of certificates other than the Class A-1, Class A-2, Class A-SB, Class A-3 and Class A-4 certificates has been reduced to zero as a result of the allocation of mortgage loan losses to those certificates, funds available for distributions of principal will be distributed to the Class A-1, Class A-2, Class A-SB, Class A-3 and Class A-4 certificates, pro rata, without regard to the distribution priorities described above or the planned principal balance of the Class A-SB certificates;
Third, to the Class A-1, Class A-2, Class A-SB, Class A-3 and Class A-4 certificates, to reimburse the Class A-1, Class A-2, Class A-SB, Class A-3 and Class A-4 certificates, first, up to an amount equal to, and pro rata, based on, any previously unreimbursed losses on the mortgage loans allocable to principal that were previously borne by each such class, and second, up to an amount equal to, and pro rata based on, interest on such unreimbursed losses previously allocated to each such class at the pass-through rate for such class from the date the related loss was allocated to such class;
Fourth, to the Class A-S certificates as follows: (a) to interest on the Class A-S certificates in the amount of its interest entitlement; (b) to the extent of funds allocable to principal remaining after distributions in respect of principal to each class with a higher priority (as set forth in prior enumerated clauses set forth above), to principal on the Class A-S certificates until its certificate balance has been reduced to zero; and (c) to reimburse the Class A-S certificates first for any previously unreimbursed losses on the mortgage loans that were previously allocated to those certificates, and second, for interest on such unreimbursed loss amount at the pass-through rate for such class;
Fifth, to the Class B certificates as follows: (a) to interest on the Class B certificates in the amount of its interest entitlement; (b) to the extent of funds allocable to principal remaining after distributions in respect of principal to each class with a higher priority (as set forth in prior enumerated clauses set forth above), to principal on the Class B certificates until its certificate balance has been reduced to zero; and (c) to reimburse the Class B certificates first, for any previously unreimbursed losses on the mortgage loans that were previously allocated to those certificates, and second, for interest on such unreimbursed loss amount at the pass-through rate for such class;
Sixth, to the Class C certificates as follows: (a) to interest on the Class C certificates in the amount of its interest entitlement; (b) to the extent of funds allocable to principal remaining after distributions in respect of principal to each class with a higher priority (as set forth in prior enumerated clauses set forth above), to principal on the Class C certificates until its certificate balance has been reduced to zero; and (c) to reimburse the Class C certificates first for any previously unreimbursed losses on the mortgage loans that were previously allocated to those certificates, and second, for interest on such unreimbursed loss amount at the pass-through rate for such class;
Seventh, to the non-offered certificates (other than the Class X-D certificates and other than the Class R and Class V certificates) in the amounts and order of priority described under “Description of the Certificates—Distributions” in the Preliminary Prospectus; and
Eighth, to the Class R certificates, any remaining amounts.
| |
| Exchangeable Certificates | The Class E-1, Class E-2, Class F-1, Class F-2, Class G-1, Class G-2, Class H-1 and Class H-2 certificates are collectively referred to herein as the “Exchangeable Certificates”, and the Class E, Class F, Class EF, Class G, Class EFG and Class H certificates are collectively referred to herein as the “Exchangeable Combined Certificates.” On the closing date, the upper-tier REMIC of the issuing entity will issue the Class E-1, Class E-2, Class F-1, Class F-2, Class G-1, Class G-2, Class H-1 and Class H-2 trust components (each a “trust component”), which will have outstanding balances on the closing date set forth in the table below and |
| This is not a research report and was not prepared by the Underwriters’ research departments. Please see additional important information and qualifications at the end of this Term Sheet. |
| T-7 |
| MSBAM 2016-C28 | Structural Overview |
| will be held in the grantor trust for the benefit of the holders of the Exchangeable Certificates and the Exchangeable Combined Certificates. Exchangeable Certificates will at all times represent undivided beneficial ownership interests, held through the grantor trust, in one or more of such trust components, as further described in the Preliminary Prospectus. |
| Trust Component | Closing Date Balance | |||
| Class E-1 trust component | $ | 14,335,000 | ||
| Class E-2 trust component | $ | 14,335,000 | ||
| Class F-1 trust component | $ | 4,778,000 | ||
| Class F-2 trust component | $ | 4,778,000 | ||
| Class G-1 trust component | $ | 11,348,500 | ||
| Class G-2 trust component | $ | 11,348,500 | ||
| Class H-1 trust component | $ | 14,334,677 | ||
| Class H-2 trust component | $ | 14,334,677 | ||
Each class of Exchangeable Combined Certificates may be exchanged for the corresponding classes of Exchangeable Certificates set forth next to such class in the table below, and vice versa. The Exchange Percentage set forth next to each class of Exchangeable Certificates in the table below represents the percentage of the aggregate certificate balance of the Exchangeable Certificates involved in an exchange that is represented by the certificate balance of such class of Exchangeable Certificates that is required to be surrendered to receive the corresponding Exchangeable Combined Certificates (or that will be received if Exchangeable Combined Certificates are surrendered). |
| Class of Exchangeable Combined Certificates | Corresponding Classes of Exchangeable Certificates | Exchange Percentage | |
| Class E | Class E-1 Class E-2 | 50% 50% | |
| Class F | Class F-1 Class F-2 | 50% 50% | |
| Class EF | Class E-1 Class E-2 Class F-1 Class F-2 | 37.5006540051274% 37.5006540051274% 12.4993459948726% 12.4993459948726% | |
| Class G | Class G-1 Class G-2 | 50% 50% | |
| Class EFG | Class E-1 Class E-2 Class F-1 Class F-2 Class G-1 Class G-2 | 23.5297014263907% 23.5297014263907% 7.84268667005893% 7.84268667005893% 18.6276119035504% 18.6276119035504% | |
| Class H | Class H-1 Class H-2 | 50% 50% |
No class of Exchangeable Combined Certificates will have a pass-through rate; instead, each such class of Exchangeable Combined Certificates be entitled to receive the sum of the interest that would otherwise be distributable in respect of the percentage interest in each related trust component evidenced by such class of Exchangeable Combined Certificates. The various amounts distributable on a class of Exchangeable Combined Certificates on each distribution date in respect of Interest Accrual Amounts, Interest Distribution Amounts, principal distribution amounts, reimbursements of Realized Losses and yield maintenance charges allocated to any of the related trust components evidenced by such class of Exchangeable Combined Certificates will be so distributed in a single, aggregate distribution to the holders of such class of Exchangeable Combined Certificates on such distribution date. In addition, each class of Exchangeable Combined Certificates will be allocated the aggregate amount of Realized Losses, Interest Shortfalls, and any other shortfalls in respect of the percentage interest in each related trust component evidenced by such class of Exchangeable Combined Certificates.
For the avoidance of doubt, no fee will be required with respect to any exchange of Exchangeable Certificates.
| ||
| Interest and Principal Entitlements: | The interest entitlement of each class of Offered Certificates on each distribution date generally will be the interest accrued during the related interest accrual period on the related certificate balance or notional amount at the related pass-through rate, net of any prepayment interest shortfalls allocated to that class for such |
| This is not a research report and was not prepared by the Underwriters’ research departments. Please see additional important information and qualifications at the end of this Term Sheet. |
| T-8 |
| MSBAM 2016-C28 | Structural Overview |
distribution date as described below. If prepayment interest shortfalls arise from voluntary prepayments on serviced mortgage loans during any collection period, the master servicer is required to make a compensating interest payment to offset those shortfalls. See “Description of the Certificates—Prepayment Interest Shortfalls” in the Preliminary Prospectus. The remaining amount of prepayment interest shortfalls will be allocated to reduce the interest entitlement on all classes of certificates,pro rata, based on their respective amounts of accrued interest for the related distribution date. If a class receives less than the entirety of its interest entitlement on any distribution date, then the shortfall, excluding any shortfall due to prepayment interest shortfalls, will be added to its interest entitlement for the next succeeding distribution date.
The principal distribution amount for each distribution date generally will be the aggregate amount of principal received or advanced in respect of the mortgage loans, net of any non-recoverable advances and interest thereon that are reimbursed to the master servicer, the special servicer or the trustee during the related collection period. Non-recoverable advances and interest thereon are reimbursable from principal collections before reimbursement from other amounts.
| ||
Special Servicer Compensation: | The principal compensation to be paid to the special servicer in respect of its special servicing activities will be the special servicing fee, the workout fee and the liquidation fee.
The special servicing fee for each distribution date is calculated based on the outstanding principal balance of each mortgage loan (other than any non-serviced mortgage loan) that is a specially serviced mortgage loan (and any related serviced companion loan) or as to which the related mortgaged property has become an REO property at the special servicing fee rate, which will be a rate equal to the greater of 0.25%per annum and theper annum rate that would result in a special servicing fee of $3,500 for the related month. The special servicing fee will be payable monthly,first, from liquidation proceeds, insurance and condemnation proceeds, and collections in respect of the related specially serviced mortgage loan or REO property and,then, from general collections on all the mortgage loans (other than a non-serviced mortgage loan) and any REO properties.
The special servicer will also be entitled to (i) liquidation fees generally equal to 1.0% of liquidation proceeds in respect of a specially serviced mortgage loan (and any related serviced companion loan) or related REO property and (ii) workout fees generally equal to 1.0% of interest and principal payments made in respect of a rehabilitated mortgage loan (and any related serviced companion loan), subject to a cap with respect to each such fee of $1,000,000 with respect to any mortgage loan, whole loan or related REO property and subject to certain adjustments and exceptions as described in the Preliminary Prospectus under “Pooling and Servicing Agreement—Servicing and Other Compensation and Payment of Expenses—Special Servicer Compensation”.
With respect to any non-serviced mortgage loan, the related special servicer under the related other pooling and servicing agreement pursuant to which such mortgage loan is being serviced will be entitled to similar compensation as that described above with respect to such non-serviced mortgage loan under such other pooling and servicing agreement as further described in the Preliminary Prospectus, although any related fees may accrue at a different rate and there may be a higher (or no) cap on liquidation and workout fees. | |
| Prepayment Premiums/Yield Maintenance Charges: | If any yield maintenance charge or prepayment premium is collected during any particular collection period with respect to any Mortgage Loan, then on the Distribution Date corresponding to that collection period, the certificate administrator will pay to the holders of each class of the Class A-1, Class A-2, Class A-SB, Class A-3, Class A-4, Class A-S, Class B, Class C and Class D certificates, the product of (a) such yield maintenance charge or prepayment premium, (b) the related Base Interest Fraction (as defined below) for such class, and (c) a fraction, the numerator of which is equal to the amount of principal distributed to such class for that distribution date, and the denominator of which is the total amount of principal distributed to the principal balance certificates (other than the Control Eligible Certificates) for that distribution date. Any yield maintenance charge or prepayment premium that is collected during any particular collection period with respect to any mortgage loan and remaining after the distributions in the preceding sentence (as to the applicable distribution date, the “Class X YM Distribution Amount”) will be distributed to the holders of the Class X certificates as follows: (1) first, to the Class X-A and Class X-B certificates, in each case in an amount equal to the product of (i) a fraction, the numerator of which is equal to the amount of principal distributed on the applicable distribution date with respect to the class(es) of principal balance certificates whose certificate balances comprise the notional amount of the applicable class of Class X certificates, and the denominator of which is the total amount of principal distributed on the applicable distribution date with respect to the principal balance certificates, multiplied by (ii) the Class X YM Distribution Amount for the applicable distribution date, and (2) second, to the Class X-D certificates, in an amount equal to the portion of the Class X YM Distribution Amount remaining after the distributions to the holders of the Class X-A and Class X-B certificates. “Base Interest Fraction” means, with respect to any principal prepayment of any mortgage loan that provides for the payment of a yield maintenance charge or prepayment premium, and with respect to any class of principal balance certificates, a fraction (A) the numerator of which is the greater of (x) zero and (y) the difference between (i) the pass-through rate on that class, and (ii) the applicable discount rate and (B) the denominator of which is the difference between (i) the mortgage interest rate on the related mortgage loan and (ii) the applicable discount rate; provided, however, that: under no circumstances will the Base Interest Fraction be greater than one; if the discount rate referred to above is greater than or equal to the mortgage interest rate on the related mortgage loan and is greater than or equal to the pass-through rate on that class, then the Base Interest Fraction will equal zero; and if the discount rate referred to above is greater than or equal to the mortgage interest rate on the related mortgage loan and is less than the pass-through rate on that |
| This is not a research report and was not prepared by the Underwriters’ research departments. Please see additional important information and qualifications at the end of this Term Sheet. |
| T-9 |
| MSBAM 2016-C28 | Structural Overview |
| class, then the Base Interest Fraction will be equal to 1.0. Consistent with the foregoing, the Base Interest Fraction is equal to: | ||||
| (Pass-Through Rate – Discount Rate) | ||||
| (Mortgage Rate – Discount Rate) | ||||
| Realized Losses: | On each distribution date, immediately following the distributions to be made to the certificateholders on that date, the certificate administrator is required to calculate the amount, if any, by which (i) the aggregate stated principal balance of the mortgage loans, including any successor REO loans expected to be outstanding immediately following that distribution date is less than (ii) the then aggregate certificate balance of the principal balance certificates (other than the Exchangeable Certificates and the Exchangeable Combined Certificates) and trust components after giving effect to distributions of principal on that distribution date (any such deficit, a “Realized Loss”).
first, to the Class H-2 Trust Component (and correspondingly, to the Class H-2 certificates and the Class H certificates,pro rata based on their respective percentage interests in the Class H-2 Trust Component);
second, to the Class H-1 Trust Component (and correspondingly, to the Class H-1 certificates and the Class H certificates,pro rata based on their respective percentage interests in the Class H-1 Trust Component);
third, to the Class G-2 Trust Component (and correspondingly, to the Class G-2 certificates, the Class G certificates and the Class EFG certificates,pro rata based on their respective percentage interests in the Class G-2 Trust Component);
fourth, to the Class G-1 Trust Component (and correspondingly, to the Class G-1 certificates, the Class G certificates and the Class EFG certificates,pro rata based on their respective percentage interests in the Class G-1 Trust Component);
fifth, to the Class F-2 Trust Component (and correspondingly, to the Class F-2 certificates, the Class F certificates, the Class EF certificates and the Class EFG certificates,pro rata based on their respective percentage interests in the Class F-2 Trust Component);
sixth, to the Class F-1 Trust Component (and correspondingly, to the Class F-1 certificates, the Class F certificates, the Class EF certificates and the Class EFG certificates,pro rata based on their respective percentage interests in the Class F-1 Trust Component);
seventh, to the Class E-2 Trust Component (and correspondingly, to the Class E-2 certificates, the Class E certificates, the Class EF certificates and the Class EFG certificates,pro rata based on their respective percentage interests in the Class E-2 Trust Component);
eighth, to the Class E-1 Trust Component (and correspondingly, to the Class E-1 certificates, the Class E certificates, the Class EF certificates and the Class EFG certificates,pro rata based on their respective percentage interests in the Class E-1 Trust Component),
ninth, to the Class D certificates;
tenth, to the Class C certificates;
eleventh, to the Class B certificates; and
twelfth, to the Class A-S certificates.
Following the reduction of the certificate balances of all such classes of certificates (and, in turn, the related trust components) to zero, the certificate administrator will be required to allocate Realized Losses among the Class A-1, Class A-2, Class A-SB, Class A-3 and Class A-4 certificates,pro rata, based upon their respective certificate balances, until their respective certificate balances have been reduced to zero.
| |||
| Serviced Whole Loans: | The mortgaged property identified on Annex A-1 to the Preliminary Prospectus as Princeton Pike Corporate Center secures (i) a mortgage loan (the “Princeton Pike Corporate Center mortgage loan”) with an outstanding principal balance as of the Cut-off Date of $50,000,000, representing approximately 5.2% of the initial pool balance, and (ii) two (2)pari passu promissory notes that are not part of the mortgage pool (collectively referred to as the “Princeton Pike Corporate Centerpari passu companion loan” and a “servicedpari passu companion loan”), with an aggregate outstanding principal balance as of the Cut-off Date of $80,000,000. The Princeton Pike Corporate Centerpari passu companion loan is expected to be held by Morgan Stanley Bank, N.A. or an affiliate thereof on the closing date and may be contributed to one or more future securitization transactions or may be otherwise transferred at any time. The Princeton Pike Corporate Center mortgage loan and the Princeton Pike Corporate Centerpari passu companion loan are collectively referred to as the “Princeton Pike Corporate Center whole loan” and a “servicedpari passu whole loan” and will be serviced pursuant to the related intercreditor agreement and the pooling and servicing agreement for this transaction. With respect to the Princeton Pike Corporate Center mortgage loan, any holder of the Princeton Pike Corporate Centerpari passu companion loan will have certain consultation rights under the pooling and servicing agreement with respect to certain major decisions and other matters related to the Princeton Pike Corporate Center whole loan. | |||
| This is not a research report and was not prepared by the Underwriters’ research departments. Please see additional important information and qualifications at the end of this Term Sheet. |
| T-10 |
| MSBAM 2016-C28 | Structural Overview |
| The mortgaged property identified on Annex A-1 to the Preliminary Prospectus as Le Meridien Cambridge MIT secures (i) a mortgage loan (the “Le Meridien Cambridge MIT mortgage loan”) with an outstanding principal balance as of the Cut-off Date of $30,000,000, representing approximately 3.1% of the initial pool balance, and (ii) two (2)pari passu promissory notes that are not part of the mortgage pool (collectively referred to as the “Le Meridien Cambridge MITpari passu companion loan” and a “servicedpari passu companion loan”), with an aggregate outstanding principal balance as of the Cut-off Date of $42,200,000. The Le Meridien Cambridge MITpari passu companion loan is expected to be held by Bank of America, National Association or an affiliate thereof on the closing date and may be contributed to one or more future securitization transactions or may be otherwise transferred at any time. The Le Meridien Cambridge MIT mortgage loan and the Le Meridien Cambridge MITpari passu companion loan are collectively referred to as the “Le Meridien Cambridge MIT whole loan” and a “servicedpari passu whole loan” and will be serviced pursuant to the related intercreditor agreement and the pooling and servicing agreement for this transaction. With respect to the Le Meridien Cambridge MIT mortgage loan, any holder of the Le Meridien Cambridge MITpari passu companion loan will have certain consultation rights under the pooling and servicing agreement with respect to certain major decisions and other matters related to the Le Meridien Cambridge MIT whole loan. | ||
| There are no other “servicedpari passu whole loans,” and there are no “serviced AB whole loans,” related to the issuing entity. See “Description of the Mortgage Pool—The Whole Loans” in the Preliminary Prospectus. | ||
| With respect to any mortgage loan that is part of a serviced whole loan, unless otherwise indicated, all LTV, DSCR and Debt Yield calculations herein include the related servicedpari passu companion loan. | ||
| Non-Serviced Whole Loans: | The mortgaged property identified on Annex A-1 to the Preliminary Prospectus as Penn Square Mall secures (1) on a generally seniorpari passu basis (a) a mortgage loan (the “Penn Square Mall mortgage loan”) with an outstanding principal balance as of the Cut-off Date of $90,000,000, representing approximately 9.4% of the initial pool balance, and (b) two (2)pari passu promissory notes that have an aggregate outstanding principal balance as of the Cut-off Date of $116,500,000 (collectively referred to as the “Penn Square Mall non-servicedpari passu companion loan” and a “non-servicedpari passu companion loan”), which promissory notes are not included in the issuing entity and are currently held by the MSCI 2016-PSQ securitization trust and by Morgan Stanley Bank, N.A., and (2) one (1) subordinate promissory note with an outstanding principal balance as of the Cut-off Date of $103,500,000 (the “Penn Square Mall non-serviced subordinate companion loan” and a “subordinate companion loan”), which promissory note is generally subordinate in right of payment to the Penn Square Mall mortgage loan and the Penn Square Mall non-servicedpari passu companion loan, is not included in the issuing entity and is currently held by the MSCI 2016-PSQ securitization trust. The promissory note held by Morgan Stanley Bank, N.A. may be contributed to one or more future securitization transactions or may be otherwise transferred at any time. The Penn Square Mall mortgage loan, the Penn Square Mall non-servicedpari passu companion loan and the Penn Square Mall non-serviced subordinate companion loan are collectively referred to herein as the “Penn Square Mall whole loan” and a “non-serviced whole loan”. The Penn Square Mall whole loan will be serviced pursuant to the related intercreditor agreement and the MSCI 2016-PSQ trust and servicing agreement. The holder of the controlling portion of the Penn Square Mall non-servicedpari passu companion loan (or, so long as such portion is included in the MSCI 2016-PSQ securitization trust, the controlling class representative thereunder (or other party designated to exercise the rights of such control note)) will be entitled to direct the servicing of the Penn Square Mall whole loan and will have the right to replace the special servicer with respect to the Penn Square Mall whole loan with or without cause. | |
| The mortgaged property identified on Annex A-1 to the Preliminary Prospectus as Ellenton Premium Outlets secures on apari passu basis (i) a mortgage loan (the “Ellenton Premium Outlets mortgage loan”) with an outstanding principal balance as of the Cut-off Date of $71,200,000, representing approximately 7.5% of the initial pool balance, and (ii) threepari passu promissory notes that are not part of the mortgage pool (collectively referred to as the “Ellenton Premium Outlets non-servicedpari passu companion loan” and a “non-servicedpari passu companion loan”), with an aggregate outstanding principal balance as of the Cut-off Date of $106,800,000. The Ellenton Premium Outlets non-servicedpari passu companion loan is not included in the issuing entity: a portion thereof (represented by promissory Note A-1 and Note A-3) is currently held by the MSCI 2015-UBS8 securitization trust, and a portion thereof (represented by promissory Note A-2) is currently held by UBS Real Estate Securities Inc., which may sell such portion at any time, subject to compliance with the related intercreditor agreement. The Ellenton Premium Outlets mortgage loan and the Ellenton Premium Outlets non-servicedpari passu companion loan are collectively referred to herein as the “Ellenton Premium Outlets whole loan” and a “non-serviced whole loan” and will be serviced pursuant to the related intercreditor agreement and the pooling and servicing agreement for the MSCI 2015-UBS8 securitization. The holder of the portion of the Ellenton Premium Outlets non-servicedpari passu companion loan represented by promissory Note A-1 (or, so long as such portion is included in the MSCI 2015-UBS8 securitization trust, the controlling class representative thereunder (or other party designated to exercise the rights of such control note)) will be entitled to direct the servicing of the Ellenton Premium Outlets whole loan and will have the right to replace the special servicer with respect to the Ellenton Premium Outlets whole loan with or without cause. | ||
| The portfolio of mortgaged properties identified on Annex A-1 to the Preliminary Prospectus as GLP Industrial Portfolio A secures (1) on a generally seniorpari passu basis (a) a mortgage loan (the “GLP Industrial Portfolio A mortgage loan”) with an outstanding principal balance as of the Cut-off Date of $70,000,000, representing approximately 7.3% of the initial pool balance, and (b) four (4)pari passu promissory notes that have an aggregate outstanding principal balance as of the Cut-off Date of $567,600,000 (collectively referred to as the “GLP Industrial Portfolio A non-servicedpari passucompanion loan” and a “non-serviced pari passu |
| This is not a research report and was not prepared by the Underwriters’ research departments. Please see additional important information and qualifications at the end of this Term Sheet. |
| T-11 |
| MSBAM 2016-C28 | Structural Overview |
companion loan”), which promissory notes are not included in the issuing entity and are currently held by the CSMC 2015-GLPA securitization trust, the CSAIL 2016-C5 securitization trust and Column Financial, Inc. or an affiliate thereof, and (2) two (2) subordinate promissory notes with an aggregate outstanding principal balance as of the Cut-off Date of $328,900,000 (the “GLP Industrial Portfolio A non-serviced subordinate companion loan” and a “subordinate companion loan”), which promissory notes are generally subordinate in right of payment to the GLP Industrial Portfolio A mortgage loan and the GLP Industrial Portfolio A non-servicedpari passu companion loan, are not included in the issuing entity and are currently held by the CSMC 2015-GLPA securitization trust. The promissory note held by Column Financial, Inc. or an affiliate thereof may be contributed to one or more future securitization transactions or may be otherwise transferred at any time. The GLP Industrial Portfolio A mortgage loan, the GLP Industrial Portfolio A non-servicedpari passu companion loan and the GLP Industrial Portfolio A non-serviced subordinate companion loan are collectively referred to herein as the “GLP Industrial Portfolio A whole loan” and a “non-serviced whole loan”. The GLP Industrial Portfolio A whole loan will be serviced pursuant to the related intercreditor agreement and the CSMC 2015-GLPA trust and servicing agreement. The holder of the controlling portion of the GLP Industrial Portfolio A non-servicedpari passu companion loan (or, so long as such portion is included in the CSMC 2015-GLPA securitization trust, the controlling class representative thereunder (or other party designated to exercise the rights of such control note)) will be entitled to direct the servicing of the GLP Industrial Portfolio A whole loan and will have the right to replace the special servicer with respect to the GLP Industrial Portfolio A whole loan with or without cause.
The mortgaged property identified on Annex A-1 to the Preliminary Prospectus as University West Apartments secures on apari passu basis (i) a mortgage loan (the “University West Apartments mortgage loan”) with an outstanding principal balance as of the Cut-off Date of $18,000,000, representing approximately 1.9% of the initial pool balance, and (ii) onepari passu promissory note that is not part of the mortgage pool (referred to as the “University West Apartments non-servicedpari passu companion loan” and a “non-servicedpari passu companion loan”), with an outstanding principal balance as of the Cut-off Date of $27,000,000. Thepari passu promissory note evidencing the University West Apartments non-servicedpari passu companion loan is currently held by the MSBAM 2015-C27 securitization trust. The University West Apartments mortgage loan and the University West Apartments non-servicedpari passu companion loan are collectively referred to herein as the “University West Apartments whole loan” and a “non-serviced whole loan” and will be serviced pursuant to the related intercreditor agreement and the pooling and servicing agreement for the MSBAM 2015-C27 securitization. The holder of the University West Apartments non-servicedpari passu companion loan (or, so long as such companion loan is included in the MSBAM 2015-C27 securitization trust, the controlling class representative thereunder (or other party designated to exercise the rights of such control note)) will be entitled to direct the servicing of the University West Apartments whole loan and will have the right to replace the special servicer with respect to the University West Apartments whole loan with or without cause.
No mortgage loans, other than the Penn Square Mall mortgage loan, the Ellenton Premium Outlets mortgage loan, the GLP Industrial Portfolio A mortgage loan and the University West Apartments mortgage loan will have a non-serviced companion loan or a non-serviced subordinate companion loan associated with them, and all of the mortgage loans, other than the Penn Square Mall mortgage loan, the Ellenton Premium Outlets mortgage loan, the GLP Industrial Portfolio A mortgage loan and the University West Apartments mortgage loan, are being serviced under the pooling and servicing agreement for this transaction. Accordingly, other than the Penn Square Mall whole loan, the Ellenton Premium Outlets whole loan, the GLP Industrial Portfolio A whole loan and the University West Apartments whole loan, there are no other “non-serviced whole loans” with respect to the issuing entity. See “Description of the Mortgage Pool—Whole Loans” in the Preliminary Prospectus.
With respect to any mortgage loan that is part of a non-serviced whole loan, unless otherwise indicated, all LTV, DSCR and Debt Yield calculations herein include the related non-serviced pari passucompanion loan and exclude any related subordinate companion loan. | ||
| Appraisal Reduction Amounts: | An Appraisal Reduction Amount generally will be created in the amount, if any, by which the principal balance of a required appraisal loan (which is a mortgage loan with respect to which certain defaults, modifications or insolvency events have occurred as further described in the Preliminary Prospectus) plus other amounts overdue or advanced in connection with such mortgage loan exceeds 90% of the appraised value of the related mortgaged property plus certain escrows and reserves (including letters of credit) held with respect to the mortgage loan.
A mortgage loan will cease to be subject to an Appraisal Reduction Amount when the same has been brought current for at least three consecutive months, no additional event of default is foreseeable in the reasonable judgment of the special servicer and no other circumstances exist that would cause such mortgage loan or any related companion loan to be a specially serviced loan.
Any appraisal reduction in respect of any non-serviced mortgage loan generally will be calculated in accordance with the other servicing agreement pursuant to which such mortgage loan is being serviced, which calculations are generally similar to those provided for in the pooling and servicing agreement for this transaction.
If any mortgage loan is part of a whole loan, any appraisal reduction will be calculated in respect of such whole loan taken as a whole and will be allocated first to any related subordinate companion loan and second to any related mortgage loan andpari passu companion loan on a pro rata basis by unpaid principal balance. |
| This is not a research report and was not prepared by the Underwriters’ research departments. Please see additional important information and qualifications at the end of this Term Sheet. |
| T-12 |
| MSBAM 2016-C28 | Structural Overview |
| Appraisal Reduction Amounts will proportionately reduce the interest portion of debt service advances required to be made in respect of the related mortgage loan. Appraisal Reduction Amounts will also be taken into account in the determination of the identity of the controlling class entitled to appoint the Directing Certificateholder (see “Directing Certificateholder/ Controlling Class” below.) | ||
| Control Rights: | The Control Eligible Certificates will have certain control rights attached to them. The “Directing Certificateholder” will be the Controlling Class Certificateholder (or its representative) selected by more than 50% (by certificate balance) of the Controlling Class Certificateholders;provided,however, that (1) absent that selection, (2) until a Directing Certificateholder is so selected or (3) upon receipt of a notice from a majority of the Controlling Class Certificateholders (by certificate balance) that a Directing Certificateholder is no longer designated, the Controlling Class Certificateholder that owns the largest aggregate certificate balance of the Controlling Class (or its representative) will be the Directing Certificateholder;provided,however, that (i) if such holder elects or has elected to not be the Directing Certificateholder, the holder of the next largest aggregate certificate balance of the Controlling Class will be the Directing Certificateholder, (ii) in the event no one holder owns the largest aggregate certificate balance of the Controlling Class, then there will be no Directing Certificateholder until appointed in accordance with the terms of the Pooling and Servicing Agreement, and (iii) the certificate administrator and the other parties to the Pooling and Servicing Agreement will be entitled to assume that the identity of the Directing Certificateholder has not changed until such parties receive written notice of a replacement of the Directing Certificateholder from a party holding the requisite interest in the Controlling Class (as confirmed by the certificate registrar), or the resignation of the then current Directing Certificateholder.
“Borrower Party” means borrower, a Mortgagor, a manager of a Mortgaged Property, an Accelerated Mezzanine Loan Lender, or any Borrower Party Affiliate.
“Accelerated Mezzanine Loan Lender” means a mezzanine lender under a mezzanine loan that has been accelerated or as to which foreclosure or enforcement proceedings have been commenced against the equity collateral pledged to secure such mezzanine loan.
“Borrower Party Affiliate” means, with respect to a borrower, a Mortgagor, a manager of a Mortgaged Property or an Accelerated Mezzanine Loan Lender, (a) any other Person controlling or controlled by or under common control with such borrower, Mortgagor, manager or Accelerated Mezzanine Loan Lender, as applicable, or (b) any other Person owning, directly or indirectly, 25% or more of the beneficial interests in such borrower, Mortgagor, manager or Accelerated Mezzanine Loan Lender, as applicable. For purposes of this definition, “control” when used with respect to any specified Person means the power to direct the management and policies of such Person, directly or indirectly, whether through the ownership of voting securities, by contract or otherwise and the terms “controlling” and “controlled” have meanings correlative to the foregoing.
An “Excluded Loan” is a mortgage loan or whole loan with respect to which the Directing Certificateholder or the holder of the majority of the Controlling Class is a Borrower Party. As of the closing date, it is expected that there will be no Excluded Loans with respect to this securitization.
With respect to the Princeton Pike Corporate Center whole loan, direction, consent and consultation rights with respect to the related whole loan is subject to certain consultation rights of the holder of the Princeton Pike Corporate Centerpari passu companion loan pursuant to the related intercreditor agreement.
With respect to the Penn Square Mall mortgage loan, the Ellenton Premium Outlets mortgage loan, the GLP Industrial Portfolio A mortgage loan and the University West Apartments mortgage loan, direction, consent and consultation rights with respect to the related whole loan will be exercised by the directing certificateholder or controlling class representative under the applicable pooling and servicing agreement or trust and servicing agreement, as applicable.
A “Control Termination Event” will occur when (i) the Class E-1 Trust Component and the Class E-2 Trust Component have an aggregate certificate balance (taking into account the application of any Appraisal Reduction Amounts to notionally reduce the certificate balance of such Trust Components) of less than 25% of the initial aggregate certificate balance of such Trust Components or (ii) the holder of a majority of the aggregate certificate balance of the Class E-1, Class E-2, Class E, Class EF and Class EFG certificates (such majority determined counting only the portion of the certificate balance of each such class evidencing an interest in the Class E Trust Components) has irrevocably waived its right, in writing, to exercise any of the rights of the Controlling Class Certificateholder and such rights have not been reinstated to a successor controlling class certificateholder as described below;provided,however, that a Control Termination Event will be deemed not continuing in the event that the certificate balances of the certificates other than the Control Eligible Certificates have been reduced to zero as a result of principal payments on the Mortgage Loans.
If a Control Termination Event has occurred and is continuing but no Consultation Termination Event has occurred and is continuing, the special servicer will be required to consult with the Directing Certificateholder (other than with respect to Excluded Loans) and the operating advisor in connection with asset status reports and major decisions. Such consultation rights will continue until the occurrence of a Consultation Termination Event.
A “Consultation Termination Event” will occur when (i) there is no grouping of Control Eligible Certificates as to which the related Trust Components, collectively, have a then-outstanding certificate balance at least equal to 25% of the initial aggregate certificate balance of such Trust Components, in each case, without regard to the |
| This is not a research report and was not prepared by the Underwriters’ research departments. Please see additional important information and qualifications at the end of this Term Sheet. |
| T-13 |
| MSBAM 2016-C28 | Structural Overview |
application of any Appraisal Reduction Amounts; or (ii) the holder of a majority of the aggregate certificate balance of the Class E-1, Class E-2, Class E, Class EF and Class EFG certificates (such majority determined counting only the portion of the certificate balance of each such Class evidencing an interest in the Class E Trust Components) has irrevocably waived its right, in writing, to exercise any of the rights of the Controlling Class Certificateholder and such rights have not been reinstated to a successor controlling class certificateholder pursuant to the terms of the PSA;provided that no Consultation Termination Event resulting solely from the operation of clause (ii) will be deemed to have existed or be in continuance with respect to a successor holder of any such class of certificates that has not irrevocably waived its right to exercise any of the rights of the Controlling Class Certificateholder;provided,however, that a Consultation Termination Event will be deemed not continuing in the event that the certificate balances of the certificates other than the Control Eligible Certificates have been reduced to zero as a result of principal payments on the Mortgage Loans.
If a Consultation Termination Event has occurred and is continuing, the special servicer must consult with the operating advisor in connection with asset status reports major decisions, and, in general, the Directing Certificateholder will not have any right to terminate the special servicer or approve, direct or consult with respect to servicing matters.
Notwithstanding any of the foregoing to the contrary, with respect to any Excluded Loan, a Control Termination Event and Consultation Termination Event will be deemed to exist, and the Directing Certificateholder will not be permitted to direct (or consult in respect of) the replacement of the special servicer, or direct (or consult) the special servicer in respect of major decisions and asset status reports, with respect to such Excluded Loan. | ||
| Control Eligible Certificates: | The “Control Eligible Certificates” will be all classes of certificates, collectively, within each of the following four groupings of certificates: (i) the classes of certificates related to the Class E Trust Components, being the Class E-1, Class E-2, Class E, Class EF and Class EFG certificates, in the case of each such class, only to the extent evidencing an interest in the Class E Trust Components (and the aggregate certificate balance of this grouping of certificates will only take into account the portion of the certificate balance of each such class representing an interest in the Class E Trust Components); (ii) the classes of certificates related to the Class F Trust Components, being the Class F-1, Class F-2, Class F, Class EF and Class EFG certificates, in the case of each such class, only to the extent evidencing an interest in the Class F Trust Components (and the aggregate certificate balance of this grouping of certificates will only take into account the portion of the certificate balance of each such class representing an interest in the Class F Trust Components); (iii) the classes of certificates related to the Class G Trust Components, being the Class G-1, Class G-2, Class G and Class EFG certificates, in the case of each such class, only to the extent evidencing an interest in the Class G Trust Components (and the aggregate certificate balance of this grouping of certificates will only take into account the portion of the certificate balance of each such class representing an interest in the Class G Trust Components); and (iv) the classes of certificates related to the Class H Trust Components, being the Class H-1, Class H-2 and Class H certificates. | |
| Directing Certificateholder/ Controlling Class: | An affiliated fund of, or an entity controlled by affiliated funds of, C-III High Yield Real Estate Debt Fund IV Tier Holdings Inc. is expected to be appointed the initial Directing Certificateholder.
The “Controlling Class” will be, as of any time of determination, all classes of certificates, collectively, within the grouping of Control Eligible Certificates that relates to the Controlling Trust Components. The “Controlling Trust Components” are, collectively, the most subordinate pair of Trust Components with the same alphabetical designation having an aggregate certificate balance, as notionally reduced by any Appraisal Reduction Amounts allocable to such Trust Components, at least equal to 25% of the aggregate initial certificate balance of such Trust Components;provided,however, that if at any time the certificate balances of the certificates other than the Control Eligible Certificates have been reduced to zero as a result of principal payments on the Mortgage Loans, then the Controlling Class will be the most subordinate grouping of Control Eligible Certificates as to which the related Trust Components, collectively, have an aggregate certificate balance greater than zero without regard to any Appraisal Reduction Amounts.
The Controlling Trust Components as of the closing date will be the Class H Trust Components, and the Controlling Class as of the closing date will be, collectively, the Class H-1 certificates and the Class H-2 certificates and, to the extent any Class H-1 certificates and Class H-2 certificates have been exchanged for Class H certificates, the Class H certificates. | |
| Appraised-Out Class: | Any grouping of Control Eligible Certificates that has been determined, as a result of Appraisal Reduction Amounts allocable to the related Trust Components, to no longer be the Controlling Class. | |
| Appraisal Remedy: | Holders of the majority of any Appraised-Out Class will have the right, at their sole expense, to require the special servicer to order a second appraisal report from an MAI appraiser (selected by the special servicer) for any mortgage loan (or serviced whole loan) that results in the related grouping of Control Eligible Certificates becoming an Appraised-Out Class.
Upon receipt of that second appraisal, the special servicer will be required to determine, in accordance with the Servicing Standard, whether, based on its assessment of the second appraisal, any recalculation of the Appraisal Reduction Amount is warranted, and if so warranted, the special servicer is required to recalculate the Appraisal Reduction Amount based on the second appraisal and if required by such recalculation, the Appraised-Out Class will be reinstated as the Controlling Class. The holders of an Appraised-Out Class |
| This is not a research report and was not prepared by the Underwriters’ research departments. Please see additional important information and qualifications at the end of this Term Sheet. |
| T-14 |
| MSBAM 2016-C28 | Structural Overview |
| requesting a second appraisal are not permitted to exercise any control or consent rights of the Controlling Class until such time, if any, as the applicable grouping of Control Eligible Certificates is reinstated as the Controlling Class. | ||
| Sale of Defaulted Loans: | Pursuant to the pooling and servicing agreement, under certain circumstances the special servicer may offer to sell a defaulted serviced mortgage loan, in which event it is required to use reasonable efforts to solicit offers for such defaulted serviced mortgage loan (and any related companion loan (to the extent provided under the related intercreditor agreement) and/or related REO properties).
The Directing Certificateholder will not have a right of first refusal to purchase a defaulted loan.
If the special servicer does not receive an offer at least equal to the Purchase Price, the special servicer may purchase the defaulted loan or REO property at the Purchase Price or may accept the highest offer received from any person that is determined to be a fair price for such defaulted loan or REO property. If multiple offers are received during the period designated by the special servicer for receipt of offers, the special servicer is generally required to select the highest offer. The special servicer will be required to determine whether any cash offer constitutes a fair price for any defaulted loan or REO property if the first or highest offeror is a person other than a party to the PSA, the Directing Certificateholder, any sponsor, any Borrower Party, any independent contractor engaged by the special servicer or any known affiliate of any of the preceding entities, a holder of any related companion loan or mezzanine loan, the depositor, the master servicer, the special servicer (or any independent contractor engaged by such special servicer), or the trustee for the securitization of a companion loan or any known affiliate of any such person (each, an “Interested Person”). If the first or highest offer is made by an Interested Person, the trustee will be required to determine (based upon the most recent appraisal conducted in accordance with the terms of the PSA) whether the offer constitutes a fair price for the defaulted loan or REO property unless (i) the offer is equal to or greater than the applicable Par Purchase Price and (ii) the offer is the highest offer received. Absent an offer at least equal to the Par Purchase Price, no offer from an Interested Person will constitute a fair price unless (x) it is the highest offer received and (y) at least two other offers are received from independent third parties, and the trustee will be required to rely on the opinion of an independent appraiser or other independent expert retained by the trustee in connection with making such determination. Neither the trustee nor any of its affiliates may make an offer for or purchase any specially serviced mortgage loan or REO property.
Notwithstanding any of the foregoing to the contrary, the special servicer is not required to accept the highest offer and may accept a lower offer for a defaulted loan or REO property if the special servicer determines (with respect to any mortgage loan other than an Excluded Loan, in consultation with the Directing Certificateholder (unless a Consultation Termination Event exists) and, in the case of a serviced whole loan or an REO property related to a serviced whole loan, the related companion holders), in accordance with the Servicing Standard (and subject to the requirements of any related intercreditor agreement), that a rejection of such offer would be in the best interests of the certificateholders and, with respect to a serviced whole loan or REO property related to a serviced whole loan, the holders of the related pari passu companion loans, as a collective whole as if such Certificateholders and, if applicable, the related companion holder constituted a single lender (taking into account the pari passu nature of any companion loan), so long as such lower offer was not made by the special servicer or any of its affiliates.
If title to any mortgaged property is acquired by the trust fund, the special servicer will be required to sell such mortgaged property prior to the close of the third (3rd) calendar year beginning after the year of acquisition, unless (a) the IRS grants or has not denied an extension of time to sell such mortgaged property or (b) the special servicer, trustee and the certificate administrator receive an opinion of independent counsel to the effect that the holding of the property by the trust longer than the above-referenced three-year period will not result in the imposition of a tax on any REMIC of the trust fund or cause any REMIC of the trust fund to fail to qualify as a REMIC.
The foregoing applies to mortgage loans serviced under the PSA. With respect to any non-serviced whole loan, if the special servicer under the applicable pooling and servicing agreement or trust and servicing agreement, as applicable, determines to sell the relatedcompanion loans if it becomes a defaulted loan, then the applicable special servicer will be required to sell the related whole loan, including the related mortgage loan included in the MSBAM 2016-C28 trust and the relatedpari passu companion loan(s) and any subordinate companion loans(s), as a single loan. In connection with any such sale, the special servicer under the applicable pooling and servicing agreement will be required to follow procedures substantially similar to those set forth above. | |
| Appointment and Replacement of Special Servicer: | The Directing Certificateholder will appoint the initial special servicer as of the closing date. Prior to the occurrence and continuance of a Control Termination Event, the special servicer may generally be replaced at any time by the Directing Certificateholder.
After the occurrence and during the continuance of a Control Termination Event and upon (a) the written direction of holders of certificates evidencing not less than 25% of the voting rights of all classes of certificates entitled to principal (taking into account the application of Appraisal Reduction Amounts to notionally reduce the certificate balances of classes to which such Appraisal Reduction Amounts are allocable) requesting a vote to replace the special servicer with a replacement special servicer, (b) payment by such requesting holders to the certificate administrator of all reasonable fees and expenses to be incurred by the certificate administrator in connection with administering such vote and (c) delivery by such holders to each applicable rating agency of |
| This is not a research report and was not prepared by the Underwriters’ research departments. Please see additional important information and qualifications at the end of this Term Sheet. |
| T-15 |
| MSBAM 2016-C28 | Structural Overview |
a rating agency communication, the certificate administrator will be required to promptly post such notice on its internet website and by mail and conduct the solicitation of votes of all certificates in such regard, which such vote must occur within 180 days of the posting of such notice. Upon the written direction of holders of at least 75% of a Certificateholder Quorum, the trustee will immediately replace the special servicer with a qualified replacement special servicer designated by such holders of certificates.
After the occurrence of a Consultation Termination Event, if the operating advisor determines that the special servicer is not performing its duties as required under the pooling and servicing agreement or is otherwise not acting in accordance with the servicing standard, the operating advisor may also recommend the replacement of the special servicer. The operating advisor’s recommendation to replace the special servicer must be confirmed by an affirmative vote of holders of principal balance certificates evidencing at least a majority of the aggregate voting rights (taking into account the application of any appraisal reduction amounts to notionally reduce the respective certificate balances) of all principal balance certificates on an aggregate basis.
A “Certificateholder Quorum” means, in connection with any solicitation of votes in connection with the replacement of the special servicer or the asset representations reviewer, the holders of certificates evidencing at least 75% of the aggregate voting rights (taking into account the application of Realized Losses and, other than with respect to the termination of the asset representations reviewer, the application of any Appraisal Reduction Amounts to notionally reduce the certificate balance of the certificates) of all classes of certificates entitled to principal on an aggregate basis.
With respect to each of the Princeton Pike Corporate Center whole loan, the holder of a promissory note evidencing the relatedpari passu companion loan following a servicer termination event with respect to the special servicer that affects such holder, will be entitled to direct the trustee (and the trustee will be required) to terminate the special servicer solely with respect to such serviced whole loan. A replacement special servicer will be selected by the trustee or, prior to a Control Termination Event, by the Directing Certificateholder;provided,however, that any successor special servicer appointed to replace the special servicer with respect to such whole loan can generally not be the entity (or its affiliate) that was terminated at the direction of the holder of the relatedpari passu companion loan.
With respect to any non-serviced whole loan, (other than the GLP Industrial Portfolio A whole loan), the MSBAM 2016-C28 trust, as holder of the related mortgage loan, has the right to terminate the special servicer under the related pooling and servicing agreement if a servicer termination event occurs, with respect to such special servicer that affects the trust in its capacity as such holder. Such rights may be exercised by the Directing Certificateholder prior to a Control Termination Event. However, the successor special servicer (which may not be the terminated entity or its affiliate) will be selected pursuant to the applicable pooling and servicing agreement by the related directing holder prior to a control event under such pooling and servicing agreement. The master servicer and special servicer are entitled to certain fees in connection with the servicing and administration of the mortgage loans as more fully described in “Pooling and Servicing Agreement—Servicing and Other Compensation and Payment of Expenses” in the Preliminary Prospectus. | ||
| Servicing Standard: | Each of the master servicer and the special servicer is obligated to service and administer the mortgage loans (and, if applicable, the serviced companion loans) in accordance with the definition of the “Servicing Standard” described in the Preliminary Prospectus and the terms of the pooling and servicing agreement, provided that each non-serviced mortgage loan, if any, will be serviced by another master servicer or special servicer under the pooling and servicing agreement with respect to the securitization of the related companion loan or applicable portion thereof. | |
| Excluded Special Servicer: | If the special servicer obtains knowledge that it is a Borrower Party with respect to any mortgage loan or serviced whole loan (any such mortgage loan or serviced whole loan, an “Excluded Special Servicer Loan”), the special servicer will be required to resign as special servicer of that Excluded Special Servicer Loan. Prior to the occurrence and continuance of a Control Termination Event, if the applicable Excluded Special Servicer Loan is not also an Excluded Loan, the Directing Certificateholder will be required to select a successor special servicer that is not a Borrower Party in accordance with the terms of the PSA (an “Excluded Special Servicer”) for the related Excluded Special Servicer Loan. After the occurrence and during the continuance of a Control Termination Event or if at any time the applicable Excluded Special Servicer Loan is also an Excluded Loan, the resigning special servicer will be required to select the related Excluded Special Servicer. | |
| Liquidated Loan Waterfall: | On liquidation of any mortgage loan, all net liquidation proceeds related to the mortgage loan (but not any related companion loan) will be applied so that amounts allocated as a recovery of accrued and unpaid interest will not, in the first instance, include any delinquent interest that was not advanced as a result of Appraisal Reduction Amounts. After the adjusted interest amount is so allocated, any remaining liquidation proceeds will be allocated to offset certain advances and to pay principal on the mortgage loan until the unpaid principal amount of the mortgage loan has been reduced to zero. Any remaining liquidation proceeds will then be allocated to pay delinquent interest that was not advanced as a result of Appraisal Reduction Amounts. | |
| Operating Advisor: | The operating advisor will be required to perform certain review duties if a Control Termination Event has occurred and is continuing, which will generally include a limited annual review of, and the delivery of a report regarding, certain actions of the special servicer with respect to the resolution and/or liquidation of specially serviced mortgage loans to the certificate administrator. The review and report generally will be based on any asset status reports and additional information delivered to the operating advisor by the special servicer. In |
| This is not a research report and was not prepared by the Underwriters’ research departments. Please see additional important information and qualifications at the end of this Term Sheet. |
| T-16 |
| MSBAM 2016-C28 | Structural Overview |
addition, if a Control Termination Event has occurred and is continuing, the special servicer must consult with the operating advisor (in addition to the Directing Certificateholder if no Consultation Termination Event has occurred and is continuing) in connection with major decisions with respect to mortgage loans. Furthermore, under certain circumstances, but only if a Consultation Termination Event has occurred and is continuing, the operating advisor may recommend the replacement of the special servicer as described above under “—Appointment and Replacement of Special Servicer.”
If a Consultation Termination Event has occurred and is continuing, the operating advisor may be removed and replaced without cause upon the affirmative direction of certificates owners holding not less than 75% of the appraisal-reduced voting rights of all certificates, following a proposal from certificate owners holding not less than 25% of the appraisal-reduced voting rights of all certificates. The certificateholders who initiate a vote on a termination and replacement of the operating advisor without cause and cause the payment of the fees and expenses incurred in the replacement. In addition, in the event there are no classes of certificates outstanding other than the Control Eligible Certificates, the Class V certificates and the Class R certificates, then all of the rights and obligations of the operating advisor under the PSA will terminate without payment of any penalty or termination fee (other than any rights or obligations that accrued prior to the date of such termination (including accrued and unpaid compensation) and other than indemnification rights arising out of events occurring prior to such termination). See “Pooling and Servicing Agreement—The Operating Advisor—Termination of the Operating Advisor Without Cause”in the Preliminary Prospectus. | ||
| Operating Advisor Expenses: | In addition to the Operating Advisor Fee and the Operating Advisor Consulting Fee, the operating advisor will be entitled to reimbursement of Operating Advisor Expenses in accordance with the terms of the PSA. “Operating Advisor Expenses” for each distribution date will equal any unreimbursed indemnification amounts or additional trust fund expenses payable to the operating advisor pursuant to the PSA (other than the Operating Advisor Fee and the Operating Advisor Consulting Fee). | |
| Asset Representations Reviewer: | The asset representations reviewer will be required to review certain delinquent mortgage loans after a specified delinquency threshold has been met and the required percentage of certificateholders vote to direct a review of such delinquent mortgage loans, as described below. The asset representations reviewer will be entitled to the Asset Representations Reviewer Fee with respect to such review. See “Pooling and Servicing Agreement—The Asset Representations Reviewer” in the Preliminary Prospectus.
The certificate administrator will be required to notify certificateholders if either (1) mortgage loans with an aggregate outstanding principal balance of 25.0% or more of the aggregate outstanding principal balance of all of the mortgage loans (including any REO loans (or a portion of any REO loan in the case of a whole loan)) held by the issuing entity as of the end of the applicable collection period are delinquent loans or (2) (A) prior to and including the second anniversary of the Closing Date, at least ten mortgage loans are delinquent loans as of the end of the applicable collection period and the outstanding principal balance of such delinquent loans in the aggregate constitutes at least 15.0% of the aggregate outstanding principal balance of all of the mortgage loans (including any REO loans (or a portion of any REO loan in the case of a whole loan)) held by the issuing entity as of the end of the applicable collection period.or (B) after the second anniversary of the Closing Date,at least fifteen mortgage loans are delinquent loans as of the end of the applicable collection period and the outstanding principal balance of such delinquent loans in the aggregate constitutes at least 20.0% of the aggregate outstanding principal balance of all of the mortgage loans (including any REO loans (or a portion of any REO loan in the case of a whole loan)) held by the issuing entity as of the end of the applicable collection period.
If certificateholders evidencing not less than 5.0% of the voting rights request a vote to commence an asset review, and if subsequently a majority of an Asset Review Quorum authorizes an asset review within 150 days of the request for a vote, the asset representations reviewer will be required to conduct an asset review of delinquent loans.
An “Asset Review Quorum” means, in connection with any solicitation of votes to authorize an asset review as described above, the holders of certificates evidencing at least 5.0% of the aggregate voting rights.
The asset representations reviewer may be terminated and replaced without cause. Upon (i) the written direction of certificateholders evidencing not less than 25% of the voting rights (without regard to the application of any Appraisal Reduction Amounts) requesting a vote to terminate and replace the asset representations reviewer with a proposed successor asset representations reviewer that is an eligible asset representations reviewer, and (ii) payment by such holders to the certificate administrator of the reasonable fees and expenses to be incurred by the certificate administrator in connection with administering such vote, the certificate administrator will promptly provide notice to all certificateholders and the asset representations reviewer of such request by posting such notice on its internet website, and by mailing such notice to all certificateholders and the asset representations reviewer. Upon the written direction of certificateholders evidencing at least 75% of a Certificateholder Quorum (without regard to the application of any Appraisal Reduction Amounts), the trustee will terminate all of the rights and obligations of the asset representations reviewer under the pooling and servicing agreement (other than any rights or obligations that accrued prior to the date of such termination and other than indemnification rights arising out of events occurring prior to such termination) by written notice to the asset representations reviewer, and the proposed successor asset representations reviewer will be appointed. See “Pooling and Servicing Agreement—The Asset Representations Reviewer” in the Preliminary Prospectus. |
| This is not a research report and was not prepared by the Underwriters’ research departments. Please see additional important information and qualifications at the end of this Term Sheet. |
| T-17 |
| MSBAM 2016-C28 | Structural Overview |
| Dispute Resolution Provisions: | The mortgage loan sellers will be subject to the dispute resolution provisions set forth in the PSA to the extent those provisions are triggered with respect to any mortgage loan sold to the depositor by a mortgage loan seller, and such mortgage loan seller will be obligated under the related mortgage loan purchase agreement to comply with all applicable provisions and to take part in any mediation or arbitration proceedings that may result. Generally, in the event that a Repurchase Request is not “Resolved” within 180 days after the related mortgage loan seller receives such Repurchase Request, then the enforcing servicer will be required to send a notice to the first certificateholder (or beneficial owner) to deliver a certificateholder repurchase request with respect to the mortgage loan (the “Initial Requesting Certificateholder”) (if any) and to all certificateholders (via the certificate administrator website) indicating the enforcing servicer’s intended course of action with respect to the Repurchase Request. If (a) the enforcing servicer’s intended course of action with respect to the Repurchase Request does not involve pursuing further action to exercise rights against the related mortgage loan seller with respect to the Repurchase Request and the Initial Requesting Certificateholder, if any, or any other certificateholder or certificate owner wishes to exercise its right to refer the matter to mediation (including nonbinding arbitration) or arbitration, or (b) the enforcing servicer’s intended course of action is to pursue further action to exercise rights against the related mortgage loan seller with respect to the Repurchase Request but the Initial Requesting Certificateholder, if any, or any other certificateholder or certificate owner does not agree with the dispute resolution method selected by the enforcing servicer, then the Initial Requesting Certificateholder, if any, or such other certificateholder or certificate owner may deliver a written notice to the special servicer indicating its intent to exercise its right to refer the matter to either mediation or arbitration.
“Resolved” means, with respect to a Repurchase Request, (i) that the related Material Defect has been cured, (ii) the related mortgage loan has been repurchased in accordance with the related mortgage loan purchase agreement, (iii) a mortgage loan has been substituted for the related mortgage loan in accordance with the related mortgage loan purchase agreement, (iv) the applicable mortgage loan seller has made a Loss of Value Payment, (v) a contractually binding agreement has been entered into between the enforcing servicer, on behalf of the issuing entity, and the related mortgage loan seller that settles the related mortgage loan seller’s obligations under the related mortgage loan purchase agreement, or (vi) the related mortgage loan is no longer property of the issuing entity as a result of a sale or other disposition in accordance with the pooling and servicing agreement. See “Pooling and Servicing Agreement—Dispute Resolution Provisions” in the Preliminary Prospectus. | |
| Investor Communications: | The certificate administrator is required to include on any Form 10–D any request received from a certificateholder to communicate with other certificateholders related to certificateholders exercising their rights under the terms of the PSA. Any certificateholder wishing to communicate with other certificateholders regarding the exercise of its rights under the terms of the PSA will be able to deliver a written request signed by an authorized representative of the requesting investor to the certificate administrator. | |
| Deal Website: | The certificate administrator will be required to maintain a deal website which will include, among other items: (a) summaries of asset status reports prepared by the special servicer, (b) inspection reports, (c) appraisals, (d) various “special notices” described in the Preliminary Prospectus, (e) the “Investor Q&A Forum” and (f) a voluntary “Investor Registry”. Investors may access the deal website following execution of a certification and confidentiality agreement. |
| This is not a research report and was not prepared by the Underwriters’ research departments. Please see additional important information and qualifications at the end of this Term Sheet. |
| T-18 |
| MSBAM 2016-C28 | Collateral Overview |
| Mortgage Loan Sellers | No. of Mortgage Loans | No. of Mortgaged Properties | Aggregate Cut-off Date Balance | % of Pool(1) |
| Morgan Stanley Mortgage Capital Holdings LLC | 18 | 132 | $466,048,750 | 48.8% |
| Bank of America, National Association | 12 | 12 | $332,646,635 | 34.8% |
| CIBC Inc. | 7 | 7 | $91,506,391 | 9.6% |
| Starwood Mortgage Funding III LLC | 5 | 10 | $65,446,578 | 6.8% |
| Total: | 42 | 161 | $955,648,355 | 100.0% |
Pool Statistics
| Aggregate Cut-off Date Balance: | $955,648,355 |
| Number of Mortgage Loans: | 42 |
| Average Cut-off Date Balance per Mortgage Loan: | $22,753,532 |
| Number of Mortgaged Properties: | 161 |
| Average Cut-off Date Balance per Mortgaged Property: | $5,935,704 |
| Weighted Average Mortgage Rate: | 4.618% |
| % of Pool Secured by 5 Largest Mortgage Loans: | 35.7% |
| % of Pool Secured by 10 Largest Mortgage Loans: | 57.0% |
| % of Pool Secured by ARD Loans(2): | 0.0% |
| Weighted Average Original Term to Maturity (months)(2): | 117 |
| Weighted Average Remaining Term to Maturity (months)(2): | 115 |
| Weighted Average Seasoning (months): | 2 |
| % of Pool Secured by Single Tenant Mortgaged Properties: | 6.6% |
| % of Pool Secured by Refinance Loans: | 57.4% |
| % of Pool Secured by Acquisition Loans: | 42.6% |
Additional Debt
| % of Pool withPari Passu Mortgage Debt: | 34.4% |
| % of Pool with Mezzanine Debt: | 17.6% |
| % of Pool with Subordinate Mortgage Debt: | 16.7% |
Credit Statistics(3)
| Weighted Average UW NOI DSCR: | 2.13x |
| Weighted Average UW NOI Debt Yield: | 11.4% |
| Weighted Average UW NCF DSCR: | 1.98x |
| Weighted Average UW NCF Debt Yield: | 10.5% |
| Weighted Average Cut-off Date LTV Ratio(4): | 60.8% |
| Weighted Average Maturity Date LTV Ratio(2)(4): | 54.8% |
Footnotes are set forth on the following page.
| This is not a research report and was not prepared by the Underwriters’ research departments. Please see additional important information and qualifications at the end of this Term Sheet. |
| T-19 |
| MSBAM 2016-C28 | Collateral Overview |
Amortization
| Weighted Average Original Amortization Term (months): | 357 |
| Weighted Average Remaining Amortization Term (months): | 357 |
| % of Pool Amortizing Balloon: | 18.7% |
| % of Pool Interest Only followed by Amortizing Balloon: | 54.2% |
| % of Pool Interest Only through Maturity(2): | 27.0% |
| % of Pool Fully Amortizing: | 0.0% |
Lockboxes
| % of Pool with Hard Lockboxes: | 61.8% |
| % of Pool with Soft Lockboxes: | 7.9% |
| % of Pool with Springing Lockboxes: | 26.7% |
| % of Pool with No Lockboxes: | 3.7% |
Reserves
| % of Pool Requiring Tax Reserves: | 75.0% |
| % of Pool Requiring Insurance Reserves: | 45.0% |
| % of Pool Requiring Replacement Reserves: | 65.2% |
| % of Pool Requiring TI/LC Reserves(5): | 63.8% |
Call Protection
| % of Pool with lockout period, followed by defeasance until open period: | 91.4% |
| % of Pool with lockout period, followed by the greater of a prepayment premium and yield maintenance until open period: | 1.3% |
| % of Pool with the greater of a prepayment premium and yield maintenance until open period: | 7.3% |
| (1) | Unless otherwise indicated, all references to “% of Pool” in this Term Sheet reflect a percentage of the aggregate principal balance of the mortgage pool as of the Cut-off Date, after application of all payments of principal due during or prior to February 2016. |
| (2) | With respect to any ARD Loan, unless otherwise indicated, references in this Term Sheet to the applicable “maturity date” refer to the applicable anticipated repayment date with respect to such ARD Loan, and such applicable anticipated repayment date is treated as its maturity date for all purposes hereof. |
| (3) | With respect to any mortgage loan that is part of a whole loan, unless otherwise indicated, all LTV, DSCR, Debt Yield and Balance per SF/Unit calculations in this term sheet include the relatedpari passu companion loan and exclude any subordinate notes, as applicable. Additionally, LTV, DSCR, Debt Yield and Balance per SF/Unit figures in this Term Sheet are calculated for mortgage loans without regard to any additional indebtedness that may be incurred at a future date. With respect to any leased fee loans, the SF/Unit and Balance per SF/Unit figures in this Term Sheet are based on the size of the non-collateral improvements. |
| (4) | The LTV ratios set forth in this Term Sheet are generally based on the “as-is” values of the related mortgaged properties; provided, that such LTV ratios may be based on “as-stabilized” values in certain cases in which reserves have been established at origination for the applicable condition or circumstance that is expected to result in stabilization. See the definition of “Appraised Value” under“Description of the Mortgage Pool—Additional Mortgage Loan Information” in the Preliminary Prospectus. |
| (5) | Excludes hospitality, multifamily, manufactured housing, self-storage and leased fee properties. |
| This is not a research report and was not prepared by the Underwriters’ research departments. Please see additional important information and qualifications at the end of this Term Sheet. |
| T-20 |
| MSBAM 2016-C28 | Characteristics of the Mortgage Loans |
| Top 10 Mortgage Loans | |||||||||||||
| Loan No. | Mortgage Loan Seller | Property Name | City | State | Property Type | Cut-off Date Balance | % of Pool | SF/Units | Cut-off Date Balance per SF/Unit | UW NCF DSCR | UW NOI Debt Yield | Cut-off Date LTV | Maturity Date LTV |
| 1 | MSMCH | Penn Square Mall(1) | Oklahoma City | OK | Retail | $90,000,000 | 9.4% | 1,062,281 | $194.39 | 4.10x | 16.4% | 31.3% | 31.3% |
| 2 | BANA | Ellenton Premium Outlets(2) | Ellenton | FL | Retail | $71,200,000 | 7.5% | 476,487 | $373.57 | 2.43x | 10.9% | 53.6% | 53.6% |
| 3 | MSMCH | GLP Industrial Portfolio A(3) | Various | Various | Industrial | $70,000,000 | 7.3% | 26,878,777 | $23.72 | 3.97x | 18.2% | 30.5% | 30.5% |
| 4 | BANA | Navy League Building | Arlington | VA | Office | $60,000,000 | 6.3% | 190,926 | $314.26 | 1.45x | 9.8% | 61.4% | 56.7% |
| 5 | MSMCH | Princeton Pike Corporate Center(4) | Lawrence Township | NJ | Office | $50,000,000 | 5.2% | 809,458 | $160.60 | 1.38x | 9.6% | 65.3% | 60.8% |
| 6 | MSMCH | Princeton South Corporate Center | Trenton | NJ | Office | $48,000,000 | 5.0% | 267,426 | $179.49 | 1.32x | 8.1% | 66.7% | 61.4% |
| 7 | BANA | Greenville Mall | Greenville | NC | Retail | $45,329,539 | 4.7% | 406,464 | $111.52 | 1.64x | 11.1% | 62.4% | 50.7% |
| 8 | BANA | Waterford Place Apartments | Manchester | NH | Multifamily | $40,000,000 | 4.2% | 384 | $104,166.67 | 1.21x | 7.9% | 71.9% | 66.2% |
| 9 | CIBC | Marriott - Albuquerque, NM | Albuquerque | NM | Hospitality | $37,072,435 | 3.9% | 411 | $90,200.57 | 1.58x | 11.5% | 69.2% | 57.0% |
| 10 | SMF III | Simply Self Storage OK & FL Portfolio | Various | Various | Self Storage | $33,105,000 | 3.5% | 569,991 | $58.08 | 1.33x | 8.4% | 71.5% | 60.2% |
| Total/Wtd. Avg. | $544,706,974 | 57.0% | 2.32x | 11.9% | 54.3% | 50.0% | |||||||
| (1) | The Penn Square Mall mortgage loan is part of a whole loan that is evidenced by threepari passu promissory notes with an aggregate Cut-off Date principal balance of $206,500,000, and a subordinate promissory note with an outstanding principal balance as of the Cut-off Date of $103,500,000. The Penn Square Mall mortgage loan is evidenced by one suchpari passu promissory note (Note A-1B) with an outstanding principal balance as of the Cut-off Date of $90,000,000. The “Penn Square Mall non-serviced companion loan” is evidenced by the remainingpari passu promissory notes (Notes A-1A and A-1C), with outstanding principal balances as of the Cut-off Date of $69,900,000 and $46,600,000, respectively, and the “Penn Square Mall non-serviced subordinate companion loan” is evidenced by the subordinate promissory note (Note A-2), with an outstanding principal balance as of the Cut-off Date of $103,500,000. The portion of the Penn Square Mall non-serviced companion loan represented by Note A-1A and the Penn Square Mall non-serviced subordinate companion loan are not included in the Issuing Entity and were contributed to the MSCI 2016-PSQ securitization trust. The portion of the Penn Square Mall non-serviced companion loan represented by Note A-1C is not included in the Issuing Entity and is expected to be held by Morgan Stanley Bank, N.A. or an affiliate thereof on the closing date of this transaction, and such promissory note may be contributed to one or more future securitization trusts or otherwise transferred at any time. Unless otherwise indicated, all LTV, DSCR, Debt Yield and Cut-off Date Balance PSF/Unit calculations include the relatedpari passu companion loan but exclude the related subordinate companion loan. See “Description of the Mortgage Pool—The Whole Loans—The Non-Serviced Pari Passu-AB Whole Loans—The Penn Square Mall Whole Loan” in the Preliminary Prospectus. |
| (2) | The Ellenton Premium Outlets mortgage loan is part of a whole loan that is evidenced by fourpari passu promissory notes with an aggregate Cut-off Date principal balance of $178,000,000. The Ellenton Premium Outlets mortgage loan is evidenced by one suchpari passu promissory note (Note A-4) with an outstanding principal balance as of the Cut-off Date of $71,200,000. The “Ellenton Premium Outlets non-serviced companion loan” is evidenced by the remainingpari passu promissory notes (Notes A-1, A-2 and A-3), with outstanding principal balances as of the Cut-off Date of $58,000,000, $38,800,000 and $10,000,000, respectively. The portion of the Ellenton Premium Outlets non-serviced companion loan represented by Notes A-1 and A-3 is not included in the Issuing Entity and was contributed to the MSCI 2015-UBS8 securitization trust. The portion of the Ellenton Premium Outlets non-serviced companion loan represented by Note A-2 is not included in the Issuing Entity and is expected to be held by UBS Real Estate Securities Inc. or an affiliate thereof on the closing date of this transaction, and such promissory note may be contributed to one or more future securitization trusts or otherwise transferred at any time. Unless otherwise indicated, all LTV, DSCR, Debt Yield and Cut-off Date Balance PSF/Unit calculations include the relatedpari passu companion loan. See “Description of the Mortgage Pool—The Whole Loans—The Non-Serviced PariPassu Whole Loans—The Ellenton Premium Outlets Whole Loan” in the Preliminary Prospectus. |
| (3) | The GLP Industrial Portfolio A mortgage loan is part of a whole loan that is evidenced by fivepari passu promissory notes with an aggregate Cut-off Date principal balance of $637,600,000, and two subordinate promissory notes with an aggregate outstanding principal balance as of the Cut-off Date of $328,900,000. The GLP Industrial Portfolio A mortgage loan is evidenced by one suchpari passu promissory note (Note A-4) with an outstanding principal balance as of the Cut-off Date of $70,000,000. The “GLP Industrial Portfolio A non-serviced companion loan” is evidenced by the remainingpari passu promissory notes (Notes A-1, A-2, A-3-1 and A-3-2), with outstanding principal balances as of the Cut-off Date of $284,440,000, $153,160,000, $87,100,000 and $42,900,000, respectively, and the “GLP Industrial Portfolio A subordinate companion loan” is evidenced by the subordinate promissory notes (Notes B-1 and B-2), with outstanding principal balances as of the Cut-off Date of $213,785,000 and $115,115,000, respectively. The portion of the GLP Industrial Portfolio A non-serviced companion loan represented by Notes A-1 and A-2 and the GLP Industrial Portfolio A non-serviced subordinate companion loan are not included in the Issuing Entity and were contributed to the CSMC 2015-GLPA securitization trust. The portion of the GLP Industrial Portfolio A non-serviced companion loan represented by Note A-3-1 is not included in the Issuing Entity and was contributed to the CSAIL 2016-C5 securitization trust. The portion of the GLP Industrial Portfolio A non-serviced companion loan represented by Note A-3-2 is not included in the Issuing Entity and is expected to be held by Column Financial, Inc. or an affiliate thereof on the closing date of this transaction, and such promissory note may be contributed to one or more future securitization trusts or otherwise transferred at any time. Unless otherwise indicated, all LTV, DSCR, Debt Yield and Cut-off Date Balance PSF/Unit calculations include the relatedpari passu companion loan but exclude the related subordinate companion loan. See “Description of the Mortgage Pool—The Whole Loans—The Non-Serviced Pari Passu-AB Whole Loans—The GLP Industrial Portfolio A Whole Loan” in the Preliminary Prospectus. |
| (4) | The Princeton Pike Corporate Center mortgage loan is part of a whole loan that is evidenced by threepari passu promissory notes with an aggregate Cut-off Date principal balance of $130,000,000. The Princeton Pike Corporate Center mortgage loan is evidenced by one suchpari passu promissory note (Note A-1) with an outstanding principal balance as of the Cut-off Date of $50,000,000. The “Princeton Pike Corporate Center non-serviced companion loan” is evidenced by the remainingpari passu promissory notes (Notes A-2 and A-3), with outstanding principal balances as of the Cut-off Date of $45,000,000 and $35,000,000, respectively. The Princeton Pike Corporate Center non-serviced companion loan is expected to be held by Morgan Stanley Bank, N.A. or an affiliate thereof on the closing date of this transaction and such promissory notes may be contributed to one or more future securitization trusts or otherwise transferred at any time. Unless otherwise indicated, all LTV, DSCR, Debt Yield and Cut-off Date Balance PSF/Unit calculations include the relatedpari passucompanion loan. See “Description of the Mortgage Pool—The Whole Loans—The Serviced Pari Passu Whole Loans—The Princeton Pike Corporate Center Whole Loan” in the Preliminary Prospectus. |
| This is not a research report and was not prepared by the Underwriters’ research departments. Please see additional important information and qualifications at the end of this Term Sheet. |
| T-21 |
| MSBAM 2016-C28 | Characteristics of the Mortgage Loans |
| Mortgage Loans withPari Passu Companion Loans | ||||||||||||
| Loan No. | Mortgage Loan Seller | Property Name | Mortgage Loan Cut-off Date Balance | Pari passu Companion Loan Cut-off Date Balance | Combined Cut-off Date Balance | Lead Servicing Agreement | Master Servicer | Special Servicer | Control Rights | Combined UW NCF DSCR | Combined UW NOI Debt Yield | Combined Cut-off Date LTV |
| 1 | MSMCH | Penn Square Mall(1) | $90,000,000 | $116,500,000 | $206,500,000 | MSCI 2016-PSQ | Wells Fargo | Wells Fargo | MSCI 2016-PSQ | 4.10x | 16.4% | 31.3% |
| 2 | BANA | Ellenton Premium Outlets(2) | $71,200,000 | $106,800,000 | $178,000,000 | MSCI 2015-UBS8 | Midland | Rialto | MSCI 2015-UBS8 | 2.43x | 10.9% | 53.6% |
| 3 | MSMCH | GLP Industrial Portfolio A(3) | $70,000,000 | $567,600,000 | $637,600,000 | CSMC 2015-GLPA | KeyBank | AEGON | CSMC 2015-GLPA | 3.97x | 18.2% | 30.5% |
| 5 | MSMCH | Princeton Pike Corporate Center(4) | $50,000,000 | $80,000,000 | $130,000,000 | MSBAM 2016-C28 | Wells Fargo | C-III | MSBAM 2016-C28 | 1.38x | 9.6% | 65.3% |
| 12 | BANA | Le Meridien Cambridge MIT(5) | $30,000,000 | $42,200,000 | $72,200,000 | MSBAM 2016-C28 | Wells Fargo | C-III | MSBAM 2016-C28 | 1.55x | 11.1% | 68.1% |
| 18 | BANA | University West Apartments(6) | $18,000,000 | $27,000,000 | $45,000,000 | MSBAM 2015-C27 | Wells Fargo | CWCapital | MSBAM 2015-C27 | 1.45x | 9.2% | 74.1% |
| (1) | See Footnote (1) to the table entitled “Top 10 Mortgage Loans” above for a description of the Penn Square Mall whole loan. |
| (2) | See Footnote (2) to the table entitled “Top 10 Mortgage Loans” above for a description of the Ellenton Premium Outlets whole loan. |
| (3) | See Footnote (3) to the table entitled “Top 10 Mortgage Loans” above for a description of the GLP Industrial Portfolio A whole loan. |
| (4) | See Footnote (4) to the table entitled “Top 10 Mortgage Loans” above for a description of the Princeton Pike Corporate Center whole loan. |
| (5) | The Le Meridien Cambridge MIT mortgage loan is part of a whole loan that is evidenced by three pari passu promissory notes with an aggregate Cut-off Date principal balance of $72,200,000. The Le Meridien Cambridge MIT mortgage loan is evidenced by one suchpari passu promissory note (Note A-1) wpith an outstanding principal balance as of the Cut-off Date of $30,000,000. The “Le Meridien Cambridge MIT non-serviced companion loan” is evidenced by the remainingpari passu promissory notes (Notes A-2 and A-3), with outstanding principal balances as of the Cut-off Date of $21,100,000 and $21,100,000, respectively. The Le Meridien Cambridge MIT non-serviced companion loan is not included in the Issuing Entity and is expected to be held by Bank of America, National Association or an affiliate thereof on the closing date of this transaction, and such promissory notes may be contributed to one or more future securitization trusts or otherwise transferred at any time. Unless otherwise indicated, all LTV, DSCR, Debt Yield and Cut-off Date Balance PSF/Unit calculations include the related pari passucompanion loan. See“Description of the Mortgage Pool—The Whole Loans—The Non-Serviced Pari Passu Whole Loans—The Le Meridien Cambridge MIT Whole Loan”in the Preliminary Prospectus. |
| (6) | The University West Apartments mortgage loan is part of a whole loan that is evidenced by twopari passu promissory notes with an aggregate Cut-off Date principal balance of $45,000,000. The University West Apartments mortgage loan is evidenced by one suchpari passupromissory note (Note A-2) with an outstanding principal balance as of the Cut-off Date of $18,000,000. The “University West Apartments non-serviced companion loan” is evidenced by the remainingpari passu promissory note (Note A-2), with an outstanding principal balance as of the Cut-off Date of $27,000,000. The University West Apartments non-serviced companion loan is not included in the Issuing Entity and is expected to be held by the MSBAM 2015-C27 securitization trust on the closing date of this transaction. Unless otherwise indicated, all LTV, DSCR, Debt Yield and Cut-off Date Balance PSF/Unit calculations include the relatedpari passu companion loan. See“Description of the Mortgage Pool—The Whole Loans—The Non-Serviced Pari Passu Whole Loans—The University West Apartments Whole Loan” in the Preliminary Prospectus. |
| This is not a research report and was not prepared by the Underwriters’ research departments. Please see additional important information and qualifications at the end of this Term Sheet. |
| T-22 |
| MSBAM 2016-C28 | Characteristics of the Mortgage Loans |
| Mortgage Loans with Subordinate Debt | |||||||||||
| Loan No. | Mortgage Loan Seller | Property Name | Mortgage Loan Cut-off Date Balance | Cut-off Date Loan per Unit/SF | Subordinate Debt Cut-off Date Balance | UW NCF DSCR | UW NOI Debt Yield | Cut-off Date LTV | Total Mortgage Debt UW NCF DSCR | Total Mortgage Debt UW NOI Debt Yield | Total Mortgage Debt Cut-off Date LTV |
| 1 | MSMCH | Penn Square Mall(1) | $90,000,000 | $194.39 | $103,500,000 | 4.10x | 16.4% | 31.3% | 2.73x | 10.9% | 47.0% |
| 3 | MSMCH | GLP Industrial Portfolio A(2) | $70,000,000 | $23.72 | $328,900,000 | 3.97x | 18.2% | 30.5% | 2.62x | 12.0% | 46.2% |
| (1) | See Footnote (1) to the table entitled “Top 10 Mortgage Loans” above for a description of the Penn Square Mall whole loan. |
| (2) | See Footnote (3) to the table entitled “Top 10 Mortgage Loans” above for a description of the GLP Industrial Portfolio A whole loan. |
| Mortgage Loans with Mezzanine Debt(1) | |||||||||||
| Loan No. | Mortgage Loan Seller | Property Name | Mortgage Loan Cut-off Date Balance | Cut-off Date Loan per Unit/SF | Mezzanine Debt Cut-off Date Balance | UW NCF DSCR | UW NOI Debt Yield | Cut-off Date LTV | Total Debt UW NCF DSCR | Total Debt UW NOI Debt Yield | Total Debt Cut-off Date LTV |
| 3 | MSMCH | GLP Industrial Portfolio A | $70,000,000 | $23.72 | $330,000,000 | 3.97x | 18.2% | 30.5% | 1.84x | 8.9% | 62.0% |
| 5 | MSMCH | Princeton Pike Corporate Center | $50,000,000 | $160.60 | $17,000,000 | 1.38x | 9.6% | 65.3% | 1.07x | 8.5% | 73.9% |
| 6 | MSMCH | Princeton South Corporate Center | $48,000,000 | $179.49 | $12,000,000 | 1.32x | 8.1% | 66.7% | 0.92x | 6.4% | 83.3% |
| (1) | Total Debt UW NCF DSCR, Total Debt UW NOI Debt Yield and Total Debt Cut-off Date LTV figures shown above are calculated based on any relatedpari passu notes, any related subordinate note(s) and the mezzanine debt. |
| This is not a research report and was not prepared by the Underwriters’ research departments. Please see additional important information and qualifications at the end of this Term Sheet. |
| T-23 |
| MSBAM 2016-C28 | Characteristics of the Mortgage Loans |
| Prior Securitization History(1) | ||||||||||||||
| Loan No. | Mortgage Loan Seller | Property Name | City | State | Property Type | Cut-off Date Balance | % of Pool | SF/Units | Cut-off Date Balance per SF/Unit | UW NCF DSCR | UW NOI Debt Yield | Cut-off Date LTV | Maturity Date LTV | Prior Securitization |
| 2 | BANA | Ellenton Premium Outlets | Ellenton | FL | Retail | $71,200,000 | 7.5% | 476,487 | $373.57 | 2.43x | 10.9% | 53.6% | 53.6% | WBCMT 2006-C23; WBCMT 2006-C25 |
| 4 | BANA | Navy League Building | Arlington | VA | Office | $60,000,000 | 6.3% | 190,926 | $314.26 | 1.45x | 9.8% | 61.4% | 56.7% | BACM 2006-4 |
| 7 | BANA | Greenville Mall | Greenville | NC | Retail | $45,329,539 | 4.7% | 406,464 | $111.52 | 1.64x | 11.1% | 62.4% | 50.7% | MLMT 2005-LC1 |
| 9 | CIBC | Marriott - Albuquerque, NM | Albuquerque | NM | Hospitality | $37,072,435 | 3.9% | 411 | $90,200.57 | 1.58x | 11.5% | 69.2% | 57.0% | DBUBS 2011-LC3A |
| 10 | SMF III | Simply Self Storage OK & FL Portfolio(2) | Various | Various | Self Storage | $33,105,000 | 3.5% | 569,991 | $58.08 | 1.33x | 8.4% | 71.5% | 60.2% | CGCMT 2006-C5; WFRBS 2013-UBS1 |
| 13 | MSMCH | DoubleTree by Hilton - Cleveland, OH | Cleveland | OH | Hospitality | $29,000,000 | 3.0% | 379 | $76,517.15 | 1.60x | 12.6% | 72.5% | 60.3% | GSMS 2012-GC6 |
| 18 | BANA | University West Apartments | Ames | IA | Multifamily | $18,000,000 | 1.9% | 483 | $93,167.70 | 1.45x | 9.2% | 74.1% | 68.0% | MLMT 2007-C1 |
| 20 | MSMCH | Stoneleigh on the Lake Apartments | Spring | TX | Multifamily | $16,000,000 | 1.7% | 228 | $70,175.44 | 1.75x | 8.8% | 65.0% | 65.0% | FREMF 2011-K702 |
| 22 | CIBC | Grant at One | Philadelphia | PA | Retail | $12,880,000 | 1.3% | 79,222 | $162.58 | 1.52x | 10.3% | 75.0% | 64.9% | JPMCC 2006-CB14 |
| 24 | BANA | Canyon Lakes Plaza | Las Vegas | NV | Retail | $11,625,000 | 1.2% | 65,967 | $176.22 | 1.46x | 9.9% | 74.0% | 63.8% | CD 2005-CD1 |
| 27 | BANA | Asian Village | Westminster | CA | Retail | $8,181,577 | 0.9% | 44,046 | $185.75 | 1.42x | 9.8% | 56.8% | 46.6% | MLCFC 2006-3 |
| 29 | SMF III | Park Lee Shopping Center | Phoenix | AZ | Retail | $8,000,000 | 0.8% | 75,559 | $105.88 | 1.38x | 9.9% | 74.8% | 70.0% | GECMC 2004-C3 |
| 30 | SMF III | Holiday Inn Express - Orlando, FL | Orlando | FL | Hospitality | $7,991,578 | 0.8% | 107 | $74,687.65 | 1.80x | 13.4% | 69.5% | 57.4% | CD 2007-CD4 |
| 37 | CIBC | Lindale Crossing | Cedar Rapids | IA | Retail | $6,060,000 | 0.6% | 43,544 | $139.17 | 1.27x | 9.3% | 72.1% | 62.7% | BSCMS 2006-PW12 |
| 40 | MSMCH | Walgreens - Southbury, CT | Southbury | CT | Retail | $3,920,000 | 0.4% | 13,650 | $287.18 | 1.16x | 8.0% | 66.4% | 59.1% | GMACC 2006-C1 |
| Total | $368,365,129 | 38.5% | ||||||||||||
| (1) | Includes mortgage loans for which all or a portion of the previously existing debt was most recently securitized in conduit securitizations, based on information provided by the related borrower or obtained through searches of a third-party database. The information has not otherwise been confirmed by the mortgage loan sellers. With respect to any mortgage loan that is part of a whole loan, unless otherwise indicated, all LTV, DSCR, Debt Yield and Cut-off Date Balance PSF/Unit calculations include the relatedpari passu companion loan and exclude any subordinate notes, as applicable. |
| (2) | Two of the six properties securing the Simply Self Storage OK & FL Portfolio mortgage loan secured a loan that was included in the CGCMT 2006-C5 transaction. One of the six properties securing the Simply Self Storage OK & FL Portfolio mortgage loan secured a loan that was included in the WFRBS 2013-UBS1 transaction. |
| This is not a research report and was not prepared by the Underwriters’ research departments. Please see additional important information and qualifications at the end of this Term Sheet. |
| T-24 |
| MSBAM 2016-C28 | Characteristics of the Mortgage Loans |
Mortgage Loans with Scheduled Balloon Payments and Related Classes(1)
| Class A-2 ($43,800,000) | ||||||||||||||||
| Loan No. | Mortgage Loan Seller | Property Name | State | Property Type | Cut-off Date Balance | % of Pool | Maturity Date Balance | % of Class A-2 Certificate Principal Balance | SF/ Units | Cut-off Date Balance per SF/Unit | UW NCF DSCR | UW NOI Debt Yield | Cut-off Date LTV | Maturity Date LTV | Rem. IO Period (mos.) | Rem. Term to Maturity (mos.) |
| 12 | BANA | Le Meridien Cambridge MIT(2) | MA | Hospitality | $30,000,000 | 3.1% | $28,697,831 | 65.5% | 210 | $343,809.52 | 1.55x | 11.1% | 68.1% | 65.2% | 22 | 58 |
| 29 | SMF III | Park Lee Shopping Center | AZ | Retail | $8,000,000 | 0.8% | $7,490,820 | 17.1% | 75,559 | $105.88 | 1.38x | 9.9% | 74.8% | 70.0% | 5 | 59 |
| 36 | MSMCH | Regency Plaza | FL | Retail | $6,600,000 | 0.7% | $6,044,308 | 13.8% | 205,696 | $32.09 | 2.27x | 16.4% | 55.5% | 50.8% | 0 | 60 |
| Total/Wtd. Avg. | $44,600,000 | 4.7% | $42,232,959 | 96.4% | 1.62x | 11.7% | 67.4% | 63.9% | 16 | 58 | ||||||
| (1) | The table above reflects the mortgage loans whose balloon payments will be applied to pay down the Class A-2 certificates, assuming (i) that none of the mortgage loans experience prepayments, defaults or losses; (ii) there are no extensions of maturity dates; and (iii) each mortgage loan is paid in full on its stated maturity date or, in the case of any mortgage loan with an anticipated repayment date, on such anticipated repayment date. The table above is otherwise based on the Structuring Assumptions set forth under “Yield and Maturity Considerations—Weighted Average Life” in the Preliminary Prospectus. |
| (2) | See Footnote (5) to the table entitled “Mortgage Loans with Pari Passu Companion Loans” above for a description of the Le Meridien Cambridge MIT whole loan. |
| This is not a research report and was not prepared by the Underwriters’ research departments. Please see additional important information and qualifications at the end of this Term Sheet. |
| T-25 |
| MSBAM 2016-C28 | Characteristics of the Mortgage Loans |
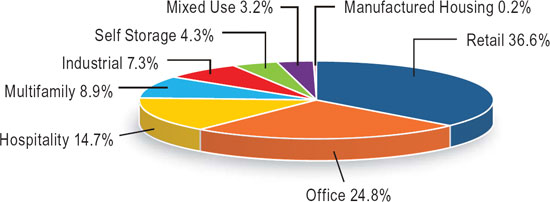
| Property Type Distribution(1) | ||||||||
| Property Type | Number of Mortgaged Properties | Aggregate Cut-off Date Balance | % of Pool | Wtd. Avg. Mortgage Rate | Wtd. Avg. UW NCF DSCR | Wtd. Avg. UW NOI Debt Yield | Wtd. Avg. Cut-off Date LTV | Wtd. Avg. Maturity Date LTV |
| Retail | 17 | $349,516,117 | 36.6% | 4.469% | 2.37x | 11.9% | 55.1% | 50.2% |
| Anchored | 7 | $171,660,000 | 18.0% | 4.423% | 2.80x | 13.2% | 50.6% | 46.6% |
| Outlet Center | 1 | $71,200,000 | 7.5% | 4.299% | 2.43x | 10.9% | 53.6% | 53.6% |
| Regional Mall | 1 | $45,329,539 | 4.7% | 4.460% | 1.64x | 11.1% | 62.4% | 50.7% |
| Shadow Anchored | 3 | $26,606,577 | 2.8% | 4.755% | 1.48x | 10.0% | 65.1% | 56.3% |
| Free-Standing | 4 | $21,840,000 | 2.3% | 4.791% | 1.92x | 10.8% | 55.9% | 49.6% |
| Unanchored | 1 | $12,880,000 | 1.3% | 4.930% | 1.52x | 10.3% | 75.0% | 64.9% |
| Office | 8 | $237,058,750 | 24.8% | 4.608% | 1.43x | 9.8% | 66.7% | 60.3% |
| Suburban | 7 | $177,058,750 | 18.5% | 4.496% | 1.43x | 9.7% | 68.4% | 61.5% |
| CBD | 1 | $60,000,000 | 6.3% | 4.938% | 1.45x | 9.8% | 61.4% | 56.7% |
| Hospitality | 9 | $140,179,340 | 14.7% | 5.034% | 1.66x | 12.5% | 67.8% | 57.5% |
| Full Service | 3 | $96,072,435 | 10.1% | 5.017% | 1.58x | 11.7% | 69.9% | 60.6% |
| Limited Service | 6 | $44,106,906 | 4.6% | 5.071% | 1.85x | 14.3% | 63.4% | 50.8% |
| Multifamily | 4 | $85,200,000 | 8.9% | 4.814% | 1.37x | 8.4% | 70.9% | 66.0% |
| Garden | 3 | $67,200,000 | 7.0% | 4.884% | 1.34x | 8.2% | 70.1% | 65.4% |
| Student Housing | 1 | $18,000,000 | 1.9% | 4.553% | 1.45x | 9.2% | 74.1% | 68.0% |
| Industrial | 114 | $70,000,000 | 7.3% | 4.144% | 3.97x | 18.2% | 30.5% | 30.5% |
| Distribution Warehouse | 59 | $44,413,769 | 4.6% | 4.144% | 3.97x | 18.2% | 30.5% | 30.5% |
| Warehouse | 46 | $24,092,093 | 2.5% | 4.144% | 3.97x | 18.2% | 30.5% | 30.5% |
| Flex | 9 | $1,494,138 | 0.2% | 4.144% | 3.97x | 18.2% | 30.5% | 30.5% |
| Self Storage | 7 | $40,998,750 | 4.3% | 4.838% | 1.33x | 8.5% | 72.2% | 61.1% |
| Self Storage | 7 | $40,998,750 | 4.3% | 4.838% | 1.33x | 8.5% | 72.2% | 61.1% |
| Mixed Use | 1 | $30,487,500 | 3.2% | 4.690% | 1.31x | 8.4% | 74.5% | 68.5% |
| Multifamily/Retail | 1 | $30,487,500 | 3.2% | 4.690% | 1.31x | 8.4% | 74.5% | 68.5% |
| Manufactured Housing | 1 | $2,207,898 | 0.2% | 5.190% | 1.37x | 9.2% | 71.2% | 59.2% |
| Manufactured Housing | 1 | $2,207,898 | 0.2% | 5.190% | 1.37x | 9.2% | 71.2% | 59.2% |
| Total/Wtd. Avg. | 161 | $955,648,355 | 100.0% | 4.618% | 1.98x | 11.4% | 60.8% | 54.8% |
| (1) | All numerical information concerning the mortgage loans is approximate and, in the case of mortgage loans secured by multiple properties, is based on allocated loan amounts with respect to such properties. All weighted average information regarding the mortgage loans reflects the weighting of the mortgage loans based on their outstanding principal balances as of the Cut-off Date or, in the case of mortgage loans secured by multiple properties, allocated loan amounts. The sum of numbers and percentages in columns may not match the “Total” due to rounding. With respect to any mortgage loan that is part of a whole loan, unless otherwise indicated, all LTV, DSCR and Debt Yield calculations include the relatedpari passu companion loan and exclude any subordinate notes, as applicable. |
| This is not a research report and was not prepared by the Underwriters’ research departments. Please see additional important information and qualifications at the end of this Term Sheet. |
| T-26 |
| MSBAM 2016-C28 | Characteristics of the Mortgage Loans |
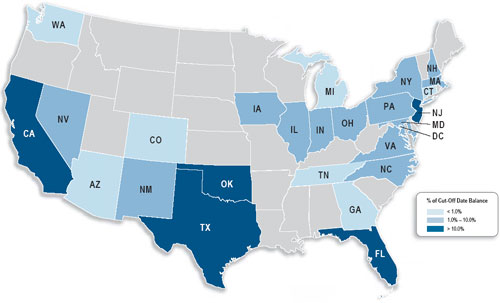
| Geographic Distribution(1) | |||||||||
| State or Other Jurisdiction | Number of Mortgaged Properties | Aggregate Cut-off Date Balance | % of Pool | Wtd. Avg. Mortgage Rate | Wtd. Avg. UW NCF DSCR | Wtd. Avg. UW NOI Debt Yield | Wtd. Avg. Cut-off Date LTV | Wtd. Avg. Maturity Date LTV | |
| Florida | 8 | $116,078,433 | 12.1% | 4.532% | 2.14x | 11.5% | 58.7% | 53.7% | |
| California | 24 | $107,701,025 | 11.3% | 4.556% | 2.11x | 12.6% | 56.9% | 50.6% | |
| California – Southern(2) | 22 | $74,923,525 | 7.8% | 4.557% | 2.25x | 13.4% | 52.6% | 46.7% | |
| California – Northern(2) | 2 | $32,777,500 | 3.4% | 4.556% | 1.80x | 10.9% | 66.6% | 59.4% | |
| Oklahoma | 5 | $105,220,000 | 11.0% | 3.984% | 3.70x | 15.2% | 37.1% | 35.5% | |
| New Jersey | 11 | $103,257,541 | 10.8% | 4.356% | 1.48x | 9.3% | 64.2% | 59.5% | |
| Texas | 34 | $98,725,933 | 10.3% | 4.681% | 1.70x | 10.2% | 68.0% | 61.9% | |
| Virginia | 5 | $66,484,298 | 7.0% | 4.950% | 1.51x | 10.2% | 61.6% | 56.4% | |
| North Carolina | 1 | $45,329,539 | 4.7% | 4.460% | 1.64x | 11.1% | 62.4% | 50.7% | |
| Ohio | 2 | $43,100,000 | 4.5% | 5.215% | 1.47x | 11.1% | 72.0% | 62.0% | |
| Maryland | 23 | $41,108,979 | 4.3% | 4.932% | 2.11x | 11.8% | 59.9% | 52.4% | |
| New Hampshire | 1 | $40,000,000 | 4.2% | 4.793% | 1.21x | 7.9% | 71.9% | 66.2% | |
| New Mexico | 1 | $37,072,435 | 3.9% | 4.880% | 1.58x | 11.5% | 69.2% | 57.0% | |
| Massachusetts | 1 | $30,000,000 | 3.1% | 4.933% | 1.55x | 11.1% | 68.1% | 65.2% | |
| Iowa | 2 | $24,060,000 | 2.5% | 4.693% | 1.40x | 9.2% | 73.6% | 66.7% | |
| Pennsylvania | 1 | $12,880,000 | 1.3% | 4.930% | 1.52x | 10.3% | 75.0% | 64.9% | |
| Indiana | 8 | $11,694,233 | 1.2% | 4.796% | 2.33x | 14.3% | 61.9% | 53.9% | |
| Nevada | 1 | $11,625,000 | 1.2% | 4.767% | 1.46x | 9.9% | 74.0% | 63.8% | |
| New York | 1 | $11,200,000 | 1.2% | 5.400% | 1.24x | 8.6% | 70.9% | 63.4% | |
| Illinois | 19 | $10,353,743 | 1.1% | 4.144% | 3.97x | 18.2% | 30.5% | 30.5% | |
| Georgia | 1 | $8,100,000 | 0.8% | 5.240% | 1.65x | 12.1% | 69.8% | 58.0% | |
| Arizona | 1 | $8,000,000 | 0.8% | 5.316% | 1.38x | 9.9% | 74.8% | 70.0% | |
| Michigan | 1 | $7,893,750 | 0.8% | 4.901% | 1.33x | 8.7% | 75.0% | 64.9% | |
| Tennessee | 6 | $5,141,798 | 0.5% | 4.144% | 3.97x | 18.2% | 30.5% | 30.5% | |
| Washington | 1 | $4,250,000 | 0.4% | 4.845% | 1.73x | 8.6% | 65.4% | 65.4% | |
| Connecticut | 1 | $3,920,000 | 0.4% | 4.805% | 1.16x | 8.0% | 66.4% | 59.1% | |
| Colorado | 1 | $1,806,293 | 0.2% | 4.144% | 3.97x | 18.2% | 30.5% | 30.5% | |
| District of Columbia | 1 | $645,355 | 0.1% | 4.144% | 3.97x | 18.2% | 30.5% | 30.5% | |
| Total/Wtd. Avg. | 161 | $955,648,355 | 100.0% | 4.618% | 1.98x | 11.4% | 60.8% | 54.8% | |
| (1) | All numerical information concerning the mortgage loans is approximate and, in the case of mortgage loans secured by multiple properties, is based on allocated loan amounts with respect to such properties. All weighted average information regarding the mortgage loans reflects the weighting of the mortgage loans based on their outstanding principal balances as of the Cut-off Date or, in the case of mortgage loans secured by multiple properties, allocated loan amounts. The sum of numbers and percentages in columns may not match the “Total” due to rounding. With respect to any mortgage loan that is part of a whole loan, unless otherwise indicated, all LTV, DSCR and Debt Yield calculations include the relatedpari passu companion loan and exclude any subordinate notes, as applicable. |
| (2) | “California – Northern” includes zip codes above 93600, and “California – Southern” includes zip codes at or below 93600. |
| This is not a research report and was not prepared by the Underwriters’ research departments. Please see additional important information and qualifications at the end of this Term Sheet. |
| T-27 |
| MSBAM 2016-C28 | Collateral Statistics |
Collateral Statistics(1)
Cut-off Date Balance ($)
| No. of Mortgage Loans | Aggregate Cut-off Date Balance ($) | % of Pool | |
| 1 - 5,000,000 | 4 | 13,563,576 | 1.4 |
| 5,000,001 - 10,000,000 | 13 | 93,945,184 | 9.8 |
| 10,000,001 - 15,000,000 | 5 | 62,236,371 | 6.5 |
| 15,000,001 - 25,000,000 | 4 | 69,481,250 | 7.3 |
| 25,000,001 - 50,000,000 | 12 | 425,221,974 | 44.5 |
| 50,000,001 - 75,000,000 | 3 | 201,200,000 | 21.1 |
| 75,000,001 - 90,000,000 | 1 | 90,000,000 | 9.4 |
| Total: | 42 | $955,648,355 | 100.0% |
| Min: $2,207,898 | Max: $90,000,000 | Avg: $22,753,532 |
State or Other Jurisdiction
| No. of Mortgaged Properties | Aggregate Cut-off Date Balance ($) | % of Pool | |
| Florida | 8 | 116,078,433 | 12.1 |
| California | 24 | 107,701,025 | 11.3 |
| California – Southern(2) | 22 | 74,923,525 | 7.8 |
| California – Northern(2) | 2 | 32,777,500 | 3.4 |
| Oklahoma | 5 | 105,220,000 | 11.0 |
| New Jersey | 11 | 103,257,541 | 10.8 |
| Texas | 34 | 98,725,933 | 10.3 |
| Virginia | 5 | 66,484,298 | 7.0 |
| North Carolina | 1 | 45,329,539 | 4.7 |
| Ohio | 2 | 43,100,000 | 4.5 |
| Maryland | 23 | 41,108,979 | 4.3 |
| New Hampshire | 1 | 40,000,000 | 4.2 |
| New Mexico | 1 | 37,072,435 | 3.9 |
| Massachusetts | 1 | 30,000,000 | 3.1 |
| Iowa | 2 | 24,060,000 | 2.5 |
| Pennsylvania | 1 | 12,880,000 | 1.3 |
| Indiana | 8 | 11,694,233 | 1.2 |
| Nevada | 1 | 11,625,000 | 1.2 |
| New York | 1 | 11,200,000 | 1.2 |
| Illinois | 19 | 10,353,743 | 1.1 |
| Georgia | 1 | 8,100,000 | 0.8 |
| Arizona | 1 | 8,000,000 | 0.8 |
| Michigan | 1 | 7,893,750 | 0.8 |
| Tennessee | 6 | 5,141,798 | 0.5 |
| Washington | 1 | 4,250,000 | 0.4 |
| Connecticut | 1 | 3,920,000 | 0.4 |
| Colorado | 1 | 1,806,293 | 0.2 |
| District of Columbia | 1 | 645,355 | 0.1 |
| Total: | 161 | $955,648,355 | 100.0% |
Property Type
| No. of Mortgaged Properties | Aggregate Cut-off Date Balance ($) | % of Pool | ||
| Retail | 17 | 349,516,117 | 36.6 | |
| Anchored | 7 | 171,660,000 | 18.0 | |
| Outlet Center | 1 | 71,200,000 | 7.5 | |
| Regional Mall | 1 | 45,329,539 | 4.7 | |
| Shadow Anchored | 3 | 26,606,577 | 2.8 | |
| Free-Standing | 4 | 21,840,000 | 2.3 | |
| Unanchored | 1 | 12,880,000 | 1.3 | |
| Office | 8 | 237,058,750 | 24.8 | |
| Suburban | 7 | 177,058,750 | 18.5 | |
| CBD | 1 | 60,000,000 | 6.3 | |
| Hospitality | 9 | 140,179,340 | 14.7 | |
| Full Service | 3 | 96,072,435 | 10.1 | |
| Limited Service | 6 | 44,106,906 | 4.6 | |
| Multifamily | 4 | 85,200,000 | 8.9 | |
| Garden | 3 | 67,200,000 | 7.0 | |
| Student Housing | 1 | 18,000,000 | 1.9 | |
| Industrial | 114 | 70,000,000 | 7.3 | |
| Distribution Warehouse | 59 | 44,413,769 | 4.6 | |
| Warehouse | 46 | 24,092,093 | 2.5 | |
| Flex | 9 | 1,494,138 | 0.2 | |
| Self Storage | 7 | 40,998,750 | 4.3 | |
| Self Storage | 7 | 40,998,750 | 4.3 | |
| Mixed Use | 1 | 30,487,500 | 3.2 | |
| Multifamily/Retail | 1 | 30,487,500 | 3.2 | |
| Manufactured Housing | 1 | 2,207,898 | 0.2 | |
| Manufactured Housing | 1 | 2,207,898 | 0.2 | |
| Total/Wtd. Avg. | 161 | $955,648,355 | 100.0% | |
Mortgage Rate (%)
| No. of Mortgage Loans | Aggregate Cut-off Date Balance ($) | % of Pool | |
| 3.842 - 4.000 | 1 | 90,000,000 | 9.4 |
| 4.001 - 4.500 | 5 | 241,129,539 | 25.2 |
| 4.501 - 5.000 | 23 | 485,525,383 | 50.8 |
| 5.001 - 5.400 | 13 | 138,993,433 | 14.5 |
| Total: | 42 | $955,648,355 | 100.0% |
| Min: 3.842% | Max: 5.400% | Wtd Avg: 4.618% |
Original Term to Maturity (mos.)
| No. of Mortgage Loans | Aggregate Cut-off Date Balance ($) | % of Pool | |
| 60 | 3 | 44,600,000 | 4.7 |
| 84 | 1 | 12,431,371 | 1.3 |
| 120 | 37 | 870,116,984 | 91.0 |
| 144 | 1 | 28,500,000 | 3.0 |
| Total: | 42 | $955,648,355 | 100.0% |
| Min: 60 mos. | Max: 144 mos. | Wtd Avg: 117 mos. |
Remaining Term to Maturity (mos.)
| No. of Mortgage Loans | Aggregate Cut-off Date Balance ($) | % of Pool | |
| 58 - 60 | 3 | 44,600,000 | 4.7 |
| 72 - 84 | 1 | 12,431,371 | 1.3 |
| 110 - 120 | 37 | 870,116,984 | 91.0 |
| 144 - 144 | 1 | 28,500,000 | 3.0 |
| Total: | 42 | $955,648,355 | 100.0% |
| Min: 58 mos. | Max: 144 mos. | Wtd Avg: 115 mos. |
Original Amortization Term (mos.)
| No. of Mortgage Loans | Aggregate Cut-off Date Balance ($) | % of Pool | |
| Interest Only | 6 | 258,450,000 | 27.0 |
| 240 | 2 | 10,193,957 | 1.1 |
| 300 | 2 | 10,590,000 | 1.1 |
| 360 | 32 | 676,414,398 | 70.8 |
| Total: | 42 | $955,648,355 | 100.0% |
| Min: 240 mos. | Max: 360 mos. | Wtd Avg: 357 mos. |
Remaining Amortization Term (mos.)
| No. of Mortgage Loans | Aggregate Cut-off Date Balance ($) | % of Pool | |
| Interest Only | 6 | 258,450,000 | 27.0 |
| 238 - 240 | 2 | 10,193,957 | 1.1 |
| 300 - 300 | 2 | 10,590,000 | 1.1 |
| 348 - 360 | 32 | 676,414,398 | 70.8 |
| Total: | 42 | $955,648,355 | 100.0% |
| Min: 238 mos. | Max: 360 mos. | Wtd Avg: 357 mos. |
Amortization Type
| No. of Mortgage Loans | Aggregate Cut-off Date Balance ($) | % of Pool | |
| Partial Interest Only | 23 | 518,030,000 | 54.2 |
| Interest Only | 6 | 258,450,000 | 27.0 |
| Amortizing Balloon | 13 | 179,168,355 | 18.7 |
| Total: | 42 | $955,648,355 | 100.0% |
Cut-off Date LTV Ratio (%)
| No. of Mortgage Loans | Aggregate Cut-off Date Balance ($) | % of Pool | |
| 30.5 - 40.0 | 3 | 167,000,000 | 17.5 |
| 40.1 - 60.0 | 6 | 108,398,626 | 11.3 |
| 60.1 - 65.0 | 5 | 155,949,539 | 16.3 |
| 65.1 - 70.0 | 10 | 201,732,291 | 21.1 |
| 70.1 - 75.0 | 17 | 304,167,898 | 31.8 |
| 75.1 - 75.1 | 1 | 18,400,000 | 1.9 |
| Total: | 42 | $955,648,355 | 100.0% |
| Min: 30.5% | Max: 75.1% | Wtd Avg: 60.8% |
Maturity Date LTV Ratio (%)
| No. of Mortgage Loans | Aggregate Cut-off Date Balance ($) | % of Pool | |
| 30.5 - 40.0 | 4 | 170,185,678 | 17.8 |
| 40.1 - 50.0 | 4 | 34,291,226 | 3.6 |
| 50.1 - 60.0 | 12 | 282,561,450 | 29.6 |
| 60.1 - 65.0 | 12 | 262,513,750 | 27.5 |
| 65.1 - 70.0 | 10 | 206,096,250 | 21.6 |
| Total: | 42 | $955,648,355 | 100.0% |
| Min: 30.5% | Max: 70.0% | Wtd Avg: 54.8% |
UW DSCR (x)
| No. of Mortgage Loans | Aggregate Cut-off Date Balance ($) | % of Pool | |
| 1.16 - 1.30 | 6 | 103,780,000 | 10.9 |
| 1.31 - 1.40 | 9 | 204,764,148 | 21.4 |
| 1.41 - 1.50 | 5 | 123,584,077 | 12.9 |
| 1.51 - 1.60 | 7 | 160,783,685 | 16.8 |
| 1.61 - 1.70 | 4 | 68,687,818 | 7.2 |
| 1.71 - 1.80 | 4 | 33,631,578 | 3.5 |
| 1.81 - 2.50 | 4 | 93,417,049 | 9.8 |
| 2.51 - 3.00 | 1 | 7,000,000 | 0.7 |
| 3.01 - 4.10 | 2 | 160,000,000 | 16.7 |
| Total: | 42 | $955,648,355 | 100.0% |
| Min: 1.16x | Max: 4.10x | Wtd Avg: 1.98x |
UW NOI Debt Yield (%)
| No. of Mortgage Loans | Aggregate Cut-off Date Balance ($) | % of Pool | |
| 7.9 - 8.0 | 3 | 58,020,000 | 6.1 |
| 8.1 - 8.5 | 3 | 111,592,500 | 11.7 |
| 8.6 - 9.0 | 5 | 67,843,750 | 7.1 |
| 9.1 - 9.5 | 4 | 44,667,898 | 4.7 |
| 9.6 - 10.0 | 6 | 163,584,077 | 17.1 |
| 10.1 - 11.0 | 5 | 114,631,250 | 12.0 |
| 11.1 - 12.0 | 4 | 140,351,974 | 14.7 |
| 12.1 - 13.0 | 4 | 50,740,000 | 5.3 |
| 13.1 - 14.0 | 1 | 7,991,578 | 0.8 |
| 14.1 - 15.0 | 2 | 19,431,371 | 2.0 |
| 15.1 - 16.0 | 1 | 7,008,278 | 0.7 |
| 16.1 - 19.8 | 4 | 169,785,678 | 17.8 |
| Total: | 42 | $955,648,355 | 100.0% |
| Min: 7.9% | Max: 19.8% | Wtd Avg: 11.4% |
Mortgage Loan Sellers
| No. of Mortgage Loans | Aggregate Cut-off Date Balance ($) | % of Pool | |
| Morgan Stanley Mortgage Capital Holdings LLC | 18 | 466,048,750 | 48.8 |
| Bank of America, National Association | 12 | 332,646,635 | 34.8 |
| CIBC Inc. | 7 | 91,506,391 | 9.6 |
| Starwood Mortgage Funding III LLC | 5 | 65,446,578 | 6.8 |
| Total: | 42 | $955,648,355 | 100.0% |
| (1) | All numerical information concerning the mortgage loans is approximate and, in the case of mortgage loans secured by multiple properties, is based on allocated loan amounts with respect to such properties. All weighted average information regarding the mortgage loans reflects the weighting of the mortgage loans based on their outstanding principal balances as of the Cut-off Date or, in the case of mortgage loans secured by multiple properties, allocated loan amounts. The sum of numbers and percentages in columns may not match the “Total” due to rounding. With respect to any mortgage loan that is part of a whole loan, unless otherwise indicated, all LTV, DSCR and Debt Yield calculations include the relatedpari passu companion loan and exclude any subordinate notes, as applicable. |
| (2) | “California – Northern” includes zip codes above 93600, and “California – Southern” includes zip codes at or below 93600. |
| This is not a research report and was not prepared by the Underwriters’ research departments. Please see additional important information and qualifications at the end of this Term Sheet. |
| T-28 |
| MSBAM 2016-C28 | Collateral Statistics |
Prepayment Restrictions
Percentage of Collateral by Prepayment Restrictions (%)(1)(2)(3)(4)
| Prepayment Restrictions | February 2016 | February 2017 | February 2018 | February 2019 | February 2020 |
| Locked Out | 92.7% | 92.7% | 91.4% | 91.3% | 91.3% |
| Yield Maintenance Total | 7.3% | 7.3% | 8.6% | 8.7% | 8.7% |
| Open | 0.0% | 0.0% | 0.0% | 0.0% | 0.0% |
| TOTAL | 100.0% | 100.0% | 100.0% | 100.0% | 100.0% |
| Pool Balance Outstanding | $955,648,355 | $952,745,500 | $948,865,656 | $943,467,536 | $936,486,745 |
| % Initial Pool Balance | 100.0% | 99.7% | 99.3% | 98.7% | 98.0% |
| Prepayment Restrictions | February 2021 | February 2022 | February 2023 | February 2024 | February 2025 |
| Locked Out | 90.8% | 91.9% | 91.8% | 91.7% | 86.2% |
| Yield Maintenance Total | 9.2% | 8.1% | 8.2% | 8.3% | 8.4% |
| Open | 0.0% | 0.0% | 0.0% | 0.0% | 5.3% |
| TOTAL | 100.0% | 100.0% | 100.0% | 100.0% | 100.0% |
| Pool Balance Outstanding | $886,123,857 | $864,134,149 | $852,974,568 | $841,247,997 | $829,008,800 |
| % Initial Pool Balance | 92.7% | 90.4% | 89.3% | 88.0% | 86.7% |
| Prepayment Restrictions | February 2026 | February 2027 | |||
| Locked Out | 0.0% | 0.0% | |||
| Yield Maintenance Total | 0.0% | 0.0% | |||
| Open | 100.0% | 100.0% | |||
| TOTAL | 100.0% | 100.0% | |||
| Pool Balance Outstanding | $25,379,833 | $24,829,853 | |||
| % Initial Pool Balance | 2.7% | 2.6% |
| (1) | The analysis is based on Structuring Assumptions set forth under “Yield and Maturity Considerations—Weighted Average Life” in the Preliminary Prospectus and a 0% CPR as discussed in the Preliminary Prospectus. |
| (2) | See description of Yield Maintenance under “Description of the Offered Certificates—Distributions of Prepayment Premiums and Yield Maintenance Charges” in the Preliminary Prospectus. |
| (3) | Mortgage loans modeled as Yield Maintenance include mortgage loans characterized by YM1 on Annex A-1 I to the Preliminary Prospectus. |
| (4) | There may be limited exceptions to the indicated prepayment restrictions arising out of casualties, condemnations, property releases and the application of earnout reserves. |
| This is not a research report and was not prepared by the Underwriters’ research departments. Please see additional important information and qualifications at the end of this Term Sheet. |
| T-29 |
| MSBAM 2016-C28 | Penn Square Mall |
Mortgage Loan No. 1 – Penn Square Mall
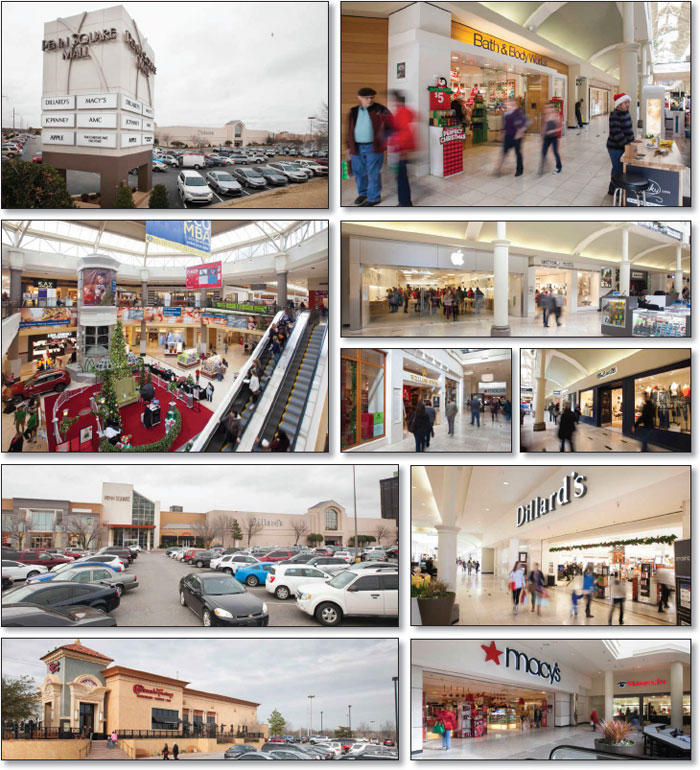
| This is not a research report and was not prepared by the Underwriters’ research departments. Please see additional important information and qualifications at the end of this Term Sheet. |
| T-30 |
| MSBAM 2016-C28 | Penn Square Mall |
Mortgage Loan No. 1 – Penn Square Mall
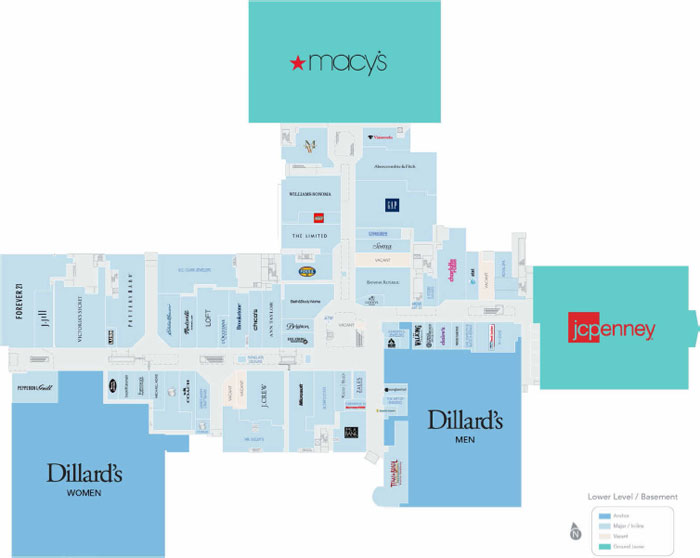
| This is not a research report and was not prepared by the Underwriters’ research departments. Please see additional important information and qualifications at the end of this Term Sheet. |
| T-31 |
| MSBAM 2016-C28 | Penn Square Mall |
Mortgage Loan No. 1 – Penn Square Mall
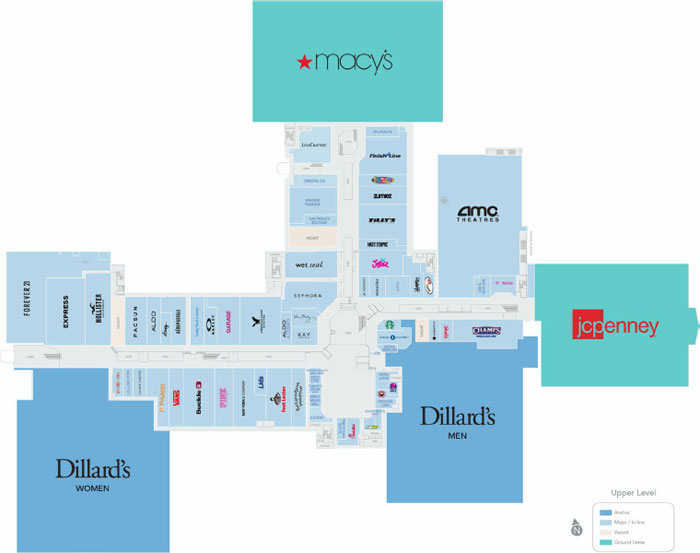
| This is not a research report and was not prepared by the Underwriters’ research departments. Please see additional important information and qualifications at the end of this Term Sheet. |
| T-32 |
| MSBAM 2016-C28 | Penn Square Mall |
Mortgage Loan No. 1 – Penn Square Mall
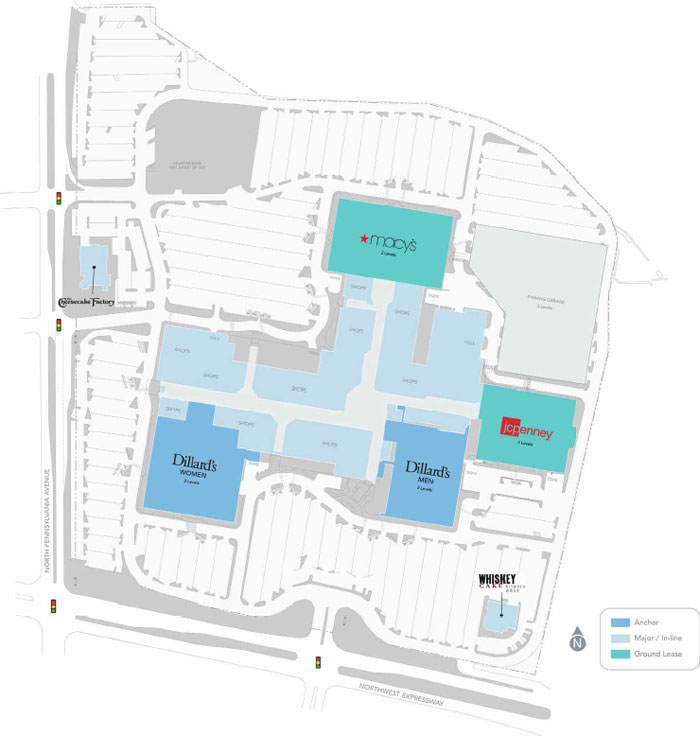
| This is not a research report and was not prepared by the Underwriters’ research departments. Please see additional important information and qualifications at the end of this Term Sheet. |
| T-33 |
| MSBAM 2016-C28 | Penn Square Mall |
Mortgage Loan No. 1 – Penn Square Mall

| This is not a research report and was not prepared by the Underwriters’ research departments. Please see additional important information and qualifications at the end of this Term Sheet. |
| T-34 |
| MSBAM 2016-C28 | Penn Square Mall |
| Mortgage Loan No. 1 – Penn Square Mall |
| Mortgage Loan Information | Property Information | ||||||
| Mortgage Loan Seller: | MSMCH | Single Asset/Portfolio: | Single Asset | ||||
| Original Balance(1): | $90,000,000 | Location: | Oklahoma City, OK 73118 | ||||
| Cut-off Date Balance(1): | $90,000,000 | General Property Type: | Retail | ||||
| % of Initial Pool Balance: | 9.4% | Detailed Property Type: | Anchored | ||||
| Loan Purpose: | Refinance | Title Vesting: | Leasehold | ||||
| Sponsor: | Simon Property Group, L.P. | Year Built/Renovated: | 1960/1982;2013 | ||||
| Mortgage Rate: | 3.842% | Size(4): | 1,062,281 SF | ||||
| Note Date: | 12/22/2015 | Cut-off Date Balance per Unit(1): | $194 | ||||
| First Payment Date: | 2/1/2016 | Maturity Date Balance per Unit(1): | $194 | ||||
| Maturity Date: | 1/1/2026 | Property Manager: | Simon Management Associates, LLC (borrower related) | ||||
| Original Term to Maturity: | 120 months | ||||||
| Original Amortization Term: | None | Underwriting and Financial Information | |||||
| IO Period: | 120 Months | UW NOI: | $33,917,200 | ||||
| Seasoning: | 1 month | UW NOI Debt Yield(1): | 16.4% | ||||
| Prepayment Provisions(2): | LO (25); DEF (88); O (7) | UW NOI Debt Yield at Maturity(1): | 16.4% | ||||
| Lockbox/Cash Mgmt Status: | Hard/Springing | UW NCF DSCR(1): | 4.10x | ||||
| Additional Debt Type: | Pari passu/B Note | Most Recent NOI: | $31,670,307 (12/31/2014) | ||||
| Additional Debt Balance: | $116,500,000/$103,500,000 | 2nd Most Recent NOI: | $27,850,874 (12/31/2013) | ||||
| Future Debt Permitted (Type): | None | 3rd Most Recent NOI: | $25,588,235 (12/31/2012) | ||||
| Reserves(3) | Most Recent Occupancy: | 98.8% (12/7/2015) | |||||
| Type | Initial | Monthly | Cap | 2nd Most Recent Occupancy: | 99.0% (12/31/2014) | ||
| RE Tax: | $0 | Springing | N/A | 3rd Most Recent Occupancy: | 99.0% (12/31/2013) | ||
| Insurance: | $0 | Springing | N/A | Appraised Value (as of): | $660,000,000 (11/17/2015) | ||
| Recurring Replacements: | $0 | Springing | N/A | Cut-off Date LTV Ratio(1): | 31.3% | ||
| TI/LC: | $0 | Springing | N/A | Maturity Date LTV Ratio(1): | 31.3% | ||
| Sources and Uses | ||||||
| Sources | Proceeds | % of Total | Uses | Proceeds | % of Total | |
| Loan Amount(1): | $310,000,000 | 100.0% | Loan Payoff: | $93,238,354 | 30.1% | |
| Closing Costs: | $1,083,949 | 0.3% | ||||
| Return of Equity: | $215,677,697 | 69.6% | ||||
| Total Sources: | $310,000,000 | 100.0% | Total Uses: | $310,000,000 | 100.0% | |
| (1) | The Penn Square Mall Mortgage Loan is part of the Penn Square Mall Whole Loan, which is comprised of threepari passu seniornotes and one subordinate note with an aggregate original principal balance of $310,000,000. The three Penn Square Mallpari passu senior notes have a combined original principal balance of $206,500,000 and the subordinate note has an original principal balance of $103,500,000. The Cut-off Date Balance per Unit, Maturity Date Balance per Unit, UW NOI, UW NCF DSCR, UW NOI Debt Yield, UW NOI Debt Yield at Maturity, Cut-off Date LTV Ratio and Maturity Date LTV Ratio numbers presented above are based on the three senior notes totaling $206,500,000 without regard to the subordinate note. The Cut-off Date Balance per Unit, Maturity Date Balance per Unit, UW NCF DSCR, UW NOI Debt Yield, UW NOI Debt Yield at Maturity, Cut-off Date LTV Ratio and Maturity Date LTV Ratio based on the aggregate note balance of the Penn Square Mall Whole Loan (including the subordinate note) are $291.82, $291.82, 2.73x, 10.9% 10.9%, 47.0% and 47.0%, respectively. |
| (2) | Defeasance is permitted at any time on or after the earlier to occur of (a) the end of the two-year period commencing on the closing date of the securitization of the last Penn Square Mall promissory note to be securitized and (b) June 1, 2019. This assumes that the Penn Square Mall Mortgage Loan is the last Penn Square Mall promissory note to be securitized. |
| (3) | See “—Escrowsand Reserves” below for further discussion of reserve requirements. |
| (4) | The Penn Square Mall Property size includes two anchor tenants, J.C. Penney (125,000 SF) and Macy’s (160,000 SF), which stores were constructed, and are owned, by the anchors themselves upon land sub-ground leased from the Borrower. |
The Mortgage Loan. The largest mortgage loan (the “Penn Square Mall Mortgage Loan”) is part of a non-servicedpari passu-AB whole loan (the “Penn Square Mall Whole Loan”) evidenced by (i) threepari passu senior notes in the aggregate original principal amount of $206,500,000 and (ii) one subordinate note in the original principal amount of $103,500,000, all of which are secured by the same leasehold mortgage encumbering the super-regional mall known as Penn Square Mall in Oklahoma City, Oklahoma (the “Penn Square Mall Property”). The Penn Square Mall Mortgage Loan is evidenced by onepari passu note (Note A-1B) with an outstanding principal balance as of the Cut-off Date of $90,000,000. Note A-1A in the original principal amount of $69,900,000 and Note A-1C in the original principal amount of $46,600,000 represent a non-servicedpari passu companion loan (the “Penn Square Mall Non-ServicedPari passu Companion Loan”), and ispari passuwith the Penn Square Mall Mortgage Loan. Note A-2 in the original principal amount of $103,500,000 (the “Penn Square Mall Subordinate Companion Loan”) is generally subordinate to the Penn Square Mall Mortgage Loan and the Penn Square Mall Non-ServicedPari passu Companion Loan. See “Description of the Mortgage Pool—The Whole Loans—the Non-Serviced Pari passu-AB Whole Loans—The Penn Square Mall Whole Loan” and “Pooling and Servicing Agreement—Servicing of the Non-Serviced Mortgage Loans” in the Preliminary Prospectus.
The Penn Square Mall Mortgage Loan will be included in the MSBAM 2016-C28 securitization trust. The Penn Square Mall Non-ServicedPari passu Companion Loan represented by promissory Note A-1A and the Penn Square Mall Subordinate Companion Loan were contributed to the MSCI 2016-PSQ securitization trust. The Penn Square Mall Non-ServicedPari passu Companion Loan represented by Note A-1C in the original principal amount of $46,600,000 is expected to be held by Morgan Stanley Bank, N.A. or an affiliate on the closing date of this transaction and may be contributed to one or
| This is not a research report and was not prepared by the Underwriters’ research departments. Please see additional important information and qualifications at the end of this Term Sheet. |
| T-35 |
| MSBAM 2016-C28 | Penn Square Mall |
more future securitization transactions. The Penn Square Mall Whole Loan will be serviced pursuant to the terms of the MSCI 2016-PSQ pooling and servicing agreement.
The proceeds of the Penn Square Mall Whole Loan were used to refinance a previous loan of approximately $93,238,354, secured by the Penn Square Mall Property, pay closing costs and return equity to the Penn Square Mall Borrower (as defined below).
The Borrower and the Sponsor.The borrower is Penn Square Mall, LLC (the “Penn Square Mall Borrower”), a previously existing single-purpose Delaware limited liability company with two independent directors. The Penn Square Mall Borrower is owned indirectly by Simon Property Group, L.P. (the “Penn Square Mall Sponsor”), which is the operating partnership of Simon Property Group, Inc. (“Simon”). The Penn Square Mall Property is managed by Simon Management Associates, LLC, an affiliate of the Penn Square Mall Borrower and the Penn Square Mall Sponsor. Simon is a publicly traded self-administered and self-managed real estate investment trust (NYSE: SPG) focused on retail property ownership and management. Simon is one of the largest publicly traded owner, operator and developer of retail assets in the United States. As of December 31, 2014, Simon operated 207 income-producing properties in the United States, consisting of 109 malls, 68 outlet centers, thirteen mills, three community centers, and fourteen other retail properties located in 37 states and Puerto Rico containing an aggregate of approximately 182.0 million SF.
The Penn Square Mall Whole Loan will be recourse to the Penn Square Mall Sponsor pursuant to standard carve-outs, however, the guaranty and the environmental indemnity agreement provide that the Penn Square Mall Sponsor’s recourse liability under the non-recourse carve-out guaranty and environmental indemnity may not exceed $62,000,000 in the aggregate.
The Penn Square Mall Borrower is affiliated with the borrower of another mortgage loan through partial or complete direct or indirect ownership, identified as Ellenton Premium Outlets in Annex A-1 to the Preliminary Prospectus.
The Property.The Penn Square Mall Property is an enclosed, two-level super regional mall, comprised of approximately 1,062,281 total SF. The mall was originally developed in 1960 as an outdoor retail center, converted to an indoor mall in 1982 and renovated in 1995, 2000, 2007 and most recently in 2013, which included updates to the food court and building entrances as well as new landscaping, pylon and monument signs and updates to mall finishes. Penn Square Mall is located approximately five miles north of the Oklahoma City central business district, at the intersection of North Pennsylvania Avenue and Northwest Expressway and is located just west of Interstate 44. Interstate 44 connects to Interstates 235 and 35, approximately two miles and five miles, respectively, to the east of the Penn Square Mall Property.
Penn Square Mall features four anchor tenants – J.C. Penney and Macy’s, which stores were constructed, and are owned, by the anchors themselves upon land sub-ground leased from the Penn Square Mall Borrower and do not contribute underwritten base rent, as well as Dillard’s Women and Dillard’s Men. Three out of four anchors have been at Penn Square Mall for at least 20 years. The total anchor space comprises approximately 55.4% of the total SF at Penn Square Mall. In addition to the anchors, the Penn Square Mall Property is leased to over 120 additional tenants including a 10-screen AMC Theatres, Apple, Forever 21, Pottery Barn, Victoria’s Secret and The Gap, as well as thirteen food court tenants. As of December 7, 2015, the Penn Square Mall Property had an occupancy rate of 98.8%. Since 2006, total occupancy excluding anchors, outparcels and office space and including temporary tenants at Penn Square Mall has ranged from 96.0% to 100.0%, with an average occupancy rate of 98.5%. Over the same time period, total occupancy excluding temporary tenants ranged from 94.0% to 99.0%, with an average occupancy rate of 97.0%.
The Penn Square Mall Property consists of a ground leasehold interest (the “Penn Square Mall Ground Lease”). The Penn Square Mall Ground Lease means that certain Lease Agreement dated as of September 29, 1958 with an expiration date of September 30, 2060, with no extension options. Ground rent due during the loan term under the terms of the ground lease is equal to the greater of (i) $500,000 (increased every five years, commencing January 1, 1996, based on the consumer price index) or (ii) the sum of (a) 0.375% of the gross annual sales made during each lease year by all retail tenants and (b) 4.625% of the gross annual rents of all tenants not included in clause (a) and who occupy their respective premises on a monthly “flat rate” or annual rental basis. An additional $25,000, subject to increase (based on the consumer price index) every five (5) years commencing January 1, 1991, is due with respect to an additional parcel that was added to the initial ground leased property, which is also included in the percentage rent calculation described above.
Comparable tenants produced TTM August 2015 sales of approximately $753 PSF. Without the Apple tenant, comparable sales were approximately $618 PSF. The average TTM August 2015 comparable tenant occupancy cost was 12.5% (15.3% excluding Apple). Since 2012, the Penn Square Mall Borrower has pushed occupancy costs higher, from 10.4% as of 2012 to 12.5% as of TTM August 2015, by increasing rents. Despite increasing occupancy costs, the Penn Square Mall Property has remained nearly 100.0% occupied.
The following table presents a summary of historical in-line sales, occupancy costs and total mall sales.
| Historical Sales Summary | |||||||
Comparable In-line Tenant Sales PSF | Comparable In-line Tenant Occupancy Cost(1) | Total Comparable In-line Sales | Total Mall Sales(2) | ||||
| Year | w/ Apple | w/o Apple | w/ Apple | w/o Apple | |||
| 2011 | $780 | $623 | 10.7% | 13.5% | $167,532,000 | $279,057,000 | |
| 2012 | $799 | $626 | 10.4% | 13.4% | $180,188,000 | $316,247,000 | |
| 2013 | $753 | $619 | 10.9% | 13.3% | $181,715,000 | $334,893,000 | |
| 2014 | $759 | $634 | 11.1% | 13.3% | $193,013,000 | $353,690,000 | |
| 8/31/2015 TTM(3) | $753 | $618 | 12.5% | 15.3% | $191,488,000 | $352,463,000 | |
| (1) | Occupancy Cost % calculations are based on UW Total Rent (base rent, recoveries, % rent in lieu and overage rent) excluding utilities/HVAC recoveries, divided by sales from the respective year. |
| (2) | Total Mall Sales include borrower provided estimates for anchor tenants. |
| (3) | For TTM figures, comparable in-line tenants are defined as all stores less than 10,000 SF with at least 12 months of sales data. |
Major Tenants.
AMC Theatres (37,657 SF, 4% of NRA, 3% of underwritten base rent). American Multi-Cinema, Inc. leases 37,657 SF at the Penn Square Mall Property and operates the space as a 10-screen movie theater. The lease began on January 28, 2013 and has a current expiration date of January 31, 2028, with two five-year lease renewal options. American Multi-Cinema, Inc. is owned by AMC Entertainment Holdings, Inc. (“AMC”) (NYSE: AMC). As of September 30, 2015, AMC operates 348 locations with 4,937 screens in the United States.
| This is not a research report and was not prepared by the Underwriters’ research departments. Please see additional important information and qualifications at the end of this Term Sheet. |
| T-36 |
| MSBAM 2016-C28 | Penn Square Mall |
Forever 21 (31,255 SF, 3% of NRA, 5% of underwritten base rent). Forever 21 Retail, Inc. (“Forever 21”) leases 31,255 SF at the Penn Square Mall Property. The lease began on November 12, 2012 and has a current expiration date of January 31, 2023. Forever 21 is a privately held fashion retailer with over 480 stores under the Forever 21, XXI Forever, For Love 21, Heritage 1981 and Reference brands.
The Gap (12,827 SF, 1% of NRA, 4% of underwritten base rent). The Gap (“Gap”) leases 12,827 SF at the Penn Square Mall Property. The lease began on September 3, 2013 and has a current expiration date of January 31, 2024. Founded in 1969, Gap (NYSE: GPS) is a fashion retailer with over 3,300 stores, almost 400 franchise stores and e-commerce sites.
The following table presents certain information relating to the anchor tenants and major tenants. Certain tenants may have co-tenancy provisions permitting the early termination of their leases based on sales performance and/or occupancy at the Penn Square Mall Property. The operating covenants of the anchor tenants have expired.
| Tenant Summary | |||||||||
| Credit Rating | Tenant | % of Collateral | Annual UW | Annual UW Rent | Sales (TTM 8/31/2015)(4) | Occ. | Lease | ||
| Tenant Name | (Moody’s/S&P/Fitch)(1) | SF | SF | Rent(2) | PSF(3) | $ | PSF(3) | Cost %(5) | Expiration |
| Anchors | |||||||||
| Dillard’s Women | Baa3/BBB-/BBB- | 170,609 | 16% | $871,800 | $5.11 | $40,728,000 | $239 | 2.4% | 1/31/2017 |
| Macy’s (Ground Lease) | Baa2/BBB+/BBB+ | 160,000 | 15% | N/A | N/A | 26,300,000 | $164 | 0.3% | 9/30/2060 |
| Dillard’s Men | Baa3/BBB-/BBB- | 132,528 | 12% | $157,483 | $1.19 | 21,594,000 | $163 | 3.4% | 1/31/2017 |
| J.C. Penney (Ground Lease) | Caa1/CCC+/B- | 125,000 | 12% | N/A | N/A | 12,938,000 | $104 | 1.1% | 12/31/2025 |
| Subtotal/Wtd. Avg. | 588,137 | 55% | $101,560,000 | $173 | 1.9% | ||||
| Major > 10,000 SF | |||||||||
| AMC Theatres(6) | NR/NR/NR | 37,657 | 4% | $658,998 | $17.50 | $9,526,000 | $952,600 | 10.4% | 1/31/2028 |
| Forever 21 | NR/NR/NR | 31,255 | 3% | $1,181,784 | $37.81 | 5,665,000 | $181 | 21.1% | 1/31/2023 |
| The Gap | Baa2/BBB-/BBB- | 12,827 | 1% | $954,073 | $74.38 | 4,663,000 | $364 | 29.2% | 1/31/2024 |
| Victoria’s Secret | NR/NR/NR | 11,136 | 1% | $551,232 | $49.50 | 7,301,000 | $656 | 11.5% | 1/31/2024 |
| Cheesecake Factory | NR/NR/NR | 10,481 | 1% | $419,240 | $40.00 | 9,125,000 | $871 | 6.4% | 1/31/2027 |
| Pottery Barn | NR/NR/NR | 10,340 | 1% | $281,145 | $27.19 | 4,375,000 | $423 | 13.6% | 1/31/2023 |
| Subtotal/Wtd. Avg. | 113,696 | 11% | $4,046,472 | $35.59 | $40,655,000 | $358 | 13.7% | ||
| Top 10 In-Line(7) | |||||||||
| Microsoft(8) | Aaa / AAA / AA+ | 6,526 | 1% | $735,611 | $112.72 | $8,826,000 | $1,352 | 10.9% | 1/31/2024 |
| Zales Jewelers | NR / NR / NR | 1,317 | 0% | $646,980 | $491.25 | $3,812,000 | $2,894 | 17.1% | 2/28/2023 |
| Champs Sports | NR / NR / NR | 6,322 | 1% | $568,980 | $90.00 | N/A | N/A | N/A | 6/30/2025 |
| Helzberg Diamonds | NR / NR / NR | 1,737 | 0% | $492,449 | $283.51 | $4,507,000 | $2,595 | 12.2% | 1/31/2023 |
| Williams-Sonoma | NR / NR / NR | 7,952 | 1% | $415,731 | $52.28 | $3,876,000 | $487 | 16.6% | 1/31/2024 |
| Buckle | NR / NR / NR | 6,390 | 1% | $408,002 | $63.85 | $5,661,000 | $886 | 10.7% | 1/31/2021 |
| Bath & Body Works | NR / NR / NR | 5,454 | 1% | $370,872 | $68.00 | N/A | N/A | N/A | 2/28/2027 |
| American Eagle Outfitters | NR / NR / NR | 6,879 | 1% | $371,397 | $53.99 | $3,112,000 | $452 | 18.8% | 1/31/2020 |
| Express | NR / NR / NR | 9,000 | 1% | $371,160 | $41.24 | $3,940,000 | $438 | 16.8% | 1/31/2024 |
| Apple | NR / Aa1 / AA+ | 4,600 | 0% | $336,076 | $73.06 | $37,139,000 | $8,074 | 0.9% | 1/31/2016 |
| All other Tenants < 10,000 SF | 347,712 | 33% | $21,111,085 | $60.71 | $210,249,000 | ||||
| Vacant | 12,736 | 1% | $0 | $0.00 | |||||
| Total Property SF | 1,062,281 | 100% | $26,186,840 | $34.25 | $352,464,000 | ||||
| Comparable In-Line | 254,280 | $191,488,000 | $753 | 12.5% | |||||
| Comparable In-Line Without Apple(9) | 249,680 | $154,348,000 | $618 | 15.3% | |||||
| (1) | Certain ratings are those of the parent company whether or not the parent company guarantees the lease. |
| (2) | Annual UW Rent includes contractual rent steps equal to $592,858 through December 2016, as well as a total of $661,758 of rent for three tenants (Texas de Brazil, Bath & Body Works and Great Wraps Grill) which have executed leases but have not yet taken occupancy of their space or commenced paying rent, and an additional $85,118 for The Finish Line which is in negotiations to renew its lease at $46.26 per SF. Annual UW Rent PSF excludes Macy’s (Ground Lease) and J.C. Penney (Ground Lease), as well as vacant space. See “Underwritten Base Rental Revenue” in the notes to the Cash Flow Analysis for additional detail. |
| (3) | PSF figures exclude vacant space. |
| (4) | Tenant sales for TTM ended August 31, 2015, except for J.C. Penney which sales information is as of year-end 2014. |
| (5) | Occupancy Cost % calculations are based on UW Total Rent (UW base rent, recoveries, % rent in lieu and overage rent) including utilities/HVAC recoveries, divided by 8/31/15 TTM Sales. |
| (6) | Sales PSF for AMC Theatres are based on 10 screens. |
| (7) | Top 10 In-Line tenants based on UW base rent. |
| (8) | Tenant may terminate the lease with 150-day notice if annual sales during the 3rd lease year (November 2016) are less than $15,000,000. |
| (9) | Apple leases approximately 4,600 SF (0.4% of NRA) of in-line space at the Penn Square Mall Property. |
| This is not a research report and was not prepared by the Underwriters’ research departments. Please see additional important information and qualifications at the end of this Term Sheet. |
| T-37 |
| MSBAM 2016-C28 | Penn Square Mall |
The following table presents certain information relating to the lease rollover schedule at the Penn Square Mall Property:
| Lease Rollover Schedule | ||||||||
| Year | # of Leases Rolling | SF Rolling(1) | % of Total SF Rolling | Cumulative % of Total SF Rolling | Total UW Rent Rolling(2) | UW Rent PSF Rolling(3) | % of Total Rent Rolling | Cumulative % of Total Rent Rolling |
| MTM | 0 | 0 | 0% | 1% | $0 | $0.00 | 0% | 0% |
| 2016 | 14 | 29,376 | 3% | 4% | $1,718,570 | $58.50 | 7% | 7% |
| 2017 | 14 | 343,278 | 32% | 36% | $3,074,590 | $8.96 | 12% | 18% |
| 2018 | 8 | 17,616 | 2% | 38% | $905,956 | $51.43 | 3% | 22% |
| 2019 | 13 | 32,382 | 3% | 41% | $1,717,056 | $53.03 | 7% | 28% |
| 2020 | 10 | 28,388 | 3% | 44% | $1,536,394 | $54.12 | 6% | 34% |
| 2021 | 9 | 41,488 | 4% | 48% | $1,771,300 | $42.69 | 7% | 41% |
| 2022 | 15 | 28,488 | 3% | 50% | $2,498,532 | $87.70 | 10% | 50% |
| 2023 | 12 | 53,975 | 5% | 55% | $3,427,895 | $63.51 | 13% | 64% |
| 2024 | 18 | 77,915 | 7% | 63% | $4,884,786 | $62.69 | 19% | 82% |
| 2025 | 12 | 169,118 | 16% | 79% | $2,555,105 | $57.92 | 10% | 92% |
| 2026 | 4 | 13,928 | 1% | 80% | $647,545 | $46.49 | 2% | 94% |
| 2027 and Beyond | 5 | 213,593 | 20% | 100% | $1,449,110 | $27.04 | 6% | 100% |
| Vacant | 0 | 12,736 | 0% | 100% | $0 | $0.00 | 0% | 100% |
| Total/Wtd. Avg. | 134 | 1,062,281 | 100% | $26,186,840 | $34.25 | 100% | ||
| (1) | Based on Borrower’s owned space and excludes storage space. |
| (2) | Total UW Rent Rolling includes contractual rent steps equal to $592,858 through December 2016, as well as a total of $661,758 of rent for three tenants (Texas de Brazil, Bath & Body Works and Great Wraps Grill) which have executed leases but have not yet taken occupancy of their space or commenced paying rent, and an additional $85,118 for The Finish Line which is in negotiations to renew its lease at $46.26 per SF. |
| (3) | UW Rent PSF Rolling excludes Macy’s (Ground Lease) and J.C. Penney (Ground Lease), as well as vacant space. |
The Market. The Penn Square Mall Property is located in Oklahoma City, Oklahoma in Oklahoma County, within the central portion of the Oklahoma City central business statistical area (the “Oklahoma City CBSA”), which is part of the larger Oklahoma City Metropolitan Statistical Area (the “Oklahoma City MSA”). The Penn Square Mall Property is situated in the northeast corner of the Northwest Expressway and North Pennsylvania Avenue intersection in the City of Oklahoma City. This location is approximately five miles north of the Oklahoma City central business district and approximately eight miles northeast of the Will Rogers International Airport. The Penn Square Mall Property is located just west of the Interstate 44 and Northwest Expressway exchange. Interstate 44 runs in an east-west direction through the north portion of the Oklahoma City CBSA and connects to Interstates 235 and 35 approximately two miles and five miles, respectively, to the east. Interstates 235 and 35 are north-south thoroughfares connecting the Oklahoma City CBSA to the Dallas/Fort Worth Metroplex. The Penn Square Mall Property acts as a commercial/retail hub for the area, with additional retail development in the area consisting of power and strip centers. Average household income in the Penn Square Mall primary trade area was $62,478 for 2015.
| This is not a research report and was not prepared by the Underwriters’ research departments. Please see additional important information and qualifications at the end of this Term Sheet. |
| T-38 |
| MSBAM 2016-C28 | Penn Square Mall |
The appraiser concluded a primary trade area of a 10-mile radius around the Penn Square Mall Property and a secondary trade area of a 15-mile radius around the Penn Square Mall Property. A summary of demographics in the primary and secondary trade areas compared to the Oklahoma City CBSA, Oklahoma and the United States is presented below.
| Demographic Summary | |||||
| Statistic | 10-mile Radius | 15-mile Radius | Oklahoma City CBSA | Oklahoma | United States |
| Population | |||||
| 2000 | 553,072 | 766,021 | 1,095,420 | 3,450,691 | 281,422,025 |
| 2015 | 629,512 | 935,893 | 1,347,294 | 3,897,660 | 319,507,044 |
| 2020 (projected) | 643,166 | 976,022 | 1,410,727 | 4,019,455 | 332,559,851 |
| % Increase 2000-2015 | 13.8% | 22.2% | 23.0% | 13.0% | 13.5% |
| % Increase 2015-2020 | 2.2% | 4.3% | 4.7% | 3.1% | 4.1% |
| Average Household Income | |||||
| 2000 | $45,638 | $48,857 | $48,339 | $44,478 | $56,675 |
| 2015 | $62,478 | $69,247 | $69,143 | $63,093 | $76,502 |
| 2020 (projected) | $71,894 | $79,978 | $80,109 | $73,331 | $87,705 |
| % Increase 2000-2015 | 36.9% | 41.7% | 43.0% | 41.9% | 35.0% |
| % Increase 2015-2020 | 15.1% | 15.5% | 15.9% | 16.2% | 14.6% |
| Household Statistics | |||||
| 2000 | 226,874 | 305,761 | 429,743 | 1,342,311 | 105,480,443 |
| 2015 | 255,541 | 372,011 | 527,775 | 1,520,138 | 120,853,189 |
| 2020 (projected) | 262,812 | 390,190 | 555,686 | 1,576,576 | 126,398,391 |
| % Increase 2000-2014 | 12.6% | 21.7% | 22.8% | 13.2% | 14.6% |
| % Increase 2014-2019 | 2.8% | 4.9% | 5.3% | 3.7% | 4.6% |
As provided by a third party research provider, the Penn Square Mall Property is located in the North Central submarket of the Oklahoma City retail market, encompassing approximately 23.3% of the region’s retail inventory. As of Q3 2015, the Oklahoma City retail market had a vacancy rate of 13.3% and the North Central submarket had a vacancy rate of 11.7%. In the same period, asking rents in the Oklahoma City retail market were $11.75 PSF and the asking rents in the North Central submarket were $12.39 PSF.
| Competitive Property Summary | ||||||||
| Property Name | Center Type | Proximity | Total GLA | Year Built | Year Renovated | Anchor Tenants | Occupancy | In-line Sales PSF(1) |
| Penn Square Mall | Super Regional | N/A | 1,062,281 | 1960 | 1982, 1995, 2000, 2007, 2013 | Dillard’s Women J.C. Penney, Macy’s Dillard’s Men | 99% | $753 |
| Primary Competition | ||||||||
| Quail Springs Mall | Super Regional | 6 miles N | 1,114,927 | 1980 | 1998 | Dillard’s J.C. Penney Macy’s Von Maur AMC Theatres | 88% | $350 |
| Sooner Mall | Regional | 21 miles S | 487,774 | 1975 | 2000 | Dillard’s J.C. Penney Sears | 99% | $410 |
| Secondary Competition | ||||||||
| Outlet Shoppes at Oklahoma City | Outlet | 7 miles SW | 406,951 | 2011 | 2014 | Forever 21 Nike Polo Ralph Lauren Hanesbrand | 100% | NAP |
| Shawnee Mall | Super Regional | 36 miles W | 719,326 | 1989 | 2011 | Dillard’s J.C. Penney Kohl’s Jones Theatre Vacant | 80% | NAP |
Source: Appraisal
| (1) | In-line Sales PSF for the Penn Square Mall Property is as of August 31, 2015. |
| This is not a research report and was not prepared by the Underwriters’ research departments. Please see additional important information and qualifications at the end of this Term Sheet. |
| T-39 |
| MSBAM 2016-C28 | Penn Square Mall |
Operating History and Underwritten Net Cash Flow.The following table presents certain information relating to historical operating performance and the Underwritten Net Cash Flow at the Penn Square Mall Property:
| Cash Flow Analysis | |||||||
| 2012 | 2013 | 2014 | T-11 11/30/2015(1) | 2015 Reforecast(2) | UW | UW PSF(3) | |
| Base Rental Revenue | $19,702,651 | $21,824,466 | $24,056,721 | $22,775,678 | $24,946,421 | $26,186,839(4) | $33.69 |
| Temp Tenant Rent | $1,731,051 | $2,002,734 | $2,000,430 | $1,672,091 | $2,055,188 | $2,000,430 | $2.57 |
| Overage Rent | $986,243 | $819,084 | $965,740 | $1,010,224 | $1,044,554 | $1,044,554 | $1.34 |
| Other Rent | $241,473 | $217,856 | $218,615 | $218,594 | $238,796 | $218,615 | $0.28 |
| Total Minimum Rent | $22,661,418 | $24,864,140 | $27,241,506 | $25,676,587 | $28,284,959 | $29,450,438 | $37.89 |
| Expense Reimbursements | 10,917,474 | $11,583,612 | $12,996,061 | $12,251,574 | $13,515,171 | $13,435,697 | $17.29 |
| Other Income | $446,828 | $315,625 | $436,375 | $358,364 | $478,442 | $478,442(5) | $0.62 |
| Total Gross Income | $34,025,720 | $36,763,377 | $40,673,942 | $38,286,525 | $42,278,572 | $43,364,577 | $55.79 |
| Vacancy and Credit Loss | $0 | $0 | $0 | $0 | $0 | $0 | $0 |
| Effective Gross Income | $34,025,720 | $36,763,377 | $40,673,942 | $38,286,525 | $42,278,572 | $43,364,577 | $55.79 |
| Recoverable Expenses | |||||||
| Repairs & Maintenance | $633,488 | $792,953 | $450,178 | $502,479 | $585,693 | $585,693 | $0.75 |
| Security | $739,103 | $786,142 | $753,142 | $702,977 | $780,876 | $780,876 | $1.00 |
| Cleaning Expense | $584,890 | $590,722 | $595,082 | $539,008 | $570,599 | $570,599 | $0.73 |
| Utilities | $1,566,083 | $1,416,376 | $1,628,541 | $1,397,920 | $1,529,457 | $1,529,457 | $1.97 |
| Real Estate Taxes | $1,168,192 | $1,342,888 | $1,429,091 | $1,382,620 | $1,538,157 | $1,461,824 | $1.88 |
| Insurance | $506,813 | $528,534 | $490,016 | $431,111 | $470,255 | $450,737 | $0.58 |
| Administrative | $456,320 | $488,638 | $525,204 | $445,744 | $489,694 | $489,694 | $0.63 |
| Marketing | $558,950 | $750,171 | $823,816 | $862,752 | $982,915 | $982,915 | $1.26 |
| Management Fees | $676,328 | $729,913 | $807,021 | $766,980 | $839,831 | $1,000,000 | $1.29 |
| Ground Lease | $1,409,217 | $1,418,963 | $1,481,410 | $1,330,604 | $1,391,166 | $1,496,037 | $1.92 |
| Other Expenses | $138,101 | $67,203 | $20,134 | $73,196 | $99,546 | $99,546 | $0.13 |
| Total Expenses | $8,437,485 | $8,912,503 | $9,003,635 | $8,435,391 | $9,278,189 | $9,447,378 | $12.15 |
| Net Operating Income | $25,588,235 | $27,850,874 | $31,670,307 | $29,851,134 | $33,000,383 | $33,917,199 | $43.64 |
| Capital Reserves | $0 | $0 | $0 | $0 | $0 | $77,728 | $0.10 |
| Tenant Improvements | $0 | $0 | $0 | $0 | $0 | $135,083 | $0.17 |
| Leasing Commissions | $0 | $0 | $0 | $0 | $0 | $686,485 | $0.88 |
| Net Cash Flow | $25,588,235 | $27,850,874 | $31,670,307 | $29,851,134 | $33,000,383 | $33,017,904 | $42.48 |
| Occupancy% | 99.0% | 99.0% | 99.0% | N/A | N/A | 98.8%(6) | |
| NOI DSCR(7) | 3.18x | 3.46x | 3.94x | 3.71x | 4.10x | 4.22x | |
| NCF DSCR(7) | 3.18x | 3.46x | 3.94x | 3.71x | 4.10x | 4.10x | |
| NOI Debt Yield(8) | 12.4% | 13.5% | 15.3% | 14.5% | 16.0% | 16.4% | |
| NCF Debt Yield(8) | 12.4% | 13.5% | 15.3% | 14.5% | 16.0% | 16.0% | |
| (1) | T-11 November 2015 consists of only eleven months of operating history from January 2015 through November 2015. |
| (2) | 2015 Reforecast consists of the actual operating history for the eight months from January 2015 through August 2015 and the Penn Square Mall Borrower’s budget for September 2015 through December 2015. |
| (3) | UW PSF excludes 285,000 SF attributed to Macy’s (Ground Lease) and J.C. Penney (Ground Lease). |
| (4) | UW Base Rental Revenue is based on the rent roll as of December 7, 2015 and includes rent steps taken through December 2016. |
| (5) | UW Other Income includes media, valet, storage and other miscellaneous income. |
| (6) | UW Occupancy is based on square footage of 1,062,281 (based on December 7, 2015 rent roll) and reflects in place occupancy, including Texas de Brazil, Bath & Body Works and Great Wraps Grill (in aggregate representing 1.2% of square footage), which have executed leases but have not yet taken occupancy. |
| (7) | NOI DSCR and NCF DSCR are based on the three senior notes totaling $206,500,000 without regard to the subordinate note and are calculated based on the sum of the debt service payments for such senior notes. NOI DSCR and NCF DSCR for T-11 November 30, 2015 are based on eleven months of operating data; on an annualized basis, the NOI DSCR and NCF DSCR are 4.05x. |
| (8) | NOI Debt Yield and NCF Debt Yield are based on the three senior notes totaling $206,500,000 without regard to the subordinate note. NOI Debt Yield and NCF Debt Yield for T-11 November 30, 2015 are based on eleven months of operating data; on an annualized basis, the NOI Debt Yield and NCF Debt Yield are 15.8%. |
Escrows and Reserves. During the continuance of a Trigger Period (defined below), the Penn Square Mall Borrower is required to escrow monthly (i) 1/12thof the annual estimated tax payments, and (ii) 1/12th of the annual estimated insurance premiums (unless the Penn Square Mall Borrower maintains an acceptable blanket policy). During the continuance of a Trigger Period, the Penn Square Mall Borrower is required to make monthly deposits equal to $16,217 into an escrow for replacements and repairs on each monthly payment date on which the balance in such escrow is less than $389,208. During the continuance of a Trigger Period, the Penn Square Mall Borrower is required to make monthly deposits equal to $64,868 into an escrow for tenant improvements and leasing commissions on each monthly payment date on which the balance in such escrow is less than $1,556,832.
| This is not a research report and was not prepared by the Underwriters’ research departments. Please see additional important information and qualifications at the end of this Term Sheet. |
| T-40 |
| MSBAM 2016-C28 | Penn Square Mall |
Lockbox and Cash Management. A hard lockbox is in place with respect to the Penn Square Mall Whole Loan. The Penn Square Mall Whole Loan has springing cash management. Provided no Trigger Period or Cash Sweep Period (defined below) is continuing, funds in the lockbox account are swept weekly to an account designated by the Penn Square Mall Borrower. During the continuance of a Trigger Period or Cash Sweep Period, funds in the lockbox account are required to be transferred to a cash management account to be established by lender. During the continuance of a Trigger Period, such funds are required to be applied on each monthly payment date to pay debt service on the Penn Square Mall Whole Loan, to fund the required reserves deposits as described above under “Escrows and Reserves”, to disburse, during the continuance of a Cash Sweep Period, other than a Cash Sweep Period which is due to an event of default under the Penn Square Mall Whole Loan, the monthly operating expenses referenced in the annual budget (which, during a Cash Sweep Period, is required to be approved by the lender to the extent there is more than a 5% deviation from the annual budget for the prior fiscal year) and extraordinary operating expenses or capital expenses not referenced in the annual budget and approved by the lender, and to disburse the remainder (i) if a Cash Sweep Period is continuing, into an account to be held by the lender as additional security for the Penn Square Mall Whole Loan during the continuance of such Cash Sweep Period and (ii) otherwise, to the Penn Square Mall Borrower.
A “Trigger Period” will commence on the date upon which the debt service coverage ratio on the Penn Square Mall Whole Loan for the immediately preceding four calendar quarters is less than 1.75x for two consecutive calendar quarters, and end on the date the debt service coverage ratio on the Penn Square Mall Whole Loan for the immediately preceding four calendar quarters equals or exceeds 1.75x for two consecutive calendar quarters.
A “Cash Sweep Period” means the period:
(i) during the continuance of the event of default, or
(ii) commencing on the date upon which the debt service coverage ratio on the Penn Square Mall Whole Loan for the immediately preceding four calendar quarters is less than 1.25x for two consecutive calendar quarters, and ending on the date the debt service coverage ratio on the Penn Square Mall Whole Loan for the immediately preceding four calendar quarters equals or exceeds 1.25x for two consecutive calendar quarters.
Additional Secured Indebtedness (not including trade debts).In addition to the Penn Square Mall Mortgage Loan, the Penn Square Mall Property also secures the Penn Square Mall Non-ServicedPari passu Companion Loan and the Penn Square Mall Non-Serviced Subordinate Companion Loan. The Penn Square Mall Mortgage Loan, the Penn Square Mall Non-ServicedPari passu Companion Loan, and the Penn Square Mall Non-Serviced Subordinate Companion Loan all accrue interest at 3.8420%per annum. Payments under the Penn Square Mall Whole Loan are generally applied (A) prior to a triggering event of default (generally, a monetary event of default or one that results in the Penn Square Mall Whole Loan being specially serviced) (i)first,to interest on the Penn Square Mall Mortgage Loan and Penn Square Mall Non-ServicedPari passu Companion Loan (together, the “Penn Square Mall Senior Notes”),pro rataandpari passu, (ii)second, to interest on the Penn Square Mall Non-Serviced Subordinate Companion Loan, (iii)third, to principal on the Penn Square Mall Senior Notes,pro rataandpari passu,in amounts equal to their principal entitlements (if any) for the related payment date, and (iv)fourth, to principal on the Penn Square Mall Non-Serviced Subordinate Companion Loan in an amount equal to its principal entitlement (if any) for the related payment date and (B) during the continuance of a triggering event of default, (i)first, to accrued and unpaid interest on the Penn Square Mall Senior Notes on apro rataandpari passubasis, (ii)second, to accrued and unpaid interest on the Penn Square Mall Subordinate Companion Loan; (iii)third, to principal on the Penn Square Mall Senior Notes on apro rataandpari passubasis until their principal balances have been reduced to zero and then (iv)fourth, to principal on the Penn Square Mall Non-Serviced Subordinate Companion Loan until its principal balance has been reduced to zero. Such priorities and the allocation of collections on the Penn Square Mall Whole Loan are set forth in an agreement between note holders governing the promissory notes comprising the Penn Square Mall Whole Loan. See “Description of the Mortgage Pool—The Whole Loans—The Non-Serviced Pari passu-AB Whole Loans—The Penn Square Mall Whole Loan” in the Preliminary Prospectus.
The following table presents certain information relating to the Penn Square Mall Whole Loan:
| Full Debt Summary | ||||||
| Cumulative Balance | Cumulative Loan PSF(1) | Cumulative LTV(2) | Cumulative NOI DY(2)(3) | Cumulative NCF DSCR(2)(3) | ||
| Penn Square Mall Non-ServicedPari passu Companion Loan $116,500,000 Note A-1A and Note A-1C | Penn Square Mall Mortgage Loan $90,000,000 Note A-1B | $206,500,000 | $194 | 31.3% | 16.4% | 4.10x |
| Penn Square Mall Non-Serviced Subordinate Companion Loan $103,500,000 Note A-2 | $310,000,000 | $292 | 47.0% | 10.9% | 2.73x | |
| Implied Equity(4) | $350,000,000 | |||||
| (1) | Based on square footage of 1,062,281, which includes Macy’s (160,000 SF, ground leased) and J.C. Penney (125,000 SF, ground leased). |
| (2) | With respect to the Penn Square Mall Mortgage Loan, Cumulative LTV, Cumulative NOI DY and Cumulative NCF DSCR take into account the Penn Square Mall Non-Serviced Companion Loan. |
| (3) | Based on UW NOI of $33,917,200 and UW NCF of $33,017,904 and actual debt service. |
| (4) | Based on $660,000,000 appraised value as of November 17, 2015. |
Mezzanine Loan and Preferred Equity. Not permitted.
Release of Property. Not permitted.
Terrorism Insurance.The Penn Square Mall Borrower is required to obtain insurance against acts of terrorism to the extent such insurance is available; provided, that (A) the Penn Square Mall Borrower is not required to pay insurance premiums with respect to such terrorism insurance in excess of the Terrorism Cap (defined below) and (B) any such policy may have a deductible that is reasonable with respect to properties similar to the Penn Square Mall Property and for the geographic region where the Penn Square Mall Property is located, so long as such deductible does not exceed $5,000,000. “Terrorism Cap” means two times the amount of the then-current annual insurance premiums payable by the Penn Square Mall Borrower for the policies insuring only the Penn Square Mall Property (excluding the wind and flood components of such insurance premiums).
| This is not a research report and was not prepared by the Underwriters’ research departments. Please see additional important information and qualifications at the end of this Term Sheet. |
| T-41 |
| MSBAM 2016-C28 | Ellenton Premium Outlets |
Mortgage Loan No. 2 – Ellenton Premium Outlets
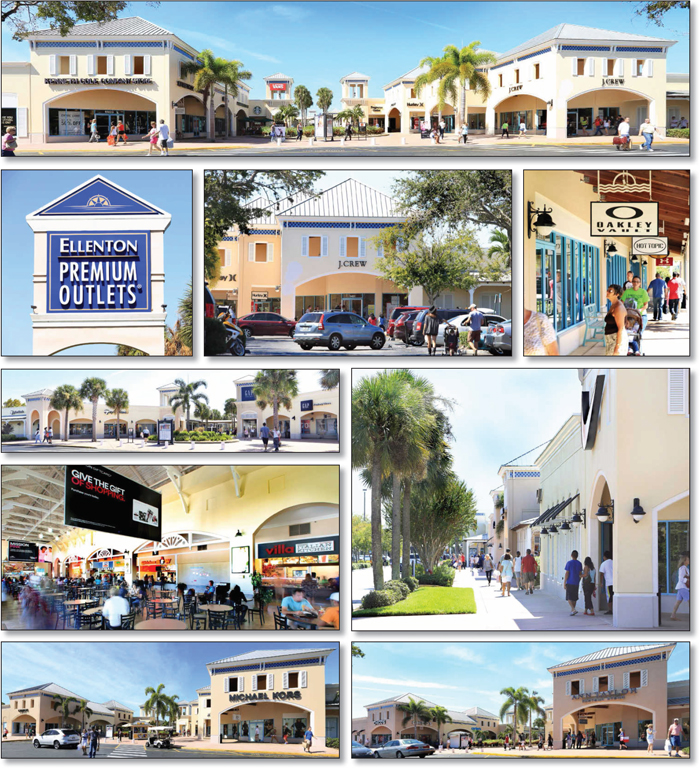
| This is not a research report and was not prepared by the Underwriters’ research departments. Please see additional important information and qualifications at the end of this Term Sheet. |
| T-42 |
| MSBAM 2016-C28 | Ellenton Premium Outlets |
Mortgage Loan No. 2 – Ellenton Premium Outlets
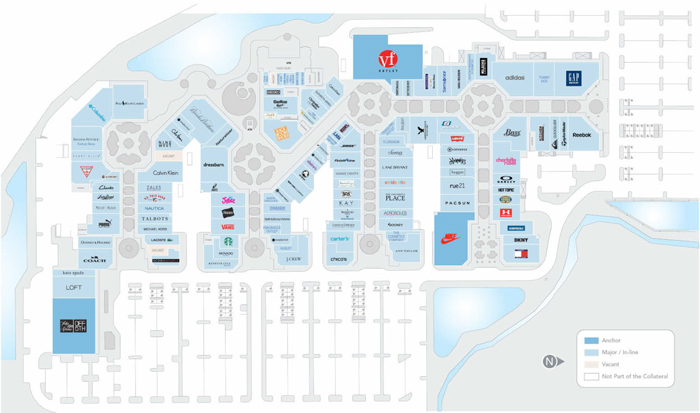
| This is not a research report and was not prepared by the Underwriters’ research departments. Please see additional important information and qualifications at the end of this Term Sheet. |
| T-43 |
| MSBAM 2016-C28 | Ellenton Premium Outlets |
Mortgage Loan No. 2 – Ellenton Premium Outlets
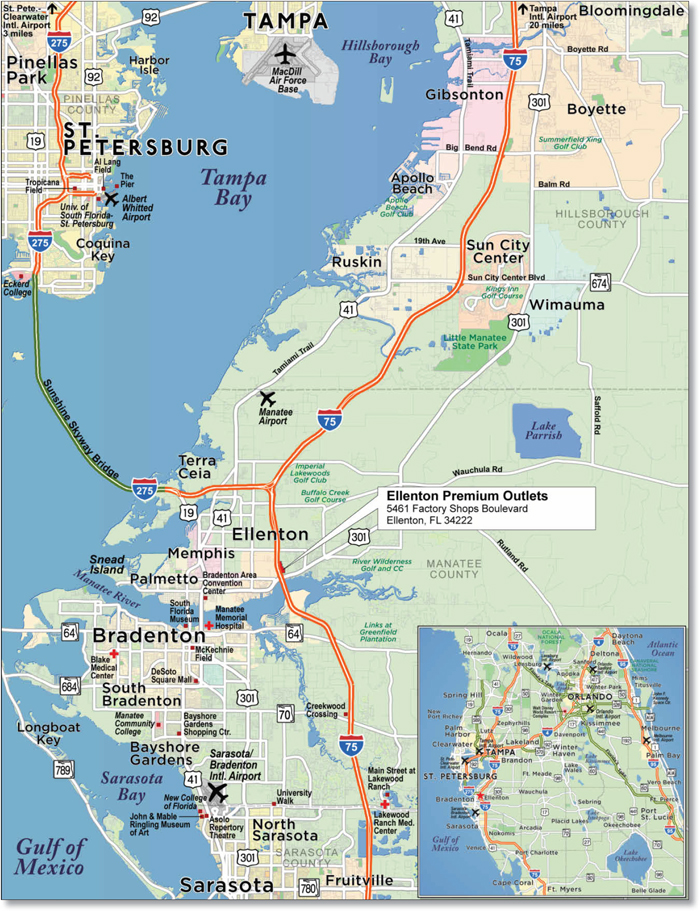
| This is not a research report and was not prepared by the Underwriters’ research departments. Please see additional important information and qualifications at the end of this Term Sheet. |
| T-44 |
| MSBAM 2016-C28 | Ellenton Premium Outlets |
| Mortgage Loan No. 2 – Ellenton Premium Outlets |
|---|
| Mortgage Loan Information | Property Information | ||||||
| Mortgage Loan Seller: | BANA | Single Asset/Portfolio: | Single Asset | ||||
| Original Balance(1): | $71,200,000 | Location: | Ellenton, FL 34222 | ||||
| Cut-off Date Balance(1): | $71,200,000 | General Property Type: | Retail | ||||
| % of Initial Pool Balance: | 7.5% | Detailed Property Type: | Outlet Center | ||||
| Loan Purpose: | Refinance | Title Vesting: | Fee | ||||
| Sponsor: | Simon Property Group, L.P. | Year Built/Renovated: | 1991/N/A | ||||
| Mortgage Rate: | 4.2985% | Size: | 476,487 SF | ||||
| Note Date: | 11/3/2015 | Cut-off Date Balance per Unit(1): | $374 | ||||
| First Payment Date: | 1/1/2016 | Maturity Date Balance per Unit(1): | $374 | ||||
| Maturity Date: | 12/1/2025 | Property Manager: | Simon Management Associates, LLC (borrower-related) | ||||
| Original Term to Maturity: | 120 months | ||||||
| Original Amortization Term: | 0 months | Underwriting and Financial Information | |||||
| IO Period: | 120 months | UW NOI: | $19,482,297 | ||||
| Seasoning: | 2 months | UW NOI Debt Yield(1): | 10.9% | ||||
| Prepayment Provisions(2): | LO (26); DEF (87); O (7) | UW NOI Debt Yield at Maturity(1): | 10.9% | ||||
| Lockbox/Cash Mgmt Status: | Hard/Springing | UW NCF DSCR(1): | 2.43x | ||||
| Additional Debt Type: | Pari passu | Most Recent NOI: | $19,928,943 (11/30/2015 TTM) | ||||
| Additional Debt Balance: | $106,800,000 | 2nd Most Recent NOI: | $19,170,080 (12/31/2014) | ||||
| Future Debt Permitted (Type): | No (N/A) | 3rd Most Recent NOI: | $17,585,591 (12/31/2013) | ||||
| Reserves(3) | Most Recent Occupancy(4): | 99.9% (1/4/2016) | |||||
| Type | Initial | Monthly | Cap | 2nd Most Recent Occupancy: | 98.7% (11/30/2015) | ||
| RE Tax: | $0 | Springing | N/A | 3rd Most Recent Occupancy: | 98.8% (12/31/2014) | ||
| Insurance: | $0 | Springing | N/A | Appraised Value (as of): | $332,000,000 (10/1/2015) | ||
| Recurring Replacements: | $0 | Springing | $285,892 | Cut-off Date LTV Ratio(1): | 53.6% | ||
| TI/LC: | $0 | Springing | $1,429,461 | Maturity Date LTV Ratio(1): | 53.6% | ||
| Sources and Uses | ||||||
| Sources | Proceeds | % of Total | Uses | Proceeds | % of Total | |
| Loan Amount(1): | $178,000,000 | 100.0% | Loan Payoff: | $98,694,610 | 55.4% | |
| Closing Costs: | $790,233 | 0.4% | ||||
| Return of Equity: | $78,515,157 | 44.1% | ||||
| Total Sources: | $178,000,000 | 100.0% | Total Uses: | $178,000,000 | 100.0% | |
| (1) | The Ellenton Premium Outlets Mortgage Loan is part of the Ellenton Premium Outlets Whole Loan, which is comprised of fourpari passu promissory notes with an aggregate principal balance of $178,000,000. The Cut-off Date Balance per Unit, Maturity Date Balance per Unit, UW NOI Debt Yield, UW NOI Debt Yield at Maturity, UW NCF DSCR, Cut-off Date LTV Ratio and Maturity Date LTV Ratio numbers presented above are based on the aggregate principal balance of the promissory notes comprising the Ellenton Premium Outlets Whole Loan. |
| (2) | Defeasance is permitted at any time on or after the earlier to occur of (a) the end of the two-year period commencing on the closing date of the securitization of the last Ellenton Premium Outlets promissory note to be securitized and (b) January 1, 2019. |
| (3) | See “—Escrows and Reserves” below for further discussion of reserve requirements. |
| (4) | Includes approximately 3,000 SF recently leased to BCBG Max Azria and approximately 2,400 SF recently leased to Billabong as occupied space. BCBG Max Azria and Billabong are not yet in occupancy, but are expected to begin paying rent as of February 1, 2016. |
The Mortgage Loan.The second largest mortgage loan (the “Ellenton Premium Outlets Mortgage Loan”) is part of a non-serviced whole loan (the “Ellenton Premium Outlets Whole Loan”) evidenced by fourpari passu promissory notes in the aggregate original principal amount of $178,000,000, all of which are secured by a first priority fee mortgage encumbering a 476,487 SF outlet center known as Ellenton Premium Outlets in Ellenton, Florida (the “Ellenton Premium Outlets Property”). Promissory Note A-4 represents the Ellenton Premium Outlets Mortgage Loan. Promissory Note A-1 in the original principal amount of $58,000,000 and Promissory Note A-3 in the original principal amount of $10,000,000, are currently held by the MSCI 2015-UBS8 securitization trust, and Promissory Note A-2 in the original principal amount of $38,800,000 is currently held by UBS Real Estate Securities Inc. or an affiliate thereof and is expected to be contributed to a future securitization trust (collectively, the “Ellenton Premium Outlets Non-ServicedPari passu Companion Loan”). The Ellenton Premium Outlets Whole Loan is being serviced pursuant to the pooling and servicing agreement for the MSCI 2015-UBS8 transaction. See “Description of the Mortgage Pool—The Whole Loans---The Non-Serviced Pari passu Whole Loans—The Ellenton Premium Outlets Whole Loan” and “Pooling and Servicing Agreement—Servicing of the Non-Serviced Mortgage Loans” in the Preliminary Prospectus.
The proceeds of the Ellenton Premium Outlets Whole Loan were used to refinance a previous mortgage loan secured by the Ellenton Premium Outlets Property in the original principal amount of approximately $98.7 million, to pay closing costs, and to return equity to the Ellenton Premium Outlets Borrower. The previous mortgage loan secured by the Ellenton Premium Outlets Property was included in the WBCMT 2006-C23 and WBCMT 2006-C25 securitization trusts.
| This is not a research report and was not prepared by the Underwriters’ research departments. Please see additional important information and qualifications at the end of this Term Sheet. |
| T-45 |
| MSBAM 2016-C28 | Ellenton Premium Outlets |
The Borrower and the Sponsor.The borrower is Gulf Coast Factory Shops Limited Partnership (the “Ellenton Premium Outlets Borrower”), a single-purpose Illinois limited partnership structured to be bankruptcy-remote, with two independent directors. The sponsor and the guarantor of the Ellenton Premium Outlets Borrower is Simon Property Group, L.P. (the “Ellenton Premium Outlets Sponsor”). Simon Property Group, L.P. is the operating partnership of Simon Property Group, Inc. (“Simon”). Simon is a publicly traded self-administered and self-managed real estate investment trust (NYSE: SPG) focused on retail property ownership and management. Simon is one of the largest publicly traded owner, operator and developer of retail assets in the United States. As of December 31, 2014, Simon operated 207 income-producing properties in the United States, consisting of 109 malls, 68 outlet centers, 13 mills, three community centers, and 14 other retail properties located in 37 states and Puerto Rico containing an aggregate of approximately 182.0 million SF. Simon’s 68 outlet centers contain a variety of designer and manufacturer stores located in open-air centers and range in size from approximately 150,000 SF to 850,000 SF located near major metropolitan areas and/or tourist destinations.
The Ellenton Premium Outlets Whole Loan will be recourse to the Ellenton Premium Outlets Sponsor pursuant to standard carve-outs, however, the guaranty and the environmental indemnity agreement provide that the Ellenton Premium Outlets Sponsor’s liability may not exceed $35.6 million in the aggregate, plus all reasonable out-of-pocket costs and expenses (including court costs and reasonable attorneys’ fees) incurred by the lender in the enforcement of the guaranty and the environmental indemnity agreement or the preservation of the lender’s rights thereunder.
The Ellenton Premium Outlets Borrower is affiliated with the borrower of another mortgage loan through partial or complete direct or indirect ownership, identified as Penn Square Mall in Annex A-1 to the Preliminary Prospectus.
The Property. The Ellenton Premium Outlets Property is a single level 476,487 SF open-air outlet center situated on a 61.83-acre site located in Ellenton, Florida with approximately 2,400 surface parking spaces (5.04 per 1,000 SF). The Ellenton Premium Outlets Property is located approximately 19.7 miles north of Sarasota, Florida and 41.6 miles south of Tampa, Florida. Access to the Ellenton Premium Outlets Property is provided by Interstate 75 and U.S. Route 301. Interstate 75, located adjacent to the Ellenton Premium Outlets Property and accessible 0.5 miles to the south, is a major north/south interstate. U.S. Route 301 is a major north/south highway, traveling in an east/west manner in the neighborhood. Traffic counts adjacent to the Ellenton Premium Outlets Property on I-75 and U.S. Route 301 are approximately 86,000 vehicles per day and approximately 30,000 vehicles per day, respectively, according to a third party market research report.
The Ellenton Premium Outlets Property includes a diverse mix of nationally recognized retailers consisting of 122 tenants, with no tenant contributing more than 4.9% of net rentable area or 3.2% of underwritten base rent. Major tenants at the Ellenton Premium Outlets Property include V.F. Factory Outlet, Saks Fifth Avenue OFF 5TH, Nike Factory Store, Gap Outlet, Adidas and Brooks Brothers. In-line tenants include vendors such as American Eagle Outfitter, Banana Republic Factory, Calvin Klein, Coach, Columbia Sportswear Company, Dress Barn, Guess?, Loft Outlet, Michael Kors and Polo Ralph Lauren. There are also six food court tenants.
As of January 4, 2016, the Ellenton Premium Outlets Property was 99.9% occupied. Based upon lender calculation, weighted average comparable sales for the trailing 12 months ending November 30, 2015 were approximately $470 PSF with 113 tenants reporting comparable sales. The trailing 12-month average occupancy cost for these tenants was 11.8%. Historical occupancy at the Ellenton Premium Outlets Property has averaged 99.1% from 2011 to the trailing twelve month period ending November 30, 2015.
| This is not a research report and was not prepared by the Underwriters’ research departments. Please see additional important information and qualifications at the end of this Term Sheet. |
| T-46 |
| MSBAM 2016-C28 | Ellenton Premium Outlets |
The following table presents certain information relating to the leases at the Ellenton Premium Outlets Property. There are no tenants currently paying rent based upon a percentage of their sales in lieu of base rent.
| Tenant Summary(1) | |||||||||
| Tenant Name | Credit Rating (Fitch/Moody’s/ S&P)(2) | Tenant SF | Approximate % of SF | Annual UW Rent | Annual UW Rent PSF(3) | Sales (TTM 11/30/2015)(4) | Occ. Cost % | Lease Expiration | |
| $ | PSF | ||||||||
| Major Tenants | |||||||||
| V.F. Factory Outlet | NR/A3/A | 23,272 | 5% | $576,240 | $24.76 | $5,176,000 | $222 | 13.3% | 12/31/2018 |
| Saks Fifth Avenue OFF 5TH | NR/NR/NR | 19,804 | 4% | $222,795 | $11.25 | $6,938,000 | $350 | 5.3% | 10/31/2016 |
| Nike Factory Store | NR/A1/AA- | 15,076 | 3% | $376,900 | $25.00 | $13,772,000 | $914 | 4.5% | 1/31/2020 |
| Gap Outlet | BBB-/Baa2/BBB- | 11,429 | 2% | $245,900 | $21.52 | $5,591,000 | $489 | 7.4% | 11/30/2016 |
| Adidas | NR/NR/NR | 10,500 | 2% | $315,000 | $30.00 | $3,801,000 | $362 | 12.1% | 1/31/2018 |
| Brooks Brothers | NR/NR/NR | 10,033 | 2% | $230,759 | $23.00 | $2,707,000 | $270 | 9.9% | 12/31/2017 |
| Subtotal/Wtd. Avg. | 90,114 | 19% | $1,967,594 | $21.83 | $37,985,000 | $422 | 7.4% | ||
| Top 10 In-Line Tenants(5) | |||||||||
| Columbia Sportswear Company | NR/NR/NR | 8,889 | 2% | $450,406 | $50.67 | $5,642,000 | $635 | 10.9% | 1/31/2019 |
| Coach | BBB/Baa2/BBB- | 5,864 | 1% | $381,160 | $65.00 | $7,656,000 | $1,306 | 6.3% | 1/31/2023 |
| Michael Kors | NR/NR/NR | 5,000 | 1% | $360,500 | $72.10 | $5,458,000 | $1,092 | 8.3% | 11/30/2025 |
| Rack Room Shoes | NR/NR/NR | 7,137 | 1% | $343,504 | $48.13 | $3,739,000 | $524 | 12.9% | 8/31/2018 |
| The Children’s Place | NR/NR/NR | 5,872 | 1% | $332,649 | $56.65 | $1,889,000 | $322 | 23.9% | 1/31/2020 |
| Charlotte Russe | NR/NR/NR | 6,587 | 1% | $310,841 | $47.19 | $1,870,000 | $284 | 23.1% | 1/31/2019 |
| Bass Shoes | NR/NR/NR | 7,069 | 1% | $293,505 | $41.52 | $2,200,000 | $311 | 20.3% | 11/30/2018 |
| Dress Barn | NR/NR/NR | 8,105 | 2% | $257,982 | $31.83 | $1,876,000 | $231 | 22.8% | 6/30/2024 |
| Calvin Klein | NR/Ba1/BB+ | 6,638 | 1% | $251,912 | $37.95 | $2,636,000 | $397 | 10.5% | 9/30/2016 |
| Sunglass Hut | NR/NR/NR | 4,770 | 1% | $250,158 | $52.44 | $2,481,000 | $520 | 13.7% | Various(6) |
| Subtotal/Wtd. Avg. | 65,931 | 14% | $3,232,616 | $49.03 | $35,447,000 | $538 | 12.5% | ||
| Other Tenants | 319,750 | 67% | $12,798,155 | $40.03 | $142,936,000 | ||||
| Vacant Space | 692 | 0% | $0 | $0.00 | |||||
| Total/Wtd. Avg. | 476,487 | 100% | $17,998,365 | $37.83 | $216,368,000 | ||||
| (1) | Information is based on the underwritten rent roll. |
| (2) | Certain ratings are those of the parent company whether or not the parent guarantees the lease. |
| (3) | Wtd. Avg. Annual UW Rent PSF excludes vacant space. |
| (4) | Sales $ and Sales PSF represent trailing 12 months ending November 30, 2015 as provided by the sponsor and only include tenants reporting comparable sales. |
| (5) | Top in-line tenants are ordered by Annual UW Rent. |
| (6) | Sunglass Hut’s space is leased pursuant to three leases. One lease totaling 1,905 SF and $62,789 of underwritten base rent expires on February 28, 2025, one lease totaling 1,794 SF and $80,730 of underwritten base rent expires on May 31, 2017, and one lease totaling 1,071 SF and $106,639 of underwritten base rent expires on August 31, 2022. |
| This is not a research report and was not prepared by the Underwriters’ research departments. Please see additional important information and qualifications at the end of this Term Sheet. |
| T-47 |
| MSBAM 2016-C28 | Ellenton Premium Outlets |
The following table presents certain information relating to the lease rollover schedule at the Ellenton Premium Outlets Property:
| Lease Rollover Schedule(1)(2) | ||||||||
| Year | # of Leases Rolling | SF Rolling | Annual UW Rent PSF Rolling(3) | Approx. % of Total SF Rolling | Approx. Cumulative % of SF Rolling | Total UW Rent Rolling | Approx. % of Total Rent Rolling | Approx. Cumulative % of Total Rent Rolling |
| MTM | 3 | 10,716 | $38.71 | 2% | 2% | $414,799 | 2% | 2% |
| 2016 | 11 | 56,577 | $27.14 | 12% | 14% | $1,535,518 | 9% | 11% |
| 2017 | 17 | 50,879 | $39.14 | 11% | 25% | $1,991,536 | 11% | 22% |
| 2018 | 18 | 92,175 | $35.10 | 19% | 44% | $3,235,472 | 18% | 40% |
| 2019 | 14 | 55,056 | $40.99 | 12% | 56% | $2,256,608 | 13% | 52% |
| 2020(4) | 9 | 39,086 | $37.71 | 8% | 64% | $1,474,003 | 8% | 61% |
| 2021 | 12 | 35,723 | $36.50 | 7% | 71% | $1,303,997 | 7% | 68% |
| 2022(5) | 11 | 39,122 | $38.99 | 8% | 80% | $1,525,454 | 8% | 76% |
| 2023 | 9 | 30,746 | $46.96 | 6% | 86% | $1,443,915 | 8% | 84% |
| 2024 | 4 | 16,071 | $36.35 | 3% | 89% | $584,174 | 3% | 88% |
| 2025 | 8 | 31,979 | $41.94 | 7% | 96% | $1,341,087 | 7% | 95% |
| 2026(6) | 6 | 17,665 | $50.48 | 4% | 100% | $891,802 | 5% | 100% |
| 2027 | 0 | 0 | $0.00 | 0% | 100% | $0 | 0% | 100% |
| 2028 | 0 | 0 | $0.00 | 0% | 100% | $0 | 0% | 100% |
| 2029 & Beyond | 0 | 0 | $0.00 | 0% | 100% | $0 | 0% | 100% |
| Vacant | 0 | 692 | $0.00 | 0% | 100% | $0 | 0% | 100% |
| Total/Wtd. Avg. | 122 | 476,487 | $37.83 | 100% | $17,998,365 | 100% | ||
| (1) | Information is based on the underwritten rent roll. |
| (2) | Certain tenants may have lease termination options that are exercisable prior to the originally stated expiration date of the subject lease and that are not considered in the lease rollover schedule. |
| (3) | Wtd. Avg. Annual UW Rent PSF Rolling excludes vacant space. |
| (4) | Includes Perfumania (1,498 SF) that has a lease out for renewal with a current expiration date of August 2015. Perfumania has a lease renewal expiration date of August 2020. However, the proposed renewal lease has not been signed. |
| (5) | Includes Easy Spirit (1,985 SF) that has a lease out for renewal with a current expiration date of February 2015. Easy Spirit has a lease renewal expiration date of February 2022. However, the proposed renewal lease has not been signed. |
| (6) | Includes Guess? (6,125 SF) which has a lease out for renewal with a current expiration date of January 2016. Guess? has a lease renewal expiration date of January 2026, however, the proposed renewal lease has not been signed. |
The Market. The Ellenton Premium Outlets Property is located in Ellenton, Florida adjacent to Interstate 75 and U.S. Route 301. Tourism serves a major role in the economy of the neighborhood, and some of the local attractions include the Siesta Key and Lido Key beaches. Siesta Key was named the best beach in the U.S. by TripAdvisor in 2015 and features six miles of beaches, white sands and clear green waters. Lido Key features tours for deep sea fishing, dolphin watching and sailing. Other leisure attractions in the area include the Ellenton Ice and Sports Complex, the DaySpring Episcopal Conference Center and the Manatee River. The Ellenton Ice and Sports Complex, located directly north of the Ellenton Premium Outlets Property, is comprised of two ice rinks, indoor soccer fields and a fitness center.
The Ellenton Premium Outlets Property is the only comparable outlet center within a 57-mile radius. A Tampa Premium Outlets recently opened in October 2015 and is also owned by the sponsor. Intercept studies conducted by the sponsor have revealed that the Ellenton Premium Outlets Property mainly draws its shoppers from vacationers visiting the Siesta Key and Lido Key beaches.
The estimated 2015 population within a three-, five- and ten-mile radius around the Ellenton Premium Outlets Property was 31,571, 98,003 and 312,888, respectively. The estimated 2015 average household income within a three-, five- and ten-mile radius was $60,961, $62,050 and $65,668, respectively.
The Ellenton Premium Outlets Property is located within the Manatee retail submarket. As of June 30, 2015, the retail properties within the submarket had an overall vacancy rate of 8.0% and an average asking annual lease rate of $13.08 PSF. According to a third party market research report, the submarket contains 1,545 buildings accounting for approximately 18.2 million SF of retail space.
| This is not a research report and was not prepared by the Underwriters’ research departments. Please see additional important information and qualifications at the end of this Term Sheet. |
| T-48 |
| MSBAM 2016-C28 | Ellenton Premium Outlets |
The following table presents leasing data at certain retail competitive properties with respect to the Ellenton Premium Outlets Property:
| Competitive Property Summary(1) | ||||||
| Property Name | Type | Year Built/Renovated | Size (SF) | Total Occupancy | Tenants | Distance to Subject (mi.) |
| Ellenton Premium Outlets Property | Outlet Center | 1991/N/A | 476,487(2) | 99.9%(2) | V.F. Factory Outlet, Saks Fifth Avenue OFF 5TH | N/A |
| DeSoto Square | Regional Center | 1973/N/A | 696,000 | 74.0% | JC Penney, Sears, Hudson’s Furniture | 8.5 |
| Mall at University Town Center | Super Regional Center/Mall | 2014/N/A | 880,000 | 96.0% | Dillard’s, Macy’s, Saks Fifth Avenue | 13.0 |
| Tyrone Square | Super Regional Center/Mall | 1972/1998 | 1,124,600 | 94.0% | Dillard’s, JC Penney, Macy’s, Sears | 30.0 |
| Brandon Town Center | Super Regional Center/Mall | 1995/2007 | 1,151,258 | 96.0% | Dillard’s, JC Penney, Macy’s, Sears, Dick’s Sporting Goods | 34.0 |
| International Plaza | Super Regional Center/Mall | 2001/2015 | 1,295,548 | 90.0% | Dillard’s, Neiman Marcus, Nordstrom, Forever XXI | 88.0 |
| Orlando Premium Outlets | Outlet Center | 2000/N/A | 550,000 | 99.0% | Polo/Ralph Lauren, Nike, Saks Fifth Avenue OFF 5TH | 98.0 |
| Gulf Coast Town Center | Regional Center | 2005/N/A | 1,651,000 | 94.0% | Bass Pro Outdoor World, Belk, Dick’s Sporting Goods, Costco, Target | 99.0 |
| Miromar Outlets | Outlet Center | 1998/2015 | 954,900 | 99.0% | Bloomingdale’s Outlet, Neiman Marcus Last Call, Saks Off Fifth, Polo/Ralph Lauren, Nike | 104.0 |
| Orlando Premium Outlets - Int’l Dr. | Outlet Center | 1989/2007 | 775,000 | 98.0% | Neiman Marcus Last Call, Nike, Saks Fifth Avenue OFF 5TH, Reebok | 105.0 |
| Sanibel Outlet Center | Outlet Center | 1993/N/A | 177,349 | 89.0% | Nike, Polo/Ralph Lauren | 108.0 |
| Total/Wtd. Avg. (3) | 9,255,655 | 94.0% | ||||
Source: Appraisal
| (1) | Tampa Premium Outlets recently opened in October 2015, after the appraisal was completed, and therefore is not included as a competitive property for the Ellenton Premium Outlets Property. |
| (2) | Information is based on the underwritten rent roll. Includes approximately 3,000 SF recently leased to BCBG Max Azria and approximately 2,400 SF recently leased to Billabong as occupied space. BCBG Max Azria and Billabong are not yet in occupancy, but are scheduled to begin paying rent as of February 1, 2016. |
| (3) | Total/Wtd. Avg. excludes the Ellenton Premium Outlets Property. |
| This is not a research report and was not prepared by the Underwriters’ research departments. Please see additional important information and qualifications at the end of this Term Sheet. |
| T-49 |
| MSBAM 2016-C28 | Ellenton Premium Outlets |
Operating History and Underwritten Net Cash Flow.The following table presents certain information relating to the historical operating performance and the Underwritten Net Cash Flow at the Ellenton Premium Outlets Property:
| Cash Flow Analysis | |||||||||||||
| 2012 | 2013 | 2014 | 11/30/2015 TTM | UW | UW PSF | ||||||||
| Base Rent | $15,792,937 | $16,660,394 | $17,590,662 | $17,987,333 | $18,779,609 | $39.41 | |||||||
| Total Recoveries | $5,762,640 | $6,362,733 | $7,068,590 | $7,220,183 | $7,686,207 | $16.13 | |||||||
| Other Income(1) | $489,955 | $495,302 | $599,560 | $639,618 | $600,000 | $1.26 | |||||||
| Less Vacancy | $79,744 | ($15,184) | ($32,932) | ($21,483) | ($1,323,291) | ($2.78) | |||||||
| Effective Gross Income | $22,125,276 | $23,503,245 | $25,225,880 | $25,825,651 | $25,742,525 | $54.03 | |||||||
| Total Operating Expenses | $5,603,067 | $5,917,654 | $6,055,800 | $5,896,708 | $6,260,229 | $13.14 | |||||||
| Net Operating Income | $16,522,209 | $17,585,591 | $19,170,080 | $19,928,943 | $19,482,297 | $40.89 | |||||||
| Capital Expenditures | $0 | $0 | $0 | $0 | $138,181 | $0.29 | |||||||
| TI/LC | $0 | $0 | $0 | $0 | $507,114 | $1.06 | |||||||
| Net Cash Flow | $16,522,209 | $17,585,591 | $19,170,080 | $19,928,943 | $18,837,001 | $39.53 | |||||||
| Occupancy % | 99.0% | 99.2% | 98.8% | 98.7% | 99.9%(2) | ||||||||
| NOI DSCR | 2.13x | 2.27x | 2.47x | 2.57x | 2.51x | ||||||||
| NCF DSCR | 2.13x | 2.27x | 2.47x | 2.57x | 2.43x | ||||||||
| NOI Debt Yield | 9.3% | 9.9% | 10.8% | 11.2% | 10.9% | ||||||||
| NCF Debt Yield | 9.3% | 9.9% | 10.8% | 11.2% | 10.6% | ||||||||
| (1) | Other income includes income from temporary tenants, SBV rents, stroller/kidkruz, directories, local media advertising, sponsorships and other miscellaneous income, |
| (2) | Occupancy as of January 4, 2016. |
Escrows and Reserves. During the continuance of a Cash Sweep Period (as defined below), the Ellenton Premium Outlets Borrower is required to escrow monthly (i) 1/12 of the estimated annual real estate taxes, (ii) 1/12 of the annual estimated insurance premiums, (iii) $7,941 for replacement reserves provided that such monthly deposits are not required if the funds on deposit in such replacement reserve account exceed $285,892 and (iv) $59,561 for TI/LC reserves provided that such monthly deposits are not required if the funds on deposit in such TI/LC reserve account exceed $1,429,461.
A “Cash Sweep Period” will occur upon (i) an event of default, (ii) a bankruptcy action involving the Ellenton Premium Outlets guarantors or property manager, or (iii) the DSCR based on the preceding four calendar quarters falling below 1.40x for two consecutive calendar quarters. A Cash Sweep Period will continue until, in regard to clause (i) above, the cure of such event of default, in regard to clause (ii) above, the filing is discharged, stayed, or dismissed and lender’s determination that such filing does not materially affect the Ellenton Premium Outlets Borrower’s, guarantor’s, or property manager’s monetary obligations, or in regard to clause (iii) above, upon the date the DSCR based on the preceding four calendar quarters is greater than or equal to 1.40x for two consecutive calendar quarters.
Lockbox and Cash Management.A hard lockbox is in place with respect to the Ellenton Premium Outlets Whole Loan. The Ellenton Premium Outlets Whole Loan has springing cash management (i.e., the Ellenton Premium Outlets Whole Loan has cash management only after the initial occurrence and during the continuance of a Cash Sweep Period). During the continuance of a Cash Sweep Period for the Ellenton Premium Outlets Whole Loan, funds in the lockbox account are required to be applied on each monthly payment date to pay debt service on the Ellenton Premium Outlets Whole Loan, to fund the required reserves deposits as described above under ”—Escrows and Reserves,” to disburse, provided no event of default has occurred or is continuing, to the Ellenton Premium Outlets Borrower the monthly amount payable for operating expenses not otherwise paid or reserved for as described above under “—Escrows and Reserves” and referenced in the annual budget approved by the lender together with other amounts incurred by the Ellenton Premium Outlets Borrower in connection with the operation and maintenance of the Ellenton Premium Outlets Property reasonably approved by the lender, and to disburse the remainder to the Ellenton Premium Outlets Borrower (or, during the continuance of a Cash Sweep Period, to an account to be held by the lender as additional security for the Ellenton Premium Outlets Whole Loan).
Additional Secured Indebtedness (not including trade debts). The Ellenton Premium Outlets Property also secures the Ellenton Premium Outlets Non-ServicedPari passu Companion Loan, which has a Cut-off Date principal balance of $106,800,000. The promissory notes evidencing the Ellenton Premium Outlets Non-ServicedPari passu Companion Loan include Promissory Note A-1 in the original principal amount of $58,000,000 and Promissory Note A-3 in the original principal amount of $10,000,000, both currently held by the MSCI 2015-UBS8 securitization trust, and Promissory Note A-2 in the original principal amount of $38,800,000 which is expected to be contributed to a future securitization trust. The Ellenton Premium Outlets Non-Serviced Pari passu Companion Loan accrues interest at the same rate as the Ellenton Premium Outlets Mortgage Loan. The Ellenton Premium Outlets Mortgage Loan is entitled to payments of principal and interest on a pro rata and pari passu basis with the Ellenton Premium Outlets Non-Serviced Pari passu Companion Loan. The holders of the Ellenton Premium Outlets Mortgage Loan and the Ellenton Premium Outlets Non-Serviced Pari passu Companion Loan have entered into a co-lender agreement which sets forth the allocation of collections on the Ellenton Premium Outlets Whole Loan. See “Description of the Mortgage Pool—The Whole Loans—The Non-Serviced Pari passu Whole Loans—The Ellenton Premium Outlets Whole Loan” and “Pooling and Servicing Agreement—Servicing of the Non-Serviced Mortgage Loans” in the Preliminary Prospectus.
Mezzanine Loan and Preferred Equity. Not permitted.
Release of Property. Not permitted.
| This is not a research report and was not prepared by the Underwriters’ research departments. Please see additional important information and qualifications at the end of this Term Sheet. |
| T-50 |
| MSBAM 2016-C28 | Ellenton Premium Outlets |
Terrorism Insurance. The Ellenton Premium Outlets Borrower is required to obtain and maintain property insurance, public liability insurance and rental loss and/or business interruption insurance that covers perils of terrorism and acts of terrorism, provided that the Ellenton Premium Outlets Mortgage Loan documents provide for an annual terrorism premium cap of two times the cost of the premium for the “All Risk” or “Special Perils” property insurance and business income or rental income insurance required under the related the Ellenton Premium Outlets Property loan documents, but excluding the wind and flood components of such premium.
| This is not a research report and was not prepared by the Underwriters’ research departments. Please see additional important information and qualifications at the end of this Term Sheet. |
| T-51 |
| MSBAM 2016-C28 | GLP Industrial Portfolio A |
Mortgage Loan No. 3 – GLP Industrial Portfolio A
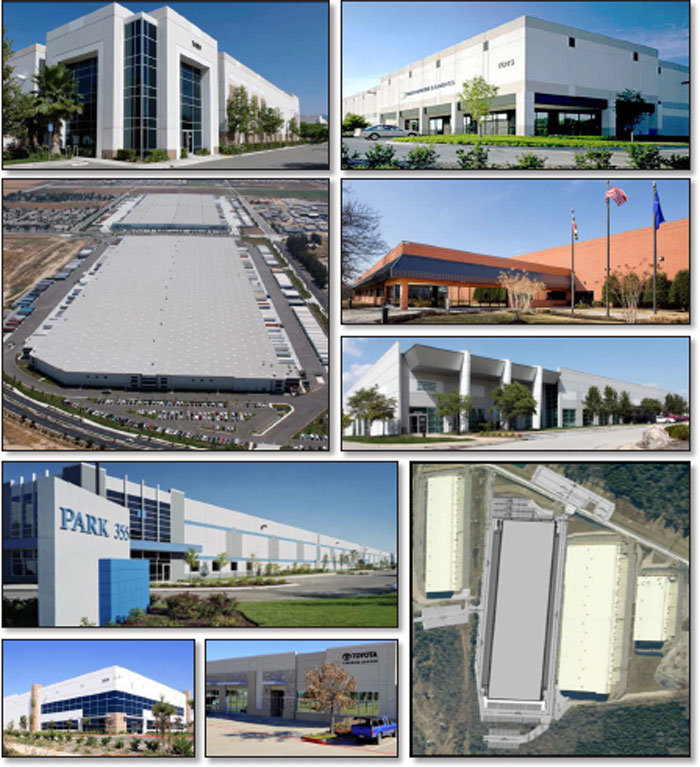
| This is not a research report and was not prepared by the Underwriters’ research departments. Please see additional important information and qualifications at the end of this Term Sheet. |
| T-52 |
| MSBAM 2016-C28 | GLP Industrial Portfolio A |
Mortgage Loan No. 3 – GLP Industrial Portfolio A
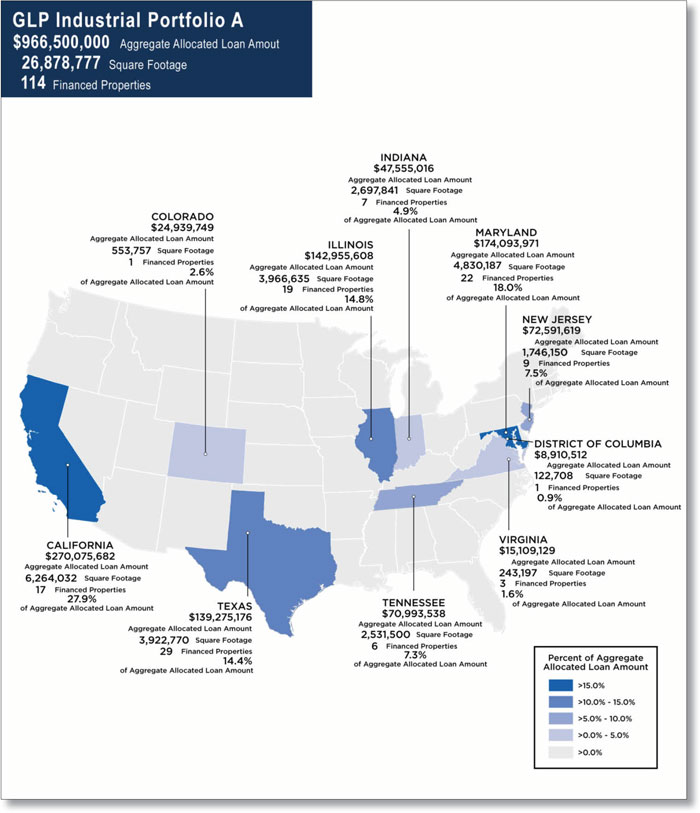
| This is not a research report and was not prepared by the Underwriters’ research departments. Please see additional important information and qualifications at the end of this Term Sheet. |
| T-53 |
| MSBAM 2016-C28 | GLP Industrial Portfolio A |
| Mortgage Loan No. 3 – GLP Industrial Portfolio A |
| Mortgage Loan Information | Mortgaged Property Information(4) | ||||||
| Mortgage Loan Seller: | MSMCH | Single Asset/Portfolio: | Portfolio | ||||
| Original Balance(1): | $70,000,000 | Location: | Various | ||||
| Cut-off Date Balance(1): | $70,000,000 | General Property Type: | Industrial | ||||
| % of Initial Pool Balance: | 7.3% | Detailed Property Type: | Various | ||||
| Loan Purpose: | Acquisition | Title Vesting: | Fee | ||||
| Sponsor(2): | Global Logistic Properties Limited | Year Built/Renovated: | Various | ||||
| Mortgage Rate: | 4.1439% | Size: | 26,878,777 SF | ||||
| Note Date: | 11/4/2015 | Cut-off Date Balance per Unit(1): | $24 | ||||
| First Payment Date: | 12/6/2015 | Maturity Date Balance per Unit(1): | $24 | ||||
| Maturity Date: | 11/6/2025 | Property Manager: | GLP US Management LLC (borrower related) | ||||
| Original Term to Maturity: | 120 months | ||||||
| Original Amortization Term: | 0 months | Underwriting and Financial Information(4) | |||||
| IO Period: | 120 months | UW NOI(5): | $115,886,815 | ||||
| Seasoning: | 3 months | UW NOI Debt Yield(1): | 18.2% | ||||
| Prepayment Provisions: | YM1 (113); O (7) | UW NOI Debt Yield at Maturity(1): | 18.2% | ||||
| Lockbox/Cash Mgmt Status: | Hard/Springing | UW NCF DSCR(1): | 3.97x | ||||
| Additional Debt Type: | Pari passu/B Note/Mezzanine | Most Recent NOI(5): | $102,686,288 (6/30/2015 TTM) | ||||
| Additional Debt Balance(1): | $567,600,000/$328,900,000/$330,000,000 | 2nd Most Recent NOI: | $98,621,458 (12/31/2014) | ||||
| Future Debt Permitted (Type): | No (N/A) | 3rd Most Recent NOI: | $70,564,730 (12/31/2013) | ||||
| Reserves(3) | Most Recent Occupancy: | 94.4% (10/1/2015) | |||||
| Type | Initial | Monthly | Cap | 2nd Most Recent Occupancy: | 91.5% (12/31/2014) | ||
| RE Tax: | $0 | Springing | N/A | 3rd Most Recent Occupancy: | 88.7% (12/31/2013) | ||
| Insurance: | $0 | Springing | N/A | Appraised Value (as of)(6): | $2,090,000,000 (8/10/2015-9/24/2015) | ||
| Replacements: | $0 | Springing | (3) | Cut-off Date LTV Ratio(1)(6): | 30.5% | ||
| TI/LC | $0 | Springing | (3) | Maturity Date LTV Ratio(1): | 30.5% | ||
| Deferred Maintenance: | $1,177,541 | $0 | N/A | ||||
| Sources and Uses | ||||||
| Sources | Proceeds | % of Total | Uses | Proceeds | % of Total | |
| Mortgage Loan (A Notes) | $637,600,000 | 29.6% | Purchase Price | $2,026,347,948 | 94.0% | |
| Mortgage Loan (B Notes) | $328,900,000 | 15.3% | Closing Costs: | $127,911,757 | 5.9% | |
| Mezzanine Loans | $330,000,000 | 15.3% | Upfront Reserves | $1,177,541 | 0.1% | |
| Sponsor Equity | $858,937,246 | 39.8% | ||||
| Total Sources: | $2,155,437,246 | 100.0% | Total Uses: | $2,155,437,246 | 100.0% | |
| (1) | The GLP Industrial Portfolio A Mortgage Loan is part of the GLP Industrial Portfolio A Whole Loan, which is comprised of fivepari passu Senior Notes and two Junior Notes (as defined below), with an aggregate original principal balance of $966,500,000. The five Senior Notes have an aggregate original principal balance of $637,600,000, and the two Junior Notes have an aggregate original principal balance of $328,900,000. The Cut-off Date Balance per Unit, Maturity Date Balance per Unit, UW NOI Debt Yield, UW NOI Debt Yield at Maturity, UW NCF DSCR, Cut-off Date LTV Ratio and Maturity Date LTV Ratio numbers presented above are based on the total principal balance of the five Senior Notes without regard to the Junior Notes. The Cut-off Date Balance per SF, Maturity Date Balance per SF, UW NOI Debt Yield, UW NCF DSCR, Cut-off Date LTV Ratio and Maturity Date LTV Ratio based on the aggregate note balance of the GLP Industrial Portfolio A Whole Loan (including the Junior Notes) are $36, $36, 12.0%, 2.62x, 46.2% and 46.2%, respectively. |
| (2) | The GLP Industrial Portfolio A loan’s sponsor and non-recourse carveout guarantors are eleven subsidiaries of Global Logistic Properties Limited. |
| (3) | See“—Escrows and Reserves” below for further discussion of reserve requirements. |
| (4) | Mortgaged Property Information and Underwriting and Financial Information are based on a combination or sum of all 114 industrial properties that comprise the GLP Industrial Portfolio A Property. |
| (5) | UW NOI exceeds TTM NOI due to increases in rents on the October 2015 rent roll and the inclusion of approximately $4.5 million for rent steps and $1.0 million for straight line rents. |
| (6) | The appraised value of $2,090.0 million is reflective of the value of the portfolio if sold in its entirety to a single buyer. The appraisal determined an appraised value on both a portfolio and an individual basis. The concluded aggregate appraised value of the individual properties was $1,995.8 million, which would result in a Cut-off Date LTV Ratio of 31.9% and a Maturity Date LTV Ratio of 31.9%. The dates of the appraised values ranged from August 10, 2015 to September 24, 2015. |
The Mortgage Loan.The third largest mortgage loan (the “GLP Industrial Portfolio A Mortgage Loan”) is part of a non-servicedpari passu-AB whole loan (the “GLP Industrial Portfolio A Whole Loan”) evidenced by fivepari passusenior notes (the “Senior Notes”) with an aggregate original principal balance of $637,600,000, and two junior notes (the “Junior Notes”) with an aggregate original principal balance of $328,900,000, all of which are secured by first priority fee mortgages encumbering 114 industrial properties comprising approximately 26.9 million SF located across nine states and the District of Columbia and 11 different markets (collectively, the “GLP Industrial Portfolio A Property”, or the “Portfolio”): (i) Promissory Note A-4 (one of the Senior Notes), in the original principal amount of $70,000,000, which represents the GLP Industrial Portfolio A Mortgage Loan, (ii) Promissory Notes A-1 and A-2 (two of the Senior Notes) and Promissory Notes B-1 and B-2 (the two Junior Notes), in the aggregate original principal amount of $766,500,000, which were contributed to the CSMC 2015-GLPA securitization trust (collectively, the “CSMC 2015-GLPA Notes���), (iii) Promissory Note A-3-1 (one of the Senior Notes), in the original principal amount of $87,100,000, which was contributed to the CSAIL 2016-C5 securitization trust and (iv) Promissory Note A-3-2 (one of the Senior Notes), in the original principal amount of $42,900,000, which is currently held by Column Financial, Inc. (or an affiliate) and is expected to be contributed to a future securitization trust. The four Senior Notes that do not comprise the GLP Industrial Portfolio A Mortgage Loan are collectively referred to as the “GLP Industrial Portfolio A Non-ServicedPari passu Companion Loan.” The GLP Industrial Portfolio A Whole Loan is
| This is not a research report and was not prepared by the Underwriters’ research departments. Please see additional important information and qualifications at the end of this Term Sheet. |
| T-54 |
| MSBAM 2016-C28 | GLP Industrial Portfolio A |
serviced according to the CSMC 2015-GLPA trust and servicing agreement. See“Description of the Mortgage Pool—The Non-Serviced Pari passu-AB Whole Loans—The GLP Industrial Portfolio A Whole Loan” and “Pooling andServicing Agreement—Servicing of the Non-Serviced Mortgage Loans” in the Preliminary Prospectus.
Proceeds of the GLP Industrial Portfolio A Whole Loan were used to acquire the GLP Industrial Portfolio A Property, pay closing costs and fund reserves.
The Borrower and the Sponsor.The borrowers are 33 special-purpose Delaware limited liability companies, each with two independent directors (collectively, the “GLP Industrial Portfolio A Borrower”). The GLP Industrial Portfolio A Borrower is 100% owned by four subsidiaries of Global Logistic Properties Limited (“GLP”): Western A West, LLC, Western A Midwest, LLC, Western A South, LLC and Western A East, LLC, and the nonrecourse carve-out guarantors are eleven subsidiaries of GLP. GLP (SGX: MC0.SI; rated BBB+/Baa2 by Fitch/Moody’s) is a public, Singapore-based investment holding company that owns, leases, manages and develops logistics facilities. GLP began operations in 2003 and is one of the largest logistics operators by square footage globally with total assets under management valued at approximately $33 billion. GLP’s portfolio comprises approximately 2,300 properties and 521 million SF and 4,000 customers globally. GLP had a market capitalization of approximately $7 billion as of January 1, 2016.
The GLP Industrial Portfolio A Whole Loan is part of a larger $2.85 billion financing completed in November 2015 to facilitate the sponsor’s $4.8 billion acquisition (the “Acquisition”) of Industrial Income Trust Inc. (“IIT”), a public, non-traded REIT. The sponsor acquired IIT for a total cost of $4.8 billion (which includes closing costs and working capital) and invested approximately $2.0 billion of cash equity to facilitate the transaction. The financing consisted of financing three separate non-crossed pools. On apro rata basis, approximately $858.9 million of invested equity was contributed for the acquisition of the Portfolio.
The recourse liability of the guarantor under the non-recourse carve-out guaranty for voluntary or collusive bankruptcy is limited to fifteen percent of the then-current principal amount of the GLP Industrial Portfolio A Whole Loan. In addition, the sponsor has no liability under the environmental indemnity so long as an environmental insurance policy meeting the requirements of the loan documents is in place. An environmental insurance policy meeting such requirements is currently in place.
The Property.The GLP Industrial Portfolio A Property is comprised of 114 cross-collateralized industrial properties located across nine states and the District of Columbia and 11 different markets with a total of approximately 26.9 million SF. The top three markets in the Portfolio, by allocated loan amount, are Inland Empire (27.9%), Chicago (14.8%) and Baltimore (11.8%). The top 10 properties in the Portfolio account for 28.0% of gross leaseable area and 31.5% of UW NOI. The top 10 tenants in the Portfolio account for 32.1% of gross leaseable area and 32.4% of Annual UW Rent. The top 3 tenants in the Portfolio by Annual UW Rent are HanesBrands, Inc. (5.4%), CEVA (4.4%) and Harbor Freight Tools (4.3%). The properties comprising the Portfolio have a weighted average age of 14 years (2001), weighted average clear heights of 29.5 feet and primary truck court depth of 155.5 feet, with weighted averages of 67 dock high doors, 4 grade level doors, 67 trailer spaces and 7.1% (GLA) office space. As of October 1, 2015, the Portfolio was 94.4% occupied by 193 tenants with a weighted average base rent of $4.86 per SF and weighted average remaining lease term of 5.1 years.
The following tables present certain information relating to the GLP Industrial Portfolio A Property:
| Top Twenty Properties(1) | |||||||||
| Property | Market | GLA (SF) | Year Built | Occupancy | UW NOI | % of UW NOI | Allocated Loan Amount(2) | % of Allocated Loan Amount | Appraised Value(3) |
| Inland Empire Indian Ave DC | Inland Empire | 1,309,754 | 2009 | 100.0% | $6,541,590 | 5.6% | $57,627,769 | 6.0% | $119,000,000 |
| Centerpointe 4 | Inland Empire | 1,280,446 | 2007 | 100.0% | $4,790,530 | 4.1% | $49,927,924 | 5.2% | $103,100,000 |
| Hofer Ranch IC Bldg 1 | Inland Empire | 612,104 | 2012 | 100.0% | $3,159,936 | 2.7% | $28,378,044 | 2.9% | $58,600,000 |
| Denver DC | Denver | 553,757 | 2013 | 100.0% | $3,282,162 | 2.8% | $24,939,749 | 2.6% | $51,500,000 |
| Freeport DC Bldg 4 | Dallas/Fort Worth | 727,508 | 1980 | 100.0% | $4,056,956 | 3.5% | $24,891,322 | 2.6% | $51,400,000 |
| Ontario Mills DC | Inland Empire | 520,161 | 2013 | 100.0% | $2,749,881 | 2.4% | $23,486,944 | 2.4% | $48,500,000 |
| Hagerstown Distribution Center | Washington, DC | 824,298 | 1998 | 100.0% | $3,398,847 | 2.9% | $22,276,280 | 2.3% | $46,000,000 |
| Beckwith Farms DC | Nashville | 706,500 | 2013 | 100.0% | $3,289,262 | 2.8% | $21,792,014 | 2.3% | $45,000,000 |
| Crossroads DC I | Baltimore | 456,500 | 2007 | 100.0% | $2,896,195 | 2.5% | $21,259,320 | 2.2% | $43,900,000 |
| Centerpointe 6 | Inland Empire | 532,926 | 2007 | 100.0% | $2,314,762 | 2.0% | $20,968,759 | 2.2% | $43,300,000 |
| I-95 DC | Baltimore | 449,299 | 2014 | 100.0% | $2,297,443 | 2.0% | $19,564,385 | 2.0% | $40,400,000 |
| Chino Spec Forward | Inland Empire | 409,930 | 2014 | 100.0% | $2,050,199 | 1.8% | $19,176,972 | 2.0% | $39,600,000 |
| Bedford Park II | Chicago | 470,160 | 2006 | 100.0% | $2,273,176 | 2.0% | $18,644,278 | 1.9% | $38,500,000 |
| Landover DC | Washington, DC | 507,072 | 1963 | 100.0% | $2,268,578 | 2.0% | $16,222,943 | 1.7% | $33,500,000 |
| North Plainfield 8 | Indianapolis | 798,096 | 1997 | 100.0% | $1,987,922 | 1.7% | $14,189,022 | 1.5% | $29,300,000 |
| Sterling DC | Inland Empire | 300,172 | 1990 | 100.0% | $1,804,632 | 1.6% | $13,946,889 | 1.4% | $28,800,000 |
| Clifton DC | Northern NJ | 230,953 | 2004 | 100.0% | $1,447,645 | 1.2% | $13,462,621 | 1.4% | $27,800,000 |
| Beckwith Farms 3 | Nashville | 480,000 | 2009 | 100.0% | $1,396,650 | 1.2% | $13,462,621 | 1.4% | $27,800,000 |
| Collington Commerce Center | Washington, DC | 239,742 | 1990 | 100.0% | $1,732,560 | 1.5% | $12,542,515 | 1.3% | $25,900,000 |
| Bedford Park IB | Chicago | 272,446 | 2006 | 100.0% | $1,322,491 | 1.1% | $12,397,234 | 1.3% | $25,600,000 |
| Subtotal – Top Twenty Properties | 11,681,824 | 2003 | 100.0% | $55,061,417 | 47.5% | $449,157,605 | 46.5% | $927,500,000 | |
| Total/Wtd. Avg. | 26,878,777 | 2001 | 94.4% | $115,886,815 | 100.0% | $966,500,000 | 100.0% | $1,995,800,000 | |
| (1) | Based on the underwritten rent roll dated October 1, 2015 |
| (2) | Based on the GLP Industrial Portfolio A Whole Loan. |
| (3) | Source: Appraisal. The appraised value of $2,090.0 million is reflective of the value of the Portfolio if sold in its entirety to a single buyer. The appraisal determined an appraised value on both a portfolio and individual basis. The concluded aggregate appraised value of the individual properties was $1,995.8 million. |
| This is not a research report and was not prepared by the Underwriters’ research departments. Please see additional important information and qualifications at the end of this Term Sheet. |
| T-55 |
| MSBAM 2016-C28 | GLP Industrial Portfolio A |
| Market Concentration(1) | |||||||||
| Market | Property Count | GLA (SF) | Year Built | Occupancy | UW NOI | % of UW NOI | Allocated Loan Amount(2) | % of Allocated Loan Amount | Appraised Value(3) |
| Inland Empire | 17 | 6,264,032 | 2008 | 98.4% | $28,741,404 | 24.8% | $270,075,682 | 27.9% | $557,700,000 |
| Chicago | 19 | 3,966,635 | 2004 | 91.4% | 16,240,694 | 14.0% | 142,955,608 | 14.8% | $295,200,000 |
| Baltimore | 17 | 2,974,705 | 1995 | 87.9% | 13,240,795 | 11.4% | 114,238,574 | 11.8% | $235,900,000 |
| Dallas/Fort Worth | 22 | 3,175,184 | 1999 | 97.5% | 14,335,584 | 12.4% | 105,763,903 | 10.9% | $218,400,000 |
| Washington, DC | 9 | 2,221,387 | 1985 | 99.3% | 11,942,326 | 10.3% | 83,875,038 | 8.7% | $173,200,000 |
| Nashville | 6 | 2,531,500 | 2009 | 100.0% | 9,347,699 | 8.1% | 70,993,538 | 7.3% | $146,600,000 |
| Indianapolis | 7 | 2,697,841 | 1998 | 82.1% | 5,320,687 | 4.6% | 47,555,016 | 4.9% | $98,200,000 |
| Northern New Jersey | 6 | 956,250 | 1986 | 100.0% | 5,802,524 | 5.0% | 46,005,363 | 4.8% | $95,000,000 |
| Austin | 7 | 747,586 | 2008 | 84.6% | 3,766,724 | 3.3% | 33,511,273 | 3.5% | $69,200,000 |
| Philadelphia | 3 | 789,900 | 1989 | 100.0% | 3,866,216 | 3.3% | 26,586,256 | 2.8% | $54,900,000 |
| Denver | 1 | 553,757 | 2013 | 100.0% | 3,282,162 | 2.8% | 24,939,749 | 2.6% | $51,500,000 |
| Total/Wtd. Avg. | 114 | 26,878,777 | 2001 | 94.4% | $115,886,815 | 100.0% | $966,500,000 | 100.0% | $1,995,800,000 |
| (1) | Based on the underwritten rent roll dated October 1, 2015 |
| (2) | Based on the GLP Industrial Portfolio A Whole Loan. |
| (3) | Source: Appraisal. The appraised value of $2,090.0 million is reflective of the value of the Portfolio if sold in its entirety to a single buyer. The appraisal determined an appraised value on both a portfolio and individual basis. The concluded aggregate appraised value of the individual properties was $1,995.8 million. |
| Property Sub-Type(1) | |||||||||
| Property Sub-Type | Property Count | GLA (SF) | Year Built | Occupancy | UW NOI | % of UW NOI | Allocated Loan Amount(2) | % of Allocated Loan Amount | Appraised Value(3) |
| Distribution Warehouse | 59 | 17,518,251 | 2006 | 94.0% | $69,300,394 | 59.8% | $613,227,253 | 63.4% | $1,266,300,000 |
| Warehouse | 46 | 8,950,487 | 1991 | 95.5% | $43,763,774 | 37.8% | $332,642,976 | 34.4% | $686,900,000 |
| Flex | 9 | 410,039 | 2000 | 87.7% | 2,822,647 | 2.4% | $20,629,771 | 2.1% | $42,600,000 |
| Total/Wtd. Avg. | 114 | 26,878,777 | 2001 | 94.4% | $115,886,815 | 100.0% | $966,500,000 | 100.0% | $1,995,800,000 |
| (1) | Based on the underwritten rent roll dated October 1, 2015 |
| (2) | Based on the GLP Industrial Portfolio A Whole Loan. |
| (3) | Source: Appraisal. The appraised value of $2,090.0 million is reflective of the value of the Portfolio if sold in its entirety to a single buyer. The appraisal determined an appraised value on both a portfolio and individual basis. The concluded aggregate appraised value of the individual properties was $1,995.8 million. |
| Tenant Summary(1) | ||||||||
| Tenant | Credit Rating (Fitch/Moody’s/S&P)(2) | Property Count | GLA | Annual UW Rent | % of Annual UW Rent | Annual UW Rent PSF | Original Lease Start | Lease Expiration |
| HanesBrands, Inc. | NR/Ba2/BB | 1 | 1,309,754 | $6,638,881 | 5.4% | $5.07 | 1/1/2011 | 10/31/2018 |
| CEVA | NR/NR/NR | 3 | 1,434,000 | $5,459,745 | 4.4% | $3.81 | Various | Various |
| Harbor Freight Tools | NR/Ba3/BB- | 2 | 1,280,446 | $5,321,841 | 4.3% | $4.16 | Various | Various |
| Home Depot USA Inc. | A/A2/A | 2 | 1,123,818 | $5,173,796 | 4.2% | $4.60 | Various | Various |
| United Natural Foods, Inc. | NR/NR/NR | 1 | 553,757 | $3,433,293 | 2.8% | $6.20 | 5/1/2013 | 10/31/2028 |
| Owens & Minor Distribution, Inc. | BBB-/Ba1/BBB | 2 | 604,161 | $3,236,710 | 2.6% | $5.36 | Various | Various |
| Samsung Electronics | A+/A1/A+ | 1 | 612,104 | $3,202,528 | 2.6% | $5.23 | 6/1/2013 | 9/30/2019 |
| Belkin Corporation | NR/NR/NR | 1 | 798,096 | $2,793,336 | 2.3% | $3.50 | 4/1/2001 | 11/30/2019 |
| Reliable Churchill | NR/NR/NR | 1 | 449,299 | $2,407,371 | 2.0% | $5.36 | 8/1/2014 | 8/31/2029 |
| Packaging Corp of America | NR/Baa3/BBB | 1 | 470,160 | $2,320,080 | 1.9% | $4.93 | 2/1/2013 | 9/30/2025 |
| Ten Largest Tenants | 8,635,595 | $39,987,581 | 32.4% | $4.63 | ||||
| Remaining Tenants | 16,745,912 | $83,402,096 | 67.6% | $4.98 | ||||
| Vacant | 1,497,270 | $0 | 0.0% | $0.00 | ||||
| Total/Wtd. Avg. | 26,878,777 | $123,389,677 | 100.0% | $4.86 | ||||
| (1) | Based on the underwritten rent roll dated October 1, 2015 |
| (2) | Ratings provided are for the parent company of the entity listed in the “Tenant” field whether or not the parent company guarantees the lease. |
| This is not a research report and was not prepared by the Underwriters’ research departments. Please see additional important information and qualifications at the end of this Term Sheet. |
| T-56 |
| MSBAM 2016-C28 | GLP Industrial Portfolio A |
| Lease Rollover Schedule(1)(2) | ||||||||
| Year | # of Leases Rolling | SF Rolling | UW Rent PSF Rolling(3) | Approx. % of Total SF Rolling | Approx. Cumulative % of SF Rolling | Total UW Rent Rolling | Approx. % of Total Rent Rolling | Approx. Cumulative % of Total Rent Rolling |
| MTM | 5 | 179,354 | $8.60 | 1% | 1% | $1,542,654 | 1% | 1% |
| 2016 | 37 | 2,574,488 | $5.14 | 10% | 10% | $13,237,578 | 11% | 12% |
| 2017 | 32 | 2,461,727 | $4.64 | 9% | 19% | $11,426,667 | 9% | 21% |
| 2018 | 35 | 4,737,391 | $4.50 | 18% | 37% | $21,311,824 | 17% | 39% |
| 2019 | 34 | 4,329,613 | $4.57 | 16% | 53% | $19,805,396 | 16% | 55% |
| 2020 | 27 | 2,546,095 | $5.01 | 9% | 63% | $12,743,662 | 10% | 65% |
| 2021 | 12 | 1,179,561 | $5.62 | 4% | 67% | $6,624,473 | 5% | 70% |
| 2022 | 13 | 1,336,256 | $4.46 | 5% | 72% | $5,955,616 | 5% | 75% |
| 2023 | 3 | 243,225 | $5.24 | 1% | 73% | $1,275,260 | 1% | 76% |
| 2024 | 8 | 1,152,305 | $5.08 | 4% | 77% | $5,854,352 | 5% | 81% |
| 2025 | 5 | 1,270,190 | $5.84 | 5% | 82% | $7,418,711 | 6% | 87% |
| 2026 & Thereafter | 9 | 3,371,302 | $4.80 | 13% | 94% | $16,193,483 | 13% | 100% |
| Vacant | 0 | 1,497,270 | $0.00 | 6% | 100% | $0 | 0% | 100% |
| Total/Wtd. Avg. | 220 | 26,878,777 | $4.86 | 100% | $123,389,677 | 100% | ||
| (1) | Based on the underwritten rent roll dated October 1, 2015 |
| (2) | Certain tenants may have lease termination options that are exercisable prior to the originally stated expiration date of the subject lease and that are not considered in the lease rollover schedule. |
| (3) | Wtd. Avg. UW Rent PSF Rolling excludes vacant space. |
Operating History and Underwritten Net Cash Flow.The following table presents certain information relating to the combined historical operating performance and the Underwritten Net Cash Flow at the GLP Industrial Portfolio A Property:
| Cash Flow Analysis(1) | |||||||||||||
| 2013 | 2014 | 6/30/2015 TTM | Year 1 Budget | UW(2) | UW PSF | ||||||||
| Base Rent | $79,931,143 | $107,113,582 | $112,598,033 | $126,908,982 | $123,389,677 | $4.59 | |||||||
| Total Recoveries | $20,337,584 | $30,188,389 | $31,444,105 | $35,562,338 | $35,361,718 | $1.32 | |||||||
| Other Income | $363,625 | $1,683,391 | $1,365,188 | $725,759 | $725,759 | $0.03 | |||||||
| Discounts Concessions | $0 | $0 | $0 | $0 | $0 | $0.00 | |||||||
| Less Vacancy & Credit Loss | ($3,893,316) | ($3,207,494) | ($5,010,206) | ($9,239,767) | ($2,585,201) | ($0.10) | |||||||
| Effective Gross Income | $96,739,036 | $135,777,869 | $140,397,120 | $153,957,312 | $156,891,953 | $5.84 | |||||||
| Total Operating Expenses | $26,174,307 | $37,156,412 | $37,710,832 | $40,905,654 | $41,005,138 | $1.53 | |||||||
| Net Operating Income | $70,564,730 | $98,621,458 | $102,686,288 | $113,051,658 | $115,886,815 | $4.31 | |||||||
| Capital Expenditures | $0 | $0 | $0 | 10,265,392 | $9,407,572 | $0.35 | |||||||
| Net Cash Flow | $70,564,730 | $98,621,458 | $102,686,288 | $102,786,266 | $106,479,243 | $3.96 | |||||||
| Total GLA | 25,827,548 | 26,686,777 | 26,878,777 | 26,878,777 | 26,878,777 | ||||||||
| Number of Assets | 110 | 113 | 114 | 114 | 114 | ||||||||
| Occupancy % | 88.7% | 91.5% | 92.4% | 97.0% | 94.4% | ||||||||
| NOI DSCR | 2.63x | 3.68x | 3.83x | 4.22x | 4.33x | ||||||||
| NCF DSCR | 2.63x | 3.68x | 3.83x | 3.84x | 3.97x | ||||||||
| NOI Debt Yield | 11.1% | 15.5% | 16.1% | 17.7% | 18.2% | ||||||||
| NCF Debt Yield | 11.1% | 15.5% | 16.1% | 16.1% | 16.7% | ||||||||
| (1) | Not all of the properties in the Portfolio were the same in each of the historical periods. “Same Store” analysis, representing 91 properties, of net operating income and occupancy for 2013, 2014, 6/30/2015 TTM and Year 1 Budget was approximately $62.6 million, $78.4 million, $79.5 million and $84.8 million, respectively, and 91.2%, 94.0%, 93.2% and 97.2%, respectively. |
| (2) | Underwritten Base Rent is based on the October 2015 rent roll and includes approximately $4.5 million for rent steps and approximately $1.0 million for credit tenant rent steps. Rent steps reflect the difference between in-place rent and annualized contractual base rent steps through December 1, 2016. Credit tenant rent steps reflects the difference between in-place rent plus annualized contractual base rent steps through December 1, 2016 and credit tenants’ average rent from October 1, 2015 through the maturity date. |
| This is not a research report and was not prepared by the Underwriters’ research departments. Please see additional important information and qualifications at the end of this Term Sheet. |
| T-57 |
| MSBAM 2016-C28 | GLP Industrial Portfolio A |
Escrows and Reserves. The GLP Industrial Portfolio A Borrower deposited $1,177,541 in escrow at loan origination for deferred maintenance items identified in the loan documents. During the continuance of a Trigger Period (defined below), the GLP Industrial Portfolio A Borrower is required to escrow monthly (i) 1/12th of the annual estimated tax payments and (ii) 1/12th of the annual estimated insurance premiums (unless the GLP Industrial Portfolio A Borrower maintains an acceptable blanket policy). During the continuance of a Trigger Period, the GLP Industrial Portfolio A Borrower is required to make monthly deposits equal to 1/12th of $0.10 per square foot of the GLP Industrial Portfolio A Property into an escrow for capital expenditures on each monthly payment date on which the balance in such escrow is less than an amount equal to $0.10 per square foot of the GLP Industrial Portfolio A Property. During the continuance of a Trigger Period, the GLP Industrial Portfolio A Borrower is required to make monthly deposits equal to 1/12th of $0.25 per square foot of the GLP Industrial Portfolio A Property into an escrow for tenant improvements and leasing commissions (the “TI/LC Escrow”) on each monthly payment date on which the balance in such TI/LC Escrow is less than an amount equal to $0.25 per square foot of the GLP Industrial Portfolio A Property.
Lockbox and Cash Management.A hard lockbox is in place with respect to the GLP Industrial Portfolio A Whole Loan. The GLP Industrial Portfolio A Whole Loan has springing cash management. Funds in the lockbox account are required to be swept to a cash management account; however, provided no event of default or Trigger Period under the GLP Industrial Portfolio A Whole Loan is continuing, funds in the cash management account are required to be swept daily to an account designated by the GLP Industrial Portfolio A Borrower, to the extent such funds exceed the aggregate amount payable to the lenders on the next monthly payment date. Funds in the cash management account are required to be applied on each monthly payment date to pay debt service on the GLP Industrial Portfolio A Whole Loan, to disburse, during the continuance of a Trigger Period, the monthly operating expenses referenced in the annual budget (which, during a Trigger Period, is required to be approved by the lender) or otherwise approved by the lender, to fund, during the continuance of a Trigger Period, the amount, if any, requested by the GLP Industrial Portfolio A Borrower in respect of leasing commissions and tenant improvement costs approved by the lender and incurred by the GLP Industrial Portfolio A Borrower in connection with a new lease (or lease extension), if and to the extent the amount contained in the TI/LC Escrow is insufficient after giving effect to the deposit required to be made therein on such monthly payment date, to fund, during the continuance of a Trigger Period, the required reserves deposits as described above under “Escrows and Reserves”, to pay, provided no event of default is continuing under the GLP Industrial Portfolio A Whole Loan, monthly debt service due under the GLP Industrial Portfolio A Senior Mezzanine Loan (defined below) and to pay, provided no event of default is continuing under either the GLP Industrial Portfolio A Whole Loan or the GLP Industrial Portfolio A Senior Mezzanine Loan, monthly debt service due under the GLP Industrial Portfolio A Junior Mezzanine Loan (defined below), and to disburse the remainder (i) if a Trigger Period is continuing, into an account to be held by the lender as additional security for the GLP Industrial Portfolio A Whole Loan during the continuance of such Trigger Period and (ii) otherwise, provided no event of default is continuing under the GLP Industrial Portfolio A Whole Loan, to the GLP Industrial Portfolio A Borrower.
A “Trigger Period” means the period:
(i) commencing as of the conclusion of the second consecutive fiscal quarter for which the combined net operating income debt yield on the GLP Industrial Portfolio A Whole Loan and GLP Industrial Portfolio A Mezzanine Loans (defined below) for the trailing twelve-month period falls below 6.75%, and ending at the conclusion of the second consecutive fiscal quarter for which such combined net operating income debt yield for the trailing twelve-month period is equal to or greater than 6.75%, or
(ii) commencing upon the GLP Industrial Portfolio A Borrower’s failure to deliver monthly, quarterly or annual financial reports and ending when such financial reports are so delivered, or
(iii) during the continuance of an event of default under either of the GLP Industrial Portfolio A Mezzanine Loans.
The GLP Industrial Portfolio A Borrower may avoid a Trigger Period by posting cash or a letter of credit in an amount such that, if the principal balance of the GLP Industrial Portfolio A Whole Loan were reduced by such amount, no Trigger Period would be continuing.
Additional Secured Indebtedness (not including trade debts).In addition to the GLP Industrial Portfolio A Mortgage Loan, the GLP Industrial Portfolio A Property also secures the GLP Industrial Portfolio A Non-ServicedPari passu Companion Loan (a portion of which was included in the CSMC 2015-GLPA securitization trust, a portion of which was included in the CSAIL 2016-C5 securitization trust, and the remaining portion of which is expected to be contributed to future securitization trusts) and the Junior Notes (which were included in the CSMC 2015-GLPA securitization trust). The GLP Industrial Portfolio A Mortgage Loan, the GLP Industrial Portfolio A Non-ServicedPari passu Companion Loan and the Junior Notes all accrue interest at 4.1439213%per annum. Payments of interest on the GLP Industrial Portfolio Whole Loan are first applied,pro rata andpari passu, to interest on the GLP Industrial Portfolio A Mortgage Loan and GLP Industrial Portfolio A Non-ServicedPari passu Companion Loan, and then to interest on the Junior Notes, and payments of principal on the GLP Industrial Portfolio A Whole Loan are first applied,pro rata andpari passu, to pay principal on the GLP Industrial Portfolio A Mortgage Loan and GLP Industrial Portfolio A Non-ServicedPari passu Companion Loan, until their principal balances are reduced to zero and then to pay principal on the Junior Notes until their principal balances are reduced to zero.. Such priorities and the allocation of collections on the GLP Industrial Portfolio A Whole Loan are set forth in an agreement between note holders governing the promissory notes comprising the GLP Industrial Portfolio A Whole Loan. See “Description of the Mortgage Pool—The Whole Loans—The Non-Serviced Pari passu-AB Whole Loans—The GLP Industrial Portfolio AWhole Loan” in the Preliminary Prospectus.
Mezzanine Loan and Preferred Equity.The “GLP Industrial Portfolio A Mezzanine Loans” refers to (i) a senior mezzanine loan in the original principal amount of $165,000,000 made to the owners of the GLP Industrial Portfolio A Borrower (the “GLP Industrial Portfolio A Senior Mezzanine Borrowers”) by Column Financial, Inc. and MSMCH, secured by 100% of the direct or indirect equity interest in the GLP Industrial Portfolio A Borrower (the “GLP Industrial Portfolio A Senior Mezzanine Loan”) and (ii) a junior mezzanine loan in the original principal amount of $165,000,000 made to the owners of the GLP Industrial Portfolio A Senior Mezzanine Borrowers by Column Financial, Inc. and MSMCH, secured by 100% of the direct or indirect equity interest in the GLP Industrial Portfolio A Senior Mezzanine Borrowers (the “GLP Industrial Portfolio A Junior Mezzanine Loan”). The GLP Industrial Portfolio A Mezzanine Loans and the GLP Industrial Portfolio A Whole Loan are subject to an intercreditor agreement between the GLP Industrial Portfolio A Whole Loan lender and the related mezzanine lenders. The GLP Industrial Portfolio A Senior Mezzanine Loan and GLP Industrial Portfolio A Junior Mezzanine Loan were transferred to Teachers Insurance and Annuity Association of America on November 20, 2015.
| This is not a research report and was not prepared by the Underwriters’ research departments. Please see additional important information and qualifications at the end of this Term Sheet. |
| T-58 |
| MSBAM 2016-C28 | GLP Industrial Portfolio A |
The following table presents certain information relating to the GLP Industrial Portfolio A Whole Loan and the GLP Industrial Portfolio A Mezzanine Loans:
| Full Debt Summary | |||||
| Notes | Original Principal Balance | Interest Rate | Cumulative UW NCF DSCR | Cumulative UW NOI Debt Yield | Cumulative Cut-off Date LTV |
| Mortgage Loan | $70,000,000 | 4.1439213% | 3.97x | 18.2% | 30.5% |
| Non-Serviced Companion Loan | $567,600,000 | 4.1439213% | 3.97x | 18.2% | 30.5% |
| Junior Notes | $328,900,000 | 4.1439213% | 2.62x | 12.0% | 46.2% |
| Senior Mezzanine Loan | $165,000,000 | 4.8500000% | 2.19x | 10.2% | 54.1% |
| Junior Mezzanine Loan | $165,000,000 | 5.4500000% | 1.84x | 8.9% | 62.0% |
| Total/Wtd. Avg. | $1,296,500,000 | 1.84x | 8.9% | 62.0% | |
Release of Property. The GLP Industrial Portfolio A Borrower may obtain the release of any of the individual GLP Industrial Portfolio A Property (each an “Individual GLP Industrial Portfolio A Property”) from the mortgage relating to the GLP Industrial Portfolio A Whole Loan by prepaying a portion of the GLP Industrial Portfolio A Whole Loan equal to the applicable allocated loan amount times (i) 105% until the first 10% of the GLP Industrial Portfolio A Whole Loan has been repaid; then (ii) 110% until 20% in aggregate of the GLP Industrial Portfolio A Whole Loan has been repaid; and (iii) thereafter 115%. All property releases under the GLP Industrial Portfolio A Whole Loan prior to the open prepayment date are subject to payment of yield maintenance, provided that if the lender applies loss proceeds from a casualty or condemnation at any Individual GLP Industrial Portfolio A Property toward prepayment of the GLP Industrial Portfolio A Whole Loan, then neither such loss proceeds nor any subsequent voluntary prepayment by the GLP Industrial Portfolio A Borrower of the remainder of the release price for such Individual GLP Industrial Portfolio A Property will be subject to payment of yield maintenance.
In addition, releases (other than releases that occur as a result of the application of loss proceeds from a casualty or condemnation) are further subject to a combined debt yield test under the GLP Industrial Portfolio A Whole Loan and GLP Industrial Portfolio A Mezzanine Loans, such that such combined debt yield after giving effect to such release is at least the lesser of (x) the debt yield immediately prior to such release and (y) 10.5%. The GLP Industrial Portfolio A Borrower may satisfy the foregoing debt yield test by posting cash or a letter of credit in an amount such that, if the principal balance of the GLP Industrial Portfolio A Whole Loan were reduced by such amount, such debt yield test would be satisfied; provided that the aggregate notional amount of all letters of credit delivered under the loan documents may not exceed 10% of the principal balance of the GLP Industrial Portfolio A Whole Loan. Release is also subject to certain additional conditions, including, among others, delivery of a REMIC opinion.
In addition, the GLP Industrial Portfolio A Borrower may obtain a release of certain excess parcels from the lien of the applicable mortgage without the lender’s consent or any requirement to prepay any portion of the GLP Industrial Portfolio A Whole Loan upon the satisfaction of certain conditions as described in the Preliminary Prospectus.
The GLP Industrial Portfolio A Borrower has the limited right, from and after the six-month anniversary of the origination date, to replace one of more individual properties included in the GLP Industrial Portfolio A Property (a “GLP Industrial Portfolio A Replaced Property”) with a qualified substitute property (a “Property Substitution”). Any Property Substitution must satisfy the following conditions, among others: (i) obtaining rating agency confirmation, (ii) the substitute property is located in one of the following states: Arizona, California, Colorado, Illinois, Indiana, Maryland, Mississippi, Nevada, New Jersey, New York, Oregon, Tennessee, Texas, Utah, Virginia, Washington or Washington D.C.; and the aggregate allocated loan amount of substitute properties located in states in which none of the Mortgaged Properties are located as of the origination date may not exceed 30% of the GLP Industrial Portfolio A Whole Loan amount, , (iii) total substitutions (by allocated loan amount) may not exceed 10% of the original principal balance of the GLP Industrial Portfolio A Whole Loan, (iv) after giving effect to the Property Substitution, the combined debt yield on the GLP Industrial Portfolio A Whole Loan and GLP Industrial Portfolio A Mezzanine Loans, recalculated to include only income and expense attributable to the remaining GLP Industrial Portfolio A Property (including the related substitute property) may not be less than such combined debt yield immediately prior to such Property Substitution; and, if such recalculated combined debt yield is less than the combined debt yield as of the origination date, then the property-specific combined debt yield of the substitute property as of the date of the related Property Substitution may not be less than the property-specific combined debt yield of the GLP Industrial Portfolio A Replaced Property as of the origination date, (v) based on current appraisals, the as-is market value of the related substitute property must be equal to or greater than the greater of (x) the as-is market value of the related GLP Industrial Portfolio A Replaced Property at the time and (y) the appraised value of the related GLP Industrial Portfolio A Replaced Property at origination, (vi) the substitute property must primarily consist of warehouse/distribution or light industrial space, unless the related GLP Industrial Portfolio A Replaced Property is a flex office space, in which case it may also be a flex office space, (vii) after giving effect to the Property Substitution, no applicable metropolitan statistical area may have a geographic concentration greater than 30%, and such Property Substitution may not increase the geographic concentration of any such metropolitan statistical area by more than 30%; (viii) the GLP Industrial Portfolio A Borrower certifies to the lender in an officer’s certificate that the Property Substitution will not have a material adverse effect, (ix) the lender receives reasonably satisfactory environmental reports and engineering reports regarding the substitute properties showing no structural, environmental or other issues that are not reasonably acceptable to the lender; and, if corrective measures are recommended in the environmental reports or engineering reports, the borrowers deposit into the deferred maintenance account 110% of the amount required to fund such corrective measures; (x) delivery of a REMIC opinion (xi) the borrowers or a party that has been added as a borrower in connection with the Property Substitution owns the fee interest (as opposed to the interest of a ground lessee) in each substitute property and (xii) satisfying the conditions to substitution under the related mezzanine loans.
Terrorism Insurance. The GLP Industrial Portfolio A Borrower is required to obtain terrorism insurance for foreign and domestic acts (as defined in the Terrorism Risk Insurance Program Reauthorization Act of 2007 or any extension thereof or other federal government program with substantially similar protection); provided that if such statute or a similar or subsequent statute is not in effect, then provided that terrorism insurance is commercially available, the GLP Industrial Portfolio A Borrower is required to carry terrorism insurance, but in such event the GLP Industrial Portfolio A Borrower is not required to pay insurance premiums with respect to such terrorism insurance in excess of the Terrorism Cap (defined below), and if the cost of terrorism insurance exceeds the Terrorism Cap, the GLP Industrial Portfolio A Borrower is required to purchase the maximum amount of terrorism insurance available with funds equal to the Terrorism Cap. “Terrorism Cap” means two times the amount of the annual insurance premiums payable at such time in respect of the property and business interruption insurance required under the loan documents on a stand-alone basis (without giving effect to the cost of terrorism and earthquake components of such insurance).
| This is not a research report and was not prepared by the Underwriters’ research departments. Please see additional important information and qualifications at the end of this Term Sheet. |
| T-59 |
| MSBAM 2016-C28 | Navy League Building |
Mortgage Loan No. 4 – Navy League Building
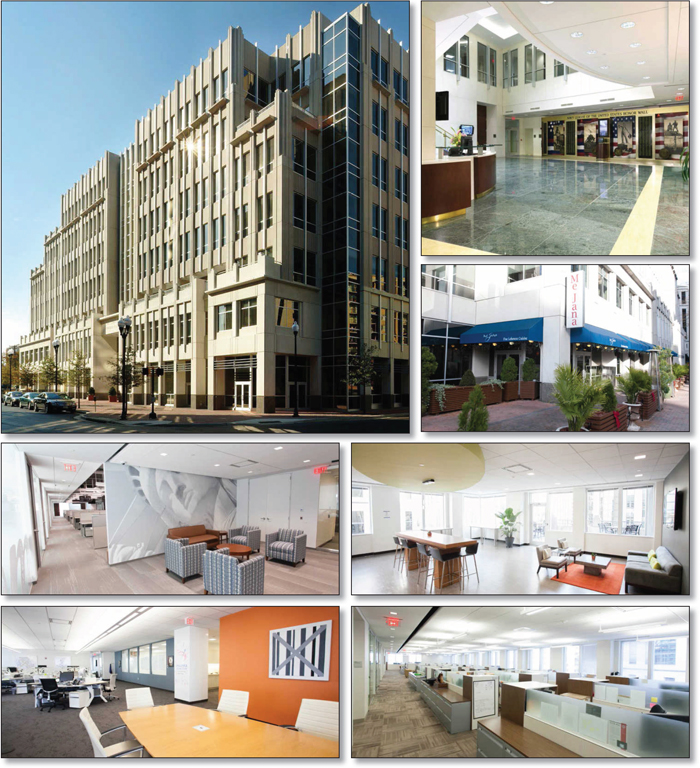
| This is not a research report and was not prepared by the Underwriters’ research departments. Please see additional important information and qualifications at the end of this Term Sheet. |
| T-60 |
| MSBAM 2016-C28 | Navy League Building |
Mortgage Loan No. 4 – Navy League Building
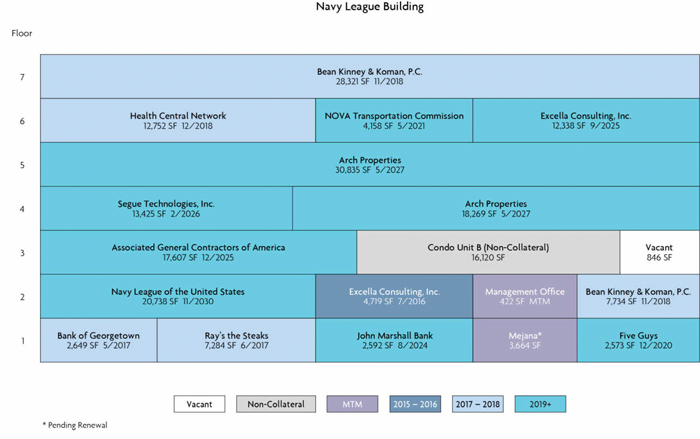
| This is not a research report and was not prepared by the Underwriters’ research departments. Please see additional important information and qualifications at the end of this Term Sheet. |
| T-61 |
| MSBAM 2016-C28 | Navy League Building |
Mortgage Loan No. 4 – Navy League Building

| This is not a research report and was not prepared by the Underwriters’ research departments. Please see additional important information and qualifications at the end of this Term Sheet. |
| T-62 |
| MSBAM 2016-C28 | Navy League Building |
| Mortgage Loan No. 4 – Navy League Building |
| Mortgage Loan Information | Mortgaged Property Information | ||||||
| Mortgage Loan Seller: | BANA | Single Asset/Portfolio: | Single Asset | ||||
| Original Balance: | $60,000,000 | Location: | Arlington, VA 22201 | ||||
| Cut-off Date Balance: | $60,000,000 | General Property Type: | Office | ||||
| % of Initial Pool Balance: | 6.3% | Detailed Property Type: | CBD | ||||
| Loan Purpose: | Refinance | Title Vesting: | Fee | ||||
| Sponsor: | Navy League of the United States | Year Built/Renovated: | 2005/N/A | ||||
| Mortgage Rate: | 4.938% | Size: | 190,926 SF | ||||
| Note Date: | 12/1/2015 | Cut-off Date Balance per Unit: | $314 | ||||
| First Payment Date: | 1/1/2016 | Maturity Date Balance per Unit: | $290 | ||||
| Maturity Date: | 12/1/2025 | Property Manager: | Cassidy Turley Commercial Real Estate Services, Inc. d/b/a Cushman & Wakefield | ||||
| Original Term to Maturity: | 120 months | ||||||
| Original Amortization Term: | 360 months | Underwriting and Financial Information | |||||
| IO Period: | 60 months | UW NOI: | $5,890,967 | ||||
| Seasoning: | 2 months | UW NOI Debt Yield: | 9.8% | ||||
| Prepayment Provisions: | LO (26); DEF (90); O (4) | UW NOI Debt Yield at Maturity: | 10.6% | ||||
| Lockbox/Cash Mgmt Status: | Hard/Springing | UW NCF DSCR: | 1.85x (IO) 1.45x (P&I) | ||||
| Additional Debt Type: | N/A | Most Recent NOI: | $3,619,309 (10/31/2015 T-10 Ann.) | ||||
| Additional Debt Balance: | N/A | 2nd Most Recent NOI: | $3,901,633 (12/31/2014) | ||||
| Future Debt Permitted (Type): | No (N/A) | 3rd Most Recent NOI: | $5,102,931 (12/31/2013) | ||||
| Reserves(1) | Most Recent Occupancy: | 99.6% (2/1/2016) | |||||
| Type | Initial | Monthly | Cap | 2nd Most Recent Occupancy: | 68.3% (12/31/2014) | ||
| RE Tax: | $174,776 | $87,388 | N/A | 3rd Most Recent Occupancy: | 75.0% (12/31/2013) | ||
| Insurance: | $42,458 | $8,492 | N/A | Appraised Value (as of): | $97,700,000 (9/9/2015) | ||
| Recurring Replacements: | $0 | $3,500 | N/A | Cut-off Date LTV Ratio: | 61.4% | ||
| TI/LC: | $3,449,320 | $19,673 | N/A | Maturity Date LTV Ratio: | 56.7% | ||
| Other: | $3,252,682 | $0 | N/A | ||||
| Sources and Uses | ||||||
| Sources | Proceeds | % of Total | Uses | Proceeds | % of Total | |
| Loan Amount: | $60,000,000 | 100.0% | Loan Payoff: | $48,171,425 | 80.3% | |
| Reserves: | $6,919,236 | 11.5% | ||||
| Closing Costs: | $526,228 | 0.9% | ||||
| Return of Equity: | $4,383,110 | 7.3% | ||||
| Total Sources: | $60,000,000 | 100.0% | Total Uses: | $60,000,000 | 100.0% | |
| (1) | See“—Escrows and Reserves” below for further discussion of reserve requirements. |
The Mortgage Loan.The fourth largest mortgage loan (the “Navy League Building Mortgage Loan”) is evidenced by a promissory note with an original principal balance of $60,000,000, secured by a first priority fee mortgage encumbering the condominium interests owned by the Navy League Building Borrower (as defined below) in a seven-story office building known as the Navy League Building (the “Navy League Building Property”) located in Arlington, Virginia. Proceeds from the Navy League Building Mortgage Loan were used to pay off the previous loan which was held by the BACM 2006-4 securitization trust, fund reserves, pay closing costs, and return $4,383,110 of equity to the sponsor.
The Borrower and the Sponsor.The borrower is The Navy League Building, LLC, a Delaware limited liability company and Navy League Development Corporation, a Virginia corporation (together, the “Navy League Building Borrower”), with one independent director. Equity ownership in the Navy League Building Borrower is held by Navy League of the United States (“The Navy League”), a 501(c)(3) non-profit organization, which is the sponsor and non-recourse carve-out guarantor for the Navy League Building Mortgage Loan. The Navy League was founded in 1902 as a citizens’ organization to serve and support the members and families of the U.S. Navy, U.S. Marine Corps, U.S. Coast Guard and U.S.-flag Merchant Marine. The Navy League is comprised of 40,000 civilians and over 240 councils and as of December 2014 had approximately $54,474,643 in total assets. The Navy League built the Navy League Building Property in 2005 and has a total cost basis of approximately $51,616,400.
The Property.The Navy League Building is located at 2300 Wilson Boulevard, Arlington, VA, with additional frontage on Clarendon Boulevard, and consists of a seven-story, LEED Silver-certified office building built in 2005 that features a fitness center, 3,815 SF conference center, terraces on multiple floors and 344 parking spaces. The building is structured as a condominium comprised of Unit A, Unit B (Suite 350) and Unit C (parking garage). The Navy League Building Property includes Unit A and Unit C, which total 190,926 SF (170,896 SF of collateral office space and 18,762 SF of ground floor retail space), and which represent approximately 95.9% of the condominium interests. Unit B (16,120 SF) is not a part of the collateral for the Navy Building Mortgage Loan.
As of February 1, 2016, the Navy League Building Property was 99.6% occupied by eight office and five retail tenants. The retail tenants include three restaurants: Ray’s the Steaks, Five Guys and MeJana, and two retail banks: Bank of Georgetown and John Marshall Bank. Historical occupancy at the Navy League Building Property in December 2014, December 2013, December 2012 and December 2011 was 68.3%, 75.0%, 98.1% and 97.9%, respectively. The lower occupancies in 2013 and 2014 were the result of the US Coast Guard Recruiting Command vacating 30,835 SF, which space has been released to Arch Properties Company.
| This is not a research report and was not prepared by the Underwriters’ research departments. Please see additional important information and qualifications at the end of this Term Sheet. |
| T-63 |
| MSBAM 2016-C28 | Navy League Building |
Property Management.The Navy League Building Property is subject to a management agreement with Cassidy Turley Commercial Real Estate Services, Inc. d/b/a Cushman & Wakefield. In January 2015, Cassidy Turley merged with DTZ and as a combined commercial real estate services company has more than 28,000 employees and manages 3.3 billion SF globally.
Major Tenants.
Arch Properties Company (49,104 SF, 26% of NRA, 24% of underwritten base rent).Arch Properties Company (“Arch”) occupies 49,104 SF under a lease commencing December 7, 2015, expiring May 7, 2027, with two five-year renewal options. The lease requires an annual base rent of $1,951,884 with 2.5% annual increases beginning June 2018. Rental payments do not commence until September 2016 and from October 2016 through January 2018 rental payments are abated by 50%. Arch is entitled to a tenant allowance of up to $3,012,030 (see “—Escrows and Reserves” below for details on reserved amounts under the Navy League Building Mortgage Loan) and has an option to terminate all or a portion of its space on the 4th floor (18,269 SF) in December 2021 or December 2023. Arch manages lease agreements for Koch Industries, Inc. Koch Industries, Inc. is a diversified holding company conducting business in polymers and fibers, minerals, ranching, fertilizers, refining and chemicals and consumer products, with more than 100,000 employees in 60 countries. The Arch lease is guaranteed by Koch Resources, LLC which is rated “Aa3” and “AA-” by Moody’s and S&P, respectively.
Bean Kinney & Korman (36,055 SF, 19% of NRA, 20% of underwritten base rent).Bean, Kinney & Korman (“Bean Kinney”) occupies 36,055 SF under a lease dated May 4, 2006, expiring November 30, 2018, with two five-year renewal options. The lease requires an annual base rent of $1,559,379 with annual increases of 2.5%. Bean Kinney is a metropolitan Washington, D.C.-area law firm founded in 1959 with practice areas in business and finance, litigation, personal legal services and real estate. In 2016, Bean Kinney was named a “Best Law Firm”, marking its fifth consecutive year being ranked nationally by the publication.
Navy League of the US (20,738 SF, 11% of NRA, 11% of underwritten base rent).Navy League of the US (“Navy League”) occupies 20,738 SF under a lease expiring November 30, 2030, with one five-year renewal option. The lease requires an annual base rent of $883,231 with 2% annual increases and provides for rent abatement for the month of September each year through and including September, 2023. Beginning September, 2023 with notice of its intent to extend its lease, Navy League may renegotiate its base rent to the then current market rent. The Navy League is the Navy League Building Mortgage Loan sponsor, built the Navy League Building Property in 2005 and since construction, continues to use its space as the company headquarters.
The following table presents certain information relating to the leases at the Navy League Building Property:
| Tenant Summary(1) | |||||||
| Tenant Name | Credit Rating (Fitch/ Moody’s/S&P)(2) | Tenant SF(3) | Approx. % of SF | Annual UW Rent | % of Total Annual UW Rent | Annual UW Rent PSF(4) | Lease Expiration |
| Arch Properties Company(5) | NR/Aa3/AA- | 49,104 | 26% | $2,000,681 | 24% | $40.74 | 5/7/2027 |
| Bean Kinney & Korman | NR/NR/NR | 36,055 | 19% | $1,598,318 | 20% | $44.33 | 11/30/2018 |
| Navy League of the US(6) | NR/NR/NR | 20,738 | 11% | $900,859 | 11% | $43.44 | 11/30/2030 |
| Associated General Contractors(7) | NR/NR/NR | 17,607 | 9% | $772,239 | 9% | $43.86 | 12/31/2025 |
| Excella Consulting, Inc.(8) | NR/NR/NR | 17,057 | 9% | $621,484 | 8% | $36.44 | Various |
| Segue Technologies, Inc.(9) | NR/NR/NR | 13,425 | 7% | $574,644 | 7% | $42.80 | 2/28/2026 |
| Health Central Network | NR/NR/NR | 12,752 | 7% | $568,580 | 7% | $44.59 | 12/31/2018 |
| NOVA Transportation | NR/NR/NR | 4,158 | 2% | $195,250 | 2% | $46.96 | 5/31/2021 |
| Retail Tenants | 18,762 | 10% | $953,653 | 12% | $50.83 | Various | |
| Vacant | 846 | 0% | $0 | 0% | $0.00 | ||
| Total/Wtd. Avg. | 190,926 | 100% | $8,185,708 | 100% | $43.16 | ||
| (1) | Information is based on the underwritten rent roll. |
| (2) | Certain ratings are those of the parent company whether or not the parent guarantees the lease. |
| (3) | Total Tenant SF includes building services space of 422 SF. |
| (4) | Wtd. Avg. Annual UW Rent PSF excludes vacant space and building services space of 422 SF. |
| (5) | Arch Properties Company’s rental payments do not commence until September 2016 and from October 2016 through January 2018, rental payments are abated by 50%. Arch Properties Company has a termination option on all or a portion of its space on the 4th floor (18,269SF) in December 2021 or December 2023. See “—Escrows and Reserves” below for details on reserved amounts under the Navy League Building Mortgage Loan. |
| (6) | Navy League of the US’ rental payments are abated for the month of September each year through and including September 2023. |
| (7) | Associated General Contractors’ rental payments are abated from January 1, 2016 to February 29, 2016. Associated General Contractors has a termination option with respect to approximately 1,350 SF in December 31, 2018 or December 31, 2020. |
| (8) | Excella Consulting, Inc. occupies 4,719 SF under a lease expiring July, 2016 and an additional 12,338 SF under a lease expiring September, 2025. Rent due on the 12,338 SF space is abated by 50% from January 2016 to April 2016. See “—Escrows and Reserves” below for details on reserved amounts under the Navy League Building Mortgage Loan. |
| (9) | Segue Technologies, Inc.’s rental payments are reduced to $23,936 from February 2016 to November 2016. Segue Technologies, Inc. has a termination option in February 2022. See “—Escrows and Reserves” below for details on reserved amounts under the Navy League Building Mortgage Loan. |
| This is not a research report and was not prepared by the Underwriters’ research departments. Please see additional important information and qualifications at the end of this Term Sheet. |
| T-64 |
| MSBAM 2016-C28 | Navy League Building |
The following table presents certain information relating to the lease rollover schedule at the Navy League Building Property:
| Lease Rollover Schedule(1)(2)(3) | ||||||||
| Year | # of Leases Rolling | SF Rolling(4) | UW Rent PSF Rolling(5) | Approx. % of Total SF Rolling | Approx. Cumulative % of SF Rolling | Total UW Rent Rolling | Approx. % of Total Rent Rolling | Approx. Cumulative % of Total Rent Rolling |
| MTM | 2 | 6,237 | $47.87 | 3% | 3% | $298,540 | 4% | 4% |
| 2016 | 1 | 4,719 | $25.43 | 2% | 6% | $120,000 | 1% | 5% |
| 2017 | 2 | 9,933 | $54.19 | 5% | 11% | $538,240 | 7% | 12% |
| 2018 | 2 | 48,807 | $44.40 | 26% | 37% | $2,166,898 | 26% | 38% |
| 2019 | 0 | 0 | $0.00 | 0% | 37% | $0 | 0% | 38% |
| 2020 | 0 | 0 | $0.00 | 0% | 37% | $0 | 0% | 38% |
| 2021 | 1 | 4,158 | $46.96 | 2% | 39% | $195,250 | 2% | 41% |
| 2022 | 0 | 0 | $0.00 | 0% | 39% | $0 | 0% | 41% |
| 2023 | 0 | 0 | $0.00 | 0% | 39% | $0 | 0% | 41% |
| 2024 | 1 | 2,592 | $45.09 | 1% | 40% | $116,873 | 1% | 42% |
| 2025 | 3 | 29,945 | $42.54 | 16% | 56% | $1,273,723 | 16% | 58% |
| 2026 and Beyond | 3 | 83,267 | $41.75 | 44% | 100% | $3,476,184 | 42% | 100% |
| Total/Wtd. Avg. | 15 | 190,926 | $43.16 | 100% | $8,185,708 | 100% | ||
| (1) | Information is based on the underwritten rent roll. |
| (2) | Certain tenants may have lease termination options that are exercisable prior to the originally stated expiration date of the subject lease and that are not considered in the lease rollover schedule. |
| (3) | Certain tenants may have multiple leases that are individually represented in the lease rollover schedule. |
| (4) | Total SF Rolling includes building services space of 422 SF and vacant space of 846 SF. |
| (5) | Wtd. Avg. UW Rent PSF Rolling excludes building services space of 422 SF and vacant space of 846 SF. |
The Market. The Navy League Building Property is located in Arlington, VA within the Court House submarket in Arlington County. Within Court House, there is approximately 3.7 million SF of office space, 6,260 housing units, 552 hotel rooms and over 200,000 SF of retail space. As of the second quarter of 2015, asking rent in the Court House neighborhood was $44.04 PSF, the third highest asking rent among all Northern Virginia office markets, driven by a predominance of Class “A” buildings and amenities including metro access, and proximity to Washington, D.C., The Pentagon and Reagan National Airport. As of year-end 2015, the Class “A” and Class “B” office inventory in the Court House submarket contained 29 buildings (5,664,414 SF) with a vacancy rate of 12.6% and average asking rent of $42.98 PSF. Court House is home to several of Arlington’s largest employers including the Arlington government, Verizon, Strayer University and large industry and trade organizations including Electronic Industries Alliance, the National Science Teachers Association and the Association of the U.S. Army.
The Navy League Building is located approximately four miles southwest of Washington, D.C. Access to Court House is provided by Clarendon and Wilson Boulevards, Arlington Boulevard (Route 50), Lee Highway (Route 29), Interstate 66, and by the Court House Metro Rail Station (Orange & Silver Lines) approximately two blocks from the Navy League Building Property.
The 2015 population within a one-, three- and five-mile radius of the Navy League Building Property was 45,550, 266,016 and 724,913, respectively, with an average household income of $146,085; $144,161 and $135,029, respectively.
The following table presents competitive office rental properties in Arlington, VA to the Navy League Building Property:
| Competitive Office Lease Summary | ||||||||||
| Property Name/Location | Year Built | Occ. | Total GLA (SF) | Distance from Subject | Tenant Name | Lease Date/ Term | Lease Area (SF) | Base Rent PSF | TI Allowance ($/SF) | |
Arlington Gateway 901 N. Glebe Road | 2005 | 96% | 334,000 | 1.9 miles | Capterra, Inc. Nixon Vanderhye | Jun-15/ 7.3 Yrs Apr-15/ 10.6 Yrs | 5,873 46,000 | $43.26 $44.75 | $0 $70 | |
Cooperative Plaza 4301 Wilson Blvd | 1995 | 88% | 278,130 | 1.8 miles | Oak Ridge Assoc. Univ. | Jun-15/ 9.0 Yrs | 14,835 | $42.00 | $0 | |
4100 N. Fairfax Drive 4100 N. Fairfax Drive | 2002 | 78% | 255,824 | 1.7 miles | George Mason Mortgage | Apr-15/ 3.3 Yrs | 6,358 | $41.25 | $5 | |
The Hartford 3101 Wilson Blvd | 2004 | 83% | 218,646 | 0.5 miles | Inspire Health | Jul-15/ 7.5 Yrs | 6,022 | $46.00 | $60 | |
Courthouse Tower 1515 N. Courthouse Road | 2000 | 100% | 249,709 | 0.4 miles | NACR | Jul-15/ 11.0 Yrs | 15,500 | $38.50 | $80 | |
| Total/Wtd. Average | 2001 | 89.5% | 1,336,309 | $43.05 | $51.31 | |||||
| Navy League Building(1) | 2005 | 170,896 | 5-10 Yrs | $45.00 | $65-70 | |||||
Source: Appraisal
| (1) | Represents available office SF and quoted rent and lease terms |
| This is not a research report and was not prepared by the Underwriters’ research departments. Please see additional important information and qualifications at the end of this Term Sheet. |
| T-65 |
| MSBAM 2016-C28 | Navy League Building |
Operating History and Underwritten Net Cash Flow.The following table presents certain information relating to the historical operating performance and the underwritten net cash flow at the Navy League Building Property:
| Cash Flow Analysis | ||||||||||||
| �� | 2012 | 2013 | 2014 | 10/31/15 TTM | UW | UW PSF | ||||||
| Base Rent | $7,665,774 | $6,891,203 | $5,501,553 | $5,352,418 | $8,185,707 | $42.87 | ||||||
| Total Recoveries | $764,074 | $688,045 | $691,754 | $535,666 | $594,831 | $3.12 | ||||||
| Parking Income | $560,479 | $520,119 | $505,533 | $549,643 | $505,000 | $2.65 | ||||||
| Other Income | $0 | $0 | $0 | $11,609 | $0 | $0.00 | ||||||
| Less Vacancy & Credit Loss | $0 | $0 | $0 | $0 | $(526,832) | -6.4% | ||||||
| Effective Gross Income | $8,990,327 | $8,099,367 | $6,698,840 | $6,449,336 | $8,758,706 | $45.87 | ||||||
| Total Operating Expenses | $2,848,175 | $2,996,436 | $2,797,207 | $2,830,027 | $2,867,739 | $15.02 | ||||||
| Net Operating Income | $6,142,152 | $5,102,931 | $3,901,633 | $3,619,309 | $5,890,967 | $30.85 | ||||||
| Capital Expenditures | $83,920 | $0 | $7,660 | $0 | $42,004 | $0.22 | ||||||
| TI/LC | $0 | $37,115 | $19,621 | $0 | $292,265 | $1.53 | ||||||
| Net Cash Flow | $6,058,232 | $5,065,816 | $3,874,352 | $3,619,309 | $5,556,698 | $29.10 | ||||||
| Occupancy % | 98.1% | 75.0% | 68.3% | 99.6%(1) | 94.0% | |||||||
| NOI DSCR | 1.60x | 1.33x | 1.02x | 0.94x | 1.53x | |||||||
| NCF DSCR | 1.58x | 1.32x | 1.01x | 0.94x | 1.45x | |||||||
| NOI Debt Yield | 10.2% | 8.5% | 6.5% | 6.0% | 9.8% | |||||||
| NCF Debt Yield | 10.1% | 8.4% | 6.5% | 6.0% | 9.3% | |||||||
| (1) | Occupancy as of February 1, 2016. |
Escrows and Reserves. The Navy League Building Borrower deposited $174,776 in escrow for annual real estate taxes and $42,458 in escrow for property and liability insurance, and is required to escrow monthly 1/12 of the annual estimated tax and insurance payments and premiums. The Navy League Building Borrower is required to make monthly deposits of $3,500 for replacement reserves. The Navy League Building Borrower deposited $3,449,320 in escrow and is required to monthly deposits of $19,673 for tenant improvements and leasing commissions. The Navy League Building Borrower deposited $3,252,682 in escrow for rent abatements attributable to the tenants Arch Properties Company, Segue Technologies, Inc., and Excella Consulting, Inc., to be released monthly through December, 2017 provided no event of default is continuing. The funds in escrow for rent abatements are held as additional security for the Navy League Building Mortgage Loan and upon the occurrence and continuance of any event of default may be applied in Lender’s sole discretion.
Lockbox and Cash Management.The Navy League Building Mortgage Loan has a hard lockbox with springing cash management upon the commencement of a Cash Sweep Period (as defined below). Also during the continuance of a Cash Sweep Period, the Navy League Building Borrower will be required to deposit all excess cash with respect to the Navy League Building Mortgage Loan to an account to be held by the lender as additional security for the Navy League Building Mortgage Loan.
A “Cash Sweep Period” will commence upon the DSCR being less than 1.10x for two consecutive calendar quarters and will end upon the DSCR being equal to or greater than 1.15x for two consecutive calendar quarters.
Additional Secured Indebtedness (not including trade debts).Not permitted.
Mezzanine Loan and Preferred Equity.Not permitted.
Release of Property. Not permitted.
Terrorism Insurance. The Navy League Building Borrower is required to obtain and maintain property insurance, public liability insurance and rental loss and/or business interruption insurance that covers perils of terrorism and acts of terrorism, provided that the Navy League Building Mortgage Loan documents provide for an annual terrorism premium cap of two times of the cost of the premium for a separate “Special Form” or “All Risks” policy or equivalent policy insuring only the Navy League Building Property on a stand-alone basis.
| This is not a research report and was not prepared by the Underwriters’ research departments. Please see additional important information and qualifications at the end of this Term Sheet. |
| T-66 |
(THIS PAGE INTENTIONALLY LEFT BLANK)
| This is not a research report and was not prepared by the Underwriters’ research departments. Please see additional important information and qualifications at the end of this Term Sheet. |
| T-67 |
| MSBAM 2016-C28 | Princeton Pike Corporate Center |
Mortgage Loan No. 5 – Princeton Pike Corporate Center
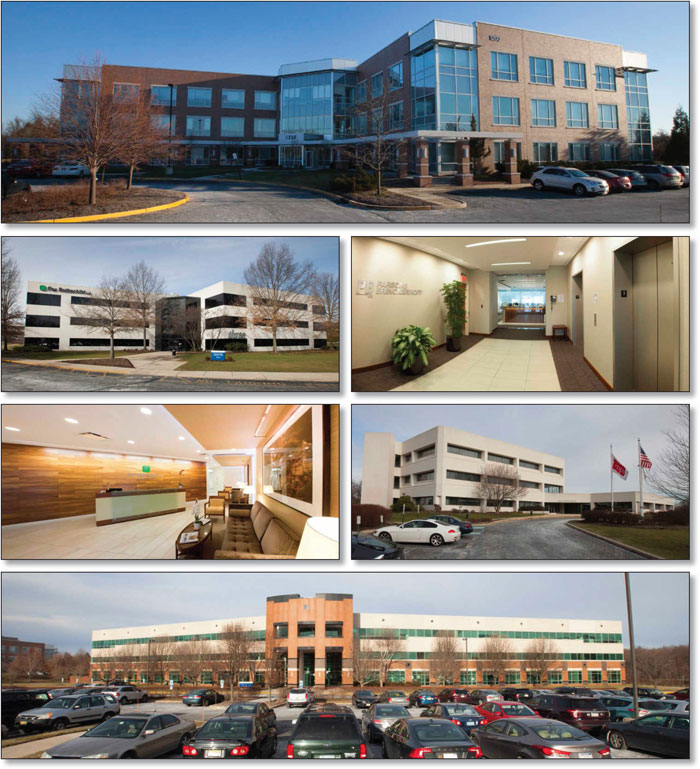
| This is not a research report and was not prepared by the Underwriters’ research departments. Please see additional important information and qualifications at the end of this Term Sheet. |
| T-68 |
| MSBAM 2016-C28 | Princeton Pike Corporate Center |
Mortgage Loan No. 5 – Princeton Pike Corporate Center
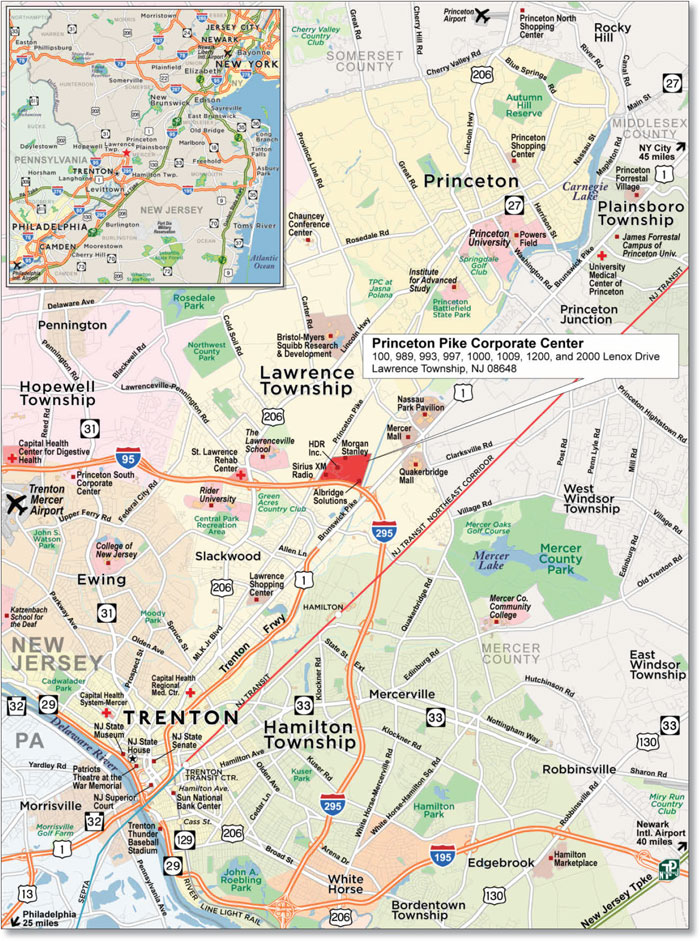
| This is not a research report and was not prepared by the Underwriters’ research departments. Please see additional important information and qualifications at the end of this Term Sheet. |
| T-69 |
| MSBAM 2016-C28 | Princeton Pike Corporate Center |
| Mortgage Loan No. 5 – Princeton Pike Corporate Center |
| Mortgage Loan Information | Property Information | ||||||
| Mortgage Loan Seller: | MSMCH | Single Asset/Portfolio: | Single Asset | ||||
| Original Balance(1): | $50,000,000 | Location: | Lawrence Township, NJ 08648 | ||||
| Cut-off Date Balance(1): | $50,000,000 | General Property Type: | Office | ||||
| % of Initial Pool Balance: | 5.2% | Detailed Property Type: | Suburban | ||||
| Loan Purpose: | Acquisition | Title Vesting: | Fee | ||||
| Sponsor: | David Werner | Year Built/Renovated: | 1978-2007/2007 | ||||
| Mortgage Rate: | 4.6726% | Size: | 809,458 SF | ||||
| Note Date: | 12/23/2015 | Cut-off Date Balance per Unit(1): | $161 | ||||
| First Payment Date: | 2/1/2016 | Maturity Date Balance per Unit(1): | $149 | ||||
| Maturity Date: | 1/1/2026 | Property Manager: | Vision Management LLC | ||||
| Original Term to Maturity: | 120 months | ||||||
| Original Amortization Term: | 360 months | ||||||
| IO Period: | 60 months | Underwriting and Financial Information | |||||
| Seasoning: | 1 month | UW NOI: | $12,501,754 | ||||
| Prepayment Provisions(2): | LO (25); DEF (90); O (5) | UW NOI Debt Yield(1): | 9.6% | ||||
| Lockbox/Cash Mgmt Status: | Hard/In Place | UW NOI Debt Yield at Maturity(1): | 10.3% | ||||
| Additional Debt Type(3): | Pari passu/Mezzanine | UW NCF DSCR(1): | 1.75x (IO) 1.38x (P&I)(5) | ||||
| Additional Debt Balance(3): | $80,000,000/$17,000,000 | Most Recent NOI: | $10,842,859 (10/31/2015 TTM) | ||||
| Future Debt Permitted (Type): | No (N/A) | 2nd Most Recent NOI: | $9,890,430 (12/31/2014) | ||||
| Reserves(4) | 3rd Most Recent NOI: | $9,764,682 (12/31/2013) | |||||
| Type | Initial | Monthly | Cap | Most Recent Occupancy(6): | 87.5% (12/15/2015) | ||
| RE Tax: | $0 | $227,566 | N/A | 2nd Most Recent Occupancy: | 83.1% (12/31/2014) | ||
| Insurance: | $30,882 | $15,441 | N/A | 3rd Most Recent Occupancy: | 80.2% (12/31/2013) | ||
| Recurring Replacements: | $0 | $18,895 | $3,000,000 | Appraised Value (as of): | $199,000,000 (11/5/2015) | ||
| TI/LC: | $11,500,000 | Springing | N/A | Cut-off Date LTV Ratio(1): | 65.3% | ||
| Other: | $6,828,740 | $23,036 | N/A | Maturity Date LTV Ratio(1)(7): | 60.8% | ||
| Sources and Uses | ||||||
| Sources | Proceeds | % of Total | Uses | Proceeds | % of Total | |
| Loan Amount: | $130,000,000 | 60.8% | Net Purchase Price(8): | $186,000,000 | 87.0% | |
| Mezzanine | $17,000,000 | 7.9% | Reserves: | $18,359,622 | 8.6% | |
| Borrower Equity: | $66,881,276 | 31.3% | Closing Costs: | $9,521,655 | 4.5% | |
| Total Sources: | $213,881,276 | 100.0% | Total Uses: | $213,881,276 | 100.0% | |
| (1) | The Princeton Pike Corporate Center Mortgage Loan is part of the Princeton Pike Corporate Center Whole Loan, which is comprised of threepari passu promissory notes with an aggregate principal balance of $130,000,000. The Cut-off Date Balance per Unit, Maturity Date Balance per Unit, UW NOI Debt Yield, UW NOI Debt Yield at Maturity, UW NCF DSCR, Cut-off Date LTV Ratio and Maturity Date LTV Ratio numbers presented above are based on the aggregate principal balance of the promissory notes comprising the Princeton Pike Corporate Center Whole Loan. |
| (2) | Defeasance is permitted at any time on or after the earlier to occur of (a) the end of the two-year period commencing on the closing date of the securitization of the last Princeton Pike Corporate Center promissory note to be securitized and (b) July 1, 2019. This assumes that the Princeton Pike Corporate Center Mortgage Loan is the last Princeton Pike Corporate Center promissory note to be securitized. |
| (3) | See “—The Mortgage Loan”, “Additional Secured Indebtedness (not including trade debt)”and“Mezzanine Loan and Preferred Equity” below for further discussion of additional debt. |
| (4) | See “—Escrows and Reserves” below for further discussion of reserve requirements. |
| (5) | The UW NCF DSCR (P&I) is based on the first twelve amortizing debt service payments pursuant to the loan agreement. |
| (6) | Includes 45,035 SF that is leased to Albridge/BNY Mellon, which has exercised its termination option effective 1/1/2017. The tenant was required to provide twelve months of notice. At loan closing, the borrower deposited $4,305,615 into the BNY Reserve Fund, which equates to approximately three years of underwritten base rent for such tenant. See “—Escrows and Reserves” below for further discussion. Also includes 11,599 SF recently leased to ADARE Pharmaceuticals, 2,606 SF recently leased to JMT Engineering and 1,898 SF recently leased to Navigant Consulting as occupied space. JMT Engineering and Navigant Consulting spaces are for expansions of their existing space. ADARE Pharmaceuticals, JMT Engineering and Navigant Consulting are not yet in occupancy, but are expected to begin paying rent between January 2016 and April 2016. The Princeton Pike Corporate Center Borrower is currently in discussions with Wells Fargo Advisors LLC to extend the term of its lease, which expires July 31, 2016, for 5 years and 4 months at a rent of $30.00/SF. It is anticipated that Wells Fargo Advisors LLC will give back 1,976 SF and the new suite under any extension lease (if entered into) would therefore be 10,575 SF. Occupancy includes the 1,976 SF that is expected to be given back; however, the space was underwritten as vacant. |
| (7) | The appraisal includes an extraordinary assumption. See “Description of the Mortgage Pool—Appraised Value” in the Preliminary Prospectus. |
| (8) | Concurrently with the origination of the Princeton Pike Corporate Center Mortgage Loan, a deed was recorded in Mercer County, New Jersey disclosing consideration of $156,000,000 paid to the third party seller by the Princeton Pike Corporate Center Borrower (as defined below) for the Princeton Pike Corporate Center Property. Simultaneously with the acquisition of the Princeton Pike Corporate Center Property, 90.0% of the indirect equity interests in the Princeton Pike Corporate Center Borrower were syndicated by the initial owners of the Princeton Pike Corporate Center Borrower pursuant to an equity contribution agreement at a purchase price of $186,000,000 for the Princeton Pike Corporate Center Property. Total cash equity consideration remaining in the transaction is $38,118,723. |
The Mortgage Loan.The fifth largest mortgage loan (the “Princeton Pike Corporate Center Mortgage Loan”) is part of a Whole Loan (the “Princeton Pike Corporate Center Whole Loan”) evidenced by threepari passu promissory notes in the aggregate original principal amount of $130,000,000, all of which are secured by a first priority fee mortgage encumbering a 809,458 SF office park known as Princeton Pike Corporate Center in Lawrence Township, New Jersey (the “Princeton Pike Corporate Center Property”). Promissory Note A-1, in the original principal amount of $50,000,000, represents the Princeton Pike Corporate Center Mortgage Loan. Promissory Notes A-2 and A-3, in the aggregate original principal amount of
| This is not a research report and was not prepared by the Underwriters’ research departments. Please see additional important information and qualifications at the end of this Term Sheet. |
| T-70 |
| MSBAM 2016-C28 | Princeton Pike Corporate Center |
$80,000,000 (collectively, the “Princeton Pike Corporate Center Serviced Companion Loan”), are expected to be held by Morgan Stanley Bank, N.A. or an affiliate thereof on the closing date of this transaction, and may be contributed to future securitization transactions or otherwise transferred at any time. The Princeton Pike Corporate Center Whole Loan will be serviced pursuant to the pooling and servicing agreement. See “Description of the Mortgage Pool—The Whole Loans— The Serviced Pari passu Whole Loans—The Princeton Pike Corporate Center Whole Loan” and “The Pooling and Servicing Agreement” in the Preliminary Prospectus.
The proceeds of the Princeton Pike Corporate Center Whole Loan and mezzanine debt (See “Mezzanine Loan and Preferred Equity” below for further discussion) were primarily used to acquire the Princeton Pike Corporate Center Property, fund upfront reserves and pay closing costs. Concurrently with the origination of the Princeton Pike Corporate Center Mortgage Loan, a deed was recorded in Mercer County, New Jersey disclosing consideration of $156,000,000 paid to the third party seller by the Princeton Pike Corporate Center Borrower for the Princeton Pike Corporate Center Property. Simultaneously with the acquisition of the Princeton Pike Corporate Center Property, 90.0% of the indirect equity interests in the Princeton Pike Corporate Center Borrower were syndicated by the initial owners of the Princeton Pike Corporate Center Borrower pursuant to an equity contribution agreement at a purchase price of $186,000,000 for the Princeton Pike Corporate Center Property. Total cash equity consideration remaining in the transaction is $38,118,723.
The Borrower and the Sponsor.The borrower is Lenox Drive Office Park LLC (the “Princeton Pike Corporate Center Borrower”), a single-purpose Delaware limited liability company structured to be bankruptcy remote, with two independent directors. The Princeton Pike Corporate Center Borrower is 100.0% owned by Lenox Mezz LLC, which is in turn 100% owned by Lenox JV LLC. Lenox JV LLC is equally owned by F-W Princeton Pike LLC, as manager, and Princent Pike Realty Group LLC. F-W Princeton Pike LLC is further owned by a group of Class A membership interests and a group of Class B membership interest. FW Lenox Manager LLC is 40% of the Class B membership interest and is owned 50% each by David Werner and Joseph Friedland. The Princeton Pike Corporate Center Mortgage Loan sponsor and non-recourse carveout guarantor is David Werner. David Werner has been involved in commercial real estate for more than 30 years including ownership in the following properties: 5 Times Square, 150 East 42nd Street, Parkmerced, 100 West 57th Street (leased fee) and Milford Plaza (leased fee).
The Princeton Pike Corporate Center Borrower and the Princeton South Corporate Center Borrower (as defined in this term sheet) are affiliated in that (i) David Werner, who is the non-recourse carve-out guarantor on the Princeton Pike Corporate Center Whole Loan, owns an equity interest in the Princeton South Corporate Center Borrower, and (ii) Joseph Friedland, who is a non-recourse carve-out guarantor on the Princeton South Corporate Center Mortgage Loan (as defined in this Term Sheet), owns an equity interest in the Princeton Pike Corporate Center Borrower.
The Property.The Princeton Pike Corporate Center Property consists of eight low-rise multi-tenant office buildings comprised of 809,458 SF situated on an 89.9 acre site located off Princeton Pike in Lawrence Township, New Jersey and contains 3,394 surface parking spaces for an overall parking ratio of 4.19 spaces per 1,000 SF of net rentable area. The Princeton Pike Corporate Center Property is located just north of the Exit 8 interchange (Princeton Pike) for Interstate 295/95. The Princeton Pike Corporate Center Property is also located near the primary artery connecting two major employment hubs in the MSA: Trenton to the south, and Princeton and the Route One corridor to the north.
Trenton is in general characterized as urban, with lower to moderate level demographics. The area has a favorable population growth trend partly driven by a relatively lower cost of living than in surrounding areas. Its base of educational institutions is another reason for growth in the population base. According to the appraisal for the Princeton Pike Corporate Center Property, in the last ten years, the Trenton MSA’s population growth rate has doubled to almost twice that of the rest of New Jersey. The metropolitan area further benefits from its location between Philadelphia and New York.
Princeton is home to one of the most prestigious universities in the United States, and is an area of upper income households and high wage employment. The Princeton Route 1 Corridor is identified as including Princeton (Borough and Township), West Windsor and Lawrence Townships in Mercer County and Plainsboro and South Brunswick in Middlesex County. The Princeton Corridor has developed along Route One in immediate proximity to Princeton University. The initial growth of this corridor dates back to the 1950’s as large scale corporate projects with an emphasis on research and development were constructed in conjunction with the university. Speculative office development was also prevalent during the most recent 15 years, and today research indicates there is more than 18 million square feet of existing owner occupied and office inventory in the Princeton Corridor.
The Princeton Pike Corporate Center Property is subject to three condominium regimes and one roadway covenant. The 100 Lenox Drive Condominium Regime is comprised of the building known as 100 Lenox Drive and is a 91,450 SF office building that is divided into two condominium units that share a structural wall. The Princeton Pike Corporate Center Borrower owns 50,942 SF, which is part of the collateral for the Princeton Pike Corporate Center Whole Loan, and Joseph Jingoli & Son, Inc. (“Jingoli”) owns 40,508 SF. The pro-rata share of the Princeton Pike Corporate Center Borrower is 55.7% and Jingoli is 44.3% of the building. Each respective unit owner is responsible for the services within their unit and the condominium association is responsible for performing all services for the common elements and billing back the respective unit owners for their pro-rata share of the expenses. The Princeton Pike Corporate Center Borrower, as majority unit owner, will be required to perform these common area services (i.e. snow removal, landscaping, fire alarm monitoring, parking lot maintenance, etc.) and bill back Jingoli for their pro-rata share. The real estate taxes are sent directly to each unit owner by the town. Within the condominium documents there is a listing defining which owner is responsible for common and limited common elements. The condominium is governed by a board of three directors with the Princeton Pike Corporate Center Borrower controlling the board.
The 1000 Lenox Condominium Regime is made up of four units, 1000 Lenox Drive, 1100 Lenox Drive, 1200 Lenox Drive and 1300 Lenox Drive. 1000 Lenox Drive and 1200 Lenox Drive are owned by the Princeton Pike Corporate Center Borrower and are part of the collateral for the Princeton Pike Corporate Center Whole Loan. The maintenance costs are directly billed to the unit owners who have improvements since this work is easily defined and there are no real shared elements at this time. Since 1100 Lenox Drive and 1300 Lenox Drive currently consist of unimproved land with no improvements and the related development rights, the condominium documents do not assess maintenance obligations for such units until improvements are put in place. The condominium is governed by a board of directors, as to which each unit owner is permitted to appoint one member; accordingly the Princeton Pike Corporate Center Borrower has the right to appoint only two of the four directors, and does not control the board.
The 2000 Lenox Condominium Regime is made up of three condominium units. 2000 Lenox Drive is the only developed lot out of those three condominium units and is the only condominium unit owned by the Princeton Pike Corporate Center Borrower and is included as collateral for the Princeton Pike Corporate Center Whole Loan. The other two condominium units are development lots (i.e. 2100 Lenox Drive and 2200 Lenox Drive). The condominium agreement defines how real estate taxes are to be handled. It also defines how maintenance responsibilities for common and limited common elements will be handled if and when the lots are developed. Since 2100 Lenox Drive and 2200 Lenox Drive have no improvements, the condominium documents do not assess maintenance obligations until improvements are put in place. The condominium association is governed by a
| This is not a research report and was not prepared by the Underwriters’ research departments. Please see additional important information and qualifications at the end of this Term Sheet. |
| T-71 |
| MSBAM 2016-C28 | Princeton Pike Corporate Center |
board of three trustees, each of which is elected by majority vote. Each unit has one vote with a value equal to its interest in the common elements. The Princeton Pike Corporate Center Borrower has a 33.33% interest in the common elements, and accordingly does not control the board.
The roadway covenant is for Lenox Drive North, and established cross access easements between 2000 Lenox Drive, 1200 Lenox Drive, 1000 Lenox Drive and 100 Lenox Drive. This covenant binds each building with the maintenance responsibility for Lenox Drive North.
Over the past three years, the former owner invested $5.7 million ($6.99 PSF) to renovate the Princeton Pike Corporate Center Property. The renovations included atrium renovation, elevator modernization, full bathroom gut renovations and roof replacements.
Property Management.The Princeton Pike Corporate Center Property is subject to a management agreement with Vision Management LLC. Vision Management LLC is a real estate investment, development and asset management company that focuses mainly on the greater New Jersey/New York metropolitan area.
Major Tenants.
Stark & Stark (93,961 SF, 12% of NRA, 14% of underwritten rent). Founded in 1933, Stark & Stark has over 105 attorneys and offers legal solutions in 27 practice areas. They have six offices located in New Jersey, New York and Pennsylvania. Stark & Stark has been a tenant at the Princeton Pike Corporate Center Property since 1995.
Fox Rothschild LLP (57,048 SF, 7% of NRA, 8% of underwritten rent).Fox Rothschild LLP is a national law firm with more than 750 attorneys practicing law in 22 offices located on both the east and west coast of the United States. They provide a full range of legal services to public and private companies, as well as represent charitable, medical and education institutions both in United States and in more than 50 countries worldwide.
GS1 US (47,215 SF, 6% of NRA, 7% of underwritten rent). GS1 US, a member of GS1, is an information standards organization that brings industry communities together to solve supply-chain problems through the adoption and implementation of GS1 Standards. More than 300,000 businesses in 25 industries rely on GS1 US for trading-partner collaboration and for maximizing the cost effectiveness, speed, visibility, security and sustainability of their business processes. They achieve these benefits through solutions based on GS1 global unique numbering and identification systems, barcodes, Electronic Product Code (EPC)-enabled Radio Frequency Identification (RFID), data synchronization, and electronic information exchange. GS1 US also manages the United Nations Standard Products and Services Code® (UNSPSC)
Albridge/BNY Mellon (“Albridge”) (45,035 SF, 6% of NRA, 7% of underwritten rent). Albridge, an affiliate of Pershing LLC, a BNY Mellon company, provides enterprise data management solutions for financial services companies. Albridge consolidates and reconciles client data and transaction data from different sources to develop downstream technology solutions. These solutions include performance reporting, sales practice monitoring, data warehousing, business intelligence, imaging and workflow. BNY Mellon (Fitch/Moody’s/S&P: AA-/A1/A), acquired Albridge in July 2010 and is the Guarantor of their lease. Albridge has exercised its termination option effective 1/1/2017. The tenant was required to provide twelve months of notice. At loan closing, the Princeton Pike Corporate Center Borrower deposited $4,305,615 into the BNY Reserve Fund, which equates to approximately three years of underwritten base rent. See “—Escrows and Reserves” below for further discussion.
Parsons Brinkerhoff(43,509 SF, 5% of NRA, 7% of underwritten rent). Parsons Brinckerhoff Group Inc. (the parent company of Parsons Brinckerhoff, Inc.) merged with WSP Global Inc. in October 2014 to create the firm that is known today as WSP/Parsons Brinckerhoff. WSP/Parsons Brinckerhoff is an engineering professional services consultant. They provide a comprehensive set of capabilities involving designing, engineering and managing property and buildings, transport and infrastructure, industry, environment, mining, oil and gas, and power and engineering projects. The firm has over 32,000 employees based in more than 500 offices, across 39 countries. For 2014, the firm reported revenues of $2.9 billion, an increase of 44% compared to 2013 due to the acquisition of Parsons Brinckerhoff. WSP Global, Inc. is listed on the Toronto Stock Exchange under the symbol WSP. Based on a letter dated 10/21/2014 from Parsons Brinckerhoff to the previous landlord, the tenant is not being merged into or consolidated with any entity, nor is any of its stock being transferred as part of the transaction. The lease was not assigned to any entity. The tenant will continue to maintain its own separate financial statements.Parsons Brinkerhoff has a one-time option to terminate its lease at the end of the seventh lease year following the rent commencement date, upon 12 months of notice. The termination option is effective November 2018 with notice given by November 2017. Upon exercising its termination option, Parsons Brinkerhoff is required to pay (i) the unamortized portion of tenant allowance, brokerage commissions and free rent, amortized over the initial term at 9.5% interest, and (ii) 3 months of fixed rent.
The following table presents certain information relating to the leases at the Princeton Pike Corporate Center Property:
| Tenant Summary(1) | |||||||
| Tenant Name | Credit Rating (Fitch/Moody’s/S&P)(2) | Tenant SF | Approximate % of SF | Annual UW Rent | % of Total Annual UW Rent | Annual UW Rent PSF(3) | Lease Expiration |
| Tenants | |||||||
| Stark & Stark | NR/NR/NR | 93,961 | 12% | $2,630,908 | 14% | $28.00 | 12/31/2022 |
| Fox Rothschild LLP | NR/NR/NR | 57,048 | 7% | $1,634,996 | 8% | $28.66 | 4/30/2024 |
| GS1 US | NR/NR/NR | 47,215 | 6% | $1,402,286 | 7% | $29.70 | 11/30/2018 |
| Albridge/BNY Mellon | AA-/A1/A | 45,035 | 6% | $1,339,791 | 7% | $29.75 | 1/1/2017(4) |
| Parsons Brinkerhoff | NR/NR/NR | 43,509 | 5% | $1,316,147 | 7% | $30.25 | 7/31/2021(5) |
| Subtotal/Wtd. Avg. | 286,768 | 35% | $8,324,127 | 43% | $29.03 | ||
| Other Tenants | 419,536 | 52% | $11,097,593 | 57% | $26.45 | ||
| Vacant Space | 103,154 | 13% | $0 | 0% | $0.00 | ||
| Total/Wtd. Avg. | 809,458 | 100% | $19,421,720 | 100% | $27.50 | ||
| (1) | Information is based on the underwritten rent roll. |
| (2) | Certain ratings are those of the parent company whether or not the parent guarantees the lease. |
| (3) | Wtd. Avg. Annual UW Rent PSF excludes vacant space. |
| (4) | Albridge/BNY Mellon has exercised its termination option effective January 1, 2017. |
| (5) | Parsons Brinkerhoff has a one-time termination option effective November 30, 2018. |
| This is not a research report and was not prepared by the Underwriters’ research departments. Please see additional important information and qualifications at the end of this Term Sheet. |
| T-72 |
| MSBAM 2016-C28 | Princeton Pike Corporate Center |
The following table presents certain information relating to the lease rollover schedule at the Princeton Pike Corporate Center Property:
| Lease Rollover Schedule(1)(2) | ||||||||
| Year | # of Leases Rolling | SF Rolling | UW Rent PSF Rolling | Approx. % of Total SF Rolling | Approx. Cumulative % of SF Rolling | Total UW Rent Rolling | Approx. % of Total Rent Rolling | Approx. Cumulative % of Total Rent Rolling |
| MTM(3) | 9 | 17,015 | $0.00 | 2% | 2% | $0 | 0% | 0% |
| 2016 | 3 | 17,825 | $28.48 | 2% | 4% | $507,625 | 3% | 3% |
| 2017 | 9 | 103,878 | $28.80 | 13% | 17% | $2,991,459 | 15% | 18% |
| 2018 | 4 | 77,971 | $30.24 | 10% | 27% | $2,357,888 | 12% | 30% |
| 2019 | 5 | 58,959 | $24.02 | 7% | 34% | $1,416,253 | 7% | 37% |
| 2020 | 6 | 72,514 | $30.73 | 9% | 43% | $2,228,444 | 11% | 49% |
| 2021 | 7 | 90,595 | $28.03 | 11% | 54% | $2,539,610 | 13% | 62% |
| 2022 | 2 | 111,124 | $27.77 | 14% | 68% | $3,085,728 | 16% | 78% |
| 2023 | 3 | 14,427 | $29.25 | 2% | 70% | $421,989 | 2% | 80% |
| 2024 | 2 | 91,677 | $27.84 | 11% | 81% | $2,552,664 | 13% | 93% |
| 2025 | 2 | 38,181 | $26.29 | 5% | 86% | $1,003,758 | 5% | 98% |
| 2026 | 2 | 12,138 | $26.06 | 1% | 87% | $316,303 | 2% | 100% |
| 2027 & Beyond | 0 | 0 | $0.00 | 0% | 87% | $0 | 0% | 100% |
| Vacant | 0 | 103,154 | $0.00 | 13% | 100% | $0 | 0% | 100% |
| Total/Wtd. Avg. | 54 | 809,458 | $27.50 | 100% | $19,421,720 | 100% | ||
| (1) | Information is based on the underwritten rent roll. |
| (2) | Certain tenants may have lease termination options that are exercisable prior to the originally stated expiration date of the subject lease and that are not considered in the lease rollover schedule. |
| (3) | MTM space is for Cafés, conference centers, fitness centers and conference room storage. |
The Market. The Princeton Pike Corporate Center Property is located in the Central New Jersey Office Market within Mercer County between Trenton and Princeton, New Jersey. Access to the Princeton Pike Corporate Center Property is provided by Princeton Pike, which intersects Interstate 295/95. According to the appraisal, Interstate 295/95 - The I-295/95 beltway ties together all of the major roadways at the southern end of the Route 1 corridor in Mercer County and acts as a primary conduit to labor pools in Pennsylvania and Southern New Jersey. The Interstate 295/95 beltway also facilitates east/west traffic via Interstate 195 and connects the New Jersey Turnpike and Garden State Parkway. A mix of office and industrial uses predominate the local arterials. Residential development in the area comprises mostly single-family subdivisions, mostly located to the south and west of the neighborhood. Directly across the road from the Princeton Pike Corporate Center Property on the east side of Princeton Pike is the site for the new Bristol Myers Squibb (BMS) corporate campus. Upon completion, the campus will include about 650,000 square feet of office campus space and will house upwards of 2,500 employees, most of whom will be transferred from the Plainsboro campus as BMS consolidates their operations. The new campus is scheduled for completion in late 2016. Also, the Green Acres Country Club & Golf Course is located less than ½ mile west of the subject, and the Quaker Bridge Mall is less than one mile to the northeast along US Route 1.
According to the appraisal for the Princeton Pike Corporate Center Property, as of 2Q 2015, the Central New Jersey office market was comprised of 78,718,146 SF with an overall vacancy rate of 17.6%, a direct vacancy rate of 16.1%, an overall asking rent of $24.55 PSF and direct Class A rent of $29.17 PSF. Year to date leasing volume achieved in 2015 surpassed the total volume achieved in 2014. The highest rental rates in the Central New Jersey market were achieved in the Mercer County Submarket, the submarket in which the Princeton Pike Corporate Center Property is located. As of 2Q 2015, the Mercer County Submarket was comprised of 16,467,540 SF with an overall vacancy rate of 14.4%, a direct vacancy of 12.7%, an overall asking rent of $26.72 PSF and a direct Class A rent of $32.48 PSF.
The estimated 2015 population within a one-, three- and five-mile radius of the Princeton Pike Corporate Center Property is 2,830, 39,159 and 152,437, respectively, according to the appraisal. The estimated 2015 average household income within a one-, three- and five-mile radius of the Princeton Pike Corporate Center Property is $110,473, $126,201 and $110,842, respectively. The respective 2015 average household incomes compare favorably to the average household income for the Mercer County and State of New Jersey of $104,567 and $101,779, respectively.
| This is not a research report and was not prepared by the Underwriters’ research departments. Please see additional important information and qualifications at the end of this Term Sheet. |
| T-73 |
| MSBAM 2016-C28 | Princeton Pike Corporate Center |
The following table presents recent occupancy and leasing data at competitive office buildings with respect to the Princeton Pike Corporate Center Property:
| Competitive Property Summary | |||||||||
| Property Name/Address | Year Built | Class | Size (SF) | Tenant Name | Lease Size (SF) | Lease Date | Lease Term (Yrs.) | Initial Rent/SF | Rent Steps |
Carnegie Center 212 Carnegie Center West Windsor, NJ | 1986 | A | 149,398 | WIRB | 15,289 | May 2015 | 5.0 | $33.00 | $0.50/SF annual increases |
University Square 1 University Square West Windsor, NJ | 2007 | A | 466,000 | Opthotech | 35,206 | May 2015 | 7.0 | $32.00 | $0.50/SF annual Increases |
Princeton South Corporate Center 200 Charles Ewing Blvd Ewing, NJ | 2008 | A | 267,244 | Berkely Insurance | 22,856 | Feb 2015 | 8.0 | $29.50 | $0.50/SF annual Increases |
Crossroads Corporate Center 3150 Brunswick Pike Lawrence Township, NJ | 1991 | A | 102,000 | RAMCO System Corporation | 2,650 | Aug 2014 | 5.0 | $23.50 | $0.50/SF annual Increases |
Carnegie Center 300 Carnegie Center Drive West Windsor, NJ | 2013 | A | 88,000 | VMS Fund Administration, LLC | 5,106 | Jun 2014 | 7.3 | $36.00 | $0.50/SF annual increases |
Metro Office Center 821 Alexander Road West Windsor, NJ | 2000 | A | 44,000 | DE Shaw | 3,621 | Feb 2014 | 5.0 | $27.25 | Bump to $28.75 in year 3 |
Source: Appraisal
| (1) | Princeton South Corporate Center is owned by an affiliate of the Princeton Pike Corporate Center Borrower and secures another mortgage loan included in the MSBAM 2016-C28 securitization. |
Operating History and Underwritten Net Cash Flow.The following table presents certain information relating to the historical operating performance and the Underwritten Net Cash Flow at the Princeton Pike Corporate Center Property:
| Cash Flow Analysis | |||||
| 2013 | 2014 | 10/31/2015 TTM | UW(1) | UW PSF | |
| Base Rent(2) | $15,413,260 | $17,137,937 | $17,765,256 | $22,501,514 | $27.80 |
| Total Recoveries | $1,111,602 | $1,439,338 | $2,092,693 | $1,719,888 | $2.12 |
| Total Other Income(3) | $99,894 | $41,687 | $78,523 | $78,523 | $0.10 |
| Less Vacancy & Credit Loss | $0 | $0 | $0 | ($3,079,794) | ($3.80) |
| Effective Gross Income | $16,624,756 | $18,618,962 | $19,936,472 | $21,220,131 | $26.22 |
| Total Operating Expenses | $6,860,074 | $8,728,532 | $9,093,613 | $8,718,377 | $10.77 |
| Net Operating Income | $9,764,682 | $9,890,430 | $10,842,859 | $12,501,754 | $15.44 |
| Capital Expenditures | $0 | $0 | $0 | $226,737 | $0.28 |
| TI/LC | $0 | $0 | $0 | $1,521,779 | $1.88 |
| Net Cash Flow | $9,764,682 | $9,890,430 | $10,842,859 | $10,753,238 | $13.28 |
| Occupancy % | 80.2% | 83.1% | N/A | 86.3% | |
| NOI DSCR | 1.26x | 1.27x | 1.40x | 1.61x | |
| NCF DSCR | 1.26x | 1.27x | 1.40x | 1.38x | |
| NOI Debt Yield | 7.5% | 7.6% | 8.3% | 9.6% | |
| NCF Debt Yield | 7.5% | 7.6% | 8.3% | 8.3% | |
| (1) | Increase in Net Operating Income is due to lease-up of 50,728 SF since October 2015 that increases base rent by $1,447,399. |
| (2) | Base Rent includes $1,339,791 in base rent that is leased to Albridge/BNY Mellon, which has exercised its termination option effective 1/1/2017. The tenant was required to provide twelve months of notice. At loan closing, the Princeton Pike Corporate Center Borrower deposited $4,305,615 into the BNY Reserve Fund, which equates to approximately three years of underwritten base rent for such tenant. |
| (3) | Historical Total Other Income included overtime HVAC, tenant work orders and other miscellaneous income. |
Escrows and Reserves. The Princeton Pike Corporate Center Borrower deposited $30,882 in escrow for insurance reserves at loan origination and is required to escrow monthly (i) 1/12th of the annual estimated tax payments, and (ii) 1/12th of the annual estimated insurance premiums (unless the Princeton Pike Corporate Center Borrower maintains an acceptable blanket policy). The Princeton Pike Corporate Center Borrower is required to make monthly deposits equal to the lesser of (A) $18,894.76 or (B) an amount equal to the positive difference of (x) $3,000,000 less (y) the amount then on deposit for such purpose, for certain capital expenditures identified in the loan documents and other capital expenditures approved by lender. The Princeton Pike Corporate Center Borrower deposited $4,000,000 in escrow at loan origination (“Vacancy Funds”), for (i) $133,448 of existing tenant improvement obligations with respect to leases to Navigant Consulting and JMT Engineering and (ii) tenant improvements and leasing commissions that may be incurred after the loan origination date with respect to space that was vacant as of the loan origination date. In addition, on each monthly payment date on which the amount then on deposit and held as Vacancy Funds is less than $1,500,000, the Princeton Pike Corporate Center Borrower is required to deposit the lesser of (A) $118,046.00 or (B) an amount equal to the positive difference of (1) $1,500,000 less (2) the amount of Vacancy Funds then remaining on deposit, for tenant improvements and leasing commissions that may be incurred after the loan origination date with respect to space that was vacant on the loan origination date. Up to $300,000 of the Vacancy Funds may be used for reasonable and market costs in preparing or building out three specified suites (totaling 39,428 square feet) of vacant space identified in the loan documents, at a cost of not more than $25 per
| This is not a research report and was not prepared by the Underwriters’ research departments. Please see additional important information and qualifications at the end of this Term Sheet. |
| T-74 |
| MSBAM 2016-C28 | Princeton Pike Corporate Center |
square foot, prior to any lease being executed, where the Princeton Pike Corporate Center Borrower reasonably believes such work will attract an acceptable tenant for such space. The Princeton Pike Corporate Center Borrower deposited $7,500,000 in escrow at loan origination (“Future Roll Funds”), and on each monthly payment date on which the amount then on deposit and held as Future Roll Funds is less than $1,500,000, the Princeton Pike Corporate Center Borrower is required to deposit the lesser of (A) $118,046.00 or (B) an amount equal to the positive difference of (1) $1,500,000 less (2) the amount of Future Roll Funds then remaining on deposit, in each case for tenant improvements and leasing commissions for space that is occupied as of the loan origination date but may become vacant thereafter. The Princeton Pike Corporate Center Borrower deposited $276,435 in escrow at loan origination for condominium assessments related to four buildings (100 Lenox Drive, 1200 Lenox Drive, 1000 Lenox Drive and 2000 Lenox Drive) included in the Princeton Pike Corporate Center Property that are subject to condominium regimes and is required to escrow monthly 1/12th of the annual estimated condominium assessments. The Princeton Pike Corporate Center Borrower deposited $578,044.60 in escrow at loan origination with respect to free rent for various tenants, of which $333,692.35 is required to be applied on each monthly payment date in lieu of the abated rent for the related tenants (Navigant Consulting, JMT Engineering, J. Knipper & Company, Segal & Company, Eckert Seamens and Bayada Nurses), and the remaining $244,352.15 is required to be released to the Princeton Pike Corporate Center Borrower upon delivery of estoppel certificates from JMT Engineering, Adare Pharmaceuticals and Consulting Services of Princetown LLC stating, among other things, that such tenant is in possession of its space, open for business and paying full unabated rent, all free rent periods have expired and all tenant improvements and similar tenant inducements have been paid for and completed. The Princeton Pike Corporate Center Borrower deposited $1,668,645 in escrow at loan origination in connection with the renewal and extension of the lease to Wells Fargo Advisors LLC (“WFB”) with respect to 10,575 square feet of space which funds are required (i) if such lease is not extended in accordance with the terms of the loan documents on or before July 31, 2016, to be deposited on each monthly payment date into the cash management account for the Princeton Pike Corporate Center Whole Loan in the amount of $27,810.75, until such funds are reduced to zero, and (ii) notwithstanding clause (i), to be released in full to the Princeton Pike Corporate Center Borrower if lender receives an estoppel certificate from WFB or from a replacement tenant reasonably acceptable to lender which, in either case, is leasing such WFB space pursuant to a lease or renewal lease with a minimum five-year term and meeting the requirements of the loan documents, stating, among other things, that such tenant is in possession of its space, open for business and paying full unabated rent, and all tenant improvements and similar tenant inducements and leasing commissions have been paid for and completed. The Princeton Pike Corporate Center Borrower deposited $4,305,615 in escrow at loan origination in connection with the termination of the lease to Albridge, which funds are required (i) to be deposited on each monthly payment date following such termination into the cash management account for the Princeton Pike Corporate Center Whole Loan in the amount of $119,600.42, until such funds are reduced to zero, and (ii) notwithstanding clause (i), to be released in full to the Princeton Pike Corporate Center Borrower if lender receives an estoppel certificate from a replacement tenant reasonably acceptable to lender which is leasing the space demised to Allbridge at loan origination pursuant to a lease with a minimum five-year term and meeting the requirements of the loan documents, stating, among other things, that such tenant is in possession of its space, open for business and paying full unabated rent, and all tenant improvements and similar tenant inducements and leasing commissions have been paid for and completed.
Seller Non-Collateral Escrows.In connection with the acquisition of the Princeton Pike Corporate Center Property, reserves were established with Fidelity National Title Insurance Company as escrow agent by various third-party seller parties as of the origination date, including $312,336.41, for tenant improvement and leasing commissions associated with the lease to Adare Pharmaceuticals, $378,286.38, for tenant improvement and leasing commissions associated with the lease to JMT Engineering, $220,944.11, for tenant improvement and leasing commissions associated with any future lease of a 4,229 square foot space at 100 Lenox Drive known as the Advantest Space, $53,645.38, for scheduled rent abatements associated with the lease to Adare Pharmaceuticals, $18,294.16 for scheduled rent abatements associated with the lease to JMT Engineering, $159,116.13, for 15 months of rent abatements associated with the vacancy of the Advantest Space, and $726,567.73 for ongoing capital expenditure work. Such reserves are not collateral for the Princeton Pike Corporate Center Whole Loan and are not held by the lender. The applicable seller party has the right to withdraw amounts from the foregoing reserves to the extent it performs the applicable pending capital expenditure work or tenant improvement work. Funds in the rent abatement escrow accounts are required to be disbursed as rent would otherwise become due under the applicable lease. To the extent such non-collateral escrows were established, reserves for the related items were not established under the Princeton Pike Corporate Center Whole Loan.
Lockbox and Cash Management.A hard lockbox is in place with respect to the Princeton Pike Corporate Center Whole Loan. The Princeton Pike Corporate Center Whole Loan has in place cash management. Funds in the lockbox account are required to be transferred to a cash management account and applied on each monthly payment date to pay debt service on the Princeton Pike Corporate Center Whole Loan, to fund the required reserves deposits as described above under “Escrows and Reserves”, to disburse, during the continuance of a Cash Sweep Period (other than a Cash Sweep Period which is due to an event of default under the Princeton Pike Corporate Center Whole Loan), the monthly operating expenses referenced in the annual budget (which is required to be approved by the lender) and pay extraordinary operating expenses or capital expenses not referenced in the annual budget and approved by the lender, to pay, provided no event of default is continuing under the Princeton Pike Corporate Center Whole Loan, monthly debt service due under the Princeton Pike Corporate Center Mezzanine Loan (as defined below), and to disburse the remainder (i) provided no event of default or Cash Sweep Period is continuing under the Princeton Pike Corporate Center Whole Loan, if lender has received notice that an event of default under the Princeton Pike Corporate Center Mezzanine Loan is continuing, to pay any other amount then due and payable under the Princeton Pike Corporate Center Mezzanine Loan (excluding accelerated principal), (ii) if a Cash Sweep Period is continuing, into an account to be held by the lender as additional security for the Princeton Pike Corporate Center Whole Loan during the continuance of such Cash Sweep Period and (iii) otherwise, to the Princeton Pike Corporate Center Borrower.
A “Cash Sweep Period” will:
| (i) | commence upon the occurrence of an event of default under the Princeton Pike Corporate Center Whole Loan and continue until the cure (if applicable) of the event of default, or |
| (ii) | commence upon the date the combined debt service coverage ratio on the Princeton Pike Corporate Center Whole Loan and Princeton Pike Corporate Center Mezzanine Loan is less than (x) from the loan origination date through and including December 31, 2020, 1.20x and (y) thereafter, 1.10x, in each case for two consecutive calendar quarters and continue until the date such combined debt service coverage ratio has been equal to or greater than greater than (x) from the loan origination date through and including December 31, 2020, 1.25x and (y) thereafter, 1.15x, in each case for two consecutive calendar quarters. During the period ending on January 31, 2021, such debt service coverage ratio is calculated based on the interest only payments due under the Princeton Pike Corporate Center Whole Loan and Princeton Pike Corporate Center Mezzanine Loan, and thereafter such debt service coverage ratio is calculated based on the principal and interest payments due under such loans. |
| This is not a research report and was not prepared by the Underwriters’ research departments. Please see additional important information and qualifications at the end of this Term Sheet. |
| T-75 |
| MSBAM 2016-C28 | Princeton Pike Corporate Center |
Additional Secured Indebtedness (not including trade debts).The Princeton Pike Corporate Center Property also secures the Princeton Pike Corporate Center Serviced Companion Loan, with a Cut-off Date Balance of $80,000,000. The Princeton Pike Corporate Center Serviced Companion Loan is expected to be held by Morgan Stanley Bank, N.A. or an affiliate on the closing date of this transaction and may be contributed to one or more future securitization transactions. The promissory notes evidencing the Princeton Pike Corporate Center Serviced Companion Loan accrue interest at the same rate as the Princeton Pike Corporate Center Mortgage Loan. The Princeton Pike Corporate Center Mortgage Loan is entitled to payments of principal and interest on a pro rata andpari passu basis with the Princeton Pike Corporate Center Serviced Companion Loan. The holders of the Princeton Pike Corporate Center Mortgage Loan and the Princeton Pike Corporate Center Serviced Companion Loan have entered into a co-lender agreement which sets forth the allocation of collections on the Princeton Pike Corporate Center Whole Loan. See “Description of the Mortgage Pool—The Whole Loans—The Serviced Pari passu Whole Loans—The Princeton Pike Corporate Center Whole Loan,” and “Pooling and Servicing Agreement” in the Preliminary Prospectus.
Mezzanine Loan and Preferred Equity.The “Princeton Pike Corporate Center Mezzanine Loan” refers to a loan in the principal amount of $17,000,000 made to Lenox Mezz LLC, a Delaware limited liability company, by MSMCH, secured by 100% of the direct or indirect equity interest in the Princeton Pike Corporate Center Borrower. The Princeton Pike Corporate Center Mezzanine Loan and the Princeton Pike Corporate Center Whole Loan are subject to an intercreditor agreement between the Princeton Pike Corporate Center Whole Loan lender and related mezzanine lender. As of the cut-off date, the Princeton Pike Corporate Center Mezzanine Loan is expected to be held by MSMCH or an affiliate.
The following table presents certain information relating to the Princeton Pike Corporate Center Mezzanine Loan:
| Mezzanine Debt Summary | |||||||
| Mezzanine Debt Original Principal Balance | Mezzanine Debt Interest Rate | Original Term to Maturity (mos.) | Original Amort. Term (mos.) | Original IO Term (mos.) | Total Debt UW NCF DSCR | Total Debt UW NOI Debt Yield | Total Debt Cut- off Date LTV |
| $17,000,000 | 12.00% | 120 | 360 | 60 | 1.07x | 8.5% | 73.9% |
Release of Property. Not permitted.
Terrorism Insurance. The Princeton Pike Corporate Center Borrower is required to obtain insurance against acts of terrorism or other similar acts or events (or “fire following”) to the extent such insurance is available in form and substance satisfactory to, and in an amount determined by, the lender (but in no event more than the sum of 100% of full replacement cost and 12 months of business interruption insurance). Notwithstanding the foregoing, for so long as the Terrorism Risk Insurance Program Reauthorization Act of 2015 (or any extension thereof or other federal government program with substantially similar protection) is in effect, the lender is required to accept terrorism insurance which covers “covered acts” (as defined by such statute or other program), as full compliance as it relates to the risks required to be covered pursuant to the preceding sentence, so long as such statute or other program covers both domestic and foreign acts of terrorism. The Princeton Pike Corporate Center Borrower is not required to pay insurance premiums solely with respect to such terrorism insurance in excess of the Terrorism Premium Cap (defined below) but must obtain as much terrorism insurance as is available for the Terrorism Premium Cap; provided that if the insurance premiums exceed the Terrorism Premium Cap, the lender may, at its option, purchase such separate terrorism policy, with the Princeton Pike Corporate Center Borrower paying insurance premiums equal to the Terrorism Premium Cap and the lender paying the excess. “Terrorism Premium Cap” means the greater of (A) the product of the rate of $0.15 per $100 and 100% of the full replacement cost and the required amount of business interruption insurance or (B) two times the amount of annual insurance premium that is payable at such time for the casualty and business interruption insurance coverage required under the loan documents (without giving effect to the cost of terrorism coverage).
| This is not a research report and was not prepared by the Underwriters’ research departments. Please see additional important information and qualifications at the end of this Term Sheet. |
| T-76 |
(THIS PAGE INTENTIONALLY LEFT BLANK)
| This is not a research report and was not prepared by the Underwriters’ research departments. Please see additional important information and qualifications at the end of this Term Sheet. |
| T-77 |
| MSBAM 2016-C28 | Princeton South Corporate Center |
Mortgage Loan No. 6 – Princeton South Corporate Center
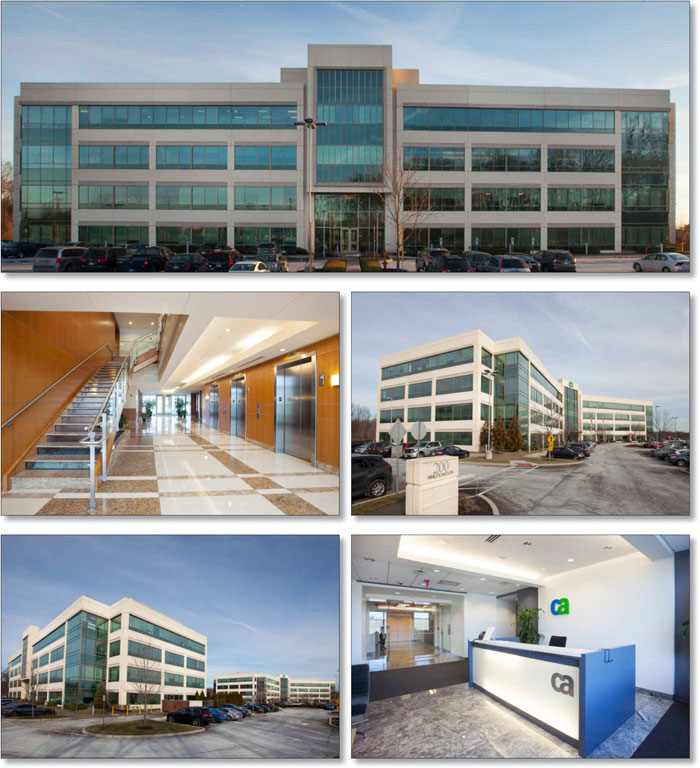
| This is not a research report and was not prepared by the Underwriters’ research departments. Please see additional important information and qualifications at the end of this Term Sheet. |
| T-78 |
| MSBAM 2016-C28 | Princeton South Corporate Center |
Mortgage Loan No. 6 – Princeton South Corporate Center
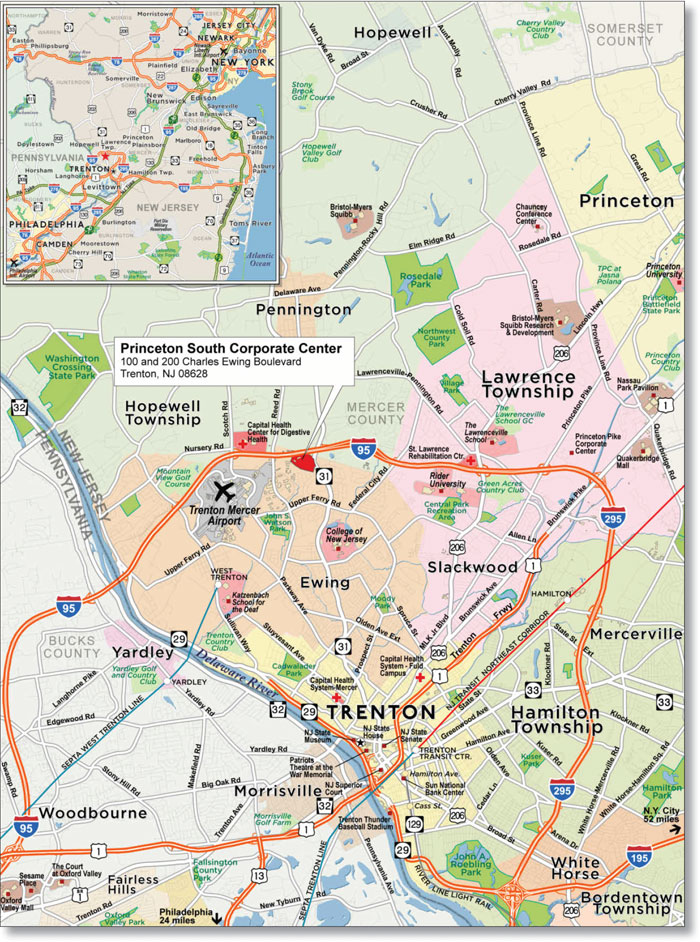
| This is not a research report and was not prepared by the Underwriters’ research departments. Please see additional important information and qualifications at the end of this Term Sheet. |
| T-79 |
| MSBAM 2016-C28 | Princeton South Corporate Center |
| Mortgage Loan No. 6 – Princeton South Corporate Center |
| Mortgage Loan Information | Property Information | ||||||
| Mortgage Loan Seller: | MSMCH | Single Asset/Portfolio: | Single Asset | ||||
| Original Balance: | $48,000,000 | Location: | Trenton, NJ 08628 | ||||
| Cut-off Date Balance: | $48,000,000 | General Property Type: | Office | ||||
| % of Initial Pool Balance: | 5.0% | Detailed Property Type: | Suburban | ||||
| Loan Purpose: | Acquisition | Title Vesting: | Fee | ||||
| Sponsor(1): | Various | Year Built/Renovated: | 2008 / N/A | ||||
| Mortgage Rate: | 4.050% | Size: | 267,426 SF | ||||
| Note Date: | 3/26/2015 | Cut-off Date Balance per Unit: | $179 | ||||
| First Payment Date: | 5/1/2015 | Maturity Date Balance per Unit: | $165 | ||||
| Maturity Date: | 4/1/2025 | Property Manager: | Vision Management LLC | ||||
| Original Term to Maturity: | 120 months | ||||||
| Original Amortization Term: | 360 months | ||||||
| IO Period: | 60 months | Underwriting and Financial Information | |||||
| Seasoning: | 10 months | UW NOI: | $3,864,618 | ||||
| Prepayment Provisions: | LO (34); DEF (82); O (4) | UW NOI Debt Yield: | 8.1% | ||||
| Lockbox/Cash Mgmt Status: | Hard/In Place | UW NOI Debt Yield at Maturity: | 8.7% | ||||
| Additional Debt Type: | Mezzanine | UW NCF DSCR: | 1.78x (IO) 1.32x (P&I)(3) | ||||
| Additional Debt Balance: | $12,000,000 | Most Recent NOI: | $2,686,139 (12/31/2014) | ||||
| Future Debt Permitted (Type): | No (N/A) | 2nd Most Recent NOI: | $1,995,192 (12/31/2013) | ||||
| Reserves(2) | 3rd Most Recent NOI: | $2,342,641 (12/31/2012) | |||||
| Type | Initial | Monthly | Cap | Most Recent Occupancy(4): | 82.1% (12/31/2015) | ||
| RE Tax: | $0 | $92,603 | N/A | 2nd Most Recent Occupancy: | 83.6% (12/31/2014) | ||
| Insurance: | $0 | $5,520 | N/A | 3rd Most Recent Occupancy: | 77.5% (12/31/2013) | ||
| Recurring Replacements: | $100,000 | Springing | N/A | Appraised Value (as of): | $72,000,000 (1/12/2016) | ||
| TI/LC: | $3,400,000 | Springing | N/A | Cut-off Date LTV Ratio: | 66.7% | ||
| Other: | $3,492,715 | $13,090 | N/A | Maturity Date LTV Ratio: | 61.4% | ||
| Sources and Uses | ||||||
| Sources | Proceeds | % of Total | Uses | Proceeds | % of Total | |
| Loan Amount: | $48,000,000 | 63.4% | Net Purchase Price(5): | $66,628,159 | 87.9% | |
| Mezzanine Loan: | $12,000,000 | 15.8% | Reserves: | $6,992,715 | 9.2% | |
| Borrower Equity: | $15,763,625 | 20.8% | Closing Costs: | $2,142,751 | 2.8% | |
| Total Sources: | $75,763,625 | 100.0% | Total Uses: | $75,763,625 | 100.0% | |
| (1) | Sponsors are Joseph Friedland, Menashe Frankel and Yeheskel Frankel. |
| (2) | See “—Escrows and Reserves” below for further discussion of reserve requirements. |
| (3) | The UW NCF DSCR (P&I) is based on the first twelve amortizing debt service payments pursuant to the loan agreement. |
| (4) | Includes 1,297 SF of expansion space leased to Emgenex, which has not been delivered and rent has not yet commenced. Emgenex is expected to take occupancy and commence rent for the expansion space on February 1, 2016. Also includes 6,675 SF that is leased to F-Squared, which had recently filed for bankruptcy. For underwriting purposes, the 6,675 SF leased to F-Squared was considered vacant. |
| (5) | Concurrently with the origination of the Princeton South Corporate Center Mortgage Loan, a deed was recorded in Mercer County, New Jersey disclosing consideration of $58,000,000 paid to the third party seller by the Princeton South Corporate Center Borrower (as defined below) for the Princeton South Corporate Center Property. Simultaneously with the acquisition of the Princeton South Corporate Center Property, 83.33% of the indirect equity interests in the Princeton South Corporate Center Borrower were syndicated by the initial owners of the Princeton South Corporate Center Borrower pursuant to an equity contribution agreement at a purchase price of $70,000,000 for the Princeton South Corporate Center Property. The net purchase price of $66,628,159 is based on such $70,000,000 purchase price less certain adjustments, including prepaid rents/credits, security deposits, escrows and tenant leasing costs, among other items. Total cash equity consideration remaining in the transaction is $7,135,466. |
The Mortgage Loan.The sixth largest mortgage loan (the “Princeton South Corporate Center Mortgage Loan”) is evidenced by a promissory note in the original principal amount of $48,000,000 secured by a first priority fee mortgage encumbering two office buildings, comprising two units in a five unit condominium and containing 267,426 SF located in Trenton, New Jersey (the “Princeton South Corporate Center Property”). The proceeds of the Princeton South Corporate Center Mortgage Loan, together with a mezzanine loan in the amount of $12,000,000 (the Princeton South Corporate Center Mezzanine Loan”), were primarily used to acquire the Princeton South Corporate Center Property, fund reserves, and pay closing costs. Concurrently with the origination of the Princeton South Corporate Center Loan, a deed was recorded in Mercer County, New Jersey disclosing consideration of $58,000,000 paid to the third party seller by the Princeton South Corporate Center Borrower for the Princeton South Corporate Center Property. Simultaneously with the acquisition of the Princeton South Corporate Center Property, 83.33% of the indirect equity interests in the Princeton South Corporate Center Borrower were syndicated by the initial owners of the Princeton South Corporate Center Borrower pursuant to an equity contribution agreement at a purchase price of $70,000,000 ($66,628,159 net of adjustments) for the Princeton South Corporate Center Property. Total cash equity consideration remaining in the transaction is $7,135,466.
| This is not a research report and was not prepared by the Underwriters’ research departments. Please see additional important information and qualifications at the end of this Term Sheet. |
| T-80 |
| MSBAM 2016-C28 | Princeton South Corporate Center |
The Borrower and the Sponsor.The borrower is Princeton Office Center LLC (the “Princeton South Corporate Center Borrower”), a single-purpose Delaware limited liability company structured to be bankruptcy remote, with two independent directors. The Princeton South Corporate Center Borrower is 100.0% owned by Princeton Mezz LLC, which is in turn 100% owned by Princeton Property Holdings LLC. Princeton Property Holdings LLC is equally owned by JFR/DW Princeton LLC and Princeton South Acquisition LLC. The Princeton South Corporate Center Mortgage Loan sponsors and non-recourse carveout guarantors are Joseph Friedland, Menashe Frankel and Yeheskel Frankel.
JFR/DW Princeton LLC is owned by J&D Princeton LLC (33.33%, managing member) and three other entities, none of which owns more than 33.33% of JFR/DW Princeton LLC. J&D Princeton LLC is owned equally by David Werner (50%) and Joseph Friedland (50%, managing member).
Princeton South Acquisition LLC is owned by Princeton Manager LLC (0%, managing member), Princeton Member LLC (32%), Princeton Associate LLC (32%) and Princeton Investor LLC (36%). Princeton Manager LLC is the managing member of Princeton Member LLC, Princeton Associate LLC and Princeton Investor LLC with 40% profit interest in each of the three entities. Princeton Manager LLC is owned equally by Menashe Frankel (50%) and Yeheskel Frankel (50%).
Menashe and Yeheskel Frankel are the principals of Lakestar Properties and have been involved with real estate investing for many years. Lakestar Properties has completed transactions in excess of $500 million with total SF of 6 million, across multiple asset types including office buildings, retail centers, apartments and land.
The Princeton South Corporate Center Borrower and the Princeton Pike Corporate Center Borrower (as defined in this Term Sheet) are affiliated in that (i) Joseph Friedland, who is a non-recourse carve-out guarantor on the Princeton South Corporate Center Mortgage Loan, owns an equity interest in the Princeton Pike Corporate Center Borrower and (ii) David Werner, who is the non-recourse carve-out guarantor on the Princeton Pike Corporate Center Whole Loan (as defined in this Term Sheet), owns an equity interest in the Princeton South Corporate Center Borrower. In addition, the Princeton South Corporate Center Borrower is affiliated with the borrower under the mortgage loan identified on Annex A-1 to the Preliminary Prospectus as 16055 Space Center, in that Menashe Frankel and Yeheskel Frankel are the non-recourse carve-out guarantors under both mortgage loans and own interests in both such borrowers.
The Property.The Princeton South Corporate Center Property consists of two 4-story office buildings comprised of 267,426 SF situated on a 12.2 acre site located in Trenton, New Jersey and contains 984 parking spaces for an overall parking ratio of 3.68 spaces per 1,000 SF of net rentable area. The Princeton South Corporate Center Property is located west of Route 31, south of Interstate Highway 95 and east of the Mercer County Airport in Trenton Township, Mercer County, New Jersey.
The Princeton South Corporate Center Property is part of the Princeton South Corporate Center, a 62.74 acre parcel of land, situated at the southwest quadrant of the Route 31 (Pennington Road) and Interstate Highway 95 intersection. This tract is approved for the development of 740,000 SF of office space, a 144-room hotel, a 10,000 SF branch bank, and two, 10,000 SF restaurants. The construction of Building 200 (153,514 SF) commenced in October 2006 and was completed in late 2007 followed by Building 100 (113,912 SF) in 2008. The most recent development is the 259,812 square foot single tenant building that is leased to Church & Dwight. This building was completed in December 2012. The Princeton South Corporate Center Property is subject to the Princeton South Corporate Center Condominium Association, Inc., which is comprised of five condominium units situated on 62.74 acres referenced above. The collateral for the Princeton South Corporate Center Mortgage loan includes condominium units 1 and 2 (Building 100 and Building 200). Condominium units 1 and 2, collectively, represent approximately 37.9% of the common area interests. Condominium units 3, 4 and 5 are not included as part of the collateral. Condominium units 3 and 4 are two undeveloped parcels located adjacent and contiguous to the collateral that are approved for 97,405 SF and 102,632 SF of office development, respectively. Condominium unit 5 is improved with the 259,812 SF single tenant build-to-suit office building that is fully leased to Church & Dwight for 20 years. The Princeton South Corporate Center Borrower has the right to appoint two members of the five unit condominium board, and accordingly does not control the board.
Property Management.The Princeton South Corporate Center Property is subject to a management agreement with Vision Management LLC. Vision Management LLC is a real estate investment, development and asset management company that focuses mainly on the greater New Jersey/New York metropolitan area.
Major Tenants.
CA, Inc. (“CA Technologies”) (42,600 SF, 15.9% of NRA, 20.2% of underwritten rent). CA Technologies provides software solutions to help its customers and partners deliver innovation by managing and securing their evolving IT environments. CA Technologies provides software solutions to a variety of customers including the majority of the Global Fortune 500 as well as government organizations, educational institutions and thousands of other companies worldwide. Founded in 1976, CA Technologies has over 13,000 employees in 45 countries. CA Technologies invests more than $660 million each year in software development. In 2015, CA Technology generated approximately $4.3 billion in revenues and $1.0 billion in cash flow from operations. CA Technologies has a one-time contraction option to reduce its leased premises by up to 25%, effective as of April 30, 2018, by providing notice not later than April 30, 2017 and payment of a contraction fee.
Philadelphia Insurance Company(29,556 SF, 11.1% of NRA, 12.7% of underwritten rent). James J. Maguire, Sr. is the Founder and Chairman Emeritus of Philadelphia Consolidated Holding Corporation. In 1980, Mr. Maguire formed the Company, which today owns several subsidiaries including Maguire Insurance Agency, Inc., an insurance marketing company licensed in all states; Tokio Marine Specialty Insurance Company, approved to write surplus lines insurance in all states; and Philadelphia Indemnity Insurance Company, its flagship company, licensed to write property and casualty insurance in all 50 states. The lease is guaranteed by its parent company, Philadelphia Consolidated Holding Corp.
Philadelphia Insurance Company has a one-time termination option as of the last day of the 102nd full calendar month of the term of the lease, December, 31 2024. Philadelphia Insurance Company must give 12 months’ notice and pay a cancellation fee equal to the unamortized portion of the (i) aggregate abatement amount, (ii) tenant improvement costs and (iii) leasing commissions paid by landlord. Within 10 days after landlord receives notice, Philadelphia Insurance Company must pay 50% of the cancelation fee with the remainder due by December 1, 2024. Philadelphia Insurance Company is in a free rent period through July 1, 2016.
Berkley Life Sciences(22,856 SF, 8.5% of NRA, 10.2% of underwritten rent). Berkley Life Science is a domestic business unit of W. R. Berkley Corporation, an insurance holding company that is among the largest commercial lines writers in the United States. Berkley Life Sciences offers a comprehensive spectrum of property casualty products to the life sciences industry on a global basis, including primary and excess liability coverage and commercial insurance. It serves pharmaceutical and biologic/ biotech companies, medical device companies, dietary supplement manufacturers,
| This is not a research report and was not prepared by the Underwriters’ research departments. Please see additional important information and qualifications at the end of this Term Sheet. |
| T-81 |
| MSBAM 2016-C28 | Princeton South Corporate Center |
medical and research software developers, contract service organizations, research institutions and organizations, and other related businesses. The lease is guaranteed by the tenant’s parent company, Berkley Insurance Company.
American Institute of CPAs (19,454 SF, 7.3% of NRA, 8.7% of underwritten rent). American Institute of CPAs is the world’s largest member association representing the accounting profession, with more than 400,000 members in 145 countries, and a history of serving the public interest since 1887. AICPA members represent many areas of practice, including business and industry, public practice, government, education and consulting. The AICPA sets ethical standards for the profession and U.S. auditing standards for private companies, nonprofit organizations, federal, state and local governments. It develops and grades the Uniform CPA Examination, and offers specialty credentials for CPAs who concentrate on personal financial planning; forensic accounting; business valuation; and information management and technology assurance.
TripAdvisor(16,502 SF, 6.2% of NRA, 7.6% of underwritten rent). TripAdvisor is the world’s largest travel site, enabling travelers to plan and book the perfect trip. TripAdvisor offers advice from millions of travelers and a wide variety of travel choices and planning features with seamless links to booking tools that check hundreds of websites to find the best hotel prices. TripAdvisor branded sites make up the largest travel community in the world, reaching 350 million monthly visitors, and featuring more than 290 million reviews and opinions covering more than 5.3 million accommodations, restaurants and attractions. The sites operate in 47 countries worldwide. TripAdvisor has a one-time termination option as of the last day of the 60th full calendar month after the rent commencement date, November 30, 2019, by giving written notice no later than the last day of the 48th month after the rent commencement date, November 30, 2018 and payment of $310,868, no later than 30 days after the tenant’s exercise of the termination option.
The following table presents certain information relating to the leases at the Princeton South Corporate Center Property:
| Tenant Summary(1) | |||||||
| Tenant Name | Credit Rating (Fitch/Moody’s/S&P)(2) | Tenant SF | Approximate % of SF | Annual UW Rent | % of Total Annual UW Rent | Annual UW Rent PSF(3) | Lease Expiration |
| Tenants | |||||||
| CA, Inc. (4) | BBB+/Baa2/BBB+ | 42,600 | 16% | $1,339,772 | 20% | $31.45 | 4/30/2022 |
| Philadelphia Insurance Company(5) | NR/NR/NR | 29,556 | 11% | $842,346 | 13% | $28.50 | 8/31/2025 |
| Berkley Life Sciences | A+/A2/A+ | 22,856 | 9% | $674,252 | 10% | $29.50 | 1/31/2023 |
| American Institute of CPAs | NR/NR/NR | 19,454 | 7% | $573,893 | 9% | $29.50 | 5/31/2026 |
| TripAdvisor(6) | NR/NR/NR | 16,502 | 6% | $503,311 | 8% | $30.50 | 11/30/2021 |
| Subtotal/Wtd. Avg. | 130,968 | 49% | $3,933,574 | 59% | $30.03 | ||
| Other Tenants | 88,657 | 33% | $2,699,346 | 41% | $30.45 | ||
| Vacant Space | 47,801 | 18% | $0 | 0% | $0.00 | ||
| Total/Wtd. Avg. | 267,426 | 100% | $6,632,920 | 100% | $30.20 | ||
| (1) | Information is based on the underwritten rent roll. |
| (2) | Certain ratings are those of the parent company whether or not the parent guarantees the lease. |
| (3) | Wtd. Avg. Annual UW Rent PSF excludes vacant space. |
| (4) | CA Technologies has a one-time contraction option to reduce its leased premises by up to 25%, effective as of April 30, 2018, by providing notice not later than April 30, 2017 and payment of a contraction fee. |
| (5) | Philadelphia Insurance Company has a one-time termination option as of the last day of the 102ndfull calendar month of the term of the lease, December, 31 2024. Philadelphia Insurance Company must give 12 months’ notice and pay a cancellation fee equal to the unamortized portion of the (i) aggregate abatement amount, (ii) tenant improvement costs and (iii) leasing commissions paid by landlord. Within 10 days after landlord receives notice, Philadelphia Insurance Company must pay 50% of the cancelation fee with the remainder due by December 1, 2024. Philadelphia Insurance Company is in a free rent period through July 1, 2016. |
| (6) | TripAdvisor has a one-time termination option as of the last day of the 60th full calendar month after the rent commencement date, November 30, 2019, by giving written notice no later than the last day of the 48th month after the rent commencement date, November 30, 2018 and payment of $310,868, no later than 30 days after the tenant’s exercise of the termination option. The termination option is void upon tenant’s exercise of any expansion option, right of first refusal or other option pursuant to which tenant leases additional space in the Property. |
| This is not a research report and was not prepared by the Underwriters’ research departments. Please see additional important information and qualifications at the end of this Term Sheet. |
| T-82 |
| MSBAM 2016-C28 | Princeton South Corporate Center |
The following table presents certain information relating to the lease rollover schedule at the Princeton South Corporate Center Property:
| Lease Rollover Schedule(1)(2) | ||||||||
| Year | # of Leases Rolling | SF Rolling | UW Rent PSF Rolling | Approx. % of Total SF Rolling | Approx. Cumulative % of SF Rolling | Total UW Rent Rolling | Approx. % of Total Rent Rolling | Approx. Cumulative % of Total Rent Rolling |
| MTM(3) | 1 | 272 | $32.00 | 0% | 0% | $8,704 | 0% | 0% |
| 2016 | 1 | 9,322 | $28.25 | 3% | 4% | $263,347 | 4% | 4% |
| 2017 | 4 | 19,898 | $30.57 | 7% | 11% | $608,344 | 9% | 13% |
| 2018 | 3 | 14,738 | $31.65 | 6% | 17% | $466,504 | 7% | 20% |
| 2019 | 4 | 22,573 | $29.59 | 8% | 25% | $667,886 | 10% | 30% |
| 2020 | 0 | 0 | $0.00 | 0% | 25% | $0 | 0% | 30% |
| 2021 | 1 | 16,502 | $30.50 | 6% | 31% | $503,311 | 8% | 38% |
| 2022 | 1 | 42,600 | $31.45 | 16% | 47% | $1,339,772 | 20% | 58% |
| 2023 | 2 | 26,065 | $29.91 | 10% | 57% | $779,601 | 12% | 70% |
| 2024 | 3 | 18,645 | $31.07 | 7% | 64% | $579,213 | 9% | 79% |
| 2025 | 1 | 29,556 | $28.50 | 11% | 75% | $842,346 | 13% | 91% |
| 2026 | 1 | 19,454 | $29.50 | 7% | 82% | $573,893 | 9% | 100% |
| 2027 & Beyond | 0 | 0 | $0.00 | 0% | 82% | $0 | 0% | 100% |
| Vacant(4) | 0 | 47,801 | $0.00 | 18% | 100% | $0 | 0% | 100% |
| Total/Wtd. Avg. | 22 | 267,426 | $30.20 | 100% | $6,632,920 | 100% | ||
| (1) | Information is based on the underwritten rent roll. |
| (2) | Certain tenants may have lease termination options that are exercisable prior to the originally stated expiration date of the subject lease and that are not considered in the lease rollover schedule. |
| (3) | MTM space is for the Management Office. |
| (4) | F-Squared occupies 6,675 SF that was underwritten as vacant. F-Squared recently filed for bankruptcy. |
The Market. The Princeton South Corporate Center Property is located in the community of Ewing which is situated in the Central New Jersey Office Market within Mercer County between Trenton and Princeton, New Jersey. Access to the Princeton South Corporate Center Property is provided by Pennington Road (a/k/a State Highway Route 31), which is located to the east of the subject. According to the appraisal, Princeton South Corporate Center Property also can be reached through Interstate 95/295, which is approximately 1.4 miles north of the subject via Bear Tavern Road and US Route 206, which is approximately four miles east of the subject. Ewing Township is home to many State of New Jersey offices, the nationally recognized College of New Jersey, businesses, industry, township owned parkland and two golf courses. Philadelphia and New York City provide cultural and economic centers, which are easily accessible via the interstates, and a commuter rail station is located within the township’s borders. Air travel is available at the Trenton Mercer Airport, also located within the township’s border. Ewing Township is a suburban community, which has a variety of existing land uses; however, the predominant uses are residential and commercial.
According to the appraisal, as of the third quarter of 2015, the Central New Jersey office market was comprised of 79,567,548 SF with an overall vacancy rate of 16.9%, a direct vacancy of 15.5%, an overall asking rent of $24.30 PSF and direct Class “A” rent of $28.37 PSF. Year to date leasing volume as of the third quarter 2015 surpassed the total volume achieved in 2014. The highest rental rates in the Central New Jersey market were achieved in the Mercer County submarket, the submarket in which the Princeton South Corporate Center Property is located. As of the third quarter of 2015, the Mercer County submarket was comprised of 16,467,540 SF with an overall vacancy rate of 14.8%, a direct vacancy of 13.2%, an overall asking rent of $26.76 PSF and a direct Class “A” rent of $32.23 PSF.
Central New Jersey’s demographic traits are characteristic of an affluent metropolitan area, highlighted by education attainment levels that are higher than the national average. Per the appraisal, the 2014 estimated median household income was $78,734 and population grew 0.4% to 2.8 million.
| This is not a research report and was not prepared by the Underwriters’ research departments. Please see additional important information and qualifications at the end of this Term Sheet. |
| T-83 |
| MSBAM 2016-C28 | Princeton South Corporate Center |
The following table presents recent occupancy and leasing data at competitive office buildings with respect to the Princeton South Corporate Center Property:
| Competitive Property Summary | |||||||||
| Property Name/Address | Year Built | Class | Size (SF) | Tenant Name | Lease Size (SF) | Lease Date | Lease Term (Yrs.) | Initial Rent/SF | Rent Steps |
Princeton Pike Corporate Center IV(1) 1009 Lenox Drive Lawrence Township, NJ | 1989 | A | 179,585 | J Knipper & Company | 27,923 | Sept 2014 | 6.0 | $22.50 | $0.50/SF annual increases |
Advance at Metro III 821 Alexander Road West Windsor, NJ | 2000 | B | 40,000 | DE Shaw | 3,621 | Feb 2014 | 5.0 | $27.25 | Bump to $28.75 in Year 3
|
Carnegie Center 300 Carnegie Center Princeton, NJ | 2013 | A | 88,000 | VMS Fund Admiration, LLC | 5,106 | June 2014 | 7.3 | $36.00 | $0.50/SF annual Increases |
Carnegie Center 212 Carnegie Center Princeton, NJ | 1986 | A | 149,398 | WIRB | 15,289 | May 2015 | 5.0 | $33.00 | $0.50/SF annual Increases |
University Square 1 University Square West Windsor, NJ | 2007 | A | 466,000 | Opthotech | 35,206 | May 2015 | 7.0 | $32.00 | $0.50/SF annual increases |
Source: Appraisal
| (1) | The Princeton Pike Corporate Center is owned by an affiliate of the Princeton Pike Corporate Center Borrower and secures another mortgage loan included in the MSBAM C28 securitization. |
Operating History and Underwritten Net Cash Flow.The following table presents certain information relating to the historical operating performance and the Underwritten Net Cash Flow at the Princeton South Corporate Center Property:
| Cash Flow Analysis | |||||||||||
| 2011 | 2012 | 2013 | 2014 | UW | UW PSF | ||||||
| Base Rent | $2,051,270 | $4,507,319 | $5,504,279 | $5,562,681 | $8,108,076 | $30.32 | |||||
| Total Recoveries | $146,785 | $745,042 | $679,187 | $526,721 | $819,913 | $3.07 | |||||
| Other Income | $0 | $0 | $0 | $0 | $0 | $0.00 | |||||
| Less Discount Concessions | $0 | $206,100 | $75,634 | $294,591 | $0 | $0.00 | |||||
| Less Vacancy & Credit Loss | $0 | $0 | $0 | $0 | $1,475,156 | $5.52 | |||||
| Effective Gross Income(1) | $2,198,055 | $5,046,261 | $6,107,832 | $5,794,811 | �� | $7,452,833 | $27.87 | ||||
| Total Operating Expenses | $1,052,774 | $2,703,620 | $4,112,640 | $3,108,671 | $3,588,215 | $13.42 | |||||
| Net Operating Income | $1,145,281 | $2,342,641 | $1,995,192 | $2,686,139 | $3,864,618 | $14.45 | |||||
| Capital Expenditures | $0 | $0 | $0 | $0 | $53,449 | $0.20 | |||||
| TI/LC | $0 | $0 | $0 | $0 | $306,541 | $1.15 | |||||
| Net Cash Flow | $1,145,281 | $2,342,641 | $1,995,192 | $2,686,139 | $3,504,628 | $13.11 | |||||
| Occupancy % | 54.4% | 69.8% | 77.5% | 83.6% | 81.8% | ||||||
| NOI DSCR | 0.43x | 0.88x | 0.75x | 1.01x | 1.46x | ||||||
| NOI DSCR (IO) | 0.58x | 1.19x | 1.01x | 1.36x | 1.96x | ||||||
| NCF DSCR | 0.43x | 0.88x | 0.75x | 1.01x | 1.32x | ||||||
| NCF DSCR (IO) | 0.58x | 1.19x | 1.01x | 1.36x | 1.78x | ||||||
| NOI Debt Yield | 2.4% | 4.9% | 4.2% | 5.6% | 8.1% | ||||||
| NCF Debt Yield | 2.4% | 4.9% | 4.2% | 5.6% | 7.3% | ||||||
| (1) | Effective Gross Income at the subject has increased over the past several years due to recent leasing. Occupancy was 54.4%, 69.8%, 77.5% and 83.6% as of 2011, 2012, 2013 and 2014, respectively. Part of the increase in Effective Gross Income from 2014 to UW is due to the signing of Philadelphia Insurance, which lease commenced on July 1, 2015 and contributes $842,346 base rent. Rent bumps through December 31, 2016 were underwritten totaling $74,556, along with $121,580 of underwritten straight line rents for investment grade tenants. |
Escrows and Reserves.The Princeton South Corporate Center Borrower is required to escrow monthly (i) 1/12th of the annual estimated tax payments, and (ii) 1/12th of the annual estimated insurance premiums (unless the Princeton South Corporate Center Borrower maintains an acceptable blanket policy). The Princeton South Corporate Center Borrower deposited $100,000 in escrow at loan origination for certain required repairs and capital expenditures identified in the loan documents and other capital expenditures approved by lender, and from and after the occurrence of the date the total amount then on deposit with lender for capital expenditures and Rollover Funds (defined below) is less than $250,000 (the “Reserve Trigger Date”) is required to make monthly deposits equal to $4,454.07, for such repairs and capital expenditures. The Princeton South Corporate Center Borrower deposited $3,400,000 in escrow at loan origination for tenant improvements and leasing commissions, and from and after the occurrence of the Reserve Trigger Date, is required to make monthly deposits of $22,270.33 for such purpose (collectively, “Rollover Funds”). Up to $200,216.75 of the Rollover Funds may be used for reasonable and market costs in preparing or building out three specified suites (totaling 7,645 square feet) of vacant space identified in the loan documents, at a cost of not more than $35 per square foot (with respect to 2,362 square feet constituting raw space), or $22.25 per square foot (with respect to the remaining square feet, constituting second generation space), prior to any lease being executed, where the Princeton South Corporate Center Borrower reasonably believes such work will attract an acceptable tenant for such space. The Princeton South Corporate Center Borrower deposited $684,617 in escrow at loan origination in respect of a one-year master lease executed by the guarantor for 21,858 square feet, which is required to be deposited on each monthly payment date commencing May 1, 2015 into the cash management account for the
| This is not a research report and was not prepared by the Underwriters’ research departments. Please see additional important information and qualifications at the end of this Term Sheet. |
| T-84 |
| MSBAM 2016-C28 | Princeton South Corporate Center |
Princeton South Corporate Center Mortgage Loan in the amount of $57,051.42, until such funds are reduced to zero. The Princeton South Corporate Center Borrower is required to escrow monthly 1/12th of the annual estimated condominium assessments for the condominium which includes the Princeton South Corporate Center Property. The Princeton South Corporate Center Borrower deposited $1,047,467 in escrow at loan origination with respect to free rent under the lease with Philadelphia Insurance Company (the “Philadelphia Insurance Lease”), which is required to be deposited, on each monthly payment date on which base rent would have been payable absent a free rent period under the Philadelphia Insurance Lease, into the cash management account for the Princeton South Corporate Center Mortgage Loan in the amount of $68,964, until such funds are reduced to zero. The Princeton South Corporate Center Borrower deposited the sums of $250,000 (the “Retained TI/LC Funds”) and $1,510,631.42 in escrow at loan origination for tenant improvements and leasing commissions with respect to the Philadelphia Insurance Lease; provided that the Retained TI/LC Funds are required to be disbursed to the Princeton South Corporate Center Borrower only upon receipt by lender of an estoppel certificate from the tenant certifying, among other things, that the Philadelphia Insurance Lease is in full force and effect, and that all tenant improvement work has been completed and all tenant improvement allowances and leasing commissions have been paid in full.
Lockbox and Cash Management.A hard lockbox is in place with respect to the Princeton South Corporate Center Mortgage Loan. The Princeton South Corporate Center Mortgage Loan has in place cash management. Funds in the lockbox account are required to be transferred to a cash management account, and applied on each monthly payment date to pay debt service on the Princeton South Corporate Center Mortgage Loan, to fund the required reserves deposits as described above under “Escrows and Reserves”, to disburse, during the continuance of a Cash Sweep Event Period (other than a Cash Sweep Event Period which is due to an event of default under the Princeton South Corporate Center Mortgage Loan), the monthly operating expenses referenced in the annual budget (which is required to be approved by the lender) and extraordinary operating expenses or capital expenses not referenced in the annual budget and approved by the lender, to pay, provided no event of default is continuing under the Princeton South Corporate Center Mortgage Loan, monthly debt service and other amounts due (other than accelerated or matured principal) under the Princeton South Corporate Center Mezzanine Loan (as defined below), and to disburse the remainder (i) provided no Cash Sweep Event Period is continuing under the Princeton South Corporate Center Mortgage Loan, if the lender has received notice that an event of default under the Princeton South Corporate Center Mezzanine Loan is continuing, to the lender under the Princeton South Corporate Center Mezzanine Loan, (ii) if a Cash Sweep Event Period is continuing, into an account to be held by the lender as additional security for the Princeton South Corporate Center Mortgage Loan during the continuance of such Cash Sweep Event Period and (iii) otherwise, to the Princeton South Corporate Center Borrower.
A “Cash Sweep Event Period” will:
(i) commence upon the occurrence of an event of default under the Princeton South Corporate Center Mortgage Loan and continue until the cure (if applicable) of the event of default, or
(ii) commence upon the date the combined debt service coverage ratio on the Princeton South Corporate Center Mortgage Loan and Princeton South Corporate Center Mezzanine Loan is less than 1.05x for two consecutive calendar quarters and continue until the date such combined debt service coverage ratio has been equal to or greater than 1.10x for two consecutive calendar quarters. During the period ending on April 30, 2020, such debt service coverage ratio is calculated based on the interest only payments due under the Princeton South Corporate Center Mortgage Loan and Princeton South Corporate Center Mezzanine Loan, and thereafter such debt service coverage ratio is calculated based on the principal and interest payments due under such loans.
Additional Secured Indebtedness (not including trade debts). Not permitted.
Mezzanine Loan and Preferred Equity. The“Princeton South Corporate Center MezzanineLoan”refers to aloanintheprincipalamountof$12,000,000madeto Princeton Mezz LLC,aDelaware limitedliabilitycompany, by MSMCH,securedby100% ofthedirectorindirectequityinterest in thePrinceton South Corporate CenterBorrower. ThePrinceton South Corporate CenterMezzanine LoanandthePrinceton South Corporate Center Mortgage Loanaresubjecttoanintercreditor agreementbetweenthePrinceton South Corporate Center Mortgage Loan lender and the related mezzanine lender.ThePrinceton South Corporate Center MezzanineLoanis expected to be held by MSMCH or an affiliate as of the cut-off date.
Thefollowing tablepresentscertaininformationrelating tothePrinceton South Corporate Center MezzanineLoan:
| Mezzanine Debt Summary | |||||||
| Mezzanine Debt Original Principal Balance | Mezzanine Debt Interest Rate | Original Term to Maturity (mos.) | Original Amort. Term (mos.) | Original IO Term (mos.) | Total Debt UW NCF DSCR | Total Debt UW NOI Debt Yield | Total Debt Cut- off Date LTV |
| $12,000,000 | 8.00% | 120 | 360 | 60 | 0.92x | 6.4% | 83.3% |
Release of Property. Not permitted.
Terrorism Insurance.The Princeton South Corporate CenterBorrower isrequiredtoobtaininsurance againstactsofterrorismorothersimilaractsorevents(or “firefollowing”) to theextentsuchinsuranceisavailable,informandsubstancesatisfactory to,andin an amount determinedby,thelender(butinnoevent morethanthesumof100%offullreplacementcostand12months ofbusinessinterruptioninsurance).Notwithstanding theforegoing,forsolongasthe TerrorismRiskInsuranceProgramReauthorizationActof2007(orany extension thereoforother federalgovernment programwith substantiallysimilar protection)is ineffect,thelenderisrequired toacceptterrorism insurancewhich covers“coveredacts”(asdefinedbysuchstatuteorotherprogram), as fullcomplianceasitrelatestotherisksrequiredtobe coveredpursuant tothepreceding sentence,solongassuchstatuteorother programcoversbothdomesticandforeignactsofterrorism. The Princeton South Corporate Center Borrower is not required to pay insurance premiums solely with respect to such terrorism insurance in excess of the Terrorism Premium Cap (defined below) but must obtain as much terrorism insurance as is available for the Terrorism Premium Cap; provided that if the insurance premiums exceed the Terrorism Premium Cap, the lender may, at its option, purchase such separate terrorism policy, with the Princeton South Corporate Center Borrower paying insurance premiums equal to the Terrorism Premium Cap and the lender paying the excess. “Terrorism Premium Cap” means the greater of (A) the product of the rate of $0.15 per $100 and 100% of the full replacement cost and the required amount of business interruption insurance or (B) two times the amount of annual insurance premium that is payable at such time for the casualty and business interruption insurance coverage required under the loan documents (without giving effect to the cost of terrorism coverage).
| This is not a research report and was not prepared by the Underwriters’ research departments. Please see additional important information and qualifications at the end of this Term Sheet. |
| T-85 |
| MSBAM 2016-C28 | Greenville Mall |
Mortgage Loan No. 7 – Greenville Mall
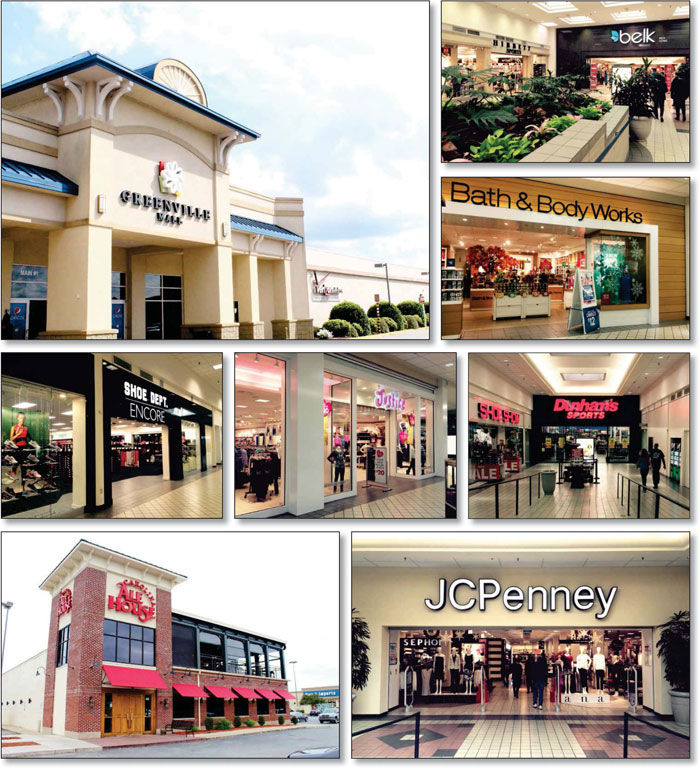
| This is not a research report and was not prepared by the Underwriters’ research departments. Please see additional important information and qualifications at the end of this Term Sheet. |
| T-86 |
| MSBAM 2016-C28 | Greenville Mall |
Mortgage Loan No. 7 – Greenville Mall
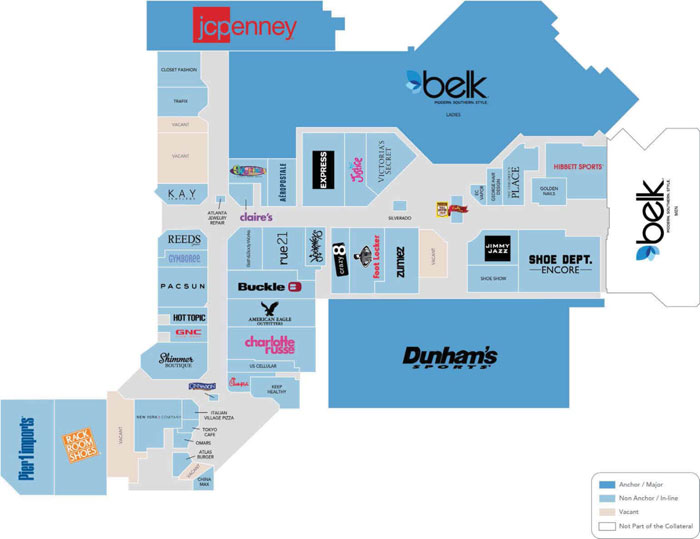
| This is not a research report and was not prepared by the Underwriters’ research departments. Please see additional important information and qualifications at the end of this Term Sheet. |
| T-87 |
| MSBAM 2016-C28 | Greenville Mall |
Mortgage Loan No. 7 – Greenville Mall
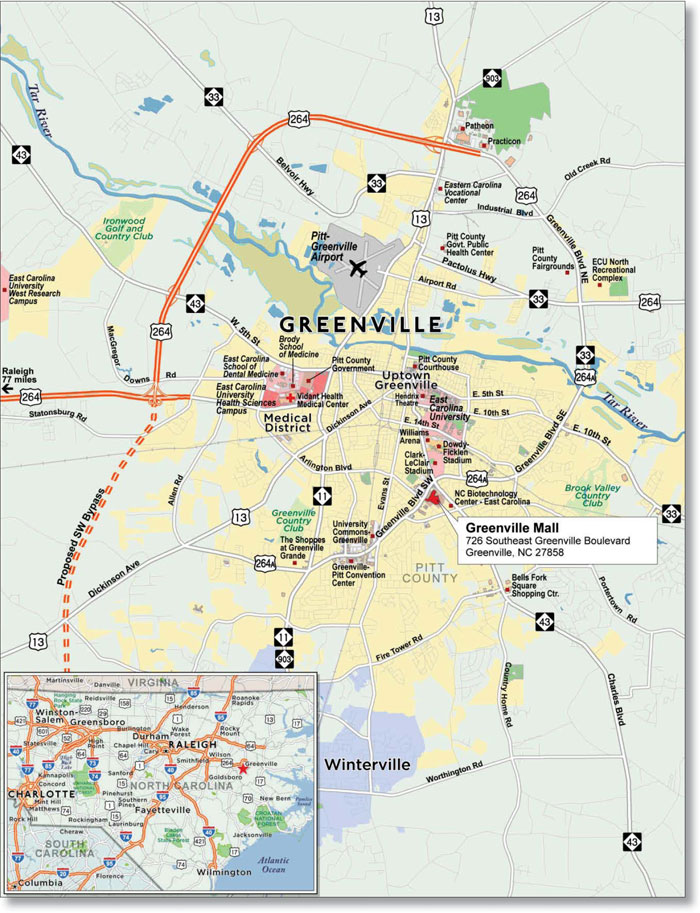
| This is not a research report and was not prepared by the Underwriters’ research departments. Please see additional important information and qualifications at the end of this Term Sheet. |
| T-88 |
| MSBAM 2016-C28 | Greenville Mall |
| Mortgage Loan No. 7 – Greenville Mall |
| Mortgage Loan Information | Mortgaged Property Information | ||||||
| Mortgage Loan Seller: | BANA | Single Asset/Portfolio: | Single Asset | ||||
| Original Balance: | $45,500,000 | Location: | Greenville, NC 27858 | ||||
| Cut-off Date Balance: | $45,329,539 | General Property Type: | Retail | ||||
| % of Initial Pool Balance: | 4.7% | Detailed Property Type: | Regional Mall | ||||
| Loan Purpose: | Refinance | Title Vesting: | Fee | ||||
| Sponsor: | Rouse Properties, LP | Year Built/Renovated: | 1965/2003 | ||||
| Mortgage Rate: | 4.460% | Size: | 406,464 SF | ||||
| Note Date: | 10/8/2015 | Cut-off Date Balance per Unit: | $112 | ||||
| First Payment Date: | 12/6/2015 | Maturity Date Balance per Unit: | $91 | ||||
| Maturity Date: | 11/6/2025 | Property Manager: | Self-Managed | ||||
| Original Term to Maturity: | 120 months | ||||||
| Original Amortization Term: | 360 months | Underwriting and Financial Information | |||||
| IO Period: | 0 months | UW NOI: | $5,010,933 | ||||
| Seasoning: | 3 months | UW NOI Debt Yield: | 11.1% | ||||
| Prepayment Provisions: | LO (27); DEF (89); O (4) | UW NOI Debt Yield at Maturity: | 13.6% | ||||
| Lockbox/Cash Mgmt Status: | Hard/Springing | UW NCF DSCR: | 1.64x | ||||
| Additional Debt Type: | N/A | Most Recent NOI: | $4,855,267 (11/30/2015 TTM) | ||||
| Additional Debt Balance: | N/A | 2nd Most Recent NOI: | $4,533,207 (12/31/2014) | ||||
| Future Debt Permitted (Type): | No (N/A) | 3rd Most Recent NOI: | N/A | ||||
| Reserves(1) | Most Recent Occupancy(2): | 95.5% (11/30/2015) | |||||
| Type | Initial | Monthly | Cap | 2nd Most Recent Occupancy: | 96.0% (12/31/2014) | ||
| RE Tax: | $167,624 | $41,906 | N/A | 3rd Most Recent Occupancy: | 96.0% (12/31/2013) | ||
| Insurance: | $0 | Springing | N/A | Appraised Value (as of): | $72,700,000 (8/28/2015) | ||
| Recurring Replacements: | $1,000,000 | $8,468 | $304,848 | Cut-off Date LTV Ratio: | 62.4% | ||
| TI/LC: | $0 | $33,872 | $1,000,000 | Maturity Date LTV Ratio: | 50.7% | ||
| Other: | $520,000 | $0 | N/A | ||||
| Sources and Uses | ||||||
| Sources | Proceeds | % of Total | Uses | Proceeds | % of Total | |
| Loan Amount: | $45,500,000 | 100.0% | Loan Payoff(3): | $40,171,352 | 88.3% | |
| Reserves: | $1,687,624 | 3.7% | ||||
| Closing Costs: | $395,299 | 0.9% | ||||
| Return of Equity: | $3,245,726 | 7.1% | ||||
| Total Sources: | $45,500,000 | 100.0% | Total Uses: | $45,500,000 | 100.0% | |
| (1) | See “—Escrows and Reserves”below for further discussion of reserve requirements. |
| (2) | Most Recent Occupancy exclusive of temporary tenants was 91.9% as of 11/30/2015. |
| (3) | In July 2013, the Greenville Mall Mortgage Loan sponsor acquired the Greenville Mall Property and assumed the prior loan of $41,700,000 which was securitized in the MLMT 2005-LC1 transaction. |
The Mortgage Loan.The seventh largest mortgage loan (the “Greenville Mall Mortgage Loan”) is evidenced by a promissory note in the original principal balance of $45,500,000, secured by a first priority fee mortgage encumbering a 406,464 SF regional mall known as Greenville Mall, in Greenville, NC (the “Greenville Mall Property”).
The Borrower and the Sponsor.The borrower is RPI Greenville Mall, LP (the “Greenville Mall Borrower”), a single-purpose Delaware limited partnership with at least one independent director. Equity ownership in the Greenville Mall Borrower is held by Rouse Properties, LP, the Greenville Mall Mortgage Loan sponsor and non-recourse guarantor, which is owned by Rouse Properties, Inc. (“Rouse”). Rouse (NYSE: RSE) is a publicly traded real estate investment trust and among the largest mall owners in the United States with ownership in 36 malls, containing over 25 million SF located across 21 states. In July 2013, Rouse purchased the Greenville Mall Property for $50,250,000 and invested approximately $2,126,500 in tenant improvements and approximately $459,400 in capital expenditures resulting in a total cost basis of approximately $52,835,900.
The Greenville Mall Mortgage Loan will be recourse to the Greenville Mall Mortgage Loan sponsor pursuant to standard carve-outs, however, the guaranty and the environmental indemnity agreement provide that the Greenville Mall Sponsor’s liability may not exceed $22,750,000 in the aggregate, plus all reasonable out-of-pocket costs and expenses (including court costs and reasonable attorneys’ fees) incurred by the lender in the enforcement of the guaranty and the environmental indemnity agreement or the preservation of the lender’s rights thereunder.
| This is not a research report and was not prepared by the Underwriters’ research departments. Please see additional important information and qualifications at the end of this Term Sheet. |
| T-89 |
| MSBAM 2016-C28 | Greenville Mall |
The Property.The Greenville Mall Property was built on a 42.61 acre site and consists of 406,464 SF of total retail space in a one-story building and two restaurant-occupied outparcels, with 2,109 surface parking spaces available. As of November 30, 2015, the Greenville Mall Property was 95.5% occupied by a mix of 56 various retailers (including specialty tenants). The Greenville Mall Property is anchored by JCPenney, Belk Ladies and Dunham’s Sports. There is also a tenant-owned Belk (Mens) store (46,051 SF), which is not a part of the collateral, that serves as an additional anchor. No other tenant occupies more than 2.6% of total SF or represents more than 3.5% of base rent. Since acquisition in 2013, the Greenville Mall Mortgage Loan sponsor has signed permanent leases on 107,990 SF at the Greenville Mall Property, including new leases with national tenants including Dunham’s Sports, Shoe Dept. Encore, Justice, Jimmy Jazz, The Children’s Place and Journeys. The November 2015 trailing twelve month inline store sales at the Greenville Mall Property were $404 PSF resulting in an occupancy cost of 10.8%. Historical inline store sales were $359 PSF and $368 PSF in 2014 and 2013, respectively.
Major Tenants
Belk Ladies(89,720 SF, 22% NRA,7% of underwritten base rent). Belk Ladies occupies 89,720 SF under a lease dated May 7, 1997, which was recently renewed through January 31, 2020, with four remaining five-year extension options. The lease requires a current annual base rental payment of $350,564 plus percentage rent of 2.0% of gross sales in excess of $17,528,200. At the Greenville Mall Property, Belk Ladies achieved November 2015 trailing twelve months, 2014 and 2013 sales of $179 PSF, $182 PSF and $181 PSF, respectively, resulting in an occupancy cost of 2.2% for all three periods. Belk, Inc. is the largest privately owned department store company in the United States with 297 department stores (approximately 22.65 million SF) in 16 southern states. In its 2015 fiscal year, Belk, Inc. reported a 1.5% increase in same store sales to a total of sales of $4.11 billion.
JCPenney(88,790 SF, 22% NRA, 7% of underwritten base rent). JCPenney occupies 88,790 SF under a lease dated February 9, 1965, which was recently renewed through February 28, 2019, with four remaining five-year extension options. The lease requires a current annual base rental payment of $315,289 plus percentage rent of 1.5% of net retail sales in excess of $17,099,290. At the Greenville Mall Property, JCPenney achieved fiscal year 2014, 2013 and 2012 sales of $109 PSF, $100 PSF and $108 PSF, respectively, resulting in an occupancy cost of 3.4%, 4.0% and 3.7%, respectively. JCPenney features a Sephora store-within-store concept at the Greenville Mall Property. JC Penney (NYSE: JCP) is one of the largest department stores and e-commerce retailers in the United States. As of January 31, 2015, JC Penney operated 1,062 stores in 49 states and Puerto Rico selling apparel, footwear, accessories, jewelry, beauty products and home furnishings, including items sold under its 24 trademarked brands and its store-within-store concepts. In Q3 2015, JC Penney reported a 6.4% increase in same store sales to a total of $2.90 billion. JC Penney is rated “Caa1”, “CCC+” and “B-” by Moody’s, S&P and Fitch, respectively.
Dunham’s Sports(54,000 SF,13% NRA,8% of underwritten base rent). Dunham’s Sports occupies 54,000 SF under a lease dated May 13, 2013, expiring January 31, 2024, with three five-year extension options. The lease requires a current annual base rental payment of $391,500 plus percentage rent of 6.0% of gross sales in excess of $6,525,000. At the Greenville Mall Property, Dunham’s Sports achieved November 2015 trailing twelve months and 2014 sales of $62 PSF and $64 PSF, respectively, resulting in an occupancy cost of 11.6% and 11.4%, respectively. Dunham’s Sports is the largest sporting goods chain in the Midwest with over 200 stores across 19 states.
The following table presents a summary regarding major tenants at the Greenville Mall Property:
| Tenant Summary(1) | ||||||||
| Tenant Name | Credit Rating (Fitch/Moody’s /S&P) | Tenant SF | Approximate % of SF | Annual UW Rent | % of Total Annual UW Rent | Annual UW Rent PSF(2) | Lease Expiration | Sales PSF(3) |
| Anchor/Major Tenants | ||||||||
| Belk Ladies | NR / NR / NR | 89,720 | 22% | $350,564 | 7% | $3.91 | 1/31/2020 | $179 |
| JCPenney | B- / Caa1 / CCC+ | 88,790 | 22% | $315,289 | 7% | $3.55 | 2/28/2019 | $109 |
| Dunham’s Sports | NR / NR / NR | 54,000 | 13% | $391,500 | 8% | $7.25 | 1/31/2024 | $62 |
| Subtotal/Wtd. Avg. | 232,510 | 57% | $1,057,353 | 23% | $4.55 | |||
| Other Tenants | 141,021 | 35% | $3,631,288 | 77% | $25.75 | |||
| Vacant Space | 32,933 | 8% | $0 | 0% | $0.00 | |||
| Total/Wtd. Avg. | 406,464 | 100% | $4,688,641 | 100% | $12.55 | |||
| (1) | Information is based on the underwritten rent roll. Tenant Summary does not include the non-collateral Belk (Mens) anchor. |
| (2) | Wtd. Avg. Annual UW Rent PSF excludes vacant space. |
| (3) | Sales PSF for Belk Ladies and Dunham’s Sports as shown are as of November 2015 TTM. Sales for JCPenney as shown are as of their 2014 fiscal year-end. |
| This is not a research report and was not prepared by the Underwriters’ research departments. Please see additional important information and qualifications at the end of this Term Sheet. |
| T-90 |
| MSBAM 2016-C28 | Greenville Mall |
The following table presents certain information relating to the lease rollover schedule at the Greenville Mall Property:
| Lease Rollover Schedule(1)(2) | ||||||||
| Year | # of Leases Rolling | SF Rolling(3) | UW Rent PSF Rolling(4) | Approx. % of Total SF Rolling | Approx. Cumulative % of SF Rolling | Total UW Rent Rolling | Approx. % of Total Rent Rolling | Approx. Cumulative % of Total Rent Rolling |
| 2016 | 6 | 3,528 | $71.25 | 1% | 1% | $251,376 | 5% | 5% |
| 2017 | 9 | 16,469 | $34.84 | 4% | 5% | $573,752 | 12% | 18% |
| 2018 | 5 | 26,551 | $14.97 | 7% | 11% | $397,593 | 8% | 26% |
| 2019 | 6 | 107,853 | $6.81 | 27% | 38% | $734,917 | 16% | 42% |
| 2020 | 4 | 92,411 | $4.91 | 23% | 61% | $454,119 | 10% | 51% |
| 2021 | 6 | 18,780 | $26.16 | 5% | 65% | $491,329 | 10% | 62% |
| 2022 | 4 | 19,046 | $21.74 | 5% | 70% | $414,038 | 9% | 71% |
| 2023 | 2 | 6,809 | $25.17 | 2% | 72% | $171,413 | 4% | 74% |
| 2024 | 2 | 64,042 | $8.61 | 16% | 87% | $551,500 | 12% | 86% |
| 2025 | 4 | 10,501 | $35.47 | 3% | 90% | $372,422 | 8% | 94% |
| 2026 & Beyond | 2 | 7,522 | $36.72 | 2% | 92% | $276,182 | 6% | 100% |
| Vacant | 0 | 32,933 | $0.00 | 8% | 100% | $0 | 0% | 100% |
| Total/Wtd. Avg. | 50 | 406,445 | $12.55 | 100% | $4,688,641 | 100% | ||
| (1) | Information is based on the underwritten rent roll. |
| (2) | Certain tenants may have lease termination options that are exercisable prior to the originally stated expiration date of the subject lease and that are not considered in the lease rollover schedule. |
| (3) | Total SF Rolling excludes a 19 SF ATM Kiosk |
| (4) | Wtd. Avg. UW Rent PSF Rolling excludes vacant space. |
The Market. The Greenville Mall Property is located in the city of Greenville, on Greenville Boulevard with additional frontage on Charles Boulevard and East Arlington Boulevard. Greenville Boulevard is a major east/west route through Greenville with significant retail development. Immediately northeast is the shopping center known as Pirates Pointe and across the street is a shopping center known as Greenville Square and the start of the East Carolina University main campus.
Greenville is the tenth largest city in North Carolina and is the county seat for Pitt County for which government represents 32.2% of the MSA’s employment. Greenville has become a growing higher education and medical community, with education and health sectors now representing 12.6% of the MSA’s employment, driven by the presence of East Carolina University (“ECU”), Pitt Community College and Vidant Medical Center. ECU has more than 27,500 students and 5,800 faculty and staff and is the third largest and fastest-growing campus in the University of North Carolina system. Pitt Community College has enrollment of approximately 12,100 with an additional approximately 9,900 continuing education and community development students. Vidant Medical Center is the teaching hospital for the Brody School of Medicine at ECU and is the flagship hospital for Vidant Health, treating 44,500 inpatients and 171,000 outpatients on average per year and providing the only children’s hospital and only Level I trauma center in eastern North Carolina. Vidant Medical Center is currently under construction to open a $170 million cancer center in 2018. Additionally, Greenville is an accommodating event and leisure destination with the expanding Greenville Convention Center Campus and the Uptown Greenville District featuring locally-owned businesses, galleries, shops, and restaurants, for which leisure and hospitality represent 11.2% of the MSA’s employment.
The primary trade area for the Greenville Mall Property is estimated to be a 20-mile radius, which had an estimated 2014 population of 227,848, average household income of $55,219, and aggregate retail sales of approximately $3.7 billion ($41,111 sales/household). Population and average household income in the primary trade area have shown stable increases, growing at a compound annual rate of 1.61% and 1.66%, respectively, since 2000.
| This is not a research report and was not prepared by the Underwriters’ research departments. Please see additional important information and qualifications at the end of this Term Sheet. |
| T-91 |
| MSBAM 2016-C28 | Greenville Mall |
The following table presents primary and secondary competitive shopping centers to the Greenville Mall Property:
| Competitive Property Summary | ||||||||
| Property Name/Location | Type | Year Built/ Renov. | Occ. | Total GLA (SF) | Anchor GLA (SF) | Anchors | Sales PSF | Distance to Subject |
Greenville Mall(1) Greenville, NC | Regional Center | 1965/2003 | 95.5% | 452,515 | 278,561 | JC Penney, Belk Ladies, Dunham’s Sports, Belk | $404 | |
| Primary Competition | ||||||||
Berkeley Mall Goldsboro, NC | Regional Center | 1976/1997 | 92% | 457,325 | 300,000 | Belk, Belk Home & Kids, JC Penney, Sears | $250 | 33.0 miles SW |
11 Galleria (fka Carolina East Mall) Greenville, NC | Lifestyle Center | 1979/1997 | 100% | 329,599 | 253,469 | Dick’s, Sears, Fresh Market | N/A | 3.7 miles SW |
| Secondary Competition | ||||||||
Carolina Premium Outlets Smithfield, NC | Outlet Center | 1990/N/A | 100% | 486,954 | 0 | N/A | $375 | 65.0 miles SW |
Greenville Square Greenville, NC | Community Center | 1977/1993 | 93% | 165,511 | 133,311 | K-Mart, Office Depot, Hancock Fabrics | N/A | 0.1 miles N |
Golden East Crossing Rocky Mt., NC | Regional Center | 1986/2000 | 87% | 584,176 | 299,000 | Belk, JC Penney, Dunham’s Sports, Bed Bath & Beyond, Ross | $290 | 47.0 miles NW |
New Bern Mall (fka Twin Rivers Mall) New Bern, NC | Regional Center | 1979/1996 | 94% | 361,000 | 307,373 | Belk, JC Penney, Sears, TJ Maxx | $245 | 40.3 miles SE |
| Total/Average | 92% | 2,837,080 | $307 | |||||
Source: Appraisal
| (1) | As presented in this Competitive Property Summary, the information for Greenville Mall includes its non-collateral Belk (Men) anchor tenant (46,051 SF). Occupancy and Sales PSF as shown are as of November 30, 2015. |
Operating History and Underwritten Net Cash Flow.The following table presents certain information relating to the historical operating performance and the underwritten net cash flow at the Greenville Mall Property:
| Cash Flow Analysis | ||||
| 2014 | 11/30/2015 TTM | UW | UW PSF | |
| Base Rent(1) | $4,432,280 | $4,307,886 | $5,684,256 | $13.98 |
| Percentage Rent | $118,345 | $358,900 | $284,344 | $0.70 |
| Total Recoveries | $1,410,402 | $1,280,657 | $1,289,036 | $3.17 |
| Specialty Leasing(2) | $626,209 | $817,848 | $750,000 | $1.85 |
| Other Income(3) | $245,516 | $230,226 | $230,226 | $0.57 |
| Less Vacancy & Credit Loss | ($74,447) | ($40) | ($995,615) | (13.7%) |
| Effective Gross Income | $6,758,304 | $6,995,477 | $7,242,247 | $17.82 |
| Total Operating Expenses | $2,225,097 | $2,140,209 | $2,231,314 | $5.49 |
| Net Operating Income | $4,533,207 | $4,855,267 | $5,010,933 | $12.33 |
| Capital Expenditures | $0 | $0 | $101,616 | $0.25 |
| TI/LC | $0 | $0 | $406,464 | $1.00 |
| Net Cash Flow | $4,533,207 | $4,855,267 | $4,502,853 | $11.08 |
| Occupancy % | 96.0% | 95.5%(4) | 91.1% | |
| NOI DSCR | 1.65x | 1.76x | 1.82x | |
| NCF DSCR | 1.65x | 1.76x | 1.64x | |
| NOI Debt Yield | 10.0% | 10.7% | 11.1% | |
| NCF Debt Yield | 10.0% | 10.7% | 9.9% | |
| (1) | Based on in-place rent roll as of November 2015 with contractual rent steps through December 2016. |
| (2) | Specialty Leasing includes income from temporary rental of available in-line spaces, kiosks and carts. |
| (3) | Other Income includes income from advertising on mall inventory, vending income, photo income, recycling income and other miscellaneous income. |
| (4) | Occupancy as of November 30, 2015. |
Escrows and Reserves. The Greenville Mall Borrower deposited $167,624 in escrow for annual real estate taxes and is required to escrow monthly 1/12 of the annual estimated tax payments. The Greenville Mall Borrower is required to escrow monthly 1/12 of the annual estimated insurance premiums (unless the Greenville Mall Borrower maintains insurance under an acceptable blanket insurance policy and no event of default is continuing). For replacement reserves, the Greenville Mall Borrower deposited $1,000,000 as an initial deposit and is required to escrow monthly the lesser of (x) $8,468 and (y) the amount by which the funds reserved for replacement reserves is less than $304,848. The Greenville Mall Borrower deposited $20,000 as an initial deposit for landlord obligations relating to the Golden Nails lease, and is required to deposit monthly the lesser of (x) $33,872 and (y) the amount by which the funds reserved for tenant improvements and leasing commissions is less than $1,000,000. The Greenville Mall Borrower deposited $500,000 as an initial deposit relating to the JCPenney lease, and is required to deposit all excess cash upon a Lease Sweep Period (as defined below).
| This is not a research report and was not prepared by the Underwriters’ research departments. Please see additional important information and qualifications at the end of this Term Sheet. |
| T-92 |
| MSBAM 2016-C28 | Greenville Mall |
A “Lease Sweep Period” will commence upon the occurrence of any of the following:
| (i) | any of JCPenney, Belk Ladies or Dunham’s Sports (a “Major Tenant”) not exercising its renewal when required; |
| (ii) | any lease to any Major Tenant (a “Major Lease) (or material portion thereof) being terminated prior to its expiration date; |
| (iii) | a Major Tenant going dark, unless such Major Tenant continues to pay rent and such go dark does not trigger any right for any other tenant to reduce its rent payable or terminate its lease; |
| (iv) | a material monetary default under any Major Lease or an event of default under any Major Lease that gives the Greenville Mall Borrower the right to terminate such lease; or |
| (v) | any Major Tenant being subject to any bankruptcy or insolvency proceeding. |
A Lease Sweep Period will end upon the earlier of:
| (i) | the date on which $30.00 PSF of the space covered by the subject Major Lease has been accumulated in the special rollover reserve subaccount held by lender in the cash management account; or |
| (ii) | (a) with respect to any Lease Sweep Period caused by items (i), (ii) or (ii) above, the earlier of (x) the Major Tenant renewing or extending its space and sufficient funds having been accumulated in the special rollover reserve subaccount to pay for all anticipated leasing expenses and (y) the Major Tenant space having been re-leased and all related leasing expense having been paid in full; (b) with respect to any Lease Sweep Period caused by item (iv) above, the cure of the default; or (c) with respect to any Lease Sweep Period caused by item (v) above, either withdrawal or resolution of the bankruptcy or insolvency of the Major Tenant and the affirmation of the Major Lease or the assignment of the Major Lease to a replacement tenant satisfactory to Lender. |
Lockbox and Cash Management.The Greenville Mall Mortgage Loan has a hard lockbox with springing cash management upon the commencement of a Cash Management Period. A “Cash Management Period” will commence upon the occurrence of any of the following:
| (i) | an Event of Default; |
| (ii) | the DSCR being less than 1.15x; or |
| (iii) | a Lease Sweep Period. |
A Cash Management Period will end upon, as applicable:
| (i) | such Event of Default being cured and no other Event of Default continuing; |
| (ii) | the DSCR being greater than or equal to 1.15x for two consecutive fiscal quarters; or |
| (iii) | any Lease Sweep Period ending. |
Additional Secured Indebtedness (not including trade debts).Not permitted.
Mezzanine Loan and Preferred Equity.Not permitted.
Release of Property. Not permitted.
Terrorism Insurance. The Greenville Mall Borrower is required to obtain and maintain property insurance, public liability insurance and rental loss and/or business interruption insurance that covers perils of terrorism and acts of terrorism, provided that the Greenville Mall Mortgage Loan documents provide for an annual terrorism premium cap equal to 200% of the then-current amount of the insurance premiums the Greenville Mall Borrower paid for the property and casualty insurance with respect to the Greenville Mall Property.
| This is not a research report and was not prepared by the Underwriters’ research departments. Please see additional important information and qualifications at the end of this Term Sheet. |
| T-93 |
| MSBAM 2016-C28 | Waterford Place Apartments |
Mortgage Loan No. 8 – Waterford Place Apartments
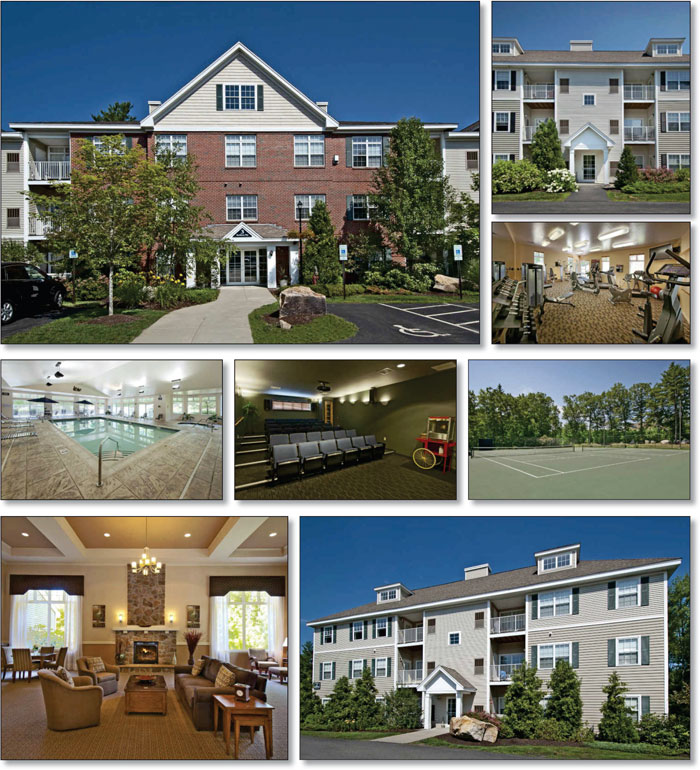
| This is not a research report and was not prepared by the Underwriters’ research departments. Please see additional important information and qualifications at the end of this Term Sheet. |
| T-94 |
| MSBAM 2016-C28 | Waterford Place Apartments |
Mortgage Loan No. 8 – Waterford Place Apartments

| This is not a research report and was not prepared by the Underwriters’ research departments. Please see additional important information and qualifications at the end of this Term Sheet. |
| T-95 |
| MSBAM 2016-C28 | Waterford Place Apartments |
| Mortgage Loan No. 8 – Waterford Place Apartments |
| Mortgage Loan Information | Mortgaged Property Information | ||||||
| Mortgage Loan Seller: | BANA | Single Asset/Portfolio: | Single Asset | ||||
| Original Balance: | $40,000,000 | Location: | Manchester, NH 03102 | ||||
| Cut-off Date Balance: | $40,000,000 | General Property Type: | Multifamily | ||||
| % of Initial Pool Balance: | 4.2% | Detailed Property Type: | Garden | ||||
| Loan Purpose: | Acquisition | Title Vesting: | Fee | ||||
| Sponsor: | Stephen M. Chapman; Louise Kwan | Year Built/Renovated: | 2004/N/A | ||||
| Mortgage Rate: | 4.793% | Size: | 384 Units | ||||
| Note Date: | 11/23/2015 | Cut-off Date Balance per Unit: | $104,167 | ||||
| First Payment Date: | 1/1/2016 | Maturity Date Balance per Unit: | $95,923 | ||||
| Maturity Date: | 12/1/2025 | Property Manager: | CP Management, Inc. | ||||
| Original Term to Maturity: | 120 months | Underwriting and Financial Information | |||||
| Original Amortization Term: | 360 months | UW NOI: | $3,152,795 | ||||
| IO Period: | 60 months | UW NOI Debt Yield: | 7.9% | ||||
| Seasoning: | 2 months | UW NOI Debt Yield at Maturity: | 8.6% | ||||
| Prepayment Provisions: | LO (26); DEF (90); O (4) | UW NCF DSCR: | 1.57x (IO) 1.21x (P&I) | ||||
| Lockbox/Cash Mgmt Status: | Soft/Springing | Most Recent NOI: | $2,974,751 (9/30/2015 TTM) | ||||
| Additional Debt Type: | N/A | 2ndMost Recent NOI: | $2,704,544 (12/31/2014) | ||||
| Additional Debt Balance: | N/A | 3rdMost Recent NOI: | $2,549,502(12/31/2013) | ||||
| Future Debt Permitted (Type): | No (N/A) | Most Recent Occupancy: | 94.3% (1/7/2016) | ||||
| Reserves(1) | 2ndMost Recent Occupancy: | 90.6% (12/31/2014) | |||||
| Type | Initial | Monthly | Cap | 3rdMost Recent Occupancy: | 86.7% (12/31/2013) | ||
| RE Tax: | $100,086 | $100,086 | N/A | Appraised Value (as of): | $55,600,000 (9/21/2015) | ||
| Insurance: | $0 | Springing | N/A | Cut-off Date LTV Ratio: | 71.9% | ||
| Recurring Replacements: | $0 | $8,000 | N/A | Maturity Date LTV Ratio: | 66.2% | ||
| Other: | $75,000 | $0 | N/A | ||||
| Sources and Uses | ||||||
| Sources | Proceeds | % of Total | Uses | Proceeds | % of Total | |
| Loan Amount: | $40,000,000 | 73.4% | Purchase Price: | $53,000,000 | 97.2% | |
| Borrower Equity | $14,515,101 | 26.6% | Reserves: | $175,086 | 0.3% | |
| Closing Costs: | $1,340,015 | 2.5% | ||||
| Total Sources: | $54,515,101 | 100.0% | Total Uses: | $54,515,101 | 100.0% | |
| (1) | See“—Escrows and Reserves” below for further discussion of reserve requirements. |
The Mortgage Loan. The eighth largest mortgage loan (the “Waterford Place Apartments Mortgage Loan”) is evidenced by a promissory note in the original principal amount of $40,000,000 secured by a first priority fee mortgage encumbering a 384-unit garden-style apartment community in Manchester, NH known as Waterford Place Apartments (the “Waterford Place Apartments Property”). The Waterford Place Apartments Mortgage Loan together with $14,515,101 of cash equity were used to purchase the Waterford Place Apartments Property and pay reserves and closing costs.
The Borrower and Sponsor. The borrower is SMC Waterford Place Apartments Limited Partnership, a single purpose New Hampshire limited partnership (the “Waterford Place Apartments Borrower”). Equity ownership in the Waterford Place Apartments Borrower is held indirectly by Stephen Chapman (50%) and other limited partners, with no other partner owning more than 10%. Stephen M. Chapman with Louise Kwan are the Waterford Place Apartments Mortgage Loan sponsors and non-recourse carveout guarantors.
Stephen M. Chapman has over thirty years of property management experience as the co-founder of Heritage Associates, a Massachusetts commercial realty development company which owned and operated 1,300 residential apartments and 500,000 SF of commercial space, and the founder of SMC Management Corporation (“SMC”), a Boston-based real estate management and development firm established to acquire and manage commercial and residential properties in New England and other selected markets. Included in its portfolio, SMC currently owns and manages 1,020 apartment units in five residential developments across New Hampshire, Massachusetts and Rhode Island.
The Property.The Waterford Place Apartments Property is a 384-unit Class “A” garden-style apartment community built on 66.51 acres in 2004 that as of January 7, 2016 was 94.3% occupied. The units are allocated across eight three-story buildings. Each unit features high-speed internet and cable TV and contains a fully equipped kitchen with dishwasher, full size washer/dryer, walk-in closets, balconies or patios, and vaulted ceilings and gas-fired fireplaces in select units. Common amenities include tenant storage, an indoor swimming pool and spa, movie theater, fitness center, media room, business center, clubhouse and playground. The Waterford Place Apartments Property includes 834 garage and surface parking spaces (2.17 spaces/unit). There is an on-site manager 24-hours. Since 2010, approximately $1,943,500 ($5,061/unit) has been spent at the Waterford Place Apartments Property in capital improvements including unit and common amenity refurnishing and upgrades.
| This is not a research report and was not prepared by the Underwriters’ research departments. Please see additional important information and qualifications at the end of this Term Sheet. |
| T-96 |
| MSBAM 2016-C28 | Waterford Place Apartments |
The table below shows the apartment unit mix at the Waterford Place Apartments Property:
| Waterford Place Apartments Unit Mix Summary | |||||
| Floor Plan | No. of Units | % of Total Units | Unit SF | Average Asking Rent | Total SF |
| 1 Bedroom/1 Bath | 104 | 27% | 805 | $1,184 | 83,688 |
| 2 Bedroom/2 Bath | 280 | 73% | 1,071 | $1,486 | 299,800 |
| Total/Avg. | 384 | 100.0% | 999 | $1,404 | 383,488 |
Source: Appraisal
Property Management. The Waterford Place Apartments Property is subject to a management agreement with CP Management, Inc. (“CP”). CP is a real estate management company providing services including property and facilities management, construction management, development, in-house asset management, maintenance and residential management and leasing. CP is headquartered in Exeter, NH with offices throughout New England, and manages approximately five million SF of commercial real estate and several thousand residential units, including sixteen residential communities in New Hampshire.
The Market.The Waterford Place Apartments Property is located at One Waterford Way, Manchester, NH, along the residential street of Countryside Boulevard, three miles northwest of the downtown area and approximately five miles northwest of the Manchester Airport.
Manchester is the business capital of and largest city in New Hampshire with a population of approximately 110,000. Manchester is approximately 35 miles north of Boston via Interstate 93, approximately 20 miles north of Nashua via Route 3, and approximately 44 miles west of Portsmouth via Route 101. The 2014 multifamily vacancy rate for Manchester was 3.5%.
Manchester is in the Southern New Hampshire region, with an April 2015 unemployment rate of 4.0% (1.5% below the national rate) and a high concentration of jobs in professional and business services, manufacturing, and education and health services that require an educated job force commanding above average salaries. Share of employment in high-tech services and manufacturing is more than twice the national average. Estimated 2015 median household income was $68,148 (30.2% higher than the national average). Major employers in Southern New Hampshire include DeMoulas Super Markets Inc. (9,000), Hannaford Brothers (4,900), BAE Systems Electronic Solutions (4,500) and Elliot Hospital (4,000).
The Waterford Place Apartments Property’s primary market is a three-mile radius, containing 9,804 units (45% renter-occupied) with a median year built of 1980. The Waterford Place Apartments Property’s multifamily secondary market extends to a five-mile radius, containing 41,591 units (52% renter-occupied) with a median year built of 1966. 2015 estimated population within a three- and five-mile radius was 21,997 and 94,590, respectively. 2015 estimated average household income within a three- and five-mile radius was $83,844 and $72,003, respectively.
Comparable rental properties to the Waterford Place Apartments Property are shown in the table below:
| Waterford Place Apartments Competitive Rental Property Summary | |||||||||
| Property City, State | Year Built | Occ. | Total Units | Avg Unit Size (SF) | Beds/Bath | Unit Size (SF) Min Max Avg | Quoted Rent/Mo ($) Min Max Avg | Concessions | Distance |
| Waterford Place Apartments | 2004 | 97.9% | 384 | 999 | 1BR/1BA 2BR/2BA | 805 805 805 1,071 1,071 1,071 | 1,184 1,184 1,184 1,486 1,486 1,486 | None | |
| Heritage on the Merrimack Bedford, NH | 1999 | 96.0% | 240 | 881 | 1BR/1BA 2BR/2BA | 739 739 739 950 1,100 1,023 | 1,300 1,625 1,463 1,400 1,905 1,653 | None | 9.7 miles |
| Kennsington Apartments Bedford, NH | 2000 | 96.0% | 100 | 1,058 | 1BR/1BA 2BR/2BA | 919 919 919 980 1,412 1,196 | 1,250 1,275 1,263 1,325 1,850 1,588 | None | 11.8 miles |
Hampshire Green Bedford, NH | 1998 | 98.0% | 204 | 1,020 | 1BR/1BA 2BR/2BA | 813 843 830 983 1,370 1,069 | 1,250 1,370 1,310 1,470 1,990 1,730 | None | 11.4 miles |
| Residences at Manchester Manchester, NH | 2005 | 100.0% | 204 | 965 | 1BR/1BA 2BR/2BA | 710 770 740 1,043 1,336 1,190 | 1,250 1,350 1,300 1,430 2,170 1,800 | None | 5.2 miles |
| Countryside Village Manchester, NH | 1987 | 97.0% | 448 | 784 | 1BR/1BA 2BR/2BA | 670 670 670 830 990 897 | 905 1,000 953 1,030 1,105 1,068 | No application fee, $100 | 0.8 miles |
| Total/Avg. | 1999 | 97.5% | 1,580 | 951 | |||||
Source: Appraisal
Until recently there has been limited new supply in the area. Anticipated new supply includes the 150-unit Class “A” Riverwalk Apartments in Manchester which is being built by the Waterford Place Apartments Mortgage Loan sponsor, and the 126-unit student housing project known as Madbury Commons nearing construction completion in Durham, NH.
| This is not a research report and was not prepared by the Underwriters’ research departments. Please see additional important information and qualifications at the end of this Term Sheet. |
| T-97 |
| MSBAM 2016-C28 | Waterford Place Apartments |
Operating History and Underwritten Net Cash Flow.The following table presents certain information relating to the historical operating performance and the Underwritten Net Cash Flow at the Waterford Place Apartments Property:
| Cash Flow Analysis | |||||||||||
| 2013 | 2014 | 9/30/2015 TTM | UW | UW per Unit | |||||||
| Base Rent | $6,222,876 | $6,257,156 | $6,306,012 | $6,312,780 | $16,440 | ||||||
| Other Income(1) | $339,944 | $339,953 | $364,172 | $364,172 | $948 | ||||||
| Utility Reimbursements | $97,022 | $108,394 | $115,316 | $115,316 | $300 | ||||||
| Discounts Concessions | ($491,546) | ($489,019) | ($253,469) | ($253,469) | ($660) | ||||||
| Less Vacancy & Credit Loss | ($679,280) | ($502,380) | ($429,645) | ($374,784) | (5.9%) | ||||||
| Effective Gross Income | $5,489,016 | $5,714,104 | $6,102,386 | $6,164,015 | $16,052 | ||||||
| Total Operating Expenses | $2,939,514 | $3,009,560 | $3,127,635 | $3,011,220 | $7,842 | ||||||
| Net Operating Income | $2,549,502 | $2,704,544 | $2,974,751 | $3,152,795 | $8,210 | ||||||
| Capital Expenditures | $0 | $0 | $0 | $96,000 | $250 | ||||||
| Net Cash Flow | $2,549,502 | $2,704,544 | $2,974,751 | $3,056,795 | $7,960 | ||||||
| Occupancy % | 86.7% | 90.6% | 94.3%(2) | 94.1% | |||||||
| NOI DSCR | 1.01x | 1.07x | 1.18x | 1.25x | |||||||
| NCF DSCR | 1.01x | 1.07x | 1.18x | 1.21x | |||||||
| NOI Debt Yield | 6.4% | 6.8% | 7.4% | 7.9% | |||||||
| NCF Debt Yield | 6.4% | 6.8% | 7.4% | 7.6% | |||||||
| (1) | Other Income includes income from parking, fees and late charges, pet income, termination fees and maintenance costs recovered. |
| (2) | Occupancy as of January 7, 2016. |
Escrows and Reserves.The Waterford Place Apartments Borrower deposited $100,086 upfront in escrow for annual real estate taxes and is required to escrow monthly 1/12 of the annual estimated tax payments. The Waterford Place Apartments Borrower is required to escrow monthly 1/12 of the annual estimated insurance premiums (unless the Waterford Place Apartments Borrower maintains an acceptable blanket insurance policy) and is required to escrow monthly $8,000 for replacement reserves. The Waterford Place Apartments Borrower deposited $75,000 upfront in an environmental reserve (174% of the estimated cost) for any expenses incurred in connection with the installation of radon mitigation systems in fifteen units and post-mitigation testing, which funds are required to be released in full provided no event of default is continuing upon satisfactory evidence that there is no radon vapor or other environmental contamination.
Lockbox and Cash Management. The Waterford Place Apartments Mortgage Loan has a soft lockbox with springing cash management upon the commencement of a Cash Sweep Period (as defined below). Also during a Cash Sweep Period, the Waterford Place Apartments Borrower will be required to deposit all excess cash with respect to the Waterford Place Apartments Mortgage Loan to an account to be held by the lender as additional security for the Waterford Place Apartments Mortgage Loan.
A “Cash Sweep Period” will commence upon the DSCR being less than 1.15x at the end of any calendar quarter and will end upon the DSCR being equal to or greater than 1.20x for two consecutive calendar quarters.
Additional Secured Indebtedness (not including trade debts). Not permitted.
Mezzanine Loan and Preferred Equity. Not permitted.
Release of Property. Not permitted.
Terrorism Insurance. The Waterford Place Apartments Borrower is required to obtain and maintain property insurance, public liability insurance and rental loss and/or business interruption insurance that covers perils of terrorism and acts of terrorism.
| This is not a research report and was not prepared by the Underwriters’ research departments. Please see additional important information and qualifications at the end of this Term Sheet. |
| T-98 |
(THIS PAGE INTENTIONALLY LEFT BLANK)
| This is not a research report and was not prepared by the Underwriters’ research departments. Please see additional important information and qualifications at the end of this Term Sheet. |
| T-99 |
| MSBAM 2016-C28 | Marriott – Albuquerque, NM |
Mortgage Loan No. 9 – Marriott – Albuquerque, NM

| This is not a research report and was not prepared by the Underwriters’ research departments. Please see additional important information and qualifications at the end of this Term Sheet. |
| T-100 |
| MSBAM 2016-C28 | Marriott – Albuquerque, NM |
Mortgage Loan No. 9 – Marriott – Albuquerque, NM
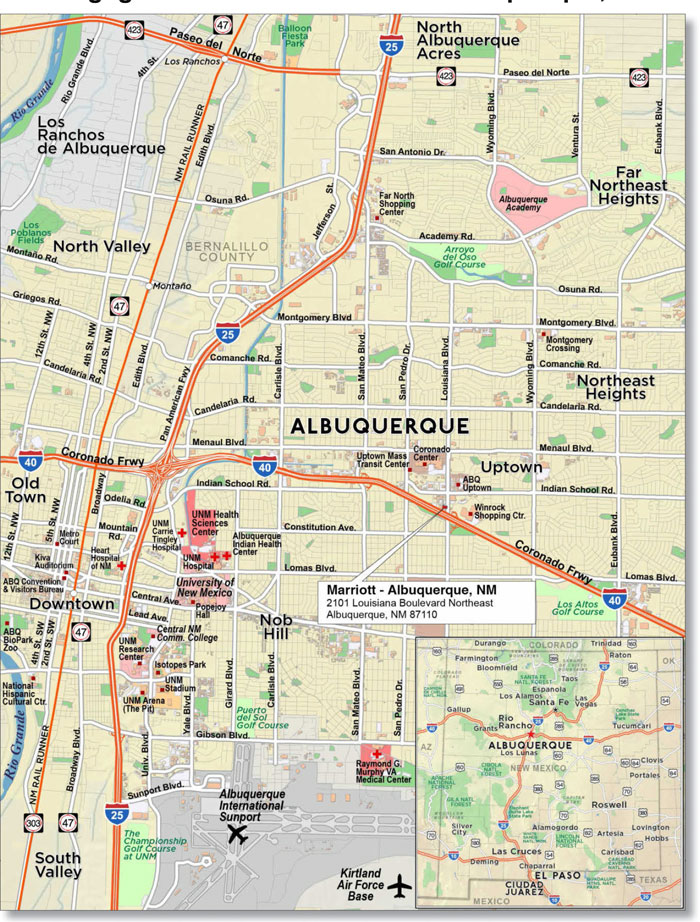
| This is not a research report and was not prepared by the Underwriters’ research departments. Please see additional important information and qualifications at the end of this Term Sheet. |
| T-101 |
| MSBAM 2016-C28 | Marriott – Albuquerque, NM |
| Mortgage Loan No. 9 – Marriott - Albuquerque, NM |
Mortgage Loan Information | Mortgaged Property Information | ||||||
| Mortgage Loan Seller: | CIBC | Single Asset/Portfolio: | Single Asset | ||||
| Original Balance: | $37,200,000 | Location: | Albuquerque, NM 87110 | ||||
| Cut-off Date Balance: | $37,072,435 | General Property Type: | Hospitality | ||||
| % of Initial Pool Balance: | 3.9% | Detailed Property Type: | Full Service | ||||
| Loan Purpose: | Refinance | Title Vesting: | Fee | ||||
| Sponsor: | Columbia Sussex Corporation; CSC Holdings LLC | Year Built/Renovated: | 1982/2004, 2007, 2012 | ||||
| Size: | 411 Rooms | ||||||
| Mortgage Rate: | 4.880% | Cut-off Date Balance per Unit: | $90,201 | ||||
| Note Date: | 10/7/2015 | Maturity Date Balance per Unit: | $74,292 | ||||
| First Payment Date: | 12/1/2015 | Property Manager: | Columbia Sussex Management, LLC (borrower-related) | ||||
| Maturity Date: | 11/1/2025 | ||||||
| Original Term to Maturity: | 120 months | Underwritingand Financial Information | |||||
| Original Amortization Term: | 360 months | UW NOI: | $4,256,962 | ||||
| IO Period: | 0 months | UW NOI Debt Yield: | 11.5% | ||||
| Seasoning: | 3 months | UW NOI Debt Yield at Maturity: | 13.9% | ||||
| Prepayment Provisions: | LO (27); DEF (90); O (3) | UW NCF DSCR: | 1.58x | ||||
| Lockbox/Cash Mgmt Status: | Hard/Springing | Most Recent NOI: | $4,273,628 (12/31/2015) | ||||
| Additional Debt Type: | N/A | 2nd Most Recent NOI: | $4,624,815 (12/31/2014) | ||||
| Additional Debt Balance: | N/A | 3rd Most Recent NOI: | $3,828,425 (12/31/2013) | ||||
| Future Debt Permitted (Type): | No (N/A) | Most Recent Occupancy: | 61.2% (12/31/2015) | ||||
| Reserves(1) | 2nd Most Recent Occupancy: | 63.8% (12/31/2014) | |||||
| Type | Initial | Monthly | Cap | 3rd Most Recent Occupancy: | 57.8% (12/31/2013) | ||
| RE Tax: | $250,607 | $35,801 | N/A | Appraised Value (as of): | $53,600,000 (7/18/2015) | ||
| Insurance: | $122,423 | $11,161 | N/A | Cut-off Date LTV Ratio: | 69.2% | ||
| Deferred Maintenance: | $77,500 | $0 | N/A | Maturity Date LTV Ratio: | 57.0% | ||
| FF&E: | $0 | $44,270 | N/A | ||||
| Other: | $3,000,000 | Springing | N/A | ||||
| Sources and Uses | ||||||
| Sources | Proceeds | % of Total | Uses | Proceeds | % of Total | |
| Loan Amount: | $37,200,000 | 98.4% | Loan Payoff: | $14,711,297 | 38.9% | |
| Borrower Equity: | $588,505 | 1.6% | Mezzanine Payoff: | $14,131,476 | 37.4% | |
| Acquisition of Fee Interest(2): | $5,100,000 | 13.5% | ||||
| Upfront Reserves: | $3,450,530 | 9.1% | ||||
| Closing Costs: | $395,202 | 1.0% | ||||
| Total Sources: | $37,788,505 | 100.0% | Total Uses: | $37,788,505 | 100.0% | |
(1) See“—Escrows and Reserves” below for further discussion of reserve requirements.
(2) At loan origination, the Marriott - Albuquerque, NM Borrower acquired the fee interest in the land parcel on which the improvements of the Marriott - Albuquerque, NM Property were built.
The Mortgage Loan.The ninth largest mortgage loan (the “Marriott - Albuquerque, NM Mortgage Loan”) is secured by a first mortgage encumbering a full service hotel known as the Marriott Albuquerque (the “Marriott - Albuquerque, NM Property”) located in Albuquerque, New Mexico. The proceeds of the Marriott - Albuquerque, NM Mortgage Loan, along with $588,505 of equity, were used to pay off existing debt which was included in the DBUBS 2011-LC3A transaction, pay off mezzanine financing, acquire the fee interest in the land parcel on which the improvements of the Marriott - Albuquerque, NM Property are located, fund upfront reserves and pay closing costs.
The Borrower and the Sponsor. The borrower is Columbia Properties Albuquerque, LLC (the “Marriott - Albuquerque, NM Borrower”), a Delaware limited liability company and single-purpose entity that has two independent managers. The Marriott - Albuquerque, NM Borrower is majority owned and controlled by CSC Holdings LLC, which is controlled by Columbia Sussex Corporation (“Columbia Sussex”). CSC Holdings LLC and Columbia Sussex are the Marriott - Albuquerque, NM Mortgage Loan sponsors and nonrecourse carve-out guarantors. Columbia Sussex is a privately owned hotel company founded by William J. Yung III in 1972. Columbia Sussex is one of the largest franchisees of full-service Marriott hotels in the United States. Its current portfolio consists of 39 hotels with approximately 12,700 rooms.
The Property.The Marriott - Albuquerque, NM Property is a 17-story full service hotel situated on a 7.4-acre site located at the northwest corner of I-40 and Louisiana Boulevard in Albuquerque, New Mexico, approximately five miles northeast of the Albuquerque central business district and approximately seven miles north of the Albuquerque International Sunport airport. The Marriott - Albuquerque, NM Property was built in 1982 and has undergone multiple renovations and upgrades over the past 25 years, most recently in 2007 and 2012. The Marriott - Albuquerque, NM Property features 411 guestrooms, a restaurant, a lobby bar/lounge, nine meeting and banquet spaces totaling 17,734 SF, a business center, and recreational facilities that include an indoor/outdoor pool, a hot tub and a fitness center. The Marriott- Albuquerque, NM Property includes 437 surface parking spaces.
| This is not a research report and was not prepared by the Underwriters’ research departments. Please see additional important information and qualifications at the end of this Term Sheet. |
| T-102 |
| MSBAM 2016-C28 | Marriott – Albuquerque, NM |
The Marriott - Albuquerque, NM Property’s guestroom configuration consists of 154 standard king rooms, 144 standard double/double rooms, 66 king suites, 28 double/double suites, 13 handicap rooms, 4 hospitality suites and 2 presidential suites. The guestrooms were completely renovated in 2007 and include a king bed or two double beds, night stands, a desk and chair, a recliner, a dresser and a 32-inch flat panel HD television with cable TV. Guest bathrooms have combination tub/showers and granite countertops. Smaller guest suites feature a small wet bar. Larger suites and presidential suites have a full kitchen, a sofa and coffee table and other related home furnishings.
The Marriott – Albuquerque, NM Property has a diversified client base. As of year to date July 2015, no single client accounted for more than 2.3% of room revenue and the top 10 corporate accounts, consisting of Lockheed Martin, General Dynamics, Fidelity, Serco, Sandia Corporation, Battelle, Presbyterian Hospital, PepsiCo, Verizon and Deloitte, combined to account for approximately 9.8% of room revenue.
The sponsors purchased the Marriott - Albuquerque, NM Property in 2005 for approximately $14.2 million. Since 2005, the sponsors have invested a total of approximately $11.6 million in renovations and repairs to the Marriott - Albuquerque, NM Property, most notably in 2007 when approximately $9.3 million was spent to renovate the guestrooms, banquet, fitness center, restaurant and lounge, and in 2012 when approximately $1.2 million was spent to renovate the lobby. In addition, at loan origination, the Marriott - Albuquerque, NM Borrower acquired the previously ground-leased parcel on which the improvements of the Marriott - Albuquerque, NM Property are located for $5.1 million. Including the original purchase price, capital improvements to date, and the land parcel acquisition, the sponsor’s total cost basis is approximately $30.8 million.
The Marriott - Albuquerque, NM Property operates under a franchise agreement with Marriott International, Inc. On January 21, 2016 the franchise agreement was amended to extend the franchise agreement termination date from January 6, 2025 to November 1, 2030. In connection with the franchise agreement extension, a property improvement plan (“PIP”) consisting of renovations to guestrooms, guest baths, ballrooms, meeting rooms and fitness center is required to be completed by December 31, 2016. Although the expected cost for the PIP has not yet been determined, the Marriott - Albuquerque, NM Borrower deposited $3 million into a reserve at loan origination for PIP expenses and is required to make an additional deposit, if necessary, such that the amount reserved for PIP expenses is equal to 110% of the PIP budget. See “—Escrows and Reserves” below for further details.
More specific information about the Marriott - Albuquerque, NM Property and the related competitive set is set forth in the table below:
| Marriott - Albuquerque, NM Propertyand Market Historical Occupancy, ADR, RevPAR | |||||||||||
| Competitive Set | Marriott - Albuquerque, NM Property | Penetration Factor | |||||||||
| Year | Occupancy | ADR | RevPAR | Occupancy | ADR | RevPAR | Occupancy | ADR | RevPAR | ||
| 2011 | 61.4% | $100.17 | $61.47 | 53.0% | $104.78 | $55.53 | 86.4% | 104.6% | 90.3% | ||
| 2012 | 60.5% | $99.97 | $60.43 | 55.2% | $105.25 | $58.07 | 91.3% | 105.3% | 96.1% | ||
| 2013 | 61.8% | $101.98 | $63.05 | 57.8% | $103.07 | $59.53 | 93.4% | 101.1% | 94.4% | ||
| 2014 | 63.4% | $102.98 | $65.26 | 63.8% | $103.25 | $65.83 | 100.6% | 100.3% | 100.9% | ||
| 2015 | 64.8% | $105.84 | $68.63 | 61.2% | $105.82 | $64.75 | 94.4% | 100.0% | 94.4% | ||
Source:Industry Report
The Market.The City of Albuquerque is the economic and geographic center of New Mexico and a regional hub with access to trade along I-40 and I-25. The largest employment sectors within the Albuquerque metropolitan statistical area (“Albuquerque MSA”) are government and education/health services. These sectors are driven by the four largest employers in the Albuquerque MSA - University of New Mexico (4 miles from the Marriott - Albuquerque, NM Property), Sandia National Laboratories (4 miles), Presbyterian Healthcare Services (9 miles) and Kirtland Air Force Base (8 miles). The Albuquerque MSA has a growing high-tech industry supported by low business costs and spin-offs from the University of New Mexico, Sandia National Laboratories and Kirtland Air Force Base. Sandia National Laboratories is a federally funded research and development center operated and managed by a subsidiary of Lockheed Martin Corporation. Kirtland Air Force Base is a center for research, development and testing of non-conventional weapons, space and missile technology and laser warfare.
The Marriott - Albuquerque, NM Property is located within the Uptown submarket of Albuquerque, a densely developed office/retail area, with visibility from I-40, a primary highway in the Albuquerque MSA, and Louisiana Boulevard NE, a primary arterial within the subject neighborhood. Hotel demand generators for the Marriott - Albuquerque, NM Property and its primary competition, as defined by the appraiser, consists of 39% commercial, 24% meeting and group, 27% leisure and 10% government. Hotel demand for the neighborhood is primarily generated by a concentration of commercial and office development in the area. The neighborhood includes a variety of telecommunications, technology, healthcare, education, and services firms, as well as a significant amount of retail and mixed-use development. The Marriott - Albuquerque, NM Property is located two miles away from a recently built Wal-Mart Supercenter-anchored shopping center, one mile away from the Macy’s, Kohl’s and Sears anchored Coronado Center regional mall and less than one mile away from the ABQ Uptown lifestyle open air shopping center.
Additional leisure-oriented demand generators include the Albuquerque International Balloon Fiesta with an estimated 2015 attendance of over 955,000, Historic Old Town, and the revitalization of Downtown Albuquerque. Government-oriented demand is generated by Kirtland Air Force Base (the city’s largest employer) and Sandia National Laboratories, as well as various government agencies located throughout the area. Other notable demand drivers include the University of New Mexico (4 miles away), the Albuquerque Convention Center (6 miles away), and the Albuquerque International Sunport (7 miles away).
The estimated 2015 population within a one-, three- and five-mile radius of the Marriott - Albuquerque, NM Property was 13,445, 143,888 and 307,610, respectively. The estimated 2015 median household income within a one-, three- and five-mile radius was $39,612, $36,494 and $40,364, respectively.
| This is not a research report and was not prepared by the Underwriters’ research departments. Please see additional important information and qualifications at the end of this Term Sheet. |
| T-103 |
| MSBAM 2016-C28 | Marriott – Albuquerque, NM |
Competitive properties to the Marriott - Albuquerque, NM Property, chosen by the appraiser due to their generally similar locations, flag quality and physical characteristics, are shown in the table below:
| Competitive Property Summary | ||||||||||||
| Estimated 2014 Market Mix | 2014 Occ. | 2014 Occ. Penetration | 2014 ADR | 2014 ADR Penetration | 2014 RevPAR | 2014 RevPAR Penetration | ||||||
| Property Name | Rooms | Year Built | Comm. % | Meeting & Group % | Leisure % | Govt % | ||||||
| Marriott - Albuquerque, NM (subject) | 411 | 1982 | 40% | 25% | 25% | 10% | 64% | 101% | $103 | 101% | $65.80 | 101% |
| Sheraton Albuquerque Uptown | 294 | 1980 | 35% | 25% | 30% | 10% | 61% | 96% | $92 | 90% | $56.12 | 86% |
| Crowne Plaza Albuquerque | 261 | 1971 | 35% | 25% | 30% | 10% | 55% | 87% | $85 | 83% | $46.75 | 72% |
| Embassy Suites Albuquerque | 261 | 2005 | 40% | 25% | 25% | 10% | 77% | 121% | $122 | 119% | $93.94 | 144% |
| Marriott Albuquerque Pyramid North | 310 | 1986 | 40% | 25% | 25% | 10% | 66% | 104% | $102 | 99% | $67.32 | 103% |
| DoubleTree Hotel Albuquerque | 295 | 1975 | 40% | 20% | 30% | 10% | 60% | 95% | $95 | 93% | $57.00 | 88% |
| Hyatt Regency Albuquerque | 395 | 1990 | 40% | 25% | 25% | 10% | 62% | 98% | $110 | 107% | $68.20 | 105% |
| Total/Wtd. Avg. | 2,227 | 39% | 24% | 27% | 10% | 63% | $103 | $65.06 | ||||
Source:Appraisal
The appraiser identified two proposed hotels expected to be completed in 2016, the Hampton Inn & Suites Albuquerque Airport with approximately 88 rooms and the Hotel Chaco with approximately 118 rooms, both of which were estimated by the appraiser to be not competitive to the Marriott - Albuquerque, NM Property due to location and/or quality characteristics.
Operating History and Underwritten Net Cash Flow. The following table presents certain information relating to the historical operating performance and the Underwritten Net Cash Flow at the Marriott - Albuquerque, NM Property:
| Cash Flow Analysis | ||||||||||||||
| 2011 | 2012 | 2013 | 2014 | 2015 | UW | UW per Room | ||||||||
| Occupancy | 53.1% | 55.2% | 57.8% | 63.8% | 61.2% | 61.2% | ||||||||
| Average Daily Rate | $104.57 | $105.19 | $102.93 | $102.68 | $105.66 | $105.66 | ||||||||
| RevPAR | $55.53 | $58.09 | $59.50 | $65.47 | $64.67 | $64.67 | ||||||||
| Rooms | $8,365,732 | $8,765,834 | $8,968,012 | $9,870,734 | $9,702,174 | $9,702,143 | $23,606 | |||||||
| Food/Beverage | $2,927,205 | $3,200,021 | $3,052,342 | $3,619,204 | $3,368,586 | $3,368,586 | $8,196 | |||||||
| Other | $179,400 | $150,258 | $120,332 | $98,388 | $69,515 | $69,515 | $169 | |||||||
| Total Revenue | $11,472,337 | $12,116,113 | $12,140,686 | $13,588,326 | $13,140,275 | $13,140,244 | $31,971 | |||||||
| Total Expenses(1) | $7,607,305 | $8,152,987 | $8,312,261 | $8,963,511 | $8,866,647 | $8,883,282 | $21,614 | |||||||
| NOI | $3,865,032 | $3,963,126 | $3,828,425 | $4,624,815 | $4,273,628 | $4,256,962 | $10,358 | |||||||
| FF&E(2) | $458,893 | $484,645 | $485,627 | $543,533 | $525,611 | $525,610 | $1,279 | |||||||
| NCF | $3,406,139 | $3,478,481 | $3,342,798 | $4,081,282 | $3,748,017 | $3,731,352 | $9,079 | |||||||
| NOI DSCR | 1.64x | 1.68x | 1.62x | 1.96x | 1.81x | 1.80x | ||||||||
| NCF DSCR | 1.44x | 1.47x | 1.41x | 1.73x | 1.59x | 1.58x | ||||||||
| NOI Debt Yield | 10.4% | 10.7% | 10.3% | 12.5% | 11.5% | 11.5% | ||||||||
| NCF Debt Yield | 9.2% | 9.4% | 9.0% | 11.0% | 10.1% | 10.1% | ||||||||
(1) Ground rent expenses were removed from historical expenses since the ground leased parcel was purchased by the Marriott - Albuquerque, NM Borrower at loan origination.
(2) FF&E is based on 4% of Total Revenue for all historical data points as well the underwritten amount.
Escrows and Reserves. The Marriott - Albuquerque, NM Borrower deposited $250,607 in escrow for annual real estate taxes at loan origination and is required to escrow monthly deposits of 1/12 of the annual estimated tax payments. The Marriott - Albuquerque, NM Borrower deposited $122,423 in escrow for annual insurance premiums at loan origination and is required to escrow monthly deposits of 1/12 of the annual estimated insurance premiums.
The Marriott - Albuquerque, NM Borrower is required to deposit monthly an amount equal to 1/12th of 4% of the gross revenues for the prior calendar year, which as of the Marriott - Albuquerque, NM Mortgage Loan origination date was $44,270, into a reserve (the “FF&E Reserve”) for furniture, fixtures and equipment. Commencing on the 37th payment date and continuing until the earlier of the 60thpayment date or the PIP Satisfaction Date (defined below), the FF&E monthly reserve amount will be 1/12th of 6% of gross revenues for the prior calendar year, and the amount of such deposit in excess of 1/12th of 2% of gross revenues for the prior calendar year is required to be transferred to the PIP Reserve (defined below). Commencing on the 61stpayment date and continuing until the earlier of the PIP Satisfaction Date or the end of the loan term of the Marriott - Albuquerque, NM Mortgage Loan, the FF&E monthly reserve amount will be 1/12th of 7.5% of gross revenues for the prior calendar year, and the amount of such deposit in excess of 1/12th of 2% of gross revenues for the prior calendar year is required to be transferred to the PIP Reserve. Following the PIP Satisfaction Date (if any), the FF&E monthly reserve amount will return to being 1/12th of 4% of the gross revenues for the prior calendar year, and no transfers from the FF&E Reserve to the PIP Reserve will occur thereafter. “PIP Satisfaction Date” means the date on which the PIP in connection with a Replacement Franchise Agreement (defined below) has been completed. “Replacement Franchise Agreement” means a new franchise agreement with Marriott or a renewal of the current franchise agreement with Marriott that has a term expiring no earlier than five years after the maturity date of the Marriott - Albuquerque, NM
| This is not a research report and was not prepared by the Underwriters’ research departments. Please see additional important information and qualifications at the end of this Term Sheet. |
| T-104 |
| MSBAM 2016-C28 | Marriott – Albuquerque, NM |
Mortgage Loan accompanied by a new comfort letter. The recent amendment to the franchise agreement constitutes a Replacement Franchise Agreement.
Commencing 24 months prior to the expiration date of the franchise agreement, or if the franchise agreement is otherwise terminated, the Marriott - Albuquerque, NM Borrower is required to deposit all excess cash flow into a reserve (the “Franchise Expiration Reserve”) until a Replacement Franchise Agreement has been entered into. At loan origination, the Marriott - Albuquerque, NM Borrower deposited $3,000,000 into a reserve (the “PIP Reserve”). No disbursements from the PIP Reserve will be made unless a Replacement Franchise Agreement has been entered into and any PIP and budget for such PIP have been approved by the lender. Prior to undertaking any PIP, the Marriott - Albuquerque, NM Borrower is required to deposit any additional amounts necessary to cause the balance of the PIP Reserve to equal at least 110% of the anticipated cost of the PIP. Such additional amounts will come first from the then current balance of the Franchise Expiration Reserve, then the FF&E Reserve, and then from the Marriott - Albuquerque, NM Borrower’s own funds, provided that no funds may be transferred from the Franchise Expiration Reserve unless a Replacement Franchise Agreement has been entered into. Following such additional funding of the PIP Reserve and possible transfer of funds from the Franchise Expiration Reserve to the PIP Reserve, deposits into the Franchise Expiration Reserve will not be subject to transfer to the PIP Reserve, but instead will accumulate in the Franchise Expiration Reserve. All amounts in the PIP Reserve are required to be used for the reimbursement of costs expended by the Marriott - Albuquerque, NM Borrower to complete the PIP. If no PIP is then required or anticipated to be required by the franchisor and a Replacement Franchise Agreement has been entered into, and if any required PIP has been completed, and so long as no other Cash Management Period (as defined below) then exists, (A) any amounts remaining in the Franchise Expiration Reserve will be disbursed to the Marriott - Albuquerque, NM Borrower and (B) any amounts remaining in the PIP Reserve will be disbursed (i) first, if any amounts of FF&E Reserve (other than those transferred on a monthly basis after the 37th payment date) have not been expended, such amounts are required to be transferred back to the FF&E Reserve, and (ii) the remainder released to the Marriott - Albuquerque, NM Borrower, provided however, that the lender will have the right, but not the obligation, at any time during the continuation of an event of default, in its sole and absolute discretion, to transfer any and all funds in the FF&E Reserve, the Franchise Expiration Reserve and/or the PIP Reserve to an account to be held by the lender as additional security for the Marriott - Albuquerque, NM Mortgage Loan.
Lockbox and Cash Management.A hard lockbox is in place with respect to the Marriott - Albuquerque, NM Mortgage Loan. The Marriott - Albuquerque, NM Mortgage Loan has springing cash management. Provided a Cash Management Period has not commenced, funds in the lockbox account are swept daily to an account designated by the Marriott - Albuquerque, NM Borrower. During the continuance of a Cash Management Period, funds in the lockbox account are applied on each monthly payment date to pay debt service on the Marriott - Albuquerque, NM Mortgage Loan, to fund the required reserves deposits as described above under “—Escrows and Reserves,” to disburse to the Marriott - Albuquerque, NM Borrower the amount of monthly operating expenses (not otherwise paid or reserved for in the required reserves) referenced in an annual budget approved by lender together with other amounts incurred by the Marriott - Albuquerque, NM Borrower in connection with the operation and maintenance of the Marriott - Albuquerque, NM Mortgaged Property approved by lender, and to remit the remainder to an account to be held by the lender as additional security for the Marriott - Albuquerque, NM Mortgage Loan.
A “Cash Management Period” will commence:
(i) upon the occurrence of an event of default and will continue until lender’s acceptance of the cure of such event of default;
(ii) if the debt service coverage ratio is less than 1.25x at the end of any calendar quarter and will continue until the debt service coverage ratio has been not less than 1.30x for two consecutive calendar quarters;
(iii) 24 months prior to the expiration date of the franchise agreement or if the franchise agreement is otherwise terminated and will continue until a Replacement Franchise Agreement has been entered into; or
(iv) if the nonrecourse carve-out guarantors fail to maintain a combined net worth of at least $100 million and a combined liquidity of at least $10 million (together the “Guarantor Financial Covenants”) and will continue until the lender determines that the Guarantor Financial Covenants are again satisfied.
Additional Secured Indebtedness (not including trade debts). Not permitted.
Mezzanine Loan and Preferred Equity. Not permitted.
Release of Property. Not permitted.
Terrorism Insurance.The Marriott - Albuquerque, NM Borrower is required to obtain and maintain property insurance, public liability insurance and rental loss and/or business interruption insurance that covers perils of terrorism and acts of terrorism, both foreign and domestic.
| This is not a research report and was not prepared by the Underwriters’ research departments. Please see additional important information and qualifications at the end of this Term Sheet. |
| T-105 |
| MSBAM 2016-C28 | Simply Self Storage OK & FL Portfolio |
Mortgage Loan No. 10 – Simply Self Storage OK & FL Portfolio
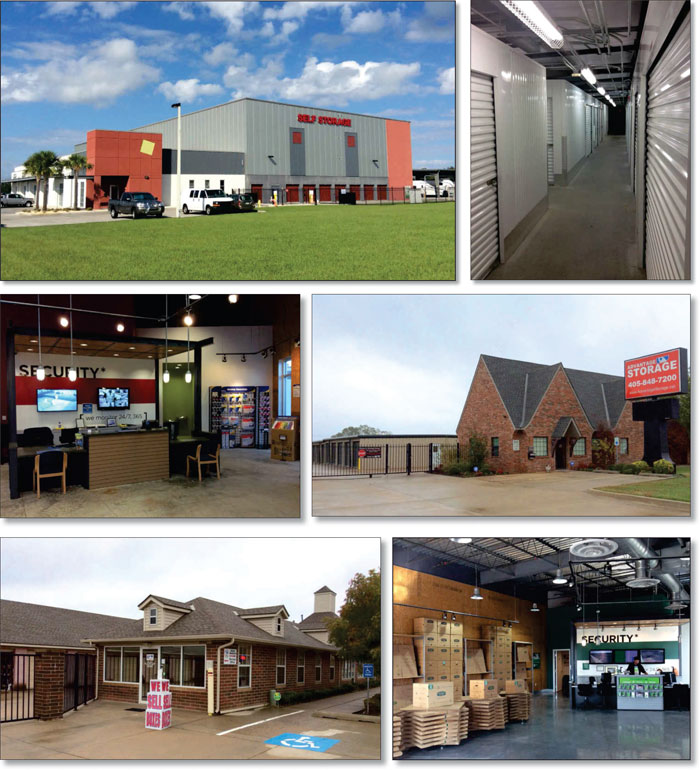
| This is not a research report and was not prepared by the Underwriters’ research departments. Please see additional important information and qualifications at the end of this Term Sheet. |
| T-106 |
| MSBAM 2016-C28 | Simply Self Storage OK & FL Portfolio |
Mortgage Loan No. 10 – Simply Self Storage OK & FL Portfolio
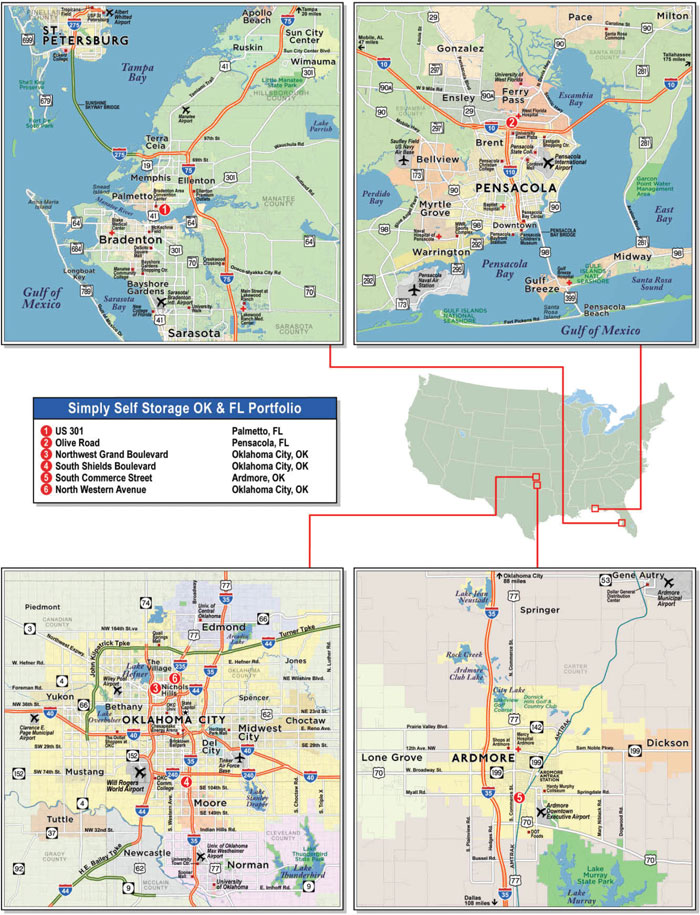
| This is not a research report and was not prepared by the Underwriters’ research departments. Please see additional important information and qualifications at the end of this Term Sheet. |
| T-107 |
| MSBAM 2016-C28 | Simply Self Storage OK & FL Portfolio |
| Mortgage Loan No. 10 – Simply Self Storage OK & FL Portfolio |
| Mortgage Loan Information | Mortgaged Property Information(2) | ||||||
| Mortgage Loan Seller: | SMF III | Single Asset/Portfolio: | Portfolio | ||||
| Original Balance: | $33,105,000 | Location: | Various | ||||
| Cut-off Date Balance: | $33,105,000 | General Property Type: | Self Storage | ||||
| % of Initial Pool Balance: | 3.5% | Detailed Property Type: | Self Storage | ||||
| Loan Purpose: | Acquisition | Title Vesting: | Fee | ||||
| Sponsor: | BSREP II Simply Storage JV LLC | Year Built/Renovated: | Various | ||||
| Mortgage Rate: | 4.823% | Size: | 569,991 SF | ||||
| Note Date: | 12/17/2015 | Cut-off Date Balance per Unit: | $58 | ||||
| First Payment Date: | 2/6/2016 | Maturity Date Balance per Unit: | $49 | ||||
| Maturity Date: | 1/6/2026 | Property Manager: | OB Management Services, Inc. | ||||
| Original Term to Maturity: | 120 months | Underwriting and Financial Information(2) | |||||
| Original Amortization Term: | 360 months | UW NOI: | $2,774,944 | ||||
| IO Period: | 12 months | UW NOI Debt Yield: | 8.4% | ||||
| Seasoning: | 1 month | UW NOI Debt Yield at Maturity: | 10.0% | ||||
| Prepayment Provisions: | LO (25); DEF (91); O (4) | UW NCF DSCR: | 1.33x | ||||
| Lockbox/Cash Mgmt Status: | None | Most Recent NOI: | $2,759,166 (10/31/2015 TTM) | ||||
| Additional Debt Type: | N/A | 2nd Most Recent NOI: | $2,487,416 (12/31/2014) | ||||
| Additional Debt Balance: | N/A | 3rd Most Recent NOI(3): | $1,163,340 (12/31/2013) | ||||
| Future Debt Permitted (Type): | No (N/A) | Most Recent Occupancy: | 81.8% (12/17/2015) | ||||
| Reserves(1) | 2ndMost Recent Occupancy: | 79.9% (12/31/2014) | |||||
| Type | Initial | Monthly | Cap | 3rdMost Recent Occupancy(3): | 79.1% (12/31/2013) | ||
| RE Tax: | $92,738 | $32,563 | N/A | Appraised Value (as of): | $46,270,000 (November 2015) | ||
| Insurance: | $99,379 | $9,034 | N/A | Cut-off Date LTV Ratio: | 71.5% | ||
| Recurring Replacements: | $607,534 | Springing | N/A | Maturity Date LTV Ratio: | 60.2% | ||
| Deferred Maintenance: | $266,509 | $0 | N/A | ||||
| Sources and Uses | ||||||
| Sources | Proceeds | % of Total | Uses | Proceeds | % of Total | |
| Loan Amount: | $33,105,000 | 69.7% | Purchase Price: | $45,675,000 | 96.2% | |
| Sponsor Equity: | $14,373,026 | 30.3% | Closing Costs: | $736,866 | 1.6% | |
| Reserves: | $1,066,160 | 2.2% | ||||
| Total Sources: | $47,478,026 | 100.0% | Total Uses: | $47,478,026 | 100.0% | |
| (1) | At closing, the borrower escrowed ten years’ worth of the recommended ongoing replacement reserves per the property condition reports. If the reserve balance falls below $50,000, the borrower will be required to escrow $2,375 monthly until the balance of the reserve is equal to $50,000. See “—Escrows and Reserves” below for further discussion of reserve requirements. |
| (2) | Mortgaged Property Information and Underwriting and Financial Information are based on a combination or sum of information relating to all six self-storage properties that comprise the Simply Self Storage OK & FL Portfolio Property. |
| (3) | The prior owner of the Simply Self Storage OK & FL Portfolio Property acquired the properties at different times from 2012 through 2014. As a result, 3rd Most Recent NOI and 3rd Most Recent Occupancy is calculated based on three of the six properties that make up the portfolio including US 301, South Commerce Street and Olive Road. |
The Mortgage Loan. The tenth largest mortgage loan (the “Simply Self Storage OK & FL Portfolio Mortgage Loan”) is evidenced by a promissory note in the original principal amount of $33,105,000 secured by first priority fee mortgages encumbering six self storage properties in Oklahoma and Florida (collectively, the “Simply Self Storage OK & FL Portfolio Property”). A previous loan secured by the South Shields Boulevard and South Commerce Street properties was included in the CGCMT 2006-C5 securitization and a previous loan secured by the Northwest Grand Boulevard property was included in the WFRBS 2013-UBS1 securitization. The proceeds of the Simply Self Storage OK & FL Portfolio Mortgage Loan were primarily used to acquire the Simply Self Storage OK & FL Portfolio Property, pay closing costs and fund reserves.
The Borrowers and the Sponsor. The borrowers are, collectively, SS Palmetto, LLC, SS Commerce Street, LLC, SS Western Avenue, LLC, SS Olive Road, LLC, SS Nichols Hills, LLC and SS Shields Boulevard, LLC (collectively, the “Simply Self Storage OK & FL Portfolio Borrower”), each a Delaware limited liability company and each with one independent director. BSREP II Simply Storage JV LLC is the loan sponsor and nonrecourse carve-out guarantor. BSREP II Simply Storage JV LLC is owned by Brookfield Asset Management Inc. (“Brookfield”). Brookfield is a global alternative asset manager with over $200 billion in assets under management and more than 350 million square feet of commercial property globally. Brookfield has over a 100-year history of owning and operating assets with a focus on renewable energy, property, infrastructure and private equity.
The Property. The Simply Self Storage OK & FL Portfolio Property consists of six self-storage properties totaling 569,991 SF. The Simply Self Storage OK & FL Portfolio Property was built between 1960 and 2009 and has an average occupancy rate of 81.8% as of December 17, 2015. The Simply Self Storage OK & FL Portfolio Property is located in Pensacola and Palmetto, Florida, and in Oklahoma City and Ardmore, Oklahoma.
US 301 is a 113,365 SF self storage property located in Palmetto, Florida. US 301 has 1,097 storage units, 62% of which are climate controlled. Olive Road is a 116,950 SF self storage property located in Pensacola, Florida. Olive Road has 953 storage units, 96% of which are climate controlled. Northwest Grand Boulevard is a 59,250 SF self storage property located in Oklahoma City, Oklahoma. Northwest Grand Boulevard has 383 storage
| This is not a research report and was not prepared by the Underwriters’ research departments. Please see additional important information and qualifications at the end of this Term Sheet. |
| T-108 |
| MSBAM 2016-C28 | Simply Self Storage OK & FL Portfolio |
units, 2% of which are climate controlled. South Commerce Street is a 123,171 SF self storage property located in Ardmore, Oklahoma. South Commerce Street has 959 storage units, 2% of which are climate controlled. South Shields Boulevard is a 101,875 SF self storage property located in Oklahoma City, Oklahoma. South Shields Boulevard has 644 storage units, 13% of which are climate controlled. North Western Avenue is a 55,380 SF self storage property located in Oklahoma City, Oklahoma. North Western Avenue has 327 storage units, 21% of which are climate controlled.
The chart below summarizes the details of the six properties comprising the Simply Self Storage OK & FL Portfolio Property:
| Property Summary | |||||||||
| Property | Allocated Cut-off Date Loan Amount | % of Allocated Loan Amount | Location | No. of Units | Area (SF) | Year Built/ Renovated | Occupancy (by Unit) | Appraised Value | UW NCF |
| US 301 | $11,360,000 | 34.3% | Palmetto, FL | 1,097 | 113,365 | 2009/N/A | 92.5% | $16,200,000 | $862,783 |
| Olive Road | $6,525,000 | 19.7% | Pensacola, FL | 953 | 116,950 | 2008/N/A | 87.6% | $9,200,000 | $487,670 |
| Northwest Grand Boulevard | $4,820,000 | 14.6% | Oklahoma City, OK | 383 | 59,250 | 2005/N/A | 86.7% | $6,400,000 | $394,595 |
| South Commerce Street | $3,625,000 | 11.0% | Ardmore, OK | 959 | 123,171 | 1970/N/A | 70.3% | $5,030,000 | $389,165 |
| South Shields Boulevard | $3,625,000 | 11.0% | Oklahoma City, OK | 644 | 101,875 | 1960/2007 | 66.9% | $5,000,000 | $365,076 |
| North Western Avenue | $3,150,000 | 9.5% | Oklahoma City, OK | 327 | 55,380 | 2006/N/A | 95.7% | $4,440,000 | $275,656 |
| Total/Wtd. Avg. | $33,105,000 | 100.0% | �� | 4,363 | 569,991 | 81.8% | $46,270,000 | $2,774,944 | |
The Market. The Simply Self Storage OK & FL Portfolio Property consists of four properties in two cities in Oklahoma and two properties in two cities in Florida. Below is a summary of the related markets:
| Market Summary | |||||
| 2015 Population | |||||
| Property | Location | One-Mile Radius | Three-Mile Radius | Five-Mile Radius | Competitive Set Occupancy Rate |
| US 301 | Palmetto, FL | 4,913 | 49,369 | 133,320 | 89.3% |
| Olive Road | Pensacola, FL | 6,130 | 58,582 | 122,558 | 87.6% |
| Northwest Grand Boulevard | Oklahoma City, OK | 8,792 | 78,528 | 227,351 | 94.4% |
| South Commerce Street | Ardmore, OK | 4,023 | 20,877 | 27,870 | 77.1% |
| South Shields Boulevard | Oklahoma City, OK | 4,833 | 82,608 | 232,416 | 85.0% |
| North Western Avenue | Oklahoma City, OK | 9,159 | 64,314 | 170,173 | 95.4% |
Source: Appraisal
| This is not a research report and was not prepared by the Underwriters’ research departments. Please see additional important information and qualifications at the end of this Term Sheet. |
| T-109 |
| MSBAM 2016-C28 | Simply Self Storage OK & FL Portfolio |
Operating History and Underwritten Net Cash Flow.The following table presents certain information relating to the historical operating performance and the Underwritten Net Cash Flow at the Simply Self Storage OK & FL Portfolio Property:
| Cash Flow Analysis | |||||
| 2013(1) | 2014 | 10/31/2015 TTM | UW | UW Per Unit | |
| Base Rent | $2,028,367 | $3,760,144 | $4,123,552 | $5,424,600 | $9.52 |
| Total Recoveries | $0 | $0 | $0 | $0 | $0.00 |
| Other Income(2) | $150,930 | $298,540 | $323,867 | $323,867 | $0.57 |
| Discounts Concessions | $0 | $0 | $0 | $0 | $0.00 |
| Less Vacancy & Credit Loss | $0 | $0 | $0 | ($1,301,048) | ($2.28) |
| Effective Gross Income | $2,179,298 | $4,058,684 | $4,447,418 | $4,447,419 | $7.80 |
| Total Operating Expenses | $1,015,957 | $1,571,268 | $1,688,253 | $1,672,474 | $2.93 |
| Net Operating Income | $1,163,340 | $2,487,416 | $2,759,166 | $2,774,944 | $4.87 |
| Capital Expenditures(3) | $0 | $0 | $0 | $0 | $0.00 |
| TI/LC | $0 | $0 | $0 | $0 | $0.00 |
| Net Cash Flow | $1,163,340 | $2,487,416 | $2,759,166 | $2,774,944 | $4.87 |
| Occupancy % | 79.1% | 79.9% | 81.8%(4) | 76.0% | |
| NOI DSCR | 0.56x | 1.19x | 1.32x | 1.33x | |
| NCF DSCR | 0.56x | 1.19x | 1.32x | 1.33x | |
| NOI Debt Yield | 3.5% | 7.5% | 8.3% | 8.4% | |
| NCF Debt Yield | 3.5% | 7.5% | 8.3% | 8.4% | |
| (1) | The prior owner of the Simply Self Storage OK & FL Portfolio Property acquired the properties at different times from 2012 through 2014. As a result, 2013 financial information is calculated based on three of the six properties that make up the portfolio including US 301, South Commerce Street and Olive Road. |
| (2) | Other Income consists primarily of fee income, tenant insurance and merchandise sales. |
| (3) | At closing, the Simply Self Storage OK & FL Portfolio Borrower escrowed ten years’ worth of the recommended ongoing replacement reserves per the property condition reports. If the reserve balance falls below $50,000, the Simply Self Storage OK & FL Portfolio Borrower will be required to escrow $2,375 monthly through and until the maturity date. |
| (4) | The 10/31/2015 TTM Occupancy % is based on the 12/17/2015 rent roll. |
Escrows and Reserves. The Simply Self Storage OK & FL Portfolio Borrower is required to escrow monthly an amount equal to: (i) 1/12 of the estimated annual tax payments and (ii) 1/12 of the estimated annual insurance premiums. At origination, the Simply Self Storage OK & FL Portfolio Borrower deposited $607,534 for replacement reserves (which equates to more than ten years’ worth of collections as recommended by the related property condition reports), $266,509 for deferred maintenance, $99,379 for insurance premiums and $92,738 for real estate taxes. If the replacement reserve falls below $50,000, the borrowers are required to escrow $2,375 on a monthly basis for replacement reserves through and until the maturity date.
Lockbox and Cash Management.None.
Additional Secured Indebtedness (not including trade debts). Not permitted.
Mezzanine Loan and Preferred Equity. Not permitted.
Release of Property. Provided no event of default exists under the Simply Self Storage OK & FL Portfolio Mortgage Loan, at any time after the date that is two years from the closing date of the securitization, the Simply Self Storage OK & FL Portfolio Borrower may obtain a release of any of the individual properties comprising the Simply Self Storage OK & FL Portfolio Property, provided, among other conditions, (a) the Simply Self Storage OK & FL Portfolio Borrower defeases the Simply Self Storage OK & FL Portfolio Loan with U.S. government securities in an amount equal to the greatest of (i) 120% of the allocated loan amount with respect to the individual property or properties being released, (ii) an amount that results, with respect to the individual property or properties remaining after the release, in the loan-to-value ratio being not greater than 72.5%, (iii) an amount that results, with respect to the individual property or properties remaining after the release, in the debt service coverage ratio being not less than 1.45x and (iv) an amount that results, with respect to the individual property or properties remaining after the release, in the debt yield being not less than 8.5%, and (b) the Simply Self Storage OK & FL Portfolio Borrower delivers a rating agency confirmation and a REMIC opinion with respect to such individual property release.
Terrorism Insurance.The Simply Self Storage OK & FL Portfolio Borrower is required to obtain terrorism insurance for domestic and foreign acts of terrorism (as defined in the Terrorism Risk Insurance Program Reauthorization Act of 2007) in an amount equal to full replacement cost of the Simply Self Storage OK & FL Portfolio Property and business interruption insurance for 12 months.
| This is not a research report and was not prepared by the Underwriters’ research departments. Please see additional important information and qualifications at the end of this Term Sheet. |
| T-110 |
(THIS PAGE INTENTIONALLY LEFT BLANK)
| This is not a research report and was not prepared by the Underwriters’ research departments. Please see additional important information and qualifications at the end of this Term Sheet. |
| T-111 |
| MSBAM 2016-C28 | Landmark Gardens & Lofts Apartments |
| Mortgage Loan No. 11 – Landmark Gardens & Lofts Apartments |
| Mortgage Loan Information | Property Information | ||||||
| Mortgage Loan Seller: | MSMCH | Single Asset/Portfolio: | Single Asset | ||||
| Original Balance: | $30,487,500 | Location: | New Braunfels, TX 78130 | ||||
| Cut-off Date Balance: | $30,487,500 | General Property Type: | Mixed Use | ||||
| % of Initial Pool Balance: | 3.2% | Detailed Property Type: | Multifamily/Retail | ||||
| Loan Purpose: | Acquisition | Title Vesting: | Fee | ||||
Sponsor: | T4 Housing Interests Management, LLC | Year Built/Renovated: | 1926; 2005/2007 | ||||
| Mortgage Rate: | 4.6900% | Size: | 290 Units | ||||
| Note Date: | 11/16/2015 | Cut-off Date Balance per Unit: | $105,129 | ||||
| First Payment Date: | 1/1/2016 | Maturity Date Balance per Unit: | $96,657 | ||||
| Maturity Date: | 12/1/2025 | Property Manager: | T4 Housing Interests Management, LLC (borrower-affiliated) | ||||
| Original Term to Maturity: | 120 months | ||||||
| Original Amortization Term: | 360 months | ||||||
| IO Period: | 60 months | Underwriting and Financial Information | |||||
| Seasoning: | 2 months | UW NOI: | $2,552,939 | ||||
| Prepayment Provisions: | LO (26); DEF (90); O (4) | UW NOI Debt Yield: | 8.4% | ||||
| Lockbox/Cash Mgmt Status: | Springing/Springing | UW NOI Debt Yield at Maturity: | 9.1% | ||||
| Additional Debt Type: | N/A | UW NCF DSCR: | 1.71x (IO) 1.31x (P&I) | ||||
| Additional Debt Balance: | N/A | Most Recent NOI: | $2,542,667 (9/30/2015 TTM) | ||||
| Future Debt Permitted (Type): | Yes (Mezzanine) | 2nd Most Recent NOI: | $2,333,195 (12/31/2014) | ||||
| Reserves | 3rd Most Recent NOI: | $2,259,569 (12/31/2013) | |||||
| Type | Initial | Monthly | Cap | Most Recent Occupancy: | 92.4% (10/15/2015) | ||
| RE Tax: | $0 | $51,809 | N/A | 2nd Most Recent Occupancy: | 91.9% (12/31/2014) | ||
| Insurance: | $10,769 | $10,769 | N/A | 3rd Most Recent Occupancy: | 90.9% (12/31/2013) | ||
| Deferred Maintenance: | $227,488 | $0 | N/A | Appraised Value (as of): | $40,900,000 (10/14/2015) | ||
| Recurring Replacements: | $0 | $7,250 | N/A | Cut-off Date LTV Ratio: | 74.5% | ||
| Other: | $210,500 | $0 | N/A | Maturity Date LTV Ratio: | 68.5% | ||
| Sources and Uses | ||||||
| Sources | Proceeds | % of Total | Uses | Proceeds | % of Total | |
| Loan Amount: | $30,487,500 | 74.2% | Acquisition Price(1): | $40,215,164 | 97.9% | |
| Borrower Equity: | $10,590,056 | 25.8% | Reserves: | $448,757 | 1.1% | |
| Closing Costs: | $413,635 | 1.0% | ||||
| Total Sources: | $41,077,556 | 100.0% | Total Uses: | $41,077,556 | 100.0% | |
| (1) | Acquisition Price is net of credits real estate taxes due, security deposits, rent proration, service contract proration and prepaid rent. |
The Mortgage Loan.The eleventhlargest mortgage loan (the “Landmark Gardens & Lofts Apartments Mortgage Loan”) is evidenced by a promissory note in the original principal amount of $30,487,500 secured by a first priority fee mortgage encumbering a mid-rise and garden style multifamily mixed use property with a total of 290 units located in New Braunfels, Texas (the “Landmark Gardens & Lofts Apartments Property”). The proceeds of the Landmark Gardens & Lofts Apartments Mortgage Loan, together with borrower equity of $10,590,056, were used to acquire the Landmark Gardens & Lofts Apartments Property for a total purchase price of approximately $40,650,000 ($40,215,164 net of adjustments), fund reserves and pay closing costs.
The Borrower and the Sponsor.The borrower is T4V3, L.L.C. (the “Landmark Gardens & Lofts Apartments Borrower”), a single-purpose Texas limited liability company structured to be bankruptcy remote, with one independent director. The Landmark Gardens & Lofts Apartments Borrower is 1% owned by T4V3, Inc., its manager, which is wholly owned by Jerry W. Turner, Jr., the non-recourse carveout guarantor, and his wife, Sharon Turner.
Jerry W. Turner, Jr. is a former real estate consultant, having led KPMG’s Real Estate Consulting Practice prior to founding T4 Housing Interests Management, LLC. During his time at KPMG, Mr. Turner served as national director of valuation services. Mr. Turner founded T4 Housing Interest management in 2007 to serve as his commercial real estate investment arm and full-service property management company.
The Property.The Landmark Gardens & Lofts Apartments Property consists of eleven garden-style buildings that are two and three stories, and a redeveloped eight-story building that was once the Comal Power Plant located along the bank of the Comal River. The garden style portion contains 178 units, while the converted power plant portion (the lofts) contains 112 units. Common amenities include one community pool, one heated spa, a leasing office and various club areas (including a kitchen and small banquet room, conference center and event center), a fitness center, basement, storage area and parking areas. The loft building has 12 commercial lease spaces, plus a massage room, on the ground level. There are 513 parking spaces for a ratio of 1.77 spaces per unit, including 36 carports and 56 detached parking garages. The garden-style improvements were constructed in 2005 and the lofts were constructed in 1926 and converted in 2007.
| This is not a research report and was not prepared by the Underwriters’ research departments. Please see additional important information and qualifications at the end of this Term Sheet. |
| T-112 |
| MSBAM 2016-C28 | Landmark Gardens & Lofts Apartments |
The table below summarizes the Landmark Gardens & Lofts Apartments Property apartment unit mix:
| Unit Mix | ||||
| Type | No. of Units | Avg. Size (SF)(1) | Avg. Rent(1) | Market Rent(2) |
| 1BR/1BA | 154 | 717 | $1,037 | $1,075 |
| 2BR/1BA | 2 | 932 | $1,425 | $1,430 |
| 2BR/2BA | 134 | 1,219 | $1,562 | $1,620 |
| Total/Wtd. Avg. | 290 | 950 | $1,283 | $1,329 |
| (1) | Per October 15, 2015 rent roll. |
| (2) | Per appraisal. |
The Market. The Landmark Gardens & Lofts Apartments Property is located in the city of New Braunfels. New Braunfels is situated in the southeast portion of Comal County along the Interstate Highway 35 corridor, and is about 30 miles northeast of the San Antonio Central Business District. The Landmark Gardens & Lofts Apartments Property is located within walking distance of downtown New Braunfels. New Braunfels has a population of approximately 60,000, with a largely tourism/recreational based economy. The city has a historic Main Street and downtown district, including local shops. New Braunfels is also home to Schlitterbahn, the nation’s number one water park. Other area attractions include the Guadalupe River, the Comal River, the Gruene Historic District including Gruene Hall, Landa Park, Natural Bridge Caverns, Natural Bridge Wildlife Ranch, and Dry Comal Creek Vineyards. Local festivals, such as Wurstfest which occurs annually in November, also draw tourists to the area.
According to the appraisal, the Landmark Gardens & Lofts Apartments Property is located in the New Braunfels (“NB”) submarket of the San Antonio market. As of the third quarter of 2015, the NB submarket contain 3,481 units with an average occupancy of 94.0% and an average monthly rental rate of $1.21/SF. The appraisal notes that there are two projects in the development pipeline within the NB submarket for a total of 418 units, one of which has begun its initial lease-up (Creekside Vue Luxury Apartments). Both of the projects in the development pipeline will be Class “A” properties.
Comparable rental properties to the Landmark Gardens & Lofts Apartments Property are shown in the table below:
| Competitive Property Summary | ||||||
| Property Name/Address | Property Size (Units) | Property Size (SF) | Year Built | Occ. | Average Units Size (SF) | Average Monthly Rent per Unit |
Avenues at Creekside | 395 | 382,240 | 2013 | 97% | 973 | $1,202 |
Creekside Vue Luxury Apartments(1) | 150 | 134,196 | 2015 | 14% | 940 | $1,212 |
Mission Hill | 187 | 141,409 | 2013 | 98% | 756 | $1,009 |
Ranch at the Guadalupe | 184 | 150,800 | 2013 | 96% | 820 | $1,055 |
The Villas at Sundance | 252 | 234,666 | 2012 | 95% | 931 | $1,152 |
Westshore Colony | 204 | 179,136 | 1998 | 95% | 878 | $1,117 |
Agave Riverwalk(1) | 350 | 288,661 | 2015 | 9% | 825 | $1,774 |
River House(1) | 261 | 252,025 | 2014 | 82% | 795 | $1,544 |
Source:Appraisal
| (1) | These properties are in their lease up periods. |
| This is not a research report and was not prepared by the Underwriters’ research departments. Please see additional important information and qualifications at the end of this Term Sheet. |
| T-113 |
| MSBAM 2016-C28 | Landmark Gardens & Lofts Apartments |
Operating History and Underwritten Net Cash Flow.The following table presents certain information relating to the historical operating performance and the Underwritten Net Cash Flow at the Landmark Gardens & Lofts Apartments Property:
| Cash Flow Analysis | ||||||||||||
| 2012 | 2013 | 2014 | 9/30/2015 TTM | UW | UW Per Unit | |||||||
| Base Rent | $4,242,845 | $4,425,641 | $4,453,040 | $4,486,257 | $4,532,184 | $15,628 | ||||||
| Total Recoveries | $0 | $0 | $0 | $0 | $0 | $0 | ||||||
| Total Other Income(1) | $379,595 | $391,571 | $418,820 | $441,702 | $441,702 | $1,523 | ||||||
| Less Discounts Concessions | $30,457 | $32,178 | $44,895 | $23,662 | $23,662 | $82 | ||||||
| Less Vacancy & Credit Loss | $398,796 | $591,430 | $494,971 | $334,141 | $271,931 | $938 | ||||||
| Effective Gross Income | $4,193,187 | $4,193,604 | $4,331,994 | $4,570,156 | $4,678,293 | $16,132 | ||||||
| Total Operating Expenses | $1,825,818 | $1,934,035 | $1,998,799 | $2,027,489 | $2,125,354 | $7,329 | ||||||
| Net Operating Income | $2,367,369 | $2,259,569 | $2,333,195 | $2,542,667 | $2,552,939 | $8,803 | ||||||
| Capital Expenditures | $0 | $0 | $0 | $0 | $72,500 | $250 | ||||||
| Net Cash Flow | $2,367,369 | $2,259,569 | $2,333,195 | $2,542,667 | $2,480,439 | $8,553 | ||||||
| Occupancy % | 92.8% | 90.9% | 91.9% | 92.4%(2) | 94.0% | |||||||
| NOI DSCR | 1.25x | 1.19x | 1.23x | 1.34x | 1.35x | |||||||
| NCF DSCR | 1.25x | 1.19x | 1.23x | 1.34x | 1.31x | |||||||
| NOI Debt Yield | 7.8% | 7.4% | 7.7% | 8.3% | 8.4% | |||||||
| NCF Debt Yield | 7.8% | 7.4% | 7.7% | 8.3% | 8.1% | |||||||
| (1) | Historical Total Other Income included water reimbursements, parking income and other miscellaneous income. |
| (2) | Occupancy % as of October 15, 2015. |
| This is not a research report and was not prepared by the Underwriters’ research departments. Please see additional important information and qualifications at the end of this Term Sheet. |
| T-114 |
(THIS PAGE INTENTIONALLY LEFT BLANK)
| This is not a research report and was not prepared by the Underwriters’ research departments. Please see additional important information and qualifications at the end of this Term Sheet. |
| T-115 |
| MSBAM 2016-C28 | Le Meridien Cambridge MIT |
| Mortgage Loan No. 12 – Le Meridien Cambridge MIT |
| Mortgage Loan Information | Mortgaged Property Information | ||||||
| Mortgage Loan Seller: | BANA | Single Asset/Portfolio: | Single Asset | ||||
| Original Balance(1): | $30,000,000 | Location: | Cambridge, MA 02139 | ||||
| Cut-off Date Balance(1): | $30,000,000 | General Property Type: | Hospitality | ||||
| % of Initial Pool Balance: | 3.1% | Detailed Property Type: | Full Service | ||||
| Loan Purpose: | Acquisition | Title Vesting: | Leasehold | ||||
| Sponsor: | Kui Cai | Year Built/Renovated: | 1998/2009 | ||||
| Mortgage Rate: | 4.933% | Size: | 210 Rooms | ||||
| Note Date: | 11/25/2015 | Cut-off Date Balance per Unit(1): | $343,810 | ||||
| First Payment Date: | 1/1/2016 | Maturity Date Balance per Unit(1): | $328,886 | ||||
| Maturity Date: | 12/1/2020 | Property Manager: | Merritt Hospitality, LLC | ||||
| Original Term to Maturity: | 60 months | ||||||
| Original Amortization Term: | 360 months | Underwriting and Financial Information | |||||
| IO Period: | 24 months | UW NOI: | $8,036,893 | ||||
| Seasoning: | 2 months | UW NOI Debt Yield(1): | 11.1% | ||||
| Prepayment Provisions(2): | LO (26); DEF (30); O (4) | UW NOI Debt Yield at Maturity(1): | 11.6% | ||||
| Lockbox/Cash Mgmt Status: | Hard/Springing | UW NCF DSCR(1): | 1.55x (P&I) 1.98x (IO) | ||||
| Additional Debt Type: | Pari passu | Most Recent NOI: | $8,027,697 (10/31/2015 TTM) | ||||
| Additional Debt Balance: | $42,200,000 | 2nd Most Recent NOI: | $7,922,918 (12/31/2014) | ||||
| Future Debt Permitted (Type): | No (N/A) | 3rd Most Recent NOI: | $6,619,112 (12/31/2013) | ||||
| Reserves(3) | Most Recent Occupancy: | 90.8% (10/31/2015) | |||||
| Type | Initial | Monthly | Cap | 2nd Most Recent Occupancy: | 91.5% (12/31/2014) | ||
| RE Tax: | $177,680 | $88,840 | N/A | 3rd Most Recent Occupancy: | 88.5% (12/31/2013) | ||
| Insurance: | $0 | Springing | N/A | Appraised Value (as of): | $106,000,000 (10/1/2015) | ||
| Recurring Replacements: | $0 | $0 | N/A | Cut-off Date LTV Ratio(1) (4): | 68.1% | ||
| Other: | $3,607,284 | Springing | N/A | Maturity Date LTV Ratio(1) (4): | 65.2% | ||
| Sources and Uses | ||||||
| Sources | Proceeds | % of Total | Uses(5) | Proceeds | % of Total | |
| Loan Amount(1): | $72,200,000 | 66.9% | Purchase Price: | $103,250,000 | 95.7% | |
| Borrower Equity | $35,716,223 | 33.1% | Reserves: | $3,784,964 | 3.5% | |
| Closing Costs: | $881,259 | 0.8% | ||||
| Total Sources: | $107,916,223 | 100.0% | Total Uses: | $107,916,223 | 100.0% | |
| (1) | The Le Meridien Cambridge MIT Mortgage Loan is a part of the Le Meridien Cambridge MIT Whole Loan, which is comprised of threepari passunotes with an aggregate original principal balance of $72,200,000. The Cut-off Date Balance per Unit, Maturity Date Balance per Unit, UW NCF DSCR, UW NOI Debt Yield, UW NOI Debt Yield at Maturity, Cut-off Date LTV Ratio and Maturity Date LTV Ratio numbers presented above are based on the Le Meridien Cambridge MIT Whole Loan. |
| (2) | Defeasance is permitted at any time on or after the end of the two-year period commencing on the closing date of the securitization of the last Le Meridien Cambridge MIT promissory note to be securitized. |
| (3) | The Le Meridien Cambridge MIT Borrower deposited $3,077,284 for furniture, fixtures and equipment required by the current Property Improvement Plan (“PIP”) and is required to deposit monthly for any future PIP as required by any franchisor. The Le Meridien Cambridge MIT Borrower deposited $450,000 to a seasonality reserve and is required to deposit monthly during the months of March through November an amount which if added to the underwritten net cash flow would result in a DSCR equal to 1.30x, less the amount then available in the seasonality reserve as of February 15th of each year, divided by nine. Additionally, the Le Meridien Cambridge MIT Borrower deposited $80,000 to a ground rent reserve, which is required to be disbursed and replenished monthly to pay the monthly ground rent due. |
| (4) | The Le Meridien Cambridge MIT Property has an “Upon Completion” appraised value as of October 1, 2016 of $113,000,000 assuming completion of the proposed renovations. The Upon Completion appraised value produces a Cut-off Date LTV of 63.9% and a Maturity Date LTV of 61.1% |
| (5) | The Le Meridien Cambridge MIT Borrower acquired the Le Meridien Cambridge MIT Property for a purchase price of $103,250,000. The seller is responsible for the cost of current renovations estimated at $2,605,148 and the Le Meridien Cambridge MIT Borrower is investing an additional approximately $3,077,284 for additional renovations. After such renovations, the Le Meridien Cambridge MIT Borrower’s cost basis will be approximately $107,034,964 including closing costs and reserves. |
The Mortgage Loan.The twelfth largest mortgage loan (the “Le Meridien Cambridge MIT Mortgage Loan”) is part of a whole loan (the “Le Meridien Cambridge MIT Whole Loan”) evidenced by threepari passu promissory notes in the aggregate original principal amount of $72,200,000 all of which are secured by a first priority leasehold mortgage encumbering the condominium interests in a full service hospitality property known as Le Meridien Cambridge MIT in Cambridge, Massachusetts (the “Le Meridien Cambridge MIT Property”). Promissory Note A-1 in the original principal amount of $30,000,000 represents the Le Meridien Cambridge MIT Mortgage Loan. Promissory Note A-2 in the original principal amount of $21,100,000 and Promissory Note A-3 in the original principal amount of $21,100,000, are currently held by Bank of American, National Association or an affiliate thereof and are expected to be contributed to one or more future securitization trusts (collectively, the “Le Meridien Cambridge MIT ServicedPari passu Companion Loan”). The Le Meridien Cambridge MIT Whole Loan is being serviced pursuant to the pooling and servicing agreement for the MSBAM 2016-C28 transaction. See “Description of the Mortgage Pool—The Whole Loans—The Serviced Pari passu Whole Loans—The Le Meridien Cambridge MITWhole Loan” and “Pooling and Servicing Agreement” in the Preliminary Prospectus. The proceeds of the Le Meridien Cambridge MIT Whole Loan, together with $35,716,223 cash equity from the Le Meridien Cambridge MIT Borrower, were used to acquire the Le Meridien Cambridge MIT Property, fund upfront reserves and pay closing costs.
| This is not a research report and was not prepared by the Underwriters’ research departments. Please see additional important information and qualifications at the end of this Term Sheet. |
| T-116 |
| MSBAM 2016-C28 | Le Meridien Cambridge MIT |
The Borrower and the Sponsor.The borrower is 20 Sidney Street, Cambridge, LLC (the “Le Meridien Cambridge MIT Borrower”), a special-purpose Delaware limited liability company, with at least two independent directors. The majority equity interest (80%) in the Le Meridien Cambridge MIT Borrower is held by Kui Cai, the Le Meridien Cambridge MIT Mortgage Loan sponsor. The non-recourse guarantor for the Le Meridien Cambridge MIT Mortgage Loan is Apollo Bright LLC, a Delaware limited liability company, wholly owned by Kui Cai.
Kui Cai is the co-founder and approximately 29% shareholder of Longfor Properties Co. Ltd. (SEHK: 960) which is one of China’s biggest property developers. Through his companies in the U.S., he owns a portfolio of seven hotels in addition to the Le Meridien Cambridge MIT: the Hilton Houston Westchase, Fullerton Marriott at California State University, Detroit Marriott Southfield, Atlanta Marriott Norcross, Hilton Atlanta Northeast, DoubleTree by Hilton Berkeley Marina and DoubleTree by Hilton Hotel Wilmington.
The Property.The Le Meridien Cambridge MIT Property is located at 20 Sidney Street with frontage on Sidney, Green and Franklin Streets in Cambridge, MA, approximately two miles from Boston and approximately four miles from Logan International Airport. Public transportation is provided by the MBTA Red Line to Boston at Central Square station, and MBTA Commuter Rail at Porter Square, in addition to numerous bus lines.
The Le Meridien Cambridge MIT Property consists of an 8-story, 210-room upper upscale full service hotel. The guestroom configuration consists of 185 standard double/double or king guestrooms that are 240 SF, eleven ADA rooms that are 304 SF, thirteen king suites that are 351 SF and one presidential suite that is 1,405 SF. All guestrooms feature flat-screen televisions, desks, lounge chairs, and complimentary Wi-Fi. The Le Meridien Cambridge MIT Property features a 150-seat restaurant and lounge serving three daily meals plus room service, approximately 17,725 SF of meeting space across eight meeting and ballrooms and a roof garden, concierge services, valet, a business center, fitness room, car rental desk and access to 138 parking spaces in the adjacent garage.
The Le Meridien Cambridge MIT Property was built in 1998 and was previously known as the Hotel @ MIT. In 2009 the Le Meridien Cambridge MIT Property completed renovations and refranchising at an estimated cost of approximately $7,530,000 ($35,857/room). The Le Meridien Cambridge MIT Property is currently undergoing a capital improvement plan estimated at $2,605,148 ($12,405/room) which includes renovations of the reception area, lobby and restaurant, which is the responsibility of the seller. Additionally, planned for completion by June, 2017, the Le Meridien Cambridge MIT Mortgage Loan sponsor is investing $3,077,284 ($14,654/room) in renovations to the guestrooms, guestroom bathrooms, corridors, elevators and meeting space, which amount has been reserved by the Le Meridien Cambridge MIT Borrower (see “—Escrows and Reserves” below).
The Le Meridien Cambridge MIT Property is located within a larger mixed-use development known as University Park at MIT, a 27-acre development adjacent to the MIT campus, containing ten research buildings, 674 residential units, retail uses and structured parking for 2,700 vehicles. The development is host to prominent institutions in the bioscience industry including Alkermes, Inc., Partners HealthCare System and Millennium Pharmaceuticals. There is currently a new building under development within University Park, which will be occupied by Millennium/Takeda featuring 250 SF of office space and retail, expected to be delivered in 2016.
The Le Meridien Cambridge MIT Property is a part of a mixed-use condominium structure known as the 20 Sidney Street Condominium comprised of a Hotel Unit (the Le Meridien Cambridge MIT Property), a Parking Unit and a Commercial Unit (operated as a grocery). Neither the Parking Unit nor the Commercial Unit is collateral for the Le Meridien Cambridge MIT Mortgage Loan. The Hotel Unit (and collateral for the Le Meridien Cambridge MIT Mortgage Loan) constitutes a 57% interest in the 20 Sidney Street Condominium and occupies floors one and floors three through eight of the building. Decisions made by the condominium require the unanimous vote of each unit owner (or leasehold owner).
The 20 Sidney Street Condominium units are subject to several ground leases with MIT. The ground lease encumbering the Hotel Unit (the Le Meridien Cambridge MIT Property) commenced on December 5, 2007, expires on February 13, 2072, and requires an annual base rent of $179,114 plus percentage rent equal to 4.5% of annual gross rooms revenue in excess of the percentage rent base (percentage rent base being currently equal to $145,814 and adjusting by 15% of any increase or decrease in the fixed debt service payment). The ground lease also requires that the use of the Hotel Unit must be by an “upscale” hotel or conference center and that MIT receive the right of first refusal in connection with any sale of the Hotel Unit.
The Le Meridien Cambridge MIT Property is currently subject to a franchise agreement with Starwood (M) International, Inc. and is operating under the Le Meridien brand. The franchise agreement is currently set to expire on December 4, 2027 with no extension options. The Le Meridien brand has existed since 1972, joined Starwood Hotels & Resorts in 2005 and currently operates over 100 hotels and resorts in 35 countries.
The Le Meridien Cambridge MIT Property generates approximately 75% of its room nights from transient demand and 25% from meeting and group business.
| Historical Occupancy, ADR, RevPAR | |||||||||
Competitive Set | Le Meridien Cambridge MIT | Penetration Factor | |||||||
| Year | Occupancy | ADR | RevPAR | Occupancy | ADR | RevPAR | Occupancy | ADR | RevPAR |
| 2010 | 78.7% | $180.55 | $142.10 | 83.8% | $188.43 | $157.97 | 106.5% | 104.4% | 111.2% |
| 2011 | 78.1% | $193.89 | $151.38 | 81.3% | $204.70 | $166.41 | 104.1% | 105.6% | 109.9% |
| 2012 | 79.8% | $207.74 | $165.72 | 87.1% | $215.33 | $187.55 | 109.2% | 103.7% | 113.2% |
| 2013 | 81.0% | $212.32 | $171.92 | 88.5% | $218.76 | $193.59 | 109.3% | 103.0% | 112.6% |
| 2014 | 79.9% | $236.61 | $188.98 | 91.5% | $236.57 | $216.36 | 114.5% | 100.0% | 114.5% |
| 10/31/2015 TTM | 82.4% | $248.64 | $204.89 | 90.8% | $255.08 | $231.73 | 110.2% | 102.6% | 113.1% |
Source: Industry Report
The Market.The Le Meridien Cambridge MIT Property is located in Cambridge, MA. Cambridge has a diverse commercial base including a large mall, hotels, and office and government buildings. Additionally Cambridge is considered one of the nation’s premier technology and pharmaceutical locations, largely supported by the presence of Harvard University, MIT and several laboratories. Cambridge had a second quarter 2015 unemployment rate of 3.0%, as compared to Boston’s 4.1% and the national rate of 5.3%.
Estimated 2014 population within a one-, three-, and five-mile radius of the Le Meridien Cambridge MIT Property was 67,017, 497,648, and 984,816, respectively. Estimated household income within a one-mile radius was $97,442.
| This is not a research report and was not prepared by the Underwriters’ research departments. Please see additional important information and qualifications at the end of this Term Sheet. |
| T-117 |
| MSBAM 2016-C28 | Le Meridien Cambridge MIT |
The Cambridge/Waltham lodging submarket has the highest occupancy rate and ADR among all Suburban Boston submarkets. As of the second quarter 2015, the Cambridge/Waltham submarket had an occupancy rate of 76.6% and ADR of $193.37, resulting in a RevPar of $148.06. The Cambridge/Waltham hospitality market’s RevPAR has grown year over year by at least 5.4% since 2010. The competitive market supply has remained flat since 2003 due to barriers to entry: when land is available for development in central Cambridge, the highest and best use is typically office, laboratory, residential or institutional. There are no directly competitive properties that are either proposed or under construction within the Cambridge/Waltham submarket.
Competitive properties to the Le Meridien Cambridge MIT Property are shown in the table below:
| Competitive Property Summary | |||||||
| Property Name | Year Opened | No. of Rooms | Transient Demand | Group Demand | 2014 Occupancy | 2014 ADR | 2014 RevPAR |
| Le Meridien Cambridge MIT (subject) | 1998 | 210 | 75% | 25% | 92% | $237 | $216.36 |
| Courtyard Boston Cambridge | 1966 | 203 | 80% | 20% | 87% | $189 | $164.43 |
| Doubletree Suites Hotel Boston | 1985 | 308 | 75% | 25% | 85% | $211 | $179.35 |
| Sheraton Hotel Commander | 1926 | 173 | 75% | 25% | 81% | $243 | $196.83 |
| Kimpton Hotel Marlowe | 2003 | 236 | 80% | 20% | 81% | $238 | $192.78 |
| Residence Inn Boston Cambridge Center | 1999 | 221 | 90% | 10% | 81% | $231 | $187.11 |
| Hyatt Regency Cambridge | 1976 | 470 | 60% | 40% | 78% | $210 | $163.80 |
| Marriott Boston Cambridge | 1986 | 433 | 60% | 40% | 82% | $252 | $206.64 |
| Royal Sonesta Cambridge | 1963 | 400 | 65% | 35% | 82% | $228 | $186.96 |
| Total/Weighted Average | 2,654 | 83% | $227 | $186.96 | |||
Source: Appraisal
Operating History and Underwritten Net Cash Flow. The following table presents certain information relating to the historical operating performance and the Underwritten Net Cash Flow at the Le Meridien Cambridge MIT Property:
| Cash Flow Analysis | |||||||||||||||||||
| 2009 | 2010 | 2011 | 2012 | 2013 | 2014 | 10/31/2015 TTM | UW | UW per Room | |||||||||||
| Occupancy(1) | 76.1% | 83.8% | 81.3% | 87.1% | 88.5% | 91.5% | 90.8% | 90.8% | |||||||||||
| ADR(1) | $183.60 | $188.43 | $204.70 | $215.33 | $218.76 | $236.57 | $255.11 | $255.11 | |||||||||||
| RevPAR(1) | $139.78 | $157.96 | $166.41 | $187.55 | $193.59 | $216.37 | $231.73 | $231.73 | |||||||||||
| Rooms Revenue | $10,713,892 | $12,108,120 | $12,755,612 | $14,415,095 | $14,838,714 | $16,584,339 | $17,761,851 | $17,761,851 | $84,580 | ||||||||||
| Food & Beverage | $4,974,973 | $5,114,174 | $4,697,878 | $4,403,783 | $4,407,531 | $4,617,656 | $4,327,030 | $4,327,030 | $20,605 | ||||||||||
| Other Income(2) | $170,527 | $651,409 | $383,718 | $202,836 | $177,274 | $186,364 | $123,001 | $123,001 | $586 | ||||||||||
| Total Revenue | $15,859,392 | $17,873,703 | $17,837,208 | $19,021,714 | $19,423,519 | $21,388,359 | $22,211,882 | $22,211,882 | $105,771 | ||||||||||
| Total Expenses | $11,074,718 | $11,371,201 | $11,555,970 | $12,185,260 | $12,804,407 | $13,465,441 | $14,184,185 | $14,174,989 | $67,500 | ||||||||||
| Net Op. Income | $4,784,674 | $6,502,502 | $6,281,238 | $6,836,455 | $6,619,112 | $7,922,918 | $8,027,697 | $8,036,893 | $38,271 | ||||||||||
| FF&E | $634,376 | $714,948 | $713,488 | $760,869 | $776,941 | $855,534 | $888,475 | $888,475 | $4,231 | ||||||||||
| Net Cash Flow | $4,150,299 | $5,787,554 | $5,567,749 | $6,075,586 | $5,842,171 | $7,067,384 | $7,139,222 | $7,148,418 | $34,040 | ||||||||||
| NOI DSCR | 1.04x | 1.41x | 1.36x | 1.48x | 1.43x | 1.72x | 1.74x | 1.74x | |||||||||||
| NCF DSCR | 0.90x | 1.25x | 1.21x | 1.32x | 1.27x | 1.53x | 1.55x | 1.55x | |||||||||||
| NOI Debt Yield | 6.6% | 9.0% | 8.7% | 9.5% | 9.2% | 11.0% | 11.1% | 11.1% | |||||||||||
| NCF Debt Yield | 5.7% | 8.0% | 7.7% | 8.4% | 8.1% | 9.8% | 9.9% | 9.9% | |||||||||||
| (1) | Occupancy, ADR and RevPAR figures have been taken from the Le Meridien Cambridge MIT sponsor-provided financial statements. |
| (2) | Other income includes telephone, internet, cancellation revenue and miscellaneous income. |
| This is not a research report and was not prepared by the Underwriters’ research departments. Please see additional important information and qualifications at the end of this Term Sheet. |
| T-118 |
(THIS PAGE INTENTIONALLY LEFT BLANK)
| This is not a research report and was not prepared by the Underwriters’ research departments. Please see additional important information and qualifications at the end of this Term Sheet. |
| T-119 |
| MSBAM 2016-C28 | DoubleTree by Hilton - Cleveland, OH |
| Mortgage Loan No. 13 – DoubleTree by Hilton - Cleveland, OH |
| Mortgage Loan Information | Mortgaged Property Information | ||||||
| Mortgage Loan Seller: | MSMCH | Single Asset/Portfolio: | Single Asset | ||||
| Original Balance: | $29,000,000 | Location: | Cleveland, OH 44114 | ||||
| Cut-off Date Balance: | $29,000,000 | General Property Type: | Hospitality | ||||
| % of Initial Pool Balance: | 3.0% | Detailed Property Type: | Full Service | ||||
| Loan Purpose: | Refinance | Title Vesting: | Fee | ||||
| Sponsor: | Hotel Group Opportunity Fund III, LLC | Year Built/Renovated: | 1974/2008 | ||||
| Mortgage Rate: | 5.2800% | Size: | 379 Rooms | ||||
| Note Date: | 1/26/2016 | Cut-off Date Balance per Unit: | $76,517 | ||||
| First Payment Date: | 3/1/2016 | Maturity Date Balance per Unit: | $63,611 | ||||
| Maturity Date: | 2/1/2026 | Property Manager: | THG Management NV, LLC | ||||
| Original Term to Maturity: | 120 months | (borrower-affiliated) | |||||
| Original Amortization Term: | 360 months | Underwriting and Financial Information | |||||
| IO Period: | 0 months | UW NOI: | $3,648,354 | ||||
| Seasoning: | 0 months | UW NOI Debt Yield: | 12.6% | ||||
| Prepayment Provisions: | LO (24); DEF (92); O (4) | UW NOI Debt Yield at Maturity: | 15.1% | ||||
| Lockbox/Cash Mgmt Status: | Hard/Springing | UW NCF DSCR: | 1.60x | ||||
| Additional Debt Type: | N/A | Most Recent NOI: | $3,709,292 (11/30/2015 TTM) | ||||
| Additional Debt Balance: | N/A | 2nd Most Recent NOI: | $3,647,658 (12/31/2014) | ||||
| Future Debt Permitted (Type): | No (N/A) | 3rd Most Recent NOI: | $3,548,387 (12/31/2013) | ||||
| Most Recent Occupancy: | 66.9% (11/30/2015) | ||||||
| Reserves | 2nd Most Recent Occupancy: | 69.2% (12/31/2014) | |||||
| Type | Initial | Monthly | Cap | 3rd Most Recent Occupancy: | 70.9% (12/31/2013) | ||
| RE Tax: | $29,707 | $29,707 | N/A | Appraised Value (as of): | $40,000,000 (1/1/2016) | ||
| Insurance: | $0 | Springing | N/A | Cut-off Date LTV Ratio: | 72.5% | ||
| Recurring Replacements: | $0 | $46,486 | N/A | Maturity Date LTV Ratio: | 60.3% | ||
| Sources and Uses | ||||||
| Sources | Proceeds | % of Total | Uses | Proceeds | % of Total | |
| Loan Amount: | $29,000,000 | 100.0% | Loan Payoff(1): | $19,028,192 | 65.6% | |
| Reserves: | $29,707 | 0.1% | ||||
| Closing Costs: | $543,702 | 1.9% | ||||
| Return of Equity: | $9,398,398 | 32.4% | ||||
| Total Sources: | $29,000,000 | 100.0% | Total Uses: | $29,000,000 | 100.0% | |
| (1) | Includes approximately $3.6 million of defeasance costs. |
The Mortgage Loan.The thirteenth largest mortgage loan (the “DoubleTree by Hilton - Cleveland, OH Mortgage Loan”) is evidenced by a promissory note in the original principal amount of $29,000,000 and secured by a first priority fee mortgage encumbering a full service hospitality property known as DoubleTree by Hilton - Cleveland, OH in Cleveland, Ohio (the “DoubleTree by Hilton - Cleveland, OH Property”). The proceeds of the DoubleTree by Hilton - Cleveland, OH Mortgage Loan were used to refinance existing debt (including payment of defeasance costs of approximately $3.6 million), fund reserves, pay closing costs and return equity to the sponsor.
The Borrower and the Sponsor. The borrower is Cami Hotel Investments II, LLC (the “DoubleTree by Hilton - Cleveland, OH Borrower”), a special-purpose Delaware limited liability company with two independent directors in its organizational structure. The DoubleTree by Hilton - Cleveland, OH Borrower is owned and controlled by Hotel Group Opportunity Fund III, LLC. Hotel Group Opportunity Fund III, LLC (the “DoubleTree by Hilton - Cleveland, OH Sponsor”) is a fund sponsored by The Hotel Group and THG Capital, LLC. The Hotel Group is a national hotel investment and management company located in Edmonds, WA, with an operations office in Franklin, TN and over 5,400 keys in more than 30 properties in 10 states. Since it was formed in 1984, The Hotel Group has managed and/or owned 115 properties in 26 states and has overseen design and development of over 45 new hotels, renovations of 50 hotels and acquisition, ownership and divestment of over 20 hotels.
The Property. The DoubleTree by Hilton - Cleveland, OH Property is a 17-story, 379-room, full-service hotel located on 1.74 acres in Cleveland, Ohio. The DoubleTree by Hilton - Cleveland, OH Property was originally constructed in 1974 as a Holiday Inn Select hotel and was subsequently acquired by the sponsor in 2007 and converted to its current flag following an approximately $17.3 million ($45,729.59/key) PIP covering all guestrooms and public areas of the hotel. Since the conversion to a DoubleTree by Hilton, additional capital expenditures have totaled approximately $2.9 million, including renovations to the elevators, pool deck, fitness center and patio, as well as upgrades to the guestroom soft goods.
The guestroom configuration at the DoubleTree by Hilton - Cleveland, OH Property comprises 194 double/queen guestrooms, 151 king guestrooms, 29 queen guestrooms and five suites. Standard guestroom amenities include a work area with chair, nightstand, dresser, sofa chair, LCD flat screen TV, mini-refrigerator and coffee maker. Facilities and amenities at the DoubleTree by Hilton - Cleveland, OH Property include the Stadium 3 Bar and Grille, which is open for breakfast, lunch and dinner, a Starbucks café, lobby sundry shop, a fitness center, an indoor swimming pool, a business center, self-
| This is not a research report and was not prepared by the Underwriters’ research departments. Please see additional important information and qualifications at the end of this Term Sheet. |
| T-120 |
| MSBAM 2016-C28 | DoubleTree by Hilton - Cleveland, OH |
service laundry facility, 10,389 SF of meeting space including a 5,685 SF grand ballroom, and 321 garage parking spaces. As of 2015, demand at the DoubleTree by Hilton - Cleveland, OH Property is approximately 60% commercial, 25% leisure and 15% meeting and group.
The DoubleTree by Hilton - Cleveland, OH Property is subject to a franchise agreement with DoubleTree Franchise LLC, which expires November 30, 2026.
| Historical Occupancy, ADR, RevPAR | |||||||||
Competitive Set | DoubleTree by Hilton - Cleveland, OH Property | Penetration Factor | |||||||
| Year | Occupancy | ADR | RevPAR | Occupancy | ADR | RevPAR | Occupancy | ADR | RevPAR |
| 2011 | 52.2% | $94.74 | $49.47 | 64.3% | $90.69 | $58.31 | 123.1% | 95.7% | 117.9% |
| 2012 | 66.5% | $106.37 | $70.74 | 70.8% | $98.21 | $69.50 | 106.4% | 92.3% | 98.2% |
| 2013 | 70.9% | $116.01 | $82.22 | 71.1% | $108.16 | $76.87 | 100.3% | 93.2% | 93.5% |
| 2014 | 64.5% | $128.50 | $82.88 | 69.2% | $112.39 | $77.79 | 107.3% | 87.5% | 93.9% |
| 11/30/2015 TTM | 67.0% | $139.77 | $93.61 | 66.9% | $120.83 | $80.82 | 99.9% | 86.4% | 86.3% |
Source:Industry Report
The Market. The DoubleTree by Hilton - Cleveland, OH Property is located in downtown Cleveland, Ohio on Lakeside Avenue. The DoubleTree by Hilton - Cleveland, OH Property is located approximately 3 blocks east of the Cleveland Convention Center, which underwent an approximately $465 million renovation and re-opened in July 2013. The center includes 225,000 SF of exhibit space, 35 meeting rooms and a 32,000 SF ballroom. As part of the renovation, the adjacent Global Center for Health Innovation opened in September 2014 and serves as a facility designed to serve practitioners, manufacturers and consumers in the health care industry. Tenants at the center include GE Healthcare, Philips Healthcare, Siemens and Cardinal Health. Other leisure demand generators in the immediate area include the Rock and Roll Hall of Fame, Horseshoe Casino, Quicken Loans Arena, home of the Cleveland Cavaliers, FirstEnergy Stadium, home of the Cleveland Browns, and Progressive Field, home of the Cleveland Indians. The hotel benefits from its location along Lakeside Avenue and easy accessibility from Ohio State Route 2 and Interstate 90, as well as the Cleveland Amtrak station, which is located directly north of the property. Cleveland is served by Cleveland Hopkins International Airport located approximately 13 miles southwest of the DoubleTree by Hilton - Cleveland, OH Property.
Competitive properties to the DoubleTree by Hilton - Cleveland, OH Property are shown in the table below:
Competitive Property Summary | ||||||||
| Property Name | Rooms | Year Opened | Commercial % | Meeting & Group % | Leisure % | Est. 2015 Occupancy | Est. 2015 ADR | Est. 2015 RevPAR |
| DoubleTree by Hilton - Cleveland, OH Property | 379 | 1974 | 60% | 15% | 25% | 68% | $120 | $81 |
| The Westin Cleveland Downtown | 484 | 1975 | 60% | 20% | 20% | 64% | $155 | $99 |
| Wyndham Cleveland at Playhouse Square | 205 | 1995 | 55% | 15% | 30% | 68% | $134 | $91 |
| Hampton Inn Cleveland Downtown | 194 | 1998 | 65% | 10% | 25% | 70% | $130 | $91 |
| Holiday Inn Express Cleveland Downtown | 141 | 1999 | 60% | 10% | 30% | 70% | $118 | $83 |
| Hilton Garden Inn Cleveland Downtown | 240 | 2002 | 60% | 15% | 25% | 68% | $136 | $92 |
| Total/Weighted Average | 1,643 | 67% | $135 | $91 | ||||
Source:Appraisal
| This is not a research report and was not prepared by the Underwriters’ research departments. Please see additional important information and qualifications at the end of this Term Sheet. |
| T-121 |
| MSBAM 2016-C28 | DoubleTree by Hilton - Cleveland, OH |
Operating History and Underwritten Net Cash Flow.The following table presents certain information relating to the historical operating performance and the Underwritten Net Cash Flow at the DoubleTree by Hilton - Cleveland, OH Property:
| Cash Flow Analysis | |||||||
| 2011 | 2012 | 2013 | 2014 | 11/30/2015 TTM | UW | UW per Room | |
| Occupancy | 64.1% | 70.5% | 70.9% | 69.2% | 66.9% | 66.9% | |
| ADR | $90.69 | $98.18 | $108.16 | $112.39 | $120.83 | $120.83 | |
| RevPAR | $58.15 | $69.26 | $76.66 | $77.79 | $80.82 | $80.82 | |
| Rooms Revenue | $8,044,489 | $9,607,712 | $10,604,756 | $10,761,072 | $11,180,892 | $11,180,892 | $29,501 |
| Food & Beverage | $2,345,075 | $2,428,512 | $2,208,672 | $2,081,951 | $2,029,268 | $2,029,268 | $5,354 |
| Other Income | $764,311 | $755,962 | $728,597 | $740,788 | $735,789 | $735,789 | $1,941 |
| Total Revenue | $11,153,875 | $12,792,186 | $13,542,025 | $13,583,811 | $13,945,949 | $13,945,949 | $36,797 |
| Total Expenses(1) | $8,543,950 | $9,516,891 | $9,993,638 | $9,936,153 | $10,236,657 | $10,297,595 | $27,170 |
| Net Op. Income | $2,609,925 | $3,275,295 | $3,548,387 | $3,647,658 | $3,709,292 | $3,648,354 | $9,626 |
| FF&E | $446,155 | $511,687 | $541,681 | $543,352 | $558,653 | $557,838 | $1,472 |
| Net Cash Flow | $2,163,770 | $2,763,608 | $3,006,706 | $3,104,306 | $3,150,639 | $3,090,516 | $8,154 |
| NOI DSCR | 1.35x | 1.70x | 1.84x | 1.89x | 1.92x | 1.89x | |
| NCF DSCR | 1.12x | 1.43x | 1.56x | 1.61x | 1.63x | 1.60x | |
| NOI Debt Yield | 9.0% | 11.3% | 12.2% | 12.6% | 12.8% | 12.6% | |
| NCF Debt Yield | 7.5% | 9.5% | 10.4% | 10.7% | 10.9% | 10.7% | |
(1) Underwritten Total Expenses are based on 11/30/2015 TTM with the exception of Underwritten Real Estate Taxes, which is based on 2015 actual tax bills.
| This is not a research report and was not prepared by the Underwriters’ research departments. Please see additional important information and qualifications at the end of this Term Sheet. |
| T-122 |
(THIS PAGE INTENTIONALLY LEFT BLANK)
| This is not a research report and was not prepared by the Underwriters’ research departments. Please see additional important information and qualifications at the end of this Term Sheet. |
| T-123 |
| MSBAM 2016-C28 | 40 West Plaza |
| Mortgage Loan No. 14 – 40 West Plaza |
| Mortgage Loan Information | Property Information | ||||||
| Mortgage Loan Seller: | MSMCH | Single Asset/Portfolio: | Single Asset | ||||
| Original Balance: | $28,500,000 | Location: | Catonsville, MD 21228 | ||||
| Cut-off Date Balance: | $28,500,000 | General Property Type: | Retail | ||||
| % of Initial Pool Balance: | 3.0% | Detailed Property Type: | Anchored | ||||
| Loan Purpose: | Refinance | Title Vesting: | Fee | ||||
| Sponsor: | Ronald Haft | Year Built/Renovated: | 1964/1989, 1996, 2013 | ||||
| Mortgage Rate: | 5.280% | Size(2): | 203,406 SF | ||||
| Note Date: | 1/26/2016 | Cut-off Date Balance per Sq Ft: | $140 | ||||
| First Payment Date: | 3/1/2016 | Maturity Date Balance per Sq Ft: | $119 | ||||
| Maturity Date: | 2/1/2028 | Property Manager: | Combined Properties, Incorporated (borrower-related) | ||||
| Original Term to Maturity: | 144 months | ||||||
| Original Amortization Term: | 360 months | ||||||
| IO Period: | 36 months | Underwriting and Financial Information | |||||
| Seasoning: | 0 months | UW NOI: | $2,576,041 | ||||
| Prepayment Provisions: | LO (24); DEF (95); O (25) | UW NOI Debt Yield: | 9.0% | ||||
| Lockbox/Cash Mgmt Status: | Hard/Springing | UW NOI Debt Yield at Maturity: | 10.6% | ||||
| Additional Debt Type: | N/A | UW NCF DSCR: | 1.58x (IO) 1.28x (P&I) | ||||
| Additional Debt Balance: | N/A | Most Recent NOI: | $1,898,743 (9/30/2015 TTM) | ||||
| Future Debt Permitted (Type): | No (N/A) | 2nd Most Recent NOI: | $1,722,065 (12/31/2014) | ||||
| Reserves(1) | 3rd Most Recent NOI: | $1,658,368 (12/31/2013) | |||||
| Type | Initial | Monthly | Cap | Most Recent Occupancy(2): | 99.3% (1/20/2016) | ||
| RE Tax: | $107,884 | $26,971 | N/A | 2nd Most Recent Occupancy: | 80.4% (12/31/2014) | ||
| Insurance: | $0 | Springing | N/A | 3rd Most Recent Occupancy: | 77.4% (12/31/2013) | ||
| TI/LC: | $0 | $8,849 | $530,940 | Appraised Value (as of): | $39,100,000 (10/16/2015) | ||
| Capital Expenditures: | $0 | Springing | N/A | Cut-off Date LTV Ratio: | 72.9% | ||
| Other(1): | $3,210,172 | $0 | N/A | Maturity Date LTV Ratio: | 62.1% | ||
| Sources and Uses | ||||||
| Sources | Proceeds | % of Total | Uses | Proceeds | % of Total | |
| Loan Amount: | $28,500,000 | 100.0% | Loan Payoff: | $20,873,120 | 73.2% | |
| Reserves: | $3,318,056 | 11.6% | ||||
| Closing Costs: | $556,412 | 2.0% | ||||
| Return of Equity: | $3,752,412 | 13.2% | ||||
| Total Sources: | $28,500,000 | 100.0% | Total Uses: | $28,500,000 | 100.0% | |
| (1) | Other reserves is comprised of a Regency Furniture reserve fund of $2,659,034 (based on estimated costs of tenant improvements, leasing commissions, landlord work for entry and an economic holdback), a Regency Furniture occupancy reserve fund of $540,966 (based on rent abatements and concessions) and an outstanding reserve fund of $10,172 for tenant improvement allowances and leasing commissions due to Nature Care. If Regency Furniture or a replacement tenant acceptable to lender in its sole discretion is in occupancy and paying full rent by eighteen months after the origination date, the two Regency Furniture reserve funds are required to be released to the borrower. If such conditions are not satisfied by such date, with respect to each of such reserves, the lender may in its discretion elect (i) to retain the related funds as loan collateral, (ii) to transfer the related funds to a rollover reserve or (iii) to apply the related funds to prepay the mortgage loan (in which case such prepayment is subject to a prepayment fee equal to the greater of 1.00% of the amount prepaid and a yield maintenance premium). |
| (2) | Excludes 8,980 SF that is considered unleaseable and is not included in occupancy. |
The Mortgage Loan.The fourteenth largest mortgage loan (the “40 West Plaza Mortgage Loan”) is evidenced by a promissory note in the original principal amount of $28,500,000 secured by a first priority fee and leasehold mortgage encumbering an anchored retail community shopping center comprising 203,406 SF located in Catonsville, MD (the “40 West Plaza Property”). The proceeds of the 40 West Plaza Mortgage Loan were primarily used to refinance a previous mortgage loan secured by the 40 West Plaza Property in the original principal amount of approximately $20.9 million, to pay closing costs, fund upfront reserves and to return equity to the 40 West Plaza Borrower.
The Borrower and the Sponsor.The borrower is Forty West LLC (the “40 West Plaza Borrower”), a single-purpose Delaware limited liability company structured to be bankruptcy remote, with two independent directors. 40 West Plaza Borrower is solely owned by Forty West Mezz Borrower LLC, which is solely owned by Combined Properties Limited Partnership (“CPLP”). CPLP is majority owned by entities controlled by Ronald Haft, the sponsor, and the non-recourse carveout guarantor is Combined Holding Company LLC. Ronald Haft is founder and Chairman of Combined Properties, Incorporated (“CPI”). Founded in 1984, CPI is a comprehensive real estate firm headquartered in Washington, DC, with a full-service office in Beverly Hills, California. CPI has developed a $1 billion portfolio comprised of 44 properties totaling 5 million square feet.
The Property.The 40 West Plaza Property is a community shopping center that contains 203,406 of SF leasable area on an 18.3-acre parcel of land with 969 parking spaces (4.6 per 1,000 SF). The 40 West Plaza Property is located along the south side of Baltimore National Pike (U.S. Route 40), west of Rolling Road, in the Catonsville area of southwestern Baltimore County. U.S. Route 40 is a commuter corridor in the Baltimore region. The 40 West Plaza Property was completed in 1964, was renovated in 1989, 1996 and 2013. The 40 West Plaza Property is anchored by ALDI, Regency Furniture (which is not in occupancy and is in a free rent period), Office Depot, PetSmart and Seton Medical Group. The 40 West Plaza Property
| This is not a research report and was not prepared by the Underwriters’ research departments. Please see additional important information and qualifications at the end of this Term Sheet. |
| T-124 |
| MSBAM 2016-C28 | 40 West Plaza |
contains three retail strip buildings and two outparcels fronting U.S. Route 40 (Baltimore National Turnpike) improved with freestanding restaurants including McDonalds and Applebee’s.The 40 West Plaza Borrower’s interest in the 40 West Plaza Property is a leasehold interest; however, the fee owner, CPLP, which indirectly owns 100% of the equity interest in the 40 West Plaza Borrower, has subjected its fee interest to the mortgage.
As of January 20, 2016, the 40 West Plaza Property was 99.3% occupied by 20 tenants. The following table presents certain information relating to the leases at the 40 West Plaza Property. There are no tenants currently paying rent based upon a percentage of their sales in lieu of base rent.
| Tenant Summary(1) | |||||||||
| Tenant Name | Credit Rating (Fitch/Moody’s/S&P)(2) | Tenant SF | Approximate % of SF | Annual UW Rent | Annual UW Rent PSF(3) | Sales (12/31/2014)(4) | Occ. Cost %(5) | Lease Expiration | |
| $ | PSF | ||||||||
| Major Tenants | |||||||||
| Regency Furniture(6) | NR/NR/NR | 38,817 | 19% | $349,353 | $9.00 | N/A | N/A | N/A | 1/31/2027 |
| Seton Medical Group | NR/NR/NR | 38,124 | 19% | $707,963 | $18.57 | N/A | N/A | N/A | 4/30/2025 |
| PetSmart | NR/NR/NR | 30,000 | 15% | $378,300 | $12.61 | $5,970,000 | $199 | 6.3% | 1/31/2023 |
| Office Depot(7) | NR/NR/NR | 19,576 | 10% | $251,552 | $12.85 | $3,171,312 | $162 | 7.9% | 4/30/2022 |
| ALDI | NR/NR/NR | 18,486 | 9% | $146,584 | $7.93 | N/A | N/A | N/A | 2/28/2023 |
| Dollar Tree | NR/NR/NR | 15,334 | 8% | $141,948 | $9.26 | $2,806,122 | $183 | 5.1% | 5/31/2020 |
| Subtotal/Wtd. Avg. | 160,337 | 79% | $1,975,700 | $12.32 | $11,947,434 | $184 | 6.5% | ||
| Outparcels | |||||||||
| Applebees | NR/NR/NR | 4,665 | 2% | $50,971 | $10.93 | $3,550,065 | $761 | 1.4% | 6/30/2020 |
| McDonalds | BBB+/Baa1/BBB+ | 3,461 | 2% | $57,032 | $16.48 | $1,474,386 | $426 | 3.9% | 6/30/2017 |
| Subtotal/Wtd. Avg. | 8,126 | 4% | $108,003 | $13.29 | $5,024,451 | $618 | 2.1% | ||
| Top 10 In-Line(8) | |||||||||
| Five Below | NR/NR/NR | 7,500 | 4% | $131,250 | $17.50 | $2,205,000 | $294 | 6.0% | 3/31/2021 |
| Phenix Salon Suites | NR/NR/NR | 6,300 | 3% | $100,800 | $16.00 | N/A | N/A | N/A | 4/30/2022 |
| Davidson Beauty Supply | NR/NR/NR | 2,408 | 1% | $76,430 | $31.74 | $1,256,976 | $522 | 6.1% | 10/03/2021 |
| Lima’s Chicken | NR/NR/NR | 4,500 | 2% | $74,160 | $16.48 | N/A | N/A | N/A | 12/31/2019 |
| Lady Nails | NR/NR/NR | 1,800 | 1% | $55,249 | $30.69 | $190,800 | $106 | 29.0% | 1/31/2020 |
| Pho Van | NR/NR/NR | 1,800 | 1% | $44,937 | $24.97 | $190,800 | $106 | 23.6% | 5/31/2018 |
| Jackson Hewitt Tax | NR/NR/NR | 1,350 | 1% | $40,330 | $29.87 | N/A | N/A | N/A | 4/30/2018 |
| Naturecare Pharmacy | NR/NR/NR | 1,800 | 1% | $39,600 | $22.00 | N/A | N/A | N/A | 8/31/2025 |
| Sally Beauty Supply | NR/NR/NR | 1,725 | 1% | $36,225 | $21.00 | $565,800 | $328 | 6.4% | 12/31/2017 |
| Lendmark Financial | NR/NR/NR | 1,350 | 1% | $35,805 | $26.52 | N/A | N/A | N/A | 6/30/2019 |
| Subtotal/Wtd. Avg. | 30,533 | 15% | $634,786 | $20.79 | $4,409,376 | $289 | 7.8% | ||
| Other Tenants | 3,060 | 2% | $65,014 | $21.25 | $290,250(9) | ||||
| Vacant Space | 1,350 | 1% | $0 | $0.00 | $0 | ||||
| Total/Wtd. Avg. | 203,406 | 100% | $2,783,503 | $13.78 | $21,671,511 | ||||
| (1) | Information is based on the underwritten rent roll. |
| (2) | Certain ratings are those of the parent company whether or not the parent guarantees the lease. |
| (3) | Wtd. Avg. Annual UW Rent PSF excludes vacant space. |
| (4) | Sales $ and Sales PSF only include tenants reporting sales. Subtotal is based on tenants reporting sales. |
| (5) | Occ. Cost % is based on Annual UW Rent. Subtotal is based on tenants reporting sales. |
| (6) | Regency Furniture is not yet in occupancy. The tenant is entitled to free rent for a period of 10 months after permits for entry relocation are obtained. The rent commencement date is contingent on various events and is estimated to occur in January 2017. |
| (7) | Office Depot has the right to terminate its lease with 90 days’ notice if sales for the period from May 1, 2016 through April 30, 2017 are less than $3,500,000. |
| (8) | Top in-line tenants are ordered by UW Base Rent. |
| (9) | Sales amount is for the tenant China Haste only. |
| This is not a research report and was not prepared by the Underwriters’ research departments. Please see additional important information and qualifications at the end of this Term Sheet. |
| T-125 |
| MSBAM 2016-C28 | 40 West Plaza |
The following table presents certain information relating to the lease rollover schedule at the 40 West Plaza Property:
| Lease Rollover Schedule(1)(2) | ||||||||
| Year | # of Leases Rolling | SF Rolling | UW Rent PSF Rolling | Approx. % of Total SF Rolling | Approx. Cumulative % of SF Rolling | Total UW Rent Rolling | Approx. % of Total Rent Rolling | Approx. Cumulative % of Total Rent Rolling |
| MTM | 0 | 0 | $0.00 | 0% | 0% | $0 | 0% | 0% |
| 2016 | 1 | 1,710 | $19.57 | 1% | 1% | $33,465 | 1% | 1% |
| 2017 | 2 | 5,186 | $17.98 | 3% | 3% | $93,257 | 3% | 5% |
| 2018 | 2 | 3,150 | $27.07 | 2% | 5% | $85,267 | 3% | 8% |
| 2019 | 2 | 5,850 | $18.80 | 3% | 8% | $109,965 | 4% | 12% |
| 2020 | 4 | 23,149 | $12.08 | 11% | 19% | $279,717 | 10% | 22% |
| 2021 | 2 | 9,908 | $20.96 | 5% | 24% | $207,680 | 7% | 29% |
| 2022 | 2 | 25,876 | $13.62 | 13% | 37% | $352,352 | 13% | 42% |
| 2023 | 2 | 48,486 | $10.83 | 24% | 61% | $524,884 | 19% | 61% |
| 2024 | 0 | 0 | $0.00 | 0% | 61% | $0 | 0% | 61% |
| 2025 | 2 | 39,924 | $18.72 | 20% | 80% | $747,563 | 27% | 87% |
| 2026 | 0 | 0 | $0.00 | 0% | 80% | $0 | 0% | 87% |
| 2027 & Beyond | 1 | 38,817 | $9.00 | 19% | 99% | $349,353 | 13% | 100% |
| Vacant | 0 | 1,350 | $0.00 | 1% | 100% | $0 | 0% | 100% |
| Total/Wtd. Avg. | 20 | 203,406 | $13.78 | 100% | $2,783,503 | 100% | ||
| (1) | Information is based on the underwritten rent roll. |
| (2) | Certain tenants may have lease termination options that are exercisable prior to the originally stated expiration date of the subject lease and that are not considered in the lease rollover schedule. |
The Market. The 40 West Plaza Property is located in in Baltimore County, which is part of the Baltimore-Columbia-Towson Metropolitan Statistical Area (MSA), which is commonly known as the Baltimore MSA. The Baltimore MSA is one of the twenty-five largest metropolitan statistical areas in the United States with an estimated population of approximately 2.8 million. The 40 West Plaza Property is located along the south side of Baltimore National Pike (U.S. Route 40), west of Rolling Road, in the Catonsville area of southwestern Baltimore County. The local market area is almost completely built-out, with only a few in-fill sites remaining. There are a few office buildings along Baltimore National Pike, but most office development is located in planned business parks. The largest retail center in the area is the Security Square Mall, an approximately 1.04 million square foot super regional mall located about two miles north of the subject at the southeast quadrant of Security Road and Rolling Road. Security Square Mall opened in 1972, expanded in 1988, and was last renovated in 1998. Anchor tenants include Macy’s, Sears and a Burlington Coat Factory.
According to the appraisal, the estimated 2015 population within a one-, three- and five-mile radius of the 40 West Plaza Property is 12,983, 91,284 and 261,463, respectively. The estimated 2015 average household income within a one-, three- and five-mile radius is $94,977, $92,928 and $86,982, respectively.
The 40 West Plaza Property is located within the West/Southwest Baltimore County retail submarket. As of second quarter 2015, the retail properties within the submarket had an overall vacancy rate of 8.1% and an average asking annual lease rate of $21.75 PSF. According to the appraisal, the submarket contains approximately 8.1 million SF of retail space.
| This is not a research report and was not prepared by the Underwriters’ research departments. Please see additional important information and qualifications at the end of this Term Sheet. |
| T-126 |
| MSBAM 2016-C28 | 40 West Plaza |
The following table presents recent occupancy and leasing data at competitive retail centers with respect to the 40 West Plaza Property:
| Competitive Property Summary(1) | |||||||||||||
| Property Name | Type | Year Built/Renovated | Size (SF) | Total Occupancy | Tenants | Distance to Subject (mi.) | |||||||
| Primary Competition | |||||||||||||
| 40 West Plaza | Community Center | 1964/1989, 1996, 2013 | 203,406(1) | 99.3%(1) | Regency Furniture, Office Depot, PetSmart, Seton Medical Group | N/A | |||||||
| Pike Park Plaza | Community Center | 1955/1993 | 163,547 | 87.6% | Sports Authority, Gavigan’s Furniture | 0.1 | |||||||
| One Mile West | Community Center | 1993/2003 | 194,246 | 100.0% | Lotte Plaza | 0.2 | |||||||
| 40 West Shopping Center | Community Center | 1964/1995 | 133,592 | 96.6% | H Mart (supermarket) | 0.5 | |||||||
| Westpark Shopping Center | Convenience/Strip Center | 1986/N/A | 72,254 | 96.0% | N/A | 0.5 | |||||||
| Giant Food Plaza | Community Center | 1969/1991 | 204,498 | 100.0% | Giant Food, Walmart | 0.8 | |||||||
| Secondary Competition | |||||||||||||
| Rolling Road Plaza | Convenience/Strip Center | 1971/1994 | 63,729 | 88.6% | Cort Furniture | 1.0 | |||||||
| Westview Shopping Center | Power Center | 1958/2003 | 789,935 | 100.0% | Sam’s Club, Lowe’s, Value City Furniture | 3.0 | |||||||
| Ingleside Shopping Center | Neighborhood Center | 1957/1996 | 119,363 | 92.9% | Safeway, RiteAid | 3.5 | |||||||
| Total/Wtd. Avg.(2) | 1,741,164 | 97.5% | |||||||||||
Source:Appraisal
| (1) | Information is based on the underwritten rent roll. |
| (2) | Total/Wtd. Avg. excludes the 40 West Plaza Property. |
Operating History and Underwritten Net Cash Flow.The following table presents certain information relating to the historical operating performance and the Underwritten Net Cash Flow at the 40 West Plaza Property:
| Cash Flow Analysis | ||||||||||||
| 2012 | 2013 | 2014 | 9/30/2015 TTM | UW | UW PSF | |||||||
| Base Rent | $2,030,599 | $1,862,519 | $1,918,901 | $2,058,754 | $2,818,603 | $13.86 | ||||||
| Total Recoveries | $600,363 | $523,723 | $594,237 | $657,569 | $691,799 | $3.40 | ||||||
| Other Income | $37,424 | $36,328 | $26,124 | $16,222 | $26,200 | $0.13 | ||||||
| Less Discount Concessions | $77,533 | $56,090 | $0 | $3,150 | $0 | $0.00 | ||||||
| Less Vacancy & Credit Loss | $0 | $0 | $0 | $0 | $210,624 | $1.04 | ||||||
| Effective Gross Income | $2,590,854 | $2,366,480 | $2,539,262 | $2,729,395 | $3,325,977 | $16.35 | ||||||
| Total Operating Expenses | $606,362 | $708,112 | $817,197 | $830,652 | $749,937 | $3.69 | ||||||
| Net Operating Income | $1,984,492 | $1,658,368 | $1,722,065 | $1,898,743 | $2,576,041(1) | $12.66 | ||||||
| Capital Expenditures | $0 | $0 | $0 | $0 | $42,477 | $0.21 | ||||||
| TI/LC | $0 | $0 | $0 | $0 | $116,812 | $0.57 | ||||||
| Net Cash Flow | $1,984,492 | $1,658,368 | $1,722,065 | $1,898,743 | $2,416,751 | $11.88 | ||||||
| Occupancy % | 70.5% | 77.4% | 80.4% | 99.3% | 94.0% | |||||||
| NOI DSCR | 1.05x | 0.88x | 0.91x | 1.00x | 1.36x | |||||||
| NOI DSCR (IO) | 1.30x | 1.09x | 1.13x | 1.24x | 1.69x | |||||||
| NCF DSCR | 1.05x | 0.88x | 0.91x | 1.00x | 1.28x | |||||||
| NCF DSCR (IO) | 1.30x | 1.09x | 1.13x | 1.24x | 1.58x | |||||||
| NOI Debt Yield | 7.0% | 5.8% | 6.0% | 6.7% | 9.0% | |||||||
| NCF Debt Yield | 7.0% | 5.8% | 6.0% | 6.7% | 8.5% | |||||||
| (1) | Underwritten NOI increased from 9/30/2015 TTM due to the execution of the Regency Furniture lease (19.1% of NRA) and the Seton Medical lease (18.7% of NRA) which began in February 2015 and April 2015, respectively. |
| This is not a research report and was not prepared by the Underwriters’ research departments. Please see additional important information and qualifications at the end of this Term Sheet. |
| T-127 |
| MSBAM 2016-C28 | Solar Plaza & Sunbelt Professional Centre |
| Mortgage Loan No. 15 – Solar Plaza & Sunbelt Professional Centre |
| Mortgage Loan Information | Property Information | ||||||
| Mortgage Loan Seller: | MSMCH | Single Asset/Portfolio: | Portfolio | ||||
| Original Balance: | $27,950,000 | Location: | Oxnard, CA 93030 | ||||
| Cut-off Date Balance: | $27,950,000 | General Property Type: | Office | ||||
| % of Initial Pool Balance: | 2.9% | Detailed Property Type: | Suburban | ||||
| Loan Purpose: | Acquisition | Title Vesting: | Fee | ||||
| Sponsor: | Nasch Properties | Year Built/Renovated: | 2008; 2001; 2002/N/A | ||||
| Mortgage Rate: | 4.62500% | Size: | 192,926 SF | ||||
| Note Date: | 12/10/2015 | Cut-off Date Balance per Sq Ft: | $145 | ||||
| First Payment Date: | 2/1/2016 | Maturity Date Balance per Sq Ft: | $124 | ||||
| Maturity Date: | 1/1/2026 | Property Manager: | Greenbrier Properties, Inc. | ||||
| Original Term to Maturity: | 120 months | ||||||
| Original Amortization Term: | 360 months | ||||||
| IO Period: | 24 months | Underwriting and Financial Information | |||||
| Seasoning: | 1 month | UW NOI: | $3,089,232 | ||||
| Prepayment Provisions: | LO (25); DEF (91); O (4) | UW NOI Debt Yield: | 11.1% | ||||
| Lockbox/Cash Mgmt Status: | Springing/Springing | UW NOI Debt Yield at Maturity: | 12.9% | ||||
| Additional Debt Type: | N/A | UW NCF DSCR: | 2.01x (IO) 1.53x (P&I) | ||||
| Additional Debt Balance: | N/A | Most Recent NOI: | $3,478,779 (10/31/2015 T-10 Ann.) | ||||
| Future Debt Permitted (Type): | No (N/A) | 2nd Most Recent NOI: | $3,249,890 (12/31/2014) | ||||
| Reserves | 3rd Most Recent NOI: | $3,260,282 (12/31/2013) | |||||
| Type | Initial | Monthly | Cap | Most Recent Occupancy(1): | 85.2% (Various) | ||
| RE Tax: | $131,652 | $32,913 | N/A | 2nd Most Recent Occupancy: | 87.7% (12/31/2014) | ||
| Insurance: | $6,712 | $3,356 | N/A | 3rd Most Recent Occupancy: | 84.7% (12/31/2013) | ||
| TI/LC: | $225,000 | $24,112 | $868,032 | Appraised Value (as of): | $43,000,000 (11/3/2015) | ||
| Cut-off Date LTV Ratio: | 65.0% | ||||||
| Maturity Date LTV Ratio: | 55.8% | ||||||
| Sources and Uses | ||||||
| Sources | Proceeds | % of Total | Uses | Proceeds | % of Total | |
| Loan Amount: | $27,950,000 | 64.9% | Net Purchase Price: | $42,312,835 | 98.3% | |
| Borrower Equity: | $15,109,768 | 35.1% | Reserves: | $363,364 | 0.8% | |
| Closing Costs: | $383,569 | 0.9% | ||||
| Total Sources: | $43,059,768 | 100.0% | Total Uses: | $43,059,768 | 100.0% | |
| (1) | The Sunbelt Professional Centre Property was 90.5% occupied as of October 6, 2015 and Solar Plaza Property was 79.3% occupied as of October 1, 2015. |
The Mortgage Loan.The fifteenth largest mortgage loan (the “Solar Plaza & Sunbelt Professional Centre Mortgage Loan”) is evidenced by a promissory note in the original principal amount of $27,950,000 secured by a first priority fee mortgage encumbering a portfolio of two office properties comprising 192,926 SF located in Oxnard, California (collectively, the “Solar Plaza & Sunbelt Professional Centre Portfolio” or, individually, the “Sunbelt Professional Centre Property” and the “Solar Plaza Property”). The proceeds of the Solar Plaza & Sunbelt Professional Centre Mortgage Loan were primarily used to acquire the Solar Plaza & Sunbelt Professional Centre Portfolio for a total purchase price of $43,000,000 ($42,312,835 net of adjustments), fund reserves, and pay closing costs.
The Borrower and the Sponsor.The borrower is 1701 Solar Drive, LLC (the “Solar Plaza & Sunbelt Professional Centre Borrower”), a single-purpose Delaware limited liability company structured to be bankruptcy remote. The Solar Plaza & Sunbelt Professional Centre Borrower is majority owned by entities controlled by Helen Zeff, the Solar Plaza & Sunbelt Professional Centre Mortgage Loan non-recourse carveout guarantor. The Solar Plaza & Sunbelt Professional Centre Borrower is solely owned by Nasch Alta Vista LP. Nasch Properties LLC is the 1% general partner, and Helen Zeff, Trustee of the Helen C. Zeff Living Trust dated September 17 2007, is the sole limited partner, in Nasch Alta Vista LP. Helen Zeff comes from a family with extensive commercial real estate experience mainly in Southern California. Helen Zeff began acquiring multifamily properties in 1985 and ultimately managed and acquired nearly 1,000 units throughout Southern California, in addition to office medical, industrial, and retail properties throughout Southern California.
| This is not a research report and was not prepared by the Underwriters’ research departments. Please see additional important information and qualifications at the end of this Term Sheet. |
| T-128 |
| MSBAM 2016-C28 | Solar Plaza & Sunbelt Professional Centre |
The Portfolio.
The following table presents each property comprising the Solar Plaza & Sunbelt Professional Centre Portfolio by descending Allocated Cut-off Date Loan Amount:
| Solar Plaza & Sunbelt Professional Centre Portfolio | |||||||
| Property Name | Size (SF)(1) | Occupancy(1) | UW Average Rent PSF(1) | UW NCF | Appraised Value | Allocated Cut-off Date Loan Amount | % of Allocated Loan Amount |
| Sunbelt Professional Centre | 100,706 | 90.5% | $29.66 | $1,675,293 | $23,000,000 | $15,550,000 | 56% |
| Solar Plaza | 92,220 | 79.3% | $26.75 | $963,250 | $20,000,000 | $12,400,000 | 44% |
| Total/Wtd. Avg. | 192,926 | 85.2% | $28.27 | $2,638,543 | $43,000,000 | $27,950,000 | 100% |
| (1) | The Sunbelt Professional Centre Property was 90.5% occupied as of October 6, 2015 and the Solar Plaza Property was 79.3% occupied as of October 1, 2015. |
The Solar Plaza & Sunbelt Professional Centre Portfolio consists of two office properties, the Sunbelt Professional Centre Property and the Solar Plaza Property. The Sunbelt Professional Centre Property is an office park comprised of two buildings located on the northwest corner of North Rice Avenue and East Gonzales Road, just south of the Ventura (101) Freeway, in the city of Oxnard, Ventura County, California. Constructed in 2008, 1901 North Rice Avenue is a 62,579 SF, three-story, Class “B”, multi-tenant office. Constructed in 2008, 2401 East Gonzales Road is a 38,127 SF, two-story, Class “B”, multi-tenant office building. The total improvements consist of 100,706 SF and are situated on a 7.40 acre site. The interior office areas are typical standard office building finish, and are commensurate with competitors in the area. The Sunbelt Professional Centre Property features 460 parking spaces or 4.57 parking spaces per 1,000 SF.
The Solar Plaza Property is an office park comprised of two buildings located on the southwest corner of Solar Drive and East Gonzales Road, just south of the Ventura (101) Freeway, in the city of Oxnard, Ventura County, California. Constructed in 2002, 1701 Solar Drive is a 46,024 SF, two-story, Class B, multi-tenant office. Constructed in 2001, 1801 Solar Drive is a 46,196 SF, two-story, Class B, multi-tenant office building. The total improvements consist of 92,220 SF and are situated on a 6.02 acre site. The interior office areas are typical standard office building finish, and are commensurate with competitors in the area. The Solar Plaza Property features 400 parking spaces or 4.33 parking spaces per 1,000 SF.
As of October 6, 2015, the Sunbelt Professional Centre Property was 90.5% occupied by 10 tenants, while the Solar Plaza Property was 79.3% occupied by 32 tenants as of October 1, 2015.
The following table presents certain information relating to the leases at the Sunbelt Professional Centre Property:
| Sunbelt Professional Centre Tenant Summary(1) | |||||||
| Tenant Name | Credit Rating (Fitch/Moody’s/ S&P)(2) | Tenant SF | Approximate % of SF | Annual UW Rent | % of Total Annual UW Rent | Annual UW Rent PSF(3) | Lease Expiration |
| Tenants | |||||||
| Tri-Counties Regional Center | NR/NR/NR | 29,876 | 30% | $907,035 | 33% | $30.36 | 6/30/2018 |
| Department of Industrial Relations(4) | A+/Aa3/AA- | 17,049 | 17% | $517,608 | 19% | $30.36 | 2/28/2018 |
| CA Unemployment Insurance Appeals(5) | A+/Aa3/AA- | 14,272 | 14% | $433,298 | 16% | $30.36 | 5/31/2018 |
| Radnet Management, Inc. | NR/NR/NR | 13,904 | 14% | $422,125 | 16% | $30.36 | 5/31/2021 |
| Wells Fargo Bank | AA/Aa2/AA- | 4,232 | 4% | $122,889 | 5% | $29.04 | 5/31/2017 |
| Subtotal/Wtd. Avg. | 79,333 | 79% | $2,402,955 | 88% | $30.29 | ||
| Other Tenants | 11,808 | 12% | $320,257 | 12% | $27.12 | ||
| Vacant Space | 9,565 | 9% | $0 | 0% | $0.00 | ||
| Total/Wtd. Avg. | 100,706 | 100% | $2,723,212 | 100% | $29.88 | ||
| (1) | Information is based on the underwritten rent roll. |
| (2) | Certain ratings are those of the parent company whether or not the parent guarantees the lease. |
| (3) | Wtd. Avg. Annual UW Rent PSF excludes vacant space. |
| (4) | The Department of Industrial Relations may terminate its lease at any time by giving 90 days’ notice. |
| (5) | The CA Unemployment Insurance Appeals may terminate its lease at any time on or after March 31, 2018 by giving 90 days’ notice. |
| This is not a research report and was not prepared by the Underwriters’ research departments. Please see additional important information and qualifications at the end of this Term Sheet. |
| T-129 |
| MSBAM 2016-C28 | Solar Plaza & Sunbelt Professional Centre |
The following table presents certain information relating to the leases at the Solar Plaza Property:
| Solar Plaza Tenant Summary(1) | |||||||
| Tenant Name | Credit Rating (Fitch/Moody’s/ S&P)(2) | Tenant SF | Approximate % of SF | Annual UW Rent | % of Total Annual UW Rent | Annual UW Rent PSF(3) | Lease Expiration |
| Tenants | |||||||
| The Kavli Foundation(4) | NR/NR/NR | 10,478 | 11% | $262,128 | 13% | $25.02 | 9/30/2020 |
| Cardiology Association Medical Group | NR/NR/NR | 5,111 | 6% | $139,894 | 7% | $27.37 | 9/30/2018 |
| Neumeister, D.D.S., Inc. | NR/NR/NR | 5,064 | 5% | $136,258 | 7% | $26.91 | 5/31/2021 |
| Encephalogic Medical Group | NR/NR/NR | 4,064 | 4% | $109,728 | 6% | $27.00 | 10/31/2020 |
| Anacapa Oral Surgery and Dental Implant Center | NR/NR/NR | 3,193 | 3% | $90,626 | 5% | $28.38 | 9/30/2018 |
| Subtotal/Wtd. Avg. | 27,910 | 30% | $738,634 | 37% | $26.46 | ||
| Other Tenants | 45,265 | 49% | $1,236,431 | 63% | $27.32 | ||
| Vacant Space | 19,045 | 21% | $0 | 0% | $0.00 | ||
| Total/Wtd. Avg. | 92,220 | 100% | $1,975,065 | 100% | $26.99 | ||
| (1) | Information is based on the underwritten rent roll. |
| (2) | Certain ratings are those of the parent company whether or not the parent guarantees the lease. |
| (3) | Wtd. Avg. Annual UW Rent PSF excludes vacant space. |
| (4) | The Kavli Foundation is the seller of the Solar Plaza & Sunbelt Professional Centre Portfolio. In addition to its leased space above, the Kavli Foundation has guaranteed 9,000 square feet at the Solar Plaza Property for three years at $24.60 per square foot or approximately $221,400 per year. The mortgage loan seller has not underwritten this income and the 9,000 square feet has been underwritten as vacant. |
The following table presents certain information relating to the lease rollover schedule at the Solar Plaza & Sunbelt Professional Centre Portfolio:
| Lease Rollover Schedule(1)(2) | ||||||||
| Year | # of Leases Rolling | SF Rolling | UW Rent PSF Rolling | Approx. % of Total SF Rolling | Approx. Cumulative % of SF Rolling | Total UW Rent Rolling | Approx. % of Total Rent Rolling | Approx. Cumulative % of Total Rent Rolling |
| MTM | 2 | 550 | $50.86 | 0% | 0% | $27,972 | 1% | 1% |
| 2016 | 7 | 13,824 | $26.57 | 7% | 7% | $367,363 | 8% | 8% |
| 2017 | 6 | 11,796 | $26.92 | 6% | 14% | $317,532 | 7% | 15% |
| 2018 | 15 | 90,911 | $29.46 | 47% | 61% | $2,678,267 | 57% | 72% |
| 2019 | 5 | 8,583 | $26.85 | 4% | 65% | $230,467 | 5% | 77% |
| 2020 | 4 | 18,971 | $26.34 | 10% | 75% | $499,625 | 11% | 88% |
| 2021 | 3 | 19,681 | $29.32 | 10% | 85% | $577,051 | 12% | 100% |
| 2022 | 0 | 0 | $0 | 0% | 85% | $0 | 0% | 100% |
| 2023 | 0 | 0 | $0 | 0% | 85% | $0 | 0% | 100% |
| 2024 | 0 | 0 | $0 | 0% | 85% | $0 | 0% | 100% |
| 2025 | 0 | 0 | $0 | 0% | 85% | $0 | 0% | 100% |
| 2026 | 0 | 0 | $0 | 0% | 85% | $0 | 0% | 100% |
| 2027 & Beyond | 0 | 0 | $0 | 0% | 85% | $0 | 0% | 100% |
| Vacant | 0 | 28,610 | $0 | 15% | 100% | $0 | 0% | 100% |
| Total/Wtd. Avg. | 42 | 192,926 | $28.59 | 100% | $4,698,277 | 100% | ||
| (1) | Information is based on the underwritten rent roll. |
| (2) | Certain tenants may have lease termination options that are exercisable prior to the originally stated expiration date of the subject lease and that are not considered in the lease rollover schedule. |
The Market. The Solar Plaza & Sunbelt Professional Centre Portfolio is located in a suburban area containing residential feeder streets along with major arterials developed with commercial uses. It is located just west of Shopping at the Rose, a power retail center and east of the St. John’s Regional Medical Center. Regional access is considered very good with Ventura Freeway (101) located less than one quarter mile north of the Solar Plaza & Sunbelt Professional Centre Portfolio (via Rose Avenue). The Solar Plaza & Sunbelt Professional Centre Portfolio also has direct access to U.S. Route 118, approximately 3.20 miles north, the Pacific Coast Highway (Route 1), approximately 1.90 miles west and the U.S. Route 232, approximately 2.0 miles northwest. According to the appraisal, Oxnard is a relatively mature city, which is essentially fully built-out. However, there are still several vacant land sites for potential new construction. According to the appraisal, there are several reported planned developments/re-developments over the near term. The Pacific Senior Living at East Village (converting an existing 57 rooms into an 80 room assisted senior housing facility) will be the one closest to the Solar Plaza & Sunbelt Professional Centre Portfolio located at 2211 East Gonzales Road. There are no large scale office projects in planning.
According to the appraisal, as of the third quarter 2015, the Greater Los Angeles Office Market was comprised of 1,981 office buildings for 219,488,855 SF. The overall vacancy rate was 15.8% and the average asking rental rate was $34.08 PSF. Within the Greater Los Angeles Office Market, the Solar Plaza & Sunbelt Professional Centre Portfolio is located in the Ventura Office Market which was comprised of 419 office buildings for 18,825,987 SF. The Ventura Office Market had an overall vacancy rate of 17.3% and the average asking rental rate was $26.16 PSF. The Solar Plaza & Sunbelt Professional Centre Portfolio is located in the Oxnard Office Submarket within the West Ventura County Office Market. The West Ventura County Office
| This is not a research report and was not prepared by the Underwriters’ research departments. Please see additional important information and qualifications at the end of this Term Sheet. |
| T-130 |
| MSBAM 2016-C28 | Solar Plaza & Sunbelt Professional Centre |
Market contained 5,059,628 square feet in 139 buildings with an average vacancy rate of 25.6% and an overall rental rate of $23.76 PSF. The Oxnard Office Submarket contained 1,677,521 square feet in 37 buildings, or an average of 45,338 square feet per building. The vacancy rate for the Oxnard Office Submarket was 20.7%, which was lower than the West Ventura County Office Market vacancy rate of 25.6%. The overall rental rate was $25.92 PSF, which was the highest of the submarkets in West Ventura County.
The estimated 2015 population within a one-, three- and five-mile radius of the Solar Plaza & Sunbelt Professional Centre Portfolio was 10,971, 95,342 and 262,449, respectively, according to the appraisal. The estimated 2015 average household income within a one-, three- and five-mile radius of the Solar Plaza & Sunbelt Professional Centre Portfolio was $79,096, $71,844 and $78,457, respectively.
The following table presents recent occupancy and leasing data at competitive office buildings with respect to the Solar Plaza & Sunbelt Professional Centre Portfolio:
| Competitive Property Summary | ||||||||
| Property Name/Address | Year Built | Occ. | Size (SF) | Tenant Name | Lease Size (SF) | Lease Date | Lease Term (Yrs.) | Base Rent |
2001 Solar Building 2001 Solar Drive Oxnard, CA | 1989 | 77% | 34,780 | Dr. Famad CA Hand & Physical Therapy Engility Corp. | 2,042 2,765 11,562 | Sep-15 Feb-15 Nov-14 | 10.0 8.4 | $27.60 $24.60 $24.00 |
Sunbelt Professional Center(1) 1901 N Rice & 2401 E Gonzalez Road Oxnard, CA | 2008 | 91%(1) | 100,706 | Howard J. Wasserman Environmental Occup. Troop Real Estate | 2,702 2,083 2,134 | Dec-15 Oct-15 Mar-14 | 5.0 1.5 3.3 | $29.88 $27.00 $24.00 |
Solar Plaza(1) 1701 & 1801 Solar Drive Oxnard, CA | 2001 | 79%(1) | 92,220 | The Kavli Foundation Keith Kappers, DDS Brett Giney | 10,478 1,727 765
| Oct-15 Jun-15 Dec-14
| 5.0 5.0 3.0
| $24.60 $26.40 $25.20
|
1901 Solar Building 1901 Solar Drive Oxnard, CA | 1989 | 84% | 49,121 | Available Available Island View Gast. Assoc. SeaView | 2,244 3,077 1,566 1,269 | Nov-15 Nov-15 Jul-14 Jun-14 | -- -- 5.4 3.4 | $27.60 $27.60 $22.80 $22.80 |
2051 Solar Building 2051 Solar Drive Oxnard, CA | 1982 | 59% | 49,013 | Available Available | 2,387 5,246 | Nov-15 Nov-15 | -- -- | $27.60 $27.60 |
1889 Rice Office 1889 North Rice Avenue Oxnard, CA | 1999 | 92% | 39,028 | Available | 3,246 | Nov-15
| -- | $23.40 |
The Medical Pavilion at St. John’s 1700 North Rose Avenue Oxnard, CA | 1994 | 89% | 92,556 | New Tenant New Tenant | 1,875 1,874
| Aug-14 Jul-14
| -- --
| $31.80 $31.80 |
Topa Financial Plaza 300 East Esplanade Oxnard, CA | 1978 | 93% | 291,983 | Charles Schwab | 2,401 | Feb-15 | 1.0 | $24.84 |
Source: Appraisals
| (1) | Based on rent rolls date as of October 6, 2015 and as of October 1, 2015. These properties represent the Solar Plaza & Sunbelt Professional Centre Portfolio. |
| This is not a research report and was not prepared by the Underwriters’ research departments. Please see additional important information and qualifications at the end of this Term Sheet. |
| T-131 |
| MSBAM 2016-C28 | Solar Plaza & Sunbelt Professional Centre |
Operating History and Underwritten Net Cash Flow.The following table presents certain information relating to the historical operating performance and the Underwritten Net Cash Flow at the Solar Plaza & Sunbelt Professional Centre Portfolio:
| Cash Flow Analysis | ||||||
| 2012 | 2013 | 2014 | 10/31/2015 YTD Ann. | UW | UW PSF | |
| Base Rent | $4,659,117 | $4,490,692 | $4,499,700 | $4,631,812 | $5,453,640 | $28.27 |
| Total Recoveries | $98,491 | $141,089 | $160,775 | $163,286 | $172,065 | $0.89 |
| Other Income | $2,529 | $192 | $2 | $826 | $826 | $0.00 |
| Less Discount Concessions | $0 | $0 | $0 | $0 | $0 | $0.00 |
| Less Vacancy & Credit Loss | $0 | $0 | $0 | $0 | $755,363 | $3.92 |
| Effective Gross Income | $4,760,137 | $4,631,973 | $4,660,477 | $4,795,924 | $4,871,168 | $25.25 |
| Total Operating Expenses | $1,329,775 | $1,371,691 | $1,410,587 | $1,317,145 | $1,781,936 | $9.24 |
| Net Operating Income | $3,430,362 | $3,260,282 | $3,249,890 | $3,478,779 | $3,089,232 | $16.01 |
| Capital Expenditures | $0 | $0 | $0 | $0 | $38,585 | $0.20 |
| TI/LC | $0 | $0 | $0 | $0 | $412,104 | $2.14 |
| Net Cash Flow | $3,430,362 | $3,260,282 | $3,249,890 | $3,478,779 | $2,638,543 | $13.68 |
| Occupancy % | 84.5% | 84.7% | 87.7% | 85.2%(1) | 86.1% | |
| NOI DSCR | 1.99x | 1.89x | 1.88x | 2.02x | 1.79x | |
| NOI DSCR (IO) | 2.62x | 2.49x | 2.48x | 2.65x | 2.36x | |
| NCF DSCR | 1.99x | 1.89x | 1.88x | 2.02x | 1.53x | |
| NCF DSCR (IO) | 2.62x | 2.49x | 2.48x | 2.65x | 2.01x | |
| NOI Debt Yield | 12.3% | 11.7% | 11.6% | 12.4% | 11.1% | |
| NCF Debt Yield | 12.3% | 11.7% | 11.6% | 12.4% | 9.4% | |
| (1) | Occupancy % as of rent rolls dated October 6, 2015 and as of October 1, 2015. |
| This is not a research report and was not prepared by the Underwriters’ research departments. Please see additional important information and qualifications at the end of this Term Sheet. |
| T-132 |
| MSBAM 2016-C28 |
This Term Sheet was prepared by sales, trading, banking or other non-research personnel of one of the following: Merrill Lynch, Pierce, Fenner & Smith Incorporated (together with its affiliates, “BofA Merrill Lynch”), Morgan Stanley & Co. LLC, Morgan Stanley & Co. International Limited, Morgan Stanley Japan Limited and/or Morgan Stanley Dean Witter Asia Limited (together with their affiliates, hereinafter “Morgan Stanley”), CIBC World Markets Corp. (together with its affiliates, “CIBCWM”) or Drexel Hamilton, LLC (together with its affiliates, “Drexel” and, collectively with BofA Merrill Lynch, Morgan Stanley and CIBCWM, the “Underwriters”). This Term Sheet was not produced by an Underwriter’s research analyst, although it may refer to an Underwriter’s research analyst or research report. Unless otherwise indicated, these views (if any) are the author’s and may differ from those of the fixed income or equity research departments of the Underwriters or others in those firms.
This Term Sheet may have been prepared by or in conjunction with the respective trading desks of the Underwriters that may deal as principal in or own or act as market maker or liquidity provider for the securities/instruments (or related derivatives) mentioned herein. The trading desk of any Underwriter may have accumulated a position in the subject securities/instruments based on the information contained herein. Trading desk materials are not independent of the proprietary interests of the Underwriters, which may conflict with your interests. Each of the Underwriters may also perform or seek to perform investment banking services for the issuers of the securities and instruments mentioned herein.
The information contained in this Term Sheet is subject to change, completion or amendment from time to time, and the information in this Term Sheet supersedes information in any other communication other than in the Preliminary Prospectus or any free writing prospectus relating to the securities referred to in this Term Sheet. This Term Sheet is not a solicitation to participate in any trading strategy, and is not an offer to sell any security or instrument or a solicitation of an offer to buy or sell any security or instrument in any jurisdiction where the offer, solicitation or sale is not permitted. Unless otherwise set forth in this material, any securities referred to in this material may not have been registered under the U.S. Securities Act of 1933, as amended, and, if not, may not be offered or sold absent an exemption therefrom. Recipients are required to comply with any legal or contractual restrictions on their purchase, holding, sale, exercise of rights or performance of obligations under any securities/instruments transaction.
The securities/instruments discussed in this Term Sheet may not be suitable for all investors. This Term Sheet has been prepared and issued by the Underwriters for intended distribution to market professionals and institutional investor clients. Other recipients should seek independent investment advice prior to making any investment decision based on this Term Sheet. This Term Sheet does not provide individually tailored investment advice or offer tax, regulatory, accounting or legal advice. Prior to entering into any proposed transaction, recipients should determine, in consultation with their own investment, legal, tax, regulatory and accounting advisors, the economic risks and merits, as well as the legal, tax, regulatory and accounting characteristics and consequences, of the transaction. You should consider this Term Sheet as only a single factor in making an investment decision.
The value of and income from investments may vary because of changes in interest rates, foreign exchange rates, default rates, prepayment rates, securities/instruments prices, market indexes, operational or financial conditions of companies or other factors. There may be time limitations on the exercise of options or other rights in securities/instruments transactions. Past performance is not necessarily a guide to future performance. Estimates of future performance are based on assumptions that may not be realized. Actual events may differ from those assumed and changes to any assumptions may have a material impact on any projections or estimates. Other events not taken into account may occur and may significantly affect the projections or estimates. Certain assumptions may have been made for modeling purposes only to simplify the presentation and/or calculation of any projections or estimates, and the Underwriters do not represent that any such assumptions will reflect actual future events. Accordingly, there can be no assurance that estimated returns or projections will be realized or that actual returns or performance results will not materially differ from those estimated herein. Some of the information contained in this document may be aggregated data of transactions in securities or other financial instruments executed by one or more Underwriters that has been compiled so as not to identify the underlying transactions of any particular customer.
Notwithstanding anything herein to the contrary, the Underwriters and each recipient hereof (and their employees, representatives, and other agents) may disclose to any and all persons, without limitation of any kind from the commencement of discussions, the U.S. federal and state income tax treatment and tax structure of the transaction and all materials of any kind (including opinions or other tax analyses) that are provided to it relating to the tax treatment and tax structure (as such terms are defined in Treasury Regulation 1.6011-4). For this purpose, “tax structure” is limited to facts relevant to the U.S. federal and state income tax treatment of the transaction and does not include information relating to the identity of the parties, their affiliates, agents or advisors. This authorization of tax disclosure is retroactively effective to the commencement of discussions with prospective investors regarding the transactions contemplated herein.
In the United Kingdom, this Term Sheet is only being distributed to, and is directed only at, persons who (i) have professional experience in matters relating to investments and who qualify as investment professionals in accordance with Article 19(5) of the Financial Services and Markets Act 2000 (Financial Promotion) Order 2005 (the “Order”), or (ii) are high net worth companies, unincorporated associations, partnerships or trustees in accordance with Article 49(2) of the Order (all such persons together being referred to as “relevant persons”). This Term Sheet must not be acted on or relied on by persons who are not relevant persons. Any investment or investment activity to which this Term Sheet relates is available only to relevant persons and will be engaged in only with relevant persons.
THE OFFERED CERTIFICATES HAVE NOT BEEN AND WILL NOT BE REGISTERED UNDER THE FINANCIAL INSTRUMENTS EXCHANGE ACT OF JAPAN (LAW NO. 25 OF 1948, AS AMENDED (THE “FIEL”)), AND EACH OF MERRILL LYNCH, PIERCE, FENNER & SMITH INCORPORATED, MORGAN STANLEY & CO. LLC, CIBC WORLD MARKETS CORP. AND DREXEL HAMILTON, LLC HAS AGREED THAT IT WILL NOT OFFER OR SELL ANY OFFERED CERTIFICATES, DIRECTLY OR INDIRECTLY, IN JAPAN OR TO, OR FOR THE BENEFIT OF, ANY JAPANESE PERSON, OR TO OTHERS FOR RE-OFFERING OR RESALE, DIRECTLY OR INDIRECTLY, IN JAPAN OR TO ANY JAPANESE PERSON, EXCEPT PURSUANT TO AN EXEMPTION FROM THE REGISTRATION REQUIREMENTS OF, AND OTHERWISE IN COMPLIANCE WITH, THE FIEL AND ANY OTHER APPLICABLE LAWS AND REGULATIONS. FOR THE PURPOSES OF THIS PARAGRAPH, “JAPANESE PERSON” SHALL MEAN ANY PERSON RESIDENT IN JAPAN, INCLUDING ANY CORPORATION OR OTHER ENTITY ORGANIZED UNDER THE LAWS AND REGULATIONS OF JAPAN.
| This is not a research report and was not prepared by the Underwriters’ research departments. Please see additional important information and qualifications at the end of this Term Sheet. |
| T-133 |