Banc of America Merrill Lynch Commercial Mortgage
Filed: 17 Oct 16, 12:00am
| FREE WRITING PROSPECTUS | ||
| FILED PURSUANT TO RULE 433 | ||
| REGISTRATION FILE NO.: 333-206847-03 | ||
 |  |  |
MSBAM 2016-C31
Free Writing Prospectus
Structural and Collateral Term Sheet
$953,186,169
(Approximate Total Mortgage Pool Balance)
$822,123,000
(Approximate Offered Certificates)
Banc of America Merrill Lynch Commercial Mortgage Inc.
as Depositor
Morgan Stanley Mortgage Capital Holdings LLC
Bank of America, National Association
UBS AG
KeyBank National Association
Starwood Mortgage Funding III LLC
as Sponsors and Mortgage Loan Sellers
Commercial Mortgage Pass-Through Certificates
Series 2016-C31
October 17, 2016
| BofA Merrill Lynch | UBS Securities LLC | Morgan Stanley |
| Co-Lead Bookrunning Manager | Co-Lead Bookrunning Manager | Co-Lead Bookrunning Manager |
| KeyBanc Capital Markets Co-Managers | Drexel Hamilton Co-Managers |
STATEMENT REGARDING THIS FREE WRITING PROSPECTUS
The depositor has filed a registration statement (including a prospectus) with the SEC (File No. 333-206847) for the offering to which this communication relates. Before you invest, you should read the prospectus in that registration statement and other documents the depositor has filed with the SEC for more complete information about the depositor, the issuing entity and this offering. You may get these documents for free by visiting EDGAR on the SEC web site atwww.sec.gov. Alternatively, the depositor or any underwriter or any dealer participating in the offering will arrange to send you the prospectus if you request it by calling toll free 1-800-294-1322 or by email todg.Prospectus_Requests@baml.com.
This is not a research report and was not prepared by any Underwriter’s research departments. It was prepared by the Underwriters’ sales, trading, banking or other non-research personnel. Please see additional important information and qualifications at the end of this Term Sheet.
Neither this Term Sheet nor anything contained herein shall form the basis for any contract or commitment whatsoever.The information contained herein is preliminary as of the date hereof.This Term Sheet is subject to change, completion or amendment from time to time.The information contained herein will be superseded by similar information delivered to you as part of the Preliminary Prospectus.The information contained herein supersedes any such information previously delivered.The information contained herein should be reviewed only in conjunction with the entire Preliminary Prospectus.All of the information contained herein is subject to the same limitations and qualifications contained in the Preliminary Prospectus.The information contained herein does not contain all relevant information relating to the underlying mortgage loans or mortgaged properties.Such information is described in the Preliminary Prospectus.The information contained herein will be more fully described in the Preliminary Prospectus.The information contained herein should not be viewed as projections, forecasts, predictions or opinions with respect to value.Prior to making any investment decision, prospective investors are strongly urged to read the Preliminary Prospectus in its entirety.Neither the Securities and Exchange Commission nor any state securities commission has approved or disapproved of these securities or determined if this Term Sheet is truthful or complete.Any representation to the contrary is a criminal offense.
IMPORTANT NOTICE RELATING TO AUTOMATICALLY GENERATED EMAIL DISCLAIMERS
Any legends, disclaimers or other notices that may appear at the bottom of, or attached to, the email communication to which this Term Sheet may have been attached are not applicable to this Term Sheet and should be disregarded. Such legends, disclaimers or other notices have been automatically generated as a result of this Term Sheet having been sent via Bloomberg or another email system.
IMPORTANT NOTICE REGARDING THE CONDITIONS FOR THIS OFFERING OF ASSET-BACKED SECURITIES
THE ASSET-BACKED SECURITIES REFERRED TO IN THIS TERM SHEET ARE BEING OFFERED WHEN, AS AND IF ISSUED. IN PARTICULAR, YOU ARE ADVISED THAT THE ASSET-BACKED SECURITIES, AND THE ASSET POOL BACKING THEM, ARE SUBJECT TO MODIFICATION OR REVISION (INCLUDING, AMONG OTHER THINGS, THE POSSIBILITY THAT ONE OR MORE CLASSES OF SECURITIES MAY BE SPLIT, COMBINED OR ELIMINATED), AT ANY TIME PRIOR TO ISSUANCE OR AVAILABILITY OF A FINAL PROSPECTUS. AS A RESULT, YOU MAY COMMIT TO PURCHASE SECURITIES THAT HAVE CHARACTERISTICS THAT MAY CHANGE, AND YOU ARE ADVISED THAT ALL OR A PORTION OF THE SECURITIES MAY NOT BE ISSUED THAT HAVE THE CHARACTERISTICS DESCRIBED IN THIS TERM SHEET. OUR OBLIGATION TO SELL SECURITIES TO YOU IS CONDITIONED ON THE SECURITIES AND THE UNDERLYING TRANSACTION HAVING THE CHARACTERISTICS DESCRIBED IN THIS TERM SHEET. IF WE DETERMINE THAT THE FOREGOING CONDITION IS NOT SATISFIED IN ANY MATERIAL RESPECT, WE WILL NOTIFY YOU, AND NEITHER THE ISSUING ENTITY NOR ANY UNDERWRITER WILL HAVE ANY OBLIGATION TO YOU TO DELIVER ALL OR ANY PORTION OF THE SECURITIES WHICH YOU HAVE COMMITTED TO PURCHASE, AND THERE WILL BE NO LIABILITY BETWEEN US AS A CONSEQUENCE OF THE NON-DELIVERY.
This is not a research report and was not prepared by any Underwriter’s research departments. Please see additional important information and qualifications at the end of this Term Sheet.
| T-1 |
| MSBAM 2016-C31 | Structural Overview |
Offered Certificates
| Class | Expected Ratings (Fitch/KBRA/Moody’s)(1) | Approximate Initial Certificate Principal Balance or Notional Amount(2) | Approximate Initial Credit Support(3) | Pass-Through Rate Description | Expected Weighted Average Life (Years)(4) | Principal Window (Months)(4) | Certificate Principal UW NOI Debt Yield(5) | Certificate Principal to Value Ratio(6) | |
| Class A-1 | AAAsf/AAA(sf)/Aaa(sf) | $50,100,000 | 30.000% | (7) | 2.87 | 1 – 60 | 15.7% | 44.3% | |
| Class A-2 | AAAsf/AAA(sf)/Aaa(sf) | $27,600,000 | 30.000% | (7) | 5.00 | 60 – 60 | 15.7% | 44.3% | |
| Class A-SB | AAAsf/AAA(sf)/Aaa(sf) | $69,700,000 | 30.000% | (7) | 7.13 | 60 – 109 | 15.7% | 44.3% | |
| Class A-3 | AAAsf/AAA(sf)/Aaa(sf) | $17,811,000 | 30.000% | (7) | 6.84 | 82 – 82 | 15.7% | 44.3% | |
| Class A-4 | AAAsf/AAA(sf)/Aaa(sf) | $210,000,000 | 30.000% | (7) | 9.60 | 109 – 117 | 15.7% | 44.3% | |
| Class A-5 | AAAsf/AAA(sf)/Aaa(sf) | $292,019,000 | 30.000% | (7) | 9.88 | 117 – 119 | 15.7% | 44.3% | |
| Class X-A | AAAsf/AAA(sf)/Aaa(sf) | $667,230,000 | (8) | N/A | Variable IO(9) | N/A | N/A | N/A | N/A |
| Class X-B | AA-sf/AAA(sf)/NR | $110,808,000 | (8) | N/A | Variable IO(9) | N/A | N/A | N/A | N/A |
| Class A-S | AAAsf/AAA(sf)/Aa3(sf) | $65,531,000 | 23.125% | (7) | 9.92 | 119 – 119 | 14.3% | 48.7% | |
| Class B | AA-sf/AA(sf)/NR | $45,277,000 | 18.375% | (7) | 9.92 | 119 – 119 | 13.5% | 51.7% | |
| Class C | A-sf/A(sf)/NR | $44,085,000 | 13.750% | (7) | 9.92 | 119 – 119 | 12.8% | 54.6% | |
Privately Offered Certificates(10)
| Class | Expected Ratings (Fitch/KBRA/Moody’s)(1) | Approximate Initial Certificate Principal Balance or Notional Amount(2) | Approximate Initial Credit Support(3) | Pass-Through Rate Description | Expected Weighted Average Life (Years)(4) | Principal Window (Months)(4) | Certificate Principal UW NOI Debt Yield(5) | Certificate Principal to Value Ratio(6) |
| Class X-D | BBB-sf/BBB(sf)/NR | $52,425,000(8) | N/A | Variable IO(9) | N/A | N/A | N/A | N/A |
| Class X-E | BB-sf/BB+(sf)/NR | $25,021,000(8) | N/A | Variable IO(9) | N/A | N/A | N/A | N/A |
| Class X-F | B-sf/B+(sf)/NR | $10,723,000(8) | N/A | Variable IO(9) | N/A | N/A | N/A | N/A |
| Class X-G | NR/NR/NR | $42,894,169(8) | N/A | Variable IO(9) | N/A | N/A | N/A | N/A |
| Class D | BBB-sf/BBB(sf)/NR | $52,425,000 | 8.250% | (7) | 9.92 | 119 – 119 | 12.0% | 58.1% |
| Class E | BB-sf/BB+(sf)/NR | $25,021,000 | 5.625% | (7) | 9.94 | 119 – 120 | 11.7% | 59.7% |
| Class F | B-sf/B+(sf)/NR | $10,723,000 | 4.500% | (7) | 10.00 | 120 - 120 | 11.5% | 60.5% |
| Class G | NR/NR/NR | $42,894,169 | 0.000% | (7) | 10.00 | 120 - 120 | 11.0% | 63.3% |
| (1) | Ratings shown are those of Fitch Ratings, Inc. (“Fitch”), Kroll Bond Rating Agency, Inc. (“KBRA”) and Moody’s Investors Service, Inc. (“Moody’s”). Certain nationally recognized statistical rating organizations that were not hired by the depositor may use information they receive pursuant to Rule 17g-5 under the Securities Exchange Act of 1934, as amended, or otherwise to rate the certificates. There can be no assurance as to what ratings a non-hired nationally recognized statistical rating organization would assign. See “Risk Factors—Other Risks Relating to the Certificates—Nationally Recognized Statistical Rating Organizations May Assign Different Ratings to the Certificates; Ratings of the Certificates Reflect Only the Views of the Applicable Rating Agencies as of the Dates Such Ratings Were Issued; Ratings May Affect ERISA Eligibility; Ratings May Be Downgraded” and “Ratings” in the Preliminary Prospectus, expected to be dated October 17, 2016 (the “Preliminary Prospectus”). Capitalized terms used but not defined herein have the meanings assigned to such terms in the Preliminary Prospectus. |
| (2) | Approximate, subject to a permitted variance of plus or minus 5%. In addition, the notional amounts of the Class X-A, Class X-B, Class X-D, Class X-E, Class X-F and Class X-G certificates (collectively referred to as the “Class X certificates”) may vary depending upon the final pricing of the classes of principal balance certificates whose certificate balances comprise such notional amounts, and, if as a result of such pricing the pass-through rate of any class of the Class X-A, Class X-B, Class X-D, Class X-E, Class X-F or Class X-G certificates, as applicable, would be equal to zero at all times, such class of certificates will not be issued on the closing date of this securitization. |
| (3) | The approximate initial credit support percentages set forth for the certificates are approximate and, for the Class A-1, Class A-2, Class A-SB, Class A-3, Class A-4 and Class A-5 certificates, are represented in the aggregate. |
| (4) | The Expected Weighted Average Life and Principal Window during which distributions of principal would be received as set forth in the foregoing table with respect to each class of certificates having a certificate balance are based on the assumptions set forth under “Yield and Maturity Considerations—Weighted Average Life” in the Preliminary Prospectus and on the assumptions that there are no prepayments, modifications or losses in respect of the mortgage loans and that there are no extensions or forbearances of maturity dates or anticipated repayment dates of the mortgage loans. |
| (5) | Certificate Principal UW NOI Debt Yield for any class of principal balance certificates is calculated as the product of (a) the weighted average UW NOI Debt Yield for the mortgage pool, multiplied by (b) a fraction, the numerator of which is the total initial certificate balance of all the principal balance certificates, and the denominator of which is the total initial certificate balance of the subject class of principal balance certificates and all other classes of principal balance certificates, if any, that are senior to such class. The Certificate Principal UW NOI Debt Yields of the Class A-1, Class A-2, Class A-SB, Class A-3, Class A-4 and Class A-5 certificates are calculated in the aggregate for those classes as if they were a single class. |
| (6) | Certificate Principal to Value Ratio for any class of principal balance certificates is calculated as the product of (a) the weighted average Cut-off Date LTV Ratio of the mortgage pool, multiplied by (b) a fraction, the numerator of which is the total initial certificate balance of the subject class of principal balance certificates and all other classes of principal balance certificates, if any, that are senior to such class, and the denominator of which is the total initial |
This is not a research report and was not prepared by any Underwriter’s research departments. Please see additional important information and qualifications at the end of this Term Sheet.
| T-2 |
| MSBAM 2016-C31 | Structural Overview |
| certificate balance of all the principal balance certificates. The Certificate Principal to Value Ratios of the Class A-1, Class A-2, Class A-SB, Class A-3, Class A-4 and Class A-5 certificates are calculated in the aggregate for those classes as if they were a single class. |
| (7) | The pass-through rate for each class of the Class A-1, Class A-2, Class A-SB, Class A-3, Class A-4, Class A-5, Class A-S, Class B, Class C, Class D, Class E, Class F and Class G certificates (collectively referred to as the “principal balance certificates”) will be one of the following: (i) a fixed rateper annum, (ii) a variable rateper annum equal to the weighted average of the net mortgage interest rates on the mortgage loans for the related distribution date, (iii) a variable rateper annumequal to the lesser of (a) a fixed rate and (b) the weighted average of the net mortgage interest rates on the mortgage loans for the related distribution date or (iv) a variable rateper annum equal to the weighted average of the net mortgage interest rates on the mortgage loans for the related distribution date minus a specified percentage. For purposes of the calculation of the weighted average of the net mortgage interest rates on the mortgage loans for each distribution date, the net mortgage interest rates will be adjusted as necessary to a 30/360 basis. |
| (8) | The Class X certificates are notional amount certificates and will not be entitled to distributions of principal. The notional amount of the Class X-A certificates will be equal to the aggregate certificate balance of the Class A-1, Class A-2, Class A-SB, Class A-3, Class A-4 and Class A-5 certificates. The notional amount of the Class X-B certificates will be equal to the aggregate certificate balance of the Class A-S and Class B certificates. The notional amount of each class of the Class X-D, Class X-E, Class X-F and Class X-G certificates will be equal to the outstanding certificate balance of the class of principal balance certificates that, with the addition of “X-”, has the same alphabetical designation as the subject class of Class X certificates. |
| (9) | The pass-through rate for the Class X-A certificates for any distribution date will be aper annumrate equal to the excess, if any, of (a) the weighted average of the net mortgage interest rates on the mortgage loans for the related distribution date, over (b) the weighted average of the pass-through rates on the Class A-1, Class A-2, Class A-SB, Class A-3, Class A-4 and Class A-5 certificates for the related distribution date, weighted on the basis of their respective certificate balances outstanding immediately prior to that distribution date. The pass-through rate for the Class X-B certificates for any distribution date will be aper annum rate equal to the excess, if any, of (a) the weighted average of the net mortgage interest rates on the mortgage loans for the related distribution date, over (b) the weighted average of the pass-through rates on the Class A-S and Class B certificates for the related distribution date, weighted on the basis of their respective certificate balances outstanding immediately prior to that distribution date. The pass-through rate for each class of the Class X-D, Class X-E, Class X-F and Class X-G certificates for any distribution date will be aper annumrate equal to the excess, if any, of (a) the weighted average of the net mortgage interest rates on the mortgage loans for the related distribution date, over (b) the pass-through rate for the related distribution date of the class of principal balance certificates that, with the addition of “X-”, has the same alphabetical designation as the subject class of Class X certificates. For purposes of the calculation of the weighted average of the net mortgage interest rates on the mortgage loans for each distribution date, the net mortgage interest rates will be adjusted as necessary to a 30/360 basis. |
| (10) | Not offered pursuant to the Preliminary Prospectus or this Term Sheet. Information provided in this Term Sheet regarding the characteristics of these certificates is provided only to enhance your understanding of the offered certificates. The privately offered certificates also include the Class R certificates, which do not have a certificate balance, notional amount, pass-through rate, rating or rated final distribution date, and which are not shown in the chart. The Class R certificates represent the beneficial ownership of the residual interest in each of the real estate mortgage investment conduits, as further described in the Preliminary Prospectus. |
This is not a research report and was not prepared by any Underwriter’s research departments. Please see additional important information and qualifications at the end of this Term Sheet.
| T-3 |
| MSBAM 2016-C31 | Structural Overview |
Issue Characteristics
| Offered Certificates: | $822,123,000 (approximate) monthly pay, multi-class, commercial mortgage pass-through certificates, consisting of nine principal balance classes (Class A-1, Class A-2, Class A-SB, Class A-3, Class A-4, Class A-5, Class A-S, Class B and Class C) and two interest-only classes (Class X-A and Class X-B) |
| Co-Lead Bookrunning Managers: | Merrill Lynch, Pierce, Fenner & Smith Incorporated, Morgan Stanley & Co. LLC and UBS Securities LLC |
| Co-Managers: | KeyBanc Capital Markets Inc. and Drexel Hamilton, LLC |
| Mortgage Loan Sellers: | Morgan Stanley Mortgage Capital Holdings LLC, Bank of America, National Association, UBS AG, by and through its branch office at 1285 Avenue of the Americas, New York, New York, KeyBank National Association and Starwood Mortgage Funding III LLC |
| Rating Agencies: | Fitch Ratings, Inc., Kroll Bond Rating Agency, Inc. and Moody’s Investors Service, Inc. |
| Master Servicer: | Wells Fargo Bank, National Association |
| Special Servicer: | Rialto Capital Advisors, LLC |
| Certificate Administrator/ Certificate Registrar/Custodian: | Wells Fargo Bank, National Association |
| Trustee: | Wilmington Trust, National Association |
| Operating Advisor: | Park Bridge Lender Services LLC |
| Asset Representations Reviewer: | Park Bridge Lender Services LLC |
| Initial Directing Certificateholder: | RREF III Debt AIV, LP or an affiliate thereof |
| Cut-off Date: | The mortgage loans will be considered part of the trust fund as of their respective cut-off dates. The cut-off date with respect to each mortgage loan is the respective due date for the monthly debt service payment that is due in November 2016 (or, in the case of any mortgage loan that has its first due date after November 2016, the date that would have been its due date in November 2016 under the terms of that mortgage loan if a monthly debt service payment were scheduled to be due in that month). |
| Expected Pricing Date: | Week of October 17, 2016 |
| Expected Closing Date: | Week of November 14, 2016 |
| Determination Dates: | The 11th day of each month or, if the 11th day is not a business day, then the business day immediately following such 11th day. |
| Distribution Dates: | The 4th business day following each determination date. The first distribution date will be in December 2016. |
| Rated Final Distribution Date: | The distribution date in November 2049 |
| Interest Accrual Period: | Preceding calendar month |
| Payment Structure: | Sequential pay |
| Tax Treatment: | REMIC |
| Optional Termination: | 1.00% clean-up call |
| Minimum Denominations: | $10,000 for each class of Offered Certificates (other than Class X-A and Class X-B certificates) and in multiples of $1 in excess of $10,000; $1,000,000 for the Class X-A and Class X-B certificates and in multiples of $1 in excess of $1,000,000 |
| Settlement Terms: | DTC, Euroclear and Clearstream |
| Legal/Regulatory Status: | Each class of Offered Certificates is expected to be eligible for exemptive relief under ERISA. No class of Offered Certificates is SMMEA eligible. |
| Analytics: | The certificate administrator is expected to make available all distribution date statements, CREFC® reports and supplemental notices received by it to certain modeling financial services as described in the Preliminary Prospectus. |
| Bloomberg Ticker: | MSBAM 2016-C31<MTGE><GO> |
| Risk Factors: | THE CERTIFICATES INVOLVE CERTAIN RISKS AND MAY NOT BE SUITABLE FOR ALL INVESTORS. SEE THE “RISK FACTORS” SECTION OF THE PRELIMINARY PROSPECTUS. |
This is not a research report and was not prepared by any Underwriter’s research departments. Please see additional important information and qualifications at the end of this Term Sheet.
| T-4 |
| MSBAM 2016-C31 | Structural Overview |
Structural Overview
| Accrual: | Each class of Offered Certificates will accrue interest on a 30/360 basis. |
| Amount and Order of Distributions: | On each distribution date, funds available for distribution from the mortgage loans, net of (i) specified expenses of the issuing entity, including fees payable to, and costs and expenses reimbursable to, the master servicer, any primary servicer, the special servicer, the certificate administrator, the trustee, the operating advisor, the asset representations reviewer and CREFC® and (ii) any yield maintenance charges and prepayment premiums, will be distributed in the following amounts and order of priority:
First, to the Class A-1, Class A-2, Class A-SB, Class A-3, Class A-4, Class A-5, Class X-A, Class X-B, Class X-D, Class X-E, Class X-F and Class X-G certificates, in respect of interest, up to an amount equal to, andpro rata in accordance with, the interest entitlements for those classes;
Second, to the Class A-1, Class A-2, Class A-SB, Class A-3, Class A-4 and Class A-5 certificates as follows, to the extent of funds allocated to principal and available for distribution: either (i)(a)first, to principal on the Class A-SB certificates, until the certificate balance of the Class A-SB certificates is reduced to the planned principal balance for the related distribution date set forth in Annex E to the Preliminary Prospectus, and (b)second, to principal on each class of the Class A-1, Class A-2, Class A-3, Class A-4, Class A-5 and Class A-SB certificates, in that order, in each case until the certificate balance of such class of certificates has been reduced to zero, or (ii) if the certificate balance of each class of principal balance certificates other than the Class A-1, Class A-2, Class A-SB, Class A-3, Class A-4 and Class A-5 certificates has been reduced to zero as a result of the allocation of losses on the mortgage loans to those certificates, to principal on the Class A-1, Class A-2, Class A-SB, Class A-3, Class A-4 and Class A-5 certificates,pro rata, without regard to the distribution priorities described above or the planned principal balance of the Class A-SB certificates;
Third, to the Class A-1, Class A-2, Class A-SB, Class A-3, Class A-4 and Class A-5 certificates: (a)first, up to an amount equal to, andpro rata based on, any previously unreimbursed losses on the mortgage loans allocable to principal that were previously borne by each such class, and (b)second, up to an amount equal to, andpro rata based on, interest on such unreimbursed losses previously allocated to each such class at the pass-through rate for such class from the date the related loss was allocated to such class;
Fourth, to each class of the Class A-S, Class B and Class C certificates, in that order, as follows: (a) to interest on such class of certificates in the amount of its interest entitlement; (b) to the extent of funds allocable to principal remaining after distributions in respect of principal to each class with a higher priority (as set forth in this clause or prior enumerated clauses set forth above), to principal on such class of certificates until its certificate balance has been reduced to zero; and (c) to reimburse such class of certificates,first, for any previously unreimbursed losses on the mortgage loans that were previously allocated to those certificates, andsecond, for interest on such unreimbursed losses at the pass-through rate for such class from the date the related loss was allocated to such class;
Fifth, to the non-offered certificates (other than the Class X-D, Class X-E, Class X-F, Class X-G and Class R certificates) in the amounts and order of priority described in “Description of the Certificates—Distributions” in the Preliminary Prospectus; and
Sixth, to the Class R certificates, any remaining amounts.
|
| Interest and Principal Entitlements: | The interest entitlement of each class of Offered Certificates on each distribution date generally will be the interest accrued during the related interest accrual period on the related certificate balance or notional amount at the related pass-through rate, net of any prepayment interest shortfalls allocated to that class for such distribution date as described below. If prepayment interest shortfalls arise from voluntary prepayments on serviced mortgage loans during any collection period, the master servicer is required to make a limited compensating interest payment to offset those shortfalls. See “Description of the Certificates—Prepayment Interest Shortfalls” in the Preliminary Prospectus. The remaining amount of prepayment interest shortfalls will be allocated to reduce the interest entitlement on all classes of certificates (other than the Class R certificates),pro rata, based on their respective amounts of accrued interest for the related distribution date. If a class receives less than the entirety of its interest entitlement on any distribution date, then the shortfall, excluding any shortfall due to prepayment interest shortfalls, will be added to its interest entitlement for the next succeeding distribution date.
The principal distribution amount for each distribution date generally will be the aggregate amount of principal received or advanced in respect of the mortgage loans, net of any non-recoverable advances and interest thereon and any workout-delayed reimbursement amounts that are reimbursed to the master servicer or the trustee during the related collection period. Non-recoverable advances and interest thereon are reimbursable from principal collections before reimbursement from other amounts. Workout-delayed reimbursement amounts will be reimbursable from principal collections.
|
| Special Servicer Compensation: | The principal compensation to be paid to the special servicer in respect of its special servicing activities will be the special servicing fee, the workout fee and the liquidation fee.
The special servicing fee for each distribution date is calculated based on the outstanding principal balance of each mortgage loan (other than any non-serviced mortgage loan) that is a specially serviced mortgage loan (and any related serviced companion loan) or as to which the related mortgaged property has become an REO property at the special servicing fee rate, which will be a rate equal to 0.25%per annum(or, if such rate would result in a special servicing fee that would be less than $3,500 in any given month, such higher rate as would result in a special servicing fee equal to $3,500 for such month). The special servicing fee will be payable monthly,first, from liquidation proceeds, insurance and condemnation proceeds, and other collections |
This is not a research report and was not prepared by any Underwriter’s research departments. Please see additional important information and qualifications at the end of this Term Sheet.
| T-5 |
| MSBAM 2016-C31 | Structural Overview |
in respect of the related specially serviced mortgage loan or REO property and,then, from general collections on all the mortgage loans and any REO properties.
The special servicer will also be entitled to (i) liquidation fees generally equal to 1.0% of liquidation proceeds and certain other collections in respect of a specially serviced mortgage loan (and any related serviced companion loan) or related REO property and of amounts received in respect of mortgage loan repurchases by the related mortgage loan sellers and (ii) workout fees generally equal to 1.0% of interest (other than default interest) and principal payments made in respect of a rehabilitated mortgage loan (and any related serviced companion loan), in the case of each of clause (i) and (ii), subject to a cap of $1,000,000 and a floor of $25,000 with respect to any mortgage loan, whole loan or related REO property and subject to certain adjustments and exceptions as described in the Preliminary Prospectus under “Pooling and Servicing Agreement—Servicing and Other Compensation and Payment of Expenses—Special Servicer Compensation”.
With respect to any non-serviced mortgage loan, the related special servicer under the related other pooling and servicing agreement pursuant to which such mortgage loan is being serviced will be entitled to similar compensation as that described above with respect to such non-serviced mortgage loan under such other pooling and servicing agreement as further described in the Preliminary Prospectus, although any related fees may accrue at a different rate and there may be a higher (or no) cap on liquidation and workout fees.
| |
| Prepayment Premiums/Yield Maintenance Charges: | If any yield maintenance charge or prepayment premium is collected during any collection period with respect to any mortgage loan, then on the immediately succeeding distribution date, the certificate administrator will pay to the holders of each class of the Class A-1, Class A-2, Class A-SB, Class A-3, Class A-4, Class A-5, Class A-S, Class B, Class C and Class D certificates the product of (a) such yield maintenance charge or prepayment premium, (b) the related Base Interest Fraction for such class and the applicable principal prepayment, and (c) a fraction, the numerator of which is equal to the amount of principal distributed to such class for that distribution date, and the denominator of which is the total amount of principal distributed to all principal balance certificates (other than the Class E and the Control Eligible Certificates) for that distribution date. Any yield maintenance charge or prepayment premium that is collected during any collection period with respect to any mortgage loan and remaining after the distributions in the preceding sentence (as to the applicable distribution date, the “Class X YM Distribution Amount”) will be distributed to the holders of the Class X certificates as follows: (1) first, to the Class X-A, Class X-B, Class X-D, Class X-E and Class X-F certificates, in each case in an amount equal to the product of (i) a fraction, the numerator of which is equal to the amount of principal distributed on the applicable distribution date with respect to the class(es) of principal balance certificates whose certificate balance(s) comprise the notional amount of the applicable class of Class X certificates, and the denominator of which is the total amount of principal distributed on the applicable distribution date with respect to the principal balance certificates, multiplied by (ii) the Class X YM Distribution Amount for the applicable distribution date, and (2) second, to the Class X-G certificates, in an amount equal to the portion of the Class X YM Distribution Amount remaining after the distributions to the holders of the Class X-A, Class X-B, Class X-D, Class X-E and Class X-F certificates. Notwithstanding any of the foregoing to the contrary, if at any time the certificate balances of the principal balance certificates (other than the Class E and the Control Eligible Certificates) have been reduced to zero as a result of the allocation of principal payments on the mortgage loans, the certificate administrator will pay to the holders of each class of principal balance certificates then entitled to distributions of principal on the related distribution date the product of (a) any yield maintenance charge or prepayment premium is collected during any collection period with respect to any mortgage, (b) the related Base Interest Fraction for such class and the applicable principal prepayment and (c) a fraction, the numerator of which is equal to the amount of principal distributed to such class for that distribution date, and the denominator of which is the total amount of principal distributed to all principal balance certificates for that distribution date. Any yield maintenance charge or prepayment premium that is collected during any collection period with respect to any mortgage loan and remaining after the distributions in the preceding sentence (as to the applicable distribution date, the “Class X YM Subordinate Distribution Amount”) will be distributed to the holders of the Class X certificates as follows: (1) first, to the Class X-E and Class X-F certificates, in each case in an amount equal to the product of (i) a fraction, the numerator of which is equal to the amount of principal distributed on the applicable distribution date with respect to the class(es) of principal balance certificates whose certificate balance(s) comprise the notional amount of the applicable class of Class X certificates, and the denominator of which is the total amount of principal distributed on the applicable distribution date with respect to the principal balance certificates, multiplied by (ii) the Class X YM Subordinate Distribution Amount for the applicable distribution date, and (2) second, to the Class X-G certificates, in an amount equal to the portion of the Class X YM Subordinate Distribution Amount remaining after the distributions to the holders of the Class X-E and Class X-F certificates. “Base Interest Fraction” means, with respect to any principal prepayment of any mortgage loan that provides for the payment of a yield maintenance charge or prepayment premium, and with respect to any class of principal balance certificates, a fraction (A) the numerator of which is the greater of (x) zero and (y) the difference between (i) the pass-through rate on that class, and (ii) the applicable discount rate and (B) the denominator of which is the difference between (i) the mortgage interest rate on the related mortgage loan and (ii) the applicable discount rate; provided, that: under no circumstances will the Base Interest Fraction be greater than one; if the discount rate referred to above is greater than or equal to both the mortgage interest rate on the related mortgage loan and the pass-through rate on that class, then the Base Interest Fraction will equal zero; and if the discount rate referred to above is greater than or equal to the mortgage interest rate on the related mortgage loan and is less than the pass-through rate on that class, then the Base Interest Fraction will be equal to 1.0. |
This is not a research report and was not prepared by any Underwriter’s research departments. Please see additional important information and qualifications at the end of this Term Sheet.
| T-6 |
| MSBAM 2016-C31 | Structural Overview |
| Consistent with the foregoing, the Base Interest Fraction is equal to: |
| (Pass-Through Rate – Discount Rate) | |||
| (Mortgage Rate – Discount Rate) |
| Realized Losses: | On each distribution date, immediately following the distributions to be made to the certificateholders on that date, the certificate administrator is required to calculate the amount, if any, by which (i) the aggregate stated principal balance of the mortgage loans, including any successor REO loans, expected to be outstanding immediately following that distribution date is less than (ii) the then aggregate certificate balance of the principal balance certificates after giving effect to distributions of principal on that distribution date (any such deficit, a “Realized Loss”), which amount will be applied to the Class G, Class F, Class E, Class D, Class C, Class B and Class A-S certificates, in that order, in each case until the related certificate balance has been reduced to zero, and then to the Class A-1, Class A-2, Class A-SB, Class A-3, Class A-4 and Class A-5 certificates,pro rata, based upon their respective certificate balances, until their respective certificate balances have been reduced to zero. |
| Serviced Whole Loans: | Each of the following mortgaged properties secures a mortgage loan and one or morepari passu promissory notes (each, a “servicedpari passu companion loan”) that will be serviced pursuant to the related intercreditor agreement and (subject to the discussion in the next paragraph) the pooling and servicing agreement for this transaction: Huntington Center, Vintage Park, Harlem USA and MY Portfolio. With respect to each such mortgaged property, the related mortgage loan, together with the related servicedpari passu companion loan(s), is referred to herein (for so long as it is serviced under the pooling and servicing agreement for this transaction) as a “servicedpari passuwhole loan”. Each servicedpari passu companion loan is not part of the mortgage pool and may be contributed to one or more future securitization transactions (if not already securitized) or may be otherwise transferred at any time, subject to compliance with the related intercreditor agreement. See the tables below entitled “Mortgage Loans with Pari Passu Companion Loans” as well as “Description of the Mortgage Pool—The Whole Loans” in the Preliminary Prospectus, for additional information regarding each such whole loan.
With respect to each of the Harlem USA whole loan and the MY Portfolio whole loan (each, a “servicing shift whole loan”), the pooling and servicing agreement for this transaction will govern servicing of such whole loan until the securitization of the related control note; however, servicing of such whole loan will generally be directed by the holder of such control note (which is not included in this securitization), and such holder will have the right to replace the special servicer with respect to the related whole loan with or without cause. After the securitization of the related control note, each servicing shift whole loan will cease to be a serviced whole loan and will be serviced pursuant to the pooling and servicing agreement for another securitization transaction (see “Non-Serviced Whole Loans” below).
|
| Non-Serviced Whole Loans: | Each of the following mortgaged properties secures a mortgage loan (each, a “non-serviced mortgage loan”), one or morepari passu promissory notes and, in some cases, one or more generally subordinate promissory notes (each suchpari passu or generally subordinate promissory note, a “non-serviced companion loan”) that will be serviced pursuant to the related intercreditor agreement and the pooling and servicing agreement or trust and servicing agreement (referred to herein as a related “pooling and servicing agreement”) for another securitization transaction: Simon Premium Outlets, Harlem USA (after the securitization of the Harlem USA control note), One Stamford Forum, International Square, Coconut Point, SSTII Self Storage Portfolio, TEK Park, The Shops at Crystals and MY Portfolio (after the securitization of the MY Portfolio control note). With respect to each such mortgaged property, the related mortgage loan, together with the related non-serviced companion loan(s), is referred to herein (for so long as it is serviced under the pooling and servicing agreement for another securitization transaction) as a “non-serviced whole loan”. Each non-serviced companion loan is not part of the mortgage pool and may be contributed to one or more future securitization transactions (if not already securitized) or may be otherwise transferred at any time, subject to compliance with the related intercreditor agreement. Servicing of each non-serviced whole loan will generally be directed by the holder of the related control note (or, if such control note is included in a securitization, the directing certificateholder thereunder (or other party designated to exercise the rights of such control note)), and such holder will have the right to replace the special servicer with respect to the related whole loan with or without cause. See the tables below entitled “Mortgage Loans with Pari Passu Companion Loans” and“Mortgage Loans with Subordinate Debt” as well as “Description of the Mortgage Pool—The Whole Loans” in the Preliminary Prospectus, for additional information regarding each such whole loan. |
| Directing Certificateholder/ Controlling Class: | The initial Directing Certificateholder is expected to be RREF III Debt AIV, LP or an affiliate thereof.
The “Directing Certificateholder” will be the Controlling Class Certificateholder (or its representative) selected by more than 50% (by certificate balance) of the Controlling Class Certificateholders;provided, that (1) absent that selection, (2) until a Directing Certificateholder is so selected or (3) upon receipt of a notice from a majority of the Controlling Class Certificateholders that a Directing Certificateholder is no longer designated, the Controlling Class Certificateholder that owns the largest aggregate certificate balance of the Controlling Class (or its representative) will be the Directing Certificateholder;provided, that (i) if such holder elects or has elected to not be the Directing Certificateholder, the holder of the next largest aggregate certificate balance of the Controlling Class will be the Directing Certificateholder, (ii) in the event no one holder owns the largest aggregate certificate balance of the Controlling Class, then there will be no Directing Certificateholder until appointed in accordance with the terms of the pooling and servicing agreement, and (iii) the certificate administrator and the other parties to the pooling and servicing agreement will be entitled to assume that the identity of the Directing Certificateholder has not changed until such parties receive written notice of a
|
This is not a research report and was not prepared by any Underwriter’s research departments. Please see additional important information and qualifications at the end of this Term Sheet.
| T-7 |
| MSBAM 2016-C31 | Structural Overview |
replacement of the Directing Certificateholder from a party holding the requisite interest in the Controlling Class (as confirmed by the certificate registrar), or the resignation of the then current Directing Certificateholder.
The “Controlling Class” will be, as of any time of determination, the most subordinate class of Control Eligible Certificates then outstanding that has an aggregate certificate balance (as notionally reduced by any Cumulative Appraisal Reduction Amounts (as defined below)) at least equal to 25% of the initial certificate balance thereof; provided, that if at any time the certificate balances of the certificates other than the Control Eligible Certificates have been reduced to zero as a result of principal payments on the mortgage loans, then the Controlling Class will be the most subordinate class of Control Eligible Certificates that has a certificate balance greater than zero without regard to any Cumulative Appraisal Reduction Amounts. The Controlling Class as of the closing date will be the Class G certificates.
The “Control Eligible Certificates” will be any of the Class F and Class G certificates.
| |
| Control Rights: | Prior to a Control Termination Event, the Directing Certificateholder will have certain consent and consultation rights under the pooling and servicing agreement with respect to certain major decisions and other matters. A “Control Termination Event” will occur when (i) the Class F certificates have a certificate balance (taking into account the application of any Cumulative Appraisal Reduction Amounts to notionally reduce the certificate balance thereof) of less than 25% of the initial certificate balance thereof or (ii) a holder of the Class F certificates is the majority Controlling Class Certificateholder and has irrevocably waived its right, in writing, to exercise any of the rights of the Controlling Class Certificateholder and such rights have not been reinstated to a successor Controlling Class Certificateholder;providedthat a Control Termination Event will be deemed not continuing in the event that the certificate balances of the principal balance certificates other than the Control Eligible Certificates have been reduced to zero as a result of principal payments on the mortgage loans.
After the occurrence of a Control Termination Event but prior to the occurrence of a Consultation Termination Event, the Directing Certificateholder will not have any consent rights, but the Directing Certificateholder and the operating advisor will each have certain non-binding consultation rights under the pooling and servicing agreement with respect to certain major decisions and other matters. A “Consultation Termination Event” will occur when (i) there is no class of Control Eligible Certificates that has a then outstanding certificate balance at least equal to 25% of the initial certificate balance of that class, in each case, without regard to the application of any Cumulative Appraisal Reduction Amounts; or (ii) a holder of the Class F certificates is the majority Controlling Class Certificateholder and has irrevocably waived its right, in writing, to exercise any of the rights of the Controlling Class Certificateholder and such rights have not been reinstated to a successor Controlling Class Certificateholder pursuant to the terms of the pooling and servicing agreement; provided that no Consultation Termination Event resulting solely from the operation of clause (ii) will be deemed to have existed or be in continuance with respect to a successor holder of the Class F certificates that has not irrevocably waived its right to exercise any of the rights of the Controlling Class Certificateholder; provided, that a Consultation Termination Event will be deemed not continuing in the event that the certificate balances of the principal balance certificates other than the Control Eligible Certificates have been reduced to zero as a result of principal payments on the mortgage loans.
After the occurrence of a Consultation Termination Event, the Directing Certificateholder will not have any consent or consultation rights, except with respect to any rights expressly set forth in the pooling and servicing agreement, and the operating advisor will retain certain non-binding consultation rights under the pooling and servicing agreement with respect to certain major decisions and other matters.
Notwithstanding the proviso to the definitions of “Control Termination Event” and “Consultation Termination Event”, a Control Termination Event and a Consultation Termination Event will be deemed to have occurred with respect to any Excluded Loan, and neither the Directing Certificateholder nor any Controlling Class Certificateholder will have any consent or consultation rights with respect to the servicing of such Excluded Loan.
An “Excluded Loan” is a mortgage loan or whole loan with respect to which the Directing Certificateholder or the holder of the majority of the Controlling Class is a Borrower Party. It is expected that there will be no Excluded Loans as of the Closing Date with respect to this securitization.
“Borrower Party” means a borrower, a mortgagor, a manager of a mortgaged property, the holder of a mezzanine loan that has accelerated the related mezzanine loan (unless (i) acceleration was automatic under such mezzanine loan, (ii) the event directly giving rise to the automatic acceleration under such mezzanine loan was not initiated by such mezzanine lender or an affiliate of such mezzanine lender, and (iii) such mezzanine lender is stayed from exercising and has not commenced the exercise of remedies associated with foreclosure of the equity collateral under such mezzanine loan) or commenced foreclosure or enforcement proceedings against the equity collateral pledged to secure the related mezzanine loan, or any Borrower Party Affiliate.
“Borrower Party Affiliate” means, with respect to a borrower, a mortgagor, a manager of a mortgaged property or a mezzanine lender that has accelerated the related mezzanine loan (unless (i) acceleration was automatic under such mezzanine loan, (ii) the event directly giving rise to the automatic acceleration under such mezzanine loan was not initiated by such mezzanine lender or an affiliate of such mezzanine lender, and (iii) such mezzanine lender is stayed from exercising and has not commenced the exercise of remedies associated with foreclosure of the equity collateral under such mezzanine loan) or commenced foreclosure or enforcement proceedings against the equity collateral pledged to secure the related mezzanine loan, (a) any other person controlling or controlled by or under common control with such borrower, mortgagor, manager or mezzanine lender, as applicable, or (b) any other person owning, directly or indirectly, 25% or more of the beneficial interests in such borrower, mortgagor, manager or mezzanine lender, as applicable. For the
|
This is not a research report and was not prepared by any Underwriter’s research departments. Please see additional important information and qualifications at the end of this Term Sheet.
| T-8 |
| MSBAM 2016-C31 | Structural Overview |
| purposes of this definition, “control” when used with respect to any specified person means the power to direct the management and policies of such person, directly or indirectly, whether through the ownership of voting securities, by contract or otherwise and the terms “controlling” and “controlled” have meanings correlative to the foregoing.
Notwithstanding any of the foregoing to the contrary, if any mortgage loan is part of a whole loan, the Directing Certificateholder’s consent and/or consultation rights with respect thereto may be limited as described in the Preliminary Prospectus. In particular, with respect to each non-serviced whole loan and each servicing shift whole loan, the Directing Certificateholder will only have certain consultation rights with respect to certain major decisions and other matters related to such whole loan, in each case only prior to a Control Termination Event or Consultation Termination Event, as applicable, and the holder of the related control note (or, if such control note has been securitized, the directing certificateholder with respect to such securitization or other designated party under the related pooling and servicing agreement) will be entitled to similar consent and/or consultation rights with respect to such whole loan.
| |
| Appraisal Reduction Amounts and Collateral Deficiency Amounts: | An “Appraisal Reduction Amount” generally will be created in the amount, if any, by which the principal balance of a required appraisal loan (which is a mortgage loan with respect to which certain defaults, modifications or insolvency events have occurred as further described in the Preliminary Prospectus) plus other amounts overdue or advanced in connection with such mortgage loan exceeds 90% of the appraised value of the related mortgaged property plus certain escrows and reserves (including letters of credit) held with respect to the mortgage loan.
A mortgage loan will cease to be subject to an Appraisal Reduction Amount when it has been brought current for at least three consecutive months, no additional event of default is foreseeable in the reasonable judgment of the special servicer and no other circumstances exist that would cause such mortgage loan or any related companion loan to be a specially serviced loan; however, a “Collateral Deficiency Amount” may exist with respect to any mortgage loan that is modified into an AB loan structure (an “AB Modified Loan”) and remains a corrected mortgage loan and, if so, will generally equal the excess of (i) the stated principal balance of such AB Modified Loan (taking into account the related junior note(s) and any pari passu notes included therein, as well as any equity interests or other obligations senior thereto), over (ii) the sum of (in the case of a whole loan, solely to the extent allocable to the subject mortgage loan) (x) the appraised value of the related mortgaged property plus (y) any capital or additional collateral contributed by the related borrower at the time the loan became an AB Modified Loan plus (z) certain escrows or reserves (including letters of credit) in addition to any amounts set forth in the immediately preceding clause (y) held with respect to the mortgage loan.
As used herein, a “Cumulative Appraisal Reduction Amount” will be the sum of any Appraisal Reduction Amounts and any Collateral Deficiency Amounts.
Any Appraisal Reduction Amount in respect of any non-serviced mortgage loan generally will be calculated in accordance with the other servicing agreement pursuant to which such mortgage loan is being serviced, which calculations are expected to be generally similar to those provided for in the pooling and servicing agreement for this transaction.
If any mortgage loan is part of a whole loan, any Appraisal Reduction Amount or Collateral Deficiency Amount will (or effectively will) be calculated in respect of such whole loan taken as a whole and allocated, to the extent provided in the related intercreditor agreement and the related pooling and servicing agreement,first to any related subordinate companion loan, andsecond, to the related mortgage loan and anypari passu companion loan on apro rata basis by unpaid principal balance.
Appraisal Reduction Amounts will proportionately reduce the interest portion of debt service advances required to be made in respect of the related mortgage loan. Appraisal Reduction Amounts and Collateral Deficiency Amounts will be taken into account in determining the identity of the controlling class entitled to appoint the Directing Certificateholder, the existence of a Control Termination Event or Consultation Termination Event and the allocation of voting rights for certain purposes (see“—Directing Certificateholder/Controlling Class” above).
|
| Appraised-Out Class: | An “Appraised-Out Class” is any class of Control Eligible Certificates, the certificate balance of which (taking into account the application of any Appraisal Reduction Amounts or Collateral Deficiency Amounts to notionally reduce the certificate balance of such class) has been reduced to less than 25% of its initial certificate balance. Any Appraised-Out Class may not exercise any direction, control, consent and/or similar rights of the Controlling Class until such time, if any, as such class is reinstated as the Controlling Class, and the rights of the Controlling Class will be exercised by the most subordinate class of Control Eligible Certificates that is not an Appraised-Out Class, if any, during such period. |
| Appraisal Remedy: | The holders of the majority (by certificate balance) of an Appraised-Out Class (such holders, the “Requesting Holders”) will have the right, at their sole expense, to require the special servicer to order (or, with respect to a non-serviced mortgage loan, require the master servicer to request from the applicable outside special servicer) a second appraisal of any mortgage loan (or serviced whole loan) for which an appraisal reduction event has occurred or as to which there exists a Collateral Deficiency Amount. With respect to any serviced mortgage loan, the special servicer will be required to use its reasonable best efforts to ensure that such appraisal is delivered within 30 days from receipt of the Requesting Holders’ written request and will be required to ensure that such appraisal is prepared on an “as-is” basis by an MAI appraiser. With respect to any non-serviced mortgage loan, the master servicer will be required to use commercially reasonable efforts to obtain such second appraisal from the applicable outside special servicer and to forward such second appraisal to the special servicer. Upon receipt of such supplemental appraisal, the outside special servicer |
This is not a research report and was not prepared by any Underwriter’s research departments. Please see additional important information and qualifications at the end of this Term Sheet.
| T-9 |
| MSBAM 2016-C31 | Structural Overview |
(for Appraisal Reduction Amounts on non-serviced mortgage loans, but only to the extent provided for in the applicable outside pooling and servicing agreement and applicable intercreditor agreement) and the special servicer (for Collateral Deficiency Amounts on non-serviced mortgage loans and for all Cumulative Appraisal Reduction Amounts on serviced mortgage loans), will be required to determine, in accordance with the servicing standard, whether, based on its assessment of such supplemental appraisal, any recalculation of the applicable Appraisal Reduction Amount or Collateral Deficiency Amount is warranted and, if so warranted, will be required to recalculate such Appraisal Reduction Amount or Collateral Deficiency Amount, as applicable, based upon such supplemental appraisal and receipt of information requested by the special servicer from the master servicer. If required by any such recalculation, the applicable Appraised-Out Class will be reinstated as the Controlling Class and each Appraised-Out Class will, if applicable, have its related certificate balance notionally restored to the extent required by such recalculation of the Appraisal Reduction Amount or Collateral Deficiency Amount, if applicable.
| |
| Sale of Defaulted Loans: | Pursuant to the pooling and servicing agreement, under certain circumstances the special servicer may offer to sell a defaulted serviced mortgage loan, in which event it is required to use reasonable efforts to solicit offers for such defaulted serviced mortgage loan (and any related companion loan (to the extent provided under the related intercreditor agreement) and/or related REO properties).
The Directing Certificateholder will not have a right of first refusal to purchase a defaulted loan.
If the special servicer does not receive an offer at least equal to the outstanding principal balance plus all accrued and unpaid interest and outstanding costs and expenses and certain other amounts specified in the pooling and servicing agreement (the “Par Purchase Price”), the special servicer may purchase the defaulted loan or REO property at the Par Purchase Price or may accept the highest offer received from any person that is determined to be a fair price for such defaulted loan or REO property. If multiple offers are received during the period designated by the special servicer for receipt of offers, the special servicer is generally required to select the highest offer. The special servicer will be required to determine whether any cash offer constitutes a fair price for any defaulted loan or REO property if the highest offeror is a person other than a party to the pooling and servicing agreement for this transaction (the “PSA”), the Directing Certificateholder, any sponsor, any Borrower Party, any independent contractor engaged by the special servicer, a holder of any related companion loan or mezzanine loan, the depositor, the master servicer, the special servicer (or any independent contractor engaged by such special servicer), or the trustee for the securitization of a companion loan or any known affiliate of any of the preceding entities (each, an “Interested Person”). If the highest offer is made by an Interested Person, the trustee will be required to determine (based upon the most recent appraisal conducted in accordance with the terms of the PSA) whether the offer constitutes a fair price for the defaulted loan or REO property unless (i) the offer is equal to or greater than the applicable Par Purchase Price and (ii) the offer is the highest offer received. Absent an offer at least equal to the Par Purchase Price, no offer from an Interested Person will constitute a fair price unless (x) it is the highest offer received and (y) at least one other offer is received from an independent third party, and the trustee will be entitled to rely on the opinion of an independent appraiser or other independent expert retained by the trustee in connection with making such determination. Neither the trustee nor any of its affiliates may make an offer for or purchase any specially serviced loan or REO property.
Notwithstanding any of the foregoing to the contrary, the special servicer is not required to accept the highest offer and may accept a lower offer for a defaulted loan or REO property if the special servicer determines (with respect to any mortgage loan other than an Excluded Loan, in consultation with the Directing Certificateholder (unless a Consultation Termination Event exists) and, in the case of a serviced whole loan or an REO property related to a serviced whole loan, the related companion loan holder(s)), in accordance with the Servicing Standard (and subject to the requirements of any related intercreditor agreement), that a rejection of such offer would be in the best interests of the certificateholders and, with respect to a serviced whole loan or REO property related to a serviced whole loan, the holder(s) of the related companion loan(s), as a collective whole as if such Certificateholders and, if applicable, the related companion holder(s) constituted a single lender (taking into account the subordinate nature of any subordinate companion loan), so long as such lower offer was not made by the special servicer or any of its affiliates.
If title to any mortgaged property is acquired by the trust fund, the special servicer will be required to sell such mortgaged property prior to the close of the third calendar year beginning after the year of acquisition, unless (a) the IRS grants or has not denied an extension of time to sell such mortgaged property or (b) the special servicer, trustee and the certificate administrator receive an opinion of independent counsel to the effect that the holding of the property by the trust longer than the above-referenced three-year period will not result in the imposition of a tax on any REMIC of the trust fund or cause any REMIC of the trust fund to fail to qualify as a REMIC.
The foregoing applies to mortgage loans serviced under the PSA. With respect to any non-serviced whole loan, if the special servicer under the applicable pooling and servicing agreement or trust and servicing agreement determines to sell the related controlling companion loan if it becomes a defaulted loan, then the applicable special servicer will be required to sell the related whole loan, including the related mortgage loan included in the MSBAM 2016-C31 securitization trust and the relatedpari passu companion loan(s) and, under certain circumstances, any subordinate companion loan(s), as a single loan. In connection with any such sale, the special servicer under the applicable pooling and servicing agreement will be required to follow procedures similar to those set forth above. |
This is not a research report and was not prepared by any Underwriter’s research departments. Please see additional important information and qualifications at the end of this Term Sheet.
| T-10 |
| MSBAM 2016-C31 | Structural Overview |
| Appointment and Replacement of Special Servicer: | The Directing Certificateholder will appoint the initial special servicer as of the closing date. Prior to the occurrence and continuance of a Control Termination Event, the special servicer may generally be replaced at any time and without cause by the Directing Certificateholder.
After the occurrence and during the continuance of a Control Termination Event and upon (a) the written direction of holders of principal balance certificates evidencing not less than 25% of the voting rights of all classes of certificates entitled to principal (taking into account the application of Cumulative Appraisal Reduction Amounts to notionally reduce the certificate balances of classes to which such Cumulative Appraisal Reduction Amounts are allocable) requesting a vote to replace the special servicer with a replacement special servicer, (b) payment by such requesting holders to the certificate administrator of all reasonable fees and expenses to be incurred by the certificate administrator in connection with administering such vote and (c) delivery by such holders to each applicable rating agency of a rating agency communication, the certificate administrator will be required to promptly post such notice on its internet website and by mail and conduct the solicitation of votes of all certificates in such regard, which such vote must occur within 180 days of the posting of such notice. Upon the written direction of holders of at least 75% of a Certificateholder Quorum, the trustee will be required to immediately replace the special servicer with a qualified replacement special servicer designated by such holders of certificates.
After the occurrence of a Consultation Termination Event, if the operating advisor determines that the special servicer is not performing its duties as required under the pooling and servicing agreement or is otherwise not acting in accordance with the servicing standard, the operating advisor may also recommend the replacement of the special servicer. The operating advisor’s recommendation to replace the special servicer must be confirmed by an affirmative vote of holders of principal balance certificates evidencing at least a majority of the aggregate voting rights (taking into account the application of any Cumulative Appraisal Reduction Amounts to notionally reduce the respective certificate balances) of all principal balance certificates on an aggregate basis, which such vote must occur within 180 days of the posting of such notice.
A “Certificateholder Quorum” means, in connection with any solicitation of votes in connection with the replacement of the special servicer or the asset representations reviewer, the holders of certificates evidencing at least 75% of the aggregate voting rights (other than with respect to the termination of the asset representations reviewer, taking into account the application of any Appraisal Reduction Amounts to notionally reduce the certificate balance of the certificates) of all classes of certificates entitled to principal on an aggregate basis.
With respect to each serviced whole loan, any holder of a relatedpari passu companion loan, following a servicer termination event with respect to the special servicer that affects such holder, will be entitled to direct the trustee (and the trustee will be required) to terminate the special servicer solely with respect to such serviced whole loan. A replacement special servicer will be selected by the trustee or, prior to a Control Termination Event, by the Directing Certificateholder;provided, that any successor special servicer appointed to replace the special servicer with respect to such whole loan can generally not be the entity (or its affiliate) that was terminated at the direction of the holder of the relatedpari passu companion loan.
Notwithstanding any of the foregoing to the contrary, with respect to each servicing shift whole loan, the holder of the related control note will be entitled to replace the special servicer with respect to such whole loan at any time, with or without cause, and while it is a servicedpari passu whole loan, no other party may replace the special servicer for such whole loan unless there is a servicer termination event with respect thereto.
With respect to any non-serviced whole loan, the MSBAM 2016-C31 trust, as holder of the related mortgage loan, has the right to terminate the special servicer under the related pooling and servicing agreement if a servicer termination event occurs, with respect to such special servicer that affects the trust in its capacity as such holder. Such rights may be exercised by the Directing Certificateholder prior to a Control Termination Event (or the special servicer (consistent with the servicing standard), following the occurrence and during the continuance of a Control Termination Event). The successor special servicer will be selected pursuant to the applicable pooling and servicing agreement by the related directing holder prior to a control termination event under such pooling and servicing agreement.
|
| Servicing Standard: | Each of the master servicer and the special servicer is obligated to service and administer the mortgage loans (and, if applicable, the serviced companion loans) in accordance with the definition of the “Servicing Standard” described in the Preliminary Prospectus and the terms of the pooling and servicing agreement, provided that each non-serviced mortgage loan, if any, will be serviced by another master servicer or special servicer under the pooling and servicing agreement with respect to the securitization of the related companion loan, which entities will be obligated to service and administer such non-serviced mortgage loan pursuant to a similar standard set forth in the related pooling and servicing agreement. |
| Excluded Special Servicer: | If the special servicer obtains knowledge that it has become a Borrower Party with respect to any mortgage loan (an “Excluded Special Servicer Loan”), the special servicer will be required to resign as special servicer of that Excluded Special Servicer Loan. Prior to the occurrence of a Control Termination Event, the Directing Certificateholder will be entitled to select required to appoint (and may remove and replace with or without cause) a separate special servicer that is not a Borrower Party (an “Excluded Special Servicer”) with respect to any Excluded Special Servicer Loan, unless such Excluded Special Servicer Loan is also an Excluded Loan. After the occurrence and during the continuance of a Control Termination Event, if at any time the applicable Excluded Special Servicer Loan is also an Excluded Loan or if the Directing Certificateholder is entitled to appoint the Excluded Special Servicer but does not so appoint within 30 days of notice of such resignation, the resigning special servicer will be required to select the related Excluded Special Servicer. Any Excluded Special Servicer will be required to perform all of the obligations of the special servicer and will |
This is not a research report and was not prepared by any Underwriter’s research departments. Please see additional important information and qualifications at the end of this Term Sheet.
| T-11 |
| MSBAM 2016-C31 | Structural Overview |
| be entitled to all special servicing compensation with respect to such Excluded Special Servicer Loan earned while the related mortgage loan is an Excluded Special Servicer Loan. | |
| Liquidated Loan Waterfall: | On liquidation of any mortgage loan, all net liquidation proceeds related to the mortgage loan (but not any related companion loan) will be applied so that amounts allocated as a recovery of accrued and unpaid interest will not, in the first instance, include any delinquent interest that was not advanced as a result of Appraisal Reduction Amounts or accrued on the portion of the stated principal balance thereof equal to any related Collateral Deficiency Amount in effect from time to time and as to which no advance was made. After the adjusted interest amount is so allocated, any remaining liquidation proceeds will be allocated to offset certain advances and to pay principal on the mortgage loan until the unpaid principal amount of the mortgage loan has been reduced to zero. Any remaining liquidation proceeds will then be allocated to pay delinquent interest that was not advanced as a result of Appraisal Reduction Amounts or that accrued on the portion of the stated principal balance thereof equal to any related Collateral Deficiency Amount in effect from time to time and as to which no advance was made. |
| Operating Advisor: | The operating advisor will be required to perform certain review duties if a Control Termination Event has occurred and is continuing, which will generally include a limited annual review of, and the preparation of a report regarding, certain actions of the special servicer with respect to the resolution and/or liquidation of specially serviced loans. The review and report generally will be based on an annual meeting with the special servicer and any asset status reports and additional information delivered to the operating advisor by the special servicer. In addition, if a Control Termination Event has occurred and is continuing, the special servicer must consult with the operating advisor (in addition to the Directing Certificateholder if no Consultation Termination Event has occurred and is continuing) in connection with major decisions with respect to mortgage loans. Furthermore, under certain circumstances, but only if a Consultation Termination Event has occurred and is continuing, the operating advisor may recommend the replacement of the special servicer as described above under “—Appointment and Replacement of Special Servicer”; however, the operating advisor will not have any rights or obligations with respect to a non-serviced whole loan or servicing shift whole loan.
If a Consultation Termination Event has occurred and is continuing, the operating advisor may be removed and replaced without cause upon the affirmative direction of certificates owners holding not less than 75% of the voting rights of all certificates (taking into account the application of Cumulative Appraisal Reduction Amounts), following a proposal from certificate owners holding not less than 25% of the voting rights of all certificates (taking into account the application of Cumulative Appraisal Reduction Amounts). The certificateholders who initiate a vote on a termination and replacement of the operating advisor without cause must cause the payment of the fees and expenses incurred in the replacement. In addition, in the event there are no classes of certificates outstanding other than the Control Eligible Certificates and the Class E, Class X-E, Class X-F, Class X-G and Class R certificates, then all of the rights and obligations of the operating advisor under the PSA will terminate without payment of any penalty or termination fee (other than any rights or obligations that accrued prior to the date of such termination (including accrued and unpaid compensation) and other than indemnification rights arising out of events occurring prior to such termination). See “Pooling and Servicing Agreement—The Operating Advisor—Termination of the Operating Advisor Without Cause” in the Preliminary Prospectus.
|
| Operating Advisor Expenses: | In addition to the Operating Advisor Fee and the Operating Advisor Consulting Fee, the operating advisor will be entitled to reimbursement of Operating Advisor Expenses in accordance with the terms of the PSA. “Operating Advisor Expenses” for each distribution date will equal any unreimbursed indemnification amounts or additional trust fund expenses payable to the operating advisor pursuant to the PSA (other than the Operating Advisor Fee and the Operating Advisor Consulting Fee). |
| Asset Representations Reviewer: | The asset representations reviewer will be required to review certain delinquent mortgage loans after a specified delinquency threshold has been met and the required percentage of certificateholders vote to direct a review as described below. The asset representations reviewer will be entitled to the Asset Representations Reviewer Fee with respect to such review. See “Pooling and Servicing Agreement—The Asset Representations Reviewer” in the Preliminary Prospectus.
The certificate administrator will be required to notify certificateholders if the specified delinquency threshold has been met as described in the Preliminary Prospectus under “—The Asset Representations Reviewer”.
If certificateholders evidencing not less than 5.0% of the voting rights request a vote to commence an asset review, and if subsequently (i) a majority of those certificateholders casting a vote and (ii) a majority of an Asset Review Quorum authorizes an asset review within 150 days of the request for a vote, the asset representations reviewer will be required to conduct an asset review of delinquent loans.
The asset representations reviewer may be terminated and replaced without cause. Upon (i) the written direction of certificateholders evidencing not less than 25% of the voting rights (without regard to the application of any Cumulative Appraisal Reduction Amounts) requesting a vote to terminate and replace the asset representations reviewer with a proposed successor asset representations reviewer that is an eligible asset representations reviewer, and (ii) payment by such holders to the certificate administrator of the reasonable fees and expenses to be incurred by the certificate administrator in connection with administering such vote, the certificate administrator will be required to promptly provide notice to all certificateholders and the asset representations reviewer of such request by posting such notice on its internet website, and by mailing such notice to all certificateholders and the asset representations reviewer. Upon the written direction of certificateholders evidencing at least 75% of a Certificateholder Quorum (without regard to the application of any Cumulative Appraisal Reduction Amounts), the trustee will be required to terminate all of the rights and |
This is not a research report and was not prepared by any Underwriter’s research departments. Please see additional important information and qualifications at the end of this Term Sheet.
| T-12 |
| MSBAM 2016-C31 | Structural Overview |
obligations of the asset representations reviewer under the pooling and servicing agreement (other than any rights or obligations that accrued prior to the date of such termination and other than indemnification rights arising out of events occurring prior to such termination) by written notice to the asset representations reviewer, and the proposed successor asset representations reviewer will be appointed. See “Pooling and Servicing Agreement—The Asset Representations Reviewer” in the Preliminary Prospectus.
An “Asset Review Quorum” means, in connection with any solicitation of votes to authorize an asset review as described above, the holders of certificates evidencing at least 5.0% of the aggregate voting rights.
| |
| Dispute Resolution Provisions: | The mortgage loan sellers will be subject to the dispute resolution provisions set forth in the PSA to the extent those provisions are triggered with respect to any mortgage loan sold to the depositor by a mortgage loan seller, and such mortgage loan seller will be obligated under the related mortgage loan purchase agreement to comply with all applicable provisions and to take part in any mediation or arbitration proceedings that may result. Generally, in the event that a Repurchase Request is not “Resolved” within 180 days after the related mortgage loan seller receives such Repurchase Request, then the enforcing servicer will be required to send a notice to the first certificateholder (or beneficial owner) to deliver a certificateholder repurchase request with respect to the mortgage loan (the “Initial Requesting Certificateholder”) (if any) and to the certificate administrator (which will be required to make such notice available to certificateholders via the certificate administrator’s website) indicating the enforcing servicer’s intended course of action with respect to the Repurchase Request. If (a) the enforcing servicer’s intended course of action with respect to the Repurchase Request does not involve pursuing further action to exercise rights against the related mortgage loan seller with respect to the Repurchase Request and the Initial Requesting Certificateholder, if any, or any other certificateholder or certificate owner wishes to exercise its right to refer the matter to mediation (including nonbinding arbitration) or arbitration, or (b) the enforcing servicer’s intended course of action is to pursue further action to exercise rights against the related mortgage loan seller with respect to the Repurchase Request but the Initial Requesting Certificateholder, if any, or any other certificateholder or certificate owner does not agree with the dispute resolution method selected by the enforcing servicer, then the Initial Requesting Certificateholder, if any, or such other certificateholder or certificate owner may deliver a written notice to the special servicer indicating its intent to exercise its right to refer the matter to either mediation or arbitration.
“Resolved” means, with respect to a Repurchase Request, (i) that the related material defect or breach has been cured, (ii) the related mortgage loan has been repurchased in accordance with the related mortgage loan purchase agreement, (iii) a mortgage loan has been substituted for the related mortgage loan in accordance with the related mortgage loan purchase agreement, (iv) the applicable mortgage loan seller has made a loss of value payment, (v) a contractually binding agreement has been entered into between the enforcing servicer, on behalf of the issuing entity, and the related mortgage loan seller that settles the related mortgage loan seller’s obligations under the related mortgage loan purchase agreement, or (vi) the related mortgage loan is no longer property of the issuing entity as a result of a sale or other disposition in accordance with the pooling and servicing agreement. See “Pooling and Servicing Agreement—Dispute Resolution Provisions” in the Preliminary Prospectus.
|
| Investor Communications: | The certificate administrator is required to include on any Form 10-D any request received from a certificateholder to communicate with other certificateholders related to certificateholders exercising their rights under the terms of the PSA. Any certificateholder wishing to communicate with other certificateholders regarding the exercise of its rights under the terms of the PSA will be able to deliver a written request signed by an authorized representative of the requesting investor to the certificate administrator. |
| Deal Website: | The certificate administrator will be required to maintain a deal website which will include, among other items: (a) summaries of asset status reports prepared by the special servicer, (b) inspection reports, (c) appraisals, (d) various “special notices” described in the Preliminary Prospectus, (e) the “Investor Q&A Forum” and (f) a voluntary “Investor Registry”. Investors may access the deal website following execution of a certification and confidentiality agreement. |
This is not a research report and was not prepared by any Underwriter’s research departments. Please see additional important information and qualifications at the end of this Term Sheet.
| T-13 |
| MSBAM 2016-C31 | Collateral Overview |
| Mortgage Loan Sellers | No. of Mortgage Loans | No. of Mortgaged Properties | Aggregate Cut-off Date Balance | % of Pool(1) |
| Morgan Stanley Mortgage Capital Holdings LLC | 11 | 11 | $326,789,660 | 34.3% |
| Bank of America, National Association | 13 | 17 | $214,748,094 | 22.5% |
| UBS AG | 15 | 23 | $176,368,206 | 18.5% |
| KeyBank National Association | 14 | 43 | $156,670,194 | 16.4% |
| Starwood Mortgage Funding III LLC | 7 | 7 | $78,610,016 | 8.2% |
| Total: | 60 | 101 | $953,186,169 | 100.0% |
Pool Statistics
| Aggregate Cut-off Date Balance: | $953,186,169 |
| Number of Mortgage Loans: | 60 |
| Average Cut-off Date Balance per Mortgage Loan: | $15,886,436 |
| Number of Mortgaged Properties: | 101 |
| Average Cut-off Date Balance per Mortgaged Property: | $9,437,487 |
| Weighted Average Mortgage Rate: | 4.3408% |
| % of Pool Secured by 5 Largest Mortgage Loans: | 30.7% |
| % of Pool Secured by 10 Largest Mortgage Loans: | 49.7% |
| % of Pool Secured by ARD Loans(2): | 0.0% |
| Weighted Average Original Term to Maturity (months)(2): | 117 |
| Weighted Average Remaining Term to Maturity (months)(2): | 115 |
| Weighted Average Seasoning (months): | 2 |
| % of Pool Secured by Single Tenant Mortgaged Properties: | 8.8% |
| % of Pool Secured by Refinance Loans: | 74.7% |
| % of Pool Secured by Acquisition Loans: | 23.7% |
| % of Pool Secured by Recapitalization Loans: | 1.6% |
Additional Debt
| % of Pool withPari Passu Mortgage Debt: | 39.8% |
| % of Pool with Subordinate Mortgage Debt: | 4.7% |
| % of Pool with Mezzanine Debt: | 0.0% |
Credit Statistics(3)
| Weighted Average UW NOI DSCR: | 1.94x |
| Weighted Average UW NOI Debt Yield: | 11.0% |
| Weighted Average UW NCF DSCR: | 1.78x |
| Weighted Average UW NCF Debt Yield: | 10.1% |
| Weighted Average Cut-off Date LTV Ratio(4): | 63.3% |
| Weighted Average Maturity Date LTV Ratio(2)(4): | 54.4% |
Footnotes are set forth on the following page.
This is not a research report and was not prepared by any Underwriter’s research departments. Please see additional important information and qualifications at the end of this Term Sheet.
| T-14 |
| MSBAM 2016-C31 | Collateral Overview |
Amortization
| Weighted Average Original Amortization Term (months): | 352 |
| Weighted Average Remaining Amortization Term (months): | 350 |
| % of Pool Interest Only through Maturity(2): | 10.8% |
| % of Pool Interest Only followed by Amortizing Balloon: | 46.9% |
| % of Pool Amortizing Balloon: | 42.2% |
| % of Pool Fully Amortizing: | 0.0% |
Lockboxes
| % of Pool with Hard Lockboxes: | 54.7% |
| % of Pool with Springing Lockboxes: | 33.9% |
| % of Pool with Soft Lockboxes: | 9.5% |
| % of Pool with No Lockboxes: | 2.0% |
Reserves
| % of Pool Requiring Tax Reserves: | 80.1% |
| % of Pool Requiring Insurance Reserves: | 42.7% |
| % of Pool Requiring Replacement Reserves: | 77.0% |
| % of Pool Requiring TI/LC Reserves(5): | 61.6% |
Call Protection
| % of Pool with lockout period, followed by defeasance until open period: | 86.9% |
| % of Pool with lockout period, followed by the greater of a prepayment premium and yield maintenance until open period: | 6.3% |
| % of Pool with lockout period, followed by defeasance or the greater of a prepayment premium and yield maintenance until open period: | 6.0% |
| % of Pool with the greater of a prepayment premium and yield maintenance until open period: | 0.5% |
| % of Pool with lockout period, followed by the greater of a prepayment premium and yield maintenance, then followed by defeasance or the greater of a prepayment premium and yield maintenance until open period: | 0.3% |
| (1) | Unless otherwise indicated, all references to “% of Pool” in this Term Sheet reflect a percentage of the aggregate principal balance of the mortgage pool as of the Cut-off Date, after application of all payments of principal due during or prior to November 2016. |
| (2) | With respect to any ARD Loan, unless otherwise indicated, references in this Term Sheet to the applicable “maturity date” or “maturity” refer to the applicable anticipated repayment date with respect to such ARD Loan, and such applicable anticipated repayment date is treated as its maturity date for all purposes hereof. There are no ARD Loans included in the mortgage pool. |
| (3) | With respect to any mortgage loan that is part of a whole loan, unless otherwise indicated, all LTV, DSCR and Debt Yield calculations in this Term Sheet include any relatedpari passu companion loans and exclude any subordinate companion loans, as applicable. Additionally, LTV, DSCR and Debt Yield figures in this Term Sheet are calculated for mortgage loans without regard to any additional indebtedness that may be incurred at a future date. With respect to any leased fee loans, the SF/Unit and Balance per SF/Unit figures in this Term Sheet are based on the size of the non-collateral improvements. |
| (4) | The LTV ratios set forth in this Term Sheet are generally based on the “as-is” values of the related mortgaged properties; provided that the “as-is” value for a portfolio of mortgaged properties may include a premium relating to the valuation of the mortgaged properties as a whole rather than as the sum of individually valued mortgaged properties; provided, further, that such LTV ratios may be based on “as-stabilized”, “as complete” or other contingent values in certain cases in which reserves have been established at origination for the applicable condition or circumstance that is expected to result in stabilization. See the definition of “Appraised Value” under“Description of the Mortgage Pool—Certain Calculations and Definitions”in the Preliminary Prospectus. |
| (5) | Excludes hospitality, multifamily, manufactured housing, other (leased fee and net lease) and self-storage properties. |
This is not a research report and was not prepared by any Underwriter’s research departments. Please see additional important information and qualifications at the end of this Term Sheet.
| T-15 |
| MSBAM 2016-C31 | Characteristics of the Mortgage Loans |
| Top 10 Mortgage Loans | |||||||||||||
| Loan No. | Mortgage Loan Seller | Property Name | City | State | Property Type | Cut-off Date Balance | % of Pool | SF/Units | Cut-off Date Balance per SF/Unit | UW NCF DSCR | UW NOI Debt Yield | Cut-off Date LTV | Maturity Date LTV |
| 1 | MSMCH | Huntington Center(1) | Columbus | OH | Office | $80,000,000 | 8.4% | 907,010 | $154.35 | 1.54x | 9.2% | 75.0% | 67.7% |
| 2 | MSMCH | One Met Life Way | Hanover | NJ | Office | $68,950,000 | 7.2% | 184,960 | $372.78 | 1.37x | 8.1% | 69.3% | 63.2% |
| 3 | MSMCH | Hyatt Regency Sarasota | Sarasota | FL | Hospitality | $54,000,000 | 5.7% | 294 | $183,673.47 | 1.70x | 12.7% | 70.7% | 58.2% |
| 4 | KeyBank | SpringHill Suites - Seattle | Seattle | WA | Hospitality | $45,000,000 | 4.7% | 234 | $192,307.69 | 1.75x | 11.6% | 60.7% | 51.8% |
| 5 | UBSAG | Vintage Park(1) | Houston | TX | Retail | $45,000,000 | 4.7% | 341,107 | $246.26 | 1.33x | 8.8% | 70.1% | 61.1% |
| 6 | BANA | Simon Premium Outlets(1) | Various | Various | Retail | $42,215,616 | 4.4% | 782,765 | $133.24 | 2.55x | 16.4% | 46.6% | 37.6% |
| 7 | MSMCH | Harlem USA(1) | New York | NY | Retail | $40,000,000 | 4.2% | 245,849 | $439.29 | 2.83x | 10.0% | 55.4% | 55.4% |
| 8 | BANA | One Stamford Forum(1) | Stamford | CT | Office | $38,251,697 | 4.0% | 504,471 | $216.64 | 1.55x | 12.1% | 48.1% | 36.2% |
| 9 | BANA | International Square(1) | Washington | DC | Office | $30,000,000 | 3.1% | 1,158,732 | $212.91 | 4.31x | 17.4% | 32.6% | 32.6% |
| 10 | MSMCH | Coconut Point(1) | Estero | FL | Retail | $30,000,000 | 3.1% | 836,531 | $227.13 | 1.39x | 8.8% | 67.1% | 56.6% |
| Total/Wtd. Avg. | $473,417,313 | 49.7% | 1.90x | 11.1% | 62.3% | 54.6% | |||||||
| (1) | With respect to any mortgage loan that is part of a whole loan, unless otherwise indicated, all LTV, DSCR, Debt Yield and Balance per SF/Unit calculations in this Term Sheet include any relatedpari passucompanion loans and exclude any subordinate companion loans, as applicable. Additionally, LTV, DSCR, Debt Yield and Balance per SF/Unit figures in this Term Sheet are calculated for mortgage loans without regard to any additional indebtedness that may be incurred at a future date. With respect to any leased fee loans, the SF/Unit and Balance per SF/Unit figures in this Term Sheet are based on the size of the non-collateral improvements. |
This is not a research report and was not prepared by any Underwriter’s research departments. Please see additional important information and qualifications at the end of this Term Sheet.
| T-16 |
| MSBAM 2016-C31 | Characteristics of the Mortgage Loans |
| Mortgage Loans with Pari Passu Companion Loans | ||||||||||||
| Loan No. | Mortgage Seller | Property Name | Mortgage Loan Cut-off Date Balance | Aggregate Pari Passu Companion Loan Cut-off Date Balance | Combined Cut-off Date Balance | Lead Servicing Agreement | Master Servicer | Special Servicer | Control Rights | Combined UW NCF DSCR(1) | Combined UW NOI Debt Yield(1) | Combined Cut-off Date LTV(1) |
| 1 | MSMCH | Huntington Center | $80,000,000 | $60,000,000 | $140,000,000 | MSBAM 2016-C31 | Wells Fargo | Rialto | MSBAM 2016-C31 | 1.54x | 9.2% | 75.0% |
| 5 | UBSAG | Vintage Park | $45,000,000 | $39,000,000 | $84,000,000 | MSBAM 2016-C31 | Wells Fargo | Rialto | MSBAM 2016-C31 | 1.33x | 8.8% | 70.1% |
| 6 | BANA | Simon Premium Outlets | $42,215,616 | $62,081,789 | $104,297,405 | WFCM 2016-BNK1 | Wells Fargo | Rialto | WFCM 2016-BNK1 | 2.55x | 16.4% | 46.6% |
| 7 | MSMCH | Harlem USA | $40,000,000 | $68,000,000 | $108,000,000 | MSBAM 2016-C31(2) | Wells Fargo(2) | Rialto(2) | (2) | 2.83x | 10.0% | 55.4% |
| 8 | BANA | One Stamford Forum | $38,251,697 | $71,038,865 | $109,290,562 | WFCM 2016-BNK1 | Wells Fargo | Rialto | WFCM 2016-BNK1 | 1.55x | 12.1% | 48.1% |
| 9 | BANA | International Square | $30,000,000 | $216,700,000 | $246,700,000 | BAMLL 2016-ISQR | Wells Fargo | AEGON | BAMLL 2016-ISQR | 4.31x | 17.4% | 32.6% |
| 10 | MSMCH | Coconut Point | $30,000,000 | $160,000,000 | $190,000,000 | MSBAM 2016-C31(2) | Wells Fargo(2) | LNR(2) | (2) | 1.39x | 8.8% | 67.1% |
| 13 | KeyBank | SSTII Self Storage Portfolio | $25,000,000 | $70,000,000 | $95,000,000 | MSC 2016-UBS11 | Midland | CWCapital | MSC 2016-UBS11 | 1.84x | 10.8% | 45.0% |
| 14 | UBSAG | TEK Park | $23,893,983 | $40,818,888 | $64,712,871 | SGCMS 2016-C5 | Wells Fargo | Rialto | SGCMS 2016-C5 | 1.52x | 10.3% | 63.4% |
| 20 | BANA | The Shops at Crystals | $15,000,000 | $367,700,000 | $382,700,000 | SHOPS 2016-CSTL | KeyBank | AEGON | SHOPS 2016-CSTL | 3.28x | 12.9% | 34.8% |
| 26 | UBSAG | MY Portfolio | $9,984,518 | $19,969,037 | $29,953,555 | MSBAM 2016-C31(2) | Wells Fargo(2) | Rialto(2) | (2) | 1.93x | 15.1% | 62.4% |
| (1) | DSCR, Debt Yield and LTV calculations include any relatedpari passu companion loans and exclude any subordinate companion loans, as applicable. |
| (2) | With respect to each of the Harlem USA, Coconut Point and My Portfolio whole loans, the holder of the related control note (with respect to the Harlem USA whole loan and Coconut Point whole loan, Morgan Stanley Bank, N.A., and with respect to the MY Portfolio whole loan, UBS AG) will be the controlling noteholder. No such control note is included in this securitization. Upon a securitization of such control note, servicing of the related whole loan will be governed by the pooling and servicing agreement entered into in connection with such securitization, and the representative of the controlling class under such pooling and servicing agreement is expected to have certain consent and control rights regarding servicing of the related whole loan similar to those of the MSBAM 2016-C31 directing certificateholder with respect to the mortgage loans serviced under the pooling and servicing agreement for this securitization. The master servicer and the special servicer under the pooling and servicing agreement for any such future securitization of a related control note may not be the same as the entities listed above with respect to the related whole loan. See “Description of the Mortgage Loans—The Whole Loans” in the Preliminary Prospectus. |
This is not a research report and was not prepared by any Underwriter’s research departments. Please see additional important information and qualifications at the end of this Term Sheet.
| T-17 |
| MSBAM 2016-C31 | Characteristics of the Mortgage Loans |
| Mortgage Loans with Subordinate Debt | |||||||||||
| Loan No. | Mortgage Loan Seller | Property Name | Mortgage Loan Cut-off Date Balance | Cut-off Date Balance per Unit/SF | Subordinate Debt Cut-off Date Balance | UW NCF DSCR | UW NOI Debt Yield | Cut-off Date LTV | Total Debt UW NCF DSCR(1) | Total Debt UW NOI Debt Yield(1) | Total Debt Cut- off Date LTV(1) |
| 9 | BANA | International Square | $30,000,000 | $212.91 | $203,300,000 | 4.31x | 17.4% | 32.6% | 2.36x | 9.5% | 59.4% |
| 20 | BANA | The Shops at Crystals | $15,000,000 | $1,458.87 | $167,300,000 | 3.28x | 12.9% | 34.8% | 2.28x | 9.0% | 50.0% |
| (1) | Total Debt UW NCF DSCR, Total Debt UW NOI Debt Yield and Total Debt Cut-off Date LTV figures shown above are calculated based on any relatedpari passu notes and the related subordinate note(s). |
This is not a research report and was not prepared by any Underwriter’s research departments. Please see additional important information and qualifications at the end of this Term Sheet.
| T-18 |
| MSBAM 2016-C31 | Characteristics of the Mortgage Loans |
| Prior Securitization History(1) | ||||||||||||||
| Loan No. | Mortgage Loan Seller | Property Name | City | State | Property Type | Cut-off Date Balance | % of Pool | SF/Units | Cut-off Date Balance per SF/Unit | UW NCF DSCR | UW NOI Debt Yield | Cut-off Date LTV | Maturity Date LTV | Prior Securitization |
| 4 | KeyBank | SpringHill Suites - Seattle | Seattle | WA | Hospitality | $45,000,000 | 4.7% | 234 | $192,307.69 | 1.75x | 11.6% | 60.7% | 51.8% | CWCI 2006-C1 |
| 5 | UBSAG | Vintage Park | Houston | TX | Retail | $45,000,000 | 4.7% | 341,107 | $246.26 | 1.33x | 8.8% | 70.1% | 61.1% | GSMS 2014-GSFL |
| 6 | BANA | Simon Premium Outlets | Various | Various | Retail | $42,215,616 | 4.4% | 782,765 | $133.24 | 2.55x | 16.4% | 46.6% | 37.6% | JPMCC 2006-CB16 |
| 8 | BANA | One Stamford Forum | Stamford | CT | Office | $38,251,697 | 4.0% | 504,471 | $216.64 | 1.55x | 12.1% | 48.1% | 36.2% | BACM 2006-3 |
| 9 | BANA | International Square | Washington | DC | Office | $30,000,000 | 3.1% | 1,158,732 | $212.91 | 4.31x | 17.4% | 32.6% | 32.6% | LBUBS 2007-C1 |
| 10 | MSMCH | Coconut Point | Estero | FL | Retail | $30,000,000 | 3.1% | 836,531 | $227.13 | 1.39x | 8.8% | 67.1% | 56.6% | JPMCC 2007-LDPX |
| 12 | UBSAG | Birmingham Office Portfolio | Various | AL | Office | $29,000,000 | 3.0% | 324,741 | $89.30 | 1.48x | 10.4% | 70.2% | 67.0% | CSMC 2006-C5 |
| 14 | UBSAG | TEK Park | Breinigsville | PA | Office | $23,893,983 | 2.5% | 514,033 | $125.89 | 1.52x | 10.3% | 63.4% | 52.5% | COMM 2012-CR1 |
| 15 | BANA | North Park Crossing Shopping Center | Joplin | MO | Retail | $22,361,233 | 2.3% | 200,829 | $111.34 | 1.38x | 9.8% | 68.0% | 49.9% | CSMC 2006-C5 |
| 17 | SMF III | Perris Towne Center | Perris | CA | Retail | $19,250,000 | 2.0% | 127,510 | $150.97 | 1.43x | 9.1% | 72.1% | 62.7% | MLCFC 2006-4 |
| 22 | SMF III | Cambridge Center | Livonia | MI | Office | $13,634,158 | 1.4% | 114,623 | $118.95 | 1.46x | 10.0% | 74.1% | 60.4% | WBCMT 2006-C29 |
| 23 | UBSAG | Stockridge Plaza | Sacramento | CA | Retail | $12,537,059 | 1.3% | 94,661 | $132.44 | 1.41x | 9.8% | 72.1% | 59.7% | JPMCC 2007-LD12 |
| 25 | MSMCH | Carefree Marketplace | Carefree | AZ | Retail | $10,774,008 | 1.1% | 85,014 | $126.73 | 1.30x | 8.8% | 66.5% | 54.4% | BSCMS 2006-PW13 |
| 27 | BANA | 788 Jefferson | Milwaukee | WI | Office | $9,950,000 | 1.0% | 106,606 | $93.33 | 1.46x | 9.6% | 71.6% | 60.8% | BSCMS 2007-PW18 |
| 28 | SMF III | Town Center Promenade | Deer Park | IL | Retail | $9,500,000 | 1.0% | 63,979 | $148.49 | 1.38x | 8.9% | 74.8% | 64.1% | BSCMS 2007-T28 |
| 32 | UBSAG | StorQuest - San Rafael, CA | San Rafael | CA | Self Storage | $8,100,000 | 0.8% | 25,550 | $317.03 | 1.44x | 8.6% | 62.1% | 56.6% | LBUBS 2007-C7 |
| 34 | KeyBank | Oxbow Crossing | Montrose | CO | Retail | $7,640,780 | 0.8% | 91,813 | $83.22 | 1.31x | 9.6% | 74.9% | 60.7% | BSCMS 2006-PW14 |
| 36 | MSMCH | Glenwood Village | Perkasie | PA | Retail | $7,391,013 | 0.8% | 63,209 | $116.93 | 1.47x | 9.6% | 64.6% | 52.2% | MLCFC 2006-4 |
| 38 | SMF III | Queen Creek Village | Queen Creek | AZ | Retail | $6,500,000 | 0.7% | 52,189 | $124.55 | 1.50x | 10.4% | 70.0% | 58.4% | CSMC 2007-C5 |
| 47 | MSMCH | Eastern Springs Village | Las Vegas | NV | Retail | $4,328,596 | 0.5% | 21,588 | $200.51 | 1.33x | 8.7% | 72.1% | 58.8% | BACM 2006-6 |
| 49 | BANA | Holiday Trav-L Park MHC | Rossville | GA | Manufactured Housing | $3,930,838 | 0.4% | 178 | $22,083.36 | 1.78x | 12.1% | 56.2% | 44.7% | MSBAM 2013-C8 |
| 50 | KeyBank | Walgreens - Vista, CA | Vista | CA | Retail | $3,920,343 | 0.4% | 14,820 | $264.53 | 1.51x | 9.3% | 52.6% | 42.7% | CSMC 2007-C3 |
| 54 | UBSAG | Country Inn & Suites - Michigan City | Michigan City | IN | Hospitality | $3,095,413 | 0.3% | 56 | $55,275.23 | 1.90x | 15.2% | 63.2% | 47.8% | WBCMT 2006-C28 |
| Total | $426,274,737 | 44.7% | ||||||||||||
| (1) | Includes mortgage loans for which all or a portion of the previously existing debt was most recently securitized in conduit securitizations, based on information provided by the related borrower or obtained through searches of a third-party database. The information has not otherwise been confirmed by the mortgage loan sellers. With respect to any mortgage loan that is part of a whole loan, unless otherwise indicated, all LTV, DSCR, Debt Yield and Cut-off Date Balance per SF/Unit calculations include any relatedpari passu companion loans and exclude any related subordinate companion loans, as applicable. |
This is not a research report and was not prepared by any Underwriter’s research departments. Please see additional important information and qualifications at the end of this Term Sheet.
| T-19 |
| MSBAM 2016-C31 | Characteristics of the Mortgage Loans |
Mortgage Loans with Scheduled Balloon Payments and Related Classes(1)
| Class A-2 ($27,600,000) | ||||||||||||||||
| Loan No. | Mortgage Loan Seller | Property Name | State | Property Type | Cut-off Date Balance | % of Pool | Maturity Date Balance | % of Class A-2 Certificate Principal Balance | SF/ Units | Cut-off Date Balance per SF/Unit | UW NCF DSCR | UW NOI Debt Yield | Cut-off Date LTV | Maturity Date LTV | Rem. IO Period (mos.) | Rem. Term to Maturity (mos.) |
| 12 | UBSAG | Birmingham Office Portfolio | AL | Office | $29,000,000 | 3.0% | $27,687,854 | 100.3% | 324,741 | $89.30 | 1.48x | 10.4% | 70.2% | 67.0% | 24 | 60 |
| Total/Wtd. Avg. | $29,000,000 | 3.0% | $27,687,854 | 100.3% | 1.48x | 10.4% | 70.2% | 67.0% | 24 | 60 | ||||||
| (1) | The table above reflects the mortgage loans whose balloon payments will be applied to pay down the Class A-2 certificates, assuming (i) that none of the mortgage loans experience prepayments, defaults or losses; (ii) there are no extensions of maturity dates; and (iii) each mortgage loan is paid in full on its stated maturity date or, in the case of any mortgage loan with an anticipated repayment date, on such anticipated repayment date. The table above is otherwise based on the Structuring Assumptions set forth under “Yield and Maturity Considerations—Weighted Average Life” in the Preliminary Prospectus. |
This is not a research report and was not prepared by any Underwriter’s research departments. Please see additional important information and qualifications at the end of this Term Sheet.
| T-20 |
| MSBAM 2016-C31 | Characteristics of the Mortgage Loans |
Mortgage Loans with Scheduled Balloon Payments and Related Classes(1)
| Class A-3 ($17,811,000) | ||||||||||||||||
| Loan No. | Mortgage Loan Seller | Property Name | State | Property Type | Cut-off Date Balance | % of Pool | Maturity Date Balance | % of Class A-3 Certificate Principal Balance | SF/ Units | Cut-off Date Balance per SF/Unit | UW NCF DSCR | UW NOI Debt Yield | Cut-off Date LTV | Maturity Date LTV | Rem. IO Period (mos.) | Rem. Term to Maturity (mos.) |
| 19 | KeyBank | Shoppes of Parkland | FL | Retail | $16,513,794 | 1.7% | $14,571,740 | 81.8% | 145,720 | $113.33 | 1.41x | 9.8% | 53.4% | 47.2% | 0 | 82 |
| 52 | KeyBank | West Market Plaza | OH | Retail | $3,640,000 | 0.4% | $3,272,002 | 18.4% | 138,491 | $26.28 | 1.51x | 12.2% | 65.0% | 58.4% | 10 | 82 |
| Total/Wtd. Avg. | $20,153,794 | 2.1% | $17,843,742 | 100.2% | 1.43x | 10.2% | 55.5% | 49.2% | 2 | 82 | ||||||
| (1) | The table above reflects the mortgage loans whose balloon payments will be applied to pay down the Class A-3 certificates, assuming (i) that none of the mortgage loans experience prepayments, defaults or losses; (ii) there are no extensions of maturity dates; and (iii) each mortgage loan is paid in full on its stated maturity date or, in the case of any mortgage loan with an anticipated repayment date, on such anticipated repayment date. The table above is otherwise based on the Structuring Assumptions set forth under “Yield and Maturity Considerations—Weighted Average Life” in the Preliminary Prospectus. |
This is not a research report and was not prepared by any Underwriter’s research departments. Please see additional important information and qualifications at the end of this Term Sheet.
| T-21 |
| MSBAM 2016-C31 | Characteristics of the Mortgage Loans |
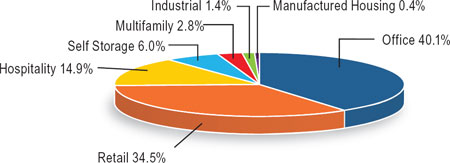
| Property Type Distribution(1) | ||||||||
| Property Type | Number of Mortgaged Properties | Aggregate Cut-off Date Balance | % of Pool | Wtd. Avg. Mortgage Rate | Wtd. Avg. UW NCF DSCR | Wtd. Avg. UW NOI Debt Yield | Wtd. Avg. Cut-off Date LTV | Wtd. Avg. Maturity Date LTV |
| Office | 20 | $382,190,790 | 40.1% | 4.2200% | 1.71x | 10.3% | 65.3% | 57.2% |
| Suburban | 14 | $217,939,094 | 22.9% | 4.4251% | 1.46x | 9.5% | 69.1% | 60.3% |
| CBD | 4 | $158,201,697 | 16.6% | 3.9195% | 2.06x | 11.5% | 60.2% | 53.0% |
| Medical | 2 | $6,050,000 | 0.6% | 4.6900% | 1.75x | 11.2% | 58.8% | 52.9% |
| Retail | 25 | $328,656,005 | 34.5% | 4.3173% | 1.85x | 10.7% | 61.9% | 53.3% |
| Anchored | 12 | $185,707,643 | 19.5% | 4.0887% | 1.88x | 10.0% | 61.6% | 53.6% |
| Regional Lifestyle Center | 1 | $45,000,000 | 4.7% | 4.9870% | 1.33x | 8.8% | 70.1% | 61.1% |
| Outlet Center | 3 | $42,215,616 | 4.4% | 4.1680% | 2.55x | 16.4% | 46.6% | 37.6% |
| Shadow Anchored | 4 | $36,856,436 | 3.9% | 4.6695% | 1.62x | 9.8% | 70.3% | 61.6% |
| Unanchored | 4 | $14,955,967 | 1.6% | 4.6414% | 1.67x | 11.9% | 64.7% | 52.4% |
| Free-Standing | 1 | $3,920,343 | 0.4% | 4.5200% | 1.51x | 9.3% | 52.6% | 42.7% |
| Hospitality | 13 | $141,581,711 | 14.9% | 4.7931% | 1.85x | 13.7% | 63.3% | 51.4% |
| Full Service | 3 | $107,210,917 | 11.2% | 4.7297% | 1.75x | 12.8% | 64.0% | 52.9% |
| Limited Service | 7 | $25,167,428 | 2.6% | 5.1697% | 1.87x | 14.9% | 63.0% | 47.8% |
| Extended Stay | 2 | $7,456,076 | 0.8% | 4.3910% | 3.23x | 21.3% | 53.8% | 42.6% |
| Select Service | 1 | $1,747,291 | 0.2% | 4.9720% | 1.93x | 15.1% | 62.4% | 46.8% |
| Self Storage | 36 | $56,870,676 | 6.0% | 4.0863% | 1.82x | 10.3% | 55.2% | 50.2% |
| Self Storage | 36 | $56,870,676 | 6.0% | 4.0863% | 1.82x | 10.3% | 55.2% | 50.2% |
| Multifamily | 2 | $26,394,817 | 2.8% | 4.2082% | 1.64x | 10.1% | 70.3% | 56.4% |
| Garden | 2 | $26,394,817 | 2.8% | 4.2082% | 1.64x | 10.1% | 70.3% | 56.4% |
| Industrial | 4 | $13,561,333 | 1.4% | 4.7747% | 1.66x | 12.2% | 65.6% | 53.0% |
| Flex | 4 | $13,561,333 | 1.4% | 4.7747% | 1.66x | 12.2% | 65.6% | 53.0% |
| Manufactured Housing | 1 | $3,930,838 | 0.4% | 4.8430% | 1.78x | 12.1% | 56.2% | 44.7% |
| Manufactured Housing | 1 | $3,930,838 | 0.4% | 4.8430% | 1.78x | 12.1% | 56.2% | 44.7% |
| Total/Wtd. Avg. | 101 | $953,186,169 | 100.0% | 4.3408% | 1.78x | 11.0% | 63.3% | 54.4% |
| (1) | All numerical information concerning the mortgage loans is approximate and, in the case of mortgage loans secured by multiple properties, is based on allocated loan amounts with respect to such properties. All weighted average information regarding the mortgage loans reflects the weighting of the mortgage loans based on their outstanding principal balances as of the Cut-off Date or, in the case of mortgage loans secured by multiple properties, allocated loan amounts. The sum of numbers and percentages in columns may not match the “Total” due to rounding. With respect to any mortgage loan that is part of a whole loan, unless otherwise indicated, all LTV, DSCR and Debt Yield calculations include any relatedpari passu companion loans and exclude any related subordinate companion loans, as applicable. |
This is not a research report and was not prepared by any Underwriter’s research departments. Please see additional important information and qualifications at the end of this Term Sheet.
| T-22 |
| MSBAM 2016-C31 | Characteristics of the Mortgage Loans |
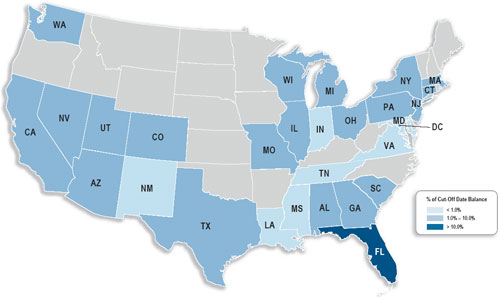
| Geographic Distribution(1) | ||||||||
| State or Other Jurisdiction | Number of Mortgaged Properties | Aggregate Cut-off Date Balance | % of Pool | Wtd. Avg. Mortgage Rate | Wtd. Avg. UW NCF DSCR | Wtd. Avg. UW NOI Debt Yield | Wtd. Avg. Cut-off Date LTV | Wtd. Avg. Maturity Date LTV |
| Florida | 6 | $107,145,589 | 11.2% | 4.6075% | 1.57x | 11.1% | 66.0% | 55.4% |
| California | 24 | $93,730,479 | 9.8% | 4.2353% | 1.61x | 9.8% | 64.5% | 56.4% |
| California – Southern(2) | 19 | $70,136,923 | 7.4% | 4.0922% | 1.66x | 9.8% | 64.2% | 56.5% |
| California – Northern(2) | 5 | $23,593,556 | 2.5% | 4.6607% | 1.47x | 9.5% | 65.3% | 56.3% |
| Ohio | 2 | $83,640,000 | 8.8% | 3.5766% | 1.54x | 9.3% | 74.6% | 67.3% |
| Texas | 6 | $77,089,437 | 8.1% | 4.6516% | 1.49x | 9.8% | 69.9% | 58.7% |
| New Jersey | 2 | $69,314,678 | 7.3% | 4.1586% | 1.37x | 8.1% | 69.2% | 63.1% |
| Washington | 2 | $45,716,332 | 4.8% | 4.3723% | 1.75x | 11.6% | 60.5% | 51.6% |
| New York | 1 | $40,000,000 | 4.2% | 3.3100% | 2.83x | 10.0% | 55.4% | 55.4% |
| Connecticut | 1 | $38,251,697 | 4.0% | 4.9000% | 1.55x | 12.1% | 48.1% | 36.2% |
| Nevada | 5 | $36,673,184 | 3.8% | 4.2145% | 2.53x | 12.0% | 51.1% | 48.4% |
| Colorado | 6 | $32,102,359 | 3.4% | 4.5599% | 1.53x | 10.4% | 67.8% | 57.7% |
| Arizona | 4 | $31,874,008 | 3.3% | 4.5946% | 1.50x | 10.0% | 67.0% | 56.4% |
| Georgia | 5 | $31,615,573 | 3.3% | 4.8643% | 1.99x | 15.1% | 51.4% | 40.7% |
| Pennsylvania | 2 | $31,284,997 | 3.3% | 4.8620% | 1.51x | 10.1% | 63.7% | 52.4% |
| Alabama | 4 | $30,087,523 | 3.2% | 4.6982% | 1.49x | 10.4% | 69.3% | 66.1% |
| District of Columbia | 1 | $30,000,000 | 3.1% | 3.6150% | 4.31x | 17.4% | 32.6% | 32.6% |
| Utah | 1 | $29,419,866 | 3.1% | 4.1100% | 1.47x | 9.5% | 73.2% | 58.7% |
| Michigan | 8 | $27,189,744 | 2.9% | 4.5003% | 1.96x | 12.9% | 65.9% | 54.2% |
| Missouri | 1 | $22,361,233 | 2.3% | 4.3400% | 1.38x | 9.8% | 68.0% | 49.9% |
| Massachusetts | 1 | $21,710,888 | 2.3% | 4.1680% | 2.55x | 16.4% | 46.6% | 37.6% |
| South Carolina | 2 | $21,591,767 | 2.3% | 4.4955% | 2.26x | 15.6% | 53.1% | 41.6% |
| Illinois | 3 | $10,554,962 | 1.1% | 4.4660% | 1.43x | 9.1% | 71.8% | 61.8% |
| Wisconsin | 1 | $9,950,000 | 1.0% | 4.2000% | 1.46x | 9.6% | 71.6% | 60.8% |
| Louisiana | 4 | $6,718,749 | 0.7% | 4.9720% | 1.93x | 15.1% | 62.4% | 46.8% |
| Indiana | 2 | $5,960,615 | 0.6% | 4.8931% | 1.65x | 13.3% | 66.4% | 49.6% |
| Tennessee | 2 | $5,900,219 | 0.6% | 4.7212% | 1.71x | 12.1% | 66.7% | 54.7% |
| New Mexico | 1 | $4,593,719 | 0.5% | 5.6500% | 1.45x | 11.7% | 68.0% | 52.2% |
| Virginia | 1 | $4,531,087 | 0.5% | 5.5600% | 1.30x | 12.5% | 58.8% | 45.7% |
| Mississippi | 2 | $3,265,770 | 0.3% | 4.9720% | 1.93x | 15.1% | 62.4% | 46.8% |
| Maryland | 1 | $911,696 | 0.1% | 3.8900% | 1.84x | 10.8% | 45.0% | 40.9% |
| Total/Wtd. Avg. | 101 | $953,186,169 | 100.0% | 4.3408% | 1.78x | 11.0% | 63.3% | 54.4% |
| (1) | All numerical information concerning the mortgage loans is approximate and, in the case of mortgage loans secured by multiple properties, is based on allocated loan amounts with respect to such properties. All weighted average information regarding the mortgage loans reflects the weighting of the mortgage loans based on their outstanding principal balances as of the Cut-off Date or, in the case of mortgage loans secured by multiple properties, allocated loan amounts. The sum of numbers and percentages in columns may not match the “Total” due to rounding. With respect to any mortgage loan that is part of a whole loan, unless otherwise indicated, all LTV, DSCR and Debt Yield calculations include any relatedpari passu companion loans and exclude any related subordinate companion loans, as applicable. |
| (2) | “California – Northern” includes zip codes above 93600, and “California – Southern” includes zip codes at or below 93600. |
This is not a research report and was not prepared by any Underwriter’s research departments. Please see additional important information and qualifications at the end of this Term Sheet.
| T-23 |
| MSBAM 2016-C31 | Collateral Statistics |
Collateral Statistics(1)
Cut-off Date Balance ($)
| No. of Mortgage Loans | Aggregate Cut-off Date Balance ($) | % of Pool | |
| 2,022,624 - 5,000,000 | 18 | 64,321,847 | 6.7 |
| 5,000,001 - 10,000,000 | 17 | 131,666,867 | 13.8 |
| 10,000,001 - 15,000,000 | 6 | 78,295,226 | 8.2 |
| 15,000,001 - 25,000,000 | 7 | 147,065,051 | 15.4 |
| 25,000,001 - 50,000,000 | 9 | 328,887,179 | 34.5 |
| 50,000,001 - 80,000,000 | 3 | 202,950,000 | 21.3 |
| Total: | 60 | $953,186,169 | 100.0 |
| Min: $2,022,624 Max: $80,000,000 Avg: $15,886,436 | |||
State or Other Jurisdiction
| No. of Mortgaged Properties | Aggregate Cut-off Date Balance ($) | % of Pool | |
| Florida | 6 | 107,145,589 | 11.2 |
| California | 24 | 93,730,479 | 9.8 |
| California – Southern(2) | 19 | 70,136,923 | 7.4 |
| California – Northern(2) | 5 | 23,593,556 | 2.5 |
| Ohio | 2 | 83,640,000 | 8.8 |
| Texas | 6 | 77,089,437 | 8.1 |
| New Jersey | 2 | 69,314,678 | 7.3 |
| Washington | 2 | 45,716,332 | 4.8 |
| New York | 1 | 40,000,000 | 4.2 |
| Connecticut | 1 | 38,251,697 | 4.0 |
| Nevada | 5 | 36,673,184 | 3.8 |
| Colorado | 6 | 32,102,359 | 3.4 |
| Arizona | 4 | 31,874,008 | 3.3 |
| Georgia | 5 | 31,615,573 | 3.3 |
| Pennsylvania | 2 | 31,284,997 | 3.3 |
| Alabama | 4 | 30,087,523 | 3.2 |
| District of Columbia | 1 | 30,000,000 | 3.1 |
| Utah | 1 | 29,419,866 | 3.1 |
| Michigan | 8 | 27,189,744 | 2.9 |
| Missouri | 1 | 22,361,233 | 2.3 |
| Massachusetts | 1 | 21,710,888 | 2.3 |
| South Carolina | 2 | 21,591,767 | 2.3 |
| Illinois | 3 | 10,554,962 | 1.1 |
| Wisconsin | 1 | 9,950,000 | 1.0 |
| Louisiana | 4 | 6,718,749 | 0.7 |
| Indiana | 2 | 5,960,615 | 0.6 |
| Tennessee | 2 | 5,900,219 | 0.6 |
| New Mexico | 1 | 4,593,719 | 0.5 |
| Virginia | 1 | 4,531,087 | 0.5 |
| Mississippi | 2 | 3,265,770 | 0.3 |
| Maryland | 1 | 911,696 | 0.1 |
| Total: | 101 | $953,186,169 | 100.0% |
Property Type
| No. of Mortgaged Properties | Aggregate Cut-off Date Balance ($) | % of Pool | |
| Office | 20 | 382,190,790 | 40.1 |
| Suburban | 14 | 217,939,094 | 22.9 |
| CBD | 4 | 158,201,697 | 16.6 |
| Medical | 2 | 6,050,000 | 0.6 |
| Retail | 25 | 328,656,005 | 34.5 |
| Anchored | 12 | 185,707,643 | 19.5 |
| Regional Lifestyle | 1 | 45,000,000 | 4.7 |
| Outlet Center | 3 | 42,215,616 | 4.4 |
| Shadow Anchored | 4 | 36,856,436 | 3.9 |
| Unanchored | 4 | 14,955,967 | 1.6 |
| Free-Standing | 1 | 3,920,343 | 0.4 |
| Hospitality | 13 | 141,581,711 | 14.9 |
| Full Service | 3 | 107,210,917 | 11.2 |
| Limited Service | 7 | 25,167,428 | 2.6 |
| Extended Stay | 2 | 7,456,076 | 0.8 |
| Select Service | 1 | 1,747,291 | 0.2 |
| Self Storage | 36 | 56,870,676 | 6.0 |
| Self Storage | 36 | 56,870,676 | 6.0 |
| Multifamily | 2 | 26,394,817 | 2.8 |
| Garden | 2 | 26,394,817 | 2.8 |
| Industrial | 4 | 13,561,333 | 1.4 |
| Flex | 4 | 13,561,333 | 1.4 |
| Manufactured Housing | 1 | 3,930,838 | 0.4 |
| Manufactured Housing | 1 | 3,930,838 | 0.4 |
| Total | 101 | $953,186,169 | 100.0% |
Mortgage Rate (%)
| No. of Mortgage Loans | Aggregate Cut-off Date Balance ($) | % of Pool | |
| 3.3100 - 4.5000 | 27 | 570,595,761 | 59.9 |
| 4.5001 - 5.0000 | 27 | 343,020,575 | 36.0 |
| 5.0001 - 5.5000 | 3 | 24,081,247 | 2.5 |
| 5.5001 - 5.6500 | 3 | 15,488,586 | 1.6 |
| Total: | 60 | $953,186,169 | 100.0% |
| Min: 3.3100% Max: 5.6500% Wtd Avg: 4.3408% | |||
Original Term to Maturity or ARD (mos.)
| No. of Mortgage Loans | Aggregate Cut-off Date Balance ($) | % of Pool | |
| 60 | 1 | 29,000,000 | 3.0 |
| 84 | 2 | 20,153,794 | 2.1 |
| 120 | 57 | 904,032,376 | 94.8 |
| Total: | 60 | $953,186,169 | 100.0% |
| Min: 60 mos. Max: 120 mos. Wtd Avg: 117 mos. | |||
Remaining Term to Maturity or ARD (mos.)
| No. of Mortgage Loans | Aggregate Cut-off Date Balance ($) | % of Pool | |
| 60 - 60 | 1 | 29,000,000 | 3.0 |
| 82 - 82 | 2 | 20,153,794 | 2.1 |
| 109 - 120 | 57 | 904,032,376 | 94.8 |
| Total: | 60 | $953,186,169 | 100.0% |
| Min: 60 mos. Max: 120 mos. Wtd Avg: 115 mos. | |||
Original Amortization Term (mos.)
| No. of Mortgage Loans | Aggregate Cut-off Date Balance ($) | % of Pool | |
| Interest Only | 5 | 103,350,000 | 10.8 |
| 240 | 1 | 8,210,917 | 0.9 |
| 300 | 9 | 100,973,732 | 10.6 |
| 330 | 1 | 3,930,838 | 0.4 |
| 360 | 44 | 736,720,683 | 77.3 |
| Total: | 60 | $953,186,169 | 100.0% |
| Min: 240 mos. Max: 360 mos. Wtd Avg: 352 mos. | |||
Remaining Amortization Term (mos.)
| No. of Mortgage Loans | Aggregate Cut-off Date Balance ($) | % of Pool | |
| Interest Only | 5 | 103,350,000 | 10.8 |
| 238 - 238 | 1 | 8,210,917 | 0.9 |
| 290 – 299 | 9 | 100,973,732 | 10.6 |
| 322 – 322 | 1 | 3,930,838 | 0.4 |
| 354 - 360 | 44 | 736,720,683 | 77.3 |
| Total: | 60 | $953,186,169 | 100.0% |
| Min: 238 mos. Max: 360 mos. Wtd Avg: 350 mos. | |||
Mortgage Loan Sellers
| No. of Mortgage Loans | Aggregate Cut-off Date Balance ($) | % of Pool | |
| Morgan Stanley Mortgage Capital Holdings LLC | 11 | 326,789,660 | 34.3 |
| Bank of America, National Association | 13 | 214,748,094 | 22.5 |
| UBS AG | 15 | 176,368,206 | 18.5 |
| KeyBank National Association | 14 | 156,670,194 | 16.4 |
| Starwood Mortgage Funding III LLC | 7 | 78,610,016 | 8.2 |
| Total: | 60 | $953,186,169 | 100.0% |
Amortization Type
| No. of Mortgage Loans | Aggregate Cut-off Date Balance ($) | % of Pool | |
| Partial Interest Only | 21 | 447,175,000 | 46.9 |
| Amortizing Balloon | 34 | 402,661,169 | 42.2 |
| Interest Only | 5 | 103,350,000 | 10.8 |
| Total: | 60 | $953,186,169 | 100.0% |
Cut-off Date LTV Ratio (%)
| No. of Mortgage Loans | Aggregate Cut-off Date Balance ($) | % of Pool | |
| 32.6 - 40.0 | 3 | 53,210,917 | 5.6 |
| 40.1 - 60.0 | 12 | 197,407,961 | 20.7 |
| 60.1 - 65.0 | 15 | 154,463,386 | 16.2 |
| 65.1 - 70.0 | 14 | 203,324,780 | 21.3 |
| 70.1 - 75.0 | 16 | 344,779,125 | 36.2 |
| Total: | 60 | $953,186,169 | 100.0% |
| Min: 32.6% | Max: 75.0% | Wtd Avg: 63.3% |
Maturity Date or ARD LTV Ratio (%)
| No. of Mortgage Loans | Aggregate Cut-off Date Balance ($) | % of Pool | |
| 24.3 - 40.0 | 6 | 138,672,817 | 14.5 |
| 40.1 - 50.0 | 11 | 110,628,088 | 11.6 |
| 50.1 - 60.0 | 30 | 393,860,326 | 41.3 |
| 60.1 - 65.0 | 11 | 201,024,938 | 21.1 |
| 65.1 - 67.7 | 2 | 109,000,000 | 11.4 |
| Total: | 60 | $953,186,169 | 100.0% |
| Min: 24.3% | Max: 67.7% | Wtd Avg: 54.4% |
UW DSCR (x)
| No. of Mortgage Loans | Aggregate Cut-off Date Balance ($) | % of Pool | |
| 1.27 - 1.30 | 3 | 19,715,095 | 2.1 |
| 1.31 - 1.40 | 9 | 193,195,812 | 20.3 |
| 1.41 - 1.50 | 15 | 183,544,609 | 19.3 |
| 1.51 - 1.60 | 7 | 176,006,023 | 18.5 |
| 1.61 - 1.70 | 4 | 72,416,852 | 7.6 |
| 1.71 - 1.80 | 7 | 90,568,255 | 9.5 |
| 1.81 - 2.50 | 9 | 78,523,908 | 8.2 |
| 2.51 - 3.00 | 3 | 88,215,616 | 9.3 |
| 3.01 - 4.31 | 3 | 51,000,000 | 5.4 |
| Total: | 60 | $953,186,169 | 100.0% |
| Min: 1.27x | Max: 4.31x | Wtd Avg: 1.78x |
UW NOI Debt Yield (%)
| No. of Mortgage Loans | Aggregate Cut-off Date Balance ($) | % of Pool | |
| 8.1 - 8.5 | 2 | 73,360,000 | 7.7 |
| 8.6 - 9.0 | 8 | 117,452,605 | 12.3 |
| 9.1 - 9.5 | 5 | 140,590,209 | 14.7 |
| 9.6 - 10.0 | 11 | 174,274,078 | 18.3 |
| 10.1 - 11.0 | 9 | 112,615,836 | 11.8 |
| 11.1 - 12.0 | 6 | 78,508,921 | 8.2 |
| 12.1 - 13.0 | 9 | 133,407,605 | 14.0 |
| 13.1 - 15.0 | 3 | 18,475,863 | 1.9 |
| 15.1 - 22.8 | 7 | 104,501,052 | 11.0 |
| Total: | 60 | $953,186,169 | 100.0% |
| Min: 8.1% | Max: 22.8% | Wtd Avg: 11.0% |
| (1) | All numerical information concerning the mortgage loans is approximate and, in the case of mortgage loans secured by multiple properties, is based on allocated loan amounts with respect to such properties. All weighted average information regarding the mortgage loans reflects the weighting of the mortgage loans based on their outstanding principal balances as of the Cut-off Date or, in the case of mortgage loans secured by multiple properties, allocated loan amounts. The sum of numbers and percentages in columns may not match the “Total” due to rounding. With respect to any mortgage loan that is part of a whole loan, unless otherwise indicated, all LTV, DSCR and Debt Yield calculations include any relatedpari passu companion loans and exclude any related subordinate companion loans, as applicable. |
| (2) | “California – Northern” includes zip codes above 93600, and “California – Southern” includes zip codes at or below 93600. |
This is not a research report and was not prepared by any Underwriter’s research departments. Please see additional important information and qualifications at the end of this Term Sheet.
| T-24 |
| MSBAM 2016-C31 | Collateral Statistics |
Prepayment Restrictions
Percentage of Collateral by Prepayment Restrictions (%)(1)(2)(3)(4)
| Prepayment Restrictions | November 2016 | November 2017 | November 2018 | November 2019 | November 2020 |
| Locked Out/Defeasance | 99.5% | 99.5% | 87.0% | 87.1% | 87.1% |
| Yield Maintenance Total | 0.5% | 0.5% | 13.0% | 12.9% | 12.9% |
| Open | 0.0% | 0.0% | 0.0% | 0.0% | 0.0% |
| TOTAL | 100.0% | 100.0% | 100.0% | 100.0% | 100.0% |
| Pool Balance Outstanding | $953,186,169 | $946,259,736 | $938,563,470 | $927,886,032 | $915,992,180 |
| % Initial Pool Balance | 100.0% | 99.3% | 98.5% | 97.3% | 96.1% |
| Prepayment Restrictions | November 2021 | November 2022 | November 2023 | November 2024 | November 2025 |
| Locked Out/Defeasance | 86.8% | 86.9% | 88.8% | 88.9% | 82.6% |
| Yield Maintenance Total | 13.2% | 13.1% | 11.2% | 11.1% | 10.6% |
| Open | 0.0% | 0.0% | 0.0% | 0.0% | 6.8% |
| TOTAL | 100.0% | 100.0% | 100.0% | 100.0% | 100.0% |
| Pool Balance Outstanding | $875,389,149 | $859,268,496 | $824,664,551 | $807,541,238 | $789,541,364 |
| % Initial Pool Balance | 91.8% | 90.1% | 86.5% | 84.7% | 82.8% |
| (1) | The analysis is based on Structuring Assumptions set forth under “Yield and Maturity Considerations—Weighted Average Life” in the Preliminary Prospectus and a 0% CPR as discussed in the Preliminary Prospectus. |
| (2) | See description of Yield Maintenance under“Description of the Mortgage Pool—Certain Terms of the Mortgage Loans—Prepayment Protections and Certain Involuntary Prepayments”in the Preliminary Prospectus and Annex A-1 to the Preliminary Prospectus. |
| (3) | Mortgage loans modeled as Yield Maintenance include mortgage loans characterized by YM2, YM1, and DEF/YM1 on Annex A-1 to the Preliminary Prospectus. |
| (4) | There may be limited exceptions to the indicated prepayment restrictions arising out of casualties, condemnations, property releases and the application of earnout reserves. |
This is not a research report and was not prepared by any Underwriter’s research departments. Please see additional important information and qualifications at the end of this Term Sheet.
| T-25 |
| MSBAM 2016-C31 | Huntington Center |
Mortgage Loan No. 1 – Huntington Center
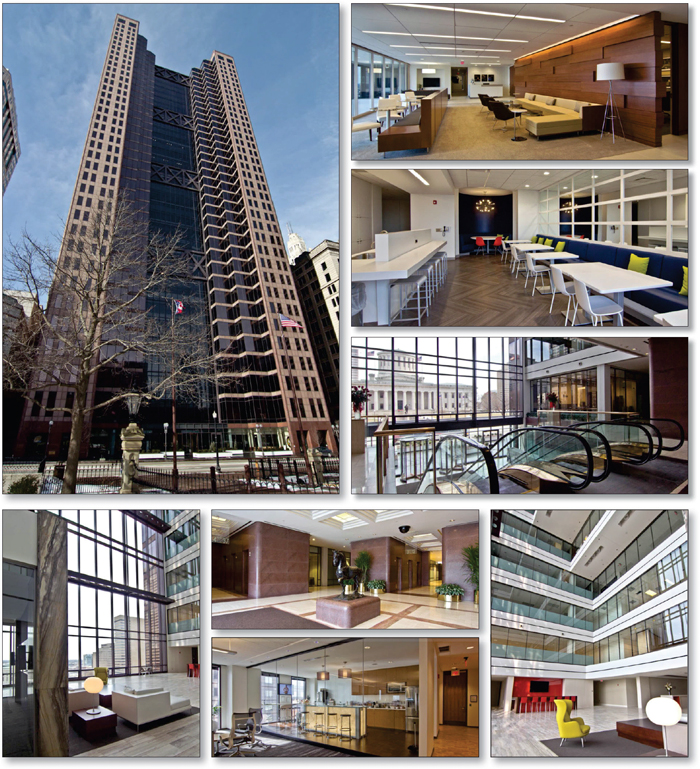
This is not a research report and was not prepared by any Underwriter’s research departments. Please see additional important information and qualifications at the end of this Term Sheet.
| T-26 |
| MSBAM 2016-C31 | Huntington Center |
Mortgage Loan No. 1 – Huntington Center

This is not a research report and was not prepared by any Underwriter’s research departments. Please see additional important information and qualifications at the end of this Term Sheet.
| T-27 |
| MSBAM 2016-C31 | Huntington Center |
Mortgage Loan No. 1 – Huntington Center

This is not a research report and was not prepared by any Underwriter’s research departments. Please see additional important information and qualifications at the end of this Term Sheet.
| T-28 |
| MSBAM 2016-C31 | Huntington Center |
| Mortgage Loan No. 1 – Huntington Center |
| Mortgage Loan Information | Property Information | ||||||
| Mortgage Loan Seller: | MSMCH | Single Asset/Portfolio: | Single Asset | ||||
| Original Balance(1): | $80,000,000 | Location: | Columbus, OH 43215 | ||||
| Cut-off Date Balance(1): | $80,000,000 | General Property Type: | Office | ||||
| % of Initial Pool Balance: | 8.4% | Detailed Property Type: | CBD | ||||
| Loan Purpose: | Refinance | Title Vesting: | Fee | ||||
| Sponsors: | Menashe Frankel; Yeheskel Frankel; Abraham J. Cohen; David J. Cohen, Hines Investment Management Holdings Limited Partnership | Year Built/Renovated: | 1984/N/A | ||||
| Size: | 907,010 SF | ||||||
| Cut-off Date Balance per SF(1): | $154 | ||||||
| Mortgage Rate: | 3.5300% | Maturity Date Balance per SF(1): | $139 | ||||
| Note Date: | 9/30/2016 | Property Manager: | Hines Interests Limited Partnership (borrower-related) | ||||
| First Payment Date: | 11/7/2016 | ||||||
| Maturity Date: | 10/7/2026 | ||||||
| Original Term to Maturity: | 120 months | ||||||
| Original Amortization Term: | 360 months | ||||||
| IO Period: | 60 months | Underwriting and Financial Information | |||||
| Seasoning: | 1 month | UW NOI: | $12,930,910 | ||||
| Prepayment Provisions(2): | LO (25); DEF (91); O (4) | UW NOI Debt Yield(1): | 9.2% | ||||
| Lockbox/Cash Mgmt Status: | Hard/In Place | UW NOI Debt Yield at Maturity(1): | 10.2% | ||||
| Additional Debt Type(3): | Pari Passu | UW NCF DSCR(1): | 2.32x (IO) 1.54x (P&I) | ||||
| Additional Debt Balance(3): | $60,000,000 | Most Recent NOI: | $13,030,807 (7/31/2016 TTM) | ||||
| Future Debt Permitted (Type): | No (N/A) | 2nd Most Recent NOI: | $13,256,029 (12/31/2015) | ||||
| Reserves(4) | 3rd Most Recent NOI: | $14,396,831 (12/31/2014) | |||||
| Type | Initial | Monthly | Cap | Most Recent Occupancy(5): | 85.8% (8/31/2016) | ||
| RE Tax: | $1,994,693 | $332,449 | N/A | 2nd Most Recent Occupancy: | 83.8% (12/31/2015) | ||
| Insurance: | $0 | Springing | N/A | 3rd Most Recent Occupancy: | 86.3% (12/31/2014) | ||
| Recurring Replacements: | $0 | $18,896 | N/A | Appraised Value (as of): | $186,600,000 (8/22/2016) | ||
| TI/LC: | $0 | $75,584 | $2,721,030 | Cut-off Date LTV Ratio(1): | 75.0% | ||
| Other: | $4,594,385 | $0 | N/A | Maturity Date LTV Ratio(1): | 67.7% | ||
| Sources and Uses | ||||||
| Sources | Proceeds | % of Total | Uses | Proceeds | % of Total | |
| Loan Amount(1): | $140,000,000 | 100.0% | Loan Payoff: | $109,892,399 | 78.5% | |
| Reserves: | $6,589,078 | 4.7% | ||||
| Closing Costs: | $2,843,713 | 2.0% | ||||
| Return of Equity: | $20,674,809 | 14.8% | ||||
| Total Sources: | $140,000,000 | 100.0% | Total Uses: | $140,000,000 | 100.0% | |
| (1) | The Huntington Center Mortgage Loan is part of the Huntington Center Whole Loan, which is comprised of twopari passupromissory notes with an aggregate original principal balance of $140,000,000. The Cut-off Date Balance per SF, Maturity Date Balance per SF, UW NOI Debt Yield, UW NOI Debt Yield at Maturity, UW NCF DSCR, Cut-off Date LTV Ratio and Maturity Date LTV Ratio numbers presented above are based on the aggregate principal balance of the promissory notes comprising the Huntington Center Whole Loan. |
| (2) | Defeasance is permitted at any time after the earlier of (i) the third anniversary of the first payment date, or (ii) two years from the closing date of the securitization of the last Huntington Center Whole Loan promissory note to be securitized. |
| (3) | See “—The Mortgage Loan”and“Additional Secured Indebtedness (not including trade debts)”below for further discussion of additional debt. |
| (4) | See “—Escrows and Reserves” below for further discussion of reserve requirements. |
| (5) | Includes a total of 37,218 SF that is leased to five tenants that have given notice to vacate. These tenants include Schneider Downs & Co., Inc., Wells Fargo Advisors LLC, The Bank of New York Mellon, Intellisource LLC and The Marlenko Group, Inc. These tenants were underwritten as vacant. Considering these tenants vacant, Most Recent Occupancy would be 81.7%. |
The Mortgage Loan. The largest mortgage loan (the “Huntington Center Mortgage Loan”) is part of a whole loan (the “Huntington Center Whole Loan”) evidenced by twopari passu promissory notes in the aggregate original principal amount of $140,000,000, all of which are secured by a first priority fee mortgage encumbering a 907,010 SF office property known as Huntington Center in Columbus, Ohio (the “Huntington Center Property”). Promissory Note A-1, in the original principal amount of $80,000,000, represents the Huntington Center Mortgage Loan and will be included in the MSBAM 2016-C31 Trust. Promissory Note A-2 with an original principal balance of $60,000,000 ( the “Huntington Center ServicedPari Passu Companion Loan”), is expected to be held by Morgan Stanley Bank, N.A. or an affiliate thereof on the closing date of this transaction, and is expected to be contributed to a future securitization transaction or may be otherwise transferred at any time. The Huntington Center Whole Loan will be serviced pursuant to the pooling and servicing agreement for the MSBAM 2016-C31 Trust. See “Description of the Mortgage Pool—The Whole Loans— The Serviced Pari Passu Whole Loans—The Huntington Center Whole Loan” and “The Pooling and Servicing Agreement” in the Preliminary Prospectus.
The proceeds of the Huntington Center Whole Loan were used to refinance a previous loan with a principal balance of $109,892,399, fund upfront reserves, pay closing costs of and return equity to the Huntington Center Borrower.
This is not a research report and was not prepared by any Underwriter’s research departments. Please see additional important information and qualifications at the end of this Term Sheet.
| T-29 |
| MSBAM 2016-C31 | Huntington Center |
The Borrower and the Sponsors. The borrower is Huntington Center Owner LLC (the “Huntington Center Borrower”), a single-purpose Delaware limited liability company. The loan sponsors and non-recourse carveout guarantors are Menashe Frankel, Yeheskel Frankel, Abraham J. Cohen, David J. Cohen, and Hines Investment Management Holdings Limited Partnership.
The Huntington Center Borrower is 100.0% owned by Huntington Center Associates, an Ohio general partnership, whose board of directors includes C. Kevin Shannahan, Richard Machinski and David J. Cohen. Huntington Center Associates is 27% owned by HDG-Columbus, Ltd. (which in turn is 56% owned by funds controlled by the Hines family and 44% by The Huntington National Bank (which is the largest tenant at the Huntington Center Property), 66.5% owned by High Street Partner LLC (which in turn is owned by a joint venture owned 50% by entities controlled by David J. Cohen and Abraham J. Cohen and 50% by Huntington Center Investment, LLC, an entity controlled by Menashe Frankel and Yeheskel Frankel and owned approximately 60% by pension fund and insurance company entities owned by The Phoenix Holdings Ltd., an Israeli public company) and 6.5% owned by 41 South High Ltd. (which in turn is owned by The Huntington National Bank).
The Property. The Huntington Center Property consists of a 37-story, Class A, multi-tenant office building totaling 907,010 SF and an adjacent five-story parking garage connected to the office building. There is a Doubletree Hotel and a Capital Club (a fitness and dining club) situated above the parking garage, both of which were constructed pursuant to air rights agreements, that are not included as part of the collateral; however, the collateral does include income generated pursuant to the air rights lease.
The Huntington Center Property is located at 41 South High Street / 50 South Front Street, mid-block between West Broad Street to the north and West State Street to the south, and within the Capitol Square area of the Columbus, Ohio Central Business District (“CBD”). Capitol Square is anchored by the Ohio Statehouse which is located directly across the street from the Huntington Center Property on South High Street. South High Street is a primary roadway through the Columbus CBD, running north through the Columbus CBD to Ohio State University’s main campus and south through the areas commonly known as German Village and the Brewery District. Broad Street is the primary east/west roadway within the Columbus CBD and bisects the broader Columbus metropolitan statistical area.
The Huntington Center Property’s local area is composed primarily of public service buildings such as courthouses, parking garages, government buildings, street front retail with upper level living spaces, as well as downtown high rise office buildings, entertainment venues, parks and open spaces. 17 South High Street, an older high-rise office building also anchored and owned by Huntington Bank is located adjacent to the Huntington Center Property to the north. Columbus City Hall, the Battelle Riverfront Park and then the Scioto River are located to the west of the Huntington Center Property. Uses to the south of the Huntington Center Property vary and include a variety of mid to high-rise office towers.
The Huntington Center Sponsors have spent $1,935,660 in capital improvements from 2011 through 2016, including garage deck upgrades, upgrading the restroom fixtures and drinking fountains, renovations to the common corridor for floors 12-13, 14-15 and 33, elevator design and tenant signage.
Additionally, the Huntington Center Borrower has informed the lender that it currently intends to make renovations estimated to cost approximately $10,000,000 over the next three years, the scope of which includes elevator modernization ($6,500,000), roof replacement ($500,000) and amenity and lobby upgrades ($3,000,000). Such renovations are not required under the Huntington Center Whole Loan documents, and no reserves have been required under the Huntington Center Whole Loan for such renovations. Accordingly there can be no assurance as to whether any such renovations will occur.
Major Tenants.
The Huntington National Bank. (199,240 SF, 22.0% of NRA, 31.7% of underwritten rent). The Huntington National Bank (“Huntington Bank”) is a subsidiary of Huntington Bancshares Incorporated (“Huntington”), a diversified regional bank holding company that provides full-service commercial, small business, consumer, and mortgage banking services, as well as automobile financing, equipment leasing, investment management, trust services, brokerage services, insurance programs, and other financial products and services.
On January 26, 2016, Huntington announced the signing of a definitive merger agreement with Ohio-based FirstMerit Corporation, the parent company of FirstMerit Bank. According to the Huntington Bank website, FirstMerit Bank is now part of The Huntington National Bank but will continue to operate independently until systems integration occurs. Pursuant to its lease, Huntington Bank has the right to terminate its lease beginning March 1, 2024 and subject to a minimum 18 months’ notice period if it enters into a merger which leads to a closure and termination of its Columbus, Ohio headquarters office operation. Huntington Bank has provided a letter addressed to the loan seller and its successors and assigns and to Huntington Center Associates (the original landlord under the lease and 100% direct owner of the Huntington Center Borrower) and its successors and assigns, stating that in connection with its acquisition of FirstMerit Bank, Huntington Bank will not exercise its option to terminate its lease. Huntington Bank has been in occupancy since 1985, has a lease expiration of February 28, 2030 and has six five-year renewal options.
Huntington Bank owns an approximately 22% interest in the Huntington Center Borrower. Huntington Bank also owns an office property that is adjacent to the Huntington Center Property, in which it occupies 43,000 square feet, and an office property located around the corner from the Huntington Center Property, in which it occupies 40,000 square feet.
Porter, Wright, Morris & Arthur (127,239 SF, 14.0% of NRA, 14.3% of underwritten rent).Porter, Wright, Morris & Arthur (“Porter Wright”), a tenant at the Huntington Center Property since 1985, is a law firm with six offices located in Ohio, Washington, D.C. and Florida. Porter Wright has been in occupancy since 1985, has a lease expiration of May 31, 2028 and has two five-year renewal options. Porter Wright is permitted to terminate up to 18,693 SF on floor 32 effective as of June 1, 2017, by written notice delivered prior to May 1, 2017, and also has a rent abatement with respect to 18,693 SF from October 1, 2016 through May 31, 2017.
Squire Patton Boggs LLP (81,693 SF, 9.0% of NRA, 10.7% of underwritten rent). Squire Patton Boggs LLP is a law firm with offices in 21 countries on five continents as well as working relationships with independent firms in Europe and Latin America. Squire Patton Boggs LLP has been in occupancy since 2008, has a lease expiration of February 28, 2025 and has two five-year renewal options.
Thompson Hines LLP (38,139 SF, 4.2% of NRA, 5.0% of underwritten rent). Thompson Hines LLP is a law firm with seven offices in three states and Washington, D.C. Thompson Hine has been in occupancy since 2008, has a lease expiration of August 31, 2018 and has two five-year options.
Benesch, Friedlander, Coplan & Aronoff (26,921 SF, 3.0% of NRA, 3.6% of underwritten rent). Benesch, Friedlander, Coplan & Aronoff is a business law firm with offices in Cleveland, Columbus, Chicago, Hackensack, Indianapolis, Shanghai and Wilmington. Benesch, Friedlander, Coplan & Aronoff has been in occupancy since 2007, has a lease expiration of February 29, 2020 and has two five-year renewal options.
This is not a research report and was not prepared by any Underwriter’s research departments. Please see additional important information and qualifications at the end of this Term Sheet.
| T-30 |
| MSBAM 2016-C31 | Huntington Center |
The following table presents certain information relating to the leases at the Huntington Center Property:
| Tenant Summary(1) | |||||||
| Tenant Name | Credit Rating (Fitch/Moody’s/S&P)(2) | Tenant SF | Approximate % of SF | Annual UW Rent | % of Total Annual UW Rent | Annual UW Rent PSF(3) | Lease Expiration |
| Tenants | |||||||
| The Huntington National Bank | A-/Baa1/BBB | 199,240 | 22.0% | $3,962,438 | 31.7% | $19.89 | 2/28/2030(4) |
| Porter, Wright, Morris & Arthur | NR/NR/NR | 127,239 | 14.0% | $1,781,346 | 14.3% | $14.00 | 5/31/2028(5) |
| Squire Patton Boggs LLP | NR/NR/NR | 81,693 | 9.0% | $1,337,540 | 10.7% | $16.37 | 2/28/2025 |
| Thompson Hines LLP | NR/NR/NR | 38,139 | 4.2% | $629,294 | 5.0% | $16.50 | 8/31/2018 |
| Benesch, Friedlander, Coplan & Aronoff | NR/NR/NR | 26,921 | 3.0% | $444,197 | 3.6% | $16.50 | 2/29/2020 |
| Subtotal/Wtd. Avg. | 473,232 | 52.2% | $8,154,814 | 65.2% | $17.23 | ||
| Other Tenants | 268,092 | 29.6% | $4,344,321 | 34.8% | $16.20 | ||
| Vacant Space | 165,686 | 18.3% | $0 | 0.0% | $0.00 | ||
| Total/Wtd. Avg. | 907,010 | 100.0% | $12,499,135 | 100.0% | $16.86 | ||
| (1) | Information is based on the underwritten rent roll. |
| (2) | Certain ratings are those of the parent company whether or not the parent guarantees the lease. |
| (3) | Wtd. Avg. Annual UW Rent PSF excludes vacant space. |
| (4) | Pursuant to its lease, Huntington Bank has the right to terminate its lease beginning March 1, 2024 and subject to a minimum 18 months’ notice period if it enters into a merger which leads to a closure and termination of its Columbus, Ohio headquarters office operation. Huntington Bank has provided a letter to the lender stating that in connection with its acquisition of FirstMerit Bank, Huntington Bank will not exercise its option to terminate its lease. |
| (5) | Porter Wright is permitted to terminate up to 18,693 SF on floor 32 effective as of June 1, 2017, by written notice delivered prior to May 1, 2017 and also has a rent abatement with respect to 18,693 SF from October 1, 2016 through May 31, 2017. |
The following table presents certain information relating to the lease rollover schedule at the Huntington Center Property:
| Lease Rollover Schedule(1)(2) | ||||||||
| Year | # of Leases Rolling | SF Rolling | UW Rent PSF Rolling(3) | Approx. % of Total SF Rolling | Approx. Cumulative % of SF Rolling | Total UW Rent Rolling(3) | Approx. % of Total Rent Rolling | Approx. Cumulative % of Total Rent Rolling |
| 2016 | 0 | 0 | $0.00 | 0.0% | 0.0% | $0 | 0.0% | 0.0% |
| 2017 | 2 | 6,388 | $14.15 | 0.7% | 0.7% | $90,377 | 0.7% | 0.7% |
| 2018 | 8 | 56,586 | $16.70 | 6.2% | 6.9% | $945,214 | 7.6% | 8.3% |
| 2019 | 7 | 24,199 | $16.37 | 2.7% | 9.6% | $396,057 | 3.2% | 11.5% |
| 2020 | 7 | 49,582 | $16.25 | 5.5% | 15.1% | $805,533 | 6.4% | 17.9% |
| 2021 | 8 | 35,994 | $16.51 | 4.0% | 19.0% | $594,392 | 4.8% | 22.7% |
| 2022 | 10 | 67,596 | $15.91 | 7.5% | 26.5% | $1,075,706 | 8.6% | 31.3% |
| 2023 | 1 | 2,083 | $16.00 | 0.2% | 26.7% | $33,328 | 0.3% | 31.5% |
| 2024 | 2 | 15,343 | $15.96 | 1.7% | 28.4% | $244,811 | 2.0% | 33.5% |
| 2025 | 9 | 96,861 | $16.36 | 10.7% | 39.1% | $1,584,872 | 12.7% | 46.2% |
| 2026 | 4 | 34,290 | $16.25 | 3.8% | 42.9% | $557,331 | 4.5% | 50.6% |
| 2027 | 0 | 0 | $0.00 | 0.0% | 42.9% | $0 | 0.0% | 50.6% |
| 2028 | 6 | 127,239 | $14.00 | 14.0% | 56.9% | $1,781,346 | 14.3% | 64.9% |
| 2029 & Beyond | 11 | 225,163 | $19.50 | 24.8% | 81.7% | $4,390,168 | 35.1% | 100.0% |
| Vacant(4) | 0 | 165,686 | $0.00 | 18.3% | 100.0% | $0 | 0.0% | 100.0% |
| Total/Wtd. Avg. | 75 | 907,010 | $16.86 | 100.0% | $12,499,135 | 100.0% | ||
| (1) | Information is based on the underwritten rent roll. |
| (2) | Certain tenants may have lease termination options that are exercisable prior to the originally stated expiration date of the subject lease and that are not considered in the lease rollover schedule. |
| (3) | UW Rent PSF Rolling and Total UW Rent Rolling exclude vacant and occupied space that has been underwritten as vacant. |
| (4) | Includes a total of 37,218 SF that is leased to five tenants that have given notice to vacate. These include Schneider Downs & Co., Inc., Wells Fargo Advisors LLC, The Bank of New York Mellon, Intellisource LLC and The Marlenko Group, Inc. |
This is not a research report and was not prepared by any Underwriter’s research departments. Please see additional important information and qualifications at the end of this Term Sheet.
| T-31 |
| MSBAM 2016-C31 | Huntington Center |
The Market. The Huntington Center Property is located in Columbus, Ohio, situated within the Lower Downtown submarket and directly across from the capitol building. The subject is considered a Class A property and is located on the west side of South High Street, mid-block between West Broad Street to the north and West State Street to the south. The Columbus, Ohio office market contains 32,222,000 SF of office space. According to the appraisal the Lower Downtown office submarket contains 4,369,000 SF and represents 13.6% of the office inventory in Columbus, Ohio.
Regional access is provided by Interstate 71, the primary north-south highway through the Columbus CBD, providing access to Cleveland to the north and Cincinnati to the south. Interstate 71 connects to other central Ohio transportation routes such as Interstates 70, 270 and 670 as well as State Route 161 and US Route 33. Located a short distance south of the Huntington Center Property is Interstate 70, a primary east-west highway providing greater regional access to Dayton and St. Louis to the west and Baltimore to the east.
According to the appraisal for the Huntington Center Property, as of the second quarter of 2016, the overall vacancy rate for the Columbus, Ohio office market was 17.6% and the vacancy for the Lower Downtown office submarket was 13.9%. For the same period the average asking rental rate for both class A and class B space within the Columbus, Ohio office market was $18.81 per square foot, and within the Lower Downtown office market was $21.72 per square foot. Class A buildings constitute 49.3% of existing inventory within the Columbus, Ohio office market and are exhibiting a lower vacancy rate (15.5%) than Class B/C buildings (19.6%) and higher average rents of $21.25 versus $16.37 per SF.
The estimated 2015 population within a one-, three- and five-mile radius of the Huntington Center Property was 10,039, 134,897 and 337,978, respectively, according to the appraisal. The estimated 2015 average household income within a one-, three- and five-mile radius of the Huntington Center Property was $69,828, $51,749 and $56,554, respectively. The 2015 average household income for the greater city of Columbus was $61,614. Over the next five years, population is projected to increase within the one-mile radius but is expected to decline or remain flat within the three-mile radius and five-mile radius.
The following table presents recent leasing data at competitive office buildings with respect to the Huntington Center Property:
| Competitive Property Summary | |||||||||
| Property Name/Address | Year Built | Class | Size (SF) | Tenant Name | Lease Size (SF) | Lease Date | Lease Term (Yrs.) | Initial Rent/SF | Rent Steps/SF |
Confidential CBD Office Building Confidential Columbus, Ohio | 2001 | A | 242,009 | Confidential | 6,885 | Feb 2016 | 3.0 | $13.50 | Up to $15.00 |
Confidential Office Property Confidential Columbus, Ohio | 1989 | A | 142,315 | Confidential | 2,301 | Oct 2015 | 5.0 | $10.25 | Up to $11.25 |
Confidential CBD Building Confidential Columbus, Ohio | 1985 | A | 407,472 | Confidential | 2,644 | Aug 2015 | 5.0 | $12.00 | Up to $14.00 |
Confidential Grandview Yard Building Confidential Columbus, Ohio | 2014 | A | 75,000 | Confidential | 17,500 | Jun 2015 | 10.3 | $15.50 | 1.75% annual Increases
|
Confidential Building Confidential Columbus, Ohio | 1928 | A | 330,000 | Confidential | 16,536 | Jan 2015 | 7.0 | $13.50 | Up to $14.50 |
Source:Appraisal
This is not a research report and was not prepared by any Underwriter’s research departments. Please see additional important information and qualifications at the end of this Term Sheet.
| T-32 |
| MSBAM 2016-C31 | Huntington Center |
Operating History and Underwritten Net Cash Flow.The following table presents certain information relating to the historical operating performance and the Underwritten Net Cash Flow at the Huntington Center Property:
| Cash Flow Analysis | ||||||
| 2013 | 2014 | 2015 | 7/31/2016 TTM | UW | UW PSF | |
| Gross Potential Rent(1) | $13,242,716 | $12,879,986 | $12,118,245 | $11,917,120 | $15,003,594(2) | $16.54 |
| Total Recoveries | $8,786,557 | $8,671,489 | $8,304,612 | $8,465,896 | $8,817,093 | $9.72 |
| Total Other Income(3) | $3,101,569 | $3,165,360 | $3,479,005 | $3,212,370 | $3,212,370 | $3.54 |
| Less Vacancy & Credit Loss(4) | $0 | $0 | $0 | $0 | ($2,866,257) | ($3.16) |
| Effective Gross Income | $25,130,842 | $24,716,835 | $23,901,862 | $23,595,386 | $24,166,800 | $26.64 |
| Total Operating Expenses | $10,202,636 | $10,320,004 | $10,645,833 | $10,564,579 | $11,235,890 | $12.39 |
| Net Operating Income | $14,928,206 | $14,396,831 | $13,256,029 | $13,030,807 | $12,930,910 | $14.26 |
| Capital Expenditures | $0 | $0 | $0 | $0 | $181,402 | $0.20 |
| TI/LC | $0 | $0 | $0 | $0 | $1,124,692 | $1.24 |
| Net Cash Flow | $14,928,206 | $14,396,831 | $13,256,029 | $13,030,807 | $11,624,816 | $12.82 |
| Occupancy % | 86.8% | 86.3% | 83.8% | 85.8% | 83.3%(5) | |
| NOI DSCR (P&I)(6) | 1.97x | 1.90x | 1.75x | 1.72x | 1.71x | |
| NOI DSCR (IO)(6) | 2.98x | 2.87x | 2.65x | 2.60x | 2.58x | |
| NCF DSCR (P&I)(6) | 1.97x | 1.90x | 1.75x | 1.72x | 1.54x | |
| NCF DSCR (IO)(6) | 2.98x | 2.87x | 2.65x | 2.60x | 2.32x | |
| NOI Debt Yield(6) | 10.7% | 10.3% | 9.5% | 9.3% | 9.2% | |
| NCF Debt Yield(6) | 10.7% | 10.3% | 9.5% | 9.3% | 8.3% | |
| (1) | Gross Potential Rent has been underwritten based on the August 31, 2016 rent roll. |
| (2) | UW Gross Potential Rent includes vacant space grossed up to market rent. The straight line average rent throughout the loan term ($19.89 PSF on a weighted average basis) has been underwritten for Huntington Bank and is above the concluded market rent of $15.00 PSF set forth in the appraisal. No mark to market adjustment has been made for Huntington Bank given the investment grade rating and the long term lease of the tenant. A contractual rent decrease to $14.00 PSF for Porter Wright totaling $699,815, which is effective October 1, 2017, has been underwritten. In addition, UW Gross Potential Rent includes contractual rent increases through October 1, 2017 totaling $430,245. A mark-to-market adjustment was applied to any tenants (other than Huntington Bank) whose contractual rent is in excess of 110% of market. Income associated with Hines Interests Limited Partnership has been underwritten, however, Hines Interests Limited Partnership is not obligated to pay rent as long as it serves as the property manager. |
| (3) | Other income includes percentage rent, parking rent, roof/antenna revenue, storage rent, telecom/riser revenue, air rights rent and other income. Parking Rent constitutes approximately 11.9% of Effective Gross Income. |
| (4) | Includes a total of 37,218 SF that is leased to five tenants that have given notice to vacate. These tenants include Schneider Downs & Co, Inc., Wells Fargo Advisors LLC, The Bank of New York Mellon, Intellisource LLC and The Marlenko Group, Inc. These tenants were underwritten as vacant. |
| (5) | UW Occupancy is based on the August 31, 2016 rent roll, and excludes five tenants totaling 37,218 SF that have given notice to vacate. |
| (6) | Debt service coverage ratios and debt yields are based on the Huntington Center Whole Loan. |
Escrows and Reserves. The Huntington Center Whole Loan documents provide for upfront reserves in the amount of $1,994,693 for real estate taxes, $1,442,959 for rent abatements for nine tenants, including Porter Wright, the second largest tenant, (as to a portion of its space), and $3,151,426 for tenant improvements and leasing commissions payable under existing leases. The Huntington Center Borrower is required to escrow monthly 1/12th of the annual estimated real estate taxes and 1/12th of the annual estimated insurance premiums (unless the Huntington Center Borrower maintains an acceptable blanket policy). The Huntington Center Borrower is required to make monthly deposits equal to $18,896 into an escrow for replacements and repairs. The Huntington Center Borrower is required to make monthly deposits equal to $75,584 into an escrow for tenant improvements and leasing commissions; provided that, so long as no event of default is continuing under the Huntington Center Whole Loan, such deposits are not required to be made at any time that funds in such escrow are equal to or greater than $2,721,030.
Lockbox and Cash Management.A hard lockbox is in place with respect to the Huntington Center Whole Loan, other than with respect to parking garage revenues, which may be initially deposited into an account held by the Huntington Center Borrower or by the parking garage manager, and are required to be deposited into the cash management account described below within one business day of receipt thereof. The Huntington Center Whole Loan has in place cash management. Funds in the lockbox account are required to be swept on each business day to a cash management account for the benefit of the lender and applied to pay debt service on the Huntington Center Whole Loan, to fund the required reserves deposits as described above under “Escrows and Reserves,” to disburse, during the continuance of a Cash Sweep Event Period (as defined below) caused solely by a DSCR Trigger or Specified Tenant Trigger (each as defined below), the monthly operating expenses referenced in the approved annual budget and extraordinary operating expenses not referenced in the annual budget and approved by the lender, and to disburse the remainder, provided no event of default is continuing under the Huntington Center Whole Loan, (i) during the continuance of a Cash Sweep Event Period, into an account to be held by the lender as additional security for the Huntington Center Whole Loan during the continuance of such Cash Sweep Event Period or (ii) otherwise, to the Huntington Center Borrower.
A “Cash Sweep Event Period” means the period:
(i) commencing upon an event of default under the Huntington Center Whole Loan and ending upon the cure (if applicable) of such event of default, or
(ii) commencing if the debt service coverage ratio on the Huntington Center Whole Loan is less than 1.20x for six consecutive calendar months (a “DSCR Trigger”), and ending on the date the debt service coverage ratio on the Huntington Center Whole Loan has been at least 1.20x for six consecutive calendar months, or
(iii) commencing upon a Specified Tenant Trigger and ending upon a Specified Tenant Cure (as defined below).
This is not a research report and was not prepared by any Underwriter’s research departments. Please see additional important information and qualifications at the end of this Term Sheet.
| T-33 |
| MSBAM 2016-C31 | Huntington Center |
A “Specified Tenant Trigger” means (i) the vacancy of any applicable space leased to a Specified Tenant (other than a portion of the 32nd floor of the Huntington Center Property leased by Porter Wright, as to which such tenant has a termination option (the “Porter Wright Termination Space”)), (ii) a Specified Tenant giving notice that it is terminating its lease for, or intends to vacate, all or any portion of its space (other than the Porter Wright Termination Space), (iii) any termination or cancellation (including without limitation, rejection in any bankruptcy or similar insolvency proceeding) or failure to be in full force and effect of any Specified Tenant’s lease, (iv) any bankruptcy or similar insolvency of a Specified Tenant, or (v) any Specified Tenant failing to extend or renew its lease by the date twelve months prior to its expiration in accordance with the terms and conditions of the Huntington Center Whole Loan documents and reasonably acceptable to the lender.
A “Specified Tenant Cure” means either (i) the Huntington Center Borrower leasing the entire applicable Specified Tenant space to a replacement tenant(s) acceptable to the lender, upon terms and conditions reasonably acceptable to the lender and otherwise in accordance with the Huntington Center Whole Loan documents, and the applicable tenant being in physical occupancy, open to the public for business and paying the full amount of the rent due under its lease or (ii) lender’s receipt of reasonably acceptable evidence of the satisfaction of the Specified Tenant Cure Conditions.
“Specified Tenant Cure Conditions” means, as applicable (i) the applicable Specified Tenant is in actual, physical occupancy of the applicable Specified Tenant Space (or applicable portion thereof other than the Porter Wright Termination Space) and conducting its business therein, (ii) the applicable Specified Tenant has revoked or rescinded all termination, cancellation or vacation notices with respect to the applicable Specified Tenant lease and re-affirmed such lease as being in full force and effect, (iii) if the Specified Tenant Trigger is the applicable Specified Tenant’s failure to extend or renew its lease in accordance with clause (v) of the definition of “Specified Tenant Trigger”, such Specified Tenant has renewed or extended its lease in accordance with the terms thereof and the Huntington Center Whole Loan documents, and (iv) with respect to any bankruptcy or insolvency proceedings involving the applicable Specified Tenant and/or the related lease, such Specified Tenant is no longer insolvent or subject to any bankruptcy or insolvency proceedings and has affirmed the applicable lease pursuant to final, non-appealable order of a court of competent jurisdiction.
“Specified Tenant” means (i) The Huntington National Bank, (ii) Porter Wright and (iii) any guarantor(s) of the applicable related Specified Tenant lease(s).
Additional Secured Indebtedness (not including trade debts).The Huntington Center Property also secures the Huntington Center ServicedPari Passu Companion Loan, which has a Cut-off Date principal balance of $60,000,000 and is currently held by Morgan Stanley Bank, N.A. or an affiliate thereof and expected to be contributed to a future securitization trust. The Huntington Center ServicedPari Passu Companion Loan accrues interest at the same rate as the Huntington Center Mortgage Loan. The Huntington Center Mortgage Loan is entitled to payments of principal and interest on apro rata andpari passu basis with the Huntington Center ServicedPari Passu Companion Loan. The holders of the Huntington Center Mortgage Loan and the Huntington Center ServicedPari Passu Companion Loan have entered into a co-lender agreement which sets forth the allocation of collections on the Huntington Center Whole Loan. See “Description of the Mortgage Pool—The Whole Loans— The Serviced Pari Passu Whole Loans”in the Preliminary Prospectus.
Mezzanine Loan and Preferred Equity.Not permitted.
Release of Property.Not permitted.
Terrorism Insurance.The Huntington Center Mortgage Loan documents require that the “all risk” insurance policy required to be maintained by the Huntington Center Borrower provides coverage for terrorism in an amount equal to the full replacement cost of the Huntington Center Property and twenty-four months of business interruption insurance; provided that if the Terrorism Risk Insurance Program Reauthorization Act of 2015 or extension thereof or substantially similar program (“TRIPRA”) is in effect and continues to cover both foreign and domestic acts of terrorism, the lender is required to accept terrorism insurance with coverage against “covered acts” within the meaning of TRIPRA.
This is not a research report and was not prepared by any Underwriter’s research departments. Please see additional important information and qualifications at the end of this Term Sheet.
| T-34 |
(THIS PAGE INTENTIONALLY LEFT BLANK)
This is not a research report and was not prepared by any Underwriter’s research departments. Please see additional important information and qualifications at the end of this Term Sheet.
| T-35 |
| MSBAM 2016-C31 | One Met Life Way |
| Mortgage Loan No. 2 – One Met Life Way |
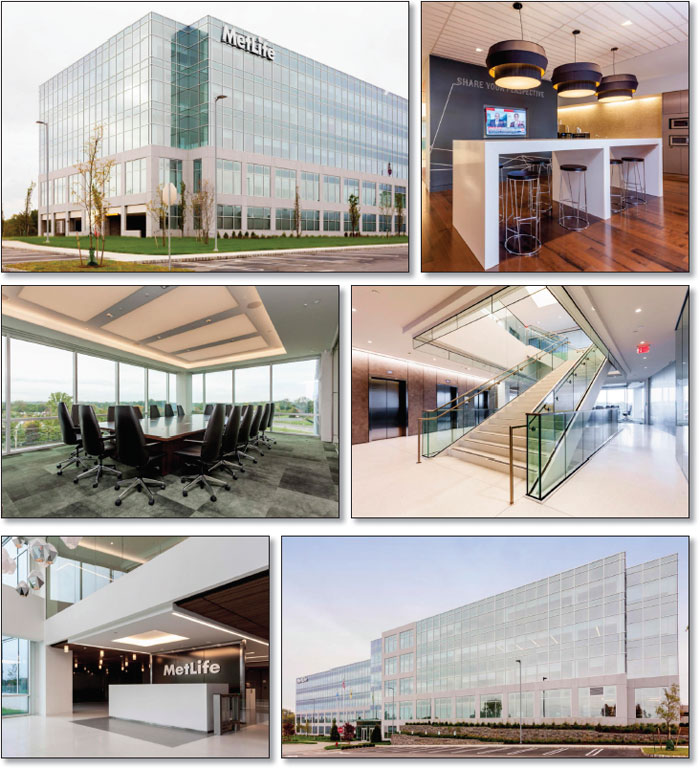
This is not a research report and was not prepared by any Underwriter’s research departments. Please see additional important information and qualifications at the end of this Term Sheet.
| T-36 |
| MSBAM 2016-C31 | One Met Life Way |
| Mortgage Loan No. 2 – One Met Life Way |

This is not a research report and was not prepared by any Underwriter’s research departments. Please see additional important information and qualifications at the end of this Term Sheet.
| T-37 |
| MSBAM 2016-C31 | One Met Life Way |
| Mortgage Loan No. 2 – One Met Life Way |
| Mortgage Loan Information | Property Information | ||||||
| Mortgage Loan Seller: | MSMCH | Single Asset/Portfolio: | Single Asset | ||||
| Original Balance: | $68,950,000 | Location: | Hanover, NJ 07981 | ||||
| Cut-off Date Balance: | $68,950,000 | General Property Type: | Office | ||||
| % of Initial Pool Balance: | 7.2% | Detailed Property Type: | Suburban | ||||
| Loan Purpose: | Acquisition | Title Vesting: | Fee | ||||
| Sponsor: | SALUS Properties | Year Built/Renovated: | 2016/N/A | ||||
| Mortgage Rate: | 4.1600% | Size: | 184,960 SF | ||||
| Note Date: | 9/29/2016 | Cut-off Date Balance per SF: | $373 | ||||
| First Payment Date: | 11/1/2016 | Maturity Date Balance per SF: | $340 | ||||
| Maturity Date: | 10/1/2026 | Property Manager: | Tenant-Managed | ||||
| Original Term to Maturity: | 120 months | ||||||
| Original Amortization Term: | 360 months | ||||||
| IO Period: | 60 months | Underwriting and Financial Information | |||||
| Seasoning: | 1 month | UW NOI: | $5,553,626 | ||||
| Prepayment Provisions: | LO (25); DEF (91); O (4) | UW NOI Debt Yield: | 8.1% | ||||
| Lockbox/Cash Mgmt Status: | Hard/In Place | UW NOI Debt Yield at Maturity: | 8.8% | ||||
| Additional Debt Type: | N/A | UW NCF DSCR: | 1.90x (IO) 1.37x (P&I) | ||||
| Additional Debt Balance: | N/A | Most Recent NOI(2): | N/A | ||||
| Future Debt Permitted (Type): | No (N/A) | 2nd Most Recent NOI(2): | N/A | ||||
| Reserves(1) | 3rd Most Recent NOI(2): | N/A | |||||
| Type | Initial | Monthly | Cap | Most Recent Occupancy: | 100.0% (11/1/2016) | ||
| RE Tax: | $0 | Springing | N/A | 2nd Most Recent Occupancy(2): | N/A | ||
| Insurance: | $0 | Springing | N/A | 3rd Most Recent Occupancy(2): | N/A | ||
| Recurring Replacements: | $0 | $3,853 | $138,720 | Appraised Value (as of): | $99,500,000 (7/13/2016) | ||
| TI/LC: | $0 | $0 | N/A | Cut-off Date LTV Ratio: | 69.3% | ||
| Other: | $7,912,789 | $0 | N/A | Maturity Date LTV Ratio: | 63.2% | ||
| Sources and Uses | ||||||
| Sources | Proceeds | % of Total | Uses | Proceeds | % of Total | |
| Loan Amount: | $68,950,000 | 63.4% | Purchase Price: | $98,450,000 | 90.5% | |
| Borrower Equity: | $39,859,810 | 36.6% | Reserves: | $7,912,789 | 7.3% | |
| Closing Costs: | $2,447,021 | 2.2% | ||||
| Total Sources: | $108,809,810 | 100.0% | Total Uses: | $108,809,810 | 100.0% | |
| (1) | See “—Escrows and Reserves” below for further discussion of reserve requirements. |
| (2) | Historical operating data and occupancy data are not available as the One Met Life Way Property was built in 2016. |
The Mortgage Loan. The second largest mortgage loan (the “One Met Life Way Mortgage Loan”) is evidenced by a promissory note in the original principal amount of $68,950,000, secured by a first priority fee mortgage encumbering an office building comprised of 184,960 SF located in Hanover, New Jersey (the “One Met Life Way Property”). The proceeds of the One Met Life Way Mortgage Loan and equity of $39,859,810 were used to acquire the One Met Life Way Property for a net purchase price of $98,450,000, fund upfront reserves and pay closing costs.
The Borrowers and the Sponsor. The borrowers are three related tenant-in-common entities, SFP ML I LLC (65.5%), SFP ML II LLC (6.8%) and SFP ML III LLC (27.7%) (collectively, the “One Met Life Way Borrowers” and individually each a “One Met Life Way Borrower”), each a single-purpose Delaware limited liability company structured to be bankruptcy remote, with two independent directors. The One Met Life Way Mortgage Loan sponsor is SALUS Properties (“SALUS”) and the non-recourse carveout guarantor is James M. Jacobson, Jr., the managing principal of SALUS. SALUS is a privately-held real estate investment manager. James M. Jacobson, Jr. oversees SALUS’ investment activities, which includes managing all existing investment partnerships, sourcing and acquiring properties, securing financing and working with development partners, equity partners and senior lenders.
The Property. The One Met Life Way Property is a Class A+ single-tenant office property containing 184,960 SF of rentable area located in Hanover, New Jersey and serves as the headquarters for Metropolitan Life Insurance Company (“Metropolitan Life Insurance”). The five-story building was constructed in 2016. The One Met Life Way Property is equipped with a 2.0 megawatt electrical generator that can power the entire building if existing electrical sources are interrupted. Furthermore, the computer data center is backed up with an internal uninterruptable power supply and a 100 kilowatt life-safety generator. Other amenities at the One Met Life Way Property include an onsite cafeteria, conference center, fitness center and Zen rooms. In addition, an extensive park-like exterior seating and lounge area is currently being constructed, which will include an amphitheater, a waterfall feature and a fire pit.
This is not a research report and was not prepared by any Underwriter’s research departments. Please see additional important information and qualifications at the end of this Term Sheet.
| T-38 |
| MSBAM 2016-C31 | One Met Life Way |
The One Met Life Way Property houses Metropolitan Life Insurance’s investment division and replaces its former location approximately 4.5 miles south of the One Met Life Way Property. Under the lease, Metropolitan Life Insurance has the right to construct an addition to its building such that the building contains a total of up to 300,000 square feet upon obtaining necessary approvals, subject to the One Met Life Way Borrower’s reasonable approval of the related plans and specifications. Obtaining the necessary approvals for the expansion is the obligation of Metropolitan Life Insurance.
The lease provides that any such addition will be owned by Metropolitan Life Insurance during the term of the lease, and no additional base rent will be payable with respect thereto.
Parking at the One Met Life Way Property is provided through a combination of surface parking, structured parking with a covered walkway and a below-grade heated executive parking garage with finished drop ceilings, totaling 832 spots for a parking ratio of 4.5 spaces for every 1,000 square feet of rentable space.
Major Tenant.The One Met Life Way Property is 100.0% leased to Metropolitan Life Insurance through July 31, 2031. The lease is triple net and has no termination options. The lease provides for initial rent of $5,260,262.40, followed by a 5.1% increase in the fourth lease year in July 2019 and then 2.5% each year thereafter commencing in the fifth lease year in July 2020 and includes two 10-year renewal options at fair market value. Metropolitan Life Insurance is a wholly-owned subsidiary of MetLife, Inc., (NYSE: MET; rated A-/A3/A- by Fitch/Moody’s/S&P) and has an Insurer Financial Strength rating of AA- from both S&P and Fitch and Aa3 from Moody’s. Metropolitan Life Insurance, together with its subsidiaries, provides insurance, annuities and employee benefit programs in the United States. The One Met Life Way Property houses Metropolitan Life Insurance’s investment division.
MetLife, Inc. was founded in 1868 and is a global provider of insurance, annuities and employee benefit programs with a market capitalization in excess of $50 billion as of October 5, 2016. Metropolitan Life Insurance’s investment division at the One Met Life Way Property is made up of three primary divisions: MetLife Real Estate Investors, MetLife Private Capital Investors and Agricultural Investments.
The following table presents certain information relating to the lease at the One Met Life Way Property:
| Tenant Summary(1) | |||||||
| Tenant Name | Credit Rating (Fitch/Moody’s/S&P)(2) | Tenant SF | Approximate % of SF | Annual UW Rent(3) | % of Total Annual UW Rent | Annual UW Rent PSF | Lease Expiration |
| Tenant | |||||||
| Metropolitan Life Insurance | A-/A3/A- | 184,960 | 100.0% | $5,705,512 | 100.0% | $30.85 | 7/31/2031 |
| Subtotal/Wtd. Avg. | 184,960 | 100.0% | $5,705,512 | 100.0% | $30.85 | ||
| Vacant Space | 0 | 0.0% | $0 | 0.0% | $0.00 | ||
| Total/Wtd. Avg. | 184,960 | 100.0% | $5,705,512 | 100.0% | $30.85 | ||
| (1) | Information is based on the underwritten rent roll. |
| (2) | Certain ratings are those of the parent company whether or not the parent guarantees the lease. |
| (3) | Annual UW Rent is equal to the first year triple net rent for Metropolitan Life Insurance of $5,260,262.40 plus the net credit tenant rent increases totaling $445,250. |
This is not a research report and was not prepared by any Underwriter’s research departments. Please see additional important information and qualifications at the end of this Term Sheet.
| T-39 |
| MSBAM 2016-C31 | One Met Life Way |
The following table presents certain information relating to the lease rollover schedule at the One Met Life Way Property:
| Lease Rollover Schedule(1) | ||||||||
| Year | # of Leases Rolling | SF Rolling | % of Total SF Rolling | Cumulative % of Total SF Rolling | Total UW Rent Rolling | UW Rent PSF Rolling | % of Total Rent Rolling | Cumulative % of Total Rent Rolling |
| MTM | 0 | 0 | 0.0% | 0.0% | $0 | $0.00 | 0.0% | 0.0% |
| 2016 | 0 | 0 | 0.0% | 0.0% | $0 | $0.00 | 0.0% | 0.0% |
| 2017 | 0 | 0 | 0.0% | 0.0% | $0 | $0.00 | 0.0% | 0.0% |
| 2018 | 0 | 0 | 0.0% | 0.0% | $0 | $0.00 | 0.0% | 0.0% |
| 2019 | 0 | 0 | 0.0% | 0.0% | $0 | $0.00 | 0.0% | 0.0% |
| 2020 | 0 | 0 | 0.0% | 0.0% | $0 | $0.00 | 0.0% | 0.0% |
| 2021 | 0 | 0 | 0.0% | 0.0% | $0 | $0.00 | 0.0% | 0.0% |
| 2022 | 0 | 0 | 0.0% | 0.0% | $0 | $0.00 | 0.0% | 0.0% |
| 2023 | 0 | 0 | 0.0% | 0.0% | $0 | $0.00 | 0.0% | 0.0% |
| 2024 | 0 | 0 | 0.0% | 0.0% | $0 | $0.00 | 0.0% | 0.0% |
| 2025 | 0 | 0 | 0.0% | 0.0% | $0 | $0.00 | 0.0% | 0.0% |
| 2026 | 0 | 0 | 0.0% | 0.0% | $0 | $0.00 | 0.0% | 0.0% |
| 2027 and Beyond | 1 | 184,960 | 100.0% | 100.0% | $5,705,512 | $30.85 | 100.0% | 100.0% |
| Vacant | 0 | 0 | 0.0% | 100.0% | $0 | $0.00 | 0.0% | 100.0% |
| Total/Wtd. Avg. | 1 | 184,960 | 100.0% | $5,705,512 | $30.85 | 100.0% | ||
| (1) | Information is based on the underwritten rent roll. UW Rent is equal to the first year triple net rent for Metropolitan Life Insurance of $5,260,262.40 plus the net credit tenant rent increases totaling $445,250. |
The Market. The One Met Life Way Property is located in the Whippany section of Hanover Township. Primary access to the area is provided by State Route 10, a main commercial highway that crosses the region in an east to west direction; and State Route 24, a major arterial that crosses Northern New Jersey in an east to west direction and connects to Interstate Route 78 to the east and Interstate Route 287 just west of the One Met Life Way Property. The major arterial serving the area is Interstate Route 287 which runs in a north to south direction and provides access to Interstate Routes 80 and 78, the New Jersey Turnpike and the Garden State Parkway. The One Met Life Way Property is approximately four miles from New Jersey Transit’s Morristown rail service which provides direct access to midtown Manhattan in less than two hours.
According to the appraisal, the One Met Life Way Property is located in the Northern New Jersey metropolitan area. As of the first quarter of 2016, the vacancy rate was 18.1% and effective rents averaged $23.88 per SF. In the same period, the vacancy rate for Class A office properties was 16.8% and asking rent averaged $33.71 per SF.
According to the appraisal, the One Met Life Way Property is located in the Florham Park submarket. As of the first quarter of 2016, the vacancy rate was 22.3% and effective rents averaged $21.58 per SF. In the same period, the vacancy rate for Class A office properties was 14.4% and asking rent averaged $29.84 per SF.
According to the appraisal, the estimated 2016 population within a one-, three- and five-mile radius of the One Met Life Way Property is 5,769, 40,301 and 156,594, respectively. The estimated 2016 median household income within a one-, three- and five-mile radius of the One Met Life Way Property is $108,817, $108,382 and $101,774, respectively.
This is not a research report and was not prepared by any Underwriter’s research departments. Please see additional important information and qualifications at the end of this Term Sheet.
| T-40 |
| MSBAM 2016-C31 | One Met Life Way |
The following table presents recent occupancy and leasing data at competitive office buildings with respect to the One Met Life Way Property:
| Competitive Property Summary | |||||||||
| Property Name/Address | Year Built | Class | Size (SF) | Tenant Name | Lease Size (SF) | Lease Date | Lease Term (Yrs.) | Rent/SF(1) | Lease Type |
One Met Life Way Hanover, NJ | 2016 | A | 184,960 | Metropolitan Life Insurance | 184,960 | July 2016 | 15.0 | $28.44 | NNN |
211 Mount Airy Road 211 Mount Airy Road Basking Ridge, NJ | 1975 | A | 301,800 | Daiichi Sankyo Pharma | 241,350 | Oct 2016 | 10.0 | $26.00 | NNN
|
Green at Florham Park 140 Park Avenue Florham Park, NJ | 2015 | A | 100,705 | Summit Medical Group | 100,705 | Apr 2015 | 15.1 | $24.82 | NNN |
1 Plainsboro Road) 1 Plainsboro Road Plainsboro, NJ | 2012 | A | 137,842 | PCHS | 79,198 | Apr 2015 | 12.2 | $30.55 | NNN |
800 Scudders Mill Road 800 Scudders Mill Road Plainsboro, NJ | 1985 | A | 731,104 | Novo Nordisk | 563,289 | Apr 2013 | 15.0 | $28.00 | NNN |
Source:Appraisal.
(1) Rent/SF shown for the One Met Life Way Property above is based on the initial rent.
Underwritten Net Cash Flow.The following table presents certain information relating to the Underwritten Net Cash Flow at the One Met Life Way Property:
| Cash Flow Analysis(1) | |||||
| 2013(1) | 2014(1) | 2015(1) | UW | UW PSF | |
| Base Rent(2) | N/A | N/A | N/A | $5,705,512 | $30.85 |
| Less Vacancy & Credit Loss | N/A | N/A | N/A | ($142,638) | ($0.77) |
| Effective Gross Income | N/A | N/A | N/A | $5,562,874 | $30.08 |
| Total Operating Expenses(2) | N/A | N/A | N/A | $9,248 | $0.05 |
| Net Operating Income | N/A | N/A | N/A | $5,553,626 | $30.03 |
| Capital Expenditures | N/A | N/A | N/A | $36,992 | $0.20 |
| TI/LC(3) | N/A | N/A | N/A | $0 | $0.00 |
| Net Cash Flow | N/A | N/A | N/A | $5,516,634 | $29.83 |
| Occupancy % | N/A | N/A | N/A | 97.5% | |
| NOI DSCR | N/A | N/A | N/A | 1.38x | |
| NOI DSCR (IO) | N/A | N/A | N/A | 1.91x | |
| NCF DSCR | N/A | N/A | N/A | 1.37x | |
| NCF DSCR (IO) | N/A | N/A | N/A | 1.90x | |
| NOI Debt Yield | N/A | N/A | N/A | 8.1% | |
| NCF Debt Yield | N/A | N/A | N/A | 8.0% | |
| (1) | Historical operating data is not available as the One Met Life Way Property was built in 2016. |
| (2) | UW Base Rent is equal to the first year triple net rent for Metropolitan Life Insurance plus the net credit tenant rent increases totaling $445,250. The Metropolitan Life Insurance lease is on a triple net basis and the tenant is responsible for all operating expenses. UW Total Operating Expenses are based on the estimate of non-reimbursable expenses set forth in the appraisal. |
| (3) | UW TI/LC is $0 due to (i) the One Met Life Way Property being newly constructed, (ii) the Metropolitan Life Insurance 15-year lease having no termination option and (iii) Metropolitan Life Insurance being a wholly-owned subsidiary of MetLife, Inc., an investment grade rated entity. |
This is not a research report and was not prepared by any Underwriter’s research departments. Please see additional important information and qualifications at the end of this Term Sheet.
| T-41 |
| MSBAM 2016-C31 | One Met Life Way |
Escrows and Reserves. The One Met Life Way Mortgage Loan documents provide for upfront reserves in the amount of $7,912,789 for tenant improvements and leasing commissions payable under the Metropolitan Life Insurance lease. The One Met Life Way Borrowers are required to escrow monthly 1/12th of the annual estimated real estate taxes (provided, that such escrows are not required so long as the One Met Life Way Borrowers provide evidence satisfactory to the lender that Metropolitan Life Insurance is obligated under the terms of its lease to pay all real estate taxes and has in fact paid all such taxes prior to their due date). The One Met Life Way Borrowers are required to escrow monthly 1/12th of the annual estimated insurance premiums (unless the One Met Life Way Borrowers maintain an acceptable blanket policy). The One Met Life Way Borrowers are required to make monthly deposits equal to $3,853 into an escrow for replacements and repairs; provided, that so long as no event of default is then continuing under the One Met Life Way Mortgage loan documents, the One Met Life Way Borrowers are not required to deposit any portion of such monthly deposit which would cause the funds then in such escrow to exceed $138,720.
Lockbox and Cash Management. A hard lockbox is in place with respect to the One Met Life Way Mortgage Loan. The One Met Life Way Mortgage Loan has in place cash management. Funds in the lockbox account are required to be swept on each business day to a cash management account for the benefit of the lender and applied to pay debt service on the One Met Life Way Mortgage Loan, to fund the required reserves as described above under “Escrows and Reserves,” to disburse, during the continuance of a Cash Sweep Event Period (as defined below) and provided no event of default is continuing under the One Met Life Way Mortgage loan documents, the monthly operating expenses referenced in the approved annual budget and extraordinary operating expenses not referenced in the annual budget and approved by the lender, and to disburse the remainder, provided no event of default is continuing under the One Met Life Way Mortgage Loan, (i) during the continuance of a Cash Sweep Event Period, into an account to be held by the lender as additional security for the One Met Life Way Mortgage Loan or (ii) otherwise, to the One Met Life Way Borrower.
A “Cash Sweep Event Period” means the period:
(i) commencing upon an event of default under the One Met Life Way Mortgage Loan and ending upon the acceptance by the lender (in its sole discretion) of a cure of such event of default, or
(ii) commencing if the debt service coverage ratio on the One Met Life Way Mortgage Loan is less than 1.25x for three consecutive calendar months (a “DSCR Trigger”), and ending on the date the debt service coverage ratio on the One Met Life Way Mortgage Loan has been at least 1.25x for three consecutive calendar months, or
(iii) commencing upon Metropolitan Life Insurance terminating or cancelling the Metropolitan Life Insurance lease in any bankruptcy or similar proceeding (including, without limitation, any rejection of the Metropolitan Life Insurance lease in a bankruptcy or similar proceeding) or if Metropolitan Life Insurance files for bankruptcy or becomes the subject of an insolvency proceeding and ending upon the Metropolitan Life Insurance lease being affirmed in bankruptcy and Metropolitan Life Insurance paying full contractual rent, or
(iv) commencing upon the credit rating of Metropolitan Life Insurance being downgraded and/or the senior unsecured credit rating of Metropolitan Life Insurance falling below BBB- as rated by S&P (or its equivalent by any other rating agency) and ending upon the credit rating issued by S&P (or its equivalent by any other rating agency) to Metropolitan Life Insurance being increased to BBB+ or higher.
Additional Secured Indebtedness. Not permitted.
Mezzanine Loan and Preferred Equity. Not permitted.
Release of Property. Not permitted.
Terrorism Insurance. The One Met Life Way Mortgage Loan documents require that the “all risk” insurance policy required to be maintained by the One Met Life Way Borrowers provide coverage for terrorism in an amount equal to the full replacement cost of the One Met Life Way Property and 12 months of business interruption insurance; provided that if the Terrorism Risk Insurance Program Reauthorization Act of 2015 or extension thereof or substantially similar program (“TRIPRA”) is in effect and continues to cover both foreign and domestic acts of terrorism, the lender is required to accept terrorism insurance with coverage against “covered acts” within the meaning of TRIPRA.
This is not a research report and was not prepared by any Underwriter’s research departments. Please see additional important information and qualifications at the end of this Term Sheet.
| T-42 |
(THIS PAGE INTENTIONALLY LEFT BLANK)
This is not a research report and was not prepared by any Underwriter’s research departments. Please see additional important information and qualifications at the end of this Term Sheet.
| T-43 |
| MSBAM 2016-C31 | Hyatt Regency Sarasota |
| Mortgage Loan No. 3 – Hyatt Regency Sarasota |
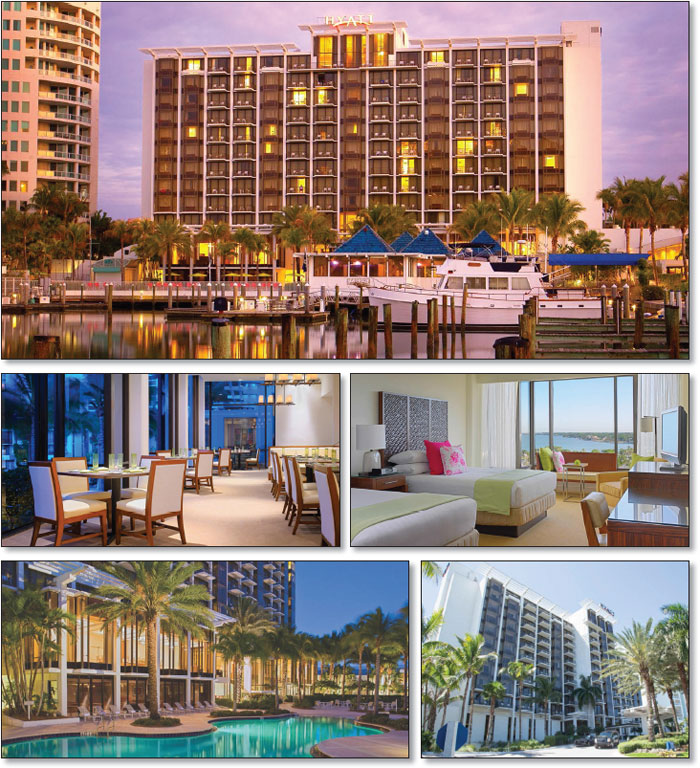
This is not a research report and was not prepared by any Underwriter’s research departments. Please see additional important information and qualifications at the end of this Term Sheet.
| T-44 |
| MSBAM 2016-C31 | Hyatt Regency Sarasota |
| Mortgage Loan No. 3 – Hyatt Regency Sarasota |
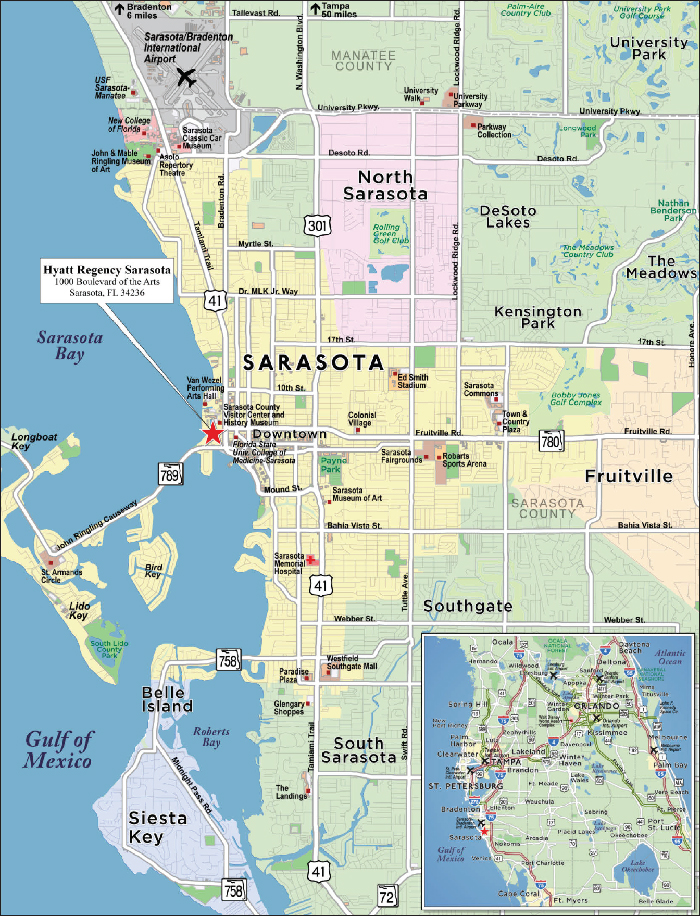
This is not a research report and was not prepared by any Underwriter’s research departments. Please see additional important information and qualifications at the end of this Term Sheet.
| T-45 |
| MSBAM 2016-C31 | Hyatt Regency Sarasota |
| Mortgage Loan No. 3 – Hyatt Regency Sarasota |
| Mortgage Loan Information | Mortgaged Property Information | ||||||
| Mortgage Loan Seller: | MSMCH | Single Asset/Portfolio: | Single Asset | ||||
| Original Balance: | $54,000,000 | Location: | Sarasota, FL 34236 | ||||
| Cut-off Date Balance: | $54,000,000 | General Property Type: | Hospitality | ||||
| % of Initial Pool Balance: | 5.7% | Detailed Property Type: | Full Service | ||||
| Loan Purpose: | Acquisition | Title Vesting: | Fee | ||||
| Sponsor: | Kiran Pallavi Investments, LLC | Year Built/Renovated: | 1975/2008-2016 | ||||
| Mortgage Rate: | 4.9800% | Size: | 294 Rooms | ||||
| Note Date: | 10/3/2016 | Cut-off Date Balance per Room: | $183,673 | ||||
| First Payment Date: | 12/1/2016 | Maturity Date Balance per Room: | $151,216 | ||||
| Maturity Date: | 11/1/2026 | Property Manager: | Hyatt Corporation
| ||||
| Original Term to Maturity: | 120 months | ||||||
| Original Amortization Term: | 360 months | ||||||
| IO Period: | 0 months | Underwriting and Financial Information | |||||
| Seasoning: | 0 months | UW NOI: | $6,861,651 | ||||
| Prepayment Provisions: | LO (24); DEF (92); O (4) | UW NOI Debt Yield: | 12.7% | ||||
| Lockbox/Cash Mgmt Status: | Soft/Springing | UW NOI Debt Yield at Maturity: | 15.4% | ||||
| Additional Debt Type: | N/A | UW NCF DSCR: | 1.70x | ||||
| Additional Debt Balance: | N/A | Most Recent NOI: | $7,004,402 (7/31/2016 TTM) | ||||
| Future Debt Permitted (Type): | No (N/A) | 2nd Most Recent NOI: | $7,600,365 (12/31/2015) | ||||
| Reserves(1) | 3rd Most Recent NOI: | $6,506,120 (12/31/2014) | |||||
| Type | Initial | Monthly | Cap | Most Recent Occupancy: | 74.6% (7/31/2016) | ||
| RE Tax: | $734,045 | $56,465 | N/A | 2nd Most Recent Occupancy: | 78.9% (12/31/2015) | ||
| Insurance: | $63,774 | $31,887 | N/A | 3rd Most Recent Occupancy: | 78.3% (12/31/2014) | ||
| Deferred Maintenance: | $260,000 | $0 | N/A | Appraised Value (as of): | $76,400,000 (7/6/2016) | ||
| Recurring Replacements: | $0 | Springing | N/A | Cut-off Date LTV Ratio: | 70.7% | ||
| PIP: | $2,300,000 | Springing | N/A | Maturity Date LTV Ratio: | 58.2% | ||
| Sources and Uses | ||||||
| Sources | Proceeds | % of Total | Uses | Proceeds | % of Total | |
| Loan Amount: | $54,000,000 | 66.8% | Purchase Price: | $76,000,000 | 94.1% | |
| Borrower Equity: | $26,790,136 | 33.2% | Reserves: | $3,357,819 | 4.2% | |
| Closing Costs: | $1,432,317 | 1.8% | ||||
| Total Sources: | $80,790,136 | 100.0% | Total Uses: | $80,790,136 | 100.0% | |
| (1) | See“—Escrows and Reserves” below for further discussion of reserve requirements. |
The Mortgage Loan. The third largest mortgage loan (the “Hyatt Regency Sarasota Mortgage Loan”) is evidenced by a promissory note in the original principal amount of $54,000,000 secured by a fee mortgage encumbering a full service hospitality property known as the Hyatt Regency Sarasota in Sarasota, Florida (the “Hyatt Regency Sarasota Property”). The proceeds of the Hyatt Regency Sarasota Mortgage Loan were used to acquire the Hyatt Regency Sarasota Property, fund reserves and pay closing costs.
The Borrower and the Sponsor. The borrower is Sarasota Hotel Acquisition Group, LLC (the “Hyatt Regency Sarasota Borrower”), a special-purpose, newly formed Delaware limited liability company with two independent directors. The Hyatt Regency Sarasota Borrower is 100% owned by Sarasota Hotel Acquisition Manager, LLC, which is 100% owned by Kiran REIF, LLC, which is 100% owned by Kiran Pallavi Investments, LLC. Kiran Pallavi Investments, LLC is 99.99% owned by KCP Dynasty Trust, whose trustee is Dr. Kiran Patel; and 0.01% owned by KCP LLC Trust, whose trustee is Dr. Pallavi Patel. Dr. Kiran Patel is the nonrecourse carve-out guarantor.
Dr. Kiran Patel is a cardiologist who has been involved in real estate for 26 years. Dr. Patel currently owns interests in approximately 45 real estate assets, comprised of 16 hotels (3,000+ keys), one hotel under development (450 keys), three medical office buildings and various office buildings, residential properties and other commercial buildings.
The Property. The Hyatt Regency Sarasota Property is an 11-story, full service resort hotel located in Sarasota, Florida with a 32-slip marina. The Hyatt Regency Sarasota Property contains 294 rooms, including 126 king rooms, 141 double/queen rooms, 12 king suites and 15 king/double ADA rooms. There are 332 parking spaces located in the parking garage and surface parking areas. Amenities include two restaurants, one lounge, an outdoor pool, a fitness center, a business center, a library, 17,547 SF of meeting space including a 9,879 SF ballroom and a private 32-slip marina. The marina can accommodate vessels up to 55+ feet and features on-shore power, water, pump out services and an on-site dock master. Guestrooms are equipped with flat screen televisions, cordless phones, single-line data ports, individual climate control, high-speed wireless internet, electronic door locks, in-room safety-deposit box, full bath amenities, coffee maker, iron/ironing board, hair dryer and an alarm clock radio. The Hyatt Regency Sarasota Property was constructed in 1975 and underwent an approximately $18,675,481 ($63,522 per room) renovation between 2007 and 2008. The work included guestrooms refurbishment, public area and restaurant renovations, and meeting space and boathouse upgrades.
This is not a research report and was not prepared by any Underwriter’s research departments. Please see additional important information and qualifications at the end of this Term Sheet.
| T-46 |
| MSBAM 2016-C31 | Hyatt Regency Sarasota |
The Hyatt Regency Sarasota Property is located near Sarasota’s downtown along the waters of Sarasota Bay approximately 3.8 miles from Sarasota-Bradenton International Airport. The Hyatt Regency Sarasota Property provides complimentary shuttle service to the beaches and the downtown shopping area of St. Armand’s Key, while a variety of cultural attractions are a short walk away, including Van Wezel Performing Arts Hall and Marie Selby Botanical Gardens.
The Hyatt Regency Sarasota Property operates under a management agreement (the “Hyatt Management Agreement”) with Hyatt Corporation (the “Hyatt Manager”) that expires on December 31, 2037. The Hyatt Regency Sarasota Mortgage Loan documents provide that the Hyatt Regency Sarasota Borrower may, with the lender’s prior written consent, terminate the Hyatt Management Agreement and enter into a franchise agreement with Hyatt Corporation or another reputable and experienced franchisor possessing experience in flagging hotel properties similar in size, scope, use and value as the Hyatt Regency Sarasota Property and approved by the lender in its sole discretion, upon satisfaction of certain conditions, including but not limited to, (i) if lender requests, a rating agency confirmation and (ii) entry into a replacement management agreement with Hyatt, Interstate Hotels & Resorts, or a reputable and experienced professional management organization approved by the lender, which approval may be conditioned upon receipt of a rating agency confirmation (a “Conversion”).
According to the appraisal, the Hyatt Regency Sarasota Property generates approximately 58% of its room nights from transient demand and 42% from meeting and group demand.
| Historical Occupancy, ADR, RevPAR | |||||||||
Competitive Set | Hyatt Regency Sarasota Property | Penetration Factor | |||||||
| Year | Occupancy | ADR | RevPAR | Occupancy | ADR | RevPAR | Occupancy | ADR | RevPAR |
| 7/31/2014 TTM | 71.4% | $168.18 | $120.02 | 79.7% | $165.97 | $132.28 | 111.7% | 98.7% | 110.2% |
| 7/31/2015 TTM | 69.8% | $179.69 | $125.41 | 78.8% | $186.34 | $146.87 | 112.9% | 103.7% | 117.1% |
| 7/31/2016 TTM | 70.1% | $190.30 | $133.35 | 74.6% | $195.17 | $145.60 | 106.5% | 102.6% | 109.2% |
Source: Industry Report
The Market. The Hyatt Regency Sarasota Property is located in Sarasota, Sarasota County, Florida, in the Sarasota-Bradenton-Venice Metropolitan Statistical Area (MSA). The Sarasota-Bradenton-Venice MSA is located on the west coast of Florida approximately 30 miles south of St. Petersburg, 40 miles south of Tampa and 108 miles southwest of the Orlando MSA. The Hyatt Regency Sarasota Property is situated in the downtown Sarasota area by the bay front. The appraisal noted possible future new supply across the immediate area surrounding the Hyatt Regency Sarasota Property totaling 785 rooms in four properties that are either under construction or proposed for development. The three properties under construction include a 255-room Westin, a 180-room Embassy Suites and a 187-room Zota Resort with scheduled completion ranging from fall of 2016 to mid-2017. The property that is proposed for development is a 163-room Hotel Sarasota Curio Collection with an anticipated opening date in 2018.The appraisal identified various local demand generators including cultural attractions such as the Sarasota Orchestra and Sarasota Opera, both of which are within walking distance from the Hyatt Regency Sarasota Property, and Sarasota Ballet which is approximately nine miles away as well as proximity to beaches and the Sarasota downtown shopping area.
Primary competitive properties to the Hyatt Regency Sarasota Property are shown in the table below:
| Property Competitive Summary | ||||||||
| Property Name | No. of Rooms | Year Built | Meeting Space (SF) | Transient | Meeting & Group | 2015 Occupancy | 2015 ADR | 2015 RevPAR |
| Hyatt Regency Sarasota | 294 | 1975 | 17,547 | 58% | 42% | 78.9% | $190.23 | $150.08 |
| Ritz-Carlton Sarasota | 266 | 2001 | 17,100 | 70% | 30% | 70.0% | $355.00 | $248.50 |
| Hotel Indigo Sarasota | 95 | 2006 | 1,200 | 80% | 20% | 86.0% | $161.00 | $139.10 |
| Lido Beach Resort | 222 | 1969 | 6,000 | 75% | 25% | 70.0% | $252.00 | $176.40 |
| Holiday Inn Sarasota Lido Beach | 135 | 1970 | 2,588 | 85% | 15% | 58.0% | $199.00 | $115.82 |
| Hilton Garden Inn Sarasota Airport | 115 | 2001 | 1,900 | 80% | 20% | 81.0% | $133.00 | $107.73 |
| Aloft Hotel Sarasota | 139 | 2016 | 550 | 0% | 0% | NAV | NAV | NAV |
| Courtyard Sarasota Airport | 81 | 1996 | 570 | 80% | 20% | 75.0% | $131.00 | $98.25 |
Source:Appraisal
This is not a research report and was not prepared by any Underwriter’s research departments. Please see additional important information and qualifications at the end of this Term Sheet.
| T-47 |
| MSBAM 2016-C31 | Hyatt Regency Sarasota |
Operating History and Underwritten Net Cash Flow. The following table presents certain information relating to the historical operating performance and the Underwritten Net Cash Flow at the Hyatt Regency Sarasota Property.
| Cash Flow Analysis | ||||||||
| 2011 | 2012 | 2013 | 2014 | 2015 | 7/31/2016 TTM | UW | UW per Room | |
| Occupancy | 77.3% | 78.5% | 80.6% | 78.3% | 78.9% | 74.6% | 74.6% | |
| ADR | $136.40 | $143.53 | $154.75 | $181.48 | $190.23 | $195.16 | $195.16 | |
| RevPAR | $105.44 | $112.67 | $124.73 | $142.15 | $150.08 | $145.60 | $145.60 | |
| Rooms Revenue | $11,319,077 | $12,123,710 | $13,386,473 | $15,254,293 | $16,104,841 | $15,666,697 | $15,623,823 | $53,142 |
| Food & Beverage | $6,428,412 | $6,389,353 | $6,780,936 | $7,415,288 | $7,923,249 | $7,728,355 | $7,707,239 | $26,215 |
| Other Income(1) | $321,099 | $303,583 | $307,781 | $339,850 | $1,045,745 | $1,055,884 | $1,052,999 | $3,582 |
| Total Revenue | $18,068,588 | $18,816,646 | $20,475,190 | $23,009,431 | $25,073,835 | $24,450,936 | $24,384,061 | $82,939 |
| Total Expenses | $14,396,312 | $14,811,176 | $15,353,239 | $16,503,311 | $17,473,470 | $17,446,534 | $17,522,410 | $59,600 |
| Net Op. Income | $3,672,276 | $4,005,470 | $5,121,951 | $6,506,120 | $7,600,365 | $7,004,402 | $6,861,651 | $23,339 |
| FF&E | $361,372 | $376,333 | $614,256 | $920,377 | $1,002,953 | $978,038 | $975,362 | $3,318 |
| Net Cash Flow | $3,310,904 | $3,629,137 | $4,507,695 | $5,585,743 | $6,597,412 | $6,026,364 | $5,886,289 | $20,021 |
| NOI DSCR | 1.06x | 1.15x | 1.48x | 1.87x | 2.19x | 2.02x | 1.98x | |
| NCF DSCR | 0.95x | 1.05x | 1.30x | 1.61x | 1.90x | 1.74x | 1.70x | |
| NOI Debt Yield | 6.8% | 7.4% | 9.5% | 12.0% | 14.1% | 13.0% | 12.7% | |
| NCF Debt Yield | 6.1% | 6.7% | 8.3% | 10.3% | 12.2% | 11.2% | 10.9% | |
| (1) | The increase in other income in 2015 is due to the implementation of resort fee of $15.00 per day, which was increased to $18.00 per day in 2016. |
Escrows and Reserves.The Hyatt Regency Sarasota Mortgage Loan documents provide for upfront reserves in the amount of $734,045 for real estate taxes, $63,774 for insurance premiums, $260,000 for required repairs, and $2,300,000 for a property improvement plan required by the Hyatt Manager. The Hyatt Regency Sarasota Borrower is required to escrow monthly 1/12th of the annual estimated real estate taxes and 1/12 of the annual estimated insurance premiums (unless the Hyatt Regency Sarasota Borrower maintains an acceptable blanket policy). The Hyatt Regency Sarasota Borrower is required to make monthly deposits into an escrow (the “FF&E Funds”) for furniture, fixtures and equipment (“FF&E”) equal to the greater of (i) 1/12th of 4.00% of the gross operating income for the Hyatt Regency Sarasota Property for the preceding calendar year and (ii) the amount (if any) of the deposit required by the property manager or franchisor for the Hyatt Regency Sarasota Property on account of FF&E pursuant to the property management agreement or franchise agreement, as applicable; however, provided that no event of default exists and no Conversion has been effectuated, the Hyatt Regency Sarasota Borrower is not required to make monthly deposits into the FF&E Funds so long as, and to the extent that, it provides the lender with reasonably satisfactory written evidence (i) specifying the amount of funds that have been reserved by the Hyatt Manager for FF&E under the Hyatt Management Agreement and (ii) that FF&E has been repaired and/or replaced, as applicable, in a manner satisfactory to the lender.
Lockbox and Cash Management.All hotel revenue with respect to the Hyatt Regency Sarasota Property is collected by the Hyatt Manager and deposited in an account to which the Hyatt Manager has access (the “Hotel Operating Account”). The Hyatt Manager is required to pay all operating expenses (other than real estate taxes and insurance premiums) from the Hotel Operating Account pursuant to its management agreement with the Hyatt Regency Sarasota Borrower (the “Hyatt Management Agreement”). The Hyatt Manager is required to remit to the Hyatt Regency Sarasota Borrower, on a monthly basis, the amount by which the total funds then in the Hotel Operating Account exceeds the amount, as reasonably determined by the Hyatt Manager, then required to be maintained in the Hotel Operating Account (after withdrawal of the management fee and other amounts due to the Hyatt Manager) in order to carry on the uninterrupted operation of the Hyatt Regency Sarasota Property in accordance with the First-Class Hotel Standard (as defined in the Hyatt Management Agreement) and in order to enable the Hyatt Manager to perform its obligations thereunder. The Hyatt Regency Sarasota Borrower has directed the Hyatt Regency Manager to deposit into a lockbox account all funds so payable to the Hyatt Regency Sarasota Borrower under the Hyatt Management Agreement.
The Hyatt Regency Sarasota Mortgage Loan has springing cash management (i.e., the Hyatt Regency Sarasota Mortgage Loan has cash management only after the initial occurrence and during the continuance of a Cash Sweep Event Period (as defined below)).So long as no Cash Sweep Event Period has occurred and is continuing, funds in the lockbox account are required to be swept on a periodic basis to an account designated by the Hyatt Regency Sarasota Borrower. Upon the occurrence and during the continuance of a Cash Sweep Event Period, the Hyatt Regency Sarasota Borrower is required to cooperate with the lender to establish a cash management account, and funds in the lockbox account are required to be swept into the cash management account on each business day and applied to pay debt service on the Hyatt Regency Sarasota Mortgage Loan, to fund the required reserves deposits as described above under “Escrows and Reserves,” to disburse, during the continuance of a Cash Sweep Event Period caused solely by a DSCR Event (as defined below), the monthly operating expenses referenced in the approved annual budget and extraordinary operating expenses not referenced in the annual budget and approved by the lender, and to disburse the remainder, provided no event of default is continuing under the Hyatt Regency Sarasota Mortgage Loan, (i) during the continuance of a Cash Sweep Event Period caused solely by a Manager Expiration Event (as defined below) or Franchise Expiration Event (as defined below), into the FF&E escrow, and (ii) after any deposit pursuant to the preceding clause (i), (A) if any Cash Sweep Event Period is continuing, into an account to be held by the lender as additional security for the Hyatt Regency Sarasota Mortgage Loan during the continuance of such Cash Sweep Event Period or (B) otherwise, to the Hyatt Regency Sarasota Borrower.
This is not a research report and was not prepared by any Underwriter’s research departments. Please see additional important information and qualifications at the end of this Term Sheet.
| T-48 |
| MSBAM 2016-C31 | Hyatt Regency Sarasota |
A “Cash Sweep Event Period” means the period:
(i) commencing upon an event of default under the Hyatt Regency Sarasota Mortgage Loan and ending if no event of default exists, or
(ii) commencing if the debt service coverage ratio for the Hyatt Regency Sarasota Mortgage Loan is less than (x) during the period from the origination date until the date of the Partial Defeasance (as defined below) or after completion of the Development (as defined below), 1.35x, or (y) from the date of the Partial Defeasance until completion of the Development, 1.45x, in each case for six consecutive calendar months (a “DSCR Event”), and ending on the date the debt service coverage ratio on the Hyatt Regency Sarasota Mortgage Loan has been at least 1.55x for six consecutive calendar months, or
(iii) commencing if the Hyatt Manager provides notice that there has occurred an uncured default by the Hyatt Regency Sarasota Borrower under the Hyatt Management Agreement and such default is not cured within 30 days, and ending if such default has been remedied to the satisfaction of the lender and (as evidenced by an estoppel certificate), the Hyatt Manager, or
(iv) commencing upon either (x) the Hyatt Management Agreement is terminated without the consent of the lender (other than pursuant to a permitted conversion to a new franchise agreement) or (y) the date that is one year prior to the expiration date of the Hyatt Management Agreement if the Hyatt Management Agreement has not been renewed and/or extended pursuant to and in accordance with its terms and/or at such time, if any, that the amount then on deposit in the FF&E escrow equals less than the product of $15,000 and the number of rooms at the Hyatt Regency Sarasota Property (a “Manager Expiration Event”) and ending upon the Hyatt Regency Sarasota Borrower either renewing or extending the Hyatt Management Agreement or entering into a replacement management or franchise agreement, as applicable, acceptable to the lender in its reasonable discretion, with a manager or franchisor, as applicable, acceptable to the lender in its reasonable discretion, or
(v) if the Hyatt Regency Sarasota Property is subject to a franchise agreement, commencing if the franchisor provides notice that there has occurred an uncured default by the Hyatt Regency Sarasota Borrower under the franchise agreement or that the Hyatt Regency Sarasota Property is not being operated and maintained in accordance with the franchisor’s standards, resulting in the Hyatt Regency Sarasota Borrower no longer being in good standing with the franchisor and such default is not cured within 30 days, and ending if such default has been remedied to the satisfaction of the lender and (as evidenced by an estoppel certificate), the franchisor, or
(vi) if the Hyatt Regency Sarasota Property is subject to a franchise agreement, commencing upon either (x) the date that is one year prior to the expiration date of the franchise agreement if such franchise agreement has not been renewed and/or extended on terms reasonably acceptable to the lender and/or (y) at such time, if any, that the amount then on deposit in the FF&E escrow equals less than the product of $15,000 and the number of rooms at the Hyatt Regency Sarasota Property (a “Franchise Expiration Event”) and ending upon the Hyatt Regency Sarasota Borrower entering into a replacement management or franchise agreement, as applicable, acceptable to the lender in its reasonable discretion, with a manager or franchisor, as applicable, acceptable to the lender in its reasonable discretion.
Additional Secured Indebtedness (not including trade debts).Not permitted.
Mezzanine Loan and Preferred Equity.Not permitted.
Release of Property.The Hyatt Regency Sarasota Mortgage Loan permits the release of a 1.3724 acre release parcel on which a parking structure is currently located (the “Release Parcel”) in connection with the partial defeasance of the Hyatt Regency Sarasota Mortgage Loan (the “Partial Defeasance”) in a principal amount equal to the greater of (1) $4,554,000.00 (115% of the appraised value of such release parcel as set forth in the related appraisal) and (2) an amount such that after release of the Release Parcel and payment of such amount, the remaining Hyatt Regency Sarasota Property shall have a loan to value ratio not greater than 65%, in connection with the development of the Release Parcel, upon satisfaction of certain conditions, including without limitation: (i) the Hyatt Regency Sarasota Borrower shall provide the lender with copies of all plans and architectural drawings with respect to the proposed development on the Release Parcel (the “Development”) and the lender shall be satisfied, it its reasonable discretion, that the Development will not have a material adverse effect on the Hyatt Regency Sarasota Property either during construction or following completion thereof, (ii) approval by the then manager or franchisor of the Hyatt Regency Sarasota Property, (iii) evidence that the Release Parcel has been legally created for zoning purposes, is or will constitute a separate tax lot, and is not necessary for the existing uses of the remainder of the Hyatt Regency Sarasota Property (and that such remainder will continue to be in material compliance with all applicable legal and zoning requirements), (iv) the Development will only contain residential (fee simple condominiums or long-term multifamily) uses and complimentary retail and service businesses and shall not contain any “timeshare” or hotel uses other than amenities to be owned by the Hyatt Regency Sarasota Borrower for use in connection with the Hyatt Regency Sarasota Property, (v) to the extent parking spaces or amenities at the Hyatt Regency Sarasota Property are impacted or temporarily unavailable during the Development, equivalent parking and amenities shall be provided in reasonable proximity at no cost to the Hyatt Regency Sarasota Borrower or Hyatt Regency Sarasota Property, (vi) the lender shall be satisfied that upon completion of the Development, either the number of parking spaces at the Hyatt Regency Sarasota Property is equal to that prior to the Development, or if the number of parking spaces is reduced, the Hyatt Regency Sarasota Borrower and the new owner of the Release Parcel must enter into a perpetual parking easement agreement satisfactory to the lender to provide replacement parking spaces in reasonable proximity and at no cost to the Hyatt Regency Sarasota Borrower or Hyatt Regency Sarasota Property, (vii) satisfaction of REMIC-related conditions, (viii) delivery of a completion guaranty by the non-recourse carveout guarantor, and (ix) at the lender’s request, rating agency confirmation.
In addition, a third party is the owner of certain air rights located over the hotel’s existing surface parking lot. In the event such third party seeks to develop such air rights parcel, the lender is required not to unreasonably withhold its consent to the Hyatt Regency Sarasota Borrower entering into additional easements and other development related agreements to permit such development.
Terrorism Insurance.The Hyatt Regency Sarasota Mortgage Loan documents require that the “all risk” insurance policy required to be maintained by the Hyatt Regency Sarasota Borrower provides coverage for terrorism in an amount equal to the full replacement cost of the Hyatt Regency Sarasota Property and twelve months of business interruption insurance; provided that if the Terrorism Risk Insurance Program Reauthorization Act of 2015 or subsequent statute, extension or reauthorization thereof (“TRIPRA”) is in effect and continues to cover both foreign and domestic acts of terrorism, the lender is required to accept terrorism insurance with coverage against “covered acts” within the meaning of TRIPRA.
This is not a research report and was not prepared by any Underwriter’s research departments. Please see additional important information and qualifications at the end of this Term Sheet.
| T-49 |
| MSBAM 2016-C31 | SpringHill Suites - Seattle |
Mortgage Loan No. 4 – SpringHill Suites - Seattle

This is not a research report and was not prepared by any Underwriter’s research departments. Please see additional important information and qualifications at the end of this Term Sheet.
| T-50 |
| MSBAM 2016-C31 | SpringHill Suites - Seattle |
Mortgage Loan No. 4 – SpringHill Suites - Seattle
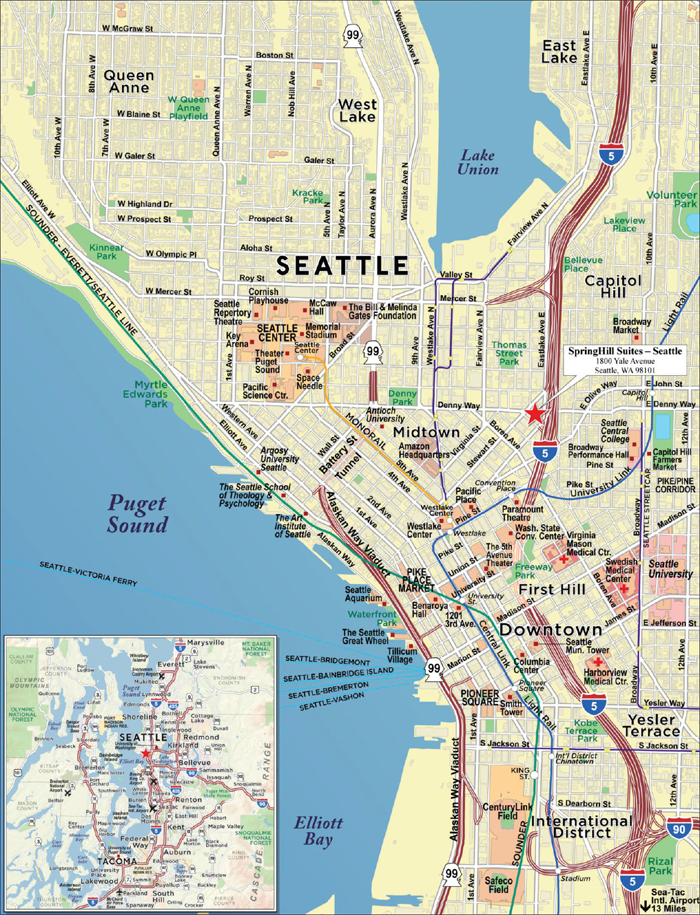
This is not a research report and was not prepared by any Underwriter’s research departments. Please see additional important information and qualifications at the end of this Term Sheet.
| T-51 |
| MSBAM 2016-C31 | SpringHill Suites - Seattle |
| Mortgage Loan No. 4 – SpringHill Suites - Seattle |
| Mortgage Loan Information | Property Information | ||||||
| Mortgage Loan Seller: | KeyBank | Single Asset/Portfolio: | Single Asset | ||||
| Original Balance: | $45,000,000 | Location: | Seattle, WA 98101 | ||||
| Cut-off Date Balance: | $45,000,000 | General Property Type: | Hospitality | ||||
| % of Initial Pool Balance: | 4.7% | Detailed Property Type: | Full Service | ||||
| Loan Purpose: | Refinance | Title Vesting: | Fee | ||||
| Sponsor: | Moody National Companies | Year Built/Renovated: | 2001/2008, 2012-2013 | ||||
| Mortgage Rate: | 4.3800% | Size: | 234 Rooms | ||||
| Note Date: | 9/20/2016 | Cut-off Date Balance per Room: | $192,308 | ||||
| First Payment Date: | 11/1/2016 | Maturity Date Balance per Room: | $164,078 | ||||
| Maturity Date: | 10/1/2026 | Property Manager: | Moody National Hospitality Management, LLC (borrower-related) | ||||
| Original Term to Maturity: | 120 months | ||||||
| Original Amortization Term: | 360 months | ||||||
| IO Period: | 24 months | ||||||
| Seasoning: | 1 month | Underwriting and Financial Information | |||||
| Prepayment Provisions: | LO (25); DEF (91); O (4) | UW NOI: | $5,237,385 | ||||
| Lockbox/Cash Mgmt Status: | Springing/Springing | UW NOI Debt Yield: | 11.6% | ||||
| Additional Debt Type: | N/A | UW NOI Debt Yield at Maturity: | 13.6% | ||||
| Additional Debt Balance: | N/A | UW NCF DSCR: | 2.36x (IO) 1.75x (P&I) | ||||
| Future Debt Permitted (Type): | No (N/A) | Most Recent NOI: | $5,792,839 (7/31/2016 TTM) | ||||
| Reserves(1) | 2nd Most Recent NOI: | $5,850,633 (12/31/2015) | |||||
| Type | Initial | Monthly | Cap | 3rd Most Recent NOI: | $4,888,320 (12/31/2014) | ||
| RE Tax: | $36,996 | $36,996 | N/A | Most Recent Occupancy: | 84.2% (7/31/2016) | ||
| Insurance: | $0 | Springing | N/A | 2nd Most Recent Occupancy: | 83.8% (12/31/2015) | ||
| Recurring Replacements: | $0 | $43,156 | N/A | 3rd Most Recent Occupancy: | 84.1% (12/31/2014) | ||
| PIP: | $1,200,000 | $0 | N/A | Appraised Value (as of): | $74,100,000 (4/12/2016) | ||
| Additional PIP: | $0 | Springing | N/A | Cut-off Date LTV Ratio: | 60.7% | ||
| Seasonality: | $234,000 | (1) | (1) | Maturity Date LTV Ratio: | 51.8% | ||
| Sources and Uses | ||||||
| Sources | Proceeds | % of Total | Uses | Proceeds | % of Total | |
| Loan Amount: | $45,000,000 | 96.7% | Loan Payoff: | $44,583,895 | 95.8% | |
| Borrower Equity: | $1,515,758 | 3.3% | Reserves: | $1,470,996 | 3.2% | |
| Closing Costs: | $460,867 | 1.0% | ||||
| Total Sources: | $46,515,758 | 100.0% | Total Uses: | $46,515,758 | 100.0% | |
(1) | See“—Escrows and Reserves” below for further discussion of reserve requirements. |
The Mortgage Loan. The fourth largest mortgage loan (“the SpringHill Suites - Seattle Mortgage Loan”) is evidenced by a promissory note in the original principal amount of $45,000,000 and secured by a first priority fee mortgage encumbering a full service hospitality property known as SpringHill Suites - Seattle located in Seattle, Washington (“the SpringHill Suites - Seattle Property”). The proceeds of the SpringHill Suites - Seattle Mortgage Loan, along with borrower equity, were used to refinance a previous loan, fund upfront reserves, and pay closing costs associated with the SpringHill Suites - Seattle Mortgage Loan. The SpringHill Suites – Seattle Property was previously securitized in the CWCI 2006-C1 transaction.
The Borrower and the Sponsor. The borrower is Moody National Yale-Seattle Holding, LLC (“the SpringHill Suites - Seattle Borrower”), a Delaware limited liability company, structured to be bankruptcy remote with one independent director. Equity ownership in the SpringHill Suites - Seattle Borrower is primarily held by the non-recourse carve-out guarantor, Moody National REIT II, Inc., a real estate investment trust.
Moody National REIT II, Inc. is an affiliate of the sponsor, Moody National Companies, which is a full service commercial real estate firm founded in 1996 that has sponsored over $1.0 billion in commercial real estate assets over the past decade. Moody National Companies provides services relating to real estate development, acquisition, disposition, financing, debt and equity structuring, equity investment opportunities, and property management through its affiliate, Moody National Management. Moody National Management has overseen the management of 3,706 multifamily units, 932,545 square feet of office space, and 67 hospitality properties.
This is not a research report and was not prepared by any Underwriter’s research departments. Please see additional important information and qualifications at the end of this Term Sheet.
| T-52 |
| MSBAM 2016-C31 | SpringHill Suites - Seattle |
The Property. The SpringHill Suites - Seattle Property is located at 1800 Yale Avenue in the Southwest quadrant of the intersection formed by Interstate 5 and East Denny Way within the Seattle Central Business District (“CBD”) and consists of a 10-story, 234-room full service hotel located on approximately 0.5 acres. The SpringHill Suites - Seattle Property was constructed in 2001, renovated in 2008, and underwent a room and lobby renovation from 2012-2013. The SpringHill Suites - Seattle Borrower purchased the SpringHill Suites - Seattle Property in May 2016 for $74.1 million and plans to invest approximately $2.5 million for a property improvement plan (the “PIP”) to be completed by 2018, of which $1.2 million was escrowed at closing and the remaining amount needed to complete the PIP is expected to be funded through deposits into an FF&E reserve. The PIP includes an exterior renovation, new guestroom entertainment systems, an exercise room renovation, guestroom conversion from double/double to queen/queen and guest bathroom renovations.
The SpringHill Suites - Seattle Property’s guestroom configuration consists of 178 king suites and 56 double/double suites. All guestrooms include a sitting room with a pull-out sofa bed, a bathroom, and a bedroom. Additional guestroom furnishings include a high definition television, a microwave, a mini-refrigerator, a coffee maker, a wet bar, and an ergonomic work area. The SpringHill Suites - Seattle Property includes 95 parking spaces, which are comprised of six surface spaces and 89 garage spaces. Amenities at the SpringHill Suites - Seattle Property include 1,621 square feet of meeting space, an exercise room, an indoor pool and whirlpool, a business center, a guest laundry room, a market pantry, a restaurant and lounge, room service, banquet service and complimentary breakfast service.
The SpringHill Suites - Seattle Property is currently subject to a franchise agreement with Marriott International, Inc. (the “Franchise Agreement”) and is operating under the SpringHill Suites Hotel brand. The Franchise Agreement expires in November 2026 with a five-year extension option upon completion of the PIP. As of year-end 2015, there were 334 SpringHill Suites hotels open in North America containing approximately 40,000 rooms in the aggregate.
According to the appraisal, the SpringHill Suites - Seattle Property generates approximately 70% of its room revenue from corporate demand, 15% from leisure demand and 15% from group demand. The top 10 corporate accounts for the SpringHill Suites - Seattle Property as of year-to-date August 2016 consist of Amazon, IBM, Crowley, Accenture, Oracle, Facebook, Epic Systems, Providence, Boeing, and Microsoft.
More specific information about the SpringHill Suites - Seattle Property and the related competitive set is set forth in the following table:
| Historical Occupancy, ADR, RevPAR | |||||||||
Competitive Set | The SpringHill Suites - Seattle Property(1) | Penetration Factor | |||||||
| Year | Occupancy | ADR | RevPAR | Occupancy | ADR | RevPAR | Occupancy | ADR | RevPAR |
| 2011 | 72.3% | $133.11 | $96.18 | 72.2% | $119.37 | $86.20 | 99.9% | 89.7% | 89.6% |
| 2012 | 74.0% | $133.22 | $98.58 | 75.2% | $130.45 | $98.04 | 101.6% | 97.9% | 99.5% |
| 2013 | 78.3% | $145.42 | $113.80 | 81.5% | $142.72 | $116.35 | 104.2% | 98.1% | 102.2% |
| 2014 | 82.4% | $163.49 | $134.75 | 83.8% | $150.00 | $125.69 | 101.7% | 91.7% | 93.3% |
| 2015 | 83.1% | $173.93 | $144.45 | 83.2% | $169.48 | $141.00 | 100.2% | 97.4% | 97.6% |
| 7/31/2016 TTM | 82.5% | $176.97 | $146.01 | 83.9% | $175.89 | $147.61 | 101.7% | 99.4% | 101.1% |
Source: Industry Report
| (1) | The minor variances between the underwriting, the appraisal and the industry report data with respect to Occupancy, ADR and RevPAR at the SpringHill Suites - Seattle Property are attributable to variances in reporting methodologies and/or timing differences. |
The Market. The SpringHill Suites - Seattle Property is located southwest of the intersection of Interstate 5 and East Denny Way in Seattle, King county, Washington. The Seattle Metropolitan Statistical Area (“MSA”) is the 15th largest in the United States and has a 2016 estimated population of 3,737,408. Seattle is located 113 miles from the U.S-Canadian border and is a port city for trans-Pacific and European travel and trade. Seattle is also a tourist destination and has an economy led by financial services, aerospace, technology, healthcare, and hospitality companies such as Boeing, Microsoft, Amazon, Providence Health Care, and Google. In the Seattle MSA, jobs grew an average of 2.8% annually from 2011 through 2015, led by construction, retail, professional and business services, and leisure and hospitality, which added jobs annually at 7.4%, 4.6%, 3.9%, and 3.9%, respectively. In a year-over-year comparison of February 2015 to February 2016, the information and leisure and hospitality segments led annual job growth at 7.8% and 6.7%, respectively.
The SpringHill Suites - Seattle Property is located approximately 15 miles north of the Seattle-Tacoma International Airport, the largest airport in the Pacific Northwest region, which has a regional economic impact of over $13.2 billion. According to the appraisal, total passengers in 2015 surpassed 42.3 million, up 12.9% from 2014. The Port of Seattle announced that the North Sea-Tac Airport renovation project is scheduled to be completed by 2020, which is expected to increase the North Satellite terminal by 181,000 square feet and add eight gates.
The SpringHill Suites - Seattle Property is located in the Seattle CBD, within the Denny Triangle neighborhood. Connecting the retail core of Seattle to the South Lake Union neighborhood, Denny Triangle is one of downtown Seattle’s fastest growing neighborhoods according to the appraisal. The area integrates professional and residential communities with restaurants, entertainment, shopping and public parks, all connected via the Seattle Streetcar Line.
Within the Denny Triangle neighborhood, Amazon is constructing its new corporate headquarters, a six-building four million square foot project. Plans include construction of three glass spheres containing plants and trees which will serve as a place for Amazon workers to meet and collaborate, and three office towers. Amazon Tower I, a 37-story office building known as Doppler, opened in December, 2015 and the second office tower called the Meeting Center opened in the summer of 2016. Amazon plans to move into a new space every six to eight months until the expansion is completed in 2017. In addition, Google announced plans to move and expand its Seattle offices to four six-story office buildings in South Lake Union, adjacent to Amazon’s new corporate headquarters. The mixed-use property will contain 307,900 square feet of office space, 79 residential units, 7,850 square feet of retail space, and 371 underground parking spaces.
Also located within blocks of the SpringHill Suites - Seattle Property is the Washington State Convention Center (“WSCC”) which had 2015 event attendance of 411,167 and generated 329,820 room nights, an increase from 306,583 room nights in 2014. The WSCC estimated $375.6 million in spending in 2015 by out-of state attendees as a result of the conventions. During the past five years WSCC has turned away $1.6 billion in business
This is not a research report and was not prepared by any Underwriter’s research departments. Please see additional important information and qualifications at the end of this Term Sheet.
| T-53 |
| MSBAM 2016-C31 | SpringHill Suites - Seattle |
due to date availability. WSCC has acquired land to construct an additional convention facility at the Metro Transit station one block from the existing WSCC facility. Plans include 300,000 square feet of heavy-load exhibition space, 100,000 square feet of meeting rooms and approximately 60,000 square feet of ballroom, freight loading and support space. Construction is estimated to start in 2017 with project opening in 2020.
Additional local demand drivers include Lake Union, and Pioneer Square, which is the destination of the Seattle Underground Tour. In addition, Weyerhaeuser has announced it intends to move 800 employees to the Pioneer Square to be headquartered in a seven-story office building currently under construction. Other local demand drivers include the Seattle Center which houses the Space Needle, Downtown Seattle’s riverfront with the Pike Place Market, Seattle Art Museum, Seattle Symphony, the NFL’s Seattle Seahawks as well as amateur, collegiate, international, World Cup and Major League Soccer competitions which are held at CenturyLink Stadium, and MLB’s Seattle Mariners who play at Safeco Field. Seattle is home to 15 research organizations including the Fred Hutchinson Cancer Research Center, three research hospitals, the Infectious Disease Research Institute and the University of Washington, a leading public research university second only to Harvard in total research funding.
Another component to Seattle’s leisure demand is the Port of Seattle and the cruise ships that sail from this location. According to the appraisal, during 2016, the cruise ship terminals serve seven major cruise lines including Carnival, Celebrity Cruises, Holland America Line, Norwegian Cruise Line, Princess Cruises, Oceania Cruises and Royal Caribbean, which will feature a total of 203 vessels, with each ship call bringing in $2.6 million to the local economy. Overall, the Seattle cruise industry generates 3,647 jobs and $441 million annual business revenue.
The appraisal identified three properties containing 491 rooms which opened in the market during 2015, including the Hilton Garden Inn, a direct competitor of the SpringHill Suites - Seattle Property, which is shown in the table below. In addition, the appraisal identified eight properties containing 2,709 rooms that are currently under construction, including a 302-room Residence Inn which is estimated to open in the fourth quarter of 2017 and expected to be a direct competitor of the SpringHill Suites – Seattle Property.
Primary competitive properties to the SpringHill Suites - Seattle Property are shown in the table below:
| Competitive Property Summary | ||||||||
| Property Name | No. of Rooms | Market Share | Corporate Demand | Meeting & Group Demand | Leisure Demand | 2015 Occupancy | 2015 ADR | 2015 RevPAR |
| The SpringHill Suites - Seattle Property(1) | 234 | 16.5% | 70% | 15% | 15% | 83.8% | $169.27 | $141.80 |
| Hampton Inn & Suites Seattle Downtown(2) | 199 | 14.0% | 67% | 21% | 12% | 83% | $176.93 | $147.03 |
| Four Points by Sheraton Downtown Seattle(2) | 158 | 11.1% | 67% | 21% | 12% | 83% | $176.93 | $147.03 |
| Courtyard Seattle Downtown Lake Union(2) | 250 | 17.6% | 67% | 21% | 12% | 83% | $176.93 | $147.03 |
| Holiday Inn Seattle Downtown(2) | 197 | 13.9% | 67% | 21% | 12% | 83% | $176.93 | $147.03 |
| Hyatt Place Seattle Downtown(2) | 160 | 11.3% | 67% | 21% | 12% | 83% | $176.93 | $147.03 |
| Hilton Garden Inn(2) | 222 | 15.6% | 67% | 21% | 12% | 83% | $176.93 | $147.03 |
| Total/Wtd. Avg.(3) | 1,186 | 83.5% | 67% | 21% | 12% | 83% | $176.93 | $147.03 |
Source:Appraisal
| (1) | 2015 Occupancy, 2015 ADR, and 2015 RevPAR are based on figures taken from the financial statement provided by the SpringHill Suites - Seattle Borrower. |
| (2) | The Corporate Demand, Meeting & Group Demand, Leisure Demand, 2015 Occupancy, 2015 ADR, and 2015 RevPAR figures represent the average for all six competitive properties, not on an individual property basis, as individual figures were not provided by the appraiser. |
| (3) | Total/Wtd. Avg. excludes the SpringHill Suites - Seattle Property. |
This is not a research report and was not prepared by any Underwriter’s research departments. Please see additional important information and qualifications at the end of this Term Sheet.
| T-54 |
| MSBAM 2016-C31 | SpringHill Suites - Seattle |
Operating History and Underwritten Net Cash Flow. The following table presents certain information relating to the historical operating performance at the SpringHill Suites - Seattle Property.
| Cash Flow Analysis | ||||||||
| 2011 | 2012 | 2013 | 2014 | 2015 | 7/31/2016 TTM | UW | UW per Room | |
| Occupancy(1) | 72.4% | 75.2% | 81.5% | 84.1% | 83.8% | 84.2% | 80.0% | |
| ADR(1) | $119.00 | $130.43 | $142.39 | $149.66 | $169.27 | $175.37 | $175.38 | |
| RevPAR(1) | $86.19 | $98.03 | $116.09 | $125.93 | $141.80 | $147.72 | $140.30 | |
| Rooms Revenue | $7,361,340 | $8,395,483 | $9,915,364 | $10,755,354 | $12,111,143 | $12,650,930 | $11,983,430 | $51,211 |
| Food & Beverage | $360,833 | $403,497 | $536,586 | $502,484 | $504,104 | $386,484 | $366,092 | $1,564 |
| Parking Income | $480,170 | $449,865 | $459,474 | $544,323 | $590,632 | $527,329 | $499,506 | $2,135 |
| Other Income | $146,019 | $147,836 | $109,135 | $121,961 | $144,730 | $103,233 | $97,786 | $418 |
| Total Revenue | $8,348,362 | $9,396,681 | $11,020,559 | $11,924,122 | $13,350,609 | $13,667,976 | $12,946,814 | $55,328 |
| Total Expenses | $5,447,604 | $5,737,735 | $6,276,020 | $7,035,802 | $7,499,976 | $7,875,137 | $7,709,429 | $32,946 |
| Net Op. Income | $2,900,758 | $3,658,946 | $4,744,539 | $4,888,320 | $5,850,633 | $5,792,839 | $5,237,385 | $22,382 |
| FF&E | $14,004 | $10,862 | $18,480 | $106,186 | $51,509 | $64,571 | $517,873 | $2,213 |
| Net Cash Flow | $2,886,754 | $3,648,084 | $4,726,059 | $4,782,134 | $5,799,124 | $5,728,268 | $4,719,512 | $20,169 |
| NOI DSCR (P&I) | 1.08x | 1.36x | 1.76x | 1.81x | 2.17x | 2.15x | 1.94x | |
| NOI DSCR (IO) | 1.45x | 1.83x | 2.37x | 2.45x | 2.93x | 2.90x | 2.62x | |
| NCF DSCR (P&I) | 1.07x | 1.35x | 1.75x | 1.77x | 2.15x | 2.12x | 1.75x | |
| NCF DSCR (IO) | 1.44x | 1.83x | 2.36x | 2.39x | 2.90x | 2.87x | 2.36x | |
| NOI Debt Yield | 6.4% | 8.1% | 10.5% | 10.9% | 13.0% | 12.9% | 11.6% | |
| NCF Debt Yield | 6.4% | 8.1% | 10.5% | 10.6% | 12.9% | 12.7% | 10.5% | |
| (1) | Occupancy, ADR and RevPAR figures have been taken from financial statements provided by the SpringHill Suites - Seattle Borrower. The minor variances between the underwriting, the appraisal and industry report data with respect to Occupancy, ADR and RevPAR at the SpringHill Suites - Seattle Property are attributable to variances in reporting methodologies and/or timing differences. |
Escrows and Reserves.In connection with the origination of the SpringHill Suites - Seattle Mortgage Loan, the SpringHill Suites - Seattle Borrower deposited $36,996 in escrow for real estate taxes and is required to escrow monthly 1/12th of the annual estimated real estate tax payments, which currently equates to $36,996. The SpringHill Suites - Seattle Borrower is required to escrow monthly 1/12th of the annual estimated insurance premiums (unless the SpringHill Suites - Seattle Borrower maintains insurance under an acceptable blanket insurance policy).
The SpringHill Suites - Seattle Borrower is required to deposit monthly for furniture, fixtures and equipment in an amount equal to the greater of (i) 1/12 of 4.0% of (a) gross income from the property in the preceding calendar year and (b) projected forward 12-month furniture, fixtures, and expenditures based on the approved annual budget, which was estimated at $43,156 at origination. The lender has the right to adjust the furniture, fixtures, and expenditures amount annually.
In connection with the origination of the SpringHill Suites - Seattle Mortgage Loan, the SpringHill Suites - Seattle Borrower deposited $234,000 in escrow to fund debt service due to seasonality. The lender, in April of each year, commencing in 2017, is required to calculate the aggregate shortfall for the months of December, January and February that are immediately prior to the date on which such calculation is made, which, if added to the net cash flow for such three month period would cause the debt service coverage ratio during such period to equal 1.10x (the “Seasonality Reserve Annual Cap”). The SpringHill Suites - Seattle Borrower is required to fund the Seasonality Reserve Annual Cap in six monthly payments annually on the payment dates for the SpringHill Suites - Seattle Mortgage Loan occurring in May-October.
The SpringHill Suites - Seattle Borrower at loan origination deposited $1,200,000 in escrow for property improvements to be completed by 2018 pursuant to the PIP required by the franchisor. If the SpringHill Suites - Seattle Borrower or the master tenant receives notice from the franchisor of additional PIP requirements, the related loan documents require that the SpringHill Suites - Seattle Borrower fund an additional escrow over the following 12 payment dates, which funds are to be disbursed by the lender to fund the additional PIP requirements upon completion.
Lockbox and Cash Management. The SpringHill Suites - Seattle Mortgage Loan is structured with a springing lockbox and springing cash management. Upon an occurrence and during the continuance of a Cash Sweep Period (as defined below), the SpringHill Suites - Seattle Borrower is required to direct all credit card companies and tenants with respect to commercial leases (if any) to deposit all receipts and rents directly into the clearing account. Notwithstanding the foregoing, the SpringHill Suites - Seattle Borrower, master tenant, and property manager are required to deposit all amounts received, minus an amount not to exceed $5,000 for operating activities, within two business days of receipt. During a Cash Sweep Period, the amounts on deposit in the clearing account are required to be swept each business day into a cash management account for the payment of, among other things, debt service, monthly escrows and operating expenses pursuant to an annual approved budget. Any excess cash is required to be remitted to a separate account to be held by the lender as additional security for the SpringHill Suites - Seattle Mortgage Loan.
This is not a research report and was not prepared by any Underwriter’s research departments. Please see additional important information and qualifications at the end of this Term Sheet.
| T-55 |
| MSBAM 2016-C31 | SpringHill Suites - Seattle |
A “Cash Sweep Period” will:
(i) commence upon the occurrence of an event of default (including a default under the related master lease) under the SpringHill Suites - Seattle Mortgage Loan and continue until the event of default is cured,
(ii) commence upon the occurrence of any bankruptcy action of the SpringHill Suites - Seattle Borrower, master tenant, the managing member of the SpringHill Suites - Seattle Borrower or master tenant, or the property manager,
(iii) commence upon the date the debt service coverage ratio for the SpringHill Suites - Seattle Mortgage Loan is less than 1.20x for the immediately preceding 12-month period and continue until the date such debt service coverage ratio equals or exceeds 1.25x for two consecutive quarters based on the immediately preceding three-month period,
(iv) commence upon the date that is one year prior to the expiration of the Franchise Agreement (or a replacement franchise agreement) and continue until a replacement Franchise Agreement in form and substance reasonably acceptable to the lender has been entered into with a franchisor approved by the lender.
Additional Secured Indebtedness (not including trade debts). Not permitted.
Mezzanine Loan and Preferred Equity. Not permitted.
Release of Property. Not permitted.
Terrorism Insurance.The SpringHill Suites - Seattle Borrower is required to obtain and maintain property, commercial general liability, and business interruption/rental loss insurance coverage including coverage for losses due to terrorism and acts of terrorism, on terms and in the amounts consistent with the requirements for maintaining property, commercial general liability and business interruption/rental loss insurance. If the Terrorism Risk Insurance Program Reauthorization Act of 2007 or a similar statute is not in effect, the SpringHill Suites - Seattle Borrower is not required to spend more than twice the amount of the insurance premiums it pays for property and business interruption/rental loss insurance, and if the cost of terrorism insurance exceeds that amount, the SpringHill Suites - Seattle Borrower must purchase the maximum amount of terrorism insurance available for that amount.
This is not a research report and was not prepared by any Underwriter’s research departments. Please see additional important information and qualifications at the end of this Term Sheet.
| T-56 |
(THIS PAGE INTENTIONALLY LEFT BLANK)
This is not a research report and was not prepared by any Underwriter’s research departments. Please see additional important information and qualifications at the end of this Term Sheet.
| T-57 |
| MSBAM 2016-C31 | Vintage Park |
Mortgage Loan No. 5 – Vintage Park
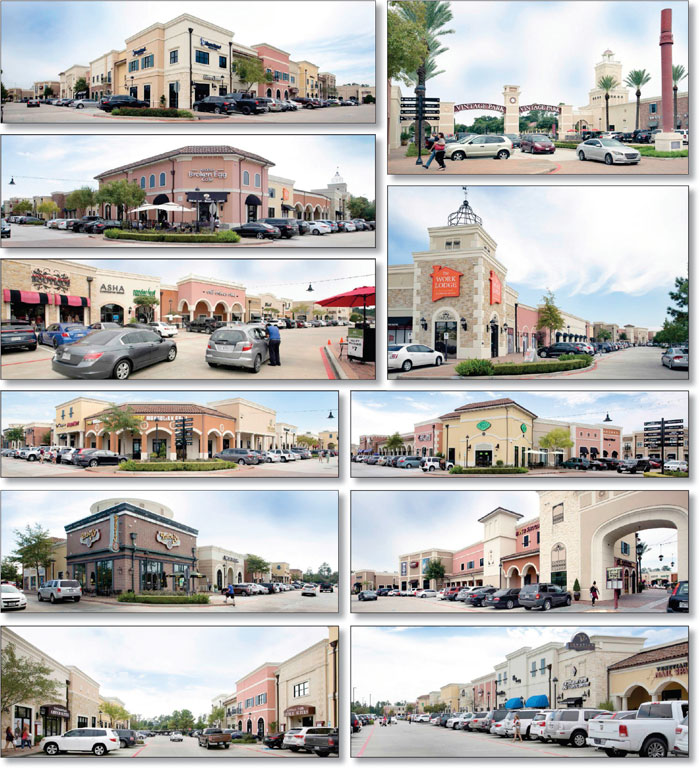
This is not a research report and was not prepared by any Underwriter’s research departments. Please see additional important information and qualifications at the end of this Term Sheet.
| T-58 |
| MSBAM 2016-C31 | Vintage Park |
Mortgage Loan No. 5 – Vintage Park

This is not a research report and was not prepared by any Underwriter’s research departments. Please see additional important information and qualifications at the end of this Term Sheet.
| T-59 |
| MSBAM 2016-C31 | Vintage Park |
Mortgage Loan No. 5 – Vintage Park
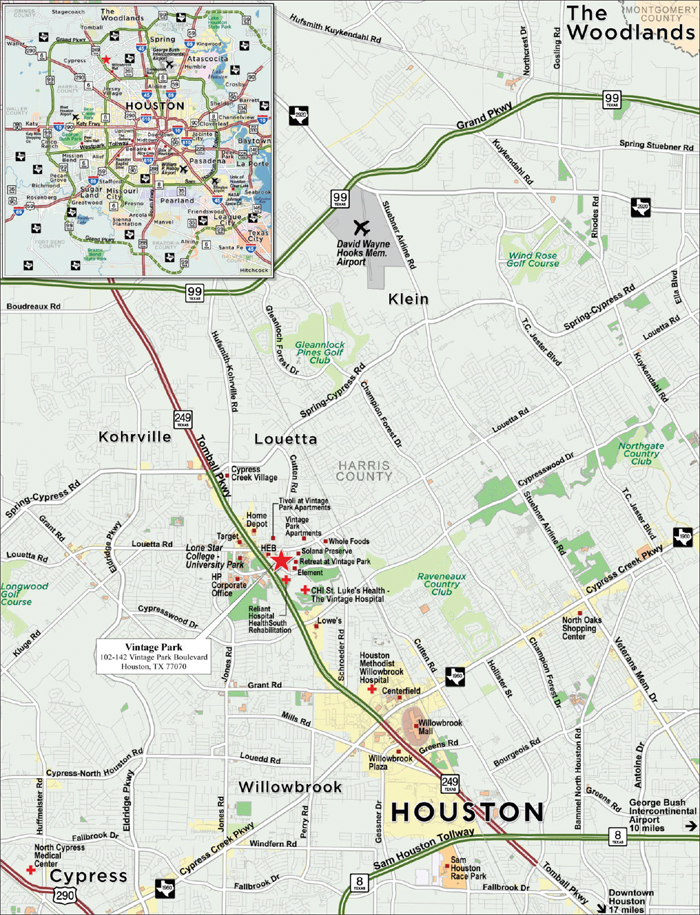
This is not a research report and was not prepared by any Underwriter’s research departments. Please see additional important information and qualifications at the end of this Term Sheet.
| T-60 |
| MSBAM 2016-C31 | Vintage Park |
| Mortgage Loan No. 5 – Vintage Park |
| Mortgage Loan Information | Property Information | ||||||
| Mortgage Loan Seller: | UBS AG | Single Asset/Portfolio: | Single Asset | ||||
| Original Balance(1): | $45,000,000 | Location: | Houston, TX 77070 | ||||
| Cut-off Date Balance(1): | $45,000,000 | General Property Type: | Retail | ||||
| % of Initial Pool Balance: | 4.7% | Detailed Property Type: | Regional Lifestyle Center | ||||
| Loan Purpose: | Refinance | Title Vesting: | Fee | ||||
| Sponsor: | William L. Hutchinson | Year Built/Renovated: | 2007/N/A | ||||
| Mortgage Rate: | 4.9870% | Size: | 341,107 SF | ||||
| Note Date: | 10/7/2016 | Cut-off Date Balance per SF(1): | $246 | ||||
| First Payment Date: | 11/6/2016 | Maturity Date Balance per SF(1): | $215 | ||||
| Maturity Date: | 10/6/2026 | Property Manager: | Dunhill Property Management Services, Inc. (borrower-related) | ||||
| Original Term to Maturity: | 120 months | ||||||
| Original Amortization Term: | 360 months | ||||||
| IO Period: | 27 months | Underwriting and Financial Information | |||||
| Seasoning: | 1 month | UW NOI(5): | $7,398,527 | ||||
| Prepayment Provisions(2): | LO (25); DEF (91); O (4) | UW NOI Debt Yield(1): | 8.8% | ||||
| Lockbox/Cash Mgmt Status: | Hard/Springing | UW NOI Debt Yield at Maturity(1): | 10.1% | ||||
| Additional Debt Type(3): | Pari Passu | UW NCF DSCR(1): | 1.69x (IO) 1.33x (P&I) | ||||
| Additional Debt Balance(3): | $39,000,000 | Most Recent NOI(5): | $6,316,553 (7/31/2016 TTM) | ||||
| Future Debt Permitted (Type): | No (N/A) | 2nd Most Recent NOI: | $4,739,719 (12/31/2015) | ||||
| Reserves(4) | 3rd Most Recent NOI: | $4,629,373 (12/31/2014) | |||||
| Type | Initial | Monthly | Cap | Most Recent Occupancy(6): | 94.1% (10/6/2016) | ||
| RE Tax: | $2,082,355 | $196,449 | N/A | 2nd Most Recent Occupancy: | 94.5% (12/31/2015) | ||
| Insurance: | $162,810 | $16,959 | N/A | 3rd Most Recent Occupancy: | 78.6% (12/31/2014) | ||
| Recurring Replacements: | $0 | $5,685 | N/A | Appraised Value (as of): | $119,760,000 (8/8/2016) | ||
| TI/LC: | $3,250,000 | Springing | $1,200,000 | Cut-off Date LTV Ratio(1): | 70.1% | ||
| Other: | $2,034,479 | $0 | N/A | Maturity Date LTV Ratio(1): | 61.1% | ||
| Sources and Uses | ||||||
| Sources | Proceeds | % of Total | Uses | Proceeds | % of Total | |
| Loan Amount(1): | $84,000,000 | 100.0% | Loan Payoff(7): | $67,271,418 | 80.1% | |
| Reserves: | $7,529,644 | 9.0% | ||||
| Closing Costs: | $1,188,146 | 1.4% | ||||
| Return of Equity: | $8,010,792 | 9.5% | ||||
| Total Sources: | $84,000,000 | 100.0% | Total Uses: | $84,000,000 | 100.0% | |
| (1) | The Vintage Park Mortgage Loan is part of the Vintage Park Whole Loan (as defined below), which is comprised of fourpari passu promissory notes with an aggregate principal balance of $84,000,000. The Cut-off Date Balance per SF, Maturity Date Balance per SF, UW NOI Debt Yield, UW NOI Debt Yield at Maturity, UW NCF DSCR, Cut-off Date LTV Ratio and Maturity Date LTV Ratio numbers presented above are based on the aggregate principal balance of the promissory notes comprising the Vintage Park Whole Loan. |
| (2) | Defeasance is permitted at any time after the earlier to occur of (a) the end of the two-year period commencing on the closing date of the securitization of the last Vintage Park Whole Loan promissory note to be securitized and (b) November 6, 2019. |
| (3) | See “—The Mortgage Loan” and “—Additional Secured Indebtedness (not including trade debts)” below for further discussion of additional debt. |
| (4) | See “—Escrows and Reserves” below for further discussion of reserve requirements. |
| (5) | The increase in UW NOI over Most Recent NOI is largely due to recent leasing activity relating to the leases for Guacho Do Sul (7,192 SF, $251,720 of UW Base Rent), Dunhill Partners Management Services, Inc. (1,634 SF, $40,850 of UW Base Rent), Ceviches Mariscos (4,873 SF, $170,555 of UW Base Rent), Hopdoddy’s Burger Bar (4,000 SF, $148,000 of UW Base Rent), and Dr. Scott Andersen, DDS (3,400 SF, $91,800 of UW Base Rent). Ceviches Mariscos, Hopdoddy’s Burger Bar, and Dr. Scott Andersen, DDS have not yet taken occupancy or commenced paying rent. Their estimated rent commencement dates are November 1, 2017, July 1, 2017, and July 1, 2017, respectively. The Vintage Park Borrower funded $350,405 into a lender-controlled reserve account at loan origination to bridge UW Base Rent to the tenants’ estimated rent commencement dates. |
| (6) | Includes 12,273 SF recently leased to Ceviches Mariscos (4,873 SF), Hopdoddy’s Burger Bar (4,000 SF), and Dr. Scott Andersen, DDS (3,400 SF) as occupied spaces. Ceviches Mariscos, Hopdoddy’s Burger Bar, and Dr. Scott Andersen, DDS have not yet taken occupancy. Excluding these tenants, physical occupancy of the Vintage Park Property is 90.5%. |
| (7) | Loan proceeds were used to pay off an existing senior loan in the principal amount of approximately $54,944,344 and an existing mezzanine loan in the principal amount of approximately $12,327,074. |
The Mortgage Loan. The fifth largest mortgage loan (the “Vintage Park Mortgage Loan”) is part of a whole loan (the “Vintage Park Whole Loan”) evidenced by fourpari passu promissory notes in the aggregate original principal amount of $84,000,000, all of which are secured by a first priority fee mortgage encumbering a 341,107 SF regional lifestyle center known as Vintage Park in Houston, Texas (the “Vintage Park Property”). Promissory Note A-2, in the original principal amount of $10,000,000, and Promissory Note A-3, in the original principal amount of $35,000,000, represent the Vintage Park Mortgage Loan in the aggregate principal amount of $45,000,000 and will be included in the MSBAM 2016-C31 Trust. Promissory Note A-1 and Promissory Note A-4, in the aggregate original principal amount of $39,000,000, represent thepari passu companion loans (the “Vintage Park ServicedPari Passu Companion Loans”) and are each currently held by UBS AG, by and through its branch office at 1285 Avenue of the Americas, New York, New York (“UBS AG, New York Branch”), or an affiliate thereof. Each of the Vintage Park ServicedPari Passu Companion Loans may be contributed to one or more future securitization transactions or otherwise transferred at any time. The Vintage Park Mortgage Loan will be serviced pursuant to the
This is not a research report and was not prepared by any Underwriter’s research departments. Please see additional important information and qualifications at the end of this Term Sheet.
| T-61 |
| MSBAM 2016-C31 | Vintage Park |
pooling and servicing agreement for the MSBAM 2016-C31 Trust. See “Description of the Mortgage Pool—The Whole Loans—The Serviced Pari Passu Whole Loans—The Vintage Park Whole Loan” in the Preliminary Prospectus.
The proceeds of the Vintage Park Whole Loan were primarily used to refinance existing debt on the Vintage Park Property consisting of approximately $54.9 million of senior debt and approximately $12.3 million of mezzanine debt, fund upfront reserves, pay closing costs, and return equity to the sponsor. The most recent prior financing of the Vintage Park Property was included in the GSMS 2014-GSFL transaction.
The Borrower and the Sponsor. The borrower is Vintage Dunhill LLC (the “Vintage Park Borrower”), a single-purpose Delaware limited liability company structured to be bankruptcy-remote, with two independent directors. The sponsor and the nonrecourse carve-out guarantor of the Vintage Park Whole Loan is William L. Hutchinson. The Vintage Park Borrower is wholly owned indirectly by Vintage Park Dunhill Investors LLC. Vintage Park Dunhill Investors LLC is comprised of Class A members and Class B members. The Class A members wholly own Vintage Park Dunhill Investors LLC while the Class B members participate in revenue through a promote structure. The Class A members are composed of 41 entities or individuals, none of whom owns more than 14.55% of the Class A membership directly. The Class B membership is wholly owned by Dunhill Advisors LLC. Dunhill Advisors LLC is owned by William L. Hutchinson (65.0%), Micah L. Ashford (15.0%), Anderson Crosland (10.0%), and Timothy Denker (10.0%).
William L. Hutchinson is the founder and president of Dunhill Partners. Mr. Hutchinson holds a B.B.A. from Southern Methodist University, and began his professional career as a real estate broker. Dunhill Partners is a commercial real estate investment firm founded in 1984, with over 4.5 million SF of investments in Texas, Oklahoma, California, and Hawaii. Headquartered in Dallas, Texas, Dunhill Partners focuses on acquiring, investing in, leasing up, and managing commercial real estate properties.
The Property.The Vintage Park Property is a 341,107 SF outdoor regional lifestyle center located in Houston, Texas, approximately 25.1 miles northwest of the Houston Central Business District (“CBD”). Built in 2007, the Vintage Park Property consists of 12 buildings and is situated on a 34.4-acre site with approximately 1,986 (5.8 per 1,000 of total SF) parking spaces. The Vintage Park Property includes a piazza and nearly one acre of pedestrian area featuring a series of fountains and landscaping. Shadow anchored by H-E-B, a supermarket chain headquartered in San Antonio, Texas, the Vintage Park Property consists of 317,657 SF of retail space and 23,450 SF of office space with no tenant comprising more than 7.0% of NRA or 5.7% of underwritten rent. Comparable inline sales PSF were $471 PSF in 2014, $498 PSF in 2015 and $494 PSF for the trailing twelve-month period ended August 31, 2016 or with respect to seven tenants, the latest trailing twelve-month period in which sales were reported. The three largest tenants at the Vintage Park Property are The Work Lodge (7.0% of NRA, 2.5% of underwritten rent), Alamo Drafthouse (“Alamo Drafthouse Cinema”) (6.9% of NRA, 5.7% underwritten rent), and Salon Boutique (6.0% of NRA, 4.2% of underwritten rent). Collectively, the top three tenants lease 19.9% of NRA and represent 12.4% of underwritten rent, with no other tenant at the Vintage Park Property leasing more than 3.2% of NRA or representing more than 3.2% of underwritten rent.
The Vintage Park Property is 94.1% leased as of October 6, 2016 by a diverse mix of 87 national and local tenants and 90.5% physically occupied. Since purchasing the Vintage Park Property in March 2012, the sponsor has invested approximately $19.9 million in capital improvements and soft costs and has increased occupancy from 38.6% at the time of purchase, to 94.5% as of year-end 2015. Recent leasing activity at the Vintage Park Property includes Guacho Do Sul (7,192 SF), Ceviches Mariscos (4,873 SF), Hopdoddy’s Burger Bar (4,000 SF), Dr. Scott Andersen, DDS (3,400 SF), Cycle Bar (2,533 SF), and Eme Fittings (1,704 SF).
Major Tenants.
The Work Lodge (23,823 SF, 7.0% of NRA, 2.5% of underwritten rent). The Work Lodge provides turnkey private office space with access to meeting rooms, event hosting rooms, and office amenities to tenants on a monthly or annual basis. The Work Lodge caters to entrepreneurs, small businesses, and corporate clients who would like office amenities without overhead expenses by providing office suites for occupancy of 1 to 5 people per suite as well as co-working space. Membership with The Work Lodge provides furniture, hookups for phones and high speed Internet, access to high speed Wi-Fi, utilities, use of conference rooms, guest reception and concierge service, security, common area, weekly happy hour, and support services. The Work Lodge leases 23,823 SF expiring in June 2025 and pays a current rental rate of $8.09 PSF on a triple net basis, which increases to $12.14 PSF in July 2018. The Work Lodge has two five-year renewal options remaining and no termination options.
Alamo Drafthouse Cinema (23,388 SF, 6.9% of NRA, 5.7% of underwritten rent).Alamo Drafthouse Cinema is an American cinema chain offering new release movies, family and independent films, repertory programming, online seat reservation, and full service in-theater food and drinks. Founded in Austin, Texas in 1997, Alamo Drafthouse Cinema is located in 22 cities nationwide with three locations in the Houston area. Alamo Drafthouse Cinema leases 23,388 SF at the Vintage Park Property as a seven screen-theater. Each auditorium is equipped with high quality 4k digital projection, high-frame-rate and 3D presentations, bi-amplified digital audio systems, and two auditoriums are also equipped with 35mm projector systems. The Alamo Drafthouse Cinema lease began in February 2013 and expires in February 2023 and requires current contractual rent of $19.00 PSF on a triple net basis, which increases to $21.00 PSF in March 2018. In addition, Alamo Drafthouse Cinema is required to pay percentage rent of 6.0% of gross sales over the breakpoint of $7,406,200. Alamo Drafthouse Cinema has four five-year renewal options remaining and no termination options.
Salon Development d/b/a Salon Boutique (20,587 SF, 6.0% of NRA, 4.2% of underwritten rent). Salon Boutique provides salon suites for independent salon professionals, offering salon professionals the opportunity to own and operate a business without the expense of facility management, maintenance costs, and construction costs. Salon Boutique suites provide salon professionals with designated spaces for skincare and massage therapy, security systems, a break room, an on-site laundry facility, and complimentary wireless internet access. Salon Boutique has eight locations in Texas and 10 locations in Arizona. Salon Boutique leases 20,587 SF expiring in October 2024 and pays current rent of $16.00 PSF on a triple net basis, which increases to $17.00 PSF in November 2018. Salon Boutique has two five-year renewal options remaining and no termination options.
This is not a research report and was not prepared by any Underwriter’s research departments. Please see additional important information and qualifications at the end of this Term Sheet.
| T-62 |
| MSBAM 2016-C31 | Vintage Park |
The following table presents certain information relating to the leases at the Vintage Park Property:
| Tenant Summary(1) | ||||||||||
| Tenant Name | Credit Rating (Fitch/ Moody’s/ S&P)(2) | Tenant SF | % of Collateral SF | Annual UW Rent | % Annual UW Rent | Annual UW Rent PSF(3) | 8/31/16 TTM Sales $(4) | 8/31/16 TTM Sales PSF(4) | Occ. Cost % | Lease Expiration |
| The Work Lodge | NR/NR/NR | 23,823 | 7.0% | $192,665 | 2.5% | $8.09 | N/A | N/A | N/A | 6/30/2025 |
| Alamo Drafthouse Cinema(5) | NR/NR/NR | 23,388 | 6.9% | $444,372 | 5.7% | $19.00 | $5,003,671 | $714,810 | 13.9% | 2/28/2023 |
| Salon Development d/b/a Salon Boutique | NR/NR/NR | 20,587 | 6.0% | $329,392 | 4.2% | $16.00 | N/A | N/A | N/A | 10/31/2024 |
| Young Leaders Campus Houston | NR/NR/NR | 10,775 | 3.2% | $199,950 | 2.6% | $18.56 | N/A | N/A | N/A | 10/31/2022 |
| Treadstone Energy | NR/NR/NR | 9,245 | 2.7% | $231,125 | 3.0% | $25.00 | N/A | N/A | N/A | 4/30/2020 |
| Dialyspa II, LLC | NR/NR/NR | 8,059 | 2.4% | $153,121 | 2.0% | $19.00 | N/A | N/A | N/A | 1/31/2023 |
| Peli Peli Vintage Park., LP. | NR/NR/NR | 7,484 | 2.2% | $230,384 | 3.0% | $30.78 | $5,299,097 | $708 | 7.3% | 8/31/2020 |
| Guacho Do Sul | NR/NR/NR | 7,192 | 2.1% | $251,720 | 3.2% | $35.00 | N/A | N/A | N/A | 1/31/2027 |
| MO’s Irish Grill | NR/NR/NR | 6,186 | 1.8% | $212,022 | 2.7% | $34.27 | $4,566,136 | $738 | 7.2% | 1/31/2025 |
| T. Carolyn, LLC | NR/NR/NR | 6,163 | 1.8% | $132,505 | 1.7% | $21.50 | N/A | N/A | N/A | 2/28/2021 |
| Subtotal/Wtd. Avg. | 122,902 | 36.0% | $2,377,256 | 30.5% | $19.34 | |||||
| Other Tenants(6) | 198,221 | 58.1% | $5,424,600 | 69.5% | $27.37 | |||||
| Vacant | 19,984 | 5.9% | $0 | 0.0% | $0.00 | |||||
| Total/Wtd. Avg. | 341,107 | 100.0% | $7,801,856 | 100.0% | $24.30 | |||||
| (1) | Information is based on the underwritten rent roll. |
| (2) | Certain ratings are those of the parent company whether or not the parent guarantees the lease. |
| (3) | Wtd. Avg. Annual UW Rent PSF excludes vacant space. |
| (4) | Sales $ and Sales PSF represent trailing 12 months ending August 31, 2016, as provided by the sponsor. |
| (5) | Sales PSF for Alamo Drafthouse Cinema is based on seven screens. |
| (6) | Includes as occupied space 12,273 SF recently leased to Ceviches Mariscos (4,873 SF), Hopdoddy’s Burger Bar (4,000 SF), and Dr. Scott Andersen, DDS (3,400 SF). Ceviches Mariscos, Hopdoddy’s Burger Bar, and Dr. Scott Andersen, DDS have not yet taken occupancy. The estimated rent commencement dates are November 1, 2017, July 1, 2017, and July 1, 2017, respectively. |
This is not a research report and was not prepared by any Underwriter’s research departments. Please see additional important information and qualifications at the end of this Term Sheet.
| T-63 |
| MSBAM 2016-C31 | Vintage Park |
The following table presents certain information relating to the lease rollover schedule at the Vintage Park Property:
Lease Rollover Schedule(1)(2)
| ||||||||
| Year | # of Leases Rolling | SF Rolling | Annual UW Rent PSF Rolling(3) | Approx. % of Total SF Rolling | Approx. Cumulative % of SF Rolling | Total UW Rent Rolling | Approx. % of Total Rent Rolling | Approx. Cumulative % of Total Rent Rolling |
| MTM | 0 | 0 | $0.00 | 0.0% | 0.0% | $0 | 0.0% | 0.0% |
| 2016 | 0 | 0 | $0.00 | 0.0% | 0.0% | $0 | 0.0% | 0.0% |
| 2017 | 7 | 19,058 | $23.17 | 5.6% | 5.6% | $441,484 | 5.7% | 5.7% |
| 2018 | 19 | 47,205 | $28.56 | 13.8% | 19.4% | $1,348,119 | 17.3% | 22.9% |
| 2019 | 19 | 50,278 | $26.77 | 14.7% | 34.2% | $1,346,120 | 17.3% | 40.2% |
| 2020 | 8 | 28,234 | $28.62 | 8.3% | 42.4% | $808,141 | 10.4% | 50.6% |
| 2021 | 7 | 18,394 | $24.15 | 5.4% | 47.8% | $444,166 | 5.7% | 56.2% |
| 2022 | 4 | 16,440 | $21.77 | 4.8% | 52.7% | $357,926 | 4.6% | 60.8% |
| 2023 | 9 | 53,435 | $21.32 | 15.7% | 68.3% | $1,138,999 | 14.6% | 75.4% |
| 2024 | 2 | 24,704 | $17.08 | 7.2% | 75.6% | $422,025 | 5.4% | 80.8% |
| 2025 | 6 | 39,743 | $17.89 | 11.7% | 87.2% | $710,895 | 9.1% | 90.0% |
| 2026 | 2 | 4,167 | $29.26 | 1.2% | 88.4% | $121,906 | 1.6% | 91.5% |
| 2027 & Beyond(4) | 4 | 19,465 | $34.01 | 5.7% | 94.1% | $662,075 | 8.5% | 100.0% |
| Vacant | 0 | 19,984 | $0.00 | 5.9% | 100.0% | $0 | 0.0% | 100.0% |
| Total/Wtd. Avg. | 87 | 341,107 | $24.30 | 100.0% | $7,801,856 | 100.0% | ||
| (1) | Information is based on the underwritten rent roll. |
| (2) | Certain tenants may have lease termination options that are exercisable prior to the originally stated expiration date of the subject lease and that are not considered in the lease rollover schedule. |
| (3) | Wtd. Avg. Annual UW Rent PSF Rolling excludes vacant space. |
| (4) | Includes Ceviches Mariscos (4,873 SF, $170,555 of UW Base Rent), Hopdoddy’s Burger Bar (4,000 SF, $148,000 of UW Base Rent), and Dr. Scott Andersen, DDS (3,400 SF, $91,800 of UW Base Rent), which have executed leases, but not yet taken occupancy or commenced paying rent. The estimated rent commencement dates are November 1, 2017, July 1, 2017, and July 1, 2017, respectively with lease expiration dates in 2027. |
The Market. The Vintage Park Property is located in Houston, Harris County, Texas, approximately 25.1 miles northwest of the Houston CBD. The Vintage Park Property is situated approximately 5.3 miles south of the Grand Parkway, 6.3 miles northwest of the Sam Houston Parkway/Beltway 8, and 20.6 miles west of the George Bush International Airport. The Vintage Park Property is part of The Vintage development, a 630-acre master planned community on a site sold to developers in 2004/2005. The Vintage development represents an investment of more than $1.0 billion and comprises over 1,600 upscale single-family homes, two apartment communities comprised of 1,500 units, senior-living, restaurants and entertainment, a variety of retail outlets and multiple healthcare facilities as well as an 80-acre office campus development for Hewlett-Packard within The Vintage development. The office campus is occupied by Hewlett-Packard, Noble Energy and Lone Star College.
According to a third party market research report, the estimated 2016 population within a one-, three-, and five-mile radius of the Vintage Park Property is 8,115, 108,923, and 262,131, respectively. The estimated 2016 average household income within a one-, three-, and five-mile radius of the Vintage Park Property is $110,081, $108,904, and $105,986, respectively. Comparatively, the estimated 2016 average household income for Harris County, the SMA, and the state of Texas are $83,338, $88,764, and $77,652, respectively. In 2016, consumer expenditures within a one-, three-, and five-mile radius were approximately $96.2 million, $1.1 billion, and $2.6 billion, respectively, according to the appraisal. Furthermore, these figures are projected to grow at annual rates of 4.7%, 3.2%, and 3.3%, respectively.
According to a third party market research report, the Vintage Park Property is located in the Cypresswood Drive retail submarket. As of the second quarter of 2016, the Cypresswood Drive retail submarket had an overall vacancy rate of 4.5% and an average asking annual lease rate of $21.24 PSF compared to the overall Houston retail market with an overall vacancy rate of 5.0% and an average asking annual lease rate of $15.77 PSF. According to a third party market research report, the Cypresswood Drive retail submarket contains 280 buildings accounting for 5.4 million SF of retail space.
This is not a research report and was not prepared by any Underwriter’s research departments. Please see additional important information and qualifications at the end of this Term Sheet.
| T-64 |
| MSBAM 2016-C31 | Vintage Park |
The following table presents leasing data at certain retail competitive properties with respect to the Vintage Park Property:
| Competitive Property Summary | ||||||
| Property Name | Type | Year Built/Renovated | Size (SF) | Total Occupancy | Anchor Tenants | Distance to Subject (mi.) |
| Vintage Park Property | Regional Lifestyle Center | 2007/N/A | 341,107(1) | 94.1%(1) | The Work Lodge, Alamo Drafthouse Cinema | N/A |
| HEB Vintage Market | Lifestyle Center | 2007/N/A | 129,350 | 100.0% | HEB | 0.2 |
| Vintage Marketplace | Community Center | 2014/N/A | 70,000 | 96.4% | Whole Foods, Orange Theory | 0.8 |
| The Vintage Center | Unanchored Retail | 2013/N/A | 12,533 | 100.0% | Mattress Firm, Serenity Dental Care | 0.6 |
| LaCenterra at Cinco Ranch Phase | Lifestyle Center | 2007/N/A | 368,525 | 95.0% | Trader Joe’s, Talbots, White House Black Market, J. Jill, Eddie Bauer | 34.3 |
| Sugar Land Town Square | Lifestyle Center | 2008/N/A | 807,000 | 92.1% | Jos A. Bank, Ann Taylor LOFT | 33.2 |
| CityCentre | Lifestyle Center | 2008/N/A | 305,975 | 98.0% | West Elm, Anthropologie, Urban Outfitters | 18.7 |
| Total/Wtd. Avg.(2) | 1,693,383 | 94.6% | ||||
Source:Appraisal
| (1) | Information is based on the underwritten rent roll. Includes as occupied space 12,273 SF recently leased to Ceviches Mariscos (4,873 SF), Hopdoddy’s Burger Bar (4,000 SF), and Dr. Scott Andersen, DDS (3,400 SF). Ceviches Mariscos, Hopdoddy’s Burger Bar, and Dr. Scott Andersen, DDS have not yet taken occupancy. The estimated rent commencement dates are November 1, 2017, July 1, 2017, and July 1, 2017, respectively. Excluding these tenants, physical occupancy of the Vintage Park Property is 90.5%. |
| (2) | Total/Wtd. Avg. excludes the Vintage Park Property. |
Operating History and Underwritten Net Cash Flow.The following table presents certain information relating to the historical operating performance and the Underwritten Net Cash Flow at the Vintage Park Property:
| Cash Flow Analysis | |||||||
| 2013(1) | 2014(1) | 2015 | 7/31/2016 TTM | UW | UW PSF | ||
| Base Rent(2) | $4,275,126 | $5,762,659 | $6,560,006 | $7,273,873 | $8,504,644 | $24.93 | |
| Total Recoveries | $1,579,713 | $2,308,869 | $2,366,679 | $3,278,815 | $4,119,415 | $12.08 | |
| Other Income | $118,079 | $151,727 | $168,260 | $178,818 | $237,506 | $0.70 | |
| Less Vacancy & Credit Loss | ($35,741) | ($171,644) | ($110,329) | ($247,712) | ($820,650) | ($2.41) | |
| Effective Gross Income | $5,937,176 | $8,051,610 | $8,984,616 | $10,483,793 | $12,040,915 | $35.30 | |
| Total Operating Expenses | $3,026,619 | $3,422,237 | $4,244,897 | $4,167,240 | $4,642,388 | $13.61 | |
| Net Operating Income | $2,910,557 | $4,629,373 | $4,739,719 | $6,316,553 | $7,398,527 | $21.69 | |
| Capital Expenditures | $0 | $0 | $0 | $0 | $51,166 | $0.15 | |
| TI/LC | $0 | $0 | $0 | $0 | $161,802 | $0.47 | |
| Net Cash Flow | $2,910,557 | $4,629,373 | $4,739,719 | $6,316,553 | $7,185,559 | $21.07 | |
| Occupancy %(3) | 73.4% | 78.6% | 94.5% | 94.1% | 93.5% | ||
| NOI DSCR (P&I)(4) | 0.54x | 0.86x | 0.88x | 1.17x | 1.37x | ||
| NOI DSCR (IO)(4) | 0.69x | 1.09x | 1.12x | 1.49x | 1.74x | ||
| NCF DSCR (P&I)(4) | 0.54x | 0.86x | 0.88x | 1.17x | 1.33x | ||
| NCF DSCR (IO)(4) | 0.69x | 1.09x | 1.12x | 1.49x | 1.69x | ||
| NOI Debt Yield(4) | 3.5% | 5.5% | 5.6% | 7.5% | 8.8% | ||
| NCF Debt Yield(4) | 3.5% | 5.5% | 5.6% | 7.5% | 8.6% | ||
| (1) | The sponsor purchased the Vintage Park Property in March 2012 when it was 38.6% leased. Subsequent leasing activity increased occupancy to 61.0% as of year-end 2012 and 73.4% as of year-end 2013. The increase in Base Rent from 2013 to 2014 is largely attributed to the timing of lease execution and rent commencement of the 16 new leases executed in 2013, accounting for 82,819 SF (24.3% of NRA) and UW Base Rent of $1,727,223. |
| (2) | The increase in UW Base Rent over 7/31/2016 TTM Base Rent is primarily attributed to approximately $196,097 of contractual rent steps effective October 1, 2017, $820,650 of vacancy gross up, and recent leasing activity to Guacho Do Sul (7,192 SF, $251,720 of UW Base Rent), Dunhill Partners Management Services, Inc. (1,634 SF, $40,850 of UW Base Rent), Ceviches Mariscos (4,873 SF, $170,555 of UW Base Rent), Hopdoddy’s Burger Bar (4,000 SF, $148,000 of UW Base Rent), and Dr. Scott Andersen, DDS (3,400 SF, $91,800 of UW Base Rent). Ceviches Mariscos, Hopdoddy’s Burger Bar, and Dr. Scott Andersen, DDS have not yet taken occupancy or commenced paying rent. The estimated rent commencement dates are November 1, 2017, July 1, 2017, and July 1, 2017, respectively. The Vintage Park Borrower funded $350,405 into a lender-controlled reserve account at closing to bridge UW Base Rent to the tenants’ estimated rent commencement dates. 7/31/2016 TTM Base Rent includes $388,378 of percentage rent which includes collections for percentage rent attributable to prior periods and UW Base Rent includes $140,731 of percentage rent, based on tenant reported sales for 8/31/2016 TTM. |
| (3) | Occupancy % for 2013, 2014, and 2015 represents physical occupancy as of December 31 of each respective year. 7/31/2016 TTM Occupancy % equates to leased occupancy as of October 6, 2016 and includes as occupied space 12,273 SF recently leased to Ceviches Mariscos (4,873 SF), Hopdoddy’s Burger Bar (4,000 SF), and Dr. Scott Andersen, DDS (3,400 SF). Ceviches Mariscos, Hopdoddy’s Burger Bar, and Dr. Scott Andersen, DDS have not yet taken occupancy. Excluding these tenants, physical occupancy of the Vintage Park Property is 90.5%. UW Occupancy % is based on underwritten economic occupancy. |
| (4) | Debt service coverage ratios and debt yields are based on the Vintage Park Whole Loan. |
This is not a research report and was not prepared by any Underwriter’s research departments. Please see additional important information and qualifications at the end of this Term Sheet.
| T-65 |
| MSBAM 2016-C31 | Vintage Park |
Escrows and Reserves. At origination of the Vintage Park Whole Loan, the Vintage Park Borrower deposited (i) $2,082,355 into a reserve for real estate taxes and $162,810 into a reserve for insurance premiums, and is required to escrow monthly (a) 1/12 of the annual estimated real estate tax payments (unless the tenants are paying any monthly real estate taxes directly to the applicable governmental authorities, among other conditions in the loan documents) and (b) 1/12 of the annual estimated insurance premiums; (ii) $3,250,000 in escrow for TI/LC reserves and is required to make monthly deposits of $28,426 for TI/LC reserves if the funds on deposit in such TI/LC reserve account fall below $1,200,000; and (iii) $2,034,479 in escrow for unfunded tenant obligations for free rent relating to four individual tenants ($458,165), any unpaid and outstanding tenant allowances, tenant improvements and leasing commissions relating to five individual tenants ($1,496,159) and/or landlord work relating to two individual tenants ($80,155). The Vintage Park Borrower is required to escrow monthly $5,685 for replacement reserves.
During the continuance of a Material Tenant Trigger Event (as defined below), on each monthly payment date, all excess cash flow is required to be deposited into a reserve (the “Material Tenant Rollover Reserve”) to be held by the lender as additional security for the Vintage Park Whole Loan. So long as no event of default exists, funds held in the Material Tenant Rollover Reserve are required to be used in connection with tenant improvements and leasing commissions incurred by the Vintage Park Borrower upon the occurrence of (i) an extension or renewal of the Material Tenant’s (as defined below) lease for a term of not less than five years, (ii) the leasing of all space formerly demised to the Material Tenant to one or more replacement tenants approved by the lender, or (iii) the leasing of substantially all of such space for aggregate rents equal to or greater than the rents previously payable by such Material Tenant.
A “Material Tenant Trigger Event” will commence upon the earlier of (i) if the Material Tenant fails to extend or renew its lease upon terms and conditions set forth in the Material Tenant’s lease (or as otherwise acceptable to the lender) on or prior to the earlier of (a) the date required for such notice period pursuant to the Material Tenant’s lease and (b) the date that is at least 12 months prior to the then-applicable expiration date of the Material Tenant’s lease, (ii) if an event of default under the Material Tenant’s lease has occurred, (iii) the Material Tenant or lease guarantor of the Material Tenant’s lease becomes insolvent or a debtor in any bankruptcy action, (iv) if the Material Tenant’s lease is terminated or no longer in full force or effect, (v) if the Material Tenant “goes dark,” vacates, ceases to occupy or discontinues its operations at the Vintage Park Property, or (vi) the decline in rating of any Material Tenant or any lease guarantor for the Material Tenant below investment grade by any of the applicable rating agencies. A Material Tenant Trigger Event will continue until, in regard to clause (i) above, the Material Tenant has entered into a renewal of all of its leased premises in accordance with the requirements of the loan documents or certain re-leasing conditions have been satisfied with respect to the Material Tenant space, in regard to clause (ii) above, the applicable event of default has been cured, in regard to clause (iii) above, the Material Tenant’s lease is unconditionally affirmed in the applicable bankruptcy and the Material Tenant is paying full unabated rent or, if applicable, the guarantor bankruptcy has been discharged or dismissed with no material adverse effect on the guarantor’s ability to perform under the lease guaranty, in regard to clause (iv) above, certain re-leasing conditions have been satisfied with respect to the Material Tenant space, in regard to clause (v) above, the applicable Material Tenant re-commences its operations at its leased premises and is paying full unabated rent, or in regard to clause (vi) above, the rating is raised so that such rating is no lower than investment grade by each applicable rating agency.
“Material Tenant” means any tenant, guarantor, or replacement that, together with its affiliates, leases space comprising 20% or more of either (a) the total rentable SF at the Vintage Park Property or (b) the total in-place base rent at the Vintage Park Property.
Lockbox and Cash Management. A hard lockbox is in place with respect to the Vintage Park Whole Loan. The Vintage Park Whole Loan has springing cash management (i.e., the Vintage Park Whole Loan has cash management only after the initial occurrence of a Trigger Period (as defined below)). During the continuance of a Trigger Period for the Vintage Park Whole Loan, funds in the lockbox account are required to be applied on each monthly payment date to pay debt service on the Vintage Park Whole Loan, to fund the required reserves deposits as described above under “—Escrows and Reserves,” to disburse, provided no event of default has occurred or is continuing, to the Vintage Park Borrower the monthly amount payable for operating expenses not otherwise paid or reserved for as described above under “—Escrows and Reserves” and referenced in the annual budget approved by the lender together with other amounts incurred by the Vintage Park Borrower in connection with the operation and maintenance of the Vintage Park Property reasonably approved by the lender, and to disburse the remainder to the Vintage Park Borrower (or, during the continuance of a Cash Sweep Period (as defined below), provided no Material Tenant Trigger Event has occurred, to an account to be held by the lender as additional security for the Vintage Park Whole Loan). During the continuance of a Material Tenant Trigger Event, on each monthly payment date, all excess cash flow is required to be deposited into the Material Tenant Rollover Reserve to be held by the lender as additional security for the Vintage Park Whole Loan.
A “Trigger Period” will occur upon (i) an event of default, (ii) any bankruptcy action involving the Vintage Park Borrower, the guarantor, or the property manager, (iii) the debt service coverage ratio based on the trailing six-month period falling below 1.20x, (iv) a Material Tenant Trigger Event, or (v) any indictment for fraud or misappropriation of funds by the Vintage Park Borrower, the guarantor or the property manager or any director or officer of the Vintage Park Borrower, the guarantor, or the property manager. A Trigger Period will continue until, in regard to clause (i) above, the cure of such event of default and acceptance of such cure by the lender, in regard to clause (ii) above, upon the filing being discharged, stayed or dismissed within 60 days for the Vintage Park Borrower or the guarantor, or within 120 days for the property manager, and the lender’s determination that such filing does not materially affect the Vintage Park Borrower’s, the guarantor’s, or the property manager’s monetary obligations, in regard to clause (iii) above, upon the date the debt service coverage ratio based on the trailing six-month period is greater than 1.25x for two consecutive calendar quarters, in regard to clause (iv) above, the Material Tenant Trigger Event is cured, or in regard to clause (v) above, solely with respect to the property manager, when the Vintage Park Borrower replaces the property manager with a qualified manager.
A “Cash Sweep Period” will occur upon (i) an event of default, (ii) any bankruptcy action involving the Vintage Park Borrower, the guarantor, or the property manager, (iii) the debt service coverage ratio based on the trailing six-month period falling below 1.20x, or (iv) any indictment for fraud or misappropriation of funds by the Vintage Park Borrower, the guarantor or the property manager or any director or officer of the Vintage Park Borrower, the guarantor, or the property manager. A Cash Sweep Period will continue until, in regard to clause (i) above, the cure of such event of default and acceptance of such cure by the lender, in regard to clause (ii) above, upon the filing being discharged, stayed or dismissed within 60 days for the Vintage Park Borrower or the guarantor, or within 120 days for the property manager, and the lender’s determination that such filing does not materially affect the Vintage Park Borrower’s, the guarantor’s, or the property manager’s monetary obligations, in regard to clause (iii) above, upon the date the debt service coverage ratio based on the trailing six-month period is greater than 1.25x for two consecutive calendar quarters, or in regard to clause (iv) above, solely with respect to the property manager, when the Vintage Park Borrower replaces the property manager with a qualified manager.
Additional Secured Indebtedness (not including trade debts). The Vintage Park Property also secures the Vintage Park Serviced Pari Passu Companion Loans, which have an aggregate cut-off date balance of $39,000,000 and are currently held by UBS AG, New York Branch, or an affiliate thereof, and may be contributed to one or more future securitization transactions or otherwise transferred at any time. Each of the Vintage Park Serviced Pari Passu Companion Loans accrues interest at the same rate as the Vintage Park Mortgage Loan. The Vintage Park Mortgage Loan is entitled to
This is not a research report and was not prepared by any Underwriter’s research departments. Please see additional important information and qualifications at the end of this Term Sheet.
| T-66 |
| MSBAM 2016-C31 | Vintage Park |
payments of principal and interest on apro rata andpari passu basis with the Vintage Park ServicedPari Passu Companion Loans. The holders of the Vintage Park Mortgage Loan and the Vintage Park ServicedPari Passu Companion Loans have entered into a co-lender agreement that sets forth the allocation of collections on the Vintage Park Whole Loan. See“Description of the Mortgage Pool—The Whole Loans—The Serviced Pari Passu Whole Loans—The Vintage Park Whole Loan” in the Preliminary Prospectus.
Mezzanine Loan and Preferred Equity. Not permitted.
Release of Property.Not permitted.
Terrorism Insurance. The Vintage Park Borrower is required to obtain and maintain property insurance, commercial general liability insurance, and business income or rental loss insurance that covers perils of terrorism and acts of terrorism, both foreign and domestic.
This is not a research report and was not prepared by any Underwriter’s research departments. Please see additional important information and qualifications at the end of this Term Sheet.
| T-67 |
| MSBAM 2016-C31 | Simon Premium Outlets |
| Mortgage Loan No. 6 – Simon Premium Outlets |
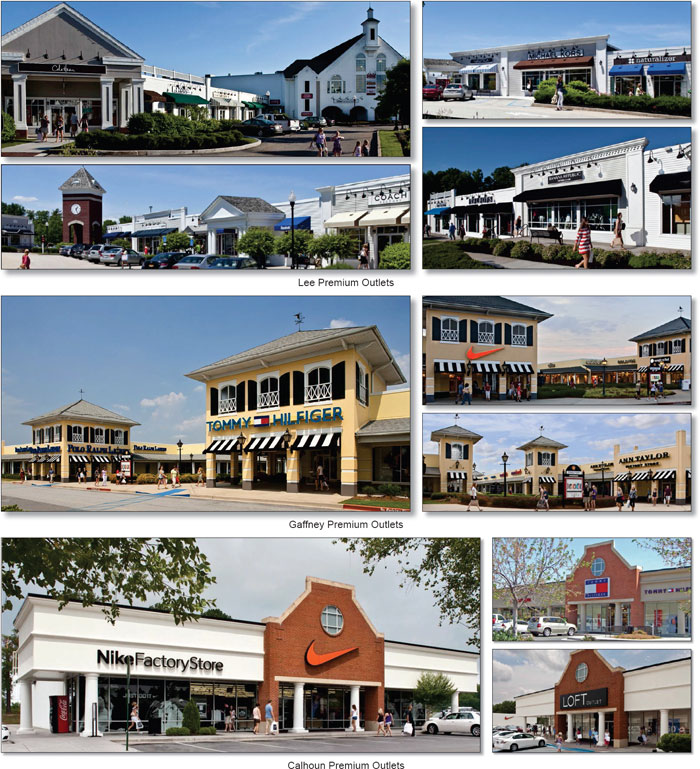
This is not a research report and was not prepared by any Underwriter’s research departments. Please see additional important information and qualifications at the end of this Term Sheet.
| T-68 |
| MSBAM 2016-C31 | Simon Premium Outlets |
| Mortgage Loan No. 6 – Simon Premium Outlets |
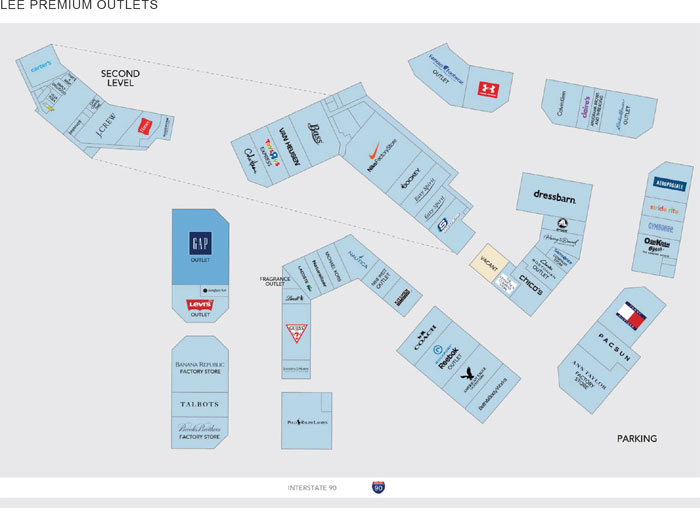
This is not a research report and was not prepared by any Underwriter’s research departments. Please see additional important information and qualifications at the end of this Term Sheet.
| T-69 |
| MSBAM 2016-C31 | Simon Premium Outlets |
| Mortgage Loan No. 6 – Simon Premium Outlets |
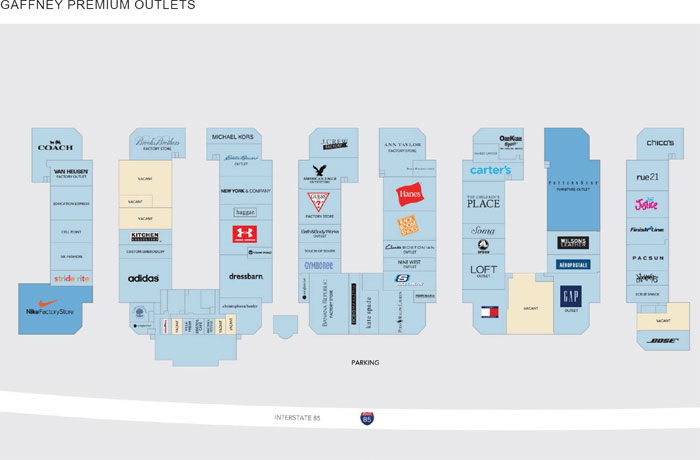
This is not a research report and was not prepared by any Underwriter’s research departments. Please see additional important information and qualifications at the end of this Term Sheet.
| T-70 |
| MSBAM 2016-C31 | Simon Premium Outlets |
| Mortgage Loan No. 6 – Simon Premium Outlets |
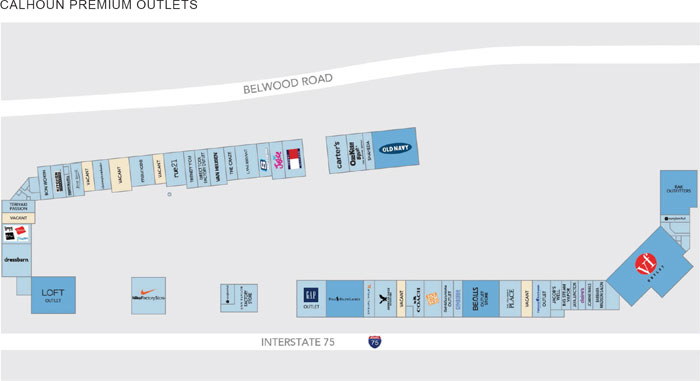
This is not a research report and was not prepared by any Underwriter’s research departments. Please see additional important information and qualifications at the end of this Term Sheet.
| T-71 |
| MSBAM 2016-C31 | Simon Premium Outlets |
| Mortgage Loan No. 6 – Simon Premium Outlets |
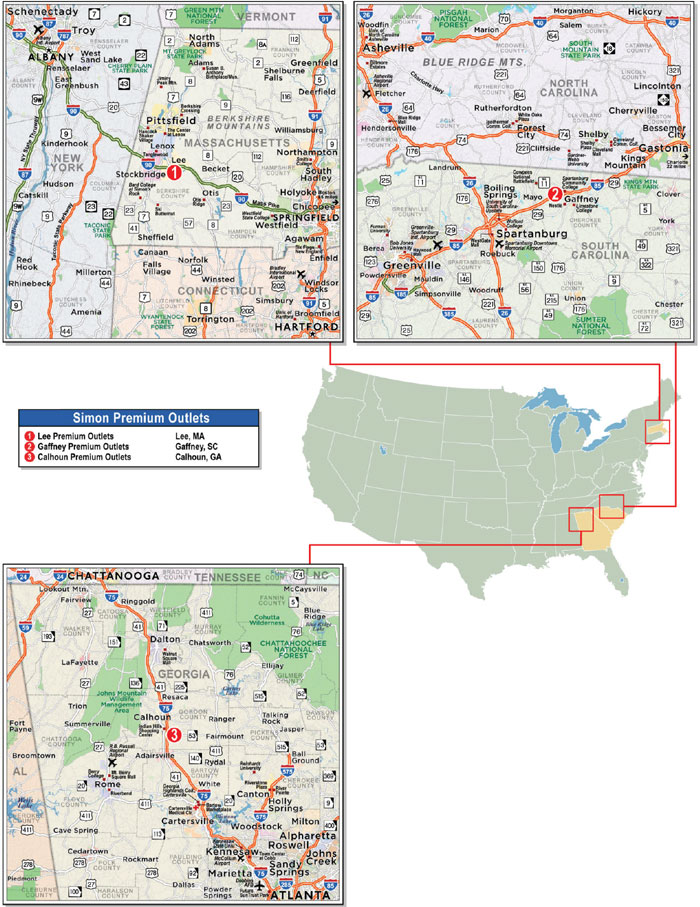
This is not a research report and was not prepared by any Underwriter’s research departments. Please see additional important information and qualifications at the end of this Term Sheet.
| T-72 |
| MSBAM 2016-C31 | Simon Premium Outlets |
| Mortgage Loan No. 6 – Simon Premium Outlets |
| Mortgage Loan Information | Property Information | ||||||
| Mortgage Loan Seller: | BANA | Single Asset/Portfolio: | Portfolio | ||||
| Original Balance(1): | $42,500,000 | Location: | Various | ||||
| Cut-off Date Balance(1): | $42,215,616 | General Property Type: | Retail | ||||
| % of Initial Pool Balance: | 4.4% | Detailed Property Type: | Outlet Center | ||||
| Loan Purpose: | Refinance | Title Vesting: | Fee | ||||
| Sponsor: | Simon Property Group, L.P. | Year Built/Renovated: | Various | ||||
| Mortgage Rate: | 4.1680% | Size: | 782,765 SF | ||||
| Note Date: | 6/1/2016 | Cut-off Date Balance per SF(1): | $133 | ||||
| First Payment Date: | 7/1/2016 | Maturity Date Balance per SF(1): | $107 | ||||
| Maturity Date: | 6/1/2026 | Property Manager: | Simon Management Associates, LLC (borrower-related) | ||||
| Original Term to Maturity: | 120 months | ||||||
| Original Amortization Term: | 360 months | Underwriting and Financial Information | |||||
| IO Period: | 0 months | UW NOI: | $17,081,104 | ||||
| Seasoning: | 5 months | UW NOI Debt Yield(1): | 16.4% | ||||
| Prepayment Provisions: | LO (29); DEF (84); O (7) | UW NOI Debt Yield at Maturity(1): | 20.3% | ||||
| Lockbox/Cash Mgmt Status: | Hard/Springing | UW NCF DSCR(1): | 2.55x | ||||
| Additional Debt Type(2): | Pari Passu | Most Recent NOI: | $18,741,076 (7/31/2016 TTM) | ||||
| Additional Debt Balance(2): | $62,081,789 | 2nd Most Recent NOI: | $17,863,226 (12/31/2015) | ||||
| Future Debt Permitted (Type): | No (N/A) | 3rd Most Recent NOI: | $17,379,729 (12/31/2014) | ||||
| Reserves(3) | Most Recent Occupancy: | 93.7% (5/19/2016) | |||||
| Type | Initial | Monthly | Cap | 2nd Most Recent Occupancy: | 95.1% (12/31/2015) | ||
| RE Tax: | $0 | Springing | N/A | 3rd Most Recent Occupancy: | 96.4% (12/31/2014) | ||
| Insurance: | $0 | Springing | N/A | Appraised Value (as of): | $223,700,000 (4/1/2016 – 4/14/2016) | ||
| Recurring Replacements: | $0 | Springing | $391,383 | Cut-off Date LTV Ratio(1): | 46.6% | ||
| TI/LC: | $0 | Springing | $3,522,443 | Maturity Date LTV Ratio(1): | 37.6% | ||
| Sources and Uses | ||||||
| Sources | Proceeds | % of Total | Uses | Proceeds | % of Total | |
| Loan Amount(1): | $105,000,000 | 100.0% | Loan Payoff: | $102,360,551 | 97.5% | |
| Closing Costs: | $592,456 | 0.6% | ||||
| Return of Equity: | $2,046,993 | 1.9% | ||||
| Total Sources: | $105,000,000 | 100.0% | Total Uses: | $105,000,000 | 100.0% | |
| (1) | The Simon Premium Outlets Mortgage Loan is part of the Simon Premium Outlets Whole Loan (defined below), which is comprised of threepari passu promissory notes with an aggregate original principal balance of $105,000,000. The Cut-off Date Balance per SF, Maturity Date Balance per SF, UW NOI Debt Yield, UW NOI Debt Yield at Maturity, UW NCF DSCR, Cut-off Date LTV Ratio and Maturity Date LTV Ratio numbers presented above are based on the aggregate principal balance of the promissory notes comprising the Simon Premium Outlets Whole Loan. |
| (2) | See “—The Mortgage Loan” and“—Additional Secured Indebtedness (not including trade debts)”below for further discussion of additional debt. |
| (3) | See “—Escrows and Reserves”below for further discussion of reserve requirements. |
The Mortgage Loan. The sixth largest mortgage loan (the “Simon Premium Outlets Mortgage Loan”) is part of a whole loan (the “Simon Premium Outlets Whole Loan”) evidenced by threepari passu promissory notes in the aggregate original principal amount of $105,000,000, all of which are secured by a first priority fee mortgage encumbering three outlet centers known as Lee Premium Outlets located in Lee, Massachusetts (the “Lee Premium Outlets Property”), Gaffney Premium Outlets located in Gaffney, South Carolina (the “Gaffney Premium Outlets Property”) and Calhoun Premium Outlets located in Calhoun, Georgia (the “Calhoun Premium Outlets Property”) (collectively, the “Simon Premium Outlets Properties”). Promissory Note A-3 in the original principal amount of $42,500,000 represents the Simon Premium Outlets Mortgage Loan. Promissory Note A-1 in the original principal amount of $37,500,000 is currently held by the WFCM 2016-BNK1 securitization trust, and Promissory Note A-2 in the original principal amount of $25,000,000 is currently held by the MSBAM 2016-C30 securitization trust (collectively, the “Simon Premium OutletsPari Passu Companion Loans”). The Simon Premium Outlets Whole Loan is being serviced pursuant to the pooling and servicing agreement for the WFCM 2016-BNK1 transaction. See “Description of the Mortgage Pool—The Whole Loans — The Non-Serviced Pari Passu Whole Loans” and “Pooling and Servicing Agreement—Servicing of the Non-Serviced Mortgage Loans” in the Preliminary Prospectus.
The proceeds of the Simon Premium Outlets Whole Loan were used to refinance a previous mortgage loan secured by the Simon Premium Outlets Properties in an amount of approximately $102.4 million, to pay closing costs, and to return equity to the Simon Premium Outlets Borrowers (as defined below). The previous mortgage loan secured by the Simon Premium Outlets Properties was included in the JPMCC 2006-CB16 securitization trust.
The Borrowers and the Sponsor. The borrowers are Calhoun Outlets LLC, Gaffney Outlets LLC and Lee Outlets LLC (the “Simon Premium Outlets Borrowers”), each a single-purpose Delaware limited liability company structured to be bankruptcy-remote, with two independent directors. The sponsor and the guarantor of the Simon Premium Outlets Borrowers is Simon Property Group, L.P. Simon Property Group, L.P. is the operating partnership of Simon Property Group, Inc. (“Simon”) (NYSE: SPG). Simon is a publicly traded self-administered and self-managed real estate investment trust focused on retail property ownership and management. Simon is one of the largest publicly traded owners, operators and developers of retail assets in the United States. As of December 31, 2015, Simon owned or had an interest in 209 properties consisting of 108 malls, 71 Premium Outlet-branded centers,
This is not a research report and was not prepared by any Underwriter’s research departments. Please see additional important information and qualifications at the end of this Term Sheet.
| T-73 |
| MSBAM 2016-C31 | Simon Premium Outlets |
14 Mills-branded centers, four lifestyle centers and twelve other retail properties in 37 states and Puerto Rico containing an aggregate of approximately 184 million SF of gross leasable area. Simon’s Premium Outlets generally contain a wide variety of designer and manufacturer stores located in open-air centers and range in size from approximately 150,000 to 870,000 SF and are generally located within close proximity to major metropolitan areas and/or tourist destinations.
The Simon Premium Outlets Whole Loan will be recourse to the guarantor pursuant to standard non-recourse carve-outs, however, the guaranty and the environmental indemnity agreement provides that for so long as Simon Property Group, L.P. is the guarantor under the guaranty and the indemnitor under the environmental indemnity agreement, the guarantor’s liability thereunder may not exceed $21.0 million in the aggregate, plus all reasonable out-of-pocket costs and expenses (including court costs and reasonable attorneys’ fees) incurred by the lender in the enforcement of the guaranty and the environmental indemnity agreement or the preservation of the lender’s rights thereunder.
Simon Property Group, L.P. is also a sponsor of each of the borrowers under the mortgage loans identified on Annex A-1 to the Preliminary Prospectus as Coconut Point and The Shops at Crystals.
The Properties. The Simon Premium Outlets Properties are secured by the fee interest in three outlet properties totaling 782,765 SF located in Lee, Massachusetts, Gaffney, South Carolina and Calhoun, Georgia. The Simon Premium Outlets Properties were 93.7% leased as of May 19, 2016 and generated total sales of approximately $203.8 million for the trailing-twelve month period ended July 2016, which was an approximate $1.8 million increase over 2015 sales. Historical occupancy for the Simon Premium Outlets Properties was 95.1%, 96.4%, 95.4% and 94.7% as of year-end 2015, 2014, 2013 and 2012, respectively.
The Lee Premium Outlets Property contains 224,825 SF and is situated on a 104.8-acre parcel. The center was constructed in 1997 and consists of ten one-story buildings and one two-story building flanking a central village “Main Street” and includes a central food court. There are 1,098 surface parking spaces. The top three tenants by size at the Lee Premium Outlets Property are Gap Outlet (12,113 SF), Nike Factory Store (9,966 SF) and Banana Republic Factory Store (8,756 SF). No other tenant comprises more than 3.5% of the net rentable area. As of May 19, 2016, the Lee Premium Outlets Property was 97.8% occupied and had inline sales of $406 PSF for the trailing twelve months ended July 31, 2016, resulting in an occupancy cost of 12.0%. Net operating income for the trailing twelve months ended July 2016 was $8,144,930, resulting in an operating margin of 73.6%.
The Gaffney Premium Outlets Property contains 303,877 SF and is situated on a 46.7-acre parcel. The center was constructed in 1996 and consists of five buildings, a food court and playground. There are 1,522 surface parking spaces. The top three tenants by size at the Gaffney Premium Outlets Property are Pottery Barn Furniture Outlet (18,286 SF), Nike Factory Store (11,620 SF) and Gap Outlet (8,970 SF) with no other tenant comprising more than 2.8% of the net rentable area. The Gaffney Premium Outlets Property is also shadow anchored by a first-run movie theater known as The Big E. As of May 19, 2016, the Gaffney Premium Outlets Property was 90.5% occupied and had inline sales of $296 PSF for the trailing twelve months ended July 31, 2016, resulting in an occupancy cost of 10.9%. Net operating income for the trailing twelve months ended July 31, 2016 was $6,490,864, resulting in an operating margin of 70.7%.
The Calhoun Premium Outlets Property contains 254,063 SF and is situated on a 27.7-acre parcel. The center was constructed in 1992 and consists of five buildings. There are 1,380 surface parking spaces. The top three tenants by size at the Calhoun Premium Outlets Property are V.F. Factory Outlet (26,000 SF), Old Navy (12,000 SF) and LOFT Outlet (12,000 SF), with no other tenant comprising more than 4.6% of the net rentable area. As of May 19, 2016, the Calhoun Premium Outlets Property was 93.9% occupied and had inline sales of $234 PSF for the trailing twelve months ended July 31, 2016, resulting in an occupancy cost of 9.3%. Net operating income for the trailing twelve months ended July 31, 2016 was $4,105,282, resulting in an operating margin of 76.3%.
The following table presents certain information relating to the Simon Premium Outlets Properties:
| Property Summary | |||||||
| Property Name & Location | Allocated Cut-off Date Balance | % of Portfolio Cut-off Date Balance | Occupancy(1) | Year Built/ Renovated | Net Rentable Area (SF)(2) | Appraised Value | Allocated LTV |
Lee Premium Outlets Property Lee, MA
| $53,638,665 | 51.4% | 97.8% | 1997/NAP | 224,825 | $115,000,000 | 46.6% |
Gaffney Premium Outlets Property Gaffney, SC
| $31,289,221 | 30.0% | 90.5% | 1996/NAP | 303,877 | $67,200,000 | 46.6% |
Calhoun Premium Outlets Property Calhoun, GA
| $19,369,518 | 18.6% | 93.9% | 1992/NAP | 254,063 | $41,500,000 | 46.7% |
| Total/Weighted Average | $104,297,405 | 100.0% | 93.7% | 782,765 | $223,700,000 | 46.6% | |
| (1) | Information obtained from the May 19, 2016 rent roll. |
| (2) | Information obtained from the underwritten rent roll. |
This is not a research report and was not prepared by any Underwriter’s research departments. Please see additional important information and qualifications at the end of this Term Sheet.
| T-74 |
| MSBAM 2016-C31 | Simon Premium Outlets |
The following table presents certain information relating to the leases at the Simon Premium Outlets Properties:
| Tenant Summary(1) | ||||||||||
| Tenant Name | Credit Rating (Fitch/Moody’s/ S&P)(2) | Tenant NRSF | % of NRSF | Annual UW Base Rent PSF | Annual UW Base Rent | % of Total Annual UW Base Rent | Sales PSF(3) | Occupancy Cost(3) | Lease Expiration Date | |
| Lee Premium Outlets Property | ||||||||||
| Major Tenants | ||||||||||
| Eddie Bauer Outlet | NR/NR/NR | 6,127 | 2.7% | $53.04 | $325,007 | 4.7% | $392 | 17.3% | 1/31/2025 | |
| Dress Barn(4) | NR/NR/NR | 7,781 | 3.5% | $40.29 | $313,467 | 4.5% | $199 | 21.7% | MTM | |
| Gap Outlet | BB+/Baa2/BB+ | 12,113 | 5.4% | $23.90 | $289,523 | 4.2% | $374 | 10.4% | 6/30/2017 | |
| Brooks Brothers Factory Store | NR/NR/NR | 4,960 | 2.2% | $49.42 | $245,107 | 3.5% | $465 | 12.3% | 3/31/2025 | |
| J. Crew Factory Store | NR/B2/B- | 6,988 | 3.1% | $35.00 | $244,580 | 3.5% | $436 | 11.7% | 1/31/2018 | |
| Total Major Tenants | 37,969 | 16.9% | $37.34 | $1,417,684 | 20.5% | |||||
| Non-Major Tenants | 174,719 | 77.7% | $31.51 | $5,505,582 | 79.5% | |||||
| Occupied Collateral Total/Wtg.Avg. | 212,688 | 94.6% | $32.55 | $6,923,266 | 100.0% | $406 | 12.0% | |||
| Vacant Space | 12,137 | 5.4% | ||||||||
| Collateral Total | 224,825 | 100.0% | ||||||||
| Gaffney Premium Outlets Property | ||||||||||
| Major Tenants | ||||||||||
| Pottery Barn Furniture Outlet | NR/NR/NR | 18,286 | 6.0% | $13.00 | $237,718 | 4.2% | $403 | 7.7% | 1/31/2020 | |
| Gap Outlet | BB+/Baa2/BB+ | 8,970 | 3.0% | $25.06 | $224,746 | 4.0% | $287 | 11.7% | 7/31/2019 | |
| Tommy Hilfiger(5) | NR/Ba1/BB+ | 6,225 | 2.0% | $32.64 | $203,184 | 3.6% | $270 | 12.0% | MTM | |
| Banana Republic Factory Store | BB+/Baa2/BB+ | 8,584 | 2.8% | $22.80 | $195,690 | 3.5% | $234 | 10.4% | 5/31/2019 | |
| The Children’s Place | NR/NR/NR | 6,547 | 2.2% | $29.22 | $191,303 | 3.4% | $248 | 14.9% | 1/31/2017 | |
| Total Major Tenants | 48,612 | 16.0% | $21.65 | $1,052,641 | 18.6% | |||||
| Non-Major Tenants | 226,494 | 74.5% | $20.39 | $4,617,711 | 81.4% | |||||
| Occupied Collateral Total/Wtg.Avg. | 275,106 | 90.5% | $20.61 | $5,670,352 | 100.0% | $296 | 10.9% | |||
| Vacant Space | 28,771 | 9.5% | ||||||||
| Collateral Total | 303,877 | 100.0% | ||||||||
| Calhoun Premium Outlets Property | ||||||||||
| Major Tenants | ||||||||||
| V.F. Factory Outlet | NR/A3/A | 26,000 | 10.2% | $16.53 | $429,780 | 10.4% | $140 | 11.3% | 9/30/2020 | |
| Old Navy(6) | BB+/Baa2/BB+ | 12,000 | 4.7% | $20.00 | $239,976 | 5.8% | $380 | 5.3% | MTM | |
| Gap Outlet | BB+/Baa2/BB+ | 7,890 | 3.1% | $25.59 | $201,867 | 4.9% | $216 | 11.5% | 4/30/2020 | |
| Loft Outlet | NR/NR/NR | 12,000 | 4.7% | $16.31 | $195,720 | 4.7% | $106 | 20.9% | 10/31/2017 | |
| American Eagle Outfitters | NR/NR/NR | 6,000 | 2.4% | $26.53 | $159,181 | 3.9% | NAV | NAV | 4/30/2024 | |
| Total Major Tenants | 63,890 | 25.1% | $19.20 | $1,226,524 | 29.7% | |||||
| Non-Major Tenants | 169,722 | 66.8% | $17.11 | $2,903,291 | 70.3% | |||||
| Occupied Collateral Total/Wtg.Avg. | 233,612 | 92.0% | $17.68 | $4,129,815 | 100.0% | $234 | 9.3% | |||
| Vacant Space | 20,451 | 8.0% | ||||||||
| Collateral Total | 254,063 | 100.0% | ||||||||
| (1) | Information is based on the underwritten rent roll. |
| (2) | Certain ratings are those of the parent company whether or not the parent guarantees the lease. |
| (3) | Sales PSF and Occupancy Cost are based on the trailing 12-month period ending July 31, 2016, as provided by the sponsor and only include tenants reporting comparable sales. Non-Major Tenant Sales PSF and Occupancy Cost as shown represent the respective in-line sales and resulting occupancy cost, which may include Major Tenants listed above. |
| (4) | Dress Barn (which is included in underwritten rent) currently has a lease out for signature with renewal terms of 5 years at an annual rent of $50.00 PSF. There can be no assurance any such renewal lease will be entered into. |
| (5) | Tommy Hilfiger (which is included in underwritten rent) is expected to renew its lease for 5 years at an annual rent of $33.37 PSF. There can be no assurance any such renewal lease will be entered into. |
| (6) | Old Navy (which is included in underwritten rent) currently has a lease out for signature with renewal terms of 5 years at an annual rent of $47.36 PSF. There can be no assurance any such renewal lease will be entered into. |
This is not a research report and was not prepared by any Underwriter’s research departments. Please see additional important information and qualifications at the end of this Term Sheet.
| T-75 |
| MSBAM 2016-C31 | Simon Premium Outlets |
The following table presents certain information relating to the lease rollover schedule at the Simon Premium Outlets Properties:
| Lease Rollover Schedule(1)(2) | ||||||||
| Year | # of Leases Rolling | SF Rolling | % of Total SF Rolling | Cumulative % of Total SF Rolling | Total UW Rent Rolling | UW Rent PSF Rolling(3) | % of Total Rent Rolling | Cumulative % of Total Rent Rolling |
| Simon Premium Outlets Properties | ||||||||
| MTM | 13 | 63,892 | 8.2% | 8.2% | $1,307,320 | $20.46 | 7.8% | 7.8% |
| 2016 | 15 | 57,953 | 7.4% | 15.6% | $785,843 | $13.56 | 4.7% | 12.5% |
| 2017 | 33 | 135,086 | 17.3% | 32.8% | $3,020,835 | $22.36 | 18.1% | 30.6% |
| 2018 | 29 | 109,195 | 13.9% | 46.8% | $2,814,286 | $25.77 | 16.8% | 47.4% |
| 2019 | 19 | 84,680 | 10.8% | 57.6% | $2,139,436 | $25.26 | 12.8% | 60.2% |
| 2020 | 11 | 79,190 | 10.1% | 67.7% | $1,649,171 | $20.83 | 9.9% | 70.1% |
| 2021 | 13 | 59,656 | 7.6% | 75.3% | $1,049,800 | $17.60 | 6.3% | 76.3% |
| 2022 | 12 | 42,961 | 5.5% | 80.8% | $1,226,086 | $28.54 | 7.3% | 83.7% |
| 2023 | 7 | 24,969 | 3.2% | 84.0% | $700,791 | $28.07 | 4.2% | 87.9% |
| 2024 | 6 | 23,509 | 3.0% | 87.0% | $602,843 | $25.64 | 3.6% | 91.5% |
| 2025 | 8 | 31,874 | 4.1% | 91.1% | $1,207,321 | $37.88 | 7.2% | 98.7% |
| 2026 | 3 | 8,441 | 1.1% | 92.2% | $219,701 | $26.03 | 1.3% | 100.0% |
| 2027 and Beyond | 0 | 0 | 0.0% | 92.2% | $0 | $0.00 | 0.0% | 100.0% |
| Vacant | 0 | 61,359 | 7.8% | 100.0% | $0 | $0.00 | 0.0% | 100.0% |
| Total/Wtd. Avg. | 169 | 782,765 | 100.0% | $16,723,432 | $23.18 | 100.0% | ||
| Lee Premium Outlets Property | ||||||||
| MTM | 1 | 7,781 | 3.5% | 3.5% | $313,467 | $40.29 | 4.5% | 4.5% |
| 2016 | 2 | 1,737 | 0.8% | 4.2% | $42,000 | $24.18 | 0.6% | 5.1% |
| 2017 | 11 | 51,633 | 23.0% | 27.2% | $1,453,874 | $28.16 | 21.0% | 26.1% |
| 2018 | 11 | 36,633 | 16.3% | 43.5% | $1,284,740 | $35.07 | 18.6% | 44.7% |
| 2019 | 11 | 46,107 | 20.5% | 64.0% | $1,208,963 | $26.22 | 17.5% | 62.2% |
| 2020 | 2 | 4,563 | 2.0% | 66.0% | $161,716 | $35.44 | 2.3% | 64.5% |
| 2021 | 2 | 6,202 | 2.8% | 68.8% | $175,574 | $28.31 | 2.5% | 67.0% |
| 2022 | 5 | 16,188 | 7.2% | 76.0% | $564,508 | $34.87 | 8.2% | 75.2% |
| 2023 | 4 | 13,102 | 5.8% | 81.8% | $486,640 | $37.14 | 7.0% | 82.2% |
| 2024 | 1 | 1,742 | 0.8% | 82.6% | $64,701 | $37.14 | 0.9% | 83.1% |
| 2025 | 6 | 26,373 | 11.7% | 94.3% | $1,124,446 | $42.64 | 16.2% | 99.4% |
| 2026 | 1 | 627 | 0.3% | 94.6% | $42,636 | $68.00 | 0.6% | 100.0% |
| 2027 and Beyond | 0 | 0 | 0.0% | 94.6% | $0 | $0.00 | 0.0% | 100.0% |
| Vacant | 0 | 12,137 | 5.4% | 100.0% | $0 | $0.00 | 0.0% | 100.0% |
| Total/Wtd. Avg. | 57 | 224,825 | 100.0% | $6,923,266 | $32.55 | 100.0% | ||
| Gaffney Premium Outlets Property | ||||||||
| MTM | 6 | 25,801 | 8.5% | 8.5% | $464,912 | $18.02 | 8.2% | 8.2% |
| 2016 | 7 | 32,356 | 10.6% | 19.1% | $503,477 | $15.56 | 8.9% | 17.1% |
| 2017 | 16 | 48,353 | 15.9% | 35.1% | $1,008,281 | $20.85 | 17.8% | 34.9% |
| 2018 | 7 | 34,632 | 11.4% | 46.4% | $782,547 | $22.60 | 13.8% | 48.7% |
| 2019 | 5 | 27,373 | 9.0% | 55.5% | $671,252 | $24.52 | 11.8% | 60.5% |
| 2020 | 4 | 32,728 | 10.8% | 66.2% | $575,160 | $17.57 | 10.1% | 70.6% |
| 2021 | 7 | 24,202 | 8.0% | 74.2% | $513,908 | $21.23 | 9.1% | 79.7% |
| 2022 | 6 | 23,013 | 7.6% | 81.8% | $585,403 | $25.44 | 10.3% | 90.0% |
| 2023 | 3 | 11,867 | 3.9% | 85.7% | $214,151 | $18.05 | 3.8% | 93.8% |
| 2024 | 3 | 10,567 | 3.5% | 89.1% | $255,772 | $24.20 | 4.5% | 98.3% |
| 2025 | 0 | 0 | 0.0% | 89.1% | $0 | $0.00 | 0.0% | 98.3% |
| 2026 | 1 | 4,214 | 1.4% | 90.5% | $95,489 | $22.66 | 1.7% | 100.0% |
| 2027 and Beyond | 0 | 0 | 0.0% | 90.5% | $0 | $0.00 | 0.0% | 100.0% |
| Vacant | 0 | 28,771 | 9.5% | 100.0% | $0 | $0.00 | 0.0% | 100.0% |
| Total/Wtd. Avg. | 65 | 303,877 | 100.0% | $5,670,352 | $20.61 | 100.0% | ||
| Calhoun Premium Outlets Property | ||||||||
| MTM | 6 | 30,310 | 11.9% | 11.9% | $528,942 | $17.45 | 12.8% | 12.8% |
| 2016 | 6 | 23,860 | 9.4% | 21.3% | $240,366 | $10.07 | 5.8% | 18.6% |
| 2017 | 6 | 35,100 | 13.8% | 35.1% | $558,680 | $15.92 | 13.5% | 32.2% |
| 2018 | 11 | 37,930 | 14.9% | 50.1% | $746,999 | $19.69 | 18.1% | 50.2% |
| 2019 | 3 | 11,200 | 4.4% | 54.5% | $259,221 | $23.14 | 6.3% | 56.5% |
| 2020 | 5 | 41,899 | 16.5% | 71.0% | $912,295 | $21.77 | 22.1% | 78.6% |
| 2021 | 4 | 29,252 | 11.5% | 82.5% | $360,317 | $12.32 | 8.7% | 87.3% |
| 2022 | 1 | 3,760 | 1.5% | 84.0% | $76,174 | $20.26 | 1.8% | 89.2% |
| 2023 | 0 | 0 | 0.0% | 84.0% | $0 | $0.00 | 0.0% | 89.2% |
| 2024 | 2 | 11,200 | 4.4% | 88.4% | $282,369 | $25.21 | 6.8% | 96.0% |
| 2025 | 2 | 5,501 | 2.2% | 90.5% | $82,875 | $15.07 | 2.0% | 98.0% |
| 2026 | 1 | 3,600 | 1.4% | 92.0% | $81,576 | $22.66 | 2.0% | 100.0% |
| 2027 and Beyond | 0 | 0 | 0.0% | 92.0% | $0 | $0.00 | 0.0% | 100.0% |
| Vacant | 0 | 20,451 | 8.0% | 100.0% | $0 | $0.00 | 0.0% | 100.0% |
| Total/Wtd. Avg. | 47 | 254,063 | 100.0% | $4,129,815 | $17.68 | 100.0% | ||
| (1) | Information is based on the underwritten rent roll. |
| (2) | Certain tenants may have lease termination options that are exercisable prior to the originally stated expiration date of the subject lease and that are not considered in the lease rollover schedule. |
| (3) | Wtd. Avg. UW Rent PSF Rolling excludes vacant space. |
This is not a research report and was not prepared by any Underwriter’s research departments. Please see additional important information and qualifications at the end of this Term Sheet.
| T-76 |
| MSBAM 2016-C31 | Simon Premium Outlets |
The Market. The Simon Premium Outlets Properties are located in Lee, Massachusetts, Gaffney, South Carolina and Calhoun, Georgia. Each property is located along major thoroughfares in expansive trade areas near multiple metropolitan markets.
Lee, Massachusetts
The Lee Premium Outlets Property is located at 50 Water Street in Lee, Massachusetts, along U.S. Route 20, just south of its intersection with Interstate 90 (Massachusetts Turnpike) and approximately 30 miles west of Interstate 91. The traffic count passing the Lee Premium Outlets Property on Interstate 90 is estimated at 55,000 vehicles daily. Albany, New York is approximately 30 miles west and Springfield, Massachusetts and Hartford, Connecticut are within approximately an hour’s drive of the Lee Premium Outlets Property.
Lee is located in the central portion of the Pittsfield, Massachusetts core-based statistical area at the foot of the Berkshire Hills and the Taconic Mountain Range in the Berkshires of Massachusetts. The Berkshires are a year-round tourist destination for hiking, camping and skiing. The area is home to the Norman Rockwell Museum, the Canyon Ranch Resort and Tanglewood Music Center. According to the appraisal, direct visitor spending in Berkshire County totaled $425.8 million in 2014. Pittsfield’s economy is driven by education and healthcare (25.1% of employment), leisure and hospitality (14.8% of employment) and retail (13.4% of employment). According to the appraisal, the 2015 population within a 15-, 30- and 45-mile radius of the Lee Premium Outlets Property was 91,815, 351,951 and 1,866,842, respectively, and the 2015 average household income within a 15-, 30- and 45-mile radius was $76,485, $80,025 and $80,828, respectively.
The nearest competitive outlet center is Manchester Designer Outlets in Manchester, Vermont (71 miles north). According to the appraisal, no new outlet centers are planned in the immediate area.
Gaffney, South Carolina
The Gaffney Premium Outlets Property is located at 1 Factory Shops Boulevard in Gaffney, South Carolina, at the intersection of Interstate 85 (at Exit 90) and SC-105 (Hyatt Street) and approximately 18 miles east of Interstate 26. The traffic count passing the Gaffney Premium Outlets Property on Interstate 85 is estimated at 56,700 vehicles daily. Gaffney’s central business district is approximately 3.5 miles east of the Gaffney Premium Outlets Property. Spartanburg and Greenville are southwest approximately 20 miles and 50 miles, respectively, and Charlotte, North Carolina is approximately 55 miles east of the Gaffney Premium Outlets Property.
Gaffney is the primary city in Cherokee County and the county seat, and is located in the Greenville-Spartanburg-Anderson combined statistical area. The adjacent Spartanburg metropolitan statistical area exerts a strong economic influence on the area. Spartanburg’s economy is driven by manufacturing (20.5% of employment), with the corporate presence of BMW, Michelin and Adidas, health services and education (18.1% of employment) with the Spartanburg Regional Healthcare System, Mary Black Health System, University of South Carolina – Upstate and seven other institutions of higher learning, and retail (12.6% of employment). According to the appraisal, the 2015 population within a 15-, 30- and 45-mile radius of the Gaffney Premium Outlets Property was 153,876, 608,584 and 1,794,169, respectively, and the 2015 average household income within a 15-, 30- and 45-mile radius was $52,198, $55,069 and $62,898, respectively.
The nearest competitive outlet centers are Charlotte Premium Outlets in Charlotte, North Carolina (45 miles east) and Concord Mills, in Concord, North Carolina (60 miles northeast), both owned and operated by the sponsor, and Asheville Outlets in Asheville, North Carolina (60 miles northeast). According to the appraiser, no new outlet centers are planned in the immediate area.
Calhoun, Georgia
The Calhoun Premium Outlets Property is located at 455 Belwood Road in Calhoun, Georgia, just south of the interchange of Highway 53 and Interstate 75 (running parallel to U.S. Highway 41). The traffic count passing the Calhoun Premium Outlets Property on Interstate 75 is estimated at 61,000 vehicles daily. Calhoun’s central business district is approximately 2.5 miles north of the Calhoun Premium Outlets Property. Chattanooga, Tennessee is approximately 45 miles northwest and Atlanta, Georgia is approximately 55 miles southeast of the Calhoun Premium Outlets Property.
Calhoun is located in Gordon County and is the county seat. The Gordon County area economy is driven by manufacturing (24.0% of employment), retail (13.3% of employment) and health services and education (11.8% of employment). The major employers in the Gordon County area include Engineered Floors, LLC, Floyd Healthcare Management, Inc. and Mohawk Carpet Distribution LP. According to the appraisal, the 2015 population within a 15-, 30- and 45-mile radius of the Calhoun Premium Outlets Property was 91,304, 564,725 and 1,958,101, respectively, and the 2015 average household income within a 15-, 30- and 45-mile radius was $54,536, $60,508 and $79,190, respectively.
The nearest competitive outlet centers are The Outlet Shoppes Atlanta in Woodstock, Georgia (33 miles southeast) and North Georgia Premium Outlets in Dawsonville, Georgia (50 miles east), which is also owned and operated by the sponsor. According to the appraisal, no new outlet centers are planned in the immediate area.
This is not a research report and was not prepared by any Underwriter’s research departments. Please see additional important information and qualifications at the end of this Term Sheet.
| T-77 |
| MSBAM 2016-C31 | Simon Premium Outlets |
Operating History and Underwritten Net Cash Flow.The following table presents certain information relating to the historical operating performance and the Underwritten Net Cash Flow at the Simon Premium Outlets Properties:
| Cash Flow Analysis | ||||||||||||||
| 2012 | 2013 | 2014 | 2015 | 7/31/2016 TTM | UW | UW PSF | ||||||||
| Base Rent | $15,354,367 | $15,844,111 | $16,164,930 | $16,373,361 | $17,139,587 | $18,889,685(1) | $24.13 | |||||||
| Percentage Rent | $367,032 | $473,692 | $559,467 | $462,372 | $499,250 | $503,811 | $0.64 | |||||||
| Total Recoveries | $6,310,260 | $6,906,907 | $7,419,714 | $7,615,381 | $7,700,525 | $7,512,165 | $9.60 | |||||||
| Other Income(2) | $468,139 | $380,979 | $399,321 | $395,684 | $414,905 | $406,347 | $0.52 | |||||||
| Less Vacancy | ($20,079) | $18,560 | ($15,784) | ($7,003) | ($122,343) | ($2,814,709) | (10.5%) | |||||||
| Effective Gross Income | $22,479,719 | $23,624,249 | $24,527,648 | $24,839,795 | $25,631,924 | $24,497,300 | $31.30 | |||||||
| Total Operating Expenses | $6,946,469 | $7,094,274 | $7,147,919 | $6,976,569 | $6,890,848 | $7,416,196 | $9.47 | |||||||
| Net Operating Income | $15,533,250 | $16,529,975 | $17,379,729 | $17,863,226 | $18,741,076 | $17,081,104 | $21.82 | |||||||
| Capital Expenditures | $0 | $0 | $0 | $0 | $0 | $211,429 | $0.27 | |||||||
| TI/LC | $0 | $0 | $0 | $0 | $0 | $1,194,140 | $1.53 | |||||||
| Net Cash Flow | $15,533,250 | $16,529,975 | $17,379,729 | $17,863,226 | $18,741,076 | $15,675,535 | $20.03 | |||||||
| Occupancy % | 94.7% | 95.4% | 96.4% | 95.1% | 93.7%(3) | 89.5% | ||||||||
| NOI DSCR(4) | 2.53x | 2.69x | 2.83x | 2.91x | 3.05x | 2.78x | ||||||||
| NCF DSCR(4) | 2.53x | 2.69x | 2.83x | 2.91x | 3.05x | 2.55x | ||||||||
| NOI Debt Yield(4) | 14.9% | 15.8% | 16.7% | 17.1% | 18.0% | 16.4% | ||||||||
| NCF Debt Yield(4) | 14.9% | 15.8% | 16.7% | 17.1% | 18.0% | 15.0% | ||||||||
| (1) | UW Base Rent is underwritten based on signed leases and the in-place rent as of July 31, 2016 (including MTM tenants) with contractual rent steps taken through June 2017. |
| (2) | Other income includes rental income from temporary tenants, sponsorships and media, beverage case rent, ATM rent and other miscellaneous income. |
| (3) | Occupancy as of May 19, 2016. |
| (4) | Debt service coverage ratios and debt yields are based on the Simon Premium Outlets Whole Loan. |
Escrows and Reserves. During a Springing Reserve Period (as defined below), the Simon Premium Outlets Borrowers are required to escrow monthly (i) 1/12th of the estimated annual real estate taxes, (ii) 1/12th of the estimated annual insurance premiums (unless the Simon Premium Outlets Properties are covered by an acceptable blanket policy), (iii) $16,308 for replacement reserves, capped at $391,383 and (iv) $97,846 for TI/LC reserves, capped at $3,522,443.
A “Springing Reserve Period” will occur upon the debt service coverage ratio based on the preceding four calendar quarters falling below 1.35x for two consecutive calendar quarters and end upon the debt service coverage ratio based on the preceding four calendar quarters being greater than or equal to 1.35x for two consecutive calendar quarters.
Lockbox and Cash Management. A hard lockbox is in place with respect to the Simon Premium Outlets Whole Loan. The Simon Premium Outlets Whole Loan has springing cash management (i.e. the Simon Premium Outlets Whole Loan has cash management only after the initial occurrence, and during the continuance, of a Cash Sweep Period (as defined below). During the continuance of a Cash Sweep Period, all sums on deposit in the lockbox account are required to be swept into a cash management account for the payment of, among other things, debt service, monthly escrows and operating expenses pursuant to an approved annual budget. Also during the continuance of a Cash Sweep Period, the Simon Premium Outlets Whole Loan documents require all excess cash to be deposited with the lender to be held as additional security for the Simon Premium Outlets Whole Loan.
A “Cash Sweep Period” will occur upon (i) an event of default, (ii) a bankruptcy action involving the Simon Premium Outlets guarantors or property manager, or (iii) the debt service coverage ratio based on the preceding four calendar quarters falling below 1.25x for two consecutive calendar quarters. A Cash Sweep Period will continue until, in regard to clause (i) above, the cure of such event of default, in regard to clause (ii) above, the Simon Premium Outlets guarantors or property manager are no longer involved in any bankruptcy action or are replaced within 60 days of commencement of the bankruptcy action by a qualified manager or an acceptable replacement guarantor as applicable, or in regard to clause (iii) above, upon the date the debt service coverage ratio based on the preceding four calendar quarters is greater than or equal to 1.25x for two consecutive calendar quarters.
Additional Secured Indebtedness (not including trade debts). The Simon Premium Outlets Properties also secure the Simon Premium Outlets Pari Passu Companion Loans, which have an aggregate Cut-off Date principal balance of $62,081,789. The promissory notes evidencing the Simon Premium Outlets Pari Passu Companion Loans include Promissory Note A-1 in the original principal amount of $37,500,000 and currently held by the WFCM 2016-BNK1 securitization trust and Promissory Note A-2 in the original principal amount of $25,000,000 and currently held by the MSBAM 2016-C30 securitization trust. The Simon Premium Outlets Pari Passu Companion Loans accrue interest at the same rate as the Simon Premium Outlets Mortgage Loan. The Simon Premium Outlets Mortgage Loan is entitled to payments of principal and interest on a pro rata and pari passu basis with the Simon Premium Outlets Pari Passu Companion Loans. The holders of the Simon Premium Outlets Mortgage Loan and the Simon Premium Outlets Pari Passu Companion Loans have entered into a co-lender agreement which sets forth the allocation of collections on the Simon Premium Outlets Whole Loan. See “Description of the Mortgage Pool—The Whole Loans—The Non-Serviced Pari Passu Whole Loans” and “Pooling and Servicing Agreement” in the Preliminary Prospectus.
Mezzanine Loan and Preferred Equity.Not permitted.
This is not a research report and was not prepared by any Underwriter’s research departments. Please see additional important information and qualifications at the end of this Term Sheet.
| T-78 |
| MSBAM 2016-C31 | Simon Premium Outlets |
Release of Property.During the lockout period, the borrower is permitted to partially release either or both of the Gaffney Premium Outlets Property and the Calhoun Premium Outlets Property in connection with a partial prepayment, subject to certain conditions including (i) no occurrence and continuance of any event of default; (ii) the debt service coverage ratio with respect to the remaining property being no less than the greater of 2.55x and the debt service coverage ratio for the preceding four calendar quarters prior to the release; (iii) the release not causing the MSBAM 2016-C31 transaction to fail to qualify as a REMIC trust; and (iv) payment of (a) 120.0% of the allocated loan amount for the Gaffney Premium Outlets Property and/or the Calhoun Premium Outlets Property (if any such property is the released property) and (b) a yield maintenance charge.
Following the lockout period, the borrower is permitted to partially release either or both of the Gaffney Premium Outlets Property and the Calhoun Premium Outlets Property in connection with a partial defeasance, subject to certain conditions including (i) no occurrence and continuance of any event of default; (ii) the principal balance of the Simon Premium Outlets Whole Loan being reduced by 120.0% of the allocated loan amount for the Gaffney Premium Outlets Property and the Calhoun Premium Outlets Property (if any such property is the released property); (iii) the debt service coverage ratio with respect to the remaining Property being no less than the greater of 2.55x and the debt service coverage ratio for the preceding four calendar quarters prior to the release; (iv) the lender receiving rating agency confirmation from Fitch, KBRA and Moody’s that the release will not result in a downgrade, withdrawal or qualification of the respective ratings assigned to the Series 2016-C31 certificates and similar confirmations from each rating agency rating any securities backed by any Simon Premium Outlets Companion Loan with respect to the ratings of such securities; and (v) the lender receiving a legal opinion that the release satisfies REMIC requirements.
Terrorism Insurance.The Simon Premium Outlets Borrowers are required to obtain and maintain property insurance, public liability insurance and rental loss and/or business interruption insurance that covers perils of terrorism and acts of terrorism, provided that the Simon Premium Outlets Whole Loan documents provide for an annual terrorism premium cap of two times the cost of the premium for “All Risk” or “Special Perils” property insurance required under the related the Simon Premium Outlets Properties Whole Loan documents, but excluding the wind and flood components of such premium.
This is not a research report and was not prepared by any Underwriter’s research departments. Please see additional important information and qualifications at the end of this Term Sheet.
| T-79 |
| MSBAM 2016-C31 | Harlem USA |
Mortgage Loan No. 7 – Harlem USA
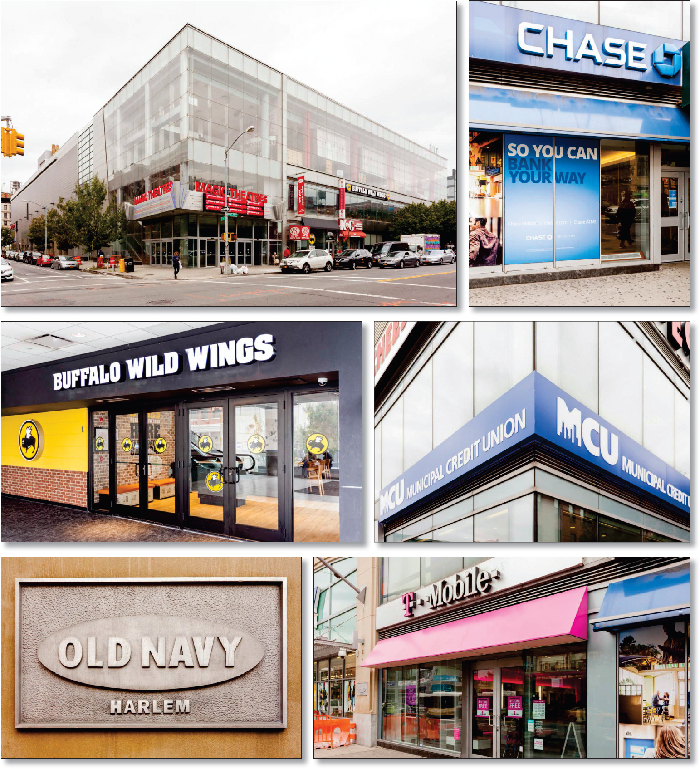
This is not a research report and was not prepared by any Underwriter’s research departments. Please see additional important information and qualifications at the end of this Term Sheet.
| T-80 |
| MSBAM 2016-C31 | Harlem USA |
Mortgage Loan No. 7 – Harlem USA
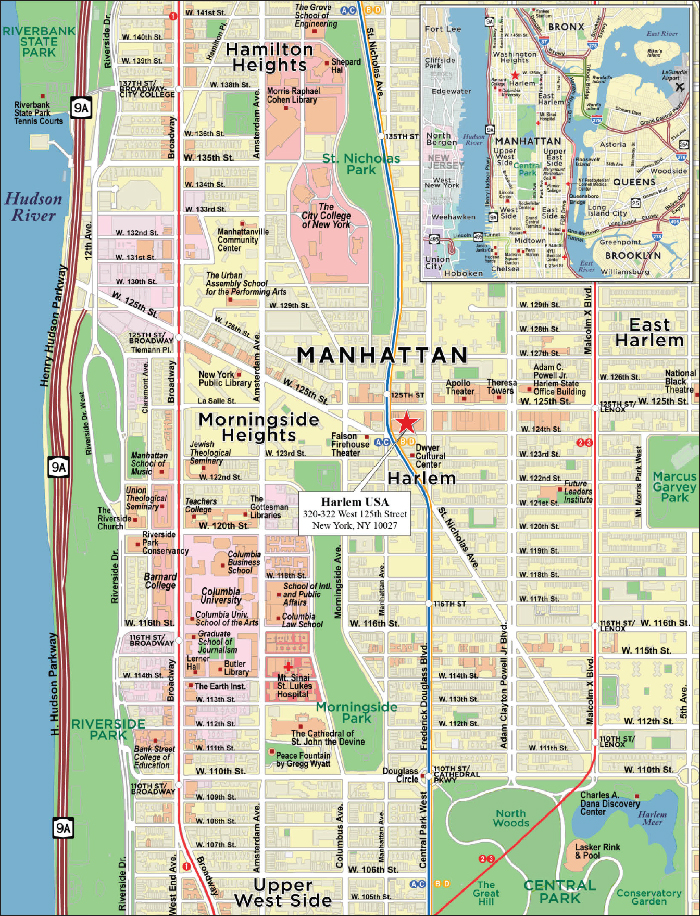
This is not a research report and was not prepared by any Underwriter’s research departments. Please see additional important information and qualifications at the end of this Term Sheet.
| T-81 |
| MSBAM 2016-C31 | Harlem USA |
| Mortgage Loan No. 7 – Harlem USA |
| Mortgage Loan Information | Mortgaged Property Information | ||||||
| Mortgage Loan Seller: | MSMCH | Single Asset/Portfolio: | Single Asset | ||||
| Original Balance(1): | $40,000,000 | Location: | New York, NY 10027 | ||||
| Cut-off Date Balance(1): | $40,000,000 | General Property Type: | Retail | ||||
| % of Initial Pool Balance: | 4.2% | Detailed Property Type: | Anchored | ||||
| Loan Purpose: | Refinance | Title Vesting: | Leasehold | ||||
| Sponsor: | Drew Greenwald; Gotham Organization Inc. | Year Built/Renovated: | 1998/2004 | ||||
| Mortgage Rate: | 3.3100% | Size: | 245,849 SF | ||||
| Note Date: | 9/28/2016 | Cut-off Date Balance per SF(1): | $439 | ||||
| First Payment Date: | 11/1/2016 | Maturity Date Balance per SF(1): | $439 | ||||
| Maturity Date: | 10/1/2026 | Property Manager: | Urban Mark USA, LLC | ||||
| Original Term to Maturity: | 120 months | ||||||
| Original Amortization Term: | 0 months | Underwriting and Financial Information | |||||
| IO Period: | 120 months | UW NOI: | $10,757,167 | ||||
| Seasoning: | 1 month | UW NOI Debt Yield(1): | 10.0% | ||||
| Prepayment Provisions(2): | LO (25); DEF (91); O (4) | UW NOI Debt Yield at Maturity(1): | 10.0% | ||||
| Lockbox/Cash Mgmt Status: | Hard/Springing | UW NCF DSCR(1): | 2.83x | ||||
| Additional Debt Type(3): | Pari Passu | Most Recent NOI: | $10,769,022 (6/30/2016 TTM) | ||||
| Additional Debt Balance(3): | $68,000,000 | 2nd Most Recent NOI: | $10,587,853 (12/31/2015) | ||||
| Future Debt Permitted (Type): | No (N/A) | 3rd Most Recent NOI: | $9,646,003 (12/31/2014) | ||||
| Reserves(4) | Most Recent Occupancy: | 97.7% (8/1/2016) | |||||
| Type | Initial | Monthly | Cap | 2nd Most Recent Occupancy: | 98.8% (12/31/2015) | ||
| RE Tax: | $404,392 | $101,098 | N/A | 3rd Most Recent Occupancy: | 98.8% (12/31/2014) | ||
| Insurance: | $17,980 | $17,980 | N/A | Appraised Value (as of): | $195,000,000 (8/3/2016) | ||
| Recurring Replacements: | $0 | $4,097 | N/A | Cut-off Date LTV Ratio(1): | 55.4% | ||
| TILC: | $0 | Springing | $921,934 | Maturity Date LTV Ratio(1): | 55.4% | ||
| Sources and Uses | ||||||
| Sources | Proceeds | % of Total | Uses | Proceeds | % of Total | |
| Loan Amount(1): | $108,000,000 | 100.0% | Loan Payoff: | $105,068,654 | 97.3% | |
| Closing Costs: | $1,460,818 | 1.4% | ||||
| Return of Equity: | $1,048,155 | 1.0% | ||||
| Reserves: | $422,373 | 0.4% | ||||
| Total Sources: | $108,000,000 | 100.0% | Total Uses: | $108,000,000 | 100.0% | |
| (1) | The Harlem USA Mortgage Loan is part of the Harlem USA Whole Loan, which is comprised of twopari passu promissory notes with an aggregate principal balance of $108,000,000. The Cut-off Date Balance per SF, Maturity Date Balance per SF, UW NCF DSCR, UW NOI Debt Yield, UW NOI Debt Yield at Maturity, Cut-off Date LTV Ratio and Maturity Date LTV Ratio numbers presented above are based on the aggregate principal balance of the promissory notes comprising the Harlem USA Whole Loan. |
| (2) | Defeasance is permitted at any time after the earlier to occur of (a) the end of the two-year period commencing on the closing date of the securitization of the last Harlem USA Whole Loan promissory note to be securitized and (b) 42 months after the origination date. |
| (3) | See “—The Mortgage Loan” and “—Additional Secured Indebtedness (not including trade debts)” below for further discussion of additional debt. |
| (4) | See “—Escrows and Reserves” below for further discussion of reserve requirements. |
The Mortgage Loan.The seventh largest mortgage loan (the “Harlem USA Mortgage Loan”) is part of a whole loan (the “Harlem USA Whole Loan”) evidenced by twopari passu promissory notes in the aggregate original principal amount of $108,000,000, both of which are secured by a first priority leasehold mortgage encumbering a multi-tenant retail property known as Harlem USA (the “Harlem USA Property”). Promissory Note A-2, in the original principal amount of $40,000,000, represents the Harlem USA Mortgage Loan and will be included in the MSBAM 2016-C31 Trust. Promissory Note A-1, in the original principal amount of $68,000,000 is currently held by Morgan Stanley Bank, N.A. or an affiliate thereof. Promissory Note A-1 (the “Harlem USAPari Passu Companion Loan”) is expected to be contributed to one or more future securitization transactions or may be otherwise transferred at any time. The Harlem USA Mortgage Loan will initially be serviced pursuant to the pooling and servicing agreement for the MSBAM 2016-C31 Trust, and from and after the securitization of the Harlem USAPari Passu Companion Loan represented by Note A-1, will be serviced pursuant to the pooling and servicing agreement for the securitization to which such Harlem USAPari Passu Companion Loan is contributed. See “Description of the Mortgage Pool—The Whole Loans— The Serviced Pari Passu Whole Loans—” and “Pooling and Servicing Agreement” in the Preliminary Prospectus.
The proceeds of the Harlem USA Whole Loan were primarily used to refinance a previous loan of approximately $105,068,654, secured by the Harlem USA Property, return equity of approximately $1,048,155 to the Harlem USA Borrower, pay closing costs and fund upfront reserves.
This is not a research report and was not prepared by any Underwriter’s research departments. Please see additional important information and qualifications at the end of this Term Sheet.
| T-82 |
| MSBAM 2016-C31 | Harlem USA |
The Borrower and the Sponsors. The borrower is HUSA Management Co., LLC (the “Harlem USA Borrower”), a single-purpose New York limited liability company with two independent directors in its organizational structure. The Harlem USA Borrower is owned by HUSA Operating Co., LLC (99.0%, non-managing member) and HUSA Managing Member, Inc. (1.0% managing member). HUSA Operating Co., LLC is owned by GOHUSA, LLC (50.0%, co-manager) and Grid Urban Ventures, LLC (50.0%, co-manager). GOHUSA, LLC is owned by a trust of the Picket family and is ultimately controlled by David L. Picket and Allison Fehrenbaker. Grid Urban Ventures, LLC is owned by members of the Greenwald family or trusts for their benefit (85.0%) and by employees of Grid Employee Capital, LLC (15.0%). Grid Urban Ventures, LLC is ultimately controlled by Drew Greenwald. HUSA Managing Member, Inc. is owned by David L. Picket (24.4%), Allison Fehrenbaker (23.9%), Joel I. Picket (1.8%), Drew Greenwald (21.3%), Mindy Greenwald (21.3%), Steven Sterneck (3.7%) and James Tuman (3.7%). The following individuals serve as the directors of HUSA Managing Member, Inc. and hold controlling interest in Harlem USA Borrower: Drew Greenwald, Joel I. Picket, David L. Picket and James Tuman. The Harlem USA Whole Loan non-recourse guarantors are Gotham Organization Inc. and Drew Greenwald; however, such non-recourse carveout guarantors are liable only for certain voluntary or collusive bankruptcy events of the Harlem USA Borrower. There is no separate environmental indemnitor apart from the Harlem USA Borrower for the Harlem USA Whole Loan.
The Property.The Harlem USA Property is a 5-story (including lower level), multi-tenanted retail property located on West 125th Street between St. Nicholas Avenue and Frederick Douglass Boulevard in the Harlem neighborhood of Upper Manhattan. Built in 1998, the Harlem USA Property is comprised of 245,849 SF and is 97.7% occupied by 13 tenants as of August 1, 2016. The majority of the retail suites are multi-level spaces located on the ground, second or lower levels. The third and fourth floors primarily comprise the Magic Johnson Theatres. The New York Sports Club leases space on the ground and fifth floors. The lower level contains retail space and building mechanical systems. The ground floor retail space has retail frontage along West 125th Street, St. Nicholas Avenue, Frederick Douglass Boulevard and West 124th Street.
The Harlem USA Property is comprised of a leasehold interest under a 124-year term ground lease which expires May 21, 2122. The current contract ground rent is $300,000 per annum through the lease expiration. The Harlem USA Borrower is also responsible for the payment of a supplemental ground rent. The supplemental ground rent is currently $250,000 and is scheduled to increase to $300,000 on January 1, 2023 and every following five-year period by $50,000.
The immediate area surrounding the Harlem USA Property consists of a combination of three to six-story walk-up multifamily buildings, mid-rise residential buildings and small to mid-rise commercial/office buildings. The Harlem USA Property is located along the primary commercial corridor within the Harlem neighborhood known as 125th Street. The retailers in the Harlem USA Property’s immediate area include a combination of national, regional and local tenants. National and regional retailers located in the immediate area include Chase Bank, Rainbow (which operates stores both at the Harlem USA Property and in the immediate area), Capital One Bank, Blink Fitness, Joe’s Crab Shack, Duane Reade, Gamestop and Rite Aid.
The area is accessible via various public buses and subways. The A, B, C and D subway lines all stop at 125th Street and Frederick Douglass Boulevard, directly across the street from the Harlem USA Property. Further east, the 4, 5 and 6 subway lines can be accessed at 125th Street and Lexington Avenue. The 2 and 3 trains are located at 125th Street and Lenox Avenue, east of the Harlem USA Property. Public bus services including M3, M10 and M60 all have stops at or near West 125th Street and Frederick Douglass Boulevard.
Major Tenants.
Magic Johnson Theatres (68,087 SF, 27.7% of NRA, 19.2% ofunderwritten rent). Magic Johnson Theatres leases 68,087 SF at the Harlem USA Property and operates the space as a nine-screen movie theater. The lease began June 30, 2000, has a lease expiration date of May 31, 2030 and three 5-year extension options. Magic Johnson Theatres is part of AMC Entertainment, Inc. (“AMC”). As of June 30, 2016, AMC (NYSE: AMC) owned or operated 386 theatres with 5,334 screens across the United States.
Old Navy(34,787 SF, 14.1% of NRA, 18.5% of underwritten rent). Old Navy leases 34,787 SF at the Harlem USA Property. The lease began February 1, 2011, has a lease expiration date of January 31, 2021 and one 5-year extension option. Old Navy is a subsidiary of the Gap, Inc. (“Gap”), which is rated BB+/Baa2/BB+ by Fitch/Moody’s/S&P. Gap (NYSE: GPS) is a leading global apparel retail company offering apparel, accessories and personal care products for men, women and children under five brands. Gap’s clothes are available in 90 countries worldwide through 3,300 company-operated stores, almost 400 franchise stores and e-commerce sites.
K&G Fashion Superstore(23,250 SF, 9.5% of NRA, 5.4% of underwritten rent).K&G Fashion Superstore (“K&G”) leases 23,250 SF at the Harlem USA Property. The lease began March 1, 2014 and has a lease expiration date of February 28, 2019 and no extension options. K&G is a fashion retailer specializing in discounted designer clothing.
This is not a research report and was not prepared by any Underwriter’s research departments. Please see additional important information and qualifications at the end of this Term Sheet.
| T-83 |
| MSBAM 2016-C31 | Harlem USA |
The following table presents a summary regarding the largest tenants at the Harlem USA Property:
| Tenant Summary(1) | ||||||||||
| Tenant Name | Credit Rating (Fitch/Moody’s/S&P)(2) | Tenant SF | Appr. % of SF | Annual UW Rent | Annual UW Rent PSF(3) | Sales (12/31/2015)(4) | ||||
| App. % of Annual UW Rent | $ | PSF(5) | Occ. Cost %(6) | Lease Expiration(7) | ||||||
| Magic Johnson Theatres | NR/NR/NR | 68,087 | 27.7% | $2,329,250 | $34.21 | 19.2% | $8,210,848 | $912,316 | 28.4% | 5/31/2030 |
| Old Navy | BB+/Baa2/BB+ | 34,787 | 14.1% | $2,240,000 | $64.39 | 18.5% | $14,038,919 | $404 | 16.0% | 1/31/2021 |
| K&G Fashion Superstore | NR/NR/NR | 23,250 | 9.5% | $650,000 | $27.96 | 5.4% | $4,355,049 | $187 | 14.9% | 2/28/2019 |
| New York Sports Club | NR/NR/NR | 21,993 | 8.9% | $412,727 | $18.77 | 3.4% | $2,002,857 | $91 | 20.6% | 4/30/2020 |
| Chuck E. Cheese | NR/NR/NR | 19,542 | 7.9% | $871,200 | $44.58 | 7.2% | $2,108,105 | $108 | 41.3% | 12/31/2021 |
| Subtotal/Wtd. Avg. | 167,659 | 68.2% | $6,503,177 | $38.79 | 53.6% | $30,715,778 | $183 | 21.2% | ||
| Other Tenants | 72,590 | 29.5% | $5,621,555 | $77.44 | 46.4% | $11,077,593 | ||||
| Vacant Space | 5,600 | 2.3% | $0 | $0.00 | 0% | $0 | ||||
| Total/Wtd. Avg. | 245,849 | 100.0% | $12,124,732 | $50.47 | 100% | $41,793,371 | ||||
| (1) | Information is based on the underwritten rent roll. |
| (2) | Certain ratings are those of the parent company whether or not the parent guarantees the lease. |
| (3) | Wtd. Avg. Annual UW Rent PSF excludes vacant space. |
| (4) | Sales $ and Sales PSF only include tenants reporting sales. Subtotal is based on tenants reporting sales and include top five tenants only. |
| (5) | Sales PSF information for Magic Johnson Theatres is based on nine screens. Weighted average sales PSF includes Magic Johnson Theatre. |
| (6) | Occ Cost % is based on Annual UW Rent. Subtotal is based on tenants reporting sales and includes top five tenants only. |
| (7) | Each of the five largest tenants (other than New York Sports Club) has the right to cease to operate at the Harlem USA Property. With respect to Magic Johnson Theatres, Old Navy, K&G Fashion Superstore and Chuck E. Cheese, if the tenant ceases operations for one year, 60 days, 90 days, and 180 days, respectively, subject to certain rights of the tenants to recommence operations, the Harlem USA Borrower has the right to terminate the related lease. |
The following table presents historical sales information at the Harlem USA Property:
| Historical Sales Summary(1) | ||||||||||||||||||||||
| 2013 | 2014 | 2015 | ||||||||||||||||||||
| Tenant | Sales ($) | Sales (PSF) | Occ. Cost(2) | Sales ($) | Sales (PSF) | Occ. Cost(2) | Sales ($) | Sales (PSF) | Occ. Cost(2) | |||||||||||||
| Magic Johnson Theatres | $8,258,916 | $121 | 28.2% | $8,183,403 | $120 | 28.5% | $8,210,848 | $121 | 28.4% | |||||||||||||
| Old Navy | $13,872,138 | $399 | 16.1% | $14,036,067 | $403 | 16.0% | $14,038,919 | $404 | 16.0% | |||||||||||||
| K&G Fashion Superstore | $4,384,927 | $189 | 14.8% | $4,501,150 | $194 | 14.4% | $4,355,049 | $187 | 14.9% | |||||||||||||
| New York Sports Club | $1,995,912 | $91 | 20.7% | $2,023,815 | $92 | 20.4% | $2,002,857 | $91 | 20.6% | |||||||||||||
| Chuck E. Cheese | $2,683,298 | $137 | 32.5% | $1,993,856 | $102 | 43.7% | $2,108,105 | $108 | 41.3% | |||||||||||||
| Modell’s | $7,007,496 | $369 | 14.3% | $7,265,158 | $382 | 13.8% | $7,006,576 | $369 | 14.3% | |||||||||||||
| Rainbow | $4,286,956 | $286 | 26.2% | $4,054,453 | $270 | 27.7% | $4,071,017 | $271 | 27.6% | |||||||||||||
| Total/Wtd. Avg. | $42,489,643 | $211 | $42,057,902 | $209 | $41,793,371 | $207 | ||||||||||||||||
| (1) | Historical sales information is based on tenants that report sales. |
| (2) | Occupancy Cost % calculations are based on UW Annual Rent divided by sales from the respective year. |
This is not a research report and was not prepared by any Underwriter’s research departments. Please see additional important information and qualifications at the end of this Term Sheet.
| T-84 |
| MSBAM 2016-C31 | Harlem USA |
The following table presents certain information relating to the lease rollover at the Harlem USA Property:
| Lease Rollover Schedule(1)(2) | ||||||||
| Year | # of Leases Rolling | SF Rolling | Annual UW Rent PSF Rolling(3) | Approx. % of Total SF Rolling | Approx. Cumulative % of SF Rolling | Total UW Rent Rolling | Approx. % of Total Rent Rolling | Approx. Cumulative % of Total Rent Rolling |
| MTM | 0 | 0 | $0.00 | 0.0% | 0.0% | $0 | 0.0% | 0.0% |
| 2016 | 0 | 0 | $0.00 | 0.0% | 0.0% | $0 | 0.0% | 0.0% |
| 2017 | 0 | 0 | $0.00 | 0.0% | 0.0% | $0 | 0.0% | 0.0% |
| 2018 | 1 | 2,340 | $220.00 | 1.0% | 1.0% | $514,800 | 4.2% | 4.2% |
| 2019 | 3 | 36,500 | $73.88 | 14.8% | 15.8% | $2,696,590 | 22.2% | 26.5% |
| 2020 | 1 | 21,993 | $18.77 | 8.9% | 24.7% | $412,727 | 3.4% | 29.9% |
| 2021 | 2 | 54,329 | $57.27 | 22.1% | 46.8% | $3,111,200 | 25.7% | 55.6% |
| 2022 | 2 | 12,500 | $33.21 | 5.1% | 51.9% | $415,165 | 3.4% | 59.0% |
| 2023 | 0 | 0 | $0.00 | 0.0% | 51.9% | $0 | 0.0% | 59.0% |
| 2024 | 1 | 15,000 | $75.00 | 6.1% | 58.0% | $1,125,000 | 9.3% | 68.3% |
| 2025 | 0 | 0 | $0.00 | 0.0% | 58.0% | $0 | 0.0% | 68.3% |
| 2026 | 1 | 19,000 | $52.63 | 7.7% | 65.8% | $1,000,000 | 8.2% | 76.5% |
| 2027 & Beyond | 2 | 78,587 | $36.26 | 32.0% | 97.7% | $2,849,250 | 23.5% | 100.0% |
| Vacant | 0 | 5,600 | $0.00 | 2.3% | 100.0% | $0 | 0.0% | 100.0% |
| Total/Wtd. Avg. | 13 | 245,849 | $50.47 | 100.0% | $12,124,732 | 100.0% | ||
| (1) | Information is based on the underwritten rent roll. |
| (2) | Certain tenants may have lease termination options that are exercisable prior to the stated expiration date of the subject lease or leases which are not considered in the lease rollover schedule. |
| (3) | Wtd. Avg. Annual UW Rent PSF Rolling excludes vacant space. |
The Market. The Harlem USA Property is located on a blockthrough parcel bound by West 125th Street to the north, St. Nicholas Avenue to the west, Frederick Douglas Boulevard to the east and West 124th Street to the south in the Harlem neighborhood of Upper Manhattan. Harlem is located within the northern section of Manhattan and has traditionally been defined as the area bound by 110th Street to the south, 155th Street to the north, the Hudson River to the west and Harlem River to the East. Harlem is bordered by the neighborhoods of the Upper East and West Sides to the south, North Harlem to the north, and Manhattanville/Morningside Heights to the west.
The 125th Street retail corridor runs from Broadway to Third Avenue and is home to various national tenants located in ground floor retail spaces as well as multi-story retail centers. National tenants located in the 125th Street retail corridor include DSW Shoe Warehouse, GSA, Blink Fitness, Party City and Capital One Bank. The 125th Street retail corridor has more than 40 local and national food, fashion, sports and entertainment retailers.
According to the appraisal, located to the west of the Harlem USA Property, at the southwest corner of Lenox Avenue and West 125th Street, is a new 3-story, 161,000 SF retail development. The property is 100% leased and will be anchored by Whole Foods and Burlington Coat Factory. Other tenants include Olive Garden, American Eagle and TD Bank. The center is expected to be completed by year end 2016.
In addition, the Harlem USA Property is located adjacent to a development site at the southeast corner of West 125th Street and St. Nicholas Avenue. The site is proposed to be improved with a 2-story retail/commercial building totaling approximately 33,000 square foot of net rentable area and rooftop space. The property is expected to feature ground floor retail space, a restaurant on the second floor and a 4,000 square foot rooftop bar. No tenants have been announced.
According to the appraisal, as of spring 2016, the 125th Street retail corridor generally exhibits a vacancy rate of 5.0% and asking rent of $138 PSF. In the section of the 125th Street corridor where the Harlem USA Property is located, the appraisal reported asking rents between $70 and $390 PSF depending on size, frontage, utility and location.
This is not a research report and was not prepared by any Underwriter’s research departments. Please see additional important information and qualifications at the end of this Term Sheet.
| T-85 |
| MSBAM 2016-C31 | Harlem USA |
The following table presents leasing data at competitive retail properties with respect to the Harlem USA Property:
| Competitive Retail Property Summary | ||||||||||
| Address in NY, NY | Cross Streets | Tenant Name | Lease Date | Lease Term (Yrs.) | Lease Area (SF) | Annual Base Rent PSF | Free Rent (mos.) | Work Letter (PSF) | ||
| 200-202 East 116th St. | 116th & Third Avenue | Confidential | Jul-16 | 10 | 450 | Grade | $160 | Grade | 3 | $0.00 |
| 290 Malcolm X Boulevard | Malcolm X Boulevard | City MD | Mar-16 | 10 | 3,780 | Grade | $135 | Grade | 3 | $0.00 |
| 272 West 125th Street | West 125th Street | Foot Locker | Dec-15 | 10 | 8,300 5,000 13,300 | Grade LL Total | $150 $30 $105 | Grade LL Avg. | 4 | $0.00 |
| 100 West 125th Street | West 125th Street & Malcom X Boulevard | American Eagle | Jul-15 | 10 | 8,500 | Grade | $160 | Grade | 3 | $20.00 |
| 281-285 Saint Nicholas Avenue | West 124th Street & St. Nicholas Avenue | Harlem Cafe | May-15 | 10 | 5,000 | Grade | $110 | Grade | 3 | $0.00 |
| 100 West 125th Street | West 125th Street & Malcom X Boulevard | Whole Foods | Feb-15 | 15 | 12,000 27,000 39,000 | Grade LL Total | $145 $35 $105 | Grade LL Avg. | 6 | $20.00 |
| 230 West 125th Street | West 125th Street | The North Face | Jan-15 | 10 | 15,000 | Grade | $200 | Grade | 6 | $0.00 |
| 100 West 125th Street | West 125th Street & Malcom X Boulevard | TD Bank | Feb-15 | 10 | 3,056 | Grade | $165 | Grade | 3 | $20.00 |
| 261 West 125th Street | West 125th Street | Banana Republic | Jul-14 | 10 | 8,200 | Grade | $200 | Grade | 6 | $10.00 |
| 301 West 125th Street | West 125th Street | Capital One | Feb-14 | 10 | 4,338 | Grade | $200 | Grade | 3 | $0.00 |
| 261 West 125th Street | West 125th Street | Red Lobster | Dec-12 | 10 | 1,300 8,500 9,800 | Grade 2nd Total | $180 $40 $59 | Grade 2nd Avg. | 3 | $10.00 |
| 112 West 125th Street | West 125th Street | Offering | Aug-16 | 15 | 11,750 11,750 12,500 36,000 | Grade 2nd LL Total | $250 $75 $65 $128 | Grade 2nd LL Avg. | 6 | $0.00 |
| 313-315 West 125th Street | West 125th Street | Offering | Aug-16 | 10 | 9,580 4,500 14,080 | Grade LL Total | $180 $40 $135 | Grade LL Avg. | 6 | $0.00 |
Source: Appraisal
This is not a research report and was not prepared by any Underwriter’s research departments. Please see additional important information and qualifications at the end of this Term Sheet.
| T-86 |
| MSBAM 2016-C31 | Harlem USA |
The following table presents leasing data at competitive movie theaters with respect to the Harlem USA Property:
| Competitive Movie Theater Summary | ||||||||
Property Name
Address, City, State
| Tenant Name | Lease Area (SF) | Lease Date | Term | Number of Screens | Annual Base Rent PSF | Annual Base Rent per Screen | Lease Type |
| Confidential, New York | Confidential-Lease Out | 30,000 | Jun-16 | 15 | 8 | $65.00 | $262,500 | Net |
| Confidential, New York | Confidential-Lease Out | 47,617 | Jun-16 | 20 | 7 | $42.00 | $285,714 | Net |
City Point Brooklyn, NY | Alamo Draft House | 39,818 | Jan-13 | 20 | 7 | $32.00 | $182,025 | Net |
Tanger Outlet at The Arches Deer Park, NY | Regal Cinema | 63,000 | May-08 | 20 | 16 | $32.00 | $126,000 | Net |
Gateway Cinemas 301 Mount Hope Avenue Rockway, NJ | Gateway Cinemas | 68,000 | May-07 | 17 | 12 | $33.11 | $187,623 | Net |
Pavilion Theatre Brooklyn, NY | Pavilion | 33,120 | Feb-05 | 10 | 10 | $34.05 | $112,774 | Net |
City Center White Plains, NY | National Amusements | 80,000 | Jan-02 | 20 | 15 | $31.35 | $167,200 | Net |
Waterfront at Port Chester Port Chester, NY | Loews Theatre | 70,000 | May-04 | 25 | 25 | $28.57 | $80,000 | Net |
One Jamaica Center Queens, NY | National Amusements | 83,000 | Jan-02 | 20 | 20 | $26.51 | $110,017 | Net |
AMC Loews Orpheum 7 312 West 34th Street New York, NY | Loews Theatre | 100,000 | Oct-01 | 20 | 7 | $54.00 | $771,429 | Net |
Regal Battery Park Stadium 102 North End Avenue New York, NY | Regal Cinema | 105,000 | Jan-00 | 20 | 11 | $33.00 | $315,000 | Net |
Source: Appraisal
Operating History and Underwritten Net Cash Flow. The following table presents certain information relating to the historical operating performance and the Underwritten Net Cash Flow at the Harlem USA Property:
| Cash Flow Analysis | |||||||
| 2012 | 2013 | 2014 | 2015 | 6/30/2016 TTM | UW | UW PSF | |
| Base Rent(1) | $10,598,088 | $10,567,765 | $10,467,303 | $11,410,518 | $11,612,016 | $12,600,732 | $51.25 |
| Total Recoveries | $1,393,996 | $1,476,544 | $1,691,146 | $1,724,912 | $1,793,944 | $2,921,783 | $11.88 |
| Other Income(2) | $372,956 | $426,476 | $453,450 | $502,452 | $508,855 | $460,793 | $1.87 |
| Discounts Concessions | $0 | $0 | $0 | $0 | $0 | $0 | $0.00 |
| Less Vacancy & Credit Loss | $0 | $0 | $0 | $0 | $0 | ($717,690) | ($2.92) |
| Effective Gross Income | $12,365,040 | $12,470,785 | $12,611,898 | $13,637,883 | $13,914,815 | $15,265,618 | $62.09 |
| Total Expenses(3) | $2,447,795 | $2,719,265 | $2,965,895 | $3,050,030 | $3,145,793 | $4,508,451 | $18.34 |
| Net Operating Income | $9,917,245 | $9,751,520 | $9,646,003 | $10,587,853 | $10,769,022 | $10,757,167 | $43.76 |
| Capital Expenditures | $0 | $0 | $0 | $0 | $0 | $48,409 | $0.20 |
| TI/LC | $0 | $0 | $0 | $0 | $0 | $459,738 | $1.87 |
| Net Cash Flow | $9,917,245 | $9,751,520 | $9,646,003 | $10,587,853 | $10,769,022 | $10,249,020 | $41.69 |
| Occupancy % | 97.6% | 95.7% | 98.8% | 98.8% | 97.7%(4) | 95.0% | |
| NOI DSCR(5) | 2.74x | 2.69x | 2.66x | 2.92x | 2.97x | 2.97x | |
| NCF DSCR(5) | 2.74x | 2.69x | 2.66x | 2.92x | 2.97x | 2.83x | |
| NOI Debt Yield(5) | 9.2% | 9.0% | 8.9% | 9.8% | 10.0% | 10.0% | |
| NCF Debt Yield(5) | 9.2% | 9.0% | 8.9% | 9.8% | 10.0% | 9.5% | |
| (1) | Underwritten Base Rent is based on the rent roll dated August 1, 2016 and includes rent steps totaling $194,400 through February 28, 2017 and vacancy gross up of $476,000. |
| (2) | Other Income includes percentage rent paid by Magic Johnson Theatres, signage revenue, license fees and miscellaneous income. |
| (3) | Underwritten Total Expenses include real estate taxes of $1,938,876, which is based on the year 2 estimate by the appraisal. The Harlem USA Property benefits from a real estate tax abatement through the New York City 25 year Industrial & Commercial Incentive Program (ICIP). Under the terms of such tax abatement, increases in real estate taxes will be phased in from year 17 through year 25. The appraisal simulated such increases for the term of the Harlem USA Whole Loan commencing in tax year 2015/2016 through tax year 2023/2024 and estimated that over the period from tax year 2015/2016 to 2025/2026, real estate taxes would increase from $866,895 to $4,427,327. There is no assurance that the actual tax increase will be such estimates. |
| (4) | Occupancy is 97.7% as of August 1, 2016. |
| (5) | Debt service coverage ratios and debt yields are based on the Harlem USA Whole Loan. |
This is not a research report and was not prepared by any Underwriter’s research departments. Please see additional important information and qualifications at the end of this Term Sheet.
| T-87 |
| MSBAM 2016-C31 | Harlem USA |
Escrows and Reserves. The Harlem USA Whole Loan documents provide for upfront reserves in the amount of $404,392 for real estate taxes and $17,980 for insurance premiums. The Harlem USA Borrower is required to escrow monthly: (i) 1/12th of the annual estimated real estate taxes; (ii) 1/12th of the annual estimated insurance premiums (unless the Harlem USA Borrower maintains an acceptable blanket policy) and (iii) $4,097 for replacements and repairs.
During the continuance of a Rollover Reserve Trigger Period (as defined below), the Harlem USA Borrower is required to deposit with the lender on each monthly payment date the sum of $25,609 into an escrow for tenant improvements, tenant allowances and leasing commissions. Provided no event of default is continuing under the Harlem USA Whole Loan documents, the Harlem USA Borrower’s obligation to make such monthly deposit will be suspended if the funds in such escrow are equal to or greater than $921,934, and will recommence if such funds are subsequently less than $921,934 during a Rollover Reserve Trigger Period. If a Rollover Reserve Trigger Period ceases to exist, all funds in the related escrow are required to be released to the Harlem USA Borrower.
A “Rollover Reserve Trigger Period” will commence on the earliest to occur of (i) an event of default under the Harlem USA Whole Loan documents and (ii) the debt yield on the Harlem USA Whole Loan being equal to or less than 7.75% for one calendar quarter, and will end upon (x) with regard to any Rollover Reserve Trigger Period under clause (i) above, the cure (if applicable) of such event of default, and (y) with regard to any Rollover Reserve Trigger Period under clause (ii) above, the date that the debt yield is greater than 7.75% for two consecutive calendar quarters.
Lockbox and Cash Management. A hard lockbox is in place with respect to the Harlem USA Whole Loan. The Harlem USA Whole Loan has springing cash management (i.e., the Harlem USA Whole Loan has cash management only after the occurrence and during the continuance of an event of default under the Harlem USA Whole Loan). So long as no event of default is continuing under the Harlem USA Whole Loan, all funds in the lockbox account are required to be swept on each business day to an operating account maintained by the Harlem USA Borrower. Upon the occurrence and during the continuance of an event of default under the Harlem USA Whole Loan, the lender has the right to direct the lockbox bank to disburse all funds then and thereafter in the lockbox account to an account held by the lender, and to apply such funds to the obligations of the Harlem USA Borrower in such order of priority as the lender shall determine in its sole discretion.
Additional Secured Indebtedness (not including trade debts). In addition to the Harlem USA Mortgage Loan, the Harlem USA Property also secures the Harlem USAPari Passu Companion Loan. The Harlem USAPari PassuCompanion Loan accrues interest at the same rate as the Harlem USA Mortgage Loan. The Harlem USA Mortgage Loan is entitled to payments of interest and principal on apro rata andpari passu basis with the Harlem USAPari Passu Companion Loan. The holders of the Harlem USA Mortgage Loan and the Harlem USAPari Passu Companion Loan have entered into a co-lender agreement which sets forth the allocation of collections on the Harlem USA Whole Loan. See “Description of the Mortgage Pool—The Whole Loans—The Serviced Pari Passu Whole Loans” in the Preliminary Prospectus.
Mezzanine Loan and Preferred Equity. Not permitted.
Release of Property. Not permitted.
Terrorism Insurance. The Harlem USA Whole Loan documents require that the “all risk” insurance policy required to be maintained by the Harlem USA Borrower provide coverage for terrorism in an amount equal to the full replacement cost of the Harlem USA Property and eighteen months of business interruption insurance; provided that if the Terrorism Risk Insurance Program Reauthorization Act of 2015 or extension thereof or substantially similar program (“TRIPRA”) is in effect and continues to cover both foreign and domestic acts of terrorism, the lender is required to accept terrorism insurance with coverage against “covered acts” within the meaning of TRIPRA. If TRIPRA is terminated or otherwise not in effect the Harlem USA Borrower is not required to pay annual premiums in excess of the TC Cap (as defined below) in order to obtain terrorism insurance coverage (but is obligated to purchase the maximum amount of such coverage available with funds equal to the TC Cap). “TC Cap” means two times the then current property insurance premium that is payable at such time in respect of the property and business interruption insurance required under the Harlem USA Whole Loan documents (without giving effect to the cost of the terrorism, flood, earthquake and windstorm components of such casualty and business interruption / rental loss insurance at the time that any terrorism insurance coverage is excluded from any policy).
This is not a research report and was not prepared by any Underwriter’s research departments. Please see additional important information and qualifications at the end of this Term Sheet.
| T-88 |
(THIS PAGE INTENTIONALLY LEFT BLANK)
This is not a research report and was not prepared by any Underwriter’s research departments. Please see additional important information and qualifications at the end of this Term Sheet.
| T-89 |
| MSBAM 2016-C31 | One Stamford Forum |
Mortgage Loan No. 8 – One Stamford Forum
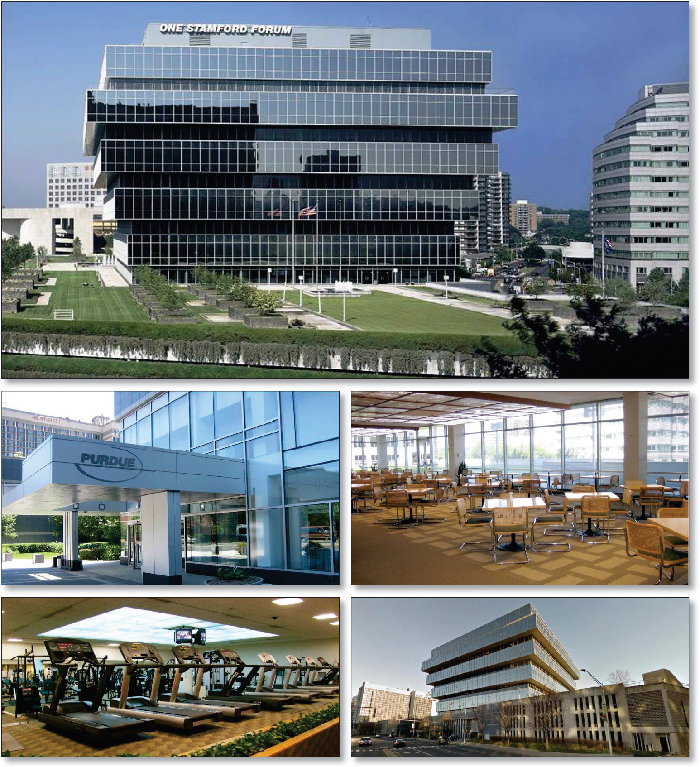
This is not a research report and was not prepared by any Underwriter’s research departments. Please see additional important information and qualifications at the end of this Term Sheet.
| T-90 |
| MSBAM 2016-C31 | One Stamford Forum |
Mortgage Loan No. 8 – One Stamford Forum

This is not a research report and was not prepared by any Underwriter’s research departments. Please see additional important information and qualifications at the end of this Term Sheet.
| T-91 |
| MSBAM 2016-C31 | One Stamford Forum |
Mortgage Loan No. 8 – One Stamford Forum
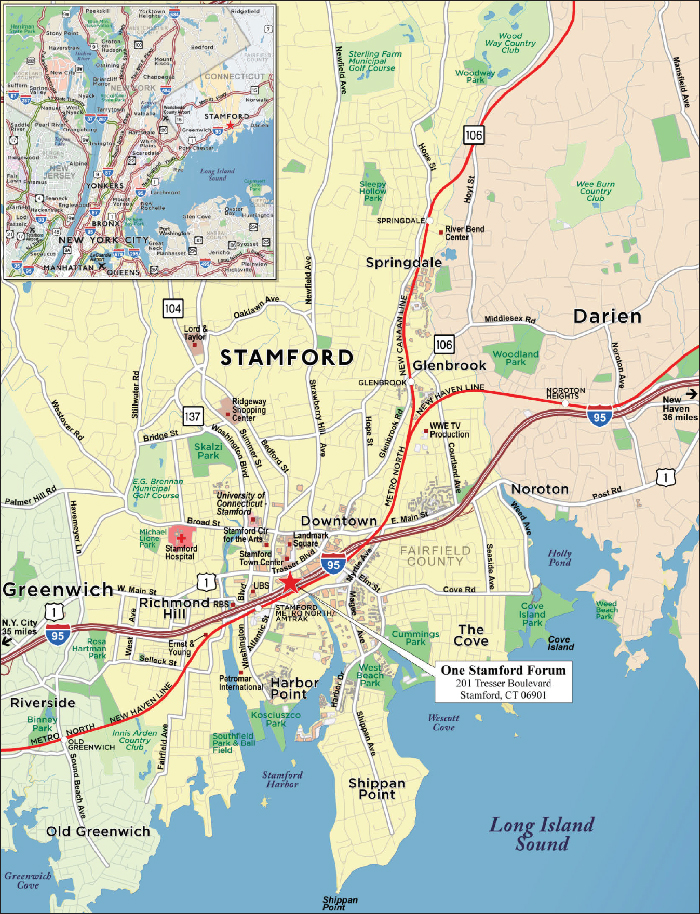
This is not a research report and was not prepared by any Underwriter’s research departments. Please see additional important information and qualifications at the end of this Term Sheet.
| T-92 |
| MSBAM 2016-C31 | One Stamford Forum |
| Mortgage Loan No. 8 – One Stamford Forum |
| Mortgage Loan Information | Property Information | ||||||
| Mortgage Loan Seller: | BANA | Single Asset/Portfolio: | Single Asset | ||||
| Original Balance(1): | $38,500,000 | Location: | Stamford, CT 06901 | ||||
| Cut-off Date Balance(1): | $38,251,697 | General Property Type: | Office | ||||
| % of Initial Pool Balance: | 4.0% | Detailed Property Type: | CBD | ||||
| Loan Purpose: | Refinance | Title Vesting(5): | Fee | ||||
| Sponsors(2): | Various | Year Built/Renovated: | 1973/2000 | ||||
| Mortgage Rate: | 4.9000% | Size: | 504,471 SF | ||||
| Note Date: | 6/28/2016 | Cut-off Date Balance per SF(1): | $217 | ||||
| First Payment Date: | 8/1/2016 | Maturity Date Balance per SF(1): | $163 | ||||
| Maturity Date: | 7/1/2026 | Property Manager: | Self-Managed | ||||
| Original Term to ARD: | 120 months | Underwriting and Financial Information | |||||
| Original Amortization Term: | 300 months | UW NOI: | $13,185,047 | ||||
| IO Period: | 0 months | UW NOI Debt Yield(1): | 12.1% | ||||
| Seasoning: | 4 months | UW NOI Debt Yield at Maturity(1): | 16.0% | ||||
| Prepayment Provisions: | LO (28); DEF/YM1 (85); O (7) | UW NCF DSCR(1): | 1.55x | ||||
| Lockbox/Cash Mgmt Status: | Hard/Springing | Most Recent NOI: | $14,414,125 (3/31/2016 TTM) | ||||
| Additional Debt Type(3): | Pari Passu | 2nd Most Recent NOI: | $14,083,466 (12/31/2015) | ||||
| Additional Debt Balance(3): | $71,038,865 | 3rd Most Recent NOI: | $14,057,626 (12/31/2014) | ||||
| Future Debt Permitted (Type): | No (N/A) | Most Recent Occupancy: | 100.0% (11/1/2016) | ||||
| Reserves(4) | 2nd Most Recent Occupancy: | 100.0% (12/31/2015) | |||||
| Type | Initial | Monthly | Cap | 3rd Most Recent Occupancy: | 100.0% (12/31/2014) | ||
| RE Tax: | $230,359 | $230,359 | N/A | Appraised Value (as of): | $227,000,000 (5/2/2016) | ||
| Insurance: | $58,814 | $19,605 | N/A | Cut-off Date LTV Ratio(1): | 48.1% | ||
| Deferred Maintenance: | $15,188 | $0 | N/A | Maturity Date LTV Ratio(1): | 36.2% | ||
| Sources and Uses | ||||||
| Sources | Proceeds | % of Total | Uses | Proceeds | % of Total | |
| Loan Amount(1): | $110,000,000 | 100.0% | Loan Payoff: | $106,275,830 | 96.6% | |
| Upfront Reserves: | $304,361 | 0.3% | ||||
| Closing Costs: | $1,798,846 | 1.6% | ||||
| Return of Equity: | $1,620,963 | 1.5% | ||||
| Total Sources: | $110,000,000 | 100.0% | Total Uses: | $110,000,000 | 100.0% | |
| (1) | The One Stamford Forum Mortgage Loan is part of the One Stamford Forum Whole Loan, which is comprised of twopari passupromissory notes with an aggregate original principal balance of $110,000,000. The Cut-off Date Balance per SF, Maturity Date Balance per SF, UW NOI Debt Yield, UW NOI Debt Yield at Maturity, UW NCF DSCR, Cut-off Date LTV Ratio and Maturity Date LTV Ratio numbers presented above are based on the aggregate principal balance of the promissory notes comprising the One Stamford Forum Whole Loan. |
| (2) | The sponsors of the One Stamford Forum Whole Loan are Beacon Company (Delaware) (“Beacon”), BRJ Fiduciary Management LLC, as Trustee under Trust Agreement dated November 5, 1974 (“BRJ”), and Rosebay Medical Company L.P. (“Rosebay”). |
| (3) | See “—The Mortgage Loan”and“ —Additional Secured Indebtedness (not including trade debts)” below for further discussion of additional debt. |
| (4) | See “—Escrows and Reserves” below for further discussion of reserve requirements. |
| (5) | The One Stamford Forum Borrower is the owner of the fee interest in the land and improvements, and is also the owner of landlord and tenant’s leasehold interest in two ground leases with respect to the One Stamford Forum Property and has mortgaged its fee and leasehold interests to the lender as security for the One Stamford Forum Whole Loan. Pursuant to the mortgage granted to the lender by the One Stamford Forum Borrower, the ground leases are subject and subordinate to the One Stamford Forum Whole Loan documents. Accordingly, the One Stamford Forum Property is being treated as a fee interest. |
The Mortgage Loan. The eighth largest mortgage loan (the “One Stamford Forum Mortgage Loan”) is part of a whole loan (the “One Stamford Forum Whole Loan”) evidenced by twopari passu promissory notes in the aggregate original principal amount of $110,000,000, which are secured by a first priority fee and leasehold mortgage encumbering a Class A office building totaling 504,471 SF in Stamford, Connecticut (the “One Stamford Forum Property”). Promissory Note A-2 in the original principal amount of $38,500,000 represents the One Stamford Forum Mortgage Loan and will be included in the MSBAM 2016-C31 Trust. Promissory Note A-1 in the original principal amount of $71,500,000, represents a companion loan (the “One Stamford ForumPari Passu Companion Loan”). The One Stamford ForumPari Passu Companion Loan, is currently held by the WFCM 2016-BNK1 securitization trust. The One Stamford Forum Whole Loan is being serviced pursuant to the pooling and servicing agreement for the WFCM 2016-BNK1 transaction. See “Description of the Mortgage Pool—The Whole Loans—The Non-Serviced Pari Passu Whole Loans” and “Pooling and Servicing Agreement—Servicing of the Non-Serviced Mortgage Loans” in the Preliminary Prospectus.
The proceeds of the One Stamford Forum Whole Loan were used to refinance a previous mortgage loan secured by the One Stamford Forum Property in the amount of approximately $106.3 million, fund upfront reserves, pay closing costs and return equity to the One Stamford Forum sponsors. The One Stamford Forum Property was previously securitized in the BACM 2006-3 transaction.
The Borrower and the Sponsors. The borrower is One Stamford Realty L.P. (the “One Stamford Forum Borrower”), a single purpose Delaware limited partnership, with a general partner that is a special purpose entity with two independent directors. Legal counsel to the borrower delivered a non-consolidation opinion in connection with the origination of the One Stamford Forum Whole Loan. Beacon, BRJ and Rosebay, individually and
This is not a research report and was not prepared by any Underwriter’s research departments. Please see additional important information and qualifications at the end of this Term Sheet.
| T-93 |
| MSBAM 2016-C31 | One Stamford Forum |
collectively, are the sponsors and nonrecourse carve-out guarantors under the One Stamford Forum Whole Loan. Each of Beacon, BRJ and Rosebay are ultimately owned by or are for the benefit of members of the Sackler family. Arthur, Mortimer and Raymond Sackler were the original founders of Purdue Pharma L.P. and the Sackler family continues to own 100% of the company. The family’s net worth has been estimated at approximately $14 billion.
The Property. The One Stamford Forum Property consists of a fee and leasehold interest in a 13-story, Class A office tower totaling 504,471 square feet located in Stamford, Connecticut. Constructed in 1973 and renovated in 2000, the One Stamford Forum Property is situated on a 6.1-acre site. The first three levels of the One Stamford Forum Property house the garage containing 1,103 spaces, the lobby, print shop, a 3,000 SF fitness center with full locker rooms, a 100-seat auditorium, conference rooms and office and storage space. The next level above (Plaza Level) houses the full-service cafeteria, convenience store, library and additional office space, and also opens out to five acres of outdoor landscaped areas accessible to building tenants. The remaining upper levels contain office space with the top two floors of the building open to one another in the center with a 3,600 SF atrium open to rooftop skylights. The One Stamford Forum Property was originally built in 1973 as the headquarters for GTE Financial. In 1999, the sponsors purchased the property for $77.0 million and subsequently invested approximately $44.4 million in renovations, bringing their cost basis to $124.5 million.
The One Stamford Forum Property has been 100.0% leased since 2006 and is currently 100.0% leased to two tenants, UBS Group AG (“UBS”) and Purdue Pharma L.P. (“Purdue Pharma”), on leases both expiring in December 2020. Purdue Pharma has signed a subsequent lease on the entire building’s square footage beginning January 2021 through June 2031 with a six and a half year lease-renewal option, and as such, the One Stamford Forum Property will remain fully leased without interruption for at least five years beyond the One Stamford Forum Whole Loan term.
UBS leases 337,456 SF (66.9% of net rentable area) and is not currently occupying its space, however, UBS is continuing to pay its rental obligations and has subleased a total of 330,796 SF to Purdue Pharma (291,679 SF), Rockit Solutions (25,075 SF) and CBRE (14,042 SF), with 6,660 SF currently not being utilized. The subleases are coterminous with UBS’ lease. UBS previously had a large presence in Stamford, but in addition to subleasing out its space at the One Stamford Forum Property, UBS has vacated its Stamford headquarters building at 677 Washington Boulevard and relocated to approximately 120,000 SF at 600 Washington Boulevard.
Purdue Pharma leases 167,015 SF (33.1% of net rentable area) in addition to the 291,679 SF it subleases from UBS. Of its subleased space, Purdue Pharma further subleases space to W.J. Deutsch & Sons Ltd. (43,563 SF), Kokino LLC (11,784 SF), Hillside Capital Inc. (8,705 SF) and Brookside Equity Partners (3,704 SF). The remaining 58,394 SF that Purdue Pharma subleases are currently not being utilized. Purdue Pharma uses the One Stamford Forum Property as its corporate headquarters. Purdue Pharma is affiliated with the One Stamford Forum Borrower.
Purdue Pharma is a privately-held pharmaceutical company founded by physicians in 1952 which has grown to approximately 1,500 employees, and is engaged in the research, development, production, sales, and licensing of prescription and over-the-counter medicines and hospital products across the following categories: pain and central nervous system, laxatives, antiseptics and dietary supplements. Purdue Pharma is known for pioneering research in pain and introducing medications with abuse-deterrent properties. Purdue Pharma owns or licenses the patents to a number of prescription drugs, most notably OxyContin. OxyContin is an extended-release opioid brand. In 2014, the global opioid market was valued at an estimated $34.9 billion, with North America being the largest market accounting for approximately 65% of revenue share.
This is not a research report and was not prepared by any Underwriter’s research departments. Please see additional important information and qualifications at the end of this Term Sheet.
| T-94 |
| MSBAM 2016-C31 | One Stamford Forum |
The following table presents certain information relating to the leases at the One Stamford Forum Property:
| Tenant Summary(1) | |||||||
| Tenant Name | Credit Rating (Fitch/Moody’s/S&P) | Tenant SF | Approximate % of SF | Annual UW Rent | % of Total Annual UW Rent | Annual UW Rent PSF | Lease Expiration |
| Major Tenant | |||||||
| UBS(2) | A/Ba1/A- | 337,456 | 66.9% | $15,005,700 | 67.5% | $44.47 | 12/31/2020 |
| Purdue Pharma(3) | NR/NR/NR | 167,015 | 33.1% | $7,224,325 | 32.5% | $43.26 | 12/31/2020(4) |
| Subtotal/Wtd. Avg. | 504,471 | 100.0% | $22,230,025 | 100.0% | $44.07 | ||
| Vacant Space | 0 | 0.0% | $0 | 0.0% | $0.00 | ||
| Total/Wtd. Avg. | 504,471 | 100.0% | $22,230,025 | 100.0% | $44.07 | ||
| (1) | Information is based on the underwritten rent roll. |
| (2) | UBS does not currently occupy any of its space but continues to pay rent pursuant to its lease. UBS has subleased a total of 330,796 SF to Purdue Pharma (291,679 SF), Rockit Solutions (25,075 SF) and CBRE (14,042 SF) through the term of its lease. The remaining 6,660 SF is not subleased by UBS and is currently not being utilized. |
| (3) | Purdue Pharma is subleasing a portion of its subleased space from UBS to W.J. Deutsch & Sons Ltd. (43,563 SF) through March 31, 2037 and to Brookside Equity Partners (3,704 SF), Hillside Capital Inc. (8,705 SF) and Kokino LLC (11,784 SF) through September 27, 2021. 58,394 SF of Purdue Pharma’s subleased space is currently not being utilized. |
| (4) | Purdue Pharma has an executed lease on 100.0% of the net rentable area at the One Stamford Forum Property beginning January 2021 through June 2031 at an average initial rent of $46.46 PSF with a six and a half year lease-renewal option. |
The following table presents certain information relating to the lease rollover schedule at the One Stamford Forum Property:
| Lease Rollover Schedule(1) | ||||||||
| Year | # of Leases Rolling | SF Rolling | Annual UW Rent PSF Rolling | Approx. % of Total SF Rolling | Approx. Cumulative % of SF Rolling | Total UW Rent Rolling | Approx. % of Total Rent Rolling | Approx. Cumulative % of Total Rent Rolling |
| MTM | 0 | 0 | $0.00 | 0.0% | 0.0% | $0 | 0.0% | 0.0% |
| 2016 | 0 | 0 | $0.00 | 0.0% | 0.0% | $0 | 0.0% | 0.0% |
| 2017 | 0 | 0 | $0.00 | 0.0% | 0.0% | $0 | 0.0% | 0.0% |
| 2018 | 0 | 0 | $0.00 | 0.0% | 0.0% | $0 | 0.0% | 0.0% |
| 2019 | 0 | 0 | $0.00 | 0.0% | 0.0% | $0 | 0.0% | 0.0% |
| 2020(2) | 0 | 0 | $0.00 | 0.0% | 0.0% | $0 | 0.0% | 0.0% |
| 2021 | 0 | 0 | $0.00 | 0.0% | 0.0% | $0 | 0.0% | 0.0% |
| 2022 | 0 | 0 | $0.00 | 0.0% | 0.0% | $0 | 0.0% | 0.0% |
| 2023 | 0 | 0 | $0.00 | 0.0% | 0.0% | $0 | 0.0% | 0.0% |
| 2024 | 0 | 0 | $0.00 | 0.0% | 0.0% | $0 | 0.0% | 0.0% |
| 2025 | 0 | 0 | $0.00 | 0.0% | 0.0% | $0 | 0.0% | 0.0% |
| 2026 | 0 | 0 | $0.00 | 0.0% | 0.0% | $0 | 0.0% | 0.0% |
| 2027 & Beyond(2) | 1 | 504,471 | $46.46 | 100.0% | 100.0% | $23,437,611 | 100.0% | 100.0% |
| Vacant | 0 | 0 | $0.00 | 0.0% | 100.0% | $0 | 0.0% | 100.0% |
| Total/Wtd. Avg. | 1 | 504,471 | $46.46 | 100.0% | $23,437,611 | 100.0% | ||
| (1) | Information is based on the tenant leases. |
| (2) | The One Stamford Forum Property is currently 100.0% leased to two tenants, UBS and Purdue Pharma, on leases both expiring in December 2020. Purdue Pharma has signed a subsequent lease on the entire building’s square footage beginning January 2021 through June 2031 at an average initial rent of $46.46 PSF with a six and a half year lease-renewal option. |
The Market. The One Stamford Forum Property is located in Stamford, Connecticut. The city of Stamford has a downtown core area with a major transportation hub, approximately 7.7 million SF of office space, Stamford Town Center, an 860,000 SF super-regional mall, and several high-density residential projects. It is also supported by a suburban area and several major throughways including Interstate 95 connecting to midtown Manhattan 40 miles southwest, Route 137 (Washington Boulevard) connecting to Westchester County to the north and Tresser Boulevard (Route 1) running along the south shore of Connecticut parallel to Interstate 95.
Current major developments under construction in the area include a waterfront redevelopment known as Harbor Point that is expected to contain over 2,360 residential units and 500,000 SF of commercial space, the $450 million expansion and renovation of Stamford Hospital, a planned 648-unit multifamily property located across the street from the One Stamford Forum Property expected to open in early 2018, and Atlantic Station, a mixed-use development comprised of 650 multifamily units and approximately 54,000-69,000 SF of retail space located just west of the One Stamford Forum Property on Tresser Boulevard.
The One Stamford Forum Property is located at the intersection of Tresser Boulevard and Canal Street. In addition to the offerings of Stamford’s core commercial area located just a few blocks northwest, immediate local amenities include dining and retail options in the Stamford Town Center located across Tresser Boulevard, and a full-service Marriott hotel across Canal Street. The Stamford Metro North/Amtrak station is two blocks from the One Stamford Forum Property, providing mass transit access along stops from New Haven south to New York City (55 minutes) and from Boston south to Philadelphia and Washington, D.C. According to the appraisal, the 2016 population within a three- and five- mile radius of the One Stamford Forum Property was 126,607 and 173,495, respectively; 2016 average household income within the same radii was $131,200 and $151,166, respectively.
This is not a research report and was not prepared by any Underwriter’s research departments. Please see additional important information and qualifications at the end of this Term Sheet.
| T-95 |
| MSBAM 2016-C31 | One Stamford Forum |
According to the appraiser, the One Stamford Forum Property is located in the broader Stamford Central Business District Office Market which includes approximately 9.7 million SF of office space with a vacancy of 23.8% and an average rent PSF of $43.55 as of the first quarter of 2016. Within the submarket, the appraiser determined the competitive set to be comprised of 13 Class A office buildings containing approximately 3.7 million SF (inclusive of the Stamford Office Forum Property), which exhibited an overall vacancy of 8.6% at an average base rent of $51.21 PSF as of the first quarter of 2016.
The following table presents certain information relating to comparable office leases to the One Stamford Forum Property:
| Comparable Lease Summary | |||||||||
| Property Name/Location | Year Built/ Renovated | Total GLA (SF) | Total Occupancy | Distance from Subject | Tenant Name | Lease Date/Term | Lease Area (SF) | Annual Base Rent PSF | TI PSF |
Stamford Towers 680 Washington Blvd | 1989/NAP | 133,000 | 87% | 0.4 miles | The Bank of Ireland NGKF | Apr-16/10.8 Yrs Jan-15/11.0 Yrs | 20,217 10,634 | $43 $40 | $60 $0 |
One Stamford Plaza 263 Tresser Blvd | 1986/NAP | 214,136 | 99% | 0.2 miles | Towers Watson Lascaux Resource Capital Regus Plc | Oct-15/1.0 Yrs Sept-15/5.4 Yrs Apr-15/5.3 Yrs | 68,234 2,697 19,450 | $42 $50 $47 | $0 $45 $22 |
400 Atlantic 400 Atlantic Street | 1980/2007 | 501,448 | 77% | 315 feet | BTG Pactual | Nov-15/11.0 Yrs | 36,782 | $48 | $50 |
1055 Washington Blvd 1055 Washington Blvd | 1987/NAP | 178,000 | 84% | 0.5 miles | Robinson & Cole LLP | Sept-15/11.1 Yrs | 28,466 | $38 | $58 |
RBS 600 Washington Blvd | 2009/NAP | 500,000 | 100% | 0.5 miles | UBS | May-15/10.0 Yrs | 119,216 | $57 | $20 |
Source: Appraisal
Operating History and Underwritten Net Cash Flow.The following table presents certain information relating to the historical operating performance and the Underwritten Net Cash Flow at the One Stamford Forum Property:
| Cash Flow Analysis | ||||||
| 2013 | 2014 | 2015 | 3/31/2016 TTM | UW | UW PSF | |
| Base Rent | $20,659,134 | $20,659,134 | $20,659,134 | $21,051,857 | $22,230,025 | $44.07 |
| Total Recoveries(1) | $2,239,776 | $1,572,030 | $1,833,926 | $1,784,562 | $2,094,342 | $4.15 |
| Less Vacancy & Credit Loss | $0 | $0 | $0 | $0 | ($2,432,437) | 10.0% |
| Effective Gross Income | $22,898,910 | $22,231,164 | $22,493,060 | $22,836,419 | $21,891,930 | $43.40 |
| Total Operating Expenses | $8,887,707 | $8,173,538 | $8,409,594 | $8,422,294 | $8,706,883 | $17.26 |
| Net Operating Income | $14,011,203 | $14,057,626 | $14,083,466 | $14,414,125 | $13,185,047 | $26.14 |
| Capital Expenditures | $0 | $0 | $0 | $0 | $126,118 | $0.25 |
| TI/LC | $0 | $0 | $0 | $0 | $1,233,793 | $2.45 |
| Net Cash Flow | $14,011,203 | $14,057,626 | $14,083,466 | $14,414,125 | $11,825,136 | $23.44 |
| Occupancy % | 100.0% | 100.0% | 100.0% | 100.0%(2) | 90.0% | |
| NOI DSCR(3) | 1.83x | 1.84x | 1.84x | 1.89x | 1.73x | |
| NCF DSCR(3) | 1.83x | 1.84x | 1.84x | 1.89x | 1.55x | |
| NOI Debt Yield(3) | 12.8% | 12.9% | 12.9% | 13.2% | 12.1% | |
| NCF Debt Yield(3) | 12.8% | 12.9% | 12.9% | 13.2% | 10.8% | |
| (1) | UW Total Recoveries are based on tenant leases and include budgeted tenant electric charges of $561,838 and an adjustment for a 3.0% management fee (the One Stamford Forum Property is currently managed by an affiliate of the borrower). |
| (2) | Occupancy as of November 1, 2016. |
| (3) | The debt service coverage ratios and debt yields are based on the One Stamford Forum Whole Loan. |
This is not a research report and was not prepared by any Underwriter’s research departments. Please see additional important information and qualifications at the end of this Term Sheet.
| T-96 |
| MSBAM 2016-C31 | One Stamford Forum |
Escrows and Reserves. At origination, the One Stamford Forum Borrower deposited $230,359 for real estate taxes, $58,814 for property insurance premiums and $15,188 for required repairs. The One Stamford Forum Borrower is required to escrow monthly 1/12th of the annual estimated taxes and 1/12th of the annual estimated insurance premiums (unless the One Stamford Forum Borrower maintains an acceptable blanket insurance policy).
Lockbox and Cash Management. The One Stamford Forum Mortgage Loan requires a lender-controlled lockbox account, which is already in place. The One Stamford Forum Borrower has directed the tenants to pay rent directly into such lockbox account. Prior to the occurrence of a Cash Sweep Period (as defined below), all funds are required to be distributed to the One Stamford Forum Borrower. During a Cash Sweep Period, all funds are required to be swept to a lender-controlled cash management account.
A “Cash Sweep Period” will commence upon (i) Purdue Pharma vacating, giving notice to vacate, or ceasing to occupy 50.0% or more of the net rentable area at the One Stamford Forum Property for a continuous 60 days (other than as a result of force majeure); (ii) any bankruptcy action of Purdue Pharma; or (iii) Purdue Pharma defaulting in rent (including failure to pay real estate taxes and property insurance premiums). A Cash Sweep Period will end upon, as it relates to clause (i) or (ii), Purdue Pharma’s vacated space being leased to one or more acceptable replacement tenant(s) and the replacement tenant(s) being in occupancy and paying full rent with no outstanding tenant improvement or leasing costs; or, as it relates to clause (iii), such default being cured.
Additional Secured Indebtedness (not including trade debts).The One Stamford Forum Property also secures the One Stamford ForumPari Passu Companion Loan, which has a Cut-off Date principal balance of $71,038,865. The promissory note evidencing the One Stamford ForumPari Passu Companion Loan is Promissory Note A-1 in the original principal amount of $71,500,000 and is currently held by the WFCM 2016-BNK1 securitization trust. The One Stamford ForumPari Passu Companion Loan accrues interest at the same rate as the One Stamford Forum Mortgage Loan. The One Stamford Forum Mortgage Loan is entitled to payments of principal and interest on a pro rata andpari passu basis with the One Stamford ForumPari Passu Companion Loan. The holders of the One Stamford Forum Mortgage Loan and the One Stamford ForumPari Passu Companion Loan have entered into a co-lender agreement which sets forth the allocation of collections on the One Stamford Forum Whole Loan. See “Description of the Mortgage Pool—The Whole Loans—The Non-Serviced Pari Passu Whole Loans” in the Preliminary Prospectus.
Mezzanine Loan and Preferred Equity.Not permitted.
Release of Property.Not permitted.
Terrorism Insurance.The One Stamford Forum Borrower is required to maintain an “all risk” insurance policy in an amount equal to the full replacement cost of the One Stamford Forum Property, as well as business interruption insurance with no time limitation, and includes an extended period of indemnity of 360 days to provide continuing coverage after the One Stamford Forum Property has been repaired.
This is not a research report and was not prepared by any Underwriter’s research departments. Please see additional important information and qualifications at the end of this Term Sheet.
| T-97 |
| MSBAM 2016-C31 | International Square |
Mortgage Loan No. 9 – International Square
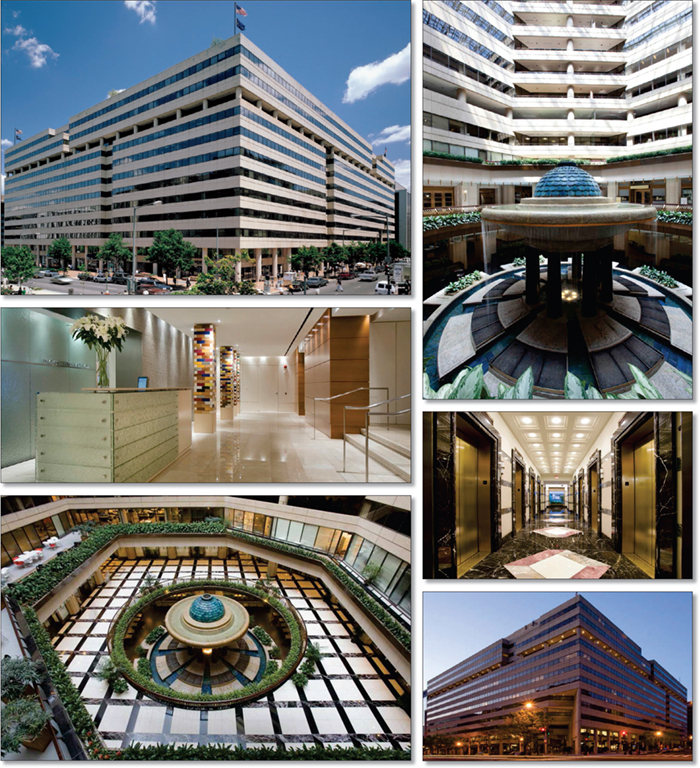
This is not a research report and was not prepared by any Underwriter’s research departments. Please see additional important information and qualifications at the end of this Term Sheet.
| T-98 |
| MSBAM 2016-C31 | International Square |
Mortgage Loan No. 9 – International Square
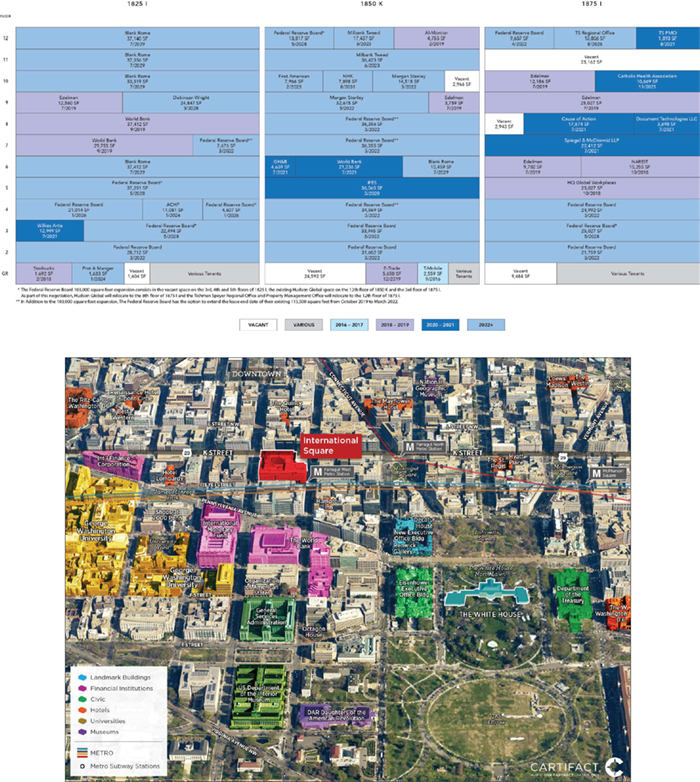
This is not a research report and was not prepared by any Underwriter’s research departments. Please see additional important information and qualifications at the end of this Term Sheet.
| T-99 |
| MSBAM 2016-C31 | International Square |
Mortgage Loan No. 9 – International Square
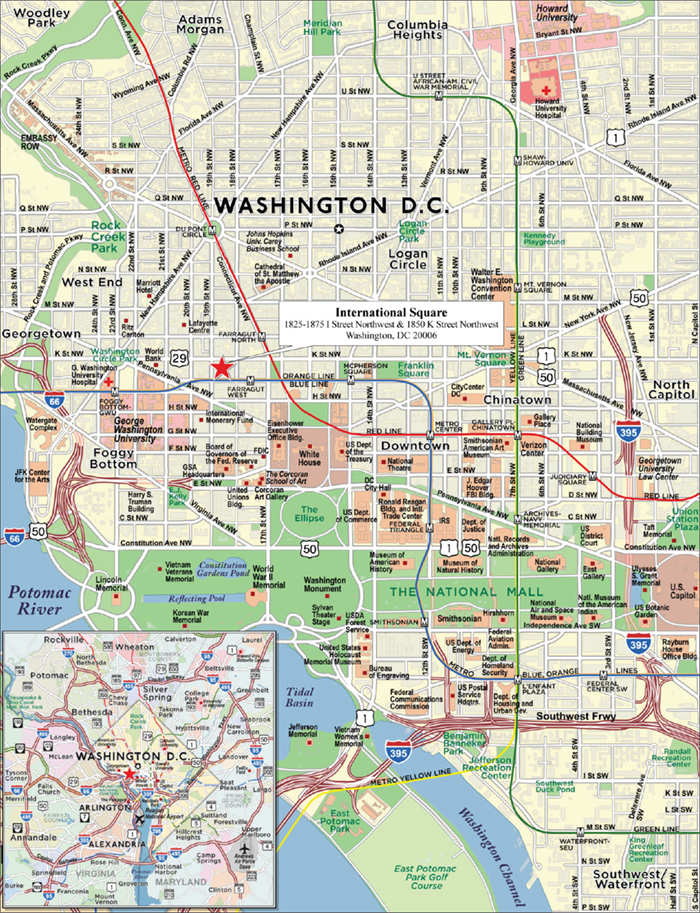
This is not a research report and was not prepared by any Underwriter’s research departments. Please see additional important information and qualifications at the end of this Term Sheet.
| T-100 |
| MSBAM 2016-C31 | International Square |
| Mortgage Loan No. 9 – International Square |
| Mortgage Loan Information | Mortgaged Property Information | ||||||
| Mortgage Loan Seller: | BANA | Single Asset/Portfolio: | Single Asset | ||||
| Original Balance(1): | $30,000,000 | Location: | Washington, D.C. 20006 | ||||
| Cut-off Date Balance(1): | $30,000,000 | General Property Type: | Office | ||||
| % of Initial Pool Balance: | 3.1% | Detailed Property Type: | CBD | ||||
| Loan Purpose: | Refinance | Title Vesting: | Fee | ||||
| Sponsor: | D.C. Area Portfolio Upper Tier JV, L.P. | Year Built/Renovated: | 1978-1982/2005 | ||||
| Mortgage Rate: | 3.6150% | Size: | 1,158,732 SF | ||||
| Note Date: | 7/11/2016 | Cut-off Date Balance per SF(1): | $213 | ||||
| First Payment Date: | 9/10/2016 | Maturity Date Balance per SF(1): | $213 | ||||
| Maturity Date: | 8/10/2026 | Property Manager: | Tishman Speyer Properties, L.P. (borrower-related) | ||||
| Original Term to Maturity: | 120 months | ||||||
| Original Amortization Term: | 0 months | ||||||
| IO Period: | 120 months | Underwriting and Financial Information | |||||
| Seasoning: | 3 months | UW NOI: | $42,883,351 | ||||
| Prepayment Provisions(2): | LO (27); DEF (86); O (7) | UW NOI Debt Yield(1): | 17.4% | ||||
| Lockbox/Cash Mgmt Status: | Hard/Springing | UW NOI Debt Yield at Maturity(1): | 17.4% | ||||
| Additional Debt Type(3): | Pari Passu/Subordinate Debt | UW NCF DSCR(1): | 4.31x | ||||
| Additional Debt Balance(3): | $216,700,000/$203,300,000 | Most Recent NOI: | $34,268,512 (6/30/2016 TTM) | ||||
| Future Debt Permitted (Type): | Yes (Mezzanine) | 2nd Most Recent NOI: | $37,214,975 (12/31/2015) | ||||
| Reserves(4) | 3rd Most Recent NOI: | $40,025,487 (12/31/2014) | |||||
| Type | Initial | Monthly | Cap | Most Recent Occupancy: | 94.2% (7/18/2016) | ||
| RE Tax: | $0 | Springing | N/A | 2nd Most Recent Occupancy: | 93.0% (12/31/2015) | ||
| Insurance: | $0 | Springing | N/A | 3rd Most Recent Occupancy: | 98.0% (12/31/2014) | ||
| Recurring Replacements: | $0 | Springing | $573,356 | Appraised Value (as of): | $757,000,000 (6/13/2016) | ||
| TI/LC: | $0 | Springing | $7,531,758 | Cut-off Date LTV Ratio(1): | 32.6% | ||
| Other: | $28,442,141 | $0 | N/A | Maturity Date LTV Ratio(1): | 32.6% | ||
| Sources and Uses | ||||||
| Sources | Proceeds | % of Total | Uses | Proceeds | % of Total | |
| Loan Amount(1): | $450,000,000 | 100.0% | Loan Payoff: | $375,380,461 | 83.4% | |
| Reserves: | $28,442,141 | 6.3% | ||||
| Closing Costs: | $4,863,763 | 1.1% | ||||
| Return of Equity: | $41,313,634 | 9.2% | ||||
| Total Sources: | $450,000,000 | 100.0% | Total Uses: | $450,000,000 | 100.0% | |
| (1) | The International Square Mortgage Loan is part of the International Square Whole Loan (as defined below), which is comprised of fourpari passu seniornotes and one subordinate note with an aggregate original principal balance of $450,000,000. The four International Squarepari passu senior notes have a combined original principal balance of $246,700,000 and the subordinate note has an original principal balance of $203,300,000. The Cut-off Date Balance per SF, Maturity Date Balance per SF, UW NCF DSCR, UW NOI Debt Yield, UW NOI Debt Yield at Maturity, Cut-off Date LTV Ratio and Maturity Date LTV Ratio numbers presented above are based on the four senior notes totaling $246,700,000 without regard to the subordinate note. The Cut-off Date Balance per SF, Maturity Date Balance per SF, UW NCF DSCR, UW NOI Debt Yield, UW NOI Debt Yield at Maturity, Cut-off Date LTV Ratio and Maturity Date LTV Ratio based on the aggregate note balance of the International Square Whole Loan (including the subordinate note) are $388, $388, 2.36x, 9.5% 9.5%, 59.4% and 59.4%, respectively. |
| (2) | Defeasance is permitted at any time after the earlier to occur of (a) the end of the two-year period commencing on the closing date of the securitization of the last International Square Whole Loan promissory note to be securitized and (b) September 10, 2019. |
| (3) | See “—The Mortgage Loan”and “—Additional Secured Indebtedness (not including trade debts)”and “—Mezzanine Loan and Preferred Equity”below for further discussion of additional debt. |
| (4) | See“—Escrows and Reserves” below for further discussion of reserve requirements. |
The Mortgage Loan. The ninth largest mortgage loan (the “International Square Mortgage Loan”) is part of a non-servicedpari passu-AB whole loan (the “International Square Whole Loan”) evidenced by (i) fourpari passu senior notes in the aggregate original principal amount of $246,700,000 and (ii) one subordinate note in the original principal amount of $203,300,000, all of which are secured by a first priority fee mortgage encumbering a three-building, approximately 1.16 million SF Class A office complex known as International Square in Washington, D.C. (the “International Square Property”). The International Square Mortgage Loan is evidenced by one of thepari passu notes (Note A-2-1) with an outstanding principal balance as of the Cut-off Date of $30,000,000. Note A-1 in the original principal amount of $166,700,000, Note A-3 in the original principal amount of $20,000,000 and Note A-2-2 in the original principal amount of $30,000,000 representpari passu companion loans (the “International Square Pari Passu Companion Loans”), and arepari passuwith the International Square Mortgage Loan. Note B in the original principal amount of $203,300,000 (the “International Square Subordinate Companion Loan”) is generally subordinate to the International Square Mortgage Loan and the International SquarePari Passu Companion Loans. See “Description of the Mortgage Pool—The Whole Loans—the Non-Serviced Pari Passu-AB Whole Loans—The International Square Whole Loan” and “Pooling and Servicing Agreement—Servicing of the Non-Serviced Mortgage Loans—Servicing of the International Square Mortgage Loan” in the Preliminary Prospectus.
This is not a research report and was not prepared by any Underwriter’s research departments. Please see additional important information and qualifications at the end of this Term Sheet.
| T-101 |
| MSBAM 2016-C31 | International Square |
The International Square Mortgage Loan will be included in the MSBAM 2016-C31 securitization trust. The International SquarePari Passu Companion Loan represented by Note A-1 and the International Square Subordinate Companion Loan were contributed to the BAMLL 2016-ISQR securitization trust. The International SquarePari Passu Companion Loan represented by Note A-3 was contributed to the MSBAM 2016-C30 securitization trust. The International SquarePari Passu Companion Loan represented by Note A-2-2 is currently held by Bank of America, N.A. or an affiliate thereof and is expected to be contributed to a future securitization trust. The International Square Whole Loan is being serviced pursuant to the terms of the BAMLL 2016-ISQR trust and servicing agreement.
The proceeds of the International Square Whole Loan were used to refinance a previous mortgage loan and mezzanine loans totaling approximately $375,380,461 secured by the International Square Property, pay closing costs, fund reserves and return equity to the International Square Borrower (as defined below). The previous mortgage loan secured by the International Square Property was securitized in the LBUBS 2007-C1 transaction.
The Borrower and the Sponsor. The borrower is International Square, L.P. (the “International Square Borrower”), a newly formed single-purpose Delaware limited partnership with two independent directors. The International Square Borrower is owned indirectly by D.C. Area Portfolio Upper Tier JV, L.P. (the “International Square Sponsor”), which is a joint venture controlled by Tishman Speyer Properties, L.P. (“Tishman Speyer”) and majority owned by one or more affiliates of Tishman Speyer and direct and indirect subsidiaries of Abu Dhabi Investment Authority (“ADIA”). Since its founding in 1978, Tishman Speyer has acquired, developed and operated over 276 investments involving 380 properties encompassing over 140.1 million SF located in major metropolitan markets of the United States, Europe, Latin America and Asia. As of September 30, 2015 Tishman Speyer has 80 investments (118 properties) globally. ADIA is a public institution established by the Government of the Emirate of Abu Dhabi in 1976 as an independent investment institution.
The International Square Whole Loan will be recourse solely to the International Square Borrower pursuant to standard carve-outs. There is no separate guarantor and no environmental indemnitor separate from the International Square Borrower.
The Property.The International Square Property is an approximately 1.16 million SF, Class A office complex comprised of three interconnected 12-story office buildings that occupy nearly a full city block in Washington, D.C. The three, 12-story buildings offer a panoramic rooftop terrace and two levels of below-grade parking. The International Square Property offers building amenities including a fitness center, ground floor retail, a lower level casual dining concourse, child care (for tenants only) and banking facilities.
As of July 18, 2016, the International Square Property was 94.2% leased to 45 tenants with the largest tenant concentrations being the U.S. Government (33.7% of total NRA), law firms (24.4% of total NRA) and professional services (15.8% of total NRA). Approximately 30.2% of the International Square Property’s square footage is occupied by tenants with lease expiration dates beyond 2025 and the weighted average remaining lease term is 7.1 years. The International Square Property has a nine year historical occupancy average of 96.3%.
Major Tenants.
Federal Reserve Board (390,233 SF, 33.7% of NRA, 36.2% of underwritten base rent).The Federal Reserve Board leases 390,233 SF on leases that have various expiration dates from 2022-2028. The Federal Reserve Board is comprised of seven board members nominated by the President and confirmed by the Senate. The Federal Reserve System is the central bank of the United States. It was founded by Congress in 1913 to provide the nation with a safer, more flexible and more stable monetary and financial system. Over the years, its role in banking and the economy has expanded. The Federal Reserve Board has been a tenant at the International Square Property since November 2007.
Federal Reserve Board has options to terminate portions of its leases as follows: (A) the option to terminate all or a portion of 6.9% of its space, provided that to exercise this option, federal legislation must have been enacted that affects the Federal Reserve Board’s mission such that its need for space is substantially reduced, upon at least 18 months’ notice for partial termination and at least 24 months’ notice for full termination and payment of four months of base rent plus unamortized transaction costs if the termination occurs prior to October 31, 2019; (B) the option to terminate all or a portion of 7.4% of its space upon notice no later than 42 months prior to the related lease expiration of March 31, 2022 for partial termination and no later than 48 months prior to the related lease expiration of March 31, 2022 for full termination and payment of four months’ fixed rent, unamortized transaction costs and a tax and expense estimate; and (C) the option to terminate 8.9% of its space upon notice by December 2024 and payment of three months’ fixed rent, unamortized transaction costs and a tax and expense estimate.
Blank Rome LLP (167,863 SF, 14.5% of NRA, 16.0% of underwritten base rent).Blank Rome LLP leases a total of 167,863 SF expiring in July 2029. Blank Rome LLP, founded in 1946, is a large law firm with nearly 540 attorneys serving clients across the globe. Blank Rome LLP is an international law firm representing businesses and organizations ranging from Fortune 500 companies to start-up entities. Blank Rome LLP acquired Dickstein Shapiro LLP in early 2016 and relocated its Washington, D.C. headquarters to International Square Property. Dickstein Shapiro LLP had been a tenant at the International Square Property since October 2005.
World Bank (99,447 SF, 8.6% of NRA, 8.6% of underwritten base rent).World Bank leases 99,447 SF on a lease that expires between 2019 and 2021. The World Bank is an international financial institution that provides loans to developing countries for capital programs. It is comprised of two institutions: the International Bank for Reconstruction and Development (IBRD) and the International Development Association (IDA). The World Bank is a component of the World Bank Group, which is part of the United Nations system. The World Bank’s official goal is the reduction of poverty. According to its Articles of Agreement, all of its decisions must be guided by a commitment to the promotion of foreign investment and international trade and to the facilitation of capital investment. The World Bank has been a tenant at the International Square Property since January 2006 and has grown their occupancy.
World Bank has the option to terminate 21.4% of its space, provided that to exercise this option the World Bank must provide (i) evidence of a Global Partnership for Education board directive that the World Bank must terminate the lease based on a material change of circumstances to the Global Partnership for Education or its secretariat, (ii) notice no later than April 30, 2019 and (iii) payment of $903,856 for said termination.
Daniel J. Edelman, Inc. (63,314 SF, 5.5% of NRA, 6.6% of underwritten base rent). Daniel J. Edelman, Inc. occupies 63,314 SF on a lease that expires in July 2019. Daniel J. Edelman, Inc. is a global public relations firm founded in 1952, named after Daniel Edelman and currently run by his son Richard Edelman. Daniel J. Edelman, Inc. has been a tenant in the 1875 I Street tower of the International Square Property since July 1999.
Milbank, Tweed, Hadley & McCloy (54,299 SF, 4.7% of NRA, 5.0% of underwritten base rent).Milbank, Tweed, Hadley & McCloy LLP occupies 54,299 square feet under a lease expiring in June 2023. Milbank, Tweed, Hadley & McCloy LLP is an international law firm that was founded in New York City in
This is not a research report and was not prepared by any Underwriter’s research departments. Please see additional important information and qualifications at the end of this Term Sheet.
| T-102 |
| MSBAM 2016-C31 | International Square |
1866. Milbank, Tweed, Hadley & McCloy LLP occupies one and a half top floors in the 1850 K Street tower of the International Square Property and has been a tenant at the International Square Property since September 1992.
The following table presents certain information relating to the leases at the International Square Property:
| Tenant Summary(1) | |||||||
| Tenant Name | Credit Rating (Fitch/Moody’s/S&P)(2) | Tenant SF | Approx. % of SF | Annual UW Rent | % of Total Annual UW Rent | Annual UW Rent PSF(3) | Lease Expiration |
| Federal Reserve Board(4) | AAA/Aaa/AA+ | 390,233 | 33.7% | $22,415,924 | 36.2% | $57.44 | Various(5) |
| Blank Rome LLP | NR/NR/NR | 167,863 | 14.5% | $9,940,483 | 16.0% | $59.22 | 7/31/2029 |
| World Bank(6) | AAA/Aaa/AAA | 99,447 | 8.6% | $5,335,304 | 8.6% | $53.65 | Various(7) |
| Daniel J. Edelman, Inc. | NR/NR/NR | 63,314 | 5.5% | $4,071,869 | 6.6% | $64.31 | 7/31/2019 |
| Milbank, Tweed, Hadley & McCloy | NR/NR/NR | 54,299 | 4.7% | $3,129,706 | 5.0% | $57.64 | Various(8) |
| Other Tenants | 316,825 | 27.3% | $17,098,323 | 27.6% | $53.97 | ||
| Vacant | 66,751 | 5.8% | $0 | 0% | $0.00 | ||
| Total/Wtd. Avg. | 1,158,732 | 100.0% | $61,991,609 | 100% | $56.77 | ||
| (1) | Information is based on the underwritten rent roll. |
| (2) | Certain ratings are those of the parent company or government whether or not the parent guarantees the lease. |
| (3) | Wtd. Avg. Annual UW Rent PSF excludes vacant space. |
| (4) | The Federal Reserve Board has various termination options with respect to portions of such leases. See “Description of the Mortgage Pool—Tenant Issues—Lease Expirations and Terminations—Terminations” in the Preliminary Prospectus. |
| (5) | The Federal Reserve Board leases multiple spaces under several leases with different expiration dates. The expiration date with respect to 266,023 SF of its space (23.0% of net rentable area) is in 2022, the expiration date with respect to 98,589 SF of its space (8.5% of net rentable area) is in 2028 and the expiration date with respect to the 25,621 SF of its space (2.2% of net rentable area) is in 2026. |
| (6) | The World Bank has a termination option with respect to 21.4% (21,236 SF) of its space. See “Description of the Mortgage Pool—Tenant Issues—Lease Expirations and Terminations—Terminations” in the Preliminary Prospectus. |
| (7) | The World Bank leases 67,167 SF expiring in September 2019, 21,236 SF expiring in July 2021 and 11,044 SF expiring in December 2020. |
| (8) | Milbank, Tweed, Hadley & McCloy leases 53,860 SF expiring in June 2023 and 439 SF expiring in January 2020. |
The following table presents certain information relating to the lease rollover schedule at the International Square Property:
| Lease Rollover Schedule(1)(2) | ||||||||
| Year | # of Leases Rolling | SF Rolling(3) | UW Rent PSF Rolling | Approx. % of Total SF Rolling | Approx. Cumulative % of SF Rolling | Total UW Rent Rolling | Approx. % of Total Rent Rolling | Approx. Cumulative % of Total Rent Rolling |
| 2016 | 3 | 9,834 | $30.51 | 0.8% | 0.8% | $300,012 | 0.5% | 0.5% |
| 2017 | 7 | 8,852 | $57.28 | 0.8% | 1.6% | $507,018 | 0.8% | 1.3% |
| 2018 | 8 | 46,872 | $57.72 | 4.0% | 5.7% | $2,705,394 | 4.4% | 5.7% |
| 2019 | 14 | 146,035 | $59.20 | 12.6% | 18.3% | $8,644,748 | 13.9% | 19.6% |
| 2020 | 4 | 49,078 | $58.04 | 4.2% | 22.5% | $2,848,400 | 4.6% | 24.2% |
| 2021 | 11 | 98,633 | $46.18 | 8.5% | 31.0% | $4,554,877 | 7.3% | 31.6% |
| 2022 | 9 | 318,857 | $59.04 | 27.5% | 58.5% | $18,825,470 | 30.4% | 61.9% |
| 2023 | 4 | 62,265 | $56.82 | 5.4% | 63.9% | $3,537,964 | 5.7% | 67.6% |
| 2024 | 1 | 1,850 | $125.09 | 0.2% | 64.1% | $231,410 | 0.4% | 68.0% |
| 2025 | 0 | 0 | $0.00 | 0.0% | 64.1% | $0 | 0.0% | 68.0% |
| 2026 | 4 | 50,508 | $50.89 | 4.4% | 68.4% | $2,570,469 | 4.1% | 72.1% |
| 2027 and Beyond | 4 | 299,197 | $57.71 | 25.8% | 94.2% | $17,265,846 | 27.9% | 100.0% |
| Vacant | 0 | 66,751 | $0.00 | 5.8% | 100.0% | $0 | 0.0% | 100.0% |
| Total/Wtd. Avg. | 69 | 1,158,732 | $56.77 | 100.0% | $61,991,609 | 100.0% | ||
| (1) | Information is based on the underwritten rent roll. |
| (2) | Certain tenants may have lease termination options that are exercisable prior to the originally stated expiration date of the subject lease and that are not considered in the lease rollover schedule. |
| (3) | Equipment room space, cleaning storage space and fitness center space totaling 5,457 SF is included in SF Rolling. |
The Market. The International Square Property is situated in the heart of the Washington, D.C. central business district (“CBD”), and is bounded by Dupont Circle to the north, the White House to the south and east and Washington Circle to the west. The International Square Property is located above Washington, D.C.’s second busiest metro station, Farragut West, and two blocks away from Washington, D.C.’s busiest metro station, Farragut North. The immediate neighborhood is comprised of nearly 33.1 million SF of office space, over 3,500 apartment units, more than 250,000 SF of urban retail space and 14 hotels.
According to the appraisal, rents at the International Square Property are 0.46% percent below market. Specifically with respect to office tenants, the comparable leases range in size from 2,234 to 117,000 SF and have terms ranging from two to 15 years. The comparables exhibit a range in rents from $50.50 to $65.00 PSF, with an average of $56.25 PSF.
This is not a research report and was not prepared by any Underwriter’s research departments. Please see additional important information and qualifications at the end of this Term Sheet.
| T-103 |
| MSBAM 2016-C31 | International Square |
The following table presents competitive office buildings to the International Square Property:
| Competitive Building Summary | ||||||||
| Property Name/Location | Year Built/ Renovated | Stories | Net Rentable Area (SF) | Primary Tenants | Percent Leased | Average Asking Rent (Low) | Average Asking Rent (High) | |
2020 K, 2020 K Street NW | 1974/1995 | 11 | 398,286 | Gensler, AECOM, Huron Consulting | 95.9% | $50.00 | $59.00 | |
Washington Square, 1050 Connecticut Ave NW | 1982/2010 | 12 | 708,753 | Baker & Hostetler, Regus, Mercer, American Bar Assoc. | 96.8% | $56.00 |
$58.00 | |
1800 M, 1800 M Street NW | 1978/2013 | 10 | 585,545 | Zuckerman Speader LLP, Berkeley Research Group, Civilian Appeals Board | 82.4% | $53.00 | $61.00 | |
1615 L, 1615 L Street NW | 1984/2004 | 13 | 417,852 | Pew Research Group, Fleishman-Hilliard, Int’l Community of Bankers | 99.7% | $43.00 | $56.00 | |
Franklin Center, 1099 14th Street NW | 1992/Various | 11 | 458,998 | CACI, Holly Hunt, Millennium Challenge Corporation | 72.0% | $50.00 | $64.00 | |
Washington Center West, 1001 G Street NW | 1989/Various | 12 | 326,000 | Keller & Heckman LLP, Podesta Group, Optoro, Quik Park | 75.0% | $59.00 | $62.00 | |
Source:Appraisal
Operating History and Underwritten Net Cash Flow.The following table presents certain information relating to the operating history and underwritten net cash flow at the International Square Property:
| Cash Flow Analysis | |||||||
| 2013 | 2014 | 2015 | TTM 6/30/2016 | UW | UW PSF | ||
| Base Rent | $55,013,802 | $56,990,549 | $55,306,107 | $53,429,990 | $65,219,350(1) | $56.29 | |
| Total Recoveries | $3,058,988 | $4,361,855 | $4,765,170 | $3,473,764 | $3,048,127 | $2.63 | |
| Parking Income | $1,867,284 | $1,630,029 | $1,760,360 | $1,641,457 | $1,707,163 | $1.47 | |
| Other Income(2) | $388,482 | $355,499 | $292,372 | $274,306 | $268,131 | $0.23 | |
| Less Vacancy & Credit Loss | ($130,229) | ($285,297) | ($145,329) | ($129,331) | ($3,413,374) | (5.1%) | |
| Effective Gross Income | $60,198,327 | $63,052,635 | $61,978,680 | $58,690,186 | $66,829,397 | $57.67 | |
| Total Operating Expenses | $21,309,086 | $23,027,148 | $24,763,705 | $24,421,674 | $23,946,047 | $20.67 | |
| Net Operating Income | $38,889,241 | $40,025,487 | $37,214,975 | $34,268,512 | $42,883,351 | $37.01 | |
| Capital Expenditures | $0 | $0 | $0 | $0 | $289,784 | $0.25 | |
| TI/LC | $0 | $0 | $0 | $0 | $3,626,417 | $3.13 | |
| Net Cash Flow | $38,889,241 | $40,025,487 | $37,214,975 | $34,268,512 | $38,967,149 | $33.63 | |
| Occupancy % | 98.0% | 98.0% | 93.0% | 94.2%(3) | 95.0% | ||
| NOI DSCR(4) | 4.30x | 4.43x | 4.12x | 3.79x | 4.74x | ||
| NCF DSCR(4) | 4.30x | 4.43x | 4.12x | 3.79x | 4.31x | ||
| NOI Debt Yield(4) | 15.8% | 16.2% | 15.1% | 13.9% | 17.4% | ||
| NCF Debt Yield(4) | 15.8% | 16.2% | 15.1% | 13.9% | 15.8% | ||
| (1) | UW Base Rent includes gross up of vacant space, rent steps through July 2017 as well as leases for the Federal Reserve Board expansion (103,196 SF). |
| (2) | Other Income includes work order income, overtime HVAC, sub-metered electric revenue, tenant condenser water, tenant water, license fees and other miscellaneous income. |
| (3) | Occupancy as of July 18, 2016. |
| (4) | Debt service coverage ratios and debt yields are based on the International Square Mortgage Loan and International SquarePari Passu Companion Loans, and exclude the International Square Subordinate Companion Loan. |
Escrows and Reserves. During the continuance of a Cash Trap Period (defined below). the International Square Borrower is required to escrow monthly (i) 1/12th of the annual estimated tax payments, and (ii) 1/12th of the annual estimated insurance premiums (unless the International Square Borrower maintains an acceptable blanket policy). The International Square Borrower funded $23,925,354 into a lender-controlled reserve account at closing, from which disbursements are required to be made to pay or reimburse the amount of outstanding landlord obligations and certain qualified leasing expenses (including but not limited to tenant improvement and leasing commission costs) ($15,303,620) relating to ten tenants, as well as to simulate the payment of rent during any free or abated rent periods ($8,621,734) relating to eight tenants. The International Square Borrower funded $4,516,787 into a lender controlled reserve account at closing, from which disbursements are required to be made, subject to certain conditions, to pay the International Square Borrower during downtime period for rents for two tenants. During the continuance of a Cash Trap Period, the International Square Borrower is required to make monthly deposits equal to $23,890 into an escrow for replacements and repairs on each monthly payment date subject to a cap of $573,356. During the continuance of a Cash Trap Period, the International Square Borrower is required to make monthly deposits equal to $313,823 into an escrow for tenant improvements and leasing commissions on each monthly payment date subject to a cap of $7,531,758.
This is not a research report and was not prepared by any Underwriter’s research departments. Please see additional important information and qualifications at the end of this Term Sheet.
| T-104 |
| MSBAM 2016-C31 | International Square |
Lockbox and Cash Management. The International Square Whole Loan has a hard lockbox with springing cash management upon the commencement of a Cash Trap Period (as defined below). So long as no Cash Trap Period exists, funds on deposit in the restricted account are required to be swept daily to one or more accounts designated by the International Square Borrower. During a Cash Trap Period, funds on deposit in the restricted account are required to be swept on a periodic basis and deposited into a cash management account.
A “Cash Trap Period” will commence upon the first to occur of (i) an event of default, (ii) the debt service coverage ratio being less than 1.30x for two consecutive calendar quarters and (iii) lender’s determination that the International Square Property’s overall occupancy has fallen below 80.0% as a result of the termination or non-renewal of the Federal Reserve Board’s lease with respect to substantially all of its leased premises. A Cash Trap Period will continue until (a) the event of default is cured, (b) the debt service coverage ratio equals or exceeds 1.30x for two consecutive calendar quarters or (c) the International Square Property’s overall occupancy is above 80.0%.
Additional Secured Indebtedness (not including trade debts).In addition to the International Square Mortgage Loan, the International Square Property also secures the International Square Pari Passu Companion Loans and the International Square Subordinate Companion Loan. The International Square Mortgage Loan, the International Square Pari Passu Companion Loans, and the International Square Subordinate Companion Loan all accrue interest at 3.6150% per annum. Payments under the International Square Whole Loan are generally applied (A) prior to a triggering event of default (generally, a monetary event of default or one that results in the International Square Whole Loan being specially serviced) (i)first, to interest on the International Square Mortgage Loan and International Square Pari Passu Companion Loans (together, the “International Square Senior Notes”), pro rata and pari passu, (ii)second, to interest on the International Square Subordinate Companion Loan, (iii)third, to principal on the International Square Senior Notes, pro rata andpari passu, in amounts equal to their principal entitlements (if any) for the related payment date, and (iv)fourth, to principal on the International Square Subordinate Companion Loan in an amount equal to its principal entitlement (if any) for the related payment date and (B) during the continuance of a triggering event of default, (i)first, to accrued and unpaid interest on the International Square Senior Notes on a pro rata andpari passu basis, (ii)second, to accrued and unpaid interest on the International Square Subordinate Companion Loan; (iii)third, to principal on the International Square Senior Notes on a pro rata andpari passu basis until their principal balances have been reduced to zero and then (iv) fourth, to principal on the International Square Subordinate Companion Loan until its principal balance has been reduced to zero. Such priorities and the allocation of collections on the International Square Whole Loan are set forth in an agreement between note holders governing the promissory notes comprising the International Square Whole Loan. See “Description of the Mortgage Pool—The Whole Loans—The Non-Serviced Pari Passu-AB Whole Loans—International Square Whole Loan” in the Preliminary Prospectus.
The following table presents certain information relating to the International Square Whole Loan:
| Full Debt Summary | ||||||
| Cumulative Balance | Cumulative Loan PSF | Cumulative LTV(1) | Cumulative NOI DY(1) | Cumulative NCF DSCR(1) | ||
| International SquarePari Passu Companion Loans $216,700,000 Note A-1 Note A-3 and Note A-2-2 | International Square Mortgage Loan
| $246,700,000 | $213 | 32.6% | 17.4% | 4.31x |
| International Square Subordinate Companion Loan $203,300,000 Note B | $450,000,000 | $388 | 59.4% | 9.5% | 2.36x | |
| Implied Equity(2) | $307,000,000 | |||||
| (1) | With respect to the International Square Mortgage Loan, Cumulative LTV, Cumulative NOI DY and Cumulative NCF DSCR take into account the International Square Pari Passu Companion Loans. |
| (2) | Based on $757,000,000 appraised value as of June 13, 2016. |
Mezzanine Loan and Preferred Equity.The loan documents permit (from and after the monthly payment date occurring in August, 2017) the incurrence of mezzanine financing secured by 100% of the direct ownership interest in the International Square Borrower, subject to the satisfaction of certain conditions, including, but not limited to (i) the related mezzanine loan’s being junior and subordinate to the International Square Whole Loan in all respects, (ii) the mezzanine loan’s being in an amount not to exceed the lesser of (a) $100,000,000 and (b) an amount that, when added to the outstanding principal balance of the International Square Whole Loan, will result in (A) a combined the loan-to-value ratio of the International Square Whole Loan and the mezzanine loan based upon an “as-is” appraised value of the International Square Property of no more than 56.5%, (B) a combined debt service coverage ratio (utilizing the debt service of both the International Square Whole Loan and the mezzanine loan) of not less than 2.35x, and (C) a combined debt yield (based on underwritten net operating income and the combined amount of the International Square Whole Loan and the mezzanine loan) of not less than 8.60%, (iii) the mezzanine loan’s being coterminous with the International Square Whole Loan, (iv) execution of an intercreditor agreement reasonably satisfactory to lender and in the form attached to the related loan agreement and (v) delivery of a rating agency confirmation with respect to the mezzanine loan.
Release of Property. Not permitted.
Terrorism Insurance.The International Square Borrower is required to obtain and maintain property insurance, public liability insurance and rental loss and/or business interruption insurance that covers perils of terrorism and acts of terrorism, provided that the International Square Whole Loan documents provide for an annual terrorism premium cap of two times the amount of the insurance premium that is payable at such time in respect of the casualty and business interruption/rental loss insurance required hereunder (without giving effect to the cost of terrorism and earthquake components of such casualty and business interruption/rental loss insurance), subject to annual consumer price index adjustments.
This is not a research report and was not prepared by any Underwriter’s research departments. Please see additional important information and qualifications at the end of this Term Sheet.
| T-105 |
| MSBAM 2016-C31 | Coconut Point |
Mortgage Loan No. 10 – Coconut Point
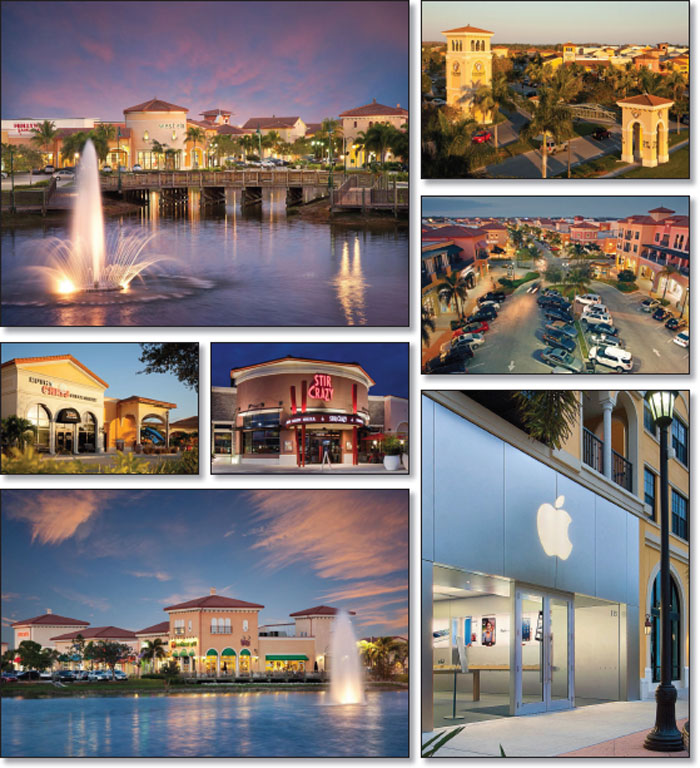
This is not a research report and was not prepared by any Underwriter’s research departments. Please see additional important information and qualifications at the end of this Term Sheet.
| T-106 |
| MSBAM 2016-C31 | Coconut Point |
Mortgage Loan No. 10 – Coconut Point
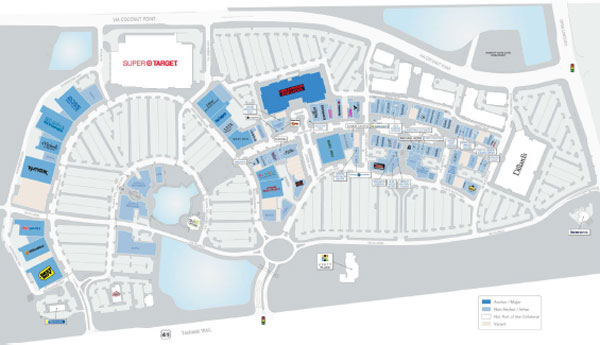
This is not a research report and was not prepared by any Underwriter’s research departments. Please see additional important information and qualifications at the end of this Term Sheet.
| T-107 |
| MSBAM 2016-C31 | Coconut Point |
Mortgage Loan No. 10 – Coconut Point
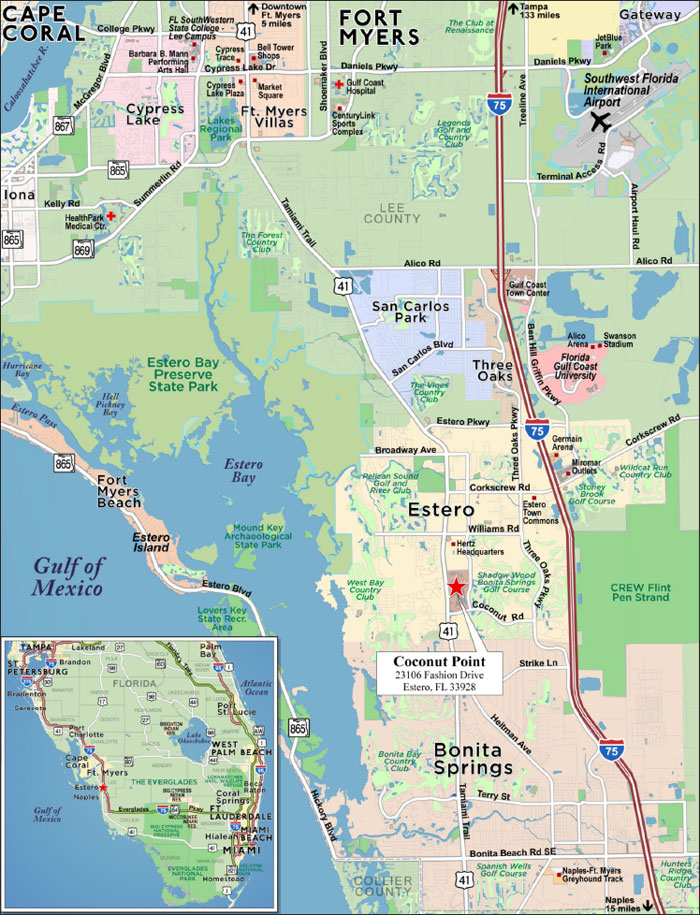
This is not a research report and was not prepared by any Underwriter’s research departments. Please see additional important information and qualifications at the end of this Term Sheet.
| T-108 |
| MSBAM 2016-C31 | Coconut Point |
| Mortgage Loan No. 10 – Coconut Point |
| Mortgage Loan Information | Property Information | ||||||
| Mortgage Loan Seller: | MSMCH | Single Asset/Portfolio: | Single Asset | ||||
| Original Balance(1): | $30,000,000 | Location: | Estero, FL 33928 | ||||
| Cut-off Date Balance(1): | $30,000,000 | General Property Type: | Retail | ||||
| % of Initial Pool Balance: | 3.1% | Detailed Property Type: | Anchored | ||||
| Loan Purpose: | Refinance | Title Vesting(5): | Fee | ||||
| Sponsor: | Simon Property Group, L.P. | Year Built/Renovated: | 2006/N/A | ||||
| Mortgage Rate: | 3.9530% | Size(6): | 836,531 SF | ||||
| Note Date: | 9/7/2016 | Cut-off Date Balance per SF(1): | $227 | ||||
| First Payment Date: | 11/1/2016 | Maturity Date Balance per SF(1): | $192 | ||||
| Maturity Date: | 10/1/2026 | Property Manager: | Simon Management Associates, LLC (borrower-related) | ||||
| Original Term to Maturity: | 120 months | ||||||
| Original Amortization Term: | 360 months | Underwriting and Financial Information | |||||
| IO Period: | 24 months | UW NOI: | $16,634,609 | ||||
| Seasoning: | 1 month | UW NOI Debt Yield(1): | 8.8% | ||||
| Prepayment Provisions(2): | LO (25); DEF (88); O (7) | UW NOI Debt Yield at Maturity(1): | 10.4% | ||||
| Lockbox/Cash Mgmt Status: | Hard/Springing | UW NCF DSCR(1): | 1.98x (IO) 1.39x (P&I) | ||||
| Additional Debt Type(3): | Pari Passu | Most Recent NOI: | $17,897,357 (6/30/2016 TTM) | ||||
| Additional Debt Balance(3): | $160,000,000 | 2nd Most Recent NOI: | $17,639,774 (12/31/2015) | ||||
| Future Debt Permitted (Type): | No (N/A) | 3rd Most Recent NOI: | $16,983,407 (12/31/2014) | ||||
| Reserves(4) | Most Recent Occupancy(7): | 88.4% (6/7/2016) | |||||
| Type | Initial | Monthly | Cap | 2nd Most Recent Occupancy: | 93.7% (12/31/2015) | ||
| RE Tax: | $0 | Springing | N/A | 3rd Most Recent Occupancy: | 92.8% (12/31/2014) | ||
| Insurance: | $0 | Springing | N/A | Appraised Value (as of): | $283,000,000 (7/19/2016) | ||
| Recurring Replacements: | $0 | Springing | N/A | Cut-off Date LTV Ratio(1): | 67.1% | ||
| TI/LC: | $0 | Springing | N/A | Maturity Date LTV Ratio(1): | 56.6% | ||
| Sources and Uses | ||||||
| Sources | Proceeds | % of Total | Uses | Proceeds | % of Total | |
| Loan Amount(1): | $190,000,000 | 82.1% | Loan Payoff: | $231,155,064 | 99.8% | |
| Borrower Equity: | $41,552,258 | 17.9% | Closing Costs: | $397,194 | 0.2% | |
| Total Sources: | $231,552,258 | 100.0% | Total Uses: | $231,552,258 | 100.0% | |
| (1) | The Coconut Point Mortgage Loan (as defined below) is part of the Coconut Point Whole Loan (as defined below), which is comprised of threepari passupromissory notes. The three Coconut Point Whole Loanpari passu promissory notes have an aggregate original principal balance of $190,000,000. The Cut-off Date Balance per SF, Maturity Date Balance per SF, UW NCF DSCR, UW NOI Debt Yield, UW NOI Debt Yield at Maturity, Cut-off Date LTV Ratio and Maturity Date LTV Ratio numbers presented above are based on the threepari passu notes totaling $190,000,000. |
| (2) | Defeasance is permitted at any time after the earlier to occur of (a) the end of the two-year period commencing on the closing date of the securitization of the last Coconut Point promissory note to be securitized and (b) November 1, 2019. |
| (3) | See “—The Mortgage Loan” and“—Additional Secured Indebtedness (not including trade debt)” below for further discussion of additional debt. |
| (4) | See “—Escrows and Reserves” below for further discussion of reserve requirements. |
| (5) | The Coconut Point Borrower owns a leasehold interest in the Coconut Point Property and the 100% equity owner of the Coconut Point Borrower owns a fee interest in the Coconut Point Whole Loan Property (as defined below), each of which is subject to a mortgage securing the Coconut Point Whole Loan. Accordingly, the Coconut Point Property (as defined below) is being treated as a fee interest. |
| (6) | The Coconut Point Property is part of a shopping center with a total SF of 1,205,351, which includes non-collateral anchor tenants, Super Target (186,995 SF) and Dillard’s, Inc. (“Dillards”) (181,825 SF). Dillards is a 50% owner of the Coconut Point Borrower. |
| (7) | Most recent occupancy information is calculated based on the collateral SF of 836,531. The occupancy including the non-collateral anchors is 92.0%. |
The Mortgage Loan. The tenth largest mortgage loan (the “Coconut Point Mortgage Loan”) is part of a whole loan (the “Coconut Point Whole Loan”) evidenced by threepari passu promissory notes in the aggregate original principal amount of $190,000,000, all of which are secured by a first priority fee mortgage encumbering an anchored retail property known as Coconut Point located in Estero, Florida (the “Coconut Point Property”). Promissory Note A-3, in the original principal amount of $30,000,000, represents the Coconut Point Mortgage Loan and will be included in the MSBAM 2016-C31 Trust. Promissory Note A-1, in the original principal amount of $100,000,000 is currently held by Column Financial Inc. or an affiliate thereof, and is expected to be contributed to one or more future securitization transactions or may be otherwise transferred at any time. Promissory Note A-2 in the original principal amount of $60,000,000 was contributed to the MSBAM 2016-C30 securitization trust. Promissory Notes A-1 and A-2 represent the non-servicedpari passu companion loans (collectively, the “Coconut PointPari Passu Companion Loans”). The Coconut Point Mortgage Loan is currently being serviced pursuant to the pooling and servicing agreement for the MSBAM 2016-C30 Trust, and from and after the securitization of the Coconut PointPari PassuCompanion Loan represented by Note A-1, will be serviced pursuant to the pooling and servicing agreement for the securitization transaction to which such Coconut PointPari Passu Companion Loan is contributed. See “Description of the Mortgage Pool—The Whole Loans— The Non-ServicedPari Passu Whole Loans—” and “Pooling and Servicing Agreement” in the Preliminary Prospectus.
The proceeds of the Coconut Point Whole Loan together with $41,552,258 of borrower equity were used to refinance a previous loan with an original balance of approximately $230,000,000 secured by the Coconut Point Property and pay closing costs. The most recent prior financing of the Coconut Point Property was included in the JPMCC 2007-LDPX transaction.
This is not a research report and was not prepared by any Underwriter’s research departments. Please see additional important information and qualifications at the end of this Term Sheet.
| T-109 |
| MSBAM 2016-C31 | Coconut Point |
The Borrower and the Sponsor. The borrower is Coconut Point Town Center, LLC (the “Coconut Point Borrower”), a single-purpose Delaware limited liability company with two independent directors. Coconut Point Town Center, LLC is 100% owned by Coconut Point Developers, LLC, a Delaware limited liability company. Coconut Point Developers, LLC is 50% owned by each of Simon Property Group, L.P., a Delaware limited partnership (the “Coconut Point Sponsor”), and Dillard’s, Inc. a Delaware corporation, which are the non-recourse carveout guarantors with respect to the Coconut Point Whole Loan. The Coconut Point Property is managed by Simon Management Associates, LLC, an affiliate of the Coconut Point Borrower and Coconut Point Sponsor. The Coconut Point Sponsor, Simon Property Group, L.P., is the operating partnership of Simon Property Group, Inc. (“Simon”). Simon is a publicly traded self-administered and self-managed real estate investment trust (NYSE: SPG) focused on retail property ownership and management. Simon is one of the largest publicly traded owners, operators and developers of retail assets in the United States. As of December 31, 2015, Simon operated 209 properties, consisting of 108 malls, 71 Premium Outlet-branded centers, fourteen Mills-branded centers, four lifestyle centers, and twelve other retail properties located in 37 states and Puerto Rico containing an aggregate of approximately 184 million square feet.
Simon Property Group, L.P. is also a sponsor of the borrowers under the mortgage loans identified on Annex A-1 to the Preliminary Prospectus as Simon Premium Outlets and The Shops at Crystals.
The Coconut Point Whole Loan will be recourse to the Coconut Point guarantors pursuant to standard non-recourse carve-outs; however, the non-recourse carve-out guaranty (which also covers environmental provisions in the Coconut Point Whole Loan documents) provides that for so long as Simon Property Group, L.P. is one of the guarantors, the liability of the Coconut Point Whole Loan guarantors may not exceed $38,000,000, in the aggregate, plus all reasonable out-of-pocket costs and expenses (including court costs and reasonable attorneys’ fees) incurred by the lender in the enforcement of the guaranty or the preservation of the lender’s rights under the guaranty. In addition, the Coconut Point Borrower is permitted to replace the existing guarantor for liabilities under the non-recourse carveout guaranty accruing after the date of such replacement with a “qualified transferee” (as defined in the Coconut Point Whole Loan documents. A “qualified transferee” must be either (A) an affiliate of Simon Property Group, L.P. or Simon Property Group, Inc., (B) an institution that owns at least five shopping centers, and owns retail properties and shopping centers totaling in the aggregate 3,000,000 square feet of gross leasable area, has total assets or invests through a fund that has total assets in excess of $600,000,000 and has a net worth or invests through a fund with a net worth in excess of $450,000,000, or (C) as to which a rating agency confirmation has been received, and in each case must satisfy certain other requirements.
The Property.The Coconut Point Property is an open-air, one-story, anchored retail property, comprised of approximately 1,205,351 total SF, 836,531 SF of which serves as collateral for the Coconut Point Whole Loan. The center was built in 2006 by the Coconut Point Sponsor, and since 2008, the Coconut Point Sponsor has invested approximately $5.0 million in capital expenditures. The center consists of 22 mostly Spanish Mediterranean style buildings on an elongated, irregularly shaped site flanked by U.S. Route 41 (west), Via Coconut Point (east), Coconut Road (south), and a nature preserve buffer to the north. The Coconut Point Property is part of a larger development. The northern portion of the development contains the Super Target anchor (non-collateral) and the majority of the “big box” retailers, configured in a semi-circle facing U.S. 41, akin to a power center. The southern portion of the development consists of buildings in a linear configuration set back from and facing U.S. 41, akin to a lifestyle center, which contains Dillard’s and most of the outparcels (Hyatt Regency Hotel, The Vitamin Shoppe, Ethan Allen, CNL Bank, Wells Fargo Bank, Verizon – none of which are collateral for the Coconut Point Whole Loan). The development also contains the two-story Residences at Coconut Point, which are condominiums and located on the southeast end near Dillard’s (non-collateral). West of the Residences at Coconut Point is a Marriott Towne Suites hotel (non-collateral).
The Coconut Point Property is anchored by Super Target (non-collateral), Dillard’s (non-collateral), Hollywood Theaters, Bed Bath & Beyond, T.J. Maxx, Ross Dress For Less and Best Buy. In addition to the anchors, the Coconut Point Property is leased to 131 additional tenants including national retailers Barnes & Noble, DSW Shoe Warehouse, PetsMart, Office Max, Cost Plus World Market, and West Elm. As of June 7, 2016, the Coconut Point Property had an occupancy rate of 92.0% (including non-collateral anchors) and 88.4% for the collateral SF.
This is not a research report and was not prepared by any Underwriter’s research departments. Please see additional important information and qualifications at the end of this Term Sheet.
| T-110 |
| MSBAM 2016-C31 | Coconut Point |
The following table presents a summary of historical comparable in-line sales and occupancy costs and total mall sales at the Coconut Point Property.
| Historical Sales Summary(1) | |||||||
Comparable In-line Tenant Sales PSF | Comparable In-line Tenant Occupancy Cost(2) | Total Comparable In-line Sales | Total Mall Sales(3) | ||||
| Year | w/ Apple | w/o Apple | w/ Apple | w/o Apple | |||
| 2013 | $446 | $356 | 11.2% | 13.9% | $121,301,000 | $152,120,000 | |
| 2014 | $463 | $369 | 10.8% | 13.4% | $125,962,000 | $161,184,000 | |
| 2015 | $460 | $373 | 10.8% | 13.3% | $125,130,000 | $170,861,000 | |
| 6/30/2016 TTM(4) | $457 | $371 | 10.9% | 13.3% | $124,549,610 | $180,971,627 | |
| (1) | Comparable In-line Tenant sales are based on tenants that have been in occupancy at the Coconut Point Property since 2013 with at least 12 months of sales data. |
| (2) | Occupancy Cost % calculations are based on UW Total Rent (base rent, recoveries, % rent in lieu and overage rent), divided by sales from the respective year. |
| (3) | Total Mall Sales excludes Super Target and Dillard’s, which are not part of the collateral. |
| (4) | For TTM figures, comparable in-line tenants are defined as all stores less than 10,000 SF with at least 12 months of sales data. |
Major Tenants.
Hollywood Theaters (79,197 SF, 9.5% of NRA, 3.6% of underwritten base rent). Hollywood Theaters, Inc. (“Hollywood Theaters”) leases 79,197 SF at the Coconut Point Property and operates the space as a 16-screen movie theater. The lease began April 17, 2009 and has a lease expiration date of April 30, 2024. Hollywood Theaters is part of the Regal Entertainment Group. Regal Entertainment Group (NYSE:RGC) is the largest theater owner in the United States. The company has 7,307 screens within 564 theaters in 42 states through its Regal Cinemas, Edwards Theatres, United Artists Theatre Company, and Hoyts Cinema brands.
Bed Bath & Beyond (35,000 SF, 4.2% of NRA, 3.1% of underwritten base rent). Bed Bath & Beyond Inc. (“Bed Bath & Beyond”) leases 35,000 SF at the Coconut Point Property. The lease began September 7, 2006 and has a lease expiration date of January 31, 2017. Bed, Bath & Beyond (NASDAQ:BBBY) is a leading domestic supplier and furnishing retailer with 1,530 stores throughout the United States, Puerto Rico, and Canada. The store specializes in domestics and home furnishings, and also operates three smaller specialty chains: Christmas Tree Shops, buybuy BABY stores, and Harmon discount health and beauty shops.
T.J. Maxx (32,311 SF, 3.9% of NRA, 2.1% of underwritten base rent). The TJX Companies, Inc. (“T.J. Maxx”) leases 32,311 SF at the Coconut Point Property. The lease began May 21, 2006 and has a lease expiration date of May 31, 2021. T.J. Maxx (NYSE:TJX) is a leading American off-price retailer of apparel and home fashions. The company operates 2,587 stores in the United States and 808 stores in Canada and Europe. In the United States, TJX Companies, Inc. operates under four brands: T.J. Maxx, HomeGoods, Marshalls, and Sierra Trading Post.
Ross Dress For Less (30,173 SF, 3.6% of NRA, 2.6% of underwritten base rent). Ross Stores, Inc. (“Ross Dress For Less”) leases 30,173 SF at the Coconut Point Property. The lease began September 20, 2006 and has a lease expiration date of January 31, 2022. Ross Dress For Less is headquartered in Pleasanton, California, and is a large national off-price retailer. The company operates two chains of off-price retail apparel and home accessories stores.
Best Buy (30,000 SF, 3.6% of NRA, 3.6% of underwritten base rent). Best Buy Stores Co., Inc. (“Best Buy”) leases 30,000 SF at the Coconut Point Property. The lease began August 11, 2006 and has a lease expiration date of January 31, 2022. Best Buy (NYSE: BBY) is a specialty retailer of consumer electronics, home-office products, entertainment software, appliances, and related services. Worldwide, the company operates 1,731 stores and is currently the largest consumer electronics retailer in the United States accounting for approximately one-third of total electronics, appliance, and computer stores sales.
This is not a research report and was not prepared by any Underwriter’s research departments. Please see additional important information and qualifications at the end of this Term Sheet.
| T-111 |
| MSBAM 2016-C31 | Coconut Point |
The following table presents certain information relating to the anchor tenants and major tenants. Certain tenants may have co-tenancy provisions permitting the early termination of its leases based on sales performance and/or occupancy at the Coconut Point Property. The operating covenants of the anchor tenants have expired.
| Tenant Summary | ||||||||||
| Tenant Name | Credit Rating (Moody’s/S&P/Fitch)(1) | Tenant SF | % of Collateral SF | Annual UW Rent(2) | % of Annual UW | Annual UW Rent PSF(3) | Sales (TTM 6/30/2016)(4) | Occ. Cost %(5) | Lease Expiration | |
$ | PSF(3) | |||||||||
| Anchors | ||||||||||
| Super Target (Not Collateral) | A2/A/A- | 186,995 | N/A | N/A | N/A | N/A | N/A | N/A | N/A | N/A |
| Dillard’s (Not Collateral) | Baa3/BBB-/BBB- | 181,825 | N/A | N/A | N/A | N/A | N/A | N/A | N/A | N/A |
| Subtotal/Wtd. Avg. | 368,820 | N/A | N/A | N/A | N/A | N/A | N/A | N/A | ||
| Hollywood Theaters(6) | NR/NR/NR | 79,197 | 9.5% | $570,180 | 3.6% | $7.20 | $4,298,021 | $268,626 | 20.2% | 4/30/2024 |
| Bed Bath & Beyond | Baa1/BBB+/A+ | 35,000 | 4.2% | $492,450 | 3.1% | $14.07 | N/A | N/A | N/A | 1/31/2017 |
| T.J. Maxx | A2/A+/NR | 32,311 | 3.9% | $331,188 | 2.1% | $10.25 | $11,406,429 | $353 | 3.3% | 5/31/2021 |
| Ross Dress For Less | A3/A-/A | 30,173 | 3.6% | $407,336 | 2.6% | $13.50 | N/A | N/A | N/A | 1/31/2022 |
| Best Buy | Baa1/BBB-/BBB- | 30,000 | 3.6% | $570,000 | 3.6% | $19.00 | N/A | N/A | N/A | 1/31/2022 |
| Subtotal/Wtd. Avg.(7) | 206,681 | 24.7% | $2,371,153 | 15.0% | $11.47 | $15,704,450 | $141 | 7.9% | ||
| Major > 10,000 SF | ||||||||||
| Barnes & Noble | NR/NR/NR | 27,544 | 3.3% | $385,616 | 2.4% | $14.00 | $3,900,781 | $142 | 11.6% | 2/28/2017 |
| DSW Shoe Warehouse | NR/NR/NR | 20,961 | 2.5% | $303,935 | 1.9% | $14.50 | N/A | N/A | N/A | 1/31/2022 |
| Office Max | NR/NR/NR | 19,899 | 2.4% | $325,000 | 2.1% | $16.33 | N/A | N/A | N/A | 7/31/2021 |
| PetsMart | NR/NR/NR | 19,624 | 2.3% | $289,454 | 1.8% | $14.75 | $5,058,086 | $258 | 6.4% | 9/30/2021 |
| Cost Plus World Market | NR/NR/NR | 18,300 | 2.2% | $356,850 | 2.3% | $19.50 | $2,356,491 | $129 | 17.3% | 1/31/2017 |
| West Elm | NR/NR/NR | 15,087 | 1.8% | $301,740 | 1.9% | $20.00 | $2,977,269 | $197 | 10.1% | 3/31/2019 |
| Michael’s | NR/NR/NR | 14,763 | 1.8% | $244,316 | 1.5% | $16.55 | $2,745,180 | $186 | 10.3% | 10/31/2023 |
| Party City(8) | B3/B-/NR | 12,000 | 1.4% | N/A | N/A | N/A | $1,111,440 | $93 | 19.3% | 1/31/2018 |
| Pier 1 Imports | NR/NR/NR | 11,030 | 1.3% | $217,843 | 1.4% | $19.75 | $2,196,735 | $199 | 11.6% | 10/31/2021 |
| Subtotal/Wtd. Avg.(7) | 159,208 | 19.0% | $2,424,753 | 15.4% | $16.47 | $20,345,982 | $172 | 11.0% | ||
| Top 10 In-Line(9) | ||||||||||
| Ruth’s Chris Steak House | NR/NR/NR | 9,946 | 1.2% | $361,040 | 2.3% | $36.30 | $5,820,996 | $585 | 10.6% | 11/30/2021 |
| Ulta 3 | NR/NR/NR | 9,829 | 1.2% | $308,041 | 2.0% | $31.34 | $5,069,798 | $516 | 7.5% | 1/31/2017 |
| Charming Charlie | B3/B-/NR | 10,000 | 1.2% | $293,900 | 1.9% | $29.39 | $1,640,100 | $164 | 19.2% | 8/31/2020 |
| Stir Crazy | NR/NR/NR | 8,258 | 1.0% | $264,550 | 1.7% | $32.04 | $2,409,932 | $292 | 20.0% | 1/31/2019 |
| Blue Water Bistro | NR/NR/NR | 6,681 | 0.8% | $233,835 | 1.5% | $35.00 | $2,377,367 | $356 | 16.9% | 4/30/2017 |
| Sephora | NR/NR/NR | 6,066 | 0.7% | $224,442 | 1.4% | $37.00 | $5,498,586 | $906 | 7.7% | 1/31/2018 |
| Tommy Bahama | NR/NR/NR | 4,476 | 0.5% | $224,000 | 1.4% | $50.04 | N/A | N/A | N/A | 11/30/2026 |
| California Pizza Kitchen | NR/NR/NR | 5,997 | 0.7% | $197,901 | 1.3% | $33.00 | $3,421,229 | $570 | 11.1% | 12/31/2021 |
| Express | NR/NR/NR | 7,575 | 0.9% | $196,950 | 1.2% | $26.00 | $2,061,688 | $272 | 16.5% | 1/31/2017 |
| Rodizio Grill | NR/NR/NR | 6,928 | 0.8% | $192,668 | 1.2% | $27.81 | $3,077,625 | $444 | 10.9% | 4/30/2026 |
| All other Tenants < 10,000 SF | 298,130 | 35.6% | $8,499,911 | 53.8% | $28.51 | $113,543,874 | ||||
| Total Occupied SF | 739,775 | 88.4% | $15,793,143 | 100.0% | $21.35 | $180,971,627 | ||||
| Vacant | 96,756 | 11.6% | ||||||||
| Total Property SF | 836,531 | 100.0% | ||||||||
| Comparable In-Line | 272,273 | $124,549,610 | $457 | 10.9% | ||||||
| Comparable In-Line Without Apple(10) | 267,473 | $99,325,754 | $371 | 13.3% | ||||||
| (1) | Certain ratings are those of the parent company whether or not the parent company guarantees the lease. |
| (2) | Annual UW Rent includes contractual rent steps equal to $510,442 through June 30, 2017, as well as $456,000 of rent associated with three tenants which have signed leases but are not yet in occupancy (Divieto, Tommy Bahama and Naples Soap Company, which in aggregate represent 1.6% of NRA). |
| (3) | Annual UW Rent PSF and PSF figures exclude vacant space. |
| (4) | Tenant sales for trailing twelve months ended June 30, 2016. |
| (5) | Occ. Cost % calculations are based on UW Total Rent (UW base rent, recoveries, % rent in lieu and overage rent), divided by TTM 6/30/2016 Sales. |
| (6) | Sales PSF for Hollywood Theaters are based on 16 screens. |
| (7) | For purposes of calculating subtotals for Sales PSF and Occ. Cost %, amounts are based on tenants that reports sales on a per square feet basis. Wtd. Avg. is based on Tenant SF. |
| (8) | Party City pays percentage rent in lieu of base rent. |
| (9) | Top 10 In-Line tenants based on UW base rent. |
| (10) | Apple leases approximately 4,800 SF (0.6% of NRA) of in-line space at the Coconut Point Property. |
This is not a research report and was not prepared by any Underwriter’s research departments. Please see additional important information and qualifications at the end of this Term Sheet.
| T-112 |
| MSBAM 2016-C31 | Coconut Point |
The following table presents certain information relating to the lease rollover schedule at the Coconut Point Property:
| Lease Rollover Schedule(1)(2) | ||||||||
| Year | # of Leases Rolling | SF Rolling | % of Total SF Rolling | Cumulative % of Total SF Rolling | Total UW Rent Rolling(3) | UW Rent PSF Rolling(4) | % of Total Rent Rolling | Cumulative % of Total Rent Rolling |
| MTM | 0 | 0 | 0.0% | 0.0% | $0 | $0.00 | 0.0% | 0.0% |
| 2016 | 3 | 8,006 | 1.0% | 1.0% | $302,096 | $37.73 | 1.9% | 1.9% |
| 2017 | 39 | 203,794 | 24.4% | 25.3% | $4,677,370 | $22.95 | 29.6% | 31.5% |
| 2018 | 14 | 46,385 | 5.5% | 30.9% | $1,024,453 | $22.09 | 6.5% | 38.0% |
| 2019 | 7 | 37,944 | 4.5% | 35.4% | $910,232 | $23.99 | 5.8% | 43.8% |
| 2020 | 8 | 25,973 | 3.1% | 38.5% | $845,316 | $32.55 | 5.4% | 49.1% |
| 2021 | 22 | 141,918 | 17.0% | 55.5% | $3,026,863 | $21.33 | 19.2% | 68.3% |
| 2022 | 9 | 102,119 | 12.2% | 67.7% | $1,868,001 | $18.29 | 11.8% | 80.1% |
| 2023 | 3 | 20,191 | 2.4% | 70.1% | $469,213 | $23.24 | 3.0% | 83.1% |
| 2024 | 7 | 101,722 | 12.2% | 82.3% | $1,095,974 | $10.77 | 6.9% | 90.0% |
| 2025 | 3 | 13,351 | 1.6% | 83.8% | $335,079 | $25.10 | 2.1% | 92.2% |
| 2026 | 6 | 24,066 | 2.9% | 86.7% | $831,769 | $34.56 | 5.3% | 97.4% |
| 2027 and Beyond | 15 | 14,306 | 1.7% | 88.4% | $406,777 | $28.43 | 2.6% | 100.0% |
| Vacant | 25 | 96,756 | 11.6% | 100.0% | $0 | $0.00 | 0.0% | 100.0% |
| Total/Wtd. Avg. | 161 | 836,531 | 100.0% | $15,793,143 | $21.35 | 100.0% | ||
| (1) | Information is based on the underwritten rent roll and the Coconut Point Borrower’s owned space. |
| (2) | Certain tenants may have lease termination options that are exercisable prior to the originally stated expiration date of the subject and that are not considered in the lease rollover schedule. |
| (3) | Total UW Rent Rolling includes contractual rent steps equal to $510,442 through June 30, 2017 as well as $456,000 of rent associated with three tenants which have signed leases but are not yet in occupancy (Divieto, Tommy Bahama and Naples Soap Company). |
| (4) | UW Rent PSF Rolling excludes vacant space. |
The Market. The Coconut Point Property is located within the Village of Estero, in the southern portion of the Fort Myers-Cape Coral CBSA, on the west coast of Florida approximately 20 miles south of Ft. Myers, Florida. The Coconut Point Property is situated at the mid-point between Ft. Myers, Florida and Naples, Florida with extensive frontage along heavily trafficked U.S. Route 41 and is 2.3 miles southwest of I-75. Estero is approximately two miles west of U.S. Route 41, beyond which is the Gulf of Mexico. I-75 provides regional access and extends northward through Florida to Alabama, and east to Ft. Lauderdale, Florida. According to the appraisal, the area surrounding the Coconut Point Property is characterized by residential development, including several golf-oriented, country club subdivisions with upscale homes separated by numerous lakes. Over the period extending from 2000 through 2015, the compound annual growth rates for the population within a one, three, and five mile radius of the Coconut Point Property have been 5.17%, 5.36% and 3.91%, respectively. Within a one, three, and five mile radius of the Coconut Point Property, the 2015 annual average household income levels were estimated at $123,919, $103,065, and $92,110, respectively. These are above the corresponding average for the Fort Myers-Cape Coral CBSA, state of Florida and United States which are estimated at $70,514, $68,907 and $77,468, respectively.
This is not a research report and was not prepared by any Underwriter’s research departments. Please see additional important information and qualifications at the end of this Term Sheet.
| T-113 |
| MSBAM 2016-C31 | Coconut Point |
The appraiser concluded a primary trade area of up to a 10-mile radius around the Coconut Point Property and a secondary trade area up to a 15-mile radius around the Coconut Point Property. A summary of demographics in the primary and secondary trade areas compared to the Fort Myers-Cape Coral CBSA, state of Florida and the United States is presented below.
| Demographic Summary | |||||
| Statistic | 10-mile Radius | 15-mile Radius | Fort Myers-Cape Coral CBSA | State of Florida | United States |
| Population | |||||
| 2000 | 118,328 | 275,807 | 440,238 | 15,967,616 | 281,422,025 |
| 2015 | 185,099 | 435,493 | 679,145 | 19,982,286 | 321,008,371 |
| 2020 (projected) | 206,994 | 490,636 | 762,623 | 21,349,479 | 334,312,036 |
| % Increase 2000-2015 | 56.4% | 57.9% | 54.3% | 25.1% | 14.1% |
| % Increase 2015-2020 (projected) | 11.8% | 12.7% | 12.3% | 6.8% | 4.1% |
| Average Household Income | |||||
| 2000 | $75,092 | $72,049 | $56,573 | $53,493 | $56,675 |
| 2015 | $94,416 | $89,924 | $70,514 | $68,907 | $77,468 |
| 2020 (projected) | $109,965 | $103,876 | $82,043 | $79,373 | $89,744 |
| % Increase 2000-2015 | 25.7% | 24.8% | 24.6% | 28.8% | 36.7% |
| % Increase 2015-2020 (projected) | 16.5% | 15.5% | 16.3% | 15.2% | 15.8% |
| Number of Households | |||||
| 2000 | 52,585 | 125,686 | 188,245 | 6,330,109 | 105,480,443 |
| 2015 | 84,508 | 198,874 | 285,218 | 7,867,777 | 121,422,322 |
| 2020 (projected) | 95,717 | 225,053 | 320,972 | 8,443,262 | 127,063,980 |
| % Increase 2000-2015 | 60.7% | 58.2% | 51.5% | 24.3% | 15.1% |
| % Increase 2015-2020 (projected) | 13.3% | 13.2% | 12.5% | 7.3% | 4.6% |
Source: Appraisal
According to the appraisal, the Coconut Point Property is located in the Estero submarket of the Southwest Florida retail market, encompassing approximately 1.7% of the region’s retail inventory. As of the second quarter of 2016, the Southwest Florida retail market had a vacancy rate of 9.7% and the Estero submarket had a vacancy rate of 10.9%. In the same period, asking rents in the Southwest Florida retail market were $14.18 PSF and asking rents in the Estero submarket were $15.86 PSF.
This is not a research report and was not prepared by any Underwriter’s research departments. Please see additional important information and qualifications at the end of this Term Sheet.
| T-114 |
| MSBAM 2016-C31 | Coconut Point |
The following table presents certain competitive retail properties to the Coconut Point Property:
| Competitive Property Summary | ||||||||
| Property Name | Center Type | Proximity | Total GLA | Year Built | Year Renovated | Anchor Tenants | Occupancy | In-line Sales PSF |
| Coconut Point Mall | Anchored | N/A | 1,205,351 (including non-collateral anchors)
| 2006 | N/A | Dillard’s, Hollywood Theaters, Barnes & Noble, West Elm, Super Target, Bed Bath & Beyond, T.J. Maxx, Ross Dress For Less, Best Buy | 92% (including non-collateral anchors)(1)
| $436 |
| Primary Competition | ||||||||
| Miromar Outlets | Outlet | 4.3 miles NE | 954,900 | 1998 | 2013 | Bloomingdale’s Outlet, Nordstrom Last Call, Saks Off Fifth | 99% | $700 |
| Gulf Coast Town Center | Regional | 8.3 miles NE | 1,651,000 | 2005 | N/A | Bass Pro, Belk, JC Penney, Target, Costco
| 91% | $310 |
| Coastland Center | Super Regional | 16.3 miles S | 934,000 | 1977 | 2007-2008 | Dillard’s, JC Penney, Macy’s, Sears | 92% | $420 |
| Promenade at Bonita Bay | Fashion/ Specialty | 2.4 miles S | 110,000 | 1998 | N/A | None | 76% | N/A |
| Bell Tower Shops | Lifestyle | 10.6 miles N | 348,565 | 1982 | 2009 | Saks Fifth Ave., Regal Cinemas, Bed Bath & Beyond, Fresh Market | 94% | $325 |
| Secondary Competition | ||||||||
| Waterside Shops at Pelican Bay | Regional | 13.2 miles S | 356,000 | 1992 | 2006 | Saks Fifth Ave., Nordstrom | 96% | $800 |
| The Mercato | Lifestyle | 10.4 miles N | 454,300 | 2008 | N/A | Whole Foods, Silverspot Cinema, Nordstrom Rack | 91% | $380 |
| Edison Mall | Super Regional | 14.2 miles N | 1,051,000 | 1965 | 1995 | Macy’s, Dillard’s, JC Penney, Sears, Macy’s | 84% | $330 |
Source: Appraisal is the source for all information other than the Coconut Point Property GLA, Occupancy, and In-line Sales PSF, which are based on information in the underwritten rent roll.
| (1) | Excluding the non-collateral anchors, the Coconut Point Property has an occupancy rate of 88.4% based on the June 7, 2016 rent roll. |
This is not a research report and was not prepared by any Underwriter’s research departments. Please see additional important information and qualifications at the end of this Term Sheet.
| T-115 |
| MSBAM 2016-C31 | Coconut Point |
Operating History and Underwritten Net Cash Flow.The following table presents certain information relating to historical operating performance and the Underwritten Net Cash Flow at the Coconut Point Property:
| Cash Flow Analysis | ||||||
| 2013 | 2014 | 2015 | 6/30/2016 TTM | UW | UW PSF | |
| Base Rental Revenue | $15,532,917 | $15,947,060 | $16,109,374 | $16,396,941 | $18,063,393(1) | $21.59 |
| Percentage Rent In Lieu(2) | $335,758 | $446,310 | $578,523 | $506,967 | $380,739 | $0.46 |
| Overage Rent(2) | $383,569 | $413,451 | $305,578 | $331,093 | $205,200 | $0.25 |
| Specialty Leasing Income | $359,608 | $357,194 | $303,318 | $278,170 | $348,411 | $0.42 |
| Total Minimum Rent | $16,611,852 | $17,164,015 | $17,296,793 | $17,513,171 | $18,997,743 | $22.71 |
| Expense Reimbursements | $8,399,018 | $8,605,619 | $9,180,668 | $9,151,647 | $10,057,802 | $12.02 |
| Other Income | $226,438 | $179,055 | $231,581 | $220,992 | $220,992 | $0.26 |
| Total Gross Income | $25,237,308 | $25,948,689 | $26,709,042 | $26,885,810 | $29,276,537 | $35.00 |
| Vacancy and Credit Loss | $0 | $0 | $0 | $0 | ($3,367,987) | ($4.03) |
| Effective Gross Income | $25,237,308 | $25,948,689 | $26,709,042 | $26,885,810 | $25,908,550 | $30.97 |
| Total Expenses | $8,762,919 | $8,965,282 | $9,069,268 | $8,988,453 | $9,273,941 | $11.09 |
| Net Operating Income | $16,474,389 | $16,983,407 | $17,639,774 | $17,897,357 | $16,634,609 | $19.89 |
| Capital Reserves | $0 | $0 | $0 | $0 | $292,786 | $0.35 |
| Tenant Improvements | $0 | $0 | $0 | $0 | $627,398 | $0.75 |
| Leasing Commissions | $0 | $0 | $0 | $0 | $627,398 | $0.75 |
| Net Cash Flow | $16,474,389 | $16,983,407 | $17,639,774 | $17,897,357 | $15,087,026 | $18.04 |
| Occupancy%(3) | 94.8% | 92.8% | 93.7% | 88.4% | 88.4%(4) | |
| NOI DSCR(5) | 1.52x | 1.57x | 1.63x | 1.65x | 1.54x | |
| NOI DSCR (IO)(5) | 2.16x | 2.23x | 2.32x | 2.35x | 2.18x | |
| NCF DSCR(5) | 1.52x | 1.57x | 1.63x | 1.65x | 1.39x | |
| NCF DSCR (IO)(5) | 2.16x | 2.23x | 2.32x | 2.35x | 1.98x | |
| NOI Debt Yield(5) | 8.7% | 8.9% | 9.3% | 9.4% | 8.8% | |
| NCF Debt Yield(5) | 8.7% | 8.9% | 9.3% | 9.4% | 7.9% | |
(1) | UW Base Rental Revenue is based on the rent roll as of June 7, 2016 and includes rent steps totaling $510,442 taken through June 30, 2017, vacancy gross up of $2,270,250 as well as $456,000 of rent associated with three tenants which have signed leases but are not yet in occupancy (Divieto, Tommy Bahama and Naples Soap Company). |
| (2) | Percentage Rent In Lieu and Overage Rent are based on year ended 2016 projected sales. |
| (3) | Historical occupancy excludes non-collateral anchors and temporary tenants. Including temporary tenants, occupancy in 2013, 2014, 2015 and 6/30/2016 TTM were 95.8%, 93.6%, 96.8% and 95.5%. 6/30/2016 TTM occupancy is based on June 7, 2016 rent roll and includes underwriting adjustments. Physical occupancy for the same period is 92.5%. |
| (4) | UW Occupancy is based on square footage of 836,531 (based on June 7, 2016 rent roll) and reflects in place occupancy, including Divieto, Tommy Bahama and Naples Soap Company (in aggregate representing 1.6% of NRA), which have executed leases but have not yet taken occupancy, and reflects the recent departure of the Sports Authority tenant. |
| (5) | Debt service coverage ratios and debt yields are based on the Coconut Point Whole Loan. |
Escrows and Reserves. During the continuance of a Lockbox Event Period (defined below), or if the Coconut Point Borrower has failed to pay real estate taxes as required by the Coconut Point Whole Loan documents, the Coconut Point Borrower is required to escrow monthly 1/12th of the annual estimated tax payments. During the continuance of a Lockbox Event Period, the Coconut Point Borrower is required to escrow monthly 1/12th of the annual estimated insurance premiums (unless the Coconut Point Borrower maintains an acceptable blanket policy). During the continuance of a Lockbox Event Period, the Coconut Point Borrower is required to make monthly deposits equal to $24,399 into an escrow for replacements and repairs. During the continuance of a Lockbox Event Period, the Coconut Point Borrower is required to make monthly deposits equal to $104,566 into an escrow for tenant improvements and leasing commissions.
Lockbox and Cash Management.A hard lockbox is in place with respect to the Coconut Point Whole Loan, and, within 30 days after the loan closing date, the Coconut Point Borrower is required to direct all tenants to pay rent directly into such lockbox. The Coconut Point Whole Loan has springing cash management (i.e., the Coconut Point Whole Loan has cash management only after the initial occurrence and during the continuance of a Lockbox Event Period). Provided a Lockbox Event Period is not continuing, funds in the lockbox account are required to be swept to an account designated by the Coconut Point Borrower. Upon the occurrence of a Lockbox Event Period, the Coconut Point Borrower is required to establish and maintain a cash management account, and, during the continuance of a Lockbox Event Period, funds in the lockbox account are required to be transferred on each Wednesday, or if not a business day, the preceding business day (or more frequently if required by the Coconut Point Borrower) to the cash management account. During the continuance of a Lockbox Event Period arising solely in connection with a DSCR Trigger Event (as defined below), funds in the cash management account are required to be applied on each monthly payment date to pay debt service on the Coconut Point Whole Loan, to fund the required reserves deposits as described above under “Escrows and Reserves”, to disburse the monthly operating expenses and capital expenditures referenced in the annual budget and extraordinary operating expenses or capital expenses approved by the lender (except for emergency expenses), and to disburse the remainder into an account to be held by the lender as additional security for the Coconut Point Whole Loan during the continuance of such Lockbox Event Period. During a Lockbox Event Period not caused solely by a DSCR Trigger Event, the lender may apply funds in the cash management account to any and all obligations of the Coconut Point Borrower under the Coconut Point Whole Loan documents in such order as the lender may determine in its sole discretion. The annual budget is required to be approved by the lender during a DSCR Trigger Event only if (A) Simon Property Group, L.P. or Simon Property Group, Inc. no longer owns at least 50% of, and controls, the Coconut Point Borrower, and (B) there is (x) more than a 5% deviation from the prior fiscal year’s annual budget or (y) an increase in fees or other payments made to an affiliate of the Coconut Point Borrower.
This is not a research report and was not prepared by any Underwriter’s research departments. Please see additional important information and qualifications at the end of this Term Sheet.
| T-116 |
| MSBAM 2016-C31 | Coconut Point |
A “Lockbox Event Period” means the period:
(i) commencing upon an event of default under the Coconut Point Whole Loan and ending upon the acceptance by the lender, in its sole discretion, of a cure of such event of default, or
(ii) commencing upon certain bankruptcy actions with respect to the Coconut Point Borrower or the property manager (if an affiliate of the Coconut Point Borrower), and ending, in the case of the property manager, if it is replaced with Simon Property Group, L.P. or Simon Property Group, Inc. or an affiliate, or with another property manager that meets the requirements of the Coconut Point Whole Loan documents, within 60 days or the applicable bankruptcy action is discharged or dismissed within 90 days without any adverse consequences to the Coconut Point Property or the Coconut Point Whole Loan (it being understood that a Lockbox Event Period triggered by a bankruptcy action of the Coconut Point Borrower cannot be cured), or
(iii) commencing on the date upon which the debt service coverage ratio on the Coconut Point Whole Loan for the immediately preceding four calendar quarters is less than 1.20x for two consecutive calendar quarters (a “DSCR Trigger Event”), and ending on the date the debt service coverage ratio on the Coconut Point Whole Loan for the immediately preceding four calendar quarters equals or exceeds 1.20x for two consecutive calendar quarters.
The Coconut Point Borrower may not cure a Lockbox Event Period more than five times during the loan term in accordance with the loan documents.
Additional Secured Indebtedness (not including trade debts). In addition to the Coconut Point Mortgage Loan, the Coconut Point Property also secures the Coconut PointPari Passu Companion Loans. The Coconut PointPari PassuCompanion Loans accrue interest at the same rate as the Coconut Point Mortgage Loan. The Coconut Point Mortgage Loan is entitled to payments of principal and interest on apro rata andpari passu basis with the Coconut PointPari Passu Companion Loans. The holders of the Coconut Point Mortgage Loan and the Coconut PointPari Passu Companion Loans have entered into a co-lender agreement which sets forth the allocation of collections on the Coconut Point Whole Loan. See “Description of the Mortgage Pool—The Whole Loans—The Non-ServicedPari Passu Whole Loans” in the Preliminary Prospectus.
Mezzanine Loan and Preferred Equity. Not permitted.
Release of Property. The Coconut Point Borrower may make transfers of non-income producing portions of the Coconut Point Property as described in the Preliminary Prospectus.
Terrorism Insurance.The Coconut Point Borrower is required to obtain insurance against acts of terrorism to the extent such insurance is available; provided, that if the Terrorism Risk Insurance Program Reauthorization Act of 2015 (as the same may be amended, restated, supplemented or otherwise modified from time to time) is not in effect (A) the Coconut Point Borrower is not required to pay insurance premiums with respect to such terrorism insurance in excess of the Terrorism Cap (defined below) and (B) any such policy may have a deductible that is reasonable with respect to properties similar to the Coconut Point Property and for the geographic region where the Coconut Point Property is located, so long as in no event shall such deductible exceed $5,000,000. “Terrorism Cap” means two times the amount of the then-current annual insurance premiums payable by the Coconut Point Borrower for the policies insuring only the Coconut Point Property (excluding the wind, flood and earthquake components of such insurance premiums) on a stand-alone basis.
This is not a research report and was not prepared by any Underwriter’s research departments. Please see additional important information and qualifications at the end of this Term Sheet.
| T-117 |
| MSBAM 2016-C31 | Thanksgiving Station IV |
Mortgage Loan No. 11 – Thanksgiving Station IV |
| Mortgage Loan Information | Mortgaged Property Information | ||||||
| Mortgage Loan Seller: | KeyBank | Single Asset/Portfolio: | Single Asset | ||||
| Original Balance: | $29,500,000 | Location: | Lehi, UT 84043 | ||||
| Cut-off Date Balance: | $29,419,866 | General Property Type: | Office | ||||
| % of Initial Pool Balance: | 3.1% | Detailed Property Type: | Suburban | ||||
| Loan Purpose: | Refinance | Title Vesting: | Fee | ||||
| Sponsors: | Nathan W. Ricks; Andrew E. Bybee; Brandon D. Fugal; John S. Petersen; Ronald S. Lindorf | Year Built/Renovated: | 2016/N/A | ||||
| Size: | 148,580 SF | ||||||
| Mortgage Rate: | 4.1100% | Cut-off Date Balance per SF: | $198 | ||||
| Note Date: | 9/1/2016 | Maturity Date Balance per SF: | $159 | ||||
| First Payment Date: | 10/1/2016 | Property Manager: | TGPark Management, LLC | ||||
| Maturity Date: | 9/1/2026 | (borrower-related) | |||||
| Original Term to Maturity: | 120 months | ||||||
| Original Amortization Term: | 360 months | ||||||
| IO Period: | 0 months | Underwriting and Financial Information | |||||
| Seasoning: | 2 months | UW NOI: | $2,793,610 | ||||
| Prepayment Provisions: | LO (26); DEF (88); O (6) | UW NOI Debt Yield: | 9.5% | ||||
| Lockbox/Cash Mgmt Status: | Springing/Springing | UW NOI Debt Yield at Maturity: | 11.8% | ||||
| Additional Debt Type: | N/A | UW NCF DSCR: | 1.47x | ||||
| Additional Debt Balance: | N/A | Most Recent NOI(3): | N/A | ||||
| Future Debt Permitted (Type): | No (N/A) | 2nd Most Recent NOI(3): | N/A | ||||
| Reserves | 3rd Most Recent NOI(3): | N/A | |||||
| Type | Initial | Monthly | Cap | Most Recent Occupancy(4): | 98.6% (8/29/2016) | ||
| RE Tax: | $272,397 | $24,763 | N/A | 2nd Most Recent Occupancy(3): | N/A | ||
| Insurance: | $0 | Springing | N/A | 3rd Most Recent Occupancy(3): | N/A | ||
| Recurring Replacements: | $2,310 | $2,310 | $83,160 | Appraised Value (as of)(5): | $40,200,000 (5/1/2017) | ||
| TI/LC(1): | $11,540 | $11,540 | $415,440 | Cut-off Date LTV Ratio(5): | 73.2% | ||
| Other(2): | $3,528,581 | $0 | N/A | Maturity Date LTV Ratio(5): | 58.7% | ||
| Sources and Uses | ||||||
| Sources | Proceeds | % of Total | Uses | Proceeds | % of Total | |
| Loan Amount: | $29,500,000 | 100.0% | Loan Payoff: | $19,412,343 | 65.8% | |
| Reserves: | $3,814,828 | 12.9% | ||||
| Closing Costs: | $96,457 | 0.3% | ||||
| Return of Equity: | $6,176,372 | 20.9% | ||||
| Total Sources: | $29,500,000 | 100.0% | Total Uses: | $29,500,000 | 100.0% | |
| (1) | TI/LC reserve collections are capped at $415,440, however, the cap will increase to $1,415,440 during the continuance of a cash sweep event due to either Digicert or Nuvi, LLC failing to renew their respective leases prior to the date that is 12 months before lease expiration. |
| (2) | Other reserves are comprised of a reduced rent reserve ($1,149,978) and two outstanding TI/LC reserves ($2,378,603). See “Tenant Summary” below. |
| (3) | The Thanksgiving Station IV Property was constructed in 2016, as such historical operating performance and occupancy information are not available. |
| (4) | Most Recent Occupancy includes 10,118 SF of space leased to Purebred Breeders, LLC and 61,594 SF of space leased to Digicert which are expected to take occupancy in November 2016 and December 2016, respectively. Both tenants are underwritten to their full, unabated rent. At loan origination, the Thanksgiving Station IV Borrower reserved funds equal to the amount of full, unabated rent for any months when no rent is due and the difference between full, unabated rent and reduced rent. Excluding the space for Purebred Breeders, LLC and Digicert, the Thanksgiving Station IV Property was 50.3% occupied as of August 29, 2016. |
| (5) | The Thanksgiving Station IV Property has an “As Stabilized” appraised value of $40,200,000 as of May 1, 2017 which assumes the completion of tenant improvements for Digicert and Purebred Breeders, LLC and assumes all leased tenants are in occupancy and paying full, unabated rent. At loan origination, the Thanksgiving Station IV Borrower reserved $2,378,603 for outstanding tenant improvement allowances and $1,149,978 for rent attributed to tenants that are not yet in occupancy and/or paying full, unabated rent for any months when no rent is due. The “As Is” appraised value of $36,100,000 as of August 10, 2016 results in a Cut-off Date LTV Ratio of 81.5%. |
The Mortgage Loan. The eleventh largest mortgage loan (the “Thanksgiving Station IV Mortgage Loan”) is evidenced by a promissory note in the original principal amount of $29,500,000 and secured by a first priority fee mortgage encumbering an office property located in Lehi, Utah (the “Thanksgiving Station IV Property”). The proceeds of the Thanksgiving Station IV Mortgage Loan were used to refinance existing debt on the Thanksgiving Station IV Property, fund reserves, pay closing costs and return equity to the Thanksgiving Station IV Borrower (as defined below).
The Borrower and the Sponsors.The borrower is Thanksgiving Station Four, LLC (the “Thanksgiving Station IV Borrower”), a single-purpose Delaware limited liability company with two independent directors. The Thanksgiving Station IV Borrower is managed and majority owned by Nathan W. Ricks and Ronald S. Lindorf, the founders of Thanksgiving Development, LLC, now known as Stack Real Estate. Mr. Ricks and Mr. Lindorf will serve as the Thanksgiving Station IV Mortgage Loan non-recourse carve-out guarantors as will minority owners Andrew E. Bybee, Brandon D. Fugal and John S. Peterson. Mr. Ricks has ownership interests in four office properties totaling 572,160 SF, four multifamily properties totaling 1,318 units, two self storage
This is not a research report and was not prepared by any Underwriter’s research departments. Please see additional important information and qualifications at the end of this Term Sheet.
| T-118 |
| MSBAM 2016-C31 | Thanksgiving Station IV |
properties totaling 960 units and 87.3 acres of development land. Mr. Lindorf has ownership interests in five office properties totaling 1,183,780 SF, one multifamily property with 111 units, one 46,792 SF retail property and 52.8 acres of development land.
The Property.The Thanksgiving Station IV Property, located at 2801 North Thanksgiving Way in Lehi, Utah, consists of a five-story Class A office property with an adjacent parking deck constructed in 2016 by the sponsors for approximately $34.0 million. The Thanksgiving Station IV Property sits on a 7.50 acre parcel immediately west of Interstate 15. Amenities at the Thanksgiving Station IV Property include covered parking, a fitness center, balconies, floor-to-ceiling windows and proximity to the Lehi Station of the FrontRunner commuter train. The Thanksgiving Station IV Property totals 148,580 SF and was 98.6% leased as of August 29, 2016 to six tenants.
The following table presents a summary regarding major tenants at the Thanksgiving Station IV Property:
| Tenant Summary(1) | |||||||
| Tenant Name | Credit Rating (Fitch/Moody’s/S&P)(2) | Tenant SF | Approximate % of SF | Annual UW Rent | % of Total Annual UW Rent | Annual UW Rent PSF(3) | Lease Expiration |
| Major Tenants | |||||||
| Digicert(4)(5) | NR/NR/B- | 61,594 | 41.5% | $1,709,234 | 42.2% | $27.75 | 4/30/2026 |
| NUVI, LLC | NR/NR/NR | 45,437 | 30.6% | $1,251,789 | 30.9% | $27.55 | 11/30/2022 |
| NLU Products, LLC (BGZ)(6) | NR/NR/NR | 20,000 | 13.5% | $556,200 | 13.7% | $27.81 | 1/31/2024 |
| Purebred Breeders, LLC(7)(8) | NR/NR/NR | 10,118 | 6.8% | $273,186 | 6.8% | $27.00 | 10/31/2023 |
| Cadence Homes(9) | NR/NR/NR | 7,259 | 4.9% | $201,873 | 5.0% | $27.81 | 3/31/2022 |
| VST, LLC(10) | NR/NR/NR | 2,024 | 1.4% | $54,648 | 1.4% | $27.00 | 7/31/2021 |
| Subtotal/Wtd. Avg. | 146,432 | 98.6% | $4,046,930 | 100.0% | $27.64 | ||
| Other Tenants | 0 | 0.0% | $0 | 0.0% | $0.00 | ||
| Vacant Space | 2,148 | 1.4% | $0 | 0.0% | $0.00 | ||
| Total/Wtd. Avg. | 148,580 | 100.0% | $4,046,930 | 100.0% | $27.64 | ||
| (1) | Information is based on the underwritten rent roll. |
| (2) | Certain ratings are those of the parent company whether or not the parent guarantees the lease. |
| (3) | Wtd. Avg. Annual UW Rent PSF excludes vacant space. |
| (4) | Digicert may terminate its lease with 10 days written notice if its space is not delivered on or before March 1, 2017. The Thanksgiving Station IV Loan will become full recourse to the non-recourse carveout guarantors if Digicert terminates its lease as a result of the failure to deliver the space on or before March 1, 2017. |
| (5) | Digicert leases 61,594 SF of space at the Thanksgiving Station IV Property but is not expected to take occupancy until December 2016. Digicert’s rent is underwritten to the full, unabated rent of $27.75 PSF due beginning May 1, 2017. Digicert is entitled to reduced rent of $6.75 PSF beginning November 1, 2016 through April 30, 2017. At loan origination, the Thanksgiving Station IV Borrower reserved $1,074,045 which is equal to three months of full, unabated rent due on Digicert’s space when no rent is due and six months of the difference between full, unabated rent and reduced rent. |
| (6) | NLU Products, LLC (BGZ) may terminate its lease effective as of April 30, 2021 by providing 12 months’ notice and payment of a termination fee equal to three months’ rent, the unamortized tenant improvement allowance, unamortized leasing commissions and abated rent. |
| (7) | Purebred Breeders, LLC may terminate its lease if its space is not delivered on or before February 1, 2017 by providing notice with an effective date of the lease termination no more than six months beyond the date of notice. However, if delivery of the Purebred Breeders, LLC space occurs within 30 days of the termination notice, the termination will be void. |
| (8) | Purebred Breeders, LLC leases 10,118 SF of space at the Thanksgiving Station IV Property but is not expected to take occupancy until November 2016. Purebred Breeders, LLC’s rent is underwritten to the full, unabated rent of $27.00 PSF due beginning November 1, 2016. At loan origination, the Thanksgiving Station IV Borrower reserved $68,297 which is equal to three months of full, unabated rent on Purebred Breeders, LLC’s space when no rent is due. |
| (9) | Cadence Homes may terminate its lease effective as of March 31, 2021 by providing 12 months’ notice and payment of a termination fee equal to three months’ rent, the unamortized tenant improvement allowance, unamortized leasing commissions and abated rent. |
| (10) | VST, LLC’s rent is underwritten to the full, unabated rent of $27.00 PSF due beginning December 1, 2016. VST, LLC is entitled to reduced rent of $7.00 PSF beginning August 1, 2016 through October 31, 2016 and $14.55 PSF for the month of November 2016. At loan origination, the Thanksgiving Station IV Borrower reserved $7,636 which is equal to difference between full, unabated rent and reduced rent. |
This is not a research report and was not prepared by any Underwriter’s research departments. Please see additional important information and qualifications at the end of this Term Sheet.
| T-119 |
| MSBAM 2016-C31 | Thanksgiving Station IV |
The following table presents certain information relating to the lease rollover schedule at the Thanksgiving Station IV Property:
| Lease Rollover Schedule(1)(2) | ||||||||
| Year | # of Leases Rolling | SF Rolling | UW Rent PSF Rolling(3) | Approx. % of Total SF Rolling | Approx. Cumulative % of SF Rolling | Total UW Rent Rolling | Approx. % of Total Rent Rolling | Approx. Cumulative % of Total Rent Rolling |
| MTM | 0 | 0 | $0.00 | 0.0% | 0.0% | $0 | 0.0% | 0.0% |
| 2016 | 0 | 0 | $0.00 | 0.0% | 0.0% | $0 | 0.0% | 0.0% |
| 2017 | 0 | 0 | $0.00 | 0.0% | 0.0% | $0 | 0.0% | 0.0% |
| 2018 | 0 | 0 | $0.00 | 0.0% | 0.0% | $0 | 0.0% | 0.0% |
| 2019 | 0 | 0 | $0.00 | 0.0% | 0.0% | $0 | 0.0% | 0.0% |
| 2020 | 0 | 0 | $0.00 | 0.0% | 0.0% | $0 | 0.0% | 0.0% |
| 2021 | 1 | 2,024 | $27.00 | 1.4% | 1.4% | $54,648 | 1.4% | 1.4% |
| 2022 | 2 | 52,696 | $27.59 | 35.5% | 36.8% | $1,453,662 | 35.9% | 37.3% |
| 2023 | 1 | 10,118 | $27.00 | 6.8% | 43.6% | $273,186 | 6.8% | 44.0% |
| 2024 | 1 | 20,000 | $27.81 | 13.5% | 57.1% | $556,200 | 13.7% | 57.8% |
| 2025 | 0 | 0 | $0.00 | 0.0% | 57.1% | $0 | 0.0% | 57.8% |
| 2026 | 1 | 61,594 | $27.75 | 41.5% | 98.6% | $1,709,234 | 42.2% | 100.0% |
| 2027 & Beyond | 0 | 0 | $0.00 | 0.0% | 98.6% | $0 | 0.0% | 100.0% |
| Vacant | 0 | 2,148 | $0.00 | 1.4% | 100.0% | $0 | 0.0% | 100.0% |
| Total/Wtd. Avg. | 6 | 148,580 | $27.64 | 100.0% | $4,046,930 | 100.0% | ||
| (1) | Information is based on the underwritten rent roll. |
| (2) | Certain tenants may have lease termination options that are exercisable prior to the originally stated expiration date of the related lease and are not considered in the rollover schedule. |
| (3) | Wtd. Avg. UW Rent PSF Rolling excludes vacant space. |
The Market. The Thanksgiving Station IV Property is located in Lehi, Utah County, Utah approximately 25 miles south of the Salt Lake City central business district (“CBD”) and 20 miles northwest of the Provo CBD. Lehi is located in the heart of Utah’s Silicon Slopes, a fast-growing region being fueled by the information technology, software development, hardware manufacturing, and technology research industries. Business firms and government agencies that have originated or have a significant presence in the area include Adobe, eBay, SanDisk, Intel, Ancestry.com, Vivint, Yardi, and the National Security Agency. The combination of a young, educated workforce coming out of the University of Utah, Utah State and Brigham Young universities, a low cost of living relative to other tech hubs, a favorable business climate, and appealing climate and geography are helping fuel growth in the area. According to the Bureau of Economic Analysis, the Provo-Orem, UT MSA’s gross domestic product grew at a rate of 9.2% in 2015 over the previous year as compared to 4.7% for the state of Utah and 3.5% for the United States. Additionally the percentage increase in personal income over the five-year period from 2009 through 2014 was 27.0% for Utah County as compared to 22.5% for the state of Utah and 17.8% for the United States. The percentage increase in population over the same period was 8.0% in Utah County as compared to 6.1% for the state of Utah and 3.1% for the United States. According to the Census Bureau estimates, the median age in Utah County is 24.5 years as compared to 29.9 years for the state of Utah and 37.4 for the United States.
The Thanksgiving Station IV Property is situated in the Salt Lake City office market. According to a second quarter 2016 third party market report, the Salt Lake City Class A office market is comprised of 203 properties with approximately 24 million SF of space and a reported vacancy rate of 8.5%. Asking rents were reported at $26.67 PSF. The Thanksgiving Station IV Property is located within the Utah County submarket which is comprised of 55 Class A office properties with approximately 5.3 million SF of space, a vacancy rate of 6.3% and asking rents of $24.09. Year-to-date deliveries for the Utah County submarket consisted of approximately 1.2 million SF of office space of which 609,558 SF was absorbed. Additionally another 535,601 SF of office space is under construction.
The appraisal highlights the velocity of leasing being achieved in the Northern Utah County market and the level of pre-leasing which is not visible relative to the amount of space under construction. According to the appraisal, much of the absorption is in Northern Utah County and is for new, Class A space. The appraisal noted a demand shift in the county-wide market as tenants are vacating space in the Orem and Provo markets and relocating to the North Utah County market. A factor driving the growth of North Utah County locations is the ability of employers to draw talent from the north in Salt Lake City and the south in Provo and Orem, a draw facilitated by Interstate 15 and the FrontRunner commuter train.
This is not a research report and was not prepared by any Underwriter’s research departments. Please see additional important information and qualifications at the end of this Term Sheet.
| T-120 |
| MSBAM 2016-C31 | Thanksgiving Station IV |
The following table reflects the competitive office properties with respect to the Thanksgiving Station IV Property as identified in the appraisal:
| Competitive Property Summary | |||||||||||
| Property Name/Location | Distance (miles) | Year Built | Occ. | Size (SF) | Tenant Name | Lease | Lease Date | Lease Term (Yrs.) | Rent PSF | Lease Type | |
| Size (SF) | |||||||||||
| Proposed University Place Office Building – NorthStar NEC University Pkwy and State St., Orem, Utah | 17.5 | 2016 | NAV | 133,161 | NorthStar Alarm Services | 29,604 | 16-Sep | 10.5 | $25.00 | Full Service; Fixed percentage annual escalations | |
| Vista Station Building 5 12930 Frontrunner Blvd. Draper, Utah | 8.0 | 2016 | NAV | 125,890 | Jet.com | 77,836 | 16-Jul | 8.3 | $24.75 | Full Service; 3% escalations; $45/sf TI allowance; 8 month partial rent abatement | |
| View 72 Office Building 7161 S. FLSmidth Dr. Midvale, Utah | 15.4 | 2016 | NAV | 121,882 | Zagg Inc. | 50,000 | 16-Feb | 7.5 | $24.50 | Full Service; 2.25% escalations; $40/sf TI allowance. | |
| Thanksgiving Park IV(1) 2600 W. Executive Pkwy. Lehi, Utah | 0.7 | 2013 | 100% | 142,928 | Tech Media Network, Inc. | 5,424 | 15-Sep | 5.1 | $26.50 | Full Service; TI allowance for paint and carpet; No rent abatement | |
| Thanksgiving Park VI(1) 3401 N. Thanksgiving Way Lehi, Utah | 0.5 | 2015 | 100% | 141,937 | Money Desktop | 37,229 | 15-May | 9.8 | $26.50 | Full Service; $35-$40/sf TI allowance; 9 months free rent | |
| Traverse Ridge Center I 3451 N. Triumph Blvd. Lehi, Utah | 1.1 | 2015 | NAV | 150,000 | Protivity, Inc. | 2,971 | 15-Feb | 6.3 | $26.00 | Full Service; $40/sf TI allowance; 3 months free rent | |
Source:Appraisal
| (1) | Owned by an affiliate of the sponsors |
Operating History and Underwritten Net Cash Flow. The following table presents certain information relating to the Underwritten Net Cash Flow at the Thanksgiving Station IV Property:
| Cash Flow Analysis(1) | |||||
| 2013(1) | 2014(1) | 2015(1) | UW | UW PSF | |
| Base Rent(2) | N/A | N/A | N/A | $4,106,000 | $27.63 |
| Total Recoveries | N/A | N/A | N/A | $0 | $0.00 |
| Other Income | N/A | N/A | N/A | $0 | $0.00 |
| Less Vacancy & Credit Loss | N/A | N/A | N/A | ($275,102) | ($1.85) |
| Effective Gross Income | N/A | N/A | N/A | $3,830,898 | $25.78 |
| Total Operating Expenses | N/A | N/A | N/A | $1,037,288 | $6.98 |
| Net Operating Income | N/A | N/A | N/A | $2,793,610 | $18.80 |
| Capital Expenditures | N/A | N/A | N/A | $29,716 | $0.20 |
| TI/LC | N/A | N/A | N/A | $246,215 | $1.66 |
| Net Cash Flow | N/A | N/A | N/A | $2,517,679 | $16.94 |
| Occupancy % | N/A | N/A | N/A | 93.3% | |
| NOI DSCR | N/A | N/A | N/A | 1.63x | |
| NCF DSCR | N/A | N/A | N/A | 1.47x | |
| NOI Debt Yield | N/A | N/A | N/A | 9.5% | |
| NCF Debt Yield | N/A | N/A | N/A | 8.6% | |
| (1) | The Thanksgiving Station IV Property was constructed and opened in 2016; as such, historical operating performance is not available. |
| (2) | UW Base Rent includes full, unabated rent for Digicert, PureBred Breeders, LLC and VST, LLC which are not yet in occupancy or not yet paying full, unabated rent. At loan origination, the Thanksgiving Station IV Borrower reserved $1,149,978 for all three tenants which is equal to the difference between full, unabated rent and periods when no rent is due or reduced rent is due. |
This is not a research report and was not prepared by any Underwriter’s research departments. Please see additional important information and qualifications at the end of this Term Sheet.
| T-121 |
| MSBAM 2016-C31 | Birmingham Office Portfolio |
| Mortgage Loan No. 12 – Birmingham Office Portfolio |
| Mortgage Loan Information | Property Information(1) | ||||||
| Mortgage Loan Seller: | UBS AG | Single Asset/Portfolio: | Portfolio | ||||
| Original Balance: | $29,000,000 | Location: | Various | ||||
| Cut-off Date Balance: | $29,000,000 | General Property Type: | Office | ||||
| % of Initial Pool Balance: | 3.0% | Detailed Property Type: | Suburban | ||||
| Loan Purpose: | Refinance | Title Vesting: | Fee | ||||
| Sponsors: | Charles Stein; Dennis Udwin | Year Built/Renovated: | Various | ||||
| Mortgage Rate: | 4.7285% | Size: | 324,741 SF | ||||
| Note Date: | 10/7/2016 | Cut-off Date Balance per SF: | $89 | ||||
| First Payment Date: | 12/6/2016 | Maturity Date Balance per SF: | $85 | ||||
| Maturity Date: | 11/6/2021 | Property Manager: | In-Rel Properties North, LLC; In-Rel Properties, Inc. (borrower-related) | ||||
| Original Term to Maturity: | 60 months | ||||||
| Original Amortization Term: | 360 months | ||||||
| IO Period: | 24 months | Underwriting and Financial Information(2) | |||||
| Seasoning: | 0 months | UW NOI: | $3,024,042 | ||||
| Prepayment Provisions: | LO (24); DEF (32); O (4) | UW NOI Debt Yield: | 10.4% | ||||
| Lockbox/Cash Mgmt Status: | Hard/Springing | UW NOI Debt Yield at Maturity: | 10.9% | ||||
| Additional Debt Type: | N/A | UW NCF DSCR: | 1.93x (IO) 1.48x (P&I) | ||||
| Additional Debt Balance: | N/A | Most Recent NOI: | $2,867,392 (6/30/2016 TTM) | ||||
| Future Debt Permitted (Type): | No (N/A) | 2nd Most Recent NOI: | $2,884,258 (12/31/2015) | ||||
| Reserves | 3rd Most Recent NOI: | $2,769,409 (12/31/2014) | |||||
| Type | Initial | Monthly | Cap | Most Recent Occupancy: | 82.6% (8/1/2016) | ||
| RE Tax: | $0 | $24,085 | N/A | 2nd Most Recent Occupancy: | 79.9% (12/31/2015) | ||
| Insurance: | $36,422 | Springing | N/A | 3rd Most Recent Occupancy: | 88.3% (12/31/2014) | ||
| Recurring Replacements: | $0 | $6,765 | $129,896 | Appraised Value (as of): | $41,300,000 (8/23/2016) | ||
| TI/LC: | $811,853 | $23,002 | $811,853 | Cut-off Date LTV Ratio: | 70.2% | ||
| Other(1): | $39,360 | Springing | $1,017,280 | Maturity Date LTV Ratio: | 67.0% | ||
| Sources and Uses | ||||||
| Sources | Proceeds | % of Total | Uses | Proceeds | % of Total | |
| Loan Amount: | $29,000,000 | 100.0% | Loan Payoff: | $24,115,166 | 83.2% | |
| Reserves: | $887,634 | 3.1% | ||||
| Closing Costs: | $833,430 | 2.9% | ||||
| Return of Equity: | $3,163,770 | 10.9% | ||||
| Total Sources: | $29,000,000 | 100.0% | Total Uses: | $29,000,000 | 100.0% | |
| (1) | Other reserves are comprised of an unfunded obligations reserve ($38,000) and a free rent reserve ($1,360) with respect to the Five Points Healthcare of Alabama, LLC lease at the Concourse 100 Property (as defined below). Upon the occurrence and during the continuance of a Material Tenant (as defined below) trigger event (as detailed in the loan documents), the Birmingham Office Portfolio Borrower is required to pay monthly all excess cash into a material tenant rollover reserve, subject to a cap of $1,017,280. “Material Tenant” means (i) PRA Holding, LLC/Portfolio Recovery and (ii) any tenant, guarantor, or replacement that, together with its affiliates, leases space comprising 15% or more of either (a) the total rentable SF at the Birmingham Office Portfolio or (b) the total in-place base rent at the Birmingham Office Portfolio. |
| (2) | Property Information and Underwriting and Financial Information are based on the combination or sum of all three office properties that comprise the Birmingham Office Portfolio. |
The Mortgage Loan. The twelfth largest mortgage loan (the “Birmingham Office Portfolio Mortgage Loan”) is evidenced by a promissory note in the original principal amount of $29,000,000, secured by first priority fee mortgages encumbering three office properties located in Hoover and Birmingham, Alabama (collectively, the “Birmingham Office Portfolio”). The proceeds of the Birmingham Office Portfolio Mortgage Loan were used to refinance existing debt on the Birmingham Office Portfolio, fund reserves, pay closing costs, and return equity to the sponsors. The most recent prior financing of the Birmingham Office Portfolio was included in the CSMC 2006-C5 transaction.
The Borrower and the Sponsor. The borrowers are Concourse 100, LLC, 800 Building Owner, LLC and Beacon Ridge, LLC (collectively, the “Birmingham Office Portfolio Borrower”), each a Delaware limited liability company structured to be bankruptcy-remote, with two independent directors in its organizational structure. The sponsors and the nonrecourse carve-out guarantors of the Birmingham Office Portfolio Borrower are Charles Stein and Dennis Udwin. Mr. Stein is a founding principal of In-Rel Properties, Inc. (“In-Rel Properties”), a privately held, vertically integrated real estate investment and management firm founded in 1984. In-Rel Properties currently manages approximately 3.0 million SF consisting primarily of office and retail properties in Florida, Georgia, Tennessee, Kentucky and Oklahoma. Mr. Stein is responsible for the company’s treasury functions, financial and tax planning and sourcing and underwriting of new transactions, and is a member of the company’s investment committee. Mr. Udwin is also a founding principal of In-Rel Properties and oversees In-Rel Properties’ leasing, property management and construction functions, as well as due diligence on new acquisitions. Mr. Udwin is also a member of the company’s investment committee.
This is not a research report and was not prepared by any Underwriter’s research departments. Please see additional important information and qualifications at the end of this Term Sheet.
| T-122 |
| MSBAM 2016-C31 | Birmingham Office Portfolio |
The Properties.The Birmingham Office Portfolio is comprised of a nine-story suburban office building located at 600 Beacon Parkway West in Birmingham, Alabama (the “Beacon Ridge Tower Property”), a three-story suburban office building located at 100 Concourse Parkway in Hoover, Alabama (the “Concourse 100 Property”) and a two-story suburban office building located at 800 Concourse Parkway in Hoover, Alabama, across the street from the Concourse 100 Property (the “Concourse 800 Property”), for a combined total of 324,741 SF. The Birmingham Office Portfolio was built between 1983 and 1990 and acquired in 2006 by the Birmingham Office Portfolio Borrower, who has since invested approximately $9.4 million in capital improvements and soft costs.
The Birmingham Office Portfolio is currently 82.6% occupied as of August 1, 2016 by a mix of 30 local, regional, and national office tenants. The five largest tenants at the Birmingham Office Portfolio are PRA Holding, LLC/Portfolio Recovery (“PRA”) (15.7% of portfolio NRA; 18.5% portfolio underwritten rent), Coca Cola Bottling Company United, Inc. (“Coca-Cola Bottling”) (11.1% of portfolio NRA; 13.7% of portfolio underwritten rent), TV Alabama, Inc. (“TV Alabama”) (8.1% of portfolio NRA; 10.8% of portfolio underwritten rent), Liberty National Ins/Torchmark (“Liberty National”) (7.3% of portfolio NRA; 8.6% of portfolio underwritten rent) and Clear Channel Broadcasting, Inc. (“Clear Channel”) (5.3% of portfolio NRA; 6.0% of portfolio underwritten rent). Collectively, these five tenants lease 47.5% of the portfolio NRA and represent approximately 57.7% of portfolio underwritten rent with no other tenant occupying more than 5.2% of the portfolio NRA or more than 7.2% of the portfolio underwritten rent.
The following table presents each property comprising the Birmingham Office Portfolio by descending allocated cut-off date mortgage loan amount:
| Birmingham Office Portfolio Property Summary | ||||||||
| Property Name | Location | Size (SF)(1) | Occ. %(1) | Allocated Cut-off Date Mortgage Loan Amount | % of Allocated Mortgage Loan Amount | Year Built/ Renovated | Appraised Value | UW NCF |
| Beacon Ridge Tower | Birmingham, Alabama | 153,287 | 80.7% | $12,990,000 | 44.8% | 1983/N/A | $18,500,000 | $1,192,956 |
| Concourse 100 | Hoover, Alabama | 125,597 | 78.5% | $11,310,000 | 39.0% | 1988/2005 | $16,100,000 | $940,428 |
| Concourse 800 | Hoover, Alabama | 45,857 | 100.0% | $4,700,000 | 16.2% | 1990/N/A | $6,700,000 | $553,721 |
| Total/Wtd. Avg. | 324,741 | 82.6% | $29,000,000 | 100.0% | $41,300,000 | $2,687,106 | ||
| (1) | Information is based on the underwritten rent roll. |
The following table presents a summary regarding the 10 largest tenants by SF within the Birmingham Office Portfolio:
| Tenant Summary(1) | ||||||||
| Tenant Name | Property Name | Credit Rating (Fitch/Moody’s/ S&P)(2) | Tenant SF | Approximate % of Portfolio SF | Annual UW Rent | % of Portfolio Total Annual UW Rent | Annual UW Rent PSF(3) | Lease Expiration |
| Top 10 Portfolio Tenants | ||||||||
| PRA Holding, LLC/Portfolio Recovery | Beacon Ridge Tower | NR/NR/NR | 50,864 | 15.7% | $864,685 | 18.5% | $17.00 | 3/31/2019 |
| Coca Cola Bottling Company United, Inc. | Beacon Ridge Tower | NR/NR/NR | 36,204 | 11.1% | $642,270 | 13.7% | $17.74 | 7/31/2021 |
| TV Alabama, Inc. | Concourse 800 | NR/NR/NR | 26,357 | 8.1% | $507,294 | 10.8% | $19.25 | 9/30/2021 |
| Liberty National Ins/Torchmark | Concourse 100 | BBB+/Baa1/A | 23,659 | 7.3% | $401,257 | 8.6% | $16.96 | 4/30/2018 |
| Clear Channel Broadcasting, Inc. | Beacon Ridge Tower | NR/NR/CCC | 17,081 | 5.3% | $283,032 | 6.0% | $16.57 | 3/31/2025 |
| Employers Mutual Casualty Company/ EMC Insurance | Concourse 800 | NR/NR/NR | 16,930 | 5.2% | $336,907 | 7.2% | $19.90 | 11/30/2022 |
| Tom McLeod Software Corporation | Concourse 100 | NR/NR/NR | 16,269 | 5.0% | $289,263 | 6.2% | $17.78 | 9/30/2019(4) |
| Veterans Affairs | Beacon Ridge Tower | AAA/Aaa/AA+ | 13,633 | 4.2% | $224,945(5) | 4.8% | $16.50(5) | 1/7/2023(5) |
| Aerotek, Inc. | Concourse 100 | NR/NR/NR | 10,087 | 3.1% | $192,863 | 4.1% | $19.12 | 1/31/2019 |
| Lumend Surgical Dermatology, LLC | Concourse 100 | NR/NR/NR | 6,345 | 2.0% | $118,715 | 2.5% | $18.71 | 9/30/2023(6) |
| Subtotal/Wtd. Avg. | 217,429 | 67.0% | $3,861,230 | 82.5% | $17.76 | |||
| Other Tenants | 50,717 | 15.6% | $818,775 | 17.5% | $16.14 | |||
| Vacant Space | 56,595 | 17.4% | $0 | 0.0% | $0.00 | |||
| Total/Wtd. Avg. | 324,741 | 100.0% | $4,680,005 | 100.0% | $17.45 | |||
| (1) | Information is based on the underwritten rent roll. |
| (2) | Certain ratings are those of the parent company whether or not the parent guarantees the lease. |
| (3) | Wtd. Avg. Annual UW Rent PSF excludes vacant space. |
| (4) | Tom McLeod Software Corporation has a one-time right to terminate upon 180 days’ notice prior to the expiration of the 42nd month of its lease, January 31, 2018 with an estimated early termination fee equal to unamortized tenant improvements, leasing commissions, and free rent (other concessions) including interest thereon at an annual rate of 8.0%, plus three months of rent for months 43 through 45. |
| (5) | Veterans Affairs currently pays base rent of $16.50 PSF and amortized tenant improvement reimbursements of $9.54 PSF through January 7, 2018. The amortized tenant improvement payments were excluded from UW Base Rent. Veteran Affairs has a right to terminate after January 7, 2018, upon 60 days’ notice. |
| (6) | Lumend Surgical Dermatology has two rights to terminate upon 12 months’ notice prior to the expiration of the 63rd month of its lease, September 30, 2021, or 75th month, September 30, 2022. |
This is not a research report and was not prepared by any Underwriter’s research departments. Please see additional important information and qualifications at the end of this Term Sheet.
| T-123 |
| MSBAM 2016-C31 | Birmingham Office Portfolio |
The following table presents certain information relating to the aggregate lease rollover at the Birmingham Office Portfolio and is based on the underwritten rent rolls of each property comprising the Birmingham Office Portfolio:
| Lease Rollover Schedule(1)(2) | ||||||||
| Year | # of Leases Rolling | SF Rolling | UW Rent PSF Rolling(3) | Approx. % of Total SF Rolling | Approx. Cumulative % of SF Rolling | Total UW Rent Rolling | Approx. % of Total Rent Rolling | Approx. Cumulative % of Total Rent Rolling |
| MTM | 0 | 0 | $0.00 | 0.0% | 0.0% | $0 | 0.0% | 0.0% |
| 2016 | 2 | 2,570 | $19.15 | 0.8% | 0.8% | $49,218 | 1.1% | 1.1% |
| 2017 | 5 | 7,838 | $17.80 | 2.4% | 3.2% | $139,482 | 3.0% | 4.0% |
| 2018 | 6 | 31,628 | $16.96 | 9.7% | 12.9% | $536,275 | 11.5% | 15.5% |
| 2019 | 9 | 93,789 | $17.97 | 28.9% | 41.8% | $1,685,428 | 36.0% | 51.5% |
| 2020 | 1 | 2,076 | $19.13 | 0.6% | 42.5% | $39,714 | 0.8% | 52.4% |
| 2021 | 6 | 68,250 | $18.55 | 21.0% | 63.5% | $1,266,290 | 27.1% | 79.4% |
| 2022 & Beyond(4) | 7 | 61,995 | $15.54 | 19.1% | 82.6% | $963,599 | 20.6% | 100.0% |
| Vacant | 0 | 56,595 | $0.00 | 17.4% | 100.0% | $0 | 0.0% | 100.0% |
| Total/Wtd. Avg. | 36 | 324,741 | $17.45 | 100.0% | $4,680,005 | 100.0% | ||
| (1) | Information is based on the underwritten rent roll. |
| (2) | Certain tenants may have lease termination options that are exercisable prior to the originally stated expiration date of the subject lease and that are not considered in the lease rollover schedule. |
| (3) | Wtd. Avg. UW Rent PSF Rolling excludes vacant space. |
| (4) | Veterans Affairs currently pays base rent of $16.50 PSF and amortized tenant improvement reimbursement of $9.54 PSF through January 7, 2018. The amortized tenant improvement payments were excluded from UW Base Rent. |
The Markets. The Beacon Ridge Tower Property is located in Birmingham, Alabama, approximately seven miles southwest of the Birmingham Central Business District (“CBD”) and approximately 11.2 miles north of the Concourse 100 Property and Concourse 800 Property (collectively, the “Concourse Properties”). Primary access to the area is provided by Interstate 65, located approximately 3.1 miles west of the Beacon Ridge Tower Property and State Route 149, located approximately 0.8 miles east of the Beacon Ridge Tower Property, providing access to the University of Alabama Birmingham Campus and the Birmingham CBD. The University of Alabama Birmingham campus is approximately 4.2 miles northwest of the Beacon Ridge Tower Property. According to a third party market research report, the estimated 2016 population within a one-, three-, and five-mile radius of the Beacon Ridge Tower Property is 15,367, 81,044, and 184,020, respectively. The estimated 2016 average household income within a one-, three-, and five-mile radius of the Beacon Ridge Tower Property is $49,370, $61,341, and $69,181, respectively.
The Concourse Properties are located across the street from each other in Hoover, Alabama, approximately 15 miles south of the Birmingham CBD and approximately 11.2 miles south of the Beacon Ridge Tower Property. Primary access to the area is provided by Interstate 65 (0.6 miles east) and State Route 31 (0.8 miles southeast). Riverchase Galleria, an approximately 1.4 million SF super-regional mall with retailers such as Macy’s, Sears, JCPenney, Belk and Von Maur, is located approximately 3.5 miles northeast of the Concourse Properties. Major national retailers within a five-mile radius include Wal-Mart, Best Buy, Sam’s Club and The Home Depot. Jefferson State Community College is located approximately 4.1 miles northeast of the Concourse Properties. According to a third party market research report, the estimated 2016 population within a one-, three-, and five-mile radius of the Concourse Properties is 3,593, 42,104, and 97,070, respectively. The estimated 2016 average household income within a one-, three-, and five-mile radius of the Concourse Properties is $73,910, $81,838, and $92,231, respectively.
The Beacon Ridge Tower Property is located within the Vulcan/Oxmoor office submarket. According to a third party market research report, as of June 30, 2016, the office properties within the submarket had an overall vacancy rate of 22.0% and an average annual asking rent of $13.59 PSF. According to a third party market research report, the submarket contains 124 buildings accounting for approximately 3.8 million SF of office space. The Concourse 100 Property and Concourse 800 Property are located within the I-65 Corr/S Shelby County office submarket. According to a third party market research report, as of June 30, 2016, the office properties within the submarket had an overall vacancy rate of 5.3% and an average annual asking rent of $15.21 PSF. According to a third party market research report, the submarket contains 321 buildings accounting for approximately 3.4 million SF of office space.
The following table presents leasing data at certain office competitive properties with respect to the Beacon Ridge Tower Property.
| Competitive Property Summary - Beacon Ridge Tower Property | |||||||
| Property Name/Address | Year Built/Renovated | Size (SF) | Occupancy | Tenant Size | Annual Base Rent PSF | Expense Basis | Class |
The Tower 530 Beacon Parkway West Birmingham, Alabama | 1979 / N/A | 58,979 | 50% | 1,500-6,500 SF | $12.50 | Base Year Stop | C |
SouthBridge 2000-2100 SouthBridge Parkway Birmingham, Alabama | 1984 / N/A | 225,156 | 92% | 650-6,500 SF | $22.50 | Base Year Stop | B |
Grand Twin 234-236 Goodwin Crest Drive Birmingham, Alabama | 1973 / N/A | 90,528 | 100% | 15,000 SF | $13.50 | Base Year Stop | B |
Independence Plaza One Independence Plaza Birmingham, Alabama | 1978 / 2004 | 106,510 | 91% | 2,500 SF | $21.50 | Base Year Stop | B |
Source:Appraisal
This is not a research report and was not prepared by any Underwriter’s research departments. Please see additional important information and qualifications at the end of this Term Sheet.
| T-124 |
| MSBAM 2016-C31 | Birmingham Office Portfolio |
The following table presents leasing data at certain office competitive properties with respect to the Concourse Properties.
| Competitive Property Summary - Concourse Properties | |||||||
| Property Name/Address | Year Built/Renovated | Size (SF) | Occupancy | Tenant Size | Annual Base Rent PSF | Expense Basis | Class |
Riverchase Galleria Office Tower 3000 Galleria Circle Hoover, Alabama | 1986 / N/A | 271,661 | 78% | 1,000-80,000 SF | $22.00 | Base Year Stop | B |
Chase Corporate Center 1 & 2 Chase Corporate Parkway Birmingham, Alabama | 1985 / N/A | 210,065 | 96% | 400-10,000 SF | $22.50 | Base Year Stop | B |
Grandview I 3535 Grandview Parkway Birmingham, Alabama | 1989 / N/A | 114,576 | 91% | 4,000 SF | $20.00 | Base Year Stop | B |
Source:Appraisal
Operating History and Underwritten Net Cash Flow. The following table presents certain information relating to the combined historical operating performance and the Underwritten Net Cash Flow at the Birmingham Office Portfolio:
| Cash Flow Analysis | ||||||
| 2013 | 2014 | 2015 | 6/30/2016 TTM | UW | UW PSF | |
| Base Rent(1) | $4,211,000 | $4,345,920 | $4,563,181 | $4,513,145 | $5,680,804 | $17.49 |
| Total Recoveries | $287,997 | $278,549 | $270,941 | $237,519 | $232,893 | $0.72 |
| Other Income | $29,143 | $4,586 | $14,851 | $2,807 | $2,807 | $0.01 |
| Less Vacancy & Credit Loss | $0 | $0 | $0 | $0 | ($987,710) | ($3.04) |
| Effective Gross Income | $4,528,140 | $4,629,055 | $4,848,973 | $4,753,471 | $4,928,795 | $15.18 |
| Total Operating Expenses | $1,850,116 | $1,859,646 | $1,964,715 | $1,886,079 | $1,904,753 | $5.87 |
| Net Operating Income | $2,678,024 | $2,769,409 | $2,884,258 | $2,867,392 | $3,024,042 | $9.31 |
| Capital Expenditures | $0 | $0 | $0 | $0 | $81,788 | $0.25 |
| TI/LC | $0 | $0 | $0 | $0 | $255,148 | $0.79 |
| Net Cash Flow | $2,678,024 | $2,769,409 | $2,884,258 | $2,867,392 | $2,687,106 | $8.27 |
| Occupancy % | 72.8% | 88.3% | 79.9% | 82.6%(2) | 83.3%(3) | |
| NOI DSCR (P&I) | 1.48x | 1.53x | 1.59x | 1.58x | 1.67x | |
| NOI DSCR (IO) | 1.93x | 1.99x | 2.07x | 2.06x | 2.18x | |
| NCF DSCR (P&I) | 1.48x | 1.53x | 1.59x | 1.58x | 1.48x | |
| NCF DSCR (IO) | 1.93x | 1.99x | 2.07x | 2.06x | 1.93x | |
| NOI Debt Yield | 9.2% | 9.5% | 9.9% | 9.9% | 10.4% | |
| NCF Debt Yield | 9.2% | 9.5% | 9.9% | 9.9% | 9.3% | |
| (1) | UW Base Rent is net of tenant improvement amortization payments of approximately $129,991 attributed to Veteran Affairs at the Beacon Ridge Tower Property, and includes approximately $11,650 of straight line contractual rent through January 2023 for the Veteran Affairs space, approximately $898 of straight line contractual rent through August 2019 for the EMC Corporation space, approximately $542 of straight line contractual rent through November 2018 for the Union Standard Insurance Group space, and approximately $114,957 of additional contractual rent steps effective October 1, 2017. |
| (2) | Occupancy as of August 1, 2016. |
| (3) | UW Occupancy % is based on underwritten economic occupancy. |
This is not a research report and was not prepared by any Underwriter’s research departments. Please see additional important information and qualifications at the end of this Term Sheet.
| T-125 |
| MSBAM 2016-C31 | SSTII Self Storage Portfolio |
| Mortgage Loan No. 13 – SSTII Self Storage Portfolio |
| Mortgage Loan Information | Property Information | ||||||
| Mortgage Loan Seller: | KeyBank | Single Asset/Portfolio: | Portfolio | ||||
| Original Balance(1): | $25,000,000 | Location: | Various | ||||
| Cut-off Date Balance(1): | $25,000,000 | General Property Type: | Self Storage | ||||
| % of Initial Pool Balance: | 2.6% | Detailed Property Type: | Self Storage | ||||
| Loan Purpose: | Refinance | Title Vesting: | Fee | ||||
| Sponsor: | Strategic Storage Trust II, Inc. | Year Built/Renovated: | Various | ||||
| Mortgage Rate: | 3.8900% | Size: | 1,765,551 SF | ||||
| Note Date: | 7/28/2016 | Cut-off Date Balance per SF(1): | $54 | ||||
| First Payment Date: | 9/1/2016 | Maturity Date Balance per SF(1): | $49 | ||||
| Maturity Date: | 8/1/2026 | Property Manager: | Strategic Storage Property Management II, LLC (borrower related) | ||||
| Original Term to Maturity: | 120 months | ||||||
| Original Amortization Term: | 360 months | Underwriting and Financial Information | |||||
| IO Period: | 60 months | UW NOI: | $10,259,659 | ||||
| Seasoning: | 3 months | UW NOI Debt Yield(1): | 10.8% | ||||
| Prepayment Provisions(2)(3): | LO (27); DEF (90); O (3) | UW NOI Debt Yield at Maturity(1): | 11.9% | ||||
| Lockbox/Cash Mgmt Status: | Springing/Springing | UW NCF DSCR(1): | 2.64x (IO) 1.84x (P&I) | ||||
| Additional Debt Type(4): | Pari Passu | Most Recent NOI(5): | $10,898,764 (5/31/2016 TTM) | ||||
| Additional Debt Balance(4): | $70,000,000 | 2nd Most Recent NOI: | $11,174,933 (12/31/2015) | ||||
| Future Debt Permitted (Type): | No (N/A) | 3rd Most Recent NOI: | $9,825,563 (12/31/2014) | ||||
| Reserves | Most Recent Occupancy(6): | 89.6% (5/31/2016) | |||||
| Type | Initial | Monthly | Cap | 2nd Most Recent Occupancy(6): | 83.7% (12/31/2015) | ||
| RE Tax: | $685,595 | $123,908 | N/A | 3rd Most Recent Occupancy(6): | 85.4% (12/31/2014) | ||
| Insurance: | $0 | Springing | N/A | Appraised Value (as of)(7): | $211,000,000 (6/30/2016) | ||
| Deferred Maintenance: | $834,971 | $0 | N/A | Cut-off Date LTV Ratio(1)(7): | 45.0% | ||
| Replacement: | $31,516 | $31,516 | N/A | Maturity Date LTV Ratio(1)(7): | 40.9% | ||
| Sources and Uses | ||||||
| Sources | Proceeds | % of Total | Uses | Proceeds | % of Total | |
| Loan Amount(1): | $95,000,000 | 100.0% | Loan Payoff: | $90,000,000 | 94.7% | |
| Reserves: | $1,552,082 | 1.6% | ||||
| Closing Costs: | $1,477,560 | 1.6% | ||||
| Return of Equity: | $1,970,358 | 2.1% | ||||
| Total Sources: | $95,000,000 | 100.0% | Total Uses: | $95,000,000 | 100.0% | |
| (1) | The SSTII Self Storage Portfolio Mortgage Loan is part of the SSTII Self Storage Portfolio Whole Loan, which is comprised of twopari passu notes with an aggregate original principal balance of $95,000,000. The Cut-off Date Balance per SF, Maturity Date Balance per SF, UW NOI Debt Yield, UW NOI Debt Yield at Maturity, UW NCF DSCR, Cut-off Date LTV Ratio and Maturity Date LTV Ratio numbers presented above are based on the SSTII Self Storage Portfolio Whole Loan. |
| (2) | Defeasance is permitted at any time after the earlier to occur of (a) the end of the two-year period commencing on the closing date of the securitization of the last SSTII Self Storage Portfolio promissory note to be securitized and (b) September 1, 2019. |
| (3) | Partial collateral releases are permitted within the terms of the SSTII Self Storage Portfolio Mortgage Loan, subject to the satisfaction of certain conditions (i) the borrowers defease a portion of the SSTII Self Storage Portfolio Whole Loan equal to the greater of (a) 125% of the allocated loan amount of the property being released or (b) 80% of the net proceeds from the sale of the property being released, (ii) the debt service coverage ratio is no less than the greater of the debt service coverage ratio immediately preceding such release and 1.84x, (iii) the debt yield is no less than the greater of the debt yield immediately preceding such release and 10.4%, and (iv) the loan-to-value ratio is no greater than the lesser of the loan-to-value ratio immediately preceding such release and 49.5%. |
| (4) | See “—The Mortgage Loan”below for further discussion of additional debt. |
| (5) | Most Recent NOI is based on the annualized trailing-five month statement as of May 31, 2016, for the SSTII Self Storage - Boynton Beach, FL and SSTII Self Storage - Lancaster, CA (43707) properties; the annualized trailing-seven month statement as of May 31, 2016, for the SSTII Self Storage - Tampa, FL property; the annualized trailing-nine month statement as of May 31, 2016, for the SSTII Self Storage - Foley, AL property; and the trailing-twelve month statement as of May 31, 2016, for all other properties. Properties with less than 12 months of operating history are due to recent acquisitions by the SSTII Self Storage Portfolio Borrower (as defined below). |
| (6) | Most Recent Occupancy rate is based on SF. 2nd Most Recent and 3rd Most Recent Occupancy rates are based on number of units. 3rd Most Recent Occupancy does not include the SSTII Self Storage - Boynton Beach, FL, SSTII Self Storage - Foley, AL, SSTII Self Storage - Lancaster, CA (43707) and SSTII Self Storage - Tampa, FL properties, which were acquired between September 2015 and January 2016, because the seller of such properties did not provide the sponsor with rent rolls prior to 2015. |
| (7) | The appraised value represents the “portfolio value” conclusion. The sum of the values on a stand-alone basis is $191,950,000. The Cut-off Date LTV Ratio and Maturity Date LTV Ratio based on the appraised value on a stand-alone basis are 49.5% and 44.9%, respectively. |
The Mortgage Loan. The thirteenth largest mortgage loan (the “SSTII Self Storage Portfolio Mortgage Loan”) is part of a whole loan (the “SSTII Self Storage Portfolio Whole Loan”) evidenced by twopari passu promissory notes in the aggregate original principal amount of $95,000,000 which are secured by first priority fee mortgages encumbering 29 self-storage properties located across nine states (collectively, the “SSTII Self Storage Portfolio”). Promissory Note A-2 in the original principal amount of $25,000,000 represents the SSTII Self Storage Portfolio Mortgage Loan. Promissory Note A-1 in the original principal amount of $70,000,000 is currently held by MSC 2016-UBS11 securitization trust (the “SSTII Self Storage PortfolioPari Passu Companion Loan”). The SSTII Self Storage Portfolio Whole Loan is being serviced pursuant to the pooling and servicing agreement for the MSC 2016-
This is not a research report and was not prepared by any Underwriter’s research departments. Please see additional important information and qualifications at the end of this Term Sheet.
| T-126 |
| MSBAM 2016-C31 | SSTII Self Storage Portfolio |
UBS11 transaction. See “Description of the Mortgage Pool—The Whole Loans—The Non-Serviced Pari Passu Whole Loans—The SSTII Self Storage Portfolio Whole Loan” and “Pooling and Servicing Agreement—Servicing of the Non-Serviced Mortgage Loans” in the Preliminary Prospectus.
The proceeds of the SSTII Self Storage Portfolio Whole Loan were used to refinance previous mortgage loans secured by the SSTII Self Storage Portfolio in the approximate amount of $90,000,000, fund reserves, pay closing costs and return equity to the SSTII Self Storage Portfolio Borrower (as defined below).
The Borrowers and the Sponsor. The borrowers are SST II 10231 S Colima RD, LLC; SST II 2234 Arrow HWY, LLC; SST II 4200 Westminster AVE, LLC; SST II 580 E Lambert RD, LLC; SST II 7611 Talbert AVE, LLC; SST II 43745 Sierra HWY, LLC; SST II 6667 Van Buren BLVD, LLC; SST II 517 N 8th ST, LLC; SST II 8920 Federal BLVD, LLC; SST II 3757 Norwood DR, LLC; SST II 4747 W Cal Sag RD, LLC; SST II 27203 Groesbeck HWY, LLC; SST II 42557 Van Dyke AVE, LLC; SST II 4233 US 130, LLC; SST II 9823 W. Hillsborough AVE, LLC; SST II 3101 S. Federal HWY, LLC; SST II 8141 HWY 59, LLC; SST II 10919 Evergreen WAY, LLC; SST II 262 E Maple RD, LLC; SST II 24623 Ryan RD, LLC; SST II 4100 Forestville RD, LLC; SST II 240 W Army Trail RD, LLC; SST II 435 Airport BLVD, LLC; SST II 3937 Santa Rosa AVE, LLC; SST II 2998 Rockville RD, LLC; SST II 43707 N. Sierra HWY, LLC; SST II 3860 Benatar WAY, LLC; SST II 404 Potrero Grande DR, LLC and SST II 1571 W Foothill BLVD, LLC (collectively, the “SSTII Self Storage Portfolio Borrower”), 29 single-purpose Delaware limited liability companies, each with two independent directors. The SSTII Self Storage Portfolio Borrower is 99.99% owned by Strategic Storage Trust II, Inc. (“SST II”), the sponsor and nonrecourse carve-out guarantor. Founded in January 2013, SST II is a public non-traded REIT focused on stabilized income-producing self-storage facilities located in primary and secondary markets across the United States and Toronto, Canada. SST II’s aggregate portfolio includes 63 properties totaling 39,970 units comprised of 4.3 million SF, valued at approximately $648.1 million.
The SSTII Self Storage Portfolio Borrower has a common affiliate with the borrower of one other mortgage loan, identified as Ladera Office Building in Annex A-1 to the Preliminary Prospectus.
The Property. The SSTII Self Storage Portfolio is comprised of 29 cross-collateralized self-storage facilities located across nine states with a total of 16,734 units and 253 parking spaces totaling approximately 1,765,551 SF, excluding space associated with the 253 parking spaces. All facilities contain a leasing office and on-site management. The SSTII Self Storage Portfolio was constructed between 1977 and 2004 and, as of May 31, 2016, was 89.6% occupied. Extra Space Management, Inc. manages the SSTII Self Storage Portfolio through a sub-management agreement with the property manager, Strategic Storage Property Management II, LLC, a borrower affiliate. The SSTII Self Storage Portfolio Borrower has a cost basis of approximately $159.2 million and approximately $64.2 million in hard equity in the SSTII Self Storage Portfolio.
The SSTII Self Storage Portfolio is located across nine states and 15 metropolitan statistical areas. California represents the largest exposure for a single state by underwritten net cash flow, with 829,450 SF totaling 47.0% of the portfolio’s total square footage and 52.3% of the underwritten net cash flow. No other state represents more than 13.7% of the portfolio’s total square footage or 12.6% of the underwritten net cash flow. The top four states by Cut-off Date allocated loan amount include California (14 properties; 52.9%), Michigan (four properties; 10.4%), Florida (two properties; 10.3%) and Colorado (three properties; 9.8%).
The eight largest facilities by Cut-off Date allocated loan amount are described below:
SSTII Self Storage - Boynton Beach, FL.The SSTII Self Storage - Boynton Beach, FL property is a three-story, 74,464 SF, 934-unit self-storage facility located in Boynton Beach, Florida, approximately 12.5 miles south of the West Palm Beach central business district. Situated on a 1.99-acre site, the property was originally constructed in 2004 and contains on-site management, surveillance cameras, and keypad gate entry. The facility consists entirely of climate controlled units as well as 102 wine cellar units. The property is 88.5% occupied as of May 31, 2016. The area surrounding the property consists primarily of single/multifamily housing and retail/commercial properties. According to a third-party market research report, the trade area consisting of a one-, three- and five-mile radius contained 9,423, 63,361 and 171,126 people, respectively, with an estimated median household income of $49,921, $44,871 and $44,143, respectively, as of 2015.
SSTII Self Storage - Santa Rosa, CA.The SSTII Self Storage - Santa Rosa, CA property is a 116,625 SF, 1,139-unit self-storage facility consisting of 16 buildings located in Santa Rosa, California, approximately 55 miles north of San Francisco. Situated on a 6.20-acre site, the property was originally constructed in 1982 and contains an office, on-site management, and keypad gate entry. The property is 89.4% occupied as of May 31, 2016. The area surrounding the property consists of a mix of commercial and light industrial businesses. According to a third-party market research report, the trade area consisting of a one-, three- and five-mile radius contained 2,760, 58,587 and 164,541 people, respectively, with an estimated median household income of $50,761, $54,769 and $56,327, respectively, as of 2015.
SSTII Self Storage - Huntington Beach, CA.The SSTII Self Storage - Huntington Beach, CA property is a 60,936 SF, 604-unit self-storage facility consisting of nine buildings located in Huntington Beach, California within Orange County. Situated on a 3.30-acre site, the property was originally constructed in 1986 and contains an office, an apartment for an on-site manager and keypad gate entry. The property is 91.7% occupied as of May 31, 2016. The area surrounding the property represents a mix of industrial and commercial uses, as well as significant residential development. According to a third-party market research report, the trade area consisting of a one-, three- and five-mile radius contained 24,305, 197,687 and 422,934 people, respectively, with an estimated median household income of $61,820, $82,545 and $76,273, respectively, as of 2015.
SSTII Self Storage - Santa Ana, CA.The SSTII Self Storage - Santa Ana, CA property is an 84,397 SF, 828-unit self-storage facility consisting of 18 buildings located in Santa Ana, California, within Orange County. Situated on a 4.20-acre site, the property was originally constructed in 1978 and contains an office, an apartment for a resident manager, keypad gate entry and 10 RV/boat parking spaces. The property is 95.8% occupied as of May 31, 2016. The area surrounding the property consists primarily of retail, industrial and single-family residential properties. According to a third-party market research report, the trade area consisting of a one-, three- and five-mile radius contained 38,302, 338,813 and 801,222 people, respectively, with an estimated median household income of $48,201, $55,926 and $57,092, respectively, as of 2015.
SSTII Self Storage - Aurora, CO.The SSTII Self Storage - Aurora, CO property is an 87,434 SF, 886-unit self-storage facility consisting of seven buildings located in Aurora, Colorado, approximately 10 miles east of the Denver central business district. Situated on a 4.49-acre site, the property was originally constructed in 1984 and contains an office, an apartment for an on-site manager, surveillance cameras, and keypad gate entry. The property is 69.8% occupied as of May 31, 2016. The area surrounding the property consists of a mix of residential, commercial and industrial uses. According to a third-party market research report, the trade area consisting of a one-, three- and five-mile radius contained 7,389, 98,784 and 311,526 people, respectively, with an estimated median household income of $41,320, $43,548 and $46,628, respectively, as of 2015.
This is not a research report and was not prepared by any Underwriter’s research departments. Please see additional important information and qualifications at the end of this Term Sheet.
| T-127 |
| MSBAM 2016-C31 | SSTII Self Storage Portfolio |
SSTII Self Storage - Whittier, CA.The SSTII Self Storage - Whittier, CA property is a 58,530 SF, 513-unit self-storage facility consisting of 13 buildings located in Whittier, California, approximately 12 miles southeast of downtown Los Angeles. Situated on a 3.96-acre site, the property was originally constructed in 1990 and contains an office, an apartment for an on-site manager and keypad gate entry. The property is 96.3% occupied as of May 31, 2016. The area surrounding the property consists primarily of single/multifamily housing and commercial properties. According to a third-party market research report, the trade area consisting of a one-, three- and five-mile radius contained 25,465, 181,701 and 449,441 people, respectively, with an estimated median household income of $74,037, $68,783 and $67,455, respectively, as of 2015.
SSTII Self Storage - Foley, AL.The SSTII Self Storage - Foley, AL property is a 141,576 SF, 1,030-unit self-storage facility consisting of 22 buildings located in Foley, Alabama, approximately four miles north of Gulf Shores and 30 miles southeast of Mobile. Situated on a 10.15-acre site, the property was originally constructed in 1994 and subsequently renovated in 2007. The facility contains 311 (30.2% of total units) climate controlled units, 56 RV/boat parking spaces, and seven small office spaces for rent, as well as amenities that include surveillance cameras, on-site management, a leasing office, and keypad gate entry. The property is 92.5% occupied as of May 31, 2016. The area surrounding the property is comprised of residential, light industrial and commercial uses and agricultural land. According to a third-party market research report, the trade area consisting of a one-, three- and five-mile radius contained 1,329, 12,360 and 29,307 people, respectively, with an estimated median household income of $55,811, $48,370 and $45,629, respectively, as of 2015.
SSTII Self Storage - La Habra, CA.The SSTII Self Storage - La Habra, CA property is a 51,402 SF, 414-unit self-storage facility consisting of 13 buildings located in La Habra, California, within Orange County. Situated on a 2.50-acre site, the property was originally constructed in 1981 and contains an office, an apartment for an on-site manager, keypad gate entry, and two RV parking spaces. The property is 93.7% occupied as of May 31, 2016.The area surrounding the property consists primarily of industrial, commercial and residential development. According to a third-party market research report, the trade area consisting of a one-, three- and five-mile radius contained 29,064, 148,152 and 425,550 people, respectively, with an estimated median household income of $55,777, $75,575 and $71,874, respectively, as of 2015.
The following tables present certain information relating to the SSTII Self Storage Portfolio:
| Property Summary | |||||||||
| Property Name | Year Built/ Renovated | % of Cut-off Date ALA | Self- Storage Units(1)(2) | Parking Spaces | GLA (SF)(1)(2) | Total SF Occ.(1) | % of UW NOI | Appraised Value(3) | % of Combined Appraised Value(3) |
| SSTII Self Storage - Boynton Beach, FL | 2004/N/A | 8.6% | 934 | 8 | 74,464 | 88.5% | 6.7% | $16,500,000 | 8.6% |
| SSTII Self Storage - Santa Rosa, CA | 1982/N/A | 7.7% | 1,139 | 0 | 116,625 | 89.4% | 6.9% | $14,800,000 | 7.7% |
| SSTII Self Storage - Huntington Beach, CA | 1986/N/A | 7.3% | 604 | 0 | 60,936 | 91.7% | 7.5% | $14,100,000 | 7.3% |
| SSTII Self Storage - Santa Ana, CA | 1978/N/A | 5.5% | 828 | 10 | 84,397 | 95.8% | 5.6% | $10,500,000 | 5.5% |
| SSTII Self Storage - Aurora, CO | 1984/N/A | 5.1% | 886 | 0 | 87,434 | 69.8% | 5.4% | $9,700,000 | 5.1% |
| SSTII Self Storage - Whittier, CA | 1990/N/A | 4.8% | 513 | 4 | 58,530 | 96.3% | 4.8% | $9,300,000 | 4.8% |
| SSTII Self Storage - Foley, AL | 1994/2007 | 4.4% | 1,030 | 56 | 141,576 | 92.5% | 4.9% | $8,350,000 | 4.4% |
| SSTII Self Storage - La Habra, CA | 1981/N/A | 3.9% | 414 | 2 | 51,402 | 93.7% | 3.6% | $7,400,000 | 3.9% |
| SSTII Self Storage - Upland, CA | 1979/N/A | 3.8% | 612 | 0 | 57,832 | 93.9% | 3.9% | $7,300,000 | 3.8% |
| SSTII Self Storage - Forestville, MD | 1988/N/A | 3.6% | 520 | 0 | 55,253 | 87.1% | 3.1% | $7,000,000 | 3.6% |
| SSTII Self Storage - Troy, MI | 1988/N/A | 3.6% | 698 | 35 | 73,940 | 87.5% | 3.9% | $6,900,000 | 3.6% |
| SSTII Self Storage - La Verne, CA | 1985/N/A | 3.3% | 497 | 13 | 49,782 | 92.9% | 3.0% | $6,400,000 | 3.3% |
| SSTII Self Storage - Lompoc, CA | 1982/N/A | 3.0% | 420 | 0 | 46,412 | 88.5% | 3.5% | $5,700,000 | 3.0% |
| SSTII Self Storage - Fairfield, CA | 1984/N/A | 2.9% | 428 | 0 | 41,010 | 92.8% | 3.1% | $5,550,000 | 2.9% |
| SSTII Self Storage - Everett, WA | 1986/2015 | 2.9% | 476 | 9 | 47,199 | 94.0% | 2.8% | $5,500,000 | 2.9% |
| SSTII Self Storage - Monterey Park, CA | 1987/N/A | 2.7% | 386 | 0 | 31,230 | 92.3% | 2.7% | $5,200,000 | 2.7% |
| SSTII Self Storage - Bloomingdale, IL | 1987/N/A | 2.5% | 567 | 0 | 58,304 | 90.9% | 2.9% | $4,800,000 | 2.5% |
| SSTII Self Storage - Federal Heights, CO | 1983/N/A | 2.5% | 446 | 0 | 41,044 | 93.5% | 2.6% | $4,800,000 | 2.5% |
| SSTII Self Storage - Lancaster, CA (43707) | 1991/N/A | 2.5% | 546 | 49 | 71,865 | 95.4% | 2.5% | $4,750,000 | 2.5% |
| SSTII Self Storage - Riverside, CA | 1985/N/A | 2.4% | 567 | 0 | 61,460 | 96.8% | 2.5% | $4,700,000 | 2.4% |
| SSTII Self Storage - Sterling Heights, MI | 1977/N/A | 2.4% | 440 | 25 | 58,820 | 84.3% | 2.9% | $4,650,000 | 2.4% |
| SSTII Self Storage - Warren, MI (Ryan) | 1987/N/A | 2.4% | 494 | 0 | 52,078 | 85.2% | 3.0% | $4,550,000 | 2.4% |
| SSTII Self Storage - Littleton, CO | 1985/N/A | 2.3% | 388 | 0 | 38,532 | 81.6% | 2.2% | $4,400,000 | 2.3% |
| SSTII Self Storage - Warren, MI (Groesbeck) | 1987/N/A | 2.1% | 480 | 21 | 57,260 | 89.8% | 2.6% | $3,950,000 | 2.1% |
| SSTII Self Storage - Lancaster, CA (43745) | 1980/N/A | 1.8% | 674 | 3 | 58,894 | 88.5% | 1.6% | $3,400,000 | 1.8% |
| SSTII Self Storage - Crestwood, IL | 1987/N/A | 1.7% | 448 | 3 | 49,322 | 83.7% | 1.2% | $3,300,000 | 1.7% |
| SSTII Self Storage - Tampa, FL | 1985/N/A | 1.7% | 513 | 0 | 50,070 | 87.8% | 1.4% | $3,300,000 | 1.7% |
| SSTII Self Storage - Beverly, NJ | 1989/N/A | 1.5% | 447 | 12 | 50,805 | 78.8% | 1.9% | $2,800,000 | 1.5% |
| SSTII Self Storage - Chico, CA | 1984/N/A | 1.2% | 339 | 3 | 39,075 | 98.9% | 1.2% | $2,350,000 | 1.2% |
| Total/Wtd. Avg. | 100.0% | 16,734 | 253 | 1,765,551 | 89.6% | 100.0% | $211,000,000 | 100.0% | |
| (1) | Information based on the underwritten rent roll. |
| (2) | Self-Storage Units exclude parking spaces and office space. GLA (SF) excludes parking spaces and includes 1,306 SF for seven office spaces at the SSTII Self Storage - Foley, AL property. At the Boynton Beach, FL property, all units are climate controlled. At the Foley, AL property, 311 units are climate controlled (30.2% of total self-storage units at the property). |
| (3) | The Total Appraised Value represents the “portfolio value” conclusion. The sum of the values on a stand-alone basis is $191,950,000. The Cut-off Date LTV Ratio and Maturity Date LTV Ratio based on the appraised value on a stand-alone basis are 49.5% and 44.9%, respectively. % of Combined Appraised Value for each individual property is based off the appraised value on a stand-alone basis. |
This is not a research report and was not prepared by any Underwriter’s research departments. Please see additional important information and qualifications at the end of this Term Sheet.
| T-128 |
| MSBAM 2016-C31 | SSTII Self Storage Portfolio |
| Property Summary by State | |||||||||
| State | Cut-off Date Whole Loan Amount | Property Count | Self-Storage Units(1)(2) | Parking Spaces | GLA (SF)(1)(2) | Total SF Occ.(1)(2) | Climate-Controlled Units %(3) | UW NOI | % of UW NOI |
| California | $50,209,689 | 14 | 7,967 | 84 | 829,450 | 93.2% | 0.0% | $5,374,542 | 52.4% |
| Michigan | $9,923,158 | 4 | 2,112 | 81 | 242,098 | 86.8% | 0.0% | $1,269,420 | 12.4% |
| Florida | $9,799,426 | 2 | 1,447 | 8 | 124,534 | 88.2% | 64.5% | $834,969 | 8.1% |
| Colorado | $9,353,998 | 3 | 1,720 | 0 | 167,010 | 78.3% | 0.0% | $1,048,024 | 10.2% |
| Alabama | $4,132,587 | 1 | 1,030 | 56 | 141,576 | 92.5% | 30.2% | $500,194 | 4.9% |
| Illinois | $4,008,857 | 2 | 1,015 | 3 | 107,626 | 87.6% | 0.0% | $426,054 | 4.2% |
| Maryland | $3,464,444 | 1 | 520 | 0 | 55,253 | 87.1% | 0.0% | $320,013 | 3.1% |
| Washington | $2,722,063 | 1 | 476 | 9 | 47,199 | 94.0% | 0.0% | $290,423 | 2.8% |
| New Jersey | $1,385,778 | 1 | 447 | 12 | 50,805 | 78.8% | 0.0% | $196,019 | 1.9% |
| Total/Wtd. Avg. | $95,000,000 | 29 | 16,734 | 253 | 1,765,551 | 89.6% | 7.4% | $10,259,659 | 100.0% |
| (1) | Information based on the underwritten rent roll. |
| (2) | Self-Storage Units exclude parking spaces and office space. GLA (SF) excludes parking spaces and includes for Alabama 1,306 SF for seven office spaces at the SSTII Self Storage - Foley, AL property. |
| (3) | Source: Appraisal. |
The Market. As of 2015, per a third party self-storage market research report, the U.S. self-storage market contained approximately 41,443 facilities with nearly 2.2 billion SF. It is estimated that Extra Space Storage Inc., an affiliate of the sub-manager of the SSTII Self Storage Portfolio, is the second largest market participant behind Public Storage. Public Storage operates approximately 157.0 million SF and Extra Space Storage Inc. operates approximately 98.8 million SF, while the next largest operators are U-Haul International Inc. with approximately 46.0 million SF and Cube Smart with approximately 41.8 million SF. The self-storage industry in the United States has experienced steadily increasing performance in recent years, with overall occupancy increasing each year since 2011. In general, self-storage customers fall into one of four main categories of renters as follows: residential (70%), commercial (18%), military (6%), and student (6%).
The following table presents certain information related to the demographic profile of the SSTII Self Storage Portfolio:
| Portfolio Demographic Profile(1) | |||||||||
2015 Population Demographics | 2015-2020 Projected Population Growth % | 2015 Household Income | |||||||
| 1 Mile | 3 Miles | 5 Miles | 1 Mile | 3 Miles | 5 Miles | 1 Mile | 3 Miles | 5 Miles | |
| Wtd. Avg. | 14,101 | 120,868 | 300,397 | 0.79% | 0.74% | 0.74% | $53,435 | $57,452 | $57,913 |
| Median | 13,087 | 102,620 | 256,342 | 0.52% | 0.56% | 0.66% | $49,921 | $54,769 | $56,327 |
| (1) | Source: A third party market research report. |
This is not a research report and was not prepared by any Underwriter’s research departments. Please see additional important information and qualifications at the end of this Term Sheet.
| T-129 |
| MSBAM 2016-C31 | SSTII Self Storage Portfolio |
Operating History and Underwritten Net Cash Flow. The following table presents certain information relating to the combined historical operating performance and the Underwritten Net Cash Flow at the SSTII Self Storage Portfolio:
| Cash Flow Analysis | ||||||
| 2013 | 2014 | 2015 | 5/31/2016 TTM(1) | UW | UW PSF | |
| Base Rent | $14,336,021 | $16,817,102 | $18,500,923 | $18,892,552 | $21,509,169 | $12.18 |
| Other Income(2) | $1,067,891 | $1,083,348 | $1,359,920 | $1,463,885 | $1,362,697 | $0.77 |
| Less Discounts Concessions | $0 | $0 | ($1,032,012) | ($1,392,631) | $0 | $0.00 |
| Less Vacancy & Credit Loss | $0 | $0 | $0 | $0 | ($4,138,329) | ($2.34) |
| Effective Gross Income | $15,403,912 | $17,900,450 | $18,828,831 | $18,963,807 | $18,733,537 | $10.61 |
| Total Operating Expenses | $8,012,485 | $8,074,887 | $7,653,898 | $8,065,043 | $8,473,878 | $4.80 |
| Net Operating Income | $7,391,427 | $9,825,563 | $11,174,933 | $10,898,764 | $10,259,659 | $5.81 |
| Capital Expenditures | $0 | $0 | $0 | $0 | $378,189 | $0.21 |
| Net Cash Flow | $7,391,427 | $9,825,563 | $11,174,933 | $10,898,764 | $9,881,470 | $5.60 |
| Occupancy %(3) | 74.6% | 85.4% | 83.7% | 89.6% | 80.8% | |
| NOI DSCR(4) | 1.38x | 1.83x | 2.08x | 2.03x | 1.91x | |
| NOI DSCR (IO)(4) | 1.97x | 2.62x | 2.98x | 2.91x | 2.74x | |
| NCF DSCR(4) | 1.38x | 1.83x | 2.08x | 2.03x | 1.84x | |
| NCF DSCR (IO)(4) | 1.38x | 1.83x | 2.08x | 2.03x | 1.84x | |
| NOI Debt Yield(4) | 7.8% | 10.3% | 11.8% | 11.5% | 10.8% | |
| NCF Debt Yield(4) | 7.8% | 10.3% | 11.8% | 11.5% | 10.4% | |
| (1) | The 5/31/2016 TTM is based on the annualized trailing-five month statement as of May 31, 2016, for the SSTII Self Storage - Boynton Beach, FL and SSTII Self Storage - Lancaster, CA (43707) properties; the annualized trailing-seven month statement as of May 31, 2016, for the SSTII Self Storage - Tampa, FL property; the annualized trailing-nine month statement as of May 31, 2016, for the SSTII Self Storage - Foley, AL property; and the trailing-twelve month statement as of May 31, 2016, for all other properties. Properties with less than 12 months of operating history are due to recent acquisitions by the SSTII Self Storage Portfolio Borrower. |
| (2) | Other Income is comprised of late fees, administration fees, merchandise sales and miscellaneous fees, and with regards to UW Other Income, parking income. |
| (3) | Occupancy % for 2013-2015 is based on number of units. Occupancy as of May 31, 2016 is based on square footage; if calculated based on units, occupancy as of May 31, 2016 would be 86.2%. Occupancy % for 2013 and 2014 does not include the SSTII Self Storage - Boynton Beach, FL, SSTII Self Storage - Foley, AL, SSTII Self Storage - Lancaster, CA (43707) and SSTII Self Storage - Tampa, FL properties, which were acquired between September 2015 and January 2016, because the seller of such properties did not provide the sponsor with rent rolls prior to 2015. |
| (4) | Debt service coverage ratios and debt yields are based on the SSTII Self Storage Portfolio Whole Loan. |
This is not a research report and was not prepared by any Underwriter’s research departments. Please see additional important information and qualifications at the end of this Term Sheet.
| T-130 |
(THIS PAGE INTENTIONALLY LEFT BLANK)
This is not a research report and was not prepared by any Underwriter’s research departments. Please see additional important information and qualifications at the end of this Term Sheet.
| T-131 |
| MSBAM 2016-C31 | TEK Park |
| Mortgage Loan No. 14 – TEK Park |
| Mortgage Loan Information | Property Information | ||||||
| Mortgage Loan Seller: | UBS AG | Single Asset/Portfolio: | Single Asset | ||||
| Original Balance(1): | $24,000,000 | Location: | Breinigsville, PA 18031 | ||||
| Cut-off Date Balance(1): | $23,893,983 | General Property Type: | Office | ||||
| % of Initial Pool Balance: | 2.5% | Detailed Property Type: | Suburban | ||||
| Loan Purpose: | Refinance | Title Vesting: | Fee | ||||
| Sponsor: | Eli Sternbuch | Year Built/Renovated: | 1987/2010 | ||||
| Mortgage Rate: | 5.0000% | Size: | 514,033 SF | ||||
| Note Date: | 6/16/2016 | Cut-off Date Balance per SF(1): | $126 | ||||
| First Payment Date: | 8/6/2016 | Maturity Date Balance per SF(1): | $104 | ||||
| Maturity Date: | 7/6/2026 | Property Manager: | EY&S Management 2011 Inc. (borrower-related) | ||||
| Original Term to Maturity: | 120 months | ||||||
| Original Amortization Term: | 360 months | ||||||
| IO Period: | 0 months | ||||||
| Seasoning: | 4 months | Underwriting and Financial Information | |||||
| Prepayment Provisions(2): | LO (28); DEF (89); O (3) | UW NOI: | $6,692,229 | ||||
| Lockbox/Cash Mgmt Status: | Hard/Springing | UW NOI Debt Yield(1): | 10.3% | ||||
| Additional Debt Type(3): | Pari Passu | UW NOI Debt Yield at Maturity(1): | 12.5% | ||||
| Additional Debt Balance(3): | $41,000,000 | UW NCF DSCR(1): | 1.52x | ||||
| Future Debt Permitted (Type)(4): | Yes (Mezzanine) | Most Recent NOI: | $6,295,779 (3/31/2016 TTM) | ||||
| Reserves | 2nd Most Recent NOI: | $6,713,869 (12/31/2015) | |||||
| Type | Initial | Monthly | Cap | 3rd Most Recent NOI: | $6,602,440 (12/31/2014) | ||
| RE Tax: | $0 | $79,880 | N/A | Most Recent Occupancy(7): | 84.7% (3/23/2016) | ||
| Insurance: | $86,250 | $17,250 | N/A | 2nd Most Recent Occupancy: | 79.9% (12/31/2015) | ||
| Recurring Replacements: | $0 | $6,425 | N/A | 3rd Most Recent Occupancy: | 85.8% (12/31/2014) | ||
| Deferred Maintenance: | $279,167 | $0 | N/A | Appraised Value (as of): | $102,000,000 (5/3/2016) | ||
| TI/LC(5): | $1,540,000 | Springing | $1,500,000 | Cut-off Date LTV Ratio(1): | 63.4% | ||
| Other(6): | $70,834 | Springing | N/A | Maturity Date LTV Ratio(1): | 52.5% | ||
| Sources and Uses | ||||||
| Sources | Proceeds | % of Total | Uses | Proceeds | % of Total | |
| Loan Amount(1): | $65,000,000 | 100.0% | Loan Payoff: | $44,715,762 | 68.8% | |
| Reserves: | $1,976,251 | 3.0% | ||||
| Closing Costs: | $1,034,298 | 1.6% | ||||
| Return of Equity: | $17,273,689 | 26.6% | ||||
| Total Sources: | $65,000,000 | 100.0% | Total Uses: | $65,000,000 | 100.0% | |
| (1) | The TEK Park Mortgage Loan is part of the TEK Park Whole Loan (as defined below), which is comprised of threepari passupromissory notes with an aggregate principal balance of $65,000,000. The Cut-off Date Balance per SF, Maturity Date Balance per SF, UW NOI Debt Yield, UW NOI Debt Yield at Maturity, UW NCF DSCR, Cut-off Date LTV Ratio and Maturity Date LTV Ratio numbers presented above are based on the aggregate principal balance of the promissory notes comprising the TEK Park Whole Loan. |
| (2) | Defeasance is permitted at any time after the earlier to occur of (a) the end of the two-year period commencing on the closing date of the securitization of the last TEK Park Whole Loan promissory note to be securitized and (b) August 6, 2020. |
| (3) | See “—The Mortgage Loan” below for further discussion of additional debt. |
| (4) | Mezzanine debt is permitted provided, among other things and pursuant to the specific terms of the loan documents, (i) taking into account the TEK Park Whole Loan and the mezzanine loan, (a) the annualized debt yield is not less than 9.5%, (b) the combined loan-to-value ratio is less than or equal to 70.0%, and (c) the annualized debt service coverage ratio is at least 1.40x, (ii) delivery of an acceptable intercreditor agreement and (iii) delivery of rating agency confirmation. |
| (5) | The TI/LC initial reserve includes $40,000 deposited with regard to tenant improvements and leasing commissions associated with the TierPoint lease (“TierPoint Rollover Reserve Deposit”).The TEK Park Borrower (as defined below) is required to deposit monthly amounts of $21,418 into the TI/LC reserve, subject to a cap of $1.5 million (excluding the TierPoint Rollover Reserve Deposit). |
| (6) | Other reserve represents a $70,834 free rent reserve related to the FoxConn Optical Interconnect lease. Upon the occurrence and during the continuance of a lease trigger period (as detailed in the loan documents), the TEK Park Borrower is required to pay all excess cash into an occupancy reserve fund with respect to the CyOptics, TierPoint and Buckeye Partners leases. |
| (7) | Most Recent Occupancy as of the rent roll dated March 23, 2016, includes a recent lease with Versum Materials US (12,212 SF) as occupied space. Versum Materials US has a lease commencement date of November 1, 2016. |
The Mortgage Loan. The fourteenth largest mortgage loan (the “TEK Park Mortgage Loan”) is part of a whole loan (the “TEK Park Whole Loan”) evidenced by threepari passu promissory notes with an aggregate original principal balance of $65,000,000, all of which are secured by a first priority fee mortgage encumbering a nine-building office and technology park totaling 514,033 SF in Breinigsville, Pennsylvania (the “TEK Park Property”). Promissory Note A-2, in the original principal amount of $24,000,000, represents the TEK Park Mortgage Loan. Promissory Note A-1, in the original principal amount of $23,500,000, is currently being held by the SGCMS 2016-C5 securitization trust and Promissory Note A-3, in the original principal amount of $17,500,000, is currently being held by Cantor Commercial Real Estate Lending, L.P. or an affiliate thereof and is expected to be contributed to one or more future securitization trusts or otherwise transferred at any time (collectively, the “TEK Park Non-ServicedPari PassuCompanion Loans”). The TEK Park Whole Loan is being serviced pursuant to the pooling and servicing agreement for the SGCMS 2016-C5 transaction. See “Description of the Mortgage Pool—The Whole Loans—The Non-Serviced Pari Passu Whole Loans” and “Pooling and Servicing Agreement—Servicing of the Non-Serviced Mortgage Loans” in the Preliminary Prospectus.
This is not a research report and was not prepared by any Underwriter’s research departments. Please see additional important information and qualifications at the end of this Term Sheet.
| T-132 |
| MSBAM 2016-C31 | TEK Park |
Proceeds of the TEK Park Whole Loan were primarily used to refinance a previous mortgage loan secured by the TEK Park Property, fund upfront reserves, pay closing costs and to return equity to the sponsor. The most recent prior financing of the TEK Park Property was included in the COMM 2012-CR1 transaction.
The Borrower and the Sponsor. The borrower is Hamilton 9999 Associates L.P. (the “TEK Park Borrower”), a single-purpose Delaware limited partnership structured to be bankruptcy-remote, with a single-purpose general partner structured to be bankruptcy-remote with two independent directors. The sponsor and the nonrecourse carve-out guarantor of the TEK Park Borrower is Eli Sternbuch. Mr. Sternbuch is the owner and president of EY&S Management 2001 LLC. Founded in 2011 by Mr. Sternbuch, EY&S Management 2001 LLC focuses on the acquisition and management of office and data center properties in the eastern United States.
The Property. Originally developed in 1987 by AT&T as a Bell Labs’ Technology Center, the TEK Park Property consists of nine buildings totaling 514,033 SF. The TEK Park Property was acquired in 2005 by MRA Group and converted to its current use as a multitenant office and technology park. In April 2012, the TEK Park Borrower acquired the TEK Park Property for $57.0 million and invested an additional approximately $3.1 million in capital improvements. The TEK Park Property features 175,554 SF of office space, 203,879 SF of lab space and 123,482 SF of data center space. Amenities at the TEK Park Property include a fitness center, basketball and volleyball courts, a full-service cafeteria, on-site daycare, an on-site helipad and a 200-seat conference center.
The TEK Park Property is currently 84.7% occupied as of March 23, 2016 by 17 tenants across a broad range of industries. The five largest tenants are CyOptics (27.1% of NRA; 24.5% of underwritten rent), which designs, develops and markets InP optical chips and components for integration into access, metro and long-haul communications systems, TierPoint (23.8% of NRA; 42.2% of underwritten rent), a provider of colocation and cloud managed services, Buckeye Partners (15.5% of NRA; 15.7% of underwritten rent), a distributor of petroleum in the northeastern and mid-western United States, Aesculap Implant Systems (6.1% of NRA; 5.6% of underwritten rent), which manufactures surgical instruments, implants, and supplies for spine and orthopedic markets, and FoxConn Optical Interconnect (“FoxConn”) (2.4% of NRA; 2.6% of underwritten rent), which engages in the development, manufacturing and marketing of electronic and optoelectronic connectors. Collectively, these five tenants lease 74.9% of the NRA and represent approximately 90.6% of the underwritten rent. No other tenant occupies more than 2.4% of the NRA or represents more than 2.5% of the underwritten rent.
The following table presents certain information relating to the leases at the TEK Park Property:
| Tenant Summary(1) | |||||||
| Tenant Name | Credit Rating (Fitch/Moody’s/S&P)(2) | Tenant SF | Approximate % of SF | Annual UW Rent | % of Total Annual UW Rent | Annual UW Rent PSF(3) | Lease Expiration |
| Major Tenants | |||||||
| CyOptics | NR/Ba1/NR | 139,401 | 27.1% | $1,821,796 | 24.5% | $13.07 | Various(4) |
| TierPoint | NR/B3/NR | 122,337 | 23.8% | $3,131,827 | 42.2% | $25.60 | 3/31/2028 |
| Buckeye Partners | BBB-/Baa3/BBB- | 79,795 | 15.5% | $1,162,613 | 15.7% | $14.57 | 10/31/2021 |
| Aesculap Implant Systems | NR/NR/NR | 31,318 | 6.1% | $418,095 | 5.6% | $13.35 | 7/31/2021 |
| FoxConn Optical Interconnect(5) | NR/NR/A- | 12,212 | 2.4% | $195,392 | 2.6% | $16.00 | 12/31/2025 |
| Subtotal/Wtd. Avg. | 385,063 | 74.9% | $6,729,723 | 90.6% | $17.48 | ||
| Other Tenants | 50,157 | 9.8% | $696,958 | 9.4% | $13.90 | ||
| Vacant Space | 78,813 | 15.3% | $0 | 0.0% | $0.00 | ||
| Total/Wtd. Avg. | 514,033 | 100.0% | $7,426,682 | 100.0% | $17.06 | ||
| (1) | Information is based on the underwritten rent roll. |
| (2) | Certain ratings are those of the parent company whether or not the parent guarantees the lease. |
| (3) | Wtd. Avg. Annual UW Rent PSF excludes vacant space. |
| (4) | CyOptics has 1,613 SF expiring on April 30, 2017 ($18,550 underwritten rent), 30,296 SF expiring on October 31, 2018 ($508,565 underwritten rent), 4,492 SF expiring on March 31, 2019 ($24,032 underwritten rent) and 103,000 SF expiring on October 31, 2023 ($1,270,649 underwritten rent). |
| (5) | FoxConn has taken occupancy but is not required to commence paying rent until January 1, 2017. Starting January 1, 2017, FoxConn will have a base rent of $14.00 PSF with annual increases of $0.50 PSF. At origination, the TEK Park Borrower deposited $70,834 into a rent reserve, which may be applied to debt service during such free rent period. Annual UW Rent and Annual UW Rent PSF are based on the average rent PSF over the FoxConn lease term. |
This is not a research report and was not prepared by any Underwriter’s research departments. Please see additional important information and qualifications at the end of this Term Sheet.
| T-133 |
| MSBAM 2016-C31 | TEK Park |
The following table presents certain information relating to the lease rollover schedule at the TEK Park Property:
| Lease Rollover Schedule(1)(2) | ||||||||
| Year | # of Leases Rolling | SF Rolling | Annual UW Rent PSF Rolling(3) | Approx. % of Total SF Rolling | Approx. Cumulative % of SF Rolling | Total UW Rent Rolling | Approx. % of Total Rent Rolling | Approx. Cumulative % of Total Rent Rolling |
| MTM | 2 | 2,520 | $11.50 | 0.5% | 0.5% | $28,992 | 0.4% | 0.4% |
| 2016 | 0 | 0 | $0.00 | 0.0% | 0.5% | $0 | 0.0% | 0.4% |
| 2017 | 2 | 8,687 | $14.96 | 1.7% | 2.2% | $129,965 | 1.7% | 2.1% |
| 2018 | 5 | 32,232 | $17.01 | 6.3% | 8.5% | $548,275 | 7.4% | 9.5% |
| 2019 | 2 | 9,568 | $6.90 | 1.9% | 10.3% | $65,972 | 0.9% | 10.4% |
| 2020 | 3 | 13,507 | $12.15 | 2.6% | 12.9% | $164,050 | 2.2% | 12.6% |
| 2021 | 3 | 111,113 | $14.23 | 21.6% | 34.6% | $1,580,708 | 21.3% | 33.9% |
| 2022 | 0 | 0 | $0.00 | 0.0% | 34.6% | $0 | 0.0% | 33.9% |
| 2023 | 4 | 108,182 | $12.42 | 21.0% | 55.6% | $1,343,197 | 18.1% | 52.0% |
| 2024 | 0 | 0 | $0.00 | 0.0% | 55.6% | $0 | 0.0% | 52.0% |
| 2025(4) | 2 | 14,862 | $16.73 | 2.9% | 58.5% | $248,684 | 3.3% | 55.3% |
| 2026 | 1 | 12,212 | $15.15 | 2.4% | 60.9% | $185,012 | 2.5% | 57.8% |
| 2027 & Beyond | 1 | 122,337 | $25.60 | 23.8% | 84.7% | $3,131,827 | 42.2% | 100.0% |
| Vacant | 0 | 78,813 | $0.00 | 15.3% | 100.0% | $0 | 0.0% | 100.0% |
| Total/Wtd. Avg. | 25 | 514,033 | $17.06 | 100.0% | $7,426,682 | 100.0% | ||
| (1) | Information is based on the underwritten rent roll. |
| (2) | Certain tenants may have lease termination options that are exercisable prior to the originally stated expiration date of the subject lease and that are not considered in the lease rollover schedule. |
| (3) | Wtd. Avg. Annual UW Rent PSF Rolling excludes vacant space. |
| (4) | FoxConn has taken occupancy but is not required to commence paying rent until January 1, 2017. Starting January 1, 2017, FoxConn will have a base rent of $14.00 PSF with annual increases of $0.50 PSF. At origination, the TEK Park Borrower deposited $70,834 into a rent reserve, which may be applied to debt service during such free rent period. Annual UW Rent PSF Rolling and Total UW Rent Rolling are based on the average rent PSF over the FoxConn lease term. |
The Market. The TEK Park Property is located in Breinigsville, Lehigh County, Pennsylvania, approximately 12.0 miles southwest of the Allentown Central Business District within the Allentown-Bethlehem-Easton metropolitan statistical area. The city of Breinigsville is situated in eastern Pennsylvania, approximately 61.8 miles north of Philadelphia, Pennsylvania and approximately 92.3 miles east of New York City, New York. Access to the TEK Park Property’s neighborhood is provided by Interstates 78 and 476, U.S. Route 222 and Pennsylvania Route 100. The TEK Park Property’s neighborhood is composed of residential, commercial, and light industrial land uses. The Lehigh Valley is also one of the largest areas on the east coast for the location of warehouses and distribution centers. Companies that own and operate warehouses and distribution centers in the Lehigh Valley include Amazon.com, B. Braun, Boston Beer Company, BMW, FedEx SmartPost, Firestone, Home Depot, JCPenney, Nestle Purina, ShopRite, The Coca-Cola Company, True Value, Uline and many others.
The TEK Park Property is located within the Reading Keystone Innovation Zone (“GR KIZ”) which is an economic development program primarily funded by the Pennsylvania Department of Community and Economic Development.
The estimated 2016 population within a one-, three- and five-mile radius of the TEK Park Property is 940, 14,016 and 47,827, respectively, according to a third party market research report. The 2016 average household income within a one-, three- and five-mile radius of the TEK Park Property is estimated to be $101,048, $90,601, and $99,759, respectively.
According to the appraisal, the TEK Park Property is located within the Lehigh Northampton office submarket in Breinigsville, Pennsylvania, which consists of 1,414 buildings totaling approximately 24.9 million SF of office space. As of the first quarter of 2016, the Lehigh Northampton office submarket vacancy rate was 10.1% and the average rental rate was $20.62 PSF. The TEK Park Property has maintained an average occupancy of 83.5% over the past four years with a current occupancy of 84.7% as of March 23, 2016.
This is not a research report and was not prepared by any Underwriter’s research departments. Please see additional important information and qualifications at the end of this Term Sheet.
| T-134 |
| MSBAM 2016-C31 | TEK Park |
The following table presents leasing data at certain competitive office properties with respect to the TEK Park Property:
Competitive Property Summary
| |||||||
| Property Name/Address | Year Built/Renovated | Tenant Name | Lease Size (SF) | Lease Date | Lease Term (Yrs.) | Rent/SF | Expense Basis |
CAI Office Park 1320 Hausman Road Allentown, PA | NAV | NAV | 4,888 | May 2016 | NAV | $17.95 | FS + E |
701 West Broad Street 701 West Broad Street Bethlehem, PA | 1960/2008 | Youth Advocate Partners | 1,900 | Dec 2015 | 3.0 | $18.00 | FS |
961 Marcon Boulevard 961 Marcon Boulevard Bethlehem, PA | 1984/N/A | Epic Personnel Partners, LLC | 1,478 | Oct 2015 | 2.0 | $15.75 | FS |
Highland Plaza Office 95 Highland Avenue Bethlehem, PA | NAV | Trans. Gas Christina Lee M & T Bank | 3,285 5,500 3,995 | Nov 2012 Oct 2012 Feb 2012 | 1.0 5.0 6.0 | $18.00 $18.17 $14.33 | FS FS FS |
Westchester Corporate Center 1550 Pond Road Allentown, PA | NAV | Credit Safe | 12,000 | Sept 2012 | 6.0 | $17.00 | FS + E |
Source: Appraisal
Operating History and Underwritten Net Cash Flow.The following table presents certain information relating to the historical operating performance and the Underwritten Net Cash Flow at the TEK Park Property:
| Cash Flow Analysis | ||||||
| 2013 | 2014 | 2015 | 3/31/2016 TTM | UW | UW PSF | |
| Base Rent(1) | $7,045,084 | $7,324,473 | $7,293,756 | $7,177,668 | $8,583,621 | $16.70 |
| Total Recoveries | $6,872,584 | $6,881,491 | $7,165,620 | $7,074,563 | $7,023,764 | $13.66 |
| Other Income | $86,571 | $16,615 | $96,873 | $59,305 | $210,873 | $0.41 |
| Less Vacancy & Credit Loss | $0 | $0 | $0 | $0 | ($1,156,940) | ($2.25) |
| Effective Gross Income | $14,004,238 | $14,222,579 | $14,556,249 | $14,311,536 | $14,661,318 | $28.52 |
| Total Operating Expenses | $7,296,330 | $7,620,139 | $7,842,379 | $8,015,757 | $7,969,089 | $15.50 |
| Net Operating Income | $6,707,908 | $6,602,440 | $6,713,869 | $6,295,779 | $6,692,229 | $13.02 |
| Capital Expenditures | $0 | $0 | $0 | $0 | $77,105 | $0.15 |
| TI/LC | $0 | $0 | $0 | $0 | $257,017 | $0.50 |
| Net Cash Flow | $6,707,908 | $6,602,440 | $6,713,869 | $6,295,779 | $6,358,108 | $12.37 |
| Occupancy % | 84.4% | 85.8% | 79.9% | 84.7%(2) | 92.6%(3) | |
| NOI DSCR(4) | 1.60x | 1.58x | 1.60x | 1.50x | 1.60x | |
| NCF DSCR(4) | 1.60x | 1.58x | 1.60x | 1.50x | 1.52x | |
| NOI Debt Yield(4) | 10.4% | 10.2% | 10.4% | 9.7% | 10.3% | |
| NCF Debt Yield(4) | 10.4% | 10.2% | 10.4% | 9.7% | 9.8% | |
| (1) | UW Base Rent includes approximately $401,155 of additional contractual rent steps effective December 31, 2017 and average rent PSF over the FoxConn lease term. FoxConn has taken occupancy but is not required to commence paying rent until January 1, 2017. At origination, the TEK Park Borrower deposited $70,834 into a concessions reserve, which may be applied to debt service during such free rent period. |
| (2) | Occupancy as of March 23, 2016 and includes a recent lease with Versum Materials US (12,212 SF) as occupied space. Versum Materials US had a lease commencement date of November 1, 2016. |
| (3) | UW Occupancy % is based on underwritten economic occupancy. |
| (4) | Debt service coverage ratios and debt yields are based on the TEK Park Whole Loan. |
This is not a research report and was not prepared by any Underwriter’s research departments. Please see additional important information and qualifications at the end of this Term Sheet.
| T-135 |
| MSBAM 2016-C31 | North Park Crossing Shopping Center |
| Mortgage Loan No. 15 – North Park Crossing Shopping Center |
| Mortgage Loan Information | Mortgaged Property Information | ||||||
| Mortgage Loan Seller: | BANA | Single Asset/Portfolio: | Single Asset | ||||
| Original Balance: | $22,400,000 | Location: | Joplin, MO 64801 | ||||
| Cut-off Date Balance: | $22,361,233 | General Property Type: | Retail | ||||
| % of Initial Pool Balance: | 2.3% | Detailed Property Type: | Anchored | ||||
| Loan Purpose: | Refinance | Title Vesting: | Fee/Leasehold | ||||
| Sponsor: | Bruce L. Christenson | Year Built/Renovated: | 2005/N/A | ||||
| Mortgage Rate: | 4.3400% | Size: | 200,829 SF | ||||
| Note Date: | 10/4/2016 | Cut-off Date Balance per SF: | $111 | ||||
| First Payment Date: | 11/6/2016 | Maturity Date Balance per SF: | $82 | ||||
| Maturity Date: | 10/6/2026 | Property Manager: | Gulf Coast Commercial Group, Inc. (borrower related) | ||||
| Original Term to Maturity: | 120 months | ||||||
| Original Amortization Term: | 300 months | ||||||
| IO Period: | 0 months | Underwriting and Financial Information | |||||
| Seasoning: | 1 month | UW NOI: | $2,182,164 | ||||
| Prepayment Provisions: | LO (25); DEF (91); O (4) | UW NOI Debt Yield: | 9.8% | ||||
| Lockbox/Cash Mgmt Status: | Springing/Springing | UW NOI Debt Yield at Maturity: | 13.3% | ||||
| Additional Debt Type: | N/A | UW NCF DSCR: | 1.38x | ||||
| Additional Debt Balance: | N/A | Most Recent NOI: | $2,047,947 (7/31/2016 TTM) | ||||
| Future Debt Permitted (Type): | No (N/A) | 2nd Most Recent NOI: | $2,116,298 (12/31/2015) | ||||
| Reserves | 3rd Most Recent NOI: | $2,225,929 (12/31/2014) | |||||
| Type | Initial | Monthly | Cap | Most Recent Occupancy: | 98.0% (7/11/2016) | ||
| RE Tax: | $258,277 | $21,519 | N/A | 2nd Most Recent Occupancy: | 95.3% (12/31/2015) | ||
| Insurance: | $46,036 | $3,541 | N/A | 3rd Most Recent Occupancy: | 99.4% (12/31/2014) | ||
| Recurring Replacements: | $0 | $3,347 | N/A | Appraised Value (as of): | $32,900,000 (7/12/2016) | ||
| TI/LC: | $0 | $10,878 | N/A | Cut-off Date LTV Ratio: | 68.0% | ||
| Other: | $0 | $0 | N/A | Maturity Date LTV Ratio: | 49.9% | ||
| Sources and Uses | ||||||
| Sources | Proceeds | % of Total | Uses | Proceeds | % of Total | |
| Loan Amount: | $22,400,000 | 81.3% | Loan Payoff: | $27,139,587 | 98.5% | |
| Borrower Equity: | $5,160,254 | 18.7% | Reserves: | $304,263 | 1.1% | |
| Closing Costs: | $116,404 | 0.4% | ||||
| Total Sources: | $27,560,254 | 100.0% | Total Uses: | $27,560,254 | 100.0% | |
The Mortgage Loan. The fifteenth largest mortgage loan (the “North Park Crossing Shopping Center Loan”) is evidenced by a promissory note in the original principal amount of $22,400,000 secured by a first priority fee/leasehold mortgage encumbering a 200,829 SF anchored retail center in Joplin, Missouri (the “North Park Crossing Shopping Center Property”). The proceeds of the North Park Crossing Shopping Center Loan, together with additional cash equity contributed by the North Park Crossing Shopping Center Borrower were used to pay off the previous loan, fund reserves and pay closing costs. The North Park Crossing Shopping Center Loan was previously securitized in the CSMC 2006-C5 transaction.
The Borrower and the Sponsor. The borrower is North Park Crossing, LC (the “North Park Crossing Shopping Center Borrower”), a single-purpose Missouri limited liability company with two independent directors. The loan sponsor and non-recourse carve-out guarantor is Bruce L. Christenson. Bruce L. Christenson is a principal and chief executive officer of a group of affiliated real estate development companies, including MRV, Inc., Equity Ventures, Inc., and Gulf Coast Commercial Group, Inc. These companies have developed nearly 6,000,000 SF of retail space for local, regional and national tenants in Southwestern and Midwestern states, including the North Park Crossing Shopping Center Property. Mr. Christenson is also Chairman of the Board of Directors of Lone Star Bank, a state chartered Houston Texas based banking institution.
The Property.The North Park Crossing Shopping Center Property, located at 301 Geneva Avenue in Joplin, Missouri, is a 200,829 SF anchored retail center situated on a 22.41-acre site. Built in 2005, the North Park Crossing Shopping Center Property consists of one main building containing the anchor tenants and in-line space and five outparcels, one of which is comprised of a ground leasehold interest. The sponsor developed the North Park Crossing Shopping Center Property in 2005 and has a total cost basis of approximately $34.93 million. TheNorth Park Crossing Shopping Center Property is located approximately two miles east of downtown Joplin,has 1,224 surface parking spaces or approximately 6.1 spaces per 1,000 SF and hasfrontage on 3rd street, 4th street, 7th street and Range Line Road, which have a combined traffic count of about 51,000 vehicles per day.
The North Park Crossing Shopping Center Property is located in a retail corridor, directly south of Northpark Mall, an approximately 1.0 million SF, 99.1% occupied super-regional mall anchored by Macy’s, JCPenney, and Sears. In addition, the North Park Crossing Shopping Center Property is shadow anchored by a single-tenant Target store and is located directly east of North Point Shopping Center, which is anchored by Ross Dress for Less and Toys ‘R’ US. Other major retailers within approximately two miles of the North Park Crossing Shopping Center Property include Best Buy, Walmart Supercenter, Academy Sports & Outdoors, Home Depot, Lowes, Aldi, and Hobby Lobby.
This is not a research report and was not prepared by any Underwriter’s research departments. Please see additional important information and qualifications at the end of this Term Sheet.
| T-136 |
| MSBAM 2016-C31 | North Park Crossing Shopping Center |
As of July 11, 2016, the North Park Crossing Shopping Center Property was 98.0% occupied by 21 tenants. Since 2006, the North Park Crossing Shopping Center Property has had an average occupancy of 98.3%. Approximately 55.3% of NRA and 32.6% of underwritten base rent is attributed to investment grade rated tenants. The largest tenant, Kohl’s(88,304 SF, 44.0% of NRA, 24.5% of underwritten base rent), is under a lease expiring in January 2026 with eight, five-year renewal options. Kohl’s leases the land from the North Park Crossing Shopping Center Borrower and constructed its own building, with a portion of the construction costs provided by the North Park Crossing Shopping Center Borrower in the form of a tenant allowance of $3,100,000. Kohl’s has been located at the North Park Crossing Shopping Center Property since it was constructed in 2005. Kohl’s Department Stores Inc. (“Kohl’s”) (NYSE: KSS; Fitch: BBB; S&P: BBB; Moody’s Baa2) was founded in 1962 and is an American department store retail chain. Kohl’s operates 1,150 stores and offers private label and national brand apparel, footwear, accessories, beauty, and home products to children, men, and women. The second largest tenant, Bed Bath & Beyond(22,813 SF, 11.4% of NRA, 9.8% of underwritten base rent) occupies the North Park Crossing Shopping Center Property under a lease that expires in January 2026 with two additional five-year renewal options. Bed Bath & Beyond recently exercised both its first and second renewal options effective February 2016 to extend the lease to January 2026. Bed Bath & Beyond (NYSE: BBBY; Moody’s: Baa1; S&P: BBB+), a domestic merchandise and home furnishings retailer, has been in occupancy since the North Park Crossing Shopping Center Property was constructed in 2005. The third largest tenant, Michael’s(21,159 SF, 10.5% of NRA, 10.0% of underwritten base rent) occupies the North Park Crossing Shopping Center Property under a lease that expires in February 2021 with four, five-year renewal options. The current lease is pursuant to a renewal of a prior lease that was effective March 2016. Michael’s (NASDAQ: MIK; Moody’s: Ba2; S&P: B+), an arts and crafts specialty retailer, has been in occupancy since the North Park Crossing Shopping Center Property was constructed in 2005.
An outparcel containing 6,225 SF and including Starbucks, GameStop and two vacant suites is comprised of a ground leasehold interest with an expiration date of September 30, 2039 with no extension options. The ground lease lessee, the North Park Crossing Shopping Center Borrower, has the option to buy the fee interest at the maturity of the ground lease for a price of $750,000.
The following table presents a summary regarding major tenants at the North Park Crossing Shopping Center Property:
| Tenant Summary(1) | ||||||||
| Tenant Name | Credit Rating (Fitch/ Moody’s/ S&P)(2) | Tenant SF | Approximate % of SF | Annual UW Rent | % of Total Annual UW Rent | Annual UW Rent PSF(3) | Lease Expiration | 2015 Sales PSF |
| Major Tenants | ||||||||
| Kohl’s | BBB/Baa2/BBB | 88,304 | 44.0% | $571,847 | 24.5% | $6.48 | 1/31/2026 | NAV |
| Bed Bath and Beyond | NR/Baa1/BBB+ | 22,813 | 11.4% | $228,537 | 9.8% | $10.02 | 1/31/2026 | NAV |
| Michael’s | NR/Ba2/B+ | 21,159 | 10.5% | $232,749 | 10.0% | $11.00 | 2/28/2021 | NAV |
| Kirkland’s Stores Inc | NR/NR/NR | 8,195 | 4.1% | $155,040 | 6.7% | $18.92 | 1/31/2021 | $192.74 |
| Dress Barn | NR/Ba2/BB- | 7,383 | 3.7% | $118,128 | 5.1% | $16.00 | 12/31/2022 | $137.63 |
| Subtotal/Wtd. Avg. | 147,854 | 73.6% | $1,306,301 | 56.0% | $8.84 | |||
| Other Tenants | 49,016 | 24.4% | $1,025,117 | 44.0% | $20.91 | |||
| Vacant Space | 3,959 | 2.0% | $0 | 0.0% | $0.00 | |||
| Total/Wtd. Avg. | 200,829 | 100.0% | $2,331,418 | 100% | $11.84 | |||
| (1) | Information is based on the underwritten rent roll. |
| (2) | Certain ratings are those of the parent company whether or not the parent guarantees the lease. |
| (3) | Annual UW Rent PSF excludes vacant space. |
This is not a research report and was not prepared by any Underwriter’s research departments. Please see additional important information and qualifications at the end of this Term Sheet.
| T-137 |
| MSBAM 2016-C31 | North Park Crossing Shopping Center |
The following table presents certain information relating to the lease rollover schedule at the North Park Crossing Shopping Center Property:
| Lease Rollover Schedule(1)(2) | ||||||||
| Year | # of Leases Rolling | SF Rolling | UW Rent PSF Rolling(3) | Approx. % of Total SF Rolling | Approx. Cumulative % of SF Rolling | Total UW Rent Rolling | Approx. % of Total UW Rent Rolling | Approx. Cumulative % of Total UW Rent Rolling |
| 2016 | 0 | 0 | $0.00 | 0.0% | 0.0% | $0 | 0.0% | 0.0% |
| 2017 | 4 | 12,051 | $18.12 | 6.0% | 6.0% | $218,393 | 9.4% | 9.4% |
| 2018 | 2 | 5,172 | $24.28 | 2.6% | 8.6% | $125,569 | 5.4% | 14.8% |
| 2019 | 0 | 0 | $0.00 | 0.0% | 8.6% | $0 | 0.0% | 14.8% |
| 2020 | 3 | 8,888 | $17.20 | 4.4% | 13.0% | $152,859 | 6.6% | 21.3% |
| 2021 | 4 | 33,644 | $14.80 | 16.8% | 29.8% | $497,897 | 21.4% | 42.7% |
| 2022 | 2 | 14,383 | $17.46 | 7.2% | 36.9% | $251,128 | 10.8% | 53.4% |
| 2023 | 0 | 0 | $0.00 | 0.0% | 36.9% | $0 | 0.0% | 53.4% |
| 2024 | 0 | 0 | $0.00 | 0.0% | 36.9% | $0 | 0.0% | 53.4% |
| 2025 | 1 | 1,953 | $37.40 | 1.0% | 37.9% | $73,042 | 3.1% | 56.6% |
| 2026 | 5 | 120,779 | $8.38 | 60.1% | 98.0% | $1,012,530 | 43.4% | 100.0% |
| 2027 & Beyond | 0 | 0 | $0.00 | 0.0% | 98.0% | $0 | 0.0% | 100.0% |
| Vacant | 0 | 3,959 | $0.00 | 2.0% | 100.0% | $0 | 0.0% | 100.0% |
| Total/Wtd. Avg. | 21 | 200,829 | $11.84 | 100.0% | $2,331,418 | 100.0% | ||
| (1) | Information is based on the underwritten rent roll. |
| (2) | Certain tenants may have lease termination options and/or co-tenancy clauses that are exercisable prior to the originally stated expiration date of the lease that are not considered in the lease rollover schedule. |
| (3) | UW Rent PSF Rolling excludes vacant space. |
The Market.The North Park Crossing Shopping Center Property is located in the Jasper County market and the Joplin submarket. According to a third party market research report, as of October 11, 2016, the Joplin submarket has a multi-tenant retail inventory of approximately 2.5 million SF with a market vacancy of 2.5% and an average rental rate of $16.14 PSF. Furthermore, as of October 11, 2016, the multi-tenant retail market within a five-mile radius of the North Park Crossing Shopping Center Property has inventory of approximately 3.0 million SF with a market vacancy of 2.4% and an average rental rate of $15.75 PSF. Comparatively, as of October 11, 2016, the multi-tenant retail market within a one-mile radius of the North Park Crossing Shopping Center Property has inventory of approximately 1.5 million SF with a market vacancy of 1.3% and an average rental rate of $19.93 PSF.
According to a third party market research report, the estimated 2016 population within a three-, five- and ten-mile radius of the North Park Crossing Shopping Center Property was approximately 41,672, 73,067 and 114,705, respectively. The 2016 estimated average household income within a three-, five- and ten-mile radius of the North Park Crossing Shopping Center Property was approximately $49,352, $52,172 and $58,185, respectively.
The following table presents rental comparables to the North Park Crossing Shopping Center Property:
| Competitive Property Summary | |||||||||
| Property Name/Location | Year Built | Occ. | Size (SF) | Tenant Name | Lease Size (SF) | Lease Term (Yrs.) | Lease Date | Rent PSF(1) | Lease Type |
Tulsa Hills 7336 South Olympia Avenue, Tulsa, Oklahoma | 2008 | 99% | 700,086 | Kirkland’s European Wax Center Staples Dick’s Sporting Goods | 7,500 1,400 18,000 50,000 | 10 5 10 10 | Oct-15 Jul-12 Nov-11 Nov-11 | $20.00 $23.00 $12.75 $11.50 | Triple Net Triple Net Triple Net Triple Net |
Yukon Village 1600 Garth Brooks Boulevard, Yukon, Oklahoma | 2008 | 92% | 185,671 | Rue 21 Kirkland’s Big Lots Hobby Lobby | 5,800 7,000 30,000 55,000 | 3 20 11 15 | Sep-14 Sep-14 Jun-14 May-14 | $15.50 $16.00 $9.75 $8.00 | Triple Net Triple Net Triple Net Triple Net |
Stoneridge Village 731 Stoneridge Parkway, Jefferson City, Missouri | 2009 | 100% | 72,483 | Five Below GameStop Big Lots | 8,000 1,926 45,000 | 10 3 10.1 | Feb-16 Feb-15 Dec-12 | $16.00 $25.00 $11.00 | Triple Net Triple Net Triple Net |
Adams Dairy Landing 1010 NE Coronado Drive, Blue Springs, Missouri | 2008 | 100% | 279,382 | Factory Connection Lane Bryant Cash for Gold Chic Nails | 3,372 4,928 1,140 1,696 | 5 5 5 5 | Jun-13 May-13 Mar-13 Feb-13 | $18.00 $28.00 $27.00 $26.00 | Triple Net Triple Net Triple Net Triple Net |
Derby Marketplace 1600 N Rock Road, Derby, Kansas | 2009 | 91% | 336,019 | TJ Maxx Ross Dress Hobby Lobby Cherry Berry Yogurt | 20,000 25,000 55,000 1,870 | 10 10 15 0.4 | Apr-16 Apr-16 Nov-15 Aug-11 | $9.75 $10.50 $6.50 $16.50 | Triple Net Triple Net Triple Net Triple Net |
New Market Square Shopping Center – Phase I 2241 - 2441 North Maize Road Wichita, Kansas | 2001 | 92% | 213,407 | White Barn Walton’s Bling Glamour Edible Arrangements | 1,955 4,112 1,958 1,415 | 8.9 0.9 1 5.1 | Sep-15 Aug-15 Apr-15 Apr-15 | $20.00 $13.00 $12.67 $17.00 | Triple Net Triple Net Triple Net Triple Net |
Source:Appraisal
| (1) | Rent PSF at the comparable properties reflect a wide range depending on size and location within the center. |
This is not a research report and was not prepared by any Underwriter’s research departments. Please see additional important information and qualifications at the end of this Term Sheet.
| T-138 |
| MSBAM 2016-C31 | North Park Crossing Shopping Center |
Operating History and Underwritten Net Cash Flow.The following table presents certain information relating to the Underwritten Net Cash Flow at the North Park Crossing Shopping Center Property:
| Cash Flow Analysis | ||||||||||||
| 2013 | 2014 | 2015 | TTM 7/31/2016 | UW | UW PSF | |||||||
| Base Rent(1) | $2,312,763 | $2,315,187 | $2,252,323 | $2,194,853 | $2,454,144 | $12.22 | ||||||
| Total Recoveries | $482,874 | $474,649 | $458,859 | $413,008 | $523,140 | $2.60 | ||||||
| Percentage Rent | $0 | $0 | $0 | $0 | $0 | $0.00 | ||||||
| Other Income | $3,000 | $3,000 | $3,000 | $3,000 | $3,000 | $0.01 | ||||||
| Vacancy & Credit Loss | $0 | $0 | $0 | $0 | ($148,864) | (5.0%) | ||||||
| Effective Gross Income(2) | $2,798,637 | $2,792,835 | $2,714,182 | $2,610,861 | $2,831,419 | $14.10 | ||||||
| Total Operating Expenses | $609,659 | $566,906 | $597,884 | $562,915 | $649,256 | $3.23 | ||||||
| Net Operating Income | $2,188,978 | $2,225,929 | $2,116,298 | $2,047,947 | $2,182,164 | $10.87 | ||||||
| Capital Expenditures | $0 | $0 | $0 | $0 | $40,166 | $0.20 | ||||||
| TI/LC | $0 | $0 | $0 | $0 | $118,489 | $0.59 | ||||||
| Net Cash Flow | $2,188,978 | $2,225,929 | $2,116,298 | $2,047,947 | $2,023,509 | $10.08 | ||||||
| Occupancy % | 100.0% | 99.4% | 95.3% | 98.0%(3) | 95.0% | |||||||
| NOI DSCR | 1.49x | 1.51x | 1.44x | 1.39x | 1.48x | |||||||
| NCF DSCR | 1.49x | 1.51x | 1.44x | 1.39x | 1.38x | |||||||
| NOI Debt Yield | 9.8% | 10.0% | 9.5% | 9.2% | 9.8% | |||||||
| NCF Debt Yield | 9.8% | 10.0% | 9.5% | 9.2% | 9.0% | |||||||
| (1) | Historical Base Rent is net of vacancy. Contractual rent steps through February 2017 are underwritten. Underwritten rent for Bed Bath & Beyond represents the tenant’s rent averaged over the loan term as the tenant has an investment grade rating (Moody’s: Baa1; S&P BBB+). Bed Bath & Beyond’s current in-place rent is $9.75 PSF compared to the underwritten rent of $10.02 PSF. |
| (2) | Historical EGI decreased from 2014 to TTM 7/31/2016 due to David’s Bridal vacating 8,046 SF in September 2015. The space has been re-let to Carter’s (occupancy of 3,984 SF in April 2016) and Men’s Wearhouse (relocating within the North Park Crossing Shopping Center Property and expanding to occupy 4,028 SF in June 2016). Additionally, a co-tenancy clause in the Chico’s lease was triggered when U.S Cellular vacated in September 2015, allowing Chico’s to only pay 50% rent for 12 months. Chico’s co-tenancy clause has expired and the tenant is now playing full rent. |
| (3) | Based on a rent roll dated July 11, 2016. |
This is not a research report and was not prepared by any Underwriter’s research departments. Please see additional important information and qualifications at the end of this Term Sheet.
| T-139 |
| MSBAM 2016-C31 |
This Term Sheet was prepared by sales, trading, banking or other non-research personnel of one of the following (or an affiliate thereof): Merrill Lynch, Pierce, Fenner & Smith Incorporated (together with its affiliates, “BofA Merrill Lynch”), Morgan Stanley & Co. LLC, Morgan Stanley & Co. International Limited, Morgan Stanley Japan Limited and/or Morgan Stanley Dean Witter Asia Limited (together with their affiliates, hereinafter “Morgan Stanley”), UBS Securites LLC (together with its affiliates, “UBS Securities LLC”), KeyBanc Capital Markets Inc. (together with its affiliates, “KeyBanc”) or Drexel Hamilton, LLC (together with its affiliates, “Drexel” and, collectively with BofA Merrill Lynch, Morgan Stanley, UBS Securities LLC and KeyBanc, the “Underwriters”). This Term Sheet was not produced by an Underwriter’s research analyst, although it may refer to and Underwriter’s research analyst or research report. Unless otherwise indicated, these views (if any) are the author’s and may differ from those of the fixed income or equity research departments of the Underwriters or others in those firms.
This Term Sheet may have been prepared by or in conjunction with the respective trading desks of the Underwriters that may deal as principal in or own or act as market maker or liquidity provider for the securities/instruments (or related derivatives) mentioned herein. The trading desk of any Underwriter may have accumulated a position in the subject securities/instruments based on the information contained herein. Trading desk Term Sheets are not independent of the proprietary interests of the Underwriters, which may conflict with your interests. Each of the Underwriters may also perform or seek to perform investment banking services for the issuers of the securities and instruments mentioned herein.
The information contained in this Term Sheet is subject to change, completion or amendment from time to time, and the information in this Term Sheet supersedes information in any other communication other than in any other Free Writing Prospectus relating to the securities referred to in this Term Sheet. This Term Sheet is not a solicitation to participate in any trading strategy, and is not an offer to sell any security or instrument or a solicitation of an offer to buy or sell any security or instrument in any jurisdiction where the offer, solicitation or sale is not permitted. Unless otherwise set forth in this material, any securities referred to in this material may not have been registered under the U.S. Securities Act of 1933, as amended, and, if not, may not be offered or sold absent an exemption therefrom. Recipients are required to comply with any legal or contractual restrictions on their purchase, holding, sale, exercise of rights or performance of obligations under any securities/instruments transaction.
The securities/instruments discussed in this Term Sheet may not be suitable for all investors. This Term Sheet has been prepared for intended distribution to market professionals and institutional investor clients. Other recipients should seek independent investment advice prior to making any investment decision based on this Term Sheet. This Term Sheet does not provide individually tailored investment advice or offer tax, regulatory, accounting or legal advice. Prior to entering into any proposed transaction, recipients should determine, in consultation with their own investment, legal, tax, regulatory and accounting advisors, the economic risks and merits, as well as the legal, tax, regulatory and accounting characteristics and consequences, of the transaction. You should consider this Term Sheet as only a single factor in making an investment decision.
The value of and income from investments may vary because of changes in interest rates, foreign exchange rates, default rates, prepayment rates, securities/instruments prices, market indexes, operational or financial conditions of companies or other factors. There may be time limitations on the exercise of options or other rights in securities/instruments transactions. Past performance is not necessarily a guide to future performance. Estimates of future performance are based on assumptions that may not be realized. Actual events may differ from those assumed and changes to any assumptions may have a material impact on any projections or estimates. Other events not taken into account may occur and may significantly affect the projections or estimates. Certain assumptions may have been made for modeling purposes only to simplify the presentation and/or calculation of any projections or estimates, and the Underwriters do not represent that any such assumptions will reflect actual future events. Accordingly, there can be no assurance that estimated returns or projections will be realized or that actual returns or performance results will not materially differ from those estimated herein. Some of the information contained in this document may be aggregated data of transactions in securities or other financial instruments executed by one or more Underwriters that has been compiled so as not to identify the underlying transactions of any particular customer.
Notwithstanding anything herein to the contrary, the Underwriters and each recipient hereof (and their employees, representatives, and other agents) may disclose to any and all persons, without limitation of any kind from the commencement of discussions, the U.S. federal and state income tax treatment and tax structure of the transaction and all materials of any kind (including opinions or other tax analyses) that are provided to it relating to the tax treatment and tax structure (as such terms are defined in Treasury Regulation 1.6011-4). For this purpose, “tax structure” is limited to facts relevant to the U.S. federal and state income tax treatment of the transaction and does not include information relating to the identity of the parties, their affiliates, agents or advisors. This authorization of tax disclosure is retroactively effective to the commencement of discussions with prospective investors regarding the transactions contemplated herein.
In the United Kingdom, this Term Sheet is only being distributed to, and is directed only at, persons who (i) have professional experience in matters relating to investments and who qualify as investment professionals in accordance with Article 19(5) of the Financial Services and Markets Act 2000 (Financial Promotion) Order 2005 (the “Order”)), or (ii) are high net worth companies, unincorporated associations, partnerships or trustees in accordance with Article 49(2) of the Order (all such persons together being referred to as “relevant persons”). This Term Sheet must not be acted on or relied on by persons who are not relevant persons. Any investment or investment activity to which this Term Sheet relates is available only to relevant persons and will be engaged in only with relevant persons.
THE OFFERED CERTIFICATES HAVE NOT BEEN AND WILL NOT BE REGISTERED UNDER THE FINANCIAL INSTRUMENTS EXCHANGE ACT OF JAPAN (LAW NO. 25 OF 1948, AS AMENDED (THE “FIEL”)), AND EACH OF MERRILL LYNCH, PIERCE, FENNER & SMITH INCORPORATED, MORGAN STANLEY & CO. LLC, CIBC WORLD MARKETS CORP. AND DREXEL HAMILTON, LLC HAS AGREED THAT IT WILL NOT OFFER OR SELL ANY OFFERED CERTIFICATES, DIRECTLY OR INDIRECTLY, IN JAPAN OR TO, OR FOR THE BENEFIT OF, ANY JAPANESE PERSON, OR TO OTHERS FOR RE-OFFERING OR RESALE, DIRECTLY OR INDIRECTLY, IN JAPAN OR TO ANY JAPANESE PERSON, EXCEPT PURSUANT TO AN EXEMPTION FROM THE REGISTRATION REQUIREMENTS OF, AND OTHERWISE IN COMPLIANCE WITH, THE FIEL AND ANY OTHER APPLICABLE LAWS AND REGULATIONS. FOR THE PURPOSES OF THIS PARAGRAPH, “JAPANESE PERSON” SHALL MEAN ANY PERSON RESIDENT IN JAPAN, INCLUDING ANY CORPORATION OR OTHER ENTITY ORGANIZED UNDER THE LAWS AND REGULATIONS OF JAPAN.
© 2016 Morgan Stanley