Banc of America Merrill Lynch Commercial Mortgage
Filed: 10 Jul 17, 12:00am
| FREE WRITING PROSPECTUS | ||
| FILED PURSUANT TO RULE 433 | ||
| REGISTRATION FILE NO.: 333-206847-06 | ||
 |  |  |
BANK 2017-BNK6
Free Writing Prospectus
Structural and Collateral Term Sheet
$933,251,927
(Approximate Total Mortgage Pool Balance)
$793,497,000
(Approximate Offered Certificates)
��
Banc of America Merrill Lynch Commercial Mortgage Inc.
as Depositor
Wells Fargo Bank, National Association
Bank of America, National Association
Morgan Stanley Mortgage Capital Holdings LLC
National Cooperative Bank, N.A.
as Sponsors and Mortgage Loan Sellers
Commercial Mortgage Pass-Through Certificates
Series 2017-BNK6
July 10, 2017
| BofA MERRILL LYNCH | MORGAN STANLEY | WELLS FARGO SECURITIES |
| Co-Lead Manager and Joint Bookrunner | Co-Lead Manager and Joint Bookrunner | Co-Lead Manager and Joint Bookrunner |
| Drexel Hamilton | ||
| Co-Manager | ||
STATEMENT REGARDING THIS FREE WRITING PROSPECTUS
The depositor has filed a registration statement (including a prospectus) with the SEC (File No. 333-206847) for the offering to which this communication relates. Before you invest, you should read the prospectus in that registration statement and other documents the depositor has filed with the SEC for more complete information about the depositor, the issuing entity and this offering. You may get these documents for free by visiting EDGAR on the SEC web site atwww.sec.gov. Alternatively, the depositor or any underwriter or any dealer participating in the offering will arrange to send you the prospectus if you request it by calling toll free 1-800-294-1322 or by email todg.Prospectus_Requests@baml.com.
This is not a research report and was not prepared by any Underwriter’s research department. Please see additional important information and qualifications at the end of this Term Sheet.
Neither this Term Sheet nor anything contained herein shall form the basis for any contract or commitment whatsoever.The information contained herein is preliminary as of the date hereof.This Term Sheet is subject to change, completion or amendment from time to time.The information contained herein will be superseded by similar information delivered to you as part of the Preliminary Prospectus.The information contained herein supersedes any such information previously delivered.The information contained herein should be reviewed only in conjunction with the entire Preliminary Prospectus.All of the information contained herein is subject to the same limitations and qualifications contained in the Preliminary Prospectus.The information contained herein does not contain all relevant information relating to the underlying mortgage loans or mortgaged properties.Such information is described in the Preliminary Prospectus.The information contained herein will be more fully described in the Preliminary Prospectus.The information contained herein should not be viewed as projections, forecasts, predictions or opinions with respect to value.Prior to making any investment decision, prospective investors are strongly urged to read the Preliminary Prospectus in its entirety.Neither the Securities and Exchange Commission nor any state securities commission has approved or disapproved of these securities or determined if this Term Sheet is truthful or complete.Any representation to the contrary is a criminal offense.
IMPORTANT NOTICE RELATING TO AUTOMATICALLY GENERATED EMAIL DISCLAIMERS
Any legends, disclaimers or other notices that may appear at the bottom of, or attached to, the email communication to which this Term Sheet may have been attached are not applicable to this Term Sheet and should be disregarded. Such legends, disclaimers or other notices have been automatically generated as a result of this Term Sheet having been sent via Bloomberg or another email system.
IMPORTANT NOTICE REGARDING THE CONDITIONS FOR THIS OFFERING OF ASSET-BACKED SECURITIES
THE ASSET-BACKED SECURITIES REFERRED TO IN THIS TERM SHEET ARE BEING OFFERED WHEN, AS AND IF ISSUED. IN PARTICULAR, YOU ARE ADVISED THAT THE ASSET-BACKED SECURITIES, AND THE ASSET POOL BACKING THEM, ARE SUBJECT TO MODIFICATION OR REVISION (INCLUDING, AMONG OTHER THINGS, THE POSSIBILITY THAT ONE OR MORE CLASSES OF SECURITIES MAY BE SPLIT, COMBINED OR ELIMINATED), AT ANY TIME PRIOR TO ISSUANCE OR AVAILABILITY OF A FINAL PROSPECTUS. AS A RESULT, YOU MAY COMMIT TO PURCHASE SECURITIES THAT HAVE CHARACTERISTICS THAT MAY CHANGE, AND YOU ARE ADVISED THAT ALL OR A PORTION OF THE SECURITIES MAY NOT BE ISSUED THAT HAVE THE CHARACTERISTICS DESCRIBED IN THIS TERM SHEET. OUR OBLIGATION TO SELL SECURITIES TO YOU IS CONDITIONED ON THE SECURITIES AND THE UNDERLYING TRANSACTION HAVING THE CHARACTERISTICS DESCRIBED IN THIS TERM SHEET. IF WE DETERMINE THAT THE FOREGOING CONDITION IS NOT SATISFIED IN ANY MATERIAL RESPECT, WE WILL NOTIFY YOU, AND NEITHER THE ISSUING ENTITY NOR ANY UNDERWRITER WILL HAVE ANY OBLIGATION TO YOU TO DELIVER ALL OR ANY PORTION OF THE SECURITIES WHICH YOU HAVE COMMITTED TO PURCHASE, AND THERE WILL BE NO LIABILITY BETWEEN US AS A CONSEQUENCE OF THE NON-DELIVERY.
This is not a research report and was not prepared by the Underwriters’ research departments. Please see additional important information and qualifications at the end of this Term Sheet.
| T-2 |
| BANK 2017-BNK6 | Structural Overview |
Offered Certificates
| Class | Expected Ratings (DBRS/Fitch/S&P)(1) | Approximate Initial Certificate Balance or Notional Amount(2) | Approximate Initial Credit Support(3) | Pass-Through Rate Description | Expected Weighted Average Life (Years)(4) | Expected Principal Window (Months)(4) | Certificate Principal UW NOI Debt Yield(5) | Certificate Principal to Value Ratio(6) | ||
| Class A-1 | AAA(sf)/AAAsf/AAA(sf) | $31,100,000 | 30.000% | (7) | 2.88 | 1 – 59 | 20.4% | 37.1% | ||
| Class A-2 | AAA(sf)/AAAsf/AAA(sf) | $26,600,000 | 30.000% | (7) | 4.88 | 59 – 59 | 20.4% | 37.1% | ||
| Class A-SB | AAA(sf)/AAAsf/AAA(sf) | $39,900,000 | 30.000% | (7) | 7.02 | 59 – 108 | 20.4% | 37.1% | ||
| Class A-3 | AAA(sf)/AAAsf/AAA(sf) | $58,200,000 | 30.000% | (7) | 6.88 | 82 – 83 | 20.4% | 37.1% | ||
| Class A-4 | AAA(sf)/AAAsf/AAA(sf) | $225,000,000 | 30.000% | (7) | 9.71 | 108 – 119 | 20.4% | 37.1% | ||
| Class A-5 | AAA(sf)/AAAsf/AAA(sf) | $239,812,000 | 30.000% | (7) | 9.88 | 119 – 119 | 20.4% | 37.1% | ||
| Class X-A | AAA(sf)/AAAsf/AAA(sf) | $620,612,000 | (8) | N/A | Variable IO(9) | N/A | N/A | N/A | N/A | |
| Class X-B | AA(high)(sf)/A-sf/A(sf) | $172,885,000 | (8) | N/A | Variable IO(9) | N/A | N/A | N/A | N/A | |
| Class A-S | AAA(sf)/AAAsf/AAA(sf) | $97,525,000 | 19.000% | (7) | 9.92 | 119 – 120 | 17.7% | 42.9% | ||
| Class B | AAA(sf)/AA-sf/AA(sf) | $41,005,000 | 14.375% | (7) | 9.97 | 120 – 120 | 16.7% | 45.4% | ||
| Class C | AA(sf)/A-sf/A(sf) | $34,355,000 | 10.500% | (7) | 9.97 | 120 – 120 | 16.0% | 47.4% | ||
Privately Offered Certificates(10)
| Class | Expected Ratings (DBRS/Fitch/S&P)(1) | Approximate Initial Certificate Balance or Notional Amount(2) | Approximate Initial Credit Support(3) | Pass-Through Rate Description | Expected Weighted Average Life (Years)(4) | Expected Principal Window (Months)(4) | Certificate Principal UW NOI Debt Yield(5) | Certificate Principal to Value Ratio(6) | ||
| Class X-D | A(low)(sf)/BBB-sf/BBB-(sf) | $35,464,000(8) | N/A | Variable IO(9) | N/A | N/A | N/A | N/A | ||
| Class X-E | BBB(sf)/BB-sf/BB-(sf) | $19,948,000(8) | N/A | Variable IO(9) | N/A | N/A | N/A | N/A | ||
| Class X-F | BB(high)(sf)/B-sf/B+(sf) | $8,866,000(8) | N/A | Variable IO(9) | N/A | N/A | N/A | N/A | ||
| Class X-G | NR/NR/NR | $28,814,330(8) | N/A | Variable IO(9) | N/A | N/A | N/A | N/A | ||
| Class D | BBB(high)(sf)/BBB-sf/BBB-(sf) | $35,464,000 | 6.500% | (7) | 9.97 | 120 – 120 | 15.3% | 49.6% | ||
| Class E | BBB(low)(sf)/BB-sf/BB-(sf) | $19,948,000 | 4.250% | (7) | 9.97 | 120 – 120 | 14.9% | 50.7% | ||
| Class F | BB(sf)/B-sf/B+(sf) | $8,866,000 | 3.250% | (7) | 9.97 | 120 – 120 | 14.8% | 51.3% | ||
| Class G | NR/NR/NR | $28,814,330 | 0.000% | (7) | 10.98 | 120 – 239 | 14.3% | 53.0% | ||
Non-Offered Eligible Vertical Interest(10)
| Class | Expected Ratings (DBRS/Fitch/S&P)(1) | Approximate Initial Certificate Balance or Notional Amount(2) | Approximate Initial Credit Support(3) | Pass-Through Rate Description | Expected Weighted Average Life (Years)(4) | Expected Principal Window (Months)(4) | Certificate Principal UW NOI Debt Yield | Certificate Principal to Value Ratio | ||
| RR Interest | NR/NR/NR | $46,662,596.37 | N/A | WAC(11) | 9.17 | 1 – 239 | N/A | N/A |
| (1) | Ratings shown are those of DBRS, Inc. (“DBRS”), Fitch Ratings, Inc. (“Fitch”) and S&P Global Ratings (“S&P”). Certain nationally recognized statistical rating organizations that were not hired by the depositor may use information they receive pursuant to Rule 17g-5 under the Securities Exchange Act of 1934, as amended, or otherwise to rate the certificates. There can be no assurance as to what ratings a non-hired nationally recognized statistical rating organization would assign. See “Risk Factors—Other Risks Relating to the Certificates—Nationally Recognized Statistical Rating Organizations May Assign Different Ratings to the Certificates; Ratings of the Certificates Reflect Only the Views of the Applicable Rating Agencies as of the Dates Such Ratings Were Issued; Ratings May Affect ERISA Eligibility; Ratings May Be Downgraded” and “Ratings” in the Preliminary Prospectus, expected to be dated July 10, 2017 (the “Preliminary Prospectus”). Capitalized terms used but not defined herein have the meanings assigned to such terms in the Preliminary Prospectus. |
| (2) | Approximate, subject to a permitted variance of plus or minus 5%. In addition, the notional amounts of the Class X-A, Class X-B, Class X-D, Class X-E, Class X-F and Class X-G certificates may vary depending upon the final pricing of the classes of principal balance certificates whose certificate balances comprise such notional amounts, and, if as a result of such pricing the pass-through rate of any class of the Class X-A, Class X-B, Class X-D, Class X-E, Class X-F or Class X-G certificates, as applicable, would be equal to zero at all times, such class of certificates will not be issued on the closing date of this securitization. |
| (3) | The approximate initial credit support percentages set forth for the certificates are approximate and, for the Class A-1, Class A-2, Class A-SB, Class A-3, Class A-4 and Class A-5 certificates, are represented in the aggregate. The RR Interest provides credit support only to the limited extent that it is allocated a portion of any losses incurred on the underlying mortgage loans, which such losses are allocated between it, on the one hand, and to the Offered Certificates and the Non-Offered Certificates, on the other hand,pro ratain accordance with their respective Percentage Allocation Entitlements (as defined below). See “Credit Risk Retention” in the Preliminary Prospectus. |
| (4) | The Expected Weighted Average Life and Expected Principal Window during which distributions of principal would be received as set forth in the foregoing table with respect to each class of certificates having a certificate balance are based on the assumptions set forth under “Yield and Maturity Considerations— |
This is not a research report and was not prepared by the Underwriters’ research departments. Please see additional important information and qualifications at the end of this Term Sheet.
| T-3 |
| BANK 2017-BNK6 | Structural Overview |
Weighted Average Life” in the Preliminary Prospectus and on the assumptions that there are no prepayments, modifications or losses in respect of the mortgage loans and that there are no extensions or forbearances of maturity dates or anticipated repayment dates of the mortgage loans.
| (5) | Certificate Principal UW NOI Debt Yield for any class of principal balance certificates (other than the RR Interest) is calculated as the product of (a) the weighted average UW NOI Debt Yield for the mortgage pool, multiplied by (b) a fraction, the numerator of which is the total initial certificate balance of all the principal balance certificates (other than the RR Interest), and the denominator of which is the total initial certificate balance of the subject class of principal balance certificates and all other classes of principal balance certificates (other than the RR Interest), if any, that are senior to such class (without regard to the RR Interest). The Certificate Principal UW NOI Debt Yields of the Class A-1, Class A-2, Class A-SB, Class A-3, Class A-4 and Class A-5 certificates are calculated in the aggregate for those classes as if they were a single class. |
| (6) | Certificate Principal to Value Ratio for any class of principal balance certificates (other than the RR Interest) is calculated as the product of (a) the weighted average Cut-off Date LTV Ratio of the mortgage pool, multiplied by (b) a fraction, the numerator of which is the total initial certificate balance of the subject class of principal balance certificates and all other classes of principal balance certificates (other than the RR Interest), if any, that are senior to such class, and the denominator of which is the total initial certificate balance of all the principal balance certificates (other than the RR Interest). The Certificate Principal to Value Ratios of the Class A-1, Class A-2, Class A-SB, Class A-3, Class A-4 and Class A-5 certificates are calculated in the aggregate for those classes as if they were a single class. |
| (7) | The pass-through rate for each class of the Class A-1, Class A-2, Class A-SB, Class A-3, Class A-4, Class A-5, Class A-S, Class B, Class C, Class D, Class E, Class F and Class G certificates (which, together with the RR Interest, are referred to as the “principal balance certificates”) will be one of the following: (i) a fixed rateper annum, (ii) a variable rateper annum equal to the weighted average of the net mortgage interest rates on the mortgage loans for the related distribution date, (iii) a variable rateper annum equal to the lesser of (a) a fixed rate and (b) the weighted average of the net mortgage interest rates on the mortgage loans for the related distribution date or (iv) a variable rateper annum equal to the weighted average of the net mortgage interest rates on the mortgage loans for the related distribution date minus a specified percentage. For purposes of the calculation of the weighted average of the net mortgage interest rates on the mortgage loans for each distribution date, the net mortgage interest rates will be adjusted as necessary to a 30/360 basis. |
| (8) | The Class X-A, Class X-B, Class X-D, Class X-E, Class X-F and Class X-G certificates (collectively referred to as the “Class X certificates”) are notional amount certificates and will not be entitled to distributions of principal. The notional amount of the Class X-A certificates will be equal to the aggregate certificate balance of the Class A-1, Class A-2, Class A-SB, Class A-3, Class A-4 and Class A-5 certificates. The notional amount of the Class X-B certificates will be equal to the aggregate certificate balance of the Class A-S, Class B and Class C certificates. The notional amount of the Class X-D certificates will be equal to the certificate balance of the Class D certificates. The notional amount of the Class X-E certificates will be equal to the certificate balance of the Class E certificates. The notional amount of the Class X-F certificates will be equal to the certificate balance of the Class F certificates. The notional amount of the Class X-G certificates will be equal to the certificate balance of the Class G certificates. |
| (9) | The pass-through rate for the Class X-A certificates for any distribution date will be aper annumrate equal to the excess, if any, of (a) the weighted average of the net mortgage interest rates on the mortgage loans for the related distribution date, over (b) the weighted average of the pass-through rates on the Class A-1, Class A-2, Class A-SB, Class A-3, Class A-4 and Class A-5 certificates for the related distribution date, weighted on the basis of their respective certificate balances outstanding immediately prior to that distribution date. The pass-through rate for the Class X-B certificates for any distribution date will be aper annum rate equal to the excess, if any, of (a) the weighted average of the net mortgage interest rates on the mortgage loans for the related distribution date, over (b) the weighted average of the pass-through rates on the Class A-S, Class B and Class C certificates for the related distribution date, weighted on the basis of their respective certificate balances outstanding immediately prior to that distribution date. The pass-through rate for the Class X-D certificates for any distribution date will be aper annum rate equal to the excess, if any, of (a) the weighted average of the net mortgage interest rates on the mortgage loans for the related distribution date, over (b) the pass-through rate on the Class D certificates for the related distribution date. The pass-through rate for the Class X-E certificates for any distribution date will be a per annum rate equal to the excess, if any, of (a) the weighted average of the net mortgage interest rates on the mortgage loans for the related distribution date, over (b) the pass-through rate on the Class E certificates for the related distribution date. The pass-through rate for the Class X-F certificates for any distribution date will be a per annum rate equal to the excess, if any, of (a) the weighted average of the net mortgage interest rates on the mortgage loans for the related distribution date, over (b) the pass-through rate on the Class F certificates for the related distribution date. The pass-through rate for the Class X-G certificates for any distribution date will be a per annum rate equal to the excess, if any, of (a) the weighted average of the net mortgage interest rates on the mortgage loans for the related distribution date, over (b) the pass-through rate on the Class G certificates for the related distribution date. For purposes of the calculation of the weighted average of the net mortgage interest rates on the mortgage loans for each distribution date, the net mortgage interest rates will be adjusted as necessary to a 30/360 basis. |
| (10) | Not offered pursuant to the Preliminary Prospectus or this Term Sheet and referred to herein as the “Non-Offered Certificates”. Information provided in this Term Sheet regarding the characteristics of these certificates is provided only to enhance your understanding of the offered certificates. The privately offered certificates also include the Class R certificates, which do not have a certificate balance, notional amount, credit support, pass-through rate, rating, assumed final distribution date or rated final distribution date, and which are not shown in the chart. The Class R certificates represent the beneficial ownership of the residual interest in each of the real estate mortgage investment conduits, as further described in the Preliminary Prospectus. |
| (11) | Although it does not have a specified pass-through rate (other than for tax reporting purposes), the effective pass-through rate for the RR Interest will be a variable rateper annumequal to the weighted average of the net mortgage interest rates on the mortgage loans for the related distribution date (in each case adjusted, if necessary, to accrue on the basis of a 360-day year consisting of twelve 30-day months). |
This is not a research report and was not prepared by the Underwriters’ research departments. Please see additional important information and qualifications at the end of this Term Sheet.
| T-4 |
| BANK 2017-BNK6 | Structural Overview |
Issue Characteristics
| Offered Certificates: | $793,497,000 (approximate) monthly pay, multi-class, commercial mortgage pass-through certificates, consisting of nine principal balance classes (Class A-1, Class A-2, Class A-SB, Class A-3, Class A-4, Class A-5, Class A-S, Class B and Class C) and two interest-only classes (Class X-A and Class X-B) | |
| Co-Lead Managers and Joint Bookrunners: | Merrill Lynch, Pierce, Fenner & Smith Incorporated, Morgan Stanley & Co. LLC, and Wells Fargo Securities, LLC | |
| Co-Manager: | Drexel Hamilton, LLC | |
| Mortgage Loan Sellers: | Wells Fargo Bank, National Association, Bank of America, National Association, Morgan Stanley Mortgage Capital Holdings LLC and National Cooperative Bank, N.A. | |
Rating Agencies: | DBRS, Inc., Fitch Ratings, Inc. and S&P Global Ratings | |
| Master Servicers: | Wells Fargo Bank, National Association and National Cooperative Bank, N.A. | |
| Special Servicers: | Midland Loan Services, a Division of PNC Bank, National Association, and National Cooperative Bank, N.A. | |
| Certificate Administrator/ Certificate Registrar/Custodian: | Wells Fargo Bank, National Association | |
| Trustee: | Wilmington Trust, National Association | |
| Operating Advisor: | Park Bridge Lender Services LLC | |
| Asset Representations Reviewer: | Park Bridge Lender Services LLC | |
| Initial Directing Certificateholder: | Prime Finance CMBS B-Piece Holdco IX, L.P. or an affiliate thereof | |
| Risk Retention Consultation Party: | Bank of America, National Association | |
| U.S. Credit Risk Retention: | For a discussion on the manner in which the U.S. credit risk retention requirements will be addressed by Bank of America, National Association, as the retaining sponsor, see “Credit Risk Retention” in the Preliminary Prospectus. | |
| EU Risk Retention: | None of the sponsors, the depositor or the issuing entity intends to retain a material net economic interest in the securitization constituted by the issue of the Offered Certificates in accordance with the EU risk retention and due diligence requirements or to take any other action which may be required by EEA-regulated investors for the purposes of their compliance with the EU risk retention and due diligence requirements or similar requirements. | |
| Cut-off Date: | The mortgage loans will be considered part of the trust fund as of their respective cut-off dates. The cut-off date with respect to each mortgage loan is the respective due date for the monthly debt service payment that is due in July 2017 (or, in the case of any mortgage loan that has its first due date after July 2017, the date that would have been its due date in July 2017 under the terms of that mortgage loan if a monthly debt service payment were scheduled to be due in that month). | |
| Expected Pricing Date: | Week of July 17, 2017 | |
| Expected Closing Date: | Week of July 24, 2017 | |
| Determination Dates: | The 11th day of each month or, if the 11th day is not a business day, then the business day immediately following such 11th day. | |
| Distribution Dates: | The 4th business day following each determination date. The first distribution date will be in August 2017. | |
| Rated Final Distribution Date: | The distribution date in July 2060 | |
| Interest Accrual Period: | Preceding calendar month | |
| Payment Structure: | Sequential pay | |
| Tax Treatment: | REMIC | |
| Optional Termination: | 1.00% clean-up call (calculated without regard to the Aliso Viejo Self Storage & Mission Viejo RV Storage loan, if the clean-up call occurs after July 2027 and such loan remains an asset of the trust fund) | |
| Minimum Denominations: | $10,000 for each class of Offered Certificates (other than Class X-A and Class X-B certificates); $1,000,000 for the Class X-A and Class X-B certificates | |
| Settlement Terms: | DTC, Euroclear and Clearstream | |
| Legal/Regulatory Status: | Each class of Offered Certificates is expected to be eligible for exemptive relief under ERISA. No class of Offered Certificates is SMMEA eligible. | |
| Analytics: | The certificate administrator is expected to make available all distribution date statements, CREFC® reports and supplemental notices received by it to certain modeling financial services as described in the Preliminary Prospectus. | |
| Bloomberg Ticker: | BANK 2017-BNK6<MTGE><GO> | |
| Risk Factors: | THE CERTIFICATES INVOLVE CERTAIN RISKS AND MAY NOT BE SUITABLE FOR ALL INVESTORS. SEE THE “RISK FACTORS” SECTION OF THE PRELIMINARY PROSPECTUS. |
This is not a research report and was not prepared by the Underwriters’ research departments. Please see additional important information and qualifications at the end of this Term Sheet.
| T-5 |
| BANK 2017-BNK6 | Structural Overview |
Structural Overview
| Allocation Between the RR Interest and the Non-Retained Certificates: | The aggregate amount available for distributions to the holders of the Certificates (including the RR Interest) on each distribution date (net of specified expenses of the issuing entity, including fees payable to, and costs and expenses reimbursable to, the master servicers, any primary servicers, the special servicers, the certificate administrator, the trustee, the operating advisor, the asset representations reviewer and CREFC®) will be allocated between amounts available for distribution to the holders of the RR Interest, on the one hand, and to all other Certificates, referred to herein as the “Non-Retained Certificates”, on the other hand. The portion of such amount allocable to (a) the RR Interest will at all times be the product of such amount multiplied by 5% and (b) the Non-Retained Certificates will at all times be the product of such amount multiplied by the difference between 100% and the percentage set forth in clause (a) (each, the respective “Percentage Allocation Entitlement”). | |
| Accrual: | Each class of Offered Certificates will accrue interest on a 30/360 basis. | |
| Amount and Order of Distributions: | On each distribution date, the Non-Retained Certificates’ Percentage Allocation Entitlement of funds available for distribution from the mortgage loans, net of (i) any yield maintenance charges and prepayment premiums and (ii) any excess interest, will be distributed in the following amounts and order of priority:
First, to the Class A-1, Class A-2, Class A-SB, Class A-3, Class A-4, Class A-5, Class X-A, Class X-B, Class X-D, Class X-E, Class X-F and Class X-G certificates, in respect of interest, up to an amount equal to, andpro rata in accordance with, the interest entitlements for those classes;
Second, to the Class A-1, Class A-2, Class A-SB, Class A-3, Class A-4 and Class A-5 certificates as follows, to the extent of applicable available funds allocated to principal: either (i)(a)first, to principal on the Class A-SB certificates, until the certificate balance of the Class A-SB certificates is reduced to the planned principal balance for the related distribution date set forth in Annex E to the Preliminary Prospectus, and (b)second, to principal on each class of the Class A-1, Class A-2, Class A-3, Class A-4, Class A-5 and Class A-SB certificates, in that order, in each case until the certificate balance of such class of certificates has been reduced to zero, or (ii) if the certificate balance of each class of principal balance certificates other than the Class A-1, Class A-2, Class A-SB, Class A-3, Class A-4 and Class A-5 certificates and the RR Interest has been reduced to zero as a result of the allocation of losses on the mortgage loans to those certificates, to principal on the Class A-1, Class A-2, Class A-SB, Class A-3, Class A-4 and Class A-5 certificates,pro rata, without regard to the distribution priorities described above or the planned principal balance of the Class A-SB certificates;
Third, to the Class A-1, Class A-2, Class A-SB, Class A-3, Class A-4 and Class A-5 certificates, up to an amount equal to, andpro rata based on, any previously unreimbursed losses (plus interest thereon) on the mortgage loans allocable to principal that were previously borne by each such class;
Fourth, to each class of the Class A-S, Class B and Class C certificates, in that order, as follows: (a) to interest on such class of certificates in the amount of its interest entitlement; (b) to the extent of applicable available funds allocable to principal remaining after distributions in respect of principal to each class with a higher priority (as set forth in this clause or prior enumerated clauses set forth above), to principal on such class of certificates until its certificate balance has been reduced to zero; and (c) to reimburse such class of certificates, for any previously unreimbursed losses on the mortgage loans (plus interest thereon) that were previously allocated to those certificates;
Fifth, to the Non-Offered Certificates (other than the Class X-D, Class X-E, Class X-F, Class X-G and Class R certificates) in the amounts and order of priority described in “Description of the Certificates—Distributions” in the Preliminary Prospectus; and
Sixth, to the Class R certificates, any remaining amounts. | |
| Interest and Principal Entitlements: | The interest entitlement of each class of Offered Certificates on each distribution date generally will be the interest accrued during the related interest accrual period on the related certificate balance or notional amount at the related pass-through rate, net of any prepayment interest shortfalls allocated to that class for such distribution date as described below. If prepayment interest shortfalls arise from voluntary prepayments on serviced mortgage loans during any collection period, the applicable master servicer is required to make a limited compensating interest payment to offset those shortfalls. See “Description of the Certificates—Prepayment Interest Shortfalls” in the Preliminary Prospectus. The remaining amount of prepayment interest shortfalls will be allocated between the RR Interest, on one hand, and the Non-Retained Certificates, on the other hand, in accordance with their respective Percentage Allocation Entitlements. The prepayment interest shortfalls allocated to the Non-Retained Certificates (other than the Class R Certificates) will be allocated among such classes of certificates entitled to interest, on apro rata basis, based on their respective amounts of accrued interest for the related distribution date, to reduce the interest entitlement on each such class of certificates. If a class receives less than the entirety of its interest entitlement on any distribution date, then the shortfall (excluding any shortfall due to prepayment interest shortfalls), together with interest thereon, will be added to its interest entitlement for the next succeeding distribution date.
The aggregate principal distribution amount for each distribution date generally will be the aggregate amount of principal received or advanced in respect of the mortgage loans, net of any non-recoverable advances and interest thereon and any workout-delayed reimbursement amounts that are reimbursed to the applicable master servicer or the trustee during the related collection period. Non-recoverable advances and interest thereon are reimbursable from principal collections before reimbursement from other amounts. Workout-delayed reimbursement amounts will be reimbursable from principal collections. The Non-Retained |
This is not a research report and was not prepared by the Underwriters’ research departments. Please see additional important information and qualifications at the end of this Term Sheet.
| T-6 |
| BANK 2017-BNK6 | Structural Overview |
Certificates and the RR Interest will be entitled to their respective Percentage Allocation Entitlements of the aggregate principal distribution amount. | ||
| Special Servicer Compensation: | The principal compensation to be paid to a special servicer in respect of its special servicing activities will be the special servicing fee, the workout fee and the liquidation fee.
The special servicing fee for each distribution date is calculated based on the outstanding principal balance of each serviced mortgage loan that is a specially serviced mortgage loan (and any related serviced companion loan) or as to which the related mortgaged property has become an REO property at the special servicing fee rate, which will be a rate equal to (i) with respect to Midland Loan Services, Inc., a Division of PNC Bank, National Association, the greater of 0.25% and theper annum rate that would result in a special servicing fee of $3,500 for the related month and (ii) with respect to National Cooperative Bank, N.A., the greater of 0.25% and theper annum rate that would result in a special servicing fee of $1,000 for the related month. The special servicing fee will be payable monthly,first, from liquidation proceeds, insurance and condemnation proceeds, and other collections in respect of the related specially serviced mortgage loan or REO property and,then, from general collections on all the mortgage loans and any REO properties.
Each special servicer will also be entitled to (i) liquidation fees generally equal to 1.0% (or, if such rate would result in an aggregate liquidation fee less than $25,000, then the liquidation fee rate will be equal to the lesser of (i) 3.0% and (ii) such lower rate as would result in an aggregate liquidation fee equal to $25,000) of liquidation proceeds and certain other collections in respect of a specially serviced mortgage loan (and any related serviced companion loan) or related REO property and of amounts received in respect of mortgage loan repurchases by the related mortgage loan sellers and (ii) workout fees generally equal to 1.00% of interest (other than post-ARD excess interest on mortgage loans with anticipated repayment dates and other than default interest) and principal payments made in respect of a rehabilitated mortgage loan (and any related serviced companion loan), subject to a floor of $25,000 with respect to any mortgage loan, whole loan or related REO property, and in the case of each of clause (i) and (ii), subject to certain adjustments and exceptions as described in the Preliminary Prospectus under “Pooling and Servicing Agreement—Servicing and Other Compensation and Payment of Expenses—Special Servicing Compensation”.
With respect to any non-serviced mortgage loan, the related special servicer under the related other pooling and servicing agreement pursuant to which such mortgage loan is being serviced will be entitled to similar compensation as that described above with respect to such non-serviced mortgage loan under such other pooling and servicing agreement as further described in the Preliminary Prospectus, although any related fees may accrue at a different rate and there may be a higher (or no) cap on liquidation and workout fees. | |
| Prepayment Premiums/Yield Maintenance Charges: | If any yield maintenance charge or prepayment premium is collected during any collection period with respect to any mortgage loan, then on the immediately succeeding distribution date, the certificate administrator will pay: (i)(a) to the holders of each class of the Class A-1, Class A-2, Class A-SB, Class A-3, Class A-4, Class A-5, Class A-S, Class B, Class C and Class D certificates, the product of (x) the Non-Retained Certificates’ Percentage Allocation Entitlement of such yield maintenance charge or prepayment premium, (y) the related Base Interest Fraction for such class and the applicable principal prepayment, and (z) a fraction, the numerator of which is equal to the amount of principal distributed to such class for that distribution date, and the denominator of which is the total amount of principal distributed to the Class A-1, Class A-2, Class A-SB, Class A-3, Class A-4, Class A-5, Class A-S, Class B, Class C and Class D certificates for that distribution date, (b) to the holders of the Class X-A certificates, the excess, if any, of (x) the product of (1) the Non-Retained Certificates’ Percentage Allocation Entitlement of such yield maintenance charge or prepayment premium and (2) a fraction, the numerator of which is equal to the amount of principal distributed to the Class A-1, Class A-2, Class A-SB, Class A-3, Class A-4 and Class A-5 certificates for that distribution date, and the denominator of which is the total amount of principal distributed to the Class A-1, Class A-2, Class A-SB, Class A-3, Class A-4, Class A-5, Class A-S, Class B, Class C and Class D certificates for that distribution date, over (y) the amount of such yield maintenance charge or prepayment premium distributed to the Class A-1, Class A-2, Class A-SB, Class A-3, Class A-4 and Class A-5 certificates as described above, (c) to the holders of the Class X-B certificates, the excess, if any, of (x) the product of (1) the Non-Retained Certificates’ Percentage Allocation Entitlement of such yield maintenance charge or prepayment premium and (2) a fraction, the numerator of which is equal to the amount of principal distributed to the Class A-S, Class B and Class C certificates for that distribution date, and the denominator of which is the total amount of principal distributed to the Class A-1, Class A-2, Class A-SB, Class A-3, Class A-4, Class A-5, Class A-S, Class B, Class C and Class D certificates for that distribution date, over (y) the amount of such yield maintenance charge or prepayment premium distributed to the Class A-S, Class B and Class C certificates as described above, and (d) to the holders of the Class X-D certificates, any remaining portion of the Non-Retained Certificates’ Percentage Allocation Entitlement of such yield maintenance charge or prepayment premium not distributed as described above, and (ii) to the RR Interest, its Percentage Allocation Entitlement of such yield maintenance charge or prepayment premium. |
This is not a research report and was not prepared by the Underwriters’ research departments. Please see additional important information and qualifications at the end of this Term Sheet.
| T-7 |
| BANK 2017-BNK6 | Structural Overview |
both the mortgage interest rate on the related mortgage loan and the pass-through rate on that class, then the Base Interest Fraction will equal zero; and if the discount rate referred to above is greater than or equal to the mortgage interest rate on the related mortgage loan and is less than the pass-through rate on that class, then the Base Interest Fraction will be equal to 1.0.
Consistent with the foregoing, the Base Interest Fraction is equal to: |
| (Pass-Through Rate – Discount Rate) | |||
| (Mortgage Rate – Discount Rate) |
| Realized Losses: | On each distribution date, immediately following the distributions to be made to the certificateholders on that date, the certificate administrator is required to calculate the amount, if any, by which (i) the aggregate stated principal balance of the mortgage loans, including any successor REO loans, expected to be outstanding immediately following that distribution date is less than (ii) the then aggregate certificate balance of the principal balance certificates after giving effect to distributions of principal on that distribution date. The Non-Retained Certificates’ Percentage Allocation Entitlement of such amount will be applied to the Class G, Class F, Class E, Class D, Class C, Class B and Class A-S certificates, in that order, in each case until the related certificate balance has been reduced to zero, and then to the Class A-1, Class A-2, Class A-SB, Class A-3, Class A-4 and Class A-5 certificates,pro rata based upon their respective certificate balances, until their respective certificate balances have been reduced to zero. The RR Interest’s Percentage Allocation Entitlement of such amount will be applied to the RR Interest until the related RR Interest balance has been reduced to zero. |
| Serviced Whole Loans: | Each of the following mortgaged properties secures a mortgage loan and one or morepari passu promissory notes (each, a “servicedpari passu companion loan”) that will be serviced pursuant to the related intercreditor agreement and the pooling and servicing agreement for this transaction: 2851 Junction and Sheraton Hotel Greensboro. With respect to each such mortgaged property, the related mortgage loan, together with the related servicedpari passu companion loan(s), is referred to herein (for so long as it is serviced under the pooling and servicing agreement for this transaction) as a “servicedpari passu whole loan.” Each servicedpari passu companion loan is not part of the mortgage pool and may be contributed to one or more future securitization transactions (if not already securitized) or may be otherwise transferred at any time, subject to compliance with the related intercreditor agreement. See the table below entitled “Mortgage Loans with Pari Passu Companion Loans,” as well as “Description of the Mortgage Pool—The Whole Loans” in the Preliminary Prospectus, for additional information regarding each such whole loan. |
| Non-Serviced Whole Loans: | Each of the following mortgaged properties secures a mortgage loan (each, a “non-serviced mortgage loan”), one or morepari passu promissory notes and, in some cases, one or more generally subordinate promissory notes (each such promissory note, a “non-serviced companion loan”) that will be serviced pursuant to the related intercreditor agreement and the pooling and servicing agreement or trust and servicing agreement (referred to herein as a related “pooling and servicing agreement”) for another securitization transaction: General Motors Building, Gateway Net Lease Portfolio, Del Amo Fashion Center, Starwood Capital Hotel Portfolio, Westchester One and Amazon Lakeland. With respect to each such mortgaged property, the related mortgage loan, together with the related non-serviced companion loan(s), is referred to herein (for so long as it is serviced under the pooling and servicing agreement for another securitization transaction) as a “non-serviced whole loan.” Each non-serviced companion loan is not part of the mortgage pool and may be contributed to one or more future securitization transactions (if not already securitized) or may be otherwise transferred at any time, subject to compliance with the related intercreditor agreement. Servicing of each non-serviced whole loan will generally be directed by the holder of the related control note (or, if such control note is included in a securitization, the directing certificateholder thereunder (or other party designated to exercise the rights of such control note)), and such holder will have the right to replace the special servicer with respect to the related whole loan with or without cause. See the tables below entitled “Mortgage Loans with Pari Passu Companion Loans” and“Mortgage Loans with Subordinate Debt,” as well as “Description of the Mortgage Pool—The Whole Loans” in the Preliminary Prospectus, for additional information regarding each such whole loan.
|
| Directing Certificateholder/ Controlling Class: | The “Directing Certificateholder” will be (i) with respect to a servicing shift mortgage loan, the related Loan-Specific Directing Certificateholder, and (ii) with respect to each other mortgage loan, the Controlling Class Certificateholder (or its representative) selected by more than 50% (by certificate balance) of the Controlling Class Certificateholders;provided, that (1) absent that selection, (2) until a Directing Certificateholder is so selected or (3) upon receipt of a notice from a majority of the Controlling Class Certificateholders (by certificate balance) that a Directing Certificateholder is no longer designated, the Controlling Class Certificateholder that owns the largest aggregate certificate balance of the Controlling Class (or its representative) will be the Directing Certificateholder;provided, that (a) in the case of clause (3), if no one holder owns the largest aggregate certificate balance of the Controlling Class, then there will be no Directing Certificateholder until appointed in accordance with the terms of the pooling and servicing agreement, and (b) the certificate administrator and the other parties to the pooling and servicing agreement will be entitled to assume that the identity of the Directing Certificateholder has not changed until such parties receive written notice of a replacement of the Directing Certificateholder from a party holding the requisite interest in the Controlling Class (as confirmed by the certificate registrar), or the resignation of the then current Directing Certificateholder.
|
This is not a research report and was not prepared by the Underwriters’ research departments. Please see additional important information and qualifications at the end of this Term Sheet.
| T-8 |
| BANK 2017-BNK6 | Structural Overview |
The “Loan-Specific Directing Certificateholder” with respect to a servicing shift mortgage loan is the “controlling holder”, the “directing certificateholder”, the “directing holder”, “directing lender” or any analogous concept under the related intercreditor agreement. Prior to the securitization of the related control note, the Loan-Specific Directing Certificateholder with respect to a servicing shift mortgage loan will be the holder of the related control note. On and after the securitization of the related control note, there will be no Loan-Specific Directing Certificateholder with respect to such servicing shift mortgage loan.
There will be no servicing shift mortgage loans related to the trust as of the Closing Date.
The “Controlling Class” will be, as of any time of determination, the most subordinate class of Control Eligible Certificates then outstanding that has an aggregate certificate balance (as notionally reduced by any Cumulative Appraisal Reduction Amounts (as defined below) allocable to such class) at least equal to 25% of the initial certificate balance of that class; provided, that if at any time the certificate balances of the certificates other than the Control Eligible Certificates and the RR Interest have been reduced to zero as a result of principal payments on the mortgage loans, then the Controlling Class will be the most subordinate class of Control Eligible Certificates that has a certificate balance greater than zero without regard to any Cumulative Appraisal Reduction Amounts. The Controlling Class as of the closing date will be the Class G certificates.
The “Control Eligible Certificates” will be any of the Class E, Class F and Class G certificates. | |
| Control Rights: | Prior to a Control Termination Event, the Directing Certificateholder will have certain consent and consultation rights under the pooling and servicing agreement with respect to certain major decisions and other matters. A “Control Termination Event” will occur when (i) the Class E certificates have a certificate balance (taking into account the application of the allocable portion of any Cumulative Appraisal Reduction Amounts to notionally reduce the certificate balance thereof) of less than 25% of the initial certificate balance of that class; or (ii) a holder of the Class E certificates is the majority controlling class certificateholder and has irrevocably waived its right, in writing, to exercise any of the rights of the controlling class certificateholder and such rights have not been reinstated to a successor controlling class certificateholder; provided that no Control Termination Event may occur with respect to the Loan-Specific Directing Certificateholder, and the term “Control Termination Event” will not be applicable to the Loan-Specific Directing Certificateholder; provided, further, that a Control Termination Event will be deemed not continuing in the event that the certificate balances of the principal balance certificates other than the Control Eligible Certificates and the RR Interest have been reduced to zero as a result of principal payments on the mortgage loans.
After the occurrence of a Control Termination Event but prior to the occurrence of a Consultation Termination Event, the Directing Certificateholder will not have any consent rights, but the Directing Certificateholder will have certain non-binding consultation rights under the pooling and servicing agreement with respect to certain major decisions and other matters. A “Consultation Termination Event” will occur when (i) no class of Control Eligible Certificates has a certificate balance (without regard to the application of the allocable portion of any Cumulative Appraisal Reduction Amounts) at least equal to 25% of the initial certificate balance of that class; or (ii) a holder of a majority of the Class E certificates is the majority controlling class certificateholder and has irrevocably waived its right, in writing, to exercise any of the rights of the controlling class certificateholder and such rights have not been reinstated to a successor controlling class certificateholder (provided that no Consultation Termination Event resulting solely from the operation of clause (ii) will be deemed to have existed or be in continuance with respect to a successor holder of the Class E certificates that has not irrevocably waived its right to exercise any of the rights of the controlling class certificateholder); provided that no Consultation Termination Event may occur with respect to the Loan-Specific Directing Certificateholder, and the term “Consultation Termination Event” will not be applicable to the Loan-Specific Directing Certificateholder; provided, further, that a Consultation Termination Event will be deemed not continuing in the event that the certificate balances of the principal balance certificates other than the Control Eligible Certificates and the RR Interest have been reduced to zero as a result of principal payments on the mortgage loans.
After the occurrence of a Consultation Termination Event, the Directing Certificateholder will not have any consent or consultation rights, and the operating advisor will retain certain non-binding consultation rights under the pooling and servicing agreement with respect to certain major decisions and other matters.
Notwithstanding the proviso to the definitions of “Control Termination Event” and “Consultation Termination Event”, a Control Termination Event and a Consultation Termination Event will each be deemed to have occurred with respect to any Excluded Loan with respect to the Directing Certificateholder or the holder of the majority of the Controlling Class, and neither the Directing Certificateholder nor any Controlling Class Certificateholder will have any consent or consultation rights with respect to the servicing of such Excluded Loan.
An “Excluded Loan” means (a) with respect to the Directing Certificateholder or the holder of the majority of the Controlling Class, a mortgage loan or whole loan with respect to which, as of any date of determination, the Directing Certificateholder or the holder of the majority of the Controlling Class is a Borrower Party or (b) with respect to the Risk Retention Consultation Party or the holder of the majority of the RR Interest, a mortgage loan or whole loan with respect to which, as of any date of determination, the Risk Retention Consultation Party or the holder of the majority of the RR Interest is a Borrower Party. It is expected that there will be no Excluded Loans with respect to this securitization on the Closing Date.
“Borrower Party” means a borrower, a mortgagor, a manager of a mortgaged property, the holder of a mezzanine loan that has been accelerated or as to which foreclosure or enforcement proceedings have been commenced against the equity collateral pledged to secure the related mezzanine loan (an “Accelerated |
This is not a research report and was not prepared by the Underwriters’ research departments. Please see additional important information and qualifications at the end of this Term Sheet.
| T-9 |
| BANK 2017-BNK6 | Structural Overview |
Mezzanine Loan Lender”), or any Borrower Party Affiliate. With respect to a mortgage loan secured by a residential cooperative property, a person will not be considered a “Borrower Party” solely by reason of such person holding one or more cooperative unit loans that are secured by direct equity interests in the related borrower or owning one or more residential cooperative units comprising the related mortgaged property as a result of any foreclosure, transfer in lieu of foreclosure or other exercise of remedies with respect to any such unit loan(s).
“Borrower Party Affiliate” means, with respect to a borrower, a mortgagor, a manager of a mortgaged property or an Accelerated Mezzanine Loan Lender, (a) any other person controlling or controlled by or under common control with such borrower, mortgagor, manager or Accelerated Mezzanine Loan Lender, as applicable, or (b) any other person owning, directly or indirectly, 25% or more of the beneficial interests in such borrower, mortgagor, manager or Accelerated Mezzanine Loan Lender, as applicable. For the purposes of this definition, “control” when used with respect to any specified person means the power to direct the management and policies of such person, directly or indirectly, whether through the ownership of voting securities, by contract or otherwise and the terms “controlling” and “controlled” have meanings correlative to the foregoing.
Notwithstanding any of the foregoing to the contrary, if any mortgage loan is part of a whole loan, the Directing Certificateholder’s consent and/or consultation rights with respect thereto may be limited as described in the Preliminary Prospectus. In particular, with respect to each non-serviced whole loan and each servicing shift whole loan, the Directing Certificateholder (other than a Loan-Specific Directing Certificateholder) will only have certain consultation rights with respect to certain major decisions and other matters related to such whole loan, in each case only prior to a Control Termination Event or Consultation Termination Event, as applicable, and the Loan-Specific Directing Certificateholder will be entitled to similar consent and/or consultation rights with respect to such whole loan. In addition, with respect to any serviced A/B whole loan, for so long as the holder of the related subordinate companion loan is the controlling note holder, the holder of such subordinate companion loan (rather than the Directing Certificateholder) will be entitled to exercise such consent and consultation rights with respect to such whole loan. | |
| Appraisal Reduction Amounts and Collateral Deficiency Amounts: | An “Appraisal Reduction Amount” generally will be created in the amount, if any, by which the principal balance of a required appraisal loan (which is a mortgage loan with respect to which certain defaults, modifications or insolvency events have occurred as further described in the Preliminary Prospectus) plus other amounts overdue or advanced in connection with such mortgage loan exceeds 90% of the appraised value of the related mortgaged property plus certain escrows and reserves (including letters of credit) held with respect to the mortgage loan.
A mortgage loan will cease to be subject to an Appraisal Reduction Amount when it has been brought current for at least three consecutive months, no additional event of default is foreseeable in the reasonable judgment of the applicable special servicer and no other circumstances exist that would cause such mortgage loan or any related companion loan to be a specially serviced loan; however, a “Collateral Deficiency Amount” may exist with respect to any mortgage loan that is modified into an AB loan structure (an “AB Modified Loan”) and remains a corrected mortgage loan and, if so, will generally equal the excess of (i) the stated principal balance of such AB Modified Loan (taking into account the related junior note(s) and anypari passu notes included therein), over (ii) the sum of (in the case of a whole loan, solely to the extent allocable to the subject mortgage loan) (x) the most recent appraised value for the related mortgaged property or mortgaged properties, plus (y) solely to the extent not reflected or taken into account in such appraised value (or in the calculation of any related Appraisal Reduction Amount) and to the extent on deposit with, or otherwise under the control of, the lender as of the date of such determination, any capital or additional collateral contributed by the related borrower at the time the mortgage loan became (and as part of the modification related thereto) such AB Modified Loan for the benefit of the related mortgaged property or mortgaged properties (provided that in the case of an non-serviced mortgage loan, the amounts set forth in this clause (y) will be taken into account solely to the extent relevant information is received by the applicable master servicer), plus (z) any other escrows or reserves (in addition to any amounts set forth in the immediately preceding clause (y) and solely to the extent not reflected or taken into account in the calculation of any related Appraisal Reduction Amount) held by the lender in respect of such AB Modified Loan as of the date of such determination, which such excess, for the avoidance of doubt, will be determined separately from and exclude any related Appraisal Reduction Amounts.
As used herein, a “Cumulative Appraisal Reduction Amount” will be the sum of any Appraisal Reduction Amounts and any Collateral Deficiency Amounts.
Any Appraisal Reduction Amount in respect of any non-serviced mortgage loan generally will be calculated in accordance with the other servicing agreement pursuant to which such mortgage loan is being serviced, which calculations are expected to be generally similar to those provided for in the pooling and servicing agreement for this transaction.
If any mortgage loan is part of a whole loan, any Appraisal Reduction Amount or Collateral Deficiency Amount will (or effectively will) be calculated in respect of such whole loan taken as a whole and allocated, to the extent provided in the related intercreditor agreement and the related pooling and servicing agreement,first, to any related subordinate companion loan, andsecond, to the related mortgage loan and anypari passu companion loan on apro rata basis by unpaid principal balance.
Appraisal Reduction Amounts will proportionately reduce the interest portion of debt service advances required to be made in respect of the related mortgage loan. Appraisal Reduction Amounts and Collateral Deficiency Amounts (to the extent of the Non-Retained Certificates’ Percentage Allocation Entitlement thereof) will be taken into account in determining the identity of the controlling class entitled to appoint the Directing |
This is not a research report and was not prepared by the Underwriters’ research departments. Please see additional important information and qualifications at the end of this Term Sheet.
| T-10 |
BANK 2017-BNK6 | Structural Overview |
| Certificateholder, the existence of a Control Termination Event and the allocation and/or exercise of voting rights for certain purposes (see“—Directing Certificateholder/Controlling Class” above). | |
| Appraised-Out Class: | An “Appraised-Out Class” is any class of Control Eligible Certificates, the certificate balance of which (taking into account the application of the Non-Retained Certificates’ Percentage Allocation Entitlement of any Appraisal Reduction Amounts or Collateral Deficiency Amounts to notionally reduce the certificate balance of such class) has been reduced to less than 25% of its initial certificate balance. Any Appraised-Out Class may not exercise any direction, control, consent and/or similar rights of the Controlling Class until such time, if any, as such class is reinstated as the Controlling Class, and the rights of the Controlling Class will be exercised by the next most senior class of Control Eligible Certificates that is not an Appraised-Out Class, if any, during such period. |
| Appraisal Remedy: | The holders of the majority (by certificate balance) of an Appraised-Out Class (such holders, the “Requesting Holders”) will have the right, at their sole expense, to require the applicable special servicer to order (or, with respect to a non-serviced mortgage loan, require the applicable master servicer to request from the applicable non-serviced special servicer) a second appraisal of any mortgage loan (or serviced whole loan) for which an appraisal reduction event has occurred or as to which there exists a Collateral Deficiency Amount. With respect to any serviced mortgage loan, such special servicer will be required to use its reasonable efforts to cause such appraisal to be (i) delivered within 30 days from receipt of the Requesting Holders’ written request and (ii) prepared on an “as-is” basis by an MAI appraiser. With respect to any such non-serviced mortgage loan, the applicable master servicer will be required to use commercially reasonable efforts to obtain such second appraisal from the applicable non-serviced special servicer and to forward such second appraisal to the applicable special servicer. Upon receipt of such supplemental appraisal, the applicable master servicer (for Collateral Deficiency Amounts on non-serviced mortgage loans), the non-serviced special servicer (for Appraisal Reduction Amounts on non-serviced mortgage loans to the extent provided for in the applicable non-serviced pooling and servicing agreement and applicable intercreditor agreement) and the applicable special servicer (for any serviced mortgage loan) will be required to determine, in accordance with the Servicing Standard, whether, based on its assessment of such supplemental appraisal, any recalculation of the applicable Appraisal Reduction Amount or Collateral Deficiency Amount is warranted and, if so warranted, such person will be required to recalculate such Appraisal Reduction Amount or Collateral Deficiency Amount, as applicable, based upon such supplemental appraisal and (for any serviced mortgage loan) receipt of information requested by such special servicer from the applicable master servicer. If required by any such recalculation, the applicable Appraised-Out Class will be reinstated as the Controlling Class and each other Appraised-Out Class will, if applicable, have its related certificate balance notionally restored to the extent required by such recalculation of the Appraisal Reduction Amount or Collateral Deficiency Amount, if applicable. |
| Sale of Defaulted Loans: | Under certain circumstances the applicable special servicer may be required to use reasonable efforts to solicit offers for a defaulted serviced mortgage loan (and any related companion loan (to the extent provided under the related intercreditor agreement) and/or related REO properties).
If the applicable special servicer does not receive an offer at least equal to the outstanding principal balance plus all accrued and unpaid interest and outstanding costs and expenses and certain other amounts specified in the pooling and servicing agreement (the “Par Purchase Price”), the applicable special servicer may purchase the defaulted loan or REO property at the Par Purchase Price or may accept the first cash offer received from any person that is determined to be a fair price for such defaulted loan or REO property. If multiple offers are received during the period designated by the applicable special servicer for receipt of offers, such special servicer is generally required to select the highest offer. The applicable special servicer will be required to determine whether any cash offer constitutes a fair price for any defaulted loan or REO property if the highest offeror is a person other than a party to the pooling and servicing agreement for this transaction (the “PSA”), the Directing Certificateholder, the Risk Retention Consultation Party, any sponsor, any Borrower Party, any independent contractor engaged by a special servicer, a holder of any related companion loan or mezzanine loan, the depositor, the applicable master servicer, the applicable special servicer (or any independent contractor engaged by such special servicer), or the trustee for the securitization of a companion loan or any known affiliate of any of the preceding entities (each, an “Interested Person”). If an offer is made by an Interested Person, the trustee will be required to determine (based upon the most recent appraisal conducted in accordance with the terms of the PSA) whether the offer constitutes a fair price for the defaulted loan or REO property unless (i) the offer is equal to or greater than the applicable Par Purchase Price and (ii) the offer is the highest offer received. Absent an offer at least equal to the Par Purchase Price, no offer from an Interested Person will constitute a fair price unless (x) it is the highest offer received and (y) at least two other offers are received from independent third parties, and the trustee will be entitled to rely on the opinion of an independent appraiser or other independent expert retained by the trustee in connection with making such determination. Neither the trustee nor any of its affiliates may make an offer for or purchase any specially serviced loan or REO property.
Notwithstanding any of the foregoing to the contrary, the applicable special servicer is not required to accept the highest offer and may accept a lower offer for a defaulted loan or REO property if such special servicer determines (with respect to (i) any mortgage loan other than an Excluded Loan with respect to the Directing Certificateholder or the holder of the majority of the Controlling Class, in consultation with the Directing Certificateholder (unless a Consultation Termination Event exists), (ii) any mortgage loan other than an Excluded Loan with respect to the Risk Retention Consultation Party or the holder of the majority of the RR Interest, in consultation with the Risk Retention Consultation Party and (iii) a serviced whole loan or an REO property related to a serviced whole loan, in consultation with the related companion loan holder(s)), in accordance with the Servicing Standard (and subject to the requirements of any related intercreditor |
This is not a research report and was not prepared by the Underwriters’ research departments. Please see additional important information and qualifications at the end of this Term Sheet.
| T-11 |
BANK 2017-BNK6 | Structural Overview |
agreement), that a rejection of such offer would be in the best interests of the certificateholders and any related companion loan holders as a collective whole as if they constituted a single lender (and with respect to a serviced A/B whole loan, taking into account the subordinate nature of any related subordinate companion loan), so long as such lower offer was not made by such special servicer or any of its affiliates.
If title to any mortgaged property is acquired by the trust fund, the applicable special servicer will be required to sell such mortgaged property prior to the close of the third calendar year beginning after the year of acquisition, unless (a) the IRS grants or has not denied an extension of time to sell such mortgaged property or (b) such special servicer, the trustee and the certificate administrator receive an opinion of independent counsel to the effect that the holding of the property by the trust longer than the above-referenced three-year period will not result in the imposition of a tax on any REMIC of the trust fund or cause any REMIC of the trust fund to fail to qualify as a REMIC.
The foregoing applies to mortgage loans serviced under the PSA. With respect to any non-serviced whole loan, if the special servicer under the applicable pooling and servicing agreement determines to sell the related controlling companion loan if it becomes a defaulted loan, then the applicable special servicer will be required to sell the related whole loan, including the related mortgage loan included in the BANK 2017-BNK6 securitization trust and the relatedpari passucompanion loan(s) and, under certain circumstances, any subordinate companion loan(s), as a single loan. In connection with any such sale, the special servicer under the applicable pooling and servicing agreement will be required to follow procedures substantially similar to those set forth above. | |
| Risk Retention Consultation Party: | A risk retention consultation party may be appointed by the holder or holders of more than 50% of the RR Interest, by certificate balance. The majority RR Interest holder will have a continuing right to appoint, remove or replace the risk retention consultation party in its sole discretion. This right may be exercised at any time and from time to time. Except with respect to an Excluded Loan as to such party, the risk retention consultation party will be entitled to consult with the applicable special servicer, upon request of the risk retention consultation party, with respect to certain material servicing actions proposed by such special servicer; provided, that prior to the occurrence and continuance of a Consultation Termination Event, such mortgage loan must also be a specially serviced mortgage loan. |
| Appointment and Replacement of Special Servicer: | The Directing Certificateholder will appoint the initial special servicers as of the closing date. Prior to the occurrence and continuance of a Control Termination Event, either special servicer may generally be replaced by the Directing Certificateholder with or without cause at any time.
After the occurrence and during the continuance of a Control Termination Event and upon (a) the written direction of holders of principal balance certificates evidencing not less than 25% of the voting rights of all classes of certificates (other than the RR Interest) entitled to principal (taking into account the application of Appraisal Reduction Amounts to notionally reduce the certificate balances of classes to which such Appraisal Reduction Amounts are allocable) requesting a vote to replace the applicable special servicer with a replacement special servicer, (b) payment by such requesting holders to the certificate administrator of all reasonable fees and expenses to be incurred by the certificate administrator in connection with administering such vote and (c) delivery by such holders of a rating agency confirmation from each applicable rating agency, the certificate administrator will be required to promptly post such notice on its internet website and by mail and conduct the solicitation of votes of all certificates in such regard, which requisite affirmative votes must be received within 180 days of the posting of such notice. Upon the written direction of holders of at least 66 2/3% of a Certificateholder Quorum, the trustee will be required to immediately replace the applicable special servicer with a qualified replacement special servicer designated by such holders of certificates.
After the occurrence and during the continuance of a Consultation Termination Event, if the operating advisor determines that the applicable special servicer is not performing its duties as required under the pooling and servicing agreement or is otherwise not acting in accordance with the Servicing Standard, the operating advisor may also recommend the replacement of such special servicer. The operating advisor’s recommendation to replace such special servicer must be confirmed by an affirmative vote of holders of principal balance certificates evidencing at least a majority of the aggregate voting rights (taking into account the application of any Appraisal Reduction Amounts to notionally reduce the respective certificate balances) of all principal balance certificates on an aggregate basis.
A “Certificateholder Quorum” means, in connection with any solicitation of votes in connection with the replacement of a special servicer or the asset representations reviewer, the holders of certificates evidencing at least 50% of the aggregate voting rights (taking into account the application of realized losses and, other than with respect to the termination of the asset representations reviewer, any Appraisal Reduction Amounts to notionally reduce the certificate balance of the certificates) of all classes of certificates entitled to principal (other than the RR Interest) on an aggregate basis.
With respect to each serviced whole loan, any holder of a relatedpari passu companion loan, following a servicer termination event with respect to the applicable special servicer that affects such holder, will be entitled to direct the trustee to terminate such special servicer solely with respect to such serviced whole loan. A replacement special servicer will be selected by the trustee or, prior to a Control Termination Event, by the Directing Certificateholder;provided, that any successor special servicer appointed to replace the special servicer with respect to such whole loan can generally not be the entity (or its affiliate) that was terminated at the direction of the holder of the relatedpari passucompanion loan.
Notwithstanding any of the foregoing to the contrary, with respect to each servicing shift whole loan and any serviced A/B whole loans as to which a subordinate companion loan holder is the related controlling note holder, the holder of the related control note will be entitled to replace the applicable special servicer with |
This is not a research report and was not prepared by the Underwriters’ research departments. Please see additional important information and qualifications at the end of this Term Sheet.
| T-12 |
BANK 2017-BNK6 | Structural Overview |
respect to such whole loan at any time, with or without cause, and while it is a serviced whole loan, no other party may replace the applicable special servicer for such whole loan unless there is a servicer termination event with respect thereto.
With respect to any non-serviced whole loan, the BANK 2017-BNK6 trust, as holder of the related mortgage loan, has the right to terminate the special servicer under the related pooling and servicing agreement if a servicer termination event occurs, with respect to such special servicer that affects the trust in its capacity as such holder. Such rights may be exercised by the trustee acting at the direction of the Directing Certificateholder, prior to a Consultation Termination Event, or the operating advisor, following the occurrence and during the continuance of a Consultation Termination Event. The successor special servicer will be selected pursuant to the applicable pooling and servicing agreement by the related directing holder prior to a control termination event under such pooling and servicing agreement. | |
| Servicing Standard: | Each master servicer and each special servicer is obligated to service and administer the mortgage loans (and, if applicable, the serviced companion loans) in accordance with the definition of the “Servicing Standard” described in the Preliminary Prospectus and the terms of the pooling and servicing agreement, provided that each non-serviced mortgage loan, if any, will be serviced by another master servicer or special servicer under the pooling and servicing agreement with respect to the securitization of the related companion loan, which entities will be obligated to service and administer such non-serviced mortgage loan pursuant to a similar standard set forth in the related pooling and servicing agreement. |
| Excluded Special Servicer: | If a special servicer obtains knowledge that it has become a Borrower Party with respect to any mortgage loan (an “Excluded Special Servicer Loan”), such special servicer will be required to resign as special servicer of that Excluded Special Servicer Loan. Prior to the occurrence of a Control Termination Event, the Directing Certificateholder will be required to appoint (and may remove and replace with or without cause) a separate special servicer that is not a Borrower Party (an “Excluded Special Servicer”) with respect to any Excluded Special Servicer Loan, unless such Excluded Special Servicer Loan is also an Excluded Loan with respect to the Directing Certificateholder or the holder of the majority of the Controlling Class. After the occurrence and during the continuance of a Control Termination Event, if at any time the applicable Excluded Special Servicer Loan is also an Excluded Loan with respect to the Directing Certificateholder or the holder of the majority of the Controlling Class or if the Directing Certificateholder is entitled to appoint the Excluded Special Servicer but does not so appoint within 30 days of notice of such resignation, the resigning special servicer will be required to use reasonable efforts to select the related Excluded Special Servicer. Any Excluded Special Servicer will be required to perform all of the obligations of the applicable special servicer and will be entitled to all special servicing compensation with respect to such Excluded Special Servicer Loan earned while the related mortgage loan is an Excluded Special Servicer Loan. |
| Liquidated Loan Waterfall: | On liquidation of any mortgage loan, all net liquidation proceeds related to the mortgage loan (but not any related companion loan) will be applied so that amounts allocated as a recovery of accrued and unpaid interest will not, in the first instance, include any delinquent interest that was not advanced as a result of Appraisal Reduction Amounts or accrued on the portion of the stated principal balance thereof equal to any related Collateral Deficiency Amount in effect from time to time and as to which no advance was made. After the adjusted interest amount is so allocated, any remaining liquidation proceeds will be allocated to offset certain advances and to pay principal on the mortgage loan until the unpaid principal amount of the mortgage loan has been reduced to zero. Any remaining liquidation proceeds will then be allocated to pay delinquent interest that was not advanced as a result of Appraisal Reduction Amounts or that accrued on the portion of the stated principal balance thereof equal to any related Collateral Deficiency Amount in effect from time to time and as to which no advance was made. |
| Operating Advisor: | The operating advisor will be required to perform certain review duties if a Control Termination Event has occurred and is continuing, which will generally include a limited annual review of, and the preparation of a report regarding, certain actions of the applicable special servicer with respect to the resolution and/or liquidation of specially serviced loans. The review and report generally will be based on any asset status reports and additional information delivered to the operating advisor by such special servicer. In addition, if a Control Termination Event has occurred and is continuing, the applicable special servicer must consult with the operating advisor (in addition to the Directing Certificateholder if no Consultation Termination Event has occurred and is continuing) in connection with major decisions with respect to mortgage loans. Furthermore, under certain circumstances, but only if a Consultation Termination Event has occurred and is continuing, the operating advisor may recommend the replacement of the applicable special servicer as described above under “—Appointment and Replacement of Special Servicer”; however, the operating advisor will not have any rights or obligations with respect to a non-serviced whole loan.
If a Consultation Termination Event has occurred and is continuing, the operating advisor may be removed and replaced without cause upon the affirmative direction of certificates owners holding not less than 75% of the voting rights of all certificates (taking into account the application of Appraisal Reduction Amounts), following a proposal from certificate owners holding not less than 25% of the voting rights of all certificates (taking into account the application of Appraisal Reduction Amounts). The certificateholders who initiate a vote on a termination and replacement of the operating advisor without cause must cause the payment of the fees and expenses incurred in the replacement. In addition, in the event there are no classes of certificates outstanding other than the Control Eligible Certificates, the RR Interest and the Class R certificates, then all of the rights and obligations of the operating advisor under the PSA will terminate without payment of any penalty or termination fee (other than any rights or obligations that accrued prior to the date of such termination (including accrued and unpaid compensation) and other than indemnification rights arising out of
|
This is not a research report and was not prepared by the Underwriters’ research departments. Please see additional important information and qualifications at the end of this Term Sheet.
| T-13 |
BANK 2017-BNK6 | Structural Overview |
| events occurring prior to such termination). See “Pooling and Servicing Agreement—The Operating Advisor—Termination of the Operating Advisor Without Cause” in the Preliminary Prospectus. | |
| Operating Advisor Expenses: | In addition to the Operating Advisor Fee and the Operating Advisor Consulting Fee, the operating advisor will be entitled to reimbursement of Operating Advisor Expenses in accordance with the terms of the PSA. “Operating Advisor Expenses” for each distribution date will equal any unreimbursed indemnification amounts or additional trust fund expenses payable to the operating advisor pursuant to the PSA (other than the Operating Advisor Fee and the Operating Advisor Consulting Fee). |
| Asset Representations Reviewer: | The asset representations reviewer will be required to review certain delinquent mortgage loans after a specified delinquency threshold has been met and the required percentage of certificateholders vote to direct a review as described below. The asset representations reviewer will be entitled to the Asset Representations Reviewer Fee with respect to such review. See “Pooling and Servicing Agreement—The Asset Representations Reviewer” in the Preliminary Prospectus.
The certificate administrator will be required to notify certificateholders if the specified delinquency threshold has been met as described in the Preliminary Prospectus under “—The Asset Representations Reviewer”.
If certificateholders evidencing not less than 5.0% of the voting rights request a vote to commence an asset review, and if subsequently (i) a majority of those certificateholders who cast votes and (ii) a majority of an Asset Review Quorum authorizes an asset review within 150 days of the request for a vote, the asset representations reviewer will be required to conduct an asset review of delinquent loans.
The asset representations reviewer may be terminated and replaced without cause. Upon (i) the written direction of certificateholders evidencing not less than 25% of the voting rights (without regard to the application of any Appraisal Reduction Amounts) requesting a vote to terminate and replace the asset representations reviewer with a proposed successor asset representations reviewer that is an eligible asset representations reviewer, and (ii) payment by such holders to the certificate administrator of the reasonable fees and expenses to be incurred by the certificate administrator in connection with administering such vote, the certificate administrator will be required to promptly provide notice to all certificateholders and the asset representations reviewer of such request by posting such notice on its internet website, and by mailing such notice to all certificateholders and the asset representations reviewer. Upon the written direction of certificateholders evidencing at least 75% of a Certificateholder Quorum (without regard to the application of any Appraisal Reduction Amounts), the trustee will be required to terminate all of the rights and obligations of the asset representations reviewer under the pooling and servicing agreement (other than any rights or obligations that accrued prior to the date of such termination and other than indemnification rights arising out of events occurring prior to such termination) by written notice to the asset representations reviewer, and the proposed successor asset representations reviewer will be appointed. See “Pooling and Servicing Agreement—The Asset Representations Reviewer” in the Preliminary Prospectus.
An “Asset Review Quorum” means, in connection with any solicitation of votes to authorize an Asset Review as described above, the holders of certificates evidencing at least 5.0% of the aggregate voting rights represented by all certificates that have voting rights.
|
| Dispute Resolution Provisions: | The mortgage loan sellers will be subject to the dispute resolution provisions set forth in the PSA to the extent those provisions are triggered with respect to any mortgage loan sold to the depositor by a mortgage loan seller, and such mortgage loan seller will be obligated under the related mortgage loan purchase agreement to comply with all applicable provisions and to take part in any mediation or arbitration proceedings that may result. Generally, in the event that a Repurchase Request is not “Resolved” within 180 days after the related mortgage loan seller receives such Repurchase Request, then the enforcing servicer will be required to send a notice to the first certificateholder (or beneficial owner) to deliver a certificateholder repurchase request with respect to the mortgage loan (the “Initial Requesting Certificateholder”) (if any) and to the certificate administrator (which will be required to make such notice available to certificateholders via the certificate administrator’s website) indicating the enforcing servicer’s intended course of action with respect to the Repurchase Request. If (a) the enforcing servicer’s intended course of action with respect to the Repurchase Request does not involve pursuing further action to exercise rights against the related mortgage loan seller with respect to the Repurchase Request and the Initial Requesting Certificateholder, if any, or any other certificateholder or certificate owner wishes to exercise its right to refer the matter to mediation (including nonbinding arbitration) or arbitration, or (b) the enforcing servicer’s intended course of action is to pursue further action to exercise rights against the related mortgage loan seller with respect to the Repurchase Request but the Initial Requesting Certificateholder, if any, or any other certificateholder or certificate owner does not agree with the dispute resolution method selected by the enforcing servicer, then the Initial Requesting Certificateholder, if any, or such other certificateholder or certificate owner may deliver a written notice to the enforcing servicer indicating its intent to exercise its right to refer the matter to either mediation or arbitration.
“Resolved” means, with respect to a Repurchase Request, (i) that the related material defect or breach has been cured, (ii) the related mortgage loan has been repurchased in accordance with the related mortgage loan purchase agreement, (iii) a mortgage loan has been substituted for the related mortgage loan in accordance with the related mortgage loan purchase agreement, (iv) the applicable mortgage loan seller has made a loss of value payment, (v) a contractually binding agreement has been entered into between the enforcing servicer, on behalf of the issuing entity, and the related mortgage loan seller that settles the related mortgage loan seller’s obligations under the related mortgage loan purchase agreement, or (vi) the related mortgage loan is no longer property of the issuing entity as a result of a sale or other disposition in accordance with the pooling and servicing agreement. See “Pooling and Servicing Agreement—Dispute Resolution Provisions” in the Preliminary Prospectus. |
This is not a research report and was not prepared by the Underwriters’ research departments. Please see additional important information and qualifications at the end of this Term Sheet.
| T-14 |
BANK 2017-BNK6 | Structural Overview |
| Investor Communications: | The certificate administrator is required to include on any Form 10-D any request received from a certificateholder to communicate with other certificateholders related to certificateholders exercising their rights under the terms of the PSA. Any certificateholder wishing to communicate with other certificateholders regarding the exercise of its rights under the terms of the PSA will be able to deliver a written request signed by an authorized representative of the requesting investor to the certificate administrator. |
| Deal Website: | The certificate administrator will be required to maintain a deal website which will include, among other items: (a) summaries of asset status reports prepared by a special servicer, (b) inspection reports, (c) appraisals, (d) various “special notices” described in the Preliminary Prospectus, (e) the “Investor Q&A Forum” and (f) a voluntary “Investor Registry”. Investors may access the deal website following execution of a certification and confidentiality agreement. |
This is not a research report and was not prepared by the Underwriters’ research departments. Please see additional important information and qualifications at the end of this Term Sheet.
| T-15 |
| BANK 2017-BNK6 | Collateral Overview |
| Mortgage Loan Sellers | No. of Mortgage Loans | No. of Mortgaged Properties | Aggregate Cut-off Date Balance | % of Pool(1) |
| Wells Fargo Bank, National Association | 24 | 30 | $334,135,986 | 35.8% |
| Bank of America, National Association | 13 | 124 | $235,604,094 | 25.2% |
| Morgan Stanley Mortgage Capital Holdings LLC | 14 | 14 | $158,600,882 | 17.0% |
| Morgan Stanley Mortgage Capital Holdings LLC / Wells Fargo Bank, National Association(2) | 1 | 1 | $90,000,000 | 9.6% |
| Bank of America, National Association / Wells Fargo Bank, National Association(3) | 1 | 1 | $59,543,000 | 6.4% |
| National Cooperative Bank, N.A.(4) | 19 | 19 | $55,367,965 | 5.9% |
| Total: | 72 | 189 | $933,251,927 | 100.0% |
Pool Statistics
| Aggregate Cut-off Date Balance: | $933,251,927 |
| Number of Mortgage Loans: | 72 |
| Average Cut-off Date Balance per Mortgage Loan: | $12,961,832 |
| Number of Mortgaged Properties: | 189 |
| Average Cut-off Date Balance per Mortgaged Property: | $4,937,841 |
| Weighted Average Mortgage Rate: | 4.1789% |
| % of Pool Secured by 5 Largest Mortgage Loans: | 33.5% |
| % of Pool Secured by 10 Largest Mortgage Loans: | 50.7% |
| % of Pool Secured by ARD Loans: | 0.0% |
| Weighted Average Original Term to Maturity (months): | 116 |
| Weighted Average Remaining Term to Maturity (months): | 116 |
| Weighted Average Seasoning (months): | 1 |
| % of Pool Secured by Single Tenant Mortgaged Properties: | 15.6% |
| % of Pool Secured by Refinance Loans: | 75.2% |
| % of Pool Secured by Acquisition Loans: | 24.8% |
Additional Debt
| % of Pool withPari Passu Mortgage Debt: | 43.1% |
| % of Pool with Subordinate Mortgage Debt(5): | 22.5% |
| % of Pool with Mezzanine Debt: | 2.7% |
Credit Statistics(6)(7)
| Weighted Average UW NOI DSCR: | 2.94x |
| Weighted Average UW NOI Debt Yield(8): | 14.3% |
| Weighted Average UW NCF DSCR: | 2.79x |
| Weighted Average UW NCF Debt Yield(8): | 13.5% |
| Weighted Average Cut-off Date LTV Ratio(8)(9): | 53.0% |
| Weighted Average Maturity Date LTV Ratio(8)(9): | 47.9% |
Footnotes are set forth on the following page.
This is not a research report and was not prepared by the Underwriters’ research departments. Please see additional important information and qualifications at the end of this Term Sheet.
| T-16 |
| BANK 2017-BNK6 | Collateral Overview |
Amortization
| Weighted Average Original Amortization Term (months)(10): | 356 |
| Weighted Average Remaining Amortization Term (months)(10): | 356 |
| % of Pool Interest Only through Maturity: | 43.9% |
| % of Pool Interest Only followed by Amortizing Balloon: | 29.5% |
| % of Pool Amortizing Balloon: | 25.7% |
| % of Pool Fully Amortizing | 1.0% |
Lockboxes
| % of Pool with Hard Lockboxes: | 38.1% |
| % of Pool with Springing Lockboxes: | 37.7% |
| % of Pool with No Lockboxes: | 9.0% |
| % of Pool with Soft Lockboxes: | 15.2% |
Reserves
| % of Pool Requiring Tax Reserves: | 60.0% |
| % of Pool Requiring Insurance Reserves: | 15.9% |
| % of Pool Requiring Replacement Reserves: | 59.4% |
| % of Pool Requiring TI/LC Reserves(11): | 47.9% |
Call Protection
| % of Pool with lockout period, followed by defeasance until open period: | 86.1% |
| % of Pool with lockout period, followed by the greater of a prepayment premium and yield maintenance until open period: | 7.3% |
| % of Pool with lockout period, followed by defeasance or the greater of a prepayment premium and yield maintenance until open period: | 0.7% |
| % of Pool with the greater of a prepayment premium and yield maintenance, followed by a prepayment premium until open period: | 5.9% |
| (1) | Unless otherwise indicated, all references to “% of Pool” in this Term Sheet reflect a percentage of the aggregate principal balance of the mortgage pool as of the Cut-off Date, after application of all payments of principal due during or prior to July 2017. |
| (2) | The General Motors Building mortgage loan was co-originated by Morgan Stanley Bank, N.A. and Wells Fargo Bank, National Association. Such mortgage loan is evidenced by three promissory notes: (i) note A-1-C2 and note A-1-C3-1, with an aggregate outstanding principal balance of $59,800,000 as of the Cut-off Date, as to which Morgan Stanley Mortgage Capital Holdings LLC is acting as mortgage loan seller; and (ii) note A-4-A3, with an outstanding principal balance of $30,200,000 as of the Cut-off Date, as to which Wells Fargo Bank, National Association is acting as mortgage loan seller. |
| (3) | The Del Amo Fashion Center mortgage loan was co-originated by Bank of America, National Association and Wells Fargo Bank, National Association. Such mortgage loan is evidenced by five promissory notes: (i) note A-1-3, note B-1-3 and note B-1-4, with an aggregate outstanding principal balance of $34,543,000 as of the Cut-off Date, as to which Bank of America, National Association is acting as mortgage loan seller; and (ii) note A-4-4 and note B-4-4 with an aggregate outstanding principal balance of $25,000,000 as of the Cut-off Date, as to which Wells Fargo Bank, National Association is acting as mortgage loan seller. |
| (4) | Seventeen (17) of the nineteen (19) mortgage loans for which National Cooperative Bank, N.A. is the mortgage loan seller were originated by its parent company, National Consumer Cooperative Bank, and transferred to National Cooperative Bank, N.A. Each such mortgage loan originated by National Consumer Cooperative Bank was underwritten pursuant to National Cooperative Bank, N.A.’s underwriting guidelines. |
| (5) | Seventeen (17) of the mortgage loans, each of which is secured by a residential cooperative property, currently have in place subordinate secured lines of credit to the related mortgage borrowers that permit future advances (such loans, collectively, the “Subordinate Coop LOCs”). The percentage figure expressed as “% of Pool with Subordinate Mortgage Debt” is determined as a percentage of the initial pool balance and does not take into account any future subordinate debt (whether or not secured by the mortgaged property), if any, that may be permitted under the terms of any mortgage loan or the pooling and servicing agreement. See “Description of the Mortgage Pool—Additional Indebtedness—Other Secured Indebtedness” and “Description of the Mortgage Pool—Additional Debt Financing for Mortgage Loans Secured by Residential Cooperatives” in the Preliminary Prospectus. |
| (6) | With respect to any mortgage loan that is part of a whole loan, unless otherwise indicated, all LTV, DSCR and Debt Yield calculations in this Term Sheet include any relatedpari passu companion loans and exclude any subordinate companion loans, as applicable. Additionally, LTV, DSCR and Debt Yield figures in this Term Sheet are calculated for mortgage loans without regard to any additional indebtedness that may be incurred at a future date. For mortgaged properties securing residential cooperative mortgage loans all LTV, DSCR and Debt Yield calculations do not take into account any subordinate debt (whether or not secured by the related mortgaged property), that currently exists or is allowed under the terms of any mortgage loan. With respect to any leased fee loans, the SF/Units and Balance per SF/Unit figures in this Term Sheet are based on the size of the non-collateral improvements. |
| (7) | For mortgaged properties securing residential cooperative mortgage loans, all DSCR and Debt Yield calculations for each such mortgaged property is calculated using underwritten net operating Income or underwritten net cash flow, as applicable, for the related residential cooperative property which is the projected net operating income or net cash flow, as applicable, reflected in the most recent appraisal obtained by or otherwise in the possession of the related mortgage loan seller as of the Cut-off Date. All LTV ratio calculations are based upon the appraised value of the residential cooperative property determined as if such residential cooperative property is operated as a residential cooperative, inclusive of the amount of the underlying debt encumbering such residential cooperative property. |
| (8) | With respect to certain mortgage loans, debt yields and LTVs (such as, for example, UW NOI Debt Yield, UW NCF Debt Yield or Cut-off Date LTV Ratio) have been calculated based on a principal balance that is net of a holdback or earnout reserve. Such mortgage loans are identified under the definitions of “Underwritten NOI Debt Yield”, “Underwritten NCF Debt Yield” and “Cut-off Date LTV Ratio” set forth under “Description of the Mortgage Pool—Certain Calculations and Definitions” in the Preliminary Prospectus. |
This is not a research report and was not prepared by the Underwriters’ research departments. Please see additional important information and qualifications at the end of this Term Sheet.
| T-17 |
| BANK 2017-BNK6 | Collateral Overview |
| (9) | The LTV ratios set forth in this Term Sheet are generally based on the “as-is” values of the related mortgaged properties; provided that the “as-is” value for a portfolio of mortgaged properties may include a premium relating to the valuation of the mortgaged properties as a whole rather than as the sum of individually valued mortgaged properties; provided, further, that such LTV ratios may be based on “as-stabilized”, “as complete” or other contingent values in certain cases in which reserves have been established at origination for the applicable condition or circumstance that is expected to result in stabilization provided, further, that such LTV ratios may have been calculated based on a principal balance that is net of a holdback or earnout reserve. See the definition of “Appraised Value” under“Description of the Mortgage Pool—Certain Calculations and Definitions”in the Preliminary Prospectus. |
| (10) | Excludes mortgage loans that provide for payments of interest only through the related maturity date or anticipated repayment date, as applicable. |
| (11) | Excludes hospitality, multifamily, manufactured housing, other (leased fee and net lease) and self storage properties. |
This is not a research report and was not prepared by the Underwriters’ research departments. Please see additional important information and qualifications at the end of this Term Sheet.
| T-18 |
| BANK 2017-BNK6 | Characteristics of the Mortgage Loans |
| Top 10 Mortgage Loans or Groups of Cross-Collateralized Mortgage Loans(1) | ||||||||||||||||||||||||||
| Loan No. | Mortgage Loan Seller | Property Name | City | State | Property Type | Cut-off Date Balance | % of Pool | SF/Units | Cut-off Date Balance per SF/Unit | UW NCF DSCR | UW NOI Debt Yield | Cut-off Date LTV | Maturity Date LTV | |||||||||||||
| 1 | MSMCH/WFB | General Motors Building | New York | NY | Mixed Use | $90,000,000 | 9.6% | 1,989,983 | $738.70 | 4.33x | 15.5% | 30.6% | 30.6% | |||||||||||||
| 2 | BANA | Gateway Net Lease Portfolio | Various | Various | Industrial / Office | $60,900,000 | 6.5% | 5,296,943 | $66.64 | 3.54x | 14.1% | 45.0% | 45.0% | |||||||||||||
| 3 | BANA/WFB | Del Amo Fashion Center | Torrance | CA | Retail | $59,543,000 | 6.4% | 1769525 | $259.56 | 3.34x | 12.9% | 39.8% | 39.8% | |||||||||||||
| 4 | BANA | Starwood Capital Hotel Portfolio | Various | Various | Hospitality | $59,317,500 | 6.4% | 6,366 | $90,680.18 | 2.72x | 12.4% | 60.4% | 60.4% | |||||||||||||
| 5 | MSMCH | Westchester One | White Plains | NY | Office | $42,500,000 | 4.6% | 907,436 | $121.22 | 1.64x | 10.5% | 63.6% | 55.2% | |||||||||||||
| 6 | BANA | Ritchie Station Marketplace | Capitol Heights | MD | Retail | $41,000,000 | 4.4% | 249,078 | $164.61 | 1.39x | 9.1% | 66.8% | 58.5% | |||||||||||||
| 7 | WFB | 2851 Junction | San Jose | CA | Office | $30,065,000 | 3.2% | 155,613 | $373.14 | 1.96x | 8.3% | 70.0% | 70.0% | |||||||||||||
| 8 | WFB | Amazon Lakeland | Lakeland | FL | Industrial | $30,000,000 | 3.2% | 1,016,080 | $62.36 | 1.65x | 7.8% | 72.0% | 72.0% | |||||||||||||
| 9 | WFB | Sheraton Hotel Greensboro | Greensboro | NC | Hospitality | $29,905,737 | 3.2% | 985 | $45,541.73 | 2.74x | 23.6% | 49.3% | 37.3% | |||||||||||||
| 10 | MSMCH | 2041 Rosecrans 831 Nash | El Segundo | CA | Mixed Use | $29,600,000 | 3.2% | 157,092 | $188.42 | 1.67x | 10.2% | 53.8% | 42.6% | |||||||||||||
| Total/Wtd. Avg. | $472,831,237 | 50.7% | 2.82x | 12.8% | 51.2% | 48.3% | ||||||||||||||||||||
| (1) | With respect to any mortgage loan that is part of a whole loan, unless otherwise indicated, all LTV, DSCR, Debt Yield and Balance per SF/Unit calculations in this Term Sheet include any related pari passu companion loans and exclude any subordinate companion loans, as applicable. Additionally, LTV, DSCR, Debt Yield and Balance per SF/Unit figures in this Term Sheet are calculated for mortgage loans without regard to any additional indebtedness that may be incurred at a future date. With respect to any leased fee loans, the SF/Units and Balance per SF/Unit figures in this Term Sheet are based on the size of the non-collateral improvements. |
This is not a research report and was not prepared by any Underwriter’s research department. Please see additional important information and qualifications at the end of this Term Sheet.
| T-19 |
| BANK 2017-BNK6 | Characteristics of the Mortgage Loans |
| Mortgage Loans with Pari Passu Companion Loans | ||||||||||||||||||||||||
| Loan No. | Mortgage | Property Name | Mortgage Loan Cut-off Date Balance | Aggregate Pari Passu Companion Loan Cut-off Date Balance | Combined Cut-off Date Balance | Lead Servicing Agreement | Master Servicer | Special Servicer | Control Rights | Combined UW NCF DSCR(1) | Combined UW NOI Debt Yield(1) | Combined Cut-off Date LTV(1) | ||||||||||||
| 1 | MSMCH/WFB | General Motors Building | $90,000,000 | $1,380,000,000 | $1,470,000,000 | BXP Trust 2017-GM | Wells Fargo | AEGON | BXP Trust 2017-GM | 4.33x | 15.5% | 30.6% | ||||||||||||
| 2 | BANA | Gateway Net Lease Portfolio | $60,900,000 | $292,100,000 | $353,000,000 | DBJPM 2017-C6 | Wells Fargo | CWCapital | DBJPM 2017-C6 | 3.54x | 14.1% | 45.0% | ||||||||||||
| 3 | BANA/WFB | Del Amo Fashion Center | $59,543,000 | $399,757,000 | $459,300,000 | BAMLL 2017-AMO | KeyBank | Cohen | BAMLL 2017-AMO | 3.34x | 12.9% | 39.8% | ||||||||||||
| 4 | BANA | Starwood Capital Hotel Portfolio | $59,317,500 | $517,952,500 | $577,270,000 | DBJPM 2017-C6 | Wells Fargo | CWCapital | DBJPM 2017-C6 | 2.72x | 12.4% | 60.4% | ||||||||||||
| 5 | MSMCH | Westchester One | $42,500,000 | $67,500,000 | $110,000,000 | BANK 2017-BNK5 | Wells Fargo | CWCapital | BANK 2017-BNK5 | 1.64x | 10.5% | 63.6% | ||||||||||||
| 7 | WFB | 2851 Junction | $30,065,000 | $28,000,000 | $58,065,000 | BANK 2017-BNK6 | Wells Fargo | Midland | BANK 2017-BNK6 | 1.96x | 8.3% | 70.0% | ||||||||||||
| 8 | WFB | Amazon Lakeland | $30,000,000 | $33,360,000 | $63,360,000 | WFCM 2017-C38 | Wells Fargo | KeyBank | WFCM 2017-C38 | 1.65x | 7.8% | 72.0% | ||||||||||||
| 9 | WFB | Sheraton Hotel Greensboro | $29,905,737 | $14,952,869 | $44,858,606 | BANK 2017-BNK6 | Wells Fargo | Midland | BANK 2017-BNK6 | 2.74x | 23.6% | 49.3% | ||||||||||||
| (1) | DSCR, Debt Yield and LTV calculations include any relatedpari passu companion loans and exclude any subordinate companion loans, as applicable. |
This is not a research report and was not prepared by any Underwriter’s research department. Please see additional important information and qualifications at the end of this Term Sheet.
| T-20 |
| BANK 2017-BNK6 | Characteristics of the Mortgage Loans |
| Mortgage Loans with Subordinate Debt(1) | ||||||||||||||||||||||
| Loan No. | Mortgage Loan Seller | Property Name | Mortgage Loan Cut-off Date Balance | Cut-off Date Balance per Unit/SF | Subordinate Debt Cut-off Date Balance | UW NCF DSCR | UW NOI Debt Yield | Cut-off Date LTV | Total Debt UW NCF DSCR(2) | Total Debt UW NOI Debt Yield(2) | Total Debt Cut-off Date LTV(2) | |||||||||||
| 1 | MSMCH/WFB | General Motors Building | $90,000,000 | $738.70 | $830,000,000 | 4.33x | 15.5% | 30.6% | 2.77x | 9.9% | 47.9% | |||||||||||
| 2 | BANA | Gateway Net Lease Portfolio | $60,900,000 | $66.64 | $170,000,000 | 3.54x | 14.1% | 45.0% | 2.04x | 9.5% | 66.6% | |||||||||||
| 3 | BANA/WFB | Del Amo Fashion Center | $59,543,000 | $259.56 | $125,700,000 | 3.34x | 12.9% | 39.8% | 2.63x | 10.1% | 50.6% | |||||||||||
| (1) | In addition, seventeen (17) of the mortgage loans, each of which is secured by a residential cooperative property, currently have in place Subordinate Coop LOCs that permit future advances. See “Description of the Mortgage Pool—Additional Indebtedness—Other Secured Indebtedness” and “Description of the Mortgage Pool—Additional Debt Financing for Mortgage Loans Secured by Residential Cooperatives” in the Preliminary Prospectus. |
| (2) | Total Debt UW NCF DSCR, Total Debt UW NOI Debt Yield and Total Debt Cut-off Date LTV figures shown above are calculated based on any relatedpari passu notes and any related subordinate note(s) and the mezzanine debt. |
| Mortgage Loans with Mezzanine Debt | ||||||||||||||||||||||
| Loan No. | Mortgage Loan Seller | Property Name | Mortgage Loan Cut-off Date Balance | Cut-off Date Balance per Unit/SF | Mezzanine Debt Cut-off Date Balance | UW NCF DSCR | UW NOI Debt Yield | Cut-off Date LTV | Total Debt UW NCF DSCR | Total Debt UW NOI Debt Yield | Total Debt Cut-off Date LTV | |||||||||||
| 11 | WFB | Center at Pearland Parkway | $25,560,000 | $166.93 | $2,840,000 | 2.16x | 9.8% | 60.6% | 1.66x | 8.8% | 67.3% | |||||||||||
This is not a research report and was not prepared by any Underwriter’s research department. Please see additional important information and qualifications at the end of this Term Sheet.
| T-21 |
| BANK 2017-BNK6 | Characteristics of the Mortgage Loans |
| Prior Securitization History(1) | ||||||||||||||||||||||||||||
| Loan No. | Mortgage Loan Seller | Property Name | City | State | Property Type | Cut-off Date Balance | % of Pool | SF/Units | Cut-off Date Balance per SF/Unit | UW NCF DSCR(2) | UW NOI Debt Yield(2) | Cut-off Date LTV(2) | Maturity Date LTV(2) | Prior Securitization | ||||||||||||||
| 4 | BANA | Starwood Capital Hotel Portfolio | Various | Various | Hospitality | $59,317,500 | 6.4% | 6,366 | $90,680.18 | 2.72x | 12.4% | 60.4% | 60.4% | (3) | ||||||||||||||
| 10 | MSMCH | 2041 Rosecrans 831 Nash | El Segundo | CA | Mixed Use | $29,600,000 | 3.2% | 157,092 | $188.42 | 1.67x | 10.2% | 53.8% | 42.6% | CWCI 2007-C3 | ||||||||||||||
| 12 | WFB | Trumbull Marriott | Trumbull | CT | Hospitality | $22,000,000 | 2.4% | 325 | $67,692.31 | 1.84x | 15.0% | 62.7% | 51.1% | BSCMS 2007-PW18 | ||||||||||||||
| 14 | BANA | Budget Store & Lock Portfolio PA | Various | PA | Self Storage | $20,550,000 | 2.2% | 244,105 | $84.19 | 1.66x | 9.7% | 67.6% | 57.2% | BACM 2007-5 | ||||||||||||||
| 17 | WFB | Crossroads Festival Retail Center | Tucson | AZ | Retail | $18,250,000 | 2.0% | 136,269 | $133.93 | 1.39x | 9.6% | 66.4% | 54.9% | COMM 2007-C9 | ||||||||||||||
| 18 | MSMCH | Majestic Industrial Portfolio | Las Vegas | NV | Leased Fee | $15,980,882 | 1.7% | 1,487,620 | $10.74 | 1.61x | 10.4% | 23.3% | 19.3% | MSC 2007-IQ14 | ||||||||||||||
| 19 | WFB | Millbrae Station Self Storage | Millbrae | CA | Self Storage | $14,480,130 | 1.6% | 75,140 | $192.71 | 1.35x | 8.1% | 65.8% | 53.0% | MSC 2007-IQ15 | ||||||||||||||
| 21 | MSMCH | Hilton Garden Bozeman | Bozeman | MT | Hospitality | $11,500,000 | 1.2% | 123 | $93,495.93 | 2.35x | 15.8% | 53.7% | 44.4% | MLMT 2007-C1 | ||||||||||||||
| 26 | WFB | Whole Foods Sauganash | Chicago | IL | Retail | $9,600,000 | 1.0% | 41,148 | $233.30 | 1.28x | 8.4% | 61.4% | 51.5% | JPMCC 2007-LD11 | ||||||||||||||
| 28 | WFB | Aliso Viejo Self Storage & Mission Viejo RV Storage | Mission Viejo; Aliso Viejo | CA | Self Storage | $8,977,594 | 1.0% | 83,136 | $107.99 | 1.97x | 15.5% | 36.1% | 0.8% | MLMT 2007-C1 | ||||||||||||||
| 30 | BANA | Bullard Creek | Tyler | TX | Multifamily | $8,560,000 | 0.9% | 200 | $42,800.00 | 1.30x | 9.1% | 68.6% | 64.7% | CSMC 2007-C4 | ||||||||||||||
| 32 | BANA | Hampton Inn Norfolk | Norfolk | VA | Hospitality | $7,900,000 | 0.8% | 88 | $89,772.73 | 2.20x | 14.4% | 58.5% | 53.4% | WBCMT 2007-C34 | ||||||||||||||
| 33 | WFB | 580 Howard | San Francisco | CA | Office | $7,330,000 | 0.8% | 24,105 | $304.09 | 3.85x | 15.9% | 37.2% | 37.2% | CGCMT 2007-C6 | ||||||||||||||
| 34 | BANA | Storage Choice - West Airport | Houston | TX | Self Storage | $7,130,598 | 0.8% | 101,875 | $69.99 | 1.40x | 8.7% | 69.9% | 56.7% | JPMCC 2010-C2 | ||||||||||||||
| 37 | BANA | El Mercado Center | Santa Fe | NM | Retail | $6,700,000 | 0.7% | 53,064 | $126.26 | 1.45x | 9.3% | 69.1% | 59.1% | BACM 2007-3 | ||||||||||||||
| 40 | WFB | Towne Place Suites - Bend, OR | Bend | OR | Hospitality | $6,292,074 | 0.7% | 71 | $88,620.76 | 2.16x | 15.3% | 61.1% | 50.0% | BSCMS 2007-T28 | ||||||||||||||
| 41 | MSMCH | Rush Creek | Arlington | TX | Retail | $5,500,000 | 0.6% | 75,931 | $72.43 | 2.04x | 12.2% | 55.2% | 43.9% | MLMT 2007-C1 | ||||||||||||||
| 43 | NCB | Ramapo Towers Owners Corp. | Spring Valley | NY | Multifamily | $5,000,000 | 0.5% | 148 | $33,783.78 | 5.73x | 28.3% | 44.6% | 39.1% | MSC 2005-IQ9 | ||||||||||||||
| 44 | BANA | Storage Choice - Mira Vista | Fort Worth | TX | Self Storage | $4,544,008 | 0.5% | 56,400 | $80.57 | 1.39x | 8.7% | 65.9% | 53.4% | JPMCC 2010-C2 | ||||||||||||||
| 47 | MSMCH | South Loop Shopping Center | Temple | TX | Retail | $4,300,000 | 0.5% | 88,298 | $48.70 | 2.11x | 12.9% | 56.7% | 45.4% | JPMCC 2007-CB19 | ||||||||||||||
| 53 | NCB | Midtown Manor Apartments, Ltd. | New York | NY | Multifamily | $3,600,000 | 0.4% | 69 | $52,173.91 | 9.31x | 36.1% | 8.4% | 8.4% | WFRBS 2014-C23 | ||||||||||||||
| 55 | MSMCH | Greater Richland Shopping Center | North Richland Hills | TX | Retail | $3,500,000 | 0.4% | 110,244 | $31.75 | 1.89x | 12.6% | 49.3% | 39.2% | JPMCC 2003-CB6 | ||||||||||||||
| 56 | MSMCH | All Storage Basswood | Fort Worth | TX | Self Storage | $3,500,000 | 0.4% | 75,775 | $46.19 | 2.22x | 13.0% | 59.3% | 47.1% | JPMCC 2003-CB6 | ||||||||||||||
| 65 | WFB | 20 Ohlone Parkway | Watsonville | CA | Retail | $2,022,452 | 0.2% | 10,540 | $191.88 | 1.38x | 9.2% | 61.3% | 50.1% | MLMT 2007-C1 | ||||||||||||||
| 67 | WFB | Vermont Center Showrooms | San Francisco | CA | Retail | $1,797,617 | 0.2% | 18,466 | $97.35 | 3.01x | 19.3% | 19.3% | 15.7% | MLCFC 2007-9 | ||||||||||||||
| Total | $287,932,855 | 30.9% | ||||||||||||||||||||||||||
| (1) | Includes mortgage loans for which all or a portion of the previously existing debt was most recently securitized in conduit securitizations, based on information provided by the related borrower or obtained through searches of a third-party database. The information has not otherwise been confirmed by the mortgage loan sellers. With respect to any mortgage loan that is part of a whole loan, unless otherwise indicated, all LTV, DSCR, Debt Yield and Cut-off Date Balance per SF/Unit calculations include any relatedpari passu companion loans and exclude any related subordinate companion loans, as applicable. |
| (2) | For mortgaged properties securing residential cooperative mortgage loans, the UW NCF DSCR and UW NOI Debt Yield for each such mortgaged property is calculated using underwritten net operating income or underwritten net cash flow, as applicable, for the related residential cooperative property which is the projected net operating income or net cash flow, as applicable, reflected in the most recent appraisal obtained by or otherwise in the possession of the related mortgage loan seller as of the Cut-off Date. LTV calculations are based upon the appraised value of the residential cooperative property determined as if such residential cooperative property is operated as a residential cooperative, inclusive of the amount of the underlying debt encumbering such residential cooperative property. The UW NCF DSCR, UW NOI Debt Yield and LTV calculations do not take into account any subordinate debt (whether or not secured by the related mortgaged property), that currently exists or is allowed under the terms of any mortgage loan. |
| (3) | The outstanding debt of the portfolio was primarily securitized in the following: WFRBS 2012-C10, WFCM 2012-LC5, GSMS 2012-GCJ9, WFRBS 2013-C11 and COMM 2013-CRE6. |
This is not a research report and was not prepared by any Underwriter’s research department. Please see additional important information and qualifications at the end of this Term Sheet.
| T-22 |
| BANK 2017-BNK6 | Characteristics of the Mortgage Loans |
Mortgage Loans with Scheduled Balloon Payments and Related Classes(1)
| Class A-2 ($26,600,000) | ||||||||||||||||||||||||||||||||
| Loan No. | Mortgage Loan Seller | Property Name | State | Property Type | Cut-off Balance | % of Pool | Maturity Date Balance | % of Class A-2 Certificate Principal Balance | SF/ Units | Cut-off Date Balance per SF/Unit | UW NCF DSCR | UW NOI Debt Yield | Cut-off Date LTV | Maturity Date LTV | Rem. | Rem. Term to Maturity (mos.) | ||||||||||||||||
| 13 | WFB | Gran Park At The Avenues | FL | Office | $21,000,000 | 2.3% | $19,981,641 | 75.1% | 241,469 | $86.97 | 1.82x | 12.4% | 74.2% | 70.6% | 23 | 59 | ||||||||||||||||
| 30 | BANA | Bullard Creek | TX | Multifamily | $8,560,000 | 0.9% | $8,070,385 | 30.3% | 200 | $42,800.00 | 1.30x | 9.1% | 68.6% | 64.7% | 11 | 59 | ||||||||||||||||
| Total/Wtd. Avg. | $29,560,000 | 3.2% | $28,052,026 | 105.5% | 1.67x | 11.4% | 72.6% | 68.9% | 20 | 59 | ||||||||||||||||||||||
| (1) | The table above reflects the mortgage loans whose balloon payments will be applied to pay down the Class A-2 certificates, assuming (i) that none of the mortgage loans experience prepayments, defaults or losses; (ii) there are no extensions of maturity dates; and (iii) each mortgage loan is paid in full on its stated maturity date or, in the case of any mortgage loan with an anticipated repayment date, on such anticipated repayment date. The table above is otherwise based on the Structuring Assumptions set forth under “Yield and Maturity Considerations—Weighted Average Life” in the Preliminary Prospectus. |
This is not a research report and was not prepared by any Underwriter’s research department. Please see additional important information and qualifications at the end of this Term Sheet.
| T-23 |
| BANK 2017-BNK6 | Characteristics of the Mortgage Loans |
Mortgage Loans with Scheduled Balloon Payments and Related Classes(1)
| Class A-3 ($58,200,000) | ||||||||||||||||||||||||||||||||
| Loan No. | Mortgage Loan Seller | Property Name | State | Property Type | Cut-off Date Balance | % of Pool | Maturity Date Balance | % of Class A-3 Certificate Principal Balance | SF/ Units | Cut-off Date Balance per SF/Unit(2) | UW NCF DSCR(2) | UW NOI Debt Yield(2) | Cut-off Date LTV(2) | Maturity Date LTV(2) | Rem. IO Period (mos.) | Rem. Term to Maturity (mos.) | ||||||||||||||||
| 2 | BANA | Gateway Net Lease Portfolio | Various | Industrial/Office | $60,900,000 | 6.5% | $60,900,000 | 104.6% | 5,296,943 | $66.64 | 3.54x | 14.1% | 45.0% | 45.0% | 83 | 83 | ||||||||||||||||
| 70 | WFB | Wells Fargo Milton | GA | Leased Fee | $987,382 | 0.1% | $370,052 | 0.6% | 4,025 | $245.31 | 1.38x | 18.2% | 25.0% | 9.4% | 0 | 82 | ||||||||||||||||
| Total/Wtd. Avg. | $61,887,382 | 6.6% | $61,270,052 | 105.3% | 3.51x | 14.2% | 44.7% | 44.4% | 82 | 83 | ||||||||||||||||||||||
| (1) | The table above reflects the mortgage loans whose balloon payments will be applied to pay down the Class A-3 certificates, assuming (i) that none of the mortgage loans experience prepayments, defaults or losses; (ii) there are no extensions of maturity dates; and (iii) each mortgage loan is paid in full on its stated maturity date or, in the case of any mortgage loan with an anticipated repayment date, on such anticipated repayment date. The table above is otherwise based on the Structuring Assumptions set forth under “Yield and Maturity Considerations—Weighted Average Life” in the Preliminary Prospectus. |
| (2) | With respect to any mortgage loan that is part of a whole loan, unless otherwise indicated, all LTV, DSCR, Debt Yield and Cut-off Date Balance per SF/Unit calculations include any relatedpari passu companion loans and exclude any related subordinate companion loans, as applicable. |
This is not a research report and was not prepared by any Underwriter’s research department. Please see additional important information and qualifications at the end of this Term Sheet.
| T-24 |
| BANK 2017-BNK6 | Characteristics of the Mortgage Loans |
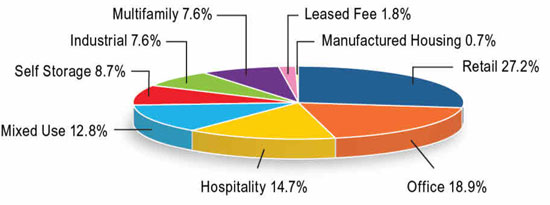
| Property Type Distribution(1) | ||||||||||||||||
| Property Type | Number of Mortgaged Properties | Aggregate | % of Pool | Wtd. Avg. Mortgage Rate | Wtd. Avg. UW NCF DSCR | Wtd. Avg. UW NOI Debt Yield | Wtd. Avg. Cut-off Date LTV | Wtd. Avg. Maturity Date LTV | ||||||||
| Retail | 20 | $253,631,069 | 27.2% | 4.2417% | 2.07x | 10.6% | 56.8% | 51.5% | ||||||||
| Anchored | 10 | $95,385,000 | 10.2% | 4.2960% | 1.80x | 10.5% | 62.7% | 55.3% | ||||||||
| Super Regional Mall | 1 | $59,543,000 | 6.4% | 3.6575% | 3.34x | 12.9% | 39.8% | 39.8% | ||||||||
| Power Center | 1 | $41,000,000 | 4.4% | 4.4500% | 1.39x | 9.1% | 66.8% | 58.5% | ||||||||
| Unanchored | 4 | $25,385,069 | 2.7% | 4.3906% | 2.07x | 10.7% | 48.5% | 44.6% | ||||||||
| Single Tenant | 3 | $21,950,000 | 2.4% | 4.6762% | 1.43x | 8.2% | 62.6% | 57.2% | ||||||||
| Shadow Anchored | 1 | $10,368,000 | 1.1% | 4.9900% | 1.39x | 9.2% | 69.8% | 59.8% | ||||||||
| Office | 29 | $176,496,363 | 18.9% | 4.1393% | 2.06x | 11.2% | 62.8% | 57.7% | ||||||||
| Suburban | 19 | $112,854,881 | 12.1% | 4.1879% | 2.05x | 11.2% | 65.7% | 61.0% | ||||||||
| CBD | 2 | $49,830,000 | 5.3% | 4.0678% | 1.97x | 11.3% | 59.7% | 52.6% | ||||||||
| Urban | 1 | $9,800,000 | 1.1% | 4.1800% | 1.99x | 9.3% | 52.4% | 52.4% | ||||||||
| Medical | 7 | $4,011,482 | 0.4% | 3.5628% | 3.54x | 14.1% | 45.0% | 45.0% | ||||||||
| Hospitality | 70 | $136,915,311 | 14.7% | 4.6311% | 2.50x | 15.8% | 57.7% | 51.6% | ||||||||
| Full Service | 5 | $54,875,596 | 5.9% | 4.9191% | 2.38x | 19.5% | 55.3% | 44.1% | ||||||||
| Extended Stay | 23 | $35,773,602 | 3.8% | 4.5324% | 2.62x | 12.9% | 60.5% | 58.6% | ||||||||
| Limited Service | 41 | $34,766,113 | 3.7% | 4.4274% | 2.60x | 12.9% | 60.0% | 58.8% | ||||||||
| Select Service | 1 | $11,500,000 | 1.2% | 4.1800% | 2.35x | 15.8% | 53.7% | 44.4% | ||||||||
| Mixed Use | 2 | $119,600,000 | 12.8% | 3.5364% | 3.67x | 14.2% | 36.3% | 33.6% | ||||||||
| Office/Retail | 2 | $119,600,000 | 12.8% | 3.5364% | 3.67x | 14.2% | 36.3% | 33.6% | ||||||||
| Self Storage | 17 | $81,002,330 | 8.7% | 4.3420% | 1.60x | 10.0% | 61.9% | 48.5% | ||||||||
| Self Storage | 17 | $81,002,330 | 8.7% | 4.3420% | 1.60x | 10.0% | 61.9% | 48.5% | ||||||||
| Industrial | 26 | $71,253,637 | 7.6% | 3.9869% | 2.74x | 11.4% | 56.4% | 56.4% | ||||||||
| Warehouse | 1 | $30,000,000 | 3.2% | 4.5700% | 1.65x | 7.8% | 72.0% | 72.0% | ||||||||
| Warehouse Distribution | 16 | $24,375,138 | 2.6% | 3.5628% | 3.54x | 14.1% | 45.0% | 45.0% | ||||||||
| Manufacturing | 5 | $12,516,522 | 1.3% | 3.5628% | 3.54x | 14.1% | 45.0% | 45.0% | ||||||||
| Flex | 4 | $4,361,977 | 0.5% | 3.5628% | 3.54x | 14.1% | 45.0% | 45.0% | ||||||||
| Multifamily | 21 | $70,927,965 | 7.6% | 4.0125% | 8.02x | 42.0% | 26.5% | 24.3% | ||||||||
| Cooperative | 19 | $55,367,965 | 5.9% | 3.7691% | 9.79x | 51.1% | 16.5% | 14.3% | ||||||||
| Garden | 2 | $15,560,000 | 1.7% | 4.8785% | 1.70x | 9.7% | 61.9% | 59.8% | ||||||||
| Leased Fee | 2 | $16,968,264 | 1.8% | 5.0405% | 1.60x | 10.9% | 23.4% | 18.7% | ||||||||
| Leased Fee | 2 | $16,968,264 | 1.8% | 5.0405% | 1.60x | 10.9% | 23.4% | 18.7% | ||||||||
| Manufactured Housing | 2 | $6,456,988 | 0.7% | 4.7436% | 1.57x | 10.1% | 65.2% | 53.3% | ||||||||
| Manufactured Housing | 2 | $6,456,988 | 0.7% | 4.7436% | 1.57x | 10.1% | 65.2% | 53.3% | ||||||||
| Total/Wtd. Avg. | 189 | $933,251,927 | 100.0% | 4.1789% | 2.79x | 14.3% | 53.0% | 47.9% | ||||||||
| (1) | All numerical information concerning the mortgage loans is approximate and, in the case of mortgage loans secured by multiple properties, is based on allocated loan amounts with respect to such properties. All weighted average information regarding the mortgage loans reflects the weighting of the mortgage loans based on their outstanding principal balances as of the Cut-off Date or, in the case of mortgage loans secured by multiple properties, allocated loan amounts. The sum of numbers and percentages in columns may not match the “Total” due to rounding. With respect to any mortgage loan that is part of a whole loan, unless otherwise indicated, all LTV, DSCR and Debt Yield calculations include any relatedpari passu companion loans and exclude any related subordinate companion loans, as applicable. For mortgaged properties securing residential cooperative mortgage loans, the UW NCF DSCR and UW NOI Debt Yield for each such mortgaged property is calculated using underwritten net operating income or underwritten net cash flow, as applicable, for the related residential cooperative property which is the projected net operating income or net cash flow, as applicable, reflected in the most recent appraisal obtained by or otherwise in the possession of the related mortgage loan seller as of the Cut-off Date. LTV calculations are based upon the appraised value of the residential cooperative property determined as if such residential cooperative property is operated as a residential cooperative, inclusive of the amount of the underlying debt encumbering such residential cooperative property. The UW NCF DSCR, UW NOI Debt Yield and LTV calculations do not take into account any subordinate debt (whether or not secured by the related mortgaged property), that currently exists or is allowed under the terms of any mortgage loan. |
This is not a research report and was not prepared by any Underwriter’s research department. Please see additional important information and qualifications at the end of this Term Sheet.
| T-25 |
| BANK 2017-BNK6 | Characteristics of the Mortgage Loans |
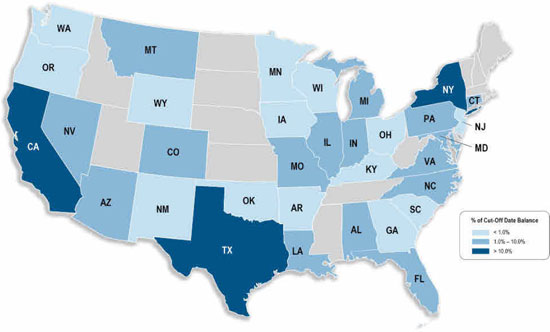
| Geographic Distribution(1) | ||||||||||||||||
| State or Other Jurisdiction | Number of Mortgaged Properties | Aggregate Cut-off Date Balance | % of Pool | Wtd. Avg. Mortgage Rate | Wtd. Avg. UW NCF DSCR | Wtd. Avg. UW NOI Debt Yield | Wtd. Avg. Cut-off Date LTV | Wtd. Avg. Maturity Date LTV | ||||||||
| California | 29 | $236,379,016 | 25.3% | 4.1026% | 2.29x | 11.1% | 53.5% | 48.5% | ||||||||
| California – Southern(2) | 7 | $135,270,594 | 14.5% | 3.9790% | 2.48x | 11.5% | 46.9% | 41.4% | ||||||||
| California – Northern(2) | 22 | $101,108,422 | 10.8% | 4.2681% | 2.05x | 10.4% | 62.4% | 58.1% | ||||||||
| New York | 22 | $194,867,965 | 20.9% | 3.7057% | 5.22x | 24.3% | 34.6% | 32.2% | ||||||||
| Texas | 37 | $111,697,887 | 12.0% | 4.3009% | 2.09x | 11.0% | 61.7% | 55.3% | ||||||||
| Florida | 7 | $56,131,265 | 6.0% | 4.4455% | 1.81x | 10.0% | 71.5% | 69.6% | ||||||||
| Maryland | 3 | $46,129,815 | 4.9% | 4.3640% | 1.62x | 9.6% | 64.6% | 57.2% | ||||||||
| North Carolina | 3 | $31,368,886 | 3.4% | 5.1126% | 2.75x | 23.1% | 49.6% | 38.1% | ||||||||
| Connecticut | 3 | $27,457,100 | 2.9% | 4.4531% | 2.16x | 14.8% | 59.5% | 50.2% | ||||||||
| Pennsylvania | 12 | $23,449,627 | 2.5% | 4.0588% | 1.82x | 10.1% | 66.1% | 57.0% | ||||||||
| Virginia | 6 | $22,677,091 | 2.4% | 4.1455% | 2.33x | 12.0% | 54.3% | 52.5% | ||||||||
| Arizona | 3 | $22,330,109 | 2.4% | 4.3152% | 1.74x | 10.3% | 63.2% | 53.8% | ||||||||
| Nevada | 3 | $19,874,949 | 2.1% | 4.9158% | 1.66x | 10.5% | 29.7% | 25.7% | ||||||||
| Indiana | 8 | $16,984,037 | 1.8% | 4.0741% | 2.83x | 12.6% | 52.7% | 49.9% | ||||||||
| Missouri | 5 | $13,969,769 | 1.5% | 4.3755% | 1.87x | 10.2% | 55.3% | 48.5% | ||||||||
| Michigan | 7 | $13,666,035 | 1.5% | 4.1032% | 2.70x | 12.0% | 55.2% | 53.6% | ||||||||
| Alabama | 3 | $12,157,738 | 1.3% | 4.7799% | 1.71x | 9.9% | 66.1% | 57.6% | ||||||||
| Illinois | 4 | $11,918,103 | 1.3% | 4.6423% | 1.56x | 9.2% | 61.2% | 53.2% | ||||||||
| Montana | 1 | $11,500,000 | 1.2% | 4.1800% | 2.35x | 15.8% | 53.7% | 44.4% | ||||||||
| Colorado | 1 | $9,225,000 | 1.0% | 4.4500% | 1.85x | 11.9% | 68.3% | 55.3% | ||||||||
| Louisiana | 2 | $8,987,690 | 1.0% | 4.6751% | 1.55x | 9.8% | 67.1% | 59.5% | ||||||||
| Oregon | 2 | $7,649,340 | 0.8% | 4.7032% | 2.26x | 14.8% | 61.0% | 51.8% | ||||||||
| New Jersey | 2 | $7,393,500 | 0.8% | 3.9266% | 2.71x | 17.3% | 56.3% | 51.9% | ||||||||
| New Mexico | 1 | $6,700,000 | 0.7% | 4.4580% | 1.45x | 9.3% | 69.1% | 59.1% | ||||||||
| Wisconsin | 4 | $4,190,099 | 0.4% | 3.6827% | 3.43x | 13.9% | 47.0% | 47.0% | ||||||||
| Minnesota | 4 | $4,180,567 | 0.4% | 3.8426% | 3.29x | 13.6% | 49.7% | 49.7% | ||||||||
| Ohio | 5 | $3,836,041 | 0.4% | 4.1870% | 2.99x | 13.0% | 55.4% | 55.4% | ||||||||
| Washington | 2 | $3,205,029 | 0.3% | 4.4860% | 2.72x | 12.4% | 60.4% | 60.4% | ||||||||
| Oklahoma | 3 | $1,178,090 | 0.1% | 4.2132% | 2.96x | 12.9% | 55.8% | 55.8% | ||||||||
| Kentucky | 1 | $1,108,658 | 0.1% | 4.4860% | 2.72x | 12.4% | 60.4% | 60.4% | ||||||||
| Georgia | 1 | $987,382 | 0.1% | 5.2100% | 1.38x | 18.2% | 25.0% | 9.4% | ||||||||
| South Carolina | 2 | $692,839 | 0.1% | 3.5628% | 3.54x | 14.1% | 45.0% | 45.0% | ||||||||
| Wyoming | 1 | $631,599 | 0.1% | 4.4860% | 2.72x | 12.4% | 60.4% | 60.4% | ||||||||
| Iowa | 1 | $512,352 | 0.1% | 3.5628% | 3.54x | 14.1% | 45.0% | 45.0% | ||||||||
| Arkansas | 1 | $214,351 | 0.0% | 4.4860% | 2.72x | 12.4% | 60.4% | 60.4% | ||||||||
| Total/Wtd Avg. | 189 | $933,251,927 | 100.0% | 4.1789% | 2.79x | 14.3% | 53.0% | 47.9% | ||||||||
| (1) | All numerical information concerning the mortgage loans is approximate and, in the case of mortgage loans secured by multiple properties, is based on allocated loan amounts with respect to such properties. All weighted average information regarding the mortgage loans reflects the weighting of the mortgage loans based on their outstanding principal balances as of the Cut-off Date or, in the case of mortgage loans secured by multiple properties, allocated loan amounts. The sum of numbers and percentages in columns may not match the “Total” due to rounding. With respect to any mortgage loan that is part of a whole loan, unless otherwise indicated, all LTV, DSCR and Debt Yield calculations include any relatedpari passu companion loans and exclude any related subordinate companion loans, as applicable. For mortgaged properties securing residential cooperative mortgage loans, the UW NCF DSCR and UW NOI Debt Yield for each such mortgaged property is calculated using underwritten net operating income or underwritten net cash flow, as applicable, for the related residential cooperative property which is the projected net operating income or net cash flow, as applicable, reflected in the most recent appraisal obtained by or otherwise in the possession of the related mortgage loan seller as of the Cut-off Date. LTV calculations are based upon the appraised value of the residential cooperative property determined as if such residential cooperative property is operated as a residential cooperative, inclusive of the amount of the underlying debt encumbering such residential cooperative property. The UW NCF DSCR, UW NOI Debt Yield and LTV calculations do not take into account any subordinate debt (whether or not secured by the related mortgaged property), that currently exists or is allowed under the terms of any mortgage loan. |
| (2) | “California – Northern” includes zip codes above 93600, and “California – Southern” includes zip codes at or below 93600. |
This is not a research report and was not prepared by any Underwriter’s research departments. Please see additional important information and qualifications at the end of this Term Sheet.
| T-26 |
| BANK 2017-BNK6 | Collateral Statistics |
Collateral Statistics(1)
Cut-off Date Balance ($)
| No. of Mortgage Loans | Aggregate Cut-off Date Balance ($) | % of Pool | |
| 800,000 - 5,000,000 | 31 | 94,196,413 | 10.1 |
| 5,000,001 - 10,000,000 | 17 | 130,685,265 | 14.0 |
| 10,000,001 - 15,000,000 | 6 | 72,348,130 | 7.8 |
| 15,000,001 - 25,000,000 | 7 | 137,630,882 | 14.7 |
| 25,000,001 - 50,000,000 | 7 | 228,630,737 | 24.5 |
| 50,000,001 - 90,000,000 | 4 | 269,760,500 | 28.9 |
| Total: | 72 | $933,251,927 | 100.0% |
Min: $800,000 Max: $90,000,000 Avg: $12,961,832 | |||
State or Other Jurisdiction(2)
| No. of Mortgaged Properties | Aggregate Cut-off Date Balance ($) | % of Pool | |
| California | 29 | 236,379,016 | 25.3 |
| California – Southern(3) | 7 | 135,270,594 | 14.5 |
| California – Northern(3) | 22 | 101,108,422 | 10.8 |
| New York | 22 | 194,867,965 | 20.9 |
| Texas | 37 | 111,697,887 | 12.0 |
| Florida | 7 | 56,131,265 | 6.0 |
| Maryland | 3 | 46,129,815 | 4.9 |
| North Carolina | 3 | 31,368,886 | 3.4 |
| Connecticut | 3 | 27,457,100 | 2.9 |
| Pennsylvania | 12 | 23,449,627 | 2.5 |
| Virginia | 6 | 22,677,091 | 2.4 |
| Arizona | 3 | 22,330,109 | 2.4 |
| Nevada | 3 | 19,874,949 | 2.1 |
| Indiana | 8 | 16,984,037 | 1.8 |
| Missouri | 5 | 13,969,769 | 1.5 |
| Michigan | 7 | 13,666,035 | 1.5 |
| Alabama | 3 | 12,157,738 | 1.3 |
| Illinois | 4 | 11,918,103 | 1.3 |
| Montana | 1 | 11,500,000 | 1.2 |
| Colorado | 1 | 9,225,000 | 1.0 |
| Louisiana | 2 | 8,987,690 | 1.0 |
| Oregon | 2 | 7,649,340 | 0.8 |
| New Jersey | 2 | 7,393,500 | 0.8 |
| New Mexico | 1 | 6,700,000 | 0.7 |
| Wisconsin | 4 | 4,190,099 | 0.4 |
| Minnesota | 4 | 4,180,567 | 0.4 |
| Ohio | 5 | 3,836,041 | 0.4 |
| Washington | 2 | 3,205,029 | 0.3 |
| Oklahoma | 3 | 1,178,090 | 0.1 |
| Kentucky | 1 | 1,108,658 | 0.1 |
| Georgia | 1 | 987,382 | 0.1 |
| South Carolina | 2 | 692,839 | 0.1 |
| Wyoming | 1 | 631,599 | 0.1 |
| Iowa | 1 | 512,352 | 0.1 |
| Arkansas | 1 | 214,351 | 0.0 |
| Total: | 189 | $933,251,927 | 100.0% |
Property Type(2)
| No. of Mortgaged Properties | Aggregate Cut-off Date Balance ($) | % of Pool | |
| Retail | 20 | 253,631,069 | 27.2 |
| Anchored | 10 | 95,385,000 | 10.2 |
| Super Regional Mall | 1 | 59,543,000 | 6.4 |
| Power Center | 1 | 41,000,000 | 4.4 |
| Unanchored | 4 | 25,385,069 | 2.7 |
| Single Tenant | 3 | 21,950,000 | 2.4 |
| Shadow Anchored | 1 | 10,368,000 | 1.1 |
| Office | 29 | 176,496,363 | 18.9 |
| Suburban | 19 | 112,854,881 | 12.1 |
| CBD | 2 | 49,830,000 | 5.3 |
| Urban | 1 | 9,800,000 | 1.1 |
| Medical | 7 | 4,011,482 | 0.4 |
| Hospitality | 70 | 136,915,311 | 14.7 |
| Full Service | 5 | 54,875,596 | 5.9 |
| Extended Stay | 23 | 35,773,602 | 3.8 |
| Limited Service | 41 | 34,766,113 | 3.7 |
| Select Service | 1 | 11,500,000 | 1.2 |
| Mixed Use | 2 | 119,600,000 | 12.8 |
| Office/Retail | 2 | 119,600,000 | 12.8 |
| Self Storage | 17 | 81,002,330 | 8.7 |
| Self Storage | 17 | 81,002,330 | 8.7 |
| Industrial | 26 | 71,253,637 | 7.6 |
| Warehouse | 1 | 30,000,000 | 3.2 |
| Warehouse Distribution | 16 | 24,375,138 | 2.6 |
| Manufacturing | 5 | 12,516,522 | 1.3 |
| Flex | 4 | 4,361,977 | 0.5 |
| Multifamily | 21 | 70,927,965 | 7.6 |
| Cooperative | 19 | 55,367,965 | 5.9 |
| Garden | 2 | 15,560,000 | 1.7 |
| Leased Fee | 2 | 16,968,264 | 1.8 |
| Leased Fee | 2 | 16,968,264 | 1.8 |
| Manufactured Housing | 2 | 6,456,988 | 0.7 |
| Manufactured Housing | 2 | 6,456,988 | 0.7 |
| Total | 189 | $933,251,927 | 100.0% |
Mortgage Rate (%)
| No. of Mortgage Loans | Aggregate Cut-off Date Balance ($) | % of Pool | |
| 3.4300 - 4.0000 | 26 | 319,016,697 | 34.2 |
| 4.0001 - 4.4999 | 23 | 377,824,516 | 40.5 |
| 4.5000 - 4.9999 | 19 | 180,976,714 | 19.4 |
| 5.0000 - 5.2100 | 4 | 55,434,001 | 5.9 |
| Total: | 72 | $933,251,927 | 100.0% |
| Min: 3.4300% Max: 5.2100% Wtd Avg:4.1789% | |||
Original Term to Maturity or ARD (mos.)
| No. of Mortgage Loans | Aggregate Cut-off Date Balance ($) | % of Pool | |
| 60 | 2 | 29,560,000 | 3.2 |
| 84 | 2 | 61,887,382 | 6.6 |
| 108 | 1 | 30,000,000 | 3.2 |
| 120 | 66 | 802,826,951 | 86.0 |
| 240 | 1 | 8,977,594 | 1.0 |
| Total: | 72 | $933,251,927 | 100.0% |
| Min: 60 mos. Max: 240 mos. Wtd Avg: 116 mos. | |||
Remaining Term to Maturity or ARD (mos.)
| No. of Mortgage Loans | Aggregate Cut-off Date Balance ($) | % of Pool | |
| 59 - 60 | 2 | 29,560,000 | 3.2 |
| 61 - 84 | 2 | 61,887,382 | 6.6 |
| 85 - 111 | 1 | 30,000,000 | 3.2 |
| 112 - 120 | 66 | 802,826,951 | 86.0 |
| 121 - 239 | 1 | 8,977,594 | 1.0 |
| Total: | 72 | $933,251,927 | 100.0% |
| Min: 59 mos. Max: 239 mos. Wtd Avg: 116 mos. | |||
Original Amortization Term (mos.)
| No. of Mortgage Loans | Aggregate Cut-off Date Balance ($) | % of Pool | |
| Interest Only | 14 | 409,415,500 | 43.9% |
| 120 | 1 | 987,382 | 0.1 |
| 240 | 1 | 8,977,594 | 1.0 |
| 300 | 2 | 48,155,737 | 5.2 |
| 360 | 47 | 447,027,764 | 47.9 |
| 480 | 7 | 18,687,950 | 2.0 |
| Total: | 72 | $933,251,927 | 100.0% |
| Min: 120 mos. Max: 480 mos. Wtd Avg: 356 mos. | |||
Remaining Amortization Term (mos.)
| No. of Mortgage Loans | Aggregate Cut-off Date Balance ($) | % of Pool | |
| Interest Only | 14 | 409,415,500 | 43.9 |
| 118 - 240 | 2 | 9,964,976 | 1.1 |
| 241 - 300 | 2 | 48,155,737 | 5.2 |
| 301 - 480 | 54 | 465,715,714 | 49.9 |
| Total: | 72 | $933,251,927 | 100.0% |
| Min: 118 mos. Max: 480 mos. Wtd Avg: 356 mos. | |||
Mortgage Loan Sellers
| No. of Mortgage Loans | Aggregate Cut-off Date Balance ($) | % of Pool | |
| WFB | 24 | 334,135,986 | 35.8 |
| BANA | 13 | 235,604,094 | 25.2 |
| MSMCH | 14 | 158,600,882 | 17.0 |
| MSMCH/WFB | 1 | 90,000,000 | 9.6 |
| BANA/WFB | 1 | 59,543,000 | 6.4 |
| NCB | 19 | 55,367,965 | 5.9 |
| Total: | 72 | $933,251,927 | 100.0% |
Amortization Type
| No. of Mortgage Loans | Aggregate Cut-off Date Balance ($) | % of Pool | |
| Interest Only | 14 | 409,415,500 | 43.9 |
| Partial Interest Only | 20 | 275,018,000 | 29.5 |
| Amortizing Balloon | 37 | 239,840,833 | 25.7 |
| Fully Amortizing | 1 | 8,977,594 | 1.0 |
| Total: | 72 | $933,251,927 | 100.0% |
Cut-off Date LTV Ratio (%)
| No. of Mortgage Loans | Aggregate Cut-off Date Balance ($) | % of Pool | |
| 2.4 - 40.0 | 26 | 247,984,439 | 26.6 |
| 40.1 - 60.0 | 17 | 210,380,737 | 22.5 |
| 60.1 - 65.0 | 10 | 200,411,514 | 21.5 |
| 65.1 - 70.0 | 14 | 190,487,736 | 20.4 |
| 70.1 - 75.0 | 5 | 83,987,500 | 9.0 |
| Total: | 72 | $933,251,927 | 100.0% |
| Min: 2.4% Max: 75.0% Wtd Avg: 53.0% | |||
Maturity Date or ARD LTV Ratio (%)
| No. of Mortgage Loans | Aggregate Cut-off Date Balance ($) | % of Pool | |
| 0.8 - 35.0 | 23 | 168,111,439 | 18.0 |
| 35.1 - 45.0 | 11 | 232,278,737 | 24.9 |
| 45.1 - 55.0 | 18 | 159,983,153 | 17.1 |
| 55.1 - 60.0 | 7 | 137,473,598 | 14.7 |
| 60.1 - 72.0 | 13 | 235,405,000 | 25.2 |
| Total: | 72 | $933,251,927 | 100.0% |
| Min: 0.8% Max: 72.0% Wtd Avg: 47.9% | |||
UW DSCR (x)
| No. of Mortgage Loans | Aggregate Cut-off Date Balance ($) | % of Pool | |
| 1.28 - 1.30 | 2 | 18,160,000 | 1.9 |
| 1.31 - 1.40 | 10 | 114,332,571 | 12.3 |
| 1.41 - 1.50 | 2 | 15,265,000 | 1.6 |
| 1.51 - 1.60 | 6 | 61,126,988 | 6.5 |
| 1.61 - 1.80 | 7 | 153,930,882 | 16.5 |
| 1.81 - 2.50 | 18 | 199,969,668 | 21.4 |
| 2.51 - 3.00 | 3 | 95,528,237 | 10.2 |
| 3.01 - 31.07 | 24 | 274,938,582 | 29.5 |
| Total: | 72 | $933,251,927 | 100.0% |
| Min: 1.28x Max: 31.07x Wtd Avg: 2.79x | |||
UW NOI Debt Yield (%)
| No. of Mortgage Loans | Aggregate Cut-off Date Balance ($) | % of Pool | |
| 7.8 - 8.5 | 6 | 96,495,130 | 10.3 |
| 8.6 - 9.0 | 3 | 23,174,606 | 2.5 |
| 9.1 - 9.5 | 7 | 89,950,452 | 9.6 |
| 9.6 - 10.0 | 7 | 103,594,488 | 11.1 |
| 10.1 - 11.0 | 8 | 134,038,382 | 14.4 |
| 11.1 - 12.0 | 1 | 9,225,000 | 1.0 |
| 12.1 - 13.0 | 9 | 167,510,500 | 17.9 |
| 13.1 - 15.0 | 3 | 90,800,000 | 9.7 |
| 15.1 - 176.0 | 28 | 218,463,369 | 23.4 |
| Total: | 72 | $933,251,927 | 100.0% |
| Min: 7.8% Max: 176.0% Wtd Avg: 14.3% | |||
Footnotes are set forth on the following page.
This is not a research report and was not prepared by any Underwriter’s research departments. Please see additional important information and qualifications at the end of this Term Sheet.
| T-27 |
| BANK 2017-BNK6 | Collateral Statistics |
| (1) | All numerical information concerning the mortgage loans is approximate. All weighted average information regarding the mortgage loans reflects the weighting of the mortgage loans based on their outstanding principal balances as of the Cut-off Date. The sum of numbers and percentages in columns may not match the “Total” due to rounding. With respect to any mortgage loan that is part of a whole loan, unless otherwise indicated, all LTV, DSCR and Debt Yield calculations include any relatedpari passu companion loans and exclude any related subordinate companion loans, as applicable. For mortgaged properties securing residential cooperative mortgage loans, the UW DSCR and UW NOI Debt Yield for each such mortgaged property is calculated using underwritten net operating income or underwritten net cash flow, as applicable, for the related residential cooperative property which is the projected net operating income or net cash flow, as applicable, reflected in the most recent appraisal obtained by or otherwise in the possession of the related mortgage loan seller as of the Cut-off Date. LTV Ratio calculations are based upon the appraised value of the residential cooperative property determined as if such residential cooperative property is operated as a residential cooperative, inclusive of the amount of the underlying debt encumbering such residential cooperative property In the case of the residential cooperative property. The UW DSCR, UW NOI Debt Yield and LTV Ratio calculations do not take into account any subordinate debt (whether or not secured by the related mortgaged property), that currently exists or is allowed under the terms of any mortgage loan. |
| (2) | In the case of mortgage loans secured by multiple properties, cut-off date balance information is based on allocated loan amounts with respect to such properties. |
| (3) | “California – Northern” includes zip codes above 93600, and “California – Southern” includes zip codes at or below 93600. |
This is not a research report and was not prepared by any Underwriter’s research departments. Please see additional important information and qualifications at the end of this Term Sheet.
| T-28 |
(THIS PAGE INTENTIONALLY LEFT BLANK)
| T-29 |
| BANK 2017-BNK6 | General Motors Building |
Mortgage Loan No. 1 – General Motors Building
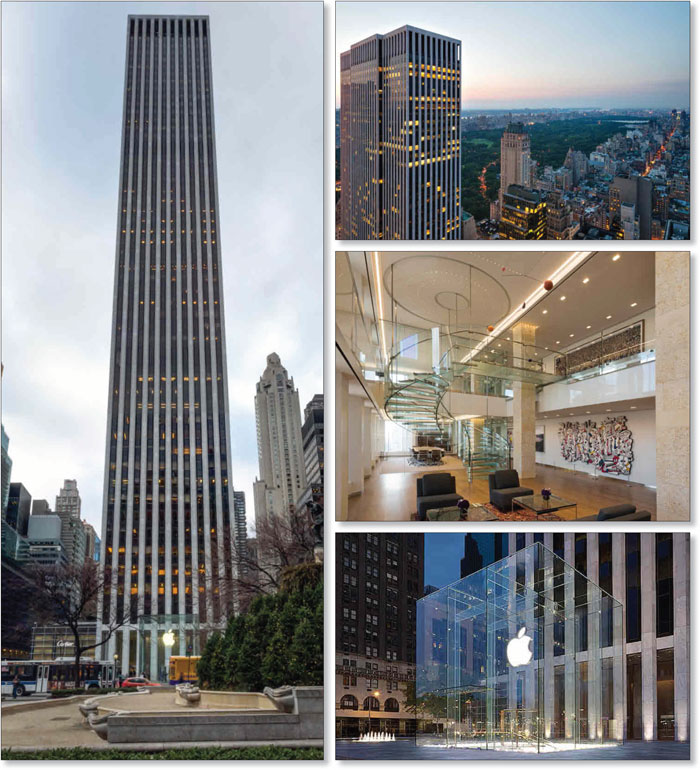
This is not a research report and was not prepared by the Underwriters’ research departments. Please see additional important information and qualifications at the end of this Term Sheet.
| T-30 |
| BANK 2017-BNK6 | General Motors Building |
Mortgage Loan No. 1 – General Motors Building
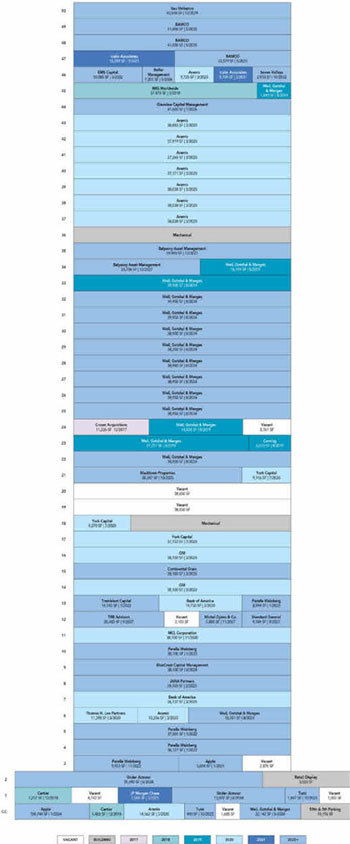
This is not a research report and was not prepared by the Underwriters’ research departments. Please see additional important information and qualifications at the end of this Term Sheet.
| T-31 |
| BANK 2017-BNK6 | General Motors Building |
Mortgage Loan No. 1 – General Motors Building
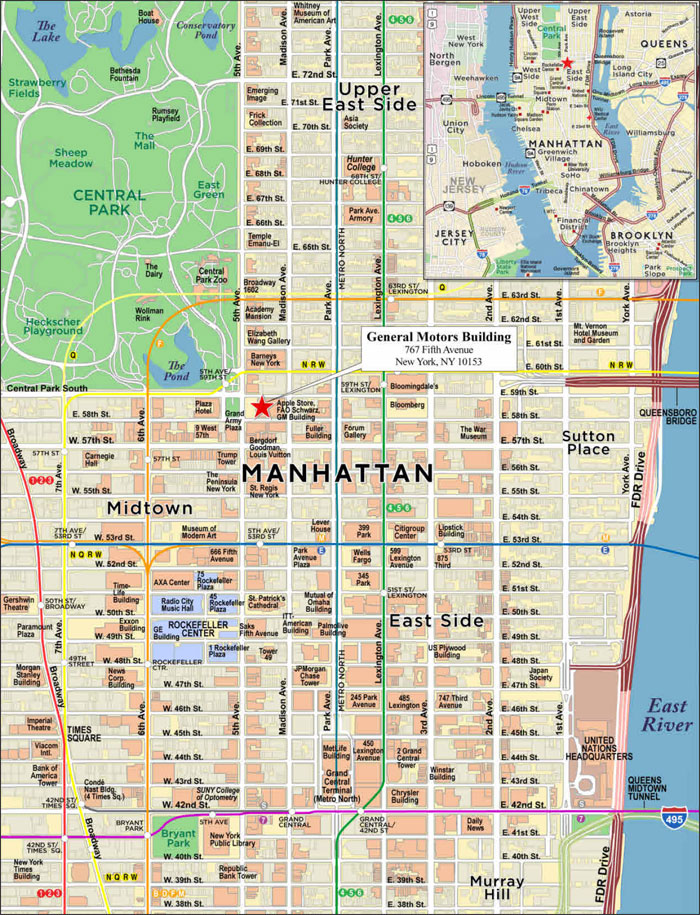
This is not a research report and was not prepared by the Underwriters’ research departments. Please see additional important information and qualifications at the end of this Term Sheet.
| T-32 |
| BANK 2017-BNK6 | General Motors Building |
| Mortgage Loan No. 1 – General Motors Building |
| Mortgage Loan Information | Property Information | ||||||
| Mortgage Loan Seller: | MSMCH/WFB | Single Asset/Portfolio: | Single Asset | ||||
| Original Balance(1): | $90,000,000 | Location: | New York, NY 10153 | ||||
| Cut-off Date Balance(1): | $90,000,000 | General Property Type: | Mixed Use | ||||
| % of Initial Pool Balance: | 9.6% | Detailed Property Type: | Office/Retail | ||||
| Loan Purpose: | Refinance | Title Vesting: | Fee | ||||
| Sponsor: | Boston Properties Limited Partnership; 767 LLC; Sungate Fifth Avenue LLC | Year Built/Renovated: | 1968/2017 | ||||
| Size: | 1,989,983 SF | ||||||
| Cut-off Date Balance per SF(1): | $739 | ||||||
| Mortgage Rate: | 3.4300% | Maturity Date Balance per SF(1): | $739 Boston Properties Limited Partnership (borrower-related) | ||||
| Note Date: | 6/7/2017 | Property Manager: | |||||
| First Payment Date: | 7/9/2017 | Single Asset/Portfolio: | Single Asset | ||||
| Maturity Date: | 6/9/2027 | ||||||
| Original Term to Maturity: | 120 months | ||||||
| Original Amortization Term: | 0 months | ||||||
| IO Period: | 120 months | Underwriting and Financial Information | |||||
| Seasoning: | 1 month | UW NOI(6): | $227,306,409 | ||||
| Prepayment Provisions(2): | LO (25); DEF (88); O (7) | UW NOI Debt Yield(1): | 15.5% | ||||
| Lockbox/Cash Mgmt Status: | Hard/Springing | UW NOI Debt Yield at Maturity(1): | 15.5% | ||||
| Additional Debt Type(3): | Pari Passu/B-Note | UW NCF DSCR(1): | 4.33x | ||||
| Additional Debt Balance(3): | $1,380,000,000 / $830,000,000 | Most Recent NOI: | $151,425,346 (12/31/2016) | ||||
| Future Debt Permitted (Type): | No (N/A) | 2nd Most Recent NOI: | $150,511,664 (12/31/2015) | ||||
| Reserves(4) | 3rd Most Recent NOI: | $165,315,617 (12/31/2014) | |||||
| Type | Initial | Monthly | Cap | Most Recent Occupancy(6): | 95.0% (6/1/2017) | ||
| RE Tax: | $0 | Springing | N/A | 2nd Most Recent Occupancy: | 96.3% (12/31/2016) | ||
| Insurance: | $0 | Springing | N/A | 3rd Most Recent Occupancy: | 96.7% (12/31/2015) | ||
| Recurring Replacements: | $0 | $0 | N/A | Appraised Value (as of): | $4,800,000,000 (5/8/2017) | ||
| TI/LC(5): | $0 | $0 | N/A | Cut-off Date LTV Ratio(1): | 30.6% | ||
| Other(5): | $0 | $0 | N/A | Maturity Date LTV Ratio(1): | 30.6% | ||
| Sources and Uses | ||||||
| Sources | Proceeds | % of Total | Uses | Proceeds | % of Total | |
| Loan Amount(1): | $2,300,000,000 | 100.0% | Loan Payoff: | $1,606,000,000 | 69.8% | |
| Closing Costs | $41,107,676 | 1.8% | ||||
| Return of Equity | $652,892,324 | 28.4% | ||||
| Total Sources: | $2,300,000,000 | 100.0% | Total Uses: | $2,300,000,000 | 100.0% | |
| (1) | The General Motors Building Mortgage Loan is part of the General Motors Building Whole Loan (as defined below), which is comprised of multiplepari passusenior promissory notes with an aggregate principal balance of $1,470,000,000 and fourpari passujunior promissory notes with an aggregate principal balance of $830,000,000. The Cut-off Date Balance per SF, Maturity Date Balance per SF, UW NOI Debt Yield, UW NOI Debt Yield at Maturity, UW NCF DSCR, Cut-off Date LTV Ratio and Maturity Date LTV Ratio numbers presented above are based on the aggregate principal balance of the promissory notes comprising the General Motors Building Senior Loan (as defined below), without regard to the General Motors Building Subordinate Companion Loan (as defined below). The Cut-off Date Balance per SF, Maturity Date Balance per SF, UW NOI Debt Yield, UW NOI Debt Yield at Maturity, UW NCF DSCR, Cut-off Date LTV Ratio and Maturity Date LTV Ratio numbers based on the entire $2,300,000,000 General Motors Building Whole Loan are $1,156, $1,156, 9.9%, 9.9%, 2.77x, 47.9% and 47.9%, respectively. |
| (2) | Defeasance of the General Motors Building Whole Loan is permitted at any time after the earlier of (i) June 7, 2020, or (ii) two years from the closing date of the securitization that includes the last note of the General Motors Building Whole Loan to be securitized. The assumed lockout period of 25 payments is based on the closing date of this transaction in July 2017. |
| (3) | See “The Mortgage Loan,” and “Additional Secured Indebtedness (not including trade debts)” below for further discussion of additional debt. |
| (4) | See “Escrows and Reserves” below for further discussion of reserve requirements. |
| (5) | Boston Properties Limited Partnership, one of the General Motors Building sponsors, has provided a guaranty for free rent and outstanding TI/LC obligations. |
| (6) | See “Operating History and Underwritten Net Cash Flow” below for an explanation of the increase in UW NOI over Most Recent NOI. Most Recent Occupancy includes Under Armour, which has an executed lease but is not expected to be in occupancy at the General Motors Building Property until January 1, 2019. |
The Mortgage Loan.The largest mortgage loan (the “General Motors Building Mortgage Loan”) is part of a whole loan (the “General Motors Building Whole Loan”) in the total original principal amount of $2,300,000,000. The General Motors Building Whole Loan is secured by a first priority fee mortgage encumbering a mixed use property in New York, New York (the “General Motors Building Property”). The General Motors Building Whole Loan was co-originated by Morgan Stanley Bank, N.A (“MSBNA”), Deutsche Bank AG, New York Branch (“DBNY”), Citigroup Global Markets Realty Corp (“CGMRC”) and Wells Fargo Bank, National Association (“WFB”) (collectively, the “General Motors Building Co-Originators”). The General Motors Building Whole Loan is comprised of (i) a senior loan, comprised of multiple senior notes that arepari passu with each other, with an outstanding principal balance of $1,470,000,000 (collectively, the “General Motors Building Senior Loan”) and (ii) a subordinate companion loan, comprised of four subordinate notes that arepari passuwith each other, with an outstanding principal balance of $830,000,000 (collectively, the “General Motors Building Subordinate Companion Loan”), each as described below. Promissory Note A-1-C2 and Promissory Note A-1-C3-1, which are being contributed by
This is not a research report and was not prepared by the Underwriters’ research departments. Please see additional important information and qualifications at the end of this Term Sheet.
| T-33 |
| BANK 2017-BNK6 | General Motors Building |
Morgan Stanley Mortgage Capital Holdings LLC (“MSMCH”), in the aggregate original principal amount of $59,800,000 and Promissory Note A-4-A3, which is being contributed by WFB, in the original principal amount of $30,200,000, represent the General Motors Building Mortgage Loan and will be included in the BANK 2017-BNK6 securitization trust. Of the remaining seniorpari passuPromissory Notes (collectively, the “General Motors Building Non-ServicedPari PassuCompanion Loans”), the General Motors Building Non-ServicedPari PassuCompanion Loans evidenced by Promissory Notes A-1-S, A-2-S, A-3-S, A-4-S, A-1-C1, A-2-C1, A-3-C1 and A-4-C1 in the aggregate original principal balance of $725,000,000, and the entire General Motors Building Subordinate Companion Loan were contributed to the BXP 2017-GM securitization trust. The General Motors Building Whole Loan will be serviced pursuant to the trust and servicing agreement for the BXP 2017-GM securitization trust. After origination of the General Motors Building Whole Loan, the General Motors Building Co-Originators sold $85,000,000 of the General Motors Building Non-ServicedPari PassuCompanion Loans to Cantor Commercial Real Estate Lending, L.P. (“CCRE”). The remaining General Motors Building Non-ServicedPari PassuCompanion Loans are held by MSBNA, DBNY, CGMRC and WFB, or affiliates thereof, and are expected to be contributed to one or more future securitization transactions or may be otherwise transferred at any time. See“Description of the Mortgage Pool—The Whole Loans—The General Motors Building Pari Passu A/B Whole Loan”and“Pooling and Servicing Agreement—Servicing of the Non-Serviced Mortgage Loans”in the Preliminary Prospectus.
| General Motors Building Senior Loan | ||
$725,000,000 BXP 2017-GM | $90,000,000 BANK 2017-BNK6 | $655,000,000 General Motors Building Non-ServicedPari PassuCompanion Loans(1) |
| General Motors Building Subordinate Companion Loan | ||
$830,000,000 BXP 2017-GM(2) | ||
| (1) | After origination of the General Motors Building Whole Loan, the General Motors Building Co-Originators sold $85,000,000 of the General Motors Building Non-ServicedPari Passu Companion Loans to CCRE. |
| (2) | Note A-1-S is the controlling note and BXP 2017-GM is the controlling noteholder. |
The proceeds of the General Motors Building Whole Loan were used to refinance a previous loan of $1,606,000,000 secured by the General Motors Building Property, return equity of approximately $652,892,324 to the General Motors Building Borrower and pay closing costs of $41,107,676.
The Borrower and the Sponsor. The borrower is 767 Fifth Partners LLC (the “General Motors Building Borrower”), a single-purpose Delaware limited liability company with two independent directors. The General Motors Building Whole Loan sponsors are Boston Properties Limited Partnership (“BPLP”), 767 LLC and Sungate Fifth Avenue LLC. Other than the General Motors Building Borrower, no person or entity guarantees the nonrecourse carveouts or provides environmental indemnities with respect to the General Motors Building Whole Loan.
Boston Properties, Inc. (“Boston Properties”) is a self-administered and self-managed publicly traded real estate investment trust that conducts its business through BPLP, which in turn holds all of Boston Properties’ interests. BPLP is one of the largest owners, managers and developers of Class A office properties in the United States, with a significant presence in five markets: Boston, Los Angeles, New York, San Francisco and Washington, D.C. As of May 31, 2017, BPLP reported that it owned or had interests in 175 commercial real estate properties, aggregating approximately 48.2 million net rentable SF.
New York is Boston Properties’ largest market by net operating income, generating a reported annualized net operating income of approximately $452 million as of the first quarter of 2017. For the same time period, Boston Properties reported that its New York central business district portfolio was 94.3% leased at an average rental rate of $102.50 PSF. Boston Properties has over 3.4 million SF of office space under development nationwide. Boston Properties’ office buildings under development are 65% pre-leased and include Salesforce Tower in San Francisco, California, which is expected to be the tallest building in San Francisco when complete.
The Property. The General Motors Building Property is a 50-story mixed use office and retail building comprised of approximately 1,989,983 total SF, including approximately 187,954 SF of retail space in the two-story retail base that wraps around the building and the below grade concourse. Originally developed in 1968 for the General Motors Corporation to serve as its headquarters, the General Motors Building Property occupies the entire city block bound by 58th Street, 59th Street, Madison Avenue and Fifth Avenue on the southeast corner of Central Park. The Fifth Avenue frontage of the General Motors Building Property features an open plaza with seating and is topped by the glass Apple cube, which serves as the entrance to Apple’s store in the below grade concourse. Because of its location, the General Motors Building Property features excellent light and unobstructed views of Central Park from every office floor.
The General Motors Building Property is 95.0% leased as of June 1, 2017 by a diverse roster of office and retail tenants. Approximately 54.0% of the General Motors Building Property’s net rentable area (“NRA”) is leased by investment grade or large law firm tenants, which contribute approximately 49.0% of the General Motors Building Property’s underwritten gross rent. The General Motors Building Property serves as the global headquarters for Weil, Gotshal & Manges (“Weil”) (24.6% of NRA, 19.3% of underwritten rent), headquarters for Aramis (15.1% of NRA, 10.3% of underwritten rent), is expected to serve as a flagship retail location for Under Armour (2.5% of NRA, 11.3% of underwritten rent, lease expected to commence in January 2019), and serves as BAMCO’s headquarters (5.3% of NRA, 8.0% of underwritten rent) and Apple’s flagship retail store (5.3% of NRA, 6.8% of underwritten rent). The top five tenants by underwritten rent at the General Motors Building Property occupy 52.8% of NRA and comprise 55.6% of the underwritten rent. The weighted average remaining lease term for the top five tenants is approximately 11.7 years, and the weighted average remaining lease term for the entire General Motors Building Property is approximately 9.4 years.
The General Motors Building Property has retained two original office tenants – Weil and Aramis, which represent a combined 39.7% of NRA and 29.6% of underwritten rent – since it was constructed in 1968. The majority of the General Motors Building Property’s annual underwritten rent comes from office tenants (73.2%), with the remaining underwritten rent coming from retail tenants (26.3%) and storage space (0.4%).
This is not a research report and was not prepared by the Underwriters’ research departments. Please see additional important information and qualifications at the end of this Term Sheet.
| T-34 |
| BANK 2017-BNK6 | General Motors Building |
Major Tenants.
Weil, Gotshal & Manges (489,867 SF, 24.6% of NRA, 19.3% of underwritten rent). Weil, an international corporate law firm, has its global headquarters at the General Motors Building Property. Founded in 1931, Weil currently has over 1,100 lawyers in 19 offices worldwide. Weil’s specialty areas include litigation, corporate, restructuring, tax and benefits. Weil was ranked #15 in a legal industry publication ranking for profits per partner for 2016. Weil is an original tenant at the General Motors Building Property, having been in continuous occupancy since 1968 and has expanded its space multiple times in its 49 years at the General Motors Building Property. Weil most recently extended its lease for 389,843 SF of its space through August 2034 at an initial base rent of $114.00 PSF, above its current in-place weighted average gross rent of $92.37 PSF. BPLP provided a payment guaranty for the gap rent between Weil’s current rent and Weil’s underwritten rent which commences in September 2019. Weil has the right to terminate (a) its 20,791 SF of below grade storage space, at any time, and (b) either (i) its 38,900 SF of space on the 22nd floor or (ii) its 39,900 SF space on the 32nd floor, on or after August 31, 2022.
Aramis (299,895 SF, 15.1% of NRA, 10.3% of underwritten rent). The General Motors Building Property serves as headquarters for Aramis, a brand launched in 1964 by The Estée Lauder Companies. Aramis was the first prestige men’s fragrance to be sold in department stores and continues to be engaged in the men’s fragrance and grooming retail category. Aramis is an original tenant at the General Motors Building Property, having been in continuous occupancy since 1968. Aramis currently subleases 9,725 SF of its space that is noncontiguous on the 46th floor, and has two five-year extension options remaining, each with eighteen months’ notice at 95% of fair market rents.
Under Armour (49,582 SF, 2.5% of NRA, 11.3% of underwritten rent).Under Armour is a developer, manufacturer and retailer of performance apparel, footwear and accessories for men, women and youth. Under Armour’s space at the General Motors Building Property is expected to be used as its flagship “Under Armour Brand House” retail store. Under Armour’s lease commences on the substantial completion of landlord’s work, which is projected to be January 1, 2019. Under Armour has the right to terminate its lease if its space is not delivered by July 1, 2019 and the failure to deliver the space is not due to tenant-caused delays or force majeure. Under Armour’s space is currently occupied by Apple while the Apple Cube Space (as defined below) and expansion is under construction. Under Armour is not currently in occupancy or paying rent. BPLP provided a payment guaranty with respect to Under Armour’s gap rent (for the difference between the rent being paid by Apple for the space anticipated to be occupied by Under Armour and the rent that will be due upon commencement of Under Armour’s lease) and free rent. Under Armour will have 12 months of free rent, equal to $30,000,000, beginning after its lease commencement date.
BAMCO(105,579 SF, 5.3% of NRA, 8.0% of underwritten rent).BAMCO is a privately owned investment manager that provides services to investment companies and manages separate client-focused equity portfolios. BAMCO is a subsidiary of Baron Capital Group Inc., both of which are headquartered at the General Motors Building Property. BAMCO recently executed an early renewal to extend its lease through May 2035. BAMCO has executed a renewal to extend its lease to May 2035, commencing in January 2024 for a weighted average base rent of approximately $201.65 PSF. BAMCO’s in place weighted average base rent is approximately $147.77 PSF. BPLP provided a payment guaranty with respect to BAMCO’s gap rent between closing and the renewal rent commencing in January 2024. After the expiry of the BPLP guaranty, the lower of market or in place rent has been underwritten.
Apple (105,748 SF, 5.3% of NRA, 6.8% of underwritten rent). Apple is a designer, developer and retailer of consumer electronics, computer software and online services headquartered in Cupertino, California. Apple has its flagship retail location at the General Motors Building Property underneath a 35-foot glass cube at the center of the pedestrian plaza on the Fifth Avenue side of the General Motors Building Property (the “Apple Cube Space”). Apple recently executed an extension for 102,994 SF through January 2034 and is currently occupying the former FAO Schwarz space on the 58th Street side of the General Motors Building Property, while its store undergoes a renovation to expand its space by approximately 34,000 SF, increasing ceiling heights by lowering the floor approximately five feet and adding storage space and back of house capacity by expanding into formerly dark space located below grade. Apple is obligated to vacate its temporary space by December 31, 2018 and has the right to terminate its entire lease if its expanded Apple Cube space is not delivered by February 3, 2020, subject to force majeure. Apple leases 2,754 SF through December 31, 2018 and 102,994 SF through January 1, 2034. Apple has 17 months of free rent, equal to $9,562,500, on its 21,907 SF of expansion space commencing in August 2017.
This is not a research report and was not prepared by the Underwriters’ research departments. Please see additional important information and qualifications at the end of this Term Sheet.
| T-35 |
| BANK 2017-BNK6 | General Motors Building |
The following table presents certain information relating to the leases at the General Motors Building Property:
| Tenant Summary(1) | |||||||
| Tenant Name | Credit Rating (Fitch/Moody’s/S&P)(2) | Tenant SF | Approximate % of SF | Annual UW Rent(3) | Annual UW Rent PSF(3)(4) | % of Total Annual UW Rent | Lease Expiration |
| Major Tenants | |||||||
| Weil, Gotshal & Manges(3)(5) | NR/NR/NR | 489,867 | 24.6% | $51,278,352 | $104.68 | 19.3% | 8/31/2034 |
| Aramis(6) | NR/A2/A+ | 299,895 | 15.1% | $27,530,236 | $91.80 | 10.3% | 3/31/2020 |
| Under Armour(7) | NR/Baa2/BB+ | 49,582 | 2.5% | $29,999,945 | $605.06 | 11.3% | 6/30/2034 |
| BAMCO(8) | NR/NR/NR | 105,579 | 5.3% | $21,290,010 | $201.65 | 8.0% | 5/31/2035 |
| Apple(3)(9) | NR/Aa1/AA+ | 105,748 | 5.3% | $18,057,615 | $170.76 | 6.8% | 1/31/2034 |
| Perella Weinberg | NR/NR/NR | 130,155 | 6.5% | $12,392,687 | $95.21 | 4.7% | 1/31/2022 |
| JP Morgan Chase | A+/A3/A- | 7,500 | 0.4% | $10,980,750 | $1,464.10 | 4.1% | 5/31/2021 |
| Cartier | NR/NR/NR | 11,745 | 0.6% | $8,891,545 | $757.05 | 3.3% | 12/31/2018 |
| GM(10) | BBB/Baa3/BBB | 76,200 | 3.8% | $7,010,400 | $92.00 | 2.6% | 3/31/2020 |
| Balyasny Asset Management(11) | NR/NR/NR | 63,606 | 3.2% | $8,150,250 | $128.14 | 3.1% | 12/31/2027 |
| Subtotal/Wtd. Avg. | 1,339,877 | 67.3% | $195,581,790 | $145.97 | 73.4% | ||
| Other Tenants | 550,242 | 27.7% | $70,735,275 | $128.55 | 26.6% | ||
| Vacant Office Space | 99,864 | 5.0% | $0 | 0.0% | |||
| Total/Wtd. Avg. | 1,989,983 | 100.0% | $266,317,065 | $140.90 | 100.0% | ||
| (1) | Information is based on the underwritten rent roll as of June 1, 2017. |
| (2) | Certain ratings are those of the parent company whether or not the parent guarantees the lease. |
| (3) | Annual UW Rent and Annual UW Rent PSF exclude $11,269,632 ($5.66 PSF) of straight line rents through the tenants’ respective lease terms associated with Weil ($6,010,916) and Apple ($4,107,800), as well as four other tenants, which are included in the “Cash Flow Analysis” table below. |
| (4) | Wtd. Avg. Annual UW Rent PSF excludes vacant space. |
| (5) | Weil leases 100,024 SF of space through August 31, 2019 and 389,843 SF through August 31, 2034. Weil has the right to terminate (a) its 20,791 SF of below grade storage space, at any time, and (b) either (i) its 38,900 SF of space on the 22nd floor or (ii) its 39,900 SF space on the 32nd floor, on or after August 31, 2022. Weil most recently extended its lease for 389,843 SF of its space through August 2034 at an initial base rent of $114.00 PSF, above its current in place weighted average gross rent of $92.37 PSF. BPLP provided a payment guaranty for the gap rent between Weil’s current rent and Weil’s underwritten rent which commences in September 2019. |
| (6) | Aramis subleases 9,725 SF of its space on the 46th floor to GF Capital Management at $107.00 PSF. |
| (7) | Under Armour’s lease commences on the substantial completion of landlord’s work, which is projected to be January 1, 2019. Under Armour has the right to terminate its lease if its space is not delivered by July 1, 2019 and the failure to deliver the space is not due to tenant-caused delays or force majeure. Under Armour’s space is currently occupied by Apple while the Apple Cube Space and expansion is under construction. Under Armour is not currently in occupancy or paying rent. BPLP provided a payment guaranty with respect to Under Armour’s gap rent (for the difference between the rent being paid by Apple for the space anticipated to be occupied by Under Armour and the rent that will be due upon commencement of Under Armour’s lease) and free rent. Under Armour has 12 months of free rent, equal to $30,000,000, beginning after its lease commencement date. |
| (8) | BAMCO has executed a renewal to extend its lease to May 2035, commencing in January 2024 for a weighted average base rent of approximately $201.65 PSF. BAMCO’s in place weighted average base rent is approximately $147.77 PSF. BPLP provided a payment guaranty with respect to BAMCO’s gap rent between closing and the renewal rent commencing in January 2024. After the expiry of the BPLP guaranty, the lower of market or in place rent has been underwritten. |
| (9) | Apple is temporarily occupying the space expected to be occupied by Under Armour once Under Armour’s lease commences, while the Apple Cube Space and expansion is under construction. Apple is obligated to vacate its temporary space by December 31, 2018 and has the right to terminate its entire lease if its space is not delivered by February 3, 2020, subject to force majeure. Apple leases 2,754 SF through December 31, 2018 and 102,994 SF through January 1, 2034. Apple has 17 months of free rent, equal to $9,562,500, on its 21,907 SF of expansion space commencing in August 2017. BPLP provided a payment guaranty with respect to Apple’s free rent. |
| (10) | GM subleases 38,100 SF on the 14th floor to Grosvenor Capital Management Holdings, LLLP at $80.00 PSF and 38,100 SF on the 16th floor to Reservoir Operations, L.P. at $85.00 PSF. |
| (11) | Balyasny Asset Management may terminate its lease effective December 31, 2022 with a minimum of one year’s notice and payment of a termination fee. Balyasny Asset Management has six months of free rent on its 34th floor space, totaling $1,481,625. BPLP has provided a payment guaranty for Balyasny Asset Management’s free rent. |
This is not a research report and was not prepared by the Underwriters’ research departments. Please see additional important information and qualifications at the end of this Term Sheet.
| T-36 |
| BANK 2017-BNK6 | General Motors Building |
The following table presents certain information relating to the lease rollover schedule at the General Motors Building Property:
| Lease Rollover Schedule(1)(2) | ||||||||
| Year | # of Leases Rolling | SF Rolling | % of Total SF Rolling | Cumulative % of Total SF Rolling | Total UW Rent Rolling(3) | UW Rent PSF Rolling(3)(4) | % of Total Rent Rolling | Cumulative % of Total Rent Rolling |
| 2017 | 1 | 11,226 | 0.6% | 0.6% | $993,600 | $88.51 | 0.4% | 0.4% |
| 2018 | 3 | 52,373 | 2.6% | 3.2% | $15,456,871 | $295.13 | 5.8% | 6.2% |
| 2019 | 2 | 106,096 | 5.3% | 8.5% | $9,123,113 | $85.99 | 3.4% | 9.6% |
| 2020 | 6 | 532,016 | 26.7% | 35.3% | $50,741,831 | $95.38 | 19.1% | 28.7% |
| 2021 | 3 | 35,486 | 1.8% | 37.0% | $16,570,250 | $466.95 | 6.2% | 34.9% |
| 2022 | 2 | 144,898 | 7.3% | 44.3% | $14,412,478 | $99.47 | 5.4% | 40.3% |
| 2023 | 1 | 2,747 | 0.1% | 44.5% | $1,870,937 | $681.08 | 0.7% | 41.0% |
| 2024 | 1 | 38,100 | 1.9% | 46.4% | $3,429,000 | $90.00 | 1.3% | 42.3% |
| 2025 | 2 | 66,347 | 3.3% | 49.7% | $6,783,128 | $102.24 | 2.5% | 44.8% |
| 2026 | 2 | 48,201 | 2.4% | 52.1% | $9,096,994 | $188.73 | 3.4% | 48.2% |
| 2027 | 5 | 99,324 | 5.0% | 57.1% | $12,273,236 | $123.57 | 4.6% | 52.9% |
| Thereafter | 10 | 753,305 | 37.9% | 95.0% | $125,565,627 | $166.69 | 47.1% | 100.0% |
| Vacant | 0 | 99,864 | 5.0% | 100.0% | $0 | $0.00 | 0.0% | 100.0% |
| Total/Wtd. Avg. | 38 | 1,989,983 | 100.0% | $266,317,065 | $140.90 | 100.0% | ||
| (1) | Information is based on the underwritten rent roll as of June 1, 2017. |
| (2) | Certain tenants may have lease termination options that are exercisable prior to the stated expiration date of the subject lease or leases which are not considered in the lease rollover schedule. |
| (3) | Total UW Rent Rolling and UW Rent PSF Rolling exclude $11,269,632 of total underwritten straight line rents associated with Weil ($6,010,916), which leases 100,024 SF of space through August 31, 2019 and 389,843 SF through August 31, 2034, and Apple ($4,107,800) which leases 2,754 SF through December 31, 2018 and 102,994 SF through January 1, 2034, as well as four other tenants. |
| (4) | Wtd. Avg. Annual UW Rent PSF Rolling excludes vacant space. |
The Market. The General Motors Building Property is located on the entire city block bound by Fifth Avenue and Madison Avenue between East 58th Street and East 59th Street. This area of Midtown Manhattan is known as the Madison/Fifth Avenue subdistrict. The General Motors Building Property is surrounded by many of New York’s landmarks, restaurants, hotels, shops and tourist attractions, made accessible by the presence of several transportation hubs. The General Motors Building Property is located within the boundaries of the Plaza District, which is generally bound by 47th Street to the south and 65th Street to the north, and from Avenue of the Americas to the East River.
As of the first quarter of 2017, the three office statistical areas that comprise the Plaza District contain 81.1 million SF of Class A office space, 6.4 million SF of Class B office space and 481,485 SF of Class C office space. Historically, the Plaza District has generated the highest rents in Midtown Manhattan due to the demand generated by its location and quality space, according to the appraisal. As of the first quarter of 2017, the Class A office space in the Plaza District had a direct vacancy rate of 9.4% and average asking rents of $99.69 PSF, above the direct primary Midtown Manhattan average of $88.93 PSF.
According to the appraisal, as of the first quarter of 2017, the Madison/Fifth Avenue subdistrict consisted of approximately 19.8 million SF of Class A office space and had a direct vacancy rate of 11.0% and overall direct weighted average asking rents of $110.15 PSF. The Class A overall vacancy rate in the Madison/Fifth Avenue subdistrict dropped by 2.0% from 13.3% in the first quarter of 2016 to 11.3% in the first quarter of 2017, the lowest quarterly total since the first quarter of 2008. Direct weighted average Class A rental rates increased by $5.10 PSF over the same time period.
This is not a research report and was not prepared by the Underwriters’ research departments. Please see additional important information and qualifications at the end of this Term Sheet.
| T-37 |
| BANK 2017-BNK6 | General Motors Building |
The following table presents certain information relating to comparable office leases for the General Motors Building Property:
| Comparable Office Lease Summary | |||||||
| Address | 590 Madison Avenue | 520 Madison Avenue | 375 Park Avenue | 9 West 57th Street | 650 Madison Avenue | 450 Park Avenue | 375 Park Avenue |
| Year Built | 1982 | 1982 | 1958 | 1971 | 1987 | 1972/2003 | 1958 |
| Office NRA (SF) | 1,016,413 | 849,600 | 830,009 | 1,500,000 | 521,544 | 247,242 | 830,009 |
| No. Stories | 43 | 43 | 38 | 50 | 27 | 33 | 38 |
| Lease Information | |||||||
| Tenant Name | Cemex | CIC Union | Servcorp NYC | Qatar Investment Authority | Carson Family Trust | Banco Bradesco | Strategic Asset Services |
| Floor(s) Leased | Part 27th | Entire 36th-37th | Part 26th | Part 38th | Part 26th | Entire 32nd-33rd | Part 20th |
| Lease Date | Feb. 2017 | Jan. 2017 | Jan. 2017 | Jan. 2017 | Jan. 2017 | Dec. 2016 | May 2016 |
| Term (Years) | 15.0 | 10.0 | 10.0 | 10.0 | 10.0 | 13.0 | 7.0 |
| Lease Type | Gross | Gross | Gross | Gross | Gross | Gross | Gross |
| Tenant Size | 5,903 | 46,822 | 9,572 | 14,000 | 4,002 | 21,822 | 16,000 |
| Rent PSF | $145.00 | $127.00 | $173.00 | $180.00 | $120.00 | $149.00 | $165.00 |
| Rent Steps | $155.00 (Yr. 5) | $136.00 (Yr. 6) | $183.00 (Yr. 6) | $185.00 (Yr. 6) | $130.00 (Yr. 6) | $159.00 (Yr. 6) | $170.00 (Yr. 5) |
| $165.00 (Yr. 10) | $145.00 (Yr. 11) | ||||||
| Free Rent (Months) | 8 | 13 | 4 | 6 | 6 | 11 | 3 |
| Workletter (PSF) | $75.00 | $77.50 | $40.00 | $65.00 | $65.00 | $70.00 | $35.00 |
| Adjustments | |||||||
| Rent Concessions | $2.89 | ($1.81) | $14.53 | $9.50 | $6.50 | $0.96 | $22.68 |
| Effective Adjusted Rent PSF | $147.89 | $125.19 | $187.53 | $189.50 | $126.50 | $149.96 | $187.68 |
Source:Appraisal.
The following table presents certain information relating to comparable retail leases for the General Motors Building Property:
| Comparable Retail Lease Summary | ||||||
| Address | 723 Madison Avenue | 650 Fifth Avenue | 680 Madison Avenue | 683 Fifth Avenue | 685 Fifth Avenue | 683 Madison Avenue |
| Tenant Name | Paule Ka | Nike | Tom Ford | Stuart Weitzman | Coach | Bally’s |
| Frontage | Madison Avenue | Fifth Avenue & 52nd Street | 61stStreet & Madison Avenue | Fifth Avenue | Fifth Avenue & 54th Street | Madison Avenue & 61st Street |
| Lease Date | December 2016 | December 2016 | August 2016 | June 2016 | February 2016 | January 2016 |
| Original Term (Yrs) | 10.0 | 15.5 | 10.0 | 10.0 | 10.0 | 10.0 |
| Lease Type | Gross | Gross | Gross | Gross | Gross | Gross |
| Tenant Size (SF) | 867 Grade | 7,008 Grade | 3,470 Grade | 1,281 Grade | 4,627 Grade | 3,013 Grade |
| 415 LL | 4,706 LL | 5,000 2nd | 5,247 LL | |||
| 379 2nd | 9,500 2nd | 1,601 Mezz | ||||
| 12,000 3rd | 6,337 2nd | |||||
| 12,000 4th | 6,337 3rd | |||||
| 12,000 5th | ||||||
| 12,000 6th | ||||||
| Base Rent | $1,452,225 | $33,190,000 | $6,300,000 | $5,000,000 | $21,000,000 | $5,001,580 |
| Base Rent (PSF) | $1,600 Grade | $3,500 Grade | $1,650 Grade | $3,903 Grade | $3,550 Grade | $1,660 Grade |
| $50 LL | $50 LL | $115 2nd | $150 LL | |||
| $125 2nd | $350 2nd | $200 Mezz | ||||
| $200 3rd | $400 2nd | |||||
| $75 4th | $150 3rd | |||||
| $75 5th | ||||||
| $75 6th | ||||||
| Escalations | N/A | % Incr. / Yr. | N/A | % Incr. / Yr. | 9% Incr. / 3 Yrs. | % Incr. / Yr. |
| Free Rent (Months) | 5 | 6 | 6 | 6 | 9 | 6 |
| Workletter (PSF) | $0.00 | $508.00 | $1,534.83 | $0.00 | $869.60 | $0.00 |
Source:Appraisal.
This is not a research report and was not prepared by the Underwriters’ research departments. Please see additional important information and qualifications at the end of this Term Sheet.
| T-38 |
| BANK 2017-BNK6 | General Motors Building |
The following table presents certain information relating to competitive office properties with respect to the General Motors Building Property:
| Competitive Property Summary | |||||||
| Direct | Sublease | % | % | Direct | |||
| Office Area | Available | Available | Occupied | Occupied | Asking Rent | ||
| Property Address | (SF) | SF | SF | (Direct) | (Total) | Low | High |
| 650 Madison Avenue | 521,544 | 18,094 | 0 | 96.5% | 96.5% | $120.00 | $130.00 |
| 660 Madison Avenue | 239,113 | 0 | 6,676 | 100.0% | 97.2% | N/A | N/A |
| 667 Madison Avenue | 267,135 | 59,435 | 0 | 77.8% | 77.8% | $135.00 | $195.00 |
| 712 Fifth Avenue | 457,281 | 31,408 | 9,813 | 93.1% | 91.0% | $85.00 | $140.00 |
| 375 Park Avenue | 830,009 | 7,650 | 0 | 99.1% | 99.1% | $150.00 | $180.00 |
| 390 Park Avenue | 260,000 | 36,979 | 10,726 | 85.8% | 81.7% | $185.00 | $185.00 |
| 9 West 57th Street | 1,500,000 | 416,505 | 0 | 72.2% | 72.2% | $110.00 | $200.00 |
| Total/Wtd. Avg. | 4,075,082 | 570,071 | 27,215 | 86.0% | 85.3% | $85.00 | $200.00 |
Source:Appraisal.
This is not a research report and was not prepared by the Underwriters’ research departments. Please see additional important information and qualifications at the end of this Term Sheet.
| T-39 |
| BANK 2017-BNK6 | General Motors Building |
Operating History and Underwritten Net Cash Flow.The following table presents certain information relating to the historical operating performance and the Underwritten Net Cash Flow at the General Motors Building Property:
| Cash Flow Analysis | ||||||
| 2013 | 2014 | 2015 | 2016 | UW(1) | UW PSF | |
| Base Rent | $188,477,818 | $197,172,437 | $193,759,747 | $206,851,492 | $266,317,065 | $133.83 |
| Total Recoveries | $29,544,790 | $35,800,858 | $38,501,366 | $39,027,298 | $27,629,542 | $13.88 |
| Vacant Space | $0 | $0 | $0 | $0 | $16,547,756 | $8.32 |
| Mark to Market(2) | $0 | $0 | $0 | $0 | $17,100,676 | $8.59 |
| Straight Line Rent(3) | $0 | $0 | $0 | $0 | $11,269,632 | $5.66 |
| Apple Percentage Rent(4) | $13,435,678 | $11,075,213 | $9,266,920 | $5,301,583 | $4,921,916 | $2.47 |
| Other Income(5) | $20,814,262 | $13,270,276 | $8,240,130 | $5,169,082 | $7,525,587 | $3.78 |
| Less Vacancy | $0 | $0 | $0 | $0 | ($16,547,756) | ($8.32) |
| Effective Gross Income | $252,272,548 | $257,318,784 | $249,768,162 | $256,349,455 | $334,764,418 | $168.22 |
| Total Expenses | $84,260,952 | $92,003,166 | $99,256,499 | $104,924,109 | $107,458,009 | $54.00 |
| Net Operating Income | $168,011,596 | $165,315,617 | $150,511,664 | $151,425,346 | $227,306,409 | $114.23 |
| Capital Expenditures | $0 | $0 | $0 | $0 | $397,997 | $0.20 |
| TI/LC | $0 | $0 | $0 | $0 | $5,363,618 | $2.70 |
| Net Cash Flow | $168,011,596 | $165,315,617 | $150,511,664 | $151,425,346 | $221,544,794 | $111.33 |
| Occupancy % | 96.9% | 98.5% | 96.7% | 96.3% | 95.0%(6) | |
| NOI DSCR(7) | 3.29x | 3.23x | 2.94x | 2.96x | 4.45x | |
| NCF DSCR(7) | 3.29x | 3.23x | 2.94x | 2.96x | 4.33x | |
| NOI Debt Yield(7) | 11.4% | 11.2% | 10.2% | 10.3% | 15.5% | |
| NCF Debt Yield(7) | 11.4% | 11.2% | 10.2% | 10.3% | 15.1% | |
| (1) | UW Base Rent reflects contractual rents as of June 1, 2017, and includes rent steps through June 2018. Various adjustments have been made to the in place rents which are detailed below. |
| i. | Apple is currently undergoing a major renovation to their Apple Cube Space. During the renovations, Apple is occupying the former FAO Schwarz space as temporary space until the earlier of the completion of their renovations or the outside kick out date of December 31, 2018. Base rent for Apple as of January 2019 has been underwritten in conjunction with the Under Armour lease commencement date. Apple is currently paying annual contractual rent of $12,500,004 on the temporary space, which steps up to $24,000,000 annually in August 2018 in addition to their existing lease for the Apple Cube Space. Lenders are underwriting $18,057,615 in base rent and $19,429,881 in gross rent (base rent plus recoveries) for Apple. |
| ii. | Under Armour has executed a lease commencing in January 2019 for the space that is currently occupied by Apple as temporary space. Contractual rent has been underwritten for Under Armour based on the rent due date as of January 2019 when the lease is expected to commence. BPLP provided a payment guaranty for the gap rent between the rent Apple is currently paying to occupy its temporary space and the rent that will be due under Under Armour’s lease once such lease commences. |
| iii. | Weil has executed a renewal for 389,843 SF of its space through August 2034, commencing in September 2019. September 2019 rents have been underwritten for this space. For the space not extended, contractual in-place rent inclusive of 12 months’ rent steps and existing recoveries has been underwritten. BPLP provided a payment guaranty for the gap rent between Weil’s current rent and their underwritten rent which commences in September 2019. |
| iv. | BAMCO has executed a renewal to extend their lease to May 2035, commencing in January 2024 for a weighted average base rent of approximately $201.65 PSF. BAMCO’s in place weighted average base rent is approximately $147.77 PSF. The gap rent between closing and the renewal rent commencing in January 2024 is guaranteed by BPLP. After the expiry of the BPLP guaranty, the lower of market or in place rent has been underwritten. |
| v. | Continental Grain is currently subleasing from GM and has executed a direct lease commencing in April 2020 on the expiration of their existing sublease. GM is currently paying $92.00 PSF in base rent. Continental Grain’s direct rent in 2020 of $110.00 PSF has been underwritten. BPLP provided a guaranty for the gap rent until 2020. |
| (2) | Rents have been marked up or down, as applicable, based on the appraiser’s conclusion of market rents. |
| (3) | Based on net present value of future contractual rent steps after June 1, 2018 for investment grade tenants and law firm tenants included in a listing of the largest 100 United States law firms through the tenants’ lease expirations (which in the case of certain tenants, expire beyond the loan term). Tenants with underwritten straight line rents include Weil ($6,010,916), Apple ($4,107,800) and four other tenants. |
| (4) | Apple has an abatement period for its percentage rent component that commences in October 2017 until Apple moves into its expanded/redeveloped Apple Cube Space. Once Apple has moved back into its space, it will be required to pay 2.25% in percentage rent above $200,000,000 a year in sales. BPLP provided a guaranty for the estimated gap percentage rent. UW Apple Percentage Rent is equal to the average Apple sales from 2013 through 2016 over the new $200,000,000 breakpoint and the 2.25% percentage rent. |
| (5) | Other Income primarily consists of net antenna income, direct utilities and service income. |
| (6) | UW Occupancy % includes Under Armour, which has an executed lease but is not expected to be in occupancy at the General Motors Building Property until January 1, 2019. |
| (7) | The debt service coverage ratios and debt yields are based on the General Motors Building Senior Loan, and exclude the General Motors Building Subordinate Companion Loan. |
This is not a research report and was not prepared by the Underwriters’ research departments. Please see additional important information and qualifications at the end of this Term Sheet.
| T-40 |
| BANK 2017-BNK6 | General Motors Building |
Escrows and Reserves. At origination, BPLP provided a guaranty in lieu of depositing $107,946,183 for existing TI/LCs and $161,161,013 for existing gap rent and free rent obligations. The loan documents do not require ongoing monthly deposits for real estate taxes and insurance premiums so long as no Cash Management Sweep Period (as defined below) has occurred and is continuing. During a Cash Management Sweep Period, monthly reserves for real estate taxes and insurance (unless the General Motors Building Property is insured as a part of a blanket policy reasonably acceptable to the lenders) equal to 1/12 of the amount that the lenders reasonably estimate will be due over the next twelve months are required to be collected.
Lockbox and Cash Management. The General Motors Building Whole Loan is structured with a hard lockbox and springing cash management. The related loan documents require the General Motors Building Borrower to direct tenants to pay rent directly to a lender-controlled lockbox account and require all rents received by the General Motors Building Borrower or the property manager with respect to the General Motors Building Property to be deposited into such lockbox account by the end of the fifth business day following receipt. All funds in the lockbox account are required to be swept on a daily basis into (i) if no Cash Management Sweep Period then exists, the General Motors Building Borrower’s operating account or (ii) if a Cash Management Sweep Period exists, a lender-controlled cash management account. Amounts on deposit in the cash management account are required to be used to fund the required reserve deposits described above under “Escrows and Reserves,” to pay debt service on the General Motors Building Whole Loan, to disburse monthly operating expenses as set forth in the annual budget (which is required to be approved by the lenders only during a Cash Management Sweep Period) and extraordinary expenses reasonably approved by the lenders, to pay capital expenditures and leasing expenses as set forth in the annual budget or incurred on commercially reasonable terms in connection with leases which do not require the lenders’ approval and to disburse the remainder (i) during the continuance of a Cash Management Sweep Period, into an account to be held as additional security for the General Motors Building Whole Loan during such Cash Management Sweep Period; provided, however, if no event of default has occurred and is continuing, such funds are required to be disbursed to the General Motors Building Borrower within ten days after the lenders’ receipt of a written request from the General Motors Building Borrower (at its election) (a) to pay shortfalls on debt service on the General Motors Building Whole Loan, (b) to disburse monthly operating expenses (including payments to any affiliate of the General Motors Building Borrower if set forth in the approved annual budget or otherwise approved by the lenders) as set forth in the approved annual budget and extraordinary expenses reasonably approved by the lender, (c) to pay capital expenditures (other than payments to any affiliate of the General Motors Building Borrower unless set forth in the approved annual budget or otherwise approved by the lenders) subject to the satisfaction of certain capital expenditure release conditions and (d) to pay tenant improvement costs, tenant improvement allowances or leasing expenses as set forth in the approved annual budget or incurred on commercially reasonable terms in connection with leases which do not require the lender’s approval, subject to satisfaction of certain tenant improvement release conditions or leasing commission/allowance release conditions, or (ii) otherwise, to the General Motors Building Borrower.
A “Cash Management Sweep Period” will commence upon the occurrence of (i) an event of default under the General Motors Building Whole Loan documents or (ii) the debt service coverage ratio (“DSCR”) being less than 1.20x at the end of any calendar quarter. A Cash Management Sweep Period will end, with respect to clause (i), upon the cure of such event of default; or, with respect to clause (ii), upon (a) the DSCR being 1.20x or greater for one calendar quarter or (b) the General Motors Building Borrower’s delivery of (x) cash to be held as an additional reserve fund, (y) a letter of credit in accordance with the loan documents or (z) so long as BPLP’s senior unsecured credit rating is “BBB” or higher by S&P and “Baa3” or higher by Moody’s, a guaranty by BPLP, in each case in an amount that would be required to be prepaid in order for the DSCR to equal at least 1.20x for one calendar quarter.
Additional Secured Indebtedness (not including trade debts). In addition to the General Motors Building Mortgage Loan, the General Motors Building Property also secures the General Motors Building Non-ServicedPari Passu Companion Loans, which have an aggregate Cut-off Date principal balance of $1,380,000,000 and the General Motors Building Subordinate Companion Loans, which have an aggregate Cut-off Date principal balance of $830,000,000. The General Motors Building Non-ServicedPari Passu Companion Loans and the General Motors Building Subordinate Companion Loans all accrue interest at the same rate as the General Motors Building Mortgage Loan. The General Motors Building Mortgage Loan is entitled to payments of interest and principal on apro rata andpari passu basis with the General Motors Building Non-ServicedPari Passu Companion Loans. Payment of principal and interest on the General Motors Building Subordinate Companion Loans is generally subordinate to payment of principal and interest on the General Motors Building Mortgage Loan and the General Motors Building Non-ServicedPari Passu Companion Loans. The holders of the General Motors Building Mortgage Loan, the General Motors Building Non-ServicedPari Passu Companion Loans and the General Motors Building Subordinate Companion Loans have entered into a co-lender agreement which sets forth the allocation of collections on the General Motors Building Whole Loan. See “Description of the Mortgage Pool—The Whole Loans—The General Motors Building Pari Passu A/B Whole Loan” in the Preliminary Prospectus.
Mezzanine Loan and Preferred Equity. Not permitted.
Release of Property. Not permitted.
Terrorism Insurance. So long as the Terrorism Risk Insurance Program Reauthorization Act of 2015 or any replacement, reauthorization or extension thereof (“TRIPRA”) is in effect, the General Motors Building Borrower is required to maintain terrorism insurance in an amount equal to the full replacement cost of the General Motors Building Property (plus 18 months of business interruption coverage), provided that so long as TRIPRA is in effect and continues to cover both foreign and domestic acts, the lender is required to accept terrorism insurance with coverage against acts which are “certified” within the meaning of TRIPRA. If TRIPRA is not in effect, then provided that terrorism insurance is commercially available, the General Motors Building Borrower is required to carry terrorism insurance throughout the term of the General Motors Building Whole Loan as described in the preceding sentence, but in that event the General Motors Building Borrower is not required to spend more than two times the amount of the insurance premium that is payable at that time in respect of the all-risk insurance and business income/rent loss insurance required under the related loan documents (without giving effect to the cost of the terrorism, earthquake or flood components of such property insurance).
Notwithstanding the foregoing, and provided TRIPRA or a similar or subsequent statute is then in full force and effect, the all-risk insurance and business income/rent loss insurance covering perils and acts of terrorism may be provided by NYXP, LLC, a captive insurance company domiciled in the State of Vermont, which is a wholly owned subsidiary of BPLP, subject to the lenders’ reasonable review and approval and provided that certain other conditions under the General Motors Building Whole Loan agreement are met. See “Risk Factors— Risks Relating to the Mortgage Loans—Terrorism Insurance May Not Be Available for All Mortgaged Properties” in the Preliminary Prospectus.
This is not a research report and was not prepared by the Underwriters’ research departments. Please see additional important information and qualifications at the end of this Term Sheet.
| T-41 |
| BANK 2017-BNK6 | Gateway Net Lease Portfolio |
Mortgage Loan No. 2 – Gateway Net Lease Portfolio
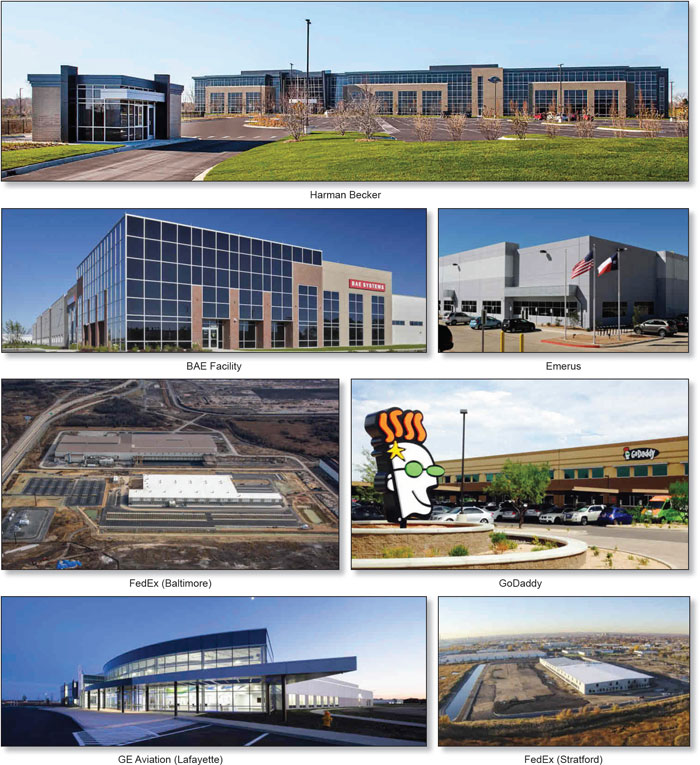
This is not a research report and was not prepared by the Underwriters’ research departments. Please see additional important information and qualifications at the end of this Term Sheet.
| T-42 |
| BANK 2017-BNK6 | Gateway Net Lease Portfolio |
Mortgage Loan No. 2 – Gateway Net Lease Portfolio
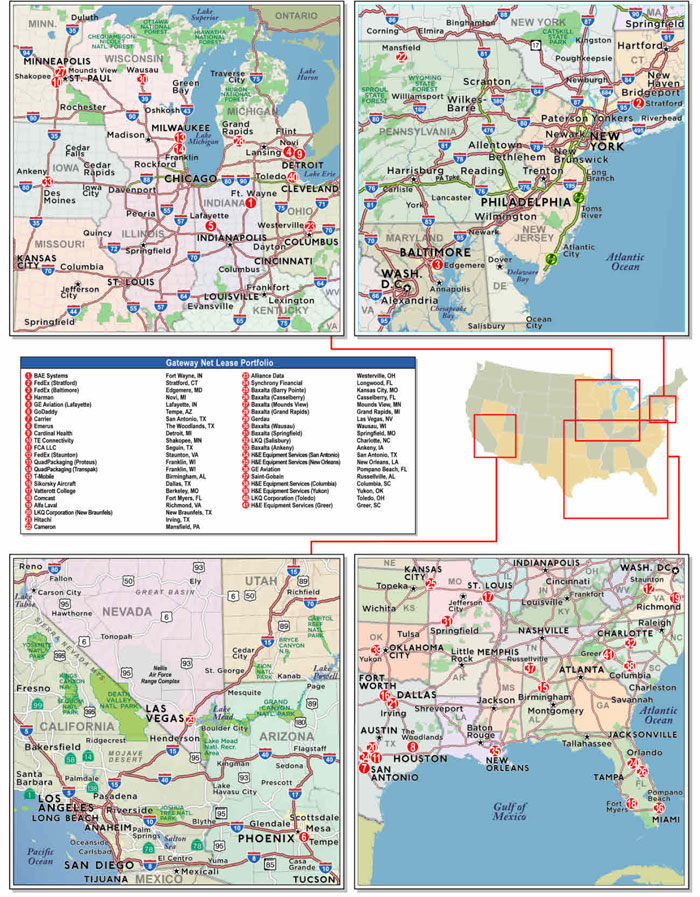
This is not a research report and was not prepared by the Underwriters’ research departments. Please see additional important information and qualifications at the end of this Term Sheet.
| T-43 |
| BANK 2017-BNK6 | Gateway Net Lease Portfolio |
| Mortgage Loan No. 2 – Gateway Net Lease Portfolio |
| Mortgage Loan Information | Property Information | ||||||
| Credit Assessment (DBRS/Fitch/S&P): | BBB(high)/NR/BB | Single Asset/Portfolio: | Portfolio | ||||
| Mortgage Loan Seller: | BANA | Location: | Various | ||||
| Original Balance(1): | $60,900,000 | General Property Type: | Various | ||||
| Cut-off Date Balance(1): | $60,900,000 | Detailed Property Type: | Various | ||||
| % of Initial Pool Balance: | 6.5% | Title Vesting(5): | Fee / Leasehold | ||||
| Loan Purpose: | Acquisition | Year Built/Renovated: | Various/Various | ||||
| Sponsor: | ETCL Venture LP | Size(6): | 5,296,943 SF | ||||
| Mortgage Rate: | 3.56283% | Cut-off Date Balance PSF(1): | $67 | ||||
| Note Date: | 5/19/2017 | Maturity Date Balance PSF(1): | $67 | ||||
| First Payment Date: | 7/5/2017 | Property Manager(7): | Various | ||||
| Maturity Date: | 6/5/2024 | ||||||
| Original Term: | 84 months | ||||||
| Original Amortization Term: | 0 months | ||||||
| IO Period: | 84 months | Underwriting and Financial Information | |||||
| Seasoning: | 1 month | UW NOI: | $49,772,586 | ||||
| Prepayment Provisions(2): | LO (25); DEF (55); O (4) | UW NOI Debt Yield(1): | 14.1% | ||||
| Lockbox/Cash Mgmt Status: | Hard/Springing | UW NOI Debt Yield at Maturity(1): | 14.1% | ||||
| Additional Debt Type(3): | Pari Passu/Subordinate Debt | UW NCF DSCR(1): | 3.54x | ||||
| Additional Debt Balance(3): | $292,100,000/$170,000,000 | Most Recent NOI(8): | N/A | ||||
| Future Debt Permitted (Type): | No (N/A) | 2nd Most Recent NOI(8): | N/A | ||||
| Reserves(4) | 3rd Most Recent NOI(8): | N/A | |||||
| Type | Initial | Monthly | Cap | Most Recent Occupancy(6): | 100.0% (7/1/2017) | ||
| RE Tax: | $0 | Springing | N/A | 2nd Most Recent Occupancy(8): | N/A | ||
| Insurance: | $0 | Springing | N/A | 3rd Most Recent Occupancy(8): | N/A | ||
| Recurring Replacements: | $0 | Springing | N/A | Appraised Value (as of)(9): | $785,215,000 (Various) | ||
| TI/LC: | $0 | Springing | N/A | Cut-off Date LTV Ratio(1): | 45.0% | ||
| Other: | $10,720,000 | Springing | N/A | Maturity Date LTV Ratio(1): | 45.0% | ||
| Sources and Uses | ||||||
| Sources | Proceeds | % of Total | Uses | Proceeds | % of Total | |
| Loan Amount(1): | $523,000,000 | 63.0% | Purchase Price: | $818,097,509 | 98.6% | |
| Borrower Sponsor Equity: | $307,050,139 | 37.0% | Closing Costs: | $1,232,630 | 0.1% | |
| Reserves: | $10,720,000 | 1.3% | ||||
| Total Sources: | $830,050,139 | 100.0% | Total Uses: | $830,050,139 | 100.0% | |
| (1) | The Gateway Net Lease Portfolio Mortgage Loan is part of the Gateway Net Lease Portfolio Whole Loan, which is comprised of seven senior promissory notes with an aggregate principal balance of $353,000,000, that arepari passu with each other (the “Gateway Net Lease Portfolio Senior Loan”) and ten subordinatepari passu promissory notes with an aggregate principal balance of $170,000,000, that are subordinate to the Gateway Net Lease Portfolio Senior Loan andpari passu with each other. The Cut-off Date Balance PSF, Maturity Date Balance PSF, UW NOI Debt Yield, UW NOI Debt Yield at Maturity, UW NCF DSCR, Cut-off Date LTV Ratio and Maturity Date LTV Ratio numbers presented above are based on the aggregate principal balance of the promissory notes comprising the Gateway Net Lease Portfolio Senior Loan. The Cut-off Date Balance PSF, Maturity Date Balance PSF, UW NOI Debt Yield, UW NOI Debt Yield at Maturity, UW NCF DSCR, Cut-off Date LTV Ratio and Maturity Date LTV Ratio numbers based on the Gateway Net Lease Portfolio Whole Loan are $99, $99, 9.5%, 9.5%, 2.04x, 66.6% and 66.6%, respectively. |
| (2) | Defeasance is permitted at any time after the earlier to occur of (i) the end of the two-year period commencing on the closing date of the securitization of the last Gateway Net Lease Portfolio Whole Loan promissory note to be securitized and (ii) May 19, 2020. The assumed lockout period of 25 payments is based on the closing date of this transaction in July 2017. After June 5, 2019, the Gateway Net Lease Portfolio Borrowers are permitted to obtain the release of any individual property with the payment of a release price equal to 110.0% of the allocated loan amount with respect to such individual property (including a payment of the yield maintenance premium, if applicable). See “Release of Property” below. |
| (3) | See “The Mortgage Loan” and “Additional Secured Indebtedness (not including trade debts)” for a discussion of additional debt. |
| (4) | See “Escrows and Reserves” below for further discussion of reserve requirements. |
| (5) | The FedEx (Baltimore), GoDaddy, Sikorsky Aircraft R&D Facility and Hitachi properties are secured by a leasehold interest. See “Ground Leases” below. |
| (6) | Size and Most Recent Occupancy include Baxalta (Barry Pointe) (16,686 SF) and Baxalta (Casselberry) (16,694 SF), which are currently under construction and will be added to the collateral upon distribution of the Earnout Reserve (see “Escrows and Reserves”), provided that certain conditions for such distribution and addition of collateral are satisfied. |
| (7) | The Property Managers are Elm Tree Funds, LLC (borrower-related), SW Management & Realty, LLC, Ryan Companies US, Inc. and Northern Equities Management Company. |
| (8) | The Gateway Net Lease Portfolio consists of 41 single tenant properties, many of which are recently constructed build-to-suit projects, each leased on a triple net basis. Historical financials and historical occupancy are unavailable. |
| (9) | The Appraised Value represents the aggregate “As Is” values for each of the properties except with respect to Baxalta (Barry Pointe) and Baxalta (Casselberry), which are currently under construction and will be added to the collateral upon distribution of the Earnout Reserve (see “Escrows and Reserves”), provided that certain conditions for such distribution and addition of collateral are satisfied, for which the “As Stabilized” and “As Complete” values, respectively, were used. The “As Stabilized” and “As Complete” values assume each property is 100.0% leased upon completion of the construction. According to the borrower sponsor, both Baxalta (Barry Pointe) and Baxalta (Casselberry) are expected to open in the fourth quarter of 2017. Both the Cut-off Date LTV Ratio and Maturity Date LTV Ratio, based on the $769.115 million “As is” value, which excludes Baxalta (Barry Pointe) and Baxalta (Casselberry), are 45.9%. |
This is not a research report and was not prepared by the Underwriters’ research departments. Please see additional important information and qualifications at the end of this Term Sheet.
| T-44 |
| BANK 2017-BNK6 | Gateway Net Lease Portfolio |
The Mortgage Loan. The second largest mortgage loan (the “Gateway Net Lease Portfolio Mortgage Loan”) is part of a whole loan (the “Gateway Net Lease Portfolio Whole Loan”) evidenced by seven senior promissory notes in the aggregate original principal amount of $353,000,000, that arepari passu with each other (the “Gateway Net Lease Portfolio Senior Loan”) and ten subordinate promissory notes in the aggregate original principal amount of $170,000,000, that are subordinate to the Gateway Net Lease Portfolio Senior Loan andpari passuwith each other (the “Gateway Net Lease Portfolio Subordinate Loan”). The Gateway Net Lease Portfolio Whole Loan is secured by the fee simple and leasehold interests in a portfolio of 41 single tenant industrial and office properties located across 20 states, totaling 5,296,943 SF (the “Gateway Net Lease Portfolio Properties”). The Gateway Net Lease Portfolio Whole Loan was co-originated by Bank of America, N.A. and JP Morgan Chase Bank, N.A. Promissory Notes A-2-2 and A-2-3, in the aggregate original principal amount of $60,900,000, represent the Gateway Net Lease Portfolio Mortgage Loan, and will be included in the BANK 2017-BNK6 securitization trust. Promissory Notes A-1-1, A-1-2, A-1-3, A-1-4, and A-2-1, in the aggregate original principal amount of $292,100,000, collectively represent thepari passu companion loans (the “Gateway Net Lease PortfolioPari Passu Companion Loans”).
The following table presents a summary of the promissory notes comprising the Gateway Net Lease Portfolio Whole Loan. The Gateway Net Lease Portfolio Whole Loan will be serviced pursuant to the pooling and servicing agreement for the DBJPM 2017-C6 transaction. See “Description of the Mortgage Pool—The Whole Loans—The Gateway Net Lease Portfolio Pari Passu A/B Whole Loan” and “Pooling and Servicing Agreement-Servicing of the Non-Serviced Mortgage Loans” in the Preliminary Prospectus.
| Gateway Net Lease Portfolio Whole Loan Summary | ||||
| Note | Original Balance | Cut-off Date Balance | Note Holder(1) | Controlling Piece |
| A-1-1 | $85,000,000 | $85,000,000 | DBJPM 2017-C6 | No(2) |
| A-1-2 | 85,000,000 | 85,000,000 | JP Morgan Chase Bank, N.A. | No |
| A-1-3 | 50,000,000 | 50,000,000 | JP Morgan Chase Bank, N.A. | No |
| A-1-4 | 27,100,000 | 27,100,000 | JP Morgan Chase Bank, N.A. | No |
| A-2-1 | 45,000,000 | 45,000,000 | BANK 2017-BNK5 | No |
| A-2-2 | 45,000,000 | 45,000,000 | BANK 2017-BNK6 | No |
| A-2-3 | 15,900,000 | 15,900,000 | BANK 2017-BNK6 | No |
| Gateway Net Lease Portfolio Subordinate Loan | 170,000,000 | 170,000,000 | Apollo(3) | Yes(2) |
| Total Gateway Net Lease Portfolio Whole Loan | $523,000,000 | $523,000,000 | ||
| (1) | The promissory notes currently held by JP Morgan Chase Bank, N.A. are expected to be contributed to future securitization transactions or may be otherwise transferred at any time. |
| (2) | The initial controlling noteholder for the Gateway Net Lease Portfolio Whole Loan is the holder of the Gateway Net Lease Portfolio Subordinate Loan evidenced in part by promissory note B-1-1. If the outstanding principal amount of the Gateway Net Lease Portfolio Subordinate Loan, as reduced by any appraisal reduction amounts or realized losses allocated to such Gateway Net Lease Portfolio Subordinate Loan, is less than 25% of the initial principal amount of such Gateway Net Lease Portfolio Subordinate Loan, the controlling noteholder will be the controlling class representative of the securitization to which Note A-1-1 is contributed. At all other times, the controlling noteholder for the Gateway Net Lease Portfolio Whole Loan will be the holder of the Gateway Net Lease Portfolio Subordinate Loan evidenced in part by promissory note B-1-1. |
| (3) | The Gateway Net Lease Portfolio Subordinate Loan is held by Athene Annuity and Life Company, Athene Annuity & Life Assurance Company, American Equity Investment Life Insurance Company, Midland National Life Insurance Company and American Equity Investment Life Insurance Company, affiliates of Apollo. |
Proceeds from the Gateway Net Lease Portfolio Whole Loan, along with approximately $307.1 million of equity from the sponsor, were used to acquire the Gateway Net Lease Portfolio Properties for a purchase price of approximately $818.1 million, fund an upfront reserve of $10.7 million in connection with two individual properties under construction, and pay closing costs of approximately $1.2 million.
The Borrowers and the Sponsor. The borrowers consist of 40 single-purpose Delaware limited liability companies, each structured to be bankruptcy-remote with at least two independent directors (the “Gateway Net Lease Portfolio Borrowers”). Upon distribution of the Earnout Reserve (see “Escrows and Reserves”), ETCL Barry Pointe Plasma, LLC and ETCL Casselberry Plasma, LLC (individually and jointly the “Construction Borrower”) are required to deliver a joinder agreement, which will provide that the Construction Borrower is added to and bound by the Gateway Net Lease Portfolio Whole Loan documents.
The sponsor, ETCL Venture LP, is a joint venture between China Life Insurance (Overseas) Company Limited (“China Life”) (94.6%) and ET II-CL 2016, LLC and ElmTree Managing Member II, LLC (collectively, “ElmTree”) (5.4%). At origination, China Life purchased 94.6% of ElmTree’s stake in the portfolio. There is no nonrecourse carve-out guarantor for the Gateway Net Lease Portfolio Whole Loan and the borrowers are the sole parties liable for any breach or violation of the nonrecourse carve-out provisions in the Gateway Net Lease Portfolio Whole Loan documents or the related environmental indemnity. Headquartered in Beijing, China, China Life and its subsidiaries comprise the largest commercial insurance group in mainland China with over 130,000 employees and approximately $361.6 billion in assets under management as of June 20, 2016. As of May 24, 2017, China Life had a market capitalization of approximately $111.6 billion and is the first insurance company to be triple-listed on the New York, Hong Kong and Shanghai exchanges. ElmTree is a real estate investment firm focusing primarily on commercial real estate net lease, sale-leaseback and build-to-suit opportunities and has completed in excess of $4.0 billion in commercial real estate transactions.
The Properties. The Gateway Net Lease Portfolio Properties are comprised of 41 single tenant industrial and office properties totaling approximately 5.3 million SF (inclusive of two properties currently under construction and expected to open in the fourth quarter of 2017, Baxalta (Barry Pointe) and Baxalta (Casselberry), which will be added to the collateral upon distribution of the allocated loan proceeds that were withheld at closing in the Earnout Reserve (see “Escrows and Reserves”), provided that certain conditions for such distribution of the Earnout Reserve and addition of collateral are satisfied. The Gateway Net Lease Portfolio Properties are located across 20 states, with the largest concentration of properties in Texas (23.8% of NRA), Indiana (12.1% of NRA) and Michigan (9.1% of NRA). The properties were built between 1960 and 2017 and 24 of the properties (58.3% of NRA) were built-to-suit for the respective tenants (including the two properties currently under construction). According to the borrower sponsor, approximately $249.9 million has been spent at the build-to-suit properties in addition to the landlord provided tenant improvements. The Gateway Net Lease Portfolio Properties are all leased on a triple net basis and range in size from approximately 16,686 SF to 517,000 SF. The weighted average remaining lease term for the portfolio is approximately 9.1 years. The Gateway Net Lease Portfolio Properties consist of 25 industrial properties (approximately 81.0% of NRA), nine suburban office properties (16.8% of NRA) and seven medical office properties (2.2% of NRA). The Gateway Net Lease Portfolio Properties are 100.0% leased to 26 individual tenants.
This is not a research report and was not prepared by the Underwriters’ research departments. Please see additional important information and qualifications at the end of this Term Sheet.
| T-45 |
| BANK 2017-BNK6 | Gateway Net Lease Portfolio |
The following table presents detailed information with respect to each of the Gateway Net Lease Portfolio Properties.
| Gateway Net Lease Portfolio Properties Summary | |||||||||||||
| Property Name | Location | Tenant SF | Year Built / Renovated | Allocated Loan Amount | % of | Appraised | % of Appraised Value | ||||||
| BAE Facility | Fort Wayne, IN | 333,750 | 2015 / NAP | $29,400,918 | 8.3% | $65,400,000 | 8.3% | ||||||
| FedEx Ground (Stratford) | Stratford, CT | 225,198 | 2016 / NAP | $28,320,994 | 8.0% | $63,000,000 | 8.0% | ||||||
| FedEx (Baltimore) | Edgemere, MD | 306,016 | 2016 / NAP | $26,073,403 | 7.4% | $58,000,000 | 7.4% | ||||||
| Harman Becker | Novi, MI | 188,042 | 2015 / NAP | $20,768,279 | 5.9% | $46,200,000 | 5.9% | ||||||
| GE Aviation (Lafayette) | Lafayette, IN | 306,406 | 2015 / NAP | $19,782,849 | 5.6% | $44,000,000 | 5.6% | ||||||
| GoDaddy | Tempe, AZ | 150,000 | 2014 / NAP | $17,535,258 | 5.0% | $39,000,000 | 5.0% | ||||||
| Carrier | San Antonio, TX | 517,000 | 2014 / NAP | $17,305,774 | 4.9% | $38,500,000 | 4.9% | ||||||
| Emerus | The Woodlands, TX | 95,640 | 2000 / NAP | $14,072,753 | 4.0% | $31,300,000 | 4.0% | ||||||
| Cardinal Health(1) | Detroit, MI | 275,951 | 2015 / NAP | $13,688,031 | 3.9% | $30,450,000 | 3.9% | ||||||
| Tyco Electronics | Shakopee, MN | 176,648 | 2014 / NAP | $13,553,040 | 3.8% | $30,150,000 | 3.8% | ||||||
| FCA/Caterpillar | Seguin, TX | 300,000 | 2012 / NAP | $12,770,096 | 3.6% | $28,400,000 | 3.6% | ||||||
| FedEx Ground (Staunton) | Staunton, VA | 225,198 | 2016 / NAP | $10,745,239 | 3.0% | $23,900,000 | 3.0% | ||||||
| Quad Packaging (Proteus)(2) | Franklin, WI | 205,000 | 2006 / NAP | $8,990,363 | 2.5% | $20,000,000 | 2.5% | ||||||
| Quad Packaging (Transpak) | Franklin, WI | 218,000 | 2006 / NAP | $8,902,620 | 2.5% | $19,800,000 | 2.5% | ||||||
| T-Mobile Call Center | Birmingham, AL | 66,500 | 1996 / 2014 | $8,308,662 | 2.4% | $18,475,000 | 2.4% | ||||||
| Sikorsky Aircraft R&D Facility(3) | Dallas, TX | 150,975 | 2008 / NAP | $8,045,430 | 2.3% | $17,900,000 | 2.3% | ||||||
| Vatterott College | Berkeley, MO | 90,000 | 2007 / NAP | $7,464,971 | 2.1% | $16,600,000 | 2.1% | ||||||
| Comcast | Fort Myers, FL | 57,260 | 2008 / NAP | $6,695,526 | 1.9% | $14,900,000 | 1.9% | ||||||
| Alfa Laval Plant | Richmond, VA | 180,252 | 1990 / 2005 | $6,108,317 | 1.7% | $13,600,000 | 1.7% | ||||||
| LKQ (New Braunfels) | New Braunfels, TX | 98,771 | 2016 / NAP | $6,027,323 | 1.7% | $13,400,000 | 1.7% | ||||||
| Hitachi | Irving, TX | 72,056 | 2000 / 2012 | $5,757,342 | 1.6% | $12,800,000 | 1.6% | ||||||
| Cameron International | Mansfield, PA | 75,000 | 2013 / NAP | $5,473,862 | 1.6% | $12,175,000 | 1.6% | ||||||
| Alliance Data Systems Office | Westerville, OH | 100,800 | 1990 / 2005 | $5,190,382 | 1.5% | $11,550,000 | 1.5% | ||||||
| Synchrony Financial | Longwood, FL | 67,775 | 1983 / NAP | $4,832,658 | 1.4% | $10,750,000 | 1.4% | ||||||
| Baxalta (Barry Pointe)(4) | Kansas City, MO | 16,686 | 2017 / NAP | $3,705,488 | 1.0% | $8,250,000 | 1.1% | ||||||
| Baxalta (Casselberry)(4) | Casselberry, FL | 16,694 | 2017 / NAP | $3,530,000 | 1.0% | $7,850,000 | 1.0% | ||||||
| Baxalta (Mounds View) | Mounds View, MN | 16,694 | 2015 / NAP | $3,334,264 | 0.9% | $7,420,000 | 0.9% | ||||||
| Baxalta (Grand Rapids) | Grand Rapids, MI | 16,694 | 2014 / NAP | $3,327,514 | 0.9% | $7,400,000 | 0.9% | ||||||
| Gerdau | Las Vegas, NV | 46,976 | 1986 / 2015 | $3,327,514 | 0.9% | $7,400,000 | 0.9% | ||||||
| Baxalta (Wausau) | Wausau, WI | 16,694 | 2015 / NAP | $3,239,771 | 0.9% | $7,200,000 | 0.9% | ||||||
| Baxalta (Springfield) | Springfield, MO | 16,694 | 2015 / NAP | $3,145,277 | 0.9% | $7,000,000 | 0.9% | ||||||
| LKQ (Salisbury) | Charlotte, NC | 205,100 | 1960 / 2005 | $3,145,277 | 0.9% | $7,000,000 | 0.9% | ||||||
| Baxalta (Ankeny) | Ankeny, IA | 16,694 | 2015 / NAP | $2,969,790 | 0.8% | $6,600,000 | 0.8% | ||||||
| H&E Equipment Services (San Antonio) | San Antonio, TX | 26,535 | 2015 / NAP | $2,605,315 | 0.7% | $5,800,000 | 0.7% | ||||||
| H&E Equipment Services (New Orleans) | New Orleans, LA | 18,808 | 2015 / NAP | $2,450,077 | 0.7% | $5,450,000 | 0.7% | ||||||
| GE Aviation (Pompano) | Pompano Beach, FL | 30,892 | 1985 / 2012 | $2,294,837 | 0.7% | $5,100,000 | 0.6% | ||||||
| Saint-Gobain Warehouse | Russellville, AL | 102,950 | 2009, 2014 / NAP | $2,065,354 | 0.6% | $4,600,000 | 0.6% | ||||||
| H&E Equipment Services (Columbia) | Columbia, SC | 19,380 | 2015 / NAP | $2,045,105 | 0.6% | $4,550,000 | 0.6% | ||||||
| H&E Equipment Services (Yukon) | Yukon, OK | 19,608 | 2015 / NAP | $2,018,107 | 0.6% | $4,490,000 | 0.6% | ||||||
| LKQ (Toledo) | Toledo, OH | 207,998 | 1975, 2012 / 2013 | $2,011,358 | 0.6% | $4,475,000 | 0.6% | ||||||
| H&E Equipment Services (Greer) | Greer, SC | 19,608 | 2015 / NAP | $1,970,860 | 0.6% | $4,380,000 | 0.6% | ||||||
| Total | 5,296,943 | $353,000,000 | 100.0% | $785,215,000 | 100.0% | ||||||||
| (1) | Cardinal Health is currently planning to exercise its option to construct an additional 40,000-70,000 SF on the existing property. Upon completion, the Cardinal Health lease will be extended to 15 years. The tenant is estimated to spend $4.9 million on the construction which is expected to begin by the end of 2018. |
| (2) | Quad Packaging (Proteus) is currently planning to construct an additional 200,000 SF on the existing property. Upon completion, the Quad Packaging (Proteus) lease will be extended to 15 years. The tenant is estimated to spend $16.0 million on the construction which is expected begin by the end of 2017. |
| (3) | Sikorsky Aircraft R&D Facility is currently planning to construct an additional 30,000 SF on the existing property. Upon completion, the Sikorsky Aircraft R&D Facility lease will be extended to 10-12 years. The tenant is estimated to spend $3.0 million on the construction which is expected begin by mid-2018. |
| (4) | “As Stabilized” and “As Complete” values were used for Baxalta (Barry Pointe) and Baxalta (Casselberry), respectively. Both properties are expected to open in the fourth quarter of 2017 and will be added to the collateral upon distribution of the Earnout Reserve, provided that certain conditions for such distribution of the Earnout Reserve and addition of collateral are satisfied. See “Escrows and Reserves.” |
This is not a research report and was not prepared by the Underwriters’ research departments. Please see additional important information and qualifications at the end of this Term Sheet.
| T-46 |
| BANK 2017-BNK6 | Gateway Net Lease Portfolio |
Major Properties (by allocated loan amount)
BAE Facility. The largest property by allocated loan amount is BAE Facility, a 333,750 SF manufacturing facility situated on approximately 39.2 acres and located in Fort Wayne, Indiana. BAE Facility was constructed in 2015 on a build-to-suit basis and consists of an approximately 86.5% manufacturing component and an approximately 13.5% office component. The manufacturing component of the property features 24-foot ceilings, two dock doors, LED lighting and air conditioning throughout approximately 93.6% of the area. The office component features a café, full commercial grade kitchen and an employee gym. The property contains 948 parking spaces (approximately 2.8 spaces per 1,000 SF.)
BAE Facility is currently 100.0% leased to BAE Systems Controls, Inc. (“BAE Systems”) on a triple net basis through August 2025 with four remaining five-year extension options. BAE Systems is a subsidiary of Bay Systems PLC, a British multinational defense, security and aerospace company headquartered in London, United Kingdom and traded publicly on the London Stock Exchange (LSE:BA). BAE Systems uses the property for electronics manufacturing for the commercial aviation and defense industries. BAE Systems accounts for approximately 6.3% and 8.6% of the net rentable area and underwritten base rent, respectively, of the Gateway Net Lease Portfolio Properties.
BAE Facility is located in Fort Wayne, Indiana and is approximately 6.6 miles southwest of the Fort Wayne central business district. Access is provided via Ardmore Avenue to the east and Airport Expressway to the south as well as Interstate 69 and Interstate 469, which are located approximately 5.0 miles east and 4.5 miles south, respectively of BAE Facility. BAE Facility is located in the Fort Wayne industrial market which according to a market report, as of year-end 2016 consisted of approximately 20.8 million SF with an overall vacancy rate of 4.7%. The average age of the industrial properties identified was approximately 44.4 years as compared to BAE Facility which was constructed in 2015. BAE Facility is one of 76 industrial facilities over 100,000 SF in the Fort Wayne industrial market. The appraisal identified six comparable single tenant industrial facilities ranging in size from 81,578 SF to 393,817 SF and constructed between 2000 and 2016. Base rents for the comparable triple-net leases ranged from $6.89 PSF to $13.73 PSF, with a weighted average of approximately $8.97 PSF, as compared to BAE Facility’s underwritten rent of $13.90 PSF. The appraisal did not identify any properties currently under construction that would compete with BAE Facility, however noted the large inventory of available development land in the subject neighborhood.
FedEx Ground (Stratford). The second largest property by allocated loan amount is FedEx Ground (Stratford), a 225,198 SF warehouse and distribution facility situated on approximately 28.2 acres in Stratford, Connecticut. FedEx Ground (Stratford) was constructed in 2016 on a build-to-suit basis and consists of an approximately 88.8% warehouse component and an approximately 11.2% office component. The distribution-warehouse component of the property features a clear height of approximately 26 feet, 61 loading docks and seven overhead drive-in steel doors, accommodates the turning radius of 18-wheel semi-trucks, and has additional areas for equipment trailer storage and truck parking. FedEx Ground (Stratford) contains 230 parking spaces (approximately 1.0 space per 1,000 SF).
FedEx Ground (Stratford) is currently 100.0% leased to FedEx Ground Package System, Inc. on a triple net basis through June 2026 with two remaining five-year extension options. FedEx Ground Package System, Inc. is a division of FedEx Corporation (“FedEx”). FedEx provides transportation, e-commerce and business services in the United States and internationally, serving more than 220 countries and territories with over 400,000 employees and 2016 fiscal year revenue of $50.4 billion. FedEx Ground Package System, Inc. provides small-package ground delivery in North America. FedEx Ground (Stratford) accounts for approximately 4.3% and 6.8% of the net rentable area and underwritten base rent, respectively, of the Gateway Net Lease Portfolio Properties.
FedEx Ground (Stratford) is located in Stratford, Connecticut within Fairfield County. Access is provided via Interstate 95 to the north and west, U.S. Route 1 and Route 130, which are approximately 2.9 and 2.3 miles north, respectively, and Route 113 approximately 1.6 miles east of FedEx Ground (Stratford). Interstate 95 provides access to New England to the east and north and New York to the west. FedEx Ground (Stratford) is less than five miles from the Metro North Stratford Center Rail station and the Bridgeport Transit Center, which provide train access to New York City (approximately 48.9 miles southwest) and to Stamford and New Haven, Connecticut. FedEx Ground (Stratford) is located in the Stratford industrial market which according to a market report consists of approximately 9.4 million SF of industrial space (207 buildings) with an overall vacancy rate of 19.2%. The appraisal identified six comparable triple net lease rentals at industrial facilities ranging in size from 50,000 SF to 362,474 SF and constructed between 1970 and 2016, concluding to a market rent of $16.00 PSF, as compared to FedEx Ground (Stratford)’s underwritten rent of $16.31 PSF. These comparable rentals were either located in Fairfield County or were similar leases to FedEx in the tri-state (New York, Connecticut and New Jersey) area. The appraisal did not identify any properties currently under construction that would compete with FedEx Ground (Stratford).
FedEx (Baltimore). The third largest property by allocated loan amount is FedEx (Baltimore), a 306,016 SF warehouse and distribution facility situated on approximately 47.4 acres and located in Edgemere, Maryland. FedEx (Baltimore) was constructed in 2016 and consists of an approximately 95.7% warehouse component and an approximately 4.3% office component. The distribution-warehouse component of the property features a clear height of approximately 32 feet and is a sorting facility that can accommodate up to 450 trucks on-site, with an additional service center which can accommodate five trucks. FedEx (Baltimore) contains 631 parking spaces (approximately 2.1 spaces per 1,000 SF).
FedEx (Baltimore) is currently 100.0% leased to FedEx Ground Package System, Inc. on a triple net basis through December 2031 with two remaining five-year extension options. FedEx (Baltimore) accounts for approximately 5.8% and 6.8% of the net rentable area and underwritten base rent, respectively, of the Gateway Net Lease Portfolio Properties.
FedEx (Baltimore) is located in Edgemere, Maryland in the Sparrows Point area of Baltimore County, approximately 10.0 miles southeast of the Baltimore central business district. Access is provided via the Baltimore Beltway (Interstate 695), which crosses the Baltimore Harbor less than 1.0 mile west of FedEx (Baltimore). Sparrows Point includes the Sparrows Point Peninsula with more than 3,000 acres of newly industrially zoned land. According to the appraisal, FedEx (Baltimore) is located in the Baltimore County East submarket of the Baltimore industrial market. As of the fourth quarter of 2016, the Baltimore County East warehouse market consisted of approximately 14.3 million SF of industrial space (140 buildings) with an overall vacancy rate of approximately 9.9%. The appraisal identified five comparable triple net lease rentals at industrial facilities ranging in size from 11,957 SF to 371,778 SF and constructed between 1970 and 2017, concluding to a market rent of $16.00 PSF, as compared to FedEx Ground (Baltimore)’s underwritten rent of $11.99 PSF. The appraisal identified approximately 1,402,144 SF of warehouse space currently under construction in the Baltimore industrial market that would compete with FedEx (Baltimore).
This is not a research report and was not prepared by the Underwriters’ research departments. Please see additional important information and qualifications at the end of this Term Sheet.
| T-47 |
| BANK 2017-BNK6 | Gateway Net Lease Portfolio |
The following table presents detailed information with respect to the tenancy of the Gateway Net Lease Portfolio Properties.
| Gateway Net Lease Portfolio Tenant Summary | |||||||
| Property Name | Credit Rating(1) Fitch/Moody’s/S&P | Tenant SF | % of Total SF | Base Rent | % of Total Base Rent | Lease Expiration Date | |
| BAE Facility | BBB/Baa2/BBB | 333,750 | 6.3% | $13.90 | 8.6% | 8/31/2025 | |
| FedEx Ground (Stratford) | NR/Baa2/BBB | 225,198 | 4.3% | $16.31 | 6.8% | 6/30/2026 | |
| FedEx (Baltimore) | NR/Baa2/BBB | 306,016 | 5.8% | $11.99 | 6.8% | 12/31/2031 | |
| Harman Becker | A+/A1/A+ | 188,042 | 3.6% | $19.56 | 6.8% | 10/31/2030 | |
| GE Aviation (Lafayette) | AA-/A1/AA- | 306,406 | 5.8% | $9.49 | 5.4% | 9/13/2030 | |
| GoDaddy | NR/NR/NR | 150,000 | 2.8% | $17.64 | 4.9% | 5/31/2025 | |
| Carrier(2) | A-/A3/A- | 517,000 | 9.8% | $4.58 | 4.4% | 9/30/2026 | |
| Emerus | NR/NR/NR | 95,640 | 1.8% | $24.25 | 4.3% | 12/31/2026 | |
| Cardinal Health | NR/NR/NR | 275,951 | 5.2% | $6.90 | 3.5% | 4/30/2030 | |
| Tyco Electronics(3) | NR/NR/A- | 176,648 | 3.3% | $11.33 | 3.7% | 4/30/2024 | |
| FCA/Caterpillar(4) | NR/NR/NR | 300,000 | 5.7% | $6.25 | 3.5% | 8/31/2022 | |
| FedEx Ground (Staunton) | NR/Baa2/BBB | 225,198 | 4.3% | $6.64 | 2.8% | 3/31/2026 | |
| Quad Packaging (Proteus) | NR/NR/NR | 205,000 | 3.9% | $6.04 | 2.3% | 12/16/2021 | |
| Quad Packaging (Transpak) | NR/NR/NR | 218,000 | 4.1% | $5.63 | 2.3% | 12/16/2021 | |
| T-Mobile Call Center | BBB+/Baa1/BBB+ | 66,500 | 1.3% | $18.50 | 2.3% | 2/28/2025 | |
| Sikorsky Aircraft R&D Facility(5) | BBB+/Baa1/BBB+ | 150,975 | 2.9% | $8.40 | 2.4% | 1/31/2019 | |
| Vatterott College | NR/NR/NR | 90,000 | 1.7% | $16.14 | 2.7% | 12/31/2024 | |
| Comcast | A-/A3/A- | 57,260 | 1.1% | $19.87 | 2.1% | 6/30/2020 | |
| Alfa Laval Plant | NR/NR/BBB+ | 180,252 | 3.4% | $6.48 | 2.2% | 12/31/2021 | |
| LKQ (New Braunfels) | NR/Ba2/BB | 98,771 | 1.9% | $10.01 | 1.8% | 8/31/2033 | |
| Hitachi | NR/NR/NR | 72,056 | 1.4% | $12.99 | 1.7% | 4/30/2022 | |
| Cameron International(6) | NR/NR/AA- | 75,000 | 1.4% | $14.74 | 2.0% | 12/14/2023 | |
| Alliance Data Systems Office | NR/NR/NR | 100,800 | 1.9% | $9.45 | 1.8% | 7/31/2024 | |
| Synchrony Financial | BBB-/NR/BBB- | 67,775 | 1.3% | $11.01 | 1.4% | 5/31/2025 | |
| Baxalta (Barry Pointe)(7) | NR/NR/BBB- | 16,686 | 0.3% | $29.66 | 0.9% | 8/31/2032 | |
| Baxalta (Casselberry)(7) | NR/NR/BBB- | 16,694 | 0.3% | $29.86 | 0.9% | 10/31/2032 | |
| Baxalta (Mounds View) | NR/NR/BBB- | 16,694 | 0.3% | $28.83 | 0.9% | 11/30/2030 | |
| Baxalta (Grand Rapids) | NR/NR/BBB- | 16,694 | 0.3% | $28.91 | 0.9% | 11/30/2030 | |
| Gerdau | NR/NR/BBB- | 46,976 | 0.9% | $13.31 | 1.2% | 3/31/2025 | |
| Baxalta (Wausau) | NR/NR/BBB- | 16,694 | 0.3% | $26.81 | 0.8% | 10/31/2030 | |
| Baxalta (Springfield) | NR/NR/BBB- | 16,694 | 0.3% | $27.03 | 0.8% | 11/30/2030 | |
| LKQ (Salisbury) | NR/Ba2/BB | 205,100 | 3.9% | $2.33 | 0.9% | 8/6/2030 | |
| Baxalta (Ankeny) | NR/NR/BBB- | 16,694 | 0.3% | $25.41 | 0.8% | 11/30/2030 | |
| H&E Equipment Services (San Antonio) | NR/B3/BB- | 26,535 | 0.5% | $15.81 | 0.8% | 11/30/2030 | |
| H&E Equipment Services (New Orleans) | NR/B3/BB- | 18,808 | 0.4% | $22.41 | 0.8% | 12/31/2030 | |
| GE Aviation (Pompano) | AA-/A1/AA- | 30,892 | 0.6% | $12.36 | 0.7% | 8/14/2022 | |
| Saint-Gobain Warehouse(8) | BBB/Baa2/BBB | 102,950 | 1.9% | $3.73 | 0.7% | 9/1/2024 | |
| H&E Equipment Services (Columbia) | NR/B3/BB- | 19,380 | 0.4% | $17.10 | 0.6% | 12/31/2030 | |
| H&E Equipment Services (Yukon) | NR/B3/BB- | 19,608 | 0.4% | $16.53 | 0.6% | 6/30/2030 | |
| LKQ (Toledo) | NR/Ba2/BB | 207,998 | 3.9% | $1.56 | 0.6% | 6/17/2027 | |
| H&E Equipment Services (Greer) | NR/B3/BB- | 19,608 | 0.4% | $17.06 | 0.6% | 11/30/2030 | |
| Total / Wtd. Avg. | 5,296,943 | 100.0% | $10.18 | 100.0% | |||
| (1) | Certain ratings are those of the parent company whether or not the parent company guarantees the lease. |
| (2) | Carrier has the right to terminate its lease on October 1, 2019 or October 1, 2021, with six months’ notice. |
| (3) | Tyco Electronics has the right to terminate its lease if either landlord’s removal of hazardous materials or defects covered by construction warranty cause a business interruption lasting more than 90 days. |
| (4) | FCA/Caterpillar has the right to terminate its lease if the related service agreement between FCA LLC and Caterpillar Inc. with respect to contracting services performed by FCA for Caterpillar at the property is terminated and not assumed by a transferee permitted under the related lease, with the payment of a termination fee. |
| (5) | Sikorsky Aircraft R&D Facility has the right to terminate its lease with 12 months’ notice and the payment of a termination fee. |
| (6) | Cameron International has the right to terminate its lease as of March 31, 2019, with 12 months’ notice and the payment of a termination fee. |
| (7) | Baxalta (Barry Pointe) and Baxalta (Casselberry) are currently under construction, expected to open in the fourth quarter of 2017 and will be added to the collateral upon distribution of the Earnout Reserve, provided that certain conditions for such distribution of the Earnout Reserve and addition of collateral are satisfied. See “Escrows and Reserves.” |
| (8) | Saint-Gobain Warehouse has the right to terminate its lease any time after August 4, 2017, if the tenant’s annual sales have fallen by at least 20.0% compared to the annual sales for the first 12 months of the lease term. |
This is not a research report and was not prepared by the Underwriters’ research departments. Please see additional important information and qualifications at the end of this Term Sheet.
| T-48 |
| BANK 2017-BNK6 | Gateway Net Lease Portfolio |
The following table presents certain information with respect to the lease rollover at the Gateway Net Lease Portfolio Properties.
| Lease Rollover Schedule(1)(2) | ||||||||
| Year | # of Leases Rolling | SF Rolling | % of Total SF Rolling | Cumulative SF Rolling | Cumulative % of SF Rolling | Annual U/W PSF Rolling | % U/W Rolling | Cumulative % of U/W Base Rent |
| 2017 | 0 | 0 | 0.0% | 0 | 0.0% | $0.00 | 0.0% | 0.0% |
| 2018 | 0 | 0 | 0.0% | 0 | 0.0% | $0.00 | 0.0% | 0.0% |
| 2019 | 1 | 150,975 | 2.9% | 150,975 | 2.9% | $8.40 | 2.4% | 2.4% |
| 2020 | 1 | 57,260 | 1.1% | 208,235 | 3.9% | $19.87 | 2.1% | 4.5% |
| 2021 | 3 | 603,252 | 11.4% | 811,487 | 15.3% | $6.03 | 6.7% | 11.2% |
| 2022 | 3 | 402,948 | 7.6% | 1,214,435 | 22.9% | $7.93 | 5.9% | 17.1% |
| 2023 | 1 | 75,000 | 1.4% | 1,289,435 | 24.3% | $14.74 | 2.0% | 19.2% |
| 2024 | 4 | 470,398 | 8.9% | 1,759,833 | 33.2% | $10.18 | 8.9% | 28.1% |
| 2025 | 5 | 665,001 | 12.6% | 2,424,834 | 45.8% | $14.87 | 18.3% | 46.4% |
| 2026 | 4 | 1,063,036 | 20.1% | 3,487,870 | 65.8% | $9.27 | 18.3% | 64.7% |
| 2027 | 1 | 207,998 | 3.9% | 3,695,868 | 69.8% | $1.56 | 0.6% | 65.3% |
| 2028 & Beyond | 18 | 1,601,075 | 30.2% | 5,296,943 | 100.0% | $11.70 | 34.7% | 100.0% |
| Vacant | 0 | 0 | 0.0% | 5,296,943 | 100.0% | $0.00 | 0.0% | 100.0% |
| Total / Wtd. Avg | 41 | 5,296,943 | 100.0% | $10.18 | 100.0% | |||
| (1) | Based on each tenant’s lease. |
| (2) | Certain tenants may have lease termination options that may become exercisable prior to the originally stated expiration date of the tenant lease that are not considered in the lease rollover schedule. |
Ground Leases.Four of the Gateway Net Lease Portfolio Properties are subject to ground leases: (i) FedEx (Baltimore), which has a current annual base rent of $1,324,400 with a lease expiration on July 31, 2021, with 17 five-year extension options; (ii) GoDaddy, which has a current annual base rent of approximately $568,222 with a lease expiration on December 31, 2101, with no renewal options; (iii) Sikorsky Aircraft R&D Facility, which has a current annual base rent of approximately $275,748 with a lease expiration on February 21, 2049, with no renewal options; and (iv) Hitachi, which has a current annual base rent of approximately $93,455 with a lease expiration on April 13, 2040, with no renewal options. Please see “Description of the Mortgage Pool—Fee & Leasehold Estates; Ground Leases”,in the Preliminary Prospectus.
The Markets. The Gateway Net Lease Portfolio Properties are geographically diverse, located in 39 different cities across 20 states. The Gateway Net Lease Portfolio Properties are located in Texas (23.8% of NRA), Indiana (12.1% of NRA), Michigan (9.1% of NRA), Wisconsin (8.3% of NRA), Virginia (7.7% of NRA), Ohio (5.8% of NRA) and Maryland (5.8% of NRA) with 27.5% of net rentable area located across an additional 13 other states.
This is not a research report and was not prepared by the Underwriters’ research departments. Please see additional important information and qualifications at the end of this Term Sheet.
| T-49 |
| BANK 2017-BNK6 | Gateway Net Lease Portfolio |
Underwritten Net Cash Flow.The following table presents certain information relating to the Underwritten Net Cash Flow at the Gateway Net Lease Portfolio Properties:
| Cash Flow Analysis(1) | ||||
| In-Place | U/W | U/W PSF | ||
| Base Rent(2)(3) | $51,948,929 | $53,930,697 | $ 10.18 | |
| Total Recoveries | $0 | $29,231,519 | $5.51 | |
| Less: Vacancy/Bad Debt | $0 | ($4,158,111) | (5.0%) | |
| Effective Gross Income | $51,948,929 | $79,004,104 | $14.92 | |
| Total Operating Expenses(4) | $0 | $29,231,519 | $5.52 | |
| Net Operating Income | $51,948,929 | $49,772,586 | $9.40 | |
| TI/LC | $0 | $3,909,520 | $0.74 | |
| Capital Expenditures | $0 | $781,904 | $0.15 | |
| Net Cash Flow | $51,948,929 | $45,081,162 | $8.51 | |
| Occupancy % | 100.0% | 95.0% | ||
| NOI DSCR(5) | 4.07x | 3.90x | ||
| NCF DSCR(5) | 4.07x | 3.54x | ||
| NOI Debt Yield(5) | 14.7% | 14.1% | ||
| NCF Debt Yield(5) | 14.7% | 12.8% | ||
| (1) | The Gateway Net Lease Portfolio consists of 41 single tenant properties, many of which are recently constructed build-to-suit projects, each leased on a triple net basis. Historical financials and historical occupancy are unavailable. |
| (2) | In-Place Base Rents based on each tenant’s lease. |
| (3) | UW Base Rent includes contractual rent underwritten through April 2017 for non-investment grade tenants and the straight-line average rent through the sooner of lease expiration and the end of the loan term for investment grade tenants. UW Base Rent also includes income from Baxalta (Barry Pointe) and Baxalta (Casselberry), which are under construction and are expected to open in the fourth quarter of 2017 and will be added to the collateral upon distribution of the Earnout Reserve, provided that certain conditions for such distribution of the Earnout Reserve and addition of collateral are satisfied. See “Escrows and Reserves.” |
| (4) | All leases are triple net. U/W Total Recoveries and U/W Total Operating Expenses are shown for illustrative purposes. |
| (5) | Debt service coverage ratios and debt yields are based on the Gateway Net Lease Portfolio Senior Loan and exclude the Gateway Net Lease Portfolio Subordinate Loan. |
Escrows and Reserves. At loan origination, the Gateway Net Lease Portfolio Borrowers established a $10,720,000 reserve (the “Earnout Reserve”) in connection with the two properties under construction, Baxalta (Barry Pointe) and Baxalta (Casselberry). Under the Gateway Net Lease Portfolio Whole Loan documents, the Gateway Net Lease Portfolio Borrowers are entitled to disbursements from this reserve upon satisfaction of the following terms and conditions, among others: (i) no event of default has occurred and is continuing on either the date of the request or the date of the advance; (ii) the net operating income for each of the two properties under construction provides for a debt yield of at least 9.8% based on the outstanding principal balance of the allocated Gateway Net Lease Portfolio Whole Loan amount for such property (including the amount requested for disbursement from the reserve); (iii) the owners of the properties deliver a joinder to the Gateway Net Lease Portfolio Whole Loan documents; (iv) the loan-to-value ratio based on the allocated loan amount for each property is not greater than 65.5%; and (v) the applicable property is 100.0% occupied by tenants paying full and unabated rent pursuant to one or more leases approved by the lender in accordance with the Gateway Net Lease Portfolio Whole Loan documents.
Upon the occurrence of a Cash Sweep Period (as defined below), the Gateway Net Lease Portfolio Borrowers are required to deposit monthly reserves of (i) 1/12 of the estimated annual real estate taxes, (ii) 1/12 of the estimated annual insurance premiums, (iii) $110,353 for replacement reserves (subject to a cap of $2,648,472 ($0.50 PSF)), (iv) $331,059 for tenant improvement and leasing commissions (subject to a cap of $7,945,415 ($1.50 PSF)), and (v) 1/12 of ground rent due under each ground lease.
Each of the foregoing monthly deposit requirements is waived to the extent (a) no Cash Sweep Period is continuing, (b) provided that no event of default is continuing, the Gateway Net Lease Portfolio Borrowers provide to the lender satisfactory evidence that such required amounts are being paid directly by one or more tenants and such tenants are not in default under the terms of their respective leases, or (c) solely with respect to clause (ii) above, the Gateway Net Lease Portfolio Borrowers provide satisfactory evidence that the property is insured under an acceptable blanket policy.
A “Cash Sweep Period” will commence upon (i) an event of default under the Gateway Net Lease Portfolio Whole Loan; (ii) any bankruptcy or insolvency action of a borrower or an affiliated manager or (iii) the debt yield (as calculated based on the Gateway Net Lease Portfolio Whole Loan less the amount of the Earnout Reserve not yet released) being less than 8.5% for one calendar quarter based on the trailing three-month period (a “Debt Yield Trigger Event”). A Cash Sweep Period will end (i) if caused solely by an event of default, the acceptance by the lender of a cure of such event of default, (ii) if caused solely by a bankruptcy action of an affiliated manager, provided no event of default is continuing, if the property manager is replaced with a qualified property manager, or (iii) if caused solely by the occurrence of a Debt Yield Trigger Event, provided no event of default is continuing, upon the debt yield being 8.5% or greater for one calendar quarter based upon the trailing three month period. A Cash Sweep Period cannot be cured if caused by a bankruptcy action of a borrower.
Lockbox and Cash Management. A hard lockbox is in place with respect to the Gateway Net Lease Portfolio Whole Loan, with springing cash management upon the occurrence of a Cash Sweep Period. During a Cash Sweep Period, all funds are required to be swept each business day to a lender-controlled cash management account and disbursed in accordance with the Gateway Net Lease Portfolio Whole Loan documents with all excess cash flow required to be held in the excess cash flow subaccount as additional security for the Gateway Net Lease Portfolio Whole Loan.
This is not a research report and was not prepared by the Underwriters’ research departments. Please see additional important information and qualifications at the end of this Term Sheet.
| T-50 |
| BANK 2017-BNK6 | Gateway Net Lease Portfolio |
Additional Secured Indebtedness (not including trade debts). The Gateway Net Lease Portfolio Properties also secure the Gateway Net Lease PortfolioPari Passu Companion Loans, with an aggregate cut-off date principal balance of $292,100,000. The promissory notes evidencing the Gateway Net Lease PortfolioPari Passu Companion Loans accrue interest at the same rate as the Gateway Net Lease Portfolio Mortgage Loan. The Gateway Net Lease Portfolio Mortgage Loan is entitled to payments of principal and interest on apro rata andpari passu basis with the Gateway Net Lease PortfolioPari Passu Companion Loans.
The Gateway Net Lease Portfolio Properties also secure the Gateway Net Lease Portfolio Subordinate Loan, with an aggregate cut-off date balance of $170,000,000, held by Athene Annuity and Life Company, Athene Annuity & Life Assurance Company, American Equity Investment Life Insurance Company, Midland National Life Insurance Company and American Equity Investment Life Insurance Company and which carries an interest rate of 5.40%per annum. The Gateway Net Lease Portfolio Subordinate Loan is co-terminous with the Gateway Net Lease Portfolio Mortgage Loan and the Gateway Net Lease PortfolioPari Passu Companion Loans and is also interest-only for the full term. Prior to the occurrence of certain events of default under the Gateway Net Lease Portfolio Whole Loan, the Gateway Net Lease Portfolio Subordinate Loan will be entitled to receive scheduled payments of principal and interest under the Gateway Net Lease Portfolio Whole Loan.
The holders of the Gateway Net Lease Portfolio Mortgage Loan, the Gateway Net Lease PortfolioPari Passu Companion Loans and the Gateway Net Lease Portfolio Subordinate Loan have entered into a co-lender agreement that sets forth the allocation of collections on the Gateway Net Lease Portfolio Whole Loan. See“Description of the Mortgage Pool—The Whole Loans—The Gateway Net Lease Portfolio Pari Passu-A/B Whole Loan”in the Preliminary Prospectus.
Mezzanine Loan and Preferred Equity.Not permitted.
Release of Property.After June 5, 2019 the Gateway Net Lease Portfolio Borrowers are permitted to obtain the release of individual properties, provided, among other things, (a) no event of default has occurred and is continuing under the Gateway Net Lease Portfolio Whole Loan; (b) the Gateway Net Lease Portfolio Borrowers prepay the Gateway Net Lease Portfolio Whole Loan by an amount equal to 110.0% of the individual property’s allocated loan amount (including payment of the yield maintenance premium, if applicable); and (c) after giving effect to the release of such individual property, the debt yield for the then remaining properties is equal to or greater than (i) the greater of (A) the debt yield for all the properties then remaining immediately prior to giving effect to the release or (B) 10.0% or (ii) 14.0% (collectively, the “Release Debt Yield”), provided that the Gateway Net Lease Portfolio Borrowers are permitted to prepay a portion of the Gateway Net Lease Portfolio Whole Loan in order to satisfy the Release Debt Yield requirements.
Terrorism Insurance.The Gateway Net Lease Portfolio Borrowers are required to obtain and maintain property insurance, public liability insurance and rental loss and/or business interruption insurance that covers perils of terrorism or other similar acts, provided that the Gateway Net Lease Portfolio Whole Loan documents provide for an annual terrorism premium cap of two times the cost of the property and business interruption insurance premiums (on a stand-alone basis) but excluding the windstorm and flood components of such premiums.
This is not a research report and was not prepared by the Underwriters’ research departments. Please see additional important information and qualifications at the end of this Term Sheet.
| T-51 |
| BANK 2017-BNK6 | Del Amo Fashion Center |
Mortgage Loan No. 3 – Del Amo Fashion Center
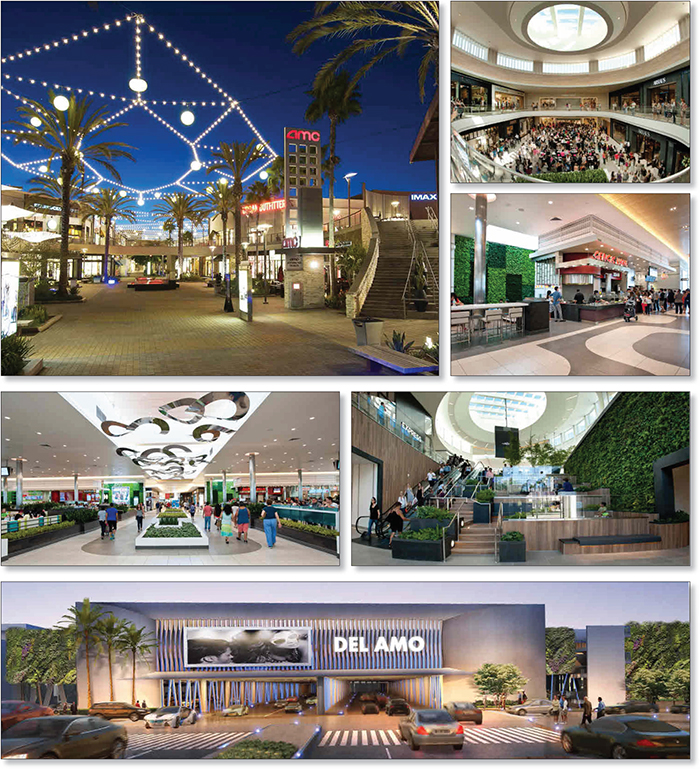
This is not a research report and was not prepared by the Underwriters’ research departments. Please see additional important information and qualifications at the end of this Term Sheet.
| T-52 |
| BANK 2017-BNK6 | Del Amo Fashion Center |
Mortgage Loan No. 3 – Del Amo Fashion Center
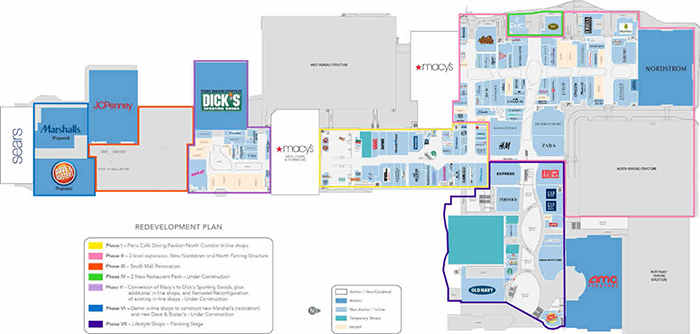
This is not a research report and was not prepared by the Underwriters’ research departments. Please see additional important information and qualifications at the end of this Term Sheet.
| T-53 |
| BANK 2017-BNK6 | Del Amo Fashion Center |
Mortgage Loan No. 3 – Del Amo Fashion Center
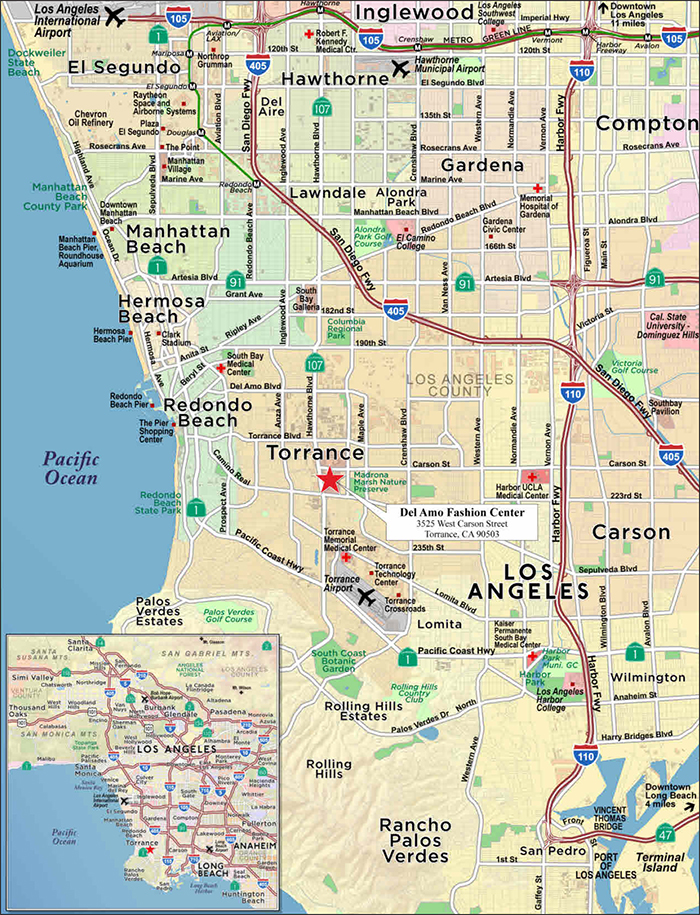
This is not a research report and was not prepared by the Underwriters’ research departments. Please see additional important information and qualifications at the end of this Term Sheet.
| T-54 |
| BANK 2017-BNK6 | Del Amo Fashion Center |
| Mortgage Loan No. 3 – Del Amo Fashion Center |
| Mortgage Loan Information | Property Information | ||||||
| Credit Assessment (DBRS/Fitch/S&P): | A(low)/AA-sf/AA- | Single Asset/Portfolio: | Single Asset | ||||
| Mortgage Loan Seller: | BANA/WFB | Location: | Torrance, CA 90503 | ||||
| Original Balance(1): | $59,543,000 | General Property Type: | Retail | ||||
| Cut-off Date Balance(1): | $59,543,000 | Detailed Property Type: | Super Regional Mall | ||||
| % of Initial Pool Balance: | 6.4% | Title Vesting: | Fee | ||||
| Loan Purpose: | Refinance | Year Built/Renovated: | 1961/2017 | ||||
| Sponsor: | Simon Property Group, L.P.; Commingled Pension Trust Fund (Strategic Property) of JPMorgan Chase Bank, N.A. | Size: | 1,769,525 SF | ||||
| Cut-off Date Balance per SF(1): | $260 | ||||||
| Maturity Date Balance per SF(1): | $260 | ||||||
| Mortgage Rate: | 3.6575% | Property Manager: | Simon Management Associates II, LLC (borrower-related) | ||||
| Note Date: | 5/12/2017 | ||||||
| First Payment Date: | 7/1/2017 | ||||||
| Maturity Date: | 6/1/2027 | ||||||
| Original Term to Maturity: | 120 months | ||||||
| Original Amortization Term: | 0 months | ||||||
| IO Period: | 120 months | Underwriting and Financial Information | |||||
| Seasoning: | 1 month | UW NOI: | $59,343,892 | ||||
| Prepayment Provisions(2): | LO (25); DEF (88); O (7) | UW NOI Debt Yield(1): | 12.9% | ||||
| Lockbox/Cash Mgmt Status: | Hard/Springing | UW NOI Debt Yield at Maturity(1): | 12.9% | ||||
| Additional Debt Type(3): | Pari Passu/Subordinate Debt | UW NCF DSCR(1): | 3.34x | ||||
| Additional Debt Balance(3): | $399,757,000/$125,700,000 | Most Recent NOI: | $53,218,707 (3/31/2017 TTM) | ||||
| Future Debt Permitted (Type): | No (N/A) | 2nd Most Recent NOI: | $51,101,092 (12/31/2016) | ||||
| Reserves(4) | 3rd Most Recent NOI: | $35,039,436 (12/31/2015) | |||||
| Type | Initial | Monthly | Cap | Most Recent Occupancy(5): | 85.2% (5/15/2017) | ||
| RE Tax: | $0 | Springing | N/A | 2nd Most Recent Occupancy: | 91.5% (12/31/2016) | ||
| Insurance: | $0 | Springing | N/A | 3rd Most Recent Occupancy: | 86.1% (12/31/2015) | ||
| Recurring Replacements: | $0 | Springing | $446,400 | Appraised Value (as of): | $1,155,000,000 (4/23/2017) | ||
| TI/LC: | $0 | Springing | $6,465,600 | Cut-off Date LTV Ratio(1): | 39.8% | ||
| Other: | $8,071,240 | $0 | N/A | Maturity Date LTV Ratio(1): | 39.8% | ||
| Sources and Uses | ||||||
| Sources | Proceeds | % of Total | Uses | Proceeds | % of Total | |
| Loan Amount(1): | $585,000,000 | 100.0% | Loan Payoff: | $511,127,344 | 87.4% | |
| Closing Costs: | $3,288,487 | 0.6% | ||||
| Return of Equity: | $70,584,168 | 12.1% | ||||
| Total Sources: | $585,000,000 | 100.0% | Total Uses: | $585,000,000 | 100.0% | |
| (1) | The Del Amo Fashion Center Mortgage Loan is part of the Del Amo Fashion Center Whole Loan, which is comprised of the $459,300,000 Del Amo Fashion Center Senior Loan (as defined below) and the $125,700,000 Del Amo Fashion Center Subordinate Loan (as defined below). The Cut-off Date Balance per SF, Maturity Date Balance per SF, UW NOI Debt Yield, UW NOI Debt Yield at Maturity, UW NCF DSCR, Cut-off Date LTV Ratio and Maturity Date LTV Ratio numbers presented above are based on the aggregate principal balance of the promissory notes comprising the Del Amo Fashion Center Senior Loan. The Cut-off Date Balance per SF, Maturity Date Balance per SF, UW NOI Debt Yield, UW NOI Debt Yield at Maturity, UW NCF DSCR, Cut-off Date LTV Ratio and Maturity Date LTV Ratio numbers based on the combined principal balance of the promissory notes comprising the Del Amo Fashion Center Senior Loan and the Del Amo Fashion Center Subordinate Loan are $331, $331, 10.1%, 10.1%, 2.63x, 50.6% and 50.6%, respectively. |
| (2) | Defeasance is permitted at any time after the earlier to occur of (a) the end of the two-year period commencing on the closing date of the securitization of the last Del Amo Fashion Center Whole Loan promissory note to be securitized and (b) May 2, 2020. The assumed lockout period of 25 payments is based on the closing date of this transaction in July 2017. |
| (3) | See “The Mortgage Loan” and “Additional Secured Indebtedness (not including trade debts)” below for further discussion of additional debt. |
| (4) | See “Escrows and Reserves” below for further discussion of reserve requirements. |
| (5) | Most Recent Occupancy includes nine tenants (1.6% of NRA and 2.3% of underwritten rent) with signed leases with future commencement dates (September 1, 2017 to January 1, 2018). Most Recent Occupancy also includes three tenants (4.5% of NRA and 5.3% of underwritten rent) with signed leases not yet in occupancy: Dave & Buster’s (expected lease commencement date of May 2018), Marshalls (expected lease commencement date of May 2018) and EMC Seafood & Raw Bar (expected lease commencement date of January 2018), for which a ten-year master lease was signed by the Del Amo Fashion Center Whole Loan guarantor which provides for annual rent equivalent to the tenants’ combined annual rent. |
This is not a research report and was not prepared by the Underwriters’ research departments. Please see additional important information and qualifications at the end of this Term Sheet.
| T-55 |
| BANK 2017-BNK6 | Del Amo Fashion Center |
The Mortgage Loan. The third largest mortgage loan (the “Del Amo Fashion Center Mortgage Loan”) is part of a whole loan (the “Del Amo Fashion Center Whole Loan”) evidenced by sixteen promissory A-Notes in the aggregate original principal amount of $375,800,000, which arepari passu with each other, sixteen promissory B-Notes in the aggregate original amount of $83,500,000, which are subordinate to the A-Notes andpari passu with each other (such A-Notes and B-Notes, collectively, the “Del Amo Fashion Center Senior Loan”) and twelve subordinate promissory notes in the aggregate original principal amount of $125,700,000, which are evidenced by four notes from each of three tranches (C-Notes, D-Notes and E-Notes, each of which is subordinate to the Del Amo Fashion Center Senior Loan and to each other such tranche with a prior alphabetical designation (collectively, the “Del Amo Fashion Center Subordinate Loan”), which are secured by a first priority fee mortgage encumbering 1,769,525 SF of a super regional mall in Torrance, California (the “Del Amo Fashion Center Property”). Promissory Notes A-1-3, B-1-3 and B-1-4 (contributed by Bank of America, N.A.) and A-4-4 and B-4-4 (contributed by Wells Fargo Bank, N.A.), in the aggregate principal amount of $59,543,000, are from each of the two A and B tranches ofpari passu components that comprise the Del Amo Fashion Center Senior Loan and represent the Del Amo Fashion Center Mortgage Loan and will be included in the BANK 2017-BNK6 securitization trust.
The following table presents a summary of the promissory notes comprising the Del Amo Fashion Center Whole Loan. The Del Amo Fashion Center Whole Loan is expected to be serviced pursuant to the trust and servicing agreement for the DAFC 2017-AMO transaction. See “Description of the Mortgage Pool—The Whole Loans—The Del Amo Fashion Center Pari Passu-A/B Whole Loan” in the Preliminary Prospectus.
| Del Amo Fashion Center Whole Loan Summary | ||||
| Note(1) | Original Balance | Cut-off Date Balance | Note Holder(2) | Controlling Piece |
| A-1-1 | $12,125,000 | $12,125,000 | DAFC 2017-AMO | Yes |
| A-1-2 | $36,821,000 | $36,821,000 | BANK 2017-BNK5 | No |
| A-1-3 | $24,547,000 | $24,547,000 | BANK 2017-BNK6 | No |
| A-1-4 | $20,457,000 | $20,457,000 | Bank of America, NA | No |
| A-2-1 | $12,125,000 | $12,125,000 | DAFC 2017-AMO | No |
| A-2-2 | $36,821,000 | $36,821,000 | Barclays Bank PLC | No |
| A-2-3 | $24,547,000 | $24,547,000 | WFCM 2017-C38 | No |
| A-2-4 | $20,457,000 | $20,457,000 | Barclays Bank PLC | No |
| A-3-1 | $12,125,000 | $12,125,000 | DAFC 2017-AMO | No |
| A-3-2 | $32,730,000 | $32,730,000 | Société Générale | No |
| A-3-3 | $28,638,000 | $28,638,000 | Société Générale | No |
| A-3-4 | $20,457,000 | $20,457,000 | Société Générale | No |
| A-4-1 | $12,125,000 | $12,125,000 | DAFC 2017-AMO | No |
| A-4-2 | $36,821,000 | $36,821,000 | BANK 2017-BNK5 | No |
| A-4-3 | $24,547,000 | $24,547,000 | WFCM 2017-C38 | No |
| A-4-4 | $20,457,000 | $20,457,000 | BANK 2017-BNK6 | No |
| B-1-1 | $2,700,000 | $2,700,000 | DAFC 2017-AMO | No |
| B-1-2 | $8,179,000 | $8,179,000 | BANK 2017-BNK5 | No |
| B-1-3 | $5,453,000 | $5,453,000 | BANK 2017-BNK6 | No |
| B-1-4 | $4,543,000 | $4,543,000 | BANK 2017-BNK6 | No |
| B-2-1 | $2,700,000 | $2,700,000 | DAFC 2017-AMO | No |
| B-2-2 | $8,179,000 | $8,179,000 | Barclays Bank PLC | No |
| B-2-3 | $5,453,000 | $5,453,000 | WFCM 2017-C38 | No |
| B-2-4 | $4,543,000 | $4,543,000 | Barclays Bank PLC | No |
| B-3-1 | $2,700,000 | $2,700,000 | DAFC 2017-AMO | No |
| B-3-2 | $7,270,000 | $7,270,000 | Société Générale | No |
| B-3-3 | $6,362,000 | $6,362,000 | Société Générale | No |
| B-3-4 | $4,543,000 | $4,543,000 | Société Générale | No |
| B-4-1 | $2,700,000 | $2,700,000 | DAFC 2017-AMO | No |
| B-4-2 | $8,179,000 | $8,179,000 | BANK 2017-BNK5 | No |
| B-4-3 | $5,453,000 | $5,453,000 | WFCM 2017-C38 | No |
| B-4-4 | $4,543,000 | $4,543,000 | BANK 2017-BNK6 | No |
| Del Amo Fashion Center Subordinate Loan | $125,700,000 | $125,700,000 | DAFC 2017-AMO | No |
| Total Del Amo Fashion Center Whole Loan | $585,000,000 | $585,000,000 | ||
| (1) | The B-Notes are subordinate to the A-Notes. |
| (2) | The promissory notes currently held by Bank of America, N.A., Barclays Bank PLC and Société Générale are expected to be contributed to future securitization transactions or may be otherwise transferred at any time. |
This is not a research report and was not prepared by the Underwriters’ research departments. Please see additional important information and qualifications at the end of this Term Sheet.
| T-56 |
| BANK 2017-BNK6 | Del Amo Fashion Center |
The Del Amo Fashion Center Whole Loan was co-originated by Bank of America, N.A., Wells Fargo Bank, N.A., Barclays Bank PLC and Société Générale. The proceeds of the Del Amo Fashion Center Whole Loan were used to pay off previous mortgage debt, pay closing costs and to return equity to the borrower sponsor. Based on the total cost basis in the Del Amo Fashion Center Property, the borrower sponsor has over $350 million in equity invested in the asset.
The Borrower and the Sponsor. The borrower is Del Amo Fashion Center Operating Company, L.L.C. (the “Del Amo Fashion Center Borrower”), a single-purpose Delaware limited liability company structured to be bankruptcy-remote, with at least two independent directors. Simon Property Group, L.P. is the non-recourse carveout guarantor. The Del Amo Fashion Center Whole Loan will be recourse to the guarantor pursuant to standard non-recourse carveouts, however, the non-recourse carveout guaranty and the environmental indemnity agreement provide that so long as Simon Property Group, L.P. is the guarantor (or SPF (as defined below) or certain affiliates of SPF should it be a replacement guarantor), its liability may not exceed $117,000,000 plus all reasonable out-of-pocket costs and expenses incurred by the lender in the enforcement of the guaranty and the environmental indemnity agreement or the preservation of the lender’s rights thereunder.
The sponsor is a 50/50 joint venture between subsidiaries of Simon Property Group, L.P. and Commingled Pension Trust Fund (Strategic Property) of J.P. Morgan Chase Bank, N.A. (“SPF”).
Simon Property Group, L.P. is the operating partnership of Simon Property Group, Inc. (“Simon”) (NYSE: SPG). Simon is a publicly-traded, self-administered and self-managed real estate investment trust focused on retail property ownership and management. Simon is one of the largest publicly-traded owners, operators and developers of retail assets in the United States. As of March 31, 2017, Simon owned or had an interest in 206 properties consisting of 108 malls, 67 Premium Outlet-branded centers, 14 Mills-branded centers, four lifestyle centers and thirteen other retail properties in 37 states and Puerto Rico, as well as redevelopment and expansion projects underway at 25 properties in the United States, Canada and Europe.
SPF is a JPMorgan Asset Management fund with a reported net asset value of approximately $30.9 billion and a gross asset value of approximately $41.7 billion as of March 31, 2017. SPF’s investment portfolio focuses on office, retail, residential and industrial investments.
The Property. The Del Amo Fashion Center Property consists of 1,769,525 SF of traditional mall, open air lifestyle and entertainment space which together with the non-collateral Macy’s and Sears anchors comprise the 2.51 million SF Del Amo Fashion Center mall, the largest shopping center in the western United States. The Del Amo Fashion Center Property is located in the suburban community of Torrance, California, at the intersection of Hawthorne and Sepulveda Boulevards. Hawthorne Boulevard is a ten-lane arterial providing access to the Pacific Coast Highway to the south and I-105 to the north. Sepulveda Boulevard is an eight-lane thoroughfare that provides access between Redondo Beach and I-110.
The Del Amo Fashion Center Property is a two-level super regional mall with a diverse tenancy including large chain stores such as Dick’s Sporting Goods, H&M, XXI Forever and Crate & Barrel, restaurants including P.F. Chang’s China Bistro, Lazy Dog Cafe, Great Maple and Din Tai Fung (a Michelin-starred restaurant), entertainment options including the 18-screen AMC Theatres and Dave & Buster’s (not yet open), as well as over 100 in-line retailers and brands including 25 first-to-market brands including Arhaus Furniture, Kate Spade New York, Hugo Boss, J. Crew, Lululemon and Michael Kors. Collateral anchors include J.C. Penney and Nordstrom. Included in the collateral are 11,892 parking spaces (approximately 6.7 spaces per 1,000 SF).
The Del Amo Fashion Center Property is currently undergoing a $423 million redevelopment that started in 2013. The multi-phased project includes (i) the renovation of the north mall area and creation of the new Patio Café Dining Pavilion which opened in 2014 and includes ten eateries, seating for 700, floor to ceiling living plant walls, skylights and lounge areas with complimentary Wi-Fi, (ii) the addition of approximately 350,000 SF of in-line shops, the Nordstrom anchor and a multi-level parking deck, delivered in 2015, (iii) the renovation of the south mall area, completed in November 2016, (iv) the construction of the Dick’s Sporting Goods store, which opened in June 2017, and additional adjacent in-line stores and renovation of neighboring in-line stores, which construction and renovation was expected to have been completed in May 2017, (v) the build-out of two restaurant pads, BRIO Tuscan Grille and EMC Seafood & Raw Bar (which is expected to be completed in 2017), and (vi) the construction of the Marshalls and Dave & Buster’s which is expected to be completed in May 2018. The remaining cost of the redevelopment has not been reserved for under the Del Amo Fashion Center Whole Loan documents and such redevelopment is not required to be completed by the Del Amo Fashion Center Borrower.
The Del Amo Fashion Center Property was 85.2% leased as of May 15, 2017 to 208 retail and restaurant tenants. The following table presents a summary of the historical in-line occupancy at the Del Amo Fashion Center Property:
| Historical In-Line Occupancy | ||||
| Historical Occupancy | 2013 | 2014 | 2015 | 2016 |
| In-Line (including temporary tenants) | 80.1% | 92.8% | 88.5% | 93.8% |
| In-Line (excluding temporary tenants) | 75.2% | 85.7% | 79.7% | 86.6% |
This is not a research report and was not prepared by the Underwriters’ research departments. Please see additional important information and qualifications at the end of this Term Sheet.
| T-57 |
| BANK 2017-BNK6 | Del Amo Fashion Center |
The 2016 estimated total gross sales for the Del Amo Fashion Center Property were approximately $543.4 million. The following table presents a summary of historical anchor sales at the Del Amo Fashion Center Property.
| Anchor Sales Summary | ||||
| Tenant | 2014 | 2015 | 2016 | Sales PSF(1) |
| Macy’s (non-collateral)(2)(3) | $75,100,000 | $62,000,000 | $73,895,000 | $175 |
| Sears (non-collateral)(2)(4) | $32,500,000 | $30,200,000 | NAV(5) | $96 |
| Nordstrom(6) | N/A | N/A | $51,480,000 | $373 |
| J.C. Penney | $23,689,000 | $24,372,000 | $21,061,000 | $129 |
| AMC Theaters(7) | $17,979,000 | $18,114,000 | $17,307,000 | $961,500 |
| (1) | Sales PSF reflects most recent year-end sales figures available. |
| (2) | Sales figures reflect estimates for non-collateral anchors. |
| (3) | Macy’s currently operates two stores at the Del Amo Fashion Center, totaling 423,307 SF. Sales figures are representative of both stores. 2014 sales represent three Macy’s stores. |
| (4) | Sears occupies 313,495 SF, with approximately two levels being used for merchandizing and one level being used for office space. When excluding the office space, the adjusted estimated Sales PSF are approximately $144 PSF. |
| (5) | 2016 sales data not yet available. |
| (6) | Nordstrom opened in October 2015. |
| (7) | AMC Theaters Sales PSF reflects sales per screen. |
As of the trailing-twelve-month period ended March 31, 2017, the Del Amo Fashion Center Property had total comparable in-line sales of $124.3 million, with average in-line sales of $611 PSF and an occupancy cost of 13.7%. While the renovations and redevelopment have been ongoing at the Del Amo Fashion Center Property since 2013, in-line sales PSF have grown from $441 PSF to $611 PSF, representing a 39% increase from 2013 to the trailing twelve month period ended March 31, 2017.
The following table presents a summary of historical comparable in-line sales at the Del Amo Fashion Center Property.
| Comparable In-Line Sales Summary(1) | |||||
| 2013 | 2014 | 2015 | 2016 | 3/31/2017 TTM | |
| In-Line Sales PSF | $441 | $449 | $499 | $560 | $611 |
| Occupancy Cost | 14.3% | 14.7% | 15.9% | 14.4% | 13.7% |
| (1) | Information as provided by the borrower sponsor and only include tenants reporting comparable sales. |
This is not a research report and was not prepared by the Underwriters’ research departments. Please see additional important information and qualifications at the end of this Term Sheet.
| T-58 |
| BANK 2017-BNK6 | Del Amo Fashion Center |
The following table presents certain information relating to the major tenants at the Del Amo Fashion Center Property.
Tenant Summary(1)
| ||||||||||
| Tenant Name | Credit Rating (Fitch/Moody’s/S&P)(2) | Tenant SF | Approx. % of SF | Annual UW Rent | Annual UW Rent PSF(3) | Most Recent Sales(4) | Occ. Cost % | Lease Expiration | ||
| % of Annual UW Rent | $ | PSF | ||||||||
| Anchor Tenants | ||||||||||
| J.C. Penney | B+/B1/B+ | 163,346 | 9.2% | $457,325 | 0.9% | $2.80 | 21,061,000 | $129 | N/A | 12/31/2018 |
| Nordstrom | BBB+/Baa1/BBB+ | 138,000 | 7.8% | $0(5) | 0.0%(5) | $0(5) | 51,480,000 | $373 | N/A | 2/28/2031 |
| AMC Theaters | NR/B1/NR | 76,800 | 4.3% | $3,066,624 | 6.1% | $39.93 | $17,307,000 | $961,500(6) | 17.7% | 9/30/2021 |
| Major Tenants(7) | ||||||||||
| LA Fitness | NR/NR/NR | 47,137 | 2.7% | $1,792,237 | 3.6% | $38.02 | N/A | N/A | N/A | 1/31/2022 |
| Dave & Buster’s(8) | NR/NR/NR | 42,336 | 2.4% | $1,439,424 | 2.9% | $34.00 | N/A | N/A | N/A | 4/30/2033 |
| Dick’s Sporting Goods | NR/NR/NR | 83,210 | 4.7% | $1,352,163 | 2.7% | $16.25 | N/A | N/A | N/A | 4/30/2027 |
| H&M | NR/NR/NR | 25,086 | 1.4% | $1,076,189 | 2.1% | $42.90 | N/A | N/A | N/A | 1/31/2026 |
| Zara | NR/NR/NR | 26,802 | 1.5% | $1,050,625 | 2.1% | $39.20 | $8,791,000 | $328 | 12.0% | 10/31/2027 |
| Burlington Coat Factory(9) | NR/NR/NR | 60,000 | 3.4% | $840,000 | 1.7% | $14.00 | N/A | N/A | N/A | 1/31/2025 |
| Marshalls(8) | NR/A2/A+ | 30,716 | 1.7% | $752,542 | 1.5% | $24.50 | N/A | N/A | N/A | 2/29/2028 |
| Express | NR/NR/NR | 11,208 | 0.6% | $741,858 | 1.5% | $66.19 | N/A | N/A | N/A | 1/31/2026 |
| Old Navy | BB+/Baa2/BB+ | 17,990 | 1.0% | $712,799 | 1.4% | $39.62 | $7,784,000 | $433 | 9.7% | 1/31/2024 |
| XXI Forever | NR/NR/NR | 20,217 | 1.1% | $707,595 | 1.4% | $35.00 | $7,613,000 | $377 | 13.4% | 1/31/2018 |
| Subtotal/Wtd. Avg. | 742,848 | 42.0% | $13,989,380 | 27.8% | $18.83 | |||||
| Other Retail Tenants(10) | 764,810 | 43.2% | $36,415,851 | 72.2% | $47.61 | |||||
| Vacant Space | 261,867 | 14.8% | ||||||||
| Total/Wtd. Avg. | 1,769,525 | 100.0% | $50,405,231 | $33.43 | ||||||
| (1) | Information is based on the underwritten rent roll. |
| (2) | Certain ratings are those of the parent company whether or not the parent guarantees the lease. |
| (3) | Wtd. Avg. Annual UW Rent PSF excludes vacant space. |
| (4) | Most Recent Sales $ and PSF represent trailing 12 months ending March 31, 2017 information for Old Navy and XXI Forever, and 2016 information for all other tenants. |
| (5) | Nordstrom opened in October 2015 and does not pay base rent but pays percentage rent equivalent to 2% of sales over a $60.0 million breakpoint. |
| (6) | Most Recent Sales PSF represents Sales per screen. |
| (7) | Major Tenants are ordered by Annual UW Rent. |
| (8) | Dave & Buster’s and Marshalls have executed leases with expected May 2018 commencement dates. The Del Amo Fashion Center Whole Loan guarantor has signed a ten-year master lease which provides for the annual rent obligations for these tenants. |
| (9) | Burlington Coat Factory has the option to terminate its lease at any time upon at least 270 days’ prior written notice. |
| (10) | Other Retail Tenants includes ten tenants (2.0% of NRA and 3.2% of underwritten rent) with signed leases with future commencement dates (September 1, 2017 to January 1, 2018). |
This is not a research report and was not prepared by the Underwriters’ research departments. Please see additional important information and qualifications at the end of this Term Sheet.
| T-59 |
| BANK 2017-BNK6 | Del Amo Fashion Center |
The following table presents certain information relating to the lease rollover at the Del Amo Fashion Center Property:
| Lease Rollover Schedule(1)(2) | ||||||||
| Year | # of Leases Rolling | SF Rolling | Annual UW Rent PSF Rolling(3) | Approx. % of Total SF Rolling | Approx. Cumulative % of SF Rolling | Total UW Rent Rolling | Approx. % of Total Rent Rolling | Approx. Cumulative % of Total Rent Rolling |
| MTM/2017 | 8 | 26,342 | $39.50 | 1.5% | 1.5% | $1,040,552 | 2.1% | 2.1% |
| 2018 | 11 | 204,233 | $10.06 | 11.5% | 13.0% | $2,054,097 | 4.1% | 6.1% |
| 2019 | 16 | 45,696 | $44.89 | 2.6% | 15.6% | $2,051,118 | 4.1% | 10.2% |
| 2020 | 12 | 88,993 | $24.44 | 5.0% | 20.6% | $2,174,566 | 4.3% | 14.5% |
| 2021 | 10 | 115,598 | $39.74 | 6.5% | 27.2% | $4,593,303 | 9.1% | 23.6% |
| 2022 | 11 | 67,982 | $47.71 | 3.8% | 31.0% | $3,243,680 | 6.4% | 30.1% |
| 2023 | 4 | 75,763 | $18.02 | 4.3% | 35.3% | $1,365,309 | 2.7% | 32.8% |
| 2024 | 17 | 51,974 | $69.18 | 2.9% | 38.2% | $3,595,680 | 7.1% | 39.9% |
| 2025 | 44 | 176,862 | $50.40 | 10.0% | 48.2% | $8,913,244 | 17.7% | 57.6% |
| 2026 | 56 | 222,472 | $51.91 | 12.6% | 60.8% | $11,548,229 | 22.9% | 80.5% |
| 2027 | 22 | 202,821 | $33.39 | 11.5% | 72.3% | $6,772,847 | 13.4% | 93.9% |
| 2028 & Beyond | 6 | 228,922 | $13.33 | 12.9% | 85.2% | $3,052,606 | 6.1% | 100.0% |
| Vacant | 0 | 261,867 | $0.00 | 14.8% | 100.0% | $0 | 0.0% | 100.0% |
| Total/Wtd. Avg. | 217 | 1,769,525 | $33.43 | 100.0% | $50,405,231 | 100.0% | ||
| (1) | Information is based on the underwritten rent roll and includes nine tenants (1.6% of NRA and 2.3% of underwritten rent) with signed leases with future commencement dates (September 1, 2017 to January 1, 2018) and three tenants (4.5% of NRA and 5.3% of underwritten rent) with signed leases not yet in occupancy: Dave & Buster’s (expected lease commencement date of May 2018), Marshalls (expected lease commencement date of May 2018) and EMC Seafood & Raw Bar (expected lease commencement date of January 2018), for which a ten-year master lease was signed by the Del Amo Fashion Center Whole Loan guarantor which provides for annual rent equivalent to the tenants’ combined annual rent. |
| (2) | Certain tenants may have lease termination options that are exercisable prior to the originally stated expiration date of the subject lease and that are not considered in the lease rollover schedule. |
| (3) | Wtd. Avg. Annual UW Rent PSF Rolling excludes vacant space. |
The Market. The Del Amo Fashion Center Property is located in Torrance, California, in the coastal area of Los Angeles’ South Bay. Family-friendly destinations such as Disneyland Resort and Santa Catalina Island as well as the numerous local beaches provide tourist attractions within a short distance of Torrance. Torrance is also the U.S. home base for the Japanese corporations Honda, Mitsuwa and All Nippon Airways, as well as Honeywell and Robinson Helicopters.
According to the appraisal, the Del Amo Fashion Center Property is located within 4.5 miles of the Kings Harbor Marina, within 10.5 miles of the Los Angeles Airport (LAX), in close proximity to I-110 and I-405, and near high income demographic areas including Palos Verdes Peninsula, Redondo Beach, Hermosa and Manhattan Beach. Demographics surrounding the Del Amo Fashion Center Property include a 5-mile radius population of 504,851 with an average household income of $112,287 as of December 2016.
The Del Amo Fashion Center Property is located in the South Bay/Torrance submarket of Los Angeles, which as of year-end 2016 contained 6,154,000 SF (9.1% of the broader Los Angeles retail market inventory) with a vacancy rate of 3.9% and average asking rents of $35.43 PSF, as compared to the Los Angeles retail market which had a vacancy rate of 6.2% and average asking rents of $32.00 PSF. According to the appraisal, there is no proposed new competitive supply within the submarket and none of the proposed supply within the broader Los Angeles market would be competitive with the Del Amo Fashion Center Property.
This is not a research report and was not prepared by the Underwriters’ research departments. Please see additional important information and qualifications at the end of this Term Sheet.
| T-60 |
| BANK 2017-BNK6 | Del Amo Fashion Center |
The following table presents certain competitive retail properties to the Del Amo Fashion Center Property:
| Competitive Property Summary | |||||||
| Property, Location | Property Type | Year Built/ Renovated | Size (SF) | Occupancy | Comparable In-line Sales PSF | Anchor Tenants | Distance to Subject (mi.) |
Del Amo Fashion Center Torrance, CA | Super Regional Mall | 1961/2017 | 1,769,525 | 85.2%(1) | $611(2) | Macy’s (non-collateral), Sears (non-collateral), Nordstrom, J.C. Penney | N/A |
South Bay Galleria Redondo Beach, CA | Super Regional Mall | 1984/2014 | 960,200 | 84.9% | $435-$445 | Macy’s, Kohl’s, Cinemas | 3.5 |
Promenade on the Peninsula Rancho Palos Verdes, CA | Regional Center | 1981/N/A | 374,186 | 80.6% | $350-$375 | Equinox Fitness, Cinemas | 5.4 |
Manhattan Village Manhattan Beach, CA | Super Regional Mall | 1981/N/A | 620,008 | 99.4% | $450-$475 | Macy’s, Fry’s Electronics, Ralph’s/CVS | 7.5 |
South Bay Pavilion Carson, CA | Super Regional Mall | 1973/ N/A | 1,016,554 | 82.2% | N/A | J.C. Penney, Target, IKEA, 24-Hour Fitness, Cinemas | 8.5 |
Source:Appraisal
| (1) | Occupancy as of May 15, 2017 which includes nine tenants (1.6% of NRA and 2.3% of underwritten rent) with signed leases with future commencement dates (September 1, 2017 to January 1, 2018) and three tenants (4.5% of NRA and 5.3% of underwritten rent) with signed leases not yet in occupancy: Dave & Buster’s (expected lease commencement date of May 2018), Marshalls (expected lease commencement date of May 2018) and EMC Seafood & Raw Bar (expected lease commencement date of January 2018), for which a ten-year master lease was signed by the Del Amo Fashion Center Whole Loan guarantor which provides for annual rent equivalent to the tenants’ combined annual rent. |
| (2) | Comparable in-line sales shown as of March 31, 2017. |
Operating History and Underwritten Net Cash Flow.The following table presents certain information relating to the historical operating performance and the Underwritten Net Cash Flow at the Del Amo Fashion Center Property:
| Cash Flow Analysis | ||||||
| 2014 | 2015 | 2016 | 3/31/2017 TTM | UW | UW PSF | |
| Base Rent(1)(2) | $29,467,993 | $33,241,859 | $45,831,077 | $46,804,573 | $51,545,895 | $29.13 |
| Vacant Space | $0 | $0 | $0 | $0 | $11,430,694 | $6.46 |
| Total Recoveries | $12,142,979 | $15,224,540 | $25,514,526 | $26,374,801 | $25,211,150 | $14.25 |
| Specialty Leasing | $1,960,645 | $2,348,117 | $3,373,175 | $3,266,342 | $3,366,899 | $1.90 |
| Other Income(3) | $584,173 | $964,983 | $1,396,597 | $1,359,783 | $1,135,576 | $0.64 |
| Less Vacancy | ($316,274) | ($134,368) | ($441,700) | ($630,344) | ($11,430,694) | (13.0%) |
| Effective Gross Income | $43,839,516 | $51,645,131 | $75,673,675 | $77,175,155 | $81,259,520 | $45.92 |
| Total Operating Expenses | $14,855,360 | $16,605,695 | $24,572,583 | $23,956,448 | $21,915,628 | $12.39 |
| Net Operating Income | $28,984,156 | $35,039,436 | $51,101,092 | $53,218,707 | $59,343,892 | $33.54 |
| Capital Expenditures | $0 | $0 | $0 | $0 | $223,460 | $0.13 |
| TI/LC | $0 | $0 | $0 | $0 | $2,154,999 | $1.22 |
| Net Cash Flow | $28,984,156 | $35,039,436 | $51,101,092 | $53,218,707 | $56,965,434 | $32.19 |
| Occupancy % | 93.5% | 86.1% | 91.5% | 85.2%(2) | 87.0% | |
| NOI DSCR(4) | 1.70x | 2.06x | 3.00x | 3.12x | 3.48x | |
| NCF DSCR(4) | 1.70x | 2.06x | 3.00x | 3.12x | 3.34x | |
| NOI Debt Yield(4) | 6.3% | 7.6% | 11.1% | 11.6% | 12.9% | |
| NCF Debt Yield(4) | 6.3% | 7.6% | 11.1% | 11.6% | 12.4% | |
| (1) | UW Base Rent is based on the May 15, 2017 underwritten rent roll and includes contractual rent steps through July 1, 2018. |
| (2) | Occupancy as of May 15, 2017. The May 15, 2017 underwritten rent roll includes nine tenants (1.6% of NRA and 2.3% of underwritten rent) with signed leases with future commencement dates (September 1, 2017 to January 1, 2018) and three tenants (4.5% of NRA and 5.3% of underwritten rent) with signed leases not yet in occupancy: Dave & Buster’s (expected lease commencement date of May 2018), Marshalls (expected lease commencement date of May 2018) and EMC Seafood & Raw Bar (expected lease commencement date of January 2018), for which a ten-year master lease was signed by the Del Amo Fashion Center Whole Loan guarantor which provides for annual rent equivalent to the tenants’ combined annual rent. |
| (3) | Other income includes income from storage, stroller rentals, ATMs and other miscellaneous rental income. |
| (4) | Debt service coverage ratios and debt yields are based on the Del Amo Fashion Center Senior Loan and exclude the Del Amo Fashion Center Subordinate Loan. |
This is not a research report and was not prepared by the Underwriters’ research departments. Please see additional important information and qualifications at the end of this Term Sheet.
| T-61 |
| BANK 2017-BNK6 | Del Amo Fashion Center |
Escrows and Reserves. During either an event of default or a DSCR Reserve Trigger Period (as defined below), the Del Amo Fashion Center Borrower is required to deposit monthly escrows for real estate taxes, insurance premiums (unless the Del Amo Fashion Center Property is insured under an acceptable blanket insurance policy), $18,600 for replacement reserves, capped at $446,400, and $179,600 for tenant improvement and leasing commissions, capped at $6,465,600. The Del Amo Fashion Center Borrower will additionally be required to deposit monthly escrows for real estate taxes if the Del Amo Fashion Center Borrower fails to provide evidence that the real estate taxes have been paid prior to the assessment of any penalty for late charges.
At loan origination, the Del Amo Fashion Center Whole Loan guarantor provided guarantees in the amount of $7,242,346 for outstanding landlord obligations relating to fourteen tenants and $828,894 for abated rent periods relating to eleven tenants which continue through as late as February 1, 2018.
A “DSCR Reserve Trigger Period” will commence upon the debt service coverage ratio for the Del Amo Fashion Center Whole Loan being less than 1.50x for two consecutive quarters based on the trailing four quarters and will end (provided no event of default has occurred and is continuing) upon the debt service coverage ratio for the Del Amo Fashion Center Whole Loan being equal to or greater than 1.50x for two consecutive quarters based on the trailing four quarters.
Lockbox and Cash Management. A hard lockbox is in place with respect to the Del Amo Fashion Center Whole Loan. Upon the occurrence of a Lockbox Event (as defined below), the Del Amo Fashion Center Borrower is required to establish a lender-controlled cash management account to which all amounts in the lockbox account are required to be automatically transferred weekly for the payment of, among other things, debt service, monthly escrows and operating expenses pursuant to an approved annual budget, with all excess cash being deposited to an excess cash reserve to be held as additional collateral for the Del Amo Fashion Center Whole Loan until the Lockbox Event ends.
A “Lockbox Event” will occur upon (i) an event of default, (ii) a bankruptcy action involving the Del Amo Fashion Center Borrower, (iii) a bankruptcy action involving Simon Management Associates II, LLC (or a borrower-affiliated manager) without the manager being replaced within 60 days, (iv) a DSCR Trigger Period (as defined below), or (v) a Nordstrom Trigger Event (as defined below).
A Lockbox Event will end, provided no event of default shall be continuing, upon, as applicable, (i) the lender’s acceptance of a cure of the event of default, (ii) Simon Management Associates II, LLC (or a borrower-affiliated manager) being replaced with a qualified manager or the bankruptcy involving the manager being discharged or dismissed, (iii) the end of a DSCR Trigger Period, or (iv) the end of a Nordstrom Trigger Event. A Lockbox Event may not be cured if triggered by a bankruptcy action of the Del Amo Fashion Center Borrower.
A “DSCR Trigger Period” will commence upon the debt service coverage ratio for the Del Amo Fashion Center Whole Loan being less than 1.40x for two consecutive quarters based on the trailing four quarters and will end upon the debt service coverage ratio for the Del Amo Fashion Center Whole Loan being equal to or greater than 1.40x for two consecutive quarters based on the trailing four quarters.
A “Nordstrom Trigger Event” will occur upon Nordstrom (i) vacating or terminating or giving notice to vacate or terminate its lease or (ii) commencing to exercise remedies pursuant to its lease in connection with the Del Amo Fashion Center Borrower’s failure to complete the removal of the former TJ Maxx/Marshalls space from the Del Amo Fashion Center Property, and will end upon the earlier of (i) at least 75% of Nordstrom’s leased space being re-leased to one or more replacement tenants, which tenant(s) are in occupancy, open for business and paying full unabated rent with no outstanding landlord obligations, or (ii) the balance collected to the excess cash flow reserve during the Nordstrom Trigger Event being equal to or greater than $1,380,000.
Additional Secured Indebtedness (not including trade debts). The Del Amo Fashion Center Property also secures fourteen seniorpari passu promissory A-Notes with an aggregate principal balance of $330,796,000 (which arepari passu with each other and the A-Notes included in the Del Amo Fashion Center Mortgage Loan) and thirteen senior promissory B-Notes (which arepari passu with each other and the B-Notes included in the Del Amo Fashion Center Mortgage Loan) with an aggregate principal balance of $68,961,000 (the“Del Amo Fashion Center Non-ServicedPari Passu Companion Loans”) as well as the Del Amo Fashion Center Subordinate Loan, which includes twelve subordinate mortgage notes, comprised of four notes from each of three tranches (C-Notes, D-Notes and E-Notes, each of which is subordinate to the Del Amo Fashion Center Senior Loan and to each other such tranche with a prior alphabetical designation), with an aggregate principal balance of $125,700,000. The Del Amo Fashion Center Non-ServicedPari Passu Companion Loans and the Del Amo Fashion Center Subordinate Loan accrue interest at the same rate as the Del Amo Fashion Center Mortgage Loan. The Del Amo Fashion Center Mortgage Loan is entitled to payments of principal (if applicable) and interest on apro rata andpari passu basis with the Del Amo Fashion Center Non-ServicedPari Passu Companion Loans (provided that all A-Notes are entitled to payments of principal (if applicable) and interest prior to all B-Notes) before payments of principal (if applicable) and interest to the Del Amo Fashion Center Subordinate Loan.
The holders of the Del Amo Fashion Center Mortgage Loan, the Del Amo Fashion Center Non-ServicedPari PassuCompanion Loans and the Del Amo Fashion Center Subordinate Loan have entered into a co-lender agreement which sets forth the allocation of collections on the Del Amo Fashion Center Whole Loan.See “Description of the Mortgage Pool—The Whole Loans—The Del Amo Fashion Center Pari Passu-A/B Whole Loan” in the Preliminary Prospectus.
Mezzanine Loan and Preferred Equity.Not permitted.
Release of Property. No material releases permitted.
Terrorism Insurance.The Del Amo Fashion Center Borrower is required to obtain and maintain property insurance, public liability insurance and rental loss and/or business interruption insurance that covers perils of terrorism and acts of terrorism, provided that the Del Amo Fashion Center Whole Loan documents provide for an annual terrorism premium cap of two times the cost of the premiums for property insurance required under the related Del Amo Fashion Center Whole Loan documents (on a stand-alone basis), but excluding the wind and flood components of such premiums.
This is not a research report and was not prepared by the Underwriters’ research departments. Please see additional important information and qualifications at the end of this Term Sheet.
| T-62 |
(THIS PAGE INTENTIONALLY LEFT BLANK)
| T-63 |
| BANK 2017-BNK6 | Starwood Capital Hotel Portfolio |
Mortgage Loan No. 4 – Starwood Capital Hotel Portfolio
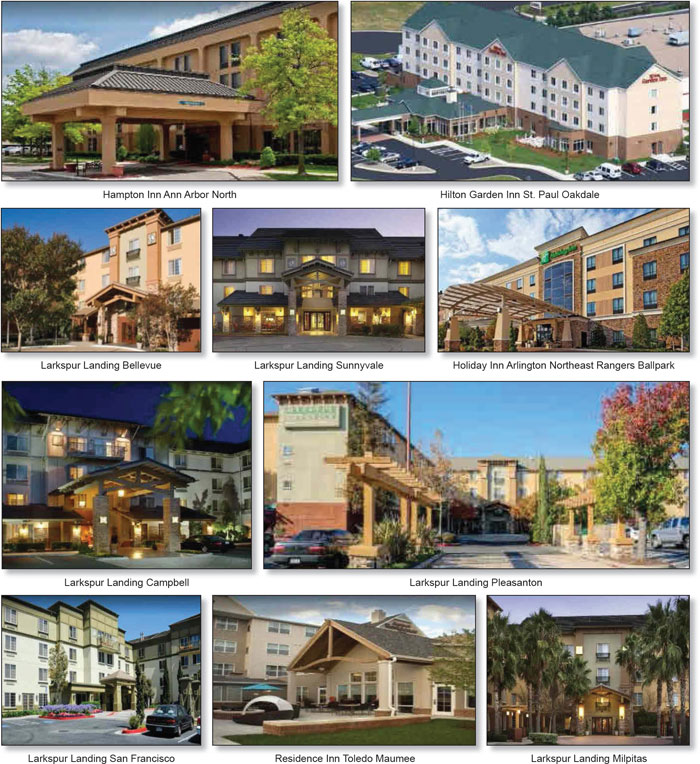
This is not a research report and was not prepared by the Underwriters’ research departments. Please see additional important information and qualifications at the end of this Term Sheet.
| T-64 |
| BANK 2017-BNK6 | Starwood Capital Hotel Portfolio |
Mortgage Loan No. 4 – Starwood Capital Hotel Portfolio
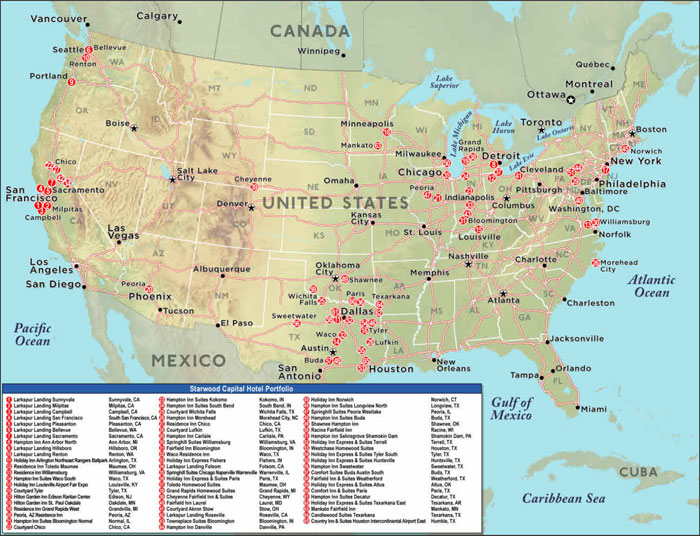
This is not a research report and was not prepared by the Underwriters’ research departments. Please see additional important information and qualifications at the end of this Term Sheet.
| T-65 |
| BANK 2017-BNK6 | Starwood Capital Hotel Portfolio |
| Mortgage Loan No. 4 – Starwood Capital Hotel Portfolio |
| Mortgage Loan Information | Property Information | ||||||
| Mortgage Loan Seller: | BANA | Single Asset/Portfolio: | Portfolio | ||||
| Original Balance(1): | $59,317,500 | Location: | Various | ||||
| Cut-off Date Balance(1): | $59,317,500 | General Property Type: | Hospitality | ||||
| % of Initial Pool Balance: | 6.4% | Detailed Property Type: | Various | ||||
| Loan Purpose: | Refinance | Title Vesting(4): | Fee / Leasehold | ||||
| Sponsor: | Starwood Capital Group Global, L.P.; | Year Built/Renovated: | Various / Various | ||||
| Starwood Capital Group Global II, L.P.; | Size: | 6,366 Rooms | |||||
| Starwood Capital Group Global I, L.L.C. | Cut-off Date Balance Per Room(1): | $90,680 | |||||
| Mortgage Rate: | 4.4860% | Maturity Date Balance Per Room(1): | $90,680 | ||||
| Note Date: | 5/24/2017 | Property Manager(5): | Various | ||||
| First Payment Date: | 7/1/2017 | ||||||
| Maturity Date: | 6/1/2027 | ||||||
| Original Term: | 120 months | ||||||
| Original Amortization Term: | 0 months | Underwriting and Financial Information | |||||
| IO Period: | 120 months | UW NOI: | $71,329,392 | ||||
| Seasoning: | 1 month | UW NOI Debt Yield(1): | 12.4% | ||||
| Prepayment Provisions: | LO (12); YM1 (105); O (3) | UW NOI Debt Yield at Maturity(1): | 12.4% | ||||
| Lockbox/Cash Mgmt Status: | Soft/Springing | UW NCF DSCR(1): | 2.72x | ||||
| Additional Debt Type(2): | Pari Passu | Most Recent NOI: | $72,574,924 (3/31/2017 TTM) | ||||
| Additional Debt Balance(2): | $517,952,500 | 2nd Most Recent NOI: | $74,469,397 (12/31/2016) | ||||
| Future Debt Permitted (Type)(2): | Yes (Mezzanine) | 3rd Most Recent NOI: | $74,006,639 (12/31/2015) | ||||
| Reserves(3) | Most Recent Occupancy: | 74.6% (3/31/2017) | |||||
| Type | Initial | Monthly | Cap | 2nd Most Recent Occupancy: | 74.7% (12/31/2016) | ||
| RE Tax: | $0 | Springing | N/A | 3rd Most Recent Occupancy: | 74.8% (12/31/2015) | ||
| Insurance: | $0 | Springing | N/A | Appraised Value (as of)(6): | $956,000,000 (4/23/2017) | ||
| Recurring Replacements: | $0 | Springing | N/A | Cut-off Date LTV Ratio(1): | 60.4% | ||
| Other: | $12,268,991 | Springing | N/A | Maturity Date LTV Ratio(1): | 60.4% | ||
| Sources and Uses | ||||||
| Sources | Proceeds | % of Total | Uses | Proceeds | % of Total | |
| Loan Amount(1): | $577,270,000 | 100.0% | Loan Payoff: | $425,033,863 | 73.6% | |
| Closing Costs: | $8,975,399 | 1.6% | ||||
| Reserves: | $12,268,991 | 2.1% | ||||
| Return of Equity: | $130,991,748 | 22.7% | ||||
| Total Sources: | $577,270,000 | 100.0% | Total Uses: | $577,270,000 | 100.0% | |
| (1) | The Starwood Capital Hotel Portfolio Mortgage Loan is part of the Starwood Capital Hotel Portfolio Whole Loan, which is comprised of eighteen pari passu promissory notes with an aggregate principal balance of $577,270,000. The Cut-off Date Balance Per Room, Maturity Date Balance Per Room, UW NOI Debt Yield, UW NOI Debt Yield at Maturity, UW NCF DSCR, Cut-off Date LTV Ratio and Maturity Date LTV Ratio numbers presented above are based on the aggregate principal balance of the promissory notes comprising the Starwood Capital Hotel Portfolio Whole Loan. |
| (2) | See “The Mortgage Loan”, and “Additional Secured Indebtedness (not including trade debts)” and “Mezzanine Loan and Preferred Equity” for a discussion of the additional debt. |
| (3) | See “Escrows and Reserves” below for further discussion of reserve requirements. |
| (4) | Hilton Garden Inn Edison Raritan Center (1.8% of allocated loan amounts) is subject to a ground lease. See “Ground Leases” below for further details. |
| (5) | The Property Managers include: Hersha Hospitality Management L.P. (“Hersha”), First Hospitality Group, Inc. (“First Hospitality”), TMI Property Management, L.L.C. (“TMI”), Schulte Hospitality Group, Inc. (“Schulte”) and Pillar Hotels and Resorts, LLC (“Pillar”). |
| (6) | The “As Portfolio” Appraised Value of $956.0 million reflects an 8.1% premium attributed to the aggregate “As-is” value of the Starwood Capital Hotel Portfolio Properties as a whole. The sum of the value of the “As-is” and “As-renovated” values, as applicable, for each of the Starwood Capital Hotel Portfolio Properties on an individual basis is $889.2 million, which represents a Cut-off Date LTV Ratio and Maturity Date LTV Ratio of 64.9%. Additionally, the aggregate “As-is” value for each individual property as of April 23, 2017 is $884.7 million, which results in a Cut-off Date LTV Ratio and Maturity Date LTV Ratio of 65.3%. |
The Mortgage Loan. The fourth largest mortgage loan (the “Starwood Capital Hotel Portfolio Mortgage Loan”) is part of a whole loan (the “Starwood Capital Hotel Portfolio Whole Loan”) evidenced by eighteenpari passu promissory notes in the aggregate original principal amount of $577,270,000. The Starwood Capital Hotel Portfolio Whole Loan is secured by the fee simple, leasehold and operating leasehold interests in a hospitality portfolio consisting of 65 properties and 6,366 rooms located across 21 states throughout the continental United States (the “Starwood Capital Hotel Portfolio Properties”). The Starwood Capital Hotel Portfolio Whole Loan was co-originated by Bank of America, N.A., Barclays Bank PLC, Deutsche Bank, AG, New York Branch and JP Morgan Chase Bank, N.A. Promissory Note A-4, in the original principal amount of $59,317,500, represents the Starwood Capital Hotel Portfolio Mortgage Loan, and will be included in the BANK 2017-BNK6 securitization trust.
This is not a research report and was not prepared by the Underwriters’ research departments. Please see additional important information and qualifications at the end of this Term Sheet.
| T-66 |
| BANK 2017-BNK6 | Starwood Capital Hotel Portfolio |
The following table presents a summary of the notes comprising the Starwood Capital Hotel Portfolio Whole Loan. The promissory notes identified below, other than the Starwood Capital Hotel Portfolio Mortgage Loan (such promissory notes, the “Starwood Capital Hotel PortfolioPari PassuCompanion Loans”) are expected to be contributed to future securitization transactions or may be otherwise transferred at any time. The Starwood Capital Hotel Portfolio Mortgage Loan will be serviced pursuant to the pooling and servicing agreement for the DBJPM 2017-C6 securitization transaction. See “Description of the Mortgage Pool—The Whole Loans—the Non-Serviced Whole Loans” and “Pooling and Servicing Agreement-Servicing of the Non-Serviced Mortgage Loans” in the Preliminary Prospectus.
| Starwood Capital Hotel Portfolio Whole Loan Summary | ||||
| Note | Original Balance | Cut-off Date Balance | Note Holder(1) | Controlling Piece |
| Note A-1 | $40,000,000 | $40,000,000 | DBJPM 2017-C6 | Yes |
| Note A-2 | $60,000,000 | $60,000,000 | JP Morgan Chase Bank, N.A. | No |
| Note A-3 | $72,500,000 | $72,500,000 | BANK 2017-BNK5 | No |
| Note A-4 | $59,317,500 | $59,317,500 | BANK 2017-BNK6 | No |
| Note A-5 | $50,000,000 | $50,000,000 | WFCM 2017-C38 | No |
| Note A-6 | $50,000,000 | $50,000,000 | Barclays Bank PLC | No |
| Note A-7 | $40,000,000 | $40,000,000 | DBJPM 2017-C6 | No |
| Note A-8 | $20,000,000 | $20,000,000 | Deutsche Bank AG, New York Branch | No |
| Note A-9 | $20,000,000 | $20,000,000 | JP Morgan Chase Bank, N.A. | No |
| Note A-10 | $20,000,000 | $20,000,000 | Deutsche Bank AG, New York Branch | No |
| Note A-11 | $15,000,000 | $15,000,000 | Deutsche Bank AG, New York Branch | No |
| Note A-12 | $15,000,000 | $15,000,000 | Deutsche Bank AG, New York Branch | No |
| Note A-13 | $21,817,500 | $21,817,500 | Deutsche Bank AG, New York Branch | No |
| Note A-14 | $11,817,500 | $11,817,500 | JP Morgan Chase Bank, N.A. | No |
| Note A-15 | $25,000,000 | $25,000,000 | Starwood Capital Mortgage Funding II LLC(2) | No |
| Note A-16-1 | $15,000,000 | $15,000,000 | Starwood Capital Mortgage Funding II LLC(2) | No |
| Note A-16-2 | $10,000,000 | $10,000,000 | Starwood Capital Mortgage Funding II LLC(2) | No |
| Note A-17 | $31,817,500 | $31,817,500 | Barclays Bank PLC | No |
| Total Starwood Capital Hotel Portfolio Whole Loan | $577,270,000 | $577,270,000 | ||
| (1) | The promissory notes currently held by JP Morgan Chase Bank, N.A., Barclays Bank PLC, Deutsche Bank AG, New York Branch and Starwood Capital Mortgage Funding II LLC are expected to be contributed to future securitization transactions or may be otherwise transferred at any time. |
| (2) | Starwood Capital Mortgage Funding II LLC is an affiliate of the Starwood Capital Hotel Portfolio Borrowers. The related co-lender agreement provides that Starwood Capital Mortgage Funding II LLC will have no non-controlling noteholder rights. |
The Borrowers and the Sponsor. The borrowers consist of 92 single-purpose Delaware limited liability companies and 36 single-purpose Delaware limited partnerships, each structured to be bankruptcy remote, with two independent directors in its organizational structure (the “Starwood Capital Hotel Portfolio Borrowers”). There are two borrowers with respect to each of the Starwood Capital Group Portfolio Properties, the property owner borrower and the operating lessee borrower.
The sponsors are any of Starwood Capital Group Global, L.P., Starwood Capital Group Global II, L.P. and Starwood Capital Group Global I, L.L.C. The non-recourse carve-out guarantor is SCG Hotel Investors Holdings, L.P., an affiliate of Starwood Capital Group, L.P. (“SCG”). The aggregate recourse to the guarantor related to bankruptcy or insolvency actions may not exceed an amount equal to 20% of the principal balance of the SCG Hotel Portfolio Whole Loan outstanding at the time of the occurrence of such event, plus reasonable third-party costs incurred by the lender in connection with the enforcement of its rights. See “Description of the Mortgage Pool–Non-Recourse Carveout Limitations” in the Preliminary Prospectus.
SCG is a private alternative investment firm with a primary focus on global real estate. Since its inception in 1991, SCG has raised over $40 billion of equity capital and currently manages over $51 billion in assets. Over the past 26 years, SCG has acquired over $86.5 billion of assets across various real estate asset classes, geographies and positions in the capital stack. SCG directly employs over 2,200 professionals and approximately 16,000 additional employees through various portfolio operating companies with offices in Atlanta, Chicago, Greenwich, Hong Kong, London, Los Angeles, Luxembourg, Miami, San Francisco and Washington, D.C.
The Properties. The Starwood Capital Hotel Portfolio Properties are comprised of 65 hotels offering a range of amenities, spanning the limited service, full service and extended stay varieties. The hotels range in size from 56 to 147 rooms, with an average count of 98 rooms. The Starwood Capital Hotel Portfolio Properties benefit from geographic and brand diversity. No individual portfolio property accounts for greater than 2.3% of total rooms or 5.8% of underwritten net cash flow. The top 10 properties based on allocated loan amount account for only 19.4% of total rooms and 35.1% of underwritten net cash flow. The hotels range in age from seven to 42 years old, with an average age of approximately 16 years, and 59.0% of the Starwood Capital Hotel Portfolio Properties based on underwritten net cash flow have been renovated since 2012.
This is not a research report and was not prepared by the Underwriters’ research departments. Please see additional important information and qualifications at the end of this Term Sheet.
| T-67 |
| BANK 2017-BNK6 | Starwood Capital Hotel Portfolio |
A summary detailing the composition of the Starwood Capital Hotel Portfolio by property sub-type is provided below:
| Starwood Capital Hotel Portfolio Property Sub-Type Summary | ||||||||
| Property Sub-Type | # Hotels | #Rooms | % of Total Rooms | UW NCF | % of Total UW NCF | Appraised Value(1) | Appraised Value Per Room | TTM RevPAR Penetration |
| Extended Stay | 22 | 2,244 | 35.2% | $35,078,267 | 49.2% | $441,700,000 | $196,836 | 112.5% |
| Limited Service | 40 | 3,734 | 58.7% | $32,572,979 | 45.7% | $403,300,000 | $108,007 | 131.5% |
| Full Service | 3 | 388 | 6.1% | $3,678,146 | 5.2% | $44,200,000 | $113,918 | 106.4% |
| Total / Weighted Average | 65 | 6,366 | 100.0% | $71,329,392 | 100.0% | $956,000,000 | $150,173 | 123.3% |
| (1) | The “As Portfolio” Appraised Value of $956.0 million reflects an 8.1% premium attributed to the aggregate “As-is” value of the Starwood Capital Hotel Portfolio Properties as a whole. The sum of the value of the “As-is” and “As-Renovated” values, as applicable, for each of the Starwood Capital Hotel Portfolio Properties on an individual basis is $889.2 million. Additionally, the aggregate “As-is” value for each individual property as of April 23, 2017 is $884.7 million. |
All 65 hotels in the Starwood Capital Hotel Portfolio are operated pursuant to management agreements with one of Hersha (39 hotels), First Hospitality (nine hotels), TMI (nine hotels), Schulte (six hotels) or Pillar (two hotels), as detailed in the below summary:
| Starwood Capital Group Hotel Management Company Summary | |||||||
| Management Company | # Hotels | #Rooms | % of Total Rooms | UW NCF | % of Total UW NCF | Appraised Value(1) | Appraised Value Per Room |
| Hersha | 39 | 3,859 | 60.6% | $44,857,243 | 62.9% | $565,900,000 | $146,644 |
| First Hospitality | 9 | 981 | 15.4% | $12,107,023 | 17.0% | $137,400,000 | $140,061 |
| TMI | 9 | 666 | 10.5% | $6,259,518 | 8.8% | $87,600,000 | $131,532 |
| Schulte | 6 | 692 | 10.9% | $5,458,243 | 7.7% | $69,700,000 | $100,723 |
| Pillar | 2 | 168 | 2.6% | $2,647,365 | 3.7% | $28,600,000 | $170,238 |
| Total | 65 | 6,366 | 100.0% | $71,329,392 | 100.0% | $956,000,000 | $150,173 |
| (1) | The “As Portfolio” Appraised Value of $956.0 million reflects an 8.1% premium attributed to the aggregate “As-is” value of the Starwood Capital Hotel Portfolio Properties as a whole. The sum of the value of the “As-is” and “As-if” values, as applicable, for each of the Starwood Capital Hotel Portfolio Properties on an individual basis is $889.2 million. Additionally, the aggregate “As-is” value for each individual property as of April 23, 2017 is $884.7 million. |
This is not a research report and was not prepared by the Underwriters’ research departments. Please see additional important information and qualifications at the end of this Term Sheet.
| T-68 |
| BANK 2017-BNK6 | Starwood Capital Hotel Portfolio |
A summary of the individual Starwood Capital Hotel Portfolio Properties is provided below:
| Starwood Capital Hotel Portfolio Property Summary | ||||||||||||||||||||
| Property Name | City / State | Rooms | Year Built / Renovated | Allocated Loan Amount | % of Allocated Loan Amount | Appraised Value(1) | UW NCF | % of UW NCF | TTM Occupancy | TTM | ||||||||||
| Larkspur Landing Sunnyvale | Sunnyvale, CA | 126 | 2000 / NAP | $34,068,063 | 5.9% | $52,100,000 | $4,171,961 | 5.8% | 83.8% | 105.3% | ||||||||||
| Larkspur Landing Milpitas | Milpitas, CA | 124 | 1998 / NAP | $28,706,103 | 5.0% | $43,900,000 | $3,562,157 | 5.0% | 85.7% | 111.6% | ||||||||||
| Larkspur Landing Campbell | Campbell, CA | 117 | 2000 / NAP | $25,240,446 | 4.4% | $38,600,000 | $3,199,426 | 4.5% | 84.3% | 93.3% | ||||||||||
| Larkspur Landing San Francisco | S. San Francisco, CA | 111 | 1999 / NAP | $20,793,943 | 3.6% | $31,800,000 | $2,426,585 | 3.4% | 84.9% | 83.6% | ||||||||||
| Larkspur Landing Pleasanton | Pleasanton, CA | 124 | 1997 / NAP | $20,336,214 | 3.5% | $31,100,000 | $2,438,362 | 3.4% | 82.9% | 87.8% | ||||||||||
| Larkspur Landing Bellevue | Bellevue, WA | 126 | 1998 / NAP | $18,112,963 | 3.1% | $27,700,000 | $2,173,526 | 3.0% | 78.8% | 108.6% | ||||||||||
| Larkspur Landing Sacramento | Sacramento, CA | 124 | 1998 / NAP | $13,535,680 | 2.3% | $20,700,000 | $1,816,912 | 2.5% | 83.0% | 110.0% | ||||||||||
| Hampton Inn Ann Arbor North | Ann Arbor, MI | 129 | 1988 / 2015 | $13,208,731 | 2.3% | $20,200,000 | $1,836,126 | 2.6% | 73.9% | 123.7% | ||||||||||
| Larkspur Landing Hillsboro | Hillsboro, OR | 124 | 1997 / NAP | $13,208,731 | 2.3% | $20,200,000 | $1,708,763 | 2.4% | 74.1% | 77.6% | ||||||||||
| Larkspur Landing Renton | Renton, WA | 127 | 1998 / NAP | $13,077,951 | 2.3% | $20,000,000 | $1,694,132 | 2.4% | 80.3% | 103.3% | ||||||||||
| Holiday Inn Arlington NE Rangers Ballpark | Arlington, TX | 147 | 2008 / 2013 | $12,554,833 | 2.2% | $19,200,000 | $1,537,247 | 2.2% | 78.3% | 100.5% | ||||||||||
| Residence Inn Toledo Maumee | Maumee, OH | 108 | 2008 / 2016 | $12,424,054 | 2.2% | $19,000,000 | $1,468,871 | 2.1% | 81.7% | 142.7% | ||||||||||
| Residence Inn Williamsburg | Williamsburg, VA | 108 | 1999 / 2012 | $11,900,936 | 2.1% | $18,200,000 | $1,358,744 | 1.9% | 73.0% | 158.8% | ||||||||||
| Hampton Inn Suites Waco South | Waco, TX | 123 | 2008 / 2013 | $10,985,479 | 1.9% | $16,800,000 | $1,414,791 | 2.0% | 77.7% | 116.2% | ||||||||||
| Holiday Inn Louisville Airport Fair Expo | Louisville, KY | 106 | 2008 / NAP | $10,789,310 | 1.9% | $16,500,000 | $1,388,767 | 1.9% | 72.9% | 102.1% | ||||||||||
| Courtyard Tyler | Tyler, TX | 121 | 2010 / 2016 | $10,593,141 | 1.8% | $16,200,000 | $1,253,360 | 1.8% | 58.8% | 125.6% | ||||||||||
| Hilton Garden Inn Edison Raritan Center(3) | Edison, NJ | 132 | 2002 / 2014 | $10,593,141 | 1.8% | $16,200,000 | $1,317,397 | 1.8% | 78.1% | 135.7% | ||||||||||
| Hilton Garden Inn St. Paul Oakdale | Oakdale, MN | 116 | 2005 / 2013 | $10,462,361 | 1.8% | $16,000,000 | $1,689,847 | 2.4% | 80.0% | 141.9% | ||||||||||
| Residence Inn Grand Rapids West | Grandville, MI | 90 | 2000 / 2017 | $10,331,582 | 1.8% | $15,800,000(5) | $1,106,127 | 1.6% | 72.6% | 115.2% | ||||||||||
| Peoria, AZ Residence Inn | Peoria, AZ | 90 | 1998 / 2013 | $10,266,192 | 1.8% | $15,700,000 | $1,158,027 | 1.6% | 80.8% | 145.9% | ||||||||||
| Hampton Inn Suites Bloomington Normal | Normal, IL | 128 | 2007 / 2015 | $10,200,802 | 1.8% | $15,600,000 | $1,396,943 | 2.0% | 70.8% | 123.5% | ||||||||||
| Courtyard Chico | Chico, CA | 90 | 2005 / 2015 | $10,004,633 | 1.7% | $15,300,000 | $1,439,185 | 2.0% | 84.6% | 157.5% | ||||||||||
| Hampton Inn Suites Kokomo | Kokomo, IN | 105 | 1997 / 2013 | $9,677,684 | 1.7% | $14,800,000 | $1,255,566 | 1.8% | 77.9% | 158.5% | ||||||||||
| Hampton Inn Suites South Bend | South Bend, IN | 117 | 1997 / 2014 | $9,677,684 | 1.7% | $14,800,000 | $1,232,210 | 1.7% | 69.9% | 113.2% | ||||||||||
| Courtyard Wichita Falls | Wichita Falls, TX | 93 | 2009 / 2017 | $9,219,956 | 1.6% | $14,100,000 | $1,095,610 | 1.5% | 77.4% | 106.0% | ||||||||||
| Hampton Inn Morehead | Morehead City, NC | 118 | 1991 / 2017 | $8,958,397 | 1.6% | $13,700,000(5) | $1,094,065 | 1.5% | 66.6% | 139.7% | ||||||||||
| Residence Inn Chico | Chico, CA | 78 | 2005 / 2014 | $8,696,838 | 1.5% | $13,300,000 | $1,208,180 | 1.7% | 88.0% | 166.0% | ||||||||||
| Courtyard Lufkin | Lufkin, TX | 101 | 2009 / 2017 | $8,304,499 | 1.4% | $12,700,000(5) | $738,285 | 1.0% | 64.9% | 105.9% | ||||||||||
| Hampton Inn Carlisle | Carlisle, PA | 97 | 1997 / 2014 | $8,239,109 | 1.4% | $12,600,000 | $1,116,905 | 1.6% | 76.1% | 175.6% | ||||||||||
| Springhill Suites Williamsburg | Williamsburg, VA | 120 | 2002 / 2012 | $8,239,109 | 1.4% | $12,600,000 | $876,108 | 1.2% | 71.7% | 106.8% | ||||||||||
| Fairfield Inn Bloomington | Bloomington, IN | 105 | 1995 / 2015 | $8,173,720 | 1.4% | $12,500,000 | $1,271,230 | 1.8% | 87.1% | 106.3% | ||||||||||
| Waco Residence Inn | Waco, TX | 78 | 1997 / 2012 | $7,977,550 | 1.4% | $12,200,000(5) | $912,234 | 1.3% | 82.0% | 112.5% | ||||||||||
| Holiday Inn Express Fishers | Fishers, IN | 115 | 2000 / 2012 | $7,454,432 | 1.3% | $11,400,000 | $951,428 | 1.3% | 67.1% | 90.5% | ||||||||||
| Larkspur Landing Folsom | Folsom, CA | 84 | 2000 / NAP | $7,258,263 | 1.3% | $11,100,000 | $858,864 | 1.2% | 86.4% | 98.1% | ||||||||||
| Springhill Suites Chi. Naperville Warrenville | Warrenville, IL | 128 | 1997 / 2013 | $6,865,924 | 1.2% | $10,500,000 | $667,822 | 0.9% | 67.1% | 96.1% | ||||||||||
| Holiday Inn Express & Suites Paris | Paris, TX | 84 | 2009 / NAP | $6,800,535 | 1.2% | $10,400,000 | $798,480 | 1.1% | 72.6% | 126.5% | ||||||||||
| Toledo Homewood Suites | Maumee, OH | 78 | 1997 / 2014 | $6,800,535 | 1.2% | $10,400,000(5) | $944,205 | 1.3% | 82.2% | 123.0% | ||||||||||
| Grand Rapids Homewood Suites | Grand Rapids, MI | 78 | 1997 / 2013 | $6,604,365 | 1.1% | $10,100,000(5) | $739,572 | 1.0% | 84.1% | 113.7% | ||||||||||
| Cheyenne Fairfield Inn & Suites | Cheyenne, WY | 60 | 1994 / 2013 | $6,146,637 | 1.1% | $9,400,000 | $753,591 | 1.1% | 74.6% | 117.6% | ||||||||||
| Fairfield Inn Laurel | Laurel, MD | 109 | 1988 / 2013 | $6,146,637 | 1.1% | $9,400,000 | $657,471 | 0.9% | 79.9% | 139.2% | ||||||||||
| Courtyard Akron Stow | Stow, OH | 101 | 2005 / 2014 | $6,015,858 | 1.0% | $9,200,000 | $886,115 | 1.2% | 65.9% | 98.4% | ||||||||||
| Larkspur Landing Roseville | Roseville, CA | 90 | 1999 / NAP | $5,688,909 | 1.0% | $8,700,000 | $786,149 | 1.1% | 79.5% | 96.9% | ||||||||||
| Towneplace Suites Bloomington | Bloomington, IN | 83 | 2000 / 2013 | $5,688,909 | 1.0% | $8,700,000 | $850,105 | 1.2% | 89.1% | 101.3% | ||||||||||
| Hampton Inn Danville | Danville, PA | 71 | 1998 / 2013 | $5,623,519 | 1.0% | $8,600,000 | $728,609 | 1.0% | 80.0% | 222.0% | ||||||||||
| Holiday Inn Norwich | Norwich, CT | 135 | 1975 / 2013 | $5,558,129 | 1.0% | $8,500,000 | $752,132 | 1.1% | 56.7% | 116.3% | ||||||||||
| Hampton Inn Suites Longview North | Longview, TX | 91 | 2008 / 2013 | $5,492,740 | 1.0% | $8,400,000 | $650,443 | 0.9% | 63.8% | 129.8% | ||||||||||
| Springhill Suites Peoria Westlake | Peoria, IL | 124 | 2000 / 2013 | $5,492,740 | 1.0% | $8,400,000 | $470,046 | 0.7% | 63.3% | 89.1% | ||||||||||
| Hampton Inn Suites Buda | Buda, TX | 74 | 2008 / NAP | $5,427,350 | 0.9% | $8,300,000 | $853,603 | 1.2% | 74.5% | 139.5% | ||||||||||
| Shawnee Hampton Inn | Shawnee, OK | 63 | 1996 / 2013 | $5,427,350 | 0.9% | $8,300,000(5) | $618,775 | 0.9% | 77.6% | 146.0% | ||||||||||
| Racine Fairfield Inn | Racine, WI | 62 | 1991 / 2016 | $5,296,570 | 0.9% | $8,100,000(5) | $603,823 | 0.8% | 68.6% | 154.1% | ||||||||||
| HI Selinsgrove Shamokin Dam | Shamokin Dam, PA | 75 | 1996 / 2013 | $5,165,791 | 0.9% | $7,900,000 | $687,279 | 1.0% | 75.6% | 184.0% | ||||||||||
| Holiday Inn Express & Suites Terrell | Terrell, TX | 68 | 2007 / 2013 | $4,904,232 | 0.8% | $7,500,000 | $605,485 | 0.8% | 84.0% | 183.4% | ||||||||||
| Westchase Homewood Suites | Houston, TX | 96 | 1998 / 2016 | $4,746,774 | 0.8% | $9,800,000(5) | $379,742 | 0.5% | 63.4% | 142.9% | ||||||||||
| HIE & Suites Tyler South | Tyler, TX | 88 | 2000 / 2015 | $4,708,062 | 0.8% | $7,200,000 | $599,880 | 0.8% | 65.9% | 132.5% | ||||||||||
| HIE & Suites Huntsville | Huntsville, TX | 87 | 2008 / 2013 | $4,511,893 | 0.8% | $6,900,000 | $689,387 | 1.0% | 65.5% | 243.3% | ||||||||||
| Hampton Inn Sweetwater | Sweetwater, TX | 72 | 2009 / NAP | $4,119,555 | 0.7% | $6,300,000 | $400,369 | 0.6% | 62.9% | 132.2% | ||||||||||
| Comfort Suites Buda Austin South | Buda, TX | 72 | 2009 / NAP | $3,465,657 | 0.6% | $5,300,000 | $541,569 | 0.8% | 76.8% | 109.7% | ||||||||||
| Fairfield Inn & Suites Weatherford | Weatherford, TX | 86 | 2009 / 2016 | $3,269,488 | 0.6% | $5,000,000 | $311,718 | 0.4% | 63.4% | 91.1% | ||||||||||
| Holiday Inn Express & Suites Altus | Altus, OK | 68 | 2008 / 2013 | $2,649,352 | 0.5% | $4,600,000 | $211,948 | 0.3% | 67.4% | 151.2% | ||||||||||
| Comfort Inn & Suites Paris | Paris, TX | 56 | 2009 / NAP | $2,354,031 | 0.4% | $3,600,000 | $251,060 | 0.4% | 67.4% | 146.2% | ||||||||||
| Hampton Inn Suites Decatur | Decatur, TX | 74 | 2008 / 2013 | $2,252,646 | 0.4% | $3,600,000 | $180,212 | 0.3% | 64.6% | 228.4% | ||||||||||
| Holiday Inn Express & Suites Texarkana E. | Texarkana, AR | 88 | 2009 / NAP | $2,086,036 | 0.4% | $4,100,000 | $166,883 | 0.2% | 66.5% | 100.5% | ||||||||||
| Mankato Fairfield Inn | Mankato, MN | 61 | 1997 / 2016 | $1,869,354 | 0.3% | $3,600,000 | $149,548 | 0.2% | 58.0% | 100.2% | ||||||||||
| Candlewood Suites Texarkana | Texarkana, TX | 80 | 2009 / 2014 | $1,445,301 | 0.3% | $2,600,000 | $115,624 | 0.2% | 75.0% | 110.1% | ||||||||||
| Country Inn & Suites Houston IC Airport E. | Humble, TX | 62 | 2001 / 2017 | $1,372,592 | 0.2% | $3,200,000 | $109,807 | 0.2% | 54.1% | 86.8% | ||||||||||
| Total / Weighted Average | 6,366 | $577,270,000 | 100.0% | $889,200,000 | $71,329,392 | 100.0% | 74.6% | 123.3% | ||||||||||||
| Total with Portfolio Premium | $956,000,000 | |||||||||||||||||||
| (1) | The “As Portfolio” Appraised Value of $956.0 million reflects an 8.1% premium attributed to the aggregate “As-is” value of the Starwood Capital Hotel Portfolio Properties as a whole. The sum of the value of the “As-is” and “As-Renovated” values, as applicable, for each of the Starwood Capital Hotel Portfolio Properties on an individual basis is $889.2 million. Additionally, the aggregate “As-is” value for each individual property as of April 23, 2017 is $884.7 million. |
| (2) | TTM RevPAR Penetration is based on operating statements as of March 31, 2017 provided by the Starwood Capital Hotel Portfolio Borrowers and competitive set data provided from a third-party hospitality research report. The Starwood Capital Hotel Portfolio weighted average is weighted based on total room count. |
| (3) | Hilton Garden Inn Edison Raritan Center is subject to a ground lease, which commenced in September 2001 for a term of 75 years, with current annual ground rent of $275,517. |
| (4) | Country Inn & Suites Houston Intercontinental Airport East was out of service from May 2016 through January 2017 due to flood damage. The Starwood Capital Hotel Portfolio Borrowers used insurance proceeds of nearly $1.1 million to renovate the property, which is now back online. |
| (5) | “As-Renovated” appraised values are shown for nine properties, which values assume the completion of certain property improvements, for which the lender has fully reserved. |
This is not a research report and was not prepared by the Underwriters’ research departments. Please see additional important information and qualifications at the end of this Term Sheet.
| T-69 |
| BANK 2017-BNK6 | Starwood Capital Hotel Portfolio |
The Starwood Capital Hotel Portfolio Properties benefit from well-known brand and flag affiliations, as well as related customer loyalty programs. Approximately 60.2% based on room count and 53.0% based on underwritten net cash flow of the portfolio is associated with Marriott or Hilton flags, providing the portfolio with institutional brand affiliations across the majority of the Starwood Capital Hotel Portfolio Properties. Approximately 20.1% based on room count and 34.8% by underwritten net cash flow of the portfolio is associated with the Larkspur Landing brand, all of which are located on the west coast. Larkspur Landing is an upscale select service and extended stay brand. The Larkspur Landing properties operate pursuant to a licensing agreement between the related operating companies (as licensee) and an affiliate of Starwood Capital Group (as licensor), which owns the licensing rights to the Larkspur Landing brand/flag. The Larkspur Landing licensing agreement for each applicable individual property calls for an annual license fee in the amount of $10 and may be terminated upon 60 days’ notice of termination by either the licensor or the licensee. Per the terms of the Starwood Capital Hotel Portfolio Whole Loan documents, the Larkspur Landing licensing agreements may not be terminated by the borrowers unless the borrowers replace the Larkspur Landing flag with a qualified franchisor.
In the event of any franchise or license agreement expiration, termination or cancellation in violation of the Starwood Capital Group Whole Loan documents, an excess cash flow sweep will be triggered (see “Lockbox and Cash Management”). Additionally, there is a recourse carve-out for any material amendment, modification, expiration, cancellation or termination of any franchise or Larkspur Landing license agreement without the prior written consent of the lender, in violation of the Starwood Capital Hotel Portfolio Whole Loan documents.
The Starwood Capital Hotel Portfolio Properties are operated under six brands and fourteen flags, a summary of which is provided below:
| Starwood Capital Hotel Portfolio Brand Summary | |||||||||
| Brand | # Hotels | # Rooms | % of Rooms | Allocated Loan Amount ($) | Allocated Loan Amount ($)/Room | Appraised Value(1) | LTV(1) | UW NCF | % UW NCF |
| Larkspur Landing(2)(3) | |||||||||
| Larkspur Landing | 11 | 1,277 | 20.1% | $200,027,266 | $156,638 | $305,900,000 | 65.4% | $24,836,836 | 34.8% |
| Total Larkspur Landing | 11 | 1,277 | 20.1% | $200,027,266 | $156,638 | $305,900,000 | 65.4% | $24,836,836 | 34.8% |
| Marriott(2) | |||||||||
| Residence Inn | 6 | 552 | 8.7% | $61,597,152 | $111,589 | $94,200,000 | 65.4% | $7,212,183 | 10.1% |
| Courtyard | 5 | 506 | 7.9% | $44,138,087 | $87,229 | $67,500,000 | 65.4% | $5,412,556 | 7.6% |
| Fairfield Inn & Suites | 6 | 483 | 7.6% | $30,902,406 | $63,980 | $48,000,000 | 64.4% | $3,747,382 | 5.3% |
| SpringHill Suites | 3 | 372 | 5.8% | $20,597,773 | $55,370 | $31,500,000 | 65.4% | $2,013,975 | 2.8% |
| TownePlace Suites | 1 | 83 | 1.3% | $5,688,909 | $68,541 | $8,700,000 | 65.4% | $850,105 | 1.2% |
| Total Marriot | 21 | 1,996 | 31.4% | $162,924,327 | $81,625 | $249,900,000 | 65.2% | $19,236,201 | 27.0% |
| Hilton | |||||||||
| Hampton Inn & Suites | 14 | 1,337 | 21.0% | $104,456,837 | $78,128 | $159,900,000 | 65.3% | $13,465,895 | 18.9% |
| Hilton Garden Inn | 2 | 248 | 3.9% | $21,055,502 | $84,901 | $32,200,000 | 65.4% | $3,007,244 | 4.2% |
| Homewood Suites | 3 | 252 | 4.0% | $18,151,674 | $72,030 | $30,300,000 | 59.9% | $2,063,519 | 2.9% |
| Total Hilton | 19 | 1,837 | 28.9% | $143,664,013 | $78,206 | $222,400,000 | 64.6% | $18,536,658 | 26.0% |
| IHG | |||||||||
| Holiday Inn Express | 7 | 598 | 9.4% | $33,114,542 | $55,375 | $52,100,000 | 63.6% | $4,023,491 | 5.6% |
| Holiday Inn | 3 | 388 | 6.1% | $28,902,272 | $74,490 | $44,200,000 | 65.4% | $3,678,146 | 5.2% |
| Candlewood | 1 | 80 | 1.3% | $1,445,301 | $18,066 | $2,600,000 | 55.6% | $115,624 | 0.2% |
| Total IHG | 11 | 1,066 | 16.7% | $63,462,115 | $59,533 | $98,900,000 | 64.2% | $7,817,261 | 11.0% |
| Choice | |||||||||
| Comfort Inn | 2 | 128 | 2.0% | $5,819,688 | $45,466 | $8,900,000 | 65.4% | $792,628 | 1.1% |
| Total Choice | 2 | 128 | 2.0% | $5,819,688 | $45,466 | $8,900,000 | 65.4% | $792,628 | 1.1% |
| Carlson | |||||||||
| Country Inn & Suites | 1 | 62 | 1.0% | $1,372,592 | $22,139 | $3,200,000 | 42.9% | $109,807 | 0.2% |
| Total Carlson | 1 | 62 | 1.0% | $1,372,592 | $22,139 | $3,200,000 | 42.9% | $109,807 | 0.2% |
| Total | 65 | 6,366 | 100.0% | $577,270,000 | $90,680 | $956,000,000 | 60.4% | $71,329,392 | 100.0% |
| (1) | The “As Portfolio” Appraised Value of $956.0 million reflects an 8.1% premium attributed to the aggregate “As-is” value of the Starwood Capital Hotel Portfolio Properties as a whole. The sum of the value of the “As-is” and “As-Renovated” values, as applicable, for each of the properties on an individual basis is $889.2 million. Additionally, the aggregate “As-is” value for each individual property as of April 23, 2017 is $884.7 million. |
| (2) | The Marriott and Larkspur Landing brand/flag are affiliated with Starwood Capital Group, L.P. |
| (3) | The Larkspur Landing individual properties operate pursuant to licensing agreements with an affiliate of the borrower sponsor, which may be terminated upon 60 days’ notice. There is a recourse carve-out for any material amendment, modification, expiration, cancellation or termination of any franchise or Larkspur Landing license agreement without the prior written consent of the lender in violation of the Starwood Capital Hotel Portfolio Whole Loan documents. Per the terms of the Starwood Capital Hotel Portfolio Whole Loan documents, the Larkspur Landing licensing agreements may not be terminated by the borrower unless the borrowers replace the Larkspur Landing flag with a qualified franchisor. |
This is not a research report and was not prepared by the Underwriters’ research departments. Please see additional important information and qualifications at the end of this Term Sheet.
| T-70 |
| BANK 2017-BNK6 | Starwood Capital Hotel Portfolio |
A summary of franchise agreement expirations within the Starwood Capital Hotel Portfolio is provided below:
| Starwood Capital Hotel Portfolio Franchise Expiration Schedule(1)(2) | ||||||||||
| Year | # Hotels | #Rooms | % of Total Rooms | UW NCF | % of Total UW NCF | Cumulative Rooms Expiring | Cumulative % of Rooms Expiring | Cumulative UW NCF Expiring | Cumulative % of UW NCF Expiring | |
| 2017 | 0 | 0 | 0.0% | $0 | 0.0% | 0 | 0.0% | $0 | 0.0% | |
| 2018 | 1 | 90 | 1.8% | $1,158,027 | 2.5% | 90 | 1.8% | $1,158,027 | 2.5% | |
| 2019 | 3 | 337 | 6.6% | $2,892,322 | 6.2% | 427 | 8.4% | $4,050,349 | 8.7% | |
| 2020 | 0 | 0 | 0.0% | $0 | 0.0% | 427 | 8.4% | $4,050,349 | 8.7% | |
| 2021 | 1 | 62 | 1.2% | $603,823 | 1.3% | 489 | 9.6% | $4,654,173 | 10.0% | |
| 2022 | 21 | 2,025 | 39.8% | $18,055,211 | 38.8% | 2,514 | 49.4% | $22,709,384 | 48.8% | |
| 2023 | 0 | 0 | 0.0% | $0 | 0.0% | 2,514 | 49.4% | $22,709,384 | 48.8% | |
| 2024 | 0 | 0 | 0.0% | $0 | 0.0% | 2,514 | 49.4% | $22,709,384 | 48.8% | |
| 2025 | 4 | 378 | 7.4% | $4,634,247 | 10.0% | 2,892 | 56.8% | $27,343,631 | 58.8% | |
| 2026 | 1 | 128 | 2.5% | $1,396,943 | 3.0% | 3,020 | 59.3% | $28,740,574 | 61.8% | |
| 2027 | 2 | 140 | 2.8% | $1,022,042 | 2.2% | 3,160 | 62.1% | $29,762,616 | 64.0% | |
| 2028 & Beyond | 21 | 1,929 | 37.9% | $16,729,941 | 36.0% | 5,089 | 100.0% | $46,492,556 | 100.0% | |
| Total(1) | 54 | 5,089 | 100.0% | $46,492,556 | 100.0% | |||||
| (1) | The information presented is exclusive of the Larkspur Landing properties, which operate pursuant to a licensing agreement with an affiliate of the borrower sponsor. The Larkspur Landing brand/flag is owned by an affiliate of Starwood Capital Group. |
| (2) | For individual lease expirations, see “Description of the Mortgage Pool—Mortgage Pool Characteristics—Property Types—Hospitality Properties” in the Preliminary Prospectus. |
Approximately $84.8 million ($13,319 per room) of capital expenditures have been made since 2012 in order to update the Starwood Capital Hotel Portfolio Properties. Going forward, the Starwood Capital Hotel Portfolio Borrowers have budgeted for approximately $28.8 million ($4,519 per room) in capital expenditures through 2019, of which approximately $5.9 million ($924 per room) is related to brand-mandated property improvement plans. At origination, the Starwood Capital Hotel Portfolio Borrowers reserved the approximately $5.9 million in capital expenditures related to a brand-mandated property improvement plan. Additionally, at loan origination, the Starwood Capital Hotel Portfolio Borrowers reserved approximately $6.4 million ($5,000 per Larkspur Landing-branded room) for any future capital work or FF&E associated with the Larkspur Landing properties. The remaining budgeted capital expenditures have not been reserved for and the Starwood Capital Hotel Portfolio Borrower is not required under the Starwood Capital Hotel Portfolio Whole Loan to complete the related capital improvements.
A summary of the historical and capital expenditures at the Starwood Capital Hotel Portfolio Properties is provided below:
| Starwood Capital Hotel Portfolio Historical Capital Expenditures | |||||
| 2012 | 2013 | 2014 | 2015 | 2016 | |
| Total | $15,974,481 | $28,295,183 | $14,870,099 | $10,258,955 | $15,388,521 |
| Per Room | $2,509 | $4,445 | $2,336 | $1,612 | $2,417 |
Historically, the Starwood Capital Hotel Portfolio Properties as a whole have outperformed their competitive set with occupancy, ADR and RevPAR penetration rates all in excess of 100.0% for 2014 through the trailing 12-month period ended March 31, 2017. The Starwood Capital Hotel Portfolio Properties have generally also outperformed on an individual basis, with 80.1% of the portfolio based on room count having achieved a RevPAR penetration in excess of 100.0% for the trailing 12-month period ended March 31, 2017.
A summary of the Starwood Capital Hotel Portfolio’s historical performance is provided below:
| Starwood Capital Hotel Portfolio Historical Occupancy, ADR, RevPAR(1) | |||||||||
| Year | Starwood Capital Hotel Portfolio | Competitive Set | Penetration Factor | ||||||
| Occupancy(2) | ADR(2) | RevPAR(2) | Occupancy(3) | ADR(3) | RevPAR(3) | Occupancy(4) | ADR(4) | RevPAR(4) | |
| 2014 | 73.7% | $112.28 | $82.80 | 66.0% | $103.25 | $67.56 | 111.7% | 108.7% | 122.6% |
| 2015 | 74.8% | $116.76 | $87.29 | 66.6% | $108.28 | $71.42 | 112.2% | 107.8% | 122.2% |
| 2016 | 74.7% | $119.48 | $89.23 | 65.9% | $110.28 | $71.95 | 113.4% | 108.3% | 124.0% |
| 3/31/2017 TTM | 74.6% | $119.07 | $88.81 | 65.9% | $110.31 | $72.05 | 113.1% | 107.9% | 123.3% |
| (1) | The variances between the underwriting, the hospitality research report and the above table with respect to Occupancy, ADR and RevPAR at the Starwood Capital Hotel Portfolio are attributable to variances in reporting methodologies and/or timing differences. |
| (2) | Based on operating statements provided by the borrower sponsor and weighted based on available rooms and occupied rooms, as applicable. |
| (3) | Competitive Set data for each individual property obtained from a third party hospitality research report. |
| (4) | Penetration Factor data for each individual property is based on operating statements provided by the borrower sponsor and competitive set data obtained from a third party hospitality research report. Portfolio level statistics are weighted based on total room count. |
This is not a research report and was not prepared by the Underwriters’ research departments. Please see additional important information and qualifications at the end of this Term Sheet.
| T-71 |
| BANK 2017-BNK6 | Starwood Capital Hotel Portfolio |
The Markets. The Starwood Capital Hotel Portfolio Properties have broad exposure across the United States with properties located across 21 states and 55 cities, with no individual state accounting for more than 16.8% of total rooms or 30.7% of underwritten net cash flow.
A summary of the regional representation of the Starwood Capital Hotel Portfolio Properties is provided below:
| Starwood Capital Hotel Portfolio Regional Summary | ||||||||||||||||||
| Region | # Hotels | # Rooms | % of Total Rooms | TTM Occupancy(1) | TTM ADR(1) | TTM RevPAR(1) | TTM RevPAR Penetration(1) | UW NCF | % of | |||||||||
| California | 10 | 1,068 | 16.8% | 84.2% | $145.73 | $122.71 | 108.5% | $21,907,781 | 30.7% | |||||||||
| Texas | 20 | 1,753 | 27.5% | 70.2% | $105.64 | $74.18 | 131.2% | $13,438,906 | 18.8% | |||||||||
| Indiana | 5 | 525 | 8.2% | 77.4% | $107.72 | $83.34 | 114.0% | $5,560,538 | 7.8% | |||||||||
| Washington | 2 | 253 | 4.0% | 79.6% | $122.62 | $97.56 | 105.9% | $3,867,658 | 5.4% | |||||||||
| Michigan | 3 | 297 | 4.7% | 76.2% | $130.98 | $99.85 | 118.5% | $3,681,825 | 5.2% | |||||||||
| Ohio | 3 | 287 | 4.5% | 76.3% | $121.84 | $92.95 | 121.8% | $3,299,191 | 4.6% | |||||||||
| Illinois | 3 | 380 | 6.0% | 67.1% | $105.14 | $70.56 | 103.1% | $2,534,810 | 3.6% | |||||||||
| Pennsylvania | 3 | 243 | 3.8% | 77.1% | $123.04 | $94.83 | 191.7% | $2,532,793 | 3.6% | |||||||||
| Virginia | 2 | 228 | 3.6% | 72.3% | $119.08 | $86.15 | 131.4% | $2,234,852 | 3.1% | |||||||||
| Minnesota | 2 | 177 | 2.8% | 72.4% | $122.88 | $88.92 | 127.6% | $1,839,395 | 2.6% | |||||||||
| Oregon | 1 | 124 | 1.9% | 74.1% | $115.72 | $85.79 | 77.6% | $1,708,763 | 2.4% | |||||||||
| Kentucky | 1 | 106 | 1.7% | 72.9% | $135.94 | $99.11 | 102.1% | $1,388,767 | 1.9% | |||||||||
| New Jersey | 1 | 132 | 2.1% | 78.1% | $126.40 | $98.76 | 135.7% | $1,317,397 | 1.8% | |||||||||
| Arizona | 1 | 90 | 1.4% | 80.8% | $120.72 | $97.54 | 145.9% | $1,158,027 | 1.6% | |||||||||
| North Carolina | 1 | 118 | 1.9% | 66.6% | $108.23 | $72.10 | 139.7% | $1,094,065 | 1.5% | |||||||||
| Oklahoma | 2 | 131 | 2.1% | 72.3% | $95.08 | $68.74 | 148.7% | $830,723 | 1.2% | |||||||||
| Wyoming | 1 | 60 | 0.9% | 74.6% | $118.88 | $88.74 | 117.6% | $753,591 | 1.1% | |||||||||
| Connecticut | 1 | 135 | 2.1% | 56.7% | $131.41 | $74.49 | 116.3% | $752,132 | 1.1% | |||||||||
| Maryland | 1 | 109 | 1.7% | 79.9% | $97.48 | $77.87 | 139.2% | $657,471 | 0.9% | |||||||||
| Wisconsin | 1 | 62 | 1.0% | 68.6% | $115.68 | $79.34 | 154.1% | $603,823 | 0.8% | |||||||||
| Arkansas | 1 | 88 | 1.4% | 66.5% | $75.50 | $50.18 | 100.5% | $166,883 | 0.2% | |||||||||
| Total / Wtd. Avg. | 65 | 6,366 | 100.0% | 74.6% | $119.07 | $88.81 | 123.3% | $71,329,392 | 100.0% | |||||||||
| (1) | TTM Occupancy, TTM ADR and TTM RevPAR are based on borrower sponsor provided operating statements dated as of March 31, 2017, and weighted based on available rooms and occupied rooms, as applicable. TTM RevPAR Penetration is calculated based on operating statements provided by the borrowers and competitive set data provided by a third-party hospitality research report, and weighted based on total rooms. The minor variances between the underwriting, the hospitality research report and the above table with respect to Occupancy, ADR and RevPAR at the Starwood Capital Hotel Portfolio Properties are attributable to variances in reporting methodologies and/or timing differences. |
This is not a research report and was not prepared by the Underwriters’ research departments. Please see additional important information and qualifications at the end of this Term Sheet.
| T-72 |
| BANK 2017-BNK6 | Starwood Capital Hotel Portfolio |
Operating History and Underwritten Net Cash Flow.The following table presents certain information relating to the historical operating performance and the Underwritten Net Cash Flow at the Starwood Capital Hotel Portfolio Properties:
| Cash Flow Analysis | |||||||||||||
| 2014 | 2015 | 2016 | 3/31/2017 TTM | U/W | U/W per | ||||||||
| Occupancy | 73.7% | 74.8% | 74.7% | 74.6% | 74.6% | ||||||||
| ADR | $112.28 | $116.76 | $119.48 | $119.07 | $118.83 | ||||||||
| RevPAR | $82.80 | $87.29 | $89.23 | $88.81 | $88.68 | ||||||||
| Room Revenue | $192,509,535 | $202,927,905 | $206,707,091 | $205,120,564 | $206,046,538 | $32,367 | |||||||
| F&B Revenue | $4,481,265 | $5,413,425 | $5,367,185 | $5,436,865 | $5,449,118 | $856 | |||||||
| Other Revenue | $2,518,145 | $1,839,946 | $2,161,754 | $2,093,187 | $2,104,554 | $331 | |||||||
| Total Revenue | $199,508,945 | $210,181,276 | $214,236,030 | $212,650,616 | $213,600,210 | $33,553 | |||||||
| Room Expense | $43,419,428 | $44,601,150 | $46,539,452 | $46,836,463 | $47,702,619 | $7,493 | |||||||
| F&B Expense | $3,731,961 | $4,181,990 | $3,877,875 | $3,826,532 | $3,826,294 | $601 | |||||||
| Other Departmental Expenses | $2,076,802 | $754,103 | $883,759 | $857,468 | $857,390 | $135 | |||||||
| Departmental Expenses | $49,228,191 | $49,537,243 | $51,301,086 | $51,520,462 | $52,386,303 | $8,229 | |||||||
| Departmental Profit | $150,280,754 | $160,644,033 | $162,934,944 | $161,130,154 | $161,213,908 | $25,324 | |||||||
| Operating Expenses | $56,768,412 | $60,404,169 | $61,876,151 | $62,127,172 | $62,263,971 | $9,781 | |||||||
| Gross Operating Profit | $93,512,342 | $100,239,865 | $101,058,793 | $99,002,982 | $98,949,936 | $15,544 | |||||||
| Management Fee | $6,387,948 | $6,809,293 | $6,853,190 | $6,818,728 | $7,967,134 | $1,252 | |||||||
| Property Taxes | $8,481,331 | $8,752,425 | $8,874,165 | $8,811,094 | $8,818,912 | $1,385 | |||||||
| Property Insurance | $1,772,892 | $1,800,134 | $1,821,444 | $1,812,439 | $1,809,568 | $284 | |||||||
| Ground Lease Expense | $261,733 | $287,860 | $284,102 | $292,098 | $292,098 | $46 | |||||||
| Other Expenses | $76,316 | $0 | $0 | $0 | $0 | $0 | |||||||
| FF&E | $7,980,358 | $8,583,513 | $8,756,495 | $8,693,699 | $8,732,831 | $1,372 | |||||||
| Total Other Expenses | $24,960,579 | $26,233,225 | $26,589,396 | $26,428,058 | $27,620,544 | $4,339 | |||||||
| Net Operating Income | $68,551,763 | $74,006,639 | $74,469,397 | $72,574,924 | $71,329,392 | $11,205 | |||||||
| Net Cash Flow | $68,551,763 | $74,006,639 | $74,469,397 | $72,574,924 | $71,329,392 | $11,205 | |||||||
| NOI DSCR(2) | 2.61x | 2.82x | 2.84x | 2.76x | 2.72x | ||||||||
| NCF DSCR(2) | 2.61x | 2.82x | 2.84x | 2.76x | 2.72x | ||||||||
| NOI Debt Yield(2) | 11.9% | 12.8% | 12.9% | 12.6% | 12.4% | ||||||||
| NCF Debt Yield(2) | 11.9% | 12.8% | 12.9% | 12.6% | 12.4% | ||||||||
| (1) | U/W per Room is based on a total of 6,366 rooms. |
| (2) | Debt service coverage ratios and debt yields are based on the Starwood Capital Hotel Portfolio Whole Loan. |
Escrows and Reserves. At loan origination, the Starwood Capital Hotel Portfolio Borrowers established a (i) $6,385,000 Larkspur Landing FF&E capital work reserve to be used towards capital work and FF&E expenditures only at the Larkspur Landing flagged properties and (ii) $5,883,991 existing capital work reserve to be used towards existing capital improvement and property improvement plan work as described in the Starwood Capital Hotel Portfolio Whole Loan documents.
The Starwood Capital Hotel Portfolio Borrowers are required to make monthly deposits equal to 1/12th of the greater of (a) 4.0% of gross revenues for the calendar month two months prior and (b) the amount required under the related franchise agreements for FF&E work. For any future capital work required under any franchise agreement, the Starwood Capital Hotel Portfolio Borrowers are required to deposit into a future capital work reserve account an amount equal to (x) 100.0% of any future capital work required pursuant to a replacement franchise agreement mandated property improvement plan less (y) any amounts then on deposit in the FF&E reserve account (provided that a capital work guaranty or a letter of credit may be provided by the Starwood Capital Hotel Portfolio guarantor in lieu of such deposit).
Upon the occurrence and during the continuance of a Trigger Period (as defined below), on a monthly basis, the Starwood Capital Hotel Portfolio Borrowers are required to make deposits of (i) 1/12 of the required annual taxes, (ii) 1/12 of the annual insurance premiums (unless an acceptable blanket policy is in place) and (iii) 1/12 of the ground rent due under the ground lease encumbering the single leasehold property.
A “Trigger Period” will occur upon (i) an event of default under the Starwood Capital Hotel Portfolio Whole Loan, (ii) any bankruptcy or insolvency action of the Starwood Capital Hotel Portfolio Borrowers or property managers, (iii) any termination, expiration or cancellation of a franchise agreement or Larkspur Landing license agreement in violation of the Starwood Capital Hotel Portfolio Whole Loan documents or (iv) the debt service coverage ratio for the Starwood Capital Hotel Portfolio Whole Loan being below 1.75x.
This is not a research report and was not prepared by the Underwriters’ research departments. Please see additional important information and qualifications at the end of this Term Sheet.
| T-73 |
| BANK 2017-BNK6 | Starwood Capital Hotel Portfolio |
A Trigger Period will end upon: (a) with respect to clause (i) above, a cure of the event of default; (b) with respect to clause (ii) above, only with respect to a bankruptcy or insolvency action of the Starwood Capital Hotel Portfolio Borrowers, the Starwood Capital Hotel Portfolio Borrowers’ bankruptcy or insolvency action being discharged, stayed or dismissed; (c) with respect to clause (ii) above, only with respect to a bankruptcy or insolvency action of a property manager, the Starwood Capital Hotel Portfolio Borrowers entering into a replacement management agreement with a qualified manager within 60 days of the initial bankruptcy or insolvency action; (d) with respect to clause (iii) above, the Starwood Capital Hotel Portfolio Borrowers entering into a replacement franchise agreement with a qualified franchisor within 60 days of the existing franchise agreement expiration, cancellation or termination; and (e) with respect to clause (iv) above, the debt service coverage ratio being equal to or greater than 1.75x for two consecutive calendar quarters, which may be achieved (provided such prepayment is to be accompanied by applicable yield maintenance premium) by a prepayment of principal or deposit of cash in an amount such that the debt service coverage ratio is at least 1.75x for two consecutive calendar quarters. In addition, a Trigger Period related to one individual property can be cured by the release of that individual property in accordance with the conditions set forth below under “Release of Property”.
Lockbox and Cash Management. At loan origination the Starwood Capital Hotel Portfolio Borrowers were required to establish seven lender-controlled lockbox accounts. Upon the occurrence and during the continuance of a Cash Management Trigger Period (as defined below), all rents and payments (including credit card receivables) are required to be deposited directly into the applicable lender-controlled lockbox account and swept each business day into the applicable borrower operating account, unless a Trigger Period has occurred and is continuing, in which case such funds are required to be swept each business day into the applicable lender-controlled cash management account and disbursed on each payment date in accordance with the Starwood Capital Hotel Portfolio Whole Loan documents. Upon the occurrence and during the continuance of a Trigger Period, all excess cash flow is required to be swept into the applicable cash management account and held by the lender as additional collateral for the Starwood Capital Hotel Portfolio Whole Loan.
A “Cash Management Trigger Period” will occur upon the debt service coverage ratio for the Starwood Capital Hotel Portfolio Whole Loan being below 2.00x and will end upon the debt service coverage ratio being equal to or greater than 2.00x for two consecutive calendar quarters.
Additional Secured Indebtedness (not including trade debts). The Starwood Capital Hotel Portfolio Properties also secure seventeenparipassu promissory notes (the “Starwood Capital Hotel PortfolioPari Passu Companion Loans”), with an aggregate cut-off date balance of $517,952,500. The Starwood Capital Hotel PortfolioPari Passu Companion Loans accrue interest at the same rate as the Starwood Capital Hotel Portfolio Mortgage Loan. The Starwood Capital Hotel Portfolio Mortgage Loan is entitled to payments of principal and interest on apro rata andpari passu basis with the Starwood Capital Hotel PortfolioPari Passu Companion Loans. The holders of the Starwood Capital Hotel Portfolio Mortgage Loan and the Starwood Capital Hotel PortfolioPari Passu Companion Loans have entered into a co-lender agreement that sets forth the allocation of collections on the Starwood Capital Hotel Portfolio Whole Loan. See“Description of the Mortgage Pool—The Whole Loans” in the Preliminary Prospectus.
Mezzanine Loan and Preferred Equity.After the earlier of (i) May 24, 2018 and (ii) the date that the last of the Starwood Capital Hotel Portfolio Non-ServicedPari Passu Companion Loans has been securitized, certain direct and indirect owners of the Starwood Capital Hotel Portfolio Borrowers are permitted to obtain a mezzanine loan secured by the direct or indirect ownership interests in the Starwood Capital Hotel Portfolio Borrowers upon satisfaction of certain terms and conditions including, among others, (i) no event of default has occurred and is continuing, (ii) the combined loan-to-value ratio (including the principal amount of the mezzanine loan) does not exceed 64.9%, (iii) the combined debt service coverage ratio (calculated for the Starwood Capital Hotel Portfolio Whole Loan and the mezzanine loan) is not less than 2.65x, (iv) in the event that the mezzanine loan bears a floating rate of interest, an interest rate cap agreement is obtained containing a strike rate that provides for a debt service coverage ratio (calculated for the Starwood Capital Hotel Portfolio Whole Loan and the mezzanine loan) of not less than 1.75x, (v) the mortgage and mezzanine lenders enter into an intercreditor agreement and (vi) delivery of a rating agency confirmation.
Release of Property.After June 1, 2018, the Starwood Capital Hotel Portfolio Borrower may obtain the release of an individual property or properties subject to, among other conditions: (i) no monetary event of default has occurred and is continuing under the Starwood Capital Hotel Portfolio Whole Loan, (ii) the remaining Starwood Capital Hotel Portfolio Properties have a debt service coverage ratio no less than the greater of (a) 2.65x and (b) the debt service coverage ratio for the remaining properties immediately prior to the release (which may be satisfied with an additional prepayment of principal with the related yield maintenance premium, as applicable, or a cash deposit with lender to meet such test), (iii) prepayment of the Starwood Capital Hotel Portfolio Whole Loan in an amount equal to the Release Price (as defined below) together with the related yield maintenance premium associated with the Release Price and (iv) satisfaction of customary REMIC requirements.
In addition, with respect to the Holiday Inn Express & Suites Terrell property, pursuant to a recorded declaration, Tanger Properties Limited Partnership, the developer of the property, together with its successors and assigns, has the right to purchase the property in the event, among other things, either the improvements are abandoned or permanently closed or the borrower fails to use the property for its intended use for 60 days or more (other than due to a casualty or remodeling) or otherwise violates the declaration. In the event that such purchase option is exercised, the purchase price is equal to the sum of the price paid by the prior owner of the property (i.e. the initial transferee from the developer) and the costs of the improvements (as described in the declaration), and the applicable borrower is required to promptly cause the release of the property in compliance with the release provisions described above (except that the applicable borrower may release the property during the lockout period with payment of the applicable yield maintenance premium). The Starwood Capital Hotel Portfolio Whole Loan documents require that any release of such property in connection with the exercise of the purchase option be in compliance with the release provisions described above (except that the release may occur on or prior to June 1, 2018 with payment of the applicable yield maintenance premium). The Starwood Capital Hotel Portfolio Hotel Portfolio Whole Loan is recourse to the guarantor for any losses suffered by the lender if and when the purchase option is exercised.
The “Release Price” means an amount equal to (a) if less than $57,727,000 has been prepaid to date, 105% of the allocated loan amount of each such individual property, (b) if less than $86,590,500 has been prepaid to date, 110% of the allocated loan amount of each such individual property, (c) if less than $115,454,000 has been prepaid to date, 115% of the allocated loan amount of each such individual property and (d) (x) for all amounts prepaid in excess of $115,454,000 or (y) if any such released individual property is to be conveyed to an affiliate of the Starwood Capital Hotel Portfolio Borrowers, principals, operating companies or guarantors, 120% of the allocated loan amount of each such individual property.
Ground Leases.The Hilton Garden Inn Edison Raritan Center property is subject to a ground lease, which expires on September 30, 2076 with no extension options. The ground lease requires a current annual rent of $275,517 and is subject to annual rent increases every five years during the term of the ground lease. See “Description of the Mortgage Pool—Fee & Leasehold Estates; Ground Leases” in the Preliminary Prospectus.
Terrorism Insurance.The Starwood Capital Hotel Portfolio Borrowers are required to obtain insurance against acts of terrorism or other similar acts or events to the extent such insurance is available in form and substance reasonably satisfactory to the lender.
This is not a research report and was not prepared by the Underwriters’ research departments. Please see additional important information and qualifications at the end of this Term Sheet.
| T-74 |
(THIS PAGE INTENTIONALLY LEFT BLANK)
| T-75 |
| BANK 2017-BNK6 | Westchester One |
Mortgage Loan No. 5 – Westchester One
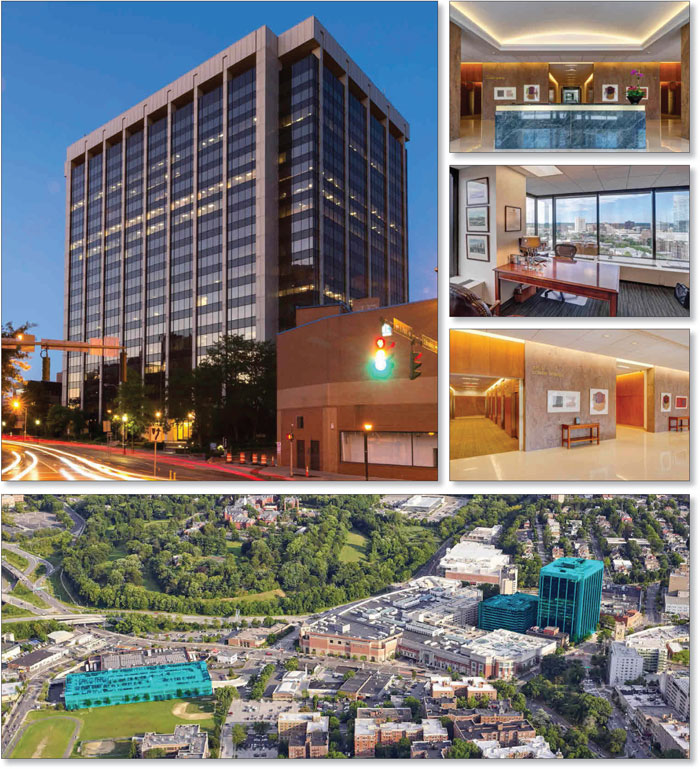
This is not a research report and was not prepared by the Underwriters’ research departments. Please see additional important information and qualifications at the end of this Term Sheet.
| T-76 |
| BANK 2017-BNK6 | Westchester One |
Mortgage Loan No. 5 – Westchester One
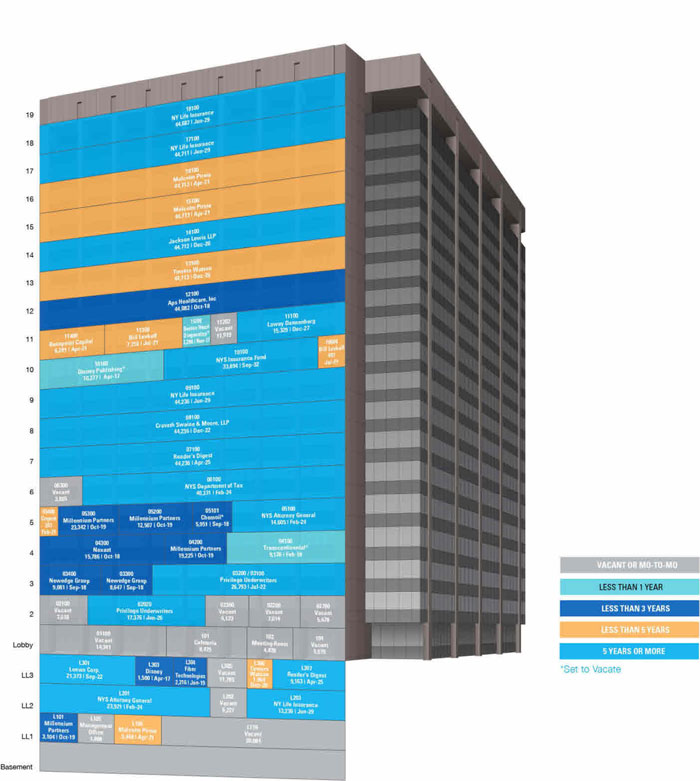
This is not a research report and was not prepared by the Underwriters’ research departments. Please see additional important information and qualifications at the end of this Term Sheet.
| T-77 |
| BANK 2017-BNK6 | Westchester One |
Mortgage Loan No. 5 – Westchester One
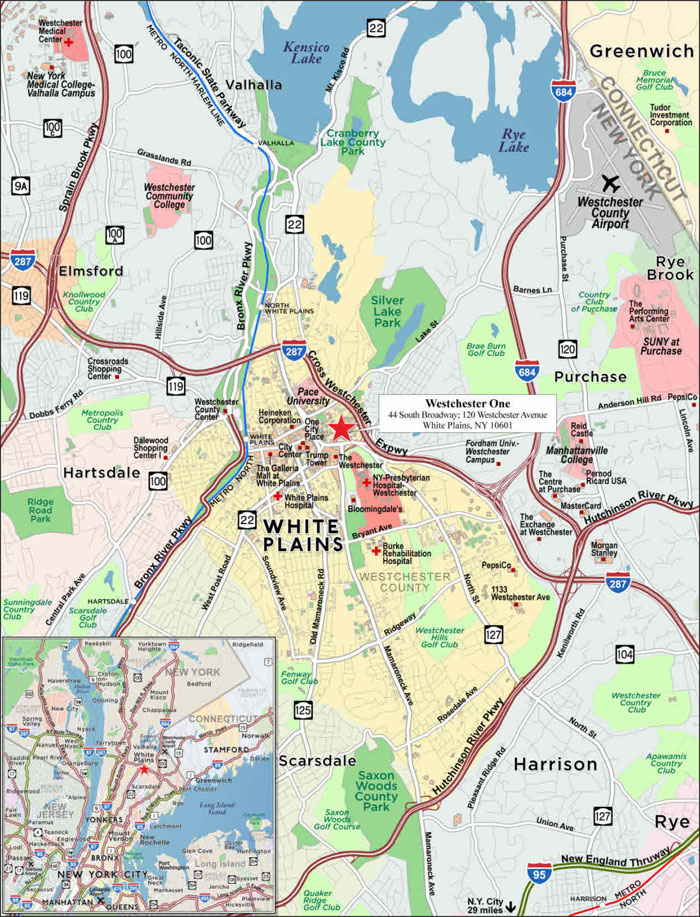
This is not a research report and was not prepared by the Underwriters’ research departments. Please see additional important information and qualifications at the end of this Term Sheet.
| T-78 |
| BANK 2017-BNK6 | Westchester One |
| Mortgage Loan No. 5 – Westchester One |
| Mortgage Loan Information | Property Information | ||||||
| Mortgage Loan Seller: | MSMCH | Single Asset/Portfolio: | Single Asset | ||||
| Original Balance(1): | $42,500,000 | Location: | White Plains, NY 10601 | ||||
| Cut-off Date Balance(1): | $42,500,000 | General Property Type: | Office | ||||
| % of Initial Pool Balance: | 4.6% | Detailed Property Type: | CBD | ||||
| Loan Purpose: | Acquisition | Title Vesting: | Fee | ||||
| Sponsors: | Andrew Penson; Aryeh Ginzberg; Leibel Lederman | Year Built/Renovated: | 1976/2016 | ||||
| Size: | 907,436 SF | ||||||
| Mortgage Rate: | 4.0760% | Cut-off Date Balance per SF(1): | $121 | ||||
| Note Date: | 6/8/2017 | Maturity Date Balance per SF(1): | $105 | ||||
| First Payment Date: | 8/1/2017 | Property Manager: | Cushman & Wakefield U.S., Inc. | ||||
| Maturity Date: | 7/1/2027 | ||||||
| Original Term to Maturity: | 120 months | ||||||
| Original Amortization Term: | 360 months | ||||||
| IO Period: | 36 months | Underwriting and Financial Information | |||||
| Seasoning: | 0 months | UW NOI(4): | $11,568,250 | ||||
| Prepayment Provisions: | LO (24); DEF (92); O (4) | UW NOI Debt Yield(1): | 10.5% | ||||
| Lockbox/Cash Mgmt Status: | Soft/Springing | UW NOI Debt Yield at Maturity(1): | 12.1% | ||||
| Additional Debt Type(2): | Pari Passu | UW NCF DSCR(1): | 2.29x (IO) 1.64x (P&I) | ||||
| Additional Debt Balance(2): | $67,500,000 | Most Recent NOI: | $10,724,767 (3/31/2017 TTM) | ||||
| Future Debt Permitted (Type): | No (N/A) | 2nd Most Recent NOI: | $10,948,376 (12/31/2016) | ||||
| Reserves(3) | 3rd Most Recent NOI: | $11,281,176 (12/31/2015) | |||||
| Type | Initial | Monthly | Cap | Most Recent Occupancy(5): | 87.8% (6/1/2017) | ||
| RE Tax: | $2,094,346 | $349,058 | N/A | 2nd Most Recent Occupancy: | 79.2% (12/31/2016) | ||
| Insurance: | $43,221 | $43,221 | N/A | 3rd Most Recent Occupancy: | 77.3% (12/31/2015) | ||
| Recurring Replacements: | $7,000,000 | $0 | N/A | Appraised Value (as of): | $173,000,000 (4/19/2017) | ||
| TI/LC: | $13,000,000 | Springing | $5,000,000 | Cut-off Date LTV Ratio(1): | 63.6% | ||
| Other: | $8,602,652 | $0 | N/A | Maturity Date LTV Ratio(1): | 55.2% | ||
| Sources and Uses | ||||||
| Sources | Proceeds | % of Total | Uses | Proceeds | % of Total | |
| Loan Amount(1): | $110,000,000 | 64.4% | Net Purchase Price(6): | $128,695,179 | 75.3% | |
| Borrower Equity: | $51,215,156 | 35.6% | Reserves: | $30,740,219 | 23.7% | |
| Closing Costs: | $1,779,758 | 1.0% | ||||
| Total Sources: | $161,215,156 | 100.0% | Total Uses: | $161,215,156 | 100.0% | |
| (1) | The Westchester One Mortgage Loan is part of the Westchester One Whole Loan, which is comprised of twopari passu promissory notes with an aggregate original principal balance of $110,000,000. The Cut-off Date Balance per SF, Maturity Date Balance per SF, UW NOI Debt Yield, UW NOI Debt Yield at Maturity, UW NCF DSCR, Cut-off Date LTV Ratio and Maturity Date LTV Ratio numbers presented above are based on the aggregate principal balance of the promissory notes comprising the Westchester One Whole Loan. |
| (2) | See “The Mortgage Loan” and “Additional Secured Indebtedness (not including trade debts)” for further discussion of additional debt. |
| (3) | See “Escrows and Reserves” below for further discussion of reserve requirements. |
| (4) | UW NOI includes UW Gross Potential Rent which has been underwritten based on the June 1, 2017 rent roll and includes rent steps of $53,099 through May 31, 2018, a downward mark to market adjustment totaling $802,909 for multiple tenants and straight line rent underwritten for New York Life Insurance in the amount of $271,506. |
| (5) | Most recent occupancy includes two tenants (30,234 SF) that are dark, but paying rent, and one tenant (3,296 SF) expected to vacate upon lease expiration on November 30, 2017. |
| (6) | The borrower acquired the property for a contract purchase price of $147,000,000, less a seller credit of $18,304,821 which represents the balance of outstanding tenant improvement obligations, leasing commissions and free rent owed to existing tenants, resulting in a Net Purchase Price of $128,695,179. The seller credit is made up of $8,602,652 for outstanding TI/LC and rent concessions, which was reserved for at origination, and $9,702,169 for outstanding tenant improvements for New York Life Insurance Company which is being held outside of the Westchester One Whole Loan pursuant to an escrow agreement among the title company, the borrower, the tenant and the lender. See “Escrows and Reserves”below. |
The Mortgage Loan. The fifth largest mortgage loan (the “Westchester One Mortgage Loan”) is part of a whole loan (the “Westchester One Whole Loan”) evidenced by twopari passu promissory notes in the aggregate original principal amount of $110,000,000, both of which are secured by a first priority fee mortgage encumbering a 907,436 SF office property known as Westchester One located in White Plains, New York (the “Westchester One Property”). Promissory Note A-2, in the original principal amount of $42,500,000, represents the Westchester One Mortgage Loan and will be included in the BANK 2017-BNK6 securitization trust. Promissory Note A-1, in the original principal amount of $67,500,000, has been contributed to the BANK 2017-BNK5 securitization trust. Promissory Note A-1 represents the non-servicedpari passu companion loan (the “Westchester One Non-ServicedPari Passu Companion Loan”). The Westchester One Whole Loan will be serviced pursuant to the pooling and servicing agreement for the BANK 2017-BNK5 securitization trust. See “Description of the Mortgage Pool—The Whole Loans—The Non-Serviced Pari Passu Whole Loans” and “Pooling and Servicing Agreement—Servicing of the Non-Serviced Mortgage Loans” in the Preliminary Prospectus.
The proceeds of the Westchester One Whole Loan, together with $51,215,156 of borrower equity, were used to acquire the Westchester One Property, fund reserves and pay closing costs.
This is not a research report and was not prepared by the Underwriters’ research departments. Please see additional important information and qualifications at the end of this Term Sheet.
| T-79 |
| BANK 2017-BNK6 | Westchester One |
The Borrower and the Sponsors. The borrower is 44 South Broadway Owner LLC (the “Westchester One Borrower”), a single-purpose Delaware limited liability company with two independent directors. The borrower sponsors and non-recourse carveout guarantors are Andrew Penson, Aryeh Ginzberg and Leibel Lederman.
Andrew Penson founded Argent Ventures LLC (“Argent”), a private real estate developer and real estate operator based in New York City, which has purchased over $2.5 billion in real estate assets and debt instruments in New York and other markets in the United States. Andrew Penson oversees all property development activities at Argent and has participated in the repositioning of New York properties such as the Manhattan Mall, One Park Avenue, and 633 Third Avenue. He was also involved in Argent’s 2006 acquisition of Grand Central Terminal.
Aryeh Ginzberg has over 35 years of real estate experience. His organizational experience includes the management of portfolios of multifamily properties throughout the tri-state (New York, Connecticut and New Jersey) area. Aryeh Ginzberg has overseen the management and rehabilitation of several thousand Department of Housing and Urban Development and Housing Preservation and Development units. Aryeh Ginzburg is currently a partner at E&M Associates (“E&M”), which is a privately-held, vertically-integrated real estate company that acquires, owns and manages over 3,000 apartments in the New York metropolitan area.
Leibel Lederman’s first exposure to the real estate industry came in 1973 as a managing agent for a boutique real estate firm in Greenpoint, Brooklyn. Between 1976 and 1985, Leibel Lederman and several partners purchased over 65 buildings in Brooklyn, The Bronx, and Manhattan, totaling 4,000 units. From 1985 to 1989, Leibel Lederman purchased shopping centers and office complexes in Pittsburgh and Philadelphia. In 1994, Lederman joined E&M, where he is currently a partner.
The Property. The Westchester One Property consists of a 20-story, Class A, multi-tenant office building totaling 907,436 SF (the “Office Tower”), an adjacent 1,800 space, 10-story parking garage (the “Adjacent Garage”) and a 750 space, four-story parking garage located a few blocks from the Office Tower (the “Off-Site Garage”). Amenities at the Westchester One Property include an on-site full service cafeteria and a shuttle service to the White Plains Metro North train service, which is one mile from the Westchester One Property. The Westchester One Property was built in 1976 and has undergone a variety of renovations in recent years. According to the borrower sponsors, the prior owner invested approximately $12.8 million in capital expenditures between 2006 and 2016, which included a comprehensive lobby renovation, cooling tower upgrades, roof replacements, cafeteria and meeting room renovations and the purchase of a new generator, among other items. The borrower sponsors’ business plan includes a capital expenditure budget of $7,007,000 for property improvements over the next 12 months. Planned expenditures include installation of new HVAC chillers ($750,000), elevator modernization ($682,000), renovation of the Adjacent Garage ($4,715,000) and lobby and cafeteria upgrades ($860,000). The Westchester One Borrower reserved $7,000,000 for recurring replacements, to be used in connection with the borrower sponsors’ business plan, at origination.
The Westchester One Property is centrally located in the White Plains central business district (“White Plains CBD”) of Westchester County, New York, in close proximity to numerous vehicular arteries. The immediate area surrounding the Westchester One Property is characterized by a variety of restaurants, bars, entertainment venues, residential and commercial buildings and retail properties. Directly to the south of the Westchester One Property sits an approximately 890,000 SF Neiman Marcus and Nordstrom anchored mall owned by Simon Property Group. A 24-story mixed use residential tower with over 700 units, approximately 90,000 SF of retail space, underground parking, outdoor dining areas and open public space is currently being developed within blocks of the Westchester One Property.
Major Tenants.
New York Life Insurance (192,060 SF, 21.2% of NRA, 24.4% of underwritten rent).New York Life Insurance (“New York Life”), America’s largest mutual life insurance company, recently signed a lease and is in the process of moving its Westchester headquarters to the Westchester One Property. New York Life provides insurance, investment, and retirement solutions and guidance. According to its 2016 annual report, as of December 31, 2016, New York Life reported $957 billion of individual life insurance policies in force, $538 billion of assets under management and $230 billion of total cash and invested assets. New York Life has approximately 20,000 employees and agents across approximately 120 offices in the United States. According to the borrower sponsors, New York Life is expected to move 500 employees to its location at the Westchester One Property over two phases. Phase I is expected to include 102,634 SF of space on the lower level, 17th and 18th floors and phase II is expected to include 89,426 SF located on the 15th and 16th floors. New York Life is expected to move into phase I during the summer of 2017 and into phase II prior to the end of 2017. The lease commencement dates for phase I and phase II are January 9, 2017 and May 1, 2017, respectively. New York Life has free rent until July 2018 for the phase I space, November 2018 for the 16th floor space and October 2019 for the 15th floor space. 100% of this free rent is being reserved for, which amount was offset against the purchase price paid by the Westchester One Borrower to the previous owner of the Westchester One Property.
Reader’s Digest (53,399 SF, 5.9% of NRA, 6.2% of underwritten rent). Reader’s Digest is a general-interest family magazine that is published ten times annually. The magazine was founded in 1922 and has a global circulation of 10.5 million, which makes it the largest paid circulation magazine in the world. Reader’s Digest has been in occupancy since 2010 and has a lease expiration of April 30, 2025. Reader’s Digest may reduce its space by 2,540 SF at any time, provided that written notice is delivered 10 months prior to such space reduction.
PURE (49,463 SF, 5.5% of NRA, 6.0% of underwritten rent). PURE is a policyholder-owned insurer that provides coverage for high value homes, vehicles, jewelry, art, personal umbrella liability, watercraft, and flood insurance. PURE has been in occupancy since 2011 and has a lease expiration of June 30, 2026. PURE has a termination option for all but 5,294 SF of its space, effective June 14, 2023, provided that written notice is delivered 12 months prior to such termination. The termination payment is equal to the sum of (i) three months of rent and (ii) the unamortized costs in connection with the delivery of the lease and the preparation of the premises for PURE’s initial occupancy. PURE originally leased 26,793 SF of the Westchester One Property and has expanded twice into its current footprint of 49,463 SF.
This is not a research report and was not prepared by the Underwriters’ research departments. Please see additional important information and qualifications at the end of this Term Sheet.
| T-80 |
| BANK 2017-BNK6 | Westchester One |
The following table presents certain information relating to the leases at the Westchester One Property:
| Tenant Summary(1) | |||||||
| Tenant Name | Credit Rating (Fitch/Moody’s/S&P)(2) | Tenant SF | Approximate % of SF | Annual UW Rent | % of Total Annual UW Rent | Annual UW Rent PSF(3) | Lease Expiration |
| Major Tenants | |||||||
| New York Life Insurance(4) | NR/NR/NR | 192,060 | 21.2% | $5,248,586 | 24.4% | $27.33 | 3/31/2030 |
| Reader’s Digest(5) | NR/NR/NR | 53,399 | 5.9% | $1,327,236 | 6.2% | $24.86 | 4/30/2025 |
| PURE(6) | NR/NR/NR | 49,463 | 5.5% | $1,289,847 | 6.0% | $26.08 | 6/30/2026 |
| Towers Watson(7) | NR/NR/NR | 46,682 | 5.1% | $1,400,460 | 6.5% | $30.00 | 12/31/2020 |
| Millennium Partners | NR/NR/NR | 45,671 | 5.0% | $1,370,130 | 6.4% | $30.00 | 10/31/2019 |
| Subtotal/Wtd. Avg. | 387,275 | 42.7% | $10,636,259 | 49.4% | $27.46 | ||
| Other Tenants(8)(9) | 409,793 | 45.2% | $10,894,290 | 50.6% | $26.58 | ||
| Vacant Space | 110,368 | 12.2% | $0 | 0.0% | $0.00 | ||
| Total/Wtd. Avg. | 907,436 | 100.0% | $21,530,549 | 100.0% | $27.53 | ||
| (1) | Information is based on the underwritten rent roll. |
| (2) | Certain ratings are those of the parent company whether or not the parent guarantees the lease. |
| (3) | Wtd. Avg. Annual UW Rent PSF excludes vacant space and 15,011 SF associated with cafeteria, meeting room and management office space. |
| (4) | New York Life is expected to take occupancy at the Westchester One Property during the summer of 2017, with respect to 102,634 SF (phase I), and prior to the end of 2017, with respect to 89,426 SF (phase II). New York Life has free rent until July 2018 for the phase I space, November 2018 for the 16th floor space and October 2019 for the 15th floor space. |
| (5) | Reader’s Digest may reduce its space by 2,540 SF, provided that written notice is delivered 10 months prior to such reduction. |
| (6) | PURE has a termination option for all but 5,294 SF, effective June 14, 2023, provided that written notice is delivered 12 months prior to such termination. The termination payment is equal to the sum of (i) three months of rent and (ii) the unamortized costs in connection with the delivery of the lease and the preparation of the premises for PURE’s initial occupancy. |
| (7) | Towers Watson has a termination option effective January 1, 2018 if (i) three or more floors of the Westchester One Property are leased to the government or a school, or (ii) Hewitt Associates, Mercer Consultants or Watson Wyatt Worldwide signs a lease at the Westchester One Property. |
| (8) | Other Tenants includes Chemoil (6,108 SF) and Cravath Swaine & Moore (24,126 SF), which are dark, but paying rent. Other Tenants also includes Boston Hearts Diagnostics (3,296 SF), which is in occupancy but expected to vacate upon lease expiration on November 30, 2017. |
| (9) | Other tenants also includes the New York State Attorney General (4.2% and 4.5% of net rentable square footage and underwritten rent, respectively) and the New York State Department of Tax (4.4% and 4.7% of net rentable square footage and underwritten rent, respectively), which have provisions in their leases requiring that their approval be obtained prior to any sale of the Westchester One Property. Notwithstanding such provision, the tenants refused to provide the approval prior to the acquisition of the Westchester One Property by the Westchester One Borrower. According to information provided by the tenants and/or the Westchester One Borrower, the tenants have advised that they do not typically provide such approval prior to transfer. The Westchester One Borrower is required to obtain such approval within 110 days after loan origination (which took place June 8, 2017). We cannot assure you that such approval will be obtained. See “Description of the Mortgage Pool—Tenant Issues—Lease Expirations and Terminations—Other” in the Preliminary Prospectus. |
The following table presents certain information relating to the lease rollover schedule at the Westchester One Property:
| Lease Rollover Schedule(1)(2) | ||||||||
| Year | # of Leases Rolling | SF Rolling | Approx. % of Total SF Rolling | Approx. Cumulative % of SF Rolling | UW Base Rent PSF Rolling(3) | Total UW Base Rent Rolling(3) | Approx. % of Total Rent Rolling | Approx. Cumulative % of Total Rent Rolling |
| 2017(4) | 1 | 3,296 | 0.4% | 0.4% | $30.00 | $98,880 | 0.5% | 0.5% |
| 2018(5) | 5 | 92,830 | 10.2% | 10.6% | $29.69 | $2,756,335 | 12.8% | 13.3% |
| 2019 | 2 | 47,887 | 5.3% | 15.9% | $30.00 | $1,436,610 | 6.7% | 19.9% |
| 2020 | 1 | 46,682 | 5.1% | 21.0% | $30.00 | $1,400,460 | 6.5% | 26.4% |
| 2021 | 4 | 58,455 | 6.4% | 27.5% | $33.69 | $1,969,461 | 9.1% | 35.6% |
| 2022(6) | 3 | 65,609 | 7.2% | 34.7% | $26.12 | $1,713,760 | 8.0% | 43.5% |
| 2023 | 0 | 0 | 0.0% | 34.7% | $0.00 | $0 | 0.0% | 43.5% |
| 2024 | 2 | 78,857 | 8.7% | 43.4% | $24.04 | $1,895,844 | 8.8% | 52.4% |
| 2025 | 1 | 53,399 | 5.9% | 49.3% | $24.86 | $1,327,236 | 6.2% | 58.5% |
| 2026 | 2 | 94,176 | 10.4% | 59.6% | $26.04 | $2,452,385 | 11.4% | 69.9% |
| 2027 | 1 | 14,912 | 1.6% | 61.3% | $28.00 | $417,536 | 1.9% | 71.8% |
| 2028 & Beyond | 2 | 240,965 | 26.6% | 87.8% | $25.16 | $6,062,042 | 28.2% | 100.0% |
| Vacant | 0 | 110,368 | 12.2% | 100.0% | $0.00 | $0 | 0.0% | 100.0% |
| Total/Wtd. Avg. | 24 | 907,436 | 100.0% | $27.53 | $21,530,549 | 100.0% | ||
| (1) | Information is based on the underwritten rent roll. |
| (2) | Certain tenants may have lease termination options that are exercisable prior to the originally stated expiration date of the subject lease and that are not considered in the lease rollover schedule. |
| (3) | UW Base Rent PSF Rolling and Total UW Base Rent Rolling exclude vacant space and 15,011 SF associated with cafeteria, meeting room and management office space. |
| (4) | 2017 includes Boston Hearts Diagnostics (3,296 SF), which is in occupancy but expected to vacate upon lease expiration on November 30, 2017. |
| (5) | 2018 includes Chemoil (6,108 SF and $181,670 of underwritten rent), which is dark, but paying rent. |
| (6) | 2022 includes Cravath Swaine & Moore (24,126 SF and $723,780 of underwritten rent), which is dark, but paying rent. |
This is not a research report and was not prepared by the Underwriters’ research departments. Please see additional important information and qualifications at the end of this Term Sheet.
| T-81 |
| BANK 2017-BNK6 | Westchester One |
The Market. The Westchester One Property is located approximately 30 miles north of Midtown Manhattan, in the White Plains CBD sub-market of Westchester County, New York. According to the appraisal, Westchester County’s transportation system and quality of life have attracted a commuter population and the corporate headquarters of over 170 businesses. At the height of the recession in 2009, Westchester County experienced only a 1.8% drop in its gross metropolitan product (GMP) and 4.8% cut in total non-farm payroll before entering its recovery. No traditional ground-up office construction has been delivered within Westchester County since 2006.
According to the appraisal, for the fourth quarter of 2016, the Westchester County office market contained 28,903,251 SF of office space, with a direct vacancy of 19.3% and direct average Class A rent of $30.31 PSF. For the fourth quarter of 2016, the White Plains CBD office sub-market contained 6,207,675 SF of office space, with a direct vacancy of 18.0% and direct average Class A rent of $33.69 PSF.
The estimated 2015 population within White Plains, Westchester County and the state of New York is 58,927, 975,229 and 19,845,348, respectively, according to the appraisal. The estimated 2015 average household income within White Plains, Westchester County and the state of New York is $122,879, $135,073 and $87,081, respectively.
The following table presents information relating to comparable office property sales for the Westchester One Property:
| Comparable Property Sales | |||||||
| Property Name/Location | Sale Date | Year Built | Total NRA (SF) | Total Occupancy | Sale Price | Sale Price PSF | Cap Rate |
Westchester One (subject) White Plains, NY | Mar-2017 | 1976 | 907,436(1) | 87.8%(1) | $147,000,000(2) | $161.99(2) | 7.75% |
140 & 150 Grand Street White Plains, NY | Dec-2015 | 1926 | 217,416 | 84.0% | $32,000,000 | $147.18 | 8.50% |
399 Knollwood Road White Plains, NY | Jun-2015 | 1985 | 145,943 | 93.0% | $24,500,000 | $167.87 | 8.00% |
1 Pepsi Way Somers, NY | Mar-2015 | 1987 | 522,800 | 100.0% | $87,000,000 | $166.41 | 9.00% |
1111-1129 Westchester Avenue White Plains, NY | Dec-2014 | 1985 | 366,460 | 100.0% | $56,629,210 | $154.53 | N/A |
| 555 Theodore Fremd Avenue Rye, NY | Nov-2014 | 1990 | 180,000 | 98.0% | $39,500,000 | $219.44 | 7.35% |
411 Theodore Fremd Avenue Rye, NY | Sep-2016 | 1982 | 118,129 | 100.0% | $25,200,000 | $213.33 | 6.89% |
Source:Appraisal
| (1) | Total NRA (SF) and Total Occupancy for the Westchester One Property are based on the underwritten rent roll. |
| (2) | Net sale price was $128,695,179 ($141.82 PSF). See Sources and Uses table and related footnotes above. |
The following table presents recent leasing data at comparable office buildings with respect to the Westchester One Property:
| Comparable Lease Summary | |||||||||
| Property Name/Address | Year Built | Class | Total NRA (SF) | Tenant Name | Lease Area (SF) | Lease Date | Lease Term (Yrs.) | Initial Rent/SF | Reimbursements |
81 Main Street 81 Main Street White Plains, NY | 1988 | A | 150,000 | Carl Bloom | 4,116 | Apr-2016 | 5.0 | $31.00 | Modified Gross |
Gateway Plaza 1 North Lexington Avenue White Plains, NY | 1985 | A | 530,000 | Osaka Gas | 9,118 | May-2016 | 10.6 | $32.00 | Modified Gross |
10 Bank Street 10 Bank Street White Plains, NY | 1988 | A | 220,000 | Mitsui & CO (USA) | 11,994 | Oct-2016 | 7.7 | $33.00 | Modified Gross |
White Plains Plaza 1 North Broadway White Plains, NY | 1971 | A | 396,000 | Little Big Brands | 8,289 | May-2016 | 7.7 | $25.16 | Modified Gross |
50 Main Street 50 Main Street White Plains, NY | 1984 | A | 310,000 | Wells Fargo | 22,500 | Apr-2016 | 4.0 | $34.26 | Modified Gross |
Courthouse Square 140 Grand Street White Plains, NY | 1990 | A | 120,000 | Belowich & Walsh | 4,763 | Apr-2016 | 10.8 | $28.50 | Modified Gross |
White Plains Plaza 445 Hamilton Avenue White Plains, NY | 1968 | A | 340,000 | Cuddy & Feder | 26,356 | Apr-2016 | 10.4 | $25.50 | Modified Gross |
Source:Appraisal
This is not a research report and was not prepared by the Underwriters’ research departments. Please see additional important information and qualifications at the end of this Term Sheet.
| T-82 |
| BANK 2017-BNK6 | Westchester One |
Operating History and Underwritten Net Cash Flow.The following table presents certain information relating to the historical operating performance and the Underwritten Net Cash Flow at Westchester One Property:
| Cash Flow Analysis | |||||||
| 2014 | 2015 | 2016 | 3/31/2017 TTM | UW | UW PSF | ||
| Gross Potential Rent(1) | $18,305,050 | $19,623,691 | $19,711,849 | $19,578,751 | $24,200,533 | $26.67 | |
| Total Recoveries | $2,251,329 | $2,838,801 | $2,205,054 | $2,122,177 | $2,361,625 | $2.60 | |
| Total Other Income(2) | $1,569,792 | $1,619,744 | $1,625,218 | $1,630,865 | $1,691,577 | $1.86 | |
| Less Vacancy & Credit Loss(3) | $0 | $0 | $0 | $0 | ($3,867,925) | ($4.26) | |
| Effective Gross Income | $22,126,171 | $24,082,236 | $23,542,121 | $23,331,793 | $24,385,810 | $26.87 | |
| Total Operating Expenses | $10,112,698 | $12,801,059 | $12,593,744 | $12,607,026 | $12,817,560 | $14.13 | |
| Net Operating Income | $12,013,473 | $11,281,176 | $10,948,376 | $10,724,767 | $11,568,250 | $12.75 | |
| Capital Expenditures | $0 | $0 | $0 | $0 | $226,859 | $0.25 | |
| TI/LC | $0 | $0 | $0 | $0 | $914,144 | $1.01 | |
| Net Cash Flow | $12,013,473 | $11,281,176 | $10,948,376 | $10,724,767 | $10,427,247 | $11.49 | |
| Occupancy % | 78.8% | 77.3% | 79.2% | 87.8%(3) | 84.4% | ||
| NOI DSCR (IO)(4) | 2.64x | 2.48x | 2.41x | 2.36x | 2.54x | ||
| NOI DSCR (P&I)(4) | 1.89x | 1.77x | 1.72x | 1.69x | 1.82x | ||
| NCF DSCR (IO)(4) | 2.64x | 2.48x | 2.41x | 2.36x | 2.29x | ||
| NCF DSCR (P&I)(4) | 1.89x | 1.77x | 1.72x | 1.69x | 1.64x | ||
| NOI Debt Yield(4) | 10.9% | 10.3% | 10.0% | 9.7% | 10.5% | ||
| NCF Debt Yield(4) | 10.9% | 10.3% | 10.0% | 9.7% | 9.5% | ||
| (1) | Gross Potential Rent has been underwritten based on the June 1, 2017 rent roll and includes rent steps of $53,099 through May 31, 2018, a downward mark to market adjustment totaling $802,909 for multiple tenants and straight line rent underwritten for New York Life Insurance in the amount of $271,506. The increase in UW Gross Potential Rent can be attributed to the recent lease signing of New York Life. |
| (2) | Total Other Income is primarily comprised of parking income. |
| (3) | 3/31/2017TTM Occupancy % is based on occupancy as of June 1, 2017 and includes Chemoil (6,108 SF) and Cravath Swaine & Moore (24,126 SF), which are dark, but paying rent, and Boston Hearts Diagnostics (3,296 SF), which is in occupancy but expected to vacate upon lease expiration on November 30, 2017. |
| (4) | Debt service coverage ratios and debt yields are based on the Westchester One Whole Loan. |
Escrows and Reserves. The Westchester One Whole Loan documents provide for upfront reserves in the amount of $13,000,000 for tenant improvements and leasing commissions that may be incurred in the future (the “Future TILC Reserve”), $7,000,000 for capital expenditures in accordance with a budget set forth in the Westchester One Whole Loan agreement and with the Westchester One Borrower’s business plan (as described above under “The Property”), $609,438 for tenant improvements and leasing commissions due under existing leases (other than those for New York Life that are to be held in an outside escrow as described in the paragraph below) and $7,993,214 for rent concessions owed to tenants (to be disbursed monthly in each month in which a free rent period applies in lieu of the rent that would have been due absent such free rent period), $2,094,346 for real estate taxes and $43,221 for insurance premiums. The Westchester One Borrower is required to escrow monthly: (i) 1/12th of the annual estimated real estate taxes and (ii) 1/12th of the annual estimated insurance premiums (unless the Westchester One Borrower maintains an acceptable blanket policy). The Westchester One Borrower is required to deposit monthly $113,430 into the Future TILC Reserve; provided that the Westchester One Borrower will not be required to make such monthly deposits if the amount on deposit in the Future TILC Reserve equals $5,000,000.
In addition, $9,702,169 was required to be escrowed post-closing by the seller of the Westchester One Property for outstanding tenant improvements for New York Life, which is being held outside of the Westchester One Whole Loan documents pursuant to an escrow agreement among the title company, the Westchester One Borrower, the lender and New York Life. The lender will not have control over the funds therein, in the way that it would have if such funds had been escrowed under the Westchester One Whole Loan, and will not be permitted to apply such funds to repay the Westchester One Whole Loan following an event of default. See “Description of the Mortgage Pool—Redevelopment, Renovation and Expansion” in the Preliminary Prospectus.
Lockbox and Cash Management.A lockbox is in place with respect to the Westchester One Whole Loan. Prior to the occurrence of a Cash Sweep Event Period (as defined below), the Westchester One Borrower and the property manager are required to deposit all rents into the lockbox account within two business days of receipt. Upon the occurrence of a Cash Sweep Event Period, the Westchester One Borrower is required to direct all tenants to deposit rents directly into the lockbox account. The Westchester One Whole Loan has springing cash management. If no Cash Sweep Event Period is continuing, all funds in the lockbox account are required to be disbursed to the Westchester One Borrower. Upon the first occurrence of a Cash Sweep Event Period, the Westchester One Borrower is required to cooperate with the lender to establish a cash management account controlled by the lender, and during the continuance of a Cash Sweep Event Period, all funds on deposit in the lockbox account are required to be swept to such cash management account on each business day, and, provided that no event of default is continuing under the Westchester One Whole Loan, applied on each monthly payment date to pay debt service on the Westchester One Whole Loan, to fund the required reserve deposits as described above under “Escrows and Reserves”, to disburse the monthly operating expenses referenced in the approved annual budget and extraordinary expenses approved by the lender and to disburse the remainder into an account to be held by the lender as additional security for the Westchester One Whole Loan during the continuance of such Cash Sweep Event Period.
This is not a research report and was not prepared by the Underwriters’ research departments. Please see additional important information and qualifications at the end of this Term Sheet.
| T-83 |
| BANK 2017-BNK6 | Westchester One |
A “Cash Sweep Event Period” means the period:
(i) commencing upon the occurrence of an event of default under the Westchester One Whole Loan documents and ending upon the date that such event of default is cured or waived, or
(ii) commencing on the date upon which the amortizing debt service coverage ratio with respect to the Westchester One Whole Loan equals less than 1.15x for nine consecutive calendar months, and ending on the date the amortizing debt service coverage ratio equals or exceeds 1.15x for six consecutive calendar months, or
(iii) commencing upon the date that New York Life (or a replacement tenant for all or a portion of the space leased by New York Life) (in either case, a “Major Tenant”) is subject to a bankruptcy or insolvency event and ending upon either (1) such Major Tenant’s lease has been affirmed in bankruptcy and the lender receives a tenant estoppel certificate stating that such Major Tenant is in occupancy of its space, open for business and paying full contractual rent, or (2) the entirety of such Major Tenant’s space has been re-let to one or more replacement tenant(s) acceptable to the lender pursuant to replacement lease(s) acceptable to the lender and the lender receives a tenant estoppel certificate(s) from each such replacement tenant(s) stating that such tenant(s) is/are in occupancy of such Major Tenant’s space, open for business and paying full contractual rent (a “Replacement Tenant Cure”), or
(iv) commencing upon (a) any Major Tenant not renewing or extending such Major Tenant’s lease by the day which is 12 months prior to the expiration of its lease, (b) any Major Tenant giving notice to vacate or exercising any termination option under its lease, or (iii) any Major Tenant canceling or terminating its lease and ending upon either (1) such Major Tenant renews or extends its lease on terms and conditions acceptable to the lender, and the lender receives a tenant estoppel certificate stating that such Major Tenant is in occupancy of its space, open for business and paying full contractual rent or (2) a Replacement Tenant Cure, or
(v) commencing upon the date any Major Tenant (or its respective subtenant(s) or assignee(s)) has, for all or substantially all of its leased space, “gone dark”, vacated its space, not opened for business or terminated its lease (or given written notice of its intention to do so), other than certain temporary closures, and ending upon either (1) such Major Tenant is in occupancy of the entirety of its space, and the lender receives a tenant estoppel certificate stating that such Major Tenant is in occupancy of its space, open for business and paying full contractual rent or (2) a Replacement Tenant Cure.
Additional Secured Indebtedness (not including trade debts).The Westchester One Property also secures the Westchester One Non-ServicedPari Passu Companion Loan, which has an aggregate Cut-off Date principal balance of $67,500,000. The Westchester One Non-ServicedPari Passu Companion Loan accrues interest at the same rate as the Westchester One Mortgage Loan. The Westchester One Mortgage Loan is entitled to payments of principal and interest on apro rata andpari passu basis with the Westchester One Non-ServicedPari Passu Companion Loan. The holders of the Westchester One Mortgage Loan and the Westchester One Non-ServicedPari Passu Companion Loan have entered into a co-lender agreement which sets forth the allocation of collections on the Westchester One Whole Loan. See “Description of the Mortgage Pool—The Whole Loans— The Non-Serviced Pari Passu Whole Loans”in the Preliminary Prospectus.
Mezzanine Loan and Preferred Equity.Not permitted.
Release of Property.Not permitted.
Terrorism Insurance.The Westchester One Whole Loan documents require that the “all risk” insurance policy required to be maintained by the Westchester One Borrower provide coverage for terrorism in an amount equal to the full replacement cost of the Westchester One Property and eighteen months of business interruption insurance, provided that if the Terrorism Risk Insurance Program Reauthorization Act of 2015 or extension thereof or substantially similar program (“TRIPRA”) is in effect and continues to cover both foreign and domestic acts of terrorism, the lender is required to accept terrorism insurance with coverage against “covered acts” within the meaning of TRIPRA.
This is not a research report and was not prepared by the Underwriters’ research departments. Please see additional important information and qualifications at the end of this Term Sheet.
| T-84 |
(THIS PAGE INTENTIONALLY LEFT BLANK)
| T-85 |
| BANK 2017-BNK6 | Ritchie Station Marketplace |
Mortgage Loan No. 6 – Ritchie Station Marketplace
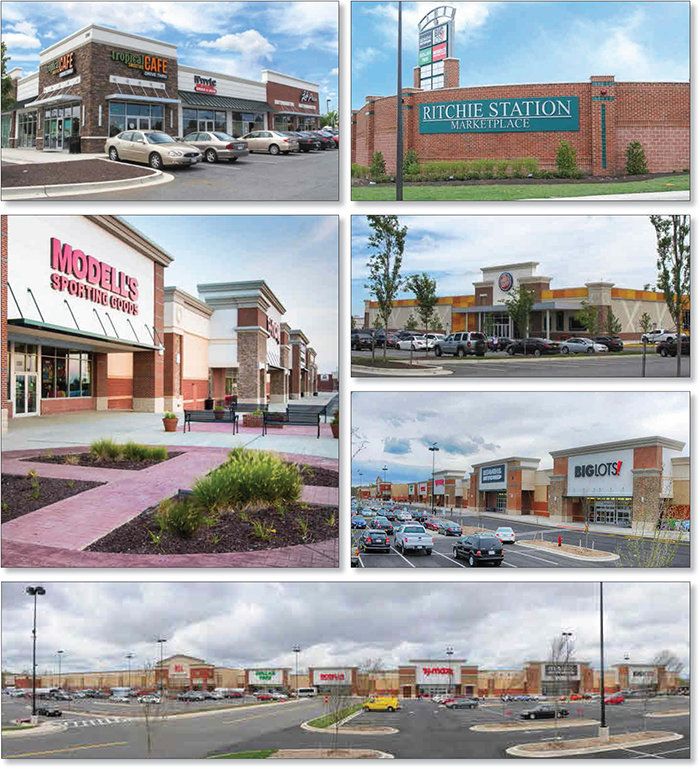
This is not a research report and was not prepared by the Underwriters’ research departments. Please see additional important information and qualifications at the end of this Term Sheet.
| T-86 |
| BANK 2017-BNK6 | Ritchie Station Marketplace |
Mortgage Loan No. 6 – Ritchie Station Marketplace
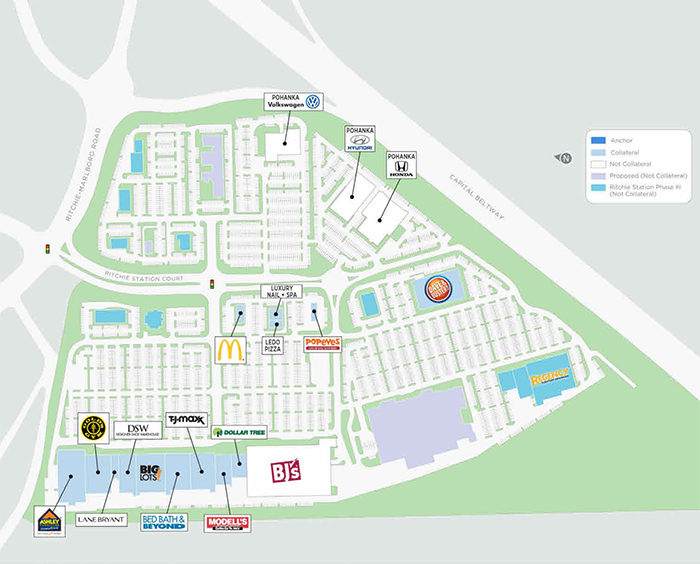
This is not a research report and was not prepared by the Underwriters’ research departments. Please see additional important information and qualifications at the end of this Term Sheet.
| T-87 |
| BANK 2017-BNK6 | Ritchie Station Marketplace |
Mortgage Loan No. 6 – Ritchie Station Marketplace
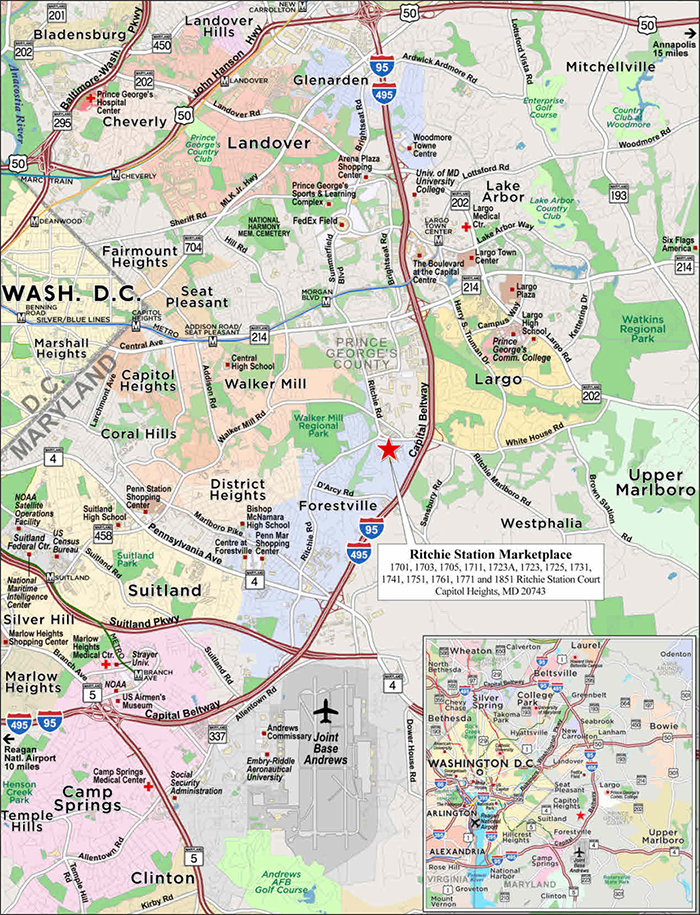
This is not a research report and was not prepared by the Underwriters’ research departments. Please see additional important information and qualifications at the end of this Term Sheet.
| T-88 |
| BANK 2017-BNK6 | Ritchie Station Marketplace |
| Mortgage Loan No. 6 – Ritchie Station Marketplace |
| Mortgage Loan Information | Property Information | ||||||
| Mortgage Loan Seller: | BANA | Single Asset/Portfolio: | Single Asset | ||||
| Original Balance: | $41,000,000 | Location: | Capitol Heights, MD 20743 | ||||
| Cut-off Date Balance: | $41,000,000 | General Property Type: | Retail | ||||
| % of Initial Pool Balance: | 4.4% | Detailed Property Type: | Power Center | ||||
| Loan Purpose: | Refinance | Title Vesting: | Fee | ||||
| Sponsor: | NAI The Michael Companies Inc. | Year Built/Renovated: | 2013-2016/N/A | ||||
| Mortgage Rate: | 4.450% | Size: | 249,078 SF | ||||
| Note Date: | 5/18/2017 | Cut-off Date Balance per SF: | $165 | ||||
| First Payment Date: | 7/1/2017 | Maturity Date Balance per SF: | $144 | ||||
| Maturity Date: | 6/1//2027 | Property Manager: | NAI The Michael Companies, Inc. (borrower-related) | ||||
| Original Term to Maturity: | 120 months | ||||||
| Original Amortization Term: | 360 months | Underwriting and Financial Information | |||||
| IO Period: | 36 months | UW NOI: | $3,719,724 | ||||
| Seasoning: | 1 month | UW NOI Debt Yield: | 9.1% | ||||
| Prepayment Provisions: | LO (25); DEF (90); O (5) | UW NOI Debt Yield at Maturity: | 10.4% | ||||
| Lockbox/Cash Mgmt Status: | Hard/Springing | UW NCF DSCR: | 1.86x (IO) 1.39x (P&I) | ||||
| Additional Debt Type: | N/A | Most Recent NOI: | $3,121,566 (3/31/2017 TTM) | ||||
| Additional Debt Balance: | N/A | 2nd Most Recent NOI(2): | $608,260 (12/31/2015) | ||||
| Future Debt Permitted (Type): | No (N/A) | 3rd Most Recent NOI(2): | N/A | ||||
| Reserves(1) | Most Recent Occupancy: | 100% (4/30/2017) | |||||
| Type | Initial | Monthly | Cap | 2nd Most Recent Occupancy(2): | N/A | ||
| RE Tax: | $482,534 | $48,253 | N/A | 3rd Most Recent Occupancy(2): | N/A | ||
| Insurance: | $0 | Springing | N/A | Appraised Value (as of): | $61,400,000 (3/21/2017) | ||
| Recurring Replacements: | $0 | $1,661 | N/A | Cut-off Date LTV Ratio: | 66.8% | ||
| TI/LC: | $0 | Springing | $750,000 | Maturity Date LTV Ratio: | 58.5% | ||
| Sources and Uses | ||||||
| Sources | Proceeds | % of Total | Uses | Proceeds | % of Total | |
| Loan Amount: | $41,000,000 | 89.2% | Loan Payoff: | $44,838,956 | 97.6% | |
| Borrower Equity: | $4,956,245 | 10.8% | Reserves: | $482,534 | 1.0% | |
| Closing Costs: | $634,755 | 1.4% | ||||
| Total Sources: | $45,956,245 | 100.0% | Total Uses: | $45,956,245 | 100.0% | |
| (1) | See “Escrows and Reserves” below for further discussion of reserve requirements. |
| (2) | The Ritchie Station Marketplace Property was developed in two phases: Phase I (103,584 SF) was completed in 2013 and Phase II (89,575 SF) was completed in 2016. 2nd Most Recent NOI does not reflect the fully constructed property. 2nd and 3rd Most Recent Occupancy and 3rd Most Recent NOI for the complete collateral are not available. |
The Mortgage Loan. The sixth largest mortgage loan (the “Ritchie Station Marketplace Mortgage Loan”) is evidenced by a promissory note in the original principal amount of $41,000,000 and secured by a first priority fee mortgage encumbering a 249,078 SF power center in Capitol Heights, Maryland (the “Ritchie Station Marketplace Property”). The proceeds of the Ritchie Station Marketplace Mortgage Loan were used to pay off previous mortgage debt, fund reserves and pay closing costs. The Ritchie Station Marketplace sponsor developed the Ritchie Station Marketplace Property for a construction cost basis of $68,194,087.
The Borrower and the Sponsor. The borrower is Ritchie Hill, LLC (the “Ritchie Station Marketplace Borrower”), a single-purpose Maryland limited liability company structured to be bankruptcy-remote, with at least one independent director. Equity ownership of the Ritchie Station Marketplace Borrower is held by Geoffrey P. Pohanka and Susan Pohanka and family and trusts (50.0%) and Kenneth H. Michael and family (50.0%).
Kenneth H. Michael is the nonrecourse carve-out guarantor. Kenneth H. Michael founded NAI The Michael Companies, Inc. (“NAI Michael”) in 1973. NAI Michael is a privately owned commercial brokerage, property management, and development consulting firm, servicing the Washington Metropolitan region. NAI Michael manages a portfolio of over five million SF of office, industrial, high technology, and retail space, and has supported the development of more than six thousand acres of land. NAI Michael has been a significant developer in Prince George’s County, Maryland.
Geoffrey Pohanka is the President of Pohanka Automotive Group in Capitol Heights, Maryland. The Pohanka Automotive Group employs over 1,400 people, selling nine makes of vehicles throughout locations in Maryland and Virginia, including a Volkswagen, Hyundai and Honda dealership adjacent to the Ritchie Station Marketplace Property.
The Property. The Ritchie Station Marketplace Property is a 249,078 SF power center built on 28.11 acres and is comprised of five single-story buildings. The Ritchie Station Marketplace Property is located in Capitol Heights, Maryland, on the south side of Ritchie Marlboro Road, with over 1,000 linear feet of frontage along the west side of the Capital Beltway.
This is not a research report and was not prepared by the Underwriters’ research departments. Please see additional important information and qualifications at the end of this Term Sheet.
| T-89 |
| BANK 2017-BNK6 | Ritchie Station Marketplace |
Phase I of the Ritchie Station Marketplace Property includes a total of 103,584 SF that was completed in 2013 and is occupied by Dollar Tree, Bed Bath & Beyond, TJ Maxx, Modell’s, Big Lots and McDonald’s. Phase II of the Ritchie Station Marketplace Property was completed in 2016 and includes 89,575 SF of anchor space attached to Phase I which is occupied by DSW, Lane Bryant, Gold’s Gym and Ashley Furniture, an additional 7,534 SF multitenant strip retail building, a 3,400 SF Popeye’s restaurant outparcel and a 40,787 SF free-standing entertainment building occupied by Dave & Busters. The Ritchie Station Marketplace Property is 100% occupied by sixteen tenants and is shadow anchored by an adjacent 117,875 SF BJ’s Wholesale Club and an adjacent Wal-Mart (expected to open in late spring 2018). Included in the collateral are approximately 1,250 parking spaces (5.02 spaces per 1,000 SF).
Phase III of Ritchie Station Marketplace (not collateral) is currently under development by an affiliate of the sponsor and is expected to include 123,738 SF of complimentary retail space.
The following table presents certain information relating to the major tenants at the Ritchie Station Marketplace Property.
Tenant Summary(1)
| ||||||||||||
| Tenant Name | Credit Rating (Fitch/Moody’s/S&P)(2) | Tenant SF | Approx % of SF | Annual UW Rent | Annual UW Rent PSF | 2016 Sales | Occ. Cost % | Lease Expiration | ||||
| % of Annual UW Rent | $ | PSF | Renewal Options | |||||||||
| Major Tenants(3) | ||||||||||||
| Dave & Busters | NR/NR/NR | 40,787 | 16.4% | $1,000,000 | 25.3% | $24.52 | N/A | N/A | N/A | 1/31/2031 | 3 x 5 yr | |
| Ashley Furniture | NR/NR/NR | 40,000 | 16.1% | $500,000 | 12.7% | $12.50 | N/A | N/A | N/A | 5/5/2026 | 2 x 5 yr | |
| Gold’s Gym | NR/NR/NR | 26,204 | 10.5% | $360,305 | 9.1% | $13.75 | N/A | N/A | N/A | 7/29/2031 | 3 x 5 yr | |
| Big Lots | NR/NR/BBB | 30,000 | 12.0% | $360,000 | 9.1% | $12.00 | N/A | N/A | N/A | 2/28/2024 | 2 x 5 yr | |
| T J Maxx | NR/A2/A+ | 25,009 | 10.0% | $300,108 | 7.6% | $12.00 | $5,204,457 | $208 | 8.4% | 2/28/2024 | 3 x 5 yr | |
| DSW(4) | NR/NR/NR | 18,321 | 7.4% | $248,009 | 6.3% | $13.54 | N/A | N/A | N/A | 1/11/2026 | 2 x 5 yr | |
| Bed Bath & Beyond(5) | NR/Baa1/BBB+ | 25,281 | 10.1% | $227,545 | 5.8% | $9.00 | $4,137,174 | $164 | 5.5% | 11/30/2023 | 4 x 5 yr | |
| Subtotal/Wtd. Avg. | 205,602 | 82.5% | $2,995,967 | 75.8% | $14.57 | |||||||
| Other Retail Tenants | 43,476 | 17.5% | $954,878 | 24.2% | $21.96 | |||||||
| Vacant Space | 0 | 0.0% | ||||||||||
| Total/Wtd. Avg. | 249,078 | 100.0% | $3,950,845 | $15.86 | ||||||||
| (1) | Information is based on the underwritten rent roll. |
| (2) | Certain ratings are those of the parent company whether or not the parent guarantees the lease. |
| (3) | Major Tenants are ordered by Annual UW Rent. |
| (4) | DSW has a termination right if gross sales are less than $4,000,000 from January 2021-January 2022, upon 90 days’ notice and payment of a lease termination fee equal to $275,565. |
| (5) | Bed Bath & Beyond currently pays percentage rent equal to (A) 5.5% of gross sales up to $6,000,000; (B) 3% of gross sales from $6,000,001 to $8,000,000; and (C) 1% of gross sales from $8,000,001 to $12,000,000, until the date 30 days after receipt of notice by the landlord (the “Fixed Rent Commencement Date”). After the Fixed Rent Commencement Date, Bed Bath & Beyond’s lease requires annual rental payments equal to the average rent paid during the three full calendar years immediately preceding the Fixed Rent Commencement Date multiplied by 75%. |
This is not a research report and was not prepared by the Underwriters’ research departments. Please see additional important information and qualifications at the end of this Term Sheet.
| T-90 |
| BANK 2017-BNK6 | Ritchie Station Marketplace |
The following table presents certain information relating to the lease rollover at the Ritchie Station Marketplace Property:
| Lease Rollover Schedule(1)(2) | ||||||||
| Year | # of Leases Rolling | SF Rolling | Annual UW Rent PSF Rolling | Approx. % of Total SF Rolling | Approx. Cumulative % of SF Rolling | Total UW Rent Rolling | Approx. % of Total Rent Rolling | Approx. Cumulative % of Total Rent Rolling |
| 2017 | 0 | 0 | $0.00 | 0.0% | 0.0% | $0 | 0.0% | 0.0% |
| 2018 | 0 | 0 | $0.00 | 0.0% | 0.0% | $0 | 0.0% | 0.0% |
| 2019 | 0 | 0 | $0.00 | 0.0% | 0.0% | $0 | 0.0% | 0.0% |
| 2020 | 0 | 0 | $0.00 | 0.0% | 0.0% | $0 | 0.0% | 0.0% |
| 2021 | 0 | 0 | $0.00 | 0.0% | 0.0% | $0 | 0.0% | 0.0% |
| 2022 | 0 | 0 | $0.00 | 0.0% | 0.0% | $0 | 0.0% | 0.0% |
| 2023 | 2 | 35,281 | $11.44 | 14.2% | 14.2% | $403,545 | 10.2% | 10.2% |
| 2024 | 3 | 68,303 | $12.19 | 27.4% | 41.6% | $832,930 | 21.1% | 31.3% |
| 2025 | 0 | 0 | $0.00 | 0.0% | 41.6% | $0 | 0.0% | 31.3% |
| 2026 | 7 | 70,855 | $16.29 | 28.4% | 70.0% | $1,154,065 | 29.2% | 60.5% |
| 2027 | 0 | 0 | $0.00 | 0.0% | 70.0% | $0 | 0.0% | 60.5% |
| 2028 & Beyond | 4 | 74,639 | $20.90 | 30.0% | 100.0% | $1,560,305 | 39.5% | 100.0% |
| Vacant | 0 | 0 | $0.00 | 0.0% | 100.0% | $0 | 0.0% | 100.0% |
| Total/Wtd. Avg. | 16 | 249,078 | $15.86 | 100.0% | $3,950,845 | 100.0% | ||
| (1) | Information is based on the underwritten rent roll. |
| (2) | Certain tenants may have lease termination options that are exercisable prior to the originally stated expiration date of the subject lease and that are not considered in the lease rollover schedule. |
The Market. The Ritchie Station Marketplace Property is located in Capitol Heights, Prince George’s County, Maryland, at the intersection of Ritchie Marlboro Road and the Capitol Beltway (Interstate 495), a highway circling the District of Columbia which also leads to Interstate 95, the major north-south interstate highway along the east coast of the United States. The Ritchie Station Marketplace Property is approximately ten miles west of the Washington, D.C. central business district. Major employers in Prince George’s County include Crosby Corp, Giant Food, H&R Block, Home Depot, Laurel Regional Hospital, McDonald’s, Med Star Southern Maryland Hospital Center, Safeway, Target and University of Maryland.
The 2016 estimated population within a three- and five-mile radius of the Ritchie Station Marketplace Property was 72,167 and 239,694, respectively, the average household income was $86,372 and $84,170, respectively, and the retail sales per household was $68,718 and $65,714, respectively. The surrounding area to the Ritchie Station Marketplace Property is dense with residential development. According to the appraisal, within a three- and five-mile radius of the Ritchie Station Marketplace Property there are 29,594 and 94,360 housing units, respectively. Additionally, the Prince George’s County Planning Board and the Maryland National Capital Park and Planning Commission have proposed plans for over 4,200 residential units (in addition to 1.2 million SF of retail space, 4.5 million SF of office space and 600 hotel rooms) just south of the Ritchie Station Marketplace Property, between the Capital Beltway, Ritchie Marlboro Road and Pennsylvania Avenue in an area known as Westphalia.
The Ritchie Station Marketplace Property is located within the Southern Prince George’s County submarket of the Suburban Maryland Retail market. According to a third party research report, the Southern Prince George’s County retail submarket as of the first quarter of 2017 was comprised of approximately 12.6 million SF with an average vacancy rate of 4.1% and average asking rents of $16.48 PSF. The Ritchie Station Marketplace Property is the newest supply in the Southern Prince George’s County submarket. The appraisal noted additional planned retail development including the adjacent Ritchie Station Phase III under development by an affiliate of the Ritchie Station Marketplace sponsor, an adjacent 158,000 SF Wal-Mart expected to open in late spring 2018, and additional strip retail across the street from the Ritchie Station Marketplace Property at Steeplechase 95 International Business Park.
This is not a research report and was not prepared by the Underwriters’ research departments. Please see additional important information and qualifications at the end of this Term Sheet.
| T-91 |
| BANK 2017-BNK6 | Ritchie Station Marketplace |
The following table presents certain competitive retail properties to the Ritchie Station Marketplace Property:
| Competitive Property Summary | ||||||
| Property, Location | Type | Year Built/ Renovated | Size (SF) | Occupancy | Anchor Tenants | Distance to Subject (mi.) |
Ritchie Station Marketplace Capitol Heights, MD | Power Center | 2013-2016/ N/A | 249,078 | 100% | Dave & Busters, Ashley Furniture, Big Lots, Bed, Bath & Beyond, TJ Maxx, Gold’s Gym, DSW | N/A |
Woodmore Towne Centre at Glenarden Lanham, MD | Lifestyle Center | 2008/ N/A | 679,187 | 88% | Costco, Wegmans, JC Penney, Best Buy, 24 Hour Fitness | 4.0 |
Rivertowne Commons Oxon Hill, MD | Community Center | 1986/ N/A | 384,343 | 99% | Kmart, Safeway, Ross Dress for Less, Staples, CVS | 8.0 |
Vista Garden Marketplace Lanham, MD | Power Center | 2006/ N/A | 399,235 | 100% | Target, Home Depot, Shoppers Food Warehouse, Office Depot | 6.0 |
Largo Town Center Upper Marlboro, MD | Community Center | 1991/ N/A | 248,706 | 98% | Regency Furniture, Shoppers Food Warehouse, Marshalls, World Gym | 2.0 |
Laurel Lakes Centre Laurel, MD | Power Center | 1985/ 1999 | 460,892 | 98% | Lowe’s, Michael’s, Ross Dress for Less, Safeway, Best Buy | 15.0 |
College Park Marketplace College Park, MD | Power Center | 1998/ N/A | 238,765 | 99% | Home Depot, Best Buy, Shoppers Food Warehouse | 10.0 |
Bowie Town Centre Bowie, MD | Lifestyle Center | 2001/ N/A | 935,693 | 99% | Macy’s, Sears, Barnes & Noble, Bed, Bath & Beyond, Old Navy | 8.0 |
Boulevard at the Capital Centre Upper Marlboro, MD | Community Center | 2002/ N/A | 485,711 | 89% | DSW, AMC Theater | 2.0 |
Largo Plaza Upper Marlboro, MD | Power Center | 1973/ 1998 | 437,438 | 95% | Giant Food, Lowe’s, Target, PetSmart, Staples | 2.0 |
Greenway Center Greenbelt, MD | Community Center | 1980/ 2008 | 284,292 | 99% | Ross Dress for Less, Safeway, Old Navy, Modell’s Sporting Goods, Dress Barn | 9.0 |
Source:Appraisal
This is not a research report and was not prepared by the Underwriters’ research departments. Please see additional important information and qualifications at the end of this Term Sheet.
| T-92 |
| BANK 2017-BNK6 | Ritchie Station Marketplace |
Operating History and Underwritten Net Cash Flow.The following table presents certain information relating to the historical operating performance and the Underwritten Net Cash Flow at the Ritchie Station Marketplace Property:
| Cash Flow Analysis | |||||
| 2014(1) | 2015(1) | 3/31/2017 TTM | UW | UW PSF | |
| Base Rent | N/A | $1,355,583 | $3,249,975 | $3,950,847(2) | $15.86(2) |
| Total Recoveries | N/A | $422,687 | $671,388 | $1,217,173 | $4.89 |
| Other Income(3) | N/A | $0 | $52,843 | $167,567 | $0.67 |
| Less Vacancy | N/A | $0 | $0 | ($258,401) | (5.0%) |
| Effective Gross Income | N/A | $1,778,270 | $3,974,206 | $5,077,186 | 20.38 |
| Total Operating Expenses | N/A | $1,170,010 | $852,640 | $1,357,462 | 5.45 |
| Net Operating Income | N/A | $608,260 | $3,121,566 | $3,719,724 | 14.93 |
| Capital Expenditures | N/A | $0 | $0 | $49,816 | 0.20 |
| TI/LC | N/A | $0 | $0 | $226,549 | 0.91 |
| Net Cash Flow | N/A | $608,260 | $3,121,566 | $3,443,359 | 13.82 |
| Occupancy % | N/A | N/A(1) | 100.0%(4) | 95.0% | |
| NOI DSCR (IO) | N/A | 0.33x | 1.69x | 2.01x | |
| NOI DSCR (P&I) | N/A | 0.25x | 1.26x | 1.50x | |
| NCF DSCR (IO) | N/A | 0.33x | 1.69x | 1.86x | |
| NCF DSCR (P&I) | N/A | 0.25x | 1.26x | 1.39x | |
| NOI Debt Yield | N/A | 1.5% | 7.6% | 9.1% | |
| NCF Debt Yield | N/A | 1.5% | 7.6% | 8.4% | |
| (1) | The Ritchie Station Marketplace Property was developed in two phases: Phase I (103,584 SF) was completed in 2013 and Phase II (89,575 SF) was completed in 2016. 2014 property performance is not available. 2015 property performance does not reflect the fully constructed property and 2015 Occupancy for the complete collateral is not available. |
| (2) | UW Base Rent is based on the April 30, 2017 underwritten rent roll. |
| (3) | Other Income includes the Ritchie Station Marketplace Borrower’s share (50%) of the income earned from digital signage along the Capital Beltway (Interstate 495/95) and a single faced wall-mounted display adjacent to the main entrance to the Ritchie Station Marketplace Property. The digital signage was established 2016. UW Other Income is based on actual receipts through May 2017 plus sold contracts for the remainder of 2017, which total $335,135. |
| (4) | Occupancy as of April 30, 2017. |
Escrows and Reserves. The Ritchie Station Marketplace Borrower deposited at closing $482,534 for property taxes and is required to deposit monthly 1/12th of the estimated annual real estate taxes. The Ritchie Station Marketplace Borrower is required to deposit monthly 1/12th of the estimated annual insurance premiums, unless the Ritchie Station Marketplace Property insurance is being maintained under an acceptable blanket policy.
The Ritchie Station Marketplace Borrower is required to deposit monthly $1,661 for replacement reserves. The Ritchie Station Marketplace Borrower is required to deposit to a tenant improvement and leasing commissions reserve (i) any excess cash deposits during a cash sweep from a Dave & Busters Trigger Event (as defined below) and/or a Major Tenant Cash Sweep Event (as defined below), (ii) any Dave & Busters Security Payment (as defined below) or Major Tenant’s (as defined below) security payment, (iii) any termination fees, and (iv) beginning July 1, 2020, $20,833 monthly, which tenant improvements and leasing commissions reserve is subject to a cap of $750,000.
Lockbox and Cash Management. A hard lockbox is in place with respect to the Ritchie Station Marketplace Mortgage Loan. Upon the occurrence of a Cash Sweep Period (as defined below), funds from the lockbox account are required to be transferred daily to the lender-controlled cash management account for the payment of, among other things, debt service, monthly escrows and operating expenses, with all excess cash being deposited to an excess cash reserve to be held as additional collateral for the Ritchie Station Marketplace Mortgage Loan during the Cash Sweep Period.
A “Cash Sweep Period” will commence upon any of (a) the debt service coverage ratio being less than 1.15x for any calendar quarter, ending on the earlier of (i) the debt service coverage ratio being equal to or greater than 1.25x or two consecutive calendar quarters or (ii) receipt by lender of a Low DSCR Security Payment (as defined below), (b) the occurrence of a Dave & Busters Trigger Event, ending upon a Dave & Busters Trigger Event Cure, and (c) the occurrence of a Major Tenant Cash Sweep Event, ending upon a Major Tenant Trigger Cure with respect to all Major Tenants then the subject of a Major Tenant Trigger. If a Cash Sweep Period has occurred four times during the loan term, the Cash Sweep Period will continue until the Ritchie Station Marketplace Mortgage Loan is repaid in full.
A “Low DSCR Security Payment”means cash or a letter of credit in an amount which if added to the underwritten net cash flow would be sufficient to cause the calculation of the debt service coverage ratio for such period to equal or exceed 1.25x.
A “Dave & Busters Trigger Event” will occur upon (i) Dave & Busters or its lease guarantor being subject to any bankruptcy or insolvency proceeding or having its assets made subject to the jurisdiction of a bankruptcy court, (ii) Dave & Busters terminating or giving notice to terminate its lease,(iii) Dave & Busters failing to pay rent or other expenses for which it is responsible under its lease, or (iv) Dave & Busters going dark, vacating or giving notice to vacate.
A “Dave & Busters Trigger Event Cure” will occur upon (i) as it relates to clause (i) of the Dave & Busters Trigger Event definition, the Ritchie Station Marketplace Borrower providing evidence that the Dave & Busters lease or guaranty has been assumed without alteration as ordered by the bankruptcy court, or the assets of Dave & Busters or such guarantor no longer are subject to bankruptcy and the obligations of Dave & Busters or such guarantor remain unaltered, (ii) as it relates to clause (ii) of the Dave & Busters Trigger Event definition, the Ritchie Station Marketplace Borrower satisfying the Dave & Busters Replacement Lease Criteria (as defined below),(iii) as it relates to clause (iii) of the Dave & Busters Trigger Event definition, Dave & Busters being current in its monetary obligations with no default under its lease, and (iv) as it relates to clause (iv) of the Dave & Busters Trigger Event
This is not a research report and was not prepared by the Underwriters’ research departments. Please see additional important information and qualifications at the end of this Term Sheet.
| T-93 |
| BANK 2017-BNK6 | Ritchie Station Marketplace |
definition, either (i) lender’s receipt of cash or a letter of credit in the amount of $1,250,000 (a “Dave and Busters Security Payment”) or (ii) the excess cash collected resulting from a Dave & Busters Trigger Event being equal to or greater than $1,250,000.
“Dave & Busters Replacement Lease Criteria” means (i) the Ritchie Station Marketplace Borrower has entered into one or more replacement leases for the Dave & Busters space, (ii) the replacement tenant(s) is in physical occupancy, open for business and paying full contractual rent, and (iii) the Ritchie Station Marketplace Borrower has provided: (A) a copy of the executed replacement lease(s), (B) tenant estoppel(s) confirming that the replacement lease(s) is in full force and effect with no defaults and the replacement tenant(s) is in physical occupancy, open for business and paying full contractual rent, (C) a subordination, non-disturbance and attornment agreement(s) (upon request by lender), (D) evidence that there are no unpaid tenant improvements or leasing commissions, and (E) an updated rent roll.
A “Major Tenant Cash Sweep Event” will occur upon any Major Tenant Trigger Period (as defined below) with respect to any two or more Major Tenants (as defined below).
A “Major Tenant” means any tenant (together with its affiliates) with a minimum of 25,000 SF of leased space, other than Dave & Busters.
A “Major Tenant Trigger Period” means the occurrence of a Major Tenant Trigger, ending upon a Major Tenant Trigger Cure. A Major Tenant Trigger means any of (i) any Major Tenant failing to satisfy the applicable Major Tenant Renewal Criteria (as defined below) at least twelve months prior to the expiration date of its lease, (ii) any Major Tenant, or its lease guarantor, being subject to any bankruptcy or insolvency proceeding or having its assets made subject to the jurisdiction of a bankruptcy court, (iii) any Major Tenant going dark, vacating or giving notice to vacate, terminating or giving notice to terminate or (iv) any Major Tenant failing to pay rent or other expenses for which it is responsible pursuant to its lease.
A “Major Tenant Trigger Cure” means (a) lender’s receipt of cash or a letter of credit equal to the product of $20.00 multiplied by the Major Tenant’s leased square footage, (b) the excess cash collected resulting from a Major Tenant Cash Sweep Event being equal to or greater than the product of $20.00 multiplied by the Major Tenant’s leased square footage, (c) (i) as it relates to clause (i) of the Major Tenant Trigger definition, the Ritchie Station Marketplace Borrower satisfying either the Major Tenant Renewal Criteria (as defined below) or the Major Tenant Replacement Lease Criteria (as defined below), (ii) as it relates to clause (ii) of the Major Tenant Trigger definition, the Ritchie Station Marketplace Borrower providing evidence that the Major Tenant lease or guaranty has been assumed without alteration as ordered by the bankruptcy court, or the assets of such Major Tenant or such guarantor no longer are subject to bankruptcy and the obligations of the Major Tenant or such guarantor remain unaltered, (iii) as it relates to clause (iii) of the Major Tenant Trigger definition, the Ritchie Station Marketplace Borrower satisfying the Major Tenant Replacement Lease Criteria, or (iv) as it relates to clause (iv) of the Major Tenant Trigger definition, the Ritchie Station Marketplace Borrower providing evidence that the applicable Major Tenant is current in all of its monetary obligations and there is no default under the applicable Major Tenant lease. Notwithstanding the foregoing, a Major Tenant Trigger Period will not end if any Major Tenant remains subject to a Major Tenant Trigger.
A Major Tenant Trigger Period will suspend while the debt service coverage ratio is equal to or greater than 1.25x for the immediately two preceding calendar quarters (excluding from the calculation all income under all Major Tenant Leases then the subject of a Major Tenant Trigger) , provided no Dave & Busters Trigger Event has occurred and is continuing and at least $500,000 is on deposit in the leasing reserve account (excluding excess cash collected through a Cash Sweep Period resulting from a Dave & Busters Trigger Event and/or Major Tenant Cash Sweep Event,any cash security payment from Dave & Busters or a Major Tenant, and any termination fees).
“Major Tenant Renewal Criteria” means lender has received (i) evidence that the applicable Major Tenant has renewed its lease for a minimum term of five years and (ii) a tenant estoppel from the applicable Major Tenant confirming (A) the terms of the renewal, (B) that the Major Tenant’s lease is in full force and effect, (C) that the Major Tenant is in physical occupancy, open for business and paying full contractual rent, and (D) that there is no landlord default under the Major Tenant’s lease.
“Major Tenant Replacement Lease Criteria” means with respect to all applicable Major Tenant ‘s leased space, (i) the Ritchie Station Marketplace Borrower has entered into one or more replacement leases for the Major Tenant space, (ii) each replacement tenant is in physical occupancy, open for business and paying full contractual rent, and (iii) the Ritchie Station Marketplace Borrower has provided: (A) a copy of each executed replacement lease; (B) a tenant estoppel executed by each replacement tenant which confirms, among other things, that the replacement lease is in full force and effect with no defaults and the replacement tenant is in physical occupancy, open for business and paying full contractual rent; (C) a subordination, non-disturbance and attornment agreement (upon request by lender); (D) evidence that there are no unpaid tenant improvements or leasing commissions; and (E) an updated rent roll.
Additional Secured Indebtedness (not including trade debts).Not permitted.
Mezzanine Loan and Preferred Equity.Not permitted.
Release of Property. Not permitted.
Terrorism Insurance.The Ritchie Station Marketplace Borrower is required to obtain and maintain property insurance, public liability insurance and rental loss and/or business interruption insurance that covers perils of terrorism and acts of terrorism.
This is not a research report and was not prepared by the Underwriters’ research departments. Please see additional important information and qualifications at the end of this Term Sheet.
| T-94 |
(THIS PAGE INTENTIONALLY LEFT BLANK)
| T-95 |
| BANK 2017-BNK6 | 2851 Junction |
Mortgage Loan No. 7 – 2851 Junction
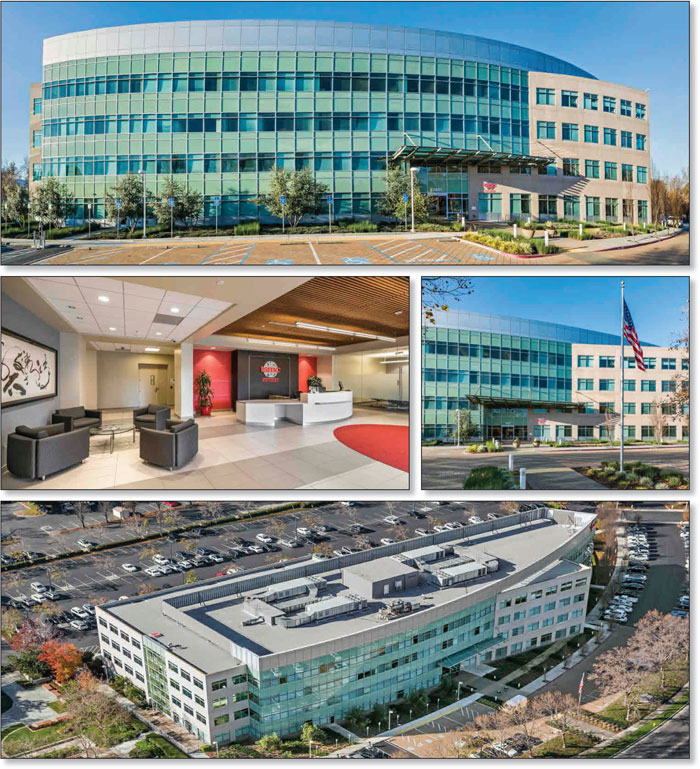
This is not a research report and was not prepared by the Underwriters’ research departments. Please see additional important information and qualifications at the end of this Term Sheet.
| T-96 |
| BANK 2017-BNK6 | 2851 Junction |
Mortgage Loan No. 7 – 2851 Junction
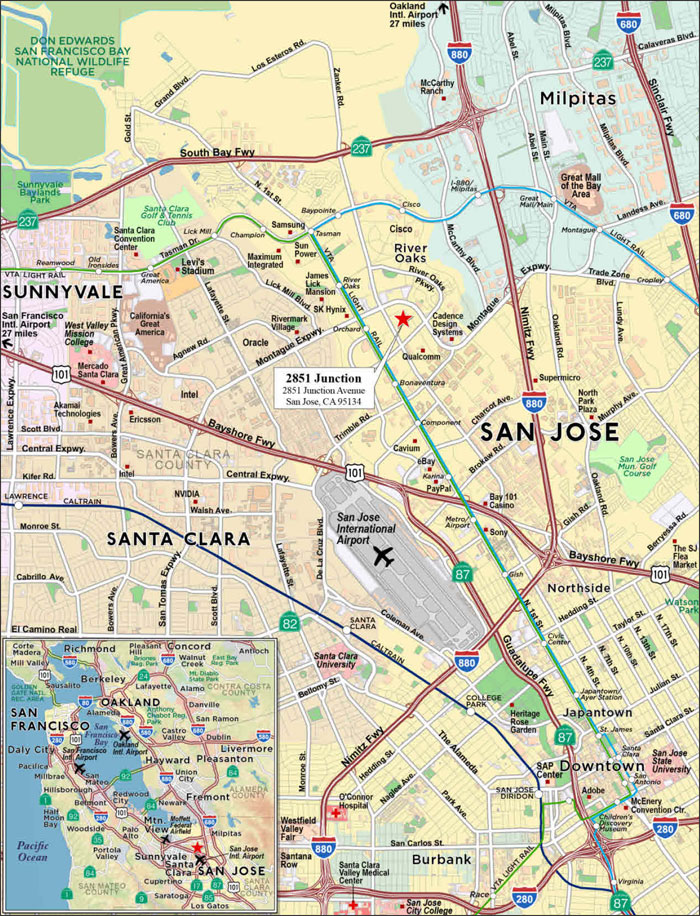
This is not a research report and was not prepared by the Underwriters’ research departments. Please see additional important information and qualifications at the end of this Term Sheet.
| T-97 |
| BANK 2017-BNK6 | 2851 Junction |
| Mortgage Loan No. 7 – 2851 Junction |
| Mortgage Loan Information | Property Information | ||||||
| Mortgage Loan Seller: | WFB | Single Asset/Portfolio: | Single Asset | ||||
| Original Balance(1): | $30,065,000 | Location: | San Jose, CA 95134 | ||||
| Cut-off Date Balance(1): | $30,065,000 | General Property Type: | Office | ||||
| % of Initial Pool Balance: | 3.2% | Detailed Property Type: | Suburban | ||||
| Loan Purpose: | Acquisition | Title Vesting: | Fee | ||||
| Sponsors: | Farshid Steve Shokouhi; Brett Michael Lipman | Year Built/Renovated: | 2002/2014 | ||||
| Size: | 155,613 SF | ||||||
| Mortgage Rate: | 4.1400% | Cut-off Date Balance per SF(1): | $373 | ||||
| Note Date: | 5/9/2017 | Maturity Date Balance per SF(1): | $373 | ||||
| First Payment Date: | 6/11/2017 | Property Manager: | Preylock Real Estate Holding, LLC (borrower-related) | ||||
| Maturity Date: | 5/11/2027 | ||||||
| Original Term to Maturity: | 120 months | ||||||
| Original Amortization Term: | 0 months | ||||||
| IO Period: | 120 months | Underwriting and Financial Information | |||||
| Seasoning: | 2 months | UW NOI: | $4,803,050 | ||||
| Prepayment Provisions: | LO (26); DEF (87); O (7) | UW NOI Debt Yield(1): | 8.3% | ||||
| Lockbox/Cash Mgmt Status: | Hard/In Place | UW NOI Debt Yield at Maturity(1): | 8.3% | ||||
| Additional Debt Type(2): | Pari Passu | UW NCF DSCR(1): | 1.96x | ||||
| Additional Debt Balance: | $28,000,000 | Most Recent NOI: | $4,475,902 (12/31/2016) | ||||
| Future Debt Permitted (Type) : | No (N/A) | 2nd Most Recent NOI: | $1,736,791 (T-7 Ann. 12/31/2015 | ||||
| Reserves(3) | |||||||
| Type | Initial | Monthly | Cap | 3rd Most Recent NOI(4): | N/A | ||
| RE Tax: | $273,525 | $91,175 | N/A | Most Recent Occupancy: | 100.0% (7/1/2017) | ||
| Insurance: | $0 | Springing | N/A | 2nd Most Recent Occupancy: | 100.0% (12/31/2016) | ||
| Recurring Replacements: | $0 | $0 | N/A | 3rd Most Recent Occupancy: | 100.0% (12/31/2015) | ||
| TI/LC: | $0 | $0 | N/A | Appraised Value (as of): | $83,000,000 (4/24/2017) | ||
| TSMC Rent Concession: | $0 | Springing | $1,556,130 | Cut-off Date LTV Ratio(1): | 70.0% | ||
| TSMC Letter of Credit: | $2,000,000 | $0 | N/A | Maturity Date LTV Ratio(1): | 70.0% | ||
| Sources and Uses | ||||||
| Sources | Proceeds | % of Total | Uses | Proceeds | % of Total | |
| Loan Amount(1): | $58,065,000 | 69.2% | Acquisition Price: | $82,000,000 | 97.7% | |
| Borrower Equity: | $25,885,000 | 30.8% | Closing Costs: | $1,950,000 | 2.3% | |
| Total Sources: | $83,950,000 | 100.0% | Total Uses: | $83,950,000 | 100.0% | |
| (1) | The 2851 Junction Mortgage Loan is part of the 2851 Junction Whole Loan, which is comprised of twopari passu notes with an aggregate original principal balance of $58,065,000. The Cut-off Date Balance per SF, Maturity Date Balance per SF, UW NCF DSCR, UW NOI Debt Yield, UW NOI Debt Yield at Maturity, Cut-off Date LTV Ratio and Maturity Date LTV Ratio numbers presented are based on the 2851 Junction Whole Loan. |
| (2) | See “The Mortgage Loan”and “Additional Secured Indebtedness (not including trade debts)” below for further discussion of additional debt. |
| (3) | See “Escrows and Reserves” below for further discussion of reserve requirements. |
| (4) | The 2851 Junction Whole Loan represents acquisition financing. Due to the change in ownership, historical performance for the 2851 Junction Property for 2014 is not available. |
The Mortgage Loan. The seventh largest mortgage loan (the “2851 Junction Mortgage Loan”) is part of a whole loan (the “2851 Junction Whole Loan”) evidenced by twopari passupromissory notes in the aggregate original principal amount of $58,065,000 which are secured by a first priority fee mortgage encumbering a four-story office property located in San Jose, California (the “2851 Junction Property”). Promissory Note A-1 in the original principal amount of $30,065,000 represents the 2851 Junction Mortgage Loan and will be included in the BANK 2017-BNK6 securitization trust. Promissory Note A-2 in the original principal amount of $28,000,000 (the “2851 Junction ServicedPari Passu Companion Loan”) is expected to be contributed to the WFCM 2017-C38 securitization trust. The 2851 Junction Mortgage Loan will be serviced pursuant to the pooling and servicing agreement for the BANK 2017-BNK6 securitization trust. See “Description of the Mortgage Pool—The Whole Loans— The Non-ServicedPari Passu Whole Loans” and “Pooling and Servicing Agreement” in the Preliminary Prospectus. The proceeds of the 2851 Junction Whole Loan were used to acquire the 2851 Junction Property, fund reserves and pay closing costs. The proceeds of the 2851 Junction Whole Loan were primarily used to refinance existing debt on the 2851 Junction Property, fund reserves and pay closing costs.
The Borrower and the Sponsors.The borrower is LL 2851 Junction, LLC (the “2851 Junction Borrower”), a single-purpose Delaware limited liability company with two independent directors. The loan sponsors and non-recourse carve-out guarantors are Farshid Steve Shokouhi and Brett Michael Lipman. Mr. Shokouhi (Managing Partner at Benchmark Holdings) and Mr. Lipman (founder and managing member of BLR Equity) have a combined commercial real estate portfolio of approximately 1.8 million SF of office, industrial and retail properties along with 14,543 multifamily units.
This is not a research report and was not prepared by the Underwriters’ research departments. Please see additional important information and qualifications at the end of this Term Sheet.
| T-98 |
| BANK 2017-BNK6 | 2851 Junction |
The Property.The 2851 Junction Property, located at 2851 Junction Avenue in San Jose, California, consists of a four-story suburban office building totaling 155,613 SF. Constructed in 2002 and renovated in 2014, the 2851 Junction Property is 100% leased to TSMC North America (“TSMC-NA”), a wholly-owned subsidiary of Taiwan Semiconductor Manufacturing Company, Ltd. (“TSMC”; rated NR/A1/A+ by Fitch/Moody’s/S&P, respectively).
TSMC fully guarantees the lease at the 2851 Junction Property. TSMC is listed on the Taiwan Stock Exchange (TWSE: 2330) and the New York Stock Exchange (NYSE: TSM) and has a total market capitalization of approximately $176.6 billion, as of May 31, 2017. TSMC generated net income of $10.38 billion on consolidated revenue of $29.43 billion in 2016, compared with net income of $9.67 billion on consolidated revenue of $26.61 billion in 2015. 2016 gross profit margin was 50.1% compared with 48.7% in 2015. TSMC is the world’s largest semiconductor foundry, manufacturing 9,275 different products using 249 distinct technologies for 449 different customers, as of 2016. TSMC exclusively manufactures the Apple A10 chip (used in the iPhone 6 and 7) and is also expected to be the sole supplier of the A11 chip (expected to be used in the upcoming iPhone 8).
The 2851 Junction Property serves as TSMC-NA’s headquarters. TSMC-NA is engaged in the manufacturing, selling, packaging, testing and computer-aided design of integrated circuits and other semiconductor devices and the manufacturing of masks. The 2014 renovation of the 2851 Junction Property was completed at a cost of $6.0 million ($38.56 PSF) plus an additional $3.0 million ($19.28 PSF) in tenant build-out work. TSMC-NA has funded an additional $6.0 million ($38.56 PSF) to complete improvements including a state of the art data center and a backup power system. The 2851 Junction Property is situated on a 6.3-acre site and contains 470 surface parking spaces, resulting in a parking ratio of 3.0 spaces per 1,000 SF of rentable area.
The following table presents a summary regarding the sole tenant at the 2851 Junction Property:
| Tenant Summary | ||||||||
| Tenant Name | Credit Rating (Fitch/Moody’s/S&P) | Tenant SF | Approximate % of SF | Annual UW Rent(1) | % of Total Annual UW Rent( | Annual UW Rent PSF(1) | Lease Expiration | |
| Major Tenants | ||||||||
| TSMC-NA(2) | NR/A1/A+(3) | 155,613 | 100.0% | $4,951,598 | 100.0% | $31.82 | 9/18/2029(4) | |
| Subtotal/Wtd. Avg. | 155,613 | 100.0% | $4,951,598 | 100.0% | $31.82 | |||
| Vacant Space | 0 | 0.0% | $0 | 0.0% | $0.00 | |||
| Total/Wtd. Avg. | 155,613 | 100.0% | $4,951,598 | 100.0% | $31.82 | |||
| (1) | Annual UW Rent and Annual UW Rent PSF include the average rent over the 10-year loan term. As of July 1, 2017, TSMN-NA is paying a current rent of $28.80 PSF annually. |
| (2) | TSMC-NA subleases 6,878 PSF (4.4% of the NRA) to Global Unichip Corporation – NA for $24.19 per square foot annually on a sublease expiring in March 2020. |
| (3) | TSMC, the rated entity, guarantees the lease. |
| (4) | TSMC-NA has one, seven-year lease extension option. |
The following table presents certain information relating to the lease rollover schedule at the 2851 Junction Property:
| Lease Rollover Schedule(1)(2) | ||||||||
| Year | # of Leases Rolling | SF Rolling | UW Rent PSF Rolling | Approx. % of Total SF Rolling | Approx. Cumulative % of SF Rolling | Total UW Rent Rolling | Approx. % of Total Rent Rolling | Approx. Cumulative % of Total Rent Rolling |
| 2017 | 0 | 0 | $0.00 | 0.0% | 0.0% | $0 | 0.0% | 0.0% |
| 2018 | 0 | 0 | $0.00 | 0.0% | 0.0% | $0 | 0.0% | 0.0% |
| 2019 | 0 | 0 | $0.00 | 0.0% | 0.0% | $0 | 0.0% | 0.0% |
| 2020 | 0 | 0 | $0.00 | 0.0% | 0.0% | $0 | 0.0% | 0.0% |
| 2021 | 0 | 0 | $0.00 | 0.0% | 0.0% | $0 | 0.0% | 0.0% |
| 2022 | 0 | 0 | $0.00 | 0.0% | 0.0% | $0 | 0.0% | 0.0% |
| 2023 | 0 | 0 | $0.00 | 0.0% | 0.0% | $0 | 0.0% | 0.0% |
| 2024 | 0 | 0 | $0.00 | 0.0% | 0.0% | $0 | 0.0% | 0.0% |
| 2025 | 0 | 0 | $0.00 | 0.0% | 0.0% | $0 | 0.0% | 0.0% |
| 2026 | 0 | 0 | $0.00 | 0.0% | 0.0% | $0 | 0.0% | 0.0% |
| 2027 | 0 | 0 | $0.00 | 0.0% | 0.0% | $0 | 0.0% | 0.0% |
| 2028 & Beyond | 1 | 155,613 | $31.82 | 100.0% | 100.0% | $4,951,598 | 100.0% | 100.0% |
| Vacant | 0 | 0 | $0.00 | 0.0% | 100.0% | $0 | 0.0% | 100.0% |
| Total/Wtd. Avg. | 1 | 155,613 | $31.82 | 100.0% | $4,951,598 | 100.0% | ||
| (1) | Information is based on the underwritten rent roll. |
| (2) | There are no existing lease termination options that are exercisable prior to the originally stated expiration date of the subject lease. |
This is not a research report and was not prepared by the Underwriters’ research departments. Please see additional important information and qualifications at the end of this Term Sheet.
| T-99 |
| BANK 2017-BNK6 | 2851 Junction |
The Market. The 2851 Junction Property is located in San Jose, Santa Clara County, California. The 2851 Junction Property is in north San Jose, in the “Golden Triangle” of Silicon Valley, which encompasses the area between State Highway 237, Interstate 880, and U.S. Highway 101. The Golden triangle is home to notable high-technology firms such as Altera, Aptina, AT&T, Cadence Design Systems, Canon, Cisco Systems, PayPal, Micron, Philips Lumileds and Samsung, according to the appraisal. The 2851 Junction Property is approximately four miles northwest of the San Jose Central Business District, and approximately one mile north of the Mineta San Jose International Airport. The 2016 estimated population within a one-, three-and five-mile radius of the 2851 Junction Property was 15,305, 108,723 and 424,973, respectively; the 2016 estimated average household income within the same radii was $162,659, $137,917 and $122,524, respectively.
According to a third party market research report, the 2851 Junction Property is located in the North San Jose submarket of the South Bay/San Jose office market, which, as of the first quarter of 2017, contained a total inventory of approximately 16.0 million SF with a 13.3% vacancy rate. The 2851 Junction appraisal determined market rent of for property to be $30.60 per SF, triple net. Annual UW Rent PSF of $31.82 PSF for the 2851 Junction Property represents average rent over the 10-year loan term. As of July 1, 2017, TSMN-NA is paying a current rent of $28.80 PSF.
The following table reflects the comparable office leases with respect to the 2851 Junction Property as identified in the appraisal:
| Competitive Property Summary | ||||||||||
| Property Name/Location | Year Built | Stories | Total GLA (SF) | Total Occupancy | Distance (miles) | Tenant Name | Lease Size (SF) | Lease Date/ Term | Rent PSF | Lease Type |
2851 Junction Property San Jose, CA | 2002/2014 | 4 | 155,613 | 100% | -- | TSMC-NA | 155,613 | Sept 2014 / 15.0 Yrs | $28.80 | NNN |
Great American Business Park 5150 Great American Parkway Santa Clara, CA | 1979/2015 | 2 | 50,946 | 100% | 3.7 | LG | 50,946 | Apr 2017 / 6.5 Yrs | $28.80 | NNN |
3250 & 3300 Olcott Street San Jose, CA | 1979/2011 | 2 & 3 | 151,560 | 100% | 3.0 | Gigamon Systems, LLC | 105,664 | Feb 2017 / 5.0 Yrs | $31.08 | NNN |
2300 Orchard Parkway San Jose, CA | 1997/2017 | 2 | 116,000 | 100% | 2.0 | Cavium Networks | 116,000 | Jan 2017 / 10.0 Yrs | $30.24 | NNN |
1740 Technology Drive San Jose, CA | 1986/2011 | 6 | 210,000 | 100% | 2.8 | Nutanix, Inc. | 210,000 | Sept 2016 / 3.0 Yrs | $39.36 | FSG |
1700 Technology Drive San Jose, CA | 2001/NAP | 8 | 194,800 | 100% | 3.2 | Qualcomm | 194,800 | May 2016 / 5.0 Yrs | $34.20 | NNN |
Source:Appraisal
Operating History and Underwritten Net Cash Flow. The following table presents certain information relating to the historical operating performance and Underwritten Net Cash Flow at the 2851 Junction Property:
| Cash Flow Analysis(1) | ||||||||||
| 2014(1) | 2015 | 2016 | UW | UW PSF | ||||||
| Base Rent | N/A | $2,034,154 | $4,481,654 | $4,951,598(3) | $31.82 | |||||
| Total Recoveries | N/A | $1,304,431 | $1,592,099 | $1,611,174 | $10.35 | |||||
| Less Vacancy & Credit Loss | N/A | $0 | $0 | ($148,548)(4) | ($0.95) | |||||
| Effective Gross Income | N/A | $3,338,585 | $6,073,753 | $6,414,224 | $41.22 | |||||
| Total Operating Expenses | N/A | $1,601,794 | $1,597,851 | $1,611,174 | $10.35 | |||||
| Net Operating Income(3) | N/A | $1,736,791 | $4,475,902 | $4,803,050 | $30.87 | |||||
| Capital Expenditures | N/A | $0 | $0 | $31,123 | $0.20 | |||||
| TI/LC | N/A | $0 | $0 | $0 | $0.00 | |||||
| Net Cash Flow | N/A | $1,736,791 | $4,475,902 | $4,771,927 | $30.67 | |||||
| Occupancy % | N/A | 100.0% | 100.0% | 97.0%(4) | ||||||
| NOI DSCR(5) | N/A | 0.71x | 1.84x | 1.97x | ||||||
| NCF DSCR(5) | N/A | 0.71x | 1.84x | 1.96x | ||||||
| NOI Debt Yield(5) | N/A | 3.0% | 7.7% | 8.3% | ||||||
| NCF Debt Yield(5) | N/A | 3.0% | 7.7% | 8.2% | ||||||
| (1) | The 2851 Junction Whole Loan represents acquisition financing. Due to the change in ownership, historical performance for the 2851 Junction Property for 2014 is not available. |
| (2) | TSMC-NA signed a lease in September 2014 and was provided free rent from September 2014 through June 2015. TSMC-NA was paying partially abated rent through December 2015 and commenced full rental payments as of January 1, 2016. |
| (3) | Annual UW Rent includes the average rent over the 10-year loan term. As of July 1, 2017, TSMN-NA is paying a current rent of $28.80 PSF annually. |
| (4) | The underwritten economic vacancy is 3.0%. The 2851 Junction Property is 100.0% physically occupied as of July 1, 2017. |
| (5) | Debt service coverage ratios and debt yields are based on the 2851 Junction Whole Loan. |
This is not a research report and was not prepared by the Underwriters’ research departments. Please see additional important information and qualifications at the end of this Term Sheet.
| T-100 |
| BANK 2017-BNK6 | 2851 Junction |
Escrows and Reserves. At origination, the 2851 Junction Borrower deposited $273,525 for real estate taxes and $2,000,000 in the form of a letter of credit (issued by Bank of Taiwan) for the security deposit pursuant to the TSMC-NA lease. The 2851 Junction Borrower is required to escrow monthly amounts equal to $91,175 for real estate taxes (1/12 of the estimated annual tax payments). The 2851 Junction Whole Loan documents do not require ongoing monthly escrows for insurance so long as (i) no event of default has occurred and is continuing, (ii) the 2851 Junction Borrower provides the lender with evidence that 2851 Junction Property is insured via an acceptable blanket insurance policy and such policy is in full force and effect and (iii) borrower provides the lender with evidence of renewal of the insurance policies and timely proof of payment of insurance premiums. On October 11, 2026, the 2851 Junction Borrower is required to deposit monthly $222,304 (subject to a cap of $1,556,130) unless prior to such date, (i) TSMC-NA has exercised its renewal option or (ii) the 2851 Junction Property has been leased to one or more lender-approved tenants.
Lockbox and Cash Management.The 2851 Junction Whole Loan is structured with a lender-controlled lockbox, which is already in place. The 2851 Junction Whole Loan documents require the borrower to direct all tenants to pay rent directly into such lockbox account, and also require that all rents received by the borrower or the property manager be deposited into the lockbox account within two business day of receipt. The 2851 Junction Whole Loan has in place cash management. Prior to the occurrence of a Cash Trap Event Period (as defined below), all excess cash flow in the cash management account is distributed to the borrower. During a Cash Trap Event Period, all funds in the lockbox account are swept to a lender-controlled cash management account and applied as provided in the 2851 Junction Whole Loan documents.
A “Cash Trap Event Period” will commence upon:
| (i) | the occurrence of an event of default under the 2851 Junction Whole Loan and continue until such event of default is no longer continuing, |
| (ii) | the debt service coverage ratio for the 2851 Junction Whole Loan being less than 1.15x, tested quarterly, and continue until the debt service coverage ratio for two consecutive calendar quarters thereafter is equal to or greater than 1.20x, or |
| (iii) | the occurrence of a Major Tenant Event Period (as defined below) and continue until the termination of such Major Tenant Event Period and provided no other Major Tenant Event Period is then continuing. |
A “Major Tenant Event Period” will commence upon:
| (i) | monetary or material non-monetary default by the 2851 Junction Borrower as landlord , in each case, beyond any applicable notice and/or cure period and continue until the lender’s receipt of satisfactory evidence that the subject default has been cured, |
| (ii) | TSMC-NA, or any replacement tenants, goes dark, vacates or otherwise fails to occupy its pace, or gives notice of its intent to commence any of the foregoing and continue until (A) the lender has received evidence that all applicable space has been leased to one or more replacement tenants and such tenants have taken occupancy of, and is conducting its normal business operations in, its entire premises and is then paying full, unabated rent pursuant to the terms of its lease, and that all tenant improvement costs and leasing commissions provided in each such replacement lease have been paid (or adequately reserved for by lender) (a “Major Tenant Re-Tenanting Event”) or (B) TSMC-NA, or any replacement tenants, has resumed occupancy of, and resumed its normal business operations in, its space for two consecutive calendar quarters, |
| (iii) | TSMC-NA, or any replacement tenants, files, as a debtor, a voluntary petition under the Bankruptcy Code or any other Creditors Rights Laws, or otherwise becomes involved, as a debtor, in a bankruptcy proceeding or other proceeding under Creditors Rights Laws and continue until (A) a Major Tenant Re-Tenanting Event has occurred, or (B) the bankruptcy proceeding or other proceeding under Creditors Rights Laws has terminated, the related lease has been affirmed, and the terms of such lease, are reasonably satisfactory to lender, |
| (iv) | TSMC-NA, or any replacement tenants, fails to renew or extend the term of its lease 270 days prior to the earlier of (A) the date on which such lease is then scheduled to expire, and (B) the 2851 Junction Whole Loan Maturity Date, and continue until (1) a Major Tenant Re-Tenanting Event has occurred or (2) or TSMC-NA, or any such replacement tenants renew or extend the term of its lease, or |
��
| (v) | the long-term debt rating for Taiwan Semiconductor Manufacturing Company, Ltd., a Republic of China corporation (or any successor guarantor of the TSMC-NA lease) and the direct parent is downgraded below “BBB-” by S&P (or the equivalent Fitch or Moody’s rating) (a “Major Tenant Downgrade Event Period”), and continue until (A) a Major Tenant Re-Tenanting Event has occurred, (B) the long-term credit rating for Taiwan Semiconductor Manufacturing Company, Ltd., a Republic of China corporation (or any successor guarantor of the TSMC-NA lease) and the direct parent is upgraded to “BBB-” or higher by S&P (or the equivalent Fitch or Moody’s rating) or (C) the amount of funds on deposit as a result of a Major Tenant Downgrade Event Period is equal to $3,890,325. |
Additional Secured Indebtedness (not including trade debts). The 2851 Junction Property also secures the 2851 Junction Serviced Pari Passu Companion Loan, which has a Cut-off Date principal balance of $28,000,000 and is expected to be contributed to the WFCM 2017-C38 Trust. The 2851 Junction Serviced Pari Passu Companion Loan accrues interest at the same rate as the 2851 Junction Mortgage Loan. The 2851 Junction Mortgage Loan is entitled to payments of principal and interest on a pro rata and pari passu basis with the 2851 Junction Serviced Pari Passu Companion Loan. The holders of the 2851 Junction Mortgage Loan and the 2851 Junction Serviced Pari Passu Companion Loan have entered into a co-lender agreement which sets forth the allocation of collections on the 2851 Junction Whole Loan. See “Description of the Mortgage Pool—The Whole Loans—The Serviced Pari Passu Whole Loans”in the Preliminary Prospectus.
Mezzanine Loan and Preferred Equity. Not permitted.
Release of Property. Not permitted.
Terrorism Insurance.The 2851 Junction Borrower is required to obtain terrorism insurance for domestic and foreign acts of terrorism (as defined in the Terrorism Risk Insurance Program Reauthorization Act of 2007, as amended or replaced) in an amount equal to full replacement cost of the 2851 Junction Property and business interruption insurance for 18 months.
This is not a research report and was not prepared by the Underwriters’ research departments. Please see additional important information and qualifications at the end of this Term Sheet.
| T-101 |
| BANK 2017-BNK6 | Amazon Lakeland |
Mortgage Loan No. 8 – Amazon Lakeland
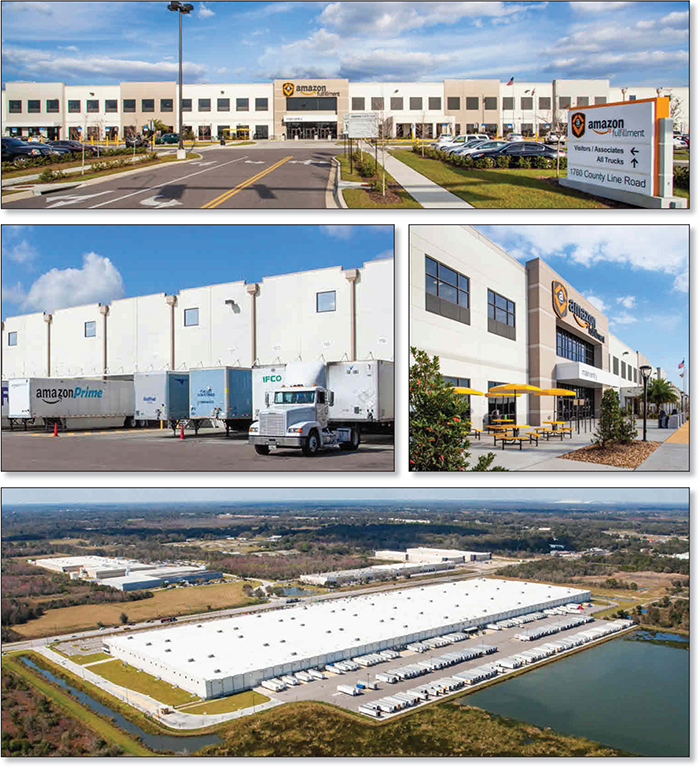
This is not a research report and was not prepared by the Underwriters’ research departments. Please see additional important information and qualifications at the end of this Term Sheet.
| T-102 |
| BANK 2017-BNK6 | Amazon Lakeland |
Mortgage Loan No. 8 – Amazon Lakeland
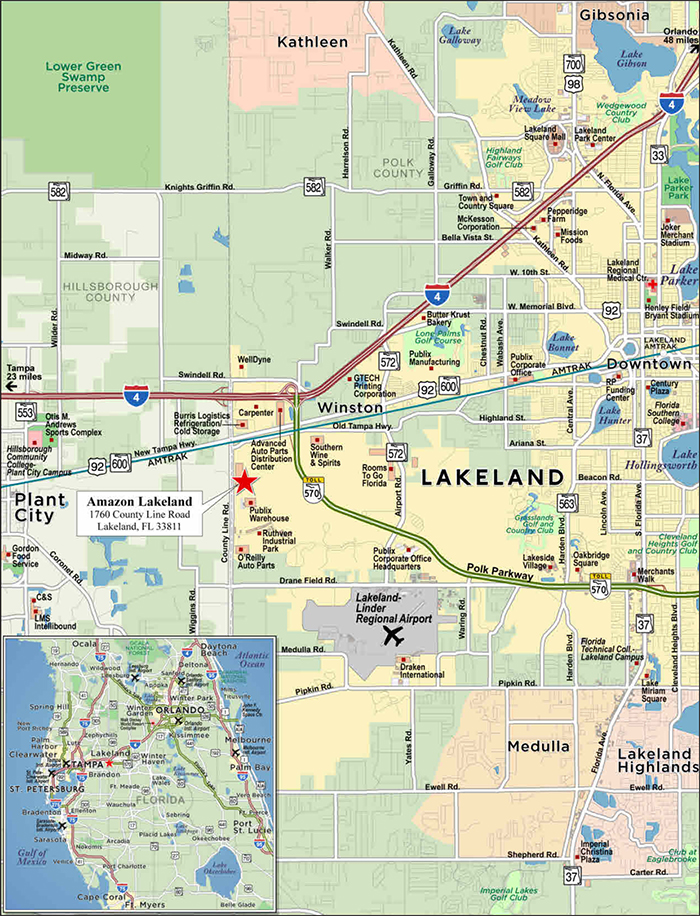
This is not a research report and was not prepared by the Underwriters’ research departments. Please see additional important information and qualifications at the end of this Term Sheet.
| T-103 |
| BANK 2017-BNK6 | Amazon Lakeland |
| Mortgage Loan No. 8 – Amazon Lakeland |
| Mortgage Loan Information | Property Information | ||||||
| Mortgage Loan Seller: | WFB | Single Asset/Portfolio: | Single Asset | ||||
| Original Balance(1): | $30,000,000 | Location: | Lakeland, FL 33811 | ||||
| Cut-off Date Balance(1): | $30,000,000 | General Property Type: | Industrial | ||||
| % of Initial Pool Balance: | 3.2% | Detailed Property Type: | Warehouse | ||||
| Loan Purpose: | Acquisition | Title Vesting: | Fee | ||||
| Sponsors: | Jonathan Tratt | Year Built/Renovated: | 2014/N/A | ||||
| Mortgage Rate: | 4.5700% | Size: | 1,016,080 SF | ||||
| Note Date: | 6/6/2017 | Cut-off Date Balance per SF(1): | $62 | ||||
| First Payment Date: | 8/5/2017 | Maturity Date Balance per SF(1): | $62 | ||||
| Maturity Date: | 7/5/2026 | Property Manager: | Tratt Properties, LLC (borrower-related) | ||||
| Original Term to Maturity: | 108 months | ||||||
| Original Amortization Term: | 0 months | Underwriting and Financial Information | |||||
| IO Period: | 108 months | UW NOI: | $4,958,522 | ||||
| Seasoning: | 0 months | UW NOI Debt Yield(1): | 7.8% | ||||
| Prepayment Provisions: | LO (24); DEF (80); O (4) | UW NOI Debt Yield at Maturity(1): | 7.8% | ||||
| Lockbox/Cash Mgmt Status: | Hard/In Place | UW NCF DSCR(1): | 1.65x | ||||
| Additional Debt Type(2): | Pari Passu | Most Recent NOI: | $4,151,320 (3/31/2017 TTM) | ||||
| Additional Debt Balance: | $33,360,000 | 2nd Most Recent NOI: | $4,375,825 (12/31/2016) | ||||
| Future Debt Permitted (Type): | No (N/A) | 3rd Most Recent NOI: | $5,009,600 (12/31/2015) | ||||
| Most Recent Occupancy: | 100.0% (7/1/2017) | ||||||
| Reserves(3) | 2nd Most Recent Occupancy: | 100.0% (12/31/2016) | |||||
| Type | Initial | Monthly | Cap | 3rd Most Recent Occupancy: | 100.0% (12/31/2015) | ||
| RE Tax: | $614,503 | $68,070 | N/A | Appraised Value (as of): | $88,000,000 (8/31/2016) | ||
| Insurance: | $164,696 | $54,921 | N/A | Cut-off Date LTV Ratio(1): | 72.0% | ||
| Recurring Replacements: | $101,608 | $8,467 | $304,824 | Maturity Date LTV Ratio(1): | 72.0% | ||
| Sources and Uses | ||||||
| Sources | Proceeds | % of Total | Uses | Proceeds | % of Total | |
| Loan Amount(1): | $63,360,000 | 100.0% | Loan Payoff(4): | $60,584,576 | 95.6% | |
| Reserves: | $880,807 | 1.4% | ||||
| Closing Costs: | $516,437 | 0.8% | ||||
| Return of Equity: | $1,378,180 | 2.2% | ||||
| Total Sources: | $63,360,000 | 100.0% | Total Uses: | $63,360,000 | 100.0% | |
| (1) | The Amazon Lakeland Mortgage Loan is part of the Amazon Lakeland Whole Loan, which is comprised of two pari passu notes with an aggregate original principal balance of $63,360,000. The Cut-off Date Balance per SF, Maturity Date Balance per SF, UW NOI Debt Yield, UW NOI Debt Yield at Maturity, UW NCF DSCR, Cut-off Date LTV Ratio and Maturity Date LTV Ratio numbers presented are based on the Amazon Lakeland Whole Loan. |
| (2) | See “The Mortgage Loan”and “Additional Secured Indebtedness (not including trade debts)” below for further discussion of additional debt. |
| (3) | See “Escrows and Reserves” below for further discussion of reserve requirements. |
| (4) | The Amazon Lakeland sponsor purchased the Amazon Lakeland Property in December 2016 for approximately $88.0 million. After origination of the Amazon Lakeland Whole Loan, the Amazon Lakeland sponsor has approximately $28.8 million of equity remaining. |
The Mortgage Loan. The eighth largest mortgage loan (the “Amazon Lakeland Mortgage Loan”) is part of a whole loan (the “Amazon Lakeland Whole Loan”) evidenced by twopari passupromissory notes in the aggregate original principal amount of $63,360,000 which are secured by a first priority fee mortgage encumbering an industrial property located in Lakeland, Florida (the “Amazon Lakeland Property”). Promissory Note A-2 in the original principal amount of $30,000,000 represents the Amazon Lakeland Mortgage Loan and will be included in the BANK 2017-BNK6 securitization trust. Promissory Note A-1 in the original principal amount of $33,360,000 (the “Amazon Lakeland Non-ServicedPari Passu Companion Loan”), is expected to be contributed to the WFCM 2017-C38 securitization trust. The Amazon Lakeland Mortgage Loan will be serviced pursuant to the pooling and servicing agreement for the WFCM 2017-C38 securitization trust. See “Description of the Mortgage Pool—The Whole Loans—The Non-Serviced Pari Passu Whole Loans”and“Pooling and Servicing Agreement” in the Preliminary Prospectus. The proceeds of the Amazon Lakeland Whole Loan were primarily used to refinance existing debt on the Amazon Lakeland Property, fund reserves, pay closing costs and return equity to the Amazon Lakeland Borrower (as defined below). The Amazon Lakeland sponsor purchased the Amazon Lakeland Property in December 2016 for approximately $88.0 million. After origination of the Amazon Lakeland Whole Loan, the Amazon Lakeland sponsor has approximately $28.8 million of equity remaining.
This is not a research report and was not prepared by the Underwriters’ research departments. Please see additional important information and qualifications at the end of this Term Sheet.
| T-104 |
| BANK 2017-BNK6 | Amazon Lakeland |
The Borrower and the Sponsor.The borrower comprises three tenants in common: Jim Amazon, LLC; New Amazon, LLC and SFLC Amazon, LLC (collectively, the “Amazon Lakeland Borrower”), each a Delaware limited liability company and single purpose entity with two independent directors. Legal counsel to the Amazon Lakeland Borrower delivered a non-consolidation opinion in connection with the origination of the Amazon Lakeland Whole Loan. Tratt Properties, LLC and Jonathan Tratt are the guarantors of certain nonrecourse carveouts under the Amazon Lakeland Whole Loan. The sponsor is Jonathan Tratt, founder and Managing Principal of Tratt Properties, LLC (“Tratt”), a real estate development and investments company founded in 1992 that specializes in warehouse and distribution properties. Over the past 15 years, Tratt has developed and acquired over 6.0 million SF of institutional grade logistics properties in key markets across the United States.
The Property.The Amazon Lakeland Property is a class A state-of-the-art industrial distribution facility totaling 1,016,080 SF and located in Lakeland, Florida, approximately 27.9 miles east of Tampa and 59.5 miles southwest of Orlando. The Amazon Lakeland Property is 100% leased to Amazon.com.dedc, LLC (“Amazon”) through July 31, 2029 on a triple-net lease with four, five-year renewal options. The lease is guaranteed by the Amazon parent company, Amazon.com, Inc. (NYSE: AMZN) (rated Baa1/AA- by Moody’s/S&P, respectively). Built in 2014, the Amazon Lakeland Property is situated on a 116.8-acre site and features a 32-foot ceiling height, a fully secured 330-foot-deep truck court with guard house and perimeter fence, 88 dock-high doors (all equipped with 40,000-pound mechanical dock levelers), 2 drive-in doors with ramped, motorized and high lift capabilities and 189 trailer parking spaces. The Amazon Lakeland Property comprises grade-level office space totaling 44,147 SF (4.3% of net rentable area) and 971,933 SF (95.7% of net rentable area) of warehouse and distribution space. Not included in the net rentable area of the Amazon Lakeland Property is 453,965 SF of structured mezzanine space, which features 125-pound-per-square-foot of floor load, 7,190 SF of equipment storage space and 17,166 SF of office space. This mezzanine space was not included in the original development of the Amazon Lakeland Property and was constructed by the tenant at a cost of approximately $25.8 million. Amazon employs approximately 800 people at the Amazon Lakeland Property.
The Amazon Lakeland Property operates as a highly-automated Kiva Non-Sort fulfillment center. Kiva robotics technology enables Amazon warehouse workers to pick faster than filling orders manually and has had positive implications for a variety of elements of Amazon’s cost structure, making its warehouses more productive, scalable, safer and efficient. According to a third party report, Amazon’s “click to ship” cycle used to be approximately 60-75 minutes when employees had to manually sift through the stacks, pick the product, pack it, and ship it. Now, Kiva robots handle the same job in 15 minutes. These robots are not only more efficient but they also take up less space than their human counterparts, meaning warehouse design can be modified to have more shelf space and narrower aisles.
Amazon is a wholly owned subsidiary of Amazon.com, Inc., a multi-national online retailer and electronic commerce company. The company primarily operates through its retail website. In 2015, Amazon.com, Inc.surpassed Wal-Mart Stores, Inc. as the most valuable retailer in the United States by market capitalization. Amazon.com, Inc.is the fourth most valuable public company in the world and the largest internet company by revenue in the world. Amazon.com, Inc.is the leading e-retailer in the United States with $136.0 billion in 2016 net sales. According to Amazon.com, Inc., the majority of the company’s revenues are generated through e-retail sales of electronics and other products, followed by third-party seller revenues, subscription services and Amazon Web Services activities. As of March 2017, the e-retailer reported approximately 80.0 million Amazon Prime members, the company’s paid subscription service.
The following table presents a summary regarding the sole tenant at the Amazon Lakeland Property:
| Tenant Summary | |||||||
| Tenant Name | Credit Rating (Fitch/Moody’s/S&P)(1) | Tenant SF | Approximate % of SF | Annual UW Rent(2) | % of Total Annual UW Rent | Annual UW Rent PSF(2) | Lease Expiration |
| Major Tenants | |||||||
| Amazon | NR/Baa1/AA-(1) | 1,016,080 | 100.0% | $5,167,181 | 100.0% | $5.09 | 7/31/2029(3) |
| Subtotal/Wtd. Avg. | 1,016,080 | 100.0% | $5,167,181 | 100.0% | $5.09 | ||
| Vacant Space | 0 | 0.0% | $0 | 0.0% | $0.00 | ||
| Total/Wtd. Avg. | 1,016,080 | 100.0% | $5,167,181 | 100.0% | $5.09 | ||
| (1) | Amazon.com, Inc., the rated entity, guarantees the lease. |
| (2) | Annual UW Rent and Annual UW Rent PSF represent Amazon’s average rent over the term of the Amazon Lakeland Whole Loan. As of July 1, 2017, Amazon current rental rate is $4.72 PSF. |
| (3) | Amazon has four, five-year lease extension options. |
This is not a research report and was not prepared by the Underwriters’ research departments. Please see additional important information and qualifications at the end of this Term Sheet.
| T-105 |
| BANK 2017-BNK6 | Amazon Lakeland |
The following table presents certain information relating to the lease rollover schedule at the Amazon Lakeland Property:
| Lease Rollover Schedule(1) | ||||||||
| Year | # of Leases Rolling | SF Rolling | UW Rent PSF Rolling | Approx. % of Total SF Rolling | Approx. Cumulative % of SF Rolling | Total UW Rent Rolling | Approx. % of Total Rent Rolling | Approx. Cumulative % of Total Rent Rolling |
| 2017 | 0 | 0 | $0.00 | 0.0% | 0.0% | $0 | 0.0% | 0.0% |
| 2018 | 0 | 0 | $0.00 | 0.0% | 0.0% | $0 | 0.0% | 0.0% |
| 2019 | 0 | 0 | $0.00 | 0.0% | 0.0% | $0 | 0.0% | 0.0% |
| 2020 | 0 | 0 | $0.00 | 0.0% | 0.0% | $0 | 0.0% | 0.0% |
| 2021 | 0 | 0 | $0.00 | 0.0% | 0.0% | $0 | 0.0% | 0.0% |
| 2022 | 0 | 0 | $0.00 | 0.0% | 0.0% | $0 | 0.0% | 0.0% |
| 2023 | 0 | 0 | $0.00 | 0.0% | 0.0% | $0 | 0.0% | 0.0% |
| 2024 | 0 | 0 | $0.00 | 0.0% | 0.0% | $0 | 0.0% | 0.0% |
| 2025 | 0 | 0 | $0.00 | 0.0% | 0.0% | $0 | 0.0% | 0.0% |
| 2026 | 0 | 0 | $0.00 | 0.0% | 0.0% | $0 | 0.0% | 0.0% |
| 2027 | 0 | 0 | $0.00 | 0.0% | 0.0% | $0 | 0.0% | 0.0% |
| 2028 & Beyond | 1 | 1,016,080 | $5.09 | 100.0% | 100.0% | $5,167,181 | 100.0% | 100.0% |
| Vacant | 0 | 0 | $0.00 | 0.0% | 100.0% | $0 | 0.0% | 100.0% |
| Total/Wtd. Avg. | 1 | 1,016,080 | $5.09 | 100.0% | $5,167,181 | 100.0% | ||
| (1) | Information is based on the underwritten rent roll. |
The Market. The Amazon Lakeland Property is located in Lakeland, Florida, approximately 0.5 miles south of Highway 92 and 1.1 miles south of Interstate 4. Situated along the Interstate 4 corridor, Lakeland’s location between Tampa and Orlando makes it well located for manufacturing and distribution. According to a third party report, Lakeland’s central location within the state and proximity to ports, two international airports (Tampa International Airport and Orlando International Airport) and existing rail and highway infrastructure have made Lakeland and Polk County a transport and logistics hub for Florida and the southeastern United States. There are approximately 9.0 million people within 100 miles of the Amazon Lakeland Property.
The area surrounding the Amazon Lakeland Property is comprised of large-scale industrial use facilities such as O’Reilly Auto Parts (387,165 SF built in 2014), Rooms To Go (1,750,000 SF built in 1999), Advance Discount Auto Parts (552,796 SF built in 1984), C & S Wholesale Grocers (836,771 SF built in 1991), Burris Logistics Refrigeration/Cold Storage (89,260 SF built in 2000), and Southern Wine & Spirits (653,000 SF built in 2006), all of which are located within five miles of the Amazon Lakeland Property.
According to a third-party market research report, the Amazon Lakeland Property is located within the Southwest Lakeland submarket of the Lakeland industrial market. As of the first quarter or 2017, the submarket reported an inventory of 107 buildings totaling approximately 12.3 million SF with a 2.4% vacancy rate and an asking rental rate of $6.09 per square foot, triple net.
The following table reflects the comparable industrial leases with respect to the Amazon Lakeland Property as identified in the appraisal:
| Comparable Leases | ||||||||||
| Property Name/Location | Year Built/ Renovated | Tenant Name | Lease Size (SF) | Distance to Subject (miles) | Clear Height (ft) | Dock Doors | Lease Date | Lease Term (Yrs.) | Rent PSF | Lease Type |
| Amazon Lakeland Property (Subject) Lakeland, FL | 2014/NAP | Amazon | 1,016,080 | -- | 32 | 88 | Aug. 2014 | 15 Yrs. | $5.09 | NNN |
| NW Quadrant of U.S. Highway 27 and I-4, Davenport, FL | 2015/NAP | Federal Express | 310,438 | 30.4 | 30 | 97 | May 2016 | 5 Yrs. | $4.85 | NNN |
Boice Pond Road, Orlando, FL | 2016/NAP | Freeman, Expositions Inc. | 451,823 | 52.9 | 25 | NAP | Oct. 2015 | 15 Yrs. | $5.25 | NNN |
| 10300 Boggy Creek Road, Orlando, FL | 2001/NAP | Daimler Chrysler | 490,000 | 58.4 | 25 | 30 | Sep. 2015 | 10 Yrs. | $5.96 | NNN |
| 2000 East Landstreet Road, Orlando, FL | 1997/NAP | U.S. Post Office | 355,732 | 56.9 | 30 | 43 | May 2014 | 3 Yrs. | $4.65 | NNN |
| 305 Deen Still Road, Davenport, FL | 1999/NAP | Amazon | 367,425 | 33.0 | 36 | 102 | March 2014 | 5 Yrs. | $3.95 | NNN |
Source:Appraisal
This is not a research report and was not prepared by the Underwriters’ research departments. Please see additional important information and qualifications at the end of this Term Sheet.
| T-106 |
| BANK 2017-BNK6 | Amazon Lakeland |
Operating History and Underwritten Net Cash Flow. The following table presents certain information relating to the historical operating performance and Underwritten Net Cash Flow at the Amazon Lakeland Property:
| Cash Flow Analysis | |||||
| 2015 | 2016 | 3/31/2017 TTM | UW | UW PSF | |
| Base Rent | $5,092,611 | $4,396,047 | $4,146,514 | $5,012,165(1) | $4.93 |
| Grossed Up Vacant Space | $0 | $0 | $0 | $155,015 | $0.15 |
| Total Recoveries | $1,150,545 | $1,246,148 | $1,290,526 | $1,730,760 | $1.70 |
| Less Vacancy & Credit Loss | $0 | $0 | $0 | ($155,015)(2) | ($0.15) |
| Effective Gross Income | $6,243,155 | $5,642,195 | $5,437,040 | $6,742,925 | $6.64 |
| Total Operating Expenses | $1,233,556 | $1,266,370 | $1,285,720 | $1,784,404 | $1.76 |
| Net Operating Income | $5,009,600 | $4,375,825 | $4,151,320 | $4,958,522 | $4.88 |
| TI/LC | $0 | $0 | $0 | $0 | $0.00 |
| Capital Expenditures | $0 | $0 | $0 | $101,608 | $0.10 |
| Net Cash Flow | $5,009,600 | $4,375,825 | $4,151,320 | $4,856,914 | $4.78 |
| Occupancy % | 100.0% | 100.0% | 100.0% | 97.0%(2) | |
| NOI DSCR(3) | 1.71x | 1.49x | 1.41x | 1.69x | |
| NCF DSCR(3) | 1.71x | 1.49x | 1.41x | 1.65x | |
| NOI Debt Yield(3) | 7.9% | 6.9% | 6.6% | 7.8% | |
| NCF Debt Yield(3) | 7.9% | 6.9% | 6.6% | 7.7% | |
| (1) | UW Base Rent represents Amazon’s average rent over the term of the Amazon Lakeland Whole Loan. As of July 1, 2017, Amazon’s current rental rate is $4.72 per square foot. |
| (2) | The underwritten economic vacancy is 3.0%. The Amazon Lakeland Property was 100.0% occupied as of July 1, 2017. |
| (3) | Debt service coverage ratios and debt yields are based on the Amazon Lakeland Whole Loan. |
Escrows and Reserves. At origination, the Amazon Lakeland Borrower deposited $614,503 for real estate taxes, $164,696 for insurance and $101,608 for replacement reserves.
The Amazon Lakeland Whole Loan documents provide for ongoing monthly escrows of $68,070 for real estate taxes, $54,921 for insurance and $8,467 for replacement reserves (subject to a cap of $304,824 so long as no event of default has occurred and is continuing, and the Amazon Lakeland Property is adequately being maintained, as determined by the lender).
Lockbox and Cash Management.The Amazon Lakeland Whole Loan requires a lender-controlled lockbox account, which is in place, and that the Amazon Lakeland Borrower directs the tenant to pay its rents directly into such lockbox account. The Amazon Lakeland Whole Loan documents also require that all rents received by the Amazon Lakeland Borrower or the property manager be deposited into the lockbox account within one business day of receipt. Prior to the occurrence of a Cash Trap Event Period (as defined below), all excess cash flow is required to be distributed to the Amazon Lakeland Borrower. During a Cash Trap Event Period, all excess funds are required to be swept to a lender-controlled cash management account.
A “Cash Trap Event Period” will commence upon the earlier of (i) the occurrence and continuance of an event of default; (ii) the net cash flow debt yield falling below 6.5% (tested quarterly); or (iii) the occurrence of a Rating Trigger Event Period (as defined below). A Cash Trap Event Period will end, with respect to clause (i), upon the cure of such event of default; with respect to clause (ii), upon the net cash flow debt yield being equal to or greater than 6.75% for two consecutive calendar quarters; and with respect to clause (iii), upon the termination of the Rating Trigger Event Period.
A “Rating Trigger Event Period” means a period commencing upon the date Amazon’s credit rating is downgraded below “BBB” or equivalent by two of Moody’s, S&P and Fitch for greater than 90 days and ending upon the date that Amazon’s credit rating is equal to or greater than “BBB” or equivalent by two of Moody’s, S&P and Fitch for two consecutive calendar quarters.
Additional Secured Indebtedness (not including trade debts). The Amazon Lakeland Property also secures the Amazon Lakeland Non-Serviced Pari Passu Companion Loan, which has a Cut-off Date principal balance of $33,360,000 and is currently expected to be contributed to the WFCM 2017-C38 securitization trust. The Amazon Lakeland Non-Serviced Pari Passu Companion Loan accrues interest at the same rate as the Amazon Lakeland Mortgage Loan. The Amazon Lakeland Mortgage Loan is entitled to payments of principal and interest on apro rata andpari passu basis with the Amazon Lakeland Non-Serviced Pari Passu Companion Loan. The holders of the Amazon Lakeland Mortgage Loan and the Amazon Lakeland Non-Serviced Pari Passu Companion Loan have entered into a co-lender agreement which sets forth the allocation of collections on the Amazon Lakeland Whole Loan. See “Description of the Mortgage Pool—The Whole Loans— The Non-Serviced Pari Passu Whole Loans” in the Preliminary Prospectus.
Mezzanine Loan and Preferred Equity. Not permitted.
Right of First Offer and Right of First Refusal.Amazon has a right of first offer (“ROFO”) to purchase the Amazon Lakeland Property if the Amazon Lakeland Borrower decides to market the Amazon Lakeland Property for sale and right of first refusal (“ROFR”) to purchase the Amazon Lakeland Property if Amazon fails to exercise the ROFO within 30 days after receipt of notice of the Amazon Lakeland Borrower’s proposed terms of sale and the Amazon Lakeland Borrower proceeds to market the Amazon Lakeland Property. The ROFO and ROFR are not extinguished by a foreclosure of the Amazon Lakeland Property; however the ROFO and ROFR do not apply to a foreclosure or deed-in-lieu thereof.
This is not a research report and was not prepared by the Underwriters’ research departments. Please see additional important information and qualifications at the end of this Term Sheet.
| T-107 |
| BANK 2017-BNK6 | Amazon Lakeland |
Release of Property. Not permitted.
Terrorism Insurance.The Amazon Lakeland Whole Loan documents require that the “all risk” insurance policy required to be maintained by the Amazon Lakeland Borrower provide coverage for terrorism in an amount equal to the full replacement cost of the Amazon Lakeland Property, as well as loss of rents and/or business interruption insurance for a period no less than 18 months following the occurrence of a casualty event together with a six-month extended period of indemnity.
Windstorm and Flood Insurance. The Amazon Lakeland Whole Loan documents require windstorm and flood insurance covering the full replacement cost of Amazon Lakeland Property during the loan term. At the time of loan closing, Amazon Lakeland Property had windstorm insurance coverage and flood insurance in the maximum limit available under the National Flood Insurance Program together with excess coverage.
This is not a research report and was not prepared by the Underwriters’ research departments. Please see additional important information and qualifications at the end of this Term Sheet.
| T-108 |
(THIS PAGE INTENTIONALLY LEFT BLANK)
| T-109 |
| BANK 2017-BNK6 | Sheraton Hotel Greensboro |
Mortgage Loan No. 9 – Sheraton Hotel Greensboro

This is not a research report and was not prepared by the Underwriters’ research departments. Please see additional important information and qualifications at the end of this Term Sheet.
| T-110 |
| BANK 2017-BNK6 | Sheraton Hotel Greensboro |
Mortgage Loan No. 9 – Sheraton Hotel Greensboro

This is not a research report and was not prepared by the Underwriters’ research departments. Please see additional important information and qualifications at the end of this Term Sheet.
| T-111 |
| BANK 2017-BNK6 | Sheraton Hotel Greensboro |
| Mortgage Loan No. 9 – Sheraton Hotel Greensboro |
| Mortgage Loan Information | Property Information | ||||||
| Mortgage Loan Seller: | WFB | Single Asset/Portfolio: | Single Asset | ||||
| Original Balance(1): | $30,000,000 | Location: | Greensboro, NC 27407 | ||||
| Cut-off Date Balance(1): | $29,905,737 | General Property Type: | Hospitality | ||||
| % of Initial Pool Balance: | 3.2% | Detailed Property Type: | Full Service | ||||
| Loan Purpose: | Refinance | Title Vesting: | Fee | ||||
| Sponsor: | Koury Corporation | Year Built/Renovated: | 1970/2015 | ||||
| Mortgage Rate: | 5.1600% | Size: | 985 Rooms | ||||
| Note Date: | 5/1/2017 | Cut-off Date Balance per Room(1): | $45,542 | ||||
| First Payment Date: | 6/11/2017 | Maturity Date Balance per Room(1): | $34,482 | ||||
| Maturity Date: | 5/11/2027 | Property Manager: | Koury Corporation (borrower-related) | ||||
| Original Term to Maturity: | 120 months | ||||||
| Original Amortization Term: | 300 months | Underwriting and Financial Information | |||||
| IO Period: | 0 months | UW NOI: | $10,577,282 | ||||
| Seasoning: | 2 months | UW NOI Debt Yield(1): | 23.6% | ||||
| Prepayment Provisions: | LO (26); DEF (90); O (4) | UW NOI Debt Yield at Maturity(1): | 31.1% | ||||
| Lockbox/Cash Mgmt Status: | Springing/Springing | UW NCF DSCR(1): | 2.74x | ||||
| Additional Debt Type(1): | Pari Passu | Most Recent NOI: | $10,719,983 (2/28/2017 TTM) | ||||
| Additional Debt Balance(1): | $14,952,869 | 2nd Most Recent NOI: | $10,339,034 (10/31/2016 TTM) | ||||
| Future Debt Permitted (Type): | No (N/A) | 3rd Most Recent NOI: | $9,624,577 (10/31/2015 TTM) | ||||
| Reserves(2) | Most Recent Occupancy: | 47.1% (2/28/2017) | |||||
| Type | Initial | Monthly | Cap | 2nd Most Recent Occupancy: | 47.5% (10/31/2016) | ||
| RE Tax: | $446,009 | $89,202 | N/A | 3rd Most Recent Occupancy: | 46.4% (10/31/2015) | ||
| Insurance: | $0 | Springing | N/A | Appraised Value (as of): | $91,000,000 (4/5/2017) | ||
| FF&E: | $0 | $148,947 | N/A | Cut-off Date LTV Ratio(1): | 49.3% | ||
| PIP: | $0 | Springing | N/A | Maturity Date LTV Ratio(1): | 37.3% | ||
| Sources and Uses | ||||||
| Sources | Proceeds | % of Total | Uses | Proceeds | % of Total | |
| Loan Amount(1): | $45,000,000 | 100.0% | Loan Payoff: | $27,165,250 | 60.4% | |
| Reserves: | $446,009 | 1.0% | ||||
| Closing Costs: | $1,516,034 | 3.4% | ||||
| Return of Equity: | $15,872,707 | 35.3% | ||||
| Total Sources: | $45,000,000 | 100.0% | Total Uses: | $45,000,000 | 100.0% | |
| (1) | The Sheraton Hotel Greensboro Mortgage Loan (as defined below) is part of the Sheraton Hotel Greensboro Whole Loan (as defined below), which is comprised of twopari passupromissory notes. The two Sheraton Hotel Greensboropari passu promissory notes have a combined original principal balance of $45,000,000. The Cut-off Date Balance per Room, Maturity Date Balance per Room, UW NCF DSCR, UW NOI Debt Yield, UW NOI Debt Yield at Maturity, Cut-off Date LTV Ratio and Maturity Date LTV Ratio numbers presented above are based on the two notes totaling $45,000,000. |
| (2) | See“Escrows and Reserves” below for further discussion of reserve requirements. |
The Mortgage Loan.The ninth largest mortgage loan (the “Sheraton Hotel Greensboro Mortgage Loan”) is part of a whole loan (the “Sheraton Hotel Greensboro Whole Loan”) evidenced by twopari passu promissory notes in the aggregate original principal amount of $45,000,000 which are secured by a first priority fee mortgage encumbering a full service hospitality property located in Greensboro, North Carolina (the “Sheraton Hotel Greensboro Property”). Promissory Note A-1 in the original principal amount of $30,000,000 represents the Sheraton Hotel Greensboro Mortgage Loan and will be included in the BANK 2017-BNK6 securitization trust. Promissory Note A-2 in the original principal amount of $15,000,000 (the “Sheraton Hotel Greensboro Serviced Pari Passu Companion Loan”) has been contributed to the UBS 2017-C1 securitization trust. The Sheraton Hotel Greensboro Mortgage Loan will be serviced pursuant to the pooling and servicing agreement for the BANK 2017-BNK6 securitization trust. See “Description of the Mortgage Pool—The Whole Loans—The Serviced Pari Passu Whole Loans” and “Pooling and Servicing Agreement” in the Preliminary Prospectus. The proceeds of the Sheraton Hotel Greensboro Whole Loan were used to refinance existing debt on the Sheraton Hotel Greensboro Property, fund upfront reserves and pay closing costs.
The Borrower and the Sponsor. The borrower is Koury SFS, LLC (the “Sheraton Hotel Greensboro Borrower”), a Delaware limited liability company, structured to be bankruptcy remote with one independent director. The Sheraton Hotel Greensboro Borrower is wholly owned by the Koury Corporation, which is also the sponsor and non-recourse carve-out guarantor of the Sheraton Hotel Greensboro Mortgage Loan.
Koury Corporation is a family-owned real estate development and investment company located in Greensboro, North Carolina and founded in 1952. Currently, the Koury Corporation owns, owns and manages approximately 2.0 million SF of commercial space, 1,400 hotel rooms, 1,400 apartment units, two championship golf courses and hundreds of acres of land for future development.
This is not a research report and was not prepared by the Underwriters’ research departments. Please see additional important information and qualifications at the end of this Term Sheet.
| T-112 |
| BANK 2017-BNK6 | Sheraton Hotel Greensboro |
The Property. The Sheraton Hotel Greensboro Property consists of a 985-room full service hotel located on the southeast side of West Gate City Boulevard, approximately 4.0 miles southwest of downtown Greensboro. The Sheraton Hotel Greensboro Property features three guestroom towers. The original L-shaped, 5-story tower (253 rooms) was constructed in 1970 as a Holiday Inn hotel. The taller, 16-story rectangular-shaped tower (266 rooms), and the 27-story triangular-shaped tower (466 rooms) were added in 1980 and 1991, respectively. The Sheraton Hotel Greensboro Property’s guestroom configuration consists of 275 king rooms, 650 double queen rooms and 60 suites. Since 2013, the sponsor has invested approximately $25.8 million ($26,201/key) at the Sheraton Hotel Greensboro Property including renovations to the guestrooms, mechanical and electrical components, meeting spaces, lobby entrance and exterior. The hotel franchise agreement with Marriott International, Inc. expires on July 31, 2026 with one, 10-year extension option.
The Sheraton Hotel Greensboro Property offers five food and beverage outlets, indoor and outdoor swimming pools, a fitness center and the signature Sheraton Club. The Sheraton Hotel Greensboro Property contains approximately 250,000 SF of meeting space, representing one of the largest blocks of meeting space offered between Washington D.C. and Atlanta, Georgia. The Sheraton Hotel Greensboro Property’s meeting spaces have the ability to accommodate approximately 6,000 people and include the 40,000 SF Guilford Ballroom, the 16,500 SF Imperial Ballroom, the 7,275 SF Victoria Ballroom, 70 smaller breakout rooms and 14 separate boardrooms. The Sheraton Hotel Greensboro Property includes 1,088 surface lot parking spaces (1.10 spaces per key). According to the appraisal, the large amount of meeting space along with 985 guest rooms allows the Sheraton Hotel Greensboro Property to capture certain group business that only a select number of hotels in the Mid-Atlantic region could handle. In addition, the different types of space offered, including large ballrooms, auditorium-style rooms, boardrooms and numerous breakout rooms, allows the Sheraton Hotel Greensboro Property to meet the needs of a wide variety of different types of groups and events. According to the appraisal, the Sheraton Hotel Greensboro Property generates approximately 25% of its room revenue from transient demand and 75% from meeting and group demand.
More specific information about the Sheraton Hotel Greensboro Property and the related competitive set is set forth in the following table:
| Historical Occupancy, ADR, RevPAR(1) | ||||||||||||
Competitive Set | The Sheraton Hotel Greensboro Property(2) | Penetration Factor | ||||||||||
| Year | Occupancy | ADR | RevPAR | Occupancy | ADR | RevPAR | Occupancy | ADR | RevPAR | |||
| 2011 | 60.6% | $125.78 | $76.20 | 39.1% | $121.16 | $47.34 | 64.5% | 96.3% | 62.1% | |||
| 2012 | 64.8% | $129.48 | $83.94 | 41.8% | $121.48 | $50.72 | 64.4% | 93.8% | 60.4% | |||
| 2013 | 63.0% | $134.76 | $84.88 | 38.7% | $127.34 | $49.28 | 61.4% | 94.5% | 58.1% | |||
| 2014 | 59.6% | $141.80 | $84.45 | 43.5% | $129.20 | $56.23 | 73.1% | 91.1% | 66.6% | |||
| 2015 | 58.8% | $144.51 | $84.94 | 46.2% | $135.85 | $62.82 | 78.7% | 94.0% | 74.0% | |||
| 2016 | 56.1% | $144.29 | $80.99 | 47.2% | $136.53 | $64.42 | 84.1% | 94.6% | 79.5% | |||
| 2/28/2017 TTM | 55.9% | $144.29 | $80.73 | 47.2% | $136.77 | $64.53 | 84.3% | 94.8% | 79.9% | |||
Source:Industry Report
| (1) | The competitive set includes Holiday Inn Greensboro Airport, Marriott Greensboro Downtown, Doubletree Greensboro, Marriott Greensboro High Point Airport, Embassy Suites Greensboro Airport, O Henry Hotel, Grandover Resort & Conference Center and Proximity Hotel. |
| (2) | The minor variances between the underwriting, the appraisal and the industry report data with respect to Occupancy, ADR and RevPAR at the Sheraton Hotel Greensboro Property are attributable to variances in reporting methodologies and/or timing differences. |
The Market. The Sheraton Hotel Greensboro Property is located in Greensboro, Guilford County, North Carolina, at the intersection of West Gate City Boulevard and Interstate-40, approximately 4.0 miles southwest of downtown Greensboro and approximately 7.0 miles southeast of the Piedmont Triad International Airport. Greensboro is centrally located in North Carolina, approximately 76.6 miles west of Raleigh and approximately 92.4 miles northeast of Charlotte. According to the appraisal, the estimated 2016 population within a three- and five-mile radius of the Sheraton Hotel Greensboro Property was 43,964 and 126,331, respectively.
Located approximately 1.5 miles northeast of the Sheraton Hotel Greensboro Property is the Greensboro Coliseum Complex, a multi-venue sports and entertainment complex which hosts 1,100 events annually. The Greensboro Coliseum Complex features the 23,500-seat Greensboro Coliseum; the 78,323 SF Greensboro Aquatic Center (which opened in 2011 and cost approximately $19.0 million to develop); the 302-seat Odeon Theatre; the Special Events Center (an exhibition center with more than 120,000 SF of space, a 5,000-seat mini-arena, and eight meeting rooms); The Fieldhouse (a 30,000 SF, column free arena that is home to the Greensboro Swarm (National Basketball Association Development League)); The Terrace (a 12,900 SF banquet facility); and the White Oak Amphitheatre (with a seating capacity of just over 7,000 people). The Greensboro Coliseum Complex is expected to host the first and second rounds of the 2020 NCAA Men’s Basketball tournament in addition to other NCAA events such as the 2019 Division I women’s basketball regional, 2021 Division I women’s swimming and diving championships, 2022 Division II men’s and women’s swimming and diving championships, 2018-2021 Division III men’s and women’s soccer championships, 2019 and 2020 Division III men’s and women’s swimming and diving championships and 2022 Division III men’s and women’s outdoor track and field championships. Additionally, the University of North Carolina Greensboro (“UNCG”) is located 2.2 miles northeast of the Sheraton Hotel Greensboro Property. UNCG had a 2016 total enrollment of 19,653 students and has benefited from three straight years of enrollment increases.
This is not a research report and was not prepared by the Underwriters’ research departments. Please see additional important information and qualifications at the end of this Term Sheet.
| T-113 |
| BANK 2017-BNK6 | Sheraton Hotel Greensboro |
Primary competitive properties to the Sheraton Hotel Greensboro Property are shown in the table below:
| Competitive Property Summary | ||||||
| Property Name | No. of Rooms | Transient Demand | Meeting & Group Demand | 2016 Occupancy | 2016 ADR | 2016 RevPAR |
| Sheraton Hotel Greensboro Property(1) | 985 | 25% | 75% | 47.5% | $135.76 | $64.49 |
| Holiday Inn Greensboro Airport | 188 | 90% | 10% | 50.0% | $110.00 | $55.00 |
| Marriott Greensboro Downtown | 281 | 85% | 15% | 60.0% | $150.00 | $90.00 |
| Doubletree Greensboro | 175 | 90% | 10% | 55.0% | $115.00 | $63.25 |
| Marriott Greensboro High Point Airport | 299 | 85% | 15% | 55.0% | $130.00 | $71.50 |
| Embassy Suites Greensboro Airport | 219 | 85% | 15% | 50.0% | $110.00 | $55.00 |
| O Henry Hotel | 131 | 90% | 10% | 62.0% | $210.00 | $130.20 |
| Grandover Resort & Conference Center | 247 | 75% | 25% | 57.0% | $145.00 | $82.65 |
| Proximity Hotel | 147 | 90% | 10% | 60.0% | $215.00 | $129.00 |
| Total/Wtd. Avg. | 2,672 | 79% | 21% | 52.8% | $141.81 | $74.88 |
Source:Appraisal
| (1) | The minor variances between the underwriting, the appraisal and industry report data with respect to Occupancy, ADR and RevPAR at the Sheraton Hotel Greensboro Property are attributable to variances in reporting methodologies and/or timing differences. |
Operating History and Underwritten Net Cash Flow. The following table presents certain information relating to the historical operating performance and the Underwritten Net Cash Flow at the Sheraton Hotel Greensboro Property:
| Cash Flow Analysis | ||||||||||||||
| 10/31/2013 TTM(1)(2) | 10/31/2014 TTM(1)(2) | 10/31/2015 TTM(2) | 10/31/2016 TTM(2) | 2/28/2017 TTM | UW | UW per Room | ||||||||
| Occupancy(3) | 37.7% | 43.4% | 46.4% | 47.5% | 47.1% | 47.1% | ||||||||
| ADR(3) | $127.34 | $128.69 | $136.19 | $135.76 | $136.61 | $136.61 | ||||||||
| RevPAR(3) | $48.01 | $55.83 | $63.21 | $64.49 | $64.35 | $64.35 | ||||||||
| Rooms Revenue | $17,261,044 | $20,071,892 | $22,725,842 | $23,250,962 | $23,198,716 | $23,198,716 | $23,552 | |||||||
| Food & Beverage | $10,227,591 | $10,755,482 | $11,181,871 | $12,396,272 | $12,571,008 | $12,571,008 | $12,762 | |||||||
| Other Income(4) | $243,906 | $230,978 | $106,243 | $137,246 | $300,735 | $300,735 | $305 | |||||||
| Total Revenue | $27,732,540 | $31,058,352 | $34,013,955 | $35,784,479 | $36,070,460 | $36,070,460 | $36,620 | |||||||
| Total Expenses | $21,488,765 | $23,333,389 | $24,389,378 | $25,445,445 | $25,350,477 | $25,493,178 | $25,881 | |||||||
| Net Operating Income | $6,243,775 | $7,724,962 | $9,624,577 | $10,339,034 | $10,719,983 | $10,577,282 | $10,738 | |||||||
| FF&E | $0 | $0 | $0 | $0 | $0 | $1,803,523 | $1,831 | |||||||
| Net Cash Flow | $6,243,775 | $7,724,962 | $9,624,577 | $10,339,034 | $10,719,983 | $8,773,759 | $8,907 | |||||||
| NOI DSCR | 1.95x | 2.41x | 3.00x | 3.22x | 3.34x | 3.30x | ||||||||
| NCF DSCR | 1.95x | 2.41x | 3.00x | 3.22x | 3.34x | 2.74x | ||||||||
| NOI Debt Yield | 13.9% | 17.2% | 21.5% | 23.0% | 23.9% | 23.6% | ||||||||
| NCF Debt Yield | 13.9% | 17.2% | 21.5% | 23.0% | 23.9% | 19.6% | ||||||||
| (1) | The Sheraton Greensboro Hotel Property was under renovation in 2013 and 2014. |
| (2) | The Sheraton Greensboro Hotel Borrower’s fiscal year ends in October of each year. |
| (3) | Occupancy, ADR and RevPAR figures have been taken from financial statements provided by the Sheraton Hotel Greensboro Borrower. The minor variances between the underwriting, the appraisal and industry report data with respect to Occupancy, ADR and RevPAR at the Sheraton Hotel Greensboro Property are attributable to variances in reporting methodologies and/or timing differences. |
| (4) | Other Income includes valet/guest laundry, vending, cancellation fees, two commercial leases, and other miscellaneous income. |
Escrows and Reserves.The Sheraton Hotel Greensboro Borrower deposited in escrow $446,009 for real estate taxes at loan origination and is required to deposit monthly escrows of $89,202 for real estate taxes and $148,947 for furniture, fixtures and equipment. The Sheraton Hotel Greensboro Whole Loan documents do not require ongoing monthly deposits for insurance premiums as long as (i) no event of default has occurred or is continuing; (ii) the Sheraton Hotel Greensboro Property is insured via an acceptable blanket insurance policy; and (iii) the borrower provides the lender with timely proof of payment of insurance premiums and renewals. On the monthly payment dates occurring in July 2018, July 2019, July 2020, February 2025, February 2026 and February 2027, the Sheraton Hotel Greensboro Borrower is required to deposit with the lender an amount equal to (a) 100% of the stated costs to complete any property improvement plan (“PIP”) for the following twelve-month period so long as the Sheraton Hotel Greensboro Borrower provides the lender satisfactory evidence of the hard contractual amounts for the PIP to be completed during such twelve-month period or (b) 115% of the estimated costs to complete the PIP for the following twelve-month period.
This is not a research report and was not prepared by the Underwriters’ research departments. Please see additional important information and qualifications at the end of this Term Sheet.
| T-114 |
| BANK 2017-BNK6 | Sheraton Hotel Greensboro |
Lockbox and Cash Management. Upon the occurrence and during the continuance of a Cash Trap Event Period (as defined below), the Sheraton Hotel Greensboro Mortgage Loan requires that the borrower establish a lockbox account and the Sheraton Hotel Greensboro Borrower or property manager is required to deposit all rents into such lockbox account and such funds will be swept to the cash management account. During a Cash Trap Event Period, all excess cash flow after payment of all sums due and payable under the loan documents and all operating expenses will be retained by the lender as additional collateral.
A “Cash Trap Event Period” will occur upon (i) an event of default under the Sheraton Hotel Greensboro Mortgage Loan, (ii) the net cash flow debt service coverage ratio tested semi-annually falling below 1.22x. A Cash Management Trigger Event will continue until, in regard to clause (i) above, the cure of such event of default and acceptance of such cure by the lender or in regard to clause (ii) above, the date the debt service coverage ratio based on the trailing 12-month period is greater than or equal to 1.22x for the last semi-annual period.
Right of First Offer. The Franchisor, Marriott International, Inc., has a right of first offer (“ROFO”) to acquire the Sheraton Hotel Greensboro Property. The ROFO is not extinguished by a foreclosure of the Sheraton Hotel Greensboro Property; however, the ROFO does not apply to a foreclosure or deed-in-lieu thereof.
Additional Secured Indebtedness (not including trade debts). The Sheraton Hotel Greensboro Property also secures the Sheraton Hotel Greensboro Serviced Pari Passu Companion Loan, which has a Cut-off Date principal balance of $14,952,869 and has been contributed to the UBS 2017-C1 securitization trust. The Sheraton Hotel Greensboro Serviced Pari Passu Companion Loan accrues interest at the same rate as the Sheraton Hotel Greensboro Mortgage Loan. The Sheraton Hotel Greensboro Mortgage Loan is entitled to payments of principal and interest on apro rata andpari passu basis with the Sheraton Hotel Greensboro Serviced Pari Passu Companion Loan. The holders of the Sheraton Hotel Greensboro Mortgage Loan and the Sheraton Hotel Greensboro Serviced Pari Passu Companion Loan have entered into a co-lender agreement which sets forth the allocation of collections on the Sheraton Hotel Greensboro Whole Loan. See “Description of the Mortgage Pool���The Whole Loans—The Serviced Pari Passu Whole Loans” in the Preliminary Prospectus.
Mezzanine Loan and Preferred Equity. Not permitted.
Release of Property. Not permitted.
Terrorism Insurance. The Sheraton Hotel Greensboro Whole Loan documents require that the “all risk” insurance policy required to be maintained by the borrower provide coverage for terrorism in an amount equal to the full replacement cost of the Sheraton Hotel Greensboro Property, as well as loss of rents and/or business interruption insurance for a period no less than 18 months following the occurrence of a casualty event together with a six-month extended period of indemnity.
This is not a research report and was not prepared by the Underwriters’ research departments. Please see additional important information and qualifications at the end of this Term Sheet.
| T-115 |
| BANK 2017-BNK6 | 2041 Rosecrans 831 Nash |
Mortgage Loan No. 10 – 2041 Rosecrans 831 Nash
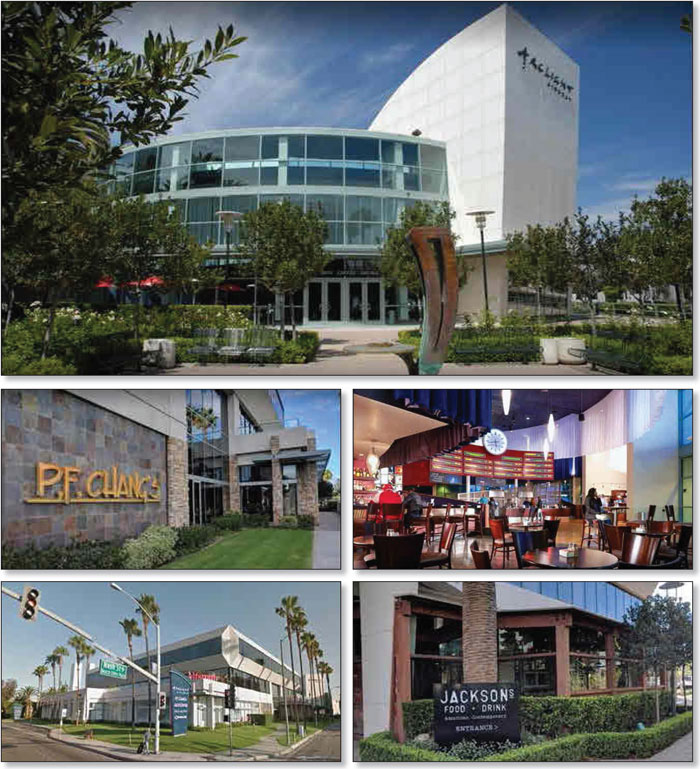
This is not a research report and was not prepared by the Underwriters’ research departments. Please see additional important information and qualifications at the end of this Term Sheet.
| T-116 |
| BANK 2017-BNK6 | 2041 Rosecrans 831 Nash |
Mortgage Loan No. 10 – 2041 Rosecrans 831 Nash
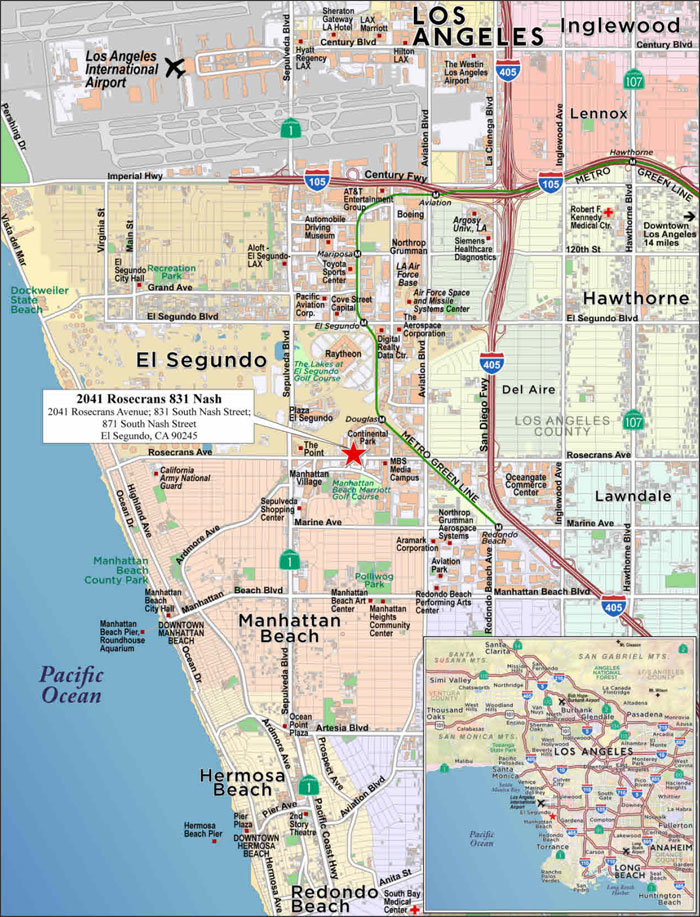
This is not a research report and was not prepared by the Underwriters’ research departments. Please see additional important information and qualifications at the end of this Term Sheet.
| T-117 |
| BANK 2017-BNK6 | 2041 Rosecrans 831 Nash |
| Mortgage Loan No. 10 – 2041 Rosecrans 831 Nash |
| Mortgage Loan Information | Property Information | ||||||
| Mortgage Loan Seller: | MSMCH | Single Asset/Portfolio: | Single Asset | ||||
| Original Balance: | $29,600,000 | Location: | El Segundo, CA 90245 | ||||
| Cut-off Date Balance: | $29,600,000 | General Property Type: | Mixed Use | ||||
| % of Initial Pool Balance: | 3.2% | Detailed Property Type: | Office/Retail | ||||
| Loan Purpose: | Refinance | Title Vesting: | Fee | ||||
| Sponsor: | Continental Development Corporation | Year Built/Renovated: | 1975, 1996/2006, 2012 | ||||
| Size: | 157,092 SF | ||||||
| Mortgage Rate: | 3.8600% | Cut-off Date Balance per SF: | $188 | ||||
| Note Date: | 6/30/2017 | Maturity Date Balance per SF: | $149 | ||||
| First Payment Date: | 8/1/2017 | Property Manager: | Continental Development Corporation (borrower related) | ||||
| Maturity Date: | 7/1/2027 | ||||||
| Original Term to Maturity: | 120 months | ||||||
| Original Amortization Term: | 360 months | ||||||
| IO Period: | 0 months | Underwriting and Financial Information | |||||
| Seasoning: | 0 months | UW NOI: | $3,014,252 | ||||
| Prepayment Provisions: | LO (24); DEF (92); O (4) | UW NOI Debt Yield: | 10.2% | ||||
| Lockbox/Cash Mgmt Status: | Springing/Springing | UW NOI Debt Yield at Maturity: | 12.9% | ||||
| Additional Debt Type: | N/A | UW NCF DSCR: | 1.67x | ||||
| Additional Debt Balance: | N/A | Most Recent NOI: | $3,627,263 (3/31/2017 TTM) | ||||
| Future Debt Permitted (Type): | No (N/A) | 2nd Most Recent NOI: | $3,355,210 (12/31/2015) | ||||
| Reserves(1) | 3rd Most Recent NOI: | $3,023,213 (12/31/2014) | |||||
| Type | Initial | Monthly | Cap | Most Recent Occupancy: | 91.2% (4/17/2017) | ||
| RE Tax: | $194,381 | $27,769 | N/A | 2nd Most Recent Occupancy: | 100.0% (12/31/2015) | ||
| Insurance: | $0 | Springing | N/A | 3rd Most Recent Occupancy: | 100.0% (12/31/2014) | ||
| Recurring Replacements: | $0 | $2,618 | N/A | Appraised Value (as of): | $55,000,000 (4/27/2017) | ||
| Deferred Maintenance: | $6,013 | $0 | N/A | Cut-off Date LTV Ratio: | 53.8% | ||
| TI/LC(2): | $900,000 | $17,018 | $500,000(2) | Maturity Date LTV Ratio: | 42.6% | ||
| Sources and Uses | ||||||
| Sources | Proceeds | % of Total | Uses | Proceeds | % of Total | |
| Loan Amount: | $29,600,000 | 100.0% | Loan Payoff(3): | $23,847,265 | 80.6% | |
| Reserves: | $1,100,394 | 3.7% | ||||
| Closing Costs: | $342,874 | 1.2% | ||||
| Return of Equity(3): | $4,309,467 | 14.6% | ||||
| Total Sources: | $29,600,000 | 100.0% | Total Uses: | $29,600,000 | 100.0% | |
| (1) | See “Escrows and Reserves” below for further discussion of reserve requirements. |
| (2) | The initial TI/LC reserve is split into two reserves: $600,000 for Pacific Theatres and $300,000 for other TI/LCs that are anticipated to be payable during the 2041 Rosecrans 831 Nash Mortgage Loan term. The $17,018 monthly reserve is associated with the $300,000 TI/LC reserve, which is capped at $500,000. |
| (3) | The prior mortgage loan secured by the 2041 Rosecrans 831 Nash Property (as defined below) was repaid in all cash by CDC (defined below) on June 1, 2017. The cash loan payoff amount was $23,847,265, resulting in an effective return of equity of $4,309,467. |
The Mortgage Loan. The tenth largest mortgage loan (the “2041 Rosecrans 831 Nash Mortgage Loan”) is evidenced by a promissory note in the original principal amount of $29,600,000 and secured by a first priority fee mortgage encumbering a mixed use property in El Segundo, California (the “2041 Rosecrans 831 Nash Property”). The proceeds of the 2041 Rosecrans 831 Nash Mortgage Loan were primarily used to refinance a previous loan of approximately $23,847,265, fund approximately $1.1 million of reserves, pay closing costs of approximately $0.3 million and return equity of approximately $4.3 million to the 2041 Rosecrans 831 Nash sponsor. The 2041 Rosecrans 831 Nash Property was previously securitized in the CWCI 2007-C3 transaction.
The Borrower and the Sponsor. The borrower is Continental Rosecrans/Nash LLC (the “2041 Rosecrans 831 Nash Borrower”), a single-purpose Delaware limited liability company with one independent director. The borrower sponsor and non-recourse carveout guarantor is Continental Development Corporation (“CDC”), a California corporation which currently indirectly owns 100% of the 2041 Rosecrans 831 Nash Borrower. CDC is owned by Richard C. Lundquist and Melanie F. Lundquist, as trustees of the Richard and Melanie Lundquist Family Trust established August 20, 2001.
CDC has over 45 years of real estate development, ownership and management experience. CDC has developed and managed over four million SF of office, research and development, commercial, retail, restaurant and entertainment properties since its inception. CDC has developed mixed-use developments such as Continental Park in El Segundo, California, office/medical centers such as the 30-acre Skypark medical facility in Torrance, California and multiple office and hotel properties in San Francisco, such as the Intercontinental Hotel. CDC occupies 15,434 SF at the 2041 Rosecrans 831 Property and signed a 5-year extension in 2017 through June 2031.
This is not a research report and was not prepared by the Underwriters’ research departments. Please see additional important information and qualifications at the end of this Term Sheet.
| T-118 |
| BANK 2017-BNK6 | 2041 Rosecrans 831 Nash |
The Property. The 2041 Rosecrans 831 Nash Property consists of a three-story, Class A, multi-tenant mixed use office and retail building totaling 84,296 SF (“2041 Rosecrans”), an adjacent 16-screen, 72,796 SF movie theatre (“831 Nash”) and a five-story, 332 space parking garage. In addition to the parking garage, there are 49 surface parking spaces associated with 2041 Rosecrans and 174 surface parking spaces associated with 831 Nash.
There are additional parking spaces for 831 Nash located on a parcel owned by an affiliate of CDC at 870 South Nash Street (the “870 South Nash Street Parcel”), which is across the street from 831 Nash. Parking at the 870 South Nash Street Parcel (comprising 844 parking spaces) is required to be made available by the 2041 Rosecrans 831 Nash Borrower to Pacific Theatres pursuant to Pacific Theatres’ lease. The 2041 Rosecrans 831 Nash Borrower does not own the 870 South Nash Street Parcel, and such additional parking spaces are not included in the 2041 Rosecrans 831 Nash Property. Accordingly, we cannot assure you that the additional parking spaces would be able to be made available to Pacific Theatres by the 2041 Rosecrans 831 Nash Borrower at all times, or by the BANK 2017-BNK6 Trust following a foreclosure on the 2041 Rosecrans 831 Nash Mortgage Loan. See “Description of the Mortgage Pool—Mortgage Pool Characteristics—Property Types—Mixed Use Properties” in the Preliminary Prospectus.
Built in 1975 and renovated in 2006, 2041 Rosecrans is made up of second and third story office space (53,693 SF) and ground floor retail space (30,603 SF). CDC ground leased the theater site at 831 Nash in 1995 (which ground lease was subsequently assigned to the 2041 Rosecrans 831 Nash Borrower) to Pacific Theatres for a 25-year term expiring in August 2022, with five, five-year renewal options; Pacific Theatres subsequently constructed a movie theater building in 1996. 831 Nash was renovated in 2012 by Pacific Theatres to include a dining experience and cocktail area. 831 Nash has an alcohol license which allows guests to consume alcoholic beverages in all parts of the theatre.
The 2041 Rosecrans 831 Nash Property is located in a commercial district within Continental Park, a 2.0 million SF development consisting of office, research and development, and commercial space. This multi-phased, master-planned park consists of approximately 20 low- and mid-rise developments on 86 acres. Integrated into the park are a variety of amenities including financial institutions, restaurants, fitness centers, cinemas, hotels and specialty stores.
55.4% of the 2041 Rosecrans 831 Nash Property’s annual underwritten rent comes from office tenants, with the remaining 44.6% of annual underwritten rent coming from retail tenants.
Major Tenants.
Pacific Theatres (72,796 SF, 46.3% of NRA, 29.3% of underwritten rent).Pacific Theatres operates at the 2041 Rosecrans 831 Nash Property as Arclight Cinemas, a privately owned company that is part of the Los Angeles based Pacific Theatre chain. The location at 831 Nash is one of their eleven Arclight locations. The Arclight brand differentiates itself by offering reserved seating and featuring a dining experience with an alcoholic beverage service. Arclight has seven locations in California and recently opened in Maryland, Chicago and Boston. Pacific Theatres developed their improvements at the 2041 Rosecrans 831 Nash Property in 1996 after signing a 25-year ground lease, which expires in August 2022 with five, five-year renewal options.
Continental Development Corporation (15,434 SF, 9.8% of NRA, 17.5% of underwritten rent). CDC has over 45 years of real estate development, ownership and management experience. CDC has developed and managed over 4.0 million SF of office, research and development, commercial, retail, restaurant and entertainment properties since its inception. CDC has developed mixed-use developments such as Continental Park in El Segundo, California, office/medical centers such as the 30-acre Skypark medical facility in Torrance, California and multiple office and hotel properties in San Francisco, such as the Intercontinental Hotel. CDC occupies 15,434 SF at the 2041 Rosecrans 831 Property and signed a 5-year extension in 2017 through June 2031. CDC is the sponsor and non-recourse carveout guarantor of the 2041 Rosecrans 831 Nash Mortgage Loan.
This is not a research report and was not prepared by the Underwriters’ research departments. Please see additional important information and qualifications at the end of this Term Sheet.
| T-119 |
| BANK 2017-BNK6 | 2041 Rosecrans 831 Nash |
The following table presents certain information relating to the leases at the 2041 Rosecrans 831 Nash Property:
| Tenant Summary(1) | ||||||||||||||
| Tenant Name | Credit Rating (Fitch/Moody’s/S&P)(2) | Tenant SF | Approximate % of SF | Annual UW Rent | % of Total Annual UW Rent | Annual UW Rent PSF(3) | Lease Expiration | |||||||
| Tenants | ||||||||||||||
| Pacific Theatres(4) | NR/NR/NR | 72,796 | 46.3% | $1,001,433 | 29.3% | $13.76 | 8/13/2022 | |||||||
| CDC(5) | NR/NR/NR | 15,434 | 9.8% | $596,505 | 17.5% | $38.65 | 6/30/2031 | |||||||
| P.F. Chang’s China Bistro | NR/NR/NR | 7,808 | 5.0% | $186,883 | 5.5% | $23.93 | 6/30/2018 | |||||||
| Kirtland & Packard LLP | NR/NR/NR | 7,218 | 4.6% | $240,095 | 7.0% | $33.26 | 12/31/2017 | |||||||
| Sola Salon Studios | NR/NR/NR | 6,220 | 4.0% | $198,638 | 5.8% | $31.94 | 8/31/2021 | |||||||
| Subtotal/Wtd. Avg.(6) | 109,476 | 69.7% | $2,223,554 | 65.2% | $20.31 | |||||||||
| Other Tenants | 33,866 | 21.6% | $1,189,348 | 34.8% | $35.12 | |||||||||
| Vacant Space | 13,750 | 8.8% | $0 | 0.0% | $0.00 | |||||||||
| Total/Wtd. Avg.(6) | 157,092 | 100.0% | $3,412,902 | 100.0% | $23.81 | |||||||||
| (1) | Information is based on the underwritten rent roll. |
| (2) | Certain ratings are those of the parent company whether or not the parent guarantees the lease. |
| (3) | Wtd. Avg. Annual UW Rent PSF excludes vacant SF. |
| (4) | Pacific Theatres is a 16-screen movie theatre, which leases its space under a ground lease. |
| (5) | CDC is the sponsor and non-recourse carveout guarantor of the 2041 Rosecrans 831 Nash Mortgage Loan. See “The Borrower and the Sponsor” above. |
| (6) | The Subtotal/Wtd. Avg. and Total/Wtd. Avg. Annual UW Rent PSF excluding Pacific Theatres are $33.32 and $34.18, respectively. |
The following table presents certain information relating to the lease rollover schedule at the 2041 Rosecrans 831 Nash Property:
| Lease Rollover Schedule(1)(2) | ||||||||||||||||
| Year | # of Leases Rolling | SF Rolling | Approx. % of Total SF Rolling | Approx. Cumulative % of SF Rolling | UW Base Rent PSF Rolling(3) | Total UW Base Rent Rolling(3) | Approx. % of Total Rent Rolling | Approx. Cumulative % of Total Rent Rolling | ||||||||
| MTM | 1 | 750 | 0.5% | 0.5% | $23.74 | $17,806 | 0.5% | 0.5% | ||||||||
| 2017 | 6 | 14,712 | 9.4% | 9.8% | $32.88 | $483,705 | 14.2% | 14.7% | ||||||||
| 2018 | 7 | 23,870 | 15.2% | 25.0% | $30.87 | $736,753 | 21.6% | 36.3% | ||||||||
| 2019 | 3 | 5,186 | 3.3% | 28.3% | $36.09 | $187,158 | 5.5% | 41.8% | ||||||||
| 2020 | 0 | 0 | 0.0% | 28.3% | $0.00 | $0 | 0.0% | 41.8% | ||||||||
| 2021 | 2 | 6,608 | 4.2% | 32.5% | $32.38 | $213,984 | 6.3% | 48.0% | ||||||||
| 2022 | 3 | 76,782 | 48.9% | 81.4% | $15.33 | $1,176,990 | 34.5% | 82.5% | ||||||||
| 2023 | 0 | 0 | 0.0% | 81.4% | $0.00 | $0 | 0.0% | 82.5% | ||||||||
| 2024 | 0 | 0 | 0.0% | 81.4% | $0.00 | $0 | 0.0% | 82.5% | ||||||||
| 2025 | 0 | 0 | 0.0% | 81.4% | $0.00 | $0 | 0.0% | 82.5% | ||||||||
| 2026 | 0 | 0 | 0.0% | 81.4% | $0.00 | $0 | 0.0% | 82.5% | ||||||||
| 2027 | 0 | 0 | 0.0% | 81.4% | $0.00 | $0 | 0.0% | 82.5% | ||||||||
| 2028 & Beyond | 1 | 15,434 | 9.8% | 91.2% | $38.65 | $596,505 | 17.5% | 100.0% | ||||||||
| Vacant | 0 | 13,750 | 8.8% | 100.0% | $0.00 | 0 | 0.0% | 100.0% | ||||||||
| Total/Wtd. Avg. | 23 | 157,092 | 100.0% | $23.81 | $3,412,902 | 100.0% | ||||||||||
| (1) | Information is based on the underwritten rent roll. |
| (2) | Certain tenants may have lease termination options that are exercisable prior to the originally stated expiration date of the subject lease and that are not considered in the lease rollover schedule. |
| (3) | UW Base Rent PSF Rolling and Total UW Base Rent Rolling exclude vacant space. |
This is not a research report and was not prepared by the Underwriters’ research departments. Please see additional important information and qualifications at the end of this Term Sheet.
| T-120 |
| BANK 2017-BNK6 | 2041 Rosecrans 831 Nash |
The Market. According to the appraisal, the 2041 Rosecrans 831 Nash Property is located in the El Segundo sub-market of Los Angeles. According to a third party industry report, as of May 2017, the Los Angeles office market had an average vacancy rate of 10.8%, which was a 0.3% increase year over year, and average gross asking rents of $36.07 PSF, which was a 4.6% increase year over year. As of May 2017, the El Segundo office sub-market had an average vacancy rate of 8.2%, which was a 3.7% decrease year over year, and average gross asking rents of $36.54 PSF, which was a 7.1% increase year over year.
According to a third party industry report, as of May 2017, the Los Angeles retail market had an average vacancy rate of 4.5%, which was a 0.2% increase year over year, and average gross asking rents of $31.65 PSF, which was a 3.8% increase year over year. As of May 2017, the El Segundo retail sub-market had an average vacancy rate of 3.3%, which was a 0.5% increase year over year, and average gross asking rents of $42.19 PSF, which was a 4.0% increase year over year.
El Segundo is located within the South Bay coastal area of Los Angeles, which also includes the cities of Manhattan Beach, Torrance and Long Beach. The 2041 Rosecrans 831 Nash Property is located less than four miles south of the Los Angeles International Airport, and within blocks of the Metro Green Line Light-Rail, which provides commuter transportation throughout the area. The Santa Ana Freeway (I-405) can be accessed 1-mile east of the 2041 Rosecrans 831 Nash Property, providing highway access both south (Long Beach, Orange County, San Diego) and north (Los Angeles, Ventura, Santa Barbara).
According to a third party industry report, there is currently approximately 159,087 SF under construction or proposed in the Los Angeles South Bay office market, a coastal zone in which the 2041 Rosecrans 831 Nash Property is located that extends south from Los Angeles International Airport to the City of Long Beach, including a proposed 80,000 SF mixed use office and retail project, in the El Segundo sub-market, to be developed by CDC with a joint venture partner.
The following table presents recent leasing data at comparable office buildings with respect to the 2041 Rosecrans 831 Nash Property:
| Comparable Office Lease Summary | ||||||||||||||||||
| Property Name/Address | Year Built | Occ. | Total NRA (SF) | Tenant Name | Lease Area (SF) | Lease Date | Lease Term (Yrs.) | Initial Rent/SF | Reimbursements | |||||||||
Manhattan Beach Towers 1230 Rosecrans Avenue Manhattan Beach, California | 1985 | 94% | 311,522 | Skechers | 36,599 | Mar-2016 | 5.0 | $37.20 | Gross | |||||||||
The Plaza 2101 Rosecrans Avenue El Segundo, California | 1983 | 84% | 448,562 | I Stone - Jones Environmental | 2,849 | May-2017 | 5.0 | $38.40 | Gross | |||||||||
The Atrium 2301 Rosecrans Avenue El Segundo, California | 2002 | 96% | 283,971 | Antires Capital | 10,025 | Mar-2017 | 10.0 | $40.20 | Gross | |||||||||
841 Apollo 841 Apollo Street El Segundo, California | 1985 | 87% | 104,781 | Urban Wealth Management | 1,520 | Apr-2017 | 5.0 | $34.20 | Gross | |||||||||
840-880 Apollo 840 Apollo Street El Segundo, California | 1980 | 96% | 177,157 | Nonstop Administration | 824 | Jun-2017 | 5.0 | $36.60 | Gross | |||||||||
The Terrace 2361 Rosecrans Avenue El Segundo, California | 1992 | 99% | 388,255 | Infolink | 1,620 | May-2017 | 1.0 | $37.20 | Gross | |||||||||
Source:Appraisal
The following table presents comparable retail leases with respect to the 2041 Rosecrans 831 Nash Property:
| Comparable Retail Lease Summary | ||||||||||||
| Property Name/Address | Tenant Name | Lease Area (SF) | Lease Date | Lease Term (Yrs.) | Initial Rent/SF | Reimbursements | ||||||
Glen Court, 5267 W. Rosecrans Avenue, Hawthorne, CA | Honeyboba | 2,275 | Jan-2015 | 5.0 | $40.80 | Net | ||||||
Glen Court, 5221 W. Rosecrans Avenue, Hawthorne, CA | Blaze Pizza | 2,900 | Aug-2015 | 5.0 | $60.00 | Net | ||||||
Runway Playa Vista, 12746 W. Jefferson Boulevard, Playa Vista, CA | Hal’s Bar & Grill | 4,699 | Dec-2015 | 10.0 | $60.00 | Net | ||||||
Plaza La Cienega, 1833 S. La Cienega Boulevard, Los Angeles, CA | Smart & Final - Extra! | 20,000 | Mar-2016 | 25.0 | $33.96 | Net | ||||||
The Enthusiast Network, 831 S. Douglas Street, El Segundo, CA | TEN | 59,908 | May-2016 | 12.0 | $27.60 | Net | ||||||
2171 Rosecrans 2171 Rosecrans Avenue, El Segundo, CA | Shake Shack | 4,060 | May-2017 | 10.0 | $69.96 | Net | ||||||
Source:Appraisal
This is not a research report and was not prepared by the Underwriters’ research departments. Please see additional important information and qualifications at the end of this Term Sheet.
| T-121 |
| BANK 2017-BNK6 | 2041 Rosecrans 831 Nash |
Operating History and Underwritten Net Cash Flow.The following table presents certain information relating to the historical operating performance and the Underwritten Net Cash Flow at the 2041 Rosecrans 831 Nash Property:
| Cash Flow Analysis | |||||||||||||
| 2014 | 2015 | 2016 | 3/31/2017 TTM | UW | UW PSF | ||||||||
| Gross Potential Rent(1) | $3,329,043 | $3,462,603 | $3,553,875 | $3,599,721 | $3,907,902 | $24.88 | |||||||
| Total Recoveries | $518,420 | $600,135 | $599,861 | $603,007 | $646,979 | $4.12 | |||||||
| Total Other Income(2) | $188,450 | $201,345 | $265,272 | $267,756 | $267,756 | $1.70 | |||||||
| Less Vacancy & Credit Loss | $0 | $0 | $0 | $0 | ($721,776) | ($4.59) | |||||||
| Effective Gross Income | $4,035,913 | $4,264,083 | $4,419,008 | $4,470,484 | $4,100,862 | $26.10 | |||||||
| Total Operating Expenses | $1,012,700 | $908,873 | $840,324 | $843,221 | $1,086,609 | $6.92 | |||||||
| Net Operating Income | $3,023,213 | $3,355,210 | $3,578,684 | $3,627,263 | $3,014,252 | $19.19 | |||||||
| Capital Expenditures | $0 | $0 | $0 | $0 | $17,280 | $0.11 | |||||||
| TI/LC | $0 | $0 | $0 | $0 | $205,638 | $1.31 | |||||||
| Net Cash Flow | $3,023,213 | $3,355,210 | $3,578,684 | $3,627,263 | $2,791,334 | $17.77 | |||||||
| Occupancy % | 100.0% | 100.0% | 100.0% | 91.2%(3) | 87.3% | ||||||||
| NOI DSCR | 1.81x | 2.01x | 2.15x | 2.18x | 1.81x | ||||||||
| NCF DSCR | 1.81x | 2.01x | 2.15x | 2.18x | 1.67x | ||||||||
| NOI Debt Yield | 10.2% | 11.3% | 12.1% | 12.3% | 10.2% | ||||||||
| NCF Debt Yield | 10.2% | 11.3% | 12.1% | 12.3% | 9.4% | ||||||||
| (1) | Gross Potential Rent has been underwritten based on the April 17, 2017 rent roll and includes rent steps of $3,738 through January 31, 2018 with one vacant retail suite grossed up to $36 PSF per the market rent set forth in the appraisal. |
| (2) | Total Other Income is primarily comprised of parking income. |
| (3) | 3/31/2017 TTM Occupancy % is based on occupancy as of April 17, 2017. |
Escrows and Reserves. The 2041 Rosecrans 831 Nash Mortgage Loan documents provide for upfront reserves in the amount of $900,000 for tenant improvements and leasing commissions, of which $600,000 relates to existing tenant allowances due to Pacific Theatres and the remaining $300,000 (the “Future TILC Reserve”) relates to tenant improvements and leasing commissions that may be incurred in future, $6,013 for immediate repairs, and $194,381 for real estate taxes. The 2041 Rosecrans 831 Nash Borrower is required to escrow monthly: (i) 1/12th of the annual estimated real estate taxes, (ii) 1/12th of the annual estimated insurance premiums (unless the 2041 Rosecrans 831 Nash Borrower maintains an acceptable blanket policy) and (iii) $2,618 into a reserve for capital expenditures. The 2041 Rosecrans 831 Nash Borrower is required to deposit monthly $17,018 into the Future TILC Reserve; provided that the 2041 Rosecrans 831 Nash Borrower will not be required to make such monthly deposits to the extent the amount on deposit in the Future TILC Reserve is greater than $500,000.
Lockbox and Cash Management.The 2041 Rosecrans 831 Nash Mortgage Loan provides for a springing lockbox and springing cash management. Prior to the occurrence of a Trigger Event (as defined below), no lockbox will be in place for the 2041 Rosecrans 831 Nash Mortgage Loan. Upon the first occurrence of a Trigger Event, the 2041 Rosecrans 831 Nash Borrower is required to establish a lender-controlled lockbox account and thereafter direct all tenants to pay rents directly into such lockbox account. During the continuance of a Cash Sweep Event Period (as defined below), all funds in the lockbox account are required to be swept to a lender controlled cash management account, and, provided that no event of default is continuing under the 2041 Rosecrans 831 Nash Mortgage Loan, applied on each monthly payment date to pay debt service on the 2041 Rosecrans 831 Nash Mortgage Loan, to fund the required reserves deposits as described above under “Escrows and Reserves”, to disburse the monthly operating expenses referenced in the approved annual budget, and to disburse the remainder into an account to be held by the lender as additional security for the 2041 Rosecrans 831 Nash Mortgage Loan during the continuance of such Cash Sweep Event Period. If no Cash Sweep Event Period is continuing, all funds in the lockbox account are required to be disbursed to the 2041 Rosecrans 831 Nash Borrower.
A “Trigger Event” means the earliest of (i) an event of default under the 2041 Rosecrans 831 Nash Mortgage Loan, (ii) a DSCR Event (as defined below), (iii) a Lease Expiration Event (as defined below) and (iv) a Tenant Credit Event (as defined below).
A “Cash Sweep Event Period” means the period:
(i) commencing upon an event of default under the 2041 Rosecrans 831 Nash Mortgage Loan and ending upon the date that such event of default is cured, and such cure has been accepted by the lender, or
(ii) commencing on the date upon which the debt service coverage ratio on the 2041 Rosecrans 831 Nash Mortgage Loan (based on the annualized trailing six month period) is less than 1.20x for six consecutive calendar months (a “DSCR Event”), and ending on the date the debt service coverage ratio (based on the annualized trailing six month period) equals or exceeds 1.20x for six consecutive calendar months, or
(iii) commencing upon the date that Pacific Theatres (a “Major Tenant”) fails to be in actual, physical possession of the premises demised to it under its lease, fails to be open to the public for business during customary hours and/or “goes dark”, or files a bankruptcy or similar insolvency proceeding (any such event, a “Tenant Credit Event”) and ending upon either (1) such Major Tenant is no longer insolvent or subject to bankruptcy or insolvency proceedings, such Major Tenant has affirmed its lease in bankruptcy pursuant to final, nonappealable order of a court of competent jurisdiction and such Major Tenant is in actual, physical occupancy of, and open to the public for business in, the space demised under its lease, or (2) the 2041 Rosecrans 831 Nash Borrower has leased the entirety of the space demised under such Major Tenant’s lease in accordance with the terms of the 2041 Rosecrans 831 Nash Mortgage Loan documents and on terms and conditions approved by the lender in its reasonable discretion and the lender receives an estoppel certificate from the new tenant stating that such new tenant is in actual, physical occupancy of, and open to the public for business in, the space demised under its lease and paying full unabated rent (a “Replacement Tenant Cure”), or
This is not a research report and was not prepared by the Underwriters’ research departments. Please see additional important information and qualifications at the end of this Term Sheet.
| T-122 |
| BANK 2017-BNK6 | 2041 Rosecrans 831 Nash |
(iv) commencing upon (a) any Major Tenant giving notice to vacate the premises demised under its lease or (b) any Major Tenant not renewing or extending such Major Tenant’s lease by the day which is 12 months prior to the expiration of its lease, or from and after 2025, nine months prior to the expiration of its lease (in either case, a “Lease Expiration Event”) and ending upon either (1) the renewal or extension of such Major Tenant’s lease on terms and conditions acceptable to the lender or (2) a Replacement Tenant Cure.
Additional Secured Indebtedness (not including trade debts).Not permitted.
Mezzanine Loan and Preferred Equity.Not permitted.
Release of Property.Not permitted.
Terrorism Insurance.The 2041 Rosecrans 831 Nash Mortgage Loan documents require that the “all risk” insurance policy required to be maintained by the 2041 Rosecrans 831 Nash Borrower provide coverage for terrorism in an amount equal to the full replacement cost of the 2041 Rosecrans 831 Nash Property and twelve months of business interruption insurance, provided that if the Terrorism Risk Insurance Program Reauthorization Act of 2015 or extension thereof or substantially similar program (“TRIPRA”) is in effect and continues to cover both foreign and domestic acts of terrorism, the lender is required to accept terrorism insurance with coverage against “covered acts” within the meaning of TRIPRA.
This is not a research report and was not prepared by the Underwriters’ research departments. Please see additional important information and qualifications at the end of this Term Sheet.
| T-123 |
| BANK 2017-BNK6 | Center at Pearland Parkway |
| Mortgage Loan No. 11 – Center at Pearland Parkway |
| Mortgage Loan Information | Property Information | ||||||
| Mortgage Loan Seller: | WFB | Single Asset/Portfolio: | Single Asset | ||||
| Original Balance: | $25,560,000 | Location: | Pearland, TX 77581 | ||||
| Cut-off Date Balance: | $25,560,000 | General Property Type: | Retail | ||||
| % of Initial Pool Balance: | 2.7% | Detailed Property Type: | Anchored | ||||
| Loan Purpose: | Acquisition | Title Vesting: | Fee | ||||
| Sponsors: | William L. Hutchinson | Year Built/Renovated: | 2014/N/A | ||||
| Mortgage Rate: | 4.2222% | Size: | 153,117 SF | ||||
| Note Date: | 6/14/2017 | Cut-off Date Balance per SF: | $167 | ||||
| First Payment Date: | 8/11/2017 | Maturity Date Balance per SF: | $167 | ||||
| Maturity Date: | 7/11/2027 | Property Manager: | Dunhill Property Management Services, Inc. (borrower-related) | ||||
| Original Term to Maturity: | 120 months | ||||||
| Original Amortization Term: | 0 months | ||||||
| IO Period: | 120 months | ||||||
| Seasoning: | 0 months | Underwriting and Financial Information | |||||
| Prepayment Provisions: | LO (24); DEF (92); O (4) | UW NOI: | $2,508,850 | ||||
| Lockbox/Cash Mgmt Status: | Hard/In Place | UW NOI Debt Yield(1): | 9.8% | ||||
| Additional Debt Type(1): | Mezzanine | UW NOI Debt Yield at Maturity(1): | 9.8% | ||||
| Additional Debt Balance(1): | $2,840,000 | UW NCF DSCR(1): | 2.16x | ||||
| Future Debt Permitted (Type): | No (N/A) | Most Recent NOI: | $2,573,955 (4/30/2017 TTM) | ||||
| Reserves | 2nd Most Recent NOI: | $2,566,847 (12/31/2016) | |||||
| Type | Initial | Monthly | Cap | 3rd Most Recent NOI: | $1,449,262 (12/31/2015) | ||
| RE Tax: | $293,174 | $36,647(2) | N/A | Most Recent Occupancy: | 96.7% (4/30/2017) | ||
| Insurance: | $11,986 | $5,993(3) | N/A | 2nd Most Recent Occupancy: | 100.0% (12/31/2016) | ||
| Recurring Replacements: | $0 | $1,914 | $114,840(4) | 3rd Most Recent Occupancy: | 96.7% (12/31/2015) | ||
| TI/LC: | $0 | $13,980 | N/A | Appraised Value (as of): | $42,210,000 (5/5/2017) | ||
| Rent Concession: | $129,407(5) | $0 | N/A | Cut-off Date LTV Ratio(1): | 60.6% | ||
| Tenant Specific TI/LC: | $44,633(6) | $0 | N/A | Maturity Date LTV Ratio(1): | 60.6% | ||
| Sources and Uses | ||||||
| Sources | Proceeds | % of Total | Uses | Proceeds | % of Total | |
| Loan Amount: | $25,560,000 | 59.2% | Purchase Price: | $41,836,735 | 96.9% | |
| Mezzanine Loan: | $2,840,000 | 6.6% | Reserves: | $479,200 | 1.1% | |
| Borrower Equity: | $14,758,298 | 34.2% | Closing Costs: | $842,363 | 2.0% | |
| Total Sources: | $43,158,298 | 100.0% | Total Uses: | $43,158,298 | 100.0% | |
| (1) | The UW NOI Debt Yield, UW NOI Debt Yield at Maturity, UW NCF DSCR, Cut-off Date LTV Ratio and Maturity Date LTV Ratio based on the combined Center at Pearland Parkway Mortgage Loan (as defined below) and Center at Pearland Parkway Mortgage Loan Mezzanine Loan (as defined below) with an aggregate principal balance of $28,400,000, are 8.8%, 8.8%, 1.66x, 67.3% and 67.3%, respectively. |
| (2) | Monthly deposits as to taxes paid directly or reimbursed by tenants are springing upon the occurrence of any of the following: (i) an event of default; (ii) the failure of any tenant required (x) to reimburse the Center at Pearland Parkway Borrower (as defined below) for its proportionate share of real estate taxes annually or (y) to pay its proportionate share of real estate taxes directly; (iii) the Center at Pearland Parkway Borrower fails to provide lender evidence taxes have been paid; (iv) leases for tenants paying taxes directly or reimbursing the Center at Pearland Parkway Borrower for taxes paid fail to be in full force and effect or any default exists thereunder; or (v) the Center at Pearland Parkway Borrower fails to make any additional deposits to the tax reserve at least 10 days prior to the delinquency date equal to the cumulative amount for which tenants are responsible to reimburse for taxes. |
| (3) | Monthly deposits for insurance premiums paid directly or reimbursed by tenants are springing upon the occurrence of any of the following: (i) an event of default; (ii) the failure of any tenant required (x) to reimburse the Center at Pearland Parkway Borrower for its proportionate share of insurance premiums or (y) to pay its proportionate share of insurance premiums directly; (iii) the Center at Pearland Parkway Borrower fails to provide the lender with evidence that the applicable insurance premiums have been paid; (iv) leases for tenants paying insurance premiums directly or reimbursing the Center at Pearland Parkway Borrower for insurance premiums fails to be in full force and effect or any default exists thereunder; (v) the Center at Pearland Parkway Borrower fails to make any additional deposits into the insurance reserve at least 10 days prior to the delinquency date equal to the cumulative amount for which tenants are responsible to reimburse for insurance premiums; or (vi) polices maintained by the Center at Pearland Parkway Borrower are part of an approved blanket or umbrella policy and the Center at Pearland Parkway Borrower provide lender evidence of timely renewal and payment premiums. |
| (4) | Recurring replacement monthly deposits are springing beyond the cap upon the occurrence of either an event of default or the lender determines the Center at Pearland Parkway Borrower is not properly maintaining the Center at Pearland Parkway Property (as defined below). |
| (5) | Includes gap rent in the amount of $38,787 for Freddy’s Frozen Custard and $90,620 for Chick-Fil-A. |
| (6) | Includes Center at Pearland Parkway Borrower obligated tenant improvements and leasing commissions for Chick-Fil-A. |
The Mortgage Loan. The eleventh largest mortgage loan (the “Center at Pearland Parkway Mortgage Loan”) is evidenced by a promissory note in the original principal amount of $25,560,000 and is secured by a first priority fee mortgage encumbering a retail property located in Pearland, Texas (the “Center at Pearland Parkway Property”). The proceeds of the Center at Pearland Parkway Mortgage Loan were primarily used to acquire the Center at Pearland Property, fund reserves and pay closing costs.
This is not a research report and was not prepared by the Underwriters’ research departments. Please see additional important information and qualifications at the end of this Term Sheet.
| T-124 |
| BANK 2017-BNK6 | Center at Pearland Parkway |
A mezzanine note (the “Center at Pearland Parkway Mezzanine Loan”) in the original principal amount of $2,840,000 is secured by the equity interests in the Center at Pearland Parkway Borrower. The Center at Pearland Parkway Mezzanine Loan carries an interest rate of 11.5%, has payments of interest only throughout the term of the Center at Pearland Parkway Mezzanine Loan and matures on July 11, 2017. The Center at Pearland Parkway Mezzanine Loan is subordinate to the Center at Pearland Parkway Mortgage Loan pursuant to a subordination and intercreditor agreement.
The Borrower and the Sponsor.The borrower is Pearland Dunhill 1 LLC (the “Center at Pearland Parkway Borrower”), a single-purpose Delaware limited liability company with one independent director. The Center at Pearland Parkway Mortgage Loan sponsor and non-recourse carve-out guarantor is William L. Hutchinson, founder and president of Dunhill Partners, Inc. (“Dunhill”). Dunhill currently manages more than 6.1 million SF of retail shopping centers in Texas, California, Hawaii, and Oklahoma. Over the past 10 years, Dunhill has been involved in the acquisition and disposition of over $4.0 billion worth of retail centers.
The Property.The Center at Pearland Parkway Property is located in Pearland, Texas, approximately 20.5 miles south of the Houston central business district. Built in 2014, the Center at Pearland Parkway Property contains 153,117 SF and is situated on a 26.7-acre parcel. As of April 30, 2017, the Center at Pearland Parkway Property was 96.7% leased by 25 tenants. Two tenants (6.6% of underwritten rent) have signed leases but are currently completing the build-out of their spaces and are not fully in occupancy (gap rent for these two tenants was fully reserved at origination of the Center at Pearland Parkway Mortgage Loan). Four of the 25 tenants are located on pad sites and operate subject to ground leases with the Center at Pearland Parkway Borrower; as such, these four tenants contribute to the total underwritten rent but have no attributed SF. Anchor and major tenants include Ross Dress For Less (“Ross”), TJ Maxx, Petco Animal Supplies Stores, Inc. (Petco), Palais Royal and Salons by JC. The Center at Pearland Parkway Property is part of a larger 382,000 SF center that includes shadow anchors HEB Grocery and Academy Sports + Outdoors (not part of the Center at Pearland Parkway Property). The Center at Pearland Parkway Property contains 1,128 surface parking spaces, resulting in a parking ratio of 7.4 spaces per 1,000 SF of rentable area.
The following table presents a summary regarding major tenants at the Center at Pearland Parkway Property:
| Tenant Summary(1) | |||||||
| Tenant Name | Credit Rating (Fitch/Moody’s/S&P)(2) | Tenant SF | Approximate % of SF | Annual UW Rent | % of Total Annual UW Rent | Annual UW Rent PSF(3) | Lease Expiration |
| Major Tenants | |||||||
| Ross | NR/A3/A- | 27,041 | 17.7% | $263,621 | 9.2% | $9.75 | 1/31/2026(4) |
| TJ Maxx | NR/A2/A+ | 23,358 | 15.3% | $216,060 | 7.6% | $9.25 | 11/30/2024(5) |
| Petco | NR/B2/B | 13,500 | 8.8% | $216,000 | 7.6% | $16.00 | 1/31/2026(6) |
| Palais Royal | NR/Caa/NR | 25,000 | 16.3% | $206,250 | 7.2% | $8.25 | 1/31/2025(7) |
| Salons by JC | NR/NR/NR | 8,000 | 5.2% | $176,000 | 6.2% | $22.00 | 3/31/2025(8) |
| Subtotal/Wtd. Avg. | 96,899 | 63.3% | $1,077,931 | 37.7% | $11.12 | ||
| Other Tenants(9) | 51,218 | 33.5% | $1,782,232 | 62.3% | $26.91(9) | ||
| Vacant Space | 5,000 | 3.3% | $0 | 0.0% | $0.00 | ||
| Total/Wtd. Avg.(9) | 153,117 | 100.0% | $2,860,162 | 100.0% | $16.58(9) | ||
| (1) | Information is based on the underwritten rent roll. |
| (2) | Certain ratings are those of the parent company whether or not the parent guarantees the lease. |
| (3) | PSF figures exclude vacant space. |
| (4) | Ross has four, five-year renewal options. |
| (5) | TJ Maxx has four, five-year renewal options. |
| (6) | Petco has four, five-year renewal options. |
| (7) | Palais Royal has four, five-year renewal options. |
| (8) | Salons by JC has two, five-year renewal options. |
| (9) | Includes approximately $404,000 of Annual UW Rent for four tenants which operate under ground leases with no attributed UW SF. The Other Tenants Annual UW Rent PSF and the Total/Wtd. Avg. Annual UW Rent PSF exclude this income from the ground lease tenants. |
This is not a research report and was not prepared by the Underwriters’ research departments. Please see additional important information and qualifications at the end of this Term Sheet.
| T-125 |
| BANK 2017-BNK6 | Center at Pearland Parkway |
The following table presents certain information relating to the lease rollover schedule at the Center at Pearland Parkway Property:
| Lease Rollover Schedule(1)(2) | ||||||||
| Year | # of Leases Rolling | SF Rolling | UW Rent PSF Rolling(3) | Approx. % of Total SF Rolling | Approx. Cumulative % of SF Rolling | Total UW Rent Rolling | Approx. % of Total Rent Rolling | Approx. Cumulative % of Total Rent Rolling |
| 2017 | 0 | 0 | $0.00 | 0.0% | 0.0% | $0 | 0.0% | 0.0% |
| 2018 | 0 | 0 | $0.00 | 0.0% | 0.0% | $0 | 0.0% | 0.0% |
| 2019 | 0 | 0 | $0.00 | 0.0% | 0.0% | $0 | 0.0% | 0.0% |
| 2020 | 2 | 7,525 | $21.45 | 4.9% | 4.9% | $161,375 | 5.6% | 5.6% |
| 2021 | 0 | 0 | $0.00 | 0.0% | 4.9% | $0 | 0.0% | 5.6% |
| 2022 | 0 | 0 | $0.00 | 0.0% | 4.9% | $0 | 0.0% | 5.6% |
| 2023 | 0 | 0 | $0.00 | 0.0% | 4.9% | $0 | 0.0% | 5.6% |
| 2024 | 1 | 23,358 | $9.25 | 15.3% | 20.2% | $216,060 | 7.6% | 13.2% |
| 2025 | 13 | 71,693 | $19.79 | 46.8% | 67.0% | $1,419,107 | 49.6% | 62.8% |
| 2026 | 5 | 45,541 | $14.48 | 29.7% | 96.7% | $659,621 | 23.1% | 85.9% |
| 2027 | 0 | 0 | $0.00 | 0.0% | 96.7% | $0 | 0.0% | 85.9% |
| 2028 & Beyond(4) | 4 | 0 | $0.00 | 0.0% | 96.7% | $404,000 | 14.1% | 100.0% |
| Vacant | 0 | 5,000 | $0.00 | 3.3% | 100.0% | $0 | 0.0% | 100.0% |
| Total/Wtd. Avg.(4) | 25 | 153,117 | $16.58 | 100.0% | $2,860,162 | 100.0% | ||
| (1) | Information is based on the underwritten rent roll. |
| (2) | Certain tenants may have lease termination options that are exercisable prior to the originally stated expiration date of the related lease and are not considered in the rollover schedule. |
| (3) | PSF figures exclude vacant space. |
| (4) | Represents four tenants subject to ground leases with no attributed UW SF. The Total/Wtd. Avg. UW Rent PSF Rolling excludes this income from the ground lease tenants. |
The Market. The Center at Pearland Parkway Property is located in Pearland, Brazoria County, Texas, near the intersection of Pearland Parkway and East Broadway Street (FM 518) which has an average daily traffic count of approximately 82,888 vehicles per day. The estimated 2016 average household income within a one-, three- and five-mile radius of the Center at Pearland Parkway Property was $85,341, $100,781 and $87,449, respectively. The estimated 2016 population within a one-, three- and five-mile radius of the Center at Pearland Parkway Property was 8,047, 71,727 and 176,938 people, respectively.
According to a third party market research report, the Center at Pearland Parkway Property is located in the Southeast Outlier submarket of the Houston retail market. As of the first quarter of 2017, the submarket contained a total inventory of approximately 14.9 million SF with a 3.6% vacancy rate and an average asking rental rate of $16.14 PSF, triple net. The Center at Pearland Parkway appraisal determined market rents of $9.50 PSF for anchor space, $16.00 PSF for junior anchor space, $20.00 PSF for in-line space, $36.00 PSF for pad in-line space and $28.00 PSF for pad site space.
The following table reflects the competitive office properties with respect to the Center at Pearland Parkway Property as identified in the appraisal:
| Competitive Property Summary | |||||||||
| Property Name/Location | Year Built | Occ. | Size (SF) | Tenant Name | Lease Size (SF) | Lease Date | Lease Term (Yrs.) | Rent PSF | Lease Type |
Broadway Square Shopping Center 2750 - 2800 Broadway Street, Pearland, TX | 1999 | 99% | 81,160 | Grocery Services (WIC) | 2,100 | Jan-17 | 2.0 | $25.43 | Triple Net |
Broadway Square Shopping Center 2750 - 2800 Broadway Street, Pearland, TX | 1999 | 99% | 81,160 | Smoothie King | 1,750 | Apr-15 | 5.0 | $29.00 | Triple Net |
Pearland Parkway SHC 2701 Pearland Parkway, Pearland, TX | 2015 | 100% | 14,950 | AT&T | 2,250 | Apr-15 | 5.0 | $30.00 | Triple Net |
Pearland Parkway SHC 2701 Pearland Parkway, Pearland, TX | 2015 | 100% | 14,950 | Little Caesar’s | 1,500 | Feb-15 | 5.0 | $28.00 | Triple Net |
Pearland Parkway SHC 2701 Pearland Parkway, Pearland, TX | 2015 | 100% | 14,950 | Wing Stop | 1,800 | Feb-15 | 7.0 | $27.00 | Triple Net |
Pearland Parkway SHC 2701 Pearland Parkway, Pearland, TX | 2015 | 100% | 14,950 | Nickelberry DDS | 2,100 | Feb-15 | 10.0 | $28.00 | Triple Net |
Discovery Bay Shopping Center 15718 S Highway 288, Pearland, TX | 2015 | 100% | 16,350 | Pet Club | 4,717 | Jun-16 | 5.0 | $31.00
| Triple Net |
Source:Appraisal
This is not a research report and was not prepared by the Underwriters’ research departments. Please see additional important information and qualifications at the end of this Term Sheet.
| T-126 |
| BANK 2017-BNK6 | Center at Pearland Parkway |
Operating History and Underwritten Net Cash Flow. The following table presents certain information relating to the historical operating performance and Underwritten Net Cash Flow at the Center at Pearland Parkway Property:
| Cash Flow Analysis | ||||||
| 2014(1) | 2015 | 2016 | 4/30/2017 TTM | UW | UW PSF | |
| Base Rent | N/A | $1,693,826 | $2,767,102 | $2,862,543 | $2,960,162 | $19.33 |
| Total Recoveries | N/A | $558,582 | $905,138 | $843,931 | $1,026,524 | $6.70 |
| Other Income | N/A | $0 | $659 | $0 | $0 | $0.00 |
| Less Vacancy & Credit Loss | N/A | $0 | $0 | $0 | ($148,008)(2) | ($0.97) |
| Effective Gross Income | N/A | $2,237,742 | $3,672,899 | $3,706,473 | $3,838,679 | $25.07 |
| Total Operating Expenses | N/A | $788,480 | $1,106,052 | $1,132,518 | $1,329,828 | $8.69 |
| Net Operating Income | N/A | $1,449,262 | $2,566,847 | $2,573,955 | $2,508,850 | $16.39 |
| Capital Expenditures | N/A | $0 | $0 | $0 | $22,968 | $0.15 |
| TI/LC | N/A | $0 | $0 | $0 | $120,849 | $0.79 |
| Net Cash Flow | N/A | $1,449,262 | $2,566,847 | $2,573,955 | $2,365,034 | $15.45 |
| Occupancy % | N/A | 96.7% | 100.0% | 96.7% | 95.0%(2) | |
| NOI DSCR | N/A | 1.32x | 2.35x | 2.35x | 2.29x | |
| NCF DSCR | N/A | 1.32x | 2.35x | 2.35x | 2.16x | |
| NOI Debt Yield | N/A | 5.7% | 10.0% | 10.1% | 9.8% | |
| NCF Debt Yield | N/A | 5.7% | 10.0% | 10.1% | 9.3% | |
| (1) | The Center at Pearland Parkway Property was constructed in 2014; as such, operating history prior to 2015 is not available. |
| (2) | The underwritten economic vacancy is 95.0%. The Center at Pearland Parkway Property is 96.7% physically occupied as of April 30, 2017. |
This is not a research report and was not prepared by the Underwriters’ research departments. Please see additional important information and qualifications at the end of this Term Sheet.
| T-127 |
| BANK 2017-BNK6 | Trumbull Marriott |
| Mortgage Loan No. 12 –Trumbull Marriott |
| Mortgage Loan Information | Property Information | ||||||
| Mortgage Loan Seller: | WFB | Single Asset/Portfolio: | Single Asset | ||||
| Original Balance: | $22,000,000 | Location: | Trumbull, CT 06611 | ||||
| Cut-off Date Balance: | $22,000,000 | General Property Type: | Hospitality | ||||
| % of Initial Pool Balance: | 2.4% | Detailed Property Type: | Full Service | ||||
| Loan Purpose: | Refinance | Title Vesting: | Fee | ||||
| Sponsors: | Thomas Point Ventures, L.P. | Year Built/Renovated: | 1986/2012 | ||||
| Mortgage Rate: | 4.6500% | Size: | 325 Rooms | ||||
| Note Date: | 6/23/2017 | Cut-off Date Balance per Room: | $67,692 | ||||
| First Payment Date: | 8/11/2017 | Maturity Date Balance per Room: | $55,145 | ||||
| Maturity Date: | 7/11/2027 | Property Manager: | Marriott Hotel Services, Inc. (borrower-related) | ||||
| Original Term to Maturity: | 120 months | ||||||
| Original Amortization Term: | 360 months | Underwriting and Financial Information | |||||
| IO Period: | 0 months | UW NOI: | $3,297,627 | ||||
| Seasoning: | 0 months | UW NOI Debt Yield: | 15.0% | ||||
| Prepayment Provisions: | LO (24); DEF (92); O (4) | UW NOI Debt Yield at Maturity: | 18.4% | ||||
| Lockbox/Cash Mgmt Status: | Springing/Springing | UW NCF DSCR: | 1.84x | ||||
| Additional Debt Type: | N/A | Most Recent NOI: | $3,166,275 (5/31/2017 TTM) | ||||
| Additional Debt Balance: | N/A | 2nd Most Recent NOI: | $3,518,071 (12/31/2016) | ||||
| Future Debt Permitted (Type): | No (N/A) | 3rd Most Recent NOI: | $3,529,748 (12/31/2015) | ||||
| Reserves | Most Recent Occupancy: | 61.4% (5/31/2017) | |||||
| Type | Initial | Monthly | Cap | 2nd Most Recent Occupancy: | 67.7% (12/31/2016) | ||
| RE Tax: | $0 | Springing(1) | N/A | 3rd Most Recent Occupancy: | 73.4% (12/31/2015) | ||
| Insurance: | $0 | Springing(2) | N/A | Appraised Value (as of): | $35,100,000 (5/2/2017) | ||
| Recurring Replacements: | $0 | Springing(3) | N/A | Cut-off Date LTV Ratio: | 62.7% | ||
| Maturity Date LTV Ratio: | 51.1% | ||||||
| Sources and Uses | ||||||
| Sources | Proceeds | % of Total | Uses | Proceeds | % of Total | |
| Loan Amount: | $22,000,000 | 80.2% | Loan Payoff: | $27,094,780 | 98.8% | |
| Borrower Equity | $5,432,618 | 19.8% | Closing Costs: | $337,838 | 1.2% | |
| Total Sources: | $27,432,618 | 100.0% | Total Uses: | $27,432,618 | 100.0% | |
| (1) | Monthly deposits for tax reserves are springing if taxes are not paid in accordance with the management agreement. |
| (2) | Monthly deposits for insurance reserves are springing any time insurance is not maintained as required by the management agreement. |
| (3) | Monthly deposits for recurring replacement reserves are springing upon the occurrence of either (i) an affiliate of Marriott International, Inc. no longer being the manager; (ii) the management agreement is no longer in effect. |
The Mortgage Loan. The twelfth largest mortgage loan (the “Trumbull Marriott Mortgage Loan”) is secured by a first mortgage encumbering a full service hospitality property known as Trumbull Marriott in Trumbull, Connecticut (the “Trumbull Marriott Property”). The proceeds of the Trumbull Marriott Mortgage Loan, together with $5.4 million cash equity from the Trumbull Marriott Borrower (as defined below), were used to refinance a previous mortgage loan and pay closing costs. The Trumbull Marriott Property was previously securitized in the BSCMS 2007-PW18 transaction.
The Borrower and the Sponsor. The borrower is Parallel Post Real Estate, LLC (the “Trumbull Marriott Borrower”), a special-purpose Delaware limited liability company. The Trumbull Marriott Borrower is majority owned and controlled by Thomas Point Ventures, L.P., the sponsor of the Trumbull Marriott Mortgage Loan. JWM Family Enterprises, L.P. is the general partner of Thomas Point Ventures, L.P., which is also majority owned by six trusts for the benefit of the Marriott family. Established in 1993, JWM Family Enterprises, L.P. owns 16 hotels in four states that are operated by Marriott International.
The non-recourse carveout guarantor for the Trumbull Marriott Mortgage Loan is the sponsor, Thomas Point Ventures, L.P. The recourse liability under the non-recourse carveout guaranty is capped at 110% of the outstanding principal balance of the Trumbull Marriott Mortgage Loan. At origination, the sponsor obtained a $3.0 million environmental insurance policy against the Trumbull Marriott Property, in lieu of the guarantor providing an environmental indemnity.
The Property. The Trumbull Marriott Property is a 5-story, 325-room full service hotel, located along Hawley Lane, in Trumbull, Connecticut, an affluent community in Fairfield County. The Trumbull Marriott Property is situated adjacent to a Target store and sits just south of Merritt Parkway, a major artery extending from the New York State line to the City of Hartford. The guestroom configuration consists of 174 king rooms, 145 double/double rooms, 4 king studio suites, one one-bedroom king suite and one presidential suite. All guestrooms feature flat-screen televisions with premium channels, desks and lounge chairs. The Trumbull Marriott Property features a full service restaurant serving three meals daily, a seasonal outdoor bar and grill, approximately 17,675 SF of meeting space, fully-equipped fitness center, indoor pool and business center.
This is not a research report and was not prepared by the Underwriters’ research departments. Please see additional important information and qualifications at the end of this Term Sheet.
| T-128 |
| BANK 2017-BNK6 | Trumbull Marriott |
The Trumbull Marriott Property was built in 1986 and was purchased by the sponsor in 2007. Since acquisition, the sponsor has spent over $16.4 million ($50,462 per room) to complete renovations to the guest rooms, common areas, meeting rooms and restaurant.
The Trumbull Marriott Property is currently subject to a management agreement with Marriott Hotel Services, Inc. and is operating under the Marriott brand. The management agreement is currently set to expire on December 31, 2028 with one, 10-year extension option.
The Trumbull Marriott Property generates approximately 60% of its room nights from commercial demand, 30% from meeting and group demand and 10% from leisure demand.
| Historical Occupancy, ADR, RevPAR(1)(2) | |||||||||
Competitive Set | Trumbull Marriott | Penetration Factor | |||||||
| Year | Occupancy | ADR | RevPAR | Occupancy | ADR | RevPAR | Occupancy | ADR | RevPAR |
| 2013 | 65.6% | $106.91 | $70.14 | 58.8% | $127.96 | $75.26 | 89.6% | 119.7% | 107.3% |
| 2014 | 68.6% | $107.27 | $73.58 | 65.6% | $119.89 | $78.68 | 95.7% | 111.8% | 106.9% |
| 2015 | 70.2% | $111.64 | $78.34 | 73.5% | $121.02 | $88.94 | 104.7% | 108.4% | 113.5% |
| 2016 | 68.7% | $113.79 | $78.15 | 67.3% | $131.28 | $88.32 | 98.0% | 115.4% | 113.0% |
| 3/31/2017 TTM | 68.4% | $113.14 | $77.35 | 64.6% | $131.59 | $85.06 | 94.5% | 116.3% | 110.0% |
Source: Industry Report
| (1) | The competitive set, based on a report dated April 18, 2017, includes Residence Inn Shelton Fairfield County, Holiday Inn Bridgeport Trumbull Fairfield, Courtyard Shelton, Hampton Inn Shelton, Springhill Suites Milford, Homewood Suites Stratford. |
| (2) | Variances between the underwriting, the appraisal and the above table with respect to Occupancy, ADR and RevPAR at the Trumbull Marriott Property are attributable to variances in reporting methodologies and/or timing differences. |
The Market. The Trumbull Marriott Property is located in Trumbull, Fairfield County, Connecticut, within the Bridgeport-Stamford-Norwalk, Connecticut Metropolitan Statistical Area (“MSA”). Fairfield County is home to a significant commuter population that travels into Manhattan during the work week. Two of Fairfield County’s largest employers, Sikorsky Aircraft Corporation and Sacred Heart University, have significant investments in the area, including a recent 66-acre, $31.5 million acquisition for Sacred Heart University, which will expand its campus and a $220 million agreement between Sikorsky Aircraft Corporation and the State of Connecticut, to keep the company in Connecticut until at least 2032. The estimated 2016 population within a one-, three-, and five-mile radius of the Trumbull Marriott Property was 5,501, 79,242, and 246,752, respectively; and the average household income within the same radii was $105,813, $93,257 and $86,111, respectively.
Competitive properties to the Trumbull Marriott Property are shown in the table below:
| Competitive Property Summary | ||||||||
| Property Name | Year Opened | No. of Rooms | Commercial Demand | Meeting & Group Demand | Leisure Demand | 2016 Occ. | 2016 ADR | 2016 RevPAR |
| Trumbull Marriott(1) | 1986 | 325 | 60% | 30% | 10% | 67% | $131 | $88 |
| Hampton Inn Shelton (Former Holiday Inn Express) | 1998 | 125 | 60% | 15% | 25% | 78% | $116 | $90 |
| Hilton Garden Inn Shelton | 1999 | 142 | 60% | 15% | 25% | 66% | $114 | $75 |
| Courtyard Shelton | 1990 | 161 | 65% | 20% | 15% | 65% | $115 | $75 |
| Residence Inn Shelton Fairfield County | 1988 | 96 | 65% | 5% | 30% | 79% | $118 | $93 |
| Homewood Suites Stratford | 2002 | 135 | 70% | 10% | 20% | 79% | $130 | $103 |
| Holiday Inn Bridgeport Trumbull Fairfield | 1987 | 209 | 60% | 20% | 20% | 50% | $100 | $50 |
| Springhill Suites Milford | 2002 | 124 | 65% | 5% | 30% | 80% | $105 | $84 |
| Total/Weighted Average | 1,317 | 68% | $118.14 | $81 | ||||
Source: Appraisal
| (1) | Variances between the underwriting, the appraisal and the above table with respect to Occupancy, ADR and RevPAR at the Trumbull Marriott Property are attributable to variances in reporting methodologies and/or timing differences. |
This is not a research report and was not prepared by the Underwriters’ research departments. Please see additional important information and qualifications at the end of this Term Sheet.
| T-129 |
| BANK 2017-BNK6 | Trumbull Marriott |
Operating History and Underwritten Net Cash Flow. The following table presents certain information relating to the historical operating performance and the Underwritten Net Cash Flow at the Trumbull Marriott:
| Cash Flow Analysis(1) | ||||||
| 2014 | 2015 | 2016 | 5/31/2017 TTM(2) | UW | UW per Room | |
| Occupancy | 65.0% | 73.4% | 67.7% | 61.4% | 61.4% | |
| ADR | $121.03 | $121.15 | $130.79 | $134.92 | $134.92 | |
| RevPAR | $78.68 | $88.94 | $88.57 | $82.80 | $82.84 | |
| Rooms Revenue | $9,333,371 | $10,550,333 | $ 10,506,052 | $9,822,556 | $ 9,826,999 | $30,237 |
| Food & Beverage | $5,280,512 | $5,613,463 | $5,579,443 | $5,728,869 | $5,728,869 | $17,627 |
| Other Income | $380,911 | $268,488 | $244,969 | $255,378 | $255,378 | $786 |
| Total Revenue | $14,994,794 | $16,432,284 | $ 16,330,464 | $15,806,803 | $15,811,246 | $48,650 |
| Total Expenses | $12,547,323 | $12,902,536 | $12,812,393 | 12,640,528 | $12,513,619 | $38,503 |
| Net Operating Income | $2,447,471 | $3,529,748 | $3,518,071 | $3,166,275 | $3,297,627 | $10,147 |
| FF&E | $0 | $0 | $0 | $0 | $790,562 | $2,432 |
| Net Cash Flow | $2,447,471 | $3,529,748 | $3,518,071 | $3,166,275 | $2,507,065 | $7,714 |
| NOI DSCR | 1.80x | 2.59x | 2.58x | 2.33x | 2.42x | |
| NCF DSCR | 1.80x | 2.59x | 2.58x | 2.33x | 1.84x | |
| NOI Debt Yield | 11.1% | 16.0% | 16.0% | 14.4% | 15.0% | |
| NCF Debt Yield | 11.1% | 16.0% | 16.0% | 14.4% | 11.4% | |
| (1) | Occupancy, ADR and RevPAR figures are based on the underwriting, which have been taken from financial statements provided by the Trumbull Marriott Borrower. Variances between the underwriting, the appraisal and the Historical Occupancy, ADR, RevPAR table with respect to Occupancy, ADR and RevPAR at the Trumbull Marriott Property are attributable to variances in reporting methodologies and/or timing differences. |
| (2) | Occupancy and Net Cash Flow are down from 2016 as an agreement with Sacred Heart University to house approximately 50-70 upperclassmen every semester expired in 2016. |
This is not a research report and was not prepared by the Underwriters’ research departments. Please see additional important information and qualifications at the end of this Term Sheet.
| T-130 |
(THIS PAGE INTENTIONALLY LEFT BLANK)
| T-131 |
| BANK 2017-BNK6 | Gran Park At The Avenues |
| Mortgage Loan No. 13 – Gran Park At The Avenues |
| Mortgage Loan Information | Property Information | ||||||
| Mortgage Loan Seller: | WFB | Single Asset/Portfolio: | Single Asset | ||||
| Original Balance: | $21,000,000 | Location: | Jacksonville, FL 32256 | ||||
| Cut-off Date Balance: | $21,000,000 | General Property Type: | Office | ||||
| % of Initial Pool Balance: | 2.3% | Detailed Property Type: | Suburban | ||||
| Loan Purpose: | Refinance | Title Vesting: | Fee | ||||
| Sponsor: | WGC Properties, LLC; John R. Ward; Jeffrey L. Shaw; Brad Andrus | Year Built/Renovated: | 1992-1995/N/A | ||||
| Mortgage Rate: | 4.3500% | Size: | 241,469 SF | ||||
| Note Date: | 6/2/2017 | Cut-off Date Balance per SF: | $87 | ||||
| First Payment Date: | 7/11/2017 | Maturity Date Balance per SF: | $83 | ||||
| Maturity Date: | 6/11/2022 | Property Manager: | Bridge Commercial Real Estate Florida LLC (borrower-related) | ||||
| Original Term to Maturity: | 60 months | ||||||
| Original Amortization Term: | 360 months | ||||||
| IO Period: | 24 months | Underwriting and Financial Information | |||||
| Seasoning: | 1 month | UW NOI: | $2,606,448 | ||||
| Prepayment Provisions: | LO (25); DEF (31); O (4) | UW NOI Debt Yield: | 12.4% | ||||
| Lockbox/Cash Mgmt Status: | Springing/Springing | UW NOI Debt Yield at Maturity: | 13.0% | ||||
| Additional Debt Type: | N/A | UW NCF DSCR: | 2.46x (IO) 1.82x (P&I) | ||||
| Additional Debt Balance: | N/A | Most Recent NOI: | $2,604,122 (5/31/2017 TTM) | ||||
| Future Debt Permitted (Type): | No (N/A) | 2nd Most Recent NOI: | $2,400,368 (12/31/2016) | ||||
| Reserves | 3rd Most Recent NOI: | $2,100,932 (12/31/2015) | |||||
| Type | Initial | Monthly | Cap | Most Recent Occupancy: | 95.3% (5/31/2017) | ||
| RE Tax: | $157,176 | $19,647 | N/A | 2nd Most Recent Occupancy: | 91.7% (12/31/2016) | ||
| Insurance: | $0 | Springing(1) | N/A | 3rd Most Recent Occupancy: | 87.3% (12/31/2015) | ||
| Recurring Replacements: | $0 | $5,634 | N/A | Appraised Value (as of): | $28,300,000 (3/27/2017) | ||
| TI/LC: | $0 | $20,122 | $1,500,000(2) | Cut-off Date LTV Ratio: | 74.2% | ||
| Other: | $1,342,167(3) | $65,000(4) | N/A | Maturity Date LTV Ratio: | 70.6% | ||
| Sources and Uses | ||||||
| Sources | Proceeds | % of Total | Uses | Proceeds | % of Total | |
| Loan Amount: | $21,000,000 | 74.1% | Loan Payoff: | $18,145,535 | 64.0% | |
| Borrower Equity: | $7,345,379 | 25.9% | Partner Buyout: | $7,682,576 | 27.1% | |
| Reserves: | $1,499,343 | 5.3% | ||||
| Closing Costs: | $1,017,925 | 3.6% | ||||
| Total Sources: | $28,345,379 | 100.0% | Total Uses: | $28,345,379 | 100.0% | |
| (1) | Monthly deposits for insurance reserves are springing upon any of the following: (i) an event of default; (ii) insurance requirements not being satisfied by a blanket policy acceptable to the lender; or (iii) the Gran Park At The Avenues Borrower (as defined below) does not timely provide lender with evidence of renewal and payment. |
| (2) | Monthly deposits for tenant improvements and leasing commissions (“TI/LC”) are springing beyond the $1,500,000 cap upon the occurrence of either an event of default or the debt yield falling below 8.0%. |
| (3) | Initial other reserves represent a $1,000,000 TI/LC reserve related to qualified leasing expenses for the Florida East Coast Railway and Beacon Health/ Value Options spaces, a $39,077 reserve for future rent credits and abatement obligations related to Blue Cross Blue Shield and a $303,090 reserve for future TI/LC obligations related to Blue Cross Blue Shield and Verizon. |
| (4) | Monthly other reserves in the amount of $65,000 for TI/LC are required from July 2017 to December 2017 related to qualified leasing expenses for the Florida East Coast Railway and Beacon Health/ Value Options spaces. |
The Mortgage Loan. The thirteenth largest mortgage loan (the “Gran Park At The Avenues Mortgage Loan”) is evidenced by a promissory note in the original principal amount of $21,000,000 and is secured by a first priority fee mortgage encumbering an office property located in Jacksonville, Florida (the “Gran Park At The Avenues Property”). The proceeds of the Gran Park At The Avenues Mortgage Loan, in addition to approximately $7.3 million of equity from the Gran Park At The Avenues Borrower (as defined below), were primarily used to refinance existing debt on the Gran Park At The Avenues Property, buyout a portion of the previous partnership, fund reserves and pay closing costs.
The Borrower and the Sponsor.The borrower is ROC II Fairlead Gran Park at Avenues, LLC (the “Gran Park At The Avenues Borrower”), a single-purpose Delaware limited liability company. The loan sponsors and non-recourse carve-out guarantors are WGC Properties, LLC; John R. Ward; Jeffrey L. Shaw and Brad Andrus. John R. Ward, Jeffrey L. Shaw and Brad Andrus are senior executives at Bridge Investment Group, a privately held real estate investment management firm with $7.4 billion in assets under management, including 5.6 million SF of office space.
This is not a research report and was not prepared by the Underwriters’ research departments. Please see additional important information and qualifications at the end of this Term Sheet.
| T-132 |
| BANK 2017-BNK6 | Gran Park At The Avenues |
The Property.The Gran Park At The Avenues Property, located in Jacksonville, Florida, consists of three adjacent three-story office buildings totaling 241,469 SF leased to 24 tenants. The Gran Park At The Avenues Property was built in phases from 1992 through 1995 and features on-site amenities such as a fitness center, training center, on-site management and an exterior landscaped patio area with lakefront views with functionality for private functions. As of May 31, 2017, the Gran Park At The Avenues Property was 95.3% leased with the three largest tenants accounting for 38.9% of the net rentable area (“NRA”) and 42.5% of the underwritten rent and no other tenants accounting for more than 9.3% of NRA or 9.5% of underwritten base rent. The Gran Park At The Avenues Property is part of the larger eight-building, approximately 788,740 SF, complex known as Gran Park Business Park. The Gran Park Business Park runs along Southside Boulevard and has experienced an average occupancy rate of 92.9% since the first quarter of 2007.The Gran Park At The Avenues Property has 990 parking spaces, which equates to 4.1 spaces per 1,000 SF of net rentable area.
The following table presents a summary regarding major tenants at the Gran Park At The Avenues Property:
| Tenant Summary(1) | |||||||
| Tenant Name | Credit Rating (Fitch/Moody’s/S&P)(2) | Tenant SF | Approximate % of SF | Annual UW Rent(3) | % of Total Annual UW Rent | Annual UW Rent PSF(4) | Lease Expiration |
| Major Tenants | |||||||
| Florida East Coast Railway | NR/B3/NR | 34,565 | 14.3% | $774,262 | 16.5% | $22.40 | 12/31/2018 |
| Beacon Health/ Value Options | NR/B2/B | 30,750 | 12.7% | $661,125 | 14.1% | $21.50 | 8/31/2018 |
| Advantage Sales & Marketing | NR/B2/B+ | 28,656 | 11.9% | $554,781 | 11.8% | $19.36 | 6/30/2020(5) |
| Progressive Insurance | A/A2/A | 22,359 | 9.3% | $445,750 | 9.5% | $19.94 | Various(6) |
| Pond & Co | NR/NR/NR | 11,415 | 4.7% | $230,697 | 4.9% | $20.21 | 8/31/2020 |
| Subtotal/Wtd. Avg. | 127,745 | 52.9% | $2,666,615 | 56.9% | $20.87 | ||
| Other Tenants(7) | 102,360 | 42.4% | $2,018,770 | 43.1% | $19.72 | ||
| Vacant Space | 11,364 | 4.7% | $0 | 0.0% | $0.00 | ||
| Total/Wtd. Avg.(7) | 241,469 | 100.0% | $4,685,386 | 100.0% | $20.36 | ||
| (1) | Information is based on the underwritten rent roll. |
| (2) | Certain ratings are those of the parent company whether or not the parent guarantees the lease. |
| (3) | Annual UW Rent includes rent steps through November 2017 totaling $49,823 and average rent over the lease terms for investment grade rated tenants (Progressive Insurance, Blue Cross Blue Shield and Verizon) totaling $38,309. |
| (4) | Wtd. Avg. Annual UW Rent PSF figures exclude vacant space. |
| (5) | Advantage Sales & Marketing has the option to terminate 100% or 25% of its leased space effective August 2018 with 6 months’ notice and payment of a termination fee equal to 4 months’ of the then-current rent for the relinquished space plus unamortized leasing costs. |
| (6) | Progressive Insurance leases 20,386 SF with an Annual UW Rent of $19.84 PSF with a lease expiration of October 1, 2019 and 1,973 SF with an Annual UW Rent of $20.91 PSF with a lease expiration of November 1, 2021. |
| (7) | Includes four units (3,809 SF) occupied as a training center (1,915 SF), management office (1,084 SF), fitness center (516 SF), mail room (294 SF), with no attributed underwritten base rent. The Other Tenants Annual UW Rent PSF and Total/Wtd. Avg. Annual UW Rent PSF excluding this space are $20.48 PSF and $20.70 per SF, respectively. |
The following table presents certain information relating to the lease rollover schedule at the Gran Park At The Avenues Property:
| Lease Rollover Schedule(1)(2) | ||||||||
| Year | # of Leases Rolling | SF Rolling | UW Rent PSF Rolling(3) | Approx. % of Total SF Rolling | Approx. Cumulative % of SF Rolling | Total UW Rent Rolling | Approx. % of Total Rent Rolling | Approx. Cumulative % of Total Rent Rolling |
| MTM(4) | 4 | 3,809 | $0.00 | 1.6% | 1.6% | $0 | 0.0% | 0.0% |
| 2017 | 1 | 6,319 | $19.63 | 2.6% | 4.2% | $124,042 | 2.6% | 2.6% |
| 2018 | 7 | 77,206 | $21.77 | 32.0% | 36.2% | $1,680,420 | 35.9% | 38.5% |
| 2019 | 8 | 50,447 | $20.10 | 20.9% | 57.1% | $1,013,832 | 21.6% | 60.2% |
| 2020 | 9 | 62,192 | $19.89 | 25.8% | 82.8% | $1,237,166 | 26.4% | 86.6% |
| 2021 | 2 | 7,105 | $20.87 | 2.9% | 85.8% | $148,316 | 3.2% | 89.7% |
| 2022 | 2 | 16,746 | $21.00 | 6.9% | 92.7% | $351,656 | 7.5% | 97.2% |
| 2023 | 1 | 6,281 | $20.69 | 2.6% | 95.3% | $129,954 | 2.8% | 100.0% |
| 2024 | 0 | 0 | $0.00 | 0.0% | 95.3% | $0 | 0.0% | 100.0% |
| 2025 | 0 | 0 | $0.00 | 0.0% | 95.3% | $0 | 0.0% | 100.0% |
| 2026 | 0 | 0 | $0.00 | 0.0% | 95.3% | $0 | 0.0% | 100.0% |
| 2027 | 0 | 0 | $0.00 | 0.0% | 95.3% | $0 | 0.0% | 100.0% |
| 2028 & Beyond | 0 | 0 | $0.00 | 0.0% | 95.3% | $0 | 0.0% | 100.0% |
| Vacant | 0 | 11,364 | $0.00 | 4.7% | 100.0% | $0 | 0.0% | 100.0% |
| Total/Wtd. Avg.(4) | 34 | 241,469 | $20.36 | 100.0% | $4,685,386 | 100.0% | ||
| (1) | Information is based on the underwritten rent roll. |
| (2) | Certain tenants may have lease termination options that are exercisable prior to the originally stated expiration date of the related lease and are not considered in the rollover schedule. |
| (3) | Total/Wtd. Avg. UW Rent PSF Rolling excludes vacant space. |
| (4) | Includes four units (3,809 SF) occupied as a training center (1,915 SF), management office (1,084 SF), fitness center (516 SF), mail room (294 SF), with no attributed underwritten base rent. The Total/Wtd. Avg. Annual UW Rent excluding this space is $20.70 PSF. |
This is not a research report and was not prepared by the Underwriters’ research departments. Please see additional important information and qualifications at the end of this Term Sheet.
| T-133 |
| BANK 2017-BNK6 | Gran Park At The Avenues |
The Market. The Gran Park At The Avenues Property is located in Jacksonville, Duval County, Florida, along Southside Boulevard, near the intersection of Interstate 295 and Interstate 95, approximately 14.2 miles southeast of Jacksonville’s central business district. Across Southside Boulevard to the east is The Avenues Mall, a Simon-owned 1.3 million SF regional mall, which according to the appraisal, is the dominant retail draw on Jacksonville’s south side. As of May 24, 2017, The Avenues Mall was 96.0% occupied with 2016 inline tenant sales of approximately $446 per SF, according to a third party report. The estimated 2017 average household income within a one-, three- and five-mile radius of the Gran Park At The Avenues Property is $103,961, $83,222 and $82,458, respectively. The estimated 2017 population within a one-, three- and five-mile radius of the Gran Park At The Avenues Property is 3,701, 48,002 and 137,245 people, respectively.
According to a third party market research report, the Gran Park At The Avenues Property is located in the Butler/Baymeadows submarket of the Jacksonville office market, which, as of the first quarter of 2017, contained a total inventory of approximately 10.0 million SF with an 8.5% vacancy rate and approximately 130,447 SF of year to date net absorption. The Class B segment of the Butler/Baymeadows submarket contained approximately 7.3 million SF with an 8.1% vacancy and approximately 45,675 SF of year to date net absorption. The Gran Park At The Avenues appraisal determined market rent for all office space to be $20.50 PSF, gross.
The following table reflects the comparable office leases with respect to the Gran Park At The Avenues Property as identified in the appraisal:
| Competitive Lease Summary | |||||||||
| Property Name/Location | Year Built | Occ. | Size (SF) | Tenant | Leased SF | Lease Start Date | Lease Term | Rent PSF | Lease Type |
Grammercy Woods 9000 Southside Boulevard Jacksonville, FL | 1989 | 61% | 1,240,000 | Aetna | 132,720 | Apr-2017 | 10.0 Yrs | $20.75 | Gross |
One Deerwood 10201 Centurion Parkway N Jacksonville, FL | 1999 | 85% | 161,000 | CIT Bank N.A | 114,247 | Feb-2017 | 10.8 Yrs | $21.50 | Gross |
Centurion II 10407 Centurion Parkway North Jacksonville, FL | 1996 | 100% | 87,600 | Yes Energy Management | 3,040 | Jan-2017 | 5.2 Yrs | $21.75 | Gross |
Deerwood South 200 10151 Deerwood Park Boulevard Jacksonville, FL | 1996 | 93% | 126,274 | Adecco Group | 2,542 | Sep-2016 | 5.5 Yrs | $22.00 | Gross |
BellSouth Building (Centurion I) 10375 Centurion Parkway North Jacksonville, FL | 1996 | 81% | 92,687 | AFLAC | 3,040 | Aug-2016 | 3.0 Yrs | $21.25 | Gross |
Concourse III 5200 Belfort Road Jacksonville, FL | 2001 | 98% | 96,000 | CPH Engineers | 3,007 | Jul-2016 | 3.0 Yrs | $18.00 | Gross |
Deerwood North 100 4600 Touchton Road Jacksonville, FL | 1999 | 97% | 135,413 | Fidelity Real Estate | 57,668 | Apr-2016 | 10.0 Yrs | $20.00 | Gross |
Prominence Building 200 8928 Freedom Commerce Parkway Jacksonville, FL | 1990 | 100% | 160,000 | Southern Grocers
| 160,000 | Apr-2016 | 10.0 Yrs | $18.50
| Gross |
Source:Appraisal
This is not a research report and was not prepared by the Underwriters’ research departments. Please see additional important information and qualifications at the end of this Term Sheet.
| T-134 |
| BANK 2017-BNK6 | Gran Park At The Avenues |
Operating History and Underwritten Net Cash Flow. The following table presents certain information relating to the historical operating performance and Underwritten Net Cash Flow at the Gran Park At The Avenues Property:
| Cash Flow Analysis | |||||||||||
| 2015 | 2016 | 5/31/2017 TTM | UW | UW Per SF | |||||||
| Base Rent | $4,672,801 | $4,763,670 | $4,829,650 | $4,914,596(1) | $20.35 | ||||||
| Total Recoveries | $341,788 | $185,586 | $155,530 | $191,868 | $0.79 | ||||||
| Other Income | $2,721 | $1,499 | $1,040 | $1,500 | $0.01 | ||||||
| Less Free Rent Adjustment | ($380,268) | ($106,512) | ($65,013) | $0 | $0.00 | ||||||
| Less Vacancy & Credit Loss | ($681,012) | ($531,507) | ($460,869) | ($491,460)(2) | ($2.04) | ||||||
| Effective Gross Income | $3,956,030 | $4,312,736 | $4,460,338 | $4,616,505 | $19.12 | ||||||
| Total Operating Expenses | $1,855,098 | $1,912,368 | $1,856,217 | $2,010,056 | $8.32 | ||||||
| Net Operating Income | $2,100,932 | $2,400,368 | $2,604,122 | $2,606,448 | $10.79 | ||||||
| Capital Expenditures | $0 | $0 | $0 | $67,611 | $0.28 | ||||||
| TI/LC | $0 | $0 | $0 | $256,809 | $1.06 | ||||||
| Net Cash Flow | $2,100,932 | $2,400,368 | $2,604,122 | $2,282,028 | $9.45 | ||||||
| Occupancy % | 87.3% | 91.7% | 95.3% | 90.0%(2) | |||||||
| NOI DSCR (IO) | 2.27x | 2.59x | 2.81x | 2.81x | |||||||
| NOI DSCR (P&I) | 1.67x | 1.91x | 2.08x | 2.08x | |||||||
| NCF DSCR (IO) | 2.27x | 2.59x | 2.81x | 2.46x | |||||||
| NCF DSCR (P&I) | 1.67x | 1.91x | 2.08x | 1.82x | |||||||
| NOI Debt Yield | 10.0% | 11.4% | 12.4% | 12.4% | |||||||
| NCF Debt Yield | 10.0% | 11.4% | 12.4% | 10.9% | |||||||
| (1) | UW Base Rent includes rent steps through November 2017 totaling $49,823 and average rent over the Gran Park At The Avenues Mortgage Loan term for investment grade rated tenants totaling $38,309. |
| (2) | The underwritten economic vacancy is 10.0%. The Gran Park At The Avenues Property is 95.3% physically occupied as of May 31, 2017. |
This is not a research report and was not prepared by the Underwriters’ research departments. Please see additional important information and qualifications at the end of this Term Sheet.
| T-135 |
| BANK 2017-BNK6 | Budget Store & Lock Portfolio PA |
| Mortgage Loan No. 14 – Budget Store & Lock Portfolio PA |
| Mortgage Loan Information | Property Information | ||||||
| Mortgage Loan Seller: | BANA | Single Asset/Portfolio: | Portfolio | ||||
| Original Balance: | $20,550,000 | Location: | Various, PA | ||||
| Cut-off Date Balance: | $20,550,000 | General Property Type: | Self Storage | ||||
| % of Initial Pool Balance: | 2.2% | Detailed Property Type: | Self Storage | ||||
| Loan Purpose: | Refinance | Title Vesting: | Fee | ||||
| Sponsor: | Michael R. Moyer; Joseph P. Mooney | Year Built/Renovated: | Various | ||||
| Mortgage Rate: | 4.0410% | Size: | 244,105 SF | ||||
| Note Date: | 6/1/2017 | Cut-off Date Balance per SF: | $84 | ||||
| First Payment Date: | 7/1/2017 | Maturity Date Balance per SF: | $71 | ||||
| Maturity Date: | 6/1/2027 | Property Manager: | Self-managed | ||||
| Original Term to Maturity: | 120 months | ||||||
| Original Amortization Term: | 360 months | Underwriting and Financial Information | |||||
| IO Period: | 24 months | UW NOI: | $1,995,464 | ||||
| Seasoning: | 1 month | UW NOI Debt Yield: | 9.7% | ||||
| Prepayment Provisions: | LO (25); DEF (91); O (4) | UW NOI Debt Yield at Maturity: | 11.5% | ||||
| Lockbox/Cash Mgmt Status: | Soft/Springing | UW NCF DSCR: | 2.33x (IO) 1.66x (P&I) | ||||
| Additional Debt Type: | N/A | Most Recent NOI: | $2,002,536 (3/31/2017 TTM) | ||||
| Additional Debt Balance: | N/A | 2nd Most Recent NOI: | $1,992,361 (12/31/2016) | ||||
| Future Debt Permitted (Type): | No (N/A) | 3rd Most Recent NOI: | $1,894,825 (12/31/2015) | ||||
| Reserves | Most Recent Occupancy: | 86.2% (4/30/2017) | |||||
| Type | Initial | Monthly | Cap | 2ndMost Recent Occupancy: | 83.9% (12/31/2016) | ||
| RE Tax: | $225,116 | $23,338 | N/A | 3rdMost Recent Occupancy: | 82.5% (12/31/2015) | ||
| Insurance: | $0 | Springing | N/A | Appraised Value (as of): | $30,380,000 (Various) | ||
| Recurring Replacements: | $0 | $3,051 | $109,847 | Cut-off Date LTV Ratio: | 67.6% | ||
| Immediate Repairs: | $97,688 | $0 | N/A | Maturity Date LTV Ratio: | 57.2% | ||
| Sources and Uses | ||||||
| Sources | Proceeds | % of Total | Uses | Proceeds | % of Total | |
| Loan Amount: | $20,550,000 | 100.0% | Loan Payoff: | $14,737,767 | 71.7% | |
| Closing Costs: | $480,980 | 2.3% | ||||
| Reserves: | $322,804 | 1.6% | ||||
| Return of Equity: | $5,008,450 | 24.4% | ||||
| Total Sources: | $20,550,000 | 100.0% | Total Uses: | $20,550,000 | 100.0% | |
The Mortgage Loan.The fourteenth largest mortgage loan (the “Budget Store & Lock Portfolio PA Mortgage Loan”) is evidenced by a promissory note in the original principal amount of $20,550,000 and secured by first priority fee mortgages encumbering eight self storage properties in Lehigh and Northampton Counties in Pennsylvania (collectively, the “Budget Store & Lock Portfolio PA Properties”). The proceeds of the Budget Store & Lock Portfolio PA Mortgage Loan were used to refinance previous loans secured by the Budget Store & Lock Portfolio PA Properties in the aggregate amount of $14,737,767, fund reserves, pay closing costs and to return equity to the Budget Store & Lock Portfolio PA Borrower. The Budget Store & Lock Portfolio PA Properties were previously securitized in the BACM 2007-5 transaction.
The Borrowers and the Sponsors.The borrowers are Michael R. Moyer and Joseph P. Mooney, Co-Partners and Budget Store & Lock, Inc. (together, the “Budget Store & Lock Portfolio PA Borrowers”), a Pennsylvania general partnership and a Pennsylvania corporation, respectively. The Budget Store & Lock Portfolio PA Mortgage Loan sponsors and nonrecourse carve-out guarantors are Michael R. Moyer and Joseph P. Mooney. Michael Moyer and Joseph Mooney have invested in the self storage industry since 1997 and maintain a portfolio of 28 self storage facilities in Pennsylvania. Michael Moyer is currently acting Vice President of the Pennsylvania Self Storage Association.
The Properties.The Budget Store & Lock Portfolio PA Properties consist of eight self storage properties totaling 2,051 units, including 177 parking units, encompassing 244,105 SF. The Budget Store & Lock Portfolio PA Properties were developed between 1987 and 2002 and acquired by the Budget Store & Lock Portfolio PA sponsors between 1997 and 2006. The Budget Store & Lock Portfolio PA Properties feature security cameras and/or on-site management or electronic gated entry. The Budget Store & Lock Portfolio PA Mortgage Loan does not permit any individual property releases.
The Budget Store & Lock Portfolio PA Properties had a current weighted average occupancy of 86.2% as of April 30, 2017, and weighted average occupancy of 83.9% and 82.5% as of year-end 2016 and 2015, respectively. The Budget Store & Lock Portfolio PA Properties had net cash flow of $2,002,536 as of March 31, 2017, which was an increase of 0.5% over year-end 2016 and an increase of 5.7% over year end 2015.
This is not a research report and was not prepared by the Underwriters’ research departments. Please see additional important information and qualifications at the end of this Term Sheet.
| T-136 |
| BANK 2017-BNK6 | Budget Store & Lock Portfolio PA |
The following table sets forth further information regarding the individual Budget Store & Lock Portfolio PA Properties:
Property Summary | |||||||||||
| Property | Allocated Loan Amount(1) | % of Allocated Loan Amount | # Units | # Parking Units | Area (SF) | Year Built/ Renovated(2) | Occ.(3) | Appraised Value | UW NCF | % of | |
Budget 4th 1614 South 4th St Allentown, PA | $5,607,620 | 27.3% | 415 | 51 | 48,850 | 1988 / N/A | 93.9% | $8,290,000 | $520,464 | 26.6% | |
Budget Mickley 184 Mickley Rd Whitehall, PA | $4,193,878 | 20.4% | 356 | 0 | 44,800 | 1998 / N/A | 93.8% | $6,200,000 | $398,157 | 20.3% | |
Budget Independence 3949 Independence Dr Schnecksville, PA | $2,908,657 | 14.2% | 386 | 0 | 50,885 | 2002 / N/A | 72.8% | $4,300,000 | $281,847 | 14.4% | |
Budget Werley Rd 767 Werley Rd Allentown, PA | $2,874,835 | 14.0% | 233 | 97 | 33,460 | 2002 / N/A | 81.7% | $4,250,000 | $277,543 | 14.2% | |
Budget E Allen 802-818 E. Allen St Allentown, PA | $1,569,322 | 7.6% | 193 | 4 | 20,268 | 1989 / N/A | 96.6% | $2,320,000 | $148,036 | 7.6% | |
Budget Washington 333 Washington St Freemansburg, PA | $1,319,042 | 6.4% | 123 | 18 | 11,330 | 1987 / N/A | 95.9% | $1,950,000 | $121,130 | 6.2% | |
Budget Quebec 1014 North Quebec St Allentown, PA | $1,089,055 | 5.3% | 217 | 7 | 24,852 | 1997/ N/A(3) | 74.9% | $1,610,000 | $112,775 | 5.8% | |
Budget Emmaus 2333 W Emmaus Ave Allentown, PA | $987,591 | 4.8% | 128 | 0 | 9,660 | 1999 / N/A | 93.3% | $1,460,000 | $98,897 | 5.0% | |
| Total/Wtd. Avg. | $20,550,000 | 100.0% | 2,051 | 177 | 244,105 | 86.2% | $30,380,000 | $1,958,849 | 100.0% | ||
| (1) | The Budget Store & Lock Portfolio PA Mortgage Loan is collateralized by eight properties with no release provisions. Allocated Loan Amounts are based on Appraised Values. |
| (2) | Budget Quebec was originally built in 1915 and was converted to self storage use in 1997. |
| (3) | Occupancy is as of April 30, 2017. |
The Market.The Budget Store & Lock Portfolio PA Properties are all located in the Lehigh Valley region of Pennsylvania within the Allentown-Bethlehem-Easton, PA NJ Metropolitan Statistical Area (“MSA”). According to the appraisal, in 2016, the number of households in the MSA was 321,578 and is projected to grow by 0.3% annually. The Lehigh Valley region is approximately 55 miles northwest of Philadelphia and 90 miles west of New York City.
The largest industries in the Lehigh Valley region are educational services, healthcare, manufacturing, transportation and warehousing. The largest employers in the region are the Lehigh Valley Hospital and Health Network and St. Luke’s Hospital and Health Network. The region is also served by a number of higher learning institutions including Lehigh University, Lafayette College, Muhlenberg College and DeSales University. The Lehigh Valley region is home to the Sands Casino Resort Bethlehem and The Outlets at Sands Bethlehem. Three major highways serve the Allentown area including Interstate 78, Interstate 476 and US Route 22.
According to the appraisals, there are no new self storage facilities planned, proposed or under construction within any of the Budget Store & Lock Portfolio PA Properties’ market areas.
Market Summary | ||||||
| Property | Property Occupancy(1) | Competitive Set Average Occupancy | Property # Units | Competitive Set # Units | Property Unit Rent Range | Competitive Set |
| Budget 4th | 93.9% | 91.7% | 415 | 2,086 | $57 – 228 | $49 – 257 |
| Budget Mickley | 93.8% | 94.4% | 356 | 2,571 | $60 – 220 | $48 – 257 |
| Budget Independence | 72.8% | 89.5% | 386 | 2,093 | $57 – 226 | $61 – 257 |
| Budget Werley Rd | 81.7% | 88.6% | 233 | 2,344 | $60 – 247 | $49 – 257 |
| Budget E Allen | 96.6% | 89.8% | 193 | 1,999 | $51 – 173 | $39 – 231 |
| Budget Washington | 95.9% | 95.4% | 123 | 1,721 | $62 – 169 | $52 – 256 |
| Budget Quebec | 74.9% | 89.3% | 217 | 2,413 | $51 – 650 | $39 – 231 |
| Budget Emmaus | 93.3% | 92.0% | 128 | 2,373 | $41 – 106 | $49 – 257 |
| Total/Wtd. Avg. | 86.2% | 91.2% | 2,051 | 17,600 | ||
Source: Appraisal
| (1) | As of April 30, 2017. |
| (2) | Competitive Set Average Occupancy is based on occupied units. |
This is not a research report and was not prepared by the Underwriters’ research departments. Please see additional important information and qualifications at the end of this Term Sheet.
| T-137 |
| BANK 2017-BNK6 | Budget Store & Lock Portfolio PA |
Operating History and Underwritten Net Cash Flow.The following table presents certain information relating to the historical operating performance and the Underwritten Net Cash Flow at the Budget Store & Lock Portfolio PA Properties:
| Cash Flow Analysis | |||||||||||||
| 2014 | 2015 | 2016 | 3/31/2017 TTM | UW | UW PSF | ||||||||
| Base Rent | $2,114,168 | $2,231,766 | $2,343,977 | $2,366,431 | $2,976,081 | $12.19 | |||||||
| Other Income | $149,251 | $241,504 | $244,083 | $239,971 | $239,971 | $0.98 | |||||||
| Concessions, Vacancy & Credit Loss(1) | $0 | $0 | $0 | $0 | ($609,471) | ($2.50) | |||||||
| Effective Gross Income | $2,263,419 | $2,473,270 | $2,588,060 | $2,606,402 | $2,606,581 | $10.68 | |||||||
| Total Operating Expenses | $259,836 | $578,445 | $595,699 | $603,866 | $611,117 | $2.50 | |||||||
| Net Operating Income | $2,003,583 | $1,894,825 | $1,992,361 | $2,002,536 | $1,995,464 | $8.17 | |||||||
| Capital Expenditures | $0 | $0 | $0 | $0 | $36,615 | $0.15 | |||||||
| Net Cash Flow | $2,003,583 | $1,894,825 | $1,992,361 | $2,002,536 | $1,958,849 | $8.02 | |||||||
| Occupancy% | N/A | 82.5% | 83.9% | 86.2%(1) | 80.8% | ||||||||
| NOI DSCR (IO) | 2.38x | 2.25x | 2.37x | 2.38x | 2.37x | ||||||||
| NCF DSCR (P&I) | 1.69x | 1.60x | 1.68x | 1.69x | 1.69x | ||||||||
| NCF DSCR (IO) | 2.38x | 2.25x | 2.37x | 2.38x | 2.33x | ||||||||
| NCF DSCR (P&I) | 1.69x | 1.60x | 1.68x | 1.69x | 1.66x | ||||||||
| NOI Debt Yield | 9.7% | 9.2% | 9.7% | 9.7% | 9.7% | ||||||||
| NCF Debt Yield | 9.7% | 9.2% | 9.7% | 9.7% | 9.5% | ||||||||
(1) Concessions underwritten to the appraiser conclusion of 2% and Vacancy underwritten to 18.9%.
(2) Occupancy as of April 30, 2017.
This is not a research report and was not prepared by the Underwriters’ research departments. Please see additional important information and qualifications at the end of this Term Sheet.
| T-138 |
(THIS PAGE INTENTIONALLY LEFT BLANK)
| T-139 |
| BANK 2017-BNK6 | Lakes and Waterfall Towers |
| Mortgage Loan No. 15 – Lakes and Waterfall Towers |
| Mortgage Loan Information | Property Information | ||||||
| Mortgage Loan Seller: | WFB | Single Asset/Portfolio: | Portfolio | ||||
| Original Balance: | $20,500,000 | Location: | Various | ||||
| Cut-off Date Balance: | $20,500,000 | General Property Type: | Office | ||||
| % of Initial Pool Balance: | 2.2% | Detailed Property Type: | Suburban | ||||
| Loan Purpose: | Refinance | Title Vesting: | Fee | ||||
| Sponsor: | Matthew T. White; Bruce J. Cardinal | Year Built/Renovated: | Various/Various | ||||
| Mortgage Rate: | 4.290% | Size: | 235,363 SF | ||||
| Note Date: | 6/2/2017 | Cut-off Date Balance per SF: | $87 | ||||
| First Payment Date: | 7/11/2017 | Maturity Date Balance per SF: | $76 | ||||
| Maturity Date: | 6/11/2027 | Property Manager: | Basin Street Properties | ||||
| Original Term to Maturity: | 120 months | ||||||
| Original Amortization Term: | 360 months | Underwriting and Financial Information | |||||
| IO Period: | 36 months | UW NOI: | $2,263,604 | ||||
| Seasoning: | 1 month | UW NOI Debt Yield: | 11.0% | ||||
| Prepayment Provisions: | LO (25); DEF (90); O (5) | UW NOI Debt Yield at Maturity: | 12.7% | ||||
| Lockbox/Cash Mgmt Status: | Springing/Springing | UW NCF DSCR: | 2.12x (IO) 1.55x (P&I) | ||||
| Additional Debt Type: | N/A | Most Recent NOI: | $1,848,242 (4/30/2017 TTM) | ||||
| Additional Debt Balance: | N/A | 2nd Most Recent NOI: | $1,736,412 (12/31/2016) | ||||
| Future Debt Permitted (Type): | No (N/A) | 3rd Most Recent NOI: | $1,325,307 (12/31/2015) | ||||
| Reserves | Most Recent Occupancy: | 86.2% (5/30/2017) | |||||
| Type | Initial | Monthly | Cap | 2nd Most Recent Occupancy: | 80.0% (12/31/2016) | ||
| RE Tax: | $62,680 | $15,670 | N/A | 3rd Most Recent Occupancy: | 72.5% (12/31/2015) | ||
| Insurance: | $0 | Springing(1) | N/A | Appraised Value (as of): | $33,640,000 (4/21/2017) | ||
| Recurring Replacements: | $500,000 | $5,800 | $800,000(2) | Cut-off Date LTV Ratio: | 60.9% | ||
| Deferred Maintenance: | $45,063 | $0 | N/A | Maturity Date LTV Ratio: | 53.2% | ||
| TI/LC: | $0 | $21,183 | N/A | ||||
| Other: | $586,823(3) | Springing(4) | N/A | ||||
| Sources and Uses | ||||||
| Sources | Proceeds | % of Total | Uses | Proceeds | % of Total | |
| Loan Amount: | $20,500,000 | 100.0% | Loan Payoff: | $18,274,238 | 89.1% | |
| Reserves: | $1,194,566 | 5.8% | ||||
| Closing Costs: | $271,502 | 1.3% | ||||
| Return of Equity: | $759,694 | 3.7% | ||||
| Total Sources: | $20,500,000 | 100.0% | Total Uses: | $20,500,000 | 100.0% | |
| (1) | Monthly deposits for insurance are springing upon any of the following: (i) an event of default; (ii) insurance requirements not being satisfied by a blanket policy acceptable to the lender; or (iii) the Lakes and Waterfall Towers Borrower (as defined below) does not timely provide lender with evidence of renewal and payment |
| (2) | The recurring replacements reserve is capped at $800,000 through June 10, 2021, and $500,000 thereafter, so long as no event of default exists and the Lakes and Waterfall Towers Properties (as defined below) are being adequately maintained. |
| (3) | Other reserves represent outstanding rent concessions ($189,891) and tenant improvement and leasing commissions ($396,932) related for the County of Sonoma. |
| (4) | Monthly other reserves are springing upon the occurrence of the County of Sonoma, California, or any successor or replacement tenant(s), terminating its lease or the lease is not in full force and effect (or the tenant gives notice of its intent to commence any of the foregoing). |
The Mortgage Loan. The fifteenth largest mortgage loan (the “Lakes and Waterfall Towers Mortgage Loan”) is evidenced by a promissory note in the original principal amount of $20,500,000 and secured by a first priority fee mortgage encumbering six office properties consisting of eight total buildings across two office complexes, located in Santa Rosa, California (collectively, the “Lakes and Waterfall Towers Properties”). The proceeds of the Lakes and Waterfall Towers Mortgage Loan were primarily used to refinance existing debt on the Lakes and Waterfall Towers Properties, fund reserves, pay closing costs and return equity to the Lakes and Waterfall Towers Borrower (as defined below).
The Borrower and the Sponsor. The borrower consists of two tenants-in-common, SR Lakes Waterfall DE LLC and Redbird SR Lakes Waterfall DE LLC (collectively, the “Lakes and Waterfall Towers Borrower”), each of which is a single-purpose Delaware limited liability company. The loan sponsors are Matthew T. White and Bruce J. Cardinal. The non-recourse carve-out guarantors are Matthew T. White and the Matthew White Family Trust. Matthew T. White is the chief executive officer of Basin Street Properties, a commercial real estate owner and operator with holdings of over 3 million SF across Northern California and Nevada.
This is not a research report and was not prepared by the Underwriters’ research departments. Please see additional important information and qualifications at the end of this Term Sheet.
| T-140 |
| BANK 2017-BNK6 | Lakes and Waterfall Towers |
The Properties.The Lakes and Waterfall Towers Properties consist of eight multi-tenant Class “B” office buildings totaling 235,363 SF located within two office complexes in Santa Rosa, California. Santa Rosa is the fifth largest city in the San Francisco Bay Area and has a diversified economy including manufacturing, retail, finance, education and medical services. The Lakes and Waterfall Towers Properties were constructed in 1981 and 1988 and renovated in 2004 and 2005. The sponsor has invested approximate $2.94 million in the Lakes and Waterfall Towers Properties since acquisition in 2012.
As of May 30, 2017, the Lakes and Waterfall Towers Properties were 86.2% leased to 56 tenants with the largest tenant concentration being the County of Sonoma, (34.4% of total NRA). The Lakes Buildings (as shown in the Property Summary Table) are situated across 11.2 acres and features 446 surface parking spaces, resulting in a parking ratio of 3.2 spaces per 1,000 SF of rentable area. The Waterfall Towers (as shown below in the Property Summary Table) is situated across 6.3 acres and features 290 surface parking spaces, resulting in a parking ratio of 3.1 spaces per 1,000 SF of rentable area.
The following table sets forth further information regarding the Lakes and Waterfall Towers Properties:
| Property Summary(1) | ||||||||
| Property Name | SF | % of Total | Allocated Loan Amount | % of Total | Year Built/ Renovated | Occupancy | Appraised Value | % of |
| Waterfall Towers(2) | 94,945 | 40.3% | $8,800,000 | 42.9% | 1981/2005 | 89.3% | $13,700,000 | 40.7% |
| Lakes Building 2227 | 79,037 | 33.6% | $7,740,000 | 37.8% | 1988/2004 | 91.3% | $13,200,000 | 39.2% |
| Lakes Building 2255 | 17,357 | 7.4% | $1,150,000 | 5.6% | 1988/2004 | 59.7% | $1,960,000 | 5.8% |
| Lakes Building 2235 | 16,688 | 7.1% | $1,130,000 | 5.5% | 1988/2004 | 49.0% | $1,930,000 | 5.7% |
| Lakes Building 2245 | 13,270 | 5.6% | $915,000 | 4.5% | 1988/2004 | 100.0% | $1,550,000 | 4.6% |
| Lakes Building 2225 | 14,066 | 6.0% | $765,000 | 3.7% | 1988/2004 | 100.0% | $1,300,000 | 3.9% |
| Total | 235,363 | 100.0% | $20,500,000 | 100.0% | 86.2% | $33,640,000 | 100.0% | |
| (1) | Information is based on the underwritten rent roll and the Lakes and Waterfall Towers Mortgage Loan documents. |
| (2) | The Waterfall Towers property comprises three office buildings. |
The following table presents certain information relating to the leases at the Lakes and Waterfall Towers Properties:
| Tenant Summary(1) | ||||||||
| Tenant Name | Credit Rating (Fitch/Moody’ | Tenant SF | Building | Approx. % of SF | Annual UW Rent | % of Total Annual UW Rent | Annual UW Rent PSF(3) | Lease Expiration |
| Major Tenants | ||||||||
| County of Sonoma | AA+/NR/AA | 81,066 | Lakes Building 2225, 2227, 2245 | 34.4% | $1,731,672 | 41.9% | $21.36 | Various(4)(5) |
| Provino | NR/NR/NR | 14,809 | Lakes Building 2227 | 6.3% | $183,201 | 4.4% | $12.37 | 12/31/2017 |
| North Bay Realtors | NR/NR/NR | 5,337 | Lakes Building 2235 | 2.3% | $93,019 | 2.2% | $17.43 | 6/30/2020 |
| Vietnam Veterans of CA | NR/NR/NR | 4,847 | Waterfall Towers | 2.1% | $94,208 | 2.3% | $19.44 | 1/31/2018 |
| Soka Gakki Intl USA | NR/NR/NR | 4,670 | Waterfall Towers | 2.0% | $98,070 | 2.4% | $21.00 | 7/31/2022 |
| Subtotal/Wtd. Avg. | 110,729 | 47.0% | $2,200,170 | 53.2% | $19.87 | |||
| Other Tenants | 92,024 | 39.1% | $1,935,728 | 46.8% | $21.04 | |||
| Vacant Space | 32,610 | 13.9% | $0 | 0.0% | $0.00 | |||
| Total/Wtd. Avg. | 235,363 | 100.0% | $4,135,898 | 100% | $20.40 | |||
| (1) | Information is based on the underwritten rent roll. |
| (2) | Certain ratings are those of the parent company or government whether or not the parent or government guarantees the lease. |
| (3) | Wtd. Avg. Annual UW Rent PSF excludes vacant space. |
| (4) | County of Sonoma occupies 81,066 SF, of which 1,896 SF (0.8% of NRA) at an Annual UW Rent of $22.20 PSF expires on May 22, 2018, 14,066 SF (6.0% of NRA) at an Annual UW Rent of $16.97 PSF expires on February 28, 2031, 51,834 SF (22.0% of NRA) at an Annual UW Rent of $22.17 PSF expires on June 30, 2023, and 13,270 SF (5.6% of NRA) at an Annual UW Rent of $22.73 expires September 14, 2032. |
| (5) | County of Sonoma has termination options in its leases. See “Description of the Mortgage Pool—Tenant Issues—Lease Expirations and Terminations—Terminations” in the Preliminary Prospectus. |
This is not a research report and was not prepared by the Underwriters’ research departments. Please see additional important information and qualifications at the end of this Term Sheet.
| T-141 |
| BANK 2017-BNK6 | Lakes and Waterfall Towers |
The following table presents certain information relating to the lease rollover schedule at the Lakes and Waterfall Towers Properties:
| Lease Rollover Schedule(1)(2) | ||||||||
| Year | # of Leases Rolling | SF Rolling | UW Rent PSF Rolling | Approx. % of Total SF Rolling | Approx. Cumulative % of SF Rolling | Total UW Rent Rolling | Approx. % of Total Rent Rolling | Approx. Cumulative % of Total Rent Rolling |
| 2017 | 12 | 27,374 | $16.01 | 11.6% | 11.6% | $438,145 | 10.6% | 10.6% |
| 2018 | 19 | 38,442 | $21.06 | 16.3% | 28.0% | $809,605 | 19.6% | 30.2% |
| 2019 | 10 | 17,656 | $20.86 | 7.5% | 35.5% | $368,236 | 8.9% | 39.1% |
| 2020 | 12 | 26,783 | $20.52 | 11.4% | 46.8% | $549,662 | 13.3% | 52.4% |
| 2021 | 3 | 4,960 | $20.84 | 2.1% | 49.0% | $103,347 | 2.5% | 54.9% |
| 2022 | 3 | 8,368 | $21.19 | 3.6% | 52.5% | $177,322 | 4.3% | 59.1% |
| 2023 | 2 | 51,834 | $22.17 | 22.0% | 74.5% | $1,149,179 | 27.8% | 86.9% |
| 2024 | 0 | 0 | $0.00 | 0.0% | 74.5% | $0 | 0.0% | 86.9% |
| 2025 | 0 | 0 | $0.00 | 0.0% | 74.5% | $0 | 0.0% | 86.9% |
| 2026 | 0 | 0 | $0.00 | 0.0% | 74.5% | $0 | 0.0% | 86.9% |
| 2027 | 0 | 0 | $0.00 | 0.0% | 74.5% | $0 | 0.0% | 86.9% |
| Thereafter | 2 | 27,336 | $19.77 | 11.6% | 86.1% | $540,402 | 13.1% | 100.0% |
| Vacant | 0 | 32,610 | $0.00 | 13.9% | 100.0% | $0 | 0.0% | 100.0% |
| Total/Weighted Average | 63 | 235,363 | $20.40 | 100.0% | $4,135,898 | 100.0% | 100.0% | |
| (1) | Information is based on the underwritten rent roll. |
| (2) | Certain tenants may have lease termination options that are exercisable prior to the originally stated expiration date of the subject lease and that are not considered in the lease rollover schedule. |
The Market. The Lakes and Waterfall Towers Properties are situated in the Santa Rosa, California, the county seat of Sonoma County. Highway 101 is approximately 2.5 miles east of the Lakes and Waterfall Towers Properties and provides direct access to Sonoma County, Marin County and San Francisco, along with broader access to the Oregon/California border and Los Angeles. According to a third party report, the 2017 population within a one-, three- and five-mile radius of the Lakes Property was 18,535, 110,511 and 188,413, respectively. The 2017 population within a one-, three- and five-mile radius of the Waterfall Towers Property was 16,973, 116,478 and 204,180, respectively. The 2017 average household income within a one-, three- and five-mile radius of the Lakes Property was $61,162, $52,733 and $58,827, respectively. The 2017 average household income within a one-, three- and five-mile radius of the Waterfall Towers Property was $57,821, $55,740 and $61,418, respectively. The Lakes and Waterfall Towers Properties are located in the Santa Rosa submarket, which features approximately 9.2 million SF of office space with a vacancy rate of 5.5% as of the second quarter of 2017, while average asking submarket rent was $21.30 per SF. According to the appraisal, rents at the Lakes and Waterfall Towers Properties are 7.3% percent below market.
The following table presents recent leasing data at comparable office properties with respect to the Lakes and Waterfall Towers Property:
| Comparable Lease Summary | ||||||||||||||||
| Property Name/Address | Year Built/ Renovated | Size (SF) | Tenant Name | Lease Size (SF) | Lease Date | Lease Term (Yrs.) | Rent/SF | Lease Type | ||||||||
Lake and Waterfall Towers Various Santa Rosa, California | 1981;1988/ 2004;2005 | 235,363 | County of Sonoma | 81,066 | Various(1) | Various(1) | $21.36 | Modified | ||||||||
Stony Point West Business Park 131 Stony Circle Santa Rosa, California | 1984/NA | 80,531 | Kenton Wood Products | 2,001 | 9/2016 | 3.1 | $21.00 | Modified | ||||||||
Park Plaza 1160 Dutton Avenue North Santa Rosa, California | 1986/NA | 31,092 | Opes Advisors | 1,981 | 7/2016 | 5.0 | $21.00 | Modified | ||||||||
Stony Point Lake 120 Stony Point Road Santa Rosa, California | 2000/NA | 66,353 | Community Matters | 2,771 | 5/2016 | 5.0 | $21.48 | Modified | ||||||||
Fountaingrove Executive Center 3700 Old Redwood Highway Santa Rosa, California | 2004/NA | 37,428 | Mendocino Forest Products Co. LLC | 6,785 | 4/2016 | 5.0 | $25.80 | Modified | ||||||||
Oak Valley Business Center 475 Aviation Boulevard Santa Rosa, California | 2002/NA | 40,791 | Pletkin & Associates | 2,445 | 3/2016 | 5.0 | $23.52 | Modified | ||||||||
Stony Point Lakes 100 Stony Point Road Santa Rosa, California | 1990/NA | 66,169 | Fidelity National Home Warranty | 4,952 | 2/2016 | 5.0 | $21.96 | Modified | ||||||||
Source:Appraisal
| (1) | County of Sonoma occupies 81,066 SF, of which 1,896 SF (0.8% of NRA) expires on May 22, 2018, 14,066 SF (6.0% of NRA) expires on February 28, 2031, 51,834 SF (22.0% of NRA) expires on June 30, 2023, and 13,270 SF (5.6% of NRA) expires September 14, 2032. |
This is not a research report and was not prepared by the Underwriters’ research departments. Please see additional important information and qualifications at the end of this Term Sheet.
| T-142 |
| BANK 2017-BNK6 | Lakes and Waterfall Towers |
Operating History and Underwritten Net Cash Flow.The following table presents certain information relating to the operating history and underwritten net cash flow at the Lakes and Waterfall Towers Properties:
| Cash Flow Analysis | ||||||||||||||
| 2013 | 2014 | 2015 | 2016 | 4/30/2017 TTM | UW | UW PSF | ||||||||
| Base Rent | $2,960,719 | $2,974,679 | $3,104,509 | $3,526,082 | $3,655,599 | $4,832,937(1) | $20.53 | |||||||
| Total Recoveries | $115,433 | $69,250 | $87,392 | $139,662 | $125,390 | $128,236 | $0.54 | |||||||
| Less Vacancy & Credit Loss | $0 | $0 | $0 | $0 | $0 | ($697,039)(2) | ($2.96) | |||||||
| Other Income | $25,510 | $20,909 | $21,230 | $24,587 | $32,051 | $45,840 | $0.19 | |||||||
| Effective Gross Income | $3,101,662 | $3,064,838 | $3,213,131 | $3,690,331 | $3,813,040 | $4,309,974 | $18.31 | |||||||
| Total Operating Expenses | $1,808,571 | $1,738,101 | $1,887,824 | $1,953,919 | $1,964,798 | $2,046,370 | $8.69 | |||||||
| Net Operating Income | $1,293,091 | $1,326,737 | $1,325,307 | $1,736,412 | $1,848,242 | $2,263,604 | $9.62 | |||||||
| Capital Expenditures | $0 | $0 | $0 | $0 | $0 | $69,600 | $0.30 | |||||||
| TI/LC | $0 | $0 | $0 | $0 | $0 | $306,554 | $1.30 | |||||||
| Net Cash Flow | $1,293,091 | $1,326,737 | $1,325,307 | $1,736,412 | $1,848,242 | $1,887,449 | $8.02 | |||||||
| Occupancy % | N/A | 69.7% | 72.5% | 80.0%(3) | 86.2%(4) | 85.6%(2) | ||||||||
| NOI DSCR (IO) | 1.45x | 1.49x | 1.49x | 1.95x | 2.07x | 2.54x | ||||||||
| NOI DSCR (P&I) | 1.06x | 1.09x | 1.09x | 1.43x | 1.52x | 1.86x | ||||||||
| NCF DSCR (IO) | 1.45x | 1.49x | 1.49x | 1.95x | 2.07x | 2.12x | ||||||||
| NCF DSCR (P&I) | 1.06x | 1.09x | 1.09x | 1.43x | 1.52x | 1.55x | ||||||||
| NOI Debt Yield | 6.3% | 6.5% | 6.5% | 8.5% | 9.0% | 11.0% | ||||||||
| NCF Debt Yield | 6.3% | 6.5% | 6.5% | 8.5% | 9.0% | 9.2% | ||||||||
| (1) | UW Base Rent includes gross up of vacant space and rent steps through May 2018. |
| (2) | The underwritten economic vacancy is 14.4%. |
| (3) | Increased occupancy is due to the County of Sonoma leasing an additional 14,066 SF in 2016 and 13,270 SF in 2017. |
| (4) | The Lakes and Waterfall Towers Properties’ physical occupancy is as of May 30, 2017. |
This is not a research report and was not prepared by the Underwriters’ research departments. Please see additional important information and qualifications at the end of this Term Sheet.
| T-143 |
| BANK 2017-BNK6 |
This material was prepared by sales, trading, banking or other non-research personnel of one of the following (or an affiliate thereof): Merrill Lynch, Pierce, Fenner & Smith Incorporated (together with its affiliates, “BofA Merrill Lynch”), Morgan Stanley & Co. LLC, Morgan Stanley & Co. International Limited, Morgan Stanley Japan Limited and/or Morgan Stanley Dean Witter Asia Limited (together with their affiliates, hereinafter “Morgan Stanley”), Wells Fargo Securities, LLC (together with its affiliates, “Wells Fargo”) or Drexel Hamilton, LLC (together with its affiliates, “Drexel”, and collectively with BofA Merrill Lynch, Morgan Stanley and Wells Fargo, the “Underwriters”). This material was not produced by an Underwriter’s research analyst, although it may refer to an Underwriter’s research analyst or research report. Unless otherwise indicated, these views (if any) are the author’s and may differ from those of the fixed income or equity research departments of the Underwriters or others in those firms.
This material may have been prepared by or in conjunction with the respective trading desks of the Underwriters that may deal as principal in or own or act as market maker or liquidity provider for the securities/instruments (or related derivatives) mentioned herein. The trading desk may have accumulated a position in the subject securities/instruments based on the information contained herein. Trading desk materials are not independent of the proprietary interests of the Underwriters, which may conflict with your interests. Each of the Underwriters may also perform or seek to perform investment banking services for the issuers of the securities and instruments mentioned herein.
The information contained in this material is subject to change, completion or amendment from time to time, and the information in this material supersedes information in any other communication relating to the securities referred to in this material. This material is not a solicitation to participate in any trading strategy, and is not an offer to sell any security or instrument or a solicitation of an offer to buy or sell any security or instrument in any jurisdiction where an offer, solicitation or sale is not permitted. Unless otherwise set forth in this material, any securities referred to in this material may not have been registered under the U.S. Securities Act of 1933, as amended, and, if not, may not be offered or sold absent an exemption therefrom. Recipients are required to comply with any legal or contractual restrictions on their purchase, holding, sale, exercise of rights or performance of obligations under any securities/instruments transaction.
The securities/instruments discussed in this material may not be suitable for all investors. This material has been prepared and issued by the Underwriters for intended distribution to market professionals and institutional investor clients. Other recipients should seek independent investment advice prior to making any investment decision based on this material. This material does not provide individually tailored investment advice or offer tax, regulatory, accounting or legal advice. Prior to entering into any proposed transaction, recipients should determine, in consultation with their own investment, legal, tax, regulatory and accounting advisors, the economic risks and merits, as well as the legal, tax, regulatory and accounting characteristics and consequences, of the transaction. You should consider this material as only a single factor in making an investment decision. The value of and income from investments may vary because of changes in interest rates, foreign exchange rates, default rates, prepayment rates, securities/instruments prices, market indexes, operational or financial conditions of companies or other factors. There may be time limitations on the exercise of options or other rights in securities/instruments transactions. Past performance is not necessarily a guide to future performance. Estimates of future performance are based on assumptions that may not be realized. Actual events may differ from those assumed and changes to any assumptions may have a material impact on any projections or estimates. Other events not taken into account may occur and may significantly affect the projections or estimates. Certain assumptions may have been made for modeling purposes only to simplify the presentation and/or calculation of any projections or estimates, and the Underwriters do not represent that any such assumptions will reflect actual future events. Accordingly, there can be no assurance that estimated returns or projections will be realized or that actual returns or performance results will not materially differ from those estimated herein. Some of the information contained in this document may be aggregated data of transactions in securities or other financial instruments executed by an Underwriter that has been compiled so as not to identify the underlying transactions of any particular customer.
Notwithstanding anything herein to the contrary, the Underwriters and each recipient hereof (and their employees, representatives, and other agents) may disclose to any and all persons, without limitation of any kind from the commencement of discussions, the U.S. federal and state income tax treatment and tax structure of the transaction and all materials of any kind (including opinions or other tax analyses) that are provided to it relating to the tax treatment and tax structure (as such terms are defined in Treasury Regulation 1.6011-4). For this purpose, “tax structure” is limited to facts relevant to the U.S. federal and state income tax treatment of the transaction and does not include information relating to the identity of the parties, their affiliates, agents or advisors. This authorization of tax disclosure is retroactively effective to the commencement of discussions with prospective investors regarding the transactions contemplated herein.
THE DISTRIBUTION OF THIS MATERIAL (A) IF MADE BY A PERSON WHO IS NOT AN AUTHORIZED PERSON UNDER THE FINANCIAL SERVICES AND MARKETS ACT 2000 (“FSMA”), IS BEING MADE ONLY TO, OR DIRECTED ONLY AT, PERSONS WHO (I) ARE OUTSIDE THE UNITED KINGDOM, OR (II) HAVE PROFESSIONAL EXPERIENCE IN MATTERS RELATING TO INVESTMENTS AND QUALIFY AS INVESTMENT PROFESSIONALS IN ACCORDANCE WITH ARTICLE 19(5) OF THE FINANCIAL SERVICES AND MARKETS ACT 2000 (FINANCIAL PROMOTION) ORDER 2005 (THE “FINANCIAL PROMOTION ORDER”), OR (III) ARE PERSONS FALLING WITHIN ARTICLE 49(2)(A) THROUGH (D) (HIGH NET WORTH COMPANIES, UNINCORPORATED ASSOCIATIONS, ETC.) OF THE FINANCIAL PROMOTION ORDER; AND (B) IF MADE BY A PERSON WHO IS AN AUTHORIZED PERSON UNDER THE FSMA, IS BEING MADE ONLY TO, OR DIRECTED ONLY AT, PERSONS WHO (I) ARE OUTSIDE THE UNITED KINGDOM, OR (II) HAVE PROFESSIONAL EXPERIENCE IN MATTERS RELATING TO INVESTMENTS AND QUALIFY AS INVESTMENT PROFESSIONALS IN ACCORDANCE WITH ARTICLE 14(5) OF THE FINANCIAL SERVICES AND MARKETS ACT 2000 (PROMOTION OF COLLECTIVE INVESTMENT SCHEMES) (EXEMPTIONS) ORDER 2001 (THE “PROMOTION OF COLLECTIVE INVESTMENT SCHEMES EXEMPTIONS ORDER”), OR (III) ARE PERSONS FALLING WITHIN ARTICLE 22(2)(A) THROUGH (D) (“HIGH NET WORTH COMPANIES, UNINCORPORATED ASSOCIATIONS, ETC.”) OF THE PROMOTION OF COLLECTIVE INVESTMENT SCHEMES EXEMPTIONS ORDER, OR (IV) ARE PERSONS TO WHOM THE ISSUING ENTITY MAY LAWFULLY BE PROMOTED IN ACCORDANCE WITH CHAPTER 4.12 OF THE UK FINANCIAL CONDUCT AUTHORITY’S CONDUCT OF BUSINESS SOURCEBOOK.
THE OFFERED CERTIFICATES HAVE NOT BEEN AND WILL NOT BE REGISTERED UNDER THE FINANCIAL INSTRUMENTS EXCHANGE ACT OF JAPAN (LAW NO. 25 OF 1948, AS AMENDED (THE “FIEL”)), AND EACH OF MERRILL LYNCH, PIERCE, FENNER & SMITH INCORPORATED, MORGAN STANLEY & CO. LLC, WELLS FARGO SECURITIES, LLC AND DREXEL HAMILTON, LLC HAS AGREED THAT IT WILL NOT OFFER OR SELL ANY OFFERED CERTIFICATES, DIRECTLY OR INDIRECTLY, IN JAPAN OR TO, OR FOR THE BENEFIT OF, ANY JAPANESE PERSON, OR TO OTHERS FOR REOFFERING OR RESALE, DIRECTLY OR INDIRECTLY, IN JAPAN OR TO ANY JAPANESE PERSON, EXCEPT PURSUANT TO AN EXEMPTION FROM THE REGISTRATION REQUIREMENTS OF, AND OTHERWISE IN COMPLIANCE WITH, THE FIEL AND ANY OTHER APPLICABLE LAWS AND REGULATIONS. FOR THE PURPOSES OF THIS PARAGRAPH, “JAPANESE PERSON” SHALL MEAN ANY PERSON RESIDENT IN JAPAN, INCLUDING ANY CORPORATION OR OTHER ENTITY ORGANIZED UNDER THE LAWS AND REGULATIONS OF JAPAN.