| | | FREE WRITING PROSPECTUS |
| | | FILED PURSUANT TO RULE 433 |
| | | REGISTRATION FILE NO.: 333-228375-03 |
| | | |
BANK 2019-BNK24
Free Writing Prospectus
Structural and Collateral Term Sheet
$1,225,920,621
(Approximate Total Mortgage Pool Balance)
$1,036,515,000
(Approximate Offered Certificates)
Banc of America Merrill Lynch Commercial Mortgage Inc.
as Depositor
Bank of America, National Association
Wells Fargo Bank, National Association
Morgan Stanley Mortgage Capital Holdings LLC
National Cooperative Bank, N.A.
as Sponsors and Mortgage Loan Sellers
Commercial Mortgage Pass-Through Certificates
Series 2019-BNK24
December 5, 2019
| BofA Securities | MORGAN STANLEY | WELLS FARGO SECURITIES |
| Co-Lead Bookrunner Manager | Co-Lead Bookrunner Manager | Co-Lead Bookrunner Manager |
| | | |
| Academy Securities, Inc. | | Drexel Hamilton |
| Co-Manager | | Co-Manager |
| | | |
STATEMENT REGARDING THIS FREE WRITING PROSPECTUS
The depositor has filed a registration statement (including a prospectus) with the SEC (File No. 333-228375) for the offering to which this communication relates. Before you invest, you should read the prospectus in that registration statement and other documents the depositor has filed with the SEC for more complete information about the depositor, the issuing entity and this offering. You may get these documents for free by visiting EDGAR on the SEC web site atwww.sec.gov. Alternatively, the depositor or any underwriter or any dealer participating in the offering will arrange to send you the prospectus if you request it by calling toll free 1-866-294-1322 or by email todg.Prospectus_Requests@baml.com.
This is not a research report and was not prepared by any Underwriter’s research department. Please see additional important information and qualifications at the end of this Term Sheet.
BANK 2019-BNK24
Neither this Term Sheet nor anything contained herein shall form the basis for any contract or commitment whatsoever.The information contained herein is preliminary as of the date hereof.This Term Sheet is subject to change, completion or amendment from time to time.The information contained herein will be superseded by similar information delivered to you as part of the Preliminary Prospectus.The information contained herein supersedes any such information previously delivered.The information contained herein should be reviewed only in conjunction with the entire Preliminary Prospectus.All of the information contained herein is subject to the same limitations and qualifications contained in the Preliminary Prospectus.The information contained herein does not contain all relevant information relating to the underlying mortgage loans or mortgaged properties.Such information is described in the Preliminary Prospectus.The information contained herein will be more fully described in the Preliminary Prospectus.The information contained herein should not be viewed as projections, forecasts, predictions or opinions with respect to value.Prior to making any investment decision, prospective investors are strongly urged to read the Preliminary Prospectus in its entirety.Neither the Securities and Exchange Commission nor any state securities commission has approved or disapproved of these securities or determined if this Term Sheet is truthful or complete.Any representation to the contrary is a criminal offense.
IMPORTANT NOTICE RELATING TO AUTOMATICALLY GENERATED EMAIL DISCLAIMERS
Any legends, disclaimers or other notices that may appear at the bottom of, or attached to, the email communication to which this Term Sheet may have been attached are not applicable to this Term Sheet and should be disregarded. Such legends, disclaimers or other notices have been automatically generated as a result of this Term Sheet having been sent via Bloomberg or another email system.
IMPORTANT NOTICE REGARDING THE CONDITIONS FOR THIS OFFERING OF ASSET-BACKED SECURITIES
THE ASSET-BACKED SECURITIES REFERRED TO IN THIS TERM SHEET ARE BEING OFFERED WHEN, AS AND IF ISSUED. IN PARTICULAR, YOU ARE ADVISED THAT THE ASSET-BACKED SECURITIES, AND THE ASSET POOL BACKING THEM, ARE SUBJECT TO MODIFICATION OR REVISION (INCLUDING, AMONG OTHER THINGS, THE POSSIBILITY THAT ONE OR MORE CLASSES OF SECURITIES MAY BE SPLIT, COMBINED OR ELIMINATED), AT ANY TIME PRIOR TO ISSUANCE OR AVAILABILITY OF A FINAL PROSPECTUS. AS A RESULT, YOU MAY COMMIT TO PURCHASE SECURITIES THAT HAVE CHARACTERISTICS THAT MAY CHANGE, AND YOU ARE ADVISED THAT ALL OR A PORTION OF THE SECURITIES MAY NOT BE ISSUED THAT HAVE THE CHARACTERISTICS DESCRIBED IN THIS TERM SHEET. OUR OBLIGATION TO SELL SECURITIES TO YOU IS CONDITIONED ON THE SECURITIES AND THE UNDERLYING TRANSACTION HAVING THE CHARACTERISTICS DESCRIBED IN THIS TERM SHEET. IF WE DETERMINE THAT THE FOREGOING CONDITION IS NOT SATISFIED IN ANY MATERIAL RESPECT, WE WILL NOTIFY YOU, AND NEITHER THE ISSUING ENTITY NOR ANY UNDERWRITER WILL HAVE ANY OBLIGATION TO YOU TO DELIVER ALL OR ANY PORTION OF THE SECURITIES WHICH YOU HAVE COMMITTED TO PURCHASE, AND THERE WILL BE NO LIABILITY BETWEEN US AS A CONSEQUENCE OF THE NON-DELIVERY.
This is not a research report and was not prepared by any Underwriter’s research department. Please see additional important information and qualifications at the end of this Term Sheet.
T-2
| BANK 2019-BNK24 | Structural Overview |
Offered Certificates
| | | | | | | | | |
| Class | Expected Ratings
(DBRS/Fitch/S&P)(1) | Approximate Initial
Certificate Balance
or Notional
Amount(2) | Approximate
Initial Credit
Support(3) | Pass-Through
Rate
Description | Expected
Weighted
Average Life
(Years)(4) | Expected
Principal
Window
(Months)(4) | Certificate
Principal
UW NOI
Debt
Yield(5) | Certificate
Principal
to Value
Ratio(6) |
| Class A-1 | AAA(sf)/AAAsf/AAA(sf) | $16,763,000 | 30.000% | (7) | 2.71 | 1-60 | 19.4% | 36.6% |
| Class A-SB | AAA(sf)/AAAsf/AAA(sf) | $26,123,000 | 30.000% | (7) | 7.21 | 60-111 | 19.4% | 36.6% |
| Class A-2 | AAA(sf)/AAAsf/AAA(sf) | (8) | 30.000% | (7) | (8) | (8) | 19.4% | 36.6% |
| Class A-3 | AAA(sf)/AAAsf/AAA(sf) | (8) | 30.000% | (7) | (8) | (8) | 19.4% | 36.6% |
| Class X-A | AAA(sf)/AAAsf/AAA(sf) | $815,237,000(9) | N/A | Variable IO(10) | N/A | N/A | N/A | N/A |
| Class X-B | AA(sf)/A-sf/NR | $221,278,000(9) | N/A | Variable IO(10) | N/A | N/A | N/A | N/A |
| Class A-S | AAA(sf)/AAAsf/AA+(sf) | $125,197,000 | 19.250% | (7) | 9.99 | 120-120 | 16.8% | 42.2% |
| Class B | AAA(sf)/AA-sf/NR | $49,496,000 | 15.000% | (7) | 9.99 | 120-120 | 16.0% | 44.5% |
| Class C | AA(low)(sf)/A-sf/NR | $46,585,000 | 11.000% | (7) | 9.99 | 120-120 | 15.3% | 46.5% |
Privately Offered Certificates(11)
| | | | | | | | | |
| | | | | | | | | |
| Class | Expected Ratings
(DBRS/Fitch/S&P)(1) | Approximate Initial
Certificate Balance
or Notional
Amount(2) | Approximate
Initial Credit
Support(3) | Pass-Through
Rate
Description | Expected
Weighted
Average Life
(Years)(4) | Expected
Principal
Window
(Months)(4) | Certificate
Principal
UW NOI
Debt
Yield(5) | Certificate
Principal
to Value
Ratio(6) |
| Class X-D | A(low)(sf)/BBB-sf/NR | $53,864,000(9) | N/A | Variable IO(10) | N/A | N/A | N/A | N/A |
| Class X-F | BBB(low)(sf)/BB-sf/NR | $24,749,000(9) | N/A | Variable IO(10) | N/A | N/A | N/A | N/A |
| Class X-G | BB(sf)/B-sf/NR | $11,646,000(9) | N/A | Variable IO(10) | N/A | N/A | N/A | N/A |
| Class X-H | NR/NR/NR | $37,850,589(9) | N/A | Variable IO(10) | N/A | N/A | N/A | N/A |
| Class D | A(low)(sf)/BBBsf/NR | $30,572,000 | 8.375% | (7) | 9.99 | 120-120 | 14.8% | 47.9% |
| Class E | BBB(high)(sf)/BBB-sf/NR | $23,292,000 | 6.375% | (7) | 9.99 | 120-120 | 14.5% | 49.0% |
| Class F | BB(high)(sf)/BB-sf/NR | $24,749,000 | 4.250% | (7) | 9.99 | 120-120 | 14.2% | 50.1% |
| Class G | BB(low)(sf)/B-sf/NR | $11,646,000 | 3.250% | (7) | 9.99 | 120-120 | 14.1% | 50.6% |
| Class H | NR/NR/NR | $37,850,589 | 0.000% | (7) | 9.99 | 120-120 | 13.6% | 52.3% |
Non-Offered Eligible Vertical Interest(11)
| Class | Expected Ratings
(DBRS/Fitch/S&P)(1) | Approximate Initial
Certificate Balance
or Notional
Amount(2) | Approximate
Initial Credit
Support(3) | Pass-Through
Rate
Description | Expected
Weighted
Average Life
(Years)(4) | Expected
Principal
Window
(Months)(4) | Certificate
Principal
UW NOI
Debt
Yield | Certificate
Principal
to Value
Ratio |
| RR Interest | NR/NR/NR | $61,296,031.03 | N/A | (12) | 9.76 | 1-120 | N/A | N/A |
| (1) | Ratings shown are those of DBRS, Inc. (“DBRS”), Fitch Ratings, Inc. (“Fitch”) and S&P Global Ratings, acting through Standard & Poor’s Financial Services LLC (“S&P”). Certain nationally recognized statistical rating organizations that were not hired by the depositor may use information they receive pursuant to Rule 17g-5 under the Securities Exchange Act of 1934, as amended, or otherwise to rate the certificates. There can be no assurance as to what ratings a non-hired nationally recognized statistical rating organization would assign. See “Risk Factors—Other Risks Relating to the Certificates—Nationally Recognized Statistical Rating Organizations May Assign Different Ratings to the Certificates; Ratings of the Certificates Reflect Only the Views of the Applicable Rating Agencies as of the Dates Such Ratings Were Issued; Ratings May Affect ERISA Eligibility; Ratings May Be Downgraded” and “Ratings” in the Preliminary Prospectus to be dated on or about the date hereof (the “Preliminary Prospectus”). Capitalized terms used but not defined herein have the meanings assigned to such terms in the Preliminary Prospectus. |
| (2) | Approximate, subject to a permitted variance of plus or minus 5% and further subject to the discussion in footnote (8) below. In addition, the notional amounts of the Class X-A, Class X-B, Class X-D, Class X-F, Class X-G and Class X-H certificates may vary depending upon the final pricing of the classes of principal balance certificates whose certificate balances comprise such notional amounts, and, if as a result of such pricing the pass-through rate of any class of the Class X-A, Class X-B, Class X-D, Class X-F, Class X-G or Class X-H certificates, as applicable, would be equal to zero at all times, such class of certificates will not be issued on the closing date of this securitization. |
| (3) | The approximate initial credit support percentages set forth for the certificates are approximate and, for the Class A-1, Class A-SB, Class A-2 and Class A-3 certificates, are represented in the aggregate. The RR Interest provides credit support only to the limited extent that it is allocated a portion of any losses incurred on the underlying mortgage loans, which such losses are allocated between it, on the one hand, and to the Non-Retained Certificates, on the other hand,pro rata in accordance with their respective Percentage Allocation Entitlements (as defined below). See “Credit Risk Retention” in the Preliminary Prospectus. |
| (4) | The Expected Weighted Average Life and Expected Principal Window during which distributions of principal would be received as set forth in the foregoing table with respect to each class of certificates having a certificate balance are based on the assumptions set forth under “Yield and Maturity Considerations—Weighted Average Life” in the Preliminary Prospectus and on the assumptions that there are no prepayments, modifications or losses in respect of the mortgage loans and that there are no extensions or forbearances of maturity dates or anticipated repayment dates of the mortgage loans. |
This is not a research report and was not prepared by any Underwriter’s research department. Please see additional important information and qualifications at the end of this Term Sheet.
T-3
| BANK 2019-BNK24 | Structural Overview |
| (5) | Certificate Principal UW NOI Debt Yield for any class of principal balance certificates (other than the RR Interest) is calculated as the product of (a) the weighted average UW NOI Debt Yield for the mortgage pool, multiplied by (b) a fraction, the numerator of which is the total initial certificate balance of all the principal balance certificates, and the denominator of which is the sum of (x) the total initial certificate balance of the subject class of principal balance certificates and all other classes of principal balance certificates (other than the RR Interest), if any, that are senior to such class and (y) the outstanding certificate balance of the RR Interest, multiplied by the applicable RR Interest Computation Percentage. The Certificate Principal UW NOI Debt Yields of the Class A-1, Class A-SB, Class A-2 and Class A-3 certificates are calculated in the aggregate for those classes as if they were a single class. With respect to any class of principal balance certificates, the “RR Interest Computation Percentage” is equal to a fraction, expressed as a percentage, the numerator of which is the total initial certificate balance of the subject class of principal balance certificates and all other classes of principal balance certificates (other than the RR Interest), if any, that are senior to such class, and the denominator of which is the sum of the total initial certificate balance of all the principal balance certificates (other than the RR Interest). |
| (6) | Certificate Principal to Value Ratio for any class of principal balance certificates (other than the RR Interest) is calculated as the product of (a) the weighted average Cut-off Date LTV Ratio of the mortgage pool, multiplied by (b) a fraction, the numerator of which is the sum of (x) the total initial certificate balance of the subject class of principal balance certificates and all other classes of principal balance certificates (other than the RR Interest), if any, that are senior to such class and (y) the outstanding certificate balance of the RR Interest, multiplied by the applicable RR Interest Computation Percentage, and the denominator of which is the total initial certificate balance of all the principal balance certificates. The Certificate Principal to Value Ratios of the Class A-1, Class A-SB, Class A-2 and Class A-3 certificates are calculated in the aggregate for those classes as if they were a single class. |
| (7) | The pass-through rate for each class of the Class A-1, Class A-SB, Class A-2, Class A-3, Class A-S, Class B, Class C, Class D, Class E, Class F, Class G and Class H certificates (which, together with the RR Interest, are referred to as the “principal balance certificates”) will be one of the following: (i) a fixed rateper annum, (ii) a variable rateper annum equal to the weighted average of the net mortgage interest rates on the mortgage loans for the related distribution date, (iii) a variable rateper annumequal to the lesser of (a) a fixed rate and (b) the weighted average of the net mortgage interest rates on the mortgage loans for the related distribution date or (iv) a variable rateper annum equal to the weighted average of the net mortgage interest rates on the mortgage loans for the related distribution date minus a specified percentage. For purposes of the calculation of the weighted average of the net mortgage interest rates on the mortgage loans for each distribution date, the net mortgage interest rates will be adjusted as necessary to a 30/360 basis. |
| (8) | The exact initial certificate balances of the Class A-2 and Class A-3 certificates are unknown and will be determined based on the final pricing of those classes of certificates. However, the initial certificate balances, weighted average lives and principal windows of the Class A-2 and Class A-3 certificates are expected to be within the applicable ranges reflected in the following chart. The aggregate initial certificate balance of the Class A-2 and Class A-3 certificates is expected to be approximately $772,351,000, subject to a variance of plus or minus 5%. |
| Class of Certificates | Expected Range of Initial Certificate
Balance | Expected Range of Weighted Average
Life (Years) | Expected Range of Principal Window
(Months) |
| Class A-2 | $250,000,000 - $375,000,000 | 9.76-9.81 | 111-119 / 111-119 |
| Class A-3 | $397,351,000 - $522,351,000 | 9.95-9.97 | 119-120 / 119-120 |
| (9) | The Class X-A, Class X-B, Class X-D, Class X-F, Class X-G and Class X-H certificates (collectively referred to as the “Class X certificates”) are notional amount certificates and will not be entitled to distributions of principal. The notional amount of the Class X-A certificates will be equal to the aggregate certificate balance of the Class A-1, Class A-SB, Class A-2 and Class A-3 certificates. The notional amount of the Class X-B certificates will be equal to the aggregate certificate balance of the Class A-S, Class B and Class C certificates. The notional amount of the Class X-D certificates will be equal to the aggregate certificate balance of the Class D and Class E certificates. The notional amount of each class of the Class X-F, Class X-G and Class X-H certificates will be equal to the certificate balance of the class of principal balance certificates that, with the addition of “X-“ has the same alphabetical designation as the subject class of Class X certificates. |
| (10) | The pass-through rate for the Class X-A certificates for any distribution date will be aper annum rate equal to the excess, if any, of (a) the weighted average of the net mortgage interest rates on the mortgage loans for the related distribution date, over (b) the weighted average of the pass-through rates on the Class A-1, Class A-SB, Class A-2 and Class A-3 certificates for the related distribution date, weighted on the basis of their respective certificate balances outstanding immediately prior to that distribution date. The pass-through rate for the Class X-B certificates for any distribution date will be aper annum rate equal to the excess, if any, of (a) the weighted average of the net mortgage interest rates on the mortgage loans for the related distribution date, over (b) the weighted average of the pass-through rates on the Class A-S, Class B and Class C certificates for the related distribution date, weighted on the basis of their respective certificate balances outstanding immediately prior to that distribution date. The pass-through rate for the Class X-D certificates for any distribution date will be aper annum rate equal to the excess, if any, of (a) the weighted average of the net mortgage interest rates on the mortgage loans for the related distribution date, over (b) the weighted average of the pass-through rates on the Class D and Class E certificates for the related distribution date, weighted on the basis of their respective certificate balances outstanding immediately prior to that distribution date. The pass-through rate for each class of the Class X-F, Class X-G and Class X-H certificates for any distribution date will be aper annum rate equal to the excess, if any, of (a) the weighted average of the net mortgage interest rates on the mortgage loans for the related distribution date, over (b) the pass-through rate for the related distribution date on the class of principal balance certificates that, with the addition of “X-“ has the same alphabetical designation as the subject class of Class X certificates. For purposes of the calculation of the weighted average of the net mortgage interest rates on the mortgage loans for each distribution date, the net mortgage interest rates will be adjusted as necessary to a 30/360 basis. |
| (11) | Not offered pursuant to the Preliminary Prospectus or this Term Sheet. Information provided in this Term Sheet regarding the characteristics of these certificates is provided only to enhance your understanding of the offered certificates. The privately offered certificates also include the Class V and Class R certificates, which do not have a certificate balance, notional amount, credit support, pass-through rate, rating, assumed final distribution date or rated final distribution date, and which are not shown in the chart. The Class V certificates represent a beneficial ownership interest held through the grantor trust in a specified percentage of certain excess interest in respect of mortgage loans having anticipated repayment dates, if any. The Class R certificates represent the beneficial ownership of the residual interest in each of the real estate mortgage investment conduits, as further described in the Preliminary Prospectus. |
| (12) | Although it does not have a specified pass-through rate (other than for tax reporting purposes), the effective pass-through rate for the RR Interest will be a variable rateper annumequal to the weighted average of the net mortgage interest rates on the mortgage loans for the related distribution date (in each case adjusted, if necessary, to accrue on the basis of a 360-day year consisting of twelve 30-day months). |
This is not a research report and was not prepared by any Underwriter’s research department. Please see additional important information and qualifications at the end of this Term Sheet.
T-4
| BANK 2019-BNK24 | Structural Overview |
Issue Characteristics
| Offered Certificates: | $1,036,515,000 (approximate) monthly pay, multi-class, commercial mortgage pass-through certificates, consisting of seven principal balance classes (Class A-1, Class A-SB, Class A-2, Class A-3, Class A-S, Class B and Class C) and two interest-only classes (Class X-A and Class X-B) |
| Co-Lead Managers and Joint Bookrunners: | BofA Securities, Inc., Wells Fargo Securities, LLC and Morgan Stanley & Co. LLC |
| Co-Managers: | Academy Securities, Inc. and Drexel Hamilton, LLC |
| Mortgage Loan Sellers: | Bank of America, National Association, Wells Fargo Bank, National Association, Morgan Stanley Mortgage Capital Holdings LLC, and National Cooperative Bank, N.A. |
| Rating Agencies: | DBRS, Fitch and S&P |
| Master Servicers: | Wells Fargo Bank, National Association and National Cooperative Bank, N.A. |
| Special Servicers: | Midland Loan Services, a Division of PNC Bank, National Association and National Cooperative Bank, N.A. |
| Certificate Administrator/ Certificate Registrar/Custodian: | Wells Fargo Bank, National Association |
| Trustee: | Wilmington Trust, National Association |
| Operating Advisor: | Park Bridge Lender Services LLC |
| Asset Representations Reviewer: | Park Bridge Lender Services LLC |
| Initial Directing Certificateholder: | Eightfold Real Estate Capital Fund V, L.P. or its affiliate |
| Risk Retention Consultation Party: | Bank of America, National Association |
| U.S. Credit Risk Retention: | For a discussion on the manner in which the U.S. credit risk retention requirements will be addressed by Bank of America, National Association, as the retaining sponsor, see “Credit Risk Retention” in the Preliminary Prospectus. |
| EU Risk Retention: | None of the sponsors or any other party to this transaction intends to retain a material net economic interest in the securitization constituted by the issue of the Certificates in a manner prescribed by Article 6 of European Union Regulation (EU) 2017/2402. In addition, no such person undertakes to take any action which may be required by any investor for the purposes of its compliance with any applicable requirement under such regulation. |
| Cut-off Date: | The mortgage loans will be considered part of the trust fund as of their respective cut-off dates. The cut-off date with respect to each mortgage loan is the respective due date for the monthly debt service payment that is due in December 2019 (or, in the case of any mortgage loan that has its first due date after December 2019, the date that would have been its due date in December 2019 under the terms of that mortgage loan if a monthly debt service payment were scheduled to be due in that month). |
| Expected Pricing Date: | Week of December 9, 2019 |
| Expected Closing Date: | December 19, 2019 |
| Determination Dates: | The 11th day of each month or, if the 11th day is not a business day, then the business day immediately following such 11th day. |
| Distribution Dates: | The 4th business day following each determination date. The first distribution date will be in January 2020. |
| Rated Final Distribution Date: | The distribution date in November 2062 |
| Interest Accrual Period: | Preceding calendar month |
| Payment Structure: | Sequential pay |
| Tax Treatment: | REMIC |
| Optional Termination: | 1.00% clean-up call (solely for the purposes of this calculation, if such right is being exercised after December 2029 and the Park Tower at Transbay mortgage loan is still an asset of the trust, then such mortgage loan will be excluded from the then-aggregate principal balance of the pool of mortgage loans and from the initial pool balance) |
| Minimum Denominations: | $10,000 for each class of Offered Certificates (other than Class X-A and Class X-B certificates); $1,000,000 for the Class X-A and Class X-B certificates |
| Settlement Terms: | DTC, Euroclear and Clearstream |
| Legal/Regulatory Status: | Each class of Offered Certificates is expected to be eligible for exemptive relief under ERISA. No class of Offered Certificates is SMMEA eligible. |
| Analytics: | The certificate administrator is expected to make available all distribution date statements, CREFC® reports and supplemental notices received by it to certain modeling financial services as described in the Preliminary Prospectus. |
| Bloomberg Ticker: | BANK 2019-BN24<MTGE><GO> |
| Risk Factors: | THE CERTIFICATES INVOLVE CERTAIN RISKS AND MAY NOT BE SUITABLE FOR ALL INVESTORS. SEE THE “RISK FACTORS” SECTION OF THE PRELIMINARY PROSPECTUS. |
This is not a research report and was not prepared by any Underwriter’s research department. Please see additional important information and qualifications at the end of this Term Sheet.
T-5
| BANK 2019-BNK24 | Structural Overview |
Structural Overview
| Allocation Between the RR Interest and the Non-Retained Certificates: | The aggregate amount available for distributions to the holders of the Certificates (including the RR Interest) on each distribution date (net of specified expenses of the issuing entity, including fees payable to, and costs and expenses reimbursable to, the master servicers, any primary servicers, the special servicers, the certificate administrator, the trustee, the operating advisor, the asset representations reviewer and CREFC®) will be allocated between amounts available for distribution to the holders of the RR Interest, on the one hand, and to all other Certificates (other than the Class R Certificates), referred to herein as the “Non-Retained Certificates”, on the other hand. The portion of such amount allocable to (a) the RR Interest will at all times be the product of such amount multiplied by 5% and (b) the Non-Retained Certificates will at all times be the product of such amount multiplied by the difference between 100% and the percentage set forth in clause (a) (each, the respective “Percentage Allocation Entitlement”). |
| Accrual: | Each class of Offered Certificates will accrue interest on a 30/360 basis. |
| Amount and Order of Distributions: | On each distribution date, the Non-Retained Certificates’ Percentage Allocation Entitlement of funds available for distribution from the mortgage loans, net of (i) any yield maintenance charges and prepayment premiums and (ii) any excess interest, will be distributed in the following amounts and order of priority: First, to the Class A-1, Class A-SB, Class A-2, Class A-3, Class X-A, Class X-B, Class X-D, Class X-F, Class X-G and Class X-H certificates, in respect of interest, up to an amount equal to, andpro rata in accordance with, the interest entitlements for those classes; Second, to the Class A-1, Class A-SB, Class A-2 and Class A-3 certificates as follows, to the extent of applicable available funds allocated to principal: either (i)(a)first, to principal on the Class A-SB certificates, until the certificate balance of the Class A-SB certificates is reduced to the planned principal balance for the related distribution date set forth in Annex E to the Preliminary Prospectus, and (b)second, to principal on each class of the Class A-1, Class A-2, Class A-3 and Class A-SB certificates, in that order, in each case until the certificate balance of such class of certificates has been reduced to zero, or (ii) if the certificate balance of each class of principal balance certificates other than the Class A-1, Class A-SB, Class A-2 and Class A-3 certificates and the RR Interest has been reduced to zero as a result of the allocation of losses on the mortgage loans to those certificates, to principal on the Class A-1, Class A-SB, Class A-2 and Class A-3 certificates,pro rata, without regard to the distribution priorities described above or the planned principal balance of the Class A-SB certificates; Third, to the Class A-1, Class A-SB, Class A-2 and Class A-3 certificates, first, up to an amount equal to, andpro rata based on, any previously unreimbursed losses on the mortgage loans allocable to principal that were previously borne by each such class and then in the amount of interest thereon; Fourth, to each class of the Class A-S, Class B and Class C certificates, in that order, in each case as follows: (a) to interest on such class of certificates in the amount of its interest entitlement; (b) to the extent of applicable available funds allocable to principal remaining after distributions in respect of principal to each class with a higher priority (as set forth in this clause or prior enumerated clauses set forth above), to principal on such class of certificates until its certificate balance has been reduced to zero; and (c) to reimburse such class of certificates, first, in the amount of any previously unreimbursed losses on the mortgage loans that were previously allocated to those certificates, then in the amount of interest thereon; Fifth, to the principal balance certificates (other than the Class A-1, Class A-SB, Class A-2, Class A-3, Class A-S, Class B and Class C certificates and the RR Interest) in the amounts and order of priority described in “Description of the Certificates—Distributions” in the Preliminary Prospectus; and Sixth, to the Class R certificates, any remaining amounts. |
| Interest and Principal Entitlements: | The interest entitlement of each class of Offered Certificates on each distribution date generally will be the interest accrued during the related interest accrual period on the related certificate balance or notional amount at the related pass-through rate, net of any prepayment interest shortfalls allocated to that class for such distribution date as described below. If prepayment interest shortfalls arise from voluntary prepayments on serviced mortgage loans during any collection period, the applicable master servicer is required to make a limited compensating interest payment to offset those shortfalls. See “Description of the Certificates—Prepayment Interest Shortfalls” in the Preliminary Prospectus. The remaining amount of prepayment interest shortfalls will be allocated between the RR Interest, on one hand, and the Non-Retained Certificates, on the other hand, in accordance with their respective Percentage Allocation Entitlements. The prepayment interest shortfalls allocated to the Non-Retained Certificates (other than the Class V Certificates) will be allocated among such classes of certificates entitled to interest, on apro rata basis, based on their respective amounts of accrued interest for the related distribution date, to reduce the interest entitlement on each such class of certificates. If a class receives less than the entirety of its interest entitlement on any distribution date, then the shortfall (excluding any shortfall due to prepayment interest shortfalls), together with interest thereon, will be added to its interest entitlement for the next succeeding distribution date. The aggregate principal distribution amount for each distribution date generally will be the aggregate amount of principal received or advanced in respect of the mortgage loans, net of any non-recoverable advances and interest thereon and any workout-delayed reimbursement amounts that are reimbursed to the applicable master servicer or the trustee during the related collection period. Non-recoverable advances and interest thereon are reimbursable from principal collections before reimbursement from other amounts. Workout-delayed reimbursement amounts will be reimbursable from principal collections. The Non-Retained Certificates and the RR Interest will be entitled to their respective Percentage Allocation Entitlements of the aggregate principal distribution amount. |
This is not a research report and was not prepared by any Underwriter’s research department. Please see additional important information and qualifications at the end of this Term Sheet.
T-6
| BANK 2019-BNK24 | Structural Overview |
| Special Servicer Compensation: | The principal compensation to be paid to a special servicer in respect of its special servicing activities will be the special servicing fee, the workout fee and the liquidation fee. The special servicing fee for each distribution date is calculated based on the outstanding principal balance of each serviced mortgage loan that is a specially serviced mortgage loan (and any related serviced companion loan) or as to which the related mortgaged property has become an REO property at the special servicing fee rate, which will be a rate equal to (a) with respect to Midland Loan Services, a Division of PNC Bank, National Association, the greater of (i) 0.25000%per annum and (ii) theper annumrate that would result in a special servicing fee for the related month of (x) $3,500 or (y) with respect to any mortgage loan with respect to which the risk retention consultation party is entitled to consult with such special servicer, for so long as the related mortgage loan is a specially serviced loan during the occurrence and continuance of a consultation termination event, $5,000, and (b) with respect to National Cooperative Bank, N.A., the greater of 0.25000%per annum and theper annumrate that would result in a special servicing fee of $1,000 for the related month. The special servicing fee will be payable monthly,first, from liquidation proceeds, insurance and condemnation proceeds, and other collections in respect of the related specially serviced mortgage loan or REO property and,then, from general collections on all the mortgage loans and any REO properties. Each special servicer will also be entitled to (i) liquidation fees generally equal to 1.0% (or, if such rate would result in an aggregate liquidation fee less than $25,000, then the liquidation fee rate will be equal to the lesser of (i) 3.0% and (ii) such lower rate as would result in an aggregate liquidation fee equal to $25,000) of liquidation proceeds and certain other collections in respect of a specially serviced mortgage loan (and any related serviced companion loan) or related REO property and of amounts received in respect of mortgage loan repurchases by the related mortgage loan sellers and (ii) workout fees generally equal to 1.0% of interest (other than post-ARD excess interest on mortgage loans with anticipated repayment dates and other than default interest) and principal payments made in respect of a rehabilitated mortgage loan (and any related serviced companion loan), subject to a floor of $25,000 with respect to any mortgage loan, whole loan or related REO property, and in the case of each of clause (i) and (ii), subject to certain adjustments and exceptions as described in the Preliminary Prospectus under “Pooling and Servicing Agreement—Servicing and Other Compensation and Payment of Expenses—Special Servicing Compensation”. With respect to any non-serviced mortgage loan, the related special servicer under the related other pooling and servicing agreement pursuant to which such mortgage loan is being serviced will be entitled to similar compensation as that described above with respect to such non-serviced mortgage loan under such other pooling and servicing agreement as further described in the Preliminary Prospectus, although any related fees may accrue at a different rate and there may be a higher (or no) cap on liquidation and workout fees. |
| Prepayment Premiums/Yield Maintenance Charges: | If any yield maintenance charge or prepayment premium is collected during any collection period with respect to any mortgage loan, then on the immediately succeeding distribution date, the certificate administrator will pay: (i)(a) to the holders of each class of the Class A-1, Class A-SB, Class A-2, Class A-3, Class A-S, Class B, Class C, Class D and Class E certificates, the product of (x) the Non-Retained Certificates’ Percentage Allocation Entitlement of such yield maintenance charge or prepayment premium, (y) the related Base Interest Fraction for such class and the applicable principal prepayment, and (z) a fraction, the numerator of which is equal to the amount of principal distributed to such class for that distribution date, and the denominator of which is the total amount of principal distributed to the Class A-1, Class A-SB, Class A-2, Class A-3, Class A-S, Class B, Class C, Class D and Class E certificates for that distribution date, (b) to the holders of the Class X-A certificates, the excess, if any, of (x) the product of (1) the Non-Retained Certificates’ Percentage Allocation Entitlement of such yield maintenance charge or prepayment premium and (2) a fraction, the numerator of which is equal to the amount of principal distributed to the Class A-1, Class A-SB, Class A-2 and Class A-3 certificates for that distribution date, and the denominator of which is the total amount of principal distributed to the Class A-1, Class A-SB, Class A-2, Class A-3, Class A-S, Class B, Class C, Class D and Class E certificates for that distribution date, over (y) the amount of such yield maintenance charge or prepayment premium distributed to the Class A-1, Class A-SB, Class A-2 and Class A-3 certificates as described above, (c) to the holders of the Class X-B certificates, the excess, if any, of (x) the product of (1) the Non-Retained Certificates’ Percentage Allocation Entitlement of such yield maintenance charge or prepayment premium and (2) a fraction, the numerator of which is equal to the amount of principal distributed to the Class A-S, Class B and Class C certificates for that distribution date, and the denominator of which is the total amount of principal distributed to the Class A-1, Class A-SB, Class A-2, Class A-3, Class A-S, Class B, Class C, Class D and Class E certificates for that distribution date, over (y) the amount of such yield maintenance charge or prepayment premium distributed to the Class A-S, Class B and Class C certificates as described above, and (d) to the holders of the Class X-D certificates, any remaining portion of the Non-Retained Certificates’ Percentage Allocation Entitlement of such yield maintenance charge or prepayment premium not distributed as described above, and (ii) to the RR Interest, its Percentage Allocation Entitlement of such yield maintenance charge or prepayment premium. All yield maintenance charges and prepayment premiums referred to above will be net of any liquidation fees payable therefrom.
No prepayment premiums or yield maintenance charges will be distributed to the holders of the Class X-F, Class X-G, Class X-H, Class F, Class G, Class H, Class V or Class R Certificates.
“Base Interest Fraction” means, with respect to any principal prepayment of any mortgage loan that provides for the payment of a yield maintenance charge or prepayment premium, and with respect to any class of principal balance certificates (other than the RR Interest), a fraction (A) the numerator of which is the greater of (x) zero and (y) the difference between (i) the pass-through rate on that class, and (ii) the applicable discount rate and (B) the denominator of which is the difference between (i) the mortgage interest rate on the related mortgage loan and (ii) the applicable discount rate; provided, that: under no circumstances will the Base Interest Fraction be greater than one; if the discount rate referred to above is greater than or equal to both the mortgage interest rate on the related mortgage loan and the pass-through rate on that class, then the Base Interest Fraction will |
This is not a research report and was not prepared by any Underwriter’s research department. Please see additional important information and qualifications at the end of this Term Sheet.
T-7
| BANK 2019-BNK24 | Structural Overview |
| | equal zero; and if the discount rate referred to above is greater than or equal to the mortgage interest rate on the related mortgage loan and is less than the pass-through rate on that class, then the Base Interest Fraction will be equal to 1.0. Consistent with the foregoing, the Base Interest Fraction is equal to: |
| | | (Pass-Through Rate – Discount Rate) | |
| | | (Mortgage Rate – Discount Rate) | |
| Realized Losses: | On each distribution date, immediately following the distributions to be made to the certificateholders on that date, the certificate administrator is required to calculate the amount, if any, by which (i) the aggregate stated principal balance of the mortgage loans, including any successor REO loans, expected to be outstanding immediately following that distribution date is less than (ii) the then aggregate certificate balance of the principal balance certificates after giving effect to distributions of principal on that distribution date. The Non-Retained Certificates’ Percentage Allocation Entitlement of such amount will be applied to the Class H, Class G, Class F, Class E, Class D, Class C, Class B and Class A-S certificates, in that order, in each case until the related certificate balance has been reduced to zero, and then to the Class A-1, Class A-SB, Class A-2 and Class A-3 certificates,pro rata based upon their respective certificate balances, until their respective certificate balances have been reduced to zero. The RR Interest’s Percentage Allocation Entitlement of such amount will be applied to the RR Interest until the related RR Interest balance has been reduced to zero. |
| Serviced Whole Loans: | The following mortgaged property secures a mortgage loan and one or morepari passu promissory notes (each, a “serviced companion loan”) that will be serviced pursuant to the related intercreditor agreement and the pooling and servicing agreement for this transaction: 1412 Broadway. With respect to such mortgaged property, the related mortgage loan, together with the related serviced companion loan(s), is referred to herein (for so long as it is serviced under the pooling and servicing agreement for this transaction) as a “serviced whole loan.” Each serviced companion loan is not part of the mortgage pool and may be contributed to one or more future securitization transactions (if not already securitized) or may be otherwise transferred at any time, subject to compliance with the related intercreditor agreement. See the table below entitled “Mortgage Loans with Pari Passu Companion Loans,” as well as “Description of the Mortgage Pool—The Whole Loans” in the Preliminary Prospectus, for additional information regarding such whole loan. |
| Non-Serviced Whole Loans: | Each of the following mortgaged properties or portfolio of mortgaged properties secures a mortgage loan (each, a “non-serviced mortgage loan”), one or morepari passu promissory notes and, in some cases, one or more generally subordinate promissory notes (each such promissory note, a “non-serviced companion loan”) that will be serviced pursuant to the related intercreditor agreement and the pooling and servicing agreement or trust and servicing agreement (referred to herein as a related “pooling and servicing agreement”) for another securitization transaction: 55 Hudson Yards, Jackson Park, Parklawn Building, Park Tower at Transbay, Giant Anchored Portfolio and ILPT Industrial Portfolio. With respect to each such mortgaged property or portfolio of mortgaged properties, the related mortgage loan, together with the related non-serviced companion loan(s), is referred to herein (for so long as it is serviced under the pooling and servicing agreement for another securitization transaction) as a “non-serviced whole loan.” Each non-serviced companion loan is not part of the mortgage pool and may be contributed to one or more future securitization transactions (if not already securitized) or may be otherwise transferred at any time, subject to compliance with the related intercreditor agreement. Servicing of each non-serviced whole loan will generally be directed by the holder of the related control note (or, if such control note is included in a securitization, the directing certificateholder thereunder (or other party designated thereunder to exercise the rights of such control note)), and such holder will have the right to replace the special servicer with respect to the related whole loan with or without cause. See the tables below entitled “Mortgage Loans with Pari Passu Companion Loans” and“Mortgage Loans with Subordinate Debt,” as well as “Description of the Mortgage Pool—The Whole Loans” in the Preliminary Prospectus, for additional information regarding each such whole loan. |
| Directing Certificateholder/ Controlling Class: | The “Directing Certificateholder” will be the Controlling Class Certificateholder (or its representative) selected by more than 50% (by certificate balance) of the Controlling Class Certificateholders;provided, that (1) absent that selection, (2) until a Directing Certificateholder is so selected or (3) upon receipt of a notice from a majority of the Controlling Class Certificateholders (by certificate balance) that a Directing Certificateholder is no longer designated, the Controlling Class Certificateholder that owns the largest aggregate certificate balance of the Controlling Class (or its representative) will be the Directing Certificateholder;provided, that (a) in the case of clause (3), if no one holder owns the largest aggregate certificate balance of the Controlling Class, then there will be no Directing Certificateholder until appointed in accordance with the terms of the pooling and servicing agreement, and (b) the certificate administrator and the other parties to the pooling and servicing agreement will be entitled to assume that the identity of the Directing Certificateholder has not changed until such parties receive written notice of a replacement of the Directing Certificateholder from a party holding the requisite interest in the Controlling Class (as confirmed by the certificate registrar), or the resignation of the then current Directing Certificateholder. As used herein, the term “Directing Certificateholder” means Controlling Class Certificateholder. The “Controlling Class” will be, as of any time of determination, the most subordinate class of Control Eligible Certificates then outstanding that has an aggregate certificate balance (as notionally reduced by any Cumulative Appraisal Reduction Amounts (as defined below) allocable to such class) at least equal to 25% of the initial certificate balance of that class; provided, that if at any time the certificate balances of the certificates other than the Control Eligible Certificates and the RR Interest have been reduced to zero as a result of principal payments on the mortgage loans, then the Controlling Class will be the most subordinate class of Control Eligible Certificates that has a certificate balance greater than zero without regard to any Cumulative Appraisal Reduction Amounts. |
This is not a research report and was not prepared by any Underwriter’s research department. Please see additional important information and qualifications at the end of this Term Sheet.
T-8
| BANK 2019-BNK24 | Structural Overview |
| | The Controlling Class as of the closing date will be the Class H certificates. The “Control Eligible Certificates” will be any of the Class F, Class G and Class H certificates. |
| Control Rights: | Prior to a Control Termination Event, the Directing Certificateholder will have certain consent and consultation rights under the pooling and servicing agreement with respect to certain major decisions and other matters. A “Control Termination Event” will occur when (i) the Class F certificates have a certificate balance (taking into account the application of the allocable portion of any Cumulative Appraisal Reduction Amounts to notionally reduce the certificate balance thereof) of less than 25% of the initial certificate balance of that class; or (ii) a holder of the Class F certificates is the majority controlling class certificateholder and has irrevocably waived its right, in writing, to exercise any of the rights of the controlling class certificateholder and such rights have not been reinstated to a successor controlling class certificateholder;provided that a Control Termination Event will be deemed not continuing in the event that the certificate balances of the principal balance certificates other than the Control Eligible Certificates and the RR Interest have been reduced to zero as a result of principal payments on the mortgage loans. After the occurrence of a Control Termination Event but prior to the occurrence of a Consultation Termination Event, the Directing Certificateholder will not have any consent rights, but the Directing Certificateholder will have certain non-binding consultation rights under the pooling and servicing agreement with respect to certain major decisions and other matters. A “Consultation Termination Event” will occur when (i) no class of Control Eligible Certificates has a certificate balance (without regard to the application of the allocable portion of any Cumulative Appraisal Reduction Amounts) at least equal to 25% of the initial certificate balance of that class; or (ii) a holder of a majority of the Class F certificates is the majority controlling class certificateholder and has irrevocably waived its right, in writing, to exercise any of the rights of the controlling class certificateholder and such rights have not been reinstated to a successor controlling class certificateholder (provided that no Consultation Termination Event resulting solely from the operation of clause (ii) will be deemed to have existed or be in continuance with respect to a successor majority holder of the Class F certificates that has not irrevocably waived its right to exercise any of the rights of the controlling class certificateholder);provided that a Consultation Termination Event will be deemed not continuing in the event that the certificate balances of the principal balance certificates other than the Control Eligible Certificates and the RR Interest have been reduced to zero as a result of principal payments on the mortgage loans. After the occurrence of a Consultation Termination Event, the Directing Certificateholder will not have any consent or consultation rights, except with respect to any rights expressly set forth in the pooling and servicing agreement, and the operating advisor will retain certain non-binding consultation rights under the pooling and servicing agreement with respect to certain major decisions and other matters. Notwithstanding the proviso to the definitions of “Control Termination Event” and “Consultation Termination Event”, a Control Termination Event and a Consultation Termination Event will each be deemed to have occurred with respect to any Excluded Loan with respect to the Directing Certificateholder or the holder of the majority of the Controlling Class, and neither the Directing Certificateholder nor any Controlling Class Certificateholder will have any consent or consultation rights with respect to the servicing of such Excluded Loan. An “Excluded Loan” means (a) with respect to the Directing Certificateholder or the holder of the majority of the Controlling Class, a mortgage loan or whole loan with respect to which, as of any date of determination, the Directing Certificateholder or the holder of the majority of the Controlling Class is a Borrower Party or (b) with respect to the Risk Retention Consultation Party or the holder of the majority of the RR Interest, a mortgage loan or whole loan with respect to which, as of any date of determination, the Risk Retention Consultation Party or the holder of the majority of the RR Interest is a Borrower Party. It is expected that there will be no Excluded Loans with respect to this securitization on the Closing Date. “Borrower Party” means a borrower, a mortgagor, a manager of a mortgaged property, the holder of a mezzanine loan that has been accelerated or as to which foreclosure or enforcement proceedings have been commenced against the equity collateral pledged to secure the related mezzanine loan, or any Borrower Party Affiliate. With respect to a mortgage loan secured by a residential cooperative property, a person will not be considered a “Borrower Party” solely by reason of such person holding one or more cooperative unit loans that are secured by direct equity interests in the related borrower or owning one or more residential cooperative units comprising the related mortgaged property as a result of any foreclosure, transfer in lieu of foreclosure or other exercise of remedies with respect to any such unit loan(s). “Borrower Party Affiliate” means, with respect to a borrower, a mortgagor, a manager of a mortgaged property or the holder of a mezzanine loan that has been accelerated or as to which foreclosure or enforcement proceedings have been commenced against the equity collateral pledged to secure the related mezzanine loan, (a) any other person controlling or controlled by or under common control with such borrower, mortgagor, manager or mezzanine lender, as applicable, or (b) any other person owning, directly or indirectly, 25% or more of the beneficial interests in such borrower, mortgagor, manager or mezzanine lender, as applicable. For the purposes of this definition, “control” when used with respect to any specified person means the power to direct the management and policies of such person, directly or indirectly, whether through the ownership of voting securities, by contract or otherwise and the terms “controlling” and “controlled” have meanings correlative to the foregoing. Notwithstanding any of the foregoing to the contrary, if any mortgage loan is part of a whole loan, the Directing Certificateholder’s consent and/or consultation rights with respect thereto may be limited as described in the Preliminary Prospectus. In particular, with respect to each non-serviced whole loan, the Directing Certificateholder will only have certain consultation rights with respect to certain major decisions and other matters related to such whole loan, in each case only prior to a Control Termination Event or Consultation Termination Event, as applicable. In addition, with respect to any serviced A/B whole loan, for so long as the holder of the related subordinate companion loan is the controlling note holder, the holder of such subordinate |
This is not a research report and was not prepared by any Underwriter’s research department. Please see additional important information and qualifications at the end of this Term Sheet.
T-9
| BANK 2019-BNK24 | Structural Overview |
| | companion loan (rather than the Directing Certificateholder) will be entitled to exercise such consent and consultation rights with respect to such whole loan. |
| Appraisal Reduction Amounts and Collateral Deficiency Amounts: | An “Appraisal Reduction Amount” generally will be created in the amount, if any, by which the principal balance of a required appraisal loan (which is a mortgage loan with respect to which certain defaults, modifications or insolvency events have occurred as further described in the Preliminary Prospectus) plus other amounts overdue or advanced in connection with such mortgage loan exceeds 90% of the appraised value of the related mortgaged property plus certain escrows and reserves (including letters of credit) held with respect to the mortgage loan. A mortgage loan will cease to be subject to an Appraisal Reduction Amount when it has been brought current for at least three consecutive months, no additional event of default is foreseeable in the reasonable judgment of the applicable special servicer and no other circumstances exist that would cause such mortgage loan or any related companion loan to be a specially serviced loan; however, a “Collateral Deficiency Amount” may exist with respect to any mortgage loan that is modified into an AB loan structure (an “AB Modified Loan”) and remains a corrected mortgage loan and, if so, will generally equal the excess of (i) the stated principal balance of such AB Modified Loan (taking into account the related junior note(s) and anypari passu notes included therein), over (ii) the sum of (in the case of a whole loan, solely to the extent allocable to the subject mortgage loan) (x) the most recent appraised value for the related mortgaged property or mortgaged properties, plus (y) solely to the extent not reflected or taken into account in such appraised value (or in the calculation of any related Appraisal Reduction Amount) and to the extent on deposit with, or otherwise under the control of, the lender as of the date of such determination, any capital or additional collateral contributed by the related borrower at the time the mortgage loan became (and as part of the modification related thereto) such AB Modified Loan for the benefit of the related mortgaged property or mortgaged properties (provided that in the case of an non-serviced mortgage loan, the amounts set forth in this clause (y) will be taken into account solely to the extent relevant information is received by the applicable master servicer), plus (z) any other escrows or reserves (in addition to any amounts set forth in the immediately preceding clause (y) and solely to the extent not reflected or taken into account in the calculation of any related Appraisal Reduction Amount) held by the lender in respect of such AB Modified Loan as of the date of such determination, which such excess, for the avoidance of doubt, will be determined separately from and exclude any related Appraisal Reduction Amounts. As used herein, a “Cumulative Appraisal Reduction Amount” will be the sum of any Appraisal Reduction Amounts and any Collateral Deficiency Amounts. Any Appraisal Reduction Amount in respect of any non-serviced mortgage loan generally will be calculated in accordance with the other servicing agreement pursuant to which such mortgage loan is being serviced, which calculations are expected to be generally similar to those provided for in the pooling and servicing agreement for this transaction. If any mortgage loan is part of a whole loan, any Appraisal Reduction Amount or Collateral Deficiency Amount will (or effectively will) be calculated in respect of such whole loan taken as a whole and allocated, to the extent provided in the related intercreditor agreement and the related pooling and servicing agreement,first, to any related subordinate companion loan, andsecond, to the related mortgage loan and anypari passu companion loan on apro rata basis by unpaid principal balance. Appraisal Reduction Amounts will proportionately reduce the interest portion of debt service advances required to be made in respect of the related mortgage loan. Appraisal Reduction Amounts and Collateral Deficiency Amounts (in each case, to the extent of the Non-Retained Certificates’ Percentage Allocation Entitlement thereof) will be taken into account in determining the identity of the controlling class entitled to appoint the Directing Certificateholder, the existence of a Control Termination Event and the allocation and/or exercise of voting rights for certain purposes (see“Directing Certificateholder/Controlling Class” above). |
| Appraised-Out Class: | An “Appraised-Out Class” is any class of Control Eligible Certificates, the certificate balance of which (taking into account the application of the Non-Retained Certificates’ Percentage Allocation Entitlement of any Appraisal Reduction Amounts or Collateral Deficiency Amounts to notionally reduce the certificate balance of such class) has been reduced to less than 25% of its initial certificate balance. Any Appraised-Out Class may not exercise any direction, control, consent and/or similar rights of the Controlling Class until such time, if any, as such class is reinstated as the Controlling Class, and the rights of the Controlling Class will be exercised by the next most senior class of Control Eligible Certificates that is not an Appraised-Out Class, if any, during such period. |
| Appraisal Remedy: | The holders of the majority (by certificate balance) of an Appraised-Out Class (such holders, the “Requesting Holders”) will have the right, at their sole expense, to require the applicable special servicer to order (or, with respect to a non-serviced mortgage loan, require the applicable master servicer to request from the applicable non-serviced special servicer) a second appraisal of any mortgage loan (or serviced whole loan) for which an appraisal reduction event has occurred or as to which there exists a Collateral Deficiency Amount. With respect to any serviced mortgage loan, the applicable special servicer will be required to use its reasonable efforts to ensure that such appraisal is delivered within 30 days from receipt of the Requesting Holders’ written request and will be required to cause such appraisal to be prepared on an “as-is” basis by an MAI appraiser. With respect to any non-serviced mortgage loan, the applicable master servicer will be required to use commercially reasonable efforts to obtain such second appraisal from the applicable non-serviced special servicer and to forward such second appraisal to the applicable special servicer. Upon receipt of such supplemental appraisal, the applicable master servicer (for Collateral Deficiency Amounts on non-serviced mortgage loans), the non-serviced special servicer (for Appraisal Reduction Amounts on non-serviced mortgage loans to the extent provided for in the related pooling and servicing agreement and applicable intercreditor agreement) and the applicable special servicer (for any serviced mortgage loan) will be required to determine, in accordance with |
This is not a research report and was not prepared by any Underwriter’s research department. Please see additional important information and qualifications at the end of this Term Sheet.
T-10
| BANK 2019-BNK24 | Structural Overview |
| | the Servicing Standard, whether, based on its assessment of such supplemental appraisal, any recalculation of the applicable Appraisal Reduction Amount or Collateral Deficiency Amount is warranted and, if so warranted, such person will be required to recalculate such Appraisal Reduction Amount or Collateral Deficiency Amount, as applicable, based upon such supplemental appraisal and (for any serviced mortgage loan) receipt of information from the applicable master servicer as described above. If required by any such recalculation, the applicable Appraised-Out Class will be reinstated as the Controlling Class and each Appraised-Out Class will, if applicable, have its related certificate balance notionally restored to the extent required by such recalculation of the Appraisal Reduction Amount or Collateral Deficiency Amount, if applicable. In addition, the Requesting Holders of any Appraised-Out Class will have the right to challenge the Appraisal Reduction Amount and to require the applicable special servicer to order an additional appraisal of any serviced mortgage loan as to which there exists a Collateral Deficiency Amount if an event has occurred at, or with respect to, the related mortgaged property or mortgaged properties that would have a material effect on its or their appraised value, and such special servicer is required to use reasonable efforts to obtain an appraisal from an MAI appraiser reasonably acceptable to such special servicer within 30 days from receipt of the Requesting Holders’ written request. |
| Sale of Defaulted Loans: | Under certain circumstances the applicable special servicer may be required to use reasonable efforts to solicit offers for a defaulted serviced mortgage loan (and any related companion loan (to the extent provided under the related intercreditor agreement) and/or related REO properties). The Directing Certificateholder will not have a right of first refusal to purchase a defaulted loan. If the applicable special servicer does not receive an offer at least equal to the outstanding principal balance plus all accrued and unpaid interest and outstanding costs and expenses and certain other amounts specified in the pooling and servicing agreement (the “Par Purchase Price”), the applicable special servicer may purchase the defaulted loan or REO property at the Par Purchase Price or may accept the first cash offer received from any person that is determined to be a fair price for such defaulted loan or REO property. If multiple offers are received during the period designated by the applicable special servicer for receipt of offers, such special servicer is generally required to select the highest offer. The applicable special servicer will be required to determine whether any cash offer constitutes a fair price for any defaulted loan or REO property if the highest offeror is a person other than a party to the pooling and servicing agreement for this transaction (the “PSA”), the Directing Certificateholder, the Risk Retention Consultation Party, any sponsor, any Borrower Party, any independent contractor engaged by a special servicer, the trustee for the securitization of a related companion loan (with respect to a whole loan if it is a defaulted loan), any related companion loan holder or its representative, any holder of a related mezzanine loan or any known affiliate of any of the preceding entities (each, an “Interested Person”). If an offer is made by an Interested Person, the trustee will be required to determine (based upon the most recent appraisal conducted in accordance with the terms of the PSA) whether the offer constitutes a fair price for the defaulted loan or REO property unless (i) the offer is equal to or greater than the applicable Par Purchase Price and (ii) the offer is the highest offer received. Absent an offer at least equal to the Par Purchase Price, no offer from an Interested Person will constitute a fair price unless (x) it is the highest offer received and (y) at least two other offers are received from independent third parties. Neither the trustee nor any of its affiliates may make an offer for or purchase any specially serviced loan or REO property. Notwithstanding any of the foregoing to the contrary, the applicable special servicer is not required to accept the highest offer and may accept a lower offer for a defaulted loan or REO property if such special servicer determines, in accordance with the Servicing Standard (and subject to the requirements of any related intercreditor agreement), that a rejection of such offer would be in the best interests of the certificateholders and any related companion loan holders as a collective whole as if they constituted a single lender (and with respect to a serviced A/B whole loan, taking into account the subordinate nature of any related subordinate companion loan), so long as such lower offer was not made by such special servicer or any of its affiliates. If title to any mortgaged property is acquired by the trust fund, the applicable special servicer will generally be required to sell such mortgaged property prior to the close of the third calendar year beginning after the year of acquisition. The foregoing applies to mortgage loans serviced under the PSA. With respect to any non-serviced whole loan, if the special servicer under the applicable pooling and servicing agreement determines to sell the related controlling companion loan if it becomes a defaulted loan, then the applicable special servicer will be required to sell the related whole loan, including the related mortgage loan included in the BANK 2019-BNK24 securitization trust and the relatedpari passucompanion loan(s) and, under certain circumstances, any subordinate companion loan(s), as a single loan. In connection with any such sale, the special servicer under the applicable pooling and servicing agreement will be required to follow procedures substantially similar to those set forth above. |
| Risk Retention Consultation Party: | A risk retention consultation party may be appointed by the holder or holders of more than 50% of the RR Interest, by certificate balance. The majority RR Interest holder will have a continuing right to appoint, remove or replace the risk retention consultation party in its sole discretion. This right may be exercised at any time and from time to time. Except with respect to an Excluded Loan as to such party or the holder of the majority of the RR Interest, the risk retention consultation party will be entitled to consult with the applicable special servicer, upon request of the risk retention consultation party, with respect to certain material servicing actions proposed by such special servicer; provided, that prior to the occurrence and continuance of a Consultation Termination Event, such mortgage loan must also be a specially serviced mortgage loan. |
| Appointment and Replacement of Special Servicers: | The Directing Certificateholder will appoint the initial special servicers as of the closing date. Prior to the occurrence and continuance of a Control Termination Event, either special servicer may generally be replaced by the Directing Certificateholder with or without cause at any time. |
This is not a research report and was not prepared by any Underwriter’s research department. Please see additional important information and qualifications at the end of this Term Sheet.
T-11
| BANK 2019-BNK24 | Structural Overview |
| | After the occurrence and during the continuance of a Control Termination Event and upon (a) the written direction of holders of principal balance certificates evidencing not less than 25% of the voting rights of all classes of certificates (other than the RR Interest) entitled to principal (taking into account the application of Cumulative Appraisal Reduction Amounts to notionally reduce the certificate balances of classes to which such Cumulative Appraisal Reduction Amounts are allocable) requesting a vote to replace the applicable special servicer with a replacement special servicer, (b) payment by such requesting holders to the certificate administrator of all reasonable fees and expenses to be incurred by the certificate administrator in connection with administering such vote and (c) delivery by such holders of a rating agency confirmation from each applicable rating agency, the certificate administrator will be required to promptly post such notice on its internet website and by mail and conduct the solicitation of votes of all certificates in such regard, which requisite affirmative votes must be received within 180 days of the posting of such notice. Upon the written direction of holders of at least 66 2/3% of a Certificateholder Quorum, the trustee will be required to immediately replace the applicable special servicer with a qualified replacement special servicer designated by such holders of certificates. After the occurrence and during the continuance of a Consultation Termination Event, if the operating advisor determines that the applicable special servicer is not performing its duties as required under the pooling and servicing agreement or is otherwise not acting in accordance with the Servicing Standard, the operating advisor may also recommend the replacement of such special servicer. The operating advisor’s recommendation to replace such special servicer must be confirmed by an affirmative vote of holders of principal balance certificates evidencing at least a majority of the aggregate voting rights (taking into account the application of any Cumulative Appraisal Reduction Amounts to notionally reduce the respective certificate balances) of all principal balance certificates on an aggregate basis (which requisite affirmative vote must be received within 180 days of posting of the notice of the operating advisor’s recommendation to the certificate administrator’s website). A “Certificateholder Quorum” means, in connection with any solicitation of votes in connection with the replacement of a special servicer or the asset representations reviewer, the holders of certificates evidencing at least 50% of the aggregate voting rights (taking into account the application of realized losses and, other than with respect to the termination of the asset representations reviewer, any Cumulative Appraisal Reduction Amounts to notionally reduce the certificate balance of the certificates) of all classes of certificates entitled to principal (other than the RR Interest) on an aggregate basis. With respect to each serviced whole loan, any holder of a relatedpari passu companion loan, following a servicer termination event with respect to the applicable special servicer that affects such holder, will be entitled to direct the trustee (and the trustee will be required) to terminate such special servicer solely with respect to such serviced whole loan. A replacement special servicer will be selected by the trustee or, prior to a Control Termination Event, by the Directing Certificateholder;provided, that any successor special servicer appointed to replace the special servicer with respect to such whole loan cannot be the entity (or its affiliate) that was terminated at the direction of the holder of the relatedpari passucompanion loan. Notwithstanding any of the foregoing to the contrary, with respect to any serviced A/B whole loans as to which a subordinate companion loan holder is the related controlling note holder, the holder of the related control note will be entitled to replace the applicable special servicer with respect to such whole loan at any time, with or without cause, and while it is a serviced whole loan, no other party may replace the applicable special servicer for such whole loan unless there is a servicer termination event with respect thereto. With respect to any non-serviced whole loan, the BANK 2019-BNK24 trust, as holder of the related mortgage loan, has the right to terminate the applicable special servicer under the related pooling and servicing agreement if a servicer termination event occurs, with respect to such special servicer that affects the trust in its capacity as such holder. Such rights may be exercised by the Directing Certificateholder prior to a Consultation Termination Event (or the operating advisor, following the occurrence and during the continuance of a Consultation Termination Event). The successor special servicer will be selected pursuant to the applicable pooling and servicing agreement by the related directing holder prior to a control termination event under such pooling and servicing agreement. |
| Servicing Standard: | Each master servicer and each special servicer is obligated to service and administer the mortgage loans (and, if applicable, the serviced companion loans) in accordance with the definition of the “Servicing Standard” described in the Preliminary Prospectus and the terms of the pooling and servicing agreement, provided that each non-serviced mortgage loan, if any, will be serviced by another master servicer or special servicer under the pooling and servicing agreement with respect to the securitization of a related companion loan, which entities will be obligated to service and administer such non-serviced mortgage loan pursuant to a similar standard set forth in the related pooling and servicing agreement. |
| Excluded Special Servicer: | If a special servicer obtains knowledge that it has become a Borrower Party with respect to any mortgage loan (an “Excluded Special Servicer Loan”), such special servicer will be required to resign as special servicer of that Excluded Special Servicer Loan. Prior to the occurrence of a Control Termination Event, the Directing Certificateholder will be required to appoint (and may remove and replace with or without cause) a separate special servicer that is not a Borrower Party (an “Excluded Special Servicer”) with respect to any Excluded Special Servicer Loan, unless such Excluded Special Servicer Loan is also an Excluded Loan with respect to the Directing Certificateholder or the holder of the majority of the Controlling Class. For avoidance of doubt, with respect to a mortgage loan secured by a residential cooperative property, a person will not be considered a borrower party solely by reason of such person holding one or more cooperative unit loans that are secured by direct equity interests in the related borrower or owning one or more residential cooperative units comprising the related mortgaged property as a result of any foreclosure, transfer in lieu of foreclosure or other exercise of remedies with respect to any such unit loan(s). After the occurrence and during the continuance of a Control Termination Event, if at any time the applicable Excluded Special Servicer Loan is also an Excluded Loan with respect to the Directing Certificateholder or the holder of the majority of the Controlling Class or if the Directing |
This is not a research report and was not prepared by any Underwriter’s research department. Please see additional important information and qualifications at the end of this Term Sheet.
T-12
| BANK 2019-BNK24 | Structural Overview |
| | Certificateholder is entitled to appoint the Excluded Special Servicer but does not so appoint within 30 days of notice of such resignation, the resigning special servicer will be required to use reasonable efforts to select the related Excluded Special Servicer. Any Excluded Special Servicer will be required to perform all of the obligations of the applicable special servicer and will be entitled to all special servicing compensation with respect to such Excluded Special Servicer Loan earned while the related mortgage loan is an Excluded Special Servicer Loan. |
Liquidated
Loan Waterfall: | On liquidation of any mortgage loan, all net liquidation proceeds related to the mortgage loan (but not any related companion loan) will be applied so that amounts allocated as a recovery of accrued and unpaid interest will not, in the first instance, include any delinquent interest that was not advanced as a result of Appraisal Reduction Amounts (or, if a non-recoverability determination was made, delinquent interest that would not have been advanced as a result of Appraisal Reduction Amounts in the absence of such non-recoverability determination) or accrued on the portion of the stated principal balance thereof equal to any related Collateral Deficiency Amount in effect from time to time and as to which no advance was made (collectively, the “Subordinated Interest Amount”). After the adjusted interest amount is so allocated, any remaining liquidation proceeds will be allocated to pay principal on the mortgage loan until the unpaid principal amount of the mortgage loan has been reduced to zero. Any remaining liquidation proceeds will then be allocated to pay the Subordinated Interest Amount. |
| Operating Advisor: | The operating advisor will be required to perform certain review duties if a Control Termination Event has occurred and is continuing, which will generally include a limited annual review of, and the preparation of a report regarding, certain actions of the applicable special servicer with respect to the resolution and/or liquidation of specially serviced loans. The review and report generally will be based on any asset status reports and additional information delivered to the operating advisor by such special servicer. In addition, if a Control Termination Event has occurred and is continuing, the applicable special servicer must consult with the operating advisor (in addition to the Directing Certificateholder if no Consultation Termination Event has occurred and is continuing) in connection with major decisions with respect to mortgage loans. Furthermore, under certain circumstances, but only if a Consultation Termination Event has occurred and is continuing, the operating advisor may recommend the replacement of the applicable special servicer as described above under “—Appointment and Replacement of Special Servicers”; however, the operating advisor will not have any rights or obligations with respect to a non-serviced whole loan. If a Consultation Termination Event has occurred and is continuing, the operating advisor may be removed and replaced without cause upon the affirmative direction of certificates owners holding not less than 75% of the voting rights of all certificates (taking into account the application of Cumulative Appraisal Reduction Amounts), following a proposal from certificate owners holding not less than 25% of the voting rights of all certificates (taking into account the application of Cumulative Appraisal Reduction Amounts). The certificateholders who initiate a vote on a termination and replacement of the operating advisor without cause must cause the payment of the fees and expenses incurred in the replacement. In addition, in the event there are no classes of certificates outstanding other than the Control Eligible Certificates, the RR Interest and the Class X-F, Class X-G, Class X-H, Class V and Class R certificates, then all of the rights and obligations of the operating advisor under the PSA will terminate without payment of any penalty or termination fee (other than any rights or obligations that accrued prior to the date of such termination (including accrued and unpaid compensation) and other than indemnification rights arising out of events occurring prior to such termination). See “Pooling and Servicing Agreement—The Operating Advisor—Termination of the Operating Advisor Without Cause” in the Preliminary Prospectus. |
| Asset Representations Reviewer: | The asset representations reviewer will be required to review certain delinquent mortgage loans after a specified delinquency threshold has been met and the required percentage of certificateholders vote to direct a review as described below. The asset representations reviewer will be entitled to the Asset Representations Reviewer Fee with respect to such review. See “Pooling and Servicing Agreement—The Asset Representations Reviewer” in the Preliminary Prospectus. The certificate administrator will be required to notify certificateholders if the specified delinquency threshold has been met as described in the Preliminary Prospectus under “—The Asset Representations Reviewer”. If certificateholders evidencing not less than 5.0% of the voting rights request a vote to commence an asset review, and if subsequently (i) a majority of those certificateholders who cast votes and (ii) a majority of an Asset Review Quorum authorizes an asset review within 150 days of the request for a vote, the asset representations reviewer will be required to conduct an asset review of delinquent loans. The asset representations reviewer may be terminated and replaced without cause. Upon (i) the written direction of certificateholders evidencing not less than 25% of the voting rights (without regard to the application of any Cumulative Appraisal Reduction Amounts) requesting a vote to terminate and replace the asset representations reviewer with a proposed successor asset representations reviewer that is an eligible asset representations reviewer, and (ii) payment by such holders to the certificate administrator of the reasonable fees and expenses to be incurred by the certificate administrator in connection with administering such vote, the certificate administrator will be required to promptly provide notice to all certificateholders and the asset representations reviewer of such request by posting such notice on its internet website, and by mailing such notice to all certificateholders and the asset representations reviewer. Upon the written direction of certificateholders evidencing at least 75% of a Certificateholder Quorum (without regard to the application of any Cumulative Appraisal Reduction Amounts), the trustee will be required to terminate all of the rights and obligations of the asset representations reviewer under the pooling and servicing agreement (other than any rights or obligations that accrued prior to the date of such termination and other than indemnification rights arising out of events occurring prior to such termination) by written notice to the asset representations reviewer, and the proposed successor asset representations reviewer will be appointed. See “Pooling and Servicing Agreement—The Asset Representations Reviewer” in the Preliminary Prospectus. |
This is not a research report and was not prepared by any Underwriter’s research department. Please see additional important information and qualifications at the end of this Term Sheet.
T-13
| BANK 2019-BNK24 | Structural Overview |
| | An “Asset Review Quorum” means, in connection with any solicitation of votes to authorize an Asset Review as described above, the holders of certificates evidencing at least 5.0% of the aggregate voting rights represented by all certificates that have voting rights. |
| Dispute Resolution Provisions: | The mortgage loan sellers will be subject to the dispute resolution provisions set forth in the PSA to the extent those provisions are triggered with respect to any mortgage loan sold to the depositor by a mortgage loan seller, and such mortgage loan seller will be obligated under the related mortgage loan purchase agreement to comply with all applicable provisions and to take part in any mediation or arbitration proceedings that may result. Generally, in the event that a Repurchase Request is not “Resolved” within 180 days after the related mortgage loan seller receives such Repurchase Request, then the enforcing servicer will be required to send a notice to the first certificateholder (or beneficial owner) to deliver a certificateholder repurchase request with respect to the mortgage loan (the “Initial Requesting Certificateholder”) (if any) and to the certificate administrator (which will be required to make such notice available to certificateholders via the certificate administrator’s website) indicating the enforcing servicer’s intended course of action with respect to the Repurchase Request. If (a) the enforcing servicer’s intended course of action with respect to the Repurchase Request does not involve pursuing further action to exercise rights against the related mortgage loan seller with respect to the Repurchase Request and the Initial Requesting Certificateholder, if any, or any other certificateholder or certificate owner wishes to exercise its right to refer the matter to mediation (including nonbinding arbitration) or arbitration, or (b) the enforcing servicer’s intended course of action is to pursue further action to exercise rights against the related mortgage loan seller with respect to the Repurchase Request but the Initial Requesting Certificateholder, if any, or any other certificateholder or certificate owner does not agree with the dispute resolution method selected by the enforcing servicer, then the Initial Requesting Certificateholder, if any, or such other certificateholder or certificate owner may deliver a written notice to the enforcing servicer indicating its intent to exercise its right to refer the matter to either mediation or arbitration. “Resolved” means, with respect to a Repurchase Request, (i) that the related material defect or breach has been cured, (ii) the related mortgage loan has been repurchased in accordance with the related mortgage loan purchase agreement, (iii) a mortgage loan has been substituted for the related mortgage loan in accordance with the related mortgage loan purchase agreement, (iv) the applicable mortgage loan seller has made a loss of value payment, (v) a contractually binding agreement has been entered into between the enforcing servicer, on behalf of the issuing entity, and the related mortgage loan seller that settles the related mortgage loan seller’s obligations under the related mortgage loan purchase agreement, or (vi) the related mortgage loan is no longer property of the issuing entity as a result of a sale or other disposition in accordance with the pooling and servicing agreement. See “Pooling and Servicing Agreement—Dispute Resolution Provisions” in the Preliminary Prospectus. |
| Investor Communications: | The certificate administrator is required to include on any Form 10-D any request received from a certificateholder to communicate with other certificateholders related to certificateholders exercising their rights under the terms of the PSA. Any certificateholder wishing to communicate with other certificateholders regarding the exercise of its rights under the terms of the PSA will be able to deliver a written request signed by an authorized representative of the requesting investor to the certificate administrator. |
| Deal Website: | The certificate administrator will be required to maintain a deal website which will include, among other items: (a) summaries of asset status reports prepared by a special servicer, (b) inspection reports, (c) appraisals, (d) various “special notices” described in the Preliminary Prospectus, (e) the “Investor Q&A Forum” and (f) a voluntary “Investor Registry”. Investors may access the deal website following execution of a certification and confidentiality agreement. |
This is not a research report and was not prepared by any Underwriter’s research department. Please see additional important information and qualifications at the end of this Term Sheet.
T-14
BANK 2019-BNK24 | Collateral Overview |
Mortgage Loan Sellers | No. of
Mortgage
Loans | No. of
Mortgaged
Properties | Aggregate
Cut-off Date
Balance | % of
Pool(1) |
Bank of America, National Association | 11 | 30 | $368,277,500 | 30.0% |
Morgan Stanley Mortgage Capital Holdings LLC | 16 | 24 | $311,656,049 | 25.4% |
Wells Fargo Bank, National Association | 10 | 16 | $237,301,590 | 19.4% |
National Cooperative Bank, N.A.(2) | 32 | 32 | $108,685,481 | 8.9% |
Wells Fargo Bank, National Association; Morgan Stanley Mortgage Capital Holdings LLC (3) | 1 | 1 | $100,000,000 | 8.2% |
Bank of America, National Association; Wells Fargo Bank, National Association (4) | 1 | 1 | $100,000,000 | 8.2% |
Total: | 71 | 104 | $1,225,920,621 | 100.0% |
Pool Statistics
Aggregate Cut-off Date Balance: | $1,225,920,621 |
Number of Mortgage Loans: | 71 |
Average Cut-off Date Balance per Mortgage Loan: | $17,266,488 |
Number of Mortgaged Properties: | 104 |
Average Cut-off Date Balance per Mortgaged Property: | $11,787,698 |
Weighted Average Mortgage Rate: | 3.5376% |
% of Pool Secured by 5 Largest Mortgage Loans: | 36.8% |
% of Pool Secured by 10 Largest Mortgage Loans: | 59.3% |
% of Pool Secured by ARD Loans(5): | 4.1% |
Weighted Average Original Term to Maturity (months)(5): | 120 |
Weighted Average Remaining Term to Maturity (months)(5): | 119 |
Weighted Average Seasoning (months): | 1 |
% of Pool Secured by Single Tenant Mortgaged Properties: | 8.2% |
% of Pool Secured by Refinance Loans: | 57.2% |
% of Pool Secured by Acquisition Loans: | 29.9% |
% of Pool Secured by Recapitalization Loans: | 12.9% |
Additional Debt
| |
% of Pool with Pari Passu Mortgage Debt: | 38.4% |
% of Pool with Subordinate Mortgage Debt(6): | 18.4% |
Credit Statistics(7)(8)
| |
Weighted Average UW NOI DSCR: | 3.36x |
Weighted Average UW NOI Debt Yield(9): | 13.6% |
Weighted Average UW NCF DSCR: | 3.23x |
Weighted Average UW NCF Debt Yield(9): | 13.0% |
Weighted Average Cut-off Date LTV Ratio(9)(10): | 52.3% |
Weighted Average Maturity Date LTV Ratio(9)(10): | 50.4% |
Footnotes are set forth on the following page.
This is not a research report and was not prepared by any Underwriters’ research department. Please see additional important information and qualifications at the end of this Term Sheet.
T-15
BANK 2019-BNK24 | Collateral Overview |
Weighted Average Original Amortization Term (months)(11): | 368 |
Weighted Average Remaining Amortization Term (months)(11): | 368 |
% of Pool Interest Only through Maturity: | 71.1% |
% of Pool Amortizing Balloon: | 13.7% |
% of Pool Interest Only followed by Amortizing Balloon: | 11.2% |
% of Pool Interest Only ARD: | 4.1% |
Lockboxes
| |
% of Pool with Hard Lockboxes: | 50.4% |
% of Pool with Springing Lockboxes: | 27.6% |
% of Pool with Soft Lockboxes: | 12.5% |
% of Pool with No Lockboxes: | 9.5% |
Reserves
| |
% of Pool Requiring Tax Reserves: | 69.2% |
% of Pool Requiring Insurance Reserves: | 25.7% |
% of Pool Requiring Replacement Reserves: | 63.0% |
% of Pool Requiring TI/LC Reserves(12): | 57.2% |
Call Protection
| |
% of Pool with lockout period, followed by defeasance until open period: | 75.4% |
% of Pool with lockout period, followed by defeasance or the greater of a prepayment premium and yield maintenance until open period: | 10.2% |
% of Pool with no lockout period. Greater of a prepayment premium and yield maintenance followed by prepayment premium until open period: | 8.9% |
% of Pool with lockout period, followed by yield maintenance until open period: | 4.1% |
% of Pool with lockout period, followed by the greater of a prepayment premium and yield maintenance until open period: | 1.5% |
(1) | Unless otherwise indicated, all references to “% of Pool” in this Term Sheet reflect a percentage of the aggregate principal balance of the mortgage pool as of the Cut-off Date, after application of all payments of principal due during or prior to December 2019. |
(2) | Twenty-eight (28) of the thirty-two (32) mortgage loans for which National Cooperative Bank, N.A. is the mortgage loan seller were originated by its parent company, National Consumer Cooperative Bank, and transferred to National Cooperative Bank, N.A. Each such mortgage loan originated by National Consumer Cooperative Bank was underwritten pursuant to National Cooperative Bank, N.A.’s underwriting guidelines. |
(3) | The 55 Hudson Yards mortgage loan was co-originated by Wells Fargo Bank, National Association and Morgan Stanley Bank, N.A. Such mortgage loan is evidenced by two promissory notes: (i) note A-1-C5 with an outstanding principal balance of $75,000,000 as of the Cut-off Date, as to which Wells Fargo Bank, National Association is acting as mortgage loan seller; and (ii) note A-3-C5, with an outstanding principal balance of $25,000,000 as of the Cut-off Date, as to which Morgan Stanley Mortgage Capital Holdings LLC is acting as mortgage loan seller. |
(4) | The Jackson Park mortgage loan was co-originated by Bank of America, N.A. and Wells Fargo Bank, National Association. Such mortgage loan is evidenced by two promissory notes: (i) note A-7, with an outstanding principal balance of $50,000,000 as of the Cut-off Date, as to which Bank of America, N.A. is acting as mortgage loan seller; and (ii) note A-8, with an outstanding principal balance of $50,000,000 as of the Cut-off Date, as to which Wells Fargo Bank, National Association is acting as mortgage loan seller. |
(5) | With respect to any ARD Loan, unless otherwise indicated, references in this Term Sheet to the applicable “maturity date” or “maturity” refer to the applicable anticipated repayment date with respect to such ARD Loan, and such applicable anticipated repayment date is treated as its maturity date for all purposes hereof. |
(6) | Twenty-three (23) of the mortgage loans, each of which is secured by a residential cooperative property, currently have in place subordinate secured lines of credit to the related mortgage borrowers that permit future advances (such loans, collectively, the “Subordinate Coop LOCs”). The percentage figure expressed as “% of Pool with Subordinate Mortgage Debt” is determined as a percentage of the initial pool balance and does not take into account any Subordinate Coop LOCs and future subordinate debt (whether or not secured by the mortgaged property), if any, that may be permitted under the terms of any mortgage loan or the pooling and servicing agreement. See “Description of the Mortgage Pool—Additional Indebtedness—Other Secured Indebtedness” and “Description of the Mortgage Pool—Additional Debt Financing for Mortgage Loans Secured by Residential Cooperatives” in the Preliminary Prospectus. |
(7) | With respect to any mortgage loan that is part of a whole loan, unless otherwise indicated, all LTV, DSCR and Debt Yield calculations in this Term Sheet include any related pari passu companion loans and exclude any subordinate companion loans, as applicable. Additionally, LTV, DSCR and Debt Yield figures in this Term Sheet are calculated for mortgage loans without regard to any additional indebtedness that may be incurred at a future date. For mortgaged properties securing residential cooperative mortgage loans all LTV, DSCR and Debt Yield calculations do not take into account any subordinate debt (whether or not secured by the related mortgaged property), that currently exists or is allowed under the terms of any mortgage loan. With respect to any leased fee loans, the SF/Units and Balance per SF/Unit figures in this Term Sheet are based on the size of the non-collateral improvements. |
(8) | For mortgaged properties securing residential cooperative mortgage loans, all DSCR and Debt Yield calculations for each such mortgaged property is calculated using underwritten net operating Income or underwritten net cash flow, as applicable, for the related residential cooperative property which is the projected net operating income or net cash flow, as applicable, reflected in the most recent appraisal obtained by or otherwise in the possession of the related mortgage loan seller as of the Cut-off Date. All LTV ratio calculations are based upon the appraised value of the residential cooperative property determined as if such residential cooperative property is operated as a residential cooperative, inclusive of the amount of the underlying debt encumbering such residential cooperative property. |
(9) | With respect to certain mortgage loans, debt yields and LTVs (such as, for example, UW NOI Debt Yield, UW NCF Debt Yield, Cut-off Date LTV Ratio or Maturity Date LTV Ratio) have been calculated based on a principal balance that is net of a holdback or earnout reserve. Such mortgage loans are identified under the definitions of “Underwritten NOI Debt Yield”, “Underwritten NCF Debt Yield” and “Cut-off Date LTV Ratio” set forth under “Description of the Mortgage Pool—Certain Calculations and Definitions” in the Preliminary Prospectus. |
(10) | The LTV ratios set forth in this Term Sheet are generally based on the “as-is” values of the related mortgaged properties; provided that the “as-is” value for a portfolio of mortgaged properties may include a premium relating to the valuation of the mortgaged properties as a whole rather than as the sum of individually valued mortgaged properties; provided, further, that such LTV ratios may be based on “as-stabilized”, “as complete” or other contingent values in certain cases in which reserves have been established at origination for the applicable condition or circumstance that is expected to result in stabilization provided, further, that such LTV ratios may have been calculated based on a principal balance that is net of a holdback or earnout reserve. See the definition of “Appraised Value” under “Description of the Mortgage Pool—Certain Calculations and Definitions” in the Preliminary Prospectus. |
(11) | Excludes mortgage loans that provide for payments of interest only through the related maturity date or anticipated repayment date, as applicable. |
(12) | Excludes hospitality, multifamily and self storage properties. |
This is not a research report and was not prepared by any Underwriters’ research department. Please see additional important information and qualifications at the end of this Term Sheet.
T-16
BANK 2019-BNK24 | Characteristics of the Mortgage Loans |
Top 10 Mortgage Loans or Groups of Cross-Collateralized Mortgage Loans(1) |
| | | | | | | | | | | | | | | | | | | | | | | | | |
Loan
No. | | Mortgage
Loan
Seller | | Property Name | | City | | State | | Property Type | | Cut-off Date
Balance | | % of
Pool | | SF/Units/
Rooms | | Cut-off Date
Balance per SF/Unit/Room | | UW
NCF
DSCR | | UW NOI
Debt Yield | | Cut-off
Date LTV | | Maturity
Date LTV |
1 | | WFB;MSMCH | | 55 Hudson Yards | | New York | | NY | | Office | | $100,000,000 | | 8.2% | | 1,431,212 | | $660 | | 3.53x | | 11.0% | | 39.4% | | 39.4% |
2 | | BANA;WFB | | Jackson Park | | Long Island City | | NY | | Multifamily | | $100,000,000 | | 8.2% | | 1,871 | | $293,960 | | 3.92x | | 13.0% | | 34.4% | | 34.4% |
3 | | MSMCH | | 1412 Broadway | | New York | | NY | | Office | | $100,000,000 | | 8.2% | | 421,396 | | $498 | | 1.92x | | 7.5% | | 58.3% | | 58.3% |
4 | | MSMCH | | Bronx Multifamily Portfolio II | | Bronx | | NY | | Multifamily | | $77,000,000 | | 6.3% | | 526 | | $146,388 | | 1.85x | | 7.3% | | 67.7% | | 67.7% |
5 | | WFB | | DoubleTree New Orleans | | New Orleans | | LA | | Hospitality | | $74,000,000 | | 6.0% | | 367 | | $201,635 | | 3.08x | | 13.3% | | 60.7% | | 60.7% |
6 | | BANA | | Parklawn Building | | Rockville | | MD | | Office | | $65,400,000 | | 5.3% | | 1,283,646 | | $204 | | 2.68x | | 9.4% | | 60.0% | | 60.0% |
7 | | BANA | | Austin Marriott Portfolio | | Austin | | TX | | Hospitality | | $62,300,000 | | 5.1% | | 602 | | $103,488 | | 2.27x | | 14.0% | | 59.7% | | 53.9% |
8 | | WFB | | Galleria 57 | | New York | | NY | | Office | | $52,000,000 | | 4.2% | | 179,562 | | $290 | | 2.44x | | 8.7% | | 38.0% | | 38.0% |
9 | | BANA | | Park Tower at Transbay | | San Francisco | | CA | | Office | | $50,000,000 | | 4.1% | | 764,659 | | $719 | | 2.93x | | 10.2% | | 49.1% | | 49.1% |
10 | | BANA | | West LA Multifamily Portfolio | | Los Angeles | | CA | | Multifamily | | $45,800,000 | | 3.7% | | 96 | | $477,083 | | 1.95x | | 7.0% | | 61.2% | | 61.2% |
| | | | Total/Wtd. Avg. | | | | | | | | $726,500,000 | | 59.3% | | | | | | 2.73x | | 10.3% | | 52.0% | | 51.5% |
(1) | With respect to any mortgage loan that is part of a whole loan, unless otherwise indicated, all LTV, DSCR, Debt Yield and Balance per SF/Unit/Room calculations in this Term Sheet include any related pari passu companion loans and exclude any subordinate companion loans, as applicable. Additionally, LTV, DSCR, Debt Yield and Balance per SF/Unit/Room figures in this Term Sheet are calculated for mortgage loans without regard to any additional indebtedness that may be incurred at a future date. With respect to any leased fee loans, the SF/Units/Rooms and Balance per SF/Unit/Room figures in this Term Sheet are based on the size of the non-collateral improvements. |
This is not a research report and was not prepared by any Underwriter’s research department. Please see additional important information and qualifications at the end of this Term Sheet.
T-17
BANK 2019-BNK24 | Characteristics of the Mortgage Loans |
Mortgage Loans with Pari Passu Companion Loans |
Loan
No. | | Mortgage Loan Seller | | Property Name | | Mortgage Loan Cut-off Date Balance | | Aggregate Pari Passu Companion Loan Cut-off Date Balance | | Combined Cut-off Date Balance | | Lead Servicing Agreement | | Master Servicer | | Special Servicer | | Control Rights | | Combined UW NCF DSCR(1) | | Combined UW NOI Debt Yield(1) | | Combined Cut-off Date LTV(1) |
1 | | WFB;MSMCH | | 55 Hudson Yards | | $100,000,000 | | $845,000,000 | | $945,000,000 | | Hudson Yards 2019-55HY | | Wells Fargo | | CWCapital | | Hudson Yards 2019-55HY | | 3.53x | | 11.0% | | 39.4% |
2 | | BANA;WFB | | Jackson Park | | $100,000,000 | | $450,000,000 | | $550,000,000 | | JAX 2019-LIC | | Wells Fargo | | Aegon | | JAX 2019-LIC | | 3.92x | | 13.0% | | 34.4% |
3 | | MSMCH | | 1412 Broadway | | $100,000,000 | | $110,000,000 | | $210,000,000 | | BANK 2019-BNK24 | | Wells Fargo | | Midland | | BANK 2019-BNK24 | | 1.92x | | 7.5% | | 58.3% |
6 | | BANA | | Parklawn Building | | $65,400,000 | | $196,200,000 | | $261,600,000 | | MSC 2019-L3 | | Wells Fargo | | LNR | | MSC 2019-L3 | | 2.68x | | 9.4% | | 60.0% |
9 | | BANA | | Park Tower at Transbay | | $50,000,000 | | $500,000,000 | | $550,000,000 | | BANK 2019-BNK21 | | Wells Fargo | | Rialto | | BANK 2019-BNK21 | | 2.93x | | 10.2% | | 49.1% |
12 | | WFB | | Giant Anchored Portfolio | | $30,000,000 | | $67,000,000 | | $97,000,000 | | CGCMT 2019-C7 | | Wells Fargo | | Midland | | CGCMT 2019-C7 | | 1.52x | | 9.1% | | 74.3% |
15 | | BANA | | ILPT Industrial Portfolio | | $25,080,000 | | $189,320,000 | | $214,400,000 | | MSC 2019-L3 | | Wells Fargo | | Situs | | (2) | | 5.05x | | 14.8% | | 39.2% |
(1) | DSCR, Debt Yield and LTV calculations include any related pari passu companion loans and exclude any subordinate companion loans, as applicable. |
(2) | The initial directing holder is the holder of the related Note B-1 until the occurrence of a control appraisal event under the related intercreditor agreement, at which time the directing holder will be the directing certificateholder (or other designated party) under the related lead servicing agreement. See “Description of the Mortgage Pool—The Whole Loans” in the Prospectus. |
This is not a research report and was not prepared by any Underwriter’s research department. Please see additional important information and qualifications at the end of this Term Sheet.
T-18
BANK 2019-BNK24 | Characteristics of the Mortgage Loans |
Mortgage Loans with Subordinate Debt(1) |
Loan No. | | Mortgage Loan Seller | | Property Name | | Mortgage Loan Cut-off Date Balance | | Cut-off Date Balance per Unit/SF | | Subordinate Debt Cut-off Date Balance | | UW NCF DSCR | | UW NOI Debt Yield | | Cut-off Date LTV | | Whole Loan UW
NCF DSCR(2) | | Whole Loan UW NOI Debt Yield(2) | | Whole Loan Cut-off Date LTV(2) |
1 | | WFB;MSMCH | | 55 Hudson Yards | | $100,000,000 | | $660 | | $300,000,000 | | 3.53x | | 11.0% | | 39.4% | | 2.68x | | 8.3% | | 51.9% |
2 | | BANA;WFB | | Jackson Park | | $100,000,000 | | $293,960 | | $450,000,000 | | 3.92x | | 13.0% | | 34.4% | | 2.15x | | 7.1% | | 62.5% |
15 | | BANA | | ILPT Industrial Portfolio | | $25,080,000 | | $26 | | $135,600,000 | | 5.05x | | 14.8% | | 39.2% | | 2.47x | | 9.1% | | 64.0% |
(1) | In addition, twenty-three (23) of the mortgage loans, each of which is secured by a residential cooperative property, currently have in place Subordinate Coop LOCs that permit future advances. See “Description of the Mortgage Pool—Additional Indebtedness—Other Secured Indebtedness” and “Description of the Mortgage Pool—Additional Debt Financing for Mortgage Loans Secured by Residential Cooperatives” in the Preliminary Prospectus. |
(2) | Whole Loan UW NCF DSCR, Whole Loan UW NOI Debt Yield and Whole Loan Cut-off Date LTV figures shown above are calculated based on any related pari passu notes and any related subordinate note(s). |
This is not a research report and was not prepared by any Underwriter’s research department. Please see additional important information and qualifications at the end of this Term Sheet.
T-19
BANK 2019-BNK24 | Characteristics of the Mortgage Loans |
Prior Securitization History(1) |
Loan No. | | Mortgage Loan Seller | | Property Name | | City | | State | | Property Type | | Cut-off Date Balance | | % of Pool | | SF/Units | | Cut-off
Date
Balance
per SF/Unit(2) | | UW
NCF
DSCR(2)(3) | | UW
NOI
Debt
Yield(2)(3) | | Cut-off
Date
LTV(2) | | Maturity Date
LTV(2) | | Prior
Securitization |
8 | | WFB | | Galleria 57 | | New York | | NY | | Office | | $52,000,000 | | 4.2% | | 179,562 | | $290 | | 2.44x | | 8.7% | | 38.0% | | 38.0% | | COMM 2013-LC13 |
10 | | BANA | | West LA Multifamily Portfolio | | Los Angeles | | CA | | Multifamily | | $45,800,000 | | 3.7% | | 96 | | $477,083 | | 1.95x | | 7.0% | | 61.2% | | 61.2% | | FREMF 2010-K7 |
24 | | MSMCH | | Haven at Highland Knolls | | Katy | | TX | | Multifamily | | $14,000,000 | | 1.1% | | 139 | | $100,719 | | 1.90x | | 7.9% | | 66.7% | | 66.7% | | FREMF 2018-KF43 |
25 | | MSMCH | | Stanford Bridge | | Irvington | | NY | | Office | | $13,500,000 | | 1.1% | | 131,574 | | $103 | | 3.40x | | 12.6% | | 60.0% | | 60.0% | | WFRBS 2014-C19 |
42 | | NCB | | Crestwood Apartment Owners Corp. | | Kew Gardens | | NY | | Multifamily | | $4,250,000 | | 0.3% | | 71 | | $59,859 | | 4.55x | | 20.8% | | 18.8% | | 16.3% | | CSFB 2004-C1 |
56 | | NCB | | The Colonial House Tenant Corp. | | New Rochelle | | NY | | Multifamily | | $2,500,000 | | 0.2% | | 60 | | $41,667 | | 6.13x | | 27.6% | | 24.9% | | 21.4% | | MSC 2003-IQ6 |
59 | | MSMCH | | Callaway Self Storage | | Callaway | | FL | | Self Storage | | $2,400,000 | | 0.2% | | 34,763 | | $69 | | 2.39x | | 11.5% | | 51.6% | | 51.6% | | M360 2018-CRE1 |
62 | | NCB | | 300 West 17th Street Housing Development Fund Corporation | | New York | | NY | | Multifamily | | $2,146,515 | | 0.2% | | 31 | | $69,242 | | 8.14x | | 43.8% | | 9.8% | | 7.6% | | CSFB 2004-C1 |
66 | | NCB | | 130 Centre Avenue Apartments, Inc. | | New Rochelle | | NY | | Multifamily | | $1,350,000 | | 0.1% | | 30 | | $45,000 | | 5.52x | | 21.0% | | 27.0% | | 27.0% | | CSFB 2003-C3 |
| | | | Total | | | | | | | | $137,946,515 | | 11.3% | | | | | | | | | | | | | | |
(1) | Includes mortgage loans for which all or a portion of the previously existing debt was most recently securitized in conduit securitizations, based on information provided by the related borrower or obtained through searches of a third-party database. The information has not otherwise been confirmed by the mortgage loan sellers. With respect to any mortgage loan that is part of a whole loan, unless otherwise indicated, all LTV, DSCR, Debt Yield and Cut-off Date Balance per SF/Unit calculations include any related pari passu companion loans and exclude any related subordinate companion loans, as applicable. |
(2) | For properties that are part of a portfolio, the Cut-off Date Balance Per SF/Unit, UW NCF DSCR, UW NOI Debt Yield, Cut-off Date LTV and Maturity Date LTV calculations reflect the values of the portfolio as a whole. |
(3) | For mortgaged properties securing residential cooperative mortgage loans, the UW NCF DSCR and UW NOI Debt Yield for each such mortgaged property is calculated using underwritten net operating income or underwritten net cash flow, as applicable, for the related residential cooperative property which is the projected net operating income or net cash flow, as applicable, reflected in the most recent appraisal obtained by or otherwise in the possession of the related mortgage loan seller as of the Cut-off Date. LTV calculations are based upon the appraised value of the residential cooperative property determined as if such residential cooperative property is operated as a residential cooperative, inclusive of the amount of the underlying debt encumbering such residential cooperative property. |
This is not a research report and was not prepared by any Underwriter’s research department. Please see additional important information and qualifications at the end of this Term Sheet.
T-20
(THIS PAGE INTENTIONALLY LEFT BLANK)
BANK 2019-BNK24 | Characteristics of the Mortgage Loans |
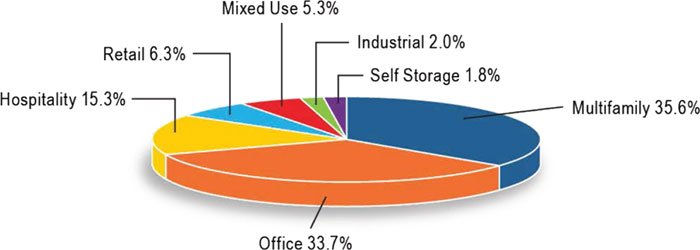
Property Type Distribution(1) |
Property Type | | Number of
Mortgaged
Properties | | Aggregate
Cut-off Date
Balance | | % of
Pool | | Wtd. Avg.
Mortgage
Rate | | Wtd. Avg.
UW NCF
DSCR | | Wtd. Avg.
UW NOI
Debt Yield | | Wtd. Avg.
Cut-off
Date LTV | | Wtd. Avg.
Maturity
Date LTV |
Multifamily | | 54 | | $436,275,481 | | 35.6% | | 3.4991% | | 4.43x | | 19.0% | | 44.1% | | 43.3% |
Mid Rise | | 14 | | $158,800,000 | | 13.0% | | 3.7591% | | 1.94x | | 7.6% | | 63.8% | | 63.8% |
High Rise | | 1 | | $100,000,000 | | 8.2% | | 3.2500% | | 3.92x | | 13.0% | | 34.4% | | 34.4% |
Cooperative | | 32 | | $108,685,481 | | 8.9% | | 3.3020% | | 9.90x | | 47.9% | | 12.5% | | 10.2% |
Garden | | 7 | | $68,790,000 | | 5.6% | | 3.5725% | | 2.25x | | 8.8% | | 62.5% | | 61.4% |
Office | | 10 | | $413,313,959 | | 33.7% | | 3.4147% | | 2.67x | | 9.6% | | 51.4% | | 50.5% |
CBD | | 4 | | $302,000,000 | | 24.6% | | 3.3400% | | 2.71x | | 9.3% | | 47.0% | | 47.0% |
Suburban | | 6 | | $111,313,959 | | 9.1% | | 3.6173% | | 2.54x | | 10.4% | | 63.1% | | 60.0% |
Hospitality | | 9 | | $187,519,319 | | 15.3% | | 3.7439% | | 2.50x | | 13.3% | | 62.8% | | 56.5% |
Full Service | | 2 | | $101,354,642 | | 8.3% | | 3.7539% | | 2.86x | | 13.5% | | 60.4% | | 58.9% |
Select Service | | 3 | | $57,449,088 | | 4.7% | | 3.6668% | | 2.02x | | 12.4% | | 67.6% | | 54.6% |
Limited Service | | 3 | | $21,895,323 | | 1.8% | | 3.9636% | | 2.13x | | 14.4% | | 62.3% | | 51.6% |
Extended Stay | | 1 | | $6,820,266 | | 0.6% | | 3.5400% | | 2.27x | | 14.0% | | 59.7% | | 53.9% |
Retail | | 12 | | $76,934,362 | | 6.3% | | 3.9026% | | 2.07x | | 9.7% | | 66.6% | | 62.8% |
Anchored | | 8 | | $56,120,000 | | 4.6% | | 3.6885% | | 2.13x | | 9.6% | | 66.0% | | 62.3% |
Unanchored | | 2 | | $8,394,362 | | 0.7% | | 4.6800% | | 1.46x | | 9.8% | | 73.2% | | 63.2% |
Shadow Anchored | | 1 | | $7,870,000 | | 0.6% | | 4.5500% | | 2.22x | | 11.0% | | 64.8% | | 64.8% |
Single Tenant | | 1 | | $4,550,000 | | 0.4% | | 3.9900% | | 2.24x | | 9.1% | | 65.0% | | 65.0% |
Mixed Use | | 4 | | $64,525,000 | | 5.3% | | 3.8724% | | 1.85x | | 8.1% | | 67.5% | | 65.2% |
Multifamily/Retail | | 2 | | $36,200,000 | | 3.0% | | 3.9479% | | 1.83x | | 7.4% | | 65.7% | | 65.7% |
Industrial/Retail | | 1 | | $16,725,000 | | 1.4% | | 3.9500% | | 1.45x | | 8.3% | | 75.0% | | 65.8% |
Office/Retail | | 1 | | $11,600,000 | | 0.9% | | 3.5250% | | 2.50x | | 9.8% | | 62.5% | | 62.5% |
Industrial | | 11 | | $25,080,000 | | 2.0% | | 2.6533% | | 5.05x | | 14.8% | | 39.2% | | 39.2% |
Warehouse Distribution | | 11 | | $25,080,000 | | 2.0% | | 2.6533% | | 5.05x | | 14.8% | | 39.2% | | 39.2% |
Self Storage | | 4 | | $22,272,500 | | 1.8% | | 3.6005% | | 2.59x | | 9.6% | | 62.1% | | 62.1% |
Self Storage | | 4 | | $22,272,500 | | 1.8% | | 3.6005% | | 2.59x | | 9.6% | | 62.1% | | 62.1% |
Total/Wtd. Avg. | | 104 | | $1,225,920,621 | | 100.0% | | 3.5376% | | 3.23x | | 13.6% | | 52.3% | | 50.4% |
(1) | All numerical information concerning the mortgage loans is approximate and, in the case of mortgage loans secured by multiple properties, is based on allocated loan amounts with respect to such properties. All weighted average information regarding the mortgage loans reflects the weighting of the mortgage loans based on their outstanding principal balances as of the Cut-off Date or, in the case of mortgage loans secured by multiple properties, allocated loan amounts. The sum of numbers and percentages in columns may not match the “Total” due to rounding. With respect to any mortgage loan that is part of a whole loan, unless otherwise indicated, all LTV, DSCR and Debt Yield calculations include any related pari passu companion loans and exclude any related subordinate companion loans, as applicable. For mortgaged properties securing residential cooperative mortgage loans, the UW NCF DSCR and UW NOI Debt Yield for each such mortgaged property is calculated using underwritten net operating income or underwritten net cash flow, as applicable, for the related residential cooperative property which is the projected net operating income or net cash flow, as applicable, reflected in the most recent appraisal obtained by or otherwise in the possession of the related mortgage loan seller as of the Cut-off Date. LTV calculations are based upon the appraised value of the residential cooperative property determined as if such residential cooperative property is operated as a residential cooperative, inclusive of the amount of the underlying debt encumbering such residential cooperative property. |
This is not a research report and was not prepared by any Underwriter’s research department. Please see additional important information and qualifications at the end of this Term Sheet.
T-22
BANK 2019-BNK24 | Characteristics of the Mortgage Loans |
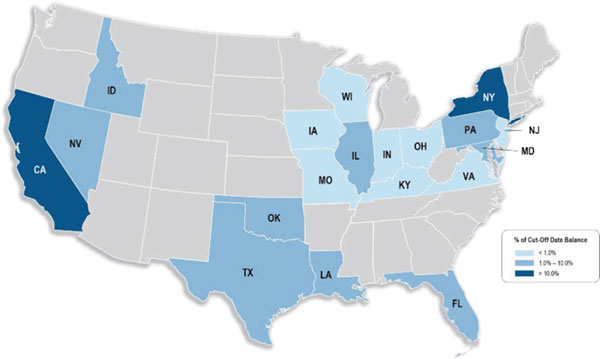
Geographic Distribution(1) |
State or Other Jurisdiction | | Number of
Mortgaged Properties | | Aggregate
Cut-off
Date
Balance | | % of
Pool | | Wtd. Avg.
Mortgage
Rate | | Wtd. Avg.
UW NCF
DSCR | | Wtd. Avg.
UW NOI Debt Yield | | Wtd. Avg.
Cut-off
Date LTV | | Wtd. Avg.
Maturity
Date LTV |
New York | | 49 | | $604,110,481 | | 49.3% | | 3.4172% | | 4.00x | | 16.5% | | 43.4% | | 42.7% |
California | | 11 | | $193,522,500 | | 15.8% | | 3.5509% | | 2.33x | | 9.4% | | 59.0% | | 56.0% |
California – Southern (2) | | 8 | | $129,450,000 | | 10.6% | | 3.6025% | | 2.08x | | 9.1% | | 62.2% | | 57.7% |
California – Northern(2) | | 3 | | $64,072,500 | | 5.2% | | 3.4467% | | 2.83x | | 9.9% | | 52.4% | | 52.4% |
Texas | | 11 | | $110,788,894 | | 9.0% | | 3.6422% | | 2.20x | | 11.6% | | 63.6% | | 59.8% |
Louisiana | | 1 | | $74,000,000 | | 6.0% | | 3.8330% | | 3.08x | | 13.3% | | 60.7% | | 60.7% |
Maryland | | 2 | | $66,752,578 | | 5.4% | | 3.3829% | | 2.73x | | 9.5% | | 59.6% | | 59.6% |
Pennsylvania | | 8 | | $30,944,512 | | 2.5% | | 3.8329% | | 1.63x | | 9.3% | | 73.2% | | 66.5% |
Nevada | | 2 | | $40,513,959 | | 3.3% | | 3.6388% | | 2.47x | | 10.3% | | 63.0% | | 57.5% |
Florida | | 2 | | $24,400,000 | | 2.0% | | 4.0815% | | 2.29x | | 9.6% | | 53.2% | | 53.2% |
Oklahoma | | 3 | | $18,701,688 | | 1.5% | | 4.1899% | | 2.05x | | 11.9% | | 67.2% | | 57.2% |
Illinois | | 2 | | $13,590,000 | | 1.1% | | 4.4027% | | 2.14x | | 11.9% | | 68.4% | | 63.7% |
Idaho | | 1 | | $12,382,631 | | 1.0% | | 4.1580% | | 1.92x | | 12.8% | | 65.9% | | 52.8% |
Indiana | | 4 | | $9,050,808 | | 0.7% | | 2.6533% | | 5.05x | | 14.8% | | 39.2% | | 39.2% |
Virginia | | 2 | | $6,195,751 | | 0.5% | | 3.1214% | | 4.11x | | 13.9% | | 52.5% | | 52.5% |
New Jersey | | 1 | | $5,880,468 | | 0.5% | | 4.6800% | | 1.38x | | 9.2% | | 75.0% | | 66.1% |
Wisconsin | | 1 | | $4,550,000 | | 0.4% | | 3.9900% | | 2.24x | | 9.1% | | 65.0% | | 65.0% |
Ohio | | 1 | | $4,332,834 | | 0.4% | | 2.6533% | | 5.05x | | 14.8% | | 39.2% | | 39.2% |
Missouri | | 1 | | $2,828,951 | | 0.2% | | 2.6533% | | 5.05x | | 14.8% | | 39.2% | | 39.2% |
Kentucky | | 1 | | $1,884,439 | | 0.2% | | 2.6533% | | 5.05x | | 14.8% | | 39.2% | | 39.2% |
Iowa | | 1 | | $1,490,128 | | 0.1% | | 2.6533% | | 5.05x | | 14.8% | | 39.2% | | 39.2% |
Total/Wtd. Avg. | | 104 | | $1,225,920,621 | | 100.0% | | 3.5376% | | 3.23x | | 13.6% | | 52.3% | | 50.4% |
(1) | All numerical information concerning the mortgage loans is approximate and, in the case of mortgage loans secured by multiple properties, is based on allocated loan amounts with respect to such properties. All weighted average information regarding the mortgage loans reflects the weighting of the mortgage loans based on their outstanding principal balances as of the Cut-off Date or, in the case of mortgage loans secured by multiple properties, allocated loan amounts. The sum of numbers and percentages in columns may not match the “Total” due to rounding. With respect to any mortgage loan that is part of a whole loan, unless otherwise indicated, all LTV, DSCR and Debt Yield calculations include any related pari passu companion loans and exclude any related subordinate companion loans, as applicable. For mortgaged properties securing residential cooperative mortgage loans, the UW NCF DSCR and UW NOI Debt Yield for each such mortgaged property is calculated using underwritten net operating income or underwritten net cash flow, as applicable, for the related residential cooperative property which is the projected net operating income or net cash flow, as applicable, reflected in the most recent appraisal obtained by or otherwise in the possession of the related mortgage loan seller as of the Cut-off Date. LTV calculations are based upon the appraised value of the residential cooperative property determined as if such residential cooperative property is operated as a residential cooperative, inclusive of the amount of the underlying debt encumbering such residential cooperative property. |
(2) | “California – Northern” includes zip codes above 93600, and “California – Southern” includes zip codes at or below 93600. |
This is not a research report and was not prepared by any Underwriter’s research department. Please see additional important information and qualifications at the end of this Term Sheet.
T-23
| BANK 2019-BNK24 | Collateral Statistics |
Collateral Statistics(1)
Cut-off Date Balance ($)
| | No. of
Mortgage
Loans | Aggregate
Cut-off Date
Balance ($) | % of
Pool |
| 1,000,000 - 5,000,000 | 34 | 91,574,524 | 7.5 |
| 5,000,001 - 15,000,000 | 17 | 168,496,097 | 13.7 |
| 15,000,001 - 25,000,000 | 5 | 95,425,000 | 7.8 |
| 25,000,001 - 45,000,000 | 5 | 143,925,000 | 11.7 |
| 45,000,001 - 75,000,000 | 6 | 349,500,000 | 28.5 |
| 75,000,001 - 100,000,000 | 4 | 377,000,000 | 30.8 |
| Total: | 71 | $1,225,920,621 | 100.0% |
Min: $1,000,000 Max: $100,000,000 Avg: $17,266,488 |
State or Other Jurisdiction(2)
| | No. of
Mortgaged
Properties | Aggregate
Cut-off Date
Balance ($) | % of Pool |
| New York | 49 | 604,110,481 | 49.3 |
| California | 11 | 193,522,500 | 15.8 |
| California – Southern(3) | 8 | 129,450,000 | 10.6 |
| California – Northern(3) | 3 | 64,072,500 | 5.2 |
| Texas | 11 | 110,788,894 | 9.0 |
| Louisiana | 1 | 74,000,000 | 6.0 |
| Maryland | 2 | 66,752,578 | 5.4 |
| Pennsylvania | 8 | 30,944,512 | 2.5 |
| Nevada | 2 | 40,513,959 | 3.3 |
| Florida | 2 | 24,400,000 | 2.0 |
| Oklahoma | 3 | 18,701,688 | 1.5 |
| Illinois | 2 | 13,590,000 | 1.1 |
| Idaho | 1 | 12,382,631 | 1.0 |
| Indiana | 4 | 9,050,808 | 0.7 |
| Virginia | 2 | 6,195,751 | 0.5 |
| New Jersey | 1 | 5,880,468 | 0.5 |
| Wisconsin | 1 | 4,550,000 | 0.4 |
| Ohio | 1 | 4,332,834 | 0.4 |
| Missouri | 1 | 2,828,951 | 0.2 |
| Kentucky | 1 | 1,884,439 | 0.2 |
| Iowa | 1 | 1,490,128 | 0.1 |
| Total: | 104 | $1,225,920,621 | 100.0% |
Property Type(2)
| | No. of
Mortgaged
Properties | Aggregate
Cut-off Date
Balance ($) | % of
Pool |
| Multifamily | 54 | 436,275,481 | 35.6 |
| Mid Rise | 14 | 158,800,000 | 13.0 |
| High Rise | 1 | 100,000,000 | 8.2 |
| Cooperative | 32 | 108,685,481 | 8.9 |
| Garden | 7 | 68,790,000 | 5.6 |
| Office | 10 | 413,313,959 | 33.7 |
| CBD | 4 | 302,000,000 | 24.6 |
| Suburban | 6 | 111,313,959 | 9.1 |
| Hospitality | 9 | 187,519,319 | 15.3 |
| Full Service | 2 | 101,354,642 | 8.3 |
| Select Service | 3 | 57,449,088 | 4.7 |
| Limited Service | 3 | 21,895,323 | 1.8 |
| Extended Stay | 1 | 6,820,266 | 0.6 |
| Retail | 12 | 76,934,362 | 6.3 |
| Anchored | 8 | 56,120,000 | 4.6 |
| Unanchored | 2 | 8,394,362 | 0.7 |
| Shadow Anchored | 1 | 7,870,000 | 0.6 |
| Single Tenant | 1 | 4,550,000 | 0.4 |
| Mixed Use | 4 | 64,525,000 | 5.3 |
| Multifamily/Retail | 2 | 36,200,000 | 3.0 |
| Industrial/Retail | 1 | 16,725,000 | 1.4 |
| Office/Retail | 1 | 11,600,000 | 0.9 |
| Industrial | 11 | 25,080,000 | 2.0 |
| Warehouse Distribution | 11 | 25,080,000 | 2.0 |
| Self Storage | 4 | 22,272,500 | 1.8 |
| Self Storage | 4 | 22,272,500 | 1.8 |
| Total: | 104 | $1,225,920,621 | 100.0% |
| | | | |
Mortgage Rate (%)
| | No. of
Mortgage
Loans | Aggregate
Cut-off Date
Balance ($) | % of
Pool |
| 2.6533 - 3.4999 | 39 | 577,107,981 | 47.1 |
| 3.5000 - 3.9999 | 22 | 572,658,959 | 46.7 |
| 4.0000 - 5.2000 | 10 | 76,153,681 | 6.2 |
| Total: | 71 | $1,225,920,621 | 100.0% |
| Min: 2.6533% Max: 5.2000% Wtd Avg: 3.5376% |
Original Term to Maturity or ARD (mos.)
| | No. of
Mortgage
Loans | Aggregate
Cut-off Date
Balance ($) | % of
Pool |
| 114 | 1 | 16,725,000 | 1.4 |
| 120 | 70 | 1,209,195,621 | 98.6 |
| Total: | 71 | $1,225,920,621 | 100.0% |
| Min: 114 mos. Max: 120 mos. Wtd Avg: 120 mos. |
Remaining Term to Maturity or ARD (mos.)
| | No. of
Mortgage
Loans | Aggregate
Cut-off Date
Balance ($) | % of
Pool |
| 111 - 114 | 2 | 26,025,000 | 2.1 |
| 115 - 120 | 69 | 1,199,895,621 | 97.9 |
| Total: | 71 | $1,225,920,621 | 100.0% |
| Min: 111 mos. Max: 120 mos. Wtd Avg: 119 mos. |
Original Amortization Term (mos.)
| | No. of
Mortgage
Loans | Aggregate
Cut-off Date
Balance ($) | % of
Pool |
| Interest Only | 30 | 921,317,500 | 75.2 |
| 240 | 1 | 5,586,688 | 0.5 |
| 312 | 1 | 4,690,253 | 0.4 |
| 324 | 1 | 2,750,000 | 0.2 |
| 360 | 30 | 261,734,986 | 21.4 |
| 480 | 8 | 29,841,194 | 2.4 |
| Total: | 71 | $1,225,920,621 | 100.0% |
| Min: 240 mos. Max: 480 mos. Wtd Avg: 368 mos. |
Remaining Amortization Term (mos.)
| | No. of
Mortgage
Loans | Aggregate
Cut-off Date
Balance ($) | % of
Pool |
| Interest Only | 30 | 921,317,500 | 75.2 |
| 239 - 358 | 4 | 15,540,834 | 1.3 |
| 359 - 480 | 37 | 289,062,286 | 23.6 |
| Total: | 71 | $1,225,920,621 | 100.0% |
| Min: 239 mos. Max: 480 mos. Wtd Avg: 368 mos. |
Mortgage Loan Sellers
| | No. of
Mortgage
Loans | Aggregate
Cut-off Date
Balance ($) | % of
Pool |
| BANA | 11 | 368,277,500 | 30.0 |
| MSMCH | 16 | 311,656,049 | 25.4 |
| WFB | 10 | 237,301,590 | 19.4 |
| NCB | 32 | 108,685,481 | 8.9 |
| WFB;MSMCH | 1 | 100,000,000 | 8.2 |
| BANA;WFB | 1 | 100,000,000 | 8.2 |
| Total: | 71 | $1,225,920,621 | 100.0% |
| | | | |
Amortization Type
| | No. of
Mortgage
Loans | Aggregate
Cut-off Date
Balance ($) | % of
Pool |
| Interest Only | 29 | 871,317,500 | 71.1 |
| Amortizing Balloon | 34 | 167,362,653 | 13.7 |
| Partial Interest Only | 7 | 137,240,468 | 11.2 |
| Interest Only, ARD | 1 | 50,000,000 | 4.1 |
| Total: | 71 | $1,225,920,621 | 100.0% |
Cut-off Date LTV Ratio (%)
| | No. of
Mortgage
Loans | Aggregate
Cut-off Date
Balance ($) | % of
Pool |
| 0.8 - 50.0 | 37 | 435,765,481 | 35.5 |
| 50.1 - 60.0 | 9 | 321,220,000 | 26.2 |
| 60.1 - 65.0 | 9 | 188,992,500 | 15.4 |
| 65.1 - 70.0 | 10 | 173,973,213 | 14.2 |
| 70.1 - 75.0 | 6 | 105,969,427 | 8.6 |
| Total: | 71 | $1,225,920,621 | 100.0% |
| Min: 0.8% | Max: 75.0% | Wtd Avg: 52.3% | |
Maturity Date or ARD LTV Ratio (%)
| | No. of
Mortgage
Loans | Aggregate
Cut-off Date
Balance ($) | % of
Pool |
| 0.8 - 30.0 | 32 | 108,685,481 | 8.9 |
| 30.1 - 55.0 | 13 | 463,749,319 | 37.8 |
| 55.1 - 65.0 | 18 | 457,205,353 | 37.3 |
| 65.1 - 69.8 | 8 | 196,280,468 | 16.0 |
| Total: | 71 | $1,225,920,621 | 100.0% |
| Min: 0.8% | Max: 69.8% | Wtd Avg: 50.4% | |
UW NCF DSCR (x)
| | No. of
Mortgage
Loans | Aggregate
Cut-off Date
Balance ($) | % of
Pool |
| 1.38 - 1.70 | 7 | 74,234,362 | 6.1 |
| 1.71 - 1.90 | 6 | 147,180,647 | 12.0 |
| 1.91 - 2.10 | 5 | 197,152,631 | 16.1 |
| 2.11 - 2.30 | 5 | 126,195,000 | 10.3 |
| 2.31 - 2.50 | 7 | 112,717,394 | 9.2 |
| 2.51 - 3.00 | 4 | 147,320,000 | 12.0 |
| 3.01 - 3.50 | 3 | 90,500,000 | 7.4 |
| 3.51 - 40.05 | 34 | 330,620,587 | 27.0 |
| Total: | 71 | $1,225,920,621 | 100.0% |
| Min: 1.38x | Max: 40.05x | Wtd Avg: 3.23x | |
UW NOI Debt Yield (%)
| | No. of
Mortgage
Loans | Aggregate
Cut-off Date
Balance ($) | % of
Pool |
| 7.0 - 8.0 | 6 | 273,000,000 | 22.3 |
| 8.1 - 9.0 | 6 | 141,772,500 | 11.6 |
| 9.1 - 10.0 | 7 | 146,745,468 | 12.0 |
| 10.1 - 12.0 | 11 | 254,147,853 | 20.7 |
| 12.1 - 14.0 | 8 | 274,047,525 | 22.4 |
| 14.1 - 213.5 | 33 | 136,207,275 | 11.1 |
| Total: | 71 | $1,225,920,621 | 100.0% |
| Min: 7.0% | Max: 213.5% | Wtd Avg: 13.6% | |
| (1) | All numerical information concerning the mortgage loans is approximate. All weighted average information regarding the mortgage loans reflects the weighting of the mortgage loans based on their outstanding principal balances as of the Cut-off Date. The sum of numbers and percentages in columns may not match the “Total” due to rounding. With respect to any mortgage loan that is part of a whole loan, unless otherwise indicated, all LTV, DSCR and Debt Yield calculations include any relatedpari passu companion loans and exclude any related subordinate companion loans, as applicable. For mortgaged properties securing residential cooperative mortgage loans, the UW DSCR and UW NOI Debt Yield for each such mortgaged property is calculated using underwritten net operating income or underwritten net cash flow, as applicable, for the related residential cooperative property which is the projected net operating income or net cash flow, as applicable, reflected in the most recent appraisal obtained by or otherwise in the possession of the related mortgage loan seller as of the Cut-off Date. LTV calculations are based upon the appraised value of the residential cooperative property determined as if such residential cooperative property is operated as a residential cooperative, inclusive of the amount of the underlying debt encumbering such residential cooperative property. |
| (2) | In the case of mortgage loans secured by multiple properties, cut-off date balance information is based on allocated loan amounts with respect to such properties. |
| (3) | “California – Northern” includes zip codes above 93600, and “California – Southern” includes zip codes at or below 93600. |
This is not a research report and was not prepared by any Underwriter’s research department. Please see additional important information and qualifications at the end of this Term Sheet.
T-24
(THIS PAGE INTENTIONALLY LEFT BLANK)
Office – CBD | Loan #1 | Cut-off Date Balance: | | $100,000,000 |
55 Hudson Yards | 55 Hudson Yards | Cut-off Date LTV: | | 39.4% |
New York, NY 10001 | | UW NCF DSCR: | | 3.53x |
| | UW NOI Debt Yield: | | 11.0% |

This is not a research report and was not prepared by any Underwriter’s research department. Please see additional important information and qualifications at the end of this Term Sheet.
T-26
Office – CBD | Loan #1 | Cut-off Date Balance: | | $100,000,000 |
55 Hudson Yards | 55 Hudson Yards | Cut-off Date LTV: | | 39.4% |
New York, NY 10001 | | UW NCF DSCR: | | 3.53x |
| | UW NOI Debt Yield: | | 11.0% |
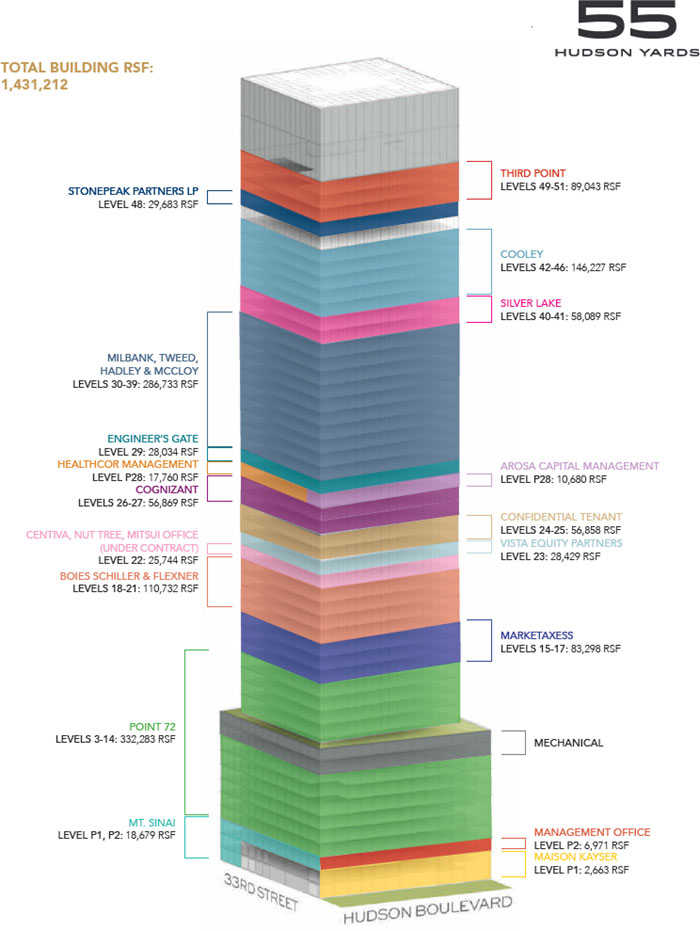
This is not a research report and was not prepared by any Underwriter’s research department. Please see additional important information and qualifications at the end of this Term Sheet.
T-27
Office – CBD | Loan #1 | Cut-off Date Balance: | | $100,000,000 |
55 Hudson Yards | 55 Hudson Yards | Cut-off Date LTV: | | 39.4% |
New York, NY 10001 | | UW NCF DSCR: | | 3.53x |
| | UW NOI Debt Yield: | | 11.0% |
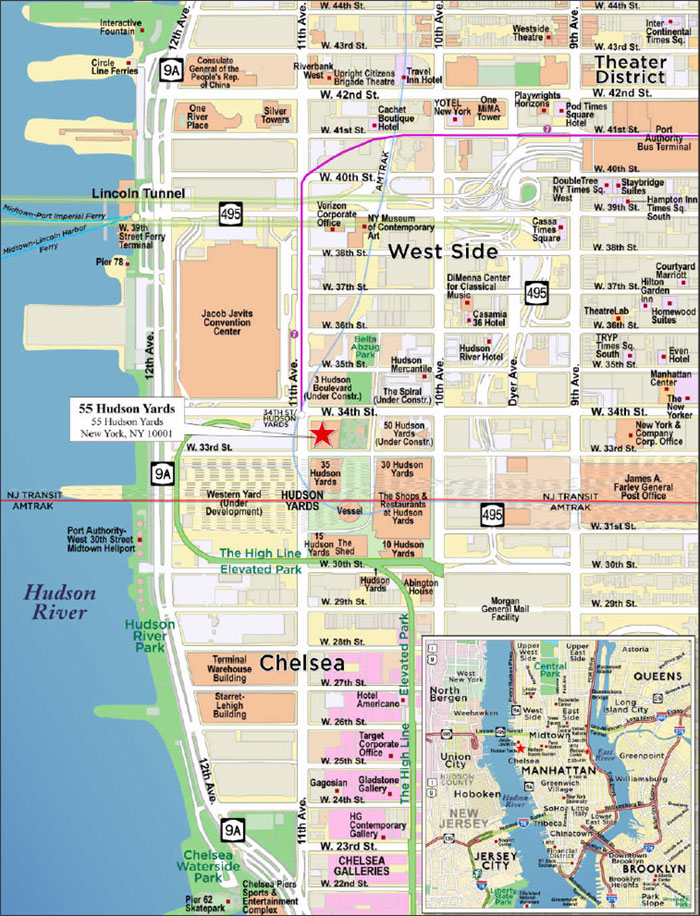
This is not a research report and was not prepared by any Underwriter’s research department. Please see additional important information and qualifications at the end of this Term Sheet.
T-28
Mortgage Loan No. 1 – 55 Hudson Yards |
Mortgage Loan Information | | Property Information |
Mortgage Loan Seller: | WFB; MSMCH | | Single Asset/Portfolio: | Single Asset |
Credit Assessment (DBRS/Fitch/S&P): | BBB(sf)/BBB-sf/BB+(sf) | | Location: | New York, NY 10001 |
Original Balance(1): | $100,000,000 | | General Property Type: | Office |
Cut-off Date Balance(1): | $100,000,000 | | Detailed Property Type: | CBD |
% of Initial Pool Balance: | 8.2% | | Title Vesting: | Fee |
Loan Purpose: | Recapitalization | | Year Built/Renovated: | 2018/N/A |
Sponsors: | Mitsui Fudosan America, Inc.; The Related Companies, L.P.; OP Olympic Capital Corp (US), Inc. | | Size: | 1,431,212 SF |
Guarantor(2): | One Hudson Yards Owner LLC | | Cut-off Date Balance per SF(1): | $660 |
Mortgage Rate: | 2.9500% | | Maturity Balance per SF(1): | $660 |
Note Date: | 11/21/2019 | | Property Manager: | Related Hudson Yards Manager LLC |
First Payment Date: | 1/6/2020 | | | (borrower-related) |
Maturity Date: | 12/6/2029 | | | |
Original Term to Maturity: | 120 months | | | |
Original Amortization Term: | 0 months | | | |
IO Period: | 120 months | | | |
Seasoning: | 0 months | | | |
Prepayment Provisions(3): | LO (24); DEF/YM1 (89); O (7) | | Underwriting and Financial Information |
Lockbox/Cash Mgmt Status: | Hard/Springing | | UW NOI: | $103,900,331 |
Additional Debt Type(1)(4): | Pari Passu/Subordinate | | UW NOI Debt Yield(1): | 11.0% |
Additional Debt Balance(1)(4): | $845,000,000/$300,000,000 | | UW NOI Debt Yield at Maturity(1): | 11.0% |
Future Debt Permitted (Type): | No (N/A) | | UW NCF DSCR(1): | 3.53x |
Reserves(5) | | Most Recent NOI(6): | N/A |
Type | Initial | Monthly | Cap | | 2nd Most Recent NOI(6): | N/A |
RE Taxes: | $0 | Springing | N/A | | 3rd Most Recent NOI(6): | N/A |
Insurance: | $0 | Springing | N/A | | Most Recent Occupancy: | 97.3% (11/19/2019) |
Replacement Reserve: | $0 | Springing | N/A | | 2nd Most Recent Occupancy(6): | N/A |
Rollover Reserve: | $0 | Springing | N/A | | 3rd Most Recent Occupancy(6): | N/A |
Tenant Specific TI/LC Reserve: | $34,260,641 | $0 | N/A | | Appraised Value (as of): | $2,400,000,000 (10/15/2019) |
Free Rent Reserve: | $11,482,346 | $0 | N/A | | Appraised Value per SF: | $1,677 |
Milbank Lease Landlord Delay Dispute Reserve: | $11,000,000 | $0 | N/A | | Cut-off Date LTV Ratio(1): | 39.4% |
MarketAxess Lease Takeover Reserve: | $4,474,631 | $0 | N/A | | Maturity Date LTV Ratio(1): | 39.4% |
| | | | | | |
Sources and Uses |
Sources | Proceeds | % of Total | | Uses | Proceeds | % of Total |
Whole Loan Amount(1): | $1,245,000,000 | 100.0% | | Upfront Reserves: | $61,217,618 | 4.9% |
| | | | Closing Costs: | $46,767,347 | 3.8% |
| | | | Return of Equity(7): | $1,137,015,035 | 91.3% |
Total Sources: | $1,245,000,000 | 100.0% | | Total Uses: | $1,245,000,000 | 100.0% |
(1) | The 55 Hudson Yards Mortgage Loan (as defined below) is part of the 55 Hudson Yards Whole Loan (as defined below) with an original aggregate principal balance of $1,245,000,000. The Cut-off Date Balance per SF, Maturity Date Balance per SF, UW NOI Debt Yield, UW NOI Debt Yield at Maturity, UW NCF DSCR, Cut-off Date LTV Ratio and Maturity Date LTV Ratio numbers presented above are based on the 55 Hudson Yards Senior Loan (as defined below). The Cut-off Date Balance per SF and Maturity Date Balance per SF, UW NOI Debt Yield, UW NOI Debt Yield at Maturity, UW NCF DSCR, Cut-off Date LTV Ratio and Maturity Date LTV Ratio based upon the 55 Hudson Yards Whole Loan (as defined below) are $870, $870, 8.3%, 8.3%, 2.68x, 51.9% and 51.9%, respectively. |
(2) | One Hudson Yards Owner LLC is the single purpose entity borrower. The 55 Hudson Yards Whole Loan is recourse to the single purpose entity borrower. There is no separate non-recourse carveout guarantor or environmental indemnitor for the 55 Hudson Yards Whole Loan. |
(3) | Defeasance or prepayment of the 55 Hudson Yards Whole Loan is permitted at any time after the earlier to occur of (a) the end of the two-year period commencing on the closing date of the securitization of the last promissory note representing a portion of the 55 Hudson Yards Whole Loan to be securitized and (b) November 21, 2022. The assumed defeasance lockout period of 24 payments is based on the closing date of this transaction in December 2019. |
(4) | See “The Mortgage Loan” and “Additional Secured Indebtedness (not including trade debts)” below for further discussion of additional debt. |
(5) | See “Escrows and Reserves” below for further discussion of reserve requirements. |
(6) | Prior historical operating statements and occupancy are not applicable, as the 55 Hudson Yards Property (as defined below) was constructed in 2018 and tenants began taking occupancy in 2019. |
(7) | Prior to the origination of the 55 Hudson Yards Whole Loan, the 55 Hudson Yards Property was unencumbered by debt. The borrower sponsor’s cost basis to date is approximately $1.31 billion. |
The Mortgage Loan. The largest mortgage loan (the “55 Hudson Yards Mortgage Loan”) is part of a whole loan (the “55 Hudson Yards Whole Loan”) that is evidenced by 33 pari passu senior promissory notes in the aggregate original principal amount of $945,000,000 (collectively, the “55 Hudson Yards Senior Loan”) and three pari passu subordinate promissory notes in the aggregate original principal amount of $300,000,000 (collectively, the “55 Hudson Yards Subordinate Companion Loan”). The 55 Hudson Yards Whole Loan was co-originated on November 21, 2019 by Wells Fargo Bank, National Association (“WFB”); DBR Investments Co. Limited (“DBRI”); and Morgan Stanley Mortgage Capital Holdings LLC (“MSMCH”). The 55 Hudson Yards Whole Loan is secured by a first priority fee mortgage encumbering an office building located in New York, New York (the “55 Hudson Yards Property”).
This is not a research report and was not prepared by any Underwriter’s research department. Please see additional important information and qualifications at the end of this Term Sheet.
T-29
Office – CBD | Loan #1 | Cut-off Date Balance: | | $100,000,000 |
55 Hudson Yards | 55 Hudson Yards | Cut-off Date LTV: | | 39.4% |
New York, NY 10001 | | UW NCF DSCR: | | 3.53x |
| | UW NOI Debt Yield: | | 11.0% |
The 55 Hudson Yards Mortgage Loan is evidenced by the non-controlling promissory Notes A-1-C5 (being contributed by WFB) and A-3-C5 (being contributed by Morgan Stanley Mortgage Capital Holdings LLC(“MSMCH”)) in the aggregate original principal amount of $100,000,000. As shown in the “55 Hudson Yards Whole Loan Summary” table below, 21 promissory notes in the original aggregate principal amount of $810,500,000 are expected to be contributed to the Hudson Yards 2019-55HY securitization trust. The 55 Hudson Yards Whole Loan is expected to be serviced pursuant to the trust and servicing agreement for the Hudson Yards 2019-55HY securitization trust. The 55 Hudson Yards Senior Loan pari passu notes other than those evidencing the 55 Hudson Yards Mortgage Loan are referred to herein as the “55 Hudson Yards Non-Serviced Pari Passu Companion Loans”. See “Description of the Mortgage Pool—The Whole Loans—The 55 Hudson Yards Pari Passu-A/B Whole Loan” and “Pooling and Servicing Agreement—Servicing of the Non-Serviced Mortgage Loans”. The proceeds of the 55 Hudson Yards Whole Loan were primarily used to fund upfront reserves, pay closing costs and return equity to the borrower sponsor.
55 Hudson Yards Whole Loan Summary |
Notes | Original Balance | Cut-off Date Balance | Note Holder | Controlling Piece |
55 Hudson Yards Senior Loan |
A-1-S1 | $28,350,000 | $28,350,000 | Hudson Yards 2019-55HY | Yes(1) |
A-2-S2 | $9,450,000 | $9,450,000 | Hudson Yards 2019-55HY | Yes(1) |
A-2-S3 | $56,700,000 | $56,700,000 | Hudson Yards 2019-55HY | Yes(1) |
A-3-S1 | $9,450,000 | $9,450,000 | Hudson Yards 2019-55HY | Yes(1) |
A-1-S2 | $28,350,000 | $28,350,000 | Hudson Yards 2019-55HY | Yes(1) |
A-1-S3 | $170,100,000 | $170,100,000 | Hudson Yards 2019-55HY | Yes(1) |
A-2-S1 | $9,450,000 | $9,450,000 | Hudson Yards 2019-55HY | Yes(1) |
A-3-S2 | $9,450,000 | $9,450,000 | Hudson Yards 2019-55HY | Yes(1) |
A-3-S3 | $56,700,000 | $56,700,000 | Hudson Yards 2019-55HY | Yes(1) |
A-1-C1 | $28,350,000 | $28,350,000 | Hudson Yards 2019-55HY | Yes(1) |
A-1-C2 | $28,350,000 | $28,350,000 | Hudson Yards 2019-55HY | Yes(1) |
A-1-C3 | $28,350,000 | $28,350,000 | WFB | No |
A-1-C4 | $28,350,000 | $28,350,000 | WFB | No |
A-1-C5 | $75,000,000 | $75,000,000 | BANK 2019-BNK24 | No |
A-1-C6 | $75,000,000 | $75,000,000 | WFB | No |
A-1-C7 | $54,000,000 | $54,000,000 | WFB | No |
A-1-C8 | $22,800,000 | $22,800,000 | Hudson Yards 2019-55HY | Yes(1) |
A-2-C1 | $9,450,000 | $9,450,000 | Hudson Yards 2019-55HY | Yes(1) |
A-2-C2 | $9,450,000 | $9,450,000 | Hudson Yards 2019-55HY | Yes(1) |
A-2-C3 | $9,450,000 | $9,450,000 | DBRI | No |
A-2-C4 | $9,450,000 | $9,450,000 | DBRI | No |
A-2-C5 | $25,000,000 | $25,000,000 | DBRI | No |
A-2-C6 | $25,000,000 | $25,000,000 | DBRI | No |
A-2-C7 | $18,000,000 | $18,000,000 | DBRI | No |
A-2-C8 | $7,600,000 | $7,600,000 | Hudson Yards 2019-55HY | Yes(1) |
A-3-C1 | $9,450,000 | $9,450,000 | Hudson Yards 2019-55HY | Yes(1) |
A-3-C2 | $9,450,000 | $9,450,000 | Hudson Yards 2019-55HY | Yes(1) |
A-3-C3 | $9,450,000 | $9,450,000 | MSBNA | No |
A-3-C4 | $9,450,000 | $9,450,000 | MSBNA | No |
A-3-C5 | $25,000,000 | $25,000,000 | BANK 2019-BNK24 | No |
A-3-C6 | $25,000,000 | $25,000,000 | MSBNA | No |
A-3-C7 | $18,000,000 | $18,000,000 | MSBNA | No |
A-3-C8 | $7,600,000 | $7,600,000 | Hudson Yards 2019-55HY | No |
Total (Senior Loan) | $945,000,000 | $945,000,000 | | |
|
55 Hudson Yards Subordinate Companion Loan |
B-1 | $180,000,000 | $180,000,000 | Hudson Yards 2019-55HY | Yes(1)(2) |
B-2 | $60,000,000 | $60,000,000 | Hudson Yards 2019-55HY | Yes(1)(2) |
B-3 | $60,000,000 | $60,000,000 | Hudson Yards 2019-55HY | Yes(1)(2) |
Total (Subordinate Companion Loan) | $300,000,000 | $300,000,000 | | |
Total (Whole Loan) | $1,245,000,000 | $1,245,000,000 | | |
(1) | No single promissory note comprising a part of the whole loan is the related control note; however, the Hudson Yards 2019-55HY securitization trust is the related controlling note holder, and a party designated under the related trust and servicing agreement is entitled to exercise the rights thereof. |
(2) | The 55 Hudson Yards Subordinate Companion Loan is subordinate to the 55 Hudson Yards Senior Loan. |
This is not a research report and was not prepared by any Underwriter’s research department. Please see additional important information and qualifications at the end of this Term Sheet.
T-30
Office – CBD | Loan #1 | Cut-off Date Balance: | | $100,000,000 |
55 Hudson Yards | 55 Hudson Yards | Cut-off Date LTV: | | 39.4% |
New York, NY 10001 | | UW NCF DSCR: | | 3.53x |
| | UW NOI Debt Yield: | | 11.0% |
The Borrower and the Borrower Sponsors. The borrower is One Hudson Yards Owner LLC (the “55 Hudson Yards Borrower”), a Delaware limited liability company and single purpose entity with two independent directors. The 55 Hudson Yards Whole Loan is recourse solely to the single purpose entity borrower. There is no separate non-recourse carveout guarantor or environmental indemnitor with respect to the 55 Hudson Yards Whole Loan.
The borrower’s sole member is One Hudson Yards Holdings LLC, which is a joint venture between MFA 55 HY LLC (“Mitsui Member”) and 55 Hudson Yards Member LLC (“Hudson Yards Member”). Mitsui Member is indirectly owned by Mitsui Fudosan America, Inc. (“Mitsui”). The managing member and owner of Hudson Yards Member is Hudson Yards Gen-Par, LLC, a joint venture between Related Hudson Yards, LLC (“Related Member”) and Oxford Hudson Yards LLC (“Oxford Member”). Related Member is indirectly wholly-owned by The Related Companies L.P. (“Related”) and Oxford Member is wholly-owned by OP Olympic Capital Corp (US) Inc. (“Oxford”, and together with Mitsui and Related, the “Borrower Sponsor”).
Founded by Stephen M. Ross in 1972, Related is a privately owned, fully integrated and diversified real estate company with experience in development, acquisition, management, finance, marketing and sales. Headquartered in New York City, Related owns and manages a portfolio of assets and has offices and major developments in Boston, Chicago, Los Angeles, San Francisco, South Florida, Washington, D.C. and London. Oxford Properties Group, comprising Oxford and its affiliates, make up the real estate investment arm of OMERS, one of Canada’s largest pension plans. OMERS was established in 1962 as a pension plan for employees of municipal governments, schoolboards, libraries, police and fire services, Children’s Aid Societies, and other local agencies throughout Ontario. The OMERS pension plan has approximately half a million active and retired members and 1,000 participating employers, and is funded by contributions and investment earnings. Oxford Properties Group, comprising Oxford and its affiliates, manages over $58 billion of office, retail, industrial, hotel and multifamily residential assets across the globe, including over 100 million SF in cities across four continents. Mitsui is the U.S. subsidiary of Japan’s largest real estate company, Mitsui Fudosan Co., Ltd. (“Mitsui Fudosan”). Mitsui is headquartered in New York, and is responsible for Mitsui Fudosan’s real estate investment and development activities in North America. Mitsui’s U.S. portfolio currently includes eight office buildings totaling 5.6 million SF; 4.7 million SF of office space under development; 1,300 residential apartments; 5,000 additional apartments under development; 360 condominiums and townhomes under development; and 753 hotel rooms. Mitsui has been active in the United States since the 1970s, and currently owns assets in the New York, Washington, D.C., Boston, Denver, Los Angeles, San Francisco, Seattle and Honolulu metropolitan areas.
The Property. The 55 Hudson Yards Property is a 1,431,232 SF, 51-story, Class A office building located within the Hudson Yards development of Manhattan in New York City. Constructed in 2018, the 55 Hudson Yards Property is situated on a 0.9-acre parcel of land with frontage along Eleventh Avenue and Hudson Boulevard between West 34th and West 35th Streets (adjacent to a No. 7 subway station entrance). The building was designed by Kohn Pedersen Fox and architect Kevin Roche, and features a unique façade consisting of matte metal and stepped articulation of the window frames that are defined by aluminum extrusions, castings, and built-up shapes. According to the appraisal, the 55 Hudson Yards Property is currently the shortest skyscraper within phase 1 of the Hudson Yards plan and is known for its distinct construction compared to the remainder of the development. The 55 Hudson Yards Property is LEED Gold certified and has incorporated technology for indoor air quality and a flexible workplace environment.
According to the appraisal, the 55 Hudson Yards Property offers amenities such as a dispatch elevator system, fingerprint access within the office lobby, floor-to-ceiling glass windows, column-free space allowing tenants to maximize the floor plates, terrace overlooking the new Hudson Boulevard Park that wraps around the 10th floor (podium level), and private terraces throughout the office component that were constructed for tenants upon request.
The 55 Hudson Yards Property was 97.3% leased to 20 tenants as of November 19, 2019. Three tenants (Milbank, Cooley and Boies Schiller) comprising approximately 38.0% of net rentable area and 35.9% of underwritten base rent are ranked within the top 100 law firms by gross revenue in the United States, according to a third party legal publication.
Major Tenants.
Point72 (332,283 SF, 23.2% NRA, 21.9% underwritten base rent, April 30, 2034 expiration). Point72 Asset Management (“Point72”) is an American hedge fund founded by Steven A. Cohen. The firm has over 1,400 employees across 10 global offices. The 55 Hudson Yards Property serves as Point72’s New York headquarters, after consolidating from 11 floors in two buildings previously occupied at 510 and 330 Madison Avenue. Point72 currently occupies floors 3-14 at the 55 Hudson Yards Property but is not yet paying full rent on all of its space. All outstanding gap rent and free rent through March 2020, in the amount of $987,380, was reserved at the time of origination of the 55 Hudson Yards Whole Loan. The rent commencement dates are as follows: April 16, 2019 for floors 5-14; December 1, 2019 for floor 4; and May 1, 2020 for floor 3 (there is no assurance that Point72 will begin paying rent by the estimated dates noted herein). Effective as of the 10th anniversary of the initial rent commencement date (which was April 16, 2019), and upon 15 months’ prior notice, the tenant has a one-time option to terminate either (i) the entirety of its leased premises or (ii) any one or more contiguous floors starting at either the highest or lowest office floor of the largest contiguous block of office floors then-leased by the tenant, such termination subject to a fee of the unamortized portion of allowances, commissions and free rent with respect to the terminated premises (calculated on a straight line basis over the period commencing on the rent commencement date and ending on the expiration date of the lease and bearing a 6% interest rate per annum). Point72 has either (i) two renewal options of 5-years each or (ii) one 10-year renewal option, each with 15 months’ prior notice and at the fair market rental rate, following its April 2034 lease expiration. Point 72 has signed a sublease for the entire 3rd floor (31,246 SF) of its space to Elite World Group, LLC, with an expected sublease commencement date of February 2020, a 5-year term and an annual rate of $90.00 PSF. Point72 also subleases 11,844 SF of its space to Light Sky Macro LP, with a sublease expiration of August 2029 and a rate of $99.00 PSF.
Milbank, Tweed Hadley & McCloy (287,333 SF, 20.1% NRA, 17.9% underwritten base rent, March 31, 2034 expiration). Milbank, Tweed Hadley & McCloy (“Milbank”) is an international law firm ranked within the top 100 law firms by gross revenue according to a third party legal publication, and is headquartered at the 55 Hudson Yards Property. The firm also has offices in Washington, D.C., Los Angeles, London, Frankfurt, Munich, Tokyo, Hong Kong, São Paulo, Seoul, Singapore and Beijing. The firm was founded in 1866 and as of 2018 had 728 attorneys. Milbank currently occupies space on floors 30-39 along with 600 SF of storage space at the 55 Hudson Yards Property. Milbank has the one-time right to contract by up to one floor upon the tenth anniversary of the rent commencement date (which was April 1, 2019) with notice no less than 15 months prior to the contraction date. Milbank has either (i) two renewal options of 5-years each or (ii) one 10-year renewal option, each with 18 months’ prior notice and at the fair market rental rate, following its March 2034 expiration.
Cooley (146,227 SF, 10.2% NRA, 11.2% underwritten base rent, September 30, 2039 expiration). Cooley LLP (“Cooley”) is a law firm ranked within the top 100 law firms by gross revenue according to a third party legal publication and is headquartered in Palo Alto, California with 16 other offices in San Francisco, Los Angeles, New York, Boston, Washington, D.C., San Diego, Seattle, Colorado, Virginia, London, Beijing and Shanghai. The firm had 946
This is not a research report and was not prepared by any Underwriter’s research department. Please see additional important information and qualifications at the end of this Term Sheet.
T-31
Office – CBD | Loan #1 | Cut-off Date Balance: | | $100,000,000 |
55 Hudson Yards | 55 Hudson Yards | Cut-off Date LTV: | | 39.4% |
New York, NY 10001 | | UW NCF DSCR: | | 3.53x |
| | UW NOI Debt Yield: | | 11.0% |
attorneys in 2018. The firm’s major practice areas include corporate, litigation, intellectual property and regulatory law. Cooley currently occupies space on floors 42-46 of the 55 Hudson Yards Property. Effective as of the 10th anniversary of the rent commencement date (which was September 1, 2019), with 18 months’ prior notice, tenant has the one-time right to surrender either (i) the highest or lowest floor of any contiguous block or (ii) if the tenant did not exercise its initial expansion option, all of the SF leased on the lowest floor of the leased premises (if tenant leases less than all of the SF on such lowest floor), subject to a fee equal to the sum of the unamortized portion of allowances, commissions and rent concessions applicable to such space. In addition, effective as of the 15th anniversary of the rent commencement date, with 24 months’ prior notice, Cooley has the one-time right to terminate its lease subject to a fee of the sum of (i) unamortized allowances, commissions, rent concessions (each including interest at the rate of 6% per annum, compounded monthly) and (ii) four months of fixed rent and recurring additional charges at the rate immediately preceding the termination date. Cooley has either (i) two renewal options of 5-years each or (ii) one 10-year renewal option, each with 18 months’ prior notice and at the fair market rental rate, following its September 2039 expiration. Cooley subleases 12,229 SF of its space to Cinctive Capital LLC, with a sublease expiration of June 2022 and an annual rate of $110 PSF.
Boies Schiller & Flexner (110,732 SF, 7.7% NRA, 6.8% underwritten base rent, June 30, 2035 expiration). Founded by David Boies and Jonathan D. Schiller in 1997, Boies, Schiller & Flexner (“Boies Schiller”) is a law firm ranked within the top 100 law firms by gross revenue according to a third party legal publication, specializing in litigation and headquartered at the 55 Hudson Yards Property. The firm has 10 offices with a total of 320 attorneys. Boies Schiller currently occupies space on floors 18-21 of the 55 Hudson Yards Property, but is not yet paying full rent on all of its space. All outstanding gap rent and free rent through June 2020, in the amount of $5,480,125, was reserved at the time of origination of the 55 Hudson Yards Whole Loan. Effective as of the 10th anniversary of the rent commencement date (July 1, 2020), with 18 months’ prior notice, the tenant has a one-time right to surrender either (i) the highest or lowest floor of any contiguous block or (ii) any partial floor, each subject to a fee of 150% of the applicable per square foot base rent and 150% of the recurring additional charges due with respect to the contracted space for the immediately preceding 12-month period. Boies Schiller has either (i) two renewal options of 5-years each or (ii) one 10-year renewal option, each with 24 months’ prior notice and at the fair market rental rate, following its June 2035 expiration. Boies Schiller subleases 18,224 SF of its space to Ashurst LLP, with a sublease expiration date of June 2026 and an annual rate of $94.00 PSF.
Third Point (89,043 SF, 6.2% NRA, 8.6% underwritten base rent, July 31, 2029 expiration). Third Point Management (“Third Point”) is a New York-based hedge fund founded by Daniel S. Loeb in 1995. The firm operates as an employee-owned and SEC-registered investment advisor. Third Point currently occupies spaces on floors 49-51 of the 55 Hudson Yards Property. Third Point has either (i) a renewal option of 5-years or (ii) a renewal option of 10-years, each with 15 months’ prior notice and at the fair market rental rate, following its July 2029 expiration.
The following table presents certain information relating to the tenancy at the 55 Hudson Yards Property:
| Tenant Summary |
Tenant Name | Credit Rating (Fitch/ Moody’s/ S&P) | Tenant SF | Approx. % of SF | Annual UW Rent(1) | % of Total Annual
UW Rent | Annual
UW Rent
PSF(1) | Lease
Expiration | Termination Option (Y/N) | Renewal Options |
Major Tenants | | | | | | | | | |
Point72 | NR/NR/NR | 332,283(3) | 23.2% | $29,364,626(2)(3) | 21.9% | $88.37(2)(3) | 4/30/2034 | Y(4) | 2-5 yr or 1-10 yr |
Milbank | NR/NR/NR | 287,333 | 20.1% | $24,040,889 | 17.9% | $83.67 | 3/31/2034 | Y(5) | 2-5 yr or 1-10 yr |
Cooley | NR/NR/NR | 146,227(6) | 10.2% | $15,061,381(6) | 11.2% | $103.00(6) | 9/30/2039 | Y(7) | 2-5 yr or 1-10 yr |
Boies Schiller | NR/NR/NR | 110,732(8) | 7.7% | $9,135,390(8)(9) | 6.8% | $82.50(8)(9) | 6/30/2035 | Y(10) | 2-5 yr or 1-10 yr |
Third Point | NR/NR/NR | 89,043 | 6.2% | $11,575,590 | 8.6% | $130.00 | 7/31/2029 | N | 1-5 yr or 1-10 yr |
Subtotal/Wtd. Avg. | | 965,618 | 67.5% | $89,177,876 | 66.4% | $92.35 | | | Termination Option (Y/N) |
| | | | | | | | | |
Other Tenants | | 426,582 | 29.8% | $45,026,413 | 33.6% | $105.55 | | | |
Vacant Space | | 39,012 | 2.7% | $0 | 0.0% | $0.00 | | | |
Total/Wtd. Avg. | | 1,431,212 | 100.0% | $134,204,289 | 100.0% | $96.40(11) | | | |
(1) | The Annual UW Rent and Annual UW Rent PSF shown above include contractual rent steps through December 2020 totaling $57,080. The lender’s underwriting gives separate credit for straight-line rent averaging for the investment grade tenant Mount Sinai through the loan term and for Milbank, Cooley and Boies Schiller through the loan term. The total implied underwritten rental rate for Milbank, Cooley and Boies Schiller, inclusive of the straight line credit, is approximately $87.72, $106.62 and $85.59 PSF, respectively. See “Underwritten Net Cash Flow” below. |
(2) | Point 72 has signed a sublease for the entire 3rd floor (31.246 SF) of its space with Elite World Group, LLC, with an expected sublease commencement date of February 2020, a 5-year term and an annual rate of $90.00 PSF. Point72 also subleases 11,844 SF of its space to Light Sky Macro LP, with a sublease expiration of August 2029 and an annual rate of $99.00 PSF. Underwriting reflects the prime rent. |
(3) | Point72 has an executed lease and has taken full occupancy of its spaces but has not yet fully commenced paying rent on all of its space (see tenant description in “Major Tenants” above for further information). |
(4) | Point72 has a one-time termination or contraction option that is further described in the “Major Tenants” section above. |
(5) | Milbank has a one-time contraction option that is further described in the “Major Tenants” section above. |
(6) | Cooley subleases 12,229 SF of its space to Cinctive Capital LLC, with a sublease expiration of June 30, 2022 and an annual rate of $110 PSF. Underwriting reflects the prime rent. |
(7) | Cooley has a one-time termination or contraction option that is further described in the “Major Tenants” section above. |
(8) | Boies Schiller subleases 18,224 SF of its space to Ashurst LLP, with a sublease expiration date of June 28, 2026 and an annual rate of $94.00 PSF. Underwriting reflects the prime rent. |
(9) | Boies Schiller has an executed lease and has taken full occupancy of its spaces but has not yet fully commenced paying rent on all of its space (see tenant description in “Major Tenants” above for further information). |
(10) | Boies Schiller has a one-time contraction option that is further described in the “Major Tenants” section above. |
(11) | Total/Wtd. Avg. Annual UW Rent PSF excludes vacant space. |
This is not a research report and was not prepared by any Underwriter’s research department. Please see additional important information and qualifications at the end of this Term Sheet.
T-32
Office – CBD | Loan #1 | Cut-off Date Balance: | | $100,000,000 |
55 Hudson Yards | 55 Hudson Yards | Cut-off Date LTV: | | 39.4% |
New York, NY 10001 | | UW NCF DSCR: | | 3.53x |
| | UW NOI Debt Yield: | | 11.0% |
The following table presents certain information relating to the lease rollover schedule at the 55 Hudson Yards Property:
Lease Rollover Schedule(1)(2) |
Year | # of
Leases
Rolling | SF Rolling | Annual UW Rent
PSF Rolling | Approx. % of
Total SF
Rolling | Approx.
Cumulative %
of SF Rolling | Total UW Rent
Rolling | Approx. % of
Total Rent
Rolling | Approx.
Cumulative %
of Total Rent
Rolling |
2019 | 0 | 0 | $0.00 | 0.0% | 0.0% | $0 | 0.0% | 0.0% |
2020 | 0 | 0 | $0.00 | 0.0% | 0.0% | $0 | 0.0% | 0.0% |
2021 | 0 | 0 | $0.00 | 0.0% | 0.0% | $0 | 0.0% | 0.0% |
2022 | 0 | 0 | $0.00 | 0.0% | 0.0% | $0 | 0.0% | 0.0% |
2023 | 0 | 0 | $0.00 | 0.0% | 0.0% | $0 | 0.0% | 0.0% |
2024 | 2 | 84,892 | $114.02 | 5.9% | 5.9% | $9,679,268 | 7.2% | 7.2% |
2025 | 2 | 18,765 | $109.00 | 1.3% | 7.2% | $2,045,385 | 1.5% | 8.7% |
2026 | 0 | 0 | $0.00 | 0.0% | 7.2% | $0 | 0.0% | 8.7% |
2027 | 0 | 0 | $0.00 | 0.0% | 7.2% | $0 | 0.0% | 8.7% |
2028 | 0 | 0 | $0.00 | 0.0% | 7.2% | $0 | 0.0% | 8.7% |
2029 | 6 | 149,603 | $125.92 | 10.5% | 17.7% | $18,838,620 | 14.0% | 22.8% |
2030 & Beyond | 21 | 1,138,940 | $91.00 | 79.6% | 97.3% | $103,641,016 | 77.2% | 100.0% |
Vacant | 0 | 39,012 | $0.00 | 2.7% | 100.0% | $0 | 0.0% | 100.0% |
Total/Wtd. Avg. | 31 | 1,431,212 | $96.40 | 100.0% | | $134,204,289(3) | 100.0% | |
(1) | Information is based on the underwritten rent roll. |
(2) | Certain tenants may have lease termination options that are exercisable prior to the originally stated expiration date of the subject lease and that are not considered in the Lease Rollover Schedule. |
(3) | Total/Wtd. Avg. Annual UW Rent PSF Rolling excludes vacant space. |
The Market. The 55 Hudson Yards Property is located at 550 West 34th Street, on the southeast corner of the intersection of 34th Street and 11th Avenue in New York, New York. The 55 Hudson Yards Property is situated within the Hudson Yards development, one of the largest private real estate development projects in the United States. Once fully developed, Hudson Yards is expected to include more than 18.0 million SF of commercial and residential space, along with more than 100 shops, a collection of restaurants, approximately 4,000 residences, affordable housing, The Shed (entertainment venue), 14 acres of open space, a 750-seat public school and an Equinox Hotel. The Hudson Yards neighborhood is traditionally bound by the Hell’s Kitchen neighborhood to the north, the Midtown, Times Square, Garment District and Penn Station neighborhoods to the east, and the West Chelsea neighborhood to the south. In September 2015, the Metropolitan Transportation Authority (MTA) completed an approximately $2.4 billion, 7,000-foot extension of the MTA’s No. 7 Flushing subway line (providing access to Queens), which was extended to include an additional subway stop at the corner of 34th Street and Eleventh Avenue (adjacent to the 50 Hudson Yards Property), from the previous last stop at 41st Street and Seventh Avenue (approximately 1.0 mile northeast of the 55 Hudson Yards Property). The 55 Hudson Yards Property is situated approximately 0.6 miles northwest of Penn Station.
The 55 Hudson Yards Property is situated approximately 0.3 miles northwest of the Shops & Restaurants at Hudson Yards, a seven-story, 676,229 SF retail center, with retailers such as Cartier, Coach, Zara, H&M, Watches of Switzerland and Fendi, as well as restaurant and food options including Hudson Yards Grill, Bouchon Bakery, Shake Shack and Jack’s Coffee. The Vessel, a 16-story structure comprising 154 interconnecting flights of stairs with approximately 2,500 individual steps and 80 landings, is located approximately 0.2 miles southwest of the 55 Hudson Yards Property.
According to the appraisal, the 55 Hudson Yards Property is situated within the Far West Side submarket of the New York Office Market. As of the third quarter of 2019, the Far West Side submarket reported a total inventory of approximately 9.1 million SF with a 1.4% vacancy rate (and a 12.2% availability rate) and average asking rents of $108.47 PSF, gross. The appraiser concluded to market rents ranging from $95.00 to $130.00 PSF, modified gross, for the various floors of office space at the 55 Hudson Yards Property (see table below).
The following table presents certain information relating to the appraisal’s market rent conclusion for the 55 Hudson Yards Property:
Market Rent Summary |
| Office –
Floor 2-9 | Office Floor
10-16 | Office Floor
17-23 | Office – Floor
24-30 | Office – Floor
31-37 | Office Floor
38-44 | Office Floor
45-51 |
Market Rent (PSF) | $95.00 | $100.00 | $110.00 | $115.00 | $120.00 | $125.00 | $130.00 |
Lease Term (Years) | 15 | 15 | 15 | 15 | 15 | 15 | 15 |
Lease Type (Reimbursements) | MG | MG | MG | MG | MG | MG | MG |
Rent Increase Projection | $10.00 PSF every 5 years | $10.00 PSF every 5 years | $10.00 PSF every 5 years | $10.00 PSF every 5 years | $10.00 PSF every 5 years | $10.00 PSF every 5 years | $10.00 PSF every 5 years |
This is not a research report and was not prepared by any Underwriter’s research department. Please see additional important information and qualifications at the end of this Term Sheet.
T-33
Office – CBD | Loan #1 | Cut-off Date Balance: | | $100,000,000 |
55 Hudson Yards | 55 Hudson Yards | Cut-off Date LTV: | | 39.4% |
New York, NY 10001 | | UW NCF DSCR: | | 3.53x |
| | UW NOI Debt Yield: | | 11.0% |
The following table presents information relating to comparable office property sales for the 55 Hudson Yards Property:
Comparable Property Sale Summary |
Property Name | Sale Date | Year Built/ Renovated | Total NRA
(SF) | Occupancy | Sale Price | Sale Price PSF |
55 Hudson Yards Property | N/A | 2019/N/A | 1,431,212(1) | 97.3%(1) | | |
711 Fifth Avenue | Sep. 2019 | 1927/N/A | 354,361 | 76% | $955,000,000 | $2,695 |
330 Madison Avenue | Jul. 2019 | 1963/N/A | 855,000 | 95% | $900,000,000 | $1,053 |
30 Hudson Yards(2) | Apr. 2019 | 2019/N/A | 1,463,234 | 100% | $2,155,000,000 | $1,473 |
640 Fifth Avenue | Apr. 2019 | 1948/2014 | 315,886 | 100% | $975,000,000 | $3,087 |
237 Park Avenue | Jan. 2019 | 1915/2015 | 1,260,160 | 98% | $1,200,000,000 | $952 |
3 Columbus Circle | Nov. 2018 | 1927/2011 | 753,405 | 100% | $1,035,000,000 | $1,374 |
1515 Broadway | Nov. 2017 | 1972/2010 | 1,897,131 | 99% | $1,950,000,000 | $1,028 |
10 Hudson Yards(2) | Aug. 2016 | 2015/N/A | 1,861,084 | 100% | $2,150,000,000 | $1,155 |
Source: Appraisal
(1) | Information obtained from the underwritten rent roll. |
(2) | Owned by affiliates of the 55 Hudson Yards Borrower. |
The following table presents certain information relating to comparable office leases for the 55 Hudson Yards Property:
Comparable Leases Summary |
Property Name/Location | Year Built/
Renovated | Total GLA
(SF) | Distance
from
Subject | Tenant Name | Lease Date/Term | Lease
Area (SF) | Annual
Base Rent
PSF | Lease Type |
55 Hudson Yards Property New York, NY | 2019/N/A | 1,431,212(1) | N/A | | | | | |
30 Hudson Yards(2) New York, NY | 2019/N/A | 1,463,234 | 0.1 Miles | Confidential Tenant Warner Media | Oct. 2019 /16.3 Yrs Jun. 2019 / 15.0 Yrs | 175,000 1,463,234 | $156.38 $120.37 | MG Net to MG adj. |
460 West 34th Street New York, NY | 1927/2021(3) | 633,530 | 0.2 Miles | First Republic Bank | Sep. 2019 /16.0 Yrs | 233,782 | $85.00 | MG |
441 Ninth Avenue New York, NY | 1962/2019 | 697,958 | 0.3 Miles | Brevert Peloton Interactive, LLC Lyft | Sep. 2019 /10.8 Yrs Nov. 2018 / 15.0 Yrs Nov. 2018 / 10.0 Yrs | 16,178 312,000 100,000 | $116.00 $106.66 $87.00 | MG MG MG |
50 Hudson Yards(2) New York, NY | 2022(3)/N/A | 2,900,000 | 0.1 Miles | Confidential | Sep. 2019 / 15.0 Yrs | 1,250,000 | $130.00 | MG |
1 Manhattan West New York, NY | 2019/N/A | 2,216,609 | 0.4 Miles | Accenture NHL McKool School Skadden, Arps, Slate, Meagher & Florn LLP | Jul. 2019 /16.1 Yrs Jun. 2019 / 22.0 Yrs Apr. 2019 / 16.0 Yrs Mar. 2019 / 21.0 Yrs | 248,673 176,007 64,120 600,867 | $119.00 $93.80 $108.00 $76.11 | MG MG MG MG |
66 Hudson Boulevard New York, NY | 2022(3)/N/A | 2,814,581 | 0.2 Miles | AllianceBernstein Pfizer Inc. | May 2019 /20.0 Yrs Apr. 2018 / 21.3 Yrs. | 186,226 790,000 | $105.00 $95.00 | MG MG |
10 Hudson Yards(2) New York, NY | 2015/N/A | 1,861,084 | 0.3 Miles | Huatai Securities | Apr. 2018 /3.6 Yrs | 5,992 | $120.00 | MG |
1 Vanderbilt Avenue New York, NY | 2020(3)/N/A | 1,730,989 | 1.6 Miles | The Carlyle Group | Jul. 2018 /15.8 Yrs | 95,367 | $166.00 | MG |
Source: Appraisal
(1) | Information obtained from the underwritten rent roll. |
(2) | Owned by affiliates of the 55 Hudson Yards Borrower. |
(3) | Denotes expected completion or renovation dates (as applicable) per the appraisal. |
This is not a research report and was not prepared by any Underwriter’s research department. Please see additional important information and qualifications at the end of this Term Sheet.
T-34
Office – CBD | Loan #1 | Cut-off Date Balance: | | $100,000,000 |
55 Hudson Yards | 55 Hudson Yards | Cut-off Date LTV: | | 39.4% |
New York, NY 10001 | | UW NCF DSCR: | | 3.53x |
| | UW NOI Debt Yield: | | 11.0% |
Underwritten Net Cash Flow. The following table presents certain information relating to the Underwritten Net Cash Flow at the 55 Hudson Yards Property:
Cash Flow Analysis(1) | |
| | UW | | UW PSF | |
Base Rent | | $134,147,209 | | $93.73 | |
Contractual Rent Steps(2) | | $57,080 | | $0.04 | |
Rent Average Benefit(3) | | $2,242,507 | | $1.57 | |
Grossed Up Vacant Space | | $5,108,740 | | $3.57 | |
Total Recoveries | | $12,516,263 | | $8.75 | |
Other Income | | $147,949 | | $0.10 | |
Less Vacancy & Credit Loss(4) | | ($5,108,740) | | ($3.57) | |
Effective Gross Income | | $149,111,008 | | $104.19 | |
| | | | | |
Real Estate Taxes (PILOT)(5) | | $19,160,307 | | $13.39 | |
Insurance | | $807,380 | | $0.56 | |
Other Operating Expenses | | $25,242,990 | | $17.64 | |
Total Expenses | | $45,210,677 | | $31.59 | |
| | | | | |
Net Operating Income | | $103,900,331 | | $72.60 | |
Capital Expenditures | | $286,242 | | $0.20 | |
TI/LC | | $3,578,030 | | $2.50 | |
Net Cash Flow | | $100,036,059 | | $69.90 | |
| | | | | |
Occupancy%(4) | | 97.3% | | | |
NOI DSCR(6) | | 3.67x | | | |
NCF DSCR(6) | | 3.53x | | | |
NOI Debt Yield(6) | | 11.0% | | | |
NCF Debt Yield(6) | | 10.6% | | | |
(1) | Prior historical operating statements are not applicable, as the 55 Hudson Yards Property was constructed in 2018 and tenants began taking occupancy in 2019. |
(2) | Represents contractual rent steps through December 2020. |
(3) | Represents straight-line rent averaging for the investment grade tenant Mount Sinai through the loan term and for Milbank, Cooley and Boies Schiller through the loan term (see “Tenant Summary” above for further information). |
(4) | The underwritten economic vacancy is 3.6%. The 55 Hudson Yards Property was 97.3% leased as of November 19, 2019. |
(5) | Represents the average of the projected PILOT payments over the loan term (see “PILOT/IDA Leases” for further details on the PILOT agreement). |
(6) | The debt service coverage ratios and debt yields are based on the 55 Hudson Yards Senior Loan, and exclude the 55 Hudson Yards Subordinate Companion Loan. |
Escrows and Reserves.
Real Estate Taxes - Upon the occurrence and continuance of a Cash Trap Event Period (as defined below under “Lockbox and Cash Management”), the 55 Hudson Yards Whole Loan documents require ongoing monthly real estate tax reserves in an amount equal to one-twelfth of the real estate taxes that the lender reasonably estimates will be payable during the next 12 months.
Insurance - Upon the occurrence and continuance of a Cash Trap Event Period, the 55 Hudson Yards Whole Loan documents require ongoing monthly insurance reserves in an amount equal to one-twelfth of the insurance premiums that the lender estimates will be payable for the renewal of the coverage during the next 12 months; provided, however, notwithstanding any prior springing conditions, the reserve will not be required if the 55 Hudson Yards Borrower maintains a blanket insurance policy reasonably acceptable to the lender.
Replacement Reserve – Upon the occurrence and continuance of a Cash Trap Event Period, the 55 Hudson Yards Whole Loan documents require ongoing monthly replacement reserves of $23,584.
Rollover Reserve – Upon the occurrence and continuance of a Cash Trap Event Period, the 55 Hudson Yards Whole Loan documents require ongoing monthly general rollover reserves of $119,268.
Tenant Specific TI/LC Reserve – The 55 Hudson Yards Whole Loan documents require an upfront deposit of $34,260,641 for approved leasing expenses outstanding at the time of origination of the 55 Hudson Yards Whole Loan.
Free Rent Reserve – The 55 Hudson Yards Whole Loan documents require an upfront reserve of $11,482,346 for the free rent and gap rent outstanding for seven tenants at the time of origination of the 55 Hudson Yards Whole Loan.
This is not a research report and was not prepared by any Underwriter’s research department. Please see additional important information and qualifications at the end of this Term Sheet.
T-35
Office – CBD | Loan #1 | Cut-off Date Balance: | | $100,000,000 |
55 Hudson Yards | 55 Hudson Yards | Cut-off Date LTV: | | 39.4% |
New York, NY 10001 | | UW NCF DSCR: | | 3.53x |
| | UW NOI Debt Yield: | | 11.0% |
Milbank Lease Landlord Delay Dispute Reserve – The 55 Hudson Yards Whole Loan documents require an upfront reserve of $11,000,000 relating to the potential settlement of a dispute between the 55 Hudson Yards Borrower and Milbank relating to a delay in the delivery of such tenant’s leased premises.
MarketAxess Lease Takeover Reserve – The 55 Hudson Yards Whole Loan documents require an upfront reserve of $4,474,631 relating to the rental expenses to be incurred by MarketAxess Holdings Inc., a tenant at the 55 Hudson Yards Property, under a prior sublease at an unrelated property which the 55 Hudson Yards Borrower agreed to pay as an inducement to such tenant’s new lease at the 55 Hudson Yards Property.
Lockbox and Cash Management. The 55 Hudson Yards Whole Loan documents require that the 55 Hudson Yards Borrower establish and maintain a lender-controlled lockbox account, which is already in-place, and direct all tenants to pay rent directly into such lockbox account. The 55 Hudson Yards Whole Loan documents also require that all rents received by the 55 Hudson Yards Borrower be deposited into the lockbox account within two business days of receipt. Prior to the occurrence of a Cash Trap Event Period, all funds on deposit in the lockbox account will be disbursed to the 55 Hudson Yards Borrower’s operating account. During a Cash Trap Event Period, all funds in the lockbox account are required to be swept each business day into the cash management account controlled by the lender and, on each payment date, all funds in the cash management account are required to be applied in accordance with the 55 Hudson Yards Whole Loan documents. During a Cash Trap Event Period, any excess cash flow remaining after satisfaction of the waterfall items is required to be swept to an excess cash flow subaccount to be held by the lender as additional security for the 55 Hudson Yards Whole Loan; provided, however, so long as no event of default exists under the 55 Hudson Yards Whole Loan, if amounts on deposit in the Rollover Reserve are not sufficient to pay approved leasing expenses, then upon request of the 55 Hudson Yards Borrower, funds in the excess cash flow subaccount are required to be disbursed for approved leasing expenses.
A “Cash Trap Event Period” will commence upon the earlier of the following:
| (i) | the occurrence and continuance of an event of default; or |
| (ii) | the net cash flow debt yield (“NCF DY”) for the 55 Hudson Yards Whole Loan falling below 6.0% at the end of any calendar quarter. |
A Cash Trap Event Period will end upon the occurrence of the following:
| ● | with regard to clause (i) above, the cure of such event of default; or |
| ● | with regard to clause (ii) above: |
| (a) | the NCF DY for the 55 Hudson Yards Whole Loan being greater than or equal to 6.0% for two consecutive calendar quarters; or |
| (b) | the 55 Hudson Yards Borrower delivering to the lender as additional collateral and security for the payment of the debt, immediately available funds or one or more letters of credits (not to exceed, in the aggregate, 10.0% of the outstanding principal balance of the 55 Hudson Yards Whole Loan) having an aggregate notional amount, that, if applied as a prepayment of the outstanding principal balance of the 55 Hudson Yards Whole Loan, would cause the NCF DY to equal or exceed 6.0%. |
Additional Secured Indebtedness (not including trade debts). The 55 Hudson Yards Property also secures the 55 Hudson Yards Non-Serviced Pari Passu Companion Loans, which have an aggregate Cut-off Date principal balance of $845,000,000 and the 55 Hudson Yards Subordinate Companion Loan, which has an aggregate Cut-off Date principal balance of $300,000,000. The 55 Hudson Yards Non-Serviced Pari Passu Companion Loans and the 55 Hudson Yards Subordinate Companion Loan are coterminous with the 55 Hudson Yards Mortgage Loan. The 55 Hudson Yards Non-Serviced Pari Passu Companion Loans accrue interest at the same rate as the 55 Hudson Yards Mortgage Loan, and the 55 Hudson Yards Subordinate Companion Loan accrues interest at an interest rate of 2.9500%. The 55 Hudson Yards Mortgage Loan and the 55 Hudson Yards Non-Serviced Pari Passu Companion Loans are each pari passu in right of payment and together are senior in right of payment to the 55 Hudson Yards Subordinate Companion Loan. The holders of the 55 Hudson Yards Mortgage Loan, the 55 Hudson Yards Non-Serviced Pari Passu Companion Loans and the 55 Hudson Yards Subordinate Companion Loan have entered into a co-lender agreement which sets forth the allocation of collections on the 55 Hudson Yards Whole Loan. See “Description of the Mortgage Pool—The Whole Loans—The 55 Hudson Yards Pari Passu-A/B Whole Loan”.
The following table presents certain information relating to the 55 Hudson Yards Subordinate Companion Loan:
B-Note Summary |
| B-Note Original
Principal Balance | B-Note
Interest Rate | Original
Term (mos.) | Original
Amort. Term (mos.) | Original IO
Term (mos.) | Total Debt
UW NCF
DSCR | Total Debt
UW NOI
Debt Yield | Total Debt Cutoff Date
LTV |
55 Hudson Yards Subordinate Companion Loan | $300,000,000 | 2.9500% | 120 | 0 | 120 | 2.68x | 8.0% | 51.9% |
Mezzanine Loan and Preferred Equity. Not permitted.
Release of Property. Not permitted.
Right of First Offer/Right of First Refusal. None.
Ground Lease. None.
Letter of Credit. None.
PILOT/IDA Leases. The 55 Hudson Yards Borrower leases the 55 Hudson Yards Property to the New York City Industrial Development Agency (the “Agency”) (such lease, the “Company Lease”), and the Agency subleases the 55 Hudson Yards Property back to the 55 Hudson Yards Borrower (the “Agency Lease”) (the Company Lease and Agency Lease, collectively, the “IDA Leases”). The benefits of this lease structure to the 55 Hudson Yards Borrower are a mortgage recording tax exemption and real property tax abatements. As such, the 55 Hudson Yards Borrower pays installment payments in lieu of real estate taxes as the rent under the Agency Lease (the “PILOT Payments”). In order for the PILOT Payments to achieve the same priority as
This is not a research report and was not prepared by any Underwriter’s research department. Please see additional important information and qualifications at the end of this Term Sheet.
T-36
Office – CBD | Loan #1 | Cut-off Date Balance: | | $100,000,000 |
55 Hudson Yards | 55 Hudson Yards | Cut-off Date LTV: | | 39.4% |
New York, NY 10001 | | UW NCF DSCR: | | 3.53x |
| | UW NOI Debt Yield: | | 11.0% |
would real estate tax payments (i.e., ahead of any mortgage or other lien), the 55 Hudson Yards Borrower (with the Agency as holder of the leasehold under the Company Lease) provided mortgages in favor of the Hudson Yards Infrastructure Corporation, a not-for-profit local development corporation (“HYIC”), to secure the PILOT Payments (collectively, the “PILOT Mortgage”). The HYIC has issued revenue bonds for which the PILOT Payments are used to repay the bondholders. The term of the IDA Leases runs to June 30, 2044 (such period, the “Initial Term”), with annual automatic one-year extensions thereafter, unless within 60 days preceding the expiration of the current term the Agency provides written notice of termination to the 55 Hudson Yards Borrower (such date, the “Expiration Date”); provided that, after the Initial Term, the IDA Leases will automatically terminate within 60 days after the repayment in full or defeasance of all revenue bonds issued by HYIC for which an assignment of the PILOT Amount payable under the Agency Lease is used to repay the bondholders.
The 55 Hudson Yards Property is subject to tax abatements in the following amounts through 2038:
| ● | 29.7% tax abatement through 2023; |
| ● | 2024 through 2034: PILOT payments are due in amount equal to 103% of the preceding year’s PILOT payment; |
| ● | 2035: PILOT payments due in amount equal to the greater of (a) 76.3% of unabated taxes and (b) 103% of the preceding year’s PILOT payment; |
| ● | 2036: PILOT payments due in amount equal to the greater of (a) 82.2% of unabated taxes and (b) 103% of the preceding year’s PILOT payment; |
| ● | 2037: PILOT payments due in amount equal to the greater of (a) 88.1% of unabated taxes and (b) 103% of the preceding year’s PILOT payment; and |
| ● | 2038: PILOT payments due in amount equal to the greater of (a) 94.1% of unabated taxes and (b) 103% of the preceding year’s PILOT payment. |
For additional information with respect to the IDA Leases and PILOT Payments, see “Description of the Mortgage Pool—Real Estate and Other Tax Considerations” in the Preliminary Prospectus.
Terrorism Insurance. The 55 Hudson Yards Whole Loan documents require that the “all risk” insurance policy required to be maintained by the 55 Hudson Yards Borrower, in an amount equal to the full replacement cost of the 55 Hudson Yards Property, contain no exclusion for damage or destruction caused by acts of terrorism, as well as business interruption insurance covering a period of restoration of 24 months and a 6-month extended period of indemnity (provided that if TRIPRA or a similar statute is not in effect, the 55 Hudson Yards Borrower will not be obligated to pay terrorism insurance premiums in excess of two times the annual premium for the casualty and business interruption coverage (without giving effect to the cost of terrorism, flood and earthquake and business interruption components of such coverage).
The 55 Hudson Yards Whole Loan documents provide that required terrorism insurance may be written by a non-rated captive insurer subject to certain conditions, including, among other things: (i) TRIPRA is in full force and effect; (ii) the terrorism policy issued by such captive insurer, together with any other qualified terrorism policies in-place, provide per occurrence limit in an amount not less than replacement cost and rent loss coverage as otherwise required; (iii) covered losses that are not reinsured by the federal government under TRIPRA and paid to the captive insurer are reinsured with a cut-through endorsement by an insurance company rated S&P “A”/ Moody’s “A2” or better; (iv) all reinsurance agreements between the captive insurer and other reinsurance providers are reasonably acceptable to the lender; (v) such captive insurer is licensed in the State of New York or other jurisdiction to the extent reasonably approved by the lender and qualified to issue the terrorism policy in accordance with applicable legal requirements; and (vi) the related policy will not contain a provision that terrorism coverage will expire or be excluded or limited in the event TRIPRA expires or is no longer in effect, so long as an insurance policy that does not contain such a provision is commercially available.
This is not a research report and was not prepared by any Underwriter’s research department. Please see additional important information and qualifications at the end of this Term Sheet.
T-37
Multifamily – High Rise | Loan #2 | Cut-off Date Balance: | | $100,000,000 |
28-10 Jackson Avenue, 28-40 Jackson | Jackson Park | Cut-off Date LTV: | | 34.4% |
Avenue, and 28-30 Jackson Avenue | | U/W NCF DSCR: | | 3.92x |
Long Island City, NY 11101 | | U/W NOI Debt Yield: | | 13.0% |

This is not a research report and was not prepared by any Underwriter’s research department. Please see additional important information and qualifications at the end of this Term Sheet.
T-38
Multifamily – High Rise | Loan #2 | Cut-off Date Balance: | | $100,000,000 |
28-10 Jackson Avenue, 28-40 Jackson | Jackson Park | Cut-off Date LTV: | | 34.4% |
Avenue, and 28-30 Jackson Avenue | | U/W NCF DSCR: | | 3.92x |
Long Island City, NY 11101 | | U/W NOI Debt Yield: | | 13.0% |
This is not a research report and was not prepared by any Underwriter’s research department. Please see additional important information and qualifications at the end of this Term Sheet.
T-39
Mortgage Loan No. 2 – Jackson Park |
Mortgage Loan Information | | Property Information |
Mortgage Loan Seller: | BANA; WFB | | Single Asset/Portfolio: | Single Asset |
Credit Assessment (DBRS/Fitch/S&P): | AA(high)/Asf/AA-(sf) | | Location: | Long Island City, NY 11101 |
Original Balance(1): | $100,000,000 | | General Property Type: | Multifamily |
Cut-off Date Balance(1): | $100,000,000 | | Detailed Property Type: | High Rise |
% of Initial Pool Balance: | 8.2% | | Title Vesting: | Fee |
Loan Purpose: | Refinance | | Year Built/Renovated: | 2018/N/A |
Borrower Sponsor: | Tishman Speyer Crown Equities 2007, LLC | | Size: | 1,871 Units |
Guarantor: | LIC Development Owner, L.P. | | Cut-off Date Balance per Unit(1): | $293,960 |
Mortgage Rate: | 3.2500% | | Maturity Date Balance per Unit(1): | $293,960 |
Note Date: | 9/27/2019 | | Property Manager: | Tishman Speyer Properties, L.P. |
First Payment Date: | 11/10/2019 | | | (borrower-related) |
Maturity Date: | 10/10/2029 | | Underwriting and Financial Information |
Original Term to Maturity: | 120 months | | UW NOI: | $71,395,371 |
Original Amortization Term: | 0 months | | UW NOI Debt Yield(1): | 13.0% |
IO Period: | 120 months | | UW NOI Debt Yield at Maturity(1): | 13.0% |
Seasoning: | 2 months | | UW NCF DSCR(1): | 3.92x |
Prepayment Provisions(2): | LO (26); DEF (87); O (7) | | Most Recent NOI(5): | N/A |
Lockbox/Cash Mgmt Status: | Soft/Springing | | 2nd Most Recent NOI(5): | N/A |
Additional Debt Type(1)(3): | Pari Passu/Subordinate | | 3rd Most Recent NOI(5): | N/A |
Additional Debt Balance(1)(3): | $450,000,000/$450,000,000 | | Most Recent Occupancy: | 96.1% (8/31/2019) |
Future Debt Permitted (Type)(3): | Yes (Mezzanine) | | 2nd Most Recent Occupancy(5): | N/A |
| | | 3rd Most Recent Occupancy(5): | N/A |
Reserves(4) | | Appraised Value (as of): | $1,600,000,000 (9/4/2019) |
Type | Initial | Monthly | Cap | | Appraised Value per Unit: | $855,158 |
RE Tax: | $0 | Springing | N/A | | Cut-off Date LTV Ratio(1): | 34.4% |
Insurance: | $0 | Springing | N/A | | Maturity Date LTV Ratio(1): | 34.4% |
Sources and Uses |
Sources | Proceeds | % of Total | | Uses | Proceeds | % of Total |
Senior Loan(1): | $550,000,000 | 55.0% | | Loan Payoff(6): | $641,983,355 | 64.2% |
Subordinate Companion Loan(1): | $450,000,000 | 45.0% | | Return of Equity: | $342,576,222 | 34.3% |
| | | | Closing Costs: | $15,440,423 | 1.5% |
Total Sources: | $1,000,000,000 | 100.0% | | Total Uses: | $1,000,000,000 | 100.0% |
(1) | The Jackson Park Mortgage Loan (as defined below) is part of the Jackson Park Whole Loan (as defined below), which is comprised of the Jackson Park Senior Loan (as defined below) evidenced by ten senior promissory notes with an original aggregate principal balance of $550,000,000, and the Jackson Park Subordinate Companion Loan (as defined below) evidenced by two promissory notes with an original aggregate principal balance of $450,000,000. The Cut-off Date Balance per Unit, Maturity Date Balance per Unit, UW NOI Debt Yield, UW NOI Debt Yield at Maturity, UW NCF DSCR, Cut-off Date LTV Ratio and Maturity Date LTV Ratio numbers presented above are based on the Cut-off Date principal balance of the Jackson Park Senior Loan, without regard to the Jackson Park Subordinate Companion Loan. The Cut-off Date Balance per Unit, Maturity Date Balance per Unit, UW NOI Debt Yield, UW NOI Debt Yield at Maturity, UW NCF DSCR, Cut-off Date LTV Ratio and Maturity Date LTV Ratio numbers based on the entire Jackson Park Whole Loan are $534,474, $534,474, 7.1%, 7.1%, 2.15x, 62.5% and 62.5%, respectively. |
(2) | Defeasance of the Jackson Park Whole Loan is permitted in whole or in part at any time after the earlier of (i) the end of the two-year period commencing on the closing date of the securitization of the last promissory note representing a portion of the Jackson Park Whole Loan to be securitized, and (ii) November 10, 2022. The assumed defeasance and prepayment lockout period of 26 payments is based on the closing date of this transaction in December 2019. |
(3) | See “The Mortgage Loan”, “Additional Secured Indebtedness (not including trade debts)” and “Mezzanine Loan and Preferred Equity” below, for a discussion of additional debt. |
(4) | See “Escrows and Reserves” below for further discussion of reserve requirements. |
(5) | Historical financial information and occupancy are not available because the Jackson Park Property (as defined below) was constructed in 2018. |
(6) | The Jackson Park borrower sponsor’s cost of development for the Jackson Park Property was approximately $1.16 billion. The Jackson Park Whole Loan is refinancing the Jackson Park borrower sponsor’s construction debt. |
The Mortgage Loan. The second largest mortgage loan (the “Jackson Park Mortgage Loan”) is part of a whole loan (the “Jackson Park Whole Loan”) in the original principal balance of $1,000,000,000 originated by Bank of America, N.A. and Wells Fargo Bank, National Association. The Jackson Park Whole Loan is secured by a first priority fee mortgage encumbering a multifamily property located in Long Island City, New York (the “Jackson Park Property”). The Jackson Park Whole Loan is comprised of ten pari passu senior promissory notes with an original aggregate principal balance of $550,000,000 (the “Jackson Park Senior Loan”) and two pari passu subordinate promissory notes with an original aggregate principal balance of $450,000,000 (the “Jackson Park Subordinate Companion Loan”) which are subordinate to the Jackson Park Senior Loan. The Jackson Park Senior Loan is evidenced by promissory Notes A-7 and A-8 in the original aggregate principal balance of $100,000,000, which comprise the Jackson Park Mortgage Loan, and eight pari passu promissory notes (together the “Jackson Park Pari Passu Non-Serviced Companion Loans”) in the original aggregate principal balance of $450,000,000. The Jackson Park Pari Passu Non-Serviced Companion Loans (except for Note A-3) have been or are expected to be contributed to the JAX 2019-LIC securitization transaction along with the Jackson Park Subordinate Companion Loan, or contributed to the BANK 2019-BNK23 securitization transaction. Note A-3 is currently held by Bank of America, N.A. and is expected to be contributed to one or more future securitization transactions or otherwise transferred at any time. The Jackson Park Whole Loan will be serviced pursuant to the trust and servicing agreement for the JAX 2019-LIC securitization transaction. See “Description of the Mortgage Pool—The Whole Loans—The Jackson Park Pari Passu-A/B Whole Loan” and “Pooling and Servicing Agreement” in the Preliminary Prospectus.
This is not a research report and was not prepared by any Underwriter’s research department. Please see additional important information and qualifications at the end of this Term Sheet.
T-40
Multifamily – High Rise | Loan #2 | Cut-off Date Balance: | | $100,000,000 |
28-10 Jackson Avenue, 28-40 Jackson | Jackson Park | Cut-off Date LTV: | | 34.4% |
Avenue, and 28-30 Jackson Avenue | | U/W NCF DSCR: | | 3.92x |
Long Island City, NY 11101 | | U/W NOI Debt Yield: | | 13.0% |
Jackson Park Whole Loan Summary |
Notes | Original Balance | Cut-off Date Balance | Anticipated Note Holder | Controlling
Piece(1) |
A-1 | $75,000,000 | $75,000,000 | JAX 2019-LIC | Yes(1) |
A-2 | $75,000,000 | $75,000,000 | JAX 2019-LIC | No |
A-3 | $75,000,000 | $75,000,000 | Bank of America, N.A. | No |
A-4 | $75,000,000 | $75,000,000 | JAX 2019-LIC | No |
A-5 | $50,000,000 | $50,000,000 | BANK 2019-BNK23 | No |
A-6 | $50,000,000 | $50,000,000 | BANK 2019-BNK23 | No |
A-7 | $50,000,000 | $50,000,000 | BANK 2019-BNK24(2) | No |
A-8 | $50,000,000 | $50,000,000 | BANK 2019-BNK24(3) | No |
A-9 | $25,000,000 | $25,000,000 | JAX 2019-LIC | No |
A-10 | $25,000,000 | $25,000,000 | JAX 2019-LIC | No |
B-1 | $225,000,000 | $225,000,000 | JAX 2019-LIC | No |
B-2 | $225,000,000 | $225,000,000 | JAX 2019-LIC | No |
Total | $1,000,000,000 | $1,000,000,000 | | |
(1) | Pursuant to the terms of trust and servicing agreement for the JAX 2019-LIC securitization trust (the “JAX 2019-LIC TSA”) and during any “Subordinate Control Period”, the “Directing Holder” (each as defined in the JAX 2019-LIC TSA) will have the right to appoint the special servicer of the Jackson Park Whole Loan and to direct certain decisions with respect to the Jackson Park Whole Loan. See “Description of the Mortgage Pool—The Whole Loans—The Non-Serviced Pari Passu-A/B Whole Loans—The Jackson Park Whole Loan” and “Pooling and Servicing Agreement—Servicing of the Non-Serviced Mortgage Loans” in the Preliminary Prospectus. |
(2) | Note A-7 is being contributed to the BANK 2019-BNK24 transaction by Bank of America, N.A. |
(3) | Note A-8 is being contributed to the BANK 2019-BNK24 transaction by Wells Fargo Bank, National Association. |
The Borrower and the Borrower Sponsor. The borrower is LIC Development Owner, L.P. (the “Jackson Park Borrower”), a single-purpose Delaware limited partnership with a single-purpose Delaware limited liability company as its general partner, which general partner has at least two independent directors. The borrower sponsor is an investment venture managed and controlled by one or more affiliates of Tishman Speyer Properties, L.P. (“Tishman Speyer”). Tishman Speyer is an owner, developer, operator and fund manager of real estate assets across the United States, Europe, Brazil, China and India. There is no non-recourse carveout guarantor and no separate environmental indemnitor for the Jackson Park Whole Loan.
The Property. The Jackson Park Property is a recently built, Class A, highly amenitized, luxury multifamily high rise development located on 2.877-acres in Long Island City, New York. The Jackson Park Property is comprised of (i) 1 Jackson Park, a 42-story building containing 550 apartments and 4,920 SF of ground floor retail space, (ii) 2 Jackson Park, a 53-story building containing 650 apartments and 4,545 SF of ground floor retail space, and (iii) 3 Jackson Park, a 44-story building containing 671 apartments and 934 SF of ground floor retail space. Each residential tower features a sky-deck, party lounge and a children’s playroom. Residential building services include two 24-hour attended lobbies, dry cleaning and laundry, package receipt, housekeeping, a lifestyle coordinator, a virtual concierge, covered valet parking, bike storage and building-wide Wi-Fi. The apartment units feature floor-to-ceiling windows with solar shades, in-unit washer/dryers, 9-foot ceilings, white oak floors, key card entry systems, resident-controlled heating and air conditioning, USB-port outlets and LED lighting. The apartment kitchens feature European soft-close cabinetry with integrated Blomberg and Whirlpool appliances, seamless Ceasarstone countertops and Moen fixtures.
The Jackson Park Property includes a total of 1,871 apartments offered as 451 studio units, 919 one-bedroom units, 396 two-bedroom units, 101 three-bedroom units, and 4 four-bedroom units. The Jackson Park Property began construction in 2014 and began leasing in late 2017. Since opening, the Jackson Park Property has achieved an average of nearly 100 new leases per month. As of August 31, 2019, the Jackson Park Property was 96.1% leased. Additionally, the Jackson Park Property includes a total 10,399 SF of retail space, which is 75.0% leased by four retail tenants including Sweetleaf (coffee shop), Murray’s LIC (cheese shop), a nail salon and dog day care. The remaining retail unit (2,602 SF) space is under negotiations with a potential national restaurant tenant according to the borrower sponsor.
Amenities at the Jackson Park Property include a five-story 45,796 SF amenity building known as “The Club”. The lower level of The Club contains a 140-space underground parking garage. The first level of The Club includes a tech lounge, demo kitchen, conference room and private dining room, poker and game room, golf simulator, fireside lounge, billiards and foosball tables, outdoor gaming lounge with fireplace and a garden. The second and third levels of The Club feature the fitness center, yoga and Pilates studios, and the 75’ indoor lap pool, locker rooms, meditation lounge, sauna, steam room and massage treatment rooms. The fourth level of The Club includes the squash court and full-size basketball/volleyball court. The fifth level of The Club features the outdoor heated pool, hot tub, cabanas, sun deck and wet bar. The three residential towers and the amenity building encircle a 1.6-acre private park containing a grilling and communal dining area, children’s play area, a dog park, bocce court, outdoor table tennis, and patio sitting areas.
The Jackson Park Property benefits from a 15-year, 421-a tax exemption through 2034, during which all residential units are subject to New York City rent stabilization guidelines which currently limits annual rental increases to 1.5% and 2.5% for one and two year leases, respectively. Taxes are fully abated for the first 10 years post-construction (through June 2029), then phased in 20% each year for the next five years.
This is not a research report and was not prepared by any Underwriter’s research department. Please see additional important information and qualifications at the end of this Term Sheet.
T-41
Multifamily – High Rise | Loan #2 | Cut-off Date Balance: | | $100,000,000 |
28-10 Jackson Avenue, 28-40 Jackson | Jackson Park | Cut-off Date LTV: | | 34.4% |
Avenue, and 28-30 Jackson Avenue | | U/W NCF DSCR: | | 3.92x |
Long Island City, NY 11101 | | U/W NOI Debt Yield: | | 13.0% |
The following table presents certain information relating to the unit mix at the Jackson Park Property:
Unit Mix |
Unit Mix / Type | | Units | | % Occupied | | Average SF per Unit | | Total SF | | Annual Average Rent per SF | | Monthly Average Rent per Unit | | Annual Market Rent per SF | | Monthly Market Rent per Unit | |
Studio | | 451 | | 97.8% | | 469 | | 211,466 | | $72.81 | | $2,846 | | $73.00 | | $2,853 | |
One-Bedroom | | 919 | | 95.3% | | 656 | | 602,522 | | $65.63 | | $3,590 | | $66.00 | | $3,608 | |
Two-Bedroom | | 396 | | 96.0% | | 947 | | 374,983 | | $65.70 | | $5,194 | | $66.00 | | $5,209 | |
Three-Bedroom | | 101 | | 96.0% | | 1,254 | | 126,692 | | $63.29 | | $6,619 | | $64.00 | | $6,688 | |
Four-Bedroom | | 4 | | 100.0% | | 1,652 | | 6,608 | | $58.92 | | $8,111 | | $59.00 | | $8,122 | |
Total/Wtd. Avg. | | 1,871 | | 96.1% | | 707 | | 1,322,271 | | $66.56 | | $3,920 | | $66.89 | | $3,941 | |
Source: Appraisal and underwritten rent roll.
The Market. The Jackson Park Property is located in Long Island City, which is located on the western tip of Queens, New York, with views of the Manhattan skyline. Long Island City is a residential and commercial neighborhood known for its arts community, with a high concentration of art galleries, art institutions and studio space. The New York City Department of Education and CUNY Law School are major employers in the area along with Brooks Brothers, Boyce Technologies Inc., DeppGlass, Doughnut Plant, J. Crew/Madewell, JetBlue Airways, Kaufman Astoria Studios, LaGuardia Community College, MANA Products, Nouveau Elevator, Silvercup Studios, and VaynerMedia. Major corporate tenants in the area include Estée Lauder, Macy’s/Bloomingdales, The New York Times and The Wirecutter. At the end of 2018, New York City announced it would invest $180 million in new funding toward Long Island City’s infrastructure including improvements to schools, transportation, parks and sewer/water systems.
Long Island City is accessible by eight subway lines, thirteen bus lines, the East River Ferry (2 stops), Citibike (13 stations) and the Long Island Railroad. The Jackson Park Property offers commuting times to Manhattan of about 10 minutes by being adjacent to the Queens Plaza subway station with service on the “E”, “M”, and “R” trains and within walking distance of the Queensboro Plaza subway station with service on the “7”, “N”, and “W” trains. The drives to LaGuardia and John F. Kennedy Airports are about 15 and 20 minutes, respectively.
According to a neighborhood development association for Long Island City, as of October 2019, Long Island City had an estimated 170,000 residents, 127,000 employees and 6,800 businesses. According to the appraisal, the estimated 2018 population within a one-, three- and five-mile radius of the Jackson Park Property was 69,225, 1,194,829 and 3,166,541, respectively. The estimated 2018 average household income within a one-, three- and five-mile radius was $94,863, $139,915 and $123,971, respectively.
According to a third party data provider, the Jackson Park Property is in the Long Island City multifamily submarket, which for 2019 in the highest (4 and 5 star) category had 14,786 units with an average rent per unit of $3,896, a vacancy rate of 4.7% and an absorption rate of 9.9%.
The following table presents certain information relating to comparable rental properties to the Jackson Park Property:
Comparable Rental Properties |
| Jackson Park Property | 1 Queens Plaza South | Tower 28 | QLIC | Alta LIC(1) | Linc Long Island City |
Year Built | 2018 | 2017 | 2017 | 2013 | 2018 | 2013 |
Number of units | 1,871 | 391 | 450 | 422 | 467 | 711 |
Occupancy(2) | 96.1% | 97.9% | 98.0% | 98.3% | 93.6% | 98.7% |
Unit size (SF)(3): | | | | | | |
- Studio | 469 | 468 | 428 | 400 | 516 | 503 |
- 1-BR | 656 | 691 | 667 | 500 | 723 | 700 |
- 2-BR | 947 | 979 | 936 | 800 | 1,153 | 1,038 |
- 3-BR | 1,254 | N/A | 1,305 | 950 | 1,317 | 1,400 |
Monthly Rent per Unit(4): | | | | | | |
- Studio | $2,846 | $2,769 | $2,308 | $2,360 | $2,715 | $3,244 |
- 1-BR | $3,590 | $3,808 | $3,361 | $3,029 | $3,324 | $3,813 |
- 2-BR | $5,194 | $5,051 | $4,900 | $3,800 | $5,187 | $5,278 |
- 3-BR | $6,619 | N/A | $6,486 | $4,999 | $6,201 | $6,329 |
Annual Rent per SF(4): | | | | | | |
- Studio | $72.81 | $71.00 | $64.71 | $70.80 | $63.14 | $77.39 |
- 1-BR | $65.63 | $66.13 | $60.47 | $72.70 | $55.17 | $65.37 |
- 2-BR | $65.70 | $61.91 | $62.82 | $57.00 | $53.98 | $61.02 |
- 3-BR | $63.29 | N/A | $59.64 | $63.15 | $56.50 | $54.25 |
Source: Appraisal
(1) | Alta LIC is in its initial lease-up period. |
(2) | Occupancy for the comparables is as of September 2019 and for the Jackson Park Property is as of the borrower rent roll dated August 31, 2019. |
(3) | Represents the average for each unit size at the Jackson Park Property. |
(4) | Rent for the Jackson Park Property is based on the underwritten rent roll. |
This is not a research report and was not prepared by any Underwriter’s research department. Please see additional important information and qualifications at the end of this Term Sheet.
T-42
Multifamily – High Rise | Loan #2 | Cut-off Date Balance: | | $100,000,000 |
28-10 Jackson Avenue, 28-40 Jackson | Jackson Park | Cut-off Date LTV: | | 34.4% |
Avenue, and 28-30 Jackson Avenue | | U/W NCF DSCR: | | 3.92x |
Long Island City, NY 11101 | | U/W NOI Debt Yield: | | 13.0% |
Underwritten Net Cash Flow. The following table presents certain information relating to the Underwritten Net Cash Flow at the Jackson Park Property:
Cash Flow Analysis(1) | |
| | UW | | UW per unit | |
Gross Potential Rent(2) | | $88,062,437 | | $47,067.04 | |
Less Vacancy(3) | | $4,403,122 | | $2,353.35 | |
Net Rental Income | | $83,659,316 | | $44,713.69 | |
Other Income(4) | | $5,315,440 | | $2,840.96 | |
Effective Gross Income | | $88,974,756 | | $47,554.65 | |
| | | | | |
Real Estate Taxes(5) | | $613,865 | | $328.09 | |
Insurance | | $871,159 | | $465.61 | |
Other Expenses | | $16,094,361 | | $8,602.01 | |
Total Expenses | | $17,579,385 | | $9,395.72 | |
| | | | | |
Net Operating Income | | $71,395,371 | | $38,158.94 | |
Capital Expenditures | | $394,276 | | $210.73 | |
Net Cash Flow | | $71,001,095 | | $37,948.21 | |
| | | | | |
Occupancy %(6) | | 96.1% | | | |
NOI DSCR(7) | | 3.94x | | | |
NCF DSCR(7) | | 3.92x | | | |
NOI Debt Yield(7) | | 13.0% | | | |
NCF Debt Yield(7) | | 12.9% | | | |
(1) | Historical financial information is not available because the Jackson Park Property was constructed in 2018. |
(2) | UW Gross Potential Rent is based on the in-place rent roll as of August 31, 2019 with the 73 vacant units grossed up at currently marketed rents. |
(3) | UW Vacancy is based on 5% economic vacancy. |
(4) | UW Other Income is comprised of budgeted parking income, commercial income as of February 2020, and budgeted other ancillary income. UW Other Income also includes $4,200,000 of budgeted amenity fee revenue for which there were $1,256,087 of corresponding amenity expenses underwritten. |
(5) | The Jackson Park Property benefits from a 15-year, 421-a tax abatement which extends through June 2034. Taxes are fully abated for the first 10 years post-construction (through June 2029), then phased in 20% each year for the next five years. UW Real Estate Taxes assume the full abatement. |
(6) | Occupancy is as of the borrower rent roll dated August 31, 2019. |
(7) | The debt service coverage ratios and debt yields are based on the Jackson Park Senior Loan, and exclude the Jackson Park Subordinate Companion Loan. |
Escrows and Reserves.
Real Estate Taxes – During a Cash Sweep Period (as defined below), the Jackson Park Borrower is required to deposit monthly 1/12 of the annual estimated real estate taxes.
Insurance – During a Cash Sweep Period or if the Jackson Park Property is no longer covered by a blanket insurance policy, the Jackson Park Borrower is required to deposit monthly 1/12 of the annual estimated insurance premiums.
Lockbox and Cash Management. The Jackson Park Whole Loan is structured with a soft lockbox and springing cash management upon the occurrence of a Cash Sweep Period (as defined below). During the continuance of a Cash Sweep Period, all funds in the lockbox account are required to be transferred to the lender-controlled cash management account and disbursed in accordance with the Jackson Park Whole Loan documents. During the continuance of a Low DSCR Period (as defined below), all excess cash flow is required to be held by the lender as additional security for the Jackson Park Whole Loan, however, the Jackson Park Borrower is permitted to request excess cash for debt service and reserve payments, leasing and operating expenses set forth in the annual budget, to cure a Low DSCR Period, and required distributions to its REIT equity holders to avoid tax impositions (not to exceed $25,000 annually). During the continuance of an event of default under the Jackson Park Whole Loan, all excess cash flow may be applied by lender in its sole discretion.
A “Cash Sweep Period” will occur during (i) an event of default under the Jackson Park Whole Loan until the event of default is cured or (ii) a Low DSCR Period.
A “Low DSCR Period” will commence when the debt service coverage ratio is less than 1.25x for two consecutive calendar quarters and continue until (x) the debt service coverage is equal to or greater than 1.25x for two consecutive calendar quarters or (y) the Jackson Park Borrower deposits cash (which may be excess cash) or a letter of credit in an amount that if applied to the reduction of the outstanding principal balance of the Jackson Park Whole Loan would result in a debt service coverage ratio of at least 1.25x for the most recent two calendar quarters. For purposes of the Cash Sweep Period test, the debt service coverage ratio will be calculated based on the Jackson Park Whole Loan and any future mezzanine debt if applicable.
This is not a research report and was not prepared by any Underwriter’s research department. Please see additional important information and qualifications at the end of this Term Sheet.
T-43
Multifamily – High Rise | Loan #2 | Cut-off Date Balance: | | $100,000,000 |
28-10 Jackson Avenue, 28-40 Jackson | Jackson Park | Cut-off Date LTV: | | 34.4% |
Avenue, and 28-30 Jackson Avenue | | U/W NCF DSCR: | | 3.92x |
Long Island City, NY 11101 | | U/W NOI Debt Yield: | | 13.0% |
Additional Secured Indebtedness (not including trade debts). In addition to the Jackson Park Mortgage Loan, the Jackson Park Property also secures the Jackson Park Non-Serviced Pari Passu Companion Loans which have a Cut-off Date principal balance of $450,000,000 and the Jackson Park Subordinate Companion Loan, which has a Cut-off Date principal balance of $450,000,000. The Jackson Park Non-Serviced Pari Passu Companion Loans and the Jackson Park Subordinate Companion Loan all accrue interest at the rate of 3.2500% per annum. The Jackson Park Senior Loan is generally senior in right of payment to the Jackson Park Subordinate Companion Loan. The holders of the Jackson Park promissory notes have entered into a co-lender agreement which sets forth the allocation of collections on the Jackson Park Whole Loan. See “Description of the Mortgage Pool—The Whole Loans—The Jackson Park Pari Passu-A/B Whole Loan” and “Pooling and Servicing Agreement—Servicing of the Non-Serviced Mortgage Loans” in the Preliminary Prospectus.
Mezzanine Loan and Preferred Equity. The Jackson Park Borrower has a one-time right to obtain a future mezzanine loan, co-terminous with the Jackson Park Whole Loan, not to exceed the lesser of (x) $200,000,000 and (y) the amount that when added to the outstanding principal balance of the Jackson Park Whole Loan would result in a (a) combined loan to value ratio of no more than 95% of the origination date loan to value ratio of 62.5%, (b) combined debt service coverage ratio of at least 105% of the origination date debt service coverage ratio of 2.15x and (c) a combined debt yield of at least 105% of the origination date debt yield of 7.1%, subject to (i) no event of default continuing, (ii) execution of an intercreditor agreement with the lender and (iii) receipt of rating agency confirmation.
Release of Property. After the earlier of (i) the end of the two-year period commencing on the closing date of the securitization of the last promissory note representing a portion of the Jackson Park Whole Loan to be securitized, and (ii) November 10, 2022, the Jackson Park Whole Loan documents permit the partial release of any residential tower within the Jackson Park Property (1 Jackson Park, 2 Jackson Park or 3 Jackson Park), but not including the amenity building or parking garage or any other portion of the Jackson Park Property, through (A) on or after April 10, 2029, prepayment equal to the Release Price or (B) prior to April 10, 2029, partial defeasance in an amount equal to the Release Price, provided (a) no event of default is continuing, (b) the released property is transferred on an arms-length basis, (c) rating agency confirmation is received and (d) after the partial release, the debt yield for the remaining property meets the “Debt Yield Test” of being at least the greater of (x) the debt yield immediately preceding the release and (y) 7.10% (provided, the Jackson Park Borrower may deposit as either cash or a letter of credit the amount which would cause the Jackson Park Property to meet the Debt Yield Test).
The “Release Price” is equal to 110% of the allocated loan amount for each residential building. The allocated loan amount for 1 Jackson Park is $375,000,000. The allocated loan amount for 2 Jackson Park is $359,375,000. The allocated loan amount for 3 Jackson Park is $265,625,000.
Ground Lease. None.
Letter of Credit. None.
Right of First Offer/Right of First Refusal. None.
Terrorism Insurance. The Jackson Park Borrower is required to obtain and maintain property insurance that covers acts of terrorism in an amount equal to the full replacement cost of the Jackson Park Property and business interruption insurance for actual loss sustained until the restoration is complete plus a 12-month extended period of indemnity, provided, if the Terrorism Risk Insurance Program Authorization Act of 2015 (as the same may be further modified, amended, or extended) is not in effect, the Jackson Park Borrower will not be required to pay annual premiums in excess of two times the premium then payable for the property and business interruption insurance (excluding earthquake and terrorism components) in order to obtain the terrorism coverage. See “Risk Factors—Risks Relating to the Mortgage Loans—Terrorism Insurance May Not Be Available for All Mortgaged Properties” in the Preliminary Prospectus.
This is not a research report and was not prepared by any Underwriter’s research department. Please see additional important information and qualifications at the end of this Term Sheet.
T-44
(THIS PAGE INTENTIONALLY LEFT BLANK)
Office – CBD | Loan #3 | Cut-off Date Balance: | | $100,000,000 |
1412 Broadway | 1412 Broadway | Cut-off Date LTV: | | 58.3% |
New York, NY 10018 | | UW NCF DSCR: | | 1.92x |
| | UW NOI Debt Yield: | | 7.5% |
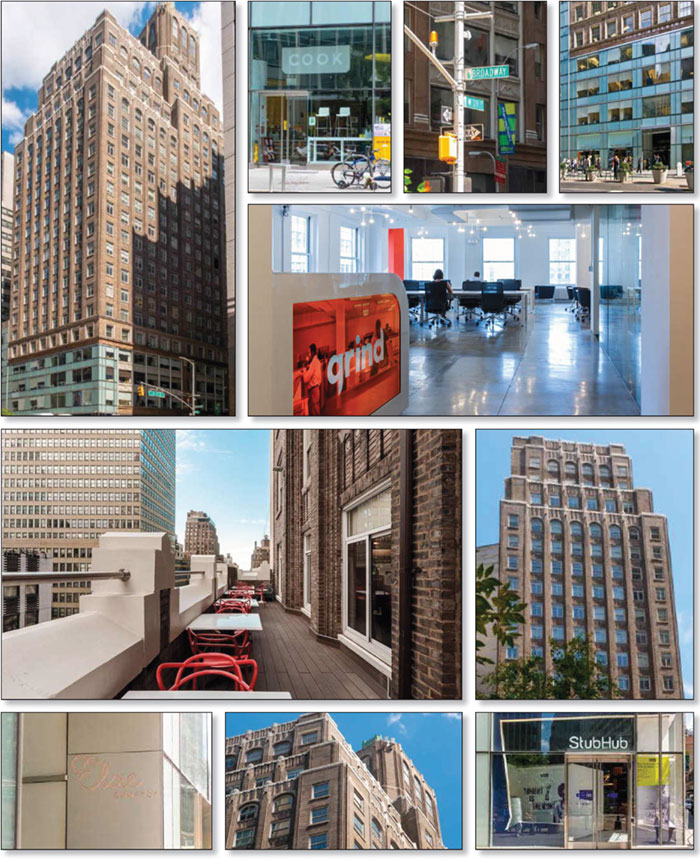
This is not a research report and was not prepared by any Underwriter’s research department. Please see additional important information and qualifications at the end of this Term Sheet.
T-46
Office – CBD | Loan #3 | Cut-off Date Balance: | | $100,000,000 |
1412 Broadway | 1412 Broadway | Cut-off Date LTV: | | 58.3% |
New York, NY 10018 | | UW NCF DSCR: | | 1.92x |
| | UW NOI Debt Yield: | | 7.5% |
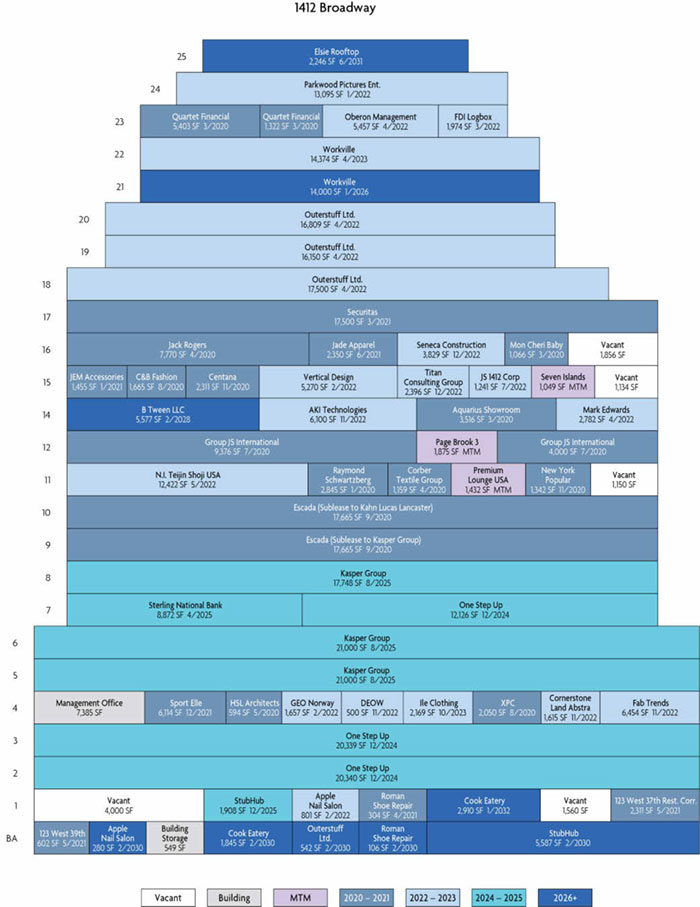
This is not a research report and was not prepared by any Underwriter’s research department. Please see additional important information and qualifications at the end of this Term Sheet.
T-47
Office – CBD | Loan #3 | Cut-off Date Balance: | | $100,000,000 |
1412 Broadway | 1412 Broadway | Cut-off Date LTV: | | 58.3% |
New York, NY 10018 | | UW NCF DSCR: | | 1.92x |
| | UW NOI Debt Yield: | | 7.5% |
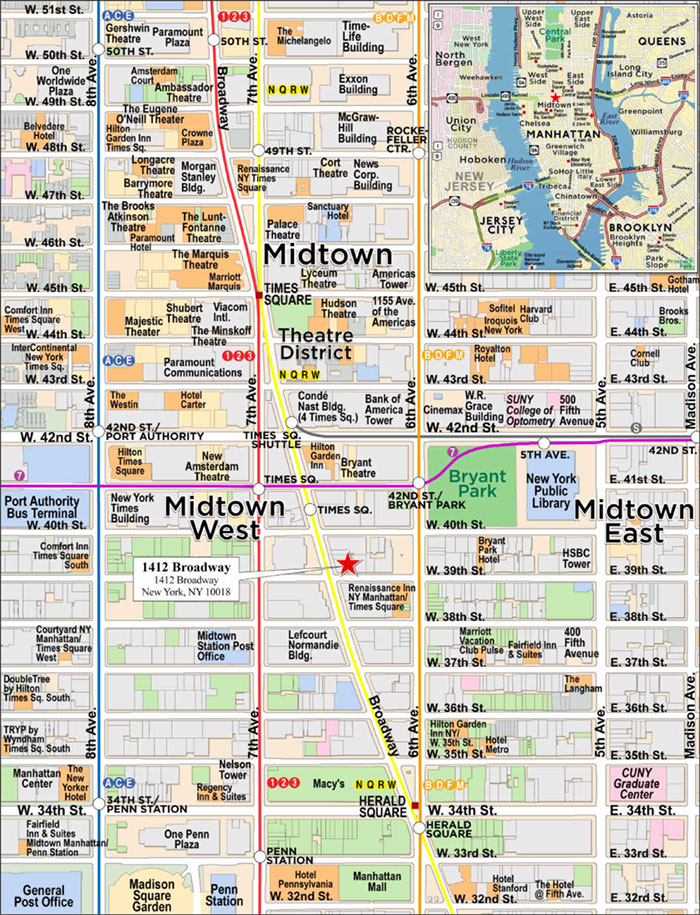
This is not a research report and was not prepared by any Underwriter’s research department. Please see additional important information and qualifications at the end of this Term Sheet.
T-48
Mortgage Loan No. 3 – 1412 Broadway |
Mortgage Loan Information | | Property Information |
Mortgage Loan Seller: | MSMCH | | Single Asset/Portfolio: | Single Asset |
Credit Assessment (DBRS/Fitch/S&P): | NR/NR/NR | | Location: | New York, NY 10018 |
Original Balance(1): | $100,000,000 | | General Property Type: | Office |
Cut-off Date Balance(1): | $100,000,000 | | Detailed Property Type: | CBD |
% of Initial Pool Balance: | 8.2% | | Title Vesting: | Fee |
Loan Purpose: | Refinance | | Year Built/Renovated: | 1926/2007-2012 |
Sponsors: | Isaac Chetrit, Eli Chetrit, Raizada | | Size: | 421,396 SF |
| Vaid, Jacob Aini | | Cut-off Date Balance per SF(1): | $498 |
Guarantors: | Isaac Chetrit, Eli Chetrit, Raizada | | Maturity Date Balance per SF(1): | $498 |
| Vaid, Jacob Aini | | Property Manager: | 1412 Management LLC |
Mortgage Rate: | 3.6100% | | | (borrower-related) |
Note Date: | 11/25/2019 | | | |
First Payment Date: | 1/1/2020 | | | |
Maturity Date: | 12/1/2029 | | | |
Original Term to Maturity: | 120 months | | | |
Original Amortization Term: | 0 months | | Underwriting and Financial Information |
IO Period: | 120 months | | UW NOI: | $15,795,032 |
Seasoning: | 0 months | | UW NOI Debt Yield(1): | 7.5% |
Prepayment Provisions(2): | LO (24); DEF (91); O (5) | | UW NOI Debt Yield at Maturity(1): | 7.5% |
Lockbox/Cash Mgmt Status: | Hard/In Place | | UW NCF DSCR(1): | 1.92x |
Additional Debt Type(1)(3): | Pari Passu | | Most Recent NOI: | $16,486,637 (9/30/2019 TTM) |
Additional Debt Balance(1)(3): | $110,000,000 | | 2nd Most Recent NOI: | $16,643,199 (12/31/2018) |
Future Debt Permitted (Type): | No (N/A) | | 3rd Most Recent NOI: | $14,043,950 (12/31/2017) |
Reserves(4) | | Most Recent Occupancy: | 97.7% (11/1/2019) |
Type | Initial | Monthly | Cap | | 2nd Most Recent Occupancy: | 97.6% (12/31/2018) |
RE Tax: | $395,861 | $395,861 | N/A | | 3rd Most Recent Occupancy: | 95.0% (12/31/2017) |
Insurance: | $28,560 | $28,560 | N/A | | Appraised Value (as of): | $360,000,000 (10/1/2019) |
Recurring Replacements: | $0 | $6,991 | $251,670 | | Appraised Value per SF: | $854 |
TI/LC: | $2,000,000 | Springing | $2,000,000 | | Cut-off Date LTV Ratio(1): | 58.3% |
Free Rent: | $1,743,133 | $0 | N/A | | Maturity Date LTV Ratio(1): | 58.3% |
| | | | | | | |
Sources and Uses |
Sources | Proceeds | % of Total | | Uses | Proceeds | % of Total |
Whole Loan Amount(1): | $210,000,000 | 100.0% | | Loan Payoff: | $145,311,576 | 69.2% |
| | | | Return of Equity: | $53,746,155 | 25.6% |
| | | | Closing Costs: | $6,774,716 | 3.2% |
| | | | Reserves: | $4,167,553 | 2.0% |
Total Sources: | $210,000,000 | 100.0% | | Total Uses: | $210,000,000 | 100.0% |
(1) | The 1412 Broadway Mortgage Loan (as defined below) is a part of the 1412 Broadway Whole Loan (as defined below) with an original aggregate principal balance of $210,000,000. The Cut-off Date Balance per SF, Maturity Date Balance per SF, UW NOI Debt Yield, UW NOI Debt Yield at Maturity, UW NCF DSCR, Cut-off Date LTV Ratio and Maturity Date LTV Ratio numbers presented above are based on the aggregate principal balance of the promissory notes comprising the 1412 Broadway Whole Loan. |
(2) | Defeasance of the 1412 Broadway Whole Loan is permitted at any time after the earlier of (i) June 1, 2023, or (ii) two years from the closing date of the securitization that includes the last pari passu note of the 1412 Broadway Whole Loan to be securitized. The assumed lockout period of 24 payments is based on the closing date of this transaction in December 2019. |
(3) | See “The Mortgage Loan” and “Additional Secured Indebtedness (not including trade debts)” below for further discussion of additional debt. |
(4) | See “Escrows and Reserves” below for further discussion of reserve requirements. |
The Mortgage Loan. The third largest mortgage loan (the “1412 Broadway Mortgage Loan”) is part of a whole loan (the “1412 Broadway Whole Loan”) evidenced by three pari passu promissory notes in the aggregate original principal amount of $210,000,000, all of which are secured by a first priority fee mortgage encumbering an office property located in New York, New York (the “1412 Broadway Property”). The controlling promissory Note A-1, in the original principal amount of $100,000,000, represents the 1412 Broadway Mortgage Loan and will be included in the BANK 2019-BNK24 securitization trust. Promissory Note A-2, in the original principal amount of $70,000,000, and promissory Note A-3, in the original principal amount of $40,000,000 (the “1412 Broadway Serviced Pari Passu Companion Loans”), represent the non-controlling interests in the 1412 Broadway Whole Loan and are expected to be contributed to one or more securitization transactions. The 1412 Broadway Whole Loan will be serviced pursuant to the pooling and servicing agreement for the BANK 2019-BNK24 securitization trust. See “Description of the Mortgage Pool—The Whole Loans—The Serviced Pari Passu Whole Loans” and “Pooling and Servicing Agreement” in the Preliminary Prospectus.
This is not a research report and was not prepared by any Underwriter’s research department. Please see additional important information and qualifications at the end of this Term Sheet.
T-49
Office – CBD | Loan #3 | Cut-off Date Balance: | | $100,000,000 |
1412 Broadway | 1412 Broadway | Cut-off Date LTV: | | 58.3% |
New York, NY 10018 | | UW NCF DSCR: | | 1.92x |
| | UW NOI Debt Yield: | | 7.5% |
1412 Broadway Whole Loan Summary |
Note | Original Balance | Cut-off Date Balance | Note Holder | Controlling Piece |
A-1 | $100,000,000 | $100,000,000 | BANK 2019-BNK24 | Yes |
A-2 | $70,000,000 | $70,000,000 | MSBNA | No |
A-3 | $40,000,000 | $40,000,000 | MSBNA | No |
Total | $210,000,000 | $210,000,000 | | |
The Borrowers and the Borrower Sponsors. The borrowers are Chetrit 1412 LLC (50%), 1412-1416 RSVP DE LLC (25%) and 1412 BH DE LLC (25%), as tenants-in-common (collectively, the “1412 Broadway Borrower”), each of which has one independent director. Isaac Chetrit, Eli Chetrit, Raizada Vaid and Jacob Aini are the borrower sponsors and the non-recourse carveout guarantors. The entities comprising the 1412 Broadway Borrower are owned by various members of the Chetrit, Aini and Vaid families. Jacob Aini has been in the real estate business for over 25 years. He has owned seven retail locations in New York and owns over 40 real estate assets comprised of partnerships and sole proprietorships. Isaac Chetrit and Eli Chetrit have acquired and currently manage a portfolio consisting of approximately one million SF of office space in Manhattan and 300,000 SF of retail and commercial space located in Brooklyn and Queens. Raizada Vaid is a businessman with numerous holdings and franchises and is the Chief Executive Officer of Fantasia World Inc., a costume jewelry company. In 2004, Mr. Vaid expanded his wholesale jewelry business to include retail stores.
The Property. The 1412 Broadway Property is a Class B, 24-story office property totaling 421,396 SF including ground floor and roof retail space, on an approximately 0.41-acre site located in the garment district of Manhattan in New York City. The 1412 Broadway Property was built in 1926 and renovated from 2007-2012. The capital expenditure totaled approximately $14 million and included selective replacement of windows on the upper floors, installation of a new curtain wall and cooling tower, elevator modernization, and lobby, common corridor and Cycle 7 façade upgrades. Floor plans above the second floor are nearly identical and the majority of the spaces are multi-tenanted. The lobby of the 1412 Broadway Property is accessible via Broadway; and a freight entrance is located on 39th Street. The grade level retail spaces have frontage along both Broadway and West 39th Street. The 1412 Broadway Property was 97.7% leased as of November 1, 2019 to 56 tenants. Other than the three largest tenants, no tenant contributes more than 10.0% of the underwritten base rent. Three tenants, Workville LLC, 1412 Broadway Rooftop LLC and ILE Clothing, LLC, comprising 7.8% of NRA and 8.6% of underwritten rent, are affiliates of the 1412 Broadway Borrower.
Major Tenants.
Kasper Group (77,413 SF, 18.4% of NRA, 19.0% of underwritten rent). Kasper Group is an apparel company offering work attire and special occasion attire for women. Brands owned by Kasper Group include Nine West, Anne Klein, and some private labels available for purchase at national department stores. 59,748 SF are leased under a direct lease with a rental rate of $56.65 PSF and an expiration date of August 1, 2025, with no renewal options remaining. Kasper Group is currently subleasing the remaining 17,665 SF (4.2% of NRA and 3.4% of underwritten rent) of the 77,413 SF from Escada at $41.68 PSF, which sublease has a lease expiration of September 1, 2020. The subleased space was underwritten to the sublease rent at $41.68 PSF (which is less than the prime lease rent for such space). The Kasper Group lease provides for free rent in July and August of each year of the lease term, which has been reserved for.
One Step Up (52,805 SF, 12.5% of NRA, 10.1% of underwritten rent). One Step Up is a wholesale apparel company that designs, manufactures and distributes outerwear for women and children. The company supplies to retail stores in the United States, and also distributes globally to Canada, Mexico, Brazil, Europe, Asia and Australia. One Step Up has a lease expiration date of December 1, 2024 and has no renewal options remaining.
Outerstuff, Ltd. (51,001 SF, 12.1% of NRA, 11.2% of underwritten rent). Outerstuff, Ltd. is a manufacturer and provider of licensed youth sports apparel for brands such as the NFL, MLB, NBA, NHL, MLS, US Olympic Committee, and more than 200 colleges and universities. Outerstuff, Ltd. leases 50,459 SF of office space and 542 SF of basement space. Outerstuff, Ltd. has a lease expiration date of April 1, 2022 for the office space and February 1, 2030 for the basement space, and has one, five-year renewal option remaining. Outerstuff, Ltd. has the one-time option to terminate its lease with respect to all or any portion of the 19th floor space (16,150 SF), provided that no event of default has occurred and is continuing under its lease, it provides notice not less than 12 months prior to termination and it pays a termination fee.
Workville (28,374 SF, 6.7% of NRA, 7.9% of underwritten rent). Workville is a co-working space, offering private offices and open workspaces at the 1412 Broadway Property. Workville leases 14,000 SF on the 21st floor and 14,374 SF on the 22nd floor. Workville has a lease expiration date of January 1, 2026 and April 1, 2023 for the 21st floor space and 22nd floor space, respectively, and has no renewal options remaining. Workville is an affiliate of the 1412 Broadway Borrower.
Kahn Lucas Lancaster (17,665 SF, 4.2% of NRA, 3.2% of underwritten rent). Kahn Lucas Lancaster is an apparel company with headquarters in New York, New York. Kahn Lucas Lancaster was established in 1889 and founded girls fashion lines Emily West, Youngland, Bloome and Sweet Heart Rose. Kahn Lucas Lancaster is subleasing all of its space from Escada at $39.98 PSF, with a sublease expiration date of September 1, 2020. The subleased space was underwritten to the sublease rent at $39.98 PSF (which is less than the prime lease rent for such space).
This is not a research report and was not prepared by any Underwriter’s research department. Please see additional important information and qualifications at the end of this Term Sheet.
T-50
Office – CBD | Loan #3 | Cut-off Date Balance: | | $100,000,000 |
1412 Broadway | 1412 Broadway | Cut-off Date LTV: | | 58.3% |
New York, NY 10018 | | UW NCF DSCR: | | 1.92x |
| | UW NOI Debt Yield: | | 7.5% |
The following table presents certain information relating to the major tenants at the 1412 Broadway Property:
Tenant Summary(1) |
Tenant Name | Credit Rating (Fitch/Moody’s/S&P) | Tenant SF | Approx. % of SF | Annual UW Rent | % of Total Annual UW Rent | Annual UW Rent PSF | Lease Expiration | Termination Option (Y/N) |
Kasper Group(2) | NR/NR/NR | 77,413 | 18.4% | $4,120,949 | 19.0% | $53.23 | Various | N |
One Step Up | NR/NR/NR | 52,805 | 12.5% | $2,205,991 | 10.1% | $41.78 | 12/1/2024 | N |
Outerstuff Ltd.(3) | NR/NR/NR | 51,001 | 12.1% | $2,426,574 | 11.2% | $47.58 | Various | Y |
Workville(4) | NR/NR/NR | 28,374 | 6.7% | $1,718,353 | 7.9% | $60.56 | Various | N |
Kahn Lucas Lancaster(5) | NR/NR/NR | 17,665 | 4.2% | $706,200 | 3.2% | $39.98 | 9/1/2020 | N |
Subtotal/Wtd. Avg. | | 227,258 | 53.9% | $11,178,067 | 51.4% | $49.19 | | |
| | | | | | | | |
Other Tenants | | 184,438 | 43.8% | $10,567,090 | 48.6% | $57.29 | | |
Vacant Space | | 9,700 | 2.3% | $0 | 0.0% | $0.00 | | |
Total/Wtd. Avg. | | 421,396 | 100.0% | $21,745,157 | 100.0% | $52.82(6) | | |
(1) | Information is based on the underwritten rent roll as of November 1, 2019. |
(2) | Kasper Group leases 59,748 SF under a direct lease with a rental rate of $56.65 PSF and an expiration date of August 1, 2025. Kasper Group is currently subleasing the remaining 17,665 SF (4.2% of NRA and 3.4% of underwritten rent) of the 77,413 SF from Escada at a rental rate of $41.68 PSF, with a sublease expiration of September 1, 2020. The $53.23 Annual UW Rent PSF is the blended rate (i.e. it reflects the direct lease rate of $56.65 PSF for the direct leased space and the sublease rate of $41.68 PSF for the subleased space). The subleased space was underwritten to the sublease rent at $41.68 PSF (which is less than the prime lease rent for such space). The Kasper Group lease provides for free rent in July and August of each year of the lease term, which has been reserved for. |
(3) | Outerstuff, Ltd. leases 50,459 SF of office space, which has a lease expiration date of April 1, 2022 and 542 SF of basement space, which has a lease expiration of February 1, 2030. Outerstuff, Ltd. has the one-time option to terminate its lease with respect to all or any portion of the 19th floor space (16,150 SF), provided that no event of default has occurred and is continuing under its lease, it provides notice not less than 12 months prior to termination and it pays a termination fee. |
(4) | Workville leases 14,000 SF on the 21st floor and 14,374 SF on the 22nd floor. Workville has a lease expiration date of January 1, 2026 and April 1, 2023 for the 21st floor space and 22nd floor space, respectively. Workville is an affiliate of the 1412 Broadway Borrower. |
(5) | Kahn Lucas Lancaster is subleasing all of its space from Escada at $39.98 PSF. The subleased space was underwritten to the sublease rent at $39.98 PSF (which is less than the prime lease rent for such space). |
(6) | Total/Wtd. Avg. Annual UW Rent PSF excludes vacant space. |
The following table presents certain information relating to the lease rollover schedule at the 1412 Broadway Property:
Lease Rollover Schedule(1)(2) |
Year | # of Leases Rolling | SF Rolling | UW Rent PSF Rolling | Approx. % of Total SF Rolling | Approx. Cumulative % of SF Rolling | Total UW Rent Rolling | Approx. % of Total Rent Rolling | Approx. Cumulative % of Total Rent Rolling |
MTM | 3 | 4,356 | $45.71 | 1.0% | 1.0% | $199,107 | 0.9% | 0.9% |
2019 | 0 | 0 | $0.00 | 0.0% | 1.0% | $0 | 0.0% | 0.9% |
2020 | 14 | 79,749 | $49.60 | 18.9% | 20.0% | $3,955,371 | 18.2% | 19.1% |
2021 | 6 | 30,636 | $57.72 | 7.3% | 27.2% | $1,768,401 | 8.1% | 27.2% |
2022 | 16 | 116,052 | $49.64 | 27.5% | 54.8% | $5,761,295 | 26.5% | 53.7% |
2023 | 2 | 16,543 | $54.94 | 3.9% | 58.7% | $908,945 | 4.2% | 57.9% |
2024 | 1 | 52,805 | $41.78 | 12.5% | 71.2% | $2,205,991 | 10.1% | 68.1% |
2025 | 3 | 70,528 | $66.94 | 16.7% | 88.0% | $4,720,926 | 21.7% | 89.8% |
2026 | 1 | 14,000 | $64.39 | 3.3% | 91.3% | $901,460 | 4.1% | 93.9% |
2027 | 0 | 0 | $0.00 | 0.0% | 91.3% | $0 | 0.0% | 93.9% |
2028 | 1 | 5,577 | $56.65 | 1.3% | 92.6% | $315,937 | 1.5% | 95.4% |
2029 | 0 | 0 | $0.00 | 0.0% | 92.6% | $0 | 0.0% | 95.4% |
2030 & Beyond | 9 | 21,450 | $46.98 | 5.1% | 97.7% | $1,007,724 | 4.6% | 100.0% |
Vacant Space | 0 | 9,700 | $0.00 | 2.3% | 100.0% | $0 | 0.0% | 100.0% |
Total/Wtd. Avg. | 56 | 421,396 | $52.82(3) | 100.0% | | $21,745,157 | 100.0% | |
(1) | Information is based on the underwritten rent roll as of November 1, 2019. |
(2) | Certain tenants may have lease termination options that are exercisable prior to the stated expiration date of the subject lease or leases that are not considered in the lease rollover schedule. |
(3) | Total/Wtd. Avg. UW Rent PSF Rolling excludes vacant space. |
This is not a research report and was not prepared by any Underwriter’s research department. Please see additional important information and qualifications at the end of this Term Sheet.
T-51
Office – CBD | Loan #3 | Cut-off Date Balance: | | $100,000,000 |
1412 Broadway | 1412 Broadway | Cut-off Date LTV: | | 58.3% |
New York, NY 10018 | | UW NCF DSCR: | | 1.92x |
| | UW NOI Debt Yield: | | 7.5% |
The Market. The 1412 Broadway Property is located in New York, New York, approximately three blocks from the Times Square subway station, which has 11 subway lines, and also one block from the Bryant Park subway station, which has an additional four subway lines. Furthermore, the 1412 Broadway Property is located in close proximity to Penn Station, Port Authority Bus Terminal, and Grand Central Station, providing access for both commuters and local residents. The 1412 Broadway Property is located in the Times Square South office submarket of the Midtown office market. According to the appraisal, as of the second quarter of 2019, the vacancy rate in the Times Square South office submarket was approximately 5.1%, with average asking rents of $57.70 PSF and inventory of approximately 35.5 million SF. According to the appraisal, as of the second quarter of 2019, the Midtown office market has average asking rents of $82.27 PSF and inventory of approximately 283 million SF. According to the appraisal, the 2018 population within a half-, one- and one and a half-mile radius of the 1412 Broadway Property was 22,460, 199,380 and 380,361, respectively. The 2018 average household income within the same half-, one- and one and a half-mile radius was $165,220, $169,183 and $180,374, respectively.
The following table presents certain information relating to the appraiser’s market rent conclusion for the 1412 Broadway Property:
Market Rent Summary |
| Office 2-9 Space | Office 10-19 Space | Office 20-24 Space | Broadway Retail Space | Side Street/Roof Space |
Market Rent (PSF) | $54.00 | $56.00 | $58.00 | $375.00 | $125.00 |
Lease Term (Months) | 120 | 120 | 120 | 120 | 120 |
Lease Type (Reimbursements) | Modified Gross | Modified Gross | Modified Gross | Modified Gross | Modified Gross |
Rent Increase Projection | 3.0% per annum | 3.0% per annum | 3.0% per annum | 3.0% per annum | 3.0% per annum |
The following table presents comparable office leases with respect to the 1412 Broadway Property:
Comparable Office Lease Summary |
| Property/Location | Year Built | SF | Tenant Name | Size (SF) | Lease Date | Lease Term (Mos.) | Rent PSF | Lease Type |
1430 Broadway New York, NY | 1955 | 364,000 | Life Adjustment | 4,236 | 8/1/2019 | 85 | $53.25 | Modified Gross |
1407 Broadway New York, NY | 1950 / 2015 | 1,118,834 | Amore Pacific | 24,714 | 6/1/2019 | 125 | $56.85 | Modified Gross |
1359 Broadway New York, NY | 1924 | - | NYS Energy | 4,618 | 8/1/2019 | 114 | $60.00 | Modified Gross |
1370 Broadway New York, NY | 1922 | 244,883 | Collection ‘18 | 16,790 | 7/1/2019 | 91 | $64.50 | Modified Gross |
498 Seventh Avenue New York, NY | 1920 | 960,000 | Tetra Tech | 59,798 | 4/1/2019 | 154 | $64.50 | Modified Gross |
25 West 39th Street New York, NY | 1907 | 185,384 | The Wing | 12,252 | 3/1/2019 | 130 | $58.00 | Modified Gross |
1400 Broadway New York, NY | 1930 | 929,405 | Signature Bank | 20,961 | 11/1/2018 | 180 | $62.00 | Modified Gross |
500 Seventh Avenue New York, NY | 1922 | 609,000 | WeWork | 255,610 | 3/1/2018 | 178 | $68.00 | Modified Gross |
Source: Appraisal.
This is not a research report and was not prepared by any Underwriter’s research department. Please see additional important information and qualifications at the end of this Term Sheet.
T-52
Office – CBD | Loan #3 | Cut-off Date Balance: | | $100,000,000 |
1412 Broadway | 1412 Broadway | Cut-off Date LTV: | | 58.3% |
New York, NY 10018 | | UW NCF DSCR: | | 1.92x |
| | UW NOI Debt Yield: | | 7.5% |
Operating History and Underwritten Net Cash Flow. The following table presents certain information relating to the operating history and Underwritten Net Cash Flow at the 1412 Broadway Property:
Cash Flow Analysis |
| | 2016 | | 2017 | | 2018 | | 9/30/2019 TTM | | UW | | UW PSF | |
Gross Potential Rent(1) | | $19,153,488 | | $20,076,624 | | $22,093,323 | | $21,904,363 | | $24,753,232 | | $58.74 | |
Total Recoveries(1) | | $1,655,765 | | $1,772,790 | | $2,381,564 | | $2,586,311 | | $2,870,065 | | $6.81 | |
Other Income | | $38,983 | | $12,489 | | $26,335 | | $29,605 | | $35,719 | | $0.08 | |
Less Vacancy & Credit Loss | | $0 | | $0 | | $0 | | $0 | | ($2,977,354) | | ($7.07) | |
Effective Gross Income | | $20,848,236 | | $21,861,903 | | $24,501,222 | | $24,520,279 | | $24,681,662 | | $58.57 | |
| | | | | | | | | | | | | |
Real Estate Taxes | | $4,024,080 | | $4,357,119 | | $4,639,521 | | $4,734,101 | | $4,822,876 | | $11.44 | |
Insurance | | $281,526 | | $281,531 | | $281,532 | | $282,405 | | $365,064 | | $0.87 | |
Other Expenses(2) | | $2,906,016 | | $3,179,304 | | $2,936,969 | | $3,017,136 | | $3,698,690 | | $8.78 | |
Total Expenses | | $7,211,622 | | $7,817,954 | | $7,858,022 | | $8,033,642 | | $8,886,630 | | $21.09 | |
| | | | | | | | | | | | | |
Net Operating Income | | $13,636,613 | | $14,043,950 | | $16,643,199 | | $16,486,637 | | $15,795,032 | | $37.48 | |
Capital Expenditures | | $0 | | $0 | | $0 | | $0 | | $84,279 | | $0.20 | |
TI/LC | | $0 | | $0 | | $0 | | $0 | | $946,027 | | $2.24 | |
Net Cash Flow | | $13,636,613 | | $14,043,950 | | $16,643,199 | | $16,486,637 | | $14,764,726 | | $35.04 | |
| | | | | | | | | | | | | | |
Occupancy % | | NAV | | 95.0% | | 97.6% | | 97.7%(3) | | 89.5% | | | |
NOI DSCR(4) | | 1.77x | | 1.83x | | 2.17x | | 2.14x | | 2.05x | | | |
NCF DSCR(4) | | 1.77x | | 1.83x | | 2.17x | | 2.14x | | 1.92x | | | |
NOI Debt Yield(4) | | 6.5% | | 6.7% | | 7.9% | | 7.9% | | 7.5% | | | |
NCF Debt Yield(4) | | 6.5% | | 6.7% | | 7.9% | | 7.9% | | 7.0% | | | |
(1) | UW Gross Potential Rent is based on the underwritten rent roll dated November 1, 2019 and includes (i) rent steps through December 1, 2020 totaling 647,877 and (ii) straight line rent taken over the life of the lease from the StubHub lease which is guaranteed by Ebay, Inc. ($66,680). The increase in UW Total Recoveries from 9/30/2019 TTM is due to the inclusion of utility reimbursements. |
(2) | The increase in UW Other Expenses from 9/30/2019 TTM is due to the inclusion of a 3% management fee, equal to $740,450. The 1412 Broadway Property is self-managed and historical operating statements did not include a management fee. |
(3) | 9/30/2019 TTM Occupancy % is as of November 1, 2019. |
(4) | Debt service coverage ratios and debt yields are based on the 1412 Broadway Whole Loan. |
Escrows and Reserves.
Real Estate Taxes – The 1412 Broadway Whole Loan documents provide for an upfront reserve of approximately $395,861 for real estate taxes and ongoing monthly reserves for real estate taxes in an amount equal to 1/12 of the real estate taxes that the lender estimates will be payable during the next twelve months (initially $395,861).
Insurance – The 1412 Broadway Whole Loan documents provide for an upfront reserve of approximately $28,560 for insurance premiums, and ongoing monthly reserve deposits for insurance premiums in an amount equal to 1/12 of the insurance premiums that the lender estimates will be payable for the renewal of coverage upon the expiration of the insurance policies; provided that such monthly deposits are not required so long as (i) no event of default is continuing, (ii) the insurance coverage for the 1412 Broadway Property is included in a blanket policy approved by the lender in its reasonable discretion, and (iii) the 1412 Broadway Borrower provides the lender with evidence of payment of the insurance premiums and renewals of the insurance policies, no later than ten days prior to the expiration of the current policy (initially $28,560).
Recurring Replacements – The 1412 Broadway Whole Loan documents provide for monthly deposits of approximately $6,991 into a replacement reserve; provided that such monthly deposits are not required on any monthly payment date on which the amount then held in such reserve is equal to or greater than $251,670.
TI/LC Reserve – The 1412 Broadway Whole Loan documents provide for an upfront reserve of $2,000,000 for future tenant improvements and leasing commissions. In addition, if at any time the amount in such reserve (including the initial upfront deposit) is less than $2,000,000, monthly deposits of approximately $52,431 are required to be made into such reserve until the amount in such reserve equals $2,000,000.
Free Rent Reserve – The 1412 Broadway Whole Loan documents provide for an upfront reserve of approximately $1,743,133 for outstanding free rent under the Kasper Group lease.
Lockbox and Cash Management. The 1412 Broadway Whole Loan documents require a hard lockbox and in place cash management. The 1412 Broadway Borrower agreed to provide a fully executed lockbox agreement and cash management agreement within 60 business days after the loan origination date. The 1412 Broadway Whole Loan documents require the 1412 Broadway Borrower to establish a lockbox account and to direct tenants to pay rents directly into the lockbox account, and, if notwithstanding such direction, the 1412 Broadway Borrower or property manager receives any rents, to deposit or cause to be deposited such rents into the lockbox account within three business days of receipt. All funds in the lockbox account are required to be deposited on each business day into a lender controlled cash management account. So long as no event of default is continuing under the 1412 Broadway Whole Loan, funds in the cash management account are required to be applied (i) to make deposits into the tax and insurance reserves (if any), as described above under “Escrows and Reserves”, (ii) to pay debt service on the 1412 Broadway Whole Loan, (iii) to make deposits into the recurring
This is not a research report and was not prepared by any Underwriter’s research department. Please see additional important information and qualifications at the end of this Term Sheet.
T-53
Office – CBD | Loan #3 | Cut-off Date Balance: | | $100,000,000 |
1412 Broadway | 1412 Broadway | Cut-off Date LTV: | | 58.3% |
New York, NY 10018 | | UW NCF DSCR: | | 1.92x |
| | UW NOI Debt Yield: | | 7.5% |
replacements reserve and TI/LC reserve, as described above under “Escrows and Reserves,” (iv) if a Cash Sweep Event Period (as defined below) is continuing, to pay operating expenses set forth in the annual budget (which is required to be reasonably approved by the lender) and extraordinary operating or capital expenses reasonably approved by the lender, and (v) to pay any remainder into an excess cash flow account, to be held by the lender as additional security for the 1412 Broadway Whole Loan during the continuance of the Cash Sweep Event Period, or if no Cash Sweep Event Period is continuing, to be disbursed to an account designated by the 1412 Broadway Borrower.
A “Cash Sweep Event Period” means a period:
| (a) | commencing upon an event of default under the 1412 Broadway Whole Loan and ending upon the cure (if applicable) of such event of default; or |
| (b) | commencing upon the debt yield of the 1412 Broadway Whole Loan being less than 6.25% at the end of any calendar quarter and ending upon the date the debt yield has been equal to or greater than 6.50% for two consecutive calendar quarters. |
Additional Secured Indebtedness (not including trade debts). In addition to the 1412 Broadway Mortgage Loan, the 1412 Broadway Property also secures the 1412 Broadway Serviced Pari Passu Companion Loans, which have an aggregate Cut-off Date principal balance of $110,000,000. The 1412 Broadway Serviced Pari Passu Companion Loans accrue interest at the same rate as the 1412 Broadway Mortgage Loan. The 1412 Broadway Mortgage Loan is entitled to payments of interest and principal on a pro rata and pari passu basis with the 1412 Broadway Serviced Pari Passu Companion Loans. The holders of the 1412 Broadway Mortgage Loan and the 1412 Broadway Serviced Pari Passu Companion Loans have entered into a co-lender agreement which sets forth the allocation of collections on the 1412 Broadway Whole Loan. See “Description of the Mortgage Pool—The Whole Loans—The Serviced Pari Passu Whole Loans” in the Preliminary Prospectus.
Mezzanine Loan and Preferred Equity. Not permitted.
Release of Property. Not permitted.
Ground Lease. None.
Right of First Refusal. None.
Letter of Credit. None.
Terrorism Insurance. The 1412 Broadway Whole Loan documents require that the “all risk” insurance policy required to be maintained by the 1412 Broadway Borrower provide coverage for terrorism in an amount equal to the full replacement cost of the 1412 Broadway Property, and business interruption insurance covering no less than the 18-month period following the occurrence of a casualty event, together with a six-month extended period of indemnity. Notwithstanding the foregoing, for so long as the Terrorism Risk Insurance Act of 2002, as extended and modified by the Terrorism Risk Insurance Program Reauthorization Act of 2015 (“TRIPRA”) is in effect (including any extensions thereof or if another federal governmental program is in effect relating to “acts of terrorism” which provides substantially similar protections as TRIPRA), and covers both domestic and foreign acts of terrorism, the lender is required to accept terrorism insurance that insures against “covered acts” as defined by TRIPRA (or such other program). See “Risk Factors—Risks Relating to the Mortgage Loans—Terrorism Insurance May Not Be Available for All Mortgaged Properties” in the Preliminary Prospectus.
This is not a research report and was not prepared by any Underwriter’s research department. Please see additional important information and qualifications at the end of this Term Sheet.
T-54
(THIS PAGE INTENTIONALLY LEFT BLANK)
| Multifamily – Mid Rise | Loan #4 | Cut-off Date Balance: | | $77,000,000 |
| Various | Bronx Multifamily Portfolio II | Cut-off Date LTV: | | 67.7% |
| Bronx, NY | | UW NCF DSCR: | | 1.85x |
| | | UW NOI Debt Yield: | | 7.3% |

This is not a research report and was not prepared by any Underwriter’s research department. Please see additional important information and qualifications at the end of this Term Sheet.
T-56
| Multifamily – Mid Rise | Loan #4 | Cut-off Date Balance: | | $77,000,000 |
| Various | Bronx Multifamily Portfolio II | Cut-off Date LTV: | | 67.7% |
| Bronx, NY | | UW NCF DSCR: | | 1.85x |
| | | UW NOI Debt Yield: | | 7.3% |
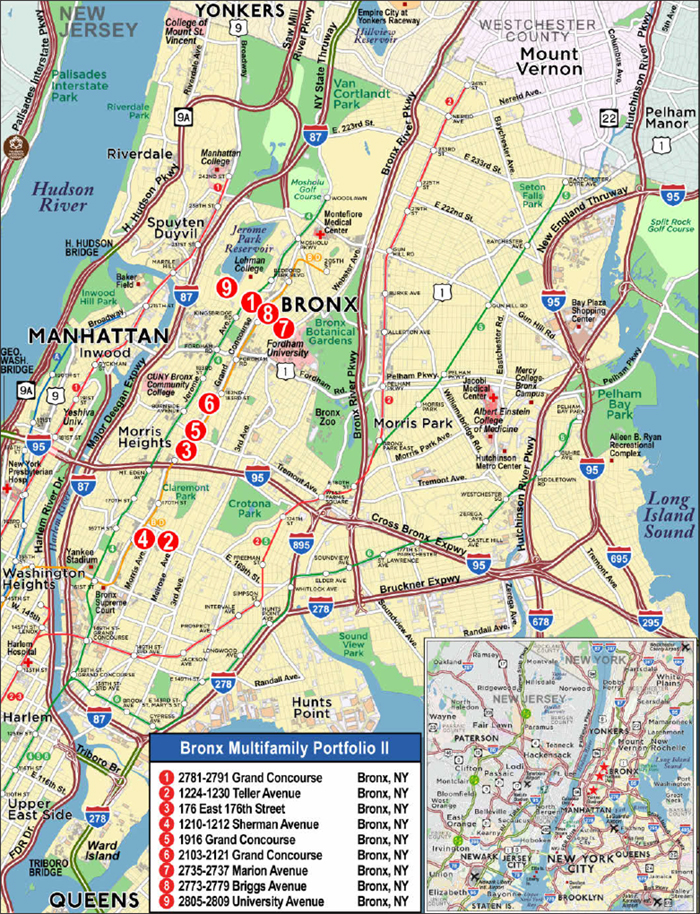
This is not a research report and was not prepared by any Underwriter’s research department. Please see additional important information and qualifications at the end of this Term Sheet.
T-57
| Mortgage Loan No. 4 – Bronx Multifamily Portfolio II |
| Mortgage Loan Information | | Property Information |
| Mortgage Loan Seller: | MSMCH | | Single Asset/Portfolio: | Portfolio |
| Credit Assessment (DBRS/Fitch/S&P): | NR/NR/NR | | Location: | Bronx, NY |
| Original Balance: | $77,000,000 | | General Property Type: | Multifamily |
| Cut-off Date Balance: | $77,000,000 | | Detailed Property Type: | Mid Rise |
| % of Initial Pool Balance: | 6.3% | | Title Vesting: | Fee |
| Loan Purpose: | Refinance | | Year Built/Renovated: | Various/N/A |
| Borrower Sponsor: | Ryan Morgan | | Size: | 526 Units |
| Guarantor: | Ryan Morgan | Cut-off Date Balance per Unit: | $146,388 |
| Mortgage Rate: | 3.7800% | Maturity Date Balance per Unit: | $146,388 |
| Note Date: | 11/22/2019 | | Property Manager: | 60 East 196th St 1 LLC |
| First Payment Date: | 1/1/2020 | | | (borrower related) |
| Maturity Date: | 12/1/2029 | | | |
| Original Term to Maturity: | 120 months | | Underwriting and Financial Information |
| Original Amortization Term: | 0 months | | UW NOI: | $5,606,786 |
| IO Period: | 120 months | | UW NOI Debt Yield: | 7.3% |
| Seasoning: | 0 months | | UW NOI Debt Yield at Maturity: | 7.3% |
| Prepayment Provisions: | LO (24); DEF (89); O (7) | | UW NCF DSCR: | 1.85x |
| Lockbox/Cash Mgmt Status: | Springing/Springing | | Most Recent NOI: | $5,964,889 (9/30/2019 TTM) |
| Additional Debt Type: | N/A | | 2nd Most Recent NOI: | $5,832,174 (12/31/2018) |
| Additional Debt Balance: | N/A | | 3rd Most Recent NOI: | $5,709,901 (12/31/2017) |
| Future Debt Permitted (Type): | No (N/A) | | Most Recent Occupancy: | 99.8% (11/1/2019) |
| Reserves(1) | | 2nd Most Recent Occupancy: | 99.9% (12/31/2018) |
| Type | Initial | Monthly | Cap | | 3rd Most Recent Occupancy: | 99.6% (12/31/2017) |
| RE Tax: | $118,523 | $118,523 | N/A | | Appraised Value (as of): | $113,800,000 (Various) |
| Insurance: | $0 | Springing | N/A | | Appraised Value per Unit: | $216,350 |
| Recurring Replacements: | $0 | $11,867 | N/A | | Cut-off Date LTV Ratio: | 67.7% |
| Deferred Maintenance: | $125,173 | $0 | N/A | | Maturity Date LTV Ratio: | 67.7% |
| | | | | | | | |
| Sources and Uses |
| Sources | Proceeds | % of Total | | Uses | Proceeds | % of Total |
| Loan Amount: | $77,000,000 | 98.2% | | Loan Payoff: | $76,278,076 | 97.3% |
| Borrower Equity: | $1,421,135 | 1.8% | | Closing Costs: | $1,899,363 | 2.4% |
| | | | | Reserves: | $243,696 | 0.3% |
| Total Sources: | $78,421,135 | 100.0% | | Total Uses: | $78,421,135 | 100.0% |
| (1) | See “Escrows and Reserves” below for further discussion of reserve requirements. |
The Mortgage Loan. The fourth largest mortgage loan (the “Bronx Multifamily Portfolio II Mortgage Loan”) is evidenced by a promissory note in the original principal balance of $77,000,000. The Bronx Multifamily Portfolio II Mortgage Loan is secured by a first priority fee mortgage encumbering nine multifamily properties located in the Bronx, New York (the “Bronx Multifamily Portfolio II” or “Bronx Multifamily Portfolio II Properties”).
The Borrowers and the Borrower Sponsor. The borrowers are Lynsey Associates LLC D, J.A.M. Associates LLC D, Lynsey Lee LTD, Rachel-Oliver Associates LLC D, 2103-2121 LLC D, 2735-37 Marion Ave LLC D, 2773-79 Briggs Ave LLC D, 2781 Grand Concourse LLC D and Morg-Hitch LLC D (collectively, the “Bronx Multifamily Portfolio II Borrowers”), each a Delaware limited liability company, except for Lynsey Lee LTD, which is a New York corporation, each structured to be bankruptcy-remote with one independent director. Ryan Morgan is the non-recourse carveout guarantor and the borrower sponsor with respect to the Bronx Multifamily Portfolio II Mortgage Loan. Ryan Morgan is one of the principals of The Morgan Group. The Morgan Group is a real estate company that has a current portfolio consisting of over 4,500 units in 75 buildings, and with an average occupancy of over 99%.
The Properties. The Bronx Multifamily Portfolio II is comprised of nine rent stabilized (or in the case of two units, rent controlled) multifamily properties totaling 526 units located in the Bronx, New York. The Bronx Multifamily Portfolio II Properties were constructed between 1915 and 1941. As of November 1, 2019, the multifamily space at the Bronx Multifamily Portfolio II was 99.8% occupied. In addition, certain of the Bronx Multifamily Portfolio II Properties have commercial space, which was 100.0% occupied as of November 1, 2019. Occupancy at the Bronx Multifamily Portfolio II has been in excess of 99.0% since 2014. According to the borrower sponsor, since acquiring the Bronx Multifamily Portfolio II, Ryan Morgan has invested approximately $1.4 million ($2,654 per unit) in capital improvements across the Bronx Multifamily II Properties in the aggregate. Seven of the Bronx Multifamily Portfolio II Properties benefit from either a J-51 exemption and/or abatement program. In addition, one of the Bronx Multifamily Portfolio II Properties is awaiting approval of an application for a J-51 abatement program and an application to increase rent under a major capital improvement program (“MCI”) program. Under the J-51 program, the tax exemption benefit temporarily exempts a property from the increase in assessed value which would otherwise occur as a result of significant renovation work. The abatement portion of the program reduces the existing taxes by a percentage of the certified reasonable costs of the work performed as determined by the Department of Finance. The MCI program allows landlords to increase rents (subject to certain limits) paid by rent stabilized tenants to recoup renovation and rehabilitation costs. 59 units at the Bronx Multifamily Portfolio II Properties are leased to tenants who pay a portion of their rent using Section 8 vouchers.
This is not a research report and was not prepared by any Underwriter’s research department. Please see additional important information and qualifications at the end of this Term Sheet.
T-58
| Multifamily – Mid Rise | Loan #4 | Cut-off Date Balance: | | $77,000,000 |
| Various | Bronx Multifamily Portfolio II | Cut-off Date LTV: | | 67.7% |
| Bronx, NY | | UW NCF DSCR: | | 1.85x |
| | | UW NOI Debt Yield: | | 7.3% |
The following table presents detailed information with respect to each of the Bronx Multifamily Portfolio II Properties:
| Bronx Multifamily Portfolio II Properties Summary |
| Building | Occ. % (1) | Units(1) | % of Total Units | Appraised Value | Allocated Loan Amount (“ALA”) | % of ALA | UW NOI | % of UW NOI |
| 2781-2791 Grand Concourse(2) | 100.0% | 106 | 20.2% | $18,000,000 | $12,200,000 | 15.8% | $876,078 | 15.6% |
| 1224-1230 Teller Avenue(3) | 98.7% | 79 | 15.0% | $17,400,000 | $11,800,000 | 15.3% | $823,285 | 14.7% |
| 176 East 176th Street(4) | 100.0% | 60 | 11.4% | $14,600,000 | $9,900,000 | 12.9% | $716,518 | 12.8% |
| 1210-1212 Sherman Avenue(5) | 100.0% | 48 | 9.1% | $13,500,000 | $9,150,000 | 11.9% | $688,623 | 12.3% |
| 1916 Grand Concourse(6) | 100.0% | 48 | 9.1% | $12,400,000 | $8,400,000 | 10.9% | $603,594 | 10.8% |
| 2103-2121 Grand Concourse | 100.0% | 43 | 8.2% | $11,000,000 | $7,400,000 | 9.6% | $577,399 | 10.3% |
| 2735-2737 Marion Avenue | 100.0% | 54 | 10.3% | $10,000,000 | $6,800,000 | 8.8% | $491,658 | 8.8% |
| 2773-2779 Briggs Avenue(7) | 100.0% | 41 | 7.8% | $9,000,000 | $6,000,000 | 7.8% | $435,635 | 7.8% |
| 2805-2809 University Avenue(8) | 100.0% | 47 | 8.9% | $7,900,000 | $5,350,000 | 6.9% | $393,995 | 7.0% |
| Total/Wtd. Avg. | 99.8% | 526 | 100.0% | $113,800,000 | $77,000,000 | 100.0% | $5,606,786 | 100.0% |
| (1) | Based on the borrower rent roll dated November 1, 2019. |
| (2) | As of the origination date, the 2781-2791 Grand Concourse Property benefits from two J-51 tax abatements expiring in 2023 under New York State’s J-51 tax abatement program. Real estate taxes were underwritten based on the in place J-51 abatements at the 2781-2791 Grand Concourse Property. The abated taxes are $230,379 per annum, compared to estimated unabated taxes for the 2019 tax year of $230,796. |
| (3) | The appraised value for the 1224-1230 Teller Avenue Property includes $3,800,000 attributable to the net present value of a J-51 tax abatement and exemption. As of the origination date, the 1224-1230 Teller Avenue Property benefits from one, 20-year tax abatement under New York State’s J-51 tax abatement program expiring in 2022 and a 34-year J-51 tax exemption expiring in 2046. Real estate taxes were underwritten based on the J-51 exemption at the 1224-1230 Teller Avenue Property. The in-place J-51 abatement was not underwritten as there are less than 3 years remaining. The abated taxes are $87,378 per annum, compared to estimated unabated taxes for the 2019 tax year of $249,434. |
| (4) | The appraised value for the 176 East 176th Street Property includes $100,000 attributable to the net present value of a J-51 tax abatement. As of the origination date, the 176 East 176th Street Property benefits from three, 20-year tax abatements under New York State’s J-51 tax abatement program, expiring in 2022, 2024 and 2027 respectively. Real estate taxes were underwritten based on two of the three J-51 abatements at the 176 East 176th Street Property (i.e. the abatement expiring in 2022 was not underwritten). The abated taxes are $174,578 per annum, compared to estimated unabated taxes for the 2019 tax year of $188,310. |
| (5) | The appraised value for the 1210-1212 Sherman Avenue Property includes $100,000 attributable to the net present value of an in place and an applied-for J-51 tax abatement and $400,000 attributable to an applied for MCI program rent increase. As of the origination date, the 1210-1212 Sherman Avenue Property benefits from one, 20-year tax abatement under New York State’s J-51 tax abatement program expiring in 2025. The borrower filed for an additional J-51 tax abatement and MCI program rent increase at the 1210-1212 Sherman Avenue Property. As of the origination date, approval documentation had not been received. Real estate taxes were underwritten based on the in place J-51 abatement at the 1210-1212 Sherman Avenue Property. The abated taxes are $276,501 per annum, compared to estimated unabated taxes for the 2019 tax year of $278,219. |
| (6) | The appraised value for the 1916 Grand Concourse Property includes $1,500,000 attributable to the net present value of a J-51 tax abatement and J-51 tax exemption. As of the origination date, the 1916 Grand Concourse Property benefits from two, 20-year tax abatements under New York State’s J-51 tax abatement program expiring in 2022 and 2025 and a 34-year J-51 tax exemption expiring in 2045. Real estate taxes were underwritten based on the J-51 tax exemption at the 1916 Grand Concourse Property. The two J-51 tax abatements were not underwritten given that one has less than two years remaining and the other is not material. The abated taxes are $65,220 per annum, compared to estimated unabated taxes for the 2019 tax year of $136,857. |
| (7) | As of the origination date, the 2773-2779 Briggs Avenue Property benefits from one J-51 tax abatement expiring in 2023 under New York State’s J-51 tax abatement program. Real estate taxes were underwritten based on the in place J-51 tax abatement at the 2773-2779 Briggs Avenue Property. The abated taxes are $156,847 per annum, compared to estimated unabated taxes for the 2019 tax year of $157,629. |
| (8) | As of the origination date, the 2805-2809 University Avenue Property benefits from one J-51 tax abatement expiring in 2024 under New York State’s J-51 tax abatement program. The in-place J-51 abatement at the 2805-2809 University Avenue Property was not underwritten. |
The following table presents detailed information with respect to each of the Bronx Multifamily Portfolio II Properties:
| Bronx Multifamily Portfolio II Properties Summary |
| Building | Units(1) | Property Subtype | NRA (SF) | Avg. Unit Size (SF) | Sec. 8 | Historical Capex | Historical Capex per Unit | # of Commercial Tenants | Annual Commercial Tenant Rent |
| 2781-2791 Grand Concourse | 106 | Mid rise | 88,700 | 837 | 4 | $2,500 | $23.58 | 0 | $0 |
| 1224-1230 Teller Avenue | 79 | Mid rise | 61,800 | 782 | 2 | $538,405 | $6,815.25 | 0 | $0 |
| 176 East 176th Street | 60 | Mid rise | 59,400 | 990 | 11 | $199,627 | $3,327.12 | 1 | $44,400 |
| 1210-1212 Sherman Avenue | 48 | Mid rise | 40,200 | 838 | 0 | $335,083 | $6,980.90 | 8 | $436,740 |
| 1916 Grand Concourse | 48 | Mid rise | 48,600 | 1,013 | 4 | $310,583 | $6,470.48 | 1 | $70,800 |
| 2103-2121 Grand Concourse | 43 | Mid rise | 32,350 | 752 | 9 | $0 | $0.00 | 7 | $290,280 |
| 2735-2737 Marion Avenue | 54 | Mid rise | 45,600 | 844 | 7 | $0 | $0.00 | 0 | $0 |
| 2773-2779 Briggs Avenue | 41 | Mid rise | 30,300 | 739 | 20 | $9,375 | $228.66 | 0 | $0 |
| 2805-2809 University Avenue | 47 | Mid rise | 37,750 | 803 | 2 | $625 | $13.30 | 0 | $0 |
| Total/Wtd. Avg. | 526 | | 444,700 | | 59 | $1,396,198 | $2,654.37 | 17 | $842,220 |
| (1) | Based on the borrower rent roll dated November 1, 2019. |
This is not a research report and was not prepared by any Underwriter’s research department. Please see additional important information and qualifications at the end of this Term Sheet.
T-59
| Multifamily – Mid Rise | Loan #4 | Cut-off Date Balance: | | $77,000,000 |
| Various | Bronx Multifamily Portfolio II | Cut-off Date LTV: | | 67.7% |
| Bronx, NY | | UW NCF DSCR: | | 1.85x |
| | | UW NOI Debt Yield: | | 7.3% |
The Market. The Bronx Multifamily Portfolio II Properties are located in the Bronx, New York within the Bronx County submarket of the New York City residential market. According to the appraisal, as of the second quarter of 2019, the vacancy rate in the New York City residential market was approximately 4.5%, with average asking rents of $3,783 per unit and inventory of approximately 219,294 units. According to the appraisal, as of the second quarter of 2019, the vacancy rate in the Bronx County submarket was approximately 3.8%, with average asking rents of $1,384 per unit and inventory of approximately 13,168 units. Primary access to the Bronx Multifamily Portfolio II Properties is provided by a number of major thoroughfares, bus lines through the MTA and numerous subway lines that connect the Bronx Multifamily Portfolio II Properties to Manhattan. The Bronx Multifamily Portfolio II neighborhood is located in a mixed-use area that supports residential, office, commercial, and retail uses.
The following table presents certain information relating to the appraiser’s market rent conclusion for the Bronx Multifamily Portfolio II Properties:
| Market Rent Summary |
| Building | Units(1) | Avg. Size (SF) | Avg. Monthly In Place Rent per Unit(1) | Avg. Monthly In Place Rent PSF(1) | Avg. Monthly Market Rent per Unit | Avg. Monthly Market Rent PSF |
| 2781-2791 Grand Concourse | 106 | 837 | $1,240 | $1.48 | $1,753 | $2.09 |
| 1224-1230 Teller Avenue | 79 | 782 | $1,343 | $1.72 | $1,811 | $2.32 |
| 176 East 176th Street | 60 | 990 | $1,572 | $1.59 | $2,188 | $2.21 |
| 1210-1212 Sherman Avenue | 48 | 838 | $1,354 | $1.62 | $1,892 | $2.26 |
| 1916 Grand Concourse | 48 | 1,013 | $1,452 | $1.43 | $2,125 | $2.10 |
| 2103-2121 Grand Concourse | 43 | 752 | $1,397 | $1.86 | $1,979 | $2.63 |
| 2735-2737 Marion Avenue | 54 | 844 | $1,352 | $1.60 | $1,875 | $2.22 |
| 2773-2779 Briggs Avenue | 41 | 739 | $1,583 | $2.14 | $2,112 | $2.86 |
| 2805-2809 University Avenue | 47 | 803 | $1,282 | $1.60 | $1,734 | $2.16 |
Source:Appraisal
| (1) | Based on the borrower rent roll dated November 1, 2019. |
The following table presents certain information relating to comparable rental properties to the 1224-1230 Teller Avenue, the 176 East 176th Street, the 1210-1212 Sherman Avenue, the 1916 Grand Concourse and the 2103-2121 Grand Concourse properties:
| Comparable Rental Properties (1224-1230 Teller Avenue, 176 East 176th Street, 1210-1212 Sherman Avenue, 1916 Grand Concourse and 2103-2121 Grand Concourse Properties) |
| Property | Year Built | # of Stories | # Units | Unit Mix | Average SF per Unit | Average Rent per Unit(1) | Average Annual Rent PSF |
| 1224-1230 Teller Avenue | 1941 | 8 | 79 | Studio 1BR 2BR | 600 800 1,000 | $1,142 $1,356 $1,641 | $22.85 $20.34 $19.69 |
| 176 East 176th Street | 1936 | 6 | 60 | Studio 1BR 2BR 3BR | 600 800 1,000 1,200 | $918 $1,351 $1,591 $1,813 | $18.36
$20.26 $19.10 $18.13 |
| 1210-1212 Sherman Avenue | 1938 | 6 | 48 | Studio 1BR 2BR | 600 800 1,000 | $1,101 $1,279 $1,574 | $22.02 $19.18 $18.89 |
| 1916 Grand Concourse | 1922 | 5 | 48 | Studio 1BR 2BR 3BR | 600 800 1,000 1,200 | $1,010 $1,375 $1,422 $1,647 | $20.20
$20.62 $17.07 $16.47 |
| 2103-2121 Grand Concourse | 1936 | 6 | 43 | 1BR 2BR 3BR | 650 850 1,050 | $1,311 $1,470 $1,658 | $24.21 $20.76 $18.95 |
Sherman Court 1240 Sherman Avenue Bronx, NY | 1927 | 7 | 58 | 1BR 2BR | 550 650 | $1,515 $1,701 | $33.05 $31.40 |
1540 Walton Avenue Bronx, NY | 1923 | 5 | 59 | 1BR 2BR | 642 906 | $1,701 $2,031 | $31.79 $26.90 |
888 Grand Concourse Bronx, NY | 1931 | 6 | 76 | Studio 1BR 2BR 3BR | 600 800 1,000 1,200 | $1,800 $2,200 $2,550 $3,200 | $36.00 $33.00 $30.60 $32.00 |
930 Sheridan Avenue Bronx, NY | 1951 | 7 | 83 | Studio 1BR | 542 669 | $1,699 $1,845 | $37.62 $33.09 |
Source:Appraisal
| (1) | Based on the borrower rent roll dated November 1, 2019. |
This is not a research report and was not prepared by any Underwriter’s research department. Please see additional important information and qualifications at the end of this Term Sheet.
T-60
| Multifamily – Mid Rise | Loan #4 | Cut-off Date Balance: | | $77,000,000 |
| Various | Bronx Multifamily Portfolio II | Cut-off Date LTV: | | 67.7% |
| Bronx, NY | | UW NCF DSCR: | | 1.85x |
| | | UW NOI Debt Yield: | | 7.3% |
The following table presents certain information relating to comparable rental properties to the 2781-2791 Grand Concourse, the 2735-2737 Marion Avenue, the 2773-2779 Briggs Avenue and the 2805-2809 University Avenue properties:
| Comparable Rental Properties (2781-2791 Grand Concourse, 2735-2737 Marion Avenue, 2773-2779 Briggs Avenue and 2805-2809 University Avenue Properties) |
| Property | Year Built | # of Stories | # Units | Unit Mix | Average SF per Unit | Average Rent per Unit(1) | Average Annual Rent PSF |
| 2781-2791 Grand Concourse | 1921 | 5 | 106 | Studio 1BR 2BR | 600 800 900 | $922 $1,182 $1,310 | $18.43 $17.72 $17.46 |
| 2735-2737 Marion Avenue | 1923 | 5 | 54 | 1BR 2BR 3BR | 750 950 1,050 | $1,248 $1,353 $1,549 | $19.97 $17.08 $17.71 |
| 2773-2779 Briggs Avenue | 1915 | 5 | 41 | 1BR 2BR 3BR | 600 700 800 | $1,488 $1,498 $1,693 | $29.75 $25.67 $25.39 |
| 2805-2809 University Avenue | 1926 | 6 | 47 | Studio 1BR 2BR 3BR 4BR | 500 750 900 1,000
1,300 | $734 $1,233 $1,558 $1,277 $1,257 | $17.62 $19.73 $20.77 $15.32 $11.60 |
2839 Bainbridge Avenue Bronx, NY | 1922 | 5 | 30 | 1BR | 600 | $2,084 | $41.68 |
2605 Marion Avenue Bronx, NY | 1925 | 5 | 25 | 1BR 2BR | 650 800 | $1,675 $1,925 | $30.92 $28.88 |
7 East Gun Hill Road Bronx, NY | 1923 | 5 | 38 | 1BR 2BR 3BR | 500 800 1,100 | $1,526 $2,012 $2,473 | $36.62 $30.18 $26.98 |
308 East 209th Street Bronx, NY | 1929 | 6 | 25 | Studio 1BR | 354 560 | $1,077 $1,236 | $36.51 $26.49 |
3339 Hull Avenue Bronx, NY | 1940 | 6 | 50 | Studio 1BR 2BR 3BR | 400 675 950 1,500 | $1,354 $1,666 $1,839 $3,218 | $40.62 $29.62 $23.23 $25.74 |
Source:Appraisal
| (1) | Based on the borrower rent roll dated November 1, 2019. |
Operating History and Underwritten Net Cash Flow.The following table presents certain information relating to the historical operating performance and the Underwritten Net Cash Flow of the Bronx Multifamily Portfolio II:
| Cash Flow Analysis |
| | 2016 | 2017 | 2018 | 9/30/2019 TTM | UW | UW Per Unit |
| Gross Potential Rent(1) | $8,463,320 | $8,841,398 | $9,168,205 | $9,370,840 | $8,697,108 | $16,534.43 |
| Other Income(2) | $0 | $0 | $0 | $0 | $848,157 | $1,612.47 |
| Vacancy | $0 | $0 | $0 | $0 | ($215,018) | ($408.78) |
| Effective Gross Income | $8,463,320 | $8,841,398 | $9,168,205 | $9,370,840 | $9,330,247 | $17,738.11 |
| | | | | | | |
| Real Estate Taxes | $943,091 | $1,062,381 | $1,168,227 | $1,240,972 | $1,458,654 | $2,773.11 |
| Insurance | $205,869 | $351,302 | $455,393 | $461,481 | $455,250 | $865.49 |
| Other Expenses | $1,699,081 | $1,717,814 | $1,712,411 | $1,703,498 | $1,809,557 | $3,440.22 |
| Total Expenses | $2,848,041 | $3,131,497 | $3,336,031 | $3,405,951 | $3,723,461 | $7,078.82 |
| | | | | | | |
| Net Operating Income | $5,615,279 | $5,709,901 | $5,832,174 | $5,964,889 | $5,606,786 | $10,659.29 |
| Capital Expenditures | $0 | $0 | $0 | $0 | $142,408 | $270.74 |
| Net Cash Flow | $5,615,279 | $5,709,901 | $5,832,174 | $5,964,889 | $5,464,378 | $10,388.55 |
| | | | | | | |
| Occupancy % | 98.9% | 99.6% | 99.9% | 99.8%(3) | 98.0% | |
| NOI DSCR | 1.90x | 1.93x | 1.98x | 2.02x | 1.90x | |
| NCF DSCR | 1.90x | 1.93x | 1.98x | 2.02x | 1.85x | |
| NOI Debt Yield | 7.3% | 7.4% | 7.6% | 7.7% | 7.3% | |
| NCF Debt Yield | 7.3% | 7.4% | 7.6% | 7.7% | 7.1% | |
| (1) | Historical Gross Potential Rent includes rent from retail tenants. UW Gross Potential Rent does not include rent from retail tenants, which is instead included in UW Other Income. |
| (2) | Other Income is comprised of rent from retail tenants. |
| (3) | As of the borrower rent roll dated November 1, 2019, the multifamily space at the Bronx Multifamily Portfolio II is 99.8% occupied. |
This is not a research report and was not prepared by any Underwriter’s research department. Please see additional important information and qualifications at the end of this Term Sheet.
T-61
| Multifamily – Mid Rise | Loan #4 | Cut-off Date Balance: | | $77,000,000 |
| Various | Bronx Multifamily Portfolio II | Cut-off Date LTV: | | 67.7% |
| Bronx, NY | | UW NCF DSCR: | | 1.85x |
| | | UW NOI Debt Yield: | | 7.3% |
Escrows and Reserves.
Real Estate Taxes– The Bronx Multifamily Portfolio II Mortgage Loan documents provide for an upfront reserve of $118,523 for real estate taxes and ongoing monthly reserves for real estate taxes in an amount equal to 1/12 of the real estate taxes that the lender estimates will be payable during the next twelve months (initially, $118,523).
Insurance– The Bronx Multifamily Portfolio II Mortgage Loan documents provide for monthly reserves for insurance premiums in an amount equal to 1/12 of the insurance premiums that the lender estimates will be payable for the renewal of coverage upon the expiration of the insurance policies; provided that such monthly reserves are not required so long as (i) no event of default has occurred and is continuing, (ii) the liability and casualty insurance coverage for each of the Bronx Multifamily Portfolio II Properties is included in a blanket policy approved by the lender in its reasonable discretion, and (iii) the Bronx Multifamily Portfolio II Borrowers provide the lender with evidence of payment of the insurance premiums and renewals of the insurance policies, no later than ten days prior to the expiration of the current policy.
Recurring Replacements Reserve – The Bronx Multifamily Portfolio II Mortgage Loan documents provide for monthly deposits of $11,867 for approved capital expenditures.
Deferred Maintenance Reserve – The Bronx Multifamily Portfolio II Mortgage Loan documents provide for an upfront reserve of $125,173, representing 115% of the estimated cost for various required repairs and for closing out open violations.
Lockbox and Cash Management.The Bronx Multifamily Portfolio II Mortgage Loan is structured with a springing lockbox and springing cash management. Upon the first occurrence of an event of default, the Bronx Multifamily Portfolio II Borrowers are required to establish and maintain a lockbox account for the benefit of the lender, to direct all commercial tenants of the Bronx Multifamily Portfolio II Properties to deposit rent directly into such lockbox account, and to deposit, or cause to be deposited, all rents from residential tenants of the Bronx Multifamily Portfolio II Properties into such lockbox account within one business day of receipt. Upon the first occurrence of an event of default, the lender is required to establish a lender-controlled cash management account, into which all funds in the lockbox account will be required to be deposited, so long as the event of default has not been cured to the satisfaction of the lender. During the continuance of an event of default, all funds in the cash management account are required to be applied on each monthly payment date: (i) to make the monthly deposits into the real estate tax and insurance reserves as described above under “Escrows and Reserves,” (ii) to pay debt service on the Bronx Multifamily Portfolio II Mortgage Loan, (iii) to make the monthly deposit into the recurring replacements reserve as described above under “Escrows and Reserves,” and (iv) to deposit any remainder into an excess cash flow subaccount to be held as additional security for the Bronx Multifamily Portfolio II Mortgage Loan during the continuance of such event of default; provided, however, that at lender’s option, upon an event of default the lender may instead apply any and all funds in the lockbox account and cash management account to pay the debts and obligations of the Bronx Multifamily Portfolio II Borrowers under the Bronx Multifamily Portfolio II Mortgage Loan documents in such order, proportion and priority as the lender determines in its sole discretion. If the event of default is cured to the satisfaction of the lender, all funds in the excess cash flow subaccount are required to be disbursed to the Bronx Multifamily Portfolio II Borrowers.
Additional Secured Indebtedness (not including trade debts).None.
Mezzanine Loan and Preferred Equity.Not permitted.
Release of Property.After the expiration of the defeasance lockout period and prior to the monthly payment date occurring in June 2029, the Bronx Multifamily Portfolio II Borrowers have the right to obtain a release of any one or more individual Bronx Multifamily Portfolio II Properties, provided no event of default is continuing and subject to the conditions set forth in the Bronx Multifamily Portfolio II Mortgage Loan documents, including, among others, (1) partial defeasance of the Bronx Multifamily Portfolio II Mortgage Loan in a principal amount equal to 110% of the allocated loan amount for the individual Bronx Multifamily Portfolio II Property being released, provided, however, that upon the written request of the Bronx Multifamily Portfolio II Borrowers and subject to the lender’s receipt of an updated appraisal, the applicable release amount may be 100% of such allocated loan amount so long as (i) the loan-to-value ratio with respect to all remaining Bronx Multifamily Portfolio II Properties is not greater than 55.0% and (ii) the debt yield with respect to all remaining Bronx Multifamily Portfolio II Properties is not less than 8.5%, (2) after giving effect to the partial defeasance the debt yield of the remaining Bronx Multifamily Portfolio II Properties is greater than the greater of the debt yield immediately prior to the partial defeasance and 7.00%, and (3) customary REMIC requirements are satisfied.
Letter of Credit.None.
Right of First Refusal/Right of First Offer. None.
Ground Lease.None.
Terrorism Insurance. The Bronx Multifamily Portfolio II Borrowers are required to obtain and maintain an “all risk” property insurance policy that covers perils of terrorism and acts of terrorism in an amount equal to the “full replacement cost” of the Bronx Multifamily Portfolio II Properties together with business income insurance covering not less than the 18-month period commencing at the time of loss, together with an extended period of indemnity endorsement of up to six months. Notwithstanding the foregoing, for so long as the Terrorism Risk Insurance Act of 2002, as extended and modified by the Terrorism Risk Insurance Program Reauthorization Act of 2015 (“TRIPRA”) is in effect (including any extensions thereof or if another federal governmental program is in effect relating to “acts of terrorism” which provides substantially similar protections as TRIPRA), and covers both domestic and foreign acts of terrorism, the lender is required to accept terrorism insurance which insures against “covered acts” as defined by TRIPRA (or such other program). See“Risk Factors—Risks Relating to the Mortgage Loans—Terrorism Insurance May Not Be Available for All Mortgaged Properties”in the Preliminary Prospectus.
This is not a research report and was not prepared by any Underwriter’s research department. Please see additional important information and qualifications at the end of this Term Sheet.
T-62
(THIS PAGE INTENTIONALLY LEFT BLANK)
| Hospitality – Full Service | Loan #5 | Cut-off Date Balance: | | $74,000,000 |
| 300 Canal Street | DoubleTree New Orleans | Cut-off Date LTV: | | 60.7% |
| New Orleans, LA 70130 | | UW NCF DSCR: | | 3.08x |
| | | UW NOI Debt Yield: | | 13.3% |

This is not a research report and was not prepared by any Underwriter’s research department. Please see additional important information and qualifications at the end of this Term Sheet.
T-64
| Hospitality – Full Service | Loan #5 | Cut-off Date Balance: | | $74,000,000 |
| 300 Canal Street | DoubleTree New Orleans | Cut-off Date LTV: | | 60.7% |
| New Orleans, LA 70130 | | UW NCF DSCR: | | 3.08x |
| | | UW NOI Debt Yield: | | 13.3% |
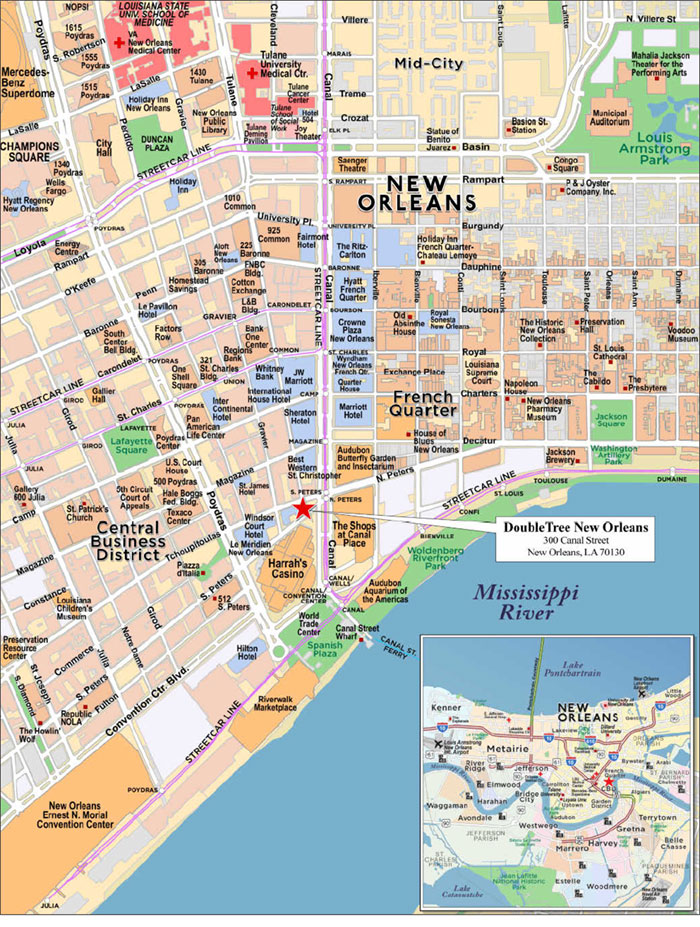
This is not a research report and was not prepared by any Underwriter’s research department. Please see additional important information and qualifications at the end of this Term Sheet.
T-65
Mortgage Loan No. 5 – DoubleTree New Orleans |
Mortgage Loan Information | | Property Information |
Mortgage Loan Seller: | WFB | | Single Asset/Portfolio: | Single Asset |
Credit Assessment (DBRS/Fitch/S&P): | NR/NR/NR | | Location: | New Orleans, LA 70130 |
Original Balance: | $74,000,000 | | General Property Type: | Hospitality |
Cut-off Date Balance: | $74,000,000 | | Detailed Property Type: | Full Service |
% of Initial Pool Balance: | 6.0% | | Title Vesting: | Fee |
Loan Purpose: | Acquisition | | Year Built/Renovated: | 1977/2017 |
Sponsor: | Allan V. Rose | | Size: | 367 Rooms |
Guarantor: | Allan V. Rose | | Cut-off Date Balance per Room: | $201,635 |
Mortgage Rate: | 3.8330% | | Maturity Date Balance per Room: | $201,635 |
Note Date: | 11/14/2019 | | Property Manager: | Dimension Development Two, LLC |
First Payment Date: | 1/11/2020 | | | |
Maturity Date: | 12/11/2029 | | | |
Original Term to Maturity: | 120 months | | Underwriting and Financial Information |
Original Amortization Term: | 0 months | | UW NOI: | $9,831,046 |
IO Period: | 120 months | | UW NOI Debt Yield: | 13.3% |
Seasoning: | 0 months | | UW NOI Debt Yield at Maturity: | 13.3% |
Prepayment Provisions: | LO(24); DEF(92); O(4) | | UW NCF DSCR: | 3.08x |
Lockbox/Cash Mgmt Status: | Hard / Springing | | Most Recent NOI: | $10,266,666 (9/30/2019 TTM) |
Additional Debt Type(1): | Unsecured Key Money Loan | | 2nd Most Recent NOI: | $9,856,550 (12/31/2018) |
Additional Debt Balance(1): | $779,938 | | 3rd Most Recent NOI: | $8,570,845 (12/31/2017) |
Future Debt Permitted (Type): | No (N/A) | | Most Recent Occupancy: | 82.9% (9/30/2019) |
Reserves(2) | | 2nd Most Recent Occupancy: | 83.7% (12/31/2018) |
Type | Initial | Monthly | Cap | | 3rd Most Recent Occupancy: | 78.0% (12/31/2017) |
RE Tax: | $638,467 | $58,043 | N/A | | Appraised Value (as of)(3): | $122,000,000 (10/10/2019) |
Insurance: | $0 | Springing | N/A | | Appraised Value per Room(3): | $332,425 |
FF&E: | $0 | $79,555 | N/A | | Cut-off Date LTV Ratio(3: | 60.7% |
PIP Reserve: | $2,663,861 | $0 | N/A | | Maturity Date LTV Ratio(3): | 60.7% |
| | | | | | | |
Sources and Uses |
Sources | Proceeds | % of Total | | Uses | Proceeds | % of Total |
Loan Amount: | $74,000,000 | 60.7% | | Purchase Price: | $118,000,000 | 96.9% |
Cash Equity Contribution | $47,836,661 | 39.3% | | Reserves: | $3,302,328 | 2.7% |
| | | | Closing Costs: | $534,333 | 0.4% |
Total Sources: | $121,836,661 | 100.0% | | Total Uses: | $121,836,661 | 100.0% |
(1) | See “The Property” below for discussion of the Development Incentive Note. |
(2) | See “Escrows and Reserves” below for further discussion of reserve requirements. |
(3) | The value shown represents the appraiser’s As-Is value. The appraiser also concluded to a Prospective As-Complete and Stabilized value of $128,500,000 ($350,136 per Room) as of October 10, 2020, which assumes the completion of the brand-mandated PIP (as defined below), the estimated cost of which was reserved at loan closing, as well as approximately $1.0 million of elective capital expenditures, which the DoubleTree New Orleans Borrower (as defined below) plans to complete, but were not reserved for and are not required to be completed by the loan documents (see “The Property” below for further details on the brand-mandated PIP and elective capital expenditures). Based on the Prospective As-Complete and Stabilized value, the Cut-off Date LTV Ratio and Maturity Date LTV Ratio would be 57.6% and 57.6%, respectively. |
The Mortgage Loan. The fifth largest mortgage loan (the “DoubleTree New Orleans Mortgage Loan”) is evidenced by a single promissory note in the original principal amount of $74,000,000 secured by a first priority fee mortgage encumbering a full service hospitality property located in New Orleans, Louisiana (the “DoubleTree New Orleans Property”).
The Borrowers and the Borrower Sponsor. The borrowers are AVR NOLA Canal Street Hotel LLC, AVR NOLA Canal Street Hotel II LLC and AVR NOLA Canal Street Hotel Tenant LLC (collectively, the “DoubleTree New Orleans Borrower”), each a single-purpose Delaware limited liability company with one independent director. Legal counsel to the DoubleTree New Orleans Borrower delivered a non-consolidation opinion in connection with the origination of the DoubleTree New Orleans Mortgage Loan. An operating lease is in-place with respect to the DoubleTree New Orleans Property between AVR NOLA Canal Street Hotel LLC and AVR NOLA Canal Street Hotel II LLC, as lessor, and AVR NOLA Canal Street Hotel Tenant LLC, as lessee (the “Operating Lessee”).
The borrower sponsor and non-recourse carveout guarantor is Allan V. Rose, owner and chief executive officer of AVR Realty, a privately held real estate development and management company. Founded by Mr. Rose over 45 years ago, AVR Realty has built, acquired and developed more than 30 million SF of commercial and residential space, including office complexes, shopping centers, corporate and industrial parks, apartment complexes, residential communities and hotels. AVR Realty’s current portfolio includes 23 full service and limited service hotels in California, Colorado, Florida, Georgia, Louisiana, New Jersey, New York, Texas and Virginia.
This is not a research report and was not prepared by any Underwriter’s research department. Please see additional important information and qualifications at the end of this Term Sheet.
T-66
| Hospitality – Full Service | Loan #5 | Cut-off Date Balance: | | $74,000,000 |
| 300 Canal Street | DoubleTree New Orleans | Cut-off Date LTV: | | 60.7% |
| New Orleans, LA 70130 | | UW NCF DSCR: | | 3.08x |
| | | UW NOI Debt Yield: | | 13.3% |
The Property. The DoubleTree New Orleans Property is a 17-story, 367-room, full service hotel located in New Orleans, Louisiana. Built in 1977 and renovated in 2017, the DoubleTree New Orleans Property is situated on a 0.5-acre site. Amenities at the DoubleTree New Orleans Property include eight meeting rooms and four ballrooms totaling 16,803 SF, a breakfast dining area, full service cafe, coffee shop, room service, outdoor swimming pool, fitness center, business center, concierge, gift shop, valet parking, valet laundry service, ATM and complimentary WiFi. The DoubleTree New Orleans Property guestroom configuration includes 120 king bed guestrooms, 217 double beds guestrooms, 14 ADA accessible guestrooms and 16 suites. In addition, the DoubleTree New Orleans Property includes leasehold interests in (i) 136 parking spaces in a parking lot across the street (not required for zoning compliance), having a December 31, 2031 lease expiration; and (ii) an area of approximately 400 SF that is currently subleased to a Pinkberry, Inc. operator, having an April 2028 lease expiration (with extensions). According to the appraisal, the demand segmentation at the DoubleTree New Orleans Property is approximately 40% commercial, 50% leisure and 10% group.
The DoubleTree New Orleans Property underwent renovations in 2016-2017 totaling approximately $15.5 million ($42,234 per room). The work included lobby renovations, new fitness equipment, renovation of guestrooms including nearly all new soft and case goods, upgrades to ballroom finishes and new boilers.
In connection with the acquisition of the DoubleTree New Orleans Property, the Operating Lessee entered into a new 23-year hotel franchise agreement with Hilton Franchise Holding LLC, expiring December 31, 2042 (the “Franchise Agreement”), as well as a management agreement with Dimension Development Two, LLC (“Dimension”). Dimension manages a portfolio of 60 hotels in 14 states. In conjunction with the Franchise Agreement, The DoubleTree New Orleans Property is required to undergo a $2.7 million ($7,258/room) brand-mandated property improvement plan (“PIP”), which was reserved for upfront, and is required to be completed by May 14, 2021. The PIP primarily includes HVAC upgrades, common area cosmetic work, improvements to the meeting space, and renovation of the dining and lounge area. In addition, the DoubleTree New Orleans Borrower plans to spend approximately $1.0 million of elective capital expenditures. Such elective capital expenditure work was not reserved for and is not required to be completed by the DoubleTree New Orleans Mortgage Loan documents.
As part of the acquisition, the Operating Lessee assumed a Development Incentive Note (the “Note”) that was originally issued by Doubletree Management LLC in the amount of $950,000 on January 30, 2015 to the previous owner of the DoubleTree New Orleans Property. As of November 14, 2019, the unamortized balance of the Note was approximately $779,938. As long as the Franchise Agreement remains in effect, on each anniversary of the Franchise Agreement effective date, one-twenty-second of the balance of the Note as of the Franchise Agreement effective date (approximately $35,452) is required to be forgiven without payment; and to the extent there is any remaining principal on the expiration date of the Franchise Agreement, it is required to be forgiven without payment. Upon the occurrence of either; (i) a termination of the Franchise Agreement, or (ii) a change in ownership where the transferee does not assume the obligations under the Note before the closing of the transfer, any outstanding unamortized principal balance of the Note will be immediately due and payable without further notice. The DoubleTree New Orleans Mortgage Loan documents provide for liability to the DoubleTree New Orleans Borrower and guarantor for losses related to repayment of the Note.
The following table presents historical occupancy, ADR, and RevPAR penetration rates of the DoubleTree New Orleans Property.
Historical Occupancy, ADR, RevPAR(1)(2) |
| | Competitive Set | | DoubleTree New Orleans Property | | Penetration Factor |
Year | | Occupancy | ADR | RevPAR | | Occupancy | ADR | RevPAR | | Occupancy | ADR | RevPAR |
9/30/2017 TTM | | 74.7% | $167.38 | $124.96 | | 73.7% | $162.25 | $119.59 | | 98.7% | 96.9% | 95.7% |
9/30/2018 TTM | | 77.1% | $170.07 | $131.15 | | 83.3% | $167.48 | $139.50 | | 108.0% | 98.5% | 106.4% |
9/30/2019 TTM | | 72.7% | $171.37 | $124.65 | | 82.6% | $176.15 | $145.51 | | 113.6% | 102.8% | 116.7% |
Source: Industry Report
(1) | According to a third party research report, the competitive set includes Wyndham New Orleans French Quarter, Westin New Orleans Canal Place, Embassy Suites by Hilton – New Orleans Convention Center, Hilton Garden Inn Convention Center, Renaissance New Orleans Pere Marquette French Quarter Area Hotel, Hilton New Orleans St. Charles, Loews New Orleans, and Marriott New Orleans at the Convention Center. |
(2) | Variances between the underwriting, the appraisal, and third party research report with respect to Occupancy, ADR and RevPAR at the DoubleTree New Orleans Property are attributable to variances in reporting methodologies and/or timing differences. |
The Market. The DoubleTree New Orleans Property is located in New Orleans, Louisiana, on lower Canal Street. It is within close proximity to many of the area’s key demand drivers, including Harrah’s Casino (adjacent), the Outlet Collection at the Riverwalk (0.3 miles), the French Quarter (approximately 1.0 mile), Canal Place (0.2 miles), the Audubon Aquarium (0.3 miles), the Mercedes-Benz Superdome/Smoothie King Center (home of the NFL New Orleans Saints; 1.1 miles), and The National WWII Museum (0.9 miles). The Louis Armstrong New Orleans International Airport is approximately 14.9 miles from the DoubleTree New Orleans Property. In addition, Tulane University, which employs approximately 4,100 people and had enrollment of approximately 8,610 undergraduates and 5,452 graduate students for the 2018-2019 school year, has its main campus approximately 4.2 miles from the DoubleTree New Orleans Property. According to a third party market research provider, the 2019 population within a three- and five-mile radius of the DoubleTree New Orleans Property was approximately 173,121 and 359,792, respectively. The 2019 average household income within the same radii was approximately $59,511 and $66,043, respectively.
The DoubleTree New Orleans Property is also situated approximately 0.6 miles from the Earnest N. Morial Convention Center, which announced a $557 million capital improvement plan in May 2018. Major components of the plan include a pedestrian park, upgrades to meeting rooms, technology upgrades, roof replacement, various cosmetic renovations and hotel incentives. The project is expected to be completed in phases from 2019 to 2023. The convention center currently comprises 1.1 million square feet of contiguous exhibit space, is the sixth largest convention facility in the nation, and consistently ranks in the country’s top ten facilities for the most annual conventions and tradeshows held.
This is not a research report and was not prepared by any Underwriter’s research department. Please see additional important information and qualifications at the end of this Term Sheet.
T-67
| Hospitality – Full Service | Loan #5 | Cut-off Date Balance: | | $74,000,000 |
| 300 Canal Street | DoubleTree New Orleans | Cut-off Date LTV: | | 60.7% |
| New Orleans, LA 70130 | | UW NCF DSCR: | | 3.08x |
| | | UW NOI Debt Yield: | | 13.3% |
According to the appraisal, the major demand generators for the area include tourism, including the cruise industry, the movie production industry, healthcare, the Port of New Orleans and groups associated with the Convention Center. Tourism has continued to expand in Louisiana with 2017 marking the 6th record year in a row with approximately 47.1 million visitors. Passenger traffic at the Louis Armstrong New Orleans International Airport has increased by approximately 35% since 2010; 2017 was a record year for cruise ships at the Port of New Orleans, with approximately 1.2 million passengers; and attendance at The Mardi Gras celebration has exceeded 1 million people for the past three years.
The appraisal did not identify any hotels that are proposed or currently under development that are expected to be directly competitive with the DoubleTree New Orleans Property.
Operating History and Underwritten Net Cash Flow. The following table presents certain information relating to the operating history and Underwritten Net Cash Flow at the DoubleTree New Orleans Property:
Cash Flow Analysis |
| | 2016(1) | | 2017(1) | | 2018 | | 9/30/2019 TTM | | UW | | UW per Room | |
Occupancy | | 59.6% | | 78.0% | | 83.7% | | 82.9%(2) | | 84.2%(2) | | | |
ADR | | $161.62 | | $164.45 | | $169.63 | | $175.50(2) | | $175.35(2) | | | |
RevPAR | | $96.34 | | $128.21 | | $142.04 | | $145.51(2) | | $147.56(2) | | | |
| | | | | | | | | | | | | |
Room Revenue | | $12,940,622 | | $17,174,265 | | $19,026,466 | | $19,491,520 | | $19,766,112 | | $53,859 | |
Food & Beverage Revenue | | $805,229 | | $1,346,045 | | $1,638,330 | | $1,994,753 | | $2,002,324 | | $5,456 | |
Parking Revenue | | $920,740 | | $1,264,098 | | $1,377,374 | | $1,416,538 | | $1,430,380 | | $3,897 | |
Other Income(3) | | $420,916 | | $729,349 | | $683,909 | | $667,617 | | $667,617 | | $1,819 | |
Total Revenue | | $15,087,507 | | $20,513,757 | | $22,726,079 | | $23,570,428 | | $23,866,433 | | $65,031 | |
| | | | | | | | | | | | | |
Room Expense | | $2,786,260 | | $3,159,664 | | $3,347,226 | | $3,378,897 | | $3,357,495 | | $9,148 | |
Food & Beverage Expense | | $641,613 | | $797,187 | | $899,861 | | $1,083,199 | | $1,022,914 | | $2,787 | |
Other Departmental Expenses | | $52,412 | | $124,718 | | $129,440 | | $127,505 | | $127,592 | | $348 | |
Total Departmental Expenses | | $3,480,285 | | $4,081,569 | | $4,376,527 | | $4,589,601 | | $4,508,001 | | $12,283 | |
Gross Operating Income | | $11,607,222 | | $16,432,188 | | $18,349,552 | | $18,980,827 | | $19,358,432 | | $52,748 | |
| | | | | | | | | | | | | |
Total Undistributed Expenses | | $5,348,292 | | $6,740,949 | | $7,381,316 | | $7,527,522 | | $7,736,638 | | $21,081 | |
Gross Operating Profit | | $6,258,930 | | $9,691,239 | | $10,968,236 | | $11,453,305 | | $11,621,794 | | $31,667 | |
| | | | | | | | | | | | | |
Total Fixed Charges | | $1,146,664 | | $1,120,394 | | $1,111,686 | | $1,186,639 | | $1,790,748(4) | | $4,879 | |
Total Operating Expenses | | $9,975,241 | | $11,942,912 | | $12,869,529 | | $13,303,762 | | $14,035,387 | | $38,244 | |
| | | | | | | | | | | | | |
Net Operating Income | | $5,112,266 | | $8,570,845 | | $9,856,550 | | $10,266,666 | | $9,831,046 | | $26,788 | |
FF&E | | $0 | | $0 | | $0 | | $0 | | $954,657 | | $2,601 | |
Net Cash Flow | | $5,112,266 | | $8,570,845 | | $9,856,550 | | $10,266,666 | | $8,876,389 | | $24,186 | |
| | | | | | | | | | | | | |
NOI DSCR | | 1.77x | | 2.97x | | 3.42x | | 3.56x | | 3.41x | | | |
NCF DSCR | | 1.77x | | 2.97x | | 3.42x | | 3.56x | | 3.08x | | | |
NOI Debt Yield | | 6.9% | | 11.6% | | 13.3% | | 13.9% | | 13.3% | | | |
NCF Debt Yield | | 6.9% | | 11.6% | | 13.3% | | 13.9% | | 12.0% | | | |
(1) | The DoubleTree New Orleans Property underwent renovations totaling approximately $15.5 million ($42,234 per room) in 2016-2017 (see “The Property” above). |
(2) | The DoubleTree New Orleans lost an estimated 1,664 room nights in July 2019 due to Hurricane Barry. The 9/30/2019 TTM statement shown reflects actual performance. If adjusted to include the estimated occupancy and related revenue from the lost room nights, the 9/30/2019 TTM Occupancy, ADR and RevPAR would be 84.2%, $175.35 and $147.56, respectively; and the Net Operating Income, NOI DSCR and NOI DY based on the DoubleTree New Orleans Mortgage Loan would be $10,408,911, 3.63x and 14.2%, respectively. The UW Occupancy, ADR and RevPar are based on the 9/30/2019 TTM statement adjusted for the July 2019 lost room nights. |
(3) | Other Income includes income from three antennas, miscellaneous income, other departmental revenue, and revenue from WOW Café and P.J.’s Coffee. |
(4) | The increase in Total Fixed Charges from TTM 9/30/2019 to UW is driven by underwritten real estate taxes. Underwritten real estate taxes are based on the appraiser’s estimate, which assumes a re-assessment following the recent sale. |
Escrows and Reserves.
Real Estate Taxes - The DoubleTree New Orleans Borrower is required to deposit an upfront real estate tax reserve of $638,467 and deposit ongoing monthly escrows for real estate taxes in an amount equal to one-twelfth of the real estate taxes that the lender estimates will be payable during the next twelve months (initially $58,043).
Insurance - The DoubleTree New Orleans Borrower is not required to deposit ongoing monthly escrows for insurance as long as (i) no event of default is continuing, (ii) the DoubleTree New Orleans Borrower provides the lender with evidence that the insurance coverage for the DoubleTree New Orleans Property is included in a blanket or umbrella policy approved by lender and such policy is in full force and effect, and (iii) the DoubleTree New Orleans Borrower provides the lender with evidence of timely payment of the insurance premiums and renewals no later than when such premiums are due and payable.
This is not a research report and was not prepared by any Underwriter’s research department. Please see additional important information and qualifications at the end of this Term Sheet.
T-68
| Hospitality – Full Service | Loan #5 | Cut-off Date Balance: | | $74,000,000 |
| 300 Canal Street | DoubleTree New Orleans | Cut-off Date LTV: | | 60.7% |
| New Orleans, LA 70130 | | UW NCF DSCR: | | 3.08x |
| | | UW NOI Debt Yield: | | 13.3% |
FF&E Reserve - The DoubleTree New Orleans Borrower is required to deposit ongoing monthly escrows for the costs and expenses of replacement and maintenance of FF&E in an amount equal to $79,555. Based on the annual operating statements for the DoubleTree New Orleans Property, the lender may adjust the FF&E Reserve monthly deposit to the greater of (x) the then-existing monthly deposit or (y) one-twelfth of 4.0% of the revenue for the prior fiscal year. In addition, the lender has the right to reassess the amount of the monthly FF&E reserve payment (not more than once per calendar year, provided no event of default exists) in its reasonable discretion that an increase is necessary to maintain proper operation of the DoubleTree New Orleans Property.
PIP Reserve - The DoubleTree New Orleans Mortgage Loan documents require an upfront reserve of $2,663,861 for estimated expenses related to the brand-mandated PIP work. In addition, if the lender reasonably determines that the amount in the PIP Reserve is insufficient to complete such work, within five business days of the lender’s demand, the DoubleTree New Orleans Borrower is required to deposit an additional deposit in an amount equal to 100% of the lender’s reasonable estimate of the cost of remaining and unpaid PIP work.
Lockbox and Cash Management. The DoubleTree New Orleans Mortgage Loan is structured with an in place hard lockbox and springing cash management. The DoubleTree New Orleans Borrower and property manager are required to deposit property income into the lockbox account within one business day of receipt, and credit card providers are required to deposit rents and income directly into the lockbox. Upon the occurrence of a Cash Trap Event Period (as defined below), all funds in the lockbox account are required to be swept each business day into the cash management account controlled by the lender and, on each payment date, all funds in the cash management account are required to be applied in accordance with the DoubleTree New Orleans Mortgage Loan documents. Prior to the occurrence of a Cash Trap Event Period, all funds in the lockbox account will be disbursed to the DoubleTree New Orleans Borrower. During a Cash Trap Event Period, all excess cash flow after satisfaction of the waterfall items is required to be held in the excess cash flow sub-account as additional security for the DoubleTree New Orleans Mortgage Loan.
A “Cash Trap Event Period” will commence upon the earlier of the following:
| (i) | the occurrence of an event of default; |
| (ii) | the termination of the Franchise Agreement; or |
| (iii) | the net cash flow debt yield falling below 8.75%. |
A Cash Trap Event Period will end upon the occurrence of the following:
| ● | with regard to clause (i), the cure of such event of default; |
| ● | with regard to clause (ii), (a) the DoubleTree New Orleans Borrower entering into and delivering to the lender a replacement franchise agreement for the DoubleTree New Orleans Property having an initial term expiring no earlier than December 31, 2042, together with any PIP then in effect and replacement comfort letter in form and substance acceptable to the lender; and |
| ● | with regard to clause (iii), upon the net cash flow debt yield being equal to or greater than 9.0% for two consecutive calendar quarters. |
Right of First Refusal. None.
Additional Secured Indebtedness (not including trade debts). None.
Mezzanine Loan and Preferred Equity. Not permitted.
Ground Lease. See “The Property” above.
Letter of Credit. None.
Release of Property. Not Permitted.
Terrorism Insurance. The DoubleTree New Orleans Mortgage Loan documents require that the “all risk” insurance policy required to be maintained by the DoubleTree New Orleans Borrower provide coverage for terrorism in an amount equal to the full replacement cost of the DoubleTree New Orleans Property, as well as business interruption insurance covering no less than the 18-month period following the occurrence of a casualty event, together with a 6-month extended period of indemnity. See “Risk Factors—Risks Relating to the Mortgage Loans—Terrorism Insurance May Not Be Available for All Mortgaged Properties” in the Preliminary Prospectus.
This is not a research report and was not prepared by any Underwriter’s research department. Please see additional important information and qualifications at the end of this Term Sheet.
T-69
| Office - Suburban | Loan #6 | Cut-off Date Balance: | | $65,400,000 |
| 5600 Fishers Lane | Parklawn Building | Cut-off Date LTV: | | 60.0% |
| Rockville, MD 20852 | | U/W NCF DSCR: | | 2.68x |
| | | U/W NOI Debt Yield: | | 9.4% |

This is not a research report and was not prepared by any Underwriter’s research department. Please see additional important information and qualifications at the end of this Term Sheet.
T-70
| Office - Suburban | Loan #6 | Cut-off Date Balance: | | $65,400,000 |
| 5600 Fishers Lane | Parklawn Building | Cut-off Date LTV: | | 60.0% |
| Rockville, MD 20852 | | U/W NCF DSCR: | | 2.68x |
| | | U/W NOI Debt Yield: | | 9.4% |
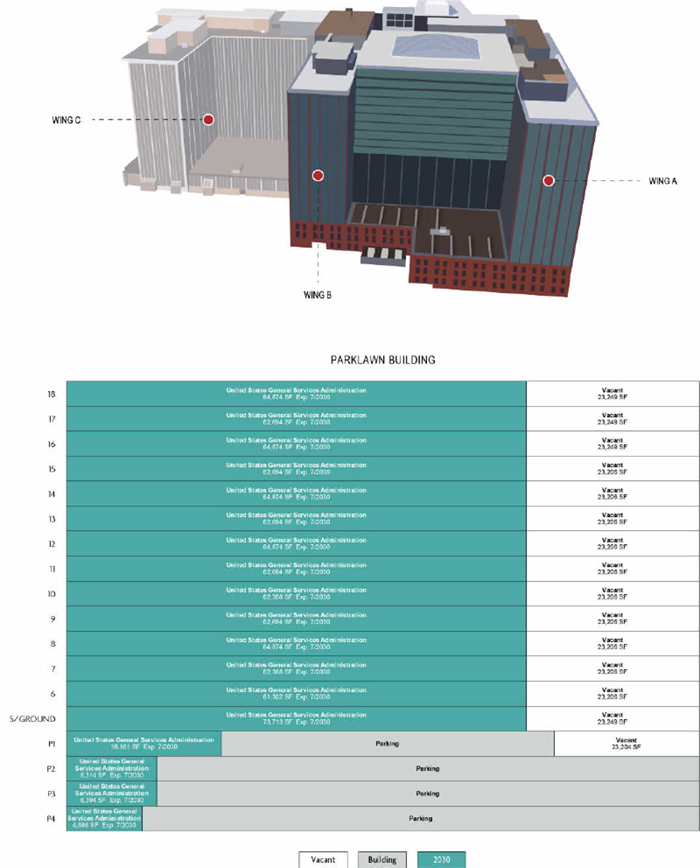
This is not a research report and was not prepared by any Underwriter’s research department. Please see additional important information and qualifications at the end of this Term Sheet.
T-71
| Office - Suburban | Loan #6 | Cut-off Date Balance: | | $65,400,000 |
| 5600 Fishers Lane | Parklawn Building | Cut-off Date LTV: | | 60.0% |
| Rockville, MD 20852 | | U/W NCF DSCR: | | 2.68x |
| | | U/W NOI Debt Yield: | | 9.4% |

This is not a research report and was not prepared by any Underwriter’s research department. Please see additional important information and qualifications at the end of this Term Sheet.
T-72
| Mortgage Loan No. 6 – Parklawn Building |
| Mortgage Loan Information | | Property Information |
| Mortgage Loan Seller: | BANA | | Single Asset/Portfolio: | Single Asset |
| Credit Assessment (DBRS/Fitch/S&P): | NR/NR/NR | | Location: | Rockville, MD 20852 |
| Original Balance(1): | $65,400,000 | | General Property Type: | Office |
| Cut-off Date Balance(1): | $65,400,000 | | Detailed Property Type: | Suburban |
| % of Initial Pool Balance: | 5.3% | | Title Vesting: | Fee |
| Loan Purpose: | Acquisition | | Year Built/Renovated: | 1970/2015 |
| Sponsor: | Boyd Watterson Asset Management | | Size: | 1,283,646 SF |
| Guarantor: | BW Government Properties II, LLC | Cut-off Date Balance per SF(1): | $204 |
| Mortgage Rate: | 3.3980% | Maturity Date Balance per SF(1): | $204 |
| Note Date: | 10/25/2019 | | Property Manager: | JBGS/TRS, L.L.C. |
| First Payment Date: | 12/1/2019 | | | |
| Maturity Date: | 11/1/2029 | | Underwriting and Financial Information |
| Original Term to Maturity: | 120 months | | UW NOI: | $24,626,402 |
| Original Amortization Term: | 0 months | | UW NOI Debt Yield(1): | 9.4% |
| IO Period: | 120 months | | UW NOI Debt Yield at Maturity(1): | 9.4% |
| Seasoning: | 1 month | | UW NCF DSCR(1): | 2.68x |
| Prepayment Provisions(2): | LO (25); DEF (89); O (6) | | Most Recent NOI: | $25,437,810 (8/31/2019 TTM) |
| Lockbox/Cash Mgmt Status: | Hard/In Place | | 2nd Most Recent NOI: | $23,893,473 (12/31/2018) |
| Additional Debt Type(1): | Pari Passu | | 3rd Most Recent NOI: | $27,578,749 (12/31/2017) |
| Additional Debt Balance(1): | $196,200,000 | | Most Recent Occupancy: | 72.9% (7/1/2019) |
| Future Debt Permitted (Type): | No (N/A) | | 2nd Most Recent Occupancy: | 72.9% (12/31/2018) |
| Reserves(3) | | 3rd Most Recent Occupancy: | 72.9% (12/31/2017) |
| Type | Initial | Monthly | Cap | | Appraised Value (as of)(4): | $436,000,000 (9/18/2019) |
| RE Tax: | $372,746 | $124,249 | N/A | | Appraised Value per SF: | $340 |
| Insurance: | $19,441 | $9,720 | N/A | | Cut-off Date LTV Ratio(1): | 60.0% |
| Deferred Maintenance: | $111,869 | $0 | N/A | | Maturity Date LTV Ratio(1): | 60.0% |
| | | | | | | | |
| Sources and Uses |
| Sources | Proceeds | % of Total | | Uses | Proceeds | % of Total |
| Whole Loan(1): | $261,600,000 | 58.8% | | Purchase Price: | $436,000,000 | 97.9% |
| Borrower Equity: | $183,626,789 | 41.2% | | Closing Costs: | $8,722,733 | 2.0% |
| | | | | Reserves: | $504,056 | 0.1% |
| Total Sources: | $445,226,789 | 100.0% | | Total Uses: | $445,226,789 | 100.0% |
| (1) | The Parklawn Building Mortgage Loan (as defined below) is part of the Parklawn Building Whole Loan (as defined below), which is comprised of fivepari passupromissory notes with an aggregate original principal balance of $261,600,000. The Cut-off Date Balance per SF, Maturity Date Balance per SF, UW NOI Debt Yield, UW NOI Debt Yield at Maturity, UW NCF DSCR, Cut-off Date LTV Ratio, and Maturity Date LTV Ratio numbers presented above are based on the aggregate principal balance of the promissory notes comprising the Parklawn Building Whole Loan. |
| (2) | Defeasance of the Parklawn Building Whole Loan is permitted at any time after the earlier to occur of (a) the end of the two-year period commencing on the closing date of the securitization of the last portion of the Parklawn Building Whole Loan to be securitized and (b) December 1, 2023. The assumed prepayment lockout period of 25 payments is based on the closing date of this transaction in December 2019. |
| (3) | See “Escrows and Reserves”below for further discussion of reserve information. |
| (4) | The Appraised Value includes $16,235,773 attributed to the present value of an economic development grant and the remainder of a LEED tax credit. |
The Mortgage Loan. The sixth largest mortgage loan (the “Parklawn Building Mortgage Loan”) is part of a whole loan (the “Parklawn Building Whole Loan”) evidenced by fivepari passu promissory notes with an aggregate original principal balance of $261,600,000, all secured by a first priority fee mortgage encumbering a suburban office property located in Rockville, Maryland ( the “Parklawn Building Property”). The Parklawn Building Whole Loan was co-originated by Bank of America, N.A and KeyBank National Association. The non-controlling Note A-4, with an original principal balance of $65,400,000, represents the Parklawn Building Mortgage Loan. The controlling Note A-1 was included in the MSC 2019-L3 securitization transaction. The non-controlling Notes A-2, A-3 and A-5 are held by Bank of America, N.A. and KeyBank National Association and are expected to be contributed to one or more future securitization transactions. The Parklawn Building Whole Loan is serviced pursuant to the pooling and servicing agreement for the MSC 2019-L3 securitization transaction. See “Description of the Mortgage Pool—The Whole Loans—The Non-Serviced Pari Passu Whole Loans” and “Pooling and Servicing Agreement” in the Preliminary Prospectus.
This is not a research report and was not prepared by any Underwriter’s research department. Please see additional important information and qualifications at the end of this Term Sheet.
T-73
| Office - Suburban | Loan #6 | Cut-off Date Balance: | | $65,400,000 |
| 5600 Fishers Lane | Parklawn Building | Cut-off Date LTV: | | 60.0% |
| Rockville, MD 20852 | | U/W NCF DSCR: | | 2.68x |
| | | U/W NOI Debt Yield: | | 9.4% |
| Parklawn Building Whole Loan Summary |
Notes | Original Balance | Cut-off Date Balance | Anticipated Note Holder | Controlling Piece |
| A-1 | $70,000,000 | $70,000,000 | MSC 2019-L3 | Yes |
| A-2 | $50,000,000 | $50,000,000 | CF 2019-CF3 | No |
| A-3 | $10,800,000 | $10,800,000 | CF 2019-CF3 | No |
| A-4 | $65,400,000 | $65,400,000 | BANK 2019-BNK24 | No |
| A-5 | $65,400,000 | $65,400,000 | Bank of America, N.A. | No |
| Total | $261,600,000 | $261,600,000 | | |
The Borrower and the Borrower Sponsor. The borrower is 5600 Fishers Lane, LLC (the “Parklawn Building Borrower”), a single-purpose Delaware limited liability company with two independent directors. The borrower sponsor is Boyd Watterson Asset Management (“Boyd Watterson”). Headquartered in Cleveland, Ohio and formed in 2009, Boyd Watterson is an independent investment advisor specializing in fixed income, real estate and equities. Boyd Watterson invests in commercial properties leased to local, state, and federal government tenants and manages such assets in separate client accounts and private funds. As of September 30, 2019, Boyd Watterson manages over $4.2 billion in real estate assets. The non-recourse carveout guarantor is BW Government Properties II, LLC, which is an entity owned by Boyd Watterson and Government Properties Investments II Limited, a fund managed by Union Bancaire Privée. Union Bancaire Privée is a wealth management firm headquartered in Geneva, Switzerland, that focuses on private and institutional clients throughout the world.
The Property. The Parklawn Building Property is a 14-story suburban office building totaling 1,283,646 SF across three wings originally constructed in 1970. Wings A and B contain an aggregate of 935,386 SF and wing C contains 348,260 SF. The Parklawn Building Property was originally 100.0% leased to the United States of America General Services Administration (“GSA”) on behalf of the U.S. Department of Health & Human Services (“HHS”), with the Parklawn Building Property serving as the headquarters for HHS. In 2015, the GSA and the prior owner of the Parklawn Building Property collectively spent nearly $300 million to completely renovate wings A and B into Class A office space featuring a 14-story atrium with a glass ceiling and glass exterior. Following the renovation, the GSA consolidated operations of HHS into wings A and B, and as a result, wing C was left vacant and in its original condition. There are no immediate plans to renovate or lease the space. As of July 1, 2019, wings A and B are 100.0% occupied by the GSA; however, the entire Parklawn Building Property, inclusive of wing C, is 72.9% occupied.
The Parklawn Building Property is LEED Platinum and Energy Star rated and features on-site amenities that include a one-acre park with a fountain, an outdoor plaza, café tables and seating, an on-site bank, a convenience store, a fitness center, and a direct trail to the nearby 1,700-acre Rock Creek Park. As part of the 2015 renovation, HHS invested more than $165 million of the total $300 million on specific upgrades including the main HHS data center for all national operations, back-up generators, modular conference center, full service cafeteria, and employee retail amenities. The 14-story, main interior atrium serves as the focal point of the Parklawn Building Property and allows HHS to host national and international symposiums and major training events on-site. Approximately 2,147 parking spaces are available throughout the Parklawn Building Property, consisting of 909 surface parking spaces and 1,238 parking spaces in a four-level below-grade parking garage beneath wings A, B, and C.
The Parklawn Building Property is situated on a 12.03-acre site in the Twinbrook neighborhood of Rockville, Maryland, approximately one-half mile northeast of Rockville Pike (Route 355) and two miles east of Interstate 270 and Montrose Road interchange. The Twinbrook Metrorail station is located approximately one-half mile to the west, connecting the area to Bethesda and downtown Washington, D.C. The Parklawn Building Property is located in a government life sciences district that features the 550,000 SF national headquarters for the companion agency, the National Institute of Allergy and Infectious Diseases, and two laboratory buildings leased to the National Institute of Health, directly across the street.
The Parklawn Building Borrower is a party to that certain Economic Development Fund Agreement (the “Grant”) with Montgomery County, Maryland (the “County”). Pursuant to the Grant, the Parklawn Building Borrower is entitled to 15 annual disbursements of $1,300,000 from 2017 through and including 2031. The County is only obligated to make disbursements once it has verified that the Parklawn Building Borrower has paid real property taxes in full for the corresponding tax year. The Parklawn Building Borrower was assigned the Grant at closing, but any further assignment of the Grant requires the assignee to demonstrate to the County that it is financially capable of fulfilling the Parklawn Building Borrower’s obligations and execute an assignment in form and substance reasonably satisfactory to the County. See “Description of the Mortgage Pool—Mortgage Pool Characteristics—Property Types—Office Properties” in the Preliminary Prospectus.
Major Tenant.
The United States General Services Administration utilizes the Parklawn Building Property for HHS which occupies the space via a lease that expires in July 2030. The lease contains one, 10-year renewal option with a notice period of at least 36 months. The lease does not provide any termination or contraction options.
HHS is a department of the United States government with the stated objective of improving the health, safety, and well-being of Americans. HHS originally took occupancy of the Parklawn Building Property after it was constructed approximately 50 years ago. As part of the most recent renovation and lease renewal, HHS aggregated the Agency for Healthcare Research and Quality, the Indian Health Service and the Substance Abuse and Mental Health Services Administration into the Parklawn Building Property. In total, approximately 4,500 government healthcare employees are housed at the Parklawn Building Property.
This is not a research report and was not prepared by any Underwriter’s research department. Please see additional important information and qualifications at the end of this Term Sheet.
T-74
| Office - Suburban | Loan #6 | Cut-off Date Balance: | | $65,400,000 |
| 5600 Fishers Lane | Parklawn Building | Cut-off Date LTV: | | 60.0% |
| Rockville, MD 20852 | | U/W NCF DSCR: | | 2.68x |
| | | U/W NOI Debt Yield: | | 9.4% |
The following table presents certain information relating to the tenant at the Parklawn Building Property:
| Tenant Summary(1) |
| Tenant Name | Credit Rating (Fitch/Moody’s/S&P) | Tenant SF | Approx. % of SF | Annual UW Rent | % of Total Annual UW Rent | Annual UW Rent PSF | Lease Expiration | Term. Options (Y/N) |
| United States General Services Administration | AAA/Aaa/AA+ | 935,386 | 72.9% | $29,695,152 | 100.0% | $31.75 | 7/31/2030 | N |
| Subtotal/Wtd. Avg. | | 935,386 | 72.9% | $29,695,152 | 100.0% | $31.75 | | |
| | | | | | | | | |
| Vacant | | 348,260 | 27.1% | $0 | 0.0% | $0.00 | | |
| Total/Wtd. Avg. | | 1,283,646 | 100.0% | $29,695,152 | 100.0% | $31.75(2) | | |
(1) Information obtained from the underwritten rent roll.
(2) Total/Wtd. Avg. Annual UW Rent PSF excludes vacant space.
The following table presents certain information relating to the lease rollover schedule at the Parklawn Building Property:
| Lease Rollover Schedule(1) |
| Year | # of Leases Rolling | SF Rolling | Annual UW Rent PSF Rolling | Approx. % of Total SF Rolling | Approx. Cumulative % of SF Rolling | Total UW Rent Rolling | Approx. % of Total Rent Rolling | Approx. Cumulative % of Total Rent Rolling |
| 2019 | 0 | 0 | $0.00 | 0.0% | 0.0% | $0 | 0.0% | 0.0% |
| 2020 | 0 | 0 | $0.00 | 0.0% | 0.0% | $0 | 0.0% | 0.0% |
| 2021 | 0 | 0 | $0.00 | 0.0% | 0.0% | $0 | 0.0% | 0.0% |
| 2022 | 0 | 0 | $0.00 | 0.0% | 0.0% | $0 | 0.0% | 0.0% |
| 2023 | 0 | 0 | $0.00 | 0.0% | 0.0% | $0 | 0.0% | 0.0% |
| 2024 | 0 | 0 | $0.00 | 0.0% | 0.0% | $0 | 0.0% | 0.0% |
| 2025 | 0 | 0 | $0.00 | 0.0% | 0.0% | $0 | 0.0% | 0.0% |
| 2026 | 0 | 0 | $0.00 | 0.0% | 0.0% | $0 | 0.0% | 0.0% |
| 2027 | 0 | 0 | $0.00 | 0.0% | 0.0% | $0 | 0.0% | 0.0% |
| 2028 | 0 | 0 | $0.00 | 0.0% | 0.0% | $0 | 0.0% | 0.0% |
| 2029 | 0 | 0 | $0.00 | 0.0% | 0.0% | $0 | 0.0% | 0.0% |
| 2030 & Beyond | 1 | 935,386 | $31.75 | 72.9% | 72.9% | $29,695,152 | 100.0% | 100.0% |
| Vacant | 0 | 348,260 | $0.00 | 27.1% | 100.0% | $0 | 0.0% | 100.0% |
| Total/Wtd. Avg. | 1 | 1,283,646 | $31.75(2) | 100.0% | | $29,695,152 | 100.0% | |
(1) Information obtained from the underwritten rent roll.
(2) Total/Wtd. Avg. Annual UW Rent PSF Rolling excludes vacant space.
The Market. The Parklawn Building Property is located in Rockville, Montgomery County, Maryland, within the Washington-Arlington-Alexandria, DC-VA-MD-WV metropolitan statistical area and approximately 13 miles northwest of the Washington D.C. central business district. Historically, Rockville’s main office demand driver has been government and quasi-government tenants, accounting for nearly 40% of occupied office space; however, the biotechnology industry has increased its presence. The I-270 Technology Corridor, which serves as a local demand generator for the Rockville market area, is a life science corridor that is home to numerous biotechnology companies and federal government institutions. Health institutions located in the area include Johns Hopkins Montgomery County campus and University of Maryland Institute for Bioscience and Biotechnology Research, as well as large pharmaceutical companies including GlaxoSmithKline, Sanofi, and MedImmune.
According to a third party research report, the Parklawn Building Property is part of the Washington office market and the Rockville office submarket. As of the third quarter of 2019, the Washington office market had a total office inventory of approximately 501.4 million SF with a vacancy rate of 12.9% and an average asking rent of $37.96 PSF. The Rockville office submarket had a total office inventory of approximately 10.8 million SF with a vacancy rate of 10.8% and an average asking rent of $30.18 PSF. The submarket had no additional inventory delivered in the third quarter of 2019, which had positive net absorption of 14,921 SF. No office buildings are currently under construction in the submarket.
According to the appraisal, the estimated 2019 populations within a one-, three- and five-mile radius of the Parklawn Building Property were 27,386, 160,957, and 357,052, respectively. The 2019 average household incomes within the same radii were $96,465, $117,574, and $130,980, respectively.
This is not a research report and was not prepared by any Underwriter’s research department. Please see additional important information and qualifications at the end of this Term Sheet.
T-75
| Office - Suburban | Loan #6 | Cut-off Date Balance: | | $65,400,000 |
| 5600 Fishers Lane | Parklawn Building | Cut-off Date LTV: | | 60.0% |
| Rockville, MD 20852 | | U/W NCF DSCR: | | 2.68x |
| | | U/W NOI Debt Yield: | | 9.4% |
The following table presents recent government agency leasing data at comparable office properties with respect to the Parklawn Building Property:
| Comparable Lease Summary |
Property Location | Year Built/ Renovated(1) | Distance from Subject | Property
Size (SF)(1) | Tenant | Lease Area (SF) | Lease Date | Initial Rent PSF | Lease Term (Yrs.) | Lease Type |
Parklawn Building(2)
Rockville, MD | 1970 / 2015 | N/A | 1,283,646 | United States General Services Administration | 935,386 | Aug-15 | $31.75 | 15.0 | Modified Gross |
Centerstone at Tysons McLean, VA | N/A | 14.5 miles | N/A | Freddie Mac | 151,949 | May-19 | $27.50 | 10.2 | NNN |
West Gude Office Park
Rockville, MD | N/A | 4.7 miles | N/A | FBI (renewal) | 10,646 | Jan-19 | $23.36 | 10.0 | Full Service |
Reston Sunrise
Reston, VA | N/A | 23.5 miles | N/A | GSA | 43,346 | Dec-18 | $35.00 | 15.0 | Full Service |
Centerpark I
Calverton, MD | N/A | 12.7 miles | N/A | FDA | 78,918 | Nov-18 | $24.51 | 10.0 | Full Service |
American Square at Quantum Park
Ashburn, VA | N/A | 31.2 miles | N/A | GSA – CBP | 444,595 | May-18 | $38.25 | 15.0 | Full Service |
American Center West
Tysons, VA | N/A | 15.6 miles | N/A | GSA (renewal) | 21,214 | Apr-18 | $33.00 | 5.3 | Full Service |
The Cinema Building
Hyattsville, MD | N/A | 14.8 miles | N/A | FEMA (renewal) | 54,000 | Nov-17 | $30.30 | 4.0 | Full Service |
2115 East Jefferson
Rockville, MD | N/A | 1.6 miles | N/A | NIH (extension) | 89,708 | Nov-17 | $29.00 | 2.1 | None |
Campus at Sunrise
Reston, VA | N/A | 20.7 miles | N/A | CIA (renewal) | 31,230 | Oct-17 | $33.50 | 5.0 | Plus Electric |
Freedom Forum
Arlington, VA | N/A | 21.0 miles | N/A | Trade and Development Agency | 36,346 | Jun-17 | $45.00 | 10.75 | Full Service |
1701 Fort Myer
Arlington, VA | N/A | 21.0 miles | N/A | Department of State | 342,967 | Jun-17 | $39.00 | 15.0 | Full Service |
Woodmont Place
Rockville, MD | N/A | 1.4 miles | N/A | FDA | 44,761 | Mar-16 | $27.00 | 5.0 | Full Service |
Source: Appraisal.
| (1) | Year Built/Renovated and Property Size (SF) for the comparable leases were not provided in the appraisal. |
| (2) | Based on the underwritten rent roll with the exception of Year Built/Renovated. |
The following table presents the appraiser’s market rent conclusions:
| Market Rent Summary |
| | Office |
| Market Rent | $35.00 |
| Lease Term (Yrs.) | 10 |
| Rental Increase Projection | 0.0%per annum |
This is not a research report and was not prepared by any Underwriter’s research department. Please see additional important information and qualifications at the end of this Term Sheet.
T-76
| Office - Suburban | Loan #6 | Cut-off Date Balance: | | $65,400,000 |
| 5600 Fishers Lane | Parklawn Building | Cut-off Date LTV: | | 60.0% |
| Rockville, MD 20852 | | U/W NCF DSCR: | | 2.68x |
| | | U/W NOI Debt Yield: | | 9.4% |
Operating History and Underwritten Net Cash Flow.The following table presents certain information relating to the historical operating performance and Underwritten Net Cash Flow of the Parklawn Building Property:
| Cash Flow Analysis |
| | 2017 | 2018 | 8/31/2019 TTM | UW | UW PSF |
| Gross Potential Rent | $29,333,705 | $29,307,147 | $29,307,147 | $40,142,952 | $31.27 |
| Total Recoveries(1) | $1,075,796 | ($71,488) | ($779,982) | $276,172 | $0.22 |
| Parking Income | $3,474,485 | $3,547,672 | $3,631,939 | $4,011,560 | $3.13 |
| Total Other Income(2) | ($798) | $0 | $57,118 | $1,300,000 | $1.01 |
| Vacancy | $0 | $0 | $0 | ($10,447,800) | ($8.14) |
| Effective Gross Income | $33,883,188 | $32,783,331 | $32,216,222 | $35,282,884 | $27.49 |
| | | | | | |
| Real Estate Taxes | $393,436 | $2,779,279 | $1,459,065 | $4,212,000 | $3.28 |
| Insurance | $180,883 | $138,229 | $126,910 | $179,664 | $0.14 |
| Other Operating Expenses | $5,730,120 | $5,972,350 | $5,192,436 | $6,264,818 | $4.88 |
| Total Expenses | $6,304,439 | $8,889,858 | $6,778,412 | $10,656,482 | $8.30 |
| | | | | | |
| Net Operating Income | $27,578,749 | $23,893,473 | $25,437,810 | $24,626,402 | $19.18 |
| Capital Expenditures | $0 | $0 | $0 | $319,897 | $0.25 |
| TI/LC(3) | $0 | $0 | $0 | $147,245 | $0.11 |
| Net Cash Flow | $27,578,749 | $23,893,473 | $25,437,810 | $24,159,260 | $18.82 |
| | | | | | |
| Occupancy % | 72.9% | 72.9% | 72.9%(4) | 77.2% | |
| NOI DSCR(5) | 3.06x | 2.65x | 2.82x | 2.73x | |
| NCF DSCR(5) | 3.06x | 2.65x | 2.82x | 2.68x | |
| NOI Debt Yield(5) | 10.5% | 9.1% | 9.7% | 9.4% | |
| NCF Debt Yield(5) | 10.5% | 9.1% | 9.7% | 9.2% | |
| (1) | Negative amounts for 2018 and 8/31/2019 TTM Total Recoveries reflect CPI and tax reconciliations as a result of estimated payments made during the respective year exceeding actual amounts due at the end of the respective year. |
| (2) | UW Total Other Income represents a Montgomery County grant, which includes 15 annual payments of $1.3 million to be paid out from 2017 through 2031. The Parklawn Building Borrower was assigned the grant at closing, but any further assignment of the grant requires the assignee to demonstrate to the County that it is financially capable of fulfilling the Parklawn Building Borrower’s obligations and execute an assignment in form and substance reasonably satisfactory to the County. |
| (3) | UW TI/LC includes a credit associated with the springing major tenant cash flow sweep set to occur 29 months prior to lease expiration and estimated to collect $1,901,631. |
| (4) | As of the rent roll dated July 1, 2019. |
| (5) | Debt service coverage ratios and debt yields are based on the Parklawn Building Whole Loan. |
Escrows and Reserves.
Real Estate Taxes- The Parklawn Building Borrower deposited $372,746 into a real estate tax reserve at origination and is required to deposit an ongoing monthly real estate tax reserve payment in an amount equal to 1/12 of the annual estimated real estate taxes, which currently equates to $124,249.
Insurance- The Parklawn Building Borrower deposited $19,441 into an insurance reserve at origination and is required to deposit an ongoing monthly insurance reserve payment in an amount equal to 1/12 of the annual estimated insurance premiums, which currently equates to $9,720.
Deferred Maintenance- The Parklawn Building Borrower deposited $111,869 for deferred maintenance at origination.
Lockbox and Cash Management. The Parklawn Building Whole Loan is structured with a hard lockbox and in-place cash management. Revenues from the Parklawn Building Property are required to be deposited directly into the clearing account controlled by the lender and transferred daily into the cash management account to be applied and disbursed in accordance with the Parklawn Building Whole Loan documents. During the occurrence and continuance of a Cash Sweep Period, all excess cash is required to be held by the lender as additional collateral for the Parklawn Building Whole Loan.
A “Cash Sweep Period” will:
| (a) | commence upon the occurrence of an event of default under the Parklawn Building Whole Loan, and will continue until such event of default is cured; |
| (b) | commence when the amortizing debt service coverage ratio based on the trailing three-month period is less than 1.55x, and will continue until the amortizing debt service coverage ratio based on the trailing three-month period is at least 1.60x for two consecutive calendar quarters; |
| (c) | commence upon the occurrence of any bankruptcy action of (i) the Parklawn Building Borrower or (ii) the property manager, and will continue either (x) as it relates to the Parklawn Building Borrower, until the full repayment of the Parklawn Building Whole Loan or (y) as it relates to the property manager, until the manager is replaced by a qualified manager within 60 days of such bankruptcy action; or |
| (d) | commence when a Sweep Tenant (as defined below) either: |
| I. | fails to exercise a renewal option under its lease on or prior to the date by which notice of such renewal option is required, and will continue until a Sweep Tenant Re-Leasing Event (as defined below) occurs; |
This is not a research report and was not prepared by any Underwriter’s research department. Please see additional important information and qualifications at the end of this Term Sheet.
T-77
| Office - Suburban | Loan #6 | Cut-off Date Balance: | | $65,400,000 |
| 5600 Fishers Lane | Parklawn Building | Cut-off Date LTV: | | 60.0% |
| Rockville, MD 20852 | | U/W NCF DSCR: | | 2.68x |
| | | U/W NOI Debt Yield: | | 9.4% |
| II. | terminates or cancels its lease, and will continue until a Sweep Tenant Re-Leasing Event occurs; |
| III. | ceases to operate in 50% or more of its leased space unless such dark space has been subleased to a subtenant which has and maintains a credit rating of at least BBB- by S&P and Baa3 by Moody’s, and will continue until (x) such Sweep Tenant has resumed operations in more than 50% of its leased space, or (y) a Sweep Tenant Re-Leasing Event occurs; |
| IV. | defaults (beyond applicable notice and cure periods) under its lease, and will continue until the Parklawn Building Borrower’s acceptance of the cure of the default in a manner acceptable to the lender; |
| V. | is the subject (or its parent is the subject) of any bankruptcy or insolvency proceedings, and will continue until the insolvency proceedings have terminated and the Sweep Tenant’s lease has been affirmed, assumed, or assigned in a manner satisfactory to the lender; or |
| VI. | has its (or its parent’s) credit rating fall below BBB- by S&P or Baa3 by Moody’s, and will continue until (x) the credit rating has been restored to at least BBB- by S&P and Baa3 by Moody’s, or (y) a Sweep Tenant Re-Leasing Event has occurred. |
A “Sweep Tenant” means each of (i) the United States of America, acting by and through the designated representative of the General Services Administration and/or (ii) its replacement tenant of at least 75% of its leased space.
A “Sweep Tenant Re-Leasing Event” means the Parklawn Building Borrower enters into a replacement lease(s) acceptable to the lender for the applicable Sweep Tenant’s entire leased space, with such replacement tenant(s) having and maintaining a credit rating of at least BBB- by S&P and Baa3 by Moody’s, provided that all tenant improvements and landlord obligations with respect to such replacement lease(s) have been paid and performed in full and that the replacement tenant(s) has commenced payment of full, unabated rent.
Additional Secured Indebtedness (not including trade debts). The Parklawn Building Property also secures the Parklawn Building Non-ServicedPari Passu Companion Loans, which have an aggregate Cut-off Date principal balance of $196,200,000. The Parklawn Building Non-ServicedPari Passu Companion Loans accrue interest at the same rate as the Parklawn Building Mortgage Loan. The Parklawn Building Mortgage Loan is entitled to payments of interest and principal on apro rata andpari passu basis with the Parklawn Building Non-ServicedPari Passu Companion Loans. The holders of the Parklawn Building Mortgage Loan and the Parklawn Building Non-ServicedPari Passu Companion Loans have entered into a co-lender agreement which sets forth the allocation of collections on the Parklawn Building Whole Loan. See “Description of the Mortgage Pool—The Whole Loans— The Non-Serviced Pari Passu Whole Loans” in the Preliminary Prospectus.
Mezzanine Loan and Preferred Equity.Not permitted.
Release of Property.Any time after the earlier of (i) two years from the closing date of the securitization trust which holds the last portion of the Parklawn Building Whole Loan to be securitized, or (ii) the payment date occurring on December 1, 2023, the Parklawn Building Borrower may establish a condominium regime acceptable to the lender for the Parklawn Building Property in order to release a portion of the collateral comprised of the above-grade portion of wing C (the “Release Unit”), provided that, among other things, (i) no Cash Sweep Period is continuing, (ii) the Parklawn Building Borrower establishes a condominium in accordance with the requirements of the Parklawn Building Whole Loan documents, (iii) the Parklawn Building Borrower defeases a portion of the Parklawn Building Whole Loan in an amount equal to (1) $2,400,000 if released to an unaffiliated third-party or (2) in connection with a transfer to any affiliate of the Parklawn Building Borrower, the greater of (A) $2,400,000, or (B) 100% of the net sales proceeds, (iv) following the release of the Release Unit and partial defeasance of the Parklawn Building Whole Loan, the debt yield (calculated with a vacancy adjustment equal to the greater of actual vacancy or 3%) is equal to or greater than the greater of (x) the debt yield immediately preceding such release and (y) 9.24%, (v) the debt service coverage ratio (calculated with a vacancy adjustment equal to the greater of actual vacancy or 3% and assuming a 30-year amortization period) is equal to or greater than the greater of (x) the debt service coverage ratio immediately preceding such release and (y) 1.74x and (vi) the loan to value ratio is equal to or less than the lesser of (x) the loan to value ratio immediately preceding such partial release and (y) 60.0%; provided that if the tests in clauses (iv), (v), and (vi) above are not satisfied, the Parklawn Building Borrower may deposit cash with the lender in the amount that if applied to the reduction of the outstanding principal balance of the Parklawn Building Whole Loan, would result in the satisfaction of such tests, which cash will be held as additional collateral for the Parklawn Building Whole Loan.
Right of First Offer/Right of First Refusal.None.
Ground Lease. None.
Letter of Credit.None.
Terrorism Insurance.The Parklawn Building Borrower is required to obtain and maintain “all risk” property insurance that covers perils of terrorism and acts of terrorism in an amount equal to the full replacement cost of the Parklawn Building Property and business interruption insurance for 18 months with a six-month extended period of indemnity. See “Risk Factors—Risks Relating to the Mortgage Loans—Terrorism Insurance May Not Be Available for All Mortgaged Properties” in the Preliminary Prospectus.
This is not a research report and was not prepared by any Underwriter’s research department. Please see additional important information and qualifications at the end of this Term Sheet.
T-78
(THIS PAGE INTENTIONALLY LEFT BLANK)
| Hospitality – Various | Loan #7 | Cut-off Date Balance: | | $62,300,000 |
| Various | Austin Marriott Portfolio | Cut-off Date LTV: | | 59.7% |
| Austin, TX 78744 | | UW NCF DSCR: | | 2.27x (P&I) |
| | | UW NOI Debt Yield: | | 14.0% |
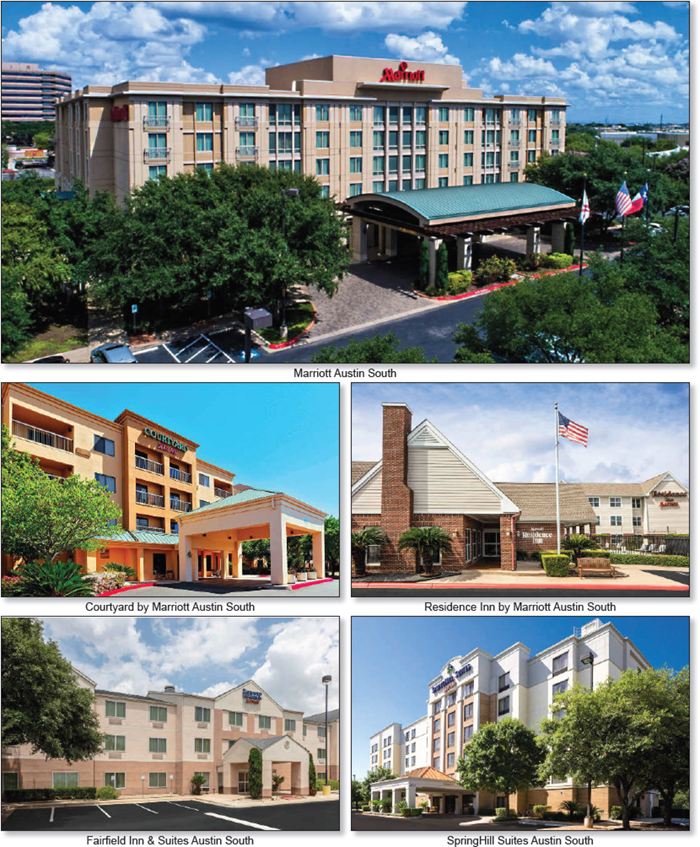
This is not a research report and was not prepared by any Underwriter’s research department. Please see additional important information and qualifications at the end of this Term Sheet.
T-80
| Hospitality – Various | Loan #7 | Cut-off Date Balance: | | $62,300,000 |
| Various | Austin Marriott Portfolio | Cut-off Date LTV: | | 59.7% |
| Austin, TX 78744 | | UW NCF DSCR: | | 2.27x (P&I) |
| | | UW NOI Debt Yield: | | 14.0% |

This is not a research report and was not prepared by any Underwriter’s research department. Please see additional important information and qualifications at the end of this Term Sheet.
T-81
| Mortgage Loan No. 7 – Austin Marriott Portfolio |
| Mortgage Loan Information | | Property Information |
| Mortgage Loan Seller: | BANA | | Single Asset/Portfolio: | Portfolio |
| Credit Assessment (DBRS/Fitch/S&P): | NR/NR/NR | | Location: | Austin, TX 78744 |
| Original Balance: | $62,300,000 | | General Property Type: | Hospitality |
| Cut-off Date Balance: | $62,300,000 | | Detailed Property Type(2): | Various |
| % of Initial Pool Balance: | 5.1% | | Title Vesting: | Fee |
| Loan Purpose: | Acquisition | | Year Built/Renovated(2): | Various |
| Sponsor: | JRK Property Holdings | | Size(2): | 602 Rooms |
| Guarantor: | JRK Hospitality Fund I, L.P. | Cut-off Date Balance per Room: | $103,488 |
| Mortgage Rate: | 3.5400% | Maturity Date Balance per Room: | $93,356 |
| Note Date: | 11/22/2019 | | Property Manager: | IH WL Acquisition Manager, LLC |
| First Payment Date: | 1/1/2020 | | | (borrower-related) |
| Maturity Date: | 12/1/2029 | | | |
| Original Term to Maturity: | 120 months | | Underwriting and Financial Information |
| Original Amortization Term: | 360 months | | UW NOI: | $8,733,775 |
| IO Period: | 60 months | | UW NOI Debt Yield: | 14.0% |
| Seasoning: | 0 months | | UW NOI Debt Yield at Maturity: | 15.5% |
| Prepayment Provisions: | LO (24); DEF (92); O (4) | | UW NCF DSCR: | 3.42x (IO) 2.27x (P&I) |
| Lockbox/Cash Mgmt Status: | Hard/Springing | | Most Recent NOI: | $8,848,360 (9/30/2019 TTM) |
| Additional Debt Type: | N/A | | 2nd Most Recent NOI: | $8,328,514 (12/31/2018) |
| Additional Debt Balance: | N/A | | 3rd Most Recent NOI: | $9,637,012 (12/31/2017) |
| Future Debt Permitted (Type): | No (N/A) | | Most Recent Occupancy: | 76.3% (9/30/2019) |
| Reserves(1) | | 2nd Most Recent Occupancy: | 75.0% (12/31/2018) |
| Type | Initial | Monthly | Cap | | 3rd Most Recent Occupancy: | 78.2% (12/31/2017) |
| RE Tax: | $0 | $139,093 | N/A | | Appraised Value (as of)(3): | $104,300,000 (9/18/2020) |
| Insurance: | $0 | Springing | N/A | | Appraised Value per Room(3): | $173,256 |
| FF&E: | $0 | $44,884 | N/A | | Cut-off Date LTV Ratio(3): | 59.7% |
| PIP: | $24,000,000 | $0 | N/A | | Maturity Date LTV Ratio(3): | 53.9% |
| | | | | | | | |
| Sources and Uses |
| Sources | Proceeds | % of Total | | Uses | Proceeds | % of Total |
| Loan Amount: | $62,300,000 | 69.2% | | Purchase Price: | $65,000,000 | 72.2% |
| Borrower Equity: | $27,694,946 | 30.8% | | Reserves: | $24,000,000 | 26.7% |
| | | | | Closing Costs: | $994,946 | 1.1% |
| Total Sources: | $89,994,946 | 100.0% | | Total Uses: | $89,994,946 | 100.0% |
| (1) | See “Escrows and Reserves”below for further discussion of reserve information. |
| (2) | See theProperty Schedule table below for details regarding the individual properties. |
| (3) | The Appraised Value represents the “As-Stabilized” aggregate value for the Austin Marriott Portfolio Properties (as defined below), which assumes completion of property improvement plans (“PIP”s) at each of the individual properties with an estimated aggregate cost (including contingency) of $24,000,000. At loan origination, the Austin Marriott Portfolio Borrower deposited into the PIP reserve 100% of such scheduled costs. The aggregate “As Is” values for the Austin Marriott Portfolio Properties is $73,600,000, which results in an Appraised Value per Room of $122,259 and a Cut-off Date LTV Ratio and a Maturity Date LTV Ratio of 84.6% and 76.4%, respectively. |
The Mortgage Loan. The seventh largest mortgage loan (the “Austin Marriott Portfolio Mortgage Loan”) is evidenced by a promissory note with an original principal balance of $62,300,000 secured by first priority fee mortgages encumbering five hospitality properties in Austin, Texas: the Marriott Austin South (the “Marriott Austin Property”), Springhill Suites Austin South (the “Springhill Austin Property”), Courtyard by Marriott Austin South (the “Courtyard Austin Property”), Residence Inn by Marriott Austin South (the “Residence Inn Austin Property”) and Fairfield Inn & Suites Austin South (the “Fairfield Inn Austin Property” and collectively, the “Austin Marriott Portfolio Properties”).
The Borrowers and the Borrower Sponsor. The borrowers are 4415 and 4501 South Austin Hotel Property Owner LLC, 4525 South Austin Hotel Property Owner LLC, 4533 South Austin Hotel Property Owner LLC and 4537 South Austin Hotel Property Owner LLC (together, the “Austin Marriott Portfolio Borrower”), each a single-purpose Delaware limited liability company with two independent directors. The sponsor is JRK Property Holdings, a Los Angeles based real estate investment firm founded in 1991 that specializes in the ownership, management, leasing and redevelopment of properties across the United States. JRK Property Holdings’ portfolio spans 20 states with over 32,000 multifamily units, and luxury and flagged hotels, including the Oceana hotel in Santa Monica, California, the Sheraton Nashville Downtown Hotel in Nashville, Tennessee, The Roger in New York, New York, and the Austin Marriott Portfolio Properties. The non-recourse carveout guarantor is JRK Hospitality Fund I, L.P.
This is not a research report and was not prepared by any Underwriter’s research department. Please see additional important information and qualifications at the end of this Term Sheet.
T-82
| Hospitality – Various | Loan #7 | Cut-off Date Balance: | | $62,300,000 |
| Various | Austin Marriott Portfolio | Cut-off Date LTV: | | 59.7% |
| Austin, TX 78744 | | UW NCF DSCR: | | 2.27x (P&I) |
| | | UW NOI Debt Yield: | | 14.0% |
The Properties.The Austin Marriott Portfolio Properties are comprised of five adjacent Marriott-flagged hotels totaling 602 rooms in Austin, Texas: the Marriott Austin Property, Springhill Austin Property, Courtyard Austin Property, Residence Inn Austin Property and Fairfield Inn Austin Property. The Austin Marriott Portfolio Properties were built between 1995 and 2001 and offer a range of full service, limited service, select service and extended stay accommodations for corporate, leisure and group guests. In connection with the acquisition of the Austin Marriott Portfolio Properties, each individual property is scheduled to complete a PIP over the next 30 months, and new 15-year franchise agreements with Marriott International, Inc. have been executed for each individual property, which agreements expire November 20, 2034. The non-recourse carveout guarantor has provided a completion guaranty for the scheduled PIP work. The Austin Marriott Portfolio Mortgage Loan is recourse to the Austin Marriott Portfolio Borrowers for losses if any franchise agreement (i) expires, (ii) is cancelled or terminated by the Austin Marriott Portfolio Borrowers or by reason of any failure by the Austin Marriott Portfolio Borrowers to perform their obligations thereunder or (iii) is amended without the lender’s prior consent.
The following table presents certain information relating to the Austin Marriott Portfolio Properties:
| Austin Marriott Portfolio Property Schedule |
Property Name Address | Property Sub-Type | Allocated Cut-Off Date Balance | % of Portfolio Cut-Off Date Balance | Year Built/ Renovated(1) | Rooms | Appraised Value | Allocated LTV |
Marriott Austin South 4415 South IH 35 | Full Service | $27,354,642 | 43.9% | 2001/N/A | 211 | $43,700,000(2) | 41.9% |
Springhill Suites Austin South 4501 South IH 35 | Limited Service | $12,762,842 | 20.5% | 2000/N/A | 152 | $22,700,000(3) | 21.8% |
Courtyard by Marriott Austin South 4533 South IH 35 | Select Service | $11,816,457 | 19.0% | 1996/N/A | 110 | $18,400,000(4) | 17.6% |
Residence Inn by Marriott Austin South 4537 South IH 35 | Extended Stay | $6,820,266 | 10.9% | 1996/N/A | 66 | $11,000,000(5) | 10.5% |
Fairfield Inn & Suites Austin South 4525 South IH 35 | Limited Service | $3,545,793 | 5.7% | 1995/2015 | 63 | $8,500,000(6) | 8.1% |
| Total/Weighted Average: | | $62,300,000 | | | 602 | $104,300,000 | |
| (1) | Each Austin Marriott Portfolio Property is scheduled to undergo a PIP which PIPs have an estimated aggregate cost (including contingency) of $24,000,000. At loan origination, the Austin Marriott Portfolio Borrower deposited into the PIP reserve 100% of such scheduled costs. Additionally, the non-recourse carveout guarantor has provided a completion guaranty for the PIP work. |
| (2) | The Appraised Value of the Marriott Austin Property represents the “As-Stabilized” value as of September 18, 2020, which value assumes completion of the proposed renovations pursuant to the brand mandated PIP that has been budgeted at $13,563,172. The “As Is” value as of September 18, 2019 was $27,100,000. |
| (3) | The Appraised Value of the Springhill Austin Property represents the “As-Stabilized” value as of September 18, 2020, which value assumes completion of the proposed renovations pursuant to the brand mandated PIP that has been budgeted at $2,328,381. The “As Is” value as of September 18, 2019 was $19,200,000. |
| (4) | The Appraised Value of the Courtyard Austin Property represents the “As-Stabilized” value as of September 18, 2020, which value assumes completion of the proposed renovations pursuant to the brand mandated PIP that has been budgeted at $3,985,870. The “As Is” value as of September 18, 2019 was $13,300,000. |
| (5) | The Appraised Value of the Residence Inn Austin Property represents the “As-Stabilized” value as of September 18, 2020, which value assumes completion of the proposed renovations pursuant to the brand mandated PIP that has been budgeted at $2,032,830. The “As Is” value as of September 18, 2019 was $8,300,000. |
| (6) | The Appraised Value of the Fairfield Inn Austin Property represents the “As-Stabilized” value as of September 18, 2020, which value assumes completion of the proposed renovations pursuant to the brand mandated PIP that has been budgeted at $2,089,747. The “As Is” value as of September 18, 2019 was $5,700,000. |
Marriott Austin Property. The Marriott Austin Property is a five-story, 211-room, full-service hotel located at 4415 S Interstate Highway 35, on a 5.58-acre site shared with the adjacent Springhill Austin Property. The Marriott Austin Property was constructed in 2001 and features 12,217 SF of meeting space, a restaurant and lounge, sundry store, heated indoor pool, 24-hour fitness center and a concierge level. There are 240 parking spaces (1.14 spaces per room). The guestroom mix at the Marriott Austin Property is 7 king suites, 142 king standard rooms and 62 double/double rooms. Guestrooms include desk areas and 50” flat screen TVs with premium channels. The Marriott Austin Property also offers concierge-level rooms with lounge access and complimentary breakfast.
Since 2014, the previous owner of the Marriott Austin Property spent $1,943,606 ($9,211/room) on maintenance and capital expenditures. Within the next 30 months, the Marriott Austin Property is scheduled to complete a PIP estimated at $13,563,172 ($64,280/room), which will predominately focus on the guest rooms and guest bathrooms, first floor lobby and restaurant, meeting rooms, guest corridors, façade, signage and landscaping, fitness center and pool.
The property segmentation at the Marriott Austin Property is estimated at 55% commercial, 20% group and 25% leisure. As of August 31 2019 year-to-date, the top corporate accounts at the Marriott Austin Property were Oracle Corporation, Accenture, General Dynamics, AMD and Centene Corp.
Springhill Austin Property. The Springhill Austin Property is a six-story, 152-room, limited service hotel located at 4501 S Interstate Highway 35, just south of the Marriott Austin Property. The Springhill Austin Property was constructed in 2000 and features a breakfast area offering complimentary daily hot breakfast, sundry store, heated indoor pool, 24-hour fitness center, guest laundry, and a shuttle to downtown Austin. There are 77 parking spaces (0.51 spaces per room). The guestroom mix at the Springhill Austin Property is 105 king suites and 47 double/double suites. Each suite is approximately 25% larger than a standard hotel room and features separate living and sleeping areas and kitchenettes equipped with a microwave, mini-fridge and coffee maker. The guestroom suites also feature pullout sofas, flat-screen TVs with free cable channels and free Wi-Fi.
Since 2014, the previous owner of the Springhill Austin Property spent $726,989 ($4,783/room) on maintenance and capital expenditures. Within the next 24 months, the Springhill Austin Property is scheduled to complete a PIP estimated at $2,328,381 ($15,318/room), which will predominately focus on guest rooms, guest bathrooms and façade and signage.
The property segmentation at the Springhill Austin Property is estimated at 70% commercial, 10% group and 20% leisure. As of August 31 2019 year-to-date, the top corporate accounts at the Springhill Austin Property were Accenture, IBM, Qvinci, Whole Foods Market and Deloitte.
This is not a research report and was not prepared by any Underwriter’s research department. Please see additional important information and qualifications at the end of this Term Sheet.
T-83
| Hospitality – Various | Loan #7 | Cut-off Date Balance: | | $62,300,000 |
| Various | Austin Marriott Portfolio | Cut-off Date LTV: | | 59.7% |
| Austin, TX 78744 | | UW NCF DSCR: | | 2.27x (P&I) |
| | | UW NOI Debt Yield: | | 14.0% |
Courtyard Austin Property. The Courtyard Austin Property is a four-story, 110-room, upscale, select-service hotel located at 4533 S Interstate Highway 35, on a 2.65-acre parcel between the Fairfield Inn Austin Property and the Residence Inn Austin Property. The Courtyard Austin Property was constructed in 1996 and features 650 SF of meeting space, an on-site restaurant serving breakfast, evening cocktails and dinner, lobby workstations, sundry store, heated indoor pool, 24-hour fitness center and a shuttle to downtown Austin. There are 132 parking spaces (1.20 spaces per room). The guestroom mix at the Courtyard Austin Property is 4 king suites, 13 king extended-stay rooms, 53 king standard rooms and 40 double/double rooms. The guestrooms feature soundproof windows and blackout curtains, flat-screen TV’s with complimentary premium channels, ergonomic workspaces and free Wi-Fi. Upgraded suites feature extra living spaces and private balconies.
Since 2014, the previous owner of the Courtyard Austin Property spent $846,347 ($7,694/room) on maintenance and capital expenditures. Within the next 24 months, the Courtyard Austin Property is scheduled to complete a PIP estimated at $3,985,870 ($36,235/room), which will predominately focus on the guest rooms and guest bathrooms, façade and signage, guest corridors, lobby and fitness center.
The property segmentation at the Courtyard Austin Property is estimated at 65% commercial, 10% group and 25% leisure. As of August 31 2019 year-to-date, the top corporate accounts at the Courtyard Austin Property were IBM, Accenture, Skyline Net, General Dynamics and AT&T.
Residence Inn Austin Property. The Residence Inn Austin Property is a three-story, 66-room, upscale, extended-stay hotel located at 4537 S Interstate Highway 35, on a 2.02-acre parcel just south of the Courtyard Austin Property. The Residence Inn Austin Property was constructed in 1996 and features complimentary hot breakfast and complimentary light food and cocktails in the evenings (Monday through Wednesday), guest laundry, a sundry store, barbeque and picnic area, outdoor pool, outdoor sport court, 24-hour fitness center, and a shuttle to downtown Austin. There are 79 parking spaces (1.20 spaces per room). The guestroom mix at the Residence Inn Austin Property is 36 king one-bedroom suites, 12 king two-bedroom suites and 18 studio suites. The apartment-style guestrooms are approximately 50% larger than the average hotel room and feature soundproof windows and blackout curtains, full kitchens with stainless steel appliances, separate living areas, workspaces and free Wi-Fi. The Residence Inn Austin Property is pet friendly and provides a complimentary grocery shopping service.
Since 2014, the previous owner of the Residence Inn Austin Property spent $955,719 ($14,481/room) on capital expenditures. Within the next 24 months, the Residence Inn Austin Property is scheduled to complete a PIP estimated at $2,032,830 ($30,800/room), which will predominately focus on guest rooms, guest bathrooms and guest corridors.
The property segmentation at the Residence Inn Austin Property is estimated at 70% commercial, 10% group and 20% leisure. As of August 31 2019 year-to-date, the top corporate accounts at the Residence Inn Austin Property were AMD, St. Edwards, Deloitte, Amazon.com and Accenture.
Fairfield Inn Austin Property. The Fairfield Inn Austin Property is a three-story,63-room, limited service hotel located at 4525 S Interstate Highway 35, on a 1.42 acre parcel between the Springhill Austin Property and the Courtyard Austin Property. The Fairfield Inn Austin Property was constructed in 1995 and renovated in 2015 and features a breakfast area offering complimentary daily hot breakfast options, business center, sundry store, heated indoor pool, 24-hour fitness center, guest laundry and a shuttle to downtown Austin. There are 74 parking spaces (1.17 spaces per room). The guestroom mix at the Fairfield Inn Austin Property is 23 king one-bedroom suites, 20 king executive suites and 20 double/double standard rooms. The guestrooms feature work desk areas, flat-screen TVs with free cable channels and free Wi-Fi.
Since 2014, the previous owner of the Fairfield Inn Austin Property spent $1,081,602 ($17,168/room) on maintenance and capital expenditures, including a PIP completed in 2015 that included new finishes to the carpeting and wall covering, new artwork, ADA work, front desk work, new millwork and new signage. Within the next 24 months, the Fairfield Inn Austin Property is expected to complete another PIP estimated at $2,089,747 ($33,171/room), which will predominately focus on the guest rooms and guest bathrooms, façade and signage, guest corridors and lobby.
The property segmentation at the Fairfield Inn Austin Property is estimated at 70% commercial, 10% group and 20% leisure. As of August 31 2019 year-to-date, the top corporate accounts at the Fairfield Inn Austin Property were General Dynamics, IBM, State of Texas, Accenture and Dell Technologies.
The Market.The Austin Marriott Portfolio Properties are located approximately 5.1 miles from downtown Austin, Texas. Primary access to the area is provided by Interstate Highway 35 (along which the Austin Marriott Portfolio Properties are located), Ben White Boulevard (also known as US Highway 71) and U.S. Highway 183. Austin is home to a number of technology companies and pharmaceutical and biotechnology companies. Austin is also the headquarter location for companies such as Whole Foods Market, NXP Semiconductors, GoodPop, Temple-Inland, Sweet Leaf Tea Company, Keller Williams Realty, National Western Life, Golfsmith, Tito’s Vodka, Indeed and YETI.
The Austin Marriott Portfolio Properties are approximately 7 miles from the Austin-Bergstrom Airport. Nearby Austin-area attractions (within a 6-mile radius) include The Yard, the South Congress neighborhood, the Rainey Street historic district, the Austin Convention Center, the 6th Street entertainment district, the Texas State Capitol, Zilker Park and Barton Springs Pool, the University of Texas, the Darrell K. Royal Texas Memorial Stadium and McKinney Falls State Park. Nearby corporate offices include Apple, IBM, Accenture, AMD, Oracle, Intel, Samsung, Farmers Insurance and Motorola. Additionally, there are several government offices nearby, including Austin Street & Bridge Division, the IRS Customer Service Center and the State of Texas Attorney General’s office.
According to a third party hospitality research report, the Austin Marriott Portfolio Properties are located in the South Austin/Airport hospitality submarket, which, as of the second quarter of 2019, had total supply of 60 hotels, which represents 17.1% of the broader Austin hospitality market supply. The South Austin/Airport hospitality submarket has performed with stable occupancy rates, ranging from 72.6% to 75.9% from 2014 through the second quarter of 2019, while the average daily rate has ranged from $124.79 to $135.27 over the same time period. Of the South Austin/Airport hospitality submarket supply, as of the second quarter of 2019, there were 19 upper-priced hotels and 41 lower-priced hotels, with occupancy rates and average daily rates of 77.4% and $160.23, and 74.5% and $103.54, respectively.
According to the appraisals, the estimated 2019 population within a one-, three- and five-mile radius of the Austin Marriott Portfolio Properties was 10,549, 158,121 and 321,080, respectively and the estimated 2019 average household income within the same radii was $65,048, $71,055 and $86,985, respectively.
This is not a research report and was not prepared by any Underwriter’s research department. Please see additional important information and qualifications at the end of this Term Sheet.
T-84
| Hospitality – Various | Loan #7 | Cut-off Date Balance: | | $62,300,000 |
| Various | Austin Marriott Portfolio | Cut-off Date LTV: | | 59.7% |
| Austin, TX 78744 | | UW NCF DSCR: | | 2.27x (P&I) |
| | | UW NOI Debt Yield: | | 14.0% |
The following tables present the primary competitive properties to the Austin Marriott Portfolio Properties:
| Competitive Property Summary(1) |
| Property | Year Built | Rooms | Distance (miles) | Commercial | Group | Leisure | 6/30/19 TTM Occupancy | 6/30/19 TTM ADR | 6/30/19 TTM RevPAR |
| Marriott Austin Property |
| Marriott Austin Property | 2001 | 211 | N/A | 55% | 20% | 25% | 74% | $155.71 | $114.51 |
| Wyndham Garden Hotel | 1985 | 210 | 1.0 | 70% | 10% | 20% | 75%-80% | $110-$115 | $80-$85 |
| Doubletree Austin North | 1983 | 350 | 8.0 | 60% | 20% | 20% | 75%-80% | $130-$135 | $100-$105 |
| Omni Southpark | 1983 | 312 | 0.3 | 70% | 10% | 20% | 80%-85% | $130-$135 | $105-$110 |
| Sheraton Hotel Austin | 1986 | 367 | 4.0 | 50% | 20% | 30% | 80%-85% | $165-$175 | $135-$140 |
| Hilton Austin Airport | 1986 | 262 | 5.0 | 40% | 5% | 30% | 80%-85% | $145-$150 | $115-$120 |
| Subtotal/Average | | 1,712 | | | | | 79% | $142.19 | |
| Springhill Austin Property |
| Springhill Austin Property | 2000 | 152 | N/A | 70% | 10% | 20% | 76% | $125.54 | $96.00 |
| Courtyard Austin Property | 1996 | 110 | N/A | 65% | 10% | 25% | 68% | $139.74 | $95.30 |
| Wyndham Garden Hotel | 1985 | 210 | 1.1 | 70% | 10% | 20% | 75%-80% | $110-115 | $80-$85 |
| La Quinta Inn Oltorf | 1975 | 132 | 1.9 | 70% | 10% | 20% | 75%-80% | $70-$75 | $55-$60 |
| Aiden by Best Western | 1973 | 158 | 1.9 | 70% | 10% | 20% | 75%-80% | $110-$115 | $80-85 |
| Hampton Inn Austin South | 1997 | 123 | 0.4 | 70% | 10% | 20% | 75%-80% | $120-$125 | $90-$95 |
| Candlewood Suites Austin South | 1998 | 122 | 0.2 | 70% | 10% | 20% | 70%-75% | $80-$85 | $55-$60 |
| Subtotal/Average | | 1,007 | | | | | 75% | $108.89 | |
| Courtyard Austin Property |
| Courtyard Austin Property | 1996 | 110 | N/A | 65% | 10% | 25% | 68% | $139.74 | $95.30 |
| Springhill Austin Property | 2000 | 152 | N/A | 70% | 10% | 20% | 76% | $125.54 | $96.00 |
| Wyndham Garden Hotel | 1985 | 210 | 1.1 | 70% | 10% | 20% | 75%-80% | $110-$115 | $80-$85 |
| La Quinta Inn Oltorf | 1975 | 132 | 1.9 | 70% | 10% | 20% | 75%-80% | $70-$75 | $55-$60 |
| Hampton Inn Austin South | 1997 | 123 | 0.5 | 70% | 10% | 20% | 75%-80% | $120-$125 | $90-$95 |
| Subtotal/Average | | 727 | | | | | 76% | $112.05 | |
| Residence Inn Austin Property |
| Residence Inn Austin Property | 1996 | 66 | N/A | 70% | 10% | 20% | 84% | $134.38 | $113.16 |
| Springhill Austin Property | 2000 | 152 | N/A | 70% | 10% | 20% | 76% | $125.54 | $96.00 |
| Courtyard Austin Property | 1996 | 110 | N/A | 65% | 10% | 25% | 68% | $139.74 | $95.30 |
| Wyndham Garden Hotel | 1985 | 210 | 1.1 | 70% | 10% | 20% | 75%-80% | $110-$115 | $80-$85 |
| Homewood Suites - Austin | 1998 | 96 | 0.5 | 70% | 10% | 20% | 80%-85% | $145-$150 | $120-$125 |
| Candlewood Suites Austin South | 1998 | 122 | 0.3 | 70% | 10% | 20% | 70%-75% | $80-$85 | $55-$60 |
| Holiday Inn Express & Suites Airport | 2001 | 80 | 4.0 | 65% | 10% | 25% | 75%-80% | $120-$125 | $90-$95 |
| Subtotal/Average | | 836 | | | | | 76% | $121.23 | |
| Fairfield Inn Austin Property |
| Fairfield Inn Austin Property | 1995 | 63 | N/A | 70% | 10% | 20% | 76% | $119.19 | $90.72 |
| Springhill Austin Property | 2000 | 152 | N/A | 70% | 10% | 20% | 76% | $125.54 | $96.00 |
| La Quinta Inn Oltorf | 1975 | 132 | 1.9 | 70% | 10% | 20% | 75%-80% | $70-$75 | $55-$60 |
| La Quinta Inn Austin South I 35 | 1983 | 131 | 0.6 | 65% | 5% | 30% | 70%-75% | $65-$70 | $45-$50 |
| Hampton Inn Austin South | 1997 | 123 | 0.6 | 70% | 10% | 20% | 75%-80% | $120-$125 | $90-$95 |
| Red Roof Inn Plus Austin South | 1998 | 137 | 0.1 | 70% | 10% | 20% | 75%-80% | $65-$70 | $50-$55 |
| Quality Suites South Austin | 1999 | 50 | 0.3 | 70% | 10% | 20% | 70%-75% | $80-$85 | $60-$65 |
| Comfort Suites Airport | 2001 | 84 | 4.0 | 70% | 10% | 20% | 70%-75% | $70-$75 | $45-$50 |
| Subtotal/Average | | 872 | | | | | 75% | $90.97 | |
Source: Appraisal.
| (1) | The variances between the underwriting, the appraisal and industry report data with respect to occupancy, ADR and RevPAR are attributable to variances in reporting methodologies and/or timing differences. |
This is not a research report and was not prepared by any Underwriter’s research department. Please see additional important information and qualifications at the end of this Term Sheet.
T-85
| Hospitality – Various | Loan #7 | Cut-off Date Balance: | | $62,300,000 |
| Various | Austin Marriott Portfolio | Cut-off Date LTV: | | 59.7% |
| Austin, TX 78744 | | UW NCF DSCR: | | 2.27x (P&I) |
| | | UW NOI Debt Yield: | | 14.0% |
The following tables presents certain information relating to the Occupancy, ADR and RevPar of the Austin Marriott Portfolio Properties and their competitive sets:
| Historical Occupancy, ADR, RevPAR(1) |
| Year | Occupancy | ADR | RevPAR | Occupancy | ADR | RevPAR | Occupancy | ADR | RevPAR |
| | | | |
| | Competitive Set(2) | Marriott Austin Property | Penetration Factor |
| 2016 | 79.6% | $139.17 | $110.78 | 75.2% | $162.76 | $122.37 | 94.4% | 117.0% | 110.5% |
| 2017 | 80.8% | $138.77 | $112.12 | 73.8% | $160.01 | $118.03 | 91.3% | 115.3% | 105.3% |
| 2018 | 78.6% | $137.34 | $108.01 | 73.7% | $156.88 | $115.67 | 93.8% | 114.2% | 107.1% |
| 9/30/2019 TTM | 76.7% | $142.63 | $109.41 | 74.5% | $155.95 | $116.25 | 97.2% | 109.3% | 106.2% |
| | Competitive Set(3) | Springhill Austin Property | Penetration Factor |
| 2016 | 73.5% | $114.20 | $83.96 | 76.9% | $136.11 | $104.63 | 104.6% | 119.2% | 124.6% |
| 2017 | 73.8% | $111.47 | $82.23 | 76.9% | $130.51 | $100.35 | 104.2% | 117.1% | 122.0% |
| 2018 | 72.2% | $106.35 | $76.76 | 73.3% | $123.96 | $90.80 | 101.5% | 116.6% | 118.3% |
| 9/30/2019 TTM | 73.8% | $107.86 | $79.64 | 77.2% | $125.80 | $97.09 | 104.5% | 116.6% | 121.9% |
| | Competitive Set(4) | Courtyard Austin Property | Penetration Factor |
| 2016 | 73.2% | $118.43 | $86.66 | 75.9% | $143.13 | $108.70 | 103.8% | 120.8% | 125.4% |
| 2017 | 75.8% | $114.30 | $86.59 | 74.4% | $138.10 | $102.70 | 98.2% | 120.8% | 118.6% |
| 2018 | 73.7% | $108.28 | $79.83 | 69.7% | $134.61 | $93.87 | 94.6% | 124.3% | 117.6% |
| 9/30/2019 TTM | 75.4% | $110.48 | $83.27 | 69.4% | $139.19 | $96.63 | 92.1% | 126.0% | 116.1% |
| | Competitive Set(5) | Residence Inn Austin Property | Penetration Factor |
| 2016 | 79.1% | $122.32 | $96.80 | 87.4% | $150.95 | $131.93 | 110.4% | 123.4% | 136.3% |
| 2017 | 77.8% | $119.59 | $93.04 | 86.3% | $140.53 | $121.29 | 110.9% | 117.5% | 130.4% |
| 2018 | 76.0% | $114.67 | $87.18 | 82.3% | $136.06 | $111.98 | 108.3% | 118.6% | 128.4% |
| 9/30/2019 TTM | 76.9% | $117.08 | $89.98 | 84.6% | $136.22 | $115.19 | 110.0% | 116.3% | 128.0% |
| | Competitive Set(6) | Fairfield Inn Austin Property | Penetration Factor |
| 2016 | 67.7% | $105.35 | $71.36 | 80.3% | $127.52 | $102.39 | 118.5% | 121.1% | 143.5% |
| 2017 | 69.7% | $102.00 | $71.06 | 79.9% | $125.20 | $100.04 | 114.7% | 122.7% | 140.8% |
| 2018 | 67.8% | $95.13 | $64.46 | 76.1% | $112.36 | $85.55 | 112.4% | 118.1% | 132.7% |
| 9/30/2019 TTM | 71.0% | $94.90 | $67.39 | 76.0% | $119.93 | $91.09 | 107.0% | 126.4% | 135.2% |
Source: Third party hospitality research reports.
| (1) | The variances between the underwriting, the appraisal and industry report data with respect to occupancy, ADR and RevPAR are attributable to variances in reporting methodologies and/or timing differences. |
| (2) | The 9/30/2019 TTM Competitive Set for the Marriott Austin Property included Wyndham Garden Hotel Austin, DoubleTree by Hilton Hotel Austin, Omni Austin Hotel @ Southpark, Sheraton Hotel Austin @ The Capitol and Hilton Austin Airport. |
| (3) | The 9/30/2019 TTM Competitive Set for the Springhill Austin Property included the Courtyard Austin Property, Wyndham Garden Hotel Austin, La Quinta Inns & Suites Austin Oltorf, Aiden by Best Western @ Austin City Hotel, Hampton by Hilton Inn Austin/Airport Area South and Candlewood Suites Austin South. |
| (4) | The 9/30/2019 TTM Competitive Set for the Courtyard Austin Property included the Springhill Austin Property, Wyndham Garden Hotel Austin, La Quinta Inns & Suites Austin Oltorf, and Hampton by Hilton Inn Austin/Airport Area South. |
| (5) | The 9/30/2019 TTM Competitive Set for the Residence Inn Austin Property included the Springhill Austin Property, Courtyard Austin Property, Wyndham Garden Hotel Austin, Homewood Suites by Hilton Austin South Airport, Candlewood Suites Austin South and Holliday Inn Express & Suites Austin Airport. |
| (6) | The 9/30/2019 TTM Competitive Set for the Fairfield Inn Austin Property included the Springhill Austin Property, La Quinta Inns & Suites Austin Oltorf, La Quinta Inns & Suites Austin South I 35, Hampton by Hilton Inn Austin/Airport Area South, Red Roof Inn Austin South, Quality Suites South Austin and Comfort Suites Austin Airport. |
This is not a research report and was not prepared by any Underwriter’s research department. Please see additional important information and qualifications at the end of this Term Sheet.
T-86
| Hospitality – Various | Loan #7 | Cut-off Date Balance: | | $62,300,000 |
| Various | Austin Marriott Portfolio | Cut-off Date LTV: | | 59.7% |
| Austin, TX 78744 | | UW NCF DSCR: | | 2.27x (P&I) |
| | | UW NOI Debt Yield: | | 14.0% |
Operating History and Underwritten Net Cash Flow.The following table presents certain information relating to the historical operating performance and Underwritten Net Cash Flow of the Austin Marriott Portfolio Properties:
| Cash Flow Analysis |
| | 2016 | 2017 | 2018 | 9/30/2019 TTM | UW | UW per Room |
| Rooms Revenue | $25,321,880 | $24,003,119 | $22,379,849 | $23,088,184 | $23,088,184 | $38,352.47 |
| Food & Beverage | $2,793,728 | $2,836,150 | $3,367,204 | $3,250,911 | $3,250,911 | $5,400.18 |
| Other Income | $509,678 | $415,577 | $525,419 | $591,147 | $591,147 | $981.97 |
| Total Revenue | $28,625,286 | $27,254,846 | $26,272,472 | $26,930,242 | $26,930,242 | $44,734.62 |
| | | | | | | |
| Real Estate Taxes | $1,801,380 | $1,864,378 | $1,803,345 | $1,648,822 | $1,648,822 | $2,738.91 |
| Insurance | $128,314 | $131,000 | $119,440 | $131,914 | $195,503 | $324.76 |
| Other Operating expenses | $15,882,032 | $15,622,456 | $16,021,173 | $16,301,146 | $16,352,142 | $27,163.03 |
| Total Expenses | $17,811,726 | $17,617,834 | $17,943,958 | $18,081,882 | $18,196,467 | $30,226.69 |
| | | | | | | |
| Net Operating Income | $10,813,560 | $9,637,012 | $8,328,514 | $8,848,360 | $8,733,775 | $14,507.93 |
| FF&E | $1,430,369 | $1,361,368 | $1,313,622 | $1,346,513 | $1,077,210 | $1,789.39 |
| Net Cash Flow | $9,383,191 | $8,275,644 | $7,014,892 | $7,501,847 | $7,656,565 | $12,718.55 |
| | | | | | | |
| NOI DSCR (IO) | 4.84x | 4.31x | 3.72x | 3.96x | 3.91x | |
| NOI DSCR (P&I) | 3.21x | 2.86x | 2.47x | 2.62x | 2.59x | |
| NCF DSCR (IO) | 4.20x | 3.70x | 3.14x | 3.35x | 3.42x | |
| NCF DSCR (P&I) | 2.78x | 2.45x | 2.08x | 2.22x | 2.27x | |
| NOI Debt Yield | 17.4% | 15.5% | 13.4% | 14.2% | 14.0% | |
| NCF Debt Yield | 15.1% | 13.3% | 11.3% | 12.0% | 12.3% | |
Escrows and Reserves.
Real Estate Taxes- The Austin Marriott Portfolio Borrower is required to deposit monthly 1/12 of the annual estimated real estate taxes (currently $139,093).
Insurance- The Austin Marriott Portfolio Borrower is required to deposit monthly 1/12 of the annual estimated insurance premiums, unless waived (as currently) due to a blanket policy in place.
FF&E Reserve- The Austin Marriott Portfolio Borrower is required to deposit monthly 2.0% of gross revenue (currently $44,884), increasing January 1, 2022 to 4.0% of gross revenue, for replacements of furniture, fixtures and equipment.
PIP Reserve –The Austin Marriott Portfolio Borrower deposited at loan origination $24,000,000 to fund the scheduled PIP work at the Austin Marriott Portfolio Properties, and within 30 days of any modification to such scheduled PIP or the determination by the lender in its sole discretion that the amounts on deposit in the PIP Reserve are insufficient, the Austin Marriott Portfolio Borrower will be required to deposit the full amount required for such modifications or insufficiency.
Lockbox and Cash Management. The Austin Marriott Portfolio Mortgage Loan is structured with a hard lockbox and springing cash management. Upon the occurrence and continuance of a Cash Sweep Period, funds in the lockbox account are required to be transferred daily to the lender-controlled cash management account and disbursed in accordance with the Austin Marriott Portfolio Mortgage Loan documents. During the occurrence and continuance of a Cash Sweep Period, all excess cash is required to be held by the lender as additional collateral for the Austin Marriott Portfolio Mortgage Loan.
A “Cash Sweep Period” will commence when the debt service coverage ratio based on amortizing payments is less than 1.35x for one calendar quarter and will end when the debt service coverage ratio based on amortizing payments is at least 1.35x for two consecutive calendar quarters;provided that the Austin Marriott Portfolio Borrower may prevent a Cash Sweep Period by either (a) depositing to the excess cash reserve or (b) delivering a letter of credit in an amount that would cause the debt service coverage ratio to be at least 1.35x for the applicable quarter.
Additional Secured Indebtedness (not including trade debts). Not permitted.
Mezzanine Loan and Preferred Equity.Not permitted.
Release of Property.Any time after the first two years following the securitization of the Austin Marriott Portfolio Mortgage Loan, in connection with a third party sale, the Austin Marriott Portfolio Mortgage Loan documents permit the partial release of any individual Austin Marriott Portfolio Property through partial defeasance in an amount equal to 125% of the allocated loan amount for such individual property, upon satisfaction of the following conditions, among other things, (i) no event of default is continuing, (ii) the lender has received rating agency confirmation, and (iii) after giving effect to the partial release, (a) the debt yield for the remaining properties is not less than the greater of the debt yield immediately preceding the release and 12.29% and (b) the loan-to-value ratio for the remaining properties is not greater than the lesser of the loan-to-value ratio immediately preceding the release and 59.7%. With respect to the Marriott Austin Property and Springhill Austin Property, both properties must be concurrently released (and neither may be individually released).
Right of First Offer/Right of First Refusal.None.
This is not a research report and was not prepared by any Underwriter’s research department. Please see additional important information and qualifications at the end of this Term Sheet.
T-87
| Hospitality – Various | Loan #7 | Cut-off Date Balance: | | $62,300,000 |
| Various | Austin Marriott Portfolio | Cut-off Date LTV: | | 59.7% |
| Austin, TX 78744 | | UW NCF DSCR: | | 2.27x (P&I) |
| | | UW NOI Debt Yield: | | 14.0% |
Ground Lease. None.
Letter of Credit.None.
Terrorism Insurance.The Austin Marriott Portfolio Borrower is required to obtain and maintain property insurance that covers perils of terrorism and acts of terrorism in an amount equal to the full replacement cost of the Austin Marriott Portfolio Properties and business interruption insurance for 18 months with a six-month extended period of indemnity. See “Risk Factors—Risks Relating to the Mortgage Loans—Terrorism Insurance May Not Be Available for All Mortgaged Properties” in the Preliminary Prospectus.
This is not a research report and was not prepared by any Underwriter’s research department. Please see additional important information and qualifications at the end of this Term Sheet.
T-88
(THIS PAGE INTENTIONALLY LEFT BLANK)
| Office – CBD | Loan #8 | Cut-off Date Balance: | | $52,000,000 |
| 115 East 57th Street | Galleria 57 | Cut-off Date LTV: | | 38.0% |
| New York, NY 10022 | | UW NCF DSCR: | | 2.44x |
| | | UW NOI Debt Yield: | | 8.7% |
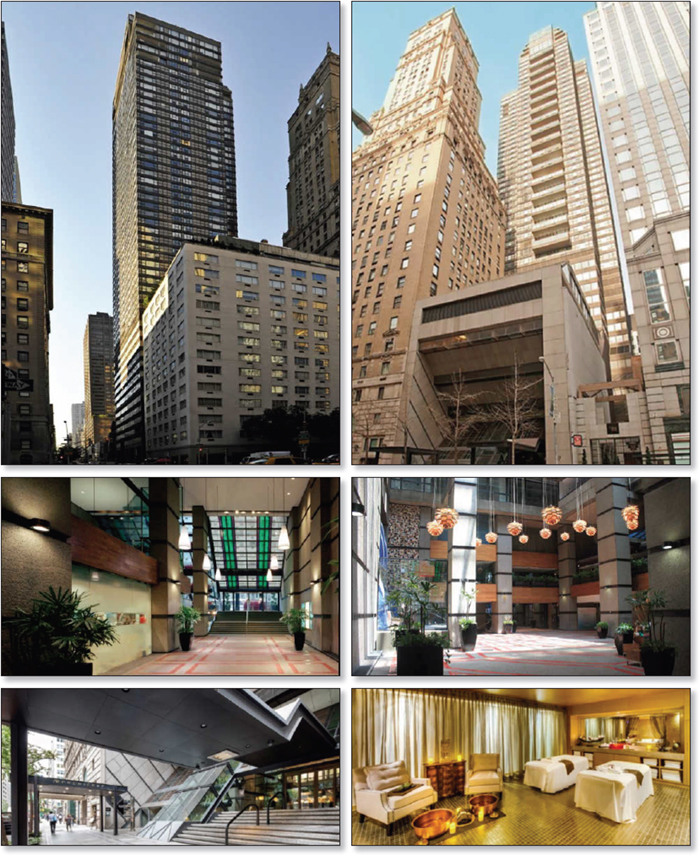
This is not a research report and was not prepared by any Underwriter’s research department. Please see additional important information and qualifications at the end of this Term Sheet.
T-90
| Office – CBD | Loan #8 | Cut-off Date Balance: | | $52,000,000 |
| 115 East 57th Street | Galleria 57 | Cut-off Date LTV: | | 38.0% |
| New York, NY 10022 | | UW NCF DSCR: | | 2.44x |
| | | UW NOI Debt Yield: | | 8.7% |
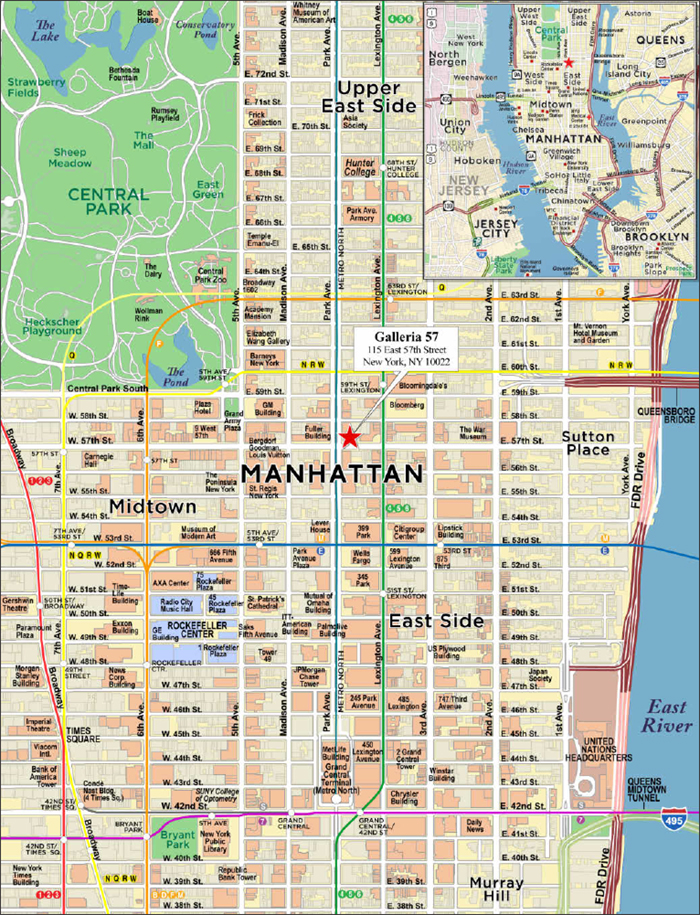
This is not a research report and was not prepared by any Underwriter’s research department. Please see additional important information and qualifications at the end of this Term Sheet.
T-91
| Mortgage Loan No. 8 – Galleria 57 |
| Mortgage Loan Information | | Property Information |
| Mortgage Loan Seller: | WFB | | Single Asset/Portfolio: | Single Asset |
| Credit Assessment (DBRS/Fitch/S&P): | NR/NR/NR | | Location: | New York, NY 10022 |
| Original Balance: | $52,000,000 | | General Property Type: | Office |
| Cut-off Date Balance: | $52,000,000 | | Detailed Property Type: | CBD |
| % of Initial Pool Balance: | 4.2% | | Title Vesting: | Fee |
| Loan Purpose: | Refinance | | Year Built/Renovated: | 1975/N/A |
| Borrower Sponsor: | Joseph Moinian | | Size: | 179,562 SF |
| Guarantor: | Joseph Moinian | | Cut-off Date Balance per SF: | $290 |
| Mortgage Rate: | 3.4650% | | Maturity Balance per SF: | $290 |
| Note Date: | 11/5/2019 | | Property Manager: | Columbus Property Management LLC |
| First Payment Date: | 12/11/2019 | | | (borrower-related) |
| Maturity Date: | 11/11/2029 | | | |
| Original Term to Maturity: | 120 months | | |
| Original Amortization Term: | 0 months | | | |
| IO Period: | 120 months | | Underwriting and Financial Information |
| Seasoning: | 1 month | | UW NOI: | $4,533,324 |
| Prepayment Provisions: | LO (25); DEF (91); O (4) | | UW NOI Debt Yield: | 8.7% |
| Lockbox/Cash Mgmt Status: | Hard/Springing | | UW NOI Debt Yield at Maturity: | 8.7% |
| Additional Debt Type: | N/A | | UW NCF DSCR: | 2.44x |
| Additional Debt Balance: | N/A | | Most Recent NOI(2): | $4,661,535 (8/31/2019 TTM) |
| Future Debt Permitted (Type): | No (N/A) | | 2nd Most Recent NOI(2): | $6,107,715 (12/31/2018) |
| Reserves(1) | | 3rd Most Recent NOI: | $5,987,024 (12/31/2017) |
| Type | Initial | Monthly | Cap | | Most Recent Occupancy(2): | 85.0% (10/15/2019) |
| RE Taxes: | $949,518 | $201,412 | N/A | | 2nd Most Recent Occupancy(2): | 95.0% (12/31/2018) |
| Insurance: | $0 | Springing | N/A | | 3rd Most Recent Occupancy: | 98.8% (12/31/2017) |
| Recurring Replacements: | $0 | $2,993 | $71,825 | | Appraised Value (as of): | $137,000,000 (7/18/2019) |
| TI/LC: | $1,680,000 | $14,964 | $359,124 | | Appraised Value per SF: | $763 |
| Rent Concession Reserve: | $733,265 | $0 | N/A | | Cut-off Date LTV Ratio: | 38.0% |
| Existing Landlord Obligations Reserve: | $1,581,856 | $0 | N/A | | Maturity Date LTV Ratio: | 38.0% |
| | | | | | | | | |
| Sources and Uses |
| Sources | Proceeds | % of Total | | Uses | Proceeds | % of Total |
| Loan Amount: | $52,000,000 | 100.0% | | Loan Payoff Amount | $45,949,791 | 88.4% |
| | | | | Upfront Reserves: | $4,944,639 | 9.5% |
| | | | | Closing Costs: | $823,443 | 1.6% |
| | | | | Return of Equity: | $282,127 | 0.5% |
| Total Sources: | $52,000,000 | 100.0% | | Total Uses: | $52,000,000 | 100.0% |
| (1) | See“Escrows and Reserves” below for further discussion of reserve requirements. |
| (2) | See “Operating History and Underwritten Net Cash Flow”below for a discussion of the decrease from 2nd Most Recent NOI and Occupancy to Most Recent NOI and Occupancy. |
The Mortgage Loan. The eighth largest mortgage loan (the “Galleria 57 Mortgage Loan”) is evidenced by a promissory note in the original principal amount of $52,000,000 secured by a first priority fee mortgage encumbering an office building located in New York, New York (the ��Galleria 57 Property”).
The Borrower and the Borrower Sponsor. The borrower is Eldad Prime LLC (the “Galleria 57 Borrower”), a Delaware limited liability company and single purpose entity with two independent directors. Legal counsel to the Galleria 57 Borrower delivered a non-consolidation opinion in connection with the origination of the Galleria 57 Mortgage Loan.
The borrower sponsor and non-recourse carveout guarantor is Joseph Moinian (the “Guarantor”), a New York City based real estate developer, investor and owner. Mr. Moinian founded The Moinian Group in 1982 and currently serves as its CEO. The Moinian Group’s commercial real estate portfolio contains approximately 20 million SF across major cities including New York, Chicago, Dallas and Los Angeles. Other notable assets in which The Moinian Group holds ownership interests include 3 Columbus Circle, Willis Tower and 3 Hudson Boulevard, which is currently under development.
The Property. The Galleria 57 Property comprises 16 floors totaling 179,562 SF of a larger 57-story mixed-use tower (the “Galleria 57 Tower”) located in Manhattan, New York, New York. The Galleria 57 Tower was built in 1975 and is situated on a 0.4-acre site. The non-collateral portion of the Galleria 57 Tower contains 253 residential condominium units.
This is not a research report and was not prepared by any Underwriter’s research department. Please see additional important information and qualifications at the end of this Term Sheet.
T-92
| Office – CBD | Loan #8 | Cut-off Date Balance: | | $52,000,000 |
| 115 East 57th Street | Galleria 57 | Cut-off Date LTV: | | 38.0% |
| New York, NY 10022 | | UW NCF DSCR: | | 2.44x |
| | | UW NOI Debt Yield: | | 8.7% |
The Galleria 57 Property is situated on floors 1 through 16 of the Galleria 57 Tower and has a dedicated lobby entrance on 57thStreet. The Galleria 57 Property features a nine-story atrium, a health and fitness club, 24-hour security, and floorplates ranging from 9,000 SF to 16,000 SF. The Galleria 57 Property contains a subterranean parking garage with access to 94 spaces (resulting in a parking ratio of approximately 0.5 spaces per 1,000 SF of NRA). The Galleria 57 Property was 85.0% leased to 28 tenants as of October 15, 2019 and averaged approximately 93.5% occupancy from 2005 to 2018. The recent decline in occupancy was due to a tenant vacating 25,000 SF of NRA on the 10th and 11th floors of the Galleria 57 Property in December 2018.
Condominium Regime.The Galleria 57 Property consists of one condominium unit of a 254-unit condominium regime and controls a 30.4% share of the voting rights in the condominium regime. The non-collateral portion of the Galleria 57 Tower (floors 18 through 57) contains 253 residential condominium units that control the remaining 69.6% of the condominium regime. The Galleria 57 Borrower does not have the voting power to affirmatively control the owners’ association, but it does have the voting power to block any material amendments. See“Description of the Mortgage Pool—Mortgage Pool Characteristics—Condominium and Other Shared Interests”in the Preliminary Prospectus.
Major Tenants.
Spa Castle Premier 57 (40,275 SF, 22.4% of NRA; 20.9% of underwritten base rent). Spa Castle Premier 57 (“Spa Castle”) is a full service spa that includes hydrotherapy pools, a water lounge, sauna, relaxation lounges, an aqua bar, café bistro, and a variety of body treatments. Spa Castle opened its first location in College Point, New York in 2006 and currently has three locations in New York and Texas. The tenant has been at the Galleria 57 Property since September 2013 and has no renewal options remaining following its October 2034 lease expiration.
Central Parking Systems of New York, Inc. (22,467 SF, 12.5% of NRA; 10.5% of underwritten base rent). Central Parking Systems of New York, Inc. (“Central Parking Systems of NY”) is a third party parking garage operator that manages the 94 parking spaces at the Galleria 57 Property. The tenant, which is a subsidiary of SP Plus Corporation, has been at the Galleria 57 Property since June 1995, through its predecessor, and has no renewal options remaining following its March 2022 lease expiration. SP Plus Corporation provides professional parking management, ground transportation, remote baggage check-in and handling, facility maintenance, security, event logistics, and other technology-driven mobility solutions to aviation, commercial, hospitality, healthcare and government clients across North America.
Generation Next Fertility (12,500 SF, 7.0% of NRA; 10.3% of underwritten base rent). Generation Next Fertility (“Generation Next”) is a boutique medical fertility practice for women. The tenant has been at the Galleria 57 Property since May 2017. Generation Next previously occupied 8,500 SF on the fifth floor and recently executed a 10-year lease for a larger 12,500 SF space on the 11th floor with no renewal options remaining following its April 2030 lease expiration. Generation Next is currently paying rent on the fifth floor space and is in a free rent period on the 11th floor space, as build-out is completed with a rent commencement date in May 2020. Gap rent for Generation Next was reserved at origination (see“Escrows and Reserves”below).
The following table presents certain information relating to the tenancy at the Galleria 57 Property:
| Tenant Summary(1) |
| Tenant Name | Credit Rating (Fitch/Moody’s/S&P) | Tenant SF | Approx. % of Total SF | Annual UW Rent(2) | % of Total Annual
UW Rent | Annual UW Rent PSF(2) | Lease Expiration | Extension Options | Term. Option (Y/N) |
| Spa Castle | NR/NR/NR | 40,275 | 22.4% | $1,772,100(3) | 20.9% | $44.00 | 10/31/2034 | N | N |
| Central Parking Systems of NY | NR/NR/NR | 22,467 | 12.5% | $892,500 | 10.5% | $39.72 | 3/31/2022 | N | N |
| Generation Next | NR/NR/NR | 12,500 | 7.0% | $875,000(4) | 10.3% | $70.00 | 4/30/2030 | N | N |
| Gary Ostrow, D.O. P.C. | NR/NR/NR | 9,656 | 5.4% | $579,360 | 6.8% | $60.00 | 10/14/2028 | 1, 5-year | N |
| Dasha Wellness Chiropractic | NR/NR/NR | 6,684 | 3.7% | $299,978 | 3.5% | $44.88 | 9/30/2029 | N | N |
| Subtotal/Wtd. Avg. | | 91,582 | 51.0% | $4,418,938 | 52.1% | $48.25 | | Termination Option | |
| | | | | | | | | | |
| Other Tenants | | 61,008 | 34.0% | $4,062,897 | 47.9% | $66.60 | | | |
| Vacant Space | | 26,972 | 15.0% | $0 | 0.0% | $0.0 | | | |
| Total/Wtd. Avg. | | 179,562 | 100.0% | $8,481,835 | 100.0% | $55.59(5) | | | |
| (1) | Information obtained from the underwritten rent roll. |
| (2) | Annual UW Rent and Annual UW Rent PSF include contractual rent steps through December 2020 totaling $78,546. |
| (3) | Spa Castle has one month of free rent in September 2023 totaling $147,675, which was reserved at closing. |
| (4) | Generation Next is currently in a free rent period with a rent commencement date of May 23, 2020. Gap rent was reserved at closing. See“Escrows and Reserves”below for further discussion of reserve requirements. |
| (5) | Total/Wtd. Avg. Annual UW Rent PSF excludes vacant space. |
This is not a research report and was not prepared by any Underwriter’s research department. Please see additional important information and qualifications at the end of this Term Sheet.
T-93
| Office – CBD | Loan #8 | Cut-off Date Balance: | | $52,000,000 |
| 115 East 57th Street | Galleria 57 | Cut-off Date LTV: | | 38.0% |
| New York, NY 10022 | | UW NCF DSCR: | | 2.44x |
| | | UW NOI Debt Yield: | | 8.7% |
The following table presents certain information relating to the lease rollover schedule at the Galleria 57 Property:
| Lease Rollover Schedule(1)(2) |
| Year | # of Leases Rolling | SF Rolling | Annual UW Rent PSF Rolling | Approx. % of Total SF Rolling | Approx. Cumulative % of SF Rolling | Total UW Rent Rolling | Approx. % of Total Rent Rolling | Approx. Cumulative % of Total Rent Rolling |
| 2019 | 0 | 0 | $0.00 | 0.0% | 0.0% | $0 | 0.0% | 0.0% |
| 2020 | 1 | 1,947 | $51.20 | 1.1% | 1.1% | $99,693 | 1.2% | 1.2% |
| 2021 | 3 | 6,829 | $60.01 | 3.8% | 4.9% | $409,790 | 4.8% | 6.0% |
| 2022 | 7 | 38,210 | $51.09 | 21.3% | 26.2% | $1,952,003 | 23.0% | 29.0% |
| 2023 | 1 | 3,951 | $58.43 | 2.2% | 28.4% | $230,845 | 2.7% | 31.7% |
| 2024 | 2 | 3,971 | $69.27 | 2.2% | 30.6% | $275,085 | 3.2% | 35.0% |
| 2025 | 4 | 13,971 | $67.56 | 7.8% | 38.4% | $943,854 | 11.1% | 46.1% |
| 2026 | 3 | 5,214 | $71.75 | 2.9% | 41.3% | $374,124 | 4.4% | 50.5% |
| 2027 | 2 | 5,438 | $75.26 | 3.0% | 44.3% | $409,247 | 4.8% | 55.3% |
| 2028 | 1 | 9,656 | $60.00 | 5.4% | 49.7% | $579,360 | 6.8% | 62.2% |
| 2029 | 2 | 10,628 | $52.76 | 5.9% | 55.6% | $560,734 | 6.6% | 68.8% |
| 2030 & Beyond | 2 | 52,775 | $50.16 | 29.4% | 85.0% | $2,647,100 | 31.2% | 100.0% |
| Vacant | 0 | 26,972 | $0.00 | 15.0% | 100.0% | $0 | 0.0% | 100.0% |
| Total/Wtd. Avg. | 28 | 179,562 | $55.59(3) | 100.0% | | $8,481,835 | 100.0% | |
| (1) | Information is based on the underwritten rent roll. |
| (2) | Certain tenants may have lease termination options that are exercisable prior to the originally stated expiration date of the subject lease and that are not considered in the Lease Rollover Schedule. |
| (3) | Total/Wtd. Avg. Annual UW Rent PSF Rolling excludes vacant space. |
The Market. The Galleria 57 Property is situated mid-block on the north side of 57th Street between Park and Lexington Avenues within the Midtown area of Manhattan, New York, New York. The Galleria 57 Property is situated approximately four blocks north of the 53rd Street Subway station (which services the E and M lines) and two blocks south of the 59th Street subway station (which services the N, R and W lines). Grand Central Terminal is 10 blocks north and Central Park is six blocks northeast of the Galleria 57 Property. According to a third party market research provider, the estimated 2018 population within a half- and one-mile radius of the Galleria 57 Property was approximately 44,297 and 175,185, respectively; and the estimated 2018 average household income within the same radii was approximately $212,946 and $199,997, respectively.
According to a third-party market research report, the Galleria 57 Property is situated within the Plaza District Office submarket of the New York Office Market. As of November 18, 2019, the Plaza District Office submarket reported a total inventory of approximately 90.9 million SF, a 9.3% vacancy rate and average asking rent of $90.13 PSF, gross.
The appraiser identified a competitive set of 24 office properties totaling approximately 6.2 million SF, with an average occupancy rate of 92.0%. In addition, the appraiser identified ten comparable leases ranging from $62.50 PSF to $77.00 PSF, modified gross (with a weighted average of $69.29 PSF; see the “Comparable Lease Summary” table below).
The following table presents certain information relating to the appraisal’s market rent conclusion for the Galleria 57 Property:
| Market Rent Summary |
| | Office – Floor 2-6 | Office Floor 7-10 | Office Floor 11-16 | Parking (BSMT) | Retail (Grade) | Retail (Floor 2) |
| Market Rent (PSF) | $66.00 | $70.00 | $74.00 | $40.00 | $100.00 | $75.00 |
| Lease Term (Years) | 10 | 10 | 10 | 10 | 10 | 10 |
| Lease Type (Reimbursements) | MG | MG | MG | MG | MG | MG |
| Rent Increase Projection | 2.5%per annum | 2.5%per annum | 2.5%per annum | 3.0%per annum | 3.0%per annum | 3.0%per annum |
This is not a research report and was not prepared by any Underwriter’s research department. Please see additional important information and qualifications at the end of this Term Sheet.
T-94
| Office – CBD | Loan #8 | Cut-off Date Balance: | | $52,000,000 |
| 115 East 57th Street | Galleria 57 | Cut-off Date LTV: | | 38.0% |
| New York, NY 10022 | | UW NCF DSCR: | | 2.44x |
| | | UW NOI Debt Yield: | | 8.7% |
The following table presents information relating to comparable office property sales for the Galleria 57 Property:
| Comparable Property Sale Summary |
| Property Name/Location | Sale Date | Year Built/ Renovated | Total NRA (SF) | Occupancy | Sale Price | Sale Price PSF |
Galleria 57 Property New York, NY | N/A | 1975/NA | 179,562 | 85.0% | | |
477 Madison Avenue New York, NY | July 2019 | 1954/NA | 322,396 | 55.6% | $260,000,000 | $806.46 |
237 Park Avenue New York, NY | Aug. 2019 | 1915/2015 | 1,251,717 | 98.0% | $1,250,000,000 | $998.63 |
521 Fifth Avenue New York, NY | March 2019 | 1929/2007 | 498,000 | 96.1% | $381,000,000 | $765.06 |
470 Park Avenue South New York, NY | Jan. 2019 | 1912/2014 | 301,178 | 87.1% | $247,000,000 | $820.11 |
1 Dag Hammarskjold Plaza New York, NY | Jan. 2019 | 1972/2007 | 782,928 | 94.9% | $574,500,000 | $733.78 |
400 Madison Avenue New York, NY | Oct. 2018 | 1929/2013-2015 | 180,181 | 80.0% | $194,500,000 | $1,079.47 |
183 Madison Avenue New York, NY | Sept. 2018 | 1925/2004 | 274,413 | 88.0% | $225,000,000 | $819.93 |
222 East 41st Street New York, NY | May 2018 | 2002/2018 | 390,000 | 100.0% | $332,500,000 | $852.56 |
1745 Broadway New York, NY | April 2018 | 2003/NA | 672,363 | 100.0% | $633,000,000 | $941.46 |
Source:Appraisal
The following table presents certain information relating to comparable office leases for the Galleria 57 Property:
| Comparable Leases Summary |
| Property Name/Location | Year Built/ Renovated | Total GLA (SF) | Occupancy(1) | Distance from Subject | Tenant Name | Lease Date/Term | Lease Area (SF) | Annual Base Rent PSF | Lease Type |
570 Lexington Avenue New York, NY | 1994/NA | 450,622 | 88.8% | 0.4 Miles | Standard Companies | Aug. 2019 / 10 Yrs | 4,081 | $73.00 | MG |
70 East 55th Street New York, NY | 1987/NA | 143,956 | 83.4% | 0.2 Miles | Molina Healthcare | March 2019 / 7.3 Yrs | 5,835 | $72.00 | MG |
575 Lexington Avenue New York, NY | 1990/NA | 739,040 | 80.4% | 0.4 Miles | Blue Matter Consulting | March 2019 / 5.6 Yrs | 4,383 | $77.00 | MG |
560 Lexington Avenue New York, NY | 1981/NA | 382,580 | 95.5% | 0.4 Miles | KPMG | Jan. 2019 / 10.9 Yrs | 17,204 | $65.00 | MG |
40 West 57th Street New York, NY | 1972/NA | 800,000 | 98.0% | 0.4 Miles | PolarityTE MD | Oct. 2018 / 3.0 Yrs | 7,250 | $70.00 | MG |
485 Lexington Avenue New York, NY | 1956/NA | 925,364 | 84.5% | 0.6 Miles | Fidelity National Title | Oct. 2018 / 10.5 Yrs | 27,996 | $67.00 | MG |
675 Third Avenue New York, NY | 1994/NA | 342,000 | 95.6% | 0.9 Miles | Meet In Place Midtown LLC | Sept. 2018 / 11.1 Yrs | 8,189 | $62.50 | MG |
295 Madison Avenue New York, NY | 1929/NA | 332,003 | 95.6% | 1.2 Miles | Eyenovia | Sept. 2018 / 6.0 Yrs | 3,800 | $66.00 | MG |
20 East 46th Street New York, NY | 1958/NA | 120,000 | 87.9% | 0.7 Miles | NY Pain Management | May 2018 / 10 Yrs | 3,018 | $64.00 | MG |
18 East 48th Street New York, NY | 1998/NA | 117,629 | 97.3% | 0.6 Miles | Affiliated Physicians | Nov. 2017 / 10.3 Yrs | 7,839 | $65.00 | MG |
Source:Appraisal, unless otherwise noted
| (1) | Information obtained from a third party market research provider. |
This is not a research report and was not prepared by any Underwriter’s research department. Please see additional important information and qualifications at the end of this Term Sheet.
T-95
| Office – CBD | Loan #8 | Cut-off Date Balance: | | $52,000,000 |
| 115 East 57th Street | Galleria 57 | Cut-off Date LTV: | | 38.0% |
| New York, NY 10022 | | UW NCF DSCR: | | 2.44x |
| | | UW NOI Debt Yield: | | 8.7% |
Operating History and Underwritten Net Cash Flow. The following table presents certain information relating to the historical operating performance and Underwritten Net Cash Flow at the Galleria 57 Property:
| Cash Flow Analysis |
| | 2016(1) | 2017(1) | 2018(2) | 8/31/2019 TTM(2) | UW | UW PSF |
| Base Rent | $8,793,062 | $9,298,426 | $9,306,769 | $8,289,242 | $8,481,835(3) | $47.24(3) |
| Grossed Up Vacant Space | $0 | $0 | $0 | $0 | $1,933,594 | $10.77 |
| Total Recoveries | $1,268,745 | $1,211,105 | $1,427,039 | $1,232,133 | $1,203,863 | $6.70 |
| Other Income(4) | $40,016 | $77,564 | $182,466 | $25,971 | $25,971 | $0.14 |
| Less Vacancy & Credit Loss | $0 | $0 | $0 | $0 | ($1,933,594)(5) | ($10.77) |
| Effective Gross Income | $10,101,823 | $10,587,095 | $10,916,274 | $9,547,345 | $9,711,669 | $54.09 |
| | | | | | | |
| Real Estate Taxes | $1,907,495 | $1,984,873 | $2,102,862 | $2,184,934 | $2,301,856 | $12.82 |
| Insurance | $28,873 | $47,821 | $80,523 | $148,115 | $136,993 | $0.76 |
| Other Operating Expenses | $3,015,894 | $2,567,376 | $2,625,174 | $2,552,762 | $2,739,496 | $15.26 |
| Total Expenses | $4,952,262 | $4,600,071 | $4,808,559 | $4,885,811 | $5,178,345 | $28.84 |
| | | | | | | |
| Net Operating Income | $5,149,561 | $5,987,024 | $6,107,715 | $4,661,535 | $4,533,324 | $25.25 |
| Capital Expenditures | $0 | $0 | $0 | $0 | $37,708 | $0.21 |
| TI/LC | $0 | $0 | $0 | $0 | $32,000(6) | $0.18 |
| Net Cash Flow | $5,149,561 | $5,987,024 | $6,107,715 | $4,661,535 | $4,463,616 | $24.86 |
| | | | | | | |
| Occupancy % | 97.5% | 98.8% | 95.0% | 85.0%(7) | 81.4% | |
| NOI DSCR | 2.81x | 3.27x | 3.33x | 2.54x | 2.47x | |
| NCF DSCR | 2.81x | 3.27x | 3.33x | 2.54x | 2.44x | |
| NOI Debt Yield | 9.9% | 11.5% | 11.7% | 9.0% | 8.7% | |
| NCF Debt Yield | 9.9% | 11.5% | 11.7% | 9.0% | 8.6% | |
| (1) | The increase in Net Operating Income from 2016 to 2017 was driven by one new lease totaling 10.3% of underwritten base rent commencing in May 2017. |
| (2) | The decrease in Net Operating Income from 2018 to TTM (8/31/2019) was due to a decrease in occupancy from 95.0% to 85.0%, The decline in occupancy was driven by a tenant vacating 25,000 SF (13.9% of NRA) of space in December 2018. |
| (3) | UW Base Rent PSF and UW Base Rent include contractual rent steps through December 2020 totaling $78,546. |
| (4) | Includes administrative fees, legal fee recovery, bank interest income, interest income, late fee, architectural/engineering review and tenant specific income. |
| (5) | The underwritten economic vacancy is 18.6%. The Galleria 57 Property was 85.0% leased as of October 15, 2019. |
| (6) | Underwritten TI/LCs reflect an underwriting credit given for an upfront general TI/LC reserve of $1,680,000. |
| (7) | Occupancy is as of October 15, 2019. |
Escrows and Reserves.
Real Estate Taxes – The Galleria 57 Borrower is required to deposit an upfront real estate tax reserve of $949,518 and ongoing monthly escrows in an amount equal to 1/12th of the real estate taxes that the lender estimates will be payable during the next 12 months (initially $201,412).
Insurance– The Galleria 57 Mortgage Loan documents require ongoing monthly insurance reserves in an amount equal to 1/12thof the insurance premiums that the lender estimates will be payable for the renewal of the coverage during the next 12 months;provided that so long as no event of default is continuing, to the extent insurance is maintained by the Galleria 57 Borrower under a blanket or umbrella policy reasonably acceptable to the lender (and the Galleria 57 Borrower provides evidence of renewal not less than 10 business days prior to expiration), the Galleria 57 Borrower is not required to make ongoing monthly insurance reserve deposits.
Replacement Reserve- The Galleria 57 Mortgage Loan documents require ongoing monthly replacement reserves of $2,993 (subject to a cap of $71,825). The lender may require the Galleria 57 Borrower to increase the ongoing monthly replacement reserve (not more than once per year), if the lender reasonably determines such increase is necessary to maintain the proper operation of the Galleria 57 Property.
Leasing Reserve - The Galleria 57 Borrower deposited an upfront TI/LC reserve of $1,680,000. Additionally, the Galleria 57 Mortgage Loan documents require ongoing monthly general TI/LC reserves of $14,964 (subject to a cap of $359,124).
Rent Concession Reserve – The Galleria 57 Borrower deposited an upfront reserve of $733,265 for future rent credits or abatements related to Dasha Wellness Chiropractic, PC ($37,900), Lloyd M. Loft MD PC & Clark Huang MD PC ($39,869), Spa Castle ($147,675), Generation Next ($491,599) and V. Celenza/DMD & F.V. Celenza ($16,221).
Existing Landlord Obligations Reserve – The Galleria 57 Borrower deposited an upfront reserve of $1,581,856 for outstanding tenant improvements and leasing commissions related to Spa Castle ($201,375), Global Fertility ($32,181), Generation Next ($875,000) and Dasha Wellness Chiropractic ($473,300).
This is not a research report and was not prepared by any Underwriter’s research department. Please see additional important information and qualifications at the end of this Term Sheet.
T-96
| Office – CBD | Loan #8 | Cut-off Date Balance: | | $52,000,000 |
| 115 East 57th Street | Galleria 57 | Cut-off Date LTV: | | 38.0% |
| New York, NY 10022 | | UW NCF DSCR: | | 2.44x |
| | | UW NOI Debt Yield: | | 8.7% |
Lockbox and Cash Management. The Galleria 57 Mortgage Loan documents require that the Galleria 57 Borrower establish and maintain a lender-controlled lockbox account, which is already in place, and direct all tenants to pay rent directly into such lockbox account. The loan documents also require that all rents received by the Galleria 57 Borrower or the property manager be deposited into the lockbox account within two business days of receipt. Upon the occurrence of a Cash Trap Event Period, all funds in the lockbox account are required to be swept each business day into the cash management account controlled by the lender and, on each payment date, all funds in the cash management account are required to be applied in accordance with the Galleria 57 Mortgage Loan documents. Prior to the occurrence of a Cash Trap Event Period, all funds in the lockbox account will be disbursed to the Galleria 57 Borrower. During a Cash Trap Event Period, any excess cash flow remaining after satisfaction of the waterfall items are required to be swept into an excess cash flow subaccount to be held by the lender as additional security for the Galleria 57 Mortgage Loan (provided that with respect to a Cash Trap Event Period caused by a Spa Castle Sweep Period, funds in the excess cash flow subaccount will be capped at $4,833,000).
A “Cash Trap Event Period” will commence upon the earlier of the following:
| (i) | the occurrence of an event of default; |
| (ii) | the net cash flow debt yield (“NCF DY”) falling below 7.0% at the end of any calendar quarter; or |
| (iii) | the occurrence of a Spa Castle Sweep Period (as defined below). |
A Cash Trap Event Period will end upon the occurrence of the earlier of the following:
| ● | with regard to clause (i), the cure of such event of default; |
| ● | with regard to clause (ii), the NCF DY being equal to or greater than 7.25% for two consecutive quarters; or |
| ● | with regard to clause (iii), a Spa Castle Sweep Period Cure (as defined below). |
A “Spa Castle Sweep Period” will commence upon the earlier of the following (provided that all references to ‘Spa Castle’ below and in the definition of Spa Castle Sweep Period Cure will also apply to Spa Castle’s successors and/or assigns):
| (i) | Spa Castle “going dark” or providing notice of its intent to discontinue its business and/or operations at the Galleria 57 Property; |
| (ii) | Spa Castle being subject to any bankruptcy action; |
| (iii) | Spa Castle surrendering, canceling or terminating its lease; or |
| (iv) | Spa Castle being in monetary or material non-monetary default under its lease, beyond any cure periods. |
A “Spa Castle Sweep Period Cure” will occur upon the following:
| ● | At least 90.0% of Spa Castle’s gross leasable area having been leased by one or more tenants, all of which have taken possession, are open for business and have commenced paying rent at a rental rate equal to or greater than Spa Castle’s contractual rental rate at the time of origination of the Galleria 57 Mortgage Loan; |
| ● | The total amount of funds in the excess cash flow subaccount being equal to or greater than $4,833,000; |
| ● | The NCF DY excluding Spa Castle being equal to or greater than 7.25% for two consecutive quarters; or |
| ● | With regard to clause (ii) above only, Spa Castle providing the lender with evidence that Spa Castle is no longer insolvent or subject to any case or proceeding that resulted from the applicable bankruptcy and Spa Castle having affirmed the lease pursuant to a final, non-appealable order of a court of competent jurisdiction. |
Additional Secured Indebtedness (not including trade debts).Not permitted.
Mezzanine Loan and Preferred Equity. Not permitted.
Release of Property.Not permitted.
Ground Lease. None.
Right of First Offer.None.
Terrorism Insurance.The Galleria 57 Mortgage Loan documents require that the “all risk” insurance policy required to be maintained by the Galleria 57 Borrower provide coverage for terrorism in an amount equal to the full replacement cost of the Galleria 57 Property, as well as business interruption insurance covering no less than the 18-month period following the occurrence of a casualty event, together with a 6-month extended period of indemnity. See “Risk Factors—Risks Relating to the Mortgage Loans—Terrorism Insurance May Not Be Available for All Mortgaged Properties” in the Preliminary Prospectus.
This is not a research report and was not prepared by any Underwriter’s research department. Please see additional important information and qualifications at the end of this Term Sheet.
T-97
Office – CBD | Loan #9 | Cut-off Date Balance: | | $50,000,000 |
250 Howard Street | Park Tower at Transbay | Cut-off Date LTV: | | 49.1% |
San Francisco, CA 94105 | | UW NCF DSCR: | | 2.93x |
| | UW NOI Debt Yield: | | 10.2% |
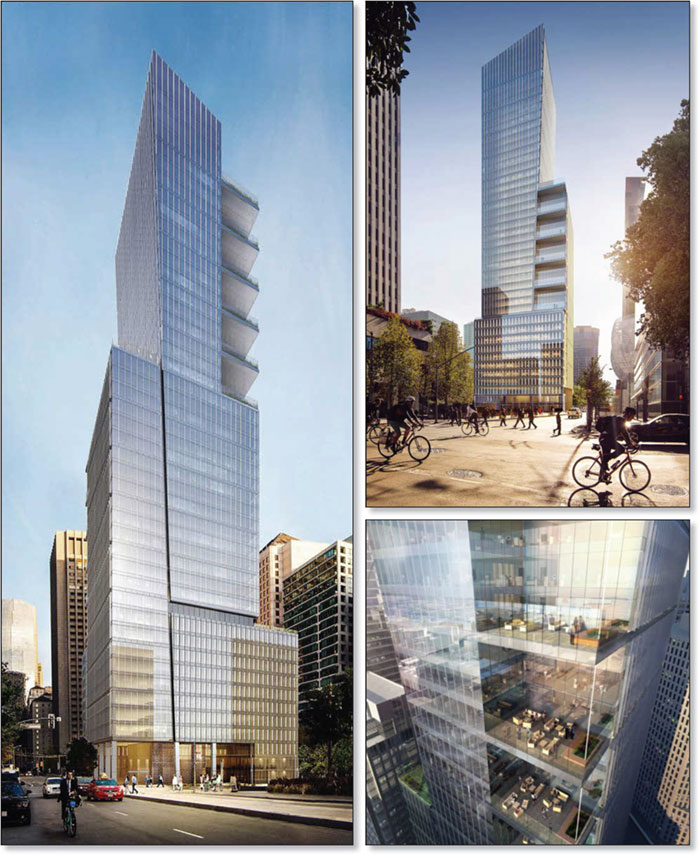
This is not a research report and was not prepared by any Underwriter’s research department. Please see additional important information and qualifications at the end of this Term Sheet.
T-98
Office – CBD | Loan #9 | Cut-off Date Balance: | | $50,000,000 |
250 Howard Street | Park Tower at Transbay | Cut-off Date LTV: | | 49.1% |
San Francisco, CA 94105 | | UW NCF DSCR: | | 2.93x |
| | UW NOI Debt Yield: | | 10.2% |

This is not a research report and was not prepared by any Underwriter’s research department. Please see additional important information and qualifications at the end of this Term Sheet.
T-99
Mortgage Loan No. 9 – Park Tower at Transbay |
Mortgage Loan Information | | Property Information |
Mortgage Loan Seller: | BANA | | Single Asset/Portfolio: | Single Asset |
Credit Assessment (DBRS/Fitch/S&P): | AAA(sf)/BBB-sf/BBB-(sf) | | Location: | San Francisco, CA 94105 |
Original Balance: | $50,000,000 | | General Property Type: | Office |
Cut-off Date Balance(1): | $50,000,000 | | Detailed Property Type: | CBD |
% of Initial Pool Balance(1): | 4.1% | | Title Vesting: | Fee |
Loan Purpose: | Refinance | | Year Built/Renovated: | 2018-2019/N/A |
Borrower Sponsor: | MetLife, Inc. | | Size: | 764,659 SF |
Guarantor: | Park Tower Owner LLC | | Cut-off Date Balance per SF(1): | $719 |
Mortgage Rate: | 3.4500% | | Maturity Date/ARD Balance per SF(1): | $719 |
Note Date: | 7/23/2019 | | Property Manager: | MA West Management LLC |
First Payment Date: | 9/1/2019 | | | (borrower-related) |
Anticipated Repayment Date (ARD)(2): | 8/1/2029 | | | |
Maturity Date(2): | 8/1/2034 | | | |
Original Term to ARD: | 120 months | | | |
Original Amortization Term: | 0 months | | Underwriting and Financial Information |
IO Period: | 120 months | | UW NOI: | $56,350,668 |
Seasoning: | 4 months | | UW NOI Debt Yield(1): | 10.2% |
Prepayment Provisions: | LO (23); YM (90); O (7) | | UW NOI Debt Yield at Maturity/ARD(1): | | 10.2% |
Lockbox/Cash Mgmt Status: | Hard/Springing | | UW NCF DSCR(1): | 2.93x |
Additional Debt Type: | Pari Passu | | Most Recent NOI(4): | N/A |
Additional Debt Balance(1): | $500,000,000 | | 2nd Most Recent NOI(4): | | N/A |
Future Debt Permitted (Type)(1): | No (N/A) | | 3rd Most Recent NOI(4): | N/A |
Reserves(3) | | Most Recent Occupancy(5): | 98.9% (10/1/2019) |
Type | Initial | Monthly | Cap | | 2nd Most Recent Occupancy(4): | N/A |
RE Tax: | $0 | Springing | N/A | | 3rd Most Recent Occupancy(4): | N/A |
Insurance: | $0 | Springing | N/A | | Appraised Value (as of)(6): | $1,120,000,000 (10/1/2019) |
Deferred Maintenance: | $4,412,926 | $0 | N/A | | Appraised Value per SF(6): | $1,465 |
TI/LC: | $80,198,366 | $0 | N/A | | Cut-off Date LTV Ratio(1)(6): | 49.1% |
Regulatory Fees Reserve: | $5,528,653 | $0 | N/A | | Maturity Date/ARD LTV Ratio(1)(6): | 49.1% |
| | | | | | | | |
Sources and Uses |
Sources | Proceeds | % of Total | | Uses | Proceeds | % of Total |
Whole Loan(1): | $550,000,000 | 100.0% | | Loan Payoff: | $294,460,472 | 53.5% |
| | | | Reserves(7): | $145,173,206 | 26.4% |
| | | | Return of Equity: | $108,543,869 | 19.7% |
| | | | Closing Costs: | $1,822,453 | 0.3% |
Total Sources: | $550,000,000 | 100.0% | | Total Uses: | $550,000,000 | 100.0% |
(1) | The Park Tower at Transbay Mortgage Loan (as defined below) is a part of the Park Tower at Transbay Whole Loan (as defined below) with an original aggregate principal balance of $550,000,000. The Cut-off Date Balance per SF, Maturity Date/ARD Balance per SF, UW NOI Debt Yield, UW NOI Debt Yield at Maturity/ARD, UW NCF DSCR, Cut-off Date LTV Ratio and Maturity Date/ARD LTV Ratio numbers presented above are based on the Park Tower at Transbay Whole Loan. |
(2) | The Park Tower at Transbay Whole Loan is structured with an Anticipated Repayment Date (“ARD”) and will be interest-only prior to the ARD. From and after the ARD, the Park Tower at Transbay Whole Loan will accrue additional interest at a fixed rate of 2.5000%, which will be deferred and due and payable on the Maturity Date (or earlier repayment in full of the Park Tower at Transbay Whole Loan.) The ARD automatically triggers a Cash Sweep Period (see “Lockbox and Cash Management”) whereby all excess cash flow is required to be used to pay down the principal balance of the Park Tower at Transbay Whole Loan and repay the additional accrued interest. |
(3) | See “Escrows and Reserves” below for further discussion of reserve requirements. |
(4) | Prior historical operating statements and occupancy are not applicable, as the Park Tower at Transbay Property (as defined below) was constructed in 2018-2019. |
(5) | The sole office tenant, Facebook, Inc. (98.9% of NRA), is currently in the process of building out its space and, according to the borrower sponsor, is in occupancy of floors 2-12 (Phase I) and is expected to move into its remaining space by September 2020. |
(6) | The Appraised Value shown reflects a “Prospective Market Value At Stabilization” value as of October 1, 2019, which assumes that Facebook, Inc. has commenced rent payments (which began in August 2019) and that all remaining construction project costs due by September 30, 2019 have been incurred (110% of the cost of which has been reserved by the lender). The “as-is” value as of May 30, 2019 of $959,000,000 results in both a Cut-off Date LTV Ratio and Maturity Date/ARD LTV Ratio of 57.4% for the Park Tower at Transbay Whole Loan. The appraiser also provided an “as dark” value as of May 30, 2019 of $1,004,000,000, which results in both a Cut-off Date LTV Ratio and Maturity Date/ARD LTV Ratio of 54.8% for the Park Tower at Transbay Whole Loan. The “as dark” value is greater than the “as-is” value due to the market rent being higher than the current contract rent at the Park Tower at Transbay Property. |
(7) | Reserves include $55,033,261 paid by the Park Tower at Transbay Borrower (as defined below) at loan origination, which amount was subsequently disbursed to Facebook, Inc. by the escrow agent to buy out Facebook Inc.’s rent abatement period. |
This is not a research report and was not prepared by any Underwriter’s research department. Please see additional important information and qualifications at the end of this Term Sheet.
T-100
Office – CBD | Loan #9 | Cut-off Date Balance: | | $50,000,000 |
250 Howard Street | Park Tower at Transbay | Cut-off Date LTV: | | 49.1% |
San Francisco, CA 94105 | | UW NCF DSCR: | | 2.93x |
| | UW NOI Debt Yield: | | 10.2% |
The Mortgage Loan. The ninth largest mortgage loan (the “Park Tower at Transbay Mortgage Loan”) is a part of a whole loan (the “Park Tower at Transbay Whole Loan”) evidenced by ten pari passu promissory notes in the aggregate original principal amount of $550,000,000. The Park Tower at Transbay Whole Loan is secured by a first priority fee mortgage on a 764,659 SF newly constructed, Class A office tower located in San Francisco, California (the “Park Tower at Transbay Property”).
The Park Tower at Transbay Mortgage Loan is evidenced by the non-controlling promissory Note A-5 in the original principal amount of $50,000,000. The controlling promissory Note A-3 and the non-controlling promissory Notes A-1, A-2, A-4, A-6, A-7, A-8, A-9 and A-10 (together, the “Park Tower at Transbay Pari Passu Companion Loans”) are in the aggregate original principal amount of $500,000,000. The Park Tower at Transbay Whole Loan will be serviced pursuant to the pooling and servicing agreement for the BANK 2019-BNK21 securitization trust. See “Description of the Mortgage Pool—The Whole Loans—The Non-Serviced Pari Passu Whole Loans” and “Pooling and Servicing Agreement” in the Preliminary Prospectus.
Park Tower at Transbay Whole Loan Summary |
Note | Original Balance | Cut-off Date Balance | Anticipated Note Holder | Controlling Piece |
A-1 | $100,000,000 | $100,000,000 | BANK 2019-BNK20 | No |
A-2 | $100,000,000 | $100,000,000 | BANK 2019-BNK23 | No |
A-3 | $100,000,000 | $100,000,000 | BANK 2019-BNK21 | Yes |
A-4 | $80,000,000 | $80,000,000 | BANK 2019-BNK22 | No |
A-5 | $50,000,000 | $50,000,000 | BANK 2019-BNK24 | No |
A-6 | $50,000,000 | $50,000,000 | Bank of America, N.A. | No |
A-7 | $25,000,000 | $25,000,000 | BANK 2019-BNK22 | No |
A-8 | $20,000,000 | $20,000,000 | BANK 2019-BNK20 | No |
A-9 | $15,000,000 | $15,000,000 | BANK 2019-BNK21 | No |
A-10 | $10,000,000 | $10,000,000 | BANK 2019-BNK22 | No |
Total | $550,000,000 | $550,000,000 | | |
The Borrower and the Borrower Sponsor. The borrower is Park Tower Owner LLC, a Delaware limited liability company, structured to be bankruptcy-remote with at least two independent directors (the “Park Tower at Transbay Borrower”).
The borrower sponsor is MetLife, Inc. (NYSE: MET), a Fortune 500 financial services company, providing insurance, annuities, employee benefits and asset management. The borrower sponsor was the original developer of the Park Tower at Transbay Property. There is no non-recourse carveout guarantor and no separate environmental indemnitor for the Park Tower at Transbay Whole Loan.
The Property. The Park Tower at Transbay Property is comprised of a newly constructed, Class A, pre-certified LEED Gold, 43-story high-rise office building located on the northeast corner of Beale Street and Howard Street in the Transbay Transit District in the South Financial District of downtown San Francisco, California. The Park Tower at Transbay Property contains a total of 764,659 SF. All of the office space (755,914 SF) and the two-level subterranean parking are leased to Facebook, Inc. (“Facebook”). Facebook’s space includes a mix of open and private offices, various common areas, a cafeteria, fitness/wellness center and a child care center. There is 50,000 SF of outdoor space including fourteen sky decks: large rooftop terraces on floors 12 and 28, and outside terraces on every third floor starting on floor 13 and ending on the top floor, 43. 70% of the floors have San Francisco Bay views.
The remaining rentable area is comprised of three retail spaces (8,745 SF) on the ground floor. One of the retail spaces was leased to Blue Bottle after loan origination and the other spaces are presently in lease negotiations with prospective tenants, according to the borrower sponsor. Building amenities include bike parking, an open plaza on the ground level, and two non-collateral adjacent public park spaces which are required to be maintained by the Park Tower at Transbay borrower sponsor.
The Park Tower at Transbay Property is located adjacent to the recently completed multi-billion-dollar Salesforce (f/k/a Transbay) Transit Center and City Park, providing immediate proximity to all forms of public transportation. The Park Tower at Transbay Property is within walking distance to the Ferry Building, waterfront AT&T Park, Moscone Center, Westfield Shopping Centre, SF MoMA, Union Square and South Park.
Major Tenant.
Facebook leases all of the office space (755,914 SF) on a long term, triple-net lease which commenced on March 1, 2019. Facebook’s lease is divided into three phases: Phase I includes floors 2-12, Phase II includes floors 13-25 and Phase III includes floors 26-43. The initial rent for Phase I, Phase II and Phase III is $60.00 PSF, $66.00 PSF and $72.00 PSF, respectively, resulting in a current weighted average rent of $65.82 PSF. The Facebook office lease requires annual rental increases of 3.0%. Facebook also leases the subterranean parking (110 spaces with capacity for 140 spaces with valet operations) based on an annual rent of $594,000 ($450/space per month), with increases to market rent every five years.
Facebook is currently in the process of building out its space and, according to the borrower sponsor, is in occupancy of Phase I and is expected to move into its remaining space by September 2020. The Park Tower at Transbay Borrower provided Facebook with a tenant improvement allowance of $110 PSF (of which $80,198,366 ($106 PSF) was outstanding as of the loan origination date and has been fully reserved by the lender) and estimates that Facebook will be spending an additional $300-$350 PSF on its build-out. Pursuant to its lease, Facebook was entitled to rent abatements, which have been bought out by the Park Tower at Transbay Borrower as of July 25, 2019. Facebook is now paying full unabated rent.
Facebook’s lease expiration for Phase I is February 28, 2033 and for Phases II and III are February 28, 2034. Each phase has two eight-year renewal options at fair market rent. In order to exercise the renewal option for Phase II, Facebook must exercise its option for Phase I. In order to exercise the renewal option for Phase III, Facebook must exercise both options for Phase I and II.
Facebook has a right of first offer to purchase the Park Tower at Transbay Property, as discussed in “Right of First Offer” below.
This is not a research report and was not prepared by any Underwriter’s research department. Please see additional important information and qualifications at the end of this Term Sheet.
T-101
Office – CBD | Loan #9 | Cut-off Date Balance: | | $50,000,000 |
250 Howard Street | Park Tower at Transbay | Cut-off Date LTV: | | 49.1% |
San Francisco, CA 94105 | | UW NCF DSCR: | | 2.93x |
| | UW NOI Debt Yield: | | 10.2% |
Facebook (NYSE: FB) provides various products to connect and share “online”. The company���s products include Facebook, which enables people to connect, share and discover through mobile devices and personal computers; Instagram, a community for sharing photos, videos, and messages; and Messenger and WhatsApp, both messaging applications. Facebook also provides Oculus, a hardware, software and developer platform, which allows people to connect through its virtual reality products. As of December 31, 2018, Facebook had approximately 1.52 billion daily active users. The company was founded in 2004 and is headquartered in Menlo Park, California. Facebook also has large block leases at 181 Fremont and 215 Fremont, in downtown San Francisco, both within one block of the Park Tower at Transbay Property. For the fiscal year ending December 31, 2018, Facebook reported total revenue of $55.8 billion, up from $40.7 billion in the prior year and $27.6 billion in 2016. Facebook has a current market capitalization of $478 billion.
The following table presents certain information relating to the tenant at the Park Tower at Transbay Property:
Tenant Summary |
Tenant Name | | Credit Rating (Fitch/Moody’s/S&P) | | Tenant SF | | Approx. % of Total SF | | Annual UW Rent | | % of Total Annual UW Rent | | Annual UW Rent PSF | | Lease Expiration | | Renewal Options | | Termination Options | |
Facebook, Inc. – Phase I | | NR/NR/NR | | 269,814 | | 35.3% | | $16,188,822 | | 32.5% | | $60.00 | | 2/28/2033 | | 2 x 8 Yrs | | N | |
Facebook, Inc. – Phase II(1) | | NR/NR/NR | | 238,962 | | 31.3% | | $15,771,464 | | 31.7% | | $66.00 | | 2/28/2034 | | 2 x 8 Yrs | | N | |
Facebook, Inc. – Phase III(1) | | NR/NR/NR | | 247,138 | | 32.3% | | $17,793,967 | | 35.8% | | $72.00 | | 2/28/2034 | | 2 x 8 Yrs | | N | |
Office Total/Wtd. Avg. | | | | 755,914 | | 98.9% | | $49,754,253 | | 100.0% | | $65.82 | | | | | | | |
| | | | | | | | | | | | | | | | | | | |
Vacant Space (Retail) | | | | 8,745 | | 1.1% | | $0 | | 0.0% | | | | | | | | | |
Total/Wtd. Avg. | | | | 764,659 | | 100.0% | | $49,754,253 | | 100.0% | | | | | | | | | |
Information is based on the underwritten rent roll.
(1) | Facebook is currently in the process of building out its space, is in occupancy of Phase I, and is expected to move into its remaining space by September 2020. |
The following table presents certain information relating to the lease rollover schedule at the Park Tower at Transbay Property:
Lease Rollover Schedule |
Year | # of Leases Rolling | SF Rolling | UW Rent PSF Rolling | Approx. % of Total SF Rolling | Approx. Cumulative % of SF Rolling | Total UW Rent Rolling | Approx. % of Total Rent Rolling | Approx. Cumulative % of Total Rent Rolling |
2019 | 0 | 0 | $0.00 | 0.0% | 0.0% | $0 | 0.0% | 0.0% |
2020 | 0 | 0 | $0.00 | 0.0% | 0.0% | $0 | 0.0% | 0.0% |
2021 | 0 | 0 | $0.00 | 0.0% | 0.0% | $0 | 0.0% | 0.0% |
2022 | 0 | 0 | $0.00 | 0.0% | 0.0% | $0 | 0.0% | 0.0% |
2023 | 0 | 0 | $0.00 | 0.0% | 0.0% | $0 | 0.0% | 0.0% |
2024 | 0 | 0 | $0.00 | 0.0% | 0.0% | $0 | 0.0% | 0.0% |
2025 | 0 | 0 | $0.00 | 0.0% | 0.0% | $0 | 0.0% | 0.0% |
2026 | 0 | 0 | $0.00 | 0.0% | 0.0% | $0 | 0.0% | 0.0% |
2027 | 0 | 0 | $0.00 | 0.0% | 0.0% | $0 | 0.0% | 0.0% |
2028 | 0 | 0 | $0.00 | 0.0% | 0.0% | $0 | 0.0% | 0.0% |
2029 | 0 | 0 | $0.00 | 0.0% | 0.0% | $0 | 0.0% | 0.0% |
2030 & Beyond | 1 | 755,914 | $65.82 | 98.9% | 98.9% | $49,754,253 | 100.0% | 100.0% |
Vacant | 0 | 8,745 | $0.00 | 1.1% | 100.0% | $0 | 0.0% | 100.0% |
Total/Wtd. Avg. | 1 | 764,659 | $65.82(1) | 100.0% | | $49,754,253 | 100.0% | |
Information is based on the underwritten rent roll.
| (1) | Total/Wtd. Avg. UW Rent PSF Rolling excludes vacant space. |
This is not a research report and was not prepared by any Underwriter’s research department. Please see additional important information and qualifications at the end of this Term Sheet.
T-102
Office – CBD | Loan #9 | Cut-off Date Balance: | | $50,000,000 |
250 Howard Street | Park Tower at Transbay | Cut-off Date LTV: | | 49.1% |
San Francisco, CA 94105 | | UW NCF DSCR: | | 2.93x |
| | UW NOI Debt Yield: | | 10.2% |
The Market. The Park Tower at Transbay Property is located in the South Financial District of San Francisco, California, just north of the Rincon Hill/South Beach/SOMA District, which has seen a resurgence in leasing activity particularly with respect to the technology sector, and east of the Yerba Buena District, home to several major redevelopment projects including the Yerba Buena complex, Moscone convention center and Westfield Shopping Center.
A significant development in the San Francisco central business district is the redevelopment of the approximately 40-acre area surrounding the Transbay Terminal, the primary transit hub in the downtown area. Redevelopment plans include replacing the outdated Transbay Terminal (which was completed in August 2018), extending Caltrain 1.3 miles (which construction began in 2012) and developing the surrounding neighborhood by widening Folsom Street and promoting sidewalk cafes and markets, and developing approximately 2,600 new homes, 3 million SF of office and commercial space, and 100,000 SF of retail space. Recent developments of the office space include the 61-story Salesforce Tower.
Salesforce has also leased approximately 325,000 SF at Transbay Parcel F (550 Howard) and approximately 335,000 SF at 350 Mission. Other technology firms leasing large blocks of space in the area include Facebook at 181 Fremont (432,000 SF) and at 215 Fremont (300,000 SF), Adobe at 100 Hooper (280,000 SF), Stripe at 510 Townsend (269,063 SF), Blend Labs at 500 Pine Street (72,000 SF), Twitch at 350 Bush Street (185,000 SF), LinkedIn at 222 Second Street (430,650 SF) and Pinterest at 88 Bluxome Street (490,000 SF). As of the first quarter of 2019, large block demand greater than 50,000 SF has climbed 41% year over year, outpacing supply. According to the appraisal, there are currently 20 tenant requirements of 100,000 SF or more but only five contiguous space options that can offer occupancy through 2023.
According to a third party market report, the Park Tower at Transbay Property is located in the South Financial District office submarket of the San Francisco office market. For the first quarter of 2019, the submarket had total inventory of approximately 28.2 million SF with a vacancy rate of 6.7% and average asking rents of $83.02 PSF.
According to the appraisal, the estimated 2019 population within a one-half-, one- and three-mile radius of the Park Tower at Transbay Property was 16,122, 59,433 and 378,299, respectively. The 2019 median household income within the same radii was $204,917, $105,624 and $113,407, respectively.
The following table presents recent leasing data at comparable office properties with respect to the Park Tower at Transbay Property:
| Comparable Lease Summary |
Property | Year Built | Distance from Subject | Property Size (SF) | Tenant | Lease Area (SF) | Lease Date | Initial Rent PSF NNN | Lease Term (Yrs.) | TI PSF |
Park Tower at Transbay | 2018-2019 | N/A | 764,659 | Facebook | 755,914 | March-19 | $65.82 | 15 | $110 |
Parcel F 546-550 Howard Street | 2023 (projected) | 0.2 miles | 1,100,000 | Salesforce | 325,000 | 4Q18 | $80.00 | 15 | $100 |
88 Bluxome Street | TBD | 1.4 miles | 1,000,000 | Pinterest | 490,000 | 1Q19 | $78.00 | 10-15 | N/A |
181 Fremont Street | 2018 | 0.1 miles | 432,000 | Facebook | 432,000 | Sep-17 | $65.00 | 10 | $100 |
45 Fremont | 1978 | 0.3 miles | 602,780 | Slack Technologies | 208,459 | Aug-19 | $69.00 | 11.3 | $100-$130 |
One Tehama | 1929 | 0.2 miles | 98,566 | Social Finance | 98,566 | Sep-18 | $70.00 | 11 | $105 |
| | | | | | | | | | |
Source: Appraisal and Facebook lease.
The following table presents the appraiser’s market rent conclusions:
Market Rent Summary |
| Office – Low | Office – Mid | Office - High | Retail |
Market Rent | $75.00 | $80.00 | $85.00 | $65.00 |
Lease Term (Yrs.) | 12 | 12 | 12 | 10 |
Rental Increase Projection | 3.0% per annum | 3.0% per annum | 3.0% per annum | 3.0% per annum |
This is not a research report and was not prepared by any Underwriter’s research department. Please see additional important information and qualifications at the end of this Term Sheet.
T-103
Office – CBD | Loan #9 | Cut-off Date Balance: | | $50,000,000 |
250 Howard Street | Park Tower at Transbay | Cut-off Date LTV: | | 49.1% |
San Francisco, CA 94105 | | UW NCF DSCR: | | 2.93x |
| | UW NOI Debt Yield: | | 10.2% |
Underwritten Net Cash Flow. The following table presents certain information relating to the Underwritten Net Cash Flow at the Park Tower at Transbay Property:
Cash Flow Analysis(1) |
| | UW | | UW PSF | |
Base Rent(2) | | $50,322,681 | | $65.81 | |
Straight Line Rent | | $7,996,394 | | $10.46 | |
Reimbursements | | $29,328,101 | | $38.35 | |
Parking Income | | $594,000 | | $0.78 | |
Vacancy(3) | | ($2,908,912) | | ($3.80) | |
Effective Gross Income | | $85,332,264 | | $111.60 | |
| | | | | |
Real Estate Taxes | | $16,161,609 | | $21.14 | |
Insurance | | $1,561,863 | | $2.04 | |
Other Operating Expenses | | $11,258,124 | | $14.72 | |
Total Operating Expenses | | $28,981,596 | | $37.90 | |
| | | | | |
Net Operating Income | | $56,350,668 | | $73.69 | |
TI/LC | | $0 | | $0.00 | |
Capital Expenditures | | $72,995 | | $0.10 | |
Net Cash Flow | | $56,277,673 | | $73.60 | |
| | | | | |
Occupancy %(3) | | 96.7% | | | |
NOI DSCR(4) | | 2.93x | | | |
NCF DSCR(4) | | 2.93x | | | |
NOI Debt Yield(4) | | 10.2% | | | |
NCF Debt Yield(4) | | 10.2% | | | |
| (1) | Prior historical operating statements and occupancy are not applicable, as the Park Tower at Transbay Property was constructed in 2018-2019. |
| (2) | UW Base Rent includes the ground floor retail space (8,745 SF) grossed up to an estimated NNN rent of $65.00 PSF. |
| (3) | The Park Tower at Transbay Property is 98.9% leased to Facebook. UW Vacancy is 2.5% for the office floors and 100.0% for the retail space. |
| (4) | The debt service coverage ratios and debt yields shown are based on the Park Tower at Transbay Whole Loan. |
Escrows and Reserves.
Taxes and Insurance Reserves - So long as (x) no Cash Sweep Period (as defined below) exists and (y) the Park Tower at Transbay Borrower provides evidence to the lender that all property taxes and insurance premiums have been paid in full, monthly escrows for taxes and insurance will be waived.
Deferred Maintenance - The Park Tower at Transbay Borrower deposited at loan origination $4,412,926, which is equal to 110% of the estimated cost for the completion of the outstanding project costs for the construction of the Park Tower at Transbay Property.
TI/LC Reserve - The Park Tower at Transbay Borrower deposited at loan origination $80,198,366 for outstanding tenant improvement allowances owed to Facebook.
Regulatory Fees Reserve - The Park Tower at Transbay Borrower deposited at loan origination $5,528,653 which is equal to 100% of the estimated cost for the regulatory fees in connection with the development of the Park Tower at Transbay Property as required pursuant to an owner participation/disposition and development agreement between the Successor Agency to the Redevelopment Agency of the City of San Francisco and the Park Tower at Transbay Borrower and as required for Municipal Transportation Agency additional street use fees.
Lockbox and Cash Management. The Park Tower at Transbay Whole Loan documents require a hard lockbox with springing cash management upon the occurrence of a Cash Sweep Period. During the continuance of a Cash Sweep Period, all funds in the lockbox account are required to be swept each business day to a lender-controlled cash management account and disbursed in accordance with the Park Tower at Transbay Whole Loan documents. Additionally, during a Cash Sweep Period, all excess cash flow is required to be held as additional security for the Park Tower at Transbay Whole Loan until the discontinuance of the Cash Sweep Period.
A “Cash Sweep Period” will commence upon:
| (i) | an event of default under the Park Tower at Transbay Whole Loan documents beyond notice and cure periods (a “Default Trigger”), |
| (ii) | the Park Tower at Transbay Borrower seeking bankruptcy protection (a “Borrower Bankruptcy Trigger”), |
| (iii) | Facebook seeking bankruptcy protection (a “Facebook Bankruptcy Trigger”), |
| (iv) | Facebook (A) being in monetary or material non-monetary default beyond notice and cure periods or (B) terminating or giving notice to terminate its lease (each, a “Tenant Trigger”), |
This is not a research report and was not prepared by any Underwriter’s research department. Please see additional important information and qualifications at the end of this Term Sheet.
T-104
Office – CBD | Loan #9 | Cut-off Date Balance: | | $50,000,000 |
250 Howard Street | Park Tower at Transbay | Cut-off Date LTV: | | 49.1% |
San Francisco, CA 94105 | | UW NCF DSCR: | | 2.93x |
| | UW NOI Debt Yield: | | 10.2% |
| (v) | the Park Tower at Transbay Borrower failing to repay the Park Tower at Transbay Whole Loan in full on or before the ARD (an “ARD Trigger”), |
| (vi) | if a Facebook Bankruptcy Trigger or a Tenant Trigger previously occurred and was cured pursuant to clause (c) below and thereafter, the debt yield is less than 7.000% (not including any straight line rent) for two consecutive calendar quarters (a “Debt Yield Trigger”), or |
| (vii) | any replacement tenant (should the Facebook lease be terminated) subsequently going dark in more than 50% the office SF at the Park Tower at Transbay Property (a “Replacement Tenant Trigger”), unless the replacement tenant has a credit rating of at least “BBB-” by S&P or Fitch or “Baa3” by Moody’s. |
A Cash Sweep Period will end when (provided no other Cash Sweep Period is continuing):
| (a) | if triggered by a Default Trigger, the cure of the event of default under the Park Tower at Transbay Whole Loan documents, |
| (b) | if triggered by a Facebook Bankruptcy Trigger, the replacement or assumption of the Facebook lease by the bankruptcy court and the dismissal of such bankruptcy proceedings, |
| (c) | if triggered by a Tenant Trigger or a Debt Yield Trigger, the debt yield being equal to or greater than 7.00% (not including any straight line rent) for the trailing two quarters, and |
| (d) | if triggered by a Replacement Tenant Trigger (x) delivery of a replacement lease(s) for at least 50% of the office SF at the Park Tower at Transbay Property, or (y) the dark replacement tenant re-opens business in at least 50% of the office SF at the Park Tower at Transbay Property. |
A Cash Sweep Period triggered by a Borrower Bankruptcy Trigger or an ARD Trigger may not be cured and will continue until the full repayment of the Park Tower at Transbay Whole Loan. All excess cash collected after an ARD Trigger will be applied to the reduction of principal, then to pay off additional accrued interest.
Additional Secured Indebtedness (not including trade debts). The Park Tower at Transbay Property also secures the Park Tower at Transbay Non-Serviced Pari Passu Companion Loans which have an aggregate Cut-off Date principal balance of $500,000,000. The Park Tower at Transbay Non-Serviced Pari Passu Companion Loans accrue interest at the same rate as the Park Tower at Transbay Mortgage Loan. The Park Tower at Transbay Mortgage Loan is entitled to payments of interest on a pro rata and pari passu basis with the Park Tower at Transbay Non-Serviced Pari Passu Companion Loans. The holders of the Park Tower at Transbay Mortgage Loan and the Park Tower at Transbay Non-Serviced Pari Passu Companion Loans have entered into a co-lender agreement which sets forth the allocation of collections on the Park Tower at Transbay Whole Loan. See “Description of the Mortgage Pool—The Whole Loans—The Non-Serviced Pari Passu Whole Loans” in the Preliminary Prospectus.
Mezzanine Loan and Preferred Equity. Not permitted.
Release of Property. Not permitted.
Right of First Offer. Facebook has a right of first offer to purchase the Park Tower at Transbay Property at the same terms as any purchase offer received by the Park Tower at Transbay Borrower. If Facebook fails to exercise its right of first offer, the Park Tower at Transbay Borrower will be free to sell the Park Tower at Transbay Property to another party other than a Facebook competitor, namely Alphabet Inc., Amazon.com, Inc., Apple Inc., Microsoft Corporation, salesforce.com, inc., Snap Inc. and Samsung Electronics, which list of competitors is subject to change by Facebook in accordance with its lease.
Letter of Credit. None.
Terrorism Insurance. The Park Tower at Transbay Borrower is required to obtain and maintain property insurance that covers perils of terrorism and acts of terrorism in an amount equal to the full replacement cost of the Park Tower at Transbay Property and business interruption insurance for 36 months with a twelve month extended period of indemnity, provided, if the Terrorism Risk Insurance Act of 2002, as extended and modified by the Terrorism Risk Insurance Program Reauthorization Act of 2015 (as the same may be further modified, amended, or extended) is not in effect, the Park Tower at Transbay Borrower will not be required to pay annual premiums in excess of two times the premium then payable for the property and business interruption/loss of rents insurance in order to obtain the terrorism coverage. See “Risk Factors—Risks Relating to the Mortgage Loans—Terrorism Insurance May Not Be Available for All Mortgaged Properties” in the Preliminary Prospectus.
This is not a research report and was not prepared by any Underwriter’s research department. Please see additional important information and qualifications at the end of this Term Sheet.
T-105
Multifamily – Mid Rise | Loan #10 | Cut-off Date Balance: | | $45,800,000 |
Various | West LA Multifamily Portfolio | Cut-off Date LTV: | | 61.2% |
Los Angeles, CA Various | | U/W NCF DSCR: | | 1.95x |
| | U/W NOI Debt Yield: | | 7.0% |
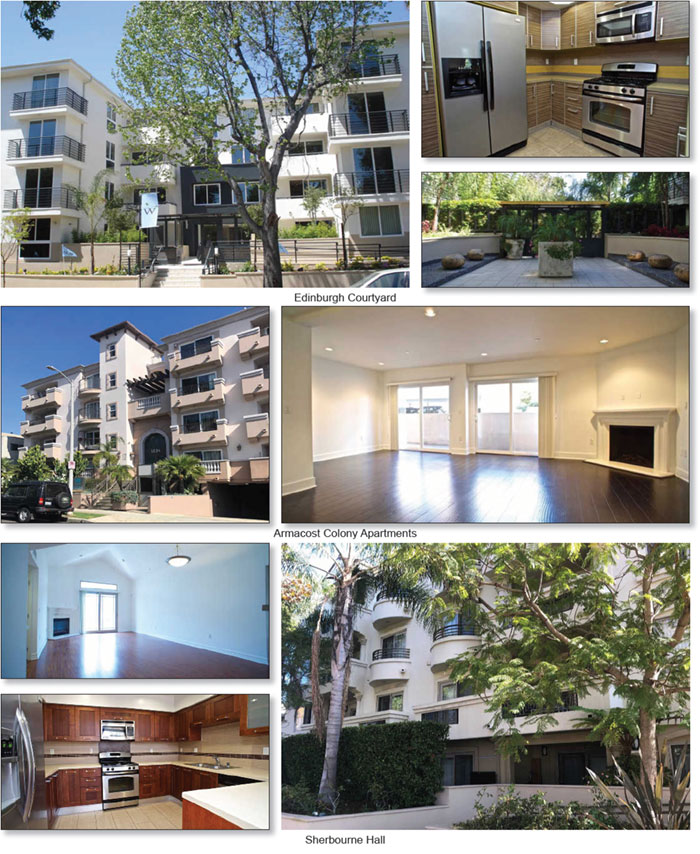
This is not a research report and was not prepared by any Underwriter’s research department. Please see additional important information and qualifications at the end of this Term Sheet.
T-106
Multifamily – Mid Rise | Loan #10 | Cut-off Date Balance: | | $45,800,000 |
Various | West LA Multifamily Portfolio | Cut-off Date LTV: | | 61.2% |
Los Angeles, CA Various | | U/W NCF DSCR: | | 1.95x |
| | U/W NOI Debt Yield: | | 7.0% |
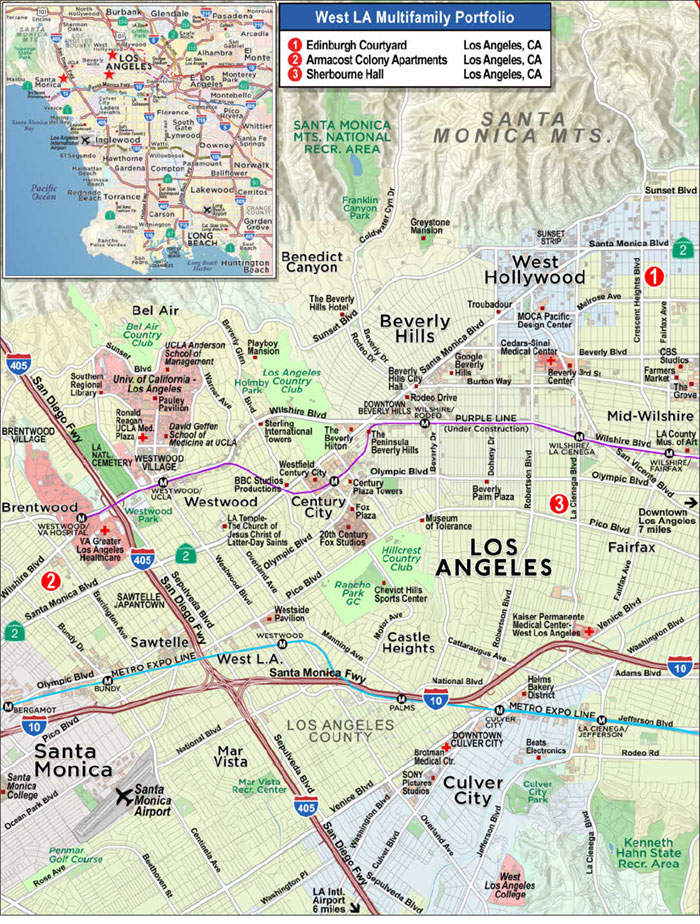
This is not a research report and was not prepared by any Underwriter’s research department. Please see additional important information and qualifications at the end of this Term Sheet.
T-107
Mortgage Loan No. 10 – West LA Multifamily Portfolio |
Mortgage Loan Information | | Property Information |
Mortgage Loan Seller: | BANA | | Single Asset/Portfolio: | Portfolio |
Credit Assessment (DBRS/Fitch/S&P): | NR/NR/NR | | Location(2): | Los Angeles, CA Various |
Original Balance: | $45,800,000 | | General Property Type: | Multifamily |
Cut-off Date Balance: | $45,800,000 | | Detailed Property Type: | Mid Rise |
% of Initial Pool Balance: | 3.7% | | Title Vesting: | Fee |
Loan Purpose: | Refinance | | Year Built/Renovated(2): | Various/N/A |
Borrower Sponsor: | Wiseman Residential | | Size(2): | 96 Units |
Guarantors: | Isaac Cohanzad; The Cohanzad Revocable Family Trust | | Cut-off Date Balance per Unit: | $477,083 |
Mortgage Rate: | 3.5280% | | Maturity Date Balance per Unit: | $477,083 |
Note Date: | 11/1/2019 | | Property Manager: | Wiseman Management, LLC |
First Payment Date: | 12/1/2019 | | | (borrower-related) |
Maturity Date: | 11/1/2029 | | Underwriting and Financial Information |
Original Term to Maturity: | 120 months | | UW NOI: | $3,222,362 |
Original Amortization Term: | 0 months | | UW NOI Debt Yield: | 7.0% |
IO Period: | 120 months | | UW NOI Debt Yield at Maturity: | 7.0% |
Seasoning: | 1 month | | UW NCF DSCR: | 1.95x |
Prepayment Provisions: | LO (25); DEF (90); O (5) | | Most Recent NOI: | $3,809,601 (9/30/2019 TTM) |
Lockbox/Cash Mgmt Status: | Springing/Springing | | 2nd Most Recent NOI: | $3,353,862 (12/31/2018) |
Additional Debt Type: | No | | 3rd Most Recent NOI: | $3,268,682 (12/31/2017) |
Additional Debt Balance: | N/A | | Most Recent Occupancy: | 100.0% (9/30/2019) |
Future Debt Permitted (Type): | No (N/A) | | 2nd Most Recent Occupancy: | 97.6% (12/31/2018) |
| Reserves(1) | | | | 3rd Most Recent Occupancy: | 97.4% (12/31/2017) |
Type | Initial | Monthly | Cap | | Appraised Value (as of)(3): | $74,800,000 (9/24/2019) |
RE Tax: | $85,289 | $42,645 | N/A | | Appraised Value per Unit(3): | $779,167 |
Insurance: | $0 | Springing | N/A | | Cut-off Date LTV Ratio(3): | 61.2% |
Recurring Replacements: | $0 | $2,600 | N/A | | Maturity Date LTV Ratio(3): | 61.2% |
| | | | | | | |
Sources and Uses |
Sources | Proceeds | % of Total | | Uses | Proceeds | % of Total |
Loan Amount: | $45,800,000 | 100.0% | | Loan Payoff: | $23,580,744 | 51.5% |
| | | | Return of Equity: | $21,569,231 | 47.1% |
| | | | Closing Costs: | $564,735 | 1.2% |
| | | | Reserves: | $85,289 | 0.2% |
Total Sources: | $45,800,000 | 100.0% | | Total Uses: | $45,800,000 | 100.0% |
(1) | See “Escrows and Reserves” below for further discussion of reserve information. |
(2) | See the West LA Multifamily Portfolio Property Schedule table below for details regarding the individual properties. |
(3) | The Appraised Value shown reflects a “Bulk Portfolio Value” for the West LA Multifamily Properties (as defined below), which assumes cost savings from operating the individual properties as a portfolio. The aggregate “As Is” values for the West LA Multifamily Properties is $74,300,000, which results in an Appraised Value per Unit of $773,958 and a Cut-off Date LTV Ratio and a Maturity Date LTV Ratio of 61.6% and 61.6%, respectively. |
The Mortgage Loan. The tenth largest mortgage loan (the “West LA Multifamily Portfolio Mortgage Loan”) is evidenced by a promissory note with an original principal balance of $45,800,000 secured by a first priority fee mortgage encumbering three multifamily properties located in Los Angeles, California: the Edinburgh Courtyard (the “Edinburgh Property”), Armacost Colony Apartments (the “Armacost Property”) and Sherbourne Hall (the “Sherbourne Property”, and together, the “West LA Multifamily Properties”).
The Borrowers and the Borrower Sponsor. The borrowers are Edinburgh Courtyard, LLC, Armacost Colony, LLC, and Sherbourne Hall, LLC (together, the “West LA Multifamily Borrowers”), each a single-purpose California limited liability company with at least one independent director. The borrower sponsor is Wiseman Residential, a real estate developer and manager with a current portfolio of 55 properties (1,740 units) and an additional 24 properties (855 units) under development in the Los Angeles area, inclusive of the West LA Multifamily Properties. The non-recourse carveout guarantors are Isaac Cohanzad (founder of Wiseman Residential) and The Cohanzad Revocable Family Trust.
The Properties. The West LA Multifamily Properties are comprised of three multifamily mid-rise properties totaling 96 units located in Los Angeles, California: the Edinburgh Property, Armacost Property and Sherbourne Property. The West LA Multifamily Properties were constructed by the borrower sponsor between 2008 and 2009. As of September 30, 2019, the West LA Multifamily Properties were 100.0% leased.
This is not a research report and was not prepared by any Underwriter’s research department. Please see additional important information and qualifications at the end of this Term Sheet.
T-108
Multifamily – Mid Rise | Loan #10 | Cut-off Date Balance: | | $45,800,000 |
Various | West LA Multifamily Portfolio | Cut-off Date LTV: | | 61.2% |
Los Angeles, CA Various | | U/W NCF DSCR: | | 1.95x |
| | U/W NOI Debt Yield: | | 7.0% |
The following table presents detailed information with respect to the West LA Multifamily Properties:
West LA Multifamily Portfolio Property Schedule |
Property Address | Year Built/ Renovated | Occupancy(1) | Units(1) | % of Total Units | Allocated Cut-Off Date Balance | % of Portfolio Cut-Off Date Balance | UW NOI | % of UW NOI | Appraised Value |
Edinburgh Property 833 North Edinburgh Avenue Los Angeles, CA 90049 | 2008/N/A | 100.0% | 57 | 59.4% | $25,581,427 | 55.9% | $1,823,438 | 56.6% | $41,500,000 |
Armacost Property 1234 Armacost Avenue Los Angeles, CA 90025 | 2009/N/A | 100.0% | 19 | 19.8% | $10,725,707 | 23.4% | $756,815 | 23.5% | $17,400,000 |
Sherbourne Property 1240 South Sherbourne Drive Los Angeles, CA 90035 | 2008/N/A | 100.0% | 20 | 20.8% | $9,492,867 | 20.7% | $642,109 | 19.9% | $15,400,000 |
Total/Wtd. Avg. | | 100.0% | 96 | 100.0% | $45,800,000 | 100.0% | $3,222,362 | 100.0% | $74,800,000(2) |
(1) | Based on the borrower rent roll dated September 30, 2019. |
(2) | The Appraised Value shown reflects a “Bulk Portfolio Value” for the West LA Multifamily Properties, which assumes cost savings from operating the individual properties as a portfolio. |
The Properties.
Edinburgh Property
The Edinburgh Property is a four-story, 57-unit apartment complex located on the southwest corner of Edinburgh Avenue and Willoughby Avenue in Los Angeles, California. The Edinburgh Property was built on a 0.77-acre parcel in 2008, features an outdoor courtyard and 143-space underground parking garage, and offers a furniture subscription and delivery service. The unit mix is comprised of 33 2-bedroom/2-bath units, 22 3-bedroom/3b-bath units, and 2 4-bedroom/3-bath units, with an average unit size of 1,287 SF. The units feature open floor plans, balconies, kitchens with Caeserstone counters and stainless steel appliances, wood laminate floors, in-suite washer/dryer hookups, walk-in closets, fireplaces, pre-wired alarm systems and views of the Hollywood Hills. As of September 30, 2019, the property was 100.0% occupied, with average in-place rent of $3,579/unit ($2.78 PSF). Five units at the Edinburgh Property (representing 5.2% of portfolio units) are subject to an affordable housing covenant, pursuant to which the West LA Multifamily Borrowers are required for a period of 30 years from the date of the certificate of occupancy (2008) to lease such units to low-income tenants at a rental rate that may not exceed 15% of the area’s net median income.
Armacost Property
The Armacost Property is a four-story, 19-unit apartment complex located on the north side of Armacost Avenue, south of Wilshire Boulevard. The Armacost Property was built on a 0.32-acre parcel in 2009 and features a 45-space underground parking garage. The unit mix is comprised of 17 3-bedroom/3-bath units and 2 4-bedroom/3-bath units, with an average unit size of 1,572 SF. The units feature balconies, kitchens with quartz counters and stainless steel appliances, wood laminate floors, in-suite washer/dryer hookups, walk-in closets and pre-wired alarm systems. As of September 30, 2019, the property was 100.0% occupied, with average in-place rent of $4,475/unit ($2.85 PSF).
Sherbourne Property
The Sherbourne Property is a four-story, 20-unit apartment complex located on the east side of South Sherbourne Drive just north of Pico Boulevard. The Sherbourne Property was built on a 0.33-acre parcel in 2008, features outdoor courtyards, a 50-space underground parking garage and laundry room, and offers a furniture subscription and delivery service. The unit mix is comprised of 4 2-bedroom/2.5-bath units and 16 3-bedroom/2.5-bath units, with an average unit size of 1,438 SF. The units feature open floor plans, balconies, kitchens with Caeserstone counters and stainless steel appliances, wood laminate floors, in-suite washer/dryer hookups, walk-in closets, fireplaces and pre-wired alarm systems. As of September 30, 2019, the property was 100.0% occupied, with average in-place rent of $3,694/unit ($2.57 PSF).
The Market. The West LA Multifamily Properties are located in Los Angeles, California. According to the appraisal, as of the second quarter of 2019, the vacancy rate in the Los Angeles multifamily market was approximately 3.96%, with average asking rents of $1,934 per unit.
The Edinburgh Property is located just south of West Hollywood, in the Beverly Grove neighborhood of Los Angeles, which is predominantly a residential neighborhood but also features retail corridors including Melrose Avenue, West 3rd Street, Fairfax Avenue, Beverly Boulevard and the Beverly Center shopping mall. The Edinburgh Property is a part of the Mid-Wilshire multifamily submarket, which had an eleven-year (2008-2018) average vacancy rate of 4.0% and year-over-year asking rent growth of 1.5%. As of the second quarter of 2019, the Mid-Wilshire submarket had a vacancy rate of 3.96%, with average asking rents of $2,462 per unit.
The Armacost Property is located east of the Santa Monica Pier and Third Street Promenade in the Sawtelle neighborhood of Los Angeles, which is a distinct Japanese American community that features multifamily mixed with office and retail uses and nearby entertainment amenities, including the Laemmle Royal Theater and Landmark’s Nuart Theater. The Armacost Property is a part of the Beverly Hills/Century City/UCLA multifamily submarket, which had an eleven -year (2008-2018) average vacancy rate of 4.90% and year-over-year asking rent growth of 1.01%. As of the second quarter of 2019, the Beverly Hills/Century City/UCLA submarket had a vacancy rate of 3.91%, with average asking rents of $2,979 per unit.
The Sherbourne Property is located directly south of Beverly Hills in the Pico-Robertson neighborhood of Los Angeles, which is predominantly a residential area. The Sherbourne Property is a part of the Mid-Wilchire multifamily submarket, which had an eleven -year (2008-2018) average vacancy rate of 4.00% and year-over-year asking rent growth of 1.5%. As of the second quarter of 2019, the Mid-Wilchire submarket had a vacancy rate of 3.96%, with average asking rents of $2,462 per unit.
This is not a research report and was not prepared by any Underwriter’s research department. Please see additional important information and qualifications at the end of this Term Sheet.
T-109
Multifamily – Mid Rise | Loan #10 | Cut-off Date Balance: | | $45,800,000 |
Various | West LA Multifamily Portfolio | Cut-off Date LTV: | | 61.2% |
Los Angeles, CA Various | | U/W NCF DSCR: | | 1.95x |
| | U/W NOI Debt Yield: | | 7.0% |
The following table presents certain information relating to the demographics surrounding the West LA Multifamily Properties:
Demographic Summary |
| Edinburgh Property | Armacost Property | Sherbourne Property |
Est. 2019 Population | | | |
1-mile radius | 52,207 | 50,784 | 47,442 |
3-mile radius | 300,529 | 259,572 | 339,206 |
5-mile radius | 881,290 | 542,010 | 933,470 |
Est. 2019 Avg. Household Income | | | |
1-mile radius | $108,246 | $124,437 | $119,027 |
3-mile radius | $116,938 | $143,221 | $118,851 |
5-mile radius | $101,894 | $142,245 | $103,249 |
The following table presents certain information relating to the appraiser’s market rent conclusion for the West LA Multifamily Properties:
Market Rent Summary |
Property | Avg. Monthly Rent per Unit(1) | Avg. Monthly Rent per SF | Avg. Monthly Market Rent per Unit | Avg. Monthly Market Rent per SF |
Edinburgh Property | $3,579 | $2.78 | $3,609 | $2.81 |
Armacost Property | $4,475 | $2.85 | $4,584 | $2.86 |
Sherbourne Property | $3,694 | $2.57 | $3,810 | $2.65 |
(1) | Information obtained from the borrower rent roll dated September 30, 2019. |
The following table presents certain information relating to comparable rental properties to the Edinburgh Property:
Comparable Rental Properties - Edinburgh Property |
Property | Year Built | Occupancy | # Units | Unit Mix | Average SF per Unit | Average Rent per Unit | Average Annual Rent PSF |
Edinburgh Property(1) | 2008 | 100% | 57 | 2BR 3BR 4BR | 1,151 1,457 1,650 | $3,188 $4,005 $5,345 | $2.77 $2.75 $3.24 |
120 S Orlando 120 S Orlando Ave | 2016 | 95% | 37 | 2BR 3BR | 1,147 1,388 | $4,000 $3,800 - $4,700 | $3.49 $2.74 – $3.39 |
Kings on Third 129 South Kings Road | 2018 | 100% | 36 | 2BR 3BR | 1,135 1,436 | $3,450 - $3,900 $4,200 - $4,800 | $3.04 - $3.44 $2.92 - $3.34 |
Hayworth Hyde 409 N Hayworth Avenue | 2016 | 97% | 34 | 2BR 3BR 3BR | 968 1,250 1,728 | $4,000 - $4,270 $4,595 $5,000 - $5,200 | $4.13 - $4.41 $3.68 $2.89 - $3.01 |
Hudson Lux 807 N Hudson Avenue | 2017 | 94% | 36 | 1BR 2BR 3BR 4BR | 679 1,160 1,346 1,609 | $2,350 $3,500 - $3,600 $3,900 - $4,000 $4,500 - $5,000 | $3.46 $3.02 - $3.10 $2.90 - $2.97 $2.80 - $3.11 |
The Highland 1411 N Highland Avenue | 2016 | 96% | 76 | Studio 1BR 2BR 3BR 3BR PH | 527 742 1,026 1,390 1,722 | $3,000 - $3,285 $2,900 - $3,700 $3,300 - $4,100 $5,350 $8,800 | $5.69 - $6.23 $3.91 - $4.99 $3.22 - $4.00 $3.85 $5.11 |
Source: Appraisal
(1) | Information obtained from the borrower rent roll dated September 30, 2019. |
This is not a research report and was not prepared by any Underwriter’s research department. Please see additional important information and qualifications at the end of this Term Sheet.
T-110
Multifamily – Mid Rise | Loan #10 | Cut-off Date Balance: | | $45,800,000 |
Various | West LA Multifamily Portfolio | Cut-off Date LTV: | | 61.2% |
Los Angeles, CA Various | | U/W NCF DSCR: | | 1.95x |
| | U/W NOI Debt Yield: | | 7.0% |
The following table presents certain information relating to comparable rental properties to the Armacost Property:
Comparable Rental Properties - Armacost Property |
Property | Year Built | Occupancy | # Units | Unit Mix | Average SF per Unit | Average Rent per Unit | Average Annual Rent PSF |
Armacost Property(1) | 2009 | 100% | 19 | 1BR 3BR 3BR 4BR | 750 1,375 1,615 1,881 | $2,600 $4,295 $4,514 $5,320 | $3.47 $3.12 $2.80 $2.83 |
NMS 1759 1759 Beloit Avenue | 2009 | 100% | 35 | 1BR 2BR 3BR 4BR | 520 1,000 1,380 1,400 | $2,450 $3,900 $6,500 $6,500 | $4.71 $3.90 $4.71 $4.64 |
Dorothy Village 111818 Dorothy Street | 2016 | 100% | 28 | 2BR 2BR 3BR | 1,279 1,435 1,531 | $4,000 $4,200 $4,900 | $3.13 $2.93 $3.20 |
Kiowa Stone 11847 Kiowa Avenue | 2019 | 91% | 32 | 3BR 4BR | 1,455 2,620 | $4,950 - $6,195 $7,295 | $3.40 - $4.26 $2.78 |
Colby at Ohio 1515 Colby Avenue | 2018 | 96% | 56 | 2BR 3BR 4BR | 1,068 1,292 1,622 | $4,000 $4,650 - $4,795 $5,000 - $5,200 | $3.75 $3.60 - $3.71 $3.08 - $3.21 |
Montclair 11965 Montana Avenue | 2018 | 92% | 49 | 2BR 3BR 4BR | 1,719 1,827 1,933 | $5,500 $6,195 $6,495 | $3.20 $3.39 $3.36 |
Source: Appraisal
(1) | Information obtained from the borrower rent roll dated September 30, 2019. |
The following table presents certain information relating to comparable rental properties to the Sherbourne Property:
Comparable Rental Properties - Sherbourne Property |
Property | Year Built | Occupancy | # Units | Unit Mix | Average SF per Unit | Average Rent per Unit | Average Annual Rent PSF |
Sherbourne Property(1) | 2008 | 100% | 20 | 2BR 3BR | 1,400 1,447 | $3,345 $3,781 | $2.39 $2.61 |
120 S Orlando 120 S Orlando Avenue | 2016 | 95% | 37 | 2BR 3BR | 1,147 1,388 | $4,000 $3,800 - $4,700 | $3.49 $2.74 – $3.39 |
Kings on Third 129 South Kings Road | 2018 | 100% | 36 | 2BR 3BR | 1,135 1,436 | $3,450 - $3,900 $4,200 - $4,800 | $3.04 - $3.44 $2.92 - $3.34 |
Hayworth Hyde 409 N Hayworth Avenue | 2016 | 97% | 34 | 2BR 3BR 3BR | 968 1,250 1,728 | $4,000 - $4,270 $4,595 $5,000 - $5,200 | $4.13 - $4.41 $3.68 $2.89 - $3.01 |
Pico Gateway 8525 W Pico Boulevard | 2010 | 94% | 39 | 2BR 3BR | 1,267 1,630 | $3,300 $3,800 | $2.60 $2.33 |
Boulevard on Wilshire 5353 Wilshire Boulevard | 2005 | 93% | 95 | 1BR 2BR 3BR | 697 949 1,197 | $2,425 $3,375 - $3,465 $3,750 | $3.48 $3.56 - $3.65 $3.13 |
Source: Appraisal
(1) | Information obtained from the borrower rent roll dated September 30, 2019. |
This is not a research report and was not prepared by any Underwriter’s research department. Please see additional important information and qualifications at the end of this Term Sheet.
T-111
Multifamily – Mid Rise | Loan #10 | Cut-off Date Balance: | | $45,800,000 |
Various | West LA Multifamily Portfolio | Cut-off Date LTV: | | 61.2% |
Los Angeles, CA Various | | U/W NCF DSCR: | | 1.95x |
| | U/W NOI Debt Yield: | | 7.0% |
Operating History and Underwritten Net Cash Flow. The following table presents certain information relating to the operating history and Underwritten Net Cash Flow at the West LA Multifamily Properties:
Cash Flow Analysis | |
| | 2016 | | 2017 | | 2018 | | 9/30/2019 TTM | | UW | | UW per Unit | |
Gross Potential Rent | | $3,876,393 | | $4,000,552 | | $4,099,367 | | $4,151,796 | | $4,354,824(1) | | $45,362.75 | |
Other Income(2) | | $38,000 | | $30,200 | | $36,710 | | $8,010 | | $32,400 | | $337.50 | |
Less Vacancy & Credit Loss | | $0 | | $0 | | $0 | | $0 | | ($217,741) | | ($2,268.14) | |
Effective Gross Income | | $3,914,393 | | $4,030,752 | | $4,136,077 | | $4,159,806 | | $4,169,483 | | $43,432.11 | |
| | | | | | | | | | | | | |
Real Estate Taxes | | $460,593 | | $471,528 | | $483,832 | | $0 | | $542,928 | | $5,655.50 | |
Insurance | | $13,213 | | $17,564 | | $15,991 | | $23,896 | | $17,800 | | $185.42 | |
Other Expenses | | $308,639 | | $272,978 | | $282,392 | | $326,309 | | $386,393 | | $4,024.93 | |
Total Expenses | | $782,445 | | $762,070 | | $782,215 | | $350,205 | | $947,121 | | $9,865.84 | |
| | | | | | | | | | | | | |
Net Operating Income | | $3,131,948 | | $3,268,682 | | $3,353,862 | | $3,809,601 | | $3,222,362 | | $33,566.27 | |
Capital Expenditures | | $0 | | $0 | | $0 | | $0 | | $31,200 | | $325.00 | |
Net Cash Flow | | $3,131,948 | | $3,268,682 | | $3,353,862 | | $3,809,601 | | $3,191,162 | | $33,241.27 | |
| | | | | | | | | | | | | |
Occupancy % | | 97.9% | | 97.4% | | 97.6% | | 97.5% | | 95.0% | | | |
NOI DSCR | | 1.91x | | 2.00x | | 2.05x | | 2.33x | | 1.97x | | | |
NCF DSCR | | 1.91x | | 2.00x | | 2.05x | | 2.33x | | 1.95x | | | |
NOI Debt Yield | | 6.8% | | 7.1% | | 7.3% | | 8.3% | | 7.0% | | | |
NCF Debt Yield | | 6.8% | | 7.1% | | 7.3% | | 8.3% | | 7.0% | | | |
(1) | UW Gross Potential Rent is based on the borrower rent roll dated September 30, 2019. |
(2) | Other Income includes parking revenue and pet fees. |
Escrows and Reserves.
Real Estate Taxes - The West LA Multifamily Borrowers deposited at loan origination $85,289 to a real estate tax reserve and are required to deposit monthly to the reserve 1/12 of the annual estimated real estate taxes (currently $42,645).
Insurance - The West LA Multifamily Borrowers are required to deposit monthly 1/12 of the annual estimated insurance premiums, unless waived (as currently) due to a blanket policy acceptable to the lender being in place.
Replacement Reserve - The West LA Multifamily Borrowers are required to deposit monthly $2,600 for replacement reserves.
Lockbox and Cash Management. Upon the first occurrence of a Cash Sweep Period, the West LA Multifamily Borrowers will be required to establish a lockbox account and a lender-controlled cash management account. During the continuance of a Cash Sweep Period, all rents or other income from the West LA Multifamily Properties are required to be deposited into the lockbox account, and on each business day, such funds are required to be transferred to the lender-controlled cash management account and disbursed in accordance with the West LA Multifamily Portfolio Mortgage Loan documents. Also during the continuance of a Cash Sweep Period, all excess cash is required to be held by the lender as additional collateral for the West LA Multifamily Portfolio Mortgage Loan.
A “Cash Sweep Period” will commence when the debt service coverage ratio based on amortizing payments is less than 1.10x on a trailing twelve month basis, tested quarterly, and will end when the debt service coverage ratio based on amortizing payments is at least 1.10x on a trailing twelve month basis, tested quarterly, for two consecutive calendar quarters.
Additional Secured Indebtedness (not including trade debts). Not permitted.
Mezzanine Loan and Preferred Equity. Not permitted.
Release of Property. Not permitted.
Right of First Offer/Right of First Refusal. None.
Ground Lease. None.
Letter of Credit. None.
Terrorism Insurance. The West LA Multifamily Borrowers are required to obtain and maintain property insurance that covers perils of terrorism and acts of terrorism in an amount equal to the full replacement cost of the West LA Multifamily Properties and business interruption insurance for 18 months with a six-month extended period of indemnity. See “Risk Factors—Risks Relating to the Mortgage Loans—Terrorism Insurance May Not Be Available for All Mortgaged Properties” in the Preliminary Prospectus.
This is not a research report and was not prepared by any Underwriter’s research department. Please see additional important information and qualifications at the end of this Term Sheet.
T-112
(THIS PAGE INTENTIONALLY LEFT BLANK)
Mortgage Loan No. 11 – Hampton Inn & Suites - John Wayne Airport |
Mortgage Loan Information | | Property Information |
Mortgage Loan Seller: | BANA | | Single Asset/Portfolio: | Single Asset |
Credit Assessment (DBRS/Fitch/S&P): | NR/NR/NR | | Location: | Irvine, CA 92612 |
Original Balance: | $33,250,000 | | General Property Type: | Hospitality |
Cut-off Date Balance: | $33,250,000 | | Detailed Property Type: | Select Service |
% of Initial Pool Balance: | 2.7% | | Title Vesting: | Fee |
Loan Purpose: | Refinance | | Year Built/Renovated: | 2018 / N/A |
Borrower Sponsors: | S3 Hotel Group | | Size: | 164 Rooms |
Guarantors: | Narendra Patel; Shetal Patel | | Cut-off Date Balance per Room: | $202,744 |
Mortgage Rate: | 3.5290% | | Maturity Date Balance per Room: | $158,728 |
Note Date: | 11/21/2019 | | Property Manager: | S3 Hotel Group |
First Payment Date: | 1/1/2020 | | | (borrower-related) |
Maturity Date: | 12/1/2029 | | Underwriting and Financial Information |
Original Term to Maturity: | 120 months | | UW NOI: | $3,880,920 |
Original Amortization Term: | 360 months | | UW NOI Debt Yield: | 11.7% |
IO Period: | 0 months | | UW NOI Debt Yield at Maturity: | 14.9% |
Seasoning: | 0 months | | UW NCF DSCR: | 1.97x |
Prepayment Provisions: | LO (24); DEF (92); O (4) | | Most Recent NOI: | $4,253,970 (9/30/2019 TTM) |
Lockbox/Cash Mgmt Status: | Hard/Springing | | 2nd Most Recent NOI: | $3,951,597 (12/31/2018 T-9 Ann.) |
Additional Debt Type: | N/A | | 3rd Most Recent NOI(1): | N/A |
Additional Debt Balance: | N/A | | Most Recent Occupancy: | 90.8% (9/30/2019) |
Future Debt Permitted (Type): | No (N/A) | | 2nd Most Recent Occupancy: | 83.0% (12/31/2018) |
| Reserves | | | | 3rd Most Recent Occupancy(1): | N/A |
Type | Initial | Monthly | Cap | | Appraised Value (as of): | $46,800,000 (10/7/2019) |
RE Tax: | $47,868 | $23,934 | N/A | | Appraised Value per Room: | $285,366 |
Insurance: | $41,837 | $4,649 | N/A | | Cut-off Date LTV Ratio: | 71.0% |
FF&E: | $0 | $14,053 | $1,600,000 | | Maturity Date LTV Ratio: | 55.6% |
Sources and Uses |
Sources | Proceeds | % of Total | | Uses | Proceeds | % of Total |
Loan Amount: | $33,250,000 | 100.0% | | Loan Payoff: | $23,328,858 | 70.2% |
| | | | Return of Equity: | $5,501,761 | 16.5% |
| | | | Closing Costs(2): | $4,329,676 | 13.0% |
| | | | Reserves: | $89,705 | 0.3% |
Total Sources: | $33,250,000 | 100.0% | | Total Uses: | $33,250,000 | 100.0% |
(1) | Historical NOI and Occupancy information is not available, as the Hampton Inn & Suites - John Wayne Airport Property (as defined below) is newly constructed and opened in March 2018. |
(2) | Includes $3,900,000 hold as part of the title indemnity agreement. See “The Borrower and the Borrower Sponsors” below. |
The Mortgage Loan. The eleventh largest mortgage loan (the “Hampton Inn & Suites - John Wayne Airport Mortgage Loan”) is evidenced by a promissory note in the original principal amount of $33,250,000 and secured by a first priority fee mortgage on a 164-room select service hotel located in Irvine, California (the “Hampton Inn & Suites - John Wayne Airport Property”).
The Borrower and the Borrower Sponsors. The borrower is Tides Hospitality, LLC (the “Hampton Inn & Suites - John Wayne Airport Borrower”), a single-purpose California limited liability company with at least one independent director.
The non-recourse carveout guarantors are Narendra Patel and Shetal Patel, the founders of S3 Hotel Group, an Orange County, California-based real estate investment firm that specializes in the development and management of limited service hotels in southern California. S3 Hotel Group currently owns and manages a portfolio of five hotels in Orange County. With a team of close to 300 members, S3 Hotel Group is focused on developing and managing high quality, select service hotels. S3 Hotel Group developed the Hampton Inn & Suites - John Wayne Airport Property at a cost of approximately $32,941,252 ($200,861 per room). Narendra Patel, one of the non-recourse carveout guarantors, is subject to pending litigation with a general contractor in connection with the construction of the Hampton Inn & Suites - John Wayne Airport Property. At loan origination, the Hampton Inn & Suites - John Wayne Airport Borrower escrowed $3,900,000 as part of an indemnity agreement with the title company (Chicago Title Insurance Company), to enable the lender to receive a clean title policy. Additionally, the non-recourse carveout guaranty includes a losses carveout in the event of a final, non-appealable court judgment in favor of the general contractor in excess of $3,900,000. See “Description of the Mortgage Pool—Litigation and Other Considerations” in the Preliminary Prospectus.
The Property. The Hampton Inn & Suites - John Wayne Airport Property is a five-story hotel located in Orange County, California within walking distance to John Wayne International Airport. The Hampton Inn & Suites - John Wayne Airport Property opened in March 2018 and contains 164 guest rooms. The room mix consists of 52 suites, 40 standard king rooms, 38 double queen rooms, and 34 king rooms with sofa beds. Each of the guestrooms features flat-screen televisions with premium channels, telephone, desk with chair, dresser, microwave, mini-fridge, nightstands, lamps, wet bar with sink in the living room, and lounge chair. The Hampton Inn & Suites - John Wayne Airport Property was developed to the Hampton Inn & Suites’ latest design concept and brand standards and offers guests several communal amenities including an outdoor swimming pool, fitness center, business center, convenience shop, 1,539 SF of meeting space and 125 parking spaces. Unique compared to other limited service hotels and other Hampton Inn & Suites hotels, the Hampton Inn & Suites - John Wayne Airport Property is improved with a full service bar and lounge area which offers a selection of alcohol and appetizers. The Hampton Inn & Suites - John Wayne Airport Property operates under a franchise agreement through July 31, 2036.
This is not a research report and was not prepared by any Underwriter’s research department. Please see additional important information and qualifications at the end of this Term Sheet.
T-114
Hospitality – Select Service | Loan #11 | Cut-off Date Balance: | | $33,250,000 |
2192 Dupont Drive | Hampton Inn & Suites - John Wayne Airport | Cut-off Date LTV: | | 71.0% |
Irvine, CA 92612 | | U/W NCF DSCR: | | 1.97x |
| | U/W NOI Debt Yield: | | 11.7% |
More specific information about the Hampton Inn & Suites - John Wayne Airport Property and the related competitive set is set forth in the following table:
Historical Occupancy, ADR, RevPAR(1) |
| |
| Competitive Set | Hampton Inn & Suites - John Wayne Airport Property | Penetration Factor |
| | | | |
Year | Occupancy | ADR | RevPAR | Occupancy | ADR | RevPAR | Occupancy | ADR | RevPAR |
12/31/2018(2) | 79.9% | $135.01 | $107.93 | 84.7% | $134.98 | $114.38 | 106.0% | 100.0% | 106.0% |
7/31/2019 T-12(3) | 82.8% | $143.07 | $118.48 | 90.4% | $138.31 | $125.02 | 109.2% | 96.7% | 105.5% |
9/30/2019 T-12(3) | 82.3% | $143.12 | $117.81 | 91.1% | $138.50 | $126.14 | 110.7% | 96.8% | 107.1% |
Source: Industry Report.
(1) | Variances between the underwriting, the appraisal and the industry report data with respect to Occupancy, ADR and RevPAR at the Hampton Inn & Suites - John Wayne Airport Property are attributable to variances in reporting methodologies and/or timing differences. |
(2) | The competitive set includes Best Western Plus Newport Mesa Inn, Courtyard Irvine John Wayne Airport Orange County, Extended Stay America Orange County John Wayne Airport, Springhill Suites Irvine John Wayne Airport Orange County and AC Hotels by Marriott Irvine. |
(3) | The competitive set includes DoubleTree Club Orange County Airport, Courtyard Irvine John Wayne Airport Orange County, Holiday Inn Santa Ana Orange County Airport, SpringHill Suites Irvine John Wayne Airport Orange County, Hyatt House Irvine John Wayne Airport and AC Hotels by Marriott Irvine. |
The Market. The Hampton Inn & Suites - John Wayne Airport Property is located in Irvine, California within walking distance to John Wayne International Airport. John Wayne International Airport is located approximately 35 miles south of Los Angeles, between the cities of Costa Mesa, Irvine, and Newport Beach. The service area includes more than three million people within the 34 cities and unincorporated areas of Orange County. In 2016, over 10 million passengers were served by John Wayne International Airport, which is the only airport in Orange County that provides commercial passenger and air-cargo service and is the primary provider of general aviation services and facilities in the county.
Hampton Inn & Suites - John Wayne Airport Property is located in Orange County, California, which is the second-most densely populated county in California and the sixth most populous county in the United States. Orange County is an influential metropolitan area with world-class educational, cultural, scientific, and business institutions. Featuring 42 miles of coastline and 34 cities spanning across 798 square miles, Orange County is located in the heart of Southern California between Los Angeles to the North, San Diego to the South, and Riverside and San Bernardino to the east. The County is consistently ranked among the most desirable places to live and work and offers an excellent quality of life due to its ideal year-round temperate climate, well-diversified economy, beautiful beaches, numerous shopping venues and established education, recreation and cultural base. The City of Irvine is the economic center of Orange County, approximately 40 miles southeast of Los Angeles and six miles from the Pacific Ocean. The City of Irvine includes residential communities, commercial retail centers, several industrial and office complexes, a 1,500-acre University of California campus, as well as civic, cultural, and recreational facilities.
According to the appraisal, the estimated 2019 population within a one-, three- and five-mile radius of the Hampton Inn & Suites - John Wayne Airport Property was 7,475, 154,680 and 539,538, respectively. The 2019 average household income within the same radii is $122,938, $121,000 and $120,000, respectively. According to the appraisal, Irvine’s residential population has grown from 10,081 in 1971 to 258,386 in 2016.
The following table presents certain information relating to the primary competitive properties to the Hampton Inn & Suites - John Wayne Airport Property:
Property Competitive Summary(1) |
Property Name | No. of Rooms | Year Built | Transient | Meeting & Group | | Estimated 2018 Occupancy | Estimated 2018 ADR | Estimated 2018 RevPAR |
Hampton Inn & Suites - John Wayne Airport | 164 | 2018 | 90% | 10% | | 84.7% | $133.15 | $112.83 |
AC Hotels by Marriott Irvine | 176 | 2017 | 90% | 10% | | 80%-85% | $165-$170 | $130-$135 |
Hyatt House Irvine John Wayne Airport | 149 | 2017 | 85% | 15% | | 80%-85% | $155-$160 | $130-$135 |
Wyndham Irvine Orange County Airport | 335 | 1986 | 75% | 25% | | 70%-75% | $115-$120 | $85-$90 |
Embassy Suites by Hilton Irvine Orange County Airport | 293 | 1986 | 80% | 20% | | 80%-85% | $165-$170 | $135-$140 |
Crowne Plaza Costa Mesa Orange County | 224 | 1973 | 75% | 25% | | 80%-85% | $125-$130 | $100-$105 |
Hampton Inn Santa Ana/Orange County Airport | 121 | 1992 | 90% | 10% | | 75%-80% | $120-$125 | $90-$95 |
DoubleTree Club Orange County Airport | 167 | 1986 | 90% | 10% | | 80%-85% | $130-$135 | $110-$115 |
Source: Appraisal.
(1) | Variances between the underwriting, the appraisal and the Historical Occupancy, ADR, RevPAR table above with respect to Occupancy, ADR and RevPAR at the Hampton Inn & Suites - John Wayne Airport Property are attributable to variances in reporting methodologies and/or timing differences. |
According to the appraisal, there is one hotel under construction in the market that is expected to directly compete with the Hampton Inn & Suites - John Wayne Airport Property, a 122-room Element Hotel that is expected to open in January 2021.
This is not a research report and was not prepared by any Underwriter’s research department. Please see additional important information and qualifications at the end of this Term Sheet.
T-115
Hospitality – Select Service | Loan #11 | Cut-off Date Balance: | | $33,250,000 |
2192 Dupont Drive | Hampton Inn & Suites - John Wayne Airport | Cut-off Date LTV: | | 71.0% |
Irvine, CA 92612 | | U/W NCF DSCR: | | 1.97x |
| | U/W NOI Debt Yield: | | 11.7% |
Operating History and Underwritten Net Cash Flow. The following table presents certain information relating to the operating history and Underwritten Net Cash Flow at the Hampton Inn & Suites - John Wayne Airport Property:
Cash Flow Analysis(1) |
| | 2018 T-9 Ann. | | 9/30/2019 TTM | | UW | | UW per Room |
Occupancy | | 83.0% | | 90.8% | | 90.5% | | |
ADR | | $135.00 | | $ 138.61 | | $138.38 | | |
RevPAR | | $112.05 | | $ 125.86 | | $125.22 | | |
| | | | | | | | |
Room Revenue | | $7,179,579 | | $7,532,908 | | $7,532,908 | | $45,932 |
Food & Beverage Revenue | | $252,670 | | $307,426 | | $307,426 | | $1,875 |
Other Income | | $503,896 | | $591,999 | | $591,999 | | $3,610 |
Total Revenue | | $7,936,145 | | $8,432,333 | | $8,432,333 | | $51,417 |
| | | | | | | | |
Real Estate Taxes | | $95,780 | | $165,940 | | $375,160 | | $2,288 |
Insurance | | $48,085 | | $57,417 | | $66,587 | | $406 |
Other Expenses | | $3,840,683 | | $3,955,006 | | $4,109,666 | | $25,059 |
Total Expenses | | $3,984,548 | | $4,178,363 | | $4,551,413 | | $27,753 |
| | | | | | | | |
Net Operating Income | | $3,951,597 | | $4,253,970 | | $3,880,920 | | $23,664 |
FF&E | | $0 | | $0 | | $337,293 | | $2,057 |
Net Cash Flow | | $3,951,597 | | $4,253,970 | | $3,543,627 | | $21,607 |
| | | | | | | | |
NOI DSCR (P&I) | | 2.20x | | 2.37x | | 2.16x | | |
NCF DSCR (P&I) | | 2.20x | | 2.37x | | 1.97x | | |
NOI Debt Yield | | 11.9% | | 12.8% | | 11.7% | | |
NCF Debt Yield | | 11.9% | | 12.8% | | 10.7% | | |
| | | | | | | | |
(1) | Further historical information is not available, as the Hampton Inn & Suites - John Wayne Airport Property is newly constructed and opened in March 2018. |
This is not a research report and was not prepared by any Underwriter’s research department. Please see additional important information and qualifications at the end of this Term Sheet.
T-116
(THIS PAGE INTENTIONALLY LEFT BLANK)
Mortgage Loan No. 12 – Giant Anchored Portfolio |
Mortgage Loan Information | | Property Information |
Mortgage Loan Seller: | WFB | | Single Asset/Portfolio: | Portfolio |
Credit Assessment (DBRS/Fitch/S&P): | NR/NR/NR | | Location: | Various |
Original Balance(1): | $30,000,000 | | General Property Type: | Retail |
Cut-off Date Balance(1): | $30,000,000 | | Detailed Property Type: | Anchored |
% of Initial Pool Balance: | 2.4% | | Title Vesting: | Fee |
Loan Purpose: | Acquisition | | Year Built/Renovated: | Various/Various |
Borrower Sponsors: | Leo Ullman; Robert F. Whalen, Jr. | | Size: | 548,482 SF |
Guarantors: | Leo Ullman; Robert F. Whalen, Jr. | Cut-off Date Balance per SF(1): | $177 |
Mortgage Rate: | 3.8700% | Maturity Date Balance per SF(1): | $160 |
Note Date: | 11/19/2019 | | Property Manager: | Vastgood Properties, LLC |
First Payment Date: | 1/6/2020 | | | (borrower-related) |
Maturity Date: | 12/6/2029 | | | |
Original Term to Maturity: | 120 months | | Underwriting and Financial Information |
Original Amortization Term: | 360 months | | UW NOI: | $8,817,765 |
IO Period: | 60 months | | UW NOI Debt Yield(1): | 9.1% |
Seasoning: | 0 months | | UW NOI Debt Yield at Maturity(1): | 10.0% |
Prepayment Provisions(2): | LO (24); DEF (92); O (4) | | UW NCF DSCR(1): | 1.52x |
Lockbox/Cash Mgmt Status: | Springing/Springing | | Most Recent NOI: | $9,094,942 (9/30/2019 TTM) |
Additional Debt Type(1)(3): | Pari Passu | | 2nd Most Recent NOI: | $9,034,687 (12/31/2018) |
Additional Debt Balance(1)(3): | $67,000,000 | | 3rd Most Recent NOI: | $8,978,911 (12/31/2017) |
Future Debt Permitted (Type): | No (N/A) | | Most Recent Occupancy: | 97.5% (9/1/2019) |
Reserves | | 2nd Most Recent Occupancy: | 98.0% (12/31/2018) |
Type | Initial | Monthly | Cap | | 3rd Most Recent Occupancy: | 97.5% (12/31/2017) |
RE Tax(4): | $0 | Springing | N/A | | Appraised Value (as of): | $130,500,000 (10/1/2019) |
Insurance(5): | $0 | Springing | N/A | | Appraised Value per SF: | $238 |
Recurring Replacements: | $0 | $12,741 | N/A | | Cut-off Date LTV Ratio(1): | 74.3% |
TI/LC: | $0 | $8,681 | $400,000 | | Maturity Date LTV Ratio(1): | 67.4% |
Sources and Uses |
Sources | Proceeds | % of Total | | Uses | Proceeds | % of Total |
Whole Loan Amount(1): | $97,000,000 | 75.7% | | Purchase Price: | $127,000,000 | 99.1% |
Equity(6): | $31,166,630 | 24.3% | | Closing Costs: | $1,166,630 | 0.9% |
Total Sources: | $128,166,630 | 100.0% | | Total Uses: | $128,166,630 | 100.0% |
(1) | The Cut-off Date Balance per SF, Maturity Date Balance per SF, UW NOI Debt Yield, UW NOI Debt Yield at Maturity, UW NCF DSCR, Cut-off Date LTV Ratio and Maturity Date LTV Ratio numbers presented above are based on the Giant Anchored Portfolio Whole Loan (as defined below). |
(2) | Defeasance of the Giant Anchored Portfolio Whole Loan is permitted at any time after the earlier to occur of (i) the end of the two-year period commencing on the closing date of the securitization of the last portion of the Giant Anchored Portfolio Whole Loan to be securitized and (ii) November 19, 2022 (the “Release Date”). The assumed defeasance lockout period of 24 payments is based on the closing date of this transaction in December 2019. |
(3) | See “The Mortgage Loan” and “Additional Secured Indebtedness (not including trade debts)” below for a discussion of additional indebtedness. |
(4) | Following the occurrence of a Cash Trap Event Period (see “Lockbox and Cash Management” section below), the Giant Anchored Portfolio Borrower is required to deposit ongoing monthly reserves for real estate taxes in an amount equal to 1/12th of the real estate taxes that the lender estimates will be payable during the next 12 months. |
(5) | Ongoing monthly reserves for insurance are not required as long as (i) no Cash Trap Event Period has occurred, and (ii) the Giant Anchored Portfolio Borrower provides the lender with evidence that the Giant Anchored Portfolio Properties’ insurance coverage is included in a blanket policy and such policy is in full force and effect. |
(6) | Peaceable has made a $20,200,000 preferred equity investment in the Giant Anchored Portfolio Borrower (see “Preferred Equity” below). |
The Mortgage Loan. The twelfth largest mortgage loan (the “Giant Anchored Portfolio Mortgage Loan”) is a part of a whole loan (the “Giant Anchored Portfolio Whole Loan”) evidenced by four pari passu promissory notes with an aggregate original principal amount of $97,000,000 secured by a first priority fee mortgage encumbering seven anchored retail properties located in Pennsylvania (the “Giant Anchored Portfolio Properties”). The Giant Anchored Portfolio Whole Loan was co-originated by Citi Real Estate Funding Inc. and Wells Fargo Bank, National Association. The Giant Anchored Portfolio Mortgage Loan is evidenced by the non-controlling promissory Note A-2-A in the original principal amount of $30,000,000. The controlling promissory Note A-1-A, and non-controlling Notes A-1-B and A-2-B, in the aggregate original principal amount of $67,000,000, are expected to be contributed to future securitization trusts or may be otherwise transferred at any time (the “Giant Anchored Portfolio Pari Passu Companion Loans”). The Giant Anchored Portfolio Whole Loan is expected to be serviced pursuant to the pooling and servicing agreement for the CGCMT 2019-C7 securitization trust. See “Description of the Mortgage Pool—The Whole Loans—The Non-Serviced Pari Passu Whole Loans” and “Pooling and Servicing Agreement—Servicing of the Non-Serviced Mortgage Loans” in the Preliminary Prospectus.
This is not a research report and was not prepared by any Underwriter’s research department. Please see additional important information and qualifications at the end of this Term Sheet.
T-118
Retail – Anchored | Loan #12 | Cut-off Date Balance: | | $30,000,000 |
Various | Giant Anchored Portfolio | Cut-off Date LTV: | | 74.3% |
Various, Various | | U/W NCF DSCR: | | 1.52x |
| | U/W NOI Debt Yield: | | 9.1% |
Giant Anchored Portfolio Whole Loan Summary |
Note | Original Balance | Cut-off Date Balance | Anticipated Note Holder | Controlling Piece |
A-1-A | $38,500,000 | $38,500,000 | CGCMT 2019-C7 | Yes |
A-1-B | $10,000,000 | $10,000,000 | Citi Real Estate Funding Inc. | No |
A-2-A | $30,000,000 | $30,000,000 | BANK 2019-BNK24 | No |
A-2-B | $18,500,000 | $18,500,000 | Wells Fargo Bank, National Association | No |
Total | $97,000,000 | $97,000,000 | | |
The Borrowers and the Borrower Sponsors. The borrowers comprise seven Delaware limited liability companies (collectively, the “Giant Anchored Portfolio Borrower”). Legal counsel to the Giant Anchored Portfolio Borrower delivered a non-consolidation opinion in connection with the origination of the Giant Anchored Portfolio Whole Loan. The borrower sponsors and non-recourse carveout guarantors for the Giant Anchored Portfolio Whole Loan are Leo Ullman and Robert F. Whalen, Jr. (collectively, the “Guarantor”).
Leo Ullman serves as the president of Vastgood Properties, LLC (“Vastgood”). Founded by Mr. Ullman in 2011, Vastgood is engaged in the ownership, development and management of primarily supermarket-anchored retail properties, focused in the Mid-Atlantic states. Vastgood partners with institutional and private investors in the acquisition of both “core” and “value add” retail properties, for which it provides physical property management, leasing, construction management and financial reporting functions. Vastgood’s principal office is located in Port Washington, New York and the firm also maintains a regional office in the greater Harrisburg/Carlisle/Lancaster area. Vastgood’s portfolio includes 15 anchored retail centers located in Pennsylvania, New York and Maryland. Robert F. Whalen, Jr., has over 20 years of commercial real estate development, leasing and management experience and has participated in the development, leasing and management of over 12 million SF of retail centers, office buildings, self storage facilities and multifamily developments.
The Properties. The Giant Anchored Portfolio Properties include seven anchored retail properties totaling 548,482 SF, located throughout Pennsylvania. Built from 1990 to 2005, the Giant Anchored Portfolio Properties range in size from 55,000 SF to 111,028 SF and are all anchored by Giant grocery stores. Four of the seven Giant Anchored Portfolio Properties contain on-site fuel stations as part of the collateral. The Giant Anchored Portfolio Properties have parking ratios ranging from 4.4 to 7.6 spaces per 1,000 SF of rentable area. For the trailing 12-month period ending December 31, 2018, the Giant stores at each of the Giant Anchored Portfolio Properties reported sales ranging from $393 to $792 PSF with occupancy costs ranging from 2.6% to 5.2% (inclusive of fuel station sales; see sales table below). As of September 1, 2019, the Giant Anchored Portfolio Properties were 97.5% occupied with individual occupancy rates ranging from 94.5% to 100.0%.
Major Tenant. Giant (409,583 SF; 74.7% of NRA; 79.5% of underwritten base rent; various lease expirations). Giant Food Stores, Inc. (“Giant”) was founded in 1923 in Carlisle, Pennsylvania. Giant is a wholly-owned subsidiary of Ahold Delhaize N.V., a Netherlands corporation (rated BBB+/Baa1/BBB by Fitch/Moody’s/S&P). Giant operates approximately 200 grocery stores in Pennsylvania, Maryland, Virginia and West Virginia under the names Giant Food Stores and Martin’s Food Markets. Royal Ahold N.V. merged with Delhaize Group N.V. in July 2016, and the combined operations involve store brands including Stop & Shop, Food Lion and Hannaford, as well as the Peapod online home delivery grocery business. The leases of the Giant stores at each of the Parkway Plaza, Aston Center, Spring Meadow, Scott Town Center and Ayr Town Center Properties are guaranteed by the rated parent company entity, Koninklijke Ahold Delhaize N.V. The Giant stores at each of the Giant Anchored Portfolio Properties have lease expiration dates occurring in 2023 through 2027, and six of the Giant leases have at least 6, 5-year renewal options remaining (the Stonehedge Square store has 2, 5-year renewal options).
The following tables present a summary of certain information relating to the Giant Anchored Portfolio Properties.
Property Name – Location | Cut-off Date Allocated Loan Amount(1) | % of ALA(1) | Appraised Value | UW NCF | % UW NCF |
Parkway Plaza – Mechanicsburg, PA | $18,500,000 | 19.1% | $24,200,000 | $1,493,430 | 18.0% |
Aston Center – Aston, PA | $16,000,000 | 16.5% | $20,700,000 | $1,314,853 | 15.8% |
Spring Meadow – Reading, PA | $15,900,000 | 16.4% | $22,400,000 | $1,356,782 | 16.3% |
Scott Town Center – Bloomsburg, PA | $13,800,000 | 14.2% | $18,200,000 | $1,171,601 | 14.1% |
Creekside Market Place – Hellertown, PA | $13,500,000 | 13.9% | $18,000,000 | $1,083,238 | 13.0% |
Stonehedge Square – Carlisle, PA | $11,200,000 | 11.5% | $16,000,000 | $1,099,246 | 13.2% |
Ayr Town Center – McConnellsburg, PA | $8,100,000 | 8.4% | $11,000,000 | $792,976 | 9.5% |
Total/Wtd. Avg.: | $97,000,000 | 100.0% | $130,500,000 | $8,312,126 | 100.0% |
| (1) | Represents the Giant Anchored Portfolio Whole Loan. |
This is not a research report and was not prepared by any Underwriter’s research department. Please see additional important information and qualifications at the end of this Term Sheet.
T-119
Retail – Anchored | Loan #12 | Cut-off Date Balance: | | $30,000,000 |
Various | Giant Anchored Portfolio | Cut-off Date LTV: | | 74.3% |
Various, Various | | U/W NCF DSCR: | | 1.52x |
| | U/W NOI Debt Yield: | | 9.1% |
Property Name – Location | Year Built / Renovated | NRA (SF) | % of NRA | Occ. | Number of Tenants | Giant Anchored NRA (SF) | Parking Spaces per 1,000 SF | Giant Fuel Station |
Parkway Plaza – Mechanicsburg, PA | 1998/N/A | 111,028 | 20.2% | 98.9% | 12 | 71,335 | 4.6 | Y |
Aston Center – Aston, PA | 2005/N/A | 55,000 | 10.0% | 100.0% | 2(1) | 55,000 | 4.5 | N(1) |
Spring Meadow – Reading, PA | 2004/2019 | 77,050 | 14.0% | 100.0% | 5 | 67,400 | 4.4 | Y |
Scott Town Center – Bloomsburg, PA | 2004/N/A | 67,923 | 12.4% | 97.6% | 8 | 54,333 | 7.6 | Y |
Creekside Market Place – Hellertown, PA | 2001/N/A | 90,804 | 16.6% | 94.6% | 13 | 57,428 | 5.3 | N |
Stonehedge Square – Carlisle, PA | 1990/2005 | 88,677 | 16.2% | 97.1% | 17 | 51,687 | 4.9 | N |
Ayr Town Center – McConnellsburg, PA | 2005/N/A | 58,000 | 10.6% | 94.5% | 4 | 52,400 | 5.6 | Y |
Total/Wtd. Avg.: | | 548,482 | 100.0% | 97.5% | 61 | 409,583 | 5.2 | |
| (1) | The rent roll for the Aston Center property contains one tenant (in addition to Giant) that leases space for a clothing donation bin with no associated square footage and an annual base rent of $5,000; and Giant occupies 100.0% of the NRA. In addition, Giant operates a fuel station across the street from the Aston Center property, which is not part of the collateral. |
The following table presents certain information relating to the anchor tenants at the Giant Anchored Portfolio Properties:
Tenant Summary |
Tenant Name | Credit Rating (Fitch/Moody’s/ S&P)(1) | Tenant SF | Approx % of SF | Annual UW Rent(2) | % of Annual UW Rent | Annual UW Rent PSF(2) | Most Recent Sales | Term. Option | Renewal Options(4) | Lease Expiration |
$(3) | PSF(3) | Occ. Cost %(3) |
Anchor Tenants | | | | | | | | | | | | |
Giant - Parkway Plaza | BBB+/Baa1/BBB | 71,335 | 13.0% | $1,268,298 | 13.1% | $17.78 | $51,684,152 | $725 | 3.1% | Y(5) | 6, 5-yr | 12/31/2023 |
Giant - Aston Center | BBB+/Baa1/BBB | 55,000 | 10.0% | $1,491,926 | 15.4% | $27.13 | $40,336,296 | $733 | 4.2% | N | 8, 5-yr | 11/30/2025 |
Giant - Spring Meadow | BBB+/Baa1/BBB | 67,400 | 12.3% | $1,462,500 | 15.1% | $21.70 | $53,399,008 | $792 | 3.6% | N | 8, 5-yr | 10/31/2024 |
Giant - Scott Town Center(6) | BBB+/Baa1/BBB | 54,333 | 9.9% | $1,156,918 | 12.0% | $21.29 | $38,926,732 | $716 | 3.4% | N | 8, 5Yr | 7/31/2023 |
Giant - Creekside Market Place | BBB+/Baa1/BBB | 57,428 | 10.5% | $862,427 | 8.9% | $15.02 | $42,439,748 | $739 | 2.6% | N | 8, 5-yr | 3/31/2027 |
Giant - Stonehedge Square | BBB+/Baa1/BBB | 51,687 | 9.4% | $597,364 | 6.2% | $11.56 | $24,764,740 | $479 | 3.2% | N | 2, 5-yr | 5/31/2026 |
Giant - Ayr Town Center | BBB+/Baa1/BBB | 52,400 | 9.6% | $888,000 | 9.2% | $16.95 | $20,573,488 | $393 | 5.2% | N | 8, 5-yr | 5/31/2025 |
Giant Total/Wtd. Avg. | | 409,583 | 74.7% | $7,727,433 | 80.0% | $18.87 | | | | | | |
| | | | | | | | | | | | |
Other Tenants | | 125,383 | 22.9% | $1,937,748 | 20.0% | $15.45 | | | | | | |
Vacant Space | | 13,516 | 2.5% | $0 | 0.0% | $0.00 | | | | | | |
Total/Wtd. Avg. | | 548,482 | 100.0% | $9,665,181 | 100.0% | $18.07 | | | | | | |
| (1) | The ratings shown represent Giant’s parent company, Koninklijke Ahold Delhaize N.V. The leases of five of the Giant Anchored Portfolio Properties are guaranteed by Koninklijke Ahold Delhaize N.V. (Parkway Plaza, Aston Center, Spring Meadow, Scott Town Center and AYR Town Center). |
| (2) | Annual UW Rent and Annual UW Rent PSF include the following adjustments: present value credit for future rent bumps for Giant at the Aston Center, Creekside Marketplace and Stonehedge Square properties (totaling $113,475), the contractual rent bump in June 2020 for the Giant at the Ayr Town Center property (totaling $25,000) and additional rent bumps for other tenants through November 1, 2020 (totaling $6,748). Annual UW Rent PSF excludes vacant space. |
| (3) | Sales and occupancy costs shown are based on the trailing 12-month period ending December 31, 2018. Occupancy costs are based on 2018 sales and underwritten rent and reimbursements. |
| (4) | All renewal options noted have 9-month notice periods, except for the Stonehedge Square property, which has a 6-month notice period. |
| (5) | The lease for the fuel station at the Parkway Plaza property (4,400 SF) may be terminated by the tenant at any time with 30 days’ written notice and a termination fee equal to two years of the then current rent with 30 days written notice. |
| (6) | Giant is subject to a ground lease at the Scott Town Center property and owns its improvements. |
This is not a research report and was not prepared by any Underwriter’s research department. Please see additional important information and qualifications at the end of this Term Sheet.
T-120
Retail – Anchored | Loan #12 | Cut-off Date Balance: | | $30,000,000 |
Various | Giant Anchored Portfolio | Cut-off Date LTV: | | 74.3% |
Various, Various | | U/W NCF DSCR: | | 1.52x |
| | U/W NOI Debt Yield: | | 9.1% |
The following table presents certain historical sales information for the Giant stores (and fuel stations, as applicable) at each of the Giant Anchored Portfolio Properties:
Historical Sales (Giant) |
| 2016(1) | 2017(1) | 2018(1) | |
Property Name | Gross Sales | PSF | Gross Sales | PSF | Gross Sales | PSF | Occ. Cost(2) |
Giant – Parkway Plaza (Grocery) | $40,863,836 | $611 | $43,887,064 | $656 | $44,855,616 | $670 | |
Giant – Parkway Plaza (Fuel) | $5,285,176 | $1,201 | $5,943,028 | $1,351 | $6,828,536 | $1,552 | |
Giant – Parkway Plaza (Total) | $46,149,012 | $647 | $49,830,092 | $699 | $51,684,152 | $725 | 3.1% |
Giant – Aston Center | $43,739,592 | $795 | $38,934,844 | $708 | $40,336,296 | $733 | 4.2% |
Giant – Spring Meadow (Grocery) | $45,144,112 | $695 | $45,091,956 | $694 | $47,238,568 | $727 | |
Giant – Spring Meadow (Fuel) | $4,595,552 | $1,915 | $5,415,020 | $2,256 | $6,160,440 | $2,567 | |
Giant – Spring Meadow (Total) | $49,739,664 | $738 | $50,506,976 | $749 | $53,399,008 | $792 | 3.6% |
Giant – Scott Town Center (Grocery) | $35,023,300 | $645 | $34,843,900 | $641 | $34,537,204 | $636 | |
Giant – Scott Town Center (Fuel) | $3,451,240 | N/A(3) | $3,901,768 | N/A(3) | $4,389,528 | N/A(3) | |
Giant – Scott Town Center (Total) | $38,474,540 | N/A(3) | $38,745,668 | N/A(3) | $38,926,732 | N/A(3) | 3.4% |
Giant – Creekside Market Place | $42,690,336 | $743 | $42,328,676 | $737 | $42,439,748 | $739 | 2.6% |
Giant – Stonehedge Square | N/A(4) | N/A(4) | $23,088,468 | $447 | $24,764,740 | $479 | 3.2% |
Giant – Ayr Town Center (Grocery) | $16,111,004 | $322 | $16,208,868 | $324 | $16,747,744 | $335 | |
Giant – Ayr Town Center (Fuel) | $2,943,044 | $1,226 | $3,408,236 | $1,420 | $3,825,744 | $1,594 | |
Giant – Ayr Town Center (Total) | $19,054,048 | $364 | $19,617,104 | $374 | $20,573,488 | $393 | 5.2% |
(1) | Sales shown represent the trailing 12-month period ending on December 31 of each year. |
(2) | Occupancy costs are based on 2018 sales and underwritten rent and reimbursements. |
(3) | The Giant grocery store and fuel station at the Scott Town Center property are subject to a ground lease, and the square footage associated with the fuel station is not available. |
(4) | The Giant store at the Stonehedge Square property was repositioned from a Nell’s Market in 2016, and 2016 sales are not available. |
The following table presents certain information relating to the lease rollover schedule at the Giant Anchored Portfolio Properties:
Lease Rollover Schedule(1)(2) |
Year | # of Leases Rolling | SF Rolling | UW Rent PSF Rolling(3) | Approx. % of Total SF Rolling | Approx. Cumulative % of SF Rolling | Total UW Rent Rolling | Approx. % of Total Rent Rolling | Approx. Cumulative % of Total Rent Rolling |
2019 | 0 | 0 | $0.00 | 0.0% | 0.0% | $0 | 0.0% | 0.0% |
2020 | 17 | 35,464 | $13.32 | 6.5% | 6.5% | $472,353 | 4.9% | 4.9% |
2021 | 7 | 12,532 | $17.89 | 2.3% | 8.8% | $224,145 | 2.3% | 7.2% |
2022 | 10 | 27,605 | $14.56 | 5.0% | 13.8% | $401,887 | 4.2% | 11.4% |
2023 | 6 | 140,048 | $19.18 | 25.5% | 39.3% | $2,685,906 | 27.8% | 39.2% |
2024 | 11 | 86,460 | $21.39 | 15.8% | 55.1% | $1,849,339 | 19.1% | 58.3% |
2025 | 3 | 107,400 | $22.16 | 19.6% | 74.7% | $2,379,926 | 24.6% | 82.9% |
2026 | 2 | 53,687 | $11.76 | 9.8% | 84.5% | $631,364 | 6.5% | 89.4% |
2027 | 3 | 62,190 | $15.18 | 11.3% | 95.8% | $944,013 | 9.8% | 99.2% |
2028 | 0 | 0 | $0.00 | 0.0% | 95.8% | $0 | 0.0% | 99.2% |
2029 | 1 | 2,880 | $10.85 | 0.5% | 96.3% | $31,248 | 0.3% | 99.5% |
2030 & Beyond | 1 | 6,700 | $6.72 | 1.2% | 97.5% | $45,000 | 0.5% | 100.0% |
Vacant Space | 0 | 13,516 | $0.00 | 2.5% | 100.0% | $0 | 0.0% | 100.0% |
Total/Wtd. Avg. | 61 | 548,482 | $18.07 | 100.0% | | $9,665,181 | 100.0% | |
(1) | Information is based on the underwritten rent roll as of September 1, 2019. |
(2) | Certain tenants may have lease termination options that are exercisable prior to the stated expiration date of the subject lease or leases which are not considered in the lease rollover schedule. |
(3) | Total/Wtd. Avg. UW Rent PSF Rolling excludes vacant space. |
This is not a research report and was not prepared by any Underwriter’s research department. Please see additional important information and qualifications at the end of this Term Sheet.
T-121
Retail – Anchored | Loan #12 | Cut-off Date Balance: | | $30,000,000 |
Various | Giant Anchored Portfolio | Cut-off Date LTV: | | 74.3% |
Various, Various | | U/W NCF DSCR: | | 1.52x |
| | U/W NOI Debt Yield: | | 9.1% |
The Markets. The Giant Anchored Portfolio Properties are located in six different submarkets across Pennsylvania. According to a third-party market research provider, as of the third quarter of 2019, the submarket vacancy rates ranged from 1.3% to 7.8%. The appraiser’s concluded market rents for the Giant spaces at each of the Giant Anchored Portfolio Properties ranged from $15.00 PSF to $22.50 PSF, triple net.
The following table presents certain information relating to the submarket information and appraiser’s market rent conclusions for the Giant Anchored Portfolio Properties:
Market/Submarket Information |
| |
Property Name - Location | Submarket Name | Total Submarket Inventory (SF)(1) | Submarket Vacancy Rate(1) | Appraiser’s Market Rent (Giant Space) |
Parkway Plaza – Mechanicsburg, PA | Harrisburg Area West | 15,277,670 | 5.9% | $20.00 PSF NNN |
Aston Center – Aston, PA | Delaware County | 22,638,250 | 4.1% | $22.50 PSF NNN |
Spring Meadow – Reading, PA | Berks County | 24,104,186 | 7.8% | $21.50 PSF NNN |
Scott Town Center – Bloomsburg, PA | Bloomsberg/Berwick | 6,699,678 | 1.3% | $21.00 PSF NNN |
Creekside Market Place – Hellertown, PA | Lehigh Valley | 40,889,813 | 4.2% | $20.00 PSF NNN |
Stonehedge Square – Carlisle, PA | Harrisburg Area West | 15,277,670 | 5.9% | $15.00 PSF NNN |
Ayr Town Center – McConnellsburg, PA | Harrisburg Metro(2) | 33,016,749(2) | 6.0%(2) | $18.00 PSF NNN |
(1) | Submarket inventory and vacancy rates shown are as of the third quarter of 2019, per a third party market research provider, unless otherwise noted. |
(2) | The Ayr Town Center property is not situated within a submarket tracked by a certain third party market research provider. The information shown above was provided by the appraiser and represents market data (rather than submarket). |
The following table presents certain local demographic data related to the Giant Anchored Portfolio Properties:
Demographic Information |
Property Name – Location | 2018 Population (within 1-mi. / 3-mi. / 5-mi- Radius) | 2018 Average Household Income (within 1-mi. / 3-mi. / 5-mi- Radius) |
Parkway Plaza – Mechanicsburg, PA | 5,608 / 46,689 / 99,480 | $75,522 / $85,295 / $96,661 |
Aston Center – Aston, PA | 8,769 / 83,775 / 190,643 | $94,264 / $90,029 / $99,918 |
Spring Meadow – Reading, PA | 7,327 / 50,511 / 181,208 | $103,536 / $93,520 / $69,540 |
Scott Town Center – Bloomsburg, PA | 8,642 / 22,791 / 30,209 | $57,046 / $63,198 / $66,651 |
Creekside Market Place – Hellertown, PA | 3,179 / 20,048 / 86,037 | $109,455 / $106,858 / $81,011 |
Stonehedge Square – Carlisle, PA | 4,177 / 28,733 / 53,786 | $93,100 / $79,126 / $86,096 |
Ayr Town Center – McConnellsburg, PA | N/A(1) / 3,361 / 5,667 | N/A(1) / $58,516 / $61,552 |
(1) | Demographic data for the 1-mile radius was not provided by the appraiser for the Ayr Town Center property. |
This is not a research report and was not prepared by any Underwriter’s research department. Please see additional important information and qualifications at the end of this Term Sheet.
T-122
Retail – Anchored | Loan #12 | Cut-off Date Balance: | | $30,000,000 |
Various | Giant Anchored Portfolio | Cut-off Date LTV: | | 74.3% |
Various, Various | | U/W NCF DSCR: | | 1.52x |
| | U/W NOI Debt Yield: | | 9.1% |
Operating History and Underwritten Net Cash Flow. The following table presents certain information relating to the historical operating performance and the Underwritten Net Cash Flow of the Giant Anchored Portfolio Whole Loan:
Cash Flow Analysis |
| | 2016 | | 2017 | | 2018 | | 9/30/2019 TTM | | UW | | UW PSF | |
Base Rent | | $8,980,419 | | $9,100,640 | | $9,229,186 | | $9,390,609 | | $9,665,181(1) | | $17.62 | |
Grossed Up Vacant Space | | $0 | | $0 | | $0 | | $0 | | $266,762 | | $0.49 | |
Total Recoveries | | $1,806,544 | | $2,205,412 | | $2,176,159 | | $2,173,819 | | $2,320,672 | | $4.23 | |
Other Income | | $4,185 | | $52,941 | | $10,943 | | $7,071 | | $0 | | $0.00 | |
Vacancy | | $0 | | $0 | | $0 | | $0 | | ($607,064)(2) | | ($1.11) | |
Effective Gross Income | | $10,791,148 | | $11,358,993 | | $11,416,288 | | $11,571,500 | | $11,645,551 | | $21.23 | |
| | | | | | | | | | | | | |
Real Estate Taxes | | $1,291,430 | | $1,233,527 | | $1,237,681 | | $1,232,061 | | $1,496,768 | | $2.73 | |
Insurance | | $96,798 | | $81,161 | | $84,402 | | $92,940 | | $120,502 | | $0.22 | |
Management Fee | | $301,308 | | $311,323 | | $314,099 | | $319,438 | | $349,367 | | $0.64 | |
Other Expenses | | $829,619 | | $754,071 | | $745,419 | | $832,119 | | $861,150 | | $1.57 | |
Total Expenses | | $2,519,155 | | $2,380,082 | | $2,381,601 | | $2,476,558 | | $2,827,787 | | $5.16 | |
| | | | | | | | | | | | | |
Net Operating Income | | $8,271,993 | | $8,978,911 | | $9,034,687 | | $9,094,942 | | $8,817,765 | | $16.08 | |
Capital Expenditures | | $0 | | $0 | | $0 | | $0 | | $153,800 | | $0.28 | |
TI/LC | | $0 | | $0 | | $0 | | $0 | | $351,839 | | $0.64 | |
Net Cash Flow | | $8,271,993 | | $8,978,911 | | $9,034,687 | | $9,094,942 | | $8,312,126 | | $15.15 | |
| | | | | | | | | | | | | |
Occupancy % | | N/A | | 97.5% | | 98.0% | | 97.5% | | 95.0%(2) | | | |
NOI DSCR(3) | | 1.51x | | 1.64x | | 1.65x | | 1.66x | | 1.61x | | | |
NCF DSCR(3) | | 1.51x | | 1.64x | | 1.65x | | 1.66x | | 1.52x | | | |
NOI Debt Yield(3) | | 8.5% | | 9.3% | | 9.3% | | 9.4% | | 9.1% | | | |
NCF Debt Yield(3) | | 8.5% | | 9.3% | | 9.3% | | 9.4% | | 8.6% | | | |
(1) | UW Base Rent includes credit for the present value of future rent bumps occurring through the term of the Giant Anchored Portfolio Whole Loan for three Giant tenants and contractual rent bumps through November 2020 totaling $145,222 (see “Tenant Summary” table above). |
(2) | The underwritten economic vacancy is 5.0%. As of September 1, 2019, the Giant Anchored Portfolio Properties were 97.5% physically occupied. |
(3) | Debt service coverage ratios and debt yields are based on the Giant Anchored Portfolio Whole Loan. |
Lockbox and Cash Management. The Giant Anchored Portfolio Whole Loan is structured with a springing lockbox and springing cash management. Upon the occurrence of a Cash Trap Event Period, the Giant Anchored Portfolio Borrower is required to establish a lockbox account for the benefit of the lender into which the Giant Anchored Portfolio Borrower is required to immediately deposit, or cause to be deposited, all revenue generated by the Giant Anchored Portfolio Properties. All funds in the lockbox account are required to be swept each business day into the cash management account controlled by the lender and, on each payment date, all funds in the cash management account are required to be applied in accordance with the Giant Anchored Portfolio Whole Loan documents. During a Cash Trap Event Period, any excess cash flow remaining after satisfaction of the waterfall items is required to be swept to an excess cash flow subaccount to be held by the lender as additional security for the Giant Anchored Portfolio Whole Loan; provided, however, that (a) if a Cash Trap Event Period is due only to the existence of a Giant Trigger Period (as defined below) with respect to no more than one property/lease and (b) the net cash flow debt yield is greater than 8.0% (without giving credit to income attributable to the applicable Giant lease), any excess cash flow in excess of $50 PSF of the related tenant space/lease is required to be disbursed to the Giant Anchored Portfolio Borrower.
A “Cash Trap Event Period” will commence upon the earlier of the following:
| (i) | the occurrence and continuance of an event of default; |
| (ii) | the net cash flow debt yield falling below 7.25%; |
| (iii) | the occurrence of a Giant Trigger Period; and |
| (iv) | Giant failing to extend or renew its lease at any of the Giant Anchored Portfolio Properties for a term of at least five years by the earlier of (I) one year prior to lease expiration and (II) the last day of the renewal notice period under the applicable lease. |
A Cash Trap Event Period will end upon the occurrence of the following:
| ● | with regard to clause (i), the cure of such event of default; |
| ● | with regard to clause (ii), the net cash flow debt yield being equal to or greater than 7.50% for two consecutive calendar quarters; |
| ● | with regard to clause (iii), a Giant Trigger Period Cure Event (as defined below); and |
| ● | with regard to clause (iv), a Renewal Cash Sweep Cure (as defined below). |
A “Giant Trigger Period” will commence upon the earliest to occur of the following (provided that any reference to ‘Giant’ in the conditions below, or within the definition of Giant Trigger Period Cure Event below will also apply to any replacement tenants and any guarantors under the applicable leases):
| (i) | Giant being in monetary default for more than 45 days (or material non-monetary default) under its lease at any of the Giant Anchored Portfolio Properties beyond any notice and cure periods; |
| (ii) | Giant failing to be in actual physical possession, failing to be open to the public during customary hours and/or “going dark” at any of the Giant |
This is not a research report and was not prepared by any Underwriter’s research department. Please see additional important information and qualifications at the end of this Term Sheet.
T-123
Retail – Anchored | Loan #12 | Cut-off Date Balance: | | $30,000,000 |
Various | Giant Anchored Portfolio | Cut-off Date LTV: | | 74.3% |
Various, Various | | U/W NCF DSCR: | | 1.52x |
| | U/W NOI Debt Yield: | | 9.1% |
| | Anchored Portfolio Properties (except for temporary renovation, re-subletting and the cessation of any gasoline or service station activities); |
| (iii) | Giant giving notice of its intent to terminate its lease for all or any portion of its space at any of the Giant Anchored Portfolio Properties; |
| (iv) | Giant terminating or cancelling its lease at any of the Giant Anchored Portfolio Properties, or any lease failing to otherwise be in full force and effect; and |
| (v) | any bankruptcy or similar insolvency of Giant. |
A “Giant Trigger Period Cure Event” will occur upon:
| ● | the amount on deposit in the excess cash flow subaccount being equal to or greater than $50 PSF for the applicable tenant space/lease, provided that (1) a Giant Trigger Period exists with respect to no more than one property/lease and (2) the net cash flow debt yield is equal to or greater than 8.0% (without giving credit to income attributable to the applicable Giant lease); |
| ● | with regard to clause (i) of the definition of Giant Trigger Period, Giant having cured all defaults under the applicable lease; |
| ● | with regard to clause (ii) of the definition of Giant Trigger Period, Giant being in actual, physical possession of the applicable space, open to the public for business during customary hours and not “dark”; |
| ● | with regard to clauses (iii) and (iv)of the definition of Giant Trigger Period, Giant revoking or rescinding the applicable termination or cancellation notices and reaffirming its lease as being in full force and effect; and |
| ● | with regard to clause (v) of the definition of Giant Trigger Period, Giant not being insolvent or subject to any bankruptcy or insolvency proceedings and Giant affirming the applicable lease in any such proceedings. |
A “Renewal Cash Sweep Cure” will commence upon the earlier of:
| ● | the amount on deposit in the excess cash flow subaccount being equal to or greater than $50 PSF for each property/lease giving rise to the applicable Cash Trap Event Period; |
| ● | the date on which Giant renews or extends the applicable lease for a term of at least five years; and |
| ● | the applicable space being leased to a replacement tenant for a term of at least five years, with such replacement tenant being in physical occupancy of its space, open to the public for business and paying full, unabated rent (or the Giant Anchored Portfolio Borrower having deposited into a reserve account any gap rent or free rent). |
Preferred Equity. Peaceable Preferred Investor XXIV (PA) LLC (“Peaceable”, or the “Giant Anchored Portfolio Preferred Equity Holder”), has made a $20,200,000 preferred equity investment in the Giant Anchored Portfolio Borrower, which (inclusive of an additional $800,000 investment to be made by the Giant Anchored Portfolio Preferred Equity Holder for capital contributions) equates to an indirect 58.3% preferred equity interest in the Giant Anchored Portfolio Borrower. Peaceable is related to Peaceable Street Capital, a privately held firm with offices in New York, Toronto and Philadelphia that provides participating financing structured as preferred equity. The CEO and Chairman of Peaceable Street Capital are Frederick Kurtz and David Henry, respectively. Mr. Kurtz has over 30 years of experience originating, structuring and managing over $6 billion in high-yield, structured real estate investments. Mr. Kurtz previously held various senior new business and operational positions at Kimco Realty Corporation (“Kimco”) and was an original member of the team that started Kimco’s preferred equity program. Mr. Henry is the retired Vice-Chairman and CEO of Kimco and previously served as Senior Vice President & Chief Investment Officer at GE Capital Real Estate.
The preferred equity return is required to be paid currently on a quarterly basis (and it is a default under the operating agreement of the Giant Anchored Portfolio Borrower’s sole member (the “Holdco Organizational Agreement”) if payments are not made currently). However, in the event that property revenue less property expenses (including debt service) is insufficient to make a payment of the quarterly current preferred return, any such unpaid quarterly current preferred return will accrue and will be deemed added to the preferred equity investment, such that quarterly current preferred return will be payable upon such accrued and unpaid amounts.
The Holdco Organizational Agreement contains certain rights of the Giant Anchored Portfolio Preferred Equity Holder upon certain events, including a material default by RW/VP 7 SC Venture LLC, the managing member under the Holdco Organizational Agreement (“Managing Member”), bankruptcy of a Giant Anchored Portfolio Borrower or Managing Member, or the making of certain major decisions without the Giant Anchored Portfolio Preferred Equity Holder’s consent. Such rights include the removal of the Managing Member, provided that the Giant Anchored Portfolio Preferred Equity Holder either obtains the release by lender of the Guarantor from liability under the guaranty and environmental indemnity for matters arising thereafter or offers lender an affiliate having a net worth of at least $18.0 million and liquidity of at least $3.5 million as a replacement guarantor. The major decisions requiring the Giant Anchored Portfolio Preferred Equity Holder’s consent include any sale or financing (other than the loan), expenditures by the Managing Member or a Giant Anchored Portfolio Borrower in excess of specified budgeted amounts, requiring additional capital contributions, and leasing outside of approved parameters.
The Holdco Organizational Agreement permits any member to exercise buy-sell rights after December 31, 2023, in which event the Giant Anchored Portfolio Preferred Equity Holder could control the Giant Anchored Portfolio Borrower. Additionally, the Giant Anchored Portfolio Preferred Equity Holder has the right to transfer its interest subject to lender’s consent if required by the Giant Anchored Portfolio Whole Loan documents.
Release of Property. Following the Release Date, provided no event of default has occurred and is continuing, the Giant Anchored Portfolio Borrower is permitted to release any of the Giant Anchored Portfolio Properties from the lien of Giant Anchored Portfolio Whole Loan, subject to the following conditions:
| ● | either (i) partial defeasance or (ii) prepayment (along with the applicable yield maintenance premium) in an amount equal to the greater of (1) 120% of the allocated loan amount of the property being released and (2) the net sales proceeds applicable to the property being released; |
| ● | immediately following the release, the net cash flow debt service coverage ratio is no less than the greater of (a) the net cash flow debt service coverage ratio immediately prior to the release and (b) 1.50x; |
| ● | immediately following the release, the net cash flow debt yield is no less than the greater of (a) the net cash flow debt yield immediately prior to the release and (b) 8.5%; |
| ● | immediately following the release, the loan-to-value ratio is no greater than the lesser of (a) the loan-to-value ratio immediately prior to the release and (b) 75.0%; and |
| ● | rating agency confirmation. |
This is not a research report and was not prepared by any Underwriter’s research department. Please see additional important information and qualifications at the end of this Term Sheet.
T-124
(THIS PAGE INTENTIONALLY LEFT BLANK)
| Mortgage Loan No. 13 – Baytown Multifamily Portfolio |
| Mortgage Loan Information | | Property Information |
| Mortgage Loan Seller: | BANA | | Single Asset/Portfolio: | Portfolio |
| Credit Assessment (DBRS/Fitch/S&P): | NR/NR/NR | | Location: | Baytown, TX Various |
| Original Balance: | $29,475,000 | | General Property Type: | Multifamily |
| Cut-off Date Balance: | $29,475,000 | | Detailed Property Type: | Garden |
| % of Initial Pool Balance: | 2.4% | | Title Vesting: | Fee |
| Loan Purpose: | Recapitalization | | Year Built/Renovated: | Various/Various |
| Borrower Sponsor: | Nitya Capital, LLC | | Size: | 481 Units |
| Guarantor: | Swapnil Agarwal | | Cut-off Date Balance per Unit: | $61,279 |
| Mortgage Rate: | 3.5650% | | Maturity Date Balance per Unit: | $61,279 |
| Note Date: | 11/8/2019 | | Property Manager: | Karya Property Management, |
| First Payment Date: | 1/1/2020 | | | LLC (borrower-related) |
| Maturity Date: | 12/1/2029 | | | |
| Original Term to Maturity: | 120 months | | | |
| Original Amortization Term: | 0 months | | Underwriting and Financial Information |
| IO Period: | 120 months | | UW NOI: | $2,546,755 |
| Seasoning: | 0 months | | UW NOI Debt Yield: | 8.6% |
| Prepayment Provisions: | LO (24); DEF (92); O (4) | | UW NOI Debt Yield at Maturity: | 8.6% |
| Lockbox/Cash Mgmt Status: | Hard/Springing | | UW NCF DSCR: | 2.28x |
| Additional Debt Type: | N/A | | Most Recent NOI: | $2,855,628 (8/31/2019 TTM) |
| Additional Debt Balance: | N/A | | 2nd Most Recent NOI: | $2,549,584 (12/31/2018) |
| Future Debt Permitted (Type): | No (N/A) | | 3rd Most Recent NOI: | $2,491,218 (12/31/2017) |
| Reserves | | Most Recent Occupancy: | 95.0% (10/22/2019) |
| Type | Initial | Monthly | Cap | | 2nd Most Recent Occupancy: | 90.0% (12/31/2018) |
| RE Tax: | $0 | $29,194 | N/A | | 3rd Most Recent Occupancy: | 92.9% (12/31/2017) |
| Insurance: | $0 | Springing(2) | N/A | | Appraised Value (as of)(1): | $42,200,000 (9/25/2019) |
| Deferred Maintenance: | $72,910 | $0 | N/A | | Appraised Value per Unit(1): | $87,734 |
| Recurring Replacements: | $0 | $10,021 | N/A | | Cut-off Date LTV Ratio(1): | 69.8% |
| Capital Improvements: | $2,179,359 | $0 | N/A | | Maturity Date LTV Ratio(1): | 69.8% |
| | | | | | | |
| Sources and Uses |
| Sources | Proceeds | % of Total | | Uses | Proceeds | % of Total |
| Loan Amount: | $29,475,000 | 70.3% | | Purchase Price: | $39,300,000 | 93.7% |
| Borrower Equity: | $12,474,765 | 29.7% | | Reserves: | $2,252,269 | 5.4% |
| | | | | Closing Costs: | $397,496 | 0.9% |
| Total Sources: | $41,949,765 | 100.0% | | Total Uses: | $41,949,765 | 100.0% |
| (1) | The Appraised Value shown reflects the “As If Complete/Stabilized” value as of September 25, 2019, which assumes all renovations at the Baytown Multifamily Portfolio Properties (as defined below) will be completed. At loan origination, the Baytown Multifamily Portfolio Borrowers (as defined below) reserved 100% of the budgeted cost of capital expenditures $2,179,359. The “As-Is” value of $39,300,000 results in both a Cut-off Date LTV Ratio and a Maturity Date LTV Ratio of 75.0% and a Value per Unit of $81,705. |
| (2) | Monthly deposits for insurance are suspended as long as the Baytown Multifamily Portfolio Properties are covered by a blanket insurance policy. |
The Mortgage Loan. The thirteenth largest mortgage loan (the “Baytown Multifamily Portfolio Mortgage Loan”) is evidenced by a promissory note in the original principal amount of $29,475,000 and secured by a first priority fee mortgage encumbering three multifamily properties located in Baytown, Texas (the “Baytown Multifamily Portfolio Properties”).
The Borrowers and the Borrower Sponsor.The borrowers are Providence at Baytown (BT3), LLC, Marina Club (BT3), LLC and Bay Oaks (BT3), LLC (the “Baytown Multifamily Portfolio Borrowers”), each of which is a single-purpose Delaware limited liability company with one independent director. The borrower sponsor is Nitya Capital, LLC (“Nitya Capital”) and the non-recourse carve-out guarantor is Swapnil Agarwal, the founder and managing principal of Nitya Capital. The Baytown Multifamily Portfolio Borrowers are 90.0% indirectly owned by multiple investors as non-voting members, 5.0% indirectly owned by Nitya Capital as a voting member and 5.0% indirectly owned by SP Baytown 3 LLC (an affiliate of Silverpeak Real Estate Partners (“Silverpeak”)) as a voting member. Nitya Capital is a privately-held real estate investment firm that focuses on the acquisition and management of multifamily properties. Since inception, Nitya Capital has acquired over 16,700 units and over 400,000 SF of commercial office space throughout Texas. In connection with the origination of the Baytown Multifamily Portfolio Mortgage Loan, the Baytown Multifamily Portfolio Borrowers were recapitalized by investments by Nitya Capital and Silverpeak.
The Portfolio.The Baytown Multifamily Portfolio Properties are comprised of three multifamily garden properties totaling 481 units located in Baytown, Texas. The Baytown Multifamily Portfolio Properties were constructed between 1970 and 1978, and have each been renovated between 2016 and 2017. As of October 22, 2019, the Baytown Multifamily Portfolio Properties were 95.0% leased. Since acquiring the Baytown Multifamily Portfolio Properties, according to the borrower sponsor, approximately $4.4 million ($9,182 per unit) have been invested in capital improvements across the Baytown Multifamily Portfolio Properties on interior and exterior improvements, flooring, appliance upgrades and bathroom renovations. The Baytown Multifamily Portfolio Borrowers plan to invest an additional $2,179,359 ($4,531 per unit) in interior and exterior capital improvements, including new appliances, kitchen upgrades, bathroom upgrades, painting and other renovations, which amount was escrowed at loan origination.
This is not a research report and was not prepared by any Underwriter’s research department. Please see additional important information and qualifications at the end of this Term Sheet.
T-126
| Multifamily – Garden | Loan #13 | Cut-off Date Balance: | | $29,475,000 |
| Various | Baytown Multifamily Portfolio | Cut-off Date LTV: | | 69.8% |
| Baytown, TX Various | | U/W NCF DSCR: | | 2.28x |
| | | U/W NOI Debt Yield: | | 8.6% |
The following table presents detailed information with respect to each of the Baytown Multifamily Portfolio Properties:
Baytown Multifamily Portfolio Properties Summary |
| Building | Occupancy(1) | Units(1) | % of Total Units | Appraised Value(2) | Allocated Loan Amount (“ALA”) | % of ALA | UW NOI | % of UW NOI |
| Providence at Baytown | 94.6% | 186 | 38.7% | $15,500,000 | $10,875,000 | 36.9% | $962,822 | 37.8% |
| Bay Oaks Apartments | 95.9% | 146 | 30.4% | $13,800,000 | $9,600,000 | 32.6% | $792,549 | 31.1% |
| Marina Club | 94.6% | 149 | 31.0% | $12,900,000 | $9,000,000 | 30.5% | $791,384 | 31.1% |
| Total/Wtd. Avg. | 95.0% | 481 | 100.0% | $42,200,000 | $29,475,000 | 100.0% | $2,546,755 | 100.0% |
| (1) | Based on the borrower rent roll dated October 22, 2019. |
| (2) | The Appraised Value shown reflects the “As If Complete/Stabilized” value as of September 25, 2019, which assumes all renovations at the Baytown Multifamily Portfolio Properties will be completed. At closing, the Baytown Multifamily Portfolio Borrowers reserved 100% of the aggregate budgeted capital expenditures for all three properties, $2,179,359. |
The Properties.
Providence at Baytown
The Providence at Baytown property is a two story, 186-unit garden-style apartment complex located in Baytown, Harris County, Texas. The Providence at Baytown property was built in 1970 and is situated on 7.4 acres with 268 parking spaces. The Providence at Baytown property’s unit mix comprises one-, two- and three-bedroom floor plans, an NRA of 159,971 SF and an average unit size of 860 SF. As of October 22, 2019, the property was 94.6% occupied, with average in-place rent of $824/unit ($0.96 PSF). Common amenities at the Providence at Baytown property include two pools, two laundry facilities, a fitness center and an onsite leasing office. All units include a shared balcony area and select floor plans have patios. Unit amenities include walk-in closets, washer/dryers, bathrooms with combination garden tub/showers and built-in porcelain sinks. The borrower sponsor acquired the Providence at Baytown property in December 2016 and has spent $1,932,960 on renovations since then.
Bay Oaks Apartments
The Bay Oaks Apartments property is a two story, 146-unit garden-style apartment complex located in Baytown, Harris County, Texas. The Bay Oaks Apartments property was built in 1978 and is situated on 7.5 acres with 284 parking spaces. The Bay Oaks Apartments property’s unit mix is comprised of one-, two- and three-bedroom floor plans, an NRA of 122,316 SF and an average unit size of 838 SF. As of October 22, 2019, the Bay Oaks Apartments property was 95.9% occupied, with average in place rent of $865/unit ($1.03 PSF). Common amenities at the Bay Oaks Apartments property include a pool, a laundry facility and an onsite leasing office. Unit amenities include granite countertops and vinyl flooring, walk-in closets, and shared balcony areas. The borrower sponsor acquired the Bay Oaks Apartments property in January 2017 and has spent $1,050,315 on renovations since then.
Marina Club
The Marina Club property is a two story, 149-unit garden-style apartment complex located in Baytown, Harris County, Texas. The Marina Club property was built in 1970 and is situated on 8.9 acres with 325 parking spaces. The Marina Club property’ unit mix includes one-, two- and three-bedroom floorplans, an NRA of 134,627 SF and an average unit size of 904 SF. As of October 22, 2019, the Marina Club property was 94.6% occupied, with average in-place rent of $865/unit ($0.96 PSF). Common amenities at the Marina Club property include two pools, two laundry facilities, and an onsite leasing office. Unit amenities include black appliances featuring a frost-free refrigerator, dishwasher, electric range/oven with vent-hood, backsplash with two-tone paint and granite countertops, vinyl flooring and shared balcony or patio area. The borrower sponsor acquired the Marina Club property in December 2016 and has spent $1,424,276 on renovations since then.
The Market. The Baytown Multifamily Portfolio Properties are located in the Baytown multifamily submarket which is 27.6 miles from downtown Houston, Texas. Houston is home to 23 Fortune 500 companies. Houston's infrastructure is served by three airports, which form the sixth-largest airport system in the world, and a massive trucking and rail system that links the southern, south central, Midwestern and western United States. Houston added 67,800 jobs in the 20 months ending March 2019. Houston leads the nation in net millennial migrations averaging nearly 15,000 net migrations to Houston per year from 2012-2017. Baytown is the third largest city in Harris County, and is easily accessible via Interstate 10, Highway 146, and the Grand Parkway (Highway 99). The city’s location has encouraged a successful and diverse blend of employment opportunities and recreational activities centered on the area’s waterways. The population of Baytown is 7,050,107 and has grown at a rate of 2.2% over the past year. The unemployment rates are 5.5% and 3.4% for the City of Baytown and the State of Texas, respectively.
The Baytown Multifamily Portfolio Properties are located in the Houston multifamily market, with inventory totaling 658,274 units and rent averaging $1.19 PSF or $1,054 per unit as of September 2019. Average rents have increased from $924 in 2014 to $1,054 in September 2019, which represents a 14.1% increase and annual growth of 2.8%. As of September 2019, the multifamily vacancy rate was 9.6% and net absorption was 12,163 units. The Baytown Multifamily Portfolio Properties are located in the Baytown submarket, with inventory totaling 10,685 units and rent averaging $1.07 PSF or $918 per unit as of September 2019. Average rents have increased from $749 in 2014 to $918 in September 2019, which represents a 22.6% increase and annual growth of 4.5%. As of September 2019, the vacancy rate was 12.8% and net absorption was 292 units.
This is not a research report and was not prepared by any Underwriter’s research department. Please see additional important information and qualifications at the end of this Term Sheet.
T-127
| Multifamily – Garden | Loan #13 | Cut-off Date Balance: | | $29,475,000 |
| Various | Baytown Multifamily Portfolio | Cut-off Date LTV: | | 69.8% |
| Baytown, TX Various | | U/W NCF DSCR: | | 2.28x |
| | | U/W NOI Debt Yield: | | 8.6% |
The following table presents certain information relating to the demographics surrounding the Baytown Multifamily Portfolio Properties:
Demographic Summary |
| | Providence at Baytown | Bay Oaks Apartments | Marina Club |
| Est. 2019 Population | | | |
| 1-mile radius | 12,500 | 10,923 | 3,715 |
| 3-mile radius | 52,213 | 53,689 | 25,432 |
| 5-mile radius | 83,520 | 93,214 | 76,134 |
| Est. 2019 Avg. Household Income | | | |
| 1-mile radius | $60,291 | $66,575 | $52,491 |
| 3-mile radius | $67,502 | $70,004 | $55,796 |
| 5-mile radius | $71,732 | $73,981 | $65,413 |
The following table presents certain information relating to the appraiser’s market rent conclusion for the Baytown Multifamily Portfolio Properties:
| | Market Rent Summary |
| Building | | | Avg. Monthly Rent
per Unit(1) | Avg. Monthly Rent
per SF(1) | Avg. Monthly Market
Rent per Unit | Avg. Monthly Market
Rent per SF |
| Providence at Baytown | | | $824 | $0.96 | $894 | $1.04 |
| Bay Oaks Apartments | | | $865 | $1.03 | $949 | $1.13 |
| Marina Club | | | $865 | $0.96 | $951 | $1.05 |
| (1) | Based on the borrower rent roll dated October 22, 2019. |
The following table presents certain information relating to comparable rental properties to the Baytown Multifamily Portfolio Properties:
| Comparable Rental Properties |
| Property | Year Built/Reno. | Occupancy | # Units | Unit Mix | Average SF per Unit | Average Rent per Unit | Average Annual Rent PSF |
| Providence at Baytown | 1970/2016 | 94.6%(1) | 186(1) | 1BR 2BR 3BR | 719 965 1,380 | $784 $979 $1,298 | $1.09 $1.01 $0.94 |
| Bay Oaks Apartments | 1978/2017 | 95.9%(1) | 146(1) | 1BR 2BR 3BR | 682 874 1,138 | $778 $918 $1,131 | $1.14 $1.05 $0.99 |
| Marina Club | 1970/2017 | 94.6%(1) | 149(1) | 1BR 2BR 3BR | 680 1,013 1,363 | $759 $958 $1,272 | $1.12 $0.95 $0.93 |
Willow Tree 1800 James Bowie Street Baytown, TX | 1983 | 90% | 100 | 1BR 2BR 2BR | 650 963 978 | $760 $929 $929 | $1.17 $0.96 $0.95 |
Greenfield Apartments 2105 Cedar Bayou Road Baytown, TX | 1984/2017 | 94% | 104 | 1BR 2BR 2BR | 684 919 988 | $875 $1,054 $1,084 | $1.28 $1.15 $1.10 |
Reserve on Garth Road 3700 Garth Road Baytown, TX | 1980/1999 | 91% | 251 | 1BR 2BR 3BR | 641 904 1,051 | $716 $972 $1,109 | $1.12 $1.08 $1.06 |
Inverness 907 N Pruett Baytown, TX | 1972 | 92% | 66 | 1BR 2BR 3BR | 624 823 1,122 | $712 $876 $999 | $1.14 $1.06 $0.89 |
Source:Appraisals
| (1) | Based on the borrower rent roll dated October 22, 2019. |
This is not a research report and was not prepared by any Underwriter’s research department. Please see additional important information and qualifications at the end of this Term Sheet.
T-128
| Multifamily – Garden | Loan #13 | Cut-off Date Balance: | | $29,475,000 |
| Various | Baytown Multifamily Portfolio | Cut-off Date LTV: | | 69.8% |
| Baytown, TX Various | | U/W NCF DSCR: | | 2.28x |
| | | U/W NOI Debt Yield: | | 8.6% |
Operating History and Underwritten Net Cash Flow. The following table presents certain information relating to the operating history and Underwritten Net Cash Flow at the Baytown Multifamily Portfolio:
| Cash Flow Analysis |
| | 2017 | 2018 | 8/31/2019 TTM | UW | UW per Unit |
| Gross Potential Rent | $4,864,114 | $5,034,747 | $5,118,535 | $5,127,622(1) | $10,660.34 |
| Discounts Concessions | ($42,676) | ($30,033) | ($63,685) | ($66,221) | ($137.67) |
| Other Income(2) | $385,937 | $472,512 | $648,596 | $648,596 | $1,348.43 |
| Less Vacancy & Credit Loss | ($542,282) | ($529,143) | ($501,162) | ($507,713) | ($1,055.54) |
| Effective Gross Income | $4,665,093 | $4,948,083 | $5,202,284 | $5,202,284 | $10,815.56 |
| | | | | | |
| Real Estate Taxes | $401,907 | $336,858 | $328,036 | $651,246 | $1,353.94 |
| Insurance | $148,032 | $130,139 | $163,317 | $163,317 | $339.54 |
| Other Expenses | $1,623,936 | $1,931,502 | $1,855,303 | $1,840,966 | $3,827.37 |
| Total Expenses | $2,173,875 | $2,398,499 | $2,346,656 | $2,655,529 | $5,520.85 |
| | | | | | |
| Net Operating Income | $2,491,218 | $2,549,584 | $2,855,628 | $2,546,755 | $5,294.71 |
| Capital Expenditures | $0 | $0 | $0 | $120,000 | $249.48 |
| Net Cash Flow | $2,491,218 | $2,549,584 | $2,855,628 | $2,426,755 | $5,045.23 |
| | | | | | |
| Occupancy % | 92.9% | 90.0% | 95.0% | 92.9% | |
| NOI DSCR | 2.34x | 2.39x | 2.68x | 2.39x | |
| NCF DSCR | 2.34x | 2.39x | 2.68x | 2.28x | |
| NOI Debt Yield | 8.5% | 8.6% | 9.7% | 8.6% | |
| NCF Debt Yield | 8.5% | 8.6% | 9.7% | 8.2% | |
| (1) | UW Gross Potential Rent is based on the borrower rent roll dated October 22, 2019. |
| (2) | Other Income includes late fees, re-letting fees, cleaning/damage charges, risk assessment fees and other miscellaneous income. |
This is not a research report and was not prepared by any Underwriter’s research department. Please see additional important information and qualifications at the end of this Term Sheet.
T-129
| Mortgage Loan No. 14 – Hualapai Commons |
| Mortgage Loan Information | | Property Information |
| Mortgage Loan Seller: | MSMCH | | Single Asset/Portfolio: | Single Asset |
| Credit Assessment (DBRS/Fitch/S&P): | NR/NR/NR | | Location: | Las Vegas, NV 89117 |
| Original Balance: | $26,120,000 | | General Property Type: | Retail |
| Cut-off Date Balance: | $26,120,000 | | Detailed Property Type: | Anchored |
| % of Initial Pool Balance: | 2.1% | | Title Vesting: | Fee |
| Loan Purpose: | Acquisition | | Year Built/Renovated: | 1999/N/A |
| Sponsor: | J.A. Kennedy Real Estate Company | | Size: | 252,947 SF |
| Guarantor: | Renaldo M. Tiberti; The Milan T. Trust | | Cut-off Date Balance per SF: | $103 |
| Mortgage Rate: | 3.4800% | | Maturity Date Balance per SF: | $103 |
| Note Date: | 11/22/2019 | | Property Manager: | J.A. Kennedy Real Estate |
| First Payment Date: | 1/1/2020 | | | Company (borrower-related) |
| Maturity Date: | 12/1/2029 | | | |
| Original Term to Maturity: | 120 months | | | |
| Original Amortization Term: | 0 months | | Underwriting and Financial Information |
| IO Period: | 120 months | | UW NOI: | $2,675,455 |
| Seasoning: | 0 months | | UW NOI Debt Yield: | 10.2% |
| Prepayment Provisions: | LO (24); DEF (92); O (4) | | UW NOI Debt Yield at Maturity: | 10.2% |
| Lockbox/Cash Mgmt Status: | Hard/In Place | | UW NCF DSCR: | 2.82x |
| Additional Debt Type: | N/A | | Most Recent NOI: | $2,345,038 (9/30/2019 TTM) |
| Additional Debt Balance: | N/A | | 2nd Most Recent NOI: | $2,431,150 (12/31/2018) |
| Future Debt Permitted (Type): | No (N/A) | | 3rd Most Recent NOI: | $2,333,291 (12/31/2017) |
| Reserves | | Most Recent Occupancy: | 97.5% (8/6/2019) |
| Type | Initial | Monthly | Cap | | 2nd Most Recent Occupancy: | 97.1% (12/31/2018) |
| RE Tax: | $23,576 | $23,576 | N/A | | 3rd Most Recent Occupancy: | 97.5% (12/31/2017) |
| Insurance(1): | $0 | Springing | N/A | | Appraised Value (as of): | $46,300,000 (9/30/2019) |
| Recurring Replacements(2): | $200,000 | Springing | $25,000 | | Appraised Value per SF: | $183 |
| TI/LC(3): | $1,100,000 | Springing | $300,000 | | Cut-off Date LTV Ratio: | 56.4% |
| Other(4): | $25,000 | N/A | N/A | | Maturity Date LTV Ratio: | 56.4% |
| | | | | | | | |
| Sources and Uses |
| Sources | Proceeds | % of Total | | Uses | Proceeds | % of Total |
| Loan Amount: | $26,120,000 | 54.6% | | Purchase price: | $46,000,000 | 96.3% |
| Borrower Equity: | $21,679,663 | 45.4% | | Reserves: | $1,348,576 | 2.8% |
| | | | | Closing Costs: | $451,087 | 0.9% |
| Total Sources: | $47,799,663 | 100.0% | | Total Uses: | $47,799,663 | 100.0% |
| (1) | Monthly deposits for insurance are springing upon any of (i) an event of default existing, (ii) the Hualapai Commons Borrower (as defined below) failing to maintain an approved blanket policy and (iii) the Hualapai Commons Borrower failing to provide evidence of renewal and paid receipts for insurance premiums. |
| (2) | If the amount in the Recurring Replacements reserve falls below $25,000, the Hualapai Commons Borrower is required to deposit monthly an amount equal to $2,108 (or such lesser amount necessary to cause the amount in such reserve to equal $25,000 in one deposit). |
| (3) | If the amount in the TI/LC reserve falls below $300,000, the Hualapai Commons Borrower is required to deposit monthly an amount equal to $36,888 (or such lesser amount necessary to cause the amount in such reserve to equal $300,000 in one deposit). |
| (4) | Other represents a zoning reserve fund. The Hualapai Commons Borrower is required to (i) prior to December 16, 2019, obtain an updated zoning report which includes (x) all applicable certificates of occupancy for the Hualapai Commons Property (as defined below), (y) confirmation from the City of Las Vegas as to whether there are any outstanding zoning, building or fire code violations at the Hualapai Commons Property (“Violations”) and (z) any other documentation from the City of Las Vegas obtained by the zoning consultant, and (ii) to the extent the updated zoning report discloses any outstanding Violations, to deliver within 30 days from receipt of such zoning report evidence reasonably satisfactory to the lender that the Violations have been remedied to the satisfaction of the City of Las Vegas;provided that if the Hualapai Commons Borrower commences the cure of Violations within such 30 day period and thereafter diligently pursues such cure to completion, it will have such additional time as is reasonably necessary to complete such cure, not to exceed an additional 30 days. The borrower has submitted an updated zoning report that does not identify any zoning, building code or fire code violations and has requested release of the zoning reserve. |
The Mortgage Loan.The fourteenth largest mortgage loan (the “Hualapai Commons Mortgage Loan”) is evidenced by a promissory note in the original principal balance of $26,120,000 and is secured by a first priority fee mortgage encumbering an anchored retail center located in Las Vegas, Nevada (the “Hualapai Commons Property”).
The Borrower and the Borrower Sponsors. The borrower is HCM Delaware, LLC (the “Hualapai Commons Borrower”), a Delaware limited liability company and single purpose entity. The borrower sponsor is J.A. Kennedy Real Estate Company and the non-recourse carveout guarantors are Renaldo M. Tiberti and The Milan T. Trust. J.A. Kennedy Real Estate Company is a real estate management and brokerage company headquartered in Las Vegas, Nevada, and was founded in 2004 by Joseph A. Kennedy. Joseph A. Kennedy currently has ownership in more than 640 acres of vacant land, approximately 180,000 SF of improved retail projects, approximately 1,500,000 SF of improved industrial projects, and approximately 35,000 SF of improved office projects. The J.A. Kennedy Real Estate Company currently has five Nevada real estate licenses and employs 12 people to operate its real estate office, manage commercial properties and work on real estate development projects. The Hualapai Commons Borrower is co-managed by Joseph A. Kennedy and Renaldo M. Tiberti (a non-recourse carveout guarantor). Renaldo M. Tiberti is Joseph A. Kennedy’s father. Mr. Kennedy is a preapproved replacement guarantor under the Hualapai Commons Mortgage Loan documents.
This is not a research report and was not prepared by any Underwriter’s research department. Please see additional important information and qualifications at the end of this Term Sheet.
T-130
| Retail – Anchored | Loan #14 | Cut-off Date Balance: | | $26,120,000 |
| Various | Hualapai Commons | Cut-off Date LTV: | | 56.4% |
| Las Vegas, NV 89117 | | U/W NCF DSCR: | | 2.82x |
| | | U/W NOI Debt Yield: | | 10.2% |
The Property.The Hualapai Commons Property is an anchored neighborhood retail center comprised of five, one-story buildings totaling 252,947 SF in Las Vegas, Nevada. Built in 1999, the Hualapai Commons Property is situated on an approximately 24.56-acre site and features 1,116 parking spaces (4.4 spaces per 1,000 SF).
As of August 6, 2019, the Hualapai Commons Property was 97.5% occupied by 21 tenants. Home Depot and Smith’s Food and Drug Center are the anchor tenants, with the junior anchor being PetSmart. There are a total of four ground leases to tenants Home Depot, Smith’s Food and Drug Center, Chevron Terrible Herbst and US Bank National Association, totaling 181,833 SF. In the last two years, 3 tenants (4.1% of NRA) have taken occupancy at the Hualapai Commons Property. Additionally, 87.6% of NRA has been in occupancy for at least 9 years. Other than the anchors and junior anchor, no single tenant occupies more than 3.6% of NRA or represents more than 5.7% of underwritten base rent.
Major Tenants.
Home Depot (107,856 SF, 42.6% of NRA, 17.6% ofunderwritten rent).Home Depot has been a tenant at the Hualapai Commons Property since 2000 and is one of the largest home improvement retailers in the United States. Home Depot was founded in 1978 and is headquartered in Atlanta, Georgia. Home Depot has a lease expiration of March 31, 2030 and has one, 10-year renewal option and two, 5-year renewal options remaining.
Smith's Food and Drug Center (59,997 SF, 23.7% of NRA, 13.6% ofunderwritten rent).Smith's Food and Drug Center has been a tenant at the Hualapai Commons Property since 1998 and is a regional supermarket chain, founded in 1911, operating approximately 132 stores in the southwest and northwest. Smith's Food and Drug Center is a subsidiary of the Kroger Company. The Kroger Company operates approximately 3,900 supermarkets, multi-department stores, jewelry stores and convenience stores throughout the United States. Smith's Food and Drug Center has a lease expiration of April 7, 2024 and eight, 5-year renewal options. Smith’s Food and Drug Center may terminate its lease at any time upon 90 days’ notice and delivery to the landlord of a bill of sale and any other documents adequate to transfer to the landlord free and clear title to any building and all improvements on the ground leased premises on the effective date of termination (excluding the tenant’s trade fixtures, personal property or equipment).
PetSmart(22,703 SF, 9.0% of NRA, 12.6% ofunderwritten rent).PetSmart has been a tenant at the Hualapai Commons Property since 2000 and is a retail chain that offers pet products and in-store services including grooming, training and pet adoption. Based in Arizona, PetSmart has approximately 56,000 employees and over 1,650 pet stores in the United States, Canada and Puerto Rico. PetSmart has a lease expiration of August 31, 2025 and has three, 5-year renewal options remaining.
Chevron Terrible Herbst(8,980 SF, 3.6% of NRA, 4.2% ofunderwritten rent).Chevron Terrible Herbst (“Chevron”) has been a tenant at the Hualapai Commons Property since 2000 and operates a gas station. Chevron has a lease expiration of October 8, 2020 and three, 5-year renewal options remaining.
A Simple Affair (5,335 SF, 2.1% of NRA, 2.9% ofunderwritten rent).A Simple Affair has been a tenant at the Hualapai Commons Property since 2018 and is an event venue for weddings, receptions, celebrations and corporate events. A Simple Affair has a lease expiration of March 31, 2023 and two, 5-year renewal options remaining.
The following table presents a summary regarding the largest tenants at the Hualapai Commons Property:
| Tenant Summary(1) |
| Tenant Name | Credit Rating (Fitch/ Moody’s/S&P)(2) | Tenant SF | Approx.% of SF | Annual UW Rent | Annual UW Rent PSF | | Most Recent Sales(3) | | | |
| App. % of Total Annual UW Rent | $ | PSF | Occ. Cost %(4) | Term. Option | Lease Expiration |
| Home Depot | A/A2/A | 107,856 | 42.6% | $500,254 | $4.64 | 17.6% | $45,500,000 | $422 | 1.1% | N | 3/31/2030 |
| Smith’s Food and Drug Center | NR/Baa1/BBB | 59,997 | 23.7% | $388,210 | $6.47 | 13.6% | $39,000,000 | $650 | 1.0% | Y(5) | 4/7/2024 |
| PetSmart | NR/B2/B- | 22,703 | 9.0% | $357,572 | $15.75 | 12.6% | NAV | NAV | NAV | N | 8/31/2025 |
| Chevron Terrible Herbst | NR/NR/NR | 8,980 | 3.6% | $120,201 | $13.39 | 4.2% | NAV | NAV | NAV | N | 10/8/2020 |
| A Simple Affair | NR/NR/NR | 5,335 | 2.1% | $83,226 | $15.60 | 2.9% | NAV | NAV | NAV | N | 3/31/2023 |
| Subtotal/Wtd. Avg. | | 204,871 | 81.0% | $1,449,463 | $7.08 | 51.0% | | | | | |
| | | | | | | | | | | | |
| Other Tenants | | 41,642 | 16.5% | $1,395,014 | $33.50 | 49.0% | | | | | |
| Vacant Space | | 6,434 | 2.5% | $0 | $0 | 0.0% | | | | | |
| Total/Wtd. Avg. | | 252,947 | 100.0% | $2,844,477 | $11.54(6) | 100.0% | | | | | |
| (1) | Information is based on the underwritten rent roll dated as of August 6, 2019. |
| (2) | Certain ratings are those of the parent company whether or not the parent guarantees the lease. |
| (3) | Most Recent Sales determined as of September 30, 2019. |
| (4) | Occ. Cost % is based on the underwritten rent as of the August 6, 2019 rent roll divided by the most recently reported sales. |
| (5) | Smith’s Food and Drug Center may terminate its lease at any time upon 90 days’ notice and delivery to the landlord of a bill of sale and any other documents adequate to transfer to the landlord free and clear title to any building and all improvements on the ground leased premises on the effective date of termination (excluding the tenant’s trade fixtures, personal property or equipment). |
| (6) | Total//Wtd. Avg. Annual UW Rent PSF excludes vacant space. |
This is not a research report and was not prepared by any Underwriter’s research department. Please see additional important information and qualifications at the end of this Term Sheet.
T-131
| Retail – Anchored | Loan #14 | Cut-off Date Balance: | | $26,120,000 |
| Various | Hualapai Commons | Cut-off Date LTV: | | 56.4% |
| Las Vegas, NV 89117 | | U/W NCF DSCR: | | 2.82x |
| | | U/W NOI Debt Yield: | | 10.2% |
The following table presents certain information with respect to the lease rollover at the Hualapai Commons Property:
| Lease Rollover Schedule(1)(2) |
| Year | # of Leases Rolling | SF Rolling | Annual UW Rent PSF Rolling | Approx. % of Total SF Rolling | Approx. Cumulative % of SF Rolling | Total UW Rent Rolling | Approx. % of Total Rent Rolling | Approx. Cumulative % of Total Rent Rolling |
| MTM | 1 | 1,441 | $27.00 | 0.6% | 0.6% | $38,907 | 1.4% | 1.4% |
| 2019 | 1 | 2,122 | $45.36 | 0.8% | 1.4% | $96,261 | 3.4% | 4.8% |
| 2020 | 2 | 12,926 | $17.69 | 5.1% | 6.5% | $228,716 | 8.0% | 12.8% |
| 2021 | 3 | 10,023 | $31.67 | 4.0% | 10.5% | $317,411 | 11.2% | 24.0% |
| 2022 | 2 | 3,746 | $34.31 | 1.5% | 12.0% | $128,521 | 4.5% | 28.5% |
| 2023 | 4 | 14,409 | $22.20 | 5.7% | 17.7% | $319,914 | 11.2% | 39.7% |
| 2024 | 5 | 69,467 | $11.22 | 27.5% | 45.1% | $779,353 | 27.4% | 67.1% |
| 2025 | 1 | 22,703 | $15.75 | 9.0% | 54.1% | $357,572 | 12.6% | 79.7% |
| 2026 | 1 | 1,820 | $42.62 | 0.7% | 54.8% | $77,568 | 2.7% | 82.4% |
| 2027 | 0 | 0 | $0.00 | 0.0% | 54.8% | $0 | 0.0% | 82.4% |
| 2028 | 0 | 0 | $0.00 | 0.0% | 54.8% | $0 | 0.0% | 82.4% |
| 2029 | 0 | 0 | $0.00 | 0.0% | 54.8% | $0 | 0.0% | 82.4% |
| 2030 & Beyond | 1 | 107,856 | $4.64 | 42.6% | 97.5% | $500,254 | 17.6% | 100.0% |
| Vacant | 0 | 6,434 | $0.00 | 2.5% | 100.0% | $0 | 0.0% | 100.0% |
| Total/Wtd. Avg. | 21 | 252,947 | $11.54(3) | 100.0% | | $2,844,477 | 100.0% | |
| (1) | Information is based on the underwritten rent roll dated as of August 6, 2019. |
| (2) | Certain tenants may have lease termination options that are exercisable prior to the originally stated expiration date of the subject lease and that are not considered in the Lease Rollover Schedule. |
| (3) | Total/Wtd. Avg. Annual UW Rent PSF Rolling excludes Vacant space. |
The Market. The Hualapai Commons Property is located in Las Vegas, Nevada within the Las Vegas retail market and the West retail submarket.
According to the appraisal, as of the third quarter of 2019, the Las Vegas retail market had approximately 79.3 million SF of retail space inventory, overall vacancy in the market was approximately 7.4% and asking rent was $18.30 PSF. According to the appraisal, as of the third quarter of 2019, the West retail submarket had approximately 7.6 million SF of retail space inventory, overall vacancy in the submarket was approximately 7.8% and asking rent was $18.87 PSF. Major employers in the area include MGM Resorts International, Clark County School district, Caesars Entertainment Corporation, Creech Air Force Base, Wynn Resorts and Stations Casinos. The Hualapai Commons Property has frontage on two major arterials, Charleston Boulevard and Hualapai Way and is located within approximately two miles of Interstate 215.
The estimated 2018 population within a one-, three- and five-mile radius of the Hualapai Commons Property was 14,410, 146,673 and 338,360, respectively. The estimated 2018 average household income within a one-, three- and five-mile radius of the Hualapai Commons Property was $102,863, $101,603 and $88,757, respectively.
The following table presents certain information relating to the appraiser’s market rent conclusion for the Hualapai Commons Property:
| Market Rent Summary |
| | Chevron Terrible Herbst | Junior Anchor | Restaurant | Pad | Smith’s Food and Drug Center | In-Line | Home Depot |
| Market Rent (PSF) | $31.13 | $14.50 | $35.00 | $45.00 | $6.47 | $24.00 | $3.99 |
| Lease Term (Years) | 10 | 10 | 10 | 5 | 10 | 5 | 10 |
| Lease Type (Reimbursements) | Ground Lease | Triple Net | Triple Net | Triple Net | Ground Lease | Triple Net | Ground Lease |
| Rent Increase Projection | Varies | 3.0%per annum | 3.0%per annum | 3.0%per annum | Varies | 3.0%per annum | Varies |
This is not a research report and was not prepared by any Underwriter’s research department. Please see additional important information and qualifications at the end of this Term Sheet.
T-132
| Retail – Anchored | Loan #14 | Cut-off Date Balance: | | $26,120,000 |
| Various | Hualapai Commons | Cut-off Date LTV: | | 56.4% |
| Las Vegas, NV 89117 | | U/W NCF DSCR: | | 2.82x |
| | | U/W NOI Debt Yield: | | 10.2% |
The following table presents recent leasing data at comparable inline properties with respect to the Hualapai Commons Property:
| Comparable Retail Property Summary (Inline) |
Property Name/ Address | GLA (SF) | Tenant Name | Year
Built | Lease Area (SF) | Lease Date | Lease Term (Years) | Rent PSF |
Boca Park 8800 West Charleston Boulevard Las Vegas, NV | 740,306 | Petland | 2001 | 7,691 | May 2018 | 10 | $24.00 |
Sea Breeze Village 1750 North Buffalo Drive Las Vegas, NV | 53,406 | Maja Salon | 2003 | 1,292 | December 2018 | 5 | $22.20 |
Canyon Gate Shopping Center 8555-8565 West Sahara Avenue Las Vegas, NV | 74,690 | Zone Spa | 1996 | 1,200 | September 2018 | 5 | $24.00 |
Siena Town Center 10180 West Tropicana Avenue Las Vegas, NV | 9,560 | N/A | 2005 | 2,100 | November 2019 | 5 | $22.20 |
Source:Appraisal
The following table presents recent leasing data at comparable junior anchor properties with respect to the Hualapai Commons Property:
| Comparable Retail Property Summary (Junior Anchor) |
Property Name/ Address | GLA (SF) | Tenant Name | Lease Area (SF) | Lease Date | Lease Term (Years) | Rent PSF |
Smart & Final 8485 West Sahara Avenue Las Vegas, NV | 24,059 | Smart & Final | 24,059 | April 2017 | 12 | $14.76 |
Sahara Center 10000 West Sahara Avenue Las Vegas, NV | 204,594 | Burlington Stores | 48,929 | March 2018 | 10 | $16.25 |
Summerlin Gateway Plaza 7500 West Lake Mead Boulevard Las Vegas, NV | 22,752 | Michaels | 22,752 | August 2018 | 10 | $14.00 |
Source:Appraisal
The following table presents recent leasing data at comparable ground leased properties with respect to the Hualapai Commons Property:
| Comparable Retail Property Summary (Ground Lease) |
Property Name/ Address | Tenant Name | Year Built | Lease Area (SF) | Lease Date | Lease Term (Months) | Rent PSF |
Rental 1 7751 North El Capitan Way | Lowes | 2010 | 175,000 | August 2010 | 240 | $4.20 |
Rental 2 2910 BiCentennial Parkway | Albertsons | 2006 | 53,963 | January 2007 | 240 | $7.75 |
Rental 3 7550 West Washington Avenue | Lowes | 2000 | 134,104 | January 2019 | 240 | $6.26 |
Rental 4 5564 Camino Al Norte | Smith’s Food and Drug Store and Fuel | 2000 | 65,296 | January 2000 | 300 | $3.36 |
Source:Appraisal
This is not a research report and was not prepared by any Underwriter’s research department. Please see additional important information and qualifications at the end of this Term Sheet.
T-133
| Retail – Anchored | Loan #14 | Cut-off Date Balance: | | $26,120,000 |
| Various | Hualapai Commons | Cut-off Date LTV: | | 56.4% |
| Las Vegas, NV 89117 | | U/W NCF DSCR: | | 2.82x |
| | | U/W NOI Debt Yield: | | 10.2% |
Operating History and Underwritten Net Cash Flow. The following table presents certain information relating to the historical operating performance and Underwritten Net Cash Flow at the Hualapai Commons Property:
| Cash Flow Analysis |
| | 2016 | 2017 | 2018 | 9/30/2019 TTM | UW | UW PSF |
| Gross Potential Rent(1) | $2,616,005 | $2,686,534 | $2,761,570 | $2,706,715 | $2,998,893 | $11.86 |
| Total Recoveries(2) | $499,035 | $545,248 | $591,259 | $560,511 | $856,589 | $3.39 |
| Discount Concessions | $0 | ($7,893) | $0 | $1 | $0 | $0.00 |
| Other Income | $0 | $0 | $0 | $0 | $0 | $0.00 |
| Less Vacancy & Credit Loss | $0 | $0 | $0 | $0 | ($323,438) | ($1.28) |
| Effective Gross Income | $3,115,040 | $3,223,889 | $3,352,829 | $3,267,227 | $3,532,044 | $13.96 |
| | | | | | | |
| Real Estate Taxes | $261,708 | $265,375 | $265,437 | $247,435 | $274,669 | $1.09 |
| Insurance | $35,153 | $33,404 | $68,062 | $42,803 | $42,803 | $0.17 |
| Other Expenses(3) | $582,824 | $591,819 | $588,180 | $631,951 | $539,117 | $2.13 |
| Total Expenses | $879,685 | $890,598 | $921,679 | $922,189 | $856,589 | $3.39 |
| | | | | | | |
| Net Operating Income | $2,235,355 | $2,333,291 | $2,431,150 | $2,345,038 | $2,675,455 | $10.58 |
| Capital Expenditures | $0 | $0 | $0 | $0 | $10,667 | $0.04 |
| TI/LC | $0 | $0 | $0 | $0 | $64,769 | $0.26 |
| Net Cash Flow | $2,235,355 | $2,333,291 | $2,431,150 | $2,345,038 | $2,600,019 | $10.28 |
| | | | | | | |
| Occupancy % | 98.0% | 97.5% | 97.1% | 97.5%(4) | 89.2% | |
| NOI DSCR | 2.43x | 2.53x | 2.64x | 2.54x | 2.90x | |
| NCF DSCR | 2.43x | 2.53x | 2.64x | 2.54x | 2.82x | |
| NOI Debt Yield | 8.6% | 8.9% | 9.3% | 9.0% | 10.2% | |
| NCF Debt Yield | 8.6% | 8.9% | 9.3% | 9.0% | 10.0% | |
| (1) | UW Gross Potential Rent is based on the underwritten rent roll dated August 6, 2019 and includes rent steps through May 1, 2020 totaling $92,659. |
| (2) | The increase in UW Total Recoveries from 9/30/2019 TTM is due to the property seller historically not having collected all recoveries due. |
| (3) | The decline in UW Other Expenses from 9/30/2019 TTM is due to the management fee being underwritten to 3% compared to the actual 6% management fee that was paid by the property seller. The current property management fee is 4%. |
| (4) | 9/30/2019 TTM Occupancy % is based on the underwritten rent roll dated August 6, 2019. |
Partial Release. The Hualapai Commons Borrower may obtain the release of an approximately 50,000 square foot outparcel (which must be vacant, non-income producing and improved only by landscaping, utility facilities that are readily relocatable and parking spaces) (the “Release Parcel”) upon satisfaction of the following conditions, among others: (i) defeasance of an amount of the Hualapai Commons Mortgage Loan equal to the Release Parcel Release Price, if any; (ii) the debt yield after the release is greater than the greater of debt yield immediately prior to the release and 8.5%; (iii) no event of default or cash sweep trigger event exists, (iv) compliance with legal requirements, zoning requirements, legal subdivision of the parcel, creation of separate tax lots and provision of adequate parking and access sufficient to comply with leases and other agreements applicable to the remaining Hualapai Commons Property, (v) compliance with the Affiliate Parcel Release Conditions (as defined below) and (vi) compliance with customary REMIC conditions.
“Release Parcel Release Price” means 115% of the amount (if any) required such that the loan-to-value ratio of the remaining Hualapai Commons Property, based on a current appraisal, does not exceed 56%.
“Affiliate Parcel Release Conditions” means, collectively, in connection with the tenanting of one or more Release Parcels, the delivery by the Hualapai Commons Borrower to the lender of (x) an officer’s certificate certifying that (A) for the time period during which the Release Parcel was part of the Hualapai Commons Property, any tenants that were relocated from other areas of the Hualapai Commons Property to the Release Parcel, have been replaced with tenants (when taken collectively) of comparable credit quality, and such replacement tenants (when taken collectively) are paying rent equal to or better than the relocated tenant(s), and (B) to the extent existing tenants of the Hualapai Commons Property are proposed to be relocated to the Release Parcel after its release, the Hualapai Commons Borrower has entered into fully-executed replacement leases with replacement tenants (when taken collectively) of comparable credit quality, on rental terms equal to or better than the existing tenant, and (C) such parcel release shall not have a material adverse effect, and (y) a copy of the then-current rent roll and leasing plan for the Hualapai Commons Property and the Release Parcel.
This is not a research report and was not prepared by any Underwriter’s research department. Please see additional important information and qualifications at the end of this Term Sheet.
T-134
(THIS PAGE INTENTIONALLY LEFT BLANK)
| Mortgage Loan No. 15 – ILPT Industrial Portfolio |
| Mortgage Loan Information | | Property Information |
| Mortgage Loan Seller(1): | BANA | | Single Asset/Portfolio: | Portfolio |
| Credit Assessment (DBRS/Fitch/S&P): | AA(low)(sf)/BBB-sf/BBB-(sf) | | Location: | Various |
| Original Balance(1): | $25,080,000 | | General Property Type: | Industrial |
| Cut-off Date Balance(1): | $25,080,000 | | Detailed Property Type: | Warehouse Distribution |
| % of Initial Pool Balance: | 2.0% | | Title Vesting: | Fee |
| Loan Purpose: | Recapitalization | | Year Built/Renovated: | Various |
| Borrower Sponsor: | Industrial Logistics Properties Trust | | Size: | 8,209,036 SF |
| Guarantor: | Industrial Logistics Properties Trust | Cut-off Date Balance per SF(1): | $26 |
| Mortgage Rate(2): | 2.65326% | Maturity Date Balance per SF(1): | $26 |
| Note Date: | 10/21/2019 | | Property Manager: | The RMR Group LLC |
| First Payment Date: | 12/7/2019 | | | (borrower-related) |
| Maturity Date: | 11/7/2029 | | Underwriting and Financial Information |
| Original Term to Maturity: | 120 months | | UW NOI: | $31,836,916 |
| Original Amortization Term: | 0 months | | UW NOI Debt Yield(1): | 14.8% |
| IO Period: | 120 months | | UW NOI Debt Yield at Maturity(1): | 14.8% |
| Seasoning: | 1 month | | UW NCF DSCR(1): | 5.05x |
| Prepayment Provisions(3): | LO (25); DEF/YM1 (88); O (7) | | Most Recent NOI: | $28,890,150 (12/31/2018) |
| Lockbox/Cash Mgmt Status: | Hard/Springing | | 2nd Most Recent NOI: | $27,259,856 (12/31/2017) |
| Additional Debt Type(1): | Pari Passu /Subordinate | | 3rd Most Recent NOI: | $16,319,258 (12/31/2016) |
| Additional Debt Balance(1): | $189,320,000 / $135,600,000 | | Most Recent Occupancy: | 100.0% (Various) |
| Future Debt Permitted (Type): | No (N/A) | | 2nd Most Recent Occupancy: | N/A |
| Reserves(4) | | 3rd Most Recent Occupancy: | N/A |
| Type | Initial | Monthly | Cap | | Appraised Value (as of): | $547,000,000 (Various) |
| RE Tax: | $0 | Springing | N/A | | Appraised Value per SF: | $67 |
| Insurance: | $0 | Springing | N/A | | Cut-off Date LTV Ratio(1): | 39.2% |
| Toro Expansion: | $6,134,904 | $0 | N/A | | Maturity Date LTV Ratio(1): | 39.2% |
| | | | | | | | |
| Sources and Uses |
| Sources | Proceeds | % of Total | | Uses | Proceeds | % of Total |
| Senior Loan Amount(1): | $214,400,000 | 61.3% | | Return of Equity(5): | $340,254,888 | 97.2% |
| Subordinate Companion Loan(1): | $135,600,000 | 38.7% | | Reserves: | $6,134,904 | 1.8% |
| | | | | Closing Costs: | $3,610,208 | 1.0% |
| Total Sources: | $350,000,000 | 100.0% | | Total Uses: | $350,000,000 | 100.0% |
| (1) | The ILPT Industrial Portfolio Mortgage Loan (as defined below) is part of the ILPT Industrial Portfolio Whole Loan (as defined below), which is comprised of eightpari passusenior promissory notes with an aggregate original principal balance of $214,400,000 (the “Senior Notes”, and collectively, the “ILPT Industrial Portfolio Senior Loan”) and twelve promissory notes that are subordinate to the Senior Notes with an original principal balance of $135,600,000 (collectively, the “ILPT Industrial Portfolio Subordinate Companion Loan”, and together with the ILPT Industrial Portfolio Senior Loan, the “ILPT Industrial Portfolio Whole Loan”). The Cut-off Date Balance per SF, Maturity Date Balance per SF, UW NOI Debt Yield, UW NOI Debt Yield at Maturity, UW NCF DSCR, Cut-off Date LTV Ratio and Maturity Date LTV Ratio numbers presented above are based on the aggregate principal balance of the promissory notes comprising the ILPT Industrial Portfolio Senior Loan, without regard to the ILPT Industrial Portfolio Subordinate Companion Loan. The Cut-off Date Balance per SF, Maturity Date Balance per SF, UW NOI Debt Yield, UW NOI Debt Yield at Maturity, UW NCF DSCR, Cut-off Date LTV Ratio and Maturity Date LTV Ratio numbers based on the combined balance of the entire ILPT Industrial Portfolio Whole Loan are $43, $43, 9.1%, 9.1%, 2.47x, 64.0% and 64.0%, respectively. The ILPT Industrial Portfolio Whole Loan was co-originated by Morgan Stanley Bank, N.A. (“MSBNA”), Bank of America, N.A. (“BANA”) and UBS AG (“UBS”) on October 21, 2019. |
| (2) | Reflects the Senior Notes only. The ILPT Industrial Portfolio Subordinate Companion Loan accrues interest at the rate of 4.40%per annum. |
| (3) | Defeasance or prepayment of the ILPT Industrial Portfolio Whole Loan is permitted at any time after the earlier to occur of (a) the end of the two-year period commencing on the closing date of the securitization of the last ILPT Industrial Portfolio Whole Loan promissory note to be securitized and (b) October 21, 2022. The assumed defeasance and prepayment lockout period of 25 payments is based on the closing date of this transaction in December 2019. |
| (4) | Monthly reserves for taxes and insurance are waived provided (a) a cash management sweep period (as defined in the ILPT Industrial Portfolio Whole Loan documents) is not continuing or (b) the taxes and insurance are paid directly by a tenant under a lease that is in full force and effect and as to which no event of default by the tenant is continuing (or with respect to insurance reserves only, if the ILPT Industrial Portfolio Borrowers (as defined below) maintain acceptable blanket insurance policies and the insurance premiums payable in connection therewith have been prepaid for not less than one year in advance). The ILPT Industrial Portfolio Borrowers were required to deposit at loan origination the amount of $6,134,904 with the lender for the payment of capital expenditures to be incurred in connection with the expansion of the premises demised pursuant to The Toro Company lease. |
| (5) | The borrower sponsor acquired the ILPT Industrial Portfolio Properties primarily from September 2018 to April 2019 for a combined purchase price of approximately $555.0 million and expects to use the proceeds of the ILPT Industrial Portfolio Whole Loan to reduce outstanding borrowings under its $750 million unsecured revolving credit facility. |
The Mortgage Loan. The fifteenth largest mortgage loan (the “ILPT Industrial Portfolio Mortgage Loan”) is part of the ILPT Industrial Portfolio Whole Loan in the original principal balance of $350,000,000. The ILPT Industrial Portfolio Whole Loan is secured by a first priority fee mortgage encumbering 11 industrial properties located in eight states (the “ILPT Industrial Portfolio” or the “ILPT Industrial Portfolio Properties”). The ILPT Industrial Portfolio Whole Loan was co-originated by MSBNA, BANA and UBS on October 21, 2019. The ILPT Industrial Portfolio Whole Loan is comprised of eight senior promissory notes, which arepari passu with each other, with an aggregate original principal balance of $214,400,000, and twelve subordinate promissory notes, which are subordinate to the senior notes andpari passu with each other, with an aggregate original principal balance of $135,600,000. The promissory Note A-4, in the original principal balance of $25,080,000, represents the ILPT Industrial Portfolio Mortgage Loan and will be included in the BANK 2019-BNK24 securitization trust. The remaining Senior Notes (collectively, the “ILPT Industrial Portfolio Non-ServicedPari PassuCompanion Loans”), which had an aggregate original principal balance of $189,320,000, have been or are expected to be contributed to one or more future securitization transactions or may be otherwise transferred at any time. The ILPT Industrial Portfolio Whole Loan will be serviced pursuant to the pooling and servicing agreement for the
This is not a research report and was not prepared by any Underwriter’s research department. Please see additional important information and qualifications at the end of this Term Sheet.
T-136
| Industrial – Warehouse Distribution | Loan #15 | Cut-off Date Balance: | | $25,080,000 |
| Various | ILPT Industrial Portfolio | Cut-off Date LTV: | | 39.2% |
| Various | | U/W NCF DSCR: | | 5.05x |
| | | U/W NOI Debt Yield: | | 14.8% |
MSC 2019-L3 securitization trust. See “Description of the Mortgage Pool—The Whole Loans—The ILPT Industrial Portfolio Pari Passu A/B Whole Loan”and “Pooling and Servicing Agreement—Servicing of the Non-Serviced Mortgage Loans” in the Preliminary Prospectus.
| ILPT Industrial Portfolio Whole Loan Summary |
| Notes | Original Balance | Cut-off Date Balance | Anticipated Note Holder | Controlling Piece |
| ILPT Industrial Portfolio Non-ServicedPari Passu Companion Loans | | | |
| A-1 | $50,000,000 | $50,000,000 | MSC 2019-L3 | No(1) |
| A-2 | $35,760,000 | $35,760,000 | BANK 2019-BNK23 | No |
| A-3 | $39,240,000 | $39,240,000 | BANK 2019-BNK23 | No |
| A-4 | $25,080,000 | $25,080,000 | BANK 2019-BNK24 | No |
| A-5 | $25,000,000 | $25,000,000 | CSAIL 2019-C18 | No |
| A-6 | $20,000,000 | $20,000,000 | UBS 2019-C18 | No |
| A-7 | $10,000,000 | $10,000,000 | UBS 2019-C18 | No |
| A-8 | $9,320,000 | $9,320,000 | CSAIL 2019-C18 | No |
| ILPT Industrial Portfolio Subordinate Companion Loan | | | | |
| B-1-A | $24,240,000 | $24,240,000 | Third Party Holder | Yes(1) |
| B-1-B | $20,000,000 | $20,000,000 | Third Party Holder | No |
| B-1-C | $5,200,000 | $5,200,000 | Third Party Holder | No |
| B-1-D | $4,800,000 | $4,800,000 | Third Party Holder | No |
| B-2-A | $18,180,000 | $18,180,000 | Third Party Holder | No |
| B-2-B | $15,000,000 | $15,000,000 | Third Party Holder | No |
| B-2-C | $3,900,000 | $3,900,000 | Third Party Holder | No |
| B-2-D | $3,600,000 | $3,600,000 | Third Party Holder | No |
| B-3-A | $18,180,000 | $18,180,000 | Third Party Holder | No |
| B-3-B | $15,000,000 | $15,000,000 | Third Party Holder | No |
| B-3-C | $3,900,000 | $3,900,000 | Third Party Holder | No |
| B-3-D | $3,600,000 | $3,600,000 | Third Party Holder | No |
| Total | $350,000,000 | $350,000,000 | | |
| (1) | The holder of the ILPT Industrial Portfolio B-1-A Note (which may transfer such right to the holder of the other B Notes) will have the right to appoint the special servicer of the ILPT Industrial Portfolio Whole Loan and to direct certain decisions with respect to the ILPT Industrial Portfolio Whole Loan, unless a control appraisal event exists under the related co-lender agreement (in which case Note A-1 will be the controlling note). The ILPT Industrial Portfolio Whole Loan will be serviced pursuant to the pooling and servicing agreement for the MSC 2019-L3 securitization. |
The Borrowers and the Borrower Sponsor. The borrowers are The Industrial Fund St. Louis LLC, The Industrial Fund PA LLC, The Industrial Fund MS LLC, and The Industrial Fund Ankeny LLC (collectively, the “ILPT Industrial Portfolio Borrowers”), each a Delaware limited liability company structured to be bankruptcy-remote with two independent directors. Industrial Logistics Properties Trust (“ILPT”) is the borrower sponsor and non-recourse carveout guarantor with respect to the ILPT Industrial Portfolio Whole Loan. ILPT’s guaranteed obligations for full recourse carveouts (consisting generally of bankruptcy related events) are capped at 15% of the outstanding principal balance of the ILPT Industrial Portfolio Whole Loan.
ILPT is a real estate investment trust formed to own and lease industrial and logistics properties throughout the United States. As of June 30, 2019, ILPT owned 298 industrial and logistics properties with approximately 42.4 million rentable SF, which were approximately 99.3% leased to 265 tenants with a weighted average remaining lease term of approximately 9.8 years. Approximately 58.0% of ILPT’s annualized rental revenues as of June 30, 2019 come from 72 industrial and logistics properties, with approximately 25.6 million SF located in 29 states on the U.S. mainland and approximately 42.0% of annualized rental revenues come from 226 properties (buildings, leasable land parcels and easements), with approximately 16.8 million SF located on the island of Oahu, Hawaii, most of which are long-term ground leases to tenants that have constructed buildings and operate businesses on land owned by ILPT.
The Properties. The ILPT Industrial Portfolio consists of a total of eleven industrial properties containing a total of 8,209,036 SF. The ILPT Industrial Portfolio Properties are located across eight states. The ILPT Industrial Portfolio Properties are located in Indiana (four properties, 40.2% of NRA), Ohio (one property, 21.8% of NRA), and Virginia (one property, 12.4% of NRA), with the five remaining ILPT Industrial Portfolio Properties located in Missouri, Iowa, Kentucky, Maryland and Pennsylvania. Built between 2001 and 2016, with seven of the eleven properties built between 2012 and 2016, the ILPT Industrial Portfolio Properties range in size from 205,090 SF to 1,791,246 SF. Based on the rent roll as of September 1, 2019, the ILPT Industrial Portfolio was 100.0% leased by a mix of national and local tenants. The largest tenant, Amazon, occupies approximately 25.0% of the ILPT Industrial Portfolio SF and contributes approximately 24.5% of underwritten base rent, and the second largest tenant, Procter & Gamble, occupies approximately 21.8% of the ILPT Industrial Portfolio SF and contributes approximately 19.5% of underwritten base rent. Excluding Amazon and Procter & Gamble, no single tenant accounts for more than 11.4% of underwritten rent or more than 11.7% of total SF of the ILPT Industrial Portfolio. The largest amount of rollover occurs in 2024, when leases comprising approximately 43.3% of the ILPT Industrial Portfolio SF and 36.0% of underwritten base rent expire. The weighted average remaining lease term at the ILPT Industrial Portfolio is approximately 6.5 years as of November 2019, and approximately 15.8% of the ILPT Industrial Portfolio SF and 24.2% of underwritten base rent rolls after the maturity of the ILPT Industrial Portfolio Whole Loan.
This is not a research report and was not prepared by any Underwriter’s research department. Please see additional important information and qualifications at the end of this Term Sheet.
T-137
| Industrial – Warehouse Distribution | Loan #15 | Cut-off Date Balance: | | $25,080,000 |
| Various | ILPT Industrial Portfolio | Cut-off Date LTV: | | 39.2% |
| Various | | U/W NCF DSCR: | | 5.05x |
| | | U/W NOI Debt Yield: | | 14.8% |
The following table presents a summary of certain information relating to the ILPT Industrial Portfolio Properties:
| ILPT Industrial Portfolio Properties Summary(1) |
Property Name | City | State | Year Built | Total GLA (SF) | % of Total GLA | Occ. % | Cut-off Date Allocated Loan Amount(2) | % of ALA(2) | Appraised Value(3) | 12/31/2018 NOI |
| 1800 Union Airpark Boulevard | Union | OH | 2014 | 1,791,246 | 21.8% | 100.0% | $37,039,854 | 17.3% | $94,500,000 | $6,123,103 |
| 4237-4255 Anson Boulevard | Whitestown | IN | 2006 | 1,036,573 | 12.6% | 100.0% | $28,612,797 | 13.3% | $73,000,000 | $4,805,740 |
| 5000 Commerce Way | Petersburg | VA | 2012 | 1,016,065 | 12.4% | 100.0% | $27,319,342 | 12.7% | $69,700,000 | $3,628,743 |
| 5142 & 5148 North Hanley Road | St. Louis | MO | 2016 | 430,986 | 5.3% | 100.0% | $24,183,693 | 11.3% | $61,700,000 | $2,679,435 |
| 945 Monument Drive | Lebanon | IN | 2014 | 962,500 | 11.7% | 100.0% | $20,068,154 | 9.4% | $51,200,000 | $2,881,565 |
| 2801 Airwest Boulevard | Plainfield | IN | 2001 | 804,586 | 9.8% | 100.0% | $16,854,113 | 7.9% | $43,000,000 | $2,411,524 |
| 20 Logistics Boulevard | Walton | KY | 2006 | 603,586 | 7.4% | 100.0% | $16,109,397 | 7.5% | $41,100,000 | $2,339,909 |
| 5500 Southeast Delaware Avenue | Ankeny | IA | 2012 | 644,104 | 7.8% | 100.0% | $12,738,574 | 5.9% | $32,500,000 | $1,497,139 |
| 2150 Stanley Road | Plainfield | IN | 2007 | 493,500 | 6.0% | 100.0% | $11,837,075 | 5.5% | $30,200,000 | $1,743,981 |
| 16101 Queens Court | Upper Marlboro | MD | 2016 | 220,800 | 2.7% | 100.0% | $11,562,706 | 5.4% | $29,500,000 | $297,684 |
| 5 Logistics Drive | Carlisle | PA | 2016 | 205,090 | 2.5% | 100.0% | $8,074,296 | 3.8% | $20,600,000 | $481,327 |
| Total/Wtd. Avg. | | | | 8,209,036 | 100.0% | 100.0% | $214,400,000 | 100.0% | $547,000,000 | $28,890,150 |
| (1) | Based on the underwritten rent roll dated September 1, 2019. |
| (2) | Based on the Senior Notes. |
| (3) | Based on the appraisals dated August 31, 2019 to September 5, 2019. |
The following table presents a summary of amenity information relating to the ILPT Industrial Portfolio Properties:
| ILPT Industrial Portfolio Properties Summary |
Property Name | State | Year Built | Total GLA (SF) | Tenant | Dock Doors / Drive-in Doors | Clear Height | Parking Spaces |
| 1800 Union Airpark Boulevard | OH | 2014 | 1,791,246 | Procter & Gamble | 230 / 2 | 36’ | 756 |
| 4237-4255 Anson Boulevard | IN | 2006 | 1,036,573 | Amazon | 80 / 4 | 36’ | 1,560 |
| 5000 Commerce Way | VA | 2012 | 1,016,065 | Amazon | 75 / 2 | 32’ | 952 |
| 5142 & 5148 North Hanley Road | MO | 2016 | 430,986 | SKF USA | 24 / 7 | 31’ | 385 |
| 945 Monument Drive | IN | 2014 | 962,500 | Subaru of America Distribution | 96 / 6 | 34’ | 260 |
| 2801 Airwest Boulevard | IN | 2001 | 804,586 | Whirlpool Corporation | 71 / 4 | 32’ – 34’ | 345 |
| 20 Logistics Boulevard | KY | 2006 | 603,586 | Cummins, Inc. | 70 / 3 | 32’ | 192 |
| 5500 Southeast Delaware Avenue | IA | 2012 | 644,104 | The Toro Company | 56 / 3 | 28’ | 45 |
| 2150 Stanley Road | IN | 2007 | 493,500 | Siemens Corporation; M D Logistics, Inc. | 57 / 4 | 36’ | 174 |
| 16101 Queens Court | MD | 2016 | 220,800 | La-Z-Boy Incorporated | 29 / 2 | 32’ | 171 |
| 5 Logistics Drive | PA | 2016 | 205,090 | Transamerica Auto Parts | 28 / 2 | 32’ | 141 |
| Total/Wtd. Avg. | | | 8,209,036 | | | | |
Source:Appraisals.
This is not a research report and was not prepared by any Underwriter’s research department. Please see additional important information and qualifications at the end of this Term Sheet.
T-138
| Industrial – Warehouse Distribution | Loan #15 | Cut-off Date Balance: | | $25,080,000 |
| Various | ILPT Industrial Portfolio | Cut-off Date LTV: | | 39.2% |
| Various | | U/W NCF DSCR: | | 5.05x |
| | | U/W NOI Debt Yield: | | 14.8% |
The following table presents certain information relating to the leases at the ILPT Industrial Portfolio Properties:
| Tenant Summary(1) |
| Tenant Name | Credit Rating (Fitch/Moody's/S&P)(2) | Tenant SF | Approx. % of SF | Annual UW Base Rent | Annual UW Base Rent PSF | % of Total Annual
UW Base Rent | Lease Expiration | Renewal Options | Term. Option |
| Amazon | A+/A3/AA- | 2,052,638 | 25.0% | $8,122,434 | $3.96 | 24.5% | Various(3) | Various(3) | N |
| Procter & Gamble | NR/Aa3/AA- | 1,791,246 | 21.8% | $6,456,575 | $3.60 | 19.5% | 10/31/2024 | 3 x 5 year | N |
| Subaru of America Distribution | NR/NR/NR | 962,500 | 11.7% | $2,994,750 | $3.11 | 9.0% | 5/31/2024 | 2 x 5 year | N |
| Whirlpool Corporation | BBB/Baa1/BBB | 804,586 | 9.8% | $2,465,221 | $3.06 | 7.4% | 1/31/2024 | 3 x 2 year | N |
| The Toro Company(4) | NR/Baa3/BBB | 644,104 | 7.8% | $2,873,813 | $4.46 | 8.7% | 10/31/2034 | 3 x 5 year | Y |
| Cummins, Inc. | NR/A2/A+ | 603,586 | 7.4% | $2,334,949 | $3.87 | 7.1% | 10/31/2021 | 2 x 5 year | N |
| SKF USA | BBB+/Baa1/NR | 430,986 | 5.3% | $3,782,146 | $8.78 | 11.4% | 10/31/2038 | 2 x 10 year | N |
| Siemens Corporation | A/NR/A+ | 320,070 | 3.9% | $1,154,836 | $3.61 | 3.5% | 9/30/2028 | 3 x 5 year | N |
| La-Z-Boy Incorporated | NR/NR/NR | 220,800 | 2.7% | $1,364,544 | $6.18 | 4.1% | 1/31/2031 | 2 x 5 year | N |
| Transamerica Auto Parts | NR/NR/NR | 205,090 | 2.5% | $990,585 | $4.83 | 3.0% | 3/31/2025 | 2 x 5 year | N |
| M D Logistics, Inc.(5) | NR/NR/NR | 173,430 | 2.1% | $563,648 | $3.25 | 1.7% | 6/30/2027 | 1 x 5 year | Y |
| Subtotal/Wtd. Avg. | | 8,209,036 | 100.0% | $33,103,501 | $4.03 | 100.0% | | | |
| | | | | | | | | | |
| Other Tenants | | 0 | 0.0% | $0 | $0.00 | 0.0% | | | |
| Vacant Space | | 0 | 0.0% | $0 | $0.00 | 0.0% | | | |
| Total/Wtd. Avg. | | 8,209,036 | 100.0% | $33,103,501 | $4.03 | 100.0% | | | |
| (1) | Information is based on the underwritten rent roll. |
| (2) | Certain ratings are those of the parent company, whether or not the parent guarantees the lease. |
| (3) | Amazon is a tenant at the 5000 Commerce Way property (1,016,065 SF; expiring September 30, 2027; four, five-year renewal options) and the 4237-4255 Anson Boulevard property (1,036,573 SF; expiring April 30, 2021; five, five-year renewal options). |
| (4) | The Toro Company is currently in the process of expanding into an additional 194,000 SF. The tenant has the right to terminate its lease if the expansion date has not occurred within 270 days after November 1, 2019. The tenant may exercise its right to terminate its lease by giving notice no later than 30 days after the expiration of such 270 day period. At closing, the lender reserved $6,134,904 into a Toro Expansion Reserve, which will be used to pay the remaining project costs associated with the expansion. The table above gives effect to the expansion. |
| (5) | M D Logistics, Inc. has the one-time right to terminate its lease effective June 30, 2022, upon providing notice by September 30, 2021 and paying a termination fee of $546,399. |
The following table presents certain information relating to the lease rollover schedule at the ILPT Industrial Portfolio Properties:
| Lease Rollover Schedule(1)(2) |
| Year | # of Leases Rolling | SF Rolling | UW Base Rent PSF Rolling | Approx. % of Total SF Rolling | Approx. Cumulative % of SF Rolling | Total UW Base Rent Rolling | Approx. % of Base Rent Rolling | Approx. Cumulative % of Total Rent Rolling |
| 2019 | 0 | 0 | $0.00 | 0.0% | 0.0% | $0 | 0.0% | 0.0% |
| 2020 | 0 | 0 | $0.00 | 0.0% | 0.0% | $0 | 0.0% | 0.0% |
| 2021 | 2 | 1,640,159 | $4.01 | 20.0% | 20.0% | $6,579,367 | 19.9% | 19.9% |
| 2022 | 0 | 0 | $0.00 | 0.0% | 20.0% | $0 | 0.0% | 19.9% |
| 2023 | 0 | 0 | $0.00 | 0.0% | 20.0% | $0 | 0.0% | 19.9% |
| 2024 | 3 | 3,558,332 | $3.35 | 43.3% | 63.3% | $11,916,546 | 36.0% | 55.9% |
| 2025 | 1 | 205,090 | $4.83 | 2.5% | 65.8% | $990,585 | 3.0% | 58.9% |
| 2026 | 0 | 0 | $0.00 | 0.0% | 65.8% | $0 | 0.0% | 58.9% |
| 2027 | 2 | 1,189,495 | $3.73 | 14.5% | 80.3% | $4,441,664 | 13.4% | 72.3% |
| 2028 | 1 | 320,070 | $3.61 | 3.9% | 84.2% | $1,154,836 | 3.5% | 75.8% |
| 2029 | 0 | 0 | $0.00 | 0.0% | 84.2% | $0 | 0.0% | 75.8% |
| 2030 & Beyond | 3 | 1,295,890 | $6.19 | 15.8% | 100.0% | $8,020,503 | 24.2% | 100.0% |
| Vacant | 0 | 0 | $0.00 | 0.0% | 100.0% | $0 | 0.0% | 100.0% |
| Total/Wtd. Avg. | 12 | 8,209,036 | $4.03 | 100.0% | | $33,103,501 | 100.0% | |
| (1) | Information is based on the underwritten rent roll. |
| (2) | Certain tenants may have lease termination options that are exercisable prior to the originally stated expiration date of the related lease and that are not considered in the lease rollover schedule. |
This is not a research report and was not prepared by any Underwriter’s research department. Please see additional important information and qualifications at the end of this Term Sheet.
T-139
| Industrial – Warehouse Distribution | Loan #15 | Cut-off Date Balance: | | $25,080,000 |
| Various | ILPT Industrial Portfolio | Cut-off Date LTV: | | 39.2% |
| Various | | U/W NCF DSCR: | | 5.05x |
| | | U/W NOI Debt Yield: | | 14.8% |
The Markets. The ILPT Industrial Portfolio Properties are located across eight states. The ILPT Industrial Portfolio Properties are located in Indiana (four properties, 40.2% of NRA), Ohio (one property, 21.8% of NRA), and Virginia (one property, 12.4% of NRA), with the five remaining ILPT Industrial Portfolio Properties located in Missouri, Iowa, Kentucky, Maryland and Pennsylvania.
The following table presents the geographical distribution of the ILPT Industrial Portfolio Properties:
| ILPT Industrial Portfolio Summary(1) |
State | Total GLA (SF) | Cut-off Date Allocated Loan Amount(2) | % of ALA(2) | 9/1/2019 Occupancy | Annual UW Base Rent | Annual UW Base Rent PSF | % of Total Annual
UW Base Rent | Appraised Value |
| Indiana | 3,297,159 | $77,372,139 | 36.1% | 100.0% | $11,422,873 | $3.46 | 34.5% | $197,400,000 |
| Ohio | 1,791,246 | $37,039,854 | 17.3% | 100.0% | $6,456,575 | $3.60 | 19.5% | $94,500,000 |
| Virginia | 1,016,065 | $27,319,342 | 12.7% | 100.0% | $3,878,016 | $3.82 | 11.7% | $69,700,000 |
| Missouri | 430,986 | $24,183,693 | 11.3% | 100.0% | $3,782,146 | $8.78 | 11.4% | $61,700,000 |
| Iowa | 644,104 | $12,738,574 | 5.9% | 100.0% | $2,873,813 | $4.46 | 8.7% | $32,500,000 |
| Kentucky | 603,586 | $16,109,397 | 7.5% | 100.0% | $2,334,949 | $3.87 | 7.1% | $41,100,000 |
| Maryland | 220,800 | $11,562,706 | 5.4% | 100.0% | $1,364,544 | $6.18 | 4.1% | $29,500,000 |
| Pennsylvania | 205,090 | $8,074,296 | 3.8% | 100.0% | $990,585 | $4.83 | 3.0% | $20,600,000 |
| Total/Wtd. Avg. | 8,209,036 | $214,400,000 | 100.0% | 100.0% | $33,103,501 | $4.03 | 100.0% | $547,000,000 |
| (1) | Based on the underwritten rent roll. |
| (2) | Based on the Senior Notes. |
The following table presents submarket information for the ILPT Industrial Portfolio Properties:
| ILPT Industrial Portfolio Properties Market Statistics |
| Property | State | Submarket | Available Space (SF) | Vacancy Rate | Wtd. Avg. Asking Rent PSF (Monthly) | Under Construction (SF) |
| 1800 Union Airpark Boulevard | OH | Northwest | 113,345,685 | 4.3% | $4.48 | 2,536,131 |
| 4237-4255 Anson Boulevard | IN | Indianapolis Far Boone County Industrial | 23,211,042 | 5.3% | $4.42 | 3,397,082 |
| 5000 Commerce Way | VA | Dinwiddie County Industrial | 4,251,769 | 2.3% | $5.39 | 0 |
| 5142 & 5148 North Hanley Road | MO | North St. Louis County – Airport Industrial | 306,000,000 | 5.1% | $5.44 | 3,300,000 |
| 945 Monument Drive | IN | Indianapolis Far Boone County Industrial | 23,211,042 | 5.3% | $4.42 | 3,397,082 |
| 2801 Airwest Boulevard | IN | Indianapolis Plainfield Industrial | 42,994,858 | 4.5% | $4.59 | 1,897,965 |
| 20 Logistics Boulevard | KY | Northern Kentucky | 73,085,428 | 2.9% | $4.59 | 6,356,231 |
| 5500 Southeast Delaware Avenue | IA | Des Moines Northwest Industrial | 10,744,905 | 1.9% | $6.11 | 185,900 |
| 2150 Stanley Road | IN | Indianapolis Plainfield Industrial | 42,994,858 | 4.5% | $4.59 | 1,897,965 |
| 16101 Queens Court | MD | Bowie Industrial | 5,500,000 | 6.9% | $8.90 | 0 |
| 5 Logistics Drive | PA | Central PA | 130,626,700 | 7.0% | $4.64 | 7,244,588 |
Source: Appraisals.
This is not a research report and was not prepared by any Underwriter’s research department. Please see additional important information and qualifications at the end of this Term Sheet.
T-140
| Industrial – Warehouse Distribution | Loan #15 | Cut-off Date Balance: | | $25,080,000 |
| Various | ILPT Industrial Portfolio | Cut-off Date LTV: | | 39.2% |
| Various | | U/W NCF DSCR: | | 5.05x |
| | | U/W NOI Debt Yield: | | 14.8% |
Operating History and Underwritten Net Cash Flow.The following table presents certain information relating to the historical operating performance and the Underwritten Net Cash Flow of the ILPT Industrial Portfolio:
| Cash Flow Analysis |
| | 2016 | 2017 | 2018 | UW | UW PSF |
| Total Rental Income | $16,490,561 | $27,070,602 | $28,111,926 | $33,103,501 | $4.03 |
| Total Recoveries | $4,184,720 | $6,235,383 | $6,901,354 | $7,400,766 | $0.90 |
| Total Other Income | $162,138 | $322,484 | 322,484 | 331,034 | $0.04 |
| Vacancy | $0 | $0 | $0 | ($1,012,607) | ($0.12) |
| Effective Gross Income | $20,837,420 | $33,628,469 | $35,335,764 | $39,822,695 | $4.85 |
| | | | | | |
| Real Estate Taxes(1) | $3,755,367 | $5,009,001 | $4,817,082 | $5,410,051 | $0.66 |
| Insurance | $24,168 | $88,147 | $94,578 | $192,515 | $0.02 |
| Other Expenses | $738,627 | $1,271,465 | $1,533,954 | $2,383,213 | $0.29 |
| Total Expenses | $4,518,161 | $6,368,613 | $6,445,614 | $7,985,779 | $0.97 |
| | | | | | |
| Net Operating Income(2) | $16,319,258 | $27,259,856 | $28,890,150 | $31,836,916 | $3.88 |
| Capital Expenditures | $584,669 | $509,338 | $0 | $656,723 | $0.08 |
| TI/LC | $0 | $0 | $0 | $2,038,736 | $0.25 |
| Net Cash Flow | $15,734,589 | $26,750,518 | $28,890,150 | $29,141,457 | $3.55 |
| | | | | | |
| Occupancy %(3) | NAV | NAV | NAV | 97.5% | |
| NOI DSCR(4) | 2.83x | 4.73x | 5.01x | 5.52x | |
| NCF DSCR(4) | 2.73x | 4.64x | 5.01x | 5.05x | |
| NOI Debt Yield(4) | 7.6% | 12.7% | 13.5% | 14.8% | |
| NCF Debt Yield(4) | 7.3% | 12.5% | 13.5% | 13.6% | |
| (1) | Certain of the ILPT Industrial Portfolio Properties benefit from tax abatements or incentives. See“Description of the Mortgage Pool—Real Estate and Other Tax Considerations”in the Preliminary Prospectus. |
| (2) | The increase in UW Net Operating Income from 2018 Net Operating Income is primarily attributed to (i) $442,662 of rent steps through August 30, 2020, (ii) $955,208 in straight line rent taken through the earlier of the loan term or the lease term for seven tenants including Procter & Gamble, Amazon, SKF USA, The Toro Company, Whirlpool Corporation, Cummins, Inc. and Siemens Corporation, and (iii) recent leasing, including Transamerica Auto Parts ($966,999 in UW base rent) and SKF USA ($709,343 in UW base rent). |
| (3) | Historical occupancy was not provided by the borrower sponsor. Based on the underwritten rent roll dated September 1, 2019, the ILPT Industrial Portfolio is 100.0% occupied. |
| (4) | Debt service coverage ratios and debt yields are based on the ILPT Industrial Portfolio Senior Loan and exclude the ILPT Industrial Portfolio Subordinate Companion Loan. |
Release of Property.The ILPT Industrial Portfolio Borrowers may obtain the release of an ILPT Industrial Portfolio Property (without payment of a yield maintenance premium) solely in connection with a casualty or condemnation, as follows. In the event that no event of default exists and a casualty or condemnation occurs as to which either (i) (a) the net proceeds of such casualty or condemnation are greater than 25% of the Casualty Release Value (as defined below) of the affected ILPT Industrial Portfolio Property (the “Affected Property”), and (b) the ILPT Industrial Portfolio Borrowers, after using commercially reasonable efforts are unable to satisfy conditions to restoration requiring that restoration be commenced as soon as reasonably practicable but no later than 90 days after net proceeds are made available to the ILPT Industrial Portfolio Borrowers, and the Affected Property and use thereof after restoration will be in compliance with legal requirements, any major lease at the Affected Property and other documents applicable to the Affected Property, and, with respect to the North Hanley Property (as defined below), the Bond Lease (as defined below), and (c) the lender does not make net proceeds available to the ILPT Industrial Portfolio Borrowers for restoration or (ii) the net proceeds of such casualty or condemnation are greater than 60% of the Casualty Release Value, then the ILPT Industrial Portfolio Borrowers may, on or prior to the second monthly payment date following the application of said net proceeds, prepay the ILPT Industrial Portfolio Whole Loan and obtain the release of the Affected Property. Such prepayment is subject to certain conditions set forth in the ILPT Industrial Portfolio Whole Loan documents, including, among others: (i) payment of an amount equal to (1) the greater of (A) the Casualty Release Value applicable to the Affected Property, and (B) the amount required to be paid under the REMIC Payment Requirement (as defined below), less (2) the portion of the net proceeds applied to the principal amount of the ILPT Industrial Portfolio Whole Loan applicable to such Affected Property (or zero if the amount in clause (2) is equal to or greater than the amount in clause (1)), (ii) transfer and conveyance of the Affected Property to a person other than the ILPT Industrial Portfolio Borrowers or any other loan party and (iii) payment of any additional amount required in order to satisfy the REMIC Payment Requirement.
The “Casualty Release Value” for each of the ILPT Industrial Portfolio Properties, as set forth in the ILPT Industrial Portfolio Whole Loan documents is as follows: 945 Monument Drive – $32,760,512; 16101 Queens Court – $18,875,686; 4237-4255 Anson Boulevard – $46,709,324; 5500 Southeast Delaware Avenue – $20,795,247; 5 Logistics Drive – $13,180,987; 1800 Union Airpark Boulevard – $60,466,179; 2150 Stanley Road –$19,323,583; 20 Logistics Boulevard – $26,297,989; 5142 & 5148 North Hanley Road – $39,478,976; 2801 Airwest Boulevard – $27,513,711; 5000 Commerce Way –$44,597,806, which in each case is 100% of the related allocated loan amount.
The “REMIC Payment Requirement” means, if immediately following a release of any Affected Property following a condemnation (but taking into account any proposed restoration on the remaining ILPT Industrial Portfolio Properties), the ratio of the unpaid principal balance of the ILPT Industrial Portfolio Whole Loan to the value of the remaining ILPT Industrial Portfolio Properties (including only real property) is greater than 125%, the principal balance of the ILPT Industrial Portfolio Whole Loan must be paid down by an amount equal to the least of the following amounts: (i) the net proceeds paid in connection with the related condemnation, (ii) the fair market value of the released Affected Property at the time of the release, or (iii) an amount such that the loan-to-value ratio of the ILPT Industrial Portfolio Whole Loan does not increase after the release, unless the ILPT Industrial Portfolio Borrowers deliver to the lender an opinion of counsel that if such amount is not paid, the securitization will not fail to maintain its status as a REMIC trust.
This is not a research report and was not prepared by any Underwriter’s research department. Please see additional important information and qualifications at the end of this Term Sheet.
T-141
| Industrial – Warehouse Distribution | Loan #15 | Cut-off Date Balance: | | $25,080,000 |
| Various | ILPT Industrial Portfolio | Cut-off Date LTV: | | 39.2% |
| Various | | U/W NCF DSCR: | | 5.05x |
| | | U/W NOI Debt Yield: | | 14.8% |
Right of First Offer/Right of First Refusal.With respect to each of the ILPT Industrial Portfolio Properties leased to Amazon, Amazon has both a right of first offer (“ROFO”) and a right of first refusal (“ROFR”) in connection with any offer for sale either of any such property or of a portfolio comprised solely of properties leased by the borrower to Amazon. The ROFO and ROFR do not apply to transfers to any affiliates of the ILPT Industrial Portfolio Borrowers, transfers to any joint venture or partnership with the ILPT Industrial Portfolio Borrowers, or transfers in connection with any debt or equity financing, pursuant to a foreclosure or deed in lieu thereof.
Additionally, The Toro Company has a ROFO with respect to the ILPT Industrial Portfolio Property leased by it. Such ROFO is personal to The Toro Company and terminates automatically if the tenant transfers the lease. The ROFO does not apply to (i) any portfolio sale where the total sale price is over $500,000,000, (ii) any transfer in connection with any financing (or a foreclosure sale or deed in lieu thereof), (iii) a transfer to any entity that is a successor to the ILPT Industrial Portfolio Borrowers by merger or to a party whose property is managed by the ILPT Industrial Portfolio Borrowers’ property manager or (iv) a simultaneous tax-free exchange.
Ground Lease and Tax Abatement. With respect to the 5142 & 5148 North Hanley Road property (the “North Hanley Property”), in connection with the development of the North Hanley Property and in order to incentivize the sole tenant, SKF USA (“SKF”), to locate at the property, a fee interest in the North Hanley Property was obtained by St. Louis County, St. Louis County ground leased the North Hanley Property to a predecessor (the “Predecessor Entity”) of the ILPT Industrial Portfolio Borrowers (the “Bond Lease”), bonds were issued by St. Louis County (the “County Bonds”) to the Predecessor Entity as payment for its costs in constructing the property, and the Predecessor Entity, SKF, and St. Louis County entered into a performance agreement (the “Performance Agreement”). The applicable ILPT Industrial Portfolio Borrower has succeeded to the rights of the Predecessor Entity under the County Bonds, the Bond Lease and the Performance Agreement. The rent payable by the ILPT Industrial Portfolio Borrowers to the County under the Bond Lease is equal to the principal and interest payments due to the ILPT Industrial Portfolio Borrowers under the County Bonds and, therefore the rental payments to be made by the applicable ILPT Industrial Portfolio Borrower and bond payments owed to such ILPT Industrial Portfolio Borrower offset each other. During the term of the Bond Lease, the ILPT Industrial Portfolio Borrowers are entitled to purchase all or any portion of the North Hanley Property back from the County and terminate the Bond Lease, in return for tender and cancellation of all outstanding County Bonds. The ILPT Industrial Portfolio Borrowers are also required to repurchase the North Hanley Property and terminate the Bond Lease, upon expiration of the Bond Lease or completion of the final bond payment, in each case in return for tender and cancellation of all outstanding County Bonds. The Bond Lease expires on the earlier of (i) the date the SKF lease is terminated and (ii) December 31 of the 10th calendar year following the completion date (as defined in the Bond Lease, provided that it is deemed to be not later than December 31, 2016). According to the appraisal, the improvements at the North Hanley Property were completed in 2015, which would result in a final expiration date of December 31, 2025 for the Bond Lease.
In connection with the above arrangements, the related ILPT Industrial Portfolio Borrower is exempt from payment of real property taxes during the term of the Bond Lease. Under the Performance Agreement, in lieu of real property taxes, the related ILPT Industrial Portfolio Borrower and SKF are jointly liable to make contributions to a special allocation fund in St. Louis, Missouri. The contributions amount is dependent on the number of jobs offered by SKF during each annual test period (a 90 day period ending on September 30 of each year), and said amount begins increasing once SKF employs less than 388 full time employees. If SKF offers less than 350 jobs, (i) the contributions amount increases to equal 100% of the unabated real property taxes that would have otherwise been paid and (ii) the County Bonds structure and Bond Lease are effectively terminated as the related ILPT Industrial Portfolio Borrower is required to purchase the fee interest in the North Hanley Property (in return for tender and cancellation of the County Bonds) by December 31 of such year. SKF is obligated under its lease to pay both the unabated taxes (when due) and the contribution payments, as applicable. Accordingly, no real estate taxes or contribution payments were underwritten. According to the appraisal, estimated unabated taxes following the expiration of the tax abatement, which is assumed to occur on December 31, 2025, are expected to be $754,225 in 2026.
The County Bonds have been pledged to the lender to secure the ILPT Industrial Portfolio Whole Loan.
Letter of Credit.The ILPT Industrial Portfolio Borrowers have the right to deliver a letter of credit meeting the requirements of the ILPT Industrial Portfolio Whole Loan documents in lieu of deposits previously made to the Toro Expansion Reserve. In addition, a letter of credit may be delivered to cure a cash sweep period relating to debt yield triggers as set forth in the ILPT Industrial Portfolio Whole Loan documents.
This is not a research report and was not prepared by any Underwriter’s research department. Please see additional important information and qualifications at the end of this Term Sheet.
T-142
This material was prepared by sales, trading, banking or other non-research personnel of one of the following (or an affiliate thereof): BofA Securities, Inc. (together with its affiliates, “BofA Securities”), Morgan Stanley & Co. LLC, Morgan Stanley & Co. International Limited, Morgan Stanley Japan Limited and/or Morgan Stanley Dean Witter Asia Limited (together with their affiliates, hereinafter “Morgan Stanley”), Wells Fargo Securities, LLC (together with its affiliates, “Wells Fargo”), Academy Securities, Inc. (together with its affiliates, “Academy”) or Drexel Hamilton, LLC (together with its affiliates, “Drexel”, and collectively with BofA Securities, Morgan Stanley, Wells Fargo and Academy, the “Underwriters”). This material was not produced by an Underwriter’s research analyst, although it may refer to an Underwriter’s research analyst or research report. Unless otherwise indicated, these views (if any) are the author’s and may differ from those of the fixed income or equity research departments of the Underwriters or others in those firms.
This material may have been prepared by or in conjunction with the respective trading desks of the Underwriters that may deal as principal in or own or act as market maker or liquidity provider for the securities/instruments (or related derivatives) mentioned herein. The trading desk of any Underwriter may have accumulated a position in the subject securities/instruments based on the information contained herein. Trading desk materials are not independent of the proprietary interests of the Underwriters, which may conflict with your interests. Each of the Underwriters may also perform or seek to perform investment banking services for the issuers of the securities and instruments mentioned herein.
The information contained in this material is subject to change, completion or amendment from time to time, and the information in this material supersedes information in any other communication relating to the securities referred to in this material. This material is not a solicitation to participate in any trading strategy, and is not an offer to sell any security or instrument or a solicitation of an offer to buy or sell any security or instrument in any jurisdiction where an offer, solicitation or sale is not permitted. Unless otherwise set forth in this material, any securities referred to in this material may not have been registered under the U.S. Securities Act of 1933, as amended, and, if not, may not be offered or sold absent an exemption therefrom. Recipients are required to comply with any legal or contractual restrictions on their purchase, holding, sale, exercise of rights or performance of obligations under any securities/instruments transaction.
The securities/instruments discussed in this material may not be suitable for all investors. This material has been prepared and issued by the Underwriters for intended distribution to market professionals and institutional investor clients. Other recipients should seek independent investment advice prior to making any investment decision based on this material. This material does not provide individually tailored investment advice or offer tax, regulatory, accounting or legal advice. Prior to entering into any proposed transaction, recipients should determine, in consultation with their own investment, legal, tax, regulatory and accounting advisors, the economic risks and merits, as well as the legal, tax, regulatory and accounting characteristics and consequences, of the transaction. You should consider this material as only a single factor in making an investment decision. The value of and income from investments may vary because of changes in interest rates, foreign exchange rates, default rates, prepayment rates, securities/instruments prices, market indexes, operational or financial conditions of companies or other factors. There may be time limitations on the exercise of options or other rights in securities/instruments transactions. Past performance is not necessarily a guide to future performance. Estimates of future performance are based on assumptions that may not be realized. Actual events may differ from those assumed and changes to any assumptions may have a material impact on any projections or estimates. Other events not taken into account may occur and may significantly affect the projections or estimates. Certain assumptions may have been made for modeling purposes only to simplify the presentation and/or calculation of any projections or estimates, and the Underwriters do not represent that any such assumptions will reflect actual future events. Accordingly, there can be no assurance that estimated returns or projections will be realized or that actual returns or performance results will not materially differ from those estimated herein. Some of the information contained in this document may be aggregated data of transactions in securities or other financial instruments executed by an Underwriter that has been compiled so as not to identify the underlying transactions of any particular customer.
Notwithstanding anything herein to the contrary, the Underwriters and each recipient hereof agree that they (and their employees, representatives, and other agents) may disclose to any and all persons, without limitation of any kind from the commencement of discussions, the U.S. federal and state income tax treatment and tax structure of the transaction and all materials of any kind (including opinions or other tax analyses) that are provided to it relating to the tax treatment and tax structure (as such terms are defined in Treasury Regulation 1.6011-4). For this purpose, "tax structure" is limited to facts relevant to the U.S. federal and state income tax treatment of the transaction and does not include information relating to the identity of the parties, their affiliates, agents or advisors. This authorization of tax disclosure is retroactively effective to the commencement of discussions with prospective investors regarding the transactions contemplated herein.
THE DISTRIBUTION OF THIS MATERIAL (A) IF MADE BY A PERSON WHO IS NOT AN AUTHORIZED PERSON UNDER THE FINANCIAL SERVICES AND MARKETS ACT 2000 (“FSMA”), IS BEING MADE ONLY TO, OR DIRECTED ONLY AT, PERSONS WHO (I) ARE OUTSIDE THE UNITED KINGDOM, OR (II) HAVE PROFESSIONAL EXPERIENCE IN MATTERS RELATING TO INVESTMENTS AND QUALIFY AS INVESTMENT PROFESSIONALS IN ACCORDANCE WITH ARTICLE 19(5) OF THE FINANCIAL SERVICES AND MARKETS ACT 2000 (FINANCIAL PROMOTION) ORDER 2005 (THE “FINANCIAL PROMOTION ORDER”), OR (III) ARE PERSONS FALLING WITHIN ARTICLE 49(2)(A) THROUGH (D) (HIGH NET WORTH COMPANIES, UNINCORPORATED ASSOCIATIONS, ETC.) OF THE FINANCIAL PROMOTION ORDER; AND (B) IF MADE BY A PERSON WHO IS AN AUTHORIZED PERSON UNDER THE FSMA, IS BEING MADE ONLY TO, OR DIRECTED ONLY AT, PERSONS WHO (I) ARE OUTSIDE THE UNITED KINGDOM, OR (II) HAVE PROFESSIONAL EXPERIENCE IN MATTERS RELATING TO INVESTMENTS AND QUALIFY AS INVESTMENT PROFESSIONALS IN ACCORDANCE WITH ARTICLE 14(5) OF THE FINANCIAL SERVICES AND MARKETS ACT 2000 (PROMOTION OF COLLECTIVE INVESTMENT SCHEMES) (EXEMPTIONS) ORDER 2001 (THE “PROMOTION OF COLLECTIVE INVESTMENT SCHEMES EXEMPTIONS ORDER”), OR (III) ARE PERSONS FALLING WITHIN ARTICLE 22(2)(A) THROUGH (D) (“HIGH NET WORTH COMPANIES, UNINCORPORATED ASSOCIATIONS, ETC.”) OF THE PROMOTION OF COLLECTIVE INVESTMENT SCHEMES EXEMPTIONS ORDER, OR (IV) ARE PERSONS TO WHOM THE ISSUING ENTITY MAY LAWFULLY BE PROMOTED IN ACCORDANCE WITH CHAPTER 4.12 OF THE UK FINANCIAL CONDUCT AUTHORITY’S CONDUCT OF BUSINESS SOURCEBOOK.
THE OFFERED CERTIFICATES HAVE NOT BEEN AND WILL NOT BE REGISTERED UNDER THE FINANCIAL INSTRUMENTS EXCHANGE ACT OF JAPAN (LAW NO. 25 OF 1948, AS AMENDED (THE “FIEL”)), AND EACH OF BOFA SECURITIES, INC., MORGAN STANLEY & CO. LLC, WELLS FARGO SECURITIES, LLC, ACADEMY SECURITIES, INC. AND DREXEL HAMILTON, LLC HAS AGREED THAT IT WILL NOT OFFER OR SELL ANY OFFERED CERTIFICATES, DIRECTLY OR INDIRECTLY, IN JAPAN OR TO, OR FOR THE BENEFIT OF, ANY JAPANESE PERSON, OR TO OTHERS FOR RE-OFFERING OR RESALE, DIRECTLY OR INDIRECTLY, IN JAPAN OR TO ANY JAPANESE PERSON, EXCEPT PURSUANT TO AN EXEMPTION FROM THE REGISTRATION REQUIREMENTS OF, AND OTHERWISE IN COMPLIANCE WITH, THE FIEL AND ANY OTHER APPLICABLE LAWS AND REGULATIONS. FOR THE PURPOSES OF THIS PARAGRAPH, “JAPANESE PERSON” SHALL MEAN ANY PERSON RESIDENT IN JAPAN, INCLUDING ANY CORPORATION OR OTHER ENTITY ORGANIZED UNDER THE LAWS AND REGULATIONS OF JAPAN.