| | | FREE WRITING PROSPECTUS |
| | | FILED PURSUANT TO RULE 433 |
| | | REGISTRATION FILE NO.: 333-228375-07 |
| | | |
BANK 2021-BNK36
Free Writing Prospectus
Structural and Collateral Term Sheet
$1,276,054,015
(Approximate Total Mortgage Pool Balance)
$1,060,719,000
(Approximate Offered Certificates)
Banc of America Merrill Lynch Commercial Mortgage Inc.
as Depositor
Bank of America, National Association
Morgan Stanley Mortgage Capital Holdings LLC
Wells Fargo Bank, National Association
National Cooperative Bank, N.A.
as Sponsors and Mortgage Loan Sellers
Commercial Mortgage Pass-Through Certificates
Series 2021-BNK36
September 20, 2021
BofA SECURITIES Co-Lead Bookrunner Manager | WELLS FARGO SECURITIES Co-Lead Bookrunner Manager | MORGAN STANLEY Co-Lead Bookrunner Manager |
| | | |
Academy Securities, Inc. Co-Manager | | Drexel Hamilton Co-Manager |
STATEMENT REGARDING THIS FREE WRITING PROSPECTUS
The depositor has filed a registration statement (including a prospectus) with the SEC (File No. 333-228375) for the offering to which this communication relates. Before you invest, you should read the prospectus in that registration statement and other documents the depositor has filed with the SEC for more complete information about the depositor, the issuing entity and this offering. You may get these documents for free by visiting EDGAR on the SEC web site at www.sec.gov. Alternatively, the depositor or any underwriter or any dealer participating in the offering will arrange to send you the prospectus if you request it by calling toll free 1-866-294-1322 or by email to dg.Prospectus_Requests@baml.com.
This is not a research report and was not prepared by any Underwriter’s research department. Please see additional important information and qualifications at the end of this Term Sheet.
Neither this Term Sheet nor anything contained herein shall form the basis for any contract or commitment whatsoever. The information contained herein is preliminary as of the date hereof. This Term Sheet is subject to change, completion or amendment from time to time. The information contained herein supersedes information in any other communication relating to the securities described herein; provided, that the information contained herein will be superseded by similar information delivered to you as part of the Preliminary Prospectus. The information contained herein should be reviewed only in conjunction with the entire Preliminary Prospectus. All of the information contained herein is subject to the same limitations and qualifications contained in the Preliminary Prospectus. The information contained herein does not contain all relevant information relating to the underlying mortgage loans or mortgaged properties. Such information is described in the Preliminary Prospectus. The information contained herein will be more fully described in the Preliminary Prospectus. The information contained herein should not be viewed as projections, forecasts, predictions or opinions with respect to value. Prior to making any investment decision, prospective investors are strongly urged to read the Preliminary Prospectus in its entirety. Neither the Securities and Exchange Commission nor any state securities commission has approved or disapproved of these securities or determined if this Term Sheet is truthful or complete. Any representation to the contrary is a criminal offense.
BofA Securities is the marketing name for the global banking and global markets businesses of Bank of America Corporation. Lending, derivatives, and other commercial banking activities are performed globally by banking affiliates of Bank of America Corporation, including Bank of America, N.A., member FDIC. Securities, strategic advisory, and other investment banking activities are performed globally by investment banking affiliates of Bank of America Corporation, including, in the United States, BofA Securities, Inc., which is a registered broker-dealer and member of the Financial Industry Regulatory Authority (“FINRA”) and the Securities Investor Protection Corporation (“SIPC”), and, in other jurisdictions, locally registered entities.
Wells Fargo Securities is the trade name for the capital markets and investment banking services of Wells Fargo & Company and its subsidiaries, including but not limited to Wells Fargo Securities, LLC, a member of the New York Stock Exchange, FINRA, the National Futures Association (“NFA”) and SIPC, Wells Fargo Prime Services, LLC, a member of FINRA, NFA and SIPC, and Wells Fargo Bank, National Association. Wells Fargo Securities, LLC and Wells Fargo Prime Services, LLC are distinct entities from affiliated banks and thrifts.
IMPORTANT NOTICE RELATING TO AUTOMATICALLY GENERATED EMAIL DISCLAIMERS
Any legends, disclaimers or other notices that may appear at the bottom of, or attached to, the email communication to which this Term Sheet may have been attached are not applicable to this Term Sheet and should be disregarded. Such legends, disclaimers or other notices have been automatically generated as a result of this Term Sheet having been sent via Bloomberg or another email system.
IMPORTANT NOTICE REGARDING THE CONDITIONS FOR THIS OFFERING OF ASSET-BACKED SECURITIES
THE ASSET-BACKED SECURITIES REFERRED TO IN THIS TERM SHEET ARE BEING OFFERED WHEN, AS AND IF ISSUED. IN PARTICULAR, YOU ARE ADVISED THAT THE ASSET-BACKED SECURITIES, AND THE ASSET POOL BACKING THEM, ARE SUBJECT TO MODIFICATION OR REVISION (INCLUDING, AMONG OTHER THINGS, THE POSSIBILITY THAT ONE OR MORE CLASSES OF SECURITIES MAY BE SPLIT, COMBINED OR ELIMINATED), AT ANY TIME PRIOR TO ISSUANCE OR AVAILABILITY OF A FINAL PROSPECTUS. AS A RESULT, YOU MAY COMMIT TO PURCHASE SECURITIES THAT HAVE CHARACTERISTICS THAT MAY CHANGE, AND YOU ARE ADVISED THAT ALL OR A PORTION OF THE SECURITIES MAY NOT BE ISSUED THAT HAVE THE CHARACTERISTICS DESCRIBED IN THIS TERM SHEET. OUR OBLIGATION TO SELL SECURITIES TO YOU IS CONDITIONED ON THE SECURITIES AND THE UNDERLYING TRANSACTION HAVING THE CHARACTERISTICS DESCRIBED IN THIS TERM SHEET. IF WE DETERMINE THAT THE FOREGOING CONDITION IS NOT SATISFIED IN ANY MATERIAL RESPECT, WE WILL NOTIFY YOU, AND NEITHER THE ISSUING ENTITY NOR ANY UNDERWRITER WILL HAVE ANY OBLIGATION TO YOU TO DELIVER ALL OR ANY PORTION OF THE SECURITIES WHICH YOU HAVE COMMITTED TO PURCHASE, AND THERE WILL BE NO LIABILITY BETWEEN US AS A CONSEQUENCE OF THE NON-DELIVERY.
This is not a research report and was not prepared by any Underwriter’s research department. Please see additional important information and qualifications at the end of this Term Sheet. |
T-2
| BANK 2021-BNK36 | Structural Overview |
Offered Certificates
| | | | | | | | | |
| Class | Expected Ratings
(Fitch/KBRA/S&P)(1) | Approximate Initial Certificate Balance or Notional Amount(2) | Approximate Initial Credit Support(3) | Pass-Through Rate Description | Expected Weighted Average Life (Years)(4) | Expected Principal
Window
(Months)(4) | Certificate Principal UW NOI Debt Yield(5) | Certificate
Principal
to Value
Ratio(6) |
| Class A-1 | AAAsf/AAA(sf)/AAA(sf) | $27,581,000 | 30.000% | (7) | 2.66 | 1 – 57 | 19.9% | 36.3% |
| Class A-2 | AAAsf/AAA(sf)/AAA(sf) | $157,181,000 | 30.000% | (7) | 4.90 | 57 – 60 | 19.9% | 36.3% |
| Class A-3 | AAAsf/AAA(sf)/AAA(sf) | $10,640,000 | 30.000% | (7) | 6.94 | 83 – 83 | 19.9% | 36.3% |
| Class A-SB | AAAsf/AAA(sf)/AAA(sf) | $27,535,000 | 30.000% | (7) | 7.15 | 60 – 109 | 19.9% | 36.3% |
| Class A-4(8) | AAAsf/AAA(sf)/AAA(sf) | (8)(9) | 30.000% | (7)(8) | (9) | (9) | 19.9% | 36.3% |
| Class A-5(8) | AAAsf/AAA(sf)/AAA(sf) | (8)(9) | 30.000% | (7)(8) | (9) | (9) | 19.9% | 36.3% |
| Class X-A | AAAsf/AAA(sf)/AAA(sf) | $848,575,000(10) | N/A | Variable IO(11) | N/A | N/A | N/A | N/A |
| Class X-B | A-sf/AAA(sf)/A+(sf) | $212,144,000(10) | N/A | Variable IO(11) | N/A | N/A | N/A | N/A |
| Class A-S(8) | AAAsf/AAA(sf)/AAA(sf) | $107,588,000(8) | 21.125% | (7)(8) | 9.99 | 119 – 120 | 17.6% | 40.9% |
| Class B(8) | AA-sf/AA(sf)/AAA(sf) | $53,036,000(8) | 16.750% | (7)(8) | 10.02 | 120 – 120 | 16.7% | 43.1% |
| Class C(8) | A-sf/A-(sf)/A+(sf) | $51,520,000(8) | 12.500% | (7)(8) | 10.02 | 120 – 120 | 15.9% | 45.3% |
Privately Offered Certificates(12)
| | | | | | | | | |
| Class | Expected Ratings
(Fitch/KBRA/S&P)(1) | Approximate Initial Certificate Balance or Notional Amount(2) | Approximate
Initial Credit
Support(3) | Pass-Through Rate Description | Expected Weighted Average Life (Years)(4) | Expected Principal
Window (Months)(4) | Certificate
Principal UW NOI Debt
Yield(5) | Certificate
Principal
to Value
Ratio(6) |
| Class X-D | BBB-sf/BBB-(sf)/NR | $65,159,000(10) | N/A | Variable IO(11) | N/A | N/A | N/A | N/A |
| Class X-F | BB-sf/B+(sf)/NR | $28,791,000(10) | N/A | Variable IO(11) | N/A | N/A | N/A | N/A |
| Class X-G | B-sf/B-(sf)/NR | $12,122,000(10) | N/A | Variable IO(11) | N/A | N/A | N/A | N/A |
| Class X-H | NR/NR/NR | $45,460,314(10) | N/A | Variable IO(11) | N/A | N/A | N/A | N/A |
| Class D | BBBsf/BBB+(sf)/NR | $34,853,000 | 9.625% | (7) | 10.02 | 120 – 120 | 15.4% | 46.8% |
| Class E | BBB-sf/BBB-(sf)/NR | $30,306,000 | 7.125% | (7) | 10.02 | 120 – 120 | 15.0% | 48.1% |
| Class F | BB-sf/B+(sf)/NR | $28,791,000 | 4.750% | (7) | 10.02 | 120 – 120 | 14.6% | 49.3% |
| Class G | B-sf/B-(sf)/NR | $12,122,000 | 3.750% | (7) | 10.02 | 120 – 120 | 14.5% | 49.9% |
| Class H | NR/NR/NR | $45,460,314 | 0.000% | (7) | 10.02 | 120 – 120 | 13.9% | 51.8% |
Non-Offered Eligible Vertical Interest(12)
| Class | Expected Ratings
(Fitch/KBRA/S&P)(1) | Approximate Initial Certificate Balance or Notional Amount(2) | Approximate
Initial Credit
Support(3) | Pass-
Through
Rate
Description | Expected
Weighted
Average Life (Years)(4) | Expected
Principal
Window
(Months)(4) | Certificate
Principal
UW NOI
Debt
Yield(5) | Certificate
Principal
to Value
Ratio(6) |
| RR Interest | NR/NR/NR | $63,802,700.76 | N/A | (13) | 9.01 | 1 – 120 | N/A | N/A |
| (1) | Ratings shown are those of Fitch Ratings, Inc. (“Fitch”), Kroll Bond Rating Agency, LLC (“KBRA”) and S&P Global Ratings (“S&P”). Certain nationally recognized statistical rating organizations that were not hired by the depositor may use information they receive pursuant to Rule 17g-5 under the Securities Exchange Act of 1934, as amended, or otherwise to rate the certificates. There can be no assurance as to what ratings a non-hired nationally recognized statistical rating organization would assign. See “Risk Factors—Other Risks Relating to the Certificates—Nationally Recognized Statistical Rating Organizations May Assign Different Ratings to the Certificates; Ratings of the Certificates Reflect Only the Views of the Applicable Rating Agencies as of the Dates Such Ratings Were Issued; Ratings May Affect ERISA Eligibility; Ratings May Be Downgraded” and “Ratings” in the Preliminary Prospectus to be dated on or about the date hereof (the “Preliminary Prospectus”). Capitalized terms used but not defined herein have the meanings assigned to such terms in the Preliminary Prospectus. |
| (2) | Approximate, subject to a permitted variance of plus or minus 5% and further subject to the discussion in footnote (9) below. In addition, the notional amounts of the Class X-A, Class X-B, Class X-D, Class X-F, Class X-G and Class X-H certificates may vary depending upon the final pricing of the classes of principal balance certificates or trust components whose certificate or principal balances comprise such notional amounts, and, if as a result of such pricing the pass-through rate of any class of the Class X-A, Class X-B, Class X-D, Class X-F, Class X-G or Class X-H certificates, as applicable, would be equal to zero at all times, such class of certificates will not be issued on the closing date of this securitization. |
| (3) | The approximate initial credit support percentages set forth for the certificates are approximate and, for the Class A-1, Class A-2, Class A-3, Class A-SB, Class A-4 and Class A-5 certificates, are presented in the aggregate, taking into account the principal balances of the Class A-4 and Class A-5 trust components. The approximate initial credit support percentage set forth for each class of the Class A-S, Class B and Class C certificates represents the approximate credit support for the underlying trust component with the same alphanumeric designation. The RR Interest provides credit support only to the limited extent that it is allocated a portion of any losses incurred on the underlying mortgage loans, which such losses are allocated between it, on the one hand, and to the Non-Retained Certificates, on the other hand, pro rata in accordance with their respective Percentage Allocation Entitlements (as defined below). See “Credit Risk Retention” in the Preliminary Prospectus. |
This is not a research report and was not prepared by any Underwriter’s research department. Please see additional important information and qualifications at the end of this Term Sheet. |
T-3
| BANK 2021-BNK36 | Structural Overview |
| (4) | The Expected Weighted Average Life and Expected Principal Window during which distributions of principal would be received as set forth in the foregoing table with respect to each class of certificates having a certificate balance are based on the assumptions set forth under “Yield and Maturity Considerations—Weighted Average Life” in the Preliminary Prospectus and on the assumptions that there are no prepayments, modifications or losses in respect of the mortgage loans and that there are no extensions or forbearances of maturity dates or anticipated repayment dates of the mortgage loans. |
| (5) | Certificate Principal UW NOI Debt Yield for any class of principal balance certificates shown in the table above (other than the RR Interest) is calculated as the product of (a) the weighted average UW NOI Debt Yield for the mortgage pool, multiplied by (b) a fraction, the numerator of which is the aggregate initial certificate or principal balance of all the principal balance certificates, and the denominator of which is the sum of (x) the aggregate initial certificate or principal balance of the subject class of principal balance certificates (or, with respect to the Class A-4, Class A-5, Class A-S, Class B or Class C certificates, the trust component with the same alphanumeric designation) and all other classes of principal balance certificates (other than the RR Interest), if any, that are senior to such class and (y) the outstanding certificate balance of the RR Interest, multiplied by the applicable RR Interest Computation Percentage. The Certificate Principal UW NOI Debt Yields of the Class A-1, Class A-2, Class A-3, Class A-SB, Class A-4 and Class A-5 certificates are calculated in the aggregate for those classes as if they were a single class. With respect to any class of principal balance certificates, the “RR Interest Computation Percentage” is equal to a fraction, expressed as a percentage, the numerator of which is the total initial certificate or principal balance of the subject class of principal balance certificates (or, with respect to the Class A-4, Class A-5, Class A-S, Class B or Class C certificates, the trust component with the same alphanumeric designation) and all other classes of principal balance certificates (other than the RR Interest), if any, that are senior to such class, and the denominator of which is the sum of the aggregate initial certificate or principal balance of all the principal balance certificates (other than the RR Interest). |
| (6) | Certificate Principal to Value Ratio for any class of principal balance certificates shown in the table above (other than the RR Interest) is calculated as the product of (a) the weighted average Cut-off Date LTV Ratio of the mortgage pool, multiplied by (b) a fraction, the numerator of which is the sum of (x) the aggregate initial certificate or principal balance of the subject class of principal balance certificates (or, with respect to the Class A-4, Class A-5, Class A-S, Class B or Class C certificates, the trust component with the same alphanumeric designation) and all other classes of principal balance certificates (other than the RR Interest), if any, that are senior to such class and (y) the outstanding certificate balance of the RR Interest, multiplied by the applicable RR Interest Computation Percentage, and the denominator of which is the aggregate initial certificate or principal balance of all the principal balance certificates. The Certificate Principal to Value Ratios of the Class A-1, Class A-2, Class A-3, Class A-SB, Class A-4 and Class A-5 certificates are calculated in the aggregate for those classes as if they were a single class. |
| (7) | The pass-through rate for each class of the Class A-1, Class A-2, Class A-3, Class A-SB, Class A-4, Class A-5, Class A-S, Class B, Class C, Class D, Class E, Class F, Class G and Class H certificates will be one of the following: (i) a fixed rate per annum, (ii) a variable rate per annum equal to the weighted average of the net mortgage interest rates on the mortgage loans for the related distribution date, (iii) a variable rate per annum equal to the lesser of (a) a fixed rate and (b) the weighted average of the net mortgage interest rates on the mortgage loans for the related distribution date or (iv) a variable rate per annum equal to the weighted average of the net mortgage interest rates on the mortgage loans for the related distribution date minus a specified percentage. For purposes of the calculation of the weighted average of the net mortgage interest rates on the mortgage loans for each distribution date, the net mortgage interest rates will be adjusted as necessary to a 30/360 basis. |
| (8) | The Class A-4-1, Class A-4-2, Class A-4-X1, Class A-4-X2, Class A-5-1, Class A-5-2, Class A-5-X1, Class A-5-X2, Class A-S-1, Class A-S-2, Class A-S-X1, Class A-S-X2, Class B-1, Class B-2, Class B-X1, Class B-X2, Class C-1, Class C-2, Class C-X1 and Class C-X2 certificates are also offered certificates. Such classes of certificates, together with the Class A-4, Class A-5, Class A-S, Class B and Class C certificates, constitute the “Exchangeable Certificates”. The Class A-1, Class A-2, Class A-3, Class A-SB, Class D, Class E, Class F, Class G and Class H certificates, together with the RR Interest and the Exchangeable Certificates with a certificate balance, are referred to as the “principal balance certificates.” |
| (9) | The exact initial principal balances or notional amounts of the Class A-4, Class A-4-X1, Class A-4-X2, Class A-5, Class A-5-X1 and Class A-5-X2 trust components (and consequently, the exact aggregate initial certificate balances or notional amounts of the Exchangeable Certificates with an “A-4” or “A-5” designation) are unknown and will be determined based on the final pricing of the certificates. However, the initial principal balances, weighted average lives and principal windows of the Class A-4 and Class A-5 trust components are expected to be within the applicable ranges reflected in the following chart. The aggregate initial principal balance of the Class A-4 and Class A-5 trust components is expected to be approximately $625,638,000, subject to a variance of plus or minus 5%. The Class A-4-X1 and Class A-4-X2 trust components will have initial notional amounts equal to the initial principal balance of the Class A-4 trust component. The Class A-5-X1 and Class A-5-X2 trust components will have initial notional amounts equal to the initial principal balance of the Class A-5 trust component. In the event that the Class A-5 trust component is issued with an initial certificate balance of $625,638,000, the Class A-4 trust component (and, correspondingly, the Class A-4 Exchangeable Certificates) will not be issued. |
| Trust Components | Expected Range of Initial Principal Balance | Expected Range of Weighted Average Life (Years) | Expected Range of Principal Window (Months) |
| Class A-4 | $0 - $300,000,000 | NAP – 9.79 | NAP / 109 – 118 |
| Class A-5 | $325,638,000 - $625,638,000 | 9.86 – 9.93 | 109 – 119 / 118 – 119 |
| (10) | The Class X-A, Class X-B, Class X-D, Class X-F, Class X-G and Class X-H certificates (collectively referred to as the “Class X certificates”) are notional amount certificates and will not be entitled to distributions of principal. The notional amount of the Class X-A certificates will be equal to the aggregate certificate or principal balance of the Class A-1, Class A-2, Class A-3 and Class A-SB certificates and the Class A-4 and Class A-5 trust components. The notional amount of the Class X-B certificates will be equal to the aggregate principal balance of the Class A-S, Class B and Class C trust components. The notional amount of the Class X-D certificates will be equal to the aggregate certificate balance of the Class D and Class E certificates. The notional amount of each class of the Class X-F, Class X-G and Class X-H certificates will be equal to the certificate balance of the class of principal balance certificates that, with the addition of “X-,” has the same alphabetical designation as the subject class of Class X certificates. |
| (11) | The pass-through rate for the Class X-A certificates for any distribution date will be a per annum rate equal to the excess, if any, of (a) the weighted average of the net mortgage interest rates on the mortgage loans for the related distribution date, over (b) the weighted average of the pass-through rates on the Class A-1, Class A-2, Class A-3 and Class A-SB certificates and the Class A-4, Class A-4-X1, Class A-4-X2, Class A-5, Class A-5-X1 and Class A-5-X2 trust components for the related distribution date, weighted on the basis of their respective certificate or principal balances or notional amounts outstanding immediately prior to that distribution date (but excluding trust components with a notional amount in the denominator of such weighted average calculation). The pass-through rate for the Class X-B certificates for any distribution date will be a per annum rate equal to the excess, if any, of (a) the weighted average of the net mortgage interest rates on the mortgage loans for the related distribution date, over (b) the weighted average of the pass-through rates on the Class A-S, Class A-S-X1, Class A-S-X2, Class B, Class B-X1, Class B-X2, Class C, Class C-X1 and Class C-X2 trust components for the related distribution date, weighted on the basis of their respective principal balances or notional amounts outstanding immediately prior to that distribution date (but excluding trust components with a notional amount in the denominator of such weighted average calculation). The pass-through rate for the Class X-D certificates for any distribution date will be a per annum rate equal to the excess, if any, of (a) the weighted average of the net mortgage interest rates on the mortgage loans for the related distribution date, over (b) the weighted average of the pass-through rates on the Class D and Class E certificates for the related distribution date, weighted on the basis of their respective certificate balances outstanding immediately prior to that distribution date. The pass-through rate for each class of the Class X-F, Class X-G and Class X-H certificates for any distribution date will be a per annum rate equal to the excess, if any, of (a) the weighted average of the net mortgage interest rates on the mortgage loans for the related distribution date, over (b) the pass-through rate for the related distribution date on the |
This is not a research report and was not prepared by any Underwriter’s research department. Please see additional important information and qualifications at the end of this Term Sheet. |
T-4
| BANK 2021-BNK36 | Structural Overview |
| | class of principal balance certificates that, with the addition of “X-,” has the same alphabetical designation as the subject class of Class X certificates. For purposes of the calculation of the weighted average of the net mortgage interest rates on the mortgage loans for each distribution date, the net mortgage interest rates will be adjusted as necessary to a 30/360 basis. |
| (12) | Not offered pursuant to the Preliminary Prospectus or this Term Sheet. Information provided in this Term Sheet regarding the characteristics of these certificates is provided only to enhance your understanding of the offered certificates. The privately offered certificates also include the Class V and Class R certificates, which do not have a certificate balance, notional amount, credit support, pass-through rate, rating, assumed final distribution date or rated final distribution date, and which are not shown in the chart. The Class V certificates represent a beneficial ownership interest held through the grantor trust in a specified percentage of certain excess interest in respect of mortgage loans having anticipated repayment dates, if any. The Class R certificates represent the beneficial ownership of the residual interest in each of the real estate mortgage investment conduits, as further described in the Preliminary Prospectus. |
| (13) | Although it does not have a specified pass-through rate (other than for tax reporting purposes), the effective pass-through rate for the RR Interest will be a variable rate per annum equal to the weighted average of the net mortgage interest rates on the mortgage loans for the related distribution date (in each case adjusted, if necessary, to accrue on the basis of a 360-day year consisting of twelve 30-day months). |
This is not a research report and was not prepared by any Underwriter’s research department. Please see additional important information and qualifications at the end of this Term Sheet. |
T-5
| BANK 2021-BNK36 | Structural Overview |
Issue Characteristics
| Offered Certificates: | $1,060,719,000 (approximate) monthly pay, multi-class, commercial mortgage pass-through certificates, consisting of 19 principal balance classes (Class A-1, Class A-2, Class A-3, Class A-SB, Class A-4, Class A-4-1, Class A-4-2, Class A-5, Class A-5-1, Class A-5-2, Class A-S, Class A-S-1, Class A-S-2, Class B, Class B-1, Class B-2, Class C, Class C-1 and Class C-2) and 12 interest-only classes (Class A-4-X1, Class A-4-X2, Class A-5-X1, Class A-5-X2, Class X-A, Class X-B, Class A-S-X1, Class A-S-X2, Class B-X1, Class B-X2, Class C-X1 and Class C-X2) |
| Co-Lead Managers and Joint Bookrunners: | BofA Securities, Inc., Morgan Stanley & Co. LLC and Wells Fargo Securities, LLC |
| Co-Managers: | Academy Securities, Inc. and Drexel Hamilton, LLC |
| Mortgage Loan Sellers: | Bank of America, National Association, Morgan Stanley Mortgage Capital Holdings LLC, Wells Fargo Bank, National Association and National Cooperative Bank, N.A. |
| Rating Agencies: | Fitch, KBRA and S&P |
| Master Servicers: | Wells Fargo Bank, National Association and National Cooperative Bank, N.A. |
| Special Servicers: | Rialto Capital Advisors, LLC and National Cooperative Bank, N.A. |
| Certificate Administrator/ Certificate Registrar/Custodian: | Wells Fargo Bank, National Association |
| Trustee: | Wilmington Trust, National Association |
| Operating Advisor: | Pentalpha Surveillance LLC |
| Asset Representations Reviewer: | Pentalpha Surveillance LLC |
| Initial Directing Certificateholder: | RREF IV Debt AIV, LP |
| Risk Retention Consultation Party: | Bank of America, National Association |
| U.S. Credit Risk Retention: | For a discussion on the manner in which the U.S. credit risk retention requirements will be addressed by Bank of America, National Association, as the retaining sponsor, see “Credit Risk Retention” in the Preliminary Prospectus. |
| EU Risk Retention: | None of the sponsors, the depositor or the underwriters or their respective affiliates, or any other person, intends to retain a material net economic interest in the securitization constituted by the issue of the certificates, or to take any other action in respect of such securitization, in a manner prescribed or contemplated by the EU Securitization Regulation or the UK Securitization Regulation. In particular, no such person undertakes to take any action which may be required by any potential investor or certificateholder for the purposes of its compliance with any requirement of the EU Securitization Regulation or the UK Securitization Regulation. In addition, the arrangements described under “Credit Risk Retention” in the Preliminary Prospectus have not been structured with the objective of ensuring compliance by any person with any requirement of the EU Securitization Regulation or the UK Securitization Regulation. Consequently, the Offered Certificates may not be a suitable investment for investors that are subject to any requirement of the EU Securitization Regulation or the UK Securitization Regulation. See “Risk Factors—Other Risks Relating to the Certificates—EU Securitization Regulation and UK Securitization Regulation” in the Preliminary Prospectus. |
| Cut-off Date: | The mortgage loans will be considered part of the trust fund as of their respective cut-off dates. The cut-off date with respect to each mortgage loan is the respective due date for the monthly debt service payment that is due in October 2021 (or, in the case of any mortgage loan that has its first due date after October 2021, the date that would have been its due date in October 2021 under the terms of that mortgage loan if a monthly debt service payment were scheduled to be due in that month). |
| Expected Pricing Date: | Week of September 20, 2021 |
| Expected Closing Date: | October 7, 2021 |
| Determination Dates: | The 11th day of each month or, if the 11th day is not a business day, then the business day immediately following such 11th day. |
| Distribution Dates: | The 4th business day following each determination date. The first distribution date will be in November 2021. |
| Rated Final Distribution Date: | The distribution date in September 2064 |
| Interest Accrual Period: | Preceding calendar month |
| Payment Structure: | Sequential pay |
| Tax Treatment: | REMIC, except that the Exchangeable Certificates will evidence interests in a grantor trust |
| Optional Termination: | 1.00% clean-up call |
| Minimum Denominations: | $10,000 for each class of Offered Certificates (other than Class X-A and Class X-B certificates); $1,000,000 for the Class X-A and Class X-B certificates |
| Settlement Terms: | DTC, Euroclear and Clearstream |
This is not a research report and was not prepared by any Underwriter’s research department. Please see additional important information and qualifications at the end of this Term Sheet. |
T-6
| BANK 2021-BNK36 | Structural Overview |
| Legal/Regulatory Status: | Each class of Offered Certificates is expected to be eligible for exemptive relief under ERISA. No class of Offered Certificates is SMMEA eligible. |
| Analytics: | The certificate administrator is expected to make available all distribution date statements, CREFC® reports and supplemental notices received by it to certain modeling financial services as described in the Preliminary Prospectus. |
| Bloomberg Ticker: | BANK 2021-BN36<MTGE><GO> |
| Risk Factors: | THE CERTIFICATES INVOLVE CERTAIN RISKS AND MAY NOT BE SUITABLE FOR ALL INVESTORS. SEE THE “RISK FACTORS” SECTION OF THE PRELIMINARY PROSPECTUS. |
This is not a research report and was not prepared by any Underwriter’s research department. Please see additional important information and qualifications at the end of this Term Sheet. |
T-7
| BANK 2021-BNK36 | Structural Overview |
Structural Overview
| Allocation Between the RR Interest and the Non-Retained Certificates: | | The aggregate amount available for distributions to the holders of the Certificates (including the RR Interest) on each distribution date (net of specified expenses of the issuing entity, including fees payable to, and costs and expenses reimbursable to, each applicable master servicer, primary servicer and special servicer, the certificate administrator, the trustee, the operating advisor, the asset representations reviewer and CREFC®) will be allocated between amounts available for distribution to the holders of the RR Interest, on the one hand, and to all other Certificates (other than the Class V and Class R Certificates), referred to herein as the “Non-Retained Certificates”, on the other hand. The portion of such amount allocable to (a) the RR Interest will at all times be the product of such amount multiplied by 5% and (b) the Non-Retained Certificates will at all times be the product of such amount multiplied by the difference between 100% and the percentage set forth in clause (a) (each, the respective “Percentage Allocation Entitlement”). |
| | | |
| Accrual: | | Each class of Offered Certificates will accrue interest on a 30/360 basis. |
| | | |
| Amount and Order of Distributions: | | On each distribution date, the Non-Retained Certificates’ Percentage Allocation Entitlement of funds available for distribution from the mortgage loans, net of (i) any yield maintenance charges and prepayment premiums and (ii) any excess interest, will be distributed in the following amounts and order of priority: First, to the Class A-1, Class A-2, Class A-3, Class A-SB, Class X-A, Class X-B, Class X-D, Class X-F, Class X-G and Class X-H certificates and the Class A-4, Class A-4-X1, Class A-4-X2, Class A-5, Class A-5-X1 and Class A-5-X2 trust components, in respect of interest, up to an amount equal to, and pro rata in accordance with, the interest entitlements for those classes of certificates and trust components; Second, to the Class A-1, Class A-2, Class A-3 and Class A-SB certificates and the Class A-4 and Class A-5 trust components as follows, to the extent of applicable available funds allocated to principal: either (i)(a) first, to principal on the Class A-SB certificates, until the certificate balance of the Class A-SB certificates is reduced to the planned principal balance for the related distribution date set forth in Annex E to the Preliminary Prospectus, and (b) second, to principal on the Class A-1 certificates, the Class A-2 certificates, the Class A-3 certificates, the Class A-4 trust component, the Class A-5 trust component and the Class A-SB certificates, in that order, in each case until the certificate or principal balance of such class of certificates or trust component has been reduced to zero, or (ii) if the certificate or principal balance of each class of principal balance certificates and trust components other than the Class A-1, Class A-2, Class A-3 and Class A-SB certificates, the Class A-4 and Class A-5 trust components and the RR Interest has been reduced to zero as a result of the allocation of losses on the mortgage loans to those certificates, to principal on the Class A-1, Class A-2, Class A-3 and Class A-SB certificates and the Class A-4 and Class A-5 trust components, pro rata, without regard to the distribution priorities described above or the planned principal balance of the Class A-SB certificates; Third, to the Class A-1, Class A-2, Class A-3 and Class A-SB certificates and the Class A-4 and Class A-5 trust components, first, up to an amount equal to, and pro rata based on, any previously unreimbursed losses on the mortgage loans allocable to principal that were previously borne by each such class or trust component and then in the amount of interest thereon; Fourth, to the Class A-S, Class A-S-X1 and Class A-S-X2 trust components, as follows: (a) to each such trust component in respect of interest, up to an amount equal to, and pro rata in accordance with, the interest entitlements for those trust components; (b) to the extent of applicable available funds allocable to principal remaining after distributions in respect of principal to each class of certificates or trust component with a higher priority (as set forth in prior enumerated clauses set forth above), to principal on the Class A-S trust component until its principal balance has been reduced to zero; and (c) to reimburse the Class A-S trust component, first, in the amount of any previously unreimbursed losses on the mortgage loans that were previously allocated thereto, then in the amount of interest thereon; Fifth, to the Class B, Class B-X1 and Class B-X2 trust components, as follows: (a) to each such trust component in respect of interest, up to an amount equal to, and pro rata in accordance with, the interest entitlements for those trust components; (b) to the extent of applicable available funds allocable to principal remaining after distributions in respect of principal to each class of certificates or trust component with a higher priority (as set forth in prior enumerated clauses set forth above), to principal on the Class B trust component until its principal balance has been reduced to zero; and (c) to reimburse the Class B trust component, first, in the amount of any previously unreimbursed losses on the mortgage loans that were previously allocated thereto, then in the amount of interest thereon; Sixth, to the Class C, Class C-X1 and Class C-X2 trust components, as follows: (a) to each such trust component in respect of interest, up to an amount equal to, and pro rata in accordance with, the interest entitlements for those trust components; (b) to the extent of applicable available funds allocable to principal remaining after distributions in respect of principal to each class of certificates or trust component with a higher priority (as set forth in prior enumerated clauses set forth above), to principal on the Class C trust component until its principal balance has been reduced to zero; and (c) to reimburse the Class C trust component, first, in the amount of any previously unreimbursed losses on the mortgage loans that were previously allocated thereto, then in the amount of interest thereon; Seventh, to the Class D, Class E, Class F, Class G and Class H certificates in the amounts and order of priority described in “Description of the Certificates—Distributions” in the Preliminary Prospectus; and Eighth, to the Class R certificates, any remaining amounts. Principal and interest payable on each trust component will be distributed pro rata to the corresponding classes of Exchangeable Certificates representing interests therein in accordance with their Class Percentage Interests therein as described below under “Exchangeable Certificates.” |
This is not a research report and was not prepared by any Underwriter’s research department. Please see additional important information and qualifications at the end of this Term Sheet. |
T-8
| BANK 2021-BNK36 | Structural Overview |
| Interest and Principal Entitlements: | | The interest entitlement of each class of Offered Certificates on each distribution date generally will be the interest accrued during the related interest accrual period on the related certificate balance or notional amount at the related pass-through rate, net of any prepayment interest shortfalls allocated to that class for such distribution date as described below. If prepayment interest shortfalls arise from voluntary prepayments on serviced mortgage loans during any collection period, the applicable master servicer is required to make a limited compensating interest payment to offset those shortfalls. See “Description of the Certificates—Prepayment Interest Shortfalls” in the Preliminary Prospectus. The remaining amount of prepayment interest shortfalls will be allocated between the RR Interest, on one hand, and the Non-Retained Certificates, on the other hand, in accordance with their respective Percentage Allocation Entitlements. The prepayment interest shortfalls allocated to the Non-Retained Certificates will be allocated among such classes of certificates (other than the Exchangeable Certificates) and trust components that are entitled to interest, on a pro rata basis, based on their respective amounts of accrued interest for the related distribution date, to reduce the interest entitlement on each such class of certificates and trust components. For any distribution date, prepayment interest shortfalls allocated to a trust component will be allocated among the related classes of Exchangeable Certificates, pro rata, in accordance with their respective class percentage interests for that distribution date. If a class of certificates or trust component receives less than the entirety of its interest entitlement on any distribution date, then the shortfall (excluding any shortfall due to prepayment interest shortfalls), together with interest thereon, will be added to its interest entitlement for the next succeeding distribution date. The aggregate principal distribution amount for each distribution date generally will be the aggregate amount of principal received or advanced in respect of the mortgage loans, net of any non-recoverable advances and interest thereon and any workout-delayed reimbursement amounts that are reimbursed to the applicable master servicer or the trustee during the related collection period. Non-recoverable advances and interest thereon are reimbursable from principal collections before reimbursement from other amounts. Workout-delayed reimbursement amounts will be reimbursable from principal collections. The Non-Retained Certificates and the RR Interest will be entitled to their respective Percentage Allocation Entitlements of the aggregate principal distribution amount. |
| | | |
| Exchangeable Certificates: | | Certificates of each class of Exchangeable Certificates may be exchanged for certificates of the corresponding classes of Exchangeable Certificates set forth next to such class in the table below, and vice versa. Following any exchange of certificates of one or more classes of Exchangeable Certificates (the applicable “Surrendered Classes”) for certificates of one or more classes of other Exchangeable Certificates (the applicable “Received Classes”), the Class Percentage Interests (as defined below) of the outstanding principal balances or notional amounts of the Corresponding Trust Components that are represented by the Surrendered Classes (and consequently their related certificate balances or notional amounts) will be decreased, and those of the Received Classes (and consequently their related certificate balances or notional amounts) will be increased. The dollar denomination of the certificates of each of the Received Classes must be equal to the dollar denomination of the certificates of each of the Surrendered Classes. No fee will be required with respect to any exchange of Exchangeable Certificates. |
| | Surrendered Classes (or Received Classes) of Certificates | Received Classes (or Surrendered Classes) of Certificates |
| | Class A-4 | Class A-4-1, Class A-4-X1 |
| | Class A-4 | Class A-4-2, Class A-4-X2 |
| | Class A-5 | Class A-5-1, Class A-5-X1 |
| | Class A-5 | Class A-5-2, Class A-5-X2 |
| | Class A-S | Class A-S-1, Class A-S-X1 |
| | Class A-S | Class A-S-2, Class A-S-X2 |
| | Class B | Class B-1, Class B-X1 |
| | Class B | Class B-2, Class B-X2 |
| | Class C | Class C-1, Class C-X1 |
| | Class C | Class C-2, Class C-X2 |
| | | On the closing date, the issuing entity will issue the following “trust components,” each with the initial principal balance (or, if such trust component has an “X” suffix, notional amount) and pass-through rate set forth next to it in the table below. Each trust component with an “X” suffix will not be entitled to distributions of principal. |
| | Trust Component | Initial Principal Balance
or Notional Amount | Pass-Through Rate |
| | Class A-4 | See footnote (9) to the first table above under “Structural Overview” | Class A-4 certificate pass-through rate minus 1.00% |
| | Class A-4-X1 | Equal to Class A-4 trust component principal balance | 0.50% |
| | Class A-4-X2 | Equal to Class A-4 trust component principal balance | 0.50% |
| | Class A-5 | See footnote (9) to the first table above under “Structural Overview” | Class A-5 certificate pass-through rate minus 1.00% |
| | Class A-5-X1 | Equal to Class A-5 trust component principal balance | 0.50% |
| | Class A-5-X2 | Equal to Class A-5 trust component principal balance | 0.50% |
This is not a research report and was not prepared by any Underwriter’s research department. Please see additional important information and qualifications at the end of this Term Sheet. |
T-9
| BANK 2021-BNK36 | Structural Overview |
| | Class A-S | $107,588,000 | Class A-S certificate pass-through rate minus 1.00% |
| | Class A-S-X1 | Equal to Class A-S trust component principal balance | 0.50% |
| | Class A-S-X2 | Equal to Class A-S trust component principal balance | 0.50% |
| | Class B | $53,036,000 | Class B certificate pass-through rate minus 1.00% |
| | Class B-X1 | Equal to Class B trust component principal balance | 0.50% |
| | Class B-X2 | Equal to Class B trust component principal balance | 0.50% |
| | Class C | $51,520,000 | Class C certificate pass-through rate minus 1.00% |
| | Class C-X1 | Equal to Class C trust component principal balance | 0.50% |
| | Class C-X2 | Equal to Class C trust component principal balance | 0.50% |
| | | Each class of Exchangeable Certificates represents an undivided beneficial ownership interest in the trust components set forth next to it in the table below (the “Corresponding Trust Components”). Each class of Exchangeable Certificates has a pass-through rate equal to the sum of the pass-through rates of the Corresponding Trust Components and represents a percentage interest (the related “Class Percentage Interest”) in each Corresponding Trust Component, including principal and interest payable thereon (and reimbursement of losses allocable thereto), equal to (x) the certificate balance (or, if such class has an “X” suffix, notional amount) of such class of certificates, divided by (y) the principal balance of the Class A-4 trust component (if such class of Exchangeable Certificates has an “A-4” designation), the Class A-5 trust component (if such class of Exchangeable Certificates has an “A-5” designation), the Class A-S trust component (if such class of Exchangeable Certificates has an “A-S” designation), the Class B trust component (if such class of Exchangeable Certificates has a “B” designation), or the Class C trust component (if such class of Exchangeable Certificates has a “C” designation). |
| | Group of Exchangeable Certificates | Class of Exchangeable Certificates | Corresponding Trust Components |
| | | Class A-4 | Class A-4, Class A-4-X1, Class A-4-X2 |
| | | Class A-4-1 | Class A-4, Class A-4-X2 |
| | “Class A-4 Exchangeable Certificates” | Class A-4-2 | Class A-4 |
| | | Class A-4-X1 | Class A-4-X1 |
| | | Class A-4-X2 | Class A-4-X1, Class A-4-X2 |
| | | Class A-5 | Class A-5, Class A-5-X1, Class A-5-X2 |
| | | Class A-5-1 | Class A-5, Class A-5-X2 |
| | “Class A-5 Exchangeable Certificates” | Class A-5-2 | Class A-5 |
| | | Class A-5-X1 | Class A-5-X1 |
| | | Class A-5-X2 | Class A-5-X1, Class A-5-X2 |
| | | Class A-S | Class A-S, Class A-S-X1, Class A-S-X2 |
| | | Class A-S-1 | Class A-S, Class A-S-X2 |
| | “Class A-S Exchangeable Certificates” | Class A-S-2 | Class A-S |
| | | Class A-S-X1 | Class A-S-X1 |
| | | Class A-S-X2 | Class A-S-X1, Class A-S-X2 |
| | | Class B | Class B, Class B-X1, Class B-X2 |
| | | Class B-1 | Class B, Class B-X2 |
| | “Class B Exchangeable Certificates” | Class B-2 | Class B |
| | | Class B-X1 | Class B-X1 |
| | | Class B-X2 | Class B-X1, Class B-X2 |
| | | Class C | Class C, Class C-X1, Class C-X2 |
| | | Class C-1 | Class C, Class C-X2 |
| | “Class C Exchangeable Certificates” | Class C-2 | Class C |
| | | Class C-X1 | Class C-X1 |
| | | Class C-X2 | Class C-X1, Class C-X2 |
| | The maximum certificate balance or notional amount of each class of Class A-4 Exchangeable Certificates, Class A-5 Exchangeable Certificates, Class A-S Exchangeable Certificates, Class B Exchangeable Certificates or Class C Exchangeable Certificates that could be issued in an exchange is equal to the principal balance of the Class A-4, Class A-5, Class A-S, Class B or Class C trust component, respectively. The maximum certificate balances of Class A-4, Class A-5, Class A-S, Class B and Class C certificates (subject to the constraint on the aggregate initial principal balance of the Class A-4 and Class A-5 trust components discussed in footnote (9) to the first table above under “Structural Overview”) will be issued on the closing date, and the certificate balance or notional amount of each other class of Exchangeable Certificates will be equal to zero on the closing date. |
This is not a research report and was not prepared by any Underwriter’s research department. Please see additional important information and qualifications at the end of this Term Sheet. |
T-10
| BANK 2021-BNK36 | Structural Overview |
| | Each class of Class A-4 Exchangeable Certificates, Class A-5 Exchangeable Certificates, Class A-S Exchangeable Certificates, Class B Exchangeable Certificates and Class C Exchangeable Certificates will have a certificate balance or notional amount equal to its Class Percentage Interest multiplied by the principal balance of the Class A-4, Class A-5, Class A-S, Class B or Class C trust component, respectively. Each class of Class A-4 Exchangeable Certificates, Class A-5 Exchangeable Certificates, Class A-S Exchangeable Certificates, Class B Exchangeable Certificates and Class C Exchangeable Certificates with a certificate balance will have the same approximate initial credit support percentage, Expected Weighted Average Life, Expected Principal Window, Certificate Principal UW NOI Debt Yield and Certificate Principal to Value Ratio as the Class A-4, Class A-5, Class A-S, Class B or Class C certificates, respectively, shown above. |
| Special Servicer Compensation: | | The principal compensation to be paid to a special servicer in respect of its special servicing activities will be the special servicing fee, the workout fee and the liquidation fee. The special servicing fee for each distribution date is calculated based on the outstanding principal balance of each serviced mortgage loan that is a specially serviced mortgage loan (and any related serviced companion loan) or as to which the related mortgaged property has become an REO property at the special servicing fee rate, which will be a rate equal to (a) with respect to Rialto Capital Advisors, LLC, the greater of 0.25000% per annum and the per annum rate that would result in a special servicing fee for the related month of $5,000, and (b) with respect to National Cooperative Bank, N.A., the greater of 0.25000% per annum and the per annum rate that would result in a special servicing fee of $1,000 for the related month. The special servicing fee will be payable monthly, first, from liquidation proceeds, insurance and condemnation proceeds, and other collections in respect of the related specially serviced mortgage loan or REO property and, then, from general collections on all the mortgage loans and any REO properties. Each applicable special servicer will also be entitled to (i) liquidation fees generally equal to 1.0% (or, if such rate would result in an aggregate liquidation fee less than $25,000, then the liquidation fee rate will be equal to the lesser of (i) 3.0% and (ii) such lower rate as would result in an aggregate liquidation fee equal to $25,000) of liquidation proceeds and certain other collections in respect of a specially serviced mortgage loan (and any related serviced companion loan) or related REO property and of amounts received in respect of mortgage loan repurchases by the related mortgage loan sellers and (ii) workout fees generally equal to 1.0% of interest (other than post-ARD excess interest on mortgage loans with anticipated repayment dates and other than default interest) and principal payments made in respect of a rehabilitated mortgage loan (and any related serviced companion loan), subject to a floor of $25,000 with respect to any mortgage loan, whole loan or related REO property, and in the case of each of clause (i) and (ii), subject to certain adjustments and exceptions as described in the Preliminary Prospectus under “Pooling and Servicing Agreement—Servicing and Other Compensation and Payment of Expenses—Special Servicing Compensation”. With respect to any non-serviced mortgage loan, the related special servicer under the related other pooling and servicing agreement pursuant to which such mortgage loan is being serviced will be entitled to similar compensation as that described above with respect to such non-serviced mortgage loan under such other pooling and servicing agreement as further described in the Preliminary Prospectus, although any related fees may accrue at a different rate and there may be a higher (or no) cap on liquidation and workout fees. |
| Prepayment Premiums/Yield Maintenance Charges: | | If any yield maintenance charge or prepayment premium is collected during any collection period with respect to any mortgage loan, then on the immediately succeeding distribution date, the certificate administrator will pay: |
| | (1) to the Non-Retained Certificates, in the following amounts: |
| (a) to the holders of each class of the Class A-1, Class A-2, Class A-3, Class A-SB, Class A-4, Class A-4-1, Class A-4-2, Class A-5, Class A-5-1, Class A-5-2, Class A-S, Class A-S-1, Class A-S-2, Class B, Class B-1, Class B-2, Class C, Class C-1, Class C-2, Class D and Class E certificates, the product of (x) the Non-Retained Certificates’ Percentage Allocation Entitlement of such yield maintenance charge or prepayment premium, (y) the related Base Interest Fraction for such class and the applicable principal prepayment, and (z) a fraction, the numerator of which is equal to the amount of principal distributed to such class for that distribution date, and the denominator of which is the total amount of principal distributed to the Class A-1, Class A-2, Class A-3, Class A-SB, Class D and Class E certificates and the Class A-4 Exchangeable Certificates, the Class A-5 Exchangeable Certificates, the Class A-S Exchangeable Certificates, the Class B Exchangeable Certificates and the Class C Exchangeable Certificates for that distribution date, |
| (b) to the holders of the Class A-4-X1 certificates, the product of (x) the Non-Retained Certificates’ Percentage Allocation Entitlement of such yield maintenance charge or prepayment premium, (y) a fraction, the numerator of which is equal to the amount of principal distributed to the Class A-4-1 certificates for that distribution date, and the denominator of which is the total amount of principal distributed to the Class A-1, Class A-2, Class A-3, Class A-SB, Class D and Class E certificates and the Class A-4 Exchangeable Certificates, the Class A-5 Exchangeable Certificates, the Class A-S Exchangeable Certificates, the Class B Exchangeable Certificates and the Class C Exchangeable Certificates for that distribution date, and (z) the difference between (1) the Base Interest Fraction for the Class A-4 certificates and the applicable principal prepayment and (2) the Base Interest Fraction for the Class A-4-1 certificates and the applicable principal prepayment, |
| (c) to the holders of the Class A-4-X2 certificates, the product of (x) the Non-Retained Certificates’ Percentage Allocation Entitlement of such yield maintenance charge or prepayment premium, (y) a fraction, the numerator of which is equal to the amount of principal distributed to the Class A-4-2 certificates for that distribution date, and the denominator of which is the total amount of principal |
This is not a research report and was not prepared by any Underwriter’s research department. Please see additional important information and qualifications at the end of this Term Sheet. |
T-11
| BANK 2021-BNK36 | Structural Overview |
| distributed to the Class A-1, Class A-2, Class A-3, Class A-SB, Class D and Class E certificates and the Class A-4 Exchangeable Certificates, the Class A-5 Exchangeable Certificates, the Class A-S Exchangeable Certificates, the Class B Exchangeable Certificates and the Class C Exchangeable Certificates for that distribution date, and (z) the difference between (1) the Base Interest Fraction for the Class A-4 certificates and the applicable principal prepayment and (2) the Base Interest Fraction for the Class A-4-2 certificates and the applicable principal prepayment, |
| (d) to the holders of the Class A-5-X1 certificates, the product of (x) the Non-Retained Certificates’ Percentage Allocation Entitlement of such yield maintenance charge or prepayment premium, (y) a fraction, the numerator of which is equal to the amount of principal distributed to the Class A-5-1 certificates for that distribution date, and the denominator of which is the total amount of principal distributed to the Class A-1, Class A-2, Class A-3, Class A-SB, Class D and Class E certificates and the Class A-4 Exchangeable Certificates, the Class A-5 Exchangeable Certificates, the Class A-S Exchangeable Certificates, the Class B Exchangeable Certificates and the Class C Exchangeable Certificates for that distribution date, and (z) the difference between (1) the Base Interest Fraction for the Class A-5 certificates and the applicable principal prepayment and (2) the Base Interest Fraction for the Class A-5-1 certificates and the applicable principal prepayment, |
| (e) to the holders of the Class A-5-X2 certificates, the product of (x) the Non-Retained Certificates’ Percentage Allocation Entitlement of such yield maintenance charge or prepayment premium, (y) a fraction, the numerator of which is equal to the amount of principal distributed to the Class A-5-2 certificates for that distribution date, and the denominator of which is the total amount of principal distributed to the Class A-1, Class A-2, Class A-3, Class A-SB, Class D and Class E certificates and the Class A-4 Exchangeable Certificates, the Class A-5 Exchangeable Certificates, the Class A-S Exchangeable Certificates, the Class B Exchangeable Certificates and the Class C Exchangeable Certificates for that distribution date, and (z) the difference between (1) the Base Interest Fraction for the Class A-5 certificates and the applicable principal prepayment and (2) the Base Interest Fraction for the Class A-5-2 certificates and the applicable principal prepayment, |
| (f) to the holders of the Class A-S-X1 certificates, the product of (x) the Non-Retained Certificates’ Percentage Allocation Entitlement of such yield maintenance charge or prepayment premium, (y) a fraction, the numerator of which is equal to the amount of principal distributed to the Class A-S-1 certificates for that distribution date, and the denominator of which is the total amount of principal distributed to the Class A-1, Class A-2, Class A-3, Class A-SB, Class D and Class E certificates and the Class A-4 Exchangeable Certificates, the Class A-5 Exchangeable Certificates, the Class A-S Exchangeable Certificates, the Class B Exchangeable Certificates and the Class C Exchangeable Certificates for that distribution date, and (z) the difference between (1) the Base Interest Fraction for the Class A-S certificates and the applicable principal prepayment and (2) the Base Interest Fraction for the Class A-S-1 certificates and the applicable principal prepayment, |
| (g) to the holders of the Class A-S-X2 certificates, the product of (x) the Non-Retained Certificates’ Percentage Allocation Entitlement of such yield maintenance charge or prepayment premium, (y) a fraction, the numerator of which is equal to the amount of principal distributed to the Class A-S-2 certificates for that distribution date, and the denominator of which is the total amount of principal distributed to the Class A-1, Class A-2, Class A-3, Class A-SB, Class D and Class E certificates and the Class A-4 Exchangeable Certificates, the Class A-5 Exchangeable Certificates, the Class A-S Exchangeable Certificates, the Class B Exchangeable Certificates and the Class C Exchangeable Certificates for that distribution date, and (z) the difference between (1) the Base Interest Fraction for the Class A-S certificates and the applicable principal prepayment and (2) the Base Interest Fraction for the Class A-S-2 certificates and the applicable principal prepayment, |
| (h) to the holders of the Class B-X1 certificates, the product of (x) the Non-Retained Certificates’ Percentage Allocation Entitlement of such yield maintenance charge or prepayment premium, (y) a fraction, the numerator of which is equal to the amount of principal distributed to the Class B-1 certificates for that distribution date, and the denominator of which is the total amount of principal distributed to the Class A-1, Class A-2, Class A-3, Class A-SB, Class D and Class E certificates and the Class A-4 Exchangeable Certificates, the Class A-5 Exchangeable Certificates, the Class A-S Exchangeable Certificates, the Class B Exchangeable Certificates and the Class C Exchangeable Certificates for that distribution date, and (z) the difference between (1) the Base Interest Fraction for the Class B certificates and the applicable principal prepayment and (2) the Base Interest Fraction for the Class B-1 certificates and the applicable principal prepayment, |
| (i) to the holders of the Class B-X2 certificates, the product of (x) the Non-Retained Certificates’ Percentage Allocation Entitlement of such yield maintenance charge or prepayment premium, (y) a fraction, the numerator of which is equal to the amount of principal distributed to the Class B-2 certificates for that distribution date, and the denominator of which is the total amount of principal distributed to the Class A-1, Class A-2, Class A-3, Class A-SB, Class D and Class E certificates and the Class A-4 Exchangeable Certificates, the Class A-5 Exchangeable Certificates, the Class A-S Exchangeable Certificates, the Class B Exchangeable Certificates and the Class C Exchangeable Certificates for that distribution date, and (z) the difference between (1) the Base Interest Fraction for the Class B certificates and the applicable principal prepayment and (2) the Base Interest Fraction for the Class B-2 certificates and the applicable principal prepayment, |
| (j) to the holders of the Class C-X1 certificates, the product of (x) the Non-Retained Certificates’ Percentage Allocation Entitlement of such yield maintenance charge or prepayment premium, (y) a fraction, the numerator of which is equal to the amount of principal distributed to the Class C-1 |
This is not a research report and was not prepared by any Underwriter’s research department. Please see additional important information and qualifications at the end of this Term Sheet. |
T-12
| BANK 2021-BNK36 | Structural Overview |
| certificates for that distribution date, and the denominator of which is the total amount of principal distributed to the Class A-1, Class A-2, Class A-3, Class A-SB, Class D and Class E certificates and the Class A-4 Exchangeable Certificates, the Class A-5 Exchangeable Certificates, the Class A-S Exchangeable Certificates, the Class B Exchangeable Certificates and the Class C Exchangeable Certificates for that distribution date, and (z) the difference between (1) the Base Interest Fraction for the Class C certificates and the applicable principal prepayment and (2) the Base Interest Fraction for the Class C-1 certificates and the applicable principal prepayment, |
| (k) to the holders of the Class C-X2 certificates, the product of (x) the Non-Retained Certificates’ Percentage Allocation Entitlement of such yield maintenance charge or prepayment premium, (y) a fraction, the numerator of which is equal to the amount of principal distributed to the Class C-2 certificates for that distribution date, and the denominator of which is the total amount of principal distributed to the Class A-1, Class A-2, Class A-3, Class A-SB, Class D and Class E certificates and the Class A-4 Exchangeable Certificates, the Class A-5 Exchangeable Certificates, the Class A-S Exchangeable Certificates, the Class B Exchangeable Certificates and the Class C Exchangeable Certificates for that distribution date, and (z) the difference between (1) the Base Interest Fraction for the Class C certificates and the applicable principal prepayment and (2) the Base Interest Fraction for the Class C-2 certificates and the applicable principal prepayment, |
| (l) to the holders of the Class X-A certificates, the excess, if any, of (x) the product of (1) the Non-Retained Certificates’ Percentage Allocation Entitlement of such yield maintenance charge or prepayment premium and (2) a fraction, the numerator of which is equal to the total amount of principal distributed to the Class A-1, Class A-2, Class A-3 and Class A-SB certificates and the Class A-4 Exchangeable Certificates and the Class A-5 Exchangeable Certificates for that distribution date, and the denominator of which is the total amount of principal distributed to the Class A-1, Class A-2, Class A-3, Class A-SB, Class D and Class E certificates and the Class A-4 Exchangeable Certificates, the Class A-5 Exchangeable Certificates, the Class A-S Exchangeable Certificates, the Class B Exchangeable Certificates and the Class C Exchangeable Certificates for that distribution date, over (y) the total amount of such yield maintenance charge or prepayment premium distributed to the Class A-1, Class A-2, Class A-3 and Class A-SB certificates and the Class A-4 Exchangeable Certificates and the Class A-5 Exchangeable Certificates as described above, |
| (m) to the holders of the Class X-B certificates, the excess, if any, of (x) the product of (1) the Non-Retained Certificates’ Percentage Allocation Entitlement of such yield maintenance charge or prepayment premium and (2) a fraction, the numerator of which is equal to the total amount of principal distributed to the Class A-S Exchangeable Certificates, the Class B Exchangeable Certificates and the Class C Exchangeable Certificates for that distribution date, and the denominator of which is the total amount of principal distributed to the Class A-1, Class A-2, Class A-3, Class A-SB, Class D and Class E certificates and the Class A-4 Exchangeable Certificates, the Class A-5 Exchangeable Certificates, the Class A-S Exchangeable Certificates, the Class B Exchangeable Certificates and the Class C Exchangeable Certificates for that distribution date, over (y) the total amount of such yield maintenance charge or prepayment premium distributed to the Class A-S Exchangeable Certificates, the Class B Exchangeable Certificates and Class C Exchangeable Certificates as described above, |
| and (n) to the holders of the Class X-D certificates, any remaining portion of the Non-Retained Certificates’ Percentage Allocation Entitlement of such yield maintenance charge or prepayment premium not distributed as described above in this clause (1), |
| | and (2) to the RR Interest, its Percentage Allocation Entitlement of such yield maintenance charge or prepayment premium. All yield maintenance charges and prepayment premiums referred to above will be net of any liquidation fees payable therefrom. |
| | No yield maintenance charges or prepayment premiums will be distributed to the holders of the Class X-F, Class X-G, Class X-H, Class F, Class G, Class H, Class V or Class R Certificates. |
| | “Base Interest Fraction” means, with respect to any principal prepayment of any mortgage loan that provides for the payment of a yield maintenance charge or prepayment premium, and with respect to any class of principal balance certificates (other than the RR Interest), a fraction (A) the numerator of which is the greater of (x) zero and (y) the difference between (i) the pass-through rate on that class, and (ii) the applicable discount rate and (B) the denominator of which is the difference between (i) the mortgage interest rate on the related mortgage loan and (ii) the applicable discount rate; provided, that: under no circumstances will the Base Interest Fraction be greater than one; if the discount rate referred to above is greater than or equal to both the mortgage interest rate on the related mortgage loan and the pass-through rate on that class, then the Base Interest Fraction will equal zero; and if the discount rate referred to above is greater than or equal to the mortgage interest rate on the related mortgage loan and is less than the pass-through rate on that class, then the Base Interest Fraction will be equal to 1.0. |
| | Consistent with the foregoing, the Base Interest Fraction is equal to: |
| | | (Pass-Through Rate – Discount Rate) | |
| | | (Mortgage Rate – Discount Rate) | |
| Realized Losses: | | On each distribution date, immediately following the distributions to be made to the certificateholders on that date, the certificate administrator is required to calculate the amount, if any, by which (i) the aggregate stated principal balance of the mortgage loans, including any successor REO loans, expected to be outstanding immediately following that distribution date is less than (ii) the then aggregate certificate balance of the principal |
This is not a research report and was not prepared by any Underwriter’s research department. Please see additional important information and qualifications at the end of this Term Sheet. |
T-13
| BANK 2021-BNK36 | Structural Overview |
| | | balance certificates after giving effect to distributions of principal on that distribution date. The Non-Retained Certificates’ Percentage Allocation Entitlement of such amount will be applied to the Class H, Class G, Class F, Class E and Class D certificates and the Class C, Class B and Class A-S trust components, in that order, in each case until the related certificate or principal balance has been reduced to zero, and then to the Class A-1, Class A-2, Class A-3 and Class A-SB certificates and the Class A-4 and Class A-5 trust components, pro rata based upon their respective certificate or principal balances, until their respective certificate or principal balances have been reduced to zero. The RR Interest’s Percentage Allocation Entitlement of such amount will be applied to the RR Interest until the related RR Interest balance has been reduced to zero. |
| | | |
| | | Any portion of such amount applied to the Class A-4, Class A-5, Class A-S, Class B or Class C trust component will reduce the certificate balance or notional amount of each class of certificates in the related group of Exchangeable Certificates by an amount equal to the product of (x) its certificate balance or notional amount, divided by the principal balance of such trust component prior to the applicable reduction, and (y) the amount applied to such trust component. |
| | | |
| Serviced Whole Loans: | | Each of the following mortgaged properties or portfolio of mortgaged properties secures a mortgage loan and, in some cases, one or more pari passu promissory notes and, in some cases, one or more generally subordinate promissory notes (each, a “serviced companion loan”) that will be serviced pursuant to the related intercreditor agreement and the pooling and servicing agreement for this transaction: One North Wacker, Arizona Mills and Suarez Puerto Rico Industrial Portfolio. With respect to each such mortgaged property or portfolio of mortgaged properties, the related mortgage loan, together with the related serviced companion loan(s), is referred to herein (for so long as it is serviced under the pooling and servicing agreement for this transaction) as a “serviced whole loan.” Each serviced companion loan is not part of the mortgage pool and may be contributed to one or more future securitization transactions (if not already securitized) or may be otherwise transferred at any time, subject to compliance with the related intercreditor agreement. See the tables below entitled “Mortgage Loans with Pari Passu Companion Loans” and “Mortgage Loans with Subordinate Debt” as well as “Description of the Mortgage Pool—The Whole Loans” in the Preliminary Prospectus, for additional information regarding each such whole loan. With respect to the Raymour & Flannigan Campus whole loan (a “servicing shift whole loan”), the pooling and servicing agreement for this transaction will govern servicing of such whole loan until the securitization of the related Note A-1; however, servicing of such whole loan will generally be directed by the holder of the related control note (which is not included in this securitization), and such holder will have the right to replace the special servicer with respect to the related whole loan with or without cause. With respect to the servicing shift whole loan, after the securitization of the related Note A-1, such servicing shift whole loan will cease to be a serviced whole loan and will be serviced pursuant to the pooling and servicing agreement for another securitization transaction (see “—Non-Serviced Whole Loans” below). |
| | | |
| Non-Serviced Whole Loans: | | Each of the following mortgaged properties or portfolio of mortgaged properties secures a mortgage loan (each, a “non-serviced mortgage loan”), one or more pari passu promissory notes and, in some cases, one or more generally subordinate promissory notes (each such promissory note, a “non-serviced companion loan”) that will be serviced pursuant to the related intercreditor agreement and the pooling and servicing agreement or trust and servicing agreement (referred to herein as a related “pooling and servicing agreement”) for another securitization transaction: Newport Pavilion, Metro Crossing, McDonald's Global HQ and Velocity Industrial Portfolio. With respect to each such mortgaged property or portfolio of mortgaged properties, the related mortgage loan, together with the related non-serviced companion loan(s), is referred to herein (for so long as it is serviced under the pooling and servicing agreement for another securitization transaction) as a “non-serviced whole loan.” Each non-serviced companion loan is not part of the mortgage pool and may be contributed to one or more future securitization transactions (if not already securitized) or may be otherwise transferred at any time, subject to compliance with the related intercreditor agreement. Servicing of each non-serviced whole loan will generally be directed by the holder of the related control note (or, if such control note is included in a securitization, the directing certificateholder thereunder (or other party designated thereunder to exercise the rights of such control note)), and such holder will have the right to replace the special servicer with respect to the related whole loan with or without cause. See the tables below entitled “Mortgage Loans with Pari Passu Companion Loans” and “Mortgage Loans with Subordinate Debt,” as well as “Description of the Mortgage Pool—The Whole Loans” in the Preliminary Prospectus, for additional information regarding each such whole loan. |
| | | |
| Directing Certificateholder/ Controlling Class: | | The “Directing Certificateholder” will be (i) with respect to a servicing shift mortgage loan, the related Loan-Specific Directing Certificateholder, and (ii) with respect to each other mortgage loan, the Controlling Class Certificateholder (or its representative) selected by more than 50% (by certificate balance) of the Controlling Class Certificateholders; provided, that (1) absent that selection, (2) until a Directing Certificateholder is so selected or (3) upon receipt of a notice from a majority of the Controlling Class Certificateholders (by certificate balance) that a Directing Certificateholder is no longer designated, the Controlling Class Certificateholder that owns the largest aggregate certificate balance of the Controlling Class (or its representative) will be the Directing Certificateholder; provided, that (a) in the case of clause (3), if no one holder owns the largest aggregate certificate balance of the Controlling Class, then there will be no Directing Certificateholder until appointed in accordance with the terms of the pooling and servicing agreement, and (b) the certificate administrator and the other parties to the pooling and servicing agreement will be entitled to assume that the identity of the Directing Certificateholder has not changed until such parties receive written notice of a replacement of the Directing Certificateholder from a party holding the requisite interest in the Controlling Class (as confirmed by the certificate registrar), or the resignation of the then current Directing Certificateholder. As used herein, the term “Directing Certificateholder,” unless used in relation to a Servicing Shift Mortgage Loan, means the entity determined pursuant to clause (ii) of the definition of such term. |
This is not a research report and was not prepared by any Underwriter’s research department. Please see additional important information and qualifications at the end of this Term Sheet. |
T-14
| BANK 2021-BNK36 | Structural Overview |
| | | The “Loan-Specific Directing Certificateholder” with respect to a servicing shift mortgage loan is the “controlling holder”, the “directing certificateholder”, the “directing holder”, “directing lender” or any analogous concept under the related intercreditor agreement. Prior to the securitization of the related control note, the Loan-Specific Directing Certificateholder with respect to a servicing shift mortgage loan will be the holder of the related control note. On and after the securitization of the related control note, there will be no Loan-Specific Directing Certificateholder under the PSA with respect to such servicing shift mortgage loan. The “Controlling Class” will be, as of any time of determination, the most subordinate class of Control Eligible Certificates then outstanding that has an aggregate certificate balance (as notionally reduced by any Cumulative Appraisal Reduction Amounts (as defined below) allocable to such class) at least equal to 25% of the initial certificate balance of that class; provided, that if at any time the certificate balances of the certificates other than the Control Eligible Certificates and the RR Interest have been reduced to zero as a result of principal payments on the mortgage loans, then the Controlling Class will be the most subordinate class of Control Eligible Certificates that has a certificate balance greater than zero without regard to any Cumulative Appraisal Reduction Amounts. The Controlling Class as of the closing date will be the Class H certificates. The “Control Eligible Certificates” will be any of the Class G and Class H certificates. |
| | | |
| Control Rights: | | Prior to a Control Termination Event, the Directing Certificateholder will have certain consent and consultation rights under the pooling and servicing agreement with respect to certain major decisions and other matters. A “Control Termination Event” will occur when (i) the Class G certificates have a certificate balance (taking into account the application of the allocable portion of any Cumulative Appraisal Reduction Amounts to notionally reduce the certificate balance thereof) of less than 25% of the initial certificate balance of that class or (ii) a holder of the Class G certificates is the majority Controlling Class Certificateholder and has irrevocably waived its right, in writing, to exercise any of the rights of the Controlling Class Certificateholder and such rights have not been reinstated to a successor controlling class certificateholder; provided that no Control Termination Event may occur with respect to the Loan-Specific Directing Certificateholder, and the term “Control Termination Event” will not be applicable to the Loan-Specific Directing Certificateholder; provided, further, that a Control Termination Event will be deemed not continuing in the event that the certificate balances of the principal balance certificates other than the Control Eligible Certificates and the RR Interest have been reduced to zero as a result of principal payments on the mortgage loans. After the occurrence of a Control Termination Event but prior to the occurrence of a Consultation Termination Event, the Directing Certificateholder will not have any consent rights, but the Directing Certificateholder will have certain non-binding consultation rights under the pooling and servicing agreement with respect to certain major decisions and other matters. A “Consultation Termination Event” will occur when (i) no class of Control Eligible Certificates has a certificate balance (without regard to the application of the allocable portion of any Cumulative Appraisal Reduction Amounts) at least equal to 25% of the initial certificate balance of that class; or (ii) a holder of the Class G certificates is the majority Controlling Class Certificateholder and has irrevocably waived its right, in writing, to exercise any of the rights of the Controlling Class Certificateholder and such rights have not been reinstated to a successor controlling class certificateholder; provided that no Consultation Termination Event resulting solely from the operation of clause (ii) will be deemed to have existed or be in continuance with respect to a successor holder of the Class G certificates that has not irrevocably waived its right to exercise any of the rights of the Controlling Class Certificateholder; provided, further, that no Consultation Termination Event may occur with respect to the Loan-Specific Directing Certificateholder, and the term “Consultation Termination Event” will not be applicable to the Loan-Specific Directing Certificateholder; provided, further, that a Consultation Termination Event will be deemed not continuing in the event that the certificate balances of the principal balance certificates other than the Control Eligible Certificates and the RR Interest have been reduced to zero as a result of principal payments on the mortgage loans. In the event of any transfer of the Class G certificates by a Controlling Class Certificateholder that had irrevocably waived its rights, the successor Controlling Class Certificateholder that purchased such Class G certificates, even if it does not waive its rights, will not have any consent rights with respect to any Mortgage Loan that became a Specially Serviced Loan prior to such successor Controlling Class Certificateholder’s purchase of such Class G certificates and had not become a Corrected Loan prior to such purchase until such Mortgage Loan becomes a Corrected Loan. After the occurrence of a Consultation Termination Event, the Directing Certificateholder will not have any consent or consultation rights, except with respect to any rights expressly set forth in the pooling and servicing agreement, and the operating advisor will retain certain non-binding consultation rights under the pooling and servicing agreement with respect to certain major decisions and other matters. Notwithstanding the proviso to the definitions of “Control Termination Event” and “Consultation Termination Event”, a Control Termination Event and a Consultation Termination Event will each be deemed to have occurred with respect to any Excluded Loan with respect to the Directing Certificateholder or the holder of the majority of the Controlling Class, and neither the Directing Certificateholder nor any Controlling Class Certificateholder will have any consent or consultation rights with respect to the servicing of such Excluded Loan. An “Excluded Loan” means (a) with respect to the Directing Certificateholder or the holder of the majority of the Controlling Class, a mortgage loan or whole loan with respect to which, as of any date of determination, the Directing Certificateholder or the holder of the majority of the Controlling Class is a Borrower Party or (b) with respect to the Risk Retention Consultation Party or the holder of the majority of the RR Interest, a mortgage loan or whole loan with respect to which, as of any date of determination, the Risk Retention Consultation Party or the holder of the majority of the RR Interest is a Borrower Party. It is expected that there will be no Excluded Loans with respect to this securitization on the closing date. |
This is not a research report and was not prepared by any Underwriter’s research department. Please see additional important information and qualifications at the end of this Term Sheet. |
T-15
| BANK 2021-BNK36 | Structural Overview |
| | | “Borrower Party” means a borrower, a mortgagor, a manager of a mortgaged property, the holder of a mezzanine loan that has been accelerated or as to which foreclosure or enforcement proceedings have been commenced against the equity collateral pledged to secure the related mezzanine loan, or any Borrower Party Affiliate. With respect to a mortgage loan secured by a residential cooperative property, a person will not be considered a “Borrower Party” solely by reason of such person holding one or more cooperative unit loans that are secured by direct equity interests in the related borrower or owning one or more residential cooperative units comprising the related mortgaged property as a result of any foreclosure, transfer in lieu of foreclosure or other exercise of remedies with respect to any such unit loan(s). “Borrower Party Affiliate” means, with respect to a borrower, a mortgagor, a manager of a mortgaged property or the holder of a mezzanine loan that has been accelerated or as to which foreclosure or enforcement proceedings have been commenced against the equity collateral pledged to secure the related mezzanine loan, (a) any other person controlling or controlled by or under common control with such borrower, mortgagor, manager or mezzanine lender, as applicable, or (b) any other person owning, directly or indirectly, 25% or more of the beneficial interests in such borrower, mortgagor, manager or mezzanine lender, as applicable. For the purposes of this definition, “control” when used with respect to any specified person means the power to direct the management and policies of such person, directly or indirectly, whether through the ownership of voting securities, by contract or otherwise and the terms “controlling” and “controlled” have meanings correlative to the foregoing. Notwithstanding any of the foregoing to the contrary, if any mortgage loan is part of a whole loan, the Directing Certificateholder’s consent and/or consultation rights with respect thereto may be limited as described in the Preliminary Prospectus. In particular, with respect to each non-serviced whole loan and each servicing shift whole loan, the Directing Certificateholder (other than a Loan-Specific Directing Certificateholder) will only have certain consultation rights with respect to certain major decisions and other matters related to such whole loan, in each case only prior to a Control Termination Event or Consultation Termination Event, as applicable, and the Loan-Specific Directing Certificateholder will be entitled to similar consent and/or consultation rights with respect to such whole loan. In addition, with respect to any serviced A/B whole loan, for so long as the holder of the related subordinate companion loan is the controlling note holder, the holder of such subordinate companion loan (rather than the Directing Certificateholder) will be entitled to exercise such consent and consultation rights with respect to such whole loan. |
| | | |
| Appraisal Reduction Amounts and Collateral Deficiency Amounts: | | An “Appraisal Reduction Amount” generally will be created in the amount, if any, by which the principal balance of a required appraisal loan (which is a mortgage loan with respect to which certain defaults, modifications or insolvency events have occurred as further described in the Preliminary Prospectus) plus other amounts overdue or advanced in connection with such mortgage loan exceeds 90% of the appraised value of the related mortgaged property plus certain escrows and reserves (including letters of credit) held with respect to the mortgage loan. A mortgage loan will cease to be subject to an Appraisal Reduction Amount when it has been brought current for at least three consecutive months, no additional event of default is foreseeable in the reasonable judgment of the applicable special servicer and no other circumstances exist that would cause such mortgage loan or any related companion loan to be a specially serviced loan; however, a “Collateral Deficiency Amount” may exist with respect to any mortgage loan that is modified into an AB loan structure (an “AB Modified Loan”) and remains a corrected mortgage loan and, if so, will generally equal the excess of (i) the stated principal balance of such AB Modified Loan (taking into account the related junior note(s) and any pari passu notes included therein), over (ii) the sum of (in the case of a whole loan, solely to the extent allocable to the subject mortgage loan) (x) the most recent appraised value for the related mortgaged property or mortgaged properties, plus (y) solely to the extent not reflected or taken into account in such appraised value (or in the calculation of any related Appraisal Reduction Amount) and to the extent on deposit with, or otherwise under the control of, the lender as of the date of such determination, any capital or additional collateral contributed by the related borrower at the time the mortgage loan became (and as part of the modification related thereto) such AB Modified Loan for the benefit of the related mortgaged property or mortgaged properties (provided that in the case of an non-serviced mortgage loan, the amounts set forth in this clause (y) will be taken into account solely to the extent relevant information is received by the applicable special servicer), plus (z) any other escrows or reserves (in addition to any amounts set forth in the immediately preceding clause (y) and solely to the extent not reflected or taken into account in the calculation of any related Appraisal Reduction Amount) held by the lender in respect of such AB Modified Loan as of the date of such determination, which such excess, for the avoidance of doubt, will be determined separately from and exclude any related Appraisal Reduction Amounts. As used herein, a “Cumulative Appraisal Reduction Amount” will be the sum of any Appraisal Reduction Amounts and any Collateral Deficiency Amounts. Any Appraisal Reduction Amount in respect of any non-serviced mortgage loan generally will be calculated in accordance with the other servicing agreement pursuant to which such mortgage loan is being serviced, which calculations are expected to be generally similar to those provided for in the pooling and servicing agreement for this transaction. If any mortgage loan is part of a whole loan, any Appraisal Reduction Amount or Collateral Deficiency Amount will (or effectively will) be calculated in respect of such whole loan taken as a whole and allocated, to the extent provided in the related intercreditor agreement and the related pooling and servicing agreement, first, to any related subordinate companion loan, and second, to the related mortgage loan and any pari passu companion loan on a pro rata basis by unpaid principal balance. Appraisal Reduction Amounts will proportionately reduce the interest portion of debt service advances required to be made in respect of the related mortgage loan. Appraisal Reduction Amounts and Collateral Deficiency Amounts (in each case, to the extent of the Non-Retained Certificates’ Percentage Allocation Entitlement |
This is not a research report and was not prepared by any Underwriter’s research department. Please see additional important information and qualifications at the end of this Term Sheet. |
T-16
| BANK 2021-BNK36 | Structural Overview |
| | | thereof) will be (i) taken into account in determining the identity of the controlling class entitled to appoint the Directing Certificateholder, the existence of a Control Termination Event and the allocation and/or exercise of voting rights for certain purposes (see “Directing Certificateholder/Controlling Class” above) and (ii) allocated to the following classes of certificates and trust components, in each case to notionally reduce their certificate balances or principal balances until the certificate balance or principal balance of each such class or trust component is notionally reduced to zero: the Class H, Class G, Class F, Class E and Class D certificates and the Class C, Class B and Class A-S trust components, in that order, and then pro rata to the Class A-1, Class A-2, Class A-3 and Class A-SB certificates and the Class A-4 and Class A-5 trust components. Appraisal Reduction Amounts and Collateral Deficiency Amounts allocated to the Class A-4, Class A-5, Class A-S, Class B or Class C trust component will be allocated to the corresponding classes of Exchangeable Certificates with certificate balances pro rata to notionally reduce their certificate balances in accordance with their Class Percentage Interests therein. Neither (i) a Payment Accommodation with respect to any mortgage loan or serviced whole loan nor (ii) any default or delinquency that would have existed but for such Payment Accommodation will constitute an appraisal reduction event, for so long as the related borrower is complying with the terms of such Payment Accommodation. A “Payment Accommodation” for any mortgage loan or serviced whole loan means the entering into of any temporary forbearance agreement as a result of the COVID-19 emergency (and qualification as a COVID-19 emergency forbearance will be determined by the special servicer in its sole and absolute discretion in accordance with the Servicing Standard) relating to payment obligations or operating covenants under the related mortgage loan documents or the use of funds on deposit in any reserve account or escrow account for any purpose other than the explicit purpose described in the related mortgage loan documents, that in each case (i) is entered into by September 30, 2021, (ii) defers no greater than 3 monthly debt service payments (but no greater than 9 monthly debt service payments in the aggregate with any other Payment Accommodations) and (iii) requires full repayment of deferred payments, reserves and escrows by the date that is 12 months following the date of the first Payment Accommodation for such mortgage loan or serviced whole loan. |
| | | |
| Appraised-Out Class: | | An “Appraised-Out Class” is any class of Control Eligible Certificates, the certificate balance of which (taking into account the application of the Non-Retained Certificates’ Percentage Allocation Entitlement of any Appraisal Reduction Amounts or Collateral Deficiency Amounts to notionally reduce the certificate balance of such class) has been reduced to less than 25% of its initial certificate balance. Any Appraised-Out Class may not exercise any direction, control, consent and/or similar rights of the Controlling Class until such time, if any, as such class is reinstated as the Controlling Class, and the rights of the Controlling Class will be exercised by the next most senior class of Control Eligible Certificates that is not an Appraised-Out Class, if any, during such period. |
| | | |
| Appraisal Remedy: | | The holders of the majority (by certificate balance) of an Appraised-Out Class (such holders, the “Requesting Holders”) will have the right, at their sole expense, to require the applicable special servicer to order (or, with respect to a non-serviced mortgage loan, require the applicable special servicer to request from the applicable non-serviced special servicer) a second appraisal of any mortgage loan (or serviced whole loan) for which an appraisal reduction event has occurred or as to which there exists a Collateral Deficiency Amount. With respect to any serviced mortgage loan, the applicable special servicer will be required to use its reasonable efforts to ensure that such appraisal is delivered within 30 days from receipt of the Requesting Holders’ written request and will be required to cause such appraisal to be prepared on an “as-is” basis by an MAI appraiser. With respect to any non-serviced mortgage loan, the applicable special servicer will be required to use commercially reasonable efforts to obtain such second appraisal from the applicable non-serviced special servicer. In addition, the Requesting Holders of any Appraised-Out Class will have the right to challenge the Appraisal Reduction Amount and to require the applicable special servicer to order an additional appraisal of any serviced mortgage loan as to which there exists a Collateral Deficiency Amount if an event has occurred at, or with respect to, the related mortgaged property or mortgaged properties that would have a material effect on its or their appraised value, and such special servicer is required to use reasonable efforts to obtain an appraisal from an MAI appraiser reasonably acceptable to such special servicer within 30 days from receipt of the Requesting Holders’ written request. Upon receipt of such supplemental appraisal, the applicable special servicer will be required to determine, in accordance with the Servicing Standard, whether, based on its assessment of such supplemental appraisal, any recalculation of the applicable Appraisal Reduction Amount or Collateral Deficiency Amount is warranted and, if so warranted, such person will be required to recalculate such Appraisal Reduction Amount or Collateral Deficiency Amount, as applicable, based upon such supplemental appraisal as described above. If required by any such recalculation, the applicable Appraised-Out Class will be reinstated as the Controlling Class and each Appraised-Out Class will, if applicable, have its related certificate balance notionally restored to the extent required by such recalculation of the Appraisal Reduction Amount or Collateral Deficiency Amount, if applicable. |
| | | |
| Sale of Defaulted Loans: | | Under certain circumstances the applicable special servicer may be required to use reasonable efforts to solicit offers for a defaulted serviced mortgage loan (and any related companion loan (to the extent provided under the related intercreditor agreement) and/or related REO properties). The Directing Certificateholder will not have a right of first refusal to purchase a defaulted loan. If the applicable special servicer does not receive an offer at least equal to the outstanding principal balance plus all accrued and unpaid interest and outstanding costs and expenses and certain other amounts specified in the pooling and servicing agreement (the “Par Purchase Price”), the applicable special servicer may purchase the defaulted loan or REO property at the Par Purchase Price or may accept the first cash offer received from any person that is determined to be a fair price for such defaulted loan or REO property. If multiple offers are received during the period designated by the applicable special servicer for receipt of offers, such special |
This is not a research report and was not prepared by any Underwriter’s research department. Please see additional important information and qualifications at the end of this Term Sheet. |
T-17
| BANK 2021-BNK36 | Structural Overview |
| | | servicer is generally required to select the highest offer. The applicable special servicer will be required to determine whether any cash offer constitutes a fair price for any defaulted loan or REO property if the highest offeror is a person other than a party to the pooling and servicing agreement for this transaction (the “PSA”), the Directing Certificateholder, the Risk Retention Consultation Party, any sponsor, any Borrower Party, any independent contractor engaged by a special servicer, the trustee for the securitization of a related companion loan (with respect to a whole loan if it is a defaulted loan), any related companion loan holder or its representative, any holder of a related mezzanine loan or any known affiliate of any of the preceding entities (each, an “Interested Person”). If an offer is made by an Interested Person, the trustee will be required to determine (based upon the most recent appraisal conducted in accordance with the terms of the PSA) whether the offer constitutes a fair price for the defaulted loan or REO property unless (i) the offer is equal to or greater than the applicable Par Purchase Price and (ii) the offer is the highest offer received. Absent an offer at least equal to the Par Purchase Price, no offer from an Interested Person will constitute a fair price unless (x) it is the highest offer received and (y) at least two other offers are received from independent third parties. Neither the trustee nor any of its affiliates may make an offer for or purchase any specially serviced loan or REO property. Notwithstanding any of the foregoing to the contrary, the applicable special servicer is not required to accept the highest offer and may accept a lower offer for a defaulted loan or REO property if such special servicer determines, in accordance with the Servicing Standard (and subject to the requirements of any related intercreditor agreement), that a rejection of such offer would be in the best interests of the certificateholders and any related companion loan holders as a collective whole as if they constituted a single lender (and with respect to a serviced A/B whole loan, taking into account the subordinate nature of any related subordinate companion loan), so long as such lower offer was not made by such special servicer or any of its affiliates. If title to any mortgaged property is acquired by the trust fund, the applicable special servicer will generally be required to sell such mortgaged property prior to the close of the third calendar year beginning after the year of acquisition. The foregoing applies to mortgage loans serviced under the PSA. With respect to any non-serviced whole loan, if the special servicer under the applicable pooling and servicing agreement determines to sell the related controlling companion loan if it becomes a defaulted loan, then the applicable special servicer will be required to sell the related whole loan, including the related mortgage loan included in the BANK 2021-BNK36 securitization trust and the related pari passu companion loan(s) and, under certain circumstances, any subordinate companion loan(s), as a single loan. In connection with any such sale, the special servicer under the applicable pooling and servicing agreement will be required to follow procedures substantially similar to those set forth above. |
| | | |
| Risk Retention Consultation Party: | | A risk retention consultation party may be appointed by the holder or holders of more than 50% of the RR Interest, by certificate balance. The majority RR Interest holder will have a continuing right to appoint, remove or replace the risk retention consultation party in its sole discretion. This right may be exercised at any time and from time to time. Except with respect to an Excluded Loan as to such party or the holder of the majority of the RR Interest, the risk retention consultation party will be entitled to consult with the applicable special servicer, upon request of the risk retention consultation party, with respect to certain material servicing actions proposed by such special servicer; provided, that prior to the occurrence and continuance of a Consultation Termination Event, such mortgage loan must also be a specially serviced mortgage loan. |
| | | |
| Appointment and Replacement of each Special Servicer: | | The Directing Certificateholder will appoint each initial special servicer as of the closing date. Prior to the occurrence and continuance of a Control Termination Event, any special servicer may generally be replaced by the Directing Certificateholder with or without cause at any time. After the occurrence and during the continuance of a Control Termination Event and upon (a) the written direction of holders of principal balance certificates evidencing not less than 25% of the voting rights of all classes of certificates (other than the RR Interest) entitled to principal (taking into account the application of Cumulative Appraisal Reduction Amounts to notionally reduce the certificate balances of classes to which such Cumulative Appraisal Reduction Amounts are allocable) requesting a vote to replace the applicable special servicer with a replacement special servicer, (b) payment by such requesting holders to the certificate administrator of all reasonable fees and expenses to be incurred by the certificate administrator in connection with administering such vote and (c) delivery by such holders of a rating agency confirmation from each applicable rating agency, the certificate administrator will be required to promptly post such notice on its internet website and by mail and conduct the solicitation of votes of all certificates in such regard, which requisite affirmative votes must be received within 180 days of the posting of such notice. Upon the written direction of holders of at least 66 2/3% of a Certificateholder Quorum, the trustee will be required to immediately replace the applicable special servicer with a qualified replacement special servicer designated by such holders of certificates. After the occurrence and during the continuance of a Consultation Termination Event, if the operating advisor determines that the applicable special servicer is not performing its duties as required under the pooling and servicing agreement or is otherwise not acting in accordance with the Servicing Standard, the operating advisor may also recommend the replacement of such special servicer. The operating advisor’s recommendation to replace such special servicer must be confirmed by an affirmative vote of holders of principal balance certificates evidencing at least a majority of the aggregate voting rights (taking into account the application of any Cumulative Appraisal Reduction Amounts to notionally reduce the respective certificate balances) of all principal balance certificates on an aggregate basis (which requisite affirmative vote must be received within 180 days of posting of the notice of the operating advisor’s recommendation to the certificate administrator’s website). A “Certificateholder Quorum” means, in connection with any solicitation of votes in connection with the replacement of a special servicer or the asset representations reviewer, the holders of certificates evidencing at least 50% of the aggregate voting rights (taking into account the application of realized losses and, other than |
This is not a research report and was not prepared by any Underwriter’s research department. Please see additional important information and qualifications at the end of this Term Sheet. |
T-18
| BANK 2021-BNK36 | Structural Overview |
| | | with respect to the termination of the asset representations reviewer, any Cumulative Appraisal Reduction Amounts to notionally reduce the certificate balance of the certificates) of all classes of certificates entitled to principal (other than the RR Interest) on an aggregate basis. With respect to each serviced whole loan, any holder of a related pari passu companion loan, following a servicer termination event with respect to the applicable special servicer that affects such holder, will be entitled to direct the trustee (and the trustee will be required) to terminate such special servicer solely with respect to such serviced whole loan. A replacement special servicer will be selected by the trustee or, prior to a Control Termination Event, by the Directing Certificateholder; provided, that any successor special servicer appointed to replace the special servicer with respect to such whole loan cannot be the entity (or its affiliate) that was terminated at the direction of the holder of the related pari passu companion loan. Notwithstanding any of the foregoing to the contrary, with respect to each servicing shift whole loan and any serviced A/B whole loans as to which a subordinate companion loan holder is the related controlling note holder, the holder of the related control note will be entitled to replace the applicable special servicer with respect to such whole loan at any time, with or without cause, and while it is a serviced whole loan, no other party may replace the applicable special servicer for such whole loan unless there is a servicer termination event with respect thereto. With respect to any non-serviced whole loan, subject to conditions or restrictions in the applicable intercreditor agreement, the BANK 2021-BNK36 trust, as holder of the related mortgage loan, has the right to terminate the applicable special servicer under the related pooling and servicing agreement if a servicer termination event occurs, with respect to such special servicer that affects the trust in its capacity as such holder. Such rights may be exercised by the Directing Certificateholder prior to a Consultation Termination Event (or the applicable special servicer, following the occurrence and during the continuance of a Consultation Termination Event). The successor special servicer will be selected pursuant to the applicable pooling and servicing agreement by the related directing holder prior to a control termination event under such pooling and servicing agreement. |
| | | |
| Servicing Standard: | | Each applicable master servicer and each applicable special servicer is obligated to service and administer the mortgage loans (and, if applicable, the serviced companion loans) in accordance with the definition of the “Servicing Standard” described in the Preliminary Prospectus and the terms of the pooling and servicing agreement, provided that each non-serviced mortgage loan, if any, will be serviced by another master servicer or special servicer under the pooling and servicing agreement with respect to the securitization of a related companion loan, which entities will be obligated to service and administer such non-serviced mortgage loan pursuant to a similar standard set forth in the related pooling and servicing agreement. |
| | | |
| Excluded Special Servicer: | | If a special servicer obtains knowledge that it has become a Borrower Party with respect to any mortgage loan (an “Excluded Special Servicer Loan”), such special servicer will be required to resign as special servicer of that Excluded Special Servicer Loan. Prior to the occurrence and continuance of a Control Termination Event, the Directing Certificateholder will be required to appoint (and may remove and replace with or without cause) a separate special servicer that is not a Borrower Party (an “Excluded Special Servicer”) with respect to any Excluded Special Servicer Loan, unless such Excluded Special Servicer Loan is also an Excluded Loan with respect to the Directing Certificateholder or the holder of the majority of the Controlling Class. For avoidance of doubt, with respect to a mortgage loan secured by a residential cooperative property, a person will not be considered a Borrower Party solely by reason of such person holding one or more cooperative unit loans that are secured by direct equity interests in the related borrower or owning one or more residential cooperative units comprising the related mortgaged property as a result of any foreclosure, transfer in lieu of foreclosure or other exercise of remedies with respect to any such unit loan(s). After the occurrence and during the continuance of a Control Termination Event, if at any time the applicable Excluded Special Servicer Loan is also an Excluded Loan with respect to the Directing Certificateholder or the holder of the majority of the Controlling Class or if the Directing Certificateholder is entitled to appoint the Excluded Special Servicer but does not so appoint within 30 days of notice of such resignation, the resigning special servicer will be required to use reasonable efforts to select the related Excluded Special Servicer. Any Excluded Special Servicer will be required to perform all of the obligations of the applicable special servicer and will be entitled to all special servicing compensation with respect to such Excluded Special Servicer Loan earned while the related mortgage loan is an Excluded Special Servicer Loan. |
| | | |
Liquidated
Loan Waterfall: | | On liquidation of any mortgage loan, all net liquidation proceeds related to the mortgage loan (but not any related companion loan) will be applied so that amounts allocated as a recovery of accrued and unpaid interest will not, in the first instance, include any delinquent interest that was not advanced as a result of Appraisal Reduction Amounts (or would not have been advanced in the absence of a non-recoverability determination) or accrued on the portion of the stated principal balance thereof equal to any related Collateral Deficiency Amount in effect from time to time and as to which no advance was made (collectively, the “Subordinated Interest Amount”). After the adjusted interest amount is so allocated, any remaining liquidation proceeds will be allocated to pay principal on the mortgage loan until the unpaid principal amount of the mortgage loan has been reduced to zero. Any remaining liquidation proceeds will then be allocated to pay the Subordinated Interest Amount. |
| | | |
| Operating Advisor: | | The operating advisor will be required to perform certain review duties if a Control Termination Event has occurred and is continuing, which will generally include a limited annual review of, and the preparation of a report regarding, certain actions of the applicable special servicer with respect to the resolution and/or liquidation of specially serviced loans. The review and report generally will be based on any asset status reports and additional information delivered to the operating advisor by such special servicer. In addition, if a Control Termination Event has occurred and is continuing, the applicable special servicer must consult with the operating advisor (in addition to the Directing Certificateholder if no Consultation Termination Event has occurred and is continuing) in connection with major decisions with respect to mortgage loans. Furthermore, |
This is not a research report and was not prepared by any Underwriter’s research department. Please see additional important information and qualifications at the end of this Term Sheet. |
T-19
| BANK 2021-BNK36 | Structural Overview |
| | | under certain circumstances, but only if a Consultation Termination Event has occurred and is continuing, the operating advisor may recommend the replacement of the applicable special servicer as described above under “—Appointment and Replacement of each Special Servicer”; however, the operating advisor will not have any rights or obligations with respect to a non-serviced whole loan. If a Consultation Termination Event has occurred and is continuing, the operating advisor may be removed and replaced without cause upon the affirmative direction of certificates owners holding not less than 75% of the voting rights of all certificates (taking into account the application of Cumulative Appraisal Reduction Amounts), following a proposal from certificate owners holding not less than 25% of the voting rights of all certificates (taking into account the application of Cumulative Appraisal Reduction Amounts). The certificateholders who initiate a vote on a termination and replacement of the operating advisor without cause must cause the payment of the fees and expenses incurred in the replacement. In addition, in the event there are no classes of certificates outstanding other than the Control Eligible Certificates, the RR Interest and the Class X-F, Class F, Class X-G, Class X-H, Class V and Class R certificates, then all of the rights and obligations of the operating advisor under the PSA will terminate without payment of any penalty or termination fee (other than any rights or obligations that accrued prior to the date of such termination (including accrued and unpaid compensation) and other than indemnification rights arising out of events occurring prior to such termination). See “Pooling and Servicing Agreement—The Operating Advisor—Termination of the Operating Advisor Without Cause” in the Preliminary Prospectus. |
| | | |
| Asset Representations Reviewer: | | The asset representations reviewer will be required to review certain delinquent mortgage loans (excluding a mortgage loan for which a Payment Accommodation has been made and the related borrower is complying with the terms of such Payment Accommodation) after a specified delinquency threshold has been met and the required percentage of certificateholders vote to direct a review as described below. The asset representations reviewer will be entitled to the Asset Representations Reviewer Fee with respect to such review. See “Pooling and Servicing Agreement—The Asset Representations Reviewer” in the Preliminary Prospectus. The certificate administrator will be required to notify certificateholders if the specified delinquency threshold has been met as described in the Preliminary Prospectus under “—The Asset Representations Reviewer”. If certificateholders evidencing not less than 5.0% of the voting rights request a vote to commence an asset review, and if subsequently (i) a majority of those certificateholders who cast votes and (ii) a majority of an Asset Review Quorum authorizes an asset review within 150 days of the request for a vote, the asset representations reviewer will be required to conduct an asset review of delinquent loans. The asset representations reviewer may be terminated and replaced without cause. Upon (i) the written direction of certificateholders evidencing not less than 25% of the voting rights (without regard to the application of any Cumulative Appraisal Reduction Amounts) requesting a vote to terminate and replace the asset representations reviewer with a proposed successor asset representations reviewer that is an eligible asset representations reviewer, and (ii) payment by such holders to the certificate administrator of the reasonable fees and expenses to be incurred by the certificate administrator in connection with administering such vote, the certificate administrator will be required to promptly provide notice to all certificateholders and the asset representations reviewer of such request by posting such notice on its internet website, and by mailing such notice to all certificateholders and the asset representations reviewer. Upon the written direction of certificateholders evidencing at least 75% of a Certificateholder Quorum (without regard to the application of any Cumulative Appraisal Reduction Amounts), the trustee will be required to terminate all of the rights and obligations of the asset representations reviewer under the pooling and servicing agreement (other than any rights or obligations that accrued prior to the date of such termination and other than indemnification rights arising out of events occurring prior to such termination) by written notice to the asset representations reviewer, and the proposed successor asset representations reviewer will be appointed. See “Pooling and Servicing Agreement—The Asset Representations Reviewer” in the Preliminary Prospectus. An “Asset Review Quorum” means, in connection with any solicitation of votes to authorize an Asset Review as described above, the holders of certificates evidencing at least 5.0% of the aggregate voting rights represented by all certificates that have voting rights. |
| Dispute Resolution Provisions: | | The mortgage loan sellers will be subject to the dispute resolution provisions set forth in the PSA to the extent those provisions are triggered with respect to any mortgage loan sold to the depositor by a mortgage loan seller, and such mortgage loan seller will be obligated under the related mortgage loan purchase agreement to comply with all applicable provisions and to take part in any mediation or arbitration proceedings that may result. Generally, in the event that a Repurchase Request is not “Resolved” within 180 days after the related mortgage loan seller receives such Repurchase Request, then the enforcing servicer will be required to send a notice to the first certificateholder (or beneficial owner) to deliver a certificateholder repurchase request with respect to the mortgage loan (the “Initial Requesting Certificateholder”) (if any) and to the certificate administrator (which will be required to make such notice available to certificateholders via the certificate administrator’s website) indicating the enforcing servicer’s intended course of action with respect to the Repurchase Request. If (a) the enforcing servicer’s intended course of action with respect to the Repurchase Request does not involve pursuing further action to exercise rights against the related mortgage loan seller with respect to the Repurchase Request and the Initial Requesting Certificateholder, if any, or any other certificateholder or certificate owner wishes to exercise its right to refer the matter to mediation (including nonbinding arbitration) or arbitration, or (b) the enforcing servicer’s intended course of action is to pursue further action to exercise rights against the related mortgage loan seller with respect to the Repurchase Request but the Initial Requesting Certificateholder, if any, or any other certificateholder or certificate owner does not agree with the dispute resolution method selected by the enforcing servicer, then the Initial Requesting Certificateholder, if any, or such other certificateholder or certificate owner may deliver a written notice to the enforcing servicer indicating its intent to exercise its right to refer the matter to either mediation or arbitration. |
This is not a research report and was not prepared by any Underwriter’s research department. Please see additional important information and qualifications at the end of this Term Sheet. |
T-20
| BANK 2021-BNK36 | Structural Overview |
| | | “Resolved” means, with respect to a Repurchase Request, (i) that the related material defect or breach has been cured, (ii) the related mortgage loan has been repurchased in accordance with the related mortgage loan purchase agreement, (iii) a mortgage loan has been substituted for the related mortgage loan in accordance with the related mortgage loan purchase agreement, (iv) the applicable mortgage loan seller has made a loss of value payment, (v) a contractually binding agreement has been entered into between the enforcing servicer, on behalf of the issuing entity, and the related mortgage loan seller that settles the related mortgage loan seller’s obligations under the related mortgage loan purchase agreement, or (vi) the related mortgage loan is no longer property of the issuing entity as a result of a sale or other disposition in accordance with the pooling and servicing agreement. See “Pooling and Servicing Agreement—Dispute Resolution Provisions” in the Preliminary Prospectus. |
| | | |
| Investor Communications: | | The certificate administrator is required to include on any Form 10-D any request received from a certificateholder to communicate with other certificateholders related to certificateholders exercising their rights under the terms of the PSA. Any certificateholder wishing to communicate with other certificateholders regarding the exercise of its rights under the terms of the PSA will be able to deliver a written request signed by an authorized representative of the requesting investor to the certificate administrator. |
| | | |
| Deal Website: | | The certificate administrator will be required to maintain a deal website which will include, among other items: (a) summaries of asset status reports prepared by a special servicer, (b) inspection reports, (c) appraisals, (d) various “special notices” described in the Preliminary Prospectus, (e) the “Investor Q&A Forum” and (f) a voluntary “Investor Registry”. Investors may access the deal website following execution of a certification and confidentiality agreement. |
This is not a research report and was not prepared by any Underwriter’s research department. Please see additional important information and qualifications at the end of this Term Sheet. |
T-21
| BANK 2021-BNK36 | Collateral Overview |
| Mortgage Loan Sellers | No. of
Mortgage
Loans | No. of
Mortgaged
Properties | Aggregate
Cut-off Date
Balance | % of
Pool(1) |
| Bank of America, National Association | 23 | 56 | $497,276,548 | 39.0% |
| Morgan Stanley Mortgage Capital Holdings LLC | 20 | 22 | $316,981,905 | 24.8% |
| Wells Fargo Bank, National Association | 17 | 18 | $265,964,072 | 20.8% |
| National Cooperative Bank, N.A.(2) | 31 | 31 | $120,943,418 | 9.5% |
| Bank of America, National Association/Wells Fargo Bank, National Association(3) | 1 | 1 | $74,888,072 | 5.9% |
| Total: | 92 | 128 | $1,276,054,015 | 100.0% |
| Pool Statistics | |
| Aggregate Cut-off Date Balance: | $1,276,054,015 |
| Number of Mortgage Loans: | 92 |
| Average Cut-off Date Balance per Mortgage Loan: | $13,870,152 |
| Number of Mortgaged Properties: | 128 |
| Average Cut-off Date Balance per Mortgaged Property: | $9,969,172 |
| Weighted Average Mortgage Rate: | 3.2249% |
| % of Pool Secured by 5 Largest Mortgage Loans: | 30.9% |
| % of Pool Secured by 10 Largest Mortgage Loans: | 49.1% |
| % of Pool Secured by ARD Loans(4): | 0.0% |
| Weighted Average Original Term to Maturity (months)(4): | 112 |
| Weighted Average Remaining Term to Maturity (months)(4): | 110 |
| Weighted Average Seasoning (months): | 1 |
| % of Pool Secured by Single Tenant Mortgaged Properties: | 15.4% |
| % of Pool Secured by Refinance Loans: | 68.4% |
| % of Pool Secured by Acquisition Loans: | 30.6% |
| % of Pool Secured by Recapitalization Loans: | 1.0% |
| Additional Debt | |
| % of Pool with Pari Passu Mortgage Debt: | 22.9% |
| % of Pool with Subordinate Mortgage Debt(5): | 5.8% |
| % of Pool with Mezzanine Debt: | 0.8% |
| Credit Statistics(6)(7) | |
| Weighted Average UW NOI DSCR: | 3.64x |
| Weighted Average UW NOI Debt Yield(8): | 13.9% |
| Weighted Average UW NCF DSCR: | 3.43x |
| Weighted Average UW NCF Debt Yield(8): | 13.1% |
| Weighted Average Cut-off Date LTV Ratio(8)(9): | 51.8% |
| Weighted Average Maturity Date LTV Ratio(4)(9): | 49.7% |
Footnotes are set forth on the following page.
This is not a research report and was not prepared by any Underwriter’s research department. Please see additional important information and qualifications at the end of this Term Sheet. |
T-22
| BANK 2021-BNK36 | Collateral Overview |
| Amortization | |
| Weighted Average Original Amortization Term (months)(10): | 368 |
| Weighted Average Remaining Amortization Term (months)(10): | 366 |
| % of Pool Interest Only through Maturity: | 70.0% |
| % of Pool Amortizing Balloon: | 19.1% |
| % of Pool Interest Only followed by Amortizing Balloon: | 10.7% |
| % of Pool Fully Amortizing: | 0.2% |
| Lockboxes | |
| % of Pool with Hard Lockboxes: | 59.0% |
| % of Pool with Springing Lockboxes: | 28.4% |
| % of Pool with No Lockboxes: | 9.5% |
| % of Pool with Soft Lockboxes: | 3.1% |
| Reserves | |
| % of Pool Requiring Tax Reserves: | 58.9% |
| % of Pool Requiring Insurance Reserves: | 20.9% |
| % of Pool Requiring Replacement Reserves: | 67.9% |
| % of Pool Requiring TI/LC Reserves(11): | 46.7% |
| Call Protection | |
| % of Pool with lockout period, followed by defeasance until open period: | 54.3% |
| % of Pool with lockout period, followed by greater of a prepayment premium and yield maintenance until open period: | 17.4% |
| % of Pool with lockout period, followed by defeasance or the greater of a prepayment premium and yield maintenance until open period: | 13.8% |
| % of Pool with no lockout period. Greater of a prepayment premium and yield maintenance followed by prepayment premium until open period: | 9.5% |
| % of Pool with no lockout period, followed by yield maintenance, followed by defeasance or yield maintenance until open period: | 4.7% |
| % of Pool with lockout period, followed by greater of a prepayment premium and yield maintenance, followed by defeasance or the greater of a prepayment premium and yield maintenance until open period: | 0.3% |
| (1) | Unless otherwise indicated, all references to “% of Pool” in this Term Sheet reflect a percentage of the aggregate principal balance of the mortgage pool as of the Cut-off Date, after application of all payments of principal due during or prior to October 2021. |
| (2) | Twenty three (23) of the thirty one (31) mortgage loans for which National Cooperative Bank, N.A. is the mortgage loan seller were originated by its parent company, National Consumer Cooperative Bank, and transferred to National Cooperative Bank, N.A. Each such mortgage loan originated by National Consumer Cooperative Bank was underwritten pursuant to National Cooperative Bank, N.A.’s underwriting guidelines. |
| (3) | The Arizona Mills mortgage loan was co-originated by Bank of America, N.A. and Wells Fargo Bank, National Association. Such mortgage loan is evidenced by three promissory notes: (i) note A-1, with an outstanding principal balance of $38,442,543 as of the Cut-off Date, as to which Bank of America, N.A. is acting as mortgage loan seller; (ii) note A-2, with an outstanding principal balance of $31,452,990 as of the Cut-off Date, as to which Wells Fargo Bank, National Association is acting as mortgage loan seller; and (iii) note A-3-2, with an outstanding principal balance of $4,992,538 as of the Cut-off Date, as to which Bank of America, N.A. is acting as mortgage loan seller |
| (4) | With respect to any ARD Loan, unless otherwise indicated, references in this Term Sheet to the applicable “maturity date” or “maturity” refer to the applicable anticipated repayment date with respect to such ARD Loan, and such applicable anticipated repayment date is treated as its maturity date for all purposes hereof. |
| (5) | Twenty four (24) of the mortgage loans, each of which is secured by a residential cooperative property, currently have in place subordinate secured lines of credit to the related mortgage borrowers that permit future advances (such loans, collectively, the “Subordinate Coop LOCs”). The percentage figure expressed as “% of Pool with Subordinate Mortgage Debt” is determined as a percentage of the initial pool balance and does not take into account any Subordinate Coop LOCs and future subordinate debt (whether or not secured by the mortgaged property), if any, that may be permitted under the terms of any mortgage loan or the pooling and servicing agreement. See “Description of the Mortgage Pool—Additional Indebtedness—Other Secured Indebtedness” and “Description of the Mortgage Pool—Additional Debt Financing for Mortgage Loans Secured by Residential Cooperatives” in the Preliminary Prospectus. |
| (6) | With respect to any mortgage loan that is part of a whole loan, unless otherwise indicated, all LTV, DSCR and Debt Yield calculations in this Term Sheet include any related pari passu companion loans and exclude any subordinate companion loans, as applicable. Additionally, LTV, DSCR and Debt Yield figures in this Term Sheet are calculated for mortgage loans without regard to any additional indebtedness that may be incurred at a future date. For mortgaged properties securing residential cooperative mortgage loans all LTV, DSCR and Debt Yield calculations do not take into account any subordinate debt (whether or not secured by the related mortgaged property), that currently exists or is allowed under the terms of any mortgage loan. With respect to any leased fee loans, the SF/Units and Balance per SF/Unit figures in this Term Sheet are based on the size of the non-collateral improvements. |
| (7) | For mortgaged properties securing residential cooperative mortgage loans, all DSCR and Debt Yield calculations for each such mortgaged property is calculated using underwritten net operating Income or underwritten net cash flow, as applicable, for the related residential cooperative property which is the projected net operating income or net cash flow, as applicable, reflected in the most recent appraisal obtained by or otherwise in the possession of the related mortgage loan seller as of the Cut-off Date. All LTV ratio calculations are based upon the appraised value of the residential cooperative property determined as if such residential cooperative property is operated as a residential cooperative, inclusive of the amount of the underlying debt encumbering such residential cooperative property (other than for the Waldo Gardens, Inc. mortgage loan). In the case of the residential cooperative property securing the Waldo Gardens, Inc., mortgage loan, the LTV ratio calculations for such mortgage loan are determined as if such residential cooperative property is operated as a market rate multifamily rental property. |
| (8) | With respect to certain mortgage loans, debt yields and LTVs (such as, for example, UW NOI Debt Yield, UW NCF Debt Yield or Cut-off Date LTV Ratio) have been calculated based on a principal balance that is net of a holdback or earnout reserve. Such mortgage loans are identified under the definitions of “Underwritten NOI Debt Yield”, “Underwritten NCF Debt Yield” and “Cut-off Date LTV Ratio” set forth under “Description of the Mortgage Pool—Certain Calculations and Definitions” in the Preliminary Prospectus. |
| (9) | The LTV ratios set forth in this Term Sheet are generally based on the “as-is” values of the related mortgaged properties; provided that the “as-is” value for a portfolio of mortgaged properties may include a premium relating to the valuation of the mortgaged properties as a whole rather than as the sum of individually valued mortgaged properties; provided, further, that such LTV ratios may be based on “as-stabilized”, “as complete” or other contingent values in certain cases in which reserves have been established at origination for the applicable condition or circumstance that is expected to result in stabilization provided, further, that such LTV ratios may have been calculated based on a principal balance that is net of a holdback or earnout reserve. See the definition of “Appraised Value” under “Description of the Mortgage Pool—Certain Calculations and Definitions” in the Preliminary Prospectus. |
| (10) | Excludes mortgage loans that provide for payments of interest only through the related maturity date or anticipated repayment date, as applicable. |
| (11) | Excludes hospitality, multifamily, manufactured housing, leased fee and self storage properties. |
This is not a research report and was not prepared by any Underwriter’s research department. Please see additional important information and qualifications at the end of this Term Sheet. |
T-23
| BANK 2021-BNK36 | Characteristics of the Mortgage Loans |
COVID-19 Update(1)
The following table contains information regarding the status of the mortgage loans and mortgaged properties provided by the respective borrowers as of the date set forth in the “Information as of Date” column. The cumulative effects of the COVID-19 emergency on the global economy may cause tenants to be unable to pay their rent and borrowers to be unable to pay debt service under the mortgage loans. As a result, we cannot assure you that the information in the following table is indicative of future performance or that tenants or borrowers will not seek rent or debt service relief (including forbearance arrangements) or other lease or loan modifications in the future. Such actions may lead to shortfalls and losses on the certificates. Any information in the following table will be superseded by the information contained under the heading “Description of the Mortgage Pool—COVID Considerations” in the prospectus.
| Loan No. | Mortgage Loan Seller | Information as of Date | Origination Date | Property Name(1) | Property Type | Rent Relief Outstanding (Y/N) | Tenants Making Full July Rent Payment (% NRA/Units)(2) | Tenants Making Full July Rent Payment (% of UW rent)(2) | Tenants Making Full August Rent Payment (% NRA/Units)(2) | Tenants Making Full August Rent Payment (% of UW rent)(2) |
| 1 | BANA | 9/9/2021 | 9/10/2021 | One North Wacker | Office | Y(3) | 100.0% | 96.9% | 100.0% | 99.5% |
| 2 | BANA/WFB | 9/10/2021 | 8/31/2021 | Arizona Mills | Retail | (4) | (4) | (4) | (4) | (4) |
| 3 | BANA | 9/1/2021 | 9/10/2021 | ExchangeRight Portfolio 50 | Various | N | 100.0% | 100.0% | 100.0% | 100.0% |
| 4 | BANA | 8/19/2021 | 8/11/2021 | International Plaza I | Office | N | 100.0% | 100.0% | 100.0% | 100.0% |
| 5 | MSMCH | 8/24/2021 | 8/24/2021 | Suarez Puerto Rico Industrial Portfolio | Various | N | NAV | NAV | NAV | NAV |
| 6 | BANA | 9/1/2021 | 6/25/2021 | The Court at Oxford Valley | Retail | Y(5) | 100.0% | 100.0% | 100.0% | 100.0% |
| 7 | BANA | 8/31/2021 | 8/12/2021 | Plaza at Imperial Valley | Retail | N | 100.0% | 100.0% | 100.0% | 100.0% |
| 8 | WFB | 9/1/2021 | 9/3/2021 | Tides Folly Beach | Hospitality | N | NAV(6) | NAV(6) | NAV(6) | NAV(6) |
| 9 | MSMCH | 8/16/2021 | 9/15/2021 | Corporate Research Center | Industrial | N | 100.0% | 100.0% | 100.0% | 100.0% |
| 10 | MSMCH | 8/16/2021 | 9/9/2021 | Lightwave Corporate Center | Industrial | N | 100.0% | 100.0% | 100.0% | 100.0% |
| 11 | WFB | 9/2/2021 | 7/9/2021 | La Brea & San Vicente | Retail | N | 100.0% | 100.0% | 100.0% | 100.0% |
| 12 | WFB | 9/1/2021 | 6/29/2021 | Norwalk Town Square | Retail | Y(7) | 86.9% | 89.0% | 86.9% | 89.0% |
| 13 | BANA | 8/30/2021 | 9/9/2021 | Raymour & Flanigan Campus | Industrial | N | 100.0% | 100.0% | 100.0% | 100.0% |
| 14 | MSMCH | 9/1/2021 | 7/20/2021 | Tomball Town Center | Retail | N | 100.0% | 100.0% | 100.0% | 100.0% |
| 15 | WFB | 9/1/2021 | 8/12/2021 | Lake Pointe Corporate Centre | Office | N | 100.0% | 100.0% | 100.0% | 100.0% |
| 16 | MSMCH | 8/24/2021 | 6/16/2021 | Newport Pavilion | Retail | Y(8) | 100.0% | 100.0% | NAV | NAV |
| 17 | WFB | 8/26/2021 | 8/5/2021 | 1925 Maple | Office | N | 100.0% | 100.0% | 100.0% | 100.0% |
| 18 | MSMCH | 9/3/2021 | 8/24/2021 | University Square Shopping Center | Retail | Y(9) | (10) | (10) | (10) | (10) |
| 19 | NCB | 8/20/2021 | 7/28/2021 | Netherland Gardens Corp. f/k/a Netherland Tenants Corp. | Multifamily | N | 92.2%(17) | N/A(18) | 85.2%(17) | N/A(18) |
| 20 | WFB | 8/25/2021 | 8/6/2021 | Central San Rafael Storage | Self-Storage | N | NAV | 100.0% | NAV | 100.0% |
| 21 | BANA | 9/3/2021 | 9/7/2021 | Southern Flexible Apartment Portfolio II | Multifamily | (11) | (11) | (11) | (11) | (11) |
| 22 | WFB | 9/3/2021 | 6/17/2021 | Metro Crossing | Retail | Y(12) | 100.0% | 100.0% | 100.0% | 100.0% |
| 23 | BANA | 9/2/2021 | 10/29/2020 | McDonald’s Global HQ | Office | N | 100.0% | 100.0% | 100.0% | 100.0% |
| 24 | WFB | 9/3/2021 | 9/1/2021 | Zions Bank | Office | Y(13) | 100.0% | 100.0% | 100.0% | 100.0% |
| 25 | MSMCH | 9/3/2021 | 8/31/2021 | 2707 Sedgwick | Mixed Use | N | 98.0% | 98.0% | 97.0% | 97.0% |
| 26 | MSMCH | 9/1/2021 | 7/2/2021 | South Main Shopping Center | Retail | Y(14) | 100.0% | 100.0% | 100.0% | 100.0% |
| 27 | MSMCH | 9/3/2021 | 7/30/2021 | 2800 Bailey | Mixed Use | N | NAV | NAV | NAV | NAV |
| 28 | WFB | 8/24/2021 | 9/1/2021 | Davidsohn Industrial Park | Industrial | N | 96.6% | 96.3% | 96.6% | 96.3% |
| 29 | MSMCH | 8/26/2021 | 7/15/2021 | Longford Shoppes | Retail | N | 100.0% | 100.0% | 100.0% | 100.0% |
| 30 | NCB | 8/31/2021 | 7/30/2021 | Fairfield Commons Owners Corp. | Multifamily | N | 97.7%(17) | N/A(18) | 94.9%(17) | N/A(18) |
| 31 | NCB | 8/27/2021 | 7/29/2021 | 2400 Johnson Avenue Owners, Inc. | Multifamily | N | 98.4%(17) | N/A(18) | 92.9%(17) | N/A(18) |
| 32 | MSMCH | 9/3/2021 | 7/14/2021 | 290 Tunxis Hill | Retail | N | NAV | NAV | 100.0% | 100.0% |
| 33 | WFB | 9/1/2021 | 6/28/2021 | Velocity Industrial Portfolio | Industrial | N | 100.0% | 100.0% | 100.0% | 100.0% |
| 34 | BANA | 8/31/2021 | 8/27/2021 | Legacy Business Park | Office | N | 100.0% | 100.0% | 95.5% | 95.3% |
| 35 | WFB | 8/26/2021 | 8/26/2021 | Park City Self Storage UT | Self-Storage | N | 99.6% | 99.9% | 98.7% | 99.1% |
| 36 | WFB | 9/7/2021 | 5/10/2021 | Grandview Court | Retail | N | 82.5% | 97.9% | 84.2% | 98.0% |
| 37 | MSMCH | 8/18/2021 | 7/21/2021 | Anaheim Hills Medical Office | Office | N | 100.0% | 100.0% | 100.0% | 100.0% |
| 38 | NCB | 8/19/2021 | 7/30/2021 | 415 East 80th Street Housing Corporation | Multifamily | N | 100.0%(17) | N/A(18) | 100.0%(17) | N/A(18) |
| 39 | WFB | 8/26/2021 | 8/26/2021 | Village At Dos Vientos | Mixed Use | Y(15) | 100.0% | 100.0% | 100.0% | 100.0% |
| 40 | WFB | 8/25/2021 | 8/19/2021 | Arville Commerce Center | Industrial | N | 100.0% | 100.0% | 100.0% | 100.0% |
| 41 | MSMCH | 8/23/2021 | 7/2/2021 | Boulder Crossroads | Retail | Y(16) | 100.0% | 100.0% | 100.0% | 100.0% |
| 42 | MSMCH | 8/30/2021 | 9/1/2021 | The Platform Santa Barbara | Mixed Use | N | 100.0% | 100.0% | 100.0% | 100.0% |
| 43 | BANA | 9/9/2021 | 9/9/2021 | Sprague Self Storage | Self Storage | N | 94.5% | 92.9% | NAV | NAV |
| 44 | BANA | 9/1/2021 | 8/20/2021 | Bella Road Self Storage | Self Storage | N | 100.0% | 99.5% | 97.1% | 92.7% |
| 45 | BANA | 8/31/2021 | 9/1/2021 | Western Skies Business Center | Office | N | 100.0% | 100.0% | 100.0% | 100.0% |
This is not a research report and was not prepared by any Underwriter’s research department. Please see additional important information and qualifications at the end of this Term Sheet. |
T-24
| BANK 2021-BNK36 | Characteristics of the Mortgage Loans |
| Loan No. | Mortgage Loan Seller | Information as of Date | Origination Date | Property Name(1) | Property Type | Rent Relief Outstanding (Y/N) | Tenants Making Full July Rent Payment (% NRA/Units)(2) | Tenants
Making Full
July Rent
Payment (%
of UW rent)(2) | Tenants Making Full August Rent Payment (% NRA/Units)(2) | Tenants Making Full August Rent Payment (% of UW rent)(2) |
| 46 | MSMCH | 9/13/2021 | 9/3/2021 | Titan Self Storage | Self Storage | N | 100.0% | 100.0% | 100.0% | 100.0% |
| 47 | BANA | 9/7/2021 | 8/5/2021 | 3508-3510 Johnson Avenue | Mixed Use | N | 100.0% | 100.0% | 100.0% | 100.0% |
| 48 | BANA | 8/31/2021 | 8/6/2021 | Matteson Ground Lease | Other | N | 100.0% | 100.0% | 100.0% | 100.0% |
| 49 | NCB | 8/23/2021 | 7/30/2021 | Waldo Gardens, Inc. | Multifamily | N | 98.2%(17) | N/A(18) | 90.0%(17) | N/A(18) |
| 50 | MSMCH | 8/13/2021 | 7/15/2021 | Kings Automall Shopping Center | Retail | N | 100.0% | 100.0% | 100.0% | 100.0% |
| 51 | WFB | 8/31/2021 | 6/17/2021 | Walgreens - Yakima | Retail | N | 100.0% | 100.0% | 100.0% | 100.0% |
| 52 | NCB | 8/30/2021 | 8/2/2021 | The Renee Owners Inc. a/k/a The Renee Owners, Inc. | Multifamily | N | 96.6%(17) | N/A(18) | 95.0%(17) | N/A(18) |
| 53 | NCB | 8/31/2021 | 8/31/2021 | Hudson House Tenants Corporation | Multifamily | N | 98.8%(17) | N/A(18) | 89.3%(17) | N/A(18) |
| 54 | WFB | 9/7/2021 | 7/7/2021 | U-Stor-It – Melrose Park | Self-Storage | N | 98.8% | 98.8% | 96.2% | 96.2% |
| 55 | BANA | 9/9/2021 | 9/9/2021 | Lincoln MHC | Manufactured Housing | N | 100.0% | 100.0% | NAV | NAV |
| 56 | WFB | 8/31/2021 | 6/17/2021 | WAG Hudson ,WI | Retail | N | 100.0% | 100.0% | 100.0% | 100.0% |
| 57 | NCB | 8/30/2021 | 7/21/2021 | 60 West Broad Street, Inc. | Multifamily | N | 93.8%(17) | N/A(18) | 84.0%(17) | N/A(18) |
| 58 | BANA | 9/2/2021 | 8/9/2021 | Monte Cristo Adult Community | Manufactured Housing | N | 100.0% | 100.0% | 100.0% | 100.0% |
| 59 | BANA | 9/7/2021 | 8/31/2021 | BuxBear Self Storage | Self Storage | N | 98.8% | 99.8% | 95.9% | 95.9% |
| 60 | BANA | 9/2/2021 | 7/20/2021 | Tomball Self Storage | Self Storage | N | 87.9% | 87.3% | 93.5% | 93.4% |
| 61 | NCB | 8/26/2021 | 8/27/2021 | 12 West 17th St. Tenants’ Corp. | Multifamily | N | 100.0%(17) | N/A(18) | 100.0%(17) | N/A(18) |
| 62 | | 8/18/2021 | 8/26/2021 | Broad Street Portfolio | Multifamily | N | 100.0% | 100.0% | 100.0% | 100.0% |
| 63 | NCB | 8/31/2021 | 8/25/2021 | Oakhurst Gardens Corp. | Multifamily | N | 93.2%(17) | N/A(18) | 88.1%(17) | N/A(18) |
| 64 | BANA | 9/1/2021 | 9/1/2021 | Lakeside Villa & Glacier View | Manufactured Housing | N | 100.0% | 100.0% | 98.9% | 98.8% |
| 65 | BANA | 9/9/2021 | 9/10/2021 | Lindon Self Storage | Self Storage | N | 98.7% | 94.1% | NAV | NAV |
| 66 | MSMCH | 8/22/2021 | 7/15/2021 | RVacation RV Park | Manufactured Housing | N | 100.0% | 100.0% | 100.0% | 100.0% |
| 67 | NCB | 8/30/2021 | 7/29/2021 | Archer Cooperative, Inc. | Multifamily | N | 94.0%(17) | N/A(18) | 87.5%(17) | N/A(18) |
| 68 | NCB | 8/31/2021 | 9/3/2021 | Caribbean House, Inc. | Multifamily | N | 96.8%(17) | N/A(18) | 88.7%(17) | N/A(18) |
| 69 | NCB | 8/30/2021 | 7/27/2021 | 111-127 Cabrini Apartments Corp. | Multifamily | N | 100.0%(17) | N/A(18) | 97.2%(17) | N/A(18) |
| 70 | NCB | 8/31/2021 | 7/28/2021 | 94-102 Hamilton Place Housing Development Fund Corporation | Multifamily | N | 88.9%(17) | N/A(18) | 88.3%(17) | N/A(18) |
| 71 | MSMCH | 8/12/2021 | 6/3/2021 | 4601 S Indiana Avenue | Multifamily | N | 100.0% | 100.0% | 100.0% | 100.0% |
| 72 | NCB | 8/31/2021 | 7/30/2021 | 250 North Village Owners, Inc. | Multifamily | N | 100.0%(17) | N/A(18) | 100.0%(17) | N/A(18) |
| 73 | NCB | 8/31/2021 | 8/20/2021 | White Oak Cooperative Housing Corp. | Multifamily | N | 93.6%(17) | N/A(18) | 89.2%(17) | N/A(18) |
| 74 | BANA | 9/1/2021 | 8/17/2021 | Brookville MHC | Manufactured Housing | N | 100.0% | 100.0% | 100.0% | 100.0% |
| 75 | NCB | 8/25/2021 | 8/26/2021 | NW-Mad 95 Owners Corp. a/k/a N W Mad-95 Owners Corp. | Multifamily | N | 100.0%(17) | N/A(18) | 87.5%(17) | N/A(18) |
| 76 | NCB | 8/25/2021 | 8/25/2021 | Garden Lofts Corp. | Multifamily | N | 100.0%(17) | N/A(18) | 95.7%(17) | N/A(18) |
| 77 | NCB | 8/31/2021 | 7/27/2021 | Crescent Tenants Corp. | Multifamily | N | 96.6%(17) | N/A(18) | 73.3%(17) | N/A(18) |
| 78 | NCB | 8/19/2021 | 8/26/2021 | Jackson Manor Inc. | Multifamily | N | 98.2%(17) | N/A(18) | 97.3%(17) | N/A(18) |
| 79 | NCB | 8/30/2021 | 8/16/2021 | Midland Manor Owners Corp. | Multifamily | N | 94.8%(17) | N/A(18) | 84.5%(17) | N/A(18) |
| 80 | MSMCH | 8/25/2021 | 7/8/2021 | Load & Lock Mini Storage | Self Storage | N | 98.6% | 98.6% | NAV | NAV |
| 81 | NCB | 8/30/2021 | 8/31/2021 | 35 East Tenants Corp. | Multifamily | N | 92.5%(17) | N/A(18) | 90.0%(17) | N/A(18) |
| 82 | NCB | 8/31/2021 | 8/31/2021 | Hudson Park Co-operative Apts., Inc., a/k/a Hudson Park Cooperative Apts., Inc. | Multifamily | N | 98.3%(17) | N/A(18) | 93.2%(17) | N/A(18) |
| 83 | BANA | 9/9/2021 | 9/9/2021 | Sunset View MHC | Manufactured Housing | N | 100.0% | 100.0% | NAV | NAV |
| 84 | NCB | 8/25/2021 | 7/30/2021 | Greene Street Associates, Inc. A/K/A Greenestreet Associates, Inc. | Multifamily | N | 100.0%(17) | N/A(18) | 100.0%(17) | N/A(18) |
| 85 | NCB | 8/30/2021 | 7/29/2021 | Cherry Lane Owners Corp. | Multifamily | N | 97.2%(17) | N/A(18) | 94.4%(17) | N/A(18) |
| 86 | NCB | 8/30/2021 | 7/26/2021 | Delano Tenants Corp. | Multifamily | N | 96.2%(17) | N/A(18) | 96.2%(17) | N/A(18) |
This is not a research report and was not prepared by any Underwriter’s research department. Please see additional important information and qualifications at the end of this Term Sheet. |
T-25
| BANK 2021-BNK36 | Characteristics of the Mortgage Loans |
| Loan No. | Mortgage Loan Seller | Information as of Date | Origination Date | Property Name(1) | Property Type | Rent Relief Outstanding (Y/N) | Tenants Making Full July Rent Payment (% NRA/Units)(2) | Tenants Making Full July Rent Payment (% of UW rent)(2) | Tenants Making Full August Rent Payment (% NRA/Units)(2) | Tenants Making Full August Rent Payment (% of UW rent)(2) |
| 87 | BANA | 9/9/2021 | 9/9/2021 | Arroyo MHC | Manufactured Housing | N | 100.0% | 100.0% | NAV | NAV |
| 88 | NCB | 8/27/2021 | 7/29/2021 | 25 Indian Road Owners Corp. | Multifamily | N | 93.9%(17) | N/A(18) | 93.9%(17) | N/A(18) |
| 89 | NCB | 8/30/2021 | 8/26/2021 | Village Gardens Tenants Corp. | Multifamily | N | 100.0%(17) | N/A(18) | 97.1%(17) | N/A(18) |
| 90 | NCB | 8/19/2021 | 7/20/2021 | 482 East 74th Street Apartment Corp. | Multifamily | N | 100.0%(17) | N/A(18) | 100.0%(17) | N/A(18) |
| 91 | NCB | 8/31/2021 | 8/17/2021 | Sherwood Village Cooperative B, Inc. | Multifamily | N | 92.5%(17) | N/A(18) | 88.1%(17) | N/A(18) |
| 92 | NCB | 8/31/2021 | 8/23/2021 | 22321 Owners Corp. | Multifamily | N | 100.0%(17) | N/A(18) | 94.5%(17) | N/A(18) |
| (1) | All loans are current on their debt service payments or have a first payment date on October or November 2021. For all NCB mortgage loans that have the first payment as either October 1, 2021 or November 1, 2021, each payment is subject to a 10-day grace period, and therefore may not be received until the 10th day of each month. |
| (2) | Tenants Making Full July Rent Payment (% NRA/Units), Tenants Making Full August Rent Payment (% NRA/Units), Tenants Making Full July Rent Payment (% of UW rent) and Tenants Making Full August Rent Payment (% of UW rent) for multifamily, self storage and mixed use properties are based on the percentage of total billed rent collected. |
| (3) | With respect to the One North Wacker mortgaged property, the borrower sponsor granted COVID-19 related rent relief to two food-service tenants, which rent relief is no longer outstanding other than approximately $10,260 of abated rent due to Munchies as of the closing date of the One North Wacker Whole Loan. |
| (4) | With respect to the Arizona Mills mortgaged property, 99.0% of the expected rents in July and August were received. Rents for open and billed tenants, which may or may not include percent in lieu rent tenants, were adjusted for active amendments, bankruptcies, write-offs and tenant credits. |
| (5) | With respect to The Court at Oxford Valley Property mortgaged property, during the period of store closures, approximately 76% of the tenants at The Court at Oxford Valley Property requested rent relief. The borrower sponsors successfully negotiated rent deferrals and 96.9% of that deferred rent will be paid by year end 2021. Old Navy and Famous Footwear received rental rate abatements, and Crunch Fitness restructured its lease. All tenants are current in their rent obligations, including deferred rent. |
| (6) | With respect to the Tides Folly Beach mortgaged property, for the month of June 2021, the mortgaged property reported an Occupancy, ADR and RevPAR of 98.6%, $338.03, and $333.17, respectively. For the month of July 2021, the mortgaged property reported an Occupancy, ADR and RevPAR of 98.1%, $360.99, and $354.20, respectively. August 2021 operating information is not yet available. |
| (7) | With respect to the Norwalk Town Square mortgaged property, four tenants totaling approximately 5.9% of net rentable area and approximately 7.3% of underwritten base rent have ongoing lease modifications or existing rent relief. |
| (8) | With respect to the Newport Pavilion mortgaged property, ten tenants (37.1% of the NRA and 43.4% of underwritten rent) were given some form of rent relief either in the form of deferred rent or abated rent. Six tenants (14.4% of the SF and 19.4% of underwritten rent) were given rent relief in the form of deferred rent ranging between two and three months and four tenants (22.7% of the SF and 24.0% of underwritten rent) were given rent relief in the form of an abatement. Approximately 48.2% of the deferred rent has already been repaid. |
| (9) | With respect to the University Square Shopping Center mortgaged property, two tenants (21.0% of NRA and 17.5% of underwritten rent) received rent relief and both tenants have repayment plans in place. |
| (10) | With respect to the University Square Shopping Center mortgaged property, the borrower purchased the mortgaged property in March 2021 and does not have monthly reporting available. All tenant estoppels were received within 60 days of loan origination and none of the estoppels showed delinquent rent. |
| (11) | With respect to the Southern Flexible Apartment Portfolio II mortgaged properties, aging reports are not utilized by property management as tenants typically pre-pay for their stays and are subsequently evicted if past their paid stay period. |
| (12) | With respect to the Metro Crossing mortgaged property, 18 tenants, representing 33.3% of net rentable area and 41.0% of underwritten base rent requested and received rent relief. |
| (13) | With respect to the Zions Bank mortgaged property, 1 tenant totaling approximately 15.5% net rentable area and 16.9% underwritten base rent requested and received rent relief. |
| (14) | With respect to the South Main Shopping Center mortgaged property, two tenants (3.2% of NRA and 5.2% of underwritten rent) received rent relief and both tenants have repayment plans in place. |
| (15) | With respect to the Village at Dos Vientos mortgaged property, two tenants totaling approximately 3.9% of net rentable area and 3.3% of underwritten base rent have outstanding rent relief lease modifications. |
| (16) | With respect to the Boulder Crossroads mortgaged property, four tenants (18.5% of NRA and 18.7% of underwritten rent) received rent relief and all four tenants have repayment plans in place between January and December 2021. |
| (17) | For residential cooperative properties, the percentages reported were determined based on available cooperative maintenance receivables reports provided from the borrowers. Generally, this information is not tracked for residential cooperative properties and the borrowers are not required, pursuant to the loan documents, to report this data on a monthly basis. In addition, for residential cooperative properties, the figures reported were determined based on revenue derived from maintenance charges payable by tenant-shareholders, and not based on rental income for commercial units as to which cooperative shares have not been allocated. Further, with respect to certain residential cooperative properties, the related cooperative borrower may have entered into a primary master lease with a third-party or the cooperative’s sponsor. Generally, however, information regarding subleases under such primary master leases are not tracked for residential cooperative properties. |
| (18) | This information is not presented for residential cooperative properties. The base rent represented in the underwritten cash flow for residential cooperative properties is the hypothetical income derived from the appraisal. Residential cooperative properties are structured to allow for an increase in unit owner maintenance charges or the assessment of additional charges to cover operating deficits, including deficits resulting from unpaid or delinquent rents or maintenance charges. |
This is not a research report and was not prepared by any Underwriter’s research department. Please see additional important information and qualifications at the end of this Term Sheet. |
T-26
| BANK 2021-BNK36 | Characteristics of the Mortgage Loans |
| Top 10 Mortgage Loans or Groups of Cross-Collateralized Mortgage Loans(1) |
| | | | | | | | | | | | | | |
Loan
No. | Mortgage
Loan
Seller | Property Name | City | State | Property Type | Cut-off Date
Balance | % of
Pool | SF/Rooms | Cut-off Date Balance per SF/Rooms | UW
NCF
DSCR | UW NOI
Debt
Yield | Cut-off
Date LTV | Maturity Date LTV |
| 1 | BANA | One North Wacker | Chicago | IL | Office | $127,000,000 | 10.0% | 1,412,035 | $249.99 | 2.96x | 8.9% | 53.2% | 53.2% |
| 2 | BANA/WFB | Arizona Mills | Tempe | AZ | Retail | $74,888,072 | 5.9% | 1,234,669 | $80.87 | 4.27x | 25.6% | 32.4% | 29.4% |
| 3 | BANA | ExchangeRight Portfolio 50 | Various | Various | Various | $66,940,000 | 5.2% | 388,591 | $172.26 | 2.60x | 8.9% | 61.3% | 61.3% |
| 4 | BANA | International Plaza I | Farmers Branch | TX | Office | $65,400,000 | 5.1% | 392,201 | $166.75 | 4.84x | 13.0% | 40.9% | 40.9% |
| 5 | MSMCH | Suarez Puerto Rico Industrial Portfolio | Various | PR | Various | $60,000,000 | 4.7% | 904,406 | $66.34 | 3.53x | 14.4% | 54.7% | 54.7% |
| 6 | BANA | The Court at Oxford Valley | Fairless Hills | PA | Retail | $55,000,000 | 4.3% | 456,286 | $120.54 | 1.97x | 10.8% | 65.9% | 56.0% |
| 7 | BANA | Plaza at Imperial Valley | El Centro | CA | Retail | $49,500,000 | 3.9% | 367,828 | $134.57 | 2.16x | 9.0% | 65.0% | 65.0% |
| 8 | WFB | Tides Folly Beach | Folly Beach | SC | Hospitality | $45,931,496 | 3.6% | 132 | $347,965.88 | 2.27x | 14.0% | 60.4% | 47.9% |
| 9 | MSMCH | Corporate Research Center | Hayward | CA | Mixed Use | $44,500,000 | 3.5% | 293,292 | $151.73 | 3.89x | 11.1% | 46.8% | 46.8% |
| 10 | MSMCH | Lightwave Corporate Center | San Diego | CA | Mixed Use | $37,125,000 | 2.9% | 166,892 | $222.45 | 4.62x | 12.8% | 49.5% | 49.5% |
| | | Total/Wtd. Avg. | | | | $626,284,568 | 49.1% | | | 3.29x | 12.8% | 52.3% | 50.2% |
| (1) | With respect to any mortgage loan that is part of a whole loan, unless otherwise indicated, all LTV, DSCR, Debt Yield and Balance per SF/Rooms calculations in this Term Sheet include any related pari passu companion loans and exclude any subordinate companion loans, as applicable. Additionally, LTV, DSCR, Debt Yield and Balance per SF/Rooms figures in this Term Sheet are calculated for mortgage loans without regard to any additional indebtedness that may be incurred at a future date. With respect to any leased fee loans, the SF/Units and Balance per SF/Rooms figures in this Term Sheet are based on the size of the non-collateral improvements. |
This is not a research report and was not prepared by any Underwriter’s research department. Please see additional important information and qualifications at the end of this Term Sheet. |
T-27
| BANK 2021-BNK36 | Characteristics of the Mortgage Loans |
| Mortgage Loans with Pari Passu Companion Loans |
Loan
No. | Mortgage
Loan Seller | Property Name |
Mortgage Loan Cut-off Date
Balance | Aggregate Pari Passu Companion Loan Cut-off Date Balance |
Combined
Cut-off Date Balance | Lead Servicing Agreement | Master Servicer | Special Servicer | Control Rights | Combined
UW NCF
DSCR(1) | Combined
UW NOI
Debt Yield(1) | Combined
Cut-off
Date LTV(1) |
| 1 | BANA | One North Wacker | $127,000,000 | $226,000,000 | $353,000,000 | BANK 2021-BNK36 | Wells Fargo | Rialto | BANK 2021-BNK36 | 2.96x | 8.9% | 53.2% |
| 2 | BANA/WFB | Arizona Mills | $74,888,072 | $24,962,691 | $99,850,762 | BANK 2021-BNK36 | Wells Fargo | Rialto | BANK 2021-BNK36 | 4.27x | 25.6% | 32.4% |
| 12 | BANA | Raymour & Flanigan Campus | $30,000,000 | $57,000,000 | $87,000,000 | BANK 2021-BNK36 | Wells Fargo | Rialto | Future Securitization(s) | 3.03x | 9.7% | 58.4% |
| 16 | MSMCH | Newport Pavilion | $21,590,000 | $30,000,000 | $51,590,000 | BANK 2021-BNK35 | Wells Fargo | KeyBank | BANK 2021-BNK35 | 3.16x | 10.5% | 69.8% |
| 22 | WFB | Metro Crossing | $14,382,576 | $19,906,679 | $34,289,255 | WFCM 2021-C60 | Wells Fargo | Midland | WFCM 2021-C60 | 2.05x | 12.0% | 63.9% |
| 23 | BANA | McDonald’s Global HQ | $14,287,548 | $147,637,996 | $271,925,544 | BANK 2020-BNK30 | Wells Fargo | Greystone | BANK 2020-BNK30 | 1.45x | 12.4% | 39.6% |
| 33 | WFB | Velocity Industrial Portfolio | $10,000,000 | $65,000,000 | $75,000,000 | WFCM 2021-C60 | Wells Fargo | Midland | WFCM 2021-C60 | 2.72x | 9.4% | 57.8% |
| (1) | DSCR, Debt Yield and LTV calculations include any related pari passu companion loans and exclude any subordinate companion loans, as applicable. |
| Mortgage Loans with Subordinate Debt(1) |
Loan
No. | Mortgage
Loan Seller | Property Name |
Mortgage Loan Cut-off Date
Balance | Cut-off Date Balance per SF |
Subordinate Debt Cut-off Date Balance | UW NCF DSCR | UW NOI Debt Yield | Cut-off Date LTV | Whole Loan UW NCF DSCR(2) | Whole Loan UW NOI Debt Yield(2) | Whole Loan Cut-off Date LTV(2) |
| 5 | MSMCH | Suarez Puerto Rico Industrial Portfolio | $60,000,000 | $66.34 | $24,950,000 | 3.53x | 14.4% | 54.7% | 2.00x | 10.1% | 77.4% |
| 23 | BANA | McDonald’s Global HQ | $14,287,548 | $281.60 | $110,000,000 | 1.45x | 12.4% | 39.6% | 1.17x | 7.4% | 66.5% |
| (1) | In addition, twenty four (24) of the mortgage loans, each of which is secured by a residential cooperative property, currently have in place Subordinate Coop LOCs that permit future advances. See “Description of the Mortgage Pool—Additional Indebtedness—Other Secured Indebtedness” and “Description of the Mortgage Pool—Additional Debt Financing for Mortgage Loans Secured by Residential Cooperatives” in the Preliminary Prospectus. |
| (2) | Whole Loan UW NCF DSCR, Whole Loan UW NOI Debt Yield and Whole Loan Cut-off Date LTV figures shown above are calculated based on any related pari passu notes and any related subordinate note(s). |
| Mortgage Loans with Mezzanine Debt |
Loan
No. | Mortgage
Loan Seller | Property Name |
Mortgage Loan Cut-off Date
Balance | Cut-off Date Balance per SF |
Cut-off Date Mezzanine Debt Balance | UW NCF DSCR | UW NOI Debt Yield | Cut-off Date LTV | Total Debt UW NCF DSCR(1) | Total Debt UW NOI Debt Yield(1) | Total Debt Cut-off Date LTV(1) |
| 33 | WFB | Velocity Industrial Portfolio | $10,000,000 | $66.33 | $10,000,000 | 2.72x | 9.4% | 57.8% | 1.92x | 8.3% | 65.5% |
| (1) | Total Debt UW NCF DSCR, Total Debt UW NOI Debt Yield and Total Debt Cut-off Date LTV figures shown above are calculated based on any related pari passu notes and any related subordinate note(s) and mezzanine note(s). |
This is not a research report and was not prepared by any Underwriter’s research department. Please see additional important information and qualifications at the end of this Term Sheet. |
T-28
| BANK 2021-BNK36 | Characteristics of the Mortgage Loans |
Mortgage Loans with Scheduled Balloon Payments and Related Classes(1)
| Class A-2 ($157,181,000) |
Loan
No. | Mortgage
Loan
Seller | Property Name | State | Property Type | Cut-off
Date
Balance | % of
Pool | Maturity Date Balance | % of
Class A-2
Certificate
Principal
Balance | SF/Pads | Cut-off
Date
Balance per
SF/Pads | UW
NCF
DSCR | UW
NOI
Debt
Yield | Cut-off
Date
LTV | Maturity Date LTV | Rem. IO Period
(mos.) | Rem.
Term to
Maturity
(mos.) |
| 2 | BANA/WFB | Arizona Mills | AZ | Retail | $74,888,072 | 5.9% | $67,958,768 | 43.2% | 1,234,669 | $80.87 | 4.27x | 25.6% | 32.4% | 29.4% | 0 | 59 |
| 5 | MSMCH | Suarez Puerto Rico Industrial Portfolio | PR | Various | $60,000,000 | 4.7% | $60,000,000 | 38.2% | 904,406 | $66.34 | 3.53x | 14.4% | 54.7% | 54.7% | 59 | 59 |
| 16 | MSMCH | Newport Pavilion | KY | Retail | $21,590,000 | 1.7% | $21,590,000 | 13.7% | 332,311 | $155.25 | 3.16x | 10.5% | 69.8% | 69.8% | 57 | 57 |
| 22 | WFB | Metro Crossing | IA | Retail | $14,382,576 | 1.1% | $12,993,304 | 8.3% | 310,130 | $110.56 | 2.05x | 12.0% | 63.9% | 57.7% | 0 | 57 |
| 87 | BANA | Arroyo MHC | NM | Manufactured Housing | $1,300,000 | 0.1% | $1,300,000 | 0.8% | 61 | $21,311.48 | 2.63x | 10.1% | 65.0% | 65.0% | 60 | 60 |
| | | Total/Wtd. Avg. | | | $172,160,647 | 13.5% | $163,842,072 | 104.2% | | | 3.68x | 18.5% | 47.7% | 45.9% | 28 | 59 |
| (1) | The table above reflects the mortgage loans whose balloon payments will be applied to pay down the Class A-2 certificates, assuming (i) that none of the mortgage loans experience prepayments, defaults or losses; (ii) there are no extensions of maturity dates; and (iii) each mortgage loan is paid in full on its stated maturity date or, in the case of any mortgage loan with an anticipated repayment date, on such anticipated repayment date. The table above is otherwise based on the Structuring Assumptions set forth under “Yield and Maturity Considerations—Weighted Average Life” in the Preliminary Prospectus. |
Mortgage Loans with Scheduled Balloon Payments and Related Classes(1)
| Class A-3 ($10,640,000) |
Loan
No. | Mortgage
Loan
Seller | Property Name | State | Property Type | Cut-off
Date
Balance | % of
Pool | Maturity Date Balance | % of
Class A-3
Certificate
Principal
Balance | SF | Cut-off
Date
Balance per
SF | UW
NCF
DSCR | UW
NOI
Debt
Yield | Cut-off
Date
LTV | Maturity Date LTV | Rem. IO Period
(mos.) | Rem.
Term to
Maturity
(mos.) |
| 45 | BANA | Western Skies Business Center | AZ | Office | $6,700,000 | 0.5% | $6,700,000 | 63.0% | 71,690 | $93.46 | 3.86x | 13.5% | 55.8% | 55.8% | 83 | 83 |
| 59 | BANA | BuxBear Self Storage | ID | Self Storage | $4,500,000 | 0.4% | $4,500,000 | 42.3% | 67,705 | $66.46 | 2.54x | 9.4% | 60.8% | 60.8% | 83 | 83 |
| | | Total/Wtd. Avg. | | | $11,200,000 | 0.9% | $11,200,000 | 105.3% | | | 3.33x | 11.9% | 57.8% | 57.8% | 83 | 83 |
| (1) | The table above reflects the mortgage loans whose balloon payments will be applied to pay down the Class A-3 certificates, assuming (i) that none of the mortgage loans experience prepayments, defaults or losses; (ii) there are no extensions of maturity dates; and (iii) each mortgage loan is paid in full on its stated maturity date or, in the case of any mortgage loan with an anticipated repayment date, on such anticipated repayment date. The table above is otherwise based on the Structuring Assumptions set forth under “Yield and Maturity Considerations—Weighted Average Life” in the Preliminary Prospectus. |
This is not a research report and was not prepared by any Underwriter’s research department. Please see additional important information and qualifications at the end of this Term Sheet. |
T-29
| BANK 2021-BNK36 | Characteristics of the Mortgage Loans |
| Prior Securitization History(1) |
Loan
No. | Mortgage
Loan
Seller | Property Name | City | State | Property
Type | Cut-off
Date
Balance | % of
Pool | SF/Unit/Pad | Cut-off
Date
Balance per SF/Unit/Pad(2) | UW
NCF
DSCR(2)(3) | UW NOI
Debt
Yield(2)(3) | Cut-off
Date
LTV(2)(3) | Maturity Date
LTV(2)(3) | Prior Securitization |
| 2 | BANA/WFB | Arizona Mills | Tempe | AZ | Retail | $74,888,072 | 5.9% | 1,234,669 | $80.87 | 4.27x | 25.6% | 32.4% | 29.4% | JPMCC 2010-C2 |
| 6 | BANA | The Court at Oxford Valley | Fairless Hills | PA | Retail | $55,000,000 | 4.3% | 456,286 | $120.54 | 1.97x | 10.8% | 65.9% | 56.0% | JPMCC 2012-CBX |
| 7 | BANA | Plaza at Imperial Valley | El Centro | CA | Retail | $49,500,000 | 3.9% | 367,828 | $134.57 | 2.16x | 9.0% | 65.0% | 65.0% | UBSBB 2012-C3 |
| 9 | MSMCH | Corporate Research Center | Hayward | CA | Mixed Use | $44,500,000 | 3.5% | 293,292 | $151.73 | 3.89x | 11.1% | 46.8% | 46.8% | COMM 2013-CR8 |
| 13 | WFB | Norwalk Town Square | Norwalk | CA | Retail | $30,000,000 | 2.4% | 232,987 | $128.76 | 3.04x | 10.9% | 56.9% | 56.9% | WFRBS 2012-C6 |
| 15 | WFB | Lake Pointe Corporate Centre | West Valley City | UT | Office | $25,300,000 | 2.0% | 182,121 | $138.92 | 3.51x | 11.3% | 65.7% | 65.7% | JPMDB 2016-C4 |
| 21.03 | BANA | Siegel Select Alexandria | Alexandria | LA | Multifamily | $2,800,000 | 0.2% | 113 | $32,307.69 | 2.55x | 15.4% | 59.6% | 53.9% | COMM 2015-CR27 |
| 37 | MSMCH | Anaheim Hills Medical Office | Anaheim | CA | Office | $9,250,000 | 0.7% | 43,944 | $210.50 | 2.74x | 10.7% | 60.1% | 60.1% | MSBAM 2013-C9 |
| 49 | NCB | Waldo Gardens, Inc. | Bronx | NY | Multifamily | $5,588,659 | 0.4% | 170 | $32,874.47 | 10.67x | 47.6% | 12.0% | 10.3% | WFRBS 2013-C12 |
| 51 | WFB | Walgreens - Yakima | Yakima | WA | Retail | $5,200,000 | 0.4% | 14,738 | $352.83 | 2.15x | 8.3% | 63.4% | 63.4% | MSBAM 2012-C6 |
| 57 | WFB | WAG Hudson, WI | Hudson | WI | Retail | $4,700,000 | 0.4% | 14,490 | $324.36 | 2.51x | 9.0% | 55.7% | 55.7% | MSBAM 2012-C6 |
| 60 | BANA | Tomball Self Storage | Tomball | TX | Self Storage | $4,394,000 | 0.3% | 70,110 | $62.67 | 2.51x | 9.4% | 60.8% | 60.8% | GSMS 2013-GC13 |
| 61 | NCB | 12 West 17th St. Tenants’ Corp. | New York | NY | Multifamily | $4,295,434 | 0.3% | 11 | $390,493.96 | 4.59x | 20.2% | 11.9% | 10.3% | WFCM 2015-C29 |
| 67 | NCB | Archer Cooperative, Inc. | Bronx | NY | Multifamily | $3,250,000 | 0.3% | 168 | $19,345.24 | 19.00x | 62.8% | 9.7% | 9.7% | WFRBS 2013-C15 |
| 68 | NCB | Caribbean House, Inc. | Edgewater | NJ | Multifamily | $3,200,000 | 0.3% | 62 | $51,612.90 | 5.98x | 31.7% | 17.7% | 13.7% | WFRBS 2013-C13 |
| 74 | BANA | Brookville MHC | Indianapolis | IN | Manufactured Housing | $2,550,000 | 0.2% | 156 | $16,346.15 | 4.30x | 15.8% | 40.0% | 40.0% | WFRBS 2013-C16 |
| 75 | NCB | Garden Lofts Corp. | New York | NY | Multifamily | $2,500,000 | 0.2% | 23 | $108,695.65 | 9.28x | 29.2% | 8.1% | 8.1% | WFRBS 2014-C23 |
| 85 | NCB | Cherry Lane Owners Corp. | Flushing | NY | Multifamily | $1,644,629 | 0.1% | 71 | $23,163.78 | 12.97x | 68.1% | 6.4% | 5.0% | WFRBS 2013-C12 |
| | | Total | | | | $328,560,793 | 25.7% | | | | | | | |
| (1) | Includes mortgage loans for which all or a portion of the previously existing debt was most recently securitized in conduit securitizations, based on information provided by the related borrower or obtained through searches of a third-party database. The information has not otherwise been confirmed by the mortgage loan sellers. With respect to any mortgage loan that is part of a whole loan, unless otherwise indicated, all LTV, DSCR, Debt Yield and Cut-off Date Balance per SF/Unit/Pad calculations include any related pari passu companion loans and exclude any related subordinate companion loans, as applicable. |
| (2) | For properties that are part of a portfolio, the Cut-off Date Balance Per SF/Unit/Pad, UW NCF DSCR, UW NOI Debt Yield, Cut-off Date LTV and Maturity Date LTV calculations reflect the values of the portfolio as a whole. |
| (3) | For mortgaged properties securing residential cooperative mortgage loans, the UW NCF DSCR and UW NOI Debt Yield for each such mortgaged property is calculated using underwritten net operating income or underwritten net cash flow, as applicable, for the related residential cooperative property which is the projected net operating income or net cash flow, as applicable, reflected in the most recent appraisal obtained by or otherwise in the possession of the related mortgage loan seller as of the Cut-off Date. LTV calculations are based upon the appraised value of the residential cooperative property determined as if such residential cooperative property is operated as a residential cooperative, inclusive of the amount of the underlying debt encumbering such residential cooperative property (other than for the Waldo Gardens, Inc. mortgage loan). In the case of the residential cooperative property securing the Waldo Gardens, Inc., mortgage loan, the LTV ratio calculations for such mortgage loan are determined as if such residential cooperative property is operated as a market rate multifamily rental property. The UW NCF DSCR, UW NOI Debt Yield and LTV calculations do not take into account any subordinate debt (whether or not secured by the related mortgaged property), that currently exists or is allowed under the terms of any mortgage loan. |
This is not a research report and was not prepared by any Underwriter’s research department. Please see additional important information and qualifications at the end of this Term Sheet. |
T-30
| BANK 2021-BNK36 | Characteristics of the Mortgage Loans |
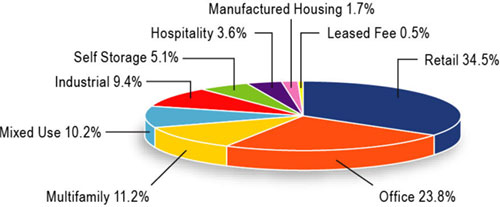
| Property Type Distribution(1) |
| Property Type | Number of
Mortgaged
Properties | Aggregate
Cut-off Date
Balance | % of
Pool | Wtd. Avg. Mortgage Rate | Wtd. Avg. UW NCF DSCR | Wtd. Avg.
UW NOI
Debt Yield | Wtd. Avg. Cut-off
Date LTV | Wtd. Avg. Maturity
Date LTV |
| Retail | 41 | $440,647,286 | 34.5% | 3.4635% | 2.73x | 12.6% | 57.7% | 55.3% |
| Anchored | 13 | $321,248,147 | 25.2% | 3.4384% | 2.86x | 13.8% | 55.9% | 52.6% |
| Single Tenant | 26 | $62,399,139 | 4.9% | 3.3284% | 2.56x | 8.9% | 61.1% | 61.1% |
| Power Center | 1 | $49,500,000 | 3.9% | 3.7500% | 2.16x | 9.0% | 65.0% | 65.0% |
| Shadow Anchored | 1 | $7,500,000 | 0.6% | 3.7700% | 2.73x | 11.6% | 57.0% | 57.0% |
| Office | 15 | $303,728,409 | 23.8% | 2.8332% | 3.29x | 10.5% | 52.3% | 50.9% |
| CBD | 3 | $154,837,548 | 12.1% | 2.7806% | 2.85x | 9.4% | 52.5% | 50.4% |
| Suburban | 4 | $115,200,000 | 9.0% | 2.7402% | 4.16x | 12.2% | 49.2% | 49.2% |
| Medical | 8 | $33,690,861 | 2.6% | 3.3928% | 2.37x | 9.9% | 61.8% | 59.0% |
| Multifamily | 37 | $142,543,418 | 11.2% | 3.1898% | 6.95x | 32.5% | 22.5% | 19.8% |
| Cooperative | 31 | $120,943,418 | 9.5% | 3.0748% | 7.78x | 36.0% | 15.6% | 13.2% |
| Flexible Apartments | 4 | $14,700,000 | 1.2% | 3.7500% | 2.55x | 15.4% | 59.6% | 53.9% |
| Garden | 1 | $4,100,000 | 0.3% | 3.5100% | 2.08x | 7.5% | 63.1% | 63.1% |
| Low Rise | 1 | $2,800,000 | 0.2% | 4.7500% | 1.37x | 8.9% | 69.6% | 61.4% |
| Mixed Use | 7 | $129,815,000 | 10.2% | 2.8441% | 3.62x | 11.0% | 52.1% | 51.6% |
| Industrial/Office | 2 | $81,625,000 | 6.4% | 2.5445% | 4.22x | 11.9% | 48.0% | 48.0% |
| Multifamily/Retail | 2 | $26,500,000 | 2.1% | 3.1538% | 2.95x | 9.5% | 60.2% | 60.2% |
| Retail/Office | 1 | $8,300,000 | 0.7% | 3.7810% | 1.74x | 10.4% | 59.3% | 51.1% |
| Industrial/Office/Retail | 1 | $7,000,000 | 0.5% | 3.4100% | 2.52x | 9.3% | 50.0% | 50.0% |
| Office/Retail | 1 | $6,390,000 | 0.5% | 3.5500% | 2.26x | 8.3% | 63.9% | 63.9% |
| Industrial | 7 | $119,705,592 | 9.4% | 3.3745% | 3.08x | 11.9% | 56.8% | 56.1% |
| Warehouse | 3 | $50,188,346 | 3.9% | 3.5711% | 3.37x | 13.4% | 55.3% | 55.3% |
| Flex | 3 | $39,517,245 | 3.1% | 3.4660% | 2.75x | 11.7% | 57.5% | 55.4% |
| Warehouse Distribution | 1 | $30,000,000 | 2.4% | 2.9250% | 3.03x | 9.7% | 58.4% | 58.4% |
| Self Storage | 10 | $64,893,405 | 5.1% | 3.4184% | 2.59x | 9.5% | 56.7% | 55.6% |
| Self Storage | 10 | $64,893,405 | 5.1% | 3.4184% | 2.59x | 9.5% | 56.7% | 55.6% |
| Hospitality | 1 | $45,931,496 | 3.6% | 3.8140% | 2.27x | 14.0% | 60.4% | 47.9% |
| Full Service | 1 | $45,931,496 | 3.6% | 3.8140% | 2.27x | 14.0% | 60.4% | 47.9% |
| Manufactured Housing | 8 | $22,070,000 | 1.7% | 3.7412% | 2.73x | 10.4% | 48.5% | 48.5% |
| Manufactured Housing | 8 | $22,070,000 | 1.7% | 3.7412% | 2.73x | 10.4% | 48.5% | 48.5% |
| Leased Fee | 2 | $6,719,408 | 0.5% | 3.1316% | 2.29x | 7.4% | 73.5% | 73.5% |
| Leased Fee | 2 | $6,719,408 | 0.5% | 3.1316% | 2.29x | 7.4% | 73.5% | 73.5% |
| Total/Wtd. Avg. | 128 | $1,276,054,015 | 100.0% | 3.2249% | 3.43x | 13.9% | 51.8% | 49.7% |
| (1) | All numerical information concerning the mortgage loans is approximate and, in the case of mortgage loans secured by multiple properties, is based on allocated loan amounts with respect to such properties. All weighted average information regarding the mortgage loans reflects the weighting of the mortgage loans based on their outstanding principal balances as of the Cut-off Date or, in the case of mortgage loans secured by multiple properties, allocated loan amounts. The sum of numbers and percentages in columns may not match the “Total” due to rounding. With respect to any mortgage loan that is part of a whole loan, unless otherwise indicated, all LTV, DSCR and Debt Yield calculations include any related pari passu companion loans and exclude any related subordinate companion loans, as applicable. For mortgaged properties securing residential cooperative mortgage loans, the UW NCF DSCR and UW NOI Debt Yield for each such mortgaged property is calculated using underwritten net operating income or underwritten net cash flow, as applicable, for the related residential cooperative property which is the projected net operating income or net cash flow, as applicable, reflected in the most recent appraisal obtained by or otherwise in the possession of the related mortgage loan seller as of the Cut-off Date. All LTV ratio calculations are based upon the appraised value of the residential cooperative property determined as if such residential cooperative property is operated as a residential cooperative, inclusive of the amount of the underlying debt encumbering such residential cooperative property (other than for the Waldo Gardens, Inc. mortgage loan). In the case of the residential cooperative property securing the Waldo Gardens, Inc., mortgage loan, the LTV ratio calculations for such mortgage loan are determined as if such residential cooperative property is operated as a market rate multifamily rental property. The UW NCF DSCR, UW NOI Debt Yield and LTV calculations do not take into account any subordinate debt (whether or not secured by the related mortgaged property), that currently exists or is allowed under the terms of any mortgage loan. |
This is not a research report and was not prepared by any Underwriter’s research department. Please see additional important information and qualifications at the end of this Term Sheet. |
T-31
| BANK 2021-BNK36 | Characteristics of the Mortgage Loans |
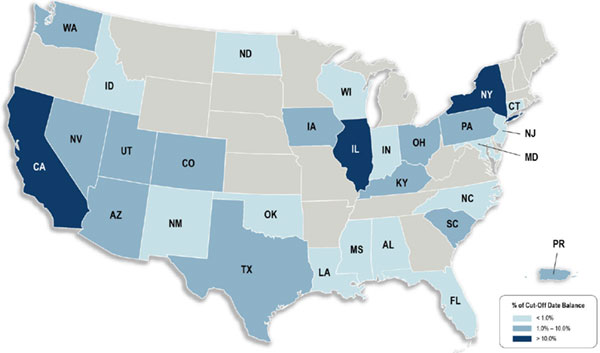
| Geographic Distribution(1) |
| State or Other Jurisdiction | Number of
Mortgaged
Properties | Aggregate
Cut-off Date
Balance | % of
Pool | Wtd. Avg.
Mortgage
Rate | Wtd. Avg.
UW NCF
DSCR | Wtd. Avg.
UW NOI
Debt Yield | Wtd. Avg. Cut-off
Date LTV | Wtd. Avg. Maturity
Date LTV |
| California | 13 | $264,873,474 | 20.8% | 3.2113% | 2.98x | 10.1% | 56.0% | 55.7% |
| Northern California(2) | 5 | $74,398,474 | 5.8% | 2.9157% | 3.29x | 10.0% | 50.9% | 50.9% |
| Southern California(2) | 8 | $190,475,000 | 14.9% | 3.3267% | 2.86x | 10.1% | 57.9% | 57.6% |
| Illinois | 12 | $181,853,781 | 14.3% | 2.8883% | 2.70x | 9.3% | 53.8% | 51.4% |
| New York | 34 | $180,633,418 | 14.2% | 3.0752% | 6.12x | 26.8% | 30.9% | 29.4% |
| Texas | 7 | $114,830,518 | 9.0% | 2.8922% | 3.72x | 11.4% | 50.8% | 50.0% |
| Arizona | 2 | $81,588,072 | 6.4% | 3.7398% | 4.24x | 24.6% | 34.3% | 31.6% |
| Pennsylvania | 5 | $68,294,292 | 5.4% | 3.2075% | 2.11x | 10.5% | 64.5% | 56.5% |
| Puerto Rico | 3 | $60,000,000 | 4.7% | 3.6560% | 3.53x | 14.4% | 54.7% | 54.7% |
| South Carolina | 2 | $52,431,496 | 4.1% | 3.8061% | 2.30x | 14.2% | 60.3% | 48.6% |
| Utah | 4 | $52,300,000 | 4.1% | 3.1383% | 3.22x | 10.7% | 58.9% | 58.9% |
| Nevada | 5 | $49,887,500 | 3.9% | 3.5030% | 2.10x | 9.6% | 61.6% | 58.2% |
| Colorado | 3 | $23,100,000 | 1.8% | 3.2561% | 2.89x | 10.4% | 61.9% | 61.9% |
| Kentucky | 1 | $21,590,000 | 1.7% | 3.0400% | 3.16x | 10.5% | 69.8% | 69.8% |
| Washington | 5 | $19,717,348 | 1.5% | 3.4930% | 2.66x | 9.6% | 56.9% | 56.9% |
| Iowa | 2 | $15,485,781 | 1.2% | 3.3513% | 2.09x | 11.8% | 63.7% | 58.0% |
| Ohio | 5 | $12,885,594 | 1.0% | 3.6867% | 2.17x | 10.6% | 66.7% | 60.2% |
| Alabama | 2 | $11,130,480 | 0.9% | 3.3751% | 2.59x | 10.4% | 60.9% | 59.6% |
| Connecticut | 1 | $11,000,000 | 0.9% | 3.3000% | 3.56x | 12.9% | 52.3% | 52.3% |
| Louisiana | 3 | $8,836,980 | 0.7% | 3.4178% | 2.58x | 11.0% | 60.8% | 59.0% |
| Indiana | 3 | $8,749,810 | 0.7% | 3.3326% | 3.10x | 10.9% | 55.1% | 55.1% |
| New Jersey | 3 | $8,617,717 | 0.7% | 3.3758% | 3.61x | 16.7% | 46.0% | 44.5% |
| Mississippi | 3 | $5,148,342 | 0.4% | 3.5329% | 2.57x | 12.5% | 60.4% | 57.2% |
| Wisconsin | 1 | $4,700,000 | 0.4% | 3.5400% | 2.51x | 9.0% | 55.7% | 55.7% |
| Idaho | 1 | $4,500,000 | 0.4% | 3.5730% | 2.54x | 9.4% | 60.8% | 60.8% |
| North Carolina | 2 | $3,976,030 | 0.3% | 3.6310% | 3.43x | 12.9% | 59.2% | 59.2% |
| Maryland | 1 | $3,003,168 | 0.2% | 3.2637% | 2.60x | 8.9% | 61.3% | 61.3% |
| Florida | 1 | $2,335,116 | 0.2% | 3.2637% | 2.60x | 8.9% | 61.3% | 61.3% |
| Oklahoma | 2 | $2,243,183 | 0.2% | 3.2637% | 2.60x | 8.9% | 61.3% | 61.3% |
| New Mexico | 1 | $1,300,000 | 0.1% | 3.7170% | 2.63x | 10.1% | 65.0% | 65.0% |
| North Dakota | 1 | $1,041,915 | 0.1% | 3.2637% | 2.60x | 8.9% | 61.3% | 61.3% |
| Total/Wtd. Avg. | 128 | $1,276,054,015 | 100.0% | 3.2249% | 3.43x | 13.9% | 51.8% | 49.7% |
| (1) | All numerical information concerning the mortgage loans is approximate and, in the case of mortgage loans secured by multiple properties, is based on allocated loan amounts with respect to such properties. All weighted average information regarding the mortgage loans reflects the weighting of the mortgage loans based on their outstanding principal balances as of the Cut-off Date or, in the case of mortgage loans secured by multiple properties, allocated loan amounts. The sum of numbers and percentages in columns may not match the “Total” due to rounding. With respect to any mortgage loan that is part of a whole loan, unless otherwise indicated, all LTV, DSCR and Debt Yield calculations include any related pari passu companion loans and exclude any related subordinate companion loans, as applicable. For mortgaged properties securing residential cooperative mortgage loans, the UW NCF DSCR and UW NOI Debt Yield for each such mortgaged property is calculated using underwritten net operating income or underwritten net cash flow, as applicable, for the related residential cooperative property which is the projected net operating income or net cash flow, as applicable, reflected in the most recent appraisal obtained by or otherwise in the possession of the related mortgage loan seller as of the Cut-off Date. All LTV ratio calculations are based upon the appraised value of the residential cooperative property determined as if such residential cooperative property is operated as a residential cooperative, inclusive of the amount of the underlying debt encumbering such residential cooperative property (other than for the Waldo Gardens, Inc. mortgage loan). In the case of the residential cooperative property securing the Waldo Gardens, Inc., mortgage loan, the LTV ratio calculations for such mortgage loan are determined as if such residential cooperative property is operated as a market rate multifamily rental property. The UW NCF DSCR, UW NOI Debt Yield and LTV calculations do not take into account any subordinate debt (whether or not secured by the related mortgaged property), that currently exists or is allowed under the terms of any mortgage loan. |
| (2) | “Northern California” includes zip codes above 93600, and “Southern California” includes zip codes at or below 93600. |
This is not a research report and was not prepared by any Underwriter’s research department. Please see additional important information and qualifications at the end of this Term Sheet. |
T-32
| BANK 2021-BNK36 | Collateral Statistics |
Collateral Statistics(1)
Cut-off Date Balance ($)
| | | No. of
Mortgage
Loans | | Aggregate
Cut-off Date
Balance ($) | | % of
Pool | |
| 992,951 - 5,000,000 | | 41 | | 120,920,421 | | 9.5 | |
| 5,000,001 - 15,000,000 | | 32 | | 313,613,842 | | 24.6 | |
| 15,000,001 - 25,000,000 | | 4 | | 72,335,184 | | 5.7 | |
| 25,000,001 - 35,000,000 | | 5 | | 142,900,000 | | 11.2 | |
| 35,000,001 - 55,000,000 | | 5 | | 232,056,496 | | 18.2 | |
| 55,000,001 - 75,000,000 | | 4 | | 267,228,072 | | 20.9 | |
| 75,000,001 - 127,000,000 | | 1 | | 127,000,000 | | 10.0 | |
| Total: | | 92 | | $1,276,054,015 | | 100.0 | % |
| Min: $992,951 | | Max: $127,000,000 Avg: $13,870,152 |
State or Other Jurisdiction(2)
| | | No. of
Mortgaged
Properties | | Aggregate
Cut-off Date
Balance ($) | | % of
Pool | |
| California | | 13 | | 264,873,474 | | 20.8 | |
| Northern California(3) | | 5 | | 74,398,474 | | 5.8 | |
| Southern California(3) | | 8 | | 190,475,000 | | 14.9 | |
| Illinois | | 12 | | 181,853,781 | | 14.3 | |
| New York | | 34 | | 180,633,418 | | 14.2 | |
| Texas | | 7 | | 114,830,518 | | 9.0 | |
| Arizona | | 2 | | 81,588,072 | | 6.4 | |
| Pennsylvania | | 5 | | 68,294,292 | | 5.4 | |
| Puerto Rico | | 3 | | 60,000,000 | | 4.7 | |
| South Carolina | | 2 | | 52,431,496 | | 4.1 | |
| Utah | | 4 | | 52,300,000 | | 4.1 | |
| Nevada | | 5 | | 49,887,500 | | 3.9 | |
| Colorado | | 3 | | 23,100,000 | | 1.8 | |
| Kentucky | | 1 | | 21,590,000 | | 1.7 | |
| Washington | | 5 | | 19,717,348 | | 1.5 | |
| Iowa | | 2 | | 15,485,781 | | 1.2 | |
| Ohio | | 5 | | 12,885,594 | | 1.0 | |
| Alabama | | 2 | | 11,130,480 | | 0.9 | |
| Connecticut | | 1 | | 11,000,000 | | 0.9 | |
| Louisiana | | 3 | | 8,836,980 | | 0.7 | |
| Indiana | | 3 | | 8,749,810 | | 0.7 | |
| New Jersey | | 3 | | 8,617,717 | | 0.7 | |
| Mississippi | | 3 | | 5,148,342 | | 0.4 | |
| Wisconsin | | 1 | | 4,700,000 | | 0.4 | |
| Idaho | | 1 | | 4,500,000 | | 0.4 | |
| North Carolina | | 2 | | 3,976,030 | | 0.3 | |
| Maryland | | 1 | | 3,003,168 | | 0.2 | |
| Florida | | 1 | | 2,335,116 | | 0.2 | |
| Oklahoma | | 2 | | 2,243,183 | | 0.2 | |
| New Mexico | | 1 | | 1,300,000 | | 0.1 | |
| North Dakota | | 1 | | 1,041,915 | | 0.1 | |
| Total: | | 128 | | $1,276,054,015 | | 100.0 | % |
Property Type(2)
| | | No. of
Mortgaged
Properties | | Aggregate
Cut-off Date Balance ($) | | % of
Pool | |
| Retail | | 41 | | 440,647,286 | | 34.5 | |
| Anchored | | 13 | | 321,248,147 | | 25.2 | |
| Single Tenant | | 26 | | 62,399,139 | | 4.9 | |
| Power Center | | 1 | | 49,500,000 | | 3.9 | |
| Shadow Anchored | | 1 | | 7,500,000 | | 0.6 | |
| Office | | 15 | | 303,728,409 | | 23.8 | |
| CBD | | 3 | | 154,837,548 | | 12.1 | |
| Suburban | | 4 | | 115,200,000 | | 9.0 | |
| Medical | | 8 | | 33,690,861 | | 2.6 | |
| Multifamily | | 37 | | 142,543,418 | | 11.2 | |
| Cooperative | | 31 | | 120,943,418 | | 9.5 | |
| Flexible Apartments | | 4 | | 14,700,000 | | 1.2 | |
| Garden | | 1 | | 4,100,000 | | 0.3 | |
| Low Rise | | 1 | | 2,800,000 | | 0.2 | |
| Mixed Use | | 7 | | 129,815,000 | | 10.2 | |
| Industrial/Office | | 2 | | 81,625,000 | | 6.4 | |
| Multifamily/Retail | | 2 | | 26,500,000 | | 2.1 | |
| Retail/Office | | 1 | | 8,300,000 | | 0.7 | |
| Industrial/Office/Retail | | 1 | | 7,000,000 | | 0.5 | |
| Office/Retail | | 1 | | 6,390,000 | | 0.5 | |
| Industrial | | 7 | | 119,705,592 | | 9.4 | |
| Warehouse | | 3 | | 50,188,346 | | 3.9 | |
| Flex | | 3 | | 39,517,245 | | 3.1 | |
| Warehouse Distribution | | 1 | | 30,000,000 | | 2.4 | |
| Self Storage | | 10 | | 64,893,405 | | 5.1 | |
| Self Storage | | 10 | | 64,893,405 | | 5.1 | |
| Hospitality | | 1 | | 45,931,496 | | 3.6 | |
| Full Service | | 1 | | 45,931,496 | | 3.6 | |
| Manufactured Housing | | 8 | | 22,070,000 | | 1.7 | |
| Manufactured Housing | | 8 | | 22,070,000 | | 1.7 | |
| Leased Fee | | 2 | | 6,719,408 | | 0.5 | |
| Leased Fee | | 2 | | 6,719,408 | | 0.5 | |
| Total: | | 128 | | $1,276,054,015 | | 100.0 | % |
Mortgage Rate (%)
| | | No. of
Mortgage
Loans | | Aggregate
Cut-off Date
Balance ($) | | % of
Pool | |
| 2.4350 - 2.9999 | | 12 | | 370,391,795 | | 29.0% | |
| 3.0000 - 3.4999 | | 55 | | 550,041,747 | | 43.1% | |
| 3.5000 - 4.7500 | | 25 | | 355,620,473 | | 27.9% | |
| Total: | | 92 | | $1,276,054,015 | | 100.0% | |
| Min: 2.4350% | | Max: 4.7500% Wtd Avg: 3.2249% |
Original Term to Maturity or ARD (mos.)
| | No. of
Mortgage
Loans | | Aggregate
Cut-off Date
Balance ($) | | % of
Pool | |
| 60 | | 5 | | 172,160,647 | | 13.5 | |
| 84 | | 2 | | 11,200,000 | | 0.9 | |
| 120 | | 85 | | 1,092,693,368 | | 85.6 | |
| Total: | | 92 | | $1,276,054,015 | | 100.0 | % |
| Min: 60 mos. | | Max: 120 mos. Wtd Avg: 112 mos. |
Remaining Term to Maturity or ARD (mos.)
| | | No. of
Mortgage
Loans | | Aggregate
Cut-off Date
Balance ($) | | % of
Pool | |
| 57 - 60 | | 5 | | 172,160,647 | | 13.5 | % |
| 83 - 84 | | 2 | | 11,200,000 | | 0.9 | |
| 106 - 120 | | 85 | | 1,092,693,368 | | 85.6 | % |
| Total: | | 92 | | $1,276,054,015 | | 100.0 | % |
| Min: 57 mos. | | Max: 120 mos. Wtd Avg: 110 mos. |
Original Amortization Term (mos.)
| | No. of
Mortgage
Loans | | Aggregate
Cut-off Date
Balance ($) | | % of
Pool | |
| Interest Only | | 53 | | 893,371,500 | | 70.0% | |
| 120 | | 2 | | 2,274,619 | | 0.2 | |
| 270 | | 1 | | 14,287,548 | | 1.1 | |
| 360 | | 30 | | 326,792,139 | | 25.6% | |
| 480 | | 6 | | 39,328,209 | | 3.1 | |
| Total: | | 92 | | $1,276,054,015 | | 100.0 | % |
| Min: 120 mos. | | Max: 480 mos. Wtd Avg: 368 mos. |
Remaining Amortization Term (mos.)
| | | No. of
Mortgage
Loans | | Aggregate
Cut-off Date
Balance ($) | | % of
Pool | |
| Interest Only | | 53 | | 893,371,500 | | 70.0 | |
| 118 - 120 | | 2 | | 2,274,619 | | 0.2 | |
| 121 - 270 | | 1 | | 14,287,548 | | 1.1 | |
| 271 - 360 | | 30 | | 326,792,139 | | 25.6% | |
| 361 - 479 | | 6 | | 39,328,209 | | 3.1 | |
| Total: | | 92 | | $1,276,054,015 | | 100.0 | % |
| Min: 118 mos. | | Max: 479 mos. Wtd Avg: 366 mos. |
Mortgage Loan Sellers
| | | No. of
Mortgage
Loans | | Aggregate
Cut-off Date
Balance ($) | | % of
Pool | |
| BANA | | 23 | | 497,276,548 | | 39.0 | |
| MSMCH | | 20 | | 316,981,905 | | 24.8 | |
| WFB | | 17 | | 265,964,072 | | 20.8 | |
| NCB | | 31 | | 120,943,418 | | 9.5 | |
| BANA/WFB | | 1 | | 74,888,072 | | 5.9 | |
| Total: | | 92 | | $1,276,054,015 | | 100.0 | % |
Amortization Type
| | | No. of
Mortgage
Loans | | Aggregate
Cut-off Date
Balance ($) | | % of
Pool | |
| Interest Only | | 53 | | 893,371,500 | | 70.0 | |
| Amortizing Balloon | | 27 | | 244,307,896 | | 19.1 | |
| Interest Only, Amortizing Balloon | | 10 | | 136,100,000 | | 10.7 | |
| Fully Amortizing | | 2 | | 2,274,619 | | 0.2 | |
| Total: | | 92 | | $1,276,054,015 | | 100.0 | % |
Cut-off Date LTV Ratio (%)
| | | No. of
Mortgage
Loans | | Aggregate
Cut-off Date
Balance ($) | | % of
Pool | |
| 2.0 - 30.0 | | 30 | | 116,208,996 | | 9.1 | |
| 30.1 - 40.0 | | 5 | | 100,160,042 | | 7.8 | |
| 40.1 - 50.0 | | 9 | | 178,715,000 | | 14.0 | |
| 50.1 - 60.0 | | 20 | | 403,380,000 | | 31.6 | |
| 60.1 - 65.0 | | 18 | | 316,925,572 | | 24.8 | |
| 65.1 - 75.0 | | 10 | | 160,664,405 | | 12.6 | |
| Total: | | 92 | | $1,276,054,015 | | 100.0 | % |
| Min: 2.0% | | Max: 75.0% | Wtd Avg: 51.8% |
Maturity Date or ARD LTV Ratio (%)
| | | No. of
Mortgage
Loans | | Aggregate
Cut-off Date
Balance ($) | | % of
Pool | |
| 0.0 - 30.0 | | 33 | | 210,119,038 | | 16.5 | |
| 30.1 - 45.0 | | 5 | | 85,500,000 | | 6.7 | |
| 45.1 - 55.0 | | 17 | | 418,046,496 | | 32.8 | |
| 55.1 - 60.0 | | 17 | | 234,911,981 | | 18.4 | |
| 60.1 - 75.0 | | 20 | | 327,476,500 | | 25.7 | |
| Total: | | 92 | | $1,276,054,015 | | 100.0 | % |
| Min: 0.0% | | Max: 75.0% | Wtd Avg: 49.7% |
UW NCF DSCR (x)
| | | No. of
Mortgage
Loans | | Aggregate
Cut-off Date
Balance ($) | | % of
Pool | |
| 1.37 - 1.70 | | 6 | | 57,237,548 | | 4.5 | |
| 1.71 - 2.10 | | 8 | | 103,731,981 | | 8.1 | |
| 2.11 - 2.50 | | 11 | | 216,433,996 | | 17.0 | |
| 2.51 - 3.50 | | 25 | | 433,964,000 | | 34.0 | |
| 3.51 - 4.50 | | 15 | | 272,300,296 | | 21.3 | |
| 4.51 - 28.86 | | 27 | | 192,386,194 | | 15.1 | |
| Total: | | 92 | | $1,276,054,015 | | 100.0 | % |
| Min: 1.37x | | Max: 28.86x | Wtd Avg: 3.43x |
UW NOI Debt Yield (%)
| | | No. of
Mortgage
Loans | | Aggregate
Cut-off Date
Balance ($) | | % of
Pool | |
| 6.8 - 9.0 | | 17 | | 390,292,500 | | 30.6 | |
| 9.1 - 10.0 | | 11 | | 106,184,000 | | 8.3 | |
| 10.1 - 11.0 | | 16 | | 212,239,405 | | 16.6 | |
| 11.1 - 14.0 | | 14 | | 302,856,620 | | 23.7 | |
| 14.1 - 24.0 | | 10 | | 108,345,989 | | 8.5 | |
| 24.1 - 153.4 | | 24 | | 156,135,500 | | 12.2 | |
| Total: | | 92 | | $1,276,054,015 | | 100.0 | % |
| Min: 6.8% | | Max: 153.4% | Wtd Avg: 13.9% |
| (1) | All numerical information concerning the mortgage loans is approximate. All weighted average information regarding the mortgage loans reflects the weighting of the mortgage loans based on their outstanding principal balances as of the Cut-off Date. The sum of numbers and percentages in columns may not match the “Total” due to rounding. With respect to any mortgage loan that is part of a whole loan, unless otherwise indicated, all LTV, DSCR and Debt Yield calculations include any related pari passu companion loans and exclude any related subordinate companion loans, as applicable. For mortgaged properties securing residential cooperative mortgage loans, the UW NCF DSCR and UW NOI Debt Yield for each such mortgaged property is calculated using underwritten net operating income or underwritten net cash flow, as applicable, for the related residential cooperative property which is the projected net operating income or net cash flow, as applicable, reflected in the most recent appraisal obtained by or otherwise in the possession of the related mortgage loan seller as of the Cut-off Date. All LTV ratio calculations are based upon the appraised value of the residential cooperative property determined as if such residential cooperative property is operated as a residential cooperative, inclusive of the amount of the underlying debt encumbering such residential cooperative property (other than for the Waldo Gardens, Inc. mortgage loan). In the case of the residential cooperative property securing the Waldo Gardens, Inc., mortgage loan, the LTV ratio calculations for such mortgage loan are determined as if such residential cooperative property is operated as a market rate multifamily rental property. The UW NCF DSCR, UW NOI Debt Yield and LTV calculations do not take into account any subordinate debt (whether or not secured by the related mortgaged property), that currently exists or is allowed under the terms of any mortgage loan. |
| (2) | In the case of mortgage loans secured by multiple properties, cut-off date balance information is based on allocated loan amounts with respect to such properties. |
| (3) | “Northern California” includes zip codes above 93600, and “Southern California” includes zip codes at or below 93600. |
This is not a research report and was not prepared by any Underwriter’s research department. Please see additional important information and qualifications at the end of this Term Sheet. |
T-33
| Office – CBD | Loan # 1 | Cut-off Date Balance: | | $127,000,000 |
| 1 North Wacker Drive | One North Wacker | Cut-off Date LTV: | | 53.2% |
| Chicago, IL 60606 | | UW NCF DSCR: | | 2.96x |
| | | UW NOI Debt Yield: | | 8.9% |

This is not a research report and was not prepared by any Underwriter’s research department. Please see additional important information and qualifications at the end of this Term Sheet. |
T-34
| Office – CBD | Loan # 1 | Cut-off Date Balance: | | $127,000,000 |
| 1 North Wacker Drive | One North Wacker | Cut-off Date LTV: | | 53.2% |
| Chicago, IL 60606 | | UW NCF DSCR: | | 2.96x |
| | | UW NOI Debt Yield: | | 8.9% |
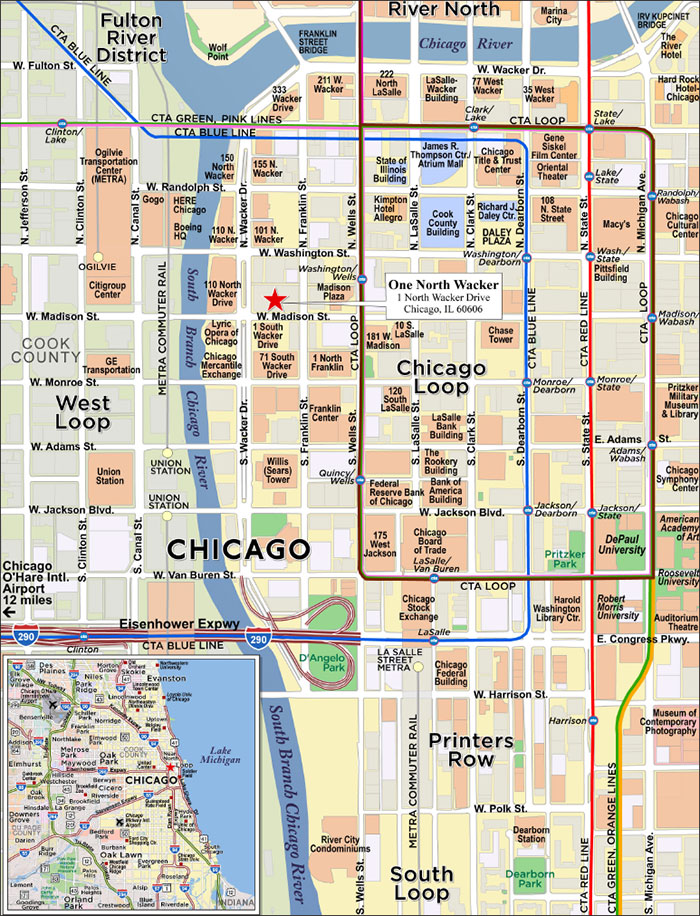
This is not a research report and was not prepared by any Underwriter’s research department. Please see additional important information and qualifications at the end of this Term Sheet. |
T-35
| Mortgage Loan No. 1 – One North Wacker |
| |
| Mortgage Loan Information | | Property Information |
| Mortgage Loan Seller: | BANA | | Single Asset/Portfolio: | Single Asset |
| Credit Assessment (Fitch/KBRA/S&P): | NR/NR/NR | | Location: | Chicago, IL 60606 |
| Original Balance(1): | $127,000,000 | | General Property Type: | Office |
| Cut-off Date Balance(1): | $127,000,000 | | Detailed Property Type: | CBD |
| % of Initial Pool Balance: | 9.95% | | Title Vesting: | Fee |
| Loan Purpose: | Refinance | | Year Built/Renovated: | 2001 / NAP |
| Borrower Sponsor: | The Irvine Company | | Size: | 1,412,035 SF |
| Guarantor: | 71 South Wacker Drive Holdings LLC | | Cut-off Date Balance PSF(1): | $250 |
| Mortgage Rate: | 2.7185% | | Maturity Date Balance PSF(1): | $250 |
| Note Date: | 9/10/2021 | | Property Manager: | Hines Interests Limited Partnership |
| First Payment Date: | 11/1/2021 | | | |
| Maturity Date: | 10/1/2031 | | | |
| Original Term to Maturity: | 120 months | | | |
| Original Amortization Term: | 0 months | | Underwriting and Financial Information(5) |
| IO Period: | 120 months | | UW NOI: | $31,276,370 |
| Seasoning: | 0 months | | UW NOI Debt Yield(1): | 8.9% |
| Prepayment Provisions(2): | L(24),DorYM1(91),O(5) | | UW NOI Debt Yield at Maturity(1): | 8.9% |
| Lockbox/Cash Mgmt Status: | Hard/Springing | | UW NCF DSCR(1): | 2.96x |
| Additional Debt Type(1): | Pari Passu | | Most Recent NOI: | $30,737,245 (7/31/2021) |
| Additional Debt Balance(1): | $226,000,000 | | 2nd Most Recent NOI: | $36,156,466 (6/30/2020) |
| Future Debt Permitted (Type): | No (NAP) | | 3rd Most Recent NOI: | $32,913,965 (6/30/2019) |
| Reserves(3) | | Most Recent Occupancy: | 81.3% (9/1/2021) |
| Type | Initial | Monthly | Cap | | 2nd Most Recent Occupancy: | 93.0% (6/30/2020) |
| RE Taxes: | $0 | Springing | NAP | | 3rd Most Recent Occupancy: | 89.2% (6/28/2019) |
| Insurance: | $0 | Springing | NAP | | Appraised Value (as of): | $664,000,000 (8/10/2021) |
| Replacement Reserve: | $0 | Springing | $299,964 | | Appraised Value PSF: | $470 |
| TI/LC Reserve: | $0 | Springing | $5,600,000 | | Cut-off Date LTV Ratio(1): | 53.2% |
| Other Reserve(4): | $6,501,426 | $0 | NAP | | Maturity Date LTV Ratio(1): | 53.2% |
| | | | | | | | |
| Sources and Uses |
| Sources | Proceeds | % of Total | | Uses | Proceeds | % of Total |
| Whole Loan Amount(1): | $353,000,000 | 98.1% | | Loan Payoff: | $352,858,833 | 98.0% |
| Borrower Equity: | $6,961,961 | 1.9% | | Reserves: | $6,501,426 | 1.8% |
| | | | | Closing Costs: | $601,702 | 0.2% |
| Total Sources: | $359,961,961 | 100.0% | | Total Uses: | $359,961,961 | 100.0% |
| (1) | The One North Wacker Mortgage Loan (as defined below) is part of the One North Wacker Whole Loan (as defined below), which is evidenced by seven pari passu promissory notes with an aggregate principal balance of $353,000,000. The Cut-off Date Balance PSF, Maturity Date Balance PSF, UW NOI Debt Yield, UW NOI Debt Yield at Maturity, UW NCF DSCR, Cut-off Date LTV Ratio and Maturity Date LTV Ratio numbers presented above are based on the aggregate principal balance of the promissory notes comprising the One North Wacker Whole Loan. |
| (2) | Defeasance of the One North Wacker Whole Loan is permitted at any time after the earlier to occur of (a) the end of the two-year period commencing on the closing date of the securitization of the last portion of the One North Wacker Whole Loan to be securitized and (b) November 1, 2024. The assumed prepayment lockout period of 24 payments is based on the closing date of this transaction in October 2021. |
| (3) | See “Escrows and Reserves” below for further discussion of reserve information. The borrower is permitted to provide a letter of credit or guaranty in lieu of certain monthly reserves. |
| (4) | Other Reserve consists of a free rent reserve ($1,915,596) and a landlord obligations reserve ($4,585,830). |
| (5) | The novel coronavirus pandemic is an evolving situation and could impact the One North Wacker Whole Loan more severely than assumed in the underwriting of the One North Wacker Whole Loan and could adversely affect the NOI, NCF and occupancy information, as well as the appraised value and the DSCR, LTV and Debt Yield metrics presented above and herein. See "Risk Factors-—Risks Related to Market Conditions and Other External Factors—The Coronavirus Pandemic Has Adversely Affected the Global Economy and Will Likely Adversely Affect the Performance of the Mortgage Loans" in the prospectus. |
The Mortgage Loan. The largest mortgage loan (the “One North Wacker Mortgage Loan”) is part of a whole loan (the “One North Wacker Whole Loan”) that is evidenced by seven pari passu promissory notes in the aggregate original principal amount of $353,000,000 and secured by a first priority fee mortgage encumbering a 1,412,035 SF Class A office tower located in Chicago, Illinois (the “One North Wacker Property”). The One North Wacker Mortgage Loan is evidenced by the controlling Note A-1 and the non-controlling Note A-7, with an aggregate original principal amount of $127,000,000. The remaining promissory notes comprising the One North Wacker Whole Loan are summarized in the below table. The One North Wacker Whole Loan will be serviced pursuant to the pooling and servicing agreement for the BANK 2021-BNK36 securitization. See “Description of the Mortgage Pool—The Whole Loans—The Serviced Pari Passu Whole Loans” and “Pooling and Servicing Agreement” in the prospectus.
This is not a research report and was not prepared by any Underwriter’s research department. Please see additional important information and qualifications at the end of this Term Sheet. |
T-36
| Office – CBD | Loan # 1 | Cut-off Date Balance: | | $127,000,000 |
| 1 North Wacker Drive | One North Wacker | Cut-off Date LTV: | | 53.2% |
| Chicago, IL 60606 | | UW NCF DSCR: | | 2.96x |
| | | UW NOI Debt Yield: | | 8.9% |
| One North Wacker Whole Loan Summary |
Note | Original Balance | Cut-off Date Balance | Note Holder | Controlling Piece |
| A-1 | $122,000,000 | $122,000,000 | BANK 2021-BNK36 | Yes |
| A-2 | $95,000,000 | $95,000,000 | Bank of America, N.A. | No |
| A-3 | $80,000,000 | $80,000,000 | Bank of America, N.A. | No |
| A-4 | $20,500,000 | $20,500,000 | Bank of America, N.A. | No |
| A-5 | $15,500,000 | $15,500,000 | Bank of America, N.A. | No |
| A-6 | $15,000,000 | $15,000,000 | Bank of America, N.A. | No |
| A-7 | $5,000,000 | $5,000,000 | BANK 2021-BNK36 | No |
| Total | $353,000,000 | $353,000,000 | | |
The Borrower and the Borrower Sponsor. The borrower is One North Wacker LLC, a Delaware limited liability company and single purpose entity with two independent directors.
The borrower sponsor is The Irvine Company, a private real estate developer, operator and investor headquartered in Newport Beach, California. The Irvine Company acquired the One North Wacker Property in two transactions in 2011 and 2015 for a purchase price of approximately $539 million and, after capital expenditures and leasing costs, maintains a current cost basis of $805 million. The non-recourse carveout guarantor is 71 South Wacker Drive Holdings LLC, an affiliate of the borrower sponsor.
The Property. The One North Wacker Property is a 51-story, 1,412,035 SF, Class A, LEED Platinum certified office tower located in Chicago, Illinois. Originally constructed in 2001, the One North Wacker Property features a three story glass atrium lobby, column-free floor plates with floor-to-ceiling glass windows, a landscaped plaza, an on-site sundry shop, a 9,597 SF conference center, a private fitness center and the One North Kitchen restaurant and bar. The One North Wacker Property also includes a two-story, 210-space below grade parking garage.
As of September 1, 2021, the One North Wacker Property was 81.3% leased to a granular rent roll of 48 tenants from a wide range of industries. The One North Wacker Property’s two largest tenants by NRA, Pricewaterhouse Coopers, LLP and UBS Americas Inc, are established, multinational corporations that have occupied the One North Wacker Property since its original construction in 2001. None of the remaining tenants contribute more than 9.5% to the underwritten base rent at the One North Wacker Property. Between 2013 and 2021, the property has maintained an average occupancy of 90%.
Major Tenants.
Pricewaterhouse Coopers, LLP (316,840 SF, 22.4% of NRA, 27.9% of underwritten base rent). Pricewaterhouse Coopers, LLP (“PWC”) is one of the world’s largest accounting firms and one of the largest privately held firms in the United States. PWC employs over 284,000 employees in 155 countries. PWC’s professional services include audit, tax and consulting in various industries. PWC occupies 316,840 SF at the One North Wacker Property on a lease that expires in October 2028, with three, five-year renewal options. PWC has the option to terminate its lease effective October 31, 2025, if notice is given by April 30, 2024. PWC is reportedly currently seeking to sublease 70,082 SF (22.1% of its space). The One North Wacker Whole Loan is structured with a cash sweep period that will commence upon the earlier of (i) PWC’s failure to exercise its extension option for all of its leased space prior to the earlier of (x) the date that PWC is required to exercise such option under its lease and (y) the date that is 15 months prior to the then applicable expiration date of its lease; and (ii) PWC providing formal written notice that it relinquishes its lease renewal option with respect to all or a portion of its leased space. See “Lockbox and Cash Management” below.
UBS Americas Inc (138,445 SF, 9.8% of NRA, 14.9% of underwritten base rent). Founded in 1862 and headquartered in Zurich, Switzerland, UBS Group AG is an international financial services company offering a full range of wealth management and investment services. UBS Americas Inc, a subsidiary of UBS Group AG, has been a tenant at the One North Wacker Property since 2001 and currently occupies 138,445 SF. UBS Americas Inc recently renewed its lease through September 2032, which renewal will be effective October 1, 2022, and has two, five-year renewal options remaining. In connection with the ten-year renewal, UBS Americas Inc committed to a 2.5% annual rent increase and received $40.00 PSF in tenant improvement allowances from the landlord and five months of abated rent from October 1, 2022 through February 28, 2023.
Barnes & Thornburg LLP (95,475 SF, 6.8% of NRA, 9.5% of underwritten base rent). Barnes & Thornburg LLP is a national, full-service law firm that employs approximately 600 attorneys and operates 19 offices in the continental United States. Barnes & Thornburg LLP occupies 95,475 SF at the One North Wacker Property on a lease that expires in February 2030, with two, five-year renewal options. Barnes & Thornburg currently subleases 27,747 SF to Baker & Hostetler through April 30, 2024.
This is not a research report and was not prepared by any Underwriter’s research department. Please see additional important information and qualifications at the end of this Term Sheet. |
T-37
| Office – CBD | Loan # 1 | Cut-off Date Balance: | | $127,000,000 |
| 1 North Wacker Drive | One North Wacker | Cut-off Date LTV: | | 53.2% |
| Chicago, IL 60606 | | UW NCF DSCR: | | 2.96x |
| | | UW NOI Debt Yield: | | 8.9% |
The following table presents certain information relating to the tenancy at the One North Wacker Property:
| Tenant Summary(1) |
| Tenant Name | Credit Rating (Fitch/Moody's/S&P)(2) | Tenant SF | Approx. % of SF | Annual UW Rent | % of Total Annual UW Rent | Annual UW Rent PSF | Lease Exp. | Renewal Options | Term. Option (Y/N) |
| Pricewaterhouse Coopers, LLP | NR/NR/NR | 316,840 | 22.4% | $10,354,159 | 27.9% | $32.68 | 10/31/2028 | 3 x 5 yr | Y(3) |
| UBS Americas Inc(4) | NR/Aa3/A+ | 138,445 | 9.8% | $5,543,627 | 14.9% | $40.04 | 9/30/2032 | 2 x 5 yr | N |
| Barnes & Thornburg LLP(5) | NR/NR/NR | 95,475 | 6.8% | $3,528,008 | 9.5% | $36.95 | 2/28/2030 | 2 x 5 yr | N |
| Fitch Group, Inc. | NR/NR/NR | 65,392 | 4.6% | $1,923,828 | 5.2% | $29.42 | 12/31/2031 | 2 x 5 yr | Y(6) |
| The McQuade Financial Group(7) | NR/NR/NR | 50,342 | 3.6% | $2,043,885 | 5.5% | $40.60 | 8/31/2027 | 2 x 5 yr | N |
| Adams Street Partners, LLC | NR/NR/NR | 40,444 | 2.9% | $1,250,124 | 3.4% | $30.91 | 9/30/2030 | 2 x 5 yr | Y(8) |
| B.C. Ziegler and Company | NR/NR/NR | 32,445 | 2.3% | $966,960 | 2.6% | $29.80 | 7/31/2030 | 2 x 5 yr | Y(9) |
| Stifel, Nicolaus & Company | BBB/NR/BBB- | 29,477 | 2.1% | $840,095 | 2.3% | $28.50 | 6/30/2034 | NAP | Y(10) |
| The Irvine Company(11) | NR/NR/NR | 25,116 | 1.8% | $0 | 0.0% | $0.00 | Various(4) | NAP | N |
| Wipfli | NR/NR/NR | 24,359 | 1.7% | $682,052 | 1.8% | $28.00 | 11/30/2029 | 2 x 5 yr + 1 x 10 yr | Y(12) |
| Subtotal/Wtd. Avg. | | 818,335 | 58.0% | $27,132,738 | 73.0% | $33.16 | | | |
| | | | | | | | | | |
| Other Tenants | | 330,251 | 23.4% | $10,032,085 | 27.0% | $30.38 | | | |
| Vacant Space | | 263,449 | 18.7% | $0 | 0.0% | $0.00 | | | |
| Total/Wtd. Avg. | | 1,412,035 | 100.0% | $37,164,823 | 100.0% | $32.36(13) | | | |
| (1) | Information is based on the underwritten rent roll dated September 1, 2021. |
| (2) | Certain ratings are those of the parent company whether or not the parent guarantees the lease. |
| (3) | Pricewaterhouse Coopers, LLP has the option to terminate its lease effective October 31, 2025, if notice is given by April 30, 2024. |
| (4) | In connection with its lease renewal, UBS Americas Inc received five months of abated rent from October 1, 2022 through February 28, 2023. |
| (5) | Barnes & Thornburg LLP currently subleases 27,747 SF to Baker & Hostetler through April 30, 2024. |
| (6) | Fitch Group, Inc. has the option to terminate its lease effective December 31, 2029, with 12 months’ notice and payment of a termination fee equal to $3,734,090. |
| (7) | The McQuade Financial Group currently subleases 3,456 SF to Waitzman Voigt, D’Aquila through August 31, 2027. |
| (8) | Adams Street Partners, LLC has the option to terminate its lease effective September 30, 2027, with 12 months’ notice and payment of a termination fee equal to $1,929,294. |
| (9) | B.C. Ziegler and Company has the option to terminate its lease effective July 31, 2025, with 12 months’ notice and payment of a termination fee equal to $3,618,303. |
| (10) | Stifel, Nicolaus & Company has the option to terminate its lease effective December 31, 2030, with 12 months’ notice and payment of a termination fee equal to $2,240,918. |
| (11) | The Irvine Company is sponsor affiliated. The Irvine Company occupies 17,379 SF expiring on July 31, 2024 and 7,737 SF expiring on October 31, 2026. |
| (12) | Wipfli has the option to terminate its lease effective May 31, 2026, with 12 months’ notice and payment of a termination fee equal to $2,032,058. |
| (13) | Wtd. Avg. Annual UW Rent PSF excludes vacant space. |
The following table presents certain information relating to the lease rollover schedule at the One North Wacker Property:
| Lease Rollover Schedule(1)(2) |
| Year | # of Leases Rolling | SF Rolling | UW Rent PSF Rolling | Approx. % of Total SF Rolling | Approx. Cumulative % of SF Rolling | Total UW Rent Rolling | Approx. % of Total Rent Rolling | Approx. Cumulative % of Total Rent Rolling |
| MTM / 2021 | 2 | 2,528 | $34.80 | 0.2% | 0.2% | $87,974 | 0.2% | 0.2% |
| 2022 | 6 | 33,154 | $29.63 | 2.3% | 2.5% | $982,472 | 2.6% | 2.9% |
| 2023 | 2 | 8,964 | $29.54 | 0.6% | 3.2% | $264,779 | 0.7% | 3.6% |
| 2024 | 9 | 66,083 | $24.53 | 4.7% | 7.8% | $1,621,042 | 4.4% | 8.0% |
| 2025 | 7 | 47,400 | $30.42 | 3.4% | 11.2% | $1,441,822 | 3.9% | 11.8% |
| 2026 | 5 | 56,331 | $27.31 | 4.0% | 15.2% | $1,538,595 | 4.1% | 16.0% |
| 2027 | 6 | 80,313 | $38.72 | 5.7% | 20.9% | $3,109,650 | 8.4% | 24.3% |
| 2028 | 7 | 363,072 | $32.55 | 25.7% | 46.6% | $11,817,770 | 31.8% | 56.1% |
| 2029 | 2 | 32,112 | $29.74 | 2.3% | 48.9% | $954,926 | 2.6% | 58.7% |
| 2030 | 8 | 203,448 | $34.59 | 14.4% | 63.3% | $7,038,243 | 18.9% | 77.6% |
| 2031 | 1 | 65,392 | $29.42 | 4.6% | 67.9% | $1,923,828 | 5.2% | 82.8% |
| 2032 & Beyond | 4 | 189,789 | $33.64 | 13.4% | 81.3% | $6,383,722 | 17.2% | 100.0% |
| Vacant | 0 | 263,449 | $0.00 | 18.7% | 100.0% | $0 | 0.0% | 100.0% |
| Total/Wtd. Avg. | 59 | 1,412,035 | $32.36(3) | 100.0% | | $37,164,823 | 100.0% | |
| (1) | Information is based on the underwritten rent roll dated September 1, 2021. |
| (2) | Certain tenants may have lease termination options that are exercisable prior to the originally stated expiration date of the related lease and are not considered in the rollover schedule. |
| (3) | Wtd. Avg. UW Rent PSF Rolling excludes vacant space. |
This is not a research report and was not prepared by any Underwriter’s research department. Please see additional important information and qualifications at the end of this Term Sheet. |
T-38
| Office – CBD | Loan # 1 | Cut-off Date Balance: | | $127,000,000 |
| 1 North Wacker Drive | One North Wacker | Cut-off Date LTV: | | 53.2% |
| Chicago, IL 60606 | | UW NCF DSCR: | | 2.96x |
| | | UW NOI Debt Yield: | | 8.9% |
COVID-19 Update. The first debt service payment on the One North Wacker Whole Loan is due in November 2021 and, as of September 15, 2021, the One North Wacker Whole Loan is not subject to any forbearance, modification or debt service relief request. As of September 9, 2021, the borrower sponsor has reported that 100.0% of the expected July and August 2021 rent payments were received. The borrower sponsor granted COVID-19 related rent relief to two food-service tenants, which rent relief is no longer outstanding other than approximately $10,260 of abated rent due to Munchies as of the closing date of the One North Wacker Whole Loan.
The Market. The One North Wacker Property is situated at the northeast corner of Wacker Drive and Madison Street along the west side of North Franklin Street in the West Loop submarket of Chicago. The site is within walking distance of several public transportation options, including Chicago Transit Authority bus and “L” systems, Union Station and Ogilvie Transportation Center. Additionally, two interstates, I-90 and I-290, are accessible in close proximity to the One North Wacker Property.
The One North Wacker Property is located in the West Loop office submarket, within the Downtown Chicago office market. At the end of the second quarter of 2021, the West Loop office submarket was 84.9% Class A space, with inventory of 52,058 SF, a vacancy rate of 15.2% and average asking rent of $44.69 PSF. From 2016 to 2020, the Class A submarket added 6,332 SF, vacancy ranged from 11.75% to 13.63% and asking rent increased by 17.0%.
The One North Wacker Property benefits from the area’s population density. The estimated 2021 population within a 1-, 3- and 5-mile radius of the One North Wacker Property was 80,323, 375,627 and 850,278, respectively. The estimated 2021 average household income within the same radii was $165,806, $145,096 and $124,630, respectively.
The following table presents the comparable office properties to the One North Wacker Property:
| Comparable Property Summary |
Property Name Address | Year Built | Rentable Area (SF) | Occupancy | Asking Rent | Major Tenants |
One North Wacker 1 North Wacker Drive | 2001 | 1,412,035(1) | 81.3%(1) | $32.36(1) | Pricewaterhouse Coopers, LLP, UBS Americas Inc, Barnes & Thornburg LLP, Fitch Group, Inc., The McQuade Financial Group |
Bank of America Tower 110 North Wacker Drive | 2020 | 1,546,909 | 76.4% | - | Bank of America, Lincoln International, Regus 18, Perkins Coie |
River Point 444 West Lake Street | 2016 | 1,081,702 | 99.4% | $46.05 | McDermott Will and Emery, DLA Piper, LLP, Mead Johnson, Harrison Street Capital |
| 300 North LaSalle Street | 2009 | 1,302,901 | 97.7% | $40.04 | Aviva USA Corporation, Hub International, PSP Capital Partners |
Mesirow Financial Building 353 North Clark Street | 2009 | 1,184,255 | 91.6% | - | Intercontinental Exchange, Inc., Insight Global LLC, American Board of Medical Specialties |
| 155 North Wacker Drive | 2009 | 1,152,953 | 92.3% | $38.34 | The Savo Group Ltd, Broker’s Risk Placement Service, Ogletree,Deakins,Nash |
Hyatt Center 71 South Wacker Drive | 2005 | 1,687,710 | 95.9% | $30.16 | Mayer Brown, LLP, IBM Corporation, iManage, Towers Watson, Milliman |
One Eleven South Wacker 111 South Wacker Drive | 2004 | 1,213,322 | 95% | $28.79 | Houlihan Lokey, Harris Associates, RBC Wealth Management |
Source: Appraisal
| (1) | Information is based on the underwritten rent roll dated September 1, 2021. |
The following table presents certain information relating to the appraisal’s market rent conclusion for the One North Wacker Property:
| Market Rent Summary |
| | Market Rent PSF | Lease Term (Mos.) | Rent Increase Projection | Lease Type |
| Low-Rise Office <10k SF | $26.00 | 60 | 2.5% per annum | NNN |
| Low-Rise Office >10k SF | $26.00 | 120 | 2.5% per annum | NNN |
| Mid-Rise Office <10k SF | $27.00 | 84 | 2.5% per annum | NNN |
| Mid-Rise Office >10k SF | $27.00 | 120 | 2.5% per annum | NNN |
| High-Rise Office <10k SF | $33.00 | 84 | 2.5% per annum | NNN |
| High-Rise Office >10k SF | $33.00 | 120 | 2.5% per annum | NNN |
| Retail | $50.00 | 120 | None | NNN |
This is not a research report and was not prepared by any Underwriter’s research department. Please see additional important information and qualifications at the end of this Term Sheet. |
T-39
| Office – CBD | Loan # 1 | Cut-off Date Balance: | | $127,000,000 |
| 1 North Wacker Drive | One North Wacker | Cut-off Date LTV: | | 53.2% |
| Chicago, IL 60606 | | UW NCF DSCR: | | 2.96x |
| | | UW NOI Debt Yield: | | 8.9% |
Operating History and Underwritten Net Cash Flow. The following table presents certain information relating to the historical operating performance and Underwritten Net Cash Flow at the One North Wacker Property:
| Cash Flow Analysis |
| | 2018(1) | 2019(1) | 2020(1) | TTM 7/31/2021 | UW | UW PSF |
| Gross Potential Rent(2) | $36,368,825 | $37,210,886 | $39,255,102 | $37,501,013 | $44,602,883 | $31.59 |
| Reimbursements | $27,554,940 | $26,297,908 | $28,082,091 | $28,380,399 | $39,387,779 | $27.89 |
| Parking Income | $885,253 | $854,306 | $687,047 | $262,917 | $450,597 | $0.32 |
| Other Income | $1,415,339 | $1,189,211 | $1,029,114 | $598,902 | $1,110,080 | $0.79 |
| (Vacancy & Concessions) | $0 | $0 | $0 | $0 | ($14,779,360) | (10.47) |
| Effective Gross Income | $66,224,357 | $65,552,311 | $69,053,354 | $66,743,231 | $70,771,979 | $50.12 |
| | | | | | | |
| Real Estate Taxes | $20,814,040 | $20,212,039 | $20,586,725 | $24,744,256 | $25,436,918 | $18.01 |
| Insurance | $473,195 | $494,509 | $502,621 | $555,747 | $698,712 | $0.49 |
| Other Operating Expenses | $12,059,082 | $11,931,798 | $11,807,543 | $10,705,982 | $13,359,979 | $9.46 |
| Total Operating Expenses | $33,346,317 | $32,638,346 | $32,896,888 | $36,005,986 | $39,495,609 | $27.97 |
| | | | | | | |
| Net Operating Income | $32,878,040 | $32,913,965 | $36,156,466 | $30,737,245 | $31,276,370 | $22.15 |
| Replacement Reserves | $0 | $0 | $0 | $0 | $299,964 | $0.21 |
| TI/LC | $0 | $0 | $0 | $0 | $2,142,602 | $1.52 |
| Net Cash Flow | $32,878,040 | $32,913,965 | $36,156,466 | $30,737,245 | $28,833,804 | $20.42 |
| | | | | | | |
| Occupancy % | 83.0% | 89.2%(3) | 93.0% | 81.3%(4) | 82.4%(5) | |
| NOI DSCR(6) | 3.38x | 3.38x | 3.72x | 3.16x | 3.21x | |
| NCF DSCR(6) | 3.38x | 3.38x | 3.72x | 3.16x | 2.96x | |
| NOI Debt Yield(6) | 9.3% | 9.3% | 10.2% | 8.7% | 8.9% | |
| NCF Debt Yield(6) | 9.3% | 9.3% | 10.2% | 8.7% | 8.2% | |
| (1) | Represents trailing 12 months as of June 30 for each respective year. |
| (2) | UW Gross Potential Rent includes contractual rent steps through October 1, 2022 ($751,146) and straight line averaged rent for investment grade rated tenants ($542,907). |
| (3) | Represents occupancy as of June 28, 2019. |
| (4) | Represents occupancy as of September 1, 2021. |
| (5) | Represents economic occupancy. |
| (6) | Debt service coverage ratios and debt yields are based on the One North Wacker Whole Loan. |
Escrows and Reserves.
Real Estate Taxes – The borrower is required to deposit monthly to a real estate tax reserve 1/12 of the annual estimated real estate taxes (i) during a Cash Trap Event Period, (ii) during a DSCR Trigger Event Period, or (iii) upon the borrower’s failure to provide the lender evidence of timely payment of taxes. Provided no event of default is continuing, in lieu of monthly deposits to the real estate tax reserve, the borrower is permitted to provide a letter of credit or a guaranty for such amounts from a borrower affiliate approved by the lender.
Insurance – The borrower is required to deposit monthly 1/12 of the annual estimated insurance premiums to the insurance reserve (i) during a Cash Trap Event Period, (ii) during a DSCR Trigger Event Period, or (iii) upon the borrower’s failure to provide the lender evidence of the renewal of a blanket policy to the extent the borrower maintains insurance pursuant to a blanket policy. Provided no event of default is continuing, in lieu of monthly deposits to the insurance reserve, the borrower is permitted to provide a letter of credit or a guaranty for such amounts from a borrower affiliate approved by the lender.
Replacement Reserve – During either a Cash Trap Event Period or a DSCR Trigger Event Period, the borrower is required to deposit monthly $24,997 to a reserve for replacements to the One North Wacker Property, subject to a cap of $299,964. Provided no event of default is continuing, in lieu of monthly deposits to the replacement reserve, the borrower is permitted to provide a letter of credit or a guaranty for such amounts from a borrower affiliate approved by the lender.
TI/LC Reserve – During a DSCR Trigger Event Period, the borrower is required to deposit monthly $178,550 for future tenant improvements and leasing commissions, subject to a cap of $5,600,000. Provided no event of default is continuing, in lieu of monthly deposits to the TI/LC reserve, the borrower is permitted to provide a letter of credit or a guaranty for such amounts from a borrower affiliate approved by the lender.
Free Rent Reserve – At loan origination, the borrower deposited $1,915,596 into a free rent reserve for outstanding obligations relating to The Alexander Group, Inc through April 1, 2022 and to Stifel, Nicolaus & Company through October 1, 2022. Funds in the free rent reserve account are required to be disbursed monthly as rent becomes due under each applicable lease.
Landlord Obligations Reserve – At loan origination, the borrower deposited $4,585,830 into a landlord obligation reserve for outstanding obligations to The Alexander Group, Inc, Stifel, Nicolaus & Company, Boyd Watterson Asset Management LLC and The Jordan Company, L.P. Upon request from the borrower, the lender will be required to disburse funds to reimburse the borrower for costs and expenses incurred in the performance of certain unfunded landlord obligations set forth in the One North Wacker Whole Loan documents.
This is not a research report and was not prepared by any Underwriter’s research department. Please see additional important information and qualifications at the end of this Term Sheet. |
T-40
| Office – CBD | Loan # 1 | Cut-off Date Balance: | | $127,000,000 |
| 1 North Wacker Drive | One North Wacker | Cut-off Date LTV: | | 53.2% |
| Chicago, IL 60606 | | UW NCF DSCR: | | 2.96x |
| | | UW NOI Debt Yield: | | 8.9% |
A “DSCR Trigger Event Period” will commence upon the date, tested quarterly, that the amortizing debt service coverage ratio is less than 1.15x and will expire on the date, tested quarterly, that the amortizing debt service coverage ratio is equal to or greater than 1.15x for two consecutive calendar quarters.
Lockbox and Cash Management. The One North Wacker Whole Loan is structured with a hard lockbox and springing cash management. All rents from the One North Wacker Property are required to be deposited directly to the lockbox account and, so long as a Cash Trap Event Period is not continuing, funds in the lockbox account will be transferred to the borrower’s operating account. During a Lockbox Event Period, the borrower will not have access to the funds in the lockbox account and such funds will be transferred to the lender-controlled cash management account and disbursed according to the One North Wacker Whole Loan documents. During a Lockbox Event Period, all excess cash is required to be held by the lender as additional security for the One North Wacker Whole Loan; provided that excess cash will be disbursed at the direction of the borrower if a PWC Excess Cash Flow Sweep Stop is in effect.
A “Cash Trap Event Period” will (a) commence upon (i) the occurrence of an event of default, (ii) PWC failing to exercise its extension option with respect to all of the PWC space prior to the earlier of (x) the date by which PWC is required to exercise such option pursuant to the lease and (y) 15 months prior to the then applicable lease expiration date, (iii) PWC providing notice that it is relinquishing its option to renew its lease with respect to all or a portion of the PWC space, (iv) PWC defaulting in the payment of rent for more than 45 days, or (v) PWC becoming subject of any proceedings as a debtor and (b) terminate when (i) with respect to clause (a)(i), the lender accepts a cure of such event of default, (ii) with respect to clause (a)(ii), PWC exercises its renewal option or one or more replacement tenants lease its space, (iii) with respect to clause (a)(iii), one or more replacement tenants lease PWC’s space, (iv) with respect to clause (a)(iv), PWC has cured such default or one or more tenants lease its space, (v) with respect to clause (a)(v), PWC is no longer subject to any proceedings as a debtor or one or more tenants lease its space.
A “PWC Excess Cash Flow Sweep Stop” will be in effect if, as of any monthly payment date during a Cash Trap Event Period, (a) no event of default exists and (b) total undisbursed funds then on deposit in the excess cash flow account on such monthly payment date are not less than an amount equal to the product of (x) the applicable square footage impacted by PWC’s non-renewal, default or bankruptcy multiplied by (y) $30.
Additional Secured Indebtedness (not including trade debts). None.
Mezzanine Loan and Preferred Equity. None.
Release of Property. None.
Letter of Credit. None.
Right of First Offer/Right of First Refusal. None.
Ground Lease. None.
Terrorism Insurance. The borrower is required to obtain and maintain property insurance and business interruption insurance for 24 months plus a 365-day extended period of indemnity. Such insurance is required to cover perils of terrorism and acts of terrorism; provided that the borrower is permitted to maintain terrorism coverage with a licensed captive insurance company that is affiliated with the borrower sponsor if certain conditions set forth in the related Whole Loan documents are satisfied, and if the Terrorism Risk Insurance Program Reauthorization Act of 2019 is not in effect, the borrowers will only be required to pay for terrorism insurance through such captive insurance company a maximum of two times the annual insurance premiums payable for the One North Wacker Property at the time with respect to the property and business interruption policies (excluding the terrorism, named storm and earthquake components of such premiums). See “Risk Factors—Risks Relating to the Mortgage Loans—Terrorism Insurance May Not Be Available for All Mortgaged Properties” in the prospectus.
This is not a research report and was not prepared by any Underwriter’s research department. Please see additional important information and qualifications at the end of this Term Sheet. |
T-41
| Retail – Anchored | Loan # 2 | Cut-off Date Balance: | | $74,888,072 |
| 5000 South Arizona Mills Circle | Arizona Mills | Cut-off Date LTV: | | 32.4% |
| Tempe, AZ 85282 | | UW NCF DSCR: | | 4.27x |
| | | UW NOI Debt Yield: | | 25.6% |

This is not a research report and was not prepared by any Underwriter’s research department. Please see additional important information and qualifications at the end of this Term Sheet. |
T-42
| Retail – Anchored | Loan # 2 | Cut-off Date Balance: | | $74,888,072 |
| 5000 South Arizona Mills Circle | Arizona Mills | Cut-off Date LTV: | | 32.4% |
| Tempe, AZ 85282 | | UW NCF DSCR: | | 4.27x |
| | | UW NOI Debt Yield: | | 25.6% |
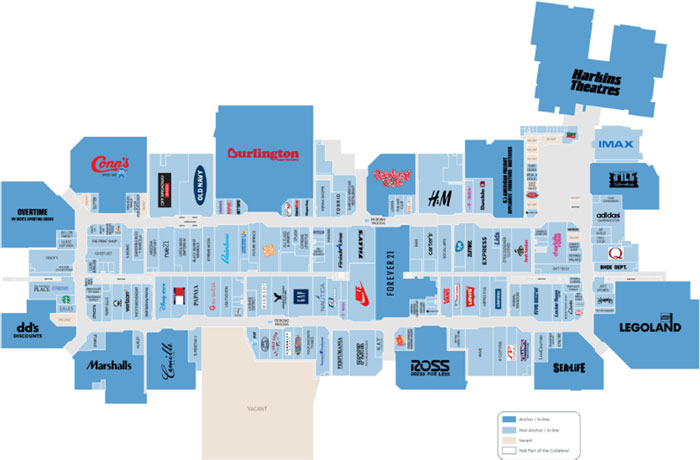
This is not a research report and was not prepared by any Underwriter’s research department. Please see additional important information and qualifications at the end of this Term Sheet. |
T-43
| Retail – Anchored | Loan # 2 | Cut-off Date Balance: | | $74,888,072 |
| 5000 South Arizona Mills Circle | Arizona Mills | Cut-off Date LTV: | | 32.4% |
| Tempe, AZ 85282 | | UW NCF DSCR: | | 4.27x |
| | | UW NOI Debt Yield: | | 25.6% |

This is not a research report and was not prepared by any Underwriter’s research department. Please see additional important information and qualifications at the end of this Term Sheet. |
T-44
| Mortgage Loan No. 2 – Arizona Mills |
| Mortgage Loan Information | | Property Information |
| Mortgage Loan Sellers: | BANA/WFB | | Single Asset/Portfolio: | Single Asset |
| Credit Assessment (Fitch/KBRA/S&P): | NR/NR/NR | | Location: | Tempe, AZ 85282 |
| Original Balance(1): | $75,000,000 | | General Property Type: | Retail |
| Cut-off Date Balance(1): | $74,888,072 | | Detailed Property Type: | Anchored |
| % of Initial Pool Balance: | 5.9% | | Title Vesting: | Fee |
| Loan Purpose: | Refinance | | Year Built/Renovated: | 1997 / NAP |
| Borrower Sponsor: | Simon Property Group, L.P. | | Size: | 1,234,669 SF |
| Guarantor: | Simon Property Group, L.P. | | Cut-off Date Balance PSF(1): | $81 |
| Mortgage Rate: | 3.8020% | | Maturity Date Balance PSF(1): | $73 |
| Note Date: | 8/31/2021 | | Property Manager: | Simon Management Associates II, LLC |
| First Payment Date: | 10/1/2021 | | | (borrower-related) |
| Maturity Date: | 9/1/2026 | | | |
| Original Term to Maturity: | 60 months | | Underwriting and Financial Information(5) |
| Original Amortization Term: | 360 months | | UW NOI: | $25,527,454 |
| IO Period: | 0 months | | UW NOI Debt Yield(1): | 25.6% |
| Seasoning: | 1 month | | UW NOI Debt Yield at Maturity(1): | 28.2% |
| Prepayment Provisions(2)(3): | L(25),D(28),O(7) | | UW NCF DSCR(1): | 4.27x |
| Lockbox/Cash Mgmt Status: | Hard/Springing | | Most Recent NOI(3): | $23,498,242 (7/31/2021) |
| Additional Debt Type(1): | Pari Passu | | 2nd Most Recent NOI: | $19,076,941 (12/31/2020) |
| Additional Debt Balance(1): | $24,962,691 | | 3rd Most Recent NOI: | $26,629,811 (12/31/2019) |
| Future Debt Permitted (Type): | No (NAP) | | Most Recent Occupancy: | 84.4% (8/23/2021) |
| Reserves(4) | | 2nd Most Recent Occupancy: | 82.6% (12/31/2020) |
| Type | Initial | Monthly | Cap | | 3rd Most Recent Occupancy: | 99.8% (12/31/2019) |
| RE Taxes: | $0 | Springing | NAP | | Appraised Value (as of): | $308,000,000 (8/23/2021) |
| Insurance: | $0 | Springing | NAP | | Appraised Value PSF: | $249 |
| Replacement Reserve: | $0 | Springing | $814,882 | | Cut-off Date LTV Ratio(1): | 32.4% |
| TI/LC Reserve: | $0 | Springing | $3,704,007 | | Maturity Date LTV Ratio(1): | 29.4% |
| | | | | | | | |
| Sources and Uses |
| Sources | Proceeds | % of Total | | Uses | Proceeds | % of Total |
| Whole Loan Amount(1): | $100,000,000 | 67.9% | | Loan Payoff: | $146,739,422 | 99.7% |
| Cash Equity Contribution: | $47,212,167 | 32.1% | | Closing Costs: | $472,745 | 0.3% |
| Total Sources: | $147,212,167 | 100.0% | | Total Uses: | $147,212,167 | 100.0% |
| (1) | The Arizona Mills Mortgage Loan (as defined below) is part of the Arizona Mills Whole Loan (as defined below), which is evidenced by five pari passu promissory notes with an aggregate principal balance of $100,000,000. The Cut-off Date Balance PSF, Maturity Date Balance PSF, UW NOI Debt Yield, UW NOI Debt Yield at Maturity, UW NCF DSCR, Cut-off Date LTV Ratio and Maturity Date LTV Ratio numbers presented above are based on the aggregate principal balance of the promissory notes comprising the Arizona Mills Whole Loan. |
| (2) | Defeasance of the Arizona Mills Whole Loan is permitted at any time after the earlier to occur of (a) the end of the two-year period commencing on the closing date of the securitization of the last portion of the Arizona Mills Whole Loan to be securitized and (b) March 1, 2025. The assumed prepayment lockout period of 25 payments is based on the closing date of this transaction in October 2021. |
| (3) | Partial defeasance is permitted in connection with a partial release in connection with Joe’s Crab Shack exercising its option to purchase its leased premises. See “Release of Property” below. |
| (4) | See “Escrows and Reserves” below for further discussion of reserve information. The borrower is permitted to provide a letter of credit or guaranty from the non-recourse carveout guarantor in lieu of certain monthly reserves. |
| (5) | The novel coronavirus pandemic is an evolving situation and could impact the Arizona Mills Whole Loan more severely than assumed in the underwriting of the Arizona Mills Whole Loan and could adversely affect the NOI, NCF and occupancy information, as well as the appraised value and the DSCR, LTV and Debt Yield metrics presented above and herein. See “Risk Factors-—Risks Related to Market Conditions and Other External Factors—The Coronavirus Pandemic Has Adversely Affected the Global Economy and Will Likely Adversely Affect the Performance of the Mortgage Loans” in the prospectus. |
The Mortgage Loan. The second largest mortgage loan (the “Arizona Mills Mortgage Loan”) is part of a whole loan (the “Arizona Mills Whole Loan”) that is evidenced by five pari passu promissory notes in the aggregate original principal amount of $100,000,000 and secured by a first priority fee mortgage encumbering a 1,234,669 SF retail development located in Tempe, Arizona (the “Arizona Mills Property”). The Arizona Mills Whole Loan was co-originated by Bank of America, N.A. and Wells Fargo Bank, National Association. The Arizona Mills Mortgage Loan, with an aggregate original principal amount of $75,000,000, is evidenced by the controlling Note A-1 and the non-controlling Note A-3-2, contributed by Bank of America, N.A., and the non-controlling Note A-2, contributed by Wells Fargo Bank, National Association. The remaining promissory notes comprising the Arizona Mills Whole Loan are summarized in the below table. The Arizona Mills Whole Loan will be serviced pursuant to the pooling and servicing agreement for the BANK 2021-BNK36 securitization trust. See “Description of the Mortgage Pool—The Whole Loans—The Serviced Pari Passu Whole Loans” and “Pooling and Servicing Agreement” in the prospectus. The Arizona Mills Whole Loan is refinancing a loan previously included in the JPMCC 2010-C2 securitization transaction.
This is not a research report and was not prepared by any Underwriter’s research department. Please see additional important information and qualifications at the end of this Term Sheet. |
T-45
| Retail – Anchored | Loan # 2 | Cut-off Date Balance: | | $74,888,072 |
| 5000 South Arizona Mills Circle | Arizona Mills | Cut-off Date LTV: | | 32.4% |
| Tempe, AZ 85282 | | UW NCF DSCR: | | 4.27x |
| | | UW NOI Debt Yield: | | 25.6% |
| Arizona Mills Whole Loan Summary |
| Note | Original Balance | Cut-off Date Balance | Note Holder | Controlling Piece |
| A-1 | $38,500,000 | | $38,442,543 | | BANK 2021-BNK36 | Yes |
| A-2 | $31,500,000 | | $31,452,990 | | BANK 2021-BNK36 | No |
| A-3-1 | $11,500,000 | | $11,482,838 | | BANA | No |
| A-3-2 | $5,000,000 | | $4,992,538 | | BANK 2021-BNK36 | No |
| A-4 | $13,500,000 | | $13,479,853 | | WFB | No |
| Total | $100,000,000 | | $99,850,762 | | | |
The Borrower and the Borrower Sponsor. The borrower is Arizona Mills Mall, LLC, a Delaware limited liability company and single purpose entity with two independent directors.
The borrower sponsor and non-recourse carveout guarantor is Simon Property Group, L.P. (“Simon”). Simon owns shopping, dining, entertainment and mixed-use destinations, with properties across North America, Europe and Asia. Simon is an S&P 100 company, publicly traded under the ticker “SPG”, and rated A3/A- by Moody’s/S&P. As of March 31, 2021, Simon owned or held an interest in 202 properties in 37 U.S. states and Puerto Rico, including 98 malls, 69 Premium Outlet branded centers, 14 Mills branded centers, 4 lifestyle centers and 17 other retail properties, along with 31 Premium Outlets and Designer Outlet branded properties primarily located in Asia, Europe and Canada. Simon also owns an 80% non-controlling interest in the Taubman Realty Group, LLC, which, as of January 2020, had an interest in 26 regional, super-regional, and outlet malls in the United States and Asia. Simon’s liability as the non-recourse carveout guarantor is limited to 20% ($20,000,000) of the original principal amount of the Arizona Mills Whole Loan, plus all reasonable out-of-pocket costs and expenses incurred in the enforcement of the guaranty or preservation of the lender’s rights under the guaranty.
The Arizona Mills Property was originally developed in 1997 by a partnership with the Taubman Group and the Mills Corporation. Simon acquired The Mills Corporation in 2007, increased its ownership interest in the Arizona Mills Property in 2012 and, in 2014, became the 100% owner. Simon maintains a cost basis of approximately $361 million in the Arizona Mills Property including approximately $20.9 million spent in modernizing the interior and exterior and re-tenanting.
The Property. The Arizona Mills Property is a 1,234,669 SF indoor outlet, value-retail and entertainment destination located in Tempe, Arizona. The Arizona Mills Property attracts over 12 million visitors a year with its unique array of entertainment concepts and value-oriented shopping options. The Arizona Mills Property is anchored by Burlington, Harkins Theatres/IMAX and LEGOLAND Discovery Center. Other major tenants include: Conn’s, Tilt, Overtime by Dick’s Sporting Goods, Marshalls, Forever 21 and Ross Dress for Less. The Arizona Mills Property includes 27 sit-down dining, food court and grab-and-go options, including Rainforest Café, Garcia’s Mexican Restaurant, Joe’s Crab Shack, Rocky Mountain Chocolate Factory, Auntie Annie, Johnny Rockets, Pretzel Wetzels, Starbucks Coffee and Dairy Queen. The Arizona Mills Property underwent an approximately $10 million redevelopment in 2016 and 2017 to create a family-friendly entertainment wing with several unique-to-Arizona tenants, including LEGOLAND Discovery Center, SEA LIFE Arizona Aquarium, Rainforest Cafe and Tilt.
The Arizona Mills Property has consistently generated strong sales. Since business restrictions in Arizona were lifted in March 2021, sales production between March and May 2021 was 36% higher than it was for the same period in 2019. The Arizona Mills Property has a strong occupancy history, with a 10-year average occupancy of 94% (excluding temporary tenants). Including temporary tenants, the 10-year average historical occupancy is 97%. The Arizona Mills Property has a granular rent roll, with no tenant occupying more than 7.5% of total rentable square feet and no tenant contributing more than 8.0% of underwritten base rent. The top 10 tenants at the Arizona Mills Property represent only 38.1% of the rentable area and 24.6% of the gross potential rent. As of August 23, 2021, the Arizona Mills Property was 84.4% leased to 144 tenants.
The following table contains inline sales history for the Arizona Mills Property:
| Inline Sales History(1) |
| | 2018 | 2019 | 2020(2) | 7/31/2021 TTM | Avg. 3/21-7/21 |
| Sales PSF (Inline < 10,000 SF) | $350 | $361 | $312 | $423 | $512 |
| Occupancy Cost (Inline < 10,000 SF) | 14.9% | 13.6% | 16.0% | 13.0% | NAV |
| (1) | Information is as of July 31, 2021, as provided by the borrower sponsor, and only includes tenants reporting sales. |
| (2) | The Arizona Mills Property was closed between March 18 and May 16, 2020 due to COVID-19 restrictions. |
This is not a research report and was not prepared by any Underwriter’s research department. Please see additional important information and qualifications at the end of this Term Sheet. |
T-46
| Retail – Anchored | Loan # 2 | Cut-off Date Balance: | | $74,888,072 |
| 5000 South Arizona Mills Circle | Arizona Mills | Cut-off Date LTV: | | 32.4% |
| Tempe, AZ 85282 | | UW NCF DSCR: | | 4.27x |
| | | UW NOI Debt Yield: | | 25.6% |
The following table contains anchor and major tenant sales history for the Arizona Mills Property:
| Major Tenant Sales History(1) |
| Tenant | SF | 2018 Sales PSF | 2019 Sales PSF | 2020 Sales PSF(2) | 7/31/2021 TTM Sales PSF |
| Burlington | 80,426 | $194 | $205 | $151 | $223 |
| Ross Dress For Less | 29,734 | $434 | $417 | $302 | $349 |
| Nike Clearance Store | 13,222 | $908 | $870 | $692 | $950 |
| Harkins Theaters/IMAX(3) | 92,253 | $631,679 | $591,385 | $39,359 | $202,694 |
| Victoria’s Secret | 11,024 | $570 | $630 | $398 | $614 |
| Marshalls | 31,315 | $206 | $207 | $153 | $123 |
| Vans Outlet | 4,169 | $1,305 | $1,466 | $786 | $1,259 |
| Forever 21 | 30,822 | $220 | $182 | $107 | $196 |
| Foot Locker Outlet | 7,391 | $556 | $581 | $547 | $707 |
| LEGOLAND Discovery Center | 65,013 | $67 | $65 | $31 | $66 |
| H&M | 17,968 | $194 | $215 | $143 | $198 |
| Bath & Body Works | 3,282 | $1,022 | $1,110 | $983 | $1,419 |
| Levi’s/Dockers Outlet | 6,005 | $557 | $596 | $417 | $661 |
| Old Navy | 15,388 | $239 | $229 | $130 | $180 |
| Rainforest Cafe | 20,057 | $168 | $154 | $92 | $131 |
| Champs Sports | 5,097 | $562 | $586 | $600 | $812 |
| Animal Kingdom | 3,056 | $904 | $959 | $945 | $1,595 |
| Shoe Palace | 4,113 | $534 | $667 | $778 | $909 |
| Disney Store Outlet | 5,761 | $422 | $456 | $348 | $648 |
| The Finish Line | 5,371 | $356 | $412 | $439 | $578 |
| Tommy Hilfiger | 5,533 | $406 | $387 | $295 | $334 |
| Sea Life Centre | 25,590 | $85 | $80 | $40 | $95 |
| adidas Clearance | 9,652 | $0 | $185 | $319 | $423 |
| (1) | Information is as of July 31, 2021, as provided by the borrower sponsor. |
| (2) | The Arizona Mills Property was closed between March 18 and May 16, 2020 due to COVID-19 restrictions. |
| (3) | Sales for Harkins Theaters/IMAX reflect Sales per screen (18 screens). |
Major Tenants.
Harkins Theaters/IMAX (92,253 SF, 7.5% of NRA, 8.0% of underwritten base rent). Founded in 1933, Harkins Theaters is a chain of movie theaters that primarily operates in the southwestern United States. It is a private subsidiary of Harkins Enterprises, LLC and is headquartered in Scottsdale, Arizona. The company presently operates 34 theaters in five states and is the dominant movie exhibitor in Phoenix, Arizona. Harkins Theaters/IMAX has been a tenant since 2000 and operates 17 screens plus 1 IMAX screen at the Arizona Mills Property, on a lease that expires in July 2035, with three, five-year renewal options. In March 2021, the tenant completed a reported $10 million renovation and extended its lease for 15 years. Sales for Harkins Theaters/IMAX at the Arizona Mills Property were reported at $631,679 per screen, $591,385 per screen, $39,359 per screen and $202,694 for 2018, 2019, 2020 and 7/31/2021 TTM, respectively. The Harkins Theaters/IMAX lease is guaranteed by Harkins Amusement Enterprises, Inc.
Burlington (80,426 SF, 6.5% of NRA, 2.3% of underwritten base rent). Burlington Coat Factory (NYSE: BURL) is a value priced department store chain. The clothing retailer, which made its name selling coats, operates 700-plus no-frills retail stores (averaging 65,000 SF) offering off-price current, brand-name clothing in 45 states plus Puerto Rico. Although it is one of the nation’s largest coat sellers, the stores also sell a wide array of products, including children’s apparel, bath items, furniture, gifts jewelry, linens and shoes. Burlington has been a tenant at the Arizona Mills Property since November 1997. Burlington’s lease term extends through January 2023, with one, five-year renewal option. Burlington pays $6.00 PSF of base rent plus overage rent equal to 1.5% of annual sales over $15,079,875. Sales for Burlington at the Arizona Mills Property were reported at $194 PSF, $205 PSF, $151 PSF and $223 PSF for 2018, 2019, 2020 and 7/31/2021 TTM, respectively. The Burlington lease is guaranteed by Burlington Coat Factory Warehouse Corporation.
LEGOLAND Discovery Center (65,013 SF, 5.3% of NRA, 0.9% of underwritten base rent). Founded in 1999 and headquartered in Carlsbad, California, LEGOLAND Discovery Center is a chain of family amusement centers centered on the Lego construction toy system. Attractions include interactive exhibits, a Lego 4D cinema, themed rides, and creative workshops. Currently, LEGOLAND Discovery Center currently operates 20 locations in the United States. LEGOLAND Discovery Center has been a tenant at the Arizona Mills Property since April 2016 and occupies 65,013 SF on a lease that expires in December 2031, with three, five-year renewal options. Sales for LEGOLAND Discovery Center at the Arizona Mills Property were reported at $67 PSF, $65 PSF, $31 PSF and $66 PSF for 2018, 2019, 2020 and 7/31/2021 TTM, respectively.
Conn’s (40,057 SF, 3.2% of NRA, 2.6% of underwritten base rent). Conn’s operates as a specialty retailer of durable consumer goods and related services in the United States. It operates through two segments, Retail and Credit. The company’s stores offer furniture and mattresses, including furniture and related accessories for the living room, dining room, and bedroom, as well as traditional and specialty mattresses; and home appliances, such as refrigerators, freezers, washers, dryers, dishwashers, and ranges. Conn’s currently operates more than 140 retail locations in 14 states. Conn’s has been a tenant at the Arizona Mills Property since July 2013 on a lease that extends through June 2023, with four, five-year renewal options. Conn’s is not required to report sales.
This is not a research report and was not prepared by any Underwriter’s research department. Please see additional important information and qualifications at the end of this Term Sheet. |
T-47
| Retail – Anchored | Loan # 2 | Cut-off Date Balance: | | $74,888,072 |
| 5000 South Arizona Mills Circle | Arizona Mills | Cut-off Date LTV: | | 32.4% |
| Tempe, AZ 85282 | | UW NCF DSCR: | | 4.27x |
| | | UW NOI Debt Yield: | | 25.6% |
Tilt (37,348 SF, 3.0% of NRA, 0.6% of underwritten base rent). Tilt features a dynamic roster of more than 150 classic and modern interactive video and redemption prize games for all skill levels. Tilt also offers an array of American and regional cuisine at the BYO Craft Kitchen & Bar, and offers beer, wine and specialty cocktails at the Taproom at Tilt Studio Bar. Tilt has been a tenant since August 2016 on a lease that extends through August 2026 with one, five-year renewal option.
The following table presents certain information relating to the tenancy at the Arizona Mills Property:
| Tenant Summary(1) |
| | | | | | | 7/31/2021 TTM Sales | | |
| Tenant Name | Credit Rating (Fitch/Moody’s/ S&P)(2) | Tenant SF | % of Total SF | Annual UW Rent | % of Total Annual
UW Rent | Annual UW Rent PSF | Sales $ | Sales PSF / Screen | Occ Cost % | Lease Expiration | Renewal Options |
| Anchor Tenants | | | | | | | | | | | |
| Harkins Theaters/IMAX | NR/NR/NR | 92,253 | 7.5% | $1,867,201 | 8.0% | $20.24 | $3,648,494 | $202,694 | 51.4% | 7/31/2035 | 3 x 5 yr |
| Burlington(3) | NR/NR/BB+ | 80,426 | 6.5% | $525,407 | 2.3% | $6.53 | $17,936,607 | $223 | 4.4% | 1/31/2023 | 1 x 5 yr |
| LEGOLAND Discovery Center | NR/NR/CCC+ | 65,013 | 5.3% | $213,600 | 0.9% | $3.29 | $4,272,004 | $66 | 6.1% | 12/31/2031 | 3 x 5 yr |
| Conn’s | NR/B1/B | 40,057 | 3.2% | $600,855 | 2.6% | $15.00 | NAV | NAV | NAV | 6/30/2023 | 4 x 5 yr |
| Tilt | NR/NR/NR | 37,348 | 3.0% | $142,879 | 0.6% | $3.83 | NAV | NAV | NAV | 8/31/2026 | 1 x 5 yr |
| Overtime by Dick’s Sporting Goods | NR/NR/NR | 34,341 | 2.8% | $343,410 | 1.5% | $10.00 | NAV | NAV | NAV | 1/31/2026 | 3 x 5 yr |
| Marshalls | NR/A2/A | 31,315 | 2.5% | $360,123 | 1.5% | $11.50 | $3,842,977 | $123 | 12.8% | 12/31/2026 | 3 x 5 yr |
| Forever 21 | NR/NR/NR | 30,822 | 2.5% | $902,076 | 3.9% | $29.27 | $6,042,037 | $196 | 16.7% | 1/31/2023 | NAP |
| Anchor Subtotal/Wtd. Avg. | 411,575 | 33.3% | $4,955,550 | 21.3% | $12.04 | | | | | |
| | | | | | | | | | | |
| Junior Anchor Tenants | | | | | | | | | | | |
| Ross Dress For Less | NR/A2/ BBB+ | 29,734 | 2.4% | $416,276 | 1.8% | $14.00 | $10,369,347 | $349 | 5.3% | 1/31/2023 | NAP |
| American Freight | NR/NR/NR | 29,390 | 2.4% | $337,985 | 1.5% | $11.50 | NAV | NAV | NAV | 9/16/2022 | NAP |
| Sea Life Centre | NR/NR/CCC+ | 25,590 | 2.1% | $307,468 | 1.3% | $12.02 | $2,434,633 | $95 | 16.1% | 12/31/2025 | 3 x 5 yr |
| Camille La Vie | NR/NR/NR | 22,774 | 1.8% | $120,000 | 0.5% | $5.27 | NAV | NAV | NAV | 12/31/2028 | NAP |
| dd’s(4) | NR/A2/BBB+ | 21,000 | 1.7% | $255,150 | 1.1% | $12.15 | NAV | NAV | NAV | 12/31/2031 | NAP |
| Rainforest Cafe | NR/Caa2/NR | 20,057 | 1.6% | $220,000 | 0.9% | $10.97 | $2,626,274 | $131 | 8.4% | 12/31/2023 | NAP |
| Junior Anchor Subtotal/Wtd. Avg. | 148,545 | 12.0% | $1,656,879 | 7.1% | $11.15 | | | | | |
| | | | | | | | | | | |
| In-Line/Pad Tenants | | 481,456 | 39.0% | $16,628,121 | 71.5% | $34.54 | | | | | |
| Vacant Space | | 193,093 | 15.6% | $0 | 0.0% | $0.00 | | | | | |
| Total/Wtd. Avg. | | 1,234,669 | 100.0% | $23,240,551 | 100.0% | $22.31(5) | | | | | |
| (1) | Information is based on the underwritten rent roll dated August 23, 2021. |
| (2) | Certain ratings are those of the parent company whether or not the parent guarantees the lease. |
| (3) | Annual UW Rent for Burlington includes 1.5% of gross sales in excess of $15,079,875, which equates to an additional $0.53 PSF based on 7/31/2021 TTM sales. |
| (4) | dd’s has an executed lease and is expected to open for operations in December 2021. |
| (5) | Wtd. Avg. Annual UW Rent PSF excludes vacant space. |
This is not a research report and was not prepared by any Underwriter’s research department. Please see additional important information and qualifications at the end of this Term Sheet. |
T-48
| Retail – Anchored | Loan # 2 | Cut-off Date Balance: | | $74,888,072 |
| 5000 South Arizona Mills Circle | Arizona Mills | Cut-off Date LTV: | | 32.4% |
| Tempe, AZ 85282 | | UW NCF DSCR: | | 4.27x |
| | | UW NOI Debt Yield: | | 25.6% |
The following table presents certain information relating to the lease rollover schedule at the Arizona Mills Property:
| Lease Rollover Schedule(1)(2) |
| Year | # of Leases Rolling | SF Rolling | UW Rent PSF Rolling | Approx. % of Total SF Rolling | Approx. Cumulative % of SF Rolling | Total UW Rent Rolling | Approx. % of Total Rent Rolling | Approx. Cumulative % of Total Rent Rolling |
| MTM / 2021 | 13 | 24,573 | $53.34 | 2.0% | 2.0% | $1,310,608 | 5.6% | 5.6% |
| 2022 | 21 | 133,265 | $26.74 | 10.8% | 12.8% | $3,563,348 | 15.3% | 21.0% |
| 2023 | 39 | 339,471 | $22.00 | 27.5% | 40.3% | $7,467,153 | 32.1% | 53.1% |
| 2024 | 17 | 52,615 | $37.98 | 4.3% | 44.5% | $1,998,132 | 8.6% | 61.7% |
| 2025 | 16 | 76,548 | $27.60 | 6.2% | 50.7% | $2,112,523 | 9.1% | 70.8% |
| 2026 | 18 | 154,743 | $15.62 | 12.5% | 63.3% | $2,416,955 | 10.4% | 81.2% |
| 2027 | 3 | 11,130 | $23.76 | 0.9% | 64.2% | $264,491 | 1.1% | 82.3% |
| 2028 | 4 | 26,156 | $11.06 | 2.1% | 66.3% | $289,190 | 1.2% | 83.6% |
| 2029 | 2 | 12,834 | $30.56 | 1.0% | 67.3% | $392,179 | 1.7% | 85.3% |
| 2030 | 7 | 27,174 | $33.44 | 2.2% | 69.5% | $908,834 | 3.9% | 89.2% |
| 2031 | 5 | 90,813 | $7.16 | 7.4% | 76.9% | $649,937 | 2.8% | 92.0% |
| 2032 & Beyond | 4 | 92,254 | $20.24 | 7.5% | 84.4% | $1,867,201 | 8.0% | 100.0% |
| Vacant | 0 | 193,093 | $0.00 | 15.6% | 100.0% | $0 | 0.0% | 100.0% |
| Total/Wtd. Avg. | 149 | 1,234,669 | $22.31(3) | 100.0% | | $23,240,551 | 100.0% | |
| (1) | Information is based on the underwritten rent roll. |
| (2) | Certain tenants may have lease termination options that are exercisable prior to the originally stated expiration date of the related lease and are not considered in the rollover schedule. |
| (3) | Wtd. Avg. UW Rent PSF Rolling excludes vacant space. |
COVID-19 Update. The first debt service payment on the Arizona Mills Whole Loan is due in October 2021 and, as of September 15, 2021, the Arizona Mills Whole Loan is not subject to any forbearance, modification or debt service relief request. On March 19, 2020, after extensive discussions with federal, state and local officials and in recognition of the need to address the spread of COVID-19, Simon closed all of its retail properties in the United States. The Arizona Mills Property re-opened on May 18, 2020. Rent collections from April through December 2020 were approximately 94%, while collections in 2021 have been over 96% and are back at typical pre-COVID-19 levels. As of September 10, 2021, the borrower sponsor has reported that 99.0% of the expected July and August 2021 rent payments were received.
The Market. The Arizona Mills Property is located at the intersection of Interstate 10 (I-10) and US Route 60 (US 60), two of the major thoroughfares in the Phoenix metropolitan statistical area. Bordered by Mesa to the east, Scottsdale to the north and Guadalupe and Chandler to the south, the Arizona Mills Property is located approximately 4.5 miles south of Phoenix Sky Harbor Airport and approximately 3.5 miles from Arizona State University, which has an enrollment of over 70,000 students. The Arizona Mills Property is approximately 1.8 miles from the baseball spring training facility Tempe Diablo Stadium, and also benefits from an adjacent cluster of hotels including the Holiday Inn Express & Suites Tempe, Sonesta ES Suites Tempe, SpringHill Suites by Marriott Tempe at Arizona Mills Mall, Hotel Tempe/Phoenix Airport InnSuites Hotel & Suites, Sonesta Simply Suites Phoenix Tempe, Ramada by Wyndham Tempe/At Arizona Mills Mall, Tempe by the Mall Phoenix Airport Hotel and TownPlace Suites by Marriott Tempe at Arizona Mills.
The Arizona Mills Property serves the greater 2,000 square-mile Phoenix area, which includes the cities of Chandler, Glendale, Scottsdale and Tempe among others. The City of Tempe continues to grow, bringing in company headquarters such as Carvana and State Farm. The Arizona Mills Property is part of the greater Phoenix area retail market and the Tempe, AZ retail submarket. According to a third party market report, the Phoenix retail market average asking rents are $19.73 and market vacancy is 7.6%. According to a third party market report, the Tempe, AZ retail submarket average asking rents are $19.17 and vacancy is 6.5%. The Arizona Mills Property benefits from strong demographics in terms of population density. The estimated 2021 population within a 1-, 3- and 5-mile radius of the Arizona Mills Property was 19,537, 119,619 and 294,558, respectively. The estimated 2021 average household income within the same radii was $63,802, $76,801 and $85,570, respectively.
This is not a research report and was not prepared by any Underwriter’s research department. Please see additional important information and qualifications at the end of this Term Sheet. |
T-49
| Retail – Anchored | Loan # 2 | Cut-off Date Balance: | | $74,888,072 |
| 5000 South Arizona Mills Circle | Arizona Mills | Cut-off Date LTV: | | 32.4% |
| Tempe, AZ 85282 | | UW NCF DSCR: | | 4.27x |
| | | UW NOI Debt Yield: | | 25.6% |
The following table presents certain information relating to the appraisal’s market rent conclusion for the Arizona Mills Property:
| Market Rent Summary |
| Tenant Type | Market Rent (PSF) | Lease Term (Yrs) | Rental Increase Projection |
| Less than 1,000 SF | $65.00 | 7 | 3.0% |
| 1,000-1,999 SF | $55.00 | 7 | 3.0% |
| 2,000-2,999 SF | $42.50 | 7 | 3.0% |
| 3,000-4,999 SF | $35.00 | 7 | 3.0% |
| 5,000-9,999 SF | $30.00 | 7 | 3.0% |
| Over 10,000 SF | $25.00 | 7 | 3.0% |
| Jewelry | $100.00 | 7 | 3.0% |
| Food Court | $125.00 | 7 | 3.0% |
| Kiosk | $750.00 | 7 | 3.0% |
| Restaurant | $25.00 | 10 | 10% Mid-term |
| ATM | $250.00 | 7 | Flat |
| Major | $11.50 | 10 | 10% Mid-term |
| Theater | $20.00 | 10 | 10% Mid-term |
| Anchor | $7.50 | 10 | 10% Mid-term |
The following table presents information regarding certain competitive properties to the Arizona Mills Property:
| Competitive Property Summary |
Property Address | Detailed Property Type | Year Built / Renovated | Size (SF) | Occ% | Major Tenants | Distance From Subject |
Arizona Mills 5000 South Arizona Mills Circle Tempe, AZ | Anchored | 1997 / NAP | 1,234,669(1) | 84.4%(1) | Harkins Theater, Burlington, LEGOLAND Discovery Center, Conn’s HomePlus, Tilt Studio, Overtime by Dick’s Sporting Goods, Marshalls, Forever 21, Ross Dress for Less, American Freight, Sea Life Centre(1) | NAP |
Arrowhead Towne Center 7700 West Arrowhead Towne Center Drive Glendale, AZ | Super Regional Mall | 1993 / 2015 | 1,197,000 | 100.0% | Dick’s Sporting Goods, Dillard’s, JC Penney, Macy’s, H&M | 35.7 mi |
Biltmore Fashion Park 2502 East Camelback Road Phoenix, AZ | Regional Mall | 1963 / 2006 | 622,000 | 100.0% | Macy’s, Saks Fifth Avenue, Arhaus, Life Time Fitness | 12.4 mi |
Scottsdale Fashion Square 6900 East Camelback Road Scottsdale, AZ | Super Regional Mall | 1964 / 2018 | 1,845,000 | 99.9% | Dillard’s, Nordstrom, Crate & Barrel, Forever 21, H&M, Harkins Theater, Neiman Marcus | 9.3 mi |
Chandler Fashion Center 3101-3199 West Chandler Boulevard Chandler, AZ | Super Regional Mall | 2001 / NAP | 1,318,000 | 100.0% | Barnes & Noble, Dillard’s, Macy’s, Forever 21, Harkins Theater | 9.7 mi |
Kierland Commons 15220-15230 North Scottsdale Road Scottsdale, AZ | Lifestyle Center | 1999 / 2005 | 367,075 | 87.7% | Arhaus, Crate & Barrel | 24.3 mi |
Desert Sky Mall 7535-7835 West Thomas Road Phoenix, AZ | Super Regional Mall | 1980 / 2007 | 844,980 | 83.1% | Burlington, Curacao, Dillard’s, Mercado de los Cielos | 21.3 mi |
Village Square at Dana Park 1758 South Val Vista Drive Mesa, AZ | Community Center | 2001 / 2009 | 366,262 | 82.5% | AJ’s Fine Foods, Barnes & Noble | 12.6 mi |
Source: Appraisal
| (1) | Information is based on the underwritten rent roll. |
This is not a research report and was not prepared by any Underwriter’s research department. Please see additional important information and qualifications at the end of this Term Sheet. |
T-50
| Retail – Anchored | Loan # 2 | Cut-off Date Balance: | | $74,888,072 |
| 5000 South Arizona Mills Circle | Arizona Mills | Cut-off Date LTV: | | 32.4% |
| Tempe, AZ 85282 | | UW NCF DSCR: | | 4.27x |
| | | UW NOI Debt Yield: | | 25.6% |
Operating History and Underwritten Net Cash Flow. The following table presents certain information relating to the historical operating performance and Underwritten Net Cash Flow at the Arizona Mills Property:
| Cash Flow Analysis |
| 2018 | 2019 | 2020 | 7/31/2021 TTM | UW | UW PSF |
| Base Rent(1) | $22,547,536 | $21,299,749 | $19,222,186 | $18,776,078 | $19,391,064 | $15.71 |
| Contractual Rent Steps(2) | $0 | $0 | $0 | $0 | $191,943 | $0.16 |
| Income from Vacant Units | $0 | $0 | $0 | $0 | $6,660,907 | $5.39 |
| Overage Rent(3) | $515,507 | $538,530 | $338,376 | $1,556,650 | $1,964,680 | $1.59 |
| Percent In Lieu(3) | $438,206 | $439,359 | $857,691 | $954,377 | $1,692,865 | $1.37 |
| Expense Reimbursement | $11,371,247 | $11,303,201 | $10,415,098 | $10,039,140 | $9,464,363 | $7.67 |
| Net Rental Income | $34,872,496 | $33,580,839 | $30,833,351 | $31,326,245 | $39,365,821 | $31.88 |
| Temp / Specialty Leasing Income | $3,437,567 | $3,505,644 | $2,494,953 | $2,815,844 | $3,072,323 | $2.49 |
| Other Income(4) | $623,994 | $625,632 | $353,015 | $414,783 | $396,573 | $0.32 |
| (Vacancy & Credit Loss) | ($72,683) | ($79,354) | ($5,362,228) | ($1,491,485) | ($6,660,907) | ($5.39) |
| Effective Gross Income | $38,861,374 | $37,632,761 | $28,319,091 | $33,065,387 | $36,173,810 | $29.30 |
| | | | | | |
| Real Estate Taxes | $2,813,372 | $2,751,446 | $2,808,093 | $2,575,788 | $2,939,737 | $2.38 |
| Insurance | $432,436 | $457,171 | $529,032 | $545,392 | $583,936 | $0.47 |
| Other Operating Expenses | $7,904,199 | $7,794,333 | $5,905,025 | $6,445,965 | $7,122,683 | $5.77 |
| Total Operating Expenses | $11,150,007 | $11,002,950 | $9,242,150 | $9,567,145 | $10,646,356 | $8.62 |
| | | | | | |
| Net Operating Income | $27,711,367 | $26,629,811 | $19,076,941 | $23,498,242 | $25,527,454 | $20.68 |
| Replacement Reserves | $0 | $0 | $0 | $0 | $407,441 | $0.33 |
| TI/LC | $0 | $0 | $0 | $0 | $1,234,669 | $1.00 |
| Net Cash Flow | $27,711,367 | $26,629,811 | $19,076,941 | $23,498,242 | $23,885,344 | $19.35 |
| | | | | | |
| Occupancy % | 99.8% | 99.8% | 82.6% | 84.4%(5) | 83.1%(7) | |
| NOI DSCR(6) | 4.95x | 4.76x | 3.41x | 4.20x | 4.56x | |
| NCF DSCR(6) | 4.95x | 4.76x | 3.41x | 4.20x | 4.27x | |
| NOI Debt Yield(6) | 27.8% | 26.7% | 19.1% | 23.5% | 25.6% | |
| NCF Debt Yield(6) | 27.8% | 26.7% | 19.1% | 23.5% | 23.9% | |
| (1) | UW Base Rent is based on the underwritten rent roll dated August 23, 2021, with adjustments made for executed leases and tenants that have given notice to vacate. |
| (2) | UW Contractual Rent Steps were taken through October 2022 ($191,943). |
| (3) | UW Overage Rent and UW Percent In Lieu are based on the terms of applicable leases using TTM July 2021 sales figures. |
| (4) | UW Other Income includes income from ATMs, rooftop cellular antenna income, stroller rentals, beverage case rentals, sponsorships, food court digital display income and other miscellaneous income. |
| (5) | Represents occupancy as of August 23, 2021. |
| (6) | Debt service coverage ratios and debt yields are based on the Arizona Mills Whole Loan. |
| (7) | Represents economic occupancy. |
Escrows and Reserves.
Real Estate Taxes – The borrower is required to deposit monthly to a real estate tax reserve 1/12 of the annual estimated real estate taxes. Provided no event of default is continuing, in lieu of monthly deposits to the real estate tax reserve, the borrower is permitted to provide a letter of credit or a guaranty for such amounts from the non-recourse carveout guarantor.
Insurance – Unless the Arizona Mills Property is covered by a blanket policy, the borrower is required to deposit monthly 1/12 of the annual estimated insurance premiums to the insurance reserve. Provided no event of default is continuing, in lieu of monthly deposits to the insurance reserve, the borrower is permitted to provide a letter of credit or a guaranty for such amounts from the non-recourse carveout guarantor.
Replacement Reserve – The borrower is required to deposit monthly $33,953 for replacements to the Arizona Mills Property, subject to a cap of $814,882 (except such cap will not apply during a Lockbox Event Period (as defined below)). Provided no event of default is continuing, in lieu of monthly deposits to the replacement reserve, the borrower is permitted to provide a letter of credit or a guaranty for such amounts from the non-recourse carveout guarantor.
TI/LC Reserve – The borrower is required to deposit monthly $154,334 for future tenant improvements and leasing commissions, subject to a cap of $3,704,007 (except such cap will not apply during a Lockbox Event Period). Provided no event of default is continuing, in lieu of monthly deposits to the TI/LC reserve, the borrower is permitted to provide a letter of credit or a guaranty for such amounts from the non-recourse carveout guarantor.
Lockbox and Cash Management. The Arizona Mills Whole Loan is structured with a hard lockbox and springing cash management. All rents from the Arizona Mills Property are required to be deposited directly to the lockbox account and so long as a Lockbox Event Period is not continuing, funds in the lockbox account will be transferred to the borrower’s operating account. During a Lockbox Event Period, the borrower will not have access to the funds in the lockbox account and such funds will be transferred weekly to the lender-controlled cash management account and disbursed according to the Arizona
This is not a research report and was not prepared by any Underwriter’s research department. Please see additional important information and qualifications at the end of this Term Sheet. |
T-51
| Retail – Anchored | Loan # 2 | Cut-off Date Balance: | | $74,888,072 |
| 5000 South Arizona Mills Circle | Arizona Mills | Cut-off Date LTV: | | 32.4% |
| Tempe, AZ 85282 | | UW NCF DSCR: | | 4.27x |
| | | UW NOI Debt Yield: | | 25.6% |
Mills Whole Loan documents. During a Lockbox Event Period, all excess cash is required to be held by the lender as additional security for the Arizona Mills Whole Loan.
A “Lockbox Event Period” will occur during any of (i) the period commencing upon the occurrence of an event of default and continuing until cured, (ii) anytime after any bankruptcy action by the borrower, (iii) the period commencing upon any bankruptcy action by the property manager if the property manager is an affiliate of the borrower, and continuing until cured by either (x) the discharge or dismissal of the bankruptcy action without any adverse consequences to the Arizona Mills Property within 90 days or (y) the replacement of the manager by a qualified manager within 60 days, or (iv) the period commencing when the trailing four- calendar quarter debt yield on the Arizona Mills Whole Loan is less than 15.0% for two consecutive calendar quarters until cured by the trailing four- calendar quarter debt yield on the Arizona Mills Whole Loan being greater than or equal to 15.0% for two consecutive calendar quarters. A Lockbox Event Period may not be cured more than five times during the term of the Arizona Mills Whole Loan.
Additional Secured Indebtedness (not including trade debts). None.
Mezzanine Loan and Preferred Equity. None.
Release of Property. In the event that the tenant Joe’s Crab Shack exercises its option to purchase its leased premises, the borrower may obtain the release of the related parcel upon the satisfaction of certain conditions, including (i) if the release occurs during the REMIC prohibition period, the borrower pays a release price of $1,000,000 and a yield maintenance premium or (ii) if the release occurs after the expiration of the REMIC prohibition period, the borrower partially defeases the Arizona Mills Whole Loan in the amount of $1,000,000.
Letter of Credit. None.
Right of First Offer/Right of First Refusal. None.
Ground Lease. None.
Terrorism Insurance. The borrower is required to obtain and maintain property insurance and business interruption insurance for 18 months plus a 365-day extended period of indemnity. Such insurance is required to cover perils of terrorism and acts of terrorism; provided that, if the Terrorism Risk Insurance Program Reauthorization Act of 2015 is not in effect and such policies contain an exclusion for acts of terrorism, the borrower will only be required to pay for terrorism insurance a maximum of two times the annual insurance premiums payable for the Arizona Mills Property at the time with respect to the property and business interruption policies (excluding the earthquake components of such premiums) on a stand-alone basis. See “Risk Factors—Risks Relating to the Mortgage Loans—Terrorism Insurance May Not Be Available for All Mortgaged Properties” in the prospectus.
This is not a research report and was not prepared by any Underwriter’s research department. Please see additional important information and qualifications at the end of this Term Sheet. |
T-52
(THIS PAGE INTENTIONALLY LEFT BLANK)
This is not a research report and was not prepared by any Underwriter’s research department. Please see additional important information and qualifications at the end of this Term Sheet. |
T-53
| Property Types – Various | Loan #3 | Cut-off Date Balance: | | $66,940,000 |
| Property Addresses – Various | ExchangeRight Portfolio 50 | Cut-off Date LTV: | | 61.3% |
| | | U/W NCF DSCR: | | 2.60x |
| | | U/W NOI Debt Yield: | | 8.9% |
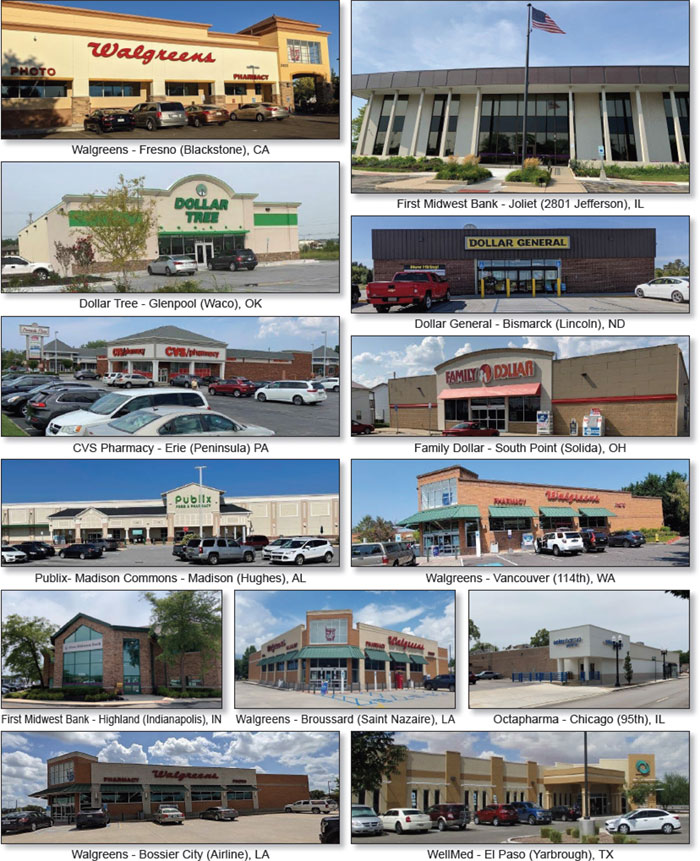
This is not a research report and was not prepared by any Underwriter’s research department. Please see additional important information and qualifications at the end of this Term Sheet. |
T-54
| Property Types – Various | Loan #3 | Cut-off Date Balance: | | $66,940,000 |
| Property Addresses – Various | ExchangeRight Portfolio 50 | Cut-off Date LTV: | | 61.3% |
| | | U/W NCF DSCR: | | 2.60x |
| | | U/W NOI Debt Yield: | | 8.9% |
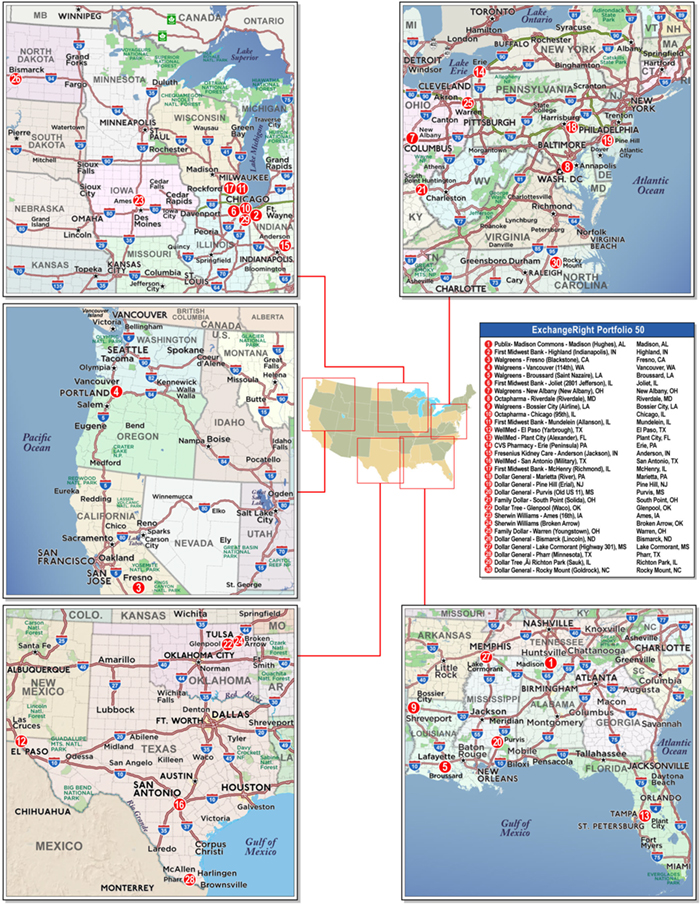
This is not a research report and was not prepared by any Underwriter’s research department. Please see additional important information and qualifications at the end of this Term Sheet. |
T-55
| Mortgage Loan No. 3 – ExchangeRight Portfolio 50 |
| Mortgage Loan Information | | Property Information |
| Mortgage Loan Seller: | BANA | | Single Asset/Portfolio: | Portfolio |
| Credit Assessment (Fitch/KBRA/S&P): | NR/NR/NR | | Location(3): | Various |
| Original Balance: | $66,940,000 | | General Property Type(3): | Various |
| Cut-off Date Balance: | $66,940,000 | | Detailed Property Type(3): | Various |
| % of Initial Pool Balance: | 5.2% | | Title Vesting: | Fee |
| Loan Purpose: | Acquisition | | Year Built/Renovated(3): | Various/Various |
| Borrower Sponsor: | ExchangeRight Real Estate, LLC | | Size: | 388,591 SF |
| Guarantors: | David Fisher, Joshua Ungerecht and | | Cut-off Date Balance PSF: | $172 |
| | Warren Thomas | | Maturity Date Balance PSF: | $172 |
| Mortgage Rate: | 3.2637% | | Property Manager: | NLP Management, LLC |
| Note Date: | 9/10/2021 | | | (borrower-related) |
| First Payment Date: | 11/1/2021 | | | |
| Maturity Date: | 10/1/2031 | | | |
| Original Term to Maturity: | 120 months | | | |
| Original Amortization Term: | 0 months | | | |
| IO Period: | 120 months | | Underwriting and Financial Information(4) |
| Seasoning: | 0 months | | UW NOI: | $5,956,582 |
| Prepayment Provisions: | L(24),D(93),O(3) | | UW NOI Debt Yield: | 8.9% |
| Lockbox/Cash Mgmt Status: | Hard/Springing | | UW NOI Debt Yield at Maturity: | 8.9% |
| Additional Debt Type: | No | | UW NCF DSCR: | 2.60x |
| Additional Debt Balance: | NAP | | Most Recent NOI(5): | NAP |
| Future Debt Permitted (Type): | No (NAP) | | 2nd Most Recent NOI(5): | NAP |
| Reserves(1) | | 3rd Most Recent NOI(5): | NAP |
| Type | Initial | Monthly | Cap | | Most Recent Occupancy: | 100.0% (10/1/2021) |
| RE Taxes: | $262,209 | $47,888 | NAP | | 2nd Most Recent Occupancy(5): | NAP |
| Insurance: | $1,939 | $646 | NAP | | 3rd Most Recent Occupancy(5): | NAP |
| Replacement Reserve: | $360,000 | $2,730 | NAP | | Appraised Value (as of)(6)(7): | $109,220,000 (Various) |
| Deferred Maintenance: | $76,699 | $0 | NAP | | Appraised Value PSF(6)(7): | $281 |
| TI/LC Reserve: | $500,000 | Springing | NAP | | Cut-off Date LTV Ratio(7): | 61.3% |
| Other Reserve(2): | $413,750 | $0 | NAP | | Maturity Date LTV Ratio(7): | 61.3% |
| | | | | | | |
| Sources and Uses |
| Sources | Proceeds | % of Total | | Uses | Proceeds | % of Total |
| Loan Amount: | $66,940,000 | 60.4% | | Purchase Price: | $107,870,658 | 97.3% |
| Borrower Equity: | $43,903,379 | 39.6% | | Closing Costs: | $1,358,124 | 1.2% |
| | | | | Reserves: | $1,614,597 | 1.5% |
| Total Sources: | $110,843,379 | 100.0% | | Total Uses: | $110,843,379 | 100.0% |
| (1) | See “Escrows and Reserves” section below for further discussion of reserve requirements. |
| (2) | Other reserve consists of an environmental reserve ($403,750) and a reserve related to the Dollar General - Marietta (River), PA property ($10,000). |
| (3) | See “The Properties” section below. |
| (4) | The novel coronavirus pandemic is an evolving situation and could impact the ExchangeRight Portfolio 50 Mortgage Loan (as defined below) more severely than assumed in the underwriting of the ExchangeRight Portfolio 50 Mortgage Loan and could adversely affect the NOI, NCF and occupancy information, as well as the appraised value and the DSCR, LTV and Debt Yield metrics presented above and herein. See “Risk Factors-—Risks Related to Market Conditions and Other External Factors—The Coronavirus Pandemic Has Adversely Affected the Global Economy and Will Likely Adversely Affect the Performance of the Mortgage Loans” in the prospectus. |
| (5) | Historical occupancy and NOI are unavailable because the ExchangeRight Properties (as defined below) were acquired by the borrower sponsor between February 10, 2021 and August 20, 2021. |
| (6) | The individual appraised value as-of dates are between July 6, 2021 and August 23, 2021. |
| (7) | The appraiser also provided as-dark values assuming the ExchangeRight Properties are unoccupied, which aggregate as-dark value for the portfolio was $72,130,000, resulting in a Cut-off Date LTV Ratio and Maturity Date LTV Ratio of 93.0%. |
The Mortgage Loan. The third largest mortgage loan (the “ExchangeRight Portfolio 50 Mortgage Loan”) is evidenced by a promissory note in the original principal amount of $66,940,000 and secured by the fee interests in 30 net leased, single-tenant retail and medical office properties located in seventeen states (the “ExchangeRight Properties”).
The Borrower and the Borrower Sponsor. The borrower for the ExchangeRight Portfolio 50 Mortgage Loan is ExchangeRight Net-Leased Portfolio 50 DST (the “ExchangeRight Portfolio 50 Borrower”), a Delaware statutory trust. The borrower sponsor is ExchangeRight Real Estate, LLC, which has more than 14 million SF of commercial properties under management and owns more than 900 properties located in 40 states. David Fisher, Joshua Ungerecht and Warren Thomas (collectively, the “Individual Guarantors”) are the guarantors of certain non-recourse carveout liabilities under the ExchangeRight Portfolio 50 Mortgage Loan and the owners of ExchangeRight Real Estate, LLC. The ExchangeRight Portfolio 50 Borrower has master leased the ExchangeRight Properties to a master tenant (the “ExchangeRight Portfolio 50 Master Tenant”) owned by ExchangeRight Real Estate, LLC, which is in turn owned by the Individual Guarantors. The ExchangeRight Portfolio 50 Master Tenant is a Delaware limited liability company structured to be bankruptcy-remote, with one independent director. The master lease generally imposes responsibility on the ExchangeRight Portfolio 50 Master Tenant for the operation, maintenance and management of the ExchangeRight Properties and payment of all expenses incurred in the maintenance and repair of
This is not a research report and was not prepared by any Underwriter’s research department. Please see additional important information and qualifications at the end of this Term Sheet. |
T-56
| Property Types – Various | Loan #3 | Cut-off Date Balance: | | $66,940,000 |
| Property Addresses – Various | ExchangeRight Portfolio 50 | Cut-off Date LTV: | | 61.3% |
| | | U/W NCF DSCR: | | 2.60x |
| | | U/W NOI Debt Yield: | | 8.9% |
the Exchange Right Properties, other than capital expenses. The ExchangeRight Portfolio 50 Master Tenant’s interest in all tenant rents was assigned to the ExchangeRight Portfolio 50 Borrower, which in turn collaterally assigned its interest to the lender. The master lease is subordinate to the ExchangeRight Portfolio 50 Mortgage Loan and, upon an event of default under the ExchangeRight Portfolio 50 Mortgage Loan, the lender has the right to cause the ExchangeRight Portfolio 50 Borrower to terminate the master lease. A default under the master lease is an event of default under the ExchangeRight Portfolio 50 Mortgage Loan and gives rise to recourse liability to the non-recourse carveout guarantors for losses, unless such default arises solely in connection with the failure of the ExchangeRight Portfolio 50 Master Tenant to pay rent as a result of the ExchangeRight Properties not generating sufficient cash flow for the payment of such rent.
The lender has the right to require the ExchangeRight Portfolio 50 Borrower to convert from a Delaware statutory trust to a limited liability company upon (i) an event of default or the lender’s good faith determination of imminent default under the ExchangeRight Portfolio 50 Mortgage Loan, (ii) the lender’s good faith determination that the ExchangeRight Portfolio 50 Borrower will be unable to make a material decision or take a material action required in connection with the operation and maintenance of any ExchangeRight Property, and (iii) 90 days prior to the maturity date of the ExchangeRight Portfolio 50 Mortgage Loan, if an executed commitment from an institutional lender to refinance the ExchangeRight Portfolio 50 Mortgage Loan is not delivered to the lender.
At any time after September 10, 2022, the borrower sponsor has the right to effect a one-time transfer of all (but not less than all) of the outstanding ownership interests in the ExchangeRight Portfolio 50 Borrower to an Approved Transferee (as defined below) and to replace the non-recourse carveout guarantors with a person or entity affiliated with such Approved Transferee or with an Approved Replacement Guarantor (as defined below); provided that certain conditions are satisfied, including among others: (i) no event of default has occurred and is continuing, (ii) the Approved Transferee or Approved Replacement Guarantor owns not less than 51% of the beneficial ownership interests in, and controls, the ExchangeRight Portfolio 50 Borrower and ExchangeRight Portfolio 50 Master Tenant, (iii) the Approved Replacement Guarantor executes a non-recourse carveout guaranty and environmental indemnity pursuant to which it agrees to be liable (from and after the transfer) for all indemnity obligations (including environmental liabilities and obligations) for which the existing non-recourse carveout guarantors are liable under the non-recourse carveout guaranty and environmental indemnity, (iv) the delivery of a REMIC opinion, a non-consolidation opinion and other opinions required by the lender and (v) the receipt of confirmation from each rating agency that such transfer and guarantor replacement will not result in a downgrade of the respective ratings assigned to the BANK 2021-BNK36 certificates (such a transfer and replacement, a “Qualified Transfer”). A Cash Management Period (as defined below) will be triggered if a Qualified Transfer does not occur by October 1, 2028 (36 months prior to the maturity date of the ExchangeRight Portfolio 50 Mortgage Loan). See “Lockbox and Cash Management” below.
In addition, to cure a Qualified Transfer Trigger Event (such event being the monthly payment date that is thirty-six (36) months prior to the loan maturity date), the ExchangeRight Portfolio 50 Borrower may elect to convert from a Delaware statutory trust to a limited liability company to effectuate a Qualified Transfer to an Approved Transferee. Provided however that, any such Approved Transferee, in addition to all other attributes set forth in the Approved Transferee definition, is required to (i) have a minimum net worth of at least $200,000,000 and total assets of at least $400,000,000, each as determined by the lender, or an investment grade rating, (ii) in lieu of executing the replacement non-recourse carveout guaranty, and prior to any release of any guarantor, execute and deliver to the lender a full recourse guaranty, in a form reasonably acceptable to the lender, guaranteeing payment of the entire amount of the ExchangeRight Portfolio 50 Mortgage Loan, (iii) at all times own no less than 100% of the legal and beneficial ownership interests in the ExchangeRight Portfolio 50 Borrower, (iv) not be a Delaware statutory trust, and (v) cause the ExchangeRight Portfolio 50 Borrower to effectuate a conversion pursuant to the terms of the loan documents. Notwithstanding the foregoing, a conversion will not be required to cure the Qualified Transfer Trigger Event if the ExchangeRight Portfolio 50 Borrower (i) is solely owned by a person under the control of the Individual Guarantors, (ii) is no longer treated as an investment trust pursuant to Regulation Section 301.7701-4(c) of the Internal Revenue Code, (iii) is no longer subject to any operating restrictions contained in its trust agreement and (iv) has delivered to the lender other documentation and opinions reasonably requested by the lender.
“Approved Transferee” means (A) a depository institution that satisfies certain ratings criteria and is wholly-owned and controlled by a bank, savings and loan association, investment bank, insurance company, trust company, Approved REIT, commercial credit corporation, pension plan, pension fund or pension advisory firm, mutual fund, government entity or plan or institution similar to any of the foregoing or (B) any person that (1)(i) has never been indicted or convicted of, or pled guilty or no contest to a felony, (ii) has never been indicted or convicted of, or pled guilty or no contest to a Patriot Act offense and is not on any government watch list, (iii) has never been the subject of a voluntary or involuntary (to the extent the same has not been discharged) bankruptcy proceeding and (iv) has no material outstanding judgments, litigations or regulatory actions against it or its interests, (2) is regularly engaged in the business of owning or operating commercial properties, or interests therein, which are similar to the ExchangeRight Properties, (3) owns interests in, or operates, at least five properties with a minimum of 750,000 SF in the aggregate and (4) satisfies certain net worth or ratings criteria.
“Approved Replacement Guarantor” means (A) any person that (1)(i) has never been indicted or convicted of, or pled guilty or no contest to a felony, (ii) has never been indicted or convicted of, or pled guilty or no contest to a Patriot Act offense and is not on any government watch list, (iii) has never been the subject of a voluntary or involuntary (to the extent the same has not been discharged) bankruptcy proceeding and (iv) has no material outstanding judgments, litigations or regulatory actions against it or its interests, (2) who either (i) possesses the experience and enjoys a reputation and standing in the business community, which in the lender’s discretion and based on underwriting and credit criteria typically applied to similar loans which are sold in the secondary market, is sufficient and comparable to others who own and operate properties similar in size, use, value and location to the ExchangeRight Property, or (ii) is at all times (y) collectively owned, directly or indirectly, by David Fisher, Joshua Ungerecht and Warren Thomas in an amount not less than one percent (1%) and (z) Controlled by David Fisher, Joshua Ungerecht and Warren Thomas, (3) possesses the financial strength which in the lender’s discretion and based on underwriting and credit criteria typically applied to similar loans which are sold in the secondary market, is sufficient and comparable to others who own and operate properties similar in size, use, value and location to the Property and (4) whose approval, at the lender’s option, may be conditioned upon the lender’s receipt of rating agency confirmation.
“Approved REIT” means a real estate investment trust, or the operating partnership that such real estate investment trust controls, that (i) is a qualified transferee, (ii) is not a sanctioned entity, (iii) is at all times (a) owned, directly or indirectly, by David Fisher, Joshua Ungerecht and Warren Thomas, in a combined amount that is not less than 1% of all equity interests (provided, however, that if the value of such direct or indirect equity interests at the time of the transfer is at least equal to $15,000,000, such 1% requirement will be reduced to the pro rata percentage which $15,000,000 equates to (i.e., if the value of the REIT is $1,750,000,000, such percentage would be 0.857% ($15,000,000/$1,750,000,000), so that guarantor owns an equity interest equal to a value of at least $15,000,000), and (b) controlled by David Fisher, Joshua Ungerecht and Warren Thomas.
This is not a research report and was not prepared by any Underwriter’s research department. Please see additional important information and qualifications at the end of this Term Sheet. |
T-57
| Property Types – Various | Loan #3 | Cut-off Date Balance: | | $66,940,000 |
| Property Addresses – Various | ExchangeRight Portfolio 50 | Cut-off Date LTV: | | 61.3% |
| | | U/W NCF DSCR: | | 2.60x |
| | | U/W NOI Debt Yield: | | 8.9% |
The Properties. The ExchangeRight Properties are comprised of 30 single-tenant properties including eleven discount retailers, six medical offices, six pharmacies, four bank branches, two paint stores and one grocery store, totaling 388,591 SF and located across seventeen states. No property releases are permitted. Built between 1924 and 2021, with 8 of the 30 properties built between 2019 and 2021 (inclusive), the ExchangeRight Properties range in size from 4,809 SF to 54,340 SF. The ExchangeRight Properties are net leased to the following eleven nationally recognized tenants operating in diverse segments: Walgreens, Dollar General, Publix, First Midwest Bank, WellMed, Octapharma, Dollar Tree, Family Dollar, Sherwin Williams, Fresenius Kidney Care and CVS Pharmacy. 27 of the 30 properties are leased to investment grade rated tenants. The ExchangeRight Properties have a weighted average remaining lease term of approximately 11.5 years. Leases representing 51.0% of NRA and 46.5% of the underwritten base rent expire after the maturity date of the ExchangeRight Portfolio 50 Mortgage Loan. For the purposes of the preceding two sentences, the Walgreens leases that grant early termination rights to Walgreens, and the Octapharma - Riverdale (Riverdale), MD lease that grants a one-time termination option to Octapharma, were assumed to expire on the date when the earliest termination right under the lease, if exercised, would be effective.
The following table presents certain information relating to the state locations of the ExchangeRight Properties:
| Location Summary(1) |
| State | No. of Properties | Approx.
% of SF | Approx. %
of Total Annual
UW Base Rent |
| Illinois | 5 | 15.6% | | 16.9% | |
| Alabama | 1 | 14.0% | | 11.3% | |
| Ohio | 3 | 8.3% | | 8.0% | |
| Texas | 3 | 8.0% | | 7.8% | |
| Louisiana | 2 | 7.5% | | 8.8% | |
| Indiana | 2 | 6.8% | | 10.1% | |
| Mississippi | 2 | 5.1% | | 3.3% | |
| Pennsylvania | 2 | 5.0% | | 4.7% | |
| Maryland | 1 | 4.7% | | 4.3% | |
| Oklahoma | 2 | 3.9% | | 3.5% | |
| Florida | 1 | 3.8% | | 3.7% | |
| Washington | 1 | 3.8% | | 5.3% | |
| California | 1 | 3.8% | | 5.8% | |
| New Jersey | 1 | 3.3% | | 2.0% | |
| North Carolina | 1 | 2.3% | | 1.3% | |
| North Dakota | 1 | 2.3% | | 1.5% | |
| Iowa | 1 | 1.5% | | 1.6% | |
| Total/Wtd. Avg. | 30 | 100.0% | | 100.0% | |
| | | |
| (1) | Information is based on the appraisals and underwritten rent roll. |
This is not a research report and was not prepared by any Underwriter’s research department. Please see additional important information and qualifications at the end of this Term Sheet. |
T-58
| Property Types – Various | Loan #3 | Cut-off Date Balance: | | $66,940,000 |
| Property Addresses – Various | ExchangeRight Portfolio 50 | Cut-off Date LTV: | | 61.3% |
| | | U/W NCF DSCR: | | 2.60x |
| | | U/W NOI Debt Yield: | | 8.9% |
The following table presents certain information relating to the ExchangeRight Properties, which are presented in descending order of their Appraised Values.
| ExchangeRight Properties Summary |
Property Name | Year Built/ Renovated | Tenant NRSF | %of
Portfolio NRSF | Lease Expiration
Date(1) | Appraised
Value | % of
Portfolio Appraised Value | Annual
UW Base
Rent | Annual
UW Base Rent PSF | % of Annual
UW Base Rent | Renewal Options(2) |
| Publix- Madison Commons - Madison (Hughes), AL | 2019 / NAP | 54,340 | 14.0% | 10/31/2038 | $14,000,000(3) | 12.8% | $733,590 | $13.50 | 11.3% | 8 x 5 yr |
| First Midwest Bank - Highland (Indianapolis), IN | 1997 / 2005 | 15,838 | 4.1% | 9/30/2030 | $7,150,000 | 6.5% | $452,328 | $28.56 | 7.0% | 5 x 5 yr |
| Walgreens - Fresno (Blackstone), CA | 2008 / NAP | 14,740 | 3.8% | 7/31/2033 | $6,200,000 | 5.7% | $375,000 | $25.44 | 5.8% | 50 x 1 yr |
| Walgreens - Vancouver (114th), WA | 2005 / NAP | 14,820 | 3.8% | 2/7/2031 | $6,000,000 | 5.5% | $345,000 | $23.28 | 5.3% | 10 x 5 yr |
| Walgreens - Broussard (Saint Nazaire), LA | 2008 / NAP | 14,490 | 3.7% | 1/31/2033 | $5,210,000 | 4.8% | $302,004 | $20.84 | 4.7% | 5 x 10 yr |
| First Midwest Bank - Joliet (2801 Jefferson), IL | 1976 / NAP | 17,668 | 4.5% | 9/30/2030 | $5,070,000 | 4.6% | $325,166 | $18.40 | 5.0% | 5 x 5 yr |
| Walgreens - New Albany (New Albany), OH | 2006 / NAP | 14,731 | 3.8% | 9/30/2031 | $5,000,000 | 4.6% | $301,500 | $20.47 | 4.7% | 10 x 5 yr |
| Octapharma - Riverdale (Riverdale), MD | 1971 / 2020 | 18,200 | 4.7% | 2/29/2032 | $4,900,000 | 4.5% | $280,800 | $15.43 | 4.3% | 3 x 5 yr |
| Walgreens - Bossier City (Airline), LA | 2006 / NAP | 14,820 | 3.8% | 2/28/2031 | $4,640,000 | 4.2% | $266,740 | $18.00 | 4.1% | None |
| Octapharma - Chicago (95th), IL | 1949 / 2020 | 15,025 | 3.9% | 12/31/2031 | $4,450,000 | 4.1% | $253,760 | $16.89 | 3.9% | 3 x 5 yr |
| First Midwest Bank - Mundelein (Allanson), IL | 2002 / NAP | 4,809 | 1.2% | 9/30/2030 | $4,290,000 | 3.9% | $272,597 | $56.68 | 4.2% | 5 x 5 yr |
| WellMed - El Paso (Yarbrough), TX | 1988; 2017 / 2018 | 13,757 | 3.5% | 10/31/2030 | $4,000,000 | 3.7% | $254,394 | $18.49 | 3.9% | 2 x 5 yr |
| WellMed - Plant City (Alexander), FL | 1998 / 2017 | 14,943 | 3.8% | 7/31/2030 | $3,810,000 | 3.5% | $238,357 | $15.95 | 3.7% | 2 x 5 yr |
| CVS Pharmacy - Erie (Peninsula) PA | 2000 / NAP | 10,282 | 2.6% | 1/1/2031 | $3,200,000 | 2.9% | $175,000 | $17.02 | 2.7% | 2 x 5 yr |
| Fresenius Kidney Care - Anderson (Jackson), IN | 2011 / NAP | 10,750 | 2.8% | 2/28/2033 | $3,100,000 | 2.8% | $200,373 | $18.64 | 3.1% | 2 x 5 yr |
| WellMed - San Antonio (Military), TX | 1985 / 2015 | 8,392 | 2.2% | 11/1/2030 | $2,420,000 | 2.2% | $145,200 | $17.30 | 2.2% | 2 x 5 yr |
| First Midwest Bank - McHenry (Richmond), IL | 1979 / NAP | 8,045 | 2.1% | 9/30/2030 | $2,260,000 | 2.1% | $144,342 | $17.94 | 2.2% | 5 x 5 yr |
| Dollar General - Marietta (River), PA | 2020 / NAP | 9,129 | 2.3% | 6/30/2036 | $2,175,000 | 2.0% | $126,997 | $13.91 | 2.0% | 3 x 5 yr |
| Dollar General - Pine Hill (Erial), NJ | 1924 / 1962; 1974; 2020-2021 | 12,928 | 3.3% | 4/30/2031 | $2,150,000 | 2.0% | $129,978 | $10.05 | 2.0% | 4 x 5 yr |
| Dollar General - Purvis (Old US 11), MS | 2021 / NAP | 10,795 | 2.8% | 6/1/2036 | $2,050,000 | 1.9% | $115,938 | $10.74 | 1.8% | None |
| Family Dollar - South Point (Solida), OH | 2016 / NAP | 9,180 | 2.4% | 3/31/2032 | $1,900,000 | 1.7% | $114,126 | $12.43 | 1.8% | 6 x 5 yr |
| Dollar Tree - Glenpool (Waco), OK | 2021 / NAP | 9,120 | 2.3% | 6/30/2031 | $1,860,000 | 1.7% | $116,100 | $12.73 | 1.8% | 3 x 5 yr |
| Sherwin Williams (Broken Arrow), OK | 2006 / NAP | 6,000 | 1.5% | 5/1/2031 | $1,800,000 | 1.6% | $107,584 | $17.93 | 1.7% | 5 x 5 yr |
| Sherwin Williams - Ames (16th), IA | 2021 / NAP | 5,980 | 1.5% | 2/1/2032 | $1,800,000 | 1.6% | $102,175 | $17.09 | 1.6% | 2 x 5 yr |
| Family Dollar - Warren (Youngstown), OH | 2016 / NAP | 8,353 | 2.1% | 3/31/2032 | $1,725,000 | 1.6% | $103,844 | $12.43 | 1.6% | 6 x 5 yr |
| Dollar General - Lake Cormorant (Highway 301), MS | 2021 / NAP | 9,100 | 2.3% | 6/30/2036 | $1,700,000 | 1.6% | $95,103 | $10.45 | 1.5% | 5 x 5 yr |
| Dollar General - Bismarck (Lincoln), ND | 2021 / NAP | 9,026 | 2.3% | 7/23/2036 | $1,700,000 | 1.6% | $98,628 | $10.93 | 1.5% | 4 x 5 yr |
| Dollar General - Pharr (Minnesota), TX | 2021 / NAP | 9,124 | 2.3% | 4/30/2036 | $1,650,000 | 1.5% | $103,413 | $11.33 | 1.6% | 5 x 5 yr |
| Dollar Tree – Richton Park (Sauk), IL | 2000 / 2021 | 15,120 | 3.9% | 6/30/2031 | $1,640,000 | 1.5% | $98,280 | $6.50 | 1.5% | None |
| Dollar General - Rocky Mount (Goldrock), NC | 2010 / NAP | 9,086 | 2.3% | 5/31/2031 | $1,370,000 | 1.3% | $85,688 | $9.43 | 1.3% | 5 x 5 yr |
| Total/Weighted Average | | 388,591 | 100.0% | | $109,220,000 | 100.00% | $6,464,006 | $16.63 | 100.0% | |
Source: Appraisals and underwritten rent roll.
| (1) | For the purposes of the table and loan underwriting, the Walgreens leases that grant early termination rights to Walgreens, and the Octapharma - Riverdale (Riverdale), MD lease, that grants a one-time termination option to Octapharma, were assumed to expire on the date when the earliest termination right under the lease, if exercised, would be effective. |
| (2) | Where any termination right effective date has been assumed to be the lease expiration date, the Renewal Options as shown reflect periods between subsequent termination right effective dates. |
| (3) | The City of Madison provided an incentive to bring Publix to the market, which incentive is paid quarterly to the landlord based on a percentage of the tax revenue from Publix’s sales. The incentive began in November 2018, with a maximum term of ten years and a maximum aggregate amount of $1.9M. The lender did not underwrite these benefits and the $14,000,000 Appraised Value excludes these benefits. |
This is not a research report and was not prepared by any Underwriter’s research department. Please see additional important information and qualifications at the end of this Term Sheet. |
T-59
| Property Types – Various | Loan #3 | Cut-off Date Balance: | | $66,940,000 |
| Property Addresses – Various | ExchangeRight Portfolio 50 | Cut-off Date LTV: | | 61.3% |
| | | U/W NCF DSCR: | | 2.60x |
| | | U/W NOI Debt Yield: | | 8.9% |
The following table presents a summary regarding the tenants at the ExchangeRight Properties:
| Tenant Summary(1) |
| Tenant Name | Credit Rating (S&P/ Moody’s/Fitch)(2) | No. of
Properties | Tenant SF | Approx.% of SF | Annual UW Base
Rent | Annual UW
Base Rent
PSF | Approx. % of Total
Annual UW Base Rent |
| Walgreens | BBB / Baa2 / BBB- | 5 | 73,601 | 18.9% | $1,590,244 | $21.61 | 24.6% |
| Dollar General | BBB / Baa2 / NR | 7 | 69,188 | 17.8% | $755,745 | $10.92 | 11.7% |
| Publix | NR / NR / NR | 1 | 54,340 | 14.0% | $733,590 | $13.50 | 11.3% |
| First Midwest Bank | BBB- / Baa2 / NR | 4 | 46,360 | 11.9% | $1,194,434 | $25.76 | 18.5% |
| WellMed | A+ / A3 / NR | 3 | 37,092 | 9.5% | $637,951 | $17.20 | 9.9% |
| Octapharma | NR / NR / NR | 2 | 33,225 | 8.6% | $534,560 | $16.09 | 8.3% |
| Dollar Tree | BBB / Baa2 / NR | 2 | 24,240 | 6.2% | $214,380 | $8.84 | 3.3% |
| Family Dollar | BBB / Baa2 / NR | 2 | 17,533 | 4.5% | $217,970 | $12.43 | 3.4% |
| Sherwin Williams | BBB / Baa2 / BBB | 2 | 11,980 | 3.1% | $209,758 | $17.51 | 3.2% |
| Fresenius Kidney Care | BBB / Baa3 / BBB- | 1 | 10,750 | 2.8% | $200,373 | $18.64 | 3.1% |
| CVS Pharmacy | BBB / Baa2 / NR | 1 | 10,282 | 2.6% | $175,000 | $17.02 | 2.7% |
| Subtotal/Wtd. Avg. | | 30 | 388,591 | 100.0% | $6,464,006 | $16.63 | 100.0% |
| | | | | | | |
| Vacant Space | | 0 | 0 | 0.0% | | | |
| Total/Wtd. Avg. | | 30 | 388,591 | 100.0% | | | |
| (1) | Information is based on the underwritten rent roll. |
| (2) | Certain ratings are those of the parent company whether or not the parent guarantees the lease. |
The following table presents certain information relating to the lease rollover at the ExchangeRight Properties:
| Lease Rollover Schedule(1)(2)(3) |
| Year | # of Leases
Rolling | SF Rolling | Annual UW
Base Rent
PSF Rolling | Approx. %
of Total SF
Rolling | Approx.
Cumulative % of
SF Rolling | Total UW
Base Rent
Rolling | Approx. %
of Total UW
Base Rent
Rolling | Approx. Cumulative
% of Total UW Base
Rent Rolling |
| 2021 | 0 | 0 | $0.00 | 0.0% | 0.0% | $0 | 0.0% | 0.0% |
| 2022 | 0 | 0 | $0.00 | 0.0% | 0.0% | $0 | 0.0% | 0.0% |
| 2023 | 0 | 0 | $0.00 | 0.0% | 0.0% | $0 | 0.0% | 0.0% |
| 2024 | 0 | 0 | $0.00 | 0.0% | 0.0% | $0 | 0.0% | 0.0% |
| 2025 | 0 | 0 | $0.00 | 0.0% | 0.0% | $0 | 0.0% | 0.0% |
| 2026 | 0 | 0 | $0.00 | 0.0% | 0.0% | $0 | 0.0% | 0.0% |
| 2027 | 0 | 0 | $0.00 | 0.0% | 0.0% | $0 | 0.0% | 0.0% |
| 2028 | 0 | 0 | $0.00 | 0.0% | 0.0% | $0 | 0.0% | 0.0% |
| 2029 | 0 | 0 | $0.00 | 0.0% | 0.0% | $0 | 0.0% | 0.0% |
| 2030 | 7 | 83,452 | $21.96 | 21.5% | 21.5% | $1,832,386 | 28.3% | 28.3% |
| 2031 | 10 | 121,932 | $15.42 | 31.4% | 52.9% | $1,879,630 | 29.1% | 57.4% |
| 2032 & Beyond | 13 | 183,207 | $15.02 | 47.1% | 100.0% | $2,751,991 | 42.6% | 100.0% |
| Vacant | 0 | 0 | $0.00 | 0.0% | 100.0% | $0 | 0.0% | 100.0% |
| Total/Wtd. Avg. | 30 | 388,591 | $16.63 | 100.0% | | $6,464,006 | 100.0% | |
| (1) | Information is based on the underwritten rent roll. |
| (2) | Certain tenants may have lease termination options that are exercisable prior to the stated expiration date of the subject lease or leases which are not considered in the lease rollover schedule. |
| (3) | For the purposes of the table and loan underwriting, the Walgreens leases that grant early termination rights to Walgreens, and the Octapharma - Riverdale (Riverdale), MD lease, that grants a one-time termination option to Octapharma, were assumed to expire on the date when the earliest termination right under the lease, if exercised, would be effective. |
COVID-19 Update. The first debt service payment on the ExchangeRight Portfolio 50 Mortgage Loan is due in November 2021 and, as of September 15, 2021, the ExchangeRight Portfolio 50 Mortgage Loan is not subject to any forbearance, modification or debt service relief request. As of September 1, 2021, 100.0% of the ExchangeRight Properties are open and operating, all tenants have remained current on all rent and lease obligations, and no lease modification or rent relief requests have been received.
This is not a research report and was not prepared by any Underwriter’s research department. Please see additional important information and qualifications at the end of this Term Sheet. |
T-60
| Property Types – Various | Loan #3 | Cut-off Date Balance: | | $66,940,000 |
| Property Addresses – Various | ExchangeRight Portfolio 50 | Cut-off Date LTV: | | 61.3% |
| | | U/W NCF DSCR: | | 2.60x |
| | | U/W NOI Debt Yield: | | 8.9% |
Underwritten Net Cash Flow. The following table presents certain information relating to the Underwritten Net Cash Flow at the ExchangeRight Properties:
| Cash Flow Analysis(1) |
| | UW | UW PSF |
| Gross Potential Rent(2) | $6,464,006 | $16.63 |
| Less Vacancy & Credit Loss | ($323,200) | ($0.83) |
| Effective Gross Income | $6,140,806 | $15.80 |
| | | |
| Management Fee | $184,224 | $0.47 |
| Total Expenses | $184,224 | $0.47 |
| | | |
| Net Operating Income | $5,956,582 | $15.33 |
| CapEx | $32,762 | $0.08 |
| TI/LC | $174,971 | $0.45 |
| Net Cash Flow | $5,748,848 | $14.79 |
| | | |
| Occupancy %(3) | 95.0% | |
| NOI DSCR | 2.69x | |
| NCF DSCR | 2.60x | |
| NOI Debt Yield | 8.9% | |
| NCF Debt Yield | 8.6% | |
| | | |
| | | |
| (1) | Historical financial information is not available because the ExchangeRight Properties were recently acquired by the borrower sponsor between February 10, 2021 and August 20, 2021. |
| (2) | Gross Potential Rent includes straight-line average rent over the lesser of: (i) the loan term and (ii) the remaining lease term for investment grade tenants that have rent increases occurring during the applicable term, totaling $92,897. |
| (3) | Occupancy % represents economic occupancy at the ExchangeRight Properties. As of October 1, 2021, the ExchangeRight Properties were 100.0% occupied. |
Escrows and Reserves.
Real Estate Taxes – The ExchangeRight Portfolio 50 Borrower deposited at loan origination $262,209 for real estate taxes and is required to deposit monthly 1/12th of estimated annual real estate taxes (currently $47,888). For the properties where the tenant is responsible for paying taxes directly, commencing upon any of (i) an event of default under the ExchangeRight Portfolio 50 Mortgage Loan, (ii) an event of default under a tenant lease with respect to the applicable individual property, (iii) a tenant no longer being liable to pay property taxes directly to the taxing authority, or (iv) the ExchangeRight Portfolio 50 Borrower failing to provide evidence that such property taxes have been paid in full on or prior to the date when due, the ExchangeRight Portfolio 50 Borrower will be required to make monthly deposits for real estate taxes with respect to the applicable individual property (or, in the case of clause (i), all of the properties) in an amount equal to 1/12th of the estimated annual amount due.
Insurance – The ExchangeRight Portfolio 50 Borrower deposited at loan origination $1,939 for flood insurance and is required to deposit monthly 1/12th of estimated annual flood insurance premiums (currently $646). Unless waived due to a blanket policy acceptable to the lender being in place or any tenant being responsible for maintaining the required insurance, the ExchangeRight Portfolio 50 Mortgage Loan documents require that the ExchangeRight Portfolio 50 Borrower make monthly escrows of 1/12th of the estimated annual insurance premiums due.
Replacement Reserve – The ExchangeRight Portfolio 50 Borrower deposited at loan origination $360,000 and is required to deposit $2,730 monthly for replacements.
TI/LC Reserve – The ExchangeRight Portfolio 50 Borrower deposited at loan origination $500,000 for tenant improvements and leasing commissions. During an event of default, the ExchangeRight Portfolio 50 Borrower will be required to make monthly deposits in the amount of $14,581 for tenant improvements and leasing commissions.
Deferred Maintenance – The ExchangeRight Portfolio 50 Borrower deposited at loan origination $76,699 (representing 125% of the estimated cost of repairs) for specified repairs at each of the Dollar General - Pine Hill (Erial), NJ, Dollar Tree – Richton Park (Sauk), IL, WellMed - El Paso (Yarbrough), TX, WellMed - San Antonio (Military), TX, WellMed - Plant City (Alexander), FL, Octapharma - Riverdale (Riverdale), MD, Fresenius Kidney Care - Anderson (Jackson), IN, Sherwin Williams (Broken Arrow), OK and CVS Pharmacy - Erie (Peninsula) PA properties.
Environmental Reserve – The ExchangeRight Portfolio 50 Borrower deposited at loan origination $403,750, representing 125% of the estimated cost of environmental remediation at each of the First Midwest Bank - Joliet (2801 Jefferson), IL, CVS Pharmacy - Erie (Peninsula) PA and Octapharma - Chicago (95th), IL properties.
Marietta Reserve – The ExchangeRight Portfolio 50 Mortgage Loan documents require an upfront reserve in the amount of $10,000 with respect to the Dollar General - Marietta (River), PA property. Such funds will be released to the borrower upon the satisfaction of certain conditions, including (i) no event of default exists and (ii) delivery by the borrower of (a) written evidence that all of the required work has been completed for the issuance of the well permit, (b) an estoppel certificate and (c) a certificate of occupancy.
This is not a research report and was not prepared by any Underwriter’s research department. Please see additional important information and qualifications at the end of this Term Sheet. |
T-61
| Property Types – Various | Loan #3 | Cut-off Date Balance: | | $66,940,000 |
| Property Addresses – Various | ExchangeRight Portfolio 50 | Cut-off Date LTV: | | 61.3% |
| | | U/W NCF DSCR: | | 2.60x |
| | | U/W NOI Debt Yield: | | 8.9% |
Lockbox and Cash Management. The ExchangeRight Portfolio 50 Mortgage Loan is structured with a hard lockbox and springing cash management. The ExchangeRight Portfolio 50 Borrower is required to (or to cause the ExchangeRight Portfolio 50 Master Tenant or property manager to) cause all rents relating to the ExchangeRight Properties to be transmitted directly by the tenants of each property into the lockbox account and, to the extent that such rents are received by the ExchangeRight Portfolio 50 Borrower (or ExchangeRight Portfolio 50 Master Tenant or property manager), cause such amounts to be deposited into the lockbox account within one business day following receipt. The lockbox account bank is required to sweep such funds into the ExchangeRight Portfolio 50 Master Tenant’s operating account on each business day other than during a Cash Management Period. During a Cash Management Period, and provided no event of default is continuing, funds in the cash management account are required to be applied (i) to make the next monthly deposits (to the extent required) into the real estate taxes and insurance reserves as described above under “Escrows and Reserves”, (ii) to reserve the next monthly debt service payment due on the ExchangeRight Portfolio 50 Mortgage Loan, (iii) to make the next monthly deposits into the replacement reserve and the TI/LC reserve (to the extent required) as described above under “Escrows and Reserves”, (iv) to pay operating expenses set forth in the annual budget (which is required to be reasonably approved by the lender during a Cash Management Period) and additional operating expenses reasonably approved by the lender and (v) to deposit any remainder into a cash collateral subaccount to be held as additional security for the ExchangeRight Portfolio 50 Mortgage Loan during such Cash Management Period. Upon cessation of a Cash Management Period, all available amounts on deposit in the cash management account must be released to the ExchangeRight Portfolio 50 Borrower or ExchangeRight Portfolio 50 Master Tenant.
A “Cash Management Period” means a period:
| (i) | commencing when the debt service coverage ratio (based on net cash flow for the trailing 12 months) as of the end of any calendar quarter is less than 1.50x and ending when the debt service coverage ratio (based on net cash flow for the trailing 12 months) is at least 1.55x as of the end of each of two consecutive calendar quarters, or |
| (ii) | commencing on October 1, 2028 (36 months before the maturity date of the ExchangeRight Portfolio 50 Mortgage Loan), unless a Qualified Transfer has occurred as of such date (see “The Borrower and the Borrower Sponsor” above), and ending when a Qualified Transfer occurs. |
Additional Secured Indebtedness (not including trade debts). None.
Mezzanine Loan and Preferred Equity. Not permitted.
Release of Property. Not permitted.
Real Estate Substitution. Not permitted.
Letter of Credit. None.
Right of First Offer/Right of First Refusal. The related single tenant at each of the following five ExchangeRight Properties has a right of first refusal (“ROFR”) to purchase the related ExchangeRight Property: Walgreens - Bossier City (Airline), LA, Family Dollar - South Point (Solida), OH, Family Dollar - Warren (Youngstown), OH, Walgreens - Broussard (Saint Nazaire), LA, Walgreens - Fresno (Blackstone), CA. In addition, the related single tenant at the following five ExchangeRight Properties has a right of first offer (“ROFO”) to purchase the related ExchangeRight Property: First Midwest Bank - Highland (Indianapolis), IN, First Midwest Bank - Joliet (2801 Jefferson), IL, First Midwest Bank - McHenry (Richmond), IL, First Midwest Bank - Mundelein (Allanson), IL, Walgreens - New Albany (New Albany), OH. No such ROFR or ROFO will apply to the mortgagee or any other party that acquires title or right of possession to the leased premises through a foreclosure, deed-in-lieu of foreclosure or any other enforcement action under the applicable mortgage, but each such ROFR or ROFO will apply to subsequent purchasers of the applicable ExchangeRight Property. See “Description of the Mortgage Pool—Tenant Issues—Purchase Options and Rights of First Refusal” in the prospectus.
Ground Lease. None.
Terrorism Insurance. The ExchangeRight Portfolio 50 Mortgage Loan documents require the borrower to obtain and maintain property insurance and business interruption insurance for 18 months plus a 12 month extended period of indemnity. Such insurance is required to cover perils of terrorism and acts of terrorism. See “Risk Factors—Risks Relating to the Mortgage Loans—Terrorism Insurance May Not Be Available for All Mortgaged Properties” in the prospectus.
This is not a research report and was not prepared by any Underwriter’s research department. Please see additional important information and qualifications at the end of this Term Sheet. |
T-62
(THIS PAGE INTENTIONALLY LEFT BLANK)
This is not a research report and was not prepared by any Underwriter’s research department. Please see additional important information and qualifications at the end of this Term Sheet. |
T-63
| Office – Suburban | Loan # 4 | Cut-off Date Balance: | | $65,400,000 |
| 14201 Dallas Parkway | International Plaza I | Cut-off Date LTV: | | 40.9% |
| Farmers Branch, TX 75254 | | UW NCF DSCR: | | 4.84x |
| | | UW NOI Debt Yield: | | 13.0% |

This is not a research report and was not prepared by any Underwriter’s research department. Please see additional important information and qualifications at the end of this Term Sheet. |
T-64
| Office – Suburban | Loan # 4 | Cut-off Date Balance: | | $65,400,000 |
| 14201 Dallas Parkway | International Plaza I | Cut-off Date LTV: | | 40.9% |
| Farmers Branch, TX 75254 | | UW NCF DSCR: | | 4.84x |
| | | UW NOI Debt Yield: | | 13.0% |

This is not a research report and was not prepared by any Underwriter’s research department. Please see additional important information and qualifications at the end of this Term Sheet. |
T-65
| Mortgage Loan No. 4 – International Plaza I |
| Mortgage Loan Information | | Property Information |
| Mortgage Loan Seller: | BANA | | Single Asset/Portfolio: | Single Asset |
| Credit Assessment (Fitch/KBRA/S&P): | NR/NR/NR | | Location: | Farmers Branch, TX 75254 |
| Original Balance: | $65,400,000 | | General Property Type: | Office |
| Cut-off Date Balance: | $65,400,000 | | Detailed Property Type: | Suburban |
| % of Initial Pool Balance: | 5.1% | | Title Vesting: | Fee |
| Loan Purpose: | Acquisition | | Year Built/Renovated: | 1998 / 2020 |
| Borrower Sponsor: | Related Fund Management, LLC | | Size(3): | 392,201 SF |
| Guarantor(1): | International Plaza I Owner LLC | Cut-off Date Balance PSF(3): | $167 |
| Mortgage Rate: | 2.4350% | Maturity Date Balance PSF(3): | $167 |
| Note Date: | 8/11/2021 | | Property Manager: | RFM Development Manager, LLC |
| First Payment Date: | 10/1/2021 | | | (Manager - borrower-related); Cushman |
| Maturity Date: | 9/1/2031 | | | & Wakefield U.S., Inc. (Sub-manager) |
| Original Term to Maturity: | 120 months | | | |
| Original Amortization Term: | 0 months | | Underwriting and Financial Information(4) |
| IO Period: | 120 months | | UW NOI: | $8,495,329 |
| Seasoning: | 1 month | | UW NOI Debt Yield: | 13.0% |
| Prepayment Provisions: | L(25), D(88), O(7) | | UW NOI Debt Yield at Maturity: | 13.0% |
| Lockbox/Cash Mgmt Status: | Hard/Springing | | UW NCF DSCR: | 4.84x |
| Additional Debt Type: | NAP | | Most Recent NOI(5): | NAP |
| Additional Debt Balance: | NAP | | 2nd Most Recent NOI(5): | NAP |
| Future Debt Permitted (Type): | No (NAP) | | 3rd Most Recent NOI(5): | NAP |
| Reserves(2) | | Most Recent Occupancy: | 100.0% (10/1/2021) |
| Type | Initial | Monthly | Cap | | 2nd Most Recent Occupancy(5): | NAP |
| RE Taxes: | $0 | Springing | NAP | | 3rd Most Recent Occupancy(5): | NAP |
| Insurance: | $0 | Springing | NAP | | Appraised Value (as of)(6): | $160,000,000 (7/13/2021) |
| Replacement Reserve: | $0 | Springing | NAP | | Appraised Value PSF(3): | $408 |
| TI/LC Reserve: | $0 | Springing | NAP | | Cut-off Date LTV Ratio(6): | 40.9% |
| Free Rent Reserve | $1,699,442 | $0 | NAP | | Maturity Date LTV Ratio(6): | 40.9% |
| | | | | | | | |
| Sources and Uses |
| Sources | Proceeds | % of Total | | Uses | Proceeds | % of Total |
| Loan Amount: | $65,400,000 | 40.7% | | Purchase Price: | $157,500,000 | 98.1% |
| Borrower Equity: | $95,157,336 | 59.3% | | Reserves: | $1,699,442 | 1.1% |
| | | | | Closing Costs: | $1,357,894 | 0.8% |
| Total Sources: | $160,557,336 | 100.0% | | Total Uses: | $160,557,336 | 100.0% |
| (1) | There is no non-recourse carveout guarantor and no environmental indemnitor (other than the borrower) for the International Plaza I Mortgage Loan (as defined below). While the borrower is obligated under the non-recourse carveout provisions in the loan agreement, no separate guaranty was executed by the borrower. |
| (2) | See “Escrows and Reserves” below for further discussion of reserve information. |
| (3) | The International Plaza I Property (as defined below) is comprised of a 371,974 SF office building leased to a single tenant, Tenet Healthcare. Tenet Healthcare’s lease also encumbers an allocated 20,227 SF of amenity space available via a reciprocal easement agreement with the adjacent International Plaza II building. The lender’s underwriting and all PSF metrics as presented are based on the total area leased by Tenet Healthcare of 392,201 SF. |
| (4) | The novel coronavirus pandemic is an evolving situation and could impact the International Plaza I Mortgage Loan more severely than assumed in the underwriting of the International Plaza I Mortgage Loan. The pandemic and resulting economic disruption could also adversely affect the NOI, NCF and occupancy information, as well as the appraised value and DSCR, LTV and Debt Yield metrics presented above and herein. See “Risk Factors—Risks Related to Market Conditions and Other External Factors—The Coronavirus Pandemic Has Adversely Affected the Global Economy and Will Likely Adversely Affect the Performance of the Mortgage Loans” in the prospectus. |
| (5) | Further historical information is not available for the International Plaza I Property because the single tenant, Tenet Healthcare, had a lease commencement date of February 29, 2020. The rents for Tenet Healthcare have been partially abated for the first three years of the lease. For the first lease year, full rent was abated through February 28, 2021. In the current (second) lease year, base rent is abated on 92,201 SF through February 28, 2022. For the third lease year (March 1, 2022 - February 28, 2023), the base rent is abated on 42,201 SF. At loan origination, the lender reserved $1,699,442, which represents the full amount of outstanding rent abatements. |
| (6) | The appraisal also provided a “Hypothetical Go Dark” value of $82,600,000 as of July 13, 2021, which value would result in an Appraised Value PSF, Cut-off Date LTV Ratio and Maturity Date/ARD LTV Ratio of $211, 79.2% and 79.2%, respectively, based on the principal balance of the International Plaza I Mortgage Loan. |
The Mortgage Loan. The fourth largest mortgage loan (the “International Plaza I Mortgage Loan”) is evidenced by a promissory note in the original principal balance of $65,400,000. The International Plaza I Mortgage Loan is secured by a first priority fee mortgage encumbering a 371,974 SF suburban office property located in Farmers Branch, Texas (the “International Plaza I Property”).
The Borrower and the Borrower Sponsor. The borrower is International Plaza I Owner LLC, a Delaware limited liability company structured to be bankruptcy-remote with at least two independent directors. The borrower sponsor is Related Fund Management, LLC.
The borrowing entity and the borrower sponsor are affiliates of Related Companies, L.P. The Related Companies, L.P. is a New York City based, vertically integrated real estate firm that was founded in 1972. The firm has an extensive track record in the development, construction, acquisition, finance and management of real estate assets. Over the course of its 49-year history, Related Companies, L.P has invested in major urban markets such as Boston, Chicago, Los Angeles, Miami, New York and San Francisco.
This is not a research report and was not prepared by any Underwriter’s research department. Please see additional important information and qualifications at the end of this Term Sheet. |
T-66
| Office – Suburban | Loan # 4 | Cut-off Date Balance: | | $65,400,000 |
| 14201 Dallas Parkway | International Plaza I | Cut-off Date LTV: | | 40.9% |
| Farmers Branch, TX 75254 | | UW NCF DSCR: | | 4.84x |
| | | UW NOI Debt Yield: | | 13.0% |
The Property. The International Plaza I Property is a 13-story, 371,974 SF suburban office property, with a 1,133-space parking deck, located on a 4.04-acre site in Farmers Branch, Dallas County, Texas. The International Plaza I Property is part of a three-building office campus (comprised of International Plaza I, II & III). International Plaza I is 100% leased to Tenet Healthcare. Tenet Healthcare’s lease encumbers a total of 392,201 SF, which includes the entire International Plaza I Property plus an allocated 20,227 SF of amenity space available via a reciprocal easement agreement with the adjacent (and connected) International Plaza II building. The total amenity space is 41,390 SF, of which Tenet Healthcare pays rent for 48.87% or an allocated 20,227 SF. The amenities include a fitness center with locker rooms and towel service, café and bar with indoor and outdoor seating, conference centers, full-floor food hall, tenant lounges, and the Lake House, an indoor and outdoor gathering space. Other amenities include 24/7 lobby security, as well as parking deck patrol and security and surveillance cameras surrounding the International Plaza I Property.
The International Plaza I Property was originally built in 1998 and was renovated in 2020 by the previous owner and the sole tenant, Tenet Healthcare. For the renovation of its leased space, the tenant reportedly contributed $29.5 million ($75 PSF) in addition to the $29.4 million provided by the landlord.
Single Tenant.
Tenet Healthcare (392,201 SF, 100.0% of NRA, 100.0% of underwritten base rent). Tenet Healthcare (NYSE: THC), founded in 1969, is a Fortune 500 nationally diversified healthcare services company. Through an expansive care network that includes United Surgical Partners International (“USPI”) and Conifer Health Solutions (“Conifer”), the company operates 65 hospitals and approximately 500 other healthcare facilities, including surgical hospitals, ambulatory surgery centers, urgent care, imaging centers and other outpatient facilities. Tenet Healthcare owns USPI and Conifer. USPI operates the largest ambulatory platform in the country. With over 400 facilities across the United States, USPI serves over 2.7 million patients each year. Conifer provides revenue cycle management and value-based care services to hospitals, health systems, physician practices, employers and other customers, and helps more than 680 unique client entities in 135 local regions across the nation. Conifer manages more than $25 billion in net patient revenue annually, supports management for more than 5.9 million people and has 110,000 employees supporting clients across multiple healthcare industries. Tenet Healthcare reported revenue of $17.6 billion, net earnings of $399 million and liquidity of $2.4 billion as of year-end 2020.
Tenet Healthcare occupies the International Plaza I Property for use as its corporate headquarters. Tenet Healthcare also operates a 2,300 SF urgent care facility on the ground floor. The tenant’s lease is on a triple net basis, commenced in February 2020 and expires in March 2036, with no termination or contraction options. Tenet Healthcare has the right to extend the term for one additional period of 10 years and following that expiration, one additional option to extend for either 5 or 10 years, at market rate upon 12 months’ prior notice. Tenet Healthcare is currently paying $23.00 PSF, which will increase to $23.52 in March 2022. The lease is structured with 2.2% - 2.3% annual rent increases. The rents for Tenet Healthcare have been fully abated for the first year of the lease and partially abated for the second and third years of the lease. In the current (second) lease year, base rent is abated on 92,201 SF through February 28, 2022. For the third lease year (March 1, 2022 - February 28, 2023), the base rent is abated on 42,201 SF. At loan origination, the lender reserved $1,699,442, which represents the full amount of outstanding rent abatements. Tenet Healthcare’s lease is guaranteed by Tenet Healthcare Corporation.
The following table presents certain information relating to the single tenant at the International Plaza I Property:
| Tenant Summary(1) |
| Tenant Name | Credit Rating (Fitch/
Moody’s/ S&P)(2) | Tenant SF | Approx. %
of SF | Annual UW
Rent | % of Total
Annual
UW Rent | Annual
UW Rent
PSF | Lease Exp. | Renewal
Options | Term. Options |
| Tenet Healthcare | B+/B1/B | 392,201 | 100.0% | $9,224,568 | 100.0% | $23.52 | 3/31/2036 | Y(3) | N |
| (1) | Information is based on the underwritten rent roll. |
| (2) | Ratings are of the parent company, Tenet Healthcare Corporation, who guarantees the lease. |
| (3) | Tenet Healthcare has the right to extend the term of its lease for one additional period of 10 years and following that expiration, one additional option to extend for either 5 or 10 years upon 12 months’ prior written notice. |
This is not a research report and was not prepared by any Underwriter’s research department. Please see additional important information and qualifications at the end of this Term Sheet. |
T-67
| Office – Suburban | Loan # 4 | Cut-off Date Balance: | | $65,400,000 |
| 14201 Dallas Parkway | International Plaza I | Cut-off Date LTV: | | 40.9% |
| Farmers Branch, TX 75254 | | UW NCF DSCR: | | 4.84x |
| | | UW NOI Debt Yield: | | 13.0% |
The following table presents certain information relating to the lease rollover schedule at the International Plaza I Property:
| Lease Rollover Schedule(1) |
| Year | # of
Leases Rolling | SF Rolling | UW Rent PSF
Rolling | Approx. % of
Total SF Rolling | Approx.
Cumulative %
of SF Rolling | Total UW Rent
Rolling | Approx. % of
Total Rent
Rolling | Approx.
Cumulative %
of Total Rent
Rolling |
| 2021 | 0 | 0 | $0.00 | 0.0% | 0.0% | $0 | 0.0% | 0.0% |
| 2022 | 0 | 0 | $0.00 | 0.0% | 0.0% | $0 | 0.0% | 0.0% |
| 2023 | 0 | 0 | $0.00 | 0.0% | 0.0% | $0 | 0.0% | 0.0% |
| 2024 | 0 | 0 | $0.00 | 0.0% | 0.0% | $0 | 0.0% | 0.0% |
| 2025 | 0 | 0 | $0.00 | 0.0% | 0.0% | $0 | 0.0% | 0.0% |
| 2026 | 0 | 0 | $0.00 | 0.0% | 0.0% | $0 | 0.0% | 0.0% |
| 2027 | 0 | 0 | $0.00 | 0.0% | 0.0% | $0 | 0.0% | 0.0% |
| 2028 | 0 | 0 | $0.00 | 0.0% | 0.0% | $0 | 0.0% | 0.0% |
| 2029 | 0 | 0 | $0.00 | 0.0% | 0.0% | $0 | 0.0% | 0.0% |
| 2030 | 0 | 0 | $0.00 | 0.0% | 0.0% | $0 | 0.0% | 0.0% |
| 2031 | 0 | 0 | $0.00 | 0.0% | 0.0% | $0 | 0.0% | 0.0% |
| 2032 & Beyond | 1 | 392,201 | $23.52 | 100.0% | 100.0% | $9,224,568 | 100.0% | 100.0% |
| Vacant | 0 | 0 | $0.00 | 0.0% | 100.0% | $0 | 0.0% | 100.0% |
| Total/Wtd. Avg. | 1 | 392,201 | $23.52 | 100.0% | | $9,224,568 | 100.0% | |
| (1) | Information is based on the underwritten rent roll. |
COVID-19 Update. The first debt service payment on the International Plaza I Mortgage Loan is due in October 2021 and, as of September 15, 2021, the International Plaza I Mortgage Loan is not subject to any forbearance, modification or debt service relief request. As of August 19, 2021, the single tenant, Tenet Healthcare, was open and operating, has remained current on all rent and lease obligations, and has not requested any lease modification or rent relief.
The Market. The International Plaza I Property is located within the Dallas/Ft. Worth office market and the Quorum/Bent Tree office submarket and is 13.4 miles from Dallas, Texas. The International Plaza I Property is located at 14201 Dallas Parkway and is within 2 miles of I-635 and approximately a half mile from the Dallas North Tollway, which the International Plaza I Property fronts. The surrounding land uses include International Plaza Buildings II and III to the north, Providence Towers Executive Suites to the south, and Chase Bank to the east. There is significant development in the immediate area, consisting of office and industrial uses as well as multifamily complexes and single-family residential developments.
The Dallas-Fort Worth-Arlington metropolitan statistical area (the “Dallas-Fort Worth Metroplex”) is home to over 18 Fortune 500 Companies. According to a third-party market data report, the Dallas-Fort Worth Metroplex was top in the nation for total and percent job growth and ranked second in the nation for fastest growing economy. The Dallas-Fort Worth Metroplex recently surpassed Chicago to become the second-largest financial services hub in the nation, as Bank of America, JP Morgan Chase, Liberty Mutual, Goldman Sachs, State Farm, TD Ameritrade, Charles Schwab and Fidelity Investments maintain significant operations in the area. The Dallas-Fort Worth Metroplex also contains the largest information technology (“IT”) industry base in the state. This area has a large number of corporate IT projects and the presence of numerous electronics, computing and telecommunication firms such as Microsoft, Texas Instruments, HP Enterprise Services, Dell Services, Samsung, Nokia, Cisco, Fujitsu, i2, Frontier, Alcatel, Ericsson, CA, Google, and Verizon. AT&T is headquartered at the Whitacre Tower in downtown Dallas.
According to the appraisal, as of the first quarter of 2021, the Quorum/Bent Tree office submarket contained approximately 24.3 million SF of office space, with a vacancy of 21.7% and an average asking rent of $26.22 PSF. The estimated 2020 population within a one, three and five-mile radius of the International Plaza I Property was 26,452, 127,462 and 388,420, respectively, and the estimated 2020 average household income within the same radii was $74,184, $113,710 and $105,971, respectively.
This is not a research report and was not prepared by any Underwriter’s research department. Please see additional important information and qualifications at the end of this Term Sheet. |
T-68
| Office – Suburban | Loan # 4 | Cut-off Date Balance: | | $65,400,000 |
| 14201 Dallas Parkway | International Plaza I | Cut-off Date LTV: | | 40.9% |
| Farmers Branch, TX 75254 | | UW NCF DSCR: | | 4.84x |
| | | UW NOI Debt Yield: | | 13.0% |
The following table presents recent sales data for comparable single-tenant office properties to the International Plaza I Property:
| Comparable Office Sales |
Property Name Location | Year Built /
Renov. | Rentable
Area (SF) | Distance from
Subject (miles) | Sale Price | Sale Date | Sale Price
(PSF) | Cap Rate |
International Plaza I Drive Dallas, TX | 1998 / 2020 | 392,201(1) | - | $157,500,000 | Jun-2021 | $402 | 5.39%(2) |
Legacy Central IV Plano, TX | 1985 / 2017 | 215,938 | 11.4 | $88,500,000 | Oct-20 | $410 | 5.25% |
8454 Parkwood Boulevard Plano, TX | 2016 / NAP | 39,324 | 10.4 | $14,700,000 | May-20 | $374 | 6.28% |
Lone Star Building Farmers TX | 2012 / NAP | 135,999 | 0.8 | $35,000,000 | Jun-20 | $257 | 6.00% |
Pioneer Natural Resources Headquarters Irving, TX | 2019 / NAP | 1,125,366 | 8.8 | $584,200,000 | Dec-19 | $519 | 5.60% |
14372 Heritage Parkway Fort Worth, TX | 2019 / NAP | 200,351 | 28.0 | $64,000,000 | Jul-19 | $319 | 5.92% |
USAA Campus Plano, TX | 1998 / NAP | 384,071 | 9.6 | $175,000,000 | Jul-19 | $456 | 5.60% |
Source: Appraisal.
| (1) | Information obtained from underwritten rent roll. SF for Tenet Healthcare includes an allocated 20,227 SF of amenity space available via a reciprocal easement agreement with the adjacent International Plaza II building. |
| (2) | Cap Rate calculated based on the lender’s underwritten net operating income. |
The following table presents recent leasing data at comparable properties to the International Plaza I Property:
| Comparable Office Leases |
Property Name Location | Year
Built | Total NRA
(SF) | Distance from Subject (miles) | Tenant | Lease Date/ Term (yrs) | Lease Size
(SF) | Base Rent
PSF | Escalations / Free rent |
International Plaza I Dallas, TX | 1998 | 392,201(1) | - | Tenet Healthcare | Jun-19 / 17.0(1) | 392,201(1) | $23.52(1) | 2.2%-2.3% Annual / 36 months(2) |
8454 Parkwood Boulevard Plano, TX | 2016 | 39,324 | 10.4 | C.H. Robinson Worldwide, Inc. | Jan-20 / 10.0 | 39,324 | $23.50 | 2.5% Annual / NAP |
Legacy Central IV Plano, TX | 1985 | 215,938 | 11.4 | Samsung Electronics America | Feb-19 / 11.0 | 215,938 | $21.50 | 2.5% Annual / 12 months |
5401 North Beach Street Fort Worth, TX | 1994 | 431,579 | 28.1 | Lockheed Martin Corporation | May-19 / 6.0 | 431,579 | $17.25 | NAP / NAP |
14372 Heritage Parkway Fort Worth, TX | 2019 | 200,351 | 28.0 | Mercedes-Benz Financial Services USA LLC | Apr-19 / 10.3 | 200,351 | $18.92 | 2.0% Annual / NAP |
NetScout at One Bethany Allen, TX | 2018 | 145,000 | 13.3 | NetScout Systems Texas, LLC | Aug-18 / 12.0 | 145,000 | $24.50 | 2.0% Annual / 0 months |
Steward Health Care System Richardson, TX | 1997 | 165,300 | 7.5 | Steward Health Care System | Apr-18 / 10.0 | 165,300 | $19.75 | NAP / 0 months |
Source: Appraisal.
| (1) | Information obtained from the underwritten rent roll. SF for Tenet Healthcare includes an allocated 20,227 SF of amenity space available via a reciprocal easement agreement with the adjacent International Plaza II building. The appraiser concluded a market rent of $24.00 PSF. |
| (2) | The rents for Tenet Healthcare have been fully abated for the first year of the lease and partially abated for the second and third year of the lease. In the current (second) lease year, base rent is abated on 92,201 SF through February 28, 2022. For the third lease year (March 1, 2022 - February 28, 2023), the base rent is abated on 42,201 SF. |
This is not a research report and was not prepared by any Underwriter’s research department. Please see additional important information and qualifications at the end of this Term Sheet. |
T-69
| Office – Suburban | Loan # 4 | Cut-off Date Balance: | | $65,400,000 |
| 14201 Dallas Parkway | International Plaza I | Cut-off Date LTV: | | 40.9% |
| Farmers Branch, TX 75254 | | UW NCF DSCR: | | 4.84x |
| | | UW NOI Debt Yield: | | 13.0% |
Underwritten Net Cash Flow. The following table presents certain information relating to the Underwritten Net Cash Flow at the International Plaza I Property:
| Cash Flow Analysis(1) |
| UW | UW PSF |
| Gross Potential Rent(2) | $9,224,568 | $23.52 |
| Reimbursements | $5,298,991 | $13.51 |
| Other Income | $0 | $0.00 |
| (Vacancy & Concessions) | ($726,178) | ($1.85) |
| Effective Gross Income | $13,797,381 | $35.18 |
| | |
| Real Estate Taxes | $2,062,989 | $5.26 |
| Insurance | $91,297 | $0.23 |
| Other Operating Expenses | $3,147,766 | $8.03 |
| Total Operating Expenses | $5,302,052 | $13.52 |
| | |
| Net Operating Income | $8,495,329 | $21.66 |
| Replacement Reserves | $98,050 | $0.25 |
| TI/LC | $588,302 | $1.50 |
| Net Cash Flow | $7,808,977 | $19.91 |
| | |
| Occupancy % | 95.0%(3) | |
| NOI DSCR | 5.26x | |
| NCF DSCR | 4.84x | |
| NOI Debt Yield | 13.0% | |
| NCF Debt Yield | 11.9% | |
| | | |
| (1) | Historical information is not available for the International Plaza I Property because the single tenant, Tenet Healthcare, had a lease commencement date of February 2020. |
| (2) | UW Gross Potential Rent is $23.52 PSF based on a rent increase that will occur in March 2022. The rents at the property have been fully abated for the first year, and partially abated for the second and third years of the lease. Base rent is abated on 92,201 SF from March 1, 2021 through February 28, 2022 and will be abated on 42,201 SF from March 1, 2022 through February 28, 2023. At origination, the lender reserved $1,699,442, which represents the full outstanding amount of rent abatements. |
| (3) | Represents economic occupancy. The International Plaza I Property is currently 100.0% occupied. |
Escrows and Reserves.
Real Estate Taxes – During a Cash Sweep Period (as defined below), ongoing monthly real estate tax reserves are required in an amount equal to 1/12th of the real estate taxes that the lender estimates will be payable during the next 12 months.
Insurance – In the event the International Plaza I Property is no longer covered by a blanket insurance policy, during a Cash Sweep Period, the borrower is required to deposit 1/12th of the annual estimated insurance premiums monthly.
Replacement Reserve – During a Cash Sweep Period, ongoing monthly replacement reserves are required in an amount currently estimated at $8,171.
TI/LC Reserve – During a Cash Sweep Period, ongoing monthly tenant improvement and leasing commission reserves are required in an amount equal to approximately $49,025.
Free Rent Reserve – The International Plaza I Mortgage Loan documents require an upfront reserve of $1,699,442 related to rent concessions through February 2023.
Lockbox and Cash Management. The International Plaza I Mortgage Loan is structured with a hard lockbox and springing cash management upon a Cash Sweep Period. Revenues from the International Plaza I Property are required to be deposited by tenants directly into the lockbox account. During a Cash Sweep Period, funds will be transferred on each business day to the lender-controlled cash management account and disbursed according to the International Plaza I Mortgage Loan documents.
A “Cash Sweep Period” will occur during (i) the period commencing upon the occurrence of an event of default and ending upon the cure of such event of default, (ii) the period commencing at such time as the debt service coverage ratio falls below 3.00x on a trailing twelve month basis (tested quarterly), and ending upon the debt service coverage ratio being at least 3.00x on a trailing twelve month basis (tested quarterly) for two consecutive calendar quarters, and (iii) a Lease Sweep Period (as defined below); provided that the borrower may avoid any cash sweep trigger by posting cash or a letter of credit in in an amount equal to the amount that would otherwise have been collected during a Cash Sweep Period.
A “Lease Sweep Period” will occur during any period (i) commencing upon the date on which Tenet Healthcare vacates or gives notice of its intent to vacate or terminate, or goes dark, and ending upon (a) the execution and delivery of a replacement lease (or assumption of all or the applicable portion
This is not a research report and was not prepared by any Underwriter’s research department. Please see additional important information and qualifications at the end of this Term Sheet. |
T-70
| Office – Suburban | Loan # 4 | Cut-off Date Balance: | | $65,400,000 |
| 14201 Dallas Parkway | International Plaza I | Cut-off Date LTV: | | 40.9% |
| Farmers Branch, TX 75254 | | UW NCF DSCR: | | 4.84x |
| | | UW NOI Debt Yield: | | 13.0% |
of the existing lease)with an investment grade-rated entity, or any other entity acceptable to the lender, covering the applicable space (a “Replacement Tenant Cure”), or (b) $50.00 PSF on the affected space is swept into the excess cash reserve, (ii) commencing upon Tenet Healthcare defaulting on its lease and ending upon the cure of such event of default or a Replacement Tenant Cure, or (iii) commencing upon Tenet Healthcare or its parent becoming subject to insolvency proceedings and ending upon Tenet Healthcare or its parent no longer being subject to such proceedings and the Tenet Healthcare lease being affirmed or a Replacement Tenant Cure.
Additional Secured Indebtedness (not including trade debts). None.
Mezzanine Loan and Preferred Equity. Not permitted.
Release of Property. Not permitted.
Letter of Credit. None.
Right of First Offer/Right of First Refusal. None.
Ground Lease. None.
Terrorism Insurance. The borrower is required to obtain and maintain property insurance and business interruption insurance for 18 months plus a 6-month extended period of indemnity. Such insurance is required to cover perils of terrorism and acts of terrorism; provided that if TRIPRA is in effect and covers both foreign and domestic acts of terror, TRIPRA will determine the acts of terrorism for which coverage is required and the borrower will not be required to spend on terrorism insurance overage more than two times the amount of the then-current insurance premium that is payable with respect to the required property and rental loss/business income insurance (exclusive of the cost of the terrorism component of such insurance). See “Risk Factors—Risks Relating to the Mortgage Loans—Terrorism Insurance May Not Be Available for All Mortgaged Properties” in the prospectus.
This is not a research report and was not prepared by any Underwriter’s research department. Please see additional important information and qualifications at the end of this Term Sheet. |
T-71
| Property Types – Various | Loan #5 | Cut-off Date Balance: | | $60,000,000 |
| Property Addresses –- Various | Suarez Puerto Rico Industrial Portfolio | Cut-off Date LTV: | | 54.7% |
| | | U/W NCF DSCR: | | 3.53x |
| | | U/W NOI Debt Yield: | | 14.4% |
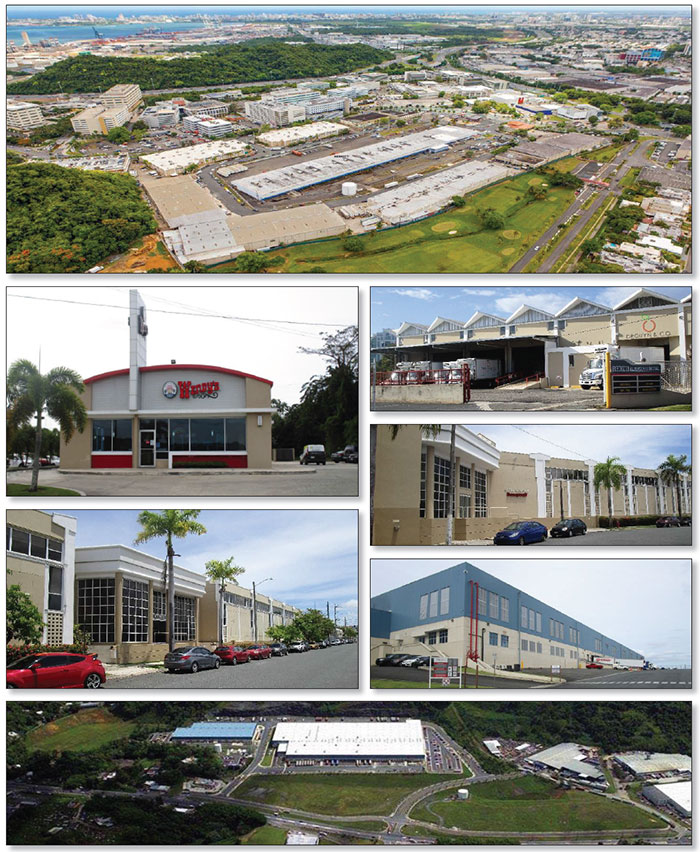
This is not a research report and was not prepared by any Underwriter’s research department. Please see additional important information and qualifications at the end of this Term Sheet. |
T-72
| Property Types – Various | Loan #5 | Cut-off Date Balance: | | $60,000,000 |
| Property Addresses –- Various | Suarez Puerto Rico Industrial Portfolio | Cut-off Date LTV: | | 54.7% |
| | | U/W NCF DSCR: | | 3.53x |
| | | U/W NOI Debt Yield: | | 14.4% |

This is not a research report and was not prepared by any Underwriter’s research department. Please see additional important information and qualifications at the end of this Term Sheet. |
T-73
| Property Types – Various | Loan #5 | Cut-off Date Balance: | | $60,000,000 |
| Property Addresses –- Various | Suarez Puerto Rico Industrial Portfolio | Cut-off Date LTV: | | 54.7% |
| | | U/W NCF DSCR: | | 3.53x |
| | | U/W NOI Debt Yield: | | 14.4% |
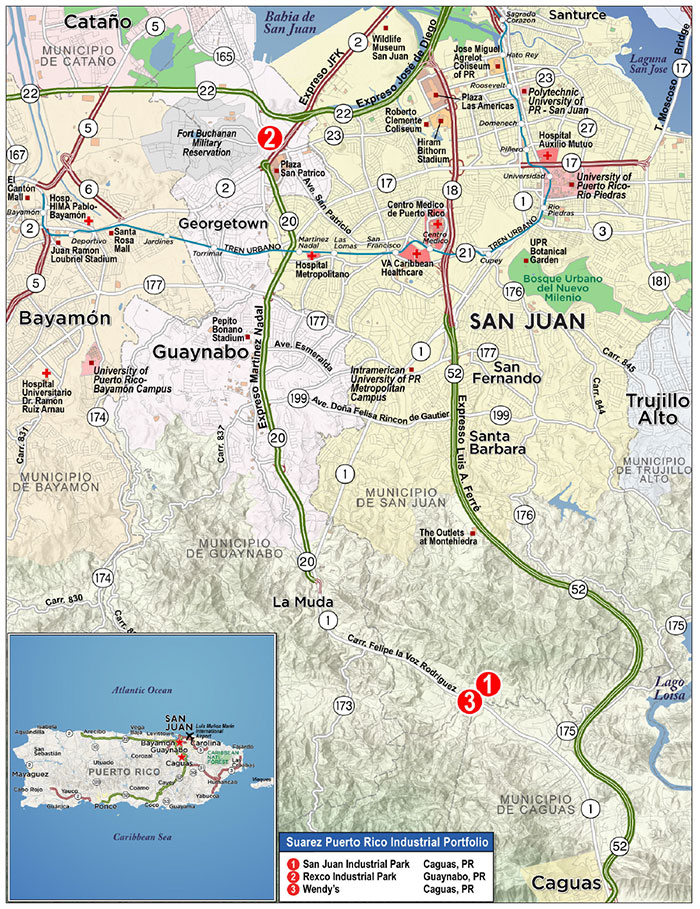
This is not a research report and was not prepared by any Underwriter’s research department. Please see additional important information and qualifications at the end of this Term Sheet. |
T-74
| Mortgage Loan No. 5 – Suarez Puerto Rico Industrial Portfolio |
| Mortgage Loan Information | | Property Information |
| Mortgage Loan Seller: | MSMCH | | Single Asset/Portfolio: | Portfolio |
| Credit Assessment (Fitch/KBRA/S&P): | NR/NR/NR | | Location: | Various, PR |
| Original Balance(1): | $60,000,000 | | General Property Type: | Various |
| Cut-off Date Balance(1): | $60,000,000 | | Detailed Property Type: | Various |
| % of Initial Pool Balance: | 4.7% | | Title Vesting: | Fee |
| Loan Purpose: | Acquisition | | Year Built/Renovated: | Various / NAP |
| Borrower Sponsors: | LatAm Property Group LLC and | | Size: | 904,406 SF |
| | Cerberus Real Estate Capital Management, LLC | | Cut-off Date Balance PSF(1): | $66 |
| Guarantors(2): | NAP | | Maturity Balance PSF(1): | $66 |
| Mortgage Rate(3): | 3.6560% | | Property Manager: | KPM Realty Advisors, Inc. dba |
| Note Date: | 8/24/2021 | | | Cushman & Wakefield/Property |
| First Payment Date: | 10/1/2021 | | | Concepts Commercial |
| Maturity Date: | 9/1/2026 | | | |
| Original Term to Maturity: | 60 months | | | |
| Original Amortization Term: | 0 months | | Underwriting and Financial Information(6) |
| IO Period: | 60 months | | UW NOI: | $8,612,032 |
| Seasoning: | 1 month | | UW NOI Debt Yield(1): | 14.4% |
| Prepayment Provisions: | YM(25),DorYM(16),O(19) | | UW NOI Debt Yield at Maturity(1): | 14.4% |
| Lockbox/Cash Mgmt Status: | Hard/In Place | | UW NCF DSCR(1): | 3.53x |
| Additional Debt Type(1)(4): | Subordinate Debt | | Most Recent NOI: | $9,467,897 (12/31/2020) |
| Additional Debt Balance(1)(4): | $24,950,000 | | 2nd Most Recent NOI: | $9,193,587 (12/31/2019) |
| Future Debt Permitted (Type): | No (NAP) | | 3rd Most Recent NOI: | NAP |
| Reserves(5) | | Most Recent Occupancy: | 92.9% (8/10/2021) |
| Type | Initial | Monthly | Cap | | 2nd Most Recent Occupancy: | 98.3% (12/31/2020) |
| RE Taxes: | $0 | $63,497 | NAP | | 3rd Most Recent Occupancy: | 98.9% (12/31/2019) |
| Insurance: | $0 | Springing | NAP | | Appraised Value (as of): | $109,700,000 (4/6/2021) |
| Required Repairs Reserve: | $248,930 | $0 | NAP | | Appraised Value PSF: | $121 |
| Cap Ex and TI/LC Reserve: | $0 | $37,684 | $1,000,000 | | Cut-off Date LTV Ratio(1): | 54.7% |
| Unfunded Obligations Reserve: | $50,000 | $0 | NAP | | Maturity Date LTV Ratio(1): | 54.7% |
| | | | | | | | |
| Sources and Uses |
| Sources | Proceeds | % of Total | | Uses | Proceeds | % of Total |
| Senior Loan Amount(1): | $60,000,000 | 52.1% | | Purchase Price: | $107,000,000 | 93.0% |
| Subordinate Loan Amount(1): | $24,950,000 | 21.7% | | Closing Costs: | $7,269,841 | 6.3% |
| Borrower Equity: | $30,135,656 | 26.2% | | Reserves: | $815,815 | 0.7% |
| Total Sources: | $115,085,656 | 100.0% | | Total Uses: | $115,085,656 | 100.0% |
| (1) | The Suarez Puerto Rico Industrial Portfolio Mortgage Loan (as defined below) is part of the Suarez Puerto Rico Industrial Portfolio Whole Loan (as defined below), which is comprised of one senior promissory note with an original principal balance of $60,000,000, and one subordinate promissory note with an original principal balance of $24,950,000 (the “Suarez Puerto Rico Industrial Portfolio Subordinate Companion Loan”). The Cut-off Date Balance PSF, Maturity Date Balance PSF, UW NOI Debt Yield, UW NOI Debt Yield at Maturity, UW NCF DSCR, Cut-off Date LTV Ratio and Maturity Date LTV Ratio numbers presented above are based on the Cut-off Date principal balance of the Suarez Puerto Rico Industrial Portfolio Mortgage Loan, without regard to the Suarez Puerto Rico Industrial Portfolio Subordinate Companion Loan. The Cut-off Date Balance PSF, Maturity Date Balance PSF, UW NOI Debt Yield, UW NOI Debt Yield at Maturity, UW NCF DSCR, Cut-off Date LTV Ratio and Maturity Date LTV Ratio numbers based on the entire Suarez Puerto Rico Industrial Portfolio Whole Loan are $94, $94, 10.1%, 10.1%, 2.00x, 77.4% and 77.4%, respectively. |
| (2) | There is no non-recourse carveout guarantor, and no environmental indemnitor (other than the single purpose entity borrowers), for the Suarez Puerto Rico Industrial Portfolio Whole Loan. |
| (3) | Reflects the Suarez Puerto Rico Industrial Portfolio Mortgage Loan only. The Suarez Puerto Rico Industrial Portfolio Subordinate Companion Loan bears interest at the rate of 6.75% per annum. |
| (4) | See "The Mortgage Loan" and "Additional Secured Indebtedness (not including trade debts)" below for further discussion of additional debt. |
| (5) | See “Escrows and Reserves” below for further discussion of reserve requirements. |
| (6) | The novel coronavirus pandemic is an evolving situation and could impact the Suarez Puerto Rico Industrial Portfolio Whole Loan more severely than assumed in the underwriting of the Suarez Puerto Rico Industrial Portfolio Whole Loan and could adversely affect the NOI, NCF and occupancy information, as well as the appraised value and the DSCR, LTV and Debt Yield metrics presented above and herein. See "Risk Factors—Risks Related to Market Conditions and Other External Factors—The Coronavirus Pandemic Has Adversely Affected the Global Economy and Will Likely Adversely Affect the Performance of the Mortgage Loans" in the prospectus. |
The Mortgage Loan. The fifth largest mortgage loan (the “Suarez Puerto Rico Industrial Portfolio Mortgage Loan”) is part of a whole loan (the “Suarez Puerto Rico Industrial Portfolio Whole Loan”) in the original principal balance of $84,950,000. The Suarez Puerto Rico Industrial Portfolio Whole Loan is comprised of the Suarez Puerto Rico Industrial Portfolio Mortgage Loan, evidenced by promissory note A in the original principal amount of $60,000,000, and the Suarez Puerto Rico Industrial Portfolio Subordinate Companion Loan, evidenced by promissory note B in the original principal amount of $24,950,000. The Suarez Puerto Rico Industrial Portfolio Whole Loan was originated by Morgan Stanley Bank, N.A., as to the Suarez Puerto Rico Industrial Portfolio Mortgage Loan, and Morgan Stanley Mortgage Capital Holdings LLC, as to the Suarez Puerto Rico Industrial Portfolio Subordinate Companion Loan. The Suarez Puerto Rico Industrial Portfolio Whole Loan is secured by a first priority fee mortgage encumbering a portfolio of two industrial properties and one leased fee property totaling 904,406 SF, which are located in Guaynabo, Puerto Rico and Caguas, Puerto Rico (the “Suarez Puerto Rico Industrial Portfolio” or the “Suarez Puerto Rico Industrial Portfolio Properties”). The Suarez Puerto Rico Industrial Portfolio Whole Loan will be serviced pursuant to the pooling and servicing agreement for the BANK 2021-BNK36 securitization trust. See “Description of the Mortgage Pool—The Whole Loans—The Suarez Puerto Rico Industrial Portfolio A/B Whole Loan” in the prospectus.
This is not a research report and was not prepared by any Underwriter’s research department. Please see additional important information and qualifications at the end of this Term Sheet. |
T-75
| Property Types – Various | Loan #5 | Cut-off Date Balance: | | $60,000,000 |
| Property Addresses –- Various | Suarez Puerto Rico Industrial Portfolio | Cut-off Date LTV: | | 54.7% |
| | | U/W NCF DSCR: | | 3.53x |
| | | U/W NOI Debt Yield: | | 14.4% |
| Suarez Puerto Rico Industrial Portfolio Whole Loan Summary |
| Notes | Original Balance | Cut-off Date Balance | Note Holder | Controlling Piece |
| A | $60,000,000 | $60,000,000 | BANK 2021-BNK36 | No |
| B | $24,950,000 | $24,950,000 | Third party holder | Yes(1) |
| Total Whole Loan | $84,950,000 | $84,950,000 | | |
| (1) | Pursuant to the related co-lender agreement, the holder of Note B is the controlling noteholder unless a “control appraisal period” has occurred and is continuing under the co-lender agreement, in which case Note A will become the controlling noteholder. See “Description of the Mortgage Pool—The Whole Loans—The Suarez Puerto Rico Industrial Portfolio A/B Whole Loan” in the prospectus. |
The Borrowers and the Borrower Sponsors. The borrowers are CLPG SJIP 1 LLC, CLPG SJIP 2 LLC and CLPG Rexco LLC, each a single purpose Puerto Rico limited liability company structured to be bankruptcy remote with two independent directors in its organizational structure. There is no non-recourse carveout guarantor, and no environmental indemnitor (other than the single purpose entity borrowers), for the Suarez Puerto Rico Industrial Portfolio Whole Loan. The borrower sponsors are LatAm Property Group LLC and Cerberus Real Estate Capital Management, LLC. Cerberus Real Estate Capital Management, LLC, founded in 1992, is an investment firm that manages credit, private equity and real estate assets worldwide. Cerberus Real Estate Capital Management, LLC is headquartered in New York City and has more than 785 employees working from 23 offices worldwide. LatAm Property Group LLC was founded in 2017 by Barry Breeman, Gary M. Kravetz and Mark Lipschutz and is an investment firm that specializes in real estate investments in Latin America. Since 1998, Barry Breeman has solely concentrated on the acquisition, finance, operation and disposition of real property and real estate related assets in Puerto Rico, other Caribbean islands and Central America. Prior to founding LatAm Property Group, Gary M. Kravetz served as General Counsel and Chief Compliance Officer of Jadian Capital, LP, as well as Managing Director of Tishman Speyer and General Counsel for its Emerging Markets Group.
The Properties. The Suarez Puerto Rico Industrial Portfolio Properties are comprised of two multi-tenant industrial properties and one leased fee property totaling approximately 904,406 SF, located in two cities, in Puerto Rico, including Caguas (57.2% of NRA; 65.6% of underwritten base rent), and Guaynabo (42.8% of total NRA; 34.4% of underwritten base rent). The Suarez Puerto Rico Industrial Portfolio Properties have 24 tenants, with no single tenant accounting for more than 33.6% of the Suarez Puerto Rico Industrial Portfolio NRA. The Suarez Puerto Rico Industrial Portfolio’s ten largest tenants by underwritten base rent comprise 81.3% of NRA and 89.7% of the underwritten base rent. The largest three tenants in the Suarez Puerto Rico Industrial Portfolio, Cesar Castillo, FEMA and Islandwide, comprise 53.6% of Suarez Puerto Rico Industrial Portfolio NRA and 59.1% of Suarez Puerto Rico Industrial Portfolio underwritten base rent.
San Juan Industrial Park
The San Juan Industrial Park property is comprised of two industrial warehouse buildings totaling 517,536 SF of industrial and office space situated on an approximately 37.86-acre site. The San Juan Industrial Park property is located in the Quebrada Arenas Ward of Caguas, Puerto Rico. Built in 2005, the San Juan Industrial Park property features 519 automobile parking spaces and 134 trailer parking spaces. There is a non-collateral vacant lot adjacent to the property where an additional building is expected to be developed. The San Juan Industrial Park property is currently 100.0% leased to six tenants. With respect to the San Juan Industrial Park property, industrial warehouse tenants account for 93.7% of NRA and 90.2% of underwritten base rent and office tenants account for 6.3% of NRA and 9.8% of underwritten base rent. The largest tenant, Cesar Castillo, leases 304,091 SF, and represents 33.6% of Suarez Puerto Rico Industrial Portfolio NRA and 32.4% of Suarez Puerto Rico Industrial Portfolio underwritten base rent, and has a lease expiration of May 31, 2030. The second largest tenant, FEMA, leases 116,295 SF, and represents 12.9% of Suarez Puerto Rico Industrial Portfolio NRA and 21.5% of Suarez Puerto Rico Industrial Portfolio underwritten base rent, and has 32,000 SF expiring October 30, 2021, and 84,295 SF expiring February 28, 2022, and has an ongoing right to terminate its leases as set forth below under “Tenant Summary.”
Rexco Industrial Park
The Rexco Industrial Park property is comprised of seven industrial warehouse buildings, two office buildings and four surface parking lots totaling 386,869 SF situated on an approximately 20.48-acre site. The Rexco Industrial Park property is located in Guaynabo, Puerto Rico. Built in stages between 1963 and 1983, the Rexco Industrial Park property features 800 parking spaces. The Rexco Industrial Park property is currently 83.5% leased to 17 tenants. With respect to the Rexco Industrial Park property, industrial warehouse tenants account for 75.7% of NRA and 86.0% of underwritten base rent and office tenants account for 7.8% of NRA and 14.0% of underwritten base rent. The largest tenant, Islandwide, leases 64,553 SF, represents 7.1% of Suarez Puerto Rico Industrial Portfolio NRA and 5.3% of Suarez Puerto Rico Industrial Portfolio underwritten base rent, and has a lease expiration of February 28, 2025. The second largest tenant, Drouyn Co., leases 49,697 SF, represents 5.5% of Suarez Puerto Rico Industrial Portfolio NRA and 4.9% of Suarez Puerto Rico Industrial Portfolio underwritten base rent, and has 7,853 SF expiring January 31, 2025 and 41,844 SF expiring June 30, 2025.
Wendy's
The Wendy’s property consists of a parcel of land located in Caguas, Puerto Rico, behind the San Juan Industrial Park, which is encumbered by a ground lease with Wendco of Puerto Rico, Inc. (“Wendy’s”), that commenced on January 1, 2010 and expires on December 31, 2030, with three five-year extension options (the “Ground Lease”). Wendy’s owns the improvements currently located on the Wendy’s property during the term of the Ground Lease. Wendy’s is required to pay annual ground rent in the current amount of $103,950.
This is not a research report and was not prepared by any Underwriter’s research department. Please see additional important information and qualifications at the end of this Term Sheet. |
T-76
| Property Types – Various | Loan #5 | Cut-off Date Balance: | | $60,000,000 |
| Property Addresses –- Various | Suarez Puerto Rico Industrial Portfolio | Cut-off Date LTV: | | 54.7% |
| | | U/W NCF DSCR: | | 3.53x |
| | | U/W NOI Debt Yield: | | 14.4% |
The following table presents certain information relating to the three properties in the Suarez Puerto Rico Industrial Portfolio.
| Portfolio Summary |
Property City, State | Property
Sub-Type | Year Built / Renovated | SF(1) | Occ % | ALA(2) | % of
ALA(2) | % of
Total
UW
Base Rent(3) | Appraised
Value | UW NOI | % of Total UW
NOI |
San Juan Industrial Park Caguas, Puerto Rico | Warehouse | 2005/ NAP | 517,536 | 100.0% | $40,188,346 | 67.0% | 64.5% | $64,300,000 | $5,523,959 | 64.1% |
Rexco Industrial Park Guaynabo, Puerto Rico | Flex | 1963 -1983/ NAP | 386,869 | 83.5% | $19,317,245 | 32.2% | 34.4% | $44,200,000 | $3,028,770 | 35.2% |
Wendy’s Caguas, Puerto Rico | Leased Fee | 2011/ NAP | 1 | 100.0% | $494,408 | 0.8% | 1.1% | $1,200,000 | $59,303 | 0.7% |
| Total | | | 904,406 | | $60,000,000 | 100.0% | 100.0% | $109,700,000 | $8,612,032 | 100.0% |
| (1) | Wendy’s is a leased fee interest and is assigned 1 SF of NRA. |
| (2) | Based solely on the Suarez Puerto Rico Industrial Portfolio Mortgage Loan, and excludes the Suarez Puerto Rico Industrial Portfolio Subordinate Companion Loan. |
| (3) | % of Total UW Base Rent is based on the underwritten rent roll dated as of August 10, 2021. |
The following table presents a summary regarding the major tenants at the Suarez Puerto Rico Industrial Portfolio Properties:
| Tenant Summary |
| Tenant | Property Name | Credit Ratings (Moody’s/Fitch/
S&P)(1) | Tenant SF | Approx.% of Total Portfolio SF | Annual UW Base Rent(2) | Annual UW Base Rent PSF | App. % of Total Portfolio Annual UW Base Rent | Termination Options | Lease Expiration |
| Cesar Castillo | San Juan Industrial Park | NR / NR / NR | 304,091 | 33.6% | $2,979,659 | $9.80 | 32.4% | N | 5/31/30 |
| FEMA | San Juan Industrial Park | Aaa / AAA / AA+ | 116,295 | 12.9% | $1,974,454 | $16.98 | 21.5% | Y(3) | (4) |
| Islandwide | Rexco Industrial Park | NR / NR / NR | 64,553 | 7.1% | $484,148 | $7.50 | 5.3% | N | 2/28/25 |
| Electrolux | San Juan Industrial Park | NR / NR / A- | 50,323 | 5.6% | $447,875 | $8.90 | 4.9% | N | 6/30/23 |
| Drouyn Co. | Rexco Industrial Park | NR / NR / NR | 49,697 | 5.5% | $452,243 | $9.10 | 4.9% | N | (5) |
| Trane | San Juan Industrial Park | Baa2 / NR / BBB | 41,628 | 4.6% | $478,722 | $11.50 | 5.2% | Y(6) | 2/28/23 |
| Baxter Sales & Dist. Corp. | Rexco Industrial Park | NR / NR / NR | 33,476 | 3.7% | $435,188 | $13.00 | 4.7% | N | 2/28/25 |
| Conduent | Rexco Industrial Park | NR / NR / B+ | 30,132 | 3.3% | $444,447 | $14.75 | 4.8% | Y(7) | 12/31/22 |
| Honeywell International | Rexco Industrial Park | A2 / A / A | 29,478 | 3.3% | $336,585 | $11.42 | 3.7% | Y(8) | (9) |
| Destileria Serralles | Rexco Industrial Park | NR / NR / NR | 15,222 | 1.7% | $219,958 | $14.45 | 2.4% | N | 7/31/26 |
| Subtotal / Wtd. Avg. | | | 734,895 | 81.3% | $8,253,278 | $11.23 | 89.7% | | |
| | | | | | | | | | |
| Remaining Tenants | | | 105,564 | 11.7% | $946,724 | $8.97 | 10.3% | | |
| Subtotal / Wtd. Avg. Occupied | | | 840,459 | 92.9% | $9,200,002 | $10.94 | 100.0% | | |
| Vacant Space | | | 63,947 | 7.1% | | | | | |
| Total/Wtd. Avg. | | | 904,406 | 100.0% | | | | | |
| (1) | Certain ratings are those of the parent company or government entity whether or not the parent guarantees the lease. |
| (2) | Annual UW Base Rent is based on the underwritten rent roll dated as of August 10, 2021. |
| (3) | FEMA has the right to terminate its 84,295 SF lease at any time upon 120 days’ notice, without payment of a termination fee, and has the right to terminate its 32,000 SF lease at any time upon 30 days’ notice, without payment of a termination fee. In addition, if FEMA fails to occupy its space for any period, rent for such period will be reduced by the portion of costs PSF of operating rent not required to maintain the space. |
| (4) | FEMA leases three suites at the San Juan Industrial Park. The lease for suite M3 (32,000 SF) has an expiration date of October 30, 2021, and the leases for suite M4a (72,615 SF) and suite M4b (11,680 SF) have an expiration date of February 28, 2022. |
| (5) | Drouyn Co. leases four suites at the San Juan Industrial Park. The lease for suite Anx3-1 (7,853 SF) has an expiration date of January 31, 2025, and the leases for suite SM5-2 (18,457 SF), suite GW-4 (12,103 SF) and suite GW-5 (11,284 SF) have an expiration date of June 30, 2025. |
| (6) | Trane has the right to terminate its 41,628 SF lease at any time upon 180 days’ notice, with payment of a termination fee equal to 6 months of the monthly base rental amount in effect as of the date of the termination notice. |
| (7) | Conduent has the right to terminate its lease at any time upon 90 days’ notice and payment of an early termination penalty equal to two months of base rent plus operating expenses, unamortized broker commissions and unamortized tenant improvement allowances at an interest rate equal to the prime rate based on New York City plus 1%. |
| (8) | Honeywell International has the right to terminate its 12,525 SF lease at any time upon 4 months’ notice, with payment of a termination fee equal to the sum of (a) the unamortized portion of the leasing commissions paid by the landlord in connection with the lease, (b) the unamortized portion of the landlord’s contribution, and (c) 6 months of base rent. |
| (9) | Honeywell International leases two suites at the Rexco Industrial Park. The lease for suite SM1-2 (16,953 SF) has an expiration date of June 30, 2022, and the lease for suite Anx3-3 (12,525 SF) has an expiration date of November 30, 2021. |
This is not a research report and was not prepared by any Underwriter’s research department. Please see additional important information and qualifications at the end of this Term Sheet. |
T-77
| Property Types – Various | Loan #5 | Cut-off Date Balance: | | $60,000,000 |
| Property Addresses –- Various | Suarez Puerto Rico Industrial Portfolio | Cut-off Date LTV: | | 54.7% |
| | | U/W NCF DSCR: | | 3.53x |
| | | U/W NOI Debt Yield: | | 14.4% |
The following table presents certain information relating to the lease rollover at the Suarez Puerto Rico Industrial Portfolio Properties:
| Lease Rollover Schedule(1)(2) |
| Year | # of Leases Rolling | SF Rolling | Annual UW Rent PSF Rolling | Approx. % of Total SF Rolling | Approx. Cumulative % of SF Rolling | Total UW
Rent Rolling | Approx. % of Total Rent Rolling | Approx. Cumulative % of Total Rent Rolling |
| 2021 | 4 | 47,604 | $14.49 | 5.3% | 5.3% | $689,652 | 7.5% | 7.5% |
| 2022 | 6 | 152,427 | $14.81 | 16.9% | 22.1% | $2,257,252 | 24.5% | 32.0% |
| 2023 | 5 | 104,868 | $9.86 | 11.6% | 33.7% | $1,034,490 | 11.2% | 43.3% |
| 2024 | 0 | 0 | $0.00 | 0.0% | 33.7% | $0 | 0.0% | 43.3% |
| 2025 | 6 | 182,171 | $8.95 | 20.1% | 53.9% | $1,630,655 | 17.7% | 61.0% |
| 2026 | 3 | 38,621 | $10.99 | 4.3% | 58.1% | $424,274 | 4.6% | 65.6% |
| 2027 | 0 | 0 | $0.00 | 0.0% | 58.1% | $0 | 0.0% | 65.6% |
| 2028 | 1 | 10,676 | $7.50 | 1.2% | 59.3% | $80,070 | 0.9% | 66.5% |
| 2029 | 0 | 0 | $0.00 | 0.0% | 59.3% | $0 | 0.0% | 66.5% |
| 2030 | 2 | 304,092 | $10.14 | 33.6% | 92.9% | $3,083,609 | 33.5% | 100.0% |
| 2031 | 0 | 0 | $0.00 | 0.0% | 92.9% | $0 | 0.0% | 100.0% |
| 2032 & Thereafter | 0 | 0 | $0.00 | 0.0% | 92.9% | $0 | 0.0% | 100.0% |
| Vacant | 0 | 63,947 | $0.00 | 7.1% | 100.0% | $0 | 0.0% | 100.0% |
| Total / Wtd. Avg. | 27 | 904,406 | $10.95(3) | 100.0% | | $9,200,002 | 100.0% | |
| (1) | Information is based on the underwritten rent roll dated August 10, 2021. |
| (2) | Certain tenants may have lease termination options that are not reflected in the Lease Rollover Schedule. |
| (3) | Wtd. Avg. Annual UW Rent PSF Rolling excludes vacant space. |
COVID-19 Update. As of August 24, 2021, the Suarez Puerto Rico Industrial Portfolio Properties are open and operating and no underwritten tenants requested rent relief. The first debt service payment on the Suarez Puerto Rico Industrial Portfolio Whole Loan is due in October 2021 and, as of August 24, 2021, the Suarez Puerto Rico Industrial Portfolio Whole Loan is not subject to any forbearance, modification or debt service relief request.
The Market. The Suarez Puerto Rico Industrial Portfolio Properties are located in Caguas, Puerto Rico and Guaynabo, Puerto Rico within the Warehouse market in the San Juan metropolitan statistical area. The San Juan metropolitan statistical area spans 358 miles. According to the appraisals, the warehouse industrial market within the San Juan metropolitan statistical area comprises six municipalities, each of which constitutes a submarket: Carolina, Bayamón, Cataño, Guaynabo, Trujillo Alto and San Juan. Access to the San Juan Industrial Park and Wendy’s is provided by Baldorioty de Castro Expressway, the 65th Infantry Highway, De Diego Expressway, Las Américas Expressway, the Luis A Ferré Expressway, and Road PR-2. Access to the Rexco Industrial Park is provided by Road PR-2 and the De Diego Expressway. According to the appraisal, as of 2020, there was approximately 540,000 SF of vacant warehouse space in the San Juan Warehouse market.
| Geographic Summary(1) |
| Submarket | Median Household Income | Population |
| Bayamón | $27,386 | 169,269 |
| Carolina | $27,658 | 146,984 |
| Cataño | $17,448 | 23,121 |
| Guaynabo | $37,499 | 83,728 |
| San Juan | $23,005 | 318,441 |
| | | |
| Source: Appraisal |
| (1) | Median Household Income and Population are as of 2019. |
The following table presents certain information relating to the appraisal’s market rent conclusions for the San Juan Industrial Park Property:
| Market Rent Summary |
| Area | Market Rent
PSF |
| Warehouses > 140,000 SF | $10.00 |
| Warehouses of 40,000-85,000 SF | $11.50 |
| Warehouses < 4,000 SF | $9.00 |
| 2-Story Offices (FEMA) | $14.00 |
| Small Office (General Retail) | $14.00 |
This is not a research report and was not prepared by any Underwriter’s research department. Please see additional important information and qualifications at the end of this Term Sheet. |
T-78
| Property Types – Various | Loan #5 | Cut-off Date Balance: | | $60,000,000 |
| Property Addresses –- Various | Suarez Puerto Rico Industrial Portfolio | Cut-off Date LTV: | | 54.7% |
| | | U/W NCF DSCR: | | 3.53x |
| | | U/W NOI Debt Yield: | | 14.4% |
The following table presents certain information relating to the appraisal’s market rent conclusions for the Rexco Industrial Park Property:
| Market Rent Summary – Warehouse Spaces |
| Building | Market Rent PSF |
| General Warehouse | $9.00 |
| Annex I | $9.00 |
| Annex II | $9.00 |
| Annex III | $9.00 |
| Santa Marina III | $9.00 |
| Santa Marina IV | $9.00 |
| Santa Marina V | $9.00 |
| Market Rent Summary – Other Spaces |
| Building | Market Rent PSF |
| Occupied Santa Marina I and Vacant Santa Marina II | $16.00 |
| Conduent at Santa Marina II (Offices) | $14.75 |
| Individually Quoted Mezzanine | $5.75 |
| Parking Level Warehouse Santa Marina I | $9.00 |
| Parking Level Warehouse Santa Marina II | $5.00 |
| Santa Marina IV Retail | $23.00 |
| Santa Marina IV Offices | $15.00 |
| Santa Marina I Ground Floor Small Office | $8.50 |
| Annex III Platform Leased to ADI | $4.50 |
| Baxter (Offices within Warehouse Building) | $13.00 |
The following table presents recent warehouse leasing data at comparable properties with respect to the Suarez Puerto Rico Industrial Portfolio Properties:
| Comparable Warehouse Leases |
| Property Name/Location | Year
Built | Total NRA (SF) | Occupancy | Tenant | Lease Date/
Term (yrs) | Lease Size
(SF) | Initial Rent PSF | Rent PSF
per annum | Lease Type |
Puerto Nuevo Distribution Center Building 2 Road PR5, KM. 27.4 Cataño, PR | NAV | 100,645 | 100% | Walgreens | Aug. 2017/ 5.0 | 100,645 | $9.00 | $9.18 | NNN |
| | | | | | | | | | |
Puerto Nuevo Distribution Center Building 1 Road PR5, KM. 27.5 Cataño, PR | NAV | 301,453 | 100% | Baxter | Jan. 2018/ 5.0 | 176,811 | $11.54 | $11.54 | NNN |
| | | | | | | | | | |
Hato Tejas Industrial Park Building 3 A Street, Hato Tejas Ward Bayamón, PR | NAV | 73,645 | 100% | Aramak Corporation | July 2017/ 6.5 | 30,128 | $7.50 | $8.20 | NNN |
| | | | | | | | | | |
Palmas Industrial Park Road PR-869, KM. 1.5 Cataño, PR | 2009 | 180,183 | 100% | Allied Logistics | Aug. 2019/ 5.0 | 80,000 | $8.50 | $8.63 | NNN |
| | | | | | | | | | |
Palmas Industrial Park Road PR-869, KM. 1.4 Cataño, PR | 2009 | 180,183 | 100% | Ryder Puerto Rico, Inc. | June 2021/ 3.0 | 40,000 | $9.42 | $9.42 | NNN |
| | | | | | | | | | |
Amelia Industrial Park Lot P45 45 Diana Street Guaynabo, PR | NAV | NAV | NAV | Allied Logistics | Jan. 2021/ 5.0 | 41,222 | $8.00 | $8.00 | NNN |
Source: Appraisal.
This is not a research report and was not prepared by any Underwriter’s research department. Please see additional important information and qualifications at the end of this Term Sheet. |
T-79
| Property Types – Various | Loan #5 | Cut-off Date Balance: | | $60,000,000 |
| Property Addresses –- Various | Suarez Puerto Rico Industrial Portfolio | Cut-off Date LTV: | | 54.7% |
| | | U/W NCF DSCR: | | 3.53x |
| | | U/W NOI Debt Yield: | | 14.4% |
The following table presents recent office leasing data at comparable properties with respect to the Suarez Puerto Rico Industrial Portfolio Properties:
| Comparable Office Leases |
| Property Name/Location | Year
Built | Total NRA
(SF) | Occupancy | Tenant | Lease Date/ Term
(yrs) | Lease Size (SF) | Rent PSF per annum |
Amelia Industrial Park Lot P45 45 Diana Street Guaynabo, PR | NAV | NAV | NAV | NAV | NAV | 15,358 | $13.00 |
| | | | | | | | |
Purico Building Road PR-165 Cataño, PR | NAV | 35,000 | 100% | Link Active | Nov. 2019/ 10.0 | 35,000 | $10.00 |
| | | | | | | | |
Amelia Commercial Properties 18 Diana Street, Amelia Industrial Park Guaynabo, PR | NAV | 185,000 | 100% | Confidential | Confidential | Confidential | $12.00 |
| | | | | | | | |
Metro Office 6 Lot 6 Street 1, Metro Office Park Guaynabo, PR | NAV | 41,617 | 85% | Yates-Bird | Aug. 2020/ 3.0 | 3,500 | $11.00 |
| | | | | | | | |
Metro Office 15 Lot 15 Metro Office Park Guaynabo, PR | NAV | 38,250 | 54% | Relisc | Sep. 2020/ 1.0 | 1,281 | $14.50 |
| | | | | | | | |
Metro Office 14 Lot 14 Metro Office Park Guaynabo, PR | NAV | 68,963 | 90% | Falcón Sánchez & Associates, PSC | Jan. 2020/ 3.0 | 2,472 | $13.50 |
Source: Appraisal.
The following table presents recent retail leasing data at comparable properties with respect to the Wendy’s Property:
| Comparable Retail Leases |
| Location | Total NRA
(SM) | Tenant | Term | Lease Date | Rent per annum |
| Road PR-2, KM. 28.5 | 2,500 | McDonalds | 20 | Jan. 2014 | $99,000 |
| Road PR-197 | 3,223.87 | Wendy's | 10 | Jan. 2021 | $66,120 |
| Plaza del Mar, Road PR-2 | 3,018 | Wendy's | 20 | Jan. 2019 | $75,000 |
| Río Bayamón, Road PR-177 | 1,601.69 | Wendy's | 20 | May 2018 | $75,000 |
| Río Bayamón, Road PR-178 | 1,226.86 | Church's | 21 | Dec. 2018 | $75,000 |
Source: Appraisal.
This is not a research report and was not prepared by any Underwriter’s research department. Please see additional important information and qualifications at the end of this Term Sheet. |
T-80
| Property Types – Various | Loan #5 | Cut-off Date Balance: | | $60,000,000 |
| Property Addresses –- Various | Suarez Puerto Rico Industrial Portfolio | Cut-off Date LTV: | | 54.7% |
| | | U/W NCF DSCR: | | 3.53x |
| | | U/W NOI Debt Yield: | | 14.4% |
Operating History and Underwritten Net Cash Flow. The following table presents certain information relating to the historic operating performance and Underwritten Net Cash Flow at the Suarez Puerto Rico Industrial Portfolio Properties:
| Cash Flow Analysis |
| | 2019 | 2020 | UW | UW PSF |
| Gross Potential Rent | $10,103,695 | $10,039,792 | $9,200,002 | $10.17 |
| Expense Reimbursement | $4,061,590 | $3,809,656 | $4,086,975 | $4.52 |
| Other Income(1) | $0 | $0 | $465,040 | $0.51 |
| Contractual Rent Steps | $0 | $0 | $134,845 | $0.15 |
| Vacancy | $0 | $0 | ($422,584) | ($0.47) |
| Effective Gross Income | $14,165,285 | $13,849,448 | $13,464,278 | $14.89 |
| | | | | |
| Real Estate Taxes | $717,917 | $751,936 | $761,964 | $0.84 |
| Insurance | $803,457 | $859,955 | $1,060,108 | $1.17 |
| Other Operating Expenses(2) | $3,450,324 | $2,769,659 | $3,030,174 | $3.35 |
| Total Operating Expenses | $4,971,698 | $4,381,551 | $4,852,246 | $5.37 |
| | | | | |
| Net Operating Income | $9,193,587 | $9,467,897 | $8,612,032 | $9.52 |
| TI/LC | $0 | $0 | $498,987 | $0.55 |
| Capital Expenditures | $0 | $0 | $258,204 | $0.29 |
| Net Cash Flow | $9,193,587 | $9,467,897 | $7,854,841 | $8.69 |
| | | | | |
| Occupancy % | 98.9% | 98.3% | 95.4% | |
| NOI DSCR(3) | 4.13x | 4.26x | 3.87x | |
| NCF DSCR(3) | 4.13x | 4.26x | 3.53x | |
| NOI Debt Yield(3) | 15.3% | 15.8% | 14.4% | |
| NCF Debt Yield(3) | 15.3% | 15.8% | 13.1% | |
| | | | | |
| (1) | Other Income includes parking income, incremental insurance and signage income. |
| (2) | Other Operating Expenses include management fee, repairs and maintenance, and general and administrative expenses. |
| (3) | The debt service coverage ratios and debt yields are based on the Suarez Puerto Rico Industrial Portfolio Mortgage Loan and exclude the Suarez Puerto Rico Industrial Portfolio Subordinate Companion Loan. |
Escrows and Reserves.
Real Estate Taxes – On each due date, the borrowers are required to fund 1/12 of the taxes that the lender reasonably estimates will be payable over the next-ensuing 12-month period.
Insurance – On each due date, the borrowers are required to fund 1/12 of the annual insurance premiums that the lender reasonably estimates will be payable for the renewal of coverage upon the expiration of the insurance policies; provided that such monthly deposits are not required so long as (i) no event of default is continuing, (ii) the liability and casualty insurance coverage for the Suarez Puerto Rico Industrial Portfolio Properties is included in a blanket policy approved by the lender in its reasonable discretion, and (iii) the borrowers provide the lender with paid receipts for the insurance premiums and certificates of insurance, no later than the expiration of the current policies.
Required Repairs – At origination, the borrowers deposited $248,930 into a reserve for required repairs to the Suarez Puerto Rico Industrial Portfolio Properties.
Capital Expenditures and TI/LC Reserve – On each due date, the borrowers are required to fund $37,684 into a capital expenditures and tenant improvements and leasing commissions reserve, provided that the borrowers are not required to fund such reserve at any time the funds in such reserve are at least $1,000,000.
Unfunded Obligations Reserve – On the origination date, the borrowers were required to fund $50,000 into a reserve for tenant improvements and leasing commissions due under an existing lease.
Lockbox and Cash Management. The Suarez Puerto Rico Industrial Portfolio Whole Loan is structured with a hard lockbox and in-place cash management. The borrowers were required to deliver tenant direction letters to all tenants of the Suarez Puerto Rico Industrial Portfolio Properties directing them to deposit all rents into a lender-controlled lockbox account. In addition, the borrowers are required to cause all rents received by the borrowers or the property manager, with respect to the Suarez Puerto Rico Industrial Portfolio Properties, notwithstanding such tenant directions, to be deposited into such lockbox account within two business days of receipt thereof. All funds in the lockbox account are required to be swept on each business day into a lender-controlled cash management account, and, provided no event of default exists, applied to make required deposits into the tax and insurance reserves, to pay debt service on the Suarez Puerto Rico Industrial Portfolio Whole Loan, to make required deposits into the capital expenditures and TI/LC reserve, during a Trigger Period (as defined below) to pay operating expenses set forth in the annual budget (which is required to be reasonably approved by the lender during a Trigger Period) and lender-approved extraordinary expenses, and to disburse any remainder (x) if a Trigger Period exists, into an excess cash flow reserve account as additional collateral for the Suarez Puerto Rico Industrial Portfolio Whole Loan during the continuance of such Trigger
This is not a research report and was not prepared by any Underwriter’s research department. Please see additional important information and qualifications at the end of this Term Sheet. |
T-81
| Property Types – Various | Loan #5 | Cut-off Date Balance: | | $60,000,000 |
| Property Addresses –- Various | Suarez Puerto Rico Industrial Portfolio | Cut-off Date LTV: | | 54.7% |
| | | U/W NCF DSCR: | | 3.53x |
| | | U/W NOI Debt Yield: | | 14.4% |
Period (subject to certain rights of the borrowers to use such funds for real estate investment trust distributions of up to $150,000 in any calendar year) or (y) if no Trigger Period exists, to the borrowers.
“Trigger Period” means the period of time (a) from and after any event of default under the Suarez Puerto Rico Industrial Portfolio Whole Loan, until such time as such event of default has been cured; or (b) from and after the debt yield on the Suarez Puerto Rico Industrial Portfolio Whole Loan falling below 8.50% for any calendar quarter, until such time as such debt yield is at least 9.0% for two consecutive calendar quarters. The borrowers have the right to avoid the commencement of, or end, a Trigger Period related to a decline in debt yield by either (a) partially prepaying the Suarez Puerto Rico Industrial Portfolio Whole Loan such that the debt yield threshold is satisfied, or (b) delivering to the lender cash or a letter of credit (“Debt Yield Collateral”), in each case in an amount which, if applied to the principal balance of the Suarez Puerto Rico Industrial Portfolio Whole Loan, would cause the debt yield threshold to be satisfied. Any such prepayment made prior to the due date in March 2025 must be accompanied by payment of a yield maintenance premium, and, provided no event of default is then continuing, is required to be applied pro rata to the Suarez Puerto Rico Industrial Portfolio Mortgage Loan and Suarez Puerto Rico Industrial Portfolio Subordinate Companion Loan. The borrowers will be entitled to return of the Debt Yield Collateral if the debt yield threshold is satisfied for two consecutive calendar quarters.
Additional Secured Indebtedness (not including trade debts). The Suarez Puerto Rico Industrial Portfolio Properties also secure the Suarez Puerto Rico Industrial Portfolio Subordinate Companion Loan, which has a Cut-off Date principal balance of $24,950,000. The Suarez Puerto Rico Industrial Portfolio Mortgage Loan is generally senior in right of payment to the Suarez Puerto Rico Industrial Portfolio Subordinate Companion Loan; however, prior to an event of default, the Suarez Puerto Rico Industrial Portfolio Subordinate Companion Loan will be entitled to receive prepayments and repayments of principal on a pro rata basis with the Suarez Puerto Rico Industrial Portfolio Mortgage Loan. The holders of the promissory notes evidencing the Suarez Puerto Rico Industrial Portfolio Whole Loan have entered into a co-lender agreement that sets forth the allocation of collections on the Suarez Puerto Rico Industrial Portfolio Whole Loan. See “Description of the Mortgage Pool—The Whole Loans—The Suarez Puerto Rico Industrial Portfolio A/B Whole Loan” in the prospectus.
Subordinate Note Summary |
| | Subordinate Note
Original Principal
Balance | Subordinate
Note Interest
Rate | Original
Term
(mos.) | Original
Amort.
Term
(mos.) | Original
IO Term
(mos.) | Whole
Loan UW
NCF DSCR | Whole
Loan UW
NOI Debt
Yield | Whole
Loan Cut-
off Date
LTV |
| Suarez Puerto Rico Industrial Portfolio Subordinate Companion Loan | $24,950,000 | 6.75% | 60 | 0 | 60 | 2.00x | 10.1% | 77.4% |
| | | | | | | | | | |
Mezzanine Loan and Preferred Equity. None.
Release of Property. The borrowers have the right to obtain the release of any individual property in connection with a bona fide sale to an unrelated third party, upon either defeasance (after the defeasance lockout period) or prepayment of 115% of the allocated loan amount of such individual property (plus any additional amount needed to satisfy the debt yield test below), provided that the following conditions, among others, are satisfied: (i) no event of default is continuing, other than an event of default that would be cured by the release of such individual property, (ii) the debt yield after the partial release is not less than the greater of (x) the debt yield immediately prior to the release (provided that such debt yield is not required to be in excess of 12.0%) and (y) 10.61%, and (iii) certain REMIC related conditions are satisfied. Any such prepayment made prior to the due date in March 2025 must be accompanied by payment of a yield maintenance premium, and, provided no event of default is then continuing, must be applied pro rata to the Suarez Puerto Rico Industrial Portfolio Mortgage Loan and Suarez Puerto Rico Industrial Portfolio Subordinate Companion Loan. Any such defeasance must be applied pro rata to the Suarez Puerto Rico Industrial Portfolio Mortgage Loan and Suarez Puerto Rico Industrial Portfolio Subordinate Companion Loan.
Real Estate Substitution. None.
Letter of Credit. The borrowers may provide a letter of credit in lieu of depositing funds into the Capital Expenditures and TI/LC Reserve, and may also provide a letter of credit to avoid or end a Trigger Period caused by a decline in debt yield.
Right of First Offer/Right of First Refusal. None.
Ground Lease. None.
Terrorism Insurance. The borrowers are required to maintain terrorism insurance in an amount equal to the full replacement cost of the Suarez Puerto Rico Industrial Portfolio Properties, as well as 18 months of rental loss and/or business interruption coverage, together with a 30-day extended period of indemnity following restoration. Notwithstanding the foregoing, for so long as the Terrorism Risk Insurance Act of 2002, as extended and modified by the Terrorism Risk Insurance Program Reauthorization Act of 2019 (“TRIPRA”), is in effect (including any extensions thereof or if another federal governmental program is in effect relating to “acts of terrorism” which provides substantially similar protections as TRIPRA), the lender is required to accept terrorism insurance which covers against “covered acts” as defined by TRIPRA (or such other program) but only in the event that TRIPRA (or such other program) continues to cover both domestic and foreign acts of terrorism. See “Risk Factors—Risks Relating to the Mortgage Loans—Terrorism Insurance May Not Be Available for All Mortgaged Properties” in the prospectus.
This is not a research report and was not prepared by any Underwriter’s research department. Please see additional important information and qualifications at the end of this Term Sheet. |
T-82
(THIS PAGE INTENTIONALLY LEFT BLANK)
This is not a research report and was not prepared by any Underwriter’s research department. Please see additional important information and qualifications at the end of this Term Sheet. |
T-83
| Retail – Anchored | Loan #6 | Cut-off Date Balance: | | $55,000,000 |
| 120, 210, 220, 310-330, 620, 640, 650, | The Court at Oxford Valley | Cut-off Date LTV: | | 65.9% |
| 610 and 630 Commerce Boulevard | | UW NCF DSCR: | | 1.97x |
| Fairless Hills, PA 19030 | | UW NOI Debt Yield: | | 10.8% |

This is not a research report and was not prepared by any Underwriter’s research department. Please see additional important information and qualifications at the end of this Term Sheet. |
T-84
| Retail – Anchored | Loan #6 | Cut-off Date Balance: | | $55,000,000 |
| 120, 210, 220, 310-330, 620, 640, 650, | The Court at Oxford Valley | Cut-off Date LTV: | | 65.9% |
| 610 and 630 Commerce Boulevard | | UW NCF DSCR: | | 1.97x |
| Fairless Hills, PA 19030 | | UW NOI Debt Yield: | | 10.8% |
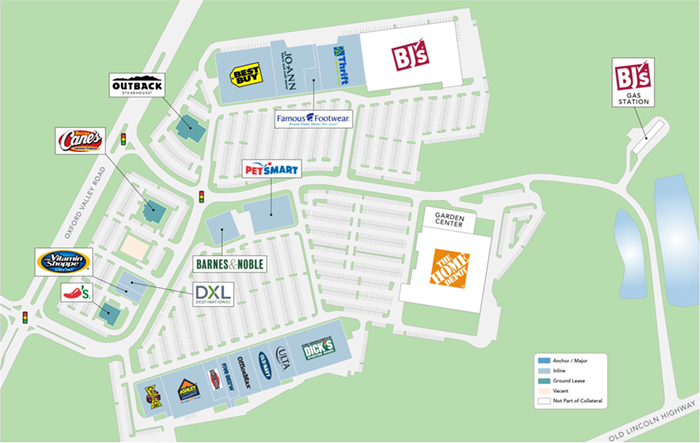
This is not a research report and was not prepared by any Underwriter’s research department. Please see additional important information and qualifications at the end of this Term Sheet. |
T-85
| Retail – Anchored | Loan #6 | Cut-off Date Balance: | | $55,000,000 |
| 120, 210, 220, 310-330, 620, 640, 650, | The Court at Oxford Valley | Cut-off Date LTV: | | 65.9% |
| 610 and 630 Commerce Boulevard | | UW NCF DSCR: | | 1.97x |
| Fairless Hills, PA 19030 | | UW NOI Debt Yield: | | 10.8% |
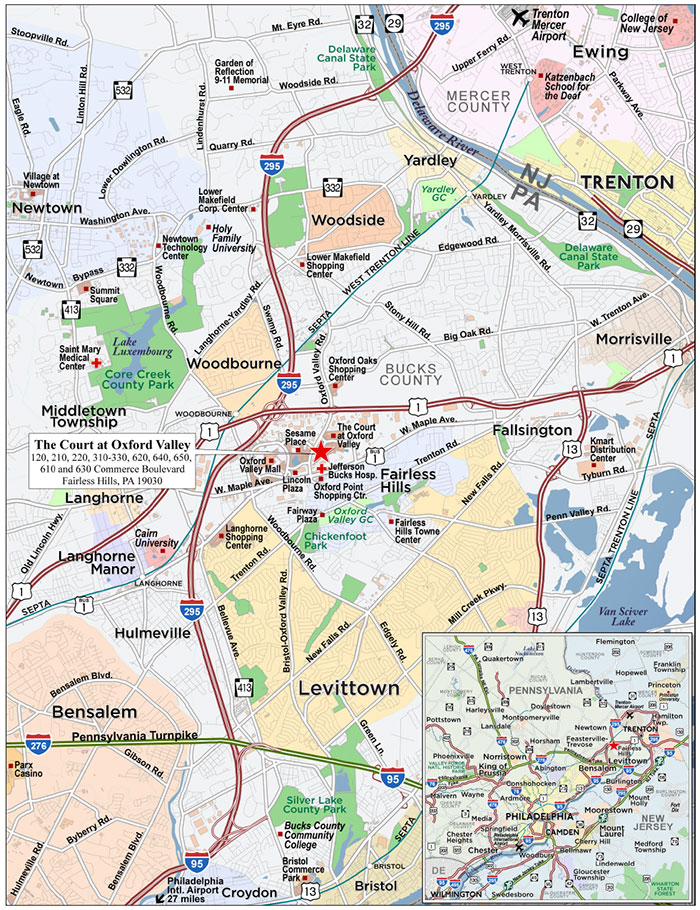
This is not a research report and was not prepared by any Underwriter’s research department. Please see additional important information and qualifications at the end of this Term Sheet. |
T-86
| Mortgage Loan No. 6 – The Court at Oxford Valley |
| Mortgage Loan Information | | Property Information |
| Mortgage Loan Seller: | BANA | | Single Asset/Portfolio: | Single Asset |
| Credit Assessment (Fitch/KBRA/S&P): | NR/NR/NR | | Location: | Fairless Hills, PA 19030 |
| Original Balance: | $55,000,000 | | General Property Type: | Retail |
| Cut-off Date Balance: | $55,000,000 | | Detailed Property Type: | Anchored |
| % of Initial Pool Balance: | 4.3% | | Title Vesting: | Fee |
| Loan Purpose: | Refinance | | Year Built/Renovated: | 1996 / NAP |
| Borrower Sponsors: | The Goldenberg Group and PREIT | | Size: | 456,286 SF |
| Guarantor: | Kenneth Goldenberg | | Cut-off Date Balance PSF: | $121 |
| Mortgage Rate: | 3.2000% | | Maturity Date Balance PSF: | $102 |
| Note Date: | 6/25/2021 | | Property Manager: | Goldenberg Management, Inc. |
| First Payment Date: | 8/1/2021 | | | (borrower-related) |
| Maturity Date: | 7/1/2031 | | | |
| Original Term to Maturity: | 120 months | | | |
| Original Amortization Term: | 360 months | | Underwriting and Financial Information(2) |
| IO Period: | 36 months | | UW NOI(3): | $5,931,638 |
| Seasoning: | 3 months | | UW NOI Debt Yield: | 10.8% |
| Prepayment Provisions: | L(27),D(89),O(4) | | UW NOI Debt Yield at Maturity: | 12.7% |
| Lockbox/Cash Mgmt Status: | Hard/Springing | | UW NCF DSCR: | 3.14x (IO) 1.97x (P&I) |
| Additional Debt Type: | None | | Most Recent NOI(3): | $4,685,498 (12/31/2020) |
| Additional Debt Balance: | NAP | | 2nd Most Recent NOI: | $5,646,157 (12/31/2019) |
| Future Debt Permitted (Type): | No (NAP) | | 3rd Most Recent NOI: | $5,895,967 (12/31/2018) |
| Reserves(1) | | Most Recent Occupancy: | 98.0% (6/1/2021) |
| Type | Initial | Monthly | Cap | | 2nd Most Recent Occupancy: | 98.0% (12/31/2020) |
| RE Taxes: | $859,197 | $105,870 | NAP | | 3rd Most Recent Occupancy: | 90.5% (12/31/2019) |
| Insurance: | $0 | Springing | NAP | | Appraised Value (as of): | $83,400,000 (5/26/2021) |
| Replacement Reserve: | $0 | $5,650 | $270,000 | | Appraised Value PSF: | $183 |
| TI/LC Reserve: | $130,000 | $22,602 | $1,250,000 | | Cut-off Date LTV Ratio: | 65.9% |
| Raising Cane Reserve: | $359,810 | $0 | NAP | | Maturity Date LTV Ratio: | 56.0% |
| | | | | | | | |
| Sources and Uses |
| Sources | Proceeds | % of Total | | Uses | Proceeds | % of Total |
| Loan Amount: | $55,000,000 | 100.0% | | Loan Payoff: | $51,886,307 | 94.3% |
| | | | | Upfront Reserves: | $1,349,007 | 2.5% |
| | | | | Return of Equity: | $1,089,230 | 2.0% |
| | | | | Closing Costs: | $675,455 | 1.2% |
| Total Sources: | $55,000,000 | 100.0% | | Total Uses: | $55,000,000 | 100.0% |
| (1) | See “Escrows and Reserves” below for further discussion of reserve requirements. |
| (2) | The novel coronavirus pandemic is an evolving situation and could impact The Court at Oxford Valley Mortgage Loan (as defined below) more severely than assumed in the underwriting of The Court at Oxford Valley Mortgage Loan and could adversely affect the NOI, NCF and occupancy information, as well as the appraised value and the DSCR, LTV and Debt Yield metrics presented above and herein. See “Risk Factors-—Risks Related to Market Conditions and Other External Factors—The Coronavirus Pandemic Has Adversely Affected the Global Economy and Will Likely Adversely Affect the Performance of the Mortgage Loans” in the prospectus. |
| (3) | The increase reflected in UW NOI over Most Recent NOI is due to newly signed leases for 2nd Avenue (Thrift Store) (9.5% of NRA, 4.0% of underwritten rent) and Raising Canes (1.7% of NRA, 2.6% of underwritten rent). |
The Mortgage Loan. The sixth largest mortgage loan (“The Court at Oxford Valley Mortgage Loan”) is evidenced by a promissory note in the original principal amount of $55,000,000 and secured by the fee interest in an anchored retail condominium property located in Fairless Hills, Pennsylvania (“The Court at Oxford Valley Property”).
The Borrower and the Borrower Sponsors. The borrower is Oxford Valley Road Associates, a Pennsylvania limited partnership and single purpose entity with two independent directors. The borrower sponsors are The Goldenberg Group (“TGG”) and PREIT. The borrower is owned approximately 50% by entities controlled by TGG and approximately 50% by entities controlled by PREIT. The borrower sponsors developed The Court at Oxford Valley Property in 1996 and have owned and managed the property since it was built.
The Court at Oxford Valley Property previously secured a loan that was securitized in JPMC 2012-CIBX, which loan was transferred to special servicing for a non-monetary default due to PREIT’s (an affiliate of the loan guarantor’s) bankruptcy in November 2020. PREIT’s declaration of bankruptcy was pre-negotiated with its creditors and it emerged from bankruptcy within 30 days. See “Description of the Mortgage Pool—Loan Purpose; Default History, Bankruptcy Issues and Other Proceedings” in the prospectus.
TGG is owned principally by Kenneth Goldenberg, the non-recourse carveout guarantor for The Court at Oxford Valley Mortgage Loan.
Since 1987, TGG has built a reputation as one of Philadelphia’s top developers of complex real estate projects. TGG originally specialized in the development of open-air shopping centers, developing over seven million SF in properties such as the Metroplex in Plymouth Meeting, Columbus Commons IKEA shopping center in South Philadelphia, and ParkWest Town Center in West Philadelphia. More recently, TGG has expanded into the
This is not a research report and was not prepared by any Underwriter’s research department. Please see additional important information and qualifications at the end of this Term Sheet. |
T-87
| Retail – Anchored | Loan #6 | Cut-off Date Balance: | | $55,000,000 |
| 120, 210, 220, 310-330, 620, 640, 650, | The Court at Oxford Valley | Cut-off Date LTV: | | 65.9% |
| 610 and 630 Commerce Boulevard | | UW NCF DSCR: | | 1.97x |
| Fairless Hills, PA 19030 | | UW NOI Debt Yield: | | 10.8% |
development of high-end condominiums (The Ayer on Washington Square), high-end homes (Haverford Reserve on the Main Line), student housing (The View at Montgomery and Vantage at Temple University) and luxury apartments (1213 Walnut in Philadelphia’s Midtown Village). TGG currently owns 18 properties in Pennsylvania and has seven more under development. TGG’s headquarters are located approximately 29 miles from The Court at Oxford Valley Property. TGG is responsible for all day-to-day management decisions at The Court at Oxford Valley Property, with major decisions requiring approval from PREIT.
PREIT (NYSE: PEI) is a publicly traded real estate investment trust specializing in the ownership and management of differentiated shopping malls. Headquartered in Philadelphia, Pennsylvania, PREIT owns and operates over 22 million SF of retail space in the eastern half of the United States, with a concentration in the Mid-Atlantic region’s top metropolitan statistical areas.
The Property. The Court at Oxford Valley Property is an anchored retail condominium property totaling 456,286 SF of rentable area located in Fairless Hills, Pennsylvania, approximately 28 miles northeast of the Philadelphia central business district. Built in 1996, The Court at Oxford Valley Property is situated on 10.38 acres. The Court at Oxford Valley Property has multiple anchors including Best Buy, Dick’s Sporting Goods, Ashley Furniture and Crunch Fitness, and is shadow anchored by two non-collateral stores, Home Depot and BJ’s Wholesale Club. The Court at Oxford Valley Property together with the Home Depot and BJ’s Wholesale Club comprise the greater The Court at Oxford development, which covers a total of 94.98 acres and contains 3,438 parking spaces, resulting in a parking ratio of 4.88 spaces per 1,000 SF of rentable area.
The Court at Oxford development was developed under a Declaration of Condominium which created eleven condominium units. Home Depot owns one condominium unit, and BJ’s Wholesale Club owns two condominium units, one of which contains their retail store and the other of which contains their gas station. The remaining eight condominium units are owned by the borrower. The collateral for The Court at Oxford Valley Mortgage Loan is a first mortgage lien on the nine condominium units and borrower’s percentage interest in the common areas.
The Court at Oxford Valley Property has a granular rent roll, with no tenant occupying more than 13.1% of the NRA or accounting for more than 15.9% of underwritten base rent. Since 2016, the Court at Oxford Valley Property’s average historical occupancy has been 97.9%, with seven tenants aggregating approximately 47% of NRA having been at the Court at Oxford Valley Property since construction. As of June 1, 2021, The Court at Oxford Valley Property was 98.0% leased and 96.4% occupied by 19 tenants (including three ground lease tenants).
Major Tenants.
Best Buy (59,620 SF; 13.1% of NRA; 15.8% of underwritten base rent). Best Buy, founded in 1966, is a provider of technology products, services and solutions in the United States, Canada, and Mexico, offering products and services to customers visiting its stores, engaging with Geek Squad agents, or using its websites or mobile applications. As of the second quarter of 2021, Best Buy had a total of 1,005 stores in the United States and 219 stores in Mexico and Canada. Best Buy has been a tenant at The Court at Oxford Valley Property since 1996 and exercised its second extension option in January 2021, effective June 2021, and has a lease expiring in May 2026, with one, 5-year renewal option remaining with a minimum seven months’ notice. Best Buy reportedly invested approximately $1.0 million into its space. Best Buy is currently paying $16.96 PSF, which will increase to $17.96 PSF during the renewal term. The lease is guaranteed by Best Buy Co. Inc. Best Buy is not required to report sales. The nearest Best Buy location is approximately 13 miles from The Court at Oxford Valley Property.
Dick’s Sporting Goods (49,381 SF; 10.8% of NRA; 9.8% of underwritten base rent). Dick’s Sporting Goods, founded in 1948, is the largest sporting goods retail company in the United States. The company sells sporting goods, fitness equipment, golf equipment, hunting and fishing gear, apparel, footwear and accessories. As of March 10th, 2020, the company operates 726 Dick’s Sporting Goods stores in 47 states. Dick’s Sporting Goods has been a tenant at The Court at Oxford Valley Property since 1996 and, in May 2020, exercised its first extension option, effective May 2021, to renew the lease until April 2026, with two, 5-year renewal options remaining, each with a minimum 9 months’ notice. The tenant currently pays a rent of $13.00 PSF, with $0.50 PSF increases during each renewal term. Sales for Dick’s Sporting Goods at The Court at Oxford Valley Property were reported at $298 PSF, $292 PSF and $258 PSF for 2018, 2019 and 2020, respectively. The nearest Dick’s Sporting Goods location is approximately 13.6 miles from The Court at Oxford Valley Property.
2nd Avenue (Thrift Store) (43,547 SF; 9.5% of NRA; 4.0% of underwritten base rent). 2nd Avenue (Thrift Store) is a for-profit thrift store that does not accept product donations at its retail locations, with product sourced, sorted and prepared offsite to maximize its retail capacity. 2nd Avenue (Thrift Store) operates nearly a dozen locations throughout the Mid-Atlantic, including two locations in Pennsylvania. 2nd Avenue (Thrift Store) executed its lease in November 2020 and opened for business upon lease commencement in June 2021. Their lease expires in May 2031 and has one, 5-year renewal option, with a minimum 180 days’ notice. 2nd Avenue (Thrift Store) pays a current base rent of $6.00 PSF, with no further increases. 2nd Avenue (Thrift Store) is not required to report sales.
This is not a research report and was not prepared by any Underwriter’s research department. Please see additional important information and qualifications at the end of this Term Sheet. |
T-88
| Retail – Anchored | Loan #6 | Cut-off Date Balance: | | $55,000,000 |
| 120, 210, 220, 310-330, 620, 640, 650, | The Court at Oxford Valley | Cut-off Date LTV: | | 65.9% |
| 610 and 630 Commerce Boulevard | | UW NCF DSCR: | | 1.97x |
| Fairless Hills, PA 19030 | | UW NOI Debt Yield: | | 10.8% |
The following table presents certain information relating to the tenancy at The Court at Oxford Valley Property:
| Tenant Summary(1) |
| | | | | | | | 2020 Sales(2) | | |
| Tenant Name | Credit Rating (Fitch/Moody’s/ S&P)(3) | Tenant SF | Approx % of Total SF | Annual UW Rent | % of Total Annual
UW Rent | Annual UW Rent PSF | $ | PSF | Occ Cost % | Lease Exp. | Renewal Options |
| Anchor Tenants | | | | | | | | | | | |
| Best Buy | NR/A3/BBB+ | 59,620 | 13.1% | $1,040,965 | 15.8% | $17.46 | NAV | NAV | NAV | 5/31/2026 | 1 x 5 yr |
| Dick’s Sporting Goods | NR/NR/NR | 49,381 | 10.8% | $641,953 | 9.8% | $13.00 | $12,751,682 | $258 | 6.5% | 4/30/2026 | 2 x 5 yr |
| 2nd Avenue (Thrift Store) | NR/NR/NR | 43,547 | 9.5% | $261,282 | 4.0% | $6.00 | NAV | NAV | NAV | 5/31/2031 | 1 x 5 yr |
| Ashley Furniture | NR/NR/NR | 39,793 | 8.7% | $497,413 | 7.6% | $12.50 | $4,009,479 | $101 | 16.6% | 4/30/2025 | 1 x 5 yr |
| Crunch | NR/NR/NR | 37,793 | 8.3% | $389,556 | 5.9% | $10.31 | $1,513,176 | $40 | 35.8% | 2/28/2031 | 2 x 5 yr |
| Jo-Ann Fabrics | NR/B2/B | 36,525 | 8.0% | $474,825 | 7.2% | $13.00 | NAV | NAV | NAV | 1/31/2029 | 2 x 5 yr |
| Anchor Subtotal/Wtd. Avg. | | 266,659 | 58.4% | $3,305,994 | 50.3% | $12.40 | | | | | |
| | | | | | | | | | | | |
| Junior Anchor Tenants | | | | | | | | | | | |
| Barnes & Noble (Pad) | NR/NR/NR | 30,751 | 6.7% | $515,079 | 7.8% | $16.75 | $2,870,257 | $93 | 22.5% | 1/31/2027 | 2 x 5 yr |
| PetSmart (Pad) | NR/B2/B | 26,717 | 5.9% | $534,340 | 8.1% | $20.00 | NAV | NAV | NAV | 1/31/2024 | 1 x 5 yr |
| OfficeMax | NR/NR/NR | 21,431 | 4.7% | $353,612 | 5.4% | $16.50 | NAV | NAV | NAV | 2/28/2024 | 2 x 5 yr |
| Junior Anchor Subtotal/ Wtd. Avg. | 78,899 | 17.3% | $1,403,031 | 21.4% | $17.78 | | | | | |
| | | | | | | | | | | | |
| In-Line/Pad Tenants | | 101,739 | 22.3% | $1,861,333 | 28.3% | $18.30 | | | | | |
| Vacant Space | | 8,989 | 2.0% | $0 | 0.0% | $0.00 | | | | | |
| Collateral Total/Wtd. Avg. | | 456,286 | 100.0% | $6,570,358 | 100.0% | $14.69(4) | | | | | |
| | | | | | | | | | | | |
| Non-Collateral Tenants(5) | | | | | | | | | | | |
| Home Depot | A/A2/A | 130,751 | | $188,281 | | | | | | | |
| BJ’s Wholesale Club | NR/Ba1/BB | 116,872 | | $183,489 | | | | | | | |
| (1) | Information is based on the underwritten rent roll dated June 1, 2021. |
| (2) | In connection with Pennsylvania’s stay at home order, Ashley Furniture was closed for business from April through August 2020 and Crunch was closed from April through December 2020. Sales shown for Crunch are based on 2019 sales, prior to the COVID-19 pandemic. |
| (3) | Certain ratings are those of the parent company whether or not the parent guarantees the lease. |
| (4) | Wtd. Avg. Annual UW Rent PSF excludes vacant space. |
| (5) | The Non-Collateral Tenants contribute to the payment of real estate taxes and common area maintenance charges relating to The Court at Oxford Valley Property. |
This is not a research report and was not prepared by any Underwriter’s research department. Please see additional important information and qualifications at the end of this Term Sheet. |
T-89
| Retail – Anchored | Loan #6 | Cut-off Date Balance: | | $55,000,000 |
| 120, 210, 220, 310-330, 620, 640, 650, | The Court at Oxford Valley | Cut-off Date LTV: | | 65.9% |
| 610 and 630 Commerce Boulevard | | UW NCF DSCR: | | 1.97x |
| Fairless Hills, PA 19030 | | UW NOI Debt Yield: | | 10.8% |
The following table presents certain information relating to the lease rollover schedule at The Court at Oxford Valley Property:
| Lease Rollover Schedule(1)(2) |
| Year | # of Leases Rolling | SF Rolling | UW Rent PSF Rolling | Approx. % of Total SF Rolling | Approx. Cumulative % of SF Rolling | Total UW Rent Rolling | Approx. % of Total Rent Rolling | Approx. Cumulative % of Total Rent Rolling |
| 2021 | 0 | 0 | $0.00 | 0.0% | 0.0% | $0 | 0.0% | 0.0% |
| 2022 | 1 | 9,187 | $14.00 | 2.0% | 2.0% | $128,618 | 2.0% | 2.0% |
| 2023 | 3 | 27,994 | $21.22 | 6.1% | 8.1% | $594,058 | 9.0% | 11.0% |
| 2024 | 5 | 88,406 | $17.17 | 19.4% | 27.5% | $1,517,505 | 23.1% | 34.1% |
| 2025 | 1 | 39,793 | $12.50 | 8.7% | 36.2% | $497,413 | 7.6% | 41.7% |
| 2026 | 3 | 115,308 | $16.06 | 25.3% | 61.5% | $1,852,022 | 28.2% | 69.9% |
| 2027 | 1 | 30,751 | $16.75 | 6.7% | 68.3% | $515,079 | 7.8% | 77.7% |
| 2028 | 0 | 0 | $0.00 | 0.0% | 68.3% | $0 | 0.0% | 77.7% |
| 2029 | 2 | 46,936 | $13.74 | 10.3% | 78.5% | $644,825 | 9.8% | 87.5% |
| 2030 | 0 | 0 | $0.00 | 0.0% | 78.5% | $0 | 0.0% | 87.5% |
| 2031 | 2 | 81,340 | $8.00 | 17.8% | 96.4% | $650,838 | 9.9% | 97.4% |
| 2032 & Beyond | 1 | 7,582 | $22.42 | 1.7% | 98.0% | $170,000 | 2.6% | 100.0% |
| Vacant | 0 | 8,989 | $0.00 | 2.0% | 100.0% | $0 | 0.0% | 100.0% |
| Total/Wtd. Avg. | 19 | 456,286 | $14.69(3) | 100.0% | | $6,570,358 | 100.0% | |
| (1) | Information is based on the underwritten rent roll. |
| (2) | Certain tenants may have lease termination options that are exercisable prior to the originally stated expiration date of the related lease and are not considered in the rollover schedule. |
| (3) | Wtd. Avg. UW Rent PSF Rolling excludes vacant space. |
COVID-19 Update. At the onset of the COVID-19 pandemic, eleven tenants accounting for 46.7% of the NRA temporarily closed their locations and one tenant, Romano’s Macaroni Grill, closed permanently. These closures coincided with Pennsylvania’s stay-at-home order. Of the eleven tenants that temporarily closed, all of them re-opened for business by September 2020 except for Crunch Fitness, which reopened in January 2021. During the period of store closures, approximately 76% of the tenants at The Court at Oxford Valley Property requested rent relief. The borrower sponsors successfully negotiated rent deferrals and 96.9% of that deferred rent is expected to be paid by year-end 2021. Old Navy and Famous Footwear received rental rate abatements, and Crunch Fitness restructured its lease. All tenants are current in their rent obligations, including deferred rent. As of September 1, 2021, the borrower sponsors have reported that 100% of tenants have paid their full August 2021 rent payments and have not requested any rent relief or lease modifications. As of September 15, 2021, the Court at Oxford Valley Mortgage Loan is not subject to any forbearance, modification or debt service relief request.
The Market. The Court at Oxford Valley Property is located in Fairless Hills, Bucks County, Pennsylvania. Direct access to The Court at Oxford Valley Property is provided by Commerce Boulevard and Oxford Valley Road, and highway access is provided by I-95, I-295, and I-276 (the Pennsylvania Turnpike). According to the appraisal, The Court at Oxford Valley Property is situated within the Bucks County submarket of the Philadelphia MSA market. As of the end of the first quarter of 2021, the submarket reported total inventory of approximately 35.6 million SF, with a 5.4% vacancy rate and average asking rent of $16.56 PSF.
According to the appraisal, The Court at Oxford Valley Property is located within the Philadelphia-Camden-Wilmington Statistical Area, also known as Greater Philadelphia, the nation’s seventh largest metropolitan area. Greater Philadelphia benefits from its location in the heart of the Northeast Corridor and is the keystone of major north-south, east-west highway and rail networks. The major employers in Greater Philadelphia include a strong bio-science employment base and several major pharmaceutical companies. The Court at Oxford Valley Property benefits from proximity to Oxford Valley Mall located 0.25 miles west, which encompasses 1.3 million SF and is anchored by JC Penney and Macy’s. The closest grocery anchored center is Oxford Oaks Shopping Center, which is less than 1 mile north of the Court at Oxford Valley Property and is anchored by a ShopRite and Kohl’s.
According to the appraisal, within a three-, five- and ten-mile radius of The Court at Oxford Valley Property, the 2020 average household income was approximately $117,530, $118,919 and $104,346, respectively; and within the same radii, the 2020 estimated population was 83,072, 197,429 and 707,451, respectively.
The following table presents certain information relating to the appraisal’s market rent conclusion for The Court at Oxford Valley Property:
| Market Rent Summary |
| Tenant Type | Market Rent (PSF) | Lease Term (Yrs) | Rental Increase Projection |
| Junior Box (35,000 to 60,000 SF) Space | $14.00 | 10 | 10% Midterm |
| Junior Anchor (20,000 to 34,999 SF) Space | $16.50 | 10 | 10% Midterm |
| Large In-Line (10,000 to 19,999 SF) Space | $20.50 | 10 | 10% Midterm |
| In-Line (5,000 to 9,999 SF) Space | $22.50 | 10 | 10% Midterm |
| Pad Space | $170,000($/year) | 10 | 10% Midterm |
| High-Visibility Box Space | $16.50 | 10 | 10% Midterm |
This is not a research report and was not prepared by any Underwriter’s research department. Please see additional important information and qualifications at the end of this Term Sheet. |
T-90
| Retail – Anchored | Loan #6 | Cut-off Date Balance: | | $55,000,000 |
| 120, 210, 220, 310-330, 620, 640, 650, | The Court at Oxford Valley | Cut-off Date LTV: | | 65.9% |
| 610 and 630 Commerce Boulevard | | UW NCF DSCR: | | 1.97x |
| Fairless Hills, PA 19030 | | UW NOI Debt Yield: | | 10.8% |
The following table presents information regarding certain competitive properties to The Court at Oxford Valley Property:
| Competitive Property Summary |
Property Address | Year Built / Renovated | Size (SF) | Occupancy | Major Tenants | Distance From Subject |
The Court at Oxford Valley 120, 210, 220, 310-330, 620, 640, 650, 610 and 630
Commerce Boulevard Fairless Hills, PA | 1996 / NAP | 456,286(1) | 98.0%(1) | Best Buy, Dick’s Sporting Goods, Ashley Furniture, Crunch | NAP |
Lincoln Plaza 2424 East Lincoln Hwy Langhorne, PA | 1974 / 1993 | 260,940 | 100% | Raymour & Flanigan | 0.7 mi |
Great Northeast Plaza 2201 Cottman Ave Philadelphia, PA | 1960 / 2021 | 293,134 | 100% | Giant Food, Ashley | 16.3 mi |
Northeast Tower Center 4640 Roosevelt Blvd Philadelphia, PA | 1980 / NAP | 467,471 | 100% | Home Depot, Walmart | 18.7 mi |
Greenleaf at Cheltenham 2401 West Cheltenham Ave Cheltenham, PA | 1954 / 2018 | 405,677 | 89% | Home Depot | 20.7 mi |
Warminster Towne Centre 918-982 West Street Road Warminster, PA | 1997 / NAP | 308,053 | 91% | Kohl’s, ShopRite, Ross | 17.1 mi |
Langhorne Square Shopping Center 1283-1419 East Lincoln Hwy Langhorne, PA | 1966 / 1989 | 241,455 | 100% | Redner’s Market | 2.2 mi |
Source: Appraisal
| (1) | Information is based on the underwritten rent roll. |
This is not a research report and was not prepared by any Underwriter’s research department. Please see additional important information and qualifications at the end of this Term Sheet. |
T-91
| Retail – Anchored | Loan #6 | Cut-off Date Balance: | | $55,000,000 |
| 120, 210, 220, 310-330, 620, 640, 650, | The Court at Oxford Valley | Cut-off Date LTV: | | 65.9% |
| 610 and 630 Commerce Boulevard | | UW NCF DSCR: | | 1.97x |
| Fairless Hills, PA 19030 | | UW NOI Debt Yield: | | 10.8% |
Operating History and Underwritten Net Cash Flow. The following table presents certain information relating to the historical operating performance and Underwritten Net Cash Flow at The Court at Oxford Valley Property:
| Cash Flow Analysis |
| | 2018 | 2019 | 2020(1) | UW | UW PSF |
| Base Rent(2) | $6,426,274 | $6,123,151 | $5,029,819 | $6,570,358 | $14.40 |
| Expense Reimbursement | $2,166,013 | $2,052,643 | $1,884,993 | $2,090,200 | $4.58 |
| Income from Vacant Units | $0 | $0 | $0 | $169,982 | $0.37 |
| Net Rental Income | $8,592,287 | $8,175,794 | $6,914,812 | $8,830,540 | $19.35 |
| (Vacancy & Credit Loss) | $0 | $0 | $0 | ($441,527) | ($0.97) |
| Effective Gross Income | $8,592,287 | $8,175,794 | $6,914,812 | $8,389,013 | $18.39 |
| | | | | | |
| Real Estate Taxes | $1,232,663 | $1,210,889 | $1,241,581 | $1,140,215 | $2.50 |
| Insurance | $211,407 | $229,292 | $309,693 | $299,890 | $0.66 |
| Other Operating Expenses | $1,252,250 | $1,089,456 | $678,040 | $1,017,270 | $2.23 |
| Total Operating Expenses | $2,696,320 | $2,529,637 | $2,229,314 | $2,457,375 | $5.39 |
| | | | | | |
| Net Operating Income | $5,895,967 | $5,646,157 | $4,685,498 | $5,931,638 | $13.00 |
| Replacement Reserves | $0 | $0 | $0 | $68,443 | $0.15 |
| TI/LC | $0 | $0 | $0 | $252,612 | $0.55 |
| Net Cash Flow | $5,895,967 | $5,646,157 | $4,685,498 | $5,610,583 | $12.30 |
| | | | | | |
| Occupancy %(3) | 90.5% | 90.5% | 98.0% | 95.0% | |
| NOI DSCR (P&I) | 2.07x | 1.98x | 1.64x | 2.08x | |
| NOI DSCR (IO) | 3.30x | 3.16x | 2.63x | 3.32x | |
| NCF DSCR (P&I) | 2.07x | 1.98x | 1.64x | 1.97x | |
| NCF DSCR (IO) | 3.30x | 3.16x | 2.63x | 3.14x | |
| NOI Debt Yield | 10.7% | 10.3% | 8.5% | 10.8% | |
| NCF Debt Yield | 10.7% | 10.3% | 8.5% | 10.2% | |
| (1) | At the onset of the COVID-19 pandemic, coinciding with Pennsylvania’s stay-at-home order, eleven tenants accounting for 47.1% of the NRA temporarily closed their locations and one tenant, Romano’s Macaroni Grill, closed permanently. Of the eleven tenants that temporarily closed, all of them re-opened for business by September 2020 except for Crunch Fitness, which reopened in January 2021. During the period of store closures, approximately 76% of the tenants at The Court at Oxford Valley Property requested rent relief, which deferred rent is expected to be fully repaid by year-end 2021. |
| (2) | UW Base Rent is based on the underwritten rent roll dated June 1, 2021 and includes the newly signed leases for 2nd Avenue (Thrift Store) and Raising Canes ($431,282) and average rent for Best Buy over the Court at Oxford Valley Mortgage Loan term ($33,218). |
| (3) | In June 2018, 43,547 SF (9.5% of NRA) was vacated by Babies R US due to its bankruptcy and was backfilled by a temporary tenant for a portion of 2018. In November 2020, this space was leased to 2nd Avenue (Thrift Store), under a lease that commenced on June 1, 2021. As of June 1, 2021, The Court at Oxford Valley Property was 98.0% leased and 96.4% occupied. |
Escrows and Reserves.
Real Estate Taxes – The Court at Oxford Valley Mortgage Loan documents provide for an upfront reserve of approximately $859,197 for real estate taxes and ongoing monthly deposits into a reserve for real estate taxes in an amount equal to 1/12th of the real estate taxes that the lender estimates will be payable during the next twelve months for The Court at Oxford Valley Property (initially approximately $105,870 per month).
Insurance – In the event The Court at Oxford Valley Property is no longer covered by a blanket insurance policy acceptable to lender, the borrower is required to deposit 1/12th of the annual estimated insurance premiums monthly.
Replacement Reserve – The Court at Oxford Valley Mortgage Loan documents require ongoing monthly replacement reserve deposits of $5,650, subject to a cap of $270,000, so long as no event of default exists.
TI/LC Reserve – The Court at Oxford Valley Mortgage Loan documents provide for an upfront reserve of approximately $130,000 for tenant improvements and leasing commissions and ongoing monthly deposits in an amount equal to (i) $22,602 prior to July 1, 2023, (ii) $38,024 starting July 1, 2023, (iii) $22,602 starting July 1, 2026, and (iv) $38,024 starting July 1, 2028 continuing through the term of The Court at Oxford Valley Mortgage Loan. Ongoing TI/LC deposits will be capped at $1,250,000 so long as no event of default exists. Additionally, during a Tenant Sweep Period (as defined below), The Court at Oxford Valley Mortgage Loan documents provide for all excess cash to be swept to the TI/LC Reserve, which amounts are not subject to any cap.
Raising Cane Reserve – The Court at Oxford Valley Mortgage Loan documents require an upfront deposit of $359,810 for existing landlord obligations for the newly signed lease for Raising Cane.
Lockbox and Cash Management. The Court at Oxford Valley Mortgage Loan is structured with a hard lockbox and springing cash management during a Cash Sweep Period (as defined below). Revenues from The Court at Oxford Valley Property are required to be deposited by tenants directly into the lockbox account. During the continuance of a Cash Sweep Period, funds are required to be transferred on each business day to the lender-controlled cash management account and disbursed according to The Court at Oxford Valley Mortgage Loan documents.
This is not a research report and was not prepared by any Underwriter’s research department. Please see additional important information and qualifications at the end of this Term Sheet. |
T-92
| Retail – Anchored | Loan #6 | Cut-off Date Balance: | | $55,000,000 |
| 120, 210, 220, 310-330, 620, 640, 650, | The Court at Oxford Valley | Cut-off Date LTV: | | 65.9% |
| 610 and 630 Commerce Boulevard | | UW NCF DSCR: | | 1.97x |
| Fairless Hills, PA 19030 | | UW NOI Debt Yield: | | 10.8% |
A “Cash Sweep Period” means any one or more of the following periods:
| (i) | beginning upon the occurrence of an event of default and ending when such event of default is cured or waived by the lender, |
| (ii) | beginning when the amortizing debt service coverage ratio falls below 1.20x for two consecutive calendar quarters (tested quarterly) and ending when the amortizing debt service coverage ratio is equal to or greater than 1.25x for one calendar quarter, and |
| (iii) | a Tenant Sweep Period. |
A “Tenant Sweep Period” means the period commencing upon the date which is 12 months prior to the lease expiration of either Best Buy Co., Inc. or Dick’s Sporting Goods, Inc. (either, a “Triggering Tenant”), if such Triggering Tenant fails to renew the term of its lease as set forth therein and the other Triggering Tenant failed to renew its lease 12 months prior to its lease expiration.
A Tenant Sweep Period will end upon the earliest to occur of (a) either (i) a Triggering Tenant has renewed or extended the term of their respective lease, is operating in its leased space and is paying rent as agreed or (ii) one or more replacement tenants have entered into replacement leases for at least 65% of the aggregate gross leasable area of the Triggering Tenant space at a rental rate (inclusive of reimbursements) that is equal to or greater than 65% of the rent being paid by the applicable Triggering Tenant, and such replacement tenant(s) is open for business and paying rent, or (b) the date which is 12 months after the commencement of the Tenant Sweep Period.
Additional Secured Indebtedness (not including trade debts). None.
Mezzanine Loan and Preferred Equity. None.
Release of Property. Not permitted.
Letter of Credit. None.
Right of First Offer/Right of First Refusal. None.
Ground Lease. None.
Terrorism Insurance. The borrower is required to obtain and maintain property insurance and business interruption insurance for 18 months plus a 6-month extended period of indemnity. Such insurance is required to cover perils of terrorism and acts of terrorism; provided that if TRIPRA is in effect and covers both foreign and domestic acts of terror, the provisions of TRIPRA will determine the acts of terrorism for which coverage will be required. See “Risk Factors—Risks Relating to the Mortgage Loans—Terrorism Insurance May Not Be Available for All Mortgaged Properties” in the prospectus.
This is not a research report and was not prepared by any Underwriter’s research department. Please see additional important information and qualifications at the end of this Term Sheet. |
T-93
| Retail – Power Center | Loan #7 | Cut-off Date Balance: | | $49,500,000 |
| 520-580 Danenberg Drive | Plaza at Imperial Valley | Cut-off Date LTV: | | 65.0% |
| El Centro, CA 92243 | | UW NCF DSCR: | | 2.16x |
| | | UW NOI Debt Yield: | | 9.0% |
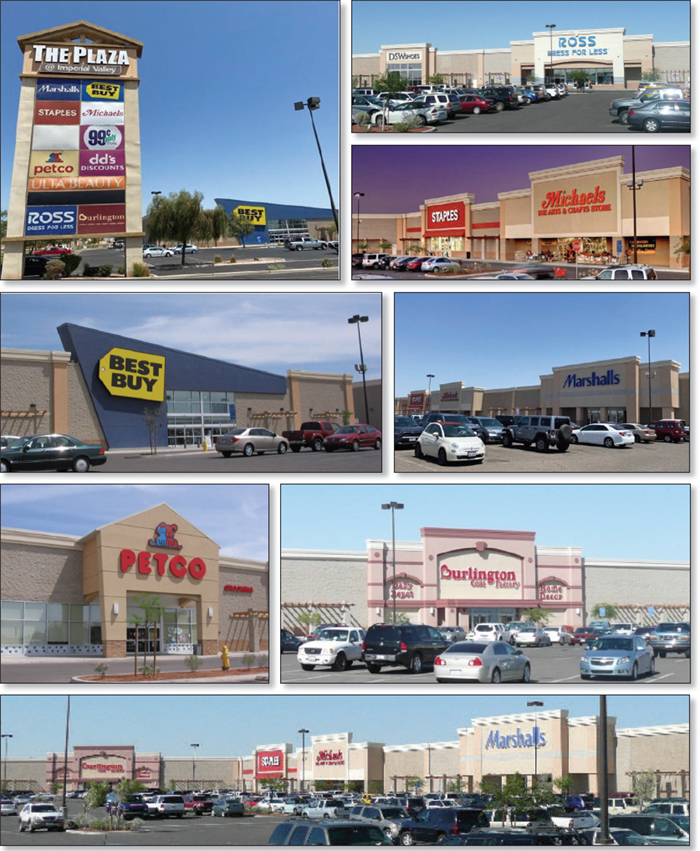
This is not a research report and was not prepared by any Underwriter’s research department. Please see additional important information and qualifications at the end of this Term Sheet. |
T-94
| Retail – Power Center | Loan #7 | Cut-off Date Balance: | | $49,500,000 |
| 520-580 Danenberg Drive | Plaza at Imperial Valley | Cut-off Date LTV: | | 65.0% |
| El Centro, CA 92243 | | UW NCF DSCR: | | 2.16x |
| | | UW NOI Debt Yield: | | 9.0% |
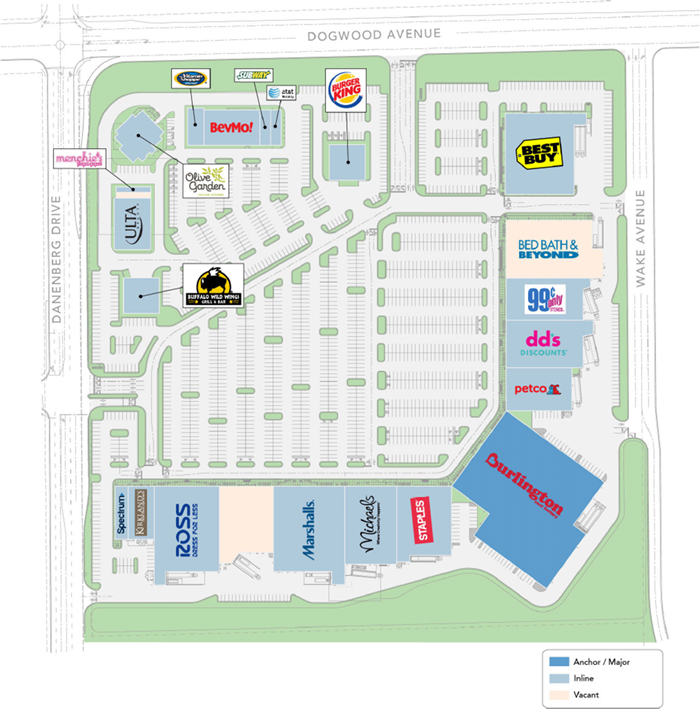
This is not a research report and was not prepared by any Underwriter’s research department. Please see additional important information and qualifications at the end of this Term Sheet. |
T-95
| Retail – Power Center | Loan #7 | Cut-off Date Balance: | | $49,500,000 |
| 520-580 Danenberg Drive | Plaza at Imperial Valley | Cut-off Date LTV: | | 65.0% |
| El Centro, CA 92243 | | UW NCF DSCR: | | 2.16x |
| | | UW NOI Debt Yield: | | 9.0% |
This is not a research report and was not prepared by any Underwriter’s research department. Please see additional important information and qualifications at the end of this Term Sheet. |
T-96
| Mortgage Loan No. 7 – Plaza at Imperial Valley |
| Mortgage Loan Information | | Property Information |
| Mortgage Loan Seller: | BANA | | Single Asset/Portfolio: | Single Asset |
| Credit Assessment (Fitch/KBRA/S&P): | NR/NR/NR | | Location: | El Centro, CA 92243 |
| Original Balance: | $49,500,000 | | General Property Type: | Retail |
| Cut-off Date Balance: | $49,500,000 | | Detailed Property Type: | Power Center |
| % of Initial Pool Balance: | 3.9% | | Title Vesting: | Fee |
| Loan Purpose: | Refinance | | Year Built/Renovated: | 2007 / NAP |
| Borrower Sponsors: | Ronald B. Russ and Jeffrey S. Gould | | Size: | 367,828 SF |
| Guarantors: | Ronald B. Russ and Jeffrey S. Gould | | Cut-off Date Balance PSF: | $135 |
| Mortgage Rate: | 3.7500% | | Maturity Date Balance PSF: | $135 |
| Note Date: | 8/12/2021 | | Property Manager: | Russ Group, Inc. |
| First Payment Date: | 10/1/2021 | | | (borrower-related) |
| Maturity Date: | 9/1/2031 | | | |
| Original Term to Maturity: | 120 months | | | |
| Original Amortization Term: | 0 months | | Underwriting and Financial Information(3) |
| IO Period: | 120 months | | UW NOI: | $4,435,174 |
| Seasoning: | 1 month | | UW NOI Debt Yield(2): | 9.0% |
| Prepayment Provisions: | L(25),DorYM1(91),O(4) | | UW NOI Debt Yield at Maturity(2): | 9.0% |
| Lockbox/Cash Mgmt Status: | Hard/Springing | | UW NCF DSCR: | 2.16x |
| Additional Debt Type: | None | | Most Recent NOI: | $4,878,568 (4/30/2021 TTM) |
| Additional Debt Balance: | NAP | | 2nd Most Recent NOI: | $4,898,990 (12/31/2020) |
| Future Debt Permitted (Type): | No (NAP) | | 3rd Most Recent NOI: | $4,852,562 (12/31/2019) |
| Reserves(1) | | Most Recent Occupancy(2): | 94.3% (8/1/2021) |
| Type | Initial | Monthly | Cap | | 2nd Most Recent Occupancy: | 94.3% (12/31/2020) |
| RE Taxes: | $364,339 | $60,723 | NAP | | 3rd Most Recent Occupancy: | 94.6% (12/31/2019) |
| Insurance: | $0 | Springing | NAP | | Appraised Value (as of): | $76,200,000 (7/2/2021) |
| Replacement Reserve: | $0 | $6,130 | NAP | | Appraised Value PSF: | $207 |
| TI/LC Reserve: | $1,500,000 | Springing | $1,500,000 | | Cut-off Date LTV Ratio(2): | 65.0% |
| Capitalized Holdback(2): | $2,000,000 | $0 | NAP | | Maturity Date LTV Ratio(2): | 65.0% |
| | | | | | | | |
| Sources and Uses |
| Sources | Proceeds | % of Total | | Uses | Proceeds | % of Total |
| Loan Amount: | $49,500,000 | 100.0% | | Loan Payoff: | $39,768,607 | 80.3% |
| | | | | Return of Equity: | $5,584,256 | 11.3% |
| | | | | Upfront Reserves: | $3,864,339 | 7.8% |
| | | | | Closing Costs: | $282,797 | 0.6% |
| Total Sources: | $49,500,000 | 100.0% | | Total Uses: | $49,500,000 | 100.0% |
| (1) | See “Escrows and Reserves” below for further discussion of reserve requirements. |
| (2) | Most recent occupancy includes Bed Bath & Beyond (7.6% of NRA), who has given notice of intent to vacate prior to its lease expiration date in January 2024 and is currently dark in its space. Reportedly, the borrower sponsors believe that Bed Bath & Beyond elected to go dark after discovering that the borrower sponsors are currently in discussions with TJ Maxx HomeGoods for a vacant space in the Plaza at Imperial Valley Property (as defined below) and Bed Bath & Beyond considers TJ Maxx HomeGoods directly competitive to its operations and Bed Bath & Beyond’s lease does not include an exclusivity clause. Despite being dark, Bed Bath & Beyond has continued to remain current on its rent obligations, but they were included in the underwritten vacancy. At loan origination, the lender reserved a Capitalized Holdback of $2,000,000 to account for upcoming leasing, which will be disbursed to the borrower on or before October 2023 if the borrower provides evidence that the Plaza at Imperial Valley Property has achieved a net cash flow debt yield (after accounting for the Capitalized Holdback) of not less than 9.0% and an amortizing net cash flow debt service coverage ratio (after accounting for the Capitalized Holdback) of not less than 1.54x. See “Escrows and Reserves”. The UW NOI Debt Yield, UW NOI Debt Yield at Maturity, Cut-off Date LTV Ratio and Maturity Date LTV Ratio based on the currently funded loan amount of $47,500,000 are 9.3%, 9.3%, 62.3% and 62.3% respectively. |
| (3) | The novel coronavirus pandemic is an evolving situation and could impact the Plaza at Imperial Valley Mortgage Loan (as defined below) more severely than assumed in the underwriting of the Plaza at Imperial Valley Mortgage Loan and could adversely affect the NOI, NCF and occupancy information, as well as the appraised value and the DSCR, LTV and Debt Yield metrics presented above and herein. See "Risk Factors—Risks Related to Market Conditions and Other External Factors—The Coronavirus Pandemic Has Adversely Affected the Global Economy and Will Likely Adversely Affect the Performance of the Mortgage Loans" in the prospectus. |
The Mortgage Loan. The seventh largest mortgage loan (the “Plaza at Imperial Valley Mortgage Loan”) is evidenced by a promissory note in the original principal amount of $49,500,000 and secured by the fee interest in a power center retail property located in El Centro, California (the “Plaza at Imperial Valley Property”). The Plaza at Imperial Valley Mortgage Loan is refinancing a loan previously included in the UBSBB 2012-C3 securitization transaction.
This is not a research report and was not prepared by any Underwriter’s research department. Please see additional important information and qualifications at the end of this Term Sheet. |
T-97
| Retail – Power Center | Loan #7 | Cut-off Date Balance: | | $49,500,000 |
| 520-580 Danenberg Drive | Plaza at Imperial Valley | Cut-off Date LTV: | | 65.0% |
| El Centro, CA 92243 | | UW NCF DSCR: | | 2.16x |
| | | UW NOI Debt Yield: | | 9.0% |
The Borrower and the Borrower Sponsors. The borrower is RJFP LLC, a Delaware limited liability company and single purpose entity with two independent directors. The borrower sponsors and non-recourse carveout guarantors are Ronald B. Russ and Jeffrey S. Gould.
Ronald B. Russ is the founder and President of Russ Group. Founded in 1987, The Russ Group specializes in the management of retail properties, as well as acquisition/brokerage services for retailers. Over the years, the company has developed key relationships with many of the major big box tenants on a national basis. The Russ Group has offices located in California and Ohio and currently owns and manages 15 properties in 8 states with 3.5 million SF of NRA inclusive of the Plaza at Imperial Valley Property. The borrower sponsors developed the Plaza at Imperial Property and maintain a cost basis in the property of approximately $65,940,280. The borrower sponsors have been involved with a previous discounted payoff relating to the construction loan on the Plaza at Imperial Valley Property in 2012 and a previous foreclosure on an unrelated property. See “Description of the Mortgage Pool—Loan Purpose; Default History, Bankruptcy Issues and Other Proceedings” in the prospectus.
Jeffrey S. Gould has over 35 years of real estate experience, having acquired, developed and redeveloped shopping centers for his own account as well as for others, representing more than 18 million SF of retail. Mr. Gould has extensive experience with the acquisition and disposition of retail chains through the purchase of retail properties, purchase of retail operating companies and liquidations.
The Property. The Plaza at Imperial Valley Property is power center retail property totaling 367,828 SF of rentable area on a 38.97-acre site located in El Centro, California, approximately 117 miles east of San Diego. The Plaza at Imperial Valley Property was developed in 2007 and includes six one-story buildings leased to 18 national tenants and three outparcel pads that are grounded leased to Buffalo Wild Wings, Burger King and Olive Garden. The site contains 1,725 parking spaces, resulting in a parking ratio of 4.7 spaces per 1,000 SF of NRA.
The Plaza at Imperial Valley Property is anchored by Burlington Coat Factory, Marshalls, Ross Dress for Less and Best Buy. Junior anchors include Michael’s, Staples and DD’s discounts. Other national tenants at the property include Petco, Ulta Salon, Beverages and More, Kirkland’s, AT&T, Spectrum, The Vitamin Shoppe, Subway and Menchies. Seven (61.6% of NRA) anchor tenants have been in occupancy since the center was developed and six have renewed in the last three years. The nearest location for any of the anchor tenants is approximately 60 miles away in Yuma, Arizona.
The Plaza at Imperial Valley Property has a granular rent roll, with no tenant occupying more than 20.8% of NRA or accounting for more than 20.9% of underwritten base rent. As of August 1, 2021, the Plaza at Imperial Valley Property was 94.3% leased by 21 tenants and 88.0% occupied by 20 tenants. The fifth largest tenant, Bed Bath & Beyond (7.6% of NRA), gave notice of its intent to vacate prior to its lease expiration date in January 2024 and is currently dark in its space. The borrower sponsors are currently in discussions with TJ Maxx HomeGoods for a space in the Plaza at Imperial Valley Property and Bed Bath & Beyond considers them directly competitive to their operations. Despite being dark, Bed Bath & Beyond continues to remain current on its rent obligations. The lender has included the Bed Bath & Beyond space in the underwritten vacancy. At closing, the lender reserved a Capitalized Holdback for $2,000,000 to account for the upcoming leasing. Historical occupancy at the Plaza at Imperial Valley Property was: 2016: 99.4%; 2017: 99.4%; 2018: 98.6%; 2019: 94.6% and 2020: 94.3%.
Major Tenants.
Burlington Coat Factory (76,450 SF; 20.8% of NRA; 20.9% of underwritten base rent). Burlington Coat Factory (NYSE: BURL) is a value priced department store chain. The clothing retailer, which made its name selling coats, operates nearly 700 no-frills retail stores (averaging 65,000 SF) offering off-price current, brand-name clothing in about 45 states plus Puerto Rico. Although it is one of the nation's largest coat sellers, the stores also sell a full range of products, including children's apparel, bath items, furniture, gifts jewelry, linens, and shoes. Burlington Coat Factory is an original tenant to the center, has been in occupancy since their space was completed in 2008, has exercised two renewal options in February 2019 to extend the lease for 10 years through January 2029 and has two five-year renewal options remaining at fixed rents. The tenant currently pays a rent of $14.00 PSF, which steps to $14.75 PSF in February 2024. Burlington Coat Factory is not required to report sales.
Marshalls (33,000 SF; 9.0% of NRA; 7.4% of underwritten base rent) Marshalls is part of The TJX Companies, Inc. (NYSE: TJX) brand of retail stores. The TJX Companies, Inc. is the leading off price retailer of apparel and home fashions in the United States and worldwide. As of May 1, 2021, the end of the company's first quarter, The TJX Companies, Inc. operated a total of 4,639 stores in nine countries. This includes 1,282 T.J. Maxx, 1,147 Marshalls, 843 HomeGoods, 52 Sierra and 39 Homesense stores, as well as four e-commerce sites. Marshalls is an original tenant to the center and has been in occupancy since their space was completed in 2008. Marshalls exercised its first renewal option in 2018, extending for five years through August 2023, and has three five-year renewal options remaining with 6 months’ notice at fixed rents. Marshalls currently pays $11.50 PSF, which increases by $1.00 PSF during each renewal period. Marshalls reported 2020 sales at the Plaza at Imperial Valley Property of $11,797,317, compared to the reported national average of $8,402,294, as of the second quarter of 2021. On a PSF basis, Marshalls’ historical sales at the Plaza at Imperial Valley Property were: 2015: $290 PSF; 2016: $296 PSF; 2017: $289 PSF; 2018: $315 PSF; 2019: $320 PSF; 2020: $357 PSF.
Ross Dress for Less (30,187 SF; 8.2% of NRA; 8.3% of underwritten base rent). Ross Dress for Less (NASDAQ: ROST) is the largest off-price apparel and home fashion chain the United States, with 1,896 locations in 40 states, the District of Columbia, and Guam. Ross Dress for Less offers first-quality, in-season, name brand and designer apparel, accessories, footwear, and home fashions for the entire family. Ross Dress for Less is an original tenant to the center and has been in occupancy since their space was completed in 2009. Ross Dress for Less exercised its first renewal option in February 2019, extending for five years through January 2024, and has five five-year renewal options remaining with 6 months’ notice at fixed rents. Ross Dress for Less currently pays $14.10 PSF, which increases by $0.50 PSF during each renewal period. Ross Dress for Less is not required to report sales. Ross Dress for Less also operates a 20,022 SF DD’s discounts store at the Plaza at Imperial Valley Property (5.4% of NRA) on a lease that expires January 31, 2023.
Best Buy (30,000 SF; 8.2% of NRA; 9.5% of underwritten base rent). Best Buy (NYSE: BBY), founded in 1966, is a provider of technology products, services and solutions in the United States, Canada and Mexico, offering products and services to customers visiting its stores, engaging with Geek Squad agents, or using its websites or mobile applications. As of the second quarter of 2021, Best Buy had a total of 1,005 stores in the United States and 219 stores in Mexico and Canada. Best Buy has is an original tenant to the center and has been in occupancy since their space was completed in 2007. Best Buy exercised a renewal option in 2018, extending for five years through January 2023 and has three five-year renewal options remaining with 6 months’ notice at fixed rents. Best Buy currently pays $16.25 PSF, which increases by $1.00 PSF during each renewal period. Best Buy is not required to report sales.
This is not a research report and was not prepared by any Underwriter’s research department. Please see additional important information and qualifications at the end of this Term Sheet. |
T-98
| Retail – Power Center | Loan #7 | Cut-off Date Balance: | | $49,500,000 |
| 520-580 Danenberg Drive | Plaza at Imperial Valley | Cut-off Date LTV: | | 65.0% |
| El Centro, CA 92243 | | UW NCF DSCR: | | 2.16x |
| | | UW NOI Debt Yield: | | 9.0% |
The following table presents certain information relating to the tenancy at the Plaza at Imperial Valley Property:
| Tenant Summary(1) |
| | | | | | | | 2020 Sales(2) | | |
| Tenant Name | Credit Rating (Fitch/Moody’s/ S&P) (3) | Tenant SF | Approx. % of Total SF | Annual UW Rent | % of Total Annual
UW Rent | Annual UW Rent PSF | $ | PSF | Occ. Cost %(4) | Lease Expiration | Term. Options |
| Anchor Tenants | | | | | | | | | | | |
| Burlington Coat Factory | NR / NR / BB+ | 76,450 | 20.8% | $1,070,300 | 20.9% | $14.00 | NAV | NAV | NAV | 1/31/2029 | N |
| Marshalls | NR / A2 / A | 33,000 | 9.0% | $379,500 | 7.4% | $11.50 | $11,797,317 | $357 | 4.3% | 8/31/2023 | N |
| Ross Dress for Less | NR / A2 / BBB+ | 30,187 | 8.2% | $425,637 | 8.3% | $14.10 | NAV | NAV | NAV | 1/31/2024 | N |
| Best Buy | NR / A3 / BBB+ | 30,000 | 8.2% | $487,500 | 9.5% | $16.25 | NAV | NAV | NAV | 1/31/2023 | N |
| Anchor Subtotal/Wtd. Avg. | 169,637 | 46.1% | $2,362,937 | 46.0% | $13.93 | | | | | |
| | | | | | | | | | | | |
| Junior Anchor Tenants | | | | | | | | | | | |
| Bed Bath & Beyond(5) | NR / Ba3 / B+ | 28,000 | 7.6% | $308,000 | 6.0% | $11.00 | NAV | NAV | NAV | 1/31/2024 | N |
| Michaels | NR / B1 / B | 21,360 | 5.8% | $320,400 | 6.2% | $15.00 | NAV | NAV | NAV | 11/30/2023 | N |
| Staples | NR / B2 / B | 20,388 | 5.5% | $275,238 | 5.4% | $13.50 | NAV | NAV | NAV | 9/30/2023 | N |
| DD's discounts | NR / NR / NR | 20,022 | 5.4% | $190,209 | 3.7% | $9.50 | NAV | NAV | NAV | 1/31/2023 | N |
| Junior Anchor Subtotal/ Wtd. Avg. | 89,770 | 24.4% | $1,093,847 | 21.3% | $12.18 | | | | | |
| | | | | | | | | | | | |
| In-Line/Pad Tenants | | 87,415 | 23.8% | $1,676,527 | 32.7% | $19.18 | | | | | |
| Vacant Space | | 21,006 | 5.7% | $0 | 0.0% | $0.00 | | | | | |
| Total/Wtd. Avg. | | 367,828 | 100.0% | $5,133,310 | 100.0% | $14.80(6) | | | | | |
| (1) | Information is based on the underwritten rent roll dated August 1, 2021. |
| (2) | Burlington Coat Factory, Ross Dress for Less, Best Buy, Bed Bath & Beyond, Michaels, Staples and DD's discounts are not required to report sales. |
| (3) | Certain ratings are those of the parent company whether or not the parent guarantees the lease. |
| (4) | Occ. Cost % is calculated based on underwritten rent. |
| (5) | Bed Bath & Beyond gave notice of its intent to vacate prior to its lease expiration date in January 2024 and is currently dark in its space. Reportedly, the borrower sponsors believe that Bed Bath & Beyond elected to go dark after discovering that the borrower sponsors are currently in discussions with TJ Maxx HomeGoods for a vacant space in the Plaza at Imperial Valley Property, as Bed Bath & Beyond considers TJ Maxx HomeGoods directly competitive to its operations and Bed Bath & Beyond’s lease does not include an exclusivity clause. Despite being dark, Bed Bath & Beyond continues to remain current on its rent obligations, but they were included in the underwritten vacancy. At loan origination, the lender reserved a Capitalized Holdback for $2,000,000 to account for the upcoming leasing. |
| (6) | Wtd. Avg. Annual UW Rent PSF excludes vacant space. |
This is not a research report and was not prepared by any Underwriter’s research department. Please see additional important information and qualifications at the end of this Term Sheet. |
T-99
| Retail – Power Center | Loan #7 | Cut-off Date Balance: | | $49,500,000 |
| 520-580 Danenberg Drive | Plaza at Imperial Valley | Cut-off Date LTV: | | 65.0% |
| El Centro, CA 92243 | | UW NCF DSCR: | | 2.16x |
| | | UW NOI Debt Yield: | | 9.0% |
The following table presents certain information relating to the lease rollover schedule at the Plaza at Imperial Valley Property:
| Lease Rollover Schedule(1)(2) |
| Year | # of Leases Rolling | SF Rolling | UW Rent PSF Rolling | Approx. % of Total SF Rolling | Approx. Cumulative % of SF Rolling | Total UW Rent Rolling | Approx. % of Total Rent Rolling | Approx. Cumulative % of Total Rent Rolling |
| 2021 | 0 | 0 | $0.00 | 0.0% | 0.0% | $0 | 0.0% | 0.0% |
| 2022 | 1 | 7,220 | $8.50 | 2.0% | 2.0% | $61,370 | 1.2% | 1.2% |
| 2023 | 7 | 135,080 | $13.79 | 36.7% | 38.7% | $1,862,122 | 36.3% | 37.5% |
| 2024(3) | 6 | 94,408 | $15.03 | 25.7% | 64.4% | $1,419,384 | 27.7% | 65.1% |
| 2025 | 2 | 20,692 | $19.99 | 5.6% | 70.0% | $413,539 | 8.1% | 73.2% |
| 2026 | 2 | 8,348 | $22.91 | 2.3% | 72.2% | $191,293 | 3.7% | 76.9% |
| 2027 | 0 | 0 | $0.00 | 0.0% | 72.2% | $0 | 0.0% | 76.9% |
| 2028 | 1 | 1,172 | $30.00 | 0.3% | 72.6% | $35,160 | 0.7% | 77.6% |
| 2029 | 1 | 76,450 | $14.00 | 20.8% | 93.4% | $1,070,300 | 20.9% | 98.4% |
| 2030 | 1 | 3,452 | $23.22 | 0.9% | 94.3% | $80,143 | 1.6% | 100.0% |
| 2031 | 0 | 0 | $0.00 | 0.0% | 94.3% | $0 | 0.0% | 100.0% |
| 2032 & Beyond | 0 | 0 | $0.00 | 0.0% | 94.3% | $0 | 0.0% | 100.0% |
| Vacant | 0 | 21,006 | $0.00 | 5.7% | 100.0% | $0 | 0.0% | 100.0% |
| Total/Wtd. Avg. | 21 | 367,828 | $14.80(4) | 100.0% | | $5,133,310 | 100.0% | |
| (1) | Information is based on the underwritten rent roll. |
| (2) | Certain tenants may have lease termination options that are exercisable prior to the originally stated expiration date of the related lease and are not considered in the rollover schedule. |
| (3) | 2024 includes Bed Bath & Beyond, which has given notice of its intent to vacate prior to its lease expiration date in January 2024 and is currently dark in its space. Reportedly, the borrower sponsors believe that Bed Bath & Beyond elected to go dark after discovering that the borrower sponsors are currently in discussions with TJ Maxx HomeGoods for a vacant space in the Plaza at Imperial Valley Property, as Bed Bath & Beyond considers TJ Maxx HomeGoods directly competitive to its operations and Bed Bath & Beyond’s lease does not include an exclusivity clause. Despite being dark, Bed Bath & Beyond continues to remain current on its rent obligations, but they were included in the underwritten vacancy. At loan origination, the lender reserved a Capitalized Holdback for $2,000,000 to account for the upcoming leasing. |
| (4) | Wtd. Avg. UW Rent PSF Rolling excludes vacant space. |
COVID-19 Update. The first debt service payment on the Plaza at Imperial Valley Mortgage Loan is due in October 2021 and, as of September 15, 2021, the Plaza at Imperial Valley Mortgage Loan is not subject to any forbearance, modification or debt service relief request. The borrower sponsor granted COVID-19 related rent abatements to three tenants which abatement periods have ended. As of August 31, 2021, the borrower sponsor has reported that 100.0% of the expected July and August 2021 rent payments were received.
The Market. The Plaza at Imperial Valley Property is located in El Centro, Imperial County, California. El Centro is the core urban area and principal city of the El Centro metropolitan statistical area, which encompasses all of Imperial County. It is home to the retail, transportation, wholesale, and agricultural industries. The area is served by major transportation routes, including Interstate 8, State Route 86 and State Route 111. Imperial County is bordered by Riverside County to the north, La Paz County in Arizona to the east, Baja California in Mexico to the south and San Diego County to the west. Additionally, the Plaza at Imperial Valley Property is located approximately 10 miles north of the Mexican border. El Centro provides businesses and retailers an opportunity to take advantage of an international population base from a Southern California location. With over 14 million vehicles and pedestrian crossings each year at the international border crossings located nearby, the Plaza at Imperial Valley Property’s location provides access to international consumers and retail shoppers purchasing products and services that are unavailable in Mexico.
According to the appraisal, as of July 2021, there were 281 existing retail buildings containing 3,378,706 SF of retail inventory within 5 miles of the Plaza at Imperial Valley Property. The current vacancy rate and market rental rate for all existing retail buildings in the 5-mile radius is 8.6% and $18.12 PSF, respectively. According to the appraisal, within a one-, three- and five-mile radius of the Plaza at Imperial Valley Property, the 2020 average household income was approximately $84,262, $65,263, and $69,151, respectively; and within the same radii, the 2020 estimated population was 2,888, 48,526 and 63,683, respectively.
The following table presents certain information relating to the appraisal’s market rent conclusion for the Plaza at Imperial Valley Property:
| Market Rent Summary |
| Tenant Type | Market Rent (PSF) | Lease Term (Yrs) | Rental Increase Projection |
| Anchor and Junior Anchor | $13.80 - $16.20 | 10 | 10% / 5 years |
| In-Line Space | $21.00 - $33.00 | 5 – 7 | 3% / year |
| Pad Space | $85,000 - $135,000 ($/year) | 20 | 10% / 5 years |
This is not a research report and was not prepared by any Underwriter’s research department. Please see additional important information and qualifications at the end of this Term Sheet. |
T-100
| Retail – Power Center | Loan #7 | Cut-off Date Balance: | | $49,500,000 |
| 520-580 Danenberg Drive | Plaza at Imperial Valley | Cut-off Date LTV: | | 65.0% |
| El Centro, CA 92243 | | UW NCF DSCR: | | 2.16x |
| | | UW NOI Debt Yield: | | 9.0% |
The following table presents information regarding the primary competitive properties to the Plaza at Imperial Valley Property:
| Competitive Property Summary |
Property Address | Year Built / Renovated | Size (SF) | Occupancy | Major Tenants | Distance From Subject |
Plaza at Imperial Valley 520-580 Danenberg Drive El Centro, CA | 2007 / NAP | 367,828(1) | 94.3%(1) | Burlington Coat Factory, Marshalls, Ross Dress for Less, Best Buy | NAP |
Centro Commons 2140-2184 N Imperial Ave El Centro, CA | 2015 / NAP | 128,826 | 94% | Ross, DD's discounts, Aldi, PetSmart | 3.8 mi |
El Centro Town Center 2295 N Imperial Ave El Centro, CA | 2003 / NAP | 262,676 | 100% | Lowe’s, Target | 3.6 mi |
Calexico Retail Center 2536 Rockwood Ave Calexico, CA | 2005 / NAP | 214,754 | 98% | Walmart | 5.5 mi |
Source: Appraisal
| (1) | Information is based on the underwritten rent roll. |
The following table presents recent leasing data for comparable properties with respect to the Plaza at Imperial Valley Property:
| Anchor & Junior Anchor Rent Comparable Summary |
Property Address | Tenant Name | Lease Date | Size (NRA) | Term (Years) | Initial Rent PSF | Rent Steps |
Chula Vista Crossings, 1830 Main Street, Chula Vista, CA | Dollar Tree | Dec-20 | 10,803 | 10 | $1.83 | 1.6% |
| | | | | | | |
14677 Palm Drive, Desert Hot Springs, CA | Grocery Outlet | Jul-20 | 20,000 | 15 | $1.67 | 10% / 5 years |
| | | | | | | |
Shops at Sycamore Square, 2801 Cochran Street, Simi Valley, CA | Hobby Lobby | Sep-19 | 52,800 | 10 | $0.84 | 10% / 5 years |
| | | | | | | |
Castle Park Retail Center, 1325 3rd Avenue, Chula Vista, CA | DD’s discounts | Mar-20 | 24,939 | 10 | $1.42 | 10% midterm |
| | | | | | | |
Paseo Corners, 865 E H Street, Chula Vista, CA | Goodwill | Jun-19 | 15,170 | 10 | $1.65 | 10% midterm |
| | | | | | | |
Chula Vista Crossings, 1810-1870 Main Street, Chula Vista, CA | Aldi | Jan-19 | 18,140. | 15 | $1.58 | NAP |
| | | | | | | |
College Plaza, 3504-3510 College Boulevard, Oceanside, CA | Hobby Lobby | Oct-18 | 58,646 | 10 | $1.25 | 5% / year 6 |
| | | | | | | |
The Ontario Marketplace, 4195 Inland Empire Blvd, Ontario, CA | Sam’s Furniture | Jan-18 | 30,000 | 10 | $1.42 | NAP |
Source: Appraisal
This is not a research report and was not prepared by any Underwriter’s research department. Please see additional important information and qualifications at the end of this Term Sheet. |
T-101
| Retail – Power Center | Loan #7 | Cut-off Date Balance: | | $49,500,000 |
| 520-580 Danenberg Drive | Plaza at Imperial Valley | Cut-off Date LTV: | | 65.0% |
| El Centro, CA 92243 | | UW NCF DSCR: | | 2.16x |
| | | UW NOI Debt Yield: | | 9.0% |
Operating History and Underwritten Net Cash Flow. The following table presents certain information relating to the historical operating performance and Underwritten Net Cash Flow at the Plaza at Imperial Valley Property:
| Cash Flow Analysis | |
| | | 2018 | | 2019 | | 2020 | | TTM 4/30/2021 | | UW | | UW PSF | |
| Base Rent(1) | | $5,372,784 | | $5,113,421 | | $5,125,281 | | $5,130,144 | | $5,470,436 | | $14.87 | |
| Expense Reimbursement | | $1,328,195 | | $1,305,717 | | $1,288,116 | | $1,299,161 | | $1,307,314 | | $3.55 | |
| Other Income | | $2,411 | | $3,013 | | $9,196 | | $9,396 | | $9,396 | | $0.03 | |
| (Vacancy & Credit Loss)(2) | | $0 | | $0 | | $0 | | $0 | | ($814,012) | | ($2.21) | |
| Effective Gross Income | | $6,703,390 | | $6,422,151 | | $6,422,593 | | $6,438,701 | | $5,973,134 | | $16.24 | |
| | | | | | | | | | | | | | |
| Real Estate Taxes | | $662,761 | | $688,202 | | $696,695 | | $703,514 | | $700,652 | | $1.90 | |
| Insurance | | $58,756 | | $60,844 | | $64,485 | | $64,485 | | $64,485 | | $0.18 | |
| Other Operating Expenses | | $847,957 | | $820,543 | | $762,423 | | $792,134 | | $772,823 | | $2.10 | |
| Total Operating Expenses | | $1,569,474 | | $1,569,589 | | $1,523,603 | | $1,560,133 | | $1,537,960 | | $4.18 | |
| | | | | | | | | | | | | | |
| Net Operating Income | | $5,133,916 | | $4,852,562 | | $4,898,990 | | $4,878,568 | | $4,435,174 | | $12.06 | |
| Replacement Reserves | | $0 | | $0 | | $0 | | $0 | | $73,566 | | $0.20 | |
| TI/LC | | $0 | | $0 | | $0 | | $0 | | $295,310 | | $0.80 | |
| Net Cash Flow | | $5,133,916 | | $4,852,562 | | $4,898,990 | | $4,878,568 | | $4,066,298 | | $11.05 | |
| | | | | | | | | | | | | | |
| Occupancy % | | 98.6% | | 94.6% | | 94.3% | | 94.3%(3) | | 88.0%(2) | | | |
| NOI DSCR | | 2.73x | | 2.58x | | 2.60x | | 2.59x | | 2.36x | | | |
| NCF DSCR | | 2.73x | | 2.58x | | 2.60x | | 2.59x | | 2.16x | | | |
| NOI Debt Yield | | 10.4% | | 9.8% | | 9.9% | | 9.9% | | 9.0% | | | |
| NCF Debt Yield | | 10.4% | | 9.8% | | 9.9% | | 9.9% | | 8.2% | | | |
| (1) | UW Base Rent is based on the underwritten rent roll dated August 1, 2021 and includes rent increases through August 1, 2022 ($3,169) and grossed up vacant space ($645,126). |
| (2) | UW vacancy includes Bed Bath & Beyond, which gave notice of its intent to vacate prior to its lease expiration date in January 2024 and is currently dark in its space. Reportedly, the borrower sponsors believe that Bed Bath & Beyond elected to go dark after discovering that the borrower sponsors are currently in discussions with TJ Maxx HomeGoods for a vacant space in the Plaza at Imperial Valley Property, as Bed Bath & Beyond considers TJ Maxx HomeGoods directly competitive to its operations and Bed Bath & Beyond’s lease does not include an exclusivity clause. Despite being dark, Bed Bath & Beyond continues to remain current on its rent obligations, but they were included in the underwritten vacancy. At loan origination, the lender reserved a Capitalized Holdback for $2,000,000 to account for the upcoming leasing. As of August 1, 2021, the Plaza at Imperial Valley Property was 94.3% leased including Bed Bath & Beyond. |
| (3) | Represents occupancy as of August 1, 2021. |
Escrows and Reserves.
Real Estate Taxes – The Plaza at Imperial Valley Mortgage Loan documents provide for an upfront reserve of approximately $364,339 for real estate taxes and ongoing monthly deposits into a reserve for real estate taxes in an amount equal to 1/12th of the real estate taxes that the lender estimates will be payable during the next twelve months for the Plaza at Imperial Valley Property (initially, approximately $60,723 per month).
Insurance – In the event the Plaza at Imperial Valley Property is no longer covered by a blanket insurance policy acceptable to the lender, the borrower is required to deposit 1/12th of the annual estimated insurance premiums monthly.
Replacement Reserve – The Plaza at Imperial Valley Mortgage Loan documents require ongoing monthly replacement reserve deposits of $6,130.
TI/LC Reserve – The Plaza at Imperial Valley Mortgage Loan documents provide for an upfront reserve of approximately $1,500,000 for tenant improvements and leasing commissions and, upon the reserve balance falling below the cap of $1,500,000, ongoing monthly deposits in an amount equal to $30,000.
Capitalized Holdback – $2,000,000 was held back at origination of the Plaza at Imperial Valley Mortgage Loan as additional collateral. Within the first two years of the securitization date, the lender is required to release so much of the holdback then remaining in escrow which, when added to the principal amount of the loan previously funded, provides for a minimum (a) amortizing net cash flow debt service coverage ratio of 1.54x and (b) net cash flow debt yield of 9.00%.
Lockbox and Cash Management. The Plaza at Imperial Valley Mortgage Loan is structured with a hard lockbox and springing cash management upon a Cash Sweep Period (as defined below). Revenues from the Plaza at Imperial Valley Property are required to be deposited by tenants directly into the lockbox account. During a Cash Sweep Period, funds are required to be transferred on each business day to the lender-controlled cash management account and disbursed according to the Plaza at Imperial Valley Mortgage Loan documents.
A “Cash Sweep Period” means any one or more of the following periods: (i) beginning when the amortizing debt service coverage ratio falls below 1.20x on a trailing six month basis (tested quarterly) and ending when the amortizing debt service coverage ratio is equal to or greater than 1.25x on a trailing six month basis (tested quarterly for two consecutive calendar quarters) and (ii) beginning upon the date that Burlington Coat Factory (a) vacates or gives notice of its intent to vacate, (b) gives notice of its intent to not renew (which notice is due 6 months prior to lease expiration pursuant to the lease), (c) defaults with respect to the payment of rent under its lease or (d) files for or is subject of any bankruptcy proceeding (or any lease guarantor does the
This is not a research report and was not prepared by any Underwriter’s research department. Please see additional important information and qualifications at the end of this Term Sheet. |
T-102
| Retail – Power Center | Loan #7 | Cut-off Date Balance: | | $49,500,000 |
| 520-580 Danenberg Drive | Plaza at Imperial Valley | Cut-off Date LTV: | | 65.0% |
| El Centro, CA 92243 | | UW NCF DSCR: | | 2.16x |
| | | UW NOI Debt Yield: | | 9.0% |
same) until (w) with respect to clause (a), Burlington or an acceptable replacement tenant continuously operates for at least 45 consecutive days and is paying rent, (x) with respect to clause (b), Burlington renewed its lease or an acceptable replacement tenant is found and takes occupancy, (y) with respect to clause (c), the default is cured or (z) with respect to clause (d), the lease is assumed without alteration or material terms and the tenant's (or lease guarantor’s) assets are no longer subject to the jurisdiction of a bankruptcy court.
Additional Secured Indebtedness (not including trade debts). None.
Mezzanine Loan and Preferred Equity. None.
Release of Property. Not permitted.
Letter of Credit. None.
Right of First Offer/Right of First Refusal. None.
Ground Lease. None.
Terrorism Insurance. The borrower is required to obtain and maintain property insurance and business interruption insurance for 18 months plus a 6-month extended period of indemnity. Such insurance is required to cover perils of terrorism and acts of terrorism; provided that if TRIPRA is in effect and covers both foreign and domestic acts of terror, the provisions of TRIPRA will determine the acts of terrorism for which coverage will be required. See “Risk Factors—Risks Relating to the Mortgage Loans—Terrorism Insurance May Not Be Available for All Mortgaged Properties” in the prospectus.
This is not a research report and was not prepared by any Underwriter’s research department. Please see additional important information and qualifications at the end of this Term Sheet. |
T-103
| Hospitality – Full Service | Loan #8 | Cut-off Date Balance: | | $45,931,496 |
| 1 Center Street | Tides Folly Beach | Cut-off Date LTV: | | 60.4% |
| Folly Beach, SC 29439 | | U/W NCF DSCR: | | 2.27x |
| | | U/W NOI Debt Yield: | | 14.0% |
This is not a research report and was not prepared by any Underwriter’s research department. Please see additional important information and qualifications at the end of this Term Sheet. |
T-104
| Hospitality – Full Service | Loan #8 | Cut-off Date Balance: | | $45,931,496 |
| 1 Center Street | Tides Folly Beach | Cut-off Date LTV: | | 60.4% |
| Folly Beach, SC 29439 | | U/W NCF DSCR: | | 2.27x |
| | | U/W NOI Debt Yield: | | 14.0% |
This is not a research report and was not prepared by any Underwriter’s research department. Please see additional important information and qualifications at the end of this Term Sheet. |
T-105
| Mortgage Loan No. 8 – Tides Folly Beach |
| Mortgage Loan Information | | Property Information |
| Mortgage Loan Seller: | WFB | | Single Asset/Portfolio: | Single Asset |
| Credit Assessment (Fitch/KBRA/S&P): | NR/NR/NR | | Location: | Folly Beach, SC 29439 |
| Original Balance: | $46,000,000 | | General Property Type: | Hospitality |
| Cut-off Date Balance: | $45,931,496 | | Detailed Property Type: | Full Service |
| % of Initial Pool Balance: | 3.6% | | Title Vesting: | Fee |
| Loan Purpose: | Refinance | | Year Built/Renovated: | 1985/2018 |
| Sponsor: | Jonathan P. Weitz | | Size: | 132 Rooms |
| Guarantors(1): | Jonathan P. Weitz and Leslie M. Muma | | Cut-off Date Balance per Room: | $347,966 |
| Mortgage Rate: | 3.8140% | | Maturity Date Balance per Room: | $275,644 |
| Note Date: | 9/3/2021 | | Property Manager: | Avocet Hospitality Group, Inc. |
| First Payment Date: | 10/11/2021 | | | (borrower-affiliated) |
| Maturity Date: | 9/11/2031 | | | |
| Original Term to Maturity: | 120 months | | | |
| Original Amortization Term: | 360 months | | Underwriting and Financial Information(3) |
| IO Period: | 0 months | | UW NOI: | $6,415,489 |
| Seasoning: | 1 month | | UW NOI Debt Yield: | 14.0% |
| Prepayment Provisions: | L(25),D(91),O(4) | | UW NOI Debt Yield at Maturity: | 17.6% |
| Lockbox/Cash Mgmt Status: | Hard/Springing | | UW NCF DSCR: | 2.27x |
| Additional Debt Type: | No | | Most Recent NOI(4): | $6,547,190 (7/31/2021 TTM) |
| Additional Debt Balance: | NAP | | 2nd Most Recent NOI(4): | $3,254,668 (12/31/2020) |
| Future Debt Permitted (Type): | No (NAP) | | 3rd Most Recent NOI(4): | $4,514,201 (12/31/2019) |
| Reserves(2) | | Most Recent Occupancy: | 82.1% (7/31/2021) |
| Type | Initial | Monthly | Cap | | 2nd Most Recent Occupancy: | 63.4% (12/31/2020) |
| RE Tax: | $256,790 | $25,679 | NAP | | 3rd Most Recent Occupancy: | 82.2% (12/31/2019) |
| Insurance: | $169,672 | $42,418 | NAP | | Appraised Value (as of): | $76,000,000 (8/1/2021) |
| FF&E: | $0 | $45,702(2) | NAP | | Appraised Value per Room: | $575,758 |
| Seasonality: | $950,000 | Springing(2) | $950,000 | | Cut-off Date LTV Ratio: | 60.4% |
| Springing Casualty Shortfall Reserve: | $0 | Springing | NAP | | Maturity Date LTV Ratio: | 47.9% |
| | | | | | | | |
| Sources and Uses |
| Sources | Proceeds | % of Total | | Uses | Proceeds | % of Total |
| Loan Amount: | $46,000,000 | 100.0% | | Loan Payoff: | $27,462,169 | 59.7% |
| | | | | Reserves: | $1,376,462 | 3.0% |
| | | | | Closing Costs: | $688,051 | 1.5% |
| | | | | Return of Equity: | $16,473,318 | 35.8% |
| Total Sources: | $46,000,000 | 100.0% | | Total Uses: | $46,000,000 | 100.0% |
| (1) | See “The Borrower and the Borrower Sponsors” below. |
| (2) | See “Escrows and Reserves” below for further discussion of reserve requirements. |
| (3) | The novel coronavirus pandemic is an evolving situation and could impact the Tides Folly Beach Mortgage Loan (as defined below) more severely than assumed in the underwriting of the Tides Folly Beach Mortgage Loan and could adversely affect the NOI, NCF and occupancy information, as well as the appraised value and the DSCR, LTV and Debt Yield metrics presented above and herein. See "Risk Factors-—Risks Related to Market Conditions and Other External Factors—The Coronavirus Pandemic Has Adversely Affected the Global Economy and Will Likely Adversely Affect the Performance of the Mortgage Loans" in the prospectus. |
| (4) | See “Operating History and Underwritten Net Cash Flow” below for information related to the fluctuations in historical NOI. |
The Mortgage Loan. The eighth largest mortgage loan (the “Tides Folly Beach Mortgage Loan”) is evidenced by a promissory note in the original principal amount of $46,000,000 and secured by the fee interest in a full service hotel located in Folly Beach, South Carolina (the “Tides Folly Beach Property”).
The Borrower and the Borrower Sponsors. The borrower is 1 Center Street Property Owner, LLC, a single-purpose Delaware limited liability company with one independent director. The borrower sponsor and non-recourse carveout guarantor is Jonathan P. Weitz. In addition, Leslie M. Muma serves as a non-recourse carveout guarantor for certain events related to zoning non-conformance and casualty insurance proceeds shortfalls only (see “Escrows and Reserves – Springing Casualty Shortfall Reserve” below).
Jonathan P. Weitz is the founder and president of Avocet Hospitality (“Avocet”), which he founded with his wife, Lisa Weitz, in 2006. Headquartered in Charleston, South Carolina, Avocet’s portfolio comprises three hotel properties (in addition to the Tides Folly Beach Property), including The Shepherd Hotel (Clemson, South Carolina), The Vendue (Charleston, South Carolina), and The Read House (Chattanooga, Tennessee). Leslie M. Muma co-founded Fiserv, Inc., a Fortune 500 company providing technology products and services to more than 17,000 financial institution clients worldwide.
This is not a research report and was not prepared by any Underwriter’s research department. Please see additional important information and qualifications at the end of this Term Sheet. |
T-106
| Hospitality – Full Service | Loan #8 | Cut-off Date Balance: | | $45,931,496 |
| 1 Center Street | Tides Folly Beach | Cut-off Date LTV: | | 60.4% |
| Folly Beach, SC 29439 | | U/W NCF DSCR: | | 2.27x |
| | | U/W NOI Debt Yield: | | 14.0% |
The Property. The Tides Folly Beach Property is a nine-story, 132-room independent full-service hotel located in Folly Beach, South Carolina, approximately 11.5 miles south of Charleston. Built in 1985 and most recently renovated in 2018, the hotel is situated on a 2.5-acre oceanfront parcel and contains 35 king guestrooms and 97 queen/queen guestrooms, each of which contains either a private Juliette balcony or semiprivate patio with views of the Folly Beach Pier and the Atlantic Ocean. The Tides Folly Beach Property was originally built and operated as a Holiday Inn-branded full-service hotel and was completely renovated and repositioned into an independent hotel in 2008-2009.
Amenities at the Tides Folly Beach Property include private beach access, restaurant and bar with indoor/outdoor seating, oceanfront tiki bar and lounge, coffee/gift shop, outdoor swimming pool, fitness center, room service, and two dedicated meeting rooms totaling approximately 4,000 SF that can accommodate up to 300 guests. The hotel’s signature restaurant, BLU, features views of the ocean and emphasizes sustainable seafood, regional flavors and local ingredients. The restaurant also has an outdoor beach tiki bar and casual indoor bar offering signature cocktails, frozen cocktails, wine, and beer. The property includes 116 surface parking spaces resulting in a parking ratio of 0.94 spaces per room. In addition, the hotel charges a resort fee of $10 per day per room, which includes bottled water, pool towels, wireless internet, parking, and private beach access.
Since 2008, the Tides Folly Beach Property has received approximately $13.8 million ($104,545 per room) in renovations. The major renovations completed in 2009 to reposition the property totaled approximately $5.5 million ($41,667 per room) and included a complete refresh of guest rooms, public areas, and the hotel’s exterior in addition to the build out of the hotel’s signature restaurant and the reconfiguration of interior space to maximize ocean views. Since 2009, additional major renovations have included $1.5 million ($11,364 per room) in 2010 for all new guest room fixtures, furniture and equipment (“FF&E”), elevator upgrades and outdoor pool upgrades; $2.6 million ($19,697 per room) in 2011-2016 to re-paint the building’s exterior, upgrade building FF&E, and replace guestroom showers/baths; and $3.1 million ($23,485 per room) in 2017-2018 to replace the building’s roof, floors and drywall sheets following damage from Hurricane Irma (inclusive of $2.5 million of insurance proceeds).
The Market. The Tides Folly Beach Property is located in Folly Beach, within Charleston County, South Carolina, approximately 11.5 miles south of Charleston. Folly Beach is a city located on Folly Island in southeastern coastal South Carolina. Folly Beach is approximately 19 square miles in size (including land and water) with over six miles of beaches and is within the Charleston-North Charleston-Summerville metropolitan area. According to the appraisal, the surrounding area is an eclectic beach community with surf shops, restaurants, gift shops, and bars that benefits from year-round appeal and accessibility as a major drive-to destination. Further, the City of Folly Beach’s economy has had an average annual growth rate of approximately 11% since 2009. The Tides Folly Beach Property is situated at the southern terminus of Folly Beach Road (South Carolina Highway 171) at its intersection with Arctic Avenue. South Carolina Highway 171 is a 12.6-mile highway that leads north/northwest through Folly Beach’s business district and then continues on as the only road that connects Folly Island to the mainland. According to the appraisal, the demand segmentation of the Tides Folly Beach Property is approximately 90% leisure with a small amount of corporate transient business travelers or social groups that are looking for an oceanfront location.
Competition. According to the appraisal, given its size, amenity offerings, and target market, the Tides Folly Beach Property lacks any true local competitors and does not primarily compete with any properties located directly on Folly Island. The other hospitality properties on Folly Island are primarily smaller, lower quality boutique villas and inns that do not contain the same amenities as the Tides Folly Beach Property or attract the same clientele. Further, the Tides Folly Beach Property does not primarily compete with properties located in the overall greater Charleston area. Although located relatively proximate to the Tides Folly Beach Property, the greater Charleston area, including downtown Charleston, is more commercial in nature with various commercial, retail, residential and restaurant uses. Per the appraisal, the Tides Folly Beach Property competes to some degree with other regional coastal resort-type properties, such as those located in Myrtle Beach, South Carolina (approximately 108 miles northeast); however, the degree of competition is considered nominal given the relatively distant location. The Tides Folly Beach Property sits in the only commercially zoned district along the coast of Folly Beach (all other future land uses along the ocean are designated residential areas). According to the appraisal, there are currently no future hotel developments under construction or in planning on Folly Beach.
COVID-19 Update. The first debt service payment on the Tides Folly Beach Mortgage Loan is due in October 2021 and as of September 15, 2021, the Tides Folly Beach Mortgage Loan is not subject to any forbearance, modification or debt service relief request. The Tides Folly Beach Property is currently fully open and operational. For the month of July 2021, the property reported an occupancy, ADR and RevPAR of 98.1%, $360.99, and $354.20, respectively.
This is not a research report and was not prepared by any Underwriter’s research department. Please see additional important information and qualifications at the end of this Term Sheet. |
T-107
| Hospitality – Full Service | Loan #8 | Cut-off Date Balance: | | $45,931,496 |
| 1 Center Street | Tides Folly Beach | Cut-off Date LTV: | | 60.4% |
| Folly Beach, SC 29439 | | U/W NCF DSCR: | | 2.27x |
| | | U/W NOI Debt Yield: | | 14.0% |
Operating History and Underwritten Net Cash Flow. The following table presents certain information relating to the operating history and Underwritten Net Cash Flow at the Tides Folly Beach Property:
| Cash Flow Analysis |
| | 2018(1) | 2019(2) | 2020(2) | TTM 7/31/2021(3) | UW | UW per Room |
| Occupancy | 79.2% | 82.2% | 63.4% | 82.1% | 82.1% | |
| ADR | $220.84 | $219.11 | $219.05 | $246.94 | $246.94 | |
| RevPAR | $174.82 | $180.04 | $138.92 | $202.70 | $202.70 | |
| | | | | | | |
| Room Revenue | $8,292,659 | $8,674,378 | $6,711,379 | $9,766,245 | $9,766,245 | $73,987 |
| Food & Beverage Revenue | $3,348,715 | $3,472,392 | $2,477,300 | $3,904,693 | $3,904,693 | $29,581 |
| Other Income(4) | $74,691 | $350,870 | $389,378 | $515,308 | $515,308 | $3,904 |
| Total Revenue | $11,716,065 | $12,497,640 | $9,578,057 | $14,186,246 | $14,186,246 | $107,472 |
| | | | | | | |
| Room Expense | $2,200,129 | $2,188,266 | $1,583,557 | $1,841,952 | $1,841,952 | $13,954 |
| Food & Beverage Expense | $2,364,934 | $2,642,966 | $1,774,313 | $2,403,199 | $2,403,199 | $18,206 |
| Other Departmental Expenses | $26,335 | $35,403 | $33,211 | $62,543 | $62,543 | $474 |
| Total Departmental Expenses | $4,591,398 | $4,866,635 | $3,391,081 | $4,307,694 | $4,307,694 | $32,634 |
| Gross Operating Income | $7,124,667 | $7,631,005 | $6,186,976 | $9,878,552 | $9,878,552 | $74,838 |
| | | | | | | |
| Total Undistributed Expenses | $2,358,770 | $2,529,740 | $2,262,576 | $2,671,648 | $2,671,648 | $20,240 |
| Gross Operating Profit | $4,765,897 | $5,101,265 | $3,924,400 | $7,206,904 | $7,206,904 | $54,598 |
| | | | | | | |
| Total Fixed Charges | $531,506 | $587,064 | $669,732 | $659,714 | $791,415 | $5,996 |
| Total Operating Expenses | $7,481,674 | $7,983,439 | $6,323,389 | $7,639,056 | $7,770,757 | $58,869 |
| | | | | | | |
| Net Operating Income | $4,234,391 | $4,514,201 | $3,254,668 | $6,547,190 | $6,415,489 | $48,602 |
| FF&E | $0 | $0 | $0 | $0 | $567,450 | $4,299 |
| Net Cash Flow | $4,234,391 | $4,514,201 | $3,254,668 | $6,547,190 | $5,848,038 | $44,303 |
| | | | | | | |
| NOI DSCR | 1.64x | 1.75x | 1.26x | 2.54x | 2.49x | |
| NCF DSCR | 1.64x | 1.75x | 1.26x | 2.54x | 2.27x | |
| NOI Debt Yield | 9.2% | 9.8% | 7.1% | 14.3% | 14.0% | |
| NCF Debt Yield | 9.2% | 9.8% | 7.1% | 14.3% | 12.7% | |
| (1) | The Tides Folly Beach Property closed in September 2017 to complete repairs related to damage from Hurricane Irma. The hotel reopened in phases beginning November 2017, reaching full operations by April 2018. |
| (2) | The decrease in Net Operating Income from 2019 to 2020 was due to the COVID-19 pandemic. Local governance resulted in the Tides Folly Beach Property being closed from March 27, 2020 through May 14, 2020. |
| (3) | The increase in Net Operating Income in TTM 7/31/2021 was due to an increase in occupancy and ADR and a decrease in Room Expense ratio and Food & Beverage Expense ratio. The hotel implemented operational changes in 2019, including (a) moving revenue management (which was previously outsourced to a third-party) in-house, and (b) adding a new Food & Beverage director and chef. In addition, the hotel began charging a resort fee of $10 per room per night in May 2019, causing the Other Income line item to increase. |
| (4) | Other Income consists of resort fee (starting in May 2019), pet fee, and miscellaneous other income. |
Escrows and Reserves.
Real Estate Taxes - The borrower is required to deposit an upfront real estate tax reserve in the amount of $256,790 and ongoing monthly reserves in an amount equal to one-twelfth of the real estate taxes that the lender estimates will be payable during the next twelve months (initially $25,679).
Insurance - The borrower is required to deposit an upfront insurance reserve in the amount of $169,672 and ongoing monthly reserves in an amount equal to one-twelfth of the insurance premiums that the lender estimates will be payable during the next twelve months (initially $42,418).
FF&E Reserve - The borrower is required to deposit ongoing monthly FF&E reserves in an amount initially equal to $45,702, subject to the greater of (i) the then existing FF&E reserve monthly deposit and (ii) one-twelfth of 4.0% of the underwritten revenue for the prior fiscal year.
Seasonality Reserve – The borrower is required to deposit an upfront seasonality reserve in the amount of $950,000. In addition, on each monthly payment date occurring in May, June, July, August, September, October and November, the borrower is required to deposit an amount equal to $135,715 (the “Seasonality Reserve Ongoing Payment”); provided that upon receipt of the annual operating statements for the Tides Folly Beach Property, the lender may adjust the Seasonality Reserve Ongoing Payment to an amount equal to the projected shortfall in revenue to cover debt service (at a debt service coverage ratio of 1.05x), based on actual operations from the prior 12-month period. Funds in the seasonality reserve account will be used for disbursement to or for the payment of all or part of any monthly payment amount due on the monthly payment dates occurring in December, January, February and/or March if and only to the extent there is insufficient cash flow from the Tides Folly Beach Property to pay such monthly payment amount; provided that the insufficiency of the seasonality reserve funds available for disbursement will not relieve the borrower from its obligation to make any required payment.
This is not a research report and was not prepared by any Underwriter’s research department. Please see additional important information and qualifications at the end of this Term Sheet. |
T-108
| Hospitality – Full Service | Loan #8 | Cut-off Date Balance: | | $45,931,496 |
| 1 Center Street | Tides Folly Beach | Cut-off Date LTV: | | 60.4% |
| Folly Beach, SC 29439 | | U/W NCF DSCR: | | 2.27x |
| | | U/W NOI Debt Yield: | | 14.0% |
Springing Casualty Shortfall Reserve – After the occurrence of a casualty in excess of 3% of the outstanding principal balance of the Tides Folly Beach Mortgage Loan, the borrower is required to deliver to the lender satisfactory documentation detailing the cost and estimated time to complete the restoration. If the borrower elects to commence restoration of the property, prior to the commencement of such restoration, the borrower is required to deposit an amount equal to the Springing Casualty Shortfall (as defined below). If at any time, the lender reasonably believes the amount of springing casualty reserve funds on deposit is insufficient, the borrower will be required to deposit such deficiency within 10 days of lender’s request (“Future Shortfalls”). Failure to deposit any Springing Casualty Shortfall or Future Shortfalls with the lender will be recourse in an amount equal to the lesser of (a) 120% of the amount the borrower failed to deposit and (b) the outstanding principal balance of the Tides Folly Beach Mortgage Loan to both Jonathan P. Weitz and Leslie M. Muma.
“Springing Casualty Shortfall” means the sum of (i) the deficiency of Net Proceeds (as defined below) to pay in full the casualty consultant’s estimated costs to complete the restoration (in the reasonable opinion of the lender); plus (ii) any operating deficits which may be incurred with respect to the property as a result of the casualty until completion of the restoration (as reasonably determined by the lender); plus (iii) any other amounts which may be due and payable by the borrower pursuant to the loan documents until completion of the restoration and commencement of the operation of the property (including, without limitation, interest, debt service, taxes, insurance and any required reserves)(with respect to this subsection (iii), to the extent such amounts are not already covered by (a) Net Proceeds, (b) Rent Loss Proceeds, (c) reserve funds on deposit, or (d) other income).
“Net Proceeds” means either (i) the net amount of all insurance proceeds payable as a result of a casualty to the property, after deduction of reasonable costs and expenses, if any, in collecting such insurance proceeds; or (ii) the net amount of any compensation paid by any governmental authority in connection with a condemnation in respect to all or any part of the property, after deduction of reasonable costs and expenses, if any, in collecting such insurance proceeds.
The Tides Folly Beach Property improvements are legally non-conforming as to height, maximum number of rooms and parking. In the event of a casualty exceeding 50% of the pre-casualty market value, the borrower would be obligated to comply with then-current zoning requirements. Absent a curative approval by the jurisdiction, the improvements could not be rebuilt as they existed pre-casualty. The loan documents provide that, if a curative approval is not obtained within the sooner to occur of 6 months from the date of the related casualty or other lease, legal or insurance-related deadlines, and the lender determines that the post-restoration LTV would be greater than 60.5% or the post-restoration DSCR would be less than 2.19x, the borrower and guarantors are required to pay the Required Casualty Paydown (available net insurance proceeds being credited against such amount). The “Required Casualty Paydown” means the amount which, when applied to the principal balance of the Tides Folly Beach Mortgage Loan, results in an LTV no greater than 60.5% and a DSCR no less than 2.19x. The borrower and guarantors have personal liability for any unpaid amounts of the Required Casualty Paydown.
Lockbox and Cash Management. The Tides Folly Beach Mortgage Loan is structured with a hard lockbox and springing cash management. The borrower and property manager are required to cause all credit card receipts to be deposited directly into the deposit account, and all other funds are required to be deposited within one business day after receipt. Upon the occurrence of a Cash Trap Event Period (as defined below), a cash management account is required to be established into which all funds in the lockbox account will be required to be deposited. During the continuance of a Cash Trap Event Period, all funds in the cash management account are required to be disbursed in accordance with the cash management waterfall set forth in the loan documents, with any excess funds required to be held as additional security in an excess cash flow subaccount controlled by the lender for so long as the Cash Trap Event Period continues.
A “Cash Trap Event Period” will commence upon the earlier of the following:
| (i) | the occurrence and continuance of an event of default; or |
| (ii) | the net cash flow debt yield falling below 8.25% (tested quarterly)(unless the borrower deposits cash or a letter of credit in an amount such that, if applied to the balance of the Tides Folly Beach Mortgage Loan, would cause the net cash flow debt yield to be equal to or greater than 8.25%). |
A Cash Trap Event Period will end upon the occurrence of the following:
| ● | with regard to clause (i), the cure of such event of default; or |
| ● | with regard to clause (ii), upon the net cash flow debt yield being equal to or greater than 8.5% for two consecutive calendar quarters. |
Additional Secured Indebtedness (not including trade debts). None.
Mezzanine Loan and Preferred Equity. Not permitted.
Release of Property. Not Permitted.
Letter of Credit. None.
Right of First Offer/Right of First Refusal. None.
Ground Lease. None.
Terrorism Insurance. The loan documents require that the “all risk” insurance policy required to be maintained by the borrower provide coverage for terrorism in an amount equal to the full replacement cost of the Tides Folly Beach Property. The loan documents also require business interruption insurance covering no less than the 18-month period following the occurrence of a casualty event, together with a six month extended period of indemnity. See “Risk Factors—Risks Relating to the Mortgage Loans—Terrorism Insurance May Not Be Available for All Mortgaged Properties” in the prospectus.
This is not a research report and was not prepared by any Underwriter’s research department. Please see additional important information and qualifications at the end of this Term Sheet. |
T-109
| Mixed Use– Industrial/Office | Loan #9 | Cut-off Date Balance: | | $44,500,000 |
| 26460, 26462 & 26464 Corporate Avenue | Corporate Research Center | Cut-off Date LTV: | | 46.8% |
| Hayward, CA 94545 | | UW NCF DSCR: | | 3.89x |
| | | UW NOI Debt Yield: | | 11.1% |

This is not a research report and was not prepared by any Underwriter’s research department. Please see additional important information and qualifications at the end of this Term Sheet. |
T-110
| Mixed Use– Industrial/Office | Loan #9 | Cut-off Date Balance: | | $44,500,000 |
| 26460, 26462 & 26464 Corporate Avenue | Corporate Research Center | Cut-off Date LTV: | | 46.8% |
| Hayward, CA 94545 | | UW NCF DSCR: | | 3.89x |
| | | UW NOI Debt Yield: | | 11.1% |

This is not a research report and was not prepared by any Underwriter’s research department. Please see additional important information and qualifications at the end of this Term Sheet. |
T-111
| Mixed Use– Industrial/Office | Loan #9 | Cut-off Date Balance: | | $44,500,000 |
| 26460, 26462 & 26464 Corporate Avenue | Corporate Research Center | Cut-off Date LTV: | | 46.8% |
| Hayward, CA 94545 | | UW NCF DSCR: | | 3.89x |
| | | UW NOI Debt Yield: | | 11.1% |

This is not a research report and was not prepared by any Underwriter’s research department. Please see additional important information and qualifications at the end of this Term Sheet. |
T-112
| Mortgage Loan No. 9 – Corporate Research Center |
| Mortgage Loan Information | | Property Information |
| Mortgage Loan Seller: | MSMCH | | Single Asset/Portfolio: | Single Asset |
| Credit Assessment (Fitch/KBRA/S&P): | NR/NR/NR | | Location: | Hayward, CA 94545 |
| Original Balance: | $44,500,000 | | General Property Type: | Mixed Use |
| Cut-off Date Balance: | $44,500,000 | | Detailed Property Type: | Industrial/Office |
| % of Initial Pool Balance: | 3.5% | | Title Vesting: | Fee |
| Loan Purpose: | Refinance | | Year Built/Renovated: | 1974-2006/NAP |
| Borrower Sponsor: | DataCore Fund L.P. | | Size: | 293,292 SF |
| Guarantor: | DataCore Fund L.P. | Cut-off Date Balance PSF: | $152 |
| Mortgage Rate: | 2.5400% | Maturity Date Balance PSF: | $152 |
| Note Date: | 9/16/2021 | Property Manager: | G&E Real Estate Management |
| First Payment Date: | 11/1/2021 | | Services, Inc. |
| Maturity Date: | 10/1/2031 | | Underwriting and Financial Information(2) |
| Original Term to Maturity: | 120 months | | UW NOI: | $4,933,237 |
| Original Amortization Term: | 0 months | | UW NOI Debt Yield: | 11.1% |
| IO Period: | 120 months | | UW NOI Debt Yield at Maturity: | 11.1% |
| Seasoning: | 0 months | | UW NCF DSCR: | 3.89x |
| Prepayment Provisions: | L(23),YM1(90),O(7) | | Most Recent NOI: | $4,357,418 (6/30/2021 TTM) |
| Lockbox/Cash Mgmt Status: | Hard/Springing | | 2nd Most Recent NOI: | $4,051,037 (12/31/2020) |
| Additional Debt Type: | NAP | | 3rd Most Recent NOI: | $3,906,098 (12/31/2019) |
| Additional Debt Balance: | NAP | | Most Recent Occupancy: | 100.0% (8/1/2021) |
| Future Debt Permitted (Type): | No (NAP) | | 2nd Most Recent Occupancy: | 90.1% (12/31/2020) |
| | | | 3rd Most Recent Occupancy: | 85.7% (12/31/2019) |
| Reserves(1) | | Appraised Value (as of): | $95,000,000 (7/13/2021) |
| Type | Initial | Monthly | Cap | | Appraised Value PSF: | $324 |
| RE Tax: | $0 | Springing | N/A | | Cut-off Date LTV Ratio: | 46.8% |
| Insurance: | $0 | Springing | N/A | | Maturity Date LTV Ratio: | 46.8% |
| | | | | | | | |
| Sources and Uses |
| Sources | Proceeds | % of Total | | Uses | Proceeds | % of Total |
| Loan Amount: | $44,500,000 | 100.0% | | Loan Payoff: | $26,119,564 | 58.7% |
| | | | | Return of Equity: | $17,594,911 | 39.5% |
| | | | | Closing Costs: | $785,525 | 1.8% |
| Total Sources: | $44,500,000 | 100.0% | | Total Uses: | $44,500,000 | 100.0% |
| (1) | See “Escrows and Reserves” below for further discussion of reserve requirements. |
| (2) | The novel coronavirus pandemic is an evolving situation and could impact the Corporate Research Center Mortgage Loan (as defined below) more severely than assumed in the underwriting of the Corporate Research Center Mortgage Loan and could adversely affect the NOI, NCF and occupancy information, as well as the appraised value and the DSCR, LTV and Debt Yield metrics presented above and herein. See "Risk Factors-—Risks Related to Market Conditions and Other External Factors—The Coronavirus Pandemic Has Adversely Affected the Global Economy and Will Likely Adversely Affect the Performance of the Mortgage Loans" in the prospectus. |
The Mortgage Loan. The ninth largest mortgage loan (the “Corporate Research Center Mortgage Loan”) is evidenced by a promissory note in the original principal amount of $44,500,000 and secured by a first priority fee mortgage encumbering a 293,292 SF mixed use industrial data center and office property located in Hayward, California (the “Corporate Research Center Property”).
The Borrower and Borrower Sponsor. The borrower is GI DC Hayward, LLC, a single-purpose Delaware limited liability company with one independent director in its organizational structure. The borrower sponsor and the non-recourse carveout guarantor is DataCore Fund L.P. The borrower is solely owned by DataCore Fund L.P., which is a partnership between the California State Teachers Retirement System (“CalSTRS”) and GI Partners. CalSTRS is the largest educator-only pension fund in the world, with more than 975,000 members. GI Partners is a multi-strategy asset manager based in San Francisco, California with data center investment experience. CalSTRS and GI Partners created DataCore Fund L.P. in 2012 as a core investment vehicle to invest in technology-advantaged real estate in the United States, including data centers, internet gateways, corporate campuses for technology tenants, and life science properties, located in primary markets and leased to industry-leading tenants. The borrower is an affiliate of the borrower under the Lightwave Corporate Center Mortgage Loan.
The Property. The Corporate Research Center Property is a mixed use industrial data center and office property comprised of three buildings totaling 293,292 SF located in Hayward, California. The Corporate Research Center Property is 100% leased to five tenants. The first building, 26460 Corporate Avenue, is a two-story, 57,685 SF office building occupied by three tenants. The second building, 26462 Corporate Avenue, is a 103,711 SF office building that is fully occupied by Ultra Clean Technology pursuant to a lease expiring on November 30, 2027. The third building, 26464 Corporate Avenue, is a 131,896 SF data center, fully leased by A100 US LLC (“A100 US”) on a ten-year term through February 28, 2026. Since 2016, the borrower sponsor has spent approximately $2.2 million on tenant improvements and building improvements, including various asphalt repairs, lobby and landscape remodeling and roof repairs.
This is not a research report and was not prepared by any Underwriter’s research department. Please see additional important information and qualifications at the end of this Term Sheet. |
T-113
| Mixed Use– Industrial/Office | Loan #9 | Cut-off Date Balance: | | $44,500,000 |
| 26460, 26462 & 26464 Corporate Avenue | Corporate Research Center | Cut-off Date LTV: | | 46.8% |
| Hayward, CA 94545 | | UW NCF DSCR: | | 3.89x |
| | | UW NOI Debt Yield: | | 11.1% |
Major Tenants.
A100 US (131,896 SF, 45.0% of NRA, 46.4% of underwritten rent). A100 US is a wholly owned subsidiary of Amazon.com Inc., a multinational technology company that focuses on e-commerce, cloud computing, digital streaming and artificial intelligence. Amazon.com Inc. was founded in 1994 by Jeff Bezos and has approximately 1.3 million employees globally. A100 US has occupied space at the Corporate Research Center Property since 2011, has a lease expiration date of February 28, 2026 and has three, five-year renewal options and one, four and a half-year renewal option remaining. A100 US has the right to terminate its lease effective February 28, 2023 with at least 9 months’ notice and payment of a termination fee.
Ultra Clean Technology (103,711 SF, 35.4% of NRA, 33.9% of underwritten rent). Ultra Clean Technology, founded in 1991, is a developer and supplier of subsystems, components and parts, and ultra-high purity cleaning and analytical services primarily for the semiconductor industry. Ultra Clean Technology is headquartered at the Corporate Research Center Property and has been a tenant since 2008. Ultra Clean Technology uses its space at the Corporate Research Center Property for office, research and development. Ultra Clean Technology has a lease expiration date of November 30, 2027.
The following table presents a summary regarding the tenants at the Corporate Research Center Property:
| Tenant Summary(1) |
| Tenant Name | Credit Rating (Fitch/Moody's
/S&P) | Tenant
SF | Approx.%
of SF | Annual UW
Base Rent | Annual UW
Base Rent
PSF | % of Total
Annual
UW Base
Rent | Lease
Expiration | Renewal
Option | Term. Option
(Y/N) |
| A100 US | AA-/A1/AA | 131,896 | 45.0% | $2,503,562 | $18.98 | 46.4% | 2/28/2026 | (2) | Y(3) |
| Ultra Clean Technology | NR/B1/B+ | 103,711 | 35.4% | $1,828,973 | $17.64 | 33.9% | 11/30/2027 | None | N |
| Voly Re, LLC | NR/NR/NR | 28,892 | 9.9% | $537,391 | $18.60 | 9.9% | 8/31/2026 | 1 x 3 yr | N |
| Delta Information Systems (Ampex Data Systems) | NR/NR/NR | 15,661 | 5.3% | $280,501 | $17.91 | 5.2% | 7/31/2026 | 2 x 5 yr | N |
| Keeco | NR/NR/NR | 13,132 | 4.5% | $250,559 | $19.08 | 4.6% | 5/31/2027 | 1 x 5 yr | N |
| Subtotal/Wtd. Avg. | | 293,292 | 100.0% | $5,400,986 | $18.42 | 100.0% | | | |
| | | | | | | | | | |
| Vacant Space | | 0 | 0.0% | $0 | | | | | |
| Total/Wtd. Avg. | | 293,292 | 100.0% | $5,400,986 | | | | | |
| (1) | Information is based on the underwritten rent roll as of August 1, 2021. |
| (2) | A100 US has three, five-year renewal options and one, four and a half-year renewal option remaining. |
| (3) | A100 US has the right to terminate its lease effective February 28, 2023 with at least 9 months’ notice and payment of a termination fee. |
The following table presents certain information relating to the lease rollover schedule at the Corporate Research Center Property:
| Lease Rollover Schedule(1)(2) |
| Year | # of
Leases Rolling | SF Rolling | UW Base Rent
PSF Rolling | Approx. % of
Total SF Rolling | Approx.
Cumulative %
of SF Rolling | Total UW Base
Rent Rolling | Approx. % of
Total Rent
Rolling | Approx.
Cumulative %
of Total Rent
Rolling |
| 2021 | 0 | 0 | $0.00 | 0.0% | 0.0% | $0 | 0.0% | 0.0% |
| 2022 | 0 | 0 | $0.00 | 0.0% | 0.0% | $0 | 0.0% | 0.0% |
| 2023 | 0 | 0 | $0.00 | 0.0% | 0.0% | $0 | 0.0% | 0.0% |
| 2024 | 0 | 0 | $0.00 | 0.0% | 0.0% | $0 | 0.0% | 0.0% |
| 2025 | 0 | 0 | $0.00 | 0.0% | 0.0% | $0 | 0.0% | 0.0% |
| 2026 | 3 | 176,449 | $18.82 | 60.2% | 60.2% | $3,321,454 | 61.5% | 61.5% |
| 2027 | 2 | 116,843 | $17.80 | 39.8% | 100.0% | $2,079,532 | 38.5% | 100.0% |
| 2028 | 0 | 0 | $0.00 | 0.0% | 100.0% | $0 | 0.0% | 100.0% |
| 2029 | 0 | 0 | $0.00 | 0.0% | 100.0% | $0 | 0.0% | 100.0% |
| 2030 | 0 | 0 | $0.00 | 0.0% | 100.0% | $0 | 0.0% | 100.0% |
| 2031 | 0 | 0 | $0.00 | 0.0% | 100.0% | $0 | 0.0% | 100.0% |
| 2032 & Beyond | 0 | 0 | $0.00 | 0.0% | 100.0% | $0 | 0.0% | 100.0% |
| Vacant | 0 | 0 | $0.00 | 0.0% | 100.0% | $0 | 0.0% | 100.0% |
| Total/Wtd. Avg. | 5 | 293,292 | $18.42 | 100.0% | | $5,400,986 | 100.0% | |
| (1) | Information is based on the underwritten rent roll as of August 1, 2021. |
| (2) | Certain tenants may have lease termination options that are not reflected in the Lease Rollover Schedule. |
COVID-19 Update. The first debt service payment date for the Corporate Research Center Mortgage Loan is November 1, 2021 and, as of September 16, 2021, the Corporate Research Center Mortgage Loan is not subject to any forbearance, modification or debt service relief request. As of August 16, 2021, the borrower has reported that the Corporate Research Center Property is open and operating, with 100.0% of tenants by occupied NRA and 100.0% of tenants by underwritten base rent having paid their full August 2021 rent payments. None of the tenants received rent relief.
This is not a research report and was not prepared by any Underwriter’s research department. Please see additional important information and qualifications at the end of this Term Sheet. |
T-114
| Mixed Use– Industrial/Office | Loan #9 | Cut-off Date Balance: | | $44,500,000 |
| 26460, 26462 & 26464 Corporate Avenue | Corporate Research Center | Cut-off Date LTV: | | 46.8% |
| Hayward, CA 94545 | | UW NCF DSCR: | | 3.89x |
| | | UW NOI Debt Yield: | | 11.1% |
The Market. The Corporate Research Center Property is located in Hayward, California, within the West Hayward/Castro Valley office submarket of the East Bay market. Primary access to the neighborhood is provided by Interstate 880 and CA Route 92. Major thoroughfares include Interstate 238, Hesperian Boulevard, Winton Avenue, CA Route 185, A Street, and Hathaway Avenue. The Corporate Research Center Property is in close proximity to the San Jose Central Business District and the Oakland International Airport. According to the appraisal, as of the first quarter of 2021, the vacancy rate in the West Hayward/Castro Valley office submarket was approximately 4.1%, with average asking rents of $24.57 PSF and inventory of approximately 3.8 million SF. According to the appraisal, as of the first quarter of 2021, the vacancy rate in the East Bay office market was approximately 9.6%, with average asking rents of $38.55 PSF and inventory of approximately 115.7 million SF. According to the appraisal, the 2021 population within a one-, three- and five-mile radius of the Corporate Research Center Property was 9,529, 113,284 and 307,608, respectively. The 2021 median household income within the same one-, three- and five-mile radius was $84,822, $86,406 and $90,934, respectively.
The following table presents certain information relating to the appraisal’s market rent conclusion for the Corporate Research Center Property:
| Market Rent Summary |
| | Data Center | Office |
| Market Rent (PSF) | $30.00 | $18.00 |
| Lease Term (Months) | 120 | 60 |
| Lease Type (Reimbursements) | NNN | NNN |
| Rent Increase Projection | 3.0% per annum | 3.0% per annum |
The following table presents comparable office leases with respect to the Corporate Research Center Property:
| Comparable Office Lease Summary |
| Property Name/Location | Tenant Name | Lease Size (SF) | Lease Term (Mos.) | Rent PSF | Lease Type |
Corporate Research Center Property (subject) Hayward, CA | Ultra Clean Technology(1) | 103,711(1) | 120(1) | $17.64(1) | NNN(1) |
1751 Harbor Bay Pkwy Alameda, CA | Exelixis | 25,749 | 125 | $24.60 | NNN |
44370 Christy St Fremont, CA | Bloom Energy | 88,246 | 84 | $23.28 | NNN |
39660 Eureka Dr Newark, CA | TYAN | 28,708 | 62 | $19.68 | NNN |
4050 Starboard Dr. Fremont, CA | LAM Research | 52,232 | 48 | $16.44 | NNN |
Hacienda Industrial Pleasanton, CA | Omron | 126,790 | 120 | $19.44 | NNN |
Fremont Rsrch. Center Fremont, CA | Lyncean Technologies | 25,008 | 63 | $16.20 | NNN |
Fremont Tech. Park Fremont, CA | CyTek BioSciences | 19,209 | 60 | $18.84 | NNN |
Source: Appraisal
| (1) | Information is based on the underwritten rent roll as of August 1, 2021. |
The following table presents comparable data center leases with respect to the Corporate Research Center Property:
| Comparable Data Center Lease Summary |
| Property Name/Location | Tenant Name | Lease Size (SF) | Lease Term (Mos.) | Rent PSF | Lease Type |
Corporate Research Center Property (subject) Hayward, CA | A100 US(1) | 131,896 (1) | 180(1) | $18.98(1) | NNN(1) |
Confidential Northern California | Confidential | 278,500 | 180 | $31.41 | NNN |
Confidential Northern California | Confidential | 120,000 | 180 | $42.00 | NNN |
Confidential Northern California | Confidential | 45,000 | 240 | $120.00 | NNN |
Confidential Northern California | Confidential | 90,000 | 240 | $82.00 | NNN |
Confidential Northern California | Confidential | 50,000 | 240 | $82.00 | NNN |
Confidential West Coast | Confidential | 279,840 | 120 | $35.61 | NNN |
Confidential Midwest | Confidential | 130,000 | 180 | $31.20 | NNN |
| | | | | | |
Source: Appraisal
| (1) | Information is based on the underwritten rent roll as of August 1, 2021. |
This is not a research report and was not prepared by any Underwriter’s research department. Please see additional important information and qualifications at the end of this Term Sheet. |
T-115
| Mixed Use– Industrial/Office | Loan #9 | Cut-off Date Balance: | | $44,500,000 |
| 26460, 26462 & 26464 Corporate Avenue | Corporate Research Center | Cut-off Date LTV: | | 46.8% |
| Hayward, CA 94545 | | UW NCF DSCR: | | 3.89x |
| | | UW NOI Debt Yield: | | 11.1% |
Operating History and Underwritten Net Cash Flow. The following table presents certain information relating to the historical operating performance and the Underwritten Net Cash Flow at the Corporate Research Center Property:
| Cash Flow Analysis |
| | 2017 | 2018 | 2019 | 2020 | 6/30/2021 TTM | UW | UW PSF |
| Gross Potential Rent(1)(2) | $4,434,565 | $4,472,093 | $4,151,525 | $4,503,939 | $4,653,966 | $5,400,986 | $18.42 |
| Reimbursements | $1,130,094 | $1,180,198 | $1,372,842 | $1,258,333 | $1,454,634 | $1,640,379 | $5.59 |
| Discounts Concessions | $0 | $0 | $0 | ($59,094) | ($86,676) | $0 | $0.00 |
| Vacancy & Credit Loss | $0 | $0 | $0 | $0 | $0 | ($352,068) | ($1.20) |
| Effective Gross Income | $5,564,659 | $5,652,291 | $5,524,366 | $5,703,179 | $6,021,924 | $6,689,297 | $22.81 |
| | | | | | | | |
| Real Estate Taxes | $741,732 | $770,937 | $807,342 | $830,273 | $826,698 | $826,197 | $2.82 |
| Insurance | $105,495 | $104,803 | $344,223 | $299,343 | $304,544 | $340,000 | $1.16 |
| Other Operating Expenses | $458,049 | $434,202 | $466,703 | $522,525 | $533,264 | $589,863 | $2.01 |
| Total Operating Expenses | $1,305,276 | $1,309,942 | $1,618,268 | $1,652,141 | $1,664,506 | $1,756,060 | $5.99 |
| | | | | | | | |
| Net Operating Income(2) | $4,259,383 | $4,342,349 | $3,906,098 | $4,051,037 | $4,357,418 | $4,933,237 | $16.82 |
| Capital Expenditures | $0 | $0 | $0 | $0 | $0 | $58,658 | $0.20 |
| TI/LC | $0 | $0 | $0 | $0 | $0 | $422,340 | $1.44 |
| Net Cash Flow | $4,259,383 | $4,342,349 | $3,906,098 | $4,051,037 | $4,357,418 | $4,452,239 | $15.18 |
| | | | | | | | |
| Occupancy % | 95.5% | 93.9% | 85.7% | 90.1% | 100.0% | 95.0% | |
| NOI DSCR | 3.72x | 3.79x | 3.41x | 3.53x | 3.80x | 4.30x | |
| NCF DSCR | 3.72x | 3.79x | 3.41x | 3.53x | 3.80x | 3.89x | |
| NOI Debt Yield | 9.6% | 9.8% | 8.8% | 9.1% | 9.8% | 11.1% | |
| NCF Debt Yield | 9.6% | 9.8% | 8.8% | 9.1% | 9.8% | 10.0% | |
| (1) | UW Gross Potential Rent is based on the August 1, 2021 rent roll and includes (i) rent steps through August 2022 ($76,418) and (ii) straight line rent for A100 US through its lease term ($163,766). |
| (2) | The increase in Gross Potential Rent and Net Operating Income between 6/30/2021 TTM and UW was mainly due to (i) contractual rent steps and straight line rent and (ii) A100 US and Delta Information Systems rent increasing. |
Escrows and Reserves.
Real Estate Taxes - The Corporate Research Center Mortgage Loan documents provide for ongoing monthly deposits into a reserve for real estate taxes in an amount equal to 1/12 of the real estate taxes that the lender estimates will be payable during the next twelve months for the Corporate Research Center Property; provided that so long as no Cash Sweep Period (as defined below) exists, the borrower will have no obligation to make such monthly real estate tax reserve deposits so long as the borrower timely pays its real estate taxes and provides the lender reasonably acceptable evidence of such payment.
Insurance - The Corporate Research Center Mortgage Loan documents provide for ongoing monthly deposits into a reserve for insurance premiums in an amount equal to 1/12 of the insurance premiums that the lender estimates will be payable for the renewal of coverage upon the expiration of the insurance policies; provided that the borrower will have no obligation to make such monthly reserve deposits with respect to any insurance that is maintained under one or more blanket policies by the borrower or a tenant that satisfy the requirements of the loan documents; provided that (i) with respect to blanket policies maintained by the borrower, the borrower provides the lender with proof of payment thereof, and (ii) with respect to blanket policies maintained by a tenant, the following conditions are satisfied; (a) the applicable tenant continues to maintain the insurance in conformance with the terms of the loan documents; (b) the tenant timely pays the applicable insurance premiums and the borrower or the tenant provides evidence thereof; (c) the tenant’s lease remains in full force and effect and there are no continuing monetary events of default thereunder; (d) the tenant has not vacated, abandoned, gone dark or ceased operations in all or substantially all of its space, and (d) the tenant (or its lease guarantor) has not been subject to certain bankruptcy or insolvency events.
Lockbox and Cash Management. The Corporate Research Center Mortgage Loan documents provide for a hard lockbox and springing cash management. The borrower is required to deliver tenant direction letters to all tenants of the Corporate Research Center Property directing them to directly deposit all rents into the lender-controlled lockbox account. In addition, the borrower is required to deposit, and cause the property manager to deposit, within two business days, all revenue from the Corporate Research Center Property received by them, notwithstanding such direction, into the lockbox account. If no Cash Sweep Period exists, all funds in the lockbox account will be disbursed to the borrower’s operating account. Upon the first occurrence of a Cash Sweep Period, the borrower is required to establish a lender-controlled cash management account, into which all funds in the lockbox account will be required to be deposited, so long as a Cash Sweep Period exists. During the existence of a Cash Sweep Period, provided no event of default under the Corporate Research Center Mortgage Loan documents is continuing, all funds in the cash management account are required to be applied on each monthly payment date: (i) to make the required monthly deposits (if any) into the real estate tax and insurance reserves as described above under “Escrows and Reserves,” (ii) to pay (x) operating expenses set forth in the annual budget (which is required to be reasonably approved by the lender during a Cash Sweep Period) and (y) lender-approved extraordinary expenses (provided that up to $100,000 annually of extraordinary expenses do not require lender approval) and capital expenditures, which disbursements under this clause (y) may not exceed $50,000 per calendar year, (iii) to pay debt service on the Corporate Research Center Mortgage Loan, and (iv) to deposit any remainder into an excess cash flow reserve to be held as additional security for the Corporate Research Center Mortgage Loan during the existence of such Cash Sweep Period; provided, that upon the borrower’s request, provided no event of default exists, the lender is required to disburse funds in the excess cash flow reserve to pay operating expenses that are then due and owing.
This is not a research report and was not prepared by any Underwriter’s research department. Please see additional important information and qualifications at the end of this Term Sheet. |
T-116
| Mixed Use– Industrial/Office | Loan #9 | Cut-off Date Balance: | | $44,500,000 |
| 26460, 26462 & 26464 Corporate Avenue | Corporate Research Center | Cut-off Date LTV: | | 46.8% |
| Hayward, CA 94545 | | UW NCF DSCR: | | 3.89x |
| | | UW NOI Debt Yield: | | 11.1% |
A “Cash Sweep Period” means a period:
| (i) | Commencing upon an event of default and ending upon the cure or waiver (if applicable) of such event of default; or |
| (ii) | Commencing upon the debt yield of the Corporate Research Center Mortgage Loan (based on the trailing four months operating statement and rent roll) falling below 8.00% as of the end of any fiscal quarter, and ending at such time as the debt yield has equaled or exceeded 8.0% for the immediately preceding four consecutive calendar months (provided, that cash trapped for any vacant space will be capped at $15 PSF, and if the debt yield has fallen below 8.00% due to a tenant’s rent being excluded from the debt yield calculation under the loan documents because it has a lease that expires within 60 days or less or, with respect to A100 US, because it has failed to give notice of renewal of its lease, or because it has given notice of its intent to vacate, at a time when no more than nine months remain of its lease term, the cash trapped will be capped at $15 PSF of the applicable space). |
Additional Secured Indebtedness (not including Trade Debts). Not permitted.
Mezzanine Loan and Preferred Equity. Not permitted.
Release of Property. Not permitted.
Letter of Credit. None.
Right of First Offer / Right of First Refusal. A100 US has a right of first offer to purchase the Corporate Research Center Property or any portion thereof. The A100 US lease provides that such right will not apply to transfers in connection with any debt or equity financing, pursuant to a foreclosure or deed in lieu thereof. Further, the tenant has agreed in a subordination, non-disturbance and attornment agreement that the right of first offer will not apply in connection with a sale by the lender following a foreclosure or deed in lieu thereof; however, such waiver will not apply if such sale is to a Tenant Competitor or its affiliate. A “Tenant Competitor” means certain competitors of the tenant listed in the lease, provided that the tenant has the right to change any one or all of the entities so listed, so long as each subsequently listed entity is not principally engaged in the real estate or real estate financing business. The A100 US lease prohibits the borrower from selling or transferring the Mortgaged Property to a Tenant Competitor or an affiliate of a Tenant Competitor.
Ground Lease. None.
Terrorism Insurance. The borrower is required to obtain and maintain an “all risk” or “special form” property insurance policy that covers acts of terrorism in an amount equal to the “full replacement cost” of the Corporate Research Center Property, together with at least 12 months of business interruption insurance, with an extended period of indemnity endorsement of up to six months. Notwithstanding the foregoing, the borrower is not required to spend on terrorism insurance more than 100% of the amount of the then-current property casualty insurance premium that is payable in respect of the Corporate Research Center Property (without giving effect to the cost of terrorism and earthquake components of the property insurance or the cost of business interruption insurance) obtained as of the date the applicable new terrorism insurance is being obtained. See “Risk Factors—Risks Relating to the Mortgage Loans—Terrorism Insurance May Not Be Available for All Mortgaged Properties” in the prospectus.
This is not a research report and was not prepared by any Underwriter’s research department. Please see additional important information and qualifications at the end of this Term Sheet. |
T-117
| Mixed Use – Industrial/Office | Loan #10 | Cut-off Date Balance: | | $37,125,000 |
| 9305 Lightwave Avenue | Lightwave Corporate Center | Cut-off Date LTV: | | 49.5% |
| San Diego, CA 92123 | | UW NCF DSCR: | | 4.62x |
| | | UW NOI Debt Yield: | | 12.8% |
This is not a research report and was not prepared by any Underwriter’s research department. Please see additional important information and qualifications at the end of this Term Sheet. |
T-118
| Mixed Use – Industrial/Office | Loan #10 | Cut-off Date Balance: | | $37,125,000 |
| 9305 Lightwave Avenue | Lightwave Corporate Center | Cut-off Date LTV: | | 49.5% |
| San Diego, CA 92123 | | UW NCF DSCR: | | 4.62x |
| | | UW NOI Debt Yield: | | 12.8% |
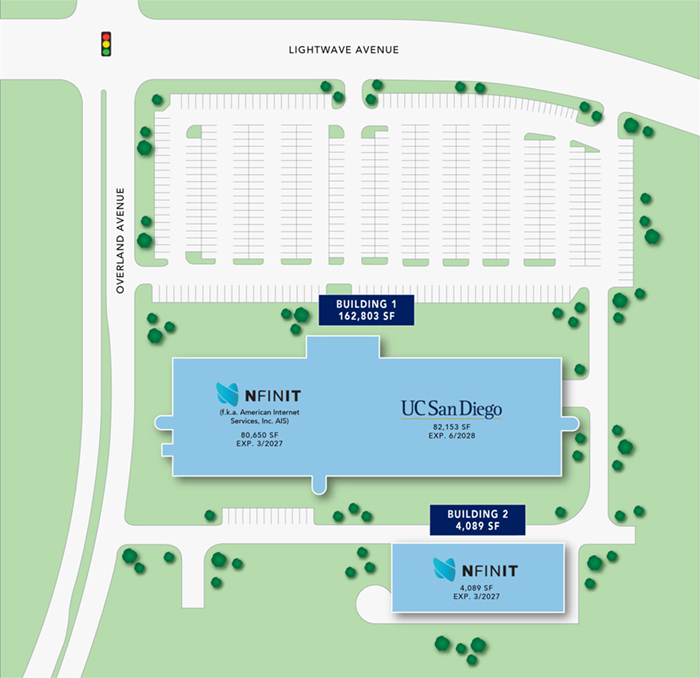
This is not a research report and was not prepared by any Underwriter’s research department. Please see additional important information and qualifications at the end of this Term Sheet. |
T-119
| Mixed Use – Industrial/Office | Loan #10 | Cut-off Date Balance: | | $37,125,000 |
| 9305 Lightwave Avenue | Lightwave Corporate Center | Cut-off Date LTV: | | 49.5% |
| San Diego, CA 92123 | | UW NCF DSCR: | | 4.62x |
| | | UW NOI Debt Yield: | | 12.8% |
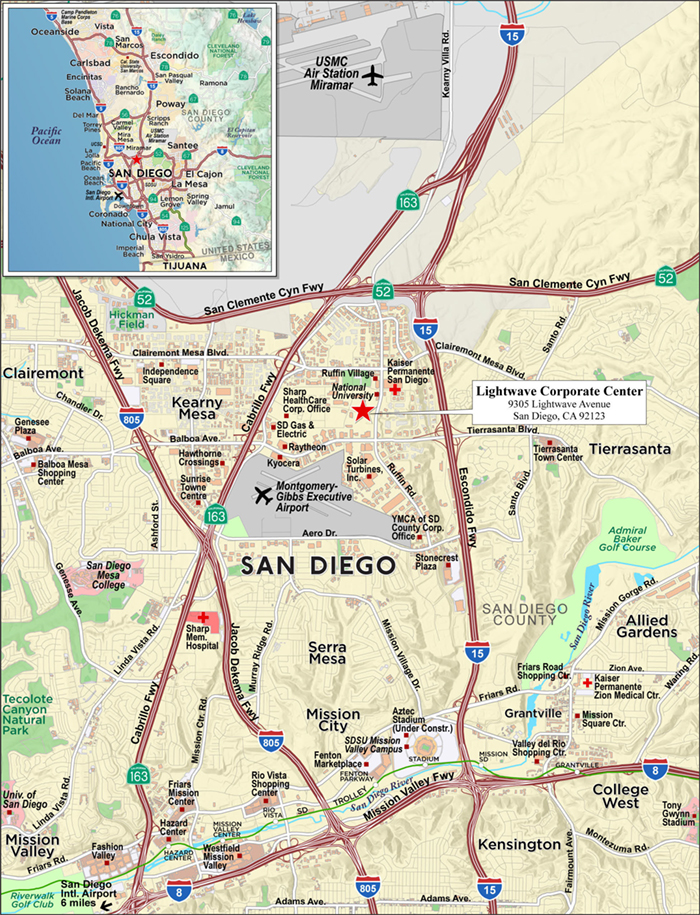
This is not a research report and was not prepared by any Underwriter’s research department. Please see additional important information and qualifications at the end of this Term Sheet. |
T-120
| Mortgage Loan No. 10 – Lightwave Corporate Center |
| | | | | | | | |
| Mortgage Loan Information | | Property Information |
| Mortgage Loan Seller: | MSMCH | | Single Asset/Portfolio: | Single Asset |
| Credit Assessment (Fitch/KBRA/S&P): | NR/NR/NR | | Location: | San Diego, CA 92123 |
| Original Balance: | $37,125,000 | | General Property Type: | Mixed Use |
| Cut-off Date Balance: | $37,125,000 | | Detailed Property Type: | Industrial/Office |
| % of Initial Pool Balance: | 2.9% | | Title Vesting: | Fee |
| Loan Purpose: | Refinance | | Year Built/Renovated: | 1985/2007 |
| Borrower Sponsor: | DataCore Fund L.P. | | Size: | 166,892 SF |
| Guarantor: | DataCore Fund L.P. | Cut-off Date Balance PSF: | $222 |
| Mortgage Rate: | 2.5500% | Maturity Date Balance PSF: | $222 |
| Note Date: | 9/9/2021 | Property Manager: | CBRE, Inc. |
| First Payment Date: | 11/1/2021 | | Underwriting and Financial Information(2) |
| Maturity Date: | 10/1/2031 | | UW NOI: | $4,742,450 |
| Original Term to Maturity: | 120 months | | UW NOI Debt Yield: | 12.8% |
| Original Amortization Term: | 0 months | | UW NOI Debt Yield at Maturity: | 12.8% |
| IO Period: | 120 months | | UW NCF DSCR: | 4.62x |
| Seasoning: | 0 months | | Most Recent NOI: | $4,936,103 (6/30/2021 TTM) |
| Prepayment Provisions(1): | L(23),YM1(90),O(7) | | 2nd Most Recent NOI: | $4,817,496 (12/31/2020) |
| Lockbox/Cash Mgmt Status: | Hard/Springing | | 3rd Most Recent NOI: | $3,840,629 (12/31/2019) |
| Additional Debt Type: | No | | Most Recent Occupancy: | 100.0% (8/1/2021) |
| Additional Debt Balance: | NAP | | 2nd Most Recent Occupancy: | 100.0% (12/31/2020) |
| Future Debt Permitted (Type): | No (NAP) | | 3rd Most Recent Occupancy: | 100.0% (12/31/2019) |
| Reserves(1) | | Appraised Value (as of): | $75,000,000 (7/21/2021) |
| Type | Initial | Monthly | Cap | | Appraised Value PSF: | $449 |
| RE Tax: | $0 | Springing | N/A | | Cut-off Date LTV Ratio: | 49.5% |
| Insurance: | $0 | Springing | N/A | | Maturity Date LTV Ratio: | 49.5% |
| Sources and Uses |
| Sources | Proceeds | % of Total | | Uses | Proceeds | % of Total |
| Loan Amount: | $37,125,000 | 100.0% | | Loan Payoff: | $21,415,365 | 57.7% |
| | | | | Return of Equity: | $15,156,492 | 40.8% |
| | | | | Closing Costs: | $553,143 | 1.5% |
| Total Sources: | $37,125,000 | 100.0% | | Total Uses: | $37,125,000 | 100.0% |
| (1) | See “Escrows and Reserves” below for further discussion of reserve requirements. |
| (2) | The novel coronavirus pandemic is an evolving situation and could impact the Lightwave Corporate Center Mortgage Loan (as defined below) more severely than assumed in the underwriting of the Lightwave Corporate Center Mortgage Loan and could adversely affect the NOI, NCF and occupancy information, as well as the appraised value and the DSCR, LTV and Debt Yield metrics presented above and herein. See “Risk Factors-—Risks Related to Market Conditions and Other External Factors—The Coronavirus Pandemic Has Adversely Affected the Global Economy and Will Likely Adversely Affect the Performance of the Mortgage Loans” in the prospectus. |
The Mortgage Loan. The tenth largest mortgage loan (the “Lightwave Corporate Center Mortgage Loan”) is evidenced by a promissory note in the original principal amount of $37,125,000 and secured by a first priority fee mortgage encumbering a 166,892 SF mixed use industrial data center and office property located in San Diego, California (the “Lightwave Corporate Center Property”).
The Borrower and Borrower Sponsor. The borrower is GI DC 9305 Lightwave Avenue, LLC, a single-purpose Delaware limited liability company with one independent director in its organizational structure. The borrower sponsor and the non-recourse carveout guarantor is DataCore Fund L.P. The borrower is solely owned by DataCore Fund L.P., which is a partnership between California State Teachers’ Retirement System (“CalSTRS”) and GI Partners. CalSTRS is the largest educator-only pension fund in the world, with more than 975,000 members. GI Partners is a multi-strategy asset manager based in San Francisco, California with data center investment experience. CalSTRS and GI Partners created DataCore Fund L.P. in 2012 as a core investment vehicle to invest in technology-advantaged real estate in the United States, including data centers, internet gateways, corporate campuses for technology tenants, and life science properties. The borrower is an affiliate of the borrower under the Corporate Research Center Mortgage Loan.
The Property. The Lightwave Corporate Center Property is a two-story mixed use industrial data center and office property comprising 166,892 SF located in San Diego, California. The Lightwave Corporate Center Property is 100% leased to NFINIT (fka American Internet Services, Inc.) and University of California, San Diego (“UCSD”). The Lightwave Corporate Center Property was built in 1985 and later renovated in 2007, and includes an operational data center facility on the first floor. The data center space comprises 84,739 SF and is leased to NFINIT through March 2027, while the office space comprises 82,153 SF and is leased to UCSD through June 2028. Since 2016, the borrower sponsor has spent approximately $4.2 million on leasing commissions, tenant improvements and building improvements, including various asphalt repairs and roof repairs.
This is not a research report and was not prepared by any Underwriter’s research department. Please see additional important information and qualifications at the end of this Term Sheet. |
T-121
| Mixed Use – Industrial/Office | Loan #10 | Cut-off Date Balance: | | $37,125,000 |
| 9305 Lightwave Avenue | Lightwave Corporate Center | Cut-off Date LTV: | | 49.5% |
| San Diego, CA 92123 | | UW NCF DSCR: | | 4.62x |
| | | UW NOI Debt Yield: | | 12.8% |
Major Tenants.
NFINIT (84,739 SF, 50.8% of NRA, 55.6% of underwritten rent). NFINIT (fka American Internet Services, Inc.) is a data center and cloud service solutions provider based in San Diego, California. The company was founded in 1989 and offers business-ready internet technology infrastructure through six carrier-neutral data centers located throughout the Southwest. In February 2020, the company rebranded as NFINIT. NFINIT has occupied space at the Lightwave Corporate Center Property since 2008 and expanded its premises in 2012 to include a 4,089 SF mechanical building and the entire cooling tower yard. The cooling tower yard houses the tenant’s cooling towers, cogeneration plant, generators, diesel fuel storage and other mechanical devices supporting the data center equipment. NFINIT has a lease expiration of March 31, 2027 and has three, five-year renewal options remaining.
University of California, San Diego (82,153 SF, 49.2% of NRA, 44.4% of underwritten rent). UCSD is a public research university located in San Diego, California. The university was established in 1960 and is comprised of six undergraduate colleges, three graduate schools, and two professional medical schools. UCSD operates 19 organized research units, which include Qualcomm Institute, San Diego Supercomputer Center, and the Kavli Institute for Brain and Mind. UCSD has been a tenant at the Lightwave Corporate Center Property since 2018, has a lease expiration of June 30, 2028 and has two, five-year renewal options remaining.
The following table presents certain information relating to the leases at the Lightwave Corporate Center Property:
| Tenant Summary(1) |
| Tenant Name | Credit Rating (Fitch/Moody’s/S&P) | Tenant SF | Approx.% of SF | Annual UW Base Rent | Annual UW Base Rent PSF | % of Total Annual
UW Base Rent | Lease Expiration | Renewal Option | Term. Option (Y/N) |
| NFINIT | NR/NR/NR | 84,739 | 50.8% | $2,865,873 | $33.82 | 55.6% | 3/31/2027 | 3 x 5 yr | N |
| UCSD | AA-/Aa3/AA- | 82,153 | 49.2% | $2,286,394 | $27.83 | 44.4% | 6/30/2028 | 2 x 5 yr | N |
| | | | | | | | | | |
| Subtotal/Wtd. Avg. | | 166,892 | 100.0% | $5,152,267 | $30.87 | 100.0% | | | |
| | | | | | | | | |
| Vacant Space | | 0 | 0.0% | $0 | | | | | |
| Total/Wtd. Avg. | | 166,892 | 100.0% | $5,152,267 | | | | | |
| (1) | Information is based on the underwritten rent roll as of August 1, 2021. |
The following table presents certain information relating to the lease rollover schedule at the Lightwave Corporate Center Property:
| Lease Rollover Schedule(1) |
| Year | # of Leases Rolling | SF Rolling | UW Base Rent PSF Rolling | Approx. % of Total SF Rolling | Approx. Cumulative % of SF Rolling | Total UW Base Rent Rolling | Approx. % of Total Rent Rolling | Approx. Cumulative % of Total Rent Rolling |
| 2021 | 0 | 0 | $0.00 | 0.0% | 0.0% | $0 | 0.0% | 0.0% |
| 2022 | 0 | 0 | $0.00 | 0.0% | 0.0% | $0 | 0.0% | 0.0% |
| 2023 | 0 | 0 | $0.00 | 0.0% | 0.0% | $0 | 0.0% | 0.0% |
| 2024 | 0 | 0 | $0.00 | 0.0% | 0.0% | $0 | 0.0% | 0.0% |
| 2025 | 0 | 0 | $0.00 | 0.0% | 0.0% | $0 | 0.0% | 0.0% |
| 2026 | 0 | 0 | $0.00 | 0.0% | 0.0% | $0 | 0.0% | 0.0% |
| 2027 | 1 | 84,739 | $33.82 | 50.8% | 50.8% | $2,865,873 | 55.6% | 55.6% |
| 2028 | 1 | 82,153 | $27.83 | 49.2% | 100.0% | $2,286,394 | 44.4% | 100.0% |
| 2029 | 0 | 0 | $0.00 | 0.0% | 100.0% | $0 | 0.0% | 100.0% |
| 2030 | 0 | 0 | $0.00 | 0.0% | 100.0% | $0 | 0.0% | 100.0% |
| 2031 | 0 | 0 | $0.00 | 0.0% | 100.0% | $0 | 0.0% | 100.0% |
| 2032 & Beyond | 0 | 0 | $0.00 | 0.0% | 100.0% | $0 | 0.0% | 100.0% |
| Vacant | 0 | 0 | $0.00 | 0.0% | 100.0% | $0 | 0.0% | 100.0% |
| Total/Wtd. Avg. | 2 | 166,892 | $30.87 | 100.0% | | $5,152,267 | 100.0% | |
| (1) | Information is based on the underwritten rent roll as of August 1, 2021. |
COVID-19 Update. The first debt service payment date for the Lightwave Corporate Center Mortgage Loan is November 1, 2021 and, as of September 8, 2021, the Lightwave Corporate Center Mortgage Loan is not subject to any forbearance, modification or debt service relief request. As of August 16, 2021, the borrower has reported that the Lightwave Corporate Center Property is open and operating, with 100.0% of tenants by occupied NRA and 100.0% of tenants by underwritten base rent having paid their full August 2021 rent payments. Neither of the tenants has received rent relief.
The Market. The Lightwave Corporate Center Property is located in San Diego, California, within the Kearny Mesa office submarket of the San Diego County office market. Primary access to the neighborhood is provided by Interstate 15 and Interstate 805. Major thoroughfares include CA Route 163, CA Route 52, Clairemont Mesa Boulevard, Balboa Avenue, Kearny Villa Road, Convoy Street and Ruffin Road. The Lightwave Corporate Center Property is in close proximity to the San Diego Central Business District and the San Diego International Airport. According to the appraisal, as of the first quarter of 2021, the vacancy rate in the Kearny Mesa office submarket was approximately 11.9%, with average asking rents of $31.09 PSF and inventory of approximately 7.1 million SF. According to the appraisal, as of the first quarter of 2021, the vacancy rate in the San Diego County office market was
This is not a research report and was not prepared by any Underwriter’s research department. Please see additional important information and qualifications at the end of this Term Sheet. |
T-122
| Mixed Use – Industrial/Office | Loan #10 | Cut-off Date Balance: | | $37,125,000 |
| 9305 Lightwave Avenue | Lightwave Corporate Center | Cut-off Date LTV: | | 49.5% |
| San Diego, CA 92123 | | UW NCF DSCR: | | 4.62x |
| | | UW NOI Debt Yield: | | 12.8% |
approximately 13.6%, with average asking rents of $38.64 PSF and inventory of approximately 72.5 million SF. According to the appraisal, the 2021 population within a one-, three- and five-mile radius of the Lightwave Corporate Center Property was 3,885, 86,932 and 259,769, respectively. The 2021 median household income within the same one-, three- and five-mile radius was $92,614, $89,282 and $87,519, respectively.
The following table presents certain information relating to the appraisal’s market rent conclusion for the Lightwave Corporate Center Property:
| Market Rent Summary |
| | Data Center | Office |
| Market Rent (PSF) | $28.80 | $27.00 |
| Lease Term (Months) | 180 | 120 |
| Lease Type (Reimbursements) | NNN | NNN |
| Rent Increase Projection | 3.0% per annum | 3.0% per annum |
The following table presents comparable office leases with respect to the Lightwave Corporate Center Property:
| Comparable Office Lease Summary |
| Property Name/Location | Year Built | Total SF | Tenant Name | Lease SF | Lease Term (Mos.) | Rent PSF | Lease Type |
Lightwave Corporate Center Property(1) San Diego, CA | 1985 | 166,892 | UCSD | 82,153 | 120 | $27.83 | NNN |
Scripps Ranch Tech Park San Diego, CA | 2001 | 60,850 | CUSO Financial Services | 30,245 | 62 | $28.80 | NNN |
| | | | | | | | |
Willow Creek Corp. Center San Diego, CA | 1981 / 2019 | 121,496 | Hitachi, LTD | 20,911 | 76 | $32.40 | FSG |
| | | | | | | | |
Innovation Corp. Center San Diego, CA | 2001 | 69,967 | Northrop Grumman | 69,967 | 84 | $29.16 | NNN |
| | | | | | | | |
Scripps Corp. Center San Diego, CA | 1991 / 2013 | 70,041 | CoreLogic | 32,775 | 13 | $28.80 | NNN |
| | | | | | | | |
10150 Meanley Drive San Diego, CA | 2001 | 60,490 | CUSO Financial | 30,245 | 62 | $28.80 | NNN |
| | | | | | | | |
4830 Ruffin Road San Diego, CA | 2005 | 66,495 | Northrop Grumman | 66,495 | 60 | $26.40 | NNN |
| | | | | | | | |
Sorrento Highlands San Diego, CA | 1991 | 49,634 | Decipher Biosciences | 28,384 | 72 | $43.00 | NNN |
| | | | | | | | |
Sorrento Mesa San Diego, CA | 1981 | 71,814 | Affinity Development Grp. | 37,170 | 36 | $28.20 | NNN |
Source: Appraisal, unless otherwise noted.
| (1) | Information is based on the underwritten rent roll as of August 1, 2021. |
The following table presents comparable data center leases with respect to the Lightwave Corporate Center Property:
| Comparable Data Center Lease Summary |
| Property Name/Location | Tenant | Lease SF | Lease Term (Mos.) | Rent PSF | Lease Type |
Lightwave Corporate Center Property(1) San Diego, CA | NFINIT | 84,739 | 180 | $33.82 | NNN |
| Confidential | Confidential | 47,820 | 144 | $21.02 | NNN |
| Confidential | Confidential | 120,000 | 180 | $42.00 | NNN |
| Confidential | Confidential | 205,075 | 120 | $20.00 | NNN |
| Confidential | Confidential | 23,800 | 127 | $25.00 | NNN |
| Confidential | Confidential | 99,300 | 180 | $26.00 | NNN |
| Confidential | Confidential | 130,000 | 180 | $31.20 | NNN |
| Confidential | Confidential | 164,450 | 180 | $19.50 | NNN |
Source: Appraisal, unless otherwise indicated.
| (1) | Information is based on the underwritten rent roll as of August 1, 2021. |
This is not a research report and was not prepared by any Underwriter’s research department. Please see additional important information and qualifications at the end of this Term Sheet. |
T-123
| Mixed Use – Industrial/Office | Loan #10 | Cut-off Date Balance: | | $37,125,000 |
| 9305 Lightwave Avenue | Lightwave Corporate Center | Cut-off Date LTV: | | 49.5% |
| San Diego, CA 92123 | | UW NCF DSCR: | | 4.62x |
| | | UW NOI Debt Yield: | | 12.8% |
Operating History and Underwritten Net Cash Flow. The following table presents certain information relating to the historical operating performance and the Underwritten Net Cash Flow at the Lightwave Corporate Center Property:
| Cash Flow Analysis | |
| | | 2017 | | 2018 | | 2019 | | 2020 | | 6/30/2021 TTM | | UW | | UW PSF | |
| Gross Potential Rent(1) | | $4,323,348 | | $3,593,847 | | $4,650,064 | | $4,788,557 | | $4,862,064 | | $5,152,267 | | $30.87 | |
| Total Recoveries | | $1,270,592 | | $1,107,345 | | $1,091,189 | | $1,267,429 | | $1,335,656 | | $1,233,023 | | $7.39 | |
| Other Income | | $3 | | $20,003 | | $636 | | $20,097 | | $10,002 | | $0 | | $0.00 | |
| Discounts Concessions | | $0 | | ($854,391) | | ($683,513) | | $0 | | $0 | | $0 | | $0.00 | |
| Less Vacancy & Credit Loss | | $0 | | $0 | | $0 | | $0 | | $0 | | ($319,265) | | ($1.91) | |
| Effective Gross Income | | $5,593,943 | | $3,866,805 | | $5,058,376 | | $6,076,082 | | $6,207,722 | | $6,066,026 | | $36.35 | |
| | | | | | | | | | | | | | | | |
| Real Estate Taxes | | $709,355 | | $688,271 | | $715,882 | | $752,771 | | $760,003 | | $759,006 | | $4.55 | |
| Insurance | | $59,623 | | $59,496 | | $22,810 | | $25,524 | | $29,798 | | $25,000 | | $0.15 | |
| Other Operating Expenses | | $457,030 | | $389,846 | | $479,055 | | $480,292 | | $481,818 | | $539,570 | | $3.23 | |
| Total Operating Expenses | | $1,226,008 | | $1,137,613 | | $1,217,747 | | $1,258,587 | | $1,271,619 | | $1,323,576 | | $7.93 | |
| | | | | | | | | | | | | | | | |
| Net Operating Income(2) | | $4,367,936 | | $2,729,192 | | $3,840,629 | | $4,817,496 | | $4,936,103 | | $4,742,450 | | $28.42 | |
| Capital Expenditures | | $0 | | $0 | | $0 | | $0 | | $0 | | $33,378 | | $0.20 | |
| TI/LC | | $0 | | $0 | | $0 | | $0 | | $0 | | $275,410 | | $1.65 | |
| Net Cash Flow | | $4,367,936 | | $2,729,192 | | $3,840,629 | | $4,817,496 | | $4,936,103 | | $4,433,662 | | $26.57 | |
| | | | | | | | | | | | | | | | |
| Occupancy % | | 100.0% | | 100.0% | | 100.0% | | 100.0% | | 100.0% | | 95.0% | | | |
| NOI DSCR | | 4.55x | | 2.84x | | 4.00x | | 5.02x | | 5.14x | | 4.94x | | | |
| NCF DSCR | | 4.55x | | 2.84x | | 4.00x | | 5.02x | | 5.14x | | 4.62x | | | |
| NOI Debt Yield | | 11.8% | | 7.4% | | 10.3% | | 13.0% | | 13.3% | | 12.8% | | | |
| NCF Debt Yield | | 11.8% | | 7.4% | | 10.3% | | 13.0% | | 13.3% | | 11.9% | | | |
| (1) | UW Gross Potential Rent is based on the August 1, 2021 rent roll and includes (i) rent steps through July 2022 ($136,372) and (ii) straight line rent for UCSD through its lease term ($153,834). |
| (2) | Net Operating Income decreased from 2017 to 2018 due to San Diego Gas & Electric lease expiration. Net Operating Income increased from 2019 to 2020 primarily due to (i) USCD free rent expiring and (ii) UCSD’s rent increasing. |
Escrows and Reserves.
Real Estate Taxes - The Lightwave Corporate Center Mortgage Loan documents provide for ongoing monthly deposits into a reserve for real estate taxes in an amount equal to 1/12 of the real estate taxes that the lender estimates will be payable during the next twelve months for the Lightwave Corporate Center Property; provided that so long as no Cash Sweep Period (as defined below) exists, the borrower will have no obligation to make such monthly real estate tax reserve deposits so long as the borrower timely pays its real estate taxes and provides the lender reasonably acceptable evidence of such payment.
Insurance - The Lightwave Corporate Center Mortgage Loan documents provide for ongoing monthly deposits into a reserve for insurance premiums in an amount equal to 1/12 of the insurance premiums that the lender estimates will be payable for the renewal of coverage upon the expiration of the insurance policies; provided that the borrower will have no obligation to make such monthly reserve deposits with respect to any insurance that is maintained under one or more blanket policies by the borrower or a tenant that satisfy the requirements of the loan documents; provided that (i) with respect to blanket policies maintained by the borrower, the borrower provides the lender with proof of payment thereof, and (ii) with respect to blanket policies maintained by a tenant, the following conditions are satisfied; (a) the applicable tenant continues to maintain the insurance in conformance with the terms of the loan documents; (b) the tenant timely pays the applicable insurance premiums and the borrower or the tenant provides evidence thereof; (c) the tenant’s lease remains in full force and effect and there are no continuing monetary events of default thereunder; (d) the tenant has not vacated, abandoned, gone dark or ceased operations in all or substantially all of its space, and (d) the tenant (or its lease guarantor) has not been subject to certain bankruptcy or insolvency events.
Unfunded Obligations Recourse – In lieu of funding a reserve for a $410,765 tenant refurbishment allowance that will be required to be paid to the tenant UCSD, the Lightwave Corporate Center Mortgage Loan documents provide for recourse to the non-recourse carveout guarantor for losses arising from any failure of the borrower to perform its obligations for payment of such tenant refurbishment allowance.
Lockbox and Cash Management. The Lightwave Corporate Center Mortgage Loan documents provide for a hard lockbox, which is required to be established within 30 days of the origination date, and springing cash management. Within 30 days of the origination date, the borrower is required to deliver tenant direction letters to all tenants of the Lightwave Corporate Center Property directing them to directly deposit all rents into the lender-controlled lockbox account. In addition, the borrower is required to deposit, and cause the property manager to deposit, within two business days, all revenue from the Lightwave Corporate Center Property received by them, notwithstanding such direction, into the lockbox account. If no Cash Sweep Period exists, all funds in the lockbox account will be disbursed to the borrower’s operating account. Upon the first occurrence of a Cash Sweep Period, the borrower is required to establish a lender-controlled cash management account, into which all funds in the lockbox account will be required to be deposited, so long as a Cash Sweep Period exists. During the existence of a Cash Sweep Period, provided no event of default under the Lightwave Corporate Center
This is not a research report and was not prepared by any Underwriter’s research department. Please see additional important information and qualifications at the end of this Term Sheet. |
T-124
| Mixed Use – Industrial/Office | Loan #10 | Cut-off Date Balance: | | $37,125,000 |
| 9305 Lightwave Avenue | Lightwave Corporate Center | Cut-off Date LTV: | | 49.5% |
| San Diego, CA 92123 | | UW NCF DSCR: | | 4.62x |
| | | UW NOI Debt Yield: | | 12.8% |
Mortgage Loan documents is continuing, all funds in the cash management account are required to be applied on each monthly payment date: (i) to make the required monthly deposits (if any) into the real estate tax and insurance reserves as described above under “Escrows and Reserves,” (ii) to pay (x) operating expenses set forth in the annual budget (which is required to be reasonably approved by the lender during a Cash Sweep Period) and (y) lender-approved extraordinary expenses (provided that up to $100,000 annually of extraordinary expenses do not require lender approval) and capital expenditures, which disbursements under this clause (y) may not exceed $50,000 per calendar year, (iii) to pay debt service on the Lightwave Corporate Center Mortgage Loan, and (iv) to deposit any remainder into an excess cash flow reserve to be held as additional security for the Lightwave Corporate Center Mortgage Loan during the existence of such Cash Sweep Period; provided, that upon the borrower’s request, provided no event of default exists, the lender is required to disburse funds in the excess cash flow reserve to pay operating expenses that are then due and owing.
A “Cash Sweep Period” means a period:
| (i) | Commencing upon an event of default and ending upon the cure or waiver (if applicable) of such event of default; or |
| (ii) | Commencing upon the debt yield of the Lightwave Corporate Center Mortgage Loan (based on the trailing four months operating statement and rent roll) falling below 8.00% as of the end of any fiscal quarter, and ending at such time as the debt yield has equaled or exceeded 8.0% for the immediately preceding four consecutive calendar months (provided, that cash trapped for any vacant space will be capped at $15 PSF, and if the debt yield has fallen below 8.00% due to a tenant’s rent being excluded from the debt yield calculation under the loan documents because it has a lease that expires within 60 days or less or, with respect to NFINIT or UCSD (or any affiliate, assignee or successor of either such tenant), because it has failed to give notice of renewal of its lease, or because it has given notice of its intent to vacate, at a time when no more than six months remain of its lease term, the cash trapped will be capped at $15 PSF of the applicable space.) |
Additional Secured Indebtedness (not including Trade Debts). Not permitted.
Mezzanine Loan and Preferred Equity. Not permitted.
Release of Property. Not permitted.
Letter of Credit. None.
Right of First Offer / Right of First Refusal. NFINIT has both a right of first refusal and a right of first offer to purchase the Lightwave Corporate Center Property. The tenant has agreed in a subordination, non-disturbance and attornment agreement that (i) it has no right or option to purchase the Mortgaged Property or any portion thereof and to the extent it has had or acquires any such right or option, such right is subordinate to the lender’s deed of trust and waived and released against the lender and any purchaser at a foreclosure sale or transferee in lieu of foreclosure, and (ii) its right of first refusal in its lease will not apply to any foreclosure sale or conveyance in lieu thereof, and is subordinate to the lender’s deed of trust and waived and released against the lender and any purchaser at a foreclosure sale or transferee in lieu of foreclosure.
Ground Lease. None.
Terrorism Insurance. The borrower is required to obtain and maintain an “all risk” or “special form” property insurance policy that covers acts of terrorism in an amount equal to the “full replacement cost” of the Lightwave Corporate Center Property, together with at least 12 months of business interruption insurance, with an extended period of indemnity endorsement of up to six months. Notwithstanding the foregoing, the borrower is not required to spend on terrorism insurance more than 100% of the amount of the then-current property casualty insurance premium that is payable in respect of the Lightwave Corporate Center Property (without giving effect to the cost of terrorism and earthquake components of the property insurance and without giving effect to the cost of business interruption insurance) obtained as of the date the applicable new terrorism insurance is being obtained. See “Risk Factors—Risks Relating to the Mortgage Loans—Terrorism Insurance May Not Be Available for All Mortgaged Properties” in the prospectus.
This is not a research report and was not prepared by any Underwriter’s research department. Please see additional important information and qualifications at the end of this Term Sheet. |
T-125
| Mortgage Loan No. 11 – La Brea & San Vicente |
| Mortgage Loan Information | | Property Information |
| Mortgage Loan Seller: | WFB | | Single Asset/Portfolio: | Single Asset |
| Credit Assessment (Fitch/KBRA/S&P): | NR/NR/NR | | Location: | Los Angeles, CA 90019 |
| Original Balance: | $31,500,000 | | General Property Type: | Retail |
| Cut-off Date Balance: | $31,500,000 | | Detailed Property Type: | Anchored |
| % of Initial Pool Balance: | 2.5% | | Title Vesting: | Fee |
| Loan Purpose: | Refinance | | Year Built/Renovated: | 2019/NAP |
| Borrower Sponsor: | SKR Holdings, LLC | | Size: | 75,928 SF |
| Guarantor: | SKR Holdings, LLC | | Cut-off Date Balance PSF: | $415 |
| Mortgage Rate: | 3.3450% | | Maturity Date Balance PSF: | $415 |
| Note Date: | 7/9/2021 | | Property Manager: | CIM Management, Inc. |
| First Payment Date: | 8/11/2021 | | | |
| Maturity Date: | 7/11/2031 | | | |
| Original Term to Maturity: | 120 months | | Underwriting and Financial Information(3) |
| Original Amortization Term: | 0 months | | UW NOI(4): | $2,444,177 |
| IO Period: | 120 months | | UW NOI Debt Yield: | 7.8% |
| Seasoning: | 3 months | | UW NOI Debt Yield at Maturity: | 7.8% |
| Prepayment Provisions: | L(27),D(86),O(7) | | UW NCF DSCR: | 2.21x |
| Lockbox/Cash Mgmt Status: | Hard/Springing | | Most Recent NOI(4): | $1,869,150 (4/30/2021 TTM) |
| Additional Debt Type: | No | | 2nd Most Recent NOI(4): | $1,568,729 (12/31/2020) |
| Additional Debt Balance: | NAP | | 3rd Most Recent NOI: | NAP |
| Future Debt Permitted (Type): | No (NAP) | | Most Recent Occupancy: | 97.5% (6/14/2021) |
| Reserves | | 2nd Most Recent Occupancy: | 97.5% (12/31/2020) |
| Type | Initial | Monthly | Cap | | 3rd Most Recent Occupancy: | 72.6% (12/31/2019) |
| RE Taxes: | $0 | Springing(1) | NAP | | Appraised Value (as of): | $51,600,000 (5/6/2021) |
| Insurance: | $0 | Springing(1) | NAP | | Appraised Value PSF: | $679.59 |
| Replacement Reserves: | $0 | $1,265 | $45,500(2) | | Cut-off Date LTV Ratio: | 61.0% |
| Leasing Reserve: | $0 | $6,325 | NAP | | Maturity Date LTV Ratio: | 61.0% |
| | | | | | | |
| Sources and Uses |
| Sources | Proceeds | % of Total | | Uses | Proceeds | % of Total |
| Loan Amount: | $31,500,000 | 100.0% | | Loan Payoff: | $30,370,607 | 96.4% |
| | | | | Closing Costs: | $220,314 | 0.7% |
| | | | | Return of Equity: | $909,080 | 2.9% |
| Total Sources: | $31,500,000 | 100.0% | | Total Uses: | $31,500,000 | 100.0% |
| (1) | The La Brea & San Vicente Mortgage Loan (as defined below) documents do not require ongoing monthly escrows for taxes or insurance as long as (i) no event of default is continuing, (ii) no Cash Trap Event Period has occurred and is continuing, (iii) the borrower provides proof of payment of taxes and insurance premiums, as applicable, and (iv) as it relates to insurance escrows, the La Brea & San Vicente Property (as defined below) is covered under a blanket policy acceptable to the lender. A “Cash Trap Event Period” will commence upon the earlier of: (a) the occurrence of an event of default; (b) the net cash flow debt service coverage ratio (“NCF DSCR”) falling below 1.15x (amortizing) (tested quarterly); (c) the borrower’s filing for bankruptcy (or a similar insolvency proceeding); (d) the property manager’s filing for bankruptcy (or a similar insolvency proceeding) and the borrower failing to replace such manager within 60 days’ following borrower’s knowledge of same, provided, however, that the borrower shall have an additional 30 days to replace such manager; or (d) the commencement of a Major Tenant Event Period. A “Major Tenant Event Period” will commence upon the earlier of Target, Sprouts, Michaels, or any replacement tenant (or any tenant comprising 25% of NRA or EGI): (a) failing to renew or extend the term of its lease before the specified renewal deadline; (b) defaulting under their lease; (c) going dark for 14 consecutive days; (d) terminating their lease (or giving notice to do so); (e) or filing for bankruptcy (or a similar insolvency proceeding). |
| (2) | The La Brea & San Vicente Mortgage Loan documents require ongoing monthly replacement reserve deposits equal to $1,265, subject to a cap of $45,500, as long as (i) no event of default is continuing and (ii) the La Brea & San Vicente Property is being adequately maintained (as reasonably determined by lender). |
| (3) | The novel coronavirus pandemic is an evolving situation and could impact the La Brea & San Vicente Mortgage Loan (as defined below) more severely than assumed in the underwriting of the La Brea & San Vicente Mortgage Loan and could adversely affect the NOI, NCF and occupancy information, as well as the appraised value and the DSCR, LTV and Debt Yield metrics presented above and herein. See “Risk Factors-—Risks Related to Market Conditions and Other External Factors—The Coronavirus Pandemic Has Adversely Affected the Global Economy and Will Likely Adversely Affect the Performance of the Mortgage Loans” in the prospectus. |
| (4) | The increase in Net Operating Income between 4/30/2021 TTM and UW is due to Michaels lease commencing in July 2020, ownership expenses being included historically, and underwriting to the actual 2020/2021 tax bill. The increase in Net Operating Income between 2020 and 4/30/2021 TTM was due to Michaels’ lease commencing in July 2020. |
The Mortgage Loan. The eleventh largest mortgage loan (the “La Brea & San Vicente Mortgage Loan”) is evidenced by a promissory note in the original principal amount of $31,500,000 and secured by the fee interest in an anchored retail property located in Los Angeles, California (the “La Brea & San Vicente Property”).
The Borrower and the Borrower Sponsor. The borrower is 4918 San Vicente Boulevard (LA) Owner, LLC, a Delaware limited liability company and single purpose entity with one independent director. The borrower sponsor and the non-recourse carveout guarantor is SKR Holdings, LLC (“SKR Holdings”).
SKR Holdings, which has real estate investments valued at approximately $830.3 million, is owned by Richard Ressler, Shaul Kuba and Avi Shemesh, who together founded CIM Group, which was founded in 1994 and, as of March 31, 2021, owns and operates $28.3 billion of assets.
The Property. The La Brea & San Vicente Property is an anchored retail center totaling 75,928 SF of rentable area. Built in 2019, the property is situated on a 1.6-acre parcel and, as of June 14, 2021, is 97.5% occupied by Target Corporation (“Target”), Sprouts Farmers Market (“Sprouts”) and Michaels Stores (“Michaels”). The property contains 305 surface and garage parking spaces, resulting in a parking ratio of 4.0 spaces per 1,000 SF of rentable area.
This is not a research report and was not prepared by any Underwriter’s research department. Please see additional important information and qualifications at the end of this Term Sheet. |
T-126
| Retail – Anchored | Loan #11 | Cut-off Date Balance: | | $31,500,000 |
| 1302 South La Brea Avenue | La Brea & San Vicente | Cut-off Date LTV: | | 61.0% |
| Los Angeles, CA 90019 | | UW NCF DSCR: | | 2.21x |
| | | UW NOI Debt Yield: | | 7.8% |
Major Tenants.
Target (29,118 SF; 38.3% of NRA; 42.1% of underwritten base rent). Target has been a tenant at the La Brea & San Vicente Property since 2019 and has a lease expiring in January 2030 with 4, 5-year renewal options remaining with 6 months’ notice. Target does not have any termination options and is not required to report sales.
Sprouts (26,000 SF; 34.2% of NRA; 30.5% of underwritten base rent). Sprouts, which currently has over 360 stores, was founded in 2002 and focuses on farm fresh produce and other healthy affordable items. Sprouts has been a tenant at the La Brea & San Vicente Property since 2019 and has a lease expiring in July 2029 with 3, 5-year renewal options remaining with 6 months’ notice. Sprouts does not have any termination options and is not required to report sales.
Michaels (18,938 SF; 24.9% of NRA; 27.4% of underwritten base rent). Michaels has been a tenant at the La Brea & San Vicente Property since 2020 and has a lease expiring in July 2030 with 4, 5-year renewal options remaining with 6 months’ notice. Michaels is not required to report sales. Michaels has the right to terminate its lease with written notice to the landlord if an ownership transfer of the La Brea & San Vicente Property results in increased real estate tax expenses in excess of 20% over the prior year, however, within 30 days receipt of such notice, the landlord may nullify tenant’s termination by electing not to include the amount of such taxes above the 20% increase.
The following table presents certain information relating to the tenancy at the La Brea & San Vicente Property:
| Tenant Summary |
| Tenant Name | Credit Rating (Fitch/Moody’s/ S&P)(1) | Tenant SF | Approx. % of SF | Annual UW Rent(2) | % of Total Annual UW Rent | Annual UW Rent PSF(2) | | Renewal Options |
| Termination Option (Y/N) | Lease Expiration |
| Anchor Tenants | | | | | | | | | |
| Target | A/A2/A | 29,118 | 38.3% | $1,078,590 | 42.1% | $37.04 | N | 1/31/2030 | 4 x 5 yr |
| Sprouts | NR/NR/NR | 26,000 | 34.2% | $780,000 | 30.5% | $30.00 | N | 7/31/2029 | 3 x 5 yr |
| Total/Wtd. Avg. | | 55,118 | 72.6% | $1,858,590 | 72.6% | $33.72 | | | |
| | | | | | | | | | |
| Major Tenant | | | | | | | | | |
| Michaels | NR/NR/NR | 18,938 | 24.9% | $700,706 | 27.4% | $37.00 | Y | 7/31/2030 | 4 x 5 yr |
| Total/Wtd. Avg. | | 18,938 | 24.9% | $700,706 | 27.4% | $37.00 | | | |
| | | | | | | | | | |
| Occupied Collateral Total | | 74,056 | 97.5% | $2,559,296 | 100.0% | $34.56 | | | |
| Vacant Space | | 1,872 | 2.5% | | | | | | |
| Total | | 75,928 | 100.0% | | | | | | |
| (1) | Certain ratings are those of the parent company whether or not the parent guarantees the lease. |
| (2) | Annual UW Rent and Annual UW Rent PSF include straight-lined average rent for Target totaling $59,460. |
This is not a research report and was not prepared by any Underwriter’s research department. Please see additional important information and qualifications at the end of this Term Sheet. |
T-127
| Retail – Anchored | Loan #11 | Cut-off Date Balance: | | $31,500,000 |
| 1302 South La Brea Avenue | La Brea & San Vicente | Cut-off Date LTV: | | 61.0% |
| Los Angeles, CA 90019 | | UW NCF DSCR: | | 2.21x |
| | | UW NOI Debt Yield: | | 7.8% |
The following table presents certain information relating to the lease rollover schedule at the La Brea & San Vicente Property:
| Lease Rollover Schedule(1)(2) |
| Year | # of Leases
Rolling | SF Rolling | UW Rent PSF Rolling | Approx.
% of Total
SF Rolling | Approx.
Cumulative %
of SF Rolling | Total UW Rent
Rolling | Approx. % of
Total Rent
Rolling | Approx. Cumulative % of Total Rent Rolling |
| 2021 | 0 | 0 | $0.00 | 0.0% | 0.0% | $0 | 0.0% | 0.0% |
| 2022 | 0 | 0 | $0.00 | 0.0% | 0.0% | $0 | 0.0% | 0.0% |
| 2023 | 0 | 0 | $0.00 | 0.0% | 0.0% | $0 | 0.0% | 0.0% |
| 2024 | 0 | 0 | $0.00 | 0.0% | 0.0% | $0 | 0.0% | 0.0% |
| 2025 | 0 | 0 | $0.00 | 0.0% | 0.0% | $0 | 0.0% | 0.0% |
| 2026 | 0 | 0 | $0.00 | 0.0% | 0.0% | $0 | 0.0% | 0.0% |
| 2027 | 0 | 0 | $0.00 | 0.0% | 0.0% | $0 | 0.0% | 0.0% |
| 2028 | 0 | 0 | $0.00 | 0.0% | 0.0% | $0 | 0.0% | 0.0% |
| 2029 | 1 | 26,000 | $30.00 | 34.2% | 34.2% | $780,000 | 30.5% | 30.5% |
| 2030 | 2 | 48,056 | $37.03 | 63.3% | 97.5% | $1,779,296 | 69.5% | 100.0% |
| 2031 | 0 | 0 | $0.00 | 0.0% | 97.5% | $0 | 0.0% | 100.0% |
| 2032 & Beyond | 0 | 0 | $0.00 | 0.0% | 97.5% | $0 | 0.0% | 100.0% |
| Vacant | 0 | 1,872 | $0.00 | 2.5% | 100.0% | $0 | 0.0% | 100.0% |
| Total/Wtd. Avg. | 3 | 75,928 | $34.56(3) | 100.0% | | $2,559,296 | 100.0% | |
| (1) | Information is based on the underwritten rent roll. |
| (2) | Certain tenants may have lease termination options that are exercisable prior to the originally stated expiration date of the related lease and are not considered in the rollover schedule. |
| (3) | Wtd. Avg. UW Rent PSF Rolling excludes vacant space. |
COVID-19 Update. As of September 2, 2021, the loan is not subject to any forbearance, modification or debt service relief request. As of September 2, 2021, the borrower sponsor reported that all tenants were open and operating. Tenants representing approximately 97.5% of the NRA (100.0% of the occupied NRA) and 100.0% of underwritten base rent made their full rent payment for August 2021 and no tenants were granted rent relief related to COVID-19.
The Market. The La Brea & San Vicente Property is located within the southeast quadrant of South La Brea Avenue and South San Vicente Boulevard in Los Angeles, California. The property is located approximately 8.4 miles west of the Los Angeles central business district and is within one mile of Interstate 10. According to the appraisal, within a one-mile radius of the La Brea & San Vicente Property, the 2020 population was approximately 48,185 and the average household income was approximately $96,566.
According to a third-party market research report, the property is situated within the Park Mile submarket of the Los Angeles retail market. As of August 2021, the submarket reported total inventory of approximately 2.1 million SF, with a 5.4% vacancy rate and average asking rent of $27.16 PSF.
The following table presents certain information relating to the appraisal’s market rent conclusion for the La Brea & San Vicente Property:
| Market Rent Summary |
| | Junior Anchor | Inline |
| Market Rent (PSF) | $33.00 | $48.00 |
| Lease Term (Years) | 10 | 5 |
| Lease Type (Reimbursements) | NNN | NNN |
| Rent Increase Projection | None | None |
The table below presents certain information relating to comparable sales pertaining to the La Brea & San Vicente Property identified by the appraiser:
| Comparable Sales |
| |
Property Name | Location | Rentable Area (SF) | Sale Date | Sale Price (PSF) |
| Home Depot | 5040 San Fernando Road San Fernando, CA | 94,103 | NAP(1) | $672.00 |
| Gaju Market Place | 450 S. Western Avenue Los Angeles, CA | 83,427 | Dec-20 | $689.00 |
| The Strand | 100 5th Street Huntington Beach, CA | 96,208 | Oct-19 | $676.00 |
| Burbank Collection | 250 N. 1st Street Burbank, CA | 39,508 | Jul-19 | $656.00 |
Source: Appraisal.
| (1) | According to the Appraisal, this comparable sale is a current listing; therefore, there is no Sale Date. |
This is not a research report and was not prepared by any Underwriter’s research department. Please see additional important information and qualifications at the end of this Term Sheet. |
T-128
| Retail – Anchored | Loan #11 | Cut-off Date Balance: | | $31,500,000 |
| 1302 South La Brea Avenue | La Brea & San Vicente | Cut-off Date LTV: | | 61.0% |
| Los Angeles, CA 90019 | | UW NCF DSCR: | | 2.21x |
| | | UW NOI Debt Yield: | | 7.8% |
Operating History and Underwritten Net Cash Flow. The following table presents certain information relating to the historical operating performance and Underwritten Net Cash Flow at the La Brea & San Vicente Property:
| Cash Flow Analysis |
| | 2020 | 4/30/2021 TTM | UW | UW PSF |
| Base Rent(1) | $1,936,634 | $2,170,203 | $2,559,296 | $33.71 |
| Grossed Up Vacant Space | $0 | $0 | $89,856 | $1.18 |
| Gross Potential Rent | $1,936,634 | $2,170,203 | $2,649,152 | $34.89 |
| Total Recoveries | $777,127 | $965,469 | $731,957 | $9.64 |
| Net Rental Income | $2,713,761 | $3,135,672 | $3,381,109 | $44.53 |
| (Vacancy & Credit Loss) | $0 | $0 | ($89,856) | ($1.18) |
| Effective Gross Income | $2,713,761 | $3,135,672 | $3,291,253 | $43.35 |
| | | | | |
| Real Estate Taxes | $601,771 | $655,416 | $441,125 | $5.81 |
| Insurance | $25,691 | $26,881 | $31,594 | $0.42 |
| Management Fee | $76,497 | $76,136 | $98,738 | $1.30 |
| Other Operating Expenses | $441,074 | $508,089 | $275,619 | $3.63 |
| Total Operating Expenses | $1,145,032 | $1,266,522 | $847,076 | $11.16 |
| | | | | |
| Net Operating Income(2) | $1,568,729 | $1,869,150 | $2,444,177 | $32.19 |
| Replacement Reserves | $0 | $0 | $11,389 | $0.15 |
| TI/LC | $0 | $0 | $75,928 | $1.00 |
| Net Cash Flow | $1,568,729 | $1,869,150 | $2,356,860 | $31.04 |
| | | | | |
| Occupancy % | 97.5% | 97.5% | 97.5%(3) | |
| NOI DSCR | 1.47x | 1.75x | 2.29x | |
| NCF DSCR | 1.47x | 1.75x | 2.21x | |
| NOI Debt Yield | 5.0% | 5.9% | 7.8% | |
| NCF Debt Yield | 5.0% | 5.9% | 7.5% | |
| (1) | UW Base Rent includes straight-lined average rent for Target totaling $59,460. |
| (2) | The increase Net Operating Income between 2020 and 4/20/2021 TTM was due to Michaels’ lease commencing in July 2020. The increase in Net Operating Income between 4/30/2021 TTM and UW is due to Michaels lease commencing in July 2020, ownership expenses being included historically, and underwriting to the actual 2020/2021 tax bill. |
| (3) | The underwritten economic vacancy is 3.4%. The La Brea & San Vicente Property was 97.5% occupied as of June 14, 2021. |
This is not a research report and was not prepared by any Underwriter’s research department. Please see additional important information and qualifications at the end of this Term Sheet. |
T-129
| Mortgage Loan No. 12 – Raymour & Flanigan Campus |
| Mortgage Loan Information | | Property Information |
| Mortgage Loan Seller: | BANA | | Single Asset/Portfolio: | Single Asset |
| Credit Assessment (Fitch/KBRA/S&P): | NR/NR/NR | | Location: | Liverpool NY 13090 |
| Original Balance(1): | $30,000,000 | | General Property Type: | Industrial |
| Cut-off Date Balance(1): | $30,000,000 | | Detailed Property Type: | Warehouse Distribution |
| % of Initial Pool Balance: | 2.4% | | Title Vesting: | Fee |
| Loan Purpose: | Refinance | | Year Built/Renovated: | 1970 / 2016-2020 |
| Borrower Sponsors: | Neil Goldberg and Seth Goldberg | | Size: | 952,214 SF |
| Guarantor: | Neil Goldberg Family Asset Preservation Trust | Cut-off Date Balance PSF(1): | $91 |
| Mortgage Rate: | 2.9250% | Maturity Date Balance PSF(1): | $91 |
| Note Date: | 9/9/2021 | | Property Manager: | Raymours Furniture Company, Inc. |
| First Payment Date: | 11/1/2021 | | | (borrower-related) |
| Maturity Date: | 10/1/2031 | | | |
| Original Term to Maturity: | 120 months | | | |
| Original Amortization Term: | 0 months | | Underwriting and Financial Information(4) |
| IO Period: | 120 months | | UW NOI(5): | $8,447,524 |
| Seasoning: | 0 months | | UW NOI Debt Yield(1): | 9.7% |
| Prepayment Provisions(2): | L(24),D(92),O(4) | | UW NOI Debt Yield at Maturity(1): | 9.7% |
| Lockbox/Cash Mgmt Status: | Hard/In Place | | UW NCF DSCR(1): | 3.03x |
| Additional Debt Type: | Pari Passu | | Most Recent NOI(5): | $4,473,049 (6/30/2021) |
| Additional Debt Balance(1): | $57,000,000 | | 2nd Most Recent NOI: | $4,473,047 (12/31/2020) |
| Future Debt Permitted (Type): | No (NAP) | | 3rd Most Recent NOI: | $4,353,047 (12/31/2019) |
| Reserves(3) | | Most Recent Occupancy: | 100.0% (10/1/2021) |
| Type | Initial | Monthly | Cap | | 2nd Most Recent Occupancy: | 100.0% (12/31/2020) |
| RE Taxes: | $216,876 | $108,438 | NAP | | 3rd Most Recent Occupancy: | 100.0% (12/31/2019) |
| Insurance: | $0 | Springing | NAP | | Appraised Value (as of)(6): | $149,000,000 (8/4/2021) |
| Replacement Reserve: | $0 | $13,490 | $650,000 | | Appraised Value PSF(6): | $156 |
| TI/LC Reserve: | $0 | Springing | NAP | | Cut-off Date LTV Ratio(1)(6): | 58.4% |
| Immediate Repairs: | $36,000 | $0 | NAP | | Maturity Date LTV Ratio(1)(6): | 58.4% |
| | | | | | | |
| Sources and Uses |
| Sources | Proceeds | % of Total | | Uses | Proceeds | % of Total |
| Whole Loan Amount: | $87,000,000 | 100.0% | | Loan Payoff: | $39,240,759 | 45.1% |
| | | | | Return of Equity: | $45,599,654 | 52.4% |
| | | | | Reserves: | $252,876 | 0.3% |
| | | | | Closing Costs: | $1,906,710 | 2.2% |
| Total Sources: | $87,000,000 | 100.0% | | Total Uses: | $87,000,000 | 100.0% |
| (1) | The Raymour & Flanigan Campus Mortgage Loan (as defined below) is part of the Raymour & Flanigan Campus Whole Loan (as defined below) that is evidenced by two pari passu promissory notes with an aggregate principal balance of $87,000,000. The Cut-off Date Balance PSF, Maturity Date Balance PSF, UW NOI Debt Yield, UW NOI Debt Yield at Maturity, UW NCF DSCR, Cut-off Date LTV Ratio and Maturity Date LTV Ratio numbers presented above are based on the aggregate principal balance of the promissory notes comprising the Raymour & Flanigan Campus Whole Loan. |
| (2) | Defeasance of the Raymour & Flanigan Campus Whole Loan is permitted at any time after the end of the two-year period commencing on the closing date of the securitization of the last portion of the Raymour & Flanigan Campus Whole Loan to be securitized. The assumed prepayment lockout period of 24 payments is based on the closing date of this transaction in October 2021. |
| (3) | Monthly reserves for insurance are waived so long as the Raymour & Flanigan Campus Property (as defined below) is subject to a blanket policy acceptable to the lender. During a “Cash Sweep Period”, the borrower is required to deposit $79,351 to the TI/LC Reserve. A Cash Sweep Period will occur (i) beginning when the trailing twelve month amortizing debt service coverage ratio is below 1.20x for any calendar quarter, and ending when the trailing twelve month amortizing debt service coverage ratio is at least 1.25x for two consecutive calendar quarters, or (ii) beginning when Raymours Furniture Company, Inc. (a) gives notice to go dark or vacate, or goes dark or vacates, and ending when Raymours Furniture Company, Inc. provides evidence that it has resumed operations or the “Raymour Replacement Criteria” has been met, (b) gives notice to terminate or terminates its lease, and ending when the Raymour Replacement Criteria has been met, (c) defaults in payment of rent, and ending when the default is cured, or (d) is (or its lease guarantor is) the subject of any bankruptcy actions, and ending when Raymours Furniture Company, Inc. (or its lease guarantor) is no longer subject to bankruptcy and the Raymours Furniture Company, Inc. lease (and guaranty) obligations remaining unaltered. Raymour Replacement Criteria means the Raymours Furniture Company, Inc. lease has been replaced by a replacement lease with a replacement tenant in occupancy and without any landlord obligations owed. |
| (4) | The novel coronavirus pandemic is an evolving situation and could impact the Raymour & Flanigan Campus Whole Loan more severely than assumed in the underwriting of the Raymour & Flanigan Campus Whole Loan. The pandemic and resulting economic disruption could also adversely affect the NOI, NCF and occupancy information, as well as the appraised value and DSCR, LTV and Debt Yield metrics presented above and herein. See “Risk Factors—Risks Related to Market Conditions and Other External Factors—The Coronavirus Pandemic Has Adversely Affected the Global Economy and Will Likely Adversely Affect the Performance of the Mortgage Loans” in the prospectus. |
| (5) | The increase in UW NOI from Most Recent NOI is attributable to the single tenant, Raymours Furniture Company, Inc., executing a new 15-year NNN lease in September 2021. |
| (6) | The appraisal also provided a “Hypothetical – As Dark” value of $90,700,000 as of August 4, 2021, a value which would result in an Appraised Value Per SF, Cut-off Date LTV Ratio and LTV Ratio at Maturity of $95, 95.9% and 95.9%, respectively. |
This is not a research report and was not prepared by any Underwriter’s research department. Please see additional important information and qualifications at the end of this Term Sheet. |
T-130
| Industrial – Warehouse Distribution | Loan # 12 | Cut-off Date Balance: | | $30,000,000 |
| 7230, 7248 & 7272 Morgan Road; | Raymour & Flanigan Campus | Cut-off Date LTV: | | 58.4% |
| 4545 & 4563 Morgan Place | | UW NCF DSCR: | | 3.03x |
| Liverpool, NY 13090 | | UW NOI Debt Yield: | | 9.7% |
The Mortgage Loan. The twelfth largest mortgage loan (the “Raymour & Flanigan Campus Mortgage Loan”) is part of a whole loan (the “Raymour & Flanigan Campus Whole Loan”) that is evidenced by two pari passu promissory notes in the aggregate original principal amount of $87,000,000 and secured by a first priority fee mortgage encumbering an 952,214 SF industrial warehouse distribution center located in Liverpool, New York (the “Raymour & Flanigan Campus Property”). The Raymour & Flanigan Campus Mortgage Loan is evidenced by the non-controlling Note A-2 with an original principal amount of $30,000,000. Note A-1 with an original principal amount of $57,000,000 (the “Raymour & Flanigan Serviced Pari Passu Companion Loan”) is currently held by Bank of America, N.A. and is intended to be securitized in one or more future transactions. The Raymour & Flanigan Whole Loan will be serviced pursuant to the pooling and servicing agreement for the BANK 2021-BNK36 securitization trust until the securitization of Note A-1. See “Description of the Mortgage Pool—The Whole Loans—The Serviced Pari Passu Whole Loans”, “—The Non-Serviced Pari Passu Whole Loans” and “Pooling and Servicing Agreement Agreement—Servicing of the Servicing Shift Mortgage Loans” in the prospectus.
| Raymour & Flanigan Campus Whole Loan Summary |
| Note | Original Balance | Cut-off Date Balance | Note Holder | Controlling Piece |
| A-1 | $57,000,000 | $57,000,000 | BANA | Yes |
| A-2 | $30,000,000 | $30,000,000 | BANK 2021-BNK36 | No |
| Total | $87,000,000 | $87,000,000 | | |
The Borrower and the Borrower Sponsors. The borrower is Campus FSC, LLC, a New York limited liability company structured to be bankruptcy-remote with two independent directors. The borrower sponsors are Neil Goldberg and Seth Goldberg, and the non-recourse carveout guarantor is Neil Goldberg Family Asset Preservation Trust.
The Goldberg family has owned and operated Raymours Furniture Company, Inc. (d.b.a. Raymour & Flanigan Furniture) (“Raymour & Flanigan”) since its founding in 1947. Neil Goldberg, the Chief Executive Officer and Chairman of Raymour & Flanigan, joined the family business in 1972 and was later joined by Steven Goldberg and Michael Goldberg. Seth Goldberg became President of Raymour & Flanigan in January 2021. Collectively, the family members serve as the senior executives of Raymour & Flanigan and oversee the operation of over 11.0 million SF of commercial real estate, which includes a portfolio of 80 retail, 20 industrial and 1 office property related to the furniture business, as well as 125 retail and 7 industrial properties with third party tenants. The borrower sponsors have owned the Raymour & Flanigan Campus Property for more than 20 years.
The Property. The Raymour & Flanigan Campus Property is a 952,214 SF, Class A, industrial warehouse distribution center that was constructed in 1970 on a 66.28-acre site in Liverpool, New York. The Raymour & Flanigan Campus Property is 100.0% occupied by Raymours Furniture Company, Inc. and serves as the company’s headquarters. In total, the campus has 818,475 SF (86.0%) of warehouse space and 133,739 SF (14.0%) of office/flex space and features 713 surface parking spaces. The five buildings that comprise the improvements include the Northern Distribution Center, the Field Support Center, the Customer Service and Learning Development Center, the Transportation Building and the Recycling Building.
The Northern Distribution Center building is located at 7230 Morgan Road and is comprised of 584,206 SF (551,602 SF of warehouse space and 32,604 SF of office space). The warehouse space is used as one of four main distribution hubs for Raymour & Flanigan, receiving furniture directly from foreign and domestic manufacturers, and features 44-foot clear ceiling heights and 74 elevated loading docks. The office space is used to house Raymour & Flanigan’s information technology department, which includes inventory management, e-commerce and technology security.
The Field Support Center building is located at 7248 Morgan Road and is comprised of 113,364 SF (67,258 SF of warehouse space and 46,106 SF of office space). The warehouse space is used as a film studio for filming of all television commercials and photography used for all print and media for Raymour & Flanigan, and features 16-foot clear ceiling heights and three elevated loading docks. The office space houses corporate functions including human resources, finance, accounting, marketing, operations, logistics, legal and real estate.
The Customer Service and Learning Development Center building is located at 7272 Morgan Road and is comprised of 195,835 SF (146,178 SF of warehouse space and 49,657 SF of office space). The warehouse space is used for customer service, delivering products to end users, and features 16-foot clear ceiling heights and 20 elevated loading docks. The office space is used for corporate leadership development programs and for the customer care department.
The Transportation Building is located at 4545 Morgan Place and is comprised of 18,419 SF (13,047 SF of warehouse space and 5,372 SF of office space). The Transportation Building is used by Raymour & Flanigan to service all trucks, trailers, tractors and fleet vehicles and features 16-foot clear ceiling heights and 12 drive-in doors.
The Recycling Building is located at 4563 Morgan Place and features 40,390 SF of warehouse space used to compact and process cardboard, plastic and Styrofoam used by Raymour & Flanigan’s operations for recycling and sale in the secondary market. The Recycling Building features 16-foot clear ceiling heights, two drive-in doors and 18 elevated loading docks.
The Raymour & Flanigan Campus Property is located approximately 6.0 miles from Syracuse. Primary access to the Raymour & Flanigan Campus Property is provided by Morgan Road, Factory Avenue, Liverpool Bypass/Crown Road and Henry Clay Boulevard. Regional access is provided by Interstate 90 (New York State Thruway), with direct access less than one mile from the Raymour & Flanigan Campus Property, and Interstates 81 and 690.
Single Tenant.
Raymours Furniture Company, Inc. (952,214 SF, 100.0% of NRA, 100.0% of underwritten base rent). Raymours Furniture Company, Inc. is the sole tenant at the Raymour & Flanigan Campus Property and is affiliated with the borrower sponsors. The borrower sponsors, Neil and Seth Goldberg, and various members of their family, own and control Raymour & Flanigan, the largest furniture retailer in the Northeast United States. Founded in 1947, Raymour & Flanigan is a privately held, family run American furniture retail chain headquartered in Liverpool, New York. Raymour & Flanigan operates 103 full-line showrooms, 27 outlet centers, 5 clearance centers, 15 customer service centers and 4 distribution centers, serving customers in seven states: Connecticut, Delaware, Massachusetts, New Jersey, New York, Pennsylvania and Rhode Island. Approximately one-third of Raymour & Flanigan’s sales are generated in the metropolitan New York market.
This is not a research report and was not prepared by any Underwriter’s research department. Please see additional important information and qualifications at the end of this Term Sheet. |
T-131
| Industrial – Warehouse Distribution | Loan # 12 | Cut-off Date Balance: | | $30,000,000 |
| 7230, 7248 & 7272 Morgan Road; | Raymour & Flanigan Campus | Cut-off Date LTV: | | 58.4% |
| 4545 & 4563 Morgan Place | | UW NCF DSCR: | | 3.03x |
| Liverpool, NY 13090 | | UW NOI Debt Yield: | | 9.7% |
Raymours Furniture Company, Inc. has been a tenant at the Raymour & Flanigan Campus Property for over 20 years and, in September 2021, signed a new 15-year NNN lease at a fixed annual rent of $9.50 PSF and no termination or contraction options.
The following table presents certain information relating to the sole tenant at the Raymour & Flanigan Campus Property:
| Tenant Summary(1) |
| Tenant Name | Credit Rating (Fitch/ Moody’s/ S&P) | Tenant SF | Approx. % of SF | Annual UW Rent | % of Total Annual
UW Rent | Annual UW Rent PSF | | |
Lease Exp. | Renewal
Options | Term. Options |
| Raymours Furniture Company, Inc. | NR/NR/NR | 952,214 | 100.0% | $9,048,156 | 100.0% | $9.50 | 9/8/2036 | N | N |
| | | | | | | | | | | |
| (1) | Information is based on the underwritten rent roll. |
The following table presents certain information relating to the lease rollover schedule at the Raymour & Flanigan Campus Property:
| Lease Rollover Schedule(1) |
| Year | # of
Leases
Rolling | SF Rolling | UW Rent PSF Rolling | Approx. % of
Total SF Rolling | Approx.
Cumulative % of
SF Rolling | Total UW Rent
Rolling | Approx. %
of Total
Rent Rolling | Approx.
Cumulative % of Total Rent Rolling |
| 2021 | 0 | 0 | $0.00 | 0.0% | 0.0% | $0 | 0.0% | 0.0% |
| 2022 | 0 | 0 | $0.00 | 0.0% | 0.0% | $0 | 0.0% | 0.0% |
| 2023 | 0 | 0 | $0.00 | 0.0% | 0.0% | $0 | 0.0% | 0.0% |
| 2024 | 0 | 0 | $0.00 | 0.0% | 0.0% | $0 | 0.0% | 0.0% |
| 2025 | 0 | 0 | $0.00 | 0.0% | 0.0% | $0 | 0.0% | 0.0% |
| 2026 | 0 | 0 | $0.00 | 0.0% | 0.0% | $0 | 0.0% | 0.0% |
| 2027 | 0 | 0 | $0.00 | 0.0% | 0.0% | $0 | 0.0% | 0.0% |
| 2028 | 0 | 0 | $0.00 | 0.0% | 0.0% | $0 | 0.0% | 0.0% |
| 2029 | 0 | 0 | $0.00 | 0.0% | 0.0% | $0 | 0.0% | 0.0% |
| 2030 | 0 | 0 | $0.00 | 0.0% | 0.0% | $0 | 0.0% | 0.0% |
| 2031 | 0 | 0 | $0.00 | 0.0% | 0.0% | $0 | 0.0% | 0.0% |
| 2032 & Beyond | 1 | 952,214 | $9.50 | 100.0% | 100.0% | $9,048,156 | 100.0% | 100.0% |
| Vacant | 0 | 0 | $0.00 | 0.0% | 100.0% | $0 | 0.0% | 100.0% |
| Total/Wtd. Avg. | 1 | 952,214 | $9.50 | 100.0% | | $9,048,156 | 100.0% | |
| (1) | Information is based on the underwritten rent roll. |
COVID-19 Update. The first debt service payment on the Raymour & Flanigan Campus Whole Loan is due in November 2021 and, as of September 15, 2021, the Raymour & Flanigan Campus Whole Loan is not subject to any forbearance, modification or debt service relief request. As of August 30, 2021, the single tenant, Raymours Furniture Company, Inc., was open and operating, has remained current on all rent and lease obligations, and has not requested any lease modification or rent relief.
The Market. The Raymour & Flanigan Campus Property is located within the Northeast Outer Onondaga County industrial submarket of the Syracuse industrial market. According to the appraisal, as of the second quarter of 2021, the Northeast Outer Onondaga County industrial submarket contained approximately 10.0 million SF of industrial space, with an additional 3.8 million SF under construction. This 3.8 million SF is an Amazon Fulfillment Center expected to be completed in the fall of 2021. The vacancy rate in the Northeast Outer Onondaga County industrial submarket was 1.9% as of the second quarter of 2021, and the average asking rent was $5.57 PSF.
According to the appraisal, the estimated 2021 population within a one, three and five-mile radius of the Raymour & Flanigan Campus Property was 6,447, 54,884 and 137,475, respectively, and the estimated 2021 average household income within the same radii was $65,227, $78,628 and $75,505, respectively.
This is not a research report and was not prepared by any Underwriter’s research department. Please see additional important information and qualifications at the end of this Term Sheet. |
T-132
| Industrial – Warehouse Distribution | Loan # 12 | Cut-off Date Balance: | | $30,000,000 |
| 7230, 7248 & 7272 Morgan Road; | Raymour & Flanigan Campus | Cut-off Date LTV: | | 58.4% |
| 4545 & 4563 Morgan Place | | UW NCF DSCR: | | 3.03x |
| Liverpool, NY 13090 | | UW NOI Debt Yield: | | 9.7% |
The following table presents recent leasing data at comparable properties with respect to the Raymour & Flanigan Campus Property:
| Comparable Industrial Leases |
Property Address | Year Built | Total NRA (SF) | Distance from Subject (miles) | Tenant | Lease Date/ Term (yrs) | Lease Size (SF) | Base Rent PSF | Escalations |
Raymour & Flanigan Campus
7230, 7248, 7272 Morgan Road;
4545 & 4563 Morgan Place Liverpool, NY 13090 | 1970 | 952,214(1) | - | Raymours Furniture Company, Inc. | Sep-21 / 15.0(1) | 952,214(1) | $9.50(1) | Flat |
400 Oritani Drive Blauvelt, NY | 2008 | 98,451 | 243 | Amazon | Apr-20 / 10.0 | 70,000 | $10.15 | 3.0% Annual |
6017 Tarbel Road Syracuse, NY | 1960 | 15,050 | 9.9 | Thresh Enterprises | Mar-20 / 5.0 | 15,050 | $5.95 | 3.0% Annual |
6600 New Venture Drive Syracuse, NY | 1988 | 88,540 | 11.3 | Empire Telecom | Dec-19 / 5.0 | 88,540 | $5.36 | 3.0% Annual |
5928 Court Street Road Syracuse, NY | 1975 | 30,000 | 9.8 | Parksite Inc | Feb-19 / 3.0 | 30,000 | $4.50 | 3.0% Annual |
147 Falso Drive Syracuse, NY | 1960 | 13,600 | 9.1 | Tomra Pacific Inc. | Oct-17 / 10.0 | 13,600 | $4.85 | 3.0% Annual |
13 Jensen Drive Somerset, NJ | 2007 | 366,896 | 241 | Turtle Hughes | Feb-21 / 10.0 | 159,170 | $8.50 | 3.0% Annual |
88 Long Hill Street East Hartford, CT | 1960 | 540,000 | 259 | Ameriport Logistics Inc. | Sep-20 / 10.0 | 165,600 | $6.35 | 3.0% Annual |
3 Enterprise Drive Newburgh, NY | 1985 | 348,673 | 205 | United Natural Foods | Aug-20 / 10.0 | 180,000 | $6.00 | 3.0% Annual |
230 Riverview Drive Perth Amboy, NJ | 2020 | 332,808 | 262 | Home Depot | Jul-20 / 10.0 | 332,808 | $8.78 | 3.0% Annual |
Source: Appraisal.
| (1) | Information obtained from the underwritten rent roll. |
The following table presents certain information relating to the appraisal’s market rent conclusions for the Raymour & Flanigan Campus Property:
| Market Rent Summary |
| Category | Market Rent (PSF) | Lease Term (Yrs) | Rental Increase Projection |
| NDC Building Space | $8.50 | 10 | 3% per annum |
| FSC Building Space | $8.50 | 10 | 3% per annum |
| LDI/CSC Building Space | $8.00 | 10 | 3% per annum |
| Transportation Building Space | $7.50 | 10 | 3% per annum |
| Recycling Building Space | $6.00 | 10 | 3% per annum |
| | | | | | | |
This is not a research report and was not prepared by any Underwriter’s research department. Please see additional important information and qualifications at the end of this Term Sheet. |
T-133
| Industrial – Warehouse Distribution | Loan # 12 | Cut-off Date Balance: | | $30,000,000 |
| 7230, 7248 & 7272 Morgan Road; | Raymour & Flanigan Campus | Cut-off Date LTV: | | 58.4% |
| 4545 & 4563 Morgan Place | | UW NCF DSCR: | | 3.03x |
| Liverpool, NY 13090 | | UW NOI Debt Yield: | | 9.7% |
Operating History and Underwritten Net Cash Flow. The following table presents certain information relating to the historical operating performance and Underwritten Net Cash Flow at the Raymour & Flanigan Campus Property:
| Cash Flow Analysis | |
| | 2018 | | 2019 | | 2020 | | 6/30/2021 TTM | | UW | | UW PSF | |
| Gross Potential Rent(1) | $4,903,048 | | $4,353,047 | | $4,473,047 | | $4,473,048 | | $9,048,156 | | $9.50 | |
| Reimbursements | $2,281,884 | | $2,562,141 | | $3,412,875 | | $2,601,350 | | $2,963,500 | | $3.11 | |
| Other Income | $0 | | $0 | | $0 | | $0 | | $0 | | $0.00 | |
| (Vacancy & Concessions) | $0 | | $0 | | $0 | | $0 | | ($600,583) | | ($0.63) | |
| Effective Gross Income | $7,184,932 | | $6,915,188 | | $7,885,922 | | $7,074,398 | | $11,411,073 | | $11.98 | |
| | | | | | | | | | | | | |
| Real Estate Taxes | $1,142,427 | | $1,222,870 | | $2,179,370 | | $1,228,260 | | $1,295,087 | | $1.36 | |
| Insurance | $262,361 | | $320,155 | | $322,525 | | $322,525 | | $351,750 | | $0.37 | |
| Other Operating Expenses | $877,096 | | $1,019,116 | | $910,980 | | $1,050,564 | | $1,316,712 | | $1.38 | |
| Total Operating Expenses | $2,281,884 | | $2,562,141 | | $3,412,875 | | $2,601,349 | | $2,963,549 | | $3.11 | |
| | | | | | | | | | | | | |
| Net Operating Income | $ 4,903,048 | | $4,353,047 | | $4,473,047 | | $4,473,049 | | $8,447,524 | | $8.87 | |
| Replacement Reserves | $0 | | $0 | | $0 | | $0 | | $161,876 | | $0.17 | |
| TI/LC | $0 | | $0 | | $0 | | $0 | | $476,108 | | $0.50 | |
| Net Cash Flow | $4,903,048 | | $4,353,047 | | $4,473,047 | | $4,473,049 | | $7,809,540 | | $8.20 | |
| | | | | | | | | | | | | |
| Occupancy % | 100.0% | | 100.0% | | 100.0% | | 100.0% | | 95.0%(2) | | | |
| NOI DSCR(3) | 1.90x | | 1.69x | | 1.73x | | 1.73x | | 3.27x | | | |
| NCF DSCR(3) | 1.90x | | 1.69x | | 1.73x | | 1.73x | | 3.03x | | | |
| NOI Debt Yield(3) | 5.6% | | 5.0% | | 5.1% | | 5.1% | | 9.7% | | | |
| NCF Debt Yield(3) | 5.6% | | 5.0% | | 5.1% | | 5.1% | | 9.0% | | | |
| (1) | UW Gross Potential Rent is based on base rent in place per lease of $9.50 PSF, which is fixed with no rent bumps. The increase in UW Gross Potential Rent from historical periods is attributable to the single tenant, Raymours Furniture Company, Inc., executing a new 15-year NNN lease in September 2021. |
| (2) | Represents economic occupancy. The Raymour & Flanigan Campus Property is currently 100.0% occupied. |
| (3) | Debt service coverage ratios and debt yields are based on the Raymour & Flanigan Campus Whole Loan. |
This is not a research report and was not prepared by any Underwriter’s research department. Please see additional important information and qualifications at the end of this Term Sheet. |
T-134
(THIS PAGE INTENTIONALLY LEFT BLANK)
This is not a research report and was not prepared by any Underwriter’s research department. Please see additional important information and qualifications at the end of this Term Sheet. |
T-135
| Mortgage Loan No. 13 – Norwalk Town Square |
| Mortgage Loan Information | | Property Information |
| Mortgage Loan Seller: | WFB | | Single Asset/Portfolio: | Single Asset |
| Credit Assessment (Fitch/KBRA/S&P): | NR/NR/NR | | Location: | Norwalk, CA 90650 |
| Original Balance: | $30,000,000 | | General Property Type: | Retail |
| Cut-off Date Balance: | $30,000,000 | | Detailed Property Type: | Anchored |
| % of Initial Pool Balance: | 2.4% | | Title Vesting: | Fee |
| Loan Purpose: | Refinance | | Year Built/Renovated: | 1953/1990 |
| Borrower Sponsors: | Hamid Hekmatravan and Javid Levian | | Size: | 232,987 SF |
| Guarantors: | Hamid Hekmatravan, Hekmat Hekmatravan, Javid Levian, Jamshid Levian, Manoochehr Levian, and Shokrollah Levian | | Cut-off Date Balance PSF: | $129 |
| Mortgage Rate: | 3.3130% | | Maturity Date Balance PSF: | $129 |
| Note Date: | 6/29/2021 | | Property Manager: | Newmark Merrill Companies, Inc. |
| First Payment Date: | 8/11/2021 | | | |
| Maturity Date: | 7/11/2031 | | | |
| Original Term to Maturity: | 120 months | | |
| Original Amortization Term: | 0 months | | |
| IO Period: | 120 months | | |
| Seasoning: | 3 months | | Underwriting and Financial Information(6) |
| Prepayment Provisions: | L(27),YM1(89),O(4) | | UW NOI(7): | $3,264,966 |
| Lockbox/Cash Mgmt Status: | Springing/Springing | | UW NOI Debt Yield: | 10.9% |
| Additional Debt Type: | No | | UW NOI Debt Yield at Maturity: | 10.9% |
| Additional Debt Balance: | NAP | | UW NCF DSCR: | 3.04x |
| Future Debt Permitted (Type): | No (NAP) | | Most Recent NOI(7): | $2,653,704 (TTM 4/30/2021) |
| Reserves | | 2nd Most Recent NOI: | $2,727,291 (12/31/2020) |
| Type | Initial | Monthly | Cap | | 3rd Most Recent NOI: | $2,837,452 (12/31/2019) |
| RE Taxes(1) | $0 | Springing | NAP | | Most Recent Occupancy: | 83.8% (7/1/2021) |
| Insurance(2) | $0 | Springing | NAP | | 2nd Most Recent Occupancy(8): | 90.8% (12/31/2020) |
| Replacement Reserves | $0 | $5,236 | $125,664 | | 3rd Most Recent Occupancy(8): | 91.8% (12/31/2019) |
| Leasing Reserve | $500,000 | $19,416 | $700,000 | | Appraised Value (as of): | $52,700,000 (5/25/2021) |
| Rent Concession Reserve Funds(3) | $32,698 | $0 | NAP | | Appraised Value PSF: | $226 |
| Existing TI/LC Reserve(4) | $297,050 | $0 | NAP | | Cut-off Date LTV Ratio: | 56.9% |
| Regency Theater Holdback Reserve(5) | $2,000,000 | $0 | NAP | | Maturity Date LTV Ratio: | 56.9% |
| | | | | | | | | |
| Sources and Uses |
| Sources | Proceeds | % of Total | | Uses | Proceeds | % of Total |
| Loan Amount: | $30,000,000 | 100.0% | | Loan Payoff: | $22,982,570 | 76.6% |
| | | | | Upfront Reserves: | $2,829,748 | 9.4% |
| | | | | Closing Costs: | $418,441 | 1.4% |
| | | | | Return of Equity: | $3,769,241 | 12.6% |
| Total Sources: | $30,000,000 | 100.0% | | Total Uses: | $30,000,000 | 100.0% |
| (1) | The Norwalk Town Square Mortgage Loan (as defined below) documents do not require ongoing monthly tax deposits as long as (i) no event of default is continuing, (ii) no Cash Trap Event Period shall have occurred and is continuing, and (iii) the borrower provides evidence of payment. A “Cash Trap Event Period” will commence upon the occurrence of (a) an event of default, or (b) the net cash flow debt yield falling below 7.25%, tested quarterly. The borrower may avoid a cash trap triggered by the debt yield by providing to the lender the Low DY Trigger Event Collateral. “Low DY Trigger Event Collateral” means cash or letter of credit in an amount that, if applied to the principal balance, would result in Debt Yield equaling 7.25%, together with the payment of the applicable yield maintenance-based prepayment premium. |
| (2) | The Norwalk Town Square Mortgage Loan documents do not require ongoing monthly escrows for insurance premiums as long as (i) no event of default is continuing, (ii) the Norwalk Town Square Property (as defined below) is covered under a blanket policy acceptable to the lender, and (iii) the borrower provides proof of renewal and receipts for the payment of insurance premiums no later than 10 business days prior to policy expiration. |
| (3) | The Norwalk Town Square Mortgage Loan documents require an upfront deposit for outstanding free rent of $16,008 for AT&T and $16,690 for JK ProRehab. |
| (4) | The Norwalk Town Square Mortgage Loan documents require an upfront deposit for outstanding tenant improvement costs of $75,000 for Blazin Claw, $200,000 for LA Care, and $22,050 for AT&T. |
| (5) | The Regency Theater Holdback will be released, net of any outstanding leasing costs in connection with the event, upon satisfaction of the following conditions, (a) no event of default is continuing, (b) the tenant, or a replacement tenant satisfactory to the landlord, has renewed its lease for a minimum term of 5 years at a rental rate equal or greater to 75% of the then current rent, and (c) the tenant is open and paying full rent. If the funds have not been fully released by the monthly payment date occurring in July 2023, the lender will apply the remaining funds to the prepayment of the Norwalk Town Square Mortgage Loan and the borrower will be responsible for any applicable yield maintenance premium. |
| (6) | The novel coronavirus pandemic is an evolving situation and could impact the Norwalk Town Square Mortgage Loan more severely than assumed in the underwriting of the Norwalk Town Square Mortgage Loan and could adversely affect the NOI, NCF and occupancy information, as well as the appraised value and the DSCR, LTV and Debt Yield metrics presented above and herein. See “Risk Factors-—Risks Related to Market Conditions and Other External Factors—The Coronavirus Pandemic Has Adversely Affected the Global Economy and Will Likely Adversely Affect the Performance of the Mortgage Loans” in the prospectus. |
| (7) | The increase in Net Operating Income between most recent NOI and the UW NOI is primarily due to four new leases beginning after May 1, 2021, representing 8.4% of the NRA and 9.6% of underwritten rent. |
| (8) | Information obtained from a third party market research report. |
This is not a research report and was not prepared by any Underwriter’s research department. Please see additional important information and qualifications at the end of this Term Sheet. |
T-136
| Retail – Anchored | Loan #13 | Cut-off Date Balance: | | $30,000,000 |
| 11633 The Plaza | Norwalk Town Square | Cut-off Date LTV: | | 56.9% |
| Norwalk, CA 90650 | | UW NCF DSCR: | | 3.04x |
| | | UW NOI Debt Yield: | | 10.9% |
The Mortgage Loan. The thirteenth largest mortgage loan (the “Norwalk Town Square Mortgage Loan”) is evidenced by a promissory note in the original principal amount of $30,000,000 and secured by the fee interest in an anchored retail property located in Norwalk, California (the “Norwalk Town Square Property”). The Norwalk Town Square Mortgage Loan is refinancing a loan previously included in the WFRBS 2012-C6 securitization transaction.
The Borrowers and the Borrower Sponsors. The borrowing entity consists of two tenants-in-common, the Levian Family Norwalk SPE, LLC and the Hekmatravan Family Norwalk SPE, LLC (collectively, the “Norwalk Town Square Borrower”), both Delaware limited liability companies and single purpose entities with one independent director each. The borrower sponsors and non-recourse guarantors are Hamid Hekmatravan, Hekmat Hekmatravan, Javid Levian, Jamshid Levian, Manoochehr Levian, and Shokrollah Levian.
The Property. The Norwalk Town Square Property is an anchored retail center totaling 232,987 SF located in Norwalk, California. Built in 1953 and renovated in 1990, the property is situated on a 14.65-acre parcel and includes 1,000 parking spaces for a parking ratio of 3.41 per 1,000 SF. The Norwalk Town Square Property has primary frontage along Rosecrans Avenue and Pioneer Boulevard. The collateral improvements comprise 10, one-story buildings with a loft management office. Major tenants include Regency Theatres, Ross Dress for Less (dba DD’s Discounts), 99¢ Only Stores, Auto Zone and Grocery Outlet Bargain Market. 20 tenants totaling 44.7% of the net rentable area and 51.1% of underwritten base rent have been in occupancy for at least 10 years. As of July 1, 2021, the Norwalk Town square Property was 83.8% occupied by 42 tenants.
The Norwalk Town Square Mortgage Loan documents provide for the partial release of a designated improved portion of the Norwalk Town Square Property that includes the Regency Theatres parcel, in connection with a sale to a person other than the Norwalk Town Square Borrower, at a release price determined in the lender’s sole and absolute discretion based upon the lender’s then-current underwriting for similar loans, among other requirements. See “Description of the Mortgage Pool – Certain Terms of the Mortgage Loans – Releases; Partial Releases; Property Additions” in the prospectus.
Major Tenants.
Regency Theatres (26,751 SF; 11.5% of NRA; 8.4% of underwritten base rent). Founded more than 25 years ago, Regency Theatres operates 28 theaters in Southern California, Nevada, Arizona, and Hawaii. The Norwalk Town Square Property location has eight screens, with 2019 sales of approximately $328,204 per screen for an approximately occupancy cost of 11.6%. Regency Theatres has been a tenant since 2012, has a lease expiration in January 2022 and has no remaining renewal options. Due to the COVID-19 pandemic, the tenant was closed from April 2020 through July 9, 2021. 50% of base rent was deferred during that time, and the tenant resumed paying full rent as of July 2021.
Ross Dress for Less (dba DD’s Discounts) (20,911 SF; 9.0% of NRA; 8.1% of underwritten base rent). DD’s Discounts is a subsidiary of Ross Dress for Less and opened its first store in 2008. DD’s Discounts operates 15 stores in California, primarily in southern California. DD’s Discounts has been a tenant at the Norwalk Town Square Property since 2004, renewed in February 2019, and has a lease expiring in January 2024, with 3, 5-year renewal options remaining. The tenant is not required to report sales. Due to the COVID-19 pandemic, the tenant received 50% base rent deferral from May to October 2020 and repaid the deferral from February to July 2021.
99¢ Only Stores (17,000 SF; 7.3% of NRA; 6.3% of underwritten base rent). Founded in 1982, 99¢ Only Stores has more than 350 stores in four states and two distribution centers in California and Texas. The stores carry an assortment of everyday household items from fresh produce to party merchandise and other basic grocery items. The tenant has been located at the Norwalk Town square Property since 1991, with the most recent renewal in 2017, a lease expiration date of January 2032, and 2, 5-year renewal options remaining.
The following table presents certain information relating to the tenancy at the Norwalk Town Square Property:
| Tenant Summary |
| Tenant Name | Credit Rating (Fitch/Moody’s/ S&P)(1) | Tenant SF | Approx.
% of SF | Annual UW
Rent(2) | % of Total Annual UW Rent | Annual UW Rent PSF(2) | | Renewal
Options |
Termination
Option (Y/N) | Lease
Expiration |
| Anchor Tenant | | | | | | | | | |
| Regency Theatres | NR/NR/NR | 26,751 | 11.5% | $315,504 | 8.4% | $11.79 | N | 1/31/2022 | N |
| Total/Wtd. Avg. | | 26,751 | 11.5% | $315,504 | 8.4% | $11.79 | | | |
| | | | | | | | | | |
| Major Tenants | | | | | | | | | |
| Ross Dress for Less (dba DD’s Discounts)(3) | NR/A2/BBB+ | 20,911 | 9.0% | $303,210 | 8.1% | $14.50 | N | 1/31/2024 | 3 x 5 yr |
| 99¢ Only Stores | NR/NR/NR | 17,000 | 7.3% | $234,600 | 6.3% | $13.80 | N | 1/31/2032 | 2 x 5 yr |
| Auto Zone | BBB/Baa1/BBB | 16,288 | 7.0% | $214,127 | 5.7% | $13.15 | N | 5/31/2027 | 1 x 5 yr |
| Grocery Outlet Bargain Market | NR/NR/NR | 16,250 | 7.0% | $241,475 | 6.5% | $14.86 | N | 11/30/2029 | N |
| Dollar Tree | NR/Baa2/BBB | 11,147 | 4.8% | $167,205 | 4.5% | $15.00 | N | 8/31/2026 | N |
| Total/Wtd. Avg. | | 81,596 | 35.0% | $1,160,617 | 31.0% | $14.22 | | | |
| | | | | | | | | | |
| Non-Major Tenants(4) | | 86,984 | 37.3% | $2,266,260 | 60.6% | $26.05 | | | |
| Occupied Collateral Total | | 195,331 | 83.8% | $3,742,381 | 100.0% | $19.16 | | | |
| Vacant Space | | 37,656 | 16.2% | | | | | | |
| Total/Wtd. Avg. | | 232,987 | 100.0% | | | | | | |
| (1) | Certain ratings are those of the parent company whether or not the parent guarantees the lease. |
| (2) | Annual UW Rent and Annual UW Rent PSF include contractual rent steps through July 2022 totaling $50,144 and straight-lined average rent for Auto Zone and Bank of America totaling $18,419. |
| (3) | Tenant began paying co-tenancy rent (2% of gross sales plus reimbursements) in July 2021 due to a dispute over the co-tenancy language in the related lease. The co-tenancy will no longer be in effect when Norwalk Buffet and LA CARE open in September 2021. |
| (4) | Non-Major Tenants includes Norwalk Buffet (3.8% of NRA) and South Bay Staffing Inc. (0.3% of NRA), each of which remain closed as a result of COVID-19. Additionally, Non-Major Tenants includes JK ProRehab (2.0% of NRA), LA CARE (4.3% of NRA), Blazin Claw (1.2% of NRA) and AT&T (0.9% of NRA) each of which are new tenants with expected opening dates in Fall 2021.
|
This is not a research report and was not prepared by any Underwriter’s research department. Please see additional important information and qualifications at the end of this Term Sheet. |
T-137
| Retail – Anchored | Loan #13 | Cut-off Date Balance: | | $30,000,000 |
| 11633 The Plaza | Norwalk Town Square | Cut-off Date LTV: | | 56.9% |
| Norwalk, CA 90650 | | UW NCF DSCR: | | 3.04x |
| | | UW NOI Debt Yield: | | 10.9% |
The following table presents certain information relating to the lease rollover schedule at the Norwalk Town Square Property:
| Lease Rollover Schedule(1)(2) |
| Year | # of Leases
Rolling | SF Rolling | UW Rent PSF
Rolling | Approx. % of
Total SF
Rolling | Approx.
Cumulative %
of SF Rolling | Total UW Rent
Rolling | Approx. % of
Total Rent
Rolling | Approx. Cumulative %
of Total
Rent
Rolling |
| 2021 | 4 | 5,900 | $30.90 | 2.5% | 2.5% | $182,299 | 4.9% | 4.9% |
| 2022 | 12 | 43,951 | $19.01 | 18.9% | 21.4% | $835,489 | 22.3% | 27.2% |
| 2023 | 5 | 21,373 | $22.63 | 9.2% | 30.6% | $483,746 | 12.9% | 40.1% |
| 2024 | 2 | 22,431 | $16.73 | 9.6% | 40.2% | $375,218 | 10.0% | 50.1% |
| 2025 | 3 | 7,495 | $33.91 | 3.2% | 43.4% | $254,174 | 6.8% | 56.9% |
| 2026 | 5 | 20,048 | $16.57 | 8.6% | 52.0% | $332,121 | 8.9% | 65.8% |
| 2027 | 2 | 17,328 | $15.78 | 7.4% | 59.5% | $273,449 | 7.3% | 73.1% |
| 2028 | 0 | 0 | $0.00 | 0.0% | 59.5% | $0 | 0.0% | 73.1% |
| 2029 | 2 | 18,000 | $18.44 | 7.7% | 67.2% | $331,934 | 8.9% | 82.0% |
| 2030 | 1 | 9,000 | $20.04 | 3.9% | 71.0% | $180,384 | 4.8% | 86.8% |
| 2031 | 2 | 12,805 | $20.22 | 5.5% | 76.5% | $258,967 | 6.9% | 93.7% |
| 2032 & Beyond | 1 | 17,000 | $13.80 | 7.3% | 83.8% | $234,600 | 6.3% | 100.0% |
| Vacant | 3 | 37,656 | $0.00 | 16.2% | 100.0% | $0 | 0.0% | 100.0% |
| Total/Wtd. Avg. | 42 | 232,987 | $19.16(3) | 100.0% | | $3,742,381 | 100.0% | |
| (1) | Information is based on the underwritten rent roll. |
| (2) | Certain tenants may have lease termination options that are exercisable prior to the originally stated expiration date of the related lease and are not considered in the rollover schedule. |
| (3) | Wtd. Avg. UW Rent PSF Rolling excludes vacant space. |
COVID-19 Update. As of September 1, 2021, the loan is current and is not subject to any forbearance, modification or debt service relief request. As of September 1, 2021, the borrower sponsor reported that all tenants were open and operating, with the exception of Norwalk Buffet (3.8% of NRA and 4.8% underwritten base rent) and South Bay Staffing Inc. (0.3% of NRA and 0.3% underwritten base rent), both of which are current on rent. In addition, four tenants with new leases have not yet opened, including JK ProRehab (2.0% of NRA), LA CARE (4.3% of NRA), Blazin Claw (1.2% of NRA), and AT&T (0.9% of NRA) with expected opening dates of November 2021, September 2021, September 2021, and Fall 2021, respectively. Tenants representing approximately 86.9% of the occupied NRA and 89.0% of underwritten rent made their full rent payment for July and August 2021. Tenants totaling 5.9% of NRA and 7.3% of underwritten base rent have ongoing lease modifications or existing rent relief.
The Market. The Norwalk Town Square Property is located within the northern portion of the City of Norwalk, California. The Norwalk Town Square Property is located approximately 15.8 miles southeast of the Los Angeles central business district and has access to major freeways including IH-5 and IH-605, which are located 1.1 and 2.1 miles from the Norwalk Town Square Property, respectively. According to the appraisal, the surrounding neighborhood is predominately residential with single-family homes as the dominate use. The Norwalk Town Square Property is the largest retail use in the neighborhood. According to a third-party market research report, within a two, five- and ten-mile radius of the Norwalk Town Square Property, the 2021 average household income was approximately $89,358, $97,566, and $92,552, respectively; and within the same radii, the 2021 estimated population was 121,333, 640,552, and 2,484,386, respectively.
According to a third-party market research report, the property is situated within the Mid-Cities submarket of the Los Angeles retail market. As of first quarter 2021, the submarket reported total inventory of approximately 49.9 million SF, with a 5.2% vacancy rate and average asking rent of $25.44 PSF.
The following table presents certain information relating to the appraisal’s market rent conclusion for the Norwalk Town Square Property:
| Market Rent Summary |
| | Theater
Anchor | Junior
Anchor | 11730A
(former LA Fitness) | Large Shop | Shop 5,000-
8,999 SF | Shop 2,000-
4,999 SF | Shop <
2,000 SF | Pad Space | Back
Space |
| Market Rent (PSF) | $15.00 | $15.00 | $4.94 | $19.80 | $24.00 | $33.00 | $42.00 | $49.20 | $21.00 |
| Lease Term (Years) | 10 | 10 | 5 | 5 | 5 | 5 | 5 | 5 | 5 |
| Lease Type (Reimbursements) | NNN | NNN | NNN | NNN | NNN | NNN | NNN | NNN | NNN |
| Rent Increase Projection | 10% every 5 years | 10% every 5 years | 3.0%/year | 3.0%/year | 3.0%/year | 3.0%/year | 3.0%/year | 3.0%/year | 3.0%/year |
This is not a research report and was not prepared by any Underwriter’s research department. Please see additional important information and qualifications at the end of this Term Sheet. |
T-138
| Retail – Anchored | Loan #13 | Cut-off Date Balance: | | $30,000,000 |
| 11633 The Plaza | Norwalk Town Square | Cut-off Date LTV: | | 56.9% |
| Norwalk, CA 90650 | | UW NCF DSCR: | | 3.04x |
| | | UW NOI Debt Yield: | | 10.9% |
The table below presents certain information relating to comparable sales pertaining to the Norwalk Town Square Property identified by the appraiser:
| Comparable Sales |
Property Name | Location | Rentable Area (SF) | Occupancy | Sale Date | Sale Price (PSF) |
| Chatsworth Plaza | 21405 Devonshire Street Chatsworth, CA | 67,841 | 97.0% | Dec-20 | $236.60 |
| Park Plaza on Maine | 14503 Ramona Boulevard Baldwin Park, CA | 94,093 | 98.0% | Mar-20 | $320.96 |
| Eastland Center | 2831 East Eastland Center Drive West Covina, CA | 811,437 | 93.0% | Dec-19 | $227.68 |
| Towne Center East | 2510-2550 Cherry Avenue Signal Hill, CA | 154,950 | 100.0% | Sep-19 | $393.68 |
| Monrovia Landing | 723-737 East Huntington Drive Monrovia, CA | 96,885 | 100.0% | Aug-19 | $314.81 |
Operating History and Underwritten Net Cash Flow. The following table presents certain information relating to the historical operating performance and Underwritten Net Cash Flow at the Norwalk Town Square Property:
| Cash Flow Analysis |
| | 2018 | 2019 | 2020 | TTM 4/30/2021 | UW | UW PSF |
| Base Rent(1)(2) | $3,670,253 | $3,342,935 | $3,068,452 | $3,135,006 | $3,742,374 | $16.06 |
| Grossed Up Vacant Space | $0 | $0 | $0 | $0 | $330,643 | $1.42 |
| Gross Potential Rent | $3,670,253 | $3,342,935 | $3,068,452 | $3,135,006 | $4,073,017 | $17.48 |
| Percentage Rent | $54,998 | $60,246 | $52,767 | $0 | $328 | $0.00 |
| Other Income(3) | $172,310 | $184,232 | $180,148 | $185,807 | $187,642 | $0.81 |
| Total Recoveries | $1,318,886 | $1,219,310 | $1,200,818 | $1,173,591 | $1,199,878 | $5.15 |
| Net Rental Income | $5,216,447 | $4,806,723 | $4,502,185 | $4,494,404 | $5,460,865 | $23.44 |
| (Vacancy & Credit Loss) | $0 | $0 | $0 | $0 | ($330,643) | ($1.42) |
| Effective Gross Income | $5,216,447 | $4,806,723 | $4,502,185 | $4,494,404 | $5,130,222 | $22.02 |
| | | | | | | |
| Real Estate Taxes | $492,140 | $536,459 | $560,081 | $562,007 | $562,006 | $2.41 |
| Insurance | $36,679 | $40,242 | $53,476 | $50,936 | $50,936 | $0.22 |
| Management Fee(4) | $225,516 | $216,341 | $165,147 | $167,826 | $192,383 | $0.83 |
| Other Operating Expenses | $1,086,297 | $1,176,230 | $996,190 | $1,059,931 | $1,059,932 | $4.55 |
| Total Operating Expenses | $1,840,632 | $1,969,272 | $1,774,894 | $1,840,700 | $1,865,257 | $8.01 |
| | | | | | | |
| Net Operating Income(5) | $3,375,815 | $2,837,452 | $2,727,291 | $2,653,704(6) | $3,264,966(6) | $14.01 |
| Replacement Reserves | $0 | $0 | $0 | $0 | $62,833 | $0.27 |
| TI/LC | $0 | $0 | $0 | $0 | $191,107 | $0.82 |
| Non-Recurring Items | $0 | $0 | $0 | $0 | ($50,000) | ($0.21) |
| Net Cash Flow | $3,375,815 | $2,837,452 | $2,727,291 | $2,653,704 | $3,061,026 | $13.14 |
| | | | | | | |
| Occupancy % | 93.5% | 91.8% | 90.8% | 83.8%(6) | 91.9%(7) | |
| NOI DSCR | 3.35x | 2.82x | 2.71x | 2.63x | 3.24x | |
| NCF DSCR | 3.35x | 2.82x | 2.71x | 2.63x | 3.04x | |
| NOI Debt Yield | 11.3% | 9.5% | 9.1% | 8.8% | 10.9% | |
| NCF Debt Yield | 11.3% | 9.5% | 9.1% | 8.8% | 10.2% | |
| (1) | UW Base Rent includes contractual rent steps through July 2022 totaling $50,144 and straight-lined average rent through remaining lease terms for Auto Zone and Bank of America totaling $18,419. |
| (2) | The UW Base Rent includes Norwalk Buffet (3.8% of NRA) and South Bay Staffing Inc. (0.3% of NRA), which remain closed as a result of COVID. Additionally, UW Base Rent includes JK ProRehab (2.0% of NRA), LA CARE (4.3% of NRA), Blazin Claw (1.2% of NRA), and AT&T (0.9% of NRA), each of which are new tenants with expected opening dates in Fall 2021. |
| (3) | Other Income primarily includes sign pole rent and antenna income. |
| (4) | The Management Fee is underwritten to the contractual fee of 3.75%. |
| (5) | The increase in Net Operating Income between TTM 4/30/2021 and UW is primarily due to 4 new leases beginning after May 1, 2021, representing 8.4% of the NRA and 9.6% of underwritten rent. |
| (6) | Occupancy % as of July 1, 2021. |
| (7) | The underwritten vacancy is 8.1%, which is reflective of the actual economic vacancy. The Norwalk Town Square Property was 83.8% physically occupied as of July 1, 2021. |
This is not a research report and was not prepared by any Underwriter’s research department. Please see additional important information and qualifications at the end of this Term Sheet. |
T-139
| Mortgage Loan No. 14 – Tomball Town Center |
| Mortgage Loan Information | | Property Information |
| Mortgage Loan Seller: | MSMCH | | Single Asset/Portfolio: | Single Asset |
| Credit Assessment (Fitch/KBRA/S&P): | NR/NR/NR | | Location: | Tomball, TX 77377 |
| Original Balance: | $26,100,000 | | General Property Type: | Retail |
| Cut-off Date Balance: | $26,100,000 | | Detailed Property Type: | Anchored |
| % of Initial Pool Balance: | 2.0% | | Title Vesting: | Fee |
| Loan Purpose: | Acquisition | | Year Built/Renovated: | 2004/NAP |
| Borrower Sponsors: | Steven Jeffrey Beard, David Kayle and | | Size: | 141,450 SF |
| | Zachary Kayle | | Cut-off Date Balance Per SF: | $185 |
| Guarantors: | Steven Jeffrey Beard, David Kayle and | | Maturity Date Balance Per SF: | $185 |
| | Zachary Kayle | | Property Manager: | The J. Beard Property |
| Mortgage Rate: | 3.4500% | | �� | Management Company, LLC |
| Note Date: | 7/20/2021 | | | (borrower-related) |
| First Payment Date: | 9/1/2021 | | | |
| Maturity Date: | 8/1/2031 | | | |
| Original Term to Maturity: | 120 months | | | |
| Original Amortization Term: | 0 months | | Underwriting and Financial Information(3) |
| IO Period: | 120 months | | UW NOI: | $2,334,758 |
| Seasoning: | 2 months | | UW NOI Debt Yield: | 8.9% |
| Prepayment Provisions: | L(23),YM1(92),O(5) | | UW NOI Debt Yield at Maturity: | 8.9% |
| Lockbox/Cash Mgmt Status: | Springing/Springing | | UW NCF DSCR: | 2.41x |
| Additional Debt Type: | No | | Most Recent NOI: | $2,275,120 (5/31/2021 TTM) |
| Additional Debt Balance: | NAP | | 2nd Most Recent NOI: | $2,284,215 (12/31/2020) |
| Future Debt Permitted (Type)(1): | Yes (Mezzanine) | | 3rd Most Recent NOI: | $1,780,014 (12/31/2019) |
| Reserves(2) | | Most Recent Occupancy: | 97.5% (6/30/2021) |
| Type | Initial | Monthly | Cap | | 2nd Most Recent Occupancy: | 97.9% (12/31/2020) |
| RE Tax: | $350,736 | $43,842 | NAP | | 3rd Most Recent Occupancy: | 97.8% (12/31/2019) |
| Insurance: | $11,045 | $5,522 | NAP | | Appraised Value (as of): | $41,630,000 (6/5/2021) |
| Recurring Replacements: | $50,000 | Springing | $50,000 | | Appraised Value Per SF: | $294 |
| TI/LC: | $300,000 | Springing | $300,000 | | Cut-off Date LTV Ratio: | 62.7% |
| Outstanding TI/LC Reserve: | $172,273 | $0 | NAP | | Maturity Date LTV Ratio: | 62.7% |
| | | | | | | | |
| Sources and Uses |
| Sources | Proceeds | % of Total | | Uses | Proceeds | % of Total |
| Loan Amount: | $26,100,000 | 62.6% | | Purchase Price(4): | $40,105,000 | 96.2% |
| Borrower Equity: | $15,599,510 | 37.4% | | Reserves: | $884,053 | 2.1% |
| | | | | Closing Costs: | $710,457 | 1.7% |
| Total Sources: | $41,699,510 | 100.0% | | Total Uses: | $41,699,510 | 100.0% |
| (1) | The sole member of the borrower or a newly formed single-purpose, bankruptcy-remote entity formed to be the sole member of the borrower is permitted to incur future mezzanine debt secured by a pledge of equity interests in the borrower (a “Tomball Town Center Permitted Future Mezzanine Loan”); provided that, among other conditions: (i) no event of default is continuing; (ii) the aggregate loan-to-value ratio of the Tomball Town Center Mortgage Loan (as defined below) and Tomball Town Center Permitted Future Mezzanine Loan (collectively, the “Tomball Town Center Total Debt”) is less than or equal to 62.7%; (iii) the aggregate debt yield of the Tomball Town Center Total Debt is at least 8.42%; (iv) the aggregate debt service coverage ratio of the Tomball Town Center Total Debt (assuming 30 year amortization on the Tomball Town Center Mortgage Loan) is at least 1.57x; (v) the terms of the Tomball Town Center Permitted Future Mezzanine Loan would be acceptable to a prudent commercial mortgage lender; (vi) an intercreditor agreement is executed that would be acceptable to a prudent commercial mortgage lender and is acceptable to the rating agencies rating the Certificates; and (vii) if requested by the lender, a rating agency confirmation is delivered by each rating agency rating the Certificates. |
| (2) | If recurring replacements fall below $50,000, borrower will deposit $1,768 until the cap is met. If TI/LC fall below $300,000, borrower will deposit $11,788 a month until the cap is met. |
| (3) | The novel coronavirus pandemic is an evolving situation and could impact the Tomball Town Center Mortgage Loan more severely than assumed in the underwriting of the Tomball Town Center Mortgage Loan and could adversely affect the NOI, NCF and occupancy information, as well as the appraised value and the DSCR, LTV and Debt Yield metrics presented above and herein. See "Risk Factors-—Risks Related to Market Conditions and Other External Factors—The Coronavirus Pandemic Has Adversely Affected the Global Economy and Will Likely Adversely Affect the Performance of the Mortgage Loans" in the prospectus. |
| (4) | The purchase price represents $13,655,000 for the Kroger store and $26,450,000 for the remaining portion of the property, which were sold by two different sellers. |
The Mortgage Loan. The fourteenth largest mortgage loan (the “Tomball Town Center Mortgage Loan”) is evidenced by a promissory note in the original principal amount of $26,100,000 and secured by a first priority fee mortgage encumbering a 141,450 SF anchored retail shopping center located in Tomball, Texas (the “Tomball Town Center Property”).
The Borrower and the Borrower Sponsor. The borrower for the Tomball Town Center Mortgage Loan is SJBC Commercial XXI, LLC, a single-purpose Texas limited liability company with no independent directors in its organizational structure. The non-recourse carveout guarantors and borrower sponsors are Steven Jeffrey Beard, David Kayle and Zachary Kayle. Steven Jeffrey Beard is the founder and president of The J. Beard Real Estate Company, which is a full-service commercial real estate company in the greater Houston area. The J. Beard Real Estate Company actively markets more than 200 retail, medical office and industrial properties, and a variety of land tracts, across the Houston area. David Kayle and Zachary Kayle own Outlier Capital, LLC, a Houston-based real estate investment group.
This is not a research report and was not prepared by any Underwriter’s research department. Please see additional important information and qualifications at the end of this Term Sheet. |
T-140
| Retail – Anchored | Loan #14 | Cut-off Date Balance: | | $26,100,000 |
| 14002, 14020, 14030, 14040, 14060, | Tomball Town Center | Cut-off Date LTV: | | 62.7% |
| 14080, 14090, 14094 F.M. 2920 | | UW NCF DSCR: | | 2.41x |
| Tomball, TX 77377 | | UW NOI Debt Yield: | | 8.9% |
The Property. The Tomball Town Center Property is a 141,450 SF anchored retail shopping center on an approximately 13.49-acre site in Tomball, Texas. The Tomball Town Center Property was built in 2004 and includes six multitenant buildings, a parcel ground leased to Wells Fargo, and a Kroger Texas LP (“Kroger”) grocery building all situated on a 13.49-acre site with 633 parking spaces (4.48 per 1,000 SF). The Tomball Town Center Property is anchored by a 74,206 SF (52.5% of NRA) Kroger grocery store that has been in operation at the Tomball Town Center Property since it was constructed in 2004. Kroger signed a new 15-year lease in May 2019 that converted the tenant from a ground lease tenant to a triple net lease tenant, with a 2034 expiration. As of June 30, 2021, the Tomball Town Center Property was 97.5% leased to 26 tenants with no tenant, other than Kroger, occupying more than 3.9% of the NRA.
The following table presents a summary regarding the major tenants at the Tomball Town Center Property:
| Tenant Summary(1) |
| Tenant Name | Credit Rating (Fitch/Moody’s/ S&P)(2) | Tenant SF | Approx.% of SF | Annual UW Rent | Annual UW Rent PSF | App. % of Total Annual
UW Rent | Most Recent Sales | | | |
| $ | PSF | Occ.
Cost % | Term. Option | Renewal Options | Lease Expiration |
| Kroger Texas LP | NR/Baa1/BBB | 74,206 | 52.5% | $664,604 | $8.96 | 26.2% | NAV | NAV | NAV | N | 8 x 5 yr | 5/31/2034 |
| Wells Fargo Bank | A+/A1/BBB+ | 5,474 | 3.9% | $153,965 | $28.13 | 6.1% | NAV | NAV | NAV | N | 2 x 5 yr | 11/30/2025 |
| Berkeley Eye Center | NR/NR/NR | 5,113 | 3.6% | $104,632 | $20.46 | 4.1% | NAV | NAV | NAV | N | 2 x 5 yr | 5/31/2025 |
| Stewart Title Company | NR/NR/NR | 4,349 | 3.1% | $128,122 | $29.46 | 5.0% | NAV | NAV | NAV | N | None | 4/30/2025 |
| FastMed Urgent Care | NR/NR/NR | 3,531 | 2.5% | $85,450 | $24.20 | 3.4% | NAV | NAV | NAV | N | 2 x 5 yr | 1/31/2024 |
| Subtotal/Wtd. Avg. | | 92,673 | 65.5% | $1,136,773 | $12.27 | 44.8% | | | | | | |
| | | | | | | | | | | | | |
| Other Tenants | | 45,277 | 32.0% | $1,403,185 | $30.99 | 55.2% | | | | | | |
| Vacant Space | | 3,500 | 2.5% | $0 | $0.00 | 0.0% | | | | | | |
| Total/Wtd. Avg. | | 141,450 | 100.0% | $2,539,958 | $18.41(3) | 100.0% | | | | | | |
| (1) | Information is based on the underwritten rent roll as of June 30, 2021. |
| (2) | Certain ratings are those of the parent company whether or not the parent company guarantees the lease. |
| (3) | Total/Wtd. Avg. Annual UW Rent PSF excludes vacant space. |
The following table presents certain information relating to the lease rollover at the Tomball Town Center Property:
| Lease Rollover Schedule(1)(2) |
| Year | # of Leases Rolling | SF Rolling | Annual UW Rent PSF Rolling | Approx. % of Total SF Rolling | Approx. Cumulative % of SF Rolling | Total UW Rent Rolling | Approx. % of Total Rent Rolling | Approx. Cumulative % of Total Rent Rolling |
| 2021 | 1 | 3,500 | $38.00 | 2.5% | 2.5% | $133,000 | 5.2% | 5.2% |
| 2022 | 2 | 4,141 | $30.84 | 2.9% | 5.4% | $127,703 | 5.0% | 10.3% |
| 2023 | 3 | 4,400 | $28.49 | 3.1% | 8.5% | $125,376 | 4.9% | 15.2% |
| 2024 | 3 | 7,053 | $24.26 | 5.0% | 13.5% | $171,079 | 6.7% | 21.9% |
| 2025 | 9 | 27,730 | $28.64 | 19.6% | 33.1% | $794,267 | 31.3% | 53.2% |
| 2026 | 4 | 8,520 | $33.17 | 6.0% | 39.1% | $282,569 | 11.1% | 64.3% |
| 2027 | 2 | 5,600 | $27.72 | 4.0% | 43.1% | $155,204 | 6.1% | 70.4% |
| 2028 | 0 | 0 | $0.00 | 0.0% | 43.1% | $0 | 0.0% | 70.4% |
| 2029 | 1 | 2,800 | $30.77 | 2.0% | 45.1% | $86,156 | 3.4% | 73.8% |
| 2030 | 0 | 0 | $0.00 | 0.0% | 45.1% | $0 | 0.0% | 73.8% |
| 2031 | 0 | 0 | $0.00 | 0.0% | 45.1% | $0 | 0.0% | 73.8% |
| 2032 & Beyond | 1 | 74,206 | $8.96 | 52.5% | 97.5% | $664,604 | 26.2% | 100.0% |
| Vacant | 0 | 3,500 | $0.00 | 2.5% | 100.0% | $0 | 0.0% | 100.0% |
| Total/Wtd. Avg. | 26 | 141,450 | $18.41(3) | 100.0% | | $2,539,958 | 100.0% | |
| (1) | Information is based on the underwritten rent roll as of June 30, 2021. |
| (2) | Certain tenants may have lease termination options that are exercisable prior to the stated expiration date of the subject lease or leases which are not considered in the lease rollover schedule. |
| (3) | Total/Wtd. Avg. Annual UW Rent PSF Rolling excludes vacant space. |
COVID-19 Update. As of September 1, 2021, the Tomball Town Center Mortgage Loan is current on its debt service payments and not subject to any forbearance, modification or debt service relief request. As of September 1, 2021, the borrower has reported that the Tomball Town Center Property is open and operating, with 100.0% of tenants by occupied NRA and 100.0% of tenants by underwritten base rent having paid their full August 2021 rent payments. All tenants that were granted COVID related rent relief have paid back their rent.
This is not a research report and was not prepared by any Underwriter’s research department. Please see additional important information and qualifications at the end of this Term Sheet. |
T-141
| Retail – Anchored | Loan #14 | Cut-off Date Balance: | | $26,100,000 |
| 14002, 14020, 14030, 14040, 14060, | Tomball Town Center | Cut-off Date LTV: | | 62.7% |
| 14080, 14090, 14094 F.M. 2920 | | UW NCF DSCR: | | 2.41x |
| Tomball, TX 77377 | | UW NOI Debt Yield: | | 8.9% |
The Market. The Tomball Town Center Property is located in Tomball, Texas, in the Far Northwest submarket within the Houston market. Primary access is provided by Highway 249 and Highway 99/Grand Parkway and major thoroughfares include FM 2920, Huffsmith Road and Hufsmith-Kohrville Road. According to the appraisal, as of the first quarter of 2021, the Far Northwest submarket had approximately 1.6 million SF of retail space inventory, overall vacancy in the submarket was approximately 4.4% and asking rent was $25.58 PSF. According to the appraisal, as of the first quarter of 2021, the Houston market had approximately 409.8 million SF of retail space inventory, overall vacancy in the market was approximately 6.0% and asking rent was $18.82 PSF. According to the appraisal, the 2020 estimated population within a one-, three- and five-mile radius of the Tomball Town Center Property was 1,231, 9,661 and 56,399, respectively. The 2020 estimated average household income within a one-, three- and five-mile radius of the Tomball Town Center Property was $139,762, $126,972 and $111,773, respectively.
The following table presents recent leasing data for grocery anchor retail tenants at comparable retail properties with respect to the Tomball Town Center Property:
| Comparable Junior Anchor Retail Lease Summary |
| Location | Tenant | Size (SF) | Lease Date | Rent PSF | Lease Type |
Tomball Town Center (subject)(1) Tomball, TX | Kroger | 74,206 | May 2019 | $8.96 | NNN |
| Garland, TX | Tom Thumb | 63,209 | Oct. 2017 | $7.56 | NNN |
| Irving, TX | El Rancho Grocery | 55,645 | July 2019 | $12.50 | NNN |
| Denton, TX | Albertson's | 57,474 | June 2019 | $14.00 | NNN |
| Odessa, TX | Albertson's | 67,328 | May 2019 | $12.00 | NNN |
| Austin, TX | 99 Ranch Market | 37,239 | May 2017 | $14.50 | NNN |
| Azle, TX | Albertson's | 55,922 | June 2019 | $7.46 | NNN |
Source: Appraisal, unless otherwise noted.
| (1) | Information is based on the underwritten rent roll as of June 30, 2021. |
The following table presents recent leasing data for in line retail tenants at comparable retail properties with respect to the Tomball Town Center Property:
| Comparable In Line Retail Lease Summary |
| Property/Location | Year Built | SF | Tenant Name | Size (SF) | Lease Date | Rent PSF | Lease Type |
Tomball Town Center (subject)(1) Tomball, TX | 2004 | 141,450 | Wells Fargo Bank Berkeley Eye Center | 5,474 5,113 | Dec. 2020 June 2020 | $28.13 $20.46 | NNN NNN |
Plaza at Lakewood Forest Tomball, TX | 2002 | 26,439 | Crust Pizza | 3,671 | Dec. 2019 | $20.00 | NNN |
Tomball Parkway Plaza Tomball, TX | 1984 | 138,605 | Houston Nails | 1,400 | Sept. 2018 | $16.77 | NNN |
Spring Cypress Shopping Center Tomball, TX | 2007 | 29,352 | Undisclosed | 2,000 | June 2021 | $24.00 | NNN |
Four Corners Shopping Center Tomball, TX | 1985 | 108,461 | Undisclosed | 1,108 | June 2021 | $27.00 | NNN |
Northpointe Crossing Tomball, TX | 2017 | 47,908 | Top Sushi | 3,200 | Feb. 2019 | $32.00 | NNN |
Augusta Woods Plaza Tomball, TX | 2018 | 32,955 | Next Level Urgent Care | 2,770 | June 2018 | $35.00 | NNN |
Source: Appraisal, unless otherwise noted.
| (1) | Information is based on the underwritten rent roll as of June 30, 2021. |
The following table presents certain information relating to the appraisal’s market rent conclusion for the Tomball Town Center Property:
| Market Rent Summary |
| | Market Rent PSF | Lease Term (Mos.) | Rent Increase Projection | Lease Type |
| In Line Space | $30.00 | 60 | None | NNN |
| In Line High Visibility Space | $35.00 | 60 | None | NNN |
| Anchor Space | $9.00 | 120 | 5.0% at mid-lease | NNN |
| Ground Lease Space | $28.15 | 120 | 5.0% at mid-lease | NNN |
This is not a research report and was not prepared by any Underwriter’s research department. Please see additional important information and qualifications at the end of this Term Sheet. |
T-142
| Retail – Anchored | Loan #14 | Cut-off Date Balance: | | $26,100,000 |
| 14002, 14020, 14030, 14040, 14060, | Tomball Town Center | Cut-off Date LTV: | | 62.7% |
| 14080, 14090, 14094 F.M. 2920 | | UW NCF DSCR: | | 2.41x |
| Tomball, TX 77377 | | UW NOI Debt Yield: | | 8.9% |
Operating History and Underwritten Net Cash Flow. The following table presents certain information relating to historical operating performance and the Underwritten Net Cash Flow at the Tomball Town Center Property:
| Cash Flow Analysis | |
| | | 2019 | | 2020 | | 5/31/2021 TTM | | UW | | UW PSF | |
| Gross Potential Rent(1) | | $1,883,390 | | $2,475,380 | | $2,459,588 | | $2,651,845 | | $18.75 | |
| Total Recoveries | | $673,810 | | $724,508 | | $742,340 | | $888,338 | | $6.28 | |
| Less Vacancy & Credit Loss | | $0 | | $0 | | $0 | | ($177,009) | | ($1.25) | |
| Effective Gross Income | | $2,557,200 | | $3,199,888 | | $3,201,928 | | $3,363,174 | | $23.78 | |
| | | | | | | | | | | | |
| Real Estate Taxes | | $381,500 | | $510,781 | | $512,591 | | $580,066 | | $4.10 | |
| Insurance | | $6,994 | | $29,209 | | $42,784 | | $64,337 | | $0.45 | |
| Other Expenses | | $388,692 | | $375,683 | | $371,433 | | $384,013 | | $2.71 | |
| Total Expenses | | $777,186 | | $915,673 | | $926,808 | | $1,028,416 | | $7.27 | |
| | | | | | | | | | | | |
| Net Operating Income | | $1,780,014 | | $2,284,215 | | $2,275,120 | | $2,334,758 | | $16.51 | |
| Capital Expenditures | | $0 | | $0 | | $0 | | $22,632 | | $0.16 | |
| TI/LC | | $0 | | $0 | | $0 | | $114,279 | | $0.81 | |
| Net Cash Flow | | $1,780,014 | | $2,284,215 | | $2,275,120 | | $2,197,847 | | $15.54 | |
| | | | | | | | | | | | |
| Occupancy % | | 97.8% | | 97.9% | | 97.5% | (1) | 95.0% | | | |
| NOI DSCR | | 1.95x | | 2.50x | | 2.49x | | 2.56x | | | |
| NCF DSCR | | 1.95x | | 2.50x | | 2.49x | | 2.41x | | | |
| NOI Debt Yield | | 6.8% | | 8.8% | | 8.7% | | 8.9% | | | |
| NCF Debt Yield | | 6.8% | | 8.8% | | 8.7% | | 8.4% | | | |
| (1) | UW Gross Potential Rent and 5/31/2021 TTM Occupancy % are based on the underwritten rent roll dated June 30, 2021, and UW Gross Potential Rent includes rent steps through July 2022. |
This is not a research report and was not prepared by any Underwriter’s research department. Please see additional important information and qualifications at the end of this Term Sheet. |
T-143
| Mortgage Loan No. 15 – Lake Pointe Corporate Centre |
| Mortgage Loan Information | | Mortgaged Property Information |
| Mortgage Loan Seller: | WFB | | Single Asset/Portfolio: | Single Asset |
| Credit Assessment (Fitch/KBRA/S&P): | NR/NR/NR | | Location: | West Valley City, UT 84119 |
| Original Balance: | $25,300,000 | | General Property Type: | Office |
| Cut-off Date Balance: | $25,300,000 | | Detailed Property Type: | Suburban |
| % of Initial Pool Balance: | 2.0% | | Title Vesting: | Fee |
| Loan Purpose: | Acquisition | | Year Built/Renovated: | 1995; 1998/2018 |
| Borrower Sponsor: | Emanuel Shaoulian | | Size: | 182,121 SF |
| Guarantors: | Emanuel Shaoulian and The Shaoulian Revocable Living Trust | | Cut-off Date Balance per SF: | $139 |
| Mortgage Rate: | 2.9660% | | Maturity Date Balance per SF: | $139 |
| Note Date: | 8/12/2021 | | Property Manager: | Acres Property Management, LLC |
| First Payment Date: | 10/11/2021 | | | |
| Maturity Date: | 9/11/2031 | | | |
| Original Term to Maturity: | 120 months | | |
| Original Amortization Term: | 0 months | | |
| IO Period: | 120 months | | |
| Seasoning: | 1 month | | |
| Prepayment Provisions: | L(25),D(91),O(4) | | |
| Lockbox/Cash Mgmt Status(1): | Springing/Springing | | Underwriting and Financial Information(8) |
| Additional Debt Type: | No | | UW NOI: | $2,854,237 |
| Additional Debt Balance: | NAP | | UW NOI Debt Yield: | 11.3% |
| Future Debt Permitted (Type): | No (NAP) | | UW NOI Debt Yield at Maturity: | 11.3% |
| Reserves | | UW NCF DSCR: | 3.51x |
| Type | Initial | Monthly | Cap | | Most Recent NOI(9): | $2,721,096 (TTM 6/30/2021) |
| RE Taxes: | $414,062 | $37,642 | NAP | | 2nd Most Recent NOI(9): | $2,202,341 (12/31/2020) |
| Insurance(2) : | $0 | Springing | NAP | | 3rd Most Recent NOI: | $2,193,246 (12/31/2019) |
| Immediate Repairs: | $83,250 | $0 | NAP | | Most Recent Occupancy: | 97.0% (8/9/2021) |
| Replacement Reserve(3) : | $500,000 | Springing | $500,000 | | 2nd Most Recent Occupancy: | 98.3% (12/31/2020) |
| TI/LC Reserve: | $500,000 | $18,867 | $1,000,000 | | 3rd Most Recent Occupancy: | 96.5% (12/31/2019) |
| Rent Concession Reserve(4) : | $839,262 | $0 | NAP | | Appraised Value (as of) (10): | $38,500,000 (7/26/2021) |
| Existing TI/LC Reserve(5) : | $1,180,484 | $0 | NAP | | Appraised Value per SF: | $211 |
| Cash Trap Avoidance Reserve(6) : | $0 | Springing | NAP | | Cut-off Date LTV Ratio: | 65.7% |
| Major Tenant Reserve(7): | $0 | Springing | NAP | | Maturity Date LTV Ratio: | 65.7% |
| | | | | | | | | |
| Sources and Uses |
| Sources | Proceeds | % of Total | | Uses | Proceeds | % of Total |
| Loan Amount: | $25,300,000 | 60.1% | | Purchase Price(11): | $37,250,000 | 88.5% |
| Borrower Equity | $16,769,843 | 39.9% | | Upfront Reserves: | $3,517,058 | 8.4% |
| | | | | Closing Costs: | $1,302,785 | 3.1% |
| Total Sources: | $42,069,843 | 100.0% | | Total Uses: | $42,069,843 | 100.0% |
| (1) | A cash trap event period will commence upon (a) an event of default, (b) the amortizing net cash flow debt service coverage ratio being less than 1.15x tested quarterly (“DSCR Trigger Event”), or (c) Progrexion ASG (“Progrexion”), eHealth Insurance Services (“eHealth”), or any replacement tenant that makes up more than 20% of the net rentable area (each, a “Major Tenant”) either (1) fails to renew its lease on or prior to the earlier of (i) nine months and (ii) the renewal deadline under the lease, (2) goes dark, (3) vacates or fails to occupy more than 25% of its space, or (4) files bankruptcy or cancels its lease (each commencing a “Major Tenant Event Period”). |
| (2) | The loan documents do not require ongoing monthly insurance reserves for insurance premiums as long as (i) no event of default is continuing (ii) the policies maintained by the borrower are part of a blanket or umbrella policy approved by the lender in its reasonable discretion, (iii) the borrower provides the lender evidence of the renewal of the policy and (iv) the borrower provides paid receipts for the premiums no later than five business days prior to the expiration dates of the policies. |
| (3) | The loan documents require a monthly deposit of $3,035 into the replacement reserve in the event of an event of default or if the replacement reserve account is below $500,000. |
| (4) | The loan documents require an upfront rent concession reserve representing the future rent credits under existing leases with Medical Review Institute of America ($239,308), Deserve ($98,090), and Progrexion ($501,864). |
| (5) | The loan documents require an existing TI/LC reserve representing the tenant improvement and leasing commissions payable under existing leases with Deserve ($47,084) and Progrexion ($1,133,400). |
| (6) | In lieu of a cash trap event period caused solely by DSCR Trigger Event, the borrower may deposit cash or a letter of credit into the cash sweep avoidance reserve in an amount that, if applied to the outstanding principal balance of the loan, would result in a net cash flow debt service coverage ratio of 1.20x. |
| (7) | In lieu of a cash trap event period caused by a Major Tenant Event Period, the borrower can deposit cash or a letter of credit into the major tenant reserve in an amount equal to $35.00 PSF of the Major Tenant space that caused the Major Tenant Event Period, less the amount of funds then on deposit in the TI/LC Reserve. |
| (8) | The novel coronavirus pandemic is an evolving situation and could impact the Lake Pointe Corporate Centre Mortgage Loan (as defined below) more severely than assumed in the underwriting of the Lake Pointe Corporate Centre Mortgage Loan and could adversely affect the NOI, NCF and occupancy information, as well as the appraised value and the DSCR, LTV and Debt Yield metrics presented above and herein. See "Risk Factors-—Risks Related to Market Conditions and Other External Factors—The Coronavirus Pandemic Has Adversely Affected the Global Economy and Will Likely Adversely Affect the Performance of the Mortgage Loans" in the prospectus. |
This is not a research report and was not prepared by any Underwriter’s research department. Please see additional important information and qualifications at the end of this Term Sheet. |
T-144
| Office – Suburban | Loan #15 | Cut-off Date Balance: | | $25,300,000 |
| 2850 & 2875 South Decker Lake Drive | Lake Pointe Corporate Centre | Cut-off Date LTV: | | 65.7% |
| West Valley City, UT 84119 | | UW NCF DSCR: | | 3.51x |
| | | UW NOI Debt Yield: | | 11.3% |
| (9) | The increase from the 2nd Most Recent NOI to the Most Recent NOI was driven by several factors including (i) eHealth expanding its space by 12,194 SF in January 2020, with 3.5 months of free rent and (ii) Progrexion renewing its space at $3.31 PSF higher than its previous rent in November of 2020, an increase of $78,686 in total reimbursements and a decrease in total expenses of $232,308. |
| (10) | The appraiser’s adjusted its “As-Is” value to exclude the outstanding leasing costs for the property. Given all leasing costs were reserved at loan origination, the appraised value is based on the appraiser’s “Hypothetical – Escrowed Reserves” valuation, which adds back the leasing costs. |
| (11) | In connection with the acquisition of the Lake Pointe Corporate Centre Property, the seller provided credits of $1,557,120 in connection with outstanding leasing costs for Progrexion, Deserve, and the Medical Review Institute of America, for a net purchase price of $35,692,880. |
The Mortgage Loan. The fifteenth largest mortgage loan (the “Lake Pointe Corporate Centre Mortgage Loan”) is evidenced by a single promissory note in the original principal amount of $25,300,000 secured by a first priority fee mortgage encumbering a 182,121 SF office building (the “Lake Pointe Corporate Centre Property”), located in West Valley City, Utah. The proceeds of the Lake Pointe Corporate Centre Mortgage Loan were used to acquire the Lake Pointe Corporate Centre Property, fund upfront reserves, and pay closing costs.
The Borrower and the Borrower Sponsors. The borrower is Shaoulian Lake Pointe Properties LLC, a California limited liability company and single purpose entity. The borrower sponsor is Emanuel Shaoulian and the non-recourse carveout guarantors are Emanuel Shaoulian and The Shaoulian Revocable Living Trust. Emanuel Shaoulian is the owner of Shaoulian Cardiology Inc., Pacific Coast Cardiology, Shaoulian Properties, and Advanced Medical Properties, LLC.
The Property. The Lake Pointe Corporate Centre Property is a two building suburban office complex totaling 182,121 SF located in West Valley City, Utah. The buildings are situated on a 15.43-acre site and include 1,177 parking spaces for a parking ratio of 6.5 per 1,000 SF. Since December 2016, the Lake Pointe Corporate Centre Property has undergone approximately $1.26 million in capital improvements including elevator modernization, roof replacement, a lobby upgrade, and restroom renovations. As of August 9, 2021, the Lake Pointe Corporate Centre Property was 97.0% leased.
The Lake Pointe Corporate Centre Mortgage Loan documents provide for partial releases in connection with a sale of the released property to a third party. Additionally, the loan documents provide for the free release of up to 4.14-acres of surplus land area. See “Description of the Mortgage Pool – Certain Terms of the Mortgage Loans – Releases; Partial Releases; Property Additions” in the prospectus.
Lake Pointe One
The Lake Pointe One Property is a Class A, 60,627 SF office building located in West Valley City, Utah (the “Lake Pointe One Property”). Originally constructed in 1995 and renovated in 2018, the Lake Pointe One Property is a three-story building and as of August 9, 2021 was 100.0% leased by Progrexion and ADP, Inc.
Lake Pointe Three
The Lake Pointe Three Property is a Class A 121,494 SF office building located in West Valley City, Utah (the “Lake Pointe Three Property”). Originally constructed in 1998 and renovated in 2018, the Lake Pointe Three Property is a five-story building that includes a balcony on the fifth floor as well as a fitness center and locker room with showers. As of August 9, 2021, the Lake Pointe Three Property was 95.5% leased to four tenants.
| Property Name – Location | Allocated Cut-off
Date Balance | % of Portfolio Cut-
off Date Balance | Occupancy | Year Built/
Renovated | Net Rentable
Area (SF) | Appraised
Value(1) | Allocated Cut-
off Date LTV | Parking
Ratio (per
1,000 SF) |
Lake Pointe One 2850 South Decker Lake Drive West Valley City, UT | $9,215,048 | 36.4% | 100.0% | 1995/2018 | 60,627 | $15,015,000 | 61.4% | 5.9 |
Lake Pointe Three 2875 South Decker Lake Drive West Valley City, UT | $16,084,952 | 63.6% | 95.5% | 1998/2018 | 121,494 | $23,485,000 | 68.5% | 6.7 |
| Total/Weighted Average | $25,300,000 | 100.0% | 97.0% | | 182,121 | $38,500,000 | 65.7% | 6.5 |
| (1) | The appraisal provides individual building values based on the As-Is appraised value. The value reflected above uses the % of total value for each building and applies it to the “Hypothetical – Escrowed Reserves” valuation, given all leasing costs were reserved at loan closing. |
Major Tenants.
Progrexion ASG (56,670 SF; 31.1% of NRA; 31.9% of underwritten base rent). Progrexion is a technology-enabled credit repair and credit care business. The company was founded over 20 years ago and is headquartered in Salt Lake City. Progrexion currently employs more than 2,200 people in nine locations. Progrexion initially leased one floor at the Lake Pointe One Property in 2012 and has since expanded in both the Lake Pointe One and Lake Pointe Three Properties. The tenant most recently signed a 7-year renewal in November 2020 with an October 31, 2027 expiration date. Progrexion has one, 5-year renewal option with 14 months’ notice at fair market rent.
eHealth Insurance Services (54,007 SF; 29.7% of NRA; 32.8% of underwritten base rent). eHealth Insurance Services is an online health insurance marketplace with technology that provides consumers with health insurance enrollment solutions. The company was founded in 1997 and primarily provides plans related to Medicare, Medigap, and Medicare Advantage plans, but also sells individual and small business plans as well. eHealth has partnerships with more than 180 health insurance carriers and offers more than 10,000 health insurance products online. eHealth has been located at the Lake Pointe Three Property since 2012, and has expanded several times, most recently in January 2020. All of the eHealth spaces are coterminous and expire on April 30, 2026. The tenant has one, 5-year renewal option with nine months’ notice, at the greater of 95% of fair market rent or the then-current rent.
Medical Review Institute of America (29,217 SF; 16.0% of NRA; 16.9% of underwritten base rent). The Medical Review Institute of America (“MRIOA”) provides external review resources for over 800 clients nationwide including insurance companies, employers, union groups, pharmacy benefit managers, and human resource consultants. Founded in 1983, the Lake Pointe Corporate Centre Property serves as the company’s headquarters. MRIOA has been a tenant at the Lake Pointe Three Property since 2002. The tenant most recently renewed its lease in January 2019 with a lease expiration of July 31, 2026. MRIOA has one, 5-year renewal option with 12 months’ notice at fair market rent.
This is not a research report and was not prepared by any Underwriter’s research department. Please see additional important information and qualifications at the end of this Term Sheet. |
T-145
| Office – Suburban | Loan #15 | Cut-off Date Balance: | | $25,300,000 |
| 2850 & 2875 South Decker Lake Drive | Lake Pointe Corporate Centre | Cut-off Date LTV: | | 65.7% |
| West Valley City, UT 84119 | | UW NCF DSCR: | | 3.51x |
| | | UW NOI Debt Yield: | | 11.3% |
The following table presents certain information relating to the tenancy at the Lake Pointe Corporate Centre Property:
| Tenant Summary |
| Tenant Name | Credit Rating (Fitch/Moody's/ S&P) | Tenant SF | Approx. % of SF | Annual UW Rent(1) | % of Total Annual UW Rent | Annual UW Rent PSF(1) | | Renewal Options |
| Termination Option (Y/N) | Lease Expiration |
| Major Tenants | | | | | | | | | |
| Progrexion ASG | NR/NR/NR | 56,670 | 31.1% | $1,298,735 | 31.9% | $22.92 | N | 10/31/2027 | 1 x 5 yr |
| eHealth Insurance Services | NR/NR/NR | 54,007 | 29.7% | $1,334,821 | 32.8% | $24.72 | N | 4/30/2026 | 1 x 5 yr |
| Medical Review Institute of America | NR/NR/NR | 29,217 | 16.0% | $686,413 | 16.9% | $23.49 | N | 7/31/2026 | 1 x 5 yr |
| SubTotal/Wtd. Avg. | | 139,894 | 76.8% | $3,319,969 | 81.6% | $23.73 | | | |
| | | | | | | | | | |
| Non-Major Tenants(2) | | 36,747 | 20.2% | $746,483 | 18.4% | $20.31 | | | |
| Occupied Collateral Total | | 176,641 | 97.0% | $4,066,452 | 100.0% | $23.02 | | | |
| Vacant Space | | 5,480 | 3.0% | | | | | | |
| Total/Wtd. Avg. | | 182,121 | 100.0% | | | | | | |
| (1) | Annual UW Rent and Annual UW Rent PSF includes contractual rent increases through June 1, 2022 of $95,332. |
| (2) | Includes a 2,469 SF fitness center, 379 SF management office, and a 1,128 SF break room, which do not generate any rental income. |
The following table presents certain information relating to the lease rollover schedule at the Lake Pointe Corporate Centre Property:
| Lease Rollover Schedule(1) |
| Year | # of Leases Rolling | SF Rolling | UW Rent PSF Rolling | Approx. % of Total SF Rolling | Approx. Cumulative % of SF Rolling | Total UW Rent Rolling | Approx. % of Total Rent Rolling | Approx. Cumulative % of Total Rent Rolling |
| 2021 | 0 | 0 | $0.00 | 0.0% | 0.0% | $0 | 0.0% | 0.0% |
| 2022 | 1 | 21,000 | $24.00 | 11.5% | 11.5% | $504,000 | 12.4% | 12.4% |
| 2023 | 0 | 0 | $0.00 | 0.0% | 11.5% | $0 | 0.0% | 12.4% |
| 2024 | 0 | 0 | $0.00 | 0.0% | 11.5% | $0 | 0.0% | 12.4% |
| 2025 | 1 | 11,771 | $20.60 | 6.5% | 18.0% | $242,483 | 6.0% | 18.4% |
| 2026 | 5 | 83,224 | $24.29 | 45.7% | 63.7% | $2,021,234 | 49.7% | 68.1% |
| 2027 | 2 | 56,670 | $22.92 | 31.1% | 94.8% | $1,298,735 | 31.9% | 100.0% |
| 2028 | 0 | 0 | $0.00 | 0.0% | 94.8% | $0 | 0.0% | 100.0% |
| 2029 | 0 | 0 | $0.00 | 0.0% | 94.8% | $0 | 0.0% | 100.0% |
| 2030 | 0 | 0 | $0.00 | 0.0% | 94.8% | $0 | 0.0% | 100.0% |
| 2031 | 0 | 0 | $0.00 | 0.0% | 94.8% | $0 | 0.0% | 100.0% |
| 2032 & Beyond(2) | 3 | 3,976 | $0.00 | 2.2% | 97.0% | $0 | 0.0% | 100.0% |
| Vacant | 0 | 5,480 | $0.00 | 3.0% | 100.0% | $0 | 0.0% | 100.0% |
| Total/Wtd. Avg. | 12 | 182,121 | $23.02(3) | 100.0% | | $4,066,452 | 100.0% | |
| (1) | Information is based on the underwritten rent roll. |
| (2) | Includes a 2,469 SF fitness center, 379 SF management office, and a 1,128 SF break room, which do not generate any rental income. |
| (3) | Total/Wtd. Avg. UW Rent PSF Rolling excludes vacant space. |
COVID-19 Update. As of September 1, 2021, the Lake Pointe Corporate Centre Property is open and operating. 100% of tenants by underwritten rent and 100% by NRA paid rent for July and August 2021. The first payment date for the Lake Pointe Corporate Centre Mortgage Loan is October 11, 2021. There have been no requests for loan modification or forbearance and no tenants have requested rent relief or modifications.
The Market. The Lake Pointe Corporate Centre Property is located approximately 6.6 miles southwest of Salt Lake City, Utah. The area consists primarily of industrial, office and hotel uses and is considered the core industrial neighborhood in the Salt Lake metropolitan area. The Lake Pointe Corporate Centre Property has access throughout the region via Interstate 215 and Interstate 15, which are located 0.8 miles and 4.0 miles, respectively, from the Lake Pointe Corporate Centre Property. The Salt Lake City International Airport is approximately 8.6 miles north, and the Lake Pointe Corporate Centre Property also has access to Utah’s light rail system (TRAX) via the Decker Lake Station located 0.3 miles to the south. Within a one-, three- and five-mile radius of the Lake Pointe Corporate Centre Property, the 2021 average household income was approximately $66,896, $69,514 and $73,637, respectively; and within the same radii, the 2021 estimated population was 11,418, 102,249 and 336,177, respectively.
According to a third-party market research report, the Lake Pointe Corporate Centre Property is situated within the West Valley/Lake Park submarket of the Salt Lake City office market. As of August 24, 2021, the submarket reported total inventory of approximately 6.7 million SF, with a 13.4% vacancy rate, 15.3% availability rate, and average asking rents of $21.05 PSF. Vacancy has increased from 9.9% as of the second quarter of 2020 and there are currently 124,410 SF under construction. The appraisal identified six comparable properties with rents ranging from $18.39 to $29.50 PSF, full service, or its equivalent.
This is not a research report and was not prepared by any Underwriter’s research department. Please see additional important information and qualifications at the end of this Term Sheet. |
T-146
| Office – Suburban | Loan #15 | Cut-off Date Balance: | | $25,300,000 |
| 2850 & 2875 South Decker Lake Drive | Lake Pointe Corporate Centre | Cut-off Date LTV: | | 65.7% |
| West Valley City, UT 84119 | | UW NCF DSCR: | | 3.51x |
| | | UW NOI Debt Yield: | | 11.3% |
The following table presents certain information relating to the appraisal’s market rent conclusion for the Lake Pointe Corporate Centre Property:
| Market Rent Summary |
| Market Rent (PSF) | $23.00 |
| Lease Term (Years) | 5 |
| Lease Type (Reimbursements) | Base Year Stop |
| Rent Increase Projection | 3.0% per annum |
The table below presents certain information relating to comparable sales pertaining to the Lake Pointe Corporate Centre Property identified by the appraiser:
| Comparable Sales |
Property Name Address | Rentable Area (SF) | Year Built/Renovated | Occupancy | Sale Date | Sale Price (PSF) |
Lake Pointe Corporate Centre (Subject) 2850 & 2875 South Decker Lake Drive West Valley City, UT | 182,121 | 1995; 1998/2018 | 97% | Aug-2021 | $205 |
Urban Grove 365 South Garden Grove Lane Pleasant Grove, UT | 105,668 | 2018/NAP | 100% | Jun-2021 | $226 |
Vista Station 4, 7, 8 & 10 12884 South Frontrunner Boulevard Draper, UT | 541,678 | 2016/NAP | 100% | Jun-2021 | $308 |
Danbury Office Park 8851, 8871, & 8911 South Sandy Parkway Sandy, UT | 90,488 | 1997/NAP | 90% | May-2021 | $192 |
Parkway Center 4811-4897 West Lake Park Boulevard West Valley City, UT | 246,523 | 2000/NAP | 87% | Dec-2020 | $224 |
Union Park 6 & 7 6955 & 6965 Union Park Center Drive Cottonwood Heights, UT | 185,017 | 1996/NAP | 92% | Nov-2019 | $236 |
Sorenson Research Park – Building 12 4383 South Riverboat Road Salt Lake City, UT | 93,275 | 1998/NAP | 95% | Jun-2019 | $184 |
The following table presents certain information relating to comparable office leases for the Lake Pointe Corporate Centre Property:
| Comparable Building Leases |
| | | | | | | |
| Property Name/Location | Year Built/ Renovated | Total GLA (SF) | Tenant Name | Lease Date/Term | Lease Area (SF) | Annual Base
Rent PSF(1) |
Lake Pointe II 2835 South Decker Lake Drive West Valley City, UT | 1997/NAP | 90,000 | ADP | May-2020 / 5.3 Yrs | 43,406 | $18.39 |
Centrepointe Office Park, Buildings A&B 1865-1885 West 2100 South Salt Lake City, UT | 2007/2016 | 108,789 | MyLabs Sintx | Feb-2021 / 5.5 Yrs Jan-2020 / 5.0 Yrs | 24,704 29,534 | $21.50 $22.74 |
Fairbourne Station 3535 South Market Street West Valley City, UT | 2020/NAP | 216,400 | Granger Orthodontics Wasatch Property Management Granger Pediatric Dentistry | Oct-2020 / 5.0 Yrs Oct-2020 / 7.0 Yrs Aug-2020 / 10.0 Yrs | 2,804 8,911 5,165 | $29.50 $28.50 $28.50 |
State of Utah DCFS – West Valley 2655 South Lake Erie Drive West Valley City, UT | 2005/NAP | 26,736 | DCFS | Apr-2019 / 6.0 Yrs | 18,623 | $21.11 |
Legacy at Lake Park 4225 & 4255 Lake Park Boulevard West Valley City, UT | 2000/NAP | 198,465 | Cranial Technologies Carboinite | Mar-2019 / 7.4 Yrs Jan-2018 / 7.0 Yrs | 4,272 26,019 | $23.50 $22.00 |
Corporate Park Buildings C&E 2737 & 2777 Corporate Park Drive Salt Lake City, UT | 2000/NAP | 190,142 | Pillpack | Apr-2020 / 10.0 Yrs | 70,363 | $23.50 |
Source: Appraisal.
(1) Represents full service or full service equivalent rental rate.
This is not a research report and was not prepared by any Underwriter’s research department. Please see additional important information and qualifications at the end of this Term Sheet. |
T-147
| Office – Suburban | Loan #15 | Cut-off Date Balance: | | $25,300,000 |
| 2850 & 2875 South Decker Lake Drive | Lake Pointe Corporate Centre | Cut-off Date LTV: | | 65.7% |
| West Valley City, UT 84119 | | UW NCF DSCR: | | 3.51x |
| | | UW NOI Debt Yield: | | 11.3% |
Operating History and Underwritten Net Cash Flow. The following table presents certain information relating to the historical operating performance and Underwritten Net Cash Flow at the Lake Pointe Corporate Centre Property:
| Cash Flow Analysis | |
| | | 2018 | | 2019 | | 2020 | | TTM 6/30/2021 | | UW | | UW PSF | |
| Base Rent(1) | | $3,528,331 | | $3,489,062 | | $3,553,772 | | $3,772,630 | | $3,982,867 | | $21.87 | |
| Grossed Up Vacant Space | | $0 | | $0 | | $0 | | $0 | | $209,625 | | $1.15 | |
| Gross Potential Rent | | $3,528,331 | | $3,489,062 | | $3,553,772 | | $3,772,630 | | $4,192,492 | | $23.02 | |
| Parking/Garage/Other Income(2) | | $31,650 | | $33,803 | | $11,268 | | $1,788 | | $23,760 | | $0.13 | |
| Other Income(3) | | $0 | | $0 | | $0 | | $0 | | $33,654 | | $0.18 | |
| Total Recoveries | | $640,230 | | $556,144 | | $334,862 | | $413,548 | | $404,685 | | $2.22 | |
| (Free Rent Adjustment) | | ($200,679) | | ($52,347) | | ($53,918) | | ($55,535) | | $0 | | $0.00 | |
| Net Rental Income | | $3,999,531 | | $4,026,661 | | $3,845,984 | | $4,132,431 | | $4,654,591 | | $25.56 | |
| (Vacancy & Credit Loss) | | $0 | | $0 | | $0 | | $0 | | ($209,625) | | ($1.15) | |
| Effective Gross Income | | $3,999,531 | | $4,026,661 | | $3,845,984 | | $4,132,431 | | $4,444,966 | | $24.41 | |
| | | | | | | | | | | | | | |
| Real Estate Taxes | | $404,307 | | $398,907 | | $410,636 | | $416,492 | | $412,629 | | $2.27 | |
| Insurance | | $31,929 | | $34,408 | | $37,510 | | $36,797 | | $41,427 | | $0.23 | |
| Management Fee | | $123,948 | | $117,112 | | $140,383 | | $28,593 | | $133,349 | | $0.73 | |
| Other Operating Expenses | | $1,239,104 | | $1,282,989 | | $1,055,114 | | $929,453 | | $1,003,325 | | $5.51 | |
| Total Operating Expenses | | $1,799,288 | | $1,833,416 | | $1,643,643 | | $1,411,335 | | $1,590,730 | | $8.73 | |
| | | | | | | | | | | | | | |
| Net Operating Income(4) | | $2,200,243 | | $2,193,246 | | $2,202,341 | | $2,721,096 | | $2,854,237 | | $15.67 | |
| Replacement Reserves | | $0 | | $0 | | $0 | | $0 | | $7,795 | | $0.04 | |
| TI/LC | | $0 | | $0 | | $0 | | $0 | | $222,308 | | $1.22 | |
| Non-Recurring Items | | $0 | | $0 | | $0 | | $0 | | ($50,000) | | ($0.27) | |
| Net Cash Flow | | $2,200,243 | | $2,193,246 | | $2,202,341 | | $2,721,096 | | $2,674,134 | | $14.68 | |
| | | | | | | | | | | | | | |
| Occupancy % | | 98.1% | | 96.5% | | 98.3% | | 94.5% | | 95.0%(5) | | | |
| NOI DSCR | | 2.89x | | 2.88x | | 2.89x | | 3.58x | | 3.75x | | | |
| NCF DSCR | | 2.89x | | 2.88x | | 2.89x | | 3.58x | | 3.51x | | | |
| NOI Debt Yield | | 8.7% | | 8.7% | | 8.7% | | 10.8% | | 11.3% | | | |
| NCF Debt Yield | | 8.7% | | 8.7% | | 8.7% | | 10.8% | | 10.6% | | | |
| (1) | UW Base Rent and UW Base Rent PSF includes contractual rent increases through June 1, 2022 of $95,332. |
| (2) | Parking/Garage/Other Income includes miscellaneous income. |
| (3) | Other Income includes telecomm lease and license agreement income from five rooftop and/or conduit agreements with various telecomm companies. |
| (4) | The increase from 2020 Net Operating Income to the TTM 6/30/2021 Net Operating Income was driven by several factors including (i) eHealth expanding its space by 12,194 SF in January 2020, with 3.5 months of free rent and (ii) Progrexion renewing its space at $3.31 PSF higher than its previous rent in November of 2020, an increase of $78,686 in total reimbursements and a decrease in total expenses of $232,308. |
| (5) | The Lake Pointe Corporate Centre Property is 97.0% occupied as of August 9, 2021 and was underwritten to a 5.0% vacancy rate. |
This is not a research report and was not prepared by any Underwriter’s research department. Please see additional important information and qualifications at the end of this Term Sheet. |
T-148
This material was prepared by sales, trading, banking or other non-research personnel of one of the following: BofA Securities, Inc. (together with its affiliates, “BofA Securities”), Morgan Stanley & Co. LLC, Morgan Stanley & Co. International Limited, Morgan Stanley Japan Limited and/or Morgan Stanley Dean Witter Asia Limited (together with their affiliates, hereinafter “Morgan Stanley”), Wells Fargo Securities, LLC (together with its affiliates, “Wells Fargo”) , Academy Securities, Inc. (together with its affiliates, “Academy”) and Drexel Hamilton, LLC (together with its affiliates, “Drexel” and, collectively with , BofA Securities, Morgan Stanley, Wells Fargo and Academy, the “Underwriters”). This material was not produced by an Underwriter’s research analyst, although it may refer to an Underwriter’s research analyst or research report. Unless otherwise indicated, these views (if any) are the author’s and may differ from those of the fixed income or equity research departments of the Underwriters or others in those firms.
This material may have been prepared by or in conjunction with the respective trading desks of the Underwriters that may deal as principal in or own or act as market maker or liquidity provider for the securities/instruments (or related derivatives) mentioned herein. The trading desk may have accumulated a position in the subject securities/instruments based on the information contained herein. Trading desk materials are not independent of the proprietary interests of the Underwriters, which may conflict with your interests. Each of the Underwriters may also perform or seek to perform investment banking services for the issuers of the securities and instruments mentioned herein.
The information contained in this material is preliminary as of the date hereof. This material is subject to change, completion or amendment from time to time. The information in this material supersedes information in any other communication relating to the securities referred to in this material; provided, that the information in this material will be superseded by similar information delivered to you as part of a preliminary prospectus. This material is not a solicitation to participate in any trading strategy, and is not an offer to sell any security or instrument or a solicitation of an offer to buy or sell any security or instrument in any jurisdiction where an offer, solicitation or sale is not permitted. Unless otherwise set forth in this material, any securities referred to in this material may not have been registered under the U.S. Securities Act of 1933, as amended, and, if not, may not be offered or sold absent an exemption therefrom. Recipients are required to comply with any legal or contractual restrictions on their purchase, holding, sale, exercise of rights or performance of obligations under any securities/instruments transaction.
The securities/instruments discussed in this material may not be suitable for all investors. This material has been prepared and issued by the Underwriters for intended distribution to market professionals and institutional investor clients. Other recipients should seek independent investment advice prior to making any investment decision based on this material. This material does not provide individually tailored investment advice or offer tax, regulatory, accounting or legal advice. Prior to entering into any proposed transaction, recipients should determine, in consultation with their own investment, legal, tax, regulatory and accounting advisors, the economic risks and merits, as well as the legal, tax, regulatory and accounting characteristics and consequences, of the transaction. You should consider this material as only a single factor in making an investment decision.
The value of and income from investments may vary because of changes in interest rates, foreign exchange rates, default rates, prepayment rates, securities/instruments prices, market indexes, operational or financial conditions of companies or other factors. There may be time limitations on the exercise of options or other rights in securities/instruments transactions. Past performance is not necessarily a guide to future performance. Estimates of future performance are based on assumptions that may not be realized. Actual events may differ from those assumed and changes to any assumptions may have a material impact on any projections or estimates. Other events not taken into account may occur and may significantly affect the projections or estimates. Certain assumptions may have been made for modeling purposes only to simplify the presentation and/or calculation of any projections or estimates, and the Underwriters do not represent that any such assumptions will reflect actual future events. Accordingly, there can be no assurance that estimated returns or projections will be realized or that actual returns or performance results will not materially differ from those estimated herein. Some of the information contained in this document may be aggregated data of transactions in securities or other financial instruments executed by an Underwriter that has been compiled so as not to identify the underlying transactions of any particular customer.
Notwithstanding anything herein to the contrary, the Underwriters and each recipient hereof (and their employees, representatives, and other agents) may disclose to any and all persons, without limitation of any kind from the commencement of discussions, the U.S. federal and state income tax treatment and tax structure of the transaction and all materials of any kind (including opinions or other tax analyses) that are provided to it relating to the tax treatment and tax structure (as such terms are defined in Treasury Regulation 1.6011-4). For this purpose, "tax structure" is limited to facts relevant to the U.S. federal and state income tax treatment of the transaction and does not include information relating to the identity of the parties, their affiliates, agents or advisors. This authorization of tax disclosure is retroactively effective to the commencement of discussions with prospective investors regarding the transactions contemplated herein.
THE DISTRIBUTION OF THIS MATERIAL (A) IF MADE BY A PERSON WHO IS NOT AN AUTHORIZED PERSON UNDER THE FINANCIAL SERVICES AND MARKETS ACT 2000 (“FSMA”), IS BEING MADE ONLY TO, OR DIRECTED ONLY AT, PERSONS WHO (I) ARE OUTSIDE THE UNITED KINGDOM, OR (II) HAVE PROFESSIONAL EXPERIENCE IN MATTERS RELATING TO INVESTMENTS AND QUALIFY AS INVESTMENT PROFESSIONALS IN ACCORDANCE WITH ARTICLE 19(5) OF THE FINANCIAL SERVICES AND MARKETS ACT 2000 (FINANCIAL PROMOTION) ORDER 2005 (AS AMENDED, THE “FINANCIAL PROMOTION ORDER”), OR (III) ARE PERSONS FALLING WITHIN ARTICLE 49(2)(A) THROUGH (D) (“HIGH NET WORTH COMPANIES, UNINCORPORATED ASSOCIATIONS, ETC.”) OF THE FINANCIAL PROMOTION ORDER OR, (IV) ARE PERSONS TO WHOM THIS MATERIAL MAY OTHERWISE LAWFULLY BE COMMUNICATED OR DIRECTED; AND (B) IF MADE BY A PERSON WHO IS AN AUTHORIZED PERSON UNDER THE FSMA, IS BEING MADE ONLY TO, OR DIRECTED ONLY AT, PERSONS WHO (I) ARE OUTSIDE THE UNITED KINGDOM, OR (II) HAVE PROFESSIONAL EXPERIENCE OF PARTICIPATING IN UNREGULATED SCHEMES (AS DEFINED FOR PURPOSES OF THE FINANCIAL SERVICES AND MARKETS ACT 2000 (PROMOTION OF COLLECTIVE INVESTMENT SCHEMES) (EXEMPTIONS) ORDER 2001 (AS AMENDED, THE “PROMOTION OF COLLECTIVE INVESTMENT SCHEMES EXEMPTIONS ORDER”)) AND QUALIFY AS INVESTMENT PROFESSIONALS IN ACCORDANCE WITH ARTICLE 14(5) OF THE PROMOTION OF COLLECTIVE INVESTMENT SCHEMES EXEMPTIONS ORDER, OR (III) ARE PERSONS FALLING WITHIN ARTICLE 22(2)(A) THROUGH (D) (HIGH NET WORTH COMPANIES, UNINCORPORATED ASSOCIATIONS, ETC.) OF THE PROMOTION OF COLLECTIVE INVESTMENT SCHEMES EXEMPTIONS ORDER, OR (IV) ARE PERSONS TO WHOM THE ISSUING ENTITY MAY LAWFULLY BE PROMOTED IN ACCORDANCE WITH SECTION 4.12 OF THE FCA HANDBOOK CONDUCT OF BUSINESS SOURCEBOOK.
THE OFFERED CERTIFICATES HAVE NOT BEEN AND WILL NOT BE REGISTERED UNDER THE FINANCIAL INSTRUMENTS AND EXCHANGE LAW OF JAPAN, AS AMENDED (THE “FIEL”), AND DISCLOSURE UNDER THE FIEL HAS NOT BEEN AND WILL NOT BE MADE WITH RESPECT TO THE OFFERED CERTIFICATES. ACCORDINGLY, EACH OF BOFA SECURITIES, INC., MORGAN STANLEY & CO. LLC, WELLS FARGO SECURITIES, LLC, ACADEMY SECURITIES, INC. AND DREXEL HAMILTON, LLC HAS REPRESENTED AND AGREED THAT IT HAS NOT, DIRECTLY OR INDIRECTLY, OFFERED OR SOLD AND WILL NOT, DIRECTLY OR INDIRECTLY, OFFER OR SELL ANY OFFERED CERTIFICATES IN JAPAN OR TO, OR FOR THE BENEFIT OF, ANY RESIDENT OF JAPAN (WHICH TERM AS USED IN THIS MATERIAL MEANS ANY PERSON RESIDENT IN JAPAN, INCLUDING ANY CORPORATION OR OTHER ENTITY ORGANIZED UNDER THE LAWS OF JAPAN) OR TO OTHERS FOR REOFFERING OR RE SALE, DIRECTLY OR INDIRECTLY, IN JAPAN OR TO, OR FOR THE BENEFIT OF, ANY RESIDENT OF JAPAN EXCEPT PURSUANT TO AN EXEMPTION FROM THE REGISTRATION REQUIREMENTS OF, AND OTHERWISE IN COMPLIANCE WITH, THE FIEL AND OTHER RELEVANT LAWS, REGULATIONS AND MINISTERIAL GUIDELINES OF JAPAN. AS PART OF THIS OFFERING OF THE OFFERED CERTIFICATES, THE UNDERWRITERS MAY OFFER THE OFFERED CERTIFICATES IN JAPAN TO UP TO 49 OFFEREES IN ACCORDANCE WITH THE ABOVE PROVISIONS.
This is not a research report and was not prepared by any Underwriter’s research department. Please see additional important information and qualifications at the end of this Term Sheet.