| FREE WRITING PROSPECTUS | ||
| FILED PURSUANT TO RULE 433 | ||
| REGISTRATION FILE NO.: 333-261279-05 |
 |  |  |  |
BANK5 2024-5YR8
Free Writing Prospectus
Structural and Collateral Term Sheet
$690,480,940
(Approximate Total Mortgage Pool Balance)
$604,170,000
(Approximate Offered Certificates)
Banc of America Merrill Lynch Commercial Mortgage Inc.
as Depositor
Bank of America, National Association
Morgan Stanley Mortgage Capital Holdings LLC
Wells Fargo Bank, National Association
JPMorgan Chase Bank, National Association
as Sponsors and Mortgage Loan Sellers
Commercial Mortgage Pass-Through Certificates
Series 2024-5YR8
July 23, 2024
| BofA SECURITIES Co-Lead Bookrunner Manager | WELLS FARGO SECURITIES Co-Lead Bookrunner Manager | J.P. MORGAN Co-Lead Bookrunner Manager | MORGAN STANLEY Co-Lead Bookrunner Manager |
Academy Securities, Inc. Co-Manager | Drexel Hamilton Co-Manager |
STATEMENT REGARDING THIS FREE WRITING PROSPECTUS
The depositor has filed a registration statement (including a prospectus) with the SEC (File No. 333-261279) for the offering to which this communication relates. Before you invest, you should read the prospectus in that registration statement and other documents the depositor has filed with the SEC for more complete information about the depositor, the issuing entity and this offering. You may get these documents for free by visiting EDGAR on the SEC web site at www.sec.gov. Alternatively, the depositor or any underwriter or any dealer participating in the offering will arrange to send you the prospectus if you request it by calling toll free 1-866-294-1322 or by email to dg.Prospectus_Requests@bofa.com.
| This is not a research report and was not prepared by any Underwriter’s research department. Please see additional important information and qualifications at the end of this Term Sheet. | ||
| 1 | ||
| BANK5 2024-5YR8 |
Neither this Term Sheet nor anything contained herein shall form the basis for any contract or commitment whatsoever. The information contained herein is preliminary as of the date hereof. This Term Sheet is subject to change, completion or amendment from time to time. The information contained herein supersedes information in any other communication relating to the securities described herein; provided, that the information contained herein will be superseded by similar information delivered to you as part of the Preliminary Prospectus. The information contained herein should be reviewed only in conjunction with the entire Preliminary Prospectus. All of the information contained herein is subject to the same limitations and qualifications contained in the Preliminary Prospectus. The information contained herein does not contain all relevant information relating to the underlying mortgage loans or mortgaged properties. Such information is described in the Preliminary Prospectus. The information contained herein will be more fully described in the Preliminary Prospectus. The information contained herein should not be viewed as projections, forecasts, predictions or opinions with respect to value. Prior to making any investment decision, prospective investors are strongly urged to read the Preliminary Prospectus in its entirety. Neither the Securities and Exchange Commission nor any state securities commission has approved or disapproved of these securities or determined if this Term Sheet is truthful or complete. Any representation to the contrary is a criminal offense.
BofA Securities is the marketing name for the global banking and global markets businesses of Bank of America Corporation. Lending, derivatives, and other commercial banking activities are performed globally by banking affiliates of Bank of America Corporation, including Bank of America, N.A., member FDIC. Securities, strategic advisory, and other investment banking activities are performed globally by investment banking affiliates of Bank of America Corporation, including, in the United States, BofA Securities, Inc., which is a registered broker-dealer and member of the Financial Industry Regulatory Authority (“FINRA”) and the Securities Investor Protection Corporation (“SIPC”), and, in other jurisdictions, locally registered entities.
Wells Fargo Securities is the trade name for the capital markets and investment banking services of Wells Fargo & Company and its subsidiaries, including but not limited to Wells Fargo Securities, LLC, a member of the New York Stock Exchange, FINRA, the National Futures Association (“NFA”) and SIPC, Wells Fargo Prime Services, LLC, a member of FINRA, NFA and SIPC, and Wells Fargo Bank, National Association. Wells Fargo Securities, LLC and Wells Fargo Prime Services, LLC are distinct entities from affiliated banks and thrifts.
J.P. Morgan is a marketing name for investment banking businesses of JPMorgan Chase & Co. and its subsidiaries worldwide. Securities, syndicated loan arranging, financial advisory and other investment banking activities are performed by J.P. Morgan Securities LLC and its securities affiliates, and lending, derivatives and other commercial banking activities are performed by JPMorgan Chase Bank, National Association and its banking affiliates. J.P. Morgan Securities LLC is a member of SIPC and the NYSE.
IMPORTANT NOTICE RELATING TO AUTOMATICALLY GENERATED EMAIL DISCLAIMERS
Any legends, disclaimers or other notices that may appear at the bottom of, or attached to, the email communication to which this Term Sheet may have been attached are not applicable to this Term Sheet and should be disregarded. Such legends, disclaimers or other notices have been automatically generated as a result of this Term Sheet having been sent via Bloomberg or another email system.
IMPORTANT NOTICE REGARDING THE CONDITIONS FOR THIS OFFERING OF ASSET-BACKED SECURITIES
THE ASSET-BACKED SECURITIES REFERRED TO IN THIS TERM SHEET ARE BEING OFFERED WHEN, AS AND IF ISSUED. IN PARTICULAR, YOU ARE ADVISED THAT THE ASSET-BACKED SECURITIES, AND THE ASSET POOL BACKING THEM, ARE SUBJECT TO MODIFICATION OR REVISION (INCLUDING, AMONG OTHER THINGS, THE POSSIBILITY THAT ONE OR MORE CLASSES OF SECURITIES MAY BE SPLIT, COMBINED OR ELIMINATED), AT ANY TIME PRIOR TO ISSUANCE OR AVAILABILITY OF A FINAL PROSPECTUS. AS A RESULT, YOU MAY COMMIT TO PURCHASE SECURITIES THAT HAVE CHARACTERISTICS THAT MAY CHANGE, AND YOU ARE ADVISED THAT ALL OR A PORTION OF THE SECURITIES MAY NOT BE ISSUED THAT HAVE THE CHARACTERISTICS DESCRIBED IN THIS TERM SHEET. OUR OBLIGATION TO SELL SECURITIES TO YOU IS CONDITIONED ON THE SECURITIES AND THE UNDERLYING TRANSACTION HAVING THE CHARACTERISTICS DESCRIBED IN THIS TERM SHEET. IF WE DETERMINE THAT THE FOREGOING CONDITION IS NOT SATISFIED IN ANY MATERIAL RESPECT, WE WILL NOTIFY YOU, AND NEITHER THE ISSUING ENTITY NOR ANY UNDERWRITER WILL HAVE ANY OBLIGATION TO YOU TO DELIVER ALL OR ANY PORTION OF THE SECURITIES WHICH YOU HAVE COMMITTED TO PURCHASE, AND THERE WILL BE NO LIABILITY BETWEEN US AS A CONSEQUENCE OF THE NON-DELIVERY.
| This is not a research report and was not prepared by any Underwriter’s research department. Please see additional important information and qualifications at the end of this Term Sheet. | ||
| 2 | ||
| BANK5 2024-5YR8 | Structural Overview |
Offered Certificates
| Class | Expected Ratings (Fitch/Moody’s/ Morningstar DBRS)(1) | Approximate Initial Certificate Balance or Notional Amount(2) | Approximate Initial Credit Support(3) | Pass-Through Rate Description | Expected Weighted Average Life (Years)(4) | Expected Principal Window (Months)(4) | Certificate Principal UW NOI Debt Yield(5) | Certificate Principal to Value Ratio(6) |
| Class A-1 | AAAsf/Aaa(sf)/AAA(sf) | $8,100,000 | 30.000% | (7) | 2.45 | 1 – 57 | 17.6% | 39.4% |
| Class A-2(8) | AAAsf/Aaa(sf)/AAA(sf) | (8)(9) | 30.000% | (7)(8) | (9) | (9) | 17.6% | 39.4% |
| Class A-3(8) | AAAsf/Aaa(sf)/AAA(sf) | (8)(9) | 30.000% | (7)(8) | (9) | (9) | 17.6% | 39.4% |
| Class X-A | AAAsf/Aaa(sf)/AAA(sf) | $483,336,000(10) | N/A | Variable IO(11) | N/A | N/A | N/A | N/A |
| Class X-B | A-sf/NR/AA(sf) | $120,834,000(10) | N/A | Variable IO(11) | N/A | N/A | N/A | N/A |
| Class A-S(8) | AAAsf/Aa1(sf)/AAA(sf) | $56,965,000(8) | 21.750% | (7)(8) | 4.92 | 59 – 59 | 15.8% | 44.1% |
| Class B(8) | AA-sf/NR/AAA(sf) | $36,250,000(8) | 16.500% | (7)(8) | 4.92 | 59 – 59 | 14.8% | 47.0% |
| Class C(8) | A-sf/NR/AA(low)(sf) | $27,619,000(8) | 12.500% | (7)(8) | 4.92 | 59 – 59 | 14.1% | 49.3% |
Privately Offered Certificates(13)
| Class | Expected Ratings (Fitch/ Moody’s/ Morningstar DBRS/)(1) | Approximate Initial Certificate Balance or Notional Amount(2) | Approximate Initial Credit Support(3) | Pass-Through Rate Description | Expected Weighted Average Life (Years)(4) | Expected Principal Window (Months)(4) | Certificate Principal UW NOI Debt Yield(5) | Certificate Principal to Value Ratio(6) |
| Class X-D | BBB-sf/NR/A(low)(sf) | $25,458,000(10)(12) | N/A | Variable IO(11) | N/A | N/A | N/A | N/A |
| Class D | BBBsf/NR/A(sf) | $18,125,000 | 9.875% | (7) | 4.92 | 59 – 59 | 13.7% | 50.7% |
| Class E | BBB-sf/NR/BBB(high)(sf) | $7,333,000(12) | 8.813% | (7) | 4.92 | 59 – 59 | 13.5% | 51.3% |
| Class F-RR | BB-sf/NR/BBB(low)(sf) | $18,560,000(12) | 6.125% | (7) | 5.00 | 59 – 60 | 13.2% | 52.9% |
| Class G-RR | B-sf/NR/BB(high)(sf) | $12,947,000 | 4.250% | (7) | 5.00 | 60 – 60 | 12.9% | 53.9% |
| Class J-RR | NR/NR/NR | $29,345,939 | 0.000% | (7) | 5.00 | 60 – 60 | 12.4% | 56.3% |
| (1) | Ratings shown are those of Fitch Ratings, Inc. (“Fitch”), DBRS, Inc. (“Morningstar DBRS”) and Moody’s Investors Service, Inc. (“Moody’s”). Certain nationally recognized statistical rating organizations that were not hired by the depositor may use information they receive pursuant to Rule 17g-5 under the Securities Exchange Act of 1934, as amended, or otherwise to rate the certificates. There can be no assurance as to what ratings a non-hired nationally recognized statistical rating organization would assign. See “Risk Factors—Other Risks Relating to the Certificates—Nationally Recognized Statistical Rating Organizations May Assign Different Ratings to the Certificates; Ratings of the Certificates Reflect Only the Views of the Applicable Rating Agencies as of the Dates Such Ratings Were Issued; Ratings May Affect ERISA Eligibility; Ratings May Be Downgraded” and “Ratings” in the Preliminary Prospectus to be dated on or about the date hereof (the “Preliminary Prospectus”). Capitalized terms used but not defined herein have the meanings assigned to such terms in the Preliminary Prospectus. |
| (2) | Approximate, subject to a permitted variance of plus or minus 5% and further subject to the discussion in footnote (9) below. In addition, the notional amounts of the Class X-A, Class X-B and Class X-D certificates may vary depending upon the final pricing of the classes of principal balance certificates or trust components whose certificate or principal balances comprise such notional amounts, and, if as a result of such pricing the pass-through rate of any class of the Class X-A, Class X-B or Class X-D certificates, as applicable, would be equal to zero at all times, such class of certificates will not be issued on the closing date of this securitization. |
| (3) | The approximate initial credit support percentages set forth for the certificates are approximate and, for the Class A-1, Class A-2 and Class A-3 certificates, are presented in the aggregate, taking into account the principal balances of the Class A-2 and Class A-3 trust components. The approximate initial credit support percentage set forth for each class of the Class A-S, Class B and Class C certificates represents the approximate credit support for the underlying trust component with the same alphanumeric designation. |
| (4) | The Expected Weighted Average Life and Expected Principal Window during which distributions of principal would be received as set forth in the foregoing table with respect to each class of principal balance certificates are based on the assumptions set forth under “Yield and Maturity Considerations—Weighted Average Life” in the Preliminary Prospectus and on the assumptions that there are no prepayments, modifications or losses in respect of the mortgage loans and that there are no extensions or forbearances of maturity dates or anticipated repayment dates of the mortgage loans. |
| (5) | Certificate Principal UW NOI Debt Yield for any class of principal balance certificates shown in the table above is calculated as the product of (a) the weighted average UW NOI Debt Yield for the mortgage pool, multiplied by (b) a fraction, the numerator of which is the aggregate initial certificate balance of all the principal balance certificates, and the denominator of which is the aggregate initial certificate balance of the subject class of principal balance certificates (or, with respect to the Class A-2, Class A-3, Class A-S, Class B or Class C certificates, the initial principal balance of the trust component with the same alphanumeric designation) and all other classes of principal balance certificates, if any, that are senior to such class. The Certificate Principal UW NOI Debt Yields of the Class A-1, Class A-2 and Class A-3 certificates are calculated in the aggregate for those classes as if they were a single class. |
| (6) | Certificate Principal to Value Ratio for any class of principal balance certificates shown in the table above is calculated as the product of (a) the weighted average Cut-off Date LTV Ratio of the mortgage pool, multiplied by (b) a fraction, the numerator of which is the aggregate initial certificate balance of the subject class of principal balance certificates (or, with respect to the Class A-2, Class A-3, Class A-S, Class B or Class C certificates, the initial principal balance of the trust component with the same alphanumeric designation) and all other classes of principal balance certificates, if any, that are senior to such class, and the denominator of which is the aggregate initial certificate balance of all the principal balance certificates. The Certificate Principal to Value Ratios of the Class A-1, Class A-2 and Class A-3 certificates are calculated in the aggregate for those classes as if they were a single class. |
| (7) | The pass-through rate for each class of the Class A-1, Class A-2, Class A-3, Class A-S, Class B, Class C, Class D, Class E, Class F-RR, Class G-RR and Class J-RR certificates for any distribution date will be one of the following: (i) a fixed rate per annum, (ii) a variable rate per annum equal to the weighted average of the net mortgage interest rates on the mortgage loans for the related distribution date, (iii) a variable rate per annum equal to the lesser of (a) a |
| This is not a research report and was not prepared by any Underwriter’s research department. Please see additional important information and qualifications at the end of this Term Sheet. | ||
| 3 | ||
| BANK5 2024-5YR8 | Structural Overview |
fixed rate and (b) the weighted average of the net mortgage interest rates on the mortgage loans for the related distribution date or (iv) a variable rate per annum equal to the weighted average of the net mortgage interest rates on the mortgage loans for the related distribution date minus a specified percentage. For purposes of the calculation of the weighted average of the net mortgage interest rates on the mortgage loans for each distribution date, the mortgage interest rates will be adjusted as necessary to a 30/360 basis.
| (8) | The Class A-2-1, Class A-2-2, Class A-2-X1, Class A-2-X2, Class A-3-1, Class A-3-2, Class A-3-X1, Class A-3-X2, Class A-S-1, Class A-S-2, Class A-S-X1, Class A-S-X2, Class B-1, Class B-2, Class B-X1, Class B-X2, Class C-1, Class C-2, Class C-X1 and Class C-X2 certificates are also offered certificates. Such classes of certificates, together with the Class A-2, Class A-3, Class A-S, Class B and Class C certificates, constitute the “Exchangeable Certificates”. The Class A-1, Class D, Class E, Class F-RR, Class G-RR and Class J-RR certificates, together with the Exchangeable Certificates with a certificate balance, are referred to as the “principal balance certificates.” Each class of Exchangeable Certificates will have the certificate balance or notional amount and pass-through rate described below under “Exchangeable Certificates.” Each class of Class A-2, Class A-3, Class A-S, Class B and Class C Exchangeable Certificates will have the same ratings as the Class A-2, Class A-3, Class A-S, Class B and Class C certificates, respectively, shown in the table above. |
| (9) | The exact initial principal balances or notional amounts of the Class A-2, Class A-2-X1, Class A-2-X2, Class A-3, Class A-3-X1 and Class A-3-X2 trust components (and consequently, the exact aggregate initial certificate balances or notional amounts of the Exchangeable Certificates with an “A-2” or “A-3” designation) are unknown and will be determined based on the final pricing of the certificates. However, the initial principal balances, weighted average lives and principal windows of the Class A-2 and Class A-3 trust components are expected to be within the applicable ranges reflected in the chart below. The aggregate initial principal balance of the Class A-2 and Class A-3 trust components is expected to be approximately $475,236,000, subject to a variance of plus or minus 5%. The Class A-2-X1 and Class A-2-X2 trust components will have initial notional amounts equal to the initial principal balance of the Class A-2 trust component. The Class A-3-X1 and Class A-3-X2 trust components will have initial notional amounts equal to the initial principal balance of the Class A-3 trust component. In the event that the Class A-3 trust component is issued with an initial certificate balance of $475,236,000, the Class A-2 trust component (and, correspondingly, the Class A-2 Exchangeable Certificates) will not be issued. |
| Trust Component | Expected Range of Initial Principal Balance | Expected Range of Weighted Average Life (Years) | Expected Range of Principal Window (Months) |
| Class A-2 trust component | $0 – $100,000,000 | N/A – 4.83 | N/A / 57 – 58 |
| Class A-3 trust component | $375,236,000 – $475,236,000 | 4.88 – 4.89 | 57 – 59 / 58 – 59 |
| (10) | The Class X-A, Class X-B and Class X-D certificates (collectively referred to as the “Class X certificates”) are notional amount certificates and will not be entitled to distributions of principal. The notional amount of the Class X-A certificates will be equal to the aggregate certificate or principal balance of the Class A-1 certificates and the Class A-2 and Class A-3 trust components outstanding from time to time. The notional amount of the Class X-B certificates will be equal to the aggregate principal balance of the Class A-S, Class B and Class C trust components outstanding from time to time. The notional amount of the Class X-D certificates will be equal to the aggregate certificate balance of the Class D and Class E certificates outstanding from time to time. |
| (11) | The pass-through rate for the Class X-A certificates for any distribution date will be a per annum rate equal to the excess, if any, of (a) the weighted average of the net mortgage interest rates on the mortgage loans for the related distribution date, over (b) the weighted average of the pass-through rates on the Class A-1 certificates and the Class A-2, Class A-2-X1, Class A-2-X2, Class A-3, Class A-3-X1 and Class A-3-X2 trust components for the related distribution date, weighted on the basis of their respective certificate or principal balances or notional amounts outstanding immediately prior to that distribution date (but excluding trust components with a notional amount in the denominator of such weighted average calculation). The pass-through rate for the Class X-B certificates for any distribution date will be a per annum rate equal to the excess, if any, of (a) the weighted average of the net mortgage interest rates on the mortgage loans for the related distribution date, over (b) the weighted average of the pass-through rates on the Class A-S, Class A-S-X1, Class A-S-X2, Class B, Class B-X1, Class B-X2, Class C, Class C-X1 and Class C-X2 trust components for the related distribution date, weighted on the basis of their respective principal balances or notional amounts outstanding immediately prior to that distribution date (but excluding trust components with a notional amount in the denominator of such weighted average calculation). The pass-through rate for the Class X-D certificates for any distribution date will be a per annum rate equal to the excess, if any, of (a) the weighted average of the net mortgage interest rates on the mortgage loans for the related distribution date, over (b) the weighted average of the pass-through rates on the Class D and Class E certificates for the related distribution date, weighted on the basis of their respective certificate balances outstanding immediately prior to that distribution date. For purposes of the calculation of the weighted average of the net mortgage interest rates on the mortgage loans for each distribution date, the mortgage interest rates will be adjusted as necessary to a 30/360 basis. |
| (12) | The approximate initial Certificate Balances of the Class E and Class F-RR certificates (and correspondingly, the initial notional amount of the Class X-D certificates) are based in part on the estimated ranges of initial certificate balances and estimated fair values described in “Credit Risk Retention” in the Preliminary Prospectus. The approximate initial certificate balances of the Class E and Class F-RR certificates are subject to change based on the final pricing of the certificates, with the ultimate initial certificate balances determined such that the aggregate fair value of the Class F-RR, Class G-RR and Class J-RR certificates will equal at least 5% of the fair value of all of the classes of certificates issued by the issuing entity (other than the Class R certificates). |
| (13) | Not offered pursuant to the Preliminary Prospectus or this Term Sheet. Information provided in this Term Sheet regarding the characteristics of these certificates is provided only to enhance your understanding of the offered certificates. The privately offered certificates also include the Class V and Class R certificates, which do not have a certificate balance, notional amount, credit support, pass-through rate, rating, assumed final distribution date or rated final distribution date, and which are not shown in the chart. The Class V certificates represent a beneficial ownership interest held through the grantor trust in certain excess interest in respect of mortgage loans having anticipated repayment dates, if any. The Class R certificates represent the beneficial ownership of the residual interest in each of the real estate mortgage investment conduits, as further described in the Preliminary Prospectus. |
| This is not a research report and was not prepared by any Underwriter’s research department. Please see additional important information and qualifications at the end of this Term Sheet. | ||
| 4 | ||
| BANK5 2024-5YR8 | Structural Overview |
Issue Characteristics
| Offered Certificates: | $604,170,000 (approximate) monthly pay, multi-class, commercial mortgage pass-through certificates, consisting of 16 principal balance classes (Class A-1, Class A-2, Class A-2-1, Class A-2-2, Class A-3, Class A-3-1, Class A-3-2, Class A-S, Class A-S-1, Class A-S-2, Class B, Class B-1, Class B-2, Class C, Class C-1 and Class C-2) and 12 interest-only classes (Class A-2-X1, Class A-2-X2, Class A-3-X1, Class A-3-X2, Class X-A, Class X-B, Class A-S-X1, Class A-S-X2, Class B-X1, Class B-X2, Class C-X1 and Class C-X2) |
| Co-Lead Managers and Joint Bookrunners: | BofA Securities, Inc., Morgan Stanley & Co. LLC, Wells Fargo Securities, LLC and J.P. Morgan Securities LLC |
| Co-Managers: | Academy Securities, Inc. and Drexel Hamilton, LLC |
| Mortgage Loan Sellers: | Bank of America, National Association, Morgan Stanley Mortgage Capital Holdings LLC, Wells Fargo Bank, National Association and JPMorgan Chase Bank, National Association |
| Rating Agencies: | Fitch, Morningstar DBRS and Moody’s |
| Master Servicer: | Wells Fargo Bank, National Association |
| Special Servicer: | Greystone Servicing Company LLC |
| Trustee/Certificate Administrator/ Certificate Registrar/Custodian: | Computershare Trust Company, National Association |
| Operating Advisor: | Pentalpha Surveillance LLC |
| Asset Representations Reviewer: | Pentalpha Surveillance LLC |
| Initial Directing Certificateholder: | 400 Capital Management LLC or an affiliate thereof |
| U.S. Credit Risk Retention: | For a discussion on the manner in which the U.S. credit risk retention requirements will be addressed by Bank of America, National Association, as the retaining sponsor, see “Credit Risk Retention” in the Preliminary Prospectus. An economic interest in the credit risk of the mortgage pool in this transaction is expected to be retained as an “eligible horizontal residual interest” (as defined in Regulation RR) in the form of the Class F-RR, Class G-RR and Class J-RR Certificates. Bank of America, National Association, as “retaining sponsor” (as defined in Regulation RR), intends to satisfy the risk retention requirements through the purchase by 660 RR Holdings LLC, a Delaware limited liability company, as a “third-party purchaser” (as defined in Regulation RR), of such classes of certificates. See “Credit Risk Retention” in the Preliminary Prospectus. |
| EU/UK Risk Retention: | None of the sponsors, the depositor or the underwriters or their respective affiliates, or any other person, intends to retain a material net economic interest in the securitization constituted by the issue of the certificates, or to take any other action in respect of such securitization, in a manner prescribed or contemplated by the EU Securitization Regulation or the UK Securitization Regulation. In particular, no such person undertakes to take any action which may be required by any potential investor or certificateholder for the purposes of its compliance with any requirement of the EU Securitization Regulation or the UK Securitization Regulation. In addition, the arrangements described under “Credit Risk Retention” in the Preliminary Prospectus have not been structured with the objective of ensuring compliance by any person with any requirement of the EU Securitization Regulation or the UK Securitization Regulation. Consequently, the Offered Certificates may not be a suitable investment for investors that are subject to any requirement of the EU Securitization Regulation or the UK Securitization Regulation. See “Risk Factors—Other Risks Relating to the Certificates—EU Securitization Regulation and UK Securitization Regulation” in the Preliminary Prospectus. |
| Cut-off Date: | The mortgage loans will be considered part of the trust fund as of their respective cut-off dates. The cut-off date with respect to each mortgage loan is the respective due date for the monthly debt service payment that is due in August 2024 (or, in the case of any mortgage loan that has its first due date after August 2024, the date that would have been its due date in August 2024 under the terms of that mortgage loan if a monthly debt service payment were scheduled to be due in that month). |
| Expected Pricing Date: | Week of July 22, 2024 |
| Expected Closing Date: | August 15, 2024 |
| Determination Dates: | The 11th day of each month or, if the 11th day is not a business day, then the business day immediately following such 11th day. |
| Distribution Dates: | The 4th business day following each determination date. The first distribution date will be in September 2024. |
| Rated Final Distribution Date: | The distribution date in August 2057 |
| Interest Accrual Period: | Preceding calendar month |
| Payment Structure: | Sequential pay |
| Tax Treatment: | REMIC, except that the Exchangeable Certificates will evidence interests in a grantor trust |
| Optional Termination: | 1.00% clean-up call |
| Minimum Denominations: | $10,000 for each class of Offered Certificates (other than Class X-A and Class X-B certificates); $1,000,000 for the Class X-A and Class X-B certificates |
| Settlement Terms: | DTC, Euroclear and Clearstream |
| This is not a research report and was not prepared by any Underwriter’s research department. Please see additional important information and qualifications at the end of this Term Sheet. | ||
| 5 | ||
| BANK5 2024-5YR8 | Structural Overview |
| Legal/Regulatory Status: | Each class of Offered Certificates is expected to be eligible for exemptive relief under ERISA. Until the SEC adopts rules establishing a different creditworthiness standard, the Class A-1 certificates, Class A-2 Exchangeable Certificates, the Class A-3 Exchangeable Certificates, the Class X-A certificates, the Class X-B Certificates, the Class A-S Exchangeable Certificates, the Class B Exchangeable Certificates and the Class C Exchangeable Certificates will constitute “mortgage related securities” for purposes of SMMEA, so long as they are rated in one of the two highest rating categories by one of the rating agencies or another NRSRO, and the other classes of certificates will not constitute “mortgage related securities” for purposes of SMMEA. |
| Analytics: | The certificate administrator is expected to make available all distribution date statements, CREFC® reports and supplemental notices received by it to certain modeling financial services as described in the Preliminary Prospectus. |
| Bloomberg Ticker: | BANK5 2024-5YR8<MTGE><GO> |
| Risk Factors: | THE CERTIFICATES INVOLVE CERTAIN RISKS AND MAY NOT BE SUITABLE FOR ALL INVESTORS. SEE THE “RISK FACTORS” SECTION OF THE PRELIMINARY PROSPECTUS. |
| This is not a research report and was not prepared by any Underwriter’s research department. Please see additional important information and qualifications at the end of this Term Sheet. | ||
| 6 | ||
| BANK5 2024-5YR8 | Structural Overview |
Structural Overview
| Accrual: | Each class of Offered Certificates will accrue interest on a 30/360 basis. |
| Amount and Order of Distributions: | On each distribution date, funds available for distribution from the mortgage loans, net of (i) any yield maintenance charges and prepayment premiums and (ii) any excess interest, will be distributed in the following amounts and order of priority: First, to the Class A-1, Class X-A, Class X-B and Class X-D certificates and the Class A-2, Class A-2-X1, Class A-2-X2, Class A-3, Class A-3-X1 and Class A-3-X2 trust components, in respect of interest, up to an amount equal to, and pro rata in accordance with, the interest entitlements for those classes of certificates and trust components; Second, to the Class A-1 certificates and the Class A-2 and Class A-3 trust components as follows, to the extent of applicable available funds allocated to principal: either (i)(a) first, to principal on (a) the Class A-1 certificates , (b) the Class A-2 trust component, and (c) the Class A-3 trust component, in that order, in each case until the certificate or principal balance of the applicable class of certificates or trust component has been reduced to zero, or (ii) if the certificate or principal balance of each class of principal balance certificates and trust components other than the Class A-1 certificates and Class A-2 and Class A-3 trust components has been reduced to zero as a result of the allocation of losses on the mortgage loans to those certificates and trust components, to principal on the Class A-1 certificates and Class A-2 and Class A-3 trust components, pro rata, without regard to the distribution priorities described above; Third, to the Class A-1 certificates and Class A-2 and Class A-3 trust components, first, up to an amount equal to, and pro rata based on, any previously unreimbursed losses on the mortgage loans allocable to principal that were previously borne by each such class or trust component and then in the amount of interest thereon; Fourth, to the Class A-S, Class A-S-X1 and Class A-S-X2 trust components, as follows: (a) to each such trust component in respect of interest, up to an amount equal to, and pro rata in accordance with, the interest entitlements for those trust components; (b) to the extent of applicable available funds allocable to principal remaining after distributions in respect of principal to each class of certificates or trust component with a higher priority (as set forth in prior enumerated clauses set forth above), to principal on the Class A-S trust component until its principal balance has been reduced to zero; and (c) to reimburse the Class A-S trust component, first, in the amount of any previously unreimbursed losses on the mortgage loans that were previously allocated thereto, then in the amount of interest thereon; Fifth, to the Class B, Class B-X1 and Class B-X2 trust components, as follows: (a) to each such trust component in respect of interest, up to an amount equal to, and pro rata in accordance with, the interest entitlements for those trust components; (b) to the extent of applicable available funds allocable to principal remaining after distributions in respect of principal to each class of certificates or trust component with a higher priority (as set forth in prior enumerated clauses set forth above), to principal on the Class B trust component until its principal balance has been reduced to zero; and (c) to reimburse the Class B trust component, first, in the amount of any previously unreimbursed losses on the mortgage loans that were previously allocated thereto, then in the amount of interest thereon; Sixth, to the Class C, Class C-X1 and Class C-X2 trust components, as follows: (a) to each such trust component in respect of interest, up to an amount equal to, and pro rata in accordance with, the interest entitlements for those trust components; (b) to the extent of applicable available funds allocable to principal remaining after distributions in respect of principal to each class of certificates or trust component with a higher priority (as set forth in prior enumerated clauses set forth above), to principal on the Class C trust component until its principal balance has been reduced to zero; and (c) to reimburse the Class C trust component, first, in the amount of any previously unreimbursed losses on the mortgage loans that were previously allocated thereto, then in the amount of interest thereon; Seventh, to the Class D, Class E, Class F-RR, Class G-RR and Class J-RR certificates in the amounts and order of priority described in “Description of the Certificates—Distributions” in the Preliminary Prospectus; and Eighth, to the Class R certificates, any remaining amounts. Principal and interest payable on each trust component will be distributed pro rata to the corresponding classes of Exchangeable Certificates representing interests therein in accordance with their Class Percentage Interests therein as described below under “Exchangeable Certificates.” |
| Interest and Principal Entitlements: | The interest entitlement of each class of Offered Certificates on each distribution date generally will be the interest accrued during the related interest accrual period on the related certificate balance or notional amount at the related pass-through rate, net of any prepayment interest shortfalls allocated to that class for such distribution date as described below. If prepayment interest shortfalls arise from voluntary prepayments on serviced mortgage loans during any collection period, the master servicer is required to make a limited compensating interest payment to offset those shortfalls. See “Description of the Certificates—Prepayment Interest Shortfalls” in the Preliminary Prospectus. The remaining amount of prepayment interest shortfalls will be allocated among the classes of certificates (other than the Exchangeable Certificates) and trust components that are entitled to interest, on a pro rata basis, based on their respective amounts of accrued interest for the related distribution date, to reduce the interest entitlement on each such class of certificates and trust components. For any distribution date, prepayment interest shortfalls allocated to a trust component will be allocated among the related classes of Exchangeable Certificates, pro rata, in accordance with their respective class percentage interests for that distribution date. If a class of certificates or trust component receives less than the entirety of its interest entitlement on any distribution date, then the shortfall (excluding any shortfall due to prepayment interest shortfalls), together with interest thereon, will be added to its interest entitlement for the next succeeding distribution date. |
| This is not a research report and was not prepared by any Underwriter’s research department. Please see additional important information and qualifications at the end of this Term Sheet. | ||
| 7 | ||
| BANK5 2024-5YR8 | Structural Overview |
The principal distribution amount for each distribution date generally will be the aggregate amount of principal received or advanced in respect of the mortgage loans, net of any non-recoverable advances and interest thereon and any workout-delayed reimbursement amounts that are reimbursed to the master servicer or the trustee during the related collection period. Non-recoverable advances and interest thereon are reimbursable from principal collections before reimbursement from other amounts. Workout-delayed reimbursement amounts will be reimbursable from principal collections. | |
| Exchangeable Certificates: | Certificates of each class of Exchangeable Certificates may be exchanged for certificates of the corresponding classes of Exchangeable Certificates set forth next to such class in the table below, and vice versa. Following any exchange of certificates of one or more classes of Exchangeable Certificates (the applicable “Surrendered Classes”) for certificates of one or more classes of other Exchangeable Certificates (the applicable “Received Classes”), the Class Percentage Interests (as defined below) of the outstanding principal balances or notional amounts of the Corresponding Trust Components that are represented by the Surrendered Classes (and consequently their related certificate balances or notional amounts) will be decreased, and those of the Received Classes (and consequently their related certificate balances or notional amounts) will be increased. The dollar denomination of the certificates of each of the Received Classes must be equal to the dollar denomination of the certificates of each of the Surrendered Classes. No fee will be required with respect to any exchange of Exchangeable Certificates. |
| Surrendered Classes (or Received Classes) of Certificates | Received Classes (or Surrendered Classes) of Certificates | |
| Class A-2 | Class A-2-1, Class A-2-X1 | |
| Class A-2 | Class A-2-2, Class A-2-X2 | |
| Class A-3 | Class A-3-1, Class A-3-X1 | |
| Class A-3 | Class A-3-2, Class A-3-X2 | |
| Class A-S | Class A-S-1, Class A-S-X1 | |
| Class A-S | Class A-S-2, Class A-S-X2 | |
| Class B | Class B-1, Class B-X1 | |
| Class B | Class B-2, Class B-X2 | |
| Class C | Class C-1, Class C-X1 | |
| Class C | Class C-2, Class C-X2 |
| On the closing date, the issuing entity will issue the following “trust components,” each with the initial principal balance (or, if such trust component has an “X” suffix, notional amount) and pass-through rate set forth next to it in the table below. Each trust component with an “X” suffix will not be entitled to distributions of principal. |
| Trust Component | Initial Principal Balance or Notional Amount | Pass-Through Rate | |
| Class A-2 | See footnote (9) to the first table above under “Structural Overview” | Class A-2 certificate pass-through rate minus 1.00% | |
| Class A-2-X1 | Equal to Class A-2 trust component principal balance | 0.50% | |
| Class A-2-X2 | Equal to Class A-2 trust component principal balance | 0.50% | |
| Class A-3 | See footnote (9) to the first table above under “Structural Overview” | Class A-3 certificate pass-through rate minus 1.00% | |
| Class A-3-X1 | Equal to Class A-3 trust component principal balance | 0.50% | |
| Class A-3-X2 | Equal to Class A-3 trust component principal balance | 0.50% | |
| Class A-S | $56,965,000 | Class A-S certificate pass-through rate minus 1.00% | |
| Class A-S-X1 | Equal to Class A-S trust component principal balance | 0.50% | |
| Class A-S-X2 | Equal to Class A-S trust component principal balance | 0.50% | |
| Class B | $36,250,000 | Class B certificate pass-through rate minus 1.00% | |
| Class B-X1 | Equal to Class B trust component principal balance | 0.50% | |
| Class B-X2 | Equal to Class B trust component principal balance | 0.50% | |
| Class C | $27,619,000 | Class C certificate pass-through rate minus 1.00% | |
| Class C-X1 | Equal to Class C trust component principal balance | 0.50% | |
| Class C-X2 | Equal to Class C trust component principal balance | 0.50% |
| Each class of Exchangeable Certificates represents an undivided beneficial ownership interest in the trust components set forth next to it in the table below (the “Corresponding Trust Components”). Each class of Exchangeable Certificates has a pass-through rate equal to the sum of the pass-through rates of the Corresponding Trust Components and represents a percentage interest (the related “Class Percentage |
| This is not a research report and was not prepared by any Underwriter’s research department. Please see additional important information and qualifications at the end of this Term Sheet. | ||
| 8 | ||
| BANK5 2024-5YR8 | Structural Overview |
| Interest”) in each Corresponding Trust Component, including principal and interest payable thereon (and reimbursements of losses allocable thereto), equal to (x) the certificate balance (or, if such class has an “X” suffix, notional amount) of such class of certificates, divided by (y) the principal balance of the Class A-2 trust component (if such class of Exchangeable Certificates has an “A-2” designation), the Class A-3 trust component (if such class of Exchangeable Certificates has an “A-3” designation), the Class A-S trust component (if such class of Exchangeable Certificates has an “A-S” designation), the Class B trust component (if such class of Exchangeable Certificates has a “B” designation), or the Class C trust component (if such class of Exchangeable Certificates has a “C” designation). |
| Group of Exchangeable Certificates | Class of Exchangeable Certificates | Corresponding Trust Components | |
| “Class A-2 Exchangeable Certificates” | Class A-2 | Class A-2, Class A-2-X1, Class A-2-X2 | |
| Class A-2-1 | Class A-2, Class A-2-X2 | ||
| Class A-2-2 | Class A-2 | ||
| Class A-2-X1 | Class A-2-X1 | ||
| Class A-2-X2 | Class A-2-X1, Class A-2-X2 | ||
| “Class A-3 Exchangeable Certificates” | Class A-3 | Class A-3, Class A-3-X1, Class A-3-X2 | |
| Class A-3-1 | Class A-3, Class A-3-X2 | ||
| Class A-3-2 | Class A-3 | ||
| Class A-3-X1 | Class A-3-X1 | ||
| Class A-3-X2 | Class A-3-X1, Class A-3-X2 | ||
| “Class A-S Exchangeable Certificates” | Class A-S | Class A-S, Class A-S-X1, Class A-S-X2 | |
| Class A-S-1 | Class A-S, Class A-S-X2 | ||
| Class A-S-2 | Class A-S | ||
| Class A-S-X1 | Class A-S-X1 | ||
| Class A-S-X2 | Class A-S-X1, Class A-S-X2 | ||
| “Class B Exchangeable Certificates” | Class B | Class B, Class B-X1, Class B-X2 | |
| Class B-1 | Class B, Class B-X2 | ||
| Class B-2 | Class B | ||
| Class B-X1 | Class B-X1 | ||
| Class B-X2 | Class B-X1, Class B-X2 | ||
| “Class C Exchangeable Certificates” | Class C | Class C, Class C-X1, Class C-X2 | |
| Class C-1 | Class C, Class C-X2 | ||
| Class C-2 | Class C | ||
| Class C-X1 | Class C-X1 | ||
| Class C-X2 | Class C-X1, Class C-X2 |
The maximum certificate balance or notional amount of each class of Class A-2 Exchangeable Certificates, Class A-3 Exchangeable Certificates, Class A-S Exchangeable Certificates, Class B Exchangeable Certificates or Class C Exchangeable Certificates that could be issued in an exchange is equal to the principal balance of the Class A-2, Class A-3, Class A-S, Class B or Class C trust component, respectively. The maximum certificate balances of Class A-2, Class A-3, Class A-S, Class B and Class C certificates (subject to the constraint on the aggregate initial principal balance of the Class A-2 and Class A-3 trust components discussed in footnote (9) to the first table above under “Structural Overview”) will be issued on the closing date, and the certificate balance or notional amount of each other class of Exchangeable Certificates will be equal to zero on the closing date. Each class of Class A-2 Exchangeable Certificates, Class A-3 Exchangeable Certificates, Class A-S Exchangeable Certificates, Class B Exchangeable Certificates and Class C Exchangeable Certificates will have a certificate balance or notional amount equal to its Class Percentage Interest multiplied by the principal balance of the Class A-2, Class A-3, Class A-S, Class B or Class C trust component, respectively. Each class of Class A-2 Exchangeable Certificates, Class A-3 Exchangeable Certificates, Class A-S Exchangeable Certificates, Class B Exchangeable Certificates and Class C Exchangeable Certificates with a certificate balance will have the same approximate initial credit support percentage, Expected Weighted Average Life, Expected Principal Window, Certificate Principal UW NOI Debt Yield and Certificate Principal to Value Ratio as the Class A-2, Class A-3, Class A-S, Class B or Class C certificates, respectively, shown above. | |
| Special Servicer Compensation: | The principal compensation to be paid to the special servicer in respect of its special servicing activities will be the special servicing fee, the workout fee and the liquidation fee. The special servicing fee for each distribution date is calculated based on the outstanding principal balance of each serviced mortgage loan that is a specially serviced mortgage loan (and any related serviced companion loan) or as to which the related mortgaged property has become an REO property at the special servicing fee rate, which will be a rate equal to the greater of 0.25% per annum and the per annum rate that would result in a special servicing fee for the related month of $3,500. The special servicing fee will be payable monthly, first, from liquidation proceeds, insurance and condemnation proceeds, and other collections in respect of the related specially serviced mortgage loan or REO property and, then, from general collections on all the mortgage loans and any REO properties. |
| This is not a research report and was not prepared by any Underwriter’s research department. Please see additional important information and qualifications at the end of this Term Sheet. | ||
| 9 | ||
| BANK5 2024-5YR8 | Structural Overview |
The special servicer will also be entitled to (i) liquidation fees generally equal to 1.0% (or, if such rate would result in an aggregate liquidation fee less than $25,000, then the liquidation fee rate will be equal to such lower rate as would result in an aggregate liquidation fee equal to $25,000) of liquidation proceeds and certain other collections in respect of a specially serviced mortgage loan (and any related serviced companion loan) or related REO property and of amounts received in respect of mortgage loan repurchases by the related mortgage loan sellers and (ii) workout fees generally equal to 1.0% of interest (other than post-ARD excess interest on mortgage loans with anticipated repayment dates and other than default interest) and principal payments made in respect of a rehabilitated mortgage loan (and any related serviced companion loan), subject to a floor of $25,000 with respect to any mortgage loan, whole loan or related REO property, and in the case of each of clause (i) and (ii), subject to certain adjustments and exceptions as described in the Preliminary Prospectus under “Pooling and Servicing Agreement—Servicing and Other Compensation and Payment of Expenses—Special Servicing Compensation”. With respect to any non-serviced mortgage loan, the related special servicer under the related other pooling and servicing agreement pursuant to which such mortgage loan is being serviced will be entitled to similar compensation as that described above with respect to such non-serviced mortgage loan under such other pooling and servicing agreement as further described in the Preliminary Prospectus, although any related fees may accrue at a different rate and there may be a higher (or no) cap on liquidation and workout fees. | |
| Prepayment Premiums/Yield Maintenance Charges: | If any yield maintenance charge or prepayment premium is collected during any collection period with respect to any mortgage loan, then on the immediately succeeding distribution date, the certificate administrator will pay: (a) to the holders of each class of the Class A-1, Class A-2, Class A-2-1, Class A-2-2, Class A-3, Class A-3-1, Class A-3-2, Class A-S, Class A-S-1, Class A-S-2, Class B, Class B-1, Class B-2, Class C, Class C-1, Class C-2, Class D and Class E certificates, the product of (x) such yield maintenance charge or prepayment premium, (y) the related Base Interest Fraction for such class and the applicable principal prepayment, and (z) a fraction, the numerator of which is equal to the amount of principal distributed to such class for that distribution date, and the denominator of which is the YM Denominator for that distribution date, (b) to the holders of the Class A-2-X1 certificates, the product of (x) such yield maintenance charge or prepayment premium, (y) a fraction, the numerator of which is equal to the amount of principal distributed to the Class A-2-1 certificates for that distribution date, and the denominator of which is the YM Denominator for that distribution date, and (z) the difference between (1) the Base Interest Fraction for the Class A-2 certificates and the applicable principal prepayment and (2) the Base Interest Fraction for the Class A-2-1 certificates and the applicable principal prepayment, (c) to the holders of the Class A-2-X2 certificates, the product of (x) such yield maintenance charge or prepayment premium, (y) a fraction, the numerator of which is equal to the amount of principal distributed to the Class A-2-2 certificates for that distribution date, and the denominator of which is the YM Denominator for that distribution date, and (z) the difference between (1) the Base Interest Fraction for the Class A-2 certificates and the applicable principal prepayment and (2) the Base Interest Fraction for the Class A-2-2 certificates and the applicable principal prepayment, (d) to the holders of the Class A-3-X1 certificates, the product of (x) such yield maintenance charge or prepayment premium, (y) a fraction, the numerator of which is equal to the amount of principal distributed to the Class A-3-1 certificates for that distribution date, and the denominator of which is the YM Denominator for that distribution date, and (z) the difference between (1) the Base Interest Fraction for the Class A-3 certificates and the applicable principal prepayment and (2) the Base Interest Fraction for the Class A-3-1 certificates and the applicable principal prepayment, (e) to the holders of the Class A-3-X2 certificates, the product of (x) such yield maintenance charge or prepayment premium, (y) a fraction, the numerator of which is equal to the amount of principal distributed to the Class A-3-2 certificates for that distribution date, and the denominator of which is the YM Denominator for that distribution date, and (z) the difference between (1) the Base Interest Fraction for the Class A-3 certificates and the applicable principal prepayment and (2) the Base Interest Fraction for the Class A-3-2 certificates and the applicable principal prepayment, (f) to the holders of the Class A-S-X1 certificates, the product of (x) such yield maintenance charge or prepayment premium, (y) a fraction, the numerator of which is equal to the amount of principal distributed to the Class A-S-1 certificates for that distribution date, and the denominator of which is the YM Denominator for that distribution date, and (z) the difference between (1) the Base Interest Fraction for the Class A-S certificates and the applicable principal prepayment and (2) the Base Interest Fraction for the Class A-S-1 certificates and the applicable principal prepayment, (g) to the holders of the Class A-S-X2 certificates, the product of (x) such yield maintenance charge or prepayment premium, (y) a fraction, the numerator of which is equal to the amount of principal distributed to the Class A-S-2 certificates for that distribution date, and the denominator of which is the YM Denominator for that distribution date, and (z) the difference between (1) the Base Interest Fraction for the Class A-S certificates and the applicable principal prepayment and (2) the Base Interest Fraction for the Class A-S-2 certificates and the applicable principal prepayment, (h) to the holders of the Class B-X1 certificates, the product of (x) such yield maintenance charge or prepayment premium, (y) a fraction, the numerator of which is equal to the amount of principal distributed to the Class B-1 certificates for that distribution date, and the denominator of which is the YM Denominator for that distribution date, and (z) the difference between (1) the Base Interest Fraction for the Class B certificates and the applicable principal prepayment and (2) the Base Interest Fraction for the Class B-1 certificates and the applicable principal |
| This is not a research report and was not prepared by any Underwriter’s research department. Please see additional important information and qualifications at the end of this Term Sheet. | ||
| 10 | ||
| BANK5 2024-5YR8 | Structural Overview |
| prepayment, (i) to the holders of the Class B-X2 certificates, the product of (x) such yield maintenance charge or prepayment premium, (y) a fraction, the numerator of which is equal to the amount of principal distributed to the Class B-2 certificates for that distribution date, and the denominator of which is the YM Denominator for that distribution date, and (z) the difference between (1) the Base Interest Fraction for the Class B certificates and the applicable principal prepayment and (2) the Base Interest Fraction for the Class B-2 certificates and the applicable principal prepayment, (j) to the holders of the Class C-X1 certificates, the product of (x) such yield maintenance charge or prepayment premium, (y) a fraction, the numerator of which is equal to the amount of principal distributed to the Class C-1 certificates for that distribution date, and the denominator of which is the YM Denominator for that distribution date, and (z) the difference between (1) the Base Interest Fraction for the Class C certificates and the applicable principal prepayment and (2) the Base Interest Fraction for the Class C-1 certificates and the applicable principal prepayment, (k) to the holders of the Class C-X2 certificates, the product of (x) such yield maintenance charge or prepayment premium, (y) a fraction, the numerator of which is equal to the amount of principal distributed to the Class C-2 certificates for that distribution date, and the denominator of which is the YM Denominator for that distribution date, and (z) the difference between (1) the Base Interest Fraction for the Class C certificates and the applicable principal prepayment and (2) the Base Interest Fraction for the Class C-2 certificates and the applicable principal prepayment, (l) to the holders of the Class X-A certificates, the excess, if any, of (x) the product of (1) such yield maintenance charge or prepayment premium and (2) a fraction, the numerator of which is equal to the total amount of principal distributed to the Class A-1 certificates, Class A-2 Exchangeable Certificates and the Class A-3 Exchangeable Certificates for that distribution date, and the denominator of which is the YM Denominator for that distribution date, over (y) the total amount of such yield maintenance charge or prepayment premium distributed to the Class A-1 certificates, Class A-2 Exchangeable Certificates and the Class A-3 Exchangeable Certificates as described above, (m) to the holders of the Class X-B certificates, the excess, if any, of (x) the product of (1) such yield maintenance charge or prepayment premium and (2) a fraction, the numerator of which is equal to the total amount of principal distributed to the Class A-S Exchangeable Certificates, the Class B Exchangeable Certificates and the Class C Exchangeable Certificates for that distribution date, and the denominator of which is the YM Denominator for that distribution date, over (y) the total amount of such yield maintenance charge or prepayment premium distributed to the Class A-S Exchangeable Certificates, the Class B Exchangeable Certificates and the Class C Exchangeable Certificates as described above, and (n) to the holders of the Class X-D certificates, any remaining portion of such yield maintenance charge or prepayment premium not distributed as described above. “YM Denominator” means, for any distribution date, the total amount of principal distributed to the Class A-1, Class D and Class E certificates and the Class A-2 Exchangeable Certificates, the Class A-3 Exchangeable Certificates, the Class A-S Exchangeable Certificates, the Class B Exchangeable Certificates and the Class C Exchangeable Certificates. All yield maintenance charges and prepayment premiums referred to above will be net of any liquidation fees payable therefrom. Notwithstanding any of the foregoing to the contrary, if at any time the certificate balances of the principal balance certificates (other than the Control Eligible Certificates) have been reduced to zero as a result of the allocation of principal payments on the mortgage loans, the certificate administrator will be required to pay to the holders of each remaining class of principal balance certificates then entitled to distributions of principal on such distribution date the product of (a) any yield maintenance charge or prepayment premium distributable on the subject distribution date (net of any liquidation fees payable therefrom) and (b) a fraction, the numerator of which is equal to the amount of principal distributed to such class for that distribution date, and the denominator of which is the total amount of principal distributed to all principal balance certificates for that distribution date. No yield maintenance charges or prepayment premiums will be distributed to the holders of the Class V or Class R Certificates. “Base Interest Fraction” means, with respect to any principal prepayment of any mortgage loan that provides for the payment of a yield maintenance charge or prepayment premium, and with respect to any class of principal balance certificates, a fraction (A) the numerator of which is the greater of (x) zero and (y) the difference between (i) the pass‑through rate on that class, and (ii) the applicable discount rate and (B) the denominator of which is the difference between (i) the mortgage interest rate on the related mortgage loan and (ii) the applicable discount rate; provided, that: under no circumstances will the Base Interest Fraction be greater than one; if the discount rate referred to above is greater than or equal to both the mortgage interest rate on the related mortgage loan and the pass‑through rate on that class, then the Base Interest Fraction will equal zero; and if the discount rate referred to above is greater than or equal to the mortgage interest rate on the related mortgage loan and is less than the pass-through rate on that class, then the Base Interest Fraction will be equal to 1.0. Consistent with the foregoing, the Base Interest Fraction is equal to: |
| (Pass-Through Rate – Discount Rate) | |||
| (Mortgage Rate – Discount Rate) |
| This is not a research report and was not prepared by any Underwriter’s research department. Please see additional important information and qualifications at the end of this Term Sheet. | ||
| 11 | ||
| BANK5 2024-5YR8 | Structural Overview |
| Realized Losses: | On each distribution date, immediately following the distributions to be made to the certificateholders on that date, the certificate administrator is required to calculate the amount, if any, by which (i) the aggregate stated principal balance of the mortgage loans, including any successor REO loans, expected to be outstanding immediately following that distribution date is less than (ii) the then aggregate certificate balance of the principal balance certificates after giving effect to distributions of principal on that distribution date, which amount will be applied to the Class J-RR, Class G-RR, Class F-RR, Class E and Class D certificates and the Class C, Class B and Class A-S trust components, in that order, in each case until the related certificate or principal balance has been reduced to zero, and then to the Class A-1 certificates and the Class A-2 and Class A-3 trust components, pro rata based upon their respective certificate or principal balances, until their respective certificate or principal balances have been reduced to zero. Any portion of such amount applied to the Class A-2, Class A-3, Class A-S, Class B or Class C trust component will reduce the certificate balance or notional amount of each class of certificates in the related group of Exchangeable Certificates by an amount equal to the product of (x) its certificate balance or notional amount, divided by the principal balance of such trust component prior to the applicable reduction, and (y) the amount applied to such trust component. |
| Serviced Whole Loans: | Each of the following mortgaged properties or portfolios of mortgaged properties secures a mortgage loan and one or more pari passu promissory notes and, in some cases, one or more generally subordinate promissory notes (each, a “serviced companion loan”) that will be serviced pursuant to the related intercreditor agreement and the pooling and servicing agreement for this transaction: Showcase I, 640 5th Avenue, Cummins Station and iPark Norwalk. With respect to each such mortgaged property or portfolio of mortgaged properties, the related mortgage loan, together with the related serviced companion loan(s), is referred to herein (for so long as it is serviced under the pooling and servicing agreement for this transaction) as a “serviced whole loan.” Each serviced companion loan is not part of the mortgage pool and may be contributed to one or more future securitization transactions (if not already securitized) or may be otherwise transferred at any time, subject to compliance with the related intercreditor agreement. See the tables below entitled “Mortgage Loans with Pari Passu Companion Loans” and “Mortgage Loans with Subordinate Debt,” as well as “Description of the Mortgage Pool—The Whole Loans” in the Preliminary Prospectus, for additional information regarding each such whole loan. With respect to each “servicing shift whole loan”, the pooling and servicing agreement for this transaction will govern servicing of such whole loan until the securitization of the related lead servicing note; however, servicing of such whole loan will generally be directed by the holder of the related control note (which is not included in this securitization), and such holder will have the right to replace the special servicer with respect to the related whole loan with or without cause. After the securitization of the related lead servicing note, such whole loan will cease to be a serviced whole loan and will be serviced pursuant to the pooling and servicing agreement for another securitization transaction (see “—Non-Serviced Whole Loans” below). As of the Closing Date, the Stonebriar Centre mortgage loan will be a servicing shift mortgage loan. |
| Non-Serviced Whole Loans: | Each of the following mortgaged properties or portfolios of mortgaged properties secures a mortgage loan (each, a “non-serviced mortgage loan”), one or more pari passu promissory notes and, in some cases, one or more generally subordinate promissory notes (each such promissory note, a “non-serviced companion loan”) that will be serviced pursuant to the related intercreditor agreement and the pooling and servicing agreement or trust and servicing agreement (referred to herein as a related “pooling and servicing agreement”) for another securitization transaction: 9950 Woodloch and Marriott Anaheim. With respect to each such mortgaged property or portfolio of mortgaged properties, the related mortgage loan, together with the related non-serviced companion loan(s), is referred to herein (for so long as it is serviced under the pooling and servicing agreement for another securitization transaction) as a “non-serviced whole loan.” Each non-serviced companion loan is not part of the mortgage pool and may be contributed to one or more future securitization transactions (if not already securitized) or may be otherwise transferred at any time, subject to compliance with the related intercreditor agreement. Servicing of each non-serviced whole loan will generally be directed by the holder of the related control note (or, if such control note is included in a securitization, the directing certificateholder thereunder (or other party designated thereunder to exercise the rights of such control note)), and such holder will have the right to replace the special servicer with respect to the related whole loan with or without cause. See the tables below entitled “Mortgage Loans with Pari Passu Companion Loans” and “Mortgage Loans with Subordinate Debt,” as well as “Description of the Mortgage Pool—The Whole Loans” in the Preliminary Prospectus, for additional information regarding each such whole loan. |
| Directing Certificateholder/ Controlling Class: | The “Directing Certificateholder” will be (i) with respect to a servicing shift mortgage loan, the related Loan-Specific Directing Certificateholder, and (ii) with respect to each other mortgage loan, the Controlling Class Certificateholder (or its representative) selected by more than 50% (by certificate balance) of the Controlling Class Certificateholders; provided, that (1) absent that selection, (2) until a Directing Certificateholder is so selected or (3) upon receipt of a notice from a majority of the Controlling Class Certificateholders (by certificate balance) that a Directing Certificateholder is no longer designated, the Controlling Class Certificateholder that owns the largest aggregate certificate balance of the Controlling Class (or its representative) will be the Directing Certificateholder; provided, that (a) in the case of clause (3), if no one holder owns the largest aggregate certificate balance of the Controlling Class, then there will be no Directing Certificateholder until appointed in accordance with the terms of the pooling and servicing agreement, and (b) the certificate administrator and the other parties to the pooling and servicing agreement will be entitled to assume that the identity of the Directing Certificateholder has not changed until such parties receive written notice of a replacement of the Directing Certificateholder from a party holding the requisite interest in the Controlling Class (as confirmed by the certificate registrar), or the resignation of the then current Directing Certificateholder. As used herein, the term “Directing Certificateholder,” unless used in relation to a Servicing Shift Mortgage |
| This is not a research report and was not prepared by any Underwriter’s research department. Please see additional important information and qualifications at the end of this Term Sheet. | ||
| 12 | ||
| BANK5 2024-5YR8 | Structural Overview |
Loan, means the entity determined pursuant to clause (ii) of the definition of such term. The “Loan-Specific Directing Certificateholder” with respect to a servicing shift mortgage loan is the “controlling holder”, the “directing certificateholder”, the “directing holder”, “directing lender” or any analogous concept under the related intercreditor agreement. Prior to the securitization of the related lead servicing note, the Loan-Specific Directing Certificateholder with respect to a servicing shift mortgage loan will be the holder of the related control note. On and after the securitization of the related lead servicing note, there will be no Loan-Specific Directing Certificateholder under the PSA with respect to such servicing shift mortgage loan. The “Controlling Class” will be, as of any time of determination, the most subordinate class of Control Eligible Certificates then outstanding that has an aggregate certificate balance (as notionally reduced by any Cumulative Appraisal Reduction Amounts (as defined below) allocable to such class) at least equal to 25% of the initial certificate balance of that class; provided, that if at any time the certificate balances of the certificates other than the Control Eligible Certificates have been reduced to zero as a result of principal payments on the mortgage loans, then the Controlling Class will be the most subordinate class of Control Eligible Certificates that has a certificate balance greater than zero without regard to any Cumulative Appraisal Reduction Amounts. The Controlling Class as of the closing date will be the Class J-RR certificates. The “Control Eligible Certificates” will be any of the Class F-RR, Class G-RR and Class J-RR certificates. | |
| Control Rights: | Prior to a Control Termination Event, the Directing Certificateholder will have certain consent and consultation rights under the pooling and servicing agreement with respect to certain major decisions and other matters. A “Control Termination Event” will occur when the Class F-RR certificates have a certificate balance (taking into account the application of any Cumulative Appraisal Reduction Amounts to notionally reduce the certificate balance thereof) of less than 25% of the initial certificate balance of that class; provided, that no Control Termination Event may occur with respect to a Loan-Specific Directing Certificateholder, and the term “Control Termination Event” will not be applicable to a Loan-Specific Directing Certificateholder; provided, further, that a Control Termination Event will be deemed not continuing in the event that the certificate balances of the principal balance certificates other than the Control Eligible Certificates have been reduced to zero as a result of principal payments on the mortgage loans. After the occurrence of a Control Termination Event but prior to the occurrence of a Consultation Termination Event, the Directing Certificateholder will not have any consent rights, but the Directing Certificateholder will have certain non-binding consultation rights under the pooling and servicing agreement with respect to certain major decisions and other matters. A “Consultation Termination Event” will occur when no class of Control Eligible Certificates has a certificate balance (without regard to the application of any Cumulative Appraisal Reduction Amounts) at least equal to 25% of the initial certificate balance of that class; provided, that no Consultation Termination Event may occur with respect to a Loan-Specific Directing Certificateholder, and the term “Consultation Termination Event” will not be applicable to a Loan-Specific Directing Certificateholder; provided, further, that a Consultation Termination Event will be deemed not continuing in the event that the certificate balances of the principal balance certificates other than the Control Eligible Certificates have been reduced to zero as a result of principal payments on the mortgage loans. After the occurrence of a Consultation Termination Event, the Directing Certificateholder will not have any consent or consultation rights, except with respect to any rights expressly set forth in the pooling and servicing agreement. If an Operating Advisor Consultation Event has occurred and is continuing, the operating advisor will have certain non-binding consultation rights under the PSA with respect to certain major decisions and other matters. Notwithstanding any proviso to, or any other contrary provision in, the definitions of “Control Termination Event”, “Consultation Termination Event” and “Operating Advisor Consultation Event”, a Control Termination Event, a Consultation Termination Event and an Operating Advisor Consultation Event will each be deemed to have occurred with respect to any Excluded Loan with respect to the Directing Certificateholder or the holder of the majority of the Controlling Class, and neither the Directing Certificateholder nor any Controlling Class Certificateholder will have any consent or consultation rights with respect to the servicing of such Excluded Loan. An “Excluded Loan” means, with respect to the Directing Certificateholder or the holder of the majority of the Controlling Class, a mortgage loan or whole loan with respect to which, as of any date of determination, the Directing Certificateholder or the holder of the majority of the Controlling Class is a Borrower Party. It is expected that there will be no Excluded Loans with respect to this securitization on the closing date. “Borrower Party” means a borrower, a mortgagor, a manager of a mortgaged property, the holder of a mezzanine loan that has been accelerated or as to which foreclosure or enforcement proceedings have been commenced against the equity collateral pledged to secure the related mezzanine loan, or any Borrower Party Affiliate. “Borrower Party Affiliate” means, with respect to a borrower, a mortgagor, a manager of a mortgaged property or the holder of a mezzanine loan that has been accelerated or as to which foreclosure or enforcement proceedings have been commenced against the equity collateral pledged to secure the related mezzanine loan, (a) any other person controlling or controlled by or under common control with such borrower, mortgagor, manager or mezzanine lender, as applicable, or (b) any other person owning, directly or indirectly, 25% or more of the beneficial interests in such borrower, mortgagor, manager or mezzanine lender, as applicable. For the purposes of this definition, “control” when used with respect to any specified person means the power to direct the management and policies of such person, directly or indirectly, whether through the ownership of voting securities, by contract or otherwise and the terms “controlling” and “controlled” have meanings correlative to the foregoing. Notwithstanding any of the foregoing to the contrary, if any mortgage loan is part of a whole loan, the Directing Certificateholder’s consent and/or consultation rights with respect thereto may be limited as described in the |
| This is not a research report and was not prepared by any Underwriter’s research department. Please see additional important information and qualifications at the end of this Term Sheet. | ||
| 13 | ||
| BANK5 2024-5YR8 | Structural Overview |
Preliminary Prospectus. In particular, with respect to each non-serviced whole loan and each servicing shift whole loan, the Directing Certificateholder (other than a Loan-Specific Directing Certificateholder) will only have certain consultation rights with respect to certain major decisions and other matters related to such whole loan, in each case only prior to a Consultation Termination Event, and the Loan-Specific Directing Certificateholder will be entitled to similar consent and/or consultation rights with respect to such whole loan. In addition, with respect to any serviced A/B whole loan, for so long as the holder of the related subordinate companion loan is the controlling note holder, the holder of such subordinate companion loan (rather than the Directing Certificateholder) will be entitled to exercise such consent and consultation rights with respect to such whole loan. | |
| Appraisal Reduction Amounts and Collateral Deficiency Amounts: | An “Appraisal Reduction Amount” generally will be created in the amount, if any, by which the principal balance of a required appraisal loan (which is a mortgage loan with respect to which certain defaults, modifications or insolvency events have occurred as further described in the Preliminary Prospectus) plus other amounts overdue or advanced in connection with such mortgage loan exceeds 90% of the appraised value of the related mortgaged property plus certain escrows and reserves (including letters of credit) held with respect to the mortgage loan. A mortgage loan will cease to be subject to an Appraisal Reduction Amount when it has been brought current for at least three consecutive months, no additional event of default is foreseeable in the reasonable judgment of the special servicer and no other circumstances exist that would cause such mortgage loan or any related companion loan to be a specially serviced loan; however, a “Collateral Deficiency Amount” may exist with respect to any mortgage loan that is modified into an AB loan structure (an “AB Modified Loan”) and remains a corrected mortgage loan and, if so, will generally equal the excess of (i) the stated principal balance of such AB Modified Loan (taking into account the related junior note(s) and any pari passu notes included therein), over (ii) the sum of (in the case of a whole loan, solely to the extent allocable to the subject mortgage loan) (x) the most recent appraised value for the related mortgaged property or mortgaged properties, plus (y) solely to the extent not reflected or taken into account in such appraised value (or in the calculation of any related Appraisal Reduction Amount) and to the extent on deposit with, or otherwise under the control of, the lender as of the date of such determination, any capital or additional collateral contributed by the related borrower at the time the mortgage loan became (and as part of the modification related thereto) such AB Modified Loan for the benefit of the related mortgaged property or mortgaged properties (provided that in the case of an non-serviced mortgage loan, the amounts set forth in this clause (y) will be taken into account solely to the extent relevant information is received by the special servicer), plus (z) any other escrows or reserves (in addition to any amounts set forth in the immediately preceding clause (y) and solely to the extent not reflected or taken into account in the calculation of any related Appraisal Reduction Amount) held by the lender in respect of such AB Modified Loan as of the date of such determination, which such excess, for the avoidance of doubt, will be determined separately from and exclude any related Appraisal Reduction Amounts. As used herein, a “Cumulative Appraisal Reduction Amount” will be the sum of any Appraisal Reduction Amounts and any Collateral Deficiency Amounts. Any Appraisal Reduction Amount in respect of any non-serviced mortgage loan generally will be calculated in accordance with the other servicing agreement pursuant to which such mortgage loan is being serviced, which calculations are expected to be generally similar to those provided for in the pooling and servicing agreement for this transaction. If any mortgage loan is part of a whole loan, any Appraisal Reduction Amount or Collateral Deficiency Amount will (or effectively will) be calculated in respect of such whole loan taken as a whole and allocated, to the extent provided in the related intercreditor agreement and the related pooling and servicing agreement, first, to any related subordinate companion loan, and second, to the related mortgage loan and any pari passu companion loan on a pro rata basis by unpaid principal balance. Appraisal Reduction Amounts will proportionately reduce the interest portion of debt service advances required to be made in respect of the related mortgage loan. Appraisal Reduction Amounts and Collateral Deficiency Amounts will be (i) taken into account in determining the identity of the controlling class entitled to appoint the Directing Certificateholder, the existence of a Control Termination Event or an Operating Advisor Consultation Event and the allocation and/or exercise of voting rights for certain purposes (see “Directing Certificateholder/Controlling Class” above) and (ii) allocated to the following classes of certificates and trust components, in each case to notionally reduce their certificate balances or principal balances until the certificate balance or principal balance of each such class or trust component is notionally reduced to zero: the Class J-RR, Class G-RR, Class F-RR, Class E and Class D certificates and the Class C, Class B and Class A-S trust components, in that order, and then pro rata to the Class A-1 certificates and Class A-2 and Class A-3 trust components. Appraisal Reduction Amounts and Collateral Deficiency Amounts allocated to the Class A-2, Class A-3, Class A-S, Class B or Class C trust component will be allocated to the corresponding classes of Exchangeable Certificates with certificate balances pro rata to notionally reduce their certificate balances in accordance with their Class Percentage Interests therein. |
| Appraised-Out Class: | An “Appraised-Out Class” is any class of Control Eligible Certificates, the certificate balance of which (taking into account the application of any Appraisal Reduction Amounts or Collateral Deficiency Amounts to notionally reduce the certificate balance of such class) has been reduced to less than 25% of its initial certificate balance. Any Appraised-Out Class may not exercise any direction, control, consent and/or similar rights of the Controlling Class until such time, if any, as such class is reinstated as the Controlling Class, and the rights of the Controlling Class will be exercised by the next most senior class of Control Eligible Certificates that is not an Appraised-Out Class, if any, during such period. |
| Appraisal Remedy: | The holders of the majority (by certificate balance) of an Appraised-Out Class (such holders, the “Requesting Holders”) will have the right, at their sole expense, to require the special servicer to order (or, with respect to a non- |
| This is not a research report and was not prepared by any Underwriter’s research department. Please see additional important information and qualifications at the end of this Term Sheet. | ||
| 14 | ||
| BANK5 2024-5YR8 | Structural Overview |
serviced mortgage loan, require the master servicer to request from the applicable non-serviced special servicer) a second appraisal of any mortgage loan (or serviced whole loan) for which an appraisal reduction event has occurred or as to which there exists a Collateral Deficiency Amount. With respect to any serviced mortgage loan, the special servicer will be required to use its reasonable best efforts to ensure that such appraisal is delivered within 30 days from receipt of the Requesting Holders’ written request and will be required to ensure that such appraisal is prepared on an “as-is” basis by an MAI appraiser. With respect to any non-serviced mortgage loan, the master servicer will be required to use commercially reasonable efforts to obtain such second appraisal from the applicable non-serviced special servicer. In addition, the Requesting Holders of any Appraised-Out Class will have the right to challenge the Appraisal Reduction Amount and to require the special servicer to order an additional appraisal of any serviced mortgage loan as to which there exists a Collateral Deficiency Amount if an event has occurred at, or with respect to, the related mortgaged property or mortgaged properties that would have a material effect on its or their appraised value, and the special servicer is required to use reasonable efforts to obtain an appraisal from an MAI appraiser reasonably acceptable to the special servicer within 30 days from receipt of the Requesting Holders’ written request. Upon receipt of such supplemental appraisal, the master servicer (for any non-serviced mortgage loans) and the special servicer (for any serviced mortgage loans) will be required to determine, in accordance with the Servicing Standard, whether, based on its assessment of such supplemental appraisal, any recalculation of the applicable Appraisal Reduction Amount or Collateral Deficiency Amount is warranted and, if so warranted, such person will be required to recalculate such Appraisal Reduction Amount or Collateral Deficiency Amount, as applicable, based upon such supplemental appraisal as described above. If required by any such recalculation, the applicable Appraised-Out Class will be reinstated as the Controlling Class and each Appraised-Out Class will, if applicable, have its related certificate balance notionally restored to the extent required by such recalculation of the Appraisal Reduction Amount or Collateral Deficiency Amount, if applicable. | |
| Sale of Defaulted Loans: | Under certain circumstances the special servicer may be required to use reasonable efforts to solicit offers for a defaulted serviced mortgage loan (and any related companion loan (to the extent provided under the related intercreditor agreement) and/or related REO properties). The Directing Certificateholder will not have a right of first refusal to purchase a defaulted loan. If the special servicer does not receive an offer at least equal to the outstanding principal balance plus all accrued and unpaid interest and outstanding costs and expenses and certain other amounts specified in the pooling and servicing agreement (the “Par Purchase Price”), the special servicer may purchase the defaulted loan or REO property at the Par Purchase Price or may accept the first cash offer received from any person that is determined to be a fair price for such defaulted loan or REO property. If multiple offers are received during the period designated by the special servicer for receipt of offers, the special servicer is generally required to select the highest offer. The special servicer will be required to determine whether any cash offer constitutes a fair price for any defaulted loan or REO property if the highest offeror is a person other than a party to the pooling and servicing agreement for this transaction (the “PSA”), the Directing Certificateholder, any sponsor, any Borrower Party, any independent contractor engaged by the special servicer, the trustee for the securitization of a related companion loan (with respect to a whole loan if it is a defaulted loan), any related companion loan holder or its representative, any holder of a related mezzanine loan or any known affiliate of any of the preceding entities (each, an “Interested Person”). If an offer is made by an Interested Person, the trustee will be required to determine (based upon the most recent appraisal conducted in accordance with the terms of the PSA) whether the offer constitutes a fair price for the defaulted loan or REO property unless (i) the offer is equal to or greater than the applicable Par Purchase Price and (ii) the offer is the highest offer received. Absent an offer at least equal to the Par Purchase Price, no offer from an Interested Person will constitute a fair price unless (x) it is the highest offer received and (y) at least two other offers are received from independent third parties. Neither the trustee nor any of its affiliates may make an offer for or purchase any specially serviced loan or REO property. Notwithstanding any of the foregoing to the contrary, the special servicer is not required to accept the highest offer and may accept a lower offer for a defaulted loan or REO property if the special servicer determines, in accordance with the Servicing Standard (and subject to the requirements of any related intercreditor agreement), that a rejection of such offer would be in the best interests of the certificateholders and any related companion loan holders as a collective whole as if they constituted a single lender (and with respect to a serviced A/B whole loan, taking into account the subordinate nature of any related subordinate companion loan), so long as such lower offer was not made by the special servicer or any of its affiliates. If title to any mortgaged property is acquired by the trust fund, the special servicer will generally be required to sell such mortgaged property prior to the close of the third calendar year beginning after the year of acquisition. The foregoing applies to mortgage loans serviced under the PSA. With respect to any non-serviced whole loan, if the special servicer under the applicable pooling and servicing agreement determines to sell the related controlling companion loan if it becomes a defaulted loan, then the special servicer will be required to sell the related whole loan, including the related mortgage loan included in the BANK5 2024-5YR8 securitization trust and the related pari passu companion loan(s) and, under certain circumstances, any subordinate companion loan(s), as a single loan. In connection with any such sale, the special servicer under the applicable pooling and servicing agreement will be required to follow procedures substantially similar to those set forth above. |
| Appointment and Replacement of the Special Servicer: | The Directing Certificateholder will appoint the initial special servicer as of the closing date. Prior to the occurrence and continuance of a Control Termination Event, the special servicer may generally be replaced by the Directing Certificateholder with or without cause at any time. After the occurrence and during the continuance of a Control Termination Event and upon (a) the written direction |
| This is not a research report and was not prepared by any Underwriter’s research department. Please see additional important information and qualifications at the end of this Term Sheet. | ||
| 15 | ||
| BANK5 2024-5YR8 | Structural Overview |
of holders of principal balance certificates evidencing not less than 25% of the voting rights of all classes of certificates entitled to principal (taking into account the application of Cumulative Appraisal Reduction Amounts to notionally reduce the certificate balances of classes to which such Cumulative Appraisal Reduction Amounts are allocable) requesting a vote to replace the special servicer with a replacement special servicer, (b) payment by such requesting holders to the certificate administrator of all reasonable fees and expenses to be incurred by the certificate administrator in connection with administering such vote and (c) delivery by such holders of a rating agency confirmation from each applicable rating agency, the certificate administrator will be required to promptly post such notice on its internet website and by mail and conduct the solicitation of votes of all certificates in such regard, which requisite affirmative votes must be received within 180 days of the posting of such notice. Upon the written direction of holders of at least 66 2/3% of a Certificateholder Quorum, the trustee will be required to immediately replace the special servicer with a qualified replacement special servicer designated by such holders of certificates. If the operating advisor determines, in its sole discretion exercised in good faith, that (i) the special servicer is not performing its duties as required under the pooling and servicing agreement or is otherwise not acting in accordance with the Servicing Standard and (ii) the replacement of the special servicer would be in the best interests of the certificateholders as a collective whole, then the operating advisor will have the right to recommend the replacement of the special servicer. The operating advisor’s recommendation to replace the special servicer must be confirmed by an affirmative majority vote of holders of certificates representing at least a quorum of certificateholders (which, for this purpose, is the holders of certificates that (i) evidence at least 20% of the voting rights (taking into account the application of any Appraisal Reduction Amounts to notionally reduce the respective certificate balances) of all principal balance certificates on an aggregate basis and (ii) consist of at least three certificateholders or certificate owners that are not “affiliated with” (as defined in Regulation RR) each other). A “Certificateholder Quorum” means, in connection with any solicitation of votes in connection with the replacement of the special servicer or the asset representations reviewer, the holders of certificates evidencing at least 50% of the aggregate voting rights (taking into account the application of realized losses and, other than with respect to the termination of the asset representations reviewer, any Cumulative Appraisal Reduction Amounts to notionally reduce the certificate balance of the certificates) of all classes of certificates entitled to principal on an aggregate basis. With respect to each serviced whole loan, any holder of a related pari passu companion loan, following a servicer termination event with respect to the special servicer that affects such holder, will be entitled to direct the trustee (and the trustee will be required) to terminate the special servicer solely with respect to such serviced whole loan. A replacement special servicer will be selected by the trustee or, prior to a Control Termination Event, by the Directing Certificateholder; provided, that any successor special servicer appointed to replace the special servicer with respect to such whole loan cannot be the entity (or its affiliate) that was terminated at the direction of the holder of the related pari passu companion loan. Notwithstanding any of the foregoing to the contrary, with respect to each servicing shift whole loan and any serviced A/B whole loans as to which a subordinate companion loan holder is the related controlling note holder, the holder of the related control note will be entitled to replace the special servicer with respect to such whole loan at any time, with or without cause, and while it is a serviced whole loan, no other party may replace the special servicer for such whole loan unless there is a servicer termination event with respect thereto. With respect to any non-serviced whole loan, subject to conditions or restrictions in the applicable intercreditor agreement, the BANK5 2024-5YR8 trust, as holder of the related mortgage loan, has the right to terminate the special servicer under the related pooling and servicing agreement if a servicer termination event occurs with respect to the special servicer that affects the trust in its capacity as such holder. Such rights may be exercised by the Directing Certificateholder prior to a Consultation Termination Event (or the special servicer, following the occurrence and during the continuance of a Consultation Termination Event). The successor special servicer will be selected pursuant to the applicable pooling and servicing agreement by the related directing holder prior to a control termination event under such pooling and servicing agreement. | |
| Servicing Standard: | Each of the master servicer and the special servicer is obligated to service and administer the mortgage loans (and, if applicable, the serviced companion loans) in accordance with the definition of the “Servicing Standard” described in the Preliminary Prospectus and the terms of the pooling and servicing agreement, provided that each non-serviced mortgage loan, if any, will be serviced by another master servicer or special servicer under the pooling and servicing agreement with respect to the securitization of a related companion loan, which entities will be obligated to service and administer such non-serviced mortgage loan pursuant to a similar standard set forth in the related pooling and servicing agreement. |
| Excluded Special Servicer: | If the special servicer obtains knowledge that it has become a Borrower Party with respect to any mortgage loan (an “Excluded Special Servicer Loan”), the special servicer will be required to resign as special servicer of that Excluded Special Servicer Loan. Prior to the occurrence and continuance of a Control Termination Event, the Directing Certificateholder will be required to appoint (and may remove and replace with or without cause) a separate special servicer that is not a Borrower Party (an “Excluded Special Servicer”) with respect to any Excluded Special Servicer Loan, unless such Excluded Special Servicer Loan is also an Excluded Loan with respect to the Directing Certificateholder or the holder of the majority of the Controlling Class. At any time after the occurrence and during the continuance of a Control Termination Event, or if at any time the applicable Excluded Special Servicer Loan is also an Excluded Loan with respect to the Directing Certificateholder or the holder of the majority of the Controlling Class or if the Directing Certificateholder is entitled to appoint the Excluded Special Servicer but does not so appoint a replacement special servicer within 30 days of notice of such resignation, the resigning special servicer will be required to use reasonable efforts to select the related Excluded Special Servicer. Any Excluded Special Servicer will be required to perform all of the obligations of |
| This is not a research report and was not prepared by any Underwriter’s research department. Please see additional important information and qualifications at the end of this Term Sheet. | ||
| 16 | ||
| BANK5 2024-5YR8 | Structural Overview |
| the special servicer and will be entitled to all special servicing compensation with respect to such Excluded Special Servicer Loan earned while the related mortgage loan is an Excluded Special Servicer Loan. | |
| Liquidated Loan Waterfall: | On liquidation of any mortgage loan, all net liquidation proceeds related to the mortgage loan (but not any related companion loan) will be applied so that amounts allocated as a recovery of accrued and unpaid interest will not, in the first instance, include any delinquent interest that was not advanced as a result of Appraisal Reduction Amounts (or would not have been advanced in the absence of a non-recoverability determination) or accrued on the portion of the stated principal balance thereof equal to any related Collateral Deficiency Amount in effect from time to time and as to which no advance was made (collectively, the “Subordinated Interest Amount”). After the adjusted interest amount is so allocated, any remaining liquidation proceeds will be allocated to pay principal on the mortgage loan until the unpaid principal amount of the mortgage loan has been reduced to zero. Any remaining liquidation proceeds will then be allocated to pay the Subordinated Interest Amount. |
| Operating Advisor: | The operating advisor will have certain review and consultation rights relating to the performance of the special servicer and with respect to its actions taken in connection with the resolution and/or liquidation of specially serviced loans. With respect to each serviced mortgage loan or serviced whole loan, the operating advisor will be responsible for: ● reviewing the actions of the special servicer with respect to any specially serviced loan; ● reviewing (i) all reports by the special servicer made available to privileged persons that are posted on the certificate administrator’s website that are relevant to the operating advisor’s obligations under the PSA and (ii) each asset status report (after the occurrence and during the continuance of an Operating Advisor Consultation Event) and final asset status report; ● reviewing for accuracy and consistency with the PSA the mathematical calculations by the special servicer and the corresponding application of the non-discretionary portion of the applicable formulas required to be utilized in connection with (1) any Appraisal Reduction Amount or Collateral Deficiency Amount (if the special servicer has calculated any such Appraisal Reduction Amount or Collateral Deficiency Amount) and (2) any net present value calculations used in the special servicer’s determination of what course of action to take in connection with the workout or liquidation of a specially serviced loan; and ● preparing an annual report (if any serviced mortgage loan or serviced whole loan was a specially serviced loan at any time during the prior calendar year or if the operating advisor was entitled to consult with the special servicer with respect to any major decision during the prior calendar year) that sets forth whether the operating advisor believes, in its sole discretion exercised in good faith, that the special servicer is operating in compliance with the Servicing Standard with respect to its performance of its duties under the PSA with respect to specially serviced loans (and, after the occurrence and continuance of an Operating Advisor Consultation Event, with respect to major decisions on non-specially serviced loans) during the prior calendar year on an “trust-level basis”. The operating advisor will be required to identify (1) which, if any, standards the operating advisor believes, in its sole discretion exercised in good faith, the special servicer has failed to comply with and (2) any material deviations from the special servicer’s obligations under the PSA with respect to the resolution or liquidation of any specially serviced loan or REO property (other than with respect to any REO property related to any non-serviced mortgage loan). In preparing any operating advisor annual report, the operating advisor will not be required to report on instances of non-compliance with, or deviations from, the Servicing Standard or the special servicer’s obligations under the PSA that the operating advisor determines, in its sole discretion exercised in good faith, to be immaterial. With respect to each serviced mortgage loan or serviced whole loan, after the operating advisor has received notice that an Operating Advisor Consultation Event has occurred and is continuing, in addition to the duties described above, the operating advisor will be required to perform the following additional duties: ● to consult (on a non-binding basis) with the special servicer in respect of asset status reports; and ● to consult (on a non-binding basis) with the special servicer with respect to major decisions processed by the special servicer. An “Operating Advisor Consultation Event” will occur when either (i) the aggregate certificate balance of the Class F-RR, Class G-RR and Class J-RR certificates (taking into account the application of any Cumulative Appraisal Reduction Amounts to notionally reduce the certificate balances of such classes) is 25% or less of the initial aggregate certificate balance of such portions of such classes or (ii) a Control Termination Event has occurred and is continuing. |
| Asset Representations Reviewer: | The asset representations reviewer will be required to review certain delinquent mortgage loans after a specified delinquency threshold has been met and the required percentage of certificateholders vote to direct a review as described below. The asset representations reviewer will be entitled to the Asset Representations Reviewer Fee with respect to such review. See “Pooling and Servicing Agreement—The Asset Representations Reviewer” in the Preliminary Prospectus. The certificate administrator will be required to notify certificateholders if the specified delinquency threshold has been met as described in the Preliminary Prospectus under “—The Asset Representations Reviewer”. If certificateholders evidencing not less than 5.0% of the voting rights request a vote to commence an asset review, and if subsequently (i) a majority of those certificateholders who cast votes and (ii) a majority of an Asset Review Quorum authorizes an asset review within 150 days of the request for a vote, the asset representations reviewer will be required to conduct an asset review of delinquent loans. The asset representations reviewer may be terminated and replaced without cause. Upon (i) the written direction of certificateholders evidencing not less than 25% of the voting rights (without regard to the application of any |
| This is not a research report and was not prepared by any Underwriter’s research department. Please see additional important information and qualifications at the end of this Term Sheet. | ||
| 17 | ||
| BANK5 2024-5YR8 | Structural Overview |
Cumulative Appraisal Reduction Amounts) requesting a vote to terminate and replace the asset representations reviewer with a proposed successor asset representations reviewer that is an eligible asset representations reviewer, and (ii) payment by such holders to the certificate administrator of the reasonable fees and expenses to be incurred by the certificate administrator in connection with administering such vote, the certificate administrator will be required to promptly provide notice to all certificateholders and the asset representations reviewer of such request by posting such notice on its internet website, and by mailing such notice to all certificateholders and the asset representations reviewer. Upon the written direction of certificateholders evidencing at least 75% of a Certificateholder Quorum (without regard to the application of any Cumulative Appraisal Reduction Amounts), the trustee will be required to terminate all of the rights and obligations of the asset representations reviewer under the pooling and servicing agreement (other than any rights or obligations that accrued prior to the date of such termination and other than indemnification rights arising out of events occurring prior to such termination) by written notice to the asset representations reviewer, and the proposed successor asset representations reviewer will be appointed. See “Pooling and Servicing Agreement—The Asset Representations Reviewer” in the Preliminary Prospectus. An “Asset Review Quorum” means, in connection with any solicitation of votes to authorize an Asset Review as described above, the holders of certificates evidencing at least 5.0% of the aggregate voting rights represented by all certificates that have voting rights. | |
| Dispute Resolution Provisions: | The mortgage loan sellers will be subject to the dispute resolution provisions set forth in the PSA to the extent those provisions are triggered with respect to any mortgage loan sold to the depositor by a mortgage loan seller, and such mortgage loan seller will be obligated under the related mortgage loan purchase agreement to comply with all applicable provisions and to take part in any mediation or arbitration proceedings that may result. Generally, in the event that a Repurchase Request is not “Resolved” within 180 days after the related mortgage loan seller receives such Repurchase Request, then the enforcing servicer will be required to send a notice to the first certificateholder (or beneficial owner) to deliver a certificateholder repurchase request with respect to the mortgage loan (the “Initial Requesting Certificateholder”) (if any) and to the certificate administrator (which will be required to make such notice available to certificateholders via the certificate administrator’s website) indicating the enforcing servicer’s intended course of action with respect to the Repurchase Request. If (a) the enforcing servicer’s intended course of action with respect to the Repurchase Request does not involve pursuing further action to exercise rights against the related mortgage loan seller with respect to the Repurchase Request and the Initial Requesting Certificateholder, if any, or any other certificateholder, or certificate owner wishes to exercise its right to refer the matter to mediation (including non-binding arbitration) or arbitration, or (b) the enforcing servicer’s intended course of action is to pursue further action to exercise rights against the related mortgage loan seller with respect to the Repurchase Request but the Initial Requesting Certificateholder, if any, or any other certificateholder or certificate owner does not agree with the dispute resolution method selected by the enforcing servicer, then the Initial Requesting Certificateholder, if any, or such other certificateholder or certificate owner may deliver a written notice to the enforcing servicer indicating its intent to exercise its right to refer the matter to either mediation or arbitration. “Resolved” means, with respect to a Repurchase Request, (i) that the related material defect or breach has been cured, (ii) the related mortgage loan has been repurchased in accordance with the related mortgage loan purchase agreement, (iii) a mortgage loan has been substituted for the related mortgage loan in accordance with the related mortgage loan purchase agreement, (iv) the applicable mortgage loan seller has made a loss of value payment, (v) a contractually binding agreement has been entered into between the enforcing servicer, on behalf of the issuing entity, and the related mortgage loan seller that settles the related mortgage loan seller’s obligations under the related mortgage loan purchase agreement, or (vi) the related mortgage loan is no longer property of the issuing entity as a result of a sale or other disposition in accordance with the pooling and servicing agreement. See “Pooling and Servicing Agreement—Dispute Resolution Provisions” in the Preliminary Prospectus. |
| Investor Communications: | The certificate administrator is required to include on any Form 10-D any request received from a certificateholder to communicate with other certificateholders related to certificateholders exercising their rights under the terms of the PSA. Any certificateholder wishing to communicate with other certificateholders regarding the exercise of its rights under the terms of the PSA will be able to deliver a written request signed by an authorized representative of the requesting investor to the certificate administrator. |
| Deal Website: | The certificate administrator will be required to maintain a deal website which will include, among other items: (a) summaries of asset status reports prepared by the special servicer, (b) inspection reports, (c) appraisals, (d) various “special notices” described in the Preliminary Prospectus, (e) the “Investor Q&A Forum” and (f) a voluntary “Investor Registry”. Investors may access the deal website following execution of a certification and confidentiality agreement. |
| This is not a research report and was not prepared by any Underwriter’s research department. Please see additional important information and qualifications at the end of this Term Sheet. | ||
| 18 | ||
| BANK5 2024-5YR8 | Collateral Overview |
| Mortgage Loan Sellers | No. of Mortgage Loans | No. of Mortgaged Properties | Aggregate Cut-off Date Balance | % of Pool(1) |
| Morgan Stanley Mortgage Capital Holdings LLC | 20 | 21 | $292,593,967 | 42.4% |
| Bank of America, National Association | 7 | 7 | $195,440,000 | 28.3% |
| Wells Fargo Bank, National Association | 3 | 3 | $106,446,972 | 15.4% |
| JPMorgan Chase Bank, National Association | 2 | 2 | $96,000,000 | 13.9% |
| Total: | 32 | 33 | $690,480,940 | 100.0% |
Pool Statistics
| Aggregate Cut-off Date Balance: | $690,480,940 |
| Number of Mortgage Loans: | 32 |
| Average Cut-off Date Balance per Mortgage Loan: | $21,577,529 |
| Number of Mortgaged Properties: | 33 |
| Average Cut-off Date Balance per Mortgaged Property: | $20,923,665 |
| Weighted Average Mortgage Rate: | 6.7982% |
| % of Pool Secured by 5 Largest Mortgage Loans: | 46.0% |
| % of Pool Secured by 10 Largest Mortgage Loans: | 69.8% |
| % of Pool Secured by ARD Loans: | 0.0% |
| Weighted Average Original Term to Maturity (months): | 60 |
| Weighted Average Remaining Term to Maturity (months): | 59 |
| Weighted Average Seasoning (months): | 1 |
| % of Pool Secured by Single Tenant Mortgaged Properties: | 5.7% |
| % of Pool Secured by Refinance Loans: | 87.5% |
| % of Pool Secured by Acquisition Loans: | 11.6% |
| % of Pool Secured by Recapitalization Loans: | 0.9% |
Additional Debt
| % of Pool with Pari Passu Mortgage Debt: | 52.5% |
| % of Pool with Mezzanine Debt: | 23.7% |
| % of Pool with Subordinate Mortgage Debt: | 0.0% |
Credit Statistics(2)
| Weighted Average UW NOI DSCR: | 1.72x |
| Weighted Average UW NOI Debt Yield: | 12.4% |
| Weighted Average UW NCF DSCR: | 1.63x |
| Weighted Average UW NCF Debt Yield: | 11.7% |
| Weighted Average Cut-off Date LTV Ratio(3): | 56.3% |
| Weighted Average Maturity Date LTV Ratio(3): | 55.8% |
Footnotes are set forth on the following page.
| This is not a research report and was not prepared by any Underwriter’s research department. Please see additional important information and qualifications at the end of this Term Sheet. | ||
| 19 | ||
| BANK5 2024-5YR8 | Collateral Overview |
Amortization
| Weighted Average Original Amortization Term (months)(4): | 360 |
| Weighted Average Remaining Amortization Term (months)(4): | 359 |
| % of Pool Interest Only through Maturity: | 83.1% |
| % of Pool Amortizing Balloon: | 16.9% |
| % of Pool Interest Only, Amortizing Balloon: | 0.0% |
Lockboxes
| % of Pool with Hard Lockboxes: | 69.2% |
| % of Pool with Springing Lockboxes: | 30.3% |
| % of Pool with No Lockboxes: | 0.5% |
Reserves
| % of Pool Requiring Tax Reserves: | 76.1% |
| % of Pool Requiring Insurance Reserves: | 35.2% |
| % of Pool Requiring Replacement Reserves: | 76.0% |
| % of Pool Requiring TI/LC Reserves(5): | 96.0% |
Call Protection
| % of Pool with lockout period, followed by defeasance until open period: | 74.1% |
| % of Pool with lockout period, followed by the greater of a prepayment premium and yield maintenance until open period: | 23.7% |
| % of Pool with lockout period, followed by defeasance or the greater of a prepayment premium and yield maintenance until open period: | 2.2% |
| (1) | Unless otherwise indicated, all references to “% of Pool” in this Term Sheet reflect a percentage of the aggregate principal balance of the mortgage pool as of the Cut-off Date, after application of all payments of principal due during or prior to August 2024. |
| (2) | With respect to any mortgage loan that is part of a whole loan, unless otherwise indicated, all LTV, DSCR and Debt Yield calculations in this Term Sheet include any related pari passu companion loans and exclude any subordinate companion loans and/or mezzanine loans, as applicable. Additionally, LTV, DSCR and Debt Yield figures in this Term Sheet are calculated for mortgage loans without regard to any additional indebtedness that may be incurred at a future date. For mortgaged properties securing residential cooperative mortgage loans all LTV, DSCR and Debt Yield calculations do not take into account any subordinate debt (whether or not secured by the related mortgaged property), that currently exists or is allowed under the terms of any mortgage loan. |
| (3) | The LTV ratios set forth in this Term Sheet are generally based on the “as-is” values of the related mortgaged properties; provided that the “as-is” value for a portfolio of mortgaged properties may include a premium relating to the valuation of the mortgaged properties as a whole rather than as the sum of individually valued mortgaged properties; provided, further, that such LTV ratios may be based on “as-stabilized”, “as complete” or other contingent values in certain cases in which reserves have been established at origination for the applicable condition or circumstance that is expected to result in stabilization provided, further, that such LTV ratios may have been calculated based on a principal balance that is net of a holdback or earnout reserve. See the definition of “Appraised Value” under “Description of the Mortgage Pool—Certain Calculations and Definitions” in the Preliminary Prospectus. |
| (4) | Excludes 640 5th Avenue which is on a planned amortization schedule and mortgage loans that provide for payments of interest only through the related maturity date or anticipated repayment date, as applicable. |
| (5) | Excludes multifamily, self storage, hospitality and manufactured housing properties. |
| This is not a research report and was not prepared by any Underwriter’s research department. Please see additional important information and qualifications at the end of this Term Sheet. | ||
| 20 | ||
| BANK5 2024-5YR8 | Characteristics of the Mortgage Loans |
| Top 10 Mortgage Loans(1) | |||||||||||||
| Loan No. | Mortgage Loan Seller | Property Name | City | State | Property Type | Cut-off Date Balance | % of Pool | SF/Rooms/Units | Cut-off Date Balance per SF/Room/Unit | UW NCF DSCR | UW NOI Debt Yield | Cut-off Date LTV | Maturity Date LTV |
| 1 | JPMCB | Showcase I | Las Vegas | NV | Retail | 69,000,000 | 9.99% | 180,848 | $937.25 | 1.30x | 8.5% | 67.8% | 67.8% |
| 2 | MSMCH | 640 5th Avenue | New York | NY | Mixed Use | $68,899,375 | 9.98% | 314,533 | $952.40 | 2.04x | 18.8% | 41.6% | 38.1% |
| 3 | BANA | Stonebriar Centre | Frisco | TX | Retail | $65,000,000 | 9.4% | 1,096,880 | $232.48 | 2.30x | 16.8% | 42.1% | 42.1% |
| 4 | WFB | Cummins Station | Nashville | TN | Office | 60,000,000 | 8.7% | 410,740 | $328.68 | 1.40x | 10.2% | 58.8% | 58.8% |
| 5 | BANA | iPark Norwalk | Norwalk | CT | Mixed Use | $55,000,000 | 8.0% | 372,175 | $255.26 | 1.60x | 10.9% | 56.6% | 56.6% |
| 6 | MSMCH | Johns Creek Town Center | Suwanee | GA | Retail | $40,000,000 | 5.8% | 303,297 | $131.88 | 1.53x | 11.5% | 67.7% | 67.7% |
| 7 | MSMCH | Embassy Suites Atlanta Airport North | Hapeville | GA | Hospitality | $37,250,000 | 5.4% | 178 | $209,269.66 | 1.45x | 13.0% | 61.1% | 61.1% |
| 8 | BANA | 2568-2574 Broadway | New York | NY | Mixed Use | $30,250,000 | 4.4% | 71 | $426,056.34 | 1.52x | 10.7% | 64.2% | 64.2% |
| 9 | WFB | 9950 Woodloch | The Woodlands | TX | Office | 29,481,972 | 4.3% | 601,151 | $216.12 | 1.50x | 13.1% | 56.1% | 53.3% |
| 10 | JPMCB | 8400 Winchester | Memphis | TN | Industrial | $27,000,000 | 3.9% | 817,274 | $33.04 | 1.36x | 10.9% | 55.1% | 55.1% |
| Total/Wtd. Avg. | $481,881,347 | 69.8% | 1.65x | 12.7% | 56.0% | 55.3% | |||||||
| (1) | With respect to any mortgage loan that is part of a whole loan, unless otherwise indicated, all LTV, DSCR, Debt Yield and Balance per SF/Room/Unit calculations in this Term Sheet include any related pari passu companion loans and exclude any subordinate companion loans and/or mezzanine loans, as applicable. Additionally, LTV, DSCR, Debt Yield and Balance per SF/Room/Unit figures in this Term Sheet are calculated for mortgage loans without regard to any additional indebtedness that may be incurred at a future date. |
| This is not a research report and was not prepared by any Underwriter’s research department. Please see additional important information and qualifications at the end of this Term Sheet. | ||
| 21 | ||
| BANK5 2024-5YR8 | Characteristics of the Mortgage Loans |
| Mortgage Loans with Pari Passu Companion Loans | ||||||||||||
| Loan No. | Mortgage Loan Seller | Property Name | Mortgage Loan Cut-off Date Balance | Aggregate Pari Passu Companion Loan Cut-off Date Balance | Combined Cut-off Date Balance | Lead Servicing Agreement | Master Servicer | Special Servicer | Control Rights | Combined UW NCF DSCR(1) | Combined UW NOI Debt Yield(1) | Combined Cut-off Date LTV(1) |
| 1 | JPMCB | Showcase I | $69,000,000 | $100,500,000 | $169,500,000 | BANK5 2024-5YR8 | Wells Fargo | Greystone | BANK5 2024-5YR8 | 1.30x | 8.5% | 67.8% |
| 2 | MSMCH | 640 5th Avenue | $68,899,375 | $230,663,125 | $299,562,500 | BANK5 2024-5YR8 | Wells Fargo | Greystone | BANK5 2024-5YR8 | 2.04x | 18.8% | 41.6% |
| 3 | BANA | Stonebriar Centre | $65,000,000 | $190,000,000 | $255,000,000 | (2) | (2) | (2) | (2) | 2.30x | 16.8% | 42.1% |
| 4 | WFB | Cummins Station | $60,000,000 | $75,000,000 | $135,000,000 | BANK5 2024-5YR8 | Wells Fargo | Greystone | BANK5 2024-5YR8 | 1.40x | 10.2% | 58.8% |
| 5 | BANA | iPark Norwalk | $55,000,000 | $40,000,000 | $95,000,000 | BANK5 2024-5YR8 | Wells Fargo | Greystone | BANK5 2024-5YR8 | 1.60x | 10.9% | 56.6% |
| 9 | WFB | 9950 Woodloch | $29,481,972 | $100,438,583 | $129,920,556 | WFCM 2024-5C1 | Wells Fargo | Argentic | WFCM 2024-5C1 | 1.50x | 13.1% | 56.1% |
| 15 | BANA | Marriott Anaheim | $15,000,000 | $110,000,000 | $125,000,000 | BANK5 2024-5YR7 | Wells Fargo | KeyBank | BANK5 2024-5YR7 | 1.28x | 8.2% | 65.8% |
| (1) | DSCR, Debt Yield and LTV calculations include any related pari passu companion loans and exclude any subordinate companion loans and/or mezzanine loans, as applicable. |
| (2) | The Stonebriar Centre controlling companion loan is currently held by Goldman Sachs Bank USA. The Stonebriar Center whole loan will be serviced pursuant to the BANK5 2024-5YR8 pooling and servicing agreement until the securitization of the related controlling pari passu companion loan. |
| Mortgage Loans with Mezzanine Debt | |||||||||||
| Loan No. | Mortgage Loan Seller | Property Name | Mortgage Loan Cut-off Date Balance | Cut-off Date Balance per SF | Mezzanine Debt Cut-off Date Balance | UW NCF DSCR | UW NOI Debt Yield | Cut-off Date LTV | Total Debt UW NCF DSCR(1) | Total Debt UW NOI Debt Yield(1) | Total Debt Cut-off Date LTV(1) |
| 2 | MSMCH | 640 5th Avenue | $68,899,375 | $952.40 | $99,854,167 | 2.04x | 18.8% | 41.6% | 1.31x | 14.1% | 55.5% |
| 5 | BANA | iPark Norwalk | $55,000,000 | $255.26 | $15,000,000 | 1.60x | 10.9% | 56.6% | 1.20x | 9.4% | 65.5% |
| 6 | MSMCH | Johns Creek Town Center | $40,000,000 | $131.88 | $10,000,000 | 1.53x | 11.5% | 67.7% | 1.07x | 9.2% | 84.6% |
| (1) | Total Debt UW NCF DSCR, Total Debt UW NOI Debt Yield and Total Debt Cut-off Date LTV figures shown above are calculated based on any related pari passu notes, any related subordinate note(s) and the mezzanine debt. |
| This is not a research report and was not prepared by any Underwriter’s research department. Please see additional important information and qualifications at the end of this Term Sheet. | ||
| 22 | ||
| BANK5 2024-5YR8 | Characteristics of the Mortgage Loans |
| Prior Securitization History(1) | ||||||||||||||
| Loan No. | Mortgage Loan Seller | Property Name | City | State | Property Type | Cut-off Date Balance | % of Pool | SF/ Units/ Rooms | Cut-off Date Balance per SF/ Unit/ Room | UW NCF DSCR | UW NOI Debt Yield | Cut-off Date LTV | Maturity Date LTV | Prior Securitization |
| 1 | JPMCB | Showcase I | Las Vegas | NV | Retail | $69,000,000 | 9.99% | 180,848 | $937.25 | 1.30x | 8.5% | 67.8% | 67.8% | JPMBB 2014-C21 |
| 5 | BANA | iPark Norwalk | Norwalk | CT | Mixed Use | $55,000,000 | 8.0% | 372,175 | $255.26 | 1.60x | 10.9% | 56.6% | 56.6% | COMM 2014-CR16 |
| 10 | JPMCB | 8400 Winchester | Memphis | TN | Industrial | $27,000,000 | 3.9% | 817,274 | $33.04 | 1.36x | 10.9% | 55.1% | 55.1% | RCMT 2021-FL5 |
| 11 | BANA | Pioneer | Santa Fe Springs | CA | Office | $20,000,000 | 2.9% | 177,383 | $112.75 | 1.65x | 13.5% | 55.2% | 55.2% | COMM 2014-LC17 |
| 15 | BANA | Marriott Anaheim | Anaheim | CA | Hospitality | $15,000,000 | 2.2% | 1,030 | $121,359.22 | 1.28x | 8.2% | 65.8% | 65.8% | JPMBB 2014-C18, JPMBB 2014-C19 |
| 19 | MSMCH | San Rafael Self Storage | San Rafael | CA | Self Storage | $10,000,000 | 1.4% | 35,747 | $279.74 | 1.64x | 10.6% | 53.7% | 53.7% | WFRBS 2014-C23 |
| 22 | MSMCH | Holiday Inn Express Warminster | Warminster | PA | Hospitality | $7,850,000 | 1.1% | 92 | $85,326.09 | 1.49x | 14.6% | 62.8% | 60.1% | JPMBB 2014-C25 |
| 26 | MSMCH | Creswell Plaza | Opelousas | LA | Retail | $5,400,000 | 0.8% | 42,540 | $126.94 | 1.70x | 12.9% | 61.4% | 61.4% | MSBAM 2014-C16 |
| Total | $209,250,000 | 30.3% | ||||||||||||
| (1) | Includes mortgage loans for which all or a portion of the previously existing debt was most recently securitized in conduit securitizations, based on information provided by the related borrower or obtained through searches of a third-party database. The information has not otherwise been confirmed by the mortgage loan sellers. With respect to any mortgage loan that is part of a whole loan, unless otherwise indicated, all LTV, DSCR, Debt Yield and Cut-off Date Balance per SF/Unit/Room calculations include any related pari passu companion loans and exclude any related subordinate companion loans and/or mezzanine loans, as applicable. |
| This is not a research report and was not prepared by any Underwriter’s research department. Please see additional important information and qualifications at the end of this Term Sheet. | ||
| 23 | ||
| BANK5 2024-5YR8 | Characteristics of the Mortgage Loans |
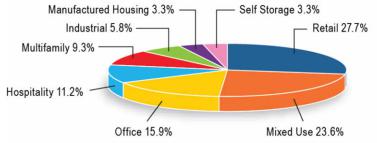
| Property Type Distribution(1) | ||||||||
| Property Type | Number of Mortgaged Properties | Aggregate Cut-off Date Balance | % of Pool | Wtd. Avg. Mortgage Rate | Wtd. Avg. UW NCF DSCR | Wtd. Avg. UW NOI Debt Yield | Wtd. Avg. Cut-off Date LTV | Wtd. Avg. Maturity Date LTV |
| Retail | 6 | $191,100,000 | 27.7% | 6.7061% | 1.75x | 12.5% | 56.8% | 56.8% |
| Anchored | 3 | $116,700,000 | 16.9% | 6.5174% | 1.46x | 10.1% | 64.3% | 64.3% |
| Super Regional Mall | 1 | $65,000,000 | 9.4% | 6.9990% | 2.30x | 16.8% | 42.1% | 42.1% |
| Shadow Anchored | 1 | $5,400,000 | 0.8% | 7.0200% | 1.70x | 12.9% | 61.4% | 61.4% |
| Single Tenant | 1 | $4,000,000 | 0.6% | 7.0300% | 1.31x | 9.4% | 71.4% | 71.4% |
| Mixed Use | 4 | $163,149,375 | 23.6% | 6.4350% | 1.76x | 14.1% | 52.0% | 50.5% |
| Office/Retail | 1 | $68,899,375 | 9.98% | 6.1293% | 2.04x | 18.8% | 41.6% | 38.1% |
| Medical Office/Office/Retail | 1 | $55,000,000 | 8.0% | 6.5890% | 1.60x | 10.9% | 56.6% | 56.6% |
| Multifamily/Retail | 1 | $30,250,000 | 4.4% | 6.8780% | 1.52x | 10.7% | 64.2% | 64.2% |
| Retail/Multifamily | 1 | $9,000,000 | 1.3% | 6.3450% | 1.42x | 9.3% | 62.9% | 62.9% |
| Office | 3 | $109,481,972 | 15.9% | 7.1198% | 1.47x | 11.6% | 57.4% | 56.7% |
| CBD | 1 | $60,000,000 | 8.7% | 7.1550% | 1.40x | 10.2% | 58.8% | 58.8% |
| Suburban | 2 | $49,481,972 | 7.2% | 7.0770% | 1.56x | 13.3% | 55.7% | 54.1% |
| Hospitality | 4 | $77,065,000 | 11.2% | 7.5066% | 1.47x | 12.3% | 63.0% | 62.8% |
| Full Service | 2 | $52,250,000 | 7.6% | 7.5614% | 1.40x | 11.6% | 62.4% | 62.4% |
| Limited Service | 2 | $24,815,000 | 3.6% | 7.3911% | 1.61x | 13.8% | 64.3% | 63.4% |
| Multifamily | 7 | $63,944,592 | 9.3% | 6.5071% | 1.67x | 11.5% | 56.6% | 56.1% |
| Garden | 3 | $23,600,000 | 3.4% | 6.7881% | 1.51x | 10.9% | 62.3% | 62.3% |
| Mid Rise | 2 | $20,322,592 | 2.9% | 6.1366% | 1.62x | 11.3% | 58.6% | 57.1% |
| High Rise | 1 | $16,572,000 | 2.4% | 6.7000% | 1.27x | 8.7% | 54.6% | 54.6% |
| Cooperative | 1 | $3,450,000 | 0.5% | 5.8400% | 5.05x | 30.4% | 15.8% | 15.8% |
| Industrial | 4 | $40,190,000 | 5.8% | 7.2610% | 1.45x | 11.3% | 55.3% | 55.3% |
| Warehouse/Distribution | 1 | $27,000,000 | 3.9% | 7.3760% | 1.36x | 10.9% | 55.1% | 55.1% |
| Warehouse | 2 | $8,500,000 | 1.2% | 7.1900% | 1.75x | 13.1% | 47.6% | 47.6% |
| Flex | 1 | $4,690,000 | 0.7% | 6.7280% | 1.41x | 10.4% | 70.0% | 70.0% |
| Manufactured Housing | 3 | $23,050,000 | 3.3% | 6.5995% | 1.35x | 9.2% | 56.3% | 56.3% |
| Manufactured Housing | 2 | $19,000,000 | 2.8% | 6.6100% | 1.33x | 9.1% | 55.2% | 55.2% |
| Manufactured Housing/RV Park | 1 | $4,050,000 | 0.6% | 6.5500% | 1.42x | 9.6% | 61.4% | 61.4% |
| Self Storage | 2 | $22,500,000 | 3.3% | 6.4276% | 1.51x | 9.9% | 55.7% | 55.7% |
| Self Storage | 2 | $22,500,000 | 3.3% | 6.4276% | 1.51x | 9.9% | 55.7% | 55.7% |
| Total/Wtd. Avg. | 33 | $690,480,940 | 100.0% | 6.7982% | 1.63x | 12.4% | 56.3% | 55.8% |
| (1) | All numerical information concerning the mortgage loans is approximate and, in the case of mortgage loans secured by multiple properties, is based on allocated loan amounts with respect to such properties. All weighted average information regarding the mortgage loans reflects the weighting of the mortgage loans based on their outstanding principal balances as of the Cut-off Date or, in the case of mortgage loans secured by multiple properties, allocated loan amounts. The sum of numbers and percentages in columns may not match the “Total” due to rounding. With respect to any mortgage loan that is part of a whole loan, unless otherwise indicated, all LTV, DSCR and Debt Yield calculations include any related pari passu companion loans and exclude any related subordinate companion loans and/or mezzanine loans, as applicable. The UW NCF DSCR, UW NOI Debt Yield and LTV calculations do not take into account any subordinate debt (whether or not secured by the related mortgaged property), that currently exists or is allowed under the terms of any mortgage loan. |
| This is not a research report and was not prepared by any Underwriter’s research department. Please see additional important information and qualifications at the end of this Term Sheet. | ||
| 24 | ||
| BANK5 2024-5YR8 | Characteristics of the Mortgage Loans |
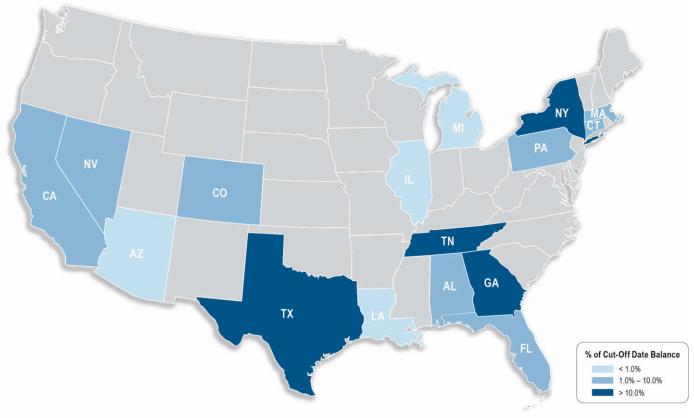
| Geographic Distribution(1) | ||||||||
| State or Other Jurisdiction | Number of Mortgaged Properties | Aggregate Cut-off Date Balance | % of Pool | Wtd. Avg. Mortgage Rate | Wtd. Avg. UW NCF DSCR | Wtd. Avg. UW NOI Debt Yield | Wtd. Avg. Cut-off Date LTV | Wtd. Avg. Maturity Date LTV |
| New York | 9 | $148,121,967 | 21.5% | 6.3676% | 1.91x | 15.4% | 48.2% | 46.4% |
| Texas | 4 | $104,671,972 | 15.2% | 7.0361% | 1.99x | 15.2% | 48.2% | 47.4% |
| Tennessee | 3 | $95,385,000 | 13.8% | 7.1696% | 1.38x | 10.3% | 57.4% | 57.4% |
| Georgia | 2 | $77,250,000 | 11.2% | 7.3979% | 1.49x | 12.2% | 64.5% | 64.5% |
| Nevada | 1 | $69,000,000 | 9.99% | 6.3600% | 1.30x | 8.5% | 67.8% | 67.8% |
| California | 4 | $61,572,000 | 8.9% | 6.6848% | 1.46x | 10.4% | 57.4% | 57.4% |
| Connecticut | 1 | $55,000,000 | 8.0% | 6.5890% | 1.60x | 10.9% | 56.6% | 56.6% |
| Colorado | 1 | $16,965,000 | 2.5% | 7.1880% | 1.66x | 13.4% | 65.0% | 65.0% |
| Florida | 1 | $14,900,000 | 2.2% | 6.3600% | 1.46x | 9.7% | 65.1% | 65.1% |
| Massachusetts | 1 | $12,500,000 | 1.8% | 6.5000% | 1.40x | 9.4% | 57.3% | 57.3% |
| Alabama | 1 | $10,615,000 | 1.5% | 6.6100% | 1.33x | 9.1% | 55.2% | 55.2% |
| Pennsylvania | 1 | $7,850,000 | 1.1% | 7.8300% | 1.49x | 14.6% | 62.8% | 60.1% |
| Louisiana | 1 | $5,400,000 | 0.8% | 7.0200% | 1.70x | 12.9% | 61.4% | 61.4% |
| Arizona | 1 | $4,050,000 | 0.6% | 6.5500% | 1.42x | 9.6% | 61.4% | 61.4% |
| Michigan | 1 | $4,000,000 | 0.6% | 7.0300% | 1.31x | 9.4% | 71.4% | 71.4% |
| Illinois | 1 | $3,200,000 | 0.5% | 7.5100% | 1.69x | 13.6% | 53.6% | 53.6% |
| Total/Wtd. Avg. | 33 | $690,480,940 | 100.0% | 6.7982% | 1.63x | 12.4% | 56.3% | 55.8% |
| (1) | All numerical information concerning the mortgage loans is approximate and, in the case of mortgage loans secured by multiple properties, is based on allocated loan amounts with respect to such properties. All weighted average information regarding the mortgage loans reflects the weighting of the mortgage loans based on their outstanding principal balances as of the Cut-off Date or, in the case of mortgage loans secured by multiple properties, allocated loan amounts. The sum of numbers and percentages in columns may not match the “Total” due to rounding. With respect to any mortgage loan that is part of a whole loan, unless otherwise indicated, all LTV, DSCR and Debt Yield calculations include any related pari passu companion loans and exclude any related subordinate companion loans and/or mezzanine loans, as applicable. |
| This is not a research report and was not prepared by any Underwriter’s research department. Please see additional important information and qualifications at the end of this Term Sheet. | ||
| 25 | ||
| BANK5 2024-5YR8 | Collateral Statistics |
Collateral Statistics(1)
Cut-off Date Balance ($)
| No. of Mortgage Loans | Aggregate Cut-off Date Balance ($) | % of Pool | ||
| 2,500,000 - 5,000,000 | 6 | $21,890,000 | 3.2% | |
| 5,000,001 - 15,000,000 | 12 | $114,172,592 | 16.5% | |
| 15,000,001 - 25,000,000 | 4 | $72,537,000 | 10.5% | |
| 25,000,001 - 35,000,000 | 3 | $86,731,972 | 12.6% | |
| 35,000,001 - 55,000,000 | 3 | $132,250,000 | 19.2% | |
| 55,000,001 - 69,000,000 | 4 | $262,899,375 | 38.1% | |
| Total: | 32 | $690,480,940 | 100.0% | |
| Min: $2,500,000 | Max: $69,000,000 | Avg: $21,577,529 | ||
State or Other Jurisdiction(2)
| No. of Mortgaged Properties | Aggregate Cut-off Date Balance ($) | % of Pool | |
| New York | 9 | $148,121,967 | 21.5% |
| Texas | 4 | $104,671,972 | 15.2% |
| Tennessee | 3 | $95,385,000 | 13.8% |
| Georgia | 2 | $77,250,000 | 11.2% |
| Nevada | 1 | $69,000,000 | 9.99% |
| California | 4 | $61,572,000 | 8.9% |
| Connecticut | 1 | $55,000,000 | 8.0% |
| Colorado | 1 | $16,965,000 | 2.5% |
| Florida | 1 | $14,900,000 | 2.2% |
| Massachusetts | 1 | $12,500,000 | 1.8% |
| Alabama | 1 | $10,615,000 | 1.5% |
| Pennsylvania | 1 | $7,850,000 | 1.1% |
| Louisiana | 1 | $5,400,000 | 0.8% |
| Arizona | 1 | $4,050,000 | 0.6% |
| Michigan | 1 | $4,000,000 | 0.6% |
| Illinois | 1 | $3,200,000 | 0.5% |
| Total: | 33 | $690,480,940 | 100.0% |
Property Type(2)
| No. of Mortgaged Properties | Aggregate Cut-off Date Balance ($) | % of Pool | |
| Retail | 6 | $191,100,000 | 27.7% |
| Anchored | 3 | $116,700,000 | 16.9% |
| Super Regional Mall | 1 | $65,000,000 | 9.4% |
| Shadow Anchored | 1 | $5,400,000 | 0.8% |
| Single Tenant | 1 | $4,000,000 | 0.6% |
| Mixed Use | 4 | $163,149,375 | 23.6% |
| Office/Retail | 1 | $68,899,375 | 9.98% |
| Medical Office/Office/Retail | 1 | $55,000,000 | 8.0% |
| Multifamily/Retail | 1 | $30,250,000 | 4.4% |
| Retail/Multifamily | 1 | $9,000,000 | 1.3% |
| Office | 3 | $109,481,972 | 15.9% |
| CBD | 1 | $60,000,000 | 8.7% |
| Suburban | 2 | $49,481,972 | 7.2% |
| Hospitality | 4 | $77,065,000 | 11.2% |
| Full Service | 2 | $52,250,000 | 7.6% |
| Limited Service | 2 | $24,815,000 | 3.6% |
| Multifamily | 7 | $63,944,592 | 9.3% |
| Garden | 3 | $23,600,000 | 3.4% |
| Mid Rise | 2 | $20,322,592 | 2.9% |
| High Rise | 1 | $16,572,000 | 2.4% |
| Cooperative | 1 | $3,450,000 | 0.5% |
| Industrial | 4 | $40,190,000 | 5.8% |
| Warehouse/Distribution | 1 | $27,000,000 | 3.9% |
| Warehouse | 2 | $8,500,000 | 1.2% |
| Flex | 1 | $4,690,000 | 0.7% |
| Manufactured Housing | 3 | $23,050,000 | 3.3% |
| Manufactured Housing | 2 | $19,000,000 | 2.8% |
| Manufactured Housing/RV Park | 1 | $4,050,000 | 0.6% |
| Self Storage | 2 | $22,500,000 | 3.3% |
| Self Storage | 2 | $22,500,000 | 3.3% |
| Total: | 33 | $690,480,940 | 100.0% |
Mortgage Rate (%)
| No. of Mortgage Loans | Aggregate Cut-off Date Balance ($) | % of Pool | |||
| 5.8000 - 5.9999 | 2 | $13,250,000 | 1.9% | ||
| 6.0000 - 6.9999 | 18 | $458,083,967 | 66.3% | ||
| 7.0000 - 7.9999 | 11 | $181,896,972 | 26.3% | ||
| 8.0000 - 8.0400 | 1 | $37,250,000 | 5.4% | ||
| Total: | 32 | $690,480,940 | 100.0% | ||
| Min: 5.8000% | Max: 8.0400% | Wtd Avg: 6.7982% | |||
Original Term to Maturity or ARD (mos.)
| No. of Mortgage Loans | Aggregate Cut-off Date Balance ($) | % of Pool | |||
| 60 | 32 | $690,480,940 | 100.0% | ||
| Total: | 32 | $690,480,940 | 100.0% | ||
| Min: 60 mos. | Max: 60 mos. | Wtd Avg: 60 mos. | |||
Remaining Term to Maturity or ARD (mos.)
| No. of Mortgage Loans | Aggregate Cut-off Date Balance ($) | % of Pool | |||
| 57 – 60 | 32 | $690,480,940 | 100.0% | ||
| Total: | 32 | $690,480,940 | 100.0% | ||
| Min: 57 mos. | Max: 60 mos. | Wtd Avg: 59 mos. | |||
Original Amortization Term (mos.)
| No. of Mortgage Loans | Aggregate Cut-off Date Balance ($) | % of Pool | |||
| Interest Only | 28 | $573,727,000 | 83.1% | ||
| Planned Amortization | 1 | $68,899,375 | 9.98% | ||
| 360 | 3 | $47,854,565 | 6.9% | ||
| Total: | 32 | $690,480,940 | 100.0% | ||
| Min: 360 mos. | Max: 360 mos. | Wtd Avg(3): 360 mos. | |||
Remaining Amortization Term (mos.)
| No. of Mortgage Loans | Aggregate Cut-off Date Balance ($) | % of Pool | |||
| Interest Only | 28 | $573,727,000 | 83.1% | ||
| Planned Amortization | 1 | $68,899,375 | 9.98% | ||
| 358-360 | 3 | $47,854,565 | 6.9% | ||
| Total: | 32 | $690,480,940 | 100.0% | ||
| Min: 358 mos. | Max: 360 mos. | Wtd Avg(3): 359 mos. | |||
Mortgage Loan Sellers
| No. of Mortgage Loans | Aggregate Cut-off Date Balance ($) | % of Pool | |||
| MSMCH | 20 | $292,593,967 | 42.4% | ||
| BANA | 7 | $195,440,000 | 28.3% | ||
| WFB | 3 | $106,446,972 | 15.4% | ||
| JPMCB | 2 | $96,000,000 | 13.9% | ||
| Total: | 32 | $690,480,940 | 100.0% | ||
Amortization Type
| No. of Mortgage Loans | Aggregate Cut-off Date Balance ($) | % of Pool | |||
| Interest Only | 28 | $573,727,000 | 83.1% | ||
| Amortizing Balloon | 4 | $116,753,940 | 16.9% | ||
| Total: | 32 | $690,480,940 | 100.0% | ||
Cut-off Date LTV Ratio (%)
| No. of Mortgage Loans | Aggregate Cut-off Date Balance ($) | % of Pool | |||
| 14.8 - 40.0 | 2 | $11,150,000 | 1.6% | ||
| 40.1 - 50.0 | 3 | $139,899,375 | 20.3% | ||
| 50.1 - 60.0 | 12 | $268,776,565 | 38.9% | ||
| 60.1 - 65.0 | 8 | $113,265,000 | 16.4% | ||
| 65.1 - 71.4 | 7 | $157,390,000 | 22.8% | ||
| Total: | 32 | $690,480,940 | 100.0 | % | |
| Min: 14.8% | Max: 71.4% | Wtd Avg: 56.3% | |||
Maturity Date or ARD LTV Ratio (%)
| No. of Mortgage Loans | Aggregate Cut-off Date Balance ($) | % of Pool | |||
| 14.8 - 40.0 | 3 | $80,049,375 | 11.6% | ||
| 40.1 - 45.0 | 2 | $71,000,000 | 10.3% | ||
| 45.1 - 55.0 | 5 | $69,776,565 | 10.1% | ||
| 55.1 - 60.0 | 7 | $199,000,000 | 28.8% | ||
| 60.1 - 71.4 | 15 | $270,655,000 | 39.2% | ||
| Total: | 32 | $690,480,940 | 100.0% | ||
| Min: 14.8% | Max: 71.4% | Wtd Avg: 55.8% | |||
UW NCF DSCR (x)
| No. of Mortgage Loans | Aggregate Cut-off Date Balance ($) | % of Pool | |||
| 1.27 - 1.70 | 26 | $528,908,972 | 76.6% | ||
| 1.71 - 2.10 | 3 | $85,421,967 | 12.4% | ||
| 2.11 - 2.50 | 2 | $72,700,000 | 10.5% | ||
| 2.51 - 5.05 | 1 | $3,450,000 | 0.5% | ||
| Total: | 32 | $690,480,940 | 100.0% | ||
| Min: 1.27x | Max: 5.05x | Wtd Avg: 1.63x | |||
UW NOI Debt Yield (%)
| No. of Mortgage Loans | Aggregate Cut-off Date Balance ($) | % of Pool | |||
| 7.6 - 9.0 | 4 | $110,372,000 | 16.0% | ||
| 9.1 - 10.0 | 6 | $63,450,000 | 9.2% | ||
| 10.1 - 11.0 | 7 | $189,440,000 | 27.4% | ||
| 11.1 - 14.0 | 8 | $157,796,972 | 22.9% | ||
| 14.1 - 30.4 | 7 | $169,421,967 | 24.5% | ||
| Total: | 32 | $690,480,940 | 100.0% | ||
| Min: 7.6% | Max: 30.4% | Wtd Avg: 12.4% | |||
| (1) | All numerical information concerning the mortgage loans is approximate. All weighted average information regarding the mortgage loans reflects the weighting of the mortgage loans based on their outstanding principal balances as of the Cut-off Date. The sum of numbers and percentages in columns may not match the “Total” due to rounding. With respect to any mortgage loan that is part of a whole loan, unless otherwise indicated, all LTV, DSCR and Debt Yield calculations include any related pari passu companion loans and exclude any related subordinate companion loans and/or mezzanine loans, as applicable. The UW NCF DSCR, UW NOI Debt Yield and LTV calculations do not take into account any subordinate debt (whether or not secured by the related mortgaged property), that currently exists or is allowed under the terms of any mortgage loan. |
| (2) | In the case of mortgage loans secured by multiple properties, cut-off date balance information is based on allocated loan amounts with respect to such properties. |
| (3) | Excludes the non-amortizing mortgage loans and 640 5th Avenue which is on a planned amortization schedule. |
| This is not a research report and was not prepared by any Underwriter’s research department. Please see additional important information and qualifications at the end of this Term Sheet. | ||
| 26 | ||
| Retail - Anchored | Loan #1 | Cut-off Date Balance: | $69,000,000 | |
| 3785 South Las Vegas Boulevard | Showcase I | Cut-off Date LTV: | 67.8% | |
| Las Vegas, NV 89109 | UW NCF DSCR: | 1.30x | ||
| UW NOI Debt Yield: | 8.5% |

| This is not a research report and was not prepared by any Underwriter’s research department. Please see additional important information and qualifications at the end of this Term Sheet. | ||
| 27 | ||
| Retail - Anchored | Loan #1 | Cut-off Date Balance: | $69,000,000 | |
| 3785 South Las Vegas Boulevard | Showcase I | Cut-off Date LTV: | 67.8% | |
| Las Vegas, NV 89109 | UW NCF DSCR: | 1.30x | ||
| UW NOI Debt Yield: | 8.5% |
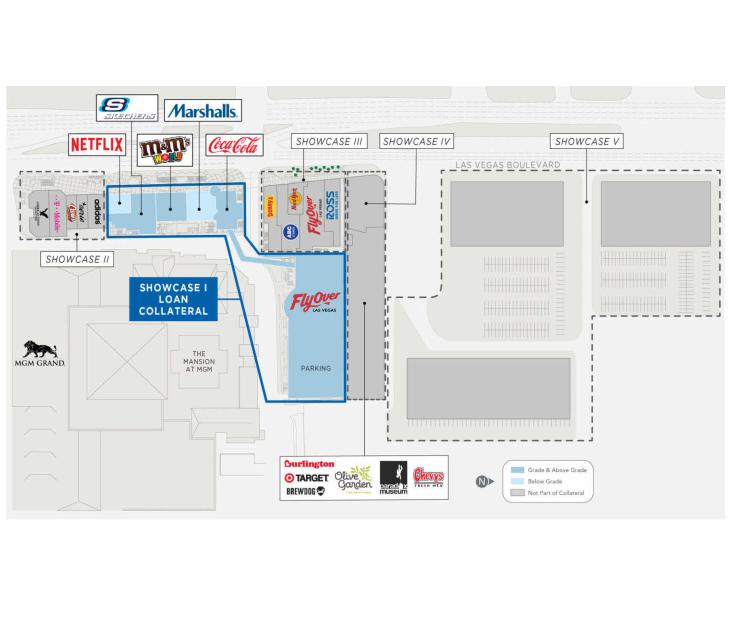
| This is not a research report and was not prepared by any Underwriter’s research department. Please see additional important information and qualifications at the end of this Term Sheet. | ||
| 28 | ||
| Retail - Anchored | Loan #1 | Cut-off Date Balance: | $69,000,000 | |
| 3785 South Las Vegas Boulevard | Showcase I | Cut-off Date LTV: | 67.8% | |
| Las Vegas, NV 89109 | UW NCF DSCR: | 1.30x | ||
| UW NOI Debt Yield: | 8.5% |
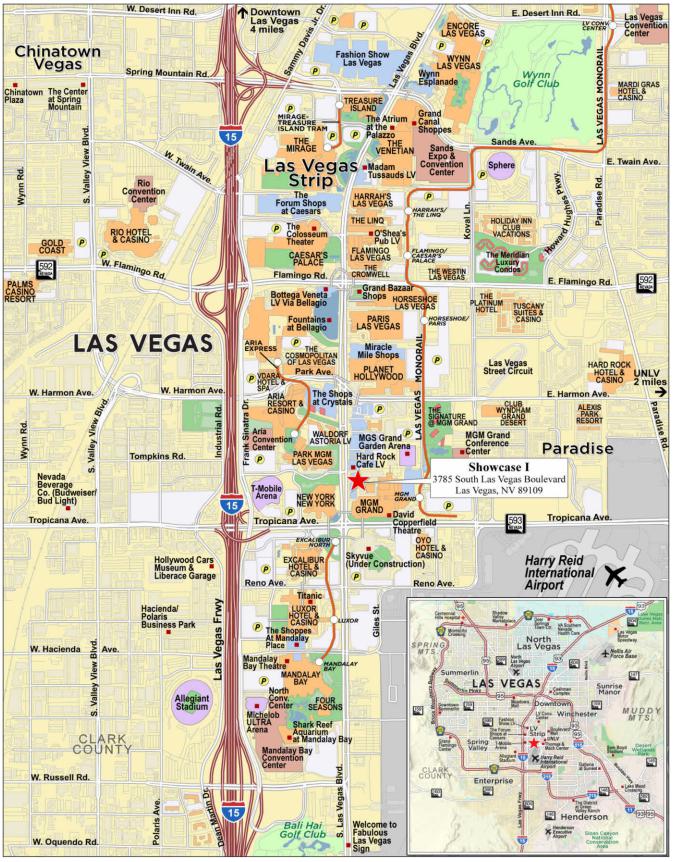
| This is not a research report and was not prepared by any Underwriter’s research department. Please see additional important information and qualifications at the end of this Term Sheet. | ||
| 29 | ||
| Mortgage Loan No. 1 – Showcase I |
| Mortgage Loan Information | Property Information | |||||
| Mortgage Loan Seller: | JPMCB | Single Asset/Portfolio: | Single Asset | |||
| Credit Assessment (Fitch/Moody’s/DBRSM): | NR/NR/NR | Location: | Las Vegas, NV 89109 | |||
| Original Balance(1): | $69,000,000 | General Property Type: | Retail | |||
| Cut-off Date Balance(1): | $69,000,000 | Detailed Property Type: | Anchored | |||
| % of Initial Pool Balance: | 9.99% | Title Vesting: | Fee | |||
| Loan Purpose: | Refinance | Year Built/Renovated: | 1997/2003 | |||
| Borrower Sponsors: | Jeffrey Gindi and Eli Gindi | Size: | 180,848 SF | |||
| Guarantors: | Jeffrey Gindi and Eli Gindi | Cut-off Date Balance Per SF(1): | $937 | |||
| Mortgage Rate: | 6.36000% | Maturity Date Balance Per SF(1): | $937 | |||
| Note Date: | 6/7/2024 | Property Manager: | Showcase Mall Vegas | |||
| Maturity Date: | 7/1/2029 | Management LLC | ||||
| Term to Maturity: | 60 months | (borrower-related) | ||||
| Amortization Term: | 0 months | Underwriting and Financial Information | ||||
| IO Period: | 60 months | UW NOI(4): | $14,408,703 | |||
| Seasoning: | 1 month | UW NCF: | $14,200,728 | |||
| Prepayment Provisions: | L(24),YM1(29),O(7) | UW NOI Debt Yield(1): | 8.5% | |||
| Lockbox/Cash Mgmt Status: | Hard/Springing | UW NCF Debt Yield(1): | 8.4% | |||
| Additional Debt Type(1): | Pari Passu | UW NOI Debt Yield at Maturity(1): | 8.5% | |||
| Additional Debt Balance(1): | $100,500,000 | UW NCF DSCR(1): | 1.30x | |||
| Future Debt Permitted (Type): | No (NAP) | Most Recent NOI(4): | $12,894,000 (4/30/2024 TTM) | |||
| 2nd Most Recent NOI: | $12,390,114 (12/31/2023) | |||||
| Reserves(2) | 3rd Most Recent NOI: | $10,800,125 (12/31/2022) | ||||
| Type | Initial | Monthly | Cap | Most Recent Occupancy(5): | 90.0% (2/29/2024) | |
| RE Taxes: | $363,322 | $121,107 | NAP | 2nd Most Recent Occupancy: | 100.0% (12/31/2023) | |
| Insurance: | $0 | Springing | NAP | 3rd Most Recent Occupancy: | 90.0% (12/31/2022) | |
| Replacement Reserve: | $2,261 | $2,261 | NAP | Appraised Value (as of): | $250,000,000 (3/27/2024) | |
| TI/LC Reserve: | $15,071 | $15,071 | $542,544 | Appraised Value PSF: | $1,382 | |
| Outstanding TI/LC: | $250,000 | $0 | NAP | Cut-off Date LTV Ratio(1): | 67.8% | |
| Other Reserve(3): | $14,152,888 | $0 | NAP | Maturity Date LTV Ratio(1): | 67.8% | |
| Sources and Uses | ||||||
| Sources | Proceeds | % of Total | Uses | Proceeds | % of Total | |
| Whole Loan Amount(1): | $169,500,000 | 97.4% | Loan Payoff: | $101,221,918 | 58.1% | |
| Borrower Sponsor Equity: | $4,571,072 | 2.6% | Preferred Equity Payoff: | $50,523,000 | 29.0% | |
| Upfront Reserves: | $14,783,541 | 8.5% | ||||
| Closing Costs: | $7,542,613 | 4.3% | ||||
| Total Sources: | $174,071,072 | 100.0% | Total Uses: | $174,071,072 | 100.0% | |
| (1) | The Showcase I Mortgage Loan (as defined below) is part of the Showcase I Whole Loan (as defined below), which is comprised of five pari passu senior promissory notes. The Cut-off Date Balance Per SF, Maturity Date Balance Per SF, UW NOI Debt Yield, UW NCF Debt Yield, UW NOI Debt Yield at Maturity, UW NCF DSCR, Cut-off Date LTV Ratio and Maturity Date LTV Ratio presented above are based on the principal balance of the Showcase I Whole Loan. |
| (2) | See “Escrows and Reserves” section below. |
| (3) | Other Reserves is comprised of $12,000,000 allocable to the Unfunded M&M TI Obligations Reserve and $2,152,888 allocable to the Unfunded M&M Free Rent Obligations Reserve (each as described under “Escrows and Reserves” below). |
| (4) | The increase from Most Recent NOI to UW NOI is primarily attributable to (i) execution of the M&M World (“M&M”) renewal lease with an effective date and rent step up in September 2025, reflected in the lender underwriting, and (ii) increased parking income in accordance with the borrower’s budget. At loan origination, $2,152,888 was reserved in connection with the M&M gap/free rent obligations, representing the difference between the current in-place rent under M&M’s lease and the renewal rent which is scheduled to take effect on the earlier to occur of (i) the delivery of the renovated M&M space to M&M and (ii) September 1, 2025 (the earlier to occur of clause (i) or (ii) above is hereinafter referred to as the “M&M Renewal Rent Commencement Date”). See “Escrows and Reserves” section for further discussion. |
| (5) | Though in occupancy and paying rent, Netflix has been underwritten as vacant as the Netflix lease is scheduled to expire on December 31, 2024. Netflix currently leases its space at a rental rate of $83.15 PSF. The Showcase I Property was 100.0% physically occupied as of February 29, 2024. |
The Mortgage Loan. The largest mortgage loan (the “Showcase I Mortgage Loan”) is part of a whole loan (the “Showcase I Whole Loan”) evidenced by five pari passu promissory notes in the aggregate original principal amount of $169,500,000. The Showcase I Loan was co-originated by JPMorgan Chase Bank, National Association and Citi Real Estate Funding Inc. (“CREFI”) on June 7, 2024.The Showcase I Whole Loan is secured by a first priority fee mortgage encumbering a 180,848 SF anchored retail property located in Las Vegas, Nevada (the “Showcase I Property”).
The Showcase I Mortgage Loan is evidenced by the controlling Note A-1-1 with an original principal amount of $69,000,000. The remaining promissory notes comprising the Showcase I Whole Loan are summarized in the below table. The Showcase I Whole Loan will be serviced pursuant to the pooling and servicing agreement for the BANK5 2024-5YR8 securitization trust. See “Description of the Mortgage Pool—The Whole Loans—The Serviced Pari Passu Whole Loans,” and “Pooling and Servicing Agreement” in the prospectus.
| This is not a research report and was not prepared by any Underwriter’s research department. Please see additional important information and qualifications at the end of this Term Sheet. | ||
| 30 | ||
| Retail - Anchored | Loan #1 | Cut-off Date Balance: | $69,000,000 | |
| 3785 South Las Vegas Boulevard | Showcase I | Cut-off Date LTV: | 67.8% | |
| Las Vegas, NV 89109 | UW NCF DSCR: | 1.30x | ||
| UW NOI Debt Yield: | 8.5% |
| Showcase I Whole Loan Summary | ||||
Note | Original Balance | Cut-off Date Balance | Note Holder | Controlling Note |
| A-1-1 | $69,000,000 | $69,000,000 | BANK5 2024-5YR8 | Yes |
| A-1-2(1) | $1,000,000 | $1,000,000 | JPMCB | No |
| A-2(1) | $20,000,000 | $20,000,000 | JPMCB | No |
| A-3(1) | $10,000,000 | $10,000,000 | JPMCB | No |
| A-4 | $40,000,000 | $40,000,000 | Benchmark 2024-V8 | No |
| A-5 | $29,500,000 | $29,500,000 | Benchmark 2024-V8 | No |
| Whole Loan | $169,500,000 | $169,500,000 | ||
| (1) | Expected to be contributed to one or more future securitization trusts. | |
The Borrower and the Borrower Sponsors. The borrower is N & G Showcase LLC, a Delaware limited liability company and single purpose entity with two independent directors. The borrower sponsors and non-recourse carveout guarantors for the Showcase I Whole Loan are Jeffery Gindi and Eli Gindi. Legal counsel to the borrower delivered a non-consolidation opinion in connection with origination of the Showcase I Whole Loan.
Founded in the late 1990s by brothers Jeffrey and Eli Gindi, Gindi Capital is a family-owned real estate and consumer products investment firm headquartered in New York, New York. Since its founding, Gindi Capital has been involved in several commercial real estate projects in markets such as New York, Miami and Las Vegas. Notable real estate holdings for Gindi Capital include Showcase One through Five located in Las Vegas (adjacent to the Showcase I Property), 100-10 125th Street located in New York, Versace Mansion located in Florida and Dizengoff Center located in Israel.
The Property. The Showcase I Property is a four-story, 180,848 SF, anchored-retail property located along the east side of the Las Vegas Boulevard within Las Vegas, Nevada. The Showcase I Property is situated on the southeast corner of the intersection of Las Vegas Boulevard and MGM Road, which provides access to MGM Resort and Casino. Additionally, just south of the Showcase I Property is Tropicana Avenue, which is home to three major resorts and casinos including the MGM Grand, New York New York Hotel & Casino and Excalibur Hotel & Casino. According to the appraisal, pedestrian traffic fronting the Showcase I Property exceeds 50,000 per day. The Showcase I Property is in close proximity to tourist attractions including the T-Mobile Arena, The Park, Park MGM and Park Theater.
The Showcase I Property was constructed in 1997 and most recently renovated in 2003. According to the appraisal, the Showcase I Property has undergone several renovations since opening, including exterior and interior improvements. The building features frontage along Las Vegas Boulevard and is structurally designed to have a large amount of billboard and advertisement exposure. Additionally, major tenants at the Showcase I Property such as M&M and Coca Cola have built out significant exterior design elements. The Showcase I Property is comprised of two parcels located directly adjacent to each other and connected via a sky bridge. The first parcel contains a retail building with four above ground floors and a sub-grade basement level. The second parcel contains a 12-story parking garage featuring 1,406 parking spaces, connected to the Showcase I Property via a pedestrian bridge on the fourth level, as well as 41,108 SF of specialty theatre concept space split across the first two floors. Furthermore, the Showcase I Property features four sets of escalators and two elevators. Lower-level major tenants including M&M and Coca Cola have their own escalators providing convenient lower-level access.
As of February 29, 2024, the Showcase I Property is 90.0% leased to a roster of nationally branded tenants (although currently in occupancy and paying rent, Netflix’s lease expires in December 2024 and has been marked vacant for purposes of lender underwriting). M&M is located across portions of all four above ground level floors and features a wide range of amenities including gift stores and a custom candy dispenser capable of producing M&M’s candies with personalized messages and images. Other amenities include a free 10-minute, 3-D movie on the third floor and Red’s Pit Stop, an ice cream and dessert bar where the store also hosts children’s birthday parties. In addition, M&M recently executed a 15-year lease renewal commencing in September 2025. M&M’s renewal rent of $4,000,000 is an approximately 75.6% increase as compared to the current in-place rent of $2,277,692. Such renewal rent is scheduled to take effect on the M&M Renewal Rent Commencement Date. In connection with the M&M renewal lease, the borrower agreed to a partial rent abatement of $166,666.67 per month (representing approximately 50% of the renewal rent) for the first 12 months after the M&M Renewal Rent Commencement Date and a rent abatement of $6,240.25 per day (representing approximately 99% of the current in-place rent) for 180 days commencing on the date that M&M vacates its entire premises and removes trade fixtures and movable personal property in connection with renovating its premises in accordance with the M&M lease (such date, if any, the “Vacate Date”). In addition, M&M is entitled to additional rent credits if delivery of its renovated premises is delayed. See “Escrows and Reserves” below. Coca Cola occupies portions of the first three above ground levels and features exclusive Coca Cola branded merchandise as well as a Coca Cola fountain on the second floor with 16 different international beverages. Outback Steakhouse leases space on the fourth floor. Marshalls and Netflix have exclusive ground floor entries providing access to the lower sub-grade leased space. Westgate Resorts occupies multiple suites at the Showcase I Property, as well as a kiosk and also maintains large exterior signage. The second floor of the Showcase I Property features a food court with multiple vendor suites, master leased to a third-party operator which runs the food court comprising 14,737 SF in aggregate. The food court also features its own entry and access from Las Vegas Boulevard frontage. The ground level and second level of the Showcase I Property parking garage is leased to FlyOver Las Vegas LLC (“FlyOver”), an operator of an immersive amusement attraction. The experience uses flight motion seats designed to swoop, dip and turn, giving a feeling of true flight. In order to enhance the ride and fully immerse the customer in the experience, certain 4D features such as a 20-meter spherical screen, wind, mists and fragrant scents are utilized.
| This is not a research report and was not prepared by any Underwriter’s research department. Please see additional important information and qualifications at the end of this Term Sheet. | ||
| 31 | ||
| Retail - Anchored | Loan #1 | Cut-off Date Balance: | $69,000,000 | |
| 3785 South Las Vegas Boulevard | Showcase I | Cut-off Date LTV: | 67.8% | |
| Las Vegas, NV 89109 | UW NCF DSCR: | 1.30x | ||
| UW NOI Debt Yield: | 8.5% |
The following table presents certain information relating to tenant sales history with respect to the Showcase I Property.
| Tenant Sales | |||||||||
| 2021 | 2022 | 2023 | 4/30/2024 TTM | ||||||
| SF | Sales | Sales PSF | Sales | Sales PSF | Sales | Sales PSF | Sales | Sales PSF | |
| FlyOver | 41,108 | NAV | NAV | $6,651,390 | $161.80 | $8,244,418 | $200.56 | $8,000,200 | $194.61 |
| M&M World | 31,025 | $32,071,045 | $1,033.72 | $33,881,880 | $1,092.08 | $30,984,942 | $998.71 | $30,360,018 | $978.57 |
| Marshalls(1) | 30,624 | $12,679,436 | $414.04 | $14,393,699 | $470.01 | $16,336,842 | $533.47 | NAV | NAV |
| Coca Cola | 18,597 | $11,317,077 | $608.54 | $13,261,687 | $713.11 | $15,093,882 | $811.63 | $15,291,122 | $822.24 |
| Total / Wtd. Avg. | 121,354 | $56,067,558 | $698.70 | $68,188,656 | $561.90 | $70,660,084 | $582.26 | $53,651,340 | $591.33 |
| (1) | Sales periods represent data from February of the current year to January of the following year. | |
Major Tenants.
M&M World (A1/A+/NR by M/S&P/F; 31,025 SF; 17.2% of NRA; 29.3% of underwritten base rent). First introduced in Newark, New Jersey in 1941, M&Ms are now offered in over 100 different countries around the world. M&M World is a retail store that specializes in M&M’s candy and related merchandise. The store features a gift shop on the first floor, candy dispensers on the second floor, collector’s items on the third floor and an authentic M&M-sponsored NASCAR race car which was driven by Ken Schrader on the fourth floor. Other core attractions include a custom candy dispenser capable of imprinting custom messages and images onto the candies as well as a digitally-remastered interactive 3-D film which runs for about 10 minutes and plays throughout the day. Although many subsequent M&M retail stores have since opened, the one at the Showcase I Property was the first, originally opened in 1997. M&M recently executed a renewal lease commencing in September 2025 for a 15-year term at a base rent of $4,000,000, 75.6% in excess of the current in-place rent. Such renewal rent is scheduled to take effect on the M&M Renewal Rent Commencement Date. The M&M lease is guaranteed by Mars Inc., the tenant’s investment grade credit-rated parent company. M&M’s renewal lease ends in August 2040 with two, five-year renewal options remaining. In connection with the M&M renewal lease, the borrower agreed to a partial rent abatement of $166,666.67 per month (representing approximately 50% of the renewal rent) for the first 12 months after the M&M Renewal Rent Commencement Date and a rent abatement of $6,240.25 per day (representing approximately 99% of the current in-place rent) for 180 days commencing on M&M’s Vacate Date (if any). At origination of the Showcase I Whole Loan, $2,152,888 was reserved in a gap and free rent reserve, representing the difference between the current in-place rent under the M&M lease and the renewal rent which is scheduled to take effect on the M&M Renewal Rent Commencement Date. The 12-month rent abatement, and the six month rent abatement described above related to renovations was not separately reserved for. Such reserve is required to be disbursed as described under “Escrows and Reserves—Unfunded M&M Free Rent Obligations Reserve” below. In addition, the borrower has a $12,000,000 landlord contribution obligation, which was reserved at origination, in the event M&M elects to renovate its space at any point prior to July 8, 2027. In the event the construction plans for the M&M renovation are not approved by the borrower or M&M by such date, M&M is instead entitled to a $2,000,000 free rent credit in lieu of the $12,000,000 available for renovations. See “Escrows and Reserves—Unfunded M&M TI Obligations Reserve” below.
Skechers (NR/NR/NR by M/S&P/F; 7,230 SF; 4.0% of NRA; 16.1% of underwritten base rent). Founded in 1992 by Robert Greenberg, Skechers is an American multinational footwear and apparel company headquartered in Manhattan Beach, California. Skechers operates 5,203 company and third-party owned retail stores across more than 180 countries. Skechers is currently the third-largest athletic footwear brand in the world and has major manufacturing facilities throughout North America, Europe, Central America, South America and Asia. 2023 saw Skechers record annual sales of $8.00 billion, a year-over-year increase of 7.5%, also recording a record gross margin of 53.1% in the fourth quarter of 2023. In 2023, Skechers introduced partnerships and a capsule collection with Martha Stewart and Snoop Dogg, who appeared in a joint Super Bowl campaign. Additionally, they continued to grow their sports presence, signing Harry Kane, Julius Randle and Terance Mann. Skecher’s lease term ends in March 2027 with two, five-year renewal options remaining.
Coca Cola (A1/A+/NR; 18,597 SF; 10.3% of NRA; 12.2% of underwritten base rent). Founded in 1886, Coca Cola has grown into an international total beverage brand sold in more than 200 countries, with 2.2 billion servings of Coca Cola branded drinks served daily. Coca Cola’s beverage portfolio is expansive, covering more than 200 brands and thousands of beverages across the globe, from soft drinks and waters, to coffee and teas. Additionally, the company has amassed over 225 bottling partners across 900 bottling plants globally. Coca Cola’s lease term ends in December 2029 with one, five-year renewal option remaining.
| This is not a research report and was not prepared by any Underwriter’s research department. Please see additional important information and qualifications at the end of this Term Sheet. | ||
| 32 | ||
| Retail - Anchored | Loan #1 | Cut-off Date Balance: | $69,000,000 | |
| 3785 South Las Vegas Boulevard | Showcase I | Cut-off Date LTV: | 67.8% | |
| Las Vegas, NV 89109 | UW NCF DSCR: | 1.30x | ||
| UW NOI Debt Yield: | 8.5% |
The following table presents certain information relating to the tenancy at the Showcase I Property:
| Tenant Summary(1) | ||||||||||||
| April 2024 TTM Sales | ||||||||||||
| Tenant Name | Credit Rating (Moody’s/ S&P/Fitch)(2) | Tenant SF | Approx. % of SF | Annual UW Rent | % of Total Annual UW Rent | Annual UW Rent PSF | Sales $ | Sales PSF | Occ Cost %(3) | Lease Exp. | Renewal Options | Term. Option (Y/N) |
| Major Tenants | ||||||||||||
| M&M World(4) | A1/A+/NR | 31,025 | 17.2% | $4,000,000 | 29.3% | $128.93 | $30,360,018 | $979 | 14.8% | 8/31/2040 | 2 x 5 yr | N |
| Skechers(5) | NR/NR/NR | 7,230 | 4.0% | $2,199,985 | 16.1% | $304.29 | NAV | NAV | NAV | 3/30/2027 | 2 x 5 yr | N |
| Coca Cola | A1/A+/NR | 18,597 | 10.3% | $1,673,730 | 12.2% | $90.00 | $15,291,122 | $822 | 12.9% | 12/31/2029 | 1 x 5 yr | N |
| Marshalls | A2/A/NR | 30,624 | 16.9% | $1,667,215 | 12.2% | $54.44 | $16,336,842(6) | $533(6) | 13.6%(6) | 1/31/2029 | 2 x 5 yr | N |
| FlyOver | NR/NR/NR | 41,108 | 22.7% | $1,124,880 | 8.2% | $27.36 | $8,000,200 | $195 | 21.3% | 8/31/2034 | 3 x 5 yr | N |
| Subtotal/Wtd. Avg. | 128,584 | 71.1% | $10,665,810 | 78.0% | $82.95 | |||||||
| Other Tenants(7) | 34,225 | 18.9% | $3,007,743 | 22.0% | $87.88 | |||||||
| Occupied Subtotal/Wtd. Avg. | 162,809 | 90.0% | $13,673,553 | 100.0% | $83.99 | |||||||
| Vacant Space(8) | 18,039 | 10.0% | ||||||||||
| Total/Wtd. Avg. | 180,848 | 100.0% | ||||||||||
| (1) | Information is based on the underwritten rent roll as of February 29, 2024, inclusive of contractual rent steps through September 30, 2025. | |
| (2) | Certain ratings are those of the parent company whether or not the parent guarantees the lease. |
| (3) | Based on underwritten base rent and borrower’s projected 2024 recoveries. |
| (4) | M&M World is entitled to free rent as described under “Major Tenants—M&M World” above. |
| (5) | Skechers pays a premium rent due to the size of its space, being on the grade level and featuring frontage along the Las Vegas Boulevard. |
| (6) | Sales $ for Marshalls represents total sales from February 2023 through January 2024. |
| (7) | Other Tenants is inclusive of 1,585 SF which is associated with an owner-occupied management office with no attributable underwritten base rent. |
| (8) | Though in occupancy and paying rent, Netflix has been underwritten as vacant as the Netflix lease is scheduled to expire in December 2024. Netflix currently leases its space at a rental rate of $83.15 PSF. |
The following table presents certain information relating to the lease rollover schedule at the Showcase I Property:
| Lease Rollover Schedule(1)(2) | ||||||||
| Year | # of Leases Rolling | SF Rolling | Approx. % of SF Rolling | Approx. Cumulative % of SF Rolling | Total UW Rent Rolling | Approx. % of Total UW Rent Rolling | Approx. Cumulative % of Total UW Rent Rolling | UW Rent PSF Rolling |
| MTM/2024(3) | 2 | 1,595 | 0.9% | 0.9% | $20,112 | 0.1% | 0.1% | $12.61 |
| 2025 | 0 | 0 | 0.0% | 0.9% | $0 | 0.0% | 0.1% | $0.00 |
| 2026 | 0 | 0 | 0.0% | 0.9% | $0 | 0.0% | 0.1% | $0.00 |
| 2027 | 1 | 7,230 | 4.0% | 4.9% | $2,199,985 | 16.1% | 16.2% | $304.29 |
| 2028 | 2 | 11,467 | 6.3% | 11.2% | $1,958,331 | 14.3% | 30.6% | $170.78 |
| 2029(4) | 2 | 49,221 | 27.2% | 38.4% | $3,340,945 | 24.4% | 55.0% | $67.88 |
| 2030 | 0 | 0 | 0.0% | 38.4% | $0 | 0.0% | 55.0% | $0.00 |
| 2031 | 0 | 0 | 0.0% | 38.4% | $0 | 0.0% | 55.0% | $0.00 |
| 2032 | 0 | 0 | 0.0% | 38.4% | $0 | 0.0% | 55.0% | $0.00 |
| 2033 | 0 | 0 | 0.0% | 38.4% | $0 | 0.0% | 55.0% | $0.00 |
| 2034 | 1 | 41,108 | 22.7% | 61.2% | $1,124,880 | 8.2% | 63.2% | $27.36 |
| 2035 & Thereafter | 3 | 52,188 | 28.9% | 90.0% | $5,029,300 | 36.8% | 100.0% | $96.37 |
| Vacant(5) | 0 | 18,039 | 10.0% | 100.0% | $0 | 0.0% | 100.0% | $0.00 |
| Total/Wtd. Avg. | 11 | 180,848 | 100.0% | $13,673,553 | 100.0% | $83.99(6) | ||
| (1) | Information is based on the underwritten rent roll as of February 29, 2024, inclusive of contractual rent steps through September 30, 2025. |
| (2) | Certain tenants may have lease termination options that are exercisable prior to the originally stated expiration date of the related lease and are not considered in the lease rollover schedule. |
| (3) | MTM/2024 is inclusive of 1,585 SF which is associated with an owner-occupied management office with no attributable UW base rent. |
| (4) | The Showcase I Whole Loan matures on July 1, 2029. |
| (5) | Though in occupancy and paying rent, Netflix has been underwritten as vacant as the Netflix lease is scheduled to expire in December 2024. Netflix currently leases its space at a rental rate of $83.15 PSF. |
| (6) | Total/Wtd. Avg. UW Rent PSF Rolling excludes vacant space. |
| This is not a research report and was not prepared by any Underwriter’s research department. Please see additional important information and qualifications at the end of this Term Sheet. | ||
| 33 | ||
| Retail - Anchored | Loan #1 | Cut-off Date Balance: | $69,000,000 | |
| 3785 South Las Vegas Boulevard | Showcase I | Cut-off Date LTV: | 67.8% | |
| Las Vegas, NV 89109 | UW NCF DSCR: | 1.30x | ||
| UW NOI Debt Yield: | 8.5% |
The Market. The Showcase I Property is situated on the east side of Las Vegas Boulevard, just north of the intersection with Tropicana Avenue. According to the appraisal, the intersections of Tropicana Avenue and Las Vegas Boulevard and Harmon Avenue and Las Vegas Boulevard are two of the busiest in Las Vegas, both in terms of vehicle and pedestrian traffic. The area, commonly known as the central/southern portion of the Las Vegas Strip Resort Corridor, consists of a mix of well-established, recently developed and redeveloped resort casino-hotels. Additionally, the area also includes business hotels, apartment complexes, commercial retail buildings, regional retail centers and industrial buildings. Within close proximity to the Showcase I Property are a variety of prominent attractions, including MGM Grand, New York New York Hotel & Casino, Excalibur Hotel & Casino, Tropicana Las Vegas, Park MGM/NoMad, CityCenter (including Aria, Vdara, Waldorf Astoria and The Shops at Crystals), The Cosmopolitan, The Luxor, T-Mobile Arena as well as other phases of The Showcase retail development.
The Showcase I Property is located in Las Vegas, Nevada within the Las Vegas-Paradise-Henderson Core Based Statistical Area (“CBSA”). The Las Vegas metro is the largest of Nevada’s 17 counties by population size and the city is considered the 28th most populated city in the United States with a population of over 2.3 million. Las Vegas is known for its grand casinos and lavish hotels, among other attractions. According to the appraisal, Las Vegas is considered one of the top three destinations in the United States for business conventions and is a global leader in the hospitality industry, claiming more AAA Five Diamond hotels than any other city in the world. Additionally, Las Vegas frequently ranks as one of the world’s most visited tourist destinations, with an economy that heavily relies on tourist traffic. The appraisal concludes that employment in the city has increased over the last 12 months preceding the appraisal date and convention activity has increased by 31% year over year as of June 2023. In terms of gross metropolitan product, the Las Vegas CBSA has outperformed the national expansion by an average of 50 basis points over the decade. A year-end 2023 study by a local visitor’s and convention authority suggests that visitors stay an average of 3.3 nights and budget approximately $788 for gaming, a continued increasing trend since 2018. The same study also indicates that visitors report spending an average of $249 per visit for shopping, $109 per visit for shows and $565 per visit for food and drinks. The 2023 visitor expenditure for food and drink is the highest on record, with expenditure on shopping being the second highest on record, falling behind 2021’s record of approximately $285 per visit.
According to the appraisal, total 2023 visitors were equal to approximately 40.8 million, up approximately 5.2% from visitation levels reported for 2022 and exceeding 40.0 million visitors for the first time since the COVID-19 pandemic. Each month of 2023 reported visits in excess of 3.0 million. Additionally, annual convention attendance neared 6.0 million in 2023, approximately 20.0% over 2022 levels. Year to date visits as of February 2024 totaled 6,757,800, up 6.3% as compared to the first two months of 2023.
According to a third-party market research report, the 2023 population within a one-, three- and five-mile radius of the Showcase I Property was 17,188, 161,038 and 386,068, respectively. The 2023 average household income within the same radii was $148,485, $71,536 and $75,009, respectively.
According to the appraisal, the Las Vegas Retail market contains approximately 30,447,000 SF of space. The Southeast submarket that the Showcase I Property is located in contains 5,083,000 SF, or 16.7% of the region’s inventory, featuring asking rents of $20.18 PSF. Moreover, the Southeast submarket has a vacancy rate of 14.8%. However, according to a third-party market research report, retail and shopping center properties located along the Las Vegas Boulevard Corridor generally exhibit an average vacancy of between 4.0% and 7.0%. According to the appraisal, 547,000 SF of space was completed between 2019 and 2023 in the Las Vegas market, an average of 109,400 SF per year. In the Southeast submarket, a total of 10,000 SF of space was completed between 2019 and 2023, equating to 1.8% of new construction for the region. Between 2019 and 2023, new construction in the Southeast submarket outpaced absorption with an annual average of 2,000 SF completed and -8,400 SF absorbed within the five-year period.
The following table presents recent large retail leases at comparable retail properties with respect to the Showcase I Property:
| Comparable Leases Summary | |||
| Property | Tenant Name | Tenant Size (SF) | Base Rent PSF |
| Showcase I(1) | Marshalls | 30,624 | $54.44 |
| Confidential | Confidential | 20,000 | $115.00 |
| Confidential | Confidential | 15,185 | $80.00 |
| Confidential | Confidential | 50,000 | $50.00 |
| Confidential | Confidential | 30,000 | $110.00 |
| Confidential | Confidential | 27,900 | $155.06 |
| Confidential | Confidential | 27,800 | $76.44 |
| Confidential | Confidential | 10,845 | $124.48 |
| Confidential | Confidential | 13,025 | $122.84 |
| Total/Wtd. Avg.(2) | 194,755 | $96.10 | |
| Source: Appraisal | ||
| (1) | Information is based on the underwritten rent roll as of February 29, 2024, inclusive of contractual rent steps through September 30, 2025. | |
| (2) | The Total/Wtd. Avg. excludes the Showcase I Property. |
| This is not a research report and was not prepared by any Underwriter’s research department. Please see additional important information and qualifications at the end of this Term Sheet. | ||
| 34 | ||
| Retail - Anchored | Loan #1 | Cut-off Date Balance: | $69,000,000 | |
| 3785 South Las Vegas Boulevard | Showcase I | Cut-off Date LTV: | 67.8% | |
| Las Vegas, NV 89109 | UW NCF DSCR: | 1.30x | ||
| UW NOI Debt Yield: | 8.5% |
The following table presents recent specialty retail leases at comparable retail properties with respect to the Showcase I Property:
| Comparable Leases Summary | |||
| Property | Tenant Name | Tenant Size (SF) | Base Rent PSF |
| Showcase I(1) | M&M World | 31,025 | $128.93 |
| Confidential | Confidential | 692 | $541.91 |
| Confidential | Confidential | 6,176 | $194.30 |
| Confidential | Confidential | 5,669 | $264.60 |
| Confidential | Confidential | 9,118 | $174.38 |
| Confidential | Confidential | 9,500 | $170.00 |
| Confidential | Confidential | 10,350 | $227.05 |
| Confidential | Confidential | 10,960 | $228.10 |
| Confidential | Confidential | 1,800 | $242.31 |
| Confidential | Confidential | 1,182 | $368.99 |
| Confidential | Confidential | 383 | $313.32 |
| Confidential | Confidential | 952 | $99.95 |
| Confidential | Confidential | 648 | $324.28 |
| Confidential | Confidential | 454 | $317.18 |
| Confidential | Confidential | 764 | $282.72 |
| Confidential | Confidential | 863 | $417.15 |
| Confidential | Confidential | 3,923 | $229.42 |
| Confidential | Confidential | 698 | $250.00 |
| Confidential | Confidential | 446 | $440.85 |
| Total/Wtd. Avg.(2) | 64,578 | $223.28 | |
| Source: Appraisal | ||
| (1) | Information is based on the underwritten rent roll as of February 29, 2024, inclusive of contractual rent steps through September 30, 2025. | |
| (2) | The Total/Wtd. Avg. excludes the Showcase I Property. |
The following table presents certain information relating to the appraisal’s market rent conclusion for the Showcase I Property:
| Market Rent Summary | ||||
| Anchor | Major | Theater | Food Court | |
| Market Rent PSF (NNN) | $115.00 | $75.00 | $27.00 | $50.00 |
| Lease Term (Years) | 10 | 10 | 10 | 10 |
| Rent Increase Projection | 10.0% year six | 3.0% per annum | 10.0% year six | 3.0% per annum |
Appraisal. The appraisal concluded to an “as-is” value for the Showcase I Property of $250,000,000 as of March 27, 2024.
Environmental Matters. According to the Phase I environmental site assessment dated April 4, 2024, there was no evidence of any recognized environmental conditions at the Showcase I Property.
| This is not a research report and was not prepared by any Underwriter’s research department. Please see additional important information and qualifications at the end of this Term Sheet. | ||
| 35 | ||
| Retail - Anchored | Loan #1 | Cut-off Date Balance: | $69,000,000 | |
| 3785 South Las Vegas Boulevard | Showcase I | Cut-off Date LTV: | 67.8% | |
| Las Vegas, NV 89109 | UW NCF DSCR: | 1.30x | ||
| UW NOI Debt Yield: | 8.5% |
Operating History and Underwritten Net Cash Flow. The following table presents certain information relating to the historical operating performance and Underwritten Net Cash Flow at the Showcase I Property:
| Cash Flow Analysis | |||||
| 2022 | 2023 | 4/30/2024 TTM | UW(1) | UW PSF | |
| Rents in Place | $10,160,383 | $12,029,049 | $12,413,607 | $13,673,553 | $75.61 |
| Vacant Income | $0 | $0 | $0 | $1,499,943 | $8.29 |
| Reimbursements | $2,357,104 | $2,375,437 | $2,587,716 | $2,941,175 | $16.26 |
| Gross Potential Income | $12,517,487 | $14,404,487 | $15,001,323 | $18,114,671 | $100.17 |
| Other Income(2) | $1,169,255 | $1,111,404 | $1,086,689 | $1,295,481 | $7.16 |
| Vacancy | $0 | $0 | $0 | ($1,499,943) | ($8.29) |
| Effective Gross Income | $13,686,743 | $15,515,891 | $16,088,013 | $17,910,209 | $99.03 |
| Real Estate Taxes | $467,369 | $495,962 | $512,323 | $522,232 | $2.89 |
| Insurance | $73,418 | $86,793 | $91,514 | $157,496 | $0.87 |
| Other Operating Expenses | $2,345,831 | $2,543,023 | $2,590,176 | $2,821,779 | $15.60 |
| Total Operating Expenses | $2,886,618 | $3,125,777 | $3,194,013 | $3,501,507 | $19.36 |
| Net Operating Income | $10,800,125 | $12,390,114 | $12,894,000(3) | $14,408,703(3) | $79.67 |
| Replacement Reserves | $0 | $0 | $0 | $27,127 | $0.15 |
| TI/LC | $0 | $0 | $0 | $180,848 | $1.00 |
| Net Cash Flow | $10,800,125 | $12,390,114 | $12,894,000 | $14,200,728 | $78.52 |
| Occupancy (%) | 90.0% | 100.0% | 100.0%(4) | 91.7%(4) | |
| NOI DSCR(5) | 0.99x | 1.13x | 1.18x | 1.32x | |
| NCF DSCR(5) | 0.99x | 1.13x | 1.18x | 1.30x | |
| NOI Debt Yield(5) | 6.4% | 7.3% | 7.6% | 8.5% | |
| NCF Debt Yield(5) | 6.4% | 7.3% | 7.6% | 8.4% | |
| (1) | Based on the underwritten rent roll as of February 29, 2024, inclusive of contractual rent steps through September 30, 2025. | |
| (2) | Other Income includes storage, stairway rental and temporary tenant and parking incomes. |
| (3) | The increase from Most Recent NOI to UW NOI is primarily attributable to (i) execution of the M&M renewal lease with an effective date and rent step up in September 2025, reflected in the lender underwriting, and (ii) increased parking income in accordance with the borrower’s budget. At loan origination, $2,152,888 was reserved in connection with the M&M gap/free rent obligations. |
| (4) | Although in occupancy and paying rent, Netflix has been underwritten as vacant as the Netflix lease is scheduled to expire December 2024. Netflix currently leases its space at a rental rate of $83.15 PSF. Occupancy (%) represents the underwritten economic occupancy based on vacant income attributable to Netflix’s space of $83.15 PSF. The Showcase I Property was 100.0% physically occupied as of February 29, 2024. |
| (5) | DSCR and Debt Yield are based on the Showcase I Whole Loan. |
Escrows and Reserves.
Real Estate Taxes – On the loan origination date, the borrower was required to make an upfront deposit of $363,322 into a reserve for real estate taxes. In addition, the borrower is required to deposit into a real estate tax reserve, on a monthly basis, an amount equal to 1/12 of the real estate taxes that the mortgage lender estimates will be payable during the next twelve months (initially estimated to be $121,107).
Insurance – The borrower is required to reserve monthly 1/12th of the annual estimated insurance payments, unless (i) no event of default is continuing under the Showcase I Whole Loan and (ii) the Showcase I Property is insured under a blanket policy meeting the requirements set forth in the related loan agreement.
Replacement Reserve – On the loan origination date, the borrower was required to make an upfront deposit of $2,261 into a reserve for replacement. In addition, the borrower is required to deposit into a replacement reserve, on a monthly basis, an amount equal to $2,261.
TI/LC Reserve – On the loan origination date, the borrower was required to make an upfront deposit of $15,071 into a TI/LC reserve. In addition, the borrower is required to deposit into a TI/LC reserve, on a monthly basis, $15,071, along with any lease termination fees or other payments received by the borrower in connection with the termination of any lease at the Showcase I Property. So long as no event of default has occurred and is continuing, the aggregate amount of the TI/LC reserve fund is subject to a cap of $542,544.
Outstanding TI/LC Reserve – On the loan origination date, the borrower was required to make an upfront deposit of $250,000 into an outstanding tenant improvement allowances reserve in connection with Outback Steak House.
Unfunded M&M TI Obligations Reserve – On the loan origination date, the borrower was required to make an upfront deposit of $12,000,000 into a reserve for certain unfunded obligations in connection with the recently extended M&M lease. The funds on deposit in the Unfunded M&M TI Obligations Reserve are required to be disbursed in the same manner as the funds on deposit in the TI/LC Reserve (and with the same restrictions and requirements, except that such disbursements from the Unfunded M&M TI Obligations Reserve are not subject to lender’s approval). In the event the borrower has provided evidence to the lender that (i) neither the borrower nor M&M World has approved construction plans for certain renovation work detailed in.
| This is not a research report and was not prepared by any Underwriter’s research department. Please see additional important information and qualifications at the end of this Term Sheet. | ||
| 36 | ||
| Retail - Anchored | Loan #1 | Cut-off Date Balance: | $69,000,000 | |
| 3785 South Las Vegas Boulevard | Showcase I | Cut-off Date LTV: | 67.8% | |
| Las Vegas, NV 89109 | UW NCF DSCR: | 1.30x | ||
| UW NOI Debt Yield: | 8.5% |
the M&M lease documents as of July 8, 2027, (ii) there are no further obligations remaining under the M&M lease with respect to such renovation work, and (iii) neither the borrower nor M&M are in monetary or material non-monetary default under the M&M lease, then, provided no event of default has occurred and is continuing under the Showcase I Whole Loan documents, (1) an amount equal to $2,000,000 will automatically be transferred from the Unfunded M&M TI Obligations Reserve to an Outstanding TI/LC reserve (which $2,000,000 is required to be disbursed to the lockbox account in respect of the related free rent in accordance with a schedule to be provided by the borrower and reasonably approved by the lender) and (2) any funds on deposit in the Unfunded M&M TI Obligations Reserve in excess of $2,000,000 will automatically be transferred into the lockbox account.
Unfunded M&M Free Rent Obligations Reserve – On the loan origination date, the borrower was required to make an upfront deposit of $2,152,888 into a reserve for M&M gap/free rent, representing the difference between the current in-place rent under the M&M lease and the renewal lease rent. The 12-month rent abatement, and the six month rent abatement related to renovations were not separately reserved for. On the payment date occurring in September 2025, provided no event of default is continuing under the Showcase I Whole Loan, an amount equal to $84,503.50 is required to be released into the lockbox account, from the Unfunded M&M Free Rent Obligations Reserve for 12 months such that the remaining reserve is equal to the abated rent M&M is entitled to during its renovation (if M&M elects to renovate). The remaining reserve is required to be released into the lockbox account, provided no event of default is continuing under the Showcase I Whole Loan, in six equal installments of $189,807.67 commencing upon M&M’s Vacate Date (if any). At such time as the borrower has provided the lender with reasonably acceptable evidence that (i) no free rent periods remain (including, without limitation, (x) actual free rent periods and/or gap periods and/or (y) rights or potential rights to apply or convert tenant improvements, allowances or any other amounts to free rent and/or gap rent) pursuant to the M&M Lease and (ii) neither borrower nor M&M is in monetary or material non-monetary default pursuant to the M&M Lease, all funds in the Unfunded M&M Free Rent Obligations Reserve will be deposited into the lockbox account (and if no Cash Sweep Period is continuing, disbursed to the borrower).
Lockbox and Cash Management. The Showcase I Whole Loan is structured with a hard lockbox and springing cash management. At origination, the borrower and property manager were required to direct the tenants to pay rent directly into the lockbox account, and are required to deposit into such lockbox account any rents otherwise received within two business days after receipt. If no Cash Sweep Period (as defined below) is continuing, all funds in the lockbox account will be swept each business day to the borrower’s operating account. During the continuance of a Cash Sweep Period, all funds in the lockbox account are required to be swept to a lender-controlled cash management account and applied in accordance with the Showcase I Whole Loan documents. During the continuance of a Cash Sweep Period, any excess cash is required to be deposited into an excess cash flow reserve account to be held as additional security for the Showcase I Whole Loan in accordance with the Showcase I Whole Loan documents. All sums remaining on deposit in the excess cash flow reserve account will be disbursed to the borrower upon payment in full of the debt. Further, if at any time during a Cash Sweep Period there are insufficient funds on deposit in the TI/LC Reserve or the Unfunded Obligations Reserve (to the extent applicable) to cover any tenant improvement costs and/or leasing commissions which would be payable utilizing funds in the TI/LC Reserve or the Unfunded Obligations Reserve, then provided no event of default is continuing and no such funds are disbursed to cover any fees payable to an affiliate of the borrower or the guarantors, then the lender is required to make funds in the excess cash flow reserve available to pay for any such tenant improvements and/or leasing commissions.
A “Cash Sweep Period” means a period commencing upon the occurrence of (i) an event of default, (ii) any bankruptcy action of the property manager or borrower or (iii) the debt service coverage ratio falling below 1.15x for two consecutive calendar quarters based on the trailing twelve-month period immediately preceding the date of such determination, and expiring upon (a) with respect to clause (i) above, the cure of such event of default and the acceptance of such cure by the mortgage lender, (b) with respect to clause (ii) above, if the Cash Sweep Period is caused solely by a bankruptcy action of the property manager, the borrower replacing the property manager with a qualified property manager under a replacement management agreement within 60 days following the occurrence of such bankruptcy or insolvency action and (c) with respect to clause (iii) above, the achievement of a debt service coverage ratio of 1.15x or greater for two consecutive calendar quarters based upon the trailing 12-month period immediately preceding the date of determination.
Terrorism Insurance. The borrower is required to obtain and maintain property insurance for 100% of full replacement cost and business interruption insurance for 18 months plus a 12-month extended period of indemnity. Such insurance is required to cover perils of terrorism and acts of terrorism. See “Risk Factors—Risks Relating to the Mortgage Loans—Terrorism Insurance May Not Be Available for All Mortgaged Properties” in the prospectus.
| This is not a research report and was not prepared by any Underwriter’s research department. Please see additional important information and qualifications at the end of this Term Sheet. | ||
| 37 | ||
| Mixed Use – Office/Retail | Loan #2 | Cut-off Date Balance: | $68,899,375 | |
| 640 5th Avenue | 640 5th Avenue | Cut-off Date LTV: | 41.6% | |
| New York, NY 10022 | UW NCF DSCR: | 2.04x | ||
| UW NOI Debt Yield: | 18.8% |

| This is not a research report and was not prepared by any Underwriter’s research department. Please see additional important information and qualifications at the end of this Term Sheet. | ||
| 38 | ||
| Mixed Use – Office/Retail | Loan #2 | Cut-off Date Balance: | $68,899,375 | |
| 640 5th Avenue | 640 5th Avenue | Cut-off Date LTV: | 41.6% | |
| New York, NY 10022 | UW NCF DSCR: | 2.04x | ||
| UW NOI Debt Yield: | 18.8% |
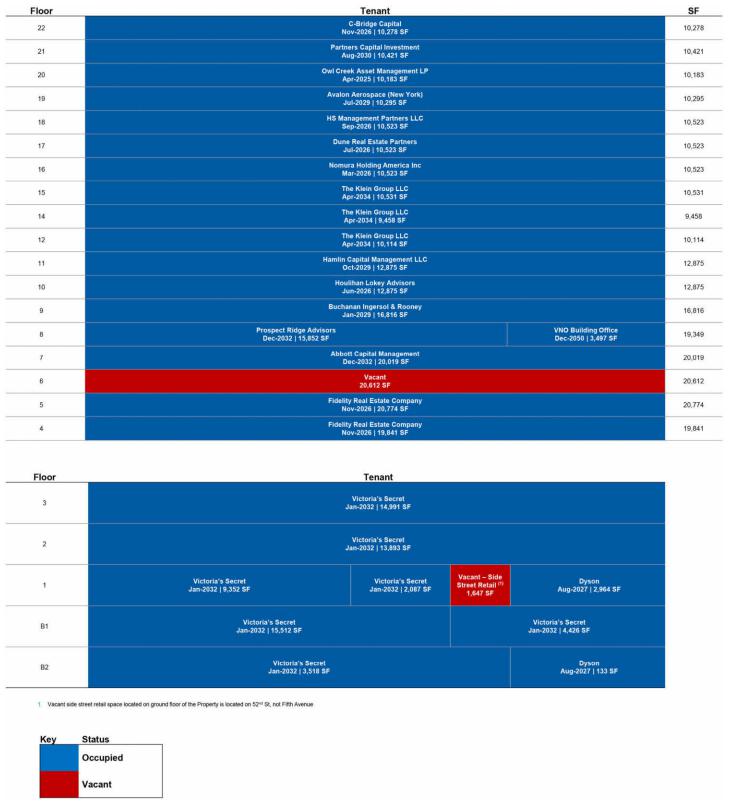
| This is not a research report and was not prepared by any Underwriter’s research department. Please see additional important information and qualifications at the end of this Term Sheet. | ||
| 39 | ||
| Mixed Use – Office/Retail | Loan #2 | Cut-off Date Balance: | $68,899,375 | |
| 640 5th Avenue | 640 5th Avenue | Cut-off Date LTV: | 41.6% | |
| New York, NY 10022 | UW NCF DSCR: | 2.04x | ||
| UW NOI Debt Yield: | 18.8% |
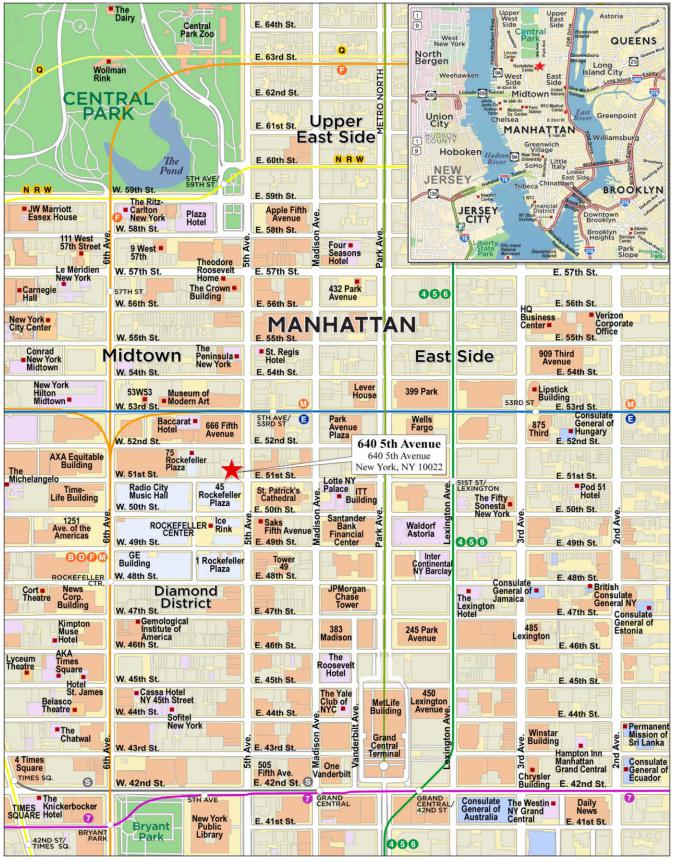
| This is not a research report and was not prepared by any Underwriter’s research department. Please see additional important information and qualifications at the end of this Term Sheet. | ||
| 40 | ||
| Mortgage Loan No. 2 – 640 5th Avenue |
| Mortgage Loan Information | Property Information | ||||||
| Mortgage Loan Seller: | MSMCH | Single Asset/Portfolio: | Single Asset | ||||
| Credit Assessment (Fitch/Moody’s/DBRSM): | BBB+sf/NR/AA(high) | Location: | New York, NY 10022 | ||||
| Original Balance(1): | $69,000,000 | General Property Type: | Mixed Use | ||||
| Cut-off Date Balance(1): | $68,899,375 | Detailed Property Type: | Office/Retail | ||||
| % of Initial Pool Balance: | 9.98% | Title Vesting(4): | Fee/Leasehold | ||||
| Loan Purpose: | Refinance | Year Built/Renovated: | 1949/2003 | ||||
| Borrower Sponsor: | Vornado Realty Trust | Size: | 314,533 SF | ||||
| Guarantor: | Manhattan High Street Holdings LP | Cut-off Date Balance Per SF(1): | $952 | ||||
| Mortgage Rate: | 6.1293333% | Maturity Date Balance Per SF(1): | $872 | ||||
| Note Date: | 6/10/2024 | Property Manager: | Vornado Office Management LLC | ||||
| Maturity Date: | 7/1/2029 | (borrower-related) | |||||
| Term to Maturity: | 60 months | Underwriting and Financial Information | |||||
| Amortization Term(2): | NAP | UW NOI: | $56,185,614 | ||||
| IO Period: | 0 months | UW NCF: | $48,532,770 | ||||
| Seasoning: | 1 month | UW NOI Debt Yield(1): | 18.8% | ||||
| Prepayment Provisions: | L(25),D(28),O(7) | UW NCF Debt Yield(1): | 16.2% | ||||
| Lockbox/Cash Mgmt Status: | Hard/In Place | UW NOI Debt Yield at Maturity(1): | 20.5% | ||||
| Additional Debt Type(1): | Pari Passu / Mezzanine | UW NCF DSCR(1): | 2.04x | ||||
| Additional Debt Balance(1): | $231,000,000 / $100,000,000 | Most Recent NOI: | $53,799,655 (12/31/2023) | ||||
| Future Debt Permitted (Type): | No (NAP) | 2nd Most Recent NOI: | $47,771,835 (12/31/2022) | ||||
| 3rd Most Recent NOI: | $48,824,168 (12/31/2021) | ||||||
| Reserves(3) | Most Recent Occupancy: | 92.9% (6/1/2024) | |||||
| Type | Initial | Monthly | Cap | 2nd Most Recent Occupancy: | 92.6% (12/31/2023) | ||
| RE Taxes: | $0 | Springing | NAP | 3rd Most Recent Occupancy: | 93.4% (12/31/2022) | ||
| Insurance: | $0 | Springing | NAP | Appraised Value (as of): | $720,000,000 (2/28/2024) | ||
| Replacement Reserve: | $0 | Springing | $195,217 | Appraised Value per SF: | $2,289 | ||
| TI/LC Reserve: | $1,567,900 | $500,000 | $15,000,000 | Cut-off Date LTV Ratio(1): | 41.6% | ||
| Free Rent Reserve: | $1,648,112 | $0 | NAP | Maturity Date LTV Ratio(1): | 38.1% | ||
| Sources and Uses | ||||||
| Sources | Proceeds | % of Total | Uses | Proceeds | % of Total | |
| Whole Loan Amount(1): | $300,000,000 | 59.3% | Loan Payoff: | $501,608,063 | 99.1% | |
| Borrower Sponsor Equity: | $106,245,190 | 21.0% | Upfront Reserves: | $3,216,012 | 0.6% | |
| Mezzanine Loan Amount: | $100,000,000 | 19.8% | Closing Costs: | $1,421,115 | 0.3% | |
| Total Sources: | $506,245,190 | 100.0% | Total Uses: | $506,245,190 | 100.0% | |
| (1) | The 640 5th Avenue Mortgage Loan (as defined below) is part of the 640 5th Avenue Whole Loan (as defined below), with an aggregate original principal amount of $300,000,000. The Cut-off Date Balance Per SF, Maturity Date Balance Per SF, UW NOI Debt Yield, UW NCF Debt Yield, UW NOI Debt Yield at Maturity, UW NCF DSCR, Cut-off Date LTV Ratio and Maturity Date LTV Ratio numbers presented above are based on the 640 5th Avenue Whole Loan. The 640 5th Avenue Whole Loan and the 650 5th Avenue Mezzanine Loan (as defined below) are referred to herein as the “640 5th Avenue Total Debt.” With respect to the 640 5th Avenue Total Debt, the Cut-off Date Balance Per SF is $1,270, the Maturity Date Balance Per SF is $1,162, the UW NOI Debt Yield is 14.1%, the UW NOI Debt Yield at Maturity is 15.4%, the UW NCF DSCR is 1.31x, the Cut-off Date LTV Ratio is 55.6% and the Maturity Date LTV Ratio is 50.8%. |
| (2) | The 640 5th Avenue Whole Loan and the 640 5th Avenue Mezzanine Loan have fixed amortization for their entire 60-month loan terms. With respect to the 640 5th Avenue Whole Loan, the borrower is required to make payments on each monthly payment date, as follows: (x) principal in the amount of $437,500 and (y) the monthly interest payment. With respect to the 640 5th Avenue Mezzanine Loan, the mezzanine borrower is required to make payments on each monthly payment date as follows: (x) principal in the amount of approximately $145,833 and (y) the monthly interest payment. |
| (3) | See “Escrows and Reserves” below for further discussion of reserve information. |
| (4) | A prior owner of the 640 5th Avenue Property (as defined below) ground leased the 640 5th Avenue Property to the owner of the property located at 650 5th Avenue (the “Air Rights Tenant”), who subleased the 640 5th Avenue Property (other than development rights relating to one of the two buildings comprising the 640 5th Avenue Property, which were retained by the Air Rights Tenant) back to such prior owner of the 640 5th Avenue Property, solely for purposes of satisfying certain zoning requirements in connection with the transfer of such development rights to the Air Rights Tenant, as further described under “Description of the Mortgage Pool—Mortgage Pool Characteristics—Fee & Leasehold Estates; Ground Leases” in the prospectus. |
The Mortgage Loan. The second largest mortgage loan (the “640 5th Avenue Mortgage Loan”) is part of a whole loan (the “640 5th Avenue Whole Loan”) evidenced by eleven pari passu promissory notes with an aggregate original principal amount of $300,000,000. The 640 5th Avenue Whole Loan is secured by the borrower’s fee and leasehold interest in a 314,533 SF mixed-use property comprised of two abutting and interconnected buildings facing Fifth Avenue and West 52nd Street (other than development rights relating to the West 52nd Street building), respectively, located in New York, New York (the “640 5th Avenue Property”). The 640 5th Avenue Whole Loan was originated by Goldman Sachs Bank USA (“GSBI”), Bank of Montreal (“BMO”) and Morgan Stanley Bank, N.A. (“MSBNA”) on June 10, 2024. The 640 5th Avenue Mortgage Loan is evidenced by the controlling Note A-1, and non-controlling Note A-2-1, with an aggregate original principal amount of $69,000,000. The 640 5th Avenue Whole Loan has fixed amortization, as described below, for the entire term and accrues interest on an actual/360 basis. The borrower is required to make payments on each monthly payment date for the 640 5th Avenue Whole Loan as follows: (x) principal in the amount of $437,500 and (y) the monthly interest payment. The 640 5th Avenue Whole Loan will be serviced pursuant to the pooling and servicing agreement for the BANK5 2024-5YR8 securitization trust. See “Description of the Mortgage Pool-The Whole Loans-The Serviced Pari Passu Whole Loans”, and “Pooling and Servicing Agreement” in the prospectus.
A prior owner of the 640 5th Avenue Property ground leased the 640 5th Avenue Property to the Air Rights Tenant, who subleased the 640 5th Avenue Property (other than development rights relating to the West 52nd Street building, which were retained by the Air Rights Tenant) back to such prior owner
| This is not a research report and was not prepared by any Underwriter’s research department. Please see additional important information and qualifications at the end of this Term Sheet. | ||
| 41 | ||
| Mixed Use – Office/Retail | Loan #2 | Cut-off Date Balance: | $68,899,375 | |
| 640 5th Avenue | 640 5th Avenue | Cut-off Date LTV: | 41.6% | |
| New York, NY 10022 | UW NCF DSCR: | 2.04x | ||
| UW NOI Debt Yield: | 18.8% |
of the 640 5th Avenue Property, solely for the purpose of satisfying certain zoning requirements in connection with the transfer of such development rights to the Air Rights Tenant, as further described under “Description of the Mortgage Pool—Mortgage Pool Characteristics—Fee & Leasehold Estates; Ground Leases” in the prospectus.
The table below summarizes the promissory notes that comprise the 640 5th Avenue Whole Loan.
| 640 5th Avenue Whole Loan Summary | ||||
| Note | Original Balance | Cut-off Date Balance | Note Holder | Controlling Note |
| A-1 | $40,000,000 | $39,941,667 | BANK5 2024-5YR8 | Yes |
| A-2-1 | $29,000,000 | $28,957,708 | BANK5 2024-5YR8 | No |
| A-2-2(1) | $8,500,000 | $8,487,604 | MSBNA | No |
| A-3(1) | $30,000,000 | $29,956,250 | MSBNA | No |
| A-4(1) | $20,000,000 | $19,970,833 | MSBNA | No |
| A-5 | $69,600,000 | $69,498,500 | Benchmark 2024-V8 | No |
| A-6 | $40,000,000 | $39,941,667 | WFCM 2024-5C1 | No |
| A-7 | $10,400,000 | $10,384,833 | WFCM 2024-5C1 | No |
| A-8 | $25,000,000 | $24,963,542 | BBCMS 2024-5C27 | No |
| A-9 | $17,500,000 | $17,474,479 | Benchmark 2024-V8 | No |
| A-10 | $10,000,000 | $9,985,417 | Benchmark 2024-V8 | No |
| Whole Loan | $300,000,000 | $299,562,500 | ||
| (1) | Expected to be contributed to one or more future securitization trusts. |
The Borrower and the Borrower Sponsor. The borrower is 640 Fifth Avenue Owner LLC, a Delaware limited liability company structured as a single purpose, bankruptcy-remote entity, with one independent director. The borrower sponsor is Vornado Realty Trust (“Vornado”). Vornado is a real estate investment firm that owns and manages over 26 million SF of LEED certified buildings and received the Energy Star Partner of the Year Award, Sustained Excellence 2022. Vornado commemorated 50 years on the New York Stock Exchange in 2012 and is a member of the S&P MidCap 400. Vornado’s portfolio is concentrated on office and retail properties in New York. Vornado has 57 Manhattan operating properties consisting of approximately 18.9 million SF of office space in 30 of the properties, approximately 2.4 million SF of street retail space in 50 of the properties and 338 residential units in four Manhattan properties, as of June 2024. The non-recourse carveout guarantor is Manhattan High Street Holdings LP, a subsidiary of Vornado. The non-recourse carveout guarantor’s recourse obligations with respect to bankruptcy or insolvency related events is capped at 25% of the outstanding principal balance of the 640 5th Avenue Whole Loan, plus the lender’s enforcement costs under the guaranty, including reasonable attorneys’ fees. Additionally, recourse for losses relating to a transfer of the related mortgaged property or interests in the borrower is limited as described under “Description of the Mortgage Pool—Non-Recourse Carveout Limitations” in the prospectus.
The Property. The 640 5th Avenue Property consists of both (i) a 22-story, Class A office building with multi-level retail space commonly known as 640 Fifth Avenue (the “Fifth Avenue Building”), and (ii) a two-story commercial building on the south side commonly known as 6 West 52nd Street (the “6 West 52nd Street Building”). The Fifth Avenue Building and the 6 West 52nd Street Building are interconnected and share certain paths of ingress and egress. The 640 5th Avenue Property (inclusive of the 6 West 52nd Street Building) totals 314,533 SF, which consists of 245,740 SF of office space (78.1% of NRA and 30.9% of underwritten base rent), 58,359 SF of retail space (18.6% of NRA and 67.8% of underwritten base rent) and 10,434 SF of storage space (3.3% of NRA and 1.2% of underwritten base rent). As of June 1, 2024, 91.7% of the office space (“Office NRA”) is leased to 15 tenants and 97.2% of the retail space (“Retail NRA”) and 97.4% of the storage space is leased to two tenants, Victoria’s Secret and Dyson. The Fifth Avenue Building includes retail spaces located on the first three levels of the building and office spaces on the remaining 19 levels of the building.
The following table presents certain information relating to the 640 5th Avenue Property.
| Property Summary(1) | ||||||
| Space Type | Total SF | % Total SF | Occupancy | UW Base Rent | % of UW Base Rent | UW Base Rent PSF(2) |
| Office: | 245,740 | 78.1% | 91.7% | $20,885,412 | 30.9% | $92.66 |
| Retail: | 58,359 | 18.6% | 97.2% | $45,771,452 | 67.8% | $807.09 |
| Storage: | 10,434 | 3.3% | 97.4% | $831,121 | 1.2% | $81.77 |
| Total/Wtd. Avg. | 314,533 | 100.0% | 92.9% | $67,487,985 | 100.0% | $230.91 |
| (1) | Information is based on the underwritten rent roll dated June 1, 2024. |
| (2) | UW Base Rent PSF excludes vacant space. |
| This is not a research report and was not prepared by any Underwriter’s research department. Please see additional important information and qualifications at the end of this Term Sheet. | ||
| 42 | ||
| Mixed Use – Office/Retail | Loan #2 | Cut-off Date Balance: | $68,899,375 | |
| 640 5th Avenue | 640 5th Avenue | Cut-off Date LTV: | 41.6% | |
| New York, NY 10022 | UW NCF DSCR: | 2.04x | ||
| UW NOI Debt Yield: | 18.8% |
The 640 5th Avenue Property has been the recipient of an Industrial and Commercial Tax Abatement (the “ICAP Tax Abatement”) that commenced on July 1, 2019 and is scheduled to end on July 1, 2029, and is set to be phased out beginning in July 2024. The ICAP Tax Abatement originally provided a 100% tax abatement of the 640 5th Avenue Property’s assessment value, which abatement amount will be reduced to 80.0% of such assessment value in July 2024, 60.0% in July 2025, 40.0% in July 2026 and 20.0% in July 2027 until termination. The total benefit from the ICAP Tax Abatement is estimated in the table below:
| ICAP Tax Abatement | ||||
| Tax Year | ICAP Year | ICAP Phase- out | ICAP Benefit | Reduction in Benefit |
| 2019/2020 | 1 | 100% | $3,074,549 | $588,138 |
| 2020/2021 | 2 | 100% | $3,074,549 | $588,138 |
| 2021/2022 | 3 | 100% | $3,074,549 | $588,138 |
| 2022/2023 | 4 | 100% | $3,074,549 | $588,138 |
| 2023/2024 | 5 | 100% | $3,074,549 | $588,138 |
| 2024/2025 | 6 | 80% | $2,459,639 | $470,511 |
| 2025/2026 | 7 | 60% | $1,844,729 | $352,883 |
| 2026/2027 | 8 | 40% | $1,229,820 | $235,255 |
| 2027/2028 | 9 | 20% | $614,910 | $117,628 |
| 2028/2029 | 10 | 20% | $614,910 | $117,628 |
| Total/Wtd. Avg. | $22,136,752 | $4,234,597 | ||
Major Tenants.
Victoria’s Secret (63,779 SF, 20.3% of NRA, 54.5% of underwritten base rent): Victoria’s Secret (NYSE: VSCO) is a clothing retailer specializing in selling intimate garments and undergarments. The company is the largest intimates retailer in the world and produces a range of products such as bras, panties, lingerie, swimwear and sleepwear, which are sold to customers across the United States and globally. Victoria’s Secret spun off L Brands in 2021 and reported a net income of $109 million on $6.182 billion of net sales in 2023. The 640 5th Avenue Property is the flagship location for Victoria’s Secret. Victoria’s Secret’s lease at the 640 5th Avenue Property commenced in February 2016, expires January 31, 2032 and has one, 10-year renewal option and no termination options.
Dyson (3,097 SF 1.0% of NRA, 14.6% of underwritten base rent): Dyson is a multi-national Singapore based appliances company. Dyson produces a range of products such as vacuum cleaners, hair care, air purifiers, headphones and lighting. Dyson was founded in 1991 and employs approximately 14,000 people. Dyson’s lease at the 640 5th Avenue Property commenced in March 2017, expires August 27, 2027 and has no renewal or termination options.
The Klein Group LLC (30,103 SF, 9.6% of NRA, 5.1% of underwritten base rent): The Klein Group LLC is a provider of brokerage services. The Klein Group LLC offers investment banking, trading, private placement of securities and investment advisory services. The Klein Group LLC’s lease at the 640 5th Avenue Property commenced in June 2015 and was amended in June 2018 and August 2022 to expand its leased space at the 640 5th Avenue Property. The lease is scheduled to expire on April 14, 2034, and the tenant has no renewal option. The Klein Group LLC has a two-time right to terminate its lease, effective either (i) December 31, 2027 or (ii) December 31, 2029, subject to, among other things, providing notice to the borrower no later than a year before the effective date of each such termination right, satisfaction of certain minimum occupancy and demise requirements under the lease, no event of default having occurred and continuing under the lease and the payment of a termination fee.
| This is not a research report and was not prepared by any Underwriter’s research department. Please see additional important information and qualifications at the end of this Term Sheet. | ||
| 43 | ||
| Mixed Use – Office/Retail | Loan #2 | Cut-off Date Balance: | $68,899,375 | |
| 640 5th Avenue | 640 5th Avenue | Cut-off Date LTV: | 41.6% | |
| New York, NY 10022 | UW NCF DSCR: | 2.04x | ||
| UW NOI Debt Yield: | 18.8% |
The following table presents certain information relating to the tenancy at the 640 5th Avenue Property:
| Tenant Summary(1) | |||||||||
| Tenant Name | Credit Rating | Tenant SF | Approx.% of SF | Annual UW Base Rent | % of Total Annual UW Base Rent | Annual UW Base Rent PSF | Lease Expiration | Renewal Options | Term. Option (Y/N) |
| Major Tenants | |||||||||
| Victoria's Secret | NR/Ba3/BB- | 63,779 | 20.3% | $36,763,592 | 54.5% | $576.42 | 1/31/2032 | 1 x 10 yr | N |
| Dyson | NR/NR/NR | 3,097 | 1.0% | $9,838,981 | 14.6% | $3,176.94 | 8/27/2027 | None | N |
| The Klein Group LLC(3) | NR/NR/NR | 30,103 | 9.6% | $3,461,845 | 5.1% | $115.00 | 4/14/2034 | None | Y |
| Fidelity Real Estate Company(4) | NR/NR/NR | 40615 | 12.9% | $3,249,200 | 4.8% | $80.00 | 11/30/2026 | None | N |
| Houlihan Lokey Advisors(5) | NR/NR/NR | 12,875 | 4.1% | $1,442,000 | 2.1% | $112.00 | 6/30/2026 | 1 x 5 yr | N |
| Abbot Capital Management | NR/NR/NR | 20,019 | 6.4% | $1,361,292 | 2.0% | $68.00 | 12/31/2032 | 1 x 5 yr | N |
| Subtotal/Wtd. Avg. | 170,488 | 54.2% | $56,116,910 | 83.2% | $329.15 | ||||
| Other Tenants | 121,786 | 38.7% | $11,371,075 | 16.8% | $93.37 | ||||
| Occupied Subtotal/Wtd. Avg. | 292,274 | 92.9% | $67,487,985 | 100.0% | $230.91 | ||||
| Vacant Space | 22,259 | 7.1% | |||||||
| Total/Wtd. Avg. | 314,533 | 100.0% | |||||||
| (1) | Information is based on the underwritten rent roll dated June 1, 2024. |
| (2) | Certain ratings are those of the parent company, whether or not the parent company guarantees the lease. |
| (3) | The Klein Group LLC is entitled to $1,648,112 in free rent through February 2025. At origination, the borrower deposited $1,648,112 into the free rent reserve, which will be disbursed in accordance with the schedule set forth in the related loan documents. In addition, the tenant has a two-time right to terminate its lease, effective either (i) December 31, 2027 or (ii) December 31, 2029, subject to, among other things, providing notice to the borrower no later than a year before the effective date of each such termination right, satisfaction of certain minimum occupancy and demise requirements under the lease, no event of default having occurred and continuing under the lease and the payment of a termination fee. |
| (4) | Fidelity Real Estate Company has subleased 19,841 SF to Advisor Group in Suite 401, which commenced on October 1, 2020, is scheduled to expire on October 31, 2026 and provides for approximately $907,726 in annual rent to Fidelity Real Estate Company. |
| (5) | Houlihan Lokey Advisors has subleased all of its 12,875 SF to Triple P Services LLC in Suite 1000, which commenced on June 7, 2023, is scheduled to expire on June 29, 2026 and provides for $965,625 in annual rent to Houlihan Lokey Advisors. |
The following table presents certain information with respect to the lease rollover at the 640 5th Avenue Property:
| Lease Rollover Schedule(1)(2) | ||||||||
| Year | # of Leases Rolling | SF Rolling | Approx. % of SF Rolling | Approx. % of SF Rolling | Total UW Rent Rolling | Approx. % of Rolling | Approx. of Total UW | UW Rent PSF Rolling |
| MTM | 2 | 0 | 0.0% | 0.0% | $0 | 0.0% | 0.0% | $0.00 |
| 2024 | 2 | 0 | 0.0% | 0.0% | $0 | 0.0% | 0.0% | $0.00 |
| 2025 | 1 | 10,183 | 3.2% | 3.2% | $855,372 | 1.3% | 1.3% | $84.00 |
| 2026 | 8 | 95,337 | 30.3% | 33.5% | $9,439,242 | 14.0% | 15.3% | $99.01 |
| 2027 | 1 | 3,097 | 1.0% | 34.5% | $9,838,981 | 14.6% | 29.8% | $3,176.94 |
| 2028 | 1 | 0 | 0.0% | 34.5% | $0 | 0.0% | 29.8% | $0.00 |
| 2029(3) | 3 | 39,986 | 12.7% | 47.2% | $3,672,575 | 5.4% | 35.3% | $91.85 |
| 2030 | 1 | 10,421 | 3.3% | 50.6% | $937,890 | 1.4% | 36.7% | $90.00 |
| 2031 | 0 | 0 | 0.0% | 50.6% | $0 | 0.0% | 36.7% | $0.00 |
| 2032 | 3 | 99,650 | 31.7% | 82.2% | $39,282,080 | 58.2% | 94.9% | $394.20 |
| 2033 | 0 | 0 | 0.0% | 82.2% | $0 | 0.0% | 94.9% | $0.00 |
| 2034 | 1 | 30,103 | 9.6% | 91.8% | $3,461,845 | 5.1% | 100.0% | $115.00 |
| 2035 & Thereafter | 1 | 3,497 | 1.1% | 92.9% | $0 | 0.0% | 100.0% | $0.00 |
| Vacant | 0 | 22,259 | 7.1% | 100.0% | $0 | 0.0% | 100.0% | $0.00 |
| Total/Wtd. Avg. | 24 | 314,533 | 100.0% | $67,487,985 | 100.0% | $230.91(4) | ||
| (1) | Information is based on the underwritten rent roll dated June 1, 2024. |
| (2) | Certain tenants may have lease termination options that are not reflected in the Lease Rollover Schedule. |
| (3) | The 640 5th Avenue Whole Loan matures on July 1, 2029. |
| (4) | Total/Wtd. Avg. UW Rent PSF Rolling excludes vacant space. |
| This is not a research report and was not prepared by any Underwriter’s research department. Please see additional important information and qualifications at the end of this Term Sheet. | ||
| 44 | ||
| Mixed Use – Office/Retail | Loan #2 | Cut-off Date Balance: | $68,899,375 | |
| 640 5th Avenue | 640 5th Avenue | Cut-off Date LTV: | 41.6% | |
| New York, NY 10022 | UW NCF DSCR: | 2.04x | ||
| UW NOI Debt Yield: | 18.8% |
The Market. The 640 5th Avenue Property is located in New York, New York, more specifically in the Manhattan retail market. The Manhattan retail market has regressed since the pandemic, but not as strongly as the office market. The retail market is driven by Manhattan’s pedestrians and tourists. According to the appraisal, New York City expected to welcome 63.2 million visitors in 2023, and total city visitors were expected to surpass 2019 levels by 2024. The 640 5th Avenue Property is situated on upper Fifth Avenue, one of the most well-known retail areas in the United States. Notable features in the proximate area of the 640 5th Avenue Property include Rockefeller Center, 4.7 million SF of Class A office space, the New York Public Library, a Ritz-Carlton hotel and conference center, Central Park and luxury residential buildings. As of the fourth quarter of 2023, total leasing velocity in the market increased 6.6% year-over-year with an average annual leasing velocity of 2.9 million SF. The 640 5th Avenue Property is also located in the Manhattan office market, which has been practically brought to a halt since March 2020. According to the appraisal, as of the fourth quarter of 2023, the Manhattan office vacancy rate reached 12.8% with an availability rate of 18.5%. According to the appraisal, the 2023 total population within a 0.25-, 0.5- and one-mile radii of the 640 5th Avenue Property was 1,772, 25,066 and 200,745, respectively, and the 2023 median household income within the same radii was $129,959, $135,306 and $124,189, respectively.
According to a third-party report, the 640 5th Avenue Property is located in the Fifth Avenue retail submarket, ranging from Saks Fifth Avenue (East 50th Street) to the GM Building (East 60th Street). According to the appraisal, this area is identified as one of the top five most expensive retail corridors in the world. As of the fourth quarter of 2023, the Fifth Avenue retail submarket had an availability rate of 17.1%, which is consistent with the previous quarter. The average asking rent was $1,201 per SF, a decrease over the asking rent of $1,345 per SF from the previous quarter. According to a third-party report, the 640 5th Avenue Property is located in the Plaza District office submarket. As of the fourth quarter of 2023, the Plaza District office submarket had an inventory of 26.2 million SF with a 13.6% vacancy rate. The average asking rent was $111.15 per SF, an increase over the asking rent of $95.83 per SF from the previous year.
The following table presents recent retail leasing data at comparable retail properties with respect to the 640 5th Avenue Property:
| Comparable Leases Summary | |||||||
| Property/Location | Year Built / Renovated | SF | Tenant Name | Tenant Size (SF) | Lease Date | Rent PSF | Lease Term (months) |
640 5th Avenue (subject)(1) New York, NY | 1949 / 2003 | 314,533 | Victoria’s Secret | 63,779 | Feb. 2016 | $576.42 | 192 |
691 Madison Avenue New York, NY | NAV | NAV | Dolce & Gabbana | 23,339 | Q4 2023 | $514.16 | 180 |
693 Fifth Avenue New York, NY | NAV | NAV | Burberry | 14,761 | Q1 2023 | $372.60 | 20 |
690 Madison Avenue New York, NY | NAV | NAV | Van Cleef and Arpels | 7,848 | Q1 2023 | $573.39 | 120 |
140 West 57th Street New York, NY | NAV | NAV | Morton Williams | 15,482 | Q3 2022 | $108.15 | 180 |
645 Fifth Avenue New York, NY | NAV | NAV | Tag Heuer | 2,320 | Q3 3033 | $1,185.34 | 132 |
680 Fifth Avenue New York, NY | NAV | NAV | Swarovski | 14,000 | Q1 2022 | $500.00 | 132 |
144 West 46th Street New York, NY | NAV | NAV | Gossip Bar | 4,500 | Q3 2022 | $93.33 | 144 |
660 Fifth Avenue New York, NY | NAV | NAV | Citibank (Side Street) | 8,071 | Q1 2021 | $164.75 | 123 |
721-725 Fifth Avenue New York, NY | NAV | NAV | Gucci | 48,167 | Q1 2021 | $519.03 | 84 |
730 Fifth Avenue New York, NY | NAV | NAV | Chopard Mikimoto | 2,808 4,505 | Q3 2020 Q2 2019 | $1,673.79 $948.94 | 120 120 |
685 Fifth Avenue New York, NY | NAV | NAV | Tag Heuer | 896 | Q1 2020 | $3,000 | 36 |
Source: Appraisal, unless otherwise indicated.
| (1) | Information based on the underwritten rent roll dated June 1, 2024, other than Year Built / Renovated. |
| This is not a research report and was not prepared by any Underwriter’s research department. Please see additional important information and qualifications at the end of this Term Sheet. | ||
| 45 | ||
| Mixed Use – Office/Retail | Loan #2 | Cut-off Date Balance: | $68,899,375 | |
| 640 5th Avenue | 640 5th Avenue | Cut-off Date LTV: | 41.6% | |
| New York, NY 10022 | UW NCF DSCR: | 2.04x | ||
| UW NOI Debt Yield: | 18.8% |
The following table presents recent office lasing data at comparable office properties with respect to the 640 5th Avenue Property:
| Comparable Leases Summary | |||||||
| Property/Location | Year Built / Renovated | SF | Tenant Name | Tenant Size (SF) | Lease Date | Rent PSF | Lease Term (months) |
640 5th Avenue (subject)(1) New York, NY | 1949 / 2003 | 314,533 | Fidelity Real Estate Company | 40,615 | Dec. 2016 | $80.00 | 120 |
745 Fifth Avenue New York, NY | 1930 / 1989 | 535,451 | Fundamental Advisors Hakluyt and Company Hildred Capital | 11,227 12,400 12,307 | Feb. 2024 Dec. 2023 Jul. 2023 | $105.45 $95.91 $69.31 | 130 135 132 |
360 Madison Avenue New York, NY | 1981 / 2002 | 373,000 | Vestwell | 14,883 | Nov. 2023 | $64.38 | 135 |
40 West 57th Street New York, NY | 1972 / NAP | 712,000 | Access Industries | 25,000 | Nov. 2023 | $88.31 | 134 |
1 Rockefeller Plaza New York, NY | 1936 / NAP | 655,350 | Ingalls & Snyder | 19,468 | Oct. 2023 | $66.36 | 132 |
767 Fifth Avenue New York, NY | 1968 / 2019 | 1,965,003 | Balyasny Asset Management L.P. CVC Capital Partners Grosvenor Capital | 15,445 48,000 38,100 | Sep. 2023 Sep. 2023 Jun. 2023 | $101.82 $87.84 $94.67 | 130 200 180 |
510 Madison Avenue New York, NY | 2009 / 2012 | 355,089 | Granger Management Holdings LLC | 5,891 | Sep. 2023 | $100.29 | 82 |
545 Madison Avenue New York, NY | 1955 / 2021 | 153,583 | Helix Partners Management | 7,000 | May 2023 | $79.20 | 60 |
595 Madison Avenue New York, NY | 1929 / 2011 | 331,000 | Matouk | 13,227 | Apr. 2023 | $55.48 | 120 |
590 Madison Avenue New York, NY | 1982 / 2006 | 1,049,759 | Schonfeld Securities, LLC | 25,030 | Mar. 2023 | $79.52 | 96 |
535 Madison Avenue New York, NY | 1982 / NAP | 548,530 | The Lanier Law Firm | 14,875 | Jan. 2023 | $69.39 | 130 |
Source: Appraisal, unless otherwise indicated.
| (1) | Information based on the underwritten rent roll dated June 1, 2024, other than Year Built / Renovated. |
Appraisal. According to the appraisal dated May 7, 2024, the 640 5th Avenue Property had an “As-Is” appraised value of $720,000,000 as of February 28, 2024.
Environmental Matters. According to the Phase I environmental assessment dated April 17, 2024, there was no evidence of any recognized environmental conditions at the 640 5th Avenue Property.
| This is not a research report and was not prepared by any Underwriter’s research department. Please see additional important information and qualifications at the end of this Term Sheet. | ||
| 46 | ||
| Mixed Use – Office/Retail | Loan #2 | Cut-off Date Balance: | $68,899,375 | |
| 640 5th Avenue | 640 5th Avenue | Cut-off Date LTV: | 41.6% | |
| New York, NY 10022 | UW NCF DSCR: | 2.04x | ||
| UW NOI Debt Yield: | 18.8% |
Operating History and Underwritten Net Cash Flow. The following table presents certain information relating to the historical operating performance and Underwritten Net Cash Flow at the 640 5th Avenue Property:
| Cash Flow Analysis | ||||||
| 2020 | 2021 | 2022 | 2023 | UW | UW PSF | |
| Gross Potential Rent(1) | $61,607,022 | $59,918,692 | $61,922,806 | $64,089,076 | $67,487,985 | $214.57 |
| Free Rent: | $0 | ($334,847) | ($2,247,718) | ($730,003) | $0 | $0.00 |
| Percentage Rent: | $0 | $0 | $0 | $0 | $0 | $0.00 |
| Reimbursements | $5,394,737 | $5,869,822 | $6,714,695 | $7,448,692 | $8,824,722 | $28.06 |
| Other Income(2) | $1,200,647 | $1,197,940 | $1,181,296 | $1,229,121 | $1,166,319 | $3.71 |
| (Vacancy / Credit Loss) | ($1,465) | $0 | $0 | $0 | $0 | $0.00 |
| Effective Gross Income | $68,200,940 | $66,651,606 | $67,571,078 | $72,036,886 | $77,479,026 | $246.33 |
| Real Estate Taxes(3) | $10,622,785 | $11,921,499 | $12,726,288 | $11,196,742 | $14,405,944 | $45.80 |
| Insurance | $218,555 | $396,326 | $279,742 | $284,533 | $314,845 | $1.00 |
| Other Operating Expenses | $5,835,119 | $5,509,613 | $6,793,215 | $6,755,956 | $6,572,623 | $20.90 |
| Total Operating Expenses | $16,676,459 | $17,827,438 | $19,799,244 | $18,237,231 | $21,293,412 | $67.70 |
| Net Operating Income(4)(5) | $51,524,481 | $48,824,168 | $47,771,835 | $53,799,655 | $56,185,614 | $178.63 |
| Replacement Reserves | $0 | $0 | $0 | $0 | $78,633 | $0.25 |
| TI/LC | $0 | $0 | $0 | $0 | $7,574,210 | $24.08 |
| Net Cash Flow | $51,524,481 | $48,824,168 | $47,771,835 | $53,799,655 | $48,532,770 | $154.30 |
| Occupancy (%)(6) | 95.7% | 85.8% | 93.4% | 92.9% | 92.9% | |
| NOI DSCR(7) | 2.17x | 2.06x | 2.01x | 2.27x | 2.37x | |
| NCF DSCR(7) | 2.17x | 2.06x | 2.01x | 2.27x | 2.04x | |
| NOI Debt Yield(7) | 17.2% | 16.3% | 15.9% | 18.0% | 18.8% | |
| NCF Debt Yield(7) | 17.2% | 16.3% | 15.9% | 18.0% | 16.2% | |
| (1) | UW Gross Potential Rent is based on the underwritten rent roll dated June 1, 2024, and includes rent steps underwritten through June 2025 totaling $1,490,537. |
| (2) | Other Income is based on the borrower’s 2024 budget and is largely comprised of the Air Rights Lease income paid in the form of a fixed annual lease payment to the borrower from the adjacent building. Income from the Air Rights Lease as of the end of 2023 was approximately $1.2 million. |
| (3) | Tax benefits from the ICAP Tax Abatement were underwritten based on the borrower provided ICAP tax abatement schedule. |
| (4) | The 640 5th Avenue Property receives an annual fixed rent payment from the Air Rights Tenant (the fee owner of the real property known as 650 5th Avenue), pursuant to the related ground leases (collectively, the “Air Rights Lease”) that expire on July 30, 2070. The annual rent from the Air Rights Lease as of July 1, 2024, is $1,166,319 per annum, payable monthly in instalments of $97,193.25. Annual rent must reset as of August 1, 2024 and must be in an amount equal to the greater of the rental rate for the prior period (i.e., $1,166,319 per annum) or an amount equal to 1.6065% of the fair value of the combined land under the 650 5th Avenue building and the 6 West 52nd Street Building as determined by a qualified, third-party appraisal (the “Appraised Rental”) which valuation is required to be as of February 1, 2024. As of the date of the loan agreement, the borrower and the Air Rights Tenant are in continuing negotiations regarding the amount of the Appraised Rental, provided, however, that such amount may not be no lower than the rental rate for the prior period (i.e., $1,166,319 per annum). If the Appraised Rental is not finalized by August 1, 2024, the Air Rights Tenant will be required to continue to pay rent at the prior rental rate (i.e., $1,166,319 per annum), and upon determination of the Appraised Rental (assuming such rate is higher than the rental rate for the prior period), the Air Rights Tenant will be required to pay the difference between the Appraised Rental and the rent paid on account for all months elapsed theretofore on the first day of the month following such determination. Upon resolution of the final rental rate, such rental rate will remain in effect through July 31, 2047, after which time the rental rate will again be the greater of the rental for the prior period or 1.6065% of the fair value of the combined land under the 650 Fifth Avenue building and the 6 West 52nd Street Building. |
| (5) | Base rent for two of the retail suites is above market. Based on the appraiser’s market rents for these two suites, the Underwritten Net Operating Income would be approximately $46,959,997. The 640 5th Avenue Whole Loan underwritten NOI Debt Yield would decrease from 18.8% to 15.7% and the underwritten NOI Debt Service Coverage Ratio would decrease from 2.37x to 1.98x. |
| (6) | UW Occupancy (%) represents economic occupancy. Historical occupancies represent physical occupancies. 2023 Occupancy (%) is based on the underwritten rent roll dated June 1, 2024. |
| (7) | DSCR and Debt Yield are based on the 640 5th Avenue Whole Loan. |
Escrows and Reserves. At origination of the 640 5th Avenue Whole Loan, the borrower deposited $1,567,900 for tenant improvements and leasing commissions and approximately $1,648,112 for free rent reserves. The borrower may provide a letter of credit for all or a portion of such deposits.
Tax Escrows – On a monthly basis during a Trigger Period (as defined below), the borrower is required to escrow 1/12th of the estimated annual real estate tax payments. The borrower may provide a letter of credit for all or a portion of such deposits.
Insurance Escrows – On a monthly basis during a Trigger Period, the borrower is required to escrow 1/12th of the annual estimated insurance payments. The borrower may provide a letter of credit for all or a portion of such deposits. Such reserve has been conditionally waived so long as the borrower maintains a blanket policy meeting the requirements of the 640 5th Avenue Whole Loan documents.
Replacement Reserve – On a monthly basis during a Trigger Period, the borrower is required to escrow approximately $8,134 for the payment or reimbursement of approved capital expenses. Such monthly deposits will not be required during such time that the balance of the capital expense reserve exceeds approximately $195,217.
Rollover Reserve – On a monthly basis, the borrower is required to escrow $500,000 for approved leasing expenses. Such monthly deposits will not be required during such time that the balance of the capital expense reserve exceeds approximately $15,000,000. The borrower may provide a letter of credit for all or a portion of such deposits.
Free Rent Reserve – Provided that no event of default exists, on each monthly payment date, the free rent funds deposited for each applicable lease will be disbursed in the amounts equal to the applicable monthly rent credits or free rent amounts set forth in the 640 5th Avenue Whole Loan documents.
| This is not a research report and was not prepared by any Underwriter’s research department. Please see additional important information and qualifications at the end of this Term Sheet. | ||
| 47 | ||
| Mixed Use – Office/Retail | Loan #2 | Cut-off Date Balance: | $68,899,375 | |
| 640 5th Avenue | 640 5th Avenue | Cut-off Date LTV: | 41.6% | |
| New York, NY 10022 | UW NCF DSCR: | 2.04x | ||
| UW NOI Debt Yield: | 18.8% |
Lease Sweep Reserve – During a Lease Sweep Period (as defined below), funds will be deposited into a lease sweep account as set forth below under “Lockbox and Cash Management” to be used for expenses of retenanting the space leased to the Dyson’s Tenant.
Lockbox and Cash Management. The 640 5th Avenue Whole Loan is structured with a hard lockbox and in-place cash management. The borrower is required to deliver tenant direction letters to all tenants at the 640 5th Avenue Property, directing them to remit their rent directly to the lender-controlled lockbox. The borrower is required to cause revenue received by the borrower or the property manager, as applicable, from the 640 5th Avenue Property to be deposited into such lockbox within 10 business days after receipt. All funds in the lockbox account are required to be swept each business day into the lender-controlled cash management account and applied and disbursed (i) if a Trigger Period is continuing, to make the required deposits (if any) into the tax escrow and insurance escrow as described under “Escrows and Reserves” above, (ii) to pay monthly interest and principal amortization payments on the 640 5th Avenue Whole Loan, (iii) to pay operating and capital expenditures in accordance with the annual budget (which is required to be reasonably approved by the lender during a Trigger Period, but is deemed approved for the fiscal year in which the Trigger Period first occurs), (iv) to make the required deposit, if any, into the rollover reserve, as described under “Escrows and Reserves” above, (v) during a Trigger Period, to make the required deposit, if any, into the replacement reserve, as described under “Escrows and Reserves” above, (vi) if a Lease Sweep Period is continuing, regardless of whether a Trigger Period is continuing, to deposit all remaining cash into the lease sweep reserve, and (vii) to the mezzanine lender, to pay monthly interest and principal amortization payments on the 640 5th Avenue Mezzanine Loan, subject to the terms of the intercreditor agreement. All excess cash flow remaining following the foregoing disbursements will be deposited, (A) provided no Trigger Period is continuing (i) for so long as the 640 5th Avenue Mezzanine Loan remains outstanding, into an account for the 640 5th Avenue Mezzanine Loan, or (ii) following the repayment in full of the 640 5th Avenue Mezzanine Loan, into the borrower’s account, or (B) during the continuance of a Trigger Period, into a cash collateral account held by the lender.
A “Trigger Period” means a period commencing upon the earliest to occur of (i) an event of default under the 640 5th Avenue Whole Loan, (ii) a Low Debt Yield Trigger Period (as defined below) or (iii) a Victoria’s Secret Event Period (as defined below), and ending if, with respect to a Trigger Period continuing pursuant to (A) clause (i), the event of default commencing the Trigger Period has been cured or waived and such cure has been accepted by the lender or the lender has waived such event of default in writing, and no other event of default is then continuing, (B) clause (ii), the Low Debt Yield Trigger Period has ended and (C) clause (iii), the Victoria’s Secret Event Period has ended.
A “Low Debt Yield Trigger Period” means a period commencing if, as of the last day of any calendar quarter, the NOI Debt Yield (as defined below) is less than 10.0%, and ending if the NOI Debt Yield is equal to or in excess of 10.0% on any subsequent calculation date; provided, however, that a Low Debt Yield Trigger Period will be deemed not to exist if, not later than 15 business days after the borrower’s receipt of notice from the lender that a Low Debt Yield Trigger Period has commenced, the borrower (a) prepays a portion of the 640 5th Avenue Whole Loan, along with any yield maintenance premium, and the 640 5th Avenue Mezzanine Loan in accordance with the terms of the 640 5th Avenue Mezzanine Loan documents, which amount will be applied, in each case, on a pro rata basis to the 640 5th Avenue Whole Loan and the 640 5th Avenue Mezzanine Loan, or (b) delivers to the lender as additional collateral for the 640 5th Avenue Whole Loan, either (i) cash, which must be deposited into, or retained in, the cash collateral account, or (ii) a letter of credit in lieu of cash, in each case, in an amount equal to the Low Debt Yield Avoidance Amount (as defined below) (the “Low Debt Yield Avoidance Collateral”). If the borrower delivers to the lender such Low Debt Yield Avoidance Collateral, then for so long as the lender holds such Low Debt Yield Avoidance Collateral, the NOI Debt Yield will be calculated based on the assumption that the outstanding principal balance of the 640 5th Avenue Whole Loan has been reduced by the value of the Low Debt Yield Avoidance Collateral, such value being the amount of cash or notional amount of any letter of credit.
The “NOI Debt Yield” means, as of any date of determination, a fraction, expressed as a percentage, of which (a) the numerator is the underwritten net operating income as of such date; and (b) the denominator is the sum of the outstanding principal balances, as of such date, of (A) the 640 5th Avenue Whole Loan and (B) the 640 5th Avenue Mezzanine Loan.
A “Low Debt Yield Avoidance Amount” means, at any point in time, the amount that when applied on a pro rata basis to the reduction of the then-current outstanding principal balance of the 640 5th Avenue Whole Loan and the then-current outstanding principal balance of the 640 5th Avenue Mezzanine Loan would cause the NOI Debt Yield to equal at least 10.0%, taking into account the aggregate amount of Low Debt Yield Avoidance Collateral previously provided by the borrower and then held by the lender.
A ”Victoria’s Secret Event Period” will (i) commence upon the occurrence, as applicable, of (x) a bankruptcy or other insolvency proceeding, whether voluntary or involuntary, with respect to the Victoria’s Secret tenant or any guarantor of the Victoria’s Secret lease, or (y) the Victoria’s Secret tenant discontinues normal business operations at the Victoria’s Secret leased space, other than a temporary cessation of business operations for permitted alterations, renovations, necessary repairs or restoration following casualty, provided that in any such case the Victoria’s Secret tenant continues to pay all contractual rent, and (ii) will end upon the first to occur of (a) in the event the Victoria’s Secret Event Period commenced due to a bankruptcy or other insolvency proceeding, the affirmation of the Victoria’s Secret lease in such applicable proceeding, provided that the Victoria’s Secret tenant is actually paying all rents and other amounts due under the Victoria’s Secret lease, (b) in the event the Victoria’s Secret Event Period commenced due to a vacancy at the Victoria’s Secret leased space, the Victoria’s Secret tenant re-commences normal business operations at the Victoria’s Secret leased space in accordance with the terms and conditions of the Victoria’s Secret lease and (c) the date on which the entirety of the Victoria’s Secret space is leased to one or more replacement tenants that are reasonably acceptable to the lender.
A “Lease Sweep Period” means a period that (i) will commence if the lease for Dyson Direct, Inc. (the “Dyson Tenant,”) (or any material portion thereof) is not extended or renewed at least 12 months prior to the expiration date thereof for at least an additional five year period as evidenced by a written acknowledgement executed by Dyson Tenant in a form reasonably acceptable to the lender and (ii) will end upon the first to occur of the following: (a) the date on which the Dyson Tenant extends or renews its existing lease for at least an additional five years as evidenced by a written acknowledgement executed by the Dyson Tenant in a form reasonably acceptable to the lender; (b) the date on which the entirety of the space leased by the Dyson Tenant is leased pursuant to one or more replacement tenants that are reasonably acceptable to the lender; and (c) the date on which the funds in the lease sweep reserve (1) collected with respect to the Dyson Tenant’s lease (including any lease termination payments) or (2) deposited by the borrower with the lender, equals or exceeds $3,000,000 (measured on a cumulative basis for the term of the 640 5th Avenue Whole Loan); provided that in lieu of a deposit by the borrower pursuant to clause (2) above, the borrower may provide to the lender a letter of credit for all or a portion of the amount described above; but a letter of credit may not be used as a substitute for any cash collected pursuant to clause (1) above.
| This is not a research report and was not prepared by any Underwriter’s research department. Please see additional important information and qualifications at the end of this Term Sheet. | ||
| 48 | ||
| Mixed Use – Office/Retail | Loan #2 | Cut-off Date Balance: | $68,899,375 | |
| 640 5th Avenue | 640 5th Avenue | Cut-off Date LTV: | 41.6% | |
| New York, NY 10022 | UW NCF DSCR: | 2.04x | ||
| UW NOI Debt Yield: | 18.8% |
Mezzanine Loan. Concurrently with the origination of the 640 5th Avenue Whole Loan, a $100,000,000 mezzanine loan (the “640 5th Avenue Mezzanine Loan” and together with the 640 5th Avenue Whole Loan, the “640 5th Avenue Total Debt”) was funded by MSBNA and GSBI, which is secured by the mezzanine borrower’s direct equity interests in the borrower. The mezzanine borrower is required under the 640 5th Avenue Mezzanine Loan to make monthly payments to the mezzanine lenders equal to (x) principal in the amount of approximately $145,833 and (y) the monthly interest payment. The 640 5th Avenue Mezzanine Loan accrues interest at a rate of 11.50000% per annum and is coterminous with the 640 5th Avenue Whole Loan.
| 640 5th Avenue Total Debt Summary | |||||
| Loan | Original Balance | Interest Rate | Cumulative UW NCF DSCR | Cumulative UW NOI Debt Yield | Cumulative Cut-off Date LTV Ratio |
| Whole Loan | $300,000,000 | 6.1293333% | 2.04x | 18.8% | 41.6% |
| Mezzanine Loan | $100,000,000 | 11.500000% | 1.31x | 14.1% | 55.5% |
| Total/Weighted Average: | $400,000,000 | 7.4719999750% | |||
Ground Lease. A prior owner of the 640 5th Avenue Property ground leased the 640 5th Avenue Property to the Air Rights Tenant, and the Air Rights Tenant who subleased the 640 5th Avenue Property (other than development rights relating to one of the two buildings comprising the 640 5th Avenue Property, which were retained by the Air Rights Tenant) back to such prior owner of the 640 5th Avenue Property, solely for purposes of satisfying certain zoning requirements in connection with the transfer of such development rights to the Air Rights Tenant. The borrower receives an annual fixed rent payment from the Air Rights Tenant pursuant to the Air Rights Lease that expires on July 30, 2070. The annual rent from the Air Rights Lease is calculated as described in “Operating History and Underwritten Net Cash Flow” above. See “Description of the Mortgage Pool—Mortgage Pool Characteristics—Fee & Leasehold Estates; Ground Leases” in the prospectus.
Terrorism Insurance. The borrower is required to obtain and maintain property insurance in an amount equal to 100% of full replacement cost and business interruption insurance for 24 months plus a 12-month extended period of indemnity, in each case which covers perils of terrorism and acts of terrorism, except for nuclear, biological, chemical or radiological terrorism events, which may be excluded to the extent such coverage is not available. For so long as TRIPRA is in effect and continues to cover both foreign and domestic acts of terrorism, the lender is required to accept terrorism insurance with coverage against acts which are “certified” within the meaning of TRIPRA. So long as TRIPRA is in effect, the borrower may obtain terrorism coverage from an unrated captive insurance company, so long as certain conditions are satisfied, including but not limited to that, except with respect to the permitted deductible of $150,000, any portion of such coverage not covered by the federal government under TRIPRA will be reinsured with a cut through endorsement by an insurance company with a financial strength and claims paying ability rating of at least “A-” with S&P and “A2” with Moody’s, or if Moody’s does not rate such insurance company, a rating of “A:VIII” or better in the current A.M. Best’s Insurance Reports. If TRIPRA is not in effect, the borrower will not be obligated to pay terrorism insurance premiums in excess of the greater of (i) two times the premium then payable in respect of the property and business interruption coverages (without giving effect to the cost of terrorism coverage) and (ii) the product of the rate of $0.10 per $100 times the lesser of (A) the outstanding principal balance of the 640 5th Avenue Whole Loan and (B) the sum of 100% of the full replacement cost and the required amount of rental loss and/or business income interruption insurance. See “Risk Factors—Risks Relating to the Mortgage Loans—Terrorism Insurance May Not Be Available for All Mortgaged Properties” in the prospectus.
| This is not a research report and was not prepared by any Underwriter’s research department. Please see additional important information and qualifications at the end of this Term Sheet. | ||
| 49 | ||
| Retail – Super Regional Mall | Loan #3 | Cut-off Date Balance: | $65,000,000 | |
| 2601 Preston Road | Stonebriar Centre | Cut-off Date LTV: | 42.1% | |
| Frisco, TX 75034 | UW NCF DSCR: | 2.30x | ||
| UW NOI Debt Yield: | 16.8% |
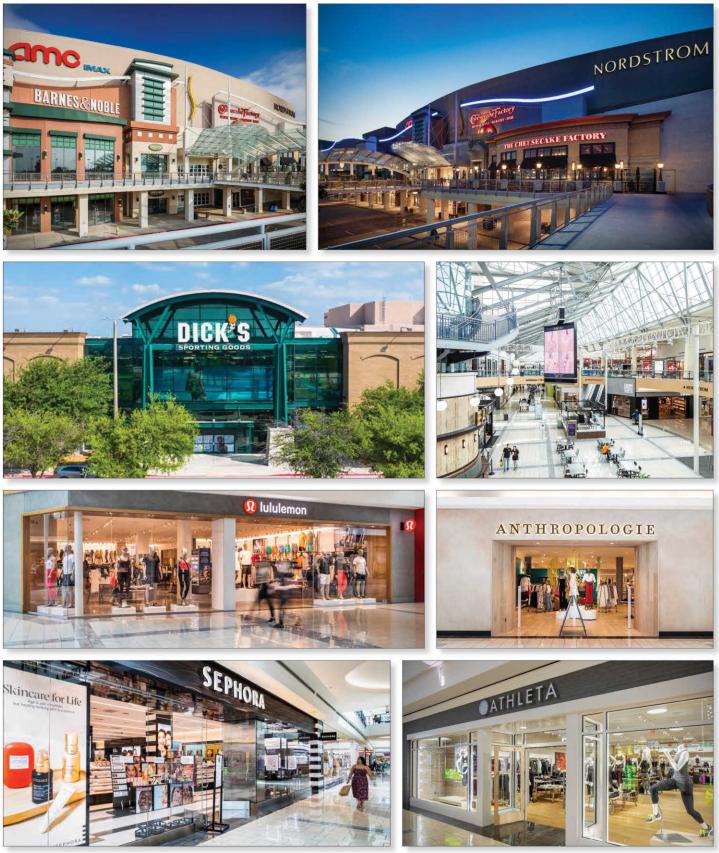
| This is not a research report and was not prepared by any Underwriter’s research department. Please see additional important information and qualifications at the end of this Term Sheet. | ||
| 50 | ||
| Retail – Super Regional Mall | Loan #3 | Cut-off Date Balance: | $65,000,000 | |
| 2601 Preston Road | Stonebriar Centre | Cut-off Date LTV: | 42.1% | |
| Frisco, TX 75034 | UW NCF DSCR: | 2.30x | ||
| UW NOI Debt Yield: | 16.8% |
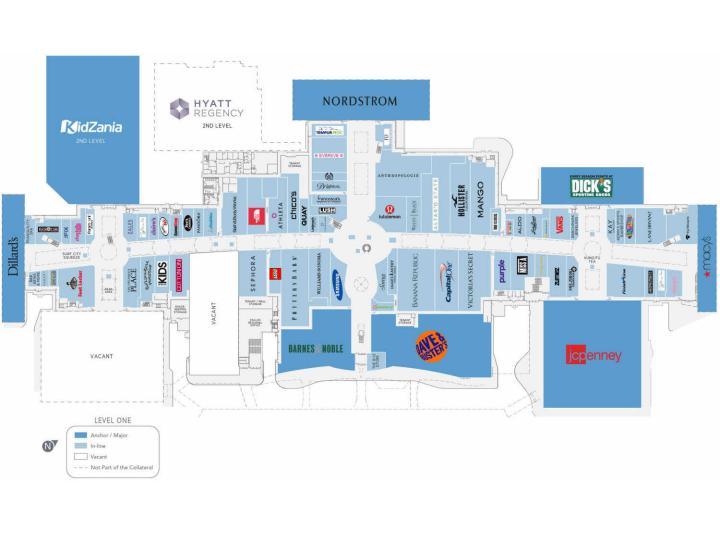
| This is not a research report and was not prepared by any Underwriter’s research department. Please see additional important information and qualifications at the end of this Term Sheet. | ||
| 51 | ||
| Retail – Super Regional Mall | Loan #3 | Cut-off Date Balance: | $65,000,000 | |
| 2601 Preston Road | Stonebriar Centre | Cut-off Date LTV: | 42.1% | |
| Frisco, TX 75034 | UW NCF DSCR: | 2.30x | ||
| UW NOI Debt Yield: | 16.8% |
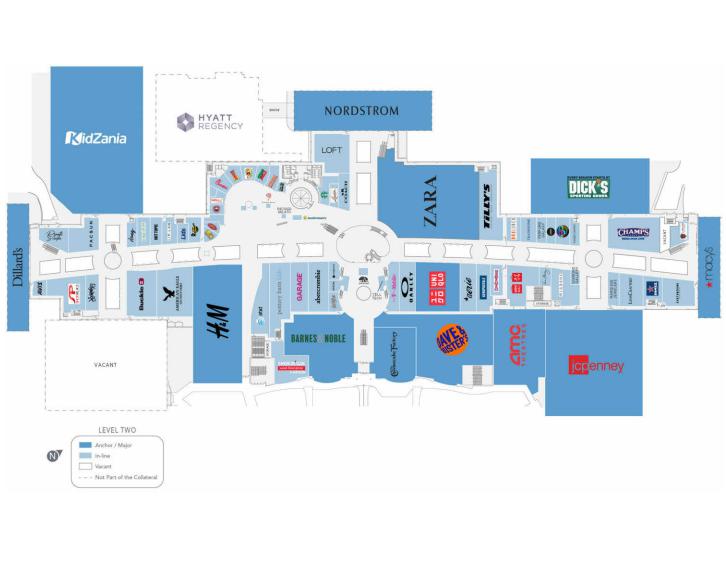
| This is not a research report and was not prepared by any Underwriter’s research department. Please see additional important information and qualifications at the end of this Term Sheet. | ||
| 52 | ||
| Retail – Super Regional Mall | Loan #3 | Cut-off Date Balance: | $65,000,000 | |
| 2601 Preston Road | Stonebriar Centre | Cut-off Date LTV: | 42.1% | |
| Frisco, TX 75034 | UW NCF DSCR: | 2.30x | ||
| UW NOI Debt Yield: | 16.8% |
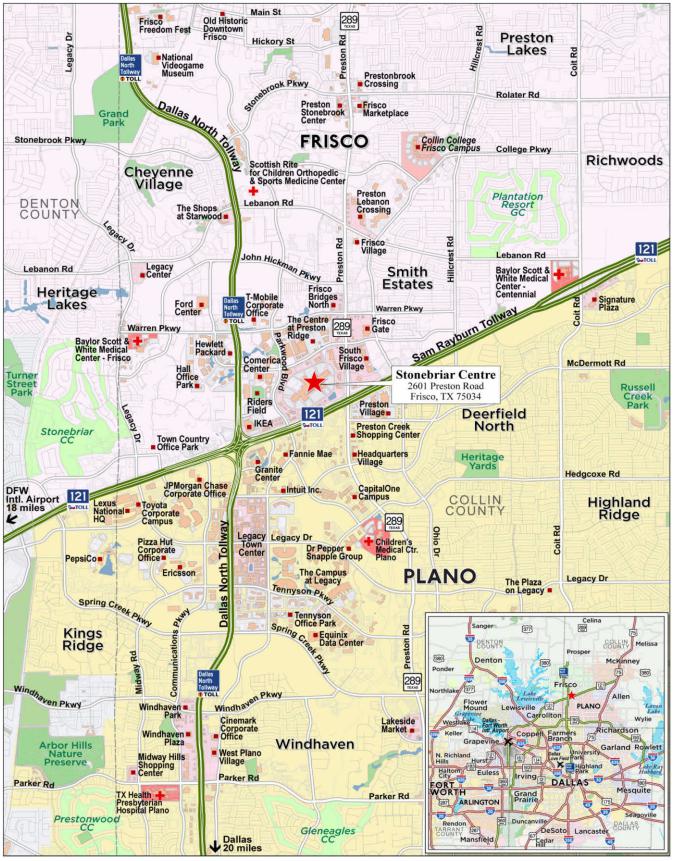
| This is not a research report and was not prepared by any Underwriter’s research department. Please see additional important information and qualifications at the end of this Term Sheet. | ||
| 53 | ||
| Mortgage Loan No. 3 – Stonebriar Centre |
| Mortgage Loan Information | Property Information | |||||
| Mortgage Loan Seller: | BANA | Single Asset/Portfolio: | Single Asset | |||
| Credit Assessment (Fitch/Moody’s/DBRSM): | NR/Aaa/AA | Location: | Frisco, TX 75034 | |||
| Original Balance(1): | $65,000,000 | General Property Type: | Retail | |||
| Cut-off Date Balance(1): | $65,000,000 | Detailed Property Type: | Super Regional Mall | |||
| % of Initial Pool Balance: | 9.4% | Title Vesting: | Fee | |||
| Loan Purpose: | Refinance | Year Built/Renovated: | 2000/NAP | |||
| Borrower Sponsors: | GGP/Homart II L.L.C., Brookfield Properties Retail Holding LLC and New York State Common Retirement Fund | Size: | 1,096,880 SF | |||
| Guarantor: | GGP/HOMART II L.L.C. | Cut-off Date Balance PSF(1): | $232 | |||
| Mortgage Rate: | 6.9990% | Maturity Date Balance PSF(1): | $232 | |||
| Note Date: | 7/1/2024 | Property Manager: | Brookfield Properties Retail Inc. | |||
| Maturity Date: | 7/1/2029 | (borrower-related) | ||||
| Original Term to Maturity: | 60 months | Underwriting and Financial Information | ||||
| Original Amortization Term: | 0 months | UW NOI: | $42,823,625 | |||
| IO Period: | 60 months | UW NCF: | $41,565,493 | |||
| Seasoning: | 1 month | UW NOI Debt Yield(1): | 16.8% | |||
| Prepayment Provisions(2): | L(25),D(28),O(7) | UW NCF Debt Yield(1): | 16.3% | |||
| Lockbox/Cash Mgmt Status: | Hard/Springing | UW NOI Debt Yield at Maturity(1): | 16.8% | |||
| Additional Debt Type(1): | Pari Passu | UW NCF DSCR(1): | 2.30x | |||
| Additional Debt Balance(1): | $190,000,000 | Most Recent NOI: | $43,691,924 (4/30/2024 TTM) | |||
| Future Debt Permitted (Type): | No (NAP) | 2nd Most Recent NOI: | $43,557,495 (12/31/2023) | |||
| 3rd Most Recent NOI: | $39,193,479 (12/31/2022) | |||||
| Reserves(3) | Most Recent Occupancy: | 96.7% (4/30/2024) | ||||
| Type | Initial | Monthly | Cap | 2nd Most Recent Occupancy: | 97.7% (12/31/2023) | |
| RE Taxes: | $0 | Springing | NAP | 3rd Most Recent Occupancy: | 95.9% (12/31/2022) | |
| Insurance: | $0 | Springing | NAP | Appraised Value (as of): | $605,000,000 (5/13/2024) | |
| Replacement Reserve: | $0 | Springing | $438,752 | Appraised Value PSF: | $552 | |
| TI/LC Reserve: | $0 | $91,407 | $2,193,760 | Cut-off Date LTV Ratio(1): | 42.1% | |
| Other Reserves(4): | $12,477,527 | $0 | NAP | Maturity Date LTV Ratio(1): | 42.1% | |
| Sources and Uses | ||||||
| Sources | Proceeds | % of Total | Uses | Proceeds | % of Total | |
| Whole Loan Amount(1): | $255,000,000 | 100.0% | Loan Payoff: | $242,815,054 | 95.2% | |
| Upfront Reserves(4): | $10,449,929 | 4.1% | ||||
| Return of Equity: | $923,513 | 0.4% | ||||
| Closing Costs: | $811,504 | 0.3% | ||||
| Total Sources: | $255,000,000 | 100.0% | Total Uses: | $255,000,000 | 100.0% | |
| (1) | The Stonebriar Centre Mortgage Loan (as defined below) is part of the Stonebriar Centre Whole Loan (as defined below), which is evidenced by nine pari passu promissory notes with an aggregate principal balance of $255,000,000. The Cut-off Date Balance PSF, Maturity Date Balance PSF, UW NOI Debt Yield, UW NOI Debt Yield at Maturity, UW NCF DSCR, Cut-off Date LTV Ratio and Maturity Date LTV Ratio numbers presented above are based on the aggregate principal balance of the promissory notes comprising the Stonebriar Centre Whole Loan. |
| (2) | Defeasance of the Stonebriar Centre Whole Loan is permitted at any time after the earlier to occur of (a) the end of the two-year period commencing on the closing date of the securitization of the last portion of the Stonebriar Centre Whole Loan to be securitized and (b) July 1, 2027. The assumed defeasance lockout period of 25 payments is based on the closing date of this transaction in August 2024. |
| (3) | See “Escrows and Reserves” below for further discussion of reserve information. |
| (4) | Other Reserves is comprised of an Upfront TI/LC Reserve ($11,720,606) and a Gap Rent Reserve ($756,921), totaling $12,477,527, of which the borrowers (i) deposited upfront cash of $10,449,929 and (ii) provided a payment guaranty for the remaining $2,027,598 of outstanding landlord obligations. The payment guaranty is from the guarantor pursuant to a guaranty of limited payment, under which the amounts guaranteed will be reduced on a dollar-for-dollar basis by the aggregate amount actually expended by the borrowers or their affiliates on upfront TI/LC expenditures. |
The Mortgage Loan. The third largest mortgage loan (the “Stonebriar Centre Mortgage Loan”) is part of a whole loan (the “Stonebriar Centre Whole Loan”) that is evidenced by nine pari passu promissory notes in the aggregate original principal amount of $255,000,000 and secured by a first priority fee mortgage encumbering a 1,096,880 SF super regional mall located in Frisco, Texas (the “Stonebriar Centre Property”). The Stonebriar Centre Whole Loan was co-originated by Bank of America, N.A., Goldman Sachs Bank USA and Societe Generale Financial Corporation. The Stonebriar Centre Mortgage Loan is evidenced by the non-controlling Note A-3-1, with an original principal balance of $65,000,000. The remaining promissory notes comprising the Stonebriar Centre Whole Loan are summarized in the below table. The Stonebriar Centre Whole Loan will be serviced pursuant to the pooling and servicing agreement for the BANK5 2024-5YR8 trust until the controlling Note A-1-1 is securitized, at which time servicing will shift to the pooling and servicing agreement for such future securitization. See “Description of the Mortgage Pool—The Whole Loans” and “Pooling and Servicing Agreement—Servicing of the Servicing Shift Mortgage Loans” in the prospectus.
| This is not a research report and was not prepared by any Underwriter’s research department. Please see additional important information and qualifications at the end of this Term Sheet. | ||
| 54 | ||
| Retail – Super Regional Mall | Loan #3 | Cut-off Date Balance: | $65,000,000 | |
| 2601 Preston Road | Stonebriar Centre | Cut-off Date LTV: | 42.1% | |
| Frisco, TX 75034 | UW NCF DSCR: | 2.30x | ||
| UW NOI Debt Yield: | 16.8% |
| Stonebriar Centre Whole Loan Summary | ||||
Note | Original Balance | Cut-off Date Balance | Note Holder | Controlling Note |
| A-1-1(1) | $25,000,000 | $25,000,000 | Goldman Sachs Bank USA | Yes |
| A-1-2(1) | $25,000,000 | $25,000,000 | Goldman Sachs Bank USA | No |
| A-1-3(1) | $25,000,000 | $25,000,000 | Goldman Sachs Bank USA | No |
| A-1-4(1) | $25,000,000 | $25,000,000 | Goldman Sachs Bank USA | No |
| A-1-5(1) | $25,000,000 | $25,000,000 | Goldman Sachs Bank USA | No |
| A-2-1(1) | $30,000,000 | $30,000,000 | Societe Generale Financial Corporation | No |
| A-2-2(1) | $20,000,000 | $20,000,000 | Societe Generale Financial Corporation | No |
| A-2-3(1) | $15,000,000 | $15,000,000 | Societe Generale Financial Corporation | No |
| A-3-1 | $65,000,000 | $65,000,000 | BANK5 2024-5YR8 | No |
| Whole Loan | $255,000,000 | $255,000,000 | ||
| (1) | Expected to be contributed to one or more future securitization trusts. |
The Borrowers and the Borrower Sponsors. The borrowers are Stonebriar Mall, LLC and Stonebriar Anchor Acquisition II LLC, each a Delaware limited liability company and single purpose entity with two independent directors. The non-recourse carveout guarantor is GGP/HOMART II L.L.C. The borrower sponsors are GGP/Homart II L.L.C. and a joint venture between Brookfield Properties Retail Holding LLC (50.0%) and New York State Common Retirement Fund (50.0%).
Brookfield Properties is a subsidiary of Brookfield Corporation, a diversified global real estate company that owns, operates and develops office, retail, multifamily, logistics and hospitality assets. Brookfield Properties owns more than 175 retail assets across eight countries, totaling over 130 million SF.
The New York State Common Retirement Fund is one of the largest public pension plans in the United States, providing retirement security for over one million New York State and local retirement system members, retirees, and beneficiaries. The fund ended the fiscal year of 2023 with assets under management of $267.7 billion.
The Property. The Stonebriar Centre Property is a 1,096,880 SF Class “A” super regional mall located in Frisco, Texas. The Stonebriar Centre Property opened in 2000 and the related mall is anchored by non-collateral tenants Dillard’s, Macy’s and Nordstrom and collateral tenants JCPenney, AMC Theatres, Dick’s Sporting Goods, Kidzania, Dave & Buster’s, Zara and Barnes & Noble Bookseller. The Stonebriar Centre Property has many other well-known national tenants, including a dining offerings such as Chick-Fil-A, Sonic Drive In, Popeye’s and Panda Express. The Stonebriar Centre Property also benefits from having a Hyatt Regency hotel on-site (non-collateral).
The Stonebriar Centre Property has a granular rent roll, with no tenant occupying more than 14.8% of total rentable SF or contributing greater than 6.5% of the total underwritten rent. The top 10 tenants at the Stonebriar Centre Property represent 56.0% of total SF and generate 24.8% of total underwritten rent. The Stonebriar Centre Property was 96.7% occupied as of April 30, 2024 by 147 unique tenants. The Stonebriar Centre Property has maintained an average occupancy (excluding anchors) of 94.8% since 2019 and 96.0% over the last ten years. Since 2023, the borrower sponsors have executed 33 new and renewal leases comprising 145,115 SF (13.2% of the collateral SF). Since 2019, the borrower sponsors have invested approximately $45.8 million in capital expenditures, tenant improvements and leasing commissions.
Over the trailing-12 months ending February 29, 2024, the Stonebriar Centre Property generated total sales of approximately $322 million. Over the same time period, inline tenants (less than 10,000 SF) generated sales of approximately $744 PSF (occupancy cost of 13.7%).
The following table contains sales history for the Stonebriar Centre Property:
| Sales History(1) | ||||||
| 2019 | 2020 | 2021 | 2022 | 2023 | February 2024 TTM | |
| Gross Mall Sales (excluding JCPenney, Dillard’s, Macy’s and Nordstrom) | $264,230,891 | $177,302,096 | $266,600,050 | $292,372,796 | $323,546,061 | $321,739,441 |
| JCPenney Sales(2) | $22,800,000 | NAV | $18,300,000 | $19,100,000 | $18,200,000 | NAV |
| Dillard’s Sales (non-collateral)(2) | $30,500,000 | NAV | $33,400,000 | $37,300,000 | $36,800,000 | NAV |
| Macy’s Sales (non-collateral) (2) | $36,200,000 | NAV | $35,400,000 | $46,900,000 | $37,700,000 | NAV |
| Nordstrom Sales (non-collateral) (2) | $47,000,000 | NAV | $49,000,000 | $55,500,000 | $56,300,000 | NAV |
| Sales PSF (Inline < 10,000 SF) | $574 | $409 | $645 | $706 | $731 | $744 |
| Occupancy Cost (Inline < 10,000 SF) | 16.2% | 21.0% | 13.0% | 13.7% | 13.9% | 13.7% |
| (1) | Information is as of February 29, 2024, as provided by the borrower sponsors, and only includes tenants reporting sales. |
| (2) | Represents estimated sales as provided by the borrower sponsors. |
| This is not a research report and was not prepared by any Underwriter’s research department. Please see additional important information and qualifications at the end of this Term Sheet. | ||
| 55 | ||
| Retail – Super Regional Mall | Loan #3 | Cut-off Date Balance: | $65,000,000 | |
| 2601 Preston Road | Stonebriar Centre | Cut-off Date LTV: | 42.1% | |
| Frisco, TX 75034 | UW NCF DSCR: | 2.30x | ||
| UW NOI Debt Yield: | 16.8% |
The following table contains anchor and major tenant sales history at the Stonebriar Centre Property:
| Major Tenant Sales History(1) | |||||||
| Tenant | SF | 2019 Sales PSF/Screen | 2020 Sales PSF/Screen | 2021 Sales PSF/Screen | 2022 Sales PSF/Screen | 2023 Sales PSF/Screen | February 2024 TTM Sales PSF/Screen |
| AMC Theatres(2) | 94,560 | $474,101 | $276,556 | $127,975 | $383,080 | $453,432 | $453,432 |
| Kidzania | 60,000 | NAV | $167 | $63 | $83 | $100 | $105 |
| Dave & Buster's | 49,784 | $179 | $65 | $157 | $191 | $187 | $189 |
| Barnes & Noble Bookseller | 34,272 | $211 | $175 | $147 | $236 | $268 | $268 |
| H&M | 26,576 | $260 | $171 | $275 | $316 | $246 | $250 |
| Banana Republic | 10,862 | $284 | $68 | $189 | $215 | $191 | $199 |
| Pottery Barn | 10,580 | $621 | $497 | $640 | $638 | $480 | $460 |
| The Cheesecake Factory | 10,567 | $1,072 | $719 | $1,007 | $1,137 | $1,144 | $1,161 |
| Altar'd State | 10,200 | $423 | $287 | $513 | $572 | $580 | $597 |
| Anthropologie | 10,115 | NAV | NAV | NAV | $369 | $533 | $535 |
| (1) | Information is as provided by the borrower sponsors, and only includes tenants reporting sales. |
| (2) | AMC Theatres sales are based on 24 screens. February 2024 TTM Sales PSF/Screen are as of year-end 2023. |
Major Tenants.
JCPenney (162,347 SF, 14.8% of NRA, 2.6% of underwritten base rent). JCPenney was founded in Wyoming in 1902 and has been one of the United States’ largest retailers of apparel, home, jewelry and beauty merchandise, with a growing portfolio of national brands. JCPenney has more than 650 stores across the United States and Puerto Rico and employs more than 50,000 people worldwide. JCPenney has been a tenant at the Stonebriar Centre Property since 2000 and most recently renewed their lease on July 29, 2021. JCPenney has a current lease expiration of December 31, 2040, subject to five additional renewal terms of five years each. JCPenney currently pays a base rent of $6.17 PSF, which increases to $6.30 PSF in December 2024. Estimated sales for JCPenney at the Stonebriar Centre Property were $18,200,000, $19,100,000 and $18,300,000 for 2023, 2022 and 2021, respectively.
AMC Theatres (94,560 SF, 8.6% of NRA, 6.5% of underwritten base rent). AMC Theatres is the largest theatrical exhibitor globally. AMC Theatres features best-in-class amenities, including AMC Signature Recliners, expanded and enhanced food and beverage menus, premium presentation experiences and an industry-leading rewards program. AMC Theatres currently operates approximately 10,000 total screens across 900 locations. AMC Theatres has been a tenant at the Stonebriar Centre Property since 2000 and recently renewed their lease in 2023. AMC Theatres currently has a lease expiration date of September 30, 2028, with two five-year renewal options and one three-year renewal option remaining. AMC Theaters currently pays a base rent of $27.07 PSF. AMC Theatres has 24 screens at the Stonebriar Centre Property and reported sales per screen of $453,432, $383,080 and $127,975 for 2023, 2022 and 2021, respectively.
Dick’s Sporting Goods (77,411 SF, 7.1% of NRA, 2.0% of underwritten base rent). Founded in 1948, Dick’s Sporting Goods is headquartered in Pittsburgh, Pennsylvania, and is the leading omnichannel retailer serving athletes and outdoor enthusiasts. There are currently more than 850 Dick’s Sporting Goods, Golf Galaxy, Public Lands, Moosejaw, Going Going Gone! and Dicks’s Sporting Goods subsidiary stores throughout the United States. Dick’s Sporting Goods has been a tenant at the Stonebriar Centre Property since 2000 and most recently renewed their lease in 2021. Dick’s Sporting Goods currently has a lease expiration date of January 31, 2027, with three five-year renewal options remaining. Dick’s Sporting Goods currently pays a base rent of $10.33 PSF and is not required to report sales.
| This is not a research report and was not prepared by any Underwriter’s research department. Please see additional important information and qualifications at the end of this Term Sheet. | ||
| 56 | ||
| Retail – Super Regional Mall | Loan #3 | Cut-off Date Balance: | $65,000,000 | |
| 2601 Preston Road | Stonebriar Centre | Cut-off Date LTV: | 42.1% | |
| Frisco, TX 75034 | UW NCF DSCR: | 2.30x | ||
| UW NOI Debt Yield: | 16.8% |
The following table presents certain information relating to the tenancy at the Stonebriar Centre Property:
| Tenant Summary(1) | |||||||||||
| February 2024 TTM Sales(3) | |||||||||||
| Tenant Name | Credit Rating (Fitch/ Moody’s/ S&P)(2) | Tenant SF | Approx % of Total SF | Annual UW Rent | % of Total Annual UW Rent | Annual UW Rent PSF | Sales $ | Sales PSF/ Screen | Occ Cost | Lease Exp | Renewal Option |
| Non-Collateral Anchors(4) | |||||||||||
| Dillard’s(5) | BBB-/Baa3/BB+ | 206,133 | 38.1% | $0 | N/A | N/A | $36,800,000 | $179 | N/A | 12/31/2050 | None |
| Macy’s(5) | BBB-/Ba1/BB+ | 200,544 | 37.1% | $0 | N/A | N/A | $37,700,000 | $188 | N/A | 12/31/2050 | None |
| Nordstrom(5) | BBB-/Ba2/BB+ | 134,150 | 24.8% | $0 | N/A | N/A | $56,300,000 | $420 | N/A | 12/31/2050 | None |
| Collateral Anchors | |||||||||||
| JCPenney(5) | NR/NR/NR | 162,347 | 14.8% | $1,022,505 | 2.6% | $6.30 | $18,200,000 | $112 | 5.6% | 12/31/2040 | 5 x 5 yr |
| AMC Theatres(6) | NR/Caa1/CCC+ | 94,560 | 8.6% | $2,559,336 | 6.5% | $27.07 | $10,882,370 | $453,432 | 23.5% | 9/30/2028 | 2 x 5 yr, 1 x 3 yr |
| Dick's Sporting Goods | NR/Baa3/BBB | 77,411 | 7.1% | $799,810 | 2.0% | $10.33 | NAV | NAV | NAV | 1/31/2027 | 3 x 5 yr |
| Kidzania | NR/NR/NR | 60,000 | 5.5% | $840,000 | 2.1% | $14.00 | $6,297,866
| $105
| 13.3% | 11/30/2046 | None |
| Dave & Buster's | NR/B1/B | 49,784 | 4.5% | $1,165,941 | 2.9% | $23.42 | $9,384,955
| $189 | 12.4% | 1/31/2027 | None |
| Zara(7) | NR/NR/NR | 34,678 | 3.2% | $700,000 | 1.8% | $20.19 | NAV | NAV | NAV | 11/30/2034 | 1 x 5 yr |
| Barnes & Noble Booksellers | NR/NR/NR | 34,272 | 3.1% | $736,030 | 1.9% | $21.48 | $9,200,370
| $268
| 8.0% | 1/31/2025 | 1 x 3 yr |
| Subtotal/Wtd. Avg. | 513,052
| 46.8%
| $7,823,622
| 19.8%
| $15.25
| ||||||
| Major Tenants | |||||||||||
| Haverty’s Furniture | NR/NR/NR | 60,000 | 5.5% | $468,372 | 1.2% | $7.81 | NAV | NAV | NAV | 1/31/2026 | None |
| H&M | NR/NR/BBB | 26,576 | 2.4% | $1,101,464 | 2.8% | $41.45 | $6,638,771
| $250 | 16.6% | 1/31/2027 | 2 x 5 yr |
| Bassett Home Furnishings | NR/NR/NR | 15,020 | 1.4% | $406,591 | 1.0% | $27.07 | NAV | NAV | NAV | 9/30/2028 | 2 x 5 yr |
| Subtotal/Wtd. Avg. | 101,596 | 9.3% | $1,976,428
| 5.0% | $19.45 | ||||||
| Other Tenants | 445,734
| 40.6% | $29,727,32
| 75.2% | $66.69 | ||||||
| Occupied Subtotal / Wtd. Avg. | 1,060,382 | 96.7% | $39,527,37 | 100.0% | $37.28 | ||||||
| Vacant Space | 36,498 | 3.3% | |||||||||
| Total/Wtd. Avg. | 1,096,880 | 100.0% | |||||||||
| (1) | Based on the underwritten rent roll dated April 30, 2024, inclusive of rent steps through July 2025 and overage rent as of February 2024 TTM sales for certain tenants. |
| (2) | Certain ratings are those of the parent company whether or not the parent guarantees the lease. |
| (3) | All sales information is based upon information provided by the borrower sponsors. In certain instances, sales figures represent estimates because the tenants are not required to report, or otherwise may not have reported, sales information on a timely basis. Further, because sales are self-reported by tenants, such information is not independently verified by the borrower sponsors. |
| (4) | Non-Collateral Anchors do not pay rent to the borrower sponsors but reimburse common area and maintenance charges. |
| (5) | Sales for Dillard’s, Macy’s, Nordstrom and JCPenney are as of year-end 2023. |
| (6) | AMC Theatres sales are based on 24 screens and are as of year-end 2023. |
| (7) | Zara has a two, one-time options to terminate its lease effective November 30, 2029 and May 31, 2032, with payment of a termination fee. |
| This is not a research report and was not prepared by any Underwriter’s research department. Please see additional important information and qualifications at the end of this Term Sheet. | ||
| 57 | ||
| Retail – Super Regional Mall | Loan #3 | Cut-off Date Balance: | $65,000,000 | |
| 2601 Preston Road | Stonebriar Centre | Cut-off Date LTV: | 42.1% | |
| Frisco, TX 75034 | UW NCF DSCR: | 2.30x | ||
| UW NOI Debt Yield: | 16.8% |
The following table presents certain information relating to the lease rollover schedule at the Stonebriar Centre Property:
| Lease Rollover Schedule(1)(2) | ||||||||
| Year | # of Leases Rolling | SF Rolling | Approx. % of SF Rolling | Approx. Cumulative % of SF Rolling | Total UW Rent Rolling | Approx. % of Total UW Rent Rolling | Approx. Cumulative % of Total UW Rent Rolling | UW Rent PSF Rolling |
| MTM/2024 | 13 | 31,769 | 2.9% | 2.9% | $2,054,163 | 5.2% | 5.2% | $64.66 |
| 2025 | 16 | 63,453 | 5.8% | 8.7% | $3,114,736 | 7.9% | 13.1% | $49.09 |
| 2026 | 31 | 171,311 | 15.6% | 24.3% | $6,336,923 | 16.0% | 29.1% | $36.99 |
| 2027 | 19 | 188,972 | 17.2% | 41.5% | $6,033,662 | 15.3% | 44.4% | $31.93 |
| 2028 | 17 | 151,950 | 13.9% | 55.4% | $5,894,407 | 14.9% | 59.3% | $38.79 |
| 2029(3) | 13 | 55,111 | 5.0% | 60.4% | $3,483,959 | 8.8% | 68.1% | $63.22 |
| 2030 | 7 | 19,971 | 1.8% | 62.2% | $2,063,949 | 5.2% | 73.3% | $103.35 |
| 2031 | 7 | 22,684 | 2.1% | 64.3% | $2,466,836 | 6.2% | 79.6% | $108.75 |
| 2032 | 6 | 13,638 | 1.2% | 65.5% | $1,071,906 | 2.7% | 82.3% | $78.60 |
| 2033 | 7 | 44,730 | 4.1% | 69.6% | $1,992,861 | 5.0% | 87.3% | $44.55 |
| 2034 | 8 | 62,610 | 5.7% | 75.3% | $2,539,666 | 6.4% | 93.7% | $40.56 |
| 2035 & Thereafter | 3 | 234,183 | 21.3% | 96.7% | $2,474,308 | 6.3% | 100.0% | $10.57 |
| Vacant | 0 | 36,498 | 3.3% | 100.0% | $0 | 0.0% | 100.0% | $0.00 |
| Total/Wtd. Avg. | 147 | 1,096,880 | 100.0% | $39,527,376 | 100.0% | $16.83(4) | ||
| (1) | Based on the underwritten rent roll dated April 30, 2024, inclusive of rent steps through July 2025 and overage rent as of February 2024 TTM sales for certain tenants. |
| (2) | Certain tenants may have lease termination options that are exercisable prior to the originally stated expiration date of the related lease and are not considered in the rollover schedule. |
| (3) | The Stonebriar Centre Whole Loan has a maturity date of July 1, 2029. |
| (4) | Wtd. Avg. UW Rent PSF Rolling excludes vacant space. |
The Market. The Stonebriar Centre Property is located in Frisco, Texas, which is in the broader Dallas Fort Worth market. The Stonebriar Centre Property can primarily be accessed by State Route 121, which is an east-west highway offering connectivity through Dallas Fort Worth’s major destinations, including business centers, residential areas and shopping districts. The Stonebriar Centre Property is situated approximately 25 minutes from the Dallas Fort Worth International Airport and approximately 35 minutes from the Dallas Business District.
The Dallas-Fort Worth-Arlington, TX metropolitan statistical area (the “Dallas MSA”) is home to over 4 million employees over many different sectors with services, retail trade and finance/insurance/real estate being the largest. The market has a low unemployment rate of 3.9% as of March 2024. The Dallas submarket is expected to continuously grow, with a high concentration of corporate headquarters, technology businesses and financial services, in addition to population growth, contributing to an above-average performance. According to the U.S. Census, the Dallas MSA experienced the largest population growth of any metropolitan area in the country in 2023, adding approximately 152,298 residents. The surge in population growth in the area has coincided with a wave of new corporate headquarters and regional offices coming to the area. Frisco has welcomed 16 new corporations and is poised to generate over 5,600 jobs in the community in the coming years. Some of the notable corporations include the Dallas Cowboys headquarters, the FedEx Office headquarters, the Frito-Lay North America, Inc. headquarters, the JCPenney corporate headquarters, Keurig Dr Pepper, Inc., and PGA of America.
According to the appraisal, the 2023 population within a 1-, 3- and 5-mile radius of the Stonebriar Centre Property was 11,962, 109,387 and 320,450, respectively. The 2023 average household income within the same radii was $119,821, $150,091 and $162,421, respectively.
The following table presents information regarding certain competitive properties to the Stonebriar Centre Property:
Competitive Property Summary
| ||||||
| Stonebriar Centre | Legacy West | The Shops at Willow Bend | Allen Premium Outlets | Galleria Dallas | Firewheel Town Center | |
Year Built/ Renovated | 2000 / NAP | 2017 / NAP | 2001 / 2004 | 2000 / 2017 | 1982 / 2005 | 2005 / NAP |
| Total GLA (SF) | 1,096,880(1) | 335,000 | 1,300,000 | 548,000 | 1,400,000 | 996,000 |
| Ownership | Brookfield Properties and New York State Common Retirement Fund | Kite Realty Group | Centennial Real Estate | Simon Property Group | UBS Realty | Simon Property Group |
| Distance to Property (miles) | N/A | 2.0 | 5.0 | 13.0 | 13.0 | 21.0 |
| Occupancy % | 96.7%(1) | 95.0% | 50.0% | 95.0% | 95.0% | 93.0% |
| Inline Sales PSF | $744(2) | $1,200 | $400 | $418 | $1,043 | $404 |
| Anchors | Dillard’s; Macy’s; JCPenney; Nordstrom | Louis Vuitton; Nike; Sephora | Dillard's; Macy's; Neiman Marcus | Nike Outlet; Tory Burch; Polo Ralph Lauren | Macy's; Nordstrom; Gucci; Louis Vuitton | Dillard's; Macy's; Barnes & Noble; AMC Theaters |
Source: Third party report, unless otherwise indicated.
| (1) | Information is based on the underwritten rent roll dated April 30, 2024. |
| (2) | Represents sales PSF as of February 2024 as provided by the borrower sponsors. |
| This is not a research report and was not prepared by any Underwriter’s research department. Please see additional important information and qualifications at the end of this Term Sheet. | ||
| 58 | ||
| Retail – Super Regional Mall | Loan #3 | Cut-off Date Balance: | $65,000,000 | |
| 2601 Preston Road | Stonebriar Centre | Cut-off Date LTV: | 42.1% | |
| Frisco, TX 75034 | UW NCF DSCR: | 2.30x | ||
| UW NOI Debt Yield: | 16.8% |
Appraisal. The appraiser concluded to an “as-is” value for the Stonebriar Centre Property of $605,000,000 as of May 13, 2024.
Environmental Matters. According to the Phase I environmental site assessment dated April 15, 2024, there was no evidence of any recognized environmental conditions at the Stonebridge Centre Property.
Operating History and Underwritten Net Cash Flow. The following table presents certain information relating to the historical operating performance and Underwritten Net Cash Flow at the Stonebriar Centre Property:
| Cash Flow Analysis | |||||||
| 2020 | 2021 | 2022 | 2023 | 4/30/2024 TTM | UW | UW PSF | |
| Base Rent(1) | $32,265,221 | $29,270,542 | $32,672,509 | $35,937,602 | $36,232,917 | $36,660,035 | $33.42 |
| Overage Rent(2) | $364,234 | $1,577,498 | $3,446,220 | $3,565,330 | $3,192,719 | $2,867,342 | $2.61 |
| Expense Reimbursement | $13,816,106 | $12,482,394 | $13,584,525 | $13,788,050 | $13,787,111 | $13,568,569 | $12.37 |
| Net Rental Income | $46,445,562 | $43,330,434 | $49,703,254 | $53,290,981 | $53,212,747 | $53,095,945 | $48.41 |
| Specialty Leasing Income(3) | $3,867,530 | $4,954,494 | $5,079,672 | $5,369,340 | $5,121,469 | $4,900,367 | $4.47 |
| Market Revenue from Vacant Units | $0 | $0 | $0 | $0 | $0 | $3,098,248 | $2.82 |
| (Vacancy & Credit Loss) | ($3,215,405) | ($191,687) | $651,169 | ($942,737) | ($753,068) | ($3,271,610) | ($2.98) |
| Other Income(4) | $587,813 | $2,406,465 | $597,165 | $1,709,405 | $1,672,315 | $645,151 | $0.59 |
| Effective Gross Income | $47,685,499 | $50,499,707 | $56,031,261 | $59,426,990 | $59,253,463 | $58,468,101 | $53.30 |
| Real Estate Taxes | $7,003,890 | $6,237,278 | $6,094,576 | $5,640,789 | $5,341,718 | $6,394,183 | $5.83 |
| Insurance | $177,438 | $235,683 | $299,456 | $373,208 | $405,536 | $412,822 | $0.38 |
| Other Operating Expenses | $7,747,077 | $8,643,457 | $10,443,749 | $9,855,497 | $9,814,285 | $8,837,471 | $8.06 |
| Total Operating Expenses | $14,928,406 | $15,116,418 | $16,837,781 | $15,869,494 | $15,561,540 | $15,644,476 | $14.26 |
| Net Operating Income | $32,757,094 | $35,383,290 | $39,193,479 | $43,557,495 | $43,691,924 | $42,823,625 | $39.04 |
| Replacement Reserves | $0 | $0 | $0 | $0 | $0 | $219,376 | $0.20 |
| TI/LC | $0 | $0 | $0 | $0 | $0 | $1,038,756 | $0.95 |
| Net Cash Flow | $32,757,094 | $35,383,290 | $39,193,479 | $43,557,495 | $43,691,924 | $41,565,493 | $37.89 |
| Occupancy % | 96.5% | 94.8% | 95.9% | 97.7% | 96.7%(5) | 95.0%(6) | |
| NOI DSCR(7) | 1.81x | 1.96x | 2.17x | 2.41x | 2.41x | 2.37x | |
| NCF DSCR(7) | 1.81x | 1.96x | 2.17x | 2.41x | 2.41x | 2.30x | |
| NOI Debt Yield(7) | 12.8% | 13.9% | 15.4% | 17.1% | 17.1% | 16.8% | |
| NCF Debt Yield(7) | 12.8% | 13.9% | 15.4% | 17.1% | 17.1% | 16.3% | |
| (1) | UW Base Rent is based on the underwritten rent roll dated April 30, 2024, inclusive of rent steps through July 2025. |
| (2) | UW Overage Rent is based on the terms of applicable leases using February 2024 TTM sales figures. |
| (3) | Specialty Leasing Income includes rents from temporary tenants and revenue from kiosks, storage, vending and other miscellaneous revenue. |
| (4) | Other Income includes miscellaneous income. |
| (5) | Represents occupancy per the underwritten rent roll dated April 30, 2024. |
| (6) | Based on the economic vacancy of 5.0%. The Stonebriar Centre Property was 96.7% occupied as of April 30, 2024. |
| (7) | DSCR and Debt Yield are based on the Stonebriar Centre Whole Loan. |
| This is not a research report and was not prepared by any Underwriter’s research department. Please see additional important information and qualifications at the end of this Term Sheet. | ||
| 59 | ||
| Retail – Super Regional Mall | Loan #3 | Cut-off Date Balance: | $65,000,000 | |
| 2601 Preston Road | Stonebriar Centre | Cut-off Date LTV: | 42.1% | |
| Frisco, TX 75034 | UW NCF DSCR: | 2.30x | ||
| UW NOI Debt Yield: | 16.8% |
Escrows and Reserves.
Real Estate Taxes – During a Reserve Trigger Period (as defined below) or a Cash Management Period (as defined below), the borrowers are required to deposit monthly to a real estate tax reserve 1/12 of the annual estimated real estate taxes.
Insurance – During a Reserve Trigger Period or a Cash Management Period, the borrowers are required to deposit monthly 1/12 of the annual estimated insurance premiums to the insurance reserve unless the Stonebriar Centre Property is maintained under a blanket policy.
Replacement Reserve – During a Reserve Trigger Period or a Cash Management Period, the borrowers are required to deposit monthly approximately $18,281 to a reserve for replacements to the Stonebriar Centre Property, subject to a cap of $438,752.
TI/LC Reserve – The borrowers are required to make monthly deposits into the TI/LC reserve in an amount equal to approximately $91,407, subject to a cap of $2,193,760.
Upfront TI/LC Reserve and Gap Rent Reserve – The borrowers deposited an upfront reserve of $10,449,929 for outstanding landlord obligations and gap rent. An additional, $2,027,598 of outstanding landlord obligations are being guaranteed by the guarantor pursuant to a guaranty of limited payment, under which the amounts guaranteed will be reduced on a dollar-for-dollar basis by the aggregate amount actually expended by the borrowers or their affiliates on upfront rollover expenditures.
Anchor Reserve – During the continuance of an Anchor Trigger Event (as defined below), the borrowers are required to deposit monthly the Anchor Reserve Monthly Deposit (as defined below) for tenant improvement and leasing commission, construction costs, required landlord work and other related costs associated with re-tenanting the applicable anchor tenant premises.
A “Reserve Trigger Period” will commence when the debt yield is less than 11.0% for two consecutive calendar quarters and will end when the debt yield is 11.0% or greater for two consecutive calendar quarters.
An “Anchor Trigger Event” will commence when any Anchor Tenant (as defined below): (i) (A) has “gone dark”, other than a temporary closure in connection with (w) restoration, repair or renovation, (x) compliance with applicable law, regulations and/or governmental mandates, (y) an event of force majeure or (z) for any reason not to exceed 60 days or (B) has vacated its anchor parcel; (ii) is the subject of a bankruptcy action, (iii) terminates, surrenders or cancels its lease (or gives notice of its intent to do any of the foregoing) or (iv) to the extent such anchor parcel is owned by the borrowers, the anchor fails to renew its lease prior to the earlier of the date specified in its lease and the date 12 months prior to such anchor lease expiration. An Anchor Trigger Event will end when (i) with respect to a trigger under clause (i) above, such Anchor Tenant operates in its space (to the extent not subject to any permitted subletting) for a period of no less than 30 consecutive operating days; (ii) with respect to a trigger under clause (ii) above, (x) if the premises occupied by the Anchor Tenant is owned by such tenant, such bankruptcy action is dismissed or the Anchor Tenant has emerged from such bankruptcy action and is continuing to occupy its premises or a substantial portion thereof or (y) if the premises occupied by the Anchor Tenant are leased by such tenant from the borrower, such lease is accepted and affirmed by Anchor Tenant in the bankruptcy action; (iii) with respect to a trigger under clause (iii) above, such Anchor Tenant rescinds its notice of cancellation, termination or non-renewal in writing; (iv) with respect to a trigger under clause (iv) above, such Anchor Tenant renews and/or extends its lease pursuant to the terms thereof; (v) for any trigger event, the anchor parcel or at least 75% of the aggregate gross leasable square footage thereof becomes owned or leased by one or more replacement tenants reasonably approved by the lender; or (vi) for any trigger event, the borrowers have satisfied the Anchor Reserve conditions with respect to the applicable anchor parcel.
An “Anchor Tenant” includes (i) non-collateral anchors, Dillard’s, Macy’s and Nordstrom, (ii) collateral anchors, JCPenney and AMC Theatres, (iii) any tenant who occupies at least 75% of the space currently occupied by the foregoing after an acquisition of such space by the borrowers or one of their affiliates, and (iv) any replacement of either of the foregoing.
The “Anchor Reserve Monthly Deposit” is equal to the excess cash flow with respect to any particular interest period; provided, however, to the extent that the Individual Anchor Threshold Amount (as defined below) has been deposited for each such Anchor Trigger Event then continuing, then the Anchor Reserve Monthly Deposit with respect to such individual Anchor Trigger Event will thereafter be zero.
The “Individual Anchor Threshold Amount” is equal to the product of (x) $50.00 and (y) the aggregate amount of gross leasable square footage of the applicable anchor parcel.
Lockbox and Cash Management. The Stonebriar Centre Whole Loan is structured with a hard lockbox and springing cash management. All rents from the Stonebriar Centre Property are required to be deposited directly to the lockbox by tenants upon delivery of a tenant direction letter. During a Cash Management Period, funds are required to be transferred to the lender-controlled cash management account on each business day and disbursed according to the Stonebriar Centre Whole Loan documents. During a Cash Management Period, all excess cash is required to be held by the lender as additional security for the Stonebriar Centre Whole Loan; provided that excess cash will be disbursed at the direction of the borrowers in the event of shortfalls in certain monthly expense items, so long as no event of default is continuing for which the lender has initiated an enforcement action.
A “Cash Management Period” will occur during the existence of any of: (i) an event of default, (ii) a Debt Yield Event (as defined below), or (iii) an Anchor Trigger Event.
A “Debt Yield Event” will commence when the debt yield is less than 10.25% for two consecutive calendar quarters and will end when the debt yield is 10.25% or greater for two consecutive calendar quarters.
Release of Property. The Stonebriar Centre Whole Loan documents permit the free release of (i) one or more parcels (including “air rights” parcels) or outlots, (ii) one or more Acquired Parcels or Acquired Expansion Parcels (each, a “Release Parcel”) proposed to be transferred to a person other than a borrower or a person owned directly or indirectly by a borrower in connection with the expansion or other development of the Stonebriar Centre Property upon satisfaction of certain conditions, including the following; (a) no event of default exists, (b) the borrowers deliver evidence reasonably satisfactory to the lender that the Release Parcel (x) has been legally subdivided (or that the borrowers have taken all action required to be taken in order for the Release Parcel to be legally subdivided), (y) is a separate tax lot (or the borrowers have taken all action required for the Release Parcel to be a separate tax lot), and (z) is not necessary for the compliance with zoning, building, land use, parking or other legal requirements applicable to the Stonebriar Centre Property,
| This is not a research report and was not prepared by any Underwriter’s research department. Please see additional important information and qualifications at the end of this Term Sheet. | ||
| 60 | ||
| Retail – Super Regional Mall | Loan #3 | Cut-off Date Balance: | $65,000,000 | |
| 2601 Preston Road | Stonebriar Centre | Cut-off Date LTV: | 42.1% | |
| Frisco, TX 75034 | UW NCF DSCR: | 2.30x | ||
| UW NOI Debt Yield: | 16.8% |
(c) the Release Parcel is vacant, non-income producing and unimproved (unless waived by the lender), provided that this condition will not apply to any Release Parcel which is an Acquired Expansion Parcel, and (d) receipt of a rating agency confirmation, provided that this condition will not apply to any Release Parcel which is an Acquired Expansion Parcel.
An “Acquired Parcel” is a fee simple or leasehold interest to a parcel at or adjacent to the shopping center of which the Stonebriar Centre Property is a part that is reasonably equivalent in value to an Exchange Parcel (as defined below) and is acquired in a substitution for such Exchange Parcel in accordance with the Stonebriar Centre Whole Loan documents.
An “Acquired Expansion Parcel” means any parcel of land, together with any improvements thereon located, (a) constituting an integral part of, or adjoining to, or proximately located near, the shopping center of which the Stonebriar Centre Property is a part, (b) that is not owned by the borrowers on the origination date and (c) is not an Acquired Parcel and is acquired by the borrowers after the origination date.
Substitution. The Stonebriar Centre Mortgage Loan permits the free release of one or more portions of the Stonebriar Centre Property (an “Exchange Parcel”) and the corresponding acquisition of an Acquired Parcel (such action, a “Substitution”) upon satisfaction of certain conditions, including the following; (i) no event of default exists, (ii) the Exchange Parcel is vacant, non-income producing and unimproved (unless waived by the lender), provided that this condition will not apply to any Exchange Parcel which is an Acquired Expansion Parcel, (iii) simultaneously with the Substitution, the borrowers acquire the fee or leasehold interest in an Acquired Parcel that is reasonably equivalent in value to the Exchange Parcel (as evidenced by a letter of value provided by the borrowers) and is at or adjacent to the Stonebriar Center Property, (iv) the borrowers deliver to the lender an officer’s certificate stating that certain of the representations and warranties in the Stonebriar Centre Mortgage Loan agreement are true and correct with respect to the Acquired Parcel, (v) the borrowers deliver certain other property diligence materials required in the loan agreement, and (vi) receipt of a rating agency confirmation.
Terrorism Insurance. The borrowers are required to obtain and maintain property insurance and business interruption insurance for 24 months plus a 12-month extended period of indemnity. Such insurance is required to cover perils of terrorism and acts of terrorism; provided that the borrowers are permitted to maintain terrorism coverage with a licensed captive insurance company that is affiliated with the borrower sponsors if certain conditions set forth in the related Stonebriar Centre Whole Loan documents are satisfied, and the borrowers will only be required to pay for terrorism insurance a maximum of two times the annual insurance premiums payable for the Stonebriar Centre Property at the time with respect to the property and business income or rental income insurance interruption policies (excluding the terrorism and earthquake components of such premiums). See “Risk Factors—Risks Relating to the Mortgage Loans—Terrorism Insurance May Not Be Available for All Mortgaged Properties” in the prospectus.
| This is not a research report and was not prepared by any Underwriter’s research department. Please see additional important information and qualifications at the end of this Term Sheet. | ||
| 61 | ||
| Office – CBD | Loan #4 | Cut-off Date Balance: | $60,000,000 | |
| 209 10th Avenue South | Cummins Station | Cut-off Date LTV: | 58.8% | |
| Nashville, TN 37203 | UW NCF DSCR: | 1.40x | ||
| UW NOI Debt Yield: | 10.2% |
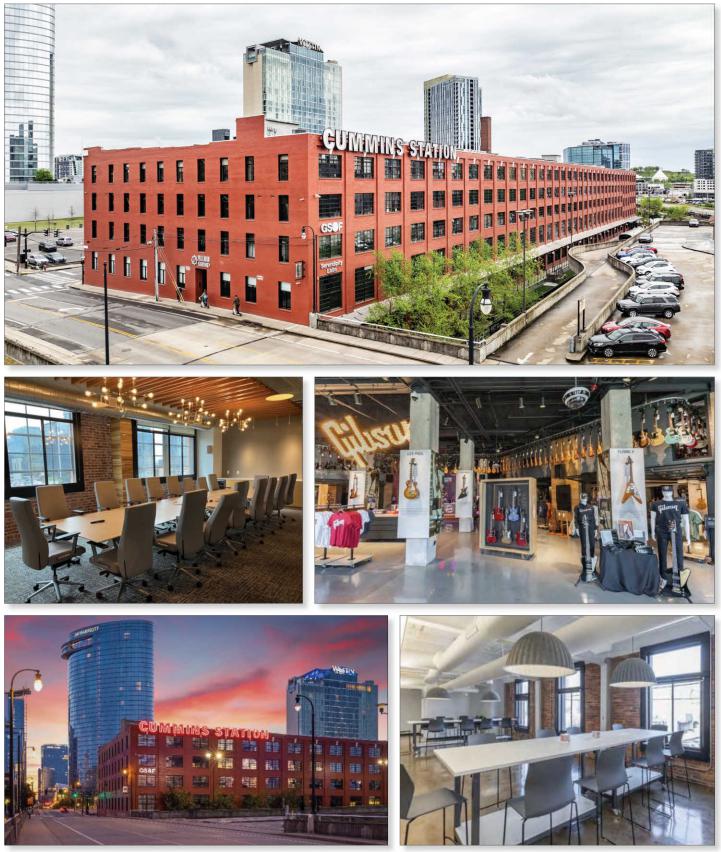
| This is not a research report and was not prepared by any Underwriter’s research department. Please see additional important information and qualifications at the end of this Term Sheet. | ||
| 62 | ||
| Office – CBD | Loan #4 | Cut-off Date Balance: | $60,000,000 | |
| 209 10th Avenue South | Cummins Station | Cut-off Date LTV: | 58.8% | |
| Nashville, TN 37203 | UW NCF DSCR: | 1.40x | ||
| UW NOI Debt Yield: | 10.2% |
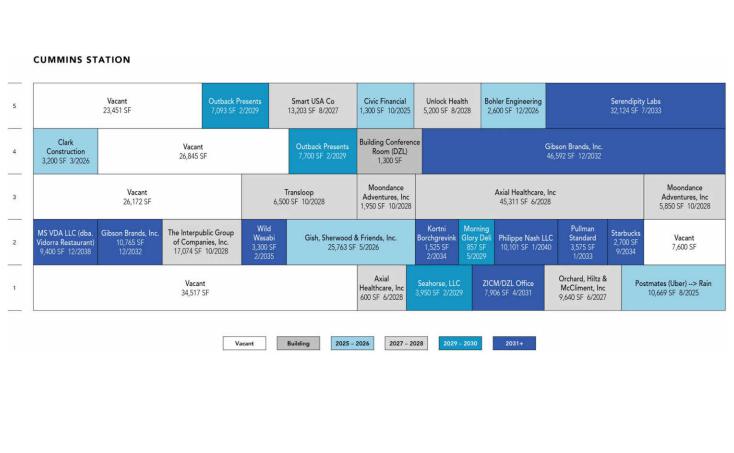
| This is not a research report and was not prepared by any Underwriter’s research department. Please see additional important information and qualifications at the end of this Term Sheet. | ||
| 63 | ||
| Office – CBD | Loan #4 | Cut-off Date Balance: | $60,000,000 | |
| 209 10th Avenue South | Cummins Station | Cut-off Date LTV: | 58.8% | |
| Nashville, TN 37203 | UW NCF DSCR: | 1.40x | ||
| UW NOI Debt Yield: | 10.2% |
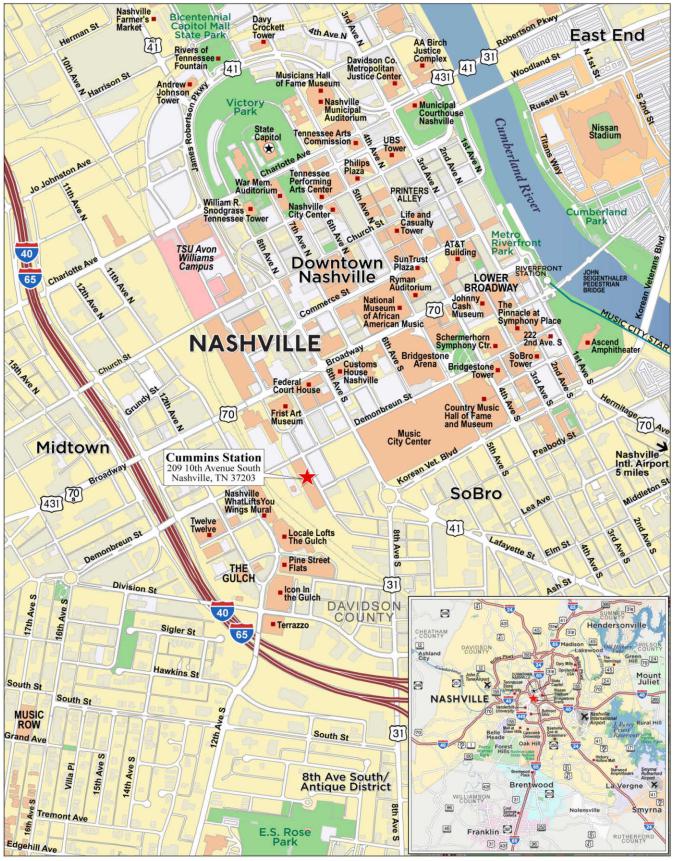
| This is not a research report and was not prepared by any Underwriter’s research department. Please see additional important information and qualifications at the end of this Term Sheet. | ||
| 64 | ||
| Mortgage Loan No. 4 – Cummins Station |
| Mortgage Loan Information | Property Information | ||||||
| Mortgage Loan Seller: | WFB | Single Asset/Portfolio: | Single Asset | ||||
| Credit Assessment (Fitch/Moody’s/DBRSM): | NR/NR/NR | Location: | Nashville, TN 37203 | ||||
| Original Balance(1): | $60,000,000 | General Property Type: | Office | ||||
| Cut-off Date Balance(1): | $60,000,000 | Detailed Property Type: | CBD | ||||
| % of Initial Pool Balance: | 8.7% | Title Vesting: | Fee | ||||
| Loan Purpose: | Refinance | Year Built/Renovated: | 1910/2017 | ||||
| Borrower Sponsor: | Zachary P. Liff | Size: | 410,740 SF | ||||
| Guarantor: | Zachary P. Liff | Cut-off Date Balance PSF(1): | $329 | ||||
| Mortgage Rate: | 7.1550% | Maturity Balance PSF(1): | $329 | ||||
| Note Date: | 6/6/2024 | Property Manager: | DZL Management Company, LLC | ||||
| Maturity Date: | 6/11/2029 | ||||||
| Term to Maturity: | 60 months | ||||||
| Amortization Term: | 0 months | Underwriting and Financial Information | |||||
| IO Period: | 60 months | UW NOI: | $13,832,966 | ||||
| Seasoning: | 2 months | UW NCF | $13,730,281 | ||||
| Prepayment Provisions(2): | L(26),D(27),O(7) | UW NOI Debt Yield(1): | 10.2% | ||||
| Lockbox/Cash Mgmt Status: | Hard/In Place | UW NCF Debt Yield(1): | 10.2% | ||||
| Additional Debt Type(1): | Pari Passu | UW NOI Debt Yield at Maturity(1): | 10.2% | ||||
| Additional Debt Balance(1): | $75,000,000 | UW NCF DSCR(1): | 1.40x | ||||
| Future Debt Permitted (Type): | Mezzanine | Most Recent NOI: | $12,694,127 (3/31/2024 TTM) | ||||
| Reserves | 2nd Most Recent NOI: | $12,292,464 (12/31/2023) | |||||
| Type | Initial | Monthly | Cap | 3rd Most Recent NOI: | $12,001,080 (12/31/2022) | ||
| RE Taxes: | $355,264 | $88,816 | NAP | Most Recent Occupancy(3): | 71.1% (5/15/2024) | ||
| Insurance: | $0 | Springing | NAP | 2nd Most Recent Occupancy(3): | 80.1% (12/31/2023) | ||
| Replacement Reserve: | $0 | $8,557 | $205,370 | 3rd Most Recent Occupancy: | 82.4% (12/31/2022) | ||
| Deferred Maintenance: | $160,050 | $0 | NAP | Appraised Value (as of): | $229,700,000 (4/16/2024) | ||
| TI/LC Reserves: | $10,000,000 | $83,333 | NAP | Appraised Value PSF: | $559 | ||
| Existing TI/LC Reserve: | $2,115,256 | $0 | NAP | Cut-off Date LTV Ratio(1): | 58.8% | ||
| Rent Concession Reserve: | $1,023,389 | $0 | NAP | Maturity Date LTV Ratio(1): | 58.8% | ||
| Sources and Uses | ||||||
| Sources | Proceeds | % of Total | Uses | Proceeds | % of Total | |
| Whole Loan Amount(1): | $135,000,000 | 99.5% | Loan Payoff: | $117,462,455 | 86.6% | |
| Borrower Sponsor Equity: | $649,890 | 0.5% | Upfront Reserves: | $13,653,959 | 10.1% | |
| Closing Costs: | $4,533,475 | 3.3% | ||||
| Total Sources: | $135,649,890 | 100.0% | Total Uses: | $135,649,890 | 100.0% | |
| (1) | The Cummins Station Mortgage Loan (as defined below) is part of the Cummins Station Whole Loan (as defined below) with an original aggregate principal balance of $135,000,000. The Cut-off Date Balance per SF, Maturity Date Balance per SF, UW NOI/NCF Debt Yield, UW NOI Debt Yield at Maturity, UW NCF DSCR, Cut-off Date LTV Ratio and Maturity Date LTV Ratio numbers presented above are based on the Cummins Station Whole Loan. |
| (2) | At any time after the earlier of (i) July 11, 2027 and (ii) two years from the closing date of the securitization that includes the last pari passu note of the Cummins Station Whole Loan to be securitized, the borrower has the right to defease the Cummins Station Whole Loan in whole, but not in part. Additionally, the borrower may prepay the Cummins Station Whole Loan with 30 days’ notice on or after December 11, 2028. |
| (3) | The decrease in occupancy between YE 2023 and Current Occupancy (as of 5/15/2024) is due to one tenant (8.8% of NRA) that is dark and current on rent being underwritten as vacant. |
The Mortgage Loan. The fourth largest mortgage loan (the “Cummins Station Mortgage Loan”) is part of a whole loan (the “Cummins Station Whole Loan”) evidenced by three pari passu promissory notes in the aggregate original principal amount of $135,000,000 and secured by a first priority fee mortgage encumbering an office property located in Nashville, Tennessee (the “Cummins Station Property”). The controlling Note A-1, in the original principal amount of $60,000,000, represents the Cummins Station Mortgage Loan and will be contributed to the BANK5 2024-5YR8 securitization trust. The Cummins Station Whole Loan will be serviced pursuant to the pooling and servicing agreement for the BANK5 2024-5YR8 securitization trust pursuant to the pooling and servicing agreement. See “Description of the Mortgage Pool—The Whole Loans—The Serviced Pari Passu Whole Loans” and “Pooling and Servicing Agreement—Servicing of the Serviced Mortgage Loans” in the prospectus.
| This is not a research report and was not prepared by any Underwriter’s research department. Please see additional important information and qualifications at the end of this Term Sheet. | ||
| 65 | ||
| Office – CBD | Loan #4 | Cut-off Date Balance: | $60,000,000 | |
| 209 10th Avenue South | Cummins Station | Cut-off Date LTV: | 58.8% | |
| Nashville, TN 37203 | UW NCF DSCR: | 1.40x | ||
| UW NOI Debt Yield: | 10.2% |
| Cummins Station Whole Loan Summary | ||||
| Note | Original Balance | Cut-off Date Balance | Note Holder | Controlling Note |
| A-1 | $60,000,000 | $60,000,000 | BANK5 2024-5YR8 | Yes |
| A-2(1) | $50,000,000 | $50,000,000 | WFB | No |
| A-3 | $25,000,000 | $25,000,000 | WFCM 2024-5C1 | No |
| Whole Loan | $135,000,000 | $135,000,000 | ||
| (1) | Expected to be contributed to one or more future securitization trusts. |
The Borrower and the Borrower Sponsor. The borrower is Cummins Station, LLC, a Delaware limited liability company and single purpose entity with one independent director. Legal counsel to the borrower delivered a non-consolidation opinion in connection with the origination of the Cummins Station Whole Loan.
The borrower sponsor is Zachary P. Liff. Zachary Liff is the owner of DZL, a real estate investment, management and development company, headquartered in Nashville, Tennessee. DZL is a market leader in real estate development and property management, featuring a high-profile mixed-use portfolio of office, retail, hospitality and co-working properties.
The Property. The Cummins Station Property comprises a 5-story Class A, creative office building totaling 410,740 SF of NRA, inclusive of 48,523 SF of ground floor retail, located in Nashville, Tennessee. Situated on a 2.4 acre site, the Cummins Station Property was constructed in 1910. Since 2017, the sponsor has invested approximately $43 million in capital improvements, equipment, and TI/LCs. Amenities at the property include a private outdoor courtyard, a conference room, onsite management, and a fitness center. The Cummins Station Property has 750 parking spaces on site, resulting in a parking ratio of approximately 1.8 spaces per 1,000 SF. As of May 15, 2024, the Cummins Station Property was 71.1% leased to 26 tenants. Eventbrite (36,241 SF; 8.8% of NRA) is currently dark and was underwritten as vacant but is current on rent payments as of June 2024. Occupancy including the dark Eventbrite space is 80.0% as of May 15, 2024.
Major Tenants.
Gibson Brands, Inc. (57,357 SF, 14.0% of NRA; 20.8% of underwritten base rent). Founded in 1894 and headquartered in Nashville, Tennessee, Gibson Brands, Inc. (“Gibson”) is a manufacturer of musical instruments with a primary focus on guitars. The Gibson portfolio includes Gibson, the company’s guitar brand, as well as music brands, including Epiphone, Kramer, Steinberger, MESA/Boogie, and the Gibson Pro Audio division, KRK Systems. Gibson has been at the property, which serves as its headquarters, since 2019 and the current lease expires on December 31, 2032 with no renewal options.
Axial Healthcare, Inc. (45,911 SF, 11.2% of NRA; 17.4% of underwritten base rent). Axial Healthcare, Inc. (“Axial Healthcare”) is a risk management solution that identifies and addresses opioid-related risk in patient populations. Axial Healthcare is the risk mitigation solution of Wayspring, a company that provides end-to-end support for members with substance abuse. Axial Healthcare‘s lease expires on June 30, 2028 with no renewal or termination options.
Serendipity Labs (32,124 SF, 7.8% of NRA; 8.2% of underwritten base rent). Founded in 2011, and headquartered in Rye, New York, Serendipity Labs is a designer of flexible workplaces that combine high-quality design, technology infrastructure and security. Since its founding, Serendipity Labs has grown to operate in over 29 locations across urban and suburban areas in the United States, as well as some international locations. The tenant is on a lease expiring on July 28, 2033, with no renewal or termination options.
| This is not a research report and was not prepared by any Underwriter’s research department. Please see additional important information and qualifications at the end of this Term Sheet. | ||
| 66 | ||
| Office – CBD | Loan #4 | Cut-off Date Balance: | $60,000,000 | |
| 209 10th Avenue South | Cummins Station | Cut-off Date LTV: | 58.8% | |
| Nashville, TN 37203 | UW NCF DSCR: | 1.40x | ||
| UW NOI Debt Yield: | 10.2% |
The following table presents certain information relating to the tenancy at the Cummins Station Property:
| Tenant Summary | |||||||||
| Tenant Name | Credit Rating (Fitch/Moody's/ S&P)(1) | Tenant SF | Approx % of Total SF | Annual UW Rent(2) | % of Total Annual UW Rent | Annual UW Rent PSF(2) | Lease Expiration | Renewal Options | Term. Option (Y/N) |
| Major Tenants | |||||||||
| Gibson | NR/B3/B | 57,357 | 14.0% | $2,542,621 | 20.8% | $44.33 | 12/31/2032 | None | Y(3) |
| Axial Healthcare(4) | NR/NR/NR | 45,911 | 11.2% | $2,123,553 | 17.4% | $46.25 | 6/30/2028 | None | N |
| Serendipity Labs | NR/NR/NR | 32,124 | 7.8% | $995,844 | 8.2% | $31.00 | 7/28/2033 | None | N |
| Gish, Sherwood & Friends, Inc. | NR/NR/NR | 28,363 | 6.9% | $795,537 | 6.5% | $28.05 | 5/31/2026 | 2 x 5 yr | N |
| The Interpublic Group of Companies, Inc. | BBB+/Baa2/BBB | 17,074 | 4.2% | $706,436 | 5.8% | $41.37 | 10/31/2028 | None | N |
| Smart USA Co | NR/NR/NR | 13,203 | 3.2% | $522,989 | 4.3% | $39.61 | 8/31/2027 | 1 x 5 yr | N |
| Subtotal/Wtd. Avg. | 194,032 | 47.2% | $7,686,980 | 63.0% | $39.62 | ||||
| Other Tenants(5)(6) | 98,123 | 23.9% | $4,514,220 | 37.0% | $46.01 | ||||
| Occupied Collateral Total | 292,155 | 71.1% | $12,201,200 | 100.0% | $41.76 | ||||
| Vacant Space | 118,585 | 28.9% | |||||||
| Total/Wtd. Avg. | 410,740 | 100.0% | |||||||
| (1) | Certain ratings are those of the parent company whether or not the parent guarantees the lease. |
| (2) | The Annual UW Rent and Annual UW Rent PSF shown above include contractual rent steps through June 2025 totaling $346,699. |
| (3) | Gibson has a one-time right to terminate 1,965 SF of its space effective December 31, 2030, by giving notice no earlier than April 1, 2030, and no later than July 31, 2030 and by paying a termination fee equal to the sum of (i) the unamortized leasing commission based on 2.0% of the applicable base rent and (ii) the unamortized allowance, calculated on an 8.0% per annum interest rate from the date of first full payment of base rent through the termination date. |
| (4) | Axial Healthcare is currently subleasing 21,697 SF of space to three subtenants on subleases that expire between November 2024 and June 2028. |
| (5) | Other Tenants include three borrower affiliated tenants totaling 14,181 SF (3.5% of NRA; 5.5% of underwritten base rent). |
| (6) | Other Tenants include three tenants (5.4% of NRA; 10.4% of underwritten base rent) with lease commencement dates between October 2024 and July 2025. Gap rent and outstanding free rent were reserved at loan origination. |
The following table presents certain information relating to the lease rollover schedule at the Cummins Station Property:
| Lease Rollover Schedule(1)(2) | ||||||||
| Year | # of Leases Rolling | SF Rolling | Approx. % of Total SF Rolling | Approx. Cumulative % of SF Rolling | Total UW Rent Rolling | Approx. % of Total Rent Rolling | Approx. Cumulative % of Total Rent Rolling | UW Rent PSF Rolling(3) |
| MTM/2024 | 3 | 2,606 | 0.6% | 0.6% | $0 | 0.0% | 0.0% | $0.00 |
| 2025 | 2 | 11,969 | 2.9% | 3.5% | $554,544 | 4.5% | 4.5% | $46.33 |
| 2026 | 4 | 34,163 | 8.3% | 11.9% | $1,031,529 | 8.5% | 13.0% | $30.19 |
| 2027 | 2 | 22,843 | 5.6% | 17.4% | $956,693 | 7.8% | 20.8% | $41.88 |
| 2028 | 4 | 74,035 | 18.0% | 35.5% | $3,285,860 | 26.9% | 47.8% | $44.38 |
| 2029(3) | 3 | 19,600 | 4.8% | 40.2% | $779,855 | 6.4% | 54.2% | $39.79 |
| 2030 | 0 | 0 | 0.0% | 40.2% | $0 | 0.0% | 54.2% | $0.00 |
| 2031 | 1 | 6,857 | 1.7% | 41.9% | $304,018 | 2.5% | 56.7% | $44.34 |
| 2032 | 1 | 57,357 | 14.0% | 55.9% | $2,542,621 | 20.8% | 77.5% | $44.33 |
| 2033 | 2 | 35,699 | 8.7% | 64.5% | $1,185,480 | 9.7% | 87.2% | $33.21 |
| 2034 | 2 | 4,225 | 1.0% | 65.6% | $269,745 | 2.2% | 89.4% | $63.84 |
| 2035 & Thereafter | 3 | 22,801 | 5.6% | 71.1% | $1,290,855 | 10.6% | 100.0% | $56.61 |
| Vacant | 0 | 118,585 | 28.9% | 100.0% | $0 | 0.0% | 100.0% | $0.00 |
| Total/Wtd. Avg. | 27 | 410,740 | 100.0% | $12,201,200 | 100.0% | $41.76(4) | ||
| (1) | Information obtained from the underwritten rent roll. |
| (2) | Certain tenants may have termination options that are not accounted for in the lease rollover schedule. |
| (3) | The Cummins Station Whole Loan has a maturity date of June 11, 2029. |
| (4) | Total UW Rent Rolling and UW Rent PSF Rolling does not include vacant space. |
The Market. The Cummins Station Property is located in downtown Nashville, Tennessee. The property is located within a quarter mile of major thoroughfares including U.S. Route 41, U.S. Route 31, and U.S. Route 70, and within one mile of Interstate 40. Additionally, the property is within a half mile of Music City Center, Nashville’s new $600 million convention center, and Bridgestone Arena. Nashville is known for being a music recording and production hub with notable record labels, including Universal Music Group, Sony Music Entertainment, and Warner Music Group. Healthcare is also a primary industry in Nashville with approximately 300 companies in the city, including the Hospital Corporation of America, the world’s largest private operator of hospitals. Additionally, Nashville is home to a number of Fortune 500 companies, including Bridgestone, Dell, Dollar General, Tractor Supply
| This is not a research report and was not prepared by any Underwriter’s research department. Please see additional important information and qualifications at the end of this Term Sheet. | ||
| 67 | ||
| Office – CBD | Loan #4 | Cut-off Date Balance: | $60,000,000 | |
| 209 10th Avenue South | Cummins Station | Cut-off Date LTV: | 58.8% | |
| Nashville, TN 37203 | UW NCF DSCR: | 1.40x | ||
| UW NOI Debt Yield: | 10.2% |
Company, and Nissan North America. Finally, Amazon and Oracle recently announced plans to invest in office space in Nashville and will be bringing approximately 5,000 and 8,500 jobs to the city, respectively.
According to the appraisal, the 2023 population and average household income within a one-, three- and five-mile radius of the Cummins Station Property was 17,500, 123,212, 240,140 and $108,972, $104,783, and $108,554, respectively. Between 2010 and 2020, the population within a one-, three-, and five-mile radius increased by 82.2%, 23.4%, and 15.4%, respectively.
According to a third party market research report, the property is located in the Downtown submarket of the Nashville office market. As of May 2024, the submarket reported a total inventory of approximately 20.2 million SF with a 14.3% vacancy rate and average asking rent of $36.75 PSF.
The following table presents certain information relating to the appraisal’s market rent conclusions for the Cummins Station Property:
| Market Rent Summary | |||||
| Office | No Windows | Retail | End Cap | Building Amenity or Support | |
| Market Rent (PSF) | $40.00 | $24.00 | $60.00 | $65.00 | $0.00 |
| Lease Term (Years) | 7 | 5 | 10 | 10 | 5 |
| Lease Type | NNN | NNN | NNN | NNN | None |
| Escalations | 3.0% annually | 3.0% annually | 3.0% annually | 3.0% annually | None |
| Tenant Improvements (New/Renewal) | $50 / $10 | $10 / $5 | $75 / $20 | $100 / $25 | $0 / $0 |
| Leasing Commissions (New/Renewal) | 6.0% / 3.0% | 6.0% / 3.0% | 6.0% / 3.0% | 6.0% / 3.0% | None |
| Free Rent (Months) (New/Renewal) | 4 / 0 | 4 / 0 | 6 / 0 | 6 / 0 | 0 / 0 |
The following table presents information relating to comparable sales pertaining to the Cummins Station Property:
| Sales Comparable(s1) | ||||||
| Property Name/Location | Year Built | Size (SF) | Occupancy | Sale Date | Sale Price | Sale Price (PSF) |
Cummins Station Nashville, TN | 1910 | 410,740(2) | 71.1%(2) | |||
Sylvan Supply Nashville, TN | 1923 | 193,650 | 53.6% | Jan-2022 | $87,500,000 | $452 |
1 Music Circle South Nashville, TN | 2019 | 107,880 | 95.0% | Oct-2022 | $55,200,000 | $512 |
Stocking 51 Complex Nashville, TN | 1920 | 124,315 | 100.0% | Apr-2022 | $58,000,000 | $467 |
The Sheds on Charlotte Nashville, TN | 1950 | 85,032 | 100.0% | Feb-2022 | $47,500,000 | $559 |
Interlock Atlanta, GA | 2021 | 336,463 | 89.0% | May-2023 | $215,000,000 | $639 |
Hartland Plaza Austin, TX | 1987 | 171,785 | 90.0% | Feb-2023 | $83,000,000 | $483 |
| (1) | Information obtained from appraisal. |
| (2) | Information obtained from the underwritten rent roll. |
| This is not a research report and was not prepared by any Underwriter’s research department. Please see additional important information and qualifications at the end of this Term Sheet. | ||
| 68 | ||
| Office – CBD | Loan #4 | Cut-off Date Balance: | $60,000,000 | |
| 209 10th Avenue South | Cummins Station | Cut-off Date LTV: | 58.8% | |
| Nashville, TN 37203 | UW NCF DSCR: | 1.40x | ||
| UW NOI Debt Yield: | 10.2% |
The following table presents certain information relating to the comparable office properties to the Cummins Station Property:
| Comparable Office Properties(1) | ||||
| Property Name/Location | Total NRA (SF) | Year Built | Stories | % Occupied |
Cummins Station Nashville, TN | 410,740(2) | 1910 | 5 | 71.1%(2) |
The Roundabout Nashville, TN | 218,319 | 2004 | 9 | 58.9% |
L&C Tower Annex Nashville, TN | 264,046 | 1957 | 9 | 87.5% |
Truist Plaza Nashville, TN | 340,000 | 2007 | 13 | 80.8% |
Gulch Crossing Nashville, TN | 205,000 | 2015 | 8 | 100.0% |
CMT Building Nashville, TN | 175,440 | 1986 | 13 | 100.0% |
1801 West End Avenue Nashville, TN | 243,000 | 1986 | 18 | 79.2% |
| (1) | Information obtained from the appraisal. |
| (2) | Information obtained from the underwritten rent roll. |
Operating History and Underwritten Net Cash Flow. The following table presents certain information relating to the historical operating performance and Underwritten Net Cash Flow at the Cummins Station Property:
| Cash Flow Analysis | ||||||
| 2021 | 2022 | 2023 | 3/31/2024 TTM | UW | UW PSF | |
| Base Rent | $11,529,469 | $10,218,153 | $10,475,526 | $10,706,829 | $12,201,200(1) | $29.71 |
| Grossed Up Vacant Space | $0 | $0 | $0 | $0 | $4,409,752 | $10.74 |
| Gross Potential Rent | $11,529,469 | $10,218,153 | $10,475,526 | $10,706,829 | $16,610,952 | $40.44 |
| Other Income | $260,183 | $29,722 | $99,027 | $137,142 | $137,142 | $0.33 |
| Parking/Garage/Other | $2,695,799 | $3,243,410 | $3,233,962 | $3,246,160 | $3,246,160 | $7.90 |
| Total Recoveries | $2,603,762 | $3,207,429 | $2,795,193 | $2,789,675 | $2,869,821 | $6.99 |
| Net Rental Income | $17,089,214 | $16,698,714 | $16,603,708 | $16,879,806 | $22,864,074 | $55.67 |
| (Vacancy & Credit Loss) | $0 | $0 | $0 | $0 | ($4,409,752)(2) | ($10.74) |
| Effective Gross Income | $17,089,214 | $16,698,714 | $16,603,708 | $16,879,806 | $18,454,322 | $44.93 |
| Real Estate Taxes | $1,567,731 | $1,307,943 | $1,015,040 | $1,015,040 | $1,015,040 | $2.47 |
| Insurance | $62,462 | $78,716 | $94,001 | $129,885 | $212,630 | $0.52 |
| Management Fee | $300,889 | $417,587 | $415,281 | $200,698 | $553,630 | $1.35 |
| Other Operating Expenses | $1,705,562 | $1,909,364 | $1,799,105 | $1,852,115 | $1,852,115 | $4.51 |
| Other Fixed Expense | $1,124,533 | $984,024 | $987,817 | $987,941 | $987,941 | $2.41 |
| Total Expenses | $4,761,178 | $4,697,634 | $4,311,244 | $4,185,679 | $4,621,356 | $11.25 |
| Net Operating Income | $12,328,036 | $12,001,080 | $12,292,464 | $12,694,127 | $13,832,966 | $33.68 |
| Replacement Reserves | $0 | $0 | $0 | $0 | $102,685 | $0.25 |
| TI/LC | $0 | $0 | $0 | $0 | $1,000,000 | $2.43 |
| Non-Recurring Items | $0 | $0 | $0 | $0 | ($1,000,000)(2) | ($2.43) |
| Net Cash Flow | $12,328,036 | $12,001,080 | $12,292,464 | $12,694,127 | $13,730,281 | $33.43 |
| Occupancy % | 86.2% | 82.4% | 80.1% | 71.1%(3) | 73.5%(3) | |
| NOI DSCR(4) | 1.26x | 1.23x | 1.26x | 1.30x | 1.41x | |
| NCF DSCR(4) | 1.26x | 1.23x | 1.26x | 1.30x | 1.40x | |
| NOI Debt Yield(4) | 9.1% | 8.9% | 9.1% | 9.4% | 10.2% | |
| NCF Debt Yield(4) | 9.1% | 8.9% | 9.1% | 9.4% | 10.2% | |
| (1) | UW Base Rent shown above includes contractual rent steps through June 2025 totaling $346,699. |
| (2) | Represents a 10% credit for the upfront TI/LC reserve funds. |
| (3) | The underwritten economic vacancy is 26.5%. The Cummins Station Property was 71.1% leased as of May 15, 2024. |
| (4) | DSCR and Debt Yield are based on the Cummins Station Whole Loan. |
| This is not a research report and was not prepared by any Underwriter’s research department. Please see additional important information and qualifications at the end of this Term Sheet. | ||
| 69 | ||
| Office – CBD | Loan #4 | Cut-off Date Balance: | $60,000,000 | |
| 209 10th Avenue South | Cummins Station | Cut-off Date LTV: | 58.8% | |
| Nashville, TN 37203 | UW NCF DSCR: | 1.40x | ||
| UW NOI Debt Yield: | 10.2% |
Escrows and Reserves.
Real Estate Taxes –The loan documents require an upfront deposit of $355,264 and ongoing monthly real estate tax reserves in an amount equal to 1/12th of the real estate taxes that the lender estimates will be payable during the next 12 months, initially $88,816.
Insurance – The loan documents require ongoing monthly insurance reserves in an amount equal to 1/12th of the insurance premiums that the lender estimates will be payable for the renewal of the coverage afforded by the policies upon the expiration thereof. Notwithstanding the above, the borrower’s obligation to make insurance reserve payments will be waived so long as (i) no event of default is continuing, (ii) the insurance policies maintained by the borrower are part of a blanket or umbrella policy approved by the lender in its reasonable discretion, and (iii) the borrower provides the lender with evidence of renewal of policies and paid receipts no later than 10 business days prior to policy expiration.
Replacement Reserve – The loan documents require ongoing monthly deposits of $8,557 for replacement reserves, subject to a cap of $205,370.
Deferred Maintenance – The loan documents require an upfront reserve of $160,050 for deferred maintenance.
Leasing Reserve – The loan documents require an upfront reserve of $10,000,000 for leasing costs and ongoing monthly reserves in an amount equal to $83,333. The reserve funds may be used for general TI/LCs and existing TI/LCs totaling $2,115,000 with respect to the Vidorra Restaurant space (9,400 SF of NRA).
Rent Concession Reserve– The loan documents require an upfront deposit of $1,023,389 for outstanding free rent and gap rent related to Philippe Chow, Serendipity Labs, and Starbucks.
Existing TI/LC Reserve – The loan documents require an upfront deposit of $2,115,256 for existing tenant improvements and leasing commissions related to Gibson, Philippe Chow, Serendipity Labs, and Starbucks.
Lockbox and Cash Management. The Cummins Station Whole Loan is structured with a hard lockbox and in place cash management. The borrower is required to direct the tenants to pay rent directly into the lockbox account, and to deposit any rents otherwise received in such account within three business days after receipt. On each business day, the lockbox bank is required to transfer amounts on deposit in the lockbox account into a lender controlled cash management account, which amounts are to be applied in accordance with the loan documents. If no Cash Trap Event Period (as defined below) exists, all excess cash flow will be disbursed to the borrower. During the continuance of a Cash Trap Event Period, excess cash flow is required to be held by the lender as additional collateral.
A “Cash Trap Event Period” will commence upon the earlier of the following:
| (i) | the occurrence of an event of default under the Cummins Station Whole Loan; |
| (ii) | the net cash flow debt service coverage ratio (“NCF DSCR”) on the Cummins Station Whole Loan falling below 1.15x (tested quarterly on or after October 1, 2024); or |
| (iii) | the commencement and continuance of a Major Tenant Event Period (as defined below). |
The borrower may avoid a Cash Trap Event Period with respect to clause (ii) above if, within 10 business days, borrower delivers to lender in the form of cash or a letter of credit an amount which, if applied to pay down the principal, would cause the DSCR to be at least 1.15x.
A Cash Trap Event Period will end upon the occurrence of the following:
| ● | with regard to clause (i), the cure of such event of default; |
| ● | with regard to clause (ii), the NCF DSCR being at least 1.20x (for 2 consecutive calendar quarters); and |
| ● | with regard to clause (iii), upon the termination of all Major Tenant Event Periods (as defined below). |
A “Major Tenant Event Period” means the occurrence of any of the following:
| (i) | Gibson and any replacement tenant that leases 50,000 SF or more at the property (“Major Tenant”) goes dark or vacates 50% or more of its space (or gives a notice to do so); |
| (ii) | a Major Tenant subleases 50% or more of its space; |
| (iii) | a Major Tenant files for bankruptcy or similar insolvency proceeding; |
| (iv) | a Major Tenant terminates or cancels its lease (or gives a notice to do so); |
| (v) | Gibson’s credit rating is equal to or less than “Caa1” by Moody’s, “CCC” by Fitch, and/or “CCC+” by Standard & Poor’s (S&P); or |
| (vi) | a monetary default occurs under a Major Tenant’s lease. |
The borrower may avoid a Major Tenant Event Period if, within 10 business days, borrower delivers to the lender in the form of cash or a letter of credit an amount which shall cause the amount of the Major Tenant Reserve Funds on deposit with lender at least $2,581,065.
A ““Major Tenant Event Period” shall end upon:
| ● | with regard to clauses (i)-(iv) and (vi) above, lender has received evidence that all of the space has been leased to one or more replacement tenants and that each tenant is in occupancy, open for business, paying full, unabated rent (or is reserved with the lender), and all tenant improvements and leasing commissions have been paid (or are reserved with the lender); |
| ● | with regard to clause (i) and (ii), the Major Tenant has resumed normal business operations in at least 51% of its space for two consecutive calendar quarters; |
| ● | with regard to clause (iii), the bankruptcy or insolvency proceeding has been dismissed or the bankruptcy has been terminated in a manner satisfactory to the lender; |
| ● | with regard to clause (iv), the Major Tenant revokes notification of termination of its lease and delivers an estoppel acceptable to the lender; |
| ● | with regard to clause (v), Gibson’s credit rating is greater than “Caa1” by Moody’s, “CCC” by Fitch, and/or “CCC+” by Standard & Poor’s (S&P); |
| This is not a research report and was not prepared by any Underwriter’s research department. Please see additional important information and qualifications at the end of this Term Sheet. | ||
| 70 | ||
| Office – CBD | Loan #4 | Cut-off Date Balance: | $60,000,000 | |
| 209 10th Avenue South | Cummins Station | Cut-off Date LTV: | 58.8% | |
| Nashville, TN 37203 | UW NCF DSCR: | 1.40x | ||
| UW NOI Debt Yield: | 10.2% |
and
| ● | with regard to clause (vi), the monetary default is cured and no other monetary default has occurred for two consecutive calendar quarters following the cure. |
Mezzanine Loan. The borrower is permitted to obtain mezzanine financing during the Loan term from a lender acceptable to lender, provided certain conditions are met including: (a) the aggregate LTV (based on the Cummins Station Whole Loan and the mezzanine financing) cannot exceed 65%, (b) the actual combined DSCR must be not less than 1.35x, (c) the actual combined debt yield must be not less than 9.5%, (d) the Cummins Station Whole Loan and the mezzanine financing must be co-terminous, (e) the mezzanine lender must execute an intercreditor agreement acceptable to the lender, (f) hard cash management must be in place and (g) the terms and documentation of the mezzanine financing must be acceptable to the lender.
Terrorism Insurance. The Cummins Station Whole Loan documents require that the “all risk” insurance policy required to be maintained by the borrower provides coverage for terrorism in an amount equal to the full replacement cost of the Cummins Station Property, as well as business interruption insurance covering no less than the 18-month period following the occurrence of a casualty event, together with a 6-month extended period of indemnity, as well as terrorism coverage as defined by TRIPRA. See “Risk Factors—Risks Relating to the Mortgage Loans—Terrorism Insurance May Not Be Available for All Mortgaged Properties” in the prospectus.
| This is not a research report and was not prepared by any Underwriter’s research department. Please see additional important information and qualifications at the end of this Term Sheet. | ||
| 71 | ||
| Mixed Use – Medical Office/Office/Retail | Loan #5 | Cut-off Date Balance: | $55,000,000 | |
| 761 Main Avenue | iPark Norwalk | Cut-off Date LTV: | 56.6% | |
| Norwalk, CT 06851 | UW NCF DSCR: | 1.60x | ||
| UW NOI Debt Yield: | 10.9% |

| This is not a research report and was not prepared by any Underwriter’s research department. Please see additional important information and qualifications at the end of this Term Sheet. | ||
| 72 | ||
| Mixed Use – Medical Office/Office/Retail | Loan #5 | Cut-off Date Balance: | $55,000,000 | |
| 761 Main Avenue | iPark Norwalk | Cut-off Date LTV: | 56.6% | |
| Norwalk, CT 06851 | UW NCF DSCR: | 1.60x | ||
| UW NOI Debt Yield: | 10.9% |
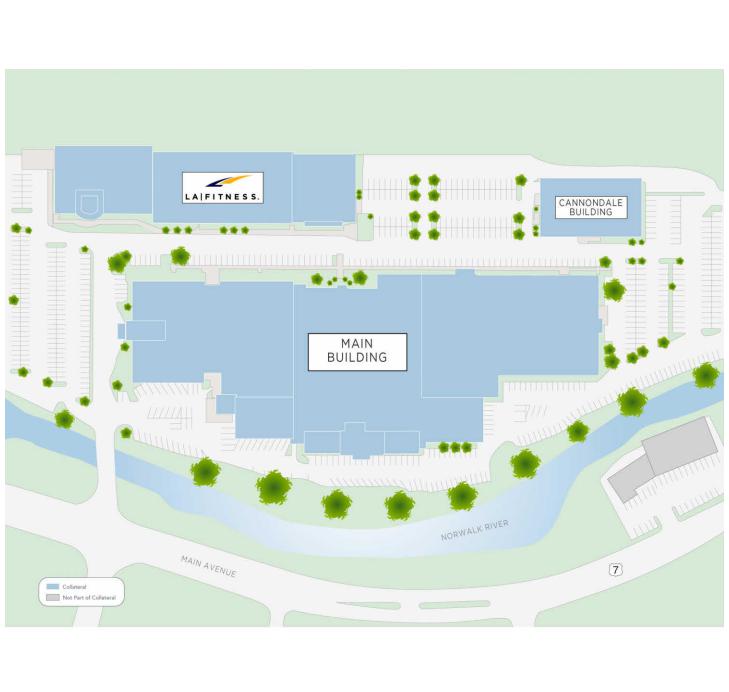
| This is not a research report and was not prepared by any Underwriter’s research department. Please see additional important information and qualifications at the end of this Term Sheet. | ||
| 73 | ||
| Mixed Use – Medical Office/Office/Retail | Loan #5 | Cut-off Date Balance: | $55,000,000 | |
| 761 Main Avenue | iPark Norwalk | Cut-off Date LTV: | 56.6% | |
| Norwalk, CT 06851 | UW NCF DSCR: | 1.60x | ||
| UW NOI Debt Yield: | 10.9% |
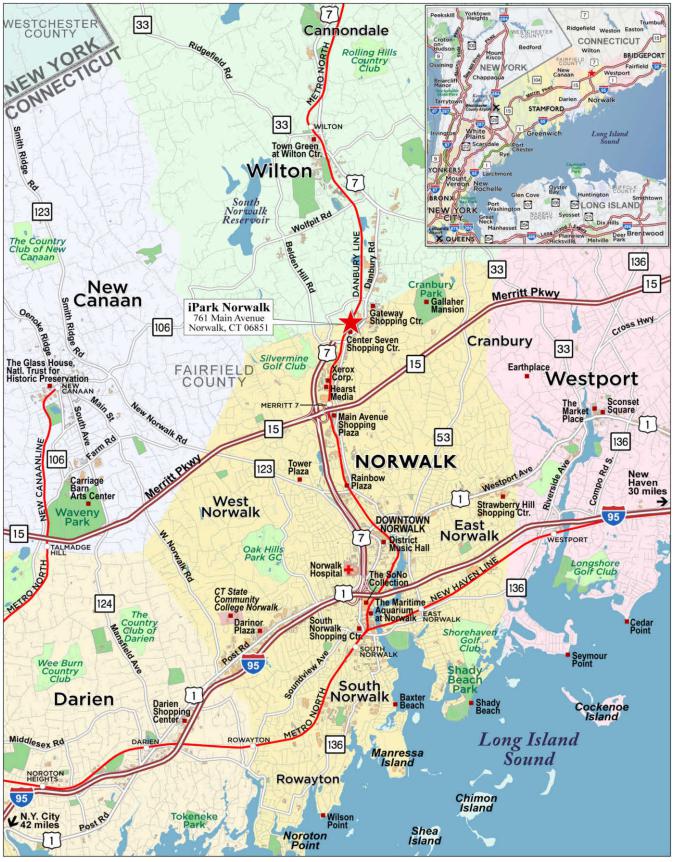
| This is not a research report and was not prepared by any Underwriter’s research department. Please see additional important information and qualifications at the end of this Term Sheet. | ||
| 74 | ||
| Mortgage Loan No. 5 – iPark Norwalk |
| Mortgage Loan Information | Property Information | ||||||
| Mortgage Loan Seller: | BANA | Single Asset/Portfolio: | Single Asset | ||||
| Credit Assessment (Fitch/Moody’s/DBRSM): | NR/NR/NR | Location(6): | Norwalk, CT 06851 | ||||
| Original Balance(1): | $55,000,000 | General Property Type(6): | Mixed Use | ||||
| Cut-off Date Balance(1): | $55,000,000 | Detailed Property Type(6): | Medical Office/Office/Retail | ||||
| % of Initial Pool Balance: | 8.0% | Title Vesting: | Fee | ||||
| Loan Purpose: | Refinance | Year Built/Renovated: | 1953/2007 | ||||
| Borrower Sponsors: | Joseph Cotter and Lynne Ward | Size: | 372,175 SF | ||||
| Guarantor: | Joseph Cotter | Cut-off Date Balance Per SF(1): | $255 | ||||
| Mortgage Rate: | 6.5890% | Maturity Date Balance Per SF:(1) | $255 | ||||
| Note Date: | 6/6/2024 | Property Manager: | Pembroke Management, Inc. | ||||
| Maturity Date: | 6/6/2029 | (borrower-related) | |||||
| Term to Maturity: | 60 months | Underwriting and Financial Information | |||||
| Amortization Term: | 0 months | UW NOI: | $10,334,426 | ||||
| IO Period: | 60 months | UW NCF: | $10,185,556 | ||||
| Seasoning: | 2 months | UW NOI Debt Yield(1): | 10.9% | ||||
| Prepayment Provisions(2): | L(26),D(30),O(4) | UW NCF Debt Yield(1): | 10.7% | ||||
| Lockbox/Cash Mgmt Status: | Hard/In Place | UW NOI Debt Yield at Maturity(1): | 10.9% | ||||
| Additional Debt Type(1)(3): | Pari Passu/Mezzanine | UW NCF DSCR(1): | 1.60x | ||||
| Additional Debt Balance(1)(3): | $40,000,000/$15,000,000 | Most Recent NOI: | $10,359,146 (3/31/2024 TTM) | ||||
| Future Debt Permitted (Type): | No (NAP) | 2nd Most Recent NOI: | $10,320,334 (12/31/2023) | ||||
| Reserves(4) | 3rd Most Recent NOI: | $10,285,098 (12/31/2022) | |||||
| Type | Initial | Monthly | Cap | Most Recent Occupancy: | 100.0% (4/1/2024) | ||
| RE Taxes: | $754,694 | $125,782 | NAP | 2nd Most Recent Occupancy: | 100.0% (12/31/2023) | ||
| Insurance: | $12,047 | Springing | NAP | 3rd Most Recent Occupancy: | 100.0% (12/31/2022) | ||
| Deferred Maintenance: | $4,875 | $0 | NAP | Appraised Value (as of): | $167,900,000 (2/27/2024) | ||
| Replacement Reserve: | $0 | $4,652 | NAP | Appraised Value PSF: | $451 | ||
| TI/LC Reserve: | $1,500,000 | Springing | $500,000 | Cut-off Date LTV Ratio(1): | 56.6% | ||
| Other Reserves(5): | $165,000 | Springing | NAP | Maturity Date LTV Ratio(1): | 56.6% | ||
| Sources and Uses | ||||||
| Sources | Proceeds | % of Total | Uses | Proceeds | % of Total | |
| Whole Loan Amount(1): | $95,000,000 | 86.4% | Loan Payoff: | $84,749,308 | 77.0% | |
| Mezzanine Loan Amount(1)(3): | $15,000,000 | 13.6% | Return of Equity: | $15,956,294 | 14.5% | |
| Closing Costs: | $6,857,783 | 6.2% | ||||
| Upfront Reserves: | $2,436,615 | 2.2% | ||||
| Total Sources: | $110,000,000 | 100.0% | Total Uses: | $110,000,000 | 100.0% | |
| (1) | The iPark Norwalk Mortgage Loan (as defined below) is part of the iPark Norwalk Whole Loan (as defined below), which is evidenced by seven pari passu promissory notes with an aggregate principal balance of $95,000,000. The Cut-off Date Balance Per SF, Maturity Date Balance Per SF, UW NOI Debt Yield, UW NCF Debt Yield, UW NOI Debt Yield at Maturity, UW NCF DSCR, Cut-off Date LTV Ratio and Maturity Date LTV Ratio numbers presented above are based on the aggregate principal balance of the promissory notes comprising the iPark Norwalk Whole Loan. The Cut-off Date Balance Per SF, Maturity Date Balance Per SF, UW NOI Debt Yield, UW NCF Debt Yield, UW NOI Debt Yield at Maturity, UW NCF DSCR, Cut-off Date LTV Ratio and Maturity Date LTV Ratio numbers based on the combined balance of the iPark Norwalk Whole Loan and the iPark Norwalk Mezzanine Loan (as defined below) are $296, $296, 9.4%, 9.3%, 9.4%, 1.20x, 65.5% and 65.5%, respectively. |
| (2) | Defeasance of the iPark Norwalk Mortgage Loan is permitted at any time after the earlier to occur of (a) the end of the two-year period commencing on the closing date of the securitization of the last portion of the iPark Norwalk Whole Loan to be securitized and (b) June 6, 2027. The assumed prepayment lockout period of 26 payments is based on the closing date of this transaction in August 2024. |
| (3) | See “The Mortgage Loan” and “Mezzanine Loan” sections below, for a discussion of additional debt. |
| (4) | See “Escrows and Reserves” section below for further discussion. |
| (5) | Other Reserves includes upfront amount for free rent reserve ($150,000) for LA Fitness, common charge reserve ($15,000) and springing monthly deposits for the common charge reserve. |
| (6) | See “The Property” section for further discussion. |
The Mortgage Loan. The fifth largest mortgage loan (the “iPark Norwalk Mortgage Loan”) is part of a whole loan (the “iPark Norwalk Whole Loan”) that is evidenced by six pari passu promissory notes in the aggregate original principal amount of $95,000,000 and secured by a first priority fee mortgage encumbering a 372,175 SF mixed use property located in Norwalk, Connecticut (the “iPark Norwalk Property”). The iPark Norwalk Whole Loan was co-originated by Bank of America, N.A. (“BANA”) and Starwood Mortgage Capital LLC (“SMC”). In addition to the iPark Norwalk Whole Loan, Powerscourt Investments 54, LP provided a $15.0 million mezzanine loan to the sole member of the borrower, which is secured by such sole member’s direct equity interests in the borrower. The iPark Norwalk Mortgage Loan is evidenced by the controlling Note A-1, the non-controlling Note A-2 and the non-controlling Note A-3, with an aggregate original principal amount of $55,000,000. The remaining promissory notes comprising the iPark Norwalk Whole Loan (the “iPark Norwalk Serviced Pari Passu Companion Loans”) are summarized in the below table. The iPark Norwalk Whole Loan will be serviced pursuant to the pooling and servicing agreement for the BANK5 2024-5YR8 securitization trust. See “Description of the Mortgage Pool—The Whole Loans—The Serviced Pari Passu Whole Loans” and “Pooling and Servicing Agreement” in the prospectus.
| This is not a research report and was not prepared by any Underwriter’s research department. Please see additional important information and qualifications at the end of this Term Sheet. | ||
| 75 | ||
| Mixed Use – Medical Office/Office/Retail | Loan #5 | Cut-off Date Balance: | $55,000,000 | |
| 761 Main Avenue | iPark Norwalk | Cut-off Date LTV: | 56.6% | |
| Norwalk, CT 06851 | UW NCF DSCR: | 1.60x | ||
| UW NOI Debt Yield: | 10.9% |
| iPark Norwalk Whole Loan Summary | ||||
| Note | Original Balance | Cut-off Date Balance | Note Holder | Controlling Note |
| A-1 | $40,000,000 | $40,000,000 | BANK5 2024-5YR8 | Yes |
| A-2 | $10,000,000 | $10,000,000 | BANK5 2024-5YR8 | No |
| A-3 | $5,000,000 | $5,000,000 | BANK5 2024-5YR8 | No |
| A-4(1) | $20,000,000 | $20,000,000 | SMC | No |
| A-5-1(1) | $5,000,000 | $5,000,000 | SMC | No |
| A-5-2(1) | $5,000,000 | $5,000,000 | SMC | No |
| A-6(1) | $10,000,000 | $10,000,000 | SMC | No |
| Whole Loan | $95,000,000 | $95,000,000 | ||
| (1) | Expected to be contributed to one or more future securitization trusts. |
The Borrower and the Borrower Sponsors. The borrower is I.Park Norwalk II LLC, a Delaware limited liability company and a single purpose entity with two independent directors. The borrower sponsors are Joseph Cotter and Lynne Ward and the non-recourse carveout guarantor for the iPark Norwalk Whole Loan is Joseph Cotter.
Joseph Cotter and Lynne Ward, President and Vice President of National Resources, respectively, each have a 50% interest in the borrower. National Resources, founded in 1988, is a real estate development and investment firm based in Greenwich, Connecticut that focuses on the development of corporate and industrial sites throughout the greater New York City area. National Resources currently owns and manages five iPark branded facilities, including the iPark Norwalk Property, which are designed to offer office and industrial space with high ceilings, large floor plates and abundant natural light.
The Property. The iPark Norwalk Property is a 372,175 SF mixed use property located in Norwalk, Connecticut. The iPark Norwalk Property is located within both the City of Norwalk and the Town of Wilton on two separate and contiguous tax parcels. The borrower sponsors acquired the iPark Norwalk Property in 2007, when it was vacant, for $23.0 million and invested $83.1 million to redevelop it. The iPark Norwalk Property consists of three-buildings in a mixed use campus situated on an 18.095-acre site. The first building (the “Main Building”) contains 295,075 SF (of which 168,066 SF is medical space) and is 100.0% leased to 12 tenants, including the largest tenant, Nuvance Health. The second building (the “LA Fitness Building”) contains 60,000 SF and is 100.0% occupied by the second largest tenant, LA Fitness. The third building (the “Cannondale Building”) contains 17,100 SF of industrial space and is 100.0% occupied as warehouse and storage space by the third largest tenant, Cycling Sports Group / Cannondale (“Cannondale”). Cannondale also leases 41,337 SF of office space in the Main Building. See the “Space Type Breakdown” chart below for more information.
Average year-end occupancy at the iPark Norwalk Property has been 97.0% for the last ten years. Year-end occupancy since 2019, and current occupancy as of April 1, 2024, has been and is 100.0%.
The iPark Norwalk Property is subject to a condominium regime, which consists of six total condominium units, each with one voting member. Three of the six condominium units serve as collateral for the iPark Norwalk Whole Loan (each building represents one unit and one voting member). The three non-collateral condominium units, which are owned and/or controlled by an affiliate of the borrower sponsors, are (1) a 407-space parking garage that is currently under construction (of which 292 spaces will be allocated for use by the collateral condominium units pursuant to the condominium declaration), (2) a parcel of land for future multifamily development, and (3) a parcel of land for future hotel development. All major condominium decisions require unanimous consent of all voting members.
| Space Type Breakdown(1) | ||||||
| Space Type | Total SF | % Occupied | % of Total SF | WALT Remaining | UW Base Rent PSF | % of Total UW Base Rent |
| Medical | 168,066 | 100.0% | 45.2% | 14.0 yrs | $41.26 | 57.0% |
| Office | 125,959 | 100.0% | 33.8% | 4.5 yrs | $28.16 | 29.1% |
| Retail | 61,050 | 100.0% | 16.4% | 2.6 yrs | $25.32 | 12.7% |
| Warehouse | 17,100 | 100.0% | 4.6% | 5.3 yrs | $8.50 | 1.2% |
| Total / Wtd. Avg. | 372,175 | 100.0% | 100.0% | 8.5 yrs | $32.71 | 100.0% |
| (1) | Information is based on the underwritten rent roll dated April 1, 2024. |
Major Tenants.
Nuvance Health (102,343 SF, 27.5% of NRA, 38.5% of UW Rent). Nuvance Health (S&P: BBB/Moody’s: Baa3) is an American not-for-profit health system with facilities spanning from New York State's Hudson Valley region to western Connecticut. Nuvance Health was formed in 2019 when Health Quest and Western Connecticut Health Network merged. It employs approximately 2,600 physicians and 12,000 ancillary staff and serves approximately 1.5 million residents. Nuvance Health’s space is utilized by physicians associated with Nuvance’s Norwalk Hospital, which serves 250,000 people in lower Fairfield County, Connecticut and employs more than 500 physicians and 2,000 health professionals and support personnel. Nuvance Health and Northwell Health, the largest healthcare provider in New York State (S&P: A-/Fitch: A-/Moody’s: A3), have recently announced a merger which will create a larger health system encompassing 88 hospitals across New York and Connecticut. Nuvance Health has been a tenant at the iPark Norwalk Property since December 2007 and in 2021 extended its lease 13 years to December 31, 2042. Nuvance Health has six, 5-year renewal options remaining and no termination options. Nuvance Health has invested approximately $13.0 million into its space and as part of their 13-year extension, they received $10.2 million in tenant improvement allowances. Nuvance Health currently pays $45.78 PSF and has 2% annual rent steps.
| This is not a research report and was not prepared by any Underwriter’s research department. Please see additional important information and qualifications at the end of this Term Sheet. | ||
| 76 | ||
| Mixed Use – Medical Office/Office/Retail | Loan #5 | Cut-off Date Balance: | $55,000,000 | |
| 761 Main Avenue | iPark Norwalk | Cut-off Date LTV: | 56.6% | |
| Norwalk, CT 06851 | UW NCF DSCR: | 1.60x | ||
| UW NOI Debt Yield: | 10.9% |
LA Fitness (60,000 SF, 16.1% of NRA, 12.5% of UW Rent). LA Fitness, which was founded in 1984, is a privately owned American health club chain based in Irvine, California, with more than 550 clubs across the United States and Canada. LA Fitness initially executed a 48,000 SF lease at the iPark Norwalk Property in November of 2006 and expanded its space in 2008 to a total of 60,000 SF. LA Fitness has invested approximately $6.0 million into its space at the iPark Norwalk Property, which includes adding a swimming pool and basketball court. LA Fitness reportedly has approximately 17,500 members at the iPark Norwalk location, making it the best performing location in the State of Connecticut. LA Fitness has a lease expiration date of October 31, 2026, with three 5-year renewal options and no termination options. LA Fitness currently pays $25.38 PSF and has no future rent steps.
Cycling Sports Group / Cannondale (58,477 SF, 15.7% of NRA, 11.5% of UW Rent). Cannondale is an American division of Dutch conglomerate Pon Holdings that manufactures bicycles. The company was founded in 1971 by Joe Montgomery and Murdock MacGregor and became publicly held in 1995. Cannondale’s global headquarters is located at the iPark Norwalk Property. Cannondale leases 41,377 SF of office space in the Main Building and 17,100 SF of warehouse space at the Cannondale Building. Cannondale has invested approximately $3.0 million into its space at the iPark Norwalk Property. Cannondale has a lease expiration date of August 1, 2029, with one 5-year renewal option and no termination options. Cannondale currently pays $30.20 PSF for their office space (with 1.5% annual rent steps) and $8.50 PSF for their warehouse space (with no future rent steps).
The following table presents certain information relating to the major tenants at the iPark Norwalk Property:
| Tenant Summary(1) | ||||||||||
| Tenant Name |
Space Type | Credit Rating (Fitch/ Moody’s/ S&P)(2) | Tenant SF | Approx. % of SF | Annual UW Rent | % of Total Annual UW Rent | Annual UW Rent PSF | Lease Exp. | Renewal Options | Term. Option (Y/N) |
| Major Tenants | ||||||||||
| Nuvance Health | Medical | NR/ Baa3/BBB | 102,343 | 27.5% | $4,685,017 | 38.5% | $45.78 | 12/31/2042 | 6 x 5 yr | N |
| LA Fitness | Retail | NR/NR/NR | 60,000 | 16.1% | $1,522,730 | 12.5% | $25.38 | 10/31/2026 | 3 x 5 yr | N |
| Cycling Sports Group / Cannondale(3) | Office/Industrial | NR/NR/NR | 58,477 | 15.7% | $1,394,913 | 11.5% | $23.85 | 8/1/2029 | 1 x 5 yr | N |
| Reproductive Medical Associates | Medical | NR/NR/NR | 25,428 | 6.8% | $890,479 | 7.3% | $35.02 | 4/30/2030 | 1 x 10 yr | N |
| ICR | Office | NR/NR/NR | 23,743 | 6.4% | $683,324 | 5.6% | $28.78 | 11/30/2029 | 1 x 5 yr | N |
| Subtotal/Wtd. Avg. | 269,991 | 72.5% | $9,176,462 | 75.4% | $33.99 | |||||
| Other Tenants | 102,184 | 27.5% | 2,996,897 | 24.6% | $29.33 | |||||
| Occupied Subtotal/Wtd. Avg. | 372,175 | 100.0% | $12,173,359 | 100.0% | $32.71 | |||||
| Vacant Space | 0 | 0.0% | ||||||||
| Total/Wtd. Avg. | 372,175 | 100.0% | ||||||||
| (1) | Information is based on the underwritten rent roll dated April 1, 2024. |
| (2) | Certain ratings are those of the parent company whether or not the parent guarantees the lease. |
| (3) | Cannondale Sports Group / Cannondale leases 41,377 SF of office space in the Main Building and 17,100 SF of warehouse space at the Cannondale Building. Cannondale currently pays $30.20 PSF for their office space (with 1.5% annual rent steps) and $8.50 PSF for their warehouse space (with no annual rent steps). |
The following table presents certain information relating to the lease rollover schedule at the iPark Norwalk Property:
| Lease Rollover Schedule(1)(2) | ||||||||
| Year | # of Leases Rolling | SF Rolling | Approx. % of SF Rolling | Approx. Cumulative % of SF Rolling | Total UW Rent Rolling | Approx. % of Total UW Rent Rolling | Approx. Cumulative % of Total UW Rent Rolling | UW Rent PSF Rolling |
| MTM/2024 | 1 | 23,682 | 6.4% | 6.4% | $544,686 | 4.5% | 4.5% | $23.00 |
| 2025 | 2 | 16,262 | 4.4% | 10.7% | $550,432 | 4.5% | 9.0% | $33.85 |
| 2026 | 1 | 60,000 | 16.1% | 26.9% | $1,522,730 | 12.5% | 21.5% | $25.38 |
| 2027 | 1 | 16,242 | 4.4% | 31.2% | $509,024 | 4.2% | 25.7% | $31.34 |
| 2028 | 0 | 0 | 0.0% | 31.2% | $0 | 0.0% | 25.7% | $0.00 |
| 2029(3) | 4 | 82,220 | 22.1% | 53.3% | $2,078,237 | 17.1% | 42.8% | $25.28 |
| 2030 | 2 | 25,428 | 6.8% | 60.1% | $890,479 | 7.3% | 50.1% | $35.02 |
| 2031 | 1 | 10,661 | 2.9% | 63.0% | $342,461 | 2.8% | 52.9% | $32.12 |
| 2032 | 1 | 20,915 | 5.6% | 68.6% | $560,522 | 4.6% | 57.5% | $26.80 |
| 2033 | 0 | 0 | 0.0% | 68.6% | $0 | 0.0% | 57.5% | $0.00 |
| 2034 | 0 | 0 | 0.0% | 68.6% | $0 | 0.0% | 57.5% | $0.00 |
| 2035 & Thereafter | 2 | 116,765 | 31.4% | 100.0% | $5,174,788 | 42.5% | 100.0% | $44.32 |
| Vacant | 0 | 0 | 0.0% | 100.0% | $0 | 0.0% | 100.0% | $0.00 |
| Total/Wtd. Avg. | 15 | 372,175 | 100.0% | $12,173,359 | 100.0% | $32.71(4) | ||
| (1) | Information is based on the underwritten rent roll dated April 1, 2024. |
| (2) | Certain tenants may have lease termination options that are exercisable prior to the originally stated expiration date of the related lease and are not considered in the rollover schedule. |
| (3) | The iPark Norwalk Whole Loan has a maturity date of June 6, 2029. |
| (4) | Wtd. Avg. UW Rent PSF Rolling excludes vacant space. |
| This is not a research report and was not prepared by any Underwriter’s research department. Please see additional important information and qualifications at the end of this Term Sheet. | ||
| 77 | ||
| Mixed Use – Medical Office/Office/Retail | Loan #5 | Cut-off Date Balance: | $55,000,000 | |
| 761 Main Avenue | iPark Norwalk | Cut-off Date LTV: | 56.6% | |
| Norwalk, CT 06851 | UW NCF DSCR: | 1.60x | ||
| UW NOI Debt Yield: | 10.9% |
The Market. The iPark Norwalk Property is located in Fairfield County, within both the City of Norwalk and the Town of Wilton. Norwalk and Wilton are affluent residential areas with access to a variety of commercial services and transportation connections to the region’s employment centers. The iPark Norwalk Property is situated on Main Avenue, approximately 2 miles from State Route 15 and four miles from U.S. Route 1 and Interstate 95. The immediate area surrounding the iPark Norwalk Property is served by the Norwalk Transit District, with bus stops on Main Avenue. Furthermore, the iPark Norwalk Property is located approximately 1.5 miles from Exits 39 and 40 of the Merritt Parkway and is approximately 5.9 miles from the South Norwalk Metro North Station, which provides superior accessibility throughout Southwestern Connecticut.
Norwalk has an active and diverse business and corporate community. The city’s largest employers include Western Connecticut Health Network, General Electric Company and Altice USA. Other companies with headquarters in Norwalk include Pepperidge Farm, Frontier Communications and Booking Holdings. Retail presence consists of restaurants, big-box stores, shopping centers and locally owned businesses.
According to the appraisal, the estimated 2022 population within a one-, three- and five-mile radius of the iPark Norwalk Property was 5,058, 53,068 and 140,507, respectively. The estimated 2022 average household income within the same radii was $201,475, $180,344 and $179,187, respectively.
The following table presents certain information relating to the appraisal’s market rent conclusion for the iPark Norwalk Property:
| Market Rent Summary | |||
| Space Type | Market Rent PSF | Lease Term (Years) | Rent Increase Projection |
| Medical Office | $40.00 | 10.0 | 2.0% per annum |
| Office | $30.00 | 10.0 | 2.0% per annum |
| LA Fitness | $27.00 | 15.0 | 10.0% every 5 yrs |
| Warehouse | $14.00 | 5.0 | 2.0% per annum |
| iPark Grille | $20.00 | 5.0 | 2.0% per annum |
Appraisal. The appraiser concluded to an “as-is” value for the iPark Norwalk Property of $167,900,000 as of February 27, 2024.
Environmental Matters. The Phase I environmental site assessment dated February 28, 2024 identified a recognized environmental condition at the iPark Norwalk Property due to the former operations by Perkin-Elmer, a manufacturer of laboratory analytical instruments and equipment, from 1950 through 2001. Manufacturing activities as well as on-site underground storage tanks and dry wells impacted soil and groundwater beneath the property. An environmental consultant designated two potential release areas (“PRAs”) in a 2024 report, which PRAs have documented impacts to on-site groundwater and soil vapor beneath the Cannondale Building exceeding the applicable remediation criteria. The lender obtained an opinion of probable cost to investigate and remediate, which resulted in a maximum probable cost estimate of $2,170,000. The borrower obtained a lender-liability environmental insurance policy from Sirius Point (rated BBB by S&P and A- by AM Best), with an eight-year term, with per incident limit of $5,000,000 and in the aggregate, and a deductible of $25,000.
| This is not a research report and was not prepared by any Underwriter’s research department. Please see additional important information and qualifications at the end of this Term Sheet. | ||
| 78 | ||
| Mixed Use – Medical Office/Office/Retail | Loan #5 | Cut-off Date Balance: | $55,000,000 | |
| 761 Main Avenue | iPark Norwalk | Cut-off Date LTV: | 56.6% | |
| Norwalk, CT 06851 | UW NCF DSCR: | 1.60x | ||
| UW NOI Debt Yield: | 10.9% |
Operating History and Underwritten Net Cash Flow. The following table presents certain information relating to the historical operating performance and Underwritten Net Cash Flow at the iPark Norwalk Property:
| Cash Flow Analysis(1) | |||||||
| 2020 |
2021 | 2022 | 2023 | 3/31/2024 TTM |
UW | UW PSF | |
| Gross Potential Rent(2) | $9,415,767 | $11,077,922 | $11,855,727 | $12,060,656 | $12,100,238 | $12,173,359 | $32.71 |
| Straight-lined Rent(3) | $0 | $0 | $0 | $0 | $0 | $429,578 | $1.15 |
| Expense Reimbursements | $1,707,263 | $1,930,030 | $1,653,588 | $1,621,542 | $1,504,633 | $1,388,823 | $3.73 |
| Net Rental Income | $11,123,030 | $13,007,953 | $13,509,314 | $13,682,197 | $13,604,871 | $13,991,760 | $37.59 |
| (Vacancy & Credit Loss) | $0 | $0 | $0 | $0 | $0 | ($594,367)(4) | ($1.60) |
| Effective Gross Income | $ 11,123,030 | $13,007,953 | $13,509,314 | $13,682,197 | $13,604,871 | $13,397,394 | $36.00 |
| Real Estate Taxes(5) | $1,748,544 | $1,758,185 | $1,770,903 | $1,731,711 | $1,742,798 | $1,396,480 | $3.75 |
| Insurance | $177,568 | $196,394 | $191,255 | $182,138 | $182,138 | $185,781 | $0.50 |
| Other operating expenses | $1,016,616 | $1,199,607 | $1,262,059 | $1,448,014 | $1,320,790 | $1,480,707 | $3.98 |
| Total Operating Expenses | $2,942,728 | $3,154,186 | $3,224,216 | $3,361,863 | $3,245,725 | $3,062,968 | $8.23 |
| Net Operating Income | $8,180,302 | $9,853,767 | $10,285,098 | $10,320,334 | $10,359,146 | $10,334,426 | $27.77 |
| Replacement Reserves | $0 | $0 | $0 | $0 | $0 | $55,826 | $0.15 |
| TI/LC | $0 | $0 | $0 | $0 | $0 | $93,044 | $0.25 |
| Net Cash Flow | $8,180,302 | $9,853,767 | $10,285,098 | $10,320,334 | $10,359,146 | $10,185,556 | $27.37 |
| Occupancy % | 100.0% | 100.0% | 100.0% | 100.0% | 100.0%(6) | 95.8%(4) | |
| NOI DSCR(7) | 1.29x | 1.55x | 1.62x | 1.63x | 1.63x | 1.63x | |
| NCF DSCR(7) | 1.29x | 1.55x | 1.62x | 1.63x | 1.63x | 1.60x | |
| NOI Debt Yield(7) | 8.6% | 10.4% | 10.8% | 10.9% | 10.9% | 10.9% | |
| NCF Debt Yield(7) | 8.6% | 10.4% | 10.8% | 10.9% | 10.9% | 10.7% | |
| (1) | Based on the underwritten rent roll as of April 1, 2024. |
| (2) | UW Gross Potential Rent includes rent steps through April 2025. |
| (3) | Includes straight-lined rent for Nuvance Health averaged through iPark Norwalk Whole Loan maturity. |
| (4) | Underwritten to 3.0% vacancy for Nuvance Health and 5% vacancy for the remaining tenants. |
| (5) | Non-collateral condominium units are included in historical Real Estate Taxes but are excluded from UW Real Estate Taxes. |
| (6) | Represents occupancy per the underwritten rent roll dated April 1, 2024. |
| (7) | DSCR and Debt Yield are based on the iPark Norwalk Whole Loan. |
Escrows and Reserves.
Real Estate Taxes – At origination, the borrower deposited approximately $754,694 for real estate taxes, and on a monthly basis, is required to escrow 1/12th of the annual estimated tax payments, which currently equates to approximately $125,782.
Insurance – At origination, the borrower deposited into escrow approximately $12,047 for insurance, If there is no approved blanket policy in place, the borrower is required to escrow 1/12th of the annual estimated insurance payments on a monthly basis.
Deferred Maintenance - At origination, the borrower deposited into escrow $4,875 for deferred maintenance.
Replacement Reserve – On a monthly basis, the borrower is required to escrow $4,652 for replacement reserves.
TI/LC Reserve – At origination, the borrower deposited into escrow $1,500,000 for upfront TI/LCs and upon the balance of the TI/LC reserve falling below $500,000, the borrower is required to make monthly deposits of $7,754, subject to a cap of $500,000.
Free Rent Reserve - At origination, the borrower deposited into escrow $150,000 for free rent owed with respect to LA Fitness.
Common Charge Reserve – At origination, the borrower deposited into escrow $15,000 to the common charge reserve. Upon the occurrence of (i) an event of default or a Sweep Event Period, (ii) borrower’s failure to pay common charges directly to the condominium board, or (iii) borrower’s failure to provide evidence of such payment of common charges directly to the condominium board, the borrower is required to make monthly deposits in the amount of common charges due for the following month.
Lockbox and Cash Management. The iPark Norwalk Whole Loan is structured with a hard lockbox and in-place cash management. The borrower is required to cause all rents to be deposited directly into the lockbox account, and all revenues relating to the iPark Norwalk Property received by the borrower or property manager be deposited into the lockbox account within two business days of receipt. Funds in the lockbox account will be swept daily into a cash management account and applied to the cash flow waterfall. During a Sweep Event Period, excess cash flow is required to be swept to an excess cash flow subaccount to be held as additional collateral for the iPark Norwalk Whole Loan, unless a Significant Tenant Trigger Period (as defined
| This is not a research report and was not prepared by any Underwriter’s research department. Please see additional important information and qualifications at the end of this Term Sheet. | ||
| 79 | ||
| Mixed Use – Medical Office/Office/Retail | Loan #5 | Cut-off Date Balance: | $55,000,000 | |
| 761 Main Avenue | iPark Norwalk | Cut-off Date LTV: | 56.6% | |
| Norwalk, CT 06851 | UW NCF DSCR: | 1.60x | ||
| UW NOI Debt Yield: | 10.9% |
below) is existing, in which case all excess cash will be swept to a Significant Tenant reserve for leasing expenses in connection with a replacement Significant Tenant (as defined below).
A “Sweep Event Period” will commence upon the earlier to occur of (i) an event of default under the iPark Norwalk Whole Loan or the iPark Norwalk Mezzanine Loan, (ii) the debt service coverage ratio for the aggregate of the iPark Norwalk Whole Loan plus the iPark Norwalk Mezzanine Loan falling below 1.05x on a trailing 12 month basis, (iii) a Significant Tenant Trigger Period, and (iv) from and after the payment date occurring in June 2028, the debt yield for the aggregate of the iPark Norwalk Whole Loan plus the iPark Norwalk Mezzanine Loan falling below 8.5%.
A Sweep Event Period will end upon (a) with respect to clause (i), the cure of such event of default, (b) with respect to clause (ii) above, the debt service coverage ratio for the aggregate of the iPark Norwalk Whole Loan plus the iPark Norwalk Mezzanine Loan being at least 1.10x on a trailing 12 month basis for two consecutive calendar quarters, and (c) with respect to clause (iii) above, the Significant Tenant Trigger Period ending.
A “Significant Tenant Trigger Period” will commence upon the earlier to occur of (x) a Significant Tenant upon the earlier of (i) failing to renew its lease for at least a five-year term by the earlier of the renewal date required in the lease or twelve months prior to the lease expiration, (ii) vacating, going dark or terminating its lease, or giving notice thereof, (iii) defaulting under its lease, (iv) subleasing (or giving notice of its intention to sublease) all or any material portion of its leased premises (unless the sublease accounts for less than 25% of its space and the Significant Tenant is investment-grade rated) or (v) becoming a debtor in bankruptcy, or (y) unless Nuvance Health and Northwell Health have completed their announced plans for merger, the credit rating for the highest parent entity of Nuvance Health is downgraded to “BB” or below by S&P and Fitch or “Ba2” or below by Moody’s.
A Significant Tenant Trigger Period will end, provided no other cause for the Significant Tenant Trigger Period is continuing, when (A) as it relates to (x)(i) and (x)(ii) above, one or more replacement leases are signed for all or substantially all of the space, (B) as it relates to (x)(iii) above, the default has been cured, (C) as it relates to (x)(iv) above, the applicable Significant Tenant has irrevocably rescinded in writing its intention to so sublet all or any material portion of the premises, (D) as it relates to (x)(v) above, when the lease for the related Significant Tenant is assumed or affirmed in such proceeding and the related Significant Tenant, among other things, is discharged from bankruptcy such that no proceedings are ongoing, or (E) as it relates to (y) above, the date upon which the corporate family credit rating for the highest rated parent entity of Nuvance Health is at least “BBB-“ or above by S&P and Fitch, and “Baa3” or above by Moody’s.
A “Significant Tenant” means either of (x) LA Fitness and/or (y) Nuvance Health.
Mezzanine Loan. Concurrently with the funding of the iPark Norwalk Whole Loan, Powerscourt Investments 54, LP funded a mezzanine loan in the amount of $15,000,000 (the “iPark Norwalk Mezzanine Loan”) to the holders of 100% of the direct equity interests in the borrower of the iPark Norwalk Whole Loan, secured by a pledge of such equity interests. The iPark Norwalk Mezzanine Loan is co-terminus with the iPark Norwalk Whole Loan, accrues interest at the rate of 14.0000% per annum and requires payments of interest only until its maturity date.
The iPark Norwalk total debt as of the origination date is summarized in the following table:
| iPark Norwalk Total Debt Summary | |||||
| Note | Original Balance | Interest Rate | Cumulative UW NCF DSCR | Cumulative UW NOI Debt Yield | Cumulative Cut-off Date LTV |
| Whole Loan | $95,000,000 | 6.5890% | 1.60x | 10.9% | 56.6% |
| Mezzanine Loan | $15,000,000 | 14.0000% | 1.20x | 9.4% | 65.5% |
| Total Debt | $110,000,000 | 7.599590909090910% | |||
Terrorism Insurance. The borrower is required to obtain and maintain property insurance and business interruption insurance for 24 months plus a 365-day extended period of indemnity. Such insurance is required to cover perils of terrorism and acts of terrorism. See “Risk Factors—Risks Relating to the Mortgage Loans—Terrorism Insurance May Not Be Available for All Mortgaged Properties” in the prospectus.
| This is not a research report and was not prepared by any Underwriter’s research department. Please see additional important information and qualifications at the end of this Term Sheet. | ||
| 80 | ||
| Retail – Anchored | Loan #6 | Cut-off Date Balance: | $40,000,000 | |
| 3630 Peachtree Parkway | Johns Creek Town Center | Cut-off Date LTV: | 67.7% | |
| Suwanee, GA 30024 | UW NCF DSCR: | 1.53x | ||
| UW NOI Debt Yield: | 11.5% |
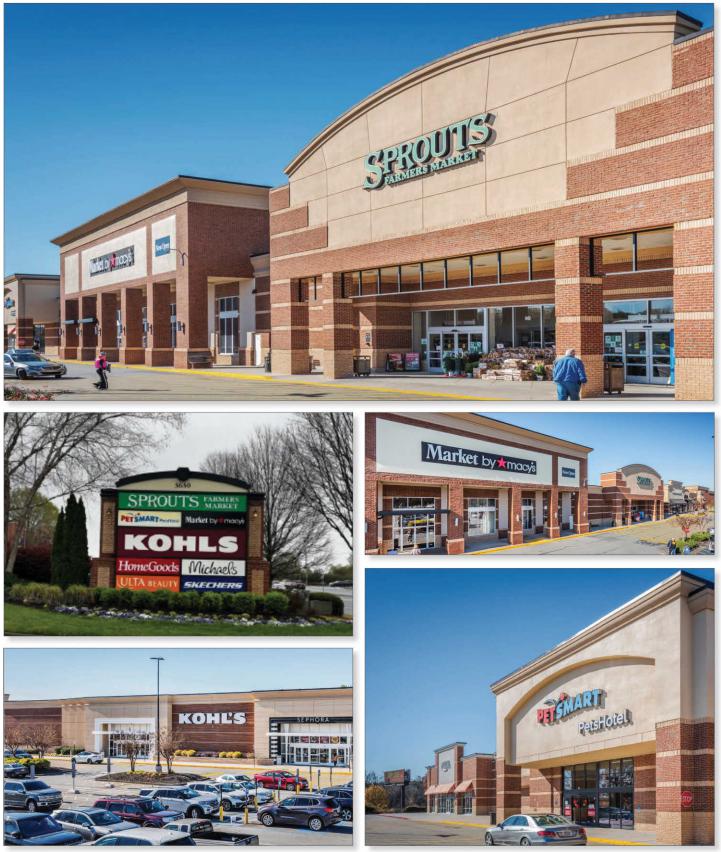
| This is not a research report and was not prepared by any Underwriter’s research department. Please see additional important information and qualifications at the end of this Term Sheet. | ||
| 81 | ||
| Retail – Anchored | Loan #6 | Cut-off Date Balance: | $40,000,000 | |
| 3630 Peachtree Parkway | Johns Creek Town Center | Cut-off Date LTV: | 67.7% | |
| Suwanee, GA 30024 | UW NCF DSCR: | 1.53x | ||
| UW NOI Debt Yield: | 11.5% |
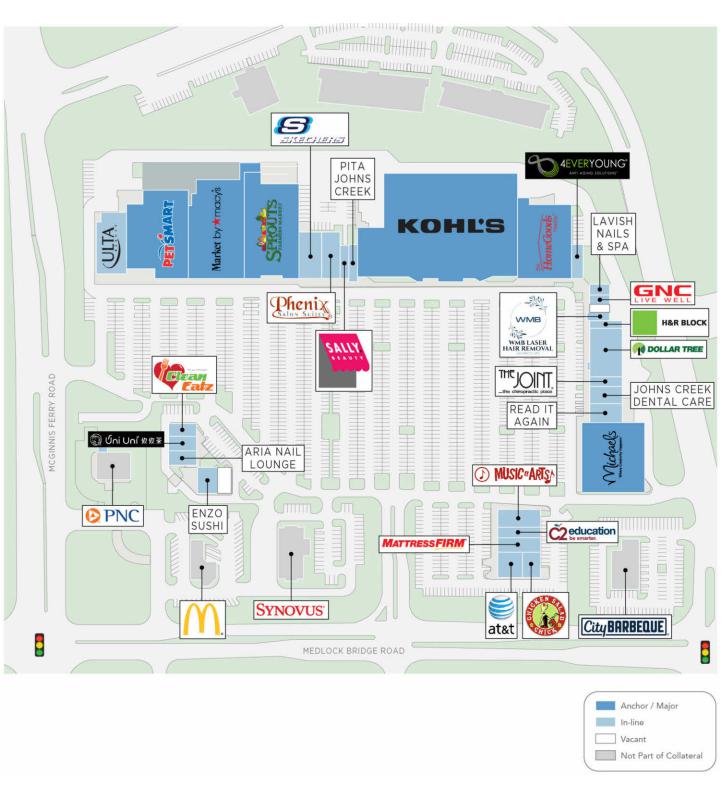
| This is not a research report and was not prepared by any Underwriter’s research department. Please see additional important information and qualifications at the end of this Term Sheet. | ||
| 82 | ||
| Retail – Anchored | Loan #6 | Cut-off Date Balance: | $40,000,000 | |
| 3630 Peachtree Parkway | Johns Creek Town Center | Cut-off Date LTV: | 67.7% | |
| Suwanee, GA 30024 | UW NCF DSCR: | 1.53x | ||
| UW NOI Debt Yield: | 11.5% |
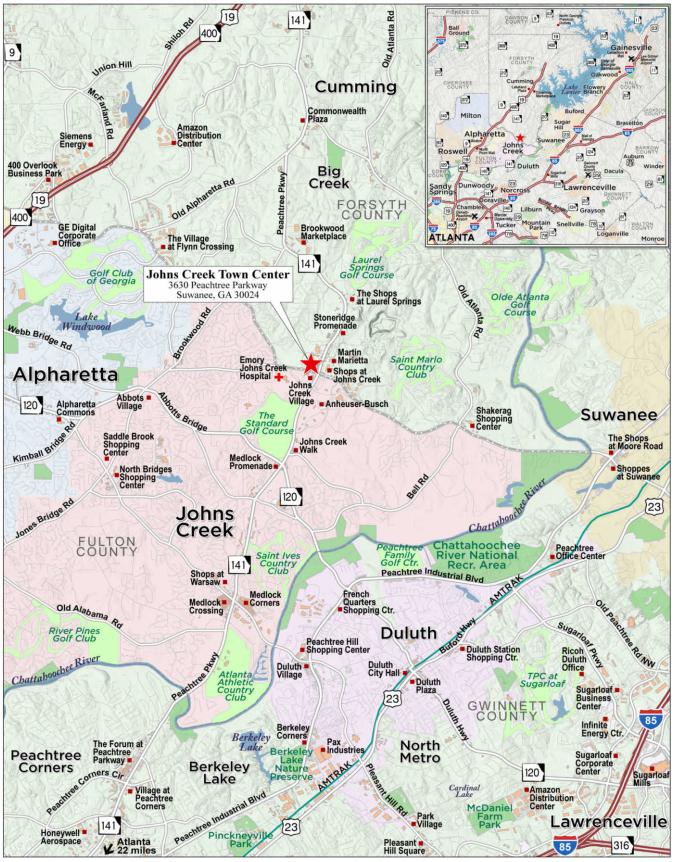
| This is not a research report and was not prepared by any Underwriter’s research department. Please see additional important information and qualifications at the end of this Term Sheet. | ||
| 83 | ||
| Mortgage Loan No. 6 – Johns Creek Town Center |
| Mortgage Loan Information | Property Information | ||||||
| Mortgage Loan Seller: | MSMCH | Single Asset/Portfolio: | Single Asset | ||||
| Credit Assessment (Fitch/Moody’s/DBRSM): | NR/NR/NR | Location: | Suwanee, GA 30024 | ||||
| Original Balance: | $40,000,000 | General Property Type: | Retail | ||||
| Cut-off Date Balance: | $40,000,000 | Detailed Property Type: | Anchored | ||||
| % of Initial Pool Balance: | 5.8% | Title Vesting: | Fee | ||||
| Loan Purpose: | Acquisition | Year Built/Renovated: | 2001/NAP | ||||
| Borrower Sponsor: | Jeffrey G. Rosenberg | Size: | 303,297 SF | ||||
| Guarantor: | Jeffrey G. Rosenberg | Cut-off Date Balance Per SF: | $132 | ||||
| Mortgage Rate: | 6.8000% | Maturity Date Balance Per SF: | $132 | ||||
| Note Date: | 6/7/2024 | Property Manager: | Big V Properties, LLC | ||||
| Maturity Date: | 7/1/2029 | (borrower-related) | |||||
| Term to Maturity: | 60 months | Underwriting and Financial Information | |||||
| Amortization Term: | 0 months | UW NOI: | $4,601,922 | ||||
| IO Period: | 60 months | UW NCF: | $4,232,291 | ||||
| Seasoning: | 1 month | UW NOI Debt Yield: | 11.5% | ||||
| Prepayment Provisions: | L(25),D(28),O(7) | UW NCF Debt Yield: | 10.6% | ||||
| Lockbox/Cash Mgmt Status: | Hard/Springing | UW NOI Debt Yield at Maturity: | 11.5% | ||||
| Additional Debt Type(1): | Mezzanine | UW NCF DSCR: | 1.53x | ||||
| Additional Debt Balance(1): | $10,000,000 | Most Recent NOI: | $4,130,642 (3/31/2024 TTM) | ||||
| Future Debt Permitted (Type): | No (NAP) | 2nd Most Recent NOI: | $3,951,009 (12/31/2023) | ||||
| Reserves(2) | 3rd Most Recent NOI: | $3,963,996 (12/31/2022) | |||||
| Type | Initial | Monthly | Cap | Most Recent Occupancy: | 99.7% (4/3/2024) | ||
| RE Taxes: | $237,059 | $26,340 | NAP | 2nd Most Recent Occupancy(3): | NAV | ||
| Insurance: | $0 | Springing | NAP | 3rd Most Recent Occupancy(3): | NAV | ||
| Deferred Maintenance: | $30,500 | $0 | NAP | Appraised Value (as of): | $59,100,000 (4/7/2024) | ||
| Replacement Reserve: | $0 | $5,275 | NAP | Appraised Value Per SF: | $195 | ||
| TI/LC Reserve: | $0 | $12,637 | NAP | Cut-off Date LTV Ratio: | 67.7% | ||
| Tenant Inducement Reserve: | $168,921 | $0 | NAP | Maturity Date LTV Ratio: | 67.7% | ||
| Sources and Uses | ||||||
| Sources | Proceeds | % of Total | Uses | Proceeds | % of Total | |
| Loan Amount: | $40,000,000 | 66.6% | Purchase Price(4): | $57,953,650 | 96.5% | |
| Mezzanine Loan Amount: | $10,000,000 | 16.7% | Closing Costs: | $1,641,781 | 2.7% | |
| Borrower Sponsor Equity: | $10,031,910 | 16.7% | Upfront Reserves: | $436,480 | 0.7% | |
| Total Sources: | $60,031,910 | 100.0% | Total Uses: | $60,031,910 | 100.0% | |
| (1) | The Johns Creek Town Center Mortgage Loan and the Johns Creek Town Center Mezzanine Loan (as defined below) are referred to herein as the “Johns Creek Town Center Total Debt.” With respect to the Johns Creek Town Center Total Debt, the Cut-off Date Balance Per SF is $165, the Maturity Date Balance Per SF is $165, the UW NOI Debt Yield is 9.2%, the UW NOI Debt Yield at Maturity is 9.2%, the UW NCF DSCR is 1.07x, the Cut-off Date LTV Ratio is 84.6% and the Maturity Date LTV Ratio is 84.6%. The Johns Creek Town Center Mezzanine Loan accrues interest at the rate of 12.000% per annum, however, at the mezzanine borrower’s election, it may pay interest monthly at the rate of 10.000% per annum (or in some circumstances, at the rate of 8.000% per annum). See “Mezzanine Loan” below. The remaining interest will not be payable currently but will instead accrue and be deferred and payable upon the maturity of the Johns Creek Town Center Mezzanine Loan or such earlier date as the Johns Creek Town Center Mezzanine Loan is due and payable or as otherwise described herein. In addition, to the extent that current interest is paid at the rate of 8.00% per annum, the difference between such rate and 10.00% per annum will be compounded monthly at the rate of 12.000% per annum. The Total Debt UW NCF DSCR is calculated based on interest accrued on the Johns Creek Town Center Mezzanine Loan at the full rate of 12.000% per annum, and the Total Debt UW NOI Debt Yield, UW NOI Debt Yield at Maturity, Cut-off Date LTV Ratio and Maturity Date LTV Ratio are calculated based on the original principal balance of the Johns Creek Town Center Mezzanine Loan, without giving effect to any accrued, deferred and, if applicable, compounded interest. Because of the potential accrual, deferral and compounding of certain deferred interest on the Johns Creek Town Center Mezzanine Loan, the amount due on the Johns Creek Town Center Mezzanine Loan at the coterminous maturity of the Johns Creek Town Center Mortgage Loan and Johns Creek Town Center Mezzanine Loan will be increased by any such deferred interest amount, which, assuming no prepayments or defaults, would be $1,000,000 assuming that interest is paid currently at the rate of 10.000% per annum for the entire mezzanine loan term and $2,361,161 assuming that interest is paid currently at the rate of 8.000% per annum for the entire mezzanine loan term. If such deferred interest amount were included in the calculation of the UW NOI Debt Yield at Maturity and Maturity Date LTV Ratio, deferred interest assuming a current pay rate of 10.000% per annum would result in a Total Debt UW NOI Debt Yield at Maturity and Total Debt Maturity Date LTV Ratio of 9.0% and 86.3%, respectively, and deferred interest assuming a current pay rate of 8.000% per annum would result in a Total Debt UW NOI Debt Yield at Maturity and Total Debt Maturity Date LTV Ratio of 8.8% and 88.6%, respectively. |
| (2) | See “Escrows and Reserves” below for further discussion of reserve requirements. |
| (3) | Historical occupancies are not available as the seller of the Johns Creek Towns Center Property (as defined below) did not provide such information at the time of the acquisition. |
| (4) | The Purchase Price for the Johns Creek Town Center Property as stated in the related purchase and sale agreement was $58,850,000. The borrower was given credits to the Purchase Price in the following amounts: (i) $500,000 for property condition concessions, primarily related to the roof of the building, (ii) a negotiated $205,000 for concessions related to a then outstanding Michael’s lease estoppel to confirm there were no outstanding co-tenancy violations (which estoppel has since been provided), and (iii) $191,350 for leasing incentives, resulting in a net Purchase Price of $57,953,650. |
The Mortgage Loan. The sixth largest mortgage loan (the “Johns Creek Town Center Mortgage Loan”) is evidenced by a promissory note in the original principal amount of $40,000,000 and secured by a first priority fee mortgage encumbering a 303,297 SF anchored retail property in Suwanee, Georgia (the “Johns Creek Town Center Property”).
The Borrower and the Borrower Sponsor. The borrower for the Johns Creek Town Center Mortgage Loan is BVE Johns SPE LLC, a single purpose Delaware limited liability company with one independent director in its organizational structure. The borrower sponsor and non-recourse carveout guarantor is Jeffrey G. Rosenberg, the president and chief executive officer of Big V Property Group. Big V Property Group is a family-owned real estate
| This is not a research report and was not prepared by any Underwriter’s research department. Please see additional important information and qualifications at the end of this Term Sheet. | ||
| 84 | ||
| Retail – Anchored | Loan #6 | Cut-off Date Balance: | $40,000,000 | |
| 3630 Peachtree Parkway | Johns Creek Town Center | Cut-off Date LTV: | 67.7% | |
| Suwanee, GA 30024 | UW NCF DSCR: | 1.53x | ||
| UW NOI Debt Yield: | 11.5% |
and investment company headquartered in Charlotte, North Carolina, with over 80 years of experience. Big V Supermarkets, Inc., the predecessor company to Big V Property Group, was founded in 1942 by William and Viola Rosenberg, the grandparents of Jeffrey G. Rosenberg. Big V Property Group currently manages a portfolio consisting of 54 shopping centers, totaling over 9.0 million SF across 14 states.
The Property. The Johns Creek Town Center Property is comprised of a fee interest in five single-story buildings encompassing a 303,297 SF anchored retail property on an approximately 31.7-acre site in Suwanee, Georgia that includes 1,643 surface parking spaces (5.4 spaces per 1,000 SF). The Johns Creek Town Center Property was built in 2001, and is currently 99.7% leased to 30 tenants comprised of a mix of national, regional and local tenants. The Johns Creek Town Center Property is anchored by Kohl’s, Sprouts Farmers Market, Michaels, PetSmart, Market by Macy’s and HomeGoods, with no other tenant occupying more than 3.2% of NRA or comprising more than 4.1% of underwritten rent. There are four additional outparcels situated adjacent to the John Creeks Town Center Property that are not included as collateral, occupied by PNC Bank, McDonalds, Synovus Bank and City BBQ.
Major Tenants.
Kohl’s (86,584 SF, 28.5% of NRA, 15.2% of underwritten base rent). Kohl’s Corporation (“Kohl’s”) is an omnichannel retailer operating over 1,100 stores in 49 states, offering moderately priced private and national brand apparel, footwear, accessories, beauty, and home products. Kohl’s merchandise mix includes both national brands and private brands that are available only at Kohl’s. Kohl’s was organized in 1962 and is a Wisconsin corporation, with a private portfolio that includes well-known established brands such as Croft & Barrow, Jumping Beans, SO, SONOMA Goods for Life, and Tek Gear, and exclusive brands that are developed and marketed through agreements with nationally recognized brands such as Food Network, LC Lauren Conrad, Nine West, and Simply Vera Vera Wang. Kohl’s is an original tenant that has anchored the Johns Creek Town Center Property under a ground lease, has a ground lease expiration date of January 31, 2027 and has five, 5-year extension options remaining.
Market by Macy’s (31,000 SF, 10.2% of NRA, 8.8% of underwritten base rent). Macy’s Inc. (“Macy’s”) (NYSE: M) is an omnichannel retailer that operates department stores, websites and mobile applications. The company offers apparel for men, women and kids, home furnishing, cosmetics, intimate apparel, fragrances, shoes, and other accessories. Macy’s has been operating department stores since 1830, and as of February 3, 2024, operated 718 store locations in 43 states, the District of Columbia, Puerto Rico and Guam. Macy’s operations are conducted through the brands Macy’s, Market by Macy’s, Macy’s Backstage, Bluemercury, Bloomingdale’s, Bloomingdale’s The Outlet and Bloomies. The Market by Macy’s store concept was launched in February 2020, and are designed to be smaller format retail stores, featuring the best of Macy’s assortment mixed with local brands and community events. Market by Macy’s has anchored the Johns Creek Town Center Property since 2021, has a lease expiration date of August 31, 2032, and has two, five-year extension options remaining.
Sprouts Farmers Market (30,355 SF, 10.0% of NRA, 11.0% of underwritten base rent). Sprouts Farmers Market is a supermarket chain, headquartered in Phoenix Arizona. Sprouts Farmers Market features an open layout with fresh produce and is one of the largest specialty retailers of fresh, natural and organic food in the United States. Sprouts Farmers Market employs approximately 31,000 employees and operates more than 410 stores in 23 states nationwide. Sprouts Farmers Market has anchored the Johns Creek Town Center Property since 2013, has a lease expiration date of September 30, 2029, and has two, five-year extension options remaining.
The following table presents a summary regarding the tenancy at the Johns Creek Town Center Property
| Tenant Summary(1) | |||||||||
| Tenant Name | Credit Rating (Fitch/Moody’s/ S&P)(2) | Tenant SF | Approx.% of SF | Annual UW Base Rent | % of Total Annual UW Base Rent | Annual UW Base Rent PSF | Lease Expiration | Renewal Options | Term. Option (Y/N) |
| Major Tenants | |||||||||
| Kohl's | BB/Ba3/BB | 86,584 | 28.5% | $774,927 | 15.2% | $8.95 | 1/31/2027 | 5 x 5 yr | N |
| Market by Macy's | BBB-/Ba2/BB+ | 31,000 | 10.2% | $449,500 | 8.8% | $14.50 | 8/31/2032 | 2 x 5 yr | Y(3) |
| Sprouts Farmers Market | NR/NR/NR | 30,355 | 10.0% | $561,568 | 11.0% | $18.50 | 9/30/2029 | 2 x 5 yr | N |
| PetSmart | NR/B3/B+ | 29,017 | 9.6% | $467,174 | 9.2% | $16.10 | 11/30/2025 | 3 x 5 yr | N |
| Michaels | NR/NR/NR | 25,348 | 8.4% | $351,323 | 6.9% | $13.86 | 6/30/2026 | 2 x 5 yr | N |
| HomeGoods | NR/A2/A | 23,942 | 7.9% | $401,029 | 7.9% | $16.75 | 11/30/2033 | 4 x 5 yr | N |
| Subtotal/Wtd. Avg. | 226,246 | 74.6% | $3,005,520 | 59.1% | $13.28 | ||||
| Other Tenants | 76,051 | 25.1% | $2,080,676 | 40.9% | $27.36 | ||||
| Occupied Subtotal/Wtd. Avg. | 302,297 | 99.7% | $5,086,196 | 100.0% | $16.83 | ||||
| Vacant Space | 1,000 | 0.3% | |||||||
| Total/Wtd. Avg. | 303,297 | 100.0% | |||||||
| (1) | Information is based on the underwritten rent roll dated April 3, 2024. |
| (2) | Certain ratings are those of the parent company whether or not the parent company guarantees the lease. |
| (3) | Market by Macy’s will have the right, exercisable by written notice to the landlord within 90 days of December 31, 2028, to terminate the lease if the tenant’s gross sales beginning on January 1, 2028 and ending upon December 31, 2028, are less than $4,650,000. |
| This is not a research report and was not prepared by any Underwriter’s research department. Please see additional important information and qualifications at the end of this Term Sheet. | ||
| 85 | ||
| Retail – Anchored | Loan #6 | Cut-off Date Balance: | $40,000,000 | |
| 3630 Peachtree Parkway | Johns Creek Town Center | Cut-off Date LTV: | 67.7% | |
| Suwanee, GA 30024 | UW NCF DSCR: | 1.53x | ||
| UW NOI Debt Yield: | 11.5% |
The following table presents certain information relating to the lease rollover at the Johns Creek Town Center Property:
| Lease Rollover Schedule(1)(2) | ||||||||
| Year | # of Leases Rolling | SF Rolling | Approx. % of SF Rolling | Approx. Cumulative % of SF Rolling | Total UW Rent Rolling | Approx. % of Total UW Rent Rolling | Approx. Cumulative % of Total UW Rent Rolling | Total UW Rent PSF Rolling |
| MTM/2024 | 1 | 1,600 | 0.5% | 0.5% | $45,760 | 0.9% | 0.9% | $28.60 |
| 2025 | 5 | 37,560 | 12.4% | 12.9% | $773,723 | 15.2% | 16.1% | $20.60 |
| 2026 | 2 | 26,348 | 8.7% | 21.6% | $381,476 | 7.5% | 23.6% | $14.48 |
| 2027 | 5 | 105,594 | 34.8% | 56.4% | $1,100,943 | 21.6% | 45.3% | $10.43 |
| 2028 | 1 | 3,600 | 1.2% | 57.6% | $108,000 | 2.1% | 47.4% | $30.00 |
| 2029(3) | 5 | 47,005 | 15.5% | 73.1% | $976,151 | 19.2% | 66.6% | $20.77 |
| 2030 | 1 | 2,500 | 0.8% | 73.9% | $108,243 | 2.1% | 68.7% | $43.30 |
| 2031 | 2 | 5300 | 1.7% | 75.7% | $179,559 | 3.5% | 72.2% | $33.88 |
| 2032 | 1 | 31,000 | 10.2% | 85.9% | $449,500 | 8.8% | 81.1% | $14.50 |
| 2033 | 5 | 37990 | 12.5% | 98.4% | $821,488 | 16.2% | 97.2% | $21.62 |
| 2034 | 2 | 3,800 | 1.3% | 99.7% | $141,354 | 2.8% | 100.0% | $37.20 |
| 2035 & Thereafter | 0 | 0 | 0.0% | 99.7% | $0 | 0.0% | 100.0% | $0.00 |
| Vacant | 0 | 1,000 | 0.3% | 100.0% | $0 | 0.0% | 100.0% | $0.00 |
| Total/Wtd. Avg. | 30 | 303,297 | 100.0% | $5,086,196 | 100.00% | $16.83(4) | ||
| (1) | Information is based on the underwritten rent roll dated April 3, 2024. |
| (2) | Certain tenants may have lease termination options that are exercisable prior to the stated expiration date of the subject lease or leases which are not considered in the Lease Rollover Schedule. |
| (3) | The Johns Creek Town Center Mortgage Loan matures on July 1, 2029. |
| (4) | Total/Wtd. Avg. UW Rent PSF Rolling excludes vacant space. |
The Market. The Johns Creek Town Center Property is located in Suwanee, Georgia, within the Cumming/Forsyth County retail submarket of the Atlanta retail market. The Johns Creek Town Center Property is situated approximately 20 miles northeast of Atlanta and approximately 7 miles east of Alpharetta. The Johns Creek Town Center Property is situated at the northwest corner of Peachtree Parkway and McGinnis Ferry Road. Peachtree Parkway is a primary north-south traffic corridor. McGinnis Ferry Road is a primary east-west traffic corridor. The Johns Creek Town Center Property is also accessible via Johns Creek Parkway, a secondary commercial roadway. The area primarily serves as both a commercial and residential corridor that serves the Atlanta Metropolitan Area. National retailers located in the immediate area include Lowe’s Home Improvement, Kroger, Publix, TJ Maxx, Ross Dress For Less, Walmart Super Center, Target, H-Mart, and LA Fitness. Other uses in the immediate area include Northside Johns Creek Hospital, St. Marlo Country Club, St. Marlo Golf Club and the Standard Club. Northside Johns Creek Hospital, an academic medical center, is located across the street from the Johns Creek Town Center Property along McGinnis Ferry Road. The St. Marlo Country Club, a gated community that is situated on 900 acres and includes a 200 acre 18-hole golf course, is located approximately 1.2 miles from the Johns Creek Town Center Property along McGinnis Ferry Road.
According to the appraisal, as of the fourth quarter of 2023, the vacancy rate in the Cumming/Forsyth County retail submarket was approximately 1.8% with average asking rents of $23.59 and inventory of approximately 13.1 million SF. According to the appraisal, as of the fourth quarter of 2023, the vacancy rate in the Atlanta retail market was approximately 3.4% with average asking rents of $22.34 and inventory of approximately 373.8 million SF. According to the appraisal, the 2024 estimated population within a one-, three- and five-mile radius of the Johns Creek Town Center Property is 5,968, 75,352, and 193,803, respectively. The 2024 estimated average household income within the same one-, three- and five-mile radius was $172,750, $210,965, and $194,099, respectively.
| This is not a research report and was not prepared by any Underwriter’s research department. Please see additional important information and qualifications at the end of this Term Sheet. | ||
| 86 | ||
| Retail – Anchored | Loan #6 | Cut-off Date Balance: | $40,000,000 | |
| 3630 Peachtree Parkway | Johns Creek Town Center | Cut-off Date LTV: | 67.7% | |
| Suwanee, GA 30024 | UW NCF DSCR: | 1.53x | ||
| UW NOI Debt Yield: | 11.5% |
The following table presents information relating to sales of comparable properties to the Johns Creek Town Center Property identified in the appraisal:
| Comparable Sales Summary | ||||||
| Property/Location | Year Built/ Renovated | Rentable Area | Occupancy | Sale Date | Sales Price | Sales Price PSF |
Johns Creek Town Center Property (subject)(1) 3630 Peachtree Parkway Suwanee, GA | 2001 / NAP | 303,297 | 99.7% | May 2024 | $58,850,000(2) | $194.03 |
Maryville Commons 726 Watkins Road Maryville, TN | 2001 / 2018 | 61,775 | 100.0% | Sep. 2023 | $14,333,642 | $232.03 |
Peachtree Parkway Plaza 5450 Peachtree Parkway Norcross, GA | 1985 / NAP | 94,117 | 95.0% | Jan. 2023 | $19,500,000 | $207.19 |
Savannah Centre/Chatham Plaza 7400 Abercorn Street Savannah, GA | 1986 / 2015 | 384,119 | 98.0% | Jan. 2023 | $63,000,000 | $164.01 |
Town Center Commons 725 Ernest West Barrett Parkway Northwest Kennesaw, GA | 1998 / NAP | 72,168 | 96.0% | Dec. 2022 | $13,000,000 | $180.14 |
Barrett Pavilion 740 Ernest West Barrett Parkway Northwest Kennesaw, GA | 1995 / 2010 | 369,971 | 100.0% | Sep. 2022 | $58,750,000 | $158.80 |
McGowin Park 1250 Satchel Paige Drive Mobile, AL | 2015 / NAP | 374,858 | 98.0% | Jul. 2022 | $71,100,000 | $189.67 |
Source: Appraisal.
| (1) | Information is based on the underwritten rent roll dated April 3, 2024 other than Year Built/Renovated. |
| (2) | The Sales Price for the Johns Creek Town Center Property as stated in the related purchase and sale agreement was $58,850,000. The borrower was given credits to the purchase price for the Johns Creek Town Center Property in the following amounts: (i) $500,000 for property condition concessions, primarily related to the roof of the building, (ii) a negotiated $205,000 for concessions related to a then outstanding Michael’s lease estoppel to confirm there were no outstanding co-tenancy violations(which estoppel has since been provided), and (iii) $191,350 for leasing incentives, resulting in a net purchase price of $57,953,650. |
The following table presents recent anchor space and ground lease leasing data at comparable retail properties with respect to the Johns Creek Town Center Property:
| Comparable Leases Summary | |||||||
| Property/Location | Year Built | SF | Tenant Name | Tenant Size (SF) | Lease Date | Rent PSF | Lease Type |
Johns Creek Town Center Property (subject)(1) 3630 Peachtree Parkway Suwanee, GA | 2001 | 303,297 | Kohl’s Sprouts Farmers Market | 86,584 30,355 | Feb. 2022 Oct. 2024 | $8.95 $18.50 | NNN NNN |
Ace Hardware Store 3740 Village Way Braselton, GA | 2008 | 29,335 | Ace Hardware | 29,335 | Apr. 2023 | $20.11 | NNN |
2480 Briarcliff NE 2480 Briarcliff Road Northeast Atlanta, GA | 1985 | 85,313 | Guitar Center | 18,278 | Feb. 2023 | $22.00 | NNN |
Fayette Pavilion 72 Pavilion Parkway Fayetteville, GA | 1995 | 1,063,840 | Conn’s HomePlus | 23,528 | Jan. 2023 | $12.00 | NNN |
Crunch Fitness 3740 Buford Drive Buford, GA | 2022 | 24,800 | Crunch Fitness | 24,800 | Nov. 2022 | $20.30 | NNN |
6000 Medlock Bridge Parkway 6000 Medlock Bridge Parkway Johns Creek, GA | 1993 | 113,112 | No Longer Bound | 17,648 | Sep. 2022 | $13.00 | NNN |
Proposed Publix Anchored Shopping Center 10227 Alcovy Crossing Drive Covington, GA | 2022 | 62,787 | Publix | 48,387 | Aug. 2022 | $14.00 | NNN |
Source: Appraisal.
| (1) | Information is based on the underwritten rent roll dated April 3, 2024 other than Year Built. |
| This is not a research report and was not prepared by any Underwriter’s research department. Please see additional important information and qualifications at the end of this Term Sheet. | ||
| 87 | ||
| Retail – Anchored | Loan #6 | Cut-off Date Balance: | $40,000,000 | |
| 3630 Peachtree Parkway | Johns Creek Town Center | Cut-off Date LTV: | 67.7% | |
| Suwanee, GA 30024 | UW NCF DSCR: | 1.53x | ||
| UW NOI Debt Yield: | 11.5% |
The following table presents recent in-line and outparcel space leasing data at comparable retail properties with respect to the Johns Creek Town Center Property:
| Comparable Leases Summary | |||||||
| Property/Location | Year Built | SF | Tenant Name | Tenant Size (SF) | Lease Date | Rent PSF | Lease Type |
Johns Creek Town Center Property (subject)(1) 3630 Peachtree Parkway Suwanee, GA | 2001 | 303,297 | AT&T Chicken Salad Chick | 3,500 2,500 | Dec. 2020 Aug. 2020 | $42.00 $43.30 | NNN NNN |
Johns Creek Village 11720 Medlock Bridge Road Duluth, GA | 2003 | 205,808 | Asking European Wax Center | 1,646 1,600 | Apr. 2024 Jan. 2023 | $35.00 $34.00 | NNN NNN |
Abbotts Bridge Station 10820 Abbotts Bridge Road Johns Creek, GA | 1998 | 83,391 | Asking ROYCE Chocolate | 2,512 1,202 | Apr. 2024 Sep. 2023 | $30.00 $29.00 | NNN NNN |
Brookwood Marketplace 2615 Peachtree Parkway Suwanee, GA | 2005 | 197,099 | Asking Tikka Pizza | 3,000 1,400 | Apr. 2024 Jan. 2024 | $34.00 $32.00 | NNN NNN |
Freestanding Retail Building 7140 McGinnis Ferry Road Suwanee, GA | 2000 | 3,175 | TD Bank, N.A. | 3,175 | Jan. 2024 | $53.54 | NNN |
The Shoppes at Suwanee 1120 Peachtree Industrial Boulevard | 2008 | 36,892 | Slay Lash Boutique | 720 | Mar. 2023 | $24.00 | NNN |
Pure Taqueria 3108 Main Street Duluth, GA | 2012 | 3,000 | PURE Taqueria | 3,000 | Apr. 2022 | $36.00 | Absolute Net |
Source: Appraisal.
| (1) | Information is based on the underwritten rent roll dated April 3, 2024 other than Year Built. |
The following table presents information relating to the appraisal’s market rent conclusion for the Johns Creek Town Center Property:
| Market Rent Summary | ||||||
| Market Rent PSF | Escalations | Term (years) | Reimbursements | Tenant Allowances PSF (New/Renewal) | Leasing Commissions (New/Renewal) | |
| In-Line <5,000 SF | $33.00 | 3.0% / year | 5 | NNN | $40.00 / $0.00 | 6.0% / 3.0% |
| In-Line >5,000 SF | $23.00 | 3.0% / year | 5 | NNN | $40.00 / $0.00 | 6.0% / 3.0% |
| Anchor | $15.00 | 3.0% / year | 10 | NNN | $10.00 / $0.00 | 6.0% / 3.0% |
| Outparcel | $37.00 | 3.0% / year | 5 | NNN | $40.00 / $0.00 | 6.0% / 3.0% |
| Ground Lease | $10.00 | 3.0% / year | 10 | NNN | $10.00 / $0.00 | 6.0% / 3.0% |
Appraisal. The appraisal concluded to an “As-is” value for the Johns Creek Town Center Property of $59,100,000 as of April 7, 2024.
Environmental Matters. According to the Phase I environmental site assessment dated May 3, 2024, there was no evidence of any recognized environmental conditions at the Johns Creek Town Center Property.
| This is not a research report and was not prepared by any Underwriter’s research department. Please see additional important information and qualifications at the end of this Term Sheet. | ||
| 88 | ||
| Retail – Anchored | Loan #6 | Cut-off Date Balance: | $40,000,000 | |
| 3630 Peachtree Parkway | Johns Creek Town Center | Cut-off Date LTV: | 67.7% | |
| Suwanee, GA 30024 | UW NCF DSCR: | 1.53x | ||
| UW NOI Debt Yield: | 11.5% |
Operating History and Underwritten Net Cash Flow. The following table presents certain information relating to the historical operating performance and the Underwritten Net Cash Flow at the Johns Creek Town Center Property:
| Cash Flow Analysis | ||||||
| 2021 | 2022 | 2023 | 3/31/2024 TTM(1) | UW(1) | UW PSF | |
| Gross Potential Rent | $4,078,659 | $4,188,172 | $4,210,669 | $4,403,939 | $5,119,196(2) | $16.88 |
| Reimbursements | $583,413 | $657,136 | $680,997 | $655,840 | $857,745 | $2.83 |
| Other Income | $111,205 | $52,401 | $37,210 | $31,456 | $31,456 | $0.10 |
| (Vacancy / Credit Loss) | $6,794 | $11,241 | $0 | ($1,605) | ($300,420) | ($0.99) |
| Effective Gross Income | $4,780,070 | $4,908,950 | $4,928,876 | $5,089,629 | $5,707,977 | $18.82 |
| Real Estate Taxes | $318,824 | $339,764 | $304,853 | $300,597 | $469,870 | $1.55 |
| Insurance | $82,854 | $85,338 | $99,299 | $99,299 | $106,154 | $0.35 |
| Other Operating Expenses | $547,911 | $519,852 | $573,715 | $559,092 | $530,031 | $1.75 |
| Total Operating Expenses | $949,589 | $944,954 | $977,867 | $958,988 | $1,106,055 | $3.65 |
| Net Operating Income | $3,830,482 | $3,963,996 | $3,951,009 | $4,130,642 | $4,601,922 | $15.17 |
| Replacement Reserves | $0 | $0 | $0 | $0 | $63,301 | $0.21 |
| TI/LC | $0 | $0 | $0 | $0 | $306,330 | $1.01 |
| Net Cash Flow | $3,830,482 | $3,963,996 | $3,951,009 | $4,130,642 | $4,232,291 | $13.95 |
| Occupancy (%)(3) | NAV | NAV | NAV | 99.7% | 95.0% | |
| NOI DSCR | 1.39x | 1.44x | 1.43x | 1.50x | 1.67x | |
| NCF DSCR | 1.39x | 1.44x | 1.43x | 1.50x | 1.53x | |
| NOI Debt Yield | 9.6% | 9.9% | 9.9% | 10.3% | 11.5% | |
| NCF Debt Yield | 9.6% | 9.9% | 9.9% | 10.3% | 10.6% | |
| (1) | The increase in Gross Potential Rent and Net Operating Income from 3/31/2024 TTM to UW is primarily due to six new leases signed between August 1, 2023 and April 1, 2024 for the tenants HomeGoods, Read It Again, Uni Uni Bubble Tea, CleanEatz, The Joint and 4Ever Young. |
| (2) | UW Gross Potential Rent is based on the underwritten rent roll dated April 3, 2024 and includes rent steps underwritten through May 1, 2025 totaling $14,269. Tenants with rent in excess of 110% of market rent as determined by the appraisal have been adjusted to reflect 110% of the market rent. Gross Potential Rent reflects a mark-to-market adjustment of $27,599. |
| (3) | UW Occupancy (%) represents economic occupancy. Historical occupancies are not available as the seller of the Johns Creek Town Center Property did not provide such information at the time of the acquisition. 3/31/2024 TTM Occupancy (%) is based on the underwritten rent roll dated April 3, 2024. |
Escrows and Reserves.
Deferred Maintenance –The Johns Creek Town Center Mortgage Loan documents require the borrower to deposit $30,500 into an upfront reserve for deferred maintenance, including clearance of multiple fire code violations. In addition, the borrower is required to complete various repairs, including repairs of pavement and sidewalk cracks, repainting and repairing of Kohl’s rear elevation, cleaning of brick and exterior insulation and finishing systems, and repair of metal canopy and damaged ceiling systems, for which no reserves were deposited.
Real Estate Taxes – The Johns Creek Town Center Mortgage Loan documents require the borrower to deposit approximately $237,059 into an upfront reserve for real estate taxes. In addition, the Johns Creek Town Center Mortgage Loan documents require ongoing monthly deposits into a reserve for real estate taxes in an amount equal to 1/12 of the real estate taxes that the lender estimates will be payable during the next twelve months for the Johns Creek Town Center Property (initially $26,340 a month).
Insurance – The borrower is not required to make deposits into a reserve for insurance premiums for the Johns Creek Town Center Property so long as (i) the liability and casualty insurance policies covering the Johns Creek Town Center Property are part of a blanket or umbrella policy approved by the lender in its reasonable discretion, (ii) no event of default is continuing under the Johns Creek Town Center Mortgage Loan documents, (iii) the borrower provides the lender with evidence of renewal of such insurance policies and paid receipts for the insurance premiums no later than 10 days prior to their expiration and (iv) if the insurance premiums are paid in installments through a financing arrangement, the borrower provides the lender with reasonable evidence that each installment payment has been timely paid in full. If such conditions are not satisfied, the Johns Creek Town Center Mortgage Loan documents provide for ongoing monthly deposits into a reserve for insurance premiums in an amount equal to 1/12 of the insurance premiums that the lender estimates will be payable for the renewal of coverage upon the expiration of the insurance policies.
Replacement Reserve – The Johns Creek Town Center Mortgage Loan documents provide for ongoing monthly deposits of approximately $5,275 into a reserve for capital expenditures.
TI/LC Reserve – The Johns Creek Town Center Mortgage Loan documents provide for ongoing monthly deposits of approximately $12,637 into a reserve for future tenant improvement and leasing commission expenses. In addition, upon a Cash Sweep Event Period (as defined below) other than (i) a Lease Sweep Period (as defined below) or (ii) an event of default under the Johns Creek Town Center Mortgage Loan, all Excess Cash Flow (as defined below) is required to be deposited into the TI/LC reserve as described under “Lockbox and Cash Management” below.
Lease Sweep Reserve – The Johns Creek Town Center Mortgage Loan documents provide that if a Lease Sweep Period is continuing, all Excess Cash Flow is required to be deposited into a lease sweep reserve as described under “Lockbox and Cash Management” below. However, if the Lease Sweep
| This is not a research report and was not prepared by any Underwriter’s research department. Please see additional important information and qualifications at the end of this Term Sheet. | ||
| 89 | ||
| Retail – Anchored | Loan #6 | Cut-off Date Balance: | $40,000,000 | |
| 3630 Peachtree Parkway | Johns Creek Town Center | Cut-off Date LTV: | 67.7% | |
| Suwanee, GA 30024 | UW NCF DSCR: | 1.53x | ||
| UW NOI Debt Yield: | 11.5% |
Period was triggered solely pursuant to pursuant to clauses (i), (ii), (iii) or (iv) of the definition of Lease Sweep Period, at the borrower’s option, the borrower may avoid depositing all Excess Cash Flow into the lease sweep reserve by depositing with the lender either cash or a letter of credit in the amount of $700,000.
Tenant Inducement Reserve – The Johns Creek Town Center Mortgage Loan documents require the borrower to deposit approximately $168,921 into an upfront reserve for outstanding tenant improvements and leasing commissions for two tenants.
Lockbox and Cash Management. The Johns Creek Town Center Mortgage Loan is structured with a hard lockbox and springing cash management. The borrower is required to establish and maintain a lockbox account for the benefit of the lender, to direct all tenants that do not pay rent by paper check to deposit rents directly into the lockbox account and to direct all tenant that pay rent by paper check to deposit rents into a check clearing lockbox (the “Yardi Lockbox”) maintained by Yardi Systems, Inc. (“Yardi”). In addition, the borrower is required to cause all rents deposited into the Yardi Lockbox to be transferred to the lockbox account within two business days of deposit into the Yardi Lockbox. The borrower was also required, within three business days after the origination date, to send a written notice to Yardi Systems, Inc. directing it to make such transfers. In addition, from and after an event of default under the Johns Creek Town Center Mortgage Loan, the borrower is required to direct all tenants to deposit rents directly into the lockbox account. If notwithstanding such directions, the borrower, property manager or any rent check lockbox provider (including Yardi) acting on their behalf receives any rents then the borrower or property manager is required to deposit them into the lockbox account within two business days of receipt.
If no Cash Sweep Event Period exists, all funds in the lockbox account will be transferred to the borrower’s account. Upon the occurrence of a Cash Sweep Event Period, the lender is required to establish a lender-controlled cash management account. During a Cash Sweep Event Period, all funds in the lockbox account are required to be swept to the cash management account and, provided no event of default is continuing under the Johns Creek Town Center Mortgage Loan documents, applied on each monthly payment date: (i) to make the monthly deposits into the real estate tax reserve and insurance reserve, if any, as described above under “Escrows and Reserves,” (ii) to pay debt service on the Johns Creek Town Center Mortgage Loan, (iii) to make the monthly deposits into the replacement reserve and TI/LC reserve, if any, as described above under “Escrows and Reserves,” (iv) to pay operating expenses set forth in the lender-approved annual budget and lender-approved extraordinary expenses, (v) to pay the scheduled payment of interest and principal (if applicable) due under the Johns Creek Town Center Mezzanine Loan and (vi) to deposit all remaining amounts (“Excess Cash Flow”) in the following order of priority (1) during a Lease Sweep Period, into the lease sweep reserve; (2) for any Cash Sweep Event Period other than (A) a Lease Sweep Period or (B) an event of default under the Johns Creek Town Center Mortgage Loan, to the TI/LC reserve to be held and used to pay tenant improvements and leasing commissions for leases entered into after the origination date, and (3) during an event of default under the Johns Creek Town Center Mortgage Loan, to an excess cash flow reserve, to be held as additional security for the Johns Creek Town Center Mortgage Loan; provided that during an event of default the lender will have the right to apply funds in the cash management account to any obligations under the Johns Creek Town Center Mortgage Loan in such priority as it may determine in its sole discretion.
“Cash Sweep Event Period” means a period:
| (i) | commencing upon an event of default under the Johns Creek Town Center Mortgage Loan documents, and ending upon the cure (if applicable) of such event of default; or |
| (ii) | commencing upon the combined debt service coverage ratio of the Johns Creek Town Center Mortgage Loan and Johns Creek Town Center Mezzanine Loan being less than 1.10x at the end of any calendar year and ending upon either (A) the date such combined debt service coverage ratio is equal to or greater than 1.10x for four consecutive calendar quarters or (B) the delivery to the lender of cash or a letter of credit in an amount which, if applied to repay the then outstanding principal balance and the combined debt service on the Johns Creek Town Center Mortgage Loan and Johns Creek Town Center Mezzanine Loan was recalculated on the then outstanding principal balance after the application of such funds, would result in the combined debt service coverage ratio being at least 1.10x; or |
| (iii) | commencing upon a Lease Sweep Period and ending upon the termination of such Lease Sweep Period; or |
| (iv) | commencing upon an event of default under the Johns Creek Town Center Mezzanine Loan and ending upon the receipt by the lender of a notice from the mezzanine lender that such event of default has been cured or waived. |
“Lease Sweep Period” means a period:
| (i) | commencing upon any default under a Lease Sweep Lease (as defined below) that continues beyond any applicable notice and/or cure periods, and ending upon either (A) the lender receiving reasonably satisfactory evidence that the tenant under the Lease Sweep Lease has cured all defaults under the Lease Sweep Lease, and the Lease Sweep Lease is in full force and effect or (B) the Lease Sweep Lease space is leased pursuant to a replacement lease or leases with an initial term that extends at least three years beyond the maturity date of the Johns Creek Town Center Mortgage Loan, containing market economic terms, and otherwise reasonably approved by the lender and the Occupancy Conditions (as defined below) have been satisfied (a “Replacement Lease Cure”); or |
| (ii) | commencing upon any tenant under a Lease Sweep Lease going dark in its space (or any substantial portion of it), other than temporary cessation or closure of normal business operations for not more than 120 consecutive days in the ordinary course of business or in connection with a governmental order or for not more than 120 days for renovations, and ending upon either (A) the lender receiving reasonably satisfactory evidence that the tenant under the Lease Sweep Lease is in actual physical possession of its space, open for business, has no longer gone dark in all or a substantial portion of its space and is paying full unabated rent or (B) a Replacement Lease Cure; or |
| (iii) | commencing upon the date that a Lease Sweep Lease is surrendered, cancelled or terminated prior to its then current expiration date (or the borrower receives written notice that the tenant intends to take such action) and ending upon either (A) the tenant under the Lease Sweep Lease having irrevocably revoked or rescinded in writing all vacating, termination or cancellation notices or otherwise indicating in writing its intention to not terminate, cancel or surrender the Lease Sweep Lease or vacate its space and such tenant is paying full unabated contractual rent and is open for business or (B) a Replacement Lease Cure; or |
| (iv) | commencing upon any voluntary or involuntary insolvency or bankruptcy action of any tenant under a Lease Sweep Lease and ending upon either (A) such tenant no longer being insolvent or subject to any bankruptcy or insolvency proceedings and the applicable Lease Sweep Lease having been affirmed pursuant to a final, non-appealable order of a court of competent jurisdiction or such bankruptcy or insolvency proceedings having been dismissed or withdrawn or (B) a Replacement Lease Cure; or |
| This is not a research report and was not prepared by any Underwriter’s research department. Please see additional important information and qualifications at the end of this Term Sheet. | ||
| 90 | ||
| Retail – Anchored | Loan #6 | Cut-off Date Balance: | $40,000,000 | |
| 3630 Peachtree Parkway | Johns Creek Town Center | Cut-off Date LTV: | 67.7% | |
| Suwanee, GA 30024 | UW NCF DSCR: | 1.53x | ||
| UW NOI Debt Yield: | 11.5% |
| (v) | commencing upon the date that is six months prior to the earliest stated expiration date set forth in the Lease Sweep Lease and ending upon either (A) the tenant under the Lease Sweep Lease having renewed or extended its Lease Sweep Lease and all Occupancy Conditions (as defined below) having been satisfied or (B) a Replacement Lease Cure. |
“Lease Sweep Lease” means the Kohl’s lease or any lease that is replacement lease for the space originally demised pursuant to the Kohl’s lease.
“Occupancy Conditions” means that the lender has received reasonably satisfactory evidence that, among other things, the applicable tenant has taken occupancy of the entire Lease Sweep Lease space that is leased to such tenant, such lease is in full force and effect, with no outstanding defaults, and all contingencies to the effectiveness of such lease have been satisfied, all leasing commissions and tenant improvements or other landlord obligations of an inducement nature have been completed or reserved for and the applicable tenant has begun to pay full contractual rent (or all rent abatements and free rent periods have been reserved for).
Mezzanine Loan. Concurrently with the origination of the Johns Creek Town Center Mortgage Loan, a $10,000,000 mezzanine loan (the “Johns Creek Town Center Mezzanine Loan” and together with the Johns Creek Town Center Mortgage Loan, the “Johns Creek Town Center Total Debt”) was funded by KRCX Capital Company, LLC, and is secured by the mezzanine borrower’s direct equity interests in the borrower. The lenders under the Johns Creek Town Center Mortgage Loan and Johns Creek Town Center mezzanine Loan have entered into an intercreditor agreement. The mezzanine borrower is required under the Johns Creek Town Center Mezzanine Loan to make monthly interest only payments to the mezzanine lender. The Johns Creek Town Center Mezzanine Loan is coterminous with the Johns Creek Town Center Mortgage Loan, and accrues interest at the rate of 12.000% per annum. However, on any payment date, the mezzanine borrower may elect to pay interest currently at the rate of 10.000% per annum (the “10% Rate”), and to defer payment of the remaining interest. In addition, at any time that a Cash Sweep Event Period under the Johns Creek Town Center Mortgage Loan is likely to occur due to the combined debt service coverage ratio of the Johns Creek Town Center Mortgage Loan and the Johns Creek Town Center Mezzanine Loan falling below 1.10x at the end of any calendar year, commencing on the beginning of the next calendar year, the mezzanine borrower may elect to pay interest currently at the rate of 8.000% per annum (the “8% Rate”), and to defer payment of the remaining interest. If (x) the Cash Sweep Event Period is cured (either due to an increase in net operating income or by providing collateral) or (y) the mezzanine lender determines that the debt service coverage ratio (using the 10% Rate) does not result in the commencement of a Cash Sweep Event Period under the Johns Creek Town Center Mortgage Loan, the rate at which the mezzanine borrower may elect to pay current interest will revert to the 10% Rate (effective as of the beginning of the applicable calendar month when such event occurs). During any period in which the mezzanine borrower pays interest at the 8.00% Rate, the difference between the 10% Rate and the 8% Rate will be compounded monthly at the rate of 12% per annum and added to the Deferred Interest (as defined below). Interest deferred due to the payment of current interest at the 10% Rate or 8% Rate (the “Deferred Interest”), will be payable on the maturity date of the Johns Creek Town Center Mezzanine Loan or such earlier date on which the Johns Creek Town Center Mezzanine Loan may be due and payable. In addition, during any period the mezzanine borrower is entitled to pay current interest at the 8% Rate, it may nevertheless elect to pay current interest at the 10% Rate or at the full 12.00% interest rate.
| Johns Creek Town Center Total Debt Summary | |||||
| Loan | Original Balance | Interest Rate | Cumulative UW NCF DSCR | Cumulative UW NOI Debt Yield | Cumulative Cut-off Date LTV Ratio |
| Mortgage Loan | $40,000,000 | 6.8000% | 1.53x | 11.5% | 67.7% |
| Mezzanine Loan | $10,000,000 | 12.000%(1) | 1.07x | 9.2% | 84.6% |
| Total/Weighted Average | $50,000,000 | 7.8400%(1) | |||
| (1) | The Weighted Average Interest Rate and Mezzanine Loan Cumulative UW NCF DSCR is calculated based on the current interest accrued on the Johns Creek Town Center Mezzanine Loan at the full rate of 12.000% per annum, and the Cumulative UW NOI Debt Yield and Cumulative Cut-off Date LTV Ratio are calculated based on the original principal balance of the Johns Creek Town Center Mezzanine Loan, without giving effect to any Deferred Interest. Because of the accrual and (to the extent described above) compounding of Deferred Interest on the Johns Creek Town Center Mezzanine Loan, the amount due on the Johns Creek Town Center Mezzanine Loan at the coterminous maturity of the Johns Creek Town Center Mortgage Loan and Johns Creek Town Center Mezzanine Loan, assuming no prepayments or defaults, will be increased by such Deferred Interest amount, which, assuming no prepayments or defaults, would be $1,000,000 assuming that interest is paid currently at the 10% Rate for the entire mezzanine loan term and $2,361,161 assuming that interest is paid currently at the 8% Rate for the entire mezzanine loan term. If such Deferred Interest amount were included in the calculation of the UW NOI Debt Yield at Maturity and Maturity Date LTV Ratio, Deferred Interest assuming a current pay rate of the 10% Rate would result in a Total Debt UW NOI Debt Yield at Maturity and Total Debt Maturity Date LTV Ratio of 9.0% and 86.3%, respectively, and Deferred Interest assuming a current pay rate of the 8% Rate would result in a Total Debt UW NOI Debt Yield at Maturity and Total Debt Maturity Date LTV Ratio of 8.8% and 88.6%, respectively. |
Release of Property. The borrower is permitted, following the defeasance lockout period, to obtain the release of an outparcel (the “John’s Creek Release Parcel”) improved with a 16,000 SF multi-tenant building that as of the origination date was 100% leased to 5 tenants: Mattress Firm, AT&T, Music & Arts, Chicken Salad Chick and C2 Education Center, provided that the borrower satisfies the following conditions, among others; (i) the borrower defeases an amount equal to 110% of the allocated loan amount of the John’s Creek Release Parcel (which allocated loan amount is $3,993,000), (ii) the combined debt yield (based on the Johns Creek Town Center Mortgage Loan and the Johns Creek Town Center Mezzanine Loan) following such release must be at least equal to the higher of the debt yield immediately prior to such release and 8.5%, (iii) the combined loan-to-value ratio (based on the Johns Creek Town Center Mortgage Loan and the Johns Creek Town Center Mezzanine Loan) following such release may not be greater than the lower of the loan-to-value ratio immediately prior to such release and 84.6%, (iv) conditions related to REMIC compliance, and (v) conditions related to separate zoning lots.
Right of First Refusal. The Johns Creek Town Center mezzanine lender has a right of first refusal to purchase the Johns Creek Town Center Property. Such right of first refusal does not apply to any sale of the Johns Creek Town Center Property pursuant to a private power of sale under or judicial foreclosure of any mortgage or other security instrument or device to which the borrower’s interest in the Johns Creek Town Center Property is subject, or any other exercise of rights available to the lender pursuant to the Johns Creek Town Center Mortgage Loan documents, or to any transfer of the borrower's interest in the Johns Creek Town Center Property to the holder of a mortgage (or its designee), or other holder of a security interest therein or its designee, by deed in lieu of foreclosure or otherwise. However, such right of first refusal may apply to subsequent transfers. In addition, such right of first refusal will not exist during the continuation of an event of default under the Johns Creek Town Center Mortgage Loan, unless the sale as to which such right of first refusal applies contemplates paying off the Johns Creek Town Center Mortgage Loan in full, and the Johns Creek Town Center Mortgage Loan may at that time be prepaid, subject to all the prepayment terms set forth in the Johns Creek Town Center Mortgage Loan documents.
| This is not a research report and was not prepared by any Underwriter’s research department. Please see additional important information and qualifications at the end of this Term Sheet. | ||
| 91 | ||
| Retail – Anchored | Loan #6 | Cut-off Date Balance: | $40,000,000 | |
| 3630 Peachtree Parkway | Johns Creek Town Center | Cut-off Date LTV: | 67.7% | |
| Suwanee, GA 30024 | UW NCF DSCR: | 1.53x | ||
| UW NOI Debt Yield: | 11.5% |
Terrorism Insurance. The borrower is required to obtain and maintain an “all risk” property insurance policy that covers perils of terrorism and acts of terrorism in an amount equal to the “full replacement cost” of the Johns Creek Town Center Property together with 12 months of business income insurance with a 6-month extended period of indemnity; provided that if “acts of terrorism” or “fire following” such acts or events are excluded from such policies, the borrower is required to obtain an endorsement to such policies or a separate policy insuring against such excluded acts or events in the amounts set forth above. For so long as the Terrorism Risk Insurance Act of 2002, as extended and modified by the Terrorism Risk Insurance Program Reauthorization Act of 2015 (“TRIPRA”) is in effect (including any extensions thereof or if another federal governmental program is in effect relating to “acts of terrorism” which provides substantially similar protections as TRIPRA) and continues to cover both foreign and domestic acts of terrorism, the lender is required to accept terrorism insurance which covers against “covered acts” as defined by TRIPRA (or such other program). See “Risk Factors—Risks Relating to the Mortgage Loans—Terrorism Insurance May Not Be Available for All Mortgaged Properties” in the prospectus
| This is not a research report and was not prepared by any Underwriter’s research department. Please see additional important information and qualifications at the end of this Term Sheet. | ||
| 92 | ||
| Hospitality – Full Service | Loan #7 | Cut-off Date Balance: | $37,250,000 | |
| 3450 International Boulevard | Embassy Suites Atlanta Airport North | Cut-off Date LTV: | 61.1% | |
| Hapeville, GA 30354 | UW NCF DSCR: | 1.45x | ||
| UW NOI Debt Yield: | 13.0% |

| This is not a research report and was not prepared by any Underwriter’s research department. Please see additional important information and qualifications at the end of this Term Sheet. | ||
| 93 | ||
| Hospitality – Full Service | Loan #7 | Cut-off Date Balance: | $37,250,000 | |
| 3450 International Boulevard | Embassy Suites Atlanta Airport North | Cut-off Date LTV: | 61.1% | |
| Hapeville, GA 30354 | UW NCF DSCR: | 1.45x | ||
| UW NOI Debt Yield: | 13.0% |
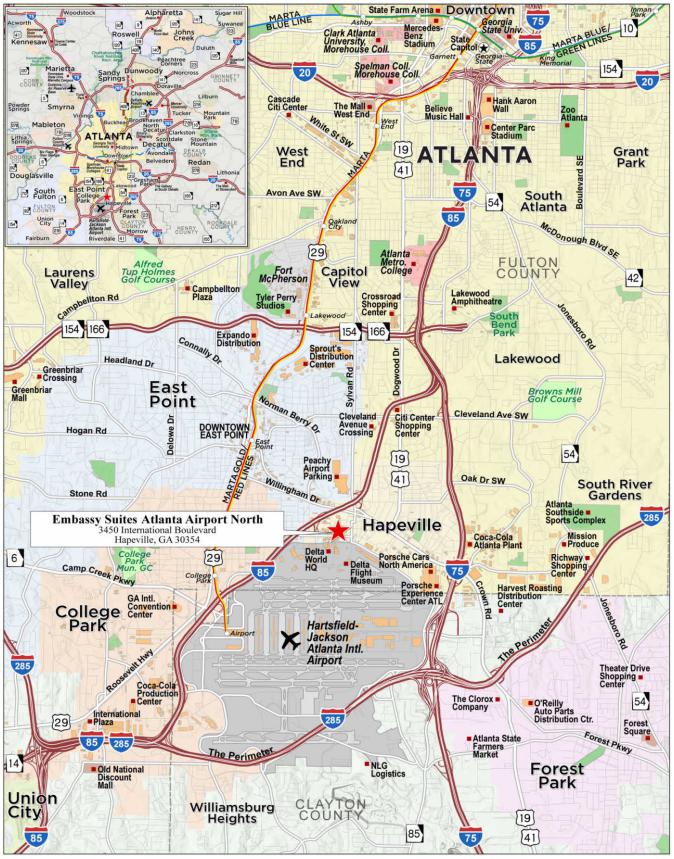
| This is not a research report and was not prepared by any Underwriter’s research department. Please see additional important information and qualifications at the end of this Term Sheet. | ||
| 94 | ||
| Mortgage Loan No. 7 – Embassy Suites Atlanta Airport North |
| Mortgage Loan Information | Property Information | ||||||
| Mortgage Loan Seller: | MSMCH | Single Asset/Portfolio: | Single Asset | ||||
| Credit Assessment (Fitch/Moody’s/DBRSM): | NR/NR/NR | Location: | Hapeville, GA 30354 | ||||
| Original Balance: | $37,250,000 | General Property Type: | Hospitality | ||||
| Cut-off Date Balance: | $37,250,000 | Detailed Property Type: | Full Service | ||||
| % of Initial Pool Balance: | 5.4% | Title Vesting: | Fee | ||||
| Loan Purpose: | Refinance | Year Built/Renovated: | 2022/NAP | ||||
| Borrower Sponsor: | Niteshkumar Patel | Size: | 178 Rooms | ||||
| Guarantor: | Niteshkumar Patel | Cut-off Date Balance Per Room: | $209,270 | ||||
| Mortgage Rate: | 8.0400% | Maturity Date Balance Per Room: | $209,270 | ||||
| Note Date: | 7/1/2024 | Property Manager: | Yashodhar Management Co., LLC | ||||
| Maturity Date: | 7/1/2029 | (borrower-related) | |||||
| Term to Maturity: | 60 months | Underwriting and Financial Information | |||||
| Amortization Term: | 0 months | UW NOI: | $4,841,482 | ||||
| IO Period: | 60 months | UW NCF: | $4,389,204 | ||||
| Seasoning: | 1 month | UW NOI Debt Yield: | 13.0% | ||||
| Prepayment Provisions: | L(25),D(28),O(7) | UW NCF Debt Yield: | 11.8% | ||||
| Lockbox/Cash Mgmt Status: | Springing/Springing | UW NOI Debt Yield at Maturity: | 13.0% | ||||
| Additional Debt Type: | NAP | UW NCF DSCR: | 1.45x | ||||
| Additional Debt Balance: | NAP | Most Recent NOI: | $4,875,114 (5/31/2024 TTM) | ||||
| Future Debt Permitted (Type): | No (NAP) | 2nd Most Recent NOI: | $4,713,259 (12/31/2023) | ||||
| 3rd Most Recent NOI(2): | NAP | ||||||
| Most Recent Occupancy: | 96.4% (5/31/2024) | ||||||
| Reserves(1) | 2nd Most Recent Occupancy: | 95.9% (12/31/2023) | |||||
| Type | Initial | Monthly | Cap | 3rd Most Recent Occupancy(2): | NAP | ||
| RE Tax: | $251,100 | $27,900 | NAP | Appraised Value (as of): | $61,000,000 (4/25/2024) | ||
| Insurance: | $30,423 | $10,141 | NAP | Appraised Value Per Room: | $342,697 | ||
| FF&E Reserve: | $0 | $37,690 | NAP | Cut-off Date LTV Ratio: | 61.1% | ||
| PIP Reserve: | $0 | Springing | NAP | Maturity Date LTV Ratio: | 61.1% | ||
| Sources and Uses | ||||||
| Sources | Proceeds | % of Total | Uses | Proceeds | % of Total | |
| Loan Amount: | $37,250,000 | 100.0% | Loan Payoff: | $32,149,731 | 86.3% | |
| Return of Equity: | $4,104,766 | 11.0% | ||||
| Upfront Reserves: | $281,523 | 0.8% | ||||
| Closing Costs: | $713,979 | 1.9% | ||||
| Total Sources: | $37,250,000 | 100.00% | Total Uses: | $37,250,000 | 100.0% | |
| (1) | See “Escrows and Reserves” below for further discussion of reserve requirements. |
| (2) | The Embassy Suites Atlanta Airport North Property (as defined below) was built in 2022. Historical NOI and Occupancy are not applicable prior to 2023. |
The Mortgage Loan. The seventh largest mortgage loan (the “Embassy Suites Atlanta Airport North Mortgage Loan”) is evidenced by a promissory note in the original principal amount of $37,250,000 and secured by a fee mortgage encumbering a 178-room full service hospitality property located in Hapeville, Georgia (the “Embassy Suites Atlanta Airport North Property”).
The Borrower and the Borrower Sponsor. The borrower for the Embassy Suites Atlanta Airport North Mortgage Loan is Lamodar, LLC, a single-purpose, Georgia limited liability company with one independent director in its organizational structure. The borrower is 30% owned by Karma Acquisitions, LLC, 20% by Keeane Holdings, LLC, 20% by Javantibhai Patel (“Jay Patel”), 20% by Niteshkumar Patel (“Nick Patel”), and 10% by Jagruti Patel. Nick Patel is the borrower sponsor and non-recourse carve-out guarantor for the Embassy Suites Atlanta Airport North Mortgage Loan, and serves as the managing member of Lamador, LLC. Jay Patel and Nick Patel are respectively the chairman and Chief Operating Officer of YM Hospitality, a full-service hospitality management company based in Stockbridge, Georgia. YM Hospitality has a current portfolio of 13 full and select service hotels, each under a Hilton, Marriott, IHG, or Wyndham flag, 11 of which are in Georgia. Jay Patel has over 30 years of hospitality experience and has served as a director of the Asian American Hotel Owners Association. Nick Patel has over 25 years of hotel experience, as well as experience in construction and renovation management.
The Property. The Embassy Suites Atlanta Airport North Property is a seven-story, 178-room, full service hospitality property built on a 2.7-acre site in Hapeville, Georgia. The Embassy Suites Atlanta Airport North Property was built in 2022 and was opened in May 2022. Featured amenities include approximately 4,521 SF of meeting and event space, the Brickstones Kitchen and Bar, complimentary breakfast area, complimentary evening reception, a concierge desk, an indoor pool, a business center, a fitness center, a sundry shop and complimentary high-speed internet access. The Embassy Suites Atlanta Airport North Property also offers ample surface parking both onsite and via a lease agreement with a nearby office building, as well as park and fly options for an additional charge, and operates a complimentary shuttle to the Atlanta Airport. Onsite overnight parking for guests is $20 per night.
| This is not a research report and was not prepared by any Underwriter’s research department. Please see additional important information and qualifications at the end of this Term Sheet. | ||
| 95 | ||
| Hospitality – Full Service | Loan #7 | Cut-off Date Balance: | $37,250,000 | |
| 3450 International Boulevard | Embassy Suites Atlanta Airport North | Cut-off Date LTV: | 61.1% | |
| Hapeville, GA 30354 | UW NCF DSCR: | 1.45x | ||
| UW NOI Debt Yield: | 13.0% |
The guestroom mix at the Embassy Suites Atlanta Airport North Property is comprised of 73 king suites, 57 suites with two queen beds, 40 king studio bedrooms, three ADA king suites, three ADA suites with two queen beds, and two ADA king studio bedrooms. Guestrooms are accessible via three passenger elevators and one service elevator, and room amenities feature a work area, nightstand, dresser, sofa chair, flat screen television, internet, iron and ironing board and coffee maker.
The Embassy Suites Atlanta Airport North Property is currently subject to a franchise agreement expiring January 31, 2041 with Hilton Franchise Holding LLC, which is wholly owned by Hilton Worldwide Holdings, Inc. (NYSE: HLT).
According to the appraisal, the property segmentation at the Embassy Suites Atlanta Airport North Property is estimated at 65% commercial, 10% meeting and group and 25% leisure.
The Market. The Embassy Suites Atlanta Airport North Property is located in Hapeville, Georgia, approximately 7.0 miles southwest of the Atlanta CBD and less than one mile away from the Hartsfield-Jackson Atlanta International Airport (ATL). The immediate neighborhood land use is primarily commercial with numerous industrial buildings, restaurants, retail uses and hotels. While the area includes numerous business and industrial parks proximate to the airport, there are several residential and multi-family apartment developments surrounding the airport area. Aside from ATL, primary demand generators include Delta Air Lines which has its headquarters on the north side of the airport off Delta Boulevard two blocks south of the subject, and accounts for 58 guaranteed room nights per night, with an option for an additional 20 rooms per night, under a contract that was most recently renewed on June 1, 2024 through May 31, 2026. The Atlanta region draws corporate demand from the numerous headquarters and regional offices in the surrounding area in addition to the Delta headquarters. The Georgia International Convention Center is located approximately three miles southwest. Access to the surrounding area is considered excellent with I-85, I-75 and I-285 having numerous exits that lead to the neighborhood, and the Metropolitan Atlanta Rapid Transit Authority (MARTA) has train and bus stops throughout the area, including direct access to ATL terminals. New developments underway in the neighborhood include Six West, a major planned 311-acre mixed-use development on the north side of Camp Creek Parkway, west of I-85 and the airport encompassing up to 10 million SF of Class A office space, six new hotels, restaurants, retail and residential space at an expected cost of $3 billion to $3.5 billion.
According to the appraisal, the estimated 2023 population within a one-, three-, and five-mile radius of the Embassy Suites Atlanta Airport North Property was 5,543, 46,860, and 188,246, respectively. According to the appraisal, the 2023 average household income within the same radii was $69,648, $61,055, and $55,466, respectively.
The following table presents the primary competitive properties to the Embassy Suites Atlanta Airport North Property:
| Competitive Property Summary(1) | ||||||||
| Property | Year Built | Rooms | Commercial | Meeting & Group | Leisure | 2023 Occupancy | 2023 ADR | 2023 RevPAR |
| Embassy Suites Atlanta Airport North Property (subject) | 2022 | 178 | 65% | 10% | 25% | 95.9% | $152.01 | $145.74 |
| Sonesta Select Atlanta Airport North | 1990 | 152 | 65% | 10% | 25% | 60%-65% | $85-$90 | $55-$60 |
| DoubleTree by Hilton Hotel Atlanta Airport | 1965 | 220 | 65% | 10% | 25% | 90%-95% | $100-$110 | $95-$100 |
| Hyatt Place Atlanta Airport North | 2002 | 150 | 65% | 5% | 30% | 65%-70% | $90-$95 | $60-$65 |
| Hotel Indigo Atlanta Airport College Park | 2012 | 142 | 65% | 5% | 30% | 70%-75% | $115-$125 | $85-$90 |
| Kimpton Overland Hotel Atlanta Airport | 2017 | 214 | 55% | 10% | 35% | 65%-70% | $145-$155 | $95-$100 |
| Subtotal/Average | 1,056 | 63% | 8% | 28% | 78% | $120.46 | $93.91 | |
Source: Appraisal.
| (1) | The variances between the underwriting, the appraisal and industry report data with respect to occupancy, ADR and RevPAR at the Embassy Suites Atlanta Airport North Property are attributable to variances in reporting methodologies and/or timing differences. |
The following table presents certain information relating to the Occupancy, ADR and RevPAR of the Embassy Suites Atlanta Airport North Property and its competitive set:
| Historical Occupancy, ADR, RevPAR(1)(2)(3) | |||||||||
| Competitive Set | Embassy Suites Atlanta Airport North Property | Penetration Factor | |||||||
| Year | Occupancy | ADR | RevPAR | Occupancy | ADR | RevPAR | Occupancy | ADR | RevPAR |
| 12/31/2023 | 74.3% | $112.21 | $83.40 | 95.9% | $152.01 | $145.74 | 129.0% | 135.5% | 174.7% |
| 4/30/2024 TTM | 72.4% | $114.22 | $82.65 | 96.8% | $152.93 | $147.99 | 133.7% | 133.9% | 179.0% |
Source: Industry Report.
| (1) | The competitive set includes Sonesta Select Atlanta Airport North, DoubleTree by Hilton Hotel Atlanta Airport, Hyatt Place Atlanta Airport North, Hotel Indigo Atlanta Airport – College Park and Kimpton Overland Atlanta Airport. |
| (2) | The variances between the underwriting, the appraisal and the industry report data with respect to Occupancy, ADR and RevPAR at the Embassy Suites Atlanta Airport North Property are attributable to variances in reporting methodologies and/or timing differences. |
| (3) | The Embassy Suites Atlanta Airport North Property was opened in May 2022. |
Appraisal. The appraisal concluded to an “as is” value for the Embassy Suites Atlanta Airport North Property of $61,000,000 as of April 25, 2024.
Environmental Matters. According to the Phase I environmental site assessment dated May 14, 2024, there was no evidence of any recognized environmental conditions at the Embassy Suites Atlanta Airport North Property.
| This is not a research report and was not prepared by any Underwriter’s research department. Please see additional important information and qualifications at the end of this Term Sheet. | ||
| 96 | ||
| Hospitality – Full Service | Loan #7 | Cut-off Date Balance: | $37,250,000 | |
| 3450 International Boulevard | Embassy Suites Atlanta Airport North | Cut-off Date LTV: | 61.1% | |
| Hapeville, GA 30354 | UW NCF DSCR: | 1.45x | ||
| UW NOI Debt Yield: | 13.0% |
Operating History and Underwritten Net Cash Flow. The following table presents certain information relating to the historical operating performance and the Underwritten Net Cash Flow at the Embassy Suites Atlanta Airport North Property:
| Cash Flow Analysis(1) | ||||
| 2023 | 5/31/2024 TTM | UW | UW per Room | |
| Occupancy(2) | 95.9% | 96.4% | 96.4% | |
| ADR(2) | $152.59 | $152.76 | $153.75 | |
| RevPAR(2) | $146.29 | $147.18 | $148.14 | |
| Room Revenue | $9,504,701 | $9,651,014 | $9,624,645 | $54,071 |
| Food & Beverage Revenue | $1,396,016 | $1,259,757 | $1,256,315 | $7,058 |
| Other Departmental Income: | $274,263 | $307,397 | $306,557 | $1,722 |
| Miscellaneous Income: | $101,678 | $119,769 | $119,442 | $671 |
| Total Revenue | $11,276,658 | $11,337,937 | $11,306,959 | $63,522 |
| Room Expense | $1,877,595 | $1,844,650 | $1,839,610 | $10,335 |
| Food & Beverage Expense | $1,179,647 | $1,086,937 | $1,083,967 | $6,090 |
| Real Estate Taxes | $337,144 | $344,000 | $326,968 | $1,837 |
| Insurance | $111,526 | $91,393 | $118,151 | $664 |
| Other Expenses | $3,057,487 | $3,095,843 | $3,096,781 | $17,398 |
| Total Expenses | $6,563,399 | $6,462,823 | $6,465,477 | $36,323 |
| Net Operating Income | $4,713,259 | $4,875,114 | $4,841,482 | $27,199 |
| FF&E | $451,066 | $453,517 | $452,278 | $2,541 |
| Net Cash Flow | $4,262,193 | $4,421,597 | $4,389,204 | $24,658 |
| NOI DSCR | 1.55x | 1.61x | 1.59x | |
| NCF DSCR | 1.40x | 1.46x | 1.45x | |
| NOI Debt Yield | 12.7% | 13.1% | 13.0% | |
| NCF Debt Yield | 11.4% | 11.9% | 11.8% | |
| (1) | The Embassy Suites Atlanta Airport North Property was built in 2022. Historical cash flows are not applicable prior to 2023. |
| (2) | The variances between the underwriting, the appraisal, and the industry report data with respect to Occupancy, ADR and RevPAR at the Embassy Suites Atlanta Airport North Property are attributable to variances in reporting methodologies and/or timing differences. |
Escrows and Reserves.
Tax – The Embassy Suites Atlanta Airport North Mortgage Loan documents provide for an upfront reserve of approximately $251,100 and ongoing monthly reserves of $27,900 to pay real estate taxes the lender estimates will be payable during the next twelve months.
Insurance – The Embassy Suites Atlanta Airport North Mortgage Loan documents provide for an upfront reserve of approximately $30,423 for insurance premiums and ongoing monthly reserves for insurance premiums in an amount equal to 1/12 of the insurance premiums that the lender estimates will be payable for the renewal of the insurance coverage (initially estimated to be $10,141); provided, however, that such monthly reserves for insurance premiums will not be required as long as (i) no event of default has occurred and is continuing under the Embassy Suites Atlanta Airport North Mortgage Loan, (ii) the liability and casualty insurance coverage for the Embassy Suites Atlanta Airport North Property is included in a blanket or umbrella policy approved by the lender in its reasonable discretion, and (iii) the borrower provides the lender with certificates of insurance for such policies and paid receipts for insurance premiums no later than 10 days prior to the expiration dates of the policies.
FF&E – The Embassy Suites Atlanta Airport North Mortgage Loan documents provide for ongoing monthly reserves for furniture, fixtures and equipment (“FF&E”) in an amount equal to the greater of (A) 1/12th of 1% of the operating income for the Embassy Suites Atlanta Airport North Property for the first two years of the loan term, 1/12th of 2% of such operating income for the third year of the loan term, 1/12th of 3% of such operating income for the fourth year of the loan term and 1/12th of 4% of such operating income for the final year of the loan term and (B) the amount of the deposit (if any) required by the franchisor for FF&E.
PIP – On the date that any new property improvement plan (“PIP”) is imposed by the franchisor, the borrower is required to deposit an amount equal to 125% of the sum required to pay for such new PIP into a PIP reserve.
Lockbox and Cash Management. The Embassy Suites Atlanta Airport North Mortgage Loan is structured with a springing lockbox and springing cash management. Upon the occurrence of a Cash Sweep Event Period (as defined below), the borrower is required to establish a lockbox for the benefit of the lender and to direct credit card companies and credit card banks to deposit all credit card receipts with respect to the Embassy Suites Atlanta Airport North Property into the lockbox account. If, notwithstanding the foregoing direction, the borrower or property manager receives any hotel or other rents from the Embassy Suites Atlanta Airport North Property, it is required to deposit such amounts into the lockbox account within one business day of receipt. In addition, upon the occurrence of a Cash Sweep Event Period the lender is required to establish, and the borrower is required to cooperate to establish, a cash management account, into which all funds on deposit in the lockbox account will be required to be transferred during such Cash Sweep Event Period, and applied, provided no event of default is continuing under the Embassy Suites Atlanta Airport North Mortgage Loan, (i) to fund the required tax
| This is not a research report and was not prepared by any Underwriter’s research department. Please see additional important information and qualifications at the end of this Term Sheet. | ||
| 97 | ||
| Hospitality – Full Service | Loan #7 | Cut-off Date Balance: | $37,250,000 | |
| 3450 International Boulevard | Embassy Suites Atlanta Airport North | Cut-off Date LTV: | 61.1% | |
| Hapeville, GA 30354 | UW NCF DSCR: | 1.45x | ||
| UW NOI Debt Yield: | 13.0% |
and insurance reserves deposits, if any, as described above under “Escrows and Reserves,” (ii) to fund the payment of debt service on the Embassy Suites Atlanta Airport North Mortgage Loan, (iii) to fund the required monthly deposit into the FF&E reserve, as described above under “Escrows and Reserves,” (iv) to pay monthly operating expenses referenced in the lender-approved annual budget, and extraordinary expenses approved by the lender, and (v) to disburse the remainder into an excess cash flow account to be held as additional collateral for the Embassy Suites Atlanta Airport North Mortgage Loan during the continuance of such Cash Sweep Event Period.
A “Cash Sweep Event Period” means a Trigger Period (as defined below) has occurred and is continuing under the Embassy Suites Atlanta Airport North Mortgage Loan.
A “Trigger Period” means a period:
| (A) | commencing upon the earliest of: |
| (i) | The occurrence and continuance of an event of default under the Embassy Suites Atlanta Airport North Mortgage Loan; |
| (ii) | The debt service coverage ratio being less than 1.15x at the end of any calendar quarter (such event, a “DSCR Trigger Event”); |
| (iii) | The occurrence of a Franchise Agreement Trigger Period (as defined below); |
| (iv) | The occurrence of a Franchise Renewal Trigger Event (as defined below); and/or |
| (v) | The occurrence of certain bankruptcy or insolvency events with respect to the property manager. |
and (B) expiring upon:
| (i) | regarding any Trigger Period commenced in connection with clause (A)(i) above, the cure (if applicable) of such event of default; |
| (ii) | regarding any DSCR Trigger Event, the earlier of (A) the date that the debt service coverage ratio is equal to or greater than 1.15x for two consecutive calendar quarters or (B) the date that the borrower delivers cash or a letter of credit to the lender in an amount which, if applied as a repayment of the Embassy Suites Atlanta Airport North Mortgage Loan, would result in the debt service coverage ratio being equal to or greater than 1.15x (which may be released if the debt service coverage ratio is greater than 1.15x for two calendar quarters without giving effect to such cash or letter of credit); |
| (iii) | regarding any Trigger Period commenced in connection with clause (A)(iii) above, a Franchise Agreement Trigger Period ceasing to exist in accordance with the definition of such term; |
| (iv) | regarding any Trigger Period commenced in connection with clause (A)(iv) above, the occurrence of a Franchise Renewal Event (as defined below); and |
| (v) | regarding any Trigger Period commenced in connection with clause (A)(v) above, the borrower’s replacement of the applicable manager with a new manager approved by the lender (which approval may be conditioned at the lender’s option on rating agency confirmation with regard to both such manager and the related management agreement). |
“Franchise Agreement Trigger Period” means a period (A) commencing upon the first to occur of (i) the borrower being in default for longer than 30 days under the related franchise agreement, (ii) the borrower or the franchisor giving notice that it is terminating the franchise agreement, (iii) any termination or cancellation of the franchise agreement (including, without limitation, rejection in any bankruptcy or similar insolvency proceeding of franchisor) and/or the franchise agreement expiring or otherwise failing to otherwise be in full force and effect, (iv) any bankruptcy or similar insolvency of the franchisor, (v) the Embassy Suites Atlanta Airport North Property failing to be operated, “flagged” and/or branded pursuant to the franchise agreement for longer than 30 days and (vi) any permit applicable to the franchise agreement ceasing to be in full force in effect; and (B) expiring upon the lender’s receipt of evidence reasonably acceptable to the lender of (1) (a) the satisfaction of the Franchise Agreement Cure Conditions (as defined below) or (b) the branding, “flagging” and operation of the Embassy Suites Atlanta Airport North Property pursuant to a replacement franchise agreement reasonably acceptable to the lender entered into with a reputable and experienced franchisor possessing experience in flagging hotel properties similar in size, scope, use and value as the Embassy Suites Atlanta Airport North Property and approved by the lender and (2) to the extent a PIP is required in connection with the foregoing, the deposit of the corresponding new PIP deposit into the PIP reserve, as described under “Escrows and Reserves” above.
“Franchise Agreement Cure Conditions” means each of the following (i) the borrower has cured all defaults (if any) under the franchise agreement to the satisfaction of the franchisor, (ii) the borrower and the franchisor have re-affirmed the franchise agreement as being in full force and effect, (iii) with respect to any applicable bankruptcy or insolvency proceedings involving the franchisor and/or franchise agreement, such franchisor is no longer insolvent or subject to any bankruptcy or insolvency proceedings and has affirmed such franchise agreement pursuant to a final, non-appealable order of a court of competent jurisdiction, (iv) the Embassy Suites Atlanta Airport North Property continues to be operated, “flagged” and branded pursuant to the franchise agreement for at least 60 days and (v) all permits applicable to the related franchise agreement are in full force and effect.
“Franchise Renewal Trigger Event” means an event which will be deemed to have occurred if a Franchise Renewal Event (as defined below) does not occur on or before the date which is twelve months prior to the expiration of the then applicable term of the franchise agreement.
“Franchise Renewal Event” means in connection with any Franchise Renewal Trigger Event, an event which will occur upon the lender’s receipt of reasonably acceptable evidence that (i) the franchise agreement has been extended or a replacement franchise agreement reasonably acceptable to the lender has been entered into with a reputable and experienced franchisor possessing experience in flagging hotel properties similar in size, scope, use and value as the Embassy Suites Atlanta Airport North Property and approved by the lender, in each case, for a term expiring no earlier than three years after the maturity date of the Embassy Suites Atlanta Airport North Mortgage Loan, (ii) such franchise agreement (as so extended) or replacement franchise agreement, as applicable, is in full force and effect with no defaults thereunder and (iii) to the extent a PIP is required in connection with the foregoing, the corresponding new PIP deposit has been deposited in the PIP reserve, as described under “Escrows and Reserves” above.
Terrorism Insurance. The Embassy Suites Atlanta Airport North Mortgage Loan documents require that the borrower maintain comprehensive “all risk” or “special form” insurance in an amount equal to 100% of full replacement cost and 18 months of business income/loss of rents insurance with a six month extended period of indemnity, which includes coverage for perils of terrorism and acts of terrorism. If “acts of terrorism” or other similar acts or events or “fire following” such acts or events are excluded from such policies, the borrower is required to obtain an endorsement to such policy or policies, or a separate policy, insuring against all such excluded acts or events and “fire following” such acts or events in the amounts set forth above. Notwithstanding the foregoing, for so long as the Terrorism Risk Insurance Act of 2002, as extended and modified by the Terrorism Risk Insurance Program Reauthorization Act of 2015 (“TRIPRA”) is in effect (including any extensions thereof or if another federal governmental program is in effect relating to
| This is not a research report and was not prepared by any Underwriter’s research department. Please see additional important information and qualifications at the end of this Term Sheet. | ||
| 98 | ||
| Hospitality – Full Service | Loan #7 | Cut-off Date Balance: | $37,250,000 | |
| 3450 International Boulevard | Embassy Suites Atlanta Airport North | Cut-off Date LTV: | 61.1% | |
| Hapeville, GA 30354 | UW NCF DSCR: | 1.45x | ||
| UW NOI Debt Yield: | 13.0% |
“acts of terrorism” which provides substantially similar protections as TRIPRA), and continues to cover both domestic and foreign acts of terrorism, the lender is required to accept terrorism insurance which covers against “covered acts” as defined by TRIPRA (or such other program). See “Risk Factors—Risks Relating to the Mortgage Loans—Terrorism Insurance May Not Be Available for All Mortgaged Properties” in the prospectus.
| This is not a research report and was not prepared by any Underwriter’s research department. Please see additional important information and qualifications at the end of this Term Sheet. | ||
| 99 | ||
| Mixed Use – Multifamily/Retail | Loan #8 | Cut-off Date Balance: | $30,250,000 | |
| 2568-2574 Broadway and 226 & 230 West 97th Street | 2568-2574 Broadway | Cut-off Date LTV: | 64.2% | |
| New York, NY 10025 | UW NCF DSCR: | 1.52x | ||
| UW NOI Debt Yield: | 10.7% |
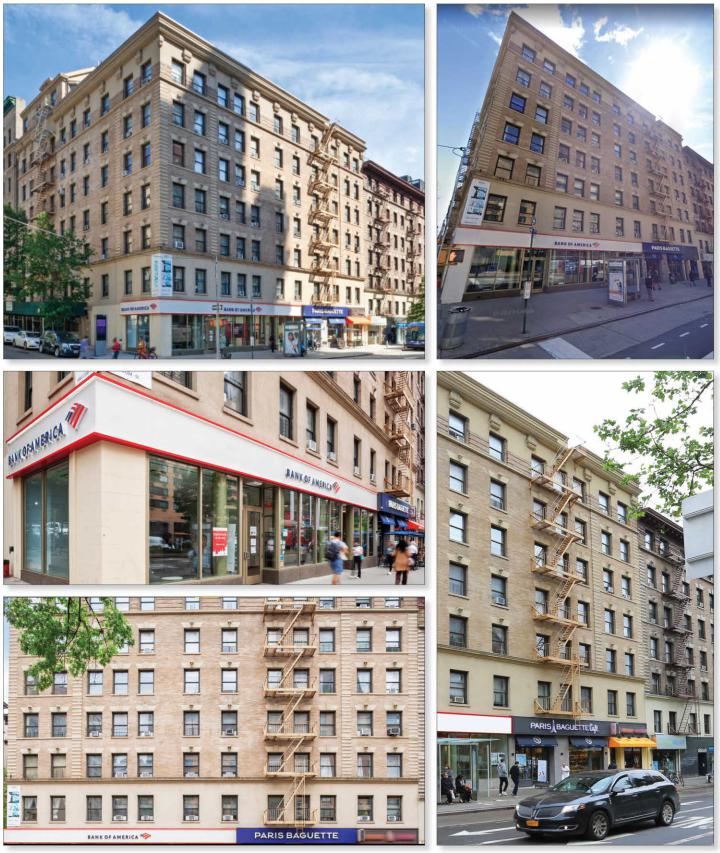
| This is not a research report and was not prepared by any Underwriter’s research department. Please see additional important information and qualifications at the end of this Term Sheet. | ||
| 100 | ||
| Mixed Use – Multifamily/Retail | Loan #8 | Cut-off Date Balance: | $30,250,000 | |
| 2568-2574 Broadway and 226 & 230 West 97th Street | 2568-2574 Broadway | Cut-off Date LTV: | 64.2% | |
| New York, NY 10025 | UW NCF DSCR: | 1.52x | ||
| UW NOI Debt Yield: | 10.7% |
| This is not a research report and was not prepared by any Underwriter’s research department. Please see additional important information and qualifications at the end of this Term Sheet. | ||
| 101 | ||
| Mortgage Loan No. 8 – 2568-2574 Broadway |
| Mortgage Loan Information | Property Information | |||||||
| Mortgage Loan Seller: | BANA | Single Asset/Portfolio: | Single Asset | |||||
| Credit Assessment (Fitch/Moody’s/DBRSM): | NR/Baa2/NR | Location: | New York, NY 10025 | |||||
| Original Balance: | $30,250,000 | General Property Type: | Mixed Use | |||||
| Cut-off Date Balance: | $30,250,000 | Detailed Property Type(2): | Multifamily/Retail | |||||
| % of Initial Pool Balance: | 4.4% | Title Vesting: | Fee | |||||
| Loan Purpose: | Acquisition | Year Built/Renovated: | 1910, 1920/2023 | |||||
| Borrower Sponsor: | Nathan Benelyahou | Size(2): | 71 Units | |||||
| Guarantors: | Nathan Benelyahou, Ladan Sohayegh, Bijan Kaypour and Alan Kaypour | Cut-off Date Balance Per Unit(2): | $426,056 | |||||
| Mortgage Rate: | 6.8780% | Maturity Date Balance Per Unit(2): | $426,056 | |||||
| Note Date: | 5/31/2024 | Property Manager: | NJB Management Corp | |||||
| Maturity Date: | 6/1/2029 | (borrower-related) | ||||||
| Term to Maturity: | 60 months | Underwriting and Financial Information | ||||||
| Amortization Term: | 0 months | UW NOI: | $3,237,020 | |||||
| IO Period: | 60 months | UW NCF: | $3,207,565 | |||||
| Seasoning: | 2 months | UW NOI Debt Yield: | 10.7% | |||||
| Prepayment Provisions: | L(26),D(27),O(7) | UW NCF Debt Yield: | 10.6% | |||||
| Lockbox/Cash Mgmt Status: | Springing/Springing | UW NOI Debt Yield at Maturity: | 10.7% | |||||
| Additional Debt Type: | NAP | UW NCF DSCR: | 1.52x | |||||
| Additional Debt Balance: | NAP | Most Recent NOI(3): | NAV | |||||
| Future Debt Permitted (Type): | No (NAP) | 2nd Most Recent NOI(3): | NAV | |||||
| 3rd Most Recent NOI(3): | NAV | |||||||
Reserves(1) | Most Recent Occupancy(2): | 95.8% (5/23/2024) | ||||||
| Type | Initial | Monthly | Cap | 2nd Most Recent Occupancy(3): | NAV | |||
| RE Taxes: | $0 | $81,250 | NAP | 3rd Most Recent Occupancy(3): | NAV | |||
| Insurance: | $19,617 | $19,617 | NAP | Appraised Value (as of): | $47,100,000 (2/9/2024) | |||
| Immediate Repairs: | $42,500 | $0 | NAP | Appraised Value Per Unit(2): | $663,380 | |||
| Replacement Reserve: | $0 | $1,953 | NAP | Cut-off Date LTV Ratio: | 64.2% | |||
| TI/LC Reserve: | $0 | $501 | NAP | Maturity Date LTV Ratio: | 64.2% | |||
| Sources and Uses | ||||||
| Sources | Proceeds | % of Total | Uses | Proceeds | % of Total | |
| Loan Amount: | $30,250,000 | 69.3% | Purchase Price: | $42,750,000 | 97.9% | |
| Borrower Sponsor Equity: | $13,399,884 | 30.7% | Closing Costs: | $837,768 | 1.9% | |
| Upfront Reserves: | $62,117 | 0.1% | ||||
| Total Sources: | $43,649,884 | 100.0% | Total Uses: | $43,649,884 | 100.0% | |
| (1) | See “Escrows and Reserves” below for further discussion. |
| (2) | The 2568-2574 Broadway Property (as defined below) is comprised of 71 multifamily units and 8,018 SF of ground floor retail space. The multifamily units represent 56.1% of UW rent and the ground floor retail represents 43.9% of UW rent. The retail space was 100.0% occupied and the multifamily units were 95.8% occupied as of May 23, 2024. Size, Cut-off Date Balance Per Unit, Maturity Date Balance Per Unit, Most Recent Occupancy and Appraised Value Per Unit shown above only represents the multifamily units. See “The Property” below for further discussion. |
| (3) | Most Recent NOI and historical NOI and occupancy are unavailable because the borrower sponsor acquired the 2568-2574 Broadway Property as the seller was completing a major renovation of the majority of the residential units. |
The Mortgage Loan. The eighth largest mortgage loan (the “2568-2574 Broadway Mortgage Loan”) is evidenced by a single promissory note in the original principal amount of $30,250,000 and secured by the borrower’s fee interest in a mixed use property with 71 multifamily units and 8,018 SF of ground floor retail space located in New York, New York (the “2568-2574 Broadway Property”).
The Borrower and the Borrower Sponsor. The borrower is 226 Capital LLC, a Delaware limited liability company and a single purpose entity with one independent director. The borrower sponsor is Nathan Benelyahou and the non-recourse carveout guarantors for the 2568-2574 Broadway Mortgage Loan are Nathan Benelyahou, Ladan Sohayegh, Bijan Kaypour and Alan Kaypour.
Nathan Benelyahou is a real estate owner and property manager with over 16 years of experience in the real estate industry. Nathan Benelyahou currently owns seven commercial real estate properties located throughout New York, including mixed use and multifamily assets. Mr. Benelyahou manages more than 10 properties owned by his family and investors.
Ladan Sohayegh has been an active real estate investor since 2003. She has built a portfolio of over 20 multifamily properties in and around the New York City area, which includes 231 residential units and 14 retail tenants.
| This is not a research report and was not prepared by any Underwriter’s research department. Please see additional important information and qualifications at the end of this Term Sheet. | ||
| 102 | ||
| Mixed Use – Multifamily/Retail | Loan #8 | Cut-off Date Balance: | $30,250,000 | |
| 2568-2574 Broadway and 226 & 230 West 97th Street | 2568-2574 Broadway | Cut-off Date LTV: | 64.2% | |
| New York, NY 10025 | UW NCF DSCR: | 1.52x | ||
| UW NOI Debt Yield: | 10.7% |
Bijan Kaypour and Alan Kaypour are brothers and have been equal business partners for the last 35 years, beginning when they started Manna Textiles in 1990, which is a textile distributor of high-end fabrics in the garment industry. The brothers continue to operate Manna Textiles while investing in real estate. They own 10 commercial real estate properties, including mixed use and multifamily.
The Property. The 2568-2574 Broadway Property is a mixed use property with 71 multifamily units and 8,018 SF of ground floor retail space located in New York, New York. The 2568-2574 Broadway Property is located on the southeast corner of Broadway and West 97th Street on the Upper West Side in the borough of Manhattan. The 2568-2574 Broadway Property consists of two interconnected pre-war elevator buildings, which include a 7-story plus penthouse mixed use building and an 8-story elevator apartment building, plus basements. The 2568-2574 Broadway Property functions as one building with one central heating system and one residential entrance, with the interiors connecting on the first floor and the basement. Residential amenities at the 2568-2574 Broadway Property include three elevators and a doorman.
The multifamily component represents 56.1% of UW rent. The residential units were 95.8% leased as of May 23, 2024. The unit mix consists of five studio units, 33 one-bedroom units, seven two-bedroom units, 13 three-bedroom units, six four-bedroom units and seven five-bedroom units. There are 40 free-market apartments, while 24 units are subject to New York City rent stabilization regulations and seven units are subject to New York City rent control regulations. Unit amenities include a full kitchen, refrigerator, centralized heating, and window A/C units. All 40 of the free-market units and five of the rent stabilized units have been renovated with luxury finishes and high-end appliances.
The following table presents certain information relating to the Unit Type Summary at the 2568-2574 Broadway Property:
| Unit Type Summary(1) | |||||||
| Unit Type |
Total Units | Free Market Units | Free Market % of Total | Rent Stabilized Units | Rent Stabilized% of Total | Rent ControlledUnits | Rent Controlled % of Total |
| Studio | 5 | 5 | 7.0% | 0 | 0.0% | 0 | 0.0% |
| 1 Bedroom | 33 | 19 | 26.8% | 13 | 18.3% | 1 | 1.4% |
| 2 Bedroom | 7 | 5 | 7.0% | 2 | 2.8% | 0 | 0.0% |
| 3 Bedroom | 13 | 10 | 14.1% | 3 | 4.2% | 0 | 0.0% |
| 4 Bedroom | 6 | 0 | 0.0% | 4 | 5.6% | 2 | 2.8% |
| 5 Bedroom | 7 | 1 | 1.4% | 2 | 2.8% | 4 | 5.6% |
| Total | 71 | 40 | 56.3% | 24 | 33.8% | 7 | 9.9% |
| (1) | Information is based on the underwritten rent roll dated May 23, 2024. |
The commercial component represents 43.9% of UW rent and is comprised of 8,018 SF of ground floor retail, which is 100.0% leased to three commercial tenants: Bank of America, N.A. (“Bank of America”), Paris Baguette America, Inc. (“Paris Baguette") and Penn Food Concepts LLC d/b/a Auntie Anne's (“Auntie Anne’s”).
Major Tenants.
Bank of America, N.A. (5,000 SF, 62.4% of commercial NRA, 73.6% of UW commercial rent, 29.2% of UW EGI). Bank of America (S&P/Moody's: A-/A1) is an American multinational investment bank and financial services holding company and is the second-largest banking institution in the United States. Bank of America has over 3,800 retail financial centers and over 15,000 ATMs worldwide. The Bank of America tenant location at the 2568-2574 Broadway Property allows for approximately 57 linear feet of grandfathered frontage along Broadway Avenue. Due to current local zoning restrictions, any new bank branch is limited to 25 linear feet. Bank of America has been a tenant at the 2568-2574 Broadway Property since 2006, and exercised a renewal option in 2016 to extend its lease for 10 years through July 24, 2026. The tenant has one, ten-year renewal option remaining at current rent. Bank of America currently pays a base rent of $300 PSF on a modified gross lease, with reimbursement of real estate taxes over a base year.
Paris Baguette America, Inc. (2,400 SF, 29.9% of commercial NRA, 21.0% of UW commercial rent, 8.3% of UW EGI). Paris Baguette is a South Korean bakery cafe chain with more than 4,000 stores worldwide, 160 of which are located in the United States, in over 20 states. Paris Baguette is working toward reaching the 1,000-store mark in the United States by 2030. Paris Baguette has been a tenant at the 2568-2574 Broadway Property since 2014 and has a current lease expiration of July 31, 2029. The tenant has one, five-year renewal option remaining. The lease also provides the tenant with 850 SF of basement space. Paris Baguette currently pays a base rent of $173 PSF on a modified gross lease, with reimbursement of real estate taxes over a base year. The tenant's base rent will increase to $178 PSF on August 1, 2024.
Penn Food Concepts LLC d/b/a Auntie Anne’s (618 SF, 7.7% of commercial NRA, 5.5% of UW commercial rent, 2.2% of UW EGI). Auntie Anne’s is a franchised chain of pretzel shops with over 1,100 locations as of December 2023. The parent company of Auntie Anne’s is Focus Brands, which currently owns the Schlotzsky's, Carvel, Cinnabon, Moe's Southwest Grill, McAllister's Deli, Auntie Anne’s, and Jamba brands. As of March 2023, Focus Brands operated over 6,600 stores across the various brands. Auntie Anne’s executed its lease in 2023 for a 10-year lease term through October 31, 2033. The tenant has two, five-year renewal options. Auntie Anne’s is currently building out its space, is expected to occupy the space as an Auntie Anne’s and Carvel, and be open for business in July 2024. The lease also provides the tenant with 1,000 SF of basement/storage space. Auntie Anne’s rent commencement date was June 24, 2024, and it currently pays a base rent of $175 PSF on a modified gross lease, with reimbursement of real estate taxes over a base year. The tenant’s base rent will increase to $180 PSF on November 1, 2024.
| This is not a research report and was not prepared by any Underwriter’s research department. Please see additional important information and qualifications at the end of this Term Sheet. | ||
| 103 | ||
| Mixed Use – Multifamily/Retail | Loan #8 | Cut-off Date Balance: | $30,250,000 | |
| 2568-2574 Broadway and 226 & 230 West 97th Street | 2568-2574 Broadway | Cut-off Date LTV: | 64.2% | |
| New York, NY 10025 | UW NCF DSCR: | 1.52x | ||
| UW NOI Debt Yield: | 10.7% |
The following table presents certain information relating to the commercial tenancy at the 2568-2574 Broadway Property:
| Tenant Summary(1) | |||||||||
| Tenant Name | Credit Rating Moody’s/ S&P)(2) | Tenant SF | Approx. % of Commercial SF | Annual UW Commercial Rent | % of Total Annual UW Commercial Rent | Annual UW Commercial Rent PSF | Lease Exp. | Renewal Options | Term. Option (Y/N) |
| Bank of America, N.A. | NR/A1/A- | 5,000 | 62.4% | $1,500,000 | 73.6% | $300.00 | 7/24/2026 | 1 x 10 yr | N |
| Paris Baguette America, Inc. | NR/NR/NR | 2,400 | 29.9% | $427,365 | 21.0% | $178.07 | 7/31/2029 | 1 x 5 yr | N |
Penn Food Concepts LLC d/b/a Auntie Anne's(3) | NR/NR/NR | 618 | 7.7% | $111,240 | 5.5% | $180.00 | 10/31/2033 | 2 x 5 yr | N |
| Subtotal/Wtd. Avg. | 8,018 | 100.0% | $2,038,605 | 100.0% | $254.25 | ||||
| Vacant Space | 0 | 0.0% | |||||||
| Total/Wtd. Avg. | 8,018 | 100.0% | |||||||
| (1) | Information is based on the underwritten rent roll dated May 23, 2024. |
| (2) | Certain ratings are those of the parent company whether or not the parent guarantees the lease. |
| (3) | Penn Food Concepts LLC d/b/a Auntie Anne’s is currently building out its space and is expected to be open for business in July 2024. The tenant commenced rent payments in June 2024. |
The following table presents certain information relating to the commercial lease rollover schedule at the 2568-2574 Broadway Property:
| Lease Rollover Schedule(1) | ||||||||
| Year | # of Leases Rolling | SF Rolling | Approx. % of Commercial SF Rolling | Approx. Cumulative % of Commercial SF Rolling | Total UW Commercial Rent Rolling | Approx. % of Total UW Commercial Rent Rolling | Approx. Cumulative % of Total UW Commercial Rent Rolling | UW Commercial Rent PSF Rolling |
| MTM/2024 | 0 | 0 | 0.0% | 0.0% | $0 | 0.0% | 0.0% | $0.00 |
| 2025 | 0 | 0 | 0.0% | 0.0% | $0 | 0.0% | 0.0% | $0.00 |
| 2026 | 1 | 5,000 | 62.4% | 62.4% | $1,500,000 | 73.6% | 73.6% | $300.00 |
| 2027 | 0 | 0 | 0.0% | 62.4% | $0 | 0.0% | 73.6% | $0.00 |
| 2028 | 0 | 0 | 0.0% | 62.4% | $0 | 0.0% | 73.6% | $0.00 |
| 2029(2) | 1 | 2,400 | 29.9% | 92.3% | $427,365 | 21.0% | 94.5% | $178.07 |
| 2030 | 0 | 0 | 0.0% | 92.3% | $0 | 0.0% | 94.5% | $0.00 |
| 2031 | 0 | 0 | 0.0% | 92.3% | $0 | 0.0% | 94.5% | $0.00 |
| 2032 | 0 | 0 | 0.0% | 92.3% | $0 | 0.0% | 94.5% | $0.00 |
| 2033 | 1 | 618 | 7.7% | 100.0% | $111,240 | 5.5% | 100.0% | $180.00 |
| 2034 | 0 | 0 | 0.0% | 100.0% | $0 | 0.0% | 100.0% | $0.00 |
| 2035 & Thereafter | 0 | 0 | 0.0% | 100.0% | $0 | 0.0% | 100.0% | $0.00 |
| Vacant | 0 | 0 | 0.0% | 100.0% | $0 | 0.0% | 100.0% | $0.00 |
| Total/Wtd. Avg. | 3 | 8,018 | 100.0% | $2,038,605 | 100.0% | $254.25 | ||
| (1) | Information is based on the underwritten rent roll dated May 23, 2024. |
| (2) | The 2568-2574 Broadway Mortgage Loan has a maturity date of June 1, 2029. |
| This is not a research report and was not prepared by any Underwriter’s research department. Please see additional important information and qualifications at the end of this Term Sheet. | ||
| 104 | ||
| Mixed Use – Multifamily/Retail | Loan #8 | Cut-off Date Balance: | $30,250,000 | |
| 2568-2574 Broadway and 226 & 230 West 97th Street | 2568-2574 Broadway | Cut-off Date LTV: | 64.2% | |
| New York, NY 10025 | UW NCF DSCR: | 1.52x | ||
| UW NOI Debt Yield: | 10.7% |
The following table presents detailed information with respect to the multifamily units at the 2568-2574 Broadway Property:
| Unit Summary(1) | ||||||||||
| Weighted Avg Rent / Occ. Unit | Weighted Avg Rent / Occ. SF | |||||||||
| Unit Type | # Occ. Units | # Unoccupied Units | Total # Of Units | Avg SF | Actual | Market(2) | Actual | Market(2) | UW Rent | % UW Rent |
| Free Market | ||||||||||
| Studio | 5 | 0 | 5 | 284 | $2,889 | $3,000 | $10.17 | $10.56 | $2,890 | 3.2% |
| 1BR | 19 | 0 | 19 | 491 | $3,673 | $3,600 | $7.49 | $7.34 | $3,676 | 15.3% |
| 2BR | 5 | 0 | 5 | 722 | $5,260 | $5,350 | $7.29 | $7.41 | $5,260 | 5.8% |
| 3BR | 10 | 0 | 10 | 1,448 | $7,774 | $7,600 | $5.37 | $5.25 | $7,779 | 17.1% |
| 4BR | 0 | 0 | 0 | 0 | $0 | $8,200 | $0.00 | $0.00 | $0.00 | 0.0% |
| 5BR | 1 | 0 | 1 | 1,858 | $7,300 | $8,600 | $3.93 | $4.63 | $7,300 | 1.6% |
| Sub-total/Wtd Avg: | 40 | 0 | 40 | 767 | $4,889 | $4,869 | $6.37 | $6.35 | $4,892 | 42.9% |
| Rent Stabilized | ||||||||||
| Studio | 0 | 0 | 0 | 0 | $0 | $0.00 | $0 | 0.0% | ||
| 1BR | 10 | 3 | 13 | 552 | $1,604 | $2.85 | $1,944 | 5.5% | ||
| 2BR | 2 | 0 | 2 | 778 | $3,656 | $4.70 | $3,677 | 1.6% | ||
| 3BR | 3 | 0 | 3 | 1,171 | $2,491 | $2.13 | $2,705 | 1.8% | ||
| 4BR | 4 | 0 | 4 | 1,873 | $954 | $0.51 | $2,011 | 1.8% | ||
| 5BR | 2 | 0 | 2 | 1,870 | $1,015 | $0.54 | $1,186 | 0.5% | ||
| Sub-total/Wtd Avg: | 21 | 3 | 24 | 978 | $1,747 | $1.67 | $2,132 | 11.2% | ||
| Rent Controlled | ||||||||||
| Studio | 0 | 0 | 0 | 0 | $0 | $0.00 | $0 | 0.0% | ||
| 1BR | 1 | 0 | 1 | 780 | $969 | $1.24 | $969 | 0.2% | ||
| 2BR | 0 | 0 | 0 | 0 | $0 | $0.00 | $0 | 0.0% | ||
| 3BR | 0 | 0 | 0 | 0 | $0 | $0.00 | $0 | 0.0% | ||
| 4BR | 2 | 0 | 2 | 1,827 | $1,329 | $0.73 | $1,391 | 0.6% | ||
| 5BR | 4 | 0 | 4 | 1,886 | $1,217 | $0.65 | $1,280 | 1.1% | ||
| Sub-total/Wtd Avg: | 7 | 0 | 7 | 1,711 | $1,214 | $0.71 | $1,267 | 1.9% | ||
| Total/Wtd Avg: | 68 | 3 | 71 | 932 | $3,540 | $4,869 | $3.73 | $6.35 | $3,602 | 56.1% |
Source: Appraisal.
| (1) | Information is based on the underwritten rent roll dated May 23, 2024, unless otherwise specified. |
The Market. The 2568-2574 Broadway Property is located on the southeast corner of Broadway and West 97th Street, in close proximity to the 1, 2 and 3 red subway lines at 96th Street and Broadway and the A, B and C blue subway lines at 96th Street on Central Park West. The 2568-2574 Broadway Property is located less than 0.5 miles from Riverside Park and 0.5 miles from Central Park. The 2568-2574 Broadway Property is also proximate to Columbia University (1 mile), Barnard College (1.1 miles) and many of New York City's top private and public schools, including Trinity School (0.4 miles), Columbia Grammar & Prep School (0.5 miles) and The Calhoun School (0.9 miles).
According to a third-party research report, the 2568-2574 Broadway Property is located in New York’s Upper West Side submarket. As of the first quarter of 2024, the Upper West Side multifamily submarket had inventory of 59,094 units, with vacancy of 2.8% and average asking rents of $5,028 per unit. As of the first quarter of 2024, the Upper West Side retail submarket had inventory of 3,486,511 SF, with vacancy of 2.4% and average asking rents of $163.73 PSF.
According to a third-party market report, the estimated 2023 population within a one-, three- and five-mile radius of the 2568-2574 Broadway Property was 142,951, 1,127,259, and 2,553,846, respectively. The estimated 2023 average household income within the same radii was $154,000, $129,304, and $119,772, respectively.
| This is not a research report and was not prepared by any Underwriter’s research department. Please see additional important information and qualifications at the end of this Term Sheet. | ||
| 105 | ||
| Mixed Use – Multifamily/Retail | Loan #8 | Cut-off Date Balance: | $30,250,000 | |
| 2568-2574 Broadway and 226 & 230 West 97th Street | 2568-2574 Broadway | Cut-off Date LTV: | 64.2% | |
| New York, NY 10025 | UW NCF DSCR: | 1.52x | ||
| UW NOI Debt Yield: | 10.7% |
The following table presents recent bank branch leasing data at comparable properties with respect to the 2568-2574 Broadway Property:
| Summary of Comparable Bank Branch Leases | ||||||
| Property / Location | Neighborhood | Tenant | Size (SF) | Date | Floor | Rent PSF |
| 2568-2574 Broadway | Upper West Side | Bank of America(1) | 5,000(1) | 3Q16 | Ground | $300.00(1) |
| 2555 Broadway | Upper West Side | Citibank | 5,300 | 1Q22 | Ground | $358.49 |
| 2251 Broadway | Upper West Side | Citibank | 4,934 | 1Q22 | Ground | $300.00 |
| 244 East 86th Street | Upper East Side | Citibank | 8,189 | 4Q23 | Ground | $400.00 |
| 734 Lexington Avenue | Upper East Side | Citibank | 7,800 | 4Q23 | Ground, 1st | $423.08 |
| 1166 Avenue of the Americas | Midtown | Citibank | 3,637 | 3Q23 | Ground | $375.03 |
| 22 West 32nd Street | Herald Square/ Midtown South | Chase | 6,000 | 2Q23 | Ground | $283.33 |
| 185 Broadway | Financial District | Wells Fargo | 2,086 | 2Q22 | Ground | $500.00 |
| 2 Penn Plaza | Herald Square/Penn Station | Chase | 7,000 | 1Q22 | Ground | $714.29 |
Source: Appraisal
| (1) | Information is based on the underwritten rent roll dated May 23, 2024. |
Appraisal. The appraiser concluded to an “as-is” value for the 2568-2574 Broadway Property of $47,100,000 as of February 9, 2024.
Environmental Matters. According to the Phase I environmental site assessment dated February 27, 2024, there was no evidence of any recognized environmental conditions at the 2568-2574 Broadway Property.
Underwritten Net Cash Flow. The following table presents certain information relating to the Underwritten Net Cash Flow at the 2568-2574 Broadway Property:
| Cash Flow Analysis(1) | ||
UW | UW Per Unit(2) | |
| Gross Potential Rent(3) | $5,402,198 | $76,087.30 |
| (Vacancy & Credit Loss)(4) | ($270,111) | ($3,804.38) |
| Effective Gross Income | $5,132,087 | $72,282.92 |
| Real Estate Taxes(6) | $937,445 | $13,203.46 |
| Insurance | $214,338 | $3,018.85 |
| Other Operating Expenses | $743,284 | $10,468.79 |
| Total Operating Expenses | $1,895,067 | $26,691.09 |
| Net Operating Income | $3,237,020 | $45,591.82 |
| Replacement Reserves | $23,441 | $330.15 |
| TI/LC | $6,014 | $84.70 |
| Net Cash Flow | $3,207,565 | $45,176.97 |
| Occupancy % | 95.8%(4) | |
| NOI DSCR | 1.53x | |
| NCF DSCR | 1.52x | |
| NOI Debt Yield | 10.7% | |
| NCF Debt Yield | 10.6% | |
| (1) | Historical financials are unavailable as the borrower sponsor acquired the 2568-2574 Broadway Property because the seller was completing a major renovation of the majority of the residential units. |
| (2) | Based on 71 multifamily units. The 2568-2574 Broadway Property also includes 8,018 SF of ground floor retail space. The multifamily units represent 56.1% of UW rent and the ground floor retail represents 43.9% of UW rent. |
| (3) | Based on the underwritten rent roll as of May 23, 2024. Retail tenants were underwritten to contract rents, with rent steps through November 2024, and Gross Potential Rent includes real estate tax reimbursement income from Bank of America, N.A. and Paris Baguette. Rent for multifamily units was underwritten based on the New York City rent regulations for the rent stabilized and rent controlled units and in-place rent for the free market value units. |
| (4) | Underwritten to 5.0% for the multifamily units and 5.0% for the ground floor retail space including the reimbursement income. |
| (5) | The commercial leases are modified gross with tenants reimbursing real estate taxes over a base year. |
| This is not a research report and was not prepared by any Underwriter’s research department. Please see additional important information and qualifications at the end of this Term Sheet. | ||
| 106 | ||
| Mixed Use – Multifamily/Retail | Loan #8 | Cut-off Date Balance: | $30,250,000 | |
| 2568-2574 Broadway and 226 & 230 West 97th Street | 2568-2574 Broadway | Cut-off Date LTV: | 64.2% | |
| New York, NY 10025 | UW NCF DSCR: | 1.52x | ||
| UW NOI Debt Yield: | 10.7% |
Escrows and Reserves. At origination, the borrower deposited into escrow (i) approximately $19,617 for insurance and (ii) $42,500 for deferred maintenance.
Real Estate Taxes – On a monthly basis, the borrower is required to escrow 1/12th of the annual estimated tax payments, which currently equates to approximately $81,250.
Insurance – On a monthly basis, the borrower is required to escrow 1/12th of the annual estimated insurance premium, which currently equates to approximately $19,617.
Replacement Reserve – On a monthly basis, the borrower is required to escrow approximately $1,953 for replacement reserves.
TI/LC Reserve – On a monthly basis, the borrower is required to deposit approximately $501 into the TI/LC reserve account.
Lockbox and Cash Management. The 2568-2574 Broadway Mortgage Loan is structured with a springing lockbox and springing cash management. Upon the occurrence of an event of default or a Cash Sweep Period (as defined below), the borrower is required to establish a lockbox account for the exclusive benefit of the lender into which the commercial tenants will be instructed to pay rents directly. During a Cash Sweep Period, all amounts in the lockbox account will be automatically transferred to the lender-controlled cash management account and applied to the payment of, among other things, the debt service, monthly escrows and operating expenses. During a Cash Sweep Period, all excess cash flow is required to be held by the lender as additional collateral for the 2568-2574 Broadway Mortgage Loan.
A “Cash Sweep Period” will commence upon the earlier to occur of (i) the debt service coverage ratio falling below 1.15x for any calendar quarter or (ii) a Bank of America Trigger Event (as defined below), and will terminate upon (a) with respect to clause (i) above, the debt service coverage ratio being at least 1.20x for two consecutive calendar quarters, and (b) with respect to clause (ii) above, a Bank of America Trigger Event Cure (as defined below).
A “Bank of America Trigger Event” will commence when (i) the Bank of America tenant “goes dark”, vacates or terminates its lease or gives notice of its intent to vacate or terminate its lease, (ii) the Bank of America tenant fails to exercise its option to extend its lease term on July 24, 2025, (iii) the Bank of America tenant defaults in the payment of any rent or other expenses for which it is responsible (after the expiration of any notice and cure periods) under its lease, (iv) Bank of America, or any guarantor of the Bank of America lease, experiences a downgrade in its long-term unsecured debt rating below "BBB" by S&P, or the equivalent by any other rating agency, or (v) Bank of America, or any guarantor of the Bank of America lease, files or is the subject of any bankruptcy or insolvency proceeding or has its assets made subject to the jurisdiction of a bankruptcy court.
A “Bank of America Trigger Event Cure” means (1) with respect to a Bank of America Trigger Event under clause (i) or (ii) above, the Bank of America space is no longer “dark”, any notice to vacate or terminate is withdrawn and the tenant is in occupancy of its space, or the space is leased to a replacement tenant acceptable to the lender for a period of time and on terms and conditions reasonably acceptable to the lender, (2) with respect to a Bank of America Trigger Event under clause (ii) above, Bank of America renews its lease for at least five years in accordance with the terms of its lease, (3) with respect to a Bank of America Trigger Event under clause (iii) above, the default is cured and the borrower provides evidence reasonably satisfactory to the lender that the Bank of America tenant is current in all of its monetary obligations under its lease, (4) with respect to a Bank of America Trigger Event under clause (iv) above, the long term unsecured debt rating of Bank of America, and any guarantor of the Bank of America lease, is increased to at least "BBB" by S&P, and the equivalent, by each rating agency that downgraded the long term unsecured debt rating of Bank of America or the guarantor of the Bank of America lease, and (5) with respect to a Bank of America Trigger Event under clause (v) above, Bank of America, or any guarantor of the Bank of America lease, is no longer subject to the jurisdiction of the related bankruptcy court and its obligations under its lease remain unaltered.
Terrorism Insurance. The borrower is required to obtain and maintain property insurance and business interruption insurance for 18 months plus a 6-month extended period of indemnity. Such insurance is required to cover perils of terrorism and acts of terrorism (provided that if TRIPRA or a similar statute is in effect, the provisions of TRIPRA will determine the acts of terrorism for which coverage is required). See “Risk Factors—Risks Relating to the Mortgage Loans—Terrorism Insurance May Not Be Available for All Mortgaged Properties” in the prospectus.
| This is not a research report and was not prepared by any Underwriter’s research department. Please see additional important information and qualifications at the end of this Term Sheet. | ||
| 107 | ||
| Office – Suburban | Loan #9 | Cut-off Date Balance: | $29,481,972 | |
| 9950 Woodloch Forest Drive | 9950 Woodloch | Cut-off Date LTV: | 56.1% | |
| The Woodlands, TX 77380 | UW NCF DSCR: | 1.50x | ||
| UW NOI Debt Yield: | 13.1% |

| This is not a research report and was not prepared by any Underwriter’s research department. Please see additional important information and qualifications at the end of this Term Sheet. | ||
| 108 | ||
| Office – Suburban | Loan #9 | Cut-off Date Balance: | $29,481,972 | |
| 9950 Woodloch Forest Drive | 9950 Woodloch | Cut-off Date LTV: | 56.1% | |
| The Woodlands, TX 77380 | UW NCF DSCR: | 1.50x | ||
| UW NOI Debt Yield: | 13.1% |
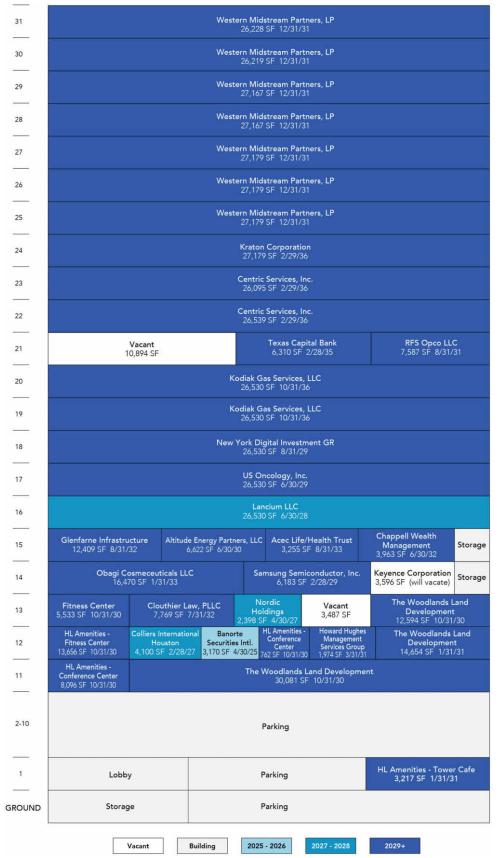
| This is not a research report and was not prepared by any Underwriter’s research department. Please see additional important information and qualifications at the end of this Term Sheet. | ||
| 109 | ||
| Office – Suburban | Loan #9 | Cut-off Date Balance: | $29,481,972 | |
| 9950 Woodloch Forest Drive | 9950 Woodloch | Cut-off Date LTV: | 56.1% | |
| The Woodlands, TX 77380 | UW NCF DSCR: | 1.50x | ||
| UW NOI Debt Yield: | 13.1% |
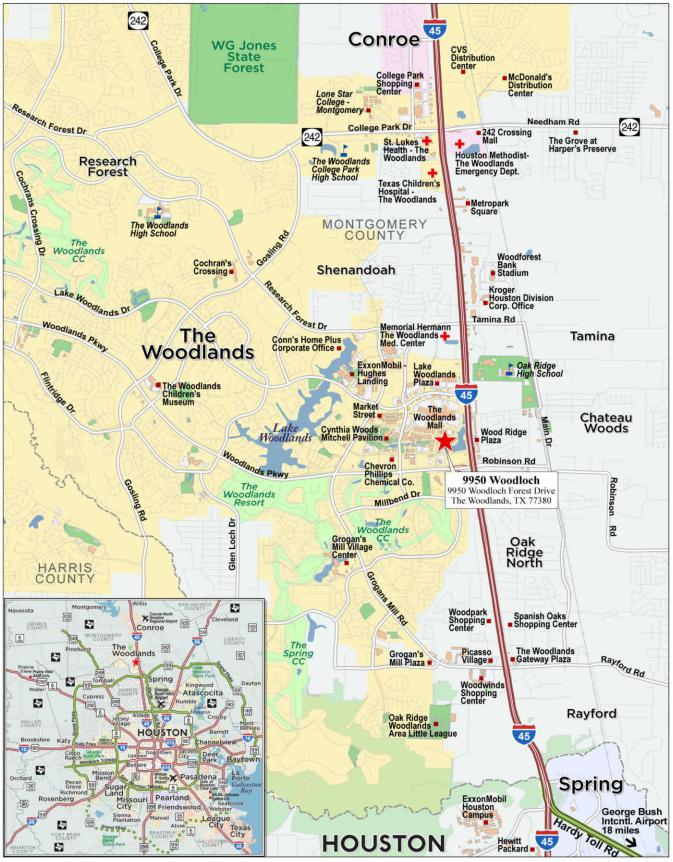
| This is not a research report and was not prepared by any Underwriter’s research department. Please see additional important information and qualifications at the end of this Term Sheet. | ||
| 110 | ||
| Mortgage Loan No. 9 – 9950 Woodloch |
| Mortgage Loan Information | Property Information | ||||||
| Mortgage Loan Seller: | WFB | Single Asset/Portfolio: | Single Asset | ||||
| Credit Assessment (Moody’s/Fitch//DBRSM): | NR/NR/NR | Location: | The Woodlands, TX 77380 | ||||
| Original Balance(1): | $29,500,000 | General Property Type: | Office | ||||
| Cut-off Date Balance(1): | $29,481,972 | Detailed Property Type: | Suburban | ||||
| % of Initial Pool Balance: | 4.3% | Title Vesting: | Fee | ||||
| Loan Purpose: | Refinance | Year Built/Renovated: | 2014/NAP | ||||
| Borrower Sponsor: | The Woodlands Land Development | Size: | 601,151 SF | ||||
| Company, L.P. | Cut-off Date Balance PSF(1): | $216 | |||||
| Guarantor: | The Woodlands Land Development | Maturity Date Balance PSF(1): | $205 | ||||
| Company, L.P. | Property Manager: | Howard Hughes | |||||
| Mortgage Rate: | 7.0750% | Management Services Company, | |||||
| Note Date: | 6/12/2024 | LLC (borrower - related) | |||||
| Maturity Date: | 7/11/2029 | ||||||
| Term to Maturity: | 60 months | Underwriting and Financial Information | |||||
| Amortization Term: | 360 months | UW NOI: | $16,990,965 | ||||
| IO Period: | 0 months | UW NCF: | $15,668,433 | ||||
| Seasoning: | 1 month | UW NOI Debt Yield(1): | 13.1% | ||||
| Prepayment Provisions(2): | L(25),D(28),O(7) | UW NCF Debt Yield(1): | 12.1% | ||||
| Lockbox/Cash Mgmt Status(3): | Hard/Springing | UW NOI Debt Yield at Maturity(1): | 13.8% | ||||
| Additional Debt Type(1): | Pari Passu | UW NCF DSCR(1): | 1.50x | ||||
| Additional Debt Balance(1): | $100,438,583 | Most Recent NOI(5) : | $6,556,466 (3/31/2024 TTM) | ||||
| Future Debt Permitted (Type): | No (NAP) | 2nd Most Recent NOI(5): | $5,438,113 (12/31/2023) | ||||
| Reserves(4) | 3rd Most Recent NOI(5): | $1,337,359 (12/31/2022) | |||||
| Type | Initial | Monthly | Cap | Most Recent Occupancy: | 97.0% (6/3/2024) | ||
| RE Taxes: | $1,309,164 | $218,194 | NAP | 2nd Most Recent Occupancy: | 91.8% (12/31/2023) | ||
| Insurance: | $0 | Springing | NAP | 3rd Most Recent Occupancy: | 57.7% (12/31/2022) | ||
| Replacement Reserve: | $0 | $10,019 | $360,684 | Appraised Value (as of): | $231,500,000 (5/9/2024) | ||
| TI/LC Reserve: | $0 | $100,192 | NAP | Appraised Value PSF: | $385 | ||
| Existing TI/LC Reserve: | $8,840,609 | $0 | NAP | Cut-off Date LTV Ratio(1): | 56.1% | ||
| Rent Concession Reserve: | $4,020,411 | $0 | NAP | Maturity Date LTV Ratio(1): | 53.3% | ||
| Sources and Uses | ||||||
| Sources | Proceeds | % of Total | Uses | Proceeds | % of Total | |
| Whole Loan Amount(1): | $130,000,000 | 95.0% | Loan Payoff: | $120,907,122 | 88.3% | |
| Borrower Sponsor Equity: | $6,865,528 | 5.0% | Upfront Reserves: | $14,170,184 | 10.4% | |
| Closing Costs: | $1,788,222 | 1.3% | ||||
| Total Sources: | $136,865,528 | 100.0% | Total Uses: | $136,865,528 | 100.0% | |
| (1) | The 9950 Woodloch Mortgage Loan (as defined below) is part of the 9950 Woodloch Whole Loan (as defined below), which is evidenced by five pari passu promissory notes with an aggregate whole principal balance of $130,000,000. The Cut-off Date Balance PSF, Maturity Date Balance PSF, UW NOI Debt Yield, UW NCF Debt Yield, UW NOI Debt Yield at Maturity, UW NCF DSCR, Cut-off Date LTV Ratio and Maturity Date LTV Ratio numbers presented above are based on the aggregate principal balance of the promissory notes comprising the 9950 Woodloch Whole Loan. |
| (2) | The lockout period will be at least 25 payment dates beginning with and including the first payment date on August 11, 2024. Defeasance of the 9950 Woodloch Whole Loan in full is permitted at any time after the earlier to occur of (i) the date that is two years from the closing date of the securitization that includes the last pari passu note of the 9950 Woodloch Whole Loan to be securitized and (ii) August 11, 2027. The assumed lockout period of 25 payment dates is based on the expected BANK5 2024-5YR8 securitization closing date in August 2024. The actual lockout period may be longer. |
| (3) | Sponsor-affiliated tenants do not pay monthly into the deposit account until there is a Cash Trap Event Period (as defined below) (see “Lockbox and Cash Management” section). |
| (4) | See “Escrows and Reserves” section. |
| (5) | The 9950 Woodloch Property (as defined below) was acquired vacant by the borrower sponsor in December 2019 after the single tenant at the time vacated. The increase in NOI from 2022 to 3/31/2024 TTM is due to the lease up of the building to 97.0% as of 6/3/2024 (see “Operating History and Underwritten Net Cash Flow”). |
The Mortgage Loan. The ninth largest mortgage loan (the “9950 Woodloch Mortgage Loan”) is part of a whole loan (the “9950 Woodloch Whole Loan”) that is evidenced by five pari passu promissory notes in the aggregate original principal amount of $130,000,000 and secured by the first priority fee interest encumbering a multi-tenant office property totaling 601,151 SF located in The Woodlands, Texas (the “9950 Woodloch Property”). The 9950 Woodloch Whole Loan was co-originated by Wells Fargo Bank, National Association (“WFB”) and Argentic Real Estate Finance 2 LLC (“AREF2”). The 9950 Woodloch Mortgage Loan is evidenced by the non-controlling Note A-3-1 with a principal balance of $29,500,000, and will be serviced under the pooling and servicing agreement for the WFCM 2024-5C1 securitization trust. See “Description of the Mortgage Pool—The Whole Loans—The Non-Serviced Pari Passu Whole Loans” and “Pooling and Servicing Agreement” in the prospectus.
| This is not a research report and was not prepared by any Underwriter’s research department. Please see additional important information and qualifications at the end of this Term Sheet. | ||
| 111 | ||
| Office – Suburban | Loan #9 | Cut-off Date Balance: | $29,481,972 | |
| 9950 Woodloch Forest Drive | 9950 Woodloch | Cut-off Date LTV: | 56.1% | |
| The Woodlands, TX 77380 | UW NCF DSCR: | 1.50x | ||
| UW NOI Debt Yield: | 13.1% |
| 9950 Woodloch Whole Loan Summary | ||||||
| Note | Original Balance | Cut-off Date Balance | Note Holder | Controlling Note | ||
| A-1 | $47,450,000 | $47,421,003 | WFCM 2024-5C1 | Yes | ||
| A-2 | $25,550,000 | $25,534,386 | WFCM 2024-5C1 | No | ||
| A-3-1 | $29,500,000 | $29,481,972 | BANK5 2024-5YR8 | No | ||
| A-3-2(1) | $7,550,000 | $7,545,386 | WFB | No | ||
| A-4(1) | $19,950,000 | $19,937,808 | AREF2 | No | ||
| Whole Loan | $130,000,000 | $129,920,556 | ||||
| (1) | Expected to be contributed to one or more future securitization trusts. |
The Borrower and the Borrower Sponsor. The borrower is HH Hackett Tower Holdings, LLC, a Delaware limited liability company, which is a single purpose entity with two independent directors. Legal counsel to the borrower delivered a non-consolidation opinion in connection with the origination of the 9950 Woodloch Whole Loan. The borrower sponsor and nonrecourse carveout guarantor is The Woodlands Land Development Company, L.P., an entity owned by the Howard Hughes Corporation.
Founded in 2010, the Howard Hughes Corporation owns, manages, and develops commercial, residential and mixed-use real estate throughout the United States. The company’s holdings include a portfolio of master planned communities including Seaport in New York City, Downtown Columbia, Maryland, The Woodlands and Bridgeland in greater Houston, Texas, Summerlin, Las Vegas, Ward Village, Honolulu, Hawai’I, and Douglas Ranch in Phoenix, Arizona.
The Property. The 9950 Woodloch Property consists of a 31-story, 601,151 SF, Class A, LEED Silver office building, located in The Woodlands, Texas. Built in 2014 and situated on a 2.25-acre site, the 9950 Woodloch Property includes a rooftop terrace, fitness center with locker rooms and an indoor basketball/pickleball court. The 9950 Woodloch Property has access to a 10-story parking garage podium via a shared garage use agreement with the adjacent office tower (same sponsorship). The 9950 Woodloch Property is allocated 1,803 spaces, resulting in a parking ratio of three spaces per 1,000 SF. As of June 3, 2024, the 9950 Woodloch Property is 97.0% occupied by 24 tenants.
Major Tenants.
Western Midstream Partners, LP (BBB-/Baa3/BBB-: F/M/S&P; 188,318 SF, 31.3% of NRA; 33.3% of UW Rent). Western Midstream Partners, LP. (“Western Midstream”) is in the business of gathering, compressing, treating, processing, and transporting natural gas; and gathering and disposing of produced water for its customers. Western Midstream also buys and sells natural gas, natural gas liquids, and condensate on its behalf and its customers under certain gas processing contracts. Western Midstream is publicly traded on the NYSE with a market capitalization of $14.9 billion (as of June 21, 2024). Western Midstream is headquartered at the 9950 Woodloch Property and took initial occupancy in December 2020 but subsequently expanded into an additional 81,537 SF from 2023 to 2024. Western Midstream has one, ten-year or two, five-year renewal options. The tenant has the option to terminate its lease effective 11/30/2028 with 12 months’ notice and the payment of a termination fee.
The Woodlands Land Development. (BB/NR/B: F/M/S&P; 57,329 SF, 9.5% of NRA; 10.2% of UW Rent). The Woodlands Land Development is an affiliate of the borrower and a subsidiary of Howard Hughes Corporation. Howard Hughes Corporation is headquartered at the 9950 Woodloch Property and is a real estate development and management company formed in 2010. Howard Hughes Corporation is publicly traded on the NYSE (HHH) with a market capitalization of $3.2 billion (as of June 21, 2024). The tenant does not have any termination or extension options.
Kodiak Gas Services, LLC. (BB/B2/B+: F/M/S&P; 53,060 SF, 8.8% of NRA; 9.0% of UW Rent). Kodiak Gas Services, LLC. (“Kodiak”) is a provider of natural gas contract compression services in the United States, bringing efficiency and reliability to all the major basins. As a developer of gas compression technology, Kodiak offers customers an array of turnkey and operations services. Kodiak is publicly traded on the NYSE (KGS) with a market capitalization of $2.2 billion (as of June 21, 2024). Kodiak has one, ten-year renewal option and no termination options.
| This is not a research report and was not prepared by any Underwriter’s research department. Please see additional important information and qualifications at the end of this Term Sheet. | ||
| 112 | ||
| Office – Suburban | Loan #9 | Cut-off Date Balance: | $29,481,972 | |
| 9950 Woodloch Forest Drive | 9950 Woodloch | Cut-off Date LTV: | 56.1% | |
| The Woodlands, TX 77380 | UW NCF DSCR: | 1.50x | ||
| UW NOI Debt Yield: | 13.1% |
The following table presents certain information relating to the tenancy at the 9950 Woodloch Property:
| Tenant Summary | |||||||||
| Tenant Name | Credit Rating (Moody's/ Fitch/S&P)(1) | Tenant SF | % of Total SF | Annual UW Rent(2) | % of Total Annual UW Rent | Annual UW Rent PSF(2) | Lease Expiration | Renewal Options | Term. Option (Y/N) |
| Western Midstream Partners, LP(3) | Baa3/BBB-/BBB- | 188,318 | 31.3% | $6,079,258 | 33.3% | $32.28 | 12/31/2031 | 1 x 10 yr (3) | Y(3) |
| The Woodlands Land Development(4) | NR/BB/B | 57,329 | 9.5% | $1,861,473 | 10.2% | $32.47 | Various(5) | N | N |
| Kodiak Gas Services, LLC | B2/BB/B+ | 53,060 | 8.8% | $1,644,860 | 9.0% | $31.00 | 10/31/2036 | 1 x 10 yr | N |
| Centric Services, Inc.(6) | NR/NR/NR | 52,634 | 8.8% | $1,629,549 | 8.9% | $30.96 | 2/29/2036 | 2 x 5 yr | Y(6) |
| Lancium LLC | NR/NR/NR | 26,530 | 4.4% | $850,021 | 4.7% | $32.04 | 6/30/2028 | N | N |
| Subtotal/Wtd. Avg. | 377,871 | 62.9% | $12,065,160 | 66.0% | $31.93 | ||||
| Other Tenants(7)(8) | 205,258 | 34.1% | $6,209,109 | 34.0% | $30.25 | ||||
| Occupied Subtotal/Wtd. Avg. | 583,129 | 97.0% | $18,274,269 | 100.0% | $31.34 | ||||
| Vacant Space | 18,022 | 3.0% | |||||||
| Total/Wtd. Avg. | 601,151 | 100.0% | |||||||
| (1) | Ratings are those of the parent company, whether or not the parent guarantees the lease. |
| (2) | The Annual UW Rent and Annual UW Rent PSF shown above include straight-line rent averaging for certain investment grade tenants through lease maturity totaling $537,710 and contractual rent steps through May 2025 totaling $472,016. |
| (3) | Western Midstream Partners, LP has two, 5-year or one, 10-year extension option. Western Midstream has the right to terminate its lease effective 11/30/2028 with 12 months’ notice and payment of a termination fee in an amount equal to (i) three times the then-current monthly rent, plus (ii) the unamortized costs of the tenant improvement and construction allowances, all broker commissions, rental abatement, and reasonable attorneys’ fees, amortized at a discount factor of 8% per year over the initial term. |
| (4) | The Woodlands Land Development is an affiliate of the borrower. |
| (5) | The Woodlands Land Development has various lease expirations dates including 42,675 SF (7.1% of NRA) on 10/31/2030 and 14,654 SF (2.4% of NRA) on 1/31/2031. |
| (6) | Centric Services, Inc. has the right to terminate its lease effective 2/28/2033 with 12 months notice and by paying a termination fee. |
| (7) | Other Tenants include 11,545 SF (1.9% of NRA) of Unleasable/Storage space with no underwritten income attributable to the space. |
| (8) | Other Tenants include two borrower affiliated tenants totaling 33,328 SF (5.5% of NRA) with various lease expirations of 10/31/2030, 1/31/2031 and 3/31/2031. |
The following table presents certain information relating to the lease rollover schedule at the 9950 Woodloch Property:
| Lease Rollover Schedule(1)(2) | ||||||||
| Year | # of Leases Rolling | SF Rolling | Approx % of SF Rolling | Approx Cumulative % of SF Rolling | Total UW Rent Rolling(2) | Approx % of Total UW Rent Rolling | Approx Cumulative % of Total UW Rent Rolling | UW Rent PSF Rolling |
| MTM/2024 | 1 | 11,545(3) | 1.9% | 1.9% | $0 | 0.0% | 0.0% | $0.00 |
| 2025 | 1 | 3,170 | 0.5% | 2.4% | $103,247 | 0.6% | 0.6% | $32.57 |
| 2026 | 0 | 0 | 0.0% | 2.4% | $0 | 0.0% | 0.6% | $0.00 |
| 2027 | 2 | 6,498 | 1.1% | 3.5% | $202,877 | 1.1% | 1.7% | $31.22 |
| 2028 | 1 | 26,530 | 4.4% | 7.9% | $850,021 | 4.7% | 6.3% | $32.04 |
| 2029(4) | 3 | 59,243 | 9.9% | 17.8% | $1,871,570 | 10.2% | 16.6% | $31.59 |
| 2030 | 3 | 77,344 | 12.9% | 30.7% | $2,495,599 | 13.7% | 30.2% | $32.27 |
| 2031 | 5 | 215,750 | 35.9% | 66.6% | $6,992,963 | 38.3% | 68.5% | $32.41 |
| 2032 | 3 | 24,141 | 4.0% | 70.6% | $771,499 | 4.2% | 72.7% | $31.96 |
| 2033 | 2 | 19,725 | 3.3% | 73.8% | $624,344 | 3.4% | 76.1% | $31.65 |
| 2034 | 0 | 0 | 0.0% | 73.8% | $0 | 0.0% | 76.1% | $0.00 |
| 2035 & Thereafter | 4 | 139,183 | 23.2% | 97.0% | $4,362,148 | 23.9% | 100.0% | $31.34 |
| Vacant | 0 | 18,022 | 3.0% | 100.0% | $0 | 0.0% | 100.0% | $0.00 |
| Total/Wtd. Avg. | 25 | 601,151 | 100.0% | $18,274,269 | 100.0% | $31.34(5) | ||
| (1) | Information obtained from the underwritten rent roll. |
| (2) | Certain tenants may have lease termination options that are exercisable prior to the originally stated expiration date of the related lease and are not considered in the rollover schedule. |
| (3) | 11,545 SF of unleasable/storage space with no underwritten income attributable to the space is classified as MTM. |
| (4) | The 9950 Woodloch Whole Loan has a maturity date of July 11, 2029. |
| (5) | UW Rent PSF Rolling does not include vacant space. |
The Market. The 9950 Woodloch Property is located in The Woodlands, Texas, approximately 33 miles north of the Houston Central Business District and 24 miles northwest of the George Bush International Airport. The Woodlands is a master planned community with a mix of moderate- to high-end residential and commercial/office/retail uses. The 9950 Woodloch Property is located on the southeast corner of Woodloch Forest Drive and Lake Robbins Drive, the outermost loop around Houston that provides accessibility throughout the area. Additionally, the 9950 Woodloch Property is located 0.4 miles
| This is not a research report and was not prepared by any Underwriter’s research department. Please see additional important information and qualifications at the end of this Term Sheet. | ||
| 113 | ||
| Office – Suburban | Loan #9 | Cut-off Date Balance: | $29,481,972 | |
| 9950 Woodloch Forest Drive | 9950 Woodloch | Cut-off Date LTV: | 56.1% | |
| The Woodlands, TX 77380 | UW NCF DSCR: | 1.50x | ||
| UW NOI Debt Yield: | 13.1% |
from The Woodlands Mall, a GreenStreet rated A+ mall featuring various dining and entertainment options. Major employers in The Woodlands include corporations such as Exxon Mobil Corp., Wood, Landry's Inc., Shell Oil Co., Fort Bend ISD and Schlumberger Ltd. According to the appraisal, the estimated 2024 population within a one, three and five-mile radius was approximately 7,425, 66,122 and 180,291, respectively and the estimated 2024 average household income within the same radii was approximately $147,624, $127,876, and $138,042, respectively.
According to the appraisal, the 9950 Woodloch Property is situated in The Woodlands Office submarket within the greater Houston Office market. As of the fourth quarter of 2023, the submarket reported a total inventory of approximately 24.9 million SF with a 13.6% vacancy rate and an average asking rent of $32.63 per SF, net. The appraiser identified five comparable buildings located within The Woodlands with rents ranging from $34.00 to $38.00 per SF, net. The appraiser concluded a market rent for the 9950 Woodloch Property of $35.50 per SF, net.
The following table presents certain information relating to the appraiser’s market rent conclusions for the 9950 Woodloch Property:
| Market Rent Summary | |
| Office | |
| Market Rent (PSF) | $35.50 |
| Lease Term (Years) | 7 |
| Lease Type | NNN |
| Escalations | 3.0%/Year |
| Tenant Improvements (New/Renewal) | $60.00 / $30.00 |
| Leasing Commissions (New/Renewal) | 6.0% / 3.0% |
The following table presents information relating to comparable office property sales for the 9950 Woodloch Property:
| Comparable Sales Summary | ||||||
| Property Name/Location | Year Built/Renovated | Total NRA (SF) | Occupancy | Sale Date | Sale Price | Sale Price PSF |
Three Barton Skyway 1221 South MoPac Expressway Austin, TX | 2001/NAP | 173,302 | 84.0% | Aug-2023 | $53,300,000 | $307.56 |
McKinney & Olive 2021 McKinney Avenue Dallas, TX | 2016/2021 | 536,000 | 100.0% | Dec-2022 | $397,000,000 | $740.67 |
200 Park Place River Oaks 4200 Westheimer Road Houston, TX | 2020/NAP | 206,943 | 100.0% | Jul-2022 | $145,000,000 | $700.68 |
Landmark One 15727 Anthem Parkway San Antonio, TX | 2017/NAP | 167,618 | 100.0% | Jul-2022 | $73,800,000 | $440.29 |
Gateway at Legacy 6860 Dallas Parkway Plano, TX | 2006/2020 | 208,978 | 96.0% | Jan-2022 | $90,500,000 | $433.06 |
Source: Appraisal.
The following table presents information relating to comparable office leases for the 9950 Woodloch Property:
| Summary of Comparable Office Leases | |||||||
| Property Name/Location | Year Built | Tenant | Lease Start Date | Term (Mos.) | Size (SF) | Annual Base Rent PSF | Lease Type |
9950 Woodloch (Subject) 9950 Woodloch Forest Drive The Woodlands, TX | 2014 | - | - | - | - | - | - |
460 Wildwood Forest Drive Spring, TX | 2014 | Cisco Systems | Jan-2024 | 12 | 21,574 | $35.93 | NNN |
730 Town & Country Boulevard Houston, TX | 2023 | LTIMindTree Limited | Nov-2023 | 87 | 6,542 | $35.00 | NNN |
609 Main Street Houston, TX | 2017 | White & Case | Aug-2023 | 60 | 85,908 | $38.00 | NNN |
730 Town & Country Boulevard Houston, TX | 2023 | Group 1 Automotive | May-2023 | 125 | 45,330 | $34.00 | NNN |
9753 Katy Freeway Houston, TX | 2023 | Callon Petroleum | Nov-2022 | 135 | 107,171 | $35.00 | NNN |
Source: Appraisal.
| This is not a research report and was not prepared by any Underwriter’s research department. Please see additional important information and qualifications at the end of this Term Sheet. | ||
| 114 | ||
| Office – Suburban | Loan #9 | Cut-off Date Balance: | $29,481,972 | |
| 9950 Woodloch Forest Drive | 9950 Woodloch | Cut-off Date LTV: | 56.1% | |
| The Woodlands, TX 77380 | UW NCF DSCR: | 1.50x | ||
| UW NOI Debt Yield: | 13.1% |
Appraisal. The appraiser concluded to an “as-is” Appraised Value for the 9950 Woodloch Property of $231,500,000 as of May 9, 2024.
Environmental Matters. According to the Phase I environmental site assessment dated May 20, 2024, there was no evidence of any recognized environmental conditions at the 9950 Woodloch Property.
Operating History and Underwritten Net Cash Flow. The following table presents certain information relating to the historical operating performance and Underwritten Net Cash Flow at the 9950 Woodloch Property:
| Cash Flow Analysis | ||||||
| 2021 | 2022 | 2023 | 3/31/2024 TTM | UW | UW PSF | |
| Base Rent(1) | $2,466,503 | $6,358,916 | $10,291,024 | $11,454,621 | $17,968,348 | $29.89 |
| Grossed Up Vacant Space | $0 | $0 | $0 | $0 | $945,703 | $1.57 |
| Gross Potential Rent | $2,466,503 | $6,358,916 | $10,291,024 | $11,454,621 | $18,914,050 | $31.46 |
| Other Income | $32,057 | $343,200 | $382,717 | $352,849 | $407,365 | $0.68 |
| Parking/Garage/Other | $3,390 | $105,980 | $131,170 | $141,368 | $623,760 | $1.04 |
| Total Recoveries | $879,158 | $3,522,474 | $5,006,809 | $5,601,766 | $10,010,374 | $16.65 |
| Net Rental Income | $3,381,108 | $10,330,570 | $15,811,720 | $17,550,604 | $29,955,549 | $49.83 |
| Less Vacancy & Credit Loss | $0 | $0 | $0 | $0 | $945,703(2) | $1.57 |
| Effective Gross Income | $3,381,108 | $10,330,570 | $15,811,720 | $17,550,604 | $29,009,847 | $48.26 |
| Real Estate Taxes | $2,223,030 | $2,015,805 | $2,493,650 | $2,666,349 | $2,493,650 | $4.15 |
| Insurance | $308,537 | $364,678 | $683,732 | $781,313 | $646,941 | $1.08 |
| Management Fee | $117,911 | $156,271 | $355,105 | $371,581 | $870,295 | $1.45 |
| Other Operating Expenses | $5,984,636 | $6,423,382 | $6,771,725 | $7,099,689 | $7,855,693 | $13.07 |
| Other Fixed Expense | $3,463 | $33,075 | $69,395 | $75,206 | $152,302 | $0.25 |
| Total Expenses | $8,637,577 | $8,993,211 | $10,373,607 | $10,994,138 | $12,018,882 | $19.99 |
| Net Operating Income(3) | ($5,256,469) | $1,337,359 | $5,438,113 | $6,556,466 | $16,990,965 | $28.26 |
| Replacement Reserves | $0 | $0 | $0 | $0 | $120,230 | $0.20 |
| TI/LC | $0 | $0 | $0 | $0 | $1,202,302 | $2.00 |
| Net Cash Flow | ($5,256,469) | $1,337,359 | $5,438,113 | $6,556,466 | $15,668,433 | $26.06 |
| Occupancy% | 44.0% | 57.7% | 91.8% | 97.0%(2) | 95.0%(2) | |
| NOI DSCR(4) | (0.50)x | 0.13x | 0.52x | 0.63x | 1.62x | |
| NCF DSCR(4) | (0.50)x | 0.13x | 0.52x | 0.63x | 1.50x | |
| NOI Debt Yield(4) | (4.0)% | 1.0% | 4.2% | 5.0% | 13.1% | |
| NCF Debt Yield(4) | (4.0)% | 1.0% | 4.2% | 5.0% | 12.1% | |
| (1) | UW Base Rent includes contractual rent steps through May 2025 totaling $472,016, as well as straight-line rent averaging credit over the remaining lease term for investment grade tenants totaling $537,710. |
| (2) | The underwritten economic vacancy is 5.0%. The 9950 Woodloch Property was 97.0% physically occupied as of June 3, 2024. |
| (3) | The 9950 Woodloch Property was acquired was acquired vacant by the borrower sponsor in December 2019. The increase in NOI from 2021 to 3/31/2024 TTM is due to the lease up of the building to 97.0% as of 6/3/2024. |
| (4) | DSCR and Debt Yield are based on the 9950 Woodloch Whole Loan. |
Escrows and Reserves.
Real Estate Taxes – The 9950 Woodloch Whole Loan documents require an upfront deposit of $1,309,164 and ongoing monthly real estate tax reserves in an amount equal to 1/12th of the real estate taxes that the lender estimates will be payable during the next 12 months, initially estimated at $218,194.
Insurance – The 9950 Woodloch Mortgage Whole Loan documents do not require ongoing monthly insurance reserves in an amount equal to 1/12 of the insurance premiums that the lender reasonably estimates will be payable during the next ensuing 12 months; provided no event of default is continuing, the borrower maintains insurance coverage for the 9950 Woodloch Property as part of blanket or umbrella coverage reasonably approved by the lender, and provides the lender with evidence of the renewals of the insurance policies and paid receipts for the payment of the insurance premiums no later than 10 business days prior to the expiration dates of the policies.
Replacement Reserve – The 9950 Woodloch Whole Loan documents require an ongoing monthly replacement reserve deposit of $10,019, capped at $360,684.
TI/LC Reserve – The 9950 Woodloch Whole Loan documents require an ongoing monthly leasing reserve deposit of $100,192 ($2 per SF), uncapped.
Existing TI/LC Reserve – The 9950 Woodloch Whole Loan documents require an upfront deposit of $8,840,609 for existing tenant improvements and leasing commissions.
| This is not a research report and was not prepared by any Underwriter’s research department. Please see additional important information and qualifications at the end of this Term Sheet. | ||
| 115 | ||
| Office – Suburban | Loan #9 | Cut-off Date Balance: | $29,481,972 | |
| 9950 Woodloch Forest Drive | 9950 Woodloch | Cut-off Date LTV: | 56.1% | |
| The Woodlands, TX 77380 | UW NCF DSCR: | 1.50x | ||
| UW NOI Debt Yield: | 13.1% |
Rent Concession Reserve – The 9950 Woodloch Whole Loan documents require an upfront deposit of $4,020,411 for outstanding free rent, gap rent, and future rent credits.
Western Midstream Termination Reserve Fund - Upon Western Midstream exercising its termination right, the borrower is required to deposit $3,600,000 with the lender in the form of cash or a letter of credit. The loan documents provide that, if the borrower fails to make such deposit, the borrower and guarantor will have personal liability for such amount provided that if the outstanding amount of the 9950 Woodloch Whole Loan is equal to or less than $3,600,000, the borrower and guarantor will have personal liability in an amount equal to such outstanding amount.
Lockbox and Cash Management. The 9950 Woodloch Whole Loan is structured with a hard lockbox and springing cash management. The tenants are required to deposit all rent into an established deposit account each business day (however, sponsor-affiliated tenants are only required to deposit rent into the deposit account following a Cash Trap Event Period). Upon the occurrence of a Cash Trap Event Period, all amounts available in the deposit account will be transferred to a cash management account controlled by the lender on each business day and applied in accordance with the cash flow waterfall in the cash management agreement.
A “Cash Trap Event Period” will commence upon the earlier of the following:
| (i) | the occurrence of an event of default; |
| (ii) | the net cash flow debt service coverage ratio (“NCF DSCR”) being less than 1.15x, tested quarterly (a “Low DSCR Trigger Event”), unless within 10 days after the lender notifies the borrower of the occurrence of a Low DSCR Trigger Event, the borrower delivers to the lender cash deposits and/or a letter of credit as additional collateral for the 9950 Woodloch Whole Loan (“DSCR Collateral”) in accordance with the 9950 Woodloch Whole Loan documents; |
| (iii) | the occurrence of a Major Tenant Event (as defined below); or |
| (iv) | the monthly payment occurring in January 2029. |
A Cash Trap Event Period will end upon the occurrence of the following:
| ● | with regard to clause (i), the cure of such event of default; |
| ● | with regard to clause (ii), above, upon the date that the NCF DSCR is equal to or greater than 1.15x for two consecutive calendar quarters or the borrower delivers the DSCR Collateral pursuant to the 9950 Woodloch Whole Loan documents; or |
| ● | with regard to clause (iii), a Major Tenant Event Cure (as defined below). |
A “Major Tenant” means Western Midstream, its successors and assigns, and any replacement tenant that enters into a lease for all or any portion of the Major Tenant space in accordance with the 9950 Woodloch Whole Loan documents.
A “Major Tenant Trigger Event” means the earliest to occur of the following:
| (i) | A Major Tenant goes dark or vacates 10% or more of its space; |
| (ii) | A Major Tenant becomes a debtor in a bankruptcy or similar insolvency proceeding, or action; or |
| (iii) | A Major Tenant terminates or cancels its lease. |
A “Major Tenant Trigger Event Cure” will occur upon the following:
| ● | with regard to clauses (i)-(iii) above, either (a) the entire Major Tenant space has been leased to one or more reasonably satisfactory replacement tenants, or (b) the Major Tenant assigns its Lease; |
| ● | with regard to clause (i) above, the Major Tenant has re-occupied its entire Major Tenant space and is open for business; |
| ● | with regard to clause (ii) above, the bankruptcy or insolvency proceeding has terminated, the related lease has been affirmed and the terms of such lease are reasonably satisfactory to the lender; and |
| ● | with regard to clause (iii) above, Major Tenant (x) revokes the termination or cancellation and (y) delivers to the lender a tenant estoppel certificate. |
Terrorism Insurance. The 9950 Woodloch Whole Loan documents require that the “all risk” insurance policy required to be maintained by the borrowers provides coverage for terrorism in an amount equal to the full replacement cost of the 9950 Woodloch Property, as well as business interruption insurance covering no less than the 18-month period following the occurrence of a casualty event, together with a 6-month extended period of indemnity (provided that if TRIPRA or a similar statute is not in effect, the borrowers will not be obligated to pay terrorism insurance premiums in excess of two times the premium for the casualty and business interruption coverage on a stand-alone basis).
| This is not a research report and was not prepared by any Underwriter’s research department. Please see additional important information and qualifications at the end of this Term Sheet. | ||
| 116 | ||
| Industrial – Warehouse/Distribution | Loan #10 | Cut-off Date Balance: | $27,000,000 | |
| 8400 Winchester Road | 8400 Winchester | Cut-off Date LTV: | 55.1% | |
| Memphis, TN 38125 | UW NCF DSCR: | 1.36x | ||
| UW NOI Debt Yield: | 10.9% |
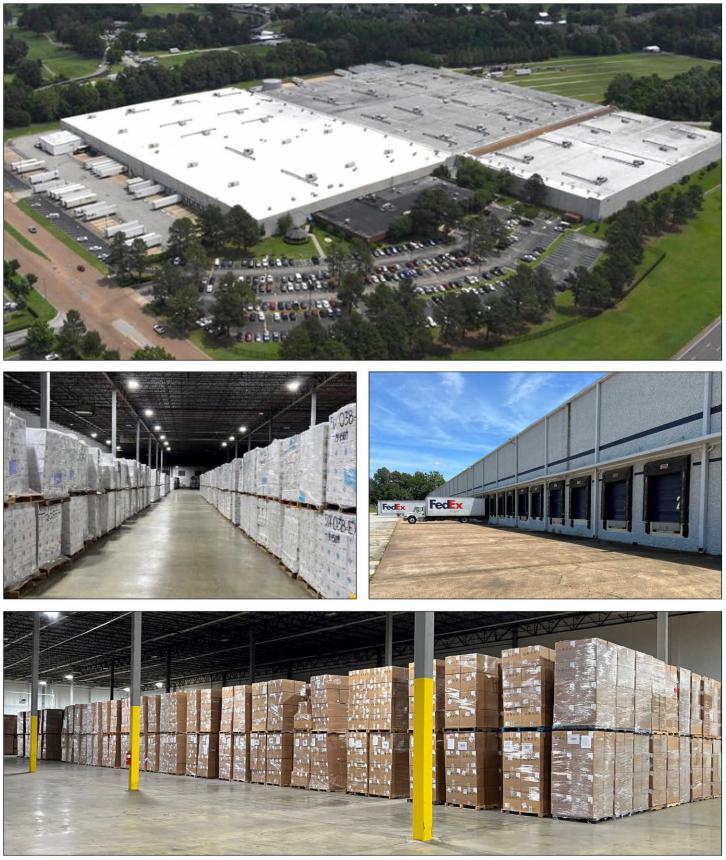
| This is not a research report and was not prepared by any Underwriter’s research department. Please see additional important information and qualifications at the end of this Term Sheet. | ||
| 117 | ||
| Industrial – Warehouse/Distribution | Loan #10 | Cut-off Date Balance: | $27,000,000 | |
| 8400 Winchester Road | 8400 Winchester | Cut-off Date LTV: | 55.1% | |
| Memphis, TN 38125 | UW NCF DSCR: | 1.36x | ||
| UW NOI Debt Yield: | 10.9% |
| This is not a research report and was not prepared by any Underwriter’s research department. Please see additional important information and qualifications at the end of this Term Sheet. | ||
| 118 | ||
| Mortgage Loan No. 10 – 8400 Winchester |
| Mortgage Loan Information | Property Information | ||||||
| Mortgage Loan Seller: | JPMCB | Single Asset/Portfolio: | Single Asset | ||||
| Credit Assessment (Fitch/Moody’s/DBRSM): | NR/NR/NR | Location: | Memphis, TN 38125 | ||||
| Original Balance: | $27,000,000 | General Property Type: | Industrial | ||||
| Cut-off Date Balance: | $27,000,000 | Detailed Property Type: | Warehouse/Distribution | ||||
| % of Initial Pool Balance: | 3.9% | Title Vesting: | Fee | ||||
| Loan Purpose: | Refinance | Year Built/Renovated: | 1982/2003 | ||||
| Borrower Sponsors: | Bain Capital Credit, L.P. and | Size: | 817,274 SF | ||||
| RealOp Investments, LLC | Cut-off Date Balance PSF: | $33 | |||||
| Guarantor: | ROIB2-A JV, LLC | Maturity Date Balance PSF: | $33 | ||||
| Mortgage Rate: | 7.3760% | Property Manager: | ROI Property Managers, LLC | ||||
| Note Date: | 7/11/2024 | ||||||
| Maturity Date: | 8/5/2029 | Underwriting and Financial Information | |||||
| Term to Maturity: | 60 months | UW NOI: | $2,948,628 | ||||
| Amortization Term: | 0 months | UW NCF: | $2,739,921 | ||||
| IO Period: | 60 months | UW NOI Debt Yield: | 10.9% | ||||
| Seasoning: | 0 months | UW NCF Debt Yield: | 10.1 % | ||||
| Prepayment Provisions: | L(25),YM1(29),O(6) | UW NOI Debt Yield at Maturity: | 10.9% | ||||
| Lockbox/Cash Mgmt Status: | Hard/Springing | UW NCF DSCR: | 1.36x | ||||
| Additional Debt Type: | NAP | Most Recent NOI: | $2,939,676 (12/31/2023) | ||||
| Additional Debt Balance: | NAP | 2nd Most Recent NOI(2): | NAV | ||||
| Future Debt Permitted (Type): | No (NAP) | 3rd Most Recent NOI(2): | NAV | ||||
| Reserves(1) | Most Recent Occupancy: | 100.0% (8/1/2024) | |||||
| Type | Initial | Monthly | Cap | 2nd Most Recent Occupancy(2): | NAV | ||
| RE Tax: | $309,488 | $35,733 | NAP | 3rd Most Recent Occupancy(2): | NAV | ||
| Insurance: | $0 | Springing | NAP | Appraised Value (as of)(3): | $49,000,000 (5/22/2024) | ||
| Deferred Maintenance: | $1,541,611 | $0 | NAP | Appraised Value PSF: | $60 | ||
| Cap Ex Reserve: | $6,811 | $6,811 | NAP | Cut-off Date LTV Ratio: | 55.1% | ||
| TI/LC Reserve: | $20,432 | $20,432 | NAP | Maturity Date LTV Ratio: | 55.1% | ||
| Sources and Uses | ||||||
| Sources | Proceeds | % of Total | Uses | Proceeds | % of Total | |
| Loan Amount: | $27,000,000 | 100.0% | Loan Payoff: | $13,433,907 | 49.8% | |
| Return of Equity: | $11,260,673 | 41.7% | ||||
| Upfront Reserves: | $1,878,341 | 7.0% | ||||
| Closing Costs: | $427,079 | 1.6% | ||||
| Total Sources: | $27,000,000 | 100.0% | Total Uses: | $27,000,000 | 100.0% | |
| (1) | See “Escrows and Reserves” below for further discussion of reserve requirements. |
| (2) | Historical financials unavailable given the timing of sponsor acquisition and vacancy prior to executing existing lease with Cart.com, Inc. |
| (3) | The appraisal also provides for an “as dark” appraised value of $45,000,000. The “as dark” appraised value results in a Cut-off Date LTV Ratio and Maturity Date LTV Ratio of 60.0% for the 8400 Winchester Mortgage Loan (as defined below). See “Appraisal” section below. |
The Mortgage Loan. The tenth largest mortgage loan (the “8400 Winchester Mortgage Loan”) is evidenced by a promissory note in the original principal amount of $27,000,000. The 8400 Winchester Mortgage Loan was originated by JPMorgan Chase Bank, National Association on July 11, 2024. The 8400 Winchester Mortgage Loan is secured by a first priority fee mortgage encumbering a 817,274 SF industrial property located in Memphis, Tennessee (the “8400 Winchester Property”).
The Borrower and Borrower Sponsor. The borrower is ROIB2 Winchester, LLC, a single purpose Delaware limited liability company with one independent director. The borrower sponsor is a joint venture between Bain Capital Credit, L.P. (“Bain”) and RealOp Investments, LLC (“RealOp”) and the non-recourse carveout guarantor is ROIB2-A JV, LLC, a Delaware limited liability company.
Founded in 1998, Bain is a leading global credit specialist with $47 billion in assets under management, investing across the credit spectrum and in credit-related strategies, including leveraged loans, high-yield bonds, structured products, middle market loans, bespoke capital solutions, distressed securities and assets, non-performing loans, hard assets and equities. Since inception, Bain has maintained a strong sense of alignment with its partners, behaving as a private partnership and allowing approximately $912 million of employee co-investment committed across Bain funds. Bain employs over 100 investment professionals across 14 offices located on four continents.
Founded in 2009, RealOp is a commercial real estate investment company that specializes in value-add and opportunistic acquisitions. RealOp’s leadership team has a combined 100 years of experience in the industry and a collective participation of over $9 billion in real estate transactions.
| This is not a research report and was not prepared by any Underwriter’s research department. Please see additional important information and qualifications at the end of this Term Sheet. | ||
| 119 | ||
| Industrial – Warehouse/Distribution | Loan #10 | Cut-off Date Balance: | $27,000,000 | |
| 8400 Winchester Road | 8400 Winchester | Cut-off Date LTV: | 55.1% | |
| Memphis, TN 38125 | UW NCF DSCR: | 1.36x | ||
| UW NOI Debt Yield: | 10.9% |
The Property. The 8400 Winchester Property is comprised of a 817,274 SF industrial warehouse/distribution building situated on an approximately 37.0 acre site located in Memphis, Tennessee. The 8400 Winchester Property was built in 1982, expanded in 1988 and most recently renovated in 2003. In addition, the 8400 Winchester Property includes 325 parking spaces and a parking ratio per 1,000 SF of 0.40x. Moreover, the 8400 Winchester Property offers 50 dock high doors, three drive-in doors and 28 foot clear heights. Other amenities at the 8400 Winchester Property include a cafeteria, conference center, data room and approximately 51,000 SF (6.2% of total SF) of front office space. Immediately adjacent to the FedEx World Headquarters campus, the 8400 Winchester Property also offers convenient access into Memphis’s major thoroughfares, including Memphis International Airport and U.S. Route 72.
Prior to the loan sponsor’s acquisition, the 8400 Winchester Property had been utilized as a single tenant distribution facility for Nike. Nike vacated the 8400 Winchester Property in February 2019, prior to the onset of the COVID-19 pandemic. Subsequently, the 8400 Winchester Property was purchased by the loan sponsor for $16 million as a vacant warehouse at the height of the COVID-19 pandemic in July 2020. Within 21 months of acquisition, the loan sponsor re-leased the 8400 Winchester Property, in its entirety to a single tenant user, Cart.com, Inc. (“Cart.com”), whose lease commenced in May 2022. Since acquiring the 8400 Winchester Property, the loan sponsor has invested an additional approximately $6 million in capital expenditures, including roof repairs, HVAC improvements, full LED lighting conversion, interior and exterior painting and slab repairs.
Though the Cart.com lease is scheduled to expire in May 2029, the 8400 Winchester Property is a mission-critical facility for tenant’s core fulfillment business, given its proximate location to the Memphis International Airport (15.6 miles), FedEx World Hub (11.8 miles) and the BNSF International Railway (8.8 miles). Further, the 8400 Winchester Mortgage Loan is structured such that 12 months prior to expiration of the Cart.com lease, a Cash Sweep Event (as defined below) will commence and continue until maturity of the 8400 Winchester Mortgage Loan, resulting in approximately $1.0 million to be swept as additional collateral prior to maturity. Coupled with approximately $1.2 million in estimated TI/LC collections over the term of the 8400 Winchester Mortgage Loan, the net basis at loan maturity is estimated to be approximately $30 PSF. See “Lockbox and Cash Management” and “Escrows and Reserves”.
Sole Tenant.
Cart.com, Inc. (817,274 SF, 100.0% of NRA, 100.0% of underwritten rent). Founded in November 2020, Cart.com is a leading provider of unified commerce and logistics solutions for B2C and B2B companies. Cart.com utilizes an interconnected suite of software and services to power cross-channel commerce operations from listing to sale to fulfillment for some of the world’s largest brands and most demanding organizations. Cart.com currently has over 6,000 customers and employs 1,600 employees across 14 fulfilment centers and 7 offices globally. Moreover, Cart.com occupies over 8.5 million SF of fulfilment space and processes over 70 million orders yearly, with notable customers such as Adidas, Guess, Pacsun and Swarovski. In June of 2023, Cart.com raised an additional $60 million in a Series C equity funding round at a $1.2 billion valuation, largely propelled by its more than 500% increase in revenue from 2022. Cart.com has been a tenant at the 8400 Winchester Property since 2022 and operates under a NNN lease that is scheduled to expire in May, 2029 with two, 5-year renewal options remaining.
The following table presents certain information relating to the sole tenant at the 8400 Winchester Property:
| Tenant Summary(1) | |||||||||
| Tenant Name | Credit Rating (Fitch/ Moody’s/S&P) | Tenant SF | Approx.% of SF | Annual UW Base Rent | Annual UW Base Rent PSF | % of Total Annual UW Base Rent | Lease Expiration | Renewal Option | Term. Option (Y/N) |
| Cart.com, Inc. | NR/NR/NR | 817,274 | 100.0% | $3,170,354 | $3.88 | 100.0% | 5/31/2029 | 2 x 5 yr | N |
| Subtotal/Wtd. Avg. | 817,274 | 100.0% | $3,170,354 | $3.88 | 100.0% | ||||
| Vacant Space | 0 | 0.0% | |||||||
| Total/Wtd. Avg. | 817,274 | 100.0% | |||||||
| (1) | Information is based on the underwritten rent roll. |
| This is not a research report and was not prepared by any Underwriter’s research department. Please see additional important information and qualifications at the end of this Term Sheet. | ||
| 120 | ||
| Industrial – Warehouse/Distribution | Loan #10 | Cut-off Date Balance: | $27,000,000 | |
| 8400 Winchester Road | 8400 Winchester | Cut-off Date LTV: | 55.1% | |
| Memphis, TN 38125 | UW NCF DSCR: | 1.36x | ||
| UW NOI Debt Yield: | 10.9% |
The following table presents certain information relating to the lease rollover schedule at the 8400 Winchester Property:
| Lease Rollover Schedule(1) | ||||||||
| Year | # of Leases Rolling | SF Rolling | Approx. % of SF Rolling | Approx. Cumulative % of SF Rolling | Total UW Base Rent Rolling | Approx. % of Total Rent Rolling | Approx. Cumulative % of Total Rent Rolling | UW Base Rent PSF Rolling |
| MTM/2024 | 0 | 0 | 0.0% | 0.0% | $0 | 0.0% | 0.0% | $0.00 |
| 2025 | 0 | 0 | 0.0% | 0.0% | $0 | 0.0% | 0.0% | $0.00 |
| 2026 | 0 | 0 | 0.0% | 0.0% | $0 | 0.0% | 0.0% | $0.00 |
| 2027 | 0 | 0 | 0.0% | 0.0% | $0 | 0.0% | 0.0% | $0.00 |
| 2028 | 0 | 0 | 0.0% | 0.0% | $0 | 0.0% | 0.0% | $0.00 |
| 2029(2) | 1 | 817,274 | 100.0% | 100.0% | $3,170,354 | 100.0% | 100.0% | $3.88 |
| 2030 | 0 | 0 | 0.0% | 100.0% | $0 | 0.0% | 100.0% | $0.00 |
| 2031 | 0 | 0 | 0.0% | 100.0% | $0 | 0.0% | 100.0% | $0.00 |
| 2032 | 0 | 0 | 0.0% | 100.0% | $0 | 0.0% | 100.0% | $0.00 |
| 2033 | 0 | 0 | 0.0% | 100.0% | $0 | 0.0% | 100.0% | $0.00 |
| 2034 | 0 | 0 | 0.0% | 100.0% | $0 | 0.0% | 100.0% | $0.00 |
| 2035 & Beyond | 0 | 0 | 0.0% | 100.0% | $0 | 0.0% | 100.0% | $0.00 |
| Vacant | 0 | 0 | 0.0% | 100.0% | $0 | 0.0% | 100.0% | $0.00 |
| Total/Wtd. Avg. | 1 | 817,274 | 100.0% | $3,170,354 | 100.0% | $3.88 | ||
| (1) | Information is based on the underwritten rent roll. |
| (2) | The 8400 Winchester Mortgage Loan matures on August 5, 2029. |
The Market. The 8400 Winchester Property is located in Shelby County, Tennessee within the Memphis metropolitan statistical area (“MSA”). Memphis serves as a popular transportation hub and is home to the second largest cargo airport in the world, the Memphis International Airport, as well as a significant freight trucking sector. Along the same vein, FedEx Corp. (“FedEx”) is the largest private employer in Memphis as well as one of the largest users of the Memphis International Airport. In 2022, FedEx opened their new global headquarters in downtown Memphis, a new focal point for the company’s global operations. Subsequently, FedEx invested more than $50 million to renovate the building to help rejuvenate the downtown area and attract additional customers. Consequently, transportation/warehousing accounts for three times as many jobs in the Memphis MSA as it does nationally. According to the appraisal, moderation in inflation as well as stabilization in fuel prices and payrolls should contribute to an optimistic economic outlook for the area.
According to the appraisal, average industrial occupancy in the Memphis MSA as of the first quarter of 2024 was 92.4%. In addition, average industrial NNN rents were $4.44 as of the first quarter of 2024. Absorption for the last 12 months in the market was flat. According to a third-party market research report, the 2023 population within a one-, three- and five-mile radius of the 8400 Winchester Property was 5,253, 55,653, and 164,575, respectively. The 2023 average household income within the same one-, three- and five-mile radius was $113,093, $115,685 and $107,806, respectively.
The following table presents comparable industrial leases with respect to the 8400 Winchester Property:
| Comparable Industrial Lease Summary | |||||||
| Property Name/Location | Year Built / Renovated | Total SF | Tenant Name | Lease SF | Lease Term (Mos.) | Rent PSF | Lease Type |
8400 Winchester (1) 8400 Winchester Road Memphis, TN | 1982 / 2003 | 817,274 | Cart.com, Inc. | 817,274 | 85 | $3.88 | NNN |
Chickasaw Distribution Center Bldg. G 6000 Freeport Avenue Memphis, TN | 1999 / NAP | 540,000 | Creative Co-Op, Inc. | 540,000 | 60 | $4.05 | NNN |
8631 Polk Lane 8631 Polk Lane Olive Branch, MS | 2005 / NAP | 720,000 | Ubique Group | 720,000 | 124 | $3.75 | NNN |
DeSoto Trade Center 5 4080 Executive Drive Southaven, MS | 2006 / NAP | 865,120 | Kuehne + Nagel | 865,120 | 63 | $4.00 | NNN |
5015 Citation Drive 5015 Citation Drive Memphis, TN | 1997 / NAP | 500,000 | GXO Logistics | 500,000 | 36 | $4.50 | NNN |
Southridge Corporate 4926 4926 Southridge Boulevard Memphis, TN | 1995 / 1999 | 640,000 | Vantiva | 640,000 | 60 | $4.00 | NNN |
4500 Mendenhall 4500 Mendenhall Road Memphis, TN | 1997 / NAP | 358,000 | Eversana | 358,000 | 120 | $4.30 | NNN |
Source: Appraisal.
| (1) | Information is based on the underwritten rent roll. |
| This is not a research report and was not prepared by any Underwriter’s research department. Please see additional important information and qualifications at the end of this Term Sheet. | ||
| 121 | ||
| Industrial – Warehouse/Distribution | Loan #10 | Cut-off Date Balance: | $27,000,000 | |
| 8400 Winchester Road | 8400 Winchester | Cut-off Date LTV: | 55.1% | |
| Memphis, TN 38125 | UW NCF DSCR: | 1.36x | ||
| UW NOI Debt Yield: | 10.9% |
The following table presents information relating to comparable industrial property sales for the 8400 Winchester Property:
| Comparable Sales Summary | ||||||
| Property Name/Location | Year Built/Renovated | Total NRA (SF) | Occupancy | Sale Date | Sale Price | Sale Price PSF |
Southridge Corporate 4926 4926 Southridge Boulevard Memphis, TN | 1995 / 1999 | 664,990 | 100.0% | Sep. 2023 | $36,250,000 | $54.51 |
Marina Commerce Center 10480 Marina Drive Olive Branch, MS | 2021 / NAP | 1,086,308 | 100.0% | Aug. 2023 | $73,500,000 | $67.66 |
DeSoto Logistics Center 8150 Nail Road Olive Branch, MS | 2022 / NAP | 445,138 | 100.0% | May. 2023 | $33,250,000 | $74.70 |
6332 and 6356 Commercial Drive 6332 Commercial Drive Olive Branch, MS | 2021 / NAP | 466,476 | 100.0% | Feb. 2023 | $38,000,000 | $81.46 |
Ridgeway Industrial Park – Bldgs. 10700, 10750, 10800 & 10795 10700, 10750, 10800 & 10795 Ridgeway Industrial Drive Olive Branch, MS | 1993 / NAP | 373,750 | 75.0% | Jun. 2022 | $20,200,000 | $54.05 |
Democrat Square North 3268 American Way Memphis, TN | 1976 / NAP | 639,200 | 98.0% | Jun. 2022 | $36,800,000 | $57.57 |
Source: Appraisal.
Appraisal. The appraiser concluded to a “as-is” value for the 8400 Winchester Property of $49,000,000 as of May 22, 2024. The appraisal also provides an “as dark” appraised value of $45,000,000. The “as dark” appraised value results in a Cut-off Date LTV Ratio and Maturity Date LTV Ratio of 60.0% for the 8400 Winchester Mortgage Loan.
Environmental Matters. According to the Phase I environmental site assessment dated May 24, 2024, there was no evidence of any recognized environmental l conditions at the 8400 Winchester Property.
Operating History and Underwritten Net Cash Flow. The following table presents certain information relating to the historical operating performance and Underwritten Net Cash Flow at the 8400 Winchester Property:
| Cash Flow Analysis | ||||
| 2023 | UW | UW PSF | ||
| Rents In Place | $2,959,349 | $3,170,354 | $3.88 | |
| Reimbursement | $773,209 | $798,255 | $0.98 | |
| Vacancy | $0 | ($198,430) | ($0.24) | |
| Effective Gross Income | $3,732,559 | $3,770,179 | $4.61 | |
| Real Estate Taxes | $416,312 | $416,312 | $0.51 | |
| Insurance | $120,261 | $124,270 | $0.15 | |
| Other Operating Expenses | $256,308 | $280,969 | $0.34 | |
| Total Operating Expenses | $792,882 | $821,551 | $1.01 | |
| Net Operating Income(3) | $2,939,676 | $2,948,628 | $3.61 | |
| TI/LC | $0 | $126,979 | $0.16 | |
| Replacement Reserve | $0 | $81,727 | $0.10 | |
| Net Cash Flow | $2,939,676 | $2,739,921 | $3.35 | |
| Occupancy % | 100.0% | 95.0% | (1) | |
| NOI DSCR | 1.46x | 1.46x | ||
| NCF DSCR | 1.46x | 1.36x | ||
| NOI Debt Yield | 10.9% | 10.9% | ||
| NCF Debt Yield | 10.9% | 10.1% | ||
| (1) | Underwritten economic vacancy is 5.0%. The 8400 Winchester Property was 100.0% leased as of August 1, 2024 |
| This is not a research report and was not prepared by any Underwriter’s research department. Please see additional important information and qualifications at the end of this Term Sheet. | ||
| 122 | ||
| Industrial – Warehouse/Distribution | Loan #10 | Cut-off Date Balance: | $27,000,000 | |
| 8400 Winchester Road | 8400 Winchester | Cut-off Date LTV: | 55.1% | |
| Memphis, TN 38125 | UW NCF DSCR: | 1.36x | ||
| UW NOI Debt Yield: | 10.9% |
Escrows and Reserves.
Real Estate Taxes – On the loan origination date, the borrower was required to make an upfront deposit of $309,488 into a reserve for real estate taxes. In addition, the borrower is required to deposit into a real estate tax reserve, on a monthly basis, an amount equal to 1/12 of the real estate taxes that the mortgage lender estimates will be payable during the next twelve months (initially estimated to be $35,733).
Insurance – The borrower is required to deposit into an insurance reserve, on a monthly basis, an amount equal to 1/12 of the insurance premiums that the mortgage lender estimates will be payable for the renewal of the insurance coverage; provided, however, that such monthly reserves for insurance premiums will not be required so long as (i) no event of default has occurred and is continuing and (ii) the insurance coverage for the 8400 Winchester Property is included in a blanket policy approved by the lender in its reasonable discretion.
Deferred Maintenance Reserve – On the loan origination date, the borrower was required to make an upfront deposit of $1,541,611 into a reserve for deferred maintenance, primarily allocated towards roof and HVAC repairs.
Cap Ex Reserve – On the loan origination date, the borrower was required to make an upfront deposit of $6,811 into a reserve for capital expenditures. In addition, the borrower is required to deposit into a cap ex reserve, on a monthly basis, an amount equal to $6,811 ($0.10 PSF annually).
TI/LC Reserve – On the loan origination date, the borrower was required to make an upfront deposit of $20,432 into a reserve for TI/LC. In addition, the borrower is required to deposit into a TI/LC reserve, on a monthly basis, an amount equal to $20,432 ($0.30 PSF annually).
Lockbox and Cash Management. The 8400 Winchester Mortgage Loan is structured with a hard lockbox and springing cash management. The borrower and property manager are required to direct the tenants to pay rent directly into the lockbox account, and to deposit any rents otherwise received into such lockbox account within one business day after receipt. If no Cash Sweep Event is continuing, all funds in the lockbox account will be swept each business day to the borrower’s operating account. During the continuance of a Cash Sweep Event, all funds in the lockbox account are required to be swept on each business day to a lender-controlled cash management account and applied in accordance with the 8400 Winchester Mortgage Loan documents. During the continuance of a Cash Sweep Period, any excess cash is required to be deposited into an excess cash flow reserve account to be held as additional security for the 8400 Winchester Mortgage Loan in accordance with the 8400 Winchester Mortgage Loan documents. During the continuance of an event of default or a Bankruptcy Trigger Event (as defined below), all funds in the cash management account may be applied by the lender in such order and priority as the lender determines. Upon payment in full of the debt, all sums remaining on deposit in the excess cash flow reserve account will be disbursed to the borrower.
A “Cash Sweep Event” means the period commencing upon the occurrence of (i) an event of default, (ii) a bankruptcy action of the borrower (a “Bankruptcy Trigger Event”) or the property manager (provided, however, that a bankruptcy action of the manager will not result in a Cash Sweep Event if (a) the property manager is not an affiliate of the borrower and (b) the borrower replaces such property manager within 30 days of such bankruptcy action in accordance with the terms of the 8400 Winchester Mortgage Loan documents), (iii) the debt service coverage ratio falling below 1.15x based on the trailing six month period immediately preceding the date of such determination, (iv) the commencement of a Lease Sweep Period (as defined below) or (v) the date that is 12 months prior to the expiration of the Cart.com lease (a “Maturity Trigger Event”). A Cash Sweep Event will be cured with respect to clause (i) above, upon the acceptance by the lender of a cure of such event of default (which cure the lender is not obligated to accept and the lender may reject or accept in its sole and absolute discretion), with respect to clause (ii) above, if the Cash Sweep Event is caused solely by a bankruptcy action of the property manager, if the borrower replaces the property manager with a qualified property manager under a replacement management agreement within 60 days after such bankruptcy action, with respect to clause (iii) above, upon the achievement of a debt service coverage ratio of 1.15x for two consecutive quarters based upon the trailing six month period immediately preceding the date of determination, with respect to clause (iv) above, upon the end of such Lease Sweep Period, provided, however, (x) no event of default has occurred and is continuing, (y) a Cash Sweep Event cure resulting from an event of default or a bankruptcy action of the property manager may occur no more than a total of four times in aggregate during the duration of the loan, (z) the borrower has paid all of the lender’s reasonable fees and expenses incurred in connection with a Cash Sweep Event cure. In no event is the borrower entitled to cure a Cash Sweep Event caused by a bankruptcy action of the borrower or a Maturity Trigger Event.
A ”Lease Sweep Period” means the period commencing on the first payment date following the occurrence of (i) any tenant under (x) the Cart.com lease or (y) any replacement lease for such lease (a “Lease Sweep Lease”) subleasing, discontinuing its business (i.e., “goes dark”), vacating or abandoning 50% or more of its leased space at the 8400 Winchester Property, or giving notice that it intends to sublease, discontinue its business, vacate or abandon 50% or more of its leased space at the 8400 Winchester Property; provided, however, that: (A) a tenant will not be deemed to have “gone dark”, vacated or abandoned a space solely due to the tenant utilizing less than all of the space demised pursuant to its lease and designated for the storage of inventory, so long as (x) the unused portion of such tenant’s demised space remains available and functional for such use and (y) tenant remains open and operating in the remainder of its space, with onsite staff in place during normal business hours; and (B) Cart.com will not be deemed to have assigned or subleased the Cart.com lease under clause (i) above if Cart.com enters into a sublease which strictly complies with the terms of the Cart.com lease (i.e., a lease to a “Tenant Affiliate”, as defined in the Cart.com lease, in connection with which Cart.com is not released from liability under the Cart.com lease, notwithstanding the assignment or sublease) or (ii) the commencement of an insolvency proceeding of any tenant under a Lease Sweep Lease, and expires upon (a) with respect to clauses (i) and (ii) above, the entirety of the leased space (or applicable portion thereof) is leased to a replacement tenant satisfying the requirements of the 8400 Winchester Mortgage Loan documents, (b) solely with respect to clause (ii) above, either (x) the termination of such tenant’s insolvency proceeding and the applicable tenant’s lease is affirmed, assumed or assigned in a manner reasonably satisfactory to the lender or (y) the applicable Lease Sweep Lease has been assumed and assigned to a third party in a manner reasonably satisfactory to the lender, and (c) solely with respect to clause (i) above, (x) such tenant revokes (in writing) its notice of intent to “go dark”, vacate or abandon 50% or more of its leased space at the 8400 Winchester Property and the borrower provides evidence reasonably satisfactory to the lender that such tenant no longer intends to “go dark”, vacate or abandon 50% of more of its leased space at the 8400 Winchester Property or (y) such tenant resumes occupancy of the applicable space under its Lease Sweep Lease and the borrower provides evidence reasonably acceptable to the lender that the applicable tenant has resumed occupancy of the applicable space.
Terrorism Insurance. The borrower is required to obtain and maintain property insurance for 100% of full replacement cost and business interruption insurance for 12 months plus a 6-month extended period of indemnity. Such insurance is required to cover perils of terrorism and acts of terrorism. See “Risk Factors—Risks Relating to the Mortgage Loans—Terrorism Insurance May Not Be Available for All Mortgaged Properties” in the prospectus.
| This is not a research report and was not prepared by any Underwriter’s research department. Please see additional important information and qualifications at the end of this Term Sheet. | ||
| 123 | ||
| Mortgage Loan No. 11 – Pioneer |
| Mortgage Loan Information | Property Information | ||||||
| Mortgage Loan Seller: | BANA | Single Asset/Portfolio: | Single Asset | ||||
| Credit Assessment (Fitch/Moody’s/DBRSM): | NR/NR/NR | Location: | Santa Fe Springs, CA 90670 | ||||
| Original Balance: | $20,000,000 | General Property Type: | Office | ||||
| Cut-off Date Balance: | $20,000,000 | Detailed Property Type: | Suburban | ||||
| % of Initial Pool Balance: | 2.9% | Title Vesting: | Fee | ||||
| Loan Purpose: | Refinance | Year Built/Renovated: | 1981;1989/NAP | ||||
| Borrower Sponsors: | Neil Kadisha and Benjamin Nazarian | Size: | 177,383 SF | ||||
| Guarantors: | Neil Kadisha and Benjamin Nazarian | Cut-off Date Balance Per SF: | $113 | ||||
| Mortgage Rate: | 7.0800% | Maturity Date Balance Per SF: | $113 | ||||
| Note Date: | 5/10/2024 | Property Manager: | Omninet Property Management LLC | ||||
| Maturity Date: | 6/1/2029 | (borrower-related) | |||||
| Term to Maturity: | 60 months | Underwriting and Financial Information | |||||
| Amortization Term: | 0 months | UW NOI: | $2,697,752 | ||||
| IO Period: | 60 months | UW NCF: | $2,375,815 | ||||
| Seasoning: | 2 months | UW NOI Debt Yield: | 13.5% | ||||
| Prepayment Provisions: | L(26),D(27),O(7) | UW NCF Debt Yield: | 11.9% | ||||
| Lockbox/Cash Mgmt Status: | Hard/Springing | UW NOI Debt Yield at Maturity: | 13.5% | ||||
| Additional Debt Type: | NAP | UW NCF DSCR: | 1.65x | ||||
| Additional Debt Balance: | NAP | Most Recent NOI: | $2,662,635 (3/31/2024) | ||||
| Future Debt Permitted (Type): | No (NAP) | 2nd Most Recent NOI: | $2,382,636 (12/31/2023) | ||||
| 3rd Most Recent NOI: | $2,656,987 (12/31/2022) | ||||||
Reserves | Most Recent Occupancy: | 91.4% (5/1/2024) | |||||
| Type | Initial | Monthly | Cap | 2nd Most Recent Occupancy: | 91.4% (12/31/2023) | ||
| RE Taxes: | $49,709 | $24,855 | NAP | 3rd Most Recent Occupancy: | 88.5% (12/31/2022) | ||
| Insurance(1): | $0 | Springing | NAP | Appraised Value (as of): | $36,200,000 (1/4/2024) | ||
| Replacement Reserve: | $22,500 | $3,695 | NAP | Appraised Value PSF: | $204 | ||
| TI/LC Reserve(2): | $2,500,000 | Springing | $1,000,000 | Cut-off Date LTV Ratio: | 55.2% | ||
| Other Reserves(3): | $755,455 | $0 | NAP | Maturity Date LTV Ratio: | 55.2% | ||
| Sources and Uses | ||||||
| Sources | Proceeds | % of Total | Uses | Proceeds | % of Total | |
| Loan Amount: | $20,000,000 | 93.5% | Loan Payoff: | $17,935,110 | 83.8% | |
| Borrower Sponsor Equity: | $1,396,909 | 6.5% | Upfront Reserves: | $3,327,665 | 15.6% | |
| Closing Costs: | $134,134 | 0.6% | ||||
| Total Sources: | $21,396,909 | 100.0% | Total Uses: | $21,396,909 | 100.0% | |
| (1) | The borrower is required to make monthly deposits upon failure to maintain a blanket insurance policy. |
| (2) | If the TI/LC Reserve balance drops below $600,000, then the borrower is required to deposit $14,782 on each payment date until the balance reaches $1,000,000. |
| (3) | Other Reserves consist of a Landlord Obligation Reserve ($745,924) and a Free Rent Reserve ($9,531). |
The Mortgage Loan. The eleventh largest mortgage loan (the “Pioneer Mortgage Loan”) is evidenced by a single promissory note in the original principal amount of $20,000,000 and secured by the borrower’s fee interest in an office property located in Santa Fe Springs, California (the “Pioneer Property”).
The Borrower and the Borrower Sponsors. The borrower is Omninet Pioneer, LLC, a Delaware limited liability company and single purpose entity with one independent director. The borrower sponsors and non-recourse carveout guarantors for the Pioneer Mortgage Loan are Neil Kadisha and Benjamin Nazarian.
Neil Kadisha and Benjamin Nazarian are principals at Omninet Capital, a private investment firm focusing on private equity and commercial real estate. Neil Kadisha, together with Izak Nazarian (the father of Benjamin Nazarian), co-founded Omninet Corp in 1984. In 2002, Neil Kadisha and Izak Nazarian co-founded Omninet Capital, a diversified investment firm with focuses on private equity and commercial real estate. The Omninet Capital commercial real estate portfolio has grown to a total of 50 properties and is well diversified in location and asset type. The portfolio includes 26 office, four industrial, three retail and 17 multifamily properties. Omninet Capital owns and operates over 10 million SF of commercial space and more than 13,000 multifamily units throughout the United States.
The Property. The Pioneer Property is a two-building, low-rise office park located in Santa Fe Springs, California. Originally built in 1981 and 1989, the Pioneer Property contains a combined 177,383 SF between the two buildings. Situated on a 2.03-acre site, the Pioneer Property has 676 parking spaces, resulting in a parking ratio of approximately 3.8 spaces per 1,000 SF. The borrower sponsors acquired the Pioneer Property in January of 2012 and have invested approximately $4.8 million in tenant improvements and approximately $2.35 million in building improvements since acquisition. Including leasing costs and other improvements, the borrower sponsors have invested a total of $9.7 million into the Pioneer Property.
| This is not a research report and was not prepared by any Underwriter’s research department. Please see additional important information and qualifications at the end of this Term Sheet. | ||
| 124 | ||
| Office – Suburban | Loan #11 | Cut-off Date Balance: | $20,000,000 | |
| 10100 and 10330 Pioneer Boulevard | Pioneer | Cut-off Date LTV: | 55.2% | |
| Santa Fe Springs, CA 90670 | UW NCF DSCR: | 1.65x | ||
| UW NOI Debt Yield: | 13.5% |
The majority of the Pioneer Property is leased to government entities, including the four largest tenants, which represent 74.0% of the total NRA and generate 79.7% of the underwritten rent. The remaining eight tenants each occupy less than 4.0% of the total SF and less than 5.0% of underwritten rent and operate local and regional business in diverse industries. The ten-year average annual occupancy for the Pioneer Property is 91.7%. As of May 1, 2024, the Pioneer Property was 91.4% leased to 12 tenants.
Major Tenants.
Los Angeles County Office of Education (62,955 SF, 35.5% of NRA, 35.0% of UW Rent). Los Angeles County Office of Education (“LACOE”) (S&P: AAA/Moody’s: Aa1/Fitch: AAA) functions as a link between local school districts and the California Department of Education. LACOE offers a diverse array of services to support school districts, including specialized business and financial services, teacher training, school reform initiatives, school-community partnerships, leadership development programs, and resources for distance learning. Additionally, LACOE provides expert consultation in areas in curriculum development, instructional strategies, and assessment techniques. LACOE serves approximately two million students within the 80 school districts in Los Angeles County. LACOE has been at the Pioneer Property since January 2005 and has renewed multiple times, most recently in 2024, extending their lease expiration to June 30, 2035. LACOE has two, five-year renewal options remaining. LACOE currently pays $23.51 PSF on a modified gross lease with 3.0% annual escalations. If at any time LACOE loses its state funding or if its federal funding is decreased more than 40.0%, the tenant may terminate its lease with 270 days’ notice and payment of unamortized leasing costs.
County of LA Department of Health Services (41,720 SF, 23.5% of NRA, 26.6% of UW Rent). The County of LA Department of Health Services (S&P: AAA/Moody's: Aa1/Fitch: AAA) is an integrated health system with a mission to advance the health of their patients and the community by providing extraordinary care. The County of LA Department of Health Services cares for about 750,000 unique patients each year, employs over 23,000 staff, has an annual operating budget of $6.2 billion, and has the second largest municipal health system in the United States.
The County of LA Department of Health Services operates the Los Angeles County Emergency Medical Services Agency (“EMS”) at the Pioneer Property. EMS serves as the lead agency for the emergency medical services system in the County and is responsible for coordinating all system participants in its jurisdiction, encompassing both public and private sectors. The Pioneer Property serves as the EMS headquarters and the space is improved with several training rooms and conference rooms utilized by both onsite employees and daily visitors. The County of LA Department of Health Services has been at the Pioneer property since 2008 and has renewed multiple times, most recently in 2023, extending its lease expiration date to May 31, 2032. The tenant pays $27.00 PSF on a full-service gross lease and has no future rent steps. The tenant has an early termination right exercisable any time on or after May 31, 2030 with six months’ notice and payment of unamortized leasing costs.
Employment Development Department (16,661 SF, 9.4% of NRA, 11.9% of UW Rent). Employment Development Services (“EDD”) is a California state entity that offers a wide variety of services to millions of Californians under unemployment insurance, state disability insurance, workforce investment (jobs and training), and labor market information programs. EDD also handles the audit and collections of payroll taxes and maintains employment records for more than 17 million California workers. EDD has been at the Pioneer Property since September 2008 and uses its space for in-person services. EDD extended its lease for eight years in 2019 and has a current lease expiration date of March 31, 2027. The tenant currently pays $30.30 PSF on a full-service gross lease and has 3.0% of annual rent steps. The tenant has an ongoing termination option exercisable anytime with 60 days’ notice.
The following table presents certain information relating to the tenancy at the Pioneer Property:
| Tenant Summary(1) | |||||||||
| Tenant Name | Credit Rating (Fitch/Moody’s/S&P)(2) | Tenant SF | Approx. % of SF | Annual UW Rent | % of Total Annual UW Rent | Annual UW Rent PSF | Lease Exp. | Renewal Options | Term. Option (Y/N) |
| Major Tenants | |||||||||
| Los Angeles County Office of Education | AAA/Aa1/AAA | 62,955 | 35.5% | $1,479,963 | 35.0% | $23.51 | 6/30/2035 | 2 x 5 yr | Y(3) |
| County of LA Department of Health Services | AAA/Aa1/AAA | 41,720 | 23.5% | $1,126,440 | 26.6% | $27.00 | 5/31/2032 | N/A | Y(4) |
| Employment Development Department | AA/Aa2/AA- | 16,661 | 9.4% | $504,826 | 11.9% | $30.30 | 3/31/2027 | N/A | Y(5) |
| The United States of America – Veterans Affairs | AA+/Aaa/AA+ | 9,885 | 5.6% | $262,150 | 6.2% | $26.52 | 12/31/2026 | N/A | Y(6) |
| Court Appearance Professionals | NR/NR/NR | 6,999 | 3.9% | $205,771 | 4.9% | $29.40 | 10/31/2026 | N/A | N |
| Subtotal/Wtd. Avg. | 138,220 | 77.9% | $3,579,150 | 84.6% | $25.89 | ||||
| Other Tenants | 23,930 | 13.5% | $652,752 | 15.4% | $27.28 | ||||
| Occupied Subtotal/Wtd. Avg. | 162,150 | 91.4% | $4,231,902 | 100.0% | $26.10 | ||||
| Vacant Space | 15,233 | 8.6% | |||||||
| Total/Wtd. Avg. | 177,383 | 100.0% | |||||||
| (1) | Information is based on the underwritten rent roll dated May 1, 2024. |
| (2) | Certain ratings are those of the government entity whether or not the government entity guarantees the lease. |
| (3) | LACOE has the right to terminate its lease at any time if it loses its state funding or if its federal funding is decreased more than 40%, upon 270 days’ prior notice and payment of unamortized leasing costs. |
| (4) | County of LA Department of Health Services has the right to terminate its lease at any time after May 31, 2030 with six months’ prior notice and payment of unamortized leasing costs. |
| (5) | Employment Development Department has the right to terminate its lease at any time with 60 days’ prior notice. |
| (6) | The United States of America – Veterans Affairs has the right to terminate its lease at any time with 180 days’ prior notice. |
| This is not a research report and was not prepared by any Underwriter’s research department. Please see additional important information and qualifications at the end of this Term Sheet. | ||
| 125 | ||
| Office – Suburban | Loan #11 | Cut-off Date Balance: | $20,000,000 | |
| 10100 and 10330 Pioneer Boulevard | Pioneer | Cut-off Date LTV: | 55.2% | |
| Santa Fe Springs, CA 90670 | UW NCF DSCR: | 1.65x | ||
| UW NOI Debt Yield: | 13.5% |
The following table presents certain information relating to the lease rollover schedule at the Pioneer Property:
| Lease Rollover Schedule(1)(2) | ||||||||
| Year | # of Leases Rolling | SF Rolling | Approx. % of SF Rolling | Approx. Cumulative % of SF Rolling | Total UW Rent Rolling | Approx. % of Total UW Rent Rolling | Approx. Cumulative % of Total UW Rent Rolling | UW Rent PSF Rolling |
| MTM/2024 | 3 | 11,293 | 6.4% | 6.4% | $344,866 | 8.1% | 8.1% | $30.54 |
| 2025 | 0 | 0 | 0.0% | 6.4% | $0 | 0.0% | 8.1% | $0.00 |
| 2026 | 2 | 16,884 | 9.5% | 15.9% | $467,921 | 11.1% | 19.2% | $27.71 |
| 2027 | 4 | 24,518 | 13.8% | 29.7% | $733,842 | 17.3% | 36.5% | $29.93 |
| 2028 | 0 | 0 | 0.0% | 29.7% | $0 | 0.0% | 36.5% | $0.00 |
| 2029(3) | 1 | 4,780 | 2.7% | 32.4% | $78,870 | 1.9% | 38.4% | $16.50 |
| 2030 | 0 | 0 | 0.0% | 32.4% | $0 | 0.0% | 38.4% | $0.00 |
| 2031 | 0 | 0 | 0.0% | 32.4% | $0 | 0.0% | 38.4% | $0.00 |
| 2032 | 1 | 41,720 | 23.5% | 55.9% | $1,126,440 | 26.6% | 65.0% | $27.00 |
| 2033 | 0 | 0 | 0.0% | 55.9% | $0 | 0.0% | 65.0% | $0.00 |
| 2034 | 0 | 0 | 0.0% | 55.9% | $0 | 0.0% | 65.0% | $0.00 |
| 2035 & Thereafter | 1 | 62,955 | 35.5% | 91.4% | $1,479,963 | 35.0% | 100.0% | $23.51 |
| Vacant | 0 | 15,233 | 8.6% | 100.0% | $0 | 0.0% | 100.0% | $0.00 |
| Total/Wtd. Avg. | 12 | 177,383 | 100.0% | $4,231,902 | 100.0% | $26.10(4) | ||
| (1) | Information is based on the underwritten rent roll dated May 1, 2024. |
| (2) | Certain tenants may have lease termination options that are exercisable prior to the originally stated expiration date of the related lease and are not considered in the rollover schedule. |
| (3) | The Pioneer Mortgage Loan has a maturity date of June 1, 2029. |
| (4) | Total/Wtd. Avg. UW Rent PSF Rolling excludes vacant space. |
The Market. The Pioneer Property is located in the Southeast Los Angeles submarket, within the broader Los Angeles County market. The Pioneer Property is situated off State Highway 60 East and Interstate 5 South, which provide access to the greater Los Angeles area. Major employers in the vicinity of the Pioneer Property include the State of California, the University of Southern California, Northrop Grumman Corp. and Amazon. The immediate area surrounding the Pioneer Property predominantly consists of office and industrial properties.
According to the appraisal, the Southeast Los Angeles submarket is ranked number 18 in inventory in the Los Angeles metro area with 9,627,006 SF, which represents 2.2% of the total inventory. The submarket’s vacancy is 5.7% while the Los Angeles metro area vacancy rate is 15.2%. Additionally, the submarket’s asking rent is $31.34 per SF, which is 24.9% less than the Los Angeles metro area average asking rent of $41.73. The Southeast Los Angeles submarket has under construction inventory of 40,000 SF, which is 1.2% of the Los Angeles metro area total 3,438,518 SF.
According to the appraisal, the estimated 2023 population within a one-, three- and five-mile radius of the Pioneer Property was 17,982, 217,865, and 613,125, respectively. The estimated 2023 average household income within the same radii was $103,190, $108,146 and $106,807, respectively.
The following table presents certain information relating to comparable office leases with respect to the Pioneer Property:
| Summary of Comparable Office Leases | |||||||||
| Property / Location | Year Built/ Renovated |
Tenant Name | Lease Start Date | Term (mos.) | Lease Type | Tenant Size (SF) | Base Rent PSF | Rent Steps | TI PSF |
Pioneer Santa Fe Springs, CA | 1981;1989/ NAP | Los Angeles County Office of Education(1) | Jan-05(1) | 125(1) | Modified Gross(1) | 62,955(1) | $23.51(1) | 3.0%/yr(1) | NAV |
Cerritos Towne Center Cerritos, CA | 2008/NAP | Atkinson, Andelson, Loya, Ruud & Romo | Jul-24 | 90 | Full Service | 60,438 | $35.88 | 3.0%/yr | $40.00 |
Pathfinder Professional Building Diamond Bar, CA | 1984/NAP | New Dream Investment Corporation | Oct-23 | 36 | Full Service | 2,228 | $31.20 | 3.0%/yr | NAV |
Anaheim City Centre Anaheim, CA | 1986/NAP | State of California | Sep-23 | 48 | Full Service | 19,387 | $35.04 | 3.0%/yr | $25.00 |
Airport Plaza Long Beach, CA | 1986/NAP | City of Long Beach | Aug-23 | 130 | Full Service | 7,184 | $33.60 | 3.0%/yr | $95.00 |
Katella Corporate Center Los Alamitos, CA | 1987/NAP | California Department of Transportation | Mar-23 | 60 | Modified Gross | 6,055 | $31.20 | 3.0%/yr | NAV |
3711 Long Beach Blvd Long Beach, CA | 1969/NAP | MemorialCare Medical Foundation | Feb-23 | 60 | Full Service | 4,568 | $34.20 | 3.0%/yr | $35.00 |
Source: Appraisal, unless otherwise noted.
| (1) | Information is based on the underwritten rent roll dated May 1, 2024. LACOE renewed its lease in 2024. |
| This is not a research report and was not prepared by any Underwriter’s research department. Please see additional important information and qualifications at the end of this Term Sheet. | ||
| 126 | ||
| Office – Suburban | Loan #11 | Cut-off Date Balance: | $20,000,000 | |
| 10100 and 10330 Pioneer Boulevard | Pioneer | Cut-off Date LTV: | 55.2% | |
| Santa Fe Springs, CA 90670 | UW NCF DSCR: | 1.65x | ||
| UW NOI Debt Yield: | 13.5% |
The following table presents certain information relating to the appraisal’s market rent conclusion for the Pioneer Property:
| Market Rent Summary | |||
| Space Type | Market Rent PSF | Lease Term (Months) | Rent Increase Projection |
| Office MLA | $33.00 | 89 | 3.0% per annum |
Appraisal. The appraiser concluded to an “as-is” value for the Pioneer Property of $36,200,000 as of January 4, 2024.
Environmental Matters. According to the Phase I environmental site assessment dated April 19, 2024, there are no recognized environmental condition at the Pioneer Property.
Operating History and Underwritten Net Cash Flow. The following table presents certain information relating to the historical operating performance and Underwritten Net Cash Flow at the Pioneer Property:
| Cash Flow Analysis(1) | |||||||
| 2020 |
2021 | 2022 | 2023 | 3/31/2024 TTM |
UW | UW PSF | |
| Gross Potential Rent(2) | $3,870,392 | $3,891,559 | $3,863,873 | $3,957,876 | $4,076,756 | $4,881,786 | $27.52 |
| Expense Reimbursements | $493,829 | $343,643 | $604,374 | $442,382 | $606,386 | $333,782 | $1.88 |
| Net Rental Income | $4,364,221 | ;$4,235,202 | $4,468,247 | $4,400,258 | ;$4,683,142 | $5,215,568 | $29.40 |
| Other Income | $3,755 | $1,049 | $3,783 | $7,269 | $6,130 | $6,130 | $0.03 |
| (Vacancy & Credit Loss) | $0 | $0 | $0 | $0 | $0 | ($502,689) | ($2.83) |
| Effective Gross Income | $4,367,976 | $4,236,251 | $4,472,030 | $4,407,527 | $4,689,272 | $4,719,009 | $26.60 |
| Real Estate Taxes | $266,709 | $268,983 | $273,939 | $282,302 | $282,302 | $286,783 | $1.62 |
| Insurance | $56,437 | $59,679 | $74,475 | $88,868 | $88,868 | $88,731 | $0.50 |
| Other Operating Expenses | $1,213,051 | $1,300,972 | $1,466,629 | $1,653,721 | $1,655,467 | $1,645,743 | $9.28 |
| Total Operating Expenses | $1,536,197 | $1,629,634 | $1,815,043 | $2,024,891 | $2,026,637 | $2,021,257 | $11.39 |
| Net Operating Income | $2,831,779 | $2,606,617 | $2,656,987 | $2,382,636 | $2,662,635 | $2,697,752 | $15.21 |
| Replacement Reserves | $0 | $0 | $0 | $0 | $0 | $44,346 | $0.25 |
| TI/LC | $0 | $0 | $0 | $0 | $0 | $277,591 | $1.56 |
| Net Cash Flow | $2,831,779 | $2,606,617 | $2,656,987 | $2,382,636 | $2,662,635 | $2,375,815 | $13.39 |
| Occupancy % | 94.9% | 93.2% | 88.5% | 91.4% | 91.4%(3) | 89.7%(4) | |
| NOI DSCR | 1.97x | 1.82x | 1.85x | 1.66x | 1.85x | 1.88x | |
| NCF DSCR | 1.97x | 1.82x | 1.85x | 1.66x | 1.85x | 1.65x | |
| NOI Debt Yield | 14.2% | 13.0% | 13.3% | 11.9% | 13.3% | 13.5% | |
| NCF Debt Yield | 14.2% | 13.0% | 13.3% | 11.9% | 13.3% | 11.9% | |
| (1) | Based on the underwritten rent roll as of May 1, 2024. |
| (2) | UW Gross Potential Rent includes rent steps through June 1, 2025. |
| (3) | Represents occupancy based on the underwritten rent roll as of May 1, 2024 |
| (4) | Represents economic occupancy. |
| This is not a research report and was not prepared by any Underwriter’s research department. Please see additional important information and qualifications at the end of this Term Sheet. | ||
| 127 | ||
| Mortgage Loan No. 12 – Deerfield and Pleasanton MHC |
| Mortgage Loan Information | Mortgaged Property Information | ||||||
| Mortgage Loan Seller: | MSMCH | Single Asset/Portfolio: | Portfolio | ||||
| Credit Assessment (Fitch/Moody’s/DBRSM): | NR/NR/NR | Location: | Various | ||||
| Original Balance: | $19,000,000 | General Property Type: | Manufactured Housing | ||||
| Cut-off Date Balance: | $19,000,000 | Detailed Property Type: | Manufactured Housing | ||||
| % of Initial Pool Balance: | 2.8% | Title Vesting: | Fee | ||||
| Loan Purpose: | Refinance | Year Built/Renovated: | Various/NAP | ||||
| Borrower Sponsor: | John A. Franklin | Size: | 511 Pads | ||||
| Guarantor: | John A. Franklin | Cut-off Date Balance Per Pad: | $37,182 | ||||
| Mortgage Rate: | 6.6100% | Maturity Date Balance Per Pad: | $37,182 | ||||
| Note Date: | 6/27/2024 | Property Manager: | Franklin Management Company | ||||
| Maturity Date: | 7/1/2029 | (borrower-affiliated) | |||||
| Term to Maturity: | 60 months | Underwriting and Financial Information | |||||
| Amortization Term: | 0 months | UW NOI: | $1,725,192 | ||||
| IO Period: | 60 months | UW NCF: | $1,699,642 | ||||
| Seasoning: | 1 month | UW NOI Debt Yield: | 9.1% | ||||
| Prepayment Provisions: | L(23),YM1(30),O(7) | UW NCF Debt Yield: | 8.9% | ||||
| Lockbox/Cash Mgmt Status: | Springing/Springing | UW NOI Debt Yield at Maturity: | 9.1% | ||||
| Additional Debt Type: | NAP | UW NCF DSCR: | 1.33x | ||||
| Additional Debt Balance: | NAP | Most Recent NOI: | $1,450,574 (3/31/2024) | ||||
| Future Debt Permitted (Type): | No (NAP) | 2nd Most Recent NOI: | $1,333,304 (12/31/2023) | ||||
| 3rd Most Recent NOI: | $1,111,707 (12/31/2022) | ||||||
| Most Recent Occupancy: | 92.7% (Various) | ||||||
| Reserves | 2nd Most Recent Occupancy: | 84.8% (12/31/2023) | |||||
| Type | Initial | Monthly | Cap | 3rd Most Recent Occupancy: | 82.2% (12/31/2022) | ||
| RE Taxes: | $45,864 | $4,888 | NAP | Appraised Value (as of): | $34,400,000 (Various) | ||
| Insurance: | $46,278 | $7,713 | NAP | Appraised Value per Pad: | $67,319 | ||
| Deferred Maintenance: | $22,385 | $0 | NAP | Cut-off Date LTV Ratio: | 55.2% | ||
| Replacement Reserve: | $0 | $2,129 | NAP | Maturity Date LTV Ratio: | 55.2% | ||
| Sources and Uses | ||||||
| Sources | Proceeds | % of Total | Uses | Proceeds | % of Total | |
| Loan Amount: | $19,000,000 | 100.0% | Loan Payoff: | $11,441,863 | 60.2% | |
| Return of Equity: | $7,014,290 | 36.9% | ||||
| Closing Costs: | $429,320 | 2.3% | ||||
| Upfront Reserves: | $114,527 | 0.6% | ||||
| Total Sources: | $19,000,000 | 100.0% | Total Uses: | $19,000,000 | 100.0% | |
The Mortgage Loan. The twelfth largest mortgage loan (the “Deerfield and Pleasanton MHC Mortgage Loan”) is evidenced by a promissory note in the original principal amount of $19,000,000 and secured by a first priority mortgage encumbering the borrowers’ fee interests in two manufactured housing properties totaling 511 units located in Alabama and Tennessee (collectively, the “Deerfield and Pleasanton MHC Properties”).
The Borrowers and the Borrower Sponsor. The borrowers for the Deerfield and Pleasanton MHC Mortgage Loan are Pleasanton Hills Mobile Home Park, L.L.C., an Alabama limited liability company, and Deerfield Mobile Home Park LLC, a Tennessee limited liability company, each of which is a single purpose entity with no independent director. Each borrower is 100% owned by Franklin Investment, LLC, which is 100% owned by John A. Franklin. John A. Franklin is the founder of Franklin Management, which is an owner and operator of manufactured housing communities with a portfolio that includes more than 4,000 manufactured housing sites across over 35 communities in Alabama, Georgia, North Carolina, Tennessee, and Virginia.
The Properties. The Deerfield and Pleasanton MHC Properties comprise a 341-pad manufactured housing property located in Mobile, Alabama (the “Pleasanton MHC Property”) and a 170-pad manufactured housing property located in Sevierville, Tennessee (the “Deerfield MHC Property”). As of various dates in May 2024, the portfolio is 92.7% leased.
Pleasanton MHC Property
Constructed in 1972, the Pleasanton MHC Property is a manufactured housing community that is situated on 63.9-acres in Mobile, Alabama. The Pleasanton MHC Property contains 339 MHC pads and two single family rental homes, for a total of 341 units that were 89.1% occupied as of May 17, 2024. The Pleasanton MHC Property has an approximate pad mix of 93.8% single-wide and 5.6% doublewide pads, with average in place monthly rent of $406 per pad. The borrower is currently seeking to implement a rent increase to $450 per pad, effective upon each tenant’s respective renewal date. Community amenities include a clubhouse, pool, tennis courts, and an onsite office. The Pleasanton MHC Property includes off street parking and paved roads. Additionally, the Pleasanton MHC Property is connected to city water and city sewer with all utilities directly billed to the tenant. 193 park owned manufactured homes are located at the Pleasanton MHC Property and were 89.6% occupied as of May 2024. Such manufactured homes are owned by
| This is not a research report and was not prepared by any Underwriter’s research department. Please see additional important information and qualifications at the end of this Term Sheet. | ||
| 128 | ||
| Manufactured Housing | Loan #12 | Cut-off Date Balance: | $19,000,000 | |
| Various | Deerfield and Pleasanton MHC | Cut-off Date LTV: | 55.2% | |
| Various | UW NCF DSCR: | 1.33x | ||
| UW NOI Debt Yield: | 9.1% |
a borrower affiliate and leased to the occupants by such affiliate. Such homes are not collateral for the Deerfield and Pleasanton MHC Mortgage Loan, and no income from home rentals has been included in underwritten rent.
Deerfield MHC Property
Constructed in 1992, the Deerfield MHC Property is a manufactured housing community that is situated on 37.6-acres in Sevierville, Tennessee. The Deerfield MHC Property contains 170 pads that were 100% occupied as of May 2, 2024. The Deerfield MHC Property has an approximate pad mix of 89.4% single-wide and 10.6% double-wide pads, with average in place monthly rents of $494 per pad. The borrower is currently seeking to implement a rent increase to $550 per pad, effective upon each tenant’s respective renewal date. Community amenities include off-street parking and paved roads, with city water and sewer. 64 park owned manufactured homes were located at the Deerfield MHC Property and were 100% occupied as of May 2024. Such manufactured homes are owned by a borrower affiliate and leased to the occupants by such affiliate. Such homes are not collateral for the Deerfield and Pleasanton MHC Mortgage Loan, and no income from home rentals has been included in underwritten rent.
The following table presents certain information relating to the Deerfield and Pleasanton MHC Properties.
| Portfolio Summary | |||||||||
| Property Name | City, State | Unit | Year Built / Renovated | Occupancy(1) | Allocated Loan Cut-off Date Balance | % of Allocated Loan Cut-off Date Balance | Appraised Value | UW NOI(1) | % of UW NOI(1) |
| Pleasanton MHC | Mobile, AL | 341 | 1972 / NAP | 89.1% | $10,615,000 | 55.9% | $19,700,000 | $959,001 | 55.6% |
| Deerfield MHC | Sevierville, TN | 170 | 1992 / NAP | 100.0% | $8,385,000 | 44.1% | $14,700,000 | $766,190 | 44.4% |
| Total/Wtd. Avg. | 511 | 92.7% | $19,000,000 | 100.0% | $34,400,000 | $1,725,192 | 100.0% | ||
Source: Appraisals, unless otherwise noted.
| (1) | Pleasanton MHC Occupancy is based on the underwritten rent roll dated May 17, 2024 and Deerfield MHC Occupancy is based on the underwritten rent roll dated May 2, 2024. |
The Market.
The Pleasanton MHC Property is located in Mobile, Alabama off of Airport Boulevard, a major arterial that crosses the Mobile area in the east/west direction. Public transportation in the area is operated by Mobile County, which provides access across the greater Mobile, Alabama area. The Pleasanton MHC Property is located approximately 13 miles from the Mobile International Airport, approximately two miles from the Mobile Regional Airport and approximately 17 miles from the Mobile, Alabama central business district. Major employers near the Pleasanton MHC Property include Infirmary Health, Pilot Catastrophe and the City of Mobile. These notable local employers are located within 20 miles of the Pleasanton MHC Property and represent significant concentrations in the health, insurance and local government industries. Local shopping in the area is located along Airport Boulevard, about a half a mile from the Pleasanton MHC Property. The regional mall closest in proximity to the Pleasanton MHC Property is The Bel Air Mall, located about seven miles away. According to the appraisal, the 2023 population within a one-, three- and five-mile radius of the Pleasanton MHC Property was 5,347, 53,505, and 130,041, respectively. According to the appraisal, the 2023 average household income within the same radii was $59,165, $73,749 and $82,807, respectively. The appraisal concluded a market rent of $450 for standard pads, $900 for single family homes and $453 for the overall mix.
The Deerfield MHC Property is located in Sevierville, Tennessee off of Winfield Dunn Parkway, a major arterial that crosses the Sevierville area in a north/south direction. Public transportation in the area is operated by Sevier County, which provides access across the greater Sevier, Tennessee area. The Deerfield MHC Property is located approximately 25 miles from the McGhee Tyson Airport and approximately 9 miles from the Sevierville central business district. Major employers near the Deerfield MHC Property include Covenant Health and the Knox County Schools. These notable local employers are located within 20 miles of the Deerfield MHC Property and represent significant concentrations in the healthcare and education industries. Local shopping in the area is located along Boyds Creek Highway, about two miles from the Deerfield MHC Property. The regional mall closest in proximity to the Deerfield MHC Property is the Sevier Plaza Shopping Center, located about eight miles from the Deerfield MHC Property. According to the appraisal, the 2023 population within a one-, three- and five-mile radius of the Deerfield MHC Property was 1,553, 10,509, and 22,967, respectively. According to the appraisal, the 2023 average household income within the same radii was $84,696, $91,946 and $88,136, respectively. The appraisal concluded a market rent of $550 for standard pads.
| This is not a research report and was not prepared by any Underwriter’s research department. Please see additional important information and qualifications at the end of this Term Sheet. | ||
| 129 | ||
| Manufactured Housing | Loan #12 | Cut-off Date Balance: | $19,000,000 | |
| Various | Deerfield and Pleasanton MHC | Cut-off Date LTV: | 55.2% | |
| Various | UW NCF DSCR: | 1.33x | ||
| UW NOI Debt Yield: | 9.1% |
The following table presents recent comparable manufactured housing properties with respect to the Pleasanton MHC Property:
| Comparable Properties Summary | |||||
| Property/Location | Distance from the subject | Year Built | Pads | Occupancy | Average Rent |
Pleasanton MHC (subject)(1) 218 Green Park Drive Mobile, AL | - | 1972 | 341 | 89.1% | $406 |
Camellia Trace MHP 1421 Cody Road N, Mobile, AL | 2.7 miles | 1995 | 48 | 100.0% | $325 |
Magnolia Pointe MHP 1300 Shillinger Road S Mobile, AL | 1.3 miles | 1980 | 130 | 95.0% | $550 |
Sullivans MHP S-R 45 Prichard, AL | 9.7 miles | 1972 | 120 | 100.0% | $300 |
Meadows Village 7699 Old Pascagoula Road, Theodore, AL | 8.6 miles | 1970 | 50 | 85.0% | $450 |
Source: Appraisal, unless otherwise indicated.
| (1) | Information based on the borrower rent roll dated May 17, 2024, other than Year Built. |
The following table presents recent comparable manufactured housing properties with respect to the Deerfield MHC Property:
| Comparable Properties Summary | |||||
| Property/Location | Distance from the subject | Year Built | Pads | Occupancy | Average Rent |
Deerfield MHC (subject)(1) 1115 White Tail Lane Sevierville, TN | - | 1992 | 170 | 100.0% | $494 |
The Stables 2606 Seattle Slew Way Sevierville, TN | 1.5 miles | 1980 | 309 | 100.0% | $745 |
Smoky Ridge MHC 430 Seaton Way Kodak, TN | 3.1 miles | 1975 | 154 | 100.0% | $500 |
Westbury Oaks 341 Happy Trails Way Sevierville, TN | 5.3 miles | 1970 | 65 | 100.0% | $440 |
Country Meadows MHP (TN) 1005 Ridge Road Sevierville, TN | 7.0 miles | 1972 | 140 | 95.0% | $550 |
Waldens Creek MHP 3029 Jess Wilson Road Pigeon Forge, TN | 9.0 miles | 1968 | 53 | 100.0% | $500 |
Source: Appraisal, unless otherwise indicated.
| (1) | Information based on the borrower rent roll dated May 2, 2024, other than Year Built. |
Appraisal. The appraisal concluded to an “as-is” value for the Pleasanton MHC Property of $19,700,000 as of April 6, 2024. The appraisal concluded to an “as-is” value for the Deerfield MHC Property of $14,700,000 as of April 5, 2024.
Environmental Matters. According to the Phase I environmental site assessments dated April 15, 2024, there was no evidence of any recognized environmental conditions at the Deerfield and Pleasanton MHC Properties.
| This is not a research report and was not prepared by any Underwriter’s research department. Please see additional important information and qualifications at the end of this Term Sheet. | ||
| 130 | ||
| Manufactured Housing | Loan #12 | Cut-off Date Balance: | $19,000,000 | |
| Various | Deerfield and Pleasanton MHC | Cut-off Date LTV: | 55.2% | |
| Various | UW NCF DSCR: | 1.33x | ||
| UW NOI Debt Yield: | 9.1% |
Operating History and Underwritten Net Cash Flow. The following table presents certain information relating to the historical operating performance and Underwritten Net Cash Flow at the Deerfield and Pleasanton MHC Properties:
| Cash Flow Analysis | |||||
| 2022 | 2023 | 3/31/2024 TTM | UW | UW Per Pad | |
| Gross Potential Rent(1) | $1,732,945 | $2,013,268 | $2,141,234 | $2,668,800 | $5,222.70 |
| Reimbursements | $0 | $0 | $0 | $0 | $0.00 |
| Other Income | $288,345 | $293,350 | $297,237 | $297,237 | $581.68 |
| (Vacancy / Credit Loss) | $0 | $0 | $0 | ($287,060) | ($561.76) |
| Effective Gross Income | $2,021,290 | $2,306,618 | $2,438,471 | $2,678,977 | $5,242.62 |
| Real Estate Taxes | $62,005 | $62,800 | $58,205 | $58,321 | $114.13 |
| Insurance | $70,453 | $3,161 | $27,480 | $89,862 | $175.86 |
| Other Operating Expenses | $777,125 | $907,353 | $902,212 | $805,602 | $1,576.52 |
| Total Operating Expenses | $909,583 | $973,314 | $987,897 | $953,786 | $1,866.51 |
| Net Operating Income(2) | $1,111,707 | $1,333,304 | $1,450,574 | $1,725,192 | $3,376.11 |
| Replacement Reserves | $0 | $0 | $0 | $25,550 | $50.00 |
| TI/LC | $0 | $0 | $0 | $0 | $0.00 |
| Net Cash Flow | $1,111,707 | $1,333,304 | $1,450,574 | $1,699,642 | $3,326.11 |
| Occupancy (%)(3) | 82.2% | 84.8% | 92.7% | 89.2% | |
| NOI DSCR | 0.87x | 1.05x | 1.14x | 1.35x | |
| NCF DSCR | 0.87x | 1.05x | 1.14x | 1.33x | |
| NOI Debt Yield | 5.9% | 7.0% | 7.6% | 9.1% | |
| NCF Debt Yield | 5.9% | 7.0% | 7.6% | 8.9% | |
| (1) | UW Gross Potential Rent is based on the underwritten rent rolls dated May 2, 2024 and May 17, 2024. |
| (2) | The increase in NOI between 3/31/2024 TTM and UW is primarily due to recent renewals at higher rents. |
| (3) | UW Occupancy (%) represents economic occupancy. Historical occupancies represent physical occupancies. 3/31/2024 TTM Occupancy (%) is based on the underwritten rent rolls dated May 2, 2024 and May 17, 2024. |
| This is not a research report and was not prepared by any Underwriter’s research department. Please see additional important information and qualifications at the end of this Term Sheet. | ||
| 131 | ||
| Mortgage Loan No. 13 - Fairfield Inn & Suites Denver West |
| Mortgage Loan Information | Property Information | |||||
| Mortgage Loan Seller: | WFB | Single Asset/Portfolio: | Single Asset | |||
| Credit Assessment (Fitch/Moody’s/DBRSM): | NR/NR/NR | Location: | Lakewood, CO 80228 | |||
| Original Balance: | $16,965,000 | General Property Type: | Hospitality | |||
| Cut-off Date Balance: | $16,965,000 | Detailed Property Type: | Limited Service | |||
| % of Initial Pool Balance: | 2.5% | Title Vesting: | Fee | |||
| Loan Purpose: | Refinance | Year Built/Renovated: | 2019/NAP | |||
| Borrower Sponsors: | Joel Sybrowsky and Cory Turner | Size: | 128 Rooms | |||
| Guarantors: | Joel Sybrowsky and Cory Turner | Cut-off Date Balance per Room: | $132,539 | |||
| Mortgage Rate: | 7.1880% | Maturity Date Balance per Room: | $132,539 | |||
| Note Date: | 6/20/2024 | Property Manager: | Lodging Dynamics Hospitality Group, LLC | |||
| Maturity Date: | 7/11/2029 | Underwriting and Financial Information | ||||
| Original Term to Maturity: | 60 months | UW NOI: | $2,281,199 | |||
| Original Amortization Term: | 0 months | UW NCF | $2,050,922 | |||
| IO Period: | 60 months | UW NOI Debt Yield: | 13.4% | |||
| Seasoning: | 1 month | UW NCF Debt Yield: | 12.1% | |||
| Prepayment Provisions: | L(25),D(31),O(4) | UW NOI Debt Yield at Maturity: | 13.4% | |||
| Lockbox/Cash Mgmt Status: | Hard/Springing | UW NCF DSCR: | 1.66x | |||
| Additional Debt Type: | NAP | Most Recent NOI: | $2,285,289 (4/30/2024 TTM) | |||
| Additional Debt Balance: | NAP | 2nd Most Recent NOI: | $2,213,734 (12/31/2023) | |||
| Future Debt Permitted (Type): | No (NAP) | 3rd Most Recent NOI: | $1,931,584 (12/31/2022) | |||
| Reserves | Most Recent Occupancy: | 86.7% (4/30/2024) | ||||
| Type | Initial | Monthly | Cap | 2nd Most Recent Occupancy: | 83.8% (12/31/2023) | |
| RE Taxes: | $26,342 | $26,342 | NAP | 3rd Most Recent Occupancy: | 86.8% (12/31/2022) | |
| Insurance(1): | $0 | Springing | NAP | Appraised Value (as of): | $26,100,000 (5/2/2024) | |
| FF&E Reserve(2): | $0 | $19,241 | NAP | Appraised Value per Room: | $203,906 | |
| Seasonality Reserve(3): | $126,000 | $63,000 | NAP | Cut-off Date LTV Ratio: | 65.0% | |
| Replacement Comfort Letter Reserve: | $2,500 | $0 | NAP | Maturity Date LTV Ratio: | 65.0% | |
| Sources and Uses | ||||||
| Sources | Proceeds | % of Total | Uses | Proceeds | % of Total | |
| Loan Amount: | $16,965,000 | 98.7% | Loan Payoff: | $12,751,085 | 74.2% | |
| Borrower Sponsor Equity: | $216,668 | 1.3% | Upfront Reserves: | $154,842 | 0.9% | |
| Other Uses: | $3,547,217 | 20.6% | ||||
| Closing Costs: | $728,523 | 4.2% | ||||
| Total Sources: | $17,181,668 | 100.0% | Total Uses: | $17,181,668 | 100.0% | |
| (1) | The loan documents do not require ongoing monthly insurance reserves; provided (i) no event of default is continuing, (ii) the borrower maintains insurance coverage for the Fairfield Inn & Suites Denver West Property (as defined below) as part of blanket or umbrella coverage reasonably approved by the lender, and (iii) the borrower provides the lender with evidence of the renewals of the insurance policies and paid receipts for the payment of the insurance premiums no later than 10 business days prior to the expiration dates of the policies. If such conditions are not satisfied, the loan documents require ongoing monthly deposits in an amount equal to 1/12th of the insurance premiums that the lender reasonably estimates will be payable during the next ensuing 12 months. |
| (2) | The loan documents require ongoing monthly deposits which may be adjusted based on annual operating statements in an amount equal to the greater of the then existing monthly deposit or 4% of the of the underwritten revenue for the applicable month in the prior fiscal year. The amount shown is the average of the first year of scheduled payments. |
| (3) | The borrower is required to deposit an initial seasonality reserve in the amount of $126,000 and monthly seasonality reserves of $63,000 in the months of August 2024 through October 2024, and from June through October of each following year during the loan term. |
The Mortgage Loan. The thirteenth largest mortgage loan (the “Fairfield Inn & Suites Denver West Mortgage Loan”) is evidenced by a promissory note in the original principal amount of $16,695,000 and secured by the fee interest in a 128-room limited-service hotel located in Lakewood, Colorado (the “Fairfield Inn & Suites Denver West Property”).
The Borrower and the Borrower Sponsor. The borrower is LD Lakewood Lodging, LLC, a single-purpose, Utah limited liability company. The borrower sponsors and non recourse carveout guarantors are Joel Sybrowsky and Cory Turner. Joel Sybrowsky and Cory Turner are the managing partners of Dynamic City Capital. Originally founded in Provo, Utah in 1991, Dynamic City Capital focuses on investment, development and asset management of primarily hospitality properties across the country. As of 2024, Dynamic City Capital maintains a portfolio of 40 premium branded hotels throughout the continental US and Hawaii.
The Property. The Fairfield Inn & Suites Denver West Property is a 4 story, 128-room, limited-service hotel located in Lakewood, Colorado. Built in 2019, the Fairfield Inn & Suites Denver West Property is operated under the Fairfield Inn & Suites by Marriott flag. The franchise agreement expires on January 1, 2039. Amenities at the Fairfield Inn & Suites Denver West Property include approximately 650 SF of meeting space, free breakfast, an indoor swimming pool and hot tub, fitness center, business center, guest laundry room, sundries shop, ice machines, and bike storage. The Fairfield Inn & Suites Denver West Property guestroom configuration consists of 60 single king rooms, 43 double queen rooms, 20 king suites and 5 double queen suites.
| This is not a research report and was not prepared by any Underwriter’s research department. Please see additional important information and qualifications at the end of this Term Sheet. | ||
| 132 | ||
| Hospitality - Limited Service | Loan #13 | Cut-off Date Balance: | $16,965,000 | |
| 140 South Union Boulevard | Fairfield Inn & Suites Denver West | Cut-off Date LTV: | 65.0% | |
| Lakewood, CO 80228 | U/W NCF DSCR: | 1.66x | ||
| U/W NOI Debt Yield: | 13.4% |
The following table presents historical occupancy, ADR, and RevPAR penetration rates of the Fairfield Inn & Suites Denver West Property:
| Historical Occupancy, ADR, RevPAR(1)(2) | ||||||||||||
| Competitive Set | Fairfield Inn & Suites Denver West Property | Penetration Factor | ||||||||||
| Year | Occupancy | ADR | RevPAR | Occupancy | ADR | RevPAR | Occupancy | ADR | RevPAR | |||
| 12/31/2021 | 59.2% | $108.66 | $64.33 | 68.0% | $113.30 | $77.06 | 114.9% | 104.3% | 119.8% | |||
| 12/31/2022 | 68.5% | $126.88 | $86.94 | 80.4% | $133.30 | $107.11 | 117.3% | 105.1% | 123.2% | |||
| 12/31/2023 | 68.1% | $138.59 | $94.42 | 83.5% | $143.77 | $120.03 | 122.5% | 103.7% | 127.1% | |||
| 4/30/2024 TTM | 68.4% | $138.27 | $94.60 | 86.5% | $140.94 | $121.87 | 126.4% | 101.9% | 128.8% | |||
Source: Third-party research report.
| (1) | According to a third party research report, the competitive set includes Hampton Inn Denver West Federal Center, TownePlace Suites Denver West Federal Center, Hampton by Hilton Inn Denver-West/Golden, Sonesta Simply Suites Denver Federal Center, Courtyard Denver Golden/Red Rocks, Home2 Suites by Hilton Denver West Federal Center, Holiday Inn Express & Suites Golden Denver Area. |
| (2) | 2021, 2022 and 2023 information is based on the 12/31/2023 STR report and 4/30/2024 information is based on the 4/30/2024 STR report. |
The Market. The Fairfield Inn & Suites Denver West Property is located in Lakewood Colorado, along the east side of South Union Street. The property is proximate to Red Rocks Park and Amphitheatre (9.4 miles), Denver Botanic Gardens (10.8 miles) and is 35.9 miles for the Denver International Airport. Other attractions in the area include the Denver Museum of Nature and Science, the Colorado Railroad Museum and Bandimere speedway. The property’s 2023 demand segmentation was 55% commercial, 43% leisure and 2% group.
According to the appraisal, the 2023 population within a two-, five- and ten-mile radius of The Fairfield Inn & Suites Denver West Property was 43,315, 238,451 and 960,072, respectively. The average household income for the same two-, five- and ten-mile radius was $99,200, $98,638 and $108,155, respectively.
According to the appraisal, the property is located in the Denver West submarket. The appraisal did not identify any new hotels under construction or planned for near term development that are expected to directly compete with the Fairfield Inn & Suites Denver West Property.
The table below presents certain information relating to comparable sales pertaining to the Fairfield Inn & Suites Denver West Property identified by the appraisal:
| Comparable Sales Summary | |||||
Property Name | Location | Year Built | Rooms | Sale Date | Sale Price / Room |
| Hampton by Hilton Denver-Cherry Creek | 4150 East Kentucky Avenue Glendale, CO | 1999 | 133 | 1/31/2024 | $135,338 |
| Courtyard Salt Lake City Downtown | 345 West 100 South Salt Lake City, UT | 2015 | 175 | 10/12/2023 | $268,571 |
| Home2 Suites by Hilton Colorado Springs South | 1235 Tenderfoot Hill Road Colorado Springs, CO | 2019 | 119 | 4/18/2023 | $243,697 |
| Holiday Inn Express & Suites Salt Lake City | 5429 South Commerce Drive Murray, UT | 2014 | 114 | 7/27/2022 | $131,579 |
| Hampton Inn & Suites Lafayette Medical Center | 317 Exempla Circle Lafayette, CO | 2018 | 84 | 7/25/2022 | $148,810 |
| Fairfield Inn & Suites Denver Airport | 16191 East 40th Avenue Aurora, CO | 2021 | 161 | 1/24/2022 | $171,500 |
| This is not a research report and was not prepared by any Underwriter’s research department. Please see additional important information and qualifications at the end of this Term Sheet. | ||
| 133 | ||
| Hospitality - Limited Service | Loan #13 | Cut-off Date Balance: | $16,965,000 | |
| 140 South Union Boulevard | Fairfield Inn & Suites Denver West | Cut-off Date LTV: | 65.0% | |
| Lakewood, CO 80228 | U/W NCF DSCR: | 1.66x | ||
| U/W NOI Debt Yield: | 13.4% |
Operating History and Underwritten Net Cash Flow. The following table presents certain information relating to the historical operating performance and Underwritten Net Cash Flow at the Fairfield Inn & Suites Denver West Property:
| Cash Flow Analysis | ||||||||
| 2019 | 2020 | 2021 | 2022 | 2023 | 4/30/2024 TTM | UW | UW per Room | |
| Occupancy | 73.5%(2) | 50.5%(2) | 68.2%(2) | 86.8%(2) | 83.8% | 86.7% | 86.7% | |
| ADR | $122.44 | $85.09 | $112.65 | $122.47 | $141.93 | $139.14 | $139.14 | |
| RevPAR | $89.94 | $42.98 | $76.81 | $106.33 | $118.89 | $120.62 | $120.62 | |
| Rooms Revenue | $3,879,507 | $2,013,629 | $3,588,485 | $4,967,658 | $5,554,764 | $5,650,656 | $5,635,217 | $44,025 |
| Food & Beverage | $3,325 | $3,805 | $2,589 | $10,229 | $18,667 | $17,917 | $17,917 | $140 |
| Other Income(1) | $92,509 | $90,390 | $141,242 | $ 109,119 | $97,618 | $103,795 | $103,795 | $811 |
| Total Revenue | $3,975,341 | $2,107,823
| $ 3,732,316 | $5,087,006 | $5,671,049 | $5,772,368 | $5,756,929 | $44,976 |
| Room Expense | $1,010,484 | $680,447 | $882,705 | $1,175,642 | $1,297,099 | $1,281,052 | $1,277,552 | $9,981 |
| Food & Beverage Expense | $0 | $91 | $0 | $2,977 | $4,685 | $4,302 | 4,302 | $34 |
| Other Department Expense | $21,198 | $18,842 | $18,731 | $23,624 | $28,404 | $27,792 | $27,792 | $217 |
| Total Department Expenses | $1,031,682 | $699,379 | $901,436 | $1,202,243 | $1,330,188 | $1,313,146 | $1,309,646 | $10,232 |
| Gross Operating Income | $2,943,659 | $1,408,444 | $2,830,880 | $3,884,763 | $4,340,861 | $4,459,222 | $4,447,283 | $34,744 |
| Total Undistributed Expenses | $1,139,239 | $861,667 | $1,139,020 | $1,521,423 | $1,699,869 | $1,759,689 | $1,756,099 | $13,720 |
| Gross Operating Profit | $1,804,419 | $546,777 | $1,691,860 | $2,363,340 | $2,640,992 | $2,699,533 | $2,691,184 | $21,025 |
| Property Taxes | $330,127 | $241,362 | $324,296 | $366,769 | $350,940 | $339,568 | $339,568 | $2,653 |
| Insurance | $36,064 | $21,177 | $37,359 | $64,987 | $76,317 | $74,676 | $70,417 | $550 |
| Total Operating Expenses | $2,537,113
| $1,823,585
| $2,402,111
| $3,155,422
| $3,457,315 | $3,487,079 | $3,475,730 | $27,154 |
| Net Operating Income | $1,438,228(2) | $ 284,238(2) | $1,330,205(2) | $1,931,584(2) | $2,213,734 | $2,285,289 | $2,281,199 | $17,822 |
| FF&E | $0 | $0 | $0 | $0 | $0 | $0 | $ 230,277 | $1,799 |
| Net Cash Flow | $1,438,228
| $284,238
| $1,330,205
| $1,931,584
| $2,213,734 | $2,285,289 | $2,050,922 | $16,023 |
| NOI DSCR | 1.16x | 0.23x | 1.08x | 1.56x | 1.79x | 1.85x | 1.85x | |
| NCF DSCR | 1.16x | 0.23x | 1.08x | 1.56x | 1.79x | 1.85x | 1.66x | |
| NOI Debt Yield | 8.5% | 1.7% | 7.8% | 11.4% | 13.0% | 13.5% | 13.4% | |
| NCF Debt Yield | 8.5% | 1.7% | 7.8% | 11.4% | 13.0% | 13.5% | 12.1% | |
| (1) | Other income consists of retail marketplace income and other miscellaneous income sources. |
| (2) | The decrease in Occupancy and Net Operating income from 2019 to 2020 and the increases in Occupancy and Net Operating Income from 2020 to 2021 and 2021 to 2022 were due to the effects of the novel coronavirus on the hospitality industry in 2020 and the subsequent recovery in 2021 and 2022. |
| This is not a research report and was not prepared by any Underwriter’s research department. Please see additional important information and qualifications at the end of this Term Sheet. | ||
| 134 | ||
| Mortgage Loan No. 14 – 435 Beverly Oakhurst |
| Mortgage Loan Information | Property Information | ||||||
| Mortgage Loan Seller: | MSMCH | Single Asset/Portfolio: | Single Asset | ||||
| Credit Assessment (Fitch/Moody’s/DBRSM): | NR/NR/NR | Location: | Beverly Hills, CA 90210 | ||||
| Original Balance: | $16,572,000 | General Property Type: | Multifamily | ||||
| Cut-off Date Balance: | $16,572,000 | Detailed Property Type: | High Rise | ||||
| % of Initial Pool Balance: | 2.4% | Title Vesting: | Fee | ||||
| Loan Purpose: | Refinance | Year Built/Renovated: | 1969/2024 | ||||
| Borrower Sponsors: | Watts Family Trust, Erik Watts and | Size: | 39 Units | ||||
| Hamilton Von Watts | Cut-off Date Balance per Unit: | $424,923 | |||||
| Guarantors: | Watts Family Trust, Erik Watts and | Maturity Date Balance per Unit: | $424,923 | ||||
| Hamilton Von Watts | Property Manager: | LMV Realty Inc. | |||||
| Mortgage Rate: | 6.7000% | (borrower-related) | |||||
| Note Date: | 7/3/2024 | Underwriting and Financial Information(2) | |||||
| Maturity Date: | 8/1/2029 | UW NOI: | $1,444,780 | ||||
| Term to Maturity: | 60 months | UW NCF: | $1,435,030 | ||||
| Amortization Term: | 0 months | UW NOI Debt Yield: | 8.7% | ||||
| IO Period: | 60 months | UW NCF Debt Yield: | 8.7% | ||||
| Seasoning: | 0 months | UW NOI Debt Yield at Maturity: | 8.7% | ||||
| Prepayment Provisions: | L(23),YM1(30),O(7) | UW NCF DSCR: | 1.27x | ||||
| Lockbox/Cash Mgmt Status: | Springing/Springing | Most Recent NOI(2): | $1,583,424 (4/30/2024 TTM) | ||||
| Additional Debt Type: | NAP | 2nd Most Recent NOI(2): | $1,576,264 (12/31/2023) | ||||
| Additional Debt Balance: | NAP | 3rd Most Recent NOI(2): | $1,580,737 (12/31/2022) | ||||
| Future Debt Permitted (Type): | No (NAP) | Most Recent Occupancy: | 94.9% (6/1/2024) | ||||
| Reserves | 2nd Most Recent Occupancy(2): | 97.4% (12/31/2023) | |||||
| Type | Initial | Monthly | Cap | 3rd Most Recent Occupancy(2): | 100.0% (12/31/2022) | ||
| RE Taxes: | $106,518 | $17,752 | NAP | Appraised Value (as of): | $30,350,000 (5/3/2024) | ||
| Insurance: | $40,503 | $14,303 | NAP | Appraised Value per Unit: | $778,205 | ||
| Deferred Maintenance: | $1,875 | $0 | NAP | Cut-off Date LTV Ratio: | 54.6% | ||
| Replacement Reserve: | $0 | $813 | $19,500 | Maturity Date LTV Ratio: | 54.6% | ||
| Sources and Uses | ||||||
| Sources | Proceeds | % of Total | Uses | Proceeds | % of Total | |
| Loan Amount: | $16,572,000 | 100.0% | Loan Payoff: | $13,544,913 | 81.7% | |
| Return of Equity: | $2,552,560 | 15.4% | ||||
| Closing Costs: | $325,631 | 2.0% | ||||
| Upfront Reserves: | $148,896 | 0.9% | ||||
| Total Sources: | $16,572,000 | 100.0% | Total Uses: | $16,572,000 | 100.0% | |
The Mortgage Loan. The fourteenth largest mortgage loan (the “435 Beverly Oakhurst Mortgage Loan”) is evidenced by a promissory note in the original principal amount of $16,572,000. The 435 Beverly Oakhurst Mortgage Loan is secured by a first priority fee mortgage encumbering a multifamily property located in Beverly Hills, California (the “435 Beverly Oakhurst Property”).
The Borrower and the Borrower Sponsors. The borrower for the 435 Beverly Oakhurst Mortgage Loan is TBO DE, LLC, a single-purpose Delaware limited liability company, with no independent director in its organizational structure. The borrower sponsors and non-recourse carveout guarantors for the 435 Beverly Oakhurst Mortgage Loan are Watts Family Trust, Erik Watts and Hamilton Von Watts. Hamilton Von Watts has 20 years of property management and development experience. He is responsible for overseeing management of the 435 Beverly Oakhurst Property, Walnut Creek retirement community, a 6-unit multifamily property in Santa Monica and a Las Vegas mixed use property. Eric Watts has been an entrepreneur for over fifty years. He has founded various companies that provided estate planning, life insurance products, and healthcare/Medicare/Medicaid audit companies from 1971 to 2007. He is currently working with Lakeside Solutions, a property management and development company he founded in 2008, and he is chairman of Comet Management Corp, a business development company.
| This is not a research report and was not prepared by any Underwriter’s research department. Please see additional important information and qualifications at the end of this Term Sheet. | ||
| 135 | ||
| Multifamily – High Rise | Loan #14 | Cut-off Date Balance: | $16,572,000 | |
| 435 North Oakhurst Drive | 435 Beverly Oakhurst | Cut-off Date LTV: | 54.6% | |
| Beverly Hills, CA 90210 | U/W NCF DSCR: | 1.27x | ||
| U/W NOI Debt Yield: | 8.7% |
The Property. The 435 Beverly Oakhurst Property is a nine-story, 39-unit high rise multifamily apartment complex located on a 0.36-acre site in Beverly Hills, California. In the past 5 years, the borrower sponsor has invested over $1.1 million on unit renovations and upgrades. The units consist of seven one-bedroom units averaging 1,503 SF and leased at between $3,398 and $5,500 with an average of $4,227 per month, thirty two-bedroom units averaging 1,729 SF and leased at between $3,874 and $7,400 with an average of $5,375 per month, and two three-bedroom units averaging 2,463 SF, one of which is leased at $5,752 per month and the other is leased at $10,500. Amenities include a rooftop pool and jacuzzi, sundeck, courtyard, concierge access, fitness center, conference room, gated garage parking, and on-site management. Each unit features spacious layouts, balconies, and dens. Some units have in-unit washer/dryer, while others have hookups for such appliances. The borrower sponsor is in the process of applying for permits to convert such unpermitted units into three additional leasable units. The 435 Beverly Oakhurst Property is subject to the City of Beverly Hills rent stabilization ordinance and State of California rent stabilization ordinance. All but two of the units are leased on a month-to month basis.
The following table presents detailed information with respect to the units at the 435 Beverly Oakhurst Property:
| Apartment Unit Mix(1) | ||||||||
| Unit Mix / Type | Total Units | Leased Units | % Leased | Average SF per Unit | Monthly Average Rent per Unit | Monthly Average Rent PSF | ||
| 1 BR | 7 | 6 | 85.7% | 1,503 | $4,227 | $2.81 | ||
| 2 BR | 30 | 29 | 96.7% | 1,729 | $5,375 | $3.11 | ||
| 3 BR | 2 | 2 | 100.0% | 2,463 | $8,126 | $3.30 | ||
| Total/Average | 39 | 37 | 94.9% | 1,726 | $5,337 | $3.09 | ||
| (1) | Information is based on the borrower rent roll dated June 1, 2024. |
The Market. The 435 Beverly Oakhurst Property is located within Beverly Hills and Los Angeles County, California. It is part of the Los Angeles-Long Beach-Glendale metropolitan area (Los Angeles County). The 435 Beverly Oakhurst Property is located within the Beverly Hills multifamily submarket of the Los Angeles multifamily market. Major employers in the Los Angeles-Long Beach-Anaheim, California MSA include Cedars-Sinai Medical Center, Los Angeles International Airport-LAX, University of California Los Angeles, VXI Global Solutions, The Walt Disney Co. and Northrop Grumman Corp.
According to the appraisal, as of the first quarter of 2024, the vacancy rate in the Los Angeles multifamily market was 4.9%, with average asking rents of $2,160 per unit and inventory of approximately 1.3 million units. According to the appraisal, as of the first quarter of 2024, the vacancy rate in the Beverly Hills multifamily submarket was 7.6%, with average asking rents of $3,302 per unit and inventory of approximately 7,226 units. According to the appraisal, the estimated 2023 population within a one-, three-, and five-mile radius of the 435 Beverly Oakhurst Property was 28,771, 253,263 and 738,425, respectively. According to the appraisal, the 2023 average household income within the same radii was $168,770, $163,561 and $143,579, respectively.
The following table presents certain information relating to comparable multifamily rental properties to the 435 Beverly Oakhurst Property:
| Comparable Rental Properties | |||||
| Property | Year Built | # Total Units | Unit Mix | Unit Size (SF) | Average Monthly Rent per Unit |
435 Beverly Oakhurst(1) 435 North Oakhurst Drive Beverly Hills, CA | 1969 | 39 | 1 BR 2 BR 3 BR | 1,503 1,729 2,463 | $4,227 $5,375 $8,126 |
313 S Reeves Drive 313 Reeves Drive Beverly Hills, CA | 2016 | 10 | 1 BR 2 BR | 1,280 1,560 | $5,500 $7,200 |
9191 Charleville Boulevard 9191 Charleville Boulevard Beverly Hills, CA | 1973 | 5 | 1 BR 2 BR | 1,179 1,331 | $4,895 $6,945 |
One Thirty One Maple 131 S Maple Drive Beverly Hills, CA | 1964 | 25 | 1 BR 2 BR | 1,500 1,600 | $5,100 $6,018 |
339 N Oakhurst 339 N Oakhurst Drive Beverly Hills, CA | 1962 | 21 | 2 BR | 1,600 | $7,400 |
121 S Canon Drive 121 S Canon Drive Beverly Hills, CA | 1996 | 10 | 3 BR | 2,921 | $11,000 |
448 N Oakhurst Drive 448 N Oakhurst Drive Beverly Hills, CA | 1990 | 4 | 3 BR | 2,683 | $9,500 |
Source: Appraisal, unless otherwise indicated.
| (1) | Based on the borrower rent roll dated June 1, 2024, other than Year Built. |
| This is not a research report and was not prepared by any Underwriter’s research department. Please see additional important information and qualifications at the end of this Term Sheet. | ||
| 136 | ||
| Multifamily – High Rise | Loan #14 | Cut-off Date Balance: | $16,572,000 | |
| 435 North Oakhurst Drive | 435 Beverly Oakhurst | Cut-off Date LTV: | 54.6% | |
| Beverly Hills, CA 90210 | U/W NCF DSCR: | 1.27x | ||
| U/W NOI Debt Yield: | 8.7% |
The following table presents certain information relating to the appraisal’s market rent conclusion for the 435 Beverly Oakhurst Property:
| Market Rent Summary | ||||||
| Unit Mix/Type | Units(1) | Average Size (SF) (1) | Avg. Monthly Rent per Unit(1) | Avg. Monthly Rent PSF(1) | Avg. Monthly Market Rent per Unit(2) | Avg. Monthly Market Rent PSF(2) |
| 1 BR | 7 | 1,503 | $4,227 | $2.81 | $5,300 | $3.53 |
| 2 BR | 30 | 1,729 | $5,375 | $3.11 | $6,500 | $3.76 |
| 3 BR | 2 | 2,463 | $8,126 | $3.30 | $10,250 | $4.16 |
| Total/Average | 39 | 1,726 | $5,337 | $3.09 | $6,477 | $3.74 |
| (1) | Based on the borrower rent roll dated June 1, 2024. |
| (2) | Based on the appraisal. |
Appraisal. The appraisal concluded to an “as-is” value for the 435 Beverly Oakhurst Property of $30,350,000 as of May 3, 2024.
Environmental Matters. According to the Phase I environmental site assessment dated May 8, 2024, there was no evidence of any recognized environmental conditions at the 435 Beverly Oakhurst Property.
Operating History and Underwritten Net Cash Flow. The following table presents certain information relating to the historical operating performance and Underwritten Net Cash Flow for the 435 Beverly Oakhurst Property:
| Cash Flow Analysis(1) | ||||||
| 12/31/2021 | 12/31/2022 | 12/31/2023 | 4/30/2024 TTM | UW | UW per Unit | |
| Gross Potential Rent | $1,938,804 | $2,446,059 | $2,478,082 | $2,463,781 | $2,511,312 | $64,393 |
| Other Income | $8,200 | $7,225 | $6,238 | $3,838 | $7,200 | $185 |
| Discounts Concessions | $0 | $0 | $0 | $0 | $0 | $0 |
| Vacancy & Credit Loss | $0 | $0 | $0 | $0 | ($141,600) | ($3,631) |
| Effective Gross Income | $1,947,004 | $2,453,284 | $2,484,320 | $2,467,619 | $2,376,912 | $60,946 |
| Real Estate Taxes | $200,131 | $200,889 | $203,260 | $208,109 | $206,819 | $5,303 |
| Insurance | $33,460 | $56,688 | $45,629 | $45,629 | $166,639 | $4,273 |
| Other Expenses | $471,203 | $614,969 | $659,168 | $630,456 | $558,674 | $14,325 |
| Total Expenses | $704,794 | $872,546 | $908,056 | $884,195 | $932,132 | $23,901 |
| Net Operating Income | $1,242,210 | $1,580,737 | $1,576,264 | $1,583,424 | $1,444,780 | $37,046 |
| Capital Expenditures | $0 | $0 | $0 | $0 | $9,750 | $250 |
| Net Cash Flow | $1,242,210 | $1,580,737 | $1,576,264 | $1,583,424 | $1,435,030 | $36,796 |
| Occupancy % | 100.0% | 100.0% | 97.4% | 94.9% | 94.4% | |
| NOI DSCR | 1.10x | 1.40x | 1.40x | 1.41x | 1.28x | |
| NCF DSCR | 1.10x | 1.40x | 1.40x | 1.41x | 1.27x | |
| NOI Debt Yield | 7.5% | 9.5% | 9.5% | 9.6% | 8.7% | |
| NCF Debt Yield | 7.5% | 9.5% | 9.5% | 9.6% | 8.7% | |
| (1) | UW Gross Potential Rent has been underwritten based on the contractual rent in place based on the borrower rent roll dated June 1, 2024 |
| This is not a research report and was not prepared by any Underwriter’s research department. Please see additional important information and qualifications at the end of this Term Sheet. | ||
| 137 | ||
| Mortgage Loan No. 15 – Marriott Anaheim |
| Mortgage Loan Information | Property Information | ||||||
| Mortgage Loan Seller: | BANA | Single Asset/Portfolio: | Single Asset | ||||
| Credit Assessment (Moody’s/Fitch//DBRSM): | NR/NR/NR | Location: | Anaheim, CA 92802 | ||||
| Original Balance(1): | $15,000,000 | General Property Type(3): | Hospitality | ||||
| Cut-off Date Balance(1): | $15,000,000 | Detailed Property Type(3): | Full Service | ||||
| % of Initial Pool Balance: | 2.2% | Title Vesting: | Fee | ||||
| Loan Purpose: | Refinance | Year Built/Renovated: | 1981; 1983; 2007/2018 | ||||
| Borrower Sponsors: | Tushar Patel and HRG Holdings I, LLC | Size: | 1,030 Rooms | ||||
| Guarantors: | Tushar Patel and HRG Holdings I, LLC | Cut-off Date Balance Per Room(1): | $121,359 | ||||
| Mortgage Rate: | 6.3730% | Maturity Date Balance Per Room(1): | $121,359 | ||||
| Note Date: | 5/17/2024 | Property Manager(3): | Tarsadia Enterprises, LLC | ||||
| Maturity Date: | 6/1/2029 | (borrower-related) | |||||
| Term to Maturity: | 60 months | Underwriting and Financial Information | |||||
| Amortization Term: | 0 months | UW NOI(3): | $10,306,767 | ||||
| IO Period: | 60 months | UW NCF(3): | $10,306,767 | ||||
| Seasoning: | 2 months | UW NOI Debt Yield(1)(3): | 8.2% | ||||
| Prepayment Provisions: | L(26),DorYM1(27),O(7) | UW NCF Debt Yield(1)(3): | 8.2% | ||||
| Lockbox/Cash Mgmt Status: | Hard/In Place | UW NOI Debt Yield at Maturity(1)(3): | 8.2% | ||||
| Additional Debt Type(1): | Pari Passu | UW NCF DSCR(1)(3): | 1.28x | ||||
| Additional Debt Balance(1): | $110,000,000 | Most Recent NOI(3): | $10,306,767 (12/31/2023) | ||||
| Future Debt Permitted (Type): | No (NAP) | 2nd Most Recent NOI(3): | $10,306,767 (12/31/2022) | ||||
| 3rd Most Recent NOI(3): | $10,303,778 (12/31/2021) | ||||||
| Most Recent Occupancy(4): | 78.2% (12/31/2023) | ||||||
| 2nd Most Recent Occupancy(4): | 72.1% (12/31/2022) | ||||||
| Reserves(2) | 3rd Most Recent Occupancy(4): | 42.8% (12/31/2021) | |||||
| Type | Initial | Monthly | Cap | Appraised Value (as of)(5): | $190,000,000 (4/9/2024) | ||
| RE Taxes: | $0 | Springing | NAP | Appraised Value Per Room: | $184,466 | ||
| Insurance: | $0 | Springing | NAP | Cut-off Date LTV Ratio(1)(5): | 65.8% | ||
| FF&E Reserve: | $0 | Springing | NAP | Maturity Date LTV Ratio(1)(5): | 65.8% | ||
| Sources and Uses | ||||||
| Sources | Proceeds | % of Total | Uses | Proceeds | % of Total | |
| Whole Loan Amount(1): | $125,000,000 | 100.0% | Loan Payoff: | $96,627,196 | 77.3% | |
| Return of Equity: | $28,058,028 | 22.4% | ||||
| Closing Costs: | $314,775 | 0.3% | ||||
| Total Sources: | $125,000,000 | 100.0% | Total Uses: | $125,000,000 | 100.0% | |
| (1) | The Marriott Anaheim Mortgage Loan (as defined below) is part of the Marriott Anaheim Whole Loan (as defined below), which is evidenced by three pari passu promissory notes with an aggregate principal balance of $125,000,000. The Cut-off Date Balance Per Room, Maturity Date Balance Per Room, UW NOI Debt Yield, UW NCF Debt Yield, UW NOI Debt Yield at Maturity, UW NCF DSCR, Cut-off Date LTV Ratio and Maturity Date LTV Ratio numbers presented above are based on the aggregate principal balance of the promissory notes comprising the Marriott Anaheim Whole Loan. |
| (2) | Monthly RE Tax reserves will be required during the continuance of a Marriott Reserve Event. Monthly Insurance reserves will be required during the continuance of a Marriot Reserve Event so long as a blanket insurance policy is not in place. During the continuance of a Marriott Reserve Event, the borrower is required to deposit to the FF&E reserve (x) a working capital refund equal to $900,000 if the Operating Lease (as defined below) is terminated (to the extent actually paid to the borrower by Marriott), and (y) monthly an amount equal to 5% of gross income of the Marriott Anaheim Property for the month which is two months prior to the next payment date. A “Marriott Reserve Event” will exist when (i) the Operating Lease is no longer in full force and effect, or (ii) Marriott (as defined below) is no longer deducting amounts from gross revenue for the FF&E reserve. |
| (3) | The Marriott Anaheim Property (as defined below) operates under a long-term operating lease agreement between the borrower, as lessor, and Marriott Hotel Services, LLC, as lessee, whereby the lessee is responsible for a monthly operating lease payment to the borrower and retains any profit in excess of the operating lease payment from the operation of the property. See “The Operating Lease” section below for further discussion. Underwritten and historical financials represent the operating lease payment. |
| (4) | Most recent and historical occupancy information represents the occupancy of the hotel operations. |
| (5) | The appraiser also provided a hypothetical fee simple value of $387,700,000, which assumes the operating lease is dissolved and the borrower assumes full ownership of the Marriott Anaheim Property’s operational cash flows. This results in a look-through Cut-off Date LTV Ratio and Maturity Date LTV Ratio of 32.2%. |
The Mortgage Loan. The fifteenth largest mortgage loan (the “Marriott Anaheim Mortgage Loan”) is part of a whole loan (the “Marriott Anaheim Whole Loan”) evidenced by three pari passu promissory notes in the aggregate original principal amount of $125,000,000 and secured by a first priority fee mortgage encumbering a 1,030-room full-service hotel located in Anaheim, California (the “Marriott Anaheim Property”). The Marriott Anaheim Mortgage Loan is evidenced by the non-controlling Note A-2 with an original principal balance of $15,000,000. The promissory notes comprising the Marriott Anaheim Whole Loan are summarized in the below table. The Marriott Anaheim Whole Loan will be serviced pursuant to the pooling and servicing agreement for the BANK5 2024-5YR7 securitization trust. See “Description of the Mortgage Pool—The Whole Loans—The Non-Serviced Pari Passu Whole Loans” and “Pooling and Servicing Agreement—Servicing of the Non-Serviced Mortgage Loans” in the prospectus.
| This is not a research report and was not prepared by any Underwriter’s research department. Please see additional important information and qualifications at the end of this Term Sheet. | ||
| 138 | ||
| Hospitality – Full Service | Loan #15 | Cut-off Date Balance: | $15,000,000 | |
| 700 West Convention Way | Marriott Anaheim | Cut-off Date LTV: | 65.8% | |
| Anaheim, CA 92802 | UW NCF DSCR: | 1.28x | ||
| UW NOI Debt Yield: | 8.2% |
| Marriott Anaheim Whole Loan Summary | ||||||
Note | Original Balance | Cut-off Date Balance | Note Holder | Controlling Piece | ||
| A-1 | $100,000,000 | $100,000,000 | BANK5 2024-5YR7 | Yes | ||
| A-2 | $15,000,000 | $15,000,000 | BANK5 2024-5YR8 | No | ||
| A-3 | $10,000,000 | $10,000,000 | BANK5 2024-5YR7 | No | ||
| Whole Loan | $125,000,000 | $125,000,000 | ||||
The Borrower and the Borrower Sponsors. The borrower is AMH, LLC, a single-purpose, Delaware limited liability company with two independent directors. The non-recourse carveout guarantors and borrower sponsors of the Marriott Anaheim Whole Loan are Tushar Patel and HRG Holdings I, LLC. However, HRG Holdings I, LLC is the only indemnitor under the environmental indemnity agreement. With respect to the non-recourse carve-out guaranty, Tushar Patel, has only guaranteed certain full recourse carveouts. For all bankruptcy-related carveouts and a carveout arising if Marriott (as defined below) exercises its option to purchase the Marriott Anaheim Property and Marriott does not agree to assume the Marriott Anaheim Whole Loan, the guaranty is limited to $50,000,000. See “Right of First Offer and Refusal/Right to Purchase” below.
Tushar Patel wholly owns HRG Holdings I, LLC and is the founder and chairman of Tarsadia Hotels and Tarsadia Investments, which are based in Newport Beach, California, approximately 15 miles from the Marriott Anaheim Property. Established in 1976, Tarsadia Investments is a real estate and investment company that currently manages over $3.0 billion in capital focused across various asset classes and investments including real estate, life sciences, financial services, and technology. Tushar Patel, in his role with Tarsadia Hotels, is an experienced hotel owner and operator having completed over $1.0 billion in hotel acquisitions and development over an almost 40-year career.
The Operating Lease. The Marriott Anaheim Property is operated under a lease agreement between the borrower, as lessor, and Marriott Hotel Services, LLC, as lessee (the “Operating Lease”). Marriott Hotel Services, LLC (“Marriott”) is a wholly-owned subsidiary of Marriott International, Inc. (NYSE: MAR) (rated Baa2/BBB by Moody’s and S&P) (“Marriott International”). One of the world's leading hoteliers, Marriott International, operates, franchises, and licenses hotel, residential, timeshare, and other lodging properties under numerous brand names. Marriott International has more than 6,100 franchised and licensed properties and its hotel portfolio comprises nearly 1.5 million guest rooms.
Marriott has operated the Marriott Anaheim Property under an operating lease since the hotel’s opening in February 1981. The borrower sponsors acquired the Marriott Anaheim Property in 1999. In December of 2004, the borrower and Marriott entered into an amended and restated lease agreement reflecting the exercise by Marriott of its first 25-year renewal option, which extended the Operating Lease term through December 31, 2031. Marriott has one remaining 25-year renewal option which would extend the Operating Lease through December 31, 2056. Since acquisition, the borrower sponsors have invested over $37.5 million into the Marriott Anaheim Property. In addition to the borrower sponsors’ capital investment, Marriott has also invested approximately $25.4 million of its own capital into the Marriott Anaheim Property.
Base rent under the Operating Lease is equal to 10.0% of the borrower’s invested capital. As of January 1, 2005, just after the Operating Lease renewal, the borrower’s investment was determined to be $86,753,562. Over the borrower’s ownership of the Marriott Anaheim Property, the borrower’s investment has increased to a current balance of $103,067,669, resulting in a current annual base rent under the Operating Lease of $10,306,767. The base rent payment cannot decline, but has the potential to increase if the borrower invests additional capital to upgrade the Marriott Anaheim Property during the Operating Lease term. The Operating Lease is triple-net, with Marriott being responsible for direct payment of all real estate taxes, insurance, utilities, operating costs and maintenance costs.
The Operating Lease requires 5% of total annual gross revenues to be deposited by Marriott into an FF&E reserve account held by the borrower. If Marriott’s annual budgeted capital expenditure costs (in its sole discretion) exceed the amount available in the FF&E reserve account, then Marriott will provide to the borrower a detailed scope of the repairs/improvements and quantify the additional contribution necessary. The responsibility for the additional contribution is split 62.5% by the borrower (the “Additional Borrower Capital Contribution”) and 37.5% by Marriott. The amount of the Additional Borrower Capital Contribution would then be added to the calculation of the borrower’s investment, and the Operating Lease base rent would increase accordingly. If the borrower does not agree to make the Additional Borrower Capital Contribution, Marriott can either pay that amount from its own funds or exercise its right to purchase the Marriott Anaheim Property. See “Right of First Offer and Refusal/Right to Purchase” below.
Marriott has a termination right under the Operating Lease if (i) the borrower attempts to sell and Marriott does not elect to purchase the Marriott Anaheim Property, and either (x) the purchaser operates or owns a controlling interest in any competing lodging facility or restaurant, (y) the purchaser is not financially sound or (z) the purchaser is of bad character or reputation, (ii) the Marriott Anaheim Property is subject to any of (x) revocation of material licenses from a governing body not arising from any action of Marriott, (y) acts of God, acts of war, civil disturbance, governmental action or similar causes that would have a significant adverse effect on operations, or (z) eminent domain, or (iii) the borrower’s failure to make payments as required by the Operating Lease or to fulfill any other Operating Lease obligations. The lender has certain notice and cure rights pursuant to a subordination, non-disturbance, and attornment agreement, as well as a right to sign a new lease to the extent the Operating Lease is terminated. Unless Marriott elects to terminate the Operating Lease, the Operating Lease will stay in place following a foreclosure, and the lender will not have the right to terminate the Operating Lease except to the extent the Operating Lease provides for termination rights of the lessor.
The Property. The Marriott Anaheim Property is a 1,030-room full-service hotel located adjacent to the Anaheim Convention Center in Anaheim, California and approximately half-a-mile south of the entrance to the Disneyland Resort. The improvements are on a 15.06-acre site and were constructed in two phases. The first phase was originally constructed in 1981 and included the 19-story tower, the lobby and registration desk, the four-story garden wing, and the main public area building. The second phase was completed in 1983 and included the five-story parking garage, the 17-story guestroom tower and the Marquis Ballroom building, which contains the majority of the meeting space.
| This is not a research report and was not prepared by any Underwriter’s research department. Please see additional important information and qualifications at the end of this Term Sheet. | ||
| 139 | ||
| Hospitality – Full Service | Loan #15 | Cut-off Date Balance: | $15,000,000 | |
| 700 West Convention Way | Marriott Anaheim | Cut-off Date LTV: | 65.8% | |
| Anaheim, CA 92802 | UW NCF DSCR: | 1.28x | ||
| UW NOI Debt Yield: | 8.2% |
The guestroom mix at the Marriott Anaheim Property is comprised of 263 king rooms, 734 double/double rooms, four executive suites, two loft suites, four luxury suites, 19 hospitality suites, two presidential suites and two VIP suites. Amenities at the Marriott Anaheim Property include an outdoor pool and spa, fitness center, business center, gift shop and FedEx store, plus four food and beverage outlets and 379,971 total SF of indoor and outdoor meeting space.
According to the appraisal, the property segmentation at the Marriott Anaheim Property is estimated at 50% transient and 50% meeting and group.
The following table presents certain information relating to the Occupancy, ADR and RevPAR of the Marriott Anaheim Property and its competitive set:
| Historical Occupancy, ADR, RevPAR(1)(2) | |||||||||
| Competitive Set | Marriott Anaheim Property | Penetration Factor | |||||||
| Year | Occupancy | ADR | RevPAR | Occupancy | ADR | RevPAR | Occupancy | ADR | RevPAR |
| 12/31/2021 | 44.5% | $148.99 | $66.30 | 42.8% | $153.12 | $65.57 | 96.2% | 102.8% | 98.9% |
| 12/31/2022 | 68.6% | $180.70 | $124.03 | 72.1% | $204.62 | $147.58 | 105.1% | 113.2% | 119.0% |
| 12/31/2023 | 73.9% | $187.32 | $138.51 | 78.2% | $216.05 | $168.95 | 105.8% | 115.3% | 122.0% |
| 2/29/2024 TTM | 75.3% | $190.04 | $143.19 | 78.5% | $219.35 | $172.13 | 104.2% | 115.4% | 120.2% |
Source: Industry Report
| (1) | The competitive set includes Hotel Lulu, BW Premier Collection, Anaheim Majestic Garden Hotel, Hilton Anaheim, Sheraton Hotel Park at the Anaheim Resort, Hyatt Regency Orange County and DoubleTree Suites by Hilton Hotel Anaheim Resort - Convention Center. |
| (2) | The variances between the Marriott operating statements, the appraisal and the industry report data with respect to Occupancy, ADR and RevPAR at the Marriott Anaheim Property are attributable in part to variances in reporting methodologies and/or timing differences. |
The Market. The Marriott Anaheim Property is located in Anaheim, California and is part of the Orange County market and the West County submarket. The Marriott Anaheim Property is located adjacent to the Anaheim Convention Center and approximately half-a-mile south of the entrance to the Disneyland Resort. The Marriott Anaheim Property is situated along the west side of South Harbor Boulevard, the main north/south arterial providing direct access to Disneyland, State Route 22 and Interstate 5.
The Marriott Anaheim Property is located in the Anaheim-Santa Ana-Irvine metropolitan statistical area (“MSA”), which includes Orange County. Orange County has a 2022 estimated population of 3.2 million, making it the third most populous county in California and the sixth most populous county in the United States. The top employers in Orange County include Disney Resorts (32,000), University of California, Irvine (21,700), St. Joseph Health (14,000), Kaiser Permanente (8,178), Target Brands Inc. (6,300) and Walmart Inc. (6,200).
Disneyland Resort and the Anaheim Convention Center are the primary demand generators for the Marriott Anaheim Property. Disneyland Resort admitted approximately 16.9 million visitors in 2022, making it the second-most visited theme park in the world that year, second to Disney’s Magic Kingdom in Orlando, Florida. In April of 2024, the Anaheim City Council unanimously approved a $1.9 billion, multi-decade Disneyland Resort expansion plan that is expected to increase Disneyland Resort by 57 acres. The Anaheim Convention Center is the largest exhibition facility on the West Coast, with 1.8 million SF, including over 1 million SF of flexible exhibit space, over 80,000 SF of meeting space, 40,000 SF ballroom, and a basketball arena. The Anaheim Convention Center underwent a $190 million expansion in 2017, and hosts events such as Star Wars Celebration, VidCon, BlizzCon, Anime Expo, D23 Expo, WonderCon, and NAMM Show. In 2023, the convention center received over one million visitors across 150 convention events, creating consistent demand for lodging.
According to the appraisal, the estimated 2022 population within a one-, three- and five-mile radius of the Marriott Anaheim Property was 28,419, 277,310 and 832,541, respectively. The 2022 average household income within the same radii was $95,173, $97,511 and $93,904, respectively.
According to the appraisal, there are no directly competitive properties that are either proposed or under construction.
The following table presents the primary competitive properties to the Marriott Anaheim Property:
| Competitive Property Summary(1) | |||||||
| Property | Year Built | Rooms | Transient | Meeting & Group | 2023 Occupancy | 2023 ADR | 2023 RevPAR |
| Marriott Anaheim (subject) | 1981; 1983; 2007 | 1,030 | 50% | 50% | 78.2% | $216.05 | $168.95 |
| Hilton Anaheim | 1984 | 1,574 | 45% | 55% | 70%-75% | $200-$220 | $140-$160 |
| JW Marriott Anaheim Resort | 2020 | 466 | 60% | 40% | 75%-80% | $260-$280 | $180-$200 |
| Westin Anaheim Resort | 2021 | 618 | 55% | 45% | 70%-75% | $320-$340 | $220-$240 |
| Hyatt Regency Orange County | 1986 | 655 | 64% | 36% | 75%-80% | $200-$220 | $160-$180 |
| Subtotal/Average | 4,343 | 75.5% | $231.72 | $174.85 | |||
| Source: | Appraisal | |
| (1) | The variances between the Marriott operating statements, the appraisal and industry report data with respect to occupancy, ADR and RevPAR are attributable in part to variances in reporting methodologies and/or timing differences. |
| This is not a research report and was not prepared by any Underwriter’s research department. Please see additional important information and qualifications at the end of this Term Sheet. | ||
| 140 | ||
| Hospitality – Full Service | Loan #15 | Cut-off Date Balance: | $15,000,000 | |
| 700 West Convention Way | Marriott Anaheim | Cut-off Date LTV: | 65.8% | |
| Anaheim, CA 92802 | UW NCF DSCR: | 1.28x | ||
| UW NOI Debt Yield: | 8.2% |
Appraisal. The appraisal concluded to an “as-is” value for the Marriott Anaheim Property of $190,000,000 as of April 9, 2024. The appraiser also provided a hypothetical fee simple value of $387,700,000, which assumes the Operating Lease is dissolved and the borrower assumes full ownership of the Marriott Anaheim Property’s operational cash flows. This results in a look-through Cut-off Date LTV Ratio and Maturity Date LTV Ratio of 32.2%.
Environmental Matters. According to the Phase I environmental site assessment dated April 16, 2024, there was no evidence of any recognized environmental conditions at the Marriott Anaheim Property.
Operating History and Underwritten Net Cash Flow. The following table presents certain information relating to the historical hotel operating performance at the Marriott Anaheim Property. The Underwritten Net Cash Flow presented below reflects the base rent collected from the Operating Lease. See “The Operating Lease” above.
| Cash Flow Analysis(1) | |||||||
| 2019(2) | 2020(2) | 2021(2) | 2022(2) | 2023(2) | UW | UW per Room | |
| Occupancy(3) | 83.0% | 22.7% | 42.8% | 72.1% | 78.2% | 100.0% | |
| ADR(3) | $183.08 | $175.00 | $153.12 | $204.62 | $216.05 | $0 | |
| RevPAR(3) | $151.96 | $39.73 | $65.54 | $147.53 | $168.95 | $0 | |
| Room Revenue | $57,104,435 | $14,980,807 | $24,651,400 | $55,484,576 | $63,515,496 | $0 | $0 |
| Food & Beverage Revenue | $37,130,423 | $9,751,746 | $8,838,221 | $28,827,711 | $42,927,056 | $0 | $0 |
| Other Income | $5,387,232 | $3,766,917 | $3,364,502 | $7,381,462 | $9,794,184 | $10,306,767 | $10,007 |
| Total Revenue | $99,622,090 | $28,499,470 | $36,854,123 | $91,693,749 | $116,236,736 | $10,306,767 | $10,007 |
| Room Expense | $16,486,364 | $6,853,843 | $7,769,599 | $17,148,143 | $20,571,984 | $0 | $0 |
| Food & Beverage Expense | $26,805,045 | $9,965,188 | $7,565,548 | $22,180,214 | $30,549,652 | $0 | $0 |
| Other Income Expense | $284,413 | $124,568 | $35,397 | $66,684 | $85,894 | $0 | $0 |
| Real Estate Taxes | $1,450,374 | $1,584,880 | $1,583,870 | $1,592,070 | $1,621,936 | $0 | $0 |
| Insurance | $1,419,255 | $1,419,255 | $1,419,255 | $1,934,698 | $1,831,181 | $0 | $0 |
| Other Expenses | $24,566,130 | $10,910,838 | $12,402,838 | $21,766,417 | $25,131,768 | $0 | $0 |
| Total Expenses | $71,011,581 | $30,858,572 | $30,776,507 | $64,688,226 | $79,792,415 | $0 | $0 |
| Net Operating Income | $28,610,509 | ($2,359,102) | $6,077,616 | $27,005,523 | $36,444,321 | $10,306,767 | $10,007 |
| FF&E(4) | $4,981,105 | $1,424,973 | $1,842,706 | $4,584,687 | $5,811,837 | $0 | $0 |
| Net Cash Flow | $23,629,404 | ($3,784,075) | $4,234,910 | $22,420,836 | $30,632,484 | $10,306,767 | $10,007 |
| NOI DSCR(5) | 3.54x | (0.29x) | 0.75x | 3.34x | 4.51x | 1.28x | |
| NCF DSCR(5) | 2.93x | (0.47x) | 0.52x | 2.78x | 3.79x | 1.28x | |
| NOI Debt Yield(5) | 22.9% | (1.9%) | 4.9% | 21.6% | 29.2% | 8.2% | |
| NCF Debt Yield(5) | 18.9% | (3.0%) | 3.4% | 17.9% | 24.5% | 8.2% | |
| (1) | The historical financial information is based on the Marriott operating statements and represents underlying hotel operations. The underwritten cash flows are based on the Operating Lease base rent payment. The borrower receives solely the payments under the Operating Lease and is not entitled to the cash flows from the underlying hotel operations. See “The Operating Lease” above. |
| (2) | The decrease in Occupancy and Net Operating Income from 2019 to 2020, as well as the recovery from 2021 through 2023, was primarily due to the effects of the COVID-19 pandemic on the hospitality industry. |
| (3) | The variances between the Marriott operating statements, the appraisal, and the industry report data with respect to Occupancy, ADR and RevPAR at the Marriott Anaheim Property are attributable in part to variances in reporting methodologies and/or timing differences. |
| (4) | The Operating Lease requires 5% of total annual gross revenues to be deposited by Marriott into the FF&E reserve account. If Marriott’s annual budgeted capital expenditure costs exceed the amount available in the FF&E reserve account, then Marriott provides to the borrower a detailed scope of the repairs/improvements and quantifies the additional contribution necessary. The Additional Borrower Capital Contribution is split 62.5% by the borrower and 37.5% by Marriott. The additional borrower contribution would then be added to the calculation of the borrower’s investment, and the Operating Lease base rent would increase accordingly. See “The Operating Lease” above and “Right of First Offer and Refusal/Right to Purchase” below. |
| (5) | DSCR and Debt Yield are based on the Marriott Anaheim Whole Loan. |
| This is not a research report and was not prepared by any Underwriter’s research department. Please see additional important information and qualifications at the end of this Term Sheet. | ||
| 141 | ||
| BANK5 2024-5YR8 |
This material was prepared by sales, trading, banking or other non-research personnel of one of the following: BofA Securities, Inc. (together with its affiliates, “BofA Securities”), Morgan Stanley & Co. LLC, Morgan Stanley & Co. International Limited, Morgan Stanley Japan Limited and/or Morgan Stanley Dean Witter Asia Limited, (together with its affiliates, “Morgan Stanley”), Wells Fargo Securities, LLC (together with its affiliates, “Wells Fargo”), J.P. Morgan Securities LLC (together with its affiliates, “J.P. Morgan”), Academy Securities, Inc. (together with its affiliates, “Academy”) and Drexel Hamilton, LLC (together with its affiliates, “Drexel”, and collectively with BofA Securities, Morgan Stanley, Wells Fargo, J.P. Morgan and Academy, the “Underwriters”). This material was not produced by an Underwriter’s research analyst, although it may refer to an Underwriter’s research analyst or research report. Unless otherwise indicated, these views (if any) are the author’s and may differ from those of the fixed income or equity research departments of the Underwriters or others in those firms.
This material may have been prepared by or in conjunction with the respective trading desks of the Underwriters that may deal as principal in or own or act as market maker or liquidity provider for the securities/instruments (or related derivatives) mentioned herein. The trading desk may have accumulated a position in the subject securities/instruments based on the information contained herein. Trading desk materials are not independent of the proprietary interests of the Underwriters, which may conflict with your interests. Each of the Underwriters may also perform or seek to perform investment banking services for the issuers of the securities and instruments mentioned herein.
The information contained in this material is preliminary as of the date hereof. This material is subject to change, completion or amendment from time to time. The information in this material supersedes information in any other communication relating to the securities referred to in this material; provided, that the information in this material will be superseded by similar information delivered to you as part of a preliminary prospectus. This material is not a solicitation to participate in any trading strategy, and is not an offer to sell any security or instrument or a solicitation of an offer to buy or sell any security or instrument in any jurisdiction where an offer, solicitation or sale is not permitted. Unless otherwise set forth in this material, any securities referred to in this material may not have been registered under the U.S. Securities Act of 1933, as amended, and, if not, may not be offered or sold absent an exemption therefrom. Recipients are required to comply with any legal or contractual restrictions on their purchase, holding, sale, exercise of rights or performance of obligations under any securities/instruments transaction.
The securities/instruments discussed in this material may not be suitable for all investors. This material has been prepared and issued by the Underwriters for intended distribution to market professionals and institutional investor clients. Other recipients should seek independent investment advice prior to making any investment decision based on this material. This material does not provide individually tailored investment advice or offer tax, regulatory, accounting or legal advice. Prior to entering into any proposed transaction, recipients should determine, in consultation with their own investment, legal, tax, regulatory and accounting advisors, the economic risks and merits, as well as the legal, tax, regulatory and accounting characteristics and consequences, of the transaction. You should consider this material as only a single factor in making an investment decision.
The value of and income from investments may vary because of changes in interest rates, foreign exchange rates, default rates, prepayment rates, securities/instruments prices, market indexes, operational or financial conditions of companies or other factors. There may be time limitations on the exercise of options or other rights in securities/instruments transactions. Past performance is not necessarily a guide to future performance. Estimates of future performance are based on assumptions that may not be realized. Actual events may differ from those assumed and changes to any assumptions may have a material impact on any projections or estimates. Other events not taken into account may occur and may significantly affect the projections or estimates. Certain assumptions may have been made for modeling purposes only to simplify the presentation and/or calculation of any projections or estimates, and the Underwriters do not represent that any such assumptions will reflect actual future events. Accordingly, there can be no assurance that estimated returns or projections will be realized or that actual returns or performance results will not materially differ from those estimated herein. Some of the information contained in this document may be aggregated data of transactions in securities or other financial instruments executed by an Underwriter that has been compiled so as not to identify the underlying transactions of any particular customer.
Notwithstanding anything herein to the contrary, the Underwriters and each recipient hereof (and their employees, representatives, and other agents) may disclose to any and all persons, without limitation of any kind from the commencement of discussions, the U.S. federal and state income tax treatment and tax structure of the transaction and all materials of any kind (including opinions or other tax analyses) that are provided to it relating to the tax treatment and tax structure (as such terms are defined in Treasury Regulation 1.6011-4). For this purpose, "tax structure" is limited to facts relevant to the U.S. federal and state income tax treatment of the transaction and does not include information relating to the identity of the parties, their affiliates, agents or advisors. This authorization of tax disclosure is retroactively effective to the commencement of discussions with prospective investors regarding the transactions contemplated herein.
THE DISTRIBUTION OF THIS MATERIAL (A) IF MADE BY A PERSON WHO IS NOT AN AUTHORIZED PERSON UNDER THE FINANCIAL SERVICES AND MARKETS ACT 2000 (“FSMA”), IS BEING MADE ONLY TO, OR DIRECTED ONLY AT, PERSONS WHO (I) ARE OUTSIDE THE UNITED KINGDOM, OR (II) HAVE PROFESSIONAL EXPERIENCE IN MATTERS RELATING TO INVESTMENTS AND QUALIFY AS INVESTMENT PROFESSIONALS IN ACCORDANCE WITH ARTICLE 19(5) OF THE FINANCIAL SERVICES AND MARKETS ACT 2000 (FINANCIAL PROMOTION) ORDER 2005 (AS AMENDED, THE “FINANCIAL PROMOTION ORDER”), OR (III) ARE PERSONS FALLING WITHIN ARTICLE 49(2)(A) THROUGH (D) (“HIGH NET WORTH COMPANIES, UNINCORPORATED ASSOCIATIONS, ETC.”) OF THE FINANCIAL PROMOTION ORDER OR, (IV) ARE PERSONS TO WHOM THIS MATERIAL MAY OTHERWISE LAWFULLY BE COMMUNICATED OR DIRECTED; AND (B) IF MADE BY A PERSON WHO IS AN AUTHORIZED PERSON UNDER THE FSMA, IS BEING MADE ONLY TO, OR DIRECTED ONLY AT, PERSONS WHO (I) ARE OUTSIDE THE UNITED KINGDOM, OR (II) HAVE PROFESSIONAL EXPERIENCE OF PARTICIPATING IN UNREGULATED SCHEMES (AS DEFINED FOR PURPOSES OF THE FINANCIAL SERVICES AND MARKETS ACT 2000 (PROMOTION OF COLLECTIVE INVESTMENT SCHEMES) (EXEMPTIONS) ORDER 2001 (AS AMENDED, THE “PROMOTION OF COLLECTIVE INVESTMENT SCHEMES EXEMPTIONS ORDER”)) AND QUALIFY AS INVESTMENT PROFESSIONALS IN ACCORDANCE WITH ARTICLE 14(5) OF THE PROMOTION OF COLLECTIVE INVESTMENT SCHEMES EXEMPTIONS ORDER, OR (III) ARE PERSONS FALLING WITHIN ARTICLE 22(2)(A) THROUGH (D) (HIGH NET WORTH COMPANIES, UNINCORPORATED ASSOCIATIONS, ETC.) OF THE PROMOTION OF COLLECTIVE INVESTMENT SCHEMES EXEMPTIONS ORDER, OR (IV) ARE PERSONS TO WHOM THE ISSUING ENTITY MAY LAWFULLY BE PROMOTED IN ACCORDANCE WITH SECTION 4.12 OF THE FCA HANDBOOK CONDUCT OF BUSINESS SOURCEBOOK.
THE OFFERED CERTIFICATES HAVE NOT BEEN AND WILL NOT BE REGISTERED UNDER THE FINANCIAL INSTRUMENTS AND EXCHANGE LAW OF JAPAN, AS AMENDED (THE “FIEL”), AND DISCLOSURE UNDER THE FIEL HAS NOT BEEN AND WILL NOT BE MADE WITH RESPECT TO THE OFFERED CERTIFICATES. ACCORDINGLY, EACH OF BOFA SECURITIES, INC., MORGAN STANLEY & CO. LLC, WELLS FARGO SECURITIES, LLC, J.P. MORGAN SECURITIES LLC, Academy Securities, Inc. AND Drexel Hamilton, LLC HAS REPRESENTED AND AGREED THAT IT HAS NOT, DIRECTLY OR INDIRECTLY, OFFERED OR SOLD AND WILL NOT, DIRECTLY OR INDIRECTLY, OFFER OR SELL ANY OFFERED CERTIFICATES IN JAPAN OR TO, OR FOR THE BENEFIT OF, ANY RESIDENT OF JAPAN (WHICH TERM AS USED IN THIS MATERIAL MEANS ANY PERSON RESIDENT IN JAPAN, INCLUDING ANY CORPORATION OR OTHER ENTITY ORGANIZED UNDER THE LAWS OF JAPAN) OR TO OTHERS FOR REOFFERING OR RE SALE, DIRECTLY OR INDIRECTLY, IN JAPAN OR TO, OR FOR THE BENEFIT OF, ANY RESIDENT OF JAPAN EXCEPT PURSUANT TO AN EXEMPTION FROM THE REGISTRATION REQUIREMENTS OF, AND OTHERWISE IN COMPLIANCE WITH, THE FIEL AND OTHER RELEVANT LAWS, REGULATIONS AND MINISTERIAL GUIDELINES OF JAPAN. AS PART OF THIS OFFERING OF THE OFFERED CERTIFICATES, THE UNDERWRITERS MAY OFFER THE OFFERED CERTIFICATES IN JAPAN TO UP TO 49 OFFEREES IN ACCORDANCE WITH THE ABOVE PROVISIONS.
© 2024 BofA Securities, Inc