Banc of America Merrill Lynch Commercial Mortgage
Filed: 28 Sep 15, 12:00am
| BofA MERRILL LYNCH | MORGAN STANLEY |
Co-Lead Bookrunning Manager CIBC World Markets | Co-Lead Bookrunning Manager Drexel Hamilton |
| Co-Managers | |
This is not a research report and was not prepared by any Underwriter’s research department. It was prepared by the Underwriters’ sales, trading, banking or other non-research personnel. Please see additional important information and qualifications at the end of this Term Sheet. |
| MSBAM 2015‑C25 | Structural Overview |
| Class | Expected Ratings (Fitch/KBRA/Moody’s)(1) | Approximate Initial Certificate Principal Balance or Notional Amount(2) | Approximate Initial Credit Support(3) | Pass-Through Rate Description | Expected Weighted Average Life (Years)(5) | Principal Window (Months)(5) | Certificate Principal UW NOI Debt Yield(6) | Certificate Principal to Value Ratio(7) |
| Class A-1 | AAAsf/AAA(sf)/Aaa(sf) | $34,000,000 | 30.000% | (4) | 2.88 | 1-57 | 13.5% | 46.3% |
| Class A-2 | AAAsf/AAA(sf)/Aaa(sf) | $28,700,000 | 30.000% | (4) | 4.85 | 57-59 | 13.5% | 46.3% |
| Class A-SB | AAAsf/AAA(sf)/Aaa(sf) | $93,700,000 | 30.000% | (4) | 7.31 | 59-116 | 13.5% | 46.3% |
| Class A-3 | AAAsf/AAA(sf)/Aaa(sf) | $115,000,000 | 30.000% | (4) | 8.25 | 99-99 | 13.5% | 46.3% |
| Class A-4 | AAAsf/AAA(sf)/Aaa(sf) | $230,000,000 | 30.000% | (4) | 9.77 | 116-118 | 13.5% | 46.3% |
| Class A-5 | AAAsf/AAA(sf)/Aaa(sf) | $324,193,000 | 30.000% | (4) | 9.83 | 118-118 | 13.5% | 46.3% |
| Class X-A | AAAsf/AAA(sf)/Aaa(sf) | $825,593,000(8) | N/A | Variable IO(9) | N/A | N/A | N/A | N/A |
| Class X-B | AA-sf/AAA(sf)/NR | $135,633,000(8) | N/A | Variable IO(9) | N/A | N/A | N/A | N/A |
| Class X-D | BBB-sf/BBB-(sf)/NR | $63,394,000(8) | N/A | Variable IO(9) | N/A | N/A | N/A | N/A |
| Class A-S | AAAsf/AAA(sf)/Aa2(sf) | $45,702,000 | 26.125% | (4) | 9.84 | 118-119 | 12.8% | 48.9% |
| Class B | AA-sf/AA-(sf)/NR | $89,931,000 | 18.500% | (4) | 9.92 | 119-119 | 11.6% | 54.0% |
| Class C | A-sf/A-(sf)/NR | $56,022,000 | 13.750% | (4) | 9.92 | 119-119 | 11.0% | 57.1% |
| Class D | BBB-sf/BBB-(sf)/NR | $63,394,000 | 8.375% | (4) | 9.92 | 119-119 | 10.3% | 60.7% |
| Class | Expected Ratings (Fitch/KBRA/Moody’s)(1) | Approximate Initial Certificate Principal Balance or Notional Amount(2) | Approximate Initial Credit Support(3) | Pass-Through Rate Description | Expected Weighted Average Life (Years)(5) | Principal Window (Months)(5) | Certificate Principal UW NOI Debt Yield(6) | Certificate Principal to Value Ratio(7) |
| Class E | BB-sf/BB-(sf)/NR | $29,485,000 | 5.875% | (4) | 9.92 | 119-119 | 10.1% | 62.3% |
| Class F | B-sf/B-(sf)/NR | $13,269,000 | 4.750% | (4) | 9.92 | 119-119 | 9.9% | 63.1% |
| Class G | NR/NR/NR | $56,022,010 | 0.000% | (4) | 10.43 | 119-179 | 9.5% | 66.2% |
| (1) | Ratings shown are those of Fitch Ratings, Inc., Kroll Bond Rating Agency, Inc. and Moody’s Investors Service, Inc. Certain nationally recognized statistical rating organizations that were not hired by the depositor may use information they receive pursuant to Rule 17g-5 under the Securities Exchange Act of 1934, as amended, or otherwise to rate the certificates. There can be no assurance as to what ratings a non-hired nationally recognized statistical rating organization would assign. See “Risk Factors—Risks Related to the Offered Certificates—Ratings of the Offered Certificates Do Not Represent Any Assessment of the Yield to Maturity That a Certificateholder May Experience and Such Ratings May Be Reviewed, Revised, Suspended, Downgraded, Qualified or Withdrawn By the Applicable Rating Agency” and “Ratings” in the other free writing prospectus, which is expected to be dated the date hereof (the “Free Writing Prospectus”), to which the prospectus dated September 14, 2015 (the “Prospectus”) is attached as Exhibit A. Capitalized terms used but not defined herein have the meanings assigned to such terms in the Free Writing Prospectus. |
| (2) | The certificate principal balances and notional amounts are approximate and on the closing date may vary by up to 5%. Mortgage loans may be removed from or added to the mortgage pool prior to the closing date within the same maximum permitted variance. Any reduction or increase in the aggregate principal balance of mortgage loans within these parameters will result in changes to the initial certificate principal balance or notional amount of each class of certificates shown in the table above and to the other statistical data contained herein and in the Free Writing Prospectus. In addition, the notional amounts of the Class X-A, Class X-B and Class X-D Certificates may vary depending upon the final pricing of the classes of principal balance certificates whose certificate principal balances comprise such notional amounts, and, if as a result of such pricing the pass-through rate of the Class X-A, Class X-B or Class X-D Certificates, as applicable, would be equal to zero, such class of certificates will not be issued on the closing date of this securitization. |
| (3) | The percentages indicated under the column “Approximate Initial Credit Support” with respect to the Class A-1, Class A-2, Class A-SB, Class A-3, Class A-4 and Class A-5 Certificates represent the approximate credit support for the Class A-1, Class A-2, Class A-SB, Class A-3, Class A-4 and Class A-5 Certificates in the aggregate. |
| (4) | The Class A-1, Class A-2, Class A-SB, Class A-3, Class A-4, Class A-5, Class A-S, Class B, Class C, Class D, Class E, Class F and Class G Certificates will, at all times, accrue interest at a per annum rate equal to (i) a fixed rate, (ii) a fixed rate subject to a cap equal to the weighted average of the net interest rates on the mortgage loans (in each case adjusted, if necessary, to accrue on the basis of a 360-day year consisting of twelve 30-day months) or (iii) a rate equal to the weighted average of the net interest rates on the mortgage loans (in each case adjusted, if necessary, to accrue on the basis of a 360-day year consisting of twelve 30-day months) less a specified percentage, which percentage may be zero. |
| (5) | The principal window is expressed in months following the closing date and reflects the period during which distributions of principal would be received under the assumptions set forth in the following sentence. The expected weighted average life and principal window figures set forth above are based on the following assumptions, among others: (i) no defaults or subsequent losses on the mortgage loans; (ii) no extensions of maturity dates of the mortgage loans; (iii) payment in full on the stated maturity date or, in the case of any mortgage loan having an anticipated repayment date, on the anticipated repayment date; and (iv) no prepayments of the mortgage loans prior to maturity or, in the case of a mortgage loan having an anticipated repayment date, prior to such anticipated repayment date. See the structuring assumptions set forth under “Yield, Prepayment and Maturity Considerations—Weighted Average Life” in the Free Writing Prospectus. |
| (6) | Certificate Principal UW NOI Debt Yield for any class of principal balance certificates is calculated as the product of (a) the weighted average UW NOI Debt Yield for the mortgage pool, multiplied by (b) a fraction, the numerator of which is the total initial principal balance of all the principal balance certificates, and the denominator of which is the total initial principal balance of the subject class of principal balance certificates and all other classes of principal balance certificates, if any, that are senior to such class. The Certificate Principal UW NOI Debt Yields of the Class A-1, Class A-2, Class A-SB, Class A-3, Class A-4 and Class A-5 Certificates are calculated in the aggregate for those classes as if they were a single class. |
| (7) | Certificate Principal to Value Ratio for any class of principal balance certificates is calculated as the product of (a) the weighted average Cut-off Date LTV Ratio of the mortgage pool, multiplied by (b) a fraction, the numerator of which is the total initial principal balance of the subject class of principal balance certificates and all other classes of principal balance certificates that are senior to such class, and the denominator of which is the total initial principal balance of all the principal balance certificates. The Certificate Principal to Value Ratios of the Class A-1, Class A-2, Class A-SB, Class A-3, Class A-4 and Class A-5 Certificates are calculated in the aggregate for those classes as if they were a single class. |
| (8) | The Class X-A, Class X-B and Class X-D Certificates (collectively, the “Class X Certificates”) will not have certificate principal balances and will not be entitled to receive distributions of principal. Interest will accrue on the Class X-A, Class X-B and Class X-D Certificates at their respective pass-through rates based upon their respective notional amounts. The notional amount of the Class X-A Certificates will equal the aggregate certificate principal balance of the Class A-1, Class A-2, Class A-SB, Class A-3, Class A-4 and Class A-5 Certificates outstanding from time to time. The notional amount of the Class X-B Certificates will equal the aggregate certificate |
| MSBAM 2015‑C25 | Structural Overview |
| (9) | The pass-through rate on the Class X-A Certificates will generally be equal to the excess, if any, of (a) the weighted average of the net interest rates on the mortgage loans (in each case adjusted, if necessary, to accrue on the basis of a 360-day year consisting of twelve 30-day months), over (b) the weighted average of the pass-through rates of the Class A-1, Class A-2, Class A-SB, Class A-3, Class A-4 and Class A-5 Certificates as described in the Free Writing Prospectus. The pass-through rate on the Class X-B Certificates will generally be equal to the excess, if any, of (a) the weighted average of the net interest rates on the mortgage loans (in each case adjusted, if necessary, to accrue on the basis of a 360-day year consisting of twelve 30-day months), over (b) the weighted average of the pass-through rates of the Class A-S and Class B Certificates as described in the Free Writing Prospectus. The pass-through rate on the Class X-D Certificates will generally be equal to the excess, if any, of (a) the weighted average of the net interest rates on the mortgage loans (in each case adjusted, if necessary, to accrue on the basis of a 360-day year consisting of twelve 30-day months), over (b) the pass-through rate of the Class D Certificates as described in the Free Writing Prospectus. |
| (10) | Not offered pursuant to the Prospectus, the Free Writing Prospectus or this Term Sheet. Information provided in this Term Sheet regarding the characteristics of these certificates is provided only to enhance your understanding of the offered certificates. The privately offered certificates also include the Class V and Class R Certificates, which do not have a certificate principal balance, notional amount, pass-through rate, rating or rated final distribution date, and which are not shown in the chart. The Class V Certificates represent a beneficial ownership interest held through the grantor trust in certain excess interest in respect of mortgage loans having anticipated repayment dates, if any. The Class R Certificates represent the beneficial ownership of the residual interest in each of the real estate mortgage investment conduits, including the separate real estate mortgage investment conduits related to the Herald Center mortgage loan, as further described in the Free Writing Prospectus. |
| MSBAM 2015‑C25 | Structural Overview |
| Offered Certificates: | $1,080,642,000 (approximate) monthly pay, multi-class, commercial mortgage pass-through certificates, consisting of ten principal balance classes (Class A‑1, Class A‑2, Class A‑SB, Class A‑3, Class A‑4, Class A‑5, Class A-S, Class B, Class C and Class D) and three interest-only classes (Class X-A, Class X-B and Class X-D) |
| Co-Lead Bookrunning Managers: | Merrill Lynch, Pierce, Fenner & Smith Incorporated and Morgan Stanley & Co. LLC |
| Co-Managers: | CIBC World Markets Corp. and Drexel Hamilton, LLC |
| Mortgage Loan Sellers: | Bank of America, National Association, Morgan Stanley Mortgage Capital Holdings LLC, CIBC Inc. and Starwood Mortgage Funding III LLC |
| Rating Agencies: | Fitch Ratings Inc., Kroll Bond Rating Agency, Inc. and Moody’s Investors Service, Inc. |
| Master Servicer: | Wells Fargo Bank, National Association |
| Special Servicer: | Midland Loan Services, a Division of PNC Bank, National Association |
| Certificate Administrator/ Certificate Registrar/Custodian: | U.S. Bank National Association |
| Trustee: | U.S. Bank National Association |
| Trust Advisor: | Pentalpha Surveillance LLC |
| Initial Controlling Class Representative: | Eightfold Real Estate Capital Fund IV, L.P. or an affiliate thereof |
| Cut-off Date: | October 1, 2015. For purposes of the information contained in this term sheet (this “Term Sheet”), scheduled payments due in October 2015 with respect to mortgage loans not having payment dates on the first day of each month have been deemed received on October 1, 2015, not the actual day on which such scheduled payments were due. |
| Expected Pricing Date: | Week of October 4, 2015 |
| Expected Closing Date: | Week of October 11, 2015 |
| Determination Dates: | The 11th calendar day of each month (if the 11th calendar day is not a business day, the next succeeding business day), commencing in November 2015. |
| Distribution Dates: | The 4th business day following the Determination Date in each month, commencing in November 2015 |
| Rated Final Distribution Date: | The Distribution Date in October 2048. |
| Interest Accrual Period: | Preceding calendar month |
| Payment Structure: | Sequential pay |
| Tax Treatment: | REMIC |
| Optional Termination: | 1.00% clean-up call |
| Minimum Denominations: | $10,000 for each class of Offered Certificates (other than Class X-A, Class X-B and Class X-D Certificates); $100,000 for the Class X-A, Class X-B and Class X-D Certificates |
| Settlement Terms: | DTC, Euroclear and Clearstream |
| Legal/Regulatory Status: | Each class of Offered Certificates is expected to be eligible for exemptive relief under ERISA. No class of Offered Certificates is SMMEA eligible. |
| Analytics: | The certificate administrator is expected to make available all distribution date statements, CREFC® reports and supplemental notices received by it to certain modeling financial services as described in the Free Writing Prospectus. |
| Bloomberg Ticker: | MSBAM 2015-C25 <MTGE><GO> |
| Risk Factors: | THE CERTIFICATES INVOLVE CERTAIN RISKS AND MAY NOT BE SUITABLE FOR ALL INVESTORS. SEE THE “RISK FACTORS” SECTION OF THE FREE WRITING PROSPECTUS AND THE “RISK FACTORS” SECTION OF THE PROSPECTUS. |
| MSBAM 2015‑C25 | Structural Overview |
| Accrual: | Each class of Offered Certificates will accrue interest on a 30/360 basis. |
| Amount and Order of Distributions: | On each distribution date, certificateholders will be entitled to receive distributions of interest and principal from funds received with respect to the mortgage loans and available for distribution. Funds available for distribution on the certificates will be net of excess interest, excess liquidation proceeds and specified trust expenses, including, without limitation, all advance reimbursements (with interest) and all servicing fees and expenses, certificate administrator fees (including trustee fees and custodian fees) and expenses, special servicer compensation, trust advisor fees (together with certain trust advisor consulting fees), CREFC® license fees and expenses as set forth below. Distributions to certificateholders on each distribution date out of payments (or advances in lieu thereof) and other collections on the mortgage loans will be in an amount equal to each class’s interest and principal entitlement, subject to: (i) payment of the respective interest entitlement for any other class of certificates bearing an earlier alphanumeric designation (except in respect of the distribution of interest among the Class A‑1, Class A‑2, Class A‑SB, Class A‑3, Class A‑4, Class A‑5, Class X-A, Class X-B and Class X-D Certificates, which will have the same senior priority and be distributed pro rata); (ii) if applicable, payment of the respective principal entitlement for the distribution date to the outstanding classes of principal balance certificates, first, to the Class A‑SB Certificates, until the principal balance of such class has been reduced to the planned principal balance for the related distribution date set forth on APPENDIX VII to the Free Writing Prospectus, then, to the Class A‑1, Class A‑2, Class A‑3, Class A‑4, Class A‑5 and Class A‑SB Certificates, in that order (or pro rata among such classes if the principal balance of all other classes of certificates has been reduced to zero as a result of the allocation of mortgage loan losses or trust advisor expenses to such other classes, or if the aggregate appraisal reduction equals or exceeds the aggregate principal balance of the Class A‑S through Class G Certificates), until the principal balance of each such class has been reduced to zero, and then to the Class A-S, Class B, Class C, Class D, Class E, Class F and Class G Certificates, in that order, until the principal balance of each such class has been reduced to zero; and (iii) the allocation of trust advisor expenses, (a) first, to reduce payments of interest on the Class D, Class C and Class B Certificates, in that order, (b) second, to reduce payments of principal on the Class D, Class C, Class B and Class A-S Certificates, in that order, and (c) third, to reduce payments of principal on the Class A‑1, Class A‑2, Class A‑SB, Class A‑3, Class A‑4 and Class A‑5 Certificates on a pro rata basis. No trust advisor expenses (which do not include the trust advisor fee) will be allocated to or otherwise borne by the Control Eligible Certificates. As a result, none of the classes of such certificates will provide protection to the more senior classes of certificates for the purposes of allocating losses based on trust advisor expenses. |
| Interest and Principal Entitlements: | Interest distributable on any class of certificates (other than the Class V and Class R Certificates) on any distribution date, with various adjustments described under “Description of the Offered Certificates—Distributions” in the Free Writing Prospectus, represents all unpaid interest accrued with respect to that class of certificates through the end of the interest accrual period that corresponds to that distribution date. Interest accrues with respect to each such interest-bearing certificate during each interest accrual period at the applicable pass-through rate for, and on the principal balance or notional amount, as applicable, of that certificate outstanding immediately prior to, the distribution date that corresponds to that interest accrual period. However, as described in “Description of the Offered Certificates—Distributions” in the Free Writing Prospectus, there are circumstances relating to the timing of prepayments in which the interest entitlement with respect to any certificate for a distribution date could be less than one full month’s interest at the pass-through rate on the certificate’s principal balance or notional amount. In addition, certain specified trust fund expenses, the right of the master servicer, the special servicer and the trustee to reimbursement for payment of advances (with interest thereon), and the rights of such parties and of the certificate administrator, the custodian and, subject to certain limitations, the trust advisor to the payments of compensation and reimbursement of certain costs and expenses will be prior to a certificateholder’s right to receive distributions of principal or interest. In addition, the right of the trust advisor to receive reimbursement of trust advisor expenses will be prior to the right of the holders of the Class B, Class C and Class D to receive payments of interest, and to the right of the holders of the Class A‑1, Class A‑2, Class A-SB, Class A‑3, Class A‑4, Class A‑5, Class A‑S, Class B, Class C and Class D Certificates to receive payments of principal. The amount of principal available to be distributed on the classes entitled to principal on a particular distribution date will, in general, be equal to the sum of: (i) the principal portion of all scheduled payments, other than balloon payments, to the extent received during the related collection period or advanced by the master servicer or other party (in accordance with the pooling and servicing agreement) in respect of such distribution date; (ii) all principal prepayments and the principal portion of balloon payments received during the related collection period; (iii) the principal portion of other collections on the mortgage loans received during the related collection period, for example liquidation proceeds, condemnation proceeds, insurance proceeds and income on other “real estate owned” (“REO”); and (iv) the principal portion of proceeds of mortgage loan repurchases received during the related collection period; subject to certain adjustments described in the Free Writing Prospectus relating to the payment or reimbursement of nonrecoverable advances, workout-delayed reimbursement amounts and trust advisor expenses, and exclusive of any late collections of principal received during the related collection period for which there is an outstanding advance. The Class V, Class R, Class X-A, Class X-B and Class X-D Certificates will not be entitled to principal distributions. |
| MSBAM 2015‑C25 | Structural Overview |
| Special Servicer Compensation: | The special servicer is entitled to a special servicing fee payable from general collections on the mortgage loans (other than any non-serviced mortgage loan) and any related serviced B note or serviced companion loan. The special servicing fee for each distribution date is calculated based on the outstanding principal balance of each mortgage loan (other than any non-serviced mortgage loan) that is a specially serviced mortgage loan (and any related serviced B note or serviced companion loan) or as to which the related mortgaged property has become an REO property at the special servicing fee rate, which will be 0.25% per annum. Any primary servicing fee or sub-servicing fee will be paid by the special servicer out of the fees described above. The special servicer is also entitled to additional fees and amounts, including, without limitation, income on the amounts held in certain permitted investments. The special servicer will also be entitled to (i) liquidation fees generally equal to 1.0% of liquidation proceeds in respect of a specially serviced mortgage loan (and any related serviced B note or serviced companion loan) or related REO property and (ii) workout fees generally equal to 1.0% of interest and principal payments made in respect of a rehabilitated mortgage loan (and any related serviced B note or serviced companion loan), subject to a cap with respect to each such fee of $1,000,000 with respect to any mortgage loan, loan pair, A/B whole loan or related REO property and subject to certain adjustments and exceptions as described in the Free Writing Prospectus under “Servicing of the Mortgage Loans—The Special Servicer—Special Servicer Compensation.” With respect to any non-serviced mortgage loan, the related special servicer under the related other pooling and servicing agreement pursuant to which such mortgage loan is being serviced will be entitled to similar compensation as that described above with respect to such non-serviced mortgage loan under such other pooling and servicing agreement as further described in the Free Writing Prospectus, although any related fees may accrue at a different rate and there may be a higher (or no) cap on liquidation and workout fees. |
| Prepayment Premiums/Yield Maintenance Charges: | On any distribution date, prepayment premiums or yield maintenance charges collected in respect of each mortgage loan during the related collection period will be distributed by the certificate administrator on the classes of certificates as follows: to each class of principal balance certificates (other than the Class E, Class F and Class G Certificates) then entitled to distributions of principal on such distribution date, an amount equal to the product of (a) a fraction, the numerator of which is the amount distributed as principal to that class on that distribution date, and the denominator of which is the total amount distributed as principal to all classes of principal balance certificates on that distribution date, (b) the Base Interest Fraction for the related principal prepayment and that class and (c) the amount of the prepayment premium or yield maintenance charge collected in respect of such principal prepayment during the one month period ending on the related determination date. Any prepayment premiums or yield maintenance charges relating to the mortgage loans collected during the related collection period and remaining after those distributions described above (as to the applicable distribution date, the “Class X YM Distribution Amount”) will be distributed to the holders of the Class X Certificates, as follows: first, to the holders of the Class X-A Certificates in an amount equal to the product of (a) a fraction, the numerator of which is the total amount of principal distributed on the applicable distribution date with respect to the class(es) of certificates whose certificate principal balances comprise the notional amount of such class of Class X Certificates, and the denominator of which is the total amount of principal distributed on the applicable distribution date with respect to all classes of principal balance certificates, multiplied by (b) the Class X YM Distribution Amount for the applicable distribution date; second, to the holders of the Class X-B Certificates in an amount equal to the product of (a) a fraction, the numerator of which is the total amount of principal distributed on the applicable distribution date with respect to the class(es) of certificates whose certificate principal balances comprise the notional amount of such class of Class X Certificates, and the denominator of which is the total amount of principal distributed on the applicable distribution date with respect to the principal balance certificates, multiplied by (b) the Class X YM Distribution Amount for the applicable distribution date; and third, to the holders of the Class X-D Certificates in an amount equal to the portion of the Class X YM Distribution Amount remaining after the distributions to the holders of the Class X-A and Class X-B Certificates. No prepayment premiums or yield maintenance charges will be distributed to holders of the Class E, Class F, Class G, Class V or Class R Certificates. The “Base Interest Fraction,” with respect to any principal prepayment of any mortgage loan that provides for payment of a prepayment premium or yield maintenance charge, and with respect to any class of principal balance certificates (other than the Class E, Class F and Class G Certificates), is a fraction (A) whose numerator is the greater of (x) zero and (y) the difference between (i) the pass-through rate on that class of certificates and (ii) the applicable discount rate and (B) whose denominator is the difference between (i) the mortgage interest rate on the related mortgage loan and (ii) the applicable discount rate; provided that under no circumstances will the Base Interest Fraction be greater than one. If the discount rate referred to above is greater than or equal to the mortgage interest rate on the related mortgage loan, then the Base Interest Fraction will equal zero; provided that if the discount rate referred to above is greater than or equal to the mortgage interest rate on the related mortgage loan, but is less than the pass-through rate on the subject class of certificates, then the Base Interest Fraction shall be equal to 1.0. Consistent with the foregoing, the Base Interest Fraction is equal to: (Pass-Through Rate – Discount Rate) (Mortgage Rate – Discount Rate) |
| MSBAM 2015‑C25 | Structural Overview |
Collateral Support Deficits: | On each distribution date, immediately following the distributions made to the certificateholders on that date, the certificate administrator will be required to calculate the amount, if any, by which (1) the aggregate stated principal balance of pool of the mortgage loans, including any mortgage loans as to which the related mortgaged properties have become REO properties, expected to be outstanding immediately following that distribution date, is less than (2) the aggregate principal balance of the principal balance certificates after giving effect to distributions of principal on that distribution date and the allocation of any excess trust advisor expenses to reduce the principal balances of the principal balance certificates that are not Control Eligible Certificates on that distribution date (any such deficit, a “Collateral Support Deficit”). On each distribution date, the certificate administrator will be required to allocate any Collateral Support Deficit to the respective classes of principal balance certificates in the following order: to the Class G, Class F, Class E, Class D, Class C, Class B and Class A-S Certificates, in that order, in each case in reduction of and until the remaining principal balance of that class of certificates has been reduced to zero. Following the reduction of the principal balances of all such classes of certificates to zero, the certificate administrator will be required to allocate the Collateral Support Deficit to the Class A‑1, Class A‑2, Class A‑SB, Class A‑3, Class A‑4 and Class A‑5 Certificates, pro rata (based upon their respective principal balances), until the remaining principal balances of those classes of certificates have been reduced to zero. Any Collateral Support Deficit allocated to a class of certificates will be allocated to the respective certificates of such class in proportion to the percentage interests evidenced by the respective certificates. |
| A/B Whole Loans and Loan Pairs: | The mortgaged property identified on APPENDIX I to the Free Writing Prospectus as Herald Center secures (i) a mortgage loan (the “Herald Center mortgage loan”) with an outstanding principal balance as of the Cut-off Date of $115,000,000, representing approximately 9.8% of the initial pool balance, and (ii) two pari passu promissory notes that are not part of the mortgage pool (collectively referred to as the “Herald Center serviced companion loan” and a “serviced companion loan”), with an aggregate outstanding principal balance as of the Cut-off Date of $140,000,000. The Herald Center serviced companion loan is expected to be held by Morgan Stanley Mortgage Capital Holdings LLC or an affiliate thereof on the closing date and may be contributed to one or more future securitization transactions or may be otherwise transferred at any time. The Herald Center mortgage loan and the Herald Center serviced companion loan are collectively referred to as the “Herald Center loan pair” and a “loan pair” and are pari passu in right of payment and will be serviced pursuant to the related intercreditor agreement and the pooling and servicing agreement for this transaction. With respect to the Herald Center mortgage loan, any holder of the Herald Center serviced companion loan will have certain consultation rights under the pooling and servicing agreement with respect to certain major decisions and other matters related to the Herald Center loan pair. The mortgaged property identified on APPENDIX I to the Free Writing Prospectus as 261 Fifth Avenue secures (i) a mortgage loan (the “261 Fifth Avenue mortgage loan”) with an outstanding principal balance as of the Cut-off Date of $110,000,000, representing approximately 9.3% of the initial pool balance, and (ii) one pari passu promissory note that is not part of the mortgage pool (referred to as the “261 Fifth Avenue serviced companion loan” and a “serviced companion loan”), with an outstanding principal balance as of the Cut-off Date of $70,000,000. The 261 Fifth Avenue serviced companion loan is currently held by the BACM 2015-UBS7 securitization trust. The 261 Fifth Avenue mortgage loan and the 261 Fifth Avenue serviced companion loan are collectively referred to as the “261 Fifth Avenue loan pair” and a “loan pair” and are pari passu in right of payment and will be serviced pursuant to the related intercreditor agreement and the pooling and servicing agreement for this transaction. With respect to the 261 Fifth Avenue mortgage loan, any holder of the 261 Fifth Avenue serviced companion loan will have certain consultation rights under the pooling and servicing agreement with respect to certain major decisions and other matters related to the 261 Fifth Avenue loan pair. There are no other “loan pairs,” and there are no “A/B whole loans,” related to the issuing entity. See “Description of the Mortgage Pool—The A/B Whole Loans and the Loan Pairs” in the Free Writing Prospectus. With respect to any mortgage loan that is part of a loan pair, unless otherwise indicated, all LTV, DSCR and Debt Yield calculations herein include the related pari passu serviced companion loan. |
| Non-Serviced Loan Combinations: | The mortgaged property identified on APPENDIX I to the Free Writing Prospectus as Roosevelt New Orleans Waldorf Astoria secures on a pari passu basis (i) a mortgage loan (the “Roosevelt New Orleans Waldorf Astoria mortgage loan”) with an outstanding principal balance as of the Cut-off Date of $82,301,306, representing approximately 7.0% of the initial pool balance, and (ii) a pari passu promissory note that had an outstanding principal balance as of the Cut-off Date of $82,301,306 ( the “Roosevelt New Orleans Waldorf Astoria non-serviced companion loan” and a “non-serviced companion loan”) that is not part of the mortgage pool. The pari passu promissory note evidencing the Roosevelt New Orleans Waldorf Astoria non-serviced companion loan is currently held by the JPMBB 2015-C31 securitization trust. The Roosevelt New Orleans Waldorf Astoria mortgage loan and the Roosevelt New Orleans Waldorf Astoria non-serviced companion loan together constitute the “Roosevelt New Orleans Waldorf Astoria non-serviced loan combination” and a “non-serviced loan combination,” are pari passu in right of payment and will be serviced pursuant to the related intercreditor agreement and the pooling and servicing agreement for the JPMBB 2015‑C31 securitization. The holder of the Roosevelt New Orleans Waldorf Astoria non-serviced companion loan (or its representative) will be entitled to direct the servicing of the Roosevelt New Orleans Waldorf Astoria non-serviced loan combination and will have the right to replace the special servicer with respect to the Roosevelt New Orleans Waldorf Astoria non-serviced loan combination with or without cause at any time. The portfolio of mortgaged properties identified on APPENDIX I to the Free Writing Prospectus as Coastal Equities Retail Portfolio secures on a pari passu basis (i) a mortgage loan (the “Coastal Equities Retail Portfolio mortgage loan”) with an outstanding principal balance as of the Cut-off Date of $60,000,000, representing approximately 5.3% of the initial pool balance, and (ii) six pari passu promissory notes that had an aggregate outstanding principal balance as of the Cut-off Date of $109,000,000 (collectively, the “Coastal Equities Retail Portfolio non-serviced companion loan” and a “non-serviced companion loan”) that are not part of the mortgage pool. Four of the pari passu promissory notes comprising such non-serviced companion loan |
| MSBAM 2015‑C25 | Structural Overview |
are expected to be held by the MSBAM 2015-C24 securitization trust, and the two other such pari passu promissory note are currently held by Morgan Stanley Bank, N.A. or an affiliate thereof on the closing date and may be contributed to one or more future securitization transactions or may be otherwise transferred at any time. The Coastal Equities Retail Portfolio mortgage loan and the Coastal Equities Retail Portfolio non-serviced companion loan together constitute the “Coastal Equities Retail Portfolio non-serviced loan combination” and a “non-serviced loan combination,” are pari passu in right of payment and will be serviced pursuant to the related intercreditor agreement and the pooling and servicing agreement for the MSBAM 2015-C24 securitization. The holder of the portion of the Coastal Equities Retail Portfolio non-serviced companion loan contributed to the MSBAM 2015-C24 securitization trust (or its representative) will be entitled to direct the servicing of the Coastal Equities Retail Portfolio non-serviced loan combination and will have the right to replace the special servicer with respect to the Coastal Equities Retail Portfolio non-serviced loan combination with or without cause at any time. No mortgage loans, other than the Roosevelt New Orleans Waldorf Astoria mortgage loan and the Coastal Equities Retail Portfolio mortgage loan, will have a non-serviced companion loan associated with them, and all of the mortgage loans, other than the Roosevelt New Orleans Waldorf Astoria mortgage loan and the Coastal Equities Retail Portfolio mortgage loan, are being serviced under the pooling and servicing agreement for this transaction. Accordingly, other than the Roosevelt New Orleans Waldorf Astoria non-serviced loan combination and the Coastal Equities Retail Portfolio non-serviced loan combination, there are no other “non-serviced loan combinations” with respect to the issuing entity. See “Description of the Mortgage Pool——The Non-Serviced Loan Combinations” in the Free Writing Prospectus. With respect to any mortgage loan that is part of a non-serviced loan combination, unless otherwise indicated, all LTV, DSCR and Debt Yield calculations herein include the related pari passu non-serviced companion loan. | |
| Appraisal Reductions: | The occurrence of certain adverse events affecting a mortgage loan (other than a non-serviced mortgage loan) (“Appraisal Events”) will require the special servicer to obtain a new appraisal or other valuation of the related mortgaged property. In general, if the principal amount of a mortgage loan plus all other amounts due under the mortgage loan and interest on advances made with respect to the mortgage loan exceeds 90% of the value of the mortgaged property determined by an appraisal or other valuation, an appraisal reduction may be created in the amount of the excess as described in the Free Writing Prospectus. Any appraisal reduction in respect of any non-serviced mortgage loan generally will be calculated in accordance with the related non-serviced mortgage loan pooling and servicing agreement, which calculations are expected to be generally similar to those provided for in the pooling and servicing agreement for this transaction. Notwithstanding the foregoing, if an appraisal is required to be obtained in accordance with the applicable pooling and servicing agreement (including with respect to any non-serviced mortgage loan) but is not obtained within 120 days following the applicable Appraisal Event (or, with respect to a non-serviced mortgage loan, 120 days following notice of the applicable appraisal event under the related pooling and servicing agreement), then, until such appraisal is obtained and solely for purposes of determining the amounts of P&I advances, the appraisal reduction will equal 25% of the stated principal balance of the related mortgage loan; provided that, upon receipt of an appraisal, the appraisal reduction for such mortgage loan will be recalculated generally in accordance with the preceding paragraphs. If any mortgage loan is part of an A/B whole loan, a loan pair or a non-serviced loan combination, any appraisal reduction will be calculated in respect of such A/B whole loan, loan pair or non-serviced loan combination taken as a whole. With respect to an A/B whole loan, any such appraisal reduction will be allocated first to the related serviced B note and then to the related A note. With respect to a loan pair or non-serviced loan combination, any such appraisal reduction will be allocated between the mortgage loan and the related serviced companion loan or non-serviced companion loan, respectively, on a pro rata basis by unpaid principal balance. If an appraisal reduction exists for, or is allocable to, any mortgage loan, the interest portion of the amount required to be advanced on that mortgage loan will be reduced in the same proportion that the appraisal reduction bears to the stated principal balance of that mortgage loan. This will reduce the funds available to pay interest on the certificates then outstanding. For a discussion of how appraisal reductions are calculated and allocated, see “Description of the Offered Certificates—Appraisal Reductions” in the Free Writing Prospectus. |
| Control Rights: | During any Subordinate Control Period, the controlling class representative will have certain consent and consultation rights under the pooling and servicing agreement with respect to certain major decisions and other matters. A “Subordinate Control Period” means any period when the aggregate principal balance of the Class E Certificates (taking into account the application of any appraisal reductions to notionally reduce the aggregate principal balance of such class) is at least 25% of the initial aggregate principal balance of that class. During any Collective Consultation Period, the controlling class representative will not have any consent rights, but the controlling class representative and the trust advisor will each have certain non-binding consultation rights under the pooling and servicing agreement with respect to certain major decisions and other matters. A “Collective Consultation Period” means any period when both (i) the aggregate principal balance of the Class E Certificates (taking into account the application of any appraisal reductions to notionally reduce the aggregate principal balance of such class), is less than 25% of the initial aggregate principal balance of the Class E Certificates and (ii) the aggregate principal balance of that class (without regard to any appraisal reductions allocable to such class), is at least 25% of the initial aggregate principal balance of that class. During any Senior Consultation Period, the controlling class representative will not have any consent or |
| MSBAM 2015‑C25 | Structural Overview |
consultation rights, except with respect to any rights expressly set forth in the pooling and servicing agreement, and the trust advisor will retain certain non-binding consultation rights under the pooling and servicing agreement with respect to certain major decisions and other matters. A “Senior Consultation Period” means a period when the aggregate principal balance of the Class E Certificates (without regard to any appraisal reductions allocable to such class) is less than 25% of the initial aggregate principal balance of that class. With respect to any excluded mortgage loan, a Senior Consultation Period will be deemed to exist. Notwithstanding any of the foregoing to the contrary, if any mortgage loan is part of an A/B whole loan, loan pair or non-serviced loan combination, the controlling class representative’s consent and/or consultation rights with respect thereto may be limited as described in the Free Writing Prospectus. In particular, with respect to each non-serviced loan combination, the controlling class representative will only have certain consultation rights with respect to certain major decisions and other matters related to such non-serviced loan combination and only during a Subordinate Control Period and a Collective Consultation Period. See “Servicing of the Mortgage Loans—The Controlling Class Representative” in the Free Writing Prospectus. | |
| A/B Whole Loan, Loan Pair and Non-Serviced Loan Combination Control and Consultation Rights: | The existence of a Subordinate Control Period, Collective Consultation Period or Senior Consultation Period will not limit any control and/or consultation rights of the holder of any related B note or companion loan. In particular, with respect to each of the Herald Center loan pair and the 261 Fifth Avenue loan pair, the holder of the related serviced companion loan will have non-binding consultation rights with respect to major decisions and other matters related to such loan pair. In addition, with respect to each non-serviced loan combination, the related controlling holder will have certain consent and consultation rights with respect to such non-serviced loan combination under the related other servicing agreement and will have the right to replace the special servicer under such other servicing agreement with respect to such non-serviced loan combination. See “Risk Factors—Risks Related to the Offered Certificates—Realization on a Mortgage Loan That Is Part of an A/B Whole Loan or Loan Pair May Be Adversely Affected by the Rights of the Related Directing Holder” and “Description of the Mortgage Pool—The A/B Whole Loans and the Loan Pairs” and “—The Non-Serviced Loan Combinations” in the Free Writing Prospectus. |
| Control Eligible Certificates: | The “Control Eligible Certificates” will be the Class E, Class F and Class G Certificates. |
| Controlling Class Representative/ Controlling Class: | The controlling class representative will be the representative appointed by more than 50% of the Controlling Class (by principal balance); provided that there will be deemed to be no controlling class representative with respect to any excluded mortgage loan, as described below. The “Controlling Class” will be the most subordinate class of Control Eligible Certificates then outstanding that has an aggregate principal balance (taking into account the application of any appraisal reductions to notionally reduce the aggregate principal balance of such class) at least equal to 25% of the initial aggregate principal balance of such class; provided that if no class of Control Eligible Certificates has an aggregate principal balance (taking into account the application of any appraisal reductions to notionally reduce the aggregate principal balance of such class) at least equal to 25% of the initial aggregate principal balance of such class, then the Controlling Class will be the most senior class of Control Eligible Certificates. A summary of the consent and consultation rights of the controlling class representative, and the limitations thereon, is set forth above under “Control Rights.” The Controlling Class on the closing date will be the Class G Certificates. The initial controlling class representative is expected to be Eightfold Real Estate Capital Fund IV, L.P. or an affiliate thereof. There will be no controlling class representative for any mortgage loan, A/B whole loan or loan pair with respect to which the controlling class representative, or any holder of more than 50% of the controlling class, is a borrower party (any such mortgage loan, an “excluded mortgage loan”). In addition, if any mortgage loan becomes an “excluded controlling class mortgage loan” (i.e., a mortgage loan, A/B whole loan or loan pair with respect to which the controlling class representative or any controlling class certificateholder, as applicable, is a borrower party), the controlling class representative or any controlling class certificateholder that is a borrower party (each such party, an “excluded controlling class holder”) will not be entitled to have access to any related “excluded information”, including any asset status reports, final asset status reports or any summaries related thereto (and any other information identified in the pooling and servicing agreement), related to such excluded controlling class mortgage loan (other than such information related to such excluded controlling class mortgage loan(s) that is aggregated with information of other mortgage loans at a pool level). Although the pooling and servicing agreement will require (i) each excluded controlling class holder to certify that it acknowledges and agrees that it is prohibited from accessing and reviewing (and that it agrees not to access and review) any related excluded information and (ii) the controlling class representative or any controlling class certificateholder that is not an excluded controlling class holder to certify and agree that they will not share any such excluded information with any excluded controlling class holder, (a) we cannot assure you that such excluded controlling class holders will not access, obtain, review and/or use, or the controlling class representative or any controlling class certificateholder that is not an excluded controlling class holder will not share with such excluded controlling class holder, such related excluded information in a manner that adversely impacts your certificates and (b) none of the master servicer, special servicer, trustee, the certificate administrator, the certificate registrar or any other agent will have any responsibility or liability as a result of such excluded controlling class holder obtaining access or otherwise reviewing such excluded information. As used herein, “borrower party” means (a) a borrower, a mortgagor, a property manager or a foreclosing mezzanine lender, (b) any other person controlling or controlled by or under common control with such borrower, mortgagor, property manager or foreclosing mezzanine lender, as applicable, and (c) any other person owning, directly or indirectly, 25% or more of the beneficial interests in such borrower, mortgagor, property manager or foreclosing mezzanine lender, as applicable. For purposes of this definition, “foreclosing |
| MSBAM 2015‑C25 | Structural Overview |
| mezzanine lender” means a mezzanine lender that has accelerated the related mezzanine loan (unless (a) acceleration was automatic under such mezzanine loan, (b) the event directly giving rise to the automatic acceleration under such mezzanine loan was not initiated by such owner or an affiliate of such owner and (c) such owner is stayed from exercising and has not commenced the exercise of remedites associated with foreclosure of the equity collateral under such mezzanine loan) or commenced foreclosure proceedings against the equity collateral pledged to secure the related mezzanine loan. For purposes of this definition, “control” when used with respect to any specified person means the power to direct the management and policies of such person, directly or indirectly, whether through the ownership of voting securities, by contract or otherwise and the terms “controlling” and “controlled” have meanings correlative to the foregoing. | |
| Appraised-Out Class: | Any class of Control Eligible Certificates, the aggregate principal balance of which (taking into account the application of any appraisal reductions to notionally reduce the aggregate principal balance of such class) has been reduced to less than 25% of its initial aggregate principal balance, is referred to as an “Appraised-Out Class.” |
| Appraisal Remedy: | The holders of the majority (by principal balance) of an Appraised-Out Class will have the right, at their sole expense, to present to the special servicer a second appraisal for any mortgage loan (other than with respect to any non-serviced mortgage loan) for which an Appraisal Event has occurred prepared by an MAI appraiser on an “as-is” basis acceptable to the special servicer in accordance with the Servicing Standard. Upon receipt of such second appraisal, the special servicer will be required to determine, in accordance with the Servicing Standard, whether, based on its assessment of such second appraisal, any recalculation of the applicable appraisal reduction is warranted and, if so warranted, will be required to recalculate such appraisal reduction based upon such second appraisal. If required by any such recalculation, any applicable Appraised-Out Class will have its related principal balance notionally restored to the extent required by such recalculation of the appraisal reduction, and there will be a redetermination of whether a Subordinate Control Period, a Collective Consultation Period or a Senior Consultation Period is then in effect. However, until an Appraised-Out Class is restored as the Controlling Class, the next most senior class of Control Eligible Certificates that is not an Appraised-Out Class (or, if all classes of Control Eligible Certificates are Appraised-Out Classes, the most senior class of Control Eligible Certificates), if any, will be the Controlling Class. The right of any Appraised-Out Class to present a second appraisal of any mortgage loan for which an Appraisal Event has occurred is limited to one appraisal with respect to each mortgaged property relating to the affected mortgage loan, subject to certain exceptions regarding a material change in circumstance. No certificateholders of an Appraised-Out Class will have appraisal remedies in respect of a non-serviced mortgage loan under the pooling and servicing agreement for this transaction. Each of the JPMBB 2015-C31 and MSBAM 2015-C25 pooling and servicing agreements has provisions similar to those in the prior paragraph as they relate to the applicable controlling class of certificates under the related securitization and appraisal remedies. |
| Sale of Defaulted Loans: | Defaulted serviced mortgage loans will be sold in a process similar to the sale process for REO property, as described under “Servicing of the Mortgage Loans—Sale of Defaulted Mortgage Loans and REO Properties” in the Free Writing Prospectus. There will be no “fair market value purchase option,” and the controlling class representative will have no right of first refusal with respect to the sale of defaulted loans. Non-serviced mortgage loans that become defaulted loans may be sold pursuant to a similar process under the related pooling and servicing agreement governing the servicing thereof. In addition, with respect to each of the Herald Center mortgage loan, the 261 Fifth Avenue mortgage loan, the Roosevelt New Orleans Waldorf Astoria mortgage loan and the Coastal Equities Retail Portfolio mortgage loan, if any such mortgage loan becomes a defaulted mortgage loan and the applicable special servicer determines to sell such mortgage loan or some or all of the related pari passu companion loan, such special servicer will be required to sell such mortgage loan together with the related pari passu companion loan as notes evidencing one whole loan, in accordance with the provisions of the related intercreditor agreement and the applicable pooling and servicing agreement. See “Description of the Mortgage Pool—The A/B Whole Loans and the Loan Pairs” and “—The Non-Serviced Loan Combinations” in the Free Writing Prospectus. |
| Appointment and Termination of Special Servicer: | The controlling class representative will appoint the initial special servicer (but not with respect to any non-serviced mortgage loan). At any time during the Subordinate Control Period, the special servicer (other than with respect to any non-serviced mortgage loan) may be replaced by the controlling class representative. During any Collective Consultation Period and any Senior Consultation Period, the special servicer (other than with respect to any non-serviced mortgage loan) will be subject to termination without cause if certificateholders evidencing not less than 25% of voting rights of the certificates request a vote of certificateholders to replace the special servicer. The certificate administrator would present the proposal to all certificateholders, and replacement would be conditioned on receipt, within 180 days thereafter, of approval of the termination from holders of 75% of the voting rights of the certificates. The holders initiating such vote will be responsible for the fees and expenses of the issuing entity in connection with the replacement. During any Senior Consultation Period, if the trust advisor determines that the special servicer is not performing its duties in accordance with the Servicing Standard, the trust advisor will have the right to recommend the replacement of the special servicer with respect to the applicable mortgage loan or mortgage loans. The trust advisor’s recommendation to replace the special servicer must be confirmed by an affirmative vote of holders of a majority of the voting rights of the principal balance certificates. Notwithstanding any of the foregoing to the contrary, if any mortgage loan is part of an A/B whole loan or a loan pair, the special servicer will not be subject to termination as described in the preceding paragraphs with respect to such A/B whole loan or loan pair so long as any related B note or companion loan holder has the right to replace the special servicer under the related intercreditor agreement. In addition, subject to the terms of any related intercreditor agreement (including the rights of an related directing holder thereunder), with respect to any non-serviced loan combination, the related special servicer under the related other pooling and |
| MSBAM 2015‑C25 | Structural Overview |
servicing agreement pursuant to which such non-serviced loan combination is being serviced may be replaced on terms set forth in such other pooling and servicing agreement that are substantially similar to those described in the preceding paragraphs above for the special servicer under the pooling and servicing agreement for this transaction (unless the holder of a related B note or companion loan has the right to replace such special servicer pursuant to the related intercreditor agreement). See “Description of the Mortgage Pool—The A/B Whole Loans and the Loan Pairs” and “—The Non-Serviced Loan Combinations” in the Free Writing Prospectus. | |
| Servicing Standard: | Each of the master servicer and the special servicer is obligated to service and administer the mortgage loans (and, if applicable, the related serviced B notes and serviced companion loans) in accordance with the definition of the “Servicing Standard” described in the Free Writing Prospectus and the terms of the pooling and servicing agreement, provided that each non-serviced mortgage loan, if any, will be serviced by another master servicer or special servicer under the pooling and servicing agreement with respect to the securitization of the related companion loan or applicable portion thereof. |
| Excluded Special Servicer: | If the special servicer obtains knowledge that it has become a borrower party with respect to any mortgage loan (referred to herein as an “excluded special servicer mortgage loan”), then the special servicer will be required to resign at its own cost with respect to such mortgage loan. The controlling class representative (during any Subordinate Control Period) will be entitled to appoint a separate special servicer that is not a borrower party (referred to herein as an “excluded special servicer”) with respect to such excluded special servicer mortgage loan unless such excluded special servicer mortgage loan is also an excluded mortgage loan, in which case the largest controlling class certificateholder (by certificate principal balance) that is not an excluded controlling class holder will be entitled to appoint the excluded special servicer. During any Collective Consultation Period the largest controlling class certificateholder (by certificate principal balance) that is not an excluded controlling class holder will be entitled to appoint the excluded special servicer. During any Senior Consultation Period, or if each controlling class certificateholder is an excluded controlling class holder, certificateholders holding more than 50% of the voting rights (provided 20% or more exercise their right to vote) will be entitled to appoint the excluded special servicer; provided, that if such certificateholders do not appoint the excluded special servicer within thirty (30) days of the special servicer’s notice of resignation, such resigning special servicer will, at the expense of the issuing entity, use reasonable efforts to appoint the excluded special servicer and if a successor excluded special servicer is not appointed within sixty (60) days of the special servicer’s notice of resignation then a petition will be made to any court of competent jurisdiction for the appointment of a successor excluded special servicer. Any excluded special servicer will be required to perform all of the obligations of the special servicer and will be entitled to all special servicing compensation with respect to such excluded special servicer mortgage loan earned during such time as the related mortgage loan is an excluded special servicer mortgage loan (provided that that special servicer will remain entitled to all other special servicing compensation with respect all loans which are not excluded special servicer mortgage loans). With respect to any excluded special servicer mortgage loan (that is also not an excluded mortgage loan) the controlling class representative (during any Subordinate Control Period) will be entitled to appoint and replace the excluded special servicer with respect thereto. During a Collective Consultation Period or Senior Consultation Period (including a deemed Senior Consultation Period with respect to any excluded mortgage loan), the excluded special servicer may be replaced in the manner described above under “—Appointment and Termination of Special Servicer” with respect to the special servicer. References herein to the “special servicer” mean individually or collectively, as the context may require, Midland Loan Services, a Division of PNC Bank, National Association as special servicer with respect to all mortgage loans other than any excluded special servicer mortgage loans and any non-serviced mortgage loans, and any excluded special servicer, as special servicer with respect to any related excluded special servicer mortgage loans. Unless specifically stated otherwise, any rights, conditions or obligations of or applicable to the “special servicer” described herein (including with respect to qualification under the pooling and servicing agreement, compensation and resignation) apply to both Midland Loan Services, a Division of PNC Bank, National Association and to any excluded special servicer, as applicable. |
Defaulted Mortgage Loan Waterfall: | Amounts received by the issuing entity in respect of defaulted mortgage loans in connection with liquidation of any mortgage loan, net of unreimbursed advances and interest thereon, servicing compensation and other amounts payable or reimbursable therefrom, will be applied so that amounts allocated as a recovery of accrued and unpaid interest will not, in the first instance, include any amount by which the interest portion of P&I advances previously made was reduced as a result of appraisal reductions. After the adjusted interest amount is so allocated, any remaining net proceeds will be allocated to pay principal on the mortgage loan until the unpaid principal amount of the mortgage loan has been reduced to zero. Any remaining proceeds would then be allocated as a recovery of accrued and unpaid interest corresponding to the amount by which the interest portion of P&I advances previously made was reduced as a result of appraisal reductions. |
| Trust Advisor: | The trust advisor will be required to promptly review all information available to certain privileged persons on the certificate administrator’s website related to any specially serviced mortgage loan or REO property and each asset status report with respect to specially serviced mortgage loans (provided that during any Subordinate Control Period, the trust advisor may only review final asset status reports). During any Collective Consultation Period and any Senior Consultation Period, within 60 days after the end of each calendar year during which any mortgage loan was a specially serviced mortgage loan or any mortgaged property was an REO property, the trust advisor will be required to meet with representatives of the special servicer that was acting as special servicer as of December 31 in the prior calendar year and is continuing in such capacity through the date of such meeting to review certain operational practices of the special servicer related to specially serviced mortgage loans and REO properties. |
| MSBAM 2015‑C25 | Structural Overview |
In addition, during any Collective Consultation Period and any Senior Consultation Period, based on (i) the trust advisor’s annual meeting with the special servicer and (ii) the trust advisor’s review of any asset status reports and other information delivered to the trust advisor by the special servicer and any other information available to certain privileged persons on the certificate administrator’s website, the trust advisor will be required to prepare an annual report to be provided to the certificate administrator (and to be made available through the certificate administrator’s website) setting forth its assessment of the special servicer’s performance of its duties under the pooling and servicing agreement during the prior calendar year on a platform-level basis with respect to the resolution and liquidation of specially serviced mortgage loans and REO properties. If the special servicer is replaced, the trust advisor’s annual report will only relate to the entity that was acting as special servicer as of December 31 in the prior calendar year and is continuing in such capacity through the date of such annual report. No such annual report will be required to be prepared or delivered with respect to any calendar year as to which no annual meeting is required to be held or with respect to any calendar year during which no asset status reports have been prepared in connection with a specially serviced mortgage loan or REO property. However, the trust advisor’s obligations described in the preceding three paragraphs will not apply to non-serviced mortgage loans. Furthermore, during any Collective Consultation Period and any Senior Consultation Period, the special servicer will be required to consult (on a non-binding basis) the trust advisor in connection with certain major decisions involving any serviced mortgage loan, A/B whole loan, loan pair or any related REO property to the extent described in this Term Sheet and the Free Writing Prospectus and as set forth in the pooling and servicing agreement; provided that, with respect to matters relating to any A/B whole loan or loan pair, the special servicer will only be required to consult the trust advisor with regard to such matters if the holder of the controlling portion of the related serviced B note or serviced companion loan, as applicable, is not (or is no longer) the directing holder with respect to such A/B whole loan or loan pair pursuant to the terms of the applicable intercreditor agreement, and prior to such time, the trust advisor will have no obligations under the pooling and servicing agreement with respect to such A/B whole loan or loan pair. The trust advisor will have no consultation rights with respect to any non-serviced mortgage loan or any related non-serviced companion loan. During any Subordinate Control Period, (A) there will be no annual meeting between the trust advisor and the special servicer or any annual report prepared by the trust advisor, and (B) the trust advisor will not distribute any report based on any review of the special servicer’s actions. In addition, the trust advisor will not have the right or obligation during any Subordinate Control Period to consult or consent with regard to any particular servicing actions or otherwise opine on the actions of the special servicer with respect to any mortgage loan during any Subordinate Control Period. | |
| Trust Advisor Expenses: | The trust advisor will be entitled, on each distribution date, to reimbursement for any trust advisor expenses, including unreimbursed indemnification amounts and other expenses (which do not include trust advisor fees) payable to the trust advisor pursuant to the terms of the pooling and servicing agreement. No trust advisor expenses (which do not include trust advisor fees) will be allocated to or otherwise borne by the Control Eligible Certificates, and all trust advisor expenses will be allocated to reduce amounts due and owing to certain classes of the non-Control Eligible Certificates as described in the Free Writing Prospectus and above in this Term Sheet. |
| Termination and Replacement of Trust Advisor: | The trust advisor may be terminated or replaced without cause as described in the Free Writing Prospectus under “Servicing of the Mortgage Loans—The Trust Advisor—Termination of the Trust Advisor Without Cause.” |
| Deal Website: | The certificate administrator will be required to maintain a deal website which will include, among other items, (i) distribution date statements, (ii) CREFC® reports, (iii) summaries of final asset status reports, (iv) inspection reports, (v) appraisals, (vi) various special notices described in the Free Writing Prospectus, (vii) the “Investor Q&A Forum” and (viii) a voluntary “Investor Registry.” Investors may access the deal website following execution of an investor certification as described in the Free Writing Prospectus. |
| MSBAM 2015-C25 | Collateral Overview |
| Mortgage Loan Sellers | No. of Mortgage Loans | No. of Mortgaged Properties | Aggregate Cut-off Date Balance | % of Pool(1) |
| Morgan Stanley Mortgage Capital Holdings LLC | 14 | 44 | $481,537,238 | 40.8% |
| Bank of America, National Association | 22 | 36 | $460,471,899 | 39.0% |
| CIBC Inc. | 9 | 9 | $127,272,224 | 10.8% |
| Starwood Mortgage Funding III LLC | 11 | 13 | $110,136,650 | 9.3% |
| Total: | 56 | 102 | $1,179,418,010 | 100.0% |
| Aggregate Cut-off Date Balance: | $1,179,418,010 |
| Number of Mortgage Loans: | 56 |
| Average Cut-off Date Balance per Mortgage Loan: | $21,061,036 |
| Number of Mortgaged Properties: | 102 |
| Average Cut-off Date Balance per Mortgaged Property: | $11,562,922 |
| Weighted Average Mortgage Rate: | 4.549% |
| % of Pool Secured by 5 Largest Mortgage Loans: | 36.1% |
| % of Pool Secured by 10 Largest Mortgage Loans: | 53.5% |
% of Pool Secured by ARD Loans(2): | 0.0% |
Weighted Average Original Term to Maturity (months)(2): | 118 |
Weighted Average Remaining Term to Maturity (months)(2): | 115 |
| Weighted Average Seasoning (months): | 4 |
| % of Pool Secured by Single Tenant Mortgaged Properties: | 5.2% |
| % of Pool Secured by Refinance Loans: | 89.3% |
| % of Pool Secured by Acquisition Loans: | 10.7% |
% of Pool with Pari Passu Mortgage Debt: | 31.1% |
| % of Pool with Mezzanine Debt: | 9.8% |
| % of Pool with Subordinate Mortgage Debt: | 0.0% |
| Weighted Average UW NOI DSCR: | 1.64x |
| Weighted Average UW NOI Debt Yield: | 9.5% |
| Weighted Average UW NCF DSCR: | 1.52x |
| Weighted Average UW NCF Debt Yield: | 8.8% |
Weighted Average Cut-off Date LTV Ratio(4): | 66.2% |
Weighted Average Maturity Date LTV Ratio(2)(4): | 59.3% |
| MSBAM 2015-C25 | Collateral Overview |
| Weighted Average Original Amortization Term (months): | 359 |
| Weighted Average Remaining Amortization Term (months): | 358 |
| % of Pool Amortizing Balloon: | 23.0% |
| % of Pool Interest Only followed by Amortizing Balloon: | 54.9% |
% of Pool Interest Only through Maturity(2): | 22.1% |
| % of Pool Fully Amortizing: | 0.0% |
| % of Pool with Hard Lockboxes: | 38.6% |
| % of Pool with Soft Lockboxes: | 9.6% |
| % of Pool with Springing Lockboxes: | 48.3% |
| % of Pool with No Lockboxes: | 3.5% |
| % of Pool Requiring Tax Reserves: | 79.8% |
| % of Pool Requiring Insurance Reserves: | 26.3% |
| % of Pool Requiring Replacement Reserves: | 71.3% |
% of Pool Requiring TI/LC Reserves(5): | 65.5% |
| % of Pool with lockout period, followed by defeasance until open period: | 90.9% |
| % of Pool with lockout period, followed by the greater of a prepayment premium and yield maintenance until open period: | 4.7% |
| % of Pool with lockout period, followed by defeasance or the greater of a prepayment premium and yield maintenance until open period: | 4.4% |
| (1) | Unless otherwise indicated, all references to “% of Pool” in this Term Sheet reflect a percentage of the aggregate principal balance of the mortgage pool as of the Cut-off Date, after application of all payments of principal due during or prior to October 2015. |
| (2) | With respect to any ARD Loan, unless otherwise indicated, references in this Term Sheet to the applicable “maturity date” refer to the applicable anticipated repayment date with respect to such ARD Loan, and such applicable anticipated repayment date is treated as its maturity date for all purposes hereof. |
| (3) | With respect to any mortgage loan that is part of a loan pair or a non-serviced loan combination, unless otherwise indicated, all LTV, DSCR, Debt Yield and Balance per SF/Unit calculations in this term sheet include the related pari passu companion loan and exclude any subordinate notes, as applicable. Additionally, LTV, DSCR, Debt Yield and Balance per SF/Unit figures in this Term Sheet are calculated for mortgage loans without regard to any additional indebtedness that may be incurred at a future date. With respect to any leased fee loans, the SF/Unit and Balance per SF/Unit figures in this Term Sheet are based on the size of the non-collateral improvements. |
| (4) | The LTV ratios set forth in this Term Sheet are generally based on the “as-is” values of the related mortgaged properties; provided, that such LTV ratios may be based on “as-stabilized” values in certain cases in which reserves have been established at origination for the applicable condition or circumstance that is expected to result in stabilization. See the definition of “Appraised Value” under “Description of the Mortgage Pool—Additional Mortgage Loan Information” in the Free Writing Prospectus. |
| (5) | Excludes hospitality, multifamily, manufactured housing, self-storage and leased fee properties. |
| MSBAM 2015-C25 | Characteristics of the Mortgage Loans |
| Top 10 Mortgage Loans | |||||||||||||
Loan No. | Mortgage Loan Seller | Property Name | City | State | Property Type | Cut-off Date Balance | % of Pool | SF/Units/ Rooms | Cut-off Date Balance per SF/Unit/ Room | UW NCF DSCR | UW NOI Debt Yield | Cut-off Date LTV | Maturity Date LTV |
| 1 | MSMCH | Herald Center(1) | New York | NY | Mixed Use | $115,000,000 | 9.8% | 249,063 | $1,023.84 | 1.94x | 9.1% | 44.6% | 44.6% |
| 2 | BANA | 261 Fifth Avenue(2) | New York | NY | Office | $110,000,000 | 9.3% | 441,922 | $407.31 | 1.52x | 7.4% | 60.0% | 60.0% |
| 3 | MSMCH | Roosevelt New Orleans Waldorf Astoria(3) | New Orleans | LA | Hospitality | $82,301,306 | 7.0% | 504 | $326,592.49 | 1.70x | 12.4% | 64.4% | 52.7% |
| 4 | MSMCH | Coastal Equities Retail Portfolio(4) | Various | Various | Retail | $60,000,000 | 5.1% | 3,458,225 | $48.87 | 1.48x | 10.1% | 72.5% | 65.2% |
| 5 | MSMCH | Colorado Technology Center Portfolio | Louisville | CO | Industrial | $59,050,000 | 5.0% | 630,880 | $93.60 | 1.25x | 8.1% | 69.9% | 61.5% |
| 6 | MSMCH | Villas at Dorsey Ridge | Hanover | MD | Multifamily | $54,440,000 | 4.6% | 238 | $228,739.50 | 1.20x | 7.3% | 70.9% | 64.8% |
| 7 | BANA | Commerce Office Park | Commerce | CA | Office | $50,000,000 | 4.2% | 281,142 | $177.85 | 1.36x | 9.0% | 74.4% | 68.1% |
| 8 | BANA | Asian Garden Mall | Westminster | CA | Retail | $41,896,211 | 3.6% | 99,140 | $422.60 | 1.62x | 10.7% | 58.6% | 47.7% |
| 9 | CIBC | Bucks County Technology Park | Trevose | PA | Office | $30,250,000 | 2.6% | 364,000 | $83.10 | 1.47x | 10.2% | 74.0% | 62.5% |
| 10 | BANA | Citrus & City Place Apartments | Las Vegas | NV | Multifamily | $27,875,000 | 2.4% | 568 | $49,075.70 | 1.40x | 9.0% | 72.5% | 66.2% |
| Total/Wtd. Avg. | $630,812,518 | 53.5% | 1.55x | 9.2% | 63.1% | 57.5% | |||||||
| (1) | The Herald Center mortgage loan is part of a $255,000,000 loan pair that is evidenced by four pari passu promissory notes. The Herald Center mortgage loan is evidenced by two of such pari passu promissory notes (Note A-2 and Note A-4) with an aggregate outstanding principal balance as of the Cut-off Date of $115,000,000. The pari passu promissory notes not included in the Issuing Entity (Note A-1 and Note A-3) evidence the related serviced companion loan, which had an aggregate outstanding balance as of the Cut-off Date of $140,000,000 and is expected to be held by Morgan Stanley Bank, N.A., or an affiliate thereof on the closing date of this transaction and may be contributed to one or more future securitization transactions or otherwise transferred at any time. Unless otherwise indicated, all LTV, DSCR, Debt Yield and Cut-off Date Balance per SF/Unit calculations include the related pari passu serviced companion loan. See “Description of the Mortgage Pool—The A/B Whole Loans and the Loan Pairs—The Herald Center Loan Pair” in the Free Writing Prospectus. |
| (2) | The 261 Fifth Avenue mortgage loan is part of a $180,000,000 loan pair that is evidenced by two pari passu promissory notes. The 261 Fifth Avenue mortgage loan is evidenced by one of such pari passu promissory notes (Note A-1) with an outstanding principal balance as of the Cut-off Date of $110,000,000. The pari passu promissory note not included in the Issuing Entity (Note A-2) evidences the related serviced companion loan, which had an outstanding balance as of the Cut-off Date of $70,000,000 and is currently held by the BACM 2015-UBS7 securitization trust. Unless otherwise indicated, all LTV, DSCR, Debt Yield and Cut-off Date Balance per SF/Unit calculations include the related pari passu serviced companion loan. See “Description of the Mortgage Pool—The A/B Whole Loans and the Loan Pairs—The 261 Fifth Avenue Loan Pair” in the Free Writing Prospectus. |
| (3) | The Roosevelt New Orleans Waldorf Astoria mortgage loan is part of a $164,602,613 non-serviced loan combination that is evidenced by three pari passu promissory notes. The Roosevelt New Orleans Waldorf Astoria mortgage loan is evidenced by two of such pari passu notes (Note A-2 and Note A-3) with an outstanding principal balance as of the Cut-off Date of $82,301,306. The pari passu note not included in the Issuing Entity (Notes A-1) evidences the related non-serviced companion loan, which had an outstanding balance as of the Cut-off Date of $82,301,306. The Roosevelt New Orleans Waldorf Astoria non-serviced companion loan was contributed to the JPMBB 2015-C31 securitization trust. Unless otherwise indicated, all LTV, DSCR, Debt Yield and Cut-off Date Balance PSF/Unit calculations include the related pari passu non-serviced companion loan. See “Description of the Mortgage Pool—The Non-Serviced Loan Combinations—The Roosevelt New Orleans Waldorf Astoria Non-Serviced Loan Combination” in the Free Writing Prospectus. |
| (4) | The Coastal Equities Retail Portfolio mortgage loan is part of a $169,000,000 non-serviced loan combination that is evidenced by ten pari passu promissory notes. The Coastal Equities Retail Portfolio mortgage loan is evidenced by four of such pari passu notes (Notes A-4, A-5, A-8 and A-9) with an aggregate outstanding principal balance as of the Cut-off Date of $60,000,000. The pari passu promissory notes not included in the Issuing Entity (Notes A-1, A-2, A-3, A-6, A-7 and A-10) evidence the related non-serviced companion loan, which had an outstanding principal balance as of the Cut-off Date of $109,000,000. A portion of the Coastal Equities Retail Portfolio non-serviced companion loan (represented by Notes A-1, A-2, A-3 and A-7 with an outstanding balance as of the Cut-off Date of $85,000,000) was contributed to the MSBAM 2015-C24 securitization trust, and the remaining portion of such non-serviced companion loan (represented by Notes A-6 and A-10 with an outstanding balance as of the Cut-off Date of $24,000,000) is expected to be held by Morgan Stanley Bank, N.A. or an affiliate thereof on the closing date of this transaction and may be contributed to one or more future securitization transactions or otherwise transferred at any time. Unless otherwise indicated, all LTV, DSCR, Debt Yield and Cut-off Date Balance PSF/Unit calculations include the related pari passu non-serviced companion loan. See “Description of the Mortgage Pool—The Non-Serviced Loan Combinations—The Coastal Equities Retail Portfolio Non-Serviced Loan Combination” in the Free Writing Prospectus. |
| MSBAM 2015-C25 | Characteristics of the Mortgage Loans |
Mortgage Loans with Pari Passu Companion Loans | ||||||||||||
Loan No. | Mortgage Loan Seller | Property Name | Mortgage Loan Cut-off Date Balance | Companion Loan Cut-off Date Balance | Combined Cut-off Date Balance | Lead Servicing Agreement | Master Servicer | Special Servicer | Control Rights | Combined UW NCF DSCR | Combined UW NOI Debt Yield | Combined Cut-off Date LTV |
| 1 | MSMCH | Herald Center(1) | $115,000,000 | $140,000,000 | $255,000,000 | MSBAM 2015-C25 | Wells Fargo | Midland | MSBAM 2015-C25 | 1.94x | 9.1% | 44.6% |
| 2 | BANA | 261 Fifth Avenue(2) | $110,000,000 | $70,000,000 | $180,000,000 | MSBAM 2015-C25 | Wells Fargo | Midland | MSBAM 2015-C25 | 1.52x | 7.4% | 60.0% |
| 3 | MSMCH | Roosevelt New Orleans Waldorf Astoria(3) | $82,301,306 | $82,301,306 | $164,602,613 | JPMBB 2015-C31 | Midland | Midland | JPMBB 2015-C31 | 1.70x | 12.4% | 64.4% |
| 4 | MSMCH | Coastal Equities Retail Portfolio(4) | $60,000,000 | $109,000,000 | $169,000,000 | MSBAM 2015-C24 | Wells Fargo | Midland | MSBAM 2015-C24 | 1.48x | 10.1% | 72.5% |
| * | “Midland” means Midland Loan Services, a Division of PNC Bank, National Association. “Wells Fargo” means Wells Fargo Bank, National Association. |
| (1) | See Footnote (1) to the table entitled “Top 10 Mortgage Loans” above for a description of the Herald Center loan pair. |
| (2) | See Footnote (2) to the table entitled “Top 10 Mortgage Loans” above for a description of the 261 Fifth Avenue loan pair. |
| (3) | See Footnote (3) to the table entitled “Top 10 Mortgage Loans” above for a description of the Roosevelt New Orleans Waldorf Astoria non-serviced loan combination. |
| (4) | See Footnote (3) to the table entitled “Top 10 Mortgage Loans” above for a description of the Coastal Equities Retail Portfolio non-serviced loan combination. |
| Mortgage Loans with Mezzanine Debt | |||||||||||
Loan No. | Mortgage Loan Seller | Property Name | Mortgage Loan Cut-off Date Balance | Cut-off Date Loan per Unit/SF | Mezzanine Debt Cut-off Date Balance | UW NCF DSCR | UW NOI Debt Yield | Cut-off Date LTV | Total Mortgage Debt UW NCF DSCR | Total Mortgage Debt UW NOI Debt Yield | Total Mortgage Debt Cut-off Date LTV |
| 1 | MSMCH | Herald Center(1) | $115,000,000 | $1,024 | $40,000,000(2) | 1.94x | 9.1% | 44.6% | 1.66x | 7.9% | 51.6% |
| (1) | See Footnote (1) to the table entitled “Top 10 Mortgage Loans” above for a description of the Herald Center loan pair. |
| (2) | The Herald Center Borrower may permit its equity owners to pledge up to a 49% indirect interest in the Herald Center Borrower subject to various conditions, including, among other conditions, (i) no event of default under the Herald Center Mortgage Loan documents and (ii) the principal amount of the mezzanine debt will not result in an aggregate LTV of greater than 75% or an aggregate debt yield of less than 8.5%. On August 24, 2015, the Herald Center Borrower notified the lender of its intent to permit the pledge of an indirect 49% interest in the Herald Center Borrower and 100% of its cash distributions to M&T Bank in return for a $40,000,000, two year term credit facility to certain equity owners of the Herald Center Borrower (which may be used for any purpose determined by such equity owners). On September 15, 2015, the Herald Center Borrower notified the lender that the then outstanding balance of the credit facility was approximately $8.4 million. The outstanding balance may change at any time without notice within the parameters of the credit facility terms and the Herald Center Mortgage Loan document conditions. |
| MSBAM 2015-C25 | Characteristics of the Mortgage Loans |
Prior Securitization History(1) | ||||||||||||||
Loan No. | Mortgage Loan Seller | Property Name | City | State | Property Type | Cut-off Date Balance | % of Pool | SF/Units/ Rooms | Cut-off Date Balance per SF/Unit/ Room | UW NCF DSCR | UW NOI Debt Yield | Cut-off Date LTV | Maturity Date LTV | Prior Securitization |
| 1 | MSMCH | Herald Center | New York | NY | Mixed Use | $115,000,000 | 9.8% | 249,063 | $1,023.84 | 1.94x | 9.1% | 44.6% | 44.6% | BACM 2006-3 |
| 2 | BANA | 261 Fifth Avenue | New York | NY | Office | $110,000,000 | 9.3% | 441,922 | $407.31 | 1.52x | 7.4% | 60.0% | 60.0% | MSC 2005-HQ7 |
| 5 | MSMCH | Colorado Technology Center Portfolio(2) | Louisville | CO | Industrial | $59,050,000 | 5.0% | 630,880 | $93.60 | 1.25x | 8.1% | 69.9% | 61.5% | WBCMT 2005-C20 |
| 7 | BANA | Commerce Office Park | Commerce | CA | Office | $50,000,000 | 4.2% | 281,142 | $177.85 | 1.36x | 9.0% | 74.4% | 68.1% | GSMS 2005-GG4 |
| 8 | BANA | Asian Garden Mall | Westminster | CA | Retail | $41,896,211 | 3.6% | 99,140 | $422.60 | 1.62x | 10.7% | 58.6% | 47.7% | BACM 2005-2 |
| 12 | CIBC | 1800 Route 34 | Wall Township | NJ | Office | $23,700,000 | 2.0% | 189,836 | $124.84 | 1.46x | 10.0% | 66.8% | 58.9% | JPMCC 2006-CB14; JPMCC 2006-LDP8; CD 2005-CD1; MEZZ 2006-C4 |
| 16 | BANA | Boise Towne Plaza | Boise | ID | Retail | $19,945,939 | 1.7% | 114,687 | $173.92 | 1.48x | 9.2% | 66.7% | 53.5% | MSC 2004-IQ7 |
| 20 | BANA | Twin City Town Center | Chehalis | WA | Retail | $17,400,000 | 1.5% | 138,466 | $125.66 | 1.48x | 9.6% | 68.2% | 59.5% | BACM 2006-2 |
| 23 | SMF III | Pageantry West Office Park | Las Vegas | NV | Office | $16,400,000 | 1.4% | 105,583 | $155.33 | 1.37x | 9.3% | 74.9% | 64.4% | MLMT 2005-CKI1 |
| 26 | BANA | Embassy Plaza | North Hollywood | CA | Retail | $14,750,000 | 1.3% | 70,165 | $210.22 | 1.41x | 9.0% | 52.5% | 45.9% | BSCMS 2006-PW13 |
| 27 | SMF III | Twinsburg Town Center(3) | Twinsburg | OH | Retail | $14,650,000 | 1.2% | 173,247 | $84.56 | 1.37x | 9.4% | 73.6% | 66.0% | GCCFC 2004-GG1 |
| 28 | BANA | MWR Midwest Retail Portfolio | Various | Various | Retail | $14,500,000 | 1.2% | 60,780 | $238.57 | 1.42x | 9.0% | 68.2% | 62.4% | MSC 2005-T17 |
| 40 | SMF III | Sierra Town Center | Las Vegas | NV | Retail | $8,500,000 | 0.7% | 43,542 | $195.21 | 1.40x | 9.3% | 65.8% | 58.0% | CSFB 2005-C5 |
| 41 | MSMCH | Crescenta Valley Mini Storage | La Crescenta | CA | Self Storage | $7,100,000 | 0.6% | 57,195 | $124.14 | 2.33x | 10.2% | 53.8% | 53.8% | BACM 2005-5 |
| 42 | BANA | Holiday Inn Express & Suites - Dallas North Tollway, TX | Plano | TX | Hospitality | $6,976,537 | 0.6% | 79 | $88,310.59 | 1.54x | 11.3% | 72.7% | 60.1% | CSFB 2005-C4 |
| 47 | SMF III | Brookworth Plaza Outparcels(4) | West Chester | PA | Retail | $5,350,000 | 0.5% | 19,625 | $272.61 | 1.33x | 8.5% | 64.7% | 55.7% | GSMS 2005-GG4 |
| 50 | MSMCH | Trocam Plaza | Las Vegas | NV | Retail | $4,937,932 | 0.4% | 23,649 | $208.80 | 1.33x | 8.9% | 71.6% | 58.4% | MSC 2005-HQ7 |
| 51 | CIBC | New York Plaza | Arlington | TX | Retail | $4,700,000 | 0.4% | 93,799 | $50.11 | 1.40x | 10.4% | 67.1% | 56.6% | LBUBS 2005-C5 |
| 54 | SMF III | Blue Diamond Business Center | Las Vegas | NV | Industrial | $3,494,735 | 0.3% | 68,750 | $50.83 | 1.36x | 10.1% | 71.8% | 56.0% | TIAAS 2007-C4 |
| Total | $423,351,353 | 35.9% | ||||||||||||
(1) | Includes mortgage loans for which all or a portion of the previously existing debt was most recently securitized in conduit securitizations, based on information provided by the related borrower or obtained through searches of a third-party database. The information has not otherwise been confirmed by the mortgage loan sellers. With respect to any mortgage loan that is part of a loan pair or a non-serviced loan combination, unless otherwise indicated, all LTV, DSCR, Debt Yield and Cut-off Date Balance PSF/Unit calculations include the related pari passu companion loan and exclude any subordinate notes, as applicable. |
| (2) | Three of the seven properties securing the Colorado Technology Center Portfolio mortgage loan secured a loan that was included in the WBCMT 2005-C20 transaction. |
| (3) | Separate parcels of the mortgaged property identified on Appendix I as “Twinsburg Town Center” previously secured loans that were securitized in three transactions—LBCMT 1999-C1, GMACC 2002-C3 and GCCFC 2004-GG1—and such parcels were referred to in such securitizations as “Twinsburg Town Center”, “Twinsburg Center II” and “Twinsburg Town Center III”, respectively. |
| (4) | A mortgage loan that was included in the GSMS 2005-GG4 securitization was secured in part by the Brookworth Plaza Outparcels mortgaged property and in part by additional collateral that does not secure the Brookworth Plaza Outparcels mortgage loan. |
| MSBAM 2015-C25 | Characteristics of the Mortgage Loans |
| Class A-2 ($28,700,000) | ||||||||||||||||
Loan No. | Mortgage Loan Seller | Property Name | State | Property Type | Cut-off Date Balance | % of Pool | Maturity Date Balance | % of Class A-2 Certificate Principal Balance | SF/ Units/ Rooms | Cut-off Date Balance per SF/Unit/ Room | UW NCF DSCR | UW NOI Debt Yield | Cut‑off Date LTV | Maturity Date LTV | Rem. IO Period (mos.) | Rem. Term to Maturity (mos.) |
| 32 | MSMCH | Brandemere Apartments | NC | Multifamily | $12,150,000 | 1.0% | $12,150,000 | 42.3% | 356 | $34,129.21 | 1.70x | 8.8% | 75.0% | 75.0% | 59 | 59 |
| 36 | CIBC | TownePlace Suites Frederick, MD | MD | Hospitality | $11,158,747 | 0.9% | $10,275,413 | 35.8% | 120 | $92,989.56 | 1.95x | 13.3% | 58.4% | 53.8% | 0 | 57 |
| 52 | SMF III | Fargo Industrial | ND | Industrial | $4,500,000 | 0.4% | $4,164,028 | 14.5% | 152,154 | $29.58 | 1.79x | 12.0% | 54.3% | 50.3% | 2 | 59 |
| Total/Wtd. Avg. | $27,808,747 | 2.4% | $26,589,441 | 92.6% | 1.81x | 11.1% | 65.0% | 62.5% | 26 | 58 | ||||||
| (1) | The table above reflects the mortgage loans whose balloon payments will be applied to pay down the Class A-2 Certificates, assuming (i) that none of the mortgage loans experience prepayments, defaults or losses; (ii) there are no extensions of maturity dates; and (iii) each mortgage loan is paid in full on its stated maturity date or, in the case of any mortgage loan with an anticipated repayment date, on such anticipated repayment date. The table above is otherwise based on the Structuring Assumptions set forth under “Yield, Prepayment and Maturity Considerations” in the Free Writing Prospectus. |
| MSBAM 2015-C25 | Characteristics of the Mortgage Loans |
| Class A-3 ($115,000,000) | ||||||||||||||||
Loan No. | Mortgage Loan Seller | Property Name | State | Property Type | Cut-off Date Balance | % of Pool | Maturity Date Balance | % of Class A-3 Certificate Principal Balance | SF/ Units | Cut-off Date Balance per SF/Unit | UW NCF DSCR | UW NOI Debt Yield | Cut‑off Date LTV | Maturity Date LTV | Rem. IO Period (mos.) | Rem. Term to Maturity (mos.) |
| 1 | MSMCH | Herald Center(2) | NY | Mixed Use | $115,000,000 | 9.8% | $115,000,000 | 100.0% | 249,063 | $1,024 | 1.94x | 9.1% | 44.6% | 44.6% | 99 | 99 |
| Total/Wtd. Avg. | $115,000,000 | 9.8% | $115,000,000 | 100.0% | 1.94x | 9.1% | 44.6% | 44.6% | 99 | 99 | ||||||
| (1) | The table above reflects the mortgage loans whose balloon payments will be applied to pay down the Class A-3 Certificates, assuming (i) that none of the mortgage loans experience prepayments, defaults or losses; (ii) there are no extensions of maturity dates; and (iii) each mortgage loan is paid in full on its stated maturity date or, in the case of any mortgage loan with an anticipated repayment date, on such anticipated repayment date. The table above is otherwise based on the Structuring Assumptions set forth under “Yield, Prepayment and Maturity Considerations” in the Free Writing Prospectus. |
| (2) | See Footnote (1) to the table entitled “Top 10 Mortgage Loans” above for a description of the Herald Center loan pair. |
| MSBAM 2015-C25 | Characteristics of the Mortgage Loans |
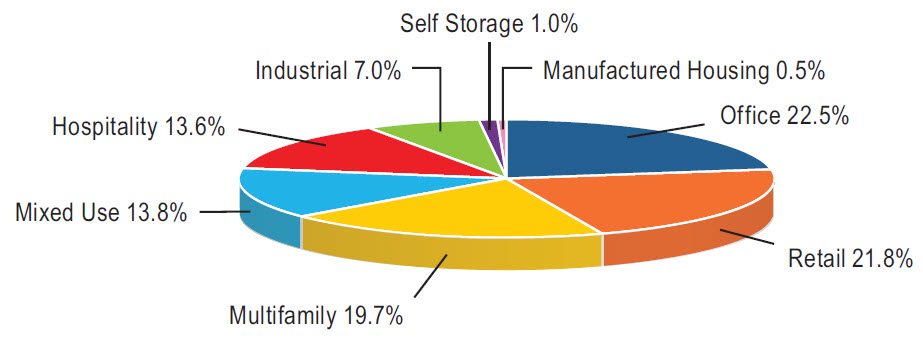
Property Type Distribution(1) | ||||||||
| Property Type | Number of Mortgaged Properties | Aggregate Cut-off Date Balance | % of Pool | Wtd. Avg. Mortgage Rate | Wtd. Avg. UW NCF DSCR | Wtd. Avg. UW NOI Debt Yield | Wtd. Avg. Cut-off Date LTV | Wtd. Avg. Maturity Date LTV |
| Office | 14 | $265,578,715 | 22.5% | 4.568% | 1.46x | 8.8% | 66.7% | 61.6% |
| Suburban | 5 | $136,850,000 | 11.6% | 4.680% | 1.41x | 9.7% | 71.3% | 63.3% |
| CBD | 1 | $110,000,000 | 9.3% | 4.420% | 1.52x | 7.4% | 60.0% | 60.0% |
| Medical | 8 | $18,728,715 | 1.6% | 4.611% | 1.53x | 10.7% | 72.3% | 59.0% |
| Retail | 47 | $257,240,914 | 21.8% | 4.569% | 1.46x | 9.7% | 67.8% | 58.8% |
| Anchored | 30 | $180,671,440 | 15.3% | 4.504% | 1.49x | 9.9% | 66.5% | 57.2% |
| Shadow Anchored | 4 | $43,450,500 | 3.7% | 4.863% | 1.34x | 9.0% | 73.3% | 64.7% |
| Free Standing | 10 | $24,985,776 | 2.1% | 4.501% | 1.53x | 9.9% | 66.5% | 59.5% |
| Unanchored | 3 | $8,133,198 | 0.7% | 4.632% | 1.39x | 9.4% | 72.0% | 61.1% |
| Multifamily | 14 | $232,323,686 | 19.7% | 4.411% | 1.41x | 8.8% | 71.6% | 65.0% |
| Garden | 13 | $230,418,686 | 19.5% | 4.407% | 1.41x | 8.8% | 71.6% | 65.0% |
| Mid Rise | 1 | $1,905,000 | 0.2% | 4.954% | 1.56x | 11.0% | 75.0% | 65.0% |
| Mixed Use | 3 | $162,625,000 | 13.8% | 4.445% | 1.76x | 8.9% | 53.5% | 51.4% |
| Retail/Office | 2 | $141,625,000 | 12.0% | 4.469% | 1.82x | 8.9% | 50.3% | 48.8% |
| Student/Retail/Office | 1 | $21,000,000 | 1.8% | 4.286% | 1.36x | 8.6% | 75.0% | 68.5% |
| Hospitality | 9 | $160,860,047 | 13.6% | 4.715% | 1.70x | 12.3% | 66.3% | 54.1% |
| Full Service | 1 | $82,301,306 | 7.0% | 4.710% | 1.70x | 12.4% | 64.4% | 52.7% |
| Limited Service | 6 | $57,412,098 | 4.9% | 4.713% | 1.68x | 12.2% | 69.9% | 55.7% |
| Extended Stay | 2 | $21,146,642 | 1.8% | 4.738% | 1.73x | 12.0% | 63.6% | 55.4% |
| Industrial | 12 | $83,019,735 | 7.0% | 4.678% | 1.37x | 8.5% | 69.8% | 62.9% |
| Light Warehouse | 6 | $50,455,000 | 4.3% | 4.640% | 1.25x | 8.1% | 69.9% | 61.5% |
| Warehouse | 1 | $15,975,000 | 1.4% | 4.755% | 1.69x | 8.4% | 73.3% | 73.3% |
| Flex | 2 | $12,089,735 | 1.0% | 4.696% | 1.28x | 8.7% | 70.4% | 59.9% |
| Warehouse Distribution | 3 | $4,500,000 | 0.4% | 4.786% | 1.79x | 12.0% | 54.3% | 50.3% |
| Self Storage | 2 | $12,163,001 | 1.0% | 4.485% | 1.99x | 10.0% | 60.1% | 54.9% |
| Self Storage | 2 | $12,163,001 | 1.0% | 4.485% | 1.99x | 10.0% | 60.1% | 54.9% |
| Manufactured Housing | 1 | $5,606,913 | 0.5% | 4.874% | 1.34x | 8.7% | 74.8% | 61.5% |
| Manufactured Housing | 1 | $5,606,913 | 0.5% | 4.874% | 1.34x | 8.7% | 74.8% | 61.5% |
| Total/Wtd. Avg. | 102 | $1,179,418,010 | 100.0% | 4.549% | 1.52x | 9.5% | 66.2% | 59.3% |
| (1) | All numerical information concerning the mortgage loans is approximate and, in the case of mortgage loans secured by multiple properties, is based on allocated loan amounts with respect to such properties. All weighted average information regarding the mortgage loans reflects the weighting of the mortgage loans based on their outstanding principal balances as of the Cut-off Date or, in the case of mortgage loans secured by multiple properties, allocated loan amounts. The sum of numbers and percentages in columns may not match the “Total” due to rounding. With respect to any mortgage loan that is part of a loan pair or a non-serviced loan combination, unless otherwise indicated, all LTV, DSCR and Debt Yield calculations include the related pari passu companion loan and exclude any subordinate notes, as applicable. |
| MSBAM 2015-C25 | Characteristics of the Mortgage Loans |
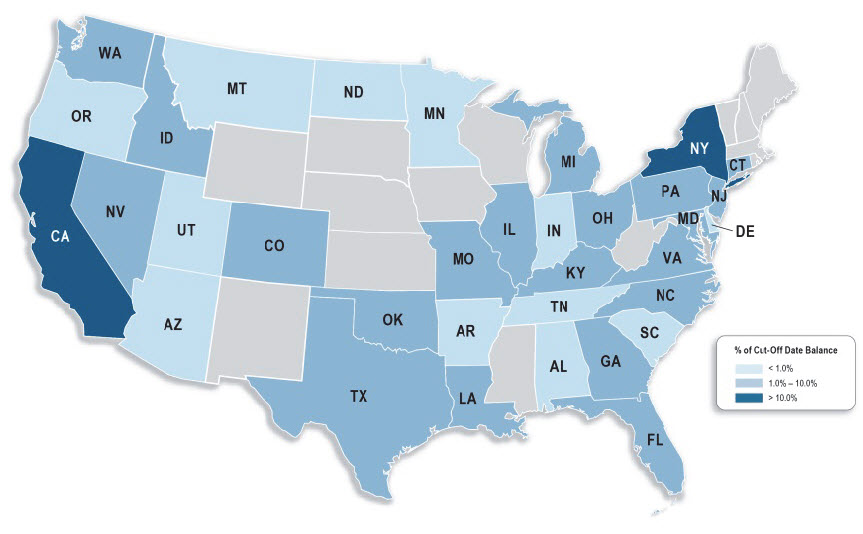
Geographic Distribution(1) | ||||||||
| State or Other Jurisdiction | Number of Mortgaged Properties | Aggregate Cut-off Date Balance | % of Pool | Wtd. Avg. Mortgage Rate | Wtd. Avg. UW NCF DSCR | Wtd. Avg. UW NOI Debt Yield | Wtd. Avg. Cut-off Date LTV | Wtd. Avg. Maturity Date LTV |
| New York | 3 | $229,508,876 | 19.5% | 4.469% | 1.73x | 8.3% | 52.5% | 52.4% |
| California | 7 | $135,252,153 | 11.5% | 4.483% | 1.56x | 10.0% | 64.7% | 56.5% |
California – Southern(2) | 5 | $126,101,316 | 10.7% | 4.474% | 1.55x | 9.9% | 64.6% | 56.6% |
California – Northern(2) | 2 | $9,150,836 | 0.8% | 4.604% | 1.73x | 11.3% | 66.1% | 56.2% |
| Pennsylvania | 11 | $95,852,908 | 8.1% | 4.710% | 1.37x | 9.2% | 74.1% | 64.1% |
| Nevada | 8 | $91,357,667 | 7.7% | 4.486% | 1.46x | 9.6% | 70.7% | 62.5% |
| Louisiana | 2 | $83,259,886 | 7.1% | 4.709% | 1.70x | 12.4% | 64.5% | 52.8% |
| Maryland | 3 | $75,586,642 | 6.4% | 4.473% | 1.35x | 8.6% | 68.9% | 62.2% |
| Colorado | 7 | $59,050,000 | 5.0% | 4.640% | 1.25x | 8.1% | 69.9% | 61.5% |
| Texas | 5 | $43,076,465 | 3.7% | 4.752% | 1.54x | 10.6% | 72.4% | 62.2% |
| Ohio | 5 | $37,590,503 | 3.2% | 4.438% | 1.51x | 10.0% | 71.6% | 64.5% |
| Connecticut | 2 | $30,530,325 | 2.6% | 4.332% | 1.34x | 8.3% | 74.7% | 66.8% |
| Illinois | 3 | $25,676,540 | 2.2% | 4.305% | 1.37x | 8.7% | 73.8% | 67.4% |
| Florida | 4 | $24,915,663 | 2.1% | 4.569% | 1.37x | 8.9% | 73.5% | 65.9% |
| North Carolina | 6 | $24,505,030 | 2.1% | 4.625% | 1.59x | 9.5% | 73.7% | 70.1% |
| New Jersey | 1 | $23,700,000 | 2.0% | 4.770% | 1.46x | 10.0% | 66.8% | 58.9% |
| Virginia | 2 | $21,830,178 | 1.9% | 4.478% | 1.34x | 8.4% | 72.2% | 66.0% |
| Idaho | 1 | $19,945,939 | 1.7% | 4.134% | 1.48x | 9.2% | 66.7% | 53.5% |
| Georgia | 3 | $19,016,822 | 1.6% | 4.468% | 1.60x | 10.1% | 68.6% | 58.2% |
| Washington | 1 | $17,400,000 | 1.5% | 4.284% | 1.48x | 9.6% | 68.2% | 59.5% |
| Oklahoma | 1 | $16,500,000 | 1.4% | 4.891% | 1.38x | 10.9% | 60.0% | 55.3% |
| Kentucky | 1 | $15,975,000 | 1.4% | 4.755% | 1.69x | 8.4% | 73.3% | 73.3% |
| Michigan | 6 | $15,148,904 | 1.3% | 4.467% | 1.44x | 9.4% | 69.7% | 63.4% |
| Missouri | 1 | $11,978,586 | 1.0% | 4.590% | 1.57x | 12.1% | 72.6% | 53.8% |
| Arizona | 1 | $10,500,000 | 0.9% | 4.676% | 1.39x | 9.5% | 75.0% | 62.9% |
| Minnesota | 1 | $9,637,442 | 0.8% | 4.565% | 1.64x | 11.5% | 71.4% | 58.1% |
| Arkansas | 1 | $6,863,000 | 0.6% | 5.505% | 1.36x | 9.8% | 75.4% | 59.7% |
| Tennessee | 4 | $6,603,550 | 0.6% | 4.605% | 1.48x | 10.1% | 72.5% | 65.2% |
| Alabama | 3 | $5,041,420 | 0.4% | 4.605% | 1.48x | 10.1% | 72.5% | 65.2% |
| Montana | 1 | $4,991,414 | 0.4% | 4.850% | 2.02x | 15.8% | 62.4% | 46.6% |
| North Dakota | 3 | $4,500,000 | 0.4% | 4.786% | 1.79x | 12.0% | 54.3% | 50.3% |
| Delaware | 1 | $4,473,373 | 0.4% | 4.605% | 1.48x | 10.1% | 72.5% | 65.2% |
| Indiana | 1 | $4,189,349 | 0.4% | 4.605% | 1.48x | 10.1% | 72.5% | 65.2% |
| Utah | 1 | $2,496,996 | 0.2% | 5.000% | 1.33x | 8.8% | 67.7% | 55.8% |
| Oregon | 1 | $1,575,807 | 0.1% | 4.419% | 2.40x | 15.4% | 44.4% | 36.0% |
| South Carolina | 1 | $887,574 | 0.1% | 4.605% | 1.48x | 10.1% | 72.5% | 65.2% |
| Total/Wtd. Avg. | 102 | $1,179,418,010 | 100.0% | 4.549% | 1.52x | 9.5% | 66.2% | 59.3% |
| (1) | All numerical information concerning the mortgage loans is approximate and, in the case of mortgage loans secured by multiple properties, is based on allocated loan amounts with respect to such properties. All weighted average information regarding the mortgage loans reflects the weighting of the mortgage loans based on their outstanding principal balances as of the Cut-off Date or, in the case of mortgage loans secured by multiple properties, allocated loan amounts. The sum of numbers and percentages in columns may not match the “Total” due to rounding. With respect to any mortgage loan that is part of a loan pair or a non-serviced loan combination, unless otherwise indicated, all LTV, DSCR and Debt Yield calculations include the related pari passu companion loan and exclude any subordinate notes, as applicable. |
| (2) | “California – Northern” includes zip codes above 93600, and “California – Southern” includes zip codes at or below 93600. |
| MSBAM 2015-C25 | Collateral Statistics |
No. of Mortgage Loans | Aggregate Cut-off Date Balance ($) | % of Pool | |
| 1 - 10,000,000 | 19 | 108,821,193 | 9.2 |
| 10,000,001 - 20,000,000 | 22 | 325,359,299 | 27.6 |
| 20,000,001 - 30,000,000 | 6 | 142,300,000 | 12.1 |
| 30,000,001 - 40,000,000 | 1 | 30,250,000 | 2.6 |
| 40,000,001 - 50,000,000 | 2 | 91,896,211 | 7.8 |
| 50,000,001 - 60,000,000 | 3 | 173,490,000 | 14.7 |
| 80,000,001 - 90,000,000 | 1 | 82,301,306 | 7.0 |
| 90,000,001 - 115,000,000 | 2 | 225,000,000 | 19.1 |
| Total: | 56 | $1,179,418,010 | 100.0% |
| Min: $1,905,000 Max: $115,000,000 Avg: $21,061,036 | |||
No. of Mortgaged Properties | Aggregate Cut-off Date Balance ($) | % of Pool | |
| New York | 3 | 229,508,876 | 19.5 |
| California | 7 | 135,252,153 | 11.5 |
California – Southern(2) | 5 | 126,101,316 | 10.7 |
California – Northern(2) | 2 | 9,150,836 | 0.8 |
| Pennsylvania | 11 | 95,852,908 | 8.1 |
| Nevada | 8 | 91,357,667 | 7.7 |
| Louisiana | 2 | 83,259,886 | 7.1 |
| Maryland | 3 | 75,586,642 | 6.4 |
| Colorado | 7 | 59,050,000 | 5.0 |
| Texas | 5 | 43,076,465 | 3.7 |
| Ohio | 5 | 37,590,503 | 3.2 |
| Connecticut | 2 | 30,530,325 | 2.6 |
| Illinois | 3 | 25,676,540 | 2.2 |
| Florida | 4 | 24,915,663 | 2.1 |
| North Carolina | 6 | 24,505,030 | 2.1 |
| New Jersey | 1 | 23,700,000 | 2.0 |
| Virginia | 2 | 21,830,178 | 1.9 |
| Idaho | 1 | 19,945,939 | 1.7 |
| Georgia | 3 | 19,016,822 | 1.6 |
| Washington | 1 | 17,400,000 | 1.5 |
| Oklahoma | 1 | 16,500,000 | 1.4 |
| Kentucky | 1 | 15,975,000 | 1.4 |
| Michigan | 6 | 15,148,904 | 1.3 |
| Missouri | 1 | 11,978,586 | 1.0 |
| Arizona | 1 | 10,500,000 | 0.9 |
| Minnesota | 1 | 9,637,442 | 0.8 |
| Arkansas | 1 | 6,863,000 | 0.6 |
| Tennessee | 4 | 6,603,550 | 0.6 |
| Alabama | 3 | 5,041,420 | 0.4 |
| Montana | 1 | 4,991,414 | 0.4 |
| North Dakota | 3 | 4,500,000 | 0.4 |
| Delaware | 1 | 4,473,373 | 0.4 |
| Indiana | 1 | 4,189,349 | 0.4 |
| Utah | 1 | 2,496,996 | 0.2 |
| Oregon | 1 | 1,575,807 | 0.1 |
| South Carolina | 1 | 887,574 | 0.1 |
| Total: | 102 | $1,179,418,010 | 100.0% |
No. of Mortgage Loans | Aggregate Cut-off Date Balance ($) | % of Pool | |
| Morgan Stanley Mortgage Capital Holdings LLC | 14 | 481,537,238 | 40.8 |
| Bank of America, National Association | 22 | 460,471,899 | 39.0 |
| CIBC Inc. | 9 | 127,272,224 | 10.8 |
| Starwood Mortgage Funding III LLC | 11 | 110,136,650 | 9.3 |
| Total: | 56 | $1,179,418,010 | 100.0% |
No. of Mortgaged Properties | Aggregate Cut-off Date Balance ($) | % of Pool | |
| Office | 14 | 265,578,715 | 22.5 |
| Suburban | 5 | 136,850,000 | 11.6 |
| CBD | 1 | 110,000,000 | 9.3 |
| Medical | 8 | 18,728,715 | 1.6 |
| Retail | 47 | 257,240,914 | 21.8 |
| Anchored | 30 | 180,671,440 | 15.3 |
| Shadow Anchored | 4 | 43,450,500 | 3.7 |
| Free Standing | 10 | 24,985,776 | 2.1 |
| Unanchored | 3 | 8,133,198 | 0.7 |
| Multifamily | 14 | 232,323,686 | 19.7 |
| Garden | 13 | 230,418,686 | 19.5 |
| Mid Rise | 1 | 1,905,000 | 0.2 |
| Mixed Use | 3 | 162,625,000 | 13.8 |
| Retail/Office | 2 | 141,625,000 | 12.0 |
| Student/Retail/Office | 1 | 21,000,000 | 1.8 |
| Hospitality | 9 | 160,860,047 | 13.6 |
| Full Service | 1 | 82,301,306 | 7.0 |
| Limited Service | 6 | 57,412,098 | 4.9 |
| Extended Stay | 2 | 21,146,642 | 1.8 |
| Industrial | 12 | 83,019,735 | 7.0 |
| Light Warehouse | 6 | 50,455,000 | 4.3 |
| Warehouse | 1 | 15,975,000 | 1.4 |
| Flex | 2 | 12,089,735 | 1.0 |
| Warehouse Distribution | 3 | 4,500,000 | 0.4 |
| Self Storage | 2 | 12,163,001 | 1.0 |
| Self Storage | 2 | 12,163,001 | 1.0 |
| Manufactured Housing | 1 | 5,606,913 | 0.5 |
| Manufactured Housing | 1 | 5,606,913 | 0.5 |
| Total/Wtd. Avg. | 102 | $1,179,418,010 | 100.0% |
No. of Mortgage Loans | Aggregate Cut-off Date Balance ($) | % of Pool | |
| 4.001 - 4.500 | 20 | 489,078,768 | 41.5 |
| 4.501 - 5.000 | 35 | 683,476,242 | 58.0 |
| 5.001 - 6.000 | 1 | 6,863,000 | 0.6 |
| Total: | 56 | $1,179,418,010 | 100.0% |
| Min: 4.104% Max: 5.505% Wtd Avg: 4.549% | |||
No. of Mortgage Loans | Aggregate Cut-off Date Balance ($) | % of Pool | |
| 60 | 3 | 27,808,747 | 2.4 |
| 84 | 1 | 14,320,000 | 1.2 |
| 120 | 51 | 1,130,426,263 | 95.8 |
| 180 | 1 | 6,863,000 | 0.6 |
| Total: | 56 | $1,179,418,010 | 100.0% |
| Min: 60 mos. Max: 180 mos. Wtd Avg: 118 mos. | |||
No. of Mortgage Loans | Aggregate Cut-off Date Balance ($) | % of Pool | |
| 55 - 79 | 3 | 27,808,747 | 2.4 |
| 80 - 109 | 2 | 129,320,000 | 11.0 |
| 116 - 118 | 33 | 678,286,288 | 57.5 |
| 119 - 180 | 18 | 344,002,976 | 29.2 |
| Total: | 56 | $1,179,418,010 | 100.0% |
| Min: 57 mos. Max: 179 mos. Wtd Avg: 115 mos. | |||
No. of Mortgage Loans | Aggregate Cut-off Date Balance ($) | % of Pool | |
| Interest Only | 5 | 260,225,000 | 22.1 |
| 300 | 2 | 16,970,000 | 1.4 |
| 324 | 1 | 3,494,735 | 0.3 |
| 360 | 48 | 898,728,276 | 76.2 |
| Total: | 56 | $1,179,418,010 | 100.0% |
| Min: 300 mos. Max: 360 mos. Wtd Avg: 359 mos. | |||
No. of Mortgage Loans | Aggregate Cut-off Date Balance ($) | % of Pool | |
| Interest Only | 5 | 260,225,000 | 22.1 |
| 251 - 300 | 2 | 16,970,000 | 1.4 |
| 301 - 350 | 1 | 3,494,735 | 0.3 |
| 351 - 360 | 48 | 898,728,276 | 76.2 |
| Total: | 56 | $1,179,418,010 | 100.0% |
| Min: 299 mos. Max: 360 mos. Wtd Avg: 358 mos. | |||
No. of Mortgage Loans | Aggregate Cut-off Date Balance ($) | % of Pool | |
| Partial Interest Only | 32 | 647,515,500 | 54.9 |
| Amortizing Balloon | 19 | 271,677,510 | 23.0 |
| Interest Only | 5 | 260,225,000 | 22.1 |
| Total: | 56 | $1,179,418,010 | 100.0% |
No. of Mortgage Loans | Aggregate Cut-off Date Balance ($) | % of Pool | |
| 40.1 - 50.0 | 2 | 119,239,144 | 10.1 |
| 50.1 - 60.0 | 8 | 211,888,644 | 18.0 |
| 60.1 - 70.0 | 16 | 303,341,656 | 25.7 |
| 70.1 - 80.0 | 30 | 544,948,567 | 46.2 |
| Total: | 56 | $1,179,418,010 | 100.0% |
| Min: 44.4% Max: 75.4% Wtd Avg: 66.2% | |||
No. of Mortgage Loans | Aggregate Cut-off Date Balance ($) | % of Pool | |
| 30.1 - 40.0 | 1 | 4,239,144 | 0.4 |
| 40.1 - 50.0 | 5 | 182,621,311 | 15.5 |
| 50.1 - 60.0 | 23 | 407,443,698 | 34.5 |
| 60.1 - 70.0 | 25 | 556,988,858 | 47.2 |
| 70.1 - 80.0 | 2 | 28,125,000 | 2.4 |
| Total: | 56 | $1,179,418,010 | 100.0% |
| Min: 36.0% Max: 75.0% Wtd Avg: 59.3% | |||
No. of Mortgage Loans | Aggregate Cut-off Date Balance ($) | % of Pool | |
| 1.11 - 1.20 | 1 | 54,440,000 | 4.6 |
| 1.21 - 1.30 | 4 | 120,150,000 | 10.2 |
| 1.31 - 1.40 | 19 | 274,499,576 | 23.3 |
| 1.41 - 1.50 | 10 | 214,174,242 | 18.2 |
| 1.51 - 1.60 | 6 | 150,243,123 | 12.7 |
| 1.61 - 1.70 | 7 | 188,432,975 | 16.0 |
| 1.71 - 1.90 | 2 | 16,855,105 | 1.4 |
| 1.91 - 2.00 | 2 | 126,158,747 | 10.7 |
| 2.01 - 2.10 | 2 | 17,141,414 | 1.5 |
| 2.11 - 2.40 | 3 | 17,322,829 | 1.5 |
| Total: | 56 | $1,179,418,010 | 100.0% |
| Min: 1.20x Max: 2.40x Wtd Avg: 1.52x | |||
No. of Mortgage Loans | Aggregate Cut-off Date Balance ($) | % of Pool | |
| 7.1 - 7.5 | 2 | 164,440,000 | 13.9 |
| 7.6 - 8.0 | 2 | 48,125,000 | 4.1 |
| 8.1 - 8.5 | 8 | 168,975,000 | 14.3 |
| 8.6 - 9.0 | 9 | 153,316,841 | 13.0 |
| 9.1 - 9.5 | 6 | 184,995,939 | 15.7 |
| 9.6 - 10.0 | 5 | 59,513,501 | 5.0 |
| 10.1 - 10.5 | 8 | 152,017,643 | 12.9 |
| 10.6 - 11.0 | 4 | 70,289,107 | 6.0 |
| 11.1 - 11.5 | 2 | 16,613,978 | 1.4 |
| 11.6 - 12.0 | 2 | 15,973,015 | 1.4 |
| 12.1 - 12.5 | 3 | 106,634,997 | 9.0 |
| 12.6 - 13.5 | 2 | 17,142,433 | 1.5 |
| 13.6 - 15.0 | 1 | 12,150,000 | 1.0 |
| 15.1 - 15.8 | 2 | 9,230,558 | 0.8 |
| Total: | 56 | $1,179,418,010 | 100.0% |
Min: 7.3% Max: 15.8% Wtd Avg: 9.5% | |||
| (1) | All numerical information concerning the mortgage loans is approximate and, in the case of mortgage loans secured by multiple properties, is based on allocated loan amounts with respect to such properties. All weighted average information regarding the mortgage loans reflects the weighting of the mortgage loans based on their outstanding principal balances as of the Cut-off Date or, in the case of mortgage loans secured by multiple properties, allocated loan amounts. The sum of numbers and percentages in columns may not match the “Total” due to rounding. With respect to any mortgage loan that is part of a loan pair or a non-serviced loan combination, unless otherwise indicated, all LTV, DSCR and Debt Yield calculations include the related pari passu companion loan and exclude any subordinate notes, as applicable. |
| (2) | “California – Northern” includes zip codes above 93600, and “California – Southern” includes zip codes at or below 93600. |
| MSBAM 2015-C25 | Collateral Statistics |
| Prepayment Restrictions | October 2015 | October 2016 | October 2017 | October 2018 | October 2019 |
| Locked Out | 100.0% | 98.5% | 90.9% | 91.0% | 91.0% |
| Yield Maintenance Total | 0.0% | 1.5% | 9.1% | 9.0% | 9.0% |
| Open | 0.0% | 0.0% | 0.0% | 0.0% | 0.0% |
| TOTAL | 100.0% | 100.0% | 100.0% | 100.0% | 100.0% |
| Pool Balance Outstanding | $1,179,418,010 | $1,175,057,986 | $1,169,789,288 | $1,163,158,290 | $1,153,677,762 |
| % Initial Pool Balance | 100% | 99.6% | 99.2% | 98.6% | 97.8% |
| Prepayment Restrictions | October 2020 | October 2021 | October 2022 | October 2023 | October 2024 |
| Locked Out | 90.8% | 90.8% | 90.8% | 79.9% | 88.0% |
| Yield Maintenance Total | 9.2% | 9.2% | 9.2% | 9.2% | 9.2% |
| Open | 0.0% | 0.0% | 0.0% | 10.9% | 2.8% |
| TOTAL | 100.0% | 100.0% | 100.0% | 100.0% | 100.0% |
| Pool Balance Outstanding | $1,115,329,653 | $1,099,600,533 | $1,069,959,480 | $1,052,982,968 | $920,307,120 |
| % Initial Pool Balance | 94.6% | 93.2% | 90.7% | 89.3% | 78.0% |
| Prepayment Restrictions | October 2025 | October 2026 | October 2027 | October 2028 | October 2029 |
| Locked Out | 0.0% | 0.0% | 0.0% | 0.0% | 0.0% |
| Yield Maintenance Total | 0.0% | 0.0% | 0.0% | 0.0% | 0.0% |
| Open | 100.0% | 100.0% | 100.0% | 100.0% | 100.0% |
| TOTAL | 100.0% | 100.0% | 100.0% | 100.0% | 100.0% |
| Pool Balance Outstanding | $6,130,030 | $6,001,038 | $5,864,660 | $5,721,391 | $5,568,999 |
| % Initial Pool Balance | 0.5% | 0.5% | 0.5% | 0.5% | 0.5% |
| (1) | The analysis is based on Structuring Assumptions and a 0% CPR as discussed in the Free Writing Prospectus. |
| (2) | See description of Yield Maintenance under “Description of the Offered Certificates—Distributions of Prepayment Premiums and Yield Maintenance Charges” in the Free Writing Prospectus. |
| (3) | Mortgage loans modeled as Yield Maintenance include mortgage loans characterized by YM1 and DEF/YM1 on APPENDIX I to the Free Writing Prospectus. |
| (4) | There may be limited exceptions to the indicated prepayment restrictions arising out of casualties, condemnations, property releases and the application of earnout reserves. |
| MSBAM 2015-C25 | Herald Center |
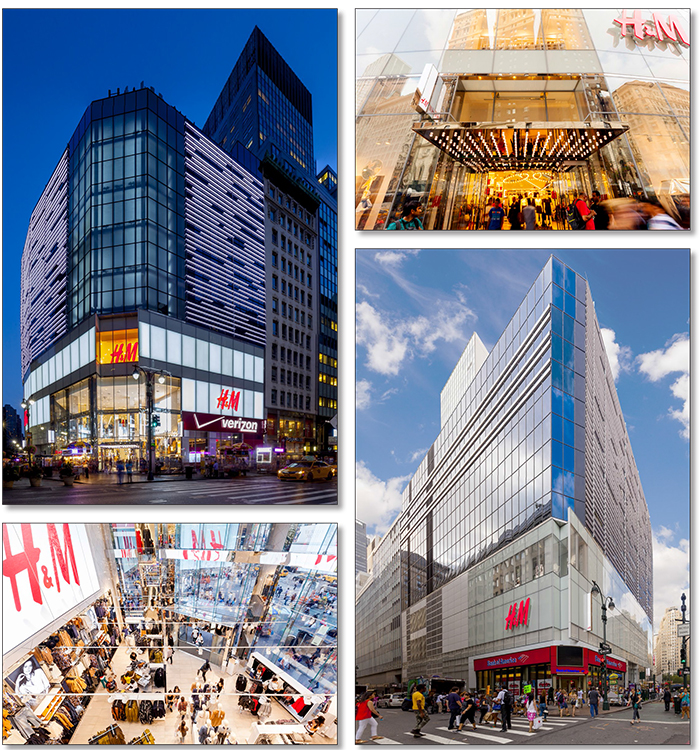
| MSBAM 2015-C25 | Herald Center |
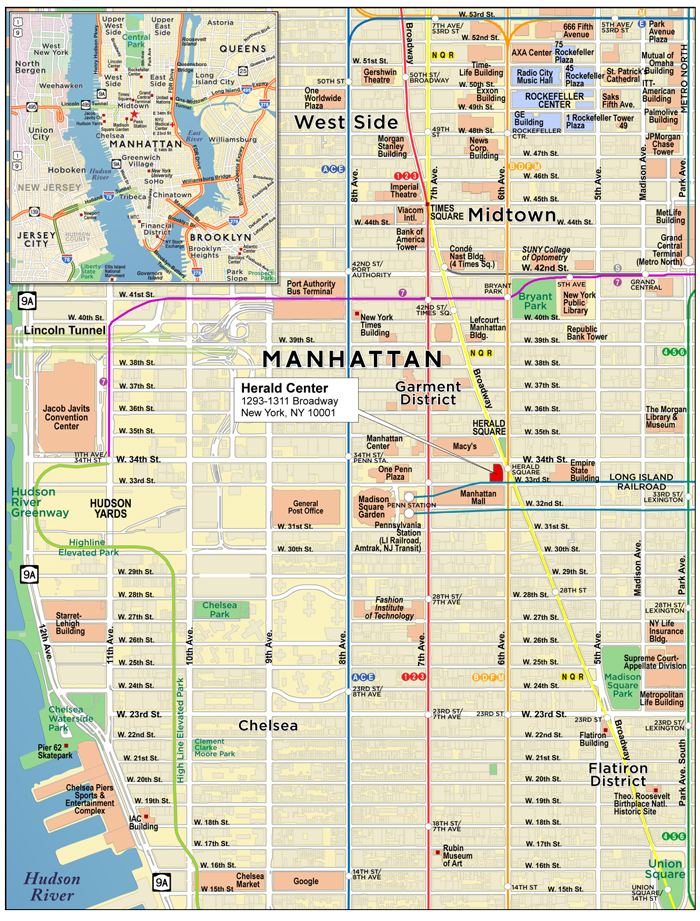
| MSBAM 2015-C25 | Herald Center |
| Mortgage Loan No. 1 – Herald Center |
| Mortgage Loan Information | Mortgaged Property Information | ||||||
| Mortgage Loan Seller: | MSMCH | Single Asset/Portfolio: | Single Asset | ||||
Original Balance(1): | $115,000,000 | Location: | New York, NY 10001 | ||||
Cut-off Date Balance(1): | $115,000,000 | General Property Type: | Mixed Use | ||||
| % of Initial Pool Balance: | 9.8% | Detailed Property Type: | Retail/Office | ||||
| Loan Purpose: | Refinance | Title Vesting: | Fee | ||||
| Sponsor: | J.E.M.B. Realty Corp. | Year Built/Renovated: | 1902/2015 | ||||
| Mortgage Rate: | 4.510% | Size: | 249,063 SF | ||||
| Note Date: | 12/20/2013 | Cut-off Date Balance per Unit(1): | $1,024 | ||||
| First Payment Date: | 2/7/2014 | Maturity Date Balance per Unit(1): | $1,024 | ||||
| Maturity Date: | 1/7/2024 | Property Manager: | J.E.M.B. Realty Corp. (borrower related) | ||||
| Original Term to Maturity: | 120 months | ||||||
| Original Amortization Term: | 0 months | Underwriting and Financial Information | |||||
| IO Period: | 120 months | UW NOI: | $23,204,073 | ||||
Seasoning(2): | 21 months | UW NOI Debt Yield(1): | 9.1% | ||||
Prepayment Provisions(3): | LO (41); DEF (72); O (7) | UW NOI Debt Yield at Maturity(1): | 9.1% | ||||
| Lockbox/Cash Mgmt Status: | Hard/Springing | UW NCF DSCR(1): | 1.94x | ||||
| Additional Debt Type: | Pari Passu/Mezzanine | Most Recent NOI: | $410,823 (4/30/2015 TTM) | ||||
| Additional Debt Balance: | $140,000,000/$40,000,000 (up to) | 2nd Most Recent NOI: | $850,169 (12/31/2014) | ||||
| Future Debt Permitted (Type): | Yes (Mezzanine) | 3rd Most Recent NOI: | $5,054,373 (12/31/2013) | ||||
Reserves(4) | Most Recent Occupancy: | 96.6% (6/12/2015) | |||||
Type | Initial | Monthly | Cap | 2nd Most Recent Occupancy: | 74.1% (12/31/2014) | ||
| RE Tax: | $0 | Springing | N/A | 3rd Most Recent Occupancy: | 67.5% (12/31/2013) | ||
| Insurance: | $0 | Springing | N/A | Appraised Value (as of): | $572,000,000 (6/29/2015) | ||
| Recurring Replacements: | $0 | Springing | N/A | Cut-off Date LTV Ratio(1): | 44.6% | ||
| Other: | $48,000,000 | $0 | N/A | Maturity Date LTV Ratio(1): | 44.6% | ||
| Sources and Uses | ||||||
| Sources | Proceeds | % of Total | Uses | Proceeds | % of Total | |
| Loan Amount: | $255,000,000 | 100.0% | Loan Payoff: | $120,960,667 | 47.4% | |
| Preferred Equity Redemption: | $51,585,830 | 20.2% | ||||
Reserves(4): | $48,000,000 | 18.8% | ||||
| Closing Costs: | $9,662,644 | 3.8% | ||||
| Return of Equity: | $24,790,859 | 9.7% | ||||
| Total Sources: | $255,000,000 | 100.0% | Total Uses: | $255,000,000 | 100.0% | |
| (1) | The Herald Center Mortgage Loan is part of the Herald Center Loan Pair, which is comprised of four pari passu promissory notes with an aggregate Cut-off Date principal balance of $255,000,000. The Cut-off Date Balance per Unit, Maturity Date Balance per Unit, UW NOI Debt Yield, UW NOI Debt Yield at Maturity, UW NCF DSCR, Cut-off Date LTV Ratio and Maturity Date LTV Ratio numbers presented above are based on the aggregate principal balance of the promissory notes comprising the Herald Center Loan Pair. |
| (2) | The Herald Center Mortgage Loan was originated in December 2013, prior to occupancy by the H & M tenant. The mortgage loan has been held by the related mortgage loan seller or an affiliate thereof pending the H & M tenant taking occupancy at the Herald Center Property and commencing to pay rent. H & M rent payments commenced in August 2015. |
| (3) | Defeasance is permitted at any time on or after the earlier of (a) the end of the two-year period commencing on the securitization closing date with respect to the last Herald Center promissory note to be securitized and (b) 42 months after the origination date. |
| (4) | See “—Escrows and Reserves” below for further discussion of reserve requirements. Substantially all of the reserves held at loan closing have been released to the Herald Center Borrower. |
| MSBAM 2015-C25 | Herald Center |
| MSBAM 2015-C25 | Herald Center |
| Tenant Summary | ||||||||
| Tenant Name | Credit Rating (Fitch/Moody’s/S&P)(1) | Tenant SF | Approximate % of SF | Annual UW Rent | % of Total Annual UW Rent | Annual UW Rent PSF | Lease Expiration | 2014 Sales PSF |
| Anchor/Major Tenants | ||||||||
| ASA College | NR/NR/NR | 165,494 | 66% | $7,774,883 | 26% | $46.98 | 6/15/2028 | N/A |
| H & M | NR/NR/NR | 62,800 | 25% | $15,000,000 | 49% | $238.85 | 1/31/2041(2) | N/A(3) |
| Verizon | A-/Baa1/BBB+ | 6,500 | 3% | $5,638,280 | 19% | $867.43 | 10/31/2025 | N/A |
| Bank of America | A/Baa1/A- | 5,293 | 2% | $1,720,437 | 6% | $325.04 | 7/31/2017 | N/A |
| Subtotal/Wtd. Avg. | 240,087 | 96% | $30,133,600 | 99% | $125.51 | |||
| Other Tenants | 550 | 0% | $319,878 | 1% | $581.60 | |||
| Vacant Space | 8,426 | 3% | $0 | 0% | $0.00 | |||
| Total/Wtd. Avg. | 249,063 | 100% | $30,453,478 | 100% | $126.55 | |||
| (1) | Certain ratings are those of the parent company whether or not the parent guarantees the lease. |
| (2) | H & M has a lease termination option any time on or after January 1, 2036 with two years of notice and a termination fee. |
| (3) | H & M opened for business on May 20, 2015 and has not yet reported sales data. |
Lease Rollover Schedule(1)(2) | ||||||||
| Year | # of Leases Rolling | SF Rolling | UW Rent PSF Rolling(3) | Approx. % of Total SF Rolling | Approx. Cumulative % of SF Rolling | Total UW Rent Rolling | Approx. % of Total Rent Rolling | Approx. Cumulative % of Total Rent Rolling |
| MTM | 1 | 100 | $787.65 | 0% | 0% | $78,765 | 0% | 0% |
| 2015 | 1 | 210 | $169.62 | 0% | 0% | $35,620 | 0% | 0% |
| 2016 | 1 | 80 | $1,618.58 | 0% | 0% | $129,486 | 0% | 1% |
| 2017 | 1 | 5,293 | $325.04 | 2% | 2% | $1,720,437 | 6% | 6% |
| 2018 | 1 | 160 | $475.04 | 0% | 2% | $76,006 | 0% | 7% |
| 2019 | 0 | 0 | $0.00 | 0% | 2% | $0 | 0% | 7% |
| 2020 | 0 | 0 | $0.00 | 0% | 2% | $0 | 0% | 7% |
| 2021 | 0 | 0 | $0.00 | 0% | 2% | $0 | 0% | 7% |
| 2022 | 0 | 0 | $0.00 | 0% | 2% | $0 | 0% | 7% |
| 2023 | 0 | 0 | $0.00 | 0% | 2% | $0 | 0% | 7% |
| 2024 | 0 | 0 | $0.00 | 0% | 2% | $0 | 0% | 7% |
| 2025 | 1 | 6,500 | $867.43 | 3% | 5% | $5,638,280 | 19% | 25% |
| 2026 & Beyond | 6 | 228,294 | $99.76 | 92% | 97% | $22,774,883 | 75% | 100% |
| Vacant | 0 | 8,426 | $0.00 | 3% | 100% | $0 | 0% | 100% |
| Total/Wtd. Avg. | 12 | 249,063 | $126.55 | 100% | $30,453,478 | 100% | ||
| (1) | Information is based on the underwritten rent roll. |
| (2) | Certain tenants may have lease termination options that are exercisable prior to the stated expiration date of the subject lease or leases which are not considered in the lease rollover schedule. |
| (3) | Wtd. Avg. UW Rent PSF Rolling excludes vacant space. |
| MSBAM 2015-C25 | Herald Center |
Competitive Retail Property Summary | ||||||||||
| Address in NY, NY | Cross Streets | Tenant Name | Lease Date | Lease Term (Yrs.) | Lease Area (SF) | Annual Base Rent PSF | Free Rent (mos.) | TI Allowance (PSF) | ||
| 112 West 34th Street | B/w 6th & 7th Aves | Foot Locker | Feb-15 | 10 | 1,890 28,651 30,541 | Grade 2nd Total | $1,000 $135 $189 | Grade 2nd Avg | 6 | $24.03 |
| 112 West 34th Street | B/w 6th & 7th Aves | Sephora | Jan-15 | 10 | 10,304 | Grade | $925 | Grade | 5 | $145.57 |
| 32 West 34th Street | B/w 6th & 7th Aves | Journey’s | Nov-13 | 10 | 3,000 3,000 1,200 7,200 | Grade LL SubLL Total | $646 $50 $50 $316 | Grade LL SubLL Avg. | 3 | $0.00 |
| 442 Seventh Avenue | N/W/C W. 34th Street | Citibank | Oct-13 | 15 | 3,465 3,465 3,465 3,465 13,858 | Grade 2nd 3rd 4th Total | $450 $25 $25 $25 $129 | Grade 2nd 3rd 4th Avg | 0 | $0.00 |
| 138 West 34th Street | B/w 6th & 7th Aves | Sprint | Aug-13 | 10 | 2,500 2,500 2,500 2,500 2,500 12,500 | Grade 2nd 3rd LL SubLL Total | $500 $75 $50 $35 $25 $136 | Grade 2nd 3rd LL SubLL Avg | 6 | $0.00 |
| 112 West 34th Street | B/w 6th & 7th Aves | Swatch | Jun-13 | 10 | 1,587 | Grade | $900 | Grade | 5 | $0.00 |
| 142 West 34th Street | B/w 6th & 7th Aves | Kids Foot Locker | Mar-13 | 15 | 2,500 2,500 5,000 | Grade 2nd Total | $550 $50 $300 | Grade Mezz Avg. | 3 | $0.00 |
| 152 West 34th Street | B/w 6th & 7th Aves | Croc’s | Oct-12 | 15 | 3,600 3,600 3,600 3,600 14,400 | Grade 2nd 3rd LL Total | $625 $25 $25 $25 $172 | Grade 2nd 3rd LL Avg. | 3 | $0.00 |
| 128 West 34th Street | B/w 6th & 7th Aves | Offering | Jun-15 | 10 | 2,500 2,500 5,000 | Grade LL Total | $1,100 $200 $550 | Grade LL Avg. | 3 | $0.00 |
| Competitive Office Property Summary | |||||||||
| Address in New York, NY | Year Built | NRA (SF) | Tenant Name | Lease Area (SF) | Lease Date | Lease Term (Yrs.) | Annual Base Rent PSF | Free Rent (mos.) | TI Allowance (PSF) |
| 1440 Broadway | 1925 | 493,000 | The Gap | 34,449 | Jun-15 | 10.00 | $56.00 | 9 | $75.00 |
| 132 West 31st Street | 1924 | 348,946 | Houghton Mifflin | 32,000 | May-15 | 10.00 | $56.00 | 10 | $60.00 |
| 469 Seventh Avenue | 1920 | 208,000 | Incubator Tenant | 36,000 | May-15 | 15.00 | $50.00 | 12 | $25.00 |
| 240 West 37th Street | 1904 | 131,000 | Work Market | 61,274 | Apr-15 | 5.25 | $46.00 | 2 | $5.00 |
| 498 Seventh Avenue | 1921 | 811,056 | 1961 Denim Co. | 12,757 | Apr-15 | 7.00 | $52.50 | 10 | $50.00 |
| Five Penn Plaza | 1916 | 608,000 | St. Vincent’s Medical Center | 16,254 | Nov-14 | 5.00 | $50.00 | 6 | $50.00 |
| Two Penn Plaza | 1968 | 1,676,438 | United Business Media PLC | 27,344 | Sep-14 | 10.75 | $55.00 | 12 | $70.00 |
| 330 West 34th Street | 1925 | 654,000 | Deutsch | 74,364 | Sep-14 | 10.83 | $59.00 | 10 | $75.00 |
| 330 West 34th Street | 1925 | 654,000 | New York & Co. | 83,639 | Apr-14 | 16.00 | $50.00 | 13 | $70.00 |
| MSBAM 2015-C25 | Herald Center |
Cash Flow Analysis(1) | ||||||||||||||
| 2011 | 2012 | 2013 | 2014 | 4/30/2015 TTM | UW | UW PSF | ||||||||
Base Rent(2) | $14,134,111 | $13,924,182 | $12,206,941 | $9,183,427 | $8,584,625 | $30,453,478 | $122.27 | |||||||
| Total Recoveries | $2,974,091 | $3,184,745 | $1,809,718 | $689,478 | $613,921 | $1,660,080 | $6.67 | |||||||
| Other Income | $439,068 | ($3,592) | $63,639 | $104,026 | $101,936 | $6,000 | $0.02 | |||||||
| Discounts Concessions | ($35,000) | ($144,000) | ($1,849,333) | ($1,562,667) | ($956,222) | $0 | $0.00 | |||||||
| Less Vacancy & Credit Loss | $0 | $0 | $0 | $0 | $0 | $0 | $0.00 | |||||||
| Effective Gross Income | $17,512,270 | $16,961,335 | $12,230,965 | $8,414,264 | $8,344,260 | $32,119,558 | $128.96 | |||||||
| Total Expenses | $6,209,098 | $6,375,396 | $7,176,592 | $7,564,095 | $7,933,437 | $8,915,485 | $35.80 | |||||||
| Net Operating Income | $11,303,172 | $10,585,939 | $5,054,373 | $850,169 | $410,823 | $23,204,073 | $93.17 | |||||||
| Capital Expenditures | $370,559 | $75,313 | $620,577 | $74,464 | $285,476 | $60,266 | $0.24 | |||||||
| TI/LC | $0 | $0 | $0 | $0 | $0 | $554,713 | $2.23 | |||||||
| Net Cash Flow | $10,932,613 | $10,510,626 | $4,433,796 | $775,705 | $125,347 | $22,589,094 | $90.70 | |||||||
| Occupancy % | 99.7% | 99.7% | 67.5% | 74.1%(3) | 95.0%(4) | 96.6% | ||||||||
| NOI DSCR | 0.97x | 0.91x | 0.43x | 0.07x | 0.04x | 1.99x | ||||||||
| NCF DSCR | 0.94x | 0.90x | 0.38x | 0.07x | 0.01x | 1.94x | ||||||||
| NOI Debt Yield | 4.4% | 4.2% | 2.0% | 0.3% | 0.2% | 9.1% | ||||||||
| NCF Debt Yield | 4.3% | 4.1% | 1.7% | 0.3% | 0.0% | 8.9% | ||||||||
| (1) | The Herald Center Property was substantially renovated and partially re-tenanted in 2014. A previous tenant, Daffy’s Inc. (“Daffy’s”), vacated its space in 2013 following a corporate bankruptcy. H & M replaced the Daffy’s tenant in a portion of its previous space in August 2014, opened for business on May 20, 2015, and began paying rent on August 14, 2015 following a one-year free rent period. The previous Daffy’s lease was for approximately 97,124 SF at $27.41 PSF in base rent pursuant to a lease beginning in 1993. The H & M tenant leases 62,800 SF at a base rent of $238.85 PSF. |
| (2) | Underwritten base rent is net of actual vacancy and includes approximately $638,280 of straight line rent credit over the 10-year loan term for the Verizon space and approximately $142,990 of additional contractual rent steps associated with the ASA College tenant effective May 1, 2016. |
| (3) | The H & M tenant took occupancy in August 2014; however, the tenant had a one-year free rent period which ended in August 2015. |
| (4) | The 4/30/2015 TTM Occupancy % is based on a Herald Center Borrower occupancy report for April 2015. |
| (i) | commence upon the occurrence of an event of default under the Herald Center Mortgage Loan and continue until the event of default under the Herald Center Mortgage Loan has been cured in accordance with the terms and provisions of the Herald Center loan agreement or otherwise to the lender’s reasonable satisfaction, or |
| (ii) | commence upon an H & M Bankruptcy Event and continue until (x) H & M Tenant affirms its lease or, if such petition is involuntary, the bankruptcy petition is dismissed or (y) all or any portion of the H & M Tenant space is re-let to one or more third-party tenants pursuant to a lease entered into in accordance with the terms of the loan agreement which tenant(s) have commenced paying rent under such replacement lease, as evidenced by an estoppel certificate, in an amount sufficient to result in the debt yield for the Herald Center Loan Pair being equal to or greater than eight and one-half percent (8.5%) and amounts sufficient to pay all leasing commissions and tenant improvements with respect to such replacement lease are on deposit with the lender (such event referred to in this clause (ii) (y), an “H & M Re-let Event”), or |
| MSBAM 2015-C25 | Herald Center |
| (iii) | commence upon an H & M Vacancy Event of the type described in clause (ii) of the definition of an H & M Vacancy Event and continue until (x) H & M Tenant re-occupies and re-commences the operation of its business in its space or (y) an H & M Re-let Event occurs. |
| MSBAM 2015-C25 | 261 Fifth Avenue |
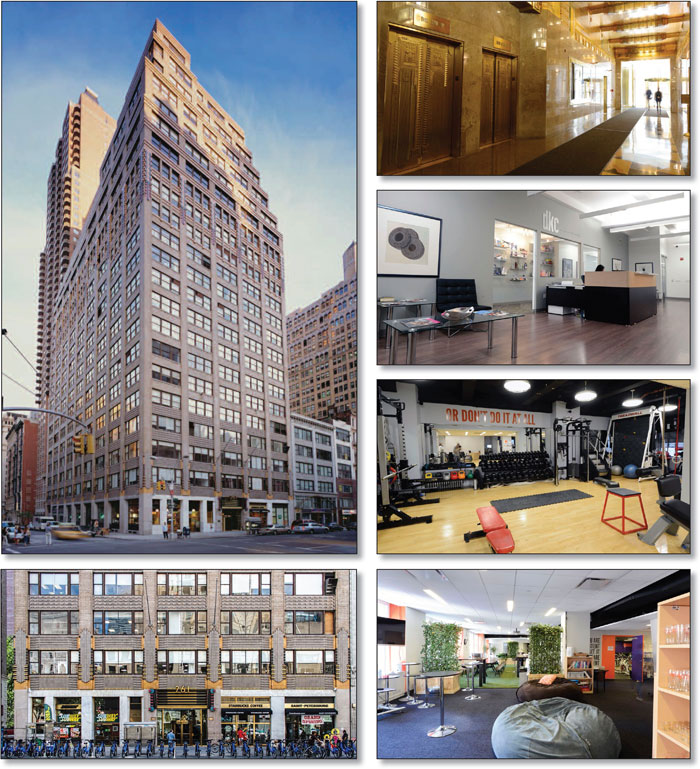
| MSBAM 2015-C25 | 261 Fifth Avenue |
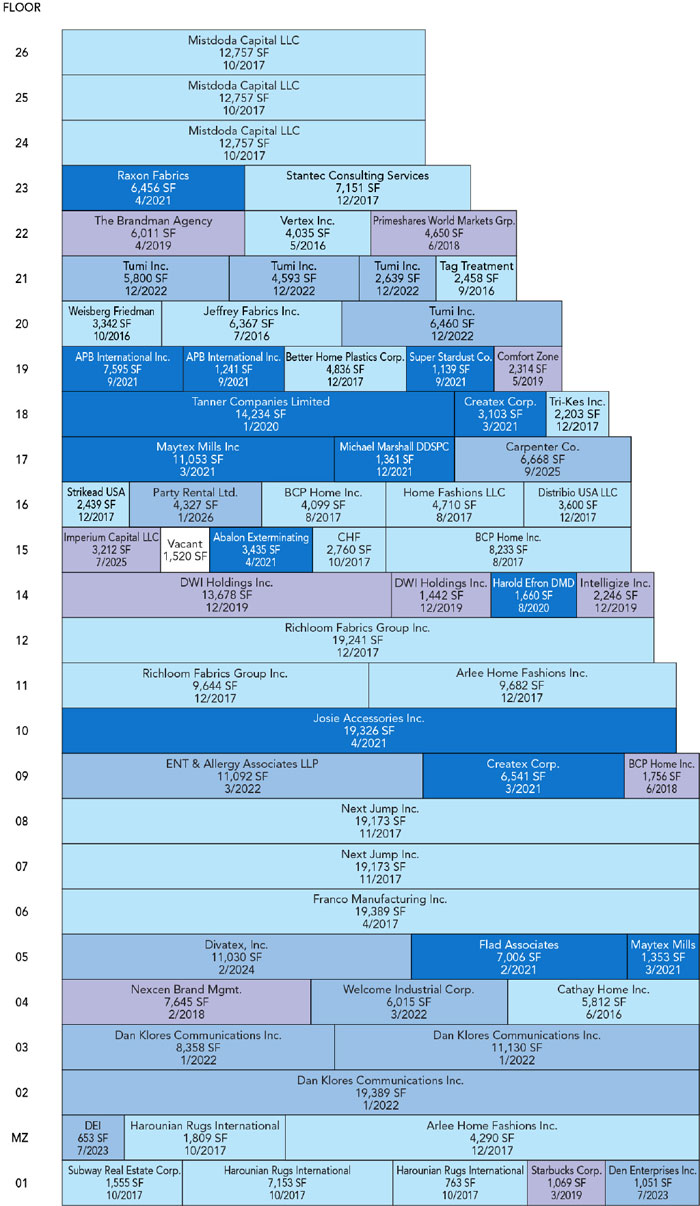
| MSBAM 2015-C25 | 261 Fifth Avenue |
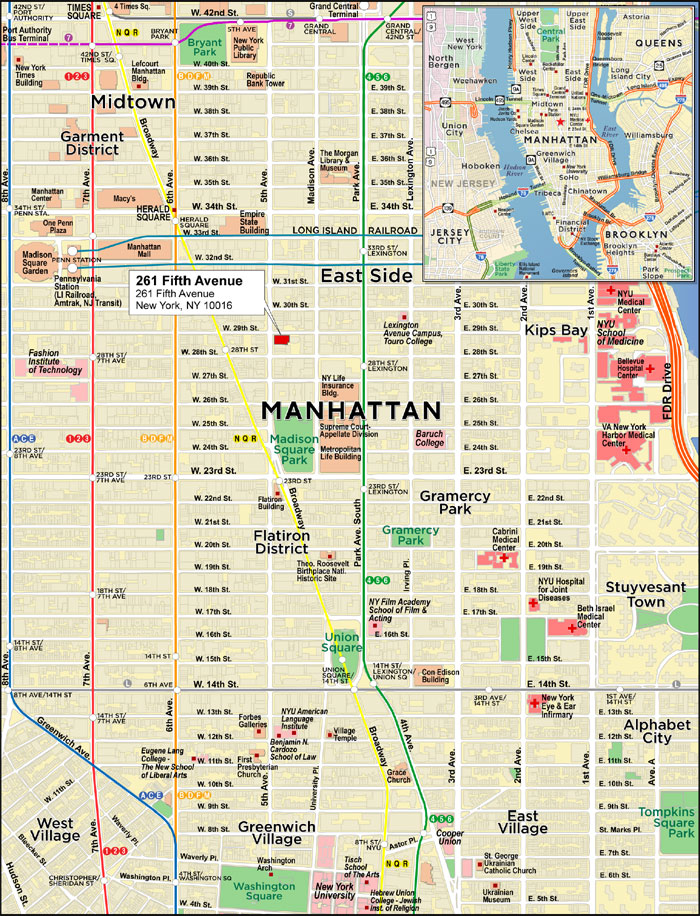
| MSBAM 2015-C25 | 261 Fifth Avenue |
| Mortgage Loan No. 2 – 261 Fifth Avenue |
| Mortgage Loan Information | Mortgaged Property Information | |||||||
| Mortgage Loan Seller: | BANA | Single Asset/Portfolio: | Single Asset | |||||
Original Balance(1): | $110,000,000 | Location: | New York, NY 10016 | |||||
Cut-off Date Balance(1): | $110,000,000 | General Property Type: | Office | |||||
| % of Initial Pool Balance: | 9.3% | Detailed Property Type: | CBD | |||||
| Loan Purpose: | Refinance | Title Vesting: | Fee | |||||
| Sponsor: | Jeffrey Feil; Lloyd Goldman | Year Built/Renovated: | 1928/2015 | |||||
| Mortgage Rate: | 4.420% | Size: | 441,922 SF | |||||
| Note Date: | 8/6/2015 | Cut-off Date Balance per Unit(1): | $407 | |||||
| First Payment Date: | 10/1/2015 | Maturity Date Balance per Unit(1): | $407 | |||||
| Maturity Date: | 9/1/2025 | Property Manager: | Jeffrey Management Corp. | |||||
| Original Term to Maturity: | 120 months | |||||||
| Original Amortization Term: | N/A | Underwriting and Financial Information | ||||||
| IO Period: | 120 months | UW NOI: | $13,235,872 | |||||
| Seasoning: | 1 month | UW NOI Debt Yield(1): | 7.4% | |||||
| Prepayment Provisions: | LO (25); DEF (91); O (4) | UW NOI Debt Yield at Maturity(1): | 7.4% | |||||
| Lockbox/Cash Mgmt Status: | Hard/Springing | UW NCF DSCR(1): | 1.52x | |||||
| Additional Debt Type: | Pari Passu | Most Recent NOI(2): | $12,335,215 (12/31/2014) | |||||
| Additional Debt Balance: | $70,000,000 | 2nd Most Recent NOI: | $10,943,668 (12/31/2013) | |||||
| Future Debt Permitted (Type): | No (N/A) | 3rd Most Recent NOI: | $11,213,823 (12/31/2012) | |||||
Reserves(3) | Most Recent Occupancy: | 99.7% (7/31/2015) | ||||||
Type | Initial | Monthly | Cap | 2nd Most Recent Occupancy: | 99.3% (12/31/2014) | |||
| RE Tax: | $1,051,424 | $350,475 | N/A | 3rd Most Recent Occupancy: | 97.8% (12/31/2013) | |||
| Insurance: | $0 | Springing | N/A | Appraised Value (as of): | $300,000,000 (7/1/2015) | |||
| Recurring Replacements: | $0 | $9,206 | N/A | Cut-off Date LTV Ratio(1): | 60.0% | |||
| TI/LC: | $0 | Springing | N/A | Maturity Date LTV Ratio(1): | 60.0% | |||
| Other: | $457,936 | $0 | N/A | |||||
| Sources and Uses | ||||||
| Sources | Proceeds | % of Total | Uses | Proceeds | % of Total | |
Loan Amount(1): | $180,000,000 | 100.0% | Loan Payoff: | $141,631,767 | 78.7% | |
| Reserves: | $1,509,360 | 0.8% | ||||
| Closing Costs: | $2,254,035 | 1.3% | ||||
| Return of Equity: | $34,604,839 | 19.2% | ||||
| Total Sources: | $180,000,000 | 100.0% | Total Uses: | $180,000,000 | 100.0% | |
| (1) | The 261 Fifth Avenue Mortgage Loan is part of the 261 Fifth Avenue Loan Pair evidenced by two pari passu notes with an aggregate original principal balance of $180,000,000. The Cut-off Date Balance per Unit, Maturity Date Balance per Unit, UW NCF DSCR, UW NOI Debt Yield, UW NOI Debt Yield at Maturity, Cut-off Date LTV Ratio and Maturity Date LTV Ratio presented above are based on the aggregate note balance of the 261 Fifth Avenue Loan Pair. |
| (2) | The June 30, 2015 year-to-date NOI as provided by the 261 Fifth Avenue borrower was $8,828,659. |
| (3) | See “—Escrows and Reserves” below for further discussion of reserve requirements. |
| MSBAM 2015-C25 | 261 Fifth Avenue |
Tenant Summary(1) | |||||||||||||
| Tenant Name | Credit Rating (Fitch/ Moody’s/S&P) | Tenant SF | Approximate % of SF | Annual UW Rent | % of Total Annual UW | Annual UW Rent PSF(2) | Lease Expiration | ||||||
| Major Tenants | |||||||||||||
| Dan Klores Communication | NR/NR/NR | 38,877 | 9% | $1,394,508 | 7% | $35.87 | 1/31/2022 | ||||||
| Next Jump Inc | NR/NR/NR | 38,346 | 9% | $1,893,528 | 10% | $49.38 | 11/30/2017 | ||||||
Mistdoda Capital LLC(3) | NR/NR/NR | 38,271 | 9% | $1,785,528 | 9% | $46.65 | 10/31/2017 | ||||||
| Richloom Fabrics Group | NR/NR/NR | 28,885 | 7% | $1,083,192 | 6% | $37.50 | 12/31/2017 | ||||||
| Subtotal/Wtd. Avg. | 144,379 | 33% | $6,156,756 | 33% | $42.64 | ||||||||
| Other Tenants | 296,023 | 67% | $12,704,100 | 67% | $42.92 | ||||||||
| Vacant Space | 1,520 | 0% | $0 | 0% | $0.00 | ||||||||
| Total/Wtd. Avg. | 441,922 | 100% | $18,860,856 | 100% | $42.83 | ||||||||
| (1) | Information is based on the underwritten rent roll. |
| (2) | Wtd. Avg. Annual UW Rent PSF excludes vacant space. |
| (3) | Mistdoda Capital LLC is currently subleasing all of its space through October 31, 2017 (the end of its lease term) to three subtenants: Christine Valmy International School, Inc. (12,757 SF), The Norwest Company, LLC (12,757 SF) and Badger & Winters Group, Inc. (12,757 SF). |
| MSBAM 2015-C25 | 261 Fifth Avenue |
Lease Rollover Schedule(1)(2) | ||||||||||||||||
| Year | # of Leases Rolling(3) | SF Rolling | UW Rent PSF Rolling(4) | Approx. % of Total SF Rolling | Approx. Cumulative % of SF Rolling | Total UW Rent Rolling | Approx. % of Total Rent Rolling | Approx. Cumulative % of Total Rent Rolling | ||||||||
| MTM | 0 | 0 | $0.00 | 0.0% | 0.0% | $0 | 0.0% | 0.0% | ||||||||
| 2015 | 0 | 0 | $0.00 | 0.0% | 0.0% | $0 | 0.0% | 0.0% | ||||||||
| 2016 | 5 | 22,014 | $45.32 | 5.0% | 5.0% | $997,740 | 5.3% | 5.3% | ||||||||
| 2017 | 16 | 190,796 | $42.60 | 43.2% | 48.2% | $8,128,716 | 43.1% | 48.4% | ||||||||
| 2018 | 3 | 14,051 | $52.22 | 3.2% | 51.3% | $733,776 | 3.9% | 52.3% | ||||||||
| 2019 | 5 | 26,760 | $48.75 | 6.1% | 57.4% | $1,304,520 | 6.9% | 59.2% | ||||||||
| 2020 | 2 | 15,894 | $38.30 | 3.6% | 61.0% | $608,736 | 3.2% | 62.4% | ||||||||
| 2021 | 8 | 68,470 | $39.42 | 15.5% | 76.5% | $2,698,848 | 14.3% | 76.7% | ||||||||
| 2022 | 4 | 75,476 | $38.53 | 17.1% | 93.6% | $2,907,912 | 15.4% | 92.1% | ||||||||
| 2023 | 1 | 1,704 | $101.09 | 0.4% | 93.9% | $172,260 | 0.9% | 93.1% | ||||||||
| 2024 | 1 | 11,030 | $50.00 | 2.5% | 96.4% | $551,496 | 2.9% | 96.0% | ||||||||
| 2025 | 2 | 9,880 | $52.52 | 2.2% | 98.7% | $518,868 | 2.8% | 98.7% | ||||||||
| 2026 & Beyond | 1 | 4,327 | $55.00 | 1.0% | 99.7% | $237,984 | 1.3% | 100.0% | ||||||||
| Vacant | NAP | 1,520 | NAP | 0.3% | 100.0% | $0 | 0% | |||||||||
| Total/Wtd. Avg. | 48 | 441,922 | $42.83 | 100.0% | $18,860,856 | 100.0% | ||||||||||
| (1) | Information is based on the underwritten rent roll. Certain tenants may have multiple co-terminous leases that are consolidated for purposes of the Lease Rollover Schedule. |
| (2) | Certain tenants may have lease termination options that are exercisable prior to the originally stated expiration date of the subject lease and that are not considered in the lease rollover schedule. |
| (3) | Mistdoda Capital LLC is currently subleasing all of its space through October 31, 2017 (the end of its lease term) to three subtenants: Christine Valmy International School, Inc. (12,757 SF), The Norwest Company, LLC (12,757 SF) and Badger & Winters Group, Inc. (12,757 SF). The subleases are consolidated for purposes of this Lease Rollover Schedule. |
| (4) | Wtd. Avg. UW Rent PSF Rolling excludes vacant space. |
| Competitive Set | ||||||||||
| Name | Asking Rent | Year Built / Renovated | Total Occupancy | Size (SF) | Stories | |||||
| 261 Fifth Avenue Property | $42(1) | 1928/2015 | 99.7%(2) | 441,922(2) | 26 | |||||
| 60 Madison Avenue | $64-$68 | 1910 | 80.5% | 183,400 | 13 | |||||
| 79 Madison Avenue | $65 | 1925/2005 | 86.9% | 216,000 | 17 | |||||
| 105 Madison Avenue | $59 | 1913 | 94.2% | 231,000 | 20 | |||||
| 11 East 26th Street | $68 | 1912 | 94.8% | 230,000 | 21 | |||||
| 345-355 Park Avenue South | N/A | 1912/1999 | 100.0% | 240,000 | 12�� | |||||
| 360 Park Avenue South | N/A | 1912 | 100.0% | 451,000 | 20 | |||||
| 381 Park Avenue South | $55 | 1910 | 87.8% | 192,000 | 17 | |||||
| 230 Fifth Avenue | N/A | 1915 | 100.0% | 300,000 | 20 | |||||
Range/Wtd Avg/Total(3) | $55-$68 | 94.5% | 2,043,400 | |||||||
| (1) | Reflects current weighted average underwritten office rent at the 261 Fifth Avenue Property. |
| (2) | Based on the rent roll dated July 31, 2015. |
| (3) | Range/Wtd Avg/Total excludes the 261 Fifth Avenue Property. |
| MSBAM 2015-C25 | 261 Fifth Avenue |
Cash Flow Analysis | ||||||||||||
| 2011 | 2012 | 2013 | 2014 | UW | UW PSF | |||||||
| Base Rent | N/A | $15,320,343 | $15,372,196 | $16,747,229 | $18,952,056 | $42.89 | ||||||
| Total Recoveries | N/A | $2,192,866 | $2,363,793 | $2,673,153 | $3,090,171 | $6.99 | ||||||
| Other Income | N/A | $129,659 | $70,161 | $134,271 | $129,484 | $0.29 | ||||||
| Less Vacancy & Credit Loss | N/A | $0 | $0 | $0 | ($1,102,111) | (5.8%) | ||||||
| Effective Gross Income | N/A | $17,642,868 | $17,806,150 | $19,554,653 | $21,069,600 | $47.68 | ||||||
| Total Operating Expenses | N/A | $6,429,045 | $6,862,482 | $7,219,438 | $7,833,728 | $17.73 | ||||||
| Net Operating Income | N/A | $11,213,823 | $10,943,668 | $12,335,215 | $13,235,872 | $29.95 | ||||||
| Capital Expenditures | N/A | $0 | $0 | $0 | $110,481 | $0.25 | ||||||
| TI/LC | N/A | $0 | $0 | $0 | $883,844 | $2.00 | ||||||
| Net Cash Flow | N/A | $11,213,823 | $10,943,668 | $12,335,215 | $12,241,547 | $27.70 | ||||||
| Occupancy % | N/A | 92.8% | 97.8% | 99.3% | 99.7%(1) | |||||||
| NOI DSCR | N/A | 1.39x | 1.36x | 1.53x | 1.64x | |||||||
| NCF DSCR | N/A | 1.39x | 1.36x | 1.53x | 1.52x | |||||||
| NOI Debt Yield | N/A | 6.2% | 6.1% | 6.9% | 7.4% | |||||||
| NCF Debt Yield | N/A | 6.2% | 6.1% | 6.9% | 6.8% | |||||||
| MSBAM 2015-C25 | Roosevelt New Orleans Waldorf Astoria |

| MSBAM 2015-C25 | Roosevelt New Orleans Waldorf Astoria |
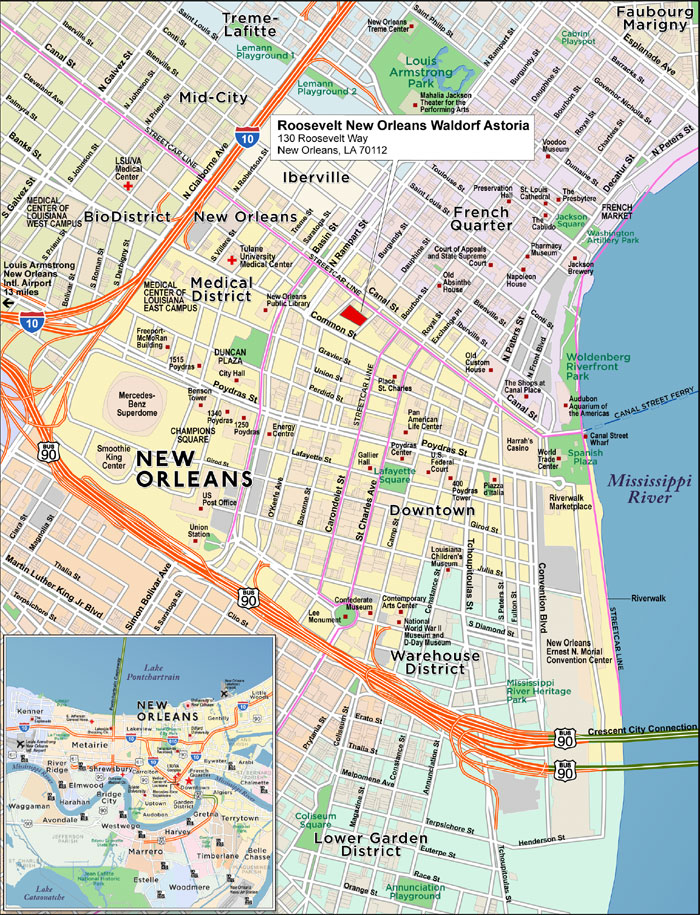
| MSBAM 2015-C25 | Roosevelt New Orleans Waldorf Astoria |
| Mortgage Loan No. 3 – Roosevelt New Orleans Waldorf Astoria |
| Mortgage Loan Information | Mortgaged Property Information | ||||||
| Mortgage Loan Seller: | MSMCH | Single Asset/Portfolio: | Single Asset | ||||
Original Balance(1): | $82,500,000 | Location: | New Orleans, LA 70112 | ||||
Cut-off Date Balance(1): | $82,301,306 | General Property Type: | Hospitality | ||||
| % of Initial Pool Balance: | 7.0% | Detailed Property Type: | Full Service | ||||
| Loan Purpose: | Refinance | Title Vesting: | Fee/Leasehold(3) | ||||
| Sponsor: | AVR Realty Company; Allan V. Rose | Year Built/Renovated: | 1893/2009 | ||||
| Mortgage Rate: | 4.710% | Size: | 504 Rooms | ||||
| Note Date: | 7/17/2015 | Cut-off Date Balance per Unit(1): | $326,592 | ||||
| First Payment Date: | 9/6/2015 | Maturity Date Balance per Unit(1): | $267,235 | ||||
| Maturity Date: | 8/6/2025 | Property Manager: | Waldorf=Astoria Management LLC | ||||
| Original Term to Maturity: | 120 months | ||||||
| Original Amortization Term: | 360 months | Underwriting and Financial Information | |||||
| IO Period: | 0 months | UW NOI: | $20,406,572 | ||||
| Seasoning: | 2 months | UW NOI Debt Yield(1): | 12.4% | ||||
| Prepayment Provisions: | LO (26); DEF (90); O (4) | UW NOI Debt Yield at Maturity(1): | 15.2% | ||||
| Lockbox/Cash Mgmt Status: | Springing/Springing | UW NCF DSCR(1): | 1.70x | ||||
| Additional Debt Type: | Pari Passu | Most Recent NOI: | $20,789,255 (5/31/2015 TTM) | ||||
| Additional Debt Balance: | $82,301,306 | 2nd Most Recent NOI: | $19,900,744 (12/31/2014) | ||||
| Future Debt Permitted (Type): | No (N/A) | 3rd Most Recent NOI: | $18,195,197 (12/31/2013) | ||||
Reserves(2) | Most Recent Occupancy: | 74.4% (5/31/2015) | |||||
Type | Initial | Monthly | Cap | 2nd Most Recent Occupancy: | 72.6% (12/31/2014) | ||
| RE Tax: | $0 | Springing | N/A | 3rd Most Recent Occupancy: | 71.0% (12/31/2013) | ||
| Insurance: | $0 | Springing | N/A | Appraised Value (as of): | $255,700,000 (1/19/2015) | ||
| Recurring Replacements: | $0 | Springing | N/A | Cut-off Date LTV Ratio(1): | 64.4% | ||
| Ground Rent Reserve: | $212,103 | Springing | N/A | Maturity Date LTV Ratio(1): | 52.7% | ||
| Sources and Uses | |||||||
| Sources | Proceeds | % of Total | Uses | Proceeds | % of Total | ||
| Loan Amount: | $165,000,000 | 100.0% | Loan Payoff: | $68,396,315 | 41.5% | ||
| Reserves: | $212,103 | 0.1% | |||||
| Closing Costs: | $2,208,524 | 1.3% | |||||
| Return of Equity: | $94,183,058 | 57.1% | |||||
| Total Sources: | $165,000,000 | 100.0% | Total Uses: | $165,000,000 | 100.0% | ||
| (1) | The Roosevelt New Orleans Waldorf Astoria Mortgage Loan is part of the Roosevelt New Orleans Waldorf Astoria Non-Serviced Loan Combination, which is comprised of three pari passu notes with an aggregate original principal balance of $165,000,000. The Cut-off Date Balance per Unit, Maturity Date Balance per Unit, UW NOI Debt Yield, UW NOI Debt Yield at Maturity, UW NCF DSCR, Cut-off Date LTV Ratio and Maturity Date LTV Ratio presented above are based on the aggregate pari passu note balance. |
| (2) | See “—Escrows and Reserves” below for further discussion of reserve requirements. |
| (3) | A portion of the Roosevelt New Orleans Waldorf Astoria Property known as The Annex is subject to a ground lease as described under “—The Property” section below. |
| MSBAM 2015-C25 | Roosevelt New Orleans Waldorf Astoria |
| Historical Occupancy, ADR, RevPAR | ||||||||||
Competitive Set | Roosevelt New Orleans Waldorf Astoria | Penetration Factor | ||||||||
| Year | Occupancy | ADR | RevPAR | Occupancy | ADR | RevPAR | Occupancy | ADR | RevPAR | |
| 2012 | 74.5% | $195.33 | $145.60 | 71.9% | $224.05 | $161.01 | 96.4% | 114.7% | 110.6% | |
| 2013 | 72.3% | $211.78 | $153.04 | 71.0% | $244.69 | $173.66 | 98.2% | 115.5% | 113.5% | |
| 2014 | 74.0% | $220.82 | $163.41 | 72.6% | $250.74 | $181.94 | 98.1% | 113.6% | 111.3% | |
| 5/31/2015 TTM | 74.8% | $224.77 | $168.12 | 74.4% | $248.52 | $184.93 | 99.5% | 110.6% | 110.0% | |
Competitive Property Summary | |||||||||||
| Property Name | No. of Rooms | Year Built | Meeting Space (SF) | Leisure | Meeting & Group | Commercial | 2014 Occupancy | 2014 ADR | 2014 RevPAR | ||
| The Roosevelt New Orleans | 504 | 1893 | 55,381 | 36% | 48% | 16% | 72.6% | $250.74 | $181.94 | ||
| Hotel Monteleone New Orleans | 570 | 1886 | 23,669 | 50% | 40% | 10% | 75.0% | $226.00 | $169.50 | ||
| Omni Royal Orleans | 345 | 1968 | 12,067 | 60% | 25% | 15% | 80.0% | $220.00 | $175.34 | ||
| Ritz-Carlton New Orleans | 527 | 2000 | 34,732 | 35% | 50% | 15% | 72.0% | $290.00 | $208.80 | ||
| Royal Sonesta New Orleans | 482 | 1969 | 19,212 | 60% | 25% | 15% | 77.0% | $208.00 | $160.16 | ||
| Windsor Court | 316 | 1984 | 9,424 | 50% | 30% | 20% | 75.0% | $301.00 | $225.75 | ||
| MSBAM 2015-C25 | Roosevelt New Orleans Waldorf Astoria |
| Cash Flow Analysis | ||||||||||||||||
| 2010 | 2011 | 2012 | 2013 | 2014 | 5/31/2015 TTM | UW | UW per Room | |||||||||
| Occupancy | 63.9% | 70.1% | 71.9% | 71.0% | 72.6% | 74.4% | 74.4% | |||||||||
| ADR | $183.66 | $208.15 | $224.05 | $244.69 | $250.74 | $248.52 | $248.52 | |||||||||
| RevPAR | $117.30 | $145.82 | $161.01 | $173.66 | $181.94 | $184.93 | $184.93 | |||||||||
| Rooms Revenue | $21,579,856 | $26,824,727 | $29,700,625 | $31,947,385 | $33,470,120 | $34,019,996 | $34,019,996 | $67,500 | ||||||||
| Food & Beverage | $11,599,345 | $15,406,441 | $15,037,143 | $16,999,100 | $18,989,513 | $21,200,143 | $20,337,170 | $40,352 | ||||||||
| Other Income | $3,380,902 | $3,702,216 | $4,826,417 | $4,618,764 | $4,991,409 | $5,013,924 | $5,070,115 | $10,060 | ||||||||
| Total Revenue | $36,560,103 | $45,933,384 | $49,564,185 | $53,565,249 | $57,451,042 | $60,234,063 | $59,427,281 | $117,911 | ||||||||
| Total Expenses | $28,599,850 | $32,395,381 | $33,723,593 | $35,370,052 | $37,550,298 | $39,444,808 | $39,020,709 | $77,422 | ||||||||
| Net Op. Income | $7,960,253 | $13,538,003 | $15,840,592 | $18,195,197 | $19,900,744 | $20,789,255 | $20,406,572 | $40,489 | ||||||||
| FF&E | $1,462,404 | $2,296,669 | $2,478,209 | $2,678,262 | $2,872,552 | $3,011,703 | $2,971,364 | $5,896 | ||||||||
| Net Cash Flow | $6,497,849 | $11,241,334 | $13,362,383 | $15,516,935 | $17,028,192 | $17,777,552 | $17,435,208 | $34,594 | ||||||||
| NOI DSCR | 0.77x | 1.32x | 1.54x | 1.77x | 1.94x | 2.02x | 1.98x | |||||||||
| NCF DSCR | 0.63x | 1.09x | 1.30x | 1.51x | 1.66x | 1.73x | 1.70x | |||||||||
| NOI Debt Yield | 4.8% | 8.2% | 9.6% | 11.0% | 12.1% | 12.6% | 12.4% | |||||||||
| NCF Debt Yield | 3.9% | 6.8% | 8.1% | 9.4% | 10.3% | 10.8% | 10.6% | |||||||||
| (i) | commence upon the cash management bank receiving notice from the lender that an event of default under the Roosevelt New Orleans Waldorf Astoria Mortgage Loan has occurred and continue until the date the cash management bank receives notice from the lender that the lender has accepted a cure of the related event of default under the Roosevelt New Orleans Waldorf Astoria Mortgage Loan, or |
| (ii) | commence upon the cash management bank receiving notice from the lender that the DSCR on the Roosevelt New Orleans Waldorf Astoria Non-Serviced Loan Combination has fallen below 1.15x for two consecutive calendar quarters, calculated on a trailing 12-month basis, and continue until the date the cash management bank receives notice from the lender that the DSCR on the Roosevelt New Orleans Waldorf Astoria Non-Serviced Loan Combination has been equal to or greater than 1.20x for two consecutive calendar quarters, calculated on a trailing 12-month basis. |
| MSBAM 2015-C25 | Roosevelt New Orleans Waldorf Astoria |
| (1) | upon the commencement of a Cash Sweep Event Period, and provided that there is no Escrow Sweep Period then in effect, the Roosevelt New Orleans Waldorf Astoria Borrower will cause (and Waldorf has agreed pursuant to the cash management agreement to deposit) the monthly owner distribution of income (after Waldorf pays all property expenses (including, without limitation, taxes, insurance, ground rent and debt service), reserves (including FF&E) and other items permitted or required under the Management Agreement) to which the Roosevelt New Orleans Waldorf Astoria Borrower is entitled, to be deposited into the lockbox account, and |
| (2) | upon the commencement of an Escrow Sweep Period, a springing hard lockbox is in place with respect to the Roosevelt New Orleans Waldorf Astoria Mortgage Loan (i.e. upon the commencement of an Escrow Sweep Period, the Roosevelt New Orleans Waldorf Astoria Borrower has agreed to establish and maintain a hard lockbox into which all income will be deposited following the commencement of such Escrow Sweep Period). |
| MSBAM 2015-C25 | Coastal Equities Retail Portfolio |
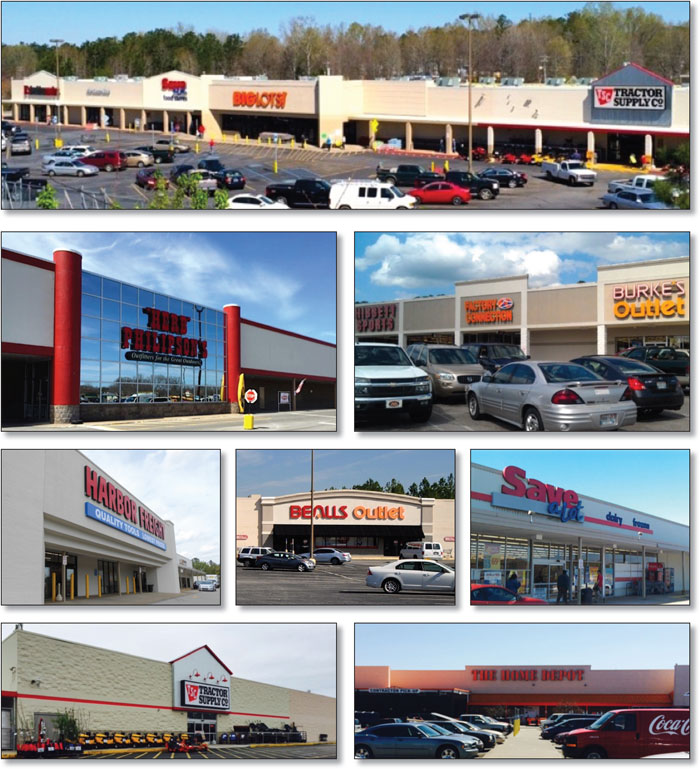
| MSBAM 2015-C25 | Coastal Equities Retail Portfolio |
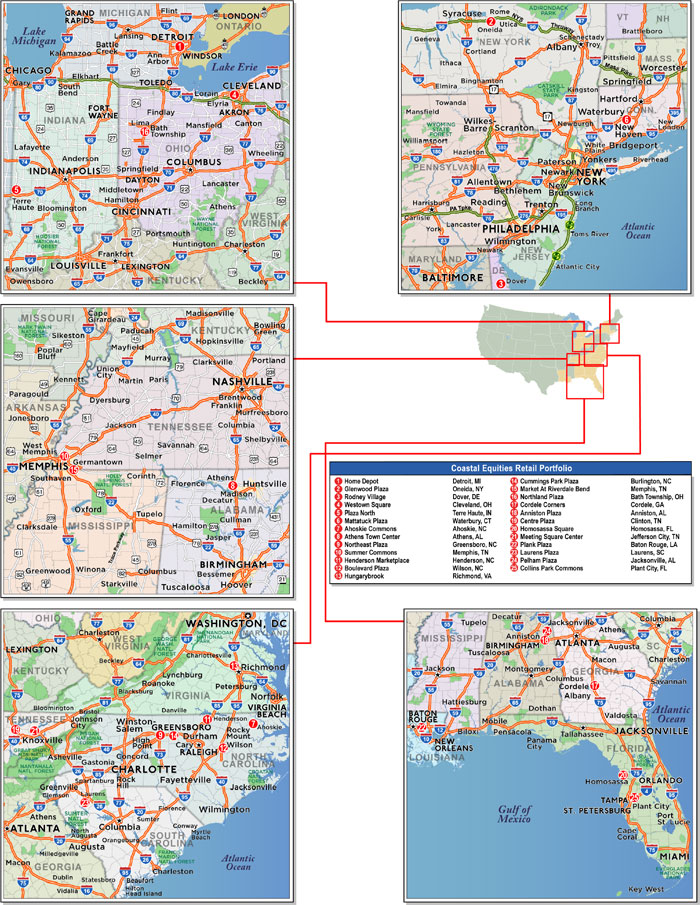
| MSBAM 2015-C25 | Coastal Equities Retail Portfolio |
| Mortgage Loan No. 4 – Coastal Equities Retail Portfolio |
| Mortgage Loan Information | Mortgaged Property Information(4) | ||||||
| Mortgage Loan Seller: | MSMCH | Single Asset/Portfolio: | Portfolio | ||||
Original Balance(1): | $60,000,000 | Location: | Various | ||||
Cut-off Date Balance(1): | $60,000,000 | General Property Type: | Retail | ||||
| % of Initial Pool Balance: | 5.1% | Detailed Property Type: | Anchored/Unanchored/Freestanding | ||||
| Loan Purpose: | Refinance | Title Vesting: | Fee | ||||
| Sponsor: | EH Scott, LLC | Year Built/Renovated: | Various | ||||
| Mortgage Rate: | 4.605% | Size: | 3,458,225 SF | ||||
| Note Date: | 6/9/2015 | Cut-off Date Balance per Unit(1): | $49 | ||||
| First Payment Date: | 8/1/2015 | Maturity Date Balance per Unit(1): | $44 | ||||
| Maturity Date: | 7/1/2025 | Property Manager: | EH Scott, LLC (borrower related) | ||||
| Original Term to Maturity: | 120 months | ||||||
| Original Amortization Term: | 360 months | Underwriting and Financial Information(4) | |||||
| IO Period: | 48 months | UW NOI: | $17,127,145 | ||||
| Seasoning: | 3 months | UW NOI Debt Yield(1): | 10.1% | ||||
Prepayment Provisions(2): | LO (27); DEF (86); O (7) | UW NOI Debt Yield at Maturity(1): | 11.3% | ||||
| Lockbox/Cash Mgmt Status: | Springing/Springing | UW NCF DSCR(1): | 1.96x (IO) 1.48x (P&I) | ||||
| Additional Debt Type: | Pari Passu | Most Recent NOI: | $18,055,385 (3/31/2015 TTM) | ||||
| Additional Debt Balance: | $109,000,000 | 2nd Most Recent NOI: | $17,731,254 (12/31/2014) | ||||
| Future Debt Permitted (Type): | No (N/A) | 3rd Most Recent NOI: | $17,353,008 (12/31/2013) | ||||
Reserves(3) | Most Recent Occupancy: | 92.2% (5/1/2015-5/21/2015) | |||||
Type | Initial | Monthly | Cap | 2nd Most Recent Occupancy: | 92.0% (12/31/2014) | ||
| RE Tax: | $930,865 | $186,173 | N/A | 3rd Most Recent Occupancy: | 90.5% (12/31/2013) | ||
| Insurance: | $0 | Springing | N/A | Appraised Value (as of)(5): | $233,250,000 | ||
| Deferred Maintenance: | $3,380,981 | $0 | N/A | Cut-off Date LTV Ratio(1): | 72.5% | ||
| Recurring Replacements: | $0 | $52,916 | N/A | Maturity Date LTV Ratio(1): | 65.2% | ||
| TI/LC: | $2,000,000 | Springing | $1,500,000 | ||||
| Other: | $1,222,250 | $0 | N/A | ||||
| Sources and Uses | ||||||
| Sources | Proceeds | % of Total | Uses | Proceeds | % of Total | |
Loan Amount(1): | $169,000,000 | 100.0% | Loan Payoff: | $115,316,891 | 68.2% | |
| Reserves: | $7,534,096 | 4.5% | ||||
Closing Costs(6): | $2,306,526 | 1.4% | ||||
| Return of Equity: | $43,842,487 | 25.9% | ||||
| Total Sources: | $169,000,000 | 100.0% | Total Uses: | $169,000,000 | 100.0% | |
| (1) | The Coastal Equities Retail Portfolio Mortgage Loan is part of the Coastal Equities Retail Portfolio Non-Serviced Loan Combination, which is comprised of 10 pari passu notes with an aggregate Cut-off Date principal balance of $169,000,000. The Cut-off Date Balance per Unit, Maturity Date Balance per Unit, UW NOI Debt Yield, UW NOI Debt Yield at Maturity, UW NCF DSCR, Cut-off Date LTV Ratio and Maturity Date LTV Ratio numbers presented above are based on the aggregate principal balance of the promissory notes comprising the Coastal Equities Retail Portfolio Non-Serviced Loan Combination. |
| (2) | Defeasance is permitted at any time on or after the earlier of (a) the end of the two-year period commencing on the closing date of the securitization of the last Coastal Equities Retail Portfolio promissory note to be securitized and (b) January 1, 2019. |
| (3) | See “—Escrows and Reserves” below for further discussion of reserve requirements. |
| (4) | Mortgaged Property Information and Underwriting and Financial Information are based on a combination or sum of all 25 retail centers that comprise the Coastal Equities Retail Portfolio Property. |
| (5) | The appraised value represents the “portfolio value” conclusion. The sum of the values on a stand-alone basis is $222,450,000. The Cut-off Date LTV Ratio and Maturity Date LTV Ratio based on the appraised value on a stand-alone basis are 76.0% and 68.3%, respectively. There are no collateral partial release provisions within the terms of the Coastal Equities Retail Portfolio Mortgage Loan. |
| (6) | Closing costs include approximately $548,457 of real estate taxes paid at loan closing. |
| MSBAM 2015-C25 | Coastal Equities Retail Portfolio |
| Property Summary | ||||||||
| Property | Location | Size (SF) | Occ. % | Allocated Cut-off Date Loan Amount(1) | % of Allocated Loan Amount | Year Built/ Renovated | Appraised Value(2) | |
| Home Depot | Detroit, MI | 139,056 | 100.0% | $15,000,000 | 8.9% | 1998/2002 | $20,184,592 | |
| Glenwood Plaza | Oneida, NY | 219,211 | 93.6% | $12,700,000 | 7.5% | 1989/N/A | $20,866,150 | |
| Rodney Village | Dover, DE | 211,299 | 100.0% | $12,600,000 | 7.5% | 1994/N/A | $15,728,254 | |
| Westown Square | Cleveland, OH | 176,722 | 99.1% | $12,300,000 | 7.3% | 1987/N/A | $16,671,949 | |
| Plaza North | Terre Haute, IN | 269,671 | 93.1% | $11,800,000 | 7.0% | 1965;1997/N/A | $14,260,283 | |
| Mattatuck Plaza | Waterbury, CT | 146,930 | 86.3% | $11,000,000 | 6.5% | 1978/2009 | $14,889,413 | |
| Ahoskie Commons | Ahoskie, NC | 193,557 | 93.3% | $8,600,000 | 5.1% | 1992/N/A | $10,957,350 | |
| Athens Town Center | Athens, AL | 209,124 | 95.4% | $8,000,000 | 4.7% | 1988/N/A | $11,271,915 | |
| Northeast Plaza | Greensboro, NC | 110,956 | 95.4% | $8,000,000 | 4.7% | 1959/2000 | $10,590,357 | |
| Summer Commons | Memphis, TN | 139,785 | 96.4% | $6,600,000 | 3.9% | 1974/2008 | $9,541,807 | |
| Henderson Marketplace | Henderson, NC | 89,100 | 94.0% | $6,500,000 | 3.8% | 1991/N/A | $8,702,967 | |
| Boulevard Plaza | Wilson, NC | 110,841 | 77.8% | $6,200,000 | 3.7% | 1965/N/A | $7,785,486 | |
| Hungarybrook | Richmond, VA | 87,190 | 96.5% | $6,000,000 | 3.6% | 1988/N/A | $9,227,242 | |
| Cummings Park Plaza | Burlington, NC | 199,011 | 79.5% | $5,500,000 | 3.3% | 1963/N/A | $6,972,859 | |
| Market At Riverdale Bend | Memphis, TN | 157,695 | 100.0% | $5,000,000 | 3.0% | 1998/N/A | $7,339,852 | |
| Northland Plaza | Bath Township, OH | 168,864 | 80.8% | $4,700,000 | 2.8% | 1960/N/A | $5,871,881 | |
| Cordele Corners | Cordele, GA | 120,868 | 73.7% | $4,600,000 | 2.7% | 1986/N/A | $7,025,287 | |
| Anniston Plaza | Anniston, AL | 159,565 | 99.2% | $4,200,000 | 2.5% | 1965/N/A | $6,501,011 | |
| Centre Plaza | Clinton, TN | 100,442 | 82.6% | $4,000,000 | 2.4% | 1989/N/A | $6,291,301 | |
| Homosassa Square | Homosassa, FL | 85,448 | 80.0% | $4,000,000 | 2.4% | 1981/N/A | $5,871,881 | |
| Meeting Square Center | Jefferson City, TN | 92,845 | 100.0% | $3,000,000 | 1.8% | 1984/N/A | $4,613,621 | |
| Plank Plaza | Baton Rouge, LA | 62,141 | 100.0% | $2,700,000 | 1.6% | 1987/N/A | $3,355,361 | |
| Laurens Plaza | Laurens, SC | 97,946 | 96.8% | $2,500,000 | 1.5% | 1989/N/A | $3,276,719 | |
| Pelham Plaza | Jacksonville, AL | 72,500 | 95.2% | $2,000,000 | 1.2% | 1974/N/A | $3,171,864 | |
| Collins Park Commons | Plant City, FL | 37,458 | 97.3% | $1,500,000 | 0.9% | 1989/N/A | $2,280,597 | |
| Total/Wtd. Avg. | 3,458,225 | 92.2% | $169,000,000 | 100.0% | $233,250,000 | |||
| (1) | The Allocated Cut-off Date Loan Amount represents the allocated loan amount for the entire Coastal Equities Retail Portfolio Non-Serviced Loan Combination balance. |
| (2) | The appraised values are based on the “portfolio value” conclusion. |
| MSBAM 2015-C25 | Coastal Equities Retail Portfolio |
| MSBAM 2015-C25 | Coastal Equities Retail Portfolio |
| Coastal Equities Retail Portfolio Tenant Summary | |||||||||
| Tenant Name | Credit Rating (Fitch/Moody’s /S&P)(1) | Total Tenant SF | Approximate % of SF | Annual UW Rent | % of Total Annual UW Rent | Annual UW Rent PSF | Lease Expiration | Center/2014 | Sales PSF |
| Top 10 Portfolio Tenants | |||||||||
| Big Lots | NR/NR/BBB- | 183,297 | 5% | $742,273 | 4% | $4.05 | 1/31/2017 1/31/2016 1/31/2018 6/30/2019 1/31/2018 1/31/2017 | Terre Haute: Laurens: Oneida: Athens: Anniston: Waterbury: | $ 93 N/A $ 90 $ 83 $ 95 $126 |
| Tractor Supply | NR/NR/NR | 142,983 | 4% | $671,883 | 3% | $4.70 | 6/30/2023 12/31/2018 11/30/2020 1/31/2018 6/30/2020 | Athens: Cordele: Plant City: Jefferson City: Laurens: | $140 N/A N/A N/A N/A |
| Home Depot | A/A2/A | 139,056 | 4% | $1,317,595 | 7% | $9.48 | 11/30/2023 | $280 | |
| Save-A-Lot | B/B3/B+ | 126,439 | 4% | $627,554 | 3% | $4.96 | 12/31/2017 1/31/2021 11/30/2016 2/29/2020 11/30/2017 7/31/2020 12/31/2017 11/30/2017 | Henderson: Athens: Laurens: Cleveland: Memphis: Anniston: Terre Haute: Memphis: | N/A N/A N/A N/A N/A N/A $397 N/A |
| Food Lion | NR/Baa3/NR | 100,826 | 3% | $487,889 | 2% | $4.84 | 11/15/2024 3/22/2017 9/30/2020 | Richmond: Ahoskie: Burlington: | $259 $291 $292 |
Dollar Tree(2) | NR/Ba2/BB | 81,355 | 2% | $584,815 | 3% | $7.19 | 5/31/2025 8/31/2019 6/30/2017 1/31/2018 5/31/2019 2/28/2018 6/30/2019 | Greensboro: Waterbury: Oneida: Memphis: Richmond: Clinton: Cordele: | N/A N/A N/A N/A N/A N/A N/A |
| Habitat For Humanity | NR/NR/NR | 75,532 | 2% | $245,480 | 1% | $3.25 | 10/31/2025 | N/A | |
| Goodwill | NR/NR/NR | 70,024 | 2% | $460,949 | 2% | $6.58 | 6/30/2023 12/31/2022 12/31/2017 10/31/2022 | Memphis: Dover: Clinton: Jefferson City: | N/A N/A N/A N/A |
| Harbor Freight | NR/Baa3/BB- | 67,183 | 2% | $460,390 | 2% | $6.85 | 1/31/2020 1/5/2025 1/15/2023 3/31/2016 | Terre Haute: Anniston: Waterbury: Dover: | N/A N/A N/A N/A |
Family Dollar(2) | NR/Ba1/BBB- | 55,324 | 2% | $440,215 | 2% | $7.96 | 3/31/2024 12/31/2020 12/31/2018 12/31/2015 12/31/2019 12/31/2018 | Cleveland: Wilson: Dover: Henderson: Terre Haute: Bath Township: | $187 $91 $149 $100 N/A $88 |
| Subtotal/Wtd. Avg. | 1,042,019 | 30% | $6,039,042 | 30% | $5.80 | ||||
| Other Tenants | 1,988,630 | 58% | $14,069,043 | 70% | $7.07 | ||||
| Vacant Space | 427,576 | 12% | $0 | 0% | $0.00 | ||||
| Total/Wtd. Avg. | 3,458,225 | 100% | $20,108,085 | 100% | $6.64 | ||||
| (1) | Certain ratings are those of the parent company whether or not the parent guarantees the lease. |
| (2) | Dollar Tree and Family Dollar merged in July 2015. The Family Dollar Total Tenant SF excludes a 13,239 SF lease that expired on June 30, 2015. |
| MSBAM 2015-C25 | Coastal Equities Retail Portfolio |
Lease Rollover Schedule(1)(2) | ||||||||
| Year | No. of Leases Rolling | SF Rolling | UW Rent PSF Rolling(3) | Approx. % of Total SF Rolling | Approx. Cumulative % of SF Rolling | Total UW Rent Rolling(3) | Approx. % of Total Rent Rolling | Approx. Cumulative % of Total Rent Rolling |
| MTM | 6 | 24,765 | $7.63 | 1% | 1% | $188,912 | 1% | 1% |
2015(4) | 19 | 54,923 | $8.77 | 2% | 2% | $481,490 | 2% | 3% |
| 2016 | 65 | 330,796 | $5.95 | 10% | 12% | $1,968,342 | 10% | 13% |
| 2017 | 69 | 549,395 | $6.40 | 16% | 28% | $3,517,348 | 17% | 31% |
| 2018 | 54 | 552,734 | $5.71 | 16% | 44% | $3,154,406 | 16% | 46% |
| 2019 | 50 | 325,467 | $7.08 | 9% | 53% | $2,303,775 | 11% | 58% |
| 2020 | 29 | 337,480 | $6.66 | 10% | 63% | $2,247,796 | 11% | 69% |
| 2021 | 13 | 88,726 | $10.05 | 3% | 65% | $891,820 | 4% | 73% |
| 2022 | 8 | 149,617 | $7.54 | 4% | 70% | $1,128,489 | 6% | 79% |
| 2023 | 16 | 325,594 | $7.66 | 9% | 79% | $2,492,515 | 12% | 91% |
| 2024 | 10 | 82,178 | $7.31 | 2% | 82% | $601,086 | 3% | 94% |
| 2025 | 10 | 173,474 | $5.61 | 5% | 87% | $972,358 | 5% | 99% |
| 2026 | 1 | 35,500 | $4.50 | 1% | 88% | $159,750 | 1% | 100% |
| 2027 & Beyond | 0 | 0 | $0.00 | 0% | 88% | $0 | 0% | 100% |
| Vacant | 0 | 427,576 | $0.00 | 12% | 100% | $0 | 0% | 100% |
| Total/Wtd. Avg. | 350 | 3,458,225 | $6.63 | 100% | $20,108,085 | 100% | ||
| (1) | Information is based on the underwritten rent roll as of the August 1, 2015 Cut-off Date for the MSBAM 2015-C24 securitization trust. |
| (2) | Certain tenants may have lease termination options that are exercisable prior to the originally stated expiration date of the subject lease and that are not considered in the lease rollover schedule. |
| (3) | UW Rent PSF Rolling and Total UW Rent Rolling exclude vacant space. |
| (4) | With respect to the leases expiring in 2015, six leases expire between August and October of 2015. The three leases expiring on August 31, 2015, totaling 11,475 SF, have each been renewed for one to three years. The two leases expiring on September 30, 2015, totaling 1,200 SF, are anticipated by the Coastal Equities Retail Portfolio Borrower to be renewed. One lease expiring on October 31, 2015, totaling 8,000 SF, will not be renewed, and will remaining on a month-to-month basis until a replacement tenant is found. |
| MSBAM 2015-C25 | Coastal Equities Retail Portfolio |
| Market Summaries | |||||
| Property | Address | Allocated Cut- off Date Loan Amount(1) | Estimated 2015 Population (five‑mile radius) | Estimated Average 2015 Household Income (five‑mile radius) | Average Submarket Retail Vacancy |
| Home Depot | 18700 Meyers Road, Detroit, MI | $15,000,000 | 406,174 | $49,226 | 11.8% |
| Glenwood Plaza | 1 Glenwood Avenue, Oneida, NY | $12,700,000 | 31,823 | $62,678 | 5.7% |
| Rodney Village | 1612 South Governors Avenue, Dover, DE | $12,600,000 | 76,689 | $67,563 | 7.5% |
| Westown Square | 10604 Lorain Avenue, Cleveland, OH | $12,300,000 | 308,727 | $51,502 | 5.0% |
| Plaza North | 1800 Fort Harrison Road, Terre Haute, IN | $11,800,000 | 69,478 | $53,392 | 6.9% |
| Mattatuck Plaza | 650 & 670 Wolcott Street, Waterbury, CT | $11,000,000 | 158,693 | $66,467 | 8.7% |
| Ahoskie Commons | 1430 East Memorial Drive, Ahoskie, NC | $8,600,000 | 10,561 | $44,536 | 5.1% |
| Athens Town Center | 601 US Highway 72 W, Athens, AL | $8,000,000 | 30,837 | $65,394 | 3.4% |
| Northeast Plaza | 1000 Summit Avenue, Greensboro, NC | $8,000,000 | 168,388 | $51,957 | 8.7% |
| Summer Commons | 5100-5130 Summer Avenue, Memphis, TN | $6,600,000 | 208,510 | $65,452 | 12.0% |
| Henderson Marketplace | 901 S. Beckford Drive, Henderson, NC | $6,500,000 | 27,229 | $47,402 | 2.6% |
| Boulevard Plaza | 1301 Ward Boulevard, Wilson, NC | $6,200,000 | 54,519 | $47,954 | 7.6% |
| Hungarybrook | 1200 Concord Avenue, Richmond, VA | $6,000,000 | 158,056 | $71,326 | 3.9% |
| Cummings Park Plaza | 2278 North Church Street, Burlington, NC | $5,500,000 | 74,783 | $47,911 | 4.3% |
| Market At Riverdale Bend | 7110 Winchester Road, Memphis, TN | $5,000,000 | 190,193 | $75,297 | 16.3% |
| Northland Plaza | 100 W. Northern Avenue, Bath Township, OH | $4,700,000 | 64,474 | $48,521 | 9.6% |
| Cordele Corners | 1407 E. 16th Avenue, Cordele, GA | $4,600,000 | 17,320 | $46,997 | 10.6% |
| Anniston Plaza | 3202 McClellan Boulevard, Anniston, AL | $4,200,000 | 41,062 | $48,353 | 8.8% |
| Centre Plaza | 1115 N. Charles G. Seivers Boulevard, Clinton, TN | $4,000,000 | 23,923 | $52,301 | 12.7% |
| Homosassa Square | 4500 S. Suncoast Boulevard, Homosassa, FL | $4,000,000 | 22,037 | $44,517 | 13.6% |
| Meeting Square Center | 125 W. Broadway, Jefferson City, TN | $3,000,000 | 18,829 | $54,628 | 4.8% |
| Plank Plaza | 5963 Plank Road, Baton Rouge, LA | $2,700,000 | 130,992 | $49,906 | 10.1% |
| Laurens Plaza | 917 East Main Street, Laurens, SC | $2,500,000 | 18,350 | $42,604 | 9.5% |
| Pelham Plaza | 800 Pelham Road South, Jacksonville, AL | $2,000,000 | 22,746 | $49,162 | 3.5% |
| Collins Park Commons | 1803 James L Redman Parkway, Plant City, FL | $1,500,000 | 66,154 | $59,427 | 6.2% |
| Total/Wtd. Avg. | $169,000,000 | 124,568 | $55,827 | 7.8% | |
| (1) | The Allocated Cut-off Date Loan Amount represents the entire allocated loan amount for the entire Coastal Equities Retail Portfolio Non-Serviced Loan Combination principal balance. |
| MSBAM 2015-C25 | Coastal Equities Retail Portfolio |
Cash Flow Analysis(1) | ||||||||||||||
| 2011 | 2012 | 2013 | 2014 | 3/31/2015 TTM | UW | UW PSF | ||||||||
Base Rent(2) | N/A | N/A | $19,763,215 | $20,128,986 | $20,204,630 | $23,140,747 | $6.69 | |||||||
Total Recoveries(3) | N/A | N/A | $3,997,262 | $3,897,974 | $4,135,641 | $4,350,000 | $1.26 | |||||||
| Other Income | N/A | N/A | $7,372 | $680 | $60 | $88,093 | $0.03 | |||||||
| Discounts Concessions | N/A | N/A | $0 | $0 | $0 | $0 | $0.00 | |||||||
Vacancy & Credit Loss(4) | N/A | N/A | $0 | $0 | $0 | ($3,153,046) | ($0.91) | |||||||
| Effective Gross Income | N/A | N/A | $23,767,849 | $24,027,640 | $24,340,330 | $24,425,794 | $7.06 | |||||||
| Total Expenses | N/A | N/A | $6,414,841 | $6,296,386 | $6,284,945 | $7,298,649 | $2.11 | |||||||
| Net Operating Income | N/A | N/A | $17,353,008 | $17,731,254 | $18,055,385 | $17,127,145 | $4.95 | |||||||
| Capital Expenditures | N/A | N/A | $0 | $0 | $0 | $634,996 | $0.18 | |||||||
| TI/LC | N/A | N/A | $2,150 | $0 | $0 | $1,244,961 | $0.36 | |||||||
Initial TI/LC Reserve Offset(5) | N/A | N/A | $0 | $0 | $0 | ($200,000) | ($0.06) | |||||||
| Net Cash Flow | N/A | N/A | $17,350,858 | $17,731,254 | $18,055,385 | $15,447,188 | $4.47 | |||||||
| Occupancy % | N/A | N/A | 90.5% | 92.0% | 92.2% | 86.5% | ||||||||
| NOI DSCR | N/A | N/A | 1.67x | 1.70x | 1.74x | 1.65x | ||||||||
| NCF DSCR | N/A | N/A | 1.67x | 1.70x | 1.74x | 1.48x | ||||||||
| NOI Debt Yield | N/A | N/A | 10.3% | 10.5% | 10.7% | 10.1% | ||||||||
| NCF Debt Yield | N/A | N/A | 10.3% | 10.5% | 10.7% | 9.1% | ||||||||
| (1) | The Coastal Equities Retail Portfolio Borrower added to the Coastal Equities Retail Portfolio Property six new shopping centers in 2012 and two new shopping centers in 2013. Historical financials prior to 2013 do not materially reflect the operations of the complete Coastal Equities Retail Portfolio Property. The 2013 financial information presented above includes only partial-year operations for two of the shopping centers comprising part of the Coastal Equities Retail Portfolio Property (Hungarybrook and Meeting Square Center). |
| (2) | Historical base rent is net of vacancy. Contractual rent steps through May 2016, totaling approximately $217,577, are underwritten. |
| (3) | Total Recoveries are underwritten net of vacancy, and additional vacancy of $145,143 is applied in the Vacancy & Credit Loss line to account for “dark” tenants that are underwritten as vacant. Increased underwritten reimbursements over the TTM reflect the pass-through of higher underwritten expenses. |
| (4) | Vacancy includes actual vacancy as of the May 1, 2015 rent rolls plus assumed vacancy applied to a bankrupt Andy’s Cheesecake tenant and a partially “dark” Walmart store at the Ahoskie Commons center (Walmart is partially subleased to Tractor Supply; however, no rent is underwritten for this space), a Holt Family Restaurant tenant at the Cummings Park Plaza center that is currently under renovation, a vacating Family Dollar tenant at the Anniston Plaza center, a “dark” Cadence Bank branch and a “dark” Kash N’ Karry space at the Homosassa center (Kash N’ Karry left the Florida market in 2013), a “dark” Herbalife tenant at the Hungarybrook center, a vacating Dollar General tenant and a dark Stringfield Memorial Hospital tenant at the Pelham Plaza center, and a closed Radio Shack tenant at the Westown Square center. The tenants referenced in the preceding sentence represent, in the aggregate, approximately 4.5% of the net square footage. Of the $3,153,046 of total underwritten vacancy, $3,007,903 represents base rents and $145,143 represents reimbursements. |
| (5) | The Coastal Equities Retail Portfolio Borrower deposited $2,000,000 into the TI/LC reserve at loan closing. The escrow is utilized as an offset to underwritten TI/LC expenses over the 10-year loan term. |
| (i) | commence upon the occurrence of an event of default under the Coastal Equities Retail Portfolio Mortgage Loan and continue until the date on which the event of default under the Coastal Equities Retail Portfolio Mortgage Loan does not exist, or |
| (ii) | commence upon the date the lender determines that the DSCR on the Coastal Equities Retail Portfolio Non-Serviced Loan Combination has fallen below 1.15x and continue until the date the lender determines that the DSCR on the Coastal Equities Retail Portfolio Non-Serviced Loan Combination has been equal to or greater than 1.25x for the immediately preceding six calendar months. |
| MSBAM 2015-C25 | Coastal Equities Retail Portfolio |
| MSBAM 2015-C25 | Colorado Technology Center Portfolio |
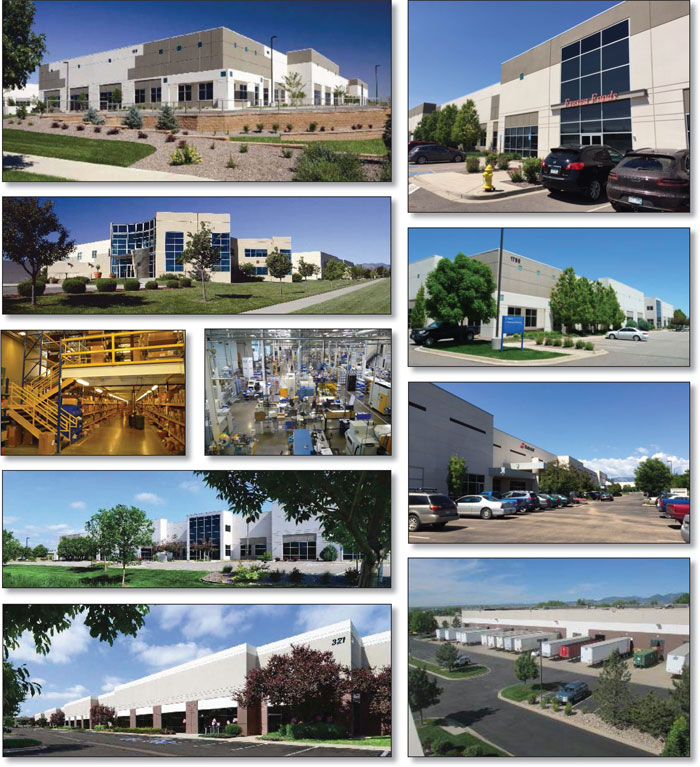
| MSBAM 2015-C25 | Colorado Technology Center Portfolio |
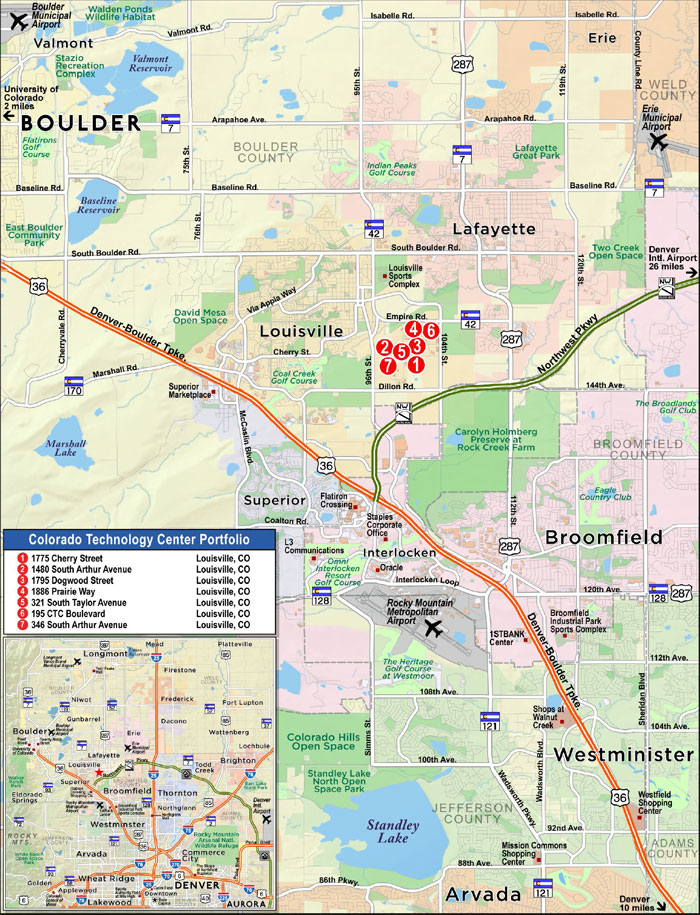
| MSBAM 2015-C25 | Colorado Technology Center Portfolio |
| Mortgage Loan No. 5 – Colorado Technology Center Portfolio |
| Mortgage Loan Information | Mortgaged Property Information(2) | ||||||
| Mortgage Loan Seller: | MSMCH | Single Asset/Portfolio: | Portfolio | ||||
| Original Balance: | $59,050,000 | Location: | Louisville, CO | ||||
| Cut-off Date Balance: | $59,050,000 | General Property Type: | Industrial | ||||
| % of Initial Pool Balance: | 5.0% | Detailed Property Type: | Light Industrial/Flex Industrial | ||||
| Loan Purpose: | Refinance | Title Vesting: | Fee | ||||
| Sponsor: | Bruce H. Etkin; David L. Johnson; Etkin Johnson Real Estate Partners LLC | Year Built/Renovated: | Various | ||||
| Size: | 630,880 SF | ||||||
| Cut-off Date Balance per Unit: | $94 | ||||||
| Mortgage Rate: | 4.640% | Maturity Date Balance per Unit: | $82 | ||||
| Note Date: | 7/10/2015 | Property Manager: | Etkin Johnson Real Estate Partners LLC (borrower related) | ||||
| First Payment Date: | 9/1/2015 | ||||||
| Maturity Date: | 8/1/2025 | ||||||
| Original Term to Maturity: | 120 months | ||||||
| Original Amortization Term: | 360 months | Underwriting and Financial Information(2) | |||||
| IO Period: | 36 months | UW NOI: | $4,807,429 | ||||
| Seasoning: | 2 months | UW NOI Debt Yield: | 8.1% | ||||
| Prepayment Provisions: | LO (26); DEF (90); O (4) | UW NOI Debt Yield at Maturity: | 9.3% | ||||
| Lockbox/Cash Mgmt Status: | Springing/Springing | UW NCF DSCR: | 1.64x (IO) 1.25x (P&I) | ||||
| Additional Debt Type: | N/A | Most Recent NOI: | $3,886,244 (4/30/2015 TTM) | ||||
| Additional Debt Balance: | N/A | 2nd Most Recent NOI: | $3,918,950 (12/31/2014) | ||||
| Future Debt Permitted (Type): | No (N/A) | 3rd Most Recent NOI: | $4,220,732 (12/31/2013) | ||||
Reserves(1) | Most Recent Occupancy: | 97.5% (7/31/2015) | |||||
Type | Initial | Monthly | Cap | 2nd Most Recent Occupancy: | 82.9% (12/31/2014) | ||
| RE Tax: | $317,355 | $105,785 | N/A | 3rd Most Recent Occupancy: | 74.2% (12/31/2013) | ||
| Insurance: | $0 | Springing | N/A | Appraised Value (as of): | $84,500,000 (6/4/2015) | ||
| Recurring Replacements: | $500,000 | $4,167 | N/A | Cut-off Date LTV Ratio: | 69.9% | ||
| Upfront TI/LC: | $1,000,000 | $0 | N/A | Maturity Date LTV Ratio: | 61.5% | ||
| On-going TI/LC: | $0 | $26,297 | $947,000 | ||||
| Other: | $4,784,006 | $0 | N/A | ||||
| Sources and Uses | ||||||
| Sources | Proceeds | % of Total | Uses | Proceeds | % of Total | |
| Loan Amount: | $59,050,000 | 100.0% | Loan Payoff: | $39,845,692 | 67.5% | |
| Reserves: | $6,601,361 | 11.2% | ||||
| Closing Costs: | $783,192 | 1.3% | ||||
| Return of Equity: | $11,819,755 | 20.0% | ||||
| Total Sources: | $59,050,000 | 100.0% | Total Uses: | $59,050,000 | 100.0% | |
| (1) | See “—Escrows and Reserves” below for further discussion of reserve requirements. |
| (2) | Mortgaged Property Information and Underwriting and Financial Information are based on a combination or sum of all seven industrial buildings that comprise the Colorado Technology Center Portfolio Property. |
| MSBAM 2015-C25 | Colorado Technology Center Portfolio |
Property Summary | ||||||||||||
| Property | Allocated Cut-off Date Loan Amount | % of Allocated Loan Amount | Size (SF) | Office/ Lab % | Clear Height (Ft.) | Occ. % | Year Built/ Renovated | Appraised Value | Cut-off Date LTV | UW NCF DSCR | ||
| 1775 Cherry Street | $11,321,000 | 19.2% | 130,182 | 10% | 24 | 100.0% | 2007 | $16,200,000 | 69.9% | 1.57x | ||
| 1480 South Arthur Avenue | $8,875,000 | 15.0% | 92,321 | 31% | 24 | 100.0% | 2000 | $12,700,000 | 69.9% | 1.28x | ||
| 1795 Dogwood Street | $8,735,000 | 14.8% | 109,068 | 38% | 24 | 100.0% | 2006 | $12,500,000 | 69.9% | 1.70x | ||
| 1886 Prairie Way | $8,665,000 | 14.7% | 91,570 | 15% | 24 | 82.9% | (1) | 2000/2014 | $12,400,000 | 69.9% | 1.07x | |
| 321 South Taylor Avenue | $8,595,000 | 14.6% | 77,872 | 48% | 24 | 100.0% | (2) | 1998 | $12,300,000 | 69.9% | 0.31x | |
| 195 Colorado Technology Center Blvd. | $6,709,000 | 11.4% | 65,195 | 9% | 24 | 100.0% | 2008 | $9,600,000 | 69.9% | 1.54x | ||
| 346 South Arthur Avenue | $6,150,000 | 10.4% | 64,672 | 24% | 24 | 100.0% | 2001 | $8,800,000 | 69.9% | 1.24x | ||
| Total/Wtd. Avg. | $59,050,000 | 100.0% | 630,880 | 25% | 24 | $84,500,000 | 69.9% | 1.25x | ||||
| (1) | A 15,671 SF tenant, Fenix Outdoor Import LLC, will vacate its space effective September 30, 2015. This space is classified and underwritten as vacant. |
| (2) | A 35,834 SF tenant, C.R. Bard, Inc., will vacate its space effective March 31, 2016. This space is underwritten as vacant. It is classified as currently occupied and vacating in 2016. |
| 1775 Cherry Street Tenant Summary | |||||||
| Tenant Name | Credit Rating (Fitch/Moody’s/S&P)(1) | Tenant SF | Approximate % of SF | Annual UW Rent | % of Total Annual UW Rent | Annual UW Rent PSF | Lease Expiration |
| Anchor/Major Tenants | |||||||
| Babolat VS North America | NR/NR/NR | 80,612 | 62% | $644,896 | 57% | $8.00 | 7/31/2019 |
| Fresca Foods | NR/NR/NR | 49,570 | 38% | $495,700 | 43% | $10.00 | 12/31/2025 |
| Subtotal/Wtd. Avg. | 130,182 | 100% | $1,140,596 | 100% | $8.76 | ||
| Vacant Space | 0 | 0% | $0 | 0% | $0.00 | ||
| Total/Wtd. Avg. | 130,182 | 100% | $1,140,596 | 100% | $8.76 | ||
| (1) | Certain ratings are those of the parent company whether or not the parent guarantees the lease. |
| MSBAM 2015-C25 | Colorado Technology Center Portfolio |
| 1480 South Arthur Avenue Tenant Summary | |||||||
| Tenant Name | Credit Rating (Fitch/Moody’s/S&P)(1) | Tenant SF | Approximate % of SF | Annual UW Rent | % of Total Annual UW Rent | Annual UW Rent PSF | Lease Expiration |
| Anchor/Major Tenants | |||||||
| Medtronic Navigation, Inc. | NR/NR/NR | 59,463 | 64% | $483,460 | 65% | $8.13 | 6/30/2016 & 5/31/2020(2) |
| Kiosk | NR/NR/NR | 32,858 | 36% | $254,649 | 35% | $7.75 | 10/31/2017 |
| Subtotal/Wtd. Avg. | 92,321 | 100% | $738,109 | 100% | $8.00 | ||
| Vacant Space | 0 | 0% | $0 | 0% | $0.00 | ||
| Total/Wtd. Avg. | 92,321 | 100% | $738,109 | 100% | $8.00 | ||
| (1) | Certain ratings are those of the parent company whether or not the parent guarantees the lease. |
| (2) | The Medtronic Navigation, Inc. space is leased pursuant to three leases. Two leases totaling 44,105 SF and $357,523 of underwritten base rent expire on June 30, 2016 and one lease for 15,358 SF and $125,937 of base rent expires on May 31, 2020. |
| 1795 Dogwood Street Tenant Summary | |||||||
| Tenant Name | Credit Rating (Fitch/Moody’s/S&P)(1) | Tenant SF | Approximate % of SF | Annual UW Rent | % of Total Annual UW Rent | Annual UW Rent PSF | Lease Expiration(2) |
| Anchor/Major Tenants | |||||||
| Graphic Packaging | NR/NR/NR | 51,974 | 48% | $493,753 | 51% | $9.50 | 11/30/2022 |
| LTF Lease Company, LLC | NR/NR/NR | 20,933 | 19% | $146,531 | 15% | $7.00 | 8/31/2020 |
| World Triathlon Corporation | NR/NR/NR | 19,386 | 18% | $155,088 | 16% | $8.00 | 6/30/2020 |
| Intertek Testing Services NA, Inc. | NR/NR/NR | 16,775 | 15% | $165,234 | 17% | $9.85 | 3/31/2020 |
| Subtotal/Wtd. Avg. | 109,068 | 100% | $960,606 | 100% | $8.81 | ||
| Vacant Space | 0 | 0% | $0 | 0% | $0.00 | ||
| Total/Wtd. Avg. | 109,068 | 100% | $960,606 | 100% | $8.81 | ||
| (1) | Certain ratings are those of the parent company whether or not the parent guarantees the lease. |
| (2) | Graphic Packaging has the right to terminate its lease in the 64th month of its lease term (November 2020) upon 12 months’ prior notice and payment of a fee of $375,000 on the date of the notice and an additional $375,000 on the termination date. LTF Lease Company, LLC has the right to terminate its lease at the end of the 50th month of its lease term (September 2019) upon nine months’ prior notice and payment of a $36,000 fee. Intertek Testing Services NA, Inc. has the right to terminate its lease at any time upon nine months’ prior notice and payment of unamortized leasing costs. |
| 1886 Prairie Way Tenant Summary | |||||||
| Tenant Name | Credit Rating (Fitch/Moody’s/S&P) (1) | Tenant SF | Approximate % of SF | Annual UW Rent | % of Total Annual UW Rent | Annual UW Rent PSF | Lease Expiration |
| Anchor/Major Tenants | |||||||
| Trelleborg Sealing Solutions | NR/NR/NR | 75,899 | 83% | $684,609 | 100% | $9.02 | 6/30/2024 |
| Subtotal/Wtd. Avg. | 75,899 | 83% | $684,609 | 100% | $9.02 | ||
Vacant Space(2) | 15,671 | 17% | $0 | 0% | $0.00 | ||
| Total/Wtd. Avg. | 91,570 | 100% | $684,609 | 100% | $9.02 | ||
| (1) | Certain ratings are those of the parent company whether or not the parent guarantees the lease. |
| (2) | A 15,671 tenant, Fenix Outdoor Import LLC, will vacate its space effective September 30, 2015. This space is classified as vacant. |
| 321 South Taylor Avenue Tenant Summary | |||||||
| Tenant Name | Credit Rating (Fitch/Moody’s/S&P) (1) | Tenant SF | Approximate % of SF | Annual UW Rent | % of Total Annual UW Rent | Annual UW Rent PSF | Lease Expiration |
| Anchor/Major Tenants | |||||||
C.R. Bard, Inc.(2) | NR/NR/NR | 35,834 | 46% | $465,842 | 55% | $13.00 | 3/31/2016 |
| C.R. Bard, Inc. | NR/NR/NR | 16,951 | 22% | $161,035 | 19% | $9.50 | 3/31/2021 |
| Zeon Corp. | NR/NR/NR | 15,710 | 20% | $128,822 | 15% | $8.20 | 7/31/2016 |
| Wish Garden Herbs, Inc. | NR/NR/NR | 9,377 | 12% | $94,520 | 11% | $10.08 | 5/31/2019 |
| Subtotal/Wtd. Avg. | 77,872 | 100% | $850,219 | 100% | $10.92 | ||
| Vacant Space | 0 | 0% | $0 | 0% | $0.00 | ||
| Total/Wtd. Avg. | 77,872 | 100% | $850,219 | 100% | $10.92 | ||
| (1) | Certain ratings are those of the parent company whether or not the parent guarantees the lease. |
| (2) | C.R. Bard, Inc. has informed the Colorado Technology Center Portfolio Borrower that it will vacate its 35,834 SF space at the end of its current lease term. A vacancy equal to the tenant’s annual rent and reimbursements is underwritten. |
| MSBAM 2015-C25 | Colorado Technology Center Portfolio |
| 195 CTC Boulevard Tenant Summary | |||||||
| Tenant Name | Credit Rating (Fitch/Moody’s/S&P)(1) | Tenant SF | Approximate % of SF | Annual UW Rent | % of Total Annual UW Rent | Annual UW Rent PSF | Lease Expiration |
| Anchor/Major Tenants | |||||||
| Fresca Foods, Inc. | NR/NR/NR | 65,195 | 100% | $660,398 | 100% | $10.13 | 12/31/2025 |
| Subtotal/Wtd. Avg. | 65,195 | 100% | $660,398 | 100% | $10.13 | ||
| Vacant Space | 0 | 0% | $0 | 0% | $0.00 | ||
| Total/Wtd. Avg. | 65,195 | 100% | $660,398 | 100% | $10.13 | ||
| (1) | Certain ratings are those of the parent company whether or not the parent guarantees the lease. |
| 346 South Arthur Avenue Tenant Summary | |||||||
| Tenant Name | Credit Rating (Fitch/Moody’s/S&P) (1) | Tenant SF | Approximate % of SF | Annual UW Rent | % of Total Annual UW Rent | Annual UW Rent PSF | Lease Expiration |
| Anchor/Major Tenants | |||||||
| Kiosk | NR/NR/NR | 64,672 | 100% | $501,208 | 100% | $7.75 | 10/31/2017 |
| Subtotal/Wtd. Avg. | 64,672 | 100% | $501,208 | 100% | $7.75 | ||
| Vacant Space | 0 | 0% | $0 | 0% | $0.00 | ||
| Total/Wtd. Avg. | 64,672 | 100% | $501,208 | 100% | $7.75 | ||
| (1) | Certain ratings are those of the parent company whether or not the parent guarantees the lease. |
Lease Rollover Schedule(1)(2) | |||||||||
| Year | # of Leases Rolling | SF Rolling | UW Rent PSF Rolling(3) | Approx. % of Total SF Rolling | Approx. Cumulative % of SF Rolling | Total UW Rent Rolling(3) | Approx. % of Total Rent Rolling | Approx. Cumulative % of Total Rent Rolling | |
| MTM | 0 | 0 | $0.00 | 0% | 0% | $0 | 0% | 0% | |
| 2015 | 0 | 0 | $0.00 | 0% | 0% | $0 | 0% | 0% | |
2016(4) | 4 | 95,649 | $9.96 | 15% | 15% | $952,187 | 17% | 17% | |
| 2017 | 2 | 97,530 | $7.75 | 15% | 31% | $755,857 | 14% | 31% | |
| 2018 | 0 | 0 | $0.00 | 0% | 31% | $0 | 0% | 31% | |
| 2019 | 2 | 89,989 | $8.22 | 14% | 45% | $739,416 | 13% | 44% | |
| 2020 | 4 | 72,452 | $8.18 | 11% | 56% | $592,789 | 11% | 55% | |
| 2021 | 1 | 16,951 | $9.50 | 3% | 59% | $161,035 | 3% | 58% | |
| 2022 | 1 | 51,974 | $9.50 | 8% | 67% | $493,753 | 9% | 67% | |
| 2023 | 0 | 0 | $0.00 | 0% | 67% | $0 | 0% | 67% | |
| 2024 | 1 | 75,899 | $9.02 | 12% | 79% | $684,609 | 12% | 79% | |
| 2025 | 2 | 114,765 | $10.07 | 18% | 98% | $1,156,098 | 21% | 100% | |
| 2026 & Beyond | 0 | 0 | $0.00 | 0% | 98% | $0 | 0% | 100% | |
Vacant(5) | 0 | 15,671 | $0.00 | 2% | 100% | $0 | 0% | 100% | |
| Total/Wtd. Avg. | 17 | 630,880 | $9.00 | 100% | $5,535,745 | 100% | |||
| (1) | Information is based on the underwritten rent roll. |
| (2) | Certain tenants may have lease termination options that are exercisable prior to the originally stated expiration date of the subject lease and that are not considered in the lease rollover schedule. |
| (3) | UW Rent PSF Rolling and Total UW Rent Rolling exclude vacant space. |
| (4) | A 35,834 SF tenant, C.R. Bard, Inc., with a March 31, 2016 lease expiration date and a base rental payment of $465,050 per year has informed the Colorado Technology Center Portfolio Borrower that it intends to vacant its space at lease expiration. This space is underwritten as vacant. |
| (5) | A 15,671 SF tenant, Fenix Outdoor Import LLC, will vacate its space effective September 30, 2015. This space is classified as vacant. |
| MSBAM 2015-C25 | Colorado Technology Center Portfolio |
| Comparable Property Summary | ||||||||||||||||
| Property Name/Address | Property Size (SF) | Year Built | Occ. | Clear Height (Ft.) | % Office | % Air Cond. | Tenant Name | Lease Size (SF) | Lease Date | Lease Term (Yrs.) | Rent PSF/Yr. | TIs | ||||
1886 Prairie Way Louisville, CO | 91,570 | 2000 | 100% | 24 | 15% | 15% | Trelleborg Sealing | 75,899 | Apr-14 | 10.3 | $8.50 | $1.15 | ||||
321 South Taylor Avenue Louisville, CO | 77,872 | 1998 | 100% | 24 | 48% | 100% | Wish Garden Herbs, Inc. | 9,377 | Apr-14 | 5.0 | $9.50 | $10.00 | ||||
1480 South Arthur Avenue Louisville, CO | 92,576 | 2001 | 100% | 24 | 24% | 100% | Medtronic Navigation | 15,358 | Jun-15 | 5.0 | $8.00 | $0.00 | ||||
1795 Dogwood Street Louisville, CO | 109,068 | 2007 | 100% | 24 | 38% | 100% | World Triathlon Lifetime Fitness Graphic Packaging | 19,386 20,933 51,974 | Jul-15 Jul-15 Jun-15 | 5.0 5.2 7.3 | $8.00 $7.00 $9.50 | $8.00 $4.67 $30.67 | ||||
2000 Cherry Street Louisville, CO | 59,137 | 2015 | 100% | 24 | 15% | 15% | Packers Plus Energy Services | 59,137 | Oct-15 | 5.0 | $10.25 | $15.00 | ||||
1775 Cherry Street Louisville, CO | 130,182 | 2008 | 100% | 24 | 10% | 10% | Babolat | 80,612 | Jan-16 | 3.6 | $8.00 | $3.10 | ||||
Cash Flow Analysis(1) | |||||||||||||||||
| 2010 | 2011 | 2012 | 2013 | 2014 | 4/30/2015 TTM | UW | UW PSF | ||||||||||
Base Rent(2) | $5,582,718 | $5,634,397 | $5,552,310 | $4,808,290 | $4,846,526 | $4,597,214 | $5,672,866 | $8.99 | |||||||||
| Total Recoveries | $2,400,287 | $2,473,858 | $2,537,974 | $2,200,511 | $2,180,675 | $2,233,105 | $2,809,421 | $4.45 | |||||||||
| Other Income | $2,496 | $2,596 | $2,250 | $17,808 | $2,946 | $3,063 | $3,037 | $0.00 | |||||||||
| Discounts Concessions | $0 | $0 | $0 | $0 | $0 | $0 | $0 | $0.00 | |||||||||
| Less Vacancy | $0 | $0 | $0 | $0 | $0 | $0 | ($826,631) | ($1.31) | |||||||||
| Effective Gross Income | $7,985,501 | $8,110,851 | $8,092,534 | $7,026,609 | $7,030,147 | $6,833,382 | $7,658,693 | $12.14 | |||||||||
| Total Expenses | $2,138,803 | $2,184,827 | $2,694,428 | $2,805,877 | $3,111,197 | $2,947,138 | $2,851,264 | $4.52 | |||||||||
| Net Operating Income | $5,846,698 | $5,926,024 | $5,398,106 | $4,220,732 | $3,918,950 | $3,886,244 | $4,807,429 | $7.62 | |||||||||
| Capital Expenditures | $0 | $0 | $0 | $0 | $404,408 | $0 | $79,153 | $0.13 | |||||||||
Capex Reserve Underwriting Offset(3) | $0 | $0 | $0 | $0 | $0 | $0 | ($50,000) | ($0.08) | |||||||||
| TI/LC | $0 | $0 | $0 | $0 | $0 | $0 | $316,355 | $0.50 | |||||||||
TI/LC Reserve Underwriting Offset(3) | $0 | $0 | $0 | $0 | $0 | $0 | ($100,000) | ($0.16) | |||||||||
| Net Cash Flow | $5,846,698 | $5,926,024 | $5,398,106 | $4,220,732 | $3,514,542 | $3,886,244 | $4,561,920 | $7.23 | |||||||||
| Occupancy % | 96.7% | 100.0% | 91.8% | 74.2% | 82.9% | 97.5%(4) | 90.3% | ||||||||||
| NOI DSCR | 1.60x | 1.62x | 1.48x | 1.16x | 1.07x | 1.06x | 1.32x | ||||||||||
| NCF DSCR | 1.60x | 1.62x | 1.48x | 1.16x | 0.96x | 1.06x | 1.25x | ||||||||||
| NOI Debt Yield | 9.9% | 10.0% | 9.1% | 7.1% | 6.6% | 6.6% | 8.1% | ||||||||||
| NCF Debt Yield | 9.9% | 10.0% | 9.1% | 7.1% | 6.0% | 6.6% | 7.7% | ||||||||||
| (1) | Three tenants at the Colorado Technology Portfolio Property vacated their spaces in 2012, 2013 and 2014. Lockheed Martin vacated 51,974 SF in 2012 due to a cancelled government contract. Ventiv Health vacated 59,718 SF in 2013 and NetDevil vacated 40,319 SF in 2014 when Lego purchased the company. These spaces were re-leased to Graphic Packing in 2015, Medtronic Navigation in 2013, 2014 and 2015 and LTF Lease Company and World Triathlon Corporation in 2015, respectively. |
| (2) | Contractual rent steps totaling approximately $137,121 are included in the underwritten base rent. |
| (3) | The Colorado Technology Portfolio Borrower deposited $500,000 into the capex reserve and $1,000,000 into the TI/LC reserve at loan closing. The escrows are utilized as offsets to the underwritten capex and TI/LC expenses over the 10-year loan term. |
| (4) | Occupancy as of July 31, 2015. |
| MSBAM 2015-C25 | Colorado Technology Center Portfolio |
| (i) | commence upon the occurrence of an event of default under the Colorado Technology Center Portfolio Mortgage Loan and continue until the date on which the event of default under the Colorado Technology Center Portfolio Mortgage Loan is cured, |
| (ii) | commence upon the date the DSCR on the Colorado Technology Center Portfolio Mortgage Loan is less than 1.07x for six consecutive calendar months and continue until the date the DSCR on the Colorado Technology Center Portfolio Mortgage Loan has been equal to or greater than 1.17x for six consecutive calendar months, |
| (iii) | commence upon the date any tenant under a Major Lease (as defined below) files for bankruptcy or becomes involved in an insolvency proceeding and continue until such filing has been dismissed or if adjudicated a bankrupt or insolvent such tenant has emerged from bankruptcy or insolvency, assumed the Major Lease and delivered to the lender an estoppel certificate reasonably acceptable to the lender, |
| (iv) | commence upon the date any Major Lease is terminated or cancelled (including any rejection of a Major Lease in a bankruptcy or similar proceeding) and continue until the space occupied by the applicable tenant is re-leased to one or more replacement tenants reasonably satisfactory to the lender on terms and conditions reasonably satisfactory to the lender, and such replacement tenants have taken possession of the premises, opened for business and commenced paying full unabated rent, as evidenced by an estoppel certificate reasonably acceptable to the lender, or |
| (v) | commence upon the date a tenant under a Major Lease vacates or otherwise fails to occupy its premises and continue until (x) the space occupied by the applicable tenant is re-leased to one or more replacement tenants reasonably satisfactory to the lender on terms and conditions reasonably satisfactory to the lender, and such replacement tenants have taken possession of the premises, opened for business and commenced paying rent, as evidenced by an estoppel certificate reasonably acceptable to the lender, or (y) the tenant under the Major Lease has re-opened to the public for business at the Colorado Technology Center Portfolio Property in substantially all of the leased premises and delivered to the lender an estoppel certificate reasonably acceptable to the lender. |
| MSBAM 2015-C25 | Colorado Technology Center Portfolio |
| (i) | the Colorado Technology Center Portfolio Borrower defeases the Colorado Technology Center Portfolio Mortgage Loan with U.S. government securities in a principal amount equal to 115% of the allocated loan amount with respect to the applicable individual property, which is the subject of the release, which allocated loan amount initially equals the amount set forth in the right hand column below with respect to each individual property set forth in the left hand column below: |
| Property Name | Allocated Loan Amount | |
| 1775 Cherry Street | $11,321,000 | |
| 1480 South Arthur Avenue | $8,875,000 | |
| 1795 Dogwood Street | $8,735,000 | |
| 1886 Prairie Way | $8,665,000 | |
| 321 South Taylor Avenue | $8,595,000 | |
| 195 Colorado Technology Center Blvd. | $6,709,000 | |
| 346 South Arthur Avenue | $6,150,000 |
| (ii) | as of the date of consummation of the individual property release and partial defeasance event, after giving effect to the release of the lien encumbering the applicable property, with respect to the remaining Colorado Technology Center Portfolio Property, (a) the LTV ratio with respect to the remaining properties will be no greater than the lesser of 69.9% and the LTV ratio of all the Colorado Technology Center Portfolio Property immediately prior to the release and partial defeasance event (as determined based upon updated appraisals), (b) the DSCR with respect to the remaining properties will be greater than the greater of the DSCR immediately prior to the release and partial defeasance event and 1.25x and (c) the debt yield of the remaining properties will be greater than the greater of the debt yield immediately prior to the release and partial defeasance event and 7.726%, and |
| (iii) | the Colorado Technology Center Portfolio Borrower delivers a rating agency confirmation with respect to such individual property release and partial defeasance event. |
| MSBAM 2015-C25 | Villas at Dorsey Ridge |
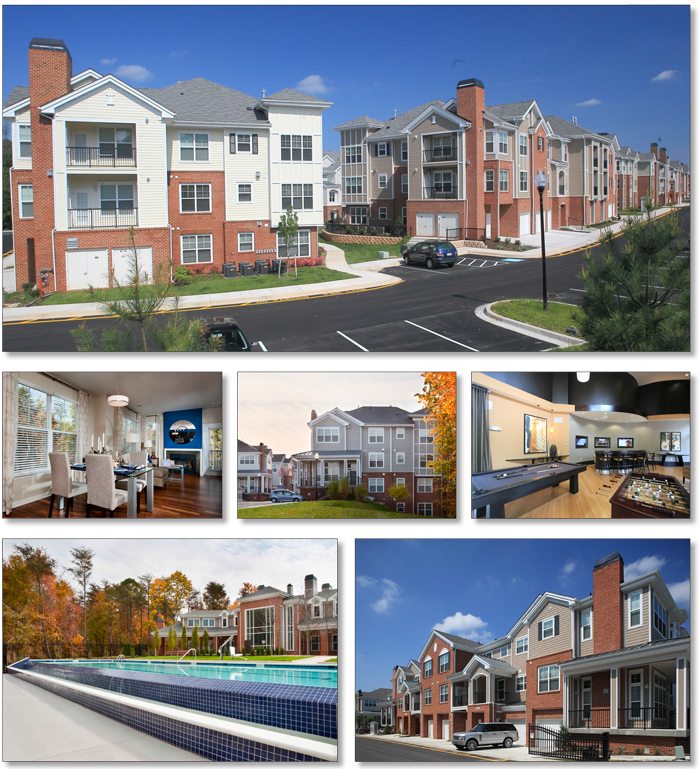
| MSBAM 2015-C25 | Villas at Dorsey Ridge |

| MSBAM 2015-C25 | Villas at Dorsey Ridge |
| Mortgage Loan No. 6 – Villas at Dorsey Ridge |
| Mortgage Loan Information | Mortgaged Property Information | ||||||
| Mortgage Loan Seller: | MSMCH | Single Asset/Portfolio: | Single Asset | ||||
| Original Balance: | $54,440,000 | Location: | Hanover, MD 21076 | ||||
| Cut-off Date Balance: | $54,440,000 | General Property Type: | Multifamily | ||||
| % of Initial Pool Balance: | 4.6% | Detailed Property Type: | Garden | ||||
| Loan Purpose: | Refinance | Title Vesting: | Fee | ||||
| Sponsor: | Stephen M. Gorn; John B. Colvin | Year Built/Renovated: | 2013/N/A | ||||
| Mortgage Rate: | 4.370% | Size: | 238 Units | ||||
| Note Date: | 6/19/2015 | Cut-off Date Balance per Unit: | $228,739 | ||||
| First Payment Date: | 8/1/2015 | Maturity Date Balance per Unit: | $209,258 | ||||
| Maturity Date: | 7/1/2025 | Property Manager: | Questar Management LLC (borrower related) | ||||
| Original Term to Maturity: | 120 months | ||||||
| Original Amortization Term: | 360 months | Underwriting and Financial Information | |||||
| IO Period: | 60 months | UW NOI: | $3,958,810 | ||||
| Seasoning: | 3 months | UW NOI Debt Yield: | 7.3% | ||||
| Prepayment Provisions: | LO (27); DEF (89); O (4) | UW NOI Debt Yield at Maturity: | 7.9% | ||||
| Lockbox/Cash Mgmt Status: | Springing/Springing | UW NCF DSCR: | 1.62x (IO) 1.20x (P&I) | ||||
| Additional Debt Type: | N/A | Most Recent NOI: | $2,269,672 (6/30/2015 TTM) | ||||
| Additional Debt Balance: | N/A | 2nd Most Recent NOI: | $1,650,373 (12/31/2014) | ||||
| Future Debt Permitted (Type): | Yes (Mezzanine) | 3rd Most Recent NOI: | N/A | ||||
Reserves(1) | Most Recent Occupancy: | 97.9% (6/14/2015) | |||||
Type | Initial | Monthly | Cap | 2nd Most Recent Occupancy(2): | 89.9% (4/30/2015) | ||
| RE Tax: | $35,516 | $35,516 | N/A | 3rd Most Recent Occupancy (2): | 83.6% (12/31/2014) | ||
| Insurance: | $0 | Springing | N/A | Appraised Value (as of): | $76,800,000 (4/3/2015) | ||
| Recurring Replacements: | $0 | Springing | $178,524 | Cut-off Date LTV Ratio: | 70.9% | ||
| Maturity Date LTV Ratio: | 64.8% | ||||||
| Sources and Uses | ||||||
| Sources | Proceeds | % of Total | Uses | Proceeds | % of Total | |
| Loan Amount: | $54,440,000 | 100.0% | First Mortgage: | $39,316,689 | 72.2% | |
| Reserves: | $35,516 | 0.1% | ||||
Closing Costs(3): | $2,410,265 | 4.4% | ||||
| Return of Equity: | $12,677,530 | 23.3% | ||||
| Total Sources: | $54,440,000 | 100.0% | Total Uses: | $54,440,000 | 100.0% | |
| (1) | See “—Escrows and Reserves” below for further discussion of reserve requirements. |
| (2) | The Villas at Dorsey Ridge Property was constructed in 2012-2013 and reached 90.8% occupancy in March 2015. |
| (3) | Closing costs include $505,629 of real estate tax payments and insurance premiums paid at loan closing. |
| MSBAM 2015-C25 | Villas at Dorsey Ridge |
| Unit Mix | |||
| Apartment Type | Number of Units | Avg. Size (SF) | Rent Range |
| One Bedroom/One Bath | 124 | 774 | $1,584-$1,821 |
Two Bedroom/Two Bath(1) | 108 | 1,175 | $2,050-$2,939 |
| Three Bedroom/Two Bath | 6 | 1,415 | $2,705 |
| (1) | Ten two-bedroom units contain 2.5 bathrooms. |
| Occupancy Trend | ||||||||||||||
| 2014 | 2015 | |||||||||||||
| JUN | JUL | AUG | SEP | OCT | NOV | DEC | JAN | FEB | MAR | APR | MAY | JUN 15TH | ||
| Percentage Occupied | 73.9 | 75.6 | 76.5 | 79.4 | 83.6 | 83.2 | 83.6 | 86.6 | 89.1 | 90.8 | 89.9 | 89.9 | 92.0 | |
| Percentage Leased | 84.5 | 84.0 | 85.3 | 86.1 | 89.9 | 90.8 | 90.3 | 89.9 | 93.7 | 94.1 | 94.5 | 95.8 | 99.1 | |
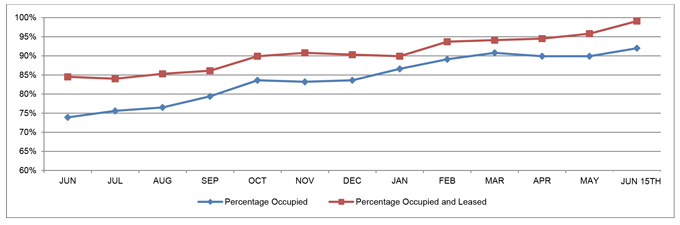
| MSBAM 2015-C25 | Villas at Dorsey Ridge |
| Competitive Property Summary | |||||||
| Property Name/Address | Year Built | Units | Occupancy | Unit Type | Unit Size (SF) | Quoted Rent per Month | Concessions |
Flats 170 at Academy Yard 8313 Telegraph Road Odenton, MD | 2013 | 369 | 96% | 1BR/1 2BR/2 BA 2BR/2 BA 3BR/2 BA | 716 - 923 1,077 - 1,098 1,274 - 1,286 1,372 - 1,372 | $1,557 - $1,776 $1,869 - $1,913 $1,826 - $1,958 $2,166 - $2,374 | None |
Beacon at Waugh Chapel 1433 S. Main Chapel Way Gambrills, MD | 2013 | 298 | 93% | 1BR/1 2BR/2 BA 3BR/2 BA | 707 - 800 1,037 - 1,158 1,217 - 1,217 | $1,680 - $1,770 $1,913 - $2,186 $2,390 - $2,417 | None |
Arbors at Arundel Preserve 2109 Piney Branch Circle Hanover, MD | 2007 | 496 | 95% | 1BR/1 2BR/2 BA 2BR/2 BA 3BR/2 BA | 681 - 757 964 - 989 1,090 - 1,192 1,324 - 1,324 | $1,338 - $1,518 $1,533 - $1,820 $1,722 - $1,843 $2,205 - $2,458 | None |
Palisades at Arundel Preserve 7694 Dorchester Boulevard Hanover, MD | 2013 | 330 | 96% | Studio 1BR/1 BA 1BR/1 BA 2BR/2 BA 2BR/1.5 BA TH 2BR/2.5 BA TH | 546 - 655 618 - 753 804 - 890 1,062 - 1,164 1,307 - 1,396 1,461 - 1,461 | $1,485 - $1,635 $1,715 - $1,860 $1,835 - $1,935 $2,305 - $2,605 $2,900 - $2,960 $3,000 - $3,000 | None |
Residences at Arundel Preserve 7789 Arundel Mills Boulevard Hanover, MD | 2011 | 242 | 95% | Studio 1BR/1 1BR/1 Den 2BR/2 BA 2BR/2 BA 2BR/2 BA Den | 489 - 530 740 - 861 938 - 938 1,050 - 1,152 1,230 - 1,311 1,407 - 1,479 | $1,400 - $1,495 $1,660 - $1,830 $1,900 - $2,010 $2,130 - $2,190 $2,390 - $2,555 $2,355 - $2,490 | None |
Verde at Howard Square 7500 Hearthside Way Elkridge, MD | 2014 | 299 | 95% | 1BR/1 1BR/1 Loft 2BR/2 BA 2BR/2 BA Loft 2BR/2 BA Den 2BR/2 BA Den + Loft | 688 - 842 822 - 932 984 - 1,190 1,214 - 1,341 1,160 - 1,284 1,357 - 1,591 | $1,385 - $1,560 $1,545 - $1,685 $1,695 - $1,920 $1,895 - $2,010 $1,835 - $1,920 $2,110 - $2,170 | None(1) |
| (1) | The mortgage loan seller has informed the depositor concessions equal to one month of rent are available on new leases at the Verde at Howard Square property. |
Cash Flow Analysis(1) | ||||||||||||||
| 2011 | 2012 | 2013 | 2014 | 6/30/2015 TTM | UW | UW Per Unit | ||||||||
| Base Rent | N/A | N/A | N/A | $5,582,328 | $5,516,801 | $5,461,068 | $22,945.66 | |||||||
Other Income(2) | N/A | N/A | N/A | $293,408 | $348,515 | $422,896 | $1,776.87 | |||||||
Discounts/Concessions(3) | N/A | N/A | N/A | ($338,279) | ($268,520) | $0 | $0.00 | |||||||
| Less Vacancy & Credit Loss | N/A | N/A | N/A | ($1,613,312) | ($954,663) | ($273,053) | ($1,147.28) | |||||||
| Effective Gross Income | N/A | N/A | N/A | $3,924,145 | $4,642,133 | $5,610,911 | $23,575.25 | |||||||
Total Expenses(4) | N/A | N/A | N/A | $2,273,772 | $2,372,461 | $1,652,100 | $6,941.60 | |||||||
| Net Operating Income | N/A | N/A | N/A | $1,650,373 | $2,269,672 | $3,958,810 | $16,633.66 | |||||||
| Capital Expenditures | N/A | N/A | N/A | $0 | $0 | $47,600 | $200.00 | |||||||
| TI/LC | N/A | N/A | N/A | $0 | $0 | $0 | $0.00 | |||||||
| Net Cash Flow | N/A | N/A | N/A | $1,650,373 | $2,269,672 | $3,911,210 | $16,433.66 | |||||||
| Occupancy % | N/A | N/A | N/A | 83.6% | 97.9%(5) | 95.0% | ||||||||
| NOI DSCR | N/A | N/A | N/A | 0.51x | 0.70x | 1.21x | ||||||||
| NCF DSCR | N/A | N/A | N/A | 0.51x | 0.70x | 1.20x | ||||||||
| NOI Debt Yield | N/A | N/A | N/A | 3.0% | 4.2% | 7.3% | ||||||||
| NCF Debt Yield | N/A | N/A | N/A | 3.0% | 4.2% | 7.2% | ||||||||
| (1) | The Villas at Dorsey Ridge Property was constructed in 2012- 2013 and reached a stabilized occupancy in March 2015; therefore, historical operating data is limited. |
| (2) | Other income includes parking garage income, storage income, internet and cable income, utility reimbursement income and various fees and charges. The appraiser and the Villas at Dorsey Ridge Borrower’s budget assume $422,896 and $449,858, respectively of other income. |
| (3) | Concessions, generally in an amount equal to one month of rent, were offered during the initial lease-up period. In March 2015, when a 90.8% occupancy rate was achieved, concessions were discontinued. |
| (4) | Total expenses are underwritten based on the appraisal estimates and the Villas at Dorsey Ridge Borrower’s budget. Total underwritten annual expenses of approximately $6,942 per apartment compare to an expense comparable range of $5,046 to $7,825 per unit. The appraiser’s concluded annual expense per unit for year one is $6,563 per apartment. The 2014 and 6/30/2015 TTM expenses included significant lease up costs that are not on-going. For example, marketing expenses associated with those two periods totaled $529,711 and $597,164, respectively. The underwritten marketing expense is $85,968, which is based on the Villas at Dorsey Ridge Borrower’s budget. The payroll expense is based on the appraiser’s estimate of $299,880, or $1,260 per apartment, while the 2014 and 6/30/2015 TTM payroll expenses were $338,366 and $344,996, respectively, and included lease-up and move-in costs. |
| (5) | The 6/30/2015 TTM Occupancy % is based on the June 14, 2015 rent roll. |
| MSBAM 2015-C25 | Villas at Dorsey Ridge |
| (i) | commence upon the occurrence of an event of default under the Villas at Dorsey Ridge Mortgage Loan and continue until the date on which the event of default under the Villas at Dorsey Ridge Mortgage Loan does not exist, or |
| (ii) | commence upon, from and after June 19, 2018, the date the lender determines that the debt service coverage ratio on the Villas at Dorsey Ridge Mortgage Loan (based solely on the Mortgage Loan balance) has fallen below 1.05x for six consecutive calendar months and continue until the date the lender determines that the debt service coverage ratio on the Villas at Dorsey Ridge Mortgage Loan has been equal to or greater than 1.15x for the immediately preceding six calendar months. |
| MSBAM 2015-C25 | Commerce Office Park |
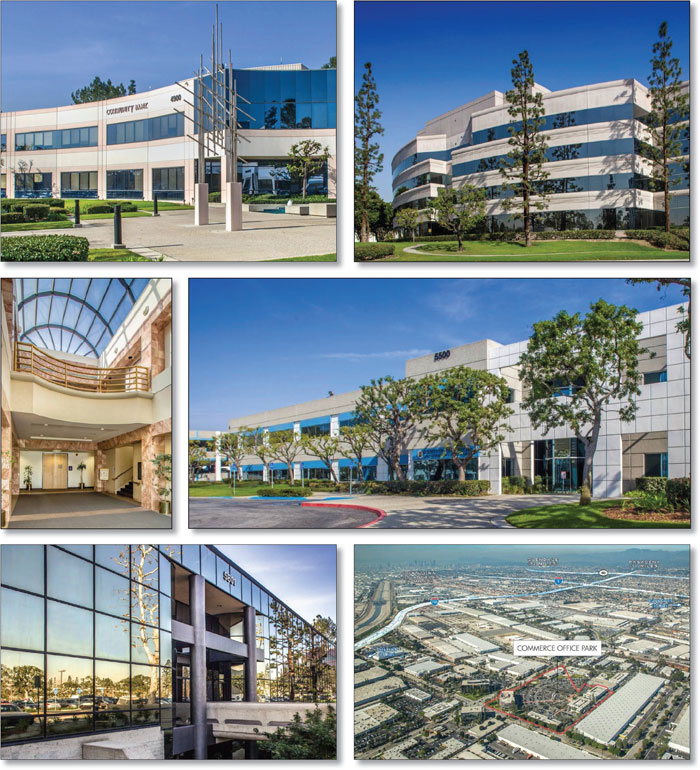
| MSBAM 2015-C25 | Commerce Office Park |
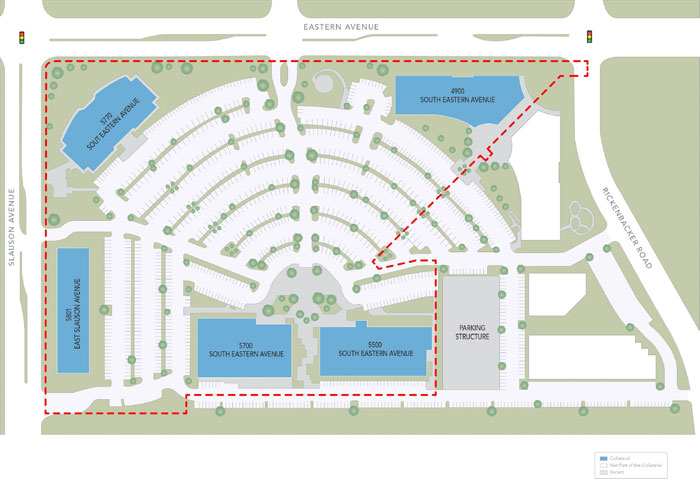
| MSBAM 2015-C25 | Commerce Office Park |

| MSBAM 2015-C25 | Commerce Office Park |
| Mortgage Loan No. 7 – Commerce Office Park |
| Mortgage Loan Information | Mortgaged Property Information | ||||||
| Mortgage Loan Seller: | BANA | Single Asset/Portfolio: | Single Asset | ||||
| Original Balance: | $50,000,000 | Location: | Commerce, CA 90040 | ||||
| Cut-off Date Balance: | $50,000,000 | General Property Type: | Office | ||||
| % of Initial Pool Balance: | 4.2% | Detailed Property Type: | Suburban | ||||
| Loan Purpose: | Refinance | Title Vesting: | Fee | ||||
| Sponsor: | Omninet Capital, LLC | Year Built/Renovated: | 1958/2004 | ||||
| Mortgage Rate: | 4.4015% | Size: | 281,142 SF | ||||
| Note Date: | 7/31/2015 | Cut-off Date Balance per Unit: | $178 | ||||
| First Payment Date: | 9/1/2015 | Maturity Date Balance per Unit: | $163 | ||||
| Maturity Date: | 8/1/2025 | Property Manager: | Omninet Property Management, Inc. | ||||
| Original Term to Maturity: | 120 months | ||||||
| Original Amortization Term: | 360 months | Underwriting and Financial Information | |||||
| IO Period: | 60 months | UW NOI: | $4,488,818 | ||||
| Seasoning: | 2 months | UW NOI Debt Yield: | 9.0% | ||||
| Prepayment Provisions: | LO (26); DEF (87); O (7) | UW NOI Debt Yield at Maturity: | 9.8% | ||||
| Lockbox/Cash Mgmt Status: | Hard/Springing | UW NCF DSCR: | 1.84x (IO) 1.36x (P&I) | ||||
| Additional Debt Type: | N/A | Most Recent NOI: | $5,051,618 (12/31/2014) | ||||
| Additional Debt Balance: | N/A | 2nd Most Recent NOI: | $4,810,185 (12/31/2013) | ||||
| Future Debt Permitted (Type): | No (N/A) | 3rd Most Recent NOI: | $4,633,961 (12/31/2012) | ||||
Reserves(1) | Most Recent Occupancy(2): | 100.0% (7/30/2015) | |||||
Type | Initial | Monthly | Cap | 2nd Most Recent Occupancy: | 86.5% (12/31/2014) | ||
| RE Tax: | $178,489 | $44,622 | N/A | 3rd Most Recent Occupancy: | 91.5% (12/31/2013) | ||
| Insurance: | $0 | Springing | N/A | Appraised Value (as of)(3): | $67,200,000 (4/10/2015) | ||
| Recurring Replacements: | $0 | $9,371 | N/A | Cut-off Date LTV Ratio: | 74.4% | ||
| TI/LC: | $0 | $25,000 | $1,200,000 | Maturity Date LTV Ratio(3): | 68.1% | ||
| Landlord Obligations: | $13,099,209 | $0 | N/A | ||||
| Sources and Uses | ||||||
| Sources | Proceeds | % of Total | Uses | Proceeds | % of Total | |
| Loan Amount: | $50,000,000 | 100.0% | Loan Payoff: | $31,686,967 | 63.4% | |
| Reserves: | $13,277,698 | 26.6% | ||||
| Closing Costs: | $1,701,355 | 3.4% | ||||
| Return of Equity: | $3,333,980 | 6.7% | ||||
| Total Sources: | $50,000,000 | 100.0% | Total Uses: | $50,000,000 | 100.0% | |
| (1) | See “—Escrows and Reserves” below for further discussion of reserve requirements. |
| (2) | The Commerce Office Park Property is 100% leased as of July 30, 2015. The largest tenant, County of Los Angeles, Department of Child Support Services (“DCS”) has signed leases to expand into 39,130 SF of additional space. Upon completion of the respective tenant improvements, DCS will occupy the expansion space and the Commerce Office Park Property will be 100% occupied. |
| (3) | The Commerce Office Park Property has an “as-stabilized” appraised value of $81,200,000 as of August 1, 2016 assuming a stabilized occupancy of 95%. This “as-stabilized” value results in a Maturity Date LTV Ratio of 56.4%. |
| MSBAM 2015-C25 | Commerce Office Park |
Tenant Summary(1) | ||||||||
| Tenant Name | Credit Rating (Fitch/ Moody’s/S&P)(2) | Tenant SF(3) | Approx. % of SF | Annual UW Rent | % of Total Annual UW Rent | Annual UW Rent PSF(4) | Lease Expiration(5) | |
| Major Tenants | ||||||||
| County of Los Angeles, Dept. of Child Support Services | AA/Aa2/AA+ | 163,598 | 58% | $4,122,670 | 58% | $25.20 | Various(6) | |
| State of California, Department of Justice | A+/Aa3/AA- | 62,723 | 22% | $1,723,837 | 24% | $27.48 | 11/30/2023 | |
| County of Los Angeles, Sheriff’s Dept. | AA/Aa2/AA+ | 38,936 | 14% | $897,268 | 13% | $23.04 | 12/31/2016 | |
| State of California, Department of Motor Vehicles | A+/Aa3/AA- | 8,630 | 3% | $262,255 | 4% | $30.39 | 9/30/2019 | |
| Community Bank | NR/NR/NR | 4,752 | 2% | $114,533 | 2% | $24.10 | 10/31/2019 | |
| FedEx Office and Print Services, Inc. | NR/Baa1/BBB | 1,328 | 0% | $32,629 | 0% | $24.57 | 2/29/2020 | |
| Total/Wtd. Avg. | 281,142 | 100% | $7,153,191 | 100% | $25.55 | |||
| (1) | Information is based on the underwritten rent roll. |
| (2) | Certain ratings are those of the parent company whether or not the parent guarantees the lease. |
| (3) | Total Tenant SF includes a management office, which occupies 1,175 SF. |
| (4) | Wtd. Avg. Annual UW Rent PSF excludes a management office, which occupies 1,175 SF. |
| (5) | County of Los Angeles, Department of Child Support Services has termination options for its space in buildings 5770 and 5801 (114,804 SF) with 180 days’ notice beginning June 2024. State of California, Department of Justice has termination options on its leases with 60 days’ notice beginning November 2019. County of Los Angeles, Sheriff’s Dept. has a termination option with 120 days’ notice. State of California, Department of Motor Vehicles has a termination option with 30 days’ notice. |
| (6) | The County of Los Angeles, Dept. of Child Support Services has leases expiring 11/30/2025 (39,991 SF) and 6/30/2026 (84,477 SF). Leases on the expansion spaces totaling 39,130 SF will expire ten years past the commencement dates, which will be determined upon completion of the related tenant improvements. |
| MSBAM 2015-C25 | Commerce Office Park |
Lease Rollover Schedule(1)(2)(3) | ||||||||
| Year | # of Leases Rolling | SF Rolling(4) | UW Rent PSF Rolling(5) | Approx. % of Total SF Rolling | Approx. Cumulative % of SF Rolling | Total UW Rent Rolling | Approx. % of Total Rent Rolling | Approx. Cumulative % of Total Rent Rolling |
| 2015 | 0 | 0 | $0.00 | 0% | 0% | $0 | 0% | 0% |
| 2016 | 1 | 38,936 | $23.04 | 14% | 14% | $897,268 | 13% | 13% |
| 2017 | 0 | 0 | $0.00 | 0% | 14% | $0 | 0% | 13% |
| 2018 | 0 | 0 | $0.00 | 0% | 14% | $0 | 0% | 13% |
| 2019 | 2 | 13,382 | $28.16 | 5% | 19% | $376,788 | 5% | 18% |
| 2020 | 1 | 1,328 | $24.57 | 0% | 19% | $32,629 | 0% | 18% |
| 2021 | 0 | 0 | $0.00 | 0% | 19% | $0 | 0% | 18% |
| 2022 | 0 | 0 | $0.00 | 0% | 19% | $0 | 0% | 18% |
| 2023 | 2 | 62,723 | $27.48 | 22% | 41% | $1,723,837 | 24% | 42% |
| 2024 | 0 | 0 | $0.00 | 0% | 41% | $0 | 0% | 42% |
2025(6) | 1 | 39,991 | $25.20 | 14% | 56% | $1,007,773 | 14% | 56% |
2026 and Beyond(6) | 4 | 123,607 | $25.20 | 44% | 100% | $3,114,896 | 44% | 100% |
| Total/Wtd. Avg. | 11 | 281,142 | $25.55 | 100% | $7,153,191 | 100% | ||
| (1) | Information is based on the underwritten rent roll. |
| (2) | Certain tenants may have lease termination options that are exercisable prior to the originally stated expiration date of the subject lease and that are not considered in the lease rollover schedule. |
| (3) | Certain tenants may have multiple leases that are individually represented in the lease rollover schedule. |
| (4) | Total SF Rolling includes a management office, which occupies 1,175 SF |
| (5) | Wtd. Avg. UW Rent PSF Rolling excludes a management office, which occupies 1,175 SF. |
| (6) | The County of Los Angeles, Dept. of Child Support Services has a total of five leases, including leases expiring 11/30/2025 (39,991 SF) and 6/30/2026 (84,477 SF). Three leases on expansion spaces totaling 39,130 SF will expire ten years past the commencement dates, which will be determined upon completion of the related tenant improvements. |
Competitive Property Summary | ||||||||||
| Property Name/Location | Year Built | Occ. | Total GLA (SF) | Distance from Subject | Tenant Name | Lease Date/ Term | Lease Area (SF) | Base Rent PSF | TI Allowance ($/SF) | |
Town Center 10330 Pioneer Blvd Santa Fe Springs, CA | 1983 | 62% | 69,228 | 5.5 miles | Brainstorm USA | May-14/ 6 Yrs | 4,100 | $20.40 | $40.00 | |
Prologis Commerce Business Park 5835-5901 S Eastern Ave Commerce, CA | 1983 | 100% | 192,659 | 0.3 mile | Department of Children and Family Services | Feb-14/ 5 Yrs | 38,819 | $24.60 | $40.00 | |
Commerce Square 6055 E Washington Blvd Commerce, CA | 1967 | 89% | 109,000 | 1.0 mile | N/A(1) | N/A | 2,814 | $24.00 | $40.00 | |
Commerce Corporate Center 5800 S Eastern Ave Commerce, CA | 1988 | 39% | 67,314 | 0.1 mile | N/A(1) | N/A | 9,261 | $25.20 | $40.00 | |
| (1) | Tenant spaces are available listings. |
| MSBAM 2015-C25 | Commerce Office Park |
Cash Flow Analysis | |||||||||||||
| 2011 | 2012 | 2013 | 2014 | UW | UW PSF | ||||||||
| Base Rent | N/A | $6,623,498 | $6,851,087 | $6,897,446 | $7,153,191 | $25.44 | |||||||
| Total Recoveries | N/A | $53,740 | $54,727 | $61,784 | $0 | $0 | |||||||
| Parking Income | N/A | $12,490 | $6,150 | $6,000 | $4,500 | $0.02 | |||||||
| Other Income | N/A | $38,834 | $1,010 | $640 | $706 | $0 | |||||||
| Less Vacancy & Credit Loss | N/A | $0 | $0 | $0 | ($357,660) | (5.0%) | |||||||
| Effective Gross Income | N/A | $6,728,562 | $6,912,974 | $6,965,870 | $6,800,737 | $24.19 | |||||||
| Total Operating Expenses | N/A | $2,094,601 | $2,102,789 | $1,914,252 | $2,311,920 | $8.22 | |||||||
| Net Operating Income | N/A | $4,633,961 | $4,810,185 | $5,051,618 | $4,488,817 | $15.97 | |||||||
| Capital Expenditures | N/A | $0 | $0 | $0 | $70,286 | $0.25 | |||||||
| TI/LC | N/A | $0 | $0 | $0 | $319,401 | $1.14 | |||||||
| Net Cash Flow | N/A | $4,633,961 | $4,810,185 | $5,051,618 | $4,099,131 | $14.58 | |||||||
| Occupancy % | N/A | 88.1% | 91.5% | 86.5% | 100.0%(1) | ||||||||
| NOI DSCR | N/A | 1.54x | 1.60x | 1.68x | 1.49x | ||||||||
| NCF DSCR | N/A | 1.54x | 1.60x | 1.68x | 1.36x | ||||||||
| NOI Debt Yield | N/A | 9.3% | 9.6% | 10.1% | 9.0% | ||||||||
| NCF Debt Yield | N/A | 9.3% | 9.6% | 10.1% | 8.2% | ||||||||
| (1) | The Commerce Office Park Property is 100% leased as of July 30, 2015. The largest tenant, County of Los Angeles, Department of Child Support Services (“DCS”) has signed leases to expand into 39,130 SF of additional space. Upon completion of the respective tenant improvements, DCS is expected to take occupancy of the expansion space and the Commerce Office Park Property will then be 100% occupied. |
| (i) | the occurrence of an event of default, |
| (ii) | the DSCR being less than 1.10x for three consecutive months, tested quarterly (or less than 1.20x for three consecutive months, tested quarterly during any period when a County of Los Angeles, Department of Child Support Services lease is subject to a dark period), and |
| (iii) | County of Los Angeles, Department of Child Support Services |
| (a) | exercising an early termination option (unless the DSCR is equal to or exceeds 1.20x for three consecutive months, tested quarterly and such date is not within 12 months of the maturity date of the Commerce Office Park Mortgage Loan), |
| (b) | having 12 months remaining prior to the expiration of any lease (unless (x) such lease has been renewed or extended or (y) the DSCR is equal to or exceeds 1.20x for three consecutive months, tested quarterly (except when such date is within 12 months of the maturity date of the Commerce Office Park Mortgage Loan or the expiring lease is the lease encumbering building 5500), |
| (c) | being in default in payment relating to 30% or more of its space, |
| (d) | being the subject of or its lease guarantor files or is the subject of any bankruptcy or insolvency proceeding, or |
| (e) | experiencing or its lease guarantor experiencing a downgrade in long-term unsecured debt rating below “BBB” by S&P or the equivalent ratings organization (unless the DSCR is equal to or exceeds 1.20x for the trailing twelve months, tested quarterly). |
| (i) | cure or waiver of the event of default, |
| (ii) | the DSCR equaling or exceeding 1.10x for three consecutive months, tested quarterly (or equaling or exceeding 1.20x for three consecutive months, tested quarterly during any period when a County of Los Angeles, Department of Child Support Services lease is subject to a dark period), and |
| MSBAM 2015-C25 | Commerce Office Park |
| (iii) | (a) the earlier of (x) County of Los Angeles, Department of Child Support Services having its terminated space leased to a replacement tenant and |
| (b) | the earlier of (x) County of Los Angeles, Department of Child Support Services extending or renewing its lease or having its space leased to a replacement tenant and (y) the DSCR equaling or exceeding 1.20x for three consecutive months, tested quarterly, provided such date is not within 12 months of the maturity date of the Commerce Office Park Mortgage Loan and the expiring lease is not the lease encumbering building 5500, |
| (c) | the earlier of (x) the DSCR equaling or exceeding 1.20x for three consecutive months, tested quarterly provided County of Los Angeles, Department of Child Support Services is not in default in payment relating to 30% or more of its space, (y) the DSCR equaling or exceeding 1.20x for three consecutive months, tested quarterly and at least 70% of County of Los Angeles, Department of Child Support Services’ space is subject to County of Los Angeles, Department of Child Support Services leases and (z) none of the tenants under such leases being in default in payment of any amounts due, |
| (d) | (A) with respect to any bankruptcy case involving County of Los Angeles, Department of Child Support Services or its assets, the earliest to occur of (x) at least 70% of the space leased by County of Los Angeles, Department of Child Support Services being assumed without alteration and (y) the DSCR equaling or exceeding 1.20x for three consecutive months, tested quarterly, and 70% of the County of Los Angeles, Department of Child Support Services space being subject to County of Los Angeles, Department of Child Support Services leases that have been assumed or leased by a replacement tenant or (B) with respect to any bankruptcy case involving County of Los Angeles, Department of Child Support Services or its lease guarantor, at such time as their assets being no longer subject to bankruptcy and its lease remains unaltered, or |
| (e) | the earlier of (x) such credit rating being not less than “BBB” by S&P or the equivalent ratings organization and (y) the DSCR equaling or exceeding 1.20x for three consecutive months, tested quarterly. |
| MSBAM 2015-C25 | Asian Garden Mall |

| MSBAM 2015-C25 | Asian Garden Mall |
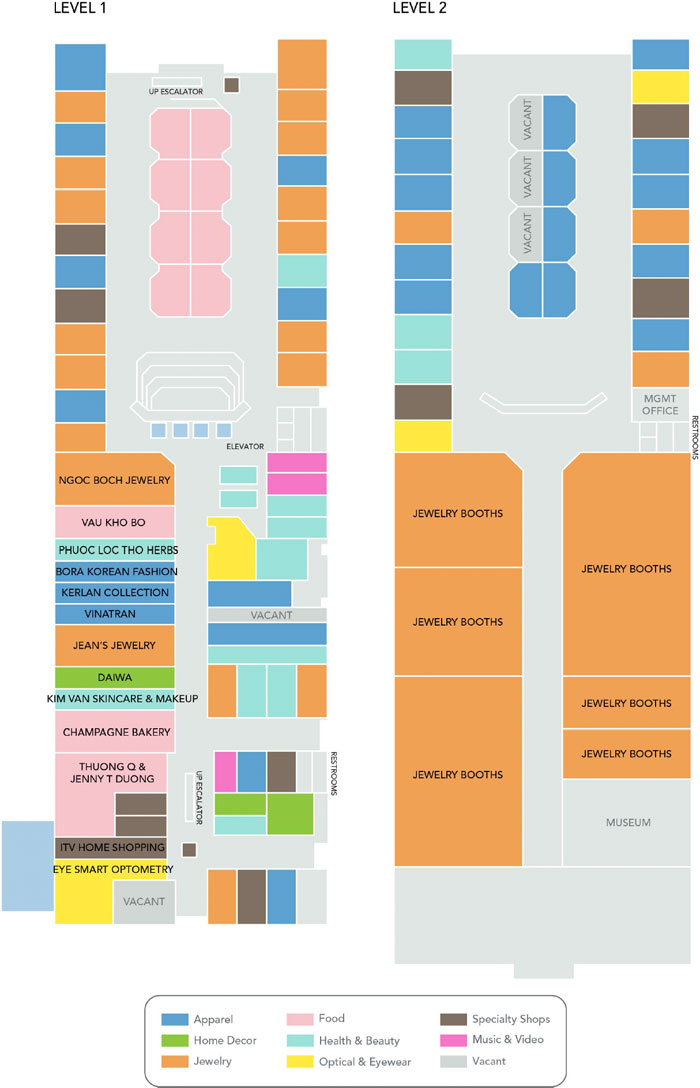
| MSBAM 2015-C25 | Asian Garden Mall |
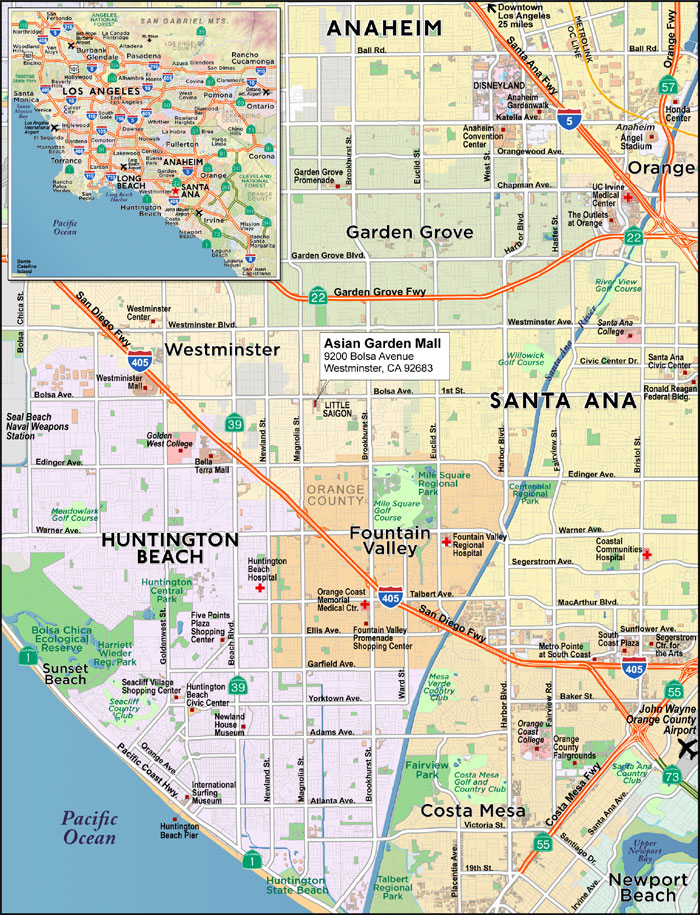
| MSBAM 2015-C25 | Asian Garden Mall |
| Mortgage Loan No. 8 – Asian Garden Mall |
| Mortgage Loan Information | Mortgaged Property Information | ||||||
| Mortgage Loan Seller: | BANA | Single Asset/Portfolio: | Single Asset | ||||
| Original Balance: | $42,000,000 | Location: | Westminster, CA 92683 | ||||
| Cut-off Date Balance: | $41,896,211 | General Property Type: | Retail | ||||
| % of Initial Pool Balance: | 3.6% | Detailed Property Type: | Anchored | ||||
| Loan Purpose: | Refinance | Title Vesting: | Fee | ||||
| Sponsor: | Frank Jao | Year Built/Renovated: | 1986/N/A | ||||
| Mortgage Rate: | 4.5835% | Size: | 99,140 SF | ||||
| Note Date: | 7/21/2015 | Cut-off Date Balance per Unit: | $423 | ||||
| First Payment Date: | 9/1/2015 | Maturity Date Balance per Unit: | $344 | ||||
| Maturity Date: | 8/1/2025 | Property Manager: | Bridgecreek Realty Investment Corp. | ||||
| Original Term to Maturity: | 120 months | ||||||
| Original Amortization Term: | 360 months | Underwriting and Financial Information | |||||
| IO Period: | 0 months | UW NOI: | $4,476,839 | ||||
| Seasoning: | 2 months | UW NOI Debt Yield: | 10.7% | ||||
| Prepayment Provisions: | LO (26); DEF (89); O (5) | UW NOI Debt Yield at Maturity: | 13.1% | ||||
| Lockbox/Cash Mgmt Status: | Soft/Springing | UW NCF DSCR: | 1.62x | ||||
| Additional Debt Type: | N/A | Most Recent NOI: | $5,206,088 (4/30/2015 TTM) | ||||
| Additional Debt Balance: | N/A | 2nd Most Recent NOI: | $4,635,713 (12/31/2014) | ||||
| Future Debt Permitted (Type): | No (N/A) | 3rd Most Recent NOI: | $4,606,514 (12/31/2013) | ||||
Reserves(1) | Most Recent Occupancy: | 98.5% (6/23/2015) | |||||
Type | Initial | Monthly | Cap | 2nd Most Recent Occupancy: | 94.0% (12/31/2014) | ||
| RE Tax: | $161,337 | $26,889 | N/A | 3rd Most Recent Occupancy: | 92.7% (12/31/2013) | ||
| Insurance: | $0 | Springing | N/A | Appraised Value (as of): | $71,550,000 (6/10/2015) | ||
| Recurring Replacements: | $0 | $1,652 | N/A | Cut-off Date LTV Ratio: | 58.6% | ||
| TI/LC: | $50,000 | Springing | N/A | Maturity Date LTV Ratio: | 47.7% | ||
| Sources and Uses | |||||||
| Sources | Proceeds | % of Total | Uses | Proceeds | % of Total | ||
| Loan Amount: | $42,000,000 | 97.9% | Loan Payoff: | $41,945,763 | 97.8% | ||
| Borrower Equity: | $898,184 | 2.1% | Reserves: | $211,337 | 0.5% | ||
| Closing Costs: | $741,084 | 1.7% | |||||
| Total Sources: | $42,898,184 | 100.0% | Total Uses: | $42,898,184 | 100.0% | ||
| (1) | See “—Escrows and Reserves” below for further discussion of reserve requirements. |
| MSBAM 2015-C25 | Asian Garden Mall |
Tenant Summary(1) | |||||||
| Tenant Space Type | Number of Tenants | Tenant Space Type SF | Approximate % of SF | Annual UW Rent | % of Total Annual UW Rent | Annual UW Rent PSF(2) | |
| Suite | 69 | 55,391 | 56% | $3,010,749 | 48% | $54.35 | |
| Booth | 121 | 29,081 | 29% | $2,312,259 | 37% | $79.51 | |
| Food Court | 7 | 5,320 | 5% | $606,641 | 10% | $114.03 | |
| Museum | 1 | 3,600 | 4% | $24,000 | 0% | $6.67 | |
| ATM | 2 | 0 | 0% | $44,400 | 1% | N/A | |
| Cart | 8 | 0 | 0% | $150,000 | 2% | N/A | |
| Display | 1 | 0 | 0% | $3,000 | 0% | N/A | |
| Kiosk | 4 | 0 | 0% | $114,000 | 2% | N/A | |
| Vacant | 0 | 5,344 | 5% | $0 | 0% | $0.00 | |
Total/Wtd. Avg.(3) | 213 | 98,736 | 100% | $6,265,049 | 100% | $67.08 | |
| (1) | Information is based on the underwritten rent roll. |
| (2) | Wtd. Avg. Annual UW Rent PSF excludes vacant space. |
| (3) | Total Number of Tenants and Tenant Space Type SF exclude a 100 SF Management Office and 304 SF of storage space. |
Lease Rollover Schedule(1)(2) | |||||||||
| Year | # of Leases Rolling | SF Rolling(3) | UW Rent PSF Rolling(4) | Approx. % of Total SF Rolling | Approx. Cumulative % of SF Rolling | Total UW Rent Rolling | Approx. % of Total Rent Rolling | Approx. Cumulative % of Total Rent Rolling | |
| MTM | 22 | 5,301 | $112.33 | 5% | 5% | $595,446 | 10% | 10% | |
| 2015 | 38 | 10,692 | $77.53 | 11% | 16% | $828,987 | 13% | 23% | |
| 2016 | 54 | 19,092 | $56.76 | 19% | 36% | $1,083,588 | 17% | 40% | |
| 2017 | 35 | 13,464 | $78.00 | 14% | 49% | $1,050,129 | 17% | 57% | |
| 2018 | 30 | 21,942 | $55.23 | 22% | 71% | $1,211,936 | 19% | 76% | |
| 2019 | 21 | 10,816 | $68.67 | 11% | 82% | $742,776 | 12% | 88% | |
| 2020 | 7 | 7,029 | $52.12 | 7% | 89% | $366,351 | 6% | 94% | |
| 2021 | 1 | 2,100 | $72.00 | 2% | 92% | $151,200 | 2% | 96% | |
| 2022 | 0 | 0 | $0.00 | 0% | 92% | $0 | 0% | 96% | |
| 2023 | 0 | 0 | $0.00 | 0% | 92% | $0 | 0% | 96% | |
| 2024 | 0 | 0 | $0.00 | 0% | 92% | $0 | 0% | 96% | |
| 2025 | 0 | 0 | $0.00 | 0% | 92% | $0 | 0% | 96% | |
| 2026 & Beyond | 5 | 2,956 | $79.38 | 3% | 95% | $234,636 | 4% | 100% | |
| Vacant | 0 | 5,344 | $0.00 | 5% | 100% | $0 | 0% | ||
| Total/Wtd. Avg. | 213 | 98,736 | $67.08 | 100% | $6,265,049 | 100% | |||
| (1) | Information is based on the underwritten rent roll. |
| (2) | Certain tenants may have lease termination options that are exercisable prior to the originally stated expiration date of the subject lease and that are not considered in the lease rollover schedule. |
| (3) | Total SF Rolling excludes a 100 SF Management Office and 304 SF of storage space. |
| (4) | Wtd. Avg. UW Rent PSF Rolling excludes vacant space. |
| MSBAM 2015-C25 | Asian Garden Mall |
| Competitive Property Summary | |||||||
| Property Name/Location | Type | Year Built | Occ. | Total GLA (SF) | Rent PSF | Distance to Subject | |
Asian Village(1) 9191 Bolsa Avenue, Westminster | Convenience/Strip | 1991 | 100% | 44,064 | $20.40-$45.00 | Across Street | |
Liberty Square(1) 9928 Bolsa Avenue, Westminster | Convenience/Strip | 1989 | 92% | 48,801 | $30.00-$48.00 | 0.2 miles | |
Dover II(1) 9211 Bolsa Ave, Westminster | Convenience/Strip | 1994 | 94% | 58,988 | $12.00-$48.00 | 0.3 miles | |
Little Saigon Plaza 9812 Bolsa Avenue, Westminster | Convenience/Strip | 2002 | NAV | 36,057 | $18.00-$52.00 | 0.3 miles | |
Bolsa West Center 10451 Bolsa Avenue, Westminster | Convenience/Strip | 2004 | NAV | 42,418 | $24.00-$55.00 | 0.2 miles | |
| (1) | Asian Village, Liberty Square and Dover II are owned by the Asian Garden Mall Mortgage Loan sponsor. |
Cash Flow Analysis | ||||||||||||||
| 2011 | 2012 | 2013 | 2014 | 4/30/2015 Ann. | UW | UW PSF | ||||||||
| Base Rent | $6,184,733 | $6,147,590 | $6,132,545 | $6,268,429 | $6,516,996 | $6,649,300 | $67.07 | |||||||
| Total Recoveries | $874,220 | $911,182 | $891,054 | $939,316 | $867,594 | $902,129 | $9.10 | |||||||
| Other Income | $330,647 | $343,226 | $445,876 | $393,041 | $713,358 | $393,041 | $3.96 | |||||||
| Less Vacancy & Credit Loss | $0 | $0 | $0 | $0 | $0 | ($463,090) | (7.0%) | |||||||
| Effective Gross Income | $7,389,600 | $7,401,998 | $7,469,475 | $7,600,786 | $8,097,948 | $7,481,380 | $75.46 | |||||||
| Total Operating Expenses | $2,827,375 | $2,861,299 | $2,862,961 | $2,965,073 | $2,891,860 | $3,004,541 | 30.31 | |||||||
| Net Operating Income | $4,562,225 | $4,540,699 | $4,606,514 | $4,635,713 | $5,206,088 | $4,476,839 | $45.16 | |||||||
| Capital Expenditures | $0 | $0 | $0 | $0 | $0 | $19,828 | $0.20 | |||||||
| TI/LC | $129,352 | $128,879 | $139,087 | $133,879 | $131,628 | $288,200 | $2.91 | |||||||
| Net Cash Flow | $4,432,873 | $4,411,820 | $4,467,427 | $4,501,834 | $5,074,460 | $4,168,811 | $42.05 | |||||||
| Occupancy % | 94.3% | 94.4% | 92.7% | 94.0% | 98.5%(1) | 93.9% | ||||||||
| NOI DSCR | 1.77x | 1.76x | 1.79x | 1.80x | 2.02x | 1.74x | ||||||||
| NCF DSCR | 1.72x | 1.71x | 1.73x | 1.75x | 1.97x | 1.62x | ||||||||
| NOI Debt Yield | 10.9% | 10.8% | 11.0% | 11.1% | 12.4% | 10.7% | ||||||||
| NCF Debt Yield | 10.6% | 10.5% | 10.7% | 10.7% | 12.1% | 10.0% | ||||||||
| (1) | Occupancy as of June 23, 2015. |
| MSBAM 2015-C25 | Bucks County Technology Park |

| MSBAM 2015-C25 | Bucks County Technology Park |

| MSBAM 2015-C25 | Bucks County Technology Park |
| Mortgage Loan No. 9 – Bucks County Technology Park |
| Mortgage Loan Information | Mortgaged Property Information | ||||||
| Mortgage Loan Seller: | CIBC | Single Asset/Portfolio: | Single Asset | ||||
| Original Balance: | $30,250,000 | Location: | Trevose, PA 19053 | ||||
| Cut-off Date Balance: | $30,250,000 | General Property Type: | Office | ||||
| % of Initial Pool Balance: | 2.6% | Detailed Property Type: | Suburban | ||||
| Loan Purpose: | Refinance | Title Vesting: | Fee | ||||
| Sponsor: | Matthew N. Cohn; Debra L.W. Cohn; Kimberli C. Bailey | Year Built/Renovated: | 1960-1965, 1975, 1979/2014 | ||||
| Mortgage Rate: | 4.960% | Size: | 364,000 SF | ||||
| Note Date: | 8/26/2015 | Cut-off Date Balance per Unit: | $83 | ||||
| First Payment Date: | 10/1/2015 | Maturity Date Balance per Unit: | $70 | ||||
| Maturity Date: | 9/1/2025 | Property Manager: | Self-Managed | ||||
| Original Term to Maturity: | 120 months | ||||||
| Original Amortization Term: | 360 months | Underwriting and Financial Information | |||||
| IO Period: | 12 months | UW NOI: | $3,094,445 | ||||
| Seasoning: | 1 month | UW NOI Debt Yield: | 10.2% | ||||
| Prepayment Provisions: | LO (25); DEF (92); O (3) | UW NOI Debt Yield at Maturity: | 12.1% | ||||
| Lockbox/Cash Mgmt Status: | Hard/Springing | UW NCF DSCR: | 1.47x (P&I) | ||||
| Additional Debt Type: | No | Most Recent NOI: | $4,149,080 (6/30/2015 TTM) | ||||
| Additional Debt Balance: | N/A | 2nd Most Recent NOI: | $3,999,440 (12/31/2014) | ||||
| Future Debt Permitted (Type): | No (N/A) | 3rd Most Recent NOI: | $3,902,356 (12/31/2013) | ||||
Reserves(1) | Most Recent Occupancy: | 91.1% (6/1/2015) | |||||
Type | Initial | Monthly | Cap | 2nd Most Recent Occupancy: | 91.1% (12/31/2014) | ||
| RE Tax: | $118,090 | $56,295 | N/A | 3rd Most Recent Occupancy: | 87.8% (12/31/2013) | ||
| Insurance: | $149,302 | $13,573 | N/A | Appraised Value (as of): | $40,900,000 (4/7/2015) | ||
| Recurring Replacements: | $845,000 | $6,067 | N/A | Cut-off Date LTV Ratio: | 74.0% | ||
| TI/LC: | $500,000 | $14,583 | $750,000 | Maturity Date LTV Ratio: | 62.5% | ||
| Other: | $250,000 | Springing | N/A | ||||
| Sources and Uses | ||||||
| Sources | Proceeds | % of Total | Uses | Proceeds | % of Total | |
| Loan Amount: | $30,250,000 | 100.0% | Loan Payoff(2): | $26,642,334 | 88.1% | |
| Reserves: | $1,862,392 | 6.2% | ||||
| Closing Costs: | $1,035,424 | 3.4% | ||||
| Return of Equity: | $709,850 | 2.3% | ||||
| Total Sources: | $30,250,000 | 100.0% | Total Uses: | $30,250,000 | 100.0% | |
| (1) | See “—Escrows and Reserves” below for further discussion of reserve requirements. |
| (2) | Loan Payoff includes the repayment of loans made by members and affiliates of the Bucks County Technology Park Borrower totaling approximately $4,734,962. |
| MSBAM 2015-C25 | Bucks County Technology Park |
Tenant Summary(1) | |||||||
| Tenant Name | Credit Rating (Fitch/Moody’s/S&P)(2) | Tenant SF | Approximate % of SF | Annual UW Base Rent | % of Total Annual UW Base Rent | Annual UW Rent PSF(3) | Lease Expiration |
| Major Tenants | |||||||
| ASI | NR/NR/NR | 192,212 | 53% | $2,244,593 | 57% | $11.68 | 9/28/2030; 5/31/2030(4) |
| Express Scripts | BBB/Baa3/BBB+ | 53,500 | 15% | $689,000 | 17% | $12.88 | 6/27/2016; 3/29/2016(5) |
| CEI Group | NR/NR/NR | 35,700 | 10% | $449,775 | 11% | $12.60 | 9/30/2017 |
| AllianceOne | NR/NR/NR | 21,000 | 6% | $294,000 | 7% | $14.00 | 8/31/2018 |
| Subtotal/Wtd. Avg. | 302,412 | 83% | $3,677,368 | 93% | $12.16 | ||
| Other Tenants | 28,758 | 8% | $282,461 | 7% | $9.82 | ||
| Vacant Space | 32,830 | 9% | $0 | 0% | $0.00 | ||
| Total/Wtd. Avg. | 364,000 | 100% | $3,959,829 | 100% | $11.96 | ||
| (1) | Information is based on the underwritten rent roll. |
| (2) | Certain ratings are those of the parent company whether or not the parent guarantees the lease. |
| (3) | Wtd. Avg. Annual UW Rent PSF excludes vacant space. |
| (4) | 188,394 SF expires September 28, 2030; 3,818 SF expires May 31, 2030. |
| (5) | Express Scripts has the right to terminate its lease on 38,500 SF by providing 270 days’ notice and paying unamortized TI/LC’s and one month of rent for each year of the remainder of the lease term. Express Scripts has the right to terminate its lease on 15,000 SF by providing 180 days’ notice. The stated lease expiration date for both of Express Scripts’ spaces is June 30, 2017. |
| MSBAM 2015-C25 | Bucks County Technology Park |
Lease Rollover Schedule(1)(2) | ||||||||
| Year | # of Leases Rolling | SF Rolling | UW Rent PSF Rolling(3) | Approx. % of Total SF Rolling | Approx. Cumulative % of SF Rolling | Total UW Rent Rolling | Approx. % of Total UW Rent Rolling | Approx. Cumulative % of Total UW Rent Rolling |
| 2015 | 0 | 0 | $0.00 | 0% | 0% | $0 | 0% | 0% |
| 2016 | 2 | 14,680 | $9.92 | 4% | 4% | $145,581 | 4% | 4% |
| 2017 | 3 | 91,800 | $12.65 | 25% | 29% | $1,160,875 | 29% | 33% |
| 2018 | 1 | 21,000 | $14.00 | 6% | 35% | $294,000 | 7% | 40% |
| 2019 | 0 | 0 | $0.00 | 0% | 35% | $0 | 0% | 40% |
| 2020 | 1 | 11,478 | $10.00 | 3% | 38% | $114,780 | 3% | 43% |
| 2021 | 0 | 0 | $0.00 | 0% | 38% | $0 | 0% | 43% |
| 2022 | 0 | 0 | $0.00 | 0% | 38% | $0 | 0% | 43% |
| 2023 | 0 | 0 | $0.00 | 0% | 38% | $0 | 0% | 43% |
| 2024 | 0 | 0 | $0.00 | 0% | 38% | $0 | 0% | 43% |
| 2025 | 0 | 0 | $0.00 | 0% | 38% | $0 | 0% | 43% |
| 2026 & Beyond | 1 | 192,212 | $11.68 | 53% | 91% | $2,244,593 | 57% | 100% |
| Vacant | 0 | 32,830 | $0.00 | 9% | 100% | $0 | 0% | 100% |
| Total/Wtd. Avg. | 8 | 364,000 | $11.96 | 100% | $3,959,829 | 100% | ||
| (1) | Information is based on the underwritten rent roll. |
| (2) | Certain tenants may have lease termination options that are exercisable prior to the originally stated expiration date of the subject lease and that are not considered in the lease rollover schedule. |
| (3) | Wtd. Avg. UW Rent PSF Rolling excludes vacant space. |
| MSBAM 2015-C25 | Bucks County Technology Park |
| Comparable Leases Summary | |||||||||
| Property Name/Location | Comp Type | Year Built | Expense Basis | Tenant Name | Lease Start Date | Lease Size (SF) | Lease Term (Mos.) | Base Rent (PSF Ann.) | NNN Base Rent (PSF Ann.) |
105 Terry Drive 105 Terry Drive, Newtown, Bucks County, PA | Office | 1987 | Mod. Gross | Magellan Behavioral | Feb-14 | 15,290 | 38 | $21.50 | $15.50 |
2010 Cabot Boulevard West 2010 Cabot Blvd W. Langhorne, Bucks County, PA | Office | 1984 | NNN | Pet Partners of Langhorne | Jul-14 | 17,300 | 84 | $12.75 | $12.75 |
900 & 1210 Northbrook Drive 900 & 1210 Northbrook Drive Bensalem, Bucks County, PA | Office | 2001 | Mod. Gross | Airclick | Sep-13 | 13,119 | 60 | $20.00 | $13.00 |
1150 Northbrook Drive 1150 Northbrook Drive Feasterville Trevose, Bucks County, PA | Office | 2007 | Gross + TE | Gamesa | Dec-12 | 67,117 | 81 | $23.00 | $16.00 |
Valley Forge Corp Center 2500-2600 Monroe Blvd Norristown, Montgomery County, PA | Office | 1988 | NNN | PJM Interconnection, LLC | Jul-13 | 45,500 | 166 | $17.33 | $17.33 |
2200 Byberry Road 2200 Byberry Road Upper Moreland Township Montgomery County, PA | Office | 1954 | NNN | Conair Corporation | Mar-14 | 39,807 | 24 | $13.25 | $13.25 |
Bonair Industrial Center 5-17, 51-57, 66-72, 67-73 Warminster, Bucks County, PA | Warehouse | 1987 | NNN | Rosewood Furniture Pierce Phelps | Jan-15 Nov-14 | 10,300 15,000 | 45 84 | $4.95 $5.50 | $4.95 $5.50 |
37 Bonair Drive 37 Bonair Drive Warminster, Bucks County, PA | Warehouse | 1988 | NNN | Rosewood Furniture | Oct-14 | 18,000 | 48 | $5.15 | $5.15 |
701 Veterans Circle 701 Veterans Circle Warminster, Bucks County, PA | Warehouse | N/A | NNN | EIC Solutions, Inc. | Apr-12 | 10,925 | 66 | $7.28 | $7.28 |
Hilltown Industrial Park 4200 Bethlehem Pike Telford, Bucks County, PA | Warehouse | 1969 | NNN | Admiral Metals | Oct-13 | 10,500 | 60 | $6.20 | $6.20 |
65 Steamboat Drive 65 Steamboat Drive Warminster, Bucks County, PA | Warehouse | 1967 | NNN | Instant Web, Inc. | Oct-12 | 57,544 | 60 | $6.29 | $6.29 |
| MSBAM 2015-C25 | Bucks County Technology Park |
| Cash Flow Analysis | |||||||||||||||
| 2011 | 2012 | 2013 | 2014 | 6/30/2015 TTM | UW | UW PSF | |||||||||
Rents in Place(1) | $4,188,678 | $3,960,891 | $4,491,257 | $4,533,691 | $4,595,443 | $3,959,829 | $10.88 | ||||||||
Vacant Rent(2) | $0 | $0 | $0 | $0 | $0 | $431,900 | $1.19 | ||||||||
| In Place Recoveries | $3,128,320 | $2,967,017 | $3,116,600 | $3,235,253 | $3,309,686 | $2,840,863 | $7.80 | ||||||||
| Vacant Recoveries | $0 | $0 | $0 | $0 | $0 | $255,678 | $0.70 | ||||||||
Other Income(3) | $182,959 | $325,383 | $167,779 | $185,794 | $188,732 | $185,000 | $0.51 | ||||||||
Less Vacancy & Credit Loss(4) | $0 | $0 | $0 | $0 | $0 | ($748,827) | ($2.06) | ||||||||
| Effective Gross Income | $7,499,957 | $7,253,291 | $7,775,636 | $7,954,738 | $8,093,861 | $6,924,442 | $19.02 | ||||||||
| Total Operating Expenses | $3,871,194 | $3,924,027 | $3,873,280 | $3,955,298 | $3,944,781 | $3,829,997 | $10.52 | ||||||||
| Net Operating Income | $3,628,763 | $3,329,264 | $3,902,356 | $3,999,440 | $4,149,080 | $3,094,446 | $8.50 | ||||||||
| Capital Expenditures | $0 | $0 | $0 | $0 | $0 | $72,800 | $0.20 | ||||||||
| TI/LC | $0 | $0 | $0 | $0 | $0 | $175,011 | $0.48 | ||||||||
| Net Cash Flow | $3,628,763 | $3,329,264 | $3,902,356 | $3,999,440 | $4,149,080 | $2,846,635 | $7.82 | ||||||||
| Occupancy % | 88.5% | 87.4% | 87.8% | 91.1% | 91.1% | 91.0% | |||||||||
| NOI DSCR | 1.87x | 1.72x | 2.01x | 2.06x | 2.14x | 1.60x | |||||||||
| NCF DSCR | 1.87x | 1.72x | 2.01x | 2.06x | 2.14x | 1.47x | |||||||||
| NOI Debt Yield | 12.0% | 11.0% | 12.9% | 13.2% | 13.7% | 10.2% | |||||||||
| NCF Debt Yield | 12.0% | 11.0% | 12.9% | 13.2% | 13.7% | 9.4% | |||||||||
| (1) | Underwritten Rents in Place based on the lower of in-place rents and the appraiser’s concluded market rents. |
| (2) | Vacant Rent is based on vacant office and storage spaces at the appraiser’s concluded market rents. |
| (3) | Other Income includes cafeteria subsidies paid by ASI, AllianceOne and CEI Group of $0.50 per SF to receive discount for employees, benefit for dropping off electric grid and using generators, weekend sales in parking lots, marketplace outside of cafeteria and ATM fees. |
| (4) | Underwritten Vacancy and Credit Loss is based on the appraiser’s conclusion of 10% versus 9% actual vacancy at the Bucks County Technology Park Property. |
| (i) | upon the occurrence of an event of default and continue until lender’s acceptance of the cure of such event of default; |
| (ii) | upon the debt service coverage ratio being less than 1.15x and continue until the debt service coverage ratio has been 1.15x or greater for two consecutive calendar quarters; |
| (iii) | upon the debt yield being less than 8.25% and continue until the debt yield has been 8.25% or greater for two consecutive calendar quarters; |
| MSBAM 2015-C25 | Bucks County Technology Park |
| (iv) | upon the commencement of an ASI Lease Sweep Period and continue until the ASI Lease Sweep Period has ended; or |
| (v) | upon commencement of a Debt Service Reserve Cash Management Period and continue until the Debt Service Reserve Cash Management Period has ended. |
| (i) | upon ASI filing for bankruptcy and continue until the bankruptcy proceeding has ended and the ASI lease has been affirmed, assumed or assigned in a manner reasonably acceptable to the lender; or |
| (ii) | upon ASI either failing to pay any required rental payments within 10 days of the date required under its lease, going dark or surrendering, canceling or terminating its lease or the lender’s receipt of notice of ASI’s intent to do so and continue until at least 90% of the ASI space is leased pursuant to one or more ASI Qualified Replacement Leases (defined below), and, in the lender’s judgment, sufficient funds have been accumulated in the ASI Lease Sweep Reserve (during the continuance of the subject ASI Lease Sweep Period) to cover all anticipated leasing costs, free rent periods and/or rent abatement periods set forth in all such ASI Qualified Replacement Leases. |
| MSBAM 2015-C25 | Citrus & City Place Apartments |
| Mortgage Loan No. 10 – Citrus & City Place Apartments |
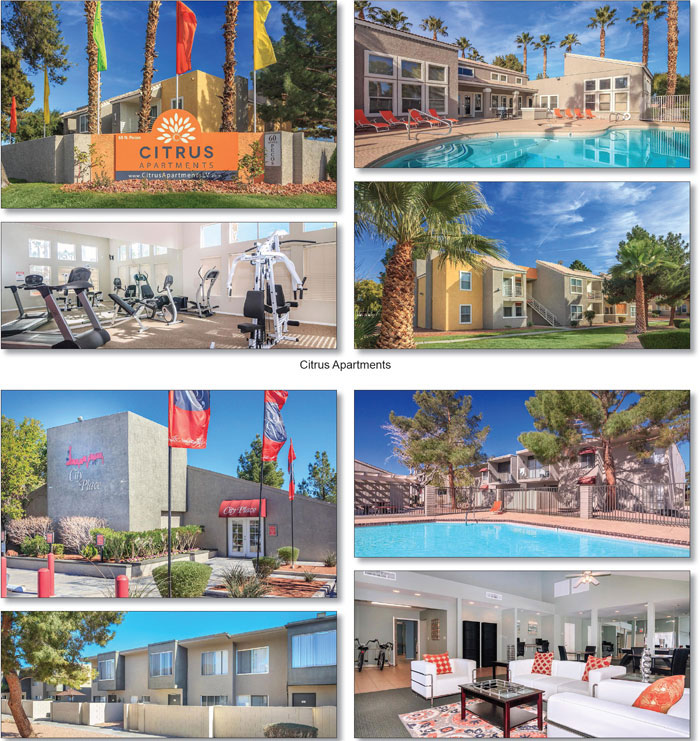
| MSBAM 2015-C25 | Citrus & City Place Apartments |
| Mortgage Loan No. 10 – Citrus & City Place Apartments |
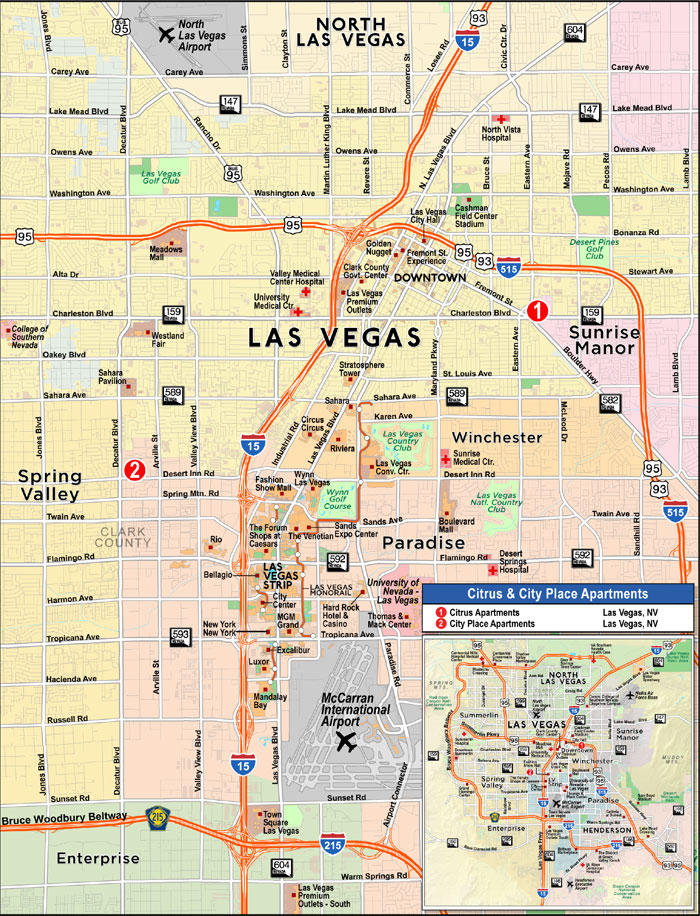
| MSBAM 2015-C25 | Citrus & City Place Apartments |
| Mortgage Loan No. 10 – Citrus & City Place Apartments |
| Mortgage Loan Information | Mortgaged Property Information | ||||||
| Mortgage Loan Seller: | BANA | Single Asset/Portfolio: | Portfolio | ||||
| Original Balance: | $27,875,000 | Location: | Las Vegas, NV | ||||
| Cut-off Date Balance: | $27,875,000 | General Property Type: | Multifamily | ||||
| % of Initial Pool Balance: | 2.4% | Detailed Property Type: | Garden | ||||
| Loan Purpose: | Refinance | Title Vesting: | Fee | ||||
| Sponsor: | Omninet Capital, LLC | Year Built/Renovated(1): | Various/N/A | ||||
| Mortgage Rate: | 4.292% | Size(1): | 568 Units | ||||
| Note Date: | 8/3/2015 | Cut-off Date Balance per Unit: | $49,076 | ||||
| First Payment Date: | 10/1/2015 | Maturity Date Balance per Unit: | $44,832 | ||||
| Maturity Date: | 9/1/2025 | Property Manager: | Rooster Philben, Inc. (d/b/a Stout Management Company) | ||||
| Original Term to Maturity: | 120 months | Underwriting and Financial Information | |||||
| Original Amortization Term: | 360 months | UW NOI: | $2,500,261 | ||||
| IO Period: | 60 months | UW NOI Debt Yield: | 9.0% | ||||
| Seasoning: | 1 month | UW NOI Debt Yield at Maturity: | 9.8% | ||||
| Prepayment Provisions: | LO (25); DEF (88); O (7) | UW NCF DSCR: | 1.90x (IO) 1.40x (P&I) | ||||
| Lockbox/Cash Mgmt Status: | Soft/Springing | Most Recent NOI: | $2,472,398 (6/30/2015 TTM) | ||||
| Additional Debt Type: | N/A | 2nd Most Recent NOI: | $2,177,902 (12/31/2014) | ||||
| Additional Debt Balance: | N/A | 3rd Most Recent NOI: | $1,344,717 (12/31/2013) | ||||
| Future Debt Permitted (Type): | No (N/A) | Most Recent Occupancy(1): | 95.4% (7/3/2015) | ||||
Reserves(2) | 2nd Most Recent Occupancy(1): | 89.3% (12/31/2014) | |||||
Type | Initial | Monthly | Cap | 3rd Most Recent Occupancy(1)(3): | 87.0% (12/31/2013) | ||
| RE Tax: | $48,880 | $16,293 | N/A | Appraised Value (as of)(1): | $38,440,000 (6/16/2015) | ||
| Insurance: | $0 | Springing | N/A | Cut-off Date LTV Ratio(1): | 72.5% | ||
| Immediate Repairs: | $80,219 | $0 | N/A | Maturity Date LTV Ratio(1): | 66.2% | ||
| Recurring Replacements: | $0 | $13,253 | N/A | ||||
| Sources and Uses | |||||||
| Sources | Proceeds | % of Total | Uses | Proceeds | % of Total | ||
| Loan Amount: | $27,875,000 | 100.0% | Loan Payoff: | $24,200,212 | 86.8% | ||
| Reserves : | $129,099 | 0.5% | |||||
| Closing Costs: | $284,986 | 1.0% | |||||
| Return of Equity: | $3,260,703 | 11.7% | |||||
| Total Sources: | $27,875,000 | 100.0% | Total Uses: | $27,875,000 | 100.0% | ||
| (1) | The Citrus & City Place Apartments Property consists of two properties known as Citrus Apartments and City Place Apartments. Citrus Apartments was built in 1991, contains 348 units, was 96.0% leased as of 7/3/2015 and had an appraised value as of 6/16/2015 of $23,000,000. City Place Apartments was built in 1975, contains 220 units, was 94.5% leased as of 7/3/2015 and had an appraised value as of 6/16/2015 of $15,440,000. Combined, the Citrus & City Place Apartments Property contains a total of 568 Units and has a combined appraised value of $38,440,000. The Occupancy figures reflect a weighted average. |
| (2) | See “—Escrows and Reserves” below for further discussion of reserve requirements. |
| (3) | Weighted average Occupancy for the first 11 months of 2013. |
| MSBAM 2015-C25 | Citrus & City Place Apartments |
| Citrus Apartments Unit Mix Summary | ||||||
| Floor Plan | No. of Units | % of Total Units | Unit SF | Average Asking Rent | Total SF | |
| 1 Bedroom/1 Bath | 176 | 50.6% | 550-740 | $593 | 114,460 | |
| 2 Bedroom/2 Bath | 140 | 40.2% | 845-945 | $720 | 124,600 | |
| 3 Bedroom/2 Bath | 32 | 9.2% | 1,120 | $790 | 35,840 | |
| Total/Avg. | 348 | 100.0% | 790 | $719 | 274,900 | |
| Citrus Apartments Competitive Rental Property Summary | ||||||||
| Property | Location | Distance | Total Units | Property Occupancy | Year Built | Average Unit Size SF | Average Rental Rate/Unit | |
| Villas East | 5055 E Charleston Blvd, Las Vegas | 2.0 miles | 160 | 86% | 1984 | 908 | $597 | |
| Oasis Meadows | 3150 S Nellis Blvd, Las Vegas | 2.8 miles | 383 | 93% | 1996 | 1,031 | $809 | |
| Oasis Springs | 451 N Nellis Blvd, Las Vegas | 2.0 miles | 304 | 92% | 1988 | 838 | $638 | |
| Corona del Sol (fka Calico Creek) | 4700 E Charleston Blvd, Las Vegas | 400 yards | 200 | 88% | 1980 | 923 | $567 | |
| Stonegate | 5075 Spyglass Hill Dr, Las Vegas | 2.5 miles | 440 | 92% | 1990 | 885 | $668 | |
| Sahara Gardens | 4801 E Sahara Ave, Las Vegas | 2.0 miles | 312 | 85% | 1983 | 878 | $600 | |
| Ridge Falls (fka Sedona Hills) | 2895 E Charleston Blvd, Las Vegas | 0.5 mile | 256 | 90% | 1997 | 801 | $648 | |
| Total/Avg. | 89% | 895 | $647 | |||||
| Citrus Apartments (Subject) | 60 N Pecos Rd, Las Vegas | 348 | 96% | 1991 | 790 | $661 | ||
| City Place Apartments Unit Mix Summary | |||||
| Floor Plan | No. of Units | % of Total Units | Unit SF | Average Asking Rent | Total SF |
| 1 Bedroom/1 Bath | 56 | 25.5% | 702 | $580 | 39,312 |
| 2 Bedroom/1 Bath | 56 | 25.5% | 1,008 | $680 | 56,448 |
| 2 Bedroom/1.5 Bath (Townhome) | 76 | 34.5% | 1,039 | $745 | 78,964 |
| 3 Bedroom/2 Bath | 32 | 14.5% | 1,168 | $828 | 37,376 |
| Total/Avg. | 220 | 100.0% | 964 | $723 | 212,100 |
| MSBAM 2015-C25 | Citrus & City Place Apartments |
| City Place Apartments Competitive Rental Property Summary | ||||||||
| Property | Location | Distance | Total Units | Property Occupancy | Year Built | Average Unit Size SF | Average Rental Rate/Unit | |
| Regency Place Apartments | 2820 S Decatur Blvd, Las Vegas | 0.5 mile | 136 | 95% | 1977 | 951 | $731 | |
| Sandpebble Village | 4480 Sirius, Las Vegas | 0.3 mile | 280 | 98% | 1979 | 737 | $600 | |
| Arbors At Decatur | 2666 S Decatur Blvd, Las Vegas | 0.7 mile | 216 | 94% | 1988 | 966 | $790 | |
| Villas at Painted Desert | 2851 S Decatur Blvd, Las Vegas | 0.4 mile | 240 | 95% | 1980 | 800 | $739 | |
| Emerald Park | 4545 Pennwood Ave, Las Vegas | 0.4 mile | 300 | 97% | 1978 | 650 | $600 | |
| Evergreen Apartments | 2950-3060 S Decatur Blvd, Las Vegas | 0.3 mile | 312 | 98% | 1979 | 675 | $576 | |
| Total/Avg. | 96% | 797 | $673 | |||||
| City Place Apartments (Subject) | 3150 S Decatur Blvd, Las Vegas | 220 | 95% | 1975 | 964 | $698 | ||
| Las Vegas Market and Submarket Summary | |||||||
| Market or Submarket | Inventory (Buildings) | Inventory (Units) | % of Total | Asking Rent | Class B/C Vacancy% | Free Rent (months) | |
| Spring Valley Submarket | 51 | 12,531 | 9.0% | $832 | 1.7% | 0.32 | |
| Northeast Submarket | 40 | 8,815 | 6.4% | $728 | 10.4% | 0.32 | |
| Las Vegas Market Total/Wtd Avg. | 634 | 138,641 | $856 | 5.2% | 0.37 | ||
| Cash Flow Analysis | |||||||||||||||
| 2011 | 2012 | 2013 | 2014 | 6/30/2015 TTM | UW | UW per Unit | |||||||||
| Base Rent | N/A | $4,181,379 | $4,026,452 | $4,333,309 | $4,351,267 | $4,393,811 | $7,736 | ||||||||
Other Income(1) | N/A | $94,758 | $107,094 | $257,347 | $308,392 | $275,844 | $486 | ||||||||
| Utility Reimbursements | N/A | $0 | $0 | $84,898 | $155,022 | $171,862 | $303 | ||||||||
| Discounts Concessions | N/A | ($82,968) | ($41,518) | ($127,798) | ($147,855) | ($125,028) | ($220) | ||||||||
| Less Vacancy & Credit Loss | N/A | ($1,017,479) | ($509,795) | ($454,389) | ($359,209) | ($266,408) | (6.1%) | ||||||||
| Effective Gross Income | N/A | $3,175,690 | $3,582,233 | $4,093,367 | $4,307,617 | $4,450,081 | $7,835 | ||||||||
| Total Operating Expenses | N/A | $2,216,114 | $2,237,516 | $1,915,465 | $1,835,219 | $1,949,820 | $3,433 | ||||||||
| Net Operating Income | N/A | $959,576 | $1,344,717 | $2,177,902 | $2,472,398 | $2,500,261 | $4,402 | ||||||||
| Capital Expenditures | N/A | $0 | $0 | $0 | $0 | $190,280 | $335 | ||||||||
| Net Cash Flow | N/A | $959,576 | $1,344,717 | $2,177,902 | $2,472,398 | $2,309,981 | $4,067 | ||||||||
| Occupancy % | N/A | 69.6% | 87.0%(2) | 89.3% | 95.4%(3) | 94.0% | |||||||||
| NOI DSCR | N/A | 0.58x | 0.81x | 1.32x | 1.50x | 1.51x | |||||||||
| NCF DSCR | N/A | 0.58x | 0.81x | 1.32x | 1.50x | 1.40x | |||||||||
| NOI Debt Yield | N/A | 3.4% | 4.8% | 7.8% | 8.9% | 9.0% | |||||||||
| NCF Debt Yield | N/A | 3.4% | 4.8% | 7.8% | 8.9% | 8.3% | |||||||||
| (1) | Other Income includes income from application fees, late fees, pet rent, MTM fees, non-sufficient funds fees, credit card fees, storage income, lease termination fees, cleaning fees and damage fees. |
| (2) | Occupancy for the first 11 months of 2013. |
| (3) | Occupancy as of July 3, 2015. |
| MSBAM 2015-C25 | Citrus & City Place Apartments |
| MSBAM 2015-C25 | 644 West Putnam Avenue |
| Mortgage Loan No. 11 – 644 West Putnam Avenue |
| Mortgage Loan Information | Mortgaged Property Information | ||||||
| Mortgage Loan Seller: | BANA | Single Asset/Portfolio: | Single Asset | ||||
| Original Balance: | $26,625,000 | Location: | Greenwich, CT 06830 | ||||
| Cut-off Date Balance: | $26,625,000 | General Property Type: | Mixed Use | ||||
| % of Initial Pool Balance: | 2.3% | Detailed Property Type: | Retail/Office | ||||
| Loan Purpose: | Refinance | Title Vesting: | Fee | ||||
| Sponsor: | Joseph Simone; John Fareri | Year Built/Renovated: | 2012/N/A | ||||
| Mortgage Rate: | 4.292% | Size: | 36,535 SF | ||||
| Note Date: | 8/12/2015 | Cut-off Date Balance per Unit: | $729 | ||||
| First Payment Date: | 10/1/2015 | Maturity Date Balance per Unit: | $651 | ||||
| Maturity Date: | 9/1/2025 | Property Manager: | Premier Management Services LLC | ||||
| Original Term to Maturity: | 120 months | (borrower related) | |||||
| Original Amortization Term: | 360 months | Underwriting and Financial Information | |||||
| IO Period: | 48 months | UW NOI: | $2,135,966 | ||||
| Seasoning: | 1 months | UW NOI Debt Yield: | 8.0% | ||||
| Prepayment Provisions: | LO (25); DEF/YM1 (91); O (4) | UW NOI Debt Yield at Maturity: | 9.0% | ||||
| Lockbox/Cash Mgmt Status: | Hard/Springing | UW NCF DSCR: | 1.80x (IO) 1.32x (P&I) | ||||
| Additional Debt Type: | N/A | Most Recent NOI(2): | NAV | ||||
| Additional Debt Balance: | N/A | 2nd Most Recent NOI(2): | NAV | ||||
| Future Debt Permitted (Type): | No (N/A) | 3rd Most Recent NOI(2): | NAV | ||||
| Reserves | Most Recent Occupancy(2): | 100.0% (8/1/2015) | |||||
Type | Initial | Monthly | Cap | 2nd Most Recent Occupancy(2): | 49.8% (12/31/2014) | ||
| RE Tax: | $56,493 | $18,831 | N/A | 3rd Most Recent Occupancy(2): | 45.6% (12/31/2013) | ||
| Insurance: | $0 | Springing | N/A | Appraised Value (as of)(3): | $35,500,000 (11/1/2015) | ||
| Recurring Replacements: | $0 | $761 | N/A | Cut-off Date LTV Ratio(3): | 75.0% | ||
| TI/LC: | $0 | $3,045 | $150,000 | Maturity Date LTV Ratio(3): | 67.0% | ||
Other(1): | $3,085,460 | $0 | N/A | ||||
| Sources and Uses | ||||||
| Sources | Proceeds | % of Total | Uses | Proceeds | % of Total | |
| Loan Amount: | $26,625,000 | 100.0% | Loan Payoff: | $16,273,241 | 61.1% | |
| Reserves: | $3,141,953 | 11.8% | ||||
| Closing Costs: | $168,728 | 0.6% | ||||
| Return of Equity: | $7,041,079 | 26.4% | ||||
| Total Sources: | $26,625,000 | 100.0% | Total Uses: | $26,625,000 | 100.0% | |
| (1) | Other Reserves represent an upfront deposit of $2,577,768 into a Landlord Obligation Reserve to cover outstanding tenant improvement obligations for WestMed and Mo Co Ho Co, an upfront deposit of $267,692 into a Free Rent Reserve to cover four full months of rent for WestMed and an upfront deposit of $240,000 into a Garage Repair Reserve to cover the cost of repairing water infiltration in the underground parking garage. |
| (2) | Historical NOI is not available as the 644 West Putnam Avenue Property was in lease-up until 2015. Most Recent Occupancy as of August 1, 2015 includes tenants WestMed (34.8% NRA, 27.7% UW Rent) and Mo Co Ho Co (15.4% NRA, 10.9% UW Rent) which had lease start dates of May 1, 2015 and June 1, 2015, respectively. WestMed is expected to take occupancy in October 2015. |
| (3) | The appraised value represents the “Prospective Market Value upon Stabilization” value, which assumes the recently signed tenants WestMed and Mo Co Ho Co are in occupancy, have commenced rent payments and are not due any tenant improvement or leasing commissions. The “as is” appraised value as of June 22, 2015 is $33,700,000, which would result in a Cut-off Date LTV Ratio of 79.0%. |
| MSBAM 2015-C25 | 644 West Putnam Avenue |
Tenant Summary(1) | |||||||
| Tenant Name | Credit Rating (Fitch/Moody’s/S&P)(2) | Tenant SF | Approximate % of SF | Annual UW Rent | % of Total Annual UW Rent | Annual UW Rent PSF | Lease Expiration |
| CVS | NR/Baa1/BBB+ | 14,169 | 39% | $1,168,952 | 52% | $82.50 | 11/30/2036 |
WestMed(3) | NR/NR/NR | 12,703 | 35% | $625,369 | 28% | $49.23 | 12/15/2025 |
| Mo Co Ho Co | NR/NR/NR | 5,623 | 15% | $245,444 | 11% | $43.65 | 7/31/2025 |
| Zanaic Greenwich | NR/NR/NR | 2,500 | 7% | $132,625 | 6% | $53.05 | 2/28/2019 |
| The Perryridge Corporation | NR/NR/NR | 1,540 | 4% | $81,697 | 4% | $53.05 | 8/31/2017 |
| Subtotal/Wtd. Avg. | 36,535 | 100% | $2,254,087 | 100% | $61.70 | ||
| Vacant Space | 0 | 0% | $0 | 0% | $0.00 | ||
| Total/Wtd. Avg. | 36,535 | 100% | $2,254,087 | 100% | $61.70 | ||
| (1) | Information is based on the underwritten rent roll. |
| (2) | Certain ratings are those of the parent company whether or not the parent guarantees the lease. |
| (3) | WestMed has an executed lease and is expected to take occupancy in October 2015. |
Lease Rollover Schedule(1) | ||||||||
| Year | # of Leases Rolling | SF Rolling | UW Rent PSF Rolling | Approx. % of Total SF Rolling | Approx. Cumulative % of SF Rolling | Total UW Rent Rolling | Approx. % of Total Rent Rolling | Approx. Cumulative % of Total Rent Rolling |
| 2015 | 0 | 0 | $0.00 | 0% | 0% | $0 | 0% | 0% |
| 2016 | 0 | 0 | $0.00 | 0% | 0% | $0 | 0% | 0% |
| 2017 | 1 | 1,540 | $53.05 | 4% | 4% | $81,697 | 4% | 4% |
| 2018 | 0 | 0 | $0.00 | 0% | 4% | $0 | 0% | 4% |
| 2019 | 1 | 2,500 | $53.05 | 7% | 11% | $132,625 | 6% | 10% |
| 2020 | 0 | 0 | $0.00 | 0% | 11% | $0 | 0% | 10% |
| 2021 | 0 | 0 | $0.00 | 0% | 11% | $0 | 0% | 10% |
| 2022 | 0 | 0 | $0.00 | 0% | 11% | $0 | 0% | 10% |
| 2023 | 0 | 0 | $0.00 | 0% | 11% | $0 | 0% | 10% |
| 2024 | 0 | 0 | $0.00 | 0% | 11% | $0 | 0% | 10% |
| 2025 | 2 | 18,326 | $47.52 | 50% | 61% | $870,813 | 39% | 48% |
| 2026 & Beyond | 1 | 14,169 | $82.50 | 39% | 100% | $1,168,952 | 52% | 100% |
| Vacant | 0 | 0 | $0.00 | 0% | 100% | $0 | 0% | 100% |
| Total/Wtd. Avg. | 5 | 36,535 | $61.70 | 100% | $2,254,087 | 100% | ||
| (1) | Information is based on the underwritten rent roll. |
| MSBAM 2015-C25 | 644 West Putnam Avenue |
Directly Competitive Office Rental Summary | ||||||||
| Address | Tenant Name | Lease Start Date | SF | Term (yrs) | Initial Rent PSF | Rent Steps | Lease Type | |
100 West Putnam Avenue Greenwich, CT | AXA | 3/1/2015 | 15,860 | NAV | $90.00 | $1 annually | Modified | |
Greenwich Office Park 51 Weaver Street Greenwich, CT | DW Investment Mgmt. | 6/1/2014 | 5,646 | 3.3 | $49.00 | $0.75 annually | Modified | |
2 Pickwick Plaza Greenwich, CT | Performance Equity | 11/1/2014 | 9,751 | 1.0 | $75.00 | Flat | Modified | |
80 Field Point Road Greenwich, CT | Gillespie, Robinson & Grimm, Inc. | 12/1/2013 | 3,852 | 5.0 | $61.92 | 2% annually | Modified | |
33 Benedict Place Greenwich, CT | NAV | 10/1/2013 | 35,023 | 10.9 | $65.00 | Average over the term | Modified | |
Directly Competitive Pharmacy Rental Summary | ||||||||
| Address | Tenant Name | Lease Start Date | SF | Term (yrs) | Initial Rent PSF | Rent Steps | Lease Type | |
Kings Crossing 330 Grasmere Avenue Fairfield, CT | CVS | 7/1/2011 | 12,960 | 25.0 | $60.25 | 5% each 5th year | Net | |
1201 Main Street Peekskill, NY | Walgreens | 1/1/2011 | 11,062 | 25.0 | $66.26 | Flat | Net | |
Shopping Center Westchester, NY | National Pharmacy | NAV | 10,171 | 25.0 | $56.00 | 10% each 5th year | Net | |
Cash Flow Analysis(1) | ||||||||||||
| 2011 | 2012 | 2013 | 2014 | UW | UW PSF | |||||||
| Base Rent | N/A | N/A | N/A | N/A | $2,254,087 | $61.70 | ||||||
| Expense Reimbursements | N/A | N/A | N/A | N/A | $536,892 | $14.70 | ||||||
| Other Income | N/A | N/A | N/A | N/A | $0 | $0.00 | ||||||
| Less Vacancy & Credit Loss | N/A | N/A | N/A | N/A | ($106,631) | (3.8%) | ||||||
| Effective Gross Income | N/A | N/A | N/A | N/A | $2,684,348 | $73.47 | ||||||
| Total Operating Expenses | N/A | N/A | N/A | N/A | $548,382 | $15.01 | ||||||
| Net Operating Income | N/A | N/A | N/A | N/A | $2,135,966 | $58.46 | ||||||
| Capital Expenditures | N/A | N/A | N/A | N/A | $9,134 | $0.25 | ||||||
| TI/LC | N/A | N/A | N/A | N/A | $39,758 | $1.09 | ||||||
| Net Cash Flow | N/A | N/A | N/A | N/A | $2,087,074 | $57.13 | ||||||
| Occupancy | N/A | N/A | N/A | N/A | 96.2% | |||||||
| NOI DSCR | N/A | N/A | N/A | N/A | 1.35x | |||||||
| NCF DSCR | N/A | N/A | N/A | N/A | 1.32x | |||||||
| NOI Debt Yield | N/A | N/A | N/A | N/A | 8.0% | |||||||
| NCF Debt Yield | N/A | N/A | N/A | N/A | 7.8% | |||||||
| (1) | Historical NOI is not available as the 644 West Putnam Avenue Property was in lease-up until 2015. |
| MSBAM 2015-C25 | 1800 Route 34 |
| Mortgage Loan No. 12 – 1800 Route 34 |
| Mortgage Loan Information | Mortgaged Property Information | ||||||
| Mortgage Loan Seller: | CIBC | Single Asset/Portfolio: | Single Asset | ||||
| Original Balance: | $23,700,000 | Location: | Wall Township, NJ 07719 | ||||
| Cut-off Date Balance: | $23,700,000 | General Property Type: | Office | ||||
| % of Initial Pool Balance: | 2.0% | Detailed Property Type: | Suburban | ||||
| Loan Purpose: | Refinance | Title Vesting: | Fee | ||||
| Sponsor: | Corbett Donato | Year Built/Renovated: | 2004-2007/N/A | ||||
| Mortgage Rate: | 4.770% | Size: | 189,836 SF | ||||
| Note Date: | 7/22/2015 | Cut-off Date Balance per Unit: | $125 | ||||
| First Payment Date: | 9/1/2015 | Maturity Date Balance per Unit: | $110 | ||||
| Maturity Date: | 8/1/2025 | Property Manager: | Donato Realty Management, LLC | ||||
| Original Term to Maturity: | 120 months | ||||||
| Original Amortization Term: | 360 months | Underwriting and Financial Information | |||||
| IO Period: | 36 months | UW NOI: | $2,377,835 | ||||
| Seasoning: | 2 months | UW NOI Debt Yield: | 10.0% | ||||
| Prepayment Provisions: | LO (26); DEF (90); O (4) | UW NOI Debt Yield at Maturity: | 11.4% | ||||
| Lockbox/Cash Mgmt Status: | Hard/Springing | UW NCF DSCR: | 1.90x (IO) 1.46x( (P&I) | ||||
| Additional Debt Type: | No | Most Recent NOI: | $2,226,423 (5/31/2015 TTM) | ||||
| Additional Debt Balance: | N/A | 2nd Most Recent NOI: | $2,366,045 (12/31/2014) | ||||
| Future Debt Permitted (Type): | No (N/A) | 3rd Most Recent NOI: | $2,196,367 (12/31/2013) | ||||
| Reserves | Most Recent Occupancy(2): | 93.3% (7/16/2015) | |||||
Type | Initial | Monthly | Cap | 2nd Most Recent Occupancy: | 91.6% (12/31/2014) | ||
| RE Tax: | $34,795 | $34,795 | N/A | 3rd Most Recent Occupancy: | 96.2% (12/31/2013) | ||
| Insurance: | $32,679 | $2,971 | N/A | Appraised Value (as of): | $35,500,000 (6/5/2015) | ||
| Deferred Maintenance: | $9,375 | $0 | N/A | Cut-off Date LTV Ratio: | 66.8% | ||
| Recurring Replacements: | $0 | $2,373 | N/A | Maturity Date LTV Ratio: | 58.9% | ||
| TI/LC: | $145,000 | $14,583 | $350,000 | ||||
Other(1): | $222,480 | Springing | Various | ||||
| Sources and Uses | ||||||
| Sources | Proceeds | % of Total | Uses | Proceeds | % of Total | |
| Loan Amount: | $23,700,000 | 100.0% | Loan Payoff(3): | $22,567,031 | 95.2% | |
| Reserves: | $444,329 | 1.9% | ||||
| Closing Costs: | $459,673 | 1.9% | ||||
| Return of Equity: | $228,967 | 1.0% | ||||
| Total Sources: | $23,700,000 | 100.0% | Total Uses: | $23,700,000 | 100.0% | |
| (1) | Commencing (i) 12 months prior to the lease expiration of French & Parrello, (ii) if French & Parrello (or 50% or more of the replacement tenants for the French & Parrello space) files bankruptcy, surrenders, cancels or terminates its lease or gives notice that it will not be exercising its renewal option or (iii) if French & Parrello goes dark or vacates, excess cash will be swept into a reserve for re-tenanting the French & Parrello space, subject to a cap of $503,385. |
| At loan origination, the 1800 Route 34 Borrower deposited $144,375 into a reserve for tenant improvements owed to the tenant Single Throw, Inc. and $69,605 into a reserve for the difference between full unabated rent due on Single Throw, Inc.’s entire space (including expansion space which it is not yet occupying) and the rent currently due on its original space until full unabated rent for the entire space commences. Single Throw, Inc. is expected to take occupancy of its expansion space in October 2015, and is expected to pay full unabated rent in January 2016. |
| At loan origination, the 1800 Route 34 Borrower deposited $5,000 into a reserve for tenant improvements owed to the tenant ANMAC Wall Lease, LLC and $3,500 into a reserve for tenant improvements owed to the tenant Roof Diagnostics Solar and Electric, LLC. |
| (2) | Excludes the management office (0.6% of NRA) and building café (1.8% of NRA) which were underwritten as vacant. |
| (3) | Loan Payoff includes defeasance costs of approximately $664,637. |
| MSBAM 2015-C25 | 1800 Route 34 |
Tenant Summary(1) | |||||||||||||||
| Tenant Name | Credit Rating (Fitch/Moody’s/S&P)(2) | Tenant SF | Approximate % of SF | Annual UW Base Rent | % of Total Annual UW Base Rent | Annual UW Rent PSF(3)(4) | Lease Expiration | ||||||||
| Major Tenants | |||||||||||||||
| French & Parrello | NR/NR/NR | 33,559 | 18% | $704,739 | 25% | $21.00 | (5) | 4/30/2021 | |||||||
| First Financial Credit Union | NR/NR/NR | 18,596 | 10% | $306,834 | 11% | $16.50 | 5/31/2016 | ||||||||
| The Earle Companies | NR/NR/NR | 12,067 | 6% | $174,655 | 6% | $14.47 | 3/31/2016 | ||||||||
| KMB Design Group | NR/NR/NR | 11,300 | 6% | $194,925 | 7% | $17.25 | 12/31/2016 | ||||||||
| Secova Securities | NR/NR/NR | 10,650 | 6% | $183,500 | 7% | $17.23 | 8/31/2020 | ||||||||
| Subtotal/Wtd. Avg. | 86,172 | 45% | $1,564,653 | 56% | $18.16 | ||||||||||
| Other Tenants | 90,908 | 48% | $1,212,150 | 44% | $13.33 | (5) | |||||||||
Vacant Space(6) | 12,756 | 7% | $0 | 0% | $0.00 | ||||||||||
| Total/Wtd. Avg. | 189,836 | 100% | $2,776,803 | 100% | $15.68 | ||||||||||
| (1) | Information is based on the underwritten rent roll. |
| (2) | Certain ratings are those of the parent company whether or not the parent guarantees the lease. |
| (3) | Triple net basis. |
| (4) | Wtd. Avg. Annual UW Rent PSF Rolling excludes vacant space. |
| (5) | French & Parrello (18% of NRA), EPS Corporation (2% of NRA) and Tuxedo King (1% of NRA) pay rent on a modified gross basis. All other tenants pay rent on a triple net basis. |
| (6) | Includes the management office (0.6% of NRA) and café (1.8% of NRA) which were underwritten as vacant. |
Lease Rollover Schedule(1)(2) | ||||||||||||||||
| Year | # of Leases Rolling | SF Rolling | UW Rent PSF Rolling(3) | Approx. % of Total SF Rolling | Approx. Cumulative % of SF Rolling | Total UW Rent Rolling | Approx. % of Total UW Rent Rolling | Approx. Cumulative % of Total UW Rent Rolling | ||||||||
2015(4) | 3 | 7,700 | $12.71 | 4% | 4% | $97,880 | 4% | 4% | ||||||||
| 2016 | 3 | 41,963 | $16.12 | 22% | 26% | $676,414 | 24% | 28% | ||||||||
| 2017 | 4 | 14,923 | $12.58 | 8% | 34% | $187,665 | 7% | 35% | ||||||||
| 2018 | 2 | 15,899 | $14.96 | 8% | 42% | $237,840 | 9% | 43% | ||||||||
| 2019 | 2 | 19,200 | $14.79 | 10% | 53% | $283,968 | 10% | 53% | ||||||||
| 2020 | 4 | 33,336 | $13.24 | 18% | 70% | $441,297 | 16% | 69% | ||||||||
| 2021 | 1 | 33,559 | $21.00 | 18% | 88% | $704,739 | 25% | 95% | ||||||||
| 2022 | 0 | 0 | $0.00 | 0% | 88% | $0 | 0% | 95% | ||||||||
| 2023 | 1 | 10,500 | $14.00 | 6% | 93% | $147,000 | 5% | 100% | ||||||||
| 2024 | 0 | 0 | $0.00 | 0% | 93% | $0 | 0% | 100% | ||||||||
| 2025 | 0 | 0 | $0.00 | 0% | 93% | $0 | 0% | 100% | ||||||||
| 2026 & Beyond | 0 | 0 | $0.00 | 0% | 93% | $0 | 0% | 100% | ||||||||
Vacant(5) | 0 | 12,756 | $0.00 | 7% | 100% | $0 | 0% | 100% | ||||||||
| Total/Wtd. Avg. | 20 | 189,836 | $15.68 | 100% | $2,776,803 | 100% | ||||||||||
| (1) | Information is based on the underwritten rent roll. |
| (2) | Certain tenants may have lease termination options that are exercisable prior to the originally stated expiration date of the subject lease and that are not considered in the lease rollover schedule. |
| (3) | Wtd. Avg. UW Rent PSF Rolling excludes vacant space. |
| (4) | The tenants rolling in 2015 were included in underwritten vacancy and credit loss. |
| (5) | Includes the management office (0.6% of NRA) and café (1.8% of NRA) which were underwritten as vacant. |
| MSBAM 2015-C25 | 1800 Route 34 |
| Comparable Leases Summary | |||||||||||||||||||||
| Property Name/Location | Year Built | Overall Occ. | Lease Size Category | Expense Basis | Tenant Name | Lease Start Date | Lease Size (SF) | Lease Term (Mos.) | Base Rent (PSF Ann.) | NNN Base Rent (PSF Ann.) | |||||||||||
Donato Contracting 2-12 Corbett Way Eatontown, NJ | 2005 | 100% | < 6,000 SF > 6,000 SF | Gross + TE Gross + TE | Lotus 823 LLC Meridian Health Realty | Feb-14 Oct-12 | 2,986 7,615 | 63 60 | $21.56 $24.90 | $15.06 $18.40 | |||||||||||
2 Story Office 2310 Route 34 Wall Township, NJ | 2001 | 100% | < 6,000 SF | Gross + TE | N/A | Aug-12 | 3,143 | 60 | $23.50 | $17.00 | |||||||||||
Shrewsbury Executive Campus 1030-1040 Broad Street Shrewsbury Borough, NJ | 1984 | N/A | < 6,000 SF > 6,000 SF | Gross + TE Gross + TE | Stifel Nicholas Morgan Stanley | Apr-12 Oct-12 | 4,976 29,987 | 84 108 | $25.13 $23.00 | $17.63 $16.50 | |||||||||||
Route 34 Office 1971 Route 34 Wall Township, NJ | 2008 | N/A | < 6,000 SF | Mod. Gross | 1969 Route 34 LLC | Nov-13 | 5,410 | 36 | $26.01 | $21.01 | |||||||||||
Office/Warehouse/Industrial 151 Industrial Way E. Eatontown, NJ | 1989 | 100% | < 6,000 SF > 6,000 SF | NNN NNN | RSI Simcom Blackhawk Management | Apr-11 Jan-13 | 5,656 19,716 | 60 85 | $13.10 $11.15 | $13.10 $11.15 | |||||||||||
30-40 Corbett Way 30-40 Corbett Way Eatontown, NJ | 2004 | 93% | < 6,000 SF | Mod. Gross | Monmouth Pulmonary | Sep-14 | 5,766 | 120 | $24.00 | $17.50 | |||||||||||
Donato Hi-Tech Center III 1-13 Christopher Way Eatontown, NJ | 2001 | 100% | > 6,000 SF | Gross + TE | Metro Federal - Eatontown | Apr-15 | 24,233 | 12 | $24.75 | $18.25 | |||||||||||
Building C Allenwood Corporate Park 1967 Route 34 Wall, NJ | 2008 | N/A | > 6,000 SF | Mod. Gross | AXA Equitable | Dec-11 | 11,994 | 60 | $23.00 | $16.50 | |||||||||||
Clayton Property 1355 Campus Pkwy. Wall Township, NJ | 2002 | 100% | > 6,000 SF | Full Service | Meridian Health Realty | Mar-12 | 6,445 | 60 | $20.00 | $13.50 | |||||||||||
| MSBAM 2015-C25 | 1800 Route 34 |
| Cash Flow Analysis | |||||||||||||||
| 2011 | 2012 | 2013 | 2014 | 5/31/2015 TTM | UW | UW PSF | |||||||||
Rents in Place(1) | N/A | $2,659,292 | $2,640,110 | $2,590,331 | $2,361,097 | $2,776,803 | $14.63 | ||||||||
Vacant Rent(2) | N/A | $0 | $0 | $0 | $0 | $158,326 | $0.83 | ||||||||
| In Place Recoveries | N/A | $780,544 | $763,602 | $935,212 | $908,307 | $930,684 | $4.90 | ||||||||
| Vacant Recoveries | N/A | $0 | $0 | $0 | $0 | $90,000 | $0.47 | ||||||||
Other Income(3) | N/A | $13,854 | $78,777 | $46,593 | $70,379 | $46,408 | $0.24 | ||||||||
Less Vacancy & Credit Loss(4) | N/A | $0 | $0 | $0 | $0 | ($427,228) | ($2.25) | ||||||||
| Effective Gross Income | N/A | $3,453,690 | $3,482,489 | $3,572,136 | $3,339,783 | $3,574,993 | $18.83 | ||||||||
| Total Operating Expenses | N/A | $1,025,884 | $1,286,122 | $1,206,091 | $1,113,360 | $1,197,158 | $6.31 | ||||||||
| Net Operating Income | N/A | $2,427,806 | $2,196,367 | $2,366,045 | $2,226,423 | $2,377,835 | $12.53 | ||||||||
| Capital Expenditures | N/A | $0 | $0 | $0 | $0 | $28,475 | $0.15 | ||||||||
| TI/LC | N/A | $0 | $0 | $0 | $0 | $174,991 | $0.92 | ||||||||
| Net Cash Flow | N/A | $2,427,806 | $2,196,367 | $2,366,045 | $2,226,423 | $2,174,369 | $11.45 | ||||||||
| Occupancy % | N/A | 96.2% | 96.2% | 91.6% | 91.4% | 93.3% | |||||||||
| NOI DSCR | N/A | 1.63x | 1.48x | 1.59x | 1.50x | 1.60x | |||||||||
| NCF DSCR | N/A | 1.63x | 1.48x | 1.59x | 1.50x | 1.46x | |||||||||
| NOI Debt Yield | N/A | 10.2% | 9.3% | 10.0% | 9.4% | 10.0% | |||||||||
| NCF Debt Yield | N/A | 10.2% | 9.3% | 10.0% | 9.4% | 9.2% | |||||||||
| (1) | Underwritten Rents in Place based on leases in place with rent steps underwritten through January 2016. |
| (2) | Vacant Rent is based on vacant space and management office at the appraiser’s concluded market rent of $15 PSF and the building café space at the contract rent. |
| (3) | Other Income based on 2014 and consists primarily of roof rent from the solar panel operator. |
| (4) | Underwritten Vacancy and Credit Loss is based on an economic vacancy rate of 10.8% which includes vacant space, the management office and building café, and the three tenants rolling in 2015. Actual physical occupancy at the 1800 Route 34 Property was 93.3% as of 7/16/2015 (excluding the management office and building café). |
| MSBAM 2015-C25 | Lycoming Crossing Shopping Center |
| Mortgage Loan No. 13 – Lycoming Crossing Shopping Center |
| Mortgage Loan Information | Mortgaged Property Information | ||||||
| Mortgage Loan Seller: | CIBC | Single Asset/Portfolio: | Single Asset | ||||
| Original Balance: | $21,600,000 | Location: | Muncy Township, PA 17756 | ||||
| Cut-off Date Balance: | $21,600,000 | General Property Type: | Retail | ||||
| % of Initial Pool Balance: | 1.8% | Detailed Property Type: | Shadow Anchored | ||||
| Loan Purpose: | Refinance | Title Vesting: | Fee | ||||
| Sponsor: | Steven D. Brand; Jeffery C. Camp; Richard S. Powell; Patrick R. Walburn | Year Built/Renovated: | 2008; 2009; 2011/N/A | ||||
| Mortgage Rate: | 4.750% | Size: | 135,999 SF | ||||
| Note Date: | 7/16/2015 | Cut-off Date Balance per Unit: | $159 | ||||
| First Payment Date: | 9/1/2015 | Maturity Date Balance per Unit: | $146 | ||||
| Maturity Date: | 8/1/2025 | Property Manager: | Vision Properties, LLC (borrower related) | ||||
| Original Term to Maturity: | 120 months | ||||||
| Original Amortization Term: | 360 months | Underwriting and Financial Information | |||||
| IO Period: | 60 months | UW NOI: | $1,834,755 | ||||
| Seasoning: | 2 months | UW NOI Debt Yield: | 8.5% | ||||
| Prepayment Provisions: | LO (26); DEF (90); O (4) | UW NOI Debt Yield at Maturity: | 9.2% | ||||
| Lockbox/Cash Mgmt Status: | Hard/Springing | UW NCF DSCR: | 1.67x (IO) 1.28x (P&I) | ||||
| Additional Debt Type: | N/A | Most Recent NOI: | $1,510,352 (12/31/2014) | ||||
| Additional Debt Balance: | N/A | 2nd Most Recent NOI: | $1,391,300 (12/31/2013) | ||||
| Future Debt Permitted (Type): | No (N/A) | 3rd Most Recent NOI: | $1,361,154 (12/31/2012) | ||||
| Reserves | Most Recent Occupancy: | 97.3% (6/30/2015) | |||||
Type | Initial | Monthly | Cap | 2nd Most Recent Occupancy: | 97.3% (12/31/2014) | ||
| RE Tax: | $138,942 | $8,710 | N/A | 3rd Most Recent Occupancy: | 84.4% (12/31/2013) | ||
| Insurance: | $8,978 | $2,993 | N/A | Appraised Value (as of): | $28,800,000 (4/10/2015) | ||
| Recurring Replacements: | $0 | $1,700 | N/A | Cut-off Date LTV Ratio: | 75.0% | ||
| TI/LC: | $0 | $6,250 | $450,000 | Maturity Date LTV Ratio: | 69.0% | ||
Other(1): | $0 | Springing | $427,360 | ||||
| Sources and Uses | ||||||
| Sources | Proceeds | % of Total | Uses | Proceeds | % of Total | |
| Loan Amount: | $21,600,000 | 81.7% | Loan Payoff: | $26,150,634 | 98.9% | |
| Equity: | $4,841,275 | 18.3% | Reserves: | $147,920 | 0.6% | |
| Closing Costs: | $142,722 | 0.5% | ||||
| Total Sources: | $26,441,275 | 100.0% | Total Uses: | $26,441,275 | 100.0% | |
| (1) | Commencing six months prior to Michael’s lease expiration date, excess cash flow is required to be swept into a reserve, subject to a cap of $427,360, for re-tenanting the Michael’s space. |
| MSBAM 2015-C25 | Lycoming Crossing Shopping Center |
Tenant Summary(1) | |||||||
| Tenant Name | Credit Rating (Fitch/Moody’s/S&P)(2) | Tenant SF | Approximate % of SF | Annual UW Rent | % of Total Annual UW Rent | Annual UW Rent PSF(3) | Lease Expiration |
| Major Tenants | |||||||
| Michael’s | NR/NR/B+ | 21,368 | 16% | $283,126 | 14% | $13.25 | 2/28/2018 |
| Bed Bath & Beyond | NR/Baa1/A- | 20,402 | 15% | $220,546 | 11% | $10.81 | 1/31/2019 |
| Petco | NR/B3/B | 15,264 | 11% | $285,437 | 14% | $18.70 | 1/31/2019 |
| Ulta Salon | NR/NR/NR | 10,233 | 8% | $204,660 | 10% | $20.00 | 2/28/2022 |
| Cracker Barrel Old Country Store | NR/NR/NR | 8,000 | 6% | $112,480 | 6% | $14.06 | 10/31/2021 |
| Subtotal/Wtd. Avg. | 75,267 | 55% | $1,106,248 | 54% | $14.70 | ||
| Other Tenants | 56,998 | 42% | $929,429 | 46% | $16.31 | ||
Vacant Space(4) | 3,734 | 3% | $0 | 0% | $0.00 | ||
| Total/Wtd. Avg. | 135,999 | 100% | $2,035,678 | 100% | $15.39 | ||
| (1) | Information is based on the underwritten rent roll. |
| (2) | Certain ratings are those of the parent company whether or not the parent guarantees the lease. |
| (3) | Wtd. Avg. Annual UW Rent PSF excludes vacant space. |
| (4) | Includes the 2,000 SF recently leased to Mariner Finance who has not taken occupancy yet. |
Lease Rollover Schedule(1)(2) | ||||||||
| Year | # of Leases Rolling | SF Rolling | UW Rent PSF Rolling(3) | Approx. % of Total SF Rolling | Approx. Cumulative % of SF Rolling | Total UW Rent Rolling | Approx. % of Total UW Rent Rolling | Approx. Cumulative % of Total UW Rent Rolling |
| 2015 | 0 | 0 | $0.00 | 0% | 0% | $0 | 0% | 0% |
| 2016 | 0 | 0 | $0.00 | 0% | 0% | $0 | 0% | 0% |
| 2017 | 0 | 0 | $0.00 | 0% | 0% | $0 | 0% | 0% |
| 2018 | 4 | 27,690 | $16.27 | 20% | 20% | $450,436 | 22% | 22% |
| 2019 | 6 | 54,781 | $14.20 | 40% | 61% | $777,882 | 38% | 60% |
| 2020 | 1 | 6,000 | $7.00 | 4% | 65% | $42,000 | 2% | 62% |
| 2021 | 2 | 15,537 | $14.03 | 11% | 76% | $217,998 | 11% | 73% |
| 2022 | 1 | 10,233 | $20.00 | 8% | 84% | $204,660 | 10% | 83% |
| 2023 | 0 | 0 | $0.00 | 0% | 84% | $0 | 0% | 83% |
| 2024 | 1 | 7,425 | $13.00 | 5% | 89% | $96,525 | 5% | 88% |
| 2025 | 1 | 7,700 | $18.50 | 6% | 95% | $142,450 | 7% | 95% |
| 2026 & Beyond | 1 | 2,899 | $35.78 | 2% | 97% | $103,726 | 5% | 100% |
Vacant(4) | 0 | 3,734 | $0.00 | 3% | 100% | $0 | 0% | 100% |
| Total/Wtd. Avg. | 17 | 135,999 | $15.39 | 100% | $2,035,678 | 100% | ||
| (1) | Information is based on the underwritten rent roll. |
| (2) | Certain tenants may have lease termination options that are exercisable prior to the originally stated expiration date of the subject lease that are not considered in the lease rollover schedule. |
| (3) | Wtd. Avg. UW Rent PSF Rolling excludes vacant space. |
| (4) | Includes the 2,000 SF recently leased to Mariner Finance who has not taken occupancy yet. |
| MSBAM 2015-C25 | Lycoming Crossing Shopping Center |
Competitive Property Summary | ||||||
| Property Name | Address | Distance from Subject | Year Built/ Renovated | Overall Occ | Size (SF) | Major Tenants |
| Lycoming Mall | 300 Lycoming Mall Circle Muncy, PA | 1 mile | 1978/1990 | 94% | 835,000 | Bon Ton, Macy’s, Sears, Burlington Coat Factory |
| Loyal Plaza | 1875-1969 E. Third Street Williamsport, PA | 8 miles | 2009 | 96% | 288,975 | Giant, Kmart |
| Parkview Center | 801 Loyalsock Avenue Montoursville, PA | 6 miles | N/A | 98% | 345,619 | Walmart, Weis Markets, Lowe’s |
| Wegman’s | 201 William Street Williamsport, PA | 11 miles | ~1980 | 100% | 200,000 | Wegman’s |
Sam’s Club | 611 Lycoming Mall Circle Muncy, PA | 1 mile | N/A | 100% | 100,000 | Sam’s Club |
Weis Markets | 305 River Avenue Williamsport, PA | 10 miles | N/A | 100% | 50,000 | Weis Markets |
Cash Flow Analysis | |||||||||||||||
| 2010 | 2011 | 2012 | 2013 | 2014 | UW | UW PSF | |||||||||
Base Rent(1) | $1,641,770 | $1,557,059 | $1,641,163 | $1,700,911 | $1,843,168 | $2,035,678 | $14.97 | ||||||||
| Vacant Rent | $0 | $0 | $0 | $0 | $0 | $96,020 | $0.71 | ||||||||
| Total Recoveries | $325,472 | $315,060 | $376,692 | $395,947 | $447,790 | $530,341 | $3.90 | ||||||||
| Other Income | $83 | $137,992 | $0 | $1,389 | ($1) | $0 | $0.00 | ||||||||
Vacancy & Credit Loss(2) | $0 | $0 | $0 | $0 | $0 | ($146,412) | ($1.08) | ||||||||
| Effective Gross Income | $1,967,325 | $2,010,111 | $2,017,855 | $2,098,247 | $2,290,957 | $2,515,626 | $18.50 | ||||||||
| Total Operating Expenses | $548,478 | $668,449 | $656,701 | $706,947 | $780,605 | $680,871 | $5.01 | ||||||||
| Net Operating Income | $1,418,847 | $1,341,661 | $1,361,154 | $1,391,300 | $1,510,352 | $1,834,756 | $13.49 | ||||||||
| Capital Expenditures | $0 | $0 | $0 | $0 | $0 | $20,400 | $0.15 | ||||||||
| TI/LC | $0 | $0 | $0 | $0 | $0 | $77,519 | $0.57 | ||||||||
| Net Cash Flow | $1,418,847 | $1,341,661 | $1,361,154 | $1,391,300 | $1,510,352 | $1,736,836 | $12.77 | ||||||||
Occupancy %(3) | 84.4% | 75.8% | 75.8% | 84.4% | 97.3% | 97.3% | |||||||||
| NOI DSCR | 1.05x | 0.99x | 1.01x | 1.03x | 1.12x | 1.36x | |||||||||
| NCF DSCR | 1.05x | 0.99x | 1.01x | 1.03x | 1.12x | 1.28x | |||||||||
| NOI Debt Yield | 6.6% | 6.2% | 6.3% | 6.4% | 7.0% | 8.5% | |||||||||
| NCF Debt Yield | 6.6% | 6.2% | 6.3% | 6.4% | 7.0% | 8.0% | |||||||||
| (1) | Underwritten Base Rent is based on leases in place, with scheduled rent increases for Aspen Dental Management, Inc. which occurs October 2015 and Five Below, Inc. which occurs August 2016. |
| (2) | Vacancy & Credit Loss based on an economic vacancy factor of 5.5%, which is greater than the actual physical vacancy of 2.7%, which includes 2,000 SF leased to but not yet occupied by Mariner Finance. |
| (3) | In 2009, a former tenant, Circuit City (20, 176 SF), vacated after filing bankruptcy. The sponsors were able to fill the majority of the space vacated by Circuit City with Ulta Salon and Five Below in 2011. In addition, when Circuit City vacated, a former tenant, Ross Dress For Less (“Ross”) (28,000 SF), claimed a co-tenancy clause was triggered that allowed it to pay percentage rent in lieu of base rent. In November 2011, Ross vacated its space after the sponsors terminated its lease when attempts to negotiate a revised base rent with Ross did not come to fruition. The majority of the space that Ross vacated was later backfilled by Lumber Liquidators and Cato Fashions in 2013, Dress Barn, Misses & Woman in 2014 and The Gap in 2015. |
| MSBAM 2015-C25 | The Gateway at Summerset Apartments |
| Mortgage Loan No. 14 – The Gateway at Summerset Apartments |
| Mortgage Loan Information | Mortgaged Property Information | |||||||
| Mortgage Loan Seller: | BANA | Single Asset/Portfolio: | Single Asset | |||||
| Original Balance: | $21,500,000 | Location: | Pittsburgh, PA 15217 | |||||
| Cut-off Date Balance: | $21,500,000 | General Property Type: | Multifamily | |||||
| % of Initial Pool Balance: | 1.8% | Detailed Property Type: | Garden | |||||
| Loan Purpose: | Refinance | Title Vesting: | Fee | |||||
| Sponsor: | Richard K. Barnhardt; Mark H. Dambly | Year Built/Renovated: | 2013/N/A | |||||
| Mortgage Rate: | 4.372% | Size: | 131 Units | |||||
| Note Date: | 7/29/2015 | Cut-off Date Balance per Unit: | $164,122 | |||||
| First Payment Date: | 9/1/2015 | Maturity Date Balance per Unit: | $143,523 | |||||
| Maturity Date: | 8/1/2025 | Property Manager: | Pennrose Management Company | |||||
| Original Term to Maturity: | 120 months | Underwriting and Financial Information | ||||||
| Original Amortization Term: | 360 months | UW NOI: | $1,678,652 | |||||
| IO Period: | 36 months | UW NOI Debt Yield: | 7.8% | |||||
| Seasoning: | 2 months | UW NOI Debt Yield at Maturity: | 8.9% | |||||
| Prepayment Provisions: | LO (26); DEF (90); O (4) | UW NCF DSCR: | 1.73x (IO) 1.28x (P&I) | |||||
| Lockbox/Cash Mgmt Status: | Springing/Springing | Most Recent NOI: | $1,414,746 (6/30/2015 TTM) | |||||
| Additional Debt Type: | N/A | 2nd Most Recent NOI: | $1,370,595 (12/31/2014) | |||||
| Additional Debt Balance: | N/A | 3rd Most Recent NOI: | N/A | |||||
| Future Debt Permitted (Type): | No (N/A) | Most Recent Occupancy: | 96.2% (7/15/2015) | |||||
| Reserves | 2nd Most Recent Occupancy: | 88.6% (12/31/2014) | ||||||
Type | Initial | Monthly | Cap | 3rd Most Recent Occupancy: | N/A | |||
| RE Tax: | $163,130 | $24,013 | N/A | Appraised Value (as of): | $28,600,000 (6/11/2015) | |||
| Insurance: | $0 | Springing | N/A | Cut-off Date LTV Ratio: | 75.2% | |||
| Recurring Replacements: | $0 | $2,729 | N/A | Maturity Date LTV Ratio: | 65.7% | |||
| Sources and Uses | |||||||
| Sources | Proceeds | % of Total | Uses | Proceeds | % of Total | ||
| Loan Amount: | $21,500,000 | 100.0% | Loan Payoff: | $16,924,910 | 78.7% | ||
| Reserves: | $163,130 | 0.8% | |||||
| Closing Costs: | $330,152 | 1.5% | |||||
| Return of Equity: | $4,081,808 | 19.0% | |||||
| Total Sources: | $21,500,000 | 100.0% | Total Uses: | $21,500,000 | 100.0% | ||
| MSBAM 2015-C25 | The Gateway at Summerset Apartments |
The Gateway at Summerset Apartments Unit Mix Summary | |||||
| Floor Plan | No. of Units | % of Total | SF | Total SF | |
| 1 Bedroom | 52 | 39.7% | 768 | 39,936 | |
| 2 Bedroom A | 20 | 15.3% | 1,051 | 21,020 | |
| 2 Bedroom B | 59 | 45.0% | 1,258 | 74,222 | |
| Total/Avg. | 131 | 100.0% | 1,032 | 135,178 | |
| Competitive Property Summary | |||||||
| Property | Location | Total Units | Property Occupancy | Year Built | Average Unit Size SF | Average Rental Rate/Unit | |
| Reserve at Summerset | 1123 Frick Lane, Pittsburgh | 40 | 92% | 2003 | 1,098 | $1,726 | |
| The Waterfront | 611 E. Waterfront Dr., Munhall Borough | 235 | NAV | 2001 | 1,049 | NAV | |
| Walnut on Highland | 121‐125 S. Highland, Pittsburgh | 117 | 100% | 2013 | 1,181 | $1,372 | |
| Shadyside Commons | 401 Amberson Ave., Pittsburgh | 148 | 99% | 1903 | 799 | $1,540 | |
| Bakery Living | 6480 Living Place, Pittsburgh | 171 | 99% | 2014 | NAV | NAV | |
| Lot 24 Apartments | 2404 Railroad Street, Pittsburgh | 96 | 99% | 2012 | NAV | $1,497 | |
| Total/Avg. | 99% | 1,013 | $1,499 | ||||
| The Gateway at Summerset Apartments (Subject) | 1876 Parkview Boulevard, Pittsburgh | 131 | 96% | 2013 | 1,032 | $1,721 | |
Cash Flow Analysis(1) | ||||||||||||||
| 2011 | 2012 | 2013 | 2014 | 6/30/2015 TTM | UW | UW per Unit | ||||||||
| Base Rent | N/A | N/A | N/A | $2,670,954 | $2,672,403 | $2,731,152 | $20,848 | |||||||
Other Income(2) | N/A | N/A | N/A | $65,222 | $69,714 | $69,714 | $532 | |||||||
| Discounts or Concessions | N/A | N/A | N/A | ($54,611) | ($16,398) | ($0) | ($0) | |||||||
| Less Vacancy & Credit Loss | N/A | N/A | N/A | ($299,899) | ($107,524) | ($182,671) | (6.7%) | |||||||
| Effective Gross Income | N/A | N/A | N/A | $2,381,666 | $2,618,195 | $2,618,195 | $19,986 | |||||||
| Total Operating Expenses | N/A | N/A | N/A | $1,011,071 | $1,203,449 | $939,543 | $7,172 | |||||||
| Net Operating Income | N/A | N/A | N/A | $1,370,595 | $1,414,746 | $1,678,652 | $12,814 | |||||||
| Capital Expenditures | N/A | N/A | N/A | $0 | $35,474 | $32,750 | $250 | |||||||
| Net Cash Flow | N/A | N/A | N/A | $1,370,595 | $1,379,272 | $1,645,902 | $12,564 | |||||||
| Occupancy % | N/A | N/A | N/A | 88.6% | 96.2%(3) | 93.3% | ||||||||
| NOI DSCR | N/A | N/A | N/A | 1.06x | 1.10x | 1.30x | ||||||||
| NCF DSCR | N/A | N/A | N/A | 1.06x | 1.07x | 1.28x | ||||||||
| NOI Debt Yield | N/A | N/A | N/A | 6.4% | 6.6% | 7.8% | ||||||||
| NCF Debt Yield | N/A | N/A | N/A | 6.4% | 6.4% | 7.7% | ||||||||
| (1) | Historical financials are not available as The Gateway at Summerset Apartments Property was constructed in 2013. |
| (2) | Other Income includes income from Utility Reimbursements, Parking Income, Repairs & Services Income, Damage Collections, Pet Fees, and Application Fees. |
| (3) | Based on rent rolls dated July 15, 2015. |
| MSBAM 2015-C25 | Uptown Crossing |
| Mortgage Loan No. 15 – Uptown Crossing |
| Mortgage Loan Information | Mortgaged Property Information | ||||||
| Mortgage Loan Seller: | SMF III | Single Asset/Portfolio: | Single Asset | ||||
| Original Balance: | $21,000,000 | Location: | Normal, IL 61761 | ||||
| Cut-off Date Balance: | $21,000,000 | General Property Type: | Mixed Use | ||||
| % of Initial Pool Balance: | 1.8% | Detailed Property Type: | Student/Retail/Office | ||||
| Loan Purpose: | Acquisition | Title Vesting: | Fee | ||||
| Sponsors: | Chad M. Packard; Beau H. Jaussi; Robert | Year Built/Renovated: | 2010/N/A | ||||
| Carter Packard | Size(1): | 126,155 SF | |||||
| Mortgage Rate: | 4.286% | Cut-off Date Balance per Unit: | $166 | ||||
| Note Date: | 6/17/2015 | Maturity Date Balance per Unit: | $152 | ||||
| First Payment Date: | 8/6/2015 | Property Manager: | Cardinal Group Management Midwest | ||||
| Maturity Date: | 7/6/2025 | LLC | |||||
| Original Term to Maturity: | 120 months | ||||||
| Original Amortization Term: | 360 months | Underwriting and Financial Information | |||||
| IO Period: | 60 months | UW NOI: | $1,804,902 | ||||
| Seasoning: | 3 months | UW NOI Debt Yield: | 8.6% | ||||
| Prepayment Provisions: | LO (27); DEF (89); O (4) | UW NOI Debt Yield at Maturity: | 9.4% | ||||
| Lockbox/Cash Mgmt Status: | Springing/Springing | UW NCF DSCR: | 1.86x (IO) 1.36x (P&I) | ||||
| Additional Debt Type: | N/A | Most Recent NOI: | $1,863,091 (4/30/2015 TTM) | ||||
| Additional Debt Balance: | N/A | 2nd Most Recent NOI: | $1,869,859 (12/31/2014) | ||||
| Future Debt Permitted (Type): | Yes (Mezzanine) | 3rd Most Recent NOI: | $1,950,730 (12/31/2013) | ||||
| Reserves | Most Recent Occupancy(1): | 97.8% (6/15/2015) | |||||
Type | Initial | Monthly | Cap | 2nd Most Recent Occupancy(1): | 100.0% (12/31/2014) | ||
| RE Tax: | $152,639 | $25,440 | N/A | 3rd Most Recent Occupancy(1): | 100.0% (12/31/2013) | ||
| Insurance: | $9,770 | $2,443 | N/A | Appraised Value (as of): | $28,000,000 (4/27/2015) | ||
Recurring Replacements(2): | $0 | $4,638 | $141,750 | Cut-off Date LTV Ratio: | 75.0% | ||
| TI/LC: | $0 | $4,668 | N/A | Maturity Date LTV Ratio: | 68.5% | ||
| Other: | $0 | $0 | N/A | ||||
| Sources and Uses | |||||||
| Sources | Proceeds | % of Total | Uses | Proceeds | % of Total | ||
| Loan Amount: | $21,000,000 | 73.7% | Purchase Price: | $27,600,000 | 96.9% | ||
| Borrower Equity: | $7,497,241 | 26.3% | Reserves: | $162,409 | 0.6% | ||
| Closing Costs: | $734,832 | 2.6% | |||||
| Total Sources: | $28,497,241 | 100.0% | Total Uses: | $28,497,241 | 100.0% | ||
| (1) | The Uptown Crossing Property is comprised of 135 student housing units totaling 70,134 SF and 56,021 SF of first and second floor retail and office space. Most Recent Occupancy, 2nd Most Recent Occupancy and 3rd Most Recent Occupancy reflect occupancy for the student housing space. The commercial space was 100.0% occupied in 2013 and 2014, and was 96.5% occupied as of June 16, 2015 as provided by the Uptown Crossing Borrower. The Uptown Crossing Borrower is permitted to make alterations and additions to the Uptown Crossing Property in connection with the conversion of space currently leased by Illinois State University, representing approximately 63% of the commercial space, into residential space used for student rental housing, subject to the satisfaction of certain conditions, including but not limited to the Uptown Crossing Borrower’s prompt payment of all costs associated with such conversion and the Uptown Crossing Property’s compliance with applicable zoning laws. |
| (2) | The Uptown Crossing Borrower is required to escrow $3,937.50 monthly for recurring replacements related to the student housing space up to a cap of $141,750. The Uptown Crossing Borrower is also required to escrow $700.26 monthly for recurring replacements related to the commercial and office space throughout the term of the Uptown Crossing Mortgage Loan. |
| MSBAM 2015-C25 | Uptown Crossing |
Unit Mix Summary | |||||
| Floor Plan | No. of Units | % of Total | SF | Total SF | |
| 1 Bedroom/1 Bath | 42 | 31% | 394 | 16,548 | |
| 1 Bedroom/1 Bath (Luxury) | 18 | 13% | 477 | 8,586 | |
| 2 Bedroom/1 Bath | 75 | 56% | 600 | 45,000 | |
| Total/Average | 135 | 100% | 520 | 70,134 | |
Tenant Summary(1) | ||||||||
| Tenant Name | Credit Rating (Fitch/Moody’s/S&P)(2) | Tenant SF | Approximate % of SF | Annual UW Rent | % of Total Annual UW Rent | Annual UW Rent PSF | Lease Expiration | 2014 Sales PSF |
| Anchor/Major Tenants | ||||||||
Illinois State University(3) | NR/NR/NR | 35,499 | 63% | $570,590 | 59% | $16.07 | (4) | N/A |
| CVS/Caremark | NR/Baa1/BBB+ | 13,109 | 23% | $281,844 | 29% | $21.50 | 7/31/2020 | N/A |
| Merry Ann’s Diner | NR/NR/NR | 2,361 | 4% | $69,678 | 7% | $29.51 | 2/28/2021 | N/A |
| Apricot Lane | NR/NR/NR | 2,000 | 4% | $42,000 | 4% | $21.00 | 9/30/2020 | N/A |
| Leasing Office | NR/NR/NR | 1,102 | 2% | N/A | N/A | N/A | N/A | N/A |
| Subtotal/Wtd. Avg. | 54,071 | 97% | $964,112 | 100% | $17.83 | |||
| Vacant Space | 1,950 | 3% | $0 | 0% | $0.00 | |||
| Total/Wtd. Avg. | 56,021 | 100% | $964,112 | 100% | $17.83 | |||
| (1) | Information is based on the underwritten rent roll. |
| (2) | Certain ratings are those of the parent company whether or not the parent guarantees the lease. |
| (3) | Illinois State University has the right to terminate its lease in any fiscal year the Illinois General Assembly fails to appropriate the necessary funds. |
| (4) | Illinois State University has a lease for 4,172 SF of space with an expiration date of October 31, 2017. The remaining 31,327 SF of space has an expiration date of May 31, 2020. |
| MSBAM 2015-C25 | Uptown Crossing |
Competitive Property Summary | ||||||||||
| Property Name/Address | Year Built | Units | Occupancy | Unit Type | Unit Size (SF) | Quoted Rent per Month | Concessions | |||
Uptown North 102 West College Avenue Normal, IL | 2013 | 39 | 99% | Studio 2 BR/2 BA 2 BR/2.5 BA 3 BR/3.5 BA | 614 1,010 1,046 1,318 | $995 $1,158 $1,478 $2,097 | None | |||
1010 Lofts on Main 1010 Main Street Normal, Illinois | 2011 | 65 | 100% | 2 BR/2 BA 3 BR/3 BA 4 BR/4 BA 4 BR/4.5 BA | 904 1,235 1,495 1,700 | $1,378 $1,947 $2,392 $2,540 | None | |||
The Edge on Hovey 800 West Hovey Avenue Normal, Illinois | 2005 | 125 | 82% | 2 BR/2 BA 3 BR/3 BA 4 BR/4 BA | 909 1,114 1,520 | $1,592 $2,058 $2,596 | None | |||
The Flats on Main 701 South Main Normal, Illinois | 2011 | 154 | 98% | 1 BR/1 BA 2 BR/2 BA 3 BR/3 BA 4 BR/4 BA | 600 798 1,300 1,400 | $1,300 $1,600 $2,250 $3,000 | None | |||
The Colburn 602 Kingsley Street Normal, Illinois | 2011 | 18 | 96% | 1 BR/1 BA 2 BR/2 BA | 620 800 | $1,045 $1,350 | None | |||
Cash Flow Analysis | |||||||||||||||
| 2011 | 2012 | 2013 | 2014 | 4/30/2015 TTM | UW | UW PSF | |||||||||
| Residential Base Rent | N/A | $1,558,744 | $1,590,358 | $1,623,057 | $1,613,655 | $1,639,860 | $13.00 | ||||||||
| Commercial Base Rent | N/A | $856,121 | $973,322 | $947,039 | $1,002,550 | $1,007,012 | $7.98 | ||||||||
| Total Recoveries | N/A | $166,845 | $200,792 | $197,410 | $193,514 | $217,275 | $1.72 | ||||||||
Other Income(1) | N/A | $95,677 | $103,998 | $93,180 | $88,622 | $87,355 | $0.69 | ||||||||
| Discounts Concessions | N/A | $0 | $0 | $0 | $0 | $0 | $0.00 | ||||||||
| Less Residential Vacancy & Credit Loss | N/A | ($5,565) | ($16,909) | ($13,593) | ($12,446) | ($81,993) | ($0.65) | ||||||||
| Less Commercial Vacancy & Credit Loss | N/A | $0 | $0 | ($1,241) | ($1,241) | ($50,351) | ($0.40) | ||||||||
| Effective Gross Income | N/A | $2,671,822 | $2,851,561 | $2,845,851 | $2,884,654 | $2,819,158 | $22.35 | ||||||||
| Total Operating Expenses | N/A | $928,657 | $900,831 | $975,992 | $1,021,563 | $1,014,256 | $8.04 | ||||||||
| Net Operating Income | N/A | $1,743,165 | $1,950,730 | $1,869,859 | $1,863,091 | $1,804,902 | $14.31 | ||||||||
| Capital Expenditures | N/A | $0 | $0 | $0 | $0 | $55,653 | $0.44 | ||||||||
| TI/LC | N/A | $0 | $0 | $0 | $0 | $56,021 | $0.44 | ||||||||
| Net Cash Flow | N/A | $1,743,165 | $1,950,730 | $1,869,859 | $1,863,091 | $1,693,228 | $13.42 | ||||||||
Occupancy %(2)(3) | N/A | N/A | 100.0% | 100.0% | 97.8% | 95.4% | |||||||||
| NOI DSCR | N/A | 1.40x | 1.57x | 1.50x | 1.50x | 1.45x | |||||||||
| NCF DSCR | N/A | 1.40x | 1.57x | 1.50x | 1.50x | 1.36x | |||||||||
| NOI Debt Yield | N/A | 8.3% | 9.3% | 8.9% | 8.9% | 8.6% | |||||||||
| NCF Debt Yield | N/A | 8.3% | 9.3% | 8.9% | 8.9% | 8.1% | |||||||||
| (1) | Other Income includes income includes parking income and miscellaneous fees. |
| (2) | As provided by the Uptown Crossing Borrower. |
| (3) | Represents the student housing space. 4/30/2015 TTM occupancy is based on the student housing rent roll dated June 15, 2015. The commercial space was 100% occupied in 2012, 2013 and 2014. The commercial space was 96.5% leased as of June 16, 2015. |
| MSBAM 2015-C25 |