| Exhibit 13.1 | Annual Report to Shareholders. |
NORTH CENTRAL BANCSHARES, INC.
Holding Company for First Federal
Savings Bank of Iowa
2006 ANNUAL REPORT
TABLE OF CONTENTS
MESSAGE OF THE CHAIRMAN, PRESIDENT AND CHIEF EXECUTIVE OFFICER
SELECTED CONSOLIDATED FINANCIAL AND OTHER DATA
MANAGEMENT'S DISCUSSION AND ANALYSIS OF FINANCIAL CONDITION AND RESULTS OF OPERATIONS
INDEX TO FINANCIAL STATEMENTS
QUARTERLY RESULTS OF OPERATIONS (Unaudited)
MANAGEMENT OF THE HOLDING COMPANY AND THE BANK
SHAREHOLDER INFORMATION
This Annual Report to Shareholders contains certain forward-looking statements consisting of estimates with respect to the financial condition, results of operations (including noninterest expense and availability of potential tax credits) and business of North Central Bancshares, Inc. (the "Company") that are subject to various factors which could cause actual results to differ materially from these estimates. These factors include changes in general, economic and market conditions, the development of an interest rate environment that adversely affects the interest rate spread or other income anticipated from the Company's operations and investments, and changes in depositor preferences for financial products. The Company does not undertake to update any forward-looking statement, whether written or oral, that may be made from time to time by or on behalf of the Company.
| | North Central Bancshares, Inc. | |
| | Holding Company for | |
| | First Federal Savings Bank of Iowa | |
| | 825 Central Avenue | |
| | Fort Dodge, Iowa 50501 | |
| | 515-576-7531 | |
| | www.firstfederaliowa.com | |
| | | |
| | Branch Locations | |
Fort Dodge, Iowa | Fort Dodge, Iowa | Ames, Iowa | Nevada, Iowa |
| 825 Central Avenue | 201 South 25th Street | 316 South Duff | 404 Lincoln Highway |
| Fort Dodge, Iowa 50501 | Fort Dodge, Iowa 50501 | Ames, Iowa 50010 | Nevada, Iowa 50201 |
| 515-576-7531 | 515-576-3177 | 515-232-4304 | 515-382-5408 |
| | | | |
Perry, Iowa | Ankeny, Iowa | Clive, Iowa | West Des Moines, Iowa |
1111 - 141st Street | 2110 SE Delaware Street | 13150 Hickman Road | 120 South 68th Street |
| Perry, Iowa 50220 | Ankeny, Iowa 50021 | Clive, Iowa 50325 | West Des Moines, Iowa 50266 |
| 515-465-3187 | 515-963-4488 | 515-440-6300 | 515-226-0800 |
Burlington, Iowa | Burlington, Iowa | Mt. Pleasant, Iowa |
| 1010 N. Roosevelt | 321 North 3rd Street | 102 South Main |
| Burlington, Iowa 52601 | Burlington, Iowa 52601 | Mt. Pleasant, Iowa 52641 |
| 319-754-6521 | 319-754-7517 | 319-385-8000 |
| | | |
| |
MESSAGE OF THE CHAIRMAN, PRESIDENT AND
CHIEF EXECUTIVE OFFICER
Dear Shareholders:
We are pleased to report to you the operating results of North Central Bancshares, Inc. (“North Central Bancshares” or the “Company”) for the year ended December 31, 2006. North Central Bancshares is the holding company for First Federal Savings Bank of Iowa (the “Bank”).
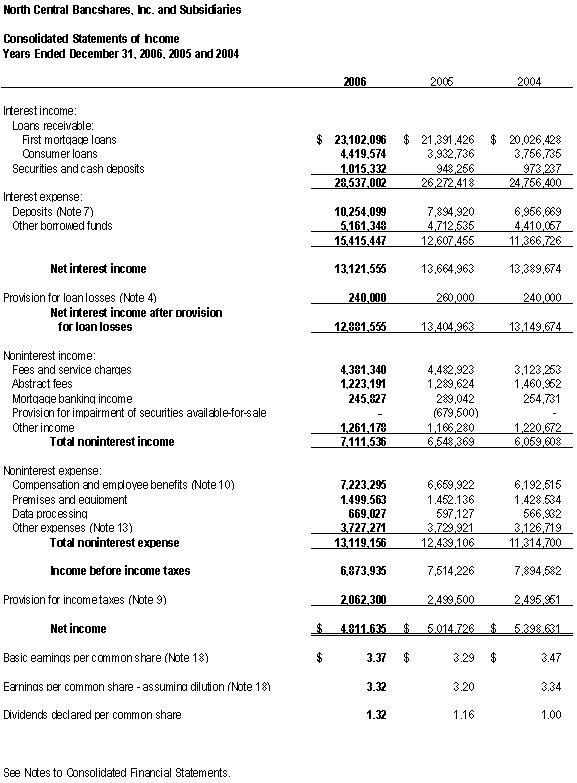
For the year ended December 31, 2006, North Central Bancshares’ net income was $4,812,000 or $3.32 diluted earnings per share. Total shareholder return was impacted favorably by a 13.8% increase in quarterly dividends effective April 2006. Some of our achievements during the past year include:
2006 HIGHLIGHTS
* Total assets increased 6.3% to a new high of $515.5 million.
* Net loans increased 4.4% to a new high of $449.0 million.
* Increased quarterly dividends in April, 2006 to $0.33 per share, a 13.8% increase.
* Repurchased a total of 151,250 shares of outstanding stock during the year ended December 31, 2006.
* Opened a new 6,000 sq. ft. full service office in West Des Moines, Iowa.
With the support of our directors, officers, staff and the continuing confidence of our shareholders, we look forward to continued success in the coming year. We remain committed to increasing shareholder value.
| | | | | | | | Sincerely, |
| | | | | | | | | | | | | | |
| | | | | | | | | | | | | | |
| | | | | | | | /s/ David M. Bradley David M. Bradley |
| | | | | | | | Chairman, President and Chief Executive Officer |
SELECTED CONSOLIDATED FINANCIAL AND OTHER DATA
The selected consolidated financial and other data of North Central Bancshares set forth below is derived in part from, and should be read in conjunction with, the Consolidated Financial Statements and Notes thereto presented elsewhere in this Annual Report.
| | | At December 31, | |
| | | 2006 | | 2005 | | 2004 | | 2003 | | 2002 | |
| | | (In thousands) | |
Selected Consolidated Financial Condition Data: | | | | | | | | | | | |
| Total assets | | $ | 515,515 | | $ | 485,191 | | $ | 462,735 | | $ | 424,009 | | $ | 403,872 | |
| Cash (noninterest-bearing) | | | 7,592 | | | 8,087 | | | 7,315 | | | 8,674 | | | 2,143 | |
Loans receivable, net: (1) First mortgage loans secured by one- to four-family residences | | | 215,992 | | | 210,793 | | | 184,324 | | | 171,468 | | | 147,479 | |
| First mortgage loans secured by multifamily properties | | | 65,237 | | | 73,453 | | | 77,995 | | | 69,507 | | | 70,194 | |
| First mortgage loans secured by commercial properties | | | 103,220 | | | 85,794 | | | 89,816 | | | 68,933 | | | 70,502 | |
| Consumer loans | | | 64,594 | | | 60,238 | | | 55,181 | | | 53,051 | | | 52,971 | |
| Total loans receivable, net | | | 449,043 | | | 430,278 | | | 407,316 | | | 362,959 | | | 341,146 | |
| Investment securities (2) | | | 32,461 | | | 21,260 | | | 23,710 | | | 28,297 | | | 35,859 | |
| Deposits (3) | | | 360,330 | | | 334,338 | | | 316,334 | | | 283,964 | | | 277,000 | |
| Borrowed funds | | | 107,908 | | | 102,444 | | | 100,975 | | | 95,005 | | | 85,026 | |
| Total shareholders' equity | | | 42,192 | | | 44,279 | | | 41,534 | | | 41,592 | | | 38,748 | |
| | | For the Year Ended December 31, | |
| | | 2006 | | 2005 | | 2004 | | 2003 | | 2002 | |
| | | (In thousands) | |
Selected Operating Data: | | | | | | | | | | | |
| Interest income | | $ | 28,537 | | $ | 26,272 | | $ | 24,757 | | $ | 25,412 | | $ | 26,965 | |
| Interest expense | | | 15,415 | | | 12,607 | | | 11,367 | | | 12,342 | | | 13,911 | |
| Net interest income before provision for loan losses | | | 13,122 | | | 13,665 | | | 13,390 | | | 13,070 | | | 13,054 | |
| Provision for loan losses | | | 240 | | | 260 | | | 240 | | | 255 | | | 383 | |
| Net interest income after provision for loan losses | | | 12,882 | | | 13,405 | | | 13,150 | | | 12,815 | | | 12,671 | |
Noninterest income: Fees and service charges | | | 4,381 | | | 4,483 | | | 3,123 | | | 2,864 | | | 2,375 | |
| Abstract fees | | | 1,223 | | | 1,289 | | | 1,461 | | | 1,811 | | | 1,686 | |
| Other income | | | 1,507 | | | 776 | | | 1,476 | | | 1,910 | | | 1,668 | |
| Total noninterest income | | | 7,111 | | | 6,548 | | | 6,060 | | | 6,585 | | | 5,729 | |
Noninterest expense: Salaries and employee benefits | | | 7,223 | | | 6,660 | | | 6,192 | | | 5,950 | | | 5,223 | |
| Premises and equipment | | | 1,500 | | | 1,452 | | | 1,429 | | | 1,287 | | | 1,192 | |
| Data processing | | | 669 | | | 597 | | | 567 | | | 578 | | | 544 | |
| Other expenses | | | 3,727 | | | 3,730 | | | 3,127 | | | 3,016 | | | 2,623 | |
| Total noninterest expense | | | 13,119 | | | 12,439 | | | 11,315 | | | 10,831 | | | 9,582 | |
| Income before income taxes | | | 6,874 | | | 7,514 | | | 7,895 | | | 8,569 | | | 8,818 | |
Income tax expense | | | 2,062 | | | 2,499 | | | 2,496 | | | 2,721 | | | 2,953 | |
| Net income | | $ | 4,812 | | $ | 5,015 | | $ | 5,399 | | $ | 5,848 | | $ | 5,865 | |
| | | At or For the Year Ended December 31, | |
| | | 2006 | | 2005 | | 2004 | | 2003 | | 2002 | |
Key Financial Ratios and Other Data: | | | | | | | | | | | |
| | | | | | | | | | | | |
Performance Ratios: (%) | | | | | | | | | | | |
| Net interest rate spread (difference between average yield on interest-earning assets and average cost of interest-bearing liabilities) | | | 2.56 | % | | 2.83 | % | | 3.02 | % | | 3.03 | % | | 3.15 | % |
| Net interest margin (net interest income as a percentage of average interest-earning assets) | | | 2.79 | | | 3.05 | | | 3.22 | | | 3.27 | | | 3.44 | |
| Return on average assets (net income divided by average total assets) | | | 0.96 | | | 1.05 | | | 1.21 | | | 1.38 | | | 1.47 | |
| Return on average equity (net income divided by average equity) | | | 11.24 | | | 11.57 | | | 12.97 | | | 14.65 | | | 15.57 | |
| Noninterest income to average assets | | | 1.42 | | | 1.37 | | | 1.36 | | | 1.55 | | | 1.43 | |
| Efficiency ratio (4) | | | 64.84 | | | 61.54 | | | 58.18 | | | 55.11 | | | 51.01 | |
| Noninterest expense to average assets | | | 2.63 | | | 2.61 | | | 2.54 | | | 2.55 | | | 2.40 | |
| Net interest income after provision for loan losses to noninterest expenses | | | 98.19 | | | 107.76 | | | 116.22 | | | 118.32 | | | 132.24 | |
| | | | | | | | | | | | | | | | | |
Financial Condition Ratios: (%) (5) | | | | | | | | | | | | | | | | |
| Equity to assets at period end | | | 8.18 | | | 9.13 | | | 8.98 | | | 9.81 | | | 9.59 | |
| Tangible equity to tangible assets at period end (6) (7) | | | 7.17 | | | 8.01 | | | 7.80 | | | 8.54 | | | 8.25 | |
| Average shareholders' equity divided by average total assets | | | 8.57 | | | 9.09 | | | 9.35 | | | 9.40 | | | 9.42 | |
| Average tangible shareholders equity divided by average tangible total assets (6) (7) | | | 7.53 | | | 7.95 | | | 8.13 | | | 8.12 | | | 8.06 | |
| Average interest-earning assets to average interest-bearing liabilities | | | 107.09 | | | 107.62 | | | 107.24 | | | 107.63 | | | 107.91 | |
Asset Quality Ratios: (%) (5) | | | | | | | | | | | | | | | | |
| Nonaccrual loans to total net loans | | | 0.13 | | | 0.14 | | | 0.16 | | | 0.17 | | | 0.19 | |
| Nonperforming assets to total assets (8) | | | 0.20 | | | 0.36 | | | 0.37 | | | 0.49 | | | 0.35 | |
| Allowance for loan losses as a percent of total loans receivable at end of period | | | 0.77 | | | 0.76 | | | 0.77 | | | 0.86 | | | 0.90 | |
| Allowance for loan losses to nonaccrual loans | | | 603.41 | | | 567.98 | | | 513.13 | | | 515.02 | | | 485.00 | |
| | | | | | | | | | | | | | | | | |
Per Share Data: | | | | | | | | | | | | | | | | |
| Book value per share | | $ | 30.56 | | $ | 29.37 | | $ | 27.14 | | $ | 25.92 | | $ | 23.62 | |
| Tangible book value per share (6) | | | 26.49 | | | 25.46 | | | 23.28 | | | 22.24 | | | 20.03 | |
| Basic earnings per share (9) | | | 3.36 | | | 3.29 | | | 3.47 | | | 3.69 | | | 3.58 | |
| Diluted earnings per share (10) | | | 3.32 | | | 3.20 | | | 3.34 | | | 3.48 | | | 3.37 | |
| Dividends declared per share | | | 1.32 | | | 1.16 | | | 1.00 | | | 0.84 | | | 0.72 | |
| Dividend payout ratio | | | 0.39 | | | 0.35 | | | 0.29 | | | 0.23 | | | 0.20 | |
_______________________
(Notes on following page)
| (1) | Loans receivable, net, represents total loans less discounts, loans in process, net deferred loan fees and allowance for loan losses, plus premiums. The allowance for loan losses at December 31, 2006, 2005, 2004, 2003 and 2002 was $3.5 million, $3.3 million, $3.2 million, $3.2 million and $3.1 million, respectively. |
| (2) | Includes interest-bearing cash and Federal Home Loan Bank stock. |
| (3) | Includes brokered certificates of deposits of $30.4 million, $4.0 million, $0.0 million, $0.0 million and $0.0 million for the years ended December 31, 2006, 2005, 2004, 2003 and 2002, respectively. |
| (4) | Efficiency ratio represents noninterest expense divided by the sum of net interest income before provision for loan losses plus noninterest income. |
| (5) | Asset Quality Ratios are end of period ratios. With the exception of end of period ratios, all ratios are based on average monthly balances during the indicated periods and are annualized where appropriate. |
| (6) | Tangible equity consists of stockholders’ equity less goodwill and title plant. Goodwill and title plant was $5.6 million for the year ended December 31, 2006 and $5.9 million for each of the years ended December 31, 2005, 2004, 2003 and 2002. |
| (7) | Tangible assets consist of total assets less goodwill and title plant. Goodwill and title plant was $5.6 million for the year ended December 31, 2006 and $5.9 million for each of the years ended December 31, 2005, 2004, 2003 and 2002. |
(8) Nonperforming assets consists of nonaccrual loans and foreclosed real estate.
| (9) | Basic earnings per share information is calculated by dividing net income by the weighted average number of shares outstanding. The weighted average number of shares outstanding for basic earnings per share computation for 2006, 2005, 2004, 2003 and 2002 were 1,429,912, 1,524,056, 1,554,329, 1,583,568 and 1,637,749, respectively. |
(10) Diluted earnings per share information is calculated by dividing net income by the weighted average number of shares outstanding, adjusted for the effect of dilutive potential common shares outstanding which consists of stock options granted. The weighted average number of shares outstanding for diluted earnings per share computation for 2006, 2005, 2004, 2003 and 2002 were 1,448,857, 1,566,848, 1,616,689, 1,679,046 and 1,739,535, respectively.
MANAGEMENT'S DISCUSSION AND ANALYSIS
OF FINANCIAL CONDITION AND RESULTS OF OPERATIONS
General
North Central Bancshares, Inc. (the "Company"), an Iowa corporation, is the holding company for First Federal Savings Bank of Iowa (the "Bank"), a federally-chartered savings bank. The principal business of the Company consists of the operation of its wholly-owned subsidiary, the Bank.
The profitability of the Company depends primarily on its level of net interest income, which is the difference between interest earned on the Company's interest-earning assets, consisting primarily of loans and investment securities, and the interest paid on interest-bearing liabilities, which primarily consist of deposits and borrowed funds in the form of advances from the Federal Home Loan Bank of Des Moines (the “FHLB”). Net interest income is a function of the Company's interest rate spread, which is the difference between the average yield on interest-earning assets and the average rate paid on interest-bearing liabilities, as well as a function of the average balance of interest-earning assets as compared to interest-bearing liabilities. The Company's net income is affected by its level of noninterest income which primarily consists of service fees and charges, abstract fees, mortgage banking income and other income, and noninterest expense, which primarily consists of compensation and employee benefit expenses, premises and equipment, data processing and other expenses. Net income also is affected significantly by general, economic and competitive conditions, particularly changes in market interest rates, government policies and actions of regulatory authorities, which events are beyond the control of the Company.
Executive Overview
The Company’s business strategy is to operate the Bank as a well-capitalized, profitable and independent community oriented savings bank. Specifically, the Company’s business strategy incorporates the following elements: (1) operating the Bank as a community oriented financial institution; (2) increasing loan and deposit balances in existing branch offices as well as by establishing de novo branch offices in markets where population growth trends are positive such as the Des Moines, Iowa metropolitan area; (3) maintaining high asset quality by emphasizing investment in residential mortgage, multifamily and commercial real estate loans and consumer loans; (4) emphasizing growth in core deposits, which includes demand deposit, NOW, money market and savings accounts; (5) maintaining capital in excess of regulatory requirements; (6) controlling noninterest expense; (7) managing interest rate risk exposure; and (8) increasing noninterest income through increases in fees and service charges.
The purpose of this summary is to provide an overview of the items management focuses on when evaluating the condition of the Company and our success in implementing our shareholder value strategy. Our shareholder value strategy has three major themes: (1) enhancing our shareholders’ value; (2) making our retail banking franchise more valuable; and (3) efficiently utilizing our capital.
Management believes the following points were the most important to that analysis this year:
| | • | The Company has effectively managed its capital since the Company’s inception in 1996. Annual dividends per share have increased from $.25 per share in 1997 to $1.32 per share in 2006. In addition, an active stock repurchase program has consistently been used by the Company to manage capital and increase earnings per share. Since the Company’s inception, it has repurchased 2,936,804 shares at a cost of $60.1 million as of December 31, 2006, including 151,250 shares purchased in 2006 at a cost of $5.9 million. |
| | • | The Bank has opened new offices in market areas where population growth trends are positive. New offices were opened in Ankeny, Iowa in February 2003 and in Clive, Iowa in March, 2004. In August, 2006, the Bank opened a new branch office in West Des Moines, Iowa near Jordan Town Center Mall. These locations are in suburbs of Des Moines, Iowa, which is Iowa’s largest metropolitan area. The Company will continue to analyze de novo branch opportunities in the Des Moines metropolitan area. Noninterest expenses have increased each year since 2003 due in part to the Company’s strategy of opening de novo branch offices. We believe that this strategy will result in long-term loan and deposit growth for the Company, but will negatively impact short-term earnings until each de novo branch achieves profitability. |
| | • | Consistent with the Bank’s emphasis on attracting and retaining core deposits, growth in deposit fees, including overdraft fees, continued a strong positive trend. |
| | • | The Company continues to be liability sensitive. The growth of interest-bearing liabilities primarily reflects the growth of higher cost certificates of deposit, including brokered certificates of deposit, and borrowed funds. Also contributing to the liability sensitivity of the Company is the continuing shift of lower cost non-maturing deposits into higher cost short-term certificates of deposit. |
| | • | The Company began utilizing brokered certificates of deposits in 2005 as an alternative funding source. At December 31, 2006, the Company had brokered certificates of deposit of $30.4 million, compared to $4.0 million at December 31, 2005. |
| | • | Noninterest income for the year ended December 31, 2006, included $569,000 in loan prepayment fees, compared to $1.0 million for the year ended December 31, 2005. |
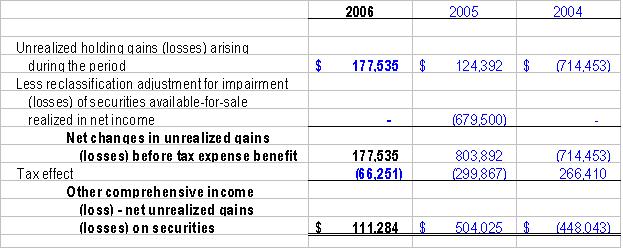
| | • | During the year ended December 31, 2005, the Company recognized an other-than-temporary impairment of $680,000 on three Freddie Mac adjustable rate, perpetual preferred stocks that had declined in value. The securities are investment grade securities that are held in the Company’s available-for-sale portfolio. The Company recognized an other-than-temporary impairment on the securities based on the facts and circumstances surrounding each of the securities at the time, including the duration and amount of the unrealized loss, as well as the prospect for the recovery of market value within a reasonable period of time. |
| | • | Management believes that the allowance for loan losses is adequate. The allowance for loan losses to nonaccrual loans was 603% at December 31, 2006. Net annualized charge-offs for 2006 were 0.02% of total loans and have averaged under 0.04% of total loans for the past five years. During 2006, the Company’s total loan portfolio increased $14.7 million, or 3.4%. This increase primarily consisted of increases in the one- to four-family first and second mortgage real estate loans. The Company’s provision for loan losses in 2006 was $240,000. |
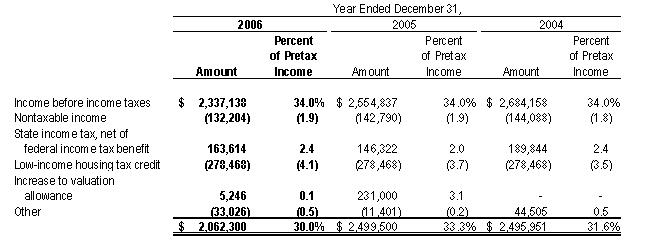
| | • | The Company has lowered its effective tax rate through the use of federal Low Income Housing Tax Credits (LIHTC). The Company owns and operates two LIHTC projects in Fort Dodge. These projects generated $278,000 in federal income tax credits in 2006. The federal income tax credits associated with these projects will decline to $173,000 in 2007. |
| | • | Purchases and originations of out of state real estate loans remained an integral part of the Company’s business plan. The Company has purchased and originated out of state real estate loans to supplement local mortgage loan originations and to diversify its mortgage loan portfolio geographically. |
Critical Accounting Policies
This “Management’s Discussion and Analysis of Financial Condition and Results of Operations,” and the disclosures included within this report, are based on the Company’s audited consolidated financial statements. These statements have been prepared in accordance with accounting principles generally accepted in the United States of America. The financial information contained in these statements is, for the most part, based on approximate measures of the financial effects of transactions and events that have already occurred. However, the preparation of these statements requires management to make certain estimates and judgments that affect the reported amounts of assets, liabilities, revenues and expenses.
The Company’s accounting policies are described in the “Notes to Consolidated Financial Statements.” Based on its consideration of accounting policies that involve the most complex and subjective estimates and judgments, management has identified its most critical accounting policies to be that related to the allowance for loan losses and asset impairment judgments, including the recoverability of goodwill.
The allowance for loan losses is established through a provision for loan losses charged to expense. Loans are charged against the allowance for loan losses when management believes that collectibility of the principal is unlikely. The Company has policies and procedures for evaluating the overall credit quality of its loan portfolio, including timely identification of potential problem credits. On a quarterly basis, management reviews the appropriate level for the allowance for loan losses, incorporating a variety of risk considerations, both quantitative and qualitative. Quantitative factors include the Company’s historical loss experience, delinquency and charge-off trends, collateral values, known information about individual loans and other factors. Qualitative factors include the general economic environment in the Company’s market area and the expected trend of those economic conditions. To the extent that actual results differ from forecasts and management’s judgment, the allowance for loan losses may be greater or less than future charge-offs.
Asset impairment judgments include evaluating the decline in fair value of available-for-sale securities below their cost. Declines in fair value of available-for-sale securities below their cost that are deemed to be other-than-temporary are reflected in earnings as realized losses. In estimating other-than-temporary impairment losses, management considers (1) the length of time and the extent to which the fair value has been less than cost, (2) the financial condition and near-term prospects of the issuer, and (3) the intent and ability of the Company to retain its investment in the issuer for a period of time sufficient to allow for any anticipated recovery in fair value.
Goodwill represents the excess of the acquisition cost over the fair value of the net assets acquired in a purchase acquisition. Goodwill is tested for impairment at least annually.
Business Strategy
The Company's current business strategy is to operate the Bank as a well-capitalized, profitable and independent community-oriented savings bank. Generally, the Company has sought to implement this strategy primarily by using deposits, including brokered certificates of deposit, and advances from the FHLB as its source of funds and maintaining a substantial part of its assets in loans secured by one- to four-family residential real estate, multifamily real estate and commercial real estate located both inside and outside the Company's market area, consumer and other loans and in other liquid investment securities. Specifically, the Company's business strategy incorporates the following elements: (1) operating the Bank as a community-oriented financial institution, maintaining a strong core customer base by providing dedicated service to the individual consumer; (2) increasing loan and deposit balances in existing branch offices as well as by establishing de novo branch offices in markets where population growth trends are positive such as the Des Moines, Iowa metropolitan area; (3) maintaining high asset quality by emphasizing investment in residential mortgage, multifamily and commercial real estate loans and consumer loans; (4) emphasizing growth in core deposits, which includes demand deposit, NOW, money market and savings accounts; (5) maintaining capital in excess of regulatory requirements; (6) controlling noninterest expense; (7) managing interest rate risk exposure; and (8) increasing noninterest income through increases in fees and service charges.
Highlights of the Company's business strategy are as follows:
Community-Oriented Institution. The Company is committed to meeting the financial needs of the communities in which it operates. Based in part on its participation in several different programs designed to facilitate residential lending to low- and moderate-income households, the Bank has received an "Outstanding" as its most recent Community Reinvestment Act rating.
Retail Deposit Base. In 2006, the Company had eleven offices located in Fort Dodge, Ames, Nevada, Perry, Ankeny, Clive, West Des Moines, Burlington and Mount Pleasant, Iowa. At December 31, 2006, 33.9% of the deposit base, or $122.3 million, consisted of core deposits, which included money market accounts, savings accounts, NOW accounts, and noninterest-bearing demand accounts. Core deposits are generally considered to be a more stable and lower cost source of funds than certificates of deposit or outside borrowings. The Company continues to emphasize growth in core deposits.
Asset Quality and Emphasis on Residential Mortgage Lending. The Company has historically emphasized residential real estate financing. The Company expects to continue its commitment to financing the purchase, construction or improvement of residential real estate in its market area. At December 31, 2006, 41.9% of the Company's total assets consisted of one- to four-family residential first mortgage loans. To supplement local mortgage loan originations and to diversify its mortgage loan portfolio geographically, the Company has originated or purchased loans in the secondary mortgage market, with an emphasis on multifamily and commercial real estate loans, secured by properties outside the State of Iowa (the "out of state properties"). At December 31, 2006, the Company's portfolio of loans which were either originated or purchased by the Company and secured by out of state properties totaled $135.3 million and consisted of $15.0 million one- to four-family residential mortgage loans, or 3.3%, $54.5 million multifamily real estate loans, or 12.0%, and $65.8 million commercial real estate loans, or 14.5%, of the Company's total loan portfolio. At December 31, 2006, the Company's ratio of nonperforming assets to total assets was 0.20%. The Company also invests in state and local obligations, mortgage-backed securities, interest-earning deposits, equity securities and FHLB stock.
Generally, the yield on mortgage loans originated and purchased by the Company is greater than that of securities purchased by the Company. Future economic conditions and continued strong banking competition could result in diminished lending opportunities. The Company may increase its investment in securities and in purchased mortgage loans outside its market area.
Increasing Noninterest Income. The Company has attempted to increase its level of noninterest income from both new and traditional lines of business to supplement net interest income. The Company generally increases noninterest income by emphasizing growth in core deposit accounts. During the year ended December 31, 2006, fees and service charges totaled $4.4 million, a decrease of $102,000 from the prior year. This decrease was primarily due to a decrease in loan prepayment fees of $444,000, offset in part by an increase in fees associated with checking accounts, including overdraft fees, of $343,000. The Company also maintains its noninterest income through emphasizing growth in mortgage banking income, annuity and mutual fund sales, and insurance sales. In addition, the Company currently owns abstract companies in Webster and Boone counties in Iowa, through First Iowa Title Services, Inc. ("First Iowa"), the Bank's wholly owned subsidiary. The abstract business performed by First Iowa replaces the function of a title insurance company. The Company believes that First Iowa can continue to be an important source of fee income. Noninterest income from First Iowa’s business for the years ended December 31, 2006 and 2005 was $1.2 and $1.3 million, respectively, offset by noninterest expense attributable to First Iowa. The decline in First Iowa’s income was due in part to the sale of one of the Company’s three abstract offices at the end of the second quarter of 2006.
Liquidity and Interest Rate Risk Management. Management seeks to manage the Company's interest rate risk exposure by monitoring the levels of interest rate sensitive assets and liabilities while maintaining an acceptable interest rate spread. At December 31, 2006, total interest-bearing liabilities maturing or repricing within one year exceeded total interest-earning assets maturing or repricing in the same period by $51.8 million, representing a one-year gap to total assets ratio of -10.1%, compared to a -12.3% at December 31, 2005. To manage the Company’s interest rate exposure, the Company emphasizes the origination of five- and seven-year fixed-rate mortgage loans that convert to adjustable rates at the conclusion of their initial terms and have overall maturities of up to 30 years, and the origination of adjustable rate home equity lines of credit and short-term consumer loans. The Company also manages its interest rate risk and liquidity by investing in mortgage-backed, municipal and equity securities. In addition, the Company generally sells all fixed rate one- to four-family residential loans with maturities of fifteen years or greater. See "Discussion of Market Risk - Interest Rate Sensitivity Analysis".
Liquidity and Capital Resources
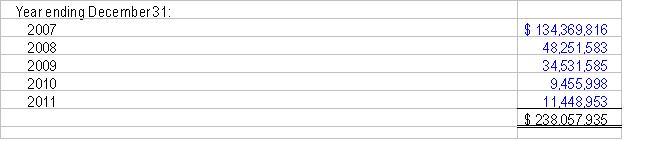
The Company's primary sources of funds are deposits, amortization and prepayment of loans, borrowings such as FHLB advances, brokered certificates of deposit, maturities of securities and other investments, and earnings and funds provided from operations. While scheduled principal repayments on loans are a relatively predictable source of funds, deposit flows and loan prepayments are greatly influenced by interest rates, economic conditions, and competition. The Company manages the pricing of its deposits to maintain a desired deposit balance. In addition, the Company invests in interest-earning assets, which provide liquidity to meet lending requirements. At December 31, 2006, $960,000, or 26.1% of the Company's investment portfolio excluding mortgage-backed, mutual fund and equity securities, was scheduled to mature within one year or less, $1.9 million, or 51.1%, was scheduled to mature within one to five years and $837,000, or 22.8%, was scheduled to mature in more than five years. At December 31, 2006, certificates of deposit scheduled to mature in less than one year totaled $134.4 million. Based on prior experience, management believes that a significant portion of such deposits will remain with the Company. If the Company requires funds beyond its ability to generate them internally, borrowing agreements exist with the FHLB, which provide an additional source of funds. The amount of eligible collateral for blanket lien pledges from the FHLB was $201.8 million as of December 31, 2006. The Company may also use brokered certificates of deposit, up to 10% of total assets, as an additional source of funds. For additional information about cash flows from the Company's operating, financing and investing activities, see the Statements of Cash Flows included in the Consolidated Financial Statements.
At December 31, 2006, the Company had outstanding loan commitments of $3.8 million. This amount does not include undisbursed overdraft loan privileges and the undisbursed home equity lines of credit. The Company monitors its liquidity position and expects to have sufficient funds to meet its current funding commitments.
The main sources of liquidity for the Company are proceeds from dividends and loan repayments from the Bank and the proceeds from stock options exercised. The main cash outflows are dividend payments to shareholders and funds used to repurchase shares of the Company’s common stock. During 2006, the Company repurchased 151,250 shares of its common stock. The Company has determined that a share repurchase program is appropriate to enhance shareholder value. Share repurchases generally increase earnings per share, return on average assets, and return on average equity, three performance benchmarks against which the Company and thrift holding companies are often measured. The Company buys stock in the open market whenever the price of the stock is deemed reasonable and the Company has funds available for the purchase. The Company's ability to pay dividends to shareholders depends substantially on dividends and loan payments received from the Bank. The Bank may not declare or pay cash dividends on any of its shares of common stock if the effect thereof would cause equity to be reduced below applicable regulatory capital requirements or the amount required to be maintained for the liquidation account. For a description of the liquidation account, see Note 17 to the Consolidated Financial Statements. Unlike the Bank, the Company is not subject to OTS formula-based regulatory restrictions on the payment of dividends to its shareholders; however, it is subject to the requirements of Iowa law. Iowa law generally prohibits the Company from paying a dividend if either of the following would result: (a) the Company would not be able to pay its debts as they become due in the usual course of business; or (b) the Company's total assets would be less than the sum of its total liabilities, plus the amount that would be needed, if the Company were to be dissolved at the time of distribution, to satisfy the preferential rights upon dissolution of shareholders whose preferential rights are superior to those receiving the distribution.
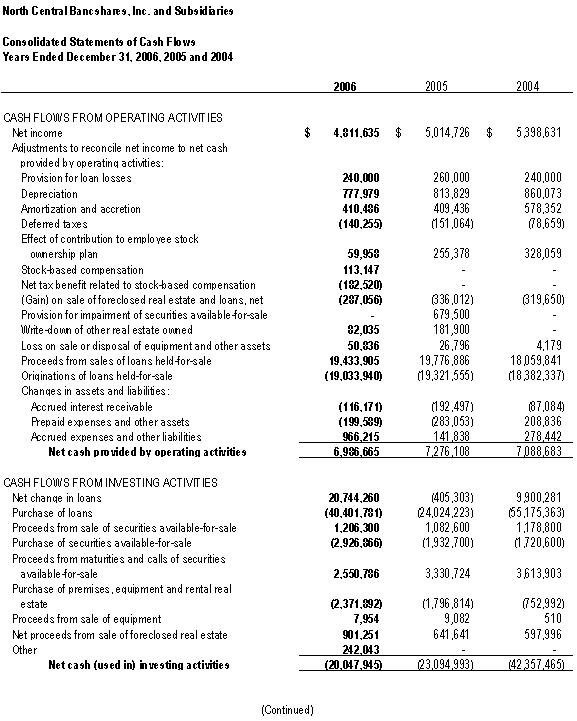
The primary investing activities of the Company are the origination and purchase of mortgage and other loans and the purchase of securities. During the years ended December 31, 2006, 2005 and 2004, the Company's disbursements for loan originations and purchases totaled $153.3 million, $143.1 million and $160.2 million, respectively. These activities were funded primarily by net deposit inflows, principal repayments on loans, proceeds from the sale of loans, proceeds from the maturity and call of securities, brokered certificates of deposit, and FHLB advances. Net cash flows (used in) investing activities were $(20.0) million, $(23.1) million and $(42.4) million for the years ended December 31, 2006, 2005 and 2004, respectively. Net cash flows provided by financing activities were $24.4 million, $16.5 million and $33.2 million for the years ended December 31, 2006, 2005 and 2004, respectively.
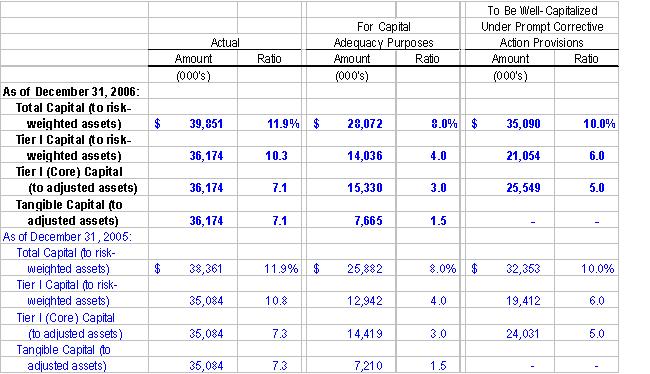
The OTS regulations require savings associations, such as the Bank, to meet three minimum capital standards: a tangible capital ratio requirement of 1.5% of total assets as adjusted under the OTS regulations; a leverage ratio requirement of 3% of core capital to such adjusted total assets; and a risk-based capital ratio requirement of 8% of core and supplementary capital to total risk-based assets. The Bank satisfied these minimum capital standards at December 31, 2006 with tangible and leverage capital ratios of 7.1% and a total risk-based capital ratio of 11.9 %. In determining the amount of risk-weighted assets for purposes of the risk-based capital requirement, a savings association must compute its risk-based assets by multiplying its assets and certain off-balance sheet items by risk-weights, which range from 0% for cash and obligations issued by the United States Government or its agencies to 100% for consumer and commercial loans, as assigned by the OTS capital regulations. These capital requirements, which are applicable to the Bank only, do not consider additional capital held at the Company level, and require certain adjustments to shareholders’ equity to arrive at the various regulatory capital amounts.
The table below presents the Bank's regulatory capital amounts as compared to the OTS regulatory capital requirements at December 31, 2006:
| | | Amount | | Capital Requirements | | Excess Capital | |
| | | | (In thousands) | |
| Tangible capital | | $ | 36,174 | | $ | 7,665 | | $ | 28,509 | |
| Core capital | | | 36,174 | | | 15,330 | | | 20,844 | |
| Risk-based capital | | | 39,851 | | | 28,072 | | | 11,779 | |
Discussion of Market Risk—Interest Rate Sensitivity Analysis
As a financial institution, the Company's primary component of market risk is interest rate volatility. Fluctuations in interest rates will ultimately impact both the level of income and expense recorded on a large portion of the Bank's assets and liabilities, and the market value of all interest-earning assets, other than those which possess a short term to maturity. Since all of the Company's interest-bearing liabilities and virtually all of the Company's interest-earning assets are located at the Bank, virtually all of the Company's interest rate risk management procedures are performed at the Bank level. Based upon the Bank's nature of operations, the Bank is not subject to foreign currency exchange or commodity price risk. The Bank's real estate loan portfolio, within Iowa, is subject to risks associated with the local economy. The Company has sought to diversify its loan portfolio by purchasing loans secured by properties outside of Iowa. At December 31, 2006, $135.3 million, or 29.8%, of the Company's total loan portfolio was secured by properties outside the State of Iowa, located in twenty-one states. The Bank does not own any trading assets. At December 31, 2006, neither the Company nor the Bank had any hedging transactions in place, such as interest rate swaps and caps.
The Company seeks to manage its interest rate risk by monitoring and controlling the variation in repricing intervals between its assets and liabilities. To a lesser extent, the Company also monitors its interest rate sensitivity by analyzing the estimated changes in market value of its assets and liabilities assuming various interest rate scenarios. As discussed more fully below, there are a variety of factors which influence the repricing characteristics of any given asset or liability.
The matching of assets and liabilities may be analyzed by examining the extent to which such assets and liabilities are “interest rate sensitive” and by monitoring an institution's “interest rate sensitivity gap.” An asset or liability is said to be interest rate sensitive within a specific time period if it will mature or reprice within that time period. The “interest rate sensitivity gap” is defined as the difference between the amount of interest-earning assets maturing or repricing within a specific time period and the amount of interest-bearing liabilities maturing or repricing within that same time period. A gap is considered positive when the amount of interest rate sensitive assets exceeds the amount of interest rate sensitive liabilities. A gap is considered negative when the amount of interest rate sensitive liabilities exceeds the amount of interest rate sensitive assets. During a period of rising interest rates, a negative gap would tend to adversely affect net interest income, while a positive gap would tend to positively affect net interest income. Similarly, during a period of falling interest rates, a negative gap would tend to positively affect net interest income, while a positive gap would tend to adversely affect net interest income.
The Company's policy in recent years has been to manage its exposure to interest rate risk generally by focusing on the maturities of its interest rate sensitive assets and by emphasizing adjustable-rate mortgage loans and short-term consumer loans, and maintaining a level of liquidity by investing in short-term interest-earning deposits and equity securities. In addition, the Company generally sells all fixed rate one- to four-family residential loans with maturities of fifteen years or greater.
At December 31, 2006, total interest-bearing liabilities maturing or repricing within one year exceeded total interest-earning assets maturing or repricing in the same period by $51.8 million, representing a one-year gap ratio of -10.1%, compared to a one-year gap ratio of -12.3% at December 31, 2005. The chief executive officer meets regularly with the Bank's senior executive officers to review trends in deposits as well as mortgage and consumer lending activities. The chief executive officer reports quarterly to the board of directors on interest rate risks and trends, as well as liquidity and capital ratio requirements.
Gap Table. The following table (the “Gap Table”) sets forth the amounts of interest-earning assets and interest-bearing liabilities outstanding at December 31, 2006, which are expected to reprice or mature, based upon certain assumptions, in each of the future time periods shown. Except as stated below, the amounts of assets and liabilities shown that reprice or mature during a particular period were determined in accordance with the earlier of the terms of repricing or the contractual terms of the asset or liability. Certain assumptions used in preparing the table are set forth in the following table. Management believes that these assumptions approximate actual experience and considers them appropriate and reasonable.
| | | At December 31, 2006 (1) | |
| | | Within 1 Year | | 1-3 Years | | 3-5 Years | | 5-10 Years | | 10-20 Years | | Over 20 Years | | Total | |
| | | (Dollars in thousands) | |
Interest-earning assets: | | | | | | | | | | | | | | | |
| First mortgage loans | | | | | | | | | | | | | | | |
| Adjustable (2) | | $ | 99,888 | | $ | 117,209 | | $ | 46,957 | | $ | - | | $ | - | | $ | - | | $ | 264,054 | |
| Fixed (2) | | | 24,845 | | | 40,045 | | | 23,625 | | | 34,870 | | | 2,468 | | | 83 | | | 125,936 | |
| Consumer and other loans | | | 23,946 | | | 26,173 | | | 10,986 | | | 4,121 | | | 197 | | | 5 | | | 65,428 | |
| Investment securities (3)(4) | | | 23,187 | | | 2,100 | | | 500 | | | 862 | | | - | | | 2,930 | | | 29,579 | |
| Total interest-earning assets | | $ | 171,866 | | $ | 185,527 | | $ | 82,068 | | $ | 39,853 | | $ | 2,665 | | $ | 3,018 | | $ | 484,997 | |
| | | | | | | | | | | | | | | | | | | | | | | |
Rate sensitive liabilities: | | | | | | | | | | | | | | | | | | | | | | |
| Savings accounts | | $ | 4,277 | | $ | 6,497 | | $ | 4,476 | | $ | 6,007 | | $ | 3,298 | | $ | 605 | | $ | 25,160 | |
| NOW accounts | | | 18,365 | | | 18,859 | | | 7,485 | | | 4,438 | | | 484 | | | 5 | | | 49,636 | |
| Money market accounts | | | 27,403 | | | 7,285 | | | - | | | - | | | - | | | - | | | 34,688 | |
| Certificate accounts | | | 134,323 | | | 82,830 | | | 20,905 | | | - | | | - | | | - | | | 238,058 | |
| Noninterest bearing deposits | | | 12,788 | | | - | | | - | | | - | | | - | | | - | | | 12,788 | |
| FHLB advances and other liabilities (5) | | | 26,529 | | | 54,561 | | | 26,565 | | | 188 | | | 64 | | | - | | | 107,907 | |
| Total interest-bearing liabilities | | $ | 223,685 | | $ | 170,032 | | $ | 59,431 | | $ | 10,633 | | $ | 3,846 | | $ | 610 | | $ | 468,237 | |
| | | | | | | | | | | | | | | | | | | | | | | |
| Interest sensitivity gap | | $ | (51,819 | ) | $ | 15,495 | | $ | 22,637 | | $ | 29,220 | | $ | (1,181 | ) | $ | 2,408 | | | | |
| Cumulative interest-sensitivity gap | | $ | (51,819 | ) | $ | (36,324 | ) | $ | (13,687 | ) | $ | 15,533 | | $ | 14,352 | | $ | 16,760 | | | | |
| | | | | | | | | | | | | | | | | | | | | | | |
| Interest sensitivity gap to total asset | | | (10.05 | )% | | 3.01 | % | | 4.39 | % | | 5.67 | % | | (0.23 | )% | | 0.47 | % | | | |
| Cumulative interest-sensitivity gap to total asset | | | (10.05 | ) | | (7.05 | ) | | (2.66 | ) | | 3.01 | | | 2.78 | | | 3.25 | | | | |
| Ratio of interest-earning assets to interest-bearing liabilities | | | 76.83 | | | 109.11 | | | 138.09 | | | 374.80 | | | 69.29 | | | 494.75 | | | 103.58 | % |
| Cumulative ratio of interest-earning assets to interest-bearing liabilities | | | 76.83 | | | 90.77 | | | 96.98 | | | 103.35 | | | 103.07 | | | 103.58 | | | 103.58 | |
| | | | | | | | | | | | | | | | | | | | | | | |
| Total assets | | $ | 515,515 | | $ | 515,515 | | $ | 515,515 | | $ | 515,515 | | $ | 515,515 | | $ | 515,515 | | $ | 515,515 | |
| Cumulative interest-earning assets | | $ | 171,866 | | $ | 357,393 | | $ | 439,461 | | $ | 479,314 | | $ | 481,979 | | $ | 484,997 | | $ | 484,997 | |
| Cumulative interest-bearing liabilities | | $ | 223,685 | | $ | 393,717 | | $ | 453,148 | | $ | 463,781 | | $ | 467,627 | | $ | 468,237 | | $ | 468,237 | |
________________________________
(1) The following assumptions were used in regard to prepayment speed for loans: (i) fixed rate commercial real estate loans and mortgage-backed securities will prepay at 10 percent per year, (ii) one- to four-family loans (both fixed rate and adjustable rate) will prepay at 12 percent per year, (iii) all multifamily loans (both fixed and adjustable rate) and adjustable rate commercial real estate loans will prepay at 15 percent per year, (iv) all second mortgage real estate loans and all other loans will prepay at 20 percent year. Besides prepayment assumptions, the chart above also includes normal principal payments based upon the loan contractual agreements. Savings accounts are assumed to be withdrawn at an annual rate of 17 percent. NOW accounts are assumed to be withdrawn at an annual rate of 37 percent. Money market accounts are assumed to be withdrawn at 79 percent during the first year with the balance being withdrawn within the one-to-three year category. These assumptions are annual percentages based on remaining balances and should not be regarded as indicative of the actual prepayments and withdrawals that may be experienced by the Company. Certain shortcomings are inherent in the analysis presented by the foregoing table.
(2) Includes $2.4 million and $0.5 million in mortgage-backed securities in adjustable and fixed first mortgage loans, respectively.
(3) Includes other equity securities, interest-bearing deposits and FHLB stock, all of which are shown in the within-one-year category. Components include interest-bearing deposits of $12.4 million and securities available-for-sale of $11.7 million.
(4) Includes $5.0 million of FHLMC preferred stock and $1.0 million of FNMA preferred stock. $2.9 million is fixed rate and $3.1 million is adjustable rate. The fixed rate preferred stock was included in the appropriate category based upon their maturity date. The adjustable rate preferred stock was included in the appropriate category based upon their repricing date.
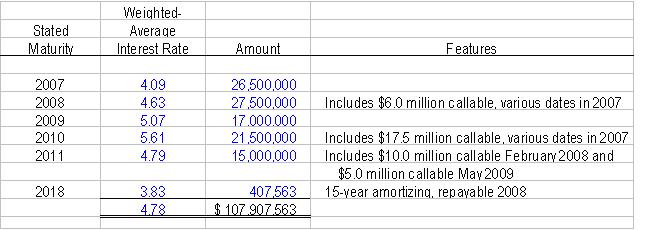
(5) Includes $107.9 million of advances from the FHLB. Of these advances, $69.4 million are term advances and $38.5 million are callable. The term advances have been categorized based upon their maturity date. Of the $38.5 million of callable advances, $28.5 million have been categorized based upon their maturity date because the interest rates on such advances are near or above current market rates. The remaining $10.0 million callable advance was placed in the repricing category based upon its call date because the rate on this advance was below current market rates.
Certain shortcomings are inherent in the method of analysis presented in the above Gap Table. For example, although certain assets and liabilities may have similar maturities or periods to repricing, they may react in different degrees to changes in market interest rates. Also, the interest rates on certain types of assets and liabilities may fluctuate in advance of changes in market interest rates, while interest rates on other types of assets and liabilities may lag behind changes in market rates. Additionally, certain assets, such as adjustable-rate loans, have features which restrict changes in interest rates both on a short-term basis and over the life of the asset. Further, in the event of changes in interest rates, prepayment and early withdrawal levels would likely deviate significantly from those assumed in calculating the table. Finally, the ability of many borrowers to service their adjustable-rate loans may decrease in the event of an interest rate increase.
Net Portfolio Value Analysis. As part of its efforts to maximize net interest income and manage the risks associated with changing interest rates, management uses the "net portfolio value" ("NPV") methodology which the OTS has adopted as part of its capital regulations.
Under this methodology, interest rate risk exposure is assessed by reviewing the estimated changes in NPV which would hypothetically occur if interest rates rapidly rise or fall along the yield curve. Projected values of NPV at both higher and lower regulatory defined rate scenarios are compared to base case values (no change in rates) to determine the sensitivity to changing interest rates.
Presented below, as of December 31, 2006, is an analysis of the Company's interest rate risk ("IRR") as measured by changes in NPV for instantaneous and sustained parallel shifts of 100 basis points in market interest rates. Such limits have been established with consideration of the impact of various rate changes and the Company's current capital position.
Interest Rate Sensitivity of Net Portfolio Value (NPV)(1)
| | | Net Portfolio Value | | | | NPV as % of PV of Assets | |
Change in Rates | | $ Amount | | $ Change | | % Change | | NPV Ratio | | Change | |
(Dollars in thousands) | |
| +300 bp | | | 40,161 | | | (11,499) | | | (22) | | | 8.01 | | | (184) bp | |
| +200 bp | | | 45,268 | | | (6,392) | | | (12) | | | 8.87 | | | (97) bp | |
| +100 bp | | | 49,267 | | | (2,393) | | | (5) | | | 9.51 | | | (34) bp | |
| 0 bp | | | 51,660 | | | - | | | - | | | 9.84 | | | - | |
| -100 bp | | | 51,601 | | | (59) | | | - | | | 9.74 | | | (10) bp | |
| -200 bp | | | 51,727 | | | 67 | | | - | | | 9.67 | | | (17) bp | |
_________________________________
(1) Denotes rate shock used to compute interest rate risk capital component.
As is the case with the Gap Table, certain shortcomings are inherent in the methodology used in the above interest rate risk measurements. Modeling changes in NPV require the making of certain assumptions which may or may not reflect the manner in which actual yields and costs respond to changes in market interest rates. In this regard, the NPV Table presented above assumes that the composition of the Company's interest sensitive assets and liabilities existing at the beginning of a period remains constant over the period being measured and also assumes that a particular change in interest rates is reflected uniformly across the yield curve regardless of the duration to maturity or repricing of specific assets and liabilities. Accordingly, although the NPV Table provides an indication of the Company's interest rate risk exposure at a particular point in time, such measurements are not intended to and do not provide a precise forecast of the effect of changes in market interest rates on the Company's net interest income and will differ from actual results.
Nonperforming Assets. Loans are reviewed on a regular basis and are placed on nonaccrual status when, in the opinion of management, the collection of additional interest is doubtful. Mortgage loans and consumer loans are placed on nonaccrual status generally when either principal or interest is 90 days or more past due. Interest accrued and unpaid at the time a loan is placed on nonaccrual status is charged against interest income.
Real estate acquired by the Company as a result of foreclosure, or by deed in lieu of foreclosure, is deemed foreclosed real estate until such time as it is sold.
When foreclosed real estate is acquired or otherwise deemed foreclosed real estate, it is recorded at the lower of the unpaid principal balance of the related loan or its estimated fair value, less estimated selling expenses. Valuations are periodically performed by management and any subsequent decline in fair value is charged to operations. At December 31, 2006, the Company's foreclosed real estate consisted of 7 properties with an aggregate carrying value of $468,000.
Delinquent Loans, Nonaccrual Loans and Nonperforming Assets. The following table sets forth information regarding loans on nonaccrual status and foreclosed real estate of the Company at the dates indicated. At the dates indicated, the Company did not have any material restructured loans and did not have any loans that were ninety days past due and still accruing interest.
| | | At December 31, | |
| | | 2006 | | 2005 | | 2004 | | 2003 | | 2002 | |
| | | (Dollars in thousands) | |
Nonaccrual loans and nonperforming assets: | | | | | | | | | | | |
| First mortgage loans: | | | | | | | | | | | |
| One- to four-family residential | | $ | 222 | | $ | 389 | | $ | 335 | | $ | 414 | | $ | 434 | |
| Multifamily and commercial properties | | | - | | | - | | | - | | | - | | | 37 | |
| Consumer loans: | | | 357 | | | 196 | | | 299 | | | 201 | | | 172 | |
| Total nonaccrual loans | | | 579 | | | 585 | | | 634 | | | 615 | | | 643 | |
| Total foreclosed real estate | | | 468 | | | 1,143 | | | 1,079 | | | 1,453 | | | 769 | |
| Other nonperforming assets | | | - | | | - | | | - | | | - | | | - | |
| Total nonperforming assets | | $ | 1,047 | | $ | 1,728 | | $ | 1,713 | | $ | 2,068 | | $ | 1,412 | |
| Total nonaccrual loans to net loans receivable | | | 0.13 | % | | 0.14 | % | | 0.16 | % | | 0.17 | % | | 0.19 | % |
| Total nonaccrual loans to total assets | | | 0.11 | | | 0.12 | | | 0.14 | | | 0.15 | | | 0.16 | |
| Total nonperforming assets to total assets | | | 0.20 | | | 0.36 | | | 0.37 | | | 0.49 | | | 0.35 | |
________________________________
The following table sets forth information with respect to loans delinquent 60-89 days in the Company's portfolio at the dates indicated.
| | | At December 31, | |
| | | 2006 | | 2005 | | 2004 | | 2003 | | 2002 | |
| | | (In thousands) | |
Loans past due 60-89 days: | | | | | | | | | | | |
| First mortgage loans: | | | | | | | | | | | |
| One- to four-family residential | | $ | 765 | | $ | 1,106 | | $ | 1,001 | | $ | 649 | | $ | 830 | |
| Multifamily and commercial properties | | | - | | | - | | | 40 | | | 463 | | | - | |
| Consumer loans | | | 68 | | | 214 | | | 238 | | | 223 | | | 183 | |
| Total past due | | $ | 833 | | $ | 1,320 | | $ | 1,279 | | $ | 1,335 | | $ | 1,013 | |
| | | | | | | | | | | | | | | | | |
The following table sets forth information with respect to the Company's delinquent loans and other problem assets at December 31, 2006.
| | | At December 31, 2006 |
| | | Balance | | Number |
| | | (Dollars in thousands) |
One- to four-family first mortgage loans: Loans 60 to 89 days delinquent | | | $ 765 | | | 17 |
| Loans 90 days or more delinquent | | | 222 | | | 6 |
Multifamily and commercial first mortgage loans: Loans 60 to 89 days delinquent | | | - | | | - |
| Loans 90 days or more delinquent | | | - | | | - |
| Consumer Loans: | | | | | | |
| Loans 60 to 89 days delinquent | | | 68 | | | 1 |
| Loans 90 days or more delinquent | | | 357 | | | 12 |
| Foreclosed real estate | | | 468 | | | 7 |
| Other nonperforming assets | | | - | | | - |
| Loans to facilitate sale of foreclosed real estate | | | 87 | | | 2 |
| Special mention loans | | | 751 | | | 27 |
Classification of Assets. Federal regulations provide for the classification of loans and other assets such as debt and equity securities considered by the OTS to be of lesser quality as "substandard," "doubtful," or "loss" assets. An asset is considered "substandard" if it is inadequately protected by the current net worth and paying capacity of the obligor or of the collateral pledged, if any. "Substandard" assets include those characterized by the "distinct possibility" that the savings institution will sustain "some loss" if the deficiencies are not corrected. Assets classified as "doubtful" have all of the weaknesses inherent in those classified "substandard," with the added characteristic that the weaknesses present make "collection or liquidation in full," on the basis of currently existing facts, conditions, and values, "highly questionable and improbable.” Assets classified as "loss" are those considered "uncollectible" and of such little value that their continuance as assets without the establishment of a specific loss reserve is not warranted. Assets that do not expose the savings institution to risk sufficient to warrant classification in one of the aforementioned categories, but which possess some weaknesses, are required to be designated "special mention" by management. Loans designated as special mention are generally loans that, while current in required payments, have exhibited some potential weaknesses that, if not corrected, could increase the level of risk in the future. At December 31, 2006, the Company had $751,000 of special mention loans, consisting of ten loans secured by one- to four-family residences and seventeen consumer loans.
The following table sets forth the aggregate amount of the Company's classified assets, which include nonperforming loans and foreclosed real estate, at the dates indicated.
| | | At December 31, | |
| | | 2006 | | 2005 | | 2004 | | 2003 | | 2002 | |
| | | (In thousands) | |
| Substandard assets | | $ | 1,038 | | $ | 1,670 | | $ | 1,680 | | $ | 2,046 | | $ | 1,361 | |
| Doubtful assets | | | - | | | - | | | - | | | - | | | - | |
| Loss assets | | | 24 | | | 58 | | | 58 | | | 22 | | | 51 | |
| Total classified assets | | $ | 1,062 | | $ | 1,728 | | $ | 1,738 | | $ | 2,068 | | $ | 1,412 | |
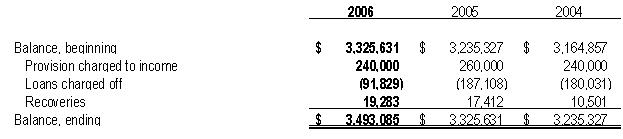
Allowance for Loan Losses. It is management's policy to provide an allowance and provision for probable losses on the Company's loan portfolio based on management's evaluation of the prior loss experience, industry standards, past due loans, economic conditions, the volume and type of loans in the Company's portfolio, which includes a significant amount of multifamily and commercial loans, substantially all of which are purchased and are collateralized by properties located outside of the Company's market area, and other factors related to the collectibility of the Company's loan portfolio. The Company regularly reviews its loan portfolio, including problem loans, to determine whether any loans require classification or the establishment of appropriate allowances for losses. Such evaluation, which includes a review of all loans of which full collectibility of interest and principal may not be reasonably assured, considers, among other matters, the estimated fair value of the underlying collateral. During 2006 the Company’s total loan portfolio increased $14.7 million, or 3.4%. During the years ended December 31, 2006, 2005 and 2004 the Company's provision for loan losses were $240,000, $260,000 and $240,000, respectively. The Company's allowance for loan losses totaled $3.5 million, $3.3 million and $3.2 million at December 31, 2006, 2005 and 2004, respectively.
Management believes that the allowance for losses on loans is adequate. While management uses available information to recognize losses on loans, future additions to the allowances may be necessary based on changes in economic conditions. In addition, various regulatory agencies, as an integral part of their examination process, periodically review the Bank's allowances for loan losses. Such agencies may require the Bank to recognize additions to the allowances based on their judgments about information available to them at the time of their examination.
Analysis of the Allowance for Loan Losses. The following table sets forth the analysis of the allowance for loan losses for the periods indicated.
| | | For the Year Ended December 31, | |
| | | 2006 | | 2005 | | 2004 | | 2003 | | 2002 | |
| | | (Dollars in thousands) | |
| Total loans outstanding | | $ | 453,335 | | $ | 438,650 | | $ | 418,841 | | $ | 367,396 | | $ | 344,574 | |
| Average loans outstanding | | | 447,440 | | | 424,633 | | | 389,190 | | | 358,260 | | | 337,693 | |
| Allowance balances (at beginning of period) | | | 3,326 | | | 3,235 | | | 3,165 | | | 3,118 | | | 2,883 | |
| Provisions for losses | | | 240 | | | 260 | | | 240 | | | 255 | | | 383 | |
Charge-Offs: First mortgage loans | | | 22 | | | 5 | | | 66 | | | 36 | | | 27 | |
| Consumer loans | | | 70 | | | 182 | | | 114 | | | 265 | | | 135 | |
Recoveries: First mortgage loans | | | - | | | 3 | | | 2 | | | - | | | - | |
| Consumer loans | | | 19 | | | 15 | | | 8 | | | 93 | | | 14 | |
| Net charge-offs | | | 73 | | | 169 | | | 170 | | | 208 | | | 148 | |
Allowance balance (at end of period) | | $ | 3,493 | | $ | 3,326 | | $ | 3,235 | | $ | 3,165 | | $ | 3,118 | |
| Allowance for loan losses as a percent of total loans receivable at end of period | �� | | 0.77 | % | | 0.76 | % | | 0.77 | % | | 0.86 | % | | 0.90 | % |
| Net loans charged off as a percent of average loans outstanding | | | 0.02 | | | 0.04 | | | 0.04 | | | 0.06 | | | 0.04 | |
| Ratio of allowance for loan losses to total nonaccrual loans at end of period | | | 603.41 | | | 567.98 | | | 513.13 | | | 515.02 | | | 485.00 | |
| Ratio of allowance for loan losses to total nonaccrual loans and foreclosed real estate at end of period | | | 333.63 | | | 192.41 | | | 188.86 | | | 153.05 | | | 220.90 | |
Allocation of Allowance for Loan Losses. The following table sets forth the allocation for loan losses by loan category for the periods indicated:
| | | At December 31, | |
| | | 2006 | | 2005 | | 2004 | | 2003 | | 2002 | |
| | | Amount | | % of Loans In Each Category to Total Loans | | Amount | | % of Loans In Each Category to Total Loans | | Amount | | % of Loans In Each Category to Total Loans | | Amount | | % of Loans In Each Category to Total Loans | | Amount | | % of Loans In Each Category to Total Loans | |
(Dollars in thousands) |
| Balance at end of period applicable to: | | | | | | | | | | | | | | | | | | | | | |
| One- to four-family residential mortgage loans | $ | 570 | | | 48.01 | % | $ | 593 | | | 49.47 | % | $ | 510 | | | 45.99 | % | $ | 517 | | | 47.33 | % | $ | 395 | | | 43.17 | % |
| Multifamily residential mortgage loans | | 646 | | | 14.52 | | | 704 | | | 16.86 | | | 731 | | | 18.73 | | | 686 | | | 19.04 | | | 709 | | | 20.54 | |
| Commercial mortgage loans | | 1,443 | | | 23.04 | | | 1,201 | | | 19.76 | | | 1,240 | | | 21.94 | | | 978 | | | 18.95 | | | 1,223 | | | 20.68 | |
| Consumer loans | | 834 | | | 14.43 | | | 828 | | | 13.91 | | | 754 | | | 13.34 | | | 984 | | | 14.68 | | | 791 | | | 15.61 | |
| Total allowance for loan losses | $ | 3,493 | | | 100.00 | % | $ | 3,326 | | | 100.00 | % | $ | 3,235 | | | 100.00 | % | $ | 3,165 | | | 100.00 | % | $ | 3,118 | | | 100.00 | % |
Average Balance Sheet
The following table sets forth certain information relating to the Company's average balance sheet and reflects the average yield on assets and average cost of liabilities for the periods indicated and the average yields earned and rates paid. Such yields and costs are derived by dividing income or expense by the average balance of assets or liabilities, respectively, for the periods presented. For purposes of this table, average balances were computed on a monthly basis.
| | | For the Year Ended December 31, | |
| | | 2006 | | 2005 | | 2004 | |
| | | Average Balance | | Interest | | Average Yield/ Cost | | Average Balance | | Interest | | Average Yield/ Cost | | Average Balance | | Interest | | Average Yield/ Cost | |
| | | (Dollars in thousands) | |
Assets: | | | | | | | | | | | | | | | | | | | |
| Interest-earning assets: | | | | | | | | | | | | | | | | | | | |
First mortgage loans(1) | | $ | 384,965 | | $ | 23,102 | | | 6.00 | % | $ | 365,647 | | $ | 21,391 | | | 5.85 | % | $ | 334,676 | | $ | 20,027 | | | 5.98 | % |
Consumer loans(1) | | | 62,474 | | | 4,420 | | | 7.07 | | | 58,986 | | | 3,933 | | | 6.67 | | | 54,513 | | | 3,757 | | | 6.89 | |
Investment securities | | | 22,403 | (4) | | 1,015 | | | 4.53 | | | 23,738 | (5) | | 948 | | | 3.99 | | | 27,232 | (6) | | 973 | | | 3.57 | |
Total interest-earning assets | | $ | 469,842 | | $ | 28,537 | | | 6.07 | % | $ | 448,371 | | $ | 26,272 | | | 5.86 | % | $ | 416,421 | | $ | 24,757 | | | 5.95 | % |
Noninterest-earning assets | | | 29,578 | | | | | | | | | 28,724 | | | | | | | | | 28,818 | | | | | | | |
Total assets | | $ | 499,420 | | | | | | | | $ | 477,095 | | | | | | | | $ | 445,239 | | | | | | | |
Liabilities and Equity: | | | | | | | | | | | | | | | | | | | | | | | | | | | | |
| Interest-bearing liabilities: | | | | | | | | | | | | | | | | | | | | | | | | | | | | |
NOW and money market savings | | $ | 85,008 | | $ | 1,048 | | | 1.23 | % | $ | 95,781 | | $ | 1,061 | | | 1.11 | % | $ | 78,865 | | $ | 542 | | | 0.69 | % |
Savings | | | 26,335 | | | 87 | | | 0.33 | | | 28,710 | | | 91 | | | 0.32 | | | 29,217 | | | 91 | | | 0.31 | |
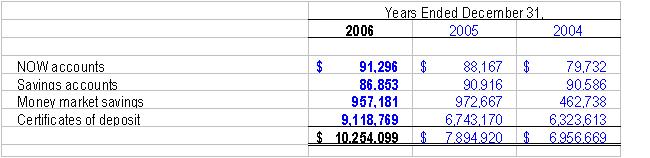
Certificates of Deposit | | | 218,655 | | | 9,119 | | | 4.17 | | | 189,900 | | | 6,743 | | | 3.55 | | | 182,368 | | | 6,324 | | | 3.47 | |
Borrowed funds | | | 108,753 | | | 5,161 | | | 4.75 | | | 102,234 | | | 4,712 | | | 4.61 | | | 97,848 | | | 4,410 | | | 4.51 | |
Total interest-bearing liabilities | | $ | 438,751 | | $ | 15,415 | | | 3.51 | % | $ | 416,625 | | $ | 12,607 | | | 3.03 | % | $ | 388,298 | | $ | 11,367 | | | 2.93 | % |
| | | | | | | | | | | | | | | | | | | | | | | | | | | | | |
Noninterest-bearing liabilities | | | 17,858 | | | | | | | | | 17,110 | | | | | | | | | 15,322 | | | | | | | |
Total liabilities | | $ | 456,609 | | | | | | | | $ | 433,735 | | | | | | | | $ | 403,620 | | | | | | | |
Equity | | | 42,811 | | | | | | | | | 43,360 | | | | | | | | | 41,619 | | | | | | | |
Total liabilities and equity | | $ | 499,420 | | | | | | | | $ | 477,095 | | | | | | | | $ | 445,239 | | | | | | | |
| | | | | | | | | | | | | | | | | | | | | | | | | | | | | |
Net interest income | | | | | $ | 13,122 | | | | | | | | $ | 13,665 | | | | | | | | $ | 13,390 | | | | |
Net interest rate spread(2) | | | | | | | | | 2.56 | % | | | | | | | | 2.83 | % | | | | | | | | 3.02 | % |
Net interest margin (3) | | | | | | | | | 2.79 | | | | | | | | | 3.05 | | | | | | | | | 3.22 | |
Ratio of average interest-earning assets to average interest-bearing liabilities | | | | | | | | | 107.09 | | | | | | | | | 107.62 | | | | | | | | | 107.24 | |
| | | | | | | | | | | | | | | | | | | | | | | | | | | | | |
| | | | | | | | | | | | | | | | | | | | | | | | | | | | | |
___________________
(1) Balance is net of deferred loan fees, deferred loan costs, loan premiums and loans in process. Nonaccrual loans are included in the balances.
(2) Net interest rate spread represents the difference between the yield on average interest-earning assets and the cost of average interest-bearing liabilities.
(3) Net interest margin represents net interest income divided by average total interest-earning assets.
(4) Includes interest-bearing deposits of $1,238,000, Federal Home Loan Bank stock of $5,563,000, and securities available-for-sale of $15,602,000.
(5) Includes interest-bearing deposits of $1,150,000, Federal Home Loan Bank stock of $5,212,000, and securities available-for-sale of $17,376,000.
(6) Includes interest-bearing deposits of $1,735,000, Federal Home Loan Bank stock of $4,993,000, and securities available-for-sale of $20,504,000.
Rate/Volume Analysis
The table below sets forth certain information regarding changes in interest income and interest expense of the Company for the periods indicated. For each category of interest-earning assets and interest-bearing liabilities, information is provided on changes attributable to (i) changes in average volume (changes in average volume multiplied by old rate); (ii) changes in rates (changes in rate multiplied by old average volume); (iii) changes in rate-volume (changes in rate multiplied by the changes in average volume); and (iv) the net change.
| | | Year Ended December 31, 2006 Compared to Year Ended December 31, 2005 | | Year Ended December 31, 2005 Compared to Year Ended December 31, 2004 | |
| | | Increase/(Decrease) Due to | | Increase/(Decrease) Due to | |
| | | Volume | | Rate | | Rate/ Volume | | Total Increase (Decrease) | | Volume | | Rate | | Rate/ Volume | | Total Increase (Decrease) | |
| | | (In thousands) |
Interest income: | | | | | | | | | | | | | | | | | |
First mortgage loans | | $ | 1,130 | | $ | 552 | | $ | 29 | | $ | 1,711 | | $ | 1,853 | | $ | (447 | ) | $ | (41 | ) | $ | 1,365 | |
Consumer loans | | | 233 | | | 240 | | | 14 | | | 487 | | | 308 | | | (122 | ) | | (10 | ) | | 176 | |
Investment securities | | | (59 | ) | | 123 | | | 3 | | | 67 | | | (125 | ) | | 113 | | | (13 | ) | | (25 | ) |
Total interest-earning assets | | $ | 1,304 | | $ | 915 | | $ | 46 | | $ | 2,265 | | $ | 2,036 | | $ | (456 | ) | $ | (64 | ) | $ | 1,516 | |
Interest expense: | | | | | | | | | | | | | | | | | | | | | | | | | |
NOW and money market savings | | $ | (119 | ) | $ | 120 | | $ | (14 | ) | $ | (13 | ) | $ | 117 | | $ | 331 | | $ | 71 | | $ | 519 | |
Savings | | | (8 | ) | | 4 | | | - | | | (4 | ) | | (2 | ) | | 2 | | | - | | | - | |
Certificate of deposits | | | 1,021 | | | 1,177 | | | 178 | | | 2,376 | | | 261 | | | 152 | | | 6 | | | 419 | |
Borrowed funds | | | 301 | | | 139 | | | 9 | | | 449 | | | 199 | | | 100 | | | 4 | | | 303 | |
Total interest-bearing liabilities | | | 1,195 | | | 1,440 | | | 173 | | | 2,808 | | | 575 | | | 585 | | | 81 | | | 1,241 | |
Net change in net interest income | | $ | 109 | | $ | (525 | ) | $ | (127 | ) | $ | (543 | ) | $ | 1,461 | | $ | (1,041 | ) | $ | (145 | ) | $ | 275 | |
Comparison of Financial Condition as of December 31, 2006 and December 31, 2005
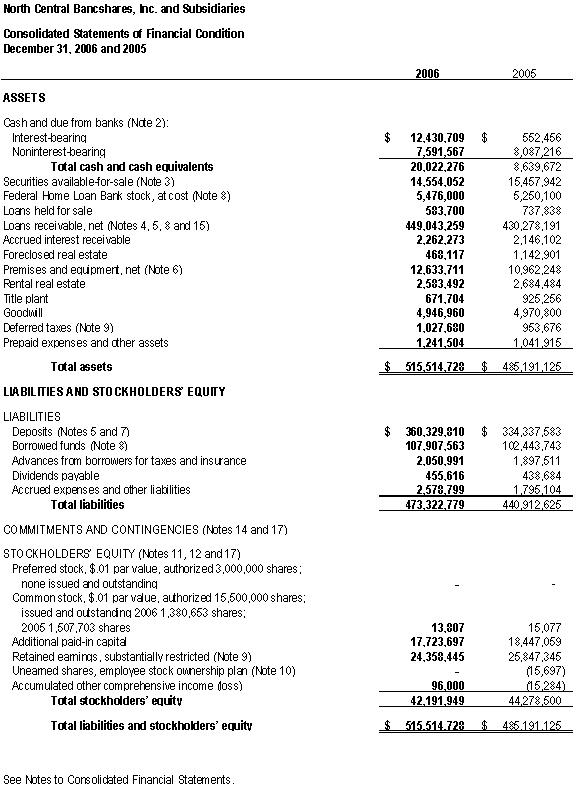
Total assets increased $30.3 million, or 6.3%, to $515.5 million at December 31, 2006 from $485.2 million at December 31, 2005. The increase in assets was primarily due to increases in net loans receivable, cash and cash equivalents, and premises and equipment, offset in part by a decrease in securities available-for-sale. Asset growth was funded by increases in deposits, consisting primarily of brokered certificates of deposit, and FHLB advances.
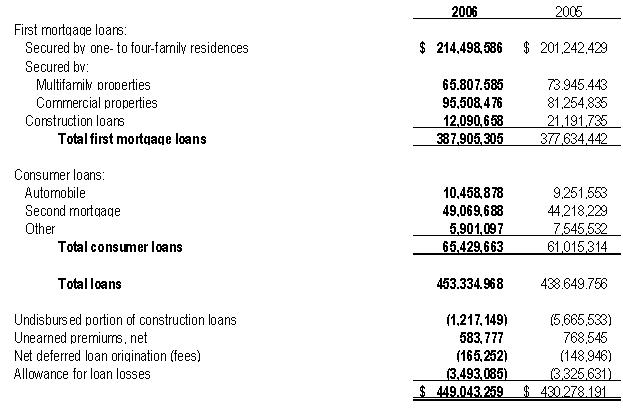
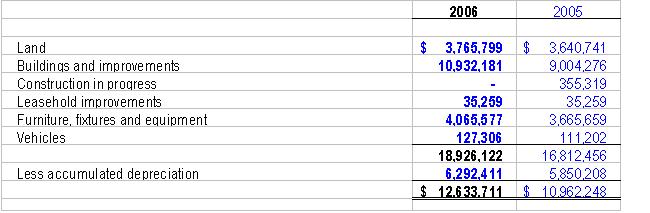
Total loans receivable, net, increased by $18.8 million, or 4.4%, to $449.0 million at December 31, 2006 from $430.3 million at December 31, 2005, primarily due to the origination of $46.2 million of first mortgage loans secured by one- to four-family residences, the origination of $16.3 million of first mortgage loans secured by commercial real estate, the origination of $9.7 million of first mortgage loans secured by multifamily residences; the purchase of first mortgage loans secured by one- to four-family residences, multifamily residences and commercial real estate of $40.4 million; and the origination of $28.8 million of second mortgage loans during the year ended December 31, 2006. These originations and purchases were offset in part by payments and prepayments of $119.2 million and sales of loans of $19.2 million during the year ended December 31, 2006. The Company sells substantially all fixed-rate loans with maturities of 15 years or more in the secondary mortgage market in order to reduce interest rate risk. Cash and cash equivalents increased $11.4 million, or 131.7%, to $20.0 million at December 31, 2006 from $8.6 million at December 31, 2005. The increase in cash and cash equivalents was primarily due to large commercial loan payoffs in December. Premises and equipment, net, increased by $1.7 million, or 15.2%, to $12.6 million at December 31, 2006 from $11.0 million at December 31, 2005. The increase in premises and equipment was primarily due to the construction costs associated with the construction of a new branch office located at the Jordan Creek Town Center in West Des Moines, Iowa and the expansion of the Crossroads branch in Fort Dodge, Iowa. Securities available-for-sale decreased $904,000, or 5.8%, to $14.6 million at December 31, 2006 from $15.5 million at December 31, 2005. The decrease in securities available-for-sale consisted primarily of a decrease in investments in mortgage-backed securities, offset in part by an increase in investments in municipal securities stock and an increase in unrealized gains. Proceeds of such calls, payments and maturities were used to fund loan growth.
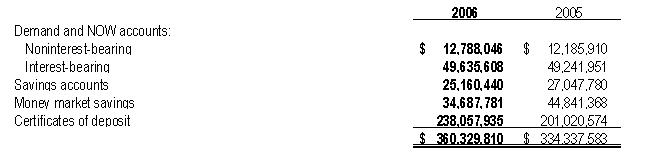
Deposits increased $26.0 million, or 7.8%, to $360.3 million at December 31, 2006 from $334.3 million at December 31, 2005, primarily reflecting an increase in certificates of deposit, offset in part by decreases in money market and savings account balances. The increase in certificates of deposit is primarily due to the utilization of brokered certificates of deposit, which increased $26.4 million, to $30.4 million at December 31, 2006. Borrowed funds, primarily FHLB advances, increased $5.5 million, or 5.3%, to $107.9 million at December 31, 2006 from $102.4 million at December 31, 2005. The increases in the deposits and borrowed funds were used to fund loan growth.
Total shareholders' equity decreased $2.1 million, or 4.7%, to $42.2 million at December 31, 2006 from $44.3 million at December 31, 2005, primarily due to stock repurchases and declared dividends, offset in part by earnings, the exercise of stock options, and an increase in unrealized gain on securities available-for-sale.
Comparison of Financial Condition as of December 31, 2005 and December 31, 2004
Total assets increased $22.5 million, or 4.9%, to $485.2 million at December 31, 2005 from $462.7 million at December 31, 2004. The increase in assets was primarily due to increases in net loans receivable, premises and equipment, and cash and cash equivalents, offset in part by a decrease in securities available-for-sale. Asset growth was funded by increases in deposits and FHLB advances.
Total loans receivable, net, increased by $23.0 million, or 5.6%, to $430.3 million at December 31, 2005 from $407.3 million at December 31, 2004, primarily due to the origination of $74.6 million of first mortgage loans secured by one- to four-family residences, originations of $8.5 million of first mortgage loans secured by commercial real estate, purchases of first mortgage loans primarily secured by one- to four-family residences, multifamily residences and commercial real estate of $24.0 million, and originations of $24.8 million of second mortgage loans during the year ended December 31, 2005. These originations and purchases were offset in part by payments and prepayments of $103.0 million and sales of loans of $19.5 million during the year ended December 31, 2005. The Company sells substantially all fixed-rate loans with maturities in excess of 15 years in the secondary mortgage market in order to reduce interest rate risk. Premises and equipment, net, increased by $1.1 million, or 10.8%, to $11.0 million at December 31, 2005 from $9.9 million at December 31, 2004. The increase in premises and equipment was primarily due to the initial construction costs associated with the construction of a new branch office located at the Jordan Creek Town Center in West Des Moines, Iowa and the expansion of the Crossroads branch in Fort Dodge, Iowa. Cash and cash equivalents increased $721,000, or 9.1%, to $8.6 million at December 31, 2005 from $7.9 million at December 31, 2004. Securities available-for-sale decreased $2.6 million, or 14.4%, to $15.5 million at December 31, 2005 from $18.1 million at December 31, 2004, primarily due to calls, payments and maturities of mortgage-backed and municipal securities. Proceeds of such calls, payments and maturities were used to fund loan growth.
Deposits increased $18.0 million, or 5.7%, to $334.3 million at December 31, 2005 from $316.3 million at December 31, 2004, primarily reflecting increases in checking accounts, NOW accounts, and certificates of deposit, offset in part by decreases in savings accounts and money market accounts. The increase in deposits is due primarily to management’s pricing strategies, continued marketing efforts, and the utilization of brokered certificates of deposit. In 2005, the Company began issuing brokered certificates of deposit. At December 31, 2005, the Company had $4.0 million of brokered certificates of deposit. Borrowed funds, primarily FHLB advances, increased $1.5 million, or 1.5%, to $102.4 million at December 31, 2005 from $101.0 million at December 31, 2004. The increases in the deposits and borrowed funds were used to fund loan growth.
Total shareholders' equity increased $2.8 million, or 6.6%, to $44.3 million at December 31, 2005 from $41.5 million at December 31, 2004, primarily due to earnings, the exercise of stock options, and a decrease in unrealized loss on securities available-for-sale, offset in part by stock repurchases and declared dividends.
Comparison of Results of Operations for the Years Ended December 31, 2006 and 2005
Net Income. Net income decreased by $203,000, or 4.1%, to $4.8 million for the year ended December 31, 2006, compared to $5.0 million for the year ended December 31, 2005. Net income is primarily dependent on net interest income, noninterest income, noninterest expense and income tax expense. The decrease in net income was primarily due to a decrease in net interest income and an increase in noninterest expense, offset in part by an increase in noninterest income.
Net Interest Income. Net interest income before provision for loan losses decreased by $543,000, or 4.0%, to $13.1 million for the year ended December 31, 2006 from $13.7 million for the year ended December 31, 2005. The decrease is due to an increase in the average balance of interest-bearing liabilities and an increase in the average cost of funds, offset in part by an increase in the average balance of interest-earning assets and an increase in the yield on interest-earning assets. The interest rate spread (i.e., the difference in the average yield on assets and average cost of liabilities) decreased to 2.56% for the year ended December 31, 2006 from 2.83% for the year ended December 31, 2005. The decrease in interest rate spread reflects the increase in the overall cost of interest-bearing liabilities, offset in part by an increase in the yield on interest-earning assets. The increase in the cost of interest-bearing liabilities primarily reflects the repricing of interest-bearing liabilities at higher current market interest rates and the growth of interest-bearing liabilities in higher cost certificates of deposit and borrowed funds. Also contributing to the increase of the cost of funds is the continuing shift of lower cost non-maturing deposits into higher cost short-term certificates of deposit.
Interest Income. Interest income increased by $2.3 million, or 8.6%, to $28.5 million for the year ended December 31, 2006, compared to $26.3 million for the year ended December 31, 2005. The increase in interest income was due to increases in the average balance of interest-earning assets and the average yield on interest-earning assets. The average balance of interest-earning assets increased $21.5 million, or 4.8%, to $469.8 million for the year ended December 31, 2006, from $448.4 million for 2005. The increase in the average balance of interest-earning assets primarily reflects increases in the average balances of first mortgage loans and consumer loans. The increases in first mortgage loans and consumer loans were primarily derived from the origination of $46.2 million of first mortgage loans secured by one- to four-family residences, the origination of $16.3 million of first mortgage loans secured by commercial real estate, the origination of $9.7 million of first mortgage loans secured by multifamily residences; the purchase of first mortgage loans secured by one- to four-family residences, multifamily residences, and commercial real estate of $40.4 million; and the origination of $28.8 million of second mortgage loans, which originations and purchases were offset in part by payments and prepayments of $119.2 million and sales of loans of $19.2 million during the year ended December 31, 2006. This reflects the Company's continued emphasis on residential lending. See “-Business Strategy.” The average yield on interest-earning assets increased to 6.07% for the year ended December 31, 2006, from 5.86% for the year ended December 31, 2005. The increase in the average yield on interest-earning assets was primarily due to loan growth at rates generally higher than portfolio rates and the repricing of adjustable rate loans within the portfolio at generally higher current market interest rates.
Interest Expense. Interest expense increased by $2.8 million, or 22.3%, to $15.4 million for the year ended December 31, 2006, compared to $12.6 million for the year ended December 31, 2005. The increase in interest expense was due to an increase in the average cost of funds and an increase in the average balance of interest-bearing liabilities. The average cost of funds increased to 3.51% for the year ended December 31, 2006 from 3.03% for the year ended December 31, 2005, due to an increase in the current market interest rates, a shift of core deposits into higher cost certificates of deposits, and an increase in certificates of deposit and borrowed funds. The average balance of interest-bearing liabilities increased $22.1 million, or 5.3%, to $438.8 million for the year ended December 31, 2006 from $416.6 million for 2005. The increase in the average balance of interest-bearing liabilities primarily reflects an increase in the average balances of certificates of deposit and borrowed funds, offset in part by a decrease in the average balance of money market and savings accounts. The increase in certificates of deposit is primarily due to the Company’s utilization of brokered certificates of deposit, which increased $26.4 million, to $30.4 million at December 31, 2006. Borrowed funds, primarily FHLB advances, increased $5.5 million, or 5.3%, to $107.9 million at December 31, 2006 from $102.4 million at December 31, 2005. The increase in interest-bearing liabilities was used to fund asset growth.
Provision for Loan Losses. The Company's provision for loan losses was $240,000 and $260,000 for the years ended December 31, 2006 and December 31, 2005, respectively. The Company establishes provisions for loan losses, which are charged to operations, in order to maintain the allowance for loan losses at a level which is deemed to be appropriate based upon an assessment of prior loss experience, industry standards, past due loans, economic conditions, the volume and type of loans in the Company's portfolio, which includes a significant amount of multifamily and commercial real estate loans, substantially all of which are purchased and are secured by properties located out of state, and other factors related to the collectibility of the Company's loan portfolio. During 2006, the Company’s total loan portfolio increased $14.7 million, or 3.4%. This increase primarily consisted of increases in commercial real estate and consumer loans, which carries a higher level of risk than other loans in the portfolio. The Company purchased $40.4 million of loans in 2006, compared to $24.0 million of loans in 2005. The properties securing the loans purchased are primarily out of state and constitute a higher rate of risk than originated loans due to the size, locations and type of collateral securing such loans. The Company’s out of state loans decreased by $7.8 million, or 5.4% during 2006. The economic conditions in the Bank’s primary market areas remain generally stable. The net charge-offs were $73,000 for the year ended December 31, 2006 and $170,000 for the year ended December 31, 2005. The charge-offs were primarily due to losses on automobile and second mortgage loans. The resulting allowance for loan loss was $3.5 million and $3.3 million at December 31, 2006 and December 31, 2005, respectively.
The allowance for loan losses as a percentage of total loans receivable increased to 0.77% at December 31, 2006 from 0.76% at December 31, 2005. The level of nonperforming loans was $579,000 at December 31, 2006 and $585,000 at December 31, 2005.
Management believes that the allowance for loan losses is adequate as of December 31, 2006. While management estimates loan losses using the best available information, such as independent appraisals for significant collateral properties, no assurance can be made that future adjustments to the allowance will not be necessary based on changes in economic and real estate market conditions, further information obtained regarding problem loans, identification of additional problem loans, and other factors, both within and outside of management's control.
Noninterest Income. Total noninterest income increased by $563,000, or 8.6%, to $7.1 million for the year ended December 31, 2006 from $6.5 million for the year ended December 31, 2005. The increase in noninterest income was primarily due to an impairment of securities available-for-sale recognized during the year ended December 31, 2005. During 2005, the Company recorded an other-than-temporary impairment of $679,500 related to three Freddie Mac adjustable rate, perpetual preferred stocks with a face value of $3.5 million, due to the facts and circumstances surrounding these securities at the time, including the duration and amount of the unrealized loss in the securities, as well as the prospect for a change in market value within a reasonable period of time. These perpetual preferred stock issues are investment grade securities that are held in the Company’s available-for-sale securities portfolio. The increase in 2006 was offset in part by decreases in fees and service charges, including loan prepayment fees, abstract fees, and mortgage banking income. Fees and service charges decreased $102,000 primarily due to a decrease in loan prepayment fees, offset in part by an increase in fees associated with checking accounts, including overdraft fees. During the year ended December 31, 2006, the Company recorded $569,000 in loan prepayment fees, compared to $1.0 million for the year ended December 31, 2005. Abstract fees decreased $66,000 due in part to the sale of one of the Company’s three abstract offices at the end of the second quarter of 2006. Mortgage banking income decreased $43,000 due to a decline in loans originated for the secondary market.
Noninterest Expense. Total noninterest expense increased by $680,000, or 5.5%, to $13.1 million for the year ended December 31, 2006 from $12.4 million for the year ended December 31, 2005. The increase is primarily due to increases in salaries and employee benefits and data processing expenses. Salaries and employee benefits increased $563,000 primarily due to normal salary increases, additions to staff, an increase in the Company’s contribution to its defined contribution retirement plan, and an increase in option expense due to the Company’s adoption of FAS 123(R) in 2006. Data processing expense increased $72,000 primarily due to outsourcing of certain data processing support functions during the year. The Company's efficiency ratio for the years ended December 31, 2006 and 2005 was 64.84% and 61.54%, respectively. The Company's ratio of noninterest expense to average assets for the years ended December 31, 2006 and 2005 was 2.63% and 2.61%, respectively.
Income Taxes. The Company’s provision for income taxes was $2.1 million and $2.5 million for the years ended December 31, 2006 and 2005, respectively. The decrease in the provision for income taxes was primarily due to the lower 2006 income before income taxes and the limited deductibility of the other-than-temporary impairment of securities available-for-sale in 2005.
Comparison of Results of Operations for the Years Ended December 31, 2005 and 2004
Net Income. Net income decreased by $384,000, or 7.1%, to $5.0 million for the year ended December 31, 2005 compared to $5.4 million for the year ended December 31, 2004. Net income is primarily dependent on net interest income, noninterest income, noninterest expense and income tax expense. The decrease in net income was primarily due to an increase in noninterest expense, offset in part by increases in net interest income and noninterest income.
Net Interest Income. Net interest income before provision for loan losses increased by $275,000, or 2.1%, to $13.7 million for the year ended December 31, 2005 from $13.4 million for the year ended December 31, 2004. The increase is primarily due to an increase in the average balance of interest-earning assets, offset in part by a decrease in the yield on interest-earning assets, an increase in the average balance of interest-bearing liabilities, and an increase in the average cost of funds. The interest rate spread (i.e., the difference in the average yield on assets and average cost of liabilities) decreased to 2.83% for the year ended December 31, 2005 from 3.02% for the year ended December 31, 2004. The decrease in interest rate spread reflects the general decrease in the yield on interest-earning assets and the increase in the overall cost of interest-bearing liabilities. The decrease in the yield on interest-earning assets primarily reflects loan growth at rates generally lower than portfolio rates. The increase in the cost of interest-bearing liabilities reflects repricing of interest-bearing liabilities at generally higher current market interest rates.
Interest Income. Interest income increased by $1.5 million, or 6.1%, to $26.3 million for the year ended December 31, 2005 compared to $24.8 million for the year ended December 31, 2004. The increase in interest income was primarily due to an increase in the average balance of interest-earning assets, offset in part by a decrease in the average yield on interest-earning assets. The average balance of interest-earning assets increased $32.0 million, or 7.7%, to $448.4 million for the year ended December 31, 2005, from $416.4 million for 2004. The increase in the average balances of interest-earning assets primarily reflects increases in the average balances of first mortgage loans and consumer loans. The increases in first mortgage loans were primarily derived from originations of $74.6 million of first mortgage loans secured by one- to four-family residences, originations of $8.5 million of first mortgage loans secured by commercial real estate, purchases of first mortgage loans secured by one- to four-family residences, multifamily residences and commercial real estate of $24.0 million, and originations of $24.8 million of second mortgage loans, which originations and purchases were offset in part by payments and prepayments of $103.0 million and sales of loans of $19.5 million during the year ended December 31, 2005. This reflects the Company's continued emphasis on residential lending. See “-Business Strategy.” The average yield on interest-earning assets decreased to 5.86% for the year ended December 31, 2005 from 5.95% for the year ended December 31, 2004, primarily due to loan growth at rates generally lower than portfolio rates.
Interest Expense. Interest expense increased by $1.2 million, or 10.9%, to $12.6 million for the year ended December 31, 2005, compared to $11.4 million for the year ended December 31, 2004. The increase in interest expense was primarily due to increases in the average cost of funds and in the average balance of interest-bearing liabilities. The average cost of funds increased to 3.03% for the year ended December 31, 2005 from 2.93% for the year ended December 31, 2004, primarily due to a general increase in market interest rates. The average balance of interest-bearing liabilities increased $28.3 million, or 7.3%, to $416.6 million for the year ended December 31, 2005 from $388.3 million for 2004. The increase in the average balance of interest-bearing liabilities primarily reflects an increase in the average balances of checking and money market accounts, certificates of deposit and borrowed funds, offset in part by a decrease in the average balance of savings accounts. The increase in average interest-bearing deposits was primarily due to the Company’s pricing strategies and continued marketing efforts. The increase in interest-bearing liabilities was used to fund asset growth.
Provision for Loan Losses. The Company's provision for loan losses was $260,000 and $240,000 for the years ended December 31, 2005 and December 31, 2004, respectively. The Company establishes provisions for loan losses, which are charged to operations, in order to maintain the allowance for loan losses at a level which is deemed to be appropriate based upon an assessment of prior loss experience, industry standards, past due loans, economic conditions, the volume and type of loans in the Company's portfolio, which includes a significant amount of multifamily and commercial real estate loans, substantially all of which are purchased and are secured by properties located out of state, and other factors related to the collectibility of the Company's loan portfolio. During 2005, the Company’s total loan portfolio increased $19.8 million, or 4.7%. This increase primarily consisted of increases in the one- to four-family first mortgage real estate loans, which carries a lower level of risk than other loans in the portfolio. The Company purchased $24.0 million of loans in 2005, compared to $52.7 million of loans in 2004. The properties securing the loans purchased are primarily out of state and constitute a higher rate of risk than originated loans due to the size, locations and type of collateral securing such loans. The Company’s out of state loans decreased by $15.0 million, or 9.5% during 2005. The economic conditions in the Bank’s primary market areas remain generally stable. The net charge-offs were $170,000 for both of the years ended December 31, 2005 and 2004. The charge-offs were primarily due to losses on automobile and second mortgage loans. The resulting allowance for loan loss was $3.3 million and $3.2 million at December 31, 2005 and December 31, 2004, respectively.
The allowance for loan losses as a percentage of total loans receivable decreased to 0.76% at December 31, 2005 from 0.77% at December 31, 2004. The level of nonperforming loans was $585,000 at December 31, 2005 and $634,000 at December 31, 2004.
Management believes that the allowance for loan losses is adequate as of December 31, 2005. While management estimates loan losses using the best available information, such as independent appraisals for significant collateral properties, no assurance can be made that future adjustments to the allowance will not be necessary based on changes in economic and real estate market conditions, further information obtained regarding problem loans, identification of additional problem loans, and other factors, both within and outside of management's control.
Noninterest Income. Total noninterest income increased by $489,000, or 8.1%, to $6.5 million for the year ended December 31, 2005 from $6.0 million for the year ended December 31, 2004. The increase is primarily due to increases in fees and service charges and mortgage banking income (gain on sale of loans), offset in part by a provision for impairment on securities available-for-sale and decreases in abstract fees and other income. Fees and service charges increased $1.36 million due primarily to an increase in loan prepayment fees of $644,000 and fees associated with checking accounts, including overdraft fees, of $328,000. Mortgage banking income increased $34,000 due in part to an increase in loan originations of loans held for sale. During 2005, the Company recognized an other-than-temporary impairment of $680,000 on three Freddie Mac adjustable rate, perpetual preferred stocks that had declined in value, reducing noninterest income for the year. The securities are investment grade securities that are held in the Company’s available-for-sale portfolio. The Company recognized an other-than-temporary impairment on the securities based on the facts and circumstances surrounding each of the securities at the time, including the duration and amount of the unrealized loss, as well as the prospect for the recovery of market value within a reasonable period of time. Abstract fees decreased $171,000 due to decreased sales volume as a result of a general decrease in real estate activity, such as loan originations, in Webster, Boone and Jasper Counties. Other income, which primarily includes insurance, annuity, and mutual fund sales, rent income, and income associated with foreclosed real estate decreased $54,000 due in part to decreases in annuity sales.
Noninterest Expense. Total noninterest expense increased by $1.1 million, or 9.9%, to $12.4 million for the year ended December 31, 2005 from $11.3 million for the year ended December 31, 2004. The increase is primarily due to an increase in salaries and employee benefits and other expenses. Salaries and employee benefits increased $467,000 primarily due to normal salary increases, additions to staff, and an increase in the Company’s contribution to its defined benefit retirement plan. Other expenses increased $603,000 due primarily to the write-down of other real estate owned and an increase in professional fees. The Company's efficiency ratio for the years ended December 31, 2005 and 2004 was 61.54% and 58.18%, respectively. The Company's ratio of noninterest expense to average assets for the years ended December 31, 2005 and 2004 was 2.61% and 2.54%, respectively.
Income Taxes. The Company’s provision for income taxes was $2.5 million for both of the years ended December 31, 2005 and 2004. The provision for income taxes remained steady primarily due to the decrease in income before income taxes, offset in part by the limited deductibility of the other-than-temporary impairment of securities available-for-sale.
Impact of Inflation and Changing Prices
The consolidated financial statements of the Company and notes thereto, presented elsewhere herein, have been prepared in accordance with accounting principles generally accepted in the United States of America, which require the measurement of financial position and operating results in terms of historical dollars without considering the change in the relative purchasing power of money over time and due to inflation. The impact of inflation is reflected in the increased cost of the Company's operations. Unlike most industrial companies, nearly all the assets and liabilities are monetary. As a result, interest rates have a greater impact on the Company's performance than do the effects of general levels of inflation. Interest rates do not necessarily move in the same direction or to the same extent as the price of goods and services.
Off-Balance Sheet Arrangements
The Company is a party to financial instruments with off-statement of financial condition risk in the normal course of business to meet the financing needs of its customers. These financial instruments consist primarily of commitments to extend credit. Those instruments involve, to varying degrees, elements of credit and interest rate risk in excess of the amount recognized in the statement of financial condition. The contract or notional amounts of those instruments reflect the extent of involvement the Company has in a particular class of financial instruments.
The Company uses the same credit polices in making commitments and conditional obligations as it does for on-statement of financial condition instruments. The Company does require collateral, or other security, to support financial instruments with credit risks.
For additional information regarding off-balance sheet arrangements, see Note 14 to the Consolidated Financial Statements.
Contractual Obligations
| | | Payments due by period | |
| | | Total | | Less than 1 year | | 1-3 years | | 3-5 years | | More than 5 years | |
| | | | | | | | | | | | |
| | | (In thousands) | |
| Borrowings (1) | | $ | 107,908 | | $ | 26,500 | | $ | 44,500 | | $ | 36,500 | | $ | 408 | |
Loan commitments | | | 3,750 | | | 3,750 | | | - | | | - | | | - | |
Available home equity and unadvanced lines of credit | | | 6,600 | | | 6,600 | | | - | | | - | | | - | |
Total | | $ | 118,258 | | $ | 36,850 | | $ | 44,500 | | $ | 36,500 | | $ | 408 | |
NORTH CENTRAL BANCSHARES, INC.
AND SUBSIDIARIES
INDEX TO FINANCIAL STATEMENTS
________________________________________________________
REPORT OF INDEPENDENT REGISTERED PUBLIC ACCOUNTING FIRM
________________________________________________________
FINANCIAL STATEMENTS
Consolidated statements of financial condition
Consolidated statements of income
Consolidated statements of stockholders' equity
Consolidated statements of cash flows
Notes to consolidated financial statements
______________________________
Report of Independent Registered Public Accounting Firm
To the Board of Directors
North Central Bancshares, Inc.
Fort Dodge, Iowa
We have audited the consolidated statements of financial condition of North Central Bancshares, Inc. and subsidiaries as of December 31, 2006 and 2005, and the related consolidated statements of income, stockholders’ equity and cash flows for each of the three years in the period ended December 31, 2006. These financial statements are the responsibility of the Company’s management. Our responsibility is to express an opinion on these financial statements based on our audits.
We conducted our audits in accordance with the standards of the Public Company Accounting Oversight Board (United States). Those standards require that we plan and perform the audit to obtain reasonable assurance about whether the financial statements are free of material misstatement. An audit includes examining, on a test basis, evidence supporting the amounts and disclosures in the financial statements. An audit also includes assessing the accounting principles used and significant estimates made by management, as well as evaluating the overall financial statement presentation. We believe that our audits provide a reasonable basis for our opinion.
In our opinion, the consolidated financial statements referred to above present fairly, in all material respects, the financial position of North Central Bancshares, Inc. and subsidiaries as of December 31, 2006 and 2005 and the results of their operations and their cash flows for each of the three years in the period ended December 31, 2006, in conformity with U.S. generally accepted accounting principles.
As described in Note 1 to the consolidated financial statements, the Company changed its method of accounting for stock-based compensation in 2006.
Des Moines, Iowa
March 12, 2007
McGladrey & Pullen, LLP is an independent member firm of RSM International, an affiliation of separate and independent legal entities.
North Central Bancshares, Inc. and Subsidiaries
| NOTES TO CONSOLIDATED FINANCIAL STATEMENTS |
Note 1. Significant Accounting Policies
Organization, nature of business and basis of presentation: North Central Bancshares, Inc. (the Company), an Iowa corporation, is a unitary savings and loan holding company that owns 100% of the outstanding stock of First Federal Savings Bank of Iowa (the Bank), which is a federally chartered stock savings bank that conducts its operations from its main office located in Fort Dodge, Iowa, and ten branch offices located in Fort Dodge, Nevada, Ames, Perry, Ankeny, Clive, West Des Moines, Burlington and Mt. Pleasant, Iowa.
Principles of consolidation: The consolidated financial statements include the accounts of the Company and its wholly owned subsidiary, the Bank, and the Bank’s wholly owned subsidiaries, First Federal Investment Services, Inc. (which sells insurance, annuity products and mutual funds), First Iowa Title Services, Inc. (which provides real estate abstracting services) and Northridge Apartments Limited Partnership and Northridge Apartments Limited Partnership II (which own multifamily apartment buildings). All significant intercompany balances and transactions have been eliminated in consolidation.
Accounting estimates and assumptions: The preparation of financial statements in conformity with generally accepted accounting principles requires management to make estimates and assumptions that affect the reported amounts of assets and liabilities and disclosures of contingent assets and liabilities at the date of the financial statements and the reported amounts of revenues and expenses during the reporting period. Actual results could differ from those estimates. Material estimates that are particularly susceptible to significant change in the near term relate to the determination of the allowance for loan losses, valuation of goodwill, unrealized gains and losses on securities available-for-sale and fair value of financial instruments.
Revenue recognition: Interest income and expense is recognized on the accrual method based on the respective outstanding balances. Other revenue is recognized at the time the service is rendered.
Cash and cash equivalents and cash flows: For purposes of the consolidated statements of cash flows, cash and cash equivalents includes cash and balances due from banks. Cash flows from loans, deposits and short-term borrowings are reported net.
Securities available-for-sale: Securities classified as available-for-sale are those debt and equity securities the Company intends to hold for an indefinite period of time, but not necessarily to maturity. Any decision to sell a security classified as available-for-sale would be based on various factors, including significant movements in interest rates, changes in the maturity mix of the Company’s assets and liabilities, liquidity needs, regulatory capital considerations and other similar factors.
Securities available-for-sale are reported at fair value with unrealized gains or losses reported as a separate component of other comprehensive income (loss), net of the related deferred tax effect. The amortization of premiums and accretion of discounts, computed by the interest method over their contractual lives, are recognized in interest income.
Realized gains or losses, determined on the basis of the amortized cost of specific securities sold, are included in earnings.
Declines in the fair value of held-to-maturity and available-for-sale securities below their cost that are deemed to be other-than-temporary are reflected in earnings as realized losses. In estimating other-than-temporary impairment losses, management considers (1) the length of time and the extent to which the fair value has been less than cost, (2) the financial condition and near-term prospects of the issuer, and (3) the intent and ability of the Company to retain its investment in the issuer for a period of time sufficient to allow for any anticipated recovery in fair value.
Loans held for sale: Residential real estate loans, which are originated and intended for resale in the secondary market in the foreseeable future, are classified as held-for-sale. These loans are carried at the lower of cost or estimated market value in the aggregate. As assets specifically acquired for resale, the origination of, disposition of, and gain/loss on these loans are classified as operating activities in the statement of cash flows.
Loans receivable: Loans that management has the intent and ability to hold for the foreseeable future, or until pay-off or maturity occurs, are classified as held for investment. These loans are stated at the amount of unpaid principal adjusted for charge-offs, the allowance for estimated losses on loans, any net deferred fees and/or costs on originated loans and net unearned premiums (discounts). Interest is credited to earnings as earned based on the principal amount outstanding. Deferred bank loan origination fees and/or costs are amortized as an adjustment of the related loan’s yield. As assets held for and used in the production of services, the origination and collection of these loans are classified as investing activities in the statement of cash flows.
The allowance for loan losses is increased by provisions charged to income and reduced by charge-offs, net of recoveries. Management’s periodic evaluation of the adequacy of the allowance is based on the Bank’s past loan loss experience, known and inherent risks in the portfolio, adverse situations that may affect the borrower’s ability to repay, estimated value of any underlying collateral and current economic conditions. While management uses the best information available to make its evaluation, future adjustments to the allowance may be necessary if there are significant changes in economic conditions.
Uncollectible interest on loans that are contractually past due is charged off or an allowance is established based on management’s periodic evaluation, generally when loans become 90 days past due. The allowance is established by a charge to interest income equal to all interest previously accrued, and income is subsequently recognized only to the extent that cash payments are received until, in management’s judgment, the borrower’s ability to make periodic interest and principal payments is no longer in doubt, in which case the loan is returned to accrual status.
A loan is considered impaired when, based on current information and events, it is probable that a creditor will be unable to collect the scheduled payments of principal or interest when due according to the contractual terms of the loan agreement. Factors considered by management in determining impairment include payment status, collateral value and the probability of collecting scheduled principal and interest payments when due. Impairment is measured by either the present value of expected future cash flows discounted at the loan’s effective interest rate, the loan’s obtainable market price or the fair value of the collateral if the loan is collateral-dependent.
Loan fees and certain direct loan origination costs are deferred, and the net fee or cost is recognized as an adjustment to interest income using the interest method over the contractual life of the loans, adjusted for estimated prepayments based on the Bank’s historical prepayment experience.
Premiums (discounts) on first mortgage loans purchased are amortized to income using the interest method over the remaining period to contractual maturity, adjusted for anticipated prepayments.
Transfers of financial assets: Transfers of financial assets are accounted for as sales when control over the assets has been surrendered. Control over transferred assets is deemed to be surrendered when (1) the assets have been isolated from the Company, (2) the transferee obtains the right (free of conditions that constrain it from taking advantage of that right) to pledge or exchange the transferred assets and (3) the Company does not maintain effective control over the transferred assets through an agreement to repurchase them before their maturity.
Foreclosed real estate: Real estate properties acquired through loan foreclosure are initially recorded at the lower of cost or fair value less selling costs at the date of foreclosure. Costs relating to development and improvement of property are capitalized, whereas costs relating to the holding of property are expensed.
Valuations are periodically performed by management, and an allowance for losses is established by a charge to income if the carrying value of a property exceeds its fair value less estimated selling costs.
Premises and equipment: Premises and equipment are stated at cost, net of accumulated depreciation. Depreciation is computed primarily by straight-line and double-declining balance methods over the following estimated useful lives:
Rental real estate: Rental real estate is comprised of two low-income housing, multifamily apartment buildings and equipment which is stated at cost, net of accumulated depreciation of approximately $1,256,000 and $1,044,000 for the years ended December 31, 2006 and 2005, respectively. Depreciation is computed primarily by the straight-line and double-declining balance methods over the estimated useful lives of the assets. Useful lives are the same as used for premises and equipment.
Title plant: Title plant is carried at cost and, in accordance with Statement No. 61, is not depreciated. Costs incurred to maintain and update the title plant are expensed as incurred. During the year ended December 31, 2006, title plant was reduced by $253,552 due to the sale of a branch of First Iowa Title Services.
Goodwill: Under the provisions of SFAS 142, goodwill is not amortized but is subject to an annual impairment test, or more often if conditions indicate a possible impairment. The Company has completed its annual goodwill impairment test and has determined that there has been no impairment of goodwill. During the year ended December 31, 2006, goodwill was reduced by $23,840 due to the sale of a branch of First Iowa Title Services.
Income taxes: Deferred taxes are provided on a liability method whereby deferred tax assets are recognized for deductible temporary differences and operating loss and tax credit carryforwards, and deferred tax liabilities are recognized for taxable temporary differences. Temporary differences are the differences between the reported amounts of assets and liabilities and their income tax basis. Income taxes are allocated to the Company and its subsidiaries based on each entity’s income tax liability as if it filed a separate return.
Deferred tax assets are reduced by a valuation allowance when, in the opinion of management, it is more likely than not that some portion or all of the deferred tax assets will not be realized. Deferred tax assets and liabilities are adjusted for the effects of changes in tax laws and rates on the date of enactment.
Comprehensive income: Accounting principles generally require that recognized revenue, expenses, gains and losses be included in net income. Although certain changes in assets and liabilities, such as unrealized gains and losses on available-for-sale securities, are reported as a separate component of the equity section of the balance sheet, such items, along with net income, are components of comprehensive income or loss. Gains and losses on available-for-sale securities are reclassified to net income as the gains or losses are realized upon sale of the securities. Other-than-temporary impairment charges are reclassified to net income at the time of the charge.
Earnings per share: Basic earnings per common share represents income available to common stockholders divided by the weighted average number of common shares outstanding during the periods presented. The earnings per common share amounts - assuming dilution were computed using the weighted average number of shares outstanding during the periods presented, adjusted for the effect of dilutive potential common shares outstanding, which consists of stock options granted. In accordance with Statement of Position 93-6, shares owned by the ESOP that have not been committed to be released are not considered to be outstanding for the purpose of computing earnings per share.
Operating segments: The Company uses the “management approach” for reporting information about segments in annual and interim financial statements. The management approach is based on the way the chief operating decision-maker organizes segments within a company for making operating decisions and assessing performance. Reportable segments are based on products and services, geography, legal structure, management structure and any other manner in which management disaggregates a company. Based on the “management approach” model, the Company has determined that its business is comprised of two reporting segments. The Company operates primarily in the banking industry, which accounts for the majority of its revenues, operating income and assets, with the remaining operations consisting of real estate abstracting services, insurance and investment services, and ownership of low-income housing tax credit apartment complexes. The primary source of income for the Company is interest from the origination or purchase of residential real estate, commercial real estate, and consumer loans. The Company accepts deposits from customers in the normal course of business primarily in north central, central and southeastern Iowa.
Stock compensation: Effective January 1, 2006, the Company adopted SFAS No. 123(R), Shared-Based Payments, using the modified prospective transition method. Prior to that date the Company accounted for stock option awards under APB Opinion No. 25, Accounting for Stock Issued to Employees. In accordance with SFAS No. 123(R), compensation expense for stock-based awards is recorded over the vesting period at the fair value of the award at the time of grant. The recording of such compensation began on January 1, 2006 for shares not yet vested as of that date and for all new grants subsequent to that date. Prior years’ results have not been restated. The exercise price of options granted under the Company’s incentive plans is equal to the fair market value of the underlying stock at the grant date. The Company assumes no projected forfeitures on its stock-based compensation, since actual historical forfeiture rates on its stock-based incentive awards have been negligible.
Recent accounting pronouncements: In February 2006, the Financial Accounting Standards Board (FASB) issued SFAS No. 155, Accounting for Certain Hybrid Financial Instruments, which permits, but does not require, fair value accounting for any hybrid financial instrument that contains an embedded derivative that would otherwise require bifurcation in accordance with SFAS No. 133, Accounting for Derivative Instruments and Hedging Activities. The statement also subjects beneficial interests in securitized financial assets to the requirements of SFAS No. 133. For the Company, this statement is effective for all financial instruments acquired, issued, or subject to remeasurement after the beginning of its fiscal year that begins after September 15, 2006, with earlier adoption permitted. The Company is currently evaluating the impact that the adoption of this statement will have on its financial position, results of operation and cash flows.
In March 2006, the FASB issued SFAS No. 156, Accounting for Servicing of Financial Assets, an amendment of FASB Statement No. 140. The statement amends SFAS No. 140 by (1) requiring the separate accounting for servicing assets and servicing liabilities, which arise from the sale of financial assets; (2) requiring all separately recognized servicing assets and servicing liabilities to be initially measured at fair value, if practicable; and (3) permitting an entity to choose between an amortization method or a fair value method for subsequent measurement for each class of separately recognized servicing assets and servicing liabilities. This statement is effective for fiscal years beginning after September 15, 2006, with earlier adoption permitted. The Company is currently evaluating the impact that the adoption of this statement will have on its financial position, results of operation and cash flows.
In June 2006, the FASB issued FASB Interpretation No. 48 (FIN 48), Accounting for Uncertainty in Income Taxes. This interpretation applies to all tax positions accounted for in accordance with SFAS No. 109, Accounting for Income Taxes. FIN 48 clarifies the application of SFAS No. 109 by defining the criteria that an individual tax position must meet in order for the position to be recognized within the financial statements and provides guidance on measurement, de-recognition, classification, interest and penalties, accounting in interim periods, disclosure and transition for tax positions. This interpretation is effective for fiscal years beginning after December 15, 2006, with earlier adoption permitted. The Company is currently evaluating the impact that the adoption of this interpretation will have on its financial position, results of operation and cash flows.
In September 2006, the FASB issued SFAS No. 157, Fair Value Measurements. This statement defines fair value, establishes a framework for measuring fair value, and expands disclosures about fair value measurements. It clarifies that fair value is the price that would be received to sell an asset or paid to transfer a liability in an orderly transaction between market participants in the market in which the reporting entity transacts. This statement does not require any new fair value measurements, but rather, it provides enhanced guidance to other pronouncements that require or permit assets or liabilities to be measured at fair value. This statement is effective for fiscal years beginning after November 15, 2007, with earlier adoption permitted. The Company is currently evaluating the impact that the adoption of this statement will have on its financial position, results of operation and cash flows.
In September 2006, the FASB issued Statement No. 158, (SFAS No. 158), Employers’ Accounting for Defined Benefit Pension and Other Postretirement Plans - an amendment of FASB Statements No. 87, 88, 106 and 132(R). SFAS No. 158 requires a company that sponsors a postretirement benefit plan (other than a multi-employer plan) to fully recognize, as an asset or liability, the over- or underfunded status of its benefit plan in its balance sheet. The funded status is measured as the difference between the fair value of the plan’s assets and its benefit obligation (projected benefit obligation for pension plans and accumulated postretirement benefit obligation for other postretirement benefit plans). Currently, the funded status of such plans are reported in the notes to the financial statements. This provision is effective for public companies for fiscal years ending after December 15, 2006. In addition, SFAS No. 158 also requires a company to measure its plan assets and benefit obligations as of its year-end balance sheet date. Currently, a company is permitted to choose a measurement date up to three months prior to its year-end to measure the plan assets and obligations. This provision is effective for all companies for fiscal years ending after December 15, 2008. Since the Company participates in a multi-employer pension plan, it expects that the adoption of SFAS No. 158 will not have a material impact on its financial position, results of operations and cash flows.
Fair value of financial instruments: The fair value of a financial instrument is the current amount that would be exchanged between willing parties, other than in a forced liquidation. Fair value is best determined based upon quoted market prices. In cases where quoted market prices are not available, fair values are based on estimates using present value or other valuation techniques. Those techniques are significantly affected by the assumptions used, including the discount rate and estimates of future cash flows. In that regard, the derived fair value estimates cannot be substantiated by comparison to independent markets and, in many cases, could not be realized in immediate settlement of the instruments. FASB Statement No. 107 excludes certain financial instruments and all nonfinancial instruments from its disclosure requirements. Accordingly, the aggregate fair value amounts presented do not represent the underlying value of the Company.
In February 2007, the FASB issued FASB Statement No. 159, The Fair Value Option for Financial Assets and Financial Liabilities - including an amendment of FASB Statement No. 115, which provides all entities, including not-for-profit organizations, with an option to report selected financial assets and liabilities at fair value. The objective of the statement is to improve financial reporting by providing entities with the opportunity to mitigate volatility in earnings caused by measuring related assets and liabilities differently without having to apply the complex provisions of hedge accounting. Certain specified items are eligible for the irrevocable fair value measurement option as established by Statement No. 159. Statement No. 159 is effective as of the beginning of an entity’s first fiscal year beginning after November 15, 2007. Early adoption is permitted as of the beginning of a fiscal year that begins on or before November 15, 2007 provided the entity also elects to apply the provisions of Statement No. 157. The Company is currently evaluating the impact that the adoption of this statement will have on its financial position, results of operation and cash flows.
The following methods and assumptions were used by the Company in estimating the fair value of its financial instruments:
Cash and due from banks: The carrying amount of cash and due from banks represents the fair value.
Securities: Fair values for all securities are based on quoted market prices, where available. If quoted market prices are not available, fair values are based on quoted market prices of comparable instruments.
Federal Home Loan Bank stock: The fair value of this untraded stock is estimated at its carrying value because the Company is able to redeem the stock with the Federal Home Loan Bank at par value.
Loans held for sale: Fair values are based on quoted market prices of similar loans sold on the secondary market.
Loans: For variable-rate loans that reprice frequently and have experienced no significant change in credit risk, fair values are based on carrying values. Fair values for all other loans are estimated based on discounted cash flows, using interest rates currently being offered for loans with similar terms to borrowers with similar credit quality.
Deposits: Fair values disclosed for demand, NOW, savings and money market savings deposits equal their carrying amounts, which represent the amount payable on demand. Fair values for certificates of deposit are estimated using a discounted cash flow calculation that applies interest rates currently being offered on certificates to a schedule of aggregate expected monthly maturities on time deposits.
Borrowed funds: The fair value of borrowed funds is estimated based on discounted cash flows using currently available borrowing rates.
Accrued interest receivable and payable: The fair values of both accrued interest receivable and payable are their carrying amounts.
Commitments to extend credit: The fair values of commitments to extend credit are based on fees currently charged to enter into similar agreements, taking into account the remaining terms of the agreements and creditworthiness of the counterparties. At December 31, 2006 and 2005, the carrying amount and fair value of the commitments were not significant.
Note 2. Restrictions on Cash and Due from Banks
The Bank is required to maintain reserve balances in cash or on deposit with the Federal Reserve Bank, based on a percentage of deposits. Those reserve balances totaled approximately $2,055,000 and $2,220,000 at December 31, 2006 and 2005, respectively.
Note 3. Securities
Securities available-for-sale as of December 31, 2006 were as follows:
Securities available-for-sale as of December 31, 2005 were as follows:
Securities available-for-sale with carrying amounts of approximately $126,000 and $205,000 at December 31, 2006 and 2005, respectively, were pledged on deposit accounts. Securities available-for-sale with carrying amounts of approximately $2,372,000 and $3,452,000 at December 31, 2006 and 2005, respectively, were pledged as collateral on Federal Home Loan Bank advances.
Gross unrealized losses and gross estimated fair value, aggregated by investment category and length of time that individual securities have been in a continuous unrealized loss position, as of December 31, 2006 and 2005, are summarized as follows:
For all of the above investment securities, the unrealized losses are generally due to changes in interest rates and, as such, are considered to be temporary by the Company. In addition, the Company has the intent and ability to hold these investment securities for a period of time sufficient to allow for an anticipated recovery. During 2005, the Company determined that the unrealized losses related to the FHLMC preferred stock issues were other-than-temporary. Accordingly, an impairment loss of $679,500 was recorded and the cost basis of the securities was reduced by the same amount.
The amortized cost and fair value of debt securities as of December 31, 2006 by contractual maturity are shown below. Certain securities have call features, which allow the issuer to call the security prior to maturity. Maturities may differ from contractual maturities in mortgage-backed securities because the mortgages underlying the securities may be called or repaid without any penalties. Therefore, these securities are not included in the maturity categories in the following maturity summary:
There were no securities sold during 2006, 2005 or 2004 except for FHLB stock.
Included in the interest income on securities and cash deposits was dividend income of $537,166, $434,251 and $371,519 for the years ended December 31, 2006, 2005 and 2004, respectively.
The components of other comprehensive income (loss) - net unrealized gains (losses) on available-for-sale securities for the years ended December 31, 2006, 2005 and 2004 were as follows:
Note 4. Loans Receivable
Loans receivable at December 31, 2006 and 2005 are summarized as follows:
Activity in the allowance for loan losses is summarized as follows for the years ended December 31:
The following is a summary of information pertaining to impaired loans:
The average investment in impaired loans during the years ended December 31, 2006, 2005 and 2004 totaled $739,601, $589,756 and $578,180, respectively. Interest income recognized on impaired loans is insignificant.
The Bank has had, and may be expected to have in the future, banking transactions in the ordinary course of business with directors, executive officers and their immediate families (commonly referred to as related parties), all of which have been, in the opinion of management, on the same terms, including interest rates and collateral, as those prevailing at the time for comparable transactions with others.
Activity in loans receivable from certain executive officers and directors of the Company consisted of the following for the years ended December 31, 2006 and 2005:
Mortgage loans serviced for FHLMC and other banks are not included in the accompanying consolidated statements of financial condition. The unpaid principal balances of these loans at December 31, 2006 and 2005 are $51,348,477 and $45,422,224, respectively. Included in deposits are custodial escrow balances maintained in connection with the foregoing loan servicing of $432,143 and $373,477 at December 31, 2006 and 2005, respectively.
Note 6. Premises and Equipment
Premises and equipment consisted of the following at December 31:
Note 7. Deposits
Deposits at December 31 were as follows:
At December 31, 2006, scheduled maturities of certificates of deposit were as follows:
Interest expense on deposits consisted of the following:
The aggregate amounts of certificates of deposit in excess of $100,000 were $55,694,178 and $28,247,725 as of December 31, 2006 and 2005, respectively. Certificates of deposit include approximately $30,400,000 and $4,000,000 of brokered certificates of deposit as of December 31, 2006 and 2005, respectively.
Note 8. Borrowed Funds
Borrowed funds at December 31, 2006 consists of borrowings from the Federal Home Loan Bank of Des Moines (FHLB) as follows:
At December 31, 2006, the Company had an unsecured $3,000,000 line of credit agreement with a bank. The line of credit bears interest at LIBOR plus 1.85% (7.20% at December 31, 2006) and matures October 1, 2007. There were no borrowings outstanding at December 31, 2006.
Borrowed funds at December 31, 2005 included miscellaneous borrowings of $8,495 and borrowings from the FHLB of $102,435,248. Such borrowings carried a weighted-average interest rate of 4.64% with maturities ranging from 2006 through 2018.
The FHLB borrowings are collateralized by FHLB stock and qualifying first and second mortgage loans representing various percentages of the total borrowings outstanding.
Note 9. Income Taxes and Retained Earnings
Under previous law, the provisions of the IRS and similar sections of Iowa law permitted the Bank to deduct from taxable income an allowance for bad debts based on 8% of taxable income before such deduction or actual loss experience. Legislation passed in 1996 eliminated the percentage of taxable income method as an option for computing bad debt deductions for 1996 and in all future years.
Deferred taxes have been provided for the difference between tax bad debt reserves and the loan loss allowances recorded in the financial statements subsequent to December 31, 1987. However, at December 31, 2006, retained earnings contains certain historical additions to bad debt reserves for income tax purposes of approximately $2,445,000 as of December 31, 1987, for which no deferred taxes have been provided because the Bank does not intend to use these reserves for purposes other than to absorb losses. If these amounts which qualified as bad debt deductions are used for purposes other than to absorb bad debt losses or adjustments arising from the carryback of net operating losses, income taxes may be imposed at the then existing rates. The approximate amount of unrecognized tax liability associated with these historical additions is $929,000.
Income tax expense is summarized as follows:
Deferred tax assets and liabilities consisted of the following components as of December 31, 2006 and 2005:
The valuation allowance for deferred tax assets at December 31, 2006 and 2005, respectively, was $236,000 and $231,000. The net change in the valuation allowance for the year ended December 31, 2006 was an increase of $5,000.
Total income tax expense differed from the amounts computed by applying the U.S. federal income tax rate of 34% to income before income taxes as a result of the following:
Note 10. Employee Benefit Plans
Retirement plans: The Bank participates in a multiemployer defined benefit pension plan covering substantially all full-time employees. This is a multiemployer plan, and information as to actuarial valuations and net assets available for benefits by participating institutions is not available. The Bank recognized $614,000, $566,000 and $404,000 pension expense for the years ended December 31, 2006, 2005 and 2004, respectively.
The Bank has a defined contribution plan covering substantially all employees. Contribution expense for the years ended December 31, 2006, 2005 and 2004 was $127,450, none and none, respectively.
Employee Stock Ownership Plan (ESOP): In conjunction with the Bank’s conversion to stock ownership, the Bank established an ESOP for eligible employees. All employees of the Bank as of January 1, 1994 were eligible to participate immediately, and employees of the Bank hired after January 1, 1994 are eligible to participate after they attain age 21 and complete one year of service during which they work at least 1,000 hours. The ESOP borrowed funds in the amount of $960,000 to purchase 104,075 shares of common stock issued in the conversion in 1994 and $840,000 to purchase 84,000 shares of common stock issued in the reorganization and conversion in 1996. These funds were borrowed from the Company.
The Bank makes contributions to the ESOP equal to the ESOP’s debt service less dividends received by the ESOP. Dividends on unallocated ESOP shares are used to pay debt service. Contributions to the ESOP and shares released from the suspense account in an amount proportional to the repayment of the ESOP loan are allocated among ESOP participants on the basis of compensation in the year of allocation. Benefits generally become 100% vested after five years of credited service. Forfeitures will be reallocated among remaining participating employees, in the same proportion as contributions. Benefits may be payable in the form of stock or cash upon termination of employment. If the Company’s stock is not traded on an established market at the time of an ESOP participant’s termination, the terminated ESOP participant has the right to require the Bank to purchase the stock at its current fair market value. Bank management believes there is an established market for the Company’s stock and therefore the Bank believes there is no potential repurchase obligation at December 31, 2006 and 2005.
As shares are released, the Bank reports compensation expense equal to the current market price of the shares. Dividends on allocated ESOP shares are recorded as a reduction of retained earnings. Dividends on unallocated ESOP shares are recorded as a reduction of debt and accrued interest. ESOP compensation expense was $62,953, $254,711 and $328,075 for the years ended December 31, 2006, 2005 and 2004, respectively.
Shares of the Company’s common stock held by the ESOP at December 31, 2006 and 2005 are as follows:
Employment agreements: The Company and the Bank have entered into employment agreements with key officers. Under the terms of the agreements, the officers are entitled to additional compensation in the event of certain conditions of involuntary termination. The agreements extend for up to 36 months.
The Bank has entered into certain employment retention agreements with key officers. Under the terms of the agreements, the employees are entitled to additional compensation in the event of a change of control of the Bank or the Company, and the employees are involuntarily terminated within the remaining unexpired employment period, up to 36 months. A change in control is generally triggered by the acquisition or control of 20% or more of the common stock.
Note 11. Stock Based Compensation Plans
In 1996, the shareholders of the Company ratified the 1996 Incentive Stock Option Plan (the Plan), which permitted the grant of 441,105 shares of common stock to its directors and employees. The Plan was intended to promote stock ownership by directors and selected officers of the Company to increase their proprietary interest in the success of the Company and to encourage them to remain in the employment of the Company or its subsidiaries. The Plan provided for the grant of options at an exercise price equal to the market price of the Company’s stock on the date of grant. The option awards have a 10-year contractual term. Options granted to officers vest in five equal annual installments commencing on the first anniversary of the grant date and continuing each anniversary date thereafter. The options granted to officers expire ten years from the date of grant unless an earlier expiration date is triggered by death, disability, retirement or termination, as described in the Plan. Options granted to directors are vested immediately and expire ten years from the date of grant, unless an earlier expiration date is triggered by removal for cause. All awards were nonqualified stock options. Effective April 2006, upon shareholder approval of the North Central Bancshares, Inc. 2006 Stock Incentive Plan, no further awards under the Plan may be granted.
On April 28, 2006, the shareholders of the Company approved the Company’s adoption of the North Central Bancshares, Inc. 2006 Stock Incentive Plan (the “2006 Plan”), which permits the grant of 125,000 shares of common stock to its directors and officers. The 2006 Plan is intended to promote growth and profitability, to provide certain key officers and non-employee directors of the Company with an incentive to achieve corporate objectives, to attract and retain individuals of outstanding competence, and to provide such individuals with an equity interest in the Company. Awards granted under the 2006 Plan may include stock options, restricted stock options and stock appreciation rights. The 2006 Plan provides for the grant of options at an exercise price no less than the market price of the Company’s stock on the date of grant. The option awards may have a contractual term up to 10 years. The 2006 Plan will be administered by the Compensation Committee of the Board of Directors, including determining the type of awards made and establishing other terms and conditions applicable to the award.
Effective January 1, 2006, the Company adopted SFAS No. 123(R), Share-Based Payments, using the modified prospective transition method. Prior to that date the Company accounted for stock option awards under APB Opinion No. 25, Accounting for Stock Issued to Employees. In accordance with SFAS No. 123(R), compensation expense for stock-based awards is recorded over the vesting period at the fair value of the award at the time of grant. The recording of such compensation began on January 1, 2006 for shares not yet vested as of that date and for all new grants subsequent to that date. Prior years’ results have not been restated. The exercise price of options granted under the Company’s incentive plans is equal to the fair market value of the underlying stock at the grant date. The Company assumes no projected forfeitures on its stock-based compensation, since actual historical forfeiture rates on its stock-based incentive awards have been negligible.
Total employee stock-based compensation was as follows as of December 31:
The following table presents the effects on net income and earnings per share had stock-based compensation expense been recorded for the years ended December 31, 2005 and 2004 based on the fair value method under FAS 123(R):
As of December 31, 2006, stock-based compensation expense not yet recognized in income totaled $191,478, which is expected to be recognized over a weighted average remaining period of 6.3 years.
At grant date, the fair value of options awarded to recipients is estimated using a Black-Scholes valuation model. The exercise price of stock options equals the fair market value of the underlying stock at the date of grant. The following table shows the key valuation assumptions used for options granted during the years ended December 31, 2006, 2005 and 2004, and other information. Options are issued for 10-year periods with 100% vesting generally occurring either at grant date or over a five-year period.
The table below reflects option activity for the period indicated:
Note 12. Stockholders’ Equity
Regulatory capital requirements: The Bank is subject to various regulatory capital requirements administered by the federal banking agencies. Failure to meet minimum capital requirements can initiate certain mandatory - and possible additional discretionary - actions by regulators that, if undertaken, could have a direct material effect on the Bank’s financial statements. Under capital adequacy guidelines and the regulatory framework for prompt corrective action, the Bank must meet specific capital guidelines that involve quantitative measures of the Bank’s assets, liabilities and certain off-balance-sheet items as calculated under regulatory accounting practices. The Bank’s capital amounts and classification are also subject to qualitative judgments by the regulators about components, risk weightings and other factors.
Quantitative measures established by regulation to ensure capital adequacy require the Bank to maintain minimum amounts and ratios (set forth in the table below) of total and Tier I capital (as defined in the regulations) to risk-weighted assets (as defined), of Tier I capital (as defined) to adjusted average assets (as defined) and tangible capital to adjusted assets. Management believes, as of December 31, 2006, the Bank meets all capital adequacy requirements to which it is subject.
The most recent notification from the federal regulatory agency categorizes the Bank as well-capitalized under the regulatory framework for prompt corrective action. To be categorized as well-capitalized, the Bank must maintain minimum total risk-based, Tier I risk-based and Tier I leverage ratios as set forth in the following table. There are no conditions or events since those notifications that management believes have changed the Bank’s category.
The Bank’s actual capital amounts and ratios are also presented in the following table:
Limitations on dividends and other capital distributions: Office of Thrift Supervision (OTS) imposes limitations upon all capital distributions by savings institutions, including cash dividends. An institution that exceeds all fully phased-in capital requirements before and after a proposed capital distribution (Tier 1 Association) and has not been advised by the OTS that it is in need of more than normal supervision could, after prior notice but without the approval of the OTS, make capital distributions during a calendar year provided the total amount of capital distributions (including the proposed capital distribution) for the applicable calendar year does not exceed the institution’s year-to-date net income plus retained net income for the preceding two years. Any additional capital distributions would require prior regulatory approval.
Note 13. Other Noninterest Expense
Other noninterest expense amounts are summarized as follows for the years ended December 31:
Note 14. Financial Instruments with Off-Statement of Financial Condition Risk
The Bank is a party to financial instruments with off-statement of financial condition risk in the normal course of business to meet the financing needs of its customers. These financial instruments consist primarily of commitments to extend credit. Those instruments involve, to varying degrees, elements of credit and interest rate risk in excess of the amount recognized in the statement of financial condition. The contract or notional amounts of those instruments reflect the extent of involvement the Bank has in particular classes of financial instruments.
The Bank uses the same credit policies in making commitments and conditional obligations as it does for on-statement of financial condition instruments.
The Bank does require collateral, or other security, to support financial instruments with credit risk.
A summary of the contract amount of the Bank’s exposure to off-statement of financial condition risk for commitments to extend credit is as follows:
At December 31, 2006, the mortgage loan commitments above were comprised of variable-rate commitments carrying a weighted-average interest rate of 7.00% and fixed-rate commitments carrying a weighted-average interest rate of 6.18%.
Commitments to extend credit are agreements to lend to a customer as long as there is no violation of any condition established in the contract. Commitments generally have fixed expiration dates or other termination clauses and may require payment of a fee. Since some of the commitments are expected to expire without being drawn upon, the total commitment amounts above do not necessarily represent future cash requirements. The Bank evaluates each customer’s creditworthiness on a case-by-case basis. The amount of collateral obtained, if deemed necessary by the Bank, upon extension of credit, is based on management’s credit evaluation of the counterparty. Collateral held varies but normally includes real estate and personal property.
Note 15. Lending Activities and Concentrations of Credit Risk
The Bank generally originates single family residential loans within its primary lending area of Webster, Story, Des Moines, Dallas, Polk and Henry counties in Iowa. The Bank’s underwriting policies require such loans to be 80% loan-to-value based upon appraised values unless private mortgage insurance is obtained. Approximately $135,309,000 of the Bank’s first mortgage loan portfolio at December 31, 2006 consisted of loans purchased or originated outside the state of Iowa. At December 31, 2006, concentrations by state include California with $20,077,000, Washington with $19,876,000 and South Carolina with $13,686,000. These are generally one- to four-family, multifamily residential and commercial real estate loans secured by the underlying properties. The loans are subject to the same underwriting guidelines as loans originated locally. The Bank is also active in originating secured consumer loans to its customers, primarily automobile and second mortgage loans. Collateral for substantially all consumer loans are security agreements and/or Uniform Commercial Code filings on the purchased asset.
Note 16. Fair Values of Financial Instruments
The carrying amounts and fair values of the Company’s financial instruments as of December 31, 2006 and 2005 were as follows:
Note 17. Restriction on Stockholders’ Equity
In 1996, the Company completed a Plan of Conversion and Reorganization, whereby the Company became a publicly traded Iowa corporation, and the previous mutual organization ceased to exist. The Plan provided that when the conversion was completed, a “Liquidation Account” would be established in an amount equal to the amount of any dividends waived by the previous mutual holding company (totaling approximately $1,897,000), plus 65.5% of the Bank’s total stockholders’ equity, as reflected in its latest statement of financial condition in the final prospectus utilized in the conversion. The Liquidation Account is established to provide a limited priority claim to the assets of the Bank to qualifying depositors as of specified dates (Eligible Account Holders and Supplemental Eligible Account Holders) who continue to maintain deposits in the Bank after the conversion. In the unlikely event of a complete liquidation of the Bank, and only in such an event, Eligible Account Holders and Supplemental Eligible Account Holders would receive from the Liquidation Account a liquidation distribution based on their proportionate share of the then total remaining qualifying deposits.
Note 18. Earnings Per Common Share
Presented below is the reconciliation of the numerators and denominators of the computations for earnings per common share and earnings per common share - diluted, for the years ended December 31:
Note 19. North Central Bancshares, Inc. (Parent Company Only) Condensed Financial Statements
Note 20. Quarterly Results of Operations (Unaudited)
Note 21. Segment Reporting
An operating segment is generally defined as a component of a business for which discrete financial information is available and whose results are reviewed by the chief operating decision-maker. The Company has determined that it has two reportable segments: a traditional banking segment and a nonbank segment. The traditional banking segment consists of the Company’s banking subsidiary, First Federal Savings Bank of Iowa, and the holding company. First Federal Savings Bank of Iowa operates as a federal savings bank providing deposit, loan and other related products to individuals and small businesses, primarily in the communities where their offices are located. The remaining grouping under the caption “All Others” consists of the operations of the subsidiaries under the Bank, which includes real estate abstracting services, insurance and investment services, and ownership of low-income housing tax credit apartment complexes.
Transactions between affiliates, the resulting revenues of which are shown in the inter-segment revenue category, are conducted at market prices, meaning prices that would be paid if the companies were not affiliates.
MANAGEMENT OF THE HOLDING COMPANY AND THE BANK
The Board of Directors of the Company is divided into three classes, each of which contains approximately one-third of the Board. The Bylaws of the Company currently authorize seven directors. Currently, all directors of the Company are also directors of the Bank.
Continuing Directors
David M. Bradley is currently Chairman of the Board, President and Chief Executive Officer of the Company and Chief Executive Officer of the Bank. Effective July 1, 2007, Mr. Bradley will serve as Chairman of the Board of the Company and of the Bank in an executive officer position.
Paul F. Bognanno has been employed with the Company since February 2007 and is currently Senior Executive Vice President of the Company. Effective July 1, 2007, Mr. Bognanno will succeed Mr. Bradley as President and Chief Executive Officer of the Company and Chief Executive Officer of the Bank. From 1993 to 2004, he was the President and Chief Executive Officer of Principal Residential Mortgage, a wholly-owned subsidiary of the Principal Financial Group. From 2000 to 2003, Mr. Bognanno also served as Chairman of the Board of Principal Bank, an OTS regulated savings bank wholly owned by the Principal Financial Group.
Robert H. Singer, Jr. is Executive Director of the Fort Dodge Area Chamber of Commerce. Mr. Singer was formerly the co-owner of Calvert, Singer & Kelley Insurance Services, Inc., an insurance agency, in Fort Dodge, Iowa.
Mark Thompson is the owner of Mark Thompson, CPA, P.C., in Fort Dodge, Iowa and has been a certified public accountant since 1978.
Nominees for Election as Directors
C. Thomas Chalstrom is Executive Vice President of the Company and President of the Bank and has been employed with the Bank since 1985. He was Executive Vice President of the Bank from 1994 until 2004. Mr. Chalstrom was named Chief Operating Officer of the Bank in December 1998. He became President of the Bank in April 2004.
Randall L. Minear is President of Terrus Real Estate Group, located in Des Moines, Iowa. He formerly served as the Director of Corporate Real Estate for The Principal Financial Group and as President of Principal Real Estate Services, a subsidiary of The Principal Financial Group.
Melvin R. Schroeder was formerly the Vice President of Instruction at Iowa Central Community College in Fort Dodge, Iowa. Mr. Schroeder retired in 2001.
Executive Officers Who are Not Directors or Nominees
Jean L. Lake is Secretary of the Company and the Bank.
David W. Edge, CPA is Chief Financial Officer and Treasurer of the Company and the Bank.
Kirk A. Yung is Senior Vice President of the Company and the Bank.
SHAREHOLDER INFORMATION
Price Range of the Company's Common Stock
The Company's common stock trades on the Nasdaq Global Market under the symbol "FFFD." The following table shows the high and low per share sales prices of the Company's common stock as reported by Nasdaq, and the dividends declared per share during the periods indicated. Such quotations reflect inter-dealer prices, without retail markup, markdown or commission and may not necessarily represent actual transactions.
| | Price Range ($) | |
Quarter Ended | High | Low | Dividends Declared Per Share |
2006 | | | |
First Quarter | 39.52 | 37.25 | 0.33 |
Second Quarter | 40.12 | 38.30 | 0.33 |
Third Quarter | 41.23 | 38.95 | 0.33 |
Fourth Quarter | 41.33 | 39.22 | 0.33 |
2005 | | | |
First Quarter | 41.98 | 38.93 | 0.29 |
Second Quarter | 40.95 | 37.30 | 0.29 |
Third Quarter | 39.50 | 37.60 | 0.29 |
Fourth Quarter | 39.12 | 37.70 | 0.29 |
The Company’s Common Stock was traded at $39.92 as of March 5, 2007.
Performance Graph
Pursuant to the regulations of the SEC, the graph below compares the performance of the Company with that of the Nasdaq Composite Index (U.S. Companies) and the Nasdaq Bank Composite Index (banks and bank holding companies, over 99% of which are based in the United States) from December 31, 2001 through December 31, 2006.
The following graph compares the Company’s total cumulative shareholder return by an investor who invested $100.00 on December 31, 2001, to December 31, 2006, to the total return by an investor who invested $100.00 in each of the Nasdaq Stock Market Index and the Nasdaq Financial Stocks Index for the same period.
Information Relating to the Company's Common Stock
As of March 5, 2007, the Company had 1,192 shareholders of record, which includes the number of persons or entities who hold their Common Stock in nominee or "street" name through various brokerage firms. As of such date 1,364,653 shares of the Common Stock were outstanding.
The Company's current quarterly dividend is $0.35 per share. The Board of Directors of the Company plans to maintain a regular quarterly dividend in the future and will continue to review the dividend payment amount in relation to the Company's earnings, financial condition and other relevant factors (such as regulatory requirements).
The Bank will not be permitted to pay dividends to the Company on its capital stock if its shareholders' equity would be reduced below the amount required for the liquidation account. For information concerning federal regulations which apply to the Bank in determining the amount of proceeds which may be retained by the Company and regarding a savings institution's ability to make capital distributions including payment of dividends to its holding company, see Note 12 to the Consolidated Financial Statements.
Unlike the Bank, the Company is not subject to OTS regulatory restrictions on the payment of dividends to its shareholders, although the source of such dividends will be dependent primarily upon the dividends from the Bank. The Company is subject to the requirements of Iowa law, which prohibit the Company from paying a dividend if, after giving it effect, either of the following would result: (a) the Company would not be able to pay its debts as they become due in the usual course of business; or (b) the Company's total assets would be less than the sum of its total liabilities plus the amount that would be needed, if the Company were to be dissolved at the time of the distribution, to satisfy the preferential rights upon dissolution of shareholders whose preferential rights are superior to those receiving the distribution.
Annual Meeting
The Annual Meeting of Shareholders of the Company will be held at 10:00 a.m., Central Time, Friday, April 27, 2007 at the Boston Centre, Suite 100, located at 809 Central Avenue, Fort Dodge, Iowa 50501.
| Stockholders and General Inquiries | Stock Exchange |
| | |
David M. Bradley North Central Bancshares, Inc. c/o First Federal Savings Bank of Iowa 825 Central Avenue Fort Dodge, Iowa 50501 (515) 576-7531 www.firstfederaliowa.com | The Company’s Common Shares are listed under the symbol “FFFD” on the Nasdaq Global Market |
General Counsel The Law Office of Eric J. Eide, P.L.C. 805 Central Avenue, Suite 619 Fort Dodge, Iowa 50501 Special Counsel Thacher Proffitt & Wood LLP 1700 Pennsylvania Avenue, N.W., Suite 800 Washington, D.C. 20006 www.tpw.com | Independent Auditor McGladrey & Pullen, LLP 400 Locust Street, Suite 640 Des Moines, Iowa 50309 Transfer Agent Computershare Investor Services 350 Indiana Street, Suite 800 Golden, Colorado 80401 (303) 262-0600 or 800-962-4284 e-mail: inquire@computershare.com www.computershare.com |
Publications - Annual Report on Form 10-K
A copy of the Company's Annual Report Form 10-K (without exhibits) for the fiscal year ended December 31, 2006 will be furnished without charge to shareholders of record as of March 5, 2007 upon written request to Jean L. Lake, Corporate Secretary, North Central Bancshares, Inc., c/o First Federal Savings Bank of Iowa, 825 Central Avenue, Fort Dodge, Iowa 50501. The Annual Report Form 10-K report is available online at www.sec.gov or via the Bank’s website at www.firstfederaliowa.com.
Dividend Reinvestment and Stock Purchase Plan
This plan provides shareholders with the ability to reinvest automatically their cash dividends in additional shares of North Central Bancshares, Inc. common stock. This plan also provides shareholders the opportunity to make quarterly cash purchases of additional shares of the Company’s common stock.
For more information, contact Computershare Investor Services (see address above) or visit Computershare’s website at www.computershare.com.