
1 1 Q4 Fiscal Year 2017 Financial Results Conference Call May 31, 2017 Mark D. Morelli President & Chief Executive Officer Gregory P. Rustowicz Vice President – Finance & Chief Financial Officer

2 2 These slides contain (and the accompanying oral discussion will contain) “forward-looking statements” within the meaning of the Private Securities Litigation Reform Act of 1995. Such statements involve known and unknown risks, uncertainties and other factors that could cause the actual results of the Company to differ materially from the results expressed or implied by such statements, including general economic and business conditions, conditions affecting the industries served by the Company and its subsidiaries, conditions affecting the Company’s customers and suppliers, competitor responses to the Company’s products and services, the overall market acceptance of such products and services, the integration of acquisitions and other factors disclosed in the Company’s periodic reports filed with the Securities and Exchange Commission. Consequently such forward looking statements should be regarded as the Company’s current plans, estimates and beliefs. The Company does not undertake and specifically declines any obligation to publicly release the results of any revisions to these forward-looking statements that may be made to reflect any future events or circumstances after the date of such statements or to reflect the occurrence of anticipated or unanticipated events. This presentation will discuss some non-GAAP financial measures, which we believe are useful in evaluating our performance. You should not consider the presentation of this additional information in isolation or as a substitute for results compared in accordance with GAAP. We have provided reconciliations of comparable GAAP to non-GAAP measures in tables found in the Supplemental Information portion of this presentation. Safe Harbor Statement

3 3 Q4 and FY 2017 Highlights Reason for joining CMCO Solid business, strong market positions with a history of cash generation Opportunities for growth and earnings power – lots of runway Solid end to year STAHL acquisition Volume uptick in U.S., APAC and Latin America $21 million of adjustments in quarter: acquisition costs & other unusual expenses Generated $60 million in cash in FY17 Paid down $46.4 million in debt in fiscal year; $12.8 million in debt reduction in quarter
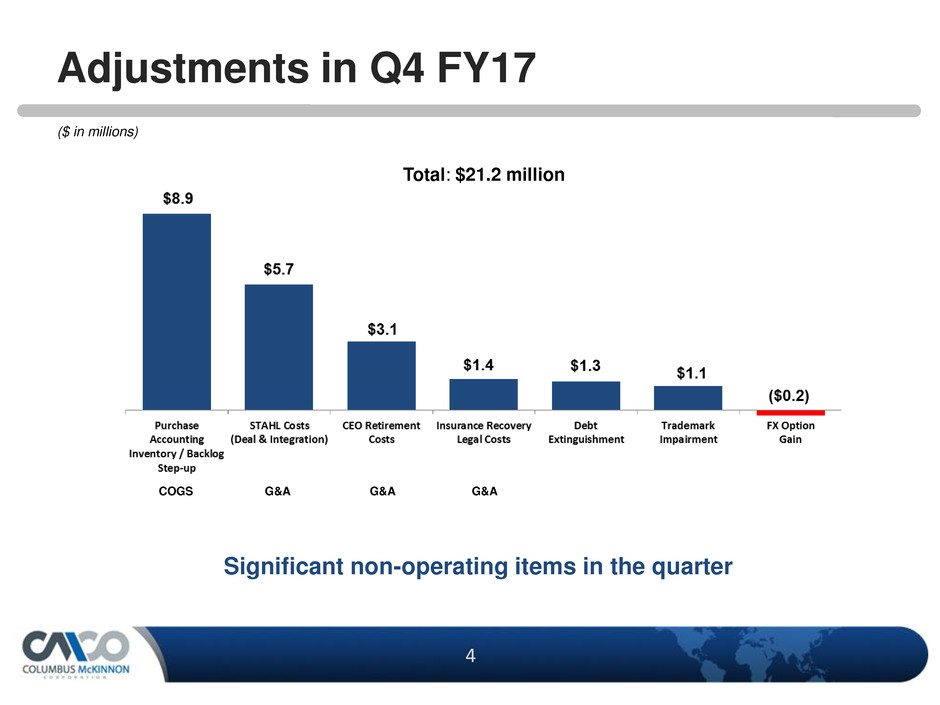
4 4 Adjustments in Q4 FY17 ($ in millions) Total: $21.2 million Significant non-operating items in the quarter COGS G&A G&A G&A

5 5 Net Sales ($ in millions) Quarter STAHL added $24.7 million Organic growth: $3.9 million, or 2.5% Year Acquired revenue of $65.0 million Q4 FY17 FY 2017 Acquisitions $ 24.7 15.9% $ 65.0 10.8% Pricing (0.1) (0.1)% 0.7 0.1% Volume 4.9 3.2% (20.6) (3.3)% Foreign currency translation (0.9) (0.6)% (5.1) (0.9)% Quarter and Fiscal Year Bridge Y/Y + 18.4% Y/Y + 6.7%
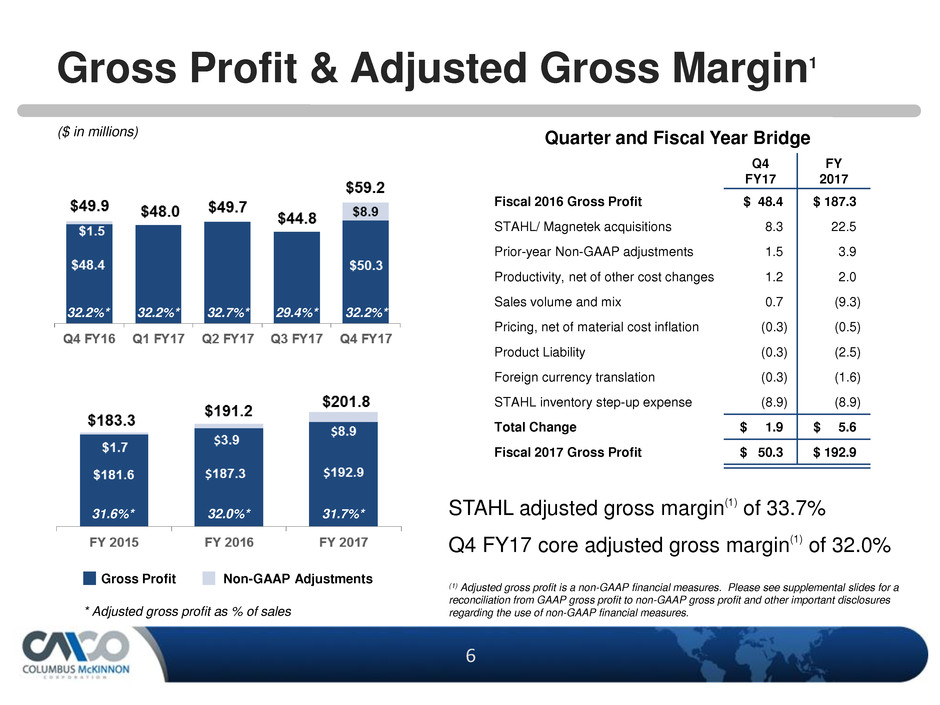
6 6 Gross Profit & Adjusted Gross Margin1 Non-GAAP Adjustments Gross Profit * Adjusted gross profit as % of sales Quarter and Fiscal Year Bridge (1) Adjusted gross profit is a non-GAAP financial measures. Please see supplemental slides for a reconciliation from GAAP gross profit to non-GAAP gross profit and other important disclosures regarding the use of non-GAAP financial measures. 32.2%* 29.4%* 32.7%* 32.2%* 32.2%* ($ in millions) 31.7%* 32.0%* 31.6%* STAHL adjusted gross margin (1) of 33.7% Q4 FY17 core adjusted gross margin(1) of 32.0% Q4 FY17 FY 2017 Fiscal 2016 Gross Profit $ 48.4 $ 187.3 STAHL/ Magnetek acquisitions 8.3 22.5 Prior-year Non-GAAP adjustments 1.5 3.9 Productivity, net of other cost changes 1.2 2.0 Sales volume and mix 0.7 (9.3) Pricing, net of material cost inflation (0.3) (0.5) Product Liability (0.3) (2.5) Foreign currency translation (0.3) (1.6) STAHL inventory step-up expense (8.9) (8.9) Total Change $ 1.9 $ 5.6 Fiscal 2017 Gross Profit $ 50.3 $ 192.9
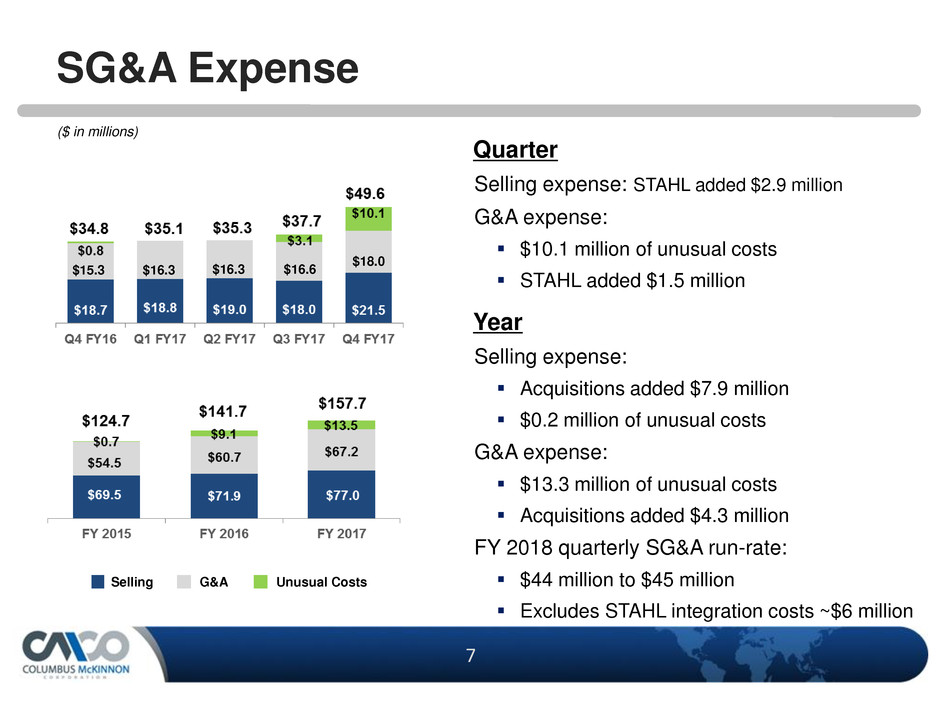
7 7 SG&A Expense $15.3 $16.3 $16.3 $16.6 $18.0 Selling G&A Unusual Costs Quarter Selling expense: STAHL added $2.9 million G&A expense: $10.1 million of unusual costs STAHL added $1.5 million Year Selling expense: Acquisitions added $7.9 million $0.2 million of unusual costs G&A expense: $13.3 million of unusual costs Acquisitions added $4.3 million FY 2018 quarterly SG&A run-rate: $44 million to $45 million Excludes STAHL integration costs ~$6 million ($ in millions)

8 8 Operating Income & Non-GAAP Margin(1) Non-GAAP Adjustments Income from Operations Quarter STAHL: $2.8 million incremental operating income 11.5% adjusted operating margin Year $23.5 million of unusual costs STAHL amortization estimated to be $6.7 million per year * Non-GAAP operating income as % of sales. (1) Adjusted operating income is a non-GAAP financial measures. Please see supplemental slides for a reconciliation from GAAP operating income to non-GAAP operating income and other important disclosures regarding the use of non-GAAP financial measures. ($ in millions) 9.2%* 5.5%* 8.3%* 7.7%* 9.2%*
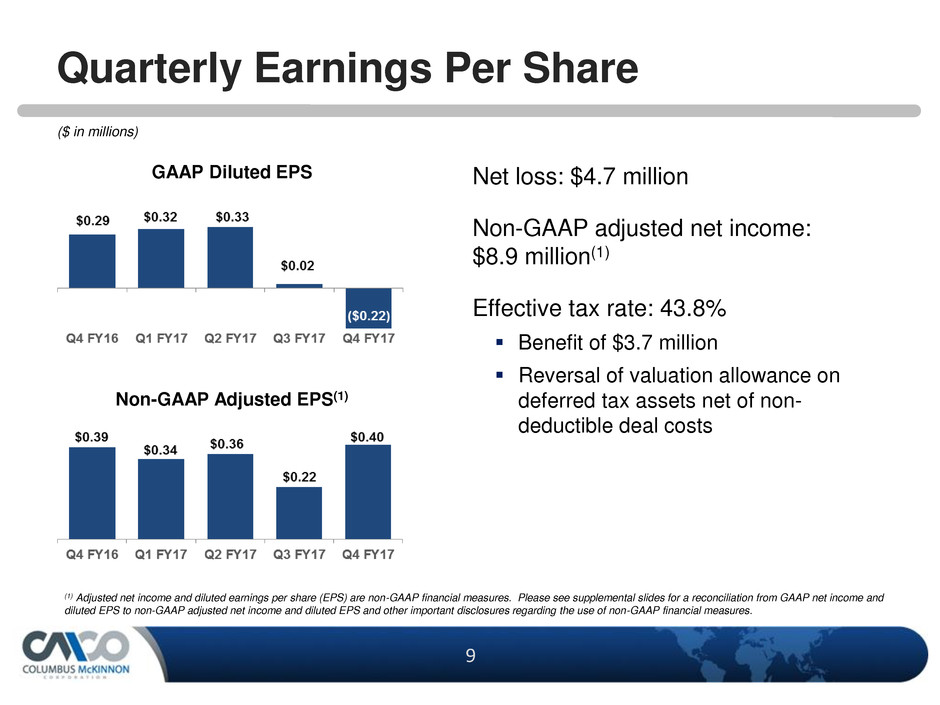
9 9 Quarterly Earnings Per Share GAAP Diluted EPS Non-GAAP Adjusted EPS(1) (1) Adjusted net income and diluted earnings per share (EPS) are non-GAAP financial measures. Please see supplemental slides for a reconciliation from GAAP net income and diluted EPS to non-GAAP adjusted net income and diluted EPS and other important disclosures regarding the use of non-GAAP financial measures. Net loss: $4.7 million Non-GAAP adjusted net income: $8.9 million(1) Effective tax rate: 43.8% Benefit of $3.7 million Reversal of valuation allowance on deferred tax assets net of non- deductible deal costs ($ in millions)
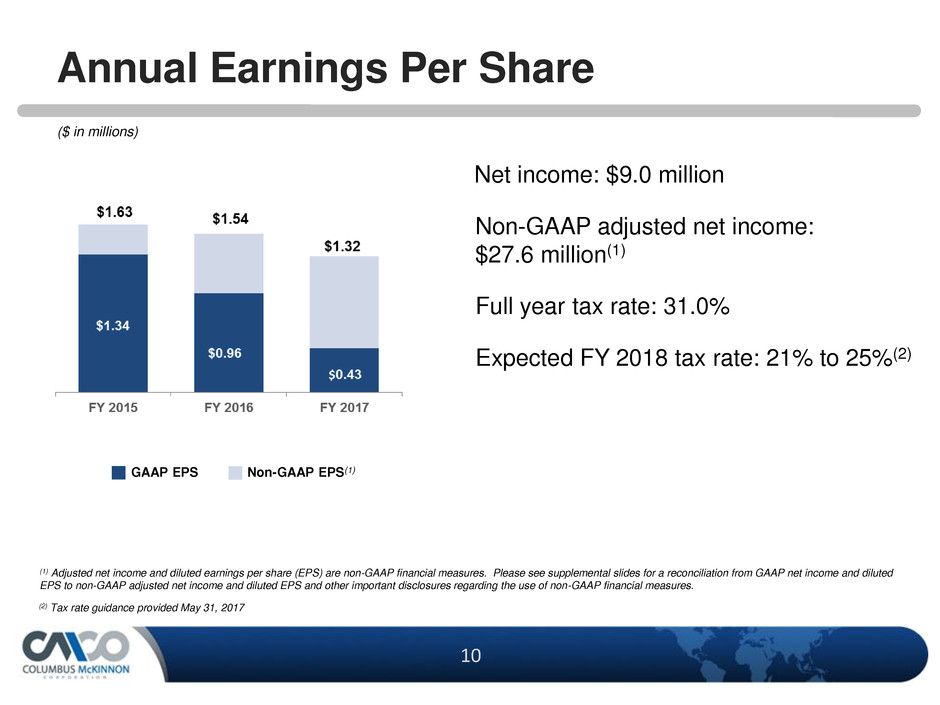
10 10 Annual Earnings Per Share (1) Adjusted net income and diluted earnings per share (EPS) are non-GAAP financial measures. Please see supplemental slides for a reconciliation from GAAP net income and diluted EPS to non-GAAP adjusted net income and diluted EPS and other important disclosures regarding the use of non-GAAP financial measures. Net income: $9.0 million Non-GAAP adjusted net income: $27.6 million(1) Full year tax rate: 31.0% Expected FY 2018 tax rate: 21% to 25%(2) Non-GAAP EPS(1) GAAP EPS (2) Tax rate guidance provided May 31, 2017 ($ in millions)

11 11 Working Capital Working Capital as a Percent of Sales Inventory Turns (1) Excludes the impact of Magnetek, which was acquired on September 2, 2015 (2) Excludes the impact of STAHL which was acquired on January 31, 2017 (1) (1) Working capital as a percent of sales was 18.6% Best performance in 4 years (2) (2) Inventory turns increased to 4.1x Targeting further improvement in FY18 Improvements drive cash flow for debt repayment
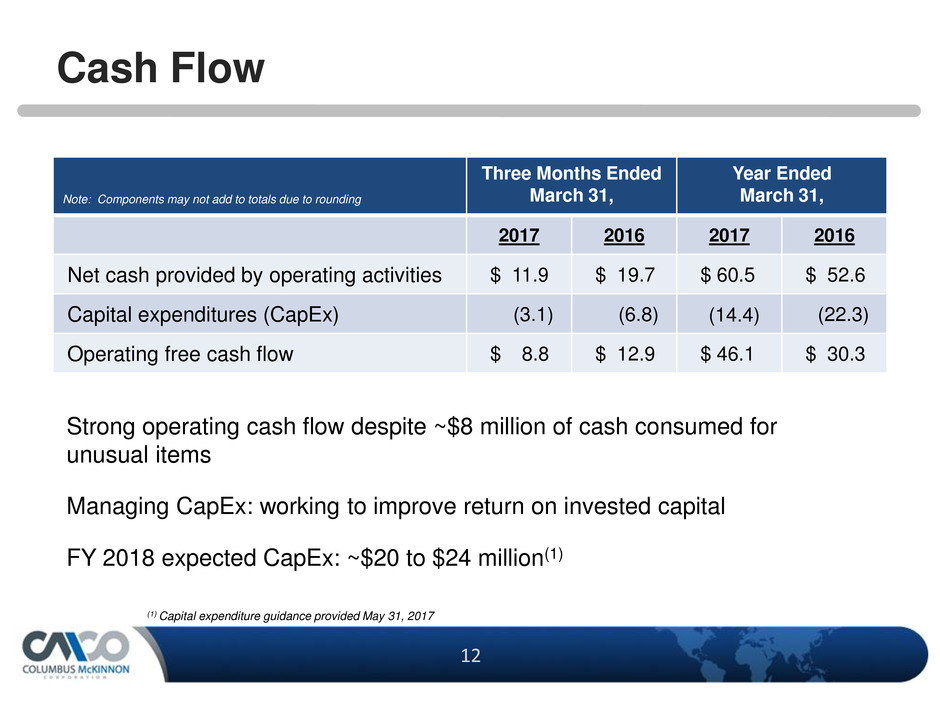
12 12 Strong operating cash flow despite ~$8 million of cash consumed for unusual items Managing CapEx: working to improve return on invested capital FY 2018 expected CapEx: ~$20 to $24 million(1) Cash Flow Note: Components may not add to totals due to rounding Three Months Ended March 31, Year Ended March 31, 2017 2016 2017 2016 Net cash provided by operating activities $ 11.9 $ 19.7 $ 60.5 $ 52.6 Capital expenditures (CapEx) (3.1) (6.8) (14.4) (22.3) Operating free cash flow $ 8.8 $ 12.9 $ 46.1 $ 30.3 (1) Capital expenditure guidance provided May 31, 2017

13 13 Capitalization March 31, 2017 March 31, 2016 Cash and cash equivalents $ 77.6 $ 51.6 Total debt 421.3 267.6 Total net debt 343.7 216.0 Shareholders’ equity 341.4 286.3 Total capitalization $ 762.7 $ 553.9 Debt/total capitalization 55.2% 48.3% Net debt/net total capitalization 50.2% 43.0% De-levering Balance Sheet Expected rate of debt reduction $45 million to $50 million in FY18 Targeting 3x Net Debt/EBITDA by end of FY18 Ramping to $50 million to $55 million in FY19 Covenant-lite No leverage maintenance covenant as long as Revolver is undrawn

14 14 Perspectives – 90 Day Review People Strength Operating system & metrics Implementing STAHL acquisition On track Magnetek technology Opportunity Operations Opportunity Financial performance Opportunity Culture of accountability Implementing
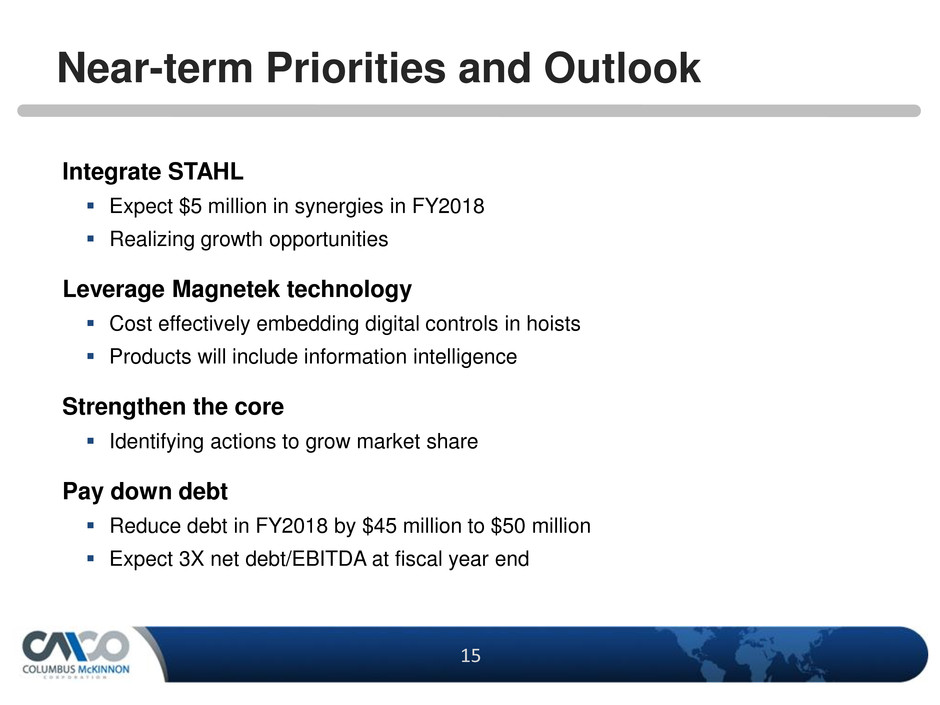
15 15 Near-term Priorities and Outlook Integrate STAHL Expect $5 million in synergies in FY2018 Realizing growth opportunities Leverage Magnetek technology Cost effectively embedding digital controls in hoists Products will include information intelligence Strengthen the core Identifying actions to grow market share Pay down debt Reduce debt in FY2018 by $45 million to $50 million Expect 3X net debt/EBITDA at fiscal year end
16 16 Supplemental Information
17 17 Replay Number: 412-317-6671 passcode: 13659715 Telephone replay available through June 7, 2017 Webcast / PowerPoint / Replay available at www.cmworks.com/investors Transcript, when available, at www.cmworks.com/investors Conference Call Playback Info
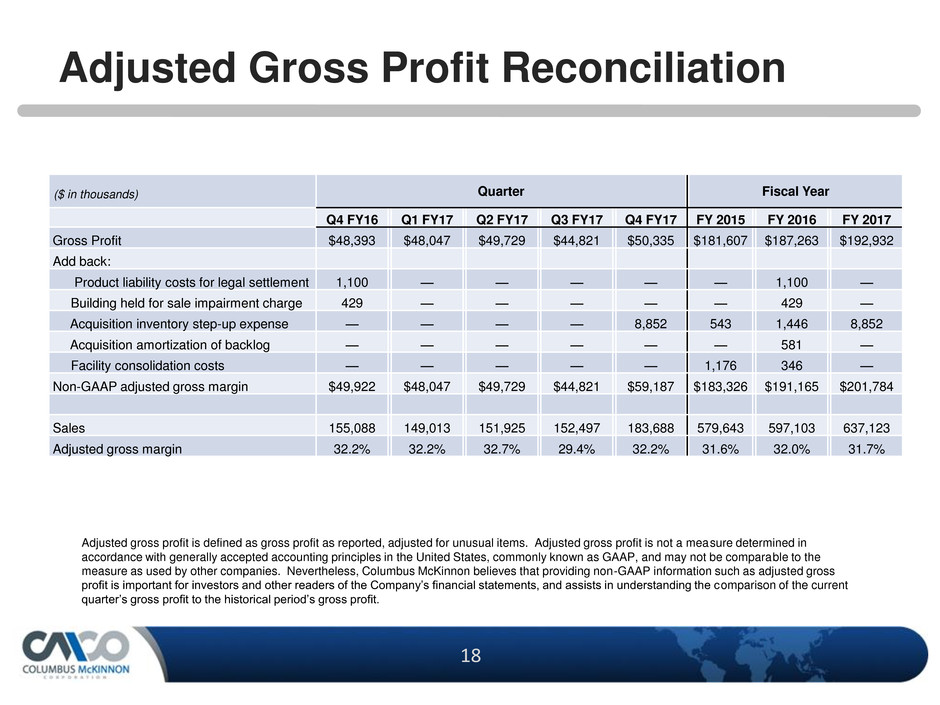
18 18 Adjusted Gross Profit Reconciliation Adjusted gross profit is defined as gross profit as reported, adjusted for unusual items. Adjusted gross profit is not a measure determined in accordance with generally accepted accounting principles in the United States, commonly known as GAAP, and may not be comparable to the measure as used by other companies. Nevertheless, Columbus McKinnon believes that providing non-GAAP information such as adjusted gross profit is important for investors and other readers of the Company’s financial statements, and assists in understanding the comparison of the current quarter’s gross profit to the historical period’s gross profit. Quarter Fiscal Year Q4 FY16 Q1 FY17 Q2 FY17 Q3 FY17 Q4 FY17 FY 2015 FY 2016 FY 2017 Gross Profit $48,393 $48,047 $49,729 $44,821 $50,335 $181,607 $187,263 $192,932 Add back: Product liability costs for legal settlement 1,100 — — — — — 1,100 — Building held for sale impairment charge 429 — — — — — 429 — Acquisition inventory step-up expense — — — — 8,852 543 1,446 8,852 Acquisition amortization of backlog — — — — — — 581 — Facility consolidation costs — — — — — 1,176 346 — Non-GAAP adjusted gross margin $49,922 $48,047 $49,729 $44,821 $59,187 $183,326 $191,165 $201,784 Sales 155,088 149,013 151,925 152,497 183,688 579,643 597,103 637,123 Adjusted gross margin 32.2% 32.2% 32.7% 29.4% 32.2% 31.6% 32.0% 31.7% ($ in thousands)
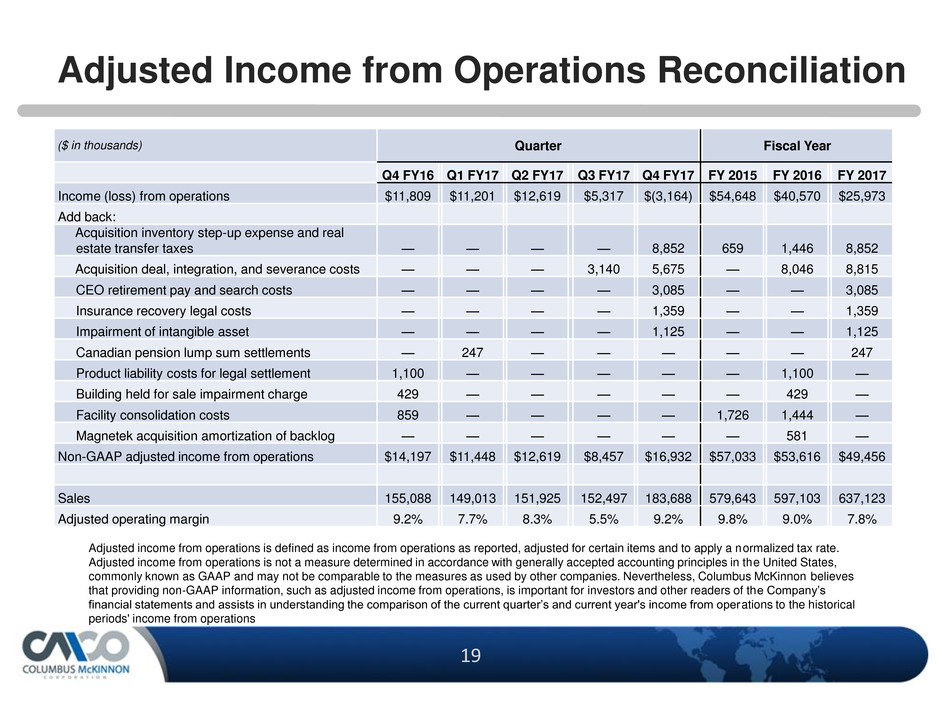
19 19 Adjusted Income from Operations Reconciliation Adjusted income from operations is defined as income from operations as reported, adjusted for certain items and to apply a normalized tax rate. Adjusted income from operations is not a measure determined in accordance with generally accepted accounting principles in the United States, commonly known as GAAP and may not be comparable to the measures as used by other companies. Nevertheless, Columbus McKinnon believes that providing non-GAAP information, such as adjusted income from operations, is important for investors and other readers of the Company’s financial statements and assists in understanding the comparison of the current quarter’s and current year's income from operations to the historical periods' income from operations Quarter Fiscal Year Q4 FY16 Q1 FY17 Q2 FY17 Q3 FY17 Q4 FY17 FY 2015 FY 2016 FY 2017 Income (loss) from operations $11,809 $11,201 $12,619 $5,317 $(3,164) $54,648 $40,570 $25,973 Add back: Acquisition inventory step-up expense and real estate transfer taxes — — — — 8,852 659 1,446 8,852 Acquisition deal, integration, and severance costs — — — 3,140 5,675 — 8,046 8,815 CEO retirement pay and search costs — — — — 3,085 — — 3,085 Insurance recovery legal costs — — — — 1,359 — — 1,359 Impairment of intangible asset — — — — 1,125 — — 1,125 Canadian pension lump sum settlements — 247 — — — — — 247 Product liability costs for legal settlement 1,100 — — — — — 1,100 — Building held for sale impairment charge 429 — — — — — 429 — Facility consolidation costs 859 — — — — 1,726 1,444 — Magnetek acquisition amortization of backlog — — — — — — 581 — Non-GAAP adjusted income from operations $14,197 $11,448 $12,619 $8,457 $16,932 $57,033 $53,616 $49,456 Sales 155,088 149,013 151,925 152,497 183,688 579,643 597,103 637,123 Adjusted operating margin 9.2% 7.7% 8.3% 5.5% 9.2% 9.8% 9.0% 7.8% ($ in thousands)
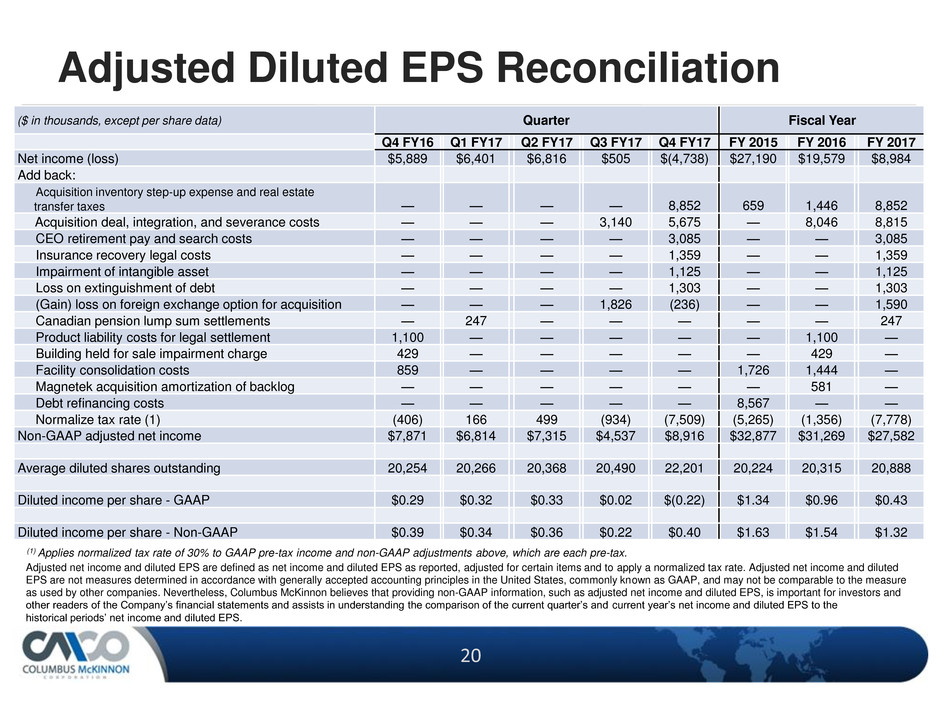
20 20 Adjusted Diluted EPS Reconciliation Adjusted net income and diluted EPS are defined as net income and diluted EPS as reported, adjusted for certain items and to apply a normalized tax rate. Adjusted net income and diluted EPS are not measures determined in accordance with generally accepted accounting principles in the United States, commonly known as GAAP, and may not be comparable to the measure as used by other companies. Nevertheless, Columbus McKinnon believes that providing non-GAAP information, such as adjusted net income and diluted EPS, is important for investors and other readers of the Company’s financial statements and assists in understanding the comparison of the current quarter’s and current year’s net income and diluted EPS to the historical periods’ net income and diluted EPS. (1) Applies normalized tax rate of 30% to GAAP pre-tax income and non-GAAP adjustments above, which are each pre-tax. Quarter Fiscal Year Q4 FY16 Q1 FY17 Q2 FY17 Q3 FY17 Q4 FY17 FY 2015 FY 2016 FY 2017 Net income (loss) $5,889 $6,401 $6,816 $505 $(4,738) $27,190 $19,579 $8,984 Add back: Acquisition inventory step-up expense and real estate transfer taxes — — — — 8,852 659 1,446 8,852 Acquisition deal, integration, and severance costs — — — 3,140 5,675 — 8,046 8,815 CEO retirement pay and search costs — — — — 3,085 — — 3,085 Insurance recovery legal costs — — — — 1,359 — — 1,359 Impairment of intangible asset — — — — 1,125 — — 1,125 Loss on extinguishment of debt — — — — 1,303 — — 1,303 (Gain) loss on foreign exchange option for acquisition — — — 1,826 (236) — — 1,590 Canadian pension lump sum settlements — 247 — — — — — 247 Product liability costs for legal settlement 1,100 — — — — — 1,100 — Building held for sale impairment charge 429 — — — — — 429 — Facility consolidation costs 859 — — — — 1,726 1,444 — Magnetek acquisition amortization of backlog — — — — — — 581 — Debt refinancing costs — — — — — 8,567 — — Normalize tax rate (1) (406) 166 499 (934) (7,509) (5,265) (1,356) (7,778) Non-GAAP adjusted net income $7,871 $6,814 $7,315 $4,537 $8,916 $32,877 $31,269 $27,582 Average diluted shares outstanding 20,254 20,266 20,368 20,490 22,201 20,224 20,315 20,888 Diluted income per share - GAAP $0.29 $0.32 $0.33 $0.02 $(0.22) $1.34 $0.96 $0.43 Diluted income per share - Non-GAAP $0.39 $0.34 $0.36 $0.22 $0.40 $1.63 $1.54 $1.32 ($ in thousands, except per share data)


