
Nov 21, 2019 FUREY HIDDEN GEMS CONFERENCE Mark D. Morelli President and Chief Executive Officer PARTNERS IN MOTION CONTROL
SAFE HARBOR STATEMENT These slides, and the accompanying oral discussion, contain “forward-looking statements” within the meaning of the Private Securities Litigation Reform Act of 1995. Such statements include, but are not limited to, statements concerning future sales and earnings, involve known and unknown risks, uncertainties and other factors that could cause the actual results of the Company to differ materially from the results expressed or implied by such statements, including the effectiveness of the Company’s 80/20 Process to simplify operations, the ability of the Company’s operational excellence initiatives to drive profitability, the success of the Company’s efforts to ramp its growth engine, global economic and business conditions, conditions affecting the industries served by the Company and its subsidiaries, conditions affecting the Company's customers and suppliers, competitor responses to the Company's products and services, the overall market acceptance of such products and services, the ability to expand into new markets and geographic regions, and other factors disclosed in the Company's periodic reports filed with the Securities and Exchange Commission. The Company assumes no obligation to update the forward- looking information contained in this presentation. Non-GAAP Financial Measures This presentation will discuss some non-GAAP (“adjusted”) financial measures which we believe are useful in evaluating our performance. You should not consider the presentation of this additional information in isolation or as a substitute for results compared in accordance with GAAP. The non-GAAP (“adjusted”) measures are notated and we have provided reconciliations of comparable GAAP to non-GAAP measures in tables found in the Supplemental Information portion of this presentation. Adoption of ASU No. 2017-07 and impact to historical information In accordance with the ASU, historical cost of good sold and RSG&A have been adjusted for the adoption and implementation on a retrospective basis of ASU No. 2017-07 “Improving the Presentation of Net Periodic Pension Cost and Net Periodic Postretirement Benefit Cost. All relevant financial data impacted by the changes has been adjusted. © 2019 Columbus McKinnon Corporation 2
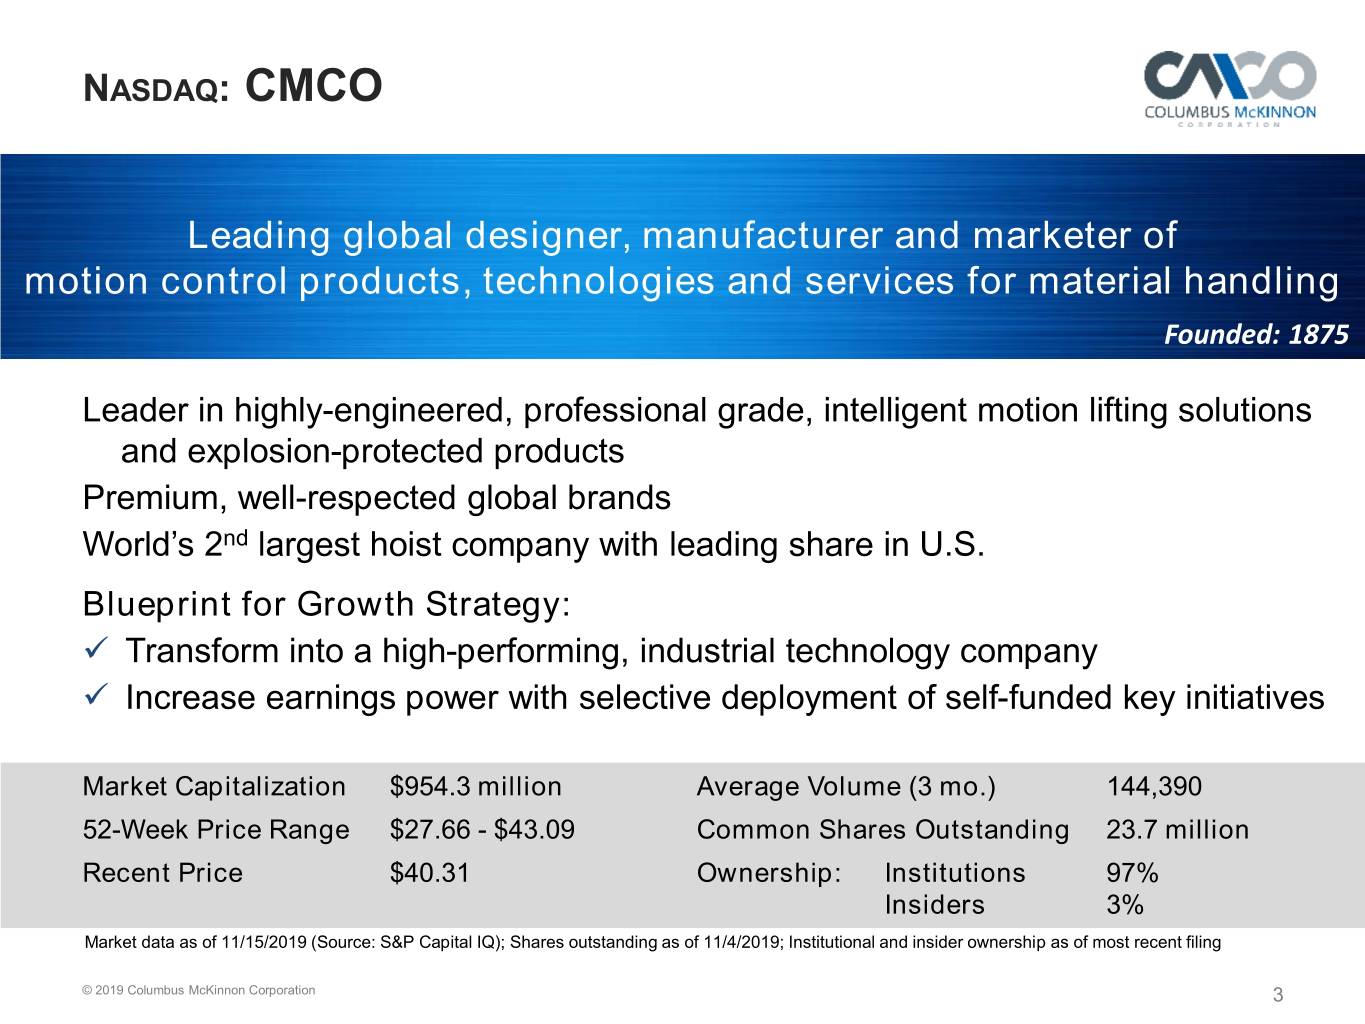
NASDAQ: CMCO Leading global designer, manufacturer and marketer of motion control products, technologies and services for material handling Founded: 1875 Leader in highly-engineered, professional grade, intelligent motion lifting solutions and explosion-protected products Premium, well-respected global brands World’s 2nd largest hoist company with leading share in U.S. Blueprint for Growth Strategy: Transform into a high-performing, industrial technology company Increase earnings power with selective deployment of self-funded key initiatives Market Capitalization $954.3 million Average Volume (3 mo.) 144,390 52-Week Price Range $27.66 - $43.09 Common Shares Outstanding 23.7 million Recent Price $40.31 Ownership: Institutions 97% Insiders 3% Market data as of 11/15/2019 (Source: S&P Capital IQ); Shares outstanding as of 11/4/2019; Institutional and insider ownership as of most recent filing © 2019 Columbus McKinnon Corporation 3

VALUE PROPOSITION Highly relevant, professional-grade solutions for solving customers’ critical problems in safety & productivity © 2019 Columbus McKinnon Corporation 4

THREE DISTINCT PRODUCT CATEGORIES Customer Driven Solutions Linear & Mechanical Actuators Lifting Tables Rail & Road Engineered Actuation Systems Products ~10% Industrial Products Manual Chain Hoist Crane ~45% ~45% Electric Chain Hoist Solutions Rigging / Clamps Industrial Winches Cranes, Wire Rope Hoists Drives and Controls Crane Kits & Components Jibs, Workstations $840.6 Million Q2 FY20 TTM Revenue (excluding divestitures) © 2019 Columbus McKinnon Corporation 5
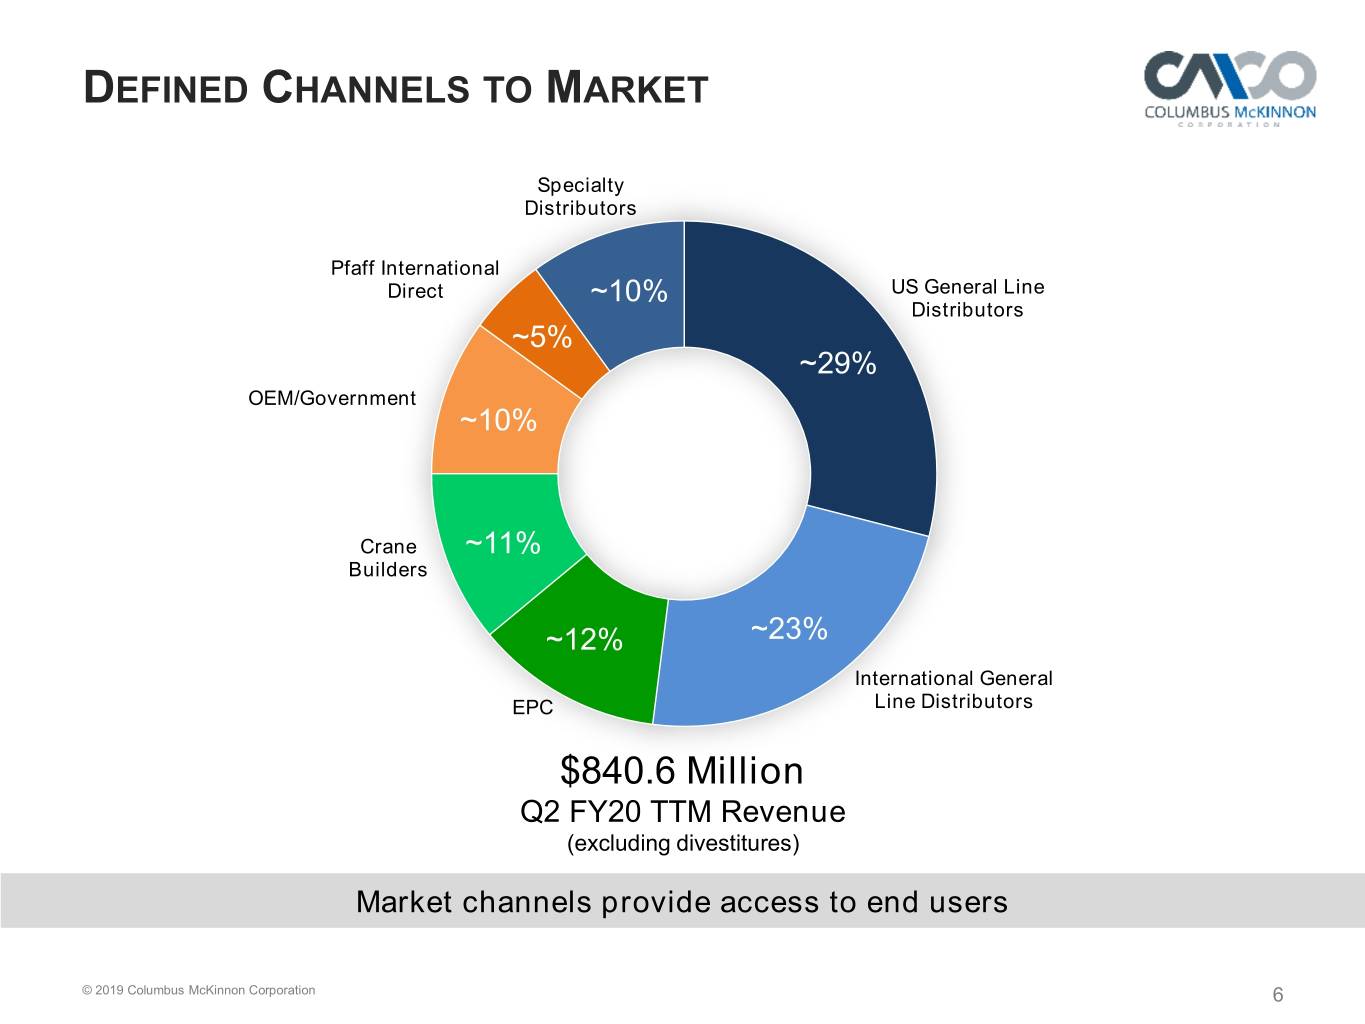
DEFINED CHANNELS TO MARKET Specialty Distributors Pfaff International Direct ~10% US General Line Distributors ~5% ~29% OEM/Government ~10% Crane ~11% Builders ~12% ~23% International General EPC Line Distributors $840.6 Million Q2 FY20 TTM Revenue (excluding divestitures) Market channels provide access to end users © 2019 Columbus McKinnon Corporation 6
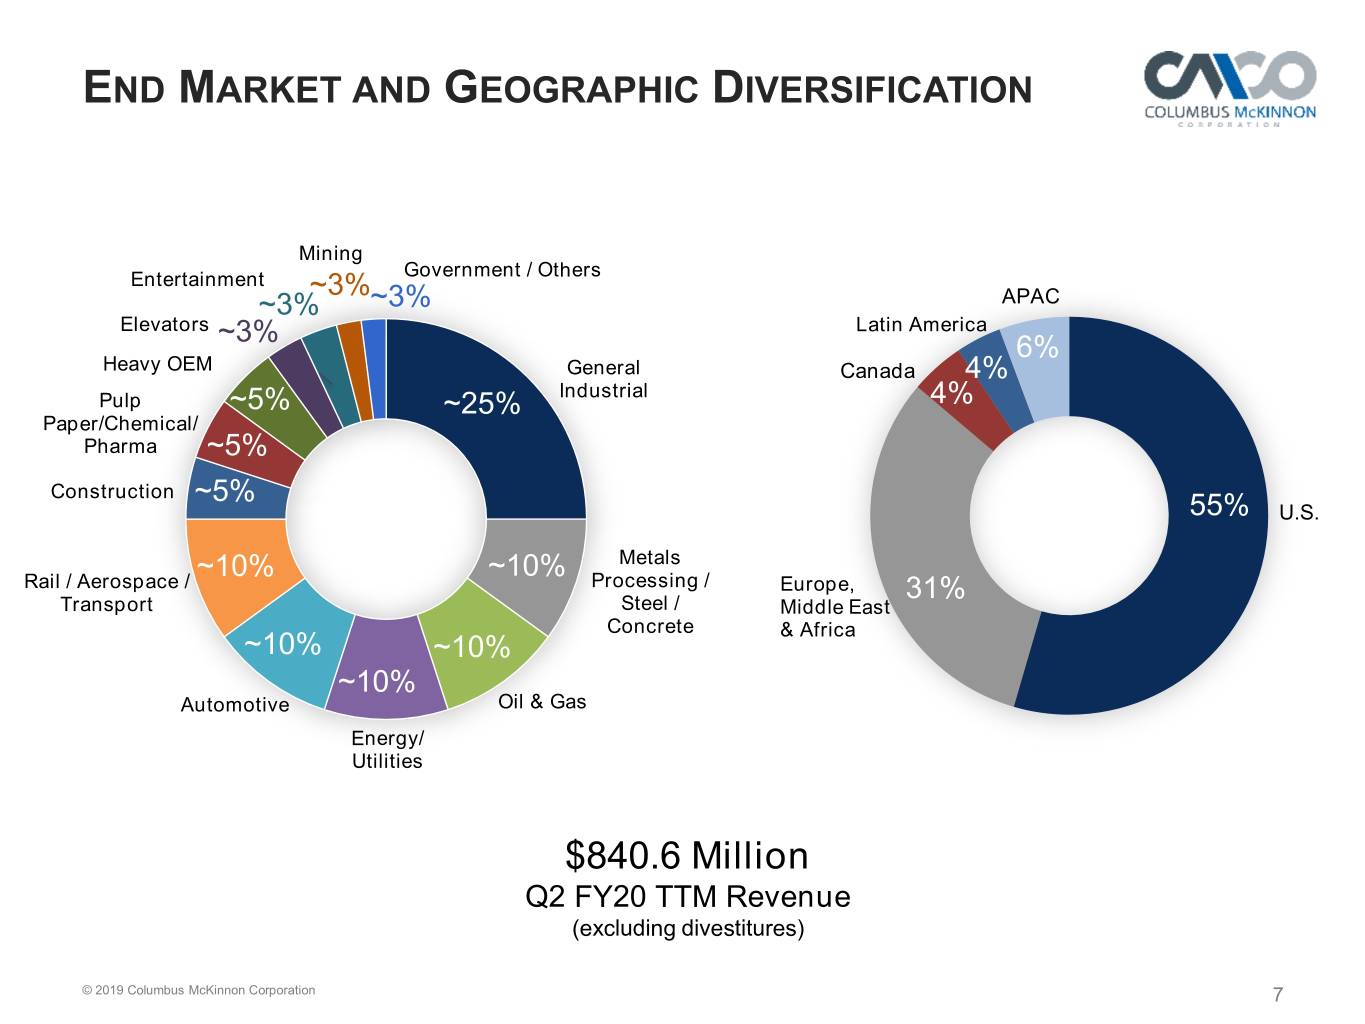
END MARKET AND GEOGRAPHIC DIVERSIFICATION Mining Government / Others Entertainment ~3% ~3% ~3% APAC Elevators ~3% Latin America 6% Heavy OEM General Canada 4% Pulp ~5% ~25% Industrial 4% Paper/Chemical/ Pharma ~5% Construction ~5% 55% U.S. ~10% ~10% Metals Rail / Aerospace / Processing / Europe, 31% Transport Steel / Middle East Concrete & Africa ~10% ~10% ~10% Automotive Oil & Gas Energy/ Utilities $840.6 Million Q2 FY20 TTM Revenue (excluding divestitures) © 2019 Columbus McKinnon Corporation 7
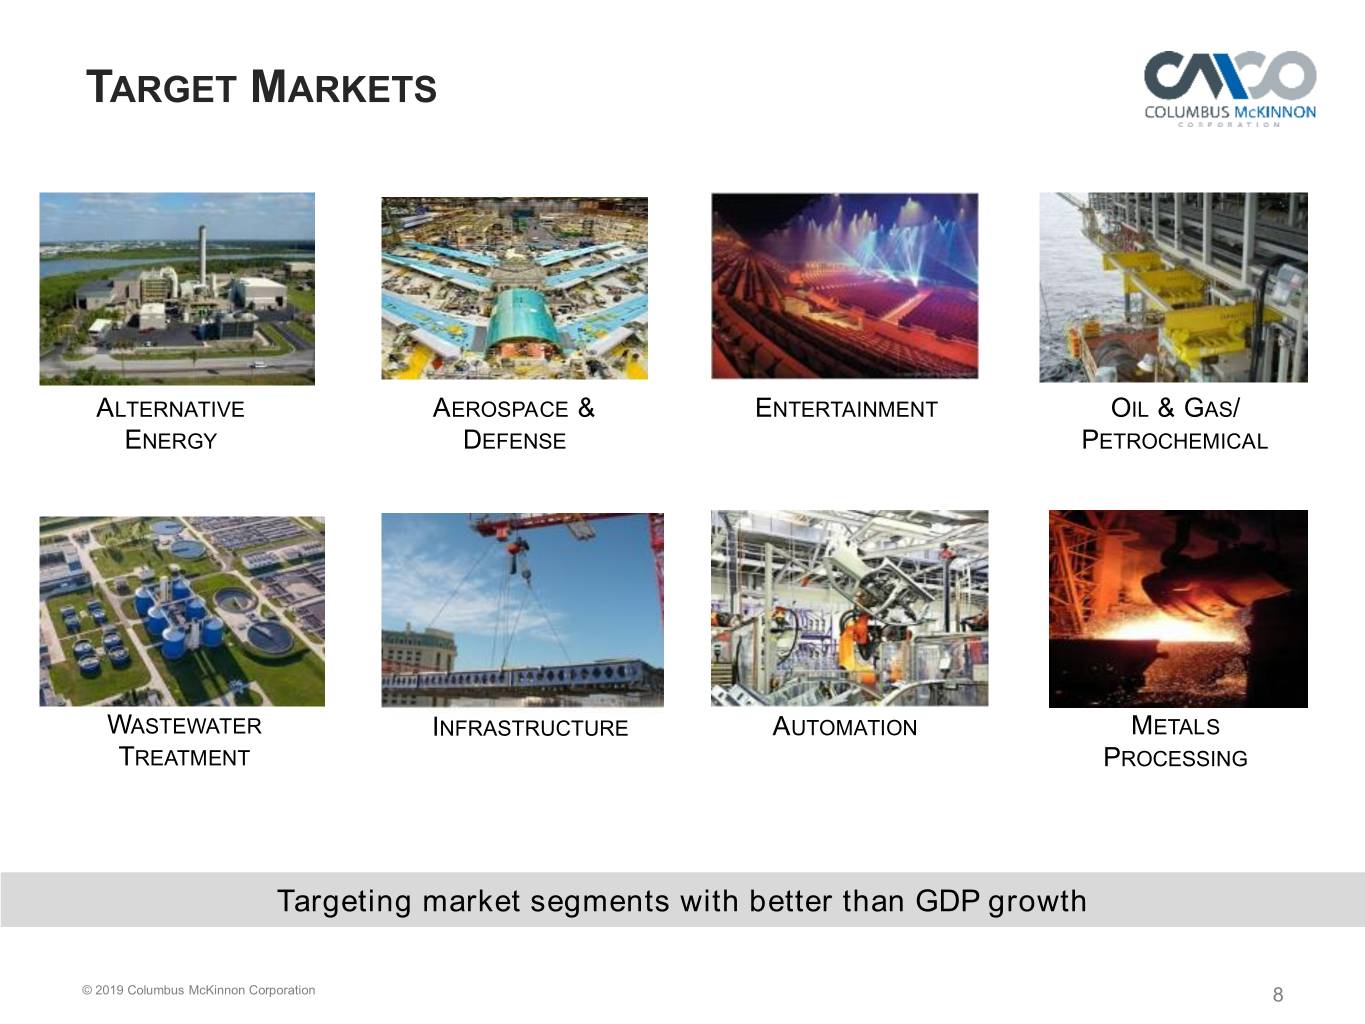
TARGET MARKETS ALTERNATIVE AEROSPACE & ENTERTAINMENT OIL & GAS/ ENERGY DEFENSE PETROCHEMICAL WASTEWATER INFRASTRUCTURE AUTOMATION METALS TREATMENT PROCESSING Targeting market segments with better than GDP growth © 2019 Columbus McKinnon Corporation 8
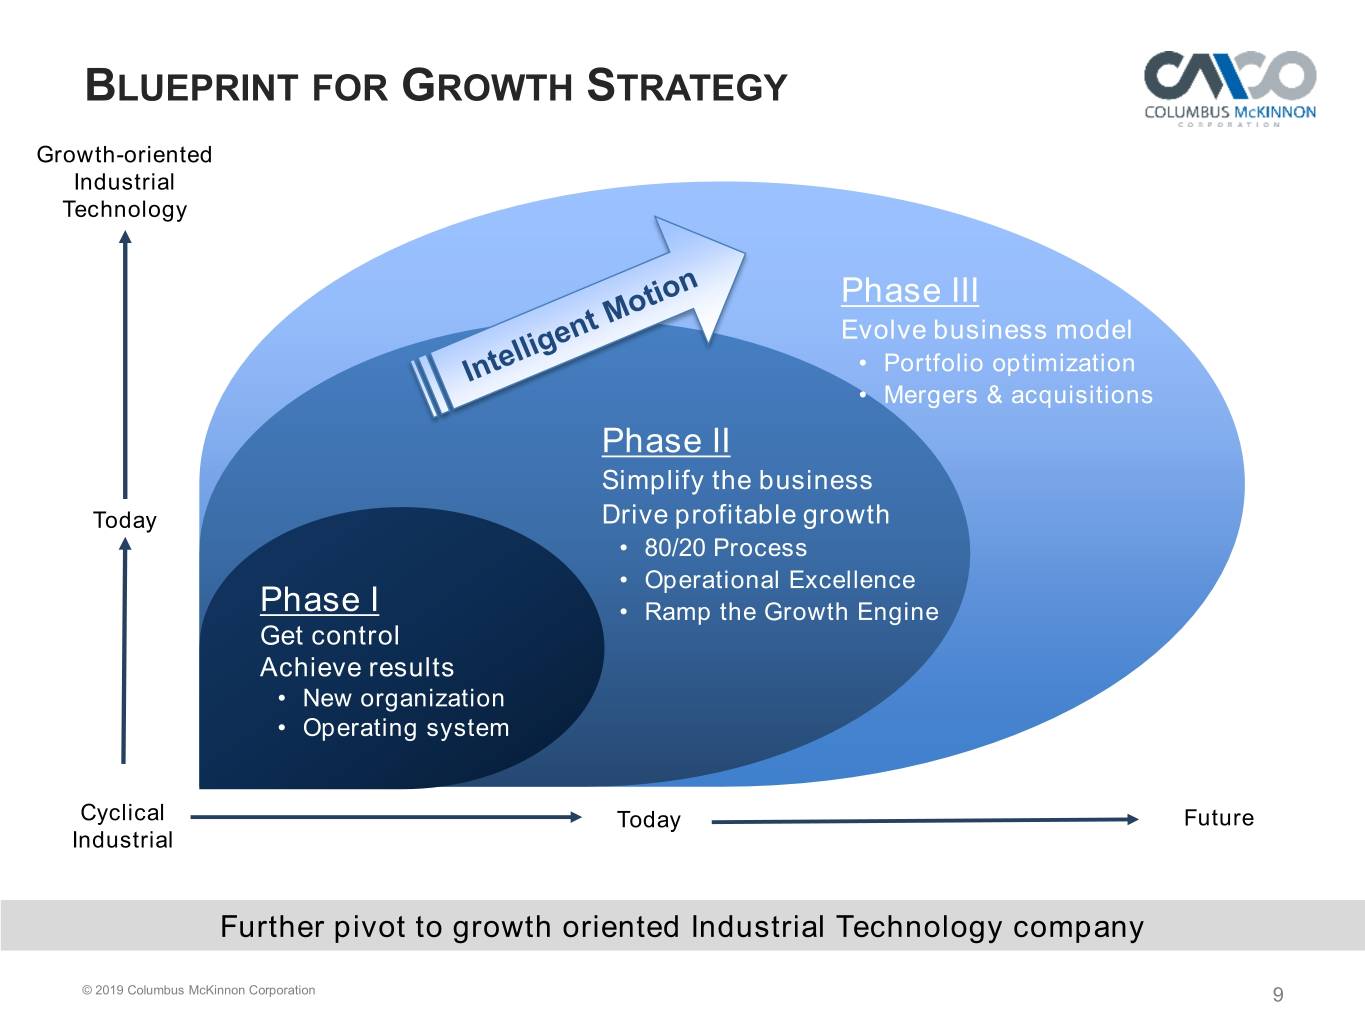
BLUEPRINT FOR GROWTH STRATEGY Growth-oriented Industrial Technology Phase III Evolve business model • Portfolio optimization • Mergers & acquisitions Phase II Simplify the business Today Drive profitable growth • 80/20 Process • Operational Excellence Phase I • Ramp the Growth Engine Get control Achieve results • New organization • Operating system Cyclical Today Future Industrial Further pivot to growth oriented Industrial Technology company © 2019 Columbus McKinnon Corporation 9
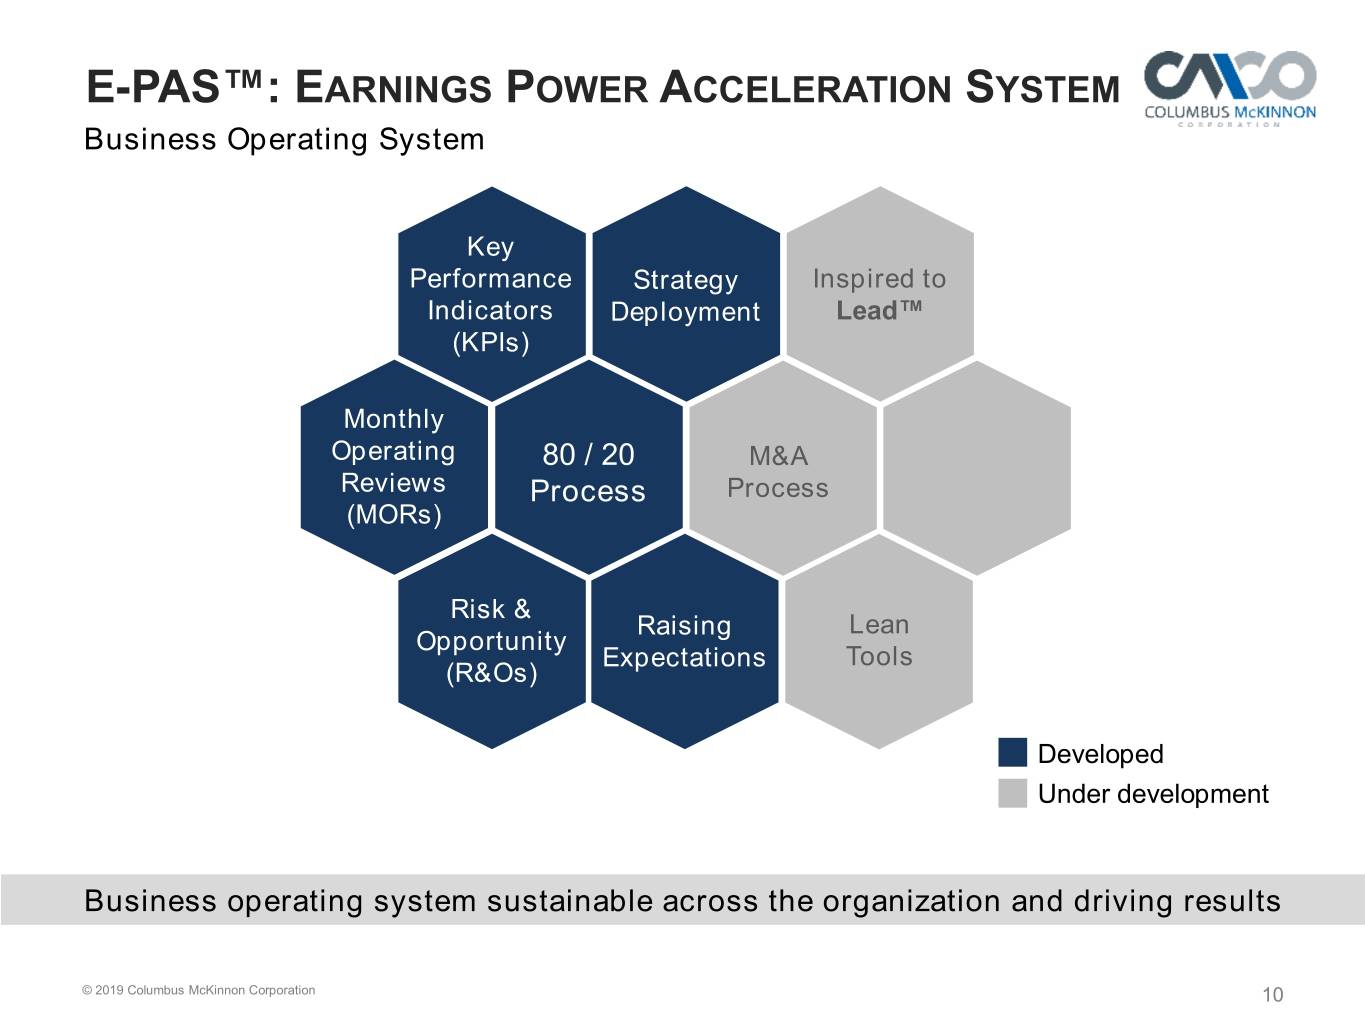
E-PAS™: EARNINGS POWER ACCELERATION SYSTEM Business Operating System Key Performance Strategy Inspired to Indicators Deployment Lead™ (KPIs) Monthly Operating 80 / 20 M&A Reviews Process Process (MORs) Risk & Raising Lean Opportunity Expectations Tools (R&Os) Developed Under development Business operating system sustainable across the organization and driving results © 2019 Columbus McKinnon Corporation 10

STRATEGY DRIVES PERFORMANCE ($ in millions) Strategy creates stronger Making significant progress towards Transformation more than earnings power… 19% EBITDA margin goal… doubles ROIC(1)… $2.85 $2.74 16.2% 15.1% $2.01 13.7% 11.7% $2.27 11.2% 11.4% $1.47 $1.80 8.7% 5.6% $0.95 $0.43 FY17 FY18 FY19 Q2 FY20 FY17 FY18 FY19 Q2 FY20 FY17 FY18 FY19 Q2 FY20 TTM TTM Non-GAAP EPS Adjustments Adjusted EBITDA Margin Return on Invested Capital GAAP Diluted EPS Almost three years of execution delivers stronger earnings power (1) ROIC is defined as adjusted income from operations, net of taxes, for the trailing 12 months divided by the average of debt plus equity less cash (average capital) for the trailing 13 months. A 30% tax rate was used for fiscal year 2017, and 22% for fiscal years 2018, 2019 & 2020. © 2019 Columbus McKinnon Corporation 11
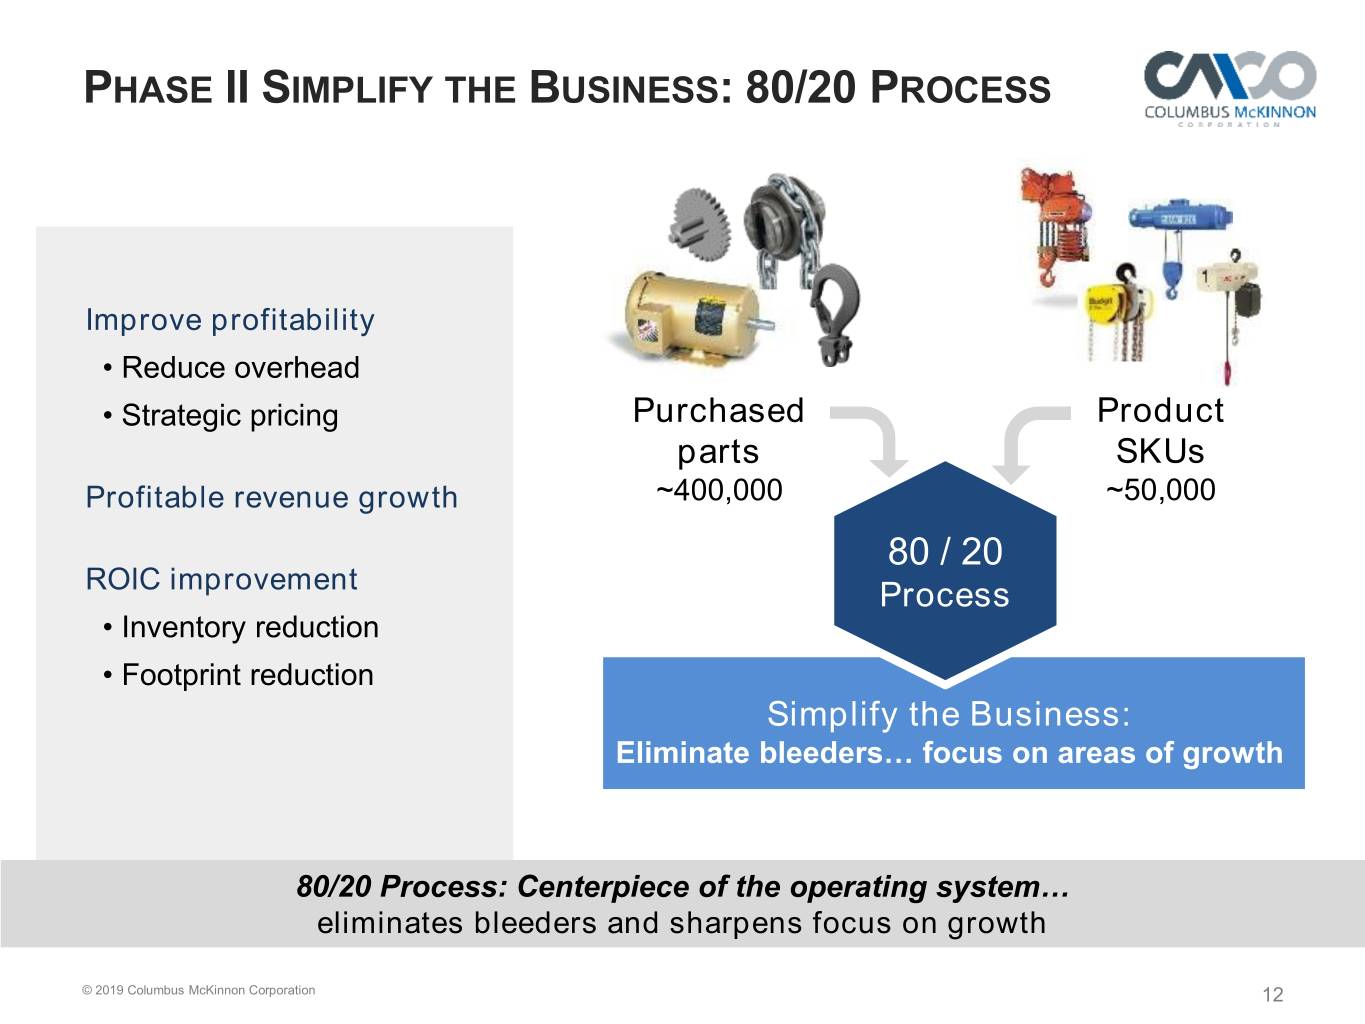
PHASE II SIMPLIFY THE BUSINESS: 80/20 PROCESS Improve profitability • Reduce overhead • Strategic pricing Purchased Product parts SKUs Profitable revenue growth ~400,000 ~50,000 80 / 20 ROIC improvement Process • Inventory reduction • Footprint reduction Simplify the Business: Eliminate bleeders… focus on areas of growth 80/20 Process: Centerpiece of the operating system… eliminates bleeders and sharpens focus on growth © 2019 Columbus McKinnon Corporation 12
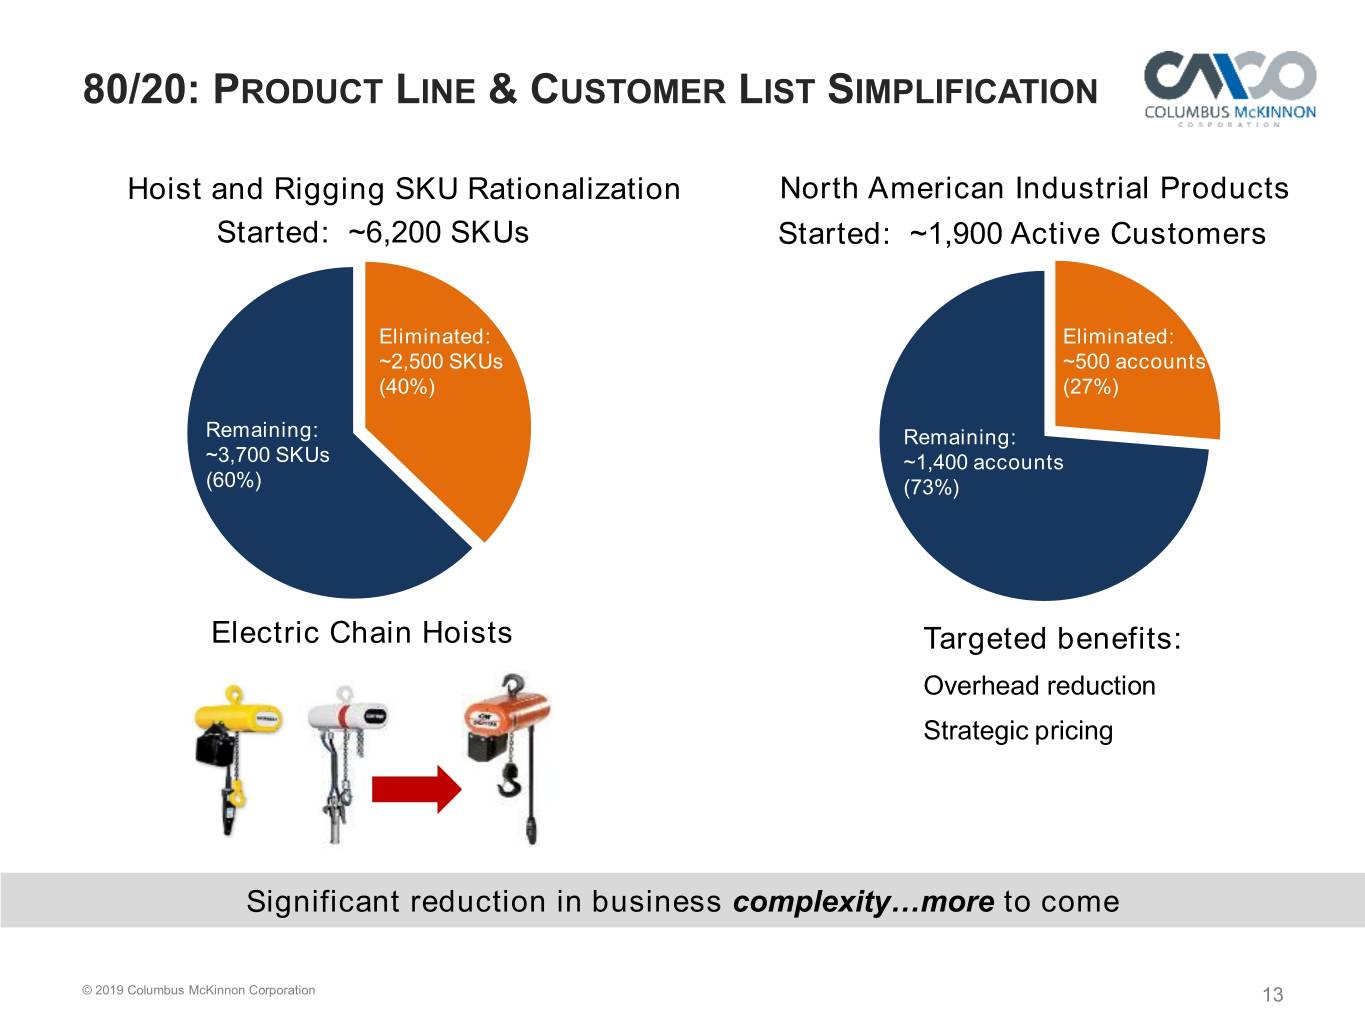
80/20: PRODUCT LINE & CUSTOMER LIST SIMPLIFICATION Hoist and Rigging SKU Rationalization North American Industrial Products Started: ~6,200 SKUs Started: ~1,900 Active Customers Eliminated: Eliminated: ~2,500 SKUs ~500 accounts (40%) (27%) Remaining: Remaining: ~3,700 SKUs ~1,400 accounts (60%) (73%) Electric Chain Hoists Targeted benefits: Overhead reduction Strategic pricing Significant reduction in business complexity…more to come © 2019 Columbus McKinnon Corporation 13

PHASE II: OPERATIONAL EXCELLENCE Path to Top Tier Operational Performance Enable Customer Improve Cost Optimize Actions Experience Structure Working Capital Consolidate Material Three Facilities Productivity Improvement of On-Time- Overhead Cost Delivery Reduction Building Team Performance Footprint Culture Optimization Meet customer expectations and optimize productivity © 2019 Columbus McKinnon Corporation 14

PHASE II: DELIVERING RESULTS ($, in millions contribution to operating income) 80/20 Process: Expecting $18 million contribution to operating income in FY20 Customer simplification (strategic pricing) FY 2019 Actual $8.5 Priority customer account program (incremental volume from sharpened customer focus) FY 2020 Estimate $9 $18 Product simplification (indirect overhead reduction and material productivity) $12 Original^ Goal Closures: Salem, OH and China 1H FY2020 FY 2019 & 2020 Revised Goal Additional operating income more than offset investments in growth and macroeconomic headwinds: Added nearly 30 growth positions in product development, marketing and digital initiatives Short-cycle business macro headwinds Increased medical costs and tariffs Divested less profitable businesses Strong performance with 80/20 Process and self–help strategy © 2019 Columbus McKinnon Corporation 15
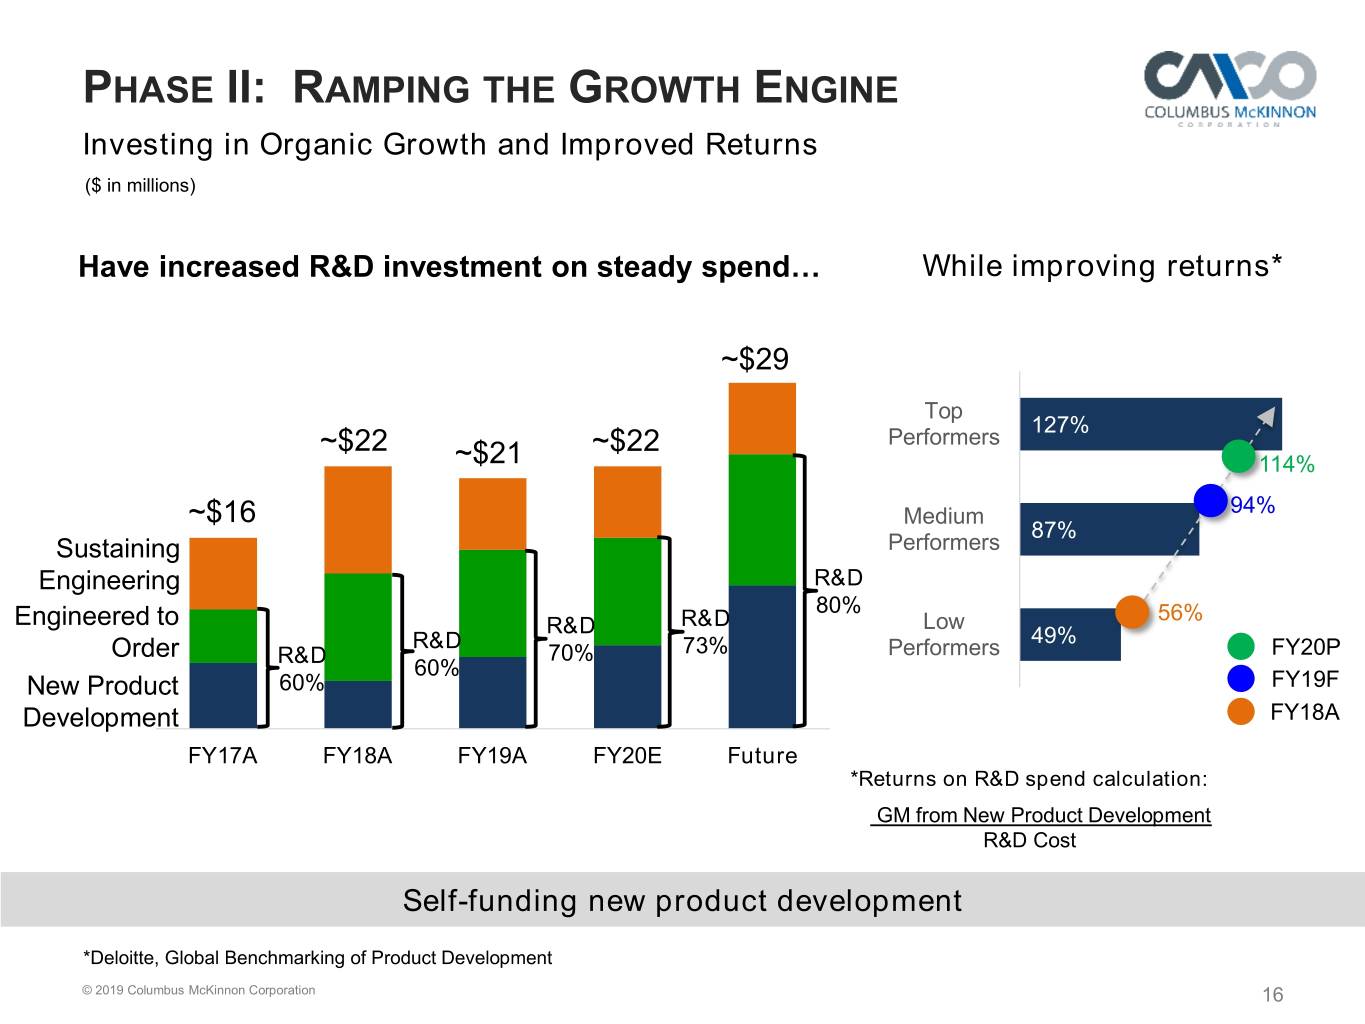
PHASE II: RAMPING THE GROWTH ENGINE Investing in Organic Growth and Improved Returns ($ in millions) Have increased R&D investment on steady spend… While improving returns* ~$29 Top 127% ~$22 ~$22 Performers ~$21 114% ~$16 Medium 94% 87% Sustaining Performers Engineering R&D 80% 56% Engineered to R&D R&D Low R&D 49% Order R&D 70% 73% Performers FY20P 60% 60% FY19F New Product 0% 20% 40% 60% 80% 100% 120% 140% Development FY18A FY17A FY18A FY19A FY20E Future *Returns on R&D spend calculation: GM from New Product Development R&D Cost Self-funding new product development *Deloitte, Global Benchmarking of Product Development © 2019 Columbus McKinnon Corporation 16

INTELLIGENT MOTION Starts with Identifying Customers “High-Value” Problems Total Addressable Lifting Automation Market ~$500 Million Current Market Expanded Market Opportunity ~$300 Million Significant growth opportunity at +40% gross margins © 2019 Columbus McKinnon Corporation 17
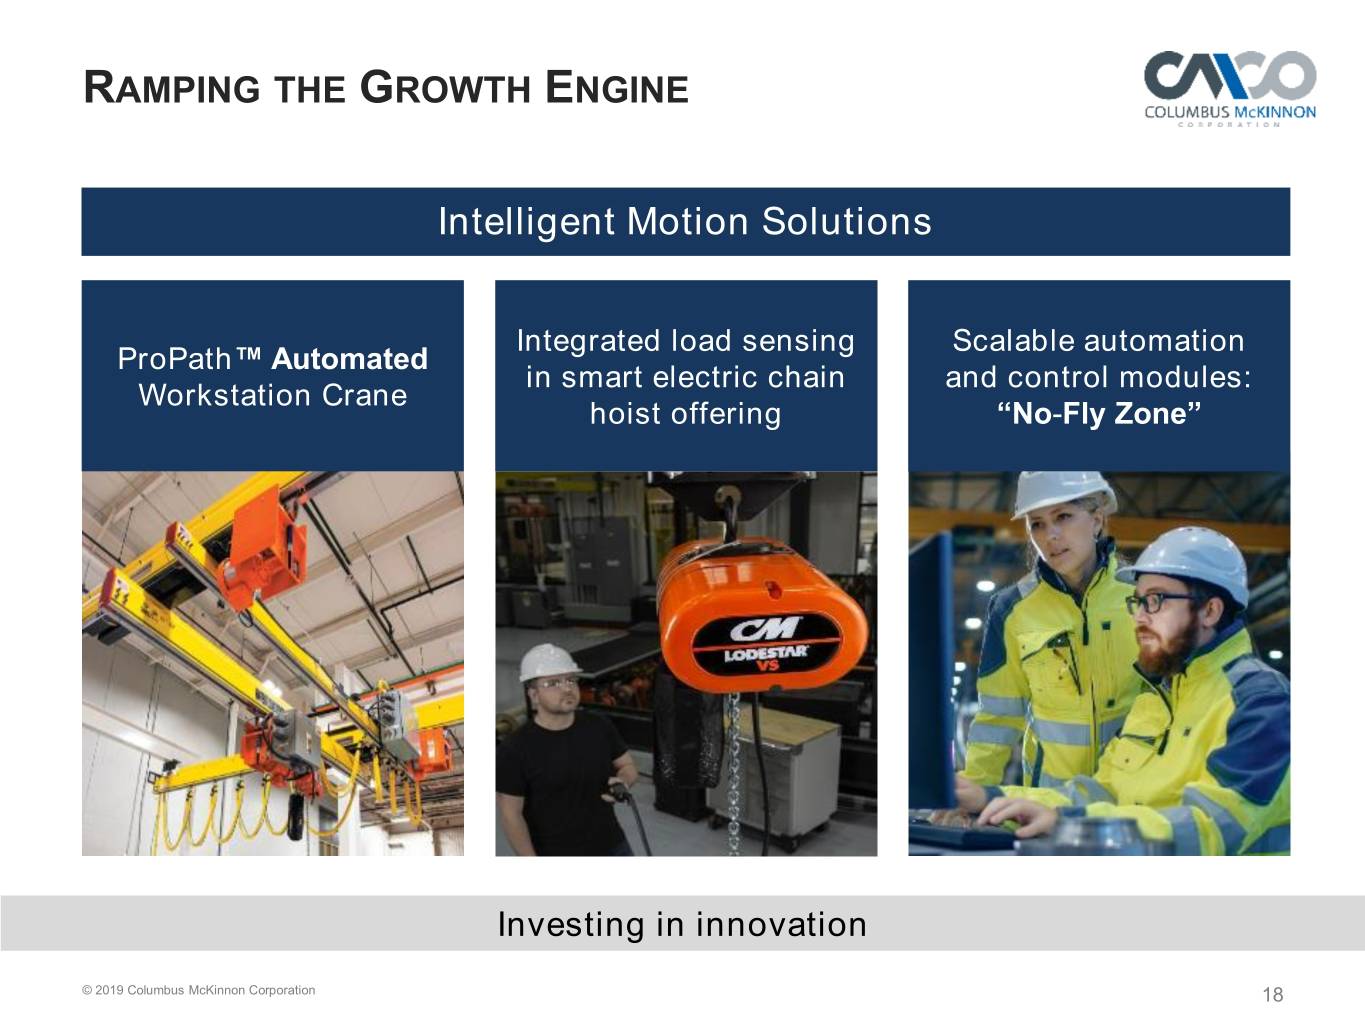
RAMPING THE GROWTH ENGINE Intelligent Motion Solutions Integrated load sensing Scalable automation ProPath™ Automated in smart electric chain and control modules: Workstation Crane hoist offering “No-Fly Zone” Investing in innovation © 2019 Columbus McKinnon Corporation 18

PHASE III: PORTFOLIO OPTIMIZATION Selective Invest / Grow Scale-Up Investment Indust. Portfolio Assessment Criteria: Tech . Business model . Profitability Fix / Exit Selective Invest / Grow . Market position Investment . Industry growth . Risk assessment Exit Fix / Exit Selective Investment Size of bubble = $ EBITDA New © 2019 Columbus McKinnon Corporation 19
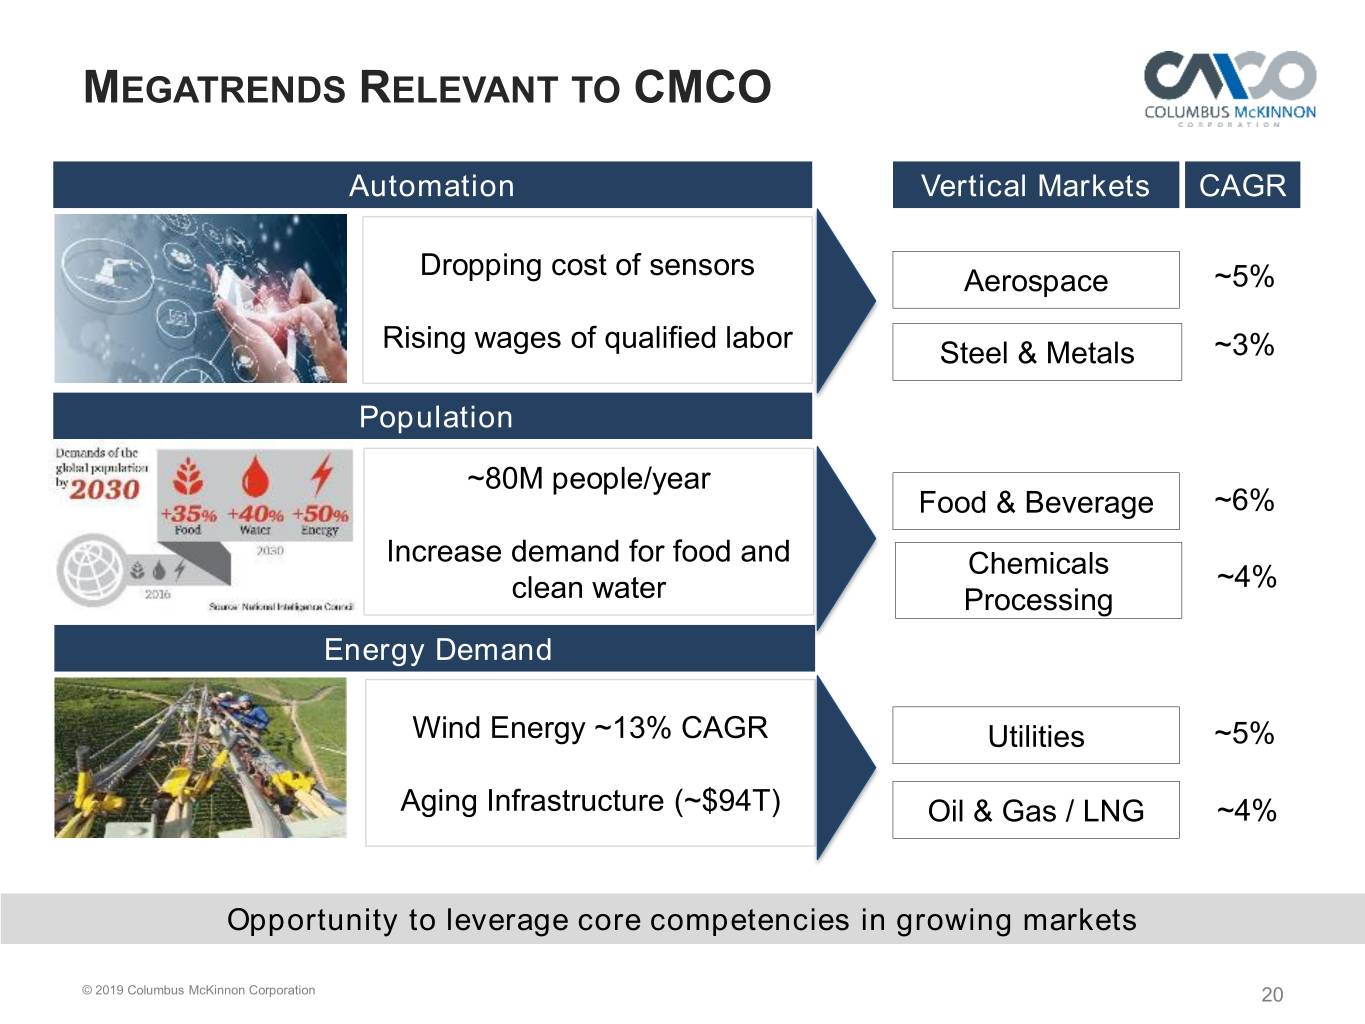
MEGATRENDS RELEVANT TO CMCO Automation Vertical Markets CAGR Dropping cost of sensors Aerospace ~5% Rising wages of qualified labor Steel & Metals ~3% Population ~80M people/year Food & Beverage ~6% Increase demand for food and Chemicals ~4% clean water Processing Energy Demand Wind Energy ~13% CAGR Utilities ~5% Aging Infrastructure (~$94T) Oil & Gas / LNG ~4% Opportunity to leverage core competencies in growing markets © 2019 Columbus McKinnon Corporation 20

Intelligent Motion Builds on core competencies, optimizes customer experience Lifting Specialist Technology Enabled • Leverages engineering & production knowhow • Leverages installed base & “reason to be” • Leverage channels, valuable brand • Responds to customer requests • Fragmented industry with niche • Competition making progress market opportunities • Greater potential for reoccurring revenue • Solutions for specialty applications • Megatrends drive higher growth Shift to Intelligent Motion enables CMCO to leverage capabilities and optimize growth © 2019 Columbus McKinnon Corporation 21

EVOLUTION OF THE BUSINESS MODEL Business Composition Evolves with the Strategy FY2015 Acquired: Now Engineered Products Aftermarket Aftermarket Industrial 6% Aftermarket 4% Engineered 13% Technology Crane ~ 20% ~13% Solutions Products 10% 9% Industrial Products 38% Crane Solutions 40% Industrial Industrial ~ 67% Products 84% Divested: FY2020 YTD, ~20% of CMCO business is comprised of industrial technology © 2019 Columbus McKinnon Corporation 22

FINANCIAL PERFORMANCE ($ in millions) Sales Blueprint for Growth strategy 1100.0 helping to offset headwinds $876.3 900.0 $839.4 $854.5 $637.1 $840.6 Organic growth of 1.8% 1H FY20 and 700.0 $801.1 $842.1 expanding margins 500.0 $601.1 300.0 • Strong gross margin of 35.4% in 100.0 Q2 FY20 -100.0 FY17 FY18 FY19 Q2 FY20 TTM • 80/20 strategic pricing initiatives driving Adjusted Sales Sales from divested businesses organic growth Gross Profit & Gross Margin Offsets investments in growth as well as: $305.0 $285.1 $298.6 • Increased medical costs & tariffs $192.9 • $4.0 million FX headwind • $9.2 million reduction of sales from 30.3% 34.0% 34.8% 34.9% divestitures FY17 FY18 FY19 Q2 FY20 TTM Customer and operational focus enhancing strong market positions and margin © 2019 Columbus McKinnon Corporation 23
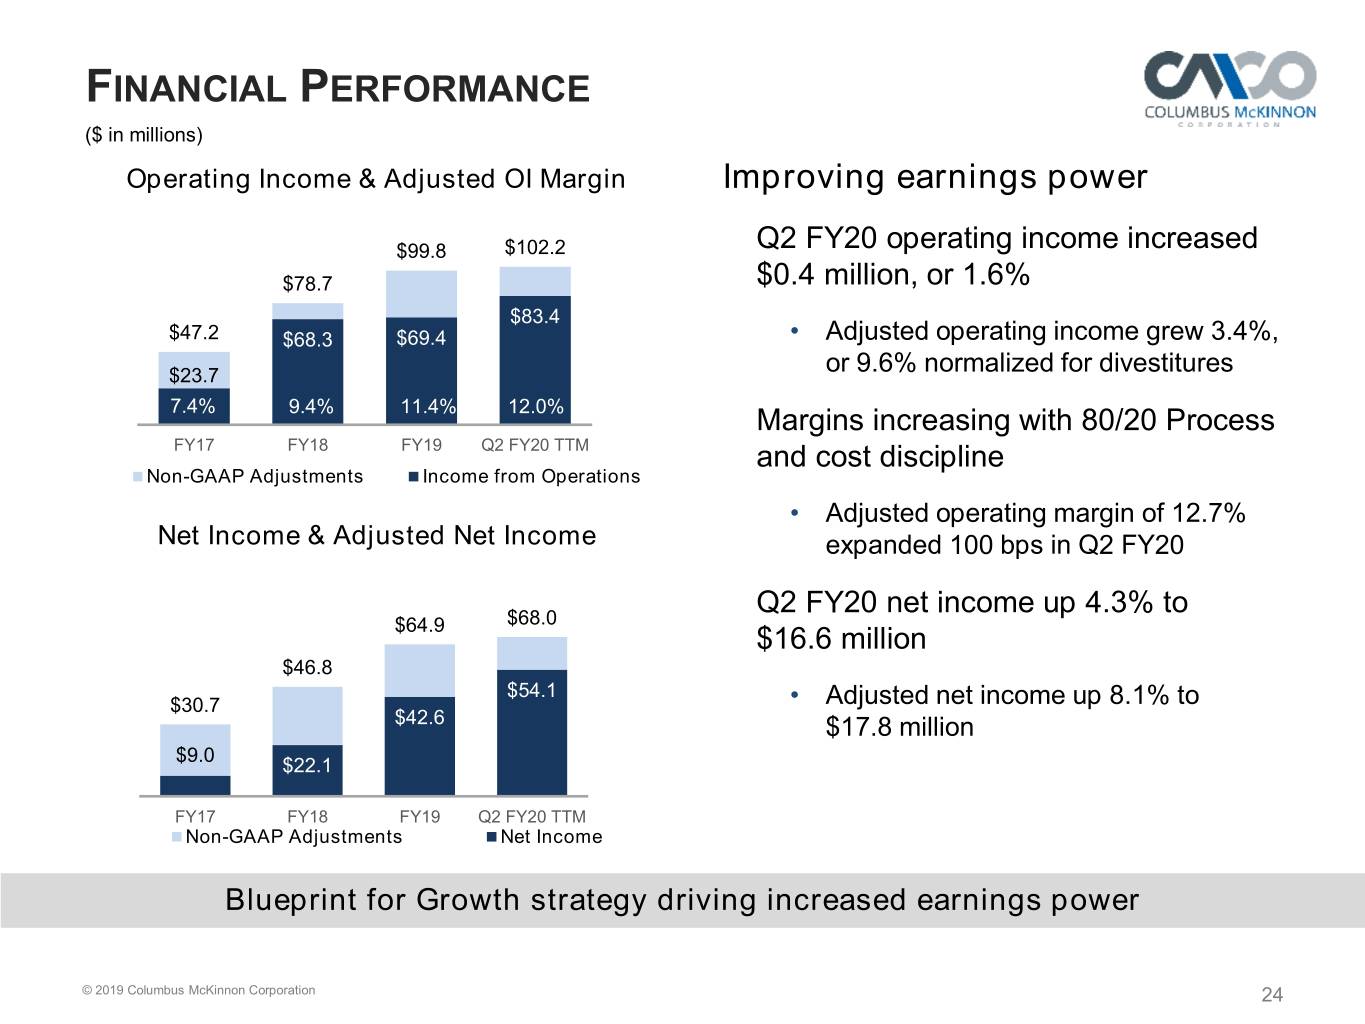
FINANCIAL PERFORMANCE ($ in millions) Operating Income & Adjusted OI Margin Improving earnings power $99.8 $102.2 Q2 FY20 operating income increased $78.7 $0.4 million, or 1.6% $83.4 $47.2 $68.3 $69.4 • Adjusted operating income grew 3.4%, $23.7 or 9.6% normalized for divestitures 7.4% 9.4% 11.4% 12.0% Margins increasing with 80/20 Process FY17 FY18 FY19 Q2 FY20 TTM and cost discipline Non-GAAP Adjustments Income from Operations • Adjusted operating margin of 12.7% Net Income & Adjusted Net Income expanded 100 bps in Q2 FY20 Q2 FY20 net income up 4.3% to $68.0 $64.9 $16.6 million $46.8 $54.1 $30.7 • Adjusted net income up 8.1% to $42.6 $17.8 million $9.0 $22.1 FY17 FY18 FY19 Q2 FY20 TTM Non-GAAP Adjustments Net Income Blueprint for Growth strategy driving increased earnings power © 2019 Columbus McKinnon Corporation 24

CASH FLOW ($ in millions) Free Cash Flow(1) Three Months Ended YTD 9/30/19 9/30/18 9/30/19 $90 - $95 $80 - $85 Net cash $70 - $75 provided by $40.0 $19.5 $37.9 $67.2 operating $55.1 activities $46.1 CapEx (3.0) (2.5) (4.8) Operating free $37.1 $17.0 $33.0 cash flow Note: Components may not add to totals due to rounding FY17 FY18 FY19 FY20E FY21E FY22E Generated $37.1 million in operating free cash FY21E to FY22E Assumptions: flow (FCF) in Q2 Annual CapEx of ~$20 million FY20 expected CapEx: approximately $15 million Annual pension contribution of ~$12 million Reliable, strong cash flow generation Capital expenditure guidance provided November 7, 2019 (1)Free cash flow is defined as cash provided by operating activities minus capital expenditures © 2019 Columbus McKinnon Corporation 25

STRONG BALANCE SHEET ($ in millions) CAPITALIZATION DE-LEVERING BALANCE SHEET Sept. 30, March 31, Paid down $125 million of debt in FY18 2019 2019 & FY19 Cash and cash equivalents $ 72.0 $ 71.1 Debt leverage ratio(1) of 1.5x Total debt 271.4 300.3 • Paid down $20 million of debt in Total net debt 199.4 229.2 Q2 FY20 Shareholders’ equity 463.8 431.2 • YTD debt reduced by $30 million Total capitalization $ 735.2 $ 731.5 • Net debt to net total capital 30.1% Debt/total capitalization 36.9% 41.1% Financial flexibility enables Net debt/net total Phase III of Blueprint for Growth 30.1% 34.7% capitalization strategy Plan to pay down $65 million of debt in FY20 (1)Debt leverage ratio is defined as Net Debt / Adjusted TTM EBITDA © 2019 Columbus McKinnon Corporation 26

ROADMAP TO ACHIEVING EBITDA MARGIN TARGET (+/- in basis points) 25.0% +50 -200 +540 20.0% +140 -180 +200 15.0% +210 10.0% 20.5% 19.0% 19.0% 15.5% 15.1% 15.1% 15.1% 13.5% 11.4% 11.4% 5.0% 0.0% FY17 Stahl 80/20 & Ops Divestitures Inflation & FY19 80/20 & Ops Ramp the Inflation & FY22E Synergies Excellence Other Excellence Growth Engine Other Adjusted EBITDA margin expansion driven by Blueprint for Growth strategy © 2019 Columbus McKinnon Corporation 27
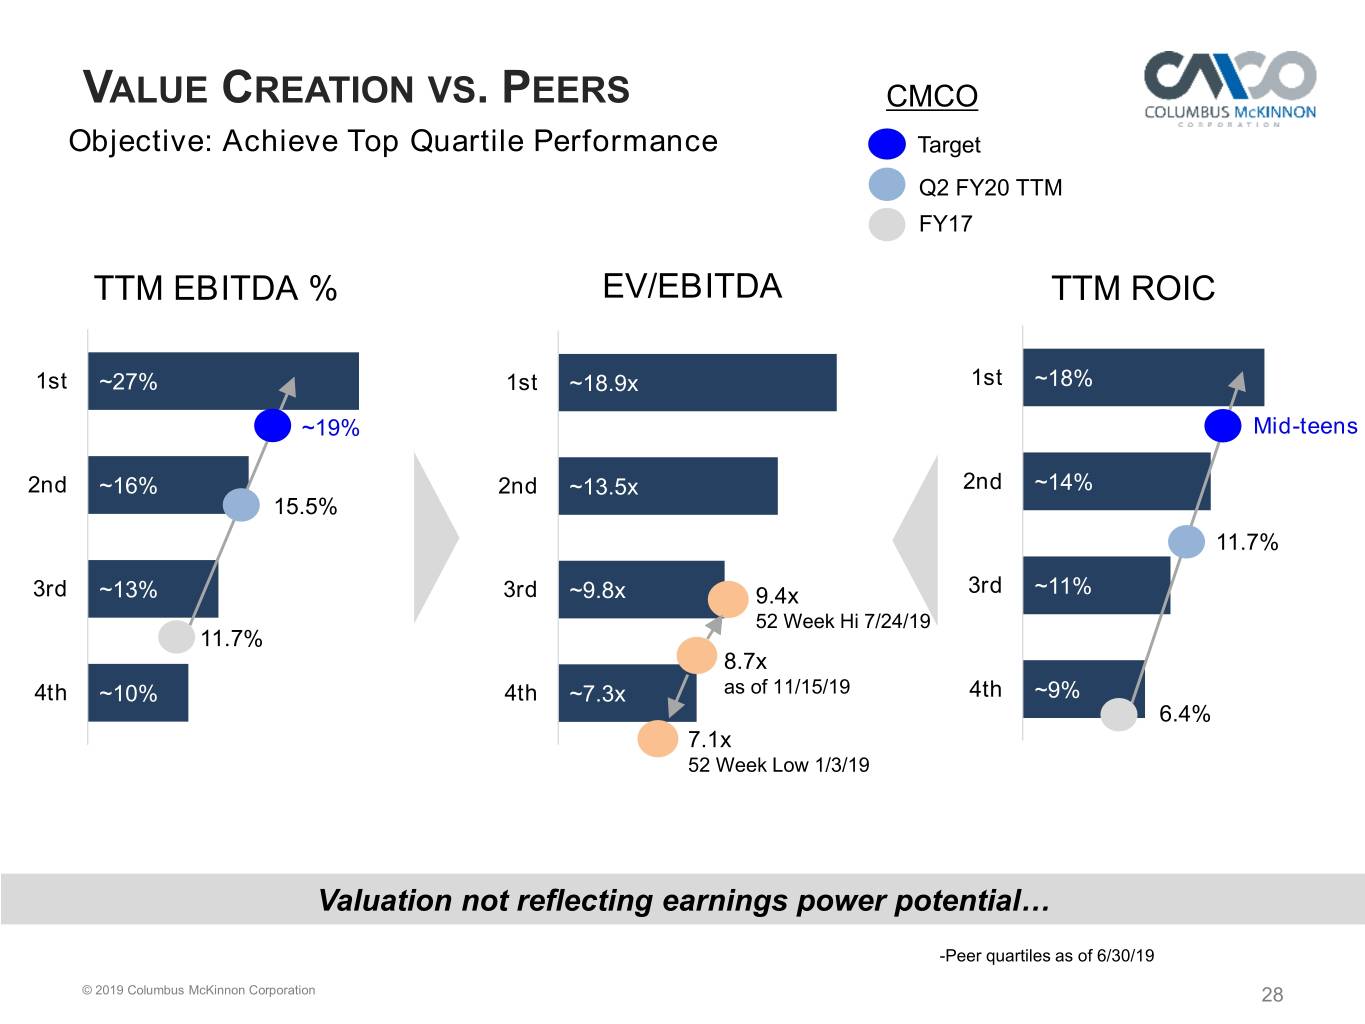
VALUE CREATION VS. PEERS CMCO Objective: Achieve Top Quartile Performance Target Q2 FY20 TTM FY17 TTM EBITDA % EV/EBITDA TTM ROIC 1st ~27% 1st ~18.9x 1st ~18% ~19% Mid-teens 2nd ~16% 2nd ~13.5x 2nd ~14% 15.5% 11.7% 3rd ~13% 3rd ~9.8x 9.4x 3rd ~11% 52 Week Hi 7/24/19 11.7% 8.7x 4th ~10% 4th ~7.3x as of 11/15/19 4th ~9% 6.4% 7.1x 52 Week Low 1/3/19 Valuation not reflecting earnings power potential… -Peer quartiles as of 6/30/19 © 2019 Columbus McKinnon Corporation 28
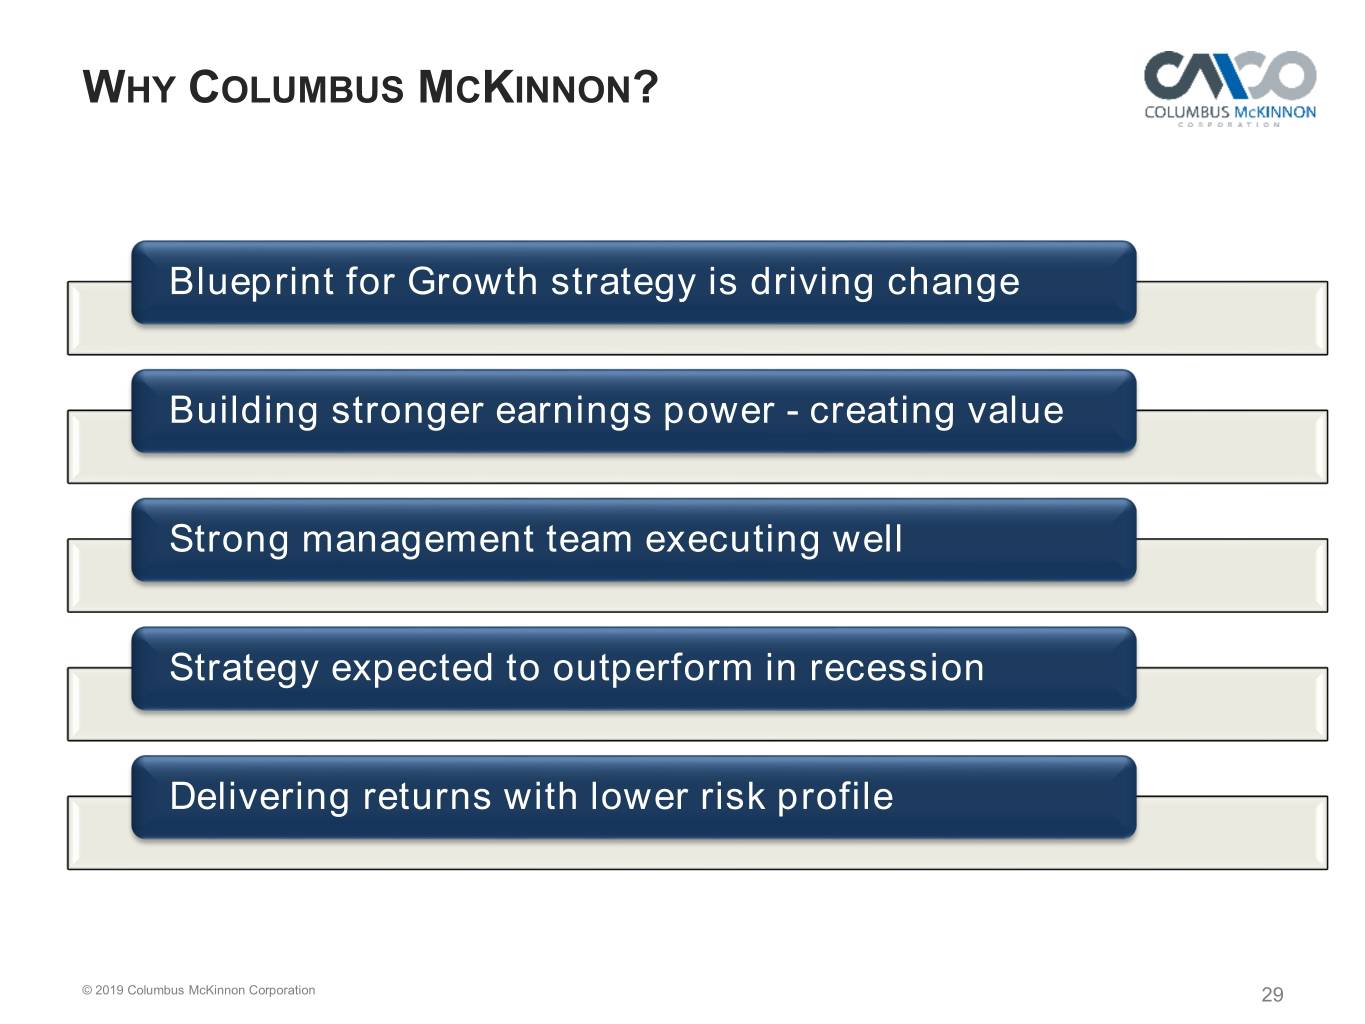
WHY COLUMBUS MCKINNON? Blueprint for Growth strategy is driving change Building stronger earnings power - creating value Strong management team executing well Strategy expected to outperform in recession Delivering returns with lower risk profile © 2019 Columbus McKinnon Corporation 29

SUPPLEMENTAL SLIDES PARTNERS IN MOTION CONTROL
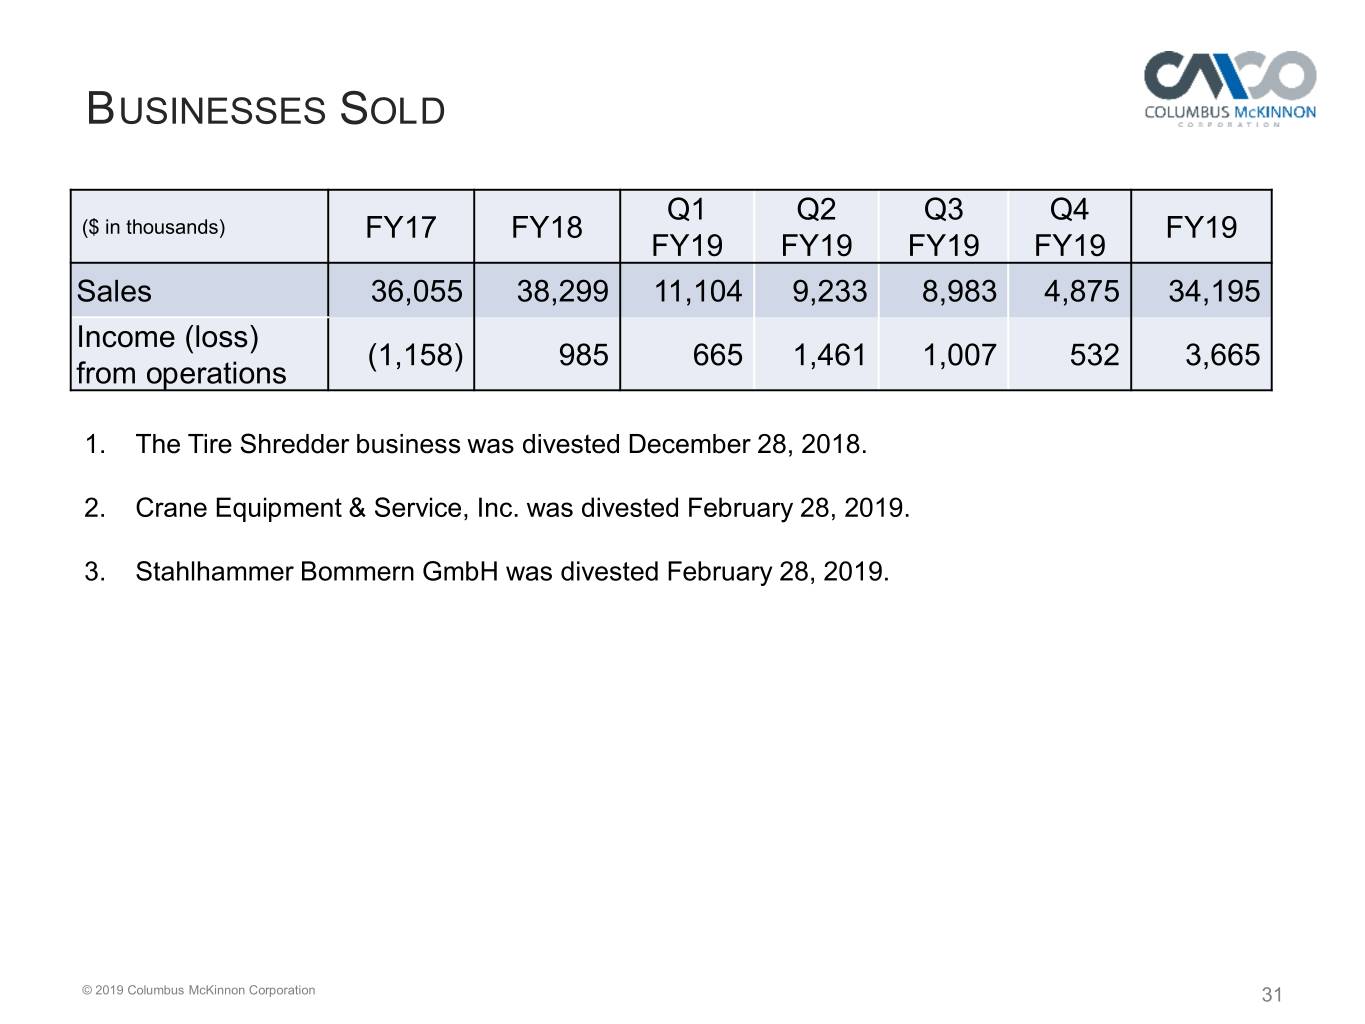
BUSINESSES SOLD Q1 Q2 Q3 Q4 ($ in thousands) FY17 FY18 FY19 FY19 FY19 FY19 FY19 Sales 36,055 38,299 11,104 9,233 8,983 4,875 34,195 Income (loss) (1,158) 985 665 1,461 1,007 532 3,665 from operations 1. The Tire Shredder business was divested December 28, 2018. 2. Crane Equipment & Service, Inc. was divested February 28, 2019. 3. Stahlhammer Bommern GmbH was divested February 28, 2019. © 2019 Columbus McKinnon Corporation 31
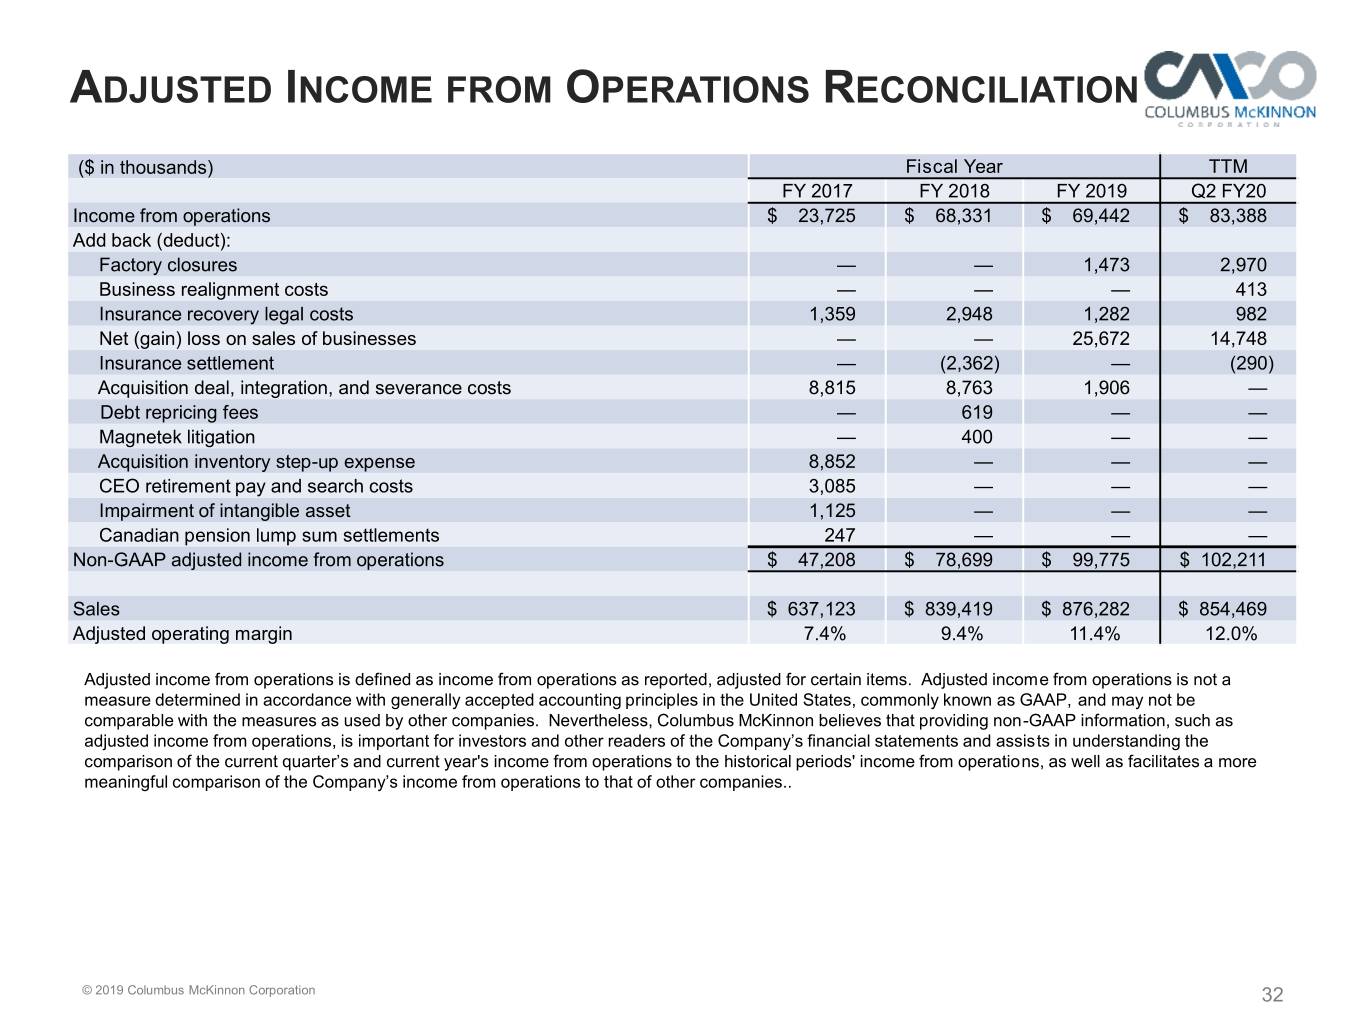
ADJUSTED INCOME FROM OPERATIONS RECONCILIATION ($ in thousands) Fiscal Year TTM FY 2017 FY 2018 FY 2019 Q2 FY20 Income from operations $ 23,725 $ 68,331 $ 69,442 $ 83,388 Add back (deduct): Factory closures — — 1,473 2,970 Business realignment costs — — — 413 Insurance recovery legal costs 1,359 2,948 1,282 982 Net (gain) loss on sales of businesses — — 25,672 14,748 Insurance settlement — (2,362) — (290) Acquisition deal, integration, and severance costs 8,815 8,763 1,906 — Debt repricing fees — 619 — — Magnetek litigation — 400 — — Acquisition inventory step-up expense 8,852 — — — CEO retirement pay and search costs 3,085 — — — Impairment of intangible asset 1,125 — — — Canadian pension lump sum settlements 247 — — — Non-GAAP adjusted income from operations $ 47,208 $ 78,699 $ 99,775 $ 102,211 Sales $ 637,123 $ 839,419 $ 876,282 $ 854,469 Adjusted operating margin 7.4% 9.4% 11.4% 12.0% Adjusted income from operations is defined as income from operations as reported, adjusted for certain items. Adjusted income from operations is not a measure determined in accordance with generally accepted accounting principles in the United States, commonly known as GAAP, and may not be comparable with the measures as used by other companies. Nevertheless, Columbus McKinnon believes that providing non-GAAP information, such as adjusted income from operations, is important for investors and other readers of the Company’s financial statements and assists in understanding the comparison of the current quarter’s and current year's income from operations to the historical periods' income from operations, as well as facilitates a more meaningful comparison of the Company’s income from operations to that of other companies.. © 2019 Columbus McKinnon Corporation 32

ADJUSTED NET INCOME RECONCILIATION ($ in thousands, except per share data) Fiscal Year TTM FY 2017 FY 2018 FY 2019 Q2 FY20 Net income $ 8,984 $ 22,065 $ 42,577 $ 54,137 Add back: Factory closures — — 1,473 2,970 Business realignment costs — — — 413 Insurance recovery legal costs 1,359 2,948 1.282 982 Net loss on sales of businesses — — 25,672 14,748 Insurance settlement — (2,362) — (290) Acquisition deal, integration, and severance costs 8,815 8,763 1,906 — Debt refinancing costs — 619 — — Magnetek litigation — 400 — — Acquisition inventory step-up expense 8,852 — — — CEO retirement pay and search costs 3,085 — — — Loss on foreign exchange option for acquisition 1,590 — — — Loss on extinguishment of debt 1,303 — — — Impairment of intangible asset 1,125 — — — Canadian pension lump sum settlements 247 — — — Normalize tax rate (1) (4,626) 14,408 (7,990) (4,917) Non-GAAP adjusted net income $ 30,734 $ 46,841 $ 64,920 68,043 Average diluted shares outstanding 20,888 23,335 23,660 23,775 Diluted income per share - GAAP $0.43 $0.95 $1.80 $2.28 Diluted income per share - Non-GAAP $1.47 $2.01 $2.74 $2.86 (1) Applies normalized tax rate of 22% to GAAP pre-tax income and non-GAAP adjustments above, which are each pre-tax. Adjusted net income and diluted EPS are defined as net income and diluted EPS as reported, adjusted for certain items and at a normalized tax rate. Adjusted net income and diluted EPS are not measures determined in accordance with generally accepted accounting principles in the United States, commonly known as GAAP, and may not be comparable to the measures as used by other companies. Nevertheless, Columbus McKinnon believes that providing non-GAAP information, such as adjusted net income and diluted EPS, is important for investors and other readers of the Company’s financial statements and assists in understanding the comparison of the current quarter’s and current year's net income and diluted EPS to the historical periods' net income and diluted EPS, as well as facilitates a more meaningful comparison of the Company’s net income and diluted EPS to that of other companies. © 2019 Columbus McKinnon Corporation 33

ADJUSTED EBITDA RECONCILIATION ($ in thousands) Fiscal Year Quarter TTM FY 2017 FY 2018 FY 2019 Q2 FY20 Q2 FY20 Net income $ 8,984 $ 22,065 $ 42,577 $ 16,599 $ 54,137 Add back (deduct): Income tax expense 4,043 27,620 10,321 5,141 14,274 Interest and debt expense 10,966 19,733 17,144 3,759 15,900 Cost of debt refinancing 1,303 — — — — Investment (income) loss (462) (157) (727) (229) (879) Foreign currency exchange (gain) loss 1,232 1,539 843 (296) (94) Other (income) expense, net (2,341) (2,469) (716) 257 50 Depreciation and amortization expense 25,162 36,136 32,675 7,344 30,560 Factory closures — — 1,473 470 2,970 Business realignment costs — — — 413 413 Net loss on sales of businesses — — 25,672 7 14,748 Insurance recovery legal costs 1,359 2,948 1,282 220 982 Insurance settlement — (2,362) — — (290) Acquisition deal, integration, and severance costs 8,815 8,763 1,906 — — Debt repricing fees — 619 — — — Magnetek litigation — 400 — — — Acquisition inventory step-up expense 8,852 — — — — CEO retirement pay and search costs 3,085 — — — — Impairment of intangible asset 1,125 — — — — Canadian pension lump sum settlements 247 — — — — Non-GAAP adjusted EBITDA $ 72,370 $ 114,835 $ 132,450 $ 33,685 $ 132,771 Sales $ 637,123 $ 839,419 $ 876,282 $ 207,609 $ 854,469 Adjusted EBITDA margin 11.4% 13.7% 15.1% 16.2% 15.5% Adjusted EBITDA is defined as net income before interest expense, income taxes, depreciation, amortization, and other adjustments. Adjusted EBITDA is not a measure determined in accordance with generally accepted accounting principles in the United States, commonly known as GAAP, and may not be comparable with the measures as used by other companies. Nevertheless, Columbus McKinnon believes that providing non-GAAP information, such as adjusted EBITDA, is important for investors and other readers of the Company’s financial statements and assists in understanding the comparison of the current quarter’s and current year's net income and diluted EPS to the historical periods' net income and diluted EPS, as well as facilitates a more meaningful comparison of the Company’s net income and diluted EPS to that of other companies. © 2019 Columbus McKinnon Corporation 34
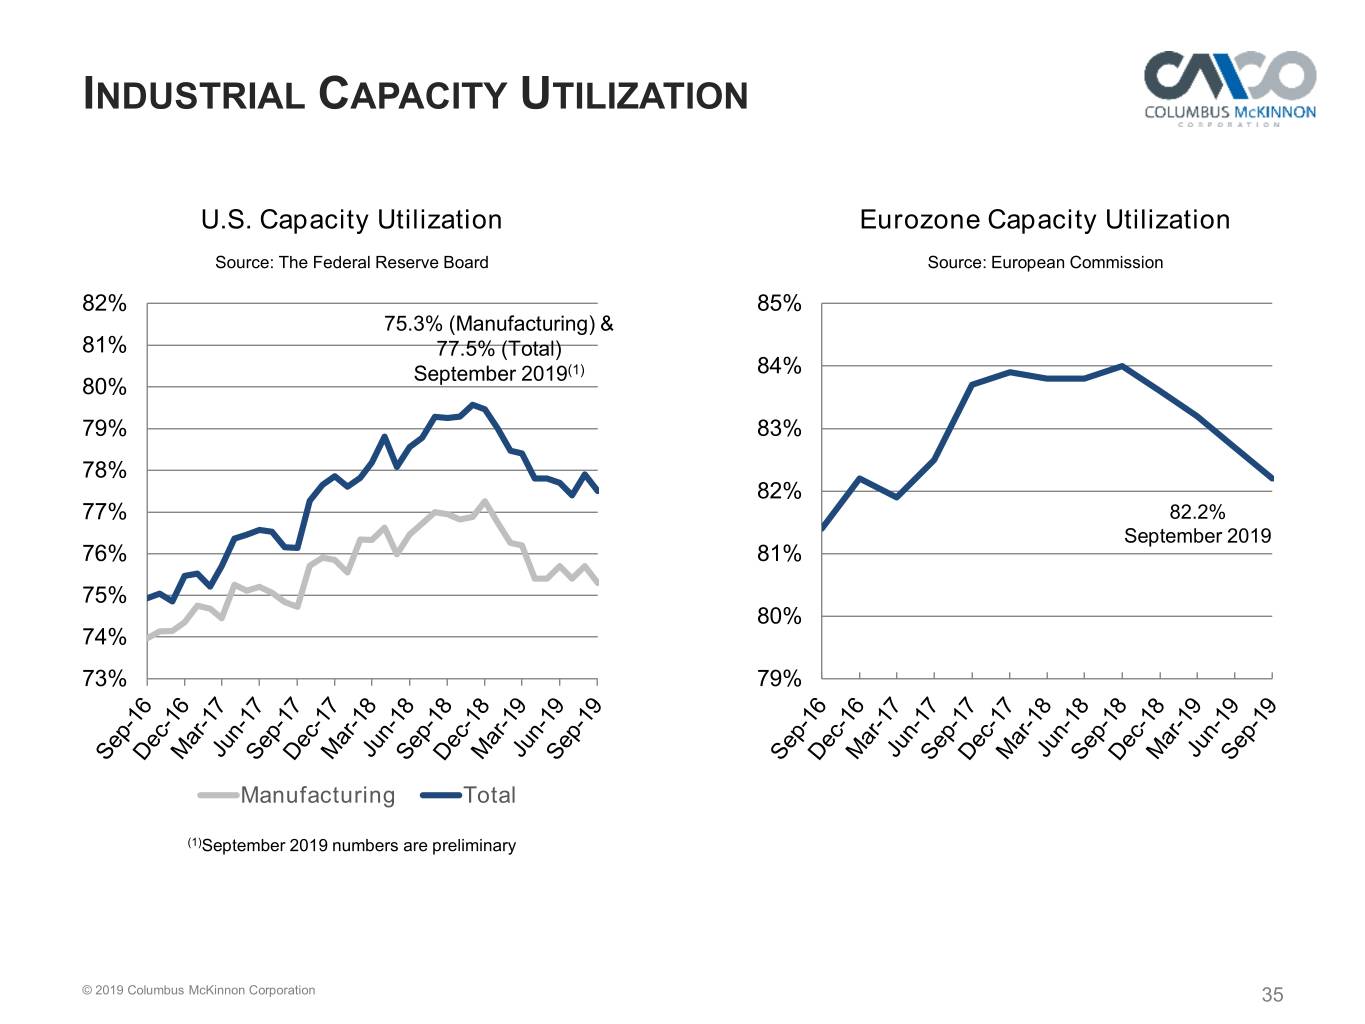
INDUSTRIAL CAPACITY UTILIZATION U.S. Capacity Utilization Eurozone Capacity Utilization Source: The Federal Reserve Board Source: European Commission 82% 85% 75.3% (Manufacturing) & 81% 77.5% (Total) September 2019(1) 84% 80% 79% 83% 78% 82% 77% 82.2% September 2019 76% 81% 75% 80% 74% 73% 79% Manufacturing Total (1)September 2019 numbers are preliminary © 2019 Columbus McKinnon Corporation 35

Nov 21, 2019 FUREY HIDDEN GEMS CONFERENCE PARTNERS IN MOTION CONTROL


