Q1 Fiscal Year 2022 Financial Results Conference Call July 29, 2021 David J. Wilson President and Chief Executive Officer Gregory P. Rustowicz Vice President – Finance & Chief Financial Officer
2 Safe Harbor Statement These slides, and the accompanying oral discussion (together, this “presentation”), contain “forward-looking statements” within the meaning of the Private Securities Litigation Reform Act of 1995. Such statements include, but are not limited to, statements concerning: future sales, earnings and plans; the success of the integration of Dorner Mfg. Corp. (“Dorner”) into Columbus McKinnon Corporation (the “Company”, “Columbus McKinnon”, “CMCO” or “our”) to achieve cost and revenue synergies and the amount of such synergies and integration costs; the ability of the Company to achieve market success and earnings per share accretion expectations; the ability of the Company to achieve its Blueprint for Growth 2.0 strategy, involve known and unknown risks, and are based upon current information and expectations. Actual results may differ materially from those anticipated if the information on which those estimates were based ultimately proves to be incorrect or as a result of certain risks and uncertainties that could cause our actual results to differ materially from the results expressed or implied by such statements, including the integration of Dorner into the Company to achieve cost and revenue synergies, the ability of the Company and Dorner to achieve revenue expectations, global economic and business conditions including the impact of COVID-19, conditions affecting the industries served by us and our subsidiaries, conditions affecting our customers and suppliers, competitor responses to our products and services, the overall market acceptance of such products and services, facility consolidations and other restructurings, the ability to expand into new markets and geographic regions, foreign currency fluctuations, the integration of acquisitions, including the acquisition of Dorner, and other factors disclosed in our periodic reports filed with the Securities and Exchange Commission. Consequently, such forward-looking statements should be regarded as our current plans, estimates and beliefs. Except as required by applicable law, we do not undertake and specifically decline any obligation to publicly release the results of any revisions to these forward-looking statements that may be made to reflect any future events or circumstances after the date of such statements or to reflect the occurrence of anticipated or unanticipated events. Non-GAAP Financial Measures This presentation will discuss some non-GAAP (“adjusted”) financial measures which we believe are useful in evaluating our performance. You should not consider the presentation of this additional information in isolation or as a substitute for results compared in accordance with GAAP. The non-GAAP (“adjusted”) measures are noted and reconciliations of comparable GAAP with non-GAAP measures can be found in tables included in the Supplemental Information portion of this presentation.

3 Accelerating growth initiatives and driving profitability Solid Start to Fiscal 2022 Strong growth, expanding margins and record backlog • Sales of $213.5 million increased 53.5% including 23.9% organic growth • Gross margin of 34.7%; record 36.3% adjusted gross margin including 80 basis points contribution from Dorner • Operating margin of 5.0%; 11.1% adjusted operating margin expanded 750 basis points; Dorner added 70 basis points • Adjusted EBITDA margin for the quarter was 16.0% Blueprint for Growth 2.0 strategy focused on growth initiatives • Strong demand from all markets; Dorner sales exceeded expectations • Achieved record backlog of $247.4 million, increased 44.1% in total and 20.5% organically compared with trailing quarter • Success with automation products and solutions; Gaining ground with Compass™ online CPQ* tool • Columbus McKinnon Business System gaining momentum *Configure, Price Quote Dorner acquisition exceeding expectations
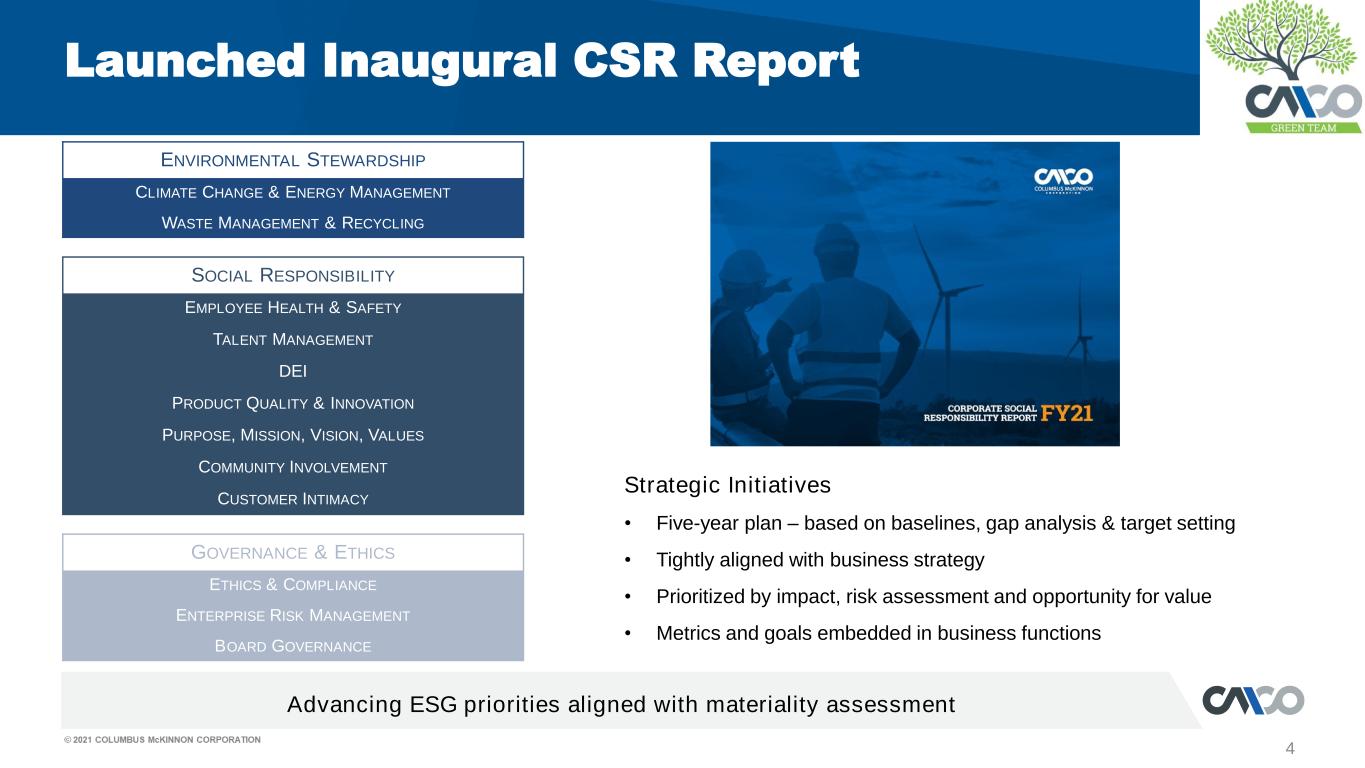
4 Advancing ESG priorities aligned with materiality assessment Launched Inaugural CSR Report Strategic Initiatives • Five-year plan – based on baselines, gap analysis & target setting • Tightly aligned with business strategy • Prioritized by impact, risk assessment and opportunity for value • Metrics and goals embedded in business functions ENVIRONMENTAL STEWARDSHIP CLIMATE CHANGE & ENERGY MANAGEMENT WASTE MANAGEMENT & RECYCLING SOCIAL RESPONSIBILITY EMPLOYEE HEALTH & SAFETY TALENT MANAGEMENT DEI PRODUCT QUALITY & INNOVATION PURPOSE, MISSION, VISION, VALUES COMMUNITY INVOLVEMENT CUSTOMER INTIMACY GOVERNANCE & ETHICS ETHICS & COMPLIANCE ENTERPRISE RISK MANAGEMENT BOARD GOVERNANCE
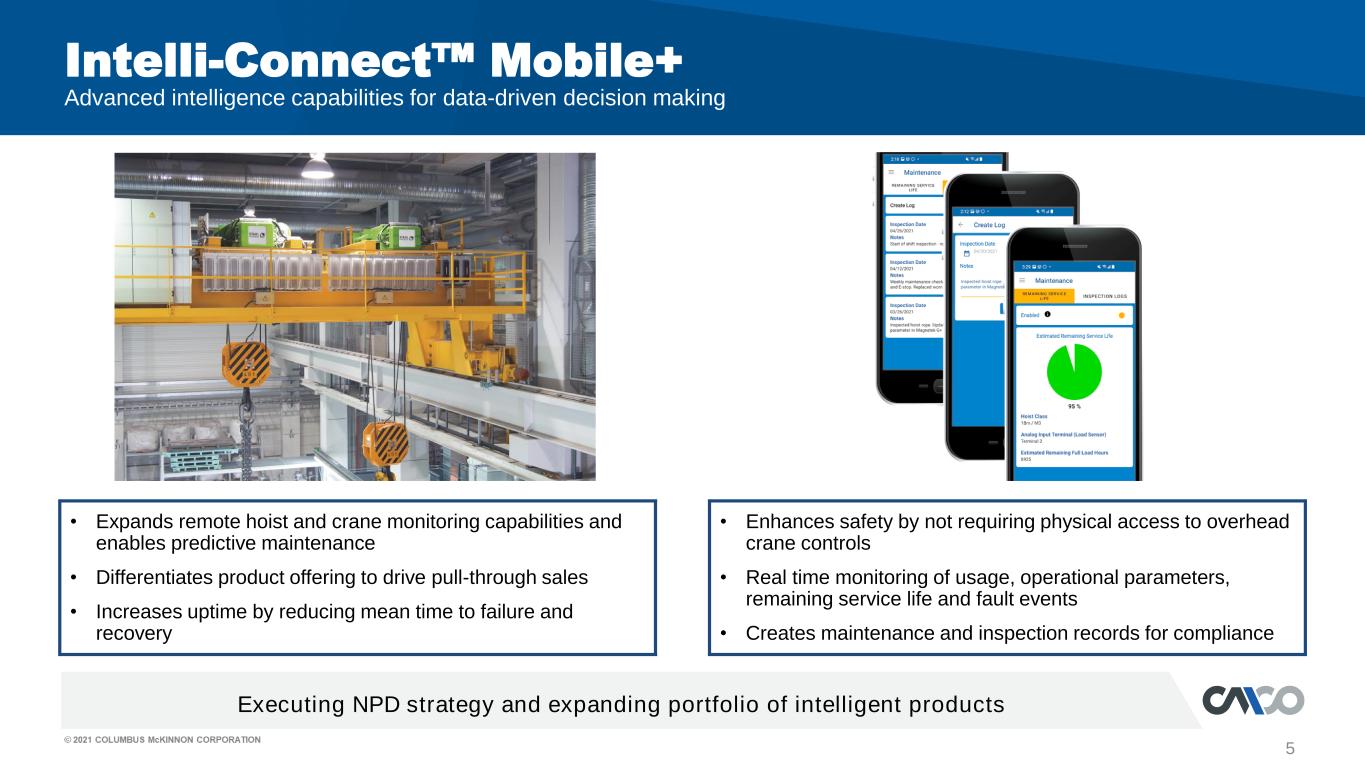
• Expands remote hoist and crane monitoring capabilities and enables predictive maintenance • Differentiates product offering to drive pull-through sales • Increases uptime by reducing mean time to failure and recovery 5 Executing NPD strategy and expanding portfolio of intelligent products Intelli-Connect™ Mobile+ Advanced intelligence capabilities for data-driven decision making • Enhances safety by not requiring physical access to overhead crane controls • Real time monitoring of usage, operational parameters, remaining service life and fault events • Creates maintenance and inspection records for compliance
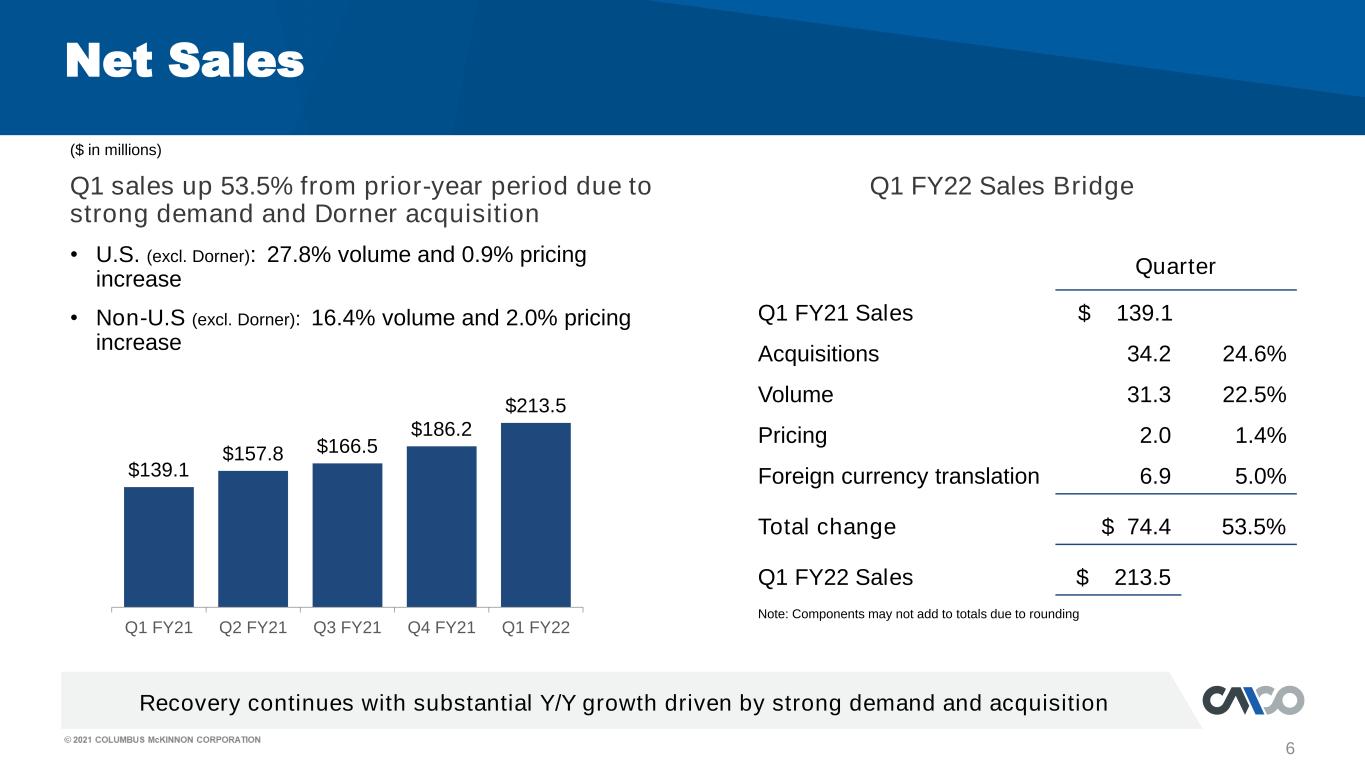
6 Q1 FY22 Sales Bridge Net Sales Recovery continues with substantial Y/Y growth driven by strong demand and acquisition Quarter Q1 FY21 Sales $ 139.1 Acquisitions 34.2 24.6% Volume 31.3 22.5% Pricing 2.0 1.4% Foreign currency translation 6.9 5.0% Total change $ 74.4 53.5% Q1 FY22 Sales $ 213.5 Note: Components may not add to totals due to rounding ($ in millions) $139.1 $157.8 $166.5 $186.2 $213.5 Q1 FY21 Q2 FY21 Q3 FY21 Q4 FY21 Q1 FY22 Q1 sales up 53.5% from prior-year period due to strong demand and Dorner acquisition • U.S. (excl. Dorner): 27.8% volume and 0.9% pricing increase • Non-U.S (excl. Dorner): 16.4% volume and 2.0% pricing increase

$44.8 $56.0 $55.3 $64.1 $74.1 32.2% 35.5% 33.2% 34.4% 34.7% Q1 FY21 Q2 FY21 Q3 FY21 Q4 FY21 Q1 FY22 7 Record adjusted gross margin of 36.3% reflects 80 bps contribution from Dorner Gross Profit & Margin Quarter Gross Profit Bridge Quarter Q1 FY21 Gross Profit $ 44.8 Acquisition 14.0 Sales volume and mix 11.6 Productivity, net of other cost changes 2.9 Foreign currency translation 2.4 Prior year factory closure costs 1.9 Pricing, net of material cost inflation 0.7 Prior year business realignment costs 0.3 Acquisition integration costs (0.5) Tariffs (1.0) Acquisition inventory step-up expense (3.0) Total Change $ 29.3 Q1 FY22 Gross Profit $ 74.1 ($ in millions)
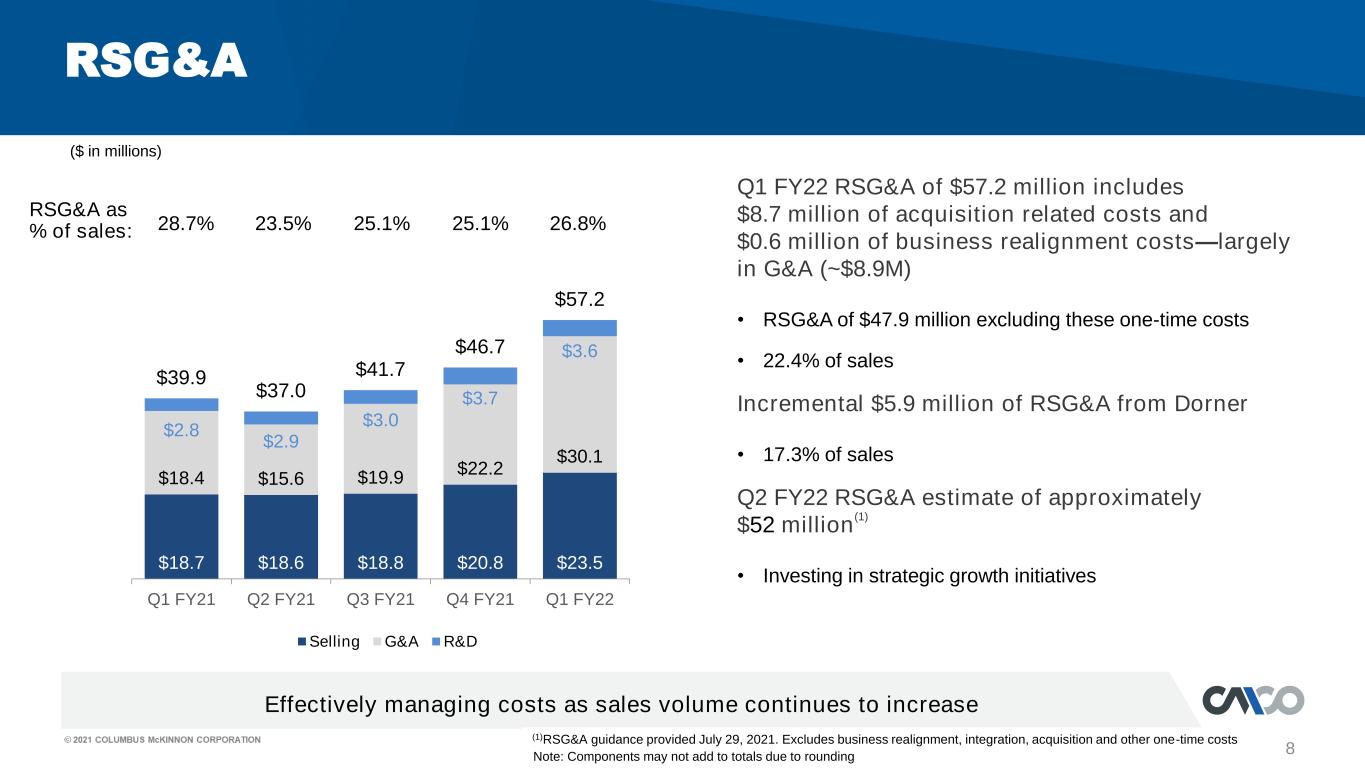
8 RSG&A $18.7 $18.6 $18.8 $20.8 $23.5 $18.4 $15.6 $19.9 $22.2 $30.1 $2.8 $2.9 $3.0 $3.7 $3.6 $39.9 $37.0 $41.7 $46.7 $57.2 Q1 FY21 Q2 FY21 Q3 FY21 Q4 FY21 Q1 FY22 Selling G&A R&D Effectively managing costs as sales volume continues to increase ($ in millions) Q1 FY22 RSG&A of $57.2 million includes $8.7 million of acquisition related costs and $0.6 million of business realignment costs—largely in G&A (~$8.9M) • RSG&A of $47.9 million excluding these one-time costs • 22.4% of sales Incremental $5.9 million of RSG&A from Dorner • 17.3% of sales Q2 FY22 RSG&A estimate of approximately $52 million (1) • Investing in strategic growth initiatives (1)RSG&A guidance provided July 29, 2021. Excludes business realignment, integration, acquisition and other one-time costs Note: Components may not add to totals due to rounding RSG&A as % of sales: 25.1% 26.8%28.7% 23.5% 25.1%
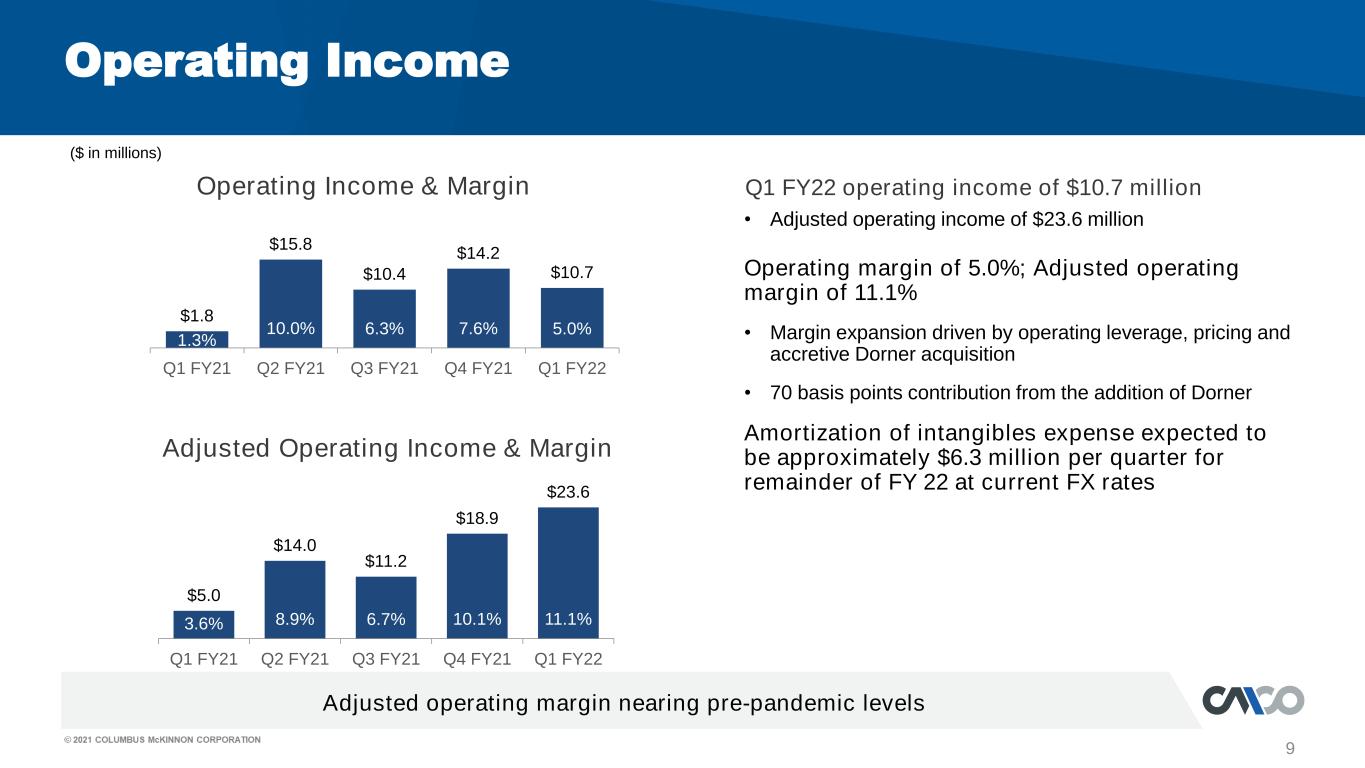
9 Q1 FY22 operating income of $10.7 million Operating Income • Adjusted operating income of $23.6 million Operating margin of 5.0%; Adjusted operating margin of 11.1% • Margin expansion driven by operating leverage, pricing and accretive Dorner acquisition • 70 basis points contribution from the addition of Dorner Amortization of intangibles expense expected to be approximately $6.3 million per quarter for remainder of FY 22 at current FX rates Adjusted operating margin nearing pre-pandemic levels ($ in millions) Operating Income & Margin Adjusted Operating Income & Margin $5.0 $14.0 $11.2 $18.9 $23.6 3.6% 8.9% 6.7% 10.1% 11.1% Q1 FY21 Q2 FY21 Q3 FY21 Q4 FY21 Q1 FY22 $1.8 $15.8 $10.4 $14.2 $10.7 1.3% 10.0% 6.3% 7.6% 5.0% Q1 FY21 Q2 FY21 Q3 FY21 Q4 FY21 Q1 FY22
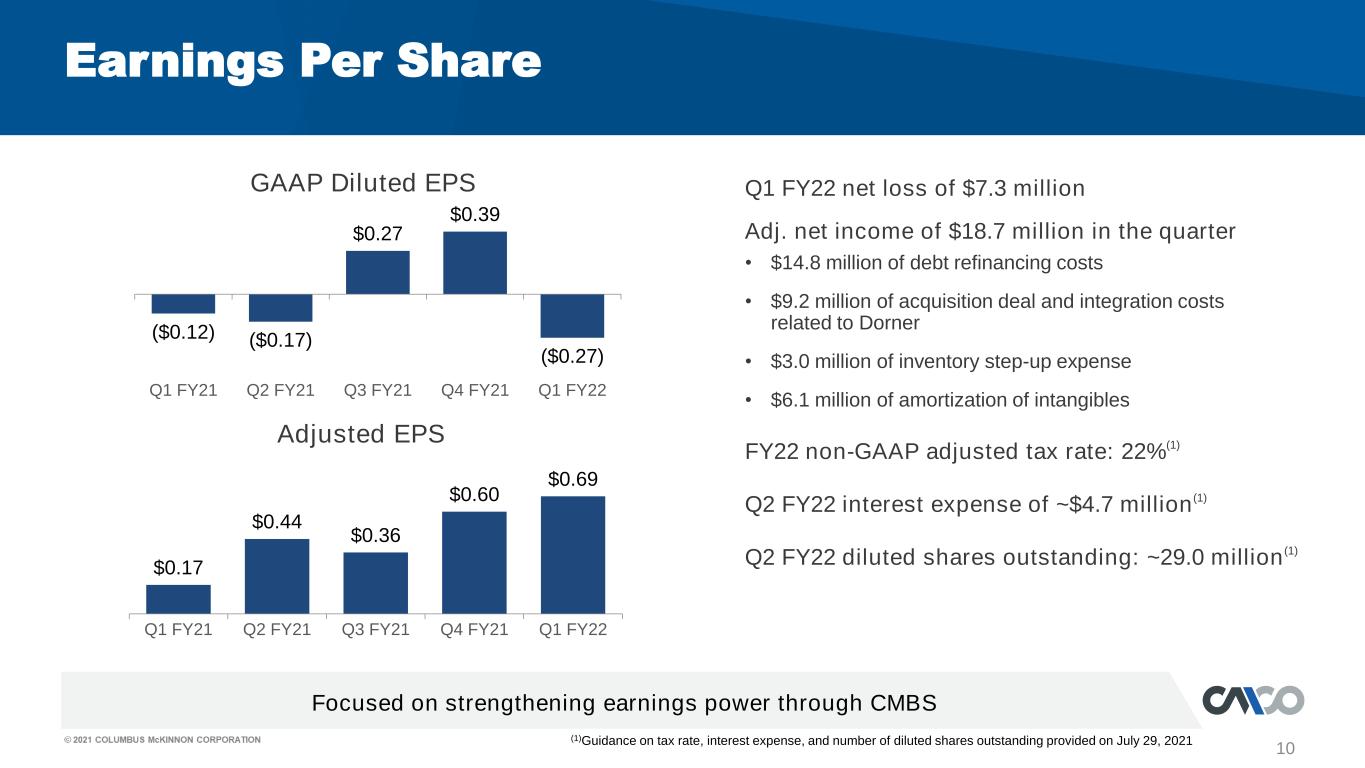
10 Q1 FY22 net loss of $7.3 million Earnings Per Share Adjusted EPS GAAP Diluted EPS ($0.12) ($0.17) $0.27 $0.39 ($0.27) Q1 FY21 Q2 FY21 Q3 FY21 Q4 FY21 Q1 FY22 $0.17 $0.44 $0.36 $0.60 $0.69 Q1 FY21 Q2 FY21 Q3 FY21 Q4 FY21 Q1 FY22 Adj. net income of $18.7 million in the quarter • $14.8 million of debt refinancing costs • $9.2 million of acquisition deal and integration costs related to Dorner • $3.0 million of inventory step-up expense • $6.1 million of amortization of intangibles FY22 non-GAAP adjusted tax rate: 22%(1) Q2 FY22 interest expense of ~$4.7 million(1) Q2 FY22 diluted shares outstanding: ~29.0 million(1) (1)Guidance on tax rate, interest expense, and number of diluted shares outstanding provided on July 29, 2021 Focused on strengthening earnings power through CMBS
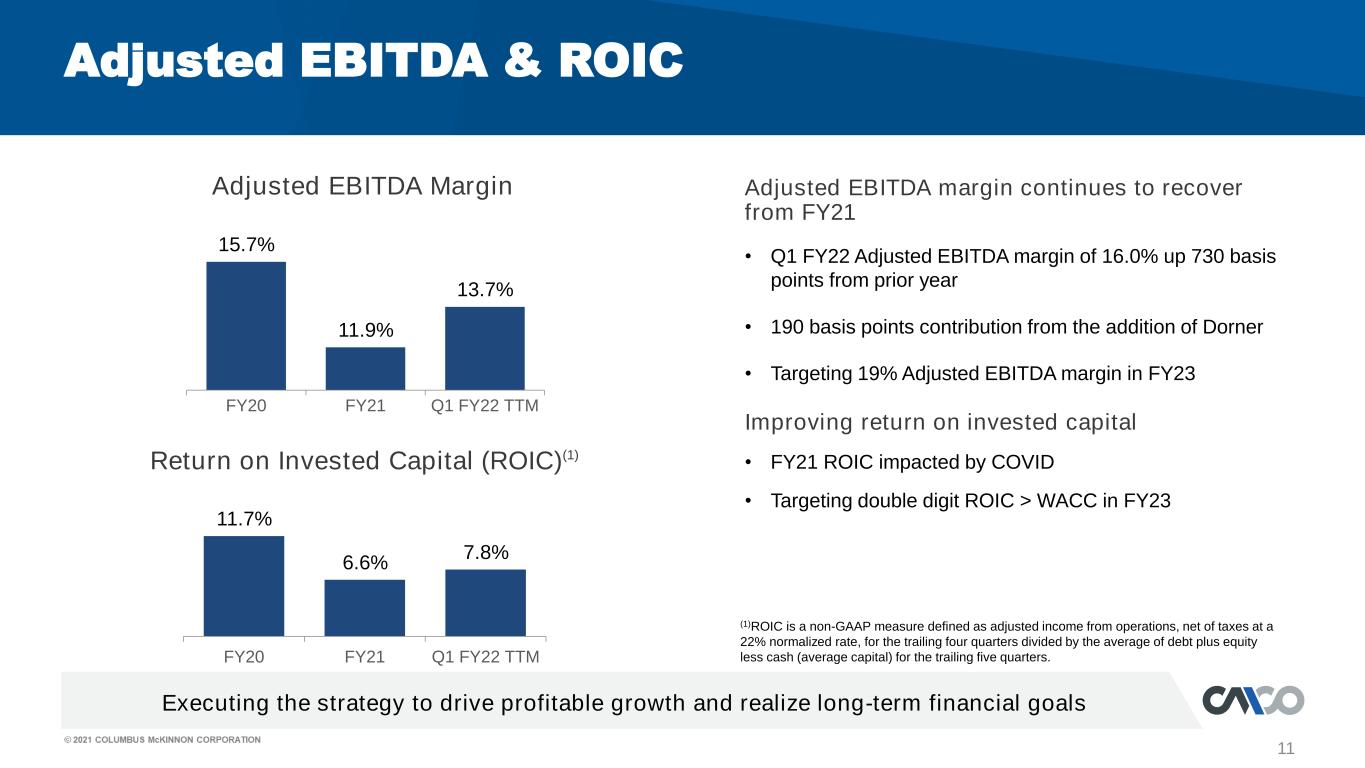
11 Adjusted EBITDA Margin Adjusted EBITDA margin continues to recover from FY21 Adjusted EBITDA & ROIC Return on Invested Capital (ROIC)(1) Executing the strategy to drive profitable growth and realize long-term financial goals 15.7% 11.9% 13.7% FY20 FY21 Q1 FY22 TTM 11.7% 6.6% 7.8% FY20 FY21 Q1 FY22 TTM (1)ROIC is a non-GAAP measure defined as adjusted income from operations, net of taxes at a 22% normalized rate, for the trailing four quarters divided by the average of debt plus equity less cash (average capital) for the trailing five quarters. • Q1 FY22 Adjusted EBITDA margin of 16.0% up 730 basis points from prior year • 190 basis points contribution from the addition of Dorner • Targeting 19% Adjusted EBITDA margin in FY23 Improving return on invested capital • FY21 ROIC impacted by COVID • Targeting double digit ROIC > WACC in FY23
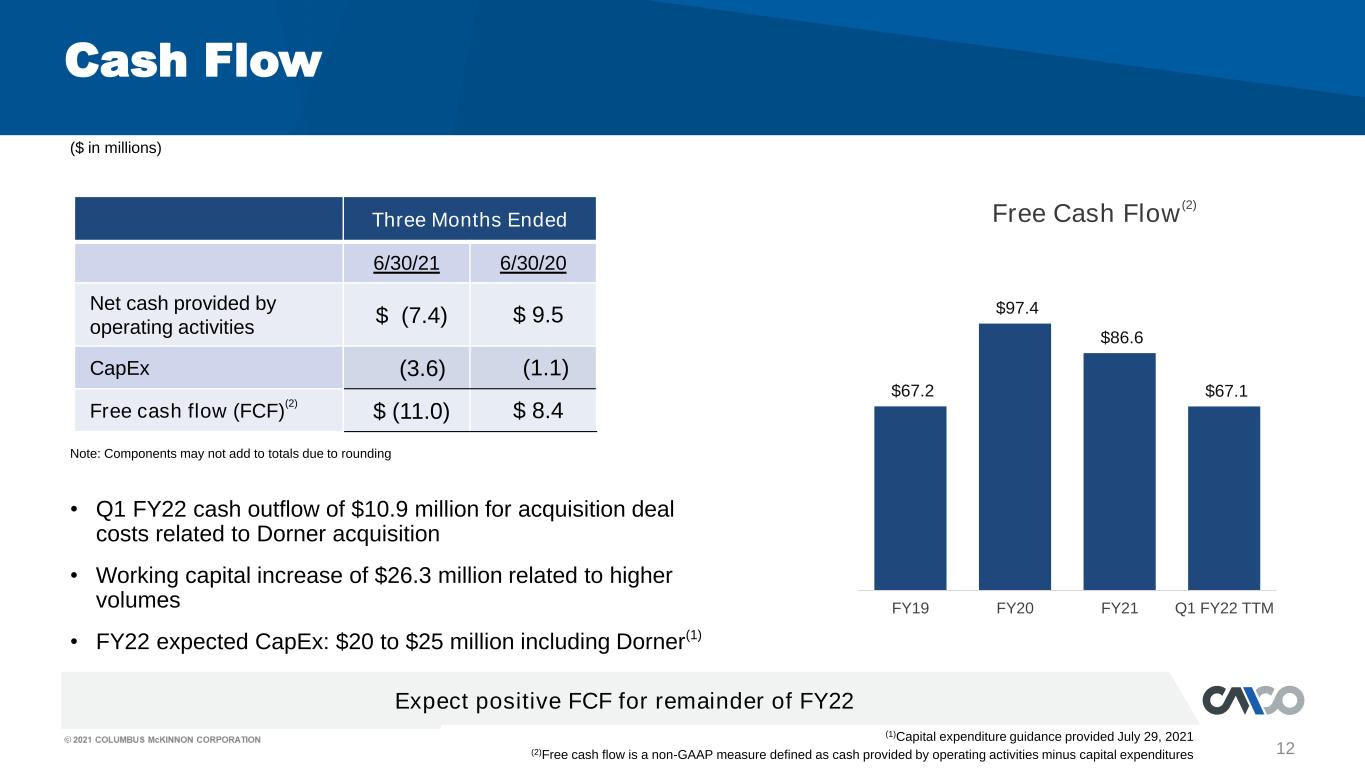
$67.2 $97.4 $86.6 $67.1 FY19 FY20 FY21 Q1 FY22 TTM 12 Free Cash Flow (2) Cash Flow • Q1 FY22 cash outflow of $10.9 million for acquisition deal costs related to Dorner acquisition • Working capital increase of $26.3 million related to higher volumes • FY22 expected CapEx: $20 to $25 million including Dorner(1) Three Months Ended 6/30/21 6/30/20 Net cash provided by operating activities $ (7.4) $ 9.5 CapEx (3.6) (1.1) Free cash flow (FCF) (2) $ (11.0) $ 8.4 Expect positive FCF for remainder of FY22 Note: Components may not add to totals due to rounding (1)Capital expenditure guidance provided July 29, 2021 (2)Free cash flow is a non-GAAP measure defined as cash provided by operating activities minus capital expenditures ($ in millions)

13 Capital Structure Pro-forma net debt leverage ratio of ~3.0x(1) • Net debt to net total capital: 33.8% ~$170 million of liquidity Financed Dorner acquisition with equity and debt • Initial bridge loan of $650 million to fund acquisition • Issued equity to de-lever balance sheet • Upsized public offering with net proceeds of ~$198.7 million • Refinanced debt with new Term Loan B of $450 million Expect to quickly de-lever to target net leverage ratio of 2.0x CAPITALIZATION June 30, 2021 March 31, 2021 Cash and cash equivalents $ 88.7 $ 202.1 Total debt 459.3 249.0 Total net debt 370.6 46.8 Shareholders’ equity 724.5 530.1 Total capitalization $ 1,183.7 $ 779.1 Debt/total capitalization 38.8% 32.0% Net debt/net total capitalization 33.8% 8.1% (1)Pro-forma net debt leverage ratio is defined as Net Debt / TTM Adjusted EBITDA including Dorner ($ in millions)
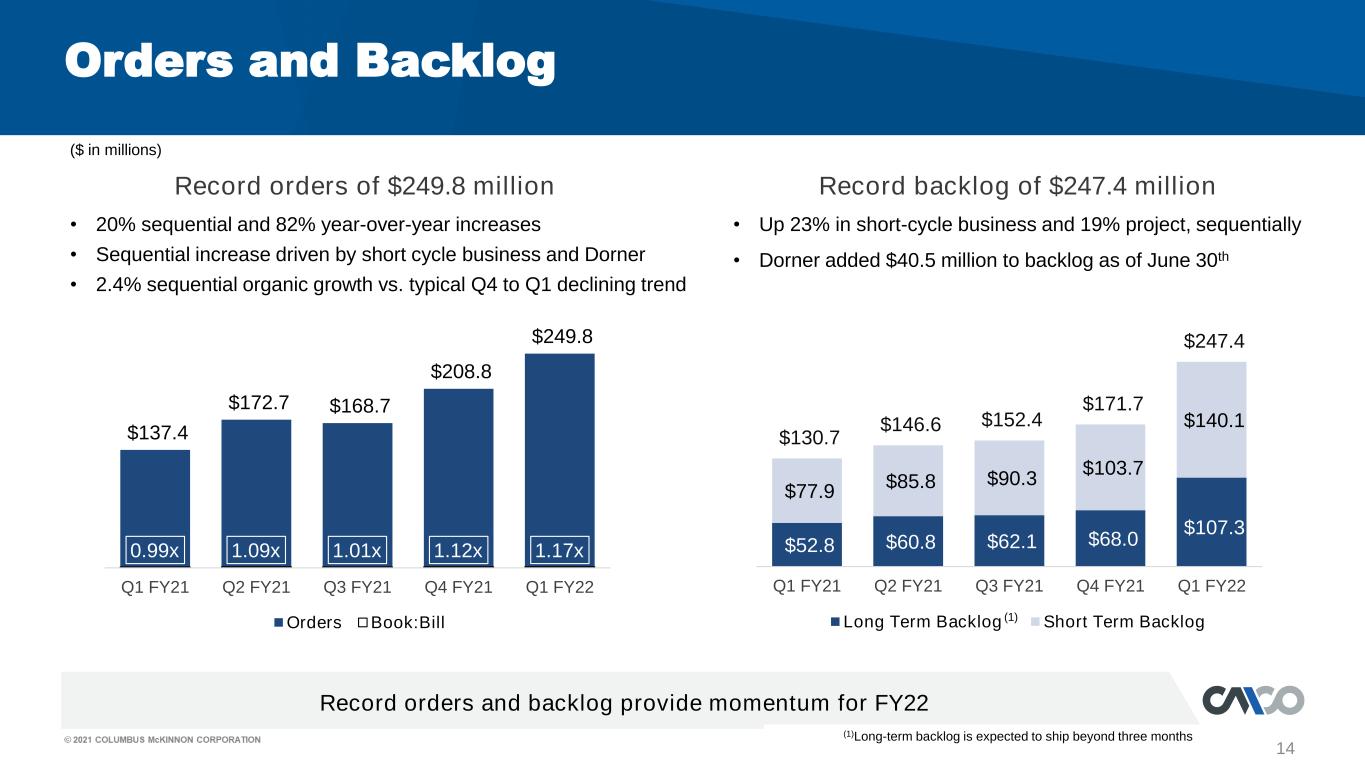
14 Record orders of $249.8 million Record backlog of $247.4 million Orders and Backlog • 20% sequential and 82% year-over-year increases • Sequential increase driven by short cycle business and Dorner • 2.4% sequential organic growth vs. typical Q4 to Q1 declining trend • Up 23% in short-cycle business and 19% project, sequentially • Dorner added $40.5 million to backlog as of June 30th Record orders and backlog provide momentum for FY22 ($ in millions) $137.4 $172.7 $168.7 $208.8 $249.8 0.99x 1.09x 1.01x 1.12x 1.17x Q1 FY21 Q2 FY21 Q3 FY21 Q4 FY21 Q1 FY22 Orders Book:Bill (1)Long-term backlog is expected to ship beyond three months $52.8 $60.8 $62.1 $68.0 $107.3 $77.9 $85.8 $90.3 $103.7 $140.1 $130.7 $146.6 $152.4 $171.7 $247.4 Q1 FY21 Q2 FY21 Q3 FY21 Q4 FY21 Q1 FY22 Long Term Backlog Short Term Backlog(1)
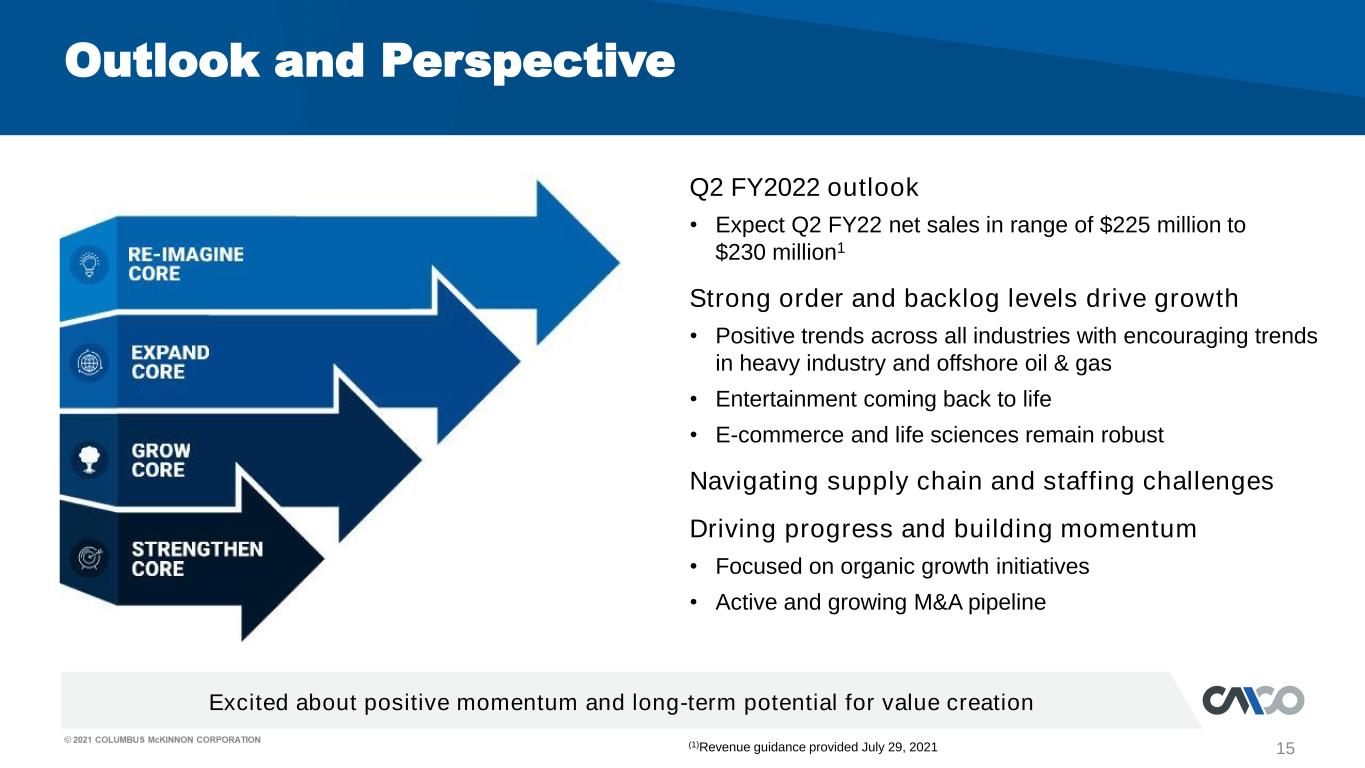
15 Excited about positive momentum and long-term potential for value creation Outlook and Perspective Q2 FY2022 outlook • Expect Q2 FY22 net sales in range of $225 million to $230 million1 Strong order and backlog levels drive growth • Positive trends across all industries with encouraging trends in heavy industry and offshore oil & gas • Entertainment coming back to life • E-commerce and life sciences remain robust Navigating supply chain and staffing challenges Driving progress and building momentum • Focused on organic growth initiatives • Active and growing M&A pipeline (1)Revenue guidance provided July 29, 2021
Q1 Fiscal Year 2022 Financial Results Conference Call July 29, 2021 David J. Wilson President and Chief Executive Officer Gregory P. Rustowicz Vice President – Finance & Chief Financial Officer
Supplemental Information
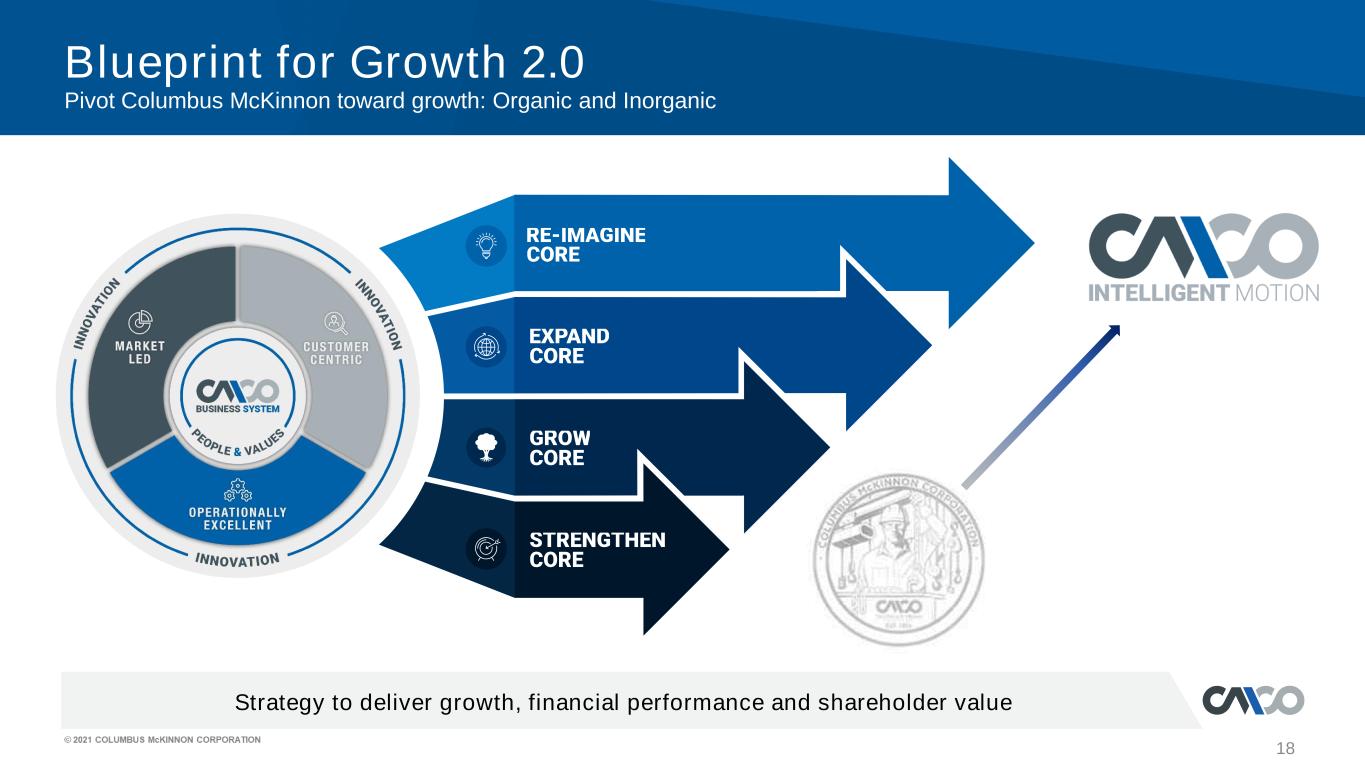
Blueprint for Growth 2.0 Pivot Columbus McKinnon toward growth: Organic and Inorganic 18 Strategy to deliver growth, financial performance and shareholder value
19 Conference Call Playback Info Replay Number: 412-317-6671 passcode: 10158268 Telephone replay available through August 5, 2021 Webcast / PowerPoint / Replay available at investors.columbusmckinnon.com Transcript, when available, at investors.columbusmckinnon.com
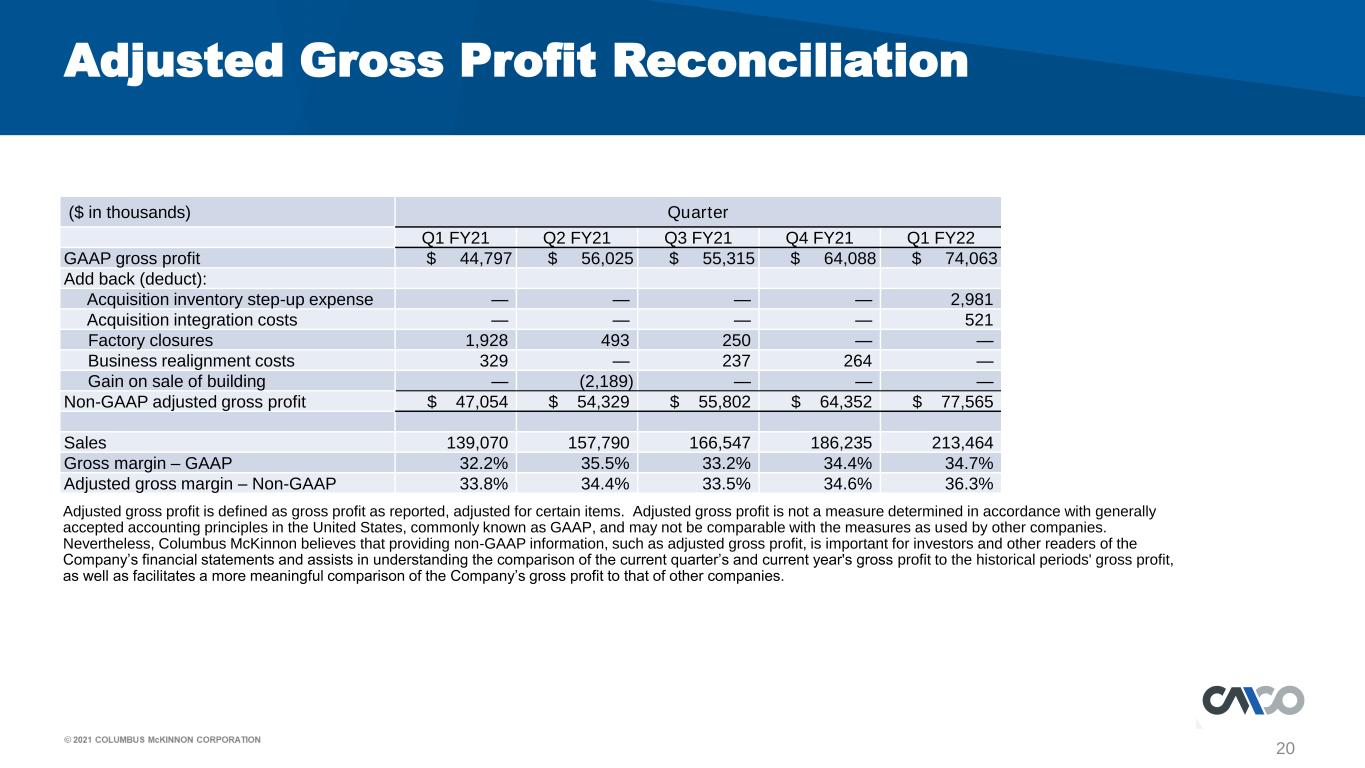
20 Adjusted Gross Profit Reconciliation Adjusted gross profit is defined as gross profit as reported, adjusted for certain items. Adjusted gross profit is not a measure determined in accordance with generally accepted accounting principles in the United States, commonly known as GAAP, and may not be comparable with the measures as used by other companies. Nevertheless, Columbus McKinnon believes that providing non-GAAP information, such as adjusted gross profit, is important for investors and other readers of the Company’s financial statements and assists in understanding the comparison of the current quarter’s and current year's gross profit to the historical periods' gross profit, as well as facilitates a more meaningful comparison of the Company’s gross profit to that of other companies. ($ in thousands) Quarter Q1 FY21 Q2 FY21 Q3 FY21 Q4 FY21 Q1 FY22 GAAP gross profit $ 44,797 $ 56,025 $ 55,315 $ 64,088 $ 74,063 Add back (deduct): Acquisition inventory step-up expense — — — — 2,981 Acquisition integration costs — — — — 521 Factory closures 1,928 493 250 — — Business realignment costs 329 — 237 264 — Gain on sale of building — (2,189) — — — Non-GAAP adjusted gross profit $ 47,054 $ 54,329 $ 55,802 $ 64,352 $ 77,565 Sales 139,070 157,790 166,547 186,235 213,464 Gross margin – GAAP 32.2% 35.5% 33.2% 34.4% 34.7% Adjusted gross margin – Non-GAAP 33.8% 34.4% 33.5% 34.6% 36.3%
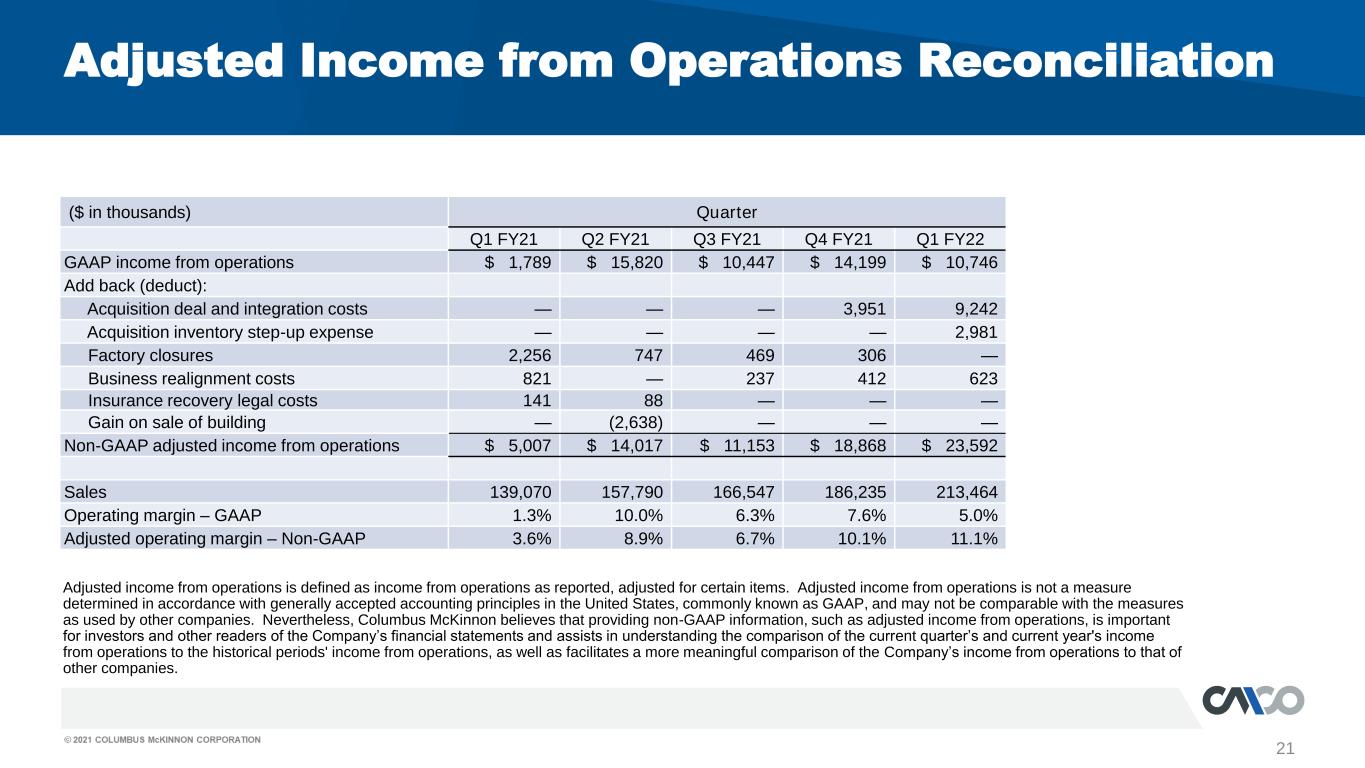
21 Adjusted Income from Operations Reconciliation Adjusted income from operations is defined as income from operations as reported, adjusted for certain items. Adjusted income from operations is not a measure determined in accordance with generally accepted accounting principles in the United States, commonly known as GAAP, and may not be comparable with the measures as used by other companies. Nevertheless, Columbus McKinnon believes that providing non-GAAP information, such as adjusted income from operations, is important for investors and other readers of the Company’s financial statements and assists in understanding the comparison of the current quarter’s and current year's income from operations to the historical periods' income from operations, as well as facilitates a more meaningful comparison of the Company’s income from operations to that of other companies. ($ in thousands) Quarter Q1 FY21 Q2 FY21 Q3 FY21 Q4 FY21 Q1 FY22 GAAP income from operations $ 1,789 $ 15,820 $ 10,447 $ 14,199 $ 10,746 Add back (deduct): Acquisition deal and integration costs — — — 3,951 9,242 Acquisition inventory step-up expense — — — — 2,981 Factory closures 2,256 747 469 306 — Business realignment costs 821 — 237 412 623 Insurance recovery legal costs 141 88 — — — Gain on sale of building — (2,638) — — — Non-GAAP adjusted income from operations $ 5,007 $ 14,017 $ 11,153 $ 18,868 $ 23,592 Sales 139,070 157,790 166,547 186,235 213,464 Operating margin – GAAP 1.3% 10.0% 6.3% 7.6% 5.0% Adjusted operating margin – Non-GAAP 3.6% 8.9% 6.7% 10.1% 11.1%
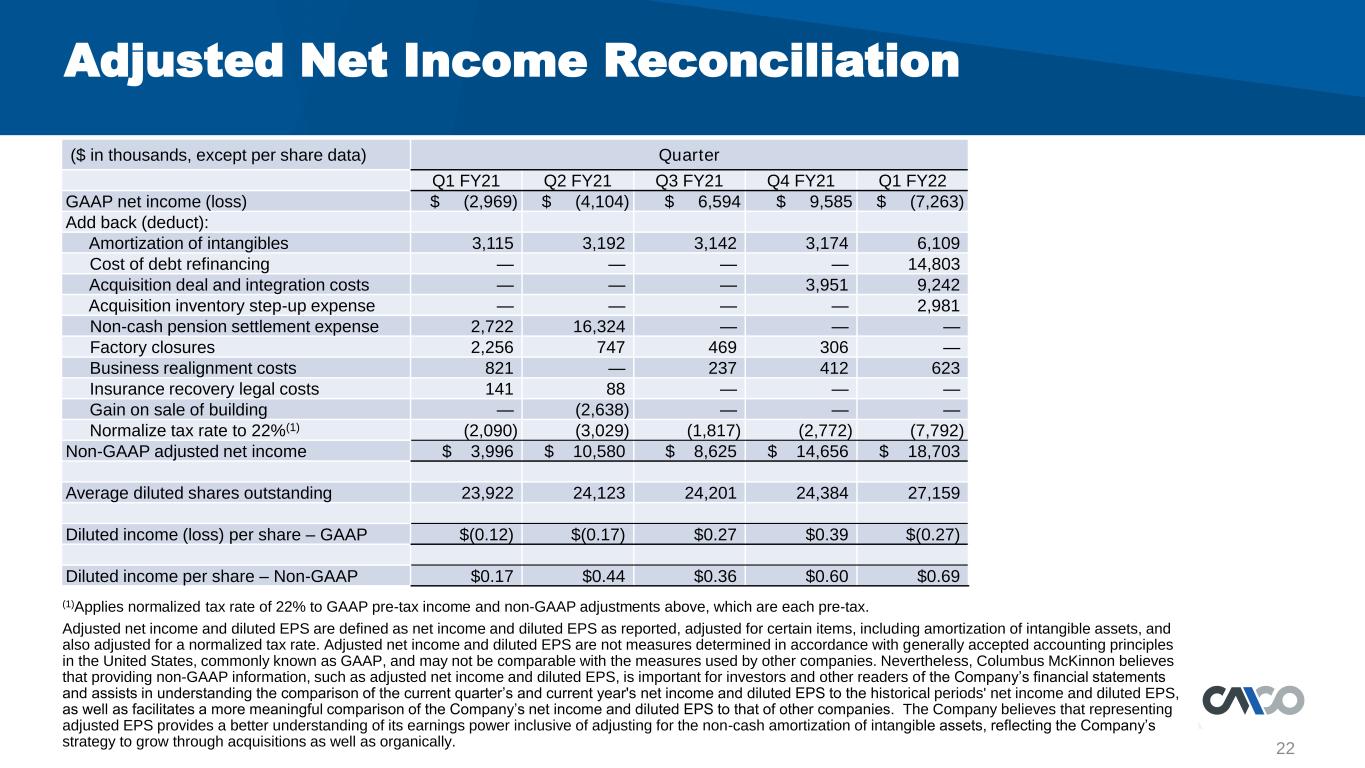
22 Adjusted Net Income Reconciliation ($ in thousands, except per share data) Quarter Q1 FY21 Q2 FY21 Q3 FY21 Q4 FY21 Q1 FY22 GAAP net income (loss) $ (2,969) $ (4,104) $ 6,594 $ 9,585 $ (7,263) Add back (deduct): Amortization of intangibles 3,115 3,192 3,142 3,174 6,109 Cost of debt refinancing — — — — 14,803 Acquisition deal and integration costs — — — 3,951 9,242 Acquisition inventory step-up expense — — — — 2,981 Non-cash pension settlement expense 2,722 16,324 — — — Factory closures 2,256 747 469 306 — Business realignment costs 821 — 237 412 623 Insurance recovery legal costs 141 88 — — — Gain on sale of building — (2,638) — — — Normalize tax rate to 22%(1) (2,090) (3,029) (1,817) (2,772) (7,792) Non-GAAP adjusted net income $ 3,996 $ 10,580 $ 8,625 $ 14,656 $ 18,703 Average diluted shares outstanding 23,922 24,123 24,201 24,384 27,159 Diluted income (loss) per share – GAAP $(0.12) $(0.17) $0.27 $0.39 $(0.27) Diluted income per share – Non-GAAP $0.17 $0.44 $0.36 $0.60 $0.69 (1)Applies normalized tax rate of 22% to GAAP pre-tax income and non-GAAP adjustments above, which are each pre-tax. Adjusted net income and diluted EPS are defined as net income and diluted EPS as reported, adjusted for certain items, including amortization of intangible assets, and also adjusted for a normalized tax rate. Adjusted net income and diluted EPS are not measures determined in accordance with generally accepted accounting principles in the United States, commonly known as GAAP, and may not be comparable with the measures used by other companies. Nevertheless, Columbus McKinnon believes that providing non-GAAP information, such as adjusted net income and diluted EPS, is important for investors and other readers of the Company’s financial statements and assists in understanding the comparison of the current quarter’s and current year's net income and diluted EPS to the historical periods' net income and diluted EPS, as well as facilitates a more meaningful comparison of the Company’s net income and diluted EPS to that of other companies. The Company believes that representing adjusted EPS provides a better understanding of its earnings power inclusive of adjusting for the non-cash amortization of intangible assets, reflecting the Company’s strategy to grow through acquisitions as well as organically.
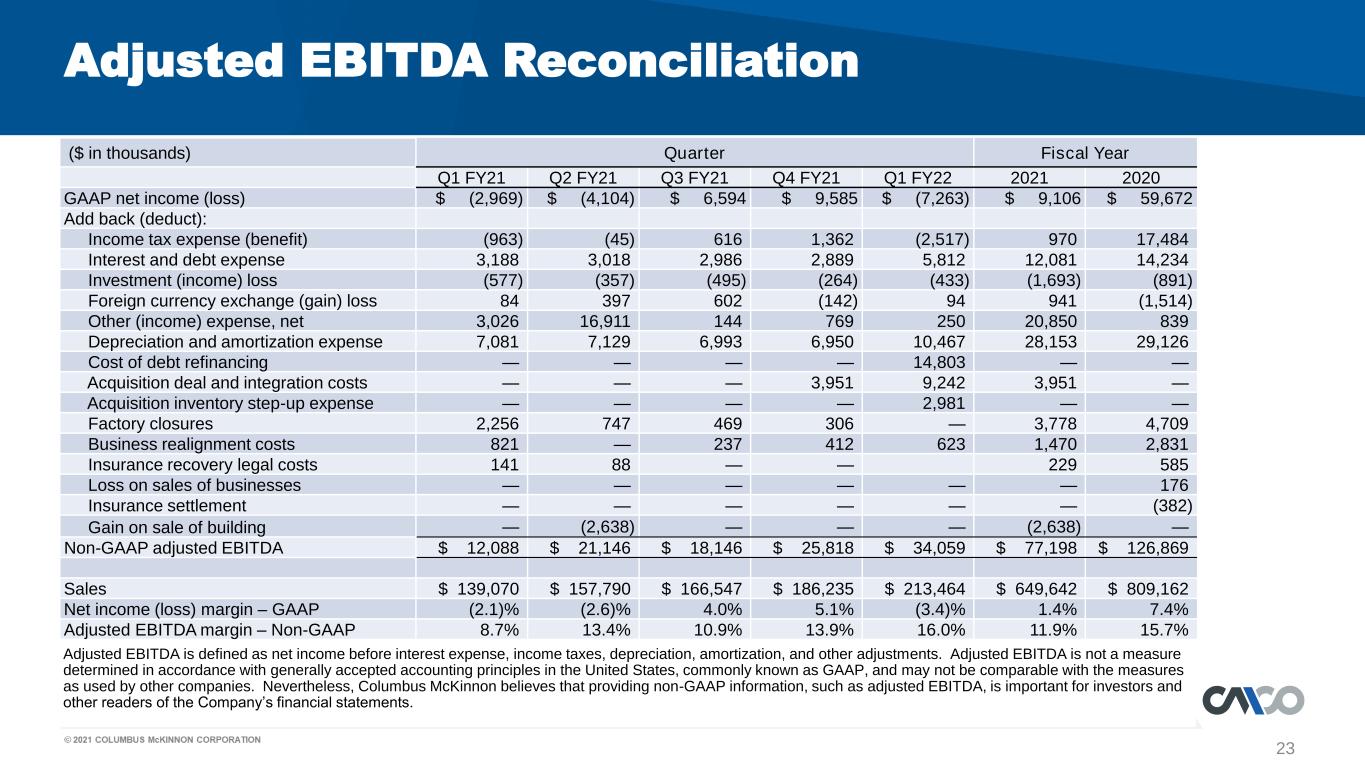
23 Adjusted EBITDA Reconciliation Adjusted EBITDA is defined as net income before interest expense, income taxes, depreciation, amortization, and other adjustments. Adjusted EBITDA is not a measure determined in accordance with generally accepted accounting principles in the United States, commonly known as GAAP, and may not be comparable with the measures as used by other companies. Nevertheless, Columbus McKinnon believes that providing non-GAAP information, such as adjusted EBITDA, is important for investors and other readers of the Company’s financial statements. ($ in thousands) Quarter Fiscal Year Q1 FY21 Q2 FY21 Q3 FY21 Q4 FY21 Q1 FY22 2021 2020 GAAP net income (loss) $ (2,969) $ (4,104) $ 6,594 $ 9,585 $ (7,263) $ 9,106 $ 59,672 Add back (deduct): Income tax expense (benefit) (963) (45) 616 1,362 (2,517) 970 17,484 Interest and debt expense 3,188 3,018 2,986 2,889 5,812 12,081 14,234 Investment (income) loss (577) (357) (495) (264) (433) (1,693) (891) Foreign currency exchange (gain) loss 84 397 602 (142) 94 941 (1,514) Other (income) expense, net 3,026 16,911 144 769 250 20,850 839 Depreciation and amortization expense 7,081 7,129 6,993 6,950 10,467 28,153 29,126 Cost of debt refinancing — — — — 14,803 — — Acquisition deal and integration costs — — — 3,951 9,242 3,951 — Acquisition inventory step-up expense — — — — 2,981 — — Factory closures 2,256 747 469 306 — 3,778 4,709 Business realignment costs 821 — 237 412 623 1,470 2,831 Insurance recovery legal costs 141 88 — — 229 585 Loss on sales of businesses — — — — — — 176 Insurance settlement — — — — — — (382) Gain on sale of building — (2,638) — — — (2,638) — Non-GAAP adjusted EBITDA $ 12,088 $ 21,146 $ 18,146 $ 25,818 $ 34,059 $ 77,198 $ 126,869 Sales $ 139,070 $ 157,790 $ 166,547 $ 186,235 $ 213,464 $ 649,642 $ 809,162 Net income (loss) margin – GAAP (2.1)% (2.6)% 4.0% 5.1% (3.4)% 1.4% 7.4% Adjusted EBITDA margin – Non-GAAP 8.7% 13.4% 10.9% 13.9% 16.0% 11.9% 15.7%
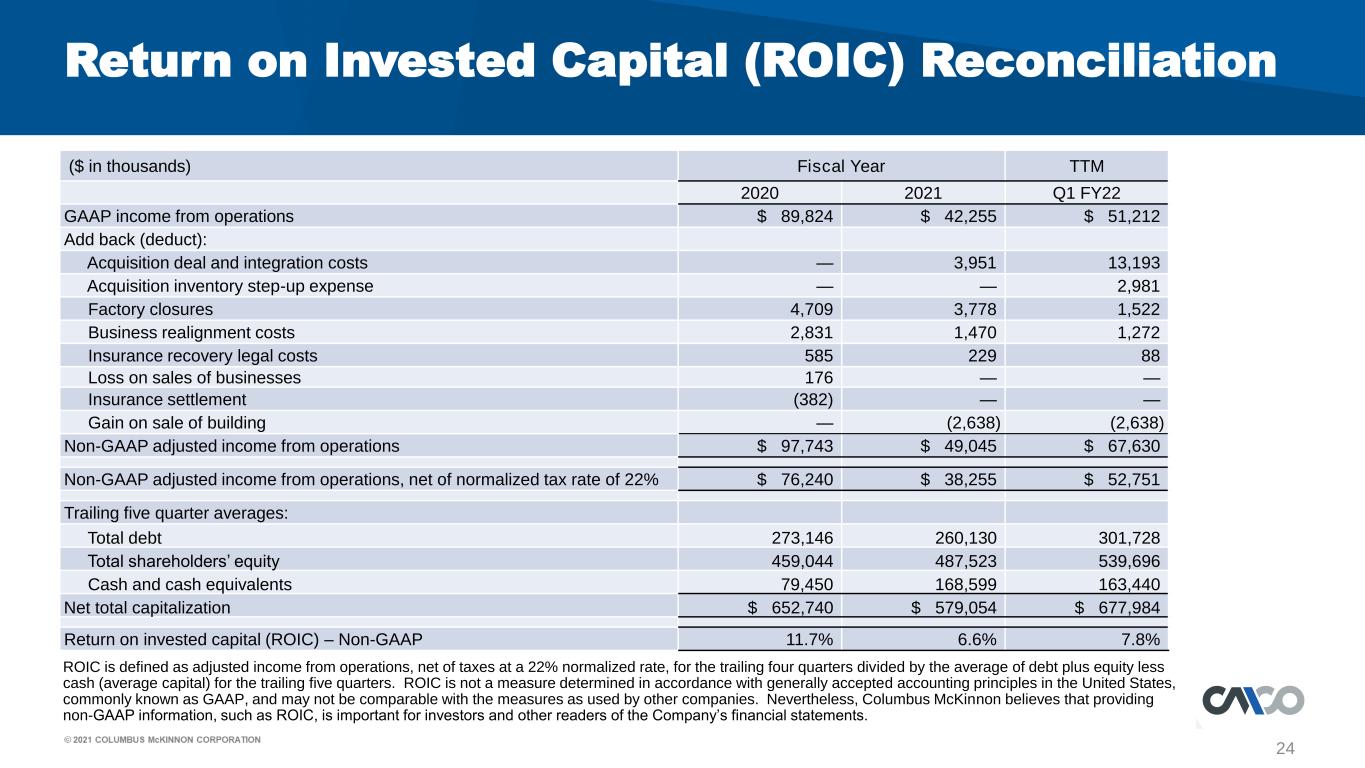
24 Return on Invested Capital (ROIC) Reconciliation ROIC is defined as adjusted income from operations, net of taxes at a 22% normalized rate, for the trailing four quarters divided by the average of debt plus equity less cash (average capital) for the trailing five quarters. ROIC is not a measure determined in accordance with generally accepted accounting principles in the United States, commonly known as GAAP, and may not be comparable with the measures as used by other companies. Nevertheless, Columbus McKinnon believes that providing non-GAAP information, such as ROIC, is important for investors and other readers of the Company’s financial statements. ($ in thousands) Fiscal Year TTM 2020 2021 Q1 FY22 GAAP income from operations $ 89,824 $ 42,255 $ 51,212 Add back (deduct): Acquisition deal and integration costs — 3,951 13,193 Acquisition inventory step-up expense — — 2,981 Factory closures 4,709 3,778 1,522 Business realignment costs 2,831 1,470 1,272 Insurance recovery legal costs 585 229 88 Loss on sales of businesses 176 — — Insurance settlement (382) — — Gain on sale of building — (2,638) (2,638) Non-GAAP adjusted income from operations $ 97,743 $ 49,045 $ 67,630 Non-GAAP adjusted income from operations, net of normalized tax rate of 22% $ 76,240 $ 38,255 $ 52,751 Trailing five quarter averages: Total debt 273,146 260,130 301,728 Total shareholders’ equity 459,044 487,523 539,696 Cash and cash equivalents 79,450 168,599 163,440 Net total capitalization $ 652,740 $ 579,054 $ 677,984 Return on invested capital (ROIC) – Non-GAAP 11.7% 6.6% 7.8%
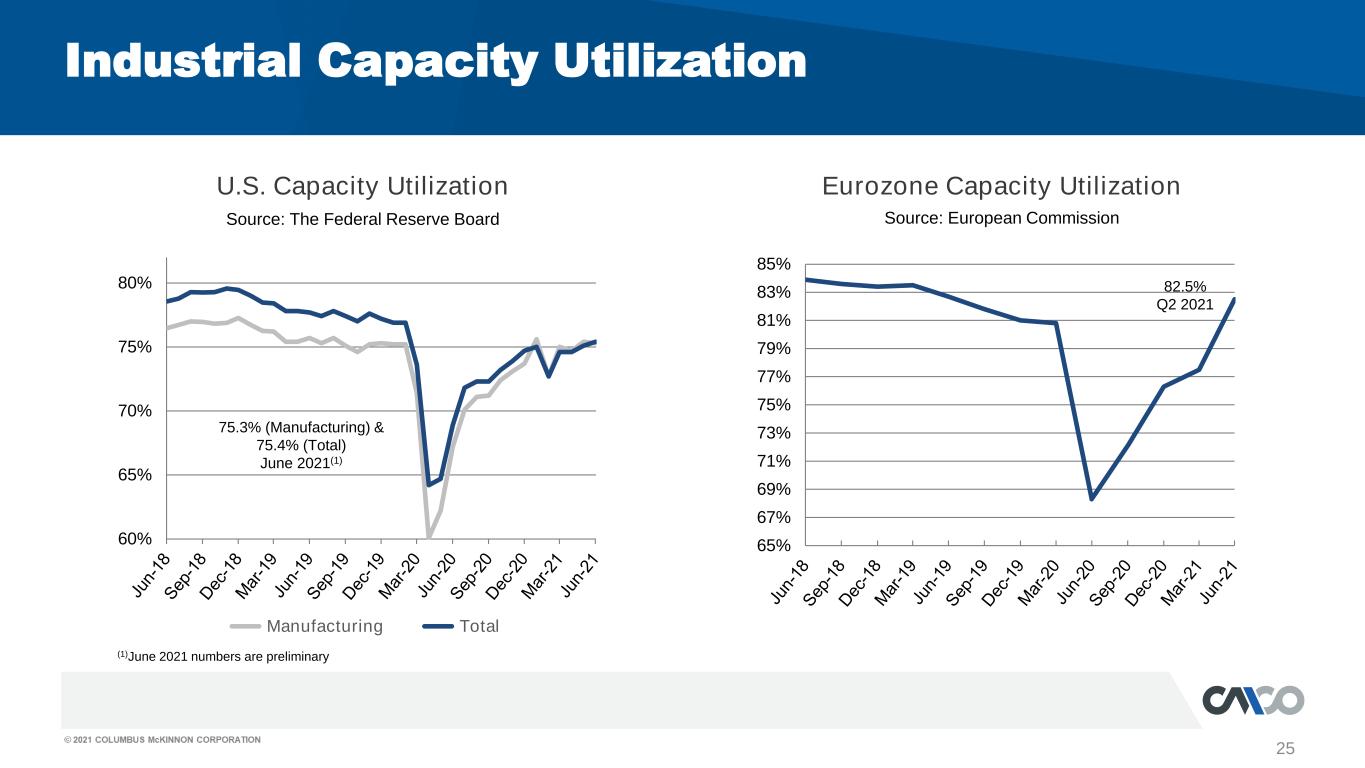
25 U.S. Capacity Utilization Eurozone Capacity Utilization Industrial Capacity Utilization Source: The Federal Reserve Board Source: European Commission 60% 65% 70% 75% 80% Manufacturing Total 75.3% (Manufacturing) & 75.4% (Total) June 2021(1) 65% 67% 69% 71% 73% 75% 77% 79% 81% 83% 85% 82.5% Q2 2021 (1)June 2021 numbers are preliminary
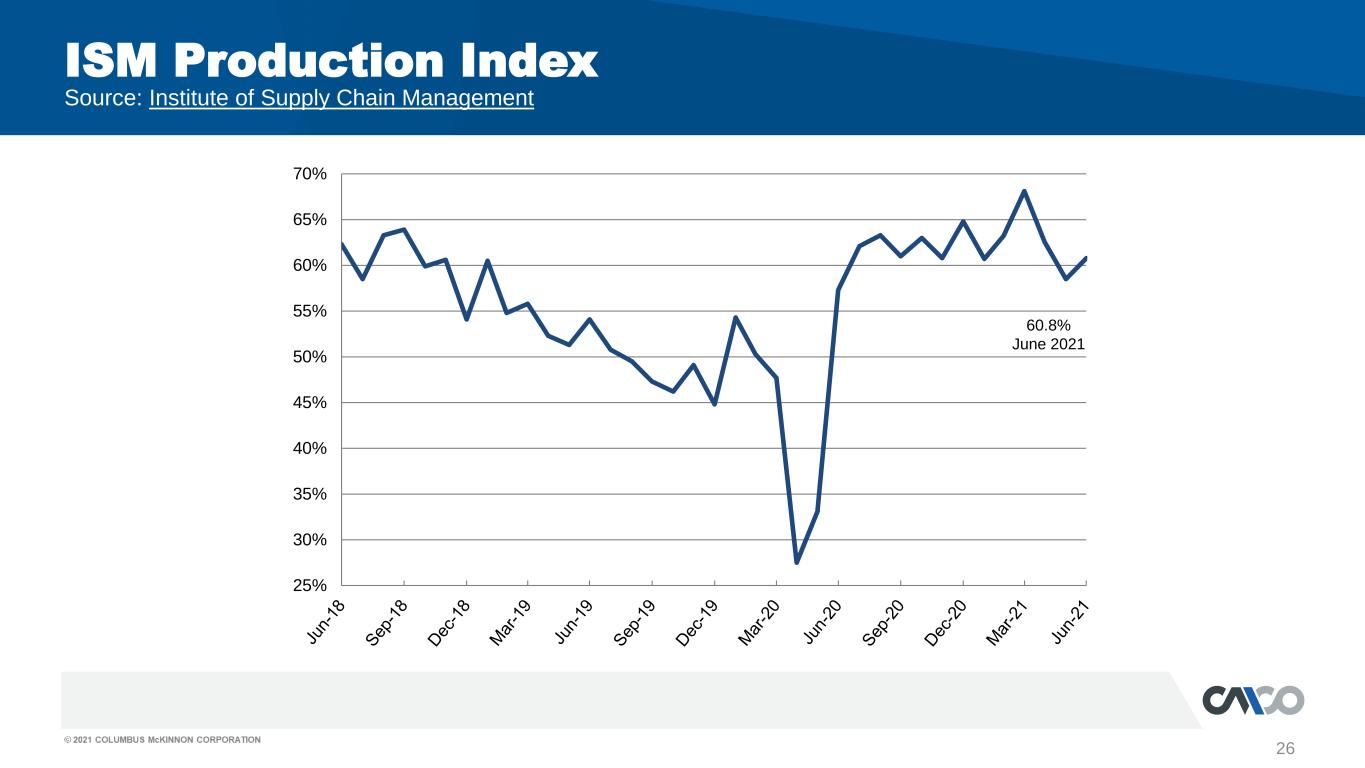
26 ISM Production Index Source: Institute of Supply Chain Management 25% 30% 35% 40% 45% 50% 55% 60% 65% 70% 60.8% June 2021
Q1 Fiscal Year 2022 Financial Results Conference Call July 29, 2021


