Q3 Fiscal Year 2022 Financial Results Conference Call January 27, 2022 David J. Wilson President and Chief Executive Officer Gregory P. Rustowicz Senior Vice President – Finance & Chief Financial Officer

© 2022 COLUMBUS McKINNON CORPORATION 2 Safe Harbor Statement These slides, and the accompanying oral discussion (together, this “presentation”), contain “forward-looking statements” within the meaning of the Private Securities Litigation Reform Act of 1995. Such statements include, but are not limited to, statements concerning: future sales, earnings and plans; the success of the Dorner Mfg. Corp. (“Dorner”) acquisitions, achievement of cost and revenue synergies and the amount of such synergies and integration costs; the ability of the Company to achieve market success and earnings per share accretion expectations; the ability of the Company to employ the Columbus McKinnon Business System to drive profitability and to grow the business with its Blueprint for Growth 2.0 strategy, involve known and unknown risks, and are based upon current information and expectations. Actual results may differ materially from those anticipated if the information on which those estimates were based ultimately proves to be incorrect or as a result of certain risks and uncertainties that could cause our actual results to differ materially from the results expressed or implied by such statements, including the integration of recent acquisitions into the Company to achieve cost and revenue synergies, the abil ity of the Company and its recent acquisitions to achieve revenue expectations, global economic and business conditions including the impact of COVID -19, conditions affecting the industries served by us and our subsidiaries, conditions affecting our customers and suppliers, competitor responses to our products and services, the overall market acceptance of such products and services, facility consolidations and other restructurings, the ability to expand into new markets and geographic regions, foreign currency fluctuations, and other factors disclosed in our periodic reports filed with the Securities and Exchange Commission. Consequently, such forward-looking statements should be regarded as our current plans, estimates and beliefs. Except as required by applicable law, we do not undertake and specifically decline any obligation to publicly release the results of any revisions to these forward-looking statements that may be made to reflect any future events or circumstances after the date of such statements or to reflect the occurrence of anticipated or unanticipated events. Non-GAAP Financial Measures This presentation will discuss some non-GAAP (“adjusted”) financial measures which we believe are useful in evaluating our performance. You should not consider the presentation of this additional information in isolation or as a substitute for results compared in accordance with GAAP. The non-GAAP (“adjusted”) measures are noted and reconciliations of comparable GAAP with non-GAAP measures can be found in tables included in the Supplemental Information portion of this presentation.
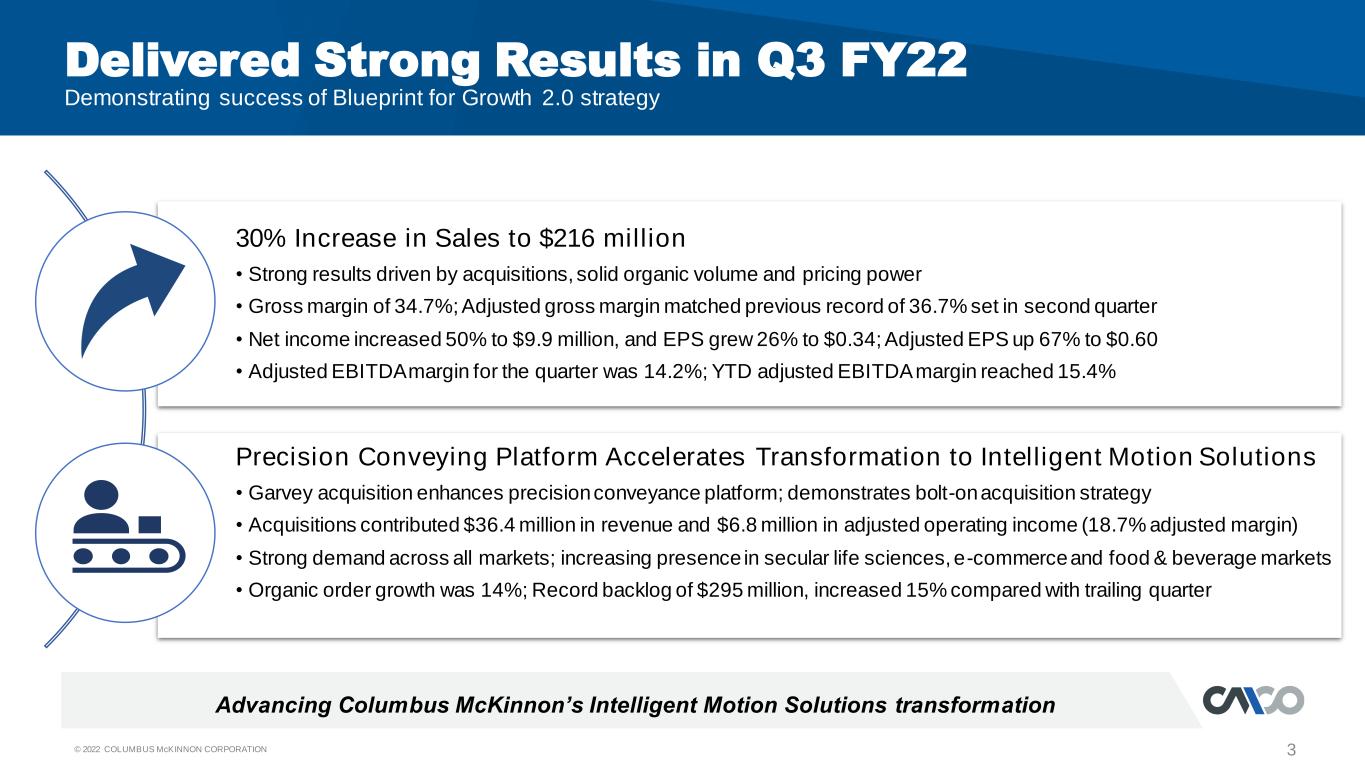
© 2022 COLUMBUS McKINNON CORPORATION 3 Delivered Strong Results in Q3 FY22 Demonstrating success of Blueprint for Growth 2.0 strategy 30% Increase in Sales to $216 million • Strong results driven by acquisitions, solid organic volume and pricing power • Gross margin of 34.7%; Adjusted gross margin matched previous record of 36.7% set in second quarter • Net income increased 50% to $9.9 million, and EPS grew 26% to $0.34; Adjusted EPS up 67% to $0.60 • Adjusted EBITDA margin for the quarter was 14.2%; YTD adjusted EBITDA margin reached 15.4% Precision Conveying Platform Accelerates Transformation to Intelligent Motion Solutions • Garvey acquisition enhances precision conveyance platform; demonstrates bolt-on acquisition strategy • Acquisitions contributed $36.4 million in revenue and $6.8 million in adjusted operating income (18.7% adjusted margin) • Strong demand across all markets; increasing presence in secular life sciences, e-commerce and food & beverage markets • Organic order growth was 14%; Record backlog of $295 million, increased 15% compared with trailing quarter Advancing Columbus McKinnon’s Intelligent Motion Solutions transformation
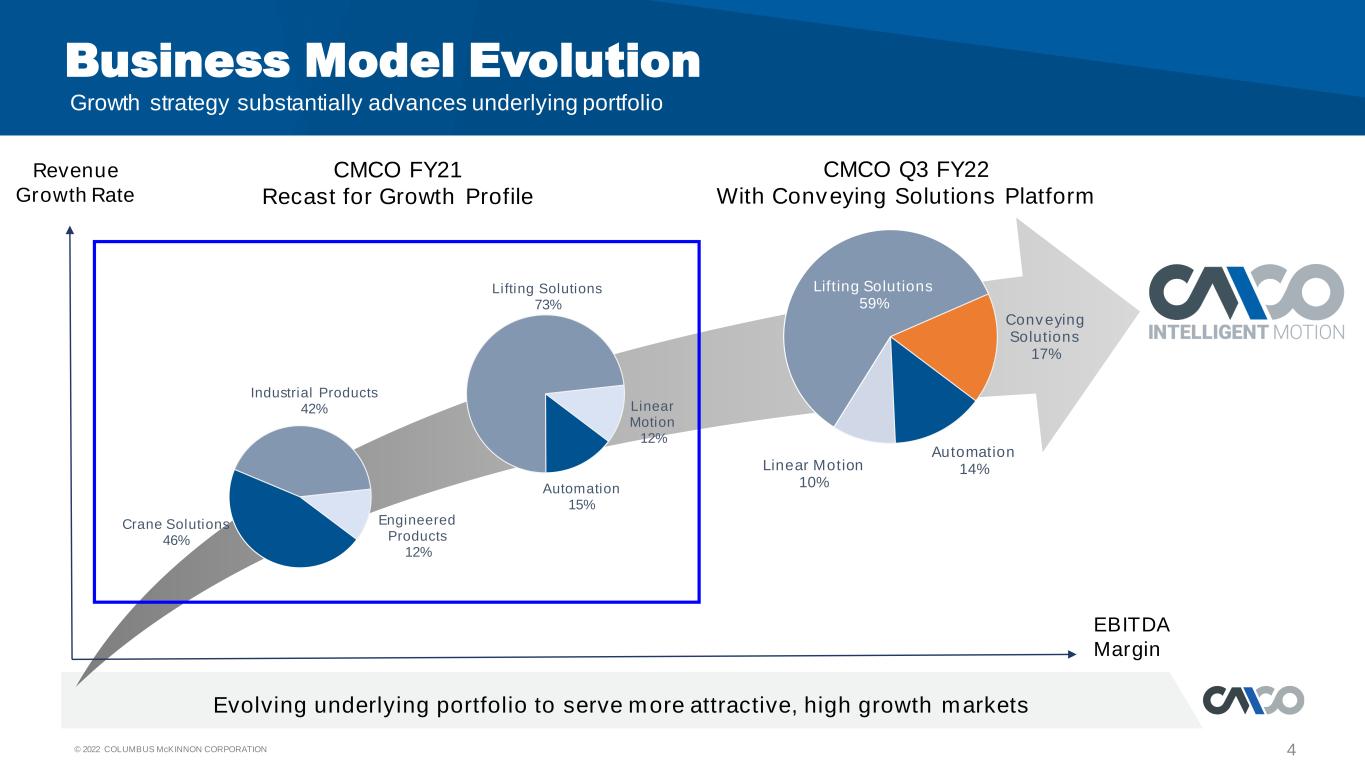
© 2022 COLUMBUS McKINNON CORPORATION 4 Business Model Evolution Revenue Growth Rate EBITDA Margin CMCO Q3 FY22 With Conveying Solutions Platform Crane Solutions 46% Industrial Products 42% Engineered Products 12% Automation 14%Linear Motion 10% Lifting Solutions 59% Conveying Solutions 17% Automation 15% Lifting Solutions 73% Linear Motion 12% CMCO FY21 Recast for Growth Profile Growth strategy substantially advances underlying portfolio Evolving underlying portfolio to serve more attractive, high growth markets
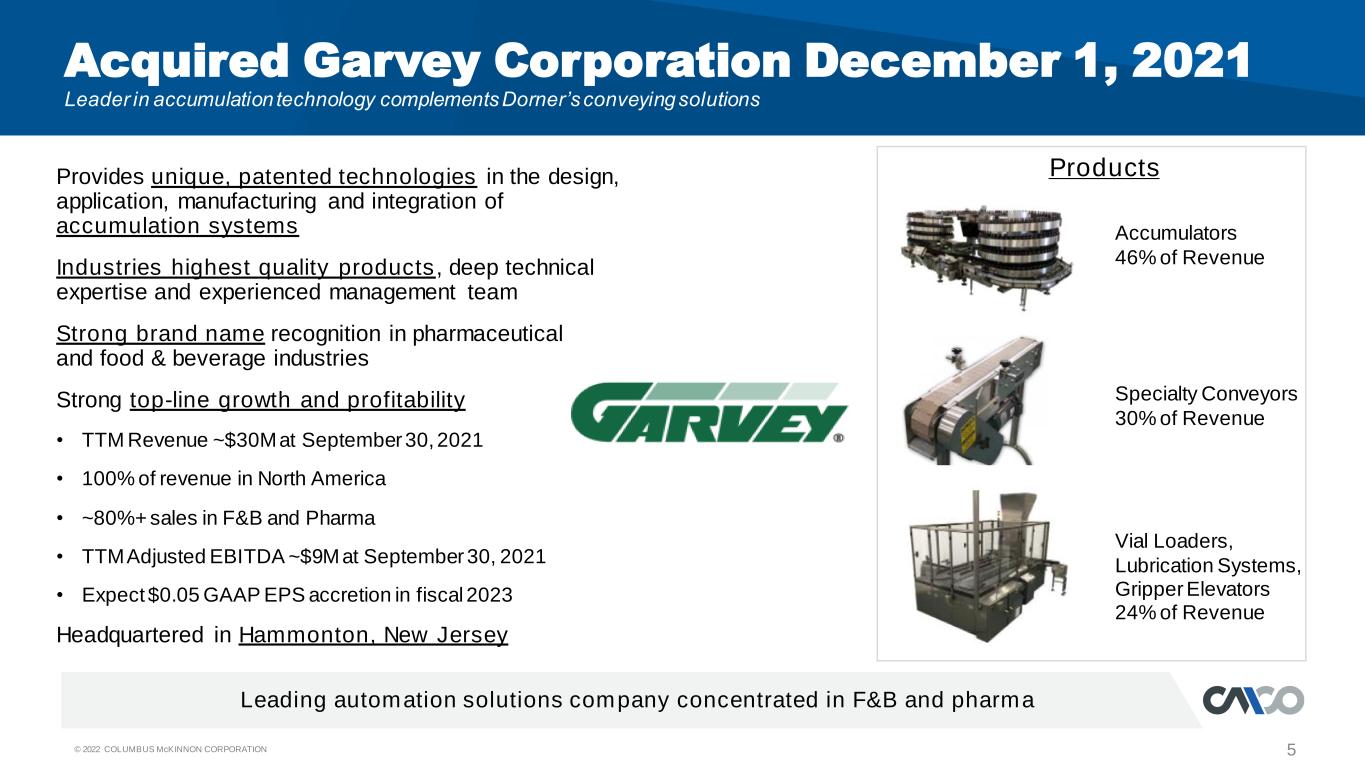
© 2022 COLUMBUS McKINNON CORPORATION 5 Acquired Garvey Corporation December 1, 2021 Leader in accumulation technology complements Dorner’s conveying solutions Leading automation solutions company concentrated in F&B and pharma Provides unique, patented technologies in the design, application, manufacturing and integration of accumulation systems Industries highest quality products, deep technical expertise and experienced management team Strong brand name recognition in pharmaceutical and food & beverage industries Strong top-line growth and profitability • TTM Revenue ~$30M at September 30, 2021 • 100% of revenue in North America • ~80%+ sales in F&B and Pharma • TTM Adjusted EBITDA ~$9M at September 30, 2021 • Expect $0.05 GAAP EPS accretion in fiscal 2023 Headquartered in Hammonton, New Jersey Products Accumulators 46% of Revenue Specialty Conveyors 30% of Revenue Vial Loaders, Lubrication Systems, Gripper Elevators 24% of Revenue
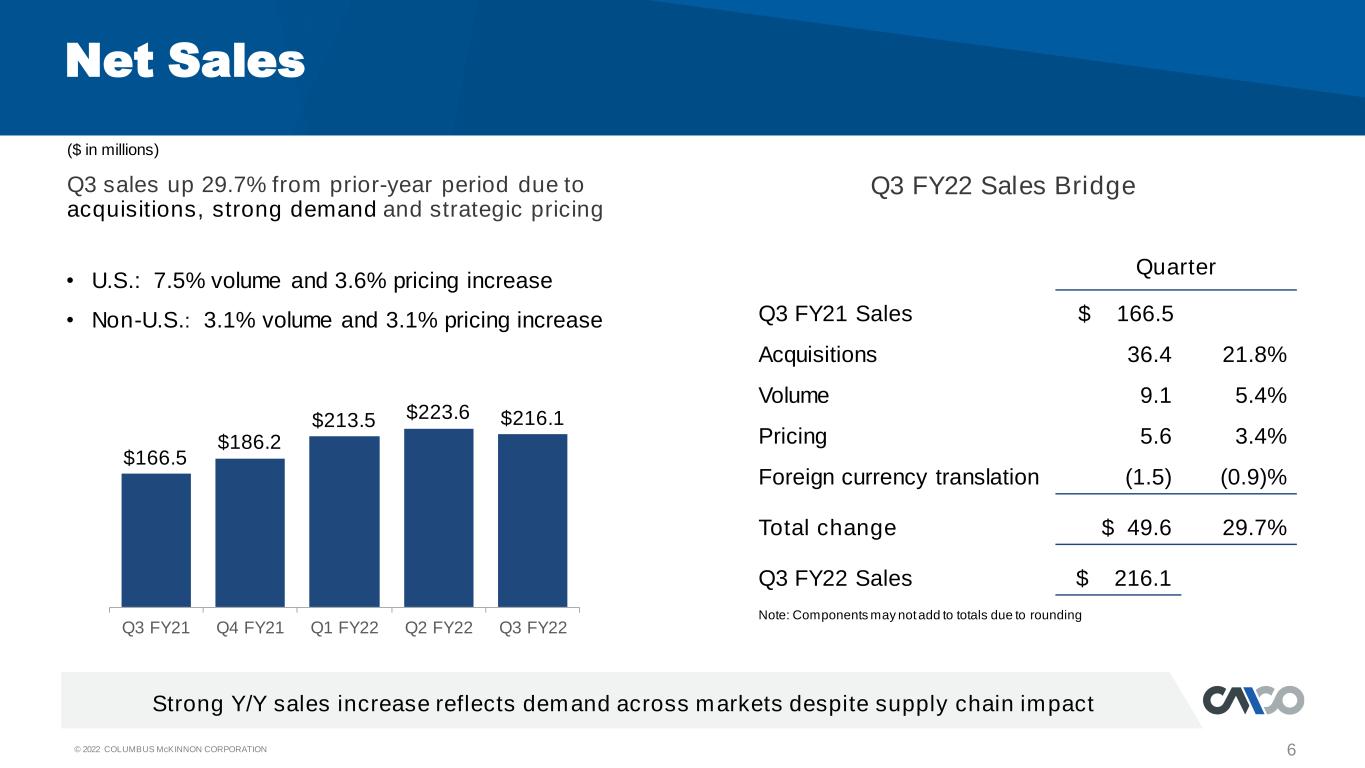
© 2022 COLUMBUS McKINNON CORPORATION 6 Q3 FY22 Sales Bridge Net Sales Strong Y/Y sales increase reflects demand across markets despite supply chain impact Quarter Q3 FY21 Sales $ 166.5 Acquisitions 36.4 21.8% Volume 9.1 5.4% Pricing 5.6 3.4% Foreign currency translation (1.5) (0.9)% Total change $ 49.6 29.7% Q3 FY22 Sales $ 216.1 Note: Components may not add to totals due to rounding ($ in millions) $166.5 $186.2 $213.5 $223.6 $216.1 Q3 FY21 Q4 FY21 Q1 FY22 Q2 FY22 Q3 FY22 Q3 sales up 29.7% from prior-year period due to acquisitions, strong demand and strategic pricing • U.S.: 7.5% volume and 3.6% pricing increase • Non-U.S.: 3.1% volume and 3.1% pricing increase
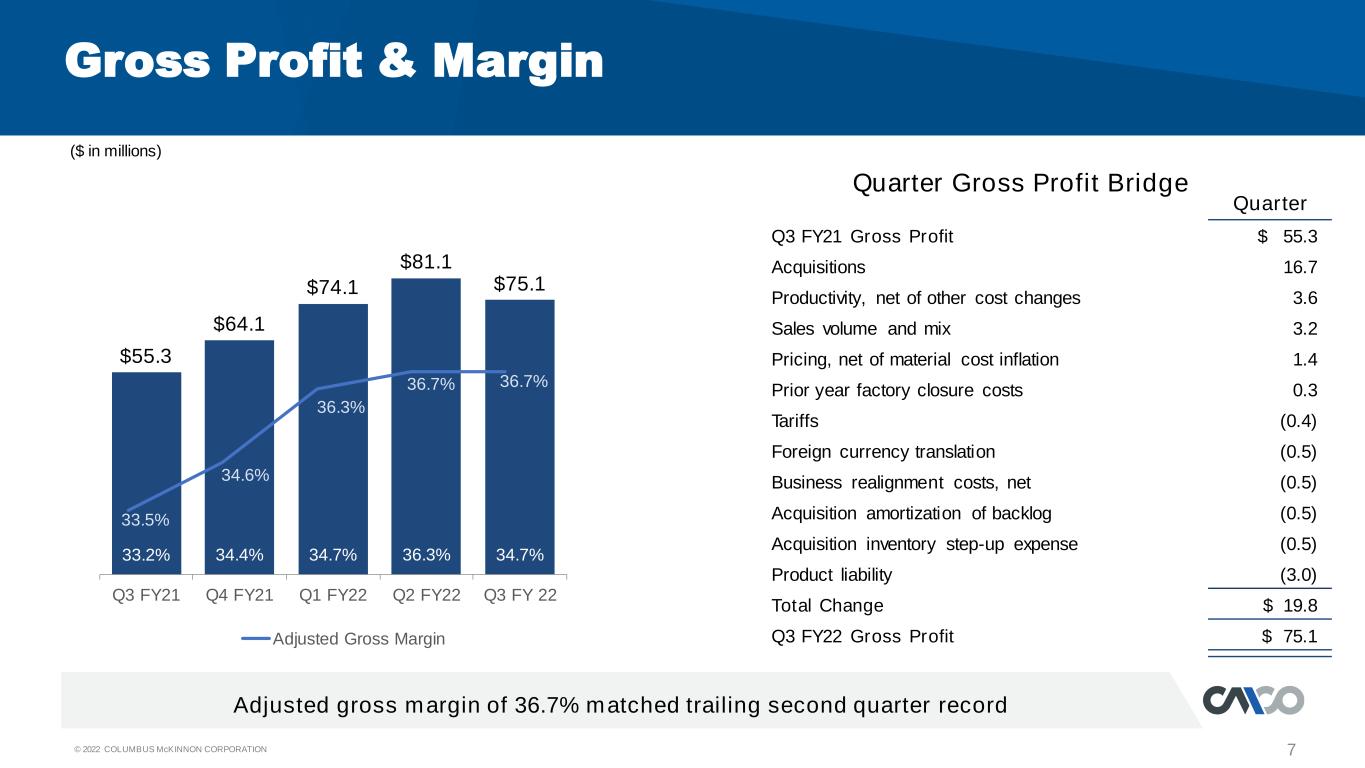
© 2022 COLUMBUS McKINNON CORPORATION 7 Adjusted gross margin of 36.7% matched trailing second quarter record Gross Profit & Margin Quarter Gross Profit Bridge Quarter Q3 FY21 Gross Profit $ 55.3 Acquisitions 16.7 Productivity, net of other cost changes 3.6 Sales volume and mix 3.2 Pricing, net of material cost inflation 1.4 Prior year factory closure costs 0.3 Tariffs (0.4) Foreign currency translation (0.5) Business realignment costs, net (0.5) Acquisition amortization of backlog (0.5) Acquisition inventory step-up expense (0.5) Product liability (3.0) Total Change $ 19.8 Q3 FY22 Gross Profit $ 75.1 ($ in millions) $55.3 $64.1 $74.1 $81.1 $75.1 33.2% 34.4% 34.7% 36.3% 34.7% Q3 FY21 Q4 FY21 Q1 FY22 Q2 FY22 Q3 FY 22 33.5% 34.6% 36.3% 36.7% 36.7% Adjusted Gross Margin
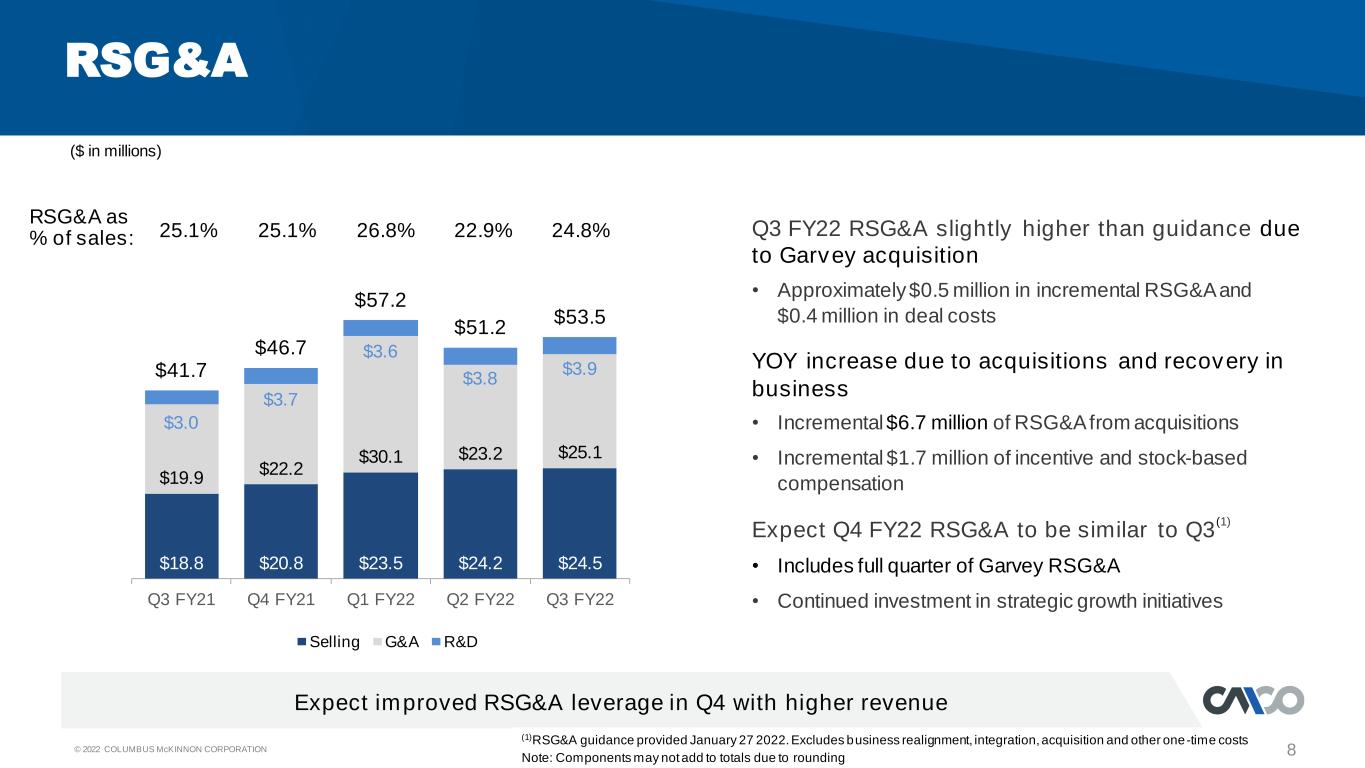
© 2022 COLUMBUS McKINNON CORPORATION 8 RSG&A $18.8 $20.8 $23.5 $24.2 $24.5 $19.9 $22.2 $30.1 $23.2 $25.1 $3.0 $3.7 $3.6 $3.8 $3.9$41.7 $46.7 $57.2 $51.2 $53.5 Q3 FY21 Q4 FY21 Q1 FY22 Q2 FY22 Q3 FY22 Selling G&A R&D Expect improved RSG&A leverage in Q4 with higher revenue ($ in millions) Q3 FY22 RSG&A slightly higher than guidance due to Garvey acquisition • Approximately $0.5 million in incremental RSG&A and $0.4 million in deal costs YOY increase due to acquisitions and recovery in business • Incremental $6.7 million of RSG&A from acquisitions • Incremental $1.7 million of incentive and stock-based compensation Expect Q4 FY22 RSG&A to be similar to Q3 (1) • Includes full quarter of Garvey RSG&A • Continued investment in strategic growth initiatives (1)RSG&A guidance provided January 27 2022. Excludes business realignment, integration, acquisition and other one-time costs Note: Components may not add to totals due to rounding RSG&A as % of sales: 26.8% 22.9% 24.8%25.1% 25.1%

© 2022 COLUMBUS McKINNON CORPORATION 9 Q3 FY22 operating income of $15.3 million Operating Income • Adjusted operating income of $20.5 million • Sequential decline reflects seasonality Operating margin of 7.1%; Adjusted operating margin of 9.5% • Margin expansion driven by acquisitions, operating leverage and strategic pricing • Acquisitions added 180 basis points to adjusted operating margin in quarter Run rate for amortization expense expected to be approximately $6.7 million at current FX rates Expect operating leverage to drive improved margin as sales grow ($ in millions) Operating Income & Margin Adjusted Operating Income & Margin $11.2 $18.9 $23.6 $25.5 $20.5 6.7% 10.1% 11.1% 11.4% 9.5% Q3 FY21 Q4 FY21 Q1 FY22 Q2 FY22 Q3 FY22 $10.4 $14.2 $10.7 $23.7 $15.3 6.3% 7.6% 5.0% 10.6% Q3 FY21 Q4 FY21 Q1 FY22 Q2 FY22 Q3 FY22 7.1%

© 2022 COLUMBUS McKINNON CORPORATION 10 Q3 FY22 net income of $9.9 million Earnings Per Share Adjusted EPS GAAP Diluted EPS $0.27 $0.39 ($0.27) $0.53 $0.34 Q3 FY21 Q4 FY21 Q1 FY22 Q2 FY22 Q3 FY22 $0.36 $0.60 $0.69 $0.74 $0.60 Q3 FY21 Q4 FY21 Q1 FY22 Q2 FY22 Q3 FY22 Adj. net income of $17.4 million in the quarter • $6.3 million of amortization of intangibles • $2.9 million of product liability settlement • $1.0 million of business realignment costs • $1.3 million of acquisition related costs FY22 non-GAAP adjusted tax rate: 22% (1) Q4 FY22 interest expense of ~$4.9 million (1) Q4 FY22 diluted shares outstanding: ~29.0 million (1) (1)Guidance on tax rate, interest expense, and number of diluted shares outstanding provided on January 27, 2022 Driving earnings growth with strengthening business model

© 2022 COLUMBUS McKINNON CORPORATION 11 Adjusted EBITDA Margin Adjusted EBITDA margin benefits from accretive acquisitions and economic recovery Adjusted EBITDA & ROIC Return on Invested Capital (ROIC)(1) Strong confidence in strategy to achieve long-term financial goals 15.7% 11.9% 15.4% FY20 FY21 Q3 FY22 YTD 11.7% 6.6% 7.7% FY20 FY21 Q3 FY22 TTM (1)ROIC is a non-GAAP measure defined as adjusted income from operations, net of taxes at a 22% normalized rate, for the trailing four quarters divided by the average of debt plus equity less cash (average capital) for the trailing five quarters. • Q3 FY22 Adjusted EBITDA margin of 14.2% up 330 basis points from prior year • 200 basis point contribution from acquisitions YTD • Targeting 19% Adjusted EBITDA margin in FY23 Improving return on invested capital • FY21 ROIC impacted by COVID • Targeting double digit ROIC > WACC in FY23
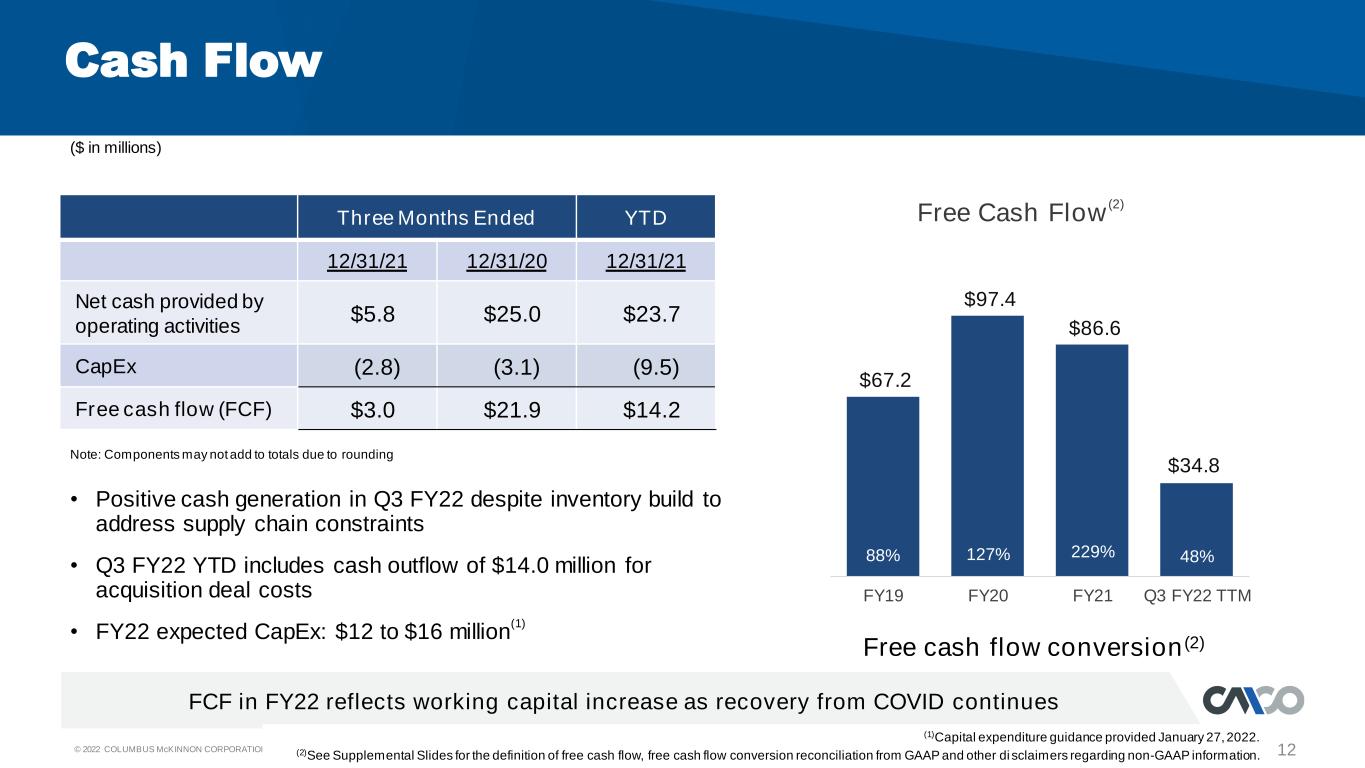
© 2022 COLUMBUS McKINNON CORPORATION $67.2 $97.4 $86.6 $34.8 88% 127% 229% 48% FY19 FY20 FY21 Q3 FY22 TTM 12 Free Cash Flow (2) Cash Flow • Positive cash generation in Q3 FY22 despite inventory build to address supply chain constraints • Q3 FY22 YTD includes cash outflow of $14.0 million for acquisition deal costs • FY22 expected CapEx: $12 to $16 million (1) FCF in FY22 reflects working capital increase as recovery from COVID continues Note: Components may not add to totals due to rounding ($ in millions) Three Months Ended YTD 12/31/21 12/31/20 12/31/21 Net cash provided by operating activities $5.8 $25.0 $23.7 CapEx (2.8) (3.1) (9.5) Free cash flow (FCF) $3.0 $21.9 $14.2 (1)Capital expenditure guidance provided January 27, 2022. (2)See Supplemental Slides for the definition of free cash flow, free cash flow conversion reconciliation from GAAP and other di sclaimers regarding non-GAAP information. Free cash flow conversion(2)
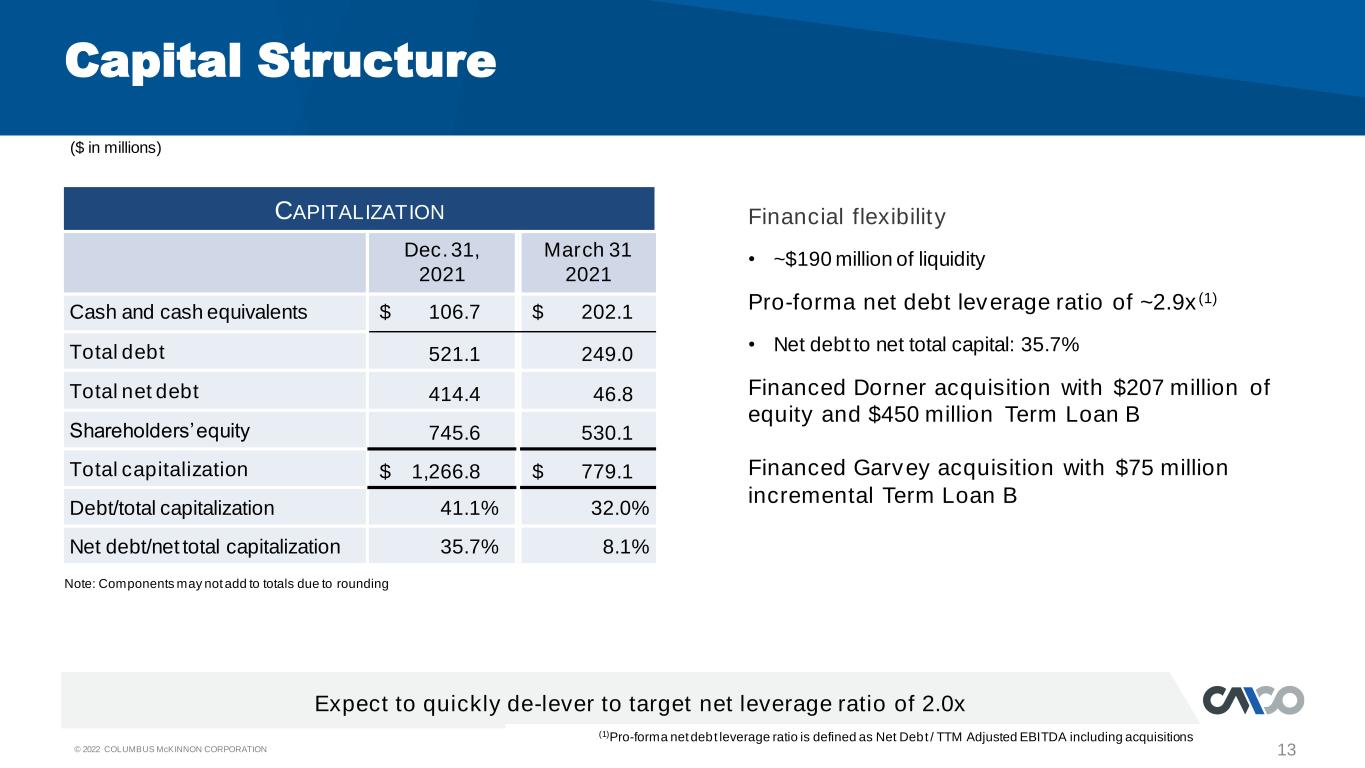
© 2022 COLUMBUS McKINNON CORPORATION 13 Capital Structure Financial flexibility • ~$190 million of liquidity Pro-forma net debt leverage ratio of ~2.9x(1) • Net debt to net total capital: 35.7% Financed Dorner acquisition with $207 million of equity and $450 million Term Loan B Financed Garvey acquisition with $75 million incremental Term Loan B Expect to quickly de-lever to target net leverage ratio of 2.0x CAPITALIZATION Dec. 31, 2021 March 31 2021 Cash and cash equivalents $ 106.7 $ 202.1 Total debt 521.1 249.0 Total net debt 414.4 46.8 Shareholders’ equity 745.6 530.1 Total capitalization $ 1,266.8 $ 779.1 Debt/total capitalization 41.1% 32.0% Net debt/net total capitalization 35.7% 8.1% (1)Pro-forma net debt leverage ratio is defined as Net Debt / TTM Adjusted EBITDA including acquisitions ($ in millions) Note: Components may not add to totals due to rounding
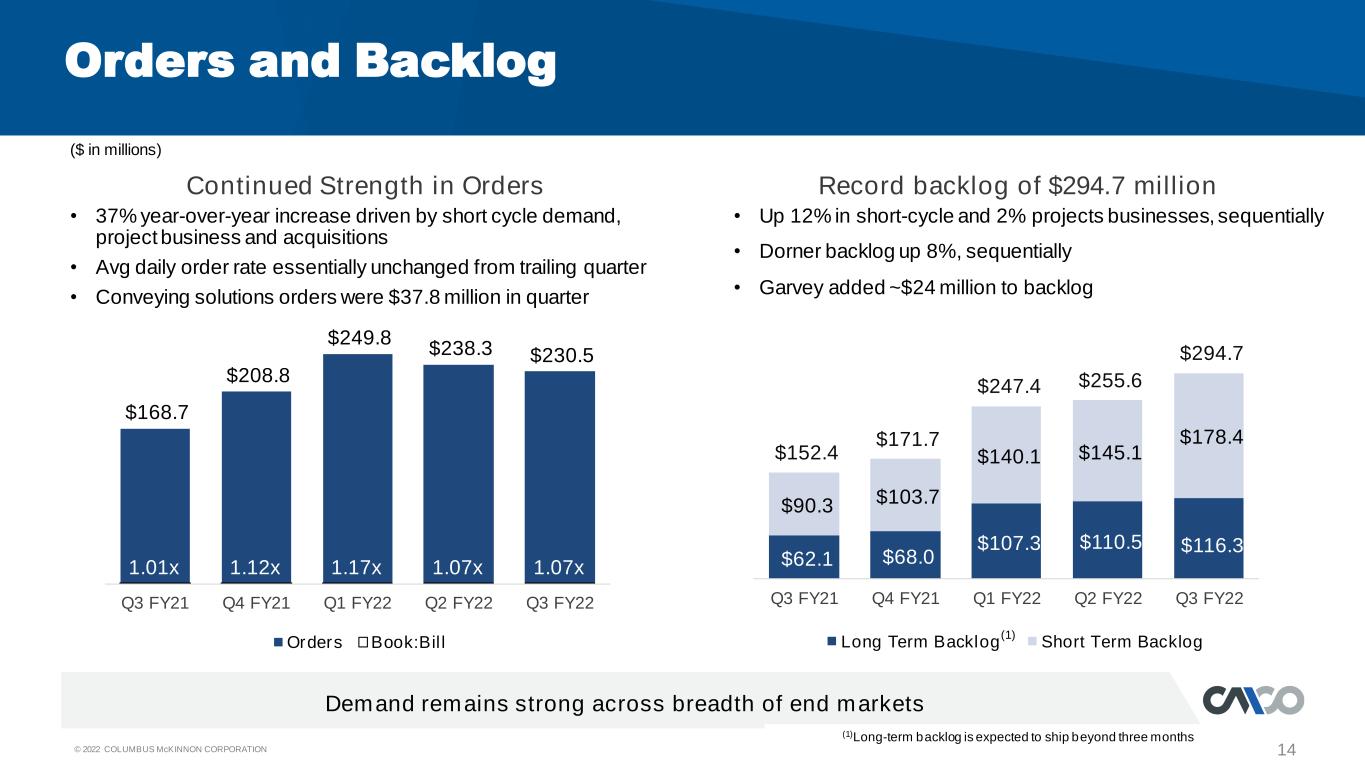
© 2022 COLUMBUS McKINNON CORPORATION 14 Continued Strength in Orders Record backlog of $294.7 million Orders and Backlog • 37% year-over-year increase driven by short cycle demand, project business and acquisitions • Avg daily order rate essentially unchanged from trailing quarter • Conveying solutions orders were $37.8 million in quarter • Up 12% in short-cycle and 2% projects businesses, sequentially • Dorner backlog up 8%, sequentially • Garvey added ~$24 million to backlog Demand remains strong across breadth of end markets ($ in millions) $168.7 $208.8 $249.8 $238.3 $230.5 1.01x 1.12x 1.17x 1.07x 1.07x Q3 FY21 Q4 FY21 Q1 FY22 Q2 FY22 Q3 FY22 Orders Book:Bill (1)Long-term backlog is expected to ship beyond three months $62.1 $68.0 $107.3 $110.5 $116.3 $90.3 $103.7 $140.1 $145.1 $178.4 $152.4 $171.7 $247.4 $255.6 $294.7 Q3 FY21 Q4 FY21 Q1 FY22 Q2 FY22 Q3 FY22 Long Term Backlog Short Term Backlog (1)
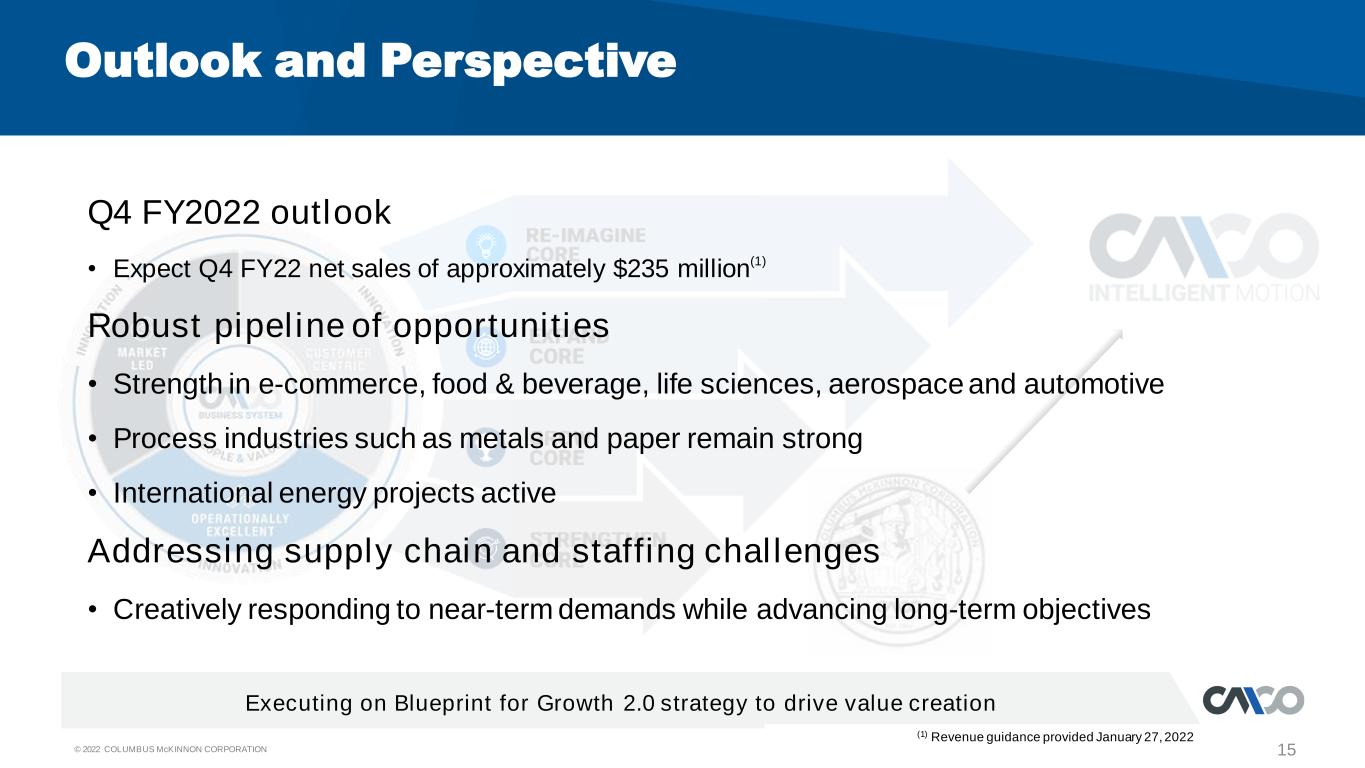
© 2022 COLUMBUS McKINNON CORPORATION 15 Executing on Blueprint for Growth 2.0 strategy to drive value creation Outlook and Perspective (1) Revenue guidance provided January 27, 2022 Q4 FY2022 outlook • Expect Q4 FY22 net sales of approximately $235 million(1) Robust pipeline of opportunities • Strength in e-commerce, food & beverage, life sciences, aerospace and automotive • Process industries such as metals and paper remain strong • International energy projects active Addressing supply chain and staffing challenges • Creatively responding to near-term demands while advancing long-term objectives
Q3 Fiscal Year 2022 Financial Results Conference Call January 27, 2022 David J. Wilson President and Chief Executive Officer Gregory P. Rustowicz Senior Vice President – Finance & Chief Financial Officer Purpose in Motion: Together we create intelligent motion solutions that move the world forward and improve lives.
Supplemental Information
© 2022 COLUMBUS McKINNON CORPORATION 18 Conference Call Playback Info Replay Number: 412-317-6671 passcode: 13725924 Telephone replay available through February 3, 2022 Webcast / PowerPoint / Replay available at investors.columbusmckinnon.com Transcript, when available, at investors.columbusmckinnon.com
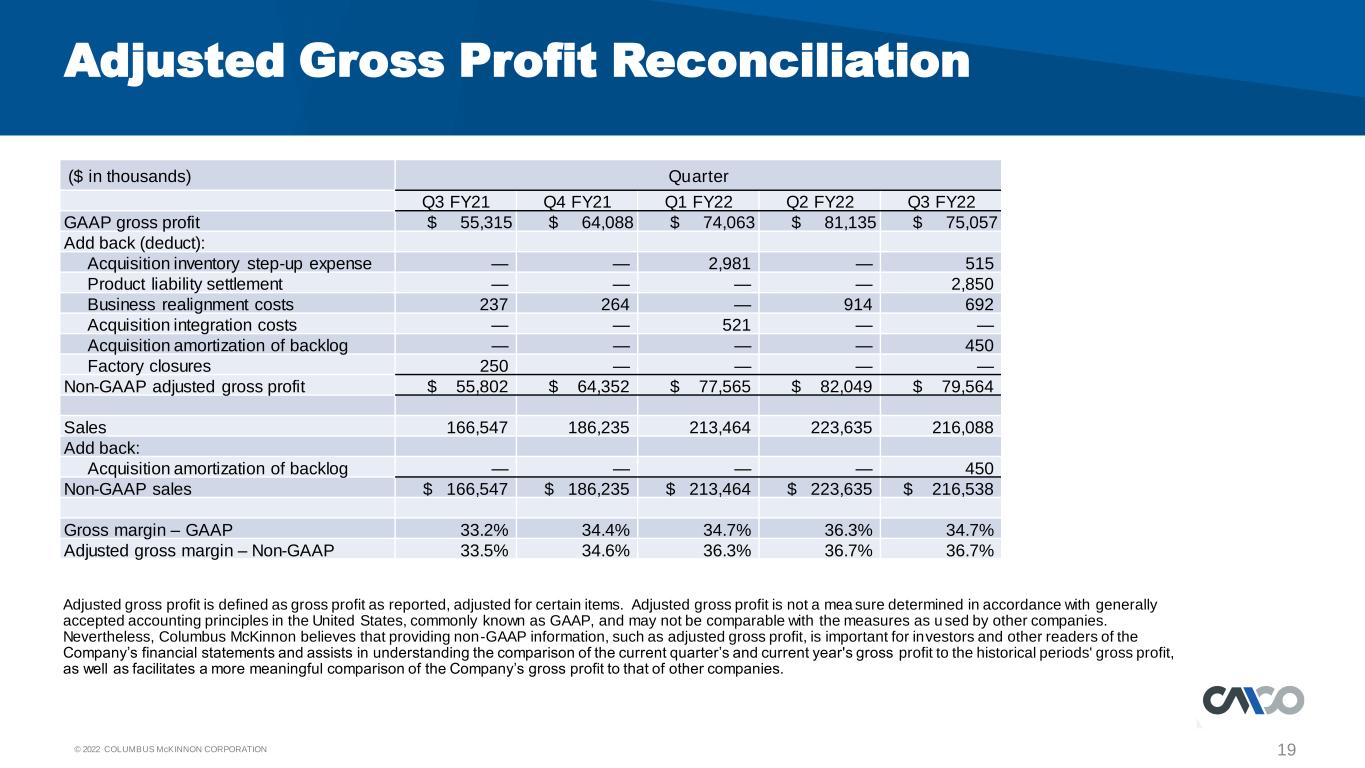
© 2022 COLUMBUS McKINNON CORPORATION 19 Adjusted Gross Profit Reconciliation Adjusted gross profit is defined as gross profit as reported, adjusted for certain items. Adjusted gross profit is not a mea sure determined in accordance with generally accepted accounting principles in the United States, commonly known as GAAP, and may not be comparable with the measures as u sed by other companies. Nevertheless, Columbus McKinnon believes that providing non-GAAP information, such as adjusted gross profit, is important for investors and other readers of the Company’s financial statements and assists in understanding the comparison of the current quarter’s and current year's gross profit to the historical periods' gross profit, as well as facilitates a more meaningful comparison of the Company’s gross profit to that of other companies. ($ in thousands) Quarter Q3 FY21 Q4 FY21 Q1 FY22 Q2 FY22 Q3 FY22 GAAP gross profit $ 55,315 $ 64,088 $ 74,063 $ 81,135 $ 75,057 Add back (deduct): Acquisition inventory step-up expense — — 2,981 — 515 Product liability settlement — — — — 2,850 Business realignment costs 237 264 — 914 692 Acquisition integration costs — — 521 — — Acquisition amortization of backlog — — — — 450 Factory closures 250 — — — — Non-GAAP adjusted gross profit $ 55,802 $ 64,352 $ 77,565 $ 82,049 $ 79,564 Sales 166,547 186,235 213,464 223,635 216,088 Add back: Acquisition amortization of backlog — — — — 450 Non-GAAP sales $ 166,547 $ 186,235 $ 213,464 $ 223,635 $ 216,538 Gross margin – GAAP 33.2% 34.4% 34.7% 36.3% 34.7% Adjusted gross margin – Non-GAAP 33.5% 34.6% 36.3% 36.7% 36.7%
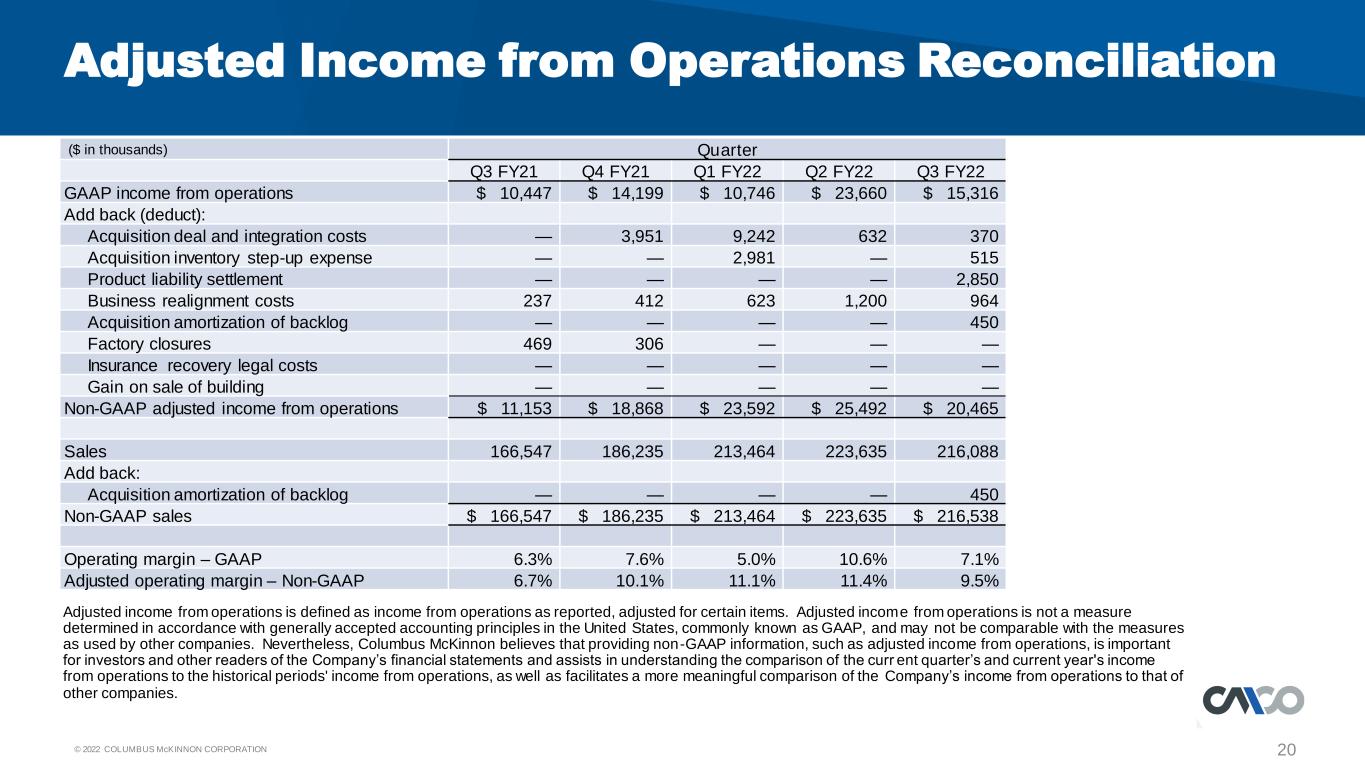
© 2022 COLUMBUS McKINNON CORPORATION 20 Adjusted Income from Operations Reconciliation Adjusted income from operations is defined as income from operations as reported, adjusted for certain items. Adjusted income from operations is not a measure determined in accordance with generally accepted accounting principles in the United States, commonly known as GAAP, and may not be comparable with the measures as used by other companies. Nevertheless, Columbus McKinnon believes that providing non-GAAP information, such as adjusted income from operations, is important for investors and other readers of the Company’s financial statements and assists in understanding the comparison of the curr ent quarter’s and current year's income from operations to the historical periods' income from operations, as well as facilitates a more meaningful comparison of the Company’s income from operations to that of other companies. ($ in thousands) Quarter Q3 FY21 Q4 FY21 Q1 FY22 Q2 FY22 Q3 FY22 GAAP income from operations $ 10,447 $ 14,199 $ 10,746 $ 23,660 $ 15,316 Add back (deduct): Acquisition deal and integration costs — 3,951 9,242 632 370 Acquisition inventory step-up expense — — 2,981 — 515 Product liability settlement — — — — 2,850 Business realignment costs 237 412 623 1,200 964 Acquisition amortization of backlog — — — — 450 Factory closures 469 306 — — — Insurance recovery legal costs — — — — — Gain on sale of building — — — — — Non-GAAP adjusted income from operations $ 11,153 $ 18,868 $ 23,592 $ 25,492 $ 20,465 Sales 166,547 186,235 213,464 223,635 216,088 Add back: Acquisition amortization of backlog — — — — 450 Non-GAAP sales $ 166,547 $ 186,235 $ 213,464 $ 223,635 $ 216,538 Operating margin – GAAP 6.3% 7.6% 5.0% 10.6% 7.1% Adjusted operating margin – Non-GAAP 6.7% 10.1% 11.1% 11.4% 9.5%
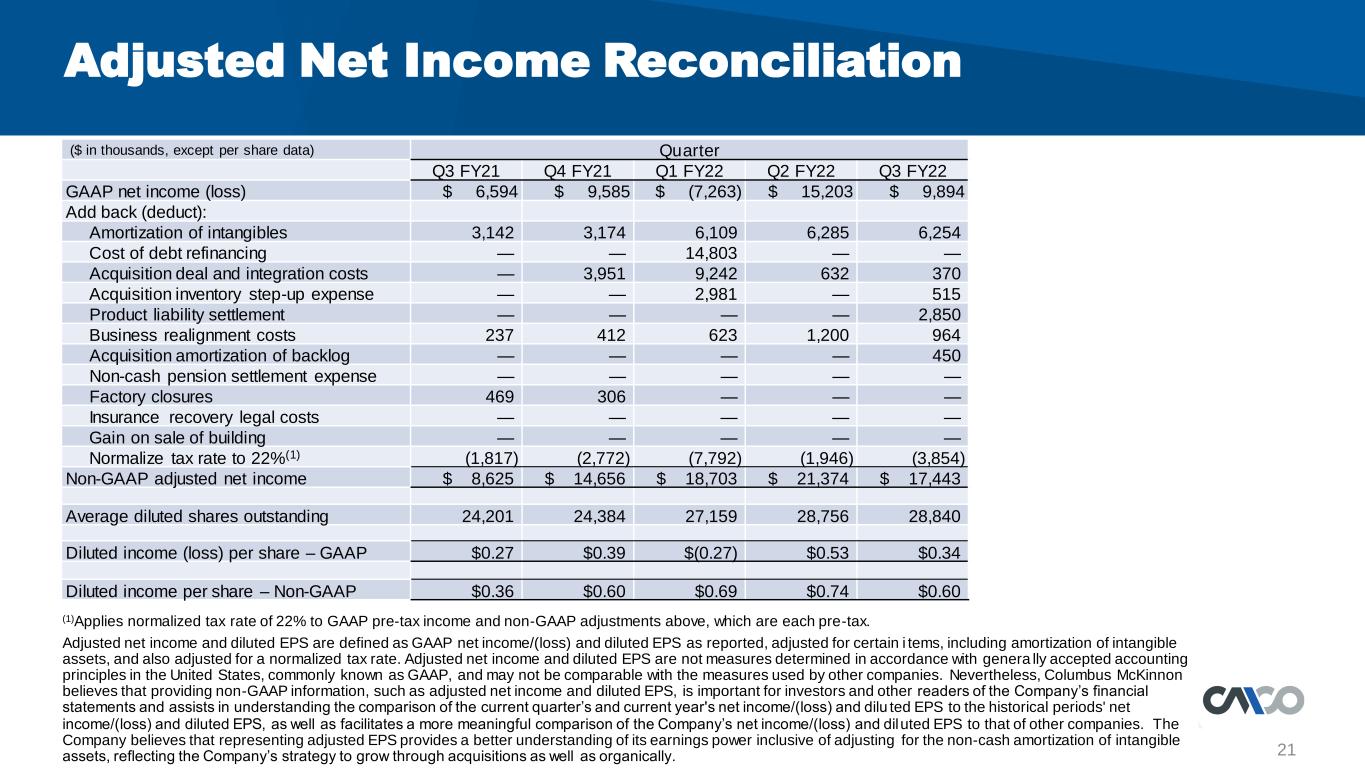
© 2022 COLUMBUS McKINNON CORPORATION 21 Adjusted Net Income Reconciliation ($ in thousands, except per share data) Quarter Q3 FY21 Q4 FY21 Q1 FY22 Q2 FY22 Q3 FY22 GAAP net income (loss) $ 6,594 $ 9,585 $ (7,263) $ 15,203 $ 9,894 Add back (deduct): Amortization of intangibles 3,142 3,174 6,109 6,285 6,254 Cost of debt refinancing — — 14,803 — — Acquisition deal and integration costs — 3,951 9,242 632 370 Acquisition inventory step-up expense — — 2,981 — 515 Product liability settlement — — — — 2,850 Business realignment costs 237 412 623 1,200 964 Acquisition amortization of backlog — — — — 450 Non-cash pension settlement expense — — — — — Factory closures 469 306 — — — Insurance recovery legal costs — — — — — Gain on sale of building — — — — — Normalize tax rate to 22%(1) (1,817) (2,772) (7,792) (1,946) (3,854) Non-GAAP adjusted net income $ 8,625 $ 14,656 $ 18,703 $ 21,374 $ 17,443 Average diluted shares outstanding 24,201 24,384 27,159 28,756 28,840 Diluted income (loss) per share – GAAP $0.27 $0.39 $(0.27) $0.53 $0.34 Diluted income per share – Non-GAAP $0.36 $0.60 $0.69 $0.74 $0.60 (1)Applies normalized tax rate of 22% to GAAP pre-tax income and non-GAAP adjustments above, which are each pre-tax. Adjusted net income and diluted EPS are defined as GAAP net income/(loss) and diluted EPS as reported, adjusted for certain i tems, including amortization of intangible assets, and also adjusted for a normalized tax rate. Adjusted net income and diluted EPS are not measures determined in accordance with genera lly accepted accounting principles in the United States, commonly known as GAAP, and may not be comparable with the measures used by other companies. Nevertheless, Columbus McKinnon believes that providing non-GAAP information, such as adjusted net income and diluted EPS, is important for investors and other readers of the Company’s financial statements and assists in understanding the comparison of the current quarter’s and current year's net income/(loss) and dilu ted EPS to the historical periods' net income/(loss) and diluted EPS, as well as facilitates a more meaningful comparison of the Company’s net income/(loss) and diluted EPS to that of other companies. The Company believes that representing adjusted EPS provides a better understanding of its earnings power inclusive of adjusting for the non-cash amortization of intangible assets, reflecting the Company’s strategy to grow through acquisitions as well as organically.

© 2022 COLUMBUS McKINNON CORPORATION 22 Adjusted Net Income Reconciliation (1)Applies normalized tax rate of 22% to GAAP pre-tax income and non-GAAP adjustments above, which are each pre-tax. Adjusted net income and diluted EPS are defined as net income and diluted EPS as reported, adjusted for certain items, includ ing amortization of intangible assets, and also adjusted for a normalized tax rate. Adjusted net income and diluted EPS are not measures determined in accordance with genera lly accepted accounting principles in the United States, commonly known as GAAP, and may not be comparable with the measures used by other companies. Neverthele ss, Columbus McKinnon believes that providing non-GAAP information, such as adjusted net income and diluted EPS, is important for investors and other readers o f the Company’s financial statements and assists in understanding the comparison of the current quarter’s and current year's net income and diluted EPS to the his torical periods' net income and diluted EPS, as well as facilitates a more meaningful comparison of the Company’s net income and diluted EPS to that of other companies. The Company believes that representing adjusted EPS provides a better understanding of its earnings power inclusive of adjusting for the non -cash amortization of intangible assets, reflecting the Company’s strategy to grow through acquisitions as well as organically. ($ in thousands, except per share data) Fiscal Year FY 2019 FY 2020 FY 2021 Q3 FY22 TTM GAAP net income $ 42,577 $ 59,672 $ 9,106 $ 27,419 Add back (deduct): Amortization of intangibles 14,900 12,942 12,623 21,822 Cost of debt refinancing — — — 14,803 Acquisition deal and integration costs — — 3,951 14,195 Acquisition inventory step-up expense — — — 3,496 Business realignment costs 1,906 2,831 1,470 3,199 Product liability settlement — (382) — 2,850 Acquisition amortization of backlog — — — 450 Factory closures 1,473 4,709 3,778 306 Non-cash pension settlement expense — — 19,046 — Insurance recovery legal costs 1,282 585 229 — Gain on sale of building — — (2,638) — Loss on sales of businesses 25,672 176 — — Normalize tax rate to 22%(1) (11,268) (4,080) (9,708) (16,363) Non-GAAP adjusted net income $ 76,542 $ 76,453 $ 37,857 $ 72,177 Average diluted shares outstanding 23,660 23,855 24,173 27,285 Diluted income per share – GAAP $1.80 $2.50 $0.38 $1.00 Diluted income per share - Non-GAAP $3.24 $3.20 $1.57 $2.65
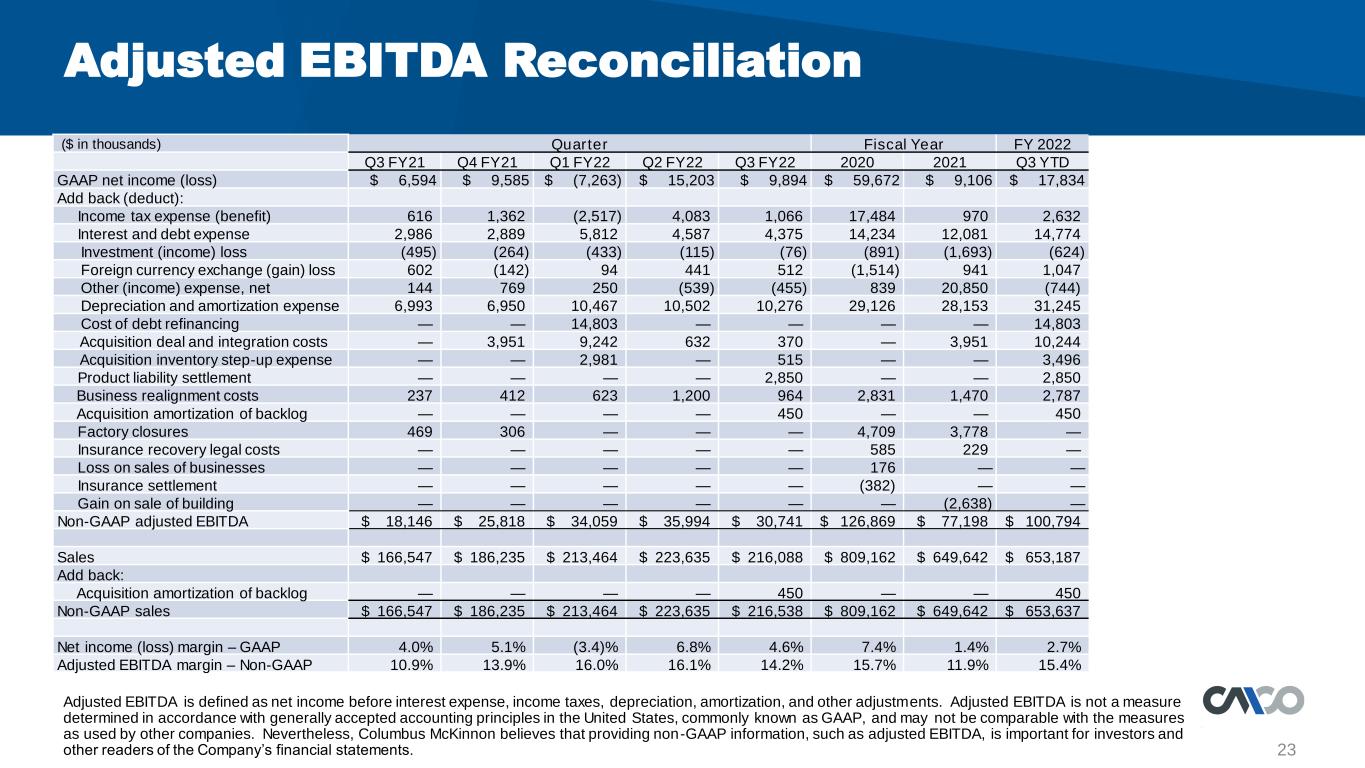
© 2022 COLUMBUS McKINNON CORPORATION 23 Adjusted EBITDA Reconciliation Adjusted EBITDA is defined as net income before interest expense, income taxes, depreciation, amortization, and other adjustments. Adjusted EBITDA is not a measure determined in accordance with generally accepted accounting principles in the United States, commonly known as GAAP, and may not be comparable with the measures as used by other companies. Nevertheless, Columbus McKinnon believes that providing non-GAAP information, such as adjusted EBITDA, is important for investors and other readers of the Company’s financial statements. ($ in thousands) Quarter Fiscal Year FY 2022 Q3 FY21 Q4 FY21 Q1 FY22 Q2 FY22 Q3 FY22 2020 2021 Q3 YTD GAAP net income (loss) $ 6,594 $ 9,585 $ (7,263) $ 15,203 $ 9,894 $ 59,672 $ 9,106 $ 17,834 Add back (deduct): Income tax expense (benefit) 616 1,362 (2,517) 4,083 1,066 17,484 970 2,632 Interest and debt expense 2,986 2,889 5,812 4,587 4,375 14,234 12,081 14,774 Investment (income) loss (495) (264) (433) (115) (76) (891) (1,693) (624) Foreign currency exchange (gain) loss 602 (142) 94 441 512 (1,514) 941 1,047 Other (income) expense, net 144 769 250 (539) (455) 839 20,850 (744) Depreciation and amortization expense 6,993 6,950 10,467 10,502 10,276 29,126 28,153 31,245 Cost of debt refinancing — — 14,803 — — — — 14,803 Acquisition deal and integration costs — 3,951 9,242 632 370 — 3,951 10,244 Acquisition inventory step-up expense — — 2,981 — 515 — — 3,496 Product liability settlement — — — — 2,850 — — 2,850 Business realignment costs 237 412 623 1,200 964 2,831 1,470 2,787 Acquisition amortization of backlog — — — — 450 — — 450 Factory closures 469 306 — — — 4,709 3,778 — Insurance recovery legal costs — — — — — 585 229 — Loss on sales of businesses — — — — — 176 — — Insurance settlement — — — — — (382) — — Gain on sale of building — — — — — — (2,638) — Non-GAAP adjusted EBITDA $ 18,146 $ 25,818 $ 34,059 $ 35,994 $ 30,741 $ 126,869 $ 77,198 $ 100,794 Sales $ 166,547 $ 186,235 $ 213,464 $ 223,635 $ 216,088 $ 809,162 $ 649,642 $ 653,187 Add back: Acquisition amortization of backlog — — — — 450 — — 450 Non-GAAP sales $ 166,547 $ 186,235 $ 213,464 $ 223,635 $ 216,538 $ 809,162 $ 649,642 $ 653,637 Net income (loss) margin – GAAP 4.0% 5.1% (3.4)% 6.8% 4.6% 7.4% 1.4% 2.7% Adjusted EBITDA margin – Non-GAAP 10.9% 13.9% 16.0% 16.1% 14.2% 15.7% 11.9% 15.4%
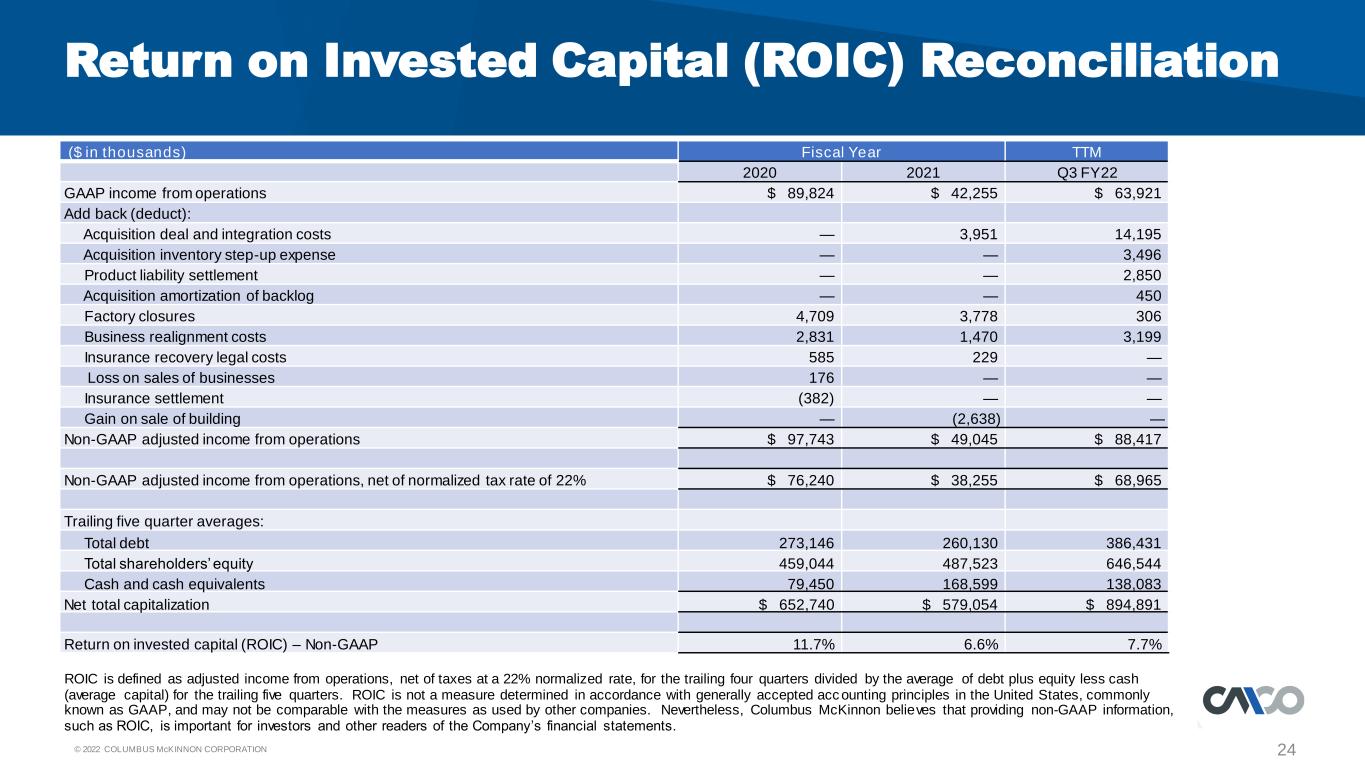
© 2022 COLUMBUS McKINNON CORPORATION 24 Return on Invested Capital (ROIC) Reconciliation ROIC is defined as adjusted income from operations, net of taxes at a 22% normalized rate, for the trailing four quarters divided by the average of debt plus equity less cash (average capital) for the trailing five quarters. ROIC is not a measure determined in accordance with generally accepted acc ounting principles in the United States, commonly known as GAAP, and may not be comparable with the measures as used by other companies. Nevertheless, Columbus McKinnon believes that providing non-GAAP information, such as ROIC, is important for investors and other readers of the Company’s financial statements. ($ in thousands) Fiscal Year TTM 2020 2021 Q3 FY22 GAAP income from operations $ 89,824 $ 42,255 $ 63,921 Add back (deduct): Acquisition deal and integration costs — 3,951 14,195 Acquisition inventory step-up expense — — 3,496 Product liability settlement — — 2,850 Acquisition amortization of backlog — — 450 Factory closures 4,709 3,778 306 Business realignment costs 2,831 1,470 3,199 Insurance recovery legal costs 585 229 — Loss on sales of businesses 176 — — Insurance settlement (382) — — Gain on sale of building — (2,638) — Non-GAAP adjusted income from operations $ 97,743 $ 49,045 $ 88,417 Non-GAAP adjusted income from operations, net of normalized tax rate of 22% $ 76,240 $ 38,255 $ 68,965 Trailing five quarter averages: Total debt 273,146 260,130 386,431 Total shareholders’ equity 459,044 487,523 646,544 Cash and cash equivalents 79,450 168,599 138,083 Net total capitalization $ 652,740 $ 579,054 $ 894,891 Return on invested capital (ROIC) – Non-GAAP 11.7% 6.6% 7.7%

© 2022 COLUMBUS McKINNON CORPORATION 25 Free Cash Flow & Free Cash Flow Conversion Reconciliation ($ in thousands) Fiscal Year FY 2019 FY 2020 FY 2021 Q3 FY 2022 TTM Cash from operations $ 79,499 $ 106,795 $ 98,890 $ 50,669 Capital expenditures (12,288) (9,432) (12,300) (15,902) Free cash flow (FCF) $ 67,211 $ 97,363 $ 86,590 $ 34,767 Non-GAAP adjusted net income* 76,542 76,453 37,857 72,177 Free cash flow conversion 88% 127% 229% 48% Free cash flow is defined as cash from operations minus capital expenditures. Free cash flow conversion is defined as free cash flow divided by adjusted net income including amortization. Free cash flow and free cash flow conversion are not measures determined in accordance with generally accepted accounting principles in the United States, commonly known as GAAP, and may not be comparable with the measures as used by other companies. Nevertheless, Columbus McKinnon believes that providing non -GAAP information, such as free cash flow and free cash flow conversion, is important for investors and other readers of the Company’s financial statements and assists in understanding the comparison of the current quarter’s and current year’s cash flow to the historical periods’ cash flow, as well as facilitates a more meaningful comparison of the Company’s cash flow to that of othe r companies. *See slide 22 for reconciliation of non-GAAP adjusted net income to GAAP net income.
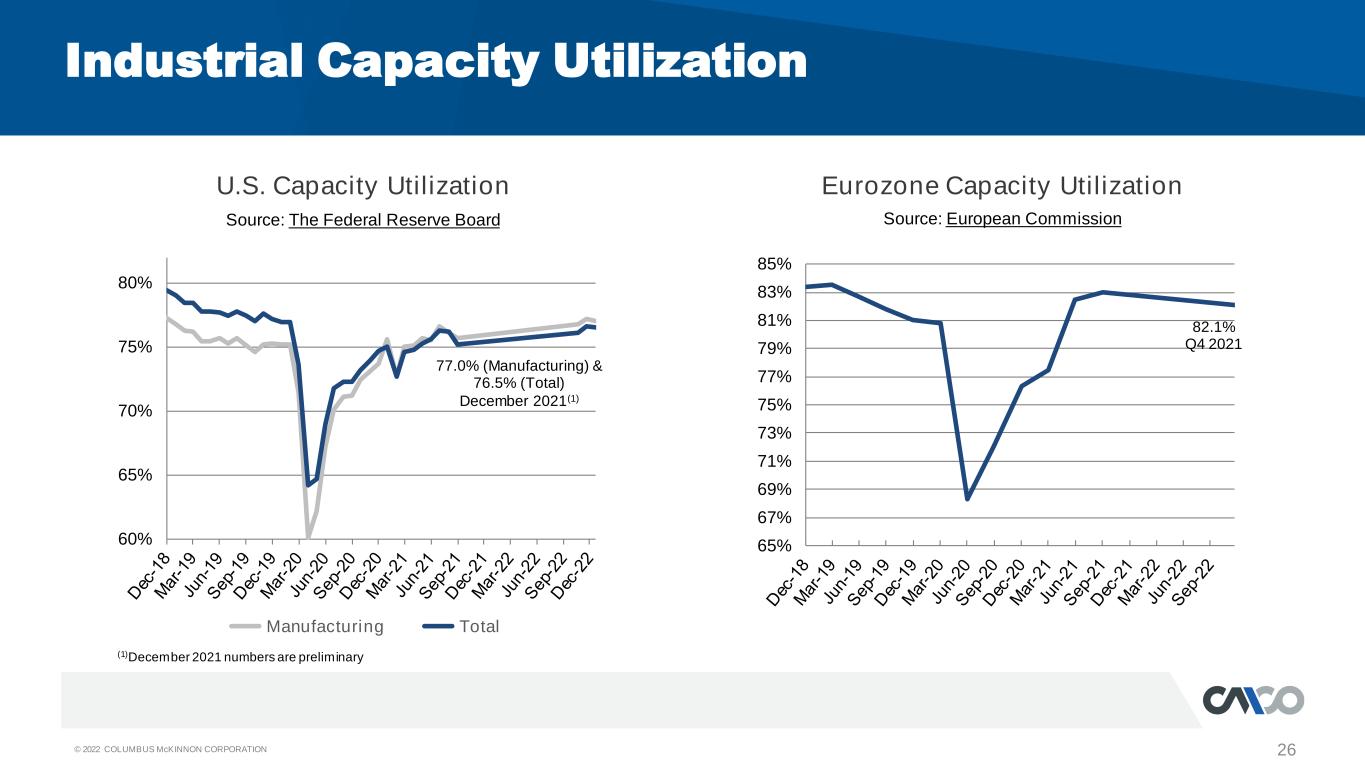
© 2022 COLUMBUS McKINNON CORPORATION 26 U.S. Capacity Utilization Eurozone Capacity Utilization Industrial Capacity Utilization Source: The Federal Reserve Board Source: European Commission 60% 65% 70% 75% 80% Manufacturing Total 77.0% (Manufacturing) & 76.5% (Total) December 2021(1) 65% 67% 69% 71% 73% 75% 77% 79% 81% 83% 85% 82.1% Q4 2021 (1)December 2021 numbers are preliminary
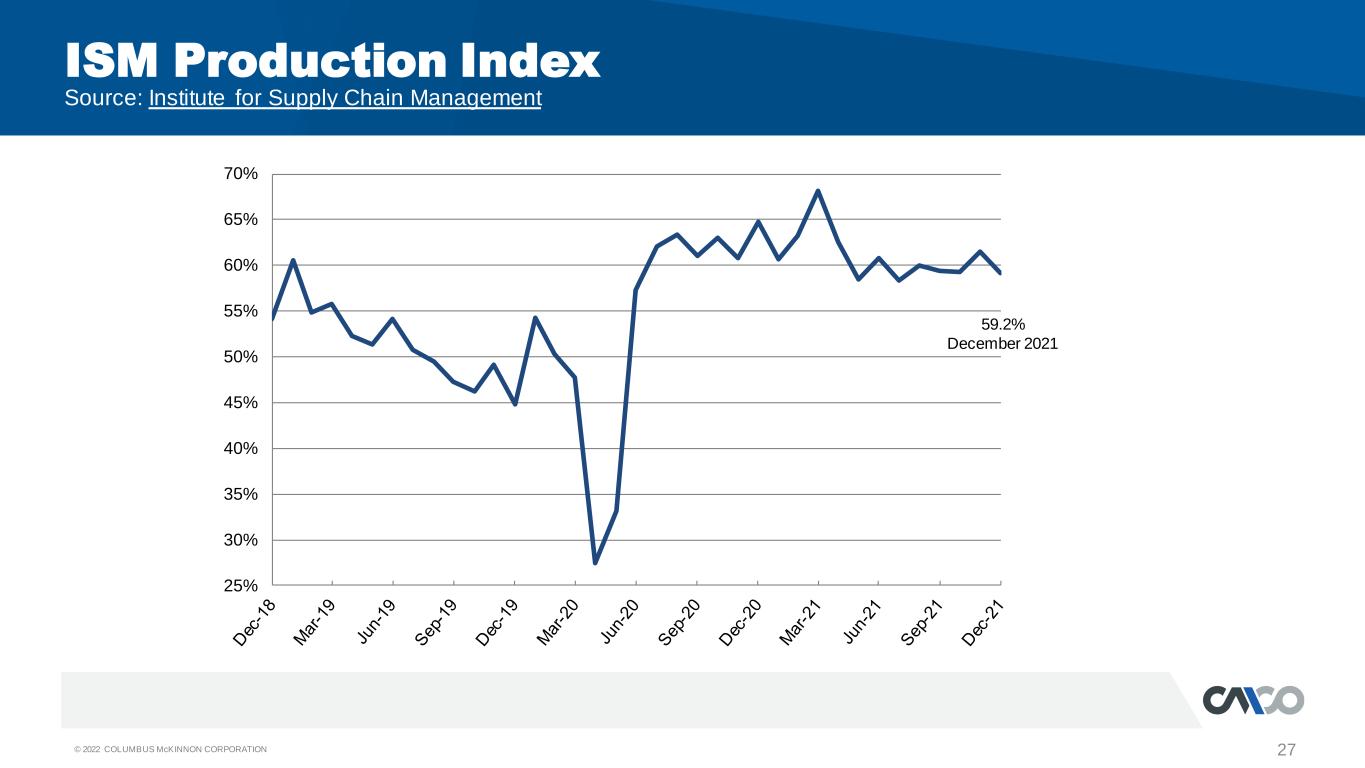
© 2022 COLUMBUS McKINNON CORPORATION 27 ISM Production Index Source: Institute for Supply Chain Management 25% 30% 35% 40% 45% 50% 55% 60% 65% 70% 59.2% December 2021
Q3 Fiscal Year 2022 Financial Results Conference Call January 27, 2022


