Q2 Fiscal Year 2023 Financial Results Conference Call President & Chief Executive Officer David J. Wilson October 27, 2022 Executive VP – Finance & Chief Financial Officer Gregory P. Rustowicz

© 2022 COLUMBUS MCKINNON CORPORATION These slides, and the accompanying oral discussion (together, this “presentation”), contain “forward-looking statements” within the meaning of the Private Securities Litigation Reform Act of 1995. Such statements include, but are not limited to, statements concerning expected growth, future sales and EBITDA margins, and future potential to deliver results; the execution of its strategy and further transformation of the Company with stronger growth, less cyclicality and higher margins, and achievement of certain goals. These statements involve known and unknown risks, uncertainties and other factors that could cause the actual results of the Company to differ materially from the results expressed or implied by such statements, including the impact of supply chain challenges and inflation, the ability of the Company to scale the organization, achieve its financial targets including revenue and adjusted EBITDA margin, and to execute CMBS and the Core Growth Framework; global economic and business conditions affecting the industries served by the Company and its subsidiaries including COVID-19; the Company's customers and suppliers, competitor responses to the Company's products and services, the overall market acceptance of such products and services, the ability to expand into new markets and geographic regions, and other factors disclosed in the Company's periodic reports filed with the Securities and Exchange Commission. Consequently, such forward-looking statements should be regarded as current plans, estimates and beliefs. The Company assumes no obligation to update the forward-looking information contained in this presentation. Non-GAAP Financial Measures and Forward-looking Non-GAAP Measures This presentation will discuss some non-GAAP (“adjusted”) financial measures which we believe are useful in evaluating our performance. You should not consider the presentation of this additional information in isolation or as a substitute for results compared in accordance with GAAP. The non-GAAP (“adjusted”) measures are noted and reconciliations of comparable GAAP with non-GAAP measures can be found in tables included in the Supplemental Information portion of this presentation. Safe Harbor Statement 2
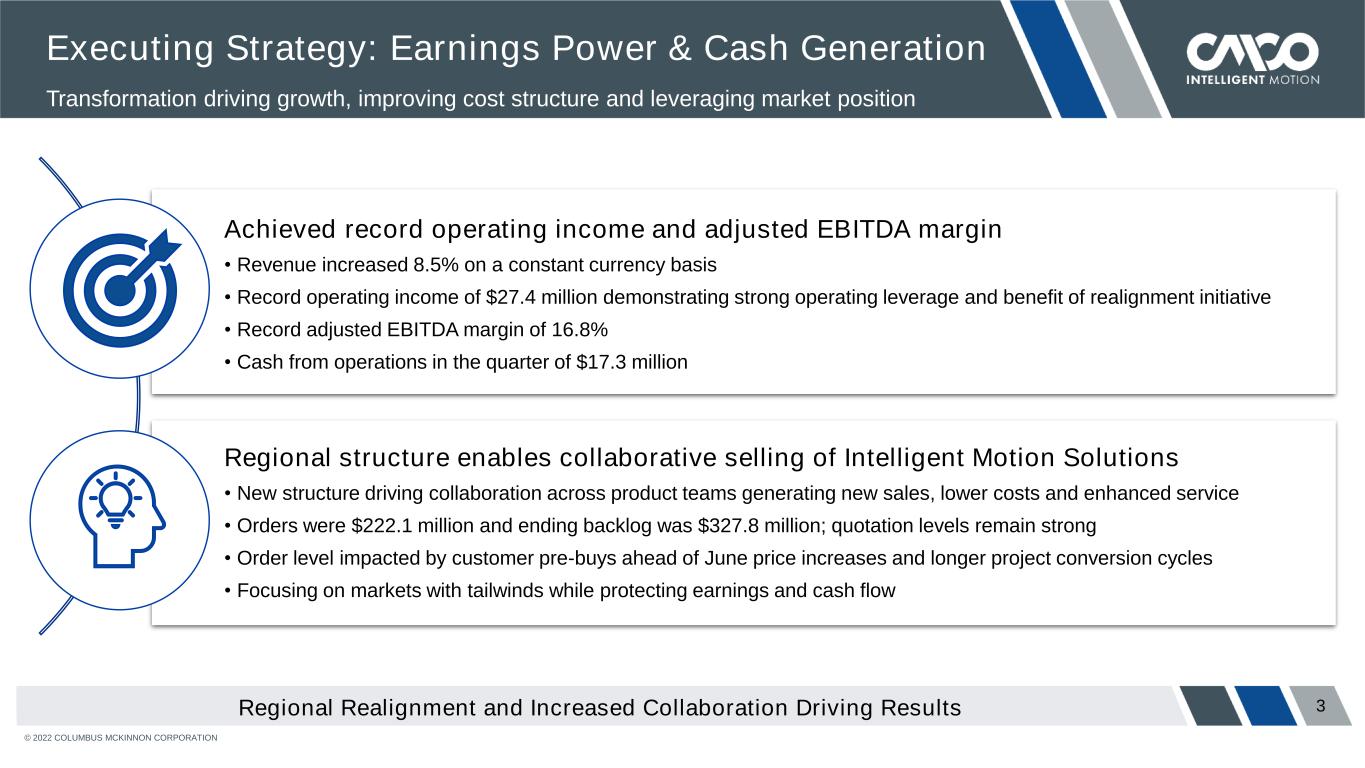
© 2022 COLUMBUS MCKINNON CORPORATION 3 Executing Strategy: Earnings Power & Cash Generation Transformation driving growth, improving cost structure and leveraging market position Achieved record operating income and adjusted EBITDA margin • Revenue increased 8.5% on a constant currency basis • Record operating income of $27.4 million demonstrating strong operating leverage and benefit of realignment initiative • Record adjusted EBITDA margin of 16.8% • Cash from operations in the quarter of $17.3 million Regional structure enables collaborative selling of Intelligent Motion Solutions • New structure driving collaboration across product teams generating new sales, lower costs and enhanced service • Orders were $222.1 million and ending backlog was $327.8 million; quotation levels remain strong • Order level impacted by customer pre-buys ahead of June price increases and longer project conversion cycles • Focusing on markets with tailwinds while protecting earnings and cash flow Regional Realignment and Increased Collaboration Driving Results
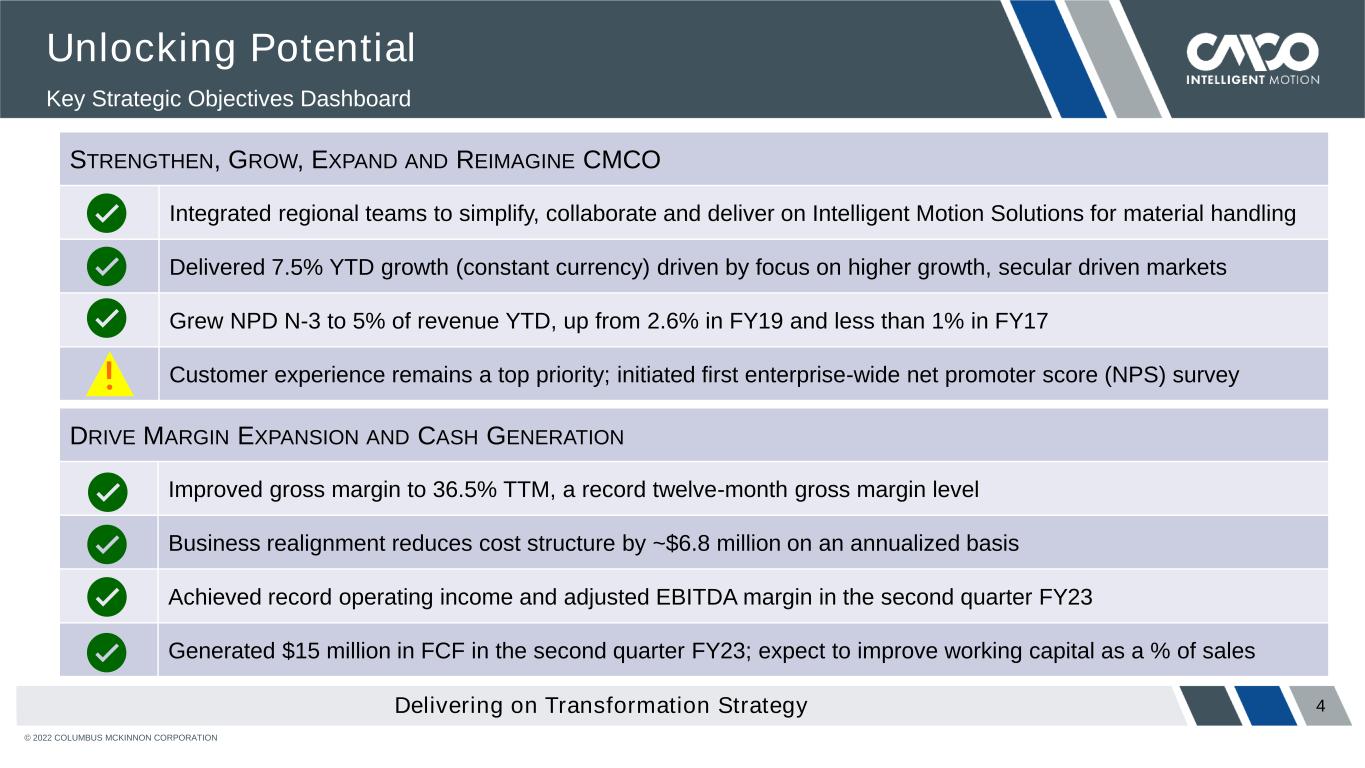
© 2022 COLUMBUS MCKINNON CORPORATION 4 Unlocking Potential Key Strategic Objectives Dashboard Delivering on Transformation Strategy STRENGTHEN, GROW, EXPAND AND REIMAGINE CMCO Integrated regional teams to simplify, collaborate and deliver on Intelligent Motion Solutions for material handling Delivered 7.5% YTD growth (constant currency) driven by focus on higher growth, secular driven markets Grew NPD N-3 to 5% of revenue YTD, up from 2.6% in FY19 and less than 1% in FY17 Customer experience remains a top priority; initiated first enterprise-wide net promoter score (NPS) survey DRIVE MARGIN EXPANSION AND CASH GENERATION Improved gross margin to 36.5% TTM, a record twelve-month gross margin level Business realignment reduces cost structure by ~$6.8 million on an annualized basis Achieved record operating income and adjusted EBITDA margin in the second quarter FY23 Generated $15 million in FCF in the second quarter FY23; expect to improve working capital as a % of sales
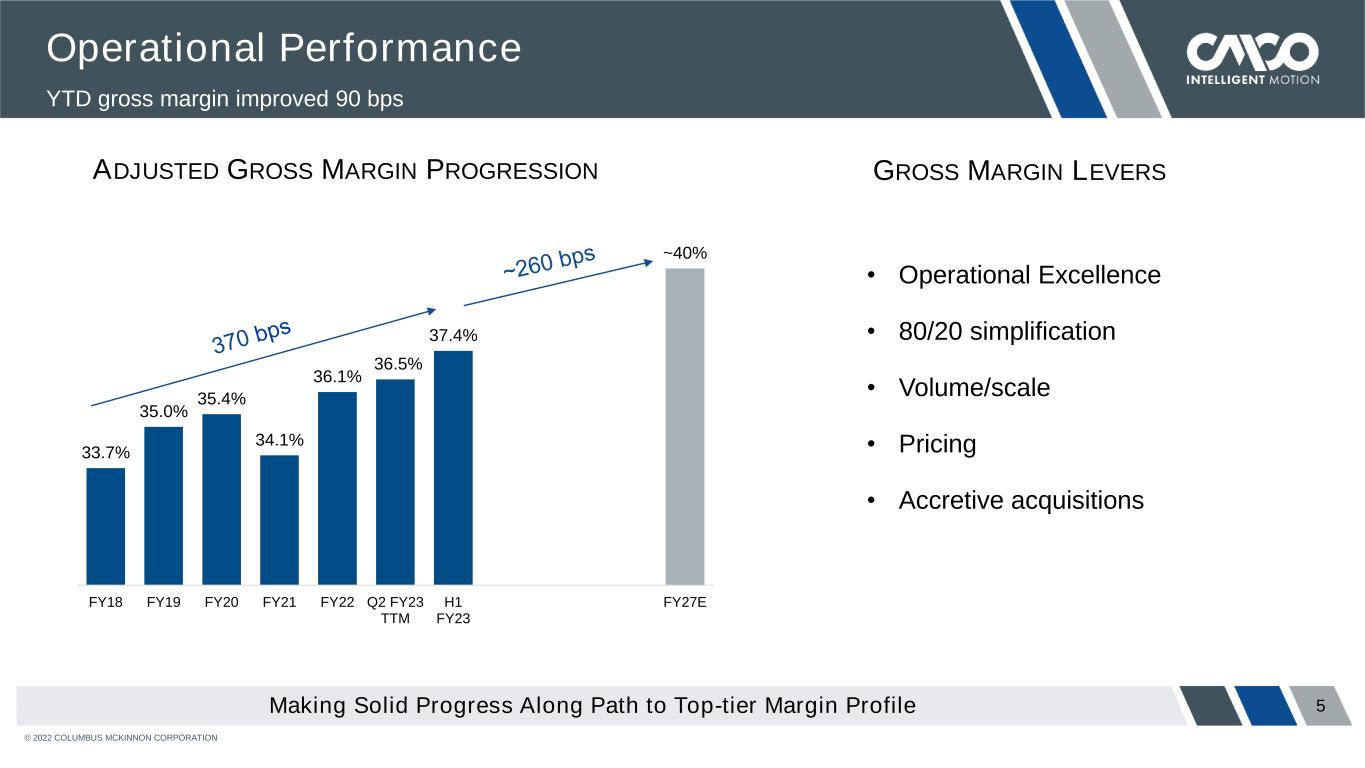
© 2022 COLUMBUS MCKINNON CORPORATION 5 Operational Performance YTD gross margin improved 90 bps Making Solid Progress Along Path to Top-tier Margin Profile ADJUSTED GROSS MARGIN PROGRESSION • Operational Excellence • 80/20 simplification • Volume/scale • Pricing • Accretive acquisitions GROSS MARGIN LEVERS 33.7% 35.0% 35.4% 34.1% 36.1% 36.5% 37.4% ~40% FY18 FY19 FY20 FY21 FY22 Q2 FY23 TTM H1 FY23 FY27E
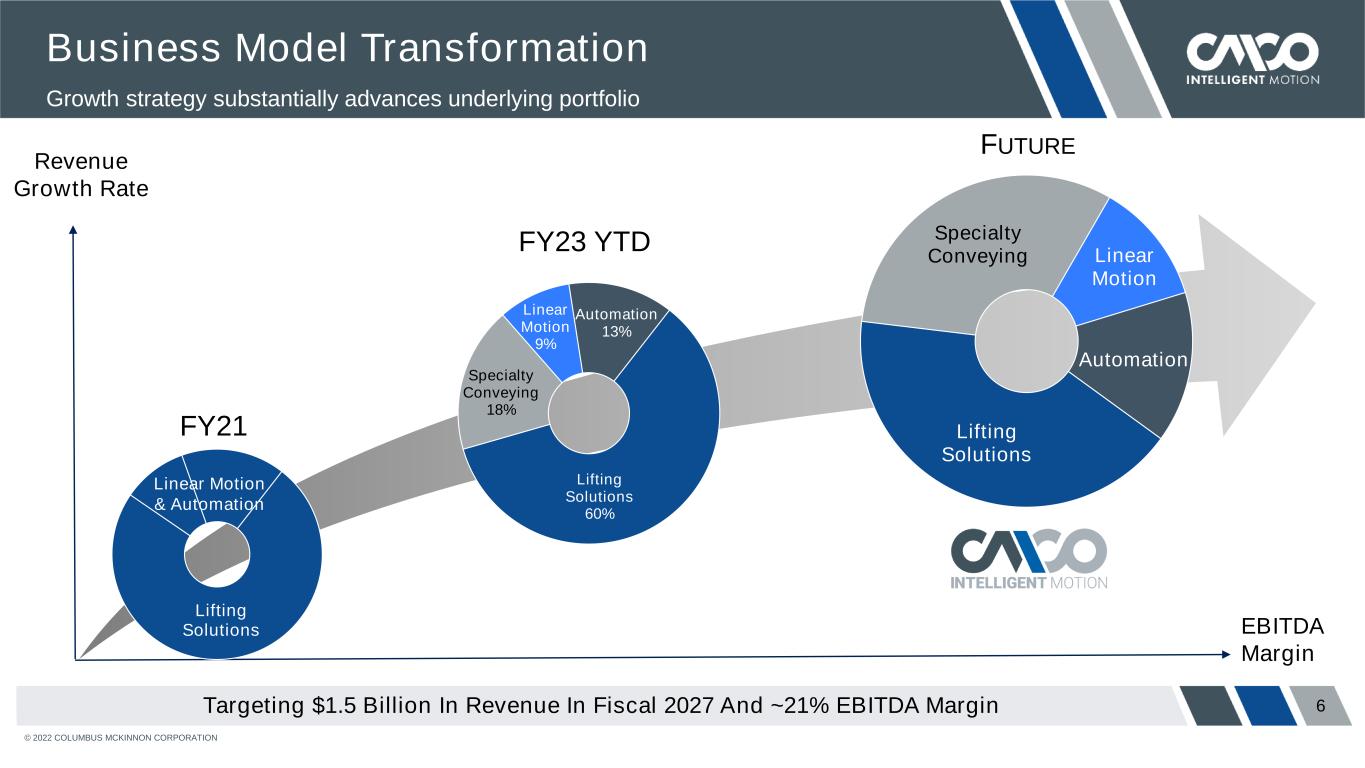
© 2022 COLUMBUS MCKINNON CORPORATION 6 Business Model Transformation Growth strategy substantially advances underlying portfolio Targeting $1.5 Billion In Revenue In Fiscal 2027 And ~21% EBITDA Margin Revenue Growth Rate EBITDA Margin Lifting Solutions 60% Specialty Conveying 18% Linear Motion 9% Automation 13% Lifting Solutions FY21 Lifting Solutions Specialty Conveying Linear Motion Automation Linear Motion & Automation FUTURE FY23 YTD
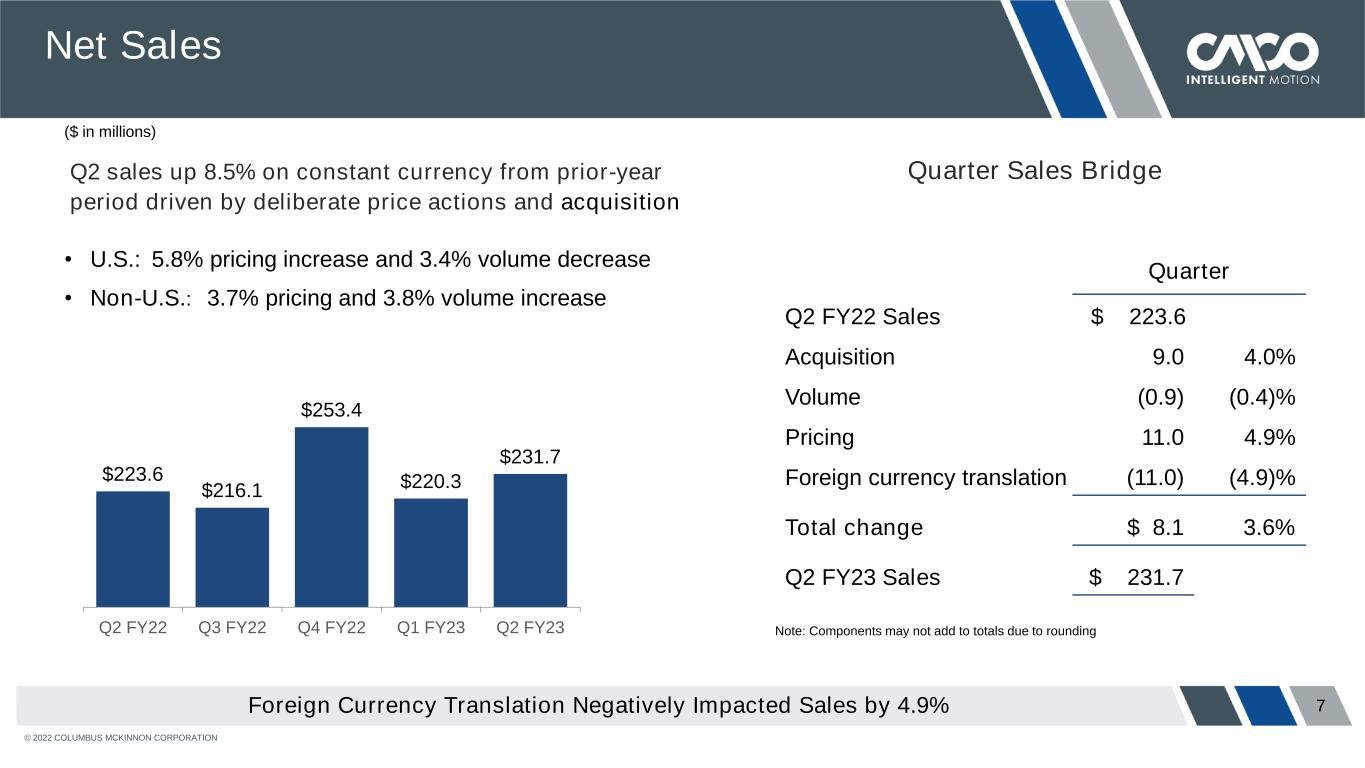
© 2022 COLUMBUS MCKINNON CORPORATION Net Sales Foreign Currency Translation Negatively Impacted Sales by 4.9% Quarter Sales Bridge • U.S.: 5.8% pricing increase and 3.4% volume decrease • Non-U.S.: 3.7% pricing and 3.8% volume increase 7 Quarter Q2 FY22 Sales $ 223.6 Acquisition 9.0 4.0% Volume (0.9) (0.4)% Pricing 11.0 4.9% Foreign currency translation (11.0) (4.9)% Total change $ 8.1 3.6% Q2 FY23 Sales $ 231.7 Q2 sales up 8.5% on constant currency from prior-year period driven by deliberate price actions and acquisition $223.6 $216.1 $253.4 $220.3 $231.7 Q2 FY22 Q3 FY22 Q4 FY22 Q1 FY23 Q2 FY23 ($ in millions) Note: Components may not add to totals due to rounding
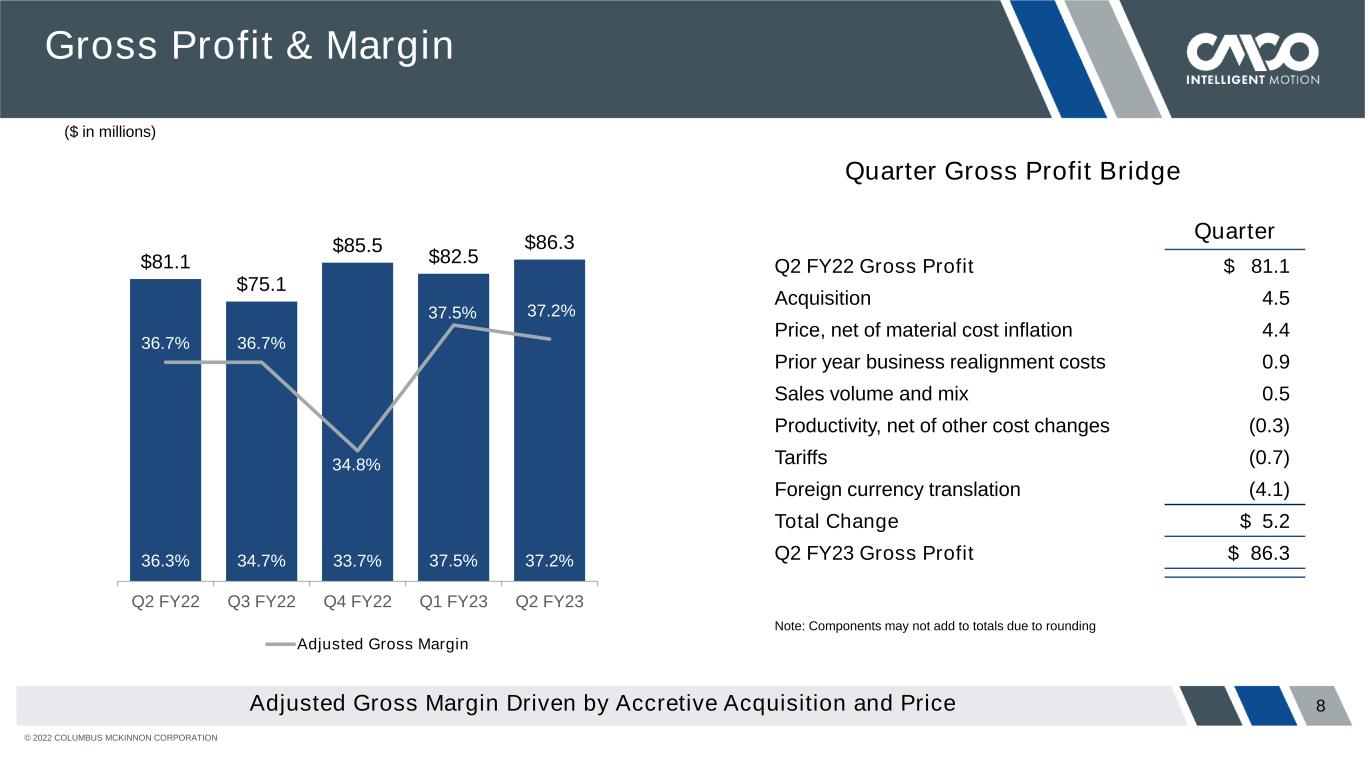
© 2022 COLUMBUS MCKINNON CORPORATION 8 Gross Profit & Margin Quarter Gross Profit Bridge Quarter Q2 FY22 Gross Profit $ 81.1 Acquisition 4.5 Price, net of material cost inflation 4.4 Prior year business realignment costs 0.9 Sales volume and mix 0.5 Productivity, net of other cost changes (0.3) Tariffs (0.7) Foreign currency translation (4.1) Total Change $ 5.2 Q2 FY23 Gross Profit $ 86.3 Adjusted Gross Margin Driven by Accretive Acquisition and Price $81.1 $75.1 $85.5 $82.5 $86.3 36.3% 34.7% 33.7% 37.5% 37.2% 36.7% 36.7% 34.8% 37.5% 37.2% Q2 FY22 Q3 FY22 Q4 FY22 Q1 FY23 Q2 FY23 Adjusted Gross Margin ($ in millions) Note: Components may not add to totals due to rounding
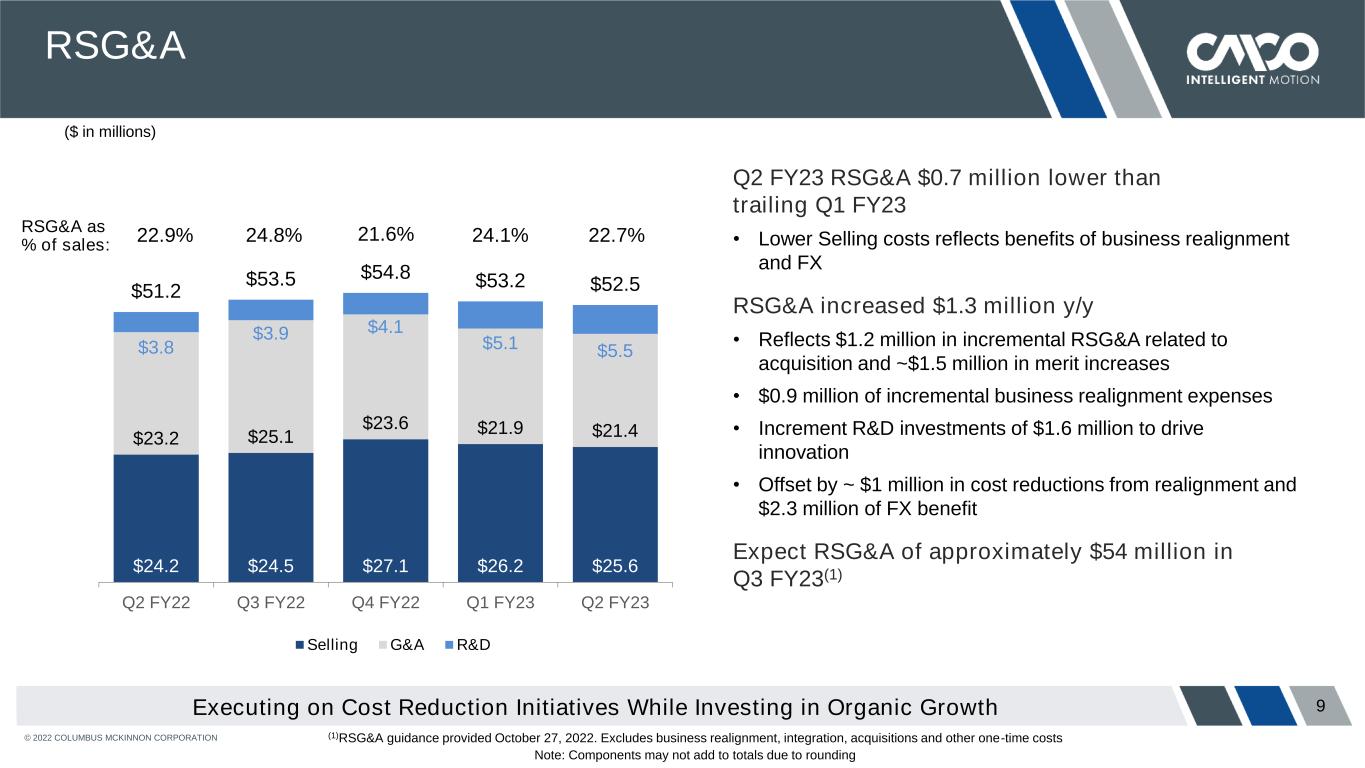
© 2022 COLUMBUS MCKINNON CORPORATION 9 RSG&A $24.2 $24.5 $27.1 $26.2 $25.6 $23.2 $25.1 $23.6 $21.9 $21.4 $3.8 $3.9 $4.1 $5.1 $5.5 $51.2 $53.5 $54.8 $53.2 $52.5 Q2 FY22 Q3 FY22 Q4 FY22 Q1 FY23 Q2 FY23 Selling G&A R&D Q2 FY23 RSG&A $0.7 million lower than trailing Q1 FY23 • Lower Selling costs reflects benefits of business realignment and FX RSG&A increased $1.3 million y/y • Reflects $1.2 million in incremental RSG&A related to acquisition and ~$1.5 million in merit increases • $0.9 million of incremental business realignment expenses • Increment R&D investments of $1.6 million to drive innovation • Offset by ~ $1 million in cost reductions from realignment and $2.3 million of FX benefit Expect RSG&A of approximately $54 million in Q3 FY23(1) (1)RSG&A guidance provided October 27, 2022. Excludes business realignment, integration, acquisitions and other one-time costs Note: Components may not add to totals due to rounding RSG&A as % of sales: 24.8% 24.1% 22.7%22.9% Executing on Cost Reduction Initiatives While Investing in Organic Growth ($ in millions) 21.6%
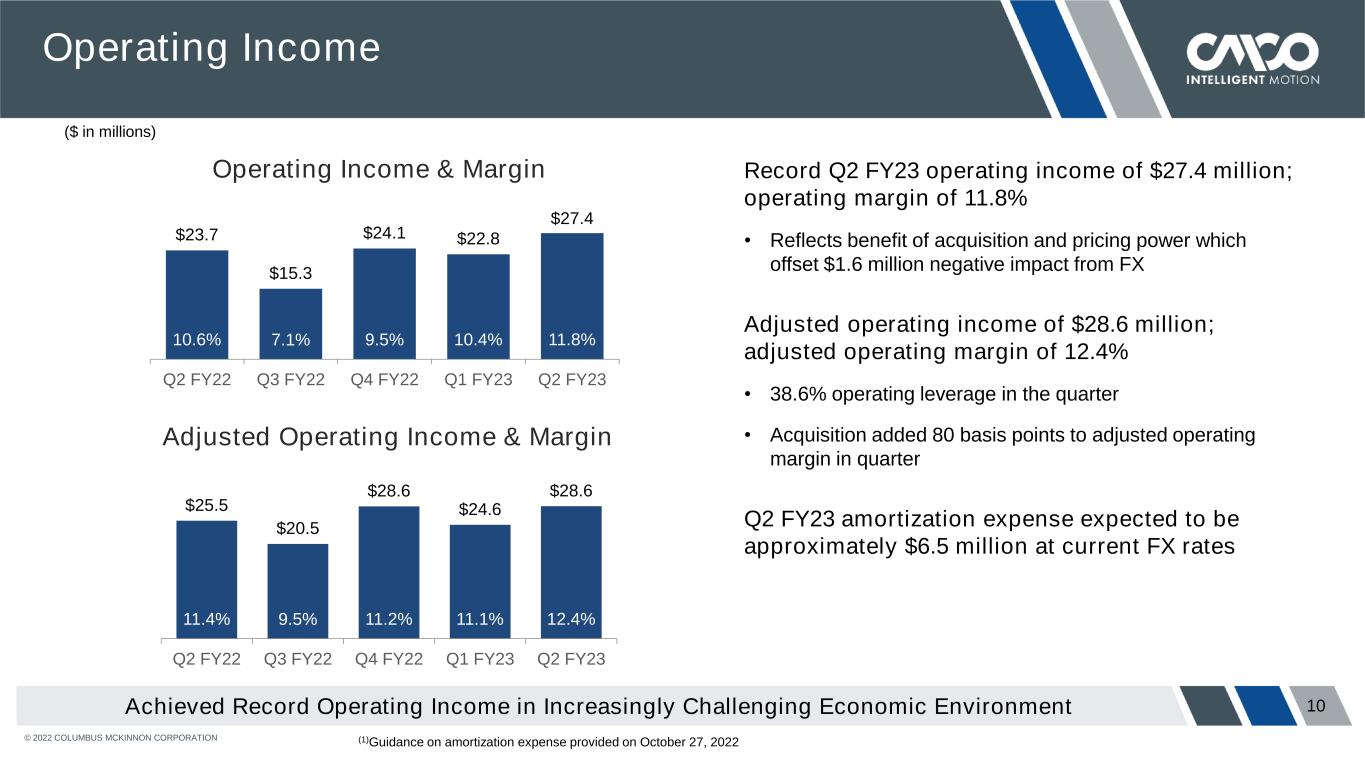
© 2022 COLUMBUS MCKINNON CORPORATION 10 Operating Income Record Q2 FY23 operating income of $27.4 million; operating margin of 11.8% • Reflects benefit of acquisition and pricing power which offset $1.6 million negative impact from FX Adjusted operating income of $28.6 million; adjusted operating margin of 12.4% • 38.6% operating leverage in the quarter • Acquisition added 80 basis points to adjusted operating margin in quarter Q2 FY23 amortization expense expected to be approximately $6.5 million at current FX rates Achieved Record Operating Income in Increasingly Challenging Economic Environment Operating Income & Margin Adjusted Operating Income & Margin $25.5 $20.5 $28.6 $24.6 $28.6 11.4% 9.5% 11.2% 11.1% 12.4% Q2 FY22 Q3 FY22 Q4 FY22 Q1 FY23 Q2 FY23 $23.7 $15.3 $24.1 $22.8 $27.4 10.6% 7.1% 9.5% 10.4% 11.8% Q2 FY22 Q3 FY22 Q4 FY22 Q1 FY23 Q2 FY23 ($ in millions) (1)Guidance on amortization expense provided on October 27, 2022
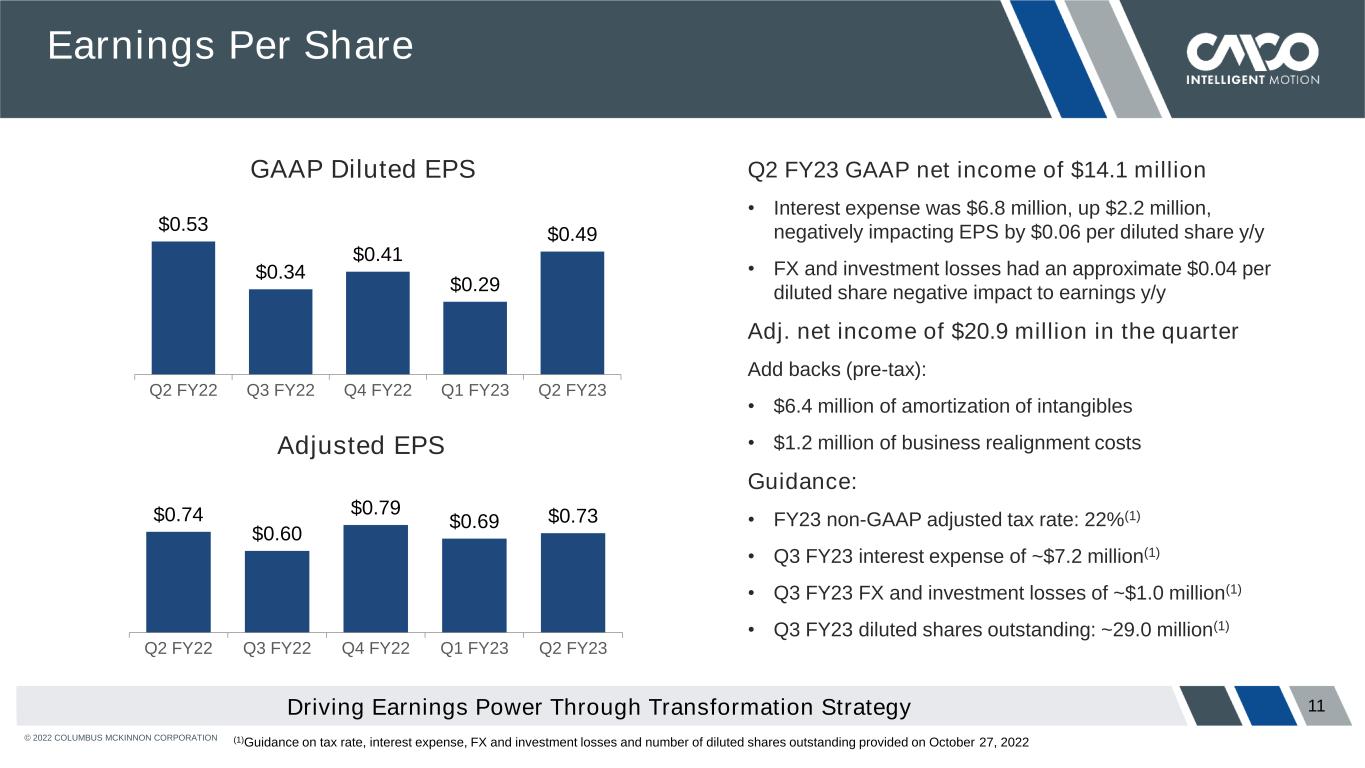
© 2022 COLUMBUS MCKINNON CORPORATION $0.53 $0.34 $0.41 $0.29 $0.49 Q2 FY22 Q3 FY22 Q4 FY22 Q1 FY23 Q2 FY23 11 Earnings Per Share Adjusted EPS GAAP Diluted EPS $0.74 $0.60 $0.79 $0.69 $0.73 Q2 FY22 Q3 FY22 Q4 FY22 Q1 FY23 Q2 FY23 Q2 FY23 GAAP net income of $14.1 million • Interest expense was $6.8 million, up $2.2 million, negatively impacting EPS by $0.06 per diluted share y/y • FX and investment losses had an approximate $0.04 per diluted share negative impact to earnings y/y Adj. net income of $20.9 million in the quarter Add backs (pre-tax): • $6.4 million of amortization of intangibles • $1.2 million of business realignment costs Guidance: • FY23 non-GAAP adjusted tax rate: 22%(1) • Q3 FY23 interest expense of ~$7.2 million(1) • Q3 FY23 FX and investment losses of ~$1.0 million(1) • Q3 FY23 diluted shares outstanding: ~29.0 million(1) (1)Guidance on tax rate, interest expense, FX and investment losses and number of diluted shares outstanding provided on October 27, 2022 Driving Earnings Power Through Transformation Strategy
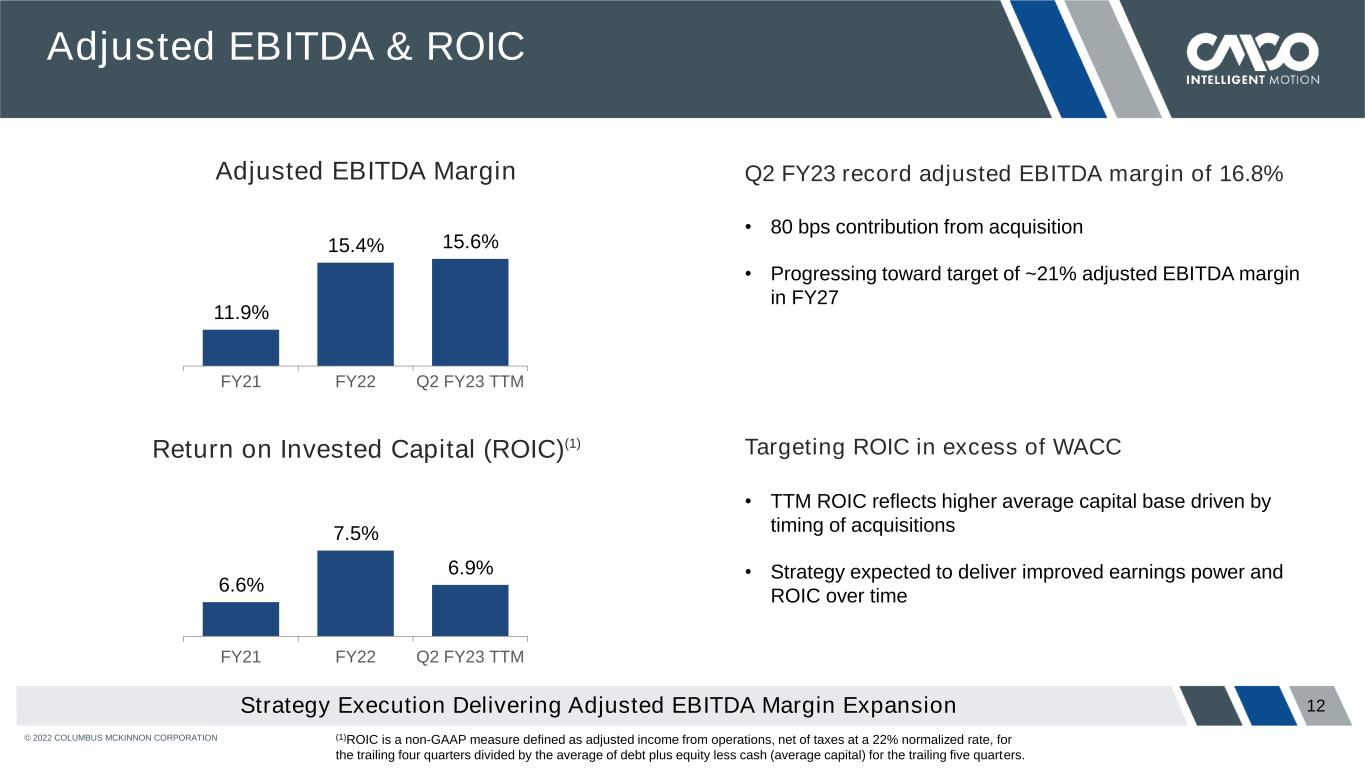
© 2022 COLUMBUS MCKINNON CORPORATION 12 Adjusted EBITDA Margin Q2 FY23 record adjusted EBITDA margin of 16.8% Adjusted EBITDA & ROIC Return on Invested Capital (ROIC)(1) 11.9% 15.4% 15.6% FY21 FY22 Q2 FY23 TTM 6.6% 7.5% 6.9% FY21 FY22 Q2 FY23 TTM (1)ROIC is a non-GAAP measure defined as adjusted income from operations, net of taxes at a 22% normalized rate, for the trailing four quarters divided by the average of debt plus equity less cash (average capital) for the trailing five quarters. • 80 bps contribution from acquisition • Progressing toward target of ~21% adjusted EBITDA margin in FY27 Targeting ROIC in excess of WACC • TTM ROIC reflects higher average capital base driven by timing of acquisitions • Strategy expected to deliver improved earnings power and ROIC over time Strategy Execution Delivering Adjusted EBITDA Margin Expansion
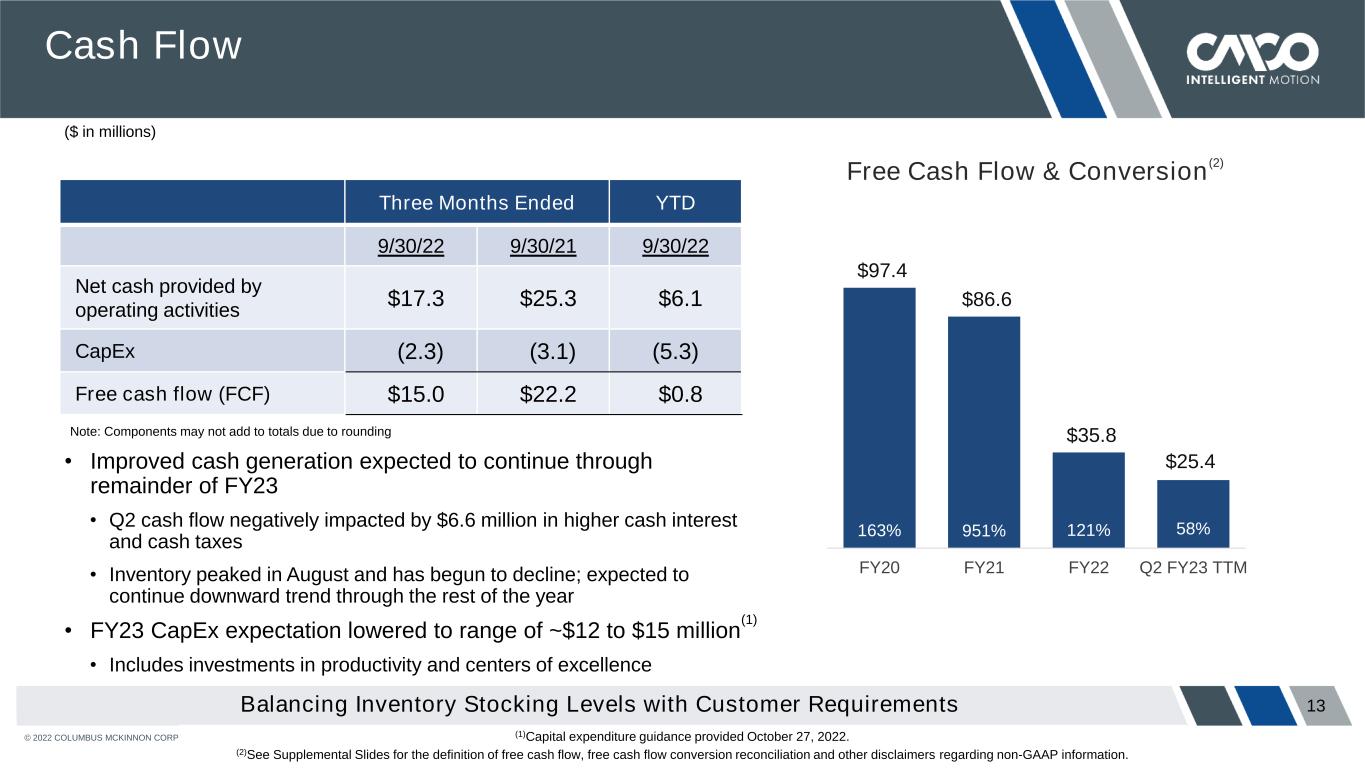
© 2022 COLUMBUS MCKINNON CORPORATION $97.4 $86.6 $35.8 $25.4 163% 951% 121% 58% FY20 FY21 FY22 Q2 FY23 TTM 13 Free Cash Flow & Conversion (2) Cash Flow Note: Components may not add to totals due to rounding Three Months Ended YTD 9/30/22 9/30/21 9/30/22 Net cash provided by operating activities $17.3 $25.3 $6.1 CapEx (2.3) (3.1) (5.3) Free cash flow (FCF) $15.0 $22.2 $0.8 (1)Capital expenditure guidance provided October 27, 2022. (2)See Supplemental Slides for the definition of free cash flow, free cash flow conversion reconciliation and other disclaimers regarding non-GAAP information. • Improved cash generation expected to continue through remainder of FY23 • Q2 cash flow negatively impacted by $6.6 million in higher cash interest and cash taxes • Inventory peaked in August and has begun to decline; expected to continue downward trend through the rest of the year • FY23 CapEx expectation lowered to range of ~$12 to $15 million (1) • Includes investments in productivity and centers of excellence Balancing Inventory Stocking Levels with Customer Requirements ($ in millions)
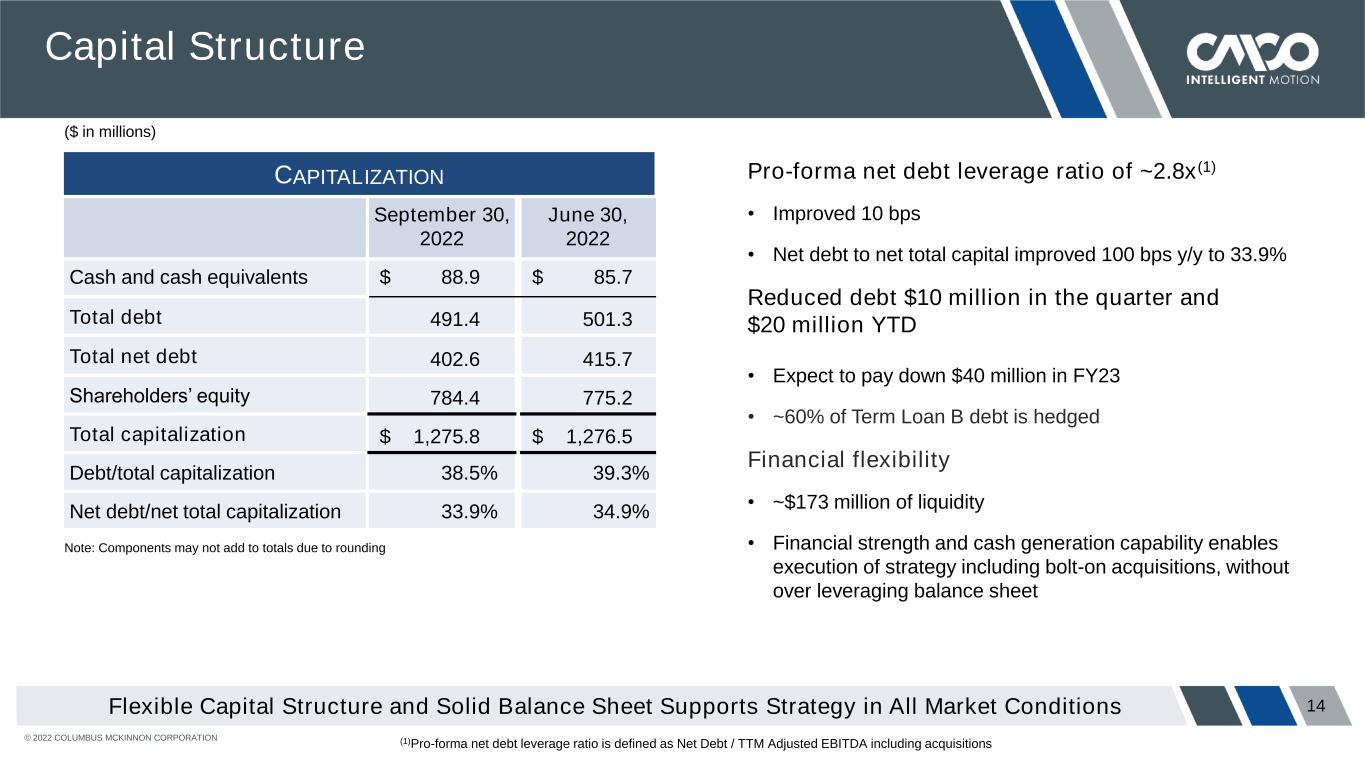
© 2022 COLUMBUS MCKINNON CORPORATION 14 Capital Structure Pro-forma net debt leverage ratio of ~2.8x(1) • Improved 10 bps • Net debt to net total capital improved 100 bps y/y to 33.9% Reduced debt $10 million in the quarter and $20 million YTD • Expect to pay down $40 million in FY23 • ~60% of Term Loan B debt is hedged Financial flexibility • ~$173 million of liquidity • Financial strength and cash generation capability enables execution of strategy including bolt-on acquisitions, without over leveraging balance sheet Flexible Capital Structure and Solid Balance Sheet Supports Strategy in All Market Conditions CAPITALIZATION September 30, 2022 June 30, 2022 Cash and cash equivalents $ 88.9 $ 85.7 Total debt 491.4 501.3 Total net debt 402.6 415.7 Shareholders’ equity 784.4 775.2 Total capitalization $ 1,275.8 $ 1,276.5 Debt/total capitalization 38.5% 39.3% Net debt/net total capitalization 33.9% 34.9% (1)Pro-forma net debt leverage ratio is defined as Net Debt / TTM Adjusted EBITDA including acquisitions ($ in millions) Note: Components may not add to totals due to rounding
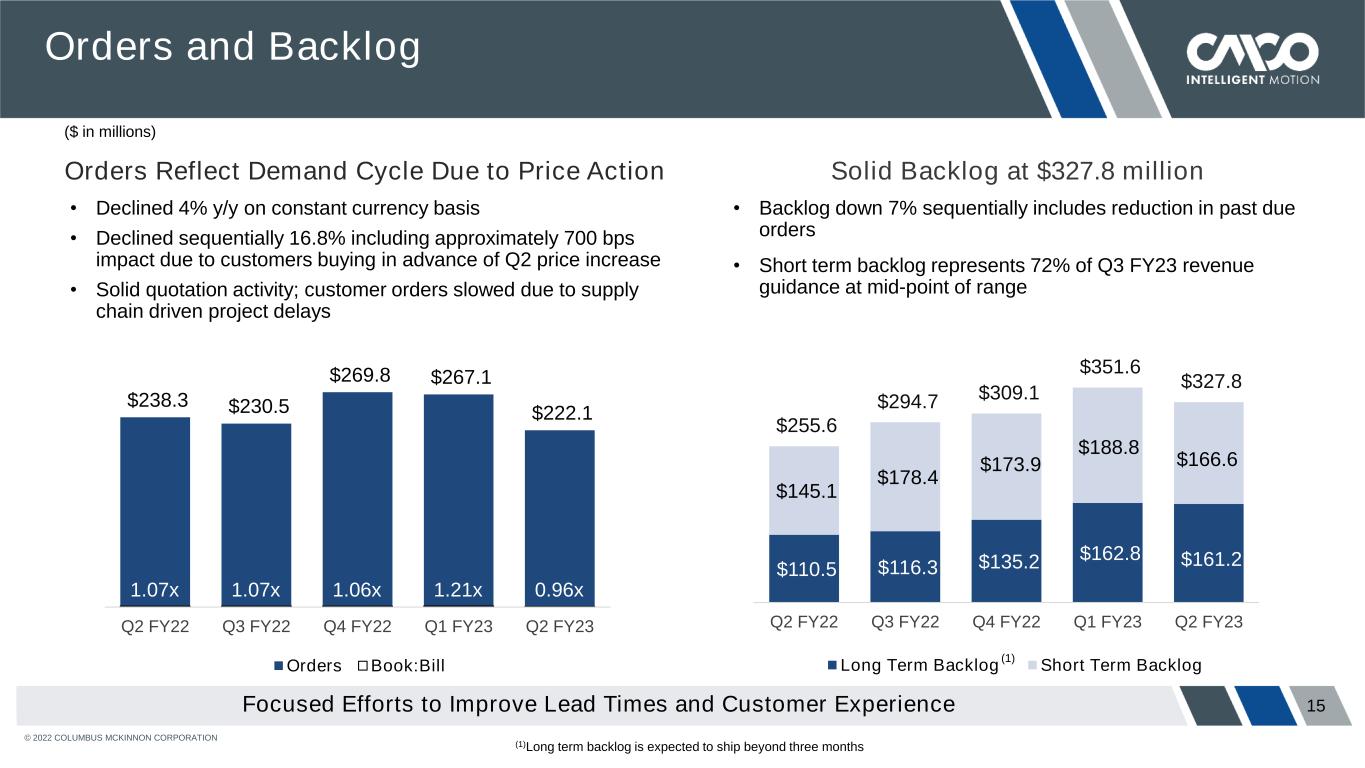
© 2022 COLUMBUS MCKINNON CORPORATION 15 Orders Reflect Demand Cycle Due to Price Action Solid Backlog at $327.8 million Orders and Backlog • Declined 4% y/y on constant currency basis • Declined sequentially 16.8% including approximately 700 bps impact due to customers buying in advance of Q2 price increase • Solid quotation activity; customer orders slowed due to supply chain driven project delays • Backlog down 7% sequentially includes reduction in past due orders • Short term backlog represents 72% of Q3 FY23 revenue guidance at mid-point of range Focused Efforts to Improve Lead Times and Customer Experience $238.3 $230.5 $269.8 $267.1 $222.1 1.07x 1.07x 1.06x 1.21x 0.96x Q2 FY22 Q3 FY22 Q4 FY22 Q1 FY23 Q2 FY23 Orders Book:Bill (1)Long term backlog is expected to ship beyond three months $110.5 $116.3 $135.2 $162.8 $161.2 $145.1 $178.4 $173.9 $188.8 $166.6 $255.6 $294.7 $309.1 $351.6 $327.8 Q2 FY22 Q3 FY22 Q4 FY22 Q1 FY23 Q2 FY23 Long Term Backlog Short Term Backlog (1) ($ in millions)
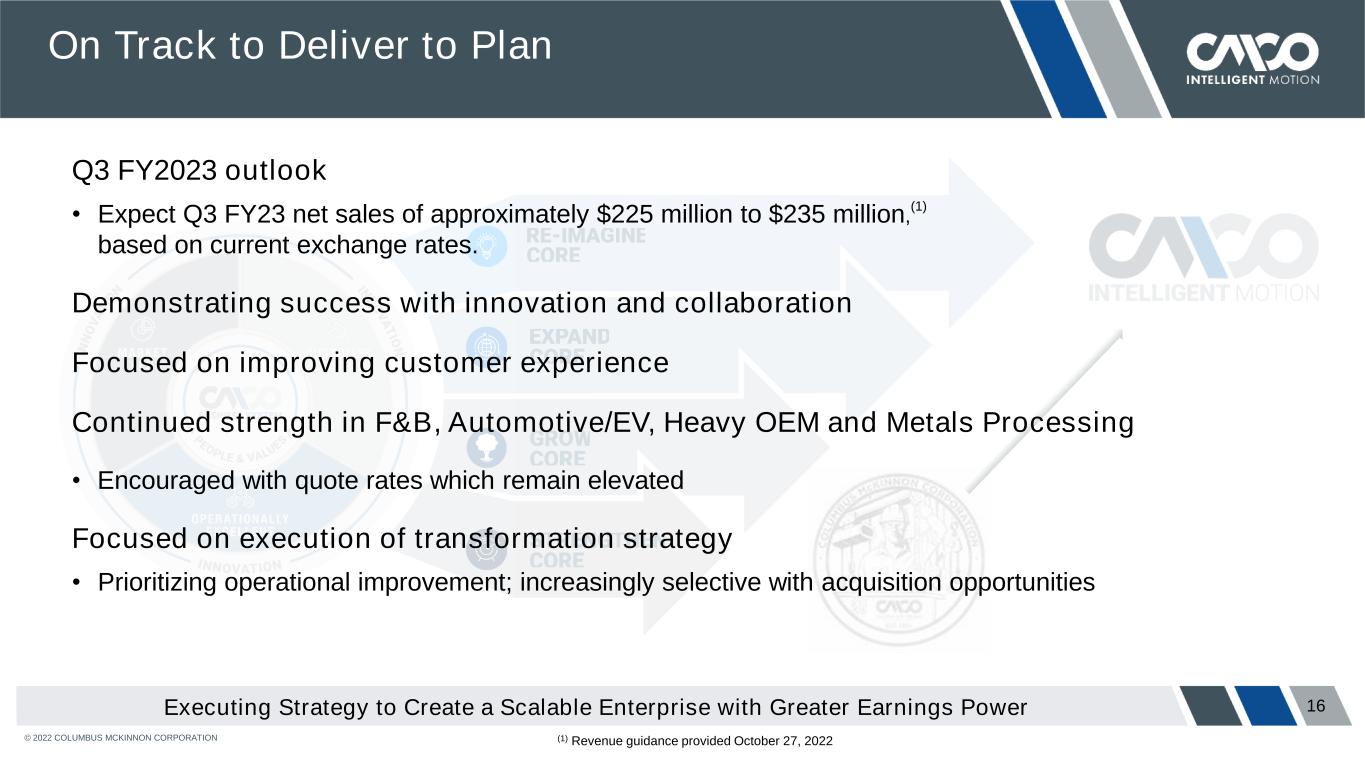
© 2022 COLUMBUS MCKINNON CORPORATION 16Executing Strategy to Create a Scalable Enterprise with Greater Earnings Power On Track to Deliver to Plan (1) Revenue guidance provided October 27, 2022 Q3 FY2023 outlook • Expect Q3 FY23 net sales of approximately $225 million to $235 million, (1) based on current exchange rates. Demonstrating success with innovation and collaboration Focused on improving customer experience Continued strength in F&B, Automotive/EV, Heavy OEM and Metals Processing • Encouraged with quote rates which remain elevated Focused on execution of transformation strategy • Prioritizing operational improvement; increasingly selective with acquisition opportunities
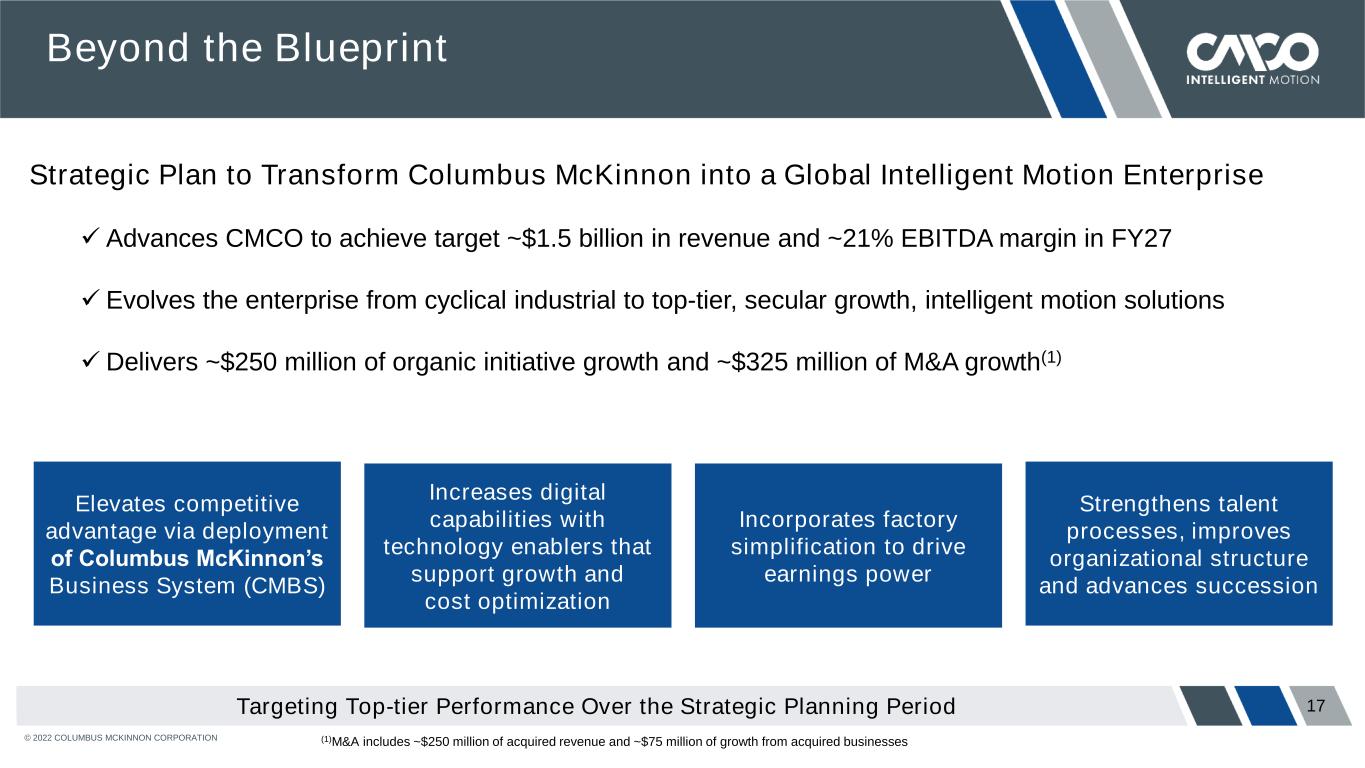
© 2022 COLUMBUS MCKINNON CORPORATION Targeting Top-tier Performance Over the Strategic Planning Period Increases digital capabilities with technology enablers that support growth and cost optimization Incorporates factory simplification to drive earnings power Elevates competitive advantage via deployment of Columbus McKinnon’s Business System (CMBS) Strengthens talent processes, improves organizational structure and advances succession Strategic Plan to Transform Columbus McKinnon into a Global Intelligent Motion Enterprise ✓ Advances CMCO to achieve target ~$1.5 billion in revenue and ~21% EBITDA margin in FY27 ✓ Evolves the enterprise from cyclical industrial to top-tier, secular growth, intelligent motion solutions ✓Delivers ~$250 million of organic initiative growth and ~$325 million of M&A growth(1) Beyond the Blueprint 17 (1)M&A includes ~$250 million of acquired revenue and ~$75 million of growth from acquired businesses

Q2 Fiscal Year 2023 Financial Results Conference Call President & Chief Executive Officer David J. Wilson October 27, 2022 Executive VP – Finance & Chief Financial Officer Gregory P. Rustowicz
Supplemental Information
© 2022 COLUMBUS MCKINNON CORPORATION 20 Conference Call Playback Info Replay Number: 412-317-6671 passcode: 13733206 Telephone replay available through November 3, 2022 Webcast / PowerPoint / Replay available at investors.columbusmckinnon.com Transcript, when available, at investors.columbusmckinnon.com
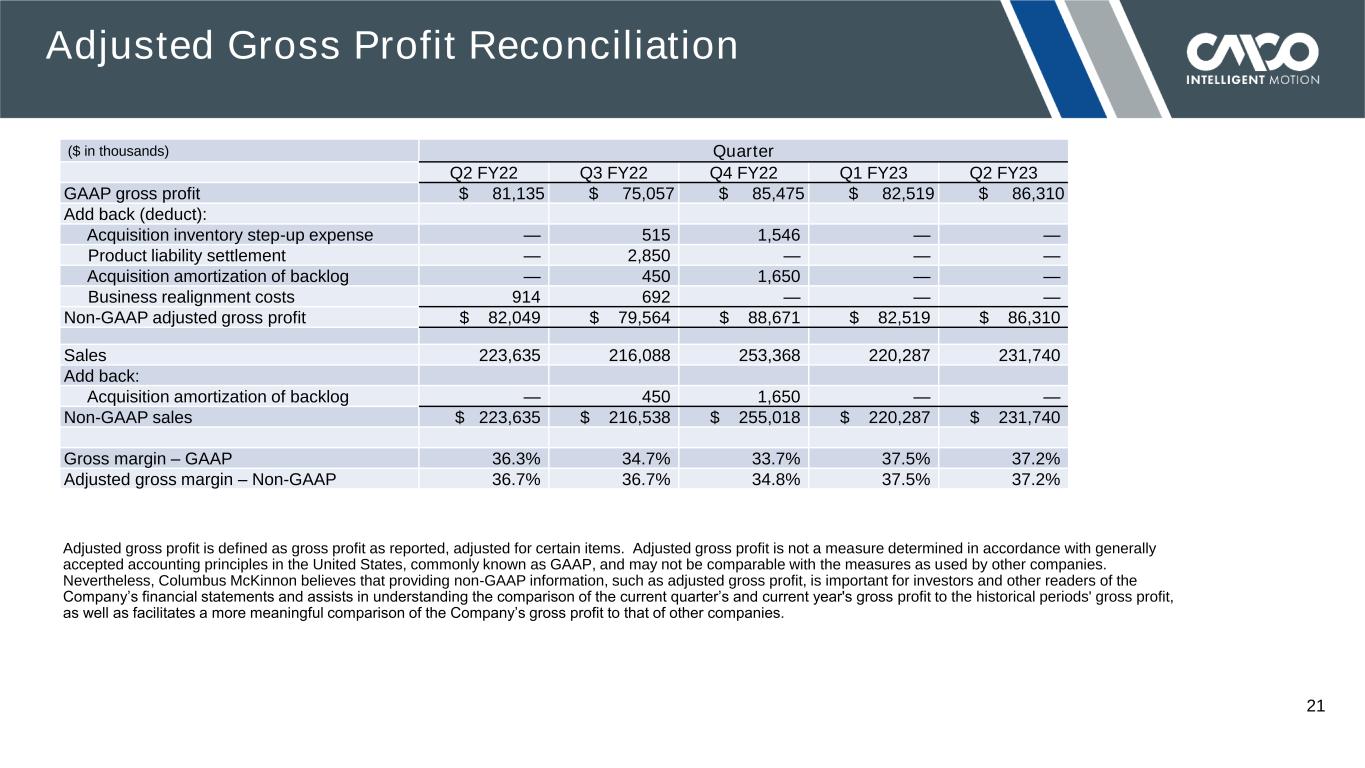
© 2022 COLUMBUS MCKINNON CORPORATION 21 Adjusted Gross Profit Reconciliation Adjusted gross profit is defined as gross profit as reported, adjusted for certain items. Adjusted gross profit is not a measure determined in accordance with generally accepted accounting principles in the United States, commonly known as GAAP, and may not be comparable with the measures as used by other companies. Nevertheless, Columbus McKinnon believes that providing non-GAAP information, such as adjusted gross profit, is important for investors and other readers of the Company’s financial statements and assists in understanding the comparison of the current quarter’s and current year's gross profit to the historical periods' gross profit, as well as facilitates a more meaningful comparison of the Company’s gross profit to that of other companies. ($ in thousands) Quarter Q2 FY22 Q3 FY22 Q4 FY22 Q1 FY23 Q2 FY23 GAAP gross profit $ 81,135 $ 75,057 $ 85,475 $ 82,519 $ 86,310 Add back (deduct): Acquisition inventory step-up expense — 515 1,546 — — Product liability settlement — 2,850 — — — Acquisition amortization of backlog — 450 1,650 — — Business realignment costs 914 692 — — — Non-GAAP adjusted gross profit $ 82,049 $ 79,564 $ 88,671 $ 82,519 $ 86,310 Sales 223,635 216,088 253,368 220,287 231,740 Add back: Acquisition amortization of backlog — 450 1,650 — — Non-GAAP sales $ 223,635 $ 216,538 $ 255,018 $ 220,287 $ 231,740 Gross margin – GAAP 36.3% 34.7% 33.7% 37.5% 37.2% Adjusted gross margin – Non-GAAP 36.7% 36.7% 34.8% 37.5% 37.2%
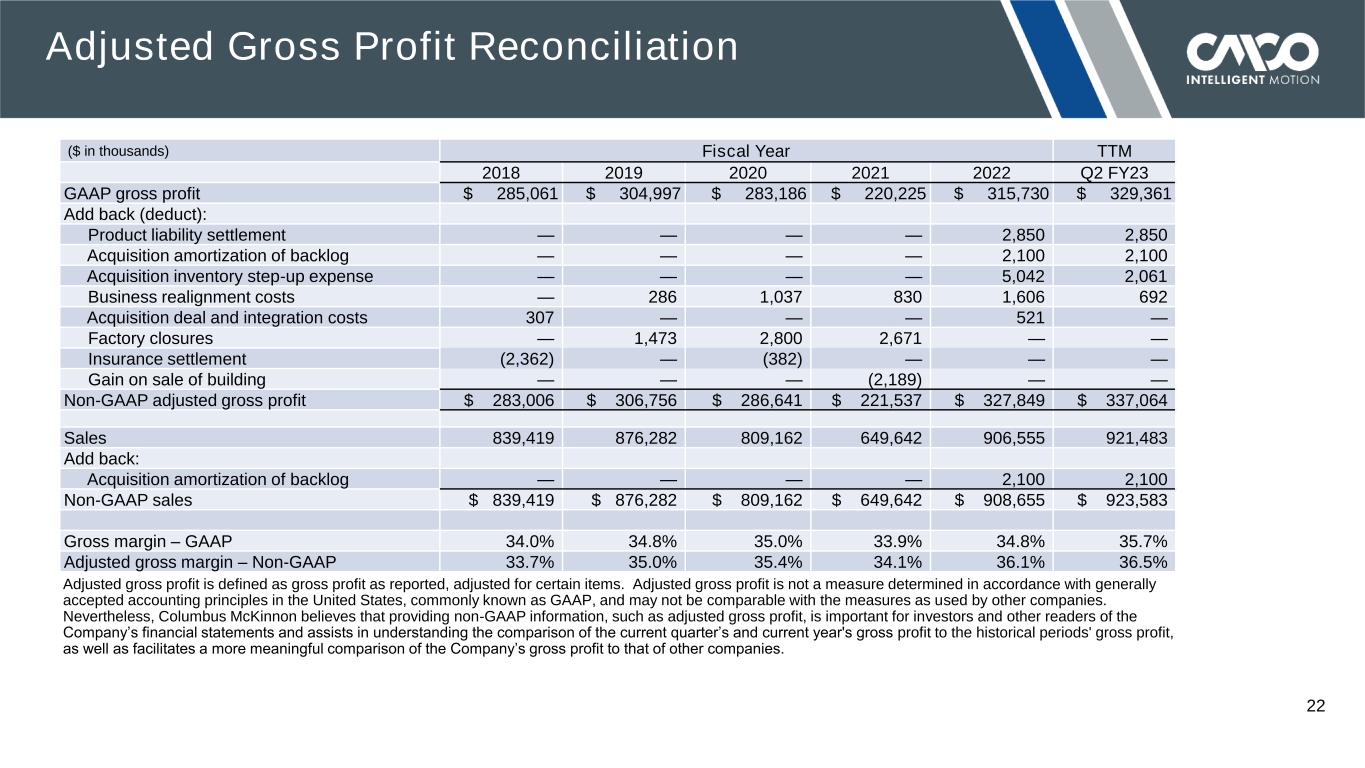
© 2022 COLUMBUS MCKINNON CORPORATION 22 Adjusted Gross Profit Reconciliation Adjusted gross profit is defined as gross profit as reported, adjusted for certain items. Adjusted gross profit is not a measure determined in accordance with generally accepted accounting principles in the United States, commonly known as GAAP, and may not be comparable with the measures as used by other companies. Nevertheless, Columbus McKinnon believes that providing non-GAAP information, such as adjusted gross profit, is important for investors and other readers of the Company’s financial statements and assists in understanding the comparison of the current quarter’s and current year's gross profit to the historical periods' gross profit, as well as facilitates a more meaningful comparison of the Company’s gross profit to that of other companies. ($ in thousands) Fiscal Year TTM 2018 2019 2020 2021 2022 Q2 FY23 GAAP gross profit $ 285,061 $ 304,997 $ 283,186 $ 220,225 $ 315,730 $ 329,361 Add back (deduct): Product liability settlement — — — — 2,850 2,850 Acquisition amortization of backlog — — — — 2,100 2,100 Acquisition inventory step-up expense — — — — 5,042 2,061 Business realignment costs — 286 1,037 830 1,606 692 Acquisition deal and integration costs 307 — — — 521 — Factory closures — 1,473 2,800 2,671 — — Insurance settlement (2,362) — (382) — — — Gain on sale of building — — — (2,189) — — Non-GAAP adjusted gross profit $ 283,006 $ 306,756 $ 286,641 $ 221,537 $ 327,849 $ 337,064 Sales 839,419 876,282 809,162 649,642 906,555 921,483 Add back: Acquisition amortization of backlog — — — — 2,100 2,100 Non-GAAP sales $ 839,419 $ 876,282 $ 809,162 $ 649,642 $ 908,655 $ 923,583 Gross margin – GAAP 34.0% 34.8% 35.0% 33.9% 34.8% 35.7% Adjusted gross margin – Non-GAAP 33.7% 35.0% 35.4% 34.1% 36.1% 36.5%
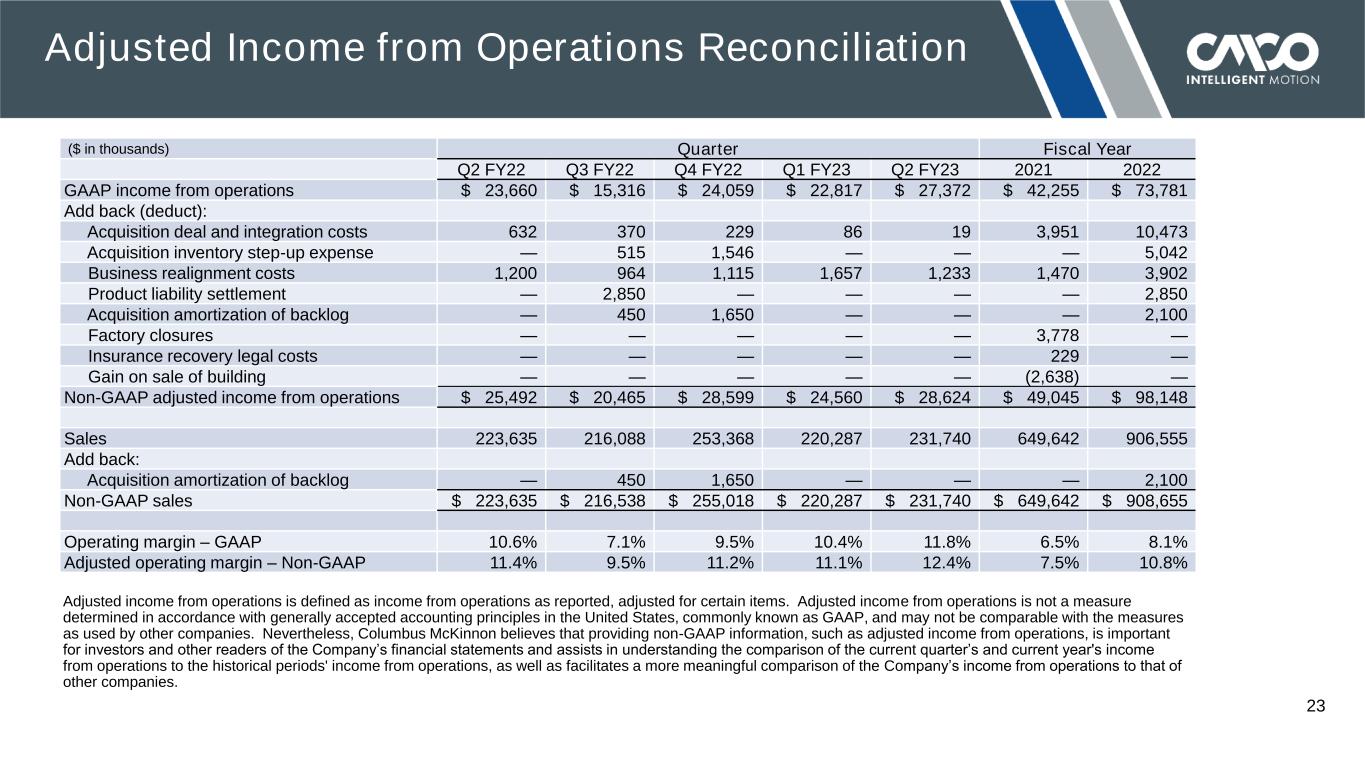
© 2022 COLUMBUS MCKINNON CORPORATION 23 Adjusted Income from Operations Reconciliation Adjusted income from operations is defined as income from operations as reported, adjusted for certain items. Adjusted income from operations is not a measure determined in accordance with generally accepted accounting principles in the United States, commonly known as GAAP, and may not be comparable with the measures as used by other companies. Nevertheless, Columbus McKinnon believes that providing non-GAAP information, such as adjusted income from operations, is important for investors and other readers of the Company’s financial statements and assists in understanding the comparison of the current quarter’s and current year's income from operations to the historical periods' income from operations, as well as facilitates a more meaningful comparison of the Company’s income from operations to that of other companies. ($ in thousands) Quarter Fiscal Year Q2 FY22 Q3 FY22 Q4 FY22 Q1 FY23 Q2 FY23 2021 2022 GAAP income from operations $ 23,660 $ 15,316 $ 24,059 $ 22,817 $ 27,372 $ 42,255 $ 73,781 Add back (deduct): Acquisition deal and integration costs 632 370 229 86 19 3,951 10,473 Acquisition inventory step-up expense — 515 1,546 — — — 5,042 Business realignment costs 1,200 964 1,115 1,657 1,233 1,470 3,902 Product liability settlement — 2,850 — — — — 2,850 Acquisition amortization of backlog — 450 1,650 — — — 2,100 Factory closures — — — — — 3,778 — Insurance recovery legal costs — — — — — 229 — Gain on sale of building — — — — — (2,638) — Non-GAAP adjusted income from operations $ 25,492 $ 20,465 $ 28,599 $ 24,560 $ 28,624 $ 49,045 $ 98,148 Sales 223,635 216,088 253,368 220,287 231,740 649,642 906,555 Add back: Acquisition amortization of backlog — 450 1,650 — — — 2,100 Non-GAAP sales $ 223,635 $ 216,538 $ 255,018 $ 220,287 $ 231,740 $ 649,642 $ 908,655 Operating margin – GAAP 10.6% 7.1% 9.5% 10.4% 11.8% 6.5% 8.1% Adjusted operating margin – Non-GAAP 11.4% 9.5% 11.2% 11.1% 12.4% 7.5% 10.8%
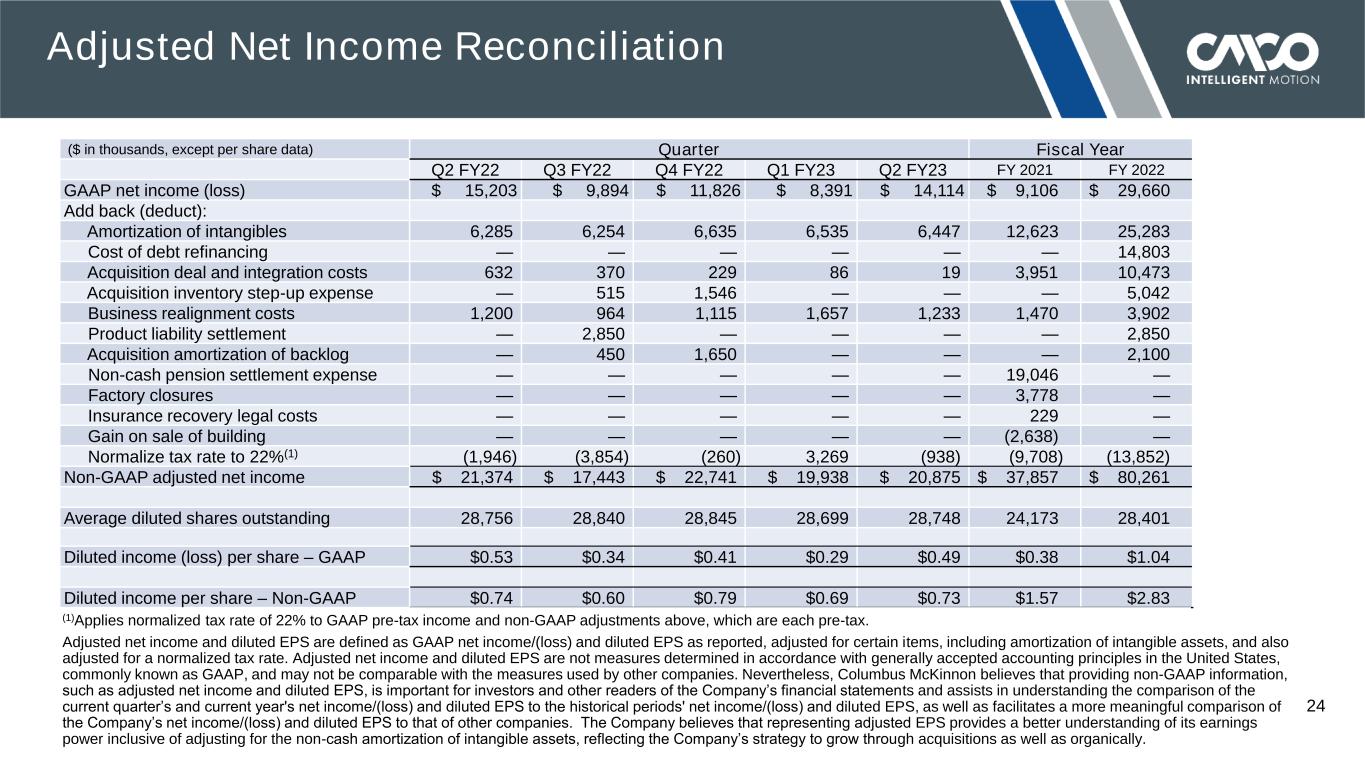
© 2022 COLUMBUS MCKINNON CORPORATION 24 Adjusted Net Income Reconciliation ($ in thousands, except per share data) Quarter Fiscal Year Q2 FY22 Q3 FY22 Q4 FY22 Q1 FY23 Q2 FY23 FY 2021 FY 2022 GAAP net income (loss) $ 15,203 $ 9,894 $ 11,826 $ 8,391 $ 14,114 $ 9,106 $ 29,660 Add back (deduct): Amortization of intangibles 6,285 6,254 6,635 6,535 6,447 12,623 25,283 Cost of debt refinancing — — — — — — 14,803 Acquisition deal and integration costs 632 370 229 86 19 3,951 10,473 Acquisition inventory step-up expense — 515 1,546 — — — 5,042 Business realignment costs 1,200 964 1,115 1,657 1,233 1,470 3,902 Product liability settlement — 2,850 — — — — 2,850 Acquisition amortization of backlog — 450 1,650 — — — 2,100 Non-cash pension settlement expense — — — — — 19,046 — Factory closures — — — — — 3,778 — Insurance recovery legal costs — — — — — 229 — Gain on sale of building — — — — — (2,638) — Normalize tax rate to 22%(1) (1,946) (3,854) (260) 3,269 (938) (9,708) (13,852) Non-GAAP adjusted net income $ 21,374 $ 17,443 $ 22,741 $ 19,938 $ 20,875 $ 37,857 $ 80,261 Average diluted shares outstanding 28,756 28,840 28,845 28,699 28,748 24,173 28,401 Diluted income (loss) per share – GAAP $0.53 $0.34 $0.41 $0.29 $0.49 $0.38 $1.04 Diluted income per share – Non-GAAP $0.74 $0.60 $0.79 $0.69 $0.73 $1.57 $2.83 (1)Applies normalized tax rate of 22% to GAAP pre-tax income and non-GAAP adjustments above, which are each pre-tax. Adjusted net income and diluted EPS are defined as GAAP net income/(loss) and diluted EPS as reported, adjusted for certain items, including amortization of intangible assets, and also adjusted for a normalized tax rate. Adjusted net income and diluted EPS are not measures determined in accordance with generally accepted accounting principles in the United States, commonly known as GAAP, and may not be comparable with the measures used by other companies. Nevertheless, Columbus McKinnon believes that providing non-GAAP information, such as adjusted net income and diluted EPS, is important for investors and other readers of the Company’s financial statements and assists in understanding the comparison of the current quarter’s and current year's net income/(loss) and diluted EPS to the historical periods' net income/(loss) and diluted EPS, as well as facilitates a more meaningful comparison of the Company’s net income/(loss) and diluted EPS to that of other companies. The Company believes that representing adjusted EPS provides a better understanding of its earnings power inclusive of adjusting for the non-cash amortization of intangible assets, reflecting the Company’s strategy to grow through acquisitions as well as organically.
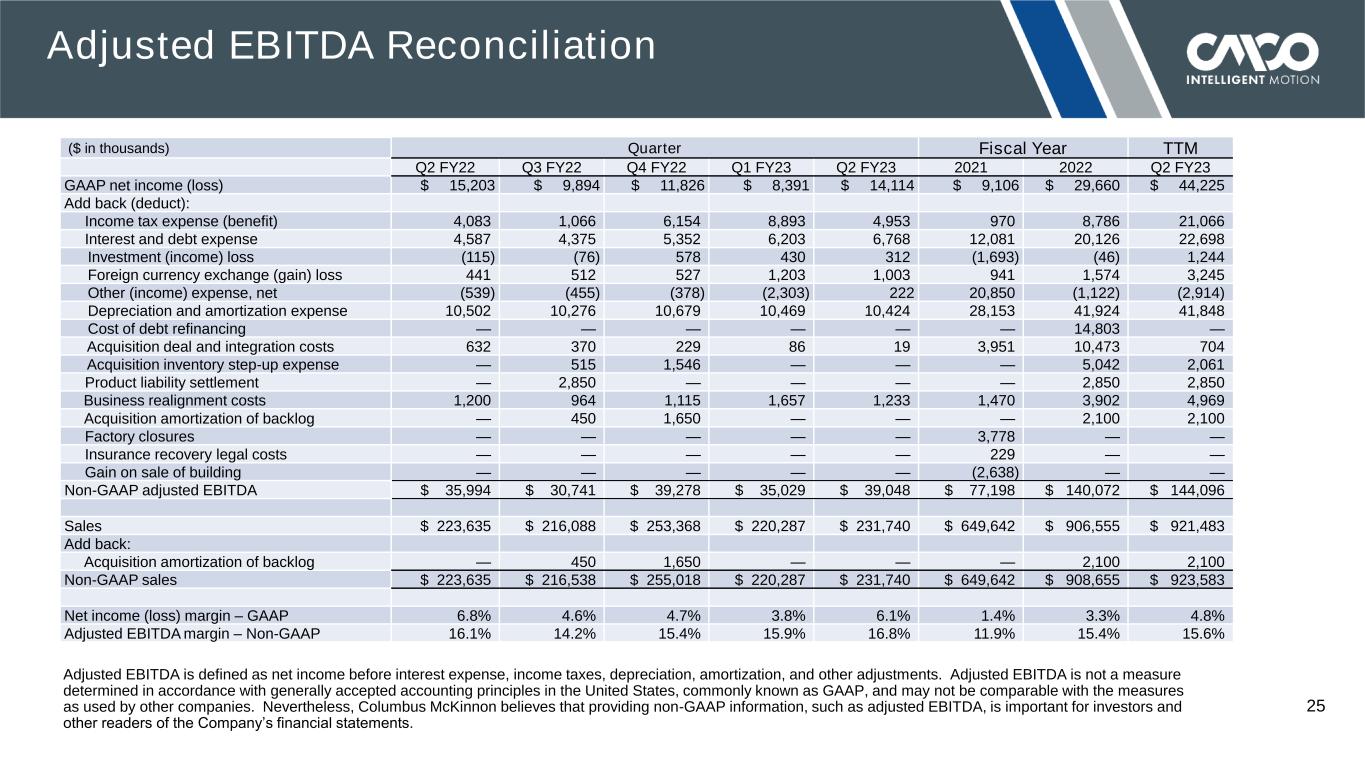
© 2022 COLUMBUS MCKINNON CORPORATION 25 Adjusted EBITDA Reconciliation Adjusted EBITDA is defined as net income before interest expense, income taxes, depreciation, amortization, and other adjustments. Adjusted EBITDA is not a measure determined in accordance with generally accepted accounting principles in the United States, commonly known as GAAP, and may not be comparable with the measures as used by other companies. Nevertheless, Columbus McKinnon believes that providing non-GAAP information, such as adjusted EBITDA, is important for investors and other readers of the Company’s financial statements. ($ in thousands) Quarter Fiscal Year TTM Q2 FY22 Q3 FY22 Q4 FY22 Q1 FY23 Q2 FY23 2021 2022 Q2 FY23 GAAP net income (loss) $ 15,203 $ 9,894 $ 11,826 $ 8,391 $ 14,114 $ 9,106 $ 29,660 $ 44,225 Add back (deduct): Income tax expense (benefit) 4,083 1,066 6,154 8,893 4,953 970 8,786 21,066 Interest and debt expense 4,587 4,375 5,352 6,203 6,768 12,081 20,126 22,698 Investment (income) loss (115) (76) 578 430 312 (1,693) (46) 1,244 Foreign currency exchange (gain) loss 441 512 527 1,203 1,003 941 1,574 3,245 Other (income) expense, net (539) (455) (378) (2,303) 222 20,850 (1,122) (2,914) Depreciation and amortization expense 10,502 10,276 10,679 10,469 10,424 28,153 41,924 41,848 Cost of debt refinancing — — — — — — 14,803 — Acquisition deal and integration costs 632 370 229 86 19 3,951 10,473 704 Acquisition inventory step-up expense — 515 1,546 — — — 5,042 2,061 Product liability settlement — 2,850 — — — — 2,850 2,850 Business realignment costs 1,200 964 1,115 1,657 1,233 1,470 3,902 4,969 Acquisition amortization of backlog — 450 1,650 — — — 2,100 2,100 Factory closures — — — — — 3,778 — — Insurance recovery legal costs — — — — — 229 — — Gain on sale of building — — — — — (2,638) — — Non-GAAP adjusted EBITDA $ 35,994 $ 30,741 $ 39,278 $ 35,029 $ 39,048 $ 77,198 $ 140,072 $ 144,096 Sales $ 223,635 $ 216,088 $ 253,368 $ 220,287 $ 231,740 $ 649,642 $ 906,555 $ 921,483 Add back: Acquisition amortization of backlog — 450 1,650 — — — 2,100 2,100 Non-GAAP sales $ 223,635 $ 216,538 $ 255,018 $ 220,287 $ 231,740 $ 649,642 $ 908,655 $ 923,583 Net income (loss) margin – GAAP 6.8% 4.6% 4.7% 3.8% 6.1% 1.4% 3.3% 4.8% Adjusted EBITDA margin – Non-GAAP 16.1% 14.2% 15.4% 15.9% 16.8% 11.9% 15.4% 15.6%
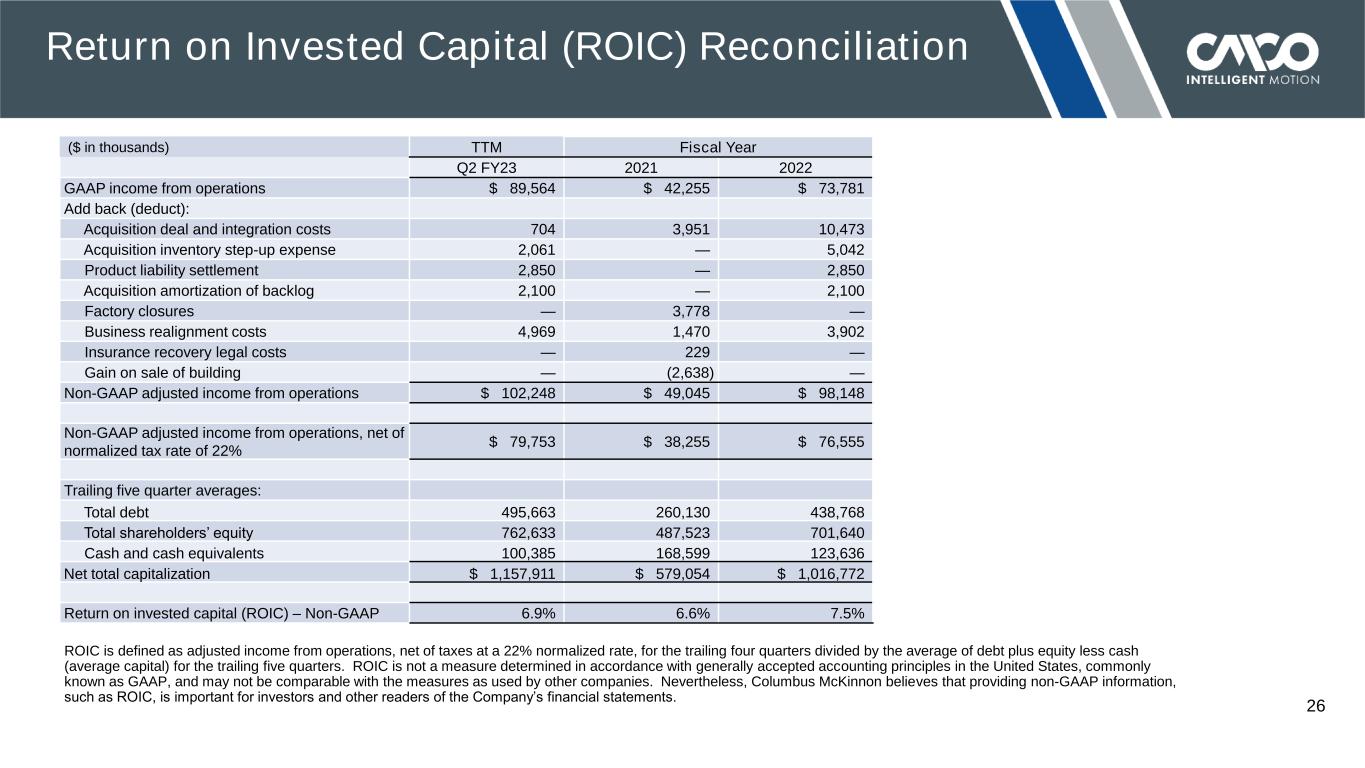
© 2022 COLUMBUS MCKINNON CORPORATION 26 Return on Invested Capital (ROIC) Reconciliation ROIC is defined as adjusted income from operations, net of taxes at a 22% normalized rate, for the trailing four quarters divided by the average of debt plus equity less cash (average capital) for the trailing five quarters. ROIC is not a measure determined in accordance with generally accepted accounting principles in the United States, commonly known as GAAP, and may not be comparable with the measures as used by other companies. Nevertheless, Columbus McKinnon believes that providing non-GAAP information, such as ROIC, is important for investors and other readers of the Company’s financial statements. ($ in thousands) TTM Fiscal Year Q2 FY23 2021 2022 GAAP income from operations $ 89,564 $ 42,255 $ 73,781 Add back (deduct): Acquisition deal and integration costs 704 3,951 10,473 Acquisition inventory step-up expense 2,061 — 5,042 Product liability settlement 2,850 — 2,850 Acquisition amortization of backlog 2,100 — 2,100 Factory closures — 3,778 — Business realignment costs 4,969 1,470 3,902 Insurance recovery legal costs — 229 — Gain on sale of building — (2,638) — Non-GAAP adjusted income from operations $ 102,248 $ 49,045 $ 98,148 Non-GAAP adjusted income from operations, net of normalized tax rate of 22% $ 79,753 $ 38,255 $ 76,555 Trailing five quarter averages: Total debt 495,663 260,130 438,768 Total shareholders’ equity 762,633 487,523 701,640 Cash and cash equivalents 100,385 168,599 123,636 Net total capitalization $ 1,157,911 $ 579,054 $ 1,016,772 Return on invested capital (ROIC) – Non-GAAP 6.9% 6.6% 7.5%
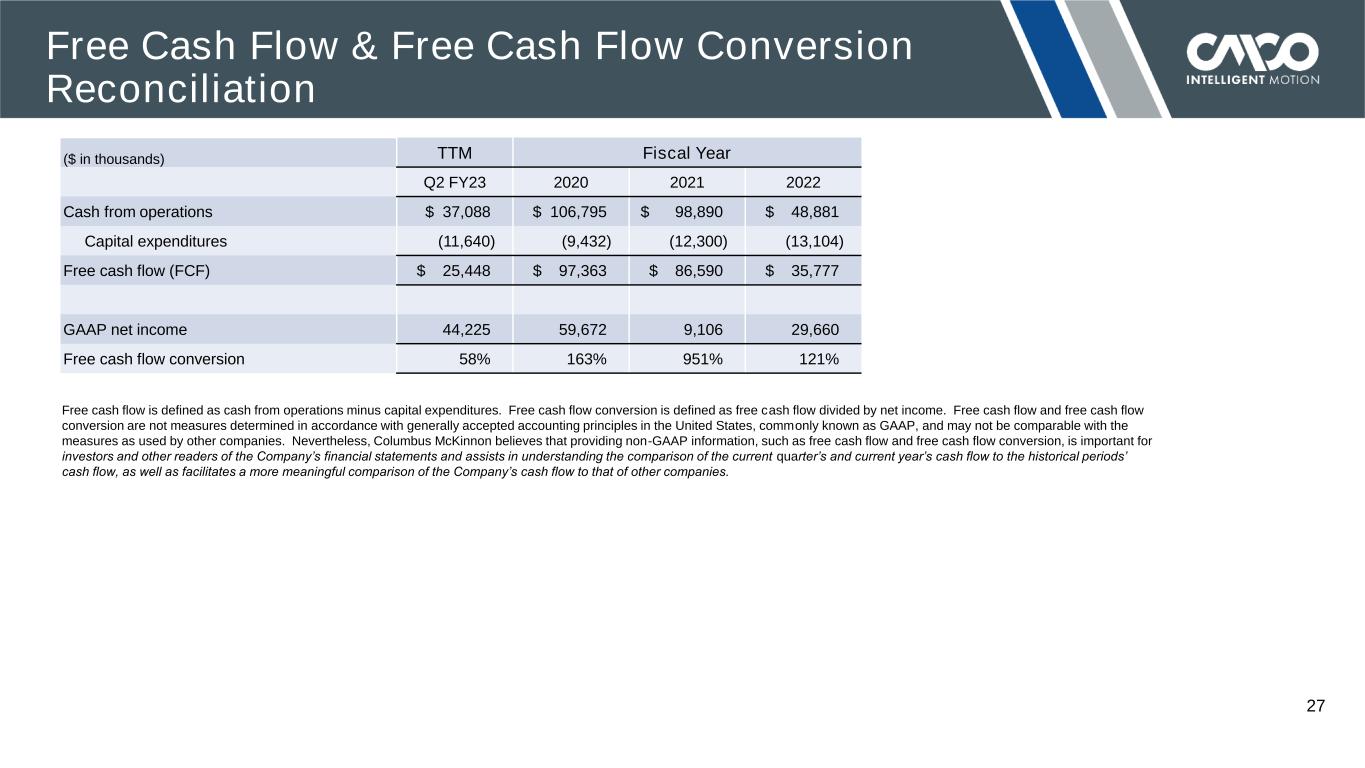
© 2022 COLUMBUS MCKINNON CORPORATION Free Cash Flow & Free Cash Flow Conversion Reconciliation ($ in thousands) TTM Fiscal Year Q2 FY23 2020 2021 2022 Cash from operations $ 37,088 $ 106,795 $ 98,890 $ 48,881 Capital expenditures (11,640) (9,432) (12,300) (13,104) Free cash flow (FCF) $ 25,448 $ 97,363 $ 86,590 $ 35,777 GAAP net income 44,225 59,672 9,106 29,660 Free cash flow conversion 58% 163% 951% 121% Free cash flow is defined as cash from operations minus capital expenditures. Free cash flow conversion is defined as free cash flow divided by net income. Free cash flow and free cash flow conversion are not measures determined in accordance with generally accepted accounting principles in the United States, commonly known as GAAP, and may not be comparable with the measures as used by other companies. Nevertheless, Columbus McKinnon believes that providing non-GAAP information, such as free cash flow and free cash flow conversion, is important for investors and other readers of the Company’s financial statements and assists in understanding the comparison of the current quarter’s and current year’s cash flow to the historical periods’ cash flow, as well as facilitates a more meaningful comparison of the Company’s cash flow to that of other companies. 27

© 2022 COLUMBUS MCKINNON CORPORATION 28 U.S. Capacity Utilization Eurozone Capacity Utilization Industrial Capacity Utilization Source: The Federal Reserve Board Source: European Commission 60% 65% 70% 75% 80% Series1 Series2 80.0% (Manufacturing) 80.3% (Total) Sept 2022(1) 65% 67% 69% 71% 73% 75% 77% 79% 81% 83% 85% 82.4% Q3 2022 (1) Numbers are preliminary
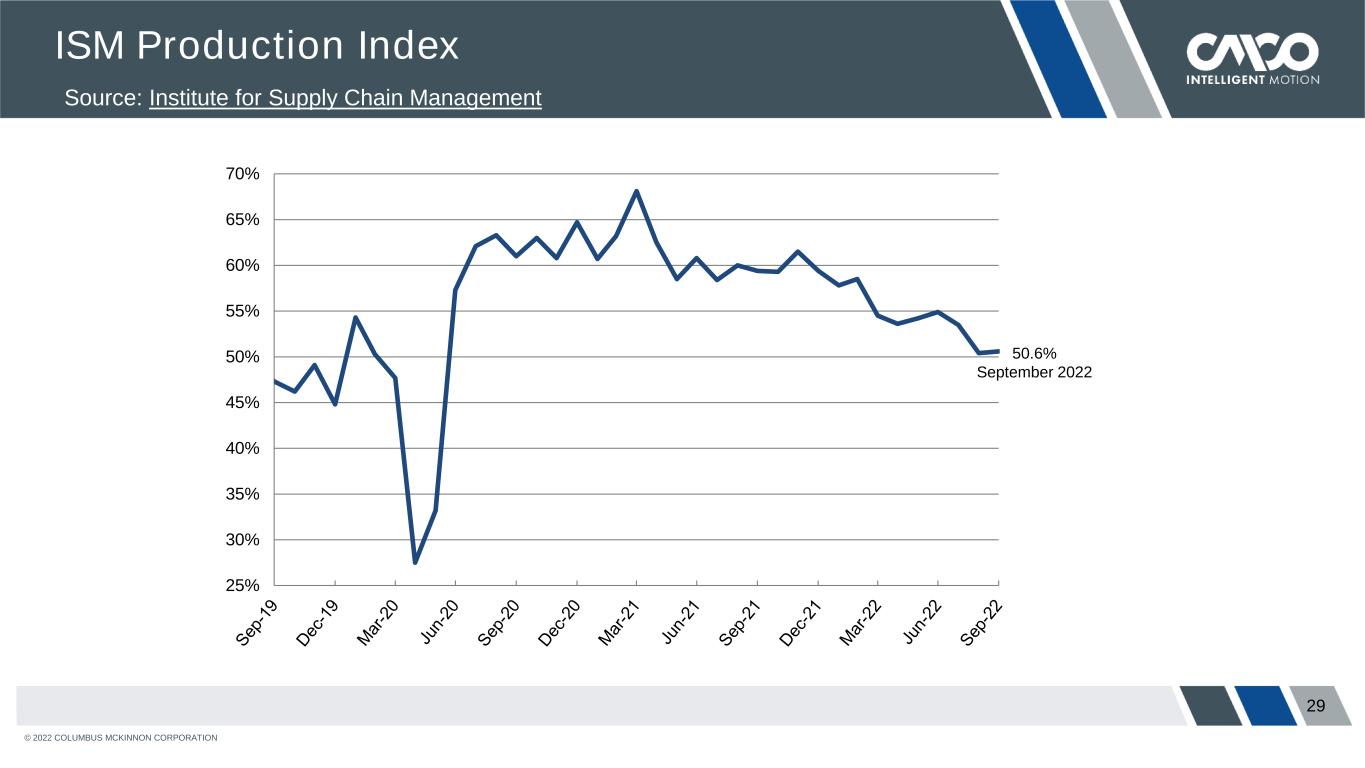
© 2022 COLUMBUS MCKINNON CORPORATION 29 ISM Production Index Source: Institute for Supply Chain Management 25% 30% 35% 40% 45% 50% 55% 60% 65% 70% 50.6% September 2022
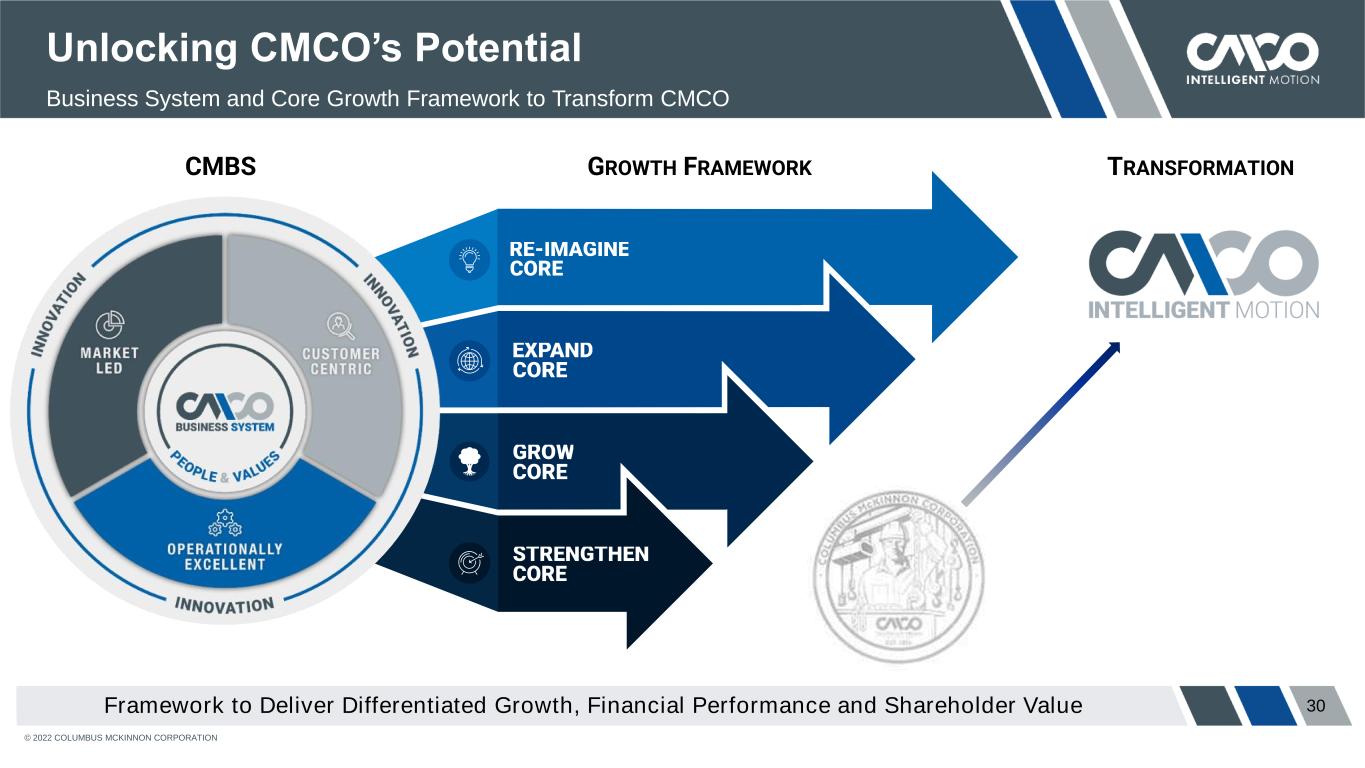
© 2022 COLUMBUS MCKINNON CORPORATION 30 Unlocking CMCO’s Potential Business System and Core Growth Framework to Transform CMCO Framework to Deliver Differentiated Growth, Financial Performance and Shareholder Value GROWTH FRAMEWORKCMBS TRANSFORMATION

Q2 Fiscal Year 2023 Financial Results Conference Call President & Chief Executive Officer David J. Wilson October 28, 2022 Executive VP – Finance & Chief Financial Officer Gregory P. Rustowicz


