- CMCO Dashboard
- Financials
- Filings
-
Holdings
- Transcripts
- ETFs
- Insider
- Institutional
- Shorts
-
8-K Filing
Columbus McKinnon (CMCO) 8-KEntry into a Material Definitive Agreement
Filed: 11 Feb 25, 9:54pm

Q3 Fiscal 2025 Earnings & Kito Crosby Deal Announcement February 10, 2025 Kristine Moser Gregory Rustowicz David Wilson President & Chief Executive Officer Executive Vice President Finance & Chief Financial Officer Vice President, Investor Relations & Treasurer Exhibit 99.2
Safe Harbor Statement This presentation and the accompanying oral discussion contains “forward-looking statements” within the meaning of the Private Securities Litigation Reform Act of 1995. Such forward-looking statements are generally identified by the use of forward-looking terminology, including the terms "anticipate," “believe,” “continue,” “could,” “estimate,” “expect,” “illustrative,” “intend,” “likely,” “may,” “opportunity,” “plan,” “possible,” “potential,” “predict,” “project,” “shall,” “should,” “target,” “will,” “would” and, in each case, their negative or other various or comparable terminology. All forward-looking statements are subject to risks, uncertainties and other factors that may cause the actual results, performance or achievements of Columbus McKinnon and Kito Crosby to differ materially from any results expressed or implied by such forward-looking statements. Such factors include, among others, (1) our strategy, outlook and growth prospects, including fiscal year 2025 net sales growth and Adjusted EPS guidance, and our fiscal year 2025 net leverage ratio and capital expenditure guidance; (2) our operational and financial targets and capital allocation policy; (3) general economic trends and trends in our industry and markets; (4) the amount of debt to be paid down by the Company during fiscal year 2025; (6) the competitive environment in which we operate, are forward looking statements; (7) the risk that the cost synergies and any revenue synergies from the transaction may not be fully realized or may take longer than anticipated to be realized, (8) disruption to the parties' businesses as a result of the announcement and pendency of the transaction, (9) the risk that the integration of Kito Crosby's business and operations into Columbus McKinnon will be materially delayed or will be more costly or difficult than expected, or that Columbus McKinnon is otherwise unable to successfully integrate Kito Crosby's businesses into its own, including as a result of unexpected factors or events; (10) the ability by each of Columbus McKinnon and Kito Crosby to obtain required governmental approvals of the transaction on the timeline expected, or at all, and the risk that such approvals may result in the imposition of conditions that could adversely affect Columbus McKinnon after the closing of the transaction or adversely affect the expected benefits of the transaction; (11) reputational risk and the reaction of each company's customers, suppliers, employees or other business partners to the transaction; (12) the failure of the closing conditions in the purchase agreement to be satisfied, or any unexpected delay in closing the transaction or the occurrence of any event, change or other circumstances that could give rise to the termination of the purchase agreement; (13) the dilution caused by the issuance of perpetual convertible preferred equity to CD&R; (14) the possibility that the transaction may be more expensive to complete than anticipated, including as a result of unexpected factors or events; (15) risks related to management and oversight of the expanded business and operations of Columbus McKinnon following the transaction due to the increased size and complexity of its business, (16) the outcome of any legal or regulatory proceedings that may be currently pending or later instituted against Columbus McKinnon before or after the transaction, or against Kito Crosby, and (17) general competitive, economic, political and market conditions and other factors that may affect future results of Columbus McKinnon and Kito Crosby. Forward-looking statements are not based on historical facts, but instead represent our current expectations and assumptions regarding our business, the economy and other future conditions, and involve known and unknown risks, uncertainties and other factors that could cause the actual results, performance or achievements of the Company to differ materially from any future results, performance or achievements expressed or implied by the forward-looking statements. It is not possible to predict or identify all such risks. These risks include, but are not limited to, the risk factors that are described under the section titled “Risk Factors” in our Annual Report on Form 10-K for the fiscal year ended March 31, 2024 as well as in our other filings with the Securities and Exchange Commission, which are available on its website at www.sec.gov. Given these uncertainties, you should not place undue reliance on these forward-looking statements. Forward-looking statements speak only as of the date they are made. Columbus McKinnon undertakes no duty to update publicly any such forward-looking statement, whether as a result of new information, future events or otherwise, except as may be required by applicable law, regulation or other competent legal authority. Non-GAAP Financial Measures and Forward-looking Non-GAAP Financial Measures This presentation will discuss some non-GAAP (“adjusted”) financial measures which we believe are useful in evaluating Columbus McKinnon and Kito Crosby’s performance. You should not consider the presentation of this additional information in isolation or as a substitute for results prepared in accordance with GAAP. The non-GAAP financial measures are noted and reconciliations of comparable historical GAAP measures with historical non-GAAP financial measures can be found in tables either included in the Supplemental Information portion of this presentation or our filings with the Securities and Exchange Comission.

Q3 Fiscal 2025 Financial Results Conference Call
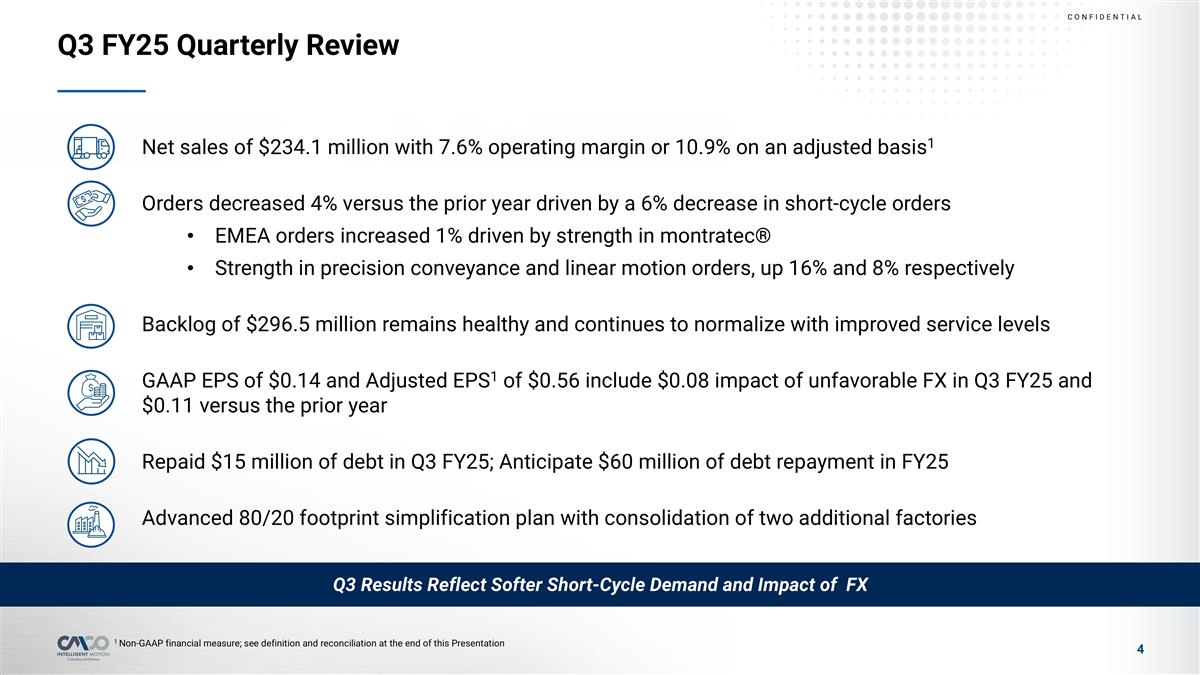
Q3 FY25 Quarterly Review Net sales of $234.1 million with 7.6% operating margin or 10.9% on an adjusted basis1 Orders decreased 4% versus the prior year driven by a 6% decrease in short-cycle orders EMEA orders increased 1% driven by strength in montratec® Strength in precision conveyance and linear motion orders, up 16% and 8% respectively Backlog of $296.5 million remains healthy and continues to normalize with improved service levels GAAP EPS of $0.14 and Adjusted EPS1 of $0.56 include $0.08 impact of unfavorable FX in Q3 FY25 and $0.11 versus the prior year Repaid $15 million of debt in Q3 FY25; Anticipate $60 million of debt repayment in FY25 Advanced 80/20 footprint simplification plan with consolidation of two additional factories Q3 Results Reflect Softer Short-Cycle Demand and Impact of FX 1 Non-GAAP financial measure; see definition and reconciliation at the end of this Presentation
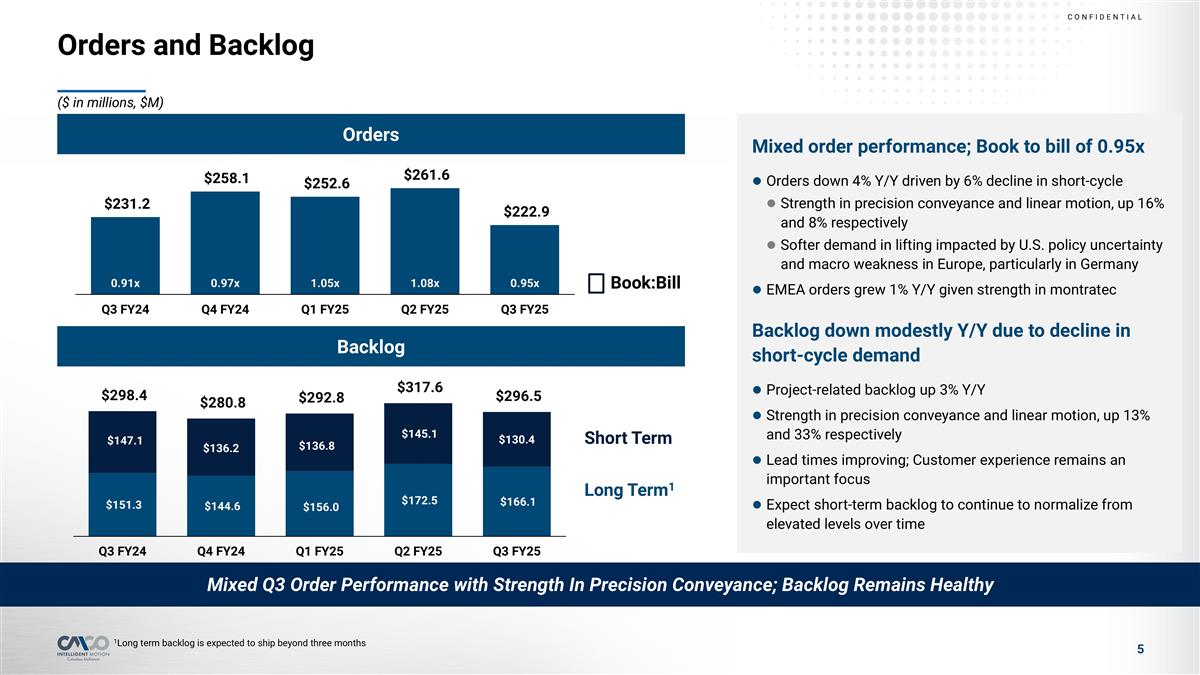
Orders and Backlog Mixed order performance; Book to bill of 0.95x Orders down 4% Y/Y driven by 6% decline in short-cycle Strength in precision conveyance and linear motion, up 16% and 8% respectively Softer demand in lifting impacted by U.S. policy uncertainty and macro weakness in Europe, particularly in Germany EMEA orders grew 1% Y/Y given strength in montratec Backlog down modestly Y/Y due to decline in short-cycle demand Project-related backlog up 3% Y/Y Strength in precision conveyance and linear motion, up 13% and 33% respectively Lead times improving; Customer experience remains an important focus Expect short-term backlog to continue to normalize from elevated levels over time Book:Bill Short Term Long Term1 ($ in millions, $M) Mixed Q3 Order Performance with Strength In Precision Conveyance; Backlog Remains Healthy 1Long term backlog is expected to ship beyond three months Orders Backlog
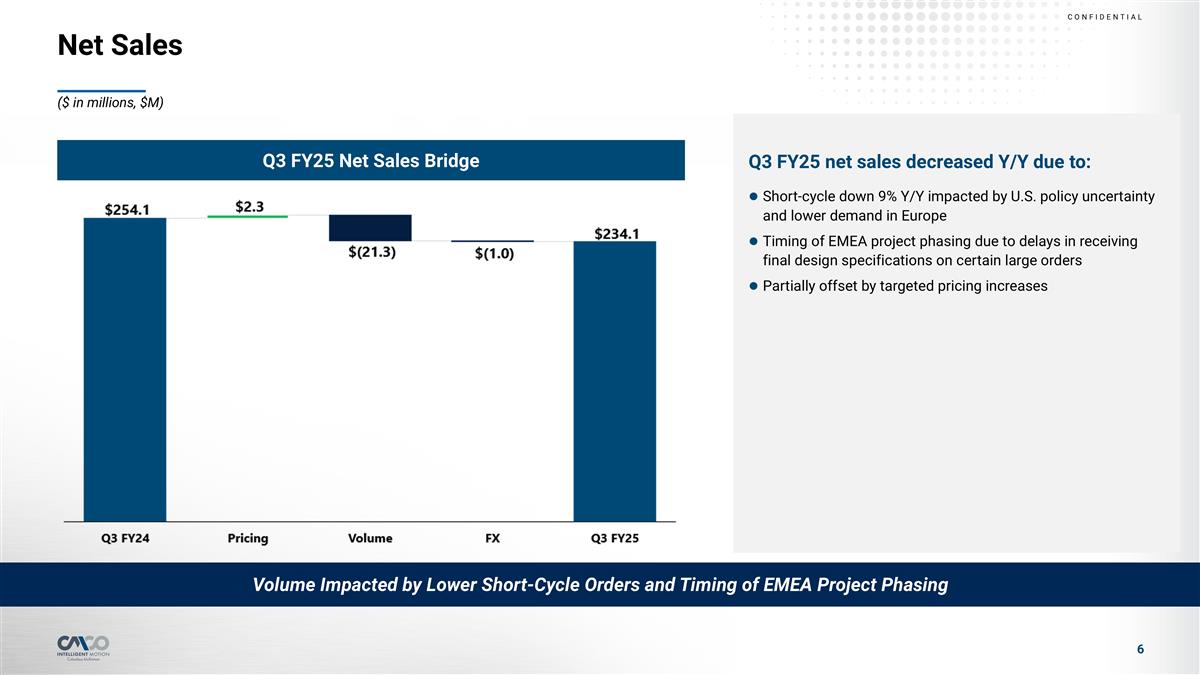
Net Sales Volume Impacted by Lower Short-Cycle Orders and Timing of EMEA Project Phasing Q3 FY25 Net Sales Bridge Q3 FY25 net sales decreased Y/Y due to: Short-cycle down 9% Y/Y impacted by U.S. policy uncertainty and lower demand in Europe Timing of EMEA project phasing due to delays in receiving final design specifications on certain large orders Partially offset by targeted pricing increases ($ in millions, $M)
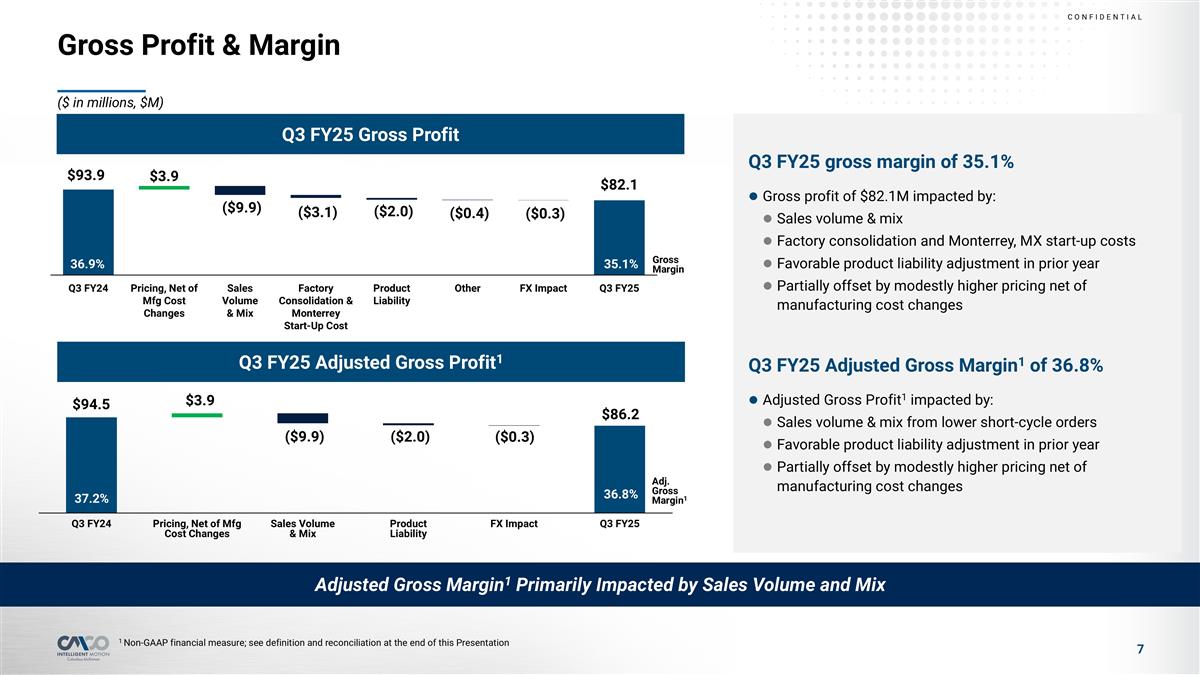
Gross Profit & Margin 36.9% 35.1% Gross Margin 37.2% Adj. Gross Margin1 Q3 FY25 Gross Profit Q3 FY25 Adjusted Gross Profit1 Adjusted Gross Margin1 Primarily Impacted by Sales Volume and Mix 1 Non-GAAP financial measure; see definition and reconciliation at the end of this Presentation Q3 FY25 gross margin of 35.1% Gross profit of $82.1M impacted by: Sales volume & mix Factory consolidation and Monterrey, MX start-up costs Favorable product liability adjustment in prior year Partially offset by modestly higher pricing net of manufacturing cost changes Q3 FY25 Adjusted Gross Margin1 of 36.8% Adjusted Gross Profit1 impacted by: Sales volume & mix from lower short-cycle orders Favorable product liability adjustment in prior year Partially offset by modestly higher pricing net of manufacturing cost changes ($ in millions, $M)
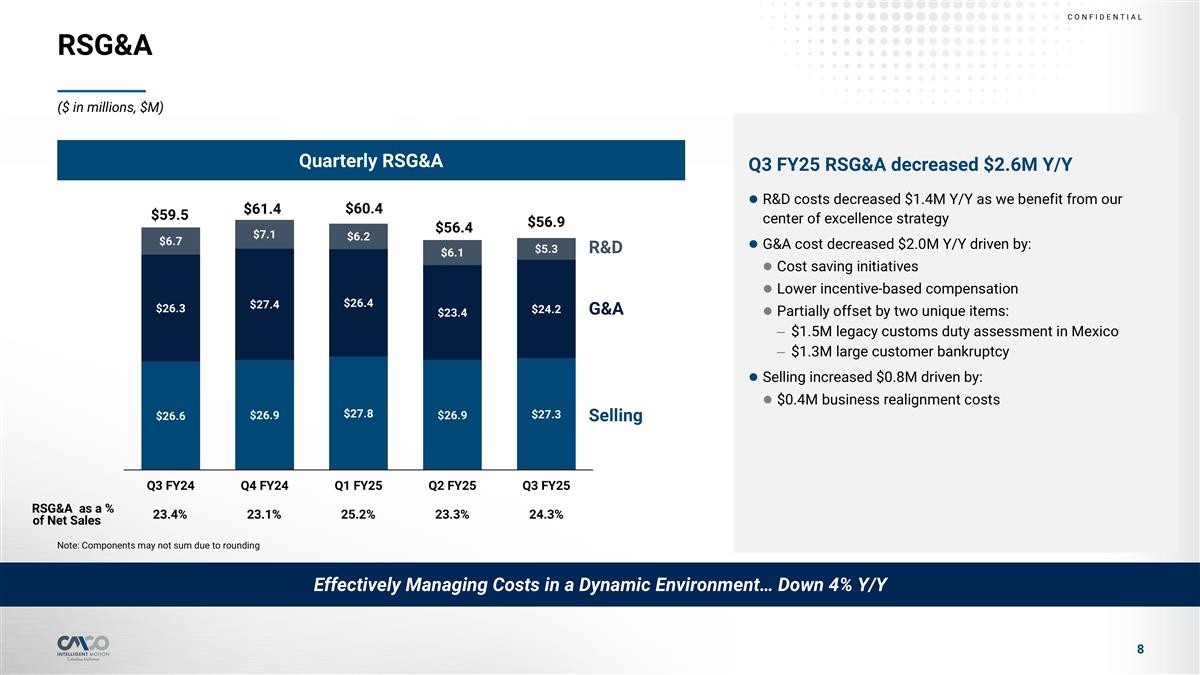
RSG&A RSG&A as a % of Net Sales 23.4% 23.1% 25.2% 23.3% 24.3% R&D Selling G&A ($ in millions, $M) Quarterly RSG&A Q3 FY25 RSG&A decreased $2.6M Y/Y R&D costs decreased $1.4M Y/Y as we benefit from our center of excellence strategy G&A cost decreased $2.0M Y/Y driven by: Cost saving initiatives Lower incentive-based compensation Partially offset by two unique items: $1.5M legacy customs duty assessment in Mexico $1.3M large customer bankruptcy Selling increased $0.8M driven by: $0.4M business realignment costs Effectively Managing Costs in a Dynamic Environment… Down 4% Y/Y Note: Components may not sum due to rounding
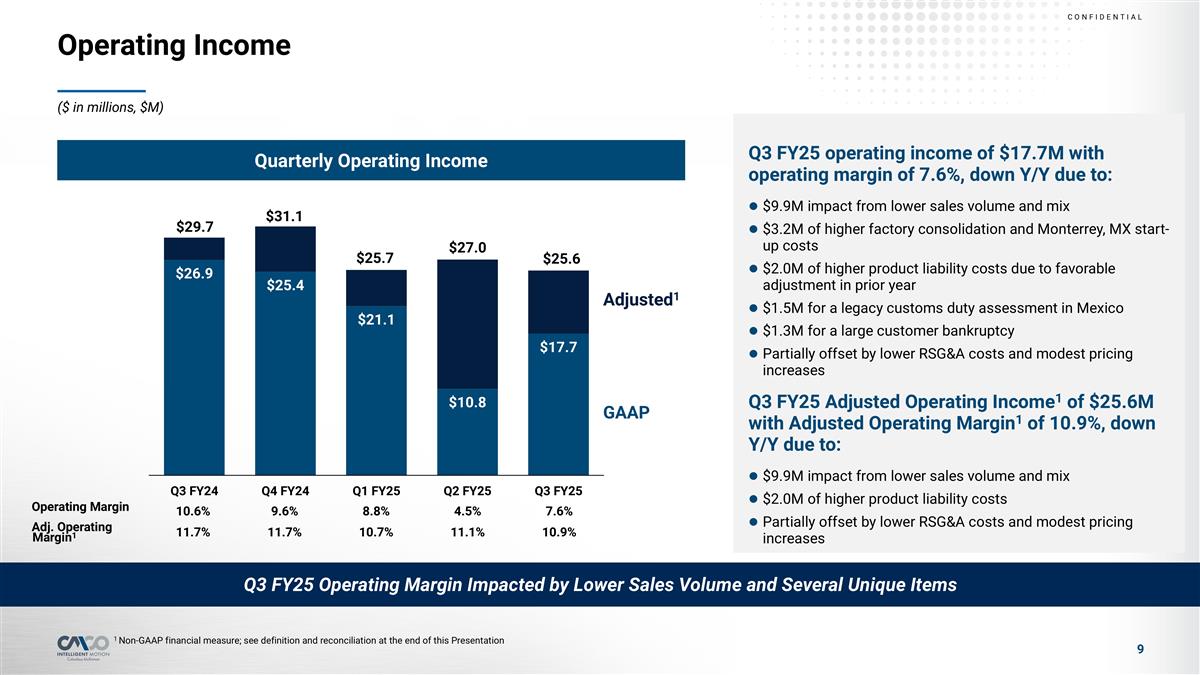
Operating Income ($ in millions, $M) Quarterly Operating Income Q3 FY25 operating income of $17.7M with operating margin of 7.6%, down Y/Y due to: $9.9M impact from lower sales volume and mix $3.2M of higher factory consolidation and Monterrey, MX start-up costs $2.0M of higher product liability costs due to favorable adjustment in prior year $1.5M for a legacy customs duty assessment in Mexico $1.3M for a large customer bankruptcy Partially offset by lower RSG&A costs and modest pricing increases Q3 FY25 Adjusted Operating Income1 of $25.6M with Adjusted Operating Margin1 of 10.9%, down Y/Y due to: $9.9M impact from lower sales volume and mix $2.0M of higher product liability costs Partially offset by lower RSG&A costs and modest pricing increases Q3 FY25 Operating Margin Impacted by Lower Sales Volume and Several Unique Items 1 Non-GAAP financial measure; see definition and reconciliation at the end of this Presentation Operating Margin 10.6% 9.6% 8.8% 4.5% 7.6% Adj. Operating Margin1 11.7% 11.7% 10.7% 11.1% 10.9% Adjusted1 GAAP
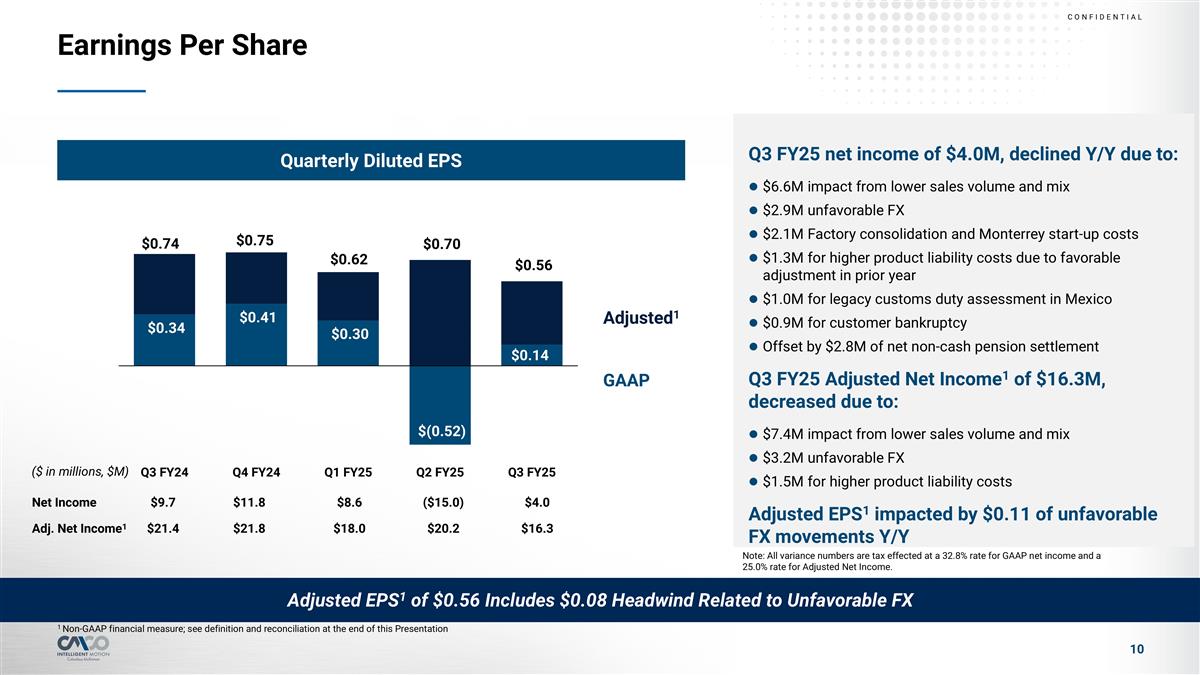
Earnings Per Share Net Income $9.7 $11.8 $8.6 ($15.0) $4.0 Adj. Net Income1 $21.4 $21.8 $18.0 $20.2 $16.3 ($ in millions, $M) Quarterly Diluted EPS Adjusted1 GAAP Adjusted EPS1 of $0.56 Includes $0.08 Headwind Related to Unfavorable FX 1 Non-GAAP financial measure; see definition and reconciliation at the end of this Presentation Q3 FY25 net income of $4.0M, declined Y/Y due to: $6.6M impact from lower sales volume and mix $2.9M unfavorable FX $2.1M Factory consolidation and Monterrey start-up costs $1.3M for higher product liability costs due to favorable adjustment in prior year $1.0M for legacy customs duty assessment in Mexico $0.9M for customer bankruptcy Offset by $2.8M of net non-cash pension settlement Q3 FY25 Adjusted Net Income1 of $16.3M, decreased due to: $7.4M impact from lower sales volume and mix $3.2M unfavorable FX $1.5M for higher product liability costs Adjusted EPS1 impacted by $0.11 of unfavorable FX movements Y/Y Note: All variance numbers are tax effected at a 32.8% rate for GAAP net income and a 25.0% rate for Adjusted Net Income.
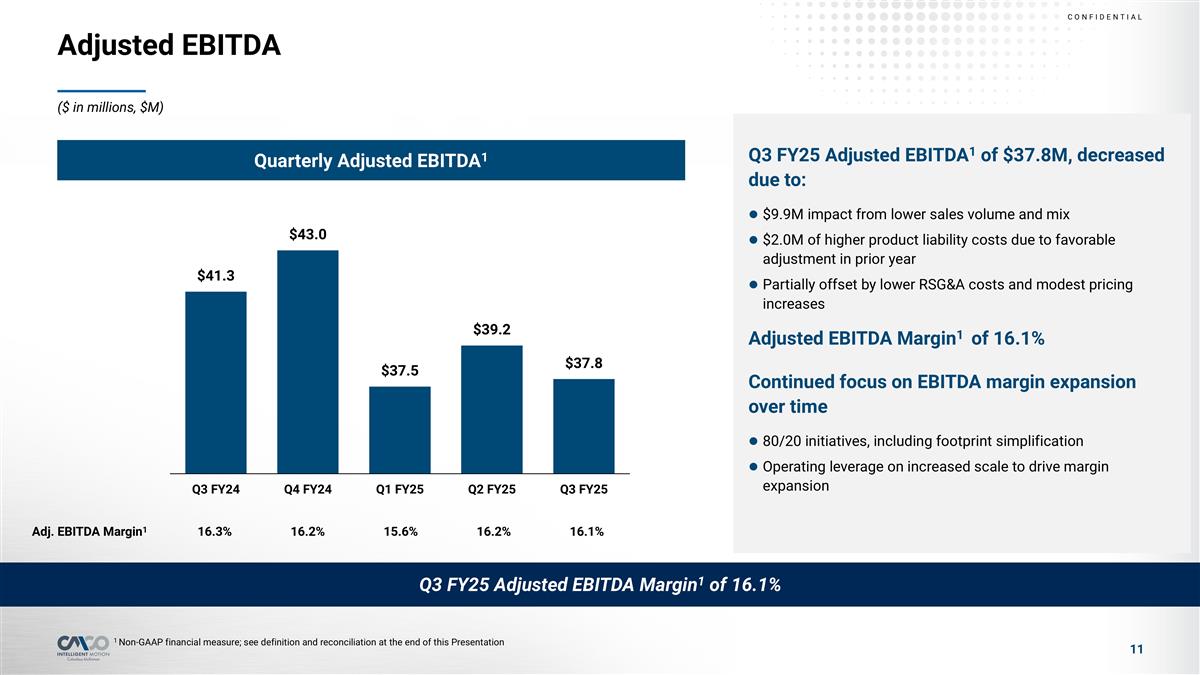
Adjusted EBITDA Adj. EBITDA Margin1 16.3% 16.2% 15.6% 16.2% 16.1% ($ in millions, $M) Quarterly Adjusted EBITDA1 Q3 FY25 Adjusted EBITDA Margin1 of 16.1% 1 Non-GAAP financial measure; see definition and reconciliation at the end of this Presentation Q3 FY25 Adjusted EBITDA1 of $37.8M, decreased due to: $9.9M impact from lower sales volume and mix $2.0M of higher product liability costs due to favorable adjustment in prior year Partially offset by lower RSG&A costs and modest pricing increases Adjusted EBITDA Margin1 of 16.1% Continued focus on EBITDA margin expansion over time 80/20 initiatives, including footprint simplification Operating leverage on increased scale to drive margin expansion
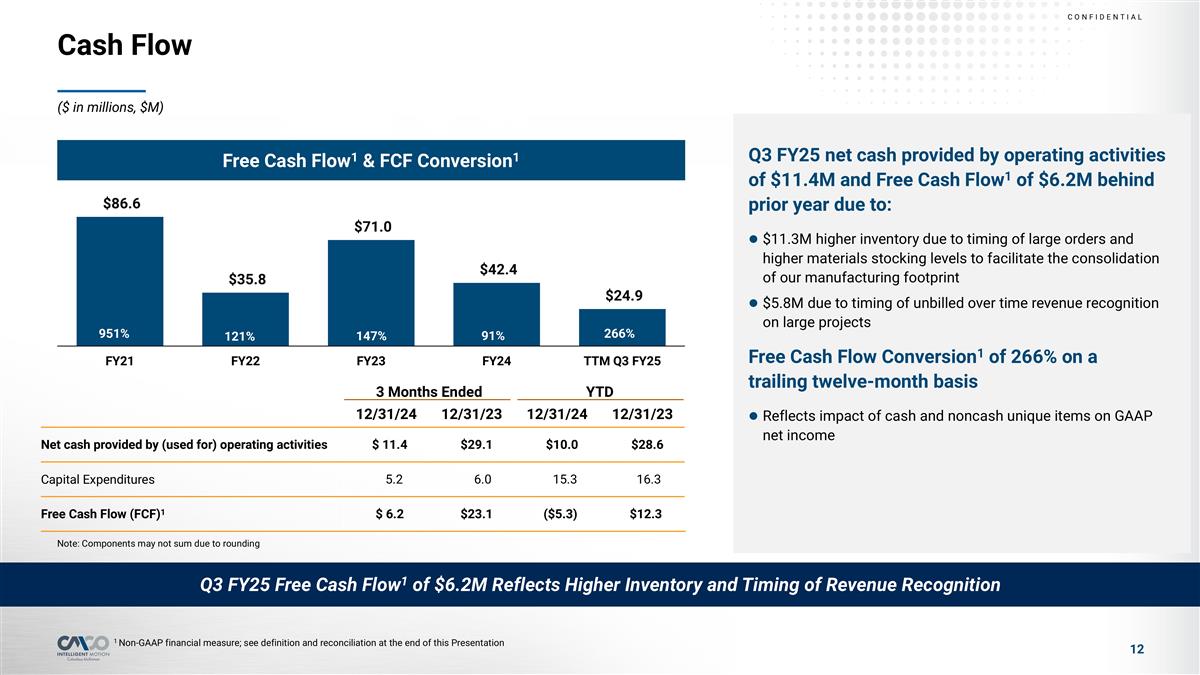
Cash Flow 3 Months Ended YTD 12/31/24 12/31/23 12/31/24 12/31/23 Net cash provided by (used for) operating activities $ 11.4 $29.1 $10.0 $28.6 Capital Expenditures 5.2 6.0 15.3 16.3 Free Cash Flow (FCF)1 $ 6.2 $23.1 ($5.3) $12.3 Note: Components may not sum due to rounding ($ in millions, $M) Free Cash Flow1 & FCF Conversion1 Q3 FY25 net cash provided by operating activities of $11.4M and Free Cash Flow1 of $6.2M behind prior year due to: $11.3M higher inventory due to timing of large orders and higher materials stocking levels to facilitate the consolidation of our manufacturing footprint $5.8M due to timing of unbilled over time revenue recognition on large projects Free Cash Flow Conversion1 of 266% on a trailing twelve-month basis Reflects impact of cash and noncash unique items on GAAP net income Q3 FY25 Free Cash Flow1 of $6.2M Reflects Higher Inventory and Timing of Revenue Recognition 1 Non-GAAP financial measure; see definition and reconciliation at the end of this Presentation
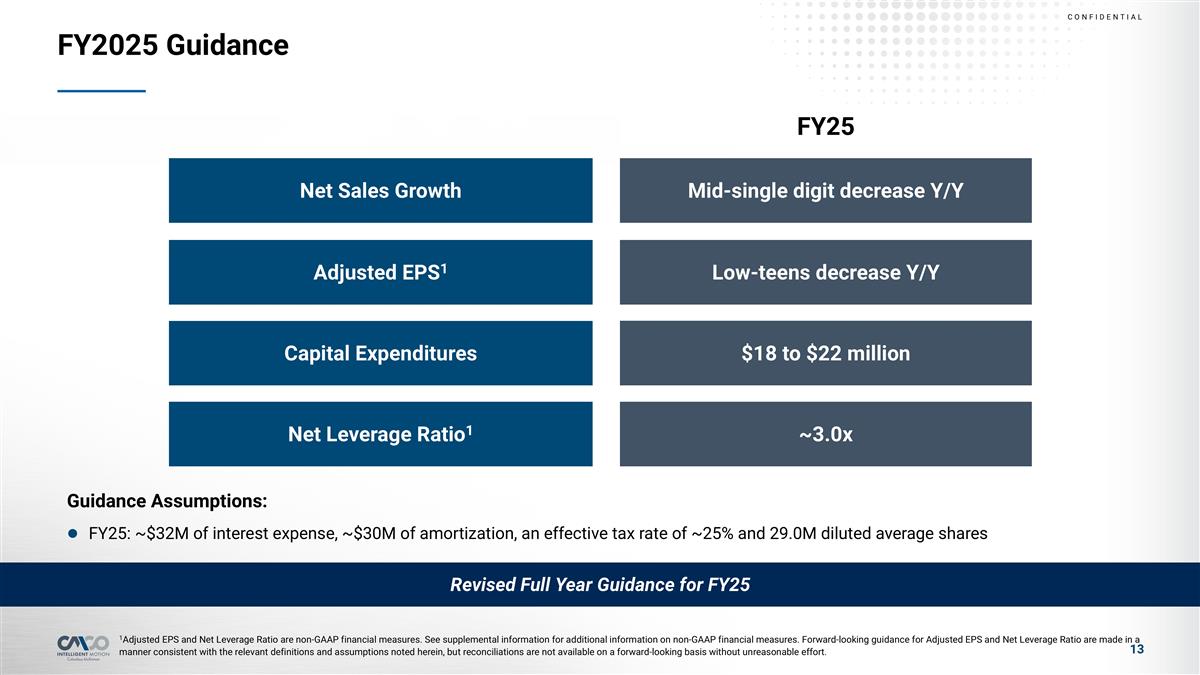
FY2025 Guidance Net Sales Growth Mid-single digit decrease Y/Y Adjusted EPS1 Low-teens decrease Y/Y Capital Expenditures $18 to $22 million Net Leverage Ratio1 ~3.0x FY25 Guidance Assumptions: FY25: ~$32M of interest expense, ~$30M of amortization, an effective tax rate of ~25% and 29.0M diluted average shares 1Adjusted EPS and Net Leverage Ratio are non-GAAP financial measures. See supplemental information for additional information on non-GAAP financial measures. Forward-looking guidance for Adjusted EPS and Net Leverage Ratio are made in a manner consistent with the relevant definitions and assumptions noted herein, but reconciliations are not available on a forward-looking basis without unreasonable effort. Revised Full Year Guidance for FY25

Columbus McKinnon to Acquire Kito Crosby Business Combination Delivers Compelling Value Creation
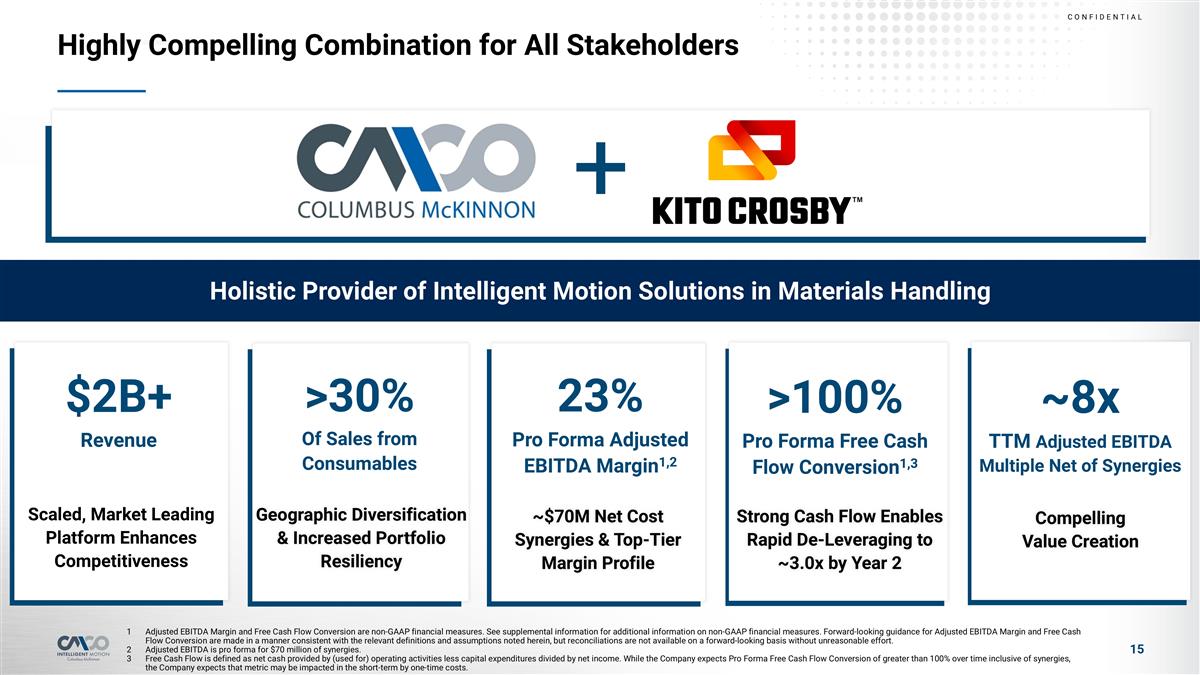
Highly Compelling Combination for All Stakeholders Holistic Provider of Intelligent Motion Solutions in Materials Handling + Adjusted EBITDA Margin and Free Cash Flow Conversion are non-GAAP financial measures. See supplemental information for additional information on non-GAAP financial measures. Forward-looking guidance for Adjusted EBITDA Margin and Free Cash Flow Conversion are made in a manner consistent with the relevant definitions and assumptions noted herein, but reconciliations are not available on a forward-looking basis without unreasonable effort. Adjusted EBITDA is pro forma for $70 million of synergies. Free Cash Flow is defined as net cash provided by (used for) operating activities less capital expenditures divided by net income. While the Company expects Pro Forma Free Cash Flow Conversion of greater than 100% over time inclusive of synergies, the Company expects that metric may be impacted in the short-term by one-time costs. Scaled, Market Leading Platform Enhances Competitiveness $2B+ Revenue 23% Pro Forma Adjusted EBITDA Margin1,2 >100% Pro Forma Free Cash Flow Conversion1,3 Strong Cash Flow Enables Rapid De-Leveraging to ~3.0x by Year 2 ~8x TTM Adjusted EBITDA Multiple Net of Synergies Compelling Value Creation ~$70M Net Cost Synergies & Top-Tier Margin Profile >30% Of Sales from Consumables Geographic Diversification & Increased Portfolio Resiliency
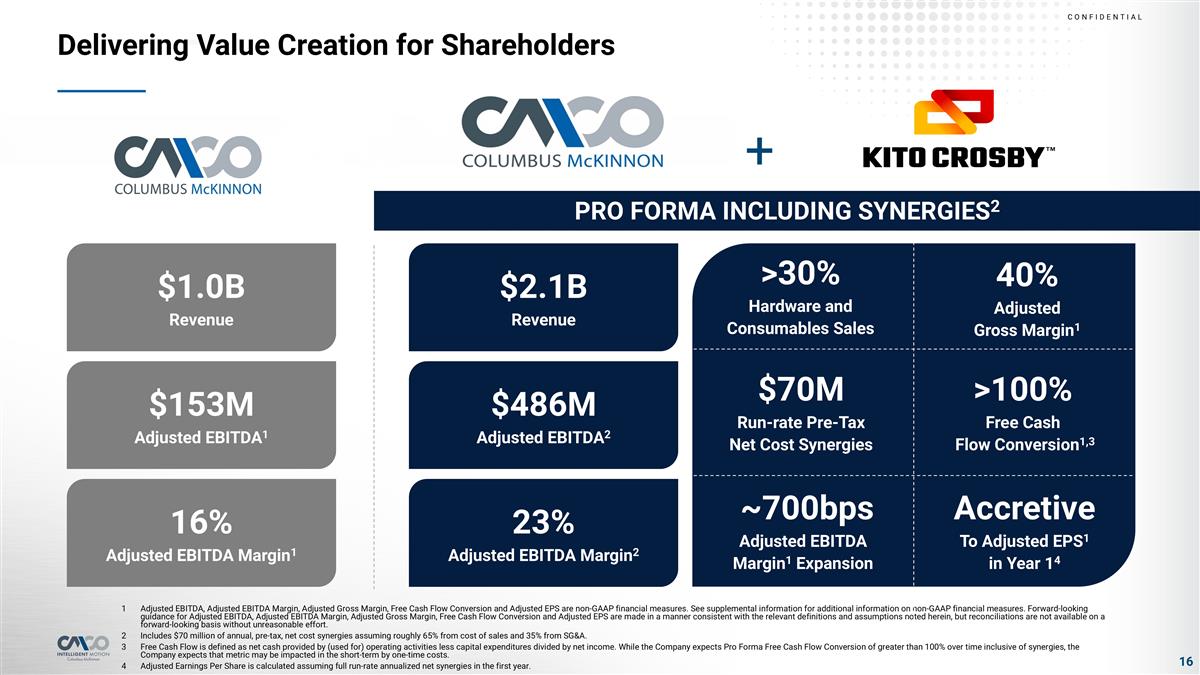
Delivering Value Creation for Shareholders Adjusted EBITDA, Adjusted EBITDA Margin, Adjusted Gross Margin, Free Cash Flow Conversion and Adjusted EPS are non-GAAP financial measures. See supplemental information for additional information on non-GAAP financial measures. Forward-looking guidance for Adjusted EBITDA, Adjusted EBITDA Margin, Adjusted Gross Margin, Free Cash Flow Conversion and Adjusted EPS are made in a manner consistent with the relevant definitions and assumptions noted herein, but reconciliations are not available on a forward-looking basis without unreasonable effort. Includes $70 million of annual, pre-tax, net cost synergies assuming roughly 65% from cost of sales and 35% from SG&A. Free Cash Flow is defined as net cash provided by (used for) operating activities less capital expenditures divided by net income. While the Company expects Pro Forma Free Cash Flow Conversion of greater than 100% over time inclusive of synergies, the Company expects that metric may be impacted in the short-term by one-time costs. Adjusted Earnings Per Share is calculated assuming full run-rate annualized net synergies in the first year. + >30% Hardware and Consumables Sales Accretive To Adjusted EPS1 in Year 14 ~700bps Adjusted EBITDA Margin1 Expansion >100% Free Cash Flow Conversion1,3 40% Adjusted Gross Margin1 $70M Run-rate Pre-Tax Net Cost Synergies $1.0B Revenue $153M Adjusted EBITDA1 16% Adjusted EBITDA Margin1 $2.1B Revenue $486M Adjusted EBITDA2 23% Adjusted EBITDA Margin2 PRO FORMA INCLUDING SYNERGIES2
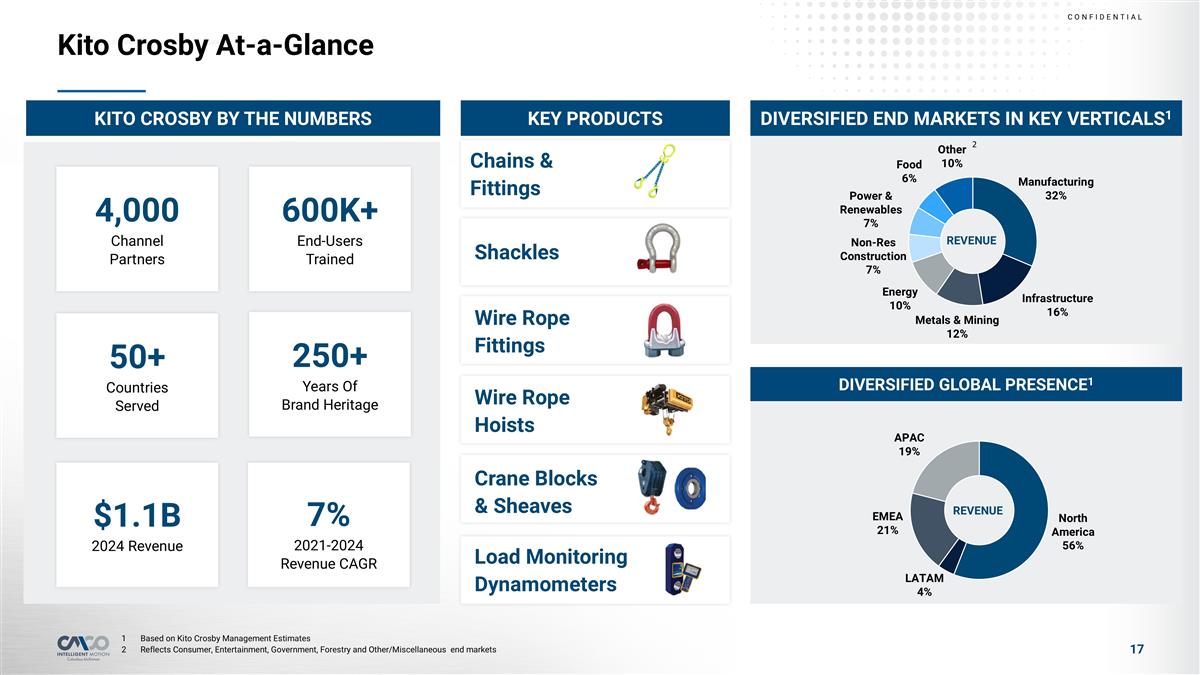
Kito Crosby At-a-Glance DIVERSIFIED END MARKETS IN KEY VERTICALS1 DIVERSIFIED GLOBAL PRESENCE1 1 Based on Kito Crosby Management Estimates 2Reflects Consumer, Entertainment, Government, Forestry and Other/Miscellaneous end markets 4,000 Channel Partners 600K+ End-Users Trained 250+ Years Of Brand Heritage 50+ Countries Served $1.1B 2024 Revenue 7% 2021-2024 Revenue CAGR KITO CROSBY BY THE NUMBERS Key Industry Brands KEY PRODUCTS Chains & Fittings Shackles Wire Rope Fittings Wire Rope Hoists Crane Blocks & Sheaves Load Monitoring Dynamometers REVENUE REVENUE
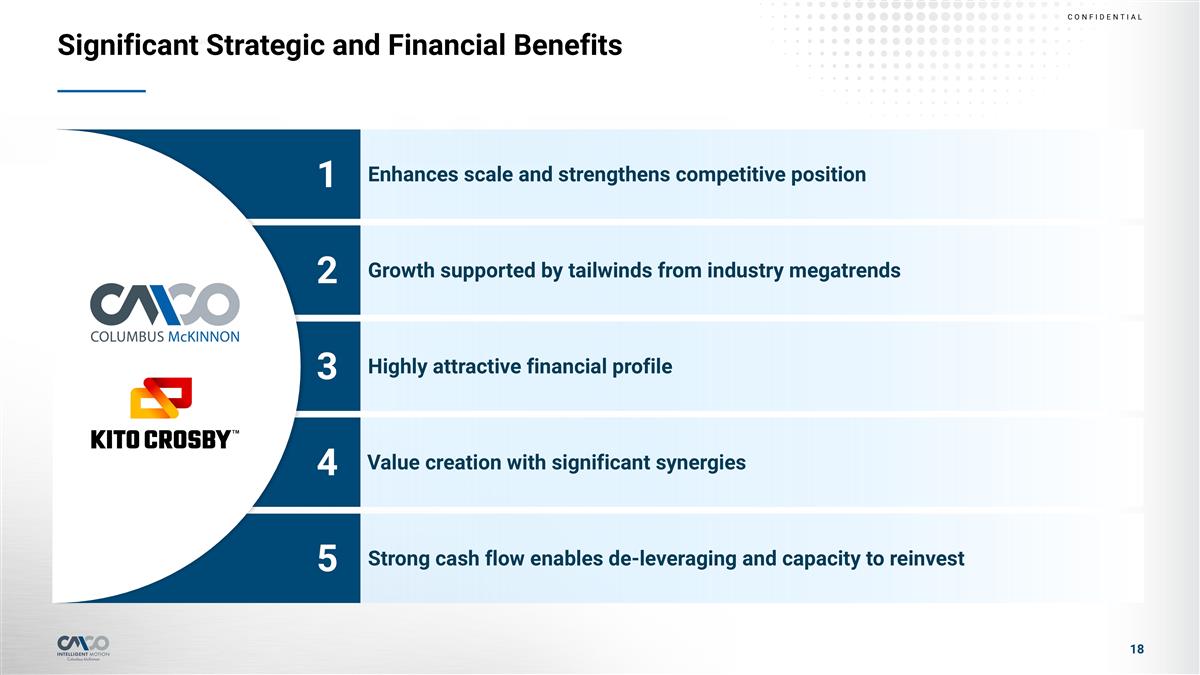
Strong cash flow enables de-leveraging and capacity to reinvest 5 Value creation with significant synergies 4 Highly attractive financial profile 3 Growth supported by tailwinds from industry megatrends 2 Enhances scale and strengthens competitive position 1 Significant Strategic and Financial Benefits
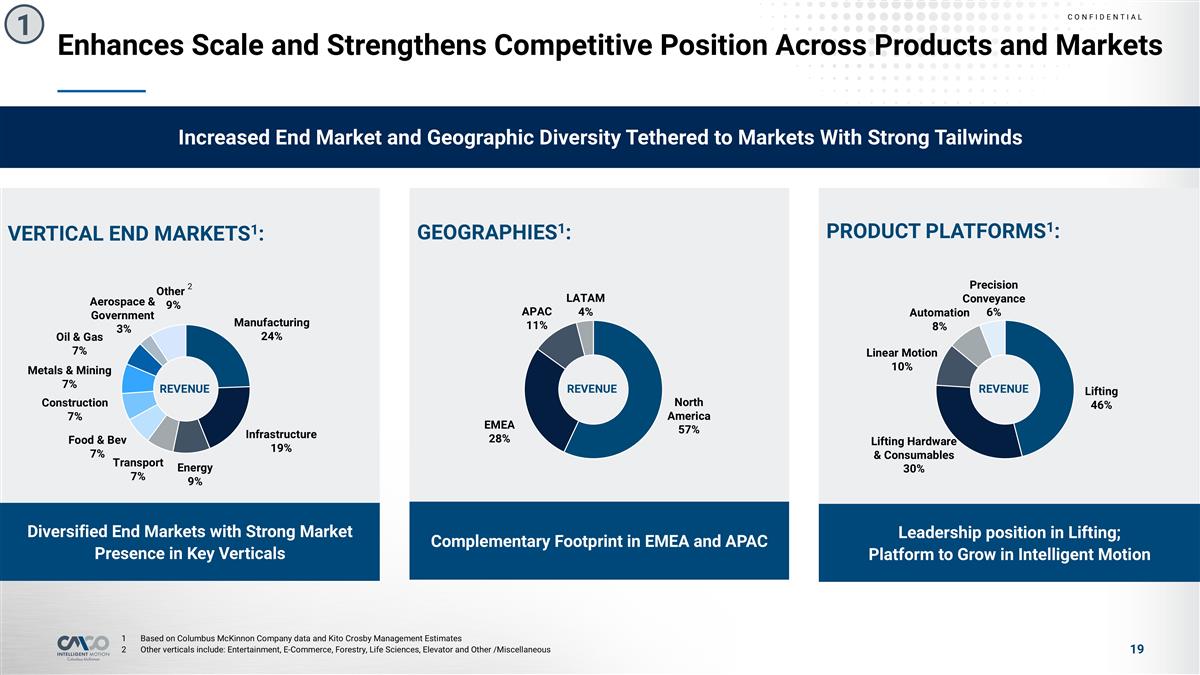
Enhances Scale and Strengthens Competitive Position Across Products and Markets PRODUCT PLATFORMS1: Leadership position in Lifting; Platform to Grow in Intelligent Motion GEOGRAPHIES1: Complementary Footprint in EMEA and APAC VERTICAL END MARKETS1: Diversified End Markets with Strong Market Presence in Key Verticals 1 Increased End Market and Geographic Diversity Tethered to Markets With Strong Tailwinds Based on Columbus McKinnon Company data and Kito Crosby Management Estimates Other verticals include: Entertainment, E-Commerce, Forestry, Life Sciences, Elevator and Other /Miscellaneous 2 REVENUE REVENUE REVENUE
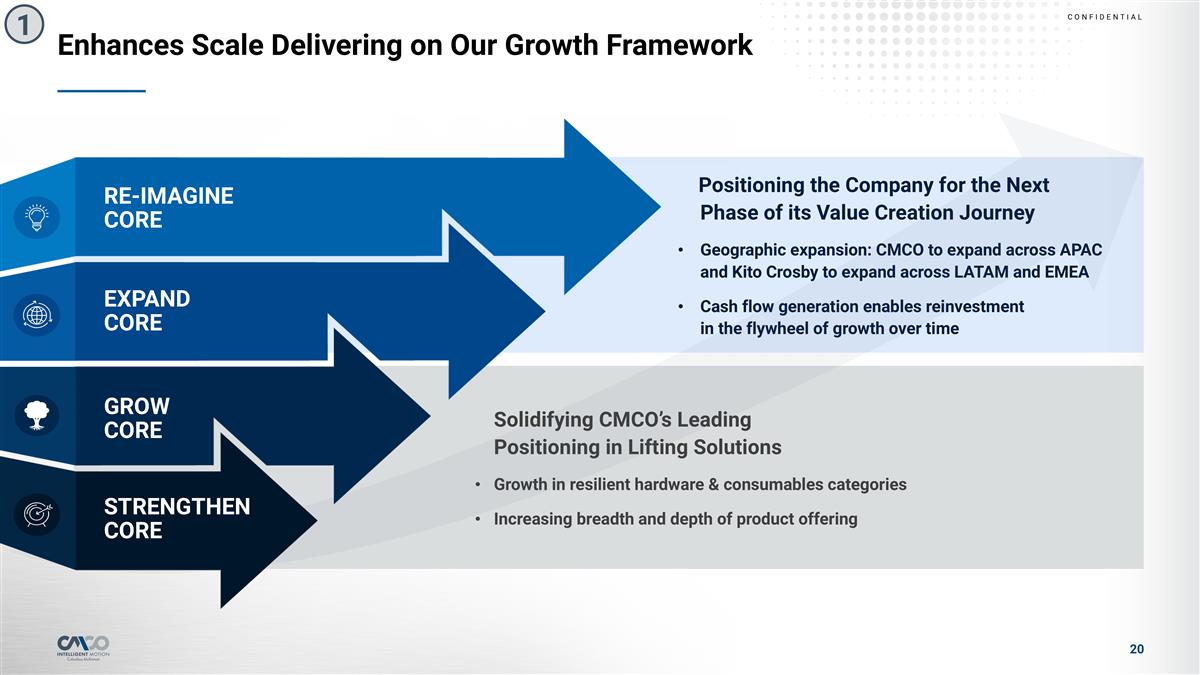
Solidifying CMCO’s Leading Positioning in Lifting Solutions Growth in resilient hardware & consumables categories Increasing breadth and depth of product offering Positioning the Company for the Next Phase of its Value Creation Journey Geographic expansion: CMCO to expand across APAC and Kito Crosby to expand across LATAM and EMEA Cash flow generation enables reinvestment in the flywheel of growth over time Enhances Scale Delivering on Our Growth Framework 1 RE-IMAGINE CORE EXPAND CORE GROW CORE STRENGTHEN CORE
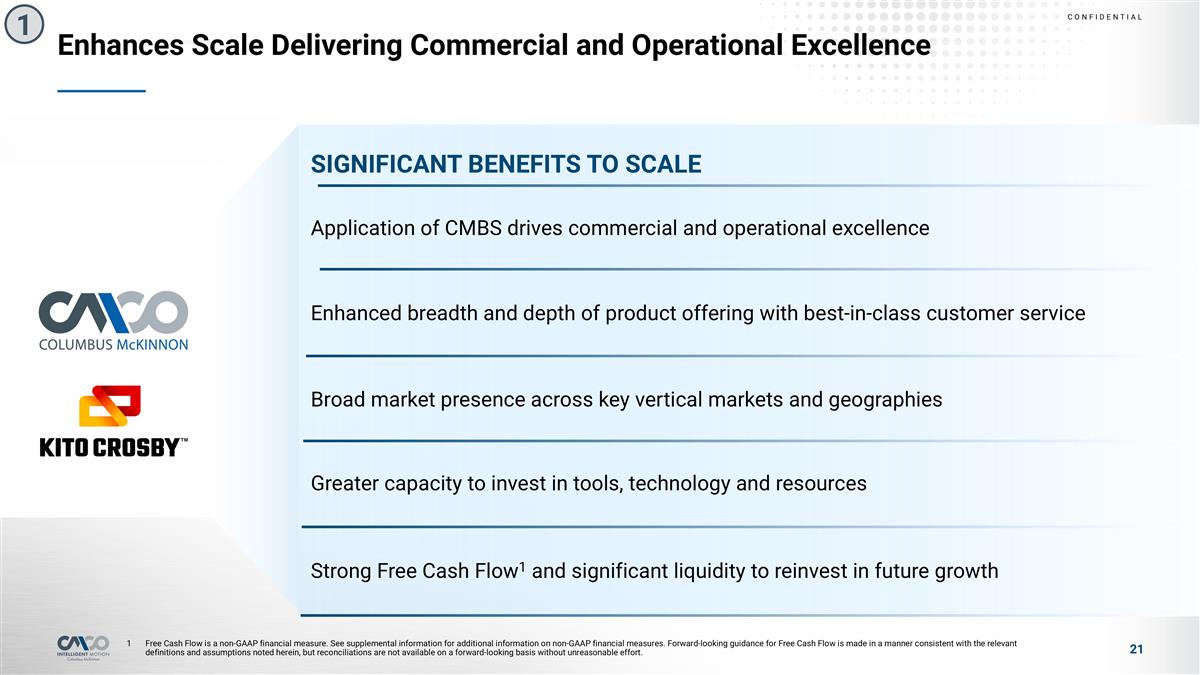
Enhances Scale Delivering Commercial and Operational Excellence 1 Application of CMBS drives commercial and operational excellence SIGNIFICANT BENEFITS TO SCALE Enhanced breadth and depth of product offering with best-in-class customer service Broad market presence across key vertical markets and geographies Greater capacity to invest in tools, technology and resources Strong Free Cash Flow1 and significant liquidity to reinvest in future growth Free Cash Flow is a non-GAAP financial measure. See supplemental information for additional information on non-GAAP financial measures. Forward-looking guidance for Free Cash Flow is made in a manner consistent with the relevant definitions and assumptions noted herein, but reconciliations are not available on a forward-looking basis without unreasonable effort.
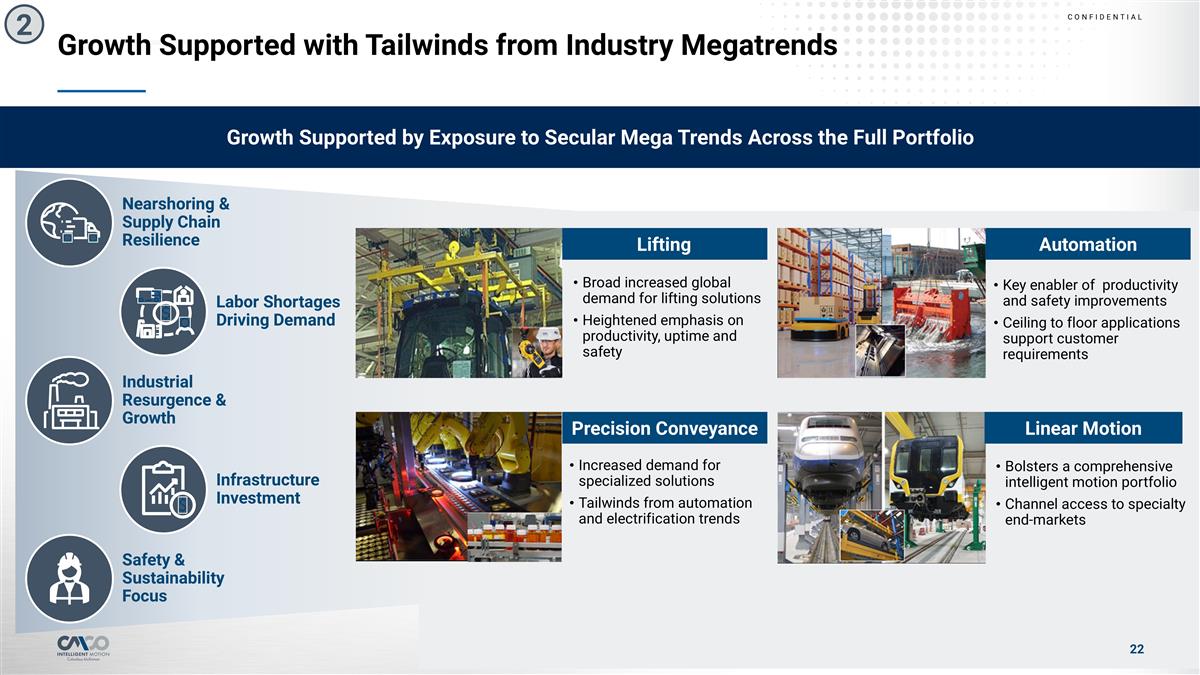
Growth Supported by Exposure to Secular Mega Trends Across the Full Portfolio Growth Supported with Tailwinds from Industry Megatrends Nearshoring & Supply Chain Resilience 2 Labor Shortages Driving Demand Industrial Resurgence & Growth Infrastructure Investment Safety & Sustainability Focus Lifting Broad increased global demand for lifting solutions Heightened emphasis on productivity, uptime and safety Precision Conveyance Increased demand for specialized solutions Tailwinds from automation and electrification trends Automation Key enabler of productivity and safety improvements Ceiling to floor applications support customer requirements Linear Motion Bolsters a comprehensive intelligent motion portfolio Channel access to specialty end-markets
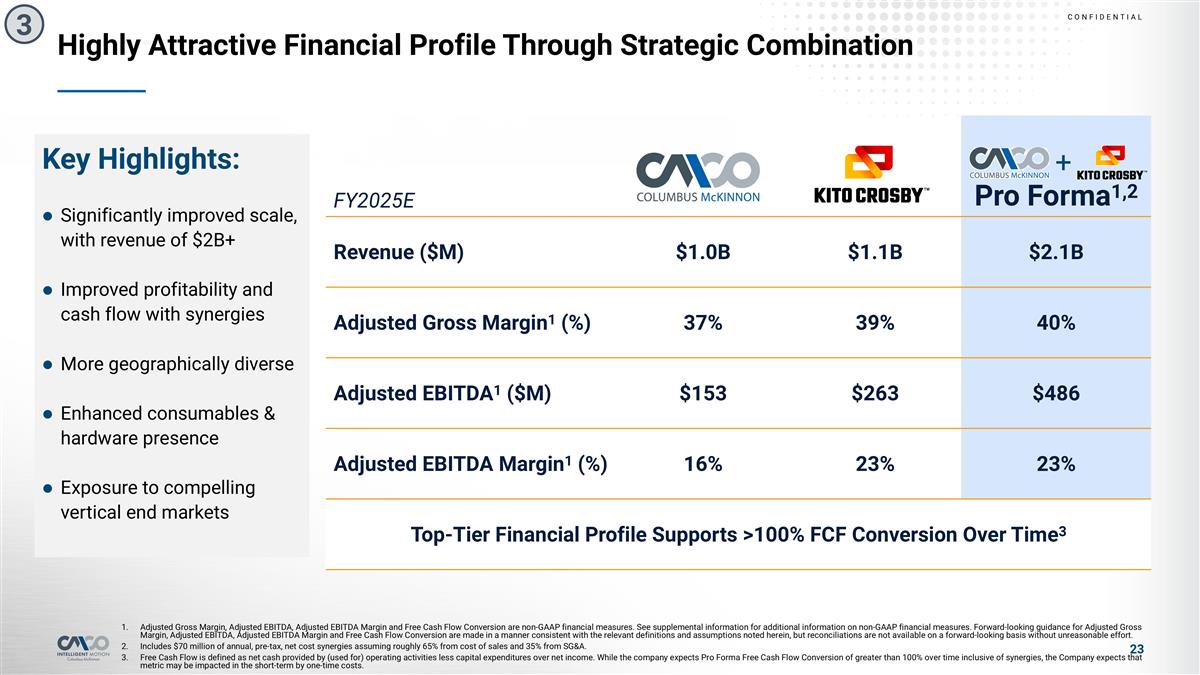
FY2025E Pro Forma1,2 Revenue ($M) $1.0B $1.1B $2.1B Adjusted Gross Margin1 (%) 37% 39% 40% Adjusted EBITDA1 ($M) $153 $263 $486 Adjusted EBITDA Margin1 (%) 16% 23% 23% Top-Tier Financial Profile Supports >100% FCF Conversion Over Time3 Key Highlights: Significantly improved scale, with revenue of $2B+ Improved profitability and cash flow with synergies More geographically diverse Enhanced consumables & hardware presence Exposure to compelling vertical end markets Highly Attractive Financial Profile Through Strategic Combination + 3 Adjusted Gross Margin, Adjusted EBITDA, Adjusted EBITDA Margin and Free Cash Flow Conversion are non-GAAP financial measures. See supplemental information for additional information on non-GAAP financial measures. Forward-looking guidance for Adjusted Gross Margin, Adjusted EBITDA, Adjusted EBITDA Margin and Free Cash Flow Conversion are made in a manner consistent with the relevant definitions and assumptions noted herein, but reconciliations are not available on a forward-looking basis without unreasonable effort. Includes $70 million of annual, pre-tax, net cost synergies assuming roughly 65% from cost of sales and 35% from SG&A. Free Cash Flow is defined as net cash provided by (used for) operating activities less capital expenditures over net income. While the company expects Pro Forma Free Cash Flow Conversion of greater than 100% over time inclusive of synergies, the Company expects that metric may be impacted in the short-term by one-time costs.
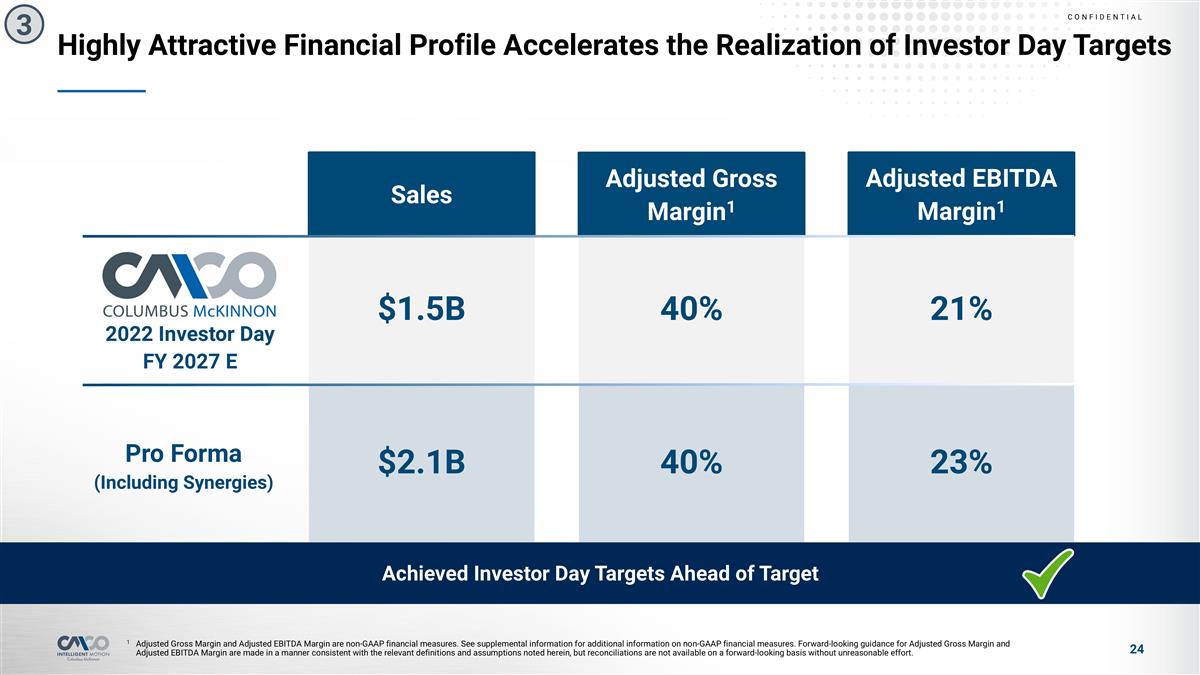
Highly Attractive Financial Profile Accelerates the Realization of Investor Day Targets 1 Adjusted Gross Margin and Adjusted EBITDA Margin are non-GAAP financial measures. See supplemental information for additional information on non-GAAP financial measures. Forward-looking guidance for Adjusted Gross Margin and Adjusted EBITDA Margin are made in a manner consistent with the relevant definitions and assumptions noted herein, but reconciliations are not available on a forward-looking basis without unreasonable effort. 3 2022 Investor Day FY 2027 E Pro Forma (Including Synergies) Adjusted Gross Margin1 Adjusted EBITDA Margin1 Sales $2.1B 40% 40% 21% 23% $1.5B Achieved Investor Day Targets Ahead of Target
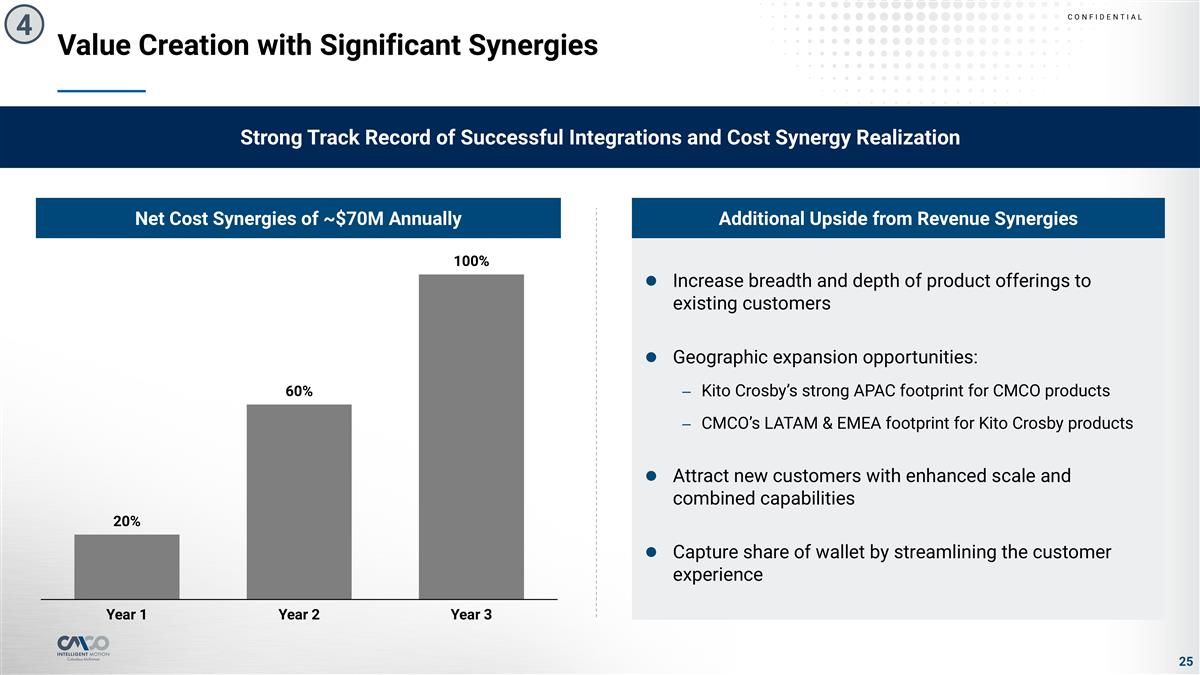
Strong Track Record of Successful Integrations and Cost Synergy Realization Value Creation with Significant Synergies Additional Upside from Revenue Synergies Net Cost Synergies of ~$70M Annually 4 Increase breadth and depth of product offerings to existing customers Geographic expansion opportunities: Kito Crosby’s strong APAC footprint for CMCO products CMCO’s LATAM & EMEA footprint for Kito Crosby products Attract new customers with enhanced scale and combined capabilities Capture share of wallet by streamlining the customer experience
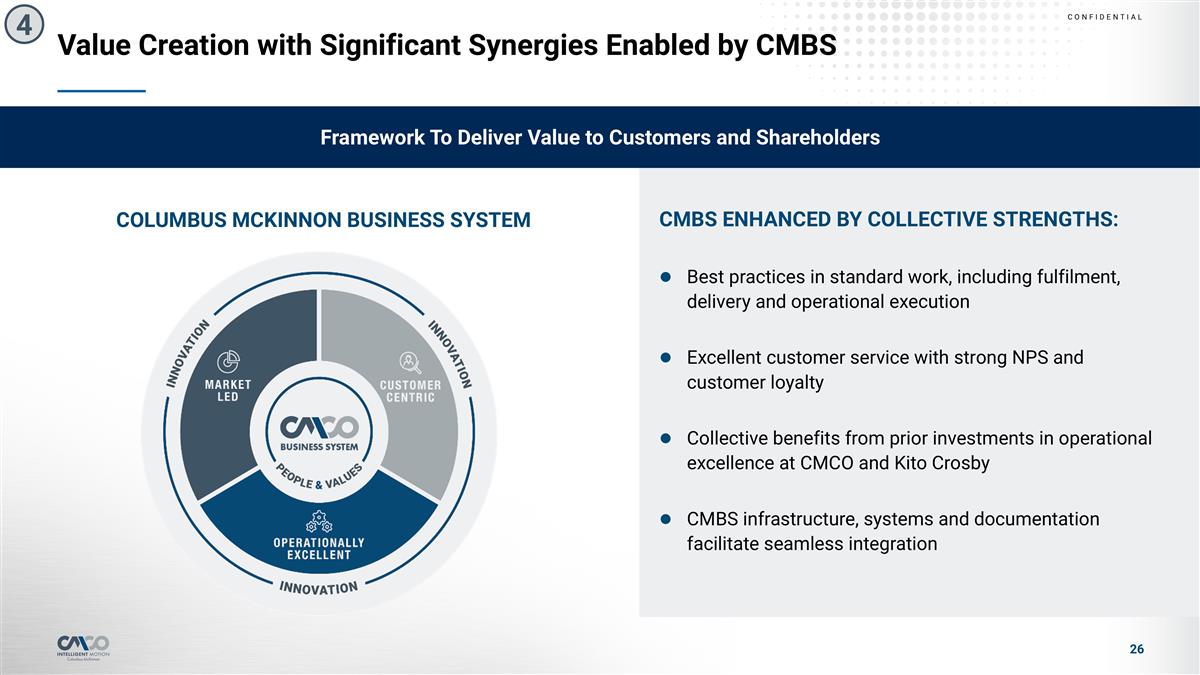
COLUMBUS MCKINNON BUSINESS SYSTEM CMBS ENHANCED BY COLLECTIVE STRENGTHS: Best practices in standard work, including fulfilment, delivery and operational execution Excellent customer service with strong NPS and customer loyalty Collective benefits from prior investments in operational excellence at CMCO and Kito Crosby CMBS infrastructure, systems and documentation facilitate seamless integration Value Creation with Significant Synergies Enabled by CMBS 4 Framework To Deliver Value to Customers and Shareholders
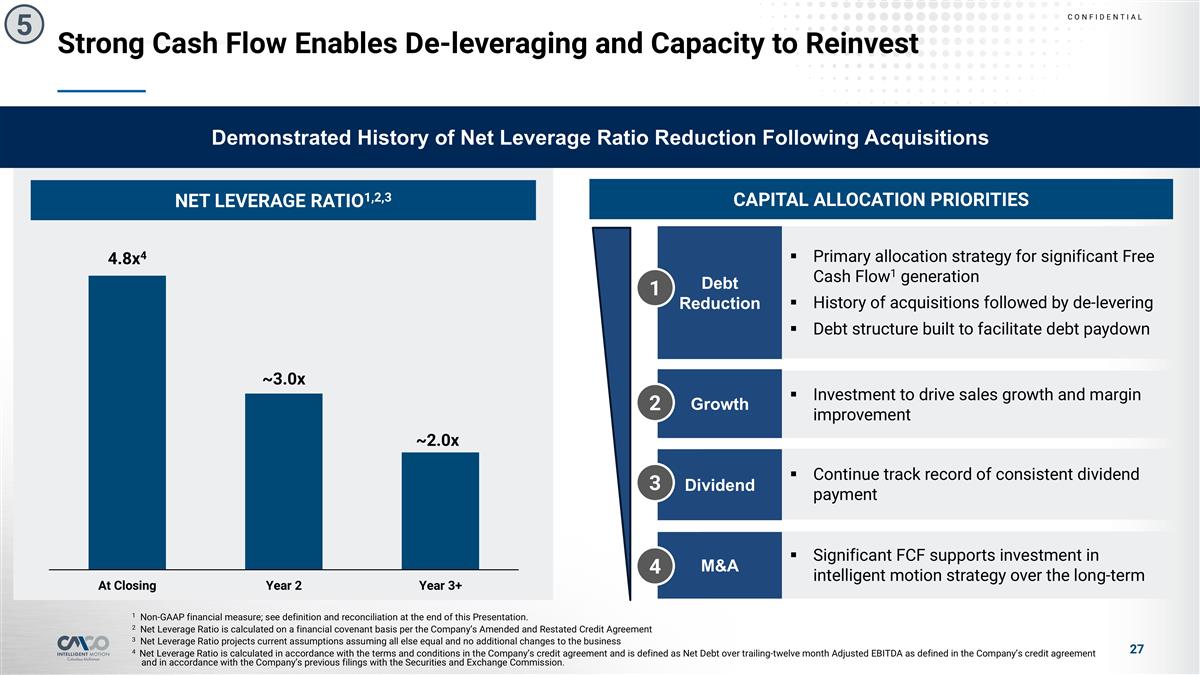
Primary allocation strategy for significant Free Cash Flow1 generation History of acquisitions followed by de-levering Debt structure built to facilitate debt paydown Strong Cash Flow Enables De-leveraging and Capacity to Reinvest 1 Non-GAAP financial measure; see definition and reconciliation at the end of this Presentation. 2 Net Leverage Ratio is calculated on a financial covenant basis per the Company’s Amended and Restated Credit Agreement 3 Net Leverage Ratio projects current assumptions assuming all else equal and no additional changes to the business 4 Net Leverage Ratio is calculated in accordance with the terms and conditions in the Company’s credit agreement and is defined as Net Debt over trailing-twelve month Adjusted EBITDA as defined in the Company’s credit agreement and in accordance with the Company’s previous filings with the Securities and Exchange Commission. PRO FORMA NET LEVERAGE RATIO1,2,3 Demonstrated History of Net Leverage Ratio Reduction Following Acquisitions 5 NET LEVERAGE RATIO1,2,3 CAPITAL ALLOCATION PRIORITIES Debt Reduction Investment to drive sales growth and margin improvement Growth Continue track record of consistent dividend payment Significant FCF supports investment in intelligent motion strategy over the long-term Dividend M&A 1 2 3 4
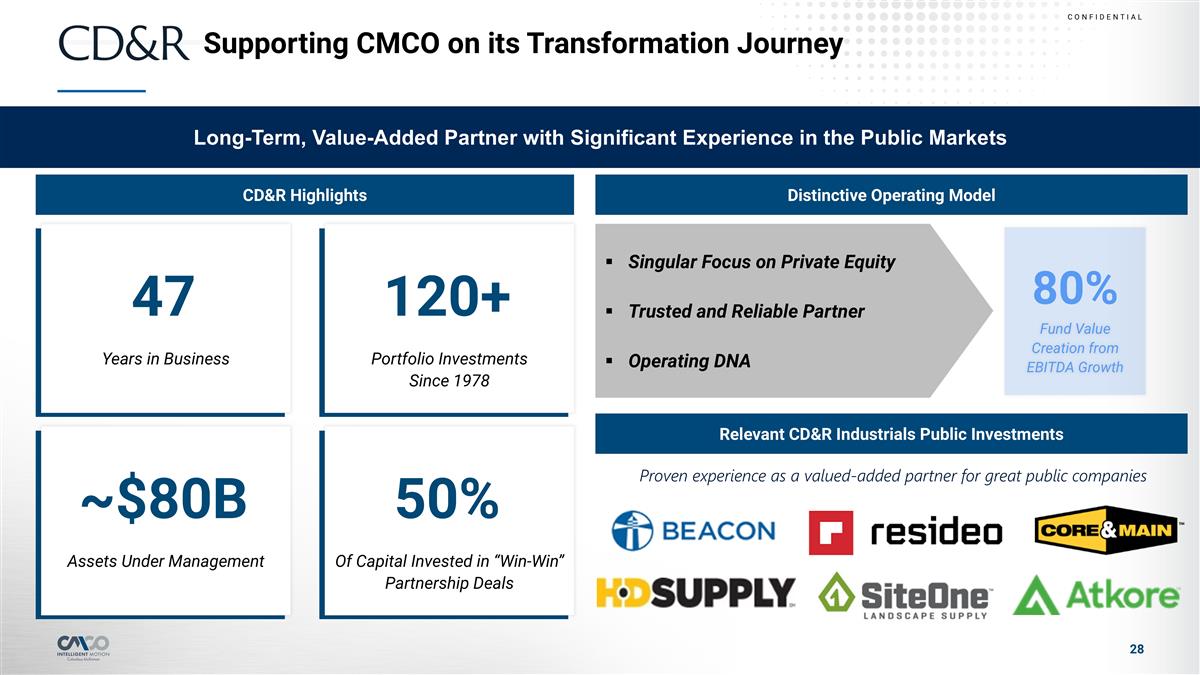
Supporting CMCO on its Transformation Journey PRO FORMA NET LEVERAGE RATIO1,2,3 Long-Term, Value-Added Partner with Significant Experience in the Public Markets CD&R Highlights Distinctive Operating Model Years in Business 47 Of Capital Invested in “Win-Win” Partnership Deals 50% Portfolio Investments Since 1978 120+ Relevant CD&R Industrials Public Investments Assets Under Management ~$80B Singular Focus on Private Equity Trusted and Reliable Partner Operating DNA Fund Value Creation from EBITDA Growth 80% Proven experience as a valued-added partner for great public companies
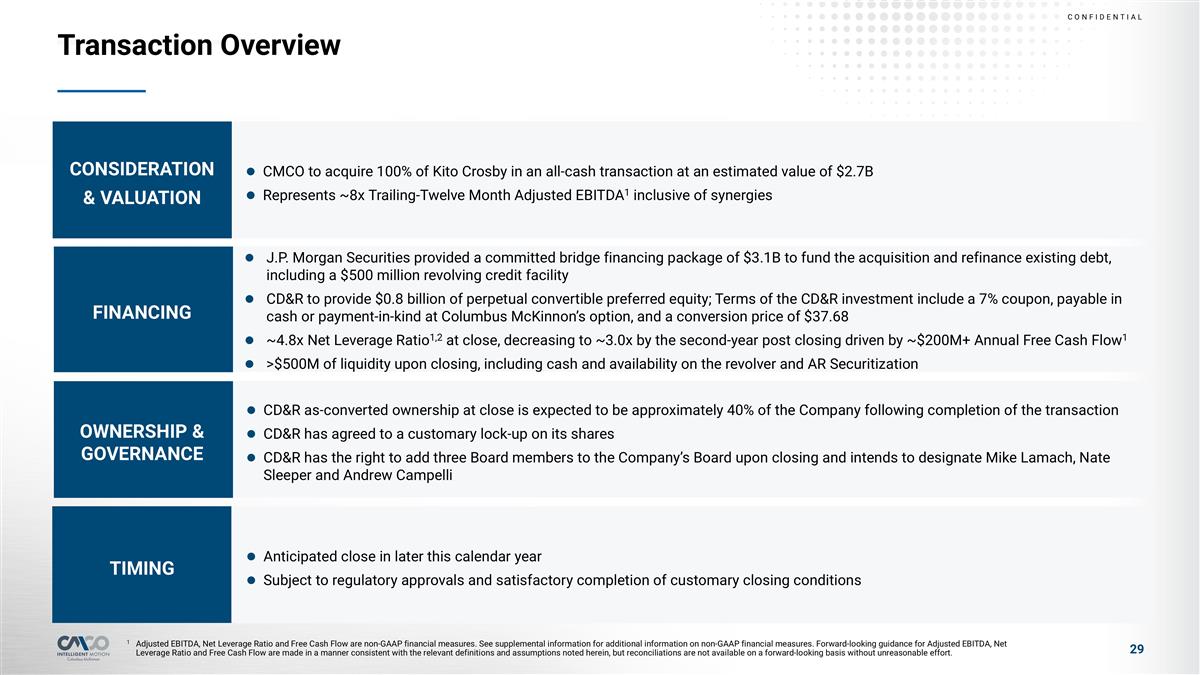
Transaction Overview CMCO to acquire 100% of Kito Crosby in an all-cash transaction at an estimated value of $2.7B Represents ~8x Trailing-Twelve Month Adjusted EBITDA1 inclusive of synergies J.P. Morgan Securities provided a committed bridge financing package of $3.1B to fund the acquisition and refinance existing debt, including a $500 million revolving credit facility CD&R to provide $0.8 billion of perpetual convertible preferred equity; Terms of the CD&R investment include a 7% coupon, payable in cash or payment-in-kind at Columbus McKinnon’s option, and a conversion price of $37.68 ~4.8x Net Leverage Ratio1,2 at close, decreasing to ~3.0x by the second-year post closing driven by ~$200M+ Annual Free Cash Flow1 >$500M of liquidity upon closing, including cash and availability on the revolver and AR Securitization CD&R as-converted ownership at close is expected to be approximately 40% of the Company following completion of the transaction CD&R has agreed to a customary lock-up on its shares CD&R has the right to add three Board members to the Company’s Board upon closing and intends to designate Mike Lamach, Nate Sleeper and Andrew Campelli Anticipated close in later this calendar year Subject to regulatory approvals and satisfactory completion of customary closing conditions CONSIDERATION & VALUATION FINANCING OWNERSHIP & GOVERNANCE TIMING 1 Adjusted EBITDA, Net Leverage Ratio and Free Cash Flow are non-GAAP financial measures. See supplemental information for additional information on non-GAAP financial measures. Forward-looking guidance for Adjusted EBITDA, Net Leverage Ratio and Free Cash Flow are made in a manner consistent with the relevant definitions and assumptions noted herein, but reconciliations are not available on a forward-looking basis without unreasonable effort.
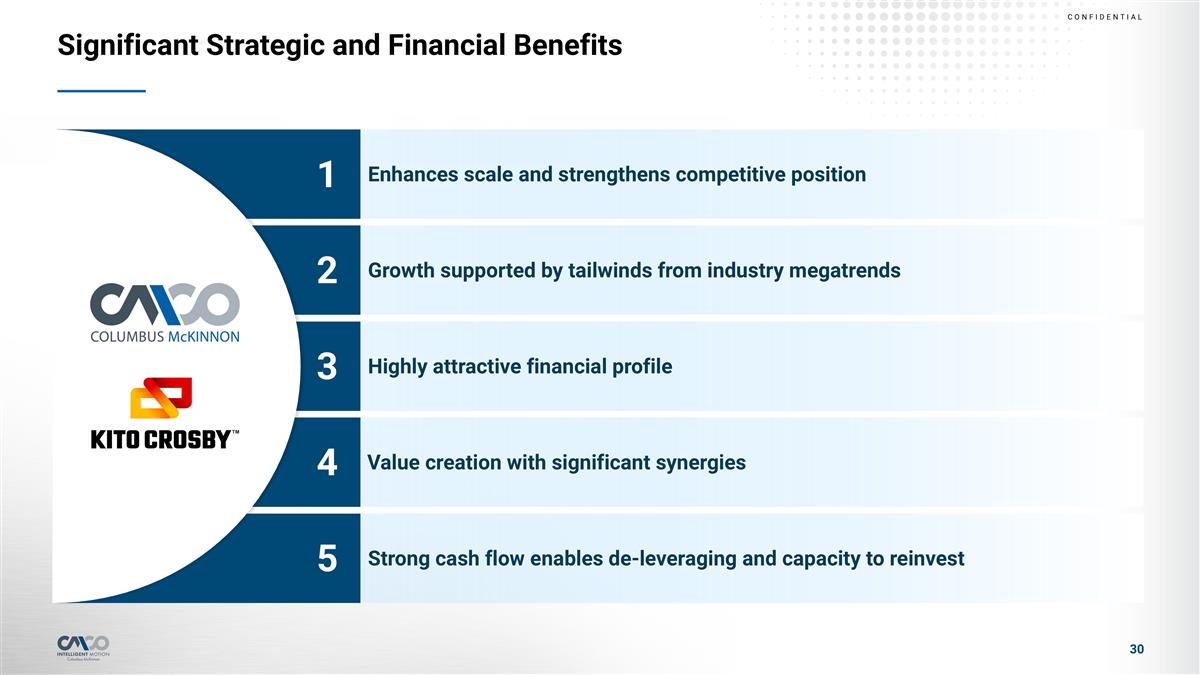
Strong cash flow enables de-leveraging and capacity to reinvest 5 Value creation with significant synergies 4 Highly attractive financial profile 3 Growth supported by tailwinds from industry megatrends 2 Enhances scale and strengthens competitive position 1 Significant Strategic and Financial Benefits
Supplemental Information
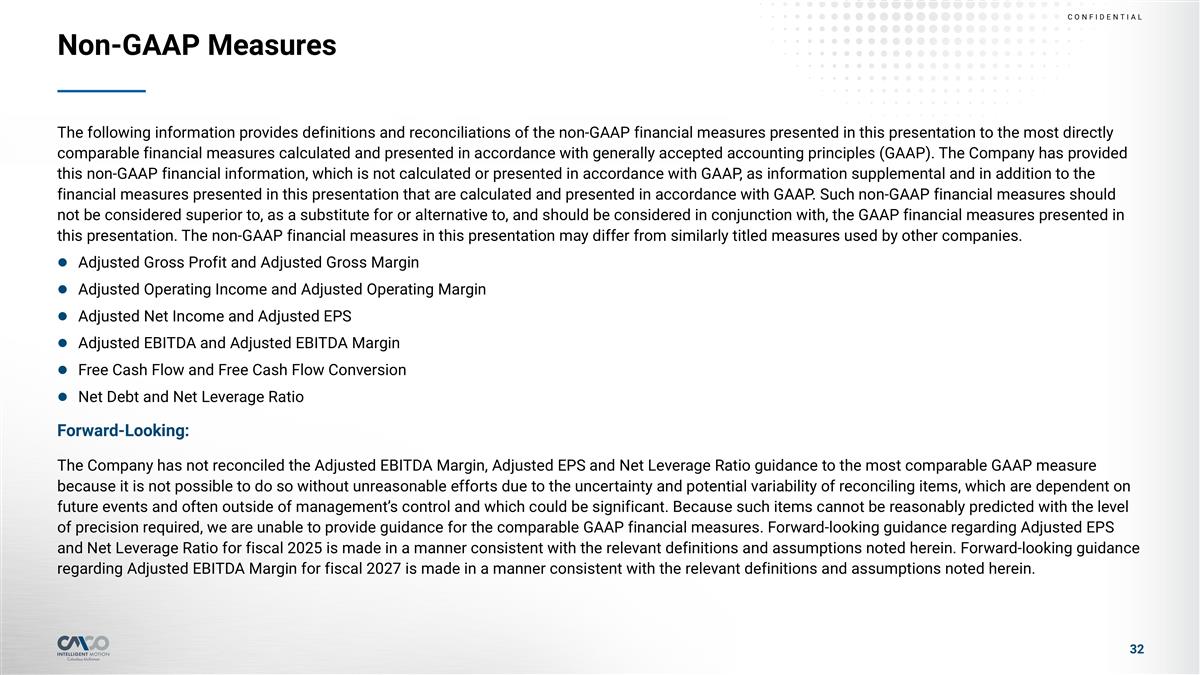
Non-GAAP Measures The following information provides definitions and reconciliations of the non-GAAP financial measures presented in this presentation to the most directly comparable financial measures calculated and presented in accordance with generally accepted accounting principles (GAAP). The Company has provided this non-GAAP financial information, which is not calculated or presented in accordance with GAAP, as information supplemental and in addition to the financial measures presented in this presentation that are calculated and presented in accordance with GAAP. Such non-GAAP financial measures should not be considered superior to, as a substitute for or alternative to, and should be considered in conjunction with, the GAAP financial measures presented in this presentation. The non-GAAP financial measures in this presentation may differ from similarly titled measures used by other companies. Adjusted Gross Profit and Adjusted Gross Margin Adjusted Operating Income and Adjusted Operating Margin Adjusted Net Income and Adjusted EPS Adjusted EBITDA and Adjusted EBITDA Margin Free Cash Flow and Free Cash Flow Conversion Net Debt and Net Leverage Ratio Forward-Looking: The Company has not reconciled the Adjusted EBITDA Margin, Adjusted EPS and Net Leverage Ratio guidance to the most comparable GAAP measure because it is not possible to do so without unreasonable efforts due to the uncertainty and potential variability of reconciling items, which are dependent on future events and often outside of management’s control and which could be significant. Because such items cannot be reasonably predicted with the level of precision required, we are unable to provide guidance for the comparable GAAP financial measures. Forward-looking guidance regarding Adjusted EPS and Net Leverage Ratio for fiscal 2025 is made in a manner consistent with the relevant definitions and assumptions noted herein. Forward-looking guidance regarding Adjusted EBITDA Margin for fiscal 2027 is made in a manner consistent with the relevant definitions and assumptions noted herein.
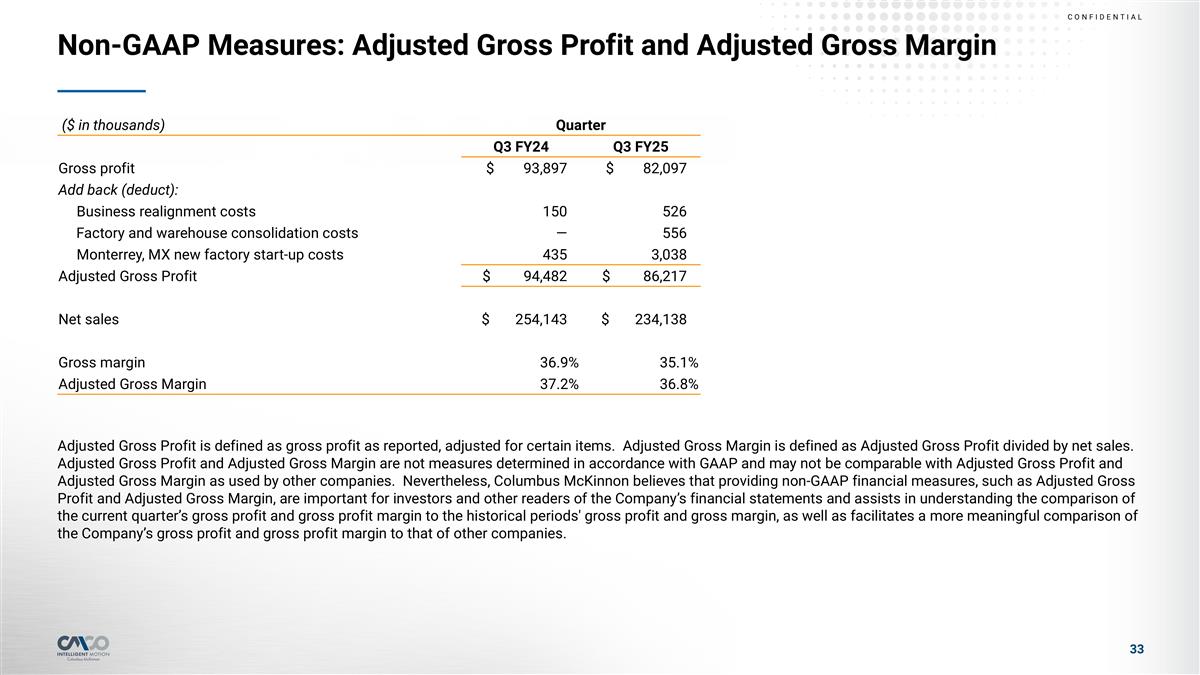
Non-GAAP Measures: Adjusted Gross Profit and Adjusted Gross Margin Adjusted Gross Profit is defined as gross profit as reported, adjusted for certain items. Adjusted Gross Margin is defined as Adjusted Gross Profit divided by net sales. Adjusted Gross Profit and Adjusted Gross Margin are not measures determined in accordance with GAAP and may not be comparable with Adjusted Gross Profit and Adjusted Gross Margin as used by other companies. Nevertheless, Columbus McKinnon believes that providing non-GAAP financial measures, such as Adjusted Gross Profit and Adjusted Gross Margin, are important for investors and other readers of the Company’s financial statements and assists in understanding the comparison of the current quarter’s gross profit and gross profit margin to the historical periods' gross profit and gross margin, as well as facilitates a more meaningful comparison of the Company’s gross profit and gross profit margin to that of other companies. ($ in thousands) Quarter TTM Q3 FY24 Q3 FY25 Gross profit $ 93,897 $ 82,097 Add back (deduct): Business realignment costs 150 526 Factory and warehouse consolidation costs — 556 Monterrey, MX new factory start-up costs 435 3,038 Adjusted Gross Profit $ 94,482 $ 86,217 Net sales $ 254,143 $ 234,138 Gross margin 36.9% 35.1% Adjusted Gross Margin 37.2% 36.8%
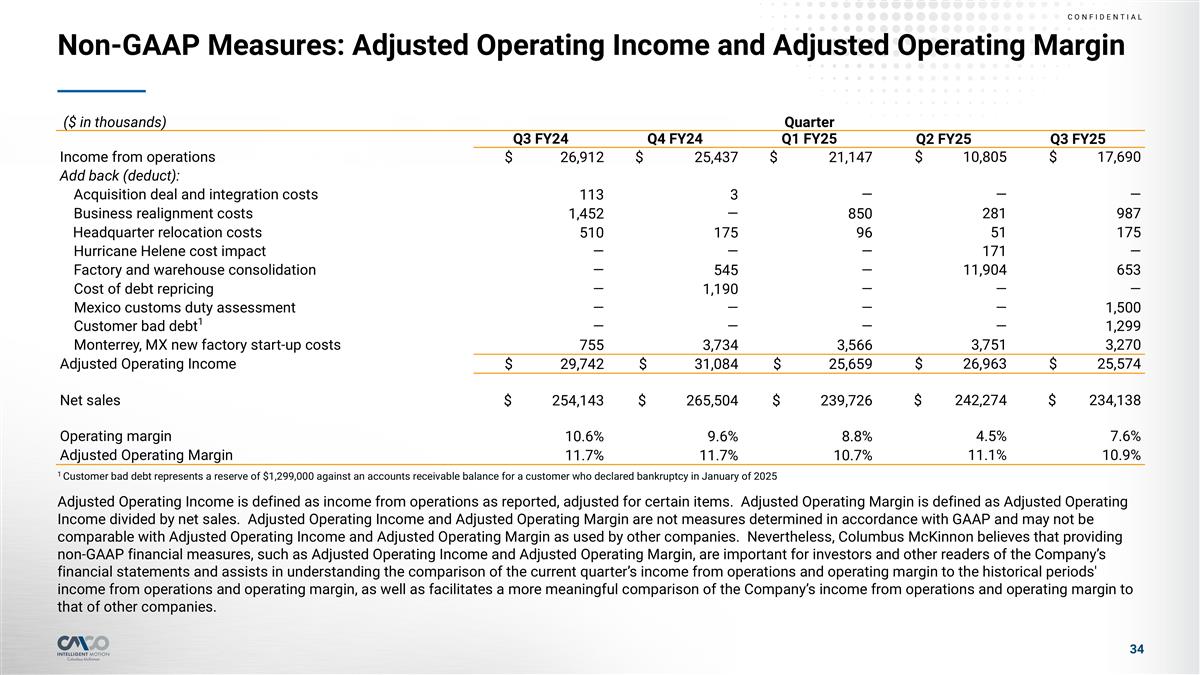
Non-GAAP Measures: Adjusted Operating Income and Adjusted Operating Margin ($ in thousands) Quarter Q3 FY24 Q4 FY24 Q1 FY25 Q2 FY25 Q3 FY25 Income from operations $ 26,912 $ 25,437 $ 21,147 $ 10,805 $ 17,690 Add back (deduct): Acquisition deal and integration costs 113 3 — — — Business realignment costs 1,452 — 850 281 987 Headquarter relocation costs 510 175 96 51 175 Hurricane Helene cost impact — — — 171 — Factory and warehouse consolidation — 545 — 11,904 653 Cost of debt repricing — 1,190 — — — Mexico customs duty assessment — — — — 1,500 Customer bad debt1 — — — — 1,299 Monterrey, MX new factory start-up costs 755 3,734 3,566 3,751 3,270 Adjusted Operating Income $ 29,742 $ 31,084 $ 25,659 $ 26,963 $ 25,574 Net sales $ 254,143 $ 265,504 $ 239,726 $ 242,274 $ 234,138 Operating margin 10.6% 9.6% 8.8% 4.5% 7.6% Adjusted Operating Margin 11.7% 11.7% 10.7% 11.1% 10.9% 1 Customer bad debt represents a reserve of $1,299,000 against an accounts receivable balance for a customer who declared bankruptcy in January of 2025 Adjusted Operating Income is defined as income from operations as reported, adjusted for certain items. Adjusted Operating Margin is defined as Adjusted Operating Income divided by net sales. Adjusted Operating Income and Adjusted Operating Margin are not measures determined in accordance with GAAP and may not be comparable with Adjusted Operating Income and Adjusted Operating Margin as used by other companies. Nevertheless, Columbus McKinnon believes that providing non-GAAP financial measures, such as Adjusted Operating Income and Adjusted Operating Margin, are important for investors and other readers of the Company’s financial statements and assists in understanding the comparison of the current quarter’s income from operations and operating margin to the historical periods' income from operations and operating margin, as well as facilitates a more meaningful comparison of the Company’s income from operations and operating margin to that of other companies.
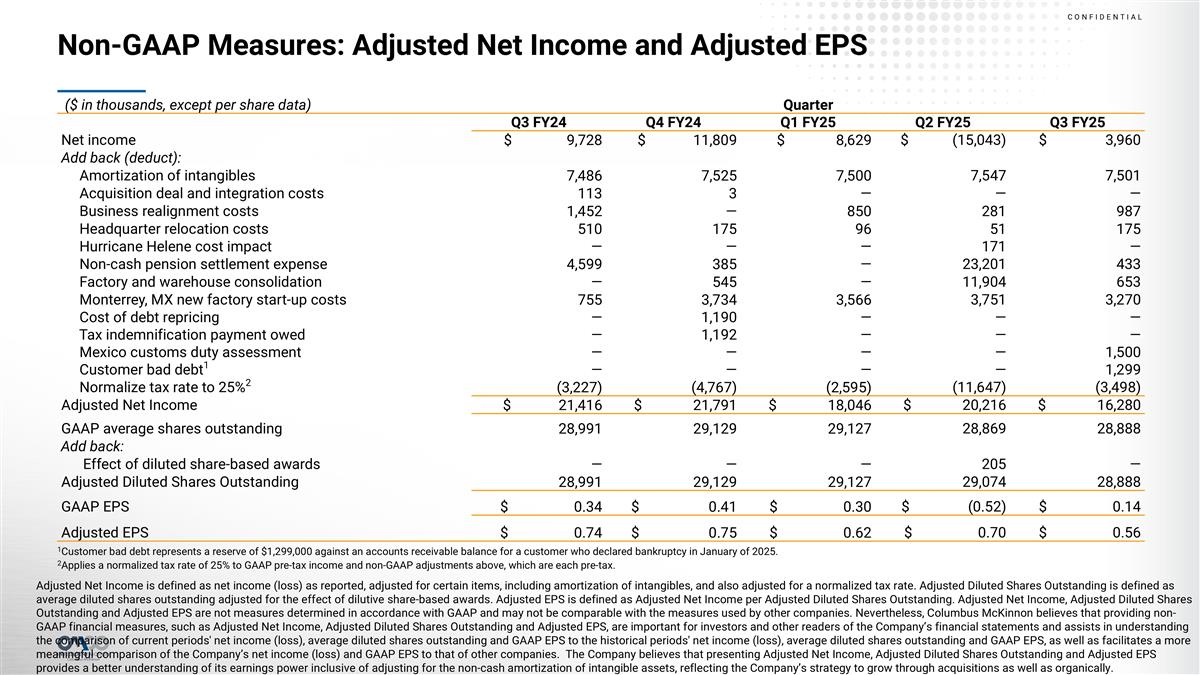
Adjusted Net Income is defined as net income (loss) as reported, adjusted for certain items, including amortization of intangibles, and also adjusted for a normalized tax rate. Adjusted Diluted Shares Outstanding is defined as average diluted shares outstanding adjusted for the effect of dilutive share-based awards. Adjusted EPS is defined as Adjusted Net Income per Adjusted Diluted Shares Outstanding. Adjusted Net Income, Adjusted Diluted Shares Outstanding and Adjusted EPS are not measures determined in accordance with GAAP and may not be comparable with the measures used by other companies. Nevertheless, Columbus McKinnon believes that providing non-GAAP financial measures, such as Adjusted Net Income, Adjusted Diluted Shares Outstanding and Adjusted EPS, are important for investors and other readers of the Company’s financial statements and assists in understanding the comparison of current periods' net income (loss), average diluted shares outstanding and GAAP EPS to the historical periods' net income (loss), average diluted shares outstanding and GAAP EPS, as well as facilitates a more meaningful comparison of the Company’s net income (loss) and GAAP EPS to that of other companies. The Company believes that presenting Adjusted Net Income, Adjusted Diluted Shares Outstanding and Adjusted EPS provides a better understanding of its earnings power inclusive of adjusting for the non-cash amortization of intangible assets, reflecting the Company’s strategy to grow through acquisitions as well as organically. Non-GAAP Measures: Adjusted Net Income and Adjusted EPS ($ in thousands, except per share data) Quarter Q3 FY24 Q4 FY24 Q1 FY25 Q2 FY25 Q3 FY25 Net income $ 9,728 $ 11,809 $ 8,629 $ (15,043) $ 3,960 Add back (deduct): Amortization of intangibles 7,486 7,525 7,500 7,547 7,501 Acquisition deal and integration costs 113 3 — — — Business realignment costs 1,452 — 850 281 987 Headquarter relocation costs 510 175 96 51 175 Hurricane Helene cost impact — — — 171 — Non-cash pension settlement expense 4,599 385 — 23,201 433 Factory and warehouse consolidation — 545 — 11,904 653 Monterrey, MX new factory start-up costs 755 3,734 3,566 3,751 3,270 Cost of debt repricing — 1,190 — — — Tax indemnification payment owed — 1,192 — — — Mexico customs duty assessment — — — — 1,500 Customer bad debt1 — — — — 1,299 Normalize tax rate to 25%2 (3,227) (4,767) (2,595) (11,647) (3,498) Adjusted Net Income $ 21,416 $ 21,791 $ 18,046 $ 20,216 $ 16,280 GAAP average shares outstanding 28,991 29,129 29,127 28,869 28,888 Add back: Effect of diluted share-based awards — — — 205 — Adjusted Diluted Shares Outstanding 28,991 29,129 29,127 29,074 28,888 GAAP EPS $ 0.34 $ 0.41 $ 0.30 $ (0.52) $ 0.14 Adjusted EPS $ 0.74 $ 0.75 $ 0.62 $ 0.70 $ 0.56 1Customer bad debt represents a reserve of $1,299,000 against an accounts receivable balance for a customer who declared bankruptcy in January of 2025. 2Applies a normalized tax rate of 25% to GAAP pre-tax income and non-GAAP adjustments above, which are each pre-tax.
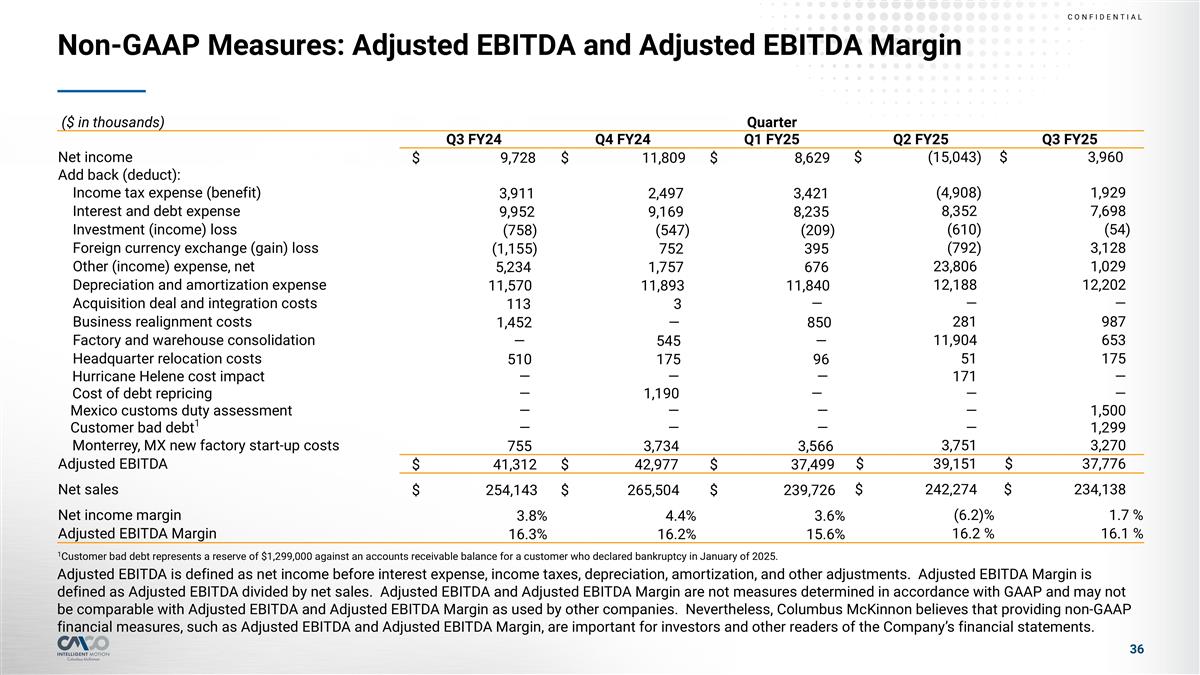
Non-GAAP Measures: Adjusted EBITDA and Adjusted EBITDA Margin Adjusted EBITDA is defined as net income before interest expense, income taxes, depreciation, amortization, and other adjustments. Adjusted EBITDA Margin is defined as Adjusted EBITDA divided by net sales. Adjusted EBITDA and Adjusted EBITDA Margin are not measures determined in accordance with GAAP and may not be comparable with Adjusted EBITDA and Adjusted EBITDA Margin as used by other companies. Nevertheless, Columbus McKinnon believes that providing non-GAAP financial measures, such as Adjusted EBITDA and Adjusted EBITDA Margin, are important for investors and other readers of the Company’s financial statements. ($ in thousands) Quarter Q3 FY24 Q4 FY24 Q1 FY25 Q2 FY25 Q3 FY25 Net income $ 9,728 $ 11,809 $ 8,629 $ (15,043) $ 3,960 Add back (deduct): Income tax expense (benefit) 3,911 2,497 3,421 (4,908) 1,929 Interest and debt expense 9,952 9,169 8,235 8,352 7,698 Investment (income) loss (758) (547) (209) (610) (54) Foreign currency exchange (gain) loss (1,155) 752 395 (792) 3,128 Other (income) expense, net 5,234 1,757 676 23,806 1,029 Depreciation and amortization expense 11,570 11,893 11,840 12,188 12,202 Acquisition deal and integration costs 113 3 — — — Business realignment costs 1,452 — 850 281 987 Factory and warehouse consolidation — 545 — 11,904 653 Headquarter relocation costs 510 175 96 51 175 Hurricane Helene cost impact — — — 171 — Cost of debt repricing — 1,190 — — — Mexico customs duty assessment — — — — 1,500 Customer bad debt1 — — — — 1,299 Monterrey, MX new factory start-up costs 755 3,734 3,566 3,751 3,270 Adjusted EBITDA $ 41,312 $ 42,977 $ 37,499 $ 39,151 $ 37,776 Net sales $ 254,143 $ 265,504 $ 239,726 $ 242,274 $ 234,138 Net income margin 3.8% 4.4% 3.6% (6.2)% 1.7 % Adjusted EBITDA Margin 16.3% 16.2% 15.6% 16.2 % 16.1 % 1Customer bad debt represents a reserve of $1,299,000 against an accounts receivable balance for a customer who declared bankruptcy in January of 2025.
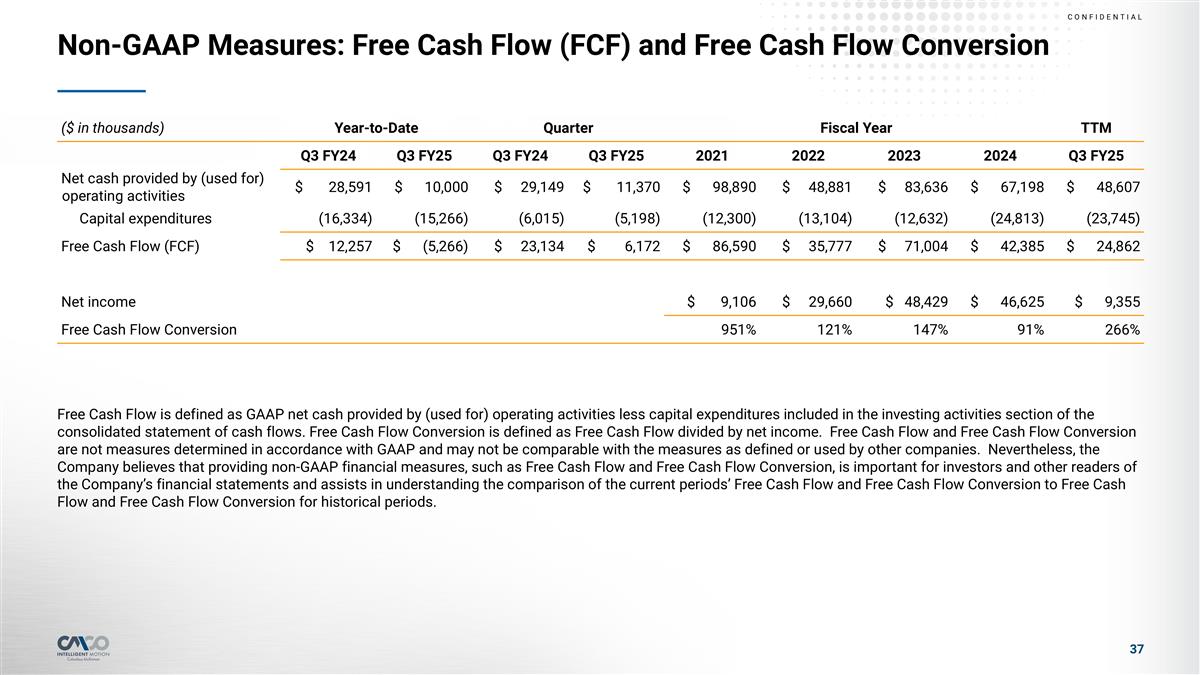
Non-GAAP Measures: Free Cash Flow (FCF) and Free Cash Flow Conversion Free Cash Flow is defined as GAAP net cash provided by (used for) operating activities less capital expenditures included in the investing activities section of the consolidated statement of cash flows. Free Cash Flow Conversion is defined as Free Cash Flow divided by net income. Free Cash Flow and Free Cash Flow Conversion are not measures determined in accordance with GAAP and may not be comparable with the measures as defined or used by other companies. Nevertheless, the Company believes that providing non-GAAP financial measures, such as Free Cash Flow and Free Cash Flow Conversion, is important for investors and other readers of the Company’s financial statements and assists in understanding the comparison of the current periods’ Free Cash Flow and Free Cash Flow Conversion to Free Cash Flow and Free Cash Flow Conversion for historical periods. ($ in thousands) Year-to-Date Quarter Fiscal Year Fiscal Year TTM Q3 FY24 Q3 FY25 Q3 FY24 Q3 FY25 2021 2022 2023 2024 Q3 FY25 Net cash provided by (used for) operating activities $ 28,591 $ 10,000 $ 29,149 $ 11,370 $ 98,890 $ 48,881 $ 83,636 $ 67,198 $ 48,607 Capital expenditures (16,334) (15,266) (6,015) (5,198) (12,300) (13,104) (12,632) (24,813) (23,745) Free Cash Flow (FCF) $ 12,257 $ (5,266) $ 23,134 $ 6,172 $ 86,590 $ 35,777 $ 71,004 $ 42,385 $ 24,862 Net income $ 9,106 $ 29,660 $ 48,429 $ 46,625 $ 9,355 Free Cash Flow Conversion 951% 121% 147% 91% 266%
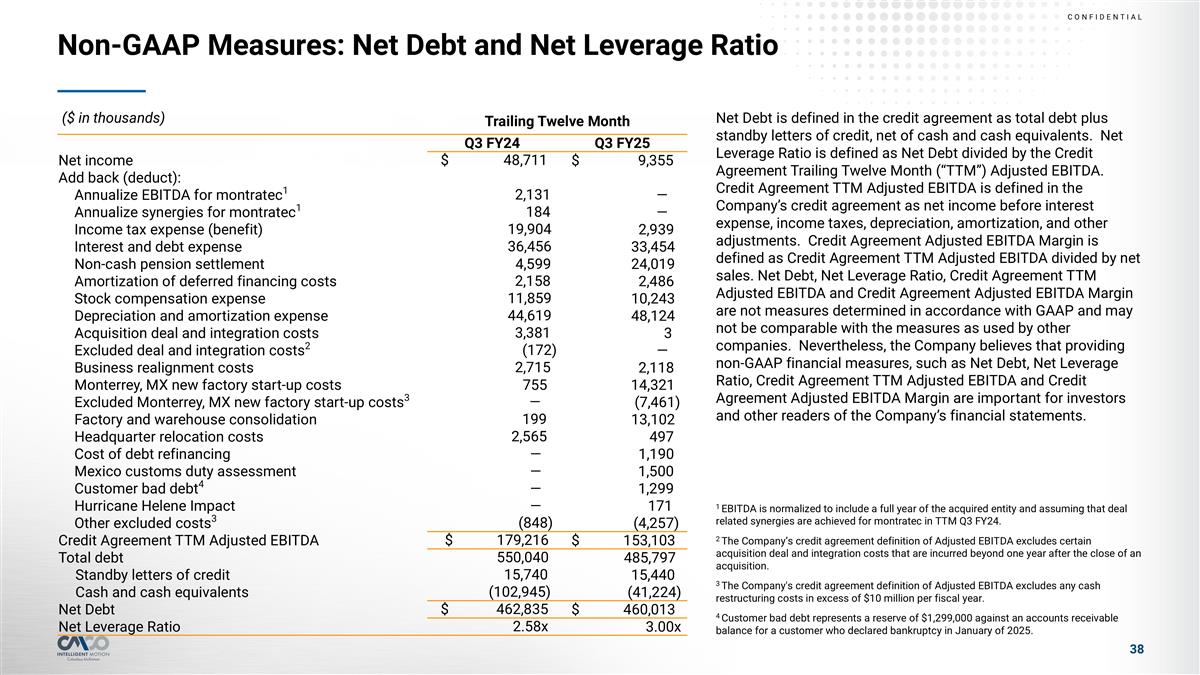
Non-GAAP Measures: Net Debt and Net Leverage Ratio Net Debt is defined in the credit agreement as total debt plus standby letters of credit, net of cash and cash equivalents. Net Leverage Ratio is defined as Net Debt divided by the Credit Agreement Trailing Twelve Month (“TTM”) Adjusted EBITDA. Credit Agreement TTM Adjusted EBITDA is defined in the Company’s credit agreement as net income before interest expense, income taxes, depreciation, amortization, and other adjustments. Credit Agreement Adjusted EBITDA Margin is defined as Credit Agreement TTM Adjusted EBITDA divided by net sales. Net Debt, Net Leverage Ratio, Credit Agreement TTM Adjusted EBITDA and Credit Agreement Adjusted EBITDA Margin are not measures determined in accordance with GAAP and may not be comparable with the measures as used by other companies. Nevertheless, the Company believes that providing non-GAAP financial measures, such as Net Debt, Net Leverage Ratio, Credit Agreement TTM Adjusted EBITDA and Credit Agreement Adjusted EBITDA Margin are important for investors and other readers of the Company’s financial statements. 1 EBITDA is normalized to include a full year of the acquired entity and assuming that deal related synergies are achieved for montratec in TTM Q3 FY24. 2 The Company’s credit agreement definition of Adjusted EBITDA excludes certain acquisition deal and integration costs that are incurred beyond one year after the close of an acquisition. 3 The Company's credit agreement definition of Adjusted EBITDA excludes any cash restructuring costs in excess of $10 million per fiscal year. 4 Customer bad debt represents a reserve of $1,299,000 against an accounts receivable balance for a customer who declared bankruptcy in January of 2025. ($ in thousands) Trailing Twelve Month Q3 FY24 Q3 FY25 Net income $ 48,711 $ 9,355 Add back (deduct): Annualize EBITDA for montratec1 2,131 — Annualize synergies for montratec1 184 — Income tax expense (benefit) 19,904 2,939 Interest and debt expense 36,456 33,454 Non-cash pension settlement 4,599 24,019 Amortization of deferred financing costs 2,158 2,486 Stock compensation expense 11,859 10,243 Depreciation and amortization expense 44,619 48,124 Acquisition deal and integration costs 3,381 3 Excluded deal and integration costs2 (172) — Business realignment costs 2,715 2,118 Monterrey, MX new factory start-up costs 755 14,321 Excluded Monterrey, MX new factory start-up costs3 — (7,461) Factory and warehouse consolidation 199 13,102 Headquarter relocation costs 2,565 497 Cost of debt refinancing — 1,190 Mexico customs duty assessment — 1,500 Customer bad debt4 — 1,299 Hurricane Helene Impact — 171 Other excluded costs3 (848) (4,257) Credit Agreement TTM Adjusted EBITDA $ 179,216 $ 153,103 Total debt 550,040 485,797 Standby letters of credit 15,740 15,440 Cash and cash equivalents (102,945) (41,224) Net Debt $ 462,835 $ 460,013 Net Leverage Ratio 2.58x 3.00x