
Investor Presentation October 2024
2 Important Information Regarding Forward-Looking Statements This presentation contains forward-looking statements regarding future events and future results of Lifecore Biomedical, Inc. ("we, "us" or the "Company") that are subject to the safe harbor created under the Private Securities Litigation Reform Act of 1995 and other safe harbors under the Securities Act of 1933 and the Securities Exchange Act of 1934. Words such as “anticipate”, “estimate”, “expect”, “project”, “plan”, “intend”, “believe”, “may”, “might”, “will”, “should”, “can have”, “likely” and similar expressions are used to identify forward-looking statements. In addition, our current operating and financial expectations, anticipated capacity and utilization, anticipated liquidity, and anticipated future customer relationships usage are forward-looking statements. All forward-looking statements involve certain risks and uncertainties that could cause actual results to differ materially, including such factors among others, as the outcome of any evaluation of the Company's strategic alternatives or any discussions with any potential bidders related thereto, the competition of the Company's financial closing procedures, the Company's ability to successfully enact its business strategies, including with respect to installation, capacity generation and its ability to attract demand for its services, the Company's ability to remain current with its reports with the Securities and Exchange Commission (the “SEC”), its ability expand its relationship with its existing customers or attract new customers, the impact of inflation on the Company's business and financial condition, indications of a change in the market cycles in the CDMO market; changes in business conditions and general economic conditions both domestically and globally including rising interest rates and fluctuation in foreign currency exchange rates, access to capital, and other risk factors set forth from time to time in the Company's SEC filings, including, but not limited to, the Annual Report on Form 10-K for the year ended May 26, 2024 (the “2024 10-K”). For additional information about factors that could cause actual results to differ materially from those described in the forward-looking statements, please refer to our filings with the Securities and Exchange Commission, including the risk factors contained in the 2024 10-K. Forward-looking statements represent management's current expectations as of the date hereof and are inherently uncertain. Except as required by law, we do not undertake any obligation to update forward-looking statements made by us to reflect subsequent events or circumstances.

3 Non-GAAP Financial Measures This presentation contains non-GAAP financial information including Adjusted EBITDA. The Company has included a reconciliation of Adjusted EBITDA to Net (loss) income, the most directly comparable financial measure calculated in accordance with GAAP. We define Adjusted EBITDA net income or loss as determined under GAAP excluding (i) interest expense, net of interest income, (ii) provision for income tax expense (benefit), (iii) depreciation and amortization, (iv) stock-based compensation, (v) change in fair value derivatives, (vi) financing fees (non- interest), (vii) reorganization costs, (viii) restructuring costs, (ix) franchise tax equivalent to income tax, (x) contract cancellations, (xi) stockholder activist settlement costs, and (xii) start-up costs. The Company has disclosed these non-GAAP financial measures to supplement its consolidated financial statements presented in accordance with GAAP. These non-GAAP financial measures exclude/include certain items that are included in the Company’s results reported in accordance with GAAP. Management believes these non-GAAP financial measures provide useful additional information to investors about trends in the Company’s operations and are useful for period-over-period comparisons. These non-GAAP financial measures should not be considered in isolation or as a substitute for the comparable GAAP measures. In addition, these non-GAAP financial measures may not be the same as similar measures provided by other companies due to the potential differences in methods of calculation and items being excluded/included. These non-GAAP financial measures should be read in conjunction with the Company’s consolidated financial statements presented in accordance with GAAP.
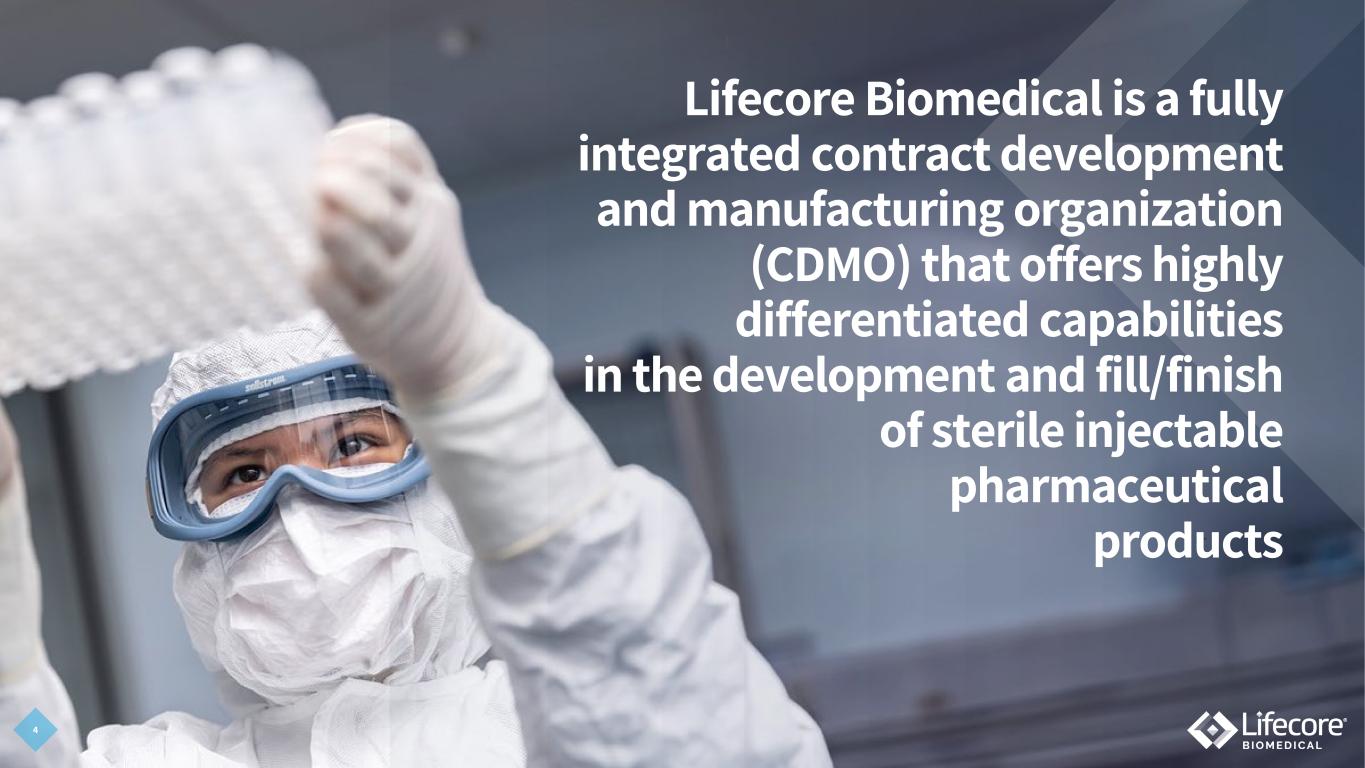
Lifecore Biomedical is a fully integrated contract development and manufacturing organization (CDMO) that offers highly differentiated capabilities in the development and fill/finish of sterile injectable pharmaceutical products 4

5 Lifecore Key Takeaways Broad Capabilities Recently expanded capabilities support a broad range of product characteristics, including the most complex formulations (small molecule, biologics, GLP-1s & monoclonal antibodies), for syringes, vials, & cartridges High-Growth Market U.S. CDMO market is expected to increase by 100% by 2030, with sterile injectable products representing the fastest growing segment of this market High-Value Pipeline Strong and growing pipeline spans projects from early to late stage, including multiple programs that are expected to commercialize in the next three years Expanded Capacity & Revenue Potential State-of-the-art isolator filler technology has significantly increased available capacity and revenue generating potential to up to ~ $300M annually* Actively Executing New Long-Term Growth Strategy Maximizing base business; advancing multiple late-stage programs toward commercialization; increasing new business via new programs & technologies Exceptional Track Record of Success 40+ years of exceptional quality, regulatory compliance, & safety support future growth New Leadership Highly experienced Lifecore management team with deep industry expertise and proven ability to execute *The information provided may not be achieved and there is continued uncertainty relating to any guidance contained herein. There can be no assurance that such results will occur or that such results will be materially different from actual results.
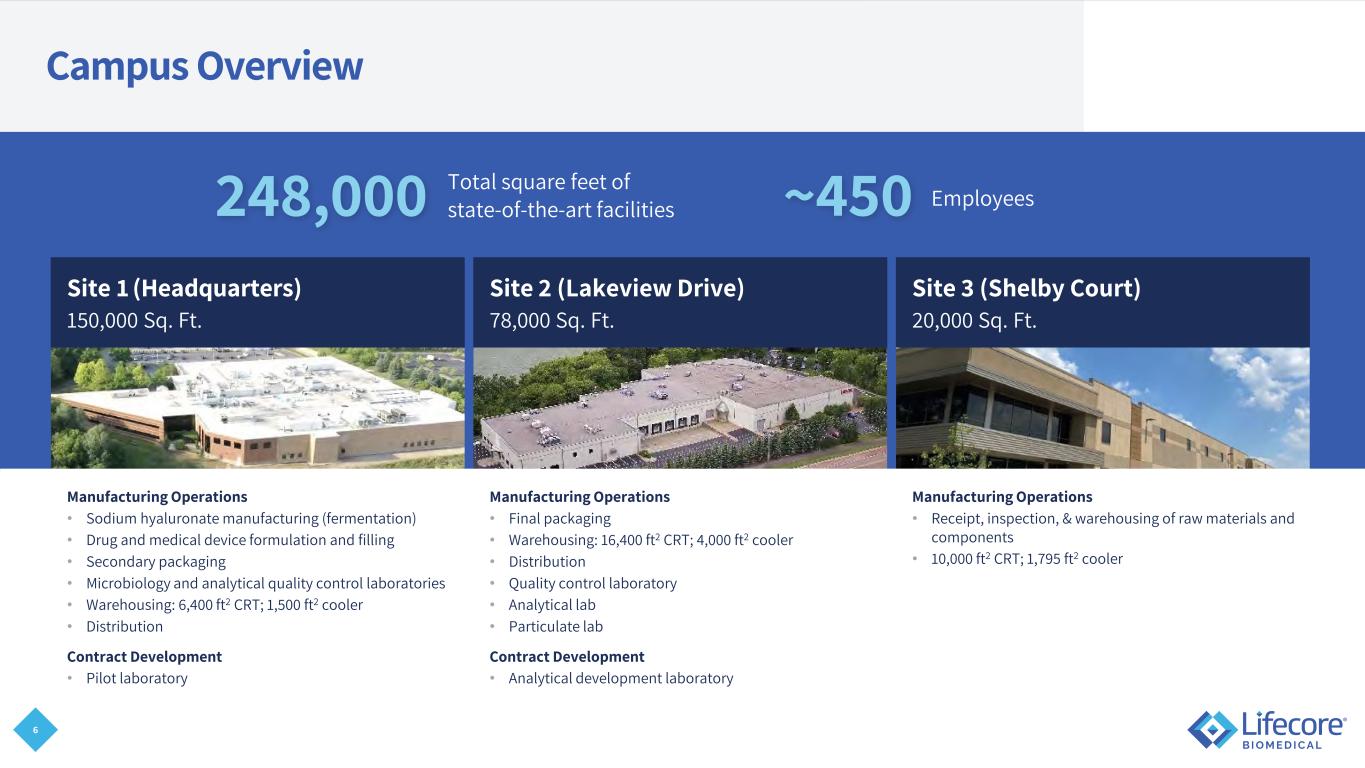
6 Campus Overview Site 1 (Headquarters) 150,000 Sq. Ft. Site 2 (Lakeview Drive) 78,000 Sq. Ft. Site 3 (Shelby Court) 20,000 Sq. Ft. Manufacturing Operations • Sodium hyaluronate manufacturing (fermentation) • Drug and medical device formulation and filling • Secondary packaging • Microbiology and analytical quality control laboratories • Warehousing: 6,400 ft2 CRT; 1,500 ft2 cooler • Distribution Contract Development • Pilot laboratory Manufacturing Operations • Final packaging • Warehousing: 16,400 ft2 CRT; 4,000 ft2 cooler • Distribution • Quality control laboratory • Analytical lab • Particulate lab Contract Development • Analytical development laboratory Manufacturing Operations • Receipt, inspection, & warehousing of raw materials and components • 10,000 ft2 CRT; 1,795 ft2 cooler 248,000 ~450Total square feet of state-of-the-art facilities Employees

7 40 Years of Success in Delivering our Customers’ Innovations to Market* 2016 First FDA drug approval 1986 First FDA approved product with Lifecore HA 1981 Lifecore initiates sodium hyaluronate (HA) production 1983 First commercial sales of sodium HA 2005 Installed first automated syringe filler 1994 First ophthalmic aseptic product 2021 FDA approval of two products manufactured at Lifecore 2024 New leadership team and growth strategy New cGMP isolator filler installed and operational, significantly expanding capacity and revenue potential 2022 Corporate transition from Landec Corp. to Lifecore Biomedical *Dates reflect calendar periods and years 201619861981 1983 20051994 2021 20242022
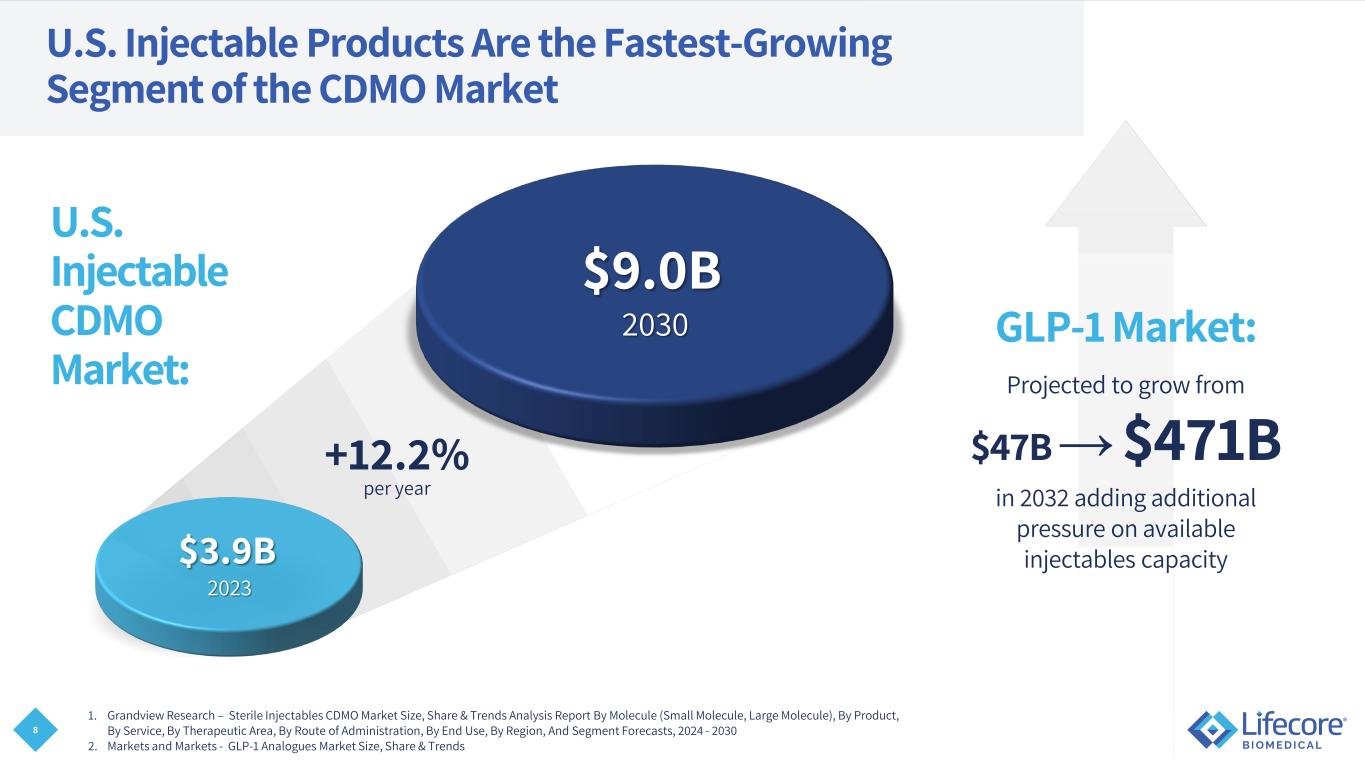
8 U.S. Injectable Products Are the Fastest-Growing Segment of the CDMO Market $9.0B 2030 +12.2% per year $3.9B 2023 GLP-1 Market: Projected to grow from $47B → $471B in 2032 adding additional pressure on available injectables capacity U.S. Injectable CDMO Market: 1. Grandview Research – Sterile Injectables CDMO Market Size, Share & Trends Analysis Report By Molecule (Small Molecule, Large Molecule), By Product, By Service, By Therapeutic Area, By Route of Administration, By End Use, By Region, And Segment Forecasts, 2024 - 2030 2. Markets and Markets - GLP-1 Analogues Market Size, Share & Trends
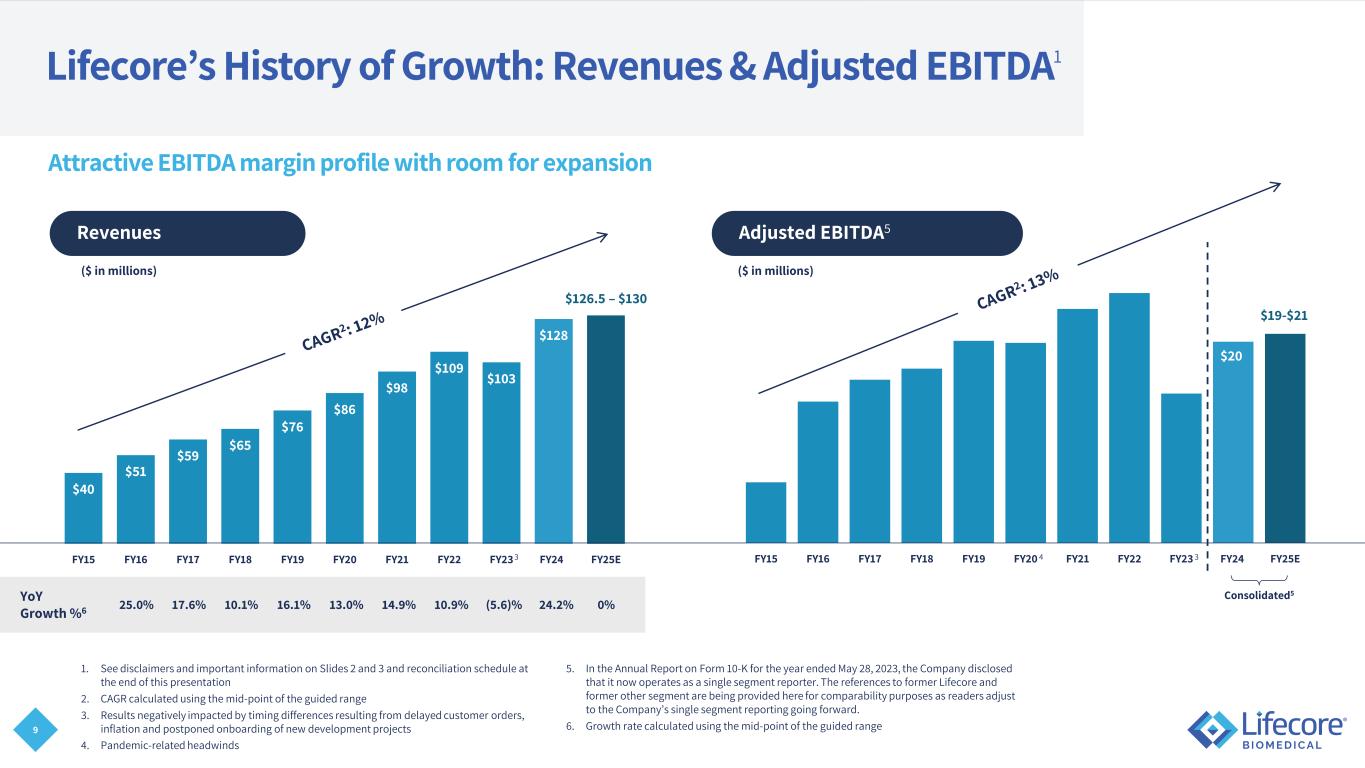
9 FY15 FY16 FY17 FY18 FY19 FY20 FY21 FY22 FY23 FY24 FY25E $40 $51 $59 $65 $76 $86 $98 $109 $103 $128 $130 FY15 FY16 FY17 FY18 FY19 FY20 FY21 FY22 FY23 FY24 FY25E Lifecore’s History of Growth: Revenues & Adjusted EBITDA1 1. See disclaimers and important information on Slides 2 and 3 and reconciliation schedule at the end of this presentation 2. CAGR calculated using the mid-point of the guided range 3. Results negatively impacted by timing differences resulting from delayed customer orders, inflation and postponed onboarding of new development projects 4. Pandemic-related headwinds 5. In the Annual Report on Form 10-K for the year ended May 28, 2023, the Company disclosed that it now operates as a single segment reporter. The references to former Lifecore and former other segment are being provided here for comparability purposes as readers adjust to the Company’s single segment reporting going forward. 6. Growth rate calculated using the mid-point of the guided range Revenues ($ in millions) Adjusted EBITDA5 ($ in millions) 25.0% 17.6% 10.1% 16.1% 13.0% 14.9%YoY Growth %6 10.9% (5.6)% 24.2% Attractive EBITDA margin profile with room for expansion $126.5 – $130 $19-$21 Consolidated5 3 34 $20 0%
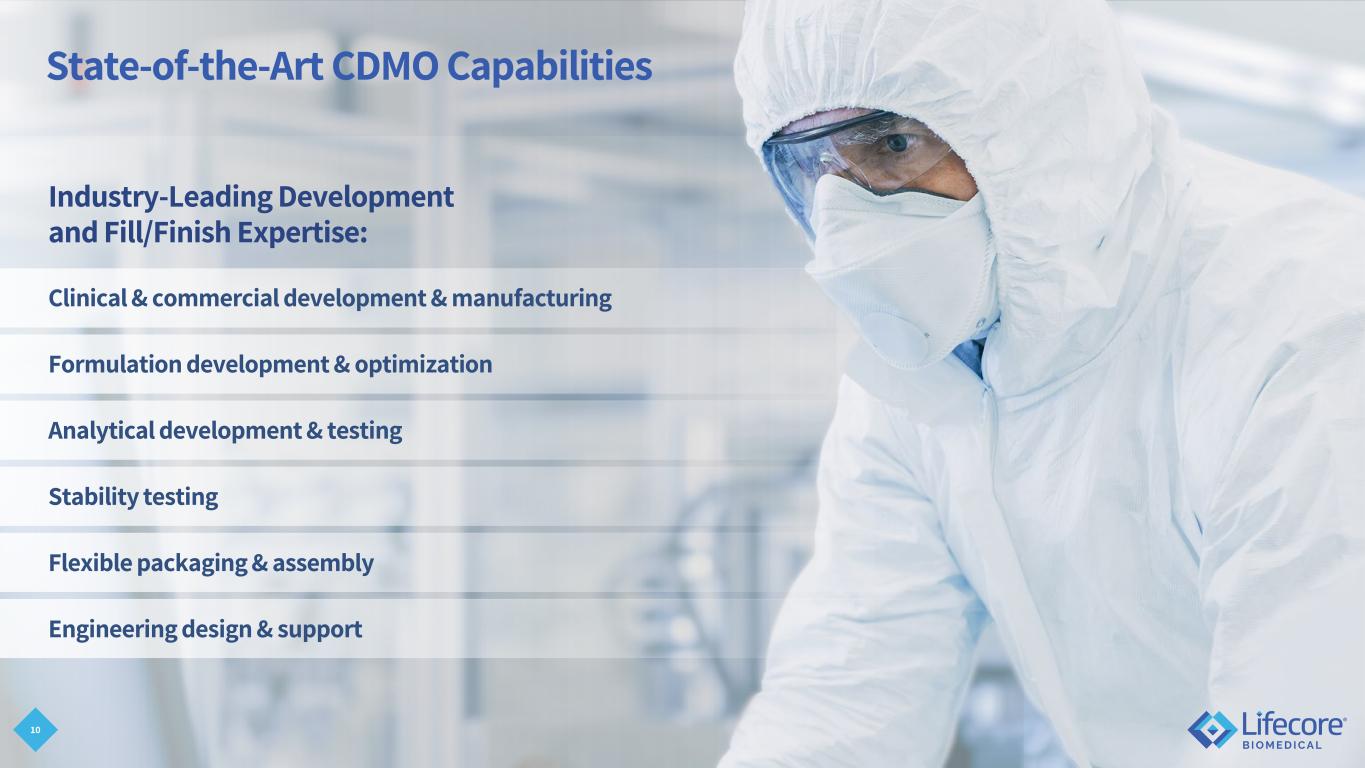
10 State-of-the-Art CDMO Capabilities Industry-Leading Development and Fill/Finish Expertise: Clinical & commercial development & manufacturing Formulation development & optimization Analytical development & testing Stability testing Flexible packaging & assembly Engineering design & support
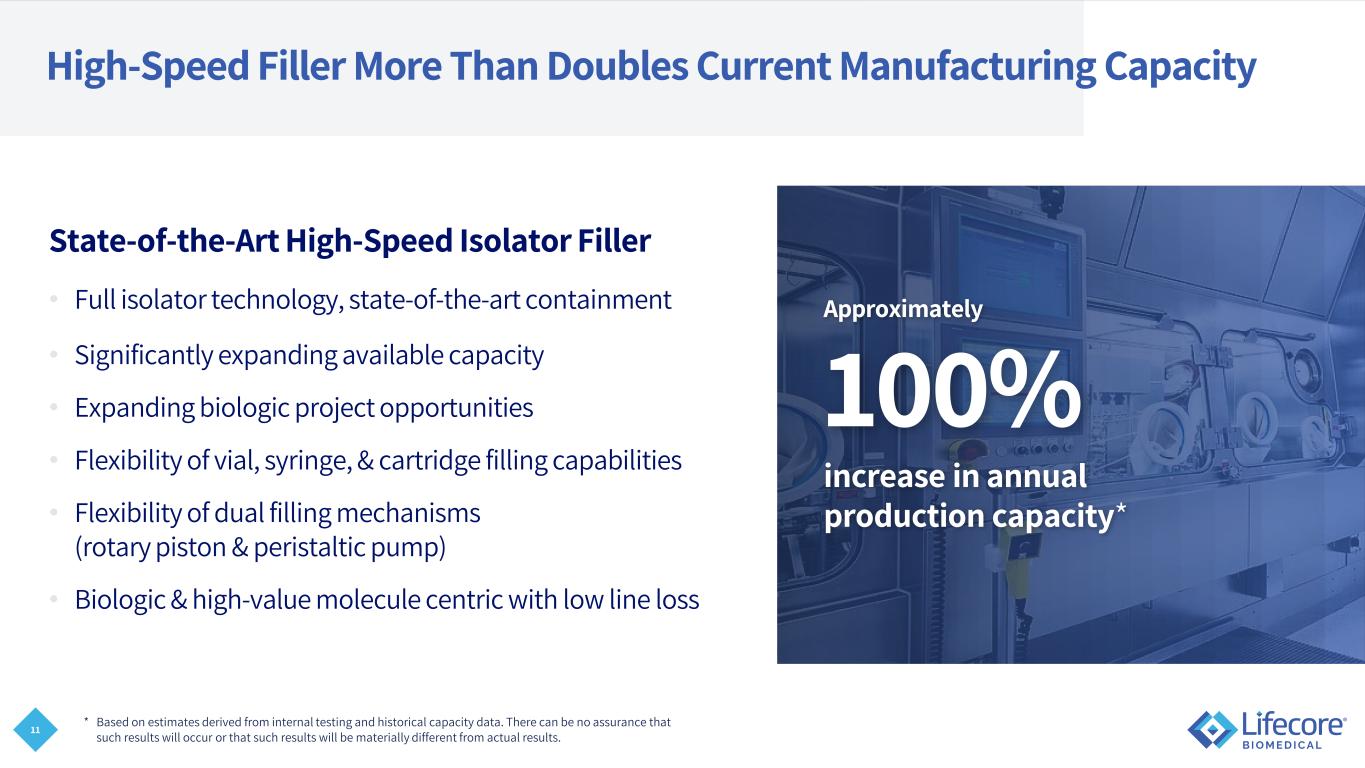
11 High-Speed Filler More Than Doubles Current Manufacturing Capacity State-of-the-Art High-Speed Isolator Filler • Full isolator technology, state-of-the-art containment • Significantly expanding available capacity • Expanding biologic project opportunities • Flexibility of vial, syringe, & cartridge filling capabilities • Flexibility of dual filling mechanisms (rotary piston & peristaltic pump) • Biologic & high-value molecule centric with low line loss Approximately 100% increase in annual production capacity* * Based on estimates derived from internal testing and historical capacity data. There can be no assurance that such results will occur or that such results will be materially different from actual results.

12 Multi-Compendial Quality Management System • 40+ years of a strong track record with global regulatory bodies • Three sites operating under cGMP and regular inspections • World-class quality system leads to excellent regulatory record • 60+ audit days routinely held annually
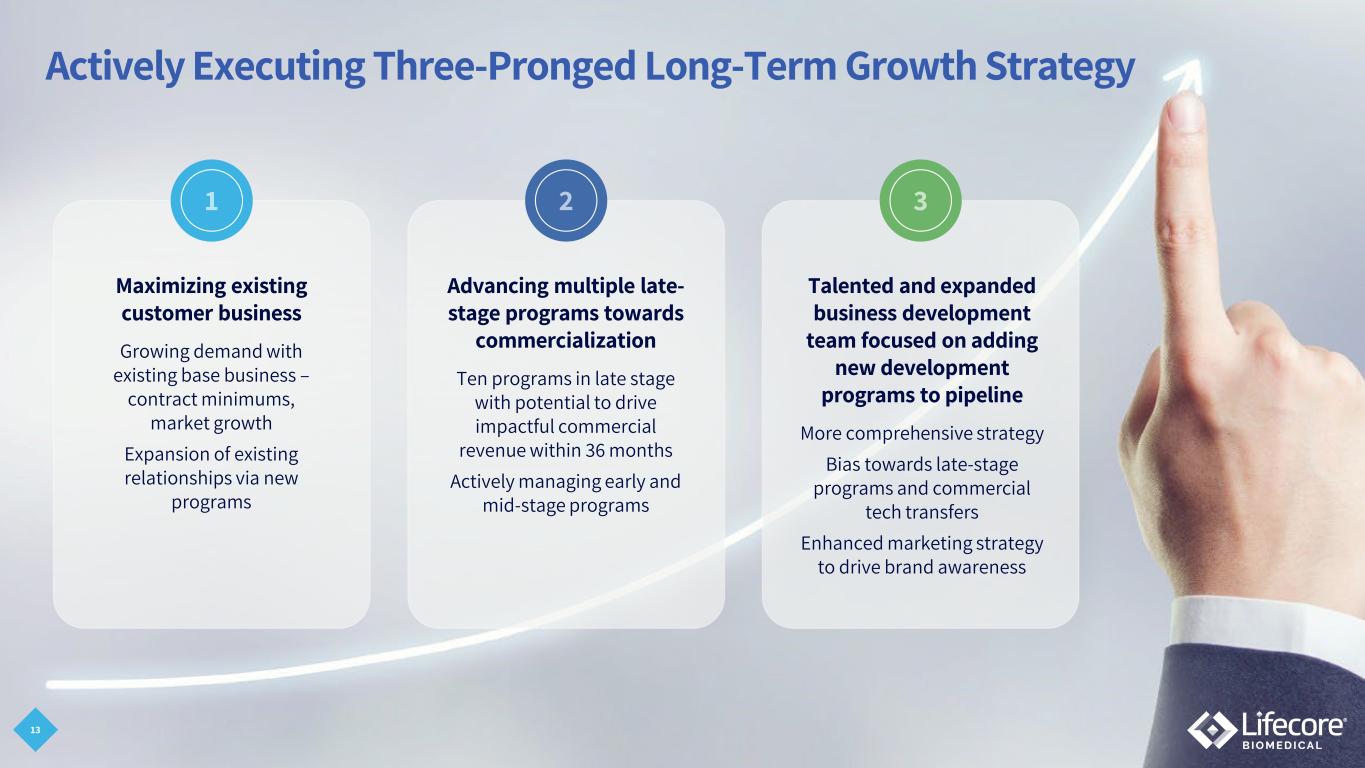
Actively Executing Three-Pronged Long-Term Growth Strategy Advancing multiple late- stage programs towards commercialization Ten programs in late stage with potential to drive impactful commercial revenue within 36 months Actively managing early and mid-stage programs Talented and expanded business development team focused on adding new development programs to pipeline More comprehensive strategy Bias towards late-stage programs and commercial tech transfers Enhanced marketing strategy to drive brand awareness Maximizing existing customer business Growing demand with existing base business – contract minimums, market growth Expansion of existing relationships via new programs 13
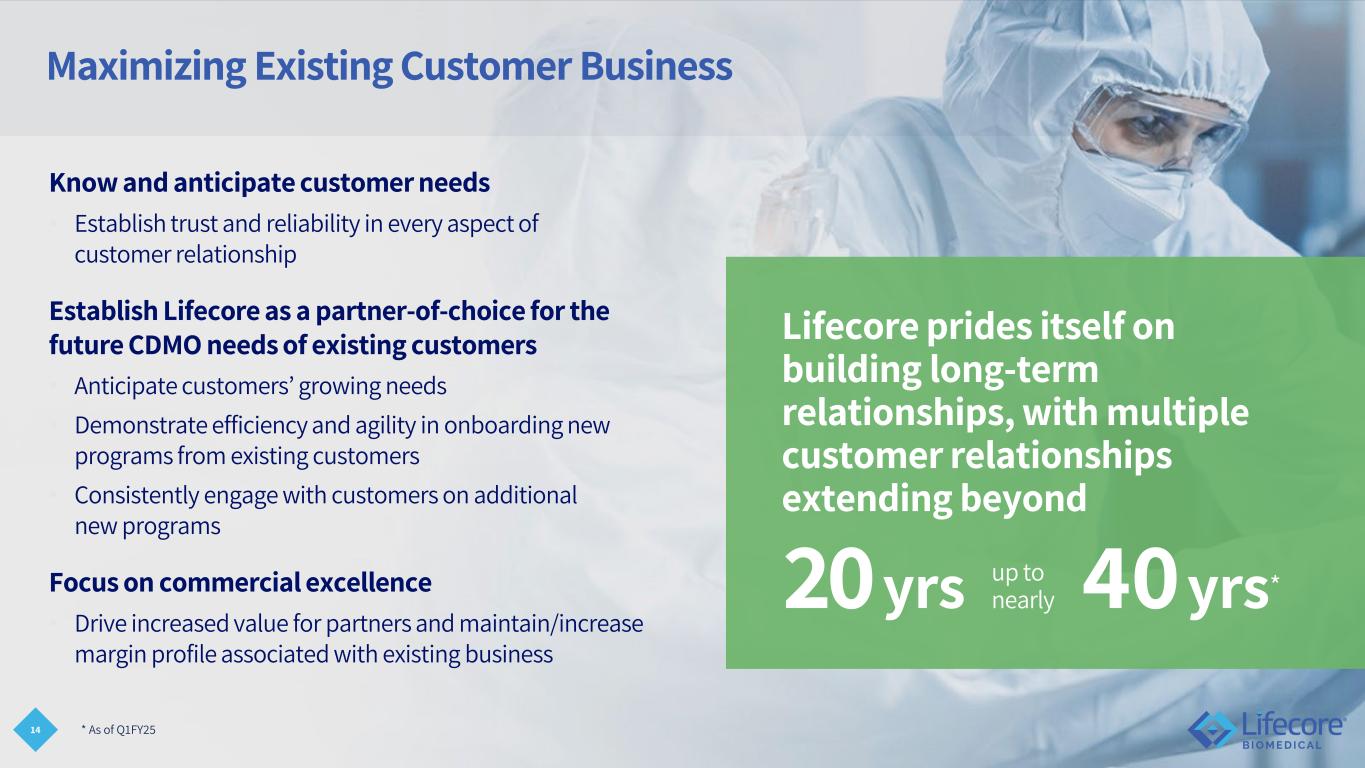
14 Maximizing Existing Customer Business Know and anticipate customer needs • Establish trust and reliability in every aspect of customer relationship Establish Lifecore as a partner-of-choice for the future CDMO needs of existing customers • Anticipate customers’ growing needs • Demonstrate efficiency and agility in onboarding new programs from existing customers • Consistently engage with customers on additional new programs Focus on commercial excellence • Drive increased value for partners and maintain/increase margin profile associated with existing business * As of Q1FY25 Lifecore prides itself on building long-term relationships, with multiple customer relationships extending beyond 20 yrs up to nearly 40 yrs*

15 Advancing Programs Towards Commercialization Strong Diverse Pipeline: • Late-stage programs represent impactful revenue potential within the next 36 months • Strong active development project pipeline across technologies – vials, syringes, and cartridges • Balance between drug and device programs • Strong diversification of projects across broad customer base Total Pipeline Represents $100M - $200M1 in Commercial Revenue Potential 1. Assumes full realization of management's estimates for commercial revenue potential from pipeline projects over the lifetime of those projects. The actual revenue realization may vary significantly. This does not assume new customer additions or attrition. There can be no assurance that such results will occur or that such results will be materially different from actual results. 2. Projects are defined as individual drugs or devices for which Lifecore provides manufacturing services; as of 09/24 Active Projects2 Late Stage: 10 Early-Mid Stage: 15

16 Invest in Technology, Outreach and Talent Required to Attract New High-Potential Business Installation of 5-head filler has significantly expanded capacity and new business opportunities Recently increased marketing spend associated with expanding the company’s visibility Strategically expand target market to include large multinational pharmaceutical companies Expanded business development team with the addition of new sales talent who will focus on key drug development geographies in the U.S.

17 Robust Financial Growth Objectives* FY25 Guidance Medium Term Maximize Base Portfolio Commercialization New Business Adj. EBITDA: 25%+ Adj. EBITDA: ~15% * There can be no assurance that such results will occur or that such results will be materially different from actual results.
Enhanced Organizational Strategies Support Value Creation 18 Reduced Operational Expenses as a Percent of Revenue Commitment to Sustained Quality Talent and Performance-Driven Culture Excellent Execution
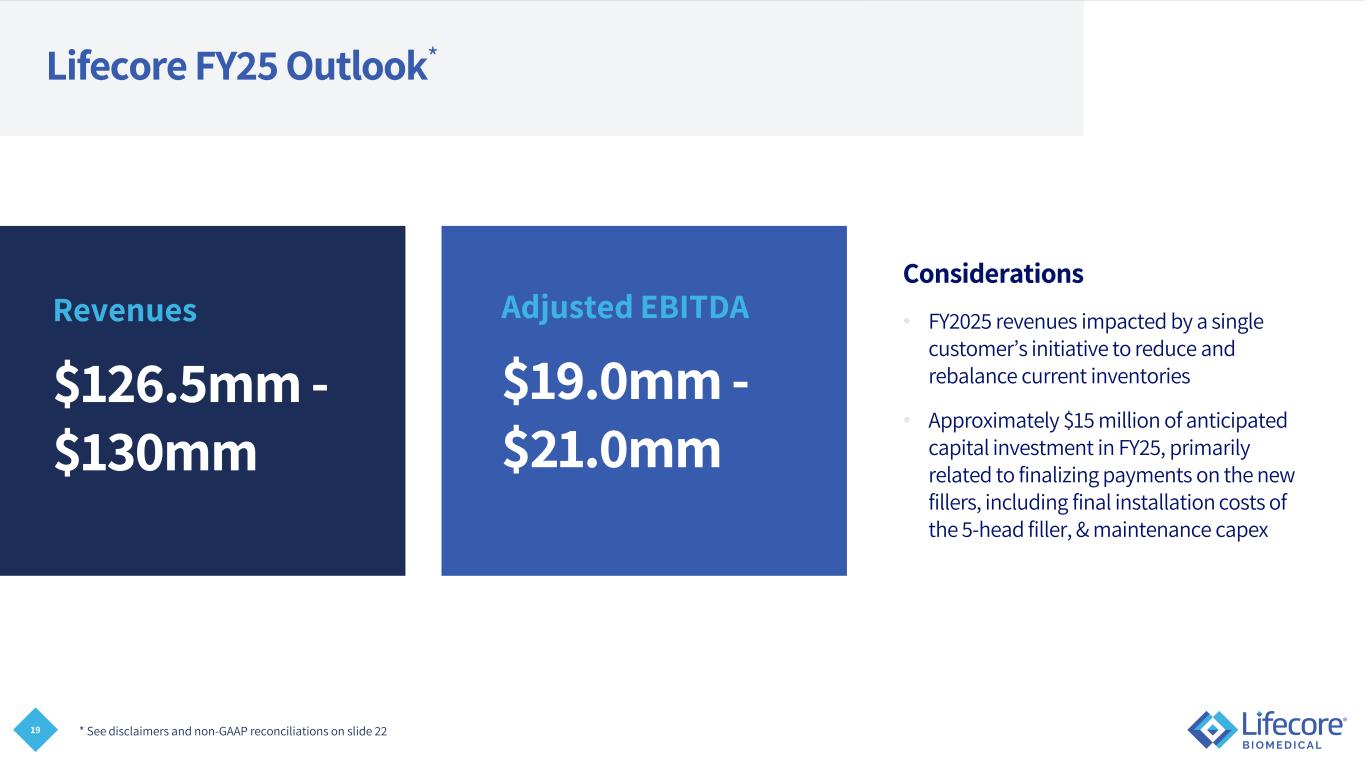
19 Lifecore FY25 Outlook* Considerations • FY2025 revenues impacted by a single customer’s initiative to reduce and rebalance current inventories • Approximately $15 million of anticipated capital investment in FY25, primarily related to finalizing payments on the new fillers, including final installation costs of the 5-head filler, & maintenance capex * See disclaimers and non-GAAP reconciliations on slide 22 Revenues $126.5mm - $130mm Adjusted EBITDA $19.0mm - $21.0mm
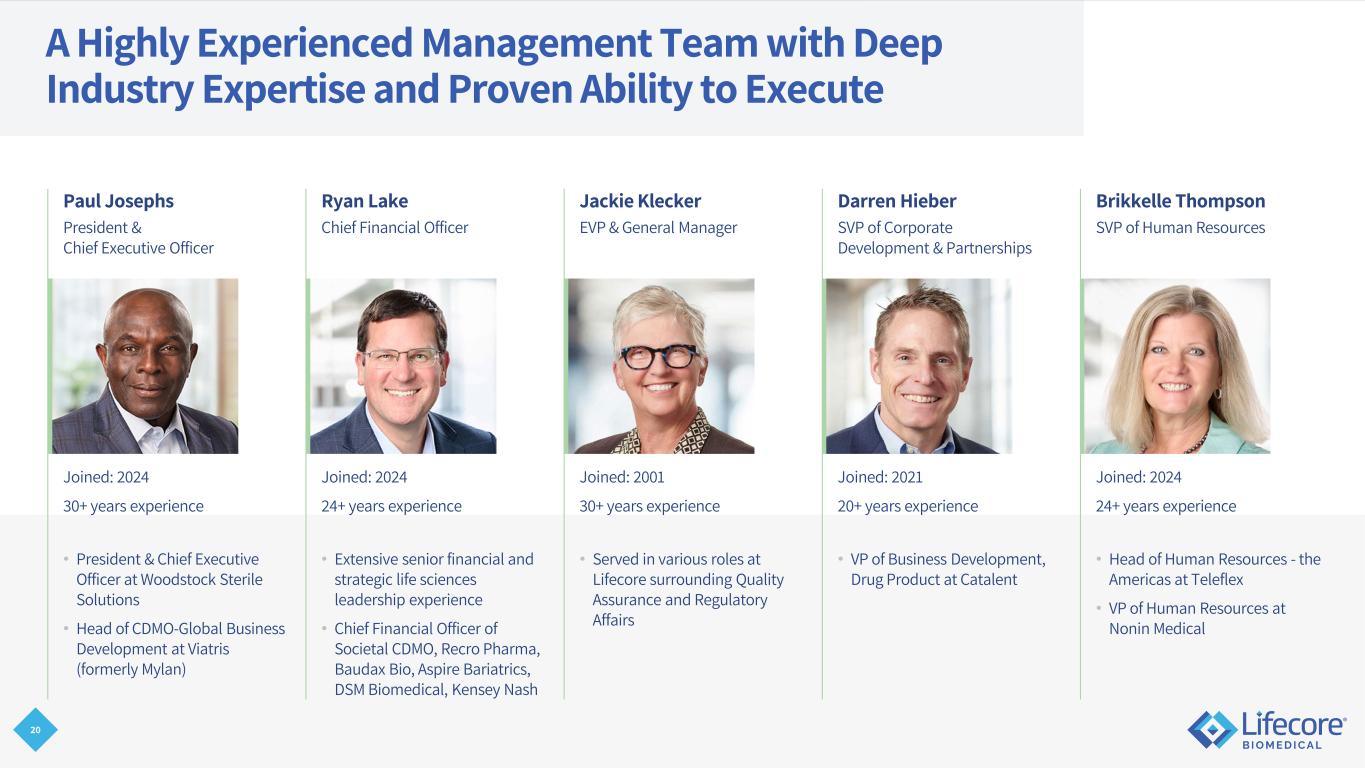
20 A Highly Experienced Management Team with Deep Industry Expertise and Proven Ability to Execute Paul Josephs President & Chief Executive Officer Ryan Lake Chief Financial Officer Jackie Klecker EVP & General Manager Darren Hieber SVP of Corporate Development & Partnerships Brikkelle Thompson SVP of Human Resources Joined: 2024 30+ years experience Joined: 2024 24+ years experience Joined: 2001 30+ years experience Joined: 2021 20+ years experience Joined: 2024 24+ years experience • President & Chief Executive Officer at Woodstock Sterile Solutions • Head of CDMO-Global Business Development at Viatris (formerly Mylan) • Extensive senior financial and strategic life sciences leadership experience • Chief Financial Officer of Societal CDMO, Recro Pharma, Baudax Bio, Aspire Bariatrics, DSM Biomedical, Kensey Nash • Served in various roles at Lifecore surrounding Quality Assurance and Regulatory Affairs • VP of Business Development, Drug Product at Catalent • Head of Human Resources - the Americas at Teleflex • VP of Human Resources at Nonin Medical
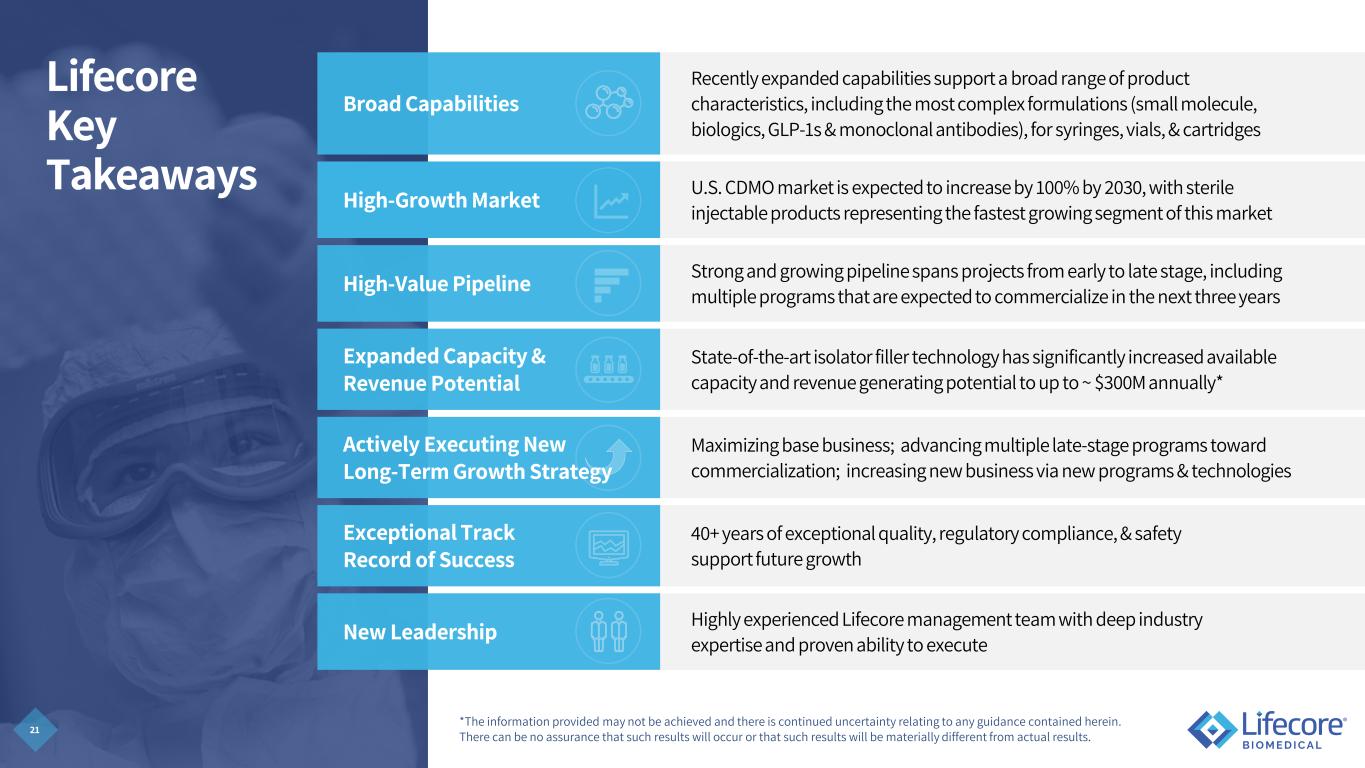
21 Lifecore Key Takeaways Broad Capabilities Recently expanded capabilities support a broad range of product characteristics, including the most complex formulations (small molecule, biologics, GLP-1s & monoclonal antibodies), for syringes, vials, & cartridges High-Growth Market U.S. CDMO market is expected to increase by 100% by 2030, with sterile injectable products representing the fastest growing segment of this market High-Value Pipeline Strong and growing pipeline spans projects from early to late stage, including multiple programs that are expected to commercialize in the next three years Expanded Capacity & Revenue Potential State-of-the-art isolator filler technology has significantly increased available capacity and revenue generating potential to up to ~ $300M annually* Actively Executing New Long-Term Growth Strategy Maximizing base business; advancing multiple late-stage programs toward commercialization; increasing new business via new programs & technologies Exceptional Track Record of Success 40+ years of exceptional quality, regulatory compliance, & safety support future growth New Leadership Highly experienced Lifecore management team with deep industry expertise and proven ability to execute *The information provided may not be achieved and there is continued uncertainty relating to any guidance contained herein. There can be no assurance that such results will occur or that such results will be materially different from actual results.
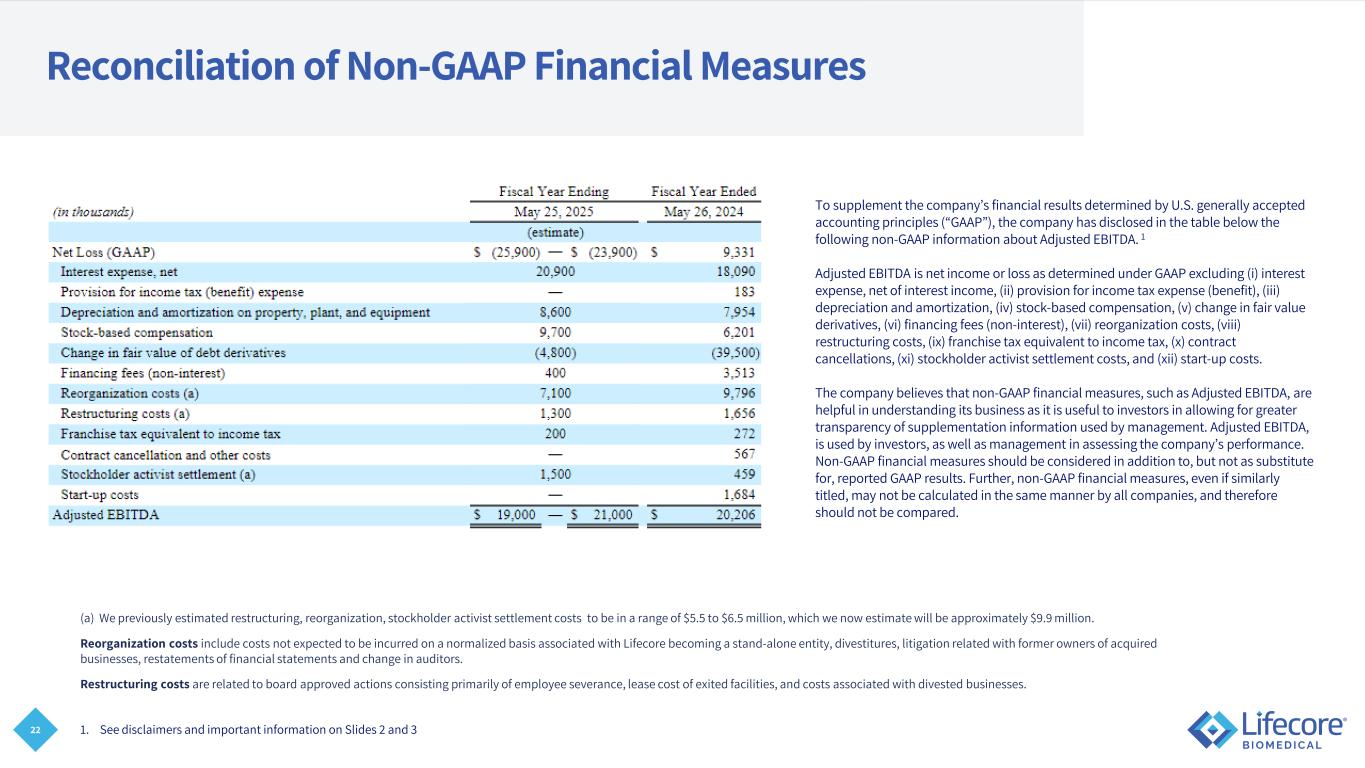
22 Reconciliation of Non-GAAP Financial Measures To supplement the company’s financial results determined by U.S. generally accepted accounting principles (“GAAP”), the company has disclosed in the table below the following non-GAAP information about Adjusted EBITDA. 1 Adjusted EBITDA is net income or loss as determined under GAAP excluding (i) interest expense, net of interest income, (ii) provision for income tax expense (benefit), (iii) depreciation and amortization, (iv) stock-based compensation, (v) change in fair value derivatives, (vi) financing fees (non-interest), (vii) reorganization costs, (viii) restructuring costs, (ix) franchise tax equivalent to income tax, (x) contract cancellations, (xi) stockholder activist settlement costs, and (xii) start-up costs. The company believes that non-GAAP financial measures, such as Adjusted EBITDA, are helpful in understanding its business as it is useful to investors in allowing for greater transparency of supplementation information used by management. Adjusted EBITDA, is used by investors, as well as management in assessing the company’s performance. Non-GAAP financial measures should be considered in addition to, but not as substitute for, reported GAAP results. Further, non-GAAP financial measures, even if similarly titled, may not be calculated in the same manner by all companies, and therefore should not be compared. 1. See disclaimers and important information on Slides 2 and 3 (a) We previously estimated restructuring, reorganization, stockholder activist settlement costs to be in a range of $5.5 to $6.5 million, which we now estimate will be approximately $9.9 million. Reorganization costs include costs not expected to be incurred on a normalized basis associated with Lifecore becoming a stand-alone entity, divestitures, litigation related with former owners of acquired businesses, restatements of financial statements and change in auditors. Restructuring costs are related to board approved actions consisting primarily of employee severance, lease cost of exited facilities, and costs associated with divested businesses.


