
UNITED STATES
SECURITIES AND EXCHANGE COMMISSION
WASHINGTON, D.C. 20549
FORM N-CSR
CERTIFIED SHAREHOLDER REPORT OF REGISTERED MANAGEMENT
INVESTMENT COMPANIES
Investment Company Act file number 811-07489
Oppenheimer International Growth Fund
(Exact name of registrant as specified in charter)
6803 South Tucson Way, Centennial, Colorado 80112-3924
(Address of principal executive offices) (Zip code)
Robert G. Zack, Esq.
OppenheimerFunds, Inc.
Two World Financial Center, New York, New York 10281-1008
(Name and address of agent for service)
Registrant's telephone number, including area code: (303) 768-3200
Date of fiscal year end: November 30
Date of reporting period: 11/30/2007
Item 1. Reports to Stockholders.

November 30, 2007
Oppenheimer
Management
International
Commentaries
Growth Fund
and
Annual Report
M A N A G E M E N T
C O M M E N T A R I E S
Market Recap and Outlook
Listing of Top Holdings
A N N U A L
R E P O R T
Fund Performance Discussion
Listing of Investments
Financial Statements
“Successful stock selection helped our results, as did an
underweighting in the financial sector, which suffered in
response to the U.S. subprime mortgage crisis.”

TOP HOLDINGS AND ALLOCATIONS
Top Ten Common Stock Holdings
ABB Ltd.
2.4%
William Demant Holding AS
2.0
Capita Group plc
1.9
Yahoo! Japan Corp.
1.8
Companhia Vale do Rio Doce, Sponsored ADR
1.8
Nintendo Co. Ltd.
1.7
Alstom
1.6
Tandberg ASA
1.4
Continental AG
1.4
Anglo Irish Bank Corp.
1.4
Portfolio holdings and allocations are subject to change. Percentages are as of
November 30, 2007, and are based on net assets. For more current Fund holdings,
please visit www.oppenheimerfunds.com.
Top Ten Geographical
Holdings
United Kingdom
15.9%
Japan
15.3
Switzerland
11.5
France
10.6
Germany
6.8
United States
6.3
Australia
5.8
The Netherlands
3.6
Denmark
3.1
Italy
3.1
Portfolio holdings and allocations are subject to change. Percentages are as of
November 30, 2007, and are based on the total market value of investments.
8
OPPENHEIMER INTERNATIONAL GROWTH FUND

Regional Allocation
●
Europe
62.8%
●
Asia
25.3
●
United States/Canada
6.4
●
Latin America
3.6
●
Middle East/Africa
1.9
Portfolio holdings and allocations are subject to change. Percentages are as of November 30,
2007, and are based on the total market value of investments.
9
OPPENHEIMER INTERNATIONAL GROWTH FUND

F U N D PERFORMANCE DISCUSSION
How has the Fund performed? Below is a discussion by OppenheimerFunds, Inc., of the
Fund’s performance during its fiscal year ended November 30, 2007, followed by a graphical
comparison of the Fund’s performance to an appropriate broad-based market index.
Management’s Discussion of Fund Performance. The Fund’s Class A shares (without
sales charge) performed well, gaining 19.78% during the 12-month reporting period. The
Fund’s benchmark, the MSCI EAFE Index, gained 17.30% during the same time frame.
A number of factors contributed to the Fund’s strong relative showing. After a long
cycle of value-stock outperformance, conditions shifted to favor growth-oriented compa-
nies during the reporting period. Successful stock selection helped our results, as did an
underweighting in the financial sector, which suffered in response to the U.S. subprime
mortgage crisis. Being fully invested—as we regularly are—was beneficial in a favorable
environment for international investing. Also, because we do not hedge our currency
exposure, the Fund benefited from a weaker U.S. dollar, which boosted returns for U.S.
investors in foreign companies. On the other hand, we would have benefited from more
direct exposure to China’s strong-performing stock market and to the materials sector. In
hindsight, both factors reduced the Fund’s outperformance relative to the benchmark
during the past year.
We continued to follow our same basic management approach, in place since the
Fund’s inception more than 10 years ago. We are long-term-oriented, “growth-theme”
investors. Our focus is on fundamentally solid growth stocks with reasonable valuations
and good appreciation prospects over the next three to five years, at least.
Our investments continued to focus on four thematic areas: mass affluence, new technolo-
gies, restructuring and aging. When choosing stocks within these themes, we regularly apply a
bottom-up approach. In other words, we select companies one-by-one based on our assess-
ment of their long-term growth potential, as opposed to investing top-down—seeking to
own stocks because they happen to belong to particular sectors. As always, turnover was rel-
atively low during the past year, reflecting our comfort with the portfolio’s composition and
our long-term investment approach.
One of the Fund’s top contributors to performance over the past year was Hyundai
Heavy Industries Co. Ltd., a South Korean shipbuilder. The company has been greatly helped
by high shipping rates, strong global trade and significant customer demand for new ships.
Also performing very well was Leighton Holdings Ltd. This Australian company consists of
two businesses—infrastructure construction and mining. On the construction side, Leighton
benefited from a favorable business environment and its market-leading position. On the
mining side, Leighton was helped by high commodity prices and the strong demand for min-
erals, especially from Asia. Two other metals and mining companies—Companhia Vale do Rio
10
OPPENHEIMER INTERNATIONAL GROWTH FUND
OPPENHEIMER INTERNATIONAL GROWTH FUND

Doce (CVRD), based in Brazil, and Rio Tinto plc, headquartered in England—gained ground as
well. Elsewhere, Japanese videogaming company Nintendo Co. Ltd. also performed well, rising
along with strong demand for its two popular gaming consoles, the Wii and DS.
On the negative side, Swedish telecommunications company Telefonaktiebolaget LM
Ericsson was a significant underperformer. Ericsson’s shares sharply fell late in the period
after the company warned of much lower third-quarter profits. In the health care sector,
two of our biotechnology stock holdings—NicOx SA and Novogen Ltd., based in France
and Australia, respectively, also fell, despite a lack of negative news about the companies
during the past year. In the financial sector, which performed poorly as a whole, two of the
Fund’s bank stocks lagged—Mitsubishi UFJ Financial Group, Inc. and Anglo Irish Bank Corp.
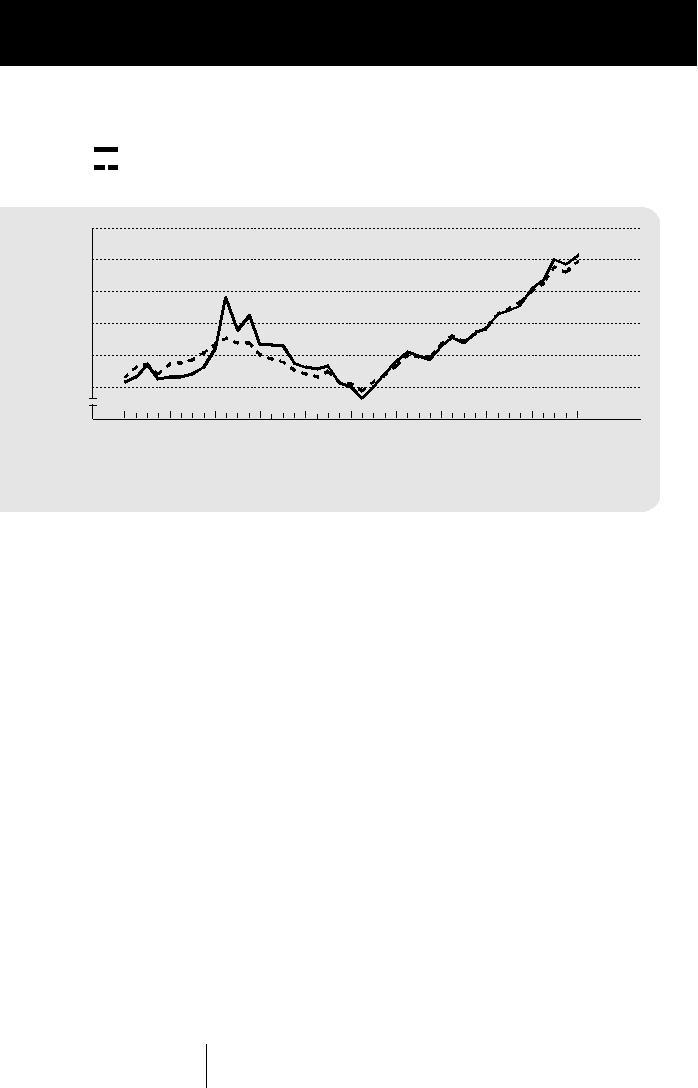
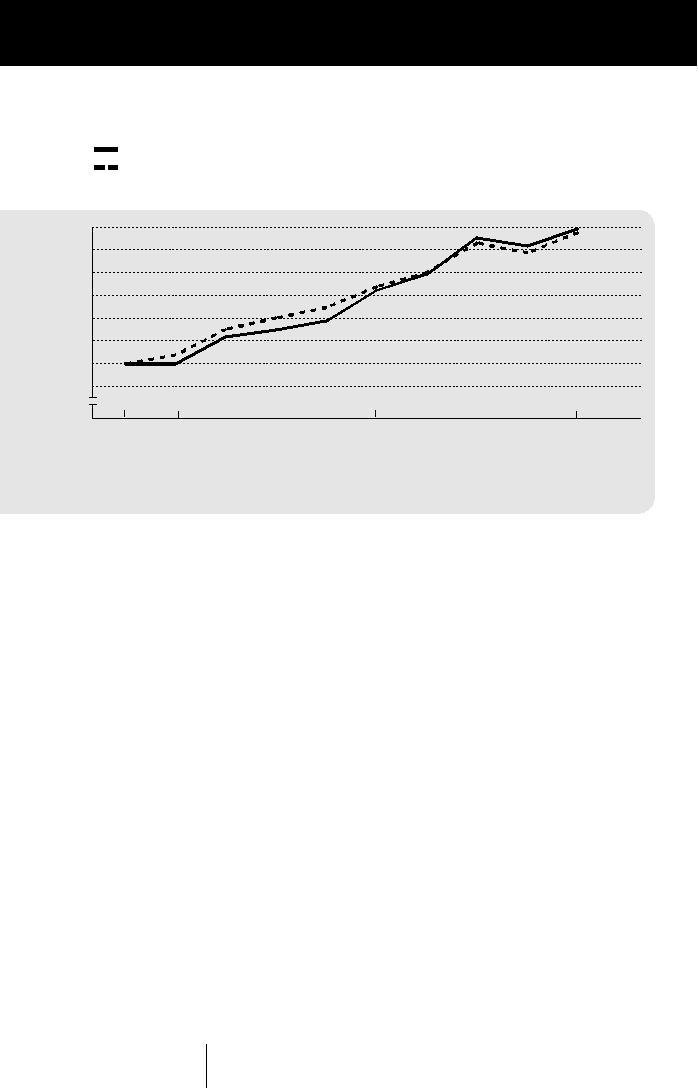
Comparing the Fund’s Performance to the Market. The graphs that follow show the per-
formance of a hypothetical $10,000 investment in each class of shares of the Fund held until
November 30, 2007. In the case of Class A, Class B and Class C shares, performance is mea-
sured over a ten fiscal-year period. In the case of Class N shares, performance is measured
from inception of the Class on March 1, 2001. In the case of Class Y shares, performance is
shown measured from inception of the Class on September 7, 2005. The Fund’s performance
reflects the deduction of the maximum initial sales charge on Class A shares, the applicable
contingent deferred sales charge on Class B, Class C and Class N shares, and reinvestments of
all dividends and capital gains distributions. Past performance cannot guarantee future results.
The Fund’s performance is compared to the performance of the Morgan Stanley
Capital International (MSCI) EAFE (Europe, Australasia, Far East) Index, which is a free
float-adjusted market capitalization index that is designed to measure developed market
equity performance, excluding the U.S. and Canada. Index performance reflects the rein-
vestment of income but does not consider the effect of transaction costs, and none of
the data in the graphs shows the effect of taxes. The Fund’s performance reflects the
effects of the Fund’s business and operating expenses. While index comparisons may be
useful to provide a benchmark for the Fund’s performance, it must be noted that the
Fund’s investments are not limited to the investments in the index.
11
OPPENHEIMER INTERNATIONAL GROWTH FUND
OPPENHEIMER INTERNATIONAL GROWTH FUND
F U N D PERFORMANCE DISCUSSION
Class A Shares
Comparison of Change in Value of $10,000 Hypothetical Investments in:
Oppenheimer International Growth Fund (Class A)
MSCI EAFE Index
$29,000
$25,290
25,000
$24,518
21,000
17,000
13,000
$10,000
9,000
$9,425
0
11/30/97
11/30/98
11/30/99
11/30/00
11/30/01
11/30/02
11/30/03
11/30/04
11/30/05
11/30/06
11/30/07
Average Annual Total Return of Class A Shares with Sales Charge of the Fund at 11/30/07
1-Year 12.89%
5-Year 22.16%
10-Year 9.72%
12
OPPENHEIMER INTERNATIONAL GROWTH FUND
OPPENHEIMER INTERNATIONAL GROWTH FUND
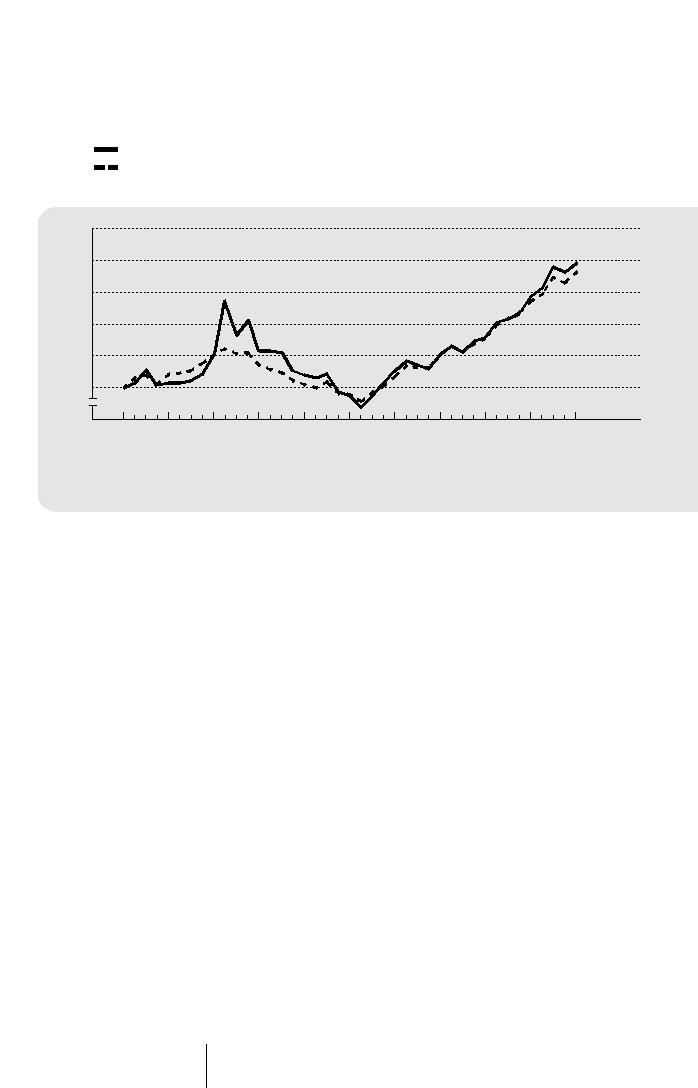
Class B Shares
Comparison of Change in Value of $10,000 Hypothetical Investments in:
Oppenheimer International Growth Fund (Class B)
MSCI EAFE Index
$30,000
26,000
$25,657
$24,518
22,000
18,000
14,000
10,000
$10,000
0
11/30/97
11/30/98
11/30/99
11/30/00
11/30/01
11/30/02
11/30/03
11/30/04
11/30/05
11/30/06
11/30/07
Average Annual Total Return of Class B Shares with Sales Charge of the Fund at 11/30/07
1-Year 13.88%
5-Year 22.47%
10-Year 9.88%
The performance data quoted represents past performance, which does not
guarantee future results. The investment return and principal value of an investment
in the Fund will fluctuate so that an investor’s shares, when redeemed, may be worth
more or less than their original cost. Current performance may be lower or higher than
the performance quoted. For performance data current to the most recent month end,
visit us at www.oppenheimerfunds.com, or call us at 1.800.525.7048. Fund returns include
changes in share price, reinvested distributions, and the applicable sales charge: for Class
A shares, the current maximum initial sales charge of 5.75%; for Class B shares, the
contingent deferred sales charge of 5% (1-year) and 2% (5-year); and for Class C and N
shares, the contingent 1% deferred sales charge for the 1-year period. There is no sales
charge for Class Y shares. Because Class B shares convert to Class A shares 72 months
after purchase, the 10-year return for Class B uses Class A performance for the period
after conversion. See page 17 for further information.
13
OPPENHEIMER INTERNATIONAL GROWTH FUND
OPPENHEIMER INTERNATIONAL GROWTH FUND
F U N D PERFORMANCE DISCUSSION
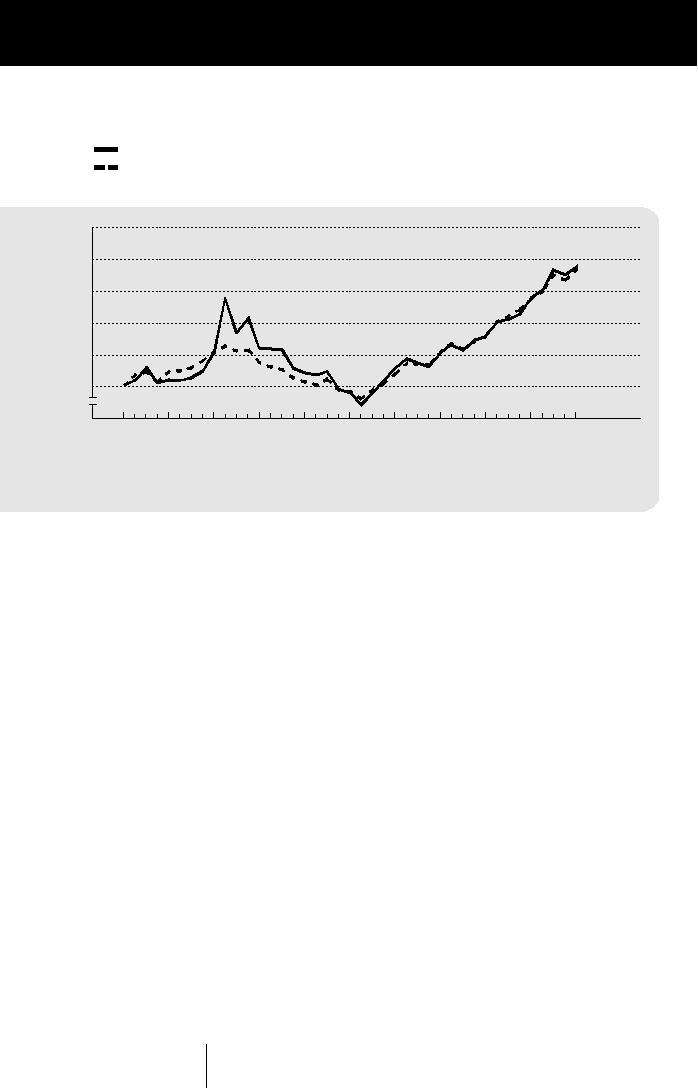
Class C Shares
Comparison of Change in Value of $10,000 Hypothetical Investments in:
Oppenheimer International Growth Fund (Class C)
MSCI EAFE Index
$30,000
26,000
$24,886
$24,518
22,000
18,000
14,000
10,000
$10,000
0
11/30/97
11/30/98
11/30/99
11/30/00
11/30/01
11/30/02
11/30/03
11/30/04
11/30/05
11/30/06
11/30/07
Average Annual Total Return of Class C Shares with Sales Charge of the Fund at 11/30/07
1-Year 17.91%
5-Year 22.69%
10-Year 9.55%
14
OPPENHEIMER INTERNATIONAL GROWTH FUND
OPPENHEIMER INTERNATIONAL GROWTH FUND
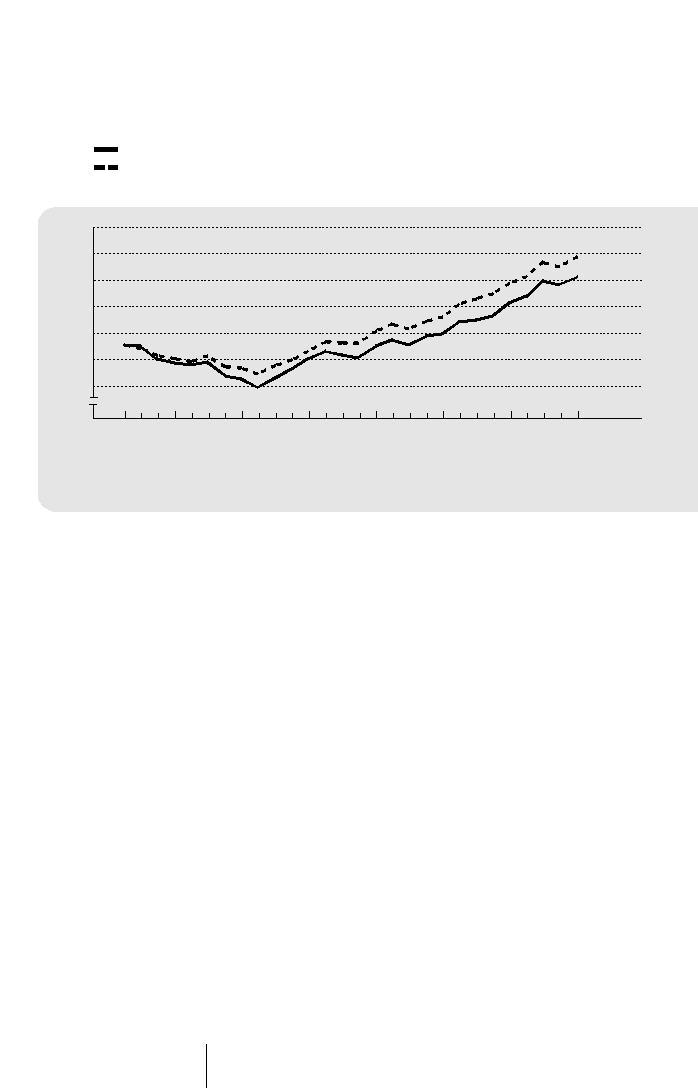
Class N Shares
Comparison of Change in Value of $10,000 Hypothetical Investments in:
Oppenheimer International Growth Fund (Class N)
MSCI EAFE Index
$23,000
20,000
$19,940
17,000
$17,623
14,000
11,000
$10,000
8,000
5,000
0
3/1/01
11/30/01
11/30/02
11/30/03
11/30/04
11/30/05
11/30/06
11/30/07
Average Annual Total Return of Class N Shares with Sales Charge of the Fund at 11/30/07
1-Year 18.42%
5-Year 23.24%
Since Inception (3/1/01) 8.76%
The performance data quoted represents past performance, which does not
guarantee future results. The investment return and principal value of an investment
in the Fund will fluctuate so that an investor’s shares, when redeemed, may be worth
more or less than their original cost. Current performance may be lower or higher than
the performance quoted. For performance data current to the most recent month end,
visit us at www.oppenheimerfunds.com, or call us at 1.800.525.7048. Fund returns include
changes in share price, reinvested distributions, and the applicable sales charge: for Class
A shares, the current maximum initial sales charge of 5.75%; for Class B shares, the
contingent deferred sales charge of 5% (1-year) and 2% (5-year); and for Class C and N
shares, the contingent 1% deferred sales charge for the 1-year period. There is no sales
charge for Class Y shares. Because Class B shares convert to Class A shares 72 months
after purchase, the 10-year return for Class B uses Class A performance for the period
after conversion. See page 17 for further information.
15
OPPENHEIMER INTERNATIONAL GROWTH FUND
OPPENHEIMER INTERNATIONAL GROWTH FUND
F U N D PERFORMANCE DISCUSSION
Class Y Shares
Comparison of Change in Value of $10,000 Hypothetical Investments in:
Oppenheimer International Growth Fund (Class Y)
MSCI EAFE Index
$16,000
$15,918
15,000
$15,759
14,000
13,000
12,000
11,000
10,000
9,000
0
9/7/05
11/30/05
11/30/06
11/30/07
Average Annual Total Return of Class Y Shares of the Fund at 11/30/07
1-Year 20.32%
5-Year N/A
Since Inception (9/7/05)
23.17%
The performance data quoted represents past performance, which does not
guarantee future results. The investment return and principal value of an investment
in the Fund will fluctuate so that an investor’s shares, when redeemed, may be worth
more or less than their original cost. Current performance may be lower or higher than
the performance quoted. For performance data current to the most recent month end,
visit us at www.oppenheimerfunds.com, or call us at 1.800.525.7048. Fund returns include
changes in share price, reinvested distributions, and the applicable sales charge: for Class
A shares, the current maximum initial sales charge of 5.75%; for Class B shares, the
contingent deferred sales charge of 5% (1-year) and 2% (5-year); and for Class C and N
shares, the contingent 1% deferred sales charge for the 1-year period. There is no sales
charge for Class Y shares. Because Class B shares convert to Class A shares 72 months
after purchase, the 10-year return for Class B uses Class A performance for the period
after conversion. See page 17 for further information.
16
OPPENHEIMER INTERNATIONAL GROWTH FUND
OPPENHEIMER INTERNATIONAL GROWTH FUND

NOTES
Total returns and the ending account values in the graphs include
changes in share price and reinvestment of dividends and capital
gains distributions in a hypothetical investment for the periods
shown. The Fund’s total returns shown do not reflect the deduc-
tion of income taxes on an individual’s investment. Taxes may
reduce your actual investment returns on income or gains paid
by the Fund or any gains you may realize if you sell your shares.
Investors should consider the Fund’s investment objectives,
risks, and other charges and expenses carefully before
investing. The Fund’s prospectus contains this and other
information about the Fund, and may be obtained by asking
your financial advisor, calling us at 1.800.525.7048 or visiting
our website at www.oppenheimerfunds.com. Read the
prospectus carefully before investing.
The Fund's investment strategy and focus can change over time.
The mention of specific fund holdings does not constitute a rec-
ommendation by OppenheimerFunds, Inc.
Class A shares of the Fund were first publicly offered on 3/25/96.
Unless otherwise noted, Class A returns include the maximum ini-
tial sales charge of 5.75%.
Class B shares of the Fund were first publicly offered on 3/25/96.
Unless otherwise noted, Class B returns include the applicable
contingent deferred sales charge of 5% (1-year) and 2% (5-year).
Because Class B shares convert to Class A shares 72 months after
purchase, the 10-year return for Class B uses Class A performance
for the period after conversion. Class B shares are subject to an
annual 0.75% asset-based sales charge.
Class C shares of the Fund were first publicly offered on 3/25/96.
Unless otherwise noted, Class C returns include the contingent
deferred sales charge of 1% for the 1-year period. Class C shares
are subject to an annual 0.75% asset-based sales charge.
Class N shares of the Fund were first publicly offered on 3/1/01.
Class N shares are offered only through retirement plans. Unless
otherwise noted, Class N returns include the contingent deferred
sales charge of 1% for the 1-year period. Class N shares are subject
to an annual 0.25% asset-based sales charge.
17
OPPENHEIMER INTERNATIONAL GROWTH FUND
OPPENHEIMER INTERNATIONAL GROWTH FUND

NOTES
Class Y shares of the Fund were first publicly offered on 9/7/05.
Class Y shares are offered only to certain institutional investors
under special agreements with the Distributor.
An explanation of the calculation of performance is in the Fund’s
Statement of Additional Information.
18
OPPENHEIMER INTERNATIONAL GROWTH FUND
OPPENHEIMER INTERNATIONAL GROWTH FUND

FUND EXPENSES
Fund Expenses. As a shareholder of the Fund, you incur two types
of costs: (1) transaction costs, which may include sales charges
(loads) on purchase payments, contingent deferred sales charges
on redemptions; and redemption fees, if any; and (2) ongoing
costs, including management fees; distribution and service fees;
and other Fund expenses. These examples are intended to help
you understand your ongoing costs (in dollars) of investing in the
Fund and to compare these costs with the ongoing costs of invest-
ing in other mutual funds.
The examples are based on an investment of $1,000.00 invested
at the beginning of the period and held for the entire 6-month
period ended November 30, 2007.
Actual Expenses. The “actual” lines of the table provide infor-
mation about actual account values and actual expenses. You
may use the information on this line for the class of shares you
hold, together with the amount you invested, to estimate the
expense that you paid over the period. Simply divide your
account value by $1,000.00 (for example, an $8,600.00 account
value divided by $1,000.00 = 8.60), then multiply the result by
the number in the “actual” line under the heading entitled
“Expenses Paid During Period” to estimate the expenses you
paid on your account during this period.
Hypothetical Example for Comparison Purposes. The “hypo-
thetical” lines of the table provide information about hypothetical
account values and hypothetical expenses based on the Fund’s
actual expense ratio for each class of shares, and an assumed rate
of return of 5% per year before expenses, which is not the Fund’s
actual return. The hypothetical account values and expenses may
not be used to estimate the actual ending account balance or
expenses you paid for the period. You may use this information
to compare the ongoing costs of investing in the Fund and other
funds. To do so, compare this 5% hypothetical example for the
class of shares you hold with the 5% hypothetical examples that
appear in the shareholder reports of the other funds.
Please note that the expenses shown in the table are meant to
highlight your ongoing costs only and do not reflect any transac-
tional costs, such as front-end or contingent deferred sales charges
(loads), redemption fees, or a $12.00 fee imposed annually on
accounts valued at less than $500.00 (subject to exceptions
described in the Statement of Additional Information). Therefore,
19
OPPENHEIMER INTERNATIONAL GROWTH FUND
OPPENHEIMER INTERNATIONAL GROWTH FUND

FUND EXPENSES
Continued
the “hypothetical” lines of the table are useful in comparing ongo-
ing costs only, and will not help you determine the relative total
costs of owning different funds. In addition, if these transactional
costs were included, your costs would have been higher.
Beginning
Ending
Expenses
Account
Account
Paid During
Value
Value
6 Months Ended
6/1/07
11/30/07
November 30, 2007
Class A Actual
$1,000.00
$1,022.00
$
5.95
Class A Hypothetical
1,000.00
1,019.20
5.94
Class B Actual
1,000.00
1,018.00
10.07
Class B Hypothetical
1,000.00
1,015.14
10.05
Class C Actual
1,000.00
1,018.40
9.76
Class C Hypothetical
1,000.00
1,015.44
9.75
Class N Actual
1,000.00
1,020.70
7.58
Class N Hypothetical
1,000.00
1,017.60
7.56
Class Y Actual
1,000.00
1,024.20
3.71
Class Y Hypothetical
1,000.00
1,021.41
3.71
Hypothetical assumes 5% annual return before expenses.
Expenses are equal to the Fund’s annualized expense ratio for that class, multiplied by
the average account value over the period, multiplied by 183/365 (to reflect the one-
half year period). Those annualized expense ratios, excluding indirect expenses from
affiliated fund, based on the 6-month period ended November 30, 2007 are as follows:
Class
Expense Ratios
Class A
1.17%
Class B
1.98
Class C
1.92
Class N
1.49
Class Y
0.73
The expense ratios reflect reduction to custodian expenses and voluntary waivers
or reimbursements by the Fund’s Manager that can be terminated at any time,
without advance notice. The “Financial Highlights” tables in the Fund’s financial
statements, included in this report, also show the gross expense ratios, without
such waivers or reimbursements and reduction to custodian expenses, if applicable.
20
OPPENHEIMER INTERNATIONAL GROWTH FUND

S T A T E M E N T
O F
INVESTMENTS
November 30, 2007
Shares
Value
Shares
Value
Common Stocks—94.9%
Media Continued
Consumer Discretionary—17.6%
Zee Entertainment
Auto Components—1.4%
Enterprises Ltd.
1,763,300
$
12,811,459
Continental AG
302,876
$
39,346,630
93,439,179
Automobiles—3.1%
Bayerische Motoren
Multiline Retail—1.2%
Werke (BMW) AG
315,207
19,178,493
Next plc
608,058
21,752,075
Ducati Motor Holding
Pinault-Printemps-
SpA1
7,223,100
18,343,166
Redoute SA
66,800
11,241,320
Honda Motor Co.
356,646
12,260,271
32,993,395
Porsche Automobil
Holding
8,105
17,963,682
Specialty Retail—2.6%
Toyota Motor Corp.
343,565
19,293,935
Carphone Warehouse
plc (The)
2,630,460
19,793,346
87,039,547
H&M Hennes &
Mauritz AB, Cl. B
403,685
25,206,819
Diversified Consumer Services—0.3%
Industria de Diseno
Dignity plc
593,780
9,662,353
Hotels, Restaurants & Leisure—0.9%
Textil SA
392,540
27,248,488
Carnival Corp.
344,960
15,564,595
72,248,653
William Hill plc
802,942
8,542,814
Textiles, Apparel & Luxury Goods—2.7%
24,107,409
Burberry Group plc
1,027,879
12,151,119
Compagnie Financiere
Household Durables—2.1%
Daito Trust Construction
Richemont AG,
A Shares
210,036
14,409,781
Co. Ltd.
315,387
15,152,146
Luxottica Group
Groupe SEB SA
119,841
21,461,103
SpA
592,050
19,747,992
Sony Corp.
437,645
23,671,390
LVMH Moet Hennessey
Louis Vuitton2
60,284,639
119,420
14,490,081
Swatch Group AG
(The), Cl. B
56,113
15,626,802
Media—3.3%
British Sky Broadcasting
76,425,775
Group plc
782,368
10,053,043
Gestevision
Consumer Staples—5.2%
Telecinco SA
126,670
3,410,897
Beverages—1.7%
Grupo Televisa SA,
Sponsored GDR
C&C Group plc
2,098,681
11,267,880
581,440
14,053,405
Foster’s Group Ltd.
672,826
3,743,501
Mediaset SpA
2,796,425
27,307,639
Heineken NV
181,595
11,871,470
Publishing &
Broadcasting Ltd.
Pernod-Ricard SA
93,676
20,741,515
250,513
4,601,806
Societe Television
47,624,366
Francaise 1
172,056
4,757,309
Vivendi SA
358,077
16,443,621
21
OPPENHEIMER INTERNATIONAL GROWTH FUND

S T A T E M E N T
O F
INVESTMENTS
Continued
Shares
Value
Shares
Value
Food & Staples Retailing—0.7%
Commercial Banks Continued
William Morrison
ICICI Bank Ltd.,
Supermarkets plc
1,066,829
$
6,766,380
Sponsored ADR
524,890
$
31,761,094
Woolworths Ltd.
404,387
12,170,871
Joyo Bank Ltd. (The)
1,700,600
10,242,709
18,937,251
Mitsubishi UFJ
Financial Group, Inc.
2,414,228
23,661,020
Food Products—2.1%
Royal Bank of
Barry Callebaut AG1
41,169
32,079,504
Scotland Group plc
Cadbury Schweppes plc
637,996
8,171,700
(The)
2,098,967
19,807,275
Koninklijke Numico NV
97,479
7,750,689
Societe Generale,
Nestle SA
22,618
10,808,794
Cl. A
109,213
16,725,305
58,810,687
UniCredito Italiano
SpA3
1,058,785
8,968,165
Personal Products—0.7%
UniCredito Italiano
SpA3
549,695
4,614,349
163,477,717
L’Oreal SA
145,033
20,141,881
Energy—4.1%
Energy Equipment & Services—1.3%
Technip SA
Insurance—2.1%
453,892
37,005,927
Allianz SE
68,850
14,239,375
Oil, Gas & Consumable Fuels—2.8%
AMP Ltd.
BG Group plc
1,237,527
25,900,545
1,146,713
10,268,981
Prudential plc
663,578
9,263,352
QBE Insurance
BP plc, ADR
212,095
15,427,790
Total SA
304,504
24,603,549
Group Ltd.
827,000
23,926,619
Tsakos Energy
Navigation Ltd.
333,950
12,055,595
57,698,327
77,987,479
Real Estate Management & Development—2.1%
DIC Asset AG
565,294
17,102,304
Financials—14.3%
Solidere, GDR3
74,732
1,629,158
Capital Markets—3.4%
Solidere, GDR3,4
785,925
17,133,165
3i Group plc
593,348
13,272,258
Sumitomo Realty &
Collins Stewart plc
5,400,173
19,207,030
Development Co. Ltd.
771,700
23,449,556
Credit Suisse Group
153,452
9,188,529
59,314,183
Mediobanca SpA
353,130
7,950,656
Tullett Prebon plc
3,231,722
31,526,564
Thrifts & Mortgage Finance—0.9%
UBS AG
282,949
14,214,054
Housing Development
Finance Corp. Ltd.
281,100
19,792,831
95,359,091
Paragon Group
Cos. plc
2,063,430
5,949,754
25,742,585
Commercial Banks—5.8%
Anglo Irish
Bank Corp.
2,195,021
38,213,371
Commerzbank AG
242,375
9,484,429
22
OPPENHEIMER INTERNATIONAL GROWTH FUND

Shares
Value
Shares
Value
Health Care—13.2%
Life Sciences Tools & Services Continued
Biotechnology—3.3%
Art Advanced
Inc., Series 11,6
3,124,013
CSL Ltd.
584,300
$
17,993,784
Research Technologies,
$
468,625
Marshall Edwards,
Inc.1,5
1,717,263
4,739,646
Art Advanced
Marshall Edwards,
Research
Technologies,
Inc.1,4
1,565,438
4,320,609
Inc., Series 21,6
976,420
146,470
NeuroSearch AS1
438,028
28,785,691
BTG plc1
2,217,651
4,718,891
6,789,228
NicOx SA1
1,731,521
32,981,352
Santhera
Pharmaceuticals1
50,423
3,517,211
Pharmaceuticals—2.4%
92,338,293
Astellas Pharma, Inc.
111,005
4,935,110
Health Care Equipment & Supplies—6.5%
GlaxoSmithKline plc
145,181
3,832,125
Essilor
H. Lundbeck AS
99,095
2,833,224
International SA
193,196
12,105,310
Novogen Ltd.1,6
6,618,140
8,096,387
Nobel Biocare
Oxagen Ltd.5
214,287
19,283
Holding AG
51,834
14,661,789
Roche Holding AG
81,065
15,424,933
Smith & Nephew plc
1,163,370
13,908,299
Sanofi-Aventis SA
154,367
14,681,294
Sonova Holding AG
231,295
24,711,222
Shionogi & Co. Ltd.
368,200
7,153,488
Straumann Holding
Takeda Pharmaceutical
AG
48,556
13,719,412
Co. Ltd.
166,850
10,782,028
Synthes, Inc.
264,178
33,006,213
67,757,872
Terumo Corp.
300,680
15,207,862
William Demant
Industrials—17.5%
Holding AS1
627,305
56,253,253
Aerospace & Defense—0.9%
183,573,360
Empresa Brasileira
de Aeronautica SA
2,370,446
25,916,629
Health Care Providers & Services—0.7%
Commercial Services & Supplies—3.0%
Sonic Healthcare Ltd.
1,332,100
19,681,918
Capita Group plc
3,535,871
53,939,479
Health Care Technology—0.1%
Experian Group Ltd.
956,925
8,361,290
Ortivus AB, Cl. B1,6
1,638,150
1,704,817
Prosegur Compania
Life Sciences Tools & Services—0.2%
de Seguridad SA
475,924
17,489,885
Art Advanced
Randstad Holding NV
58,553
2,777,959
Research
Technologies, Inc.1,4,6
6,078,506
911,821
82,568,613
Art Advanced
Research
Construction & Engineering—2.4%
Technologies, Inc.1,6
1,721,500
258,238
Koninklijke Boskalis
Westminster NV
Art Advanced
404,278
24,284,478
Research
Leighton
Holdings Ltd.
663,890
35,747,700
Technologies, Inc.1,5,6
1,901,125
285,183
23
OPPENHEIMER INTERNATIONAL GROWTH FUND

S T A T E M E N T
O F
INVESTMENTS
Continued
Shares
Value
Shares
Value
Construction & Engineering Continued
Computers & Peripherals—0.8%
Vinci SA
97,288
$
7,702,686
Logitech
67,734,864
International SA1
686,141
$
23,336,852
Electronic Equipment & Instruments—3.9%
Electrical Equipment—5.0%
Hoya Corp.
774,675
26,911,268
ABB Ltd.
2,285,861
66,968,229
Keyence Corp.
97,174
22,612,354
Alstom
196,070
43,935,399
Nidec Corp.
437,485
32,905,926
Ceres Power
Nippon Electric
Holdings plc1
2,558,260
15,147,592
Glass Co. Ltd.
403,475
6,772,740
Ushio, Inc.
644,550
13,975,298
Omron Corp.
336,018
8,791,220
140,026,518
Phoenix Mecano AG
27,811
12,891,947
110,885,455
Industrial Conglomerates—1.2%
Koninklijke (Royal)
Internet Software & Services—2.1%
Philips Electronics NV
226,810
9,438,310
United Internet AG
373,308
8,643,136
Siemens AG
164,855
25,045,998
Yahoo! Japan Corp.
106,081
50,885,275
34,484,308
59,528,411
Machinery—3.9%
IT Services—0.6%
Aalberts
Infosys
Industries NV
1,697,484
35,586,198
Technologies Ltd.
436,578
17,655,930
Demag Cranes AG
432,587
19,687,149
Office Electronics—0.7%
Hyundai Heavy
Canon, Inc.
384,460
20,244,876
Industries Co. Ltd.
72,996
37,517,697
Semiconductors & Semiconductor Equipment—0.4%
Takeuchi Mfg. Co. Ltd.
385,329
17,550,234
ASM International NV
425,995
9,946,983
110,341,278
Software—3.9%
Autonomy Corp. plc1
1,516,863
24,901,626
Trading Companies & Distributors—1.1%
Compugroup
Bunzl plc
1,683,966
24,788,644
Holding AG1
385,343
7,751,395
Wolseley plc
463,630
6,619,881
Enix Corp.
203,620
6,450,456
31,408,525
Nintendo Co. Ltd.
76,425
46,978,760
Sage Group plc (The)
1,797,290
7,972,149
Information Technology—15.7%
SAP AG
282,362
14,406,480
Communications Equipment—3.3%
108,460,866
Nokia Oyj
349,625
13,766,317
Tandberg ASA
1,809,505
40,613,552
Materials—5.9%
Telefonaktiebolaget
Chemicals—1.8%
LM Ericsson,
Filtrona plc
1,398,852
6,406,132
B Shares
15,161,930
37,015,330
Nufarm Ltd.
1,638,810
24,469,848
91,395,199
Sika AG
6,646
12,375,978
Syngenta AG
27,574
6,823,669
50,075,627
24
OPPENHEIMER INTERNATIONAL GROWTH FUND

Shares
Value
Shares
Value
Metals & Mining—4.1%
Investment Company—4.3%
Companhia Vale
Oppenheimer Institutional
do Rio Doce,
Money Market Fund,
Sponsored ADR
1,714,400
$
49,597,592
Cl. E, 4.98%6,7
Impala Platinum
(Cost $121,737,734)
121,737,734
$
121,737,734
Holdings Ltd.
971,820
33,720,808
Rio Tinto plc
276,832
32,099,763
Total Investments, at Value
(excluding Investments
115,418,163
Purchased with Cash
Collateral from
Telecommunication Services—1.1%
Securities Loaned)
Wireless Telecommunication Services—1.1%
(Cost $1,799,672,652)
2,809,740,566
KDDI Corp.
1,744
12,376,311
Vodafone Group plc
4,541,125
17,010,546
Principal
Amount
29,386,857
Investments Purchased with Cash Collateral
from Securities Loaned—0.6%8
Utilities—0.3%
Undivided interest of 0.26% in joint repurchase
Electric Utilities—0.3%
agreement (Principal Amount/Value $6,000,000,000,
Fortum Oyj
218,480
9,390,597
with a maturity value of $6,002,310,000) with Bank
of America NA, 4.62%, dated 11/30/07, to be
Total Common Stocks
repurchased at $15,309,437 on 12/3/07,
(Cost $1,660,167,930)
2,667,699,113
collateralized by U.S. Agency
Mortgages, 4.50%-7%,
Preferred Stocks—0.7%
9/1/19-2/1/36, with a
Ceres Group, Inc.:
value of $6,120,000,000
Cv., Series C1,5,6
600,000
3,900,000
(Cost $15,303,545)
$15,303,545
15,303,545
Cv., Series C-11,5,6
64,547
419,556
Cv., Series D1,5,6
459,800
2,988,700
Total Investments,
Cv., Series F1,5,6
1,900,000
12,350,000
at Value
(Cost $1,814,976,197)
100.5%
2,825,044,111
Total Preferred
Stocks
(Cost $17,766,988)
19,658,256
Liabilities in Excess
of Other Assets
(0.5)
(15,136,168)
Units
Net Assets
100.0%
$2,809,907,943
Rights, Warrants and Certificates—0.0%
Ceres Group, Inc., Cv.,
Series F Wts.,
Exp. 9/6/151,5,6
380,000
—
Marshall Edwards,
Inc. Wts.:
Exp. 7/11/101
355,403
322,423
Exp. 8/6/121
55,000
323,040
Total Rights, Warrants and Certificates
(Cost $0)
645,463
25
OPPENHEIMER INTERNATIONAL GROWTH FUND

S T A T E M E N T
O F
INVESTMENTS
Continued
Footnotes to Statement of Investments
1. Non-income producing security.
2. Partial or fully-loaned security. See Note 7 of accompanying Notes.
3. The Fund holds securities which have been issued by the same entity and that trade on separate exchanges.
4. Represents securities sold under Rule 144A, which are exempt from registration under the Securities Act of 1933, as
amended. These securities have been determined to be liquid under guidelines established by the Board of Trustees.
These securities amount to $22,365,595 or 0.80% of the Fund’s net assets as of November 30, 2007.
5. Illiquid or restricted security. The aggregate value of illiquid or restricted securities as of November 30, 2007 was
$24,702,368, which represents 0.88% of the Fund’s net assets, of which $12,352,368 is considered restricted. See Note 6
of accompanying Notes.
6. Is or was an affiliate, as defined in the Investment CompanyAct of 1940, at or during the period ended November 30, 2007,
by virtue of the Fund owning at least 5% of the voting securities of the issuer or as a result of the Fund and the issuer having
the same investment advisor.Transactions during the period in which the issuer was an affiliate are as follows:
Shares
Gross
Gross
Shares
November 30, 2006
Additions
Reductions
November 30, 2007
Art Advanced Research Technologies, Inc.
1,901,125
—
—
1,901,125
Art Advanced Research Technologies, Inc.
—
6,078,506
—
6,078,506
Art Advanced Research Technologies, Inc.
1,721,500
—
—
1,721,500
Art Advanced Research Technologies, Inc., Series 1*
3,124,013
—
—
3,124,013
Art Advanced Research Technologies, Inc., Series 2
976,420
—
—
976,420
Ceres Group, Inc., Cv., Series C-1
64,547
—
—
64,547
Ceres Group, Inc., Cv., Series C
600,000
—
—
600,000
Ceres Group, Inc., Cv., Series D
459,800
—
—
459,800
Ceres Group, Inc., Cv., Series F
—
1,900,000
—
1,900,000
Ceres Group, Inc., Cv., Series F Wts., Exp. 9/6/15
—
380,000
—
380,000
Novogen Ltd.
6,618,140
—
—
6,618,140
Oppenheimer Institutional Money Market Fund, Cl. E
10,652,417
613,961,012
502,875,695
121,737,734
Ortivus AB, Cl. B
1,638,150
—
—
1,638,150
Dividend
Value
Income
Art Advanced Research Technologies, Inc.
$ 285,183
$
—
Art Advanced Research Technologies, Inc.
911,821
—
Art Advanced Research Technologies, Inc.
258,238
—
Art Advanced Research Technologies, Inc., Series 1*
468,625
—
Art Advanced Research Technologies, Inc., Series 2
146,470
—
Ceres Group, Inc., Cv., Series C-1
419,556
—
Ceres Group, Inc., Cv., Series C
3,900,000
—
Ceres Group, Inc., Cv., Series D
2,988,700
—
Ceres Group, Inc., Cv., Series F
12,350,000
—
Ceres Group, Inc., Cv., Series F Wts., Exp. 9/6/15
—
—
Novogen Ltd.
8,096,387
—
Oppenheimer Institutional Money Market Fund, Cl. E
121,737,734
4,723,660
Ortivus AB, Cl. B
1,704,817
—
$153,267,531
$4,723,660
* The security had a name change from Art Advanced Technologies, Inc., Preference.
7. Rate shown is the 7-day yield as of November 30, 2007.
8. The security/securities have been segregated to satisfy the forward commitment to return the cash collateral
received in securities lending transactions upon the borrower’s return of the securities loaned. See Note 7 of
accompanying Notes.
26
OPPENHEIMER INTERNATIONAL GROWTH FUND

Distribution of investments representing geographic holdings, as a percentage of total investments at value, is
as follows:
Geographic Holdings
Value
Percent
United Kingdom
$
448,611,808
15.9%
Japan
432,264,233
15.3
Switzerland
323,764,919
11.5
France
299,017,652
10.6
Germany
192,849,071
6.8
United States
177,649,239
6.3
Australia
165,022,024
5.8
The Netherlands
101,656,087
3.6
Denmark
87,872,168
3.1
Italy
86,931,967
3.1
India
82,021,314
2.9
Brazil
75,514,221
2.7
Sweden
63,926,966
2.3
Ireland
49,481,251
1.7
Spain
48,149,270
1.7
Norway
40,613,552
1.4
Korea, Republic of South
37,517,697
1.3
South Africa
33,720,808
1.2
Finland
23,156,914
0.8
Lebanon
18,762,323
0.7
Mexico
14,053,405
0.5
Bermuda
12,055,595
0.4
Jersey, Channel Islands
8,361,290
0.3
Canada
2,070,337
0.1
Total
$2,825,044,111
100.0%
See accompanying Notes to Financial Statements.
27
OPPENHEIMER INTERNATIONAL GROWTH FUND

STATEMENT
OF
ASSETS AND LIABILITIES
November 30, 2007
Assets
Investments, at value—see accompanying statement of investments:
Unaffiliated companies (cost $1,639,846,626)
$
2,671,776,580
Affiliated companies (cost $175,129,571)
153,267,531
2,825,044,111
Cash
2,528,210
Unrealized appreciation on foreign currency contracts
7,806
Receivables and other assets:
Shares of beneficial interest sold
85,745,961
Dividends
4,192,579
Investments sold
129,712
Other
215,667
Total assets
2,917,864,046
Liabilities
Return of collateral for securities loaned
15,303,545
Unrealized depreciation on foreign currency contracts
21,385
Payables and other liabilities:
Shares of beneficial interest redeemed
83,857,044
Investments purchased
7,144,202
Distribution and service plan fees
800,271
Transfer and shareholder servicing agent fees
358,486
Trustees’ compensation
258,107
Shareholder communications
120,561
Other
92,502
Total liabilities
107,956,103
Net Assets
$2,809,907,943
Composition of Net Assets
Paid-in capital
$
2,040,590,288
Accumulated net investment loss
(277,080)
Accumulated net realized loss on investments and foreign currency transactions
(240,588,537)
Net unrealized appreciation on investments and translation of
assets and liabilities denominated in foreign currencies
1,010,183,272
Net Assets
$2,809,907,943
28
OPPENHEIMER INTERNATIONAL GROWTH FUND

Net Asset Value Per Share
Class A Shares:
Net asset value and redemption price per share (based on net assets of $1,399,781,618 and
43,563,916 shares of beneficial interest outstanding)
$32.13
Maximum offering price per share (net asset value plus sales charge of 5.75% of offering price)
$34.09
Class B Shares:
Net asset value, redemption price (excludes applicable contingent deferred sales charge)
and offering price per share (based on net assets of $164,175,424 and 5,376,458 shares of
beneficial interest outstanding)
$30.54
Class C Shares:
Net asset value, redemption price (excludes applicable contingent deferred sales charge)
and offering price per share (based on net assets of $292,598,415 and 9,587,183 shares of
beneficial interest outstanding)
$30.52
Class N Shares:
Net asset value, redemption price (excludes applicable contingent deferred sales charge)
and offering price per share (based on net assets of $76,908,518 and 2,432,553 shares of
beneficial interest outstanding)
$31.62
Class Y Shares:
Net asset value, redemption price and offering price per share (based on net assets of
$876,443,968 and 27,284,441 shares of beneficial interest outstanding)
$32.12
See accompanying Notes to Financial Statements.
29
OPPENHEIMER INTERNATIONAL GROWTH FUND

STATEMENT
OF
OPERATIONS
For the Year Ended November 30, 2007
Investment Income
Dividends:
Unaffiliated companies (net of foreign withholding taxes of $1,032,390)
$
41,960,937
Affiliated companies
4,723,660
Portfolio lending fees
1,467,269
Interest
99,662
Other income
30,314
Total investment income
48,281,842
Expenses
Management fees
16,748,057
Distribution and service plan fees:
Class A
3,267,050
Class B
1,673,830
Class C
2,616,391
Class N
330,629
Transfer and shareholder servicing agent fees:
Class A
2,715,949
Class B
359,338
Class C
491,014
Class N
185,737
Class Y
11,206
Shareholder communications:
Class A
157,097
Class B
55,273
Class C
37,775
Class N
5,424
Custodian fees and expenses
352,321
Trustees’ compensation
115,278
Other
88,539
Total expenses
29,210,908
Less reduction to custodian expenses
(1,416)
Less waivers and reimbursements of expenses
(89,368)
Net expenses
29,120,124
Net Investment Income
19,161,718
30
OPPENHEIMER INTERNATIONAL GROWTH FUND

Realized and Unrealized Gain
Net realized gain on:
Investments from unaffiliated companies
$
47,039,051
Foreign currency transactions
7,414,080
Net realized gain
54,453,131
Net change in unrealized appreciation on:
Investments from unaffiliated companies
208,950,464
Translation of assets and liabilities denominated in foreign currencies
103,981,680
Net change in unrealized appreciation
312,932,144
Net Increase in Net Assets Resulting from Operations
$386,546,993
See accompanying Notes to Financial Statements.
31
31
OPPENHEIMER INTERNATIONAL GROWTH FUND
OPPENHEIMER INTERNATIONAL GROWTH FUND

STATEMENTS OF CHANGES IN NET ASSETS
Year Ended November 30,
2007
2006
Operations
Net investment income
$
19,161,718
$
3,957,905
Net realized gain
54,453,131
17,973,587
Net change in unrealized appreciation
312,932,144
365,553,552
Net increase in net assets resulting from operations
386,546,993
387,485,044
Dividends and/or Distributions to Shareholders
Dividends from net investment income:
Class A
(8,785,786)
(5,755,892)
Class B
—
—
Class C
(392,748)
(90,780)
Class N
(279,118)
(180,972)
Class Y
(4,345,983)
(125,384)
(13,803,635)
(6,153,028)
Beneficial Interest Transactions
Net increase (decrease) in net assets resulting from
beneficial interest transactions:
Class A
58,664,626
81,182,535
Class B
(32,053,960)
(36,542,935)
Class C
29,164,041
11,827,417
Class N
11,076,275
6,042,568
Class Y
557,558,803
218,286,911
624,409,785
280,796,496
Net Assets
Total increase
997,153,143
662,128,512
Beginning of period
1,812,754,800
1,150,626,288
End of period (including accumulated net investment loss
of $277,080 and $8,621,389, respectively)
$2,809,907,943
$1,812,754,800
See accompanying Notes to Financial Statements.
32
OPPENHEIMER INTERNATIONAL GROWTH FUND
OPPENHEIMER INTERNATIONAL GROWTH FUND

F I N A N C I A L
HIGHLIGHTS
Class A
Year Ended November 30,
2007
2006
2005
2004
2003
Per Share Operating Data
Net asset value, beginning of period
$ 27.03
$ 20.70
$ 18.19
$ 15.72
$ 11.63
Income (loss) from investment operations:
Net investment income
.271
.101
.101
.041
.01
Net realized and unrealized gain
5.04
6.38
2.53
2.63
4.19
Total from investment operations
5.31
6.48
2.63
2.67
4.20
Dividends and/or distributions to shareholders:
Dividends from net investment income
(.21)
(.15)
(.12)
(.20)
(.11)
Net asset value, end of period
$32.13
$27.03
$20.70
$18.19
$15.72
Total Return, at Net Asset Value2
19.78%
31.49%
14.51%
17.18%
36.55%
Ratios/Supplemental Data
Net assets, end of period (in thousands)
$1,399,782
$1,115,664
$787,600
$686,313
$528,363
Average net assets (in thousands)
$1,352,329
$
924,048
$717,536
$598,265
$390,315
Ratios to average net assets:3
Net investment income
0.88%
0.40%
0.52%
0.22%
0.18%
Total expenses
1.20%4
1.28%4
1.49%
1.61%
1.88%
Expenses after waivers, payments and/or
reimbursements and reduction to
custodian expenses
1.20%
1.28%
1.41%
1.43%
1.42%
Portfolio turnover rate
8%
12%
26%
37%
61%
1. Per share amounts calculated based on the average shares outstanding during the period.
2. Assumes an investment on the business day before the first day of the fiscal period,with all dividends and distributions
reinvested in additional shares on the reinvestment date, and redemption at the net asset value calculated on the last
business day of the fiscal period. Sales charges are not reflected in the total returns.Total returns are not annualized for
periods less than one full year. Returns do not reflect the deduction of taxes that a shareholder would pay on fund
distributions or the redemption of fund shares.
3. Annualized for periods less than one full year.
4. Total expenses including indirect expenses from affiliated fund were as follows:
Year Ended November 30, 2007
1.20%
Year Ended November 30, 2006
1.28%
See accompanying Notes to Financial Statements.
33
OPPENHEIMER INTERNATIONAL GROWTH FUND
OPPENHEIMER INTERNATIONAL GROWTH FUND

F I N A N C I A L
HIGHLIGHTS
Continued
Class B
Year Ended November 30,
2007
2006
2005
2004
2003
Per Share Operating Data
Net asset value, beginning of period
$ 25.69
$ 19.69
$ 17.33
$ 15.00
$ 11.10
Income (loss) from investment operations:
Net investment income (loss)
.021
(.08)1
(.05)1
(.09)1
(.13)
Net realized and unrealized gain
4.83
6.08
2.41
2.51
4.06
Total from investment operations
4.85
6.00
2.36
2.42
3.93
Dividends and/or distributions to shareholders:
Dividends from net investment income
—
—
—
(.09)
(.03)
Net asset value, end of period
$30.54
$25.69
$19.69
$17.33
$15.00
Total Return, at Net Asset Value2
18.88%
30.47%
13.62%
16.25%
35.49%
Ratios/Supplemental Data
Net assets, end of period (in thousands)
$164,175
$167,383
$160,347
$166,973
$174,959
Average net assets (in thousands)
$167,676
$165,575
$162,953
$167,441
$148,838
Ratios to average net assets:3
Net investment income (loss)
0.07%
(0.37)%
(0.25)%
(0.57)%
(0.55)%
Total expenses
1.99%4
2.07%4
2.19%
2.24%
2.48%
Expenses after waivers, payments and/or
reimbursements and reduction to
custodian expenses
1.99%
2.07%
2.19%
2.21%
2.19%
Portfolio turnover rate
8%
12%
26%
37%
61%
1. Per share amounts calculated based on the average shares outstanding during the period.
2. Assumes an investment on the business day before the first day of the fiscal period,with all dividends and distributions
reinvested in additional shares on the reinvestment date, and redemption at the net asset value calculated on the last
business day of the fiscal period. Sales charges are not reflected in the total returns.Total returns are not annualized for
periods less than one full year. Returns do not reflect the deduction of taxes that a shareholder would pay on fund
distributions or the redemption of fund shares.
3. Annualized for periods less than one full year.
4. Total expenses including indirect expenses from affiliated fund were as follows:
Year Ended November 30, 2007
1.99%
Year Ended November 30, 2006
2.07%
See accompanying Notes to Financial Statements.
34
OPPENHEIMER INTERNATIONAL GROWTH FUND

Class C
Year Ended November 30,
2007
2006
2005
2004
2003
Per Share Operating Data
Net asset value, beginning of period
$ 25.71
$ 19.71
$ 17.34
$ 15.01
$ 11.12
Income (loss) from investment operations:
Net investment income (loss)
.041
(.08)1
(.04)1
(.08)1
(.08)
Net realized and unrealized gain
4.82
6.09
2.41
2.52
4.01
Total from investment operations
4.86
6.01
2.37
2.44
3.93
Dividends and/or distributions to shareholders:
Dividends from net investment income
(.05)
(.01)
—
(.11)
(.04)
Net asset value, end of period
$30.52
$25.71
$19.71
$17.34
$15.01
Total Return, at Net Asset Value2
18.91%
30.51%
13.67%
16.34%
35.44%
Ratios/Supplemental Data
Net assets, end of period (in thousands)
$292,598
$220,735
$158,968
$144,529
$116,659
Average net assets (in thousands)
$262,038
$188,347
$151,790
$131,125
$ 90,532
Ratios to average net assets:3
Net investment income (loss)
0.13%
(0.34)%
(0.20)%
(0.52)%
(0.59)%
Total expenses
1.94%4
2.03%4
2.13%
2.16%
2.38%
Expenses after waivers, payments and/or
reimbursements and reduction to
custodian expenses
1.94%
2.03%
2.13%
2.16%
2.22%
Portfolio turnover rate
8%
12%
26%
37%
61%
1. Per share amounts calculated based on the average shares outstanding during the period.
2. Assumes an investment on the business day before the first day of the fiscal period,with all dividends and distributions
reinvested in additional shares on the reinvestment date, and redemption at the net asset value calculated on the last
business day of the fiscal period. Sales charges are not reflected in the total returns.Total returns are not annualized for
periods less than one full year. Returns do not reflect the deduction of taxes that a shareholder would pay on fund
distributions or the redemption of fund shares.
3. Annualized for periods less than one full year.
4. Total expenses including indirect expenses from affiliated fund were as follows:
Year Ended November 30, 2007
1.94%
Year Ended November 30, 2006
2.03%
See accompanying Notes to Financial Statements.
35
OPPENHEIMER INTERNATIONAL GROWTH FUND

F I N A N C I A L
HIGHLIGHTS
Continued
Class N
Year Ended November 30,
2007
2006
2005
2004
2003
Per Share Operating Data
Net asset value, beginning of period
$ 26.61
$ 20.40
$ 17.94
$ 15.51
$ 11.55
Income (loss) from investment operations:
Net investment income (loss)
.161
.011
.051
—1,2
.02
Net realized and unrealized gain
4.99
6.30
2.49
2.60
4.08
Total from investment operations
5.15
6.31
2.54
2.60
4.10
Dividends and/or distributions to shareholders:
Dividends from net investment income
(.14)
(.10)
(.08)
(.17)
(.14)
Net asset value, end of period
$31.62
$26.61
$20.40
$17.94
$15.51
Total Return, at Net Asset Value3
19.42%
31.05%
14.19%
16.94%
36.01%
Ratios/Supplemental Data
Net assets, end of period (in thousands)
$76,909
$54,908
$36,980
$32,631
$21,180
Average net assets (in thousands)
$66,468
$44,538
$33,383
$26,738
$14,722
Ratios to average net assets:4
Net investment income (loss)
0.55%
0.06%
0.26%
(0.02)%
(0.16)%
Total expenses
1.53%5
1.64%5
1.77%
1.77%
1.90%
Expenses after waivers, payments and/or
reimbursements and reduction to
custodian expenses
1.53%
1.62%
1.67%
1.66%
1.73%
Portfolio turnover rate
8%
12%
26%
37%
61%
1. Per share amounts calculated based on the average shares outstanding during the period.
2. Less than $0.005 per share.
3. Assumes an investment on the business day before the first day of the fiscal period,with all dividends and distributions
reinvested in additional shares on the reinvestment date, and redemption at the net asset value calculated on the last
business day of the fiscal period. Sales charges are not reflected in the total returns.Total returns are not annualized for
periods less than one full year. Returns do not reflect the deduction of taxes that a shareholder would pay on fund
distributions or the redemption of fund shares.
4. Annualized for periods less than one full year.
5. Total expenses including indirect expenses from affiliated fund were as follows:
Year Ended November 30, 2007
1.53%
Year Ended November 30, 2006
1.64%
See accompanying Notes to Financial Statements.
36
OPPENHEIMER INTERNATIONAL GROWTH FUND

Class Y
Year Ended November 30,
2007
2006
20051
Per Share Operating Data
Net asset value, beginning of period
$ 27.07
$ 20.74
$ 20.71
Income (loss) from investment operations:
Net investment income2
.40
.25
.05
Net realized and unrealized gain (loss)
5.04
6.34
(.02)
Total from investment operations
5.44
6.59
.03
Dividends and/or distributions to shareholders:
Dividends from net investment income
(.39)
(.26)
—
Net asset value, end of period
$32.12
$27.07
$20.74
Total Return, at Net Asset Value3
20.32%
32.11%
0.15%
Ratios/Supplemental Data
Net assets, end of period (in thousands)
$876,444
$254,065
$6,731
Average net assets (in thousands)
$479,060
$142,489
$2,071
Ratios to average net assets:4
Net investment income
1.33%
1.03%
0.98%
Total expenses
0.74%5,6
0.77%5,6
0.85%6
Portfolio turnover rate
8%
12%
26%
1. For the period from September 7, 2005 (inception of offering) to November 30, 2005.
2. Per share amounts calculated based on the average shares outstanding during the period.
3. Assumes an investment on the business day before the first day of the fiscal period,with all dividends and distributions
reinvested in additional shares on the reinvestment date, and redemption at the net asset value calculated on the last
business day of the fiscal period. Sales charges are not reflected in the total returns.Total returns are not annualized for
periods less than one full year. Returns do not reflect the deduction of taxes that a shareholder would pay on fund
distributions or the redemption of fund shares.
4. Annualized for periods less than one full year.
5. Total expenses including indirect expenses from affiliated fund were as follows:
Year Ended November 30, 2007
0.74%
Year Ended November 30, 2006
0.77%
6. Reduction to custodian expenses less than 0.01%.
See accompanying Notes to Financial Statements.
37
OPPENHEIMER INTERNATIONAL GROWTH FUND

NOTES TO FINANCIAL STATEMENTS
1. Significant Accounting Policies
Oppenheimer International Growth Fund (the Fund) is registered under the Investment
Company Act of 1940, as amended, as an open-end management investment company.
The Fund’s investment objective is to seek long-term capital appreciation. The Fund’s
investment advisor is OppenheimerFunds, Inc. (the Manager).
The Fund offers Class A, Class B, Class C, Class N and Class Y shares. Class A shares are
sold at their offering price, which is normally net asset value plus a front-end sales charge.
Class B, Class C and Class N shares are sold without a front-end sales charge but may be
subject to a contingent deferred sales charge (CDSC). Class N shares are sold only through
retirement plans. Retirement plans that offer Class N shares may impose charges on those
accounts. Class Y shares are sold to certain institutional investors without either a front-
end sales charge or a CDSC, however, the institutional investor may impose charges on
those accounts. All classes of shares have identical rights and voting privileges with respect
to the Fund in general and exclusive voting rights on matters that affect that class alone.
Earnings, net assets and net asset value per share may differ due to each class having its
own expenses, such as transfer and shareholder servicing agent fees and shareholder
communications, directly attributable to that class. Class A, B, C and N have separate dis-
tribution and/or service plans. No such plan has been adopted for Class Y shares. Class B
shares will automatically convert to Class A shares six years after the date of purchase. The
Fund assesses a 2% fee on the proceeds of fund shares that are redeemed (either by selling
or exchanging to another Oppenheimer fund) within 30 days of their purchase. The fee,
which is retained by the Fund, is accounted for as an addition to paid-in capital.
The following is a summary of significant accounting policies consistently followed by
the Fund.
Securities Valuation. The Fund calculates the net asset value of its shares as of the close of
the New York Stock Exchange (the “Exchange”), normally 4:00 P.M. Eastern time, on each day
the Exchange is open for business. Securities may be valued primarily using dealer-supplied
valuations or a portfolio pricing service authorized by the Board of Trustees. Securities listed
or traded on National Stock Exchanges or other domestic exchanges are valued based on
the last sale price of the security traded on that exchange prior to the time when the Fund’s
assets are valued. Securities traded on NASDAQ® are valued based on the closing price pro-
vided by NASDAQ prior to the time when the Fund’s assets are valued. In the absence of a
sale, the security is valued at the last sale price on the prior trading day, if it is within the
spread of the closing “bid” and “asked” prices, and if not, at the closing bid price. Securities
traded on foreign exchanges are valued based on the last sale price on the principal
exchange on which the security is traded, as identified by the portfolio pricing service, prior
to the time when the Fund’s assets are valued. In the absence of a sale, the security is valued
at the official closing price on the principal exchange. Corporate, government and municipal
debt instruments having a remaining maturity in excess of sixty days and all mortgage-
backed securities will be valued at the mean between the “bid” and “asked” prices. Futures
contracts traded on a commodities or futures exchange will be valued at the final settlement
38
38
OPPENHEIMER INTERNATIONAL GROWTH FUND
OPPENHEIMER INTERNATIONAL GROWTH FUND

price or official closing price on the principal exchange as reported by such principal
exchange at its trading session ending at, or most recently prior to, the time when the
Fund’s assets are valued. Options are valued daily based upon the last sale price on the
principal exchange on which the option is traded. Securities (including restricted securi-
ties) for which market quotations are not readily available are valued at their fair value.
Foreign and domestic securities whose values have been materially affected by what the
Manager identifies as a significant event occurring before the Fund’s assets are valued but
after the close of their respective exchanges will be fair valued. Fair value is determined
in good faith using consistently applied procedures under the supervision of the Board
of Trustees. Investments in registered investment companies that are not traded on an
exchange are valued at that fund's net asset value. Short-term “money market type” debt
securities with remaining maturities of sixty days or less are valued at amortized cost
(which approximates market value).
Joint Repurchase Agreements. Pursuant to an Exemptive Order issued by the Securities
and Exchange Commission, the Fund, along with other affiliated funds advised by the
Manager, may transfer uninvested cash balances into joint trading accounts on a daily
basis. These balances are invested in one or more repurchase agreements. Securities
pledged as collateral for repurchase agreements are held by a custodian bank until the
agreements mature. Each agreement requires that the market value of the collateral be
sufficient to cover payments of interest and principal. In the event of default by the other
party to the agreement, retention of the collateral may be subject to legal proceedings.
Foreign Currency Translation. The Fund’s accounting records are maintained in U.S. dol-
lars. The values of securities denominated in foreign currencies and amounts related to
the purchase and sale of foreign securities and foreign investment income are translated
into U.S. dollars as of the close of the New York Stock Exchange (the “Exchange”), nor-
mally 4:00 P.M. Eastern time, on each day the Exchange is open for business. Foreign
exchange rates may be valued primarily using dealer supplied valuations or a portfolio
pricing service authorized by the Board of Trustees.
Reported net realized foreign exchange gains or losses arise from sales of portfolio secu-
rities, sales and maturities of short-term securities, sales of foreign currencies, currency gains
or losses realized between the trade and settlement dates on securities transactions, and
the difference between the amounts of dividends, interest, and foreign withholding taxes
recorded on the Fund’s books and the U.S. dollar equivalent of the amounts actually
received or paid. Net unrealized foreign exchange gains and losses arise from changes in the
values of assets and liabilities, including investments in securities at fiscal period end, result-
ing from changes in exchange rates.
The effect of changes in foreign currency exchange rates on investments is sepa-
rately identified from the fluctuations arising from changes in market values of
securities held and reported with all other foreign currency gains and losses in the
Fund’s Statement of Operations.
39
39
OPPENHEIMER INTERNATIONAL GROWTH FUND
OPPENHEIMER INTERNATIONAL GROWTH FUND

NOTES TO FINANCIAL STATEMENTS
Continued
1. Significant Accounting Policies Continued
Investment in Oppenheimer Institutional Money Market Fund. The Fund is permit-
ted to invest daily available cash balances in an affiliated money market fund. The Fund
may invest the available cash in Class E shares of Oppenheimer Institutional Money
Market Fund ("IMMF") which seeks current income and stability of principal. IMMF is a
registered open-end management investment company, regulated as a money market
fund under the Investment Company Act of 1940, as amended. The Manager is also the
investment advisor of IMMF. The Fund's investment in IMMF is included in the Statement
of Investments, if applicable. As a shareholder, the Fund is subject to its proportional
share of IMMF’s Class E expenses, including its management fee. The Manager will waive
fees and/or reimburse Fund expenses in an amount equal to the indirect management
fees incurred through the Fund’s investment in IMMF.
Allocation of Income, Expenses, Gains and Losses. Income, expenses (other than those
attributable to a specific class), gains and losses are allocated on a daily basis to each
class of shares based upon the relative proportion of net assets represented by such class.
Operating expenses directly attributable to a specific class are charged against the opera-
tions of that class.
Federal Taxes. The Fund intends to comply with provisions of the Internal Revenue
Code applicable to regulated investment companies and to distribute substantially all of
its investment company taxable income, including any net realized gain on investments
not offset by capital loss carryforwards, if any, to shareholders, therefore, no federal
income or excise tax provision is required.
The tax components of capital shown in the table below represent distribution requirements
the Fund must satisfy under the income tax regulations, losses the Fund may be able to off-
set against income and gains realized in future years and unrealized appreciation or
depreciation of securities and other investments for federal income tax purposes.
Net Unrealized
Appreciation
Based on Cost of
Securities and
Undistributed
Undistributed
Accumulated
Other Investments
Net Investment
Long-Term
Loss
for Federal Income
Income
Gain
Carryforward1,2,3,4,5,6
Tax Purposes
$20,348,326
$—
$232,652,115
$981,870,654
1. As of November 30, 2007, the Fund had $231,475,609 of net capital loss carryforwards available to offset future
realized capital gains, if any, and thereby reduce future taxable gain distributions. As of November 30, 2007, details of
the capital loss carryforwards were as follows:
40
OPPENHEIMER INTERNATIONAL GROWTH FUND
OPPENHEIMER INTERNATIONAL GROWTH FUND

Expiring
2010
$
55,861,629
2011
175,613,980
Total
$231,475,609
2. As of November 30, 2007, the Fund had $121,229 of post-October losses available to offset future realized
capital gains, if any. Such losses, if unutilized, will expire in 2016.
3. The Fund had $72,094 of post-October foreign currency losses which were deferred.
4. The Fund had $983,183 of post-October passive foreign investment company losses which were deferred.
5. During the fiscal year ended November 30, 2007, the Fund utilized $52,005,284 of capital loss carryforward to offset
capital gains realized in that fiscal year.
6. During the fiscal year ended November 30, 2006, the Fund utilized $16,226,751 of capital loss carryforward to offset
capital gains realized in that fiscal year.
Net investment income (loss) and net realized gain (loss) may differ for financial statement
and tax purposes. The character of dividends and distributions made during the fiscal year
from net investment income or net realized gains may differ from their ultimate character-
ization for federal income tax purposes. Also, due to timing of dividends and distributions,
the fiscal year in which amounts are distributed may differ from the fiscal year in which
the income or net realized gain was recorded by the Fund. Accordingly, the following
amounts have been reclassified for November 30, 2007. Net assets of the Fund were unaf-
fected by the reclassifications.
Reduction to
Increase to
Accumulated
Accumulated Net
Reduction to
Net Investment
Realized Loss
Paid-in Capital
Loss
on Investments
$1,114,203
$2,986,226
$1,872,023
The tax character of distributions paid during the years ended November 30, 2007 and
November 30, 2006 was as follows:
Year Ended
Year Ended
November 30, 2007
November 30, 2006
Distributions paid from:
Ordinary income
$13,803,635
$6,153,028
The aggregate cost of securities and other investments and the composition of unreal-
ized appreciation and depreciation of securities and other investments for federal income
tax purposes as of November 30, 2007 are noted below. The primary difference between
book and tax appreciation or depreciation of securities and other investments, if applica-
ble, is attributable to the tax deferral of losses or tax realization of financial statement
unrealized gain or loss.
Federal tax cost of securities
$
1,843,302,394
Federal tax cost of other investments
5,497,059
Total federal tax cost
$1,848,799,453
Gross unrealized appreciation
$
1,043,597,053
Gross unrealized depreciation
(61,726,399)
Net unrealized appreciation
$
981,870,654
41
OPPENHEIMER INTERNATIONAL GROWTH FUND

NOTES TO FINANCIAL STATEMENTS
Continued
1. Significant Accounting Policies Continued
Trustees' Compensation. The Fund has adopted an unfunded retirement plan (the
“Plan”) for the Fund's independent trustees. Benefits are based on years of service and
fees paid to each trustee during their period of service. The Plan was frozen with respect
to adding new participants effective December 31, 2006 (the “Freeze Date”) and existing
Plan Participants as of the Freeze Date will continue to receive accrued benefits under the
Plan. Active independent trustees as of the Freeze Date have each elected a distribution
method with respect to their benefits under the Plan. During the year ended November
30, 2007, the Fund's projected benefit obligations were increased by $70,596 and pay-
ments of $49,668 were made to retired trustees, resulting in an accumulated liability of
$170,734 as of November 30, 2007.
The Board of Trustees has adopted a compensation deferral plan for independent
trustees that enables trustees to elect to defer receipt of all or a portion of the annual
compensation they are entitled to receive from the Fund. For purposes of determining the
amount owed to the Trustee under the plan, deferred amounts are treated as though
equal dollar amounts had been invested in shares of the Fund or in other Oppenheimer
funds selected by the Trustee. The Fund purchases shares of the funds selected for deferral
by the Trustee in amounts equal to his or her deemed investment, resulting in a Fund
asset equal to the deferred compensation liability. Such assets are included as a compo-
nent of “Other” within the asset section of the Statement of Assets and Liabilities. Deferral
of trustees’ fees under the plan will not affect the net assets of the Fund, and will not
materially affect the Fund’s assets, liabilities or net investment income per share. Amounts
will be deferred until distributed in accordance to the compensation deferral plan.
Dividends and Distributions to Shareholders. Dividends and distributions to shareholders,
which are determined in accordance with income tax regulations, are recorded on the ex-
dividend date. Income and capital gain distributions, if any, are declared and paid annually.
Investment Income. Dividend income is recorded on the ex-dividend date or upon ex-
dividend notification in the case of certain foreign dividends where the ex-dividend date
may have passed. Non-cash dividends included in dividend income, if any, are recorded at
the fair market value of the securities received. Interest income, which includes accretion
of discount and amortization of premium, is accrued as earned.
Custodian Fees. “Custodian fees and expenses” in the Statement of Operations may
include interest expense incurred by the Fund on any cash overdrafts of its custodian
account during the period. Such cash overdrafts may result from the effects of failed
trades in portfolio securities and from cash outflows resulting from unanticipated share-
holder redemption activity. The Fund pays interest to its custodian on such cash
overdrafts, to the extent they are not offset by positive cash balances maintained by the
Fund, at a rate equal to the Federal Funds Rate plus 0.50%. The “Reduction to custodian
expenses” line item, if applicable, represents earnings on cash balances maintained by the
Fund during the period. Such interest expense and other custodian fees may be paid
with these earnings.
42
42
OPPENHEIMER INTERNATIONAL GROWTH FUND

Security Transactions. Security transactions are recorded on the trade date. Realized
gains and losses on securities sold are determined on the basis of identified cost.
Indemnifications. The Fund’s organizational documents provide current and former
trustees and officers with a limited indemnification against liabilities arising in connection
with the performance of their duties to the Fund. In the normal course of business, the
Fund may also enter into contracts that provide general indemnifications. The Fund’s
maximum exposure under these arrangements is unknown as this would be dependent
on future claims that may be made against the Fund. The risk of material loss from such
claims is considered remote.
Other. The preparation of financial statements in conformity with U.S. generally accepted
accounting principles requires management to make estimates and assumptions that affect
the reported amounts of assets and liabilities and disclosure of contingent assets and liabili-
ties at the date of the financial statements and the reported amounts of income and
expenses during the reporting period. Actual results could differ from those estimates.
2. Shares of Beneficial Interest
The Fund has authorized an unlimited number of no par value shares of beneficial inter-
est of each class. Transactions in shares of beneficial interest were as follows:
Year Ended November 30, 2007
Year Ended November 30, 2006
Shares
Amount
Shares
Amount
Class A
Sold
18,668,950
$
564,370,473
14,608,631
$
347,230,645
Dividends and/or
distributions reinvested
271,051
7,467,460
231,096
4,968,552
Redeemed
(16,651,667)
(513,173,307)1
(11,611,816)
(271,016,662)2
Net increase
2,288,334
$
58,664,626
3,227,911
$
81,182,535
Class B
Sold
1,603,601
$
46,416,051
1,567,352
$
35,450,476
Dividends and/or
distributions reinvested
—
—
—
—
Redeemed
(2,741,557)
(78,470,011)1
(3,194,519)
(71,993,411)2
Net decrease
(1,137,956)
$ (32,053,960)
(1,627,167)
$(36,542,935)
Class C
Sold
2,891,846
$
83,343,257
2,201,244
$
49,847,330
Dividends and/or
distributions reinvested
12,358
325,622
3,708
76,379
Redeemed
(1,901,366)
(54,504,838)1
(1,685,022)
(38,096,292)2
Net increase
1,002,838
$
29,164,041
519,930
$
11,827,417
43
43
OPPENHEIMER INTERNATIONAL GROWTH FUND

NOTES TO FINANCIAL STATEMENTS
Continued
2. Shares of Beneficial Interest Continued
Year Ended November 30, 2007
Year Ended November 30, 2006
Shares
Amount
Shares
Amount
Class N
Sold
1,186,038
$
35,359,161
957,911
$
22,435,159
Dividends and/or
distributions reinvested
9,350
254,237
8,011
170,075
Redeemed
(825,995)
(24,537,123)1
(715,044)
(16,562,666)2
Net increase
369,393
$
11,076,275
250,878
$
6,042,568
Class Y
Sold
18,336,046
$
571,056,238
12,839,289
$
306,975,962
Dividends and/or
distributions reinvested
153,526
4,342,445
5,850
125,371
Redeemed
(590,580)
(17,839,880)1
(3,784,278)
(88,814,422)2
Net increase
17,898,992
$557,558,803
9,060,861
$218,286,911
1. Net of redemption fees of $13,264, $1,645, $2,570, $652 and $4,699 for Class A, Class B, Class C, Class N and Class Y, respectively.
2. Net of redemption fees of $7,906, $1,416, $1,611, $381 and $1,219 for Class A, Class B, Class C, Class N and Class Y, respectively.
3. Purchases and Sales of Securities
The aggregate cost of purchases and proceeds from sales of securities, other than short-
term obligations and investments in IMMF, for the year ended November 30, 2007, were
as follows:
Purchases
Sales
Investment securities
$706,780,378
$188,031,058
4. Fees and Other Transactions with Affiliates
Management Fees. Management fees paid to the Manager were in accordance with the
investment advisory agreement with the Fund which provides for a fee at an annual rate
of average net assets as shown in the following table:
Fee Schedule Effective Sept. 1, 2007
Fee Schedule from Dec. 1, 2006 to Aug. 31, 2007
Up to $250 million
0.80%
Up to $250 million
0.80%
Next $250 million
0.77
Next $250 million
0.77
Next $500 million
0.75
Next $500 million
0.75
Next $1 billion
0.69
Next $1 billion
0.69
Next $3 billion
0.67
Over $2 billion
0.67
Over $5 billion
0.65
Transfer Agent Fees.
OppenheimerFunds Services (OFS), a division of the Manager, acts
as the transfer and shareholder servicing agent for the Fund. The Fund pays OFS a per
account fee. For the year ended November 30, 2007, the Fund paid $3,703,966 to OFS for
services to the Fund.
Additionally, Class Y shares are subject to minimum fees of $10,000 per annum for
assets of $10 million or more. The Class Y shares are subject to the minimum fees in the
event that the per account fee does not equal or exceed the applicable minimum fees.
OFS may voluntarily waive the minimum fees.
44
OPPENHEIMER INTERNATIONAL GROWTH FUND
OPPENHEIMER INTERNATIONAL GROWTH FUND

Distribution and Service Plan (12b-1) Fees. Under its General Distributor’s Agreement
with the Fund, OppenheimerFunds Distributor, Inc. (the Distributor) acts as the Fund’s
principal underwriter in the continuous public offering of the Fund’s classes of shares.
Service Plan for Class A Shares. The Fund has adopted a Service Plan for Class A shares.
It reimburses the Distributor for a portion of its costs incurred for services provided to
accounts that hold Class A shares. Reimbursement is made periodically at an annual rate of
up to 0.25% of the average annual net assets of Class A shares of the Fund. The Distributor
currently uses all of those fees to pay dealers, brokers, banks and other financial institutions
periodically for providing personal services and maintenance of accounts of their customers
that hold Class A shares. Any unreimbursed expenses the Distributor incurs with respect to
Class A shares in any fiscal year cannot be recovered in subsequent periods. Fees incurred by
the Fund under the plan are detailed in the Statement of Operations.
Distribution and Service Plans for Class B, Class C and Class N Shares. The Fund has
adopted Distribution and Service Plans for Class B, Class C and Class N shares to compen-
sate the Distributor for its services in connection with the distribution of those shares and
servicing accounts. Under the plans, the Fund pays the Distributor an annual asset-based
sales charge of 0.75% on Class B and Class C shares and 0.25% on Class N shares. The Dis-
tributor also receives a service fee of 0.25% per year under each plan. If either the Class B,
Class C or Class N plan is terminated by the Fund or by the shareholders of a class, the
Board of Trustees and its independent trustees must determine whether the Distributor
shall be entitled to payment from the Fund of all or a portion of the service fee and/or
asset-based sales charge in respect to shares sold prior to the effective date of such termi-
nation. The Distributor determines its uncompensated expenses under the plan at calendar
quarter ends. The Distributor’s aggregate uncompensated expenses under the plan at
September 30, 2007 for Class B, Class C and Class N shares were $2,130,775, $3,931,861 and
$464,040, respectively. Fees incurred by the Fund under the plans are detailed in the
Statement of Operations.
Sales Charges. Front-end sales charges and contingent deferred sales charges (CDSC)
do not represent expenses of the Fund. They are deducted from the proceeds of sales of
Fund shares prior to investment or from redemption proceeds prior to remittance, as
applicable. The sales charges retained by the Distributor from the sale of shares and the
CDSC retained by the Distributor on the redemption of shares is shown in the following
table for the period indicated.
Class A
Class B
Class C
Class N
Class A
Contingent
Contingent
Contingent
Contingent
Front-End
Deferred
Deferred
Deferred
Deferred
Sales Charges
Sales Charges
Sales Charges
Sales Charges
Sales Charges
Retained by
Retained by
Retained by
Retained by
Retained by
Year Ended
Distributor
Distributor
Distributor
Distributor
Distributor
November 30, 2007
$664,007
$8,005
$208,358
$15,664
$4,843
45
OPPENHEIMER INTERNATIONAL GROWTH FUND
OPPENHEIMER INTERNATIONAL GROWTH FUND

NOTES TO FINANCIAL STATEMENTS
Continued
4. Fees and Other Transactions with Affiliates Continued
Waivers and Reimbursements of Expenses. OFS has voluntarily agreed to limit transfer
and shareholder servicing agent fees for all classes to 0.35% of average annual net assets
per class. This undertaking may be amended or withdrawn at any time.
The Manager will waive fees and/or reimburse Fund expenses in an amount equal to the
indirect management fees incurred through the Fund’s investment in IMMF. During the year
ended November 30, 2007, the Manager waived $89,368 for IMMF management fees.
5. Foreign Currency Contracts
A foreign currency contract is a commitment to purchase or sell a foreign currency at a
future date, at a negotiated rate. The Fund may enter into foreign currency contracts to
settle specific purchases or sales of securities denominated in a foreign currency and for
protection from adverse exchange rate fluctuation. Risks to the Fund include the poten-
tial inability of the counterparty to meet the terms of the contract.
The net U.S. dollar value of foreign currency underlying all contractual commitments
held by the Fund and the resulting unrealized appreciation or depreciation are deter-
mined using prevailing foreign currency exchange rates. Unrealized appreciation and
depreciation on foreign currency contracts are reported in the Statement of Assets and
Liabilities as a receivable or payable and in the Statement of Operations with the change
in unrealized appreciation or depreciation.
The Fund may realize a gain or loss upon the closing or settlement of the foreign
transaction. Contracts closed or settled with the same broker are recorded as net realized
gains or losses. Such realized gains and losses are reported with all other foreign currency
gains and losses in the Statement of Operations.
As of November 30, 2007, the Fund had outstanding foreign currency contracts as follows:
Contract
Valuation as of
Expiration
Amount
November 30,
Unrealized
Unrealized
Contract Description
Dates
(000s)
2007
Appreciation
Depreciation
Contracts to Purchase
Australian Dollar (AUD)
12/4/07
2,858AUD
$2,523,852
$ 7,806
$
—
British Pound Sterling (GBP)
12/3/07
1,446GBP
2,973,206
—
21,385
Total unrealized appreciation
and depreciation
$7,806
$21,385
6. Illiquid or Restricted Securities
As of November 30, 2007, investments in securities included issues that are illiquid or
restricted. Restricted securities are purchased in private placement transactions, are not
registered under the Securities Act of 1933, may have contractual restrictions on resale,
and are valued under methods approved by the Board of Trustees as reflecting fair value.
A security may also be considered illiquid if it lacks a readily available market or if its val-
uation has not changed for a certain period of time. The Fund will not invest more than
46
OPPENHEIMER INTERNATIONAL GROWTH FUND
OPPENHEIMER INTERNATIONAL GROWTH FUND

10% of its net assets (determined at the time of purchase and reviewed periodically) in
illiquid or restricted securities. Certain restricted securities, eligible for resale to qualified
institutional investors, are not subject to that limitation. Securities that are illiquid or
restricted are marked with the applicable footnote on the Statement of Investments.
Information concerning restricted securities is as follows:
Valuation as of
Unrealized
Acquisition
November 30,
Appreciation
Security
Dates
Cost
2007
(Depreciation)
Art Advanced Research
Technologies, Inc.
6/19/01
$
7,500,000
$
285,183
$
(7,214,817)
Ceres Group, Inc., Cv., Series C-1
2/6/01-3/21/06
258,188
419,556
161,368
Ceres Group, Inc., Cv., Series C
1/6/99
2,400,000
3,900,000
1,500,000
Ceres Group, Inc., Cv., Series D
3/15/01-3/9/06
2,758,800
2,988,700
229,900
Marshall Edwards, Inc.
5/6/02-11/20/03
6,869,052
4,739,646
(2,129,406)
Oxagen Ltd.
12/20/00
2,210,700
19,283
(2,191,417)
$21,996,740
$12,352,368
$(9,644,372)
7. Securities Lending
The Fund lends portfolio securities from time to time in order to earn additional income. In
return, the Fund receives collateral in the form of securities, letters of credit or cash, against
the loaned securities and maintains collateral in an amount not less than 100% of the market
value of the loaned securities during the period of the loan. The market value of the loaned
securities is determined at the close of business each day. If the Fund is undercollateralized at
the close of business due to an increase in market value of securities on loan, additional col-
lateral is requested from the borrowing counterparty and is delivered to the Fund on the
next business day. Cash collateral may be invested in approved investments and the Fund
bears the risk of any loss in value of these investments. The Fund retains a portion of the
interest earned from the collateral. If the borrower defaults on its obligation to return the
securities loaned because of insolvency or other reasons, the Fund could experience delays
and cost in recovering the securities loaned or in gaining access to the collateral. The Fund
continues to receive the economic benefit of interest or dividends paid on the securities
loaned in the form of a substitute payment received from the borrower. As of November 30,
2007, the Fund had on loan securities valued at $14,490,081 which are included in the
Statement of Assets and Liabilities as “Investments, at value” and, when applicable, as
“Receivable for Investments sold.” Collateral of $15,303,545 was received for the loans, all of
which was received in cash and subsequently invested in approved investments.
8. Recent Accounting Pronouncement
In June 2006, the Financial Accounting Standards Board (“FASB”) issued FASB Interpretation
No. 48 (“FIN 48”), Accounting for Uncertainty in Income Taxes. FIN 48 clarifies the accounting
for uncertainty in income taxes recognized in an enterprise’s financial statements in accor-
dance with FASB Statement No. 109, Accounting for Income Taxes. FIN 48 requires the
47
OPPENHEIMER INTERNATIONAL GROWTH FUND

NOTES TO FINANCIAL STATEMENTS
Continued
8. Recent Accounting Pronouncement Continued
evaluation of tax positions taken in the course of preparing the Fund’s tax returns to deter-
mine whether it is “more-likely-than-not” that tax positions taken in the Fund’s tax return
will be ultimately sustained. A tax liability and expense must be recorded in respect of any
tax position that, in Management’s judgment, will not be fully realized. FIN 48 is effective for
fiscal years beginning after December 15, 2006. As of November 30, 2007, the Manager has
evaluated the implications of FIN 48 and does not currently anticipate a material impact to
the Fund’s financial statements. The Manager will continue to monitor the Fund's tax posi-
tions prospectively for potential future impacts.
In September 2006, the FASB issued Statement of Financial Accounting Standards
(“SFAS”) No. 157, Fair Value Measurements. This standard establishes a single authoritative
definition of fair value, sets out a framework for measuring fair value and expands disclo-
sures about fair value measurements. SFAS No. 157 applies to fair value measurements
already required or permitted by existing standards. SFAS No. 157 is effective for financial
statements issued for fiscal years beginning after November 15, 2007, and interim periods
within those fiscal years. As of November 30, 2007, the Manager does not believe the
adoption of SFAS No. 157 will materially impact the financial statement amounts; how-
ever, additional disclosures may be required about the inputs used to develop the
measurements and the effect of certain of the measurements on changes in net assets
for the period.
48
OPPENHEIMER INTERNATIONAL GROWTH FUND
OPPENHEIMER INTERNATIONAL GROWTH FUND

REPORT OF INDEPENDENT REGISTERED PUBLIC ACCOUNTING FIRM
The Board of Trustees and Shareholders of Oppenheimer International Growth Fund:
We have audited the accompanying statement of assets and liabilities of Oppenheimer
International Growth Fund, including the statement of investments, as of November 30,
2007, and the related statement of operations for the year then ended, the statements of
changes in net assets for each of the years in the two-year period then ended, and the
financial highlights for each of the years in the five-year period then ended. These finan-
cial statements and financial highlights are the responsibility of the Fund’s management.
Our responsibility is to express an opinion on these financial statements and financial
highlights based on our audits.
We conducted our audits in accordance with the standards of the Public Company
Accounting Oversight Board (United States). Those standards require that we plan and
perform the audit to obtain reasonable assurance about whether the financial statements
and financial highlights are free of material misstatement. An audit includes examining,
on a test basis, evidence supporting the amounts and disclosures in the financial state-
ments. Our procedures included confirmation of securities owned as of November 30,
2007, by correspondence with the custodian and brokers or by other appropriate audit-
ing procedures where replies from brokers were not received. An audit also includes
assessing the accounting principles used and significant estimates made by management,
as well as evaluating the overall financial statement presentation. We believe that our
audits provide a reasonable basis for our opinion.
In our opinion, the financial statements and financial highlights referred to above pre-
sent fairly, in all material respects, the financial position of Oppenheimer International
Growth Fund as of November 30, 2007, the results of its operations for the year then
ended, the changes in its net assets for each of the years in the two-year period then
ended, and the financial highlights for each of the years in the five-year period then
ended, in conformity with U.S. generally accepted accounting principles.
KPMG LLP
Denver, Colorado
January 16, 2008
49
OPPENHEIMER INTERNATIONAL GROWTH FUND
OPPENHEIMER INTERNATIONAL GROWTH FUND

FEDERAL INCOME TAX INFORMATION
Unaudited
In early 2008, if applicable, shareholders of record will receive information regarding all divi-
dends and distributions paid to them by the Fund during calendar year 2007. Regulations of
the U.S. Treasury Department require the Fund to report this information to the Internal
Revenue Service.
None of the dividends paid by the Fund during the fiscal year ended November 30,
2007 are eligible for the corporate dividend-received deduction.
A portion, if any, of the dividends paid by the Fund during the fiscal year ended November
30, 2007 which are not designated as capital gain distributions are eligible for lower individual
income tax rates to the extent that the Fund has received qualified dividend income as stipu-
lated by recent tax legislation. $37,476,929 of the Fund's fiscal year taxable income may be
eligible for the lower individual income tax rates. In early 2008, shareholders of record will
receive information regarding the percentage of distributions that are eligible for lower individ-
ual income tax rates.
Recent tax legislation allows a regulated investment company to designate distribu-
tions not designated as capital gain distributions, as either interest related dividends or
short-term capital gain dividends, both of which are exempt from the U.S. withholding
tax applicable to non U.S. taxpayers. For the fiscal year ended November 30, 2007,
$42,042 or 0.30% of the ordinary distributions paid by the Fund qualifies as an interest
related dividend.
The Fund has elected the application of Section 853 of the Internal Revenue Code to
permit shareholders to take a federal income tax credit or deduction, at their option, on a
per share basis for an aggregate amount of $825,057 of foreign income taxes paid by the
Fund during the fiscal year ended November 30, 2007. A separate notice will be mailed to
each shareholder, which will reflect the proportionate share of such foreign taxes which
must be treated by shareholders as gross income for federal income tax purposes.
Gross income of $18,636,381 was derived from sources within foreign countries or
possessions of the United States.
The foregoing information is presented to assist shareholders in reporting distribu-
tions received from the Fund to the Internal Revenue Service. Because of the complexity
of the federal regulations which may affect your individual tax return and the many
variations in state and local tax regulations, we recommend that you consult your tax
advisor for specific guidance.
50
OPPENHEIMER INTERNATIONAL GROWTH FUND

PORTFOLIO PROXY VOTING POLICIES AND PROCEDURES;
UPDATES TO STATEMENTS OF INVESTMENTS
Unaudited
The Fund has adopted Portfolio Proxy Voting Policies and Procedures under which the
Fund votes proxies relating to securities (“portfolio proxies”) held by the Fund. A descrip-
tion of the Fund’s Portfolio Proxy Voting Policies and Procedures is available (i) without
charge, upon request, by calling the Fund toll-free at 1.800.525.7048, (ii) on the Fund’s
website at www.oppenheimerfunds.com, and (iii) on the SEC’s website at www.sec.gov. In
addition, the Fund is required to file Form N-PX, with its complete proxy voting record
for the 12 months ended June 30th, no later than August 31st of each year. The Fund’s
voting record is available (i) without charge, upon request, by calling the Fund toll-free at
1.800.525.7048, and (ii) in the Form N-PX filing on the SEC’s website at www.sec.gov.
The Fund files its complete schedule of portfolio holdings with the SEC for the first
quarter and the third quarter of each fiscal year on Form N-Q. The Fund’s Form N-Q filings
are available on the SEC’s website at http://www.sec.gov. Those forms may be reviewed and
copied at the SEC’s Public Reference Room in Washington D.C. Information on the opera-
tion of the Public Reference Room may be obtained by calling 1-800-SEC-0330.
51
OPPENHEIMER INTERNATIONAL GROWTH FUND

BOARD APPROVAL OF THE FUND’S INVESTMENT
ADVISORY AGREEMENT
Unaudited
Each year, the Board of Trustees (the “Board”), including a majority of the independent
Trustees, is required to determine whether to renew the Fund’s investment advisory agree-
ment (the “Agreement”). The Investment Company Act of 1940, as amended, requires that
the Board request and evaluate, and that the Manager provide, such information as may be
reasonably necessary to evaluate the terms of the Agreement. The Board employs an inde-
pendent consultant to prepare a report that provides information, including comparative
information, that the Board requests for that purpose. In addition, the Board receives infor-
mation throughout the year regarding Fund services, fees, expenses and performance.
The Manager and the independent consultant provided information to the Board on
the following factors: (i) the nature, quality and extent of the Manager’s services, (ii) the
investment performance of the Fund and the Manager, (iii) the fees and expenses of the
Fund, including comparative expense information, (iv) the profitability of the Manager
and its affiliates, including an analysis of the cost of providing services by the Manager
and its affiliates, (v) the extent to which economies of scale are realized as the Fund
grows and whether fee levels reflect these economies of scale for Fund investors and (vi)
other benefits to the Manager from its relationship with the Fund. The Board was aware
that there are alternatives to retaining the Manager.
Nature and Extent of Services. The Board considered information about the nature
and extent of the services provided to the Fund and information regarding the Manager’s
key personnel who provide such services. The Manager’s duties include providing the
Fund with the services of the portfolio manager and the Manager's investment team,
who provide research, analysis and other advisory services in regard to the Fund’s invest-
ments; securities trading services; oversight of third party service providers; monitoring
compliance with applicable Fund policies and procedures and adherence to the Fund’s
investment restrictions. The Manager is responsible for providing certain administrative
services to the Fund as well. Those services include providing and supervising all adminis-
trative and clerical personnel who are necessary in order to provide effective corporate
administration for the Fund; compiling and maintaining records with respect to the
Fund’s operations; preparing and filing reports required by the Securities and Exchange
Commission; preparing periodic reports regarding the operations of the Fund for its
shareholders; preparing proxy materials for shareholder meetings; and preparing the regis-
tration statements required by Federal and state securities laws for the sale of the Fund’s
shares. The Manager also provides the Fund with office space, facilities and equipment.
Quality of Services. The Board also considered the quality of the services provided
and the quality of the Manager’s resources that are available to the Fund. The Board took
account of the fact that the Manager has had over forty years of experience as an
52
OPPENHEIMER INTERNATIONAL GROWTH FUND

investment adviser and that its assets under management rank it among the top mutual
fund managers in the United States. The Board evaluated the Manager’s administrative,
accounting, legal and compliance services, and information the Board has received regard-
ing the experience and professional qualifications of the Manager’s personnel and the size
and functions of its staff. In its evaluation of the quality of the portfolio management ser-
vices provided, the Board considered the experience of George R. Evans, the portfolio
manager for the Fund, and the Manager's Global investment team and analysts. The Board
members also considered their experiences with the Manager and its officers and other
personnel through their service on the Boards of the Fund and other funds advised by the
Manager. The Board considered information regarding the quality of services provided by
affiliates of the Manager, which its members have become knowledgeable about in connec-
tion with the renewal of the Fund’s service agreements. In light of the foregoing, the Board
concluded that the Fund benefits from the services provided under the Agreement and
from the Manager’s experience, reputation, personnel, operations, and resources.
Investment Performance of the Manager and the Fund. During the year, the Manager
provided information on the investment performance of the Fund and the Manager at each
regular quarterly Board meeting, including comparative performance information. The Board
also reviewed information, prepared by the Manager and by the independent consultant,
comparing the Fund’s historical performance to relevant market indices and to the perfor-
mance of other retail front-end load and no-load international multi-cap growth funds
advised by the Manager and by other investment advisers. The Board noted that the Fund’s
one-year, three-year, five-year and ten-year performance were better than the median of its
peer group of international multi-cap growth funds regardless of asset size, but that its three-
and five-year performance was less than that of a comparative group of international multi-
and large-cap load funds of similar size to the Fund.
Management Fees and Expenses. The Board reviewed the fees paid to the Manager and
its affiliates and the other expenses borne by the Fund. The Board also considered the com-
parability of the fees charged and the services provided to the Fund to the fees and services
for other clients or accounts advised by the Manager. The independent consultant provided
comparative data in regard to the fees and expenses of the Fund, other international multi-
cap growth and international large-cap growth funds and other funds with comparable asset
levels and distribution features. The Board noted that the Fund’s contractual and actual man-
agement fees and total expenses are lower than its peer group median.
Economies of Scale. The Board reviewed the extent to which the Manager may realize
economies of scale in managing and supporting the Fund, the extent to which those
economies of scale benefit the Fund’s shareholders and the current level of Fund assets in
53
OPPENHEIMER INTERNATIONAL GROWTH FUND

BOARD APPROVAL OF THE FUND’S INVESTMENT
ADVISORY AGREEMENT
Unaudited / Continued
relation to the Fund’s breakpoint schedule for its management fees. The Board also noted
the Fund’s breakpoints, which are intended to share economies of scale that may exist as the
Fund grows with its shareholders. Based on this evaluation, the Board requested and the
Manager agreed to a revised breakpoint schedule. Effective September 1, 2007, the Fund pays
the Manager at the following annual rates that declines as the Fund assets grow: 0.80% of
the first $250 million of average annual net assets, 0.77% of the next $250 million of average
annual net assets, 0.75% of the next $500 million of average annual net assets, 0.69% of the
next $1.0 billion of average annual net assets, 0.67% of the next $3.0 billion of average annual
net assets and 0.65% of average annual net assets in excess of $5.0 billion.
Benefits to the Manager. The Board considered information regarding the Manager’s
costs in serving as the Fund’s investment adviser, including the costs associated with the per-
sonnel and systems necessary to manage the Fund, and information regarding the Manager’s
profitability from its relationship with the Fund. The Board considered that the Manager
must be able to pay and retain experienced professional personnel at competitive rates to
provide services to the Fund and that maintaining the financial viability of the Manager is
important in order for the Manager to continue to provide significant services to the Fund
and its shareholders. In addition to considering the profits realized by the Manager, the
Board considered information regarding the direct and indirect benefits the Manager
receives as a result of its relationship with the Fund, including compensation paid to the
Manager’s affiliates for services provided and research provided to the Manager in connec-
tion with permissible brokerage arrangements (soft dollar arrangements).
Conclusions. These factors were also considered by the independent Trustees meet-
ing separately from the full Board, assisted by experienced counsel to the Fund and the
independent Trustees. Fund counsel is independent of the Manager within the meaning
and intent of the Securities and Exchange Commission Rules.
Based on its review of the information it received and its evaluations described above, the
Board, including a majority of the independent Trustees, concluded that the nature, extent
and quality of the services provided to the Fund by the Manager are a benefit to the Fund
and in the best interest of the Fund’s shareholders and that the amount and structure of the
compensation received by the Manager and its affiliates, and the revised management fee
structure adopted by the Board and the Manager, are reasonable in relation to the services
provided. Accordingly, the Board elected to continue the Agreement for another year. In
arriving at this decision, the Board did not single out any factor or factors as being more
important than others, but considered all of the factors together. The Board judged the
terms and conditions of the Agreement, including the management fee, in light of all of the
surrounding circumstances.
54
OPPENHEIMER INTERNATIONAL GROWTH FUND

TRUSTEES AND OFFICERS
Unaudited
Name, Position(s) Held with the
Principal Occupation(s) During the Past 5 Years; Other Trusteeships/Directorships
Fund, Length of Service, Age
Held; Number of Portfolios in the Fund Complex Currently Overseen
INDEPENDENT
The address of each Trustee in the chart below is 6803 S. Tucson Way, Centennial,
TRUSTEES
Colorado 80112-3924. Each Trustee serves for an indefinite term, or until his or her
resignation, retirement, death or removal.
Brian F. Wruble,
General Partner of Odyssey Partners, L.P. (hedge fund) (since September 1995);
Chairman of the Board of
Director of Special Value Opportunities Fund, LLC (registered investment company)
Trustees (since 2007) and
(since September 2004); Member of Zurich Financial Services Investment Advisory
Trustee (since 2005)
Board (insurance) (since October 2004); Chairman (since August 2007) and Trustee
Age: 64
(since August 1991) of the Board of Governing Trustees of The Jackson Laboratory
(non-profit); Trustee of the Institute for Advanced Study (non-profit educational
institute) (since May 1992); Special Limited Partner of Odyssey Investment Partners,
LLC (private equity investment) (January 1999-September 2004); Trustee of Research
Foundation of AIMR (2000-2002) (investment research, non-profit); Governor,
Jerome Levy Economics Institute of Bard College (August 1990-September 2001)
(economics research); Director of Ray & Berendtson, Inc. (May 2000-April 2002)
(executive search firm). Oversees 63 portfolios in the OppenheimerFunds complex.
David K. Downes,
President, Chief Executive Officer and Board Member of CRAFund Advisors, Inc.
Trustee (since 2007)
(investment management company) (since January 2004); President of The
Age: 68
Community Reinvestment Act Qualified Investment Fund (investment manage-
ment company) (since January 2004); Independent Chairman of the Board of
Trustees of Quaker Investment Trust (registered investment company) (since
January 2004); Director of Internet Capital Group (information technology com-
pany) (since October 2003); Chief Operating Officer and Chief Financial Officer
of Lincoln National Investment Companies, Inc. (subsidiary of Lincoln National
Corporation, a publicly traded company) and Delaware Investments U.S., Inc.
(investment management subsidiary of Lincoln National Corporation) (1993-
2003); President, Chief Executive Officer and Trustee of Delaware Investment
Family of Funds (1993-2003); President and Board Member of Lincoln National
Convertible Securities Funds, Inc. and the Lincoln National Income Funds, TDC
(1993-2003); Chairman and Chief Executive Officer of Retirement Financial
Services, Inc. (registered transfer agent and investment adviser and subsidiary of
Delaware Investments U.S., Inc.) (1993-2003); President and Chief Executive
Officer of Delaware Service Company, Inc. (1995-2003); Chief Administrative
Officer, Chief Financial Officer, Vice Chairman and Director of Equitable Capital
Management Corporation (investment subsidiary of Equitable Life Assurance
Society) (1985-1992); Corporate Controller of Merrill Lynch & Company (finan-
cial services holding company) (1977-1985); held the following positions at the
Colonial Penn Group, Inc. (insurance company): Corporate Budget Director
(1974-1977), Assistant Treasurer (1972-1974) and Director of Corporate Taxes
(1969-1972); held the following positions at Price Waterhouse & Company
(financial services firm): Tax Manager (1967-1969), Tax Senior (1965-1967) and
Staff Accountant (1963-1965); United States Marine Corps (1957-1959). Oversees
63 portfolios in the OppenheimerFunds complex.
Matthew P. Fink,
Trustee of the Committee for Economic Development (policy research founda-
Trustee (since 2005)
tion) (since 2005); Director of ICI Education Foundation (education foundation)
Age: 67
(October 1991-August 2006); President of the Investment Company Institute
(trade association) (October 1991-June 2004); Director of ICI Mutual Insurance
Company (insurance company) (October 1991-June 2004). Oversees 53 portfo-
lios in the OppenheimerFunds complex.
55
OPPENHEIMER INTERNATIONAL GROWTH FUND

TRUSTEES AND OFFICERS
Unaudited / Continued
Robert G. Galli,
A director or trustee of other Oppenheimer funds. Oversees 63 portfolios in the
Trustee (since 1996)
OppenheimerFunds complex.
Age: 74
Phillip A. Griffiths,
Distinguished Presidential Fellow for International Affairs (since 2002) and Member
Trustee (since 1999)
(since 1979) of the National Academy of Sciences; Council on Foreign Relations
Age: 69
(since 2002); Director of GSI Lumonics Inc. (precision medical equipment supplier)
(since 2001); Senior Advisor of The Andrew W. Mellon Foundation (since 2001);
Chair of Science Initiative Group (since 1999); Member of the American Philo-
sophical Society (since 1996); Trustee of Woodward Academy (since 1983); Foreign
Associate of Third World Academy of Sciences; Director of the Institute for
Advanced Study (1991-2004); Director of Bankers Trust New York Corporation
(1994-1999); Provost at Duke University (1983-1991). Oversees 53 portfolios in the
OppenheimerFunds complex.
Mary F. Miller,
Trustee of the American Symphony Orchestra (not-for-profit) (since October
Trustee (since 2004)
1998); and Senior Vice President and General Auditor of American Express
Age: 65
Company (financial services company) (July 1998-February 2003). Oversees 53
portfolios in the OppenheimerFunds complex.
Joel W. Motley,
Managing Director of Public Capital Advisors, LLC (privately-held financial advi-
Trustee (since 2002)
sor) (since January 2006); Director of Columbia Equity Financial Corp.
Age: 55
(privately-held financial advisor) (since 2002); Managing Director of Carmona
Motley, Inc. (privately-held financial advisor) (since January 2002); Managing
Director of Carmona Motley Hoffman Inc. (privately-held financial advisor)
(January 1998-December 2001); Member of the Finance and Budget Committee
of the Council on Foreign Relations, Member of the Investment Committee of
the Episcopal Church of America, Member of the Investment Committee and
Board of Human Rights Watch and the Investment Committee of Historic
Hudson Valley. Oversees 53 portfolios in the OppenheimerFunds complex.
Russell S. Reynolds, Jr.,
Chairman of RSR Partners (formerly “The Directorship Search Group, Inc.”) (cor-
Trustee (since 1996)
porate governance consulting and executive recruiting) (since 1993); Life Trustee
Age: 76
of International House (non-profit educational organization); Former Trustee of
The Historical Society of the Town of Greenwich; Former Director of Greenwich
Hospital Association. Oversees 53 portfolios in the OppenheimerFunds complex.
Joseph M. Wikler,
Director of the following medical device companies: Medintec (since 1992) and
Trustee (since 2005)
Cathco (since 1996); Director of Lakes Environmental Association (environmental
Age: 66
protection organization) (since 1996); Member of the Investment Committee of the
Associated Jewish Charities of Baltimore (since 1994); Director of Fortis/Hartford
mutual funds (1994-December 2001); Director of C-TASC (a privately held bio-
statistics company) (since May 2007). Oversees 53 portfolios in the
OppenheimerFunds complex.
Peter I. Wold,
President of Wold Oil Properties, Inc. (oil and gas exploration and production
Trustee (since 2005)
company) (since 1994); Vice President of American Talc Company, Inc. (talc min-
Age: 60
ing and milling) (since 1999); Managing Member of Hole-in-the-Wall Ranch
(cattle ranching) (since 1979); Vice President, Secretary and Treasurer of Wold
Trona Company, Inc. (soda ash processing and production) (1996-2006); Director
and Chairman of the Denver Branch of the Federal Reserve Bank of Kansas City
(1993-1999); and Director of PacifiCorp. (electric utility) (1995-1999). Oversees 53
portfolios in the OppenheimerFunds complex.
56
OPPENHEIMER INTERNATIONAL GROWTH FUND

INTERESTED TRUSTEE
The address of Mr. Murphy is Two World Financial Center, 225 Liberty Street, 11th
AND OFFICER
Floor, New York, New York 10281-1008. Mr. Murphy serves as a Trustee for an indef-
inite term, or until his resignation, retirement, death or removal and as an Officer
for an indefinite term, or until his resignation, retirement, death or removal. Mr.
Murphy is an interested Trustee due to his positions with OppenheimerFunds, Inc.
and its affiliates.
John V. Murphy,
Chairman, Chief Executive Officer and Director of the Manager (since June
Trustee, President and
2001); President of the Manager (September 2000-March 2007); President and
Principal Executive Officer
director or trustee of other Oppenheimer funds; President and Director of
(since 2001)
Oppenheimer Acquisition Corp. (“OAC”) (the Manager’s parent holding com-
Age: 58
pany) and of Oppenheimer Partnership Holdings, Inc. (holding company
subsidiary of the Manager) (since July 2001); Director of OppenheimerFunds
Distributor, Inc. (subsidiary of the Manager) (November 2001–December 2006);
Chairman and Director of Shareholder Services, Inc. and of Shareholder
Financial Services, Inc. (transfer agent subsidiaries of the Manager) (since July
2001); President and Director of OppenheimerFunds Legacy Program (charita-
ble trust program established by the Manager) (since July 2001); Director of the
following investment advisory subsidiaries of the Manager: OFI Institutional
Asset Management, Inc., Centennial Asset Management Corporation, Trinity
Investment Management Corporation and Tremont Capital Management, Inc.
(since November 2001), HarbourView Asset Management Corporation and OFI
Private Investments, Inc. (since July 2001); President (since November 2001) and
Director (since July 2001) of Oppenheimer Real Asset Management, Inc.;
Executive Vice President of Massachusetts Mutual Life Insurance Company
(OAC’s parent company) (since February 1997); Director of DLB Acquisition
Corporation (holding company parent of Babson Capital Management LLC)
(since June 1995); Chairman (since October 2007) and Member of the
Investment Company Institute’s Board of Governors (since October 2003).
Oversees 102 portfolios in the OppenheimerFunds complex.
OTHER OFFICERS OF
The addresses of the Officers in the chart below are as follows: for Messrs. Evans,
THE FUND
Zack and Ms. Bloomberg, Two World Financial Center, 225 Liberty Street, New York,
New York 10281-1008, for Messrs. Vandehey, Wixted, Petersen, Szilagyi and Ms. Ives,
6803 S. Tucson Way, Centennial, Colorado 80112-3924. Each Officer serves for an
indefinite term or until his or her resignation, retirement, death or removal.
George R. Evans,
Senior Vice President (since October 1993) and Director of International Equities
Vice President and Portfolio
(since July 2004) of the Manager. Formerly Vice President of HarbourView Asset
Manager (since 1996)
Management Corporation (July 1994-November 2001). An officer of 2 portfolios
Age: 48
in the OppenheimerFunds complex.
Mark S. Vandehey,
Senior Vice President and Chief Compliance Officer of the Manager (since March
Vice President and Chief
2004); Chief Compliance Officer of the Manager, OppenheimerFunds Distributor,
Compliance Officer
Inc., Centennial Asset Management and Shareholder Services, Inc. (since March
(since 2004)
2004); Vice President of OppenheimerFunds Distributor, Inc., Centennial Asset
Age: 57
Management Corporation and Shareholder Services, Inc. (since June 1983). Former
Vice President and Director of Internal Audit of the Manager (1997-February 2004).
An officer of 102 portfolios in the OppenheimerFunds complex.
Brian W. Wixted,
Senior Vice President and Treasurer of the Manager (since March 1999); Treasurer
Treasurer and Principal
of the following: HarbourView Asset Management Corporation, Shareholder Finan-
Financial & Accounting
cial Services, Inc., Shareholder Services, Inc., Oppenheimer Real Asset Management,
Officer (since 1999)
Inc. and Oppenheimer Partnership Holdings, Inc. (since March 1999), OFI Private
Age: 48
Investments, Inc. (since March 2000), OppenheimerFunds International Ltd. (since
May 2000), OppenheimerFunds plc (since May 2000), OFI Institutional Asset
57
OPPENHEIMER INTERNATIONAL GROWTH FUND
OPPENHEIMER INTERNATIONAL GROWTH FUND

TRUSTEES AND OFFICERS
Unaudited / Continued
Brian W. Wixted,
Management, Inc. (since November 2000), and OppenheimerFunds Legacy Program
Continued
(charitable trust program established by the Manager) (since June 2003); Treasurer
and Chief Financial Officer of OFI Trust Company (trust company subsidiary of the
Manager) (since May 2000); Assistant Treasurer of the following: OAC (since March
1999), Centennial Asset Management Corporation (March 1999-October 2003) and
OppenheimerFunds Legacy Program (April 2000-June 2003). An officer of 102 port-
folios in the OppenheimerFunds complex.
Brian S. Petersen,
Vice President of the Manager (since February 2007); Assistant Vice President of the
Assistant Treasurer
Manager (August 2002-February 2007); Manager/Financial Product Accounting of
(since 2004)
the Manager (November 1998-July 2002). An officer of 102 portfolios in the
Age: 37
OppenheimerFunds complex.
Brian C. Szilagyi,
Assistant Vice President of the Manager (since July 2004); Director of Financial
Assistant Treasurer
Reporting and Compliance of First Data Corporation (April 2003-July 2004);
(since 2005)
Manager of Compliance of Berger Financial Group LLC (May 2001-March 2003).
Age: 37
An officer of 102 portfolios in the OppenheimerFunds complex.
Robert G. Zack,
Executive Vice President (since January 2004) and General Counsel (since March
Secretary (since 2001)
2002) of the Manager; General Counsel and Director of the Distributor (since
Age: 59
December 2001); General Counsel of Centennial Asset Management Corporation
(since December 2001); Senior Vice President and General Counsel of HarbourView
Asset Management Corporation (since December 2001); Secretary and General
Counsel of OAC (since November 2001); Assistant Secretary (since September
1997) and Director (since November 2001) of OppenheimerFunds International
Ltd. and OppenheimerFunds plc; Vice President and Director of Oppenheimer
Partnership Holdings, Inc. (since December 2002); Director of Oppenheimer Real
Asset Management, Inc. (since November 2001); Senior Vice President, General
Counsel and Director of Shareholder Financial Services, Inc. and Shareholder
Services, Inc. (since December 2001); Senior Vice President, General Counsel and
Director of OFI Private Investments, Inc. and OFI Trust Company (since November
2001); Vice President of OppenheimerFunds Legacy Program (since June 2003);
Senior Vice President and General Counsel of OFI Institutional Asset Management,
Inc. (since November 2001); Director of OppenheimerFunds International
Distributor Limited (since December 2003); Senior Vice President (May 1985-
December 2003). An officer of 102 portfolios in the OppenheimerFunds complex.
Lisa I. Bloomberg,
Vice President and Associate Counsel of the Manager (since May 2004); First Vice
Assistant Secretary
President (April 2001-April 2004), Associate General Counsel (December 2000-April
(since 2004)
2004). An officer of 102 portfolios in the OppenheimerFunds complex.
Age: 40
Phillip S. Gillespie,
Senior Vice President and Deputy General Counsel of the Manager (since
Assistant Secretary
September 2004); First Vice President (2000-September 2004), Director (2000-
(since 2004)
September 2004) and Vice President (1998-2000) of Merrill Lynch Investment
Age: 43
Management. An officer of 102 portfolios in the OppenheimerFunds complex.
58
OPPENHEIMER INTERNATIONAL GROWTH FUND

Kathleen T. Ives,
Vice President (since June 1998) and Senior Counsel and Assistant Secretary
Assistant Secretary
(since October 2003) of the Manager; Vice President (since 1999) and Assistant
(since 2001)
Secretary (since October 2003) of the Distributor; Assistant Secretary of Centennial
Age: 42
Asset Management Corporation (since October 2003); Vice President and Assist-
ant Secretary of Shareholder Services, Inc. (since 1999); Assistant Secretary of
OppenheimerFunds Legacy Program and Shareholder Financial Services, Inc. (since
December 2001); Assistant Counsel of the Manager (August 1994-October 2003).
An officer of 102 portfolios in the OppenheimerFunds complex.
The Fund’s Statement of Additional Information contains additional information about the Fund’s Trustees
and Officers is available without charge upon request, by calling 1.800.525.7048.
59
OPPENHEIMER INTERNATIONAL GROWTH FUND

Item 2. Code of Ethics.
The registrant has adopted a code of ethics that applies to the registrant’s principal
executive officer, principal financial officer, principal accounting officer or controller or
persons performing similar functions.
Item 3. Audit Committee Financial Expert.
The Board of Trustees of the registrant has determined that David Downes, a member of
the Board’s Audit Committee, is an audit committee financial expert and that Mr.
Downes is “independent” for purposes of this Item 3.
Item 4. Principal Accountant Fees and Services.
(a)
Audit Fees
The principal accountant for the audit of the registrant’s annual financial statements
billed $26,000 in fiscal 2007 and $23,000 in fiscal 2006.
(b)
Audit-Related Fees
The principal accountant for the audit of the registrant’s annual financial statements
billed no such fees during the last two fiscal years.
The principal accountant for the audit of the registrant’s annual financial statements
billed $256,236 in fiscal 2007 and $216,204 in fiscal 2006 to the registrant’s investment
adviser or any entity controlling, controlled by, or under common control with the adviser
that provides ongoing services to the registrant.
Such services include: internal control reviews and professional services relating to FAS
123R.
(c)
Tax Fees
The principal accountant for the audit of the registrant’s annual financial statements
billed $2,334 in fiscal 2007 and $543 in fiscal 2006.
The principal accountant for the audit of the registrant’s annual financial statements
billed no such fees to the registrant during the last two fiscal years to the registrant’s
investment adviser or any entity controlling, controlled by, or under common control with
the adviser that provides ongoing services to the registrant.

(d)
All Other Fees
The principal accountant for the audit of the registrant’s annual financial statements
billed no such fees to the registrant during the last two fiscal years.
The principal accountant for the audit of the registrant’s annual financial statements
billed no such fees during the last two fiscal years to the registrant’s investment adviser
or any entity controlling, controlled by, or under common control with the adviser that
provides ongoing services to the registrant.
(e)
(1) During its regularly scheduled periodic meetings, the registrant’s audit
committee will pre-approve all audit, audit-related, tax and other services to be
provided by the principal accountants of the registrant.
The audit committee has delegated pre-approval authority to its Chairman for any
subsequent new engagements that arise between regularly scheduled meeting
dates provided that any fees such pre-approved are presented to the audit
committee at its next regularly scheduled meeting.
Under applicable laws, pre-approval of non-audit services maybe waived
provided that: 1) the aggregate amount of all such services provided constitutes
no more than five percent of the total amount of fees paid by the registrant to it
principal accountant during the fiscal year in which services are provided 2) such
services were not recognized by the registrant at the time of engagement as non-
audit services and 3) such services are promptly brought to the attention of the
audit committee of the registrant and approved prior to the completion of the
audit.
(2) 100%
(f)
Not applicable as less than 50%.
(g)
The principal accountant for the audit of the registrant’s annual financial
statements billed $256,779 in fiscal 2007 and $216,747 in fiscal 2006 to the
registrant and the registrant’s investment adviser or any entity controlling,
controlled by, or under common control with the adviser that provides ongoing
services to the registrant related to non-audit fees. Those billings did not include
any prohibited non-audit services as defined by the Securities Exchange Act of
1934.
(h)
No such services were rendered.

Item 5. Audit Committee of Listed Registrants
Not applicable.
Item 6. Schedule of Investments.
Not applicable.
Item 7. Disclosure of Proxy Voting Policies and Procedures for Closed-End
Management Investment Companies.
Not applicable.
Item 8. Portfolio Managers of Closed-End Management Investment Companies.
Not applicable.
Item 9. Purchases of Equity Securities by Closed-End Management Investment
Company and Affiliated Purchasers.
Not applicable.
Item 10. Submission of Matters to a Vote of Security Holders.
The Fund’s Governance Committee Provisions with Respect to Nominations of
Directors/Trustees to the Respective Boards
1. The Fund’s Governance Committee (the “Committee”) will evaluate potential Board
candidates to assess their qualifications. The Committee shall have the authority,
upon approval of the Board, to retain an executive search firm to assist in this effort.
The Committee may consider recommendations by business and personal contacts of
current Board members and by executive search firms which the Committee may
engage from time to time and may also consider shareholder recommendations. The
Committee may consider the advice and recommendation of the Funds’ investment
manager and its affiliates in making the selection.
2. The Committee shall screen candidates for Board membership. The Committee has
not established specific qualifications that it believes must be met by a trustee
nominee. In evaluating trustee nominees, the Committee considers, among other
things, an individual’s background, skills, and experience; whether the individual is
an “interested person” as defined in the Investment Company Act of 1940; and

whether the individual would be deemed an “audit committee financial expert” within
the meaning of applicable SEC rules. The Committee also considers whether the
individual’s background, skills, and experience will complement the background,
skills, and experience of other nominees and will contribute to the Board. There are
no differences in the manner in which the Committee evaluates nominees for trustees
based on whether the nominee is recommended by a shareholder.
3. The Committee may consider nominations from shareholders for the Board at such
times as the Committee meets to consider new nominees for the Board. The
Committee shall have the sole discretion to determine the candidates to present to the
Board and, in such cases where required, to shareholders. Recommendations for
trustee nominees should, at a minimum, be accompanied by the following:
•
the name, address, and business, educational, and/or other pertinent background
of the person being recommended;
•
a statement concerning whether the person is an “interested person” as defined in
the Investment Company Act of 1940;
•
any other information that the Funds would be required to include in a proxy
statement concerning the person if he or she was nominated; and
•
the name and address of the person submitting the recommendation and, if that
person is a shareholder, the period for which that person held Fund shares.
The recommendation also can include any additional information which the person
submitting it believes would assist the Committee in evaluating the recommendation.
4. Shareholders should note that a person who owns securities issued by Massachusetts
Mutual Life Insurance Company (the parent company of the Funds’ investment
adviser) would be deemed an “interested person” under the Investment Company Act
of 1940. In addition, certain other relationships with Massachusetts Mutual Life
Insurance Company or its subsidiaries, with registered broker-dealers, or with the
Funds’ outside legal counsel may cause a person to be deemed an “interested person.”
5. Before the Committee decides to nominate an individual as a trustee, Committee
members and other directors customarily interview the individual in person. In
addition, the individual customarily is asked to complete a detailed questionnaire
which is designed to elicit information which must be disclosed under SEC and stock
exchange rules and to determine whether the individual is subject to any statutory
disqualification from serving as a trustee of a registered investment company.

Item 11. Controls and Procedures.
Based on their evaluation of the registrant’s disclosure controls and procedures (as
defined in rule 30a-3(c) under the Investment Company Act of 1940 (17 CFR 270.30a-
3(c)) as of 11/30/2007, the registrant’s principal executive officer and principal financial
officer found the registrant’s disclosure controls and procedures to provide reasonable
assurances that information required to be disclosed by the registrant in the reports that it
files under the Securities Exchange Act of 1934 (a) is accumulated and communicated to
registrant’s management, including its principal executive officer and principal financial
officer, to allow timely decisions regarding required disclosure, and (b) is recorded,
processed, summarized and reported, within the time periods specified in the rules and
forms adopted by the U.S. Securities and Exchange Commission.
There have been no changes in the registrant’s internal controls over financial reporting
that occurred during the registrant’s second fiscal quarter of the period covered by this
report that have materially affected, or are reasonably likely to materially affect, the
registrant’s internal control over financial reporting.
Item 12. Exhibits.
(a)
(1) Exhibit attached hereto.
(2) Exhibits attached hereto.
(3) Not applicable.
(b)
Exhibit attached hereto.

SIGNATURES
Pursuant to the requirements of the Securities Exchange Act of 1934 and the Investment
Company Act of 1940, the registrant has duly caused this report to be signed on its behalf
by the undersigned, thereunto duly authorized.
Oppenheimer International Growth Fund
By: /s/ John V. Murphy
John V. Murphy
Principal Executive Officer
Date: 01/14/2008
Pursuant to the requirements of the Securities Exchange Act of 1934 and the Investment
Company Act of 1940, this report has been signed below by the following persons on
behalf of the registrant and in the capacities and on the dates indicated.
By: /s/ John V. Murphy
John V. Murphy
Principal Executive Officer
Date: 01/14/2008
By: /s/ Brian W. Wixted
Brian W. Wixted
Principal Financial Officer
Date: 01/14/2008