UNITED STATES
SECURITIES AND EXCHANGE COMMISSION
WASHINGTON, D.C. 20549
FORM N-CSRS/A
CERTIFIED SHAREHOLDER REPORT OF REGISTERED MANAGEMENT
INVESTMENT COMPANIES
Investment Company Act file number 811-07489
Oppenheimer International Growth Fund
(Exact name of registrant as specified in charter)
6803 South Tucson Way, Centennial, Colorado 80112-3924
(Address of principal executive offices) (Zip code)
Cynthia Lo Bessette
OFI Global Asset Management, Inc.
225 Liberty Street, New York, New York 10281-1008
(Name and address of agent for service)
Registrant’s telephone number, including area code: (303) 768-3200
Date of fiscal year end: November 30
Date of reporting period: 5/31/2018
This Form N-CSRS/A amends the Form N-CSRS of the registrant for the semiannual reporting period ended May 31, 2018 filed with the Securities and Exchange Commission on August 2, 2018. The report to shareholders for the semiannual period ended May 31, 2018, contained within this Form N-CSRS/A as Item 1, has been restated due to an update to front cover of the semiannual report, from Oppenheimer International Equity Fund to Oppenheimer International Growth Fund, in the Form N-CSRS. The financial statements, including the statement of investments, statement of assets and liabilities, statement of operations, statement of changes in net assets and the financial highlights were not affected.
Item 1. Reports to Stockholders.
Table of Contents
Class A Shares
AVERAGE ANNUAL TOTAL RETURNS AT 5/31/18
| | | | | | | | | | |
| | | Class A Shares of the Fund | | |
| | | Without Sales Charge | | | | With Sales Charge | | | | MSCI AC World ex-U.S.
Index |
6-Month | | 1.10% | | | | -4.71% | | | | 0.27% |
1-Year | | 8.16 | | | | 1.94 | | | | 9.67 |
5-Year | | 6.55 | | | | 5.30 | | | | 5.46 |
10-Year | | 4.72 | | | | 4.10 | | | | 1.86 |
Performance data quoted represents past performance, which does not guarantee future results. The investment return and principal value of an investment in the Fund will fluctuate so that an investor’s shares, when redeemed, may be worth more or less than their original cost. Fund returns include changes in share price, reinvested distributions, and a 5.75% maximum applicable sales charge except where “without sales charge” is indicated. Current performance may be lower or higher than the performance quoted. Returns do not consider capital gains or income taxes on an individual’s investment. Returns for periods of less than one year are cumulative and not annualized. For performance data current to the most recent month-end, visit oppenheimerfunds.com or call 1.800.CALL OPP (225.5677). See Fund prospectuses and summary prospectuses for more information on share classes and sales charges.
2 OPPENHEIMER INTERNATIONAL GROWTH FUND
Fund Performance Discussion
The Fund’s Class A shares (without sales charge) generated a cumulative total return of 1.10% during the reporting period. In comparison, the Fund outperformed the MSCI AC World ex-U.S. Index (the “Index”), which returned 0.27%. The Fund outperformed the Index in the Information Technology, Health Care and Consumer Staples sectors due to stock selection. An underweight position and stock selection in Financials also contributed to performance. Underperformers for the Fund included an underweight position in Energy, stock selection in Industrials and Consumer Discretionary, and an underweight position and stock selection in Materials.
With regard to countries, we remind investors that we are fundamental, bottom-up investors who view the world as one marketplace. Our geographic exposure is purely the result of our stock selection and does not reflect any views regarding the general economy of any country. During this reporting period, stocks in Switzerland, France and Germany benefited performance. Detractors included an underweight position and stock selection in China, and stock selection in the United Kingdom and India.
MARKET OVERVIEW
World equity markets surged in the fourth quarter of 2017 to bring a close to a very strong year. 2018 started on a similar note, with equity markets rising strongly in January on the positive sentiment provoked by the U.S. tax law changes. This was followed by a sharp correction in February and volatile range trading thereafter. Given the very strong performance of equity markets last year, a correction and consolidation seemed in order and we do not find it alarming.
The potential trade friction between the U.S. and China has garnered attention in the closing months of the reporting period. We are of the opinion that trade wars are counter-productive and slow world economic growth in general. However, in our view, the Fund would not be significantly affected should any of the proposed tariffs come into effect. Our emphasis is on highly differentiated businesses with significant pricing power in segments of the economy that are experiencing long-term secular growth. We don’t buy commodity producers or low-cost leaders. To the extent that any of our companies may incorporate some newly tariffed items into their finished products, they are expected to be able to pass on the cost.
A trade war, should it come, will not affect our investment philosophy, strategies, process, or the overall composition of our portfolio.
FUND REVIEW
Top performing holdings for the Fund this reporting period included NEX Group plc, Hermes International and Temenos AG.
3 OPPENHEIMER INTERNATIONAL GROWTH FUND
NEX Group plc, a UK company, is a “broker’s broker.” It is the intermediary between professional participants in many over-the-counter financial markets such as those for foreign exchange, bonds and some derivative instruments. During the period, the Chicago Mercantile Exchange (CME) bid for NEX and the share price rose to reflect the significant premium the CME proposes to pay.
Hermes International SCA is the well-known French luxury company that makes the iconic silk twill ties, scarves and handbags that many people crave. We have owned the company for many years as a luxury holding in our Bread, Booze and Bling theme. Luxury companies have been performing very well of late on the back of strong spending, particularly by the Chinese consumer, and Hermes is no exception.
Temenos AG is an enterprise software company focused on the banking industry. Modern regulatory requirements and the sheer weight of antiquated IT systems, often a residual of decades of mergers and acquisitions, are providing a tailwind for the company. 2016 brought several large new business wins from noteworthy developed market banks. The earnings from these new projects have begun to flow through during the reporting period and the stock price has responded favorably.
Detractors from performance included Iliad SA, Royal Boskalis Westminster and Technicolor SA.
Iliad SA is a French telecommunications and Internet service provider. It has recently entered the Italian market as a fourth carrier and is incurring significant customer acquisition costs, which are weighing on the stock. Iliad entered the French mobile market as a fourth carrier in 2012. In the short term it cratered pricing in the market to gain share. It now has 25% of the French mobile market and makes healthy returns from it.
Royal Boskalis Westminster, a Dutch company that we have owned for many years, is one of the very few major dredging companies in the world. Dredging projects are late-cycle activities, so dredging is not picking up as quickly as other industrial activities in response to the synchronized global recovery that began last year. This was clear when the company announced 2017 earnings during the reporting period. The stock declined in response. Royal Boskalis’s long-term growth has been supported by maritime trade, which requires harbor and canal maintenance and expansion; waterside landfill construction in urban centers such as New York City, Hong Kong, Singapore and so forth; offshore oil and gas and – increasingly – wind energy projects; lowering competition as smaller, government supported players fall out of the market. We believe these trends will continue to support Royal Boskalis.
Technicolor SA, a French company, is the only pure play on virtual reality available in the market. The company also has a strong DVD business and a legacy set-top box business. During the reporting period, the set-top box
4 OPPENHEIMER INTERNATIONAL GROWTH FUND
margins have suffered from a cyclical surge in the price of their component memory chips, and this has focused the attention of shorter-term investors, pressuring the share price. In our opinion, virtual reality entertainment is on a strong growth trajectory and Technicolor is well placed to monetize it. We continue to hold the stock.
STRATEGY & OUTLOOK
As is often the case in market downdrafts, our portfolio outperformed during the volatile reporting period.
Looking ahead, we would not be at all surprised to see continued volatility in equity markets the rest of the year. In our opinion, it is reasonable to expect this after the extremely high returns that equity markets delivered to investors last year. It is worth remembering the old adage “Markets don’t go up in a straight line.”
We will look to take advantage of the volatility to add to companies already held
| | |
 | | 
George R. Evans, CFA |
| | Lead-Portfolio Manager |
in our portfolio and to add new companies to the portfolio from our watch list that have heretofore been too expensive for us to buy.
We remind investors that, when we add companies to the portfolio, we are comparing their present value to the value we think they can have three to five years from now and beyond. On average, when we buy a company, we hold it for 10 years. With this long-term approach, market volatility does not change our view on the kind of companies we would like in our portfolio. It does give us the opportunity to add, or add to, such holdings.
We are bottom up, global, growth investors with a mandate to buy non-U.S. companies. We look for companies that we believe are on the winning side of long-term structural trends, that have the ability to monetize them over a long period of time and that share with us the wealth they create. Those are the companies we believe we have in the portfolio and those are the kind of companies in which we will continue to invest in, regardless of short-term market conditions.
| | |
 | | 
Robert B. Dunphy, CFA Co-Portfolio Manager |
5 OPPENHEIMER INTERNATIONAL GROWTH FUND
Top Holdings and Allocations
TOP TEN COMMON STOCK HOLDINGS
| | | | |
| | |
Infineon Technologies AG | | | 2.5% | |
Temenos AG | | | 2.2 | |
SAP SE | | | 2.0 | |
Nippon Telegraph & Telephone Corp. | | | 1.8 | |
Keyence Corp. | | | 1.7 | |
STMicroelectronics NV | | | 1.6 | |
Continental AG | | | 1.6 | |
Koito Manufacturing Co. Ltd. | | | 1.6 | |
LVMH Moet Hennessy Louis Vuitton SE | | | 1.5 | |
Hermes International | | | 1.5 | |
Portfolio holdings and allocations are subject to change. Percentages are as of May 31, 2018, and are based on net assets. For more current Fund holdings, please visit oppenheimerfunds. com.
TOP TEN GEOGRAPHICAL HOLDINGS
| | | | |
France | | | 15.9% | |
United Kingdom | | | 12.9 | |
Germany | | | 12.4 | |
Japan | | | 12.0 | |
Switzerland | | | 11.2 | |
Netherlands | | | 5.2 | |
Canada | | | 4.2 | |
Spain | | | 4.1 | |
Denmark | | | 3.9 | |
United States | | | 3.5 | |
Portfolio holdings and allocation are subject to change. Percentages are as of May 31, 2018, and are based on total market value of investments. For more current Fund holdings, please visit oppenheimerfunds.com.
SECTOR ALLOCATION
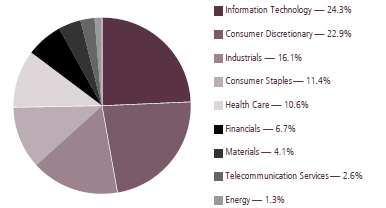
Portfolio holdings and allocations are subject to change. Percentages are as of May 31, 2018, and are based on the total market value of investments.
6 OPPENHEIMER INTERNATIONAL GROWTH FUND
Share Class Performance
AVERAGE ANNUAL TOTAL RETURNS WITHOUT SALES CHARGE AS OF 5/31/18
| | | | | | | | | | | | | | | | | | | | |
| | | | | |
| | | Inception
Date | | | 6-Month | | | 1-Year | | | 5-Year | | | 10-Year | |
Class A (OIGAX) | | | 3/25/96 | | | | 1.10 | % | | | 8.16 | % | | | 6.55 | % | | | 4.72 | % |
Class B (IGRWX) | | | 3/25/96 | | | | 0.67 | | | | 7.30 | | | | 5.74 | | | | 4.23 | |
Class C (OIGCX) | | | 3/25/96 | | | | 0.73 | | | | 7.33 | | | | 5.75 | | | | 3.94 | |
Class I (OIGIX) | | | 3/29/12 | | | | 1.30 | | | | 8.60 | | | | 7.02 | | | | 8.44 | * |
Class R (OIGNX) | | | 3/1/01 | | | | 0.96 | | | | 7.89 | | | | 6.28 | | | | 4.46 | |
Class Y (OIGYX) | | | 9/7/05 | | | | 1.21 | | | | 8.41 | | | | 6.81 | | | | 5.10 | |
AVERAGE ANNUAL TOTAL RETURNS WITH SALES CHARGE AS OF 5/31/18
| | | | | | | | | | | | | | | | | | | | |
| | | | | |
| | | Inception
Date | | | 6-Month | | | 1-Year | | | 5-Year | | | 10-Year | |
Class A (OIGAX) | | | 3/25/96 | | | | -4.71 | % | | | 1.94 | % | | | 5.30 | % | | | 4.10 | % |
Class B (IGRWX) | | | 3/25/96 | | | | -4.33 | | | | 2.30 | | | | 5.42 | | | | 4.23 | |
Class C (OIGCX) | | | 3/25/96 | | | | -0.27 | | | | 6.33 | | | | 5.75 | | | | 3.94 | |
Class I (OIGIX) | | | 3/29/12 | | | | 1.30 | | | | 8.60 | | | | 7.02 | | | | 8.44 | * |
Class R (OIGNX) | | | 3/1/01 | | | | 0.96 | | | | 7.89 | | | | 6.28 | | | | 4.46 | |
Class Y (OIGYX) | | | 9/7/05 | | | | 1.21 | | | | 8.41 | | | | 6.81 | | | | 5.10 | |
* Shows performance since inception.
Performance data quoted represents past performance, which does not guarantee future results. The investment return and principal value of an investment in the Fund will fluctuate so that an investor’s shares, when redeemed, may be worth more or less than their original cost. Current performance may be lower or higher than the performance quoted. Returns do not consider capital gains or income taxes on an individual’s investment. For performance data current to the most recent month-end, visit oppenheimerfunds.com or call 1.800. CALL OPP (225.5677). Fund returns include changes in share price, reinvested distributions, and the applicable sales charge: for Class A shares, the current maximum initial sales charge of 5.75%; for Class B shares, the contingent deferred sales charge of 5% (1-year) and 2% (5-year); and for Class C shares, the contingent deferred sales charge of 1% for the 1-year period. There is no sales charge for Class I, Class R and Class Y shares. Because Class B shares automatically converted to Class A shares 72 months after purchase, the 10-year return for Class B shares uses Class A performance for the period after conversion. Effective June 1, 2018, all Class B shares converted to Class A shares. Returns for periods of less than one year are cumulative and not annualized. See Fund prospectuses and summary prospectuses for more information on share classes and sales charges.
The Fund’s performance is compared to the performance of the MSCI AC World ex-U.S. Index. The MSCI AC World ex-U.S. Index is designed to measure the equity market performance of developed and emerging markets and excludes the U.S. The Index is unmanaged and cannot be purchased directly by investors. While index comparisons may be useful to provide a benchmark for the Fund’s performance, it must be noted that the Fund’s investments are not limited to the investments comprising the Index. Index performance includes reinvestment of income, but does not reflect transaction costs, fees, expenses or taxes. Index performance is
7 OPPENHEIMER INTERNATIONAL GROWTH FUND
shown for illustrative purposes only as a benchmark for the Fund’s performance, and does not predict or depict performance of the Fund. The Fund’s performance reflects the effects of the Fund’s business and operating expenses.
The views in the Fund Performance Discussion represent the opinions of this Fund’s portfolio managers and are not intended as investment advice or to predict or depict the performance of any investment. These views are as of the close of business on May 31, 2018, and are subject to change based on subsequent developments. The Fund’s portfolio and strategies are subject to change.
Before investing in any of the Oppenheimer funds, investors should carefully consider a fund’s investment objectives, risks, charges and expenses. Fund prospectuses and summary prospectuses contain this and other information about the funds, and may be obtained by asking your financial advisor, visiting oppenheimerfunds.com, or calling 1.800.CALL OPP (225.5677). Read prospectuses and summary prospectuses carefully before investing.
Shares of Oppenheimer funds are not deposits or obligations of any bank, are not guaranteed by any bank, are not insured by the FDIC or any other agency, and involve investment risks, including the possible loss of the principal amount invested.
8 OPPENHEIMER INTERNATIONAL GROWTH FUND
Fund Expenses
Fund Expenses. As a shareholder of the Fund, you incur two types of costs: (1) transaction costs, which may include sales charges (loads) on purchase payments and/or contingent deferred sales charges on redemptions; and (2) ongoing costs, including management fees; distribution and service fees; and other Fund expenses. These examples are intended to help you understand your ongoing costs (in dollars) of investing in the Fund and to compare these costs with the ongoing costs of investing in other mutual funds.
The examples are based on an investment of $1,000.00 invested at the beginning of the period and held for the entire 6-month period ended May 31, 2018.
Actual Expenses. The first section of the table provides information about actual account values and actual expenses. You may use the information in this section for the class of shares you hold, together with the amount you invested, to estimate the expense that you paid over the period. Simply divide your account value by $1,000.00 (for example, an $8,600.00 account value divided by $1,000.00 = 8.60), then multiply the result by the number in the first section under the heading entitled “Expenses Paid During 6 Months Ended May 31, 2018” to estimate the expenses you paid on your account during this period.
Hypothetical Example for Comparison Purposes. The second section of the table provides information about hypothetical account values and hypothetical expenses based on the Fund’s actual expense ratio for each class of shares, and an assumed rate of return of 5% per year for each class before expenses, which is not the Fund’s actual return. The hypothetical account values and expenses may not be used to estimate the actual ending account balance or expenses you paid for the period. You may use this information to compare the ongoing costs of investing in the Fund and other funds. To do so, compare this 5% hypothetical example for the class of shares you hold with the 5% hypothetical examples that appear in the shareholder reports of the other funds.
Please note that the expenses shown in the table are meant to highlight your ongoing costs only and do not reflect any transactional costs, such as front-end or contingent deferred sales charges (loads). Therefore, the “hypothetical” section of the table is useful in comparing ongoing costs only, and will not help you determine the relative total costs of owning different funds. In addition, if these transactional costs were included, your costs would have been higher.
9 OPPENHEIMER INTERNATIONAL GROWTH FUND
| | | | | | | | | | | | | | | |
| Actual | | Beginning Account Value December 1, 2017 | | Ending Account Value May 31, 2018 | | Expenses Paid During 6 Months Ended May 31, 2018 |
Class A | | $ 1,000.00 | | $ 1,011.00 | | $ 5.53 |
Class B | | 1,000.00 | | 1,006.70 | | 9.45 |
Class C | | 1,000.00 | | 1,007.30 | | 9.30 |
Class I | | 1,000.00 | | 1,013.00 | | 3.47 |
Class R | | 1,000.00 | | 1,009.60 | | 6.79 |
Class Y | | 1,000.00 | | 1,012.10 | | 4.32 |
| | | |
Hypothetical (5% return before expenses) | | | | | | |
Class A | | 1,000.00 | | 1,019.45 | | 5.55 |
Class B | | 1,000.00 | | 1,015.56 | | 9.49 |
Class C | | 1,000.00 | | 1,015.71 | | 9.34 |
Class I | | 1,000.00 | | 1,021.49 | | 3.48 |
Class R | | 1,000.00 | | 1,018.20 | | 6.82 |
Class Y | | 1,000.00 | | 1,020.64 | | 4.34 |
Expenses are equal to the Fund’s annualized expense ratio for that class, multiplied by the average account value over the period, multiplied by 182/365 (to reflect the one-half year period). Those annualized expense ratios, excluding indirect expenses from affiliated funds, based on the 6-month period ended May 31, 2018 are as follows:
| | | | |
| Class | | Expense Ratios | |
Class A | | | 1.10% | |
Class B | | | 1.88 | |
Class C | | | 1.85 | |
Class I | | | 0.69 | |
Class R | | | 1.35 | |
Class Y | | | 0.86 | |
The expense ratios reflect voluntary and/or contractual waivers and/or reimbursements of expenses by the Fund’s Manager and Transfer Agent. Some of these undertakings may be modified or terminated at any time, as indicated in the Fund’s prospectus. The “Financial Highlights” tables in the Fund’s financial statements, included in this report, also show the gross expense ratios, without such waivers or reimbursements and reduction to custodian expenses, if applicable.
10 OPPENHEIMER INTERNATIONAL GROWTH FUND
STATEMENT OF INVESTMENTS May 31, 2018 Unaudited
| | | | | | | | |
| | | Shares | | | Value | |
| |
| Common Stocks—97.6% | | | | | |
| |
| Consumer Discretionary—22.3% | | | | | |
| |
| Auto Components—4.7% | | | | | |
Continental AG | | | 1,748,023 | | | $ | 443,653,543 | |
| |
Koito Manufacturing Co. Ltd. | | | 5,882,800 | | | | 431,052,354 | |
| |
Valeo SA1 | | | 6,423,273 | | | | 407,017,994 | |
| | | | | | | | |
| | | | | | | 1,281,723,891 | |
|
| |
| Automobiles—3.3% | | | | | |
Bayerische Motoren Werke AG | | | 2,535,062 | | | | 253,024,523 | |
| |
Hero MotoCorp Ltd. | | | 7,102,282 | | | | 372,689,822 | |
| |
Subaru Corp. | | | 8,995,400 | | | | 274,543,052 | |
| | | | | | | | |
| | | | | | | 900,257,397 | |
|
| |
| Hotels, Restaurants & Leisure—3.3% | | | | | |
Carnival Corp. | | | 6,511,299 | | | | 405,523,702 | |
| |
Domino’s Pizza Group plc2 | | | 49,301,541 | | | | 248,720,968 | |
| |
Whitbread plc | | | 4,430,388 | | | | 248,274,978 | |
| | | | | | | | |
| | | | | | | 902,519,648 | |
|
| |
| Household Durables—1.2% | | | | | |
SEB SA1 | | | 1,763,577 | | | | 318,185,666 | |
|
| |
| Internet & Catalog Retail—0.5% | | | | | |
JD.com, Inc., ADR1 | | | 3,570,863 | | | | 125,622,960 | |
|
| |
| Media—2.2% | | | | | |
ProSiebenSat.1 Media SE | | | 8,531,194 | | | | 251,063,164 | |
| |
SES SA, Cl. A, FDR | | | 16,943,670 | | | | 292,683,638 | |
| |
Technicolor SA2 | | | 33,477,250 | | | | 57,753,262 | |
| | | | | | | | |
| | | | | | | 601,500,064 | |
|
| |
| Multiline Retail—0.9% | | | | | |
Dollarama, Inc. | | | 2,187,138 | | | | 252,433,443 | |
|
| |
| Specialty Retail—1.2% | | | | | |
Nitori Holdings Co. Ltd. | | | 1,823,000 | | | | 312,639,803 | |
|
| |
| Textiles, Apparel & Luxury Goods—5.0% | | | | | |
Cie Financiere Richemont SA | | | 3,141,851 | | | | 288,521,147 | |
| |
Hermes International | | | 588,352 | | | | 419,909,614 | |
| |
LVMH Moet Hennessy Louis Vuitton SE | | | 1,219,820 | | | | 423,648,546 | |
| |
Pandora AS | | | 3,020,871 | | | | 237,945,780 | |
| | | | | | | | |
| | | | | | | 1,370,025,087 | |
| | | | | | | | |
| | | Shares | | | Value | |
| |
| Consumer Staples—11.2% | | | | | |
| |
| Beverages—2.2% | | | | | |
| |
Heineken NV | | | 2,852,233 | | | $ | 285,952,337 | |
| |
Pernod Ricard SA | | | 1,839,872 | | | | 309,934,957 | |
| | | | | | | | |
| | | | | | | 595,887,294 | |
|
| |
| Food & Staples Retailing—2.7% | | | | | |
| Alimentation Couche-Tard, Inc., | | | | | |
| Cl.B | | | 5,237,865 | | | | 218,708,940 | |
| |
CP ALL PCL | | | 122,357,500 | | | | 308,647,383 | |
| |
SPAR Group Ltd. (The)2 | | | 13,969,396 | | | | 211,555,953 | |
| | | | | | | | |
| | | | | | | 738,912,276 | |
|
| |
| Food Products—3.8% | | | | | |
Barry Callebaut AG | | | 130,639 | | | | 228,397,706 | |
| |
Saputo, Inc. | | | 9,270,639 | | | | 322,177,228 | |
| |
Unilever plc | | | 3,297,246 | | | | 181,783,299 | |
| |
WH Group Ltd.3 | | | 273,303,500 | | | | 280,031,375 | |
| | | | | | | | |
| | | | | | | 1,012,389,608 | |
|
| |
| Household Products—1.4% | | | | | |
Reckitt Benckiser Group plc | | | 4,975,932 | | | | 381,132,431 | |
|
| |
| Tobacco—1.1% | | | | | |
Swedish Match AB | | | 6,270,157 | | | | 297,358,903 | |
|
| |
| Energy—1.3% | | | | | |
| |
| Energy Equipment & Services—0.6% | | | | | |
TechnipFMC plc | | | 5,613,106 | | | | 177,061,567 | |
|
| |
| Oil, Gas & Consumable Fuels—0.7% | | | | | |
Koninklijke Vopak NV | | | 3,664,982 | | | | 179,558,686 | |
|
| |
| Financials—6.6% | | | | | |
| |
| Capital Markets—2.2% | | | | | |
NEX Group plc2 | | | 22,164,434 | | | | 298,125,218 | |
| |
TP ICAP plc2 | | | 30,078,583 | | | | 167,573,701 | |
| |
UBS Group AG1 | | | 9,052,624 | | | | 136,031,795 | |
| | | | | | | | |
| | | | | | | 601,730,714 | |
|
| |
| Commercial Banks—1.2% | | | | | |
ICICI Bank Ltd., Sponsored ADR | | | 39,116,425 | | | | 328,186,806 | |
|
| |
| Consumer Finance—0.7% | | | | | |
Prosegur Cash SA3 | | | 66,118,133 | | | | 179,895,850 | |
|
| |
| Insurance—1.2% | | | | | |
Prudential plc | | | 13,909,174 | | | | 334,074,568 | |
|
| |
| Real Estate Management & Development—1.3% | | | | | |
Scout24 AG2,3 | | | 6,643,276 | | | | 340,499,727 | |
11 OPPENHEIMER INTERNATIONAL GROWTH FUND
STATEMENT OF INVESTMENTS Unaudited / Continued
| | | | | | | | |
| | | Shares | | | Value | |
| |
| Health Care—10.3% | | | | | |
| |
| Biotechnology—2.9% | | | | | |
CSL Ltd. | | | 2,876,000 | | | $ | 402,818,874 | |
| |
Grifols SA | | | 12,605,881 | | | | 370,336,859 | |
| | | | | | | | |
| | | | | | | 773,155,733 | |
|
| |
| Health Care Equipment & Supplies—3.0% | | | | | |
Essilor International Cie Generale | | | | | | | | |
d’Optique SA | | | 1,804,928 | | | | 246,678,780 | |
| |
Siemens Healthineers AG1,3 | | | 1,575,877 | | | | 62,645,569 | |
| |
Sonova Holding AG | | | 1,423,861 | | | | 248,500,872 | |
| |
William Demant Holding AS1 | | | 7,108,439 | | | | 258,631,674 | |
| | | | | | | | |
| | | | | | | 816,456,895 | |
|
| |
| Life Sciences Tools & Services—1.2% | | | | | |
Lonza Group AG1 | | | 1,218,780 | | | | 327,116,761 | |
|
| |
| Pharmaceuticals—3.2% | | | | | |
Bayer AG | | | 2,631,267 | | | | 313,139,272 | |
| |
Novo Nordisk AS, Cl. B | | | 7,406,499 | | | | 352,258,657 | |
| |
Oxagen Ltd.1, 4 | | | 214,287 | | | | 2,848 | |
| |
Roche Holding AG | | | 991,773 | | | | 212,718,013 | |
| | | | | | | | |
| | | | | | | 878,118,790 | |
|
| |
| Industrials—15.7% | | | | | |
| |
| Aerospace & Defense—1.2% | | | | | |
Airbus SE | | | 2,736,543 | | | | 313,999,855 | |
|
| |
| Commercial Services & Supplies—2.1% | | | | | |
Edenred | | | 9,023,976 | | | | 290,862,765 | |
| |
Prosegur Cia de Seguridad SA2 | | | 39,375,470 | | | | 270,691,602 | |
| | | | | | | | |
| | | | | | | 561,554,367 | |
|
| |
| Construction & Engineering—0.8% | | | | | |
Boskalis Westminster2 | | | 7,701,514 | | | | 212,548,375 | |
|
| |
| Electrical Equipment—2.7% | | | | | |
Legrand SA | | | 3,812,760 | | | | 287,206,261 | |
| |
Melrose Industries plc | | | 18,861,709 | | | | 59,188,814 | |
| |
Nidec Corp. | | | 2,573,470 | | | | 397,219,951 | |
| | | | | | | | |
| | | | | | | 743,615,026 | |
|
| |
| Machinery—4.7% | | | | | |
Aalberts Industries NV2 | | | 6,558,074 | | | | 321,833,439 | |
| |
Atlas Copco AB1 | | | 7,720,590 | | | | 7,002,642 | |
| |
Atlas Copco AB, Cl. A | | | 7,720,588 | | | | 305,566,710 | |
| | | | | | | | |
| | | Shares | | | Value | |
| |
| Machinery (Continued) | | | | | |
| |
Kubota Corp. | | | 16,171,600 | | | $ | 271,120,885 | |
| |
VAT Group AG1,2,3 | | | 1,866,992 | | | | 266,541,389 | |
| |
Weir Group plc (The) | | | 4,056,817 | | | | 118,204,575 | |
| | | | | | | | |
| | | | | | | 1,290,269,640 | |
|
| |
| Professional Services—0.7% | | | | | |
Intertek Group plc | | | 2,701,210 | | | | 196,319,621 | |
|
| |
| Trading Companies & Distributors—3.5% | |
Brenntag AG | | | 4,150,924 | | | | 239,569,207 | |
| |
Bunzl plc | | | 12,210,938 | | | | 371,771,373 | |
| |
Ferguson plc | | | 2,178,816 | | | | 168,861,840 | |
| |
Travis Perkins plc2 | | | 9,517,886 | | | | 170,270,889 | |
| | | | | | | | |
| | | | | | | 950,473,309 | |
|
| |
| Information Technology—23.7% | | | | | |
| |
| Communications Equipment—1.4% | | | | | |
Nokia OYJ | | | 64,829,243 | | | | 373,675,135 | |
|
| |
| Electronic Equipment, Instruments, & Components—4.8% | |
Hitachi Ltd. | | | 41,643,000 | | | | 303,385,867 | |
| |
Hoya Corp. | | | 5,207,110 | | | | 307,930,618 | |
| |
Keyence Corp. | | | 752,642 | | | | 460,079,815 | |
| |
Spectris plc2 | | | 5,912,436 | | | | 219,416,342 | |
| | | | | | | | |
| | | | | | | 1,290,812,642 | |
|
| |
| Internet Software & Services—2.0% | | | | | |
Baidu, Inc., Sponsored ADR1 | | | 1,300,930 | | | | 315,553,581 | |
| |
United Internet AG | | | 3,504,054 | | | | 223,874,238 | |
| | | | | | | | |
| | | | | | | 539,427,819 | |
|
| |
| IT Services—2.9% | | | | | |
Amadeus IT Group SA | | | 3,788,046 | | | | 300,197,158 | |
| |
Atos SE | | | 2,901,180 | | | | 396,379,967 | |
| |
Cielo SA | | | 20,909,100 | | | | 95,040,454 | |
| | | | | | | | |
| | | | | | | 791,617,579 | |
|
| |
| Semiconductors & Semiconductor Equipment—7.1% | |
ams AG1,2 | | | 4,580,150 | | | | 394,574,658 | |
| |
ASML Holding NV | | | 2,081,321 | | | | 406,068,030 | |
| |
Infineon Technologies AG | | | 24,630,881 | | | | 676,863,055 | |
| |
STMicroelectronics NV | | | 18,803,890 | | | | 447,631,504 | |
| | | | | | | | |
| | | | | | | 1,925,137,247 | |
|
| |
| Software—5.5% | | | | | |
Dassault Systemes SE | | | 2,447,140 | | | | 343,758,505 | |
12 OPPENHEIMER INTERNATIONAL GROWTH FUND
| | | | | | | | |
| | | Shares | | | Value | |
| |
| Software (Continued) | | | | | |
SAP SE | | | 4,895,325 | | | $ | 551,488,325 | |
| |
Temenos AG1,2 | | | 4,097,578 | | | | 608,483,224 | |
| | | | | | | | |
| | | | | | | 1,503,730,054 | |
|
| |
Materials—4.0% | | | | | | | | |
| |
Chemicals—2.2% | | | | | | | | |
Essentra plc2 | | | 21,935,344 | | | | 138,350,585 | |
| |
Novozymes AS, Cl. B | | | 4,081,737 | | | | 207,891,921 | |
| |
Sika AG | | | 31,618 | | | | 251,729,482 | |
| | | | | | | | |
| | | | | | | 597,971,988 | |
|
| |
Construction Materials—0.6% | |
James Hardie Industries plc | | | 8,986,400 | | | | 150,327,542 | |
|
| |
Containers & Packaging—1.2% | |
CCL Industries, Inc., Cl. B | | | 6,819,366 | | | | 337,497,081 | |
|
| |
Telecommunication Services—2.5% | |
| |
Diversified Telecommunication Services—2.5% | |
Iliad SA | | | 1,132,860 | | | | 192,774,265 | |
| |
Nippon Telegraph & Telephone Corp. | | | 10,631,400 | | | | 497,843,778 | |
| | | | | | | | |
| | | | | | | 690,618,043 | |
| | | | | | | | |
Total Common Stocks (Cost $18,918,538,357) | | | | | | | 26,496,039,891 | |
| | | | | | | | |
| | | Shares | | | Value | |
| |
Preferred Stock—0.0% | |
Zee Entertainment | | | | | | | | |
Enterprises Ltd., | | | | | | | | |
6% Cum. Non-Cv., 6.00% (Cost $315,166) | | | 17,213,928 | | | $ | 1,966,723 | |
| | |
| | | Units | | | | | |
| |
Rights, Warrants and Certificates—0.0% | |
| |
Sika Ltd. Rts., Strike Price 1CHF, Exp. 6/5/181 (Cost $0) | | | 197,856 | | | | — | |
| | |
| | | Shares | | | | | |
| |
Investment Company—2.0% | |
| |
Oppenheimer Institutional | | | | | | | | |
Government Money | | | | | | | | |
Market Fund, Cl. E, 1.71%2,5 (Cost $537,604,540) | | | 537,604,540 | | | | 537,604,540 | |
|
| |
Total Investments, at Value (Cost $19,456,458,063) | | | 99.6% | | | | 27,035,611,154 | |
| |
Net Other Assets (Liabilities) | | | 0.4 | | | | 101,614,122 | |
| | | | |
Net Assets | | | 100.0% | | | $ | 27,137,225,276 | |
| | | | |
Footnotes to Statement of Investments
1. Non-income producing security.
2. Is or was an affiliate, as defined in the Investment Company Act of 1940, as amended, at or during the reporting period, by virtue of the Fund owning at least 5% of the voting securities of the issuer or as a result of the Fund and the issuer having the same investment adviser. Transactions during the reporting period in which the issuer was an affiliate are as follows:
| | | | | | | | | | | | | | | | |
| | | Shares
November 30,
2017 | | | Gross
Additions | | | Gross
Reductions | | | Shares
May 31, 2018 | |
| |
Aalberts Industries NV | | | 6,839,820 | | | | — | | | | 281,746 | | | | 6,558,074 | |
ams AG | | | 1,376,153 | | | | 3,203,997 | | | | — | | | | 4,580,150 | |
Boskalis Westminster | | | 5,094,910 | | | | 2,606,604 | | | | — | | | | 7,701,514 | |
Dignity plc | | | 4,756,330 | | | | — | | | | 4,756,330 | | | | — | |
Domino’s Pizza Group plc | | | 49,301,541 | | | | — | | | | — | | | | 49,301,541 | |
Essentra plc | | | 21,935,344 | | | | — | | | | — | | | | 21,935,344 | |
NEX Group plc | | | 22,991,902 | | | | 124,732 | | | | 952,200 | | | | 22,164,434 | |
Oppenheimer Institutional Government Money Market Fund, Cl. E | | | 1,101,764,666 | | | | 1,288,558,397 | | | | 1,852,718,523 | | | | 537,604,540 | |
Prosegur Cia de Seguridad SA | | | 41,067,105 | | | | — | | | | 1,691,635 | | | | 39,375,470 | |
Scout24 AG | | | 6,643,276 | | | | — | | | | — | | | | 6,643,276 | |
SPAR Group Ltd. (The) | | | 14,569,545 | | | | — | | | | 600,149 | | | | 13,969,396 | |
13 OPPENHEIMER INTERNATIONAL GROWTH FUND
STATEMENT OF INVESTMENTS Unaudited / Continued
Footnotes to Statement of Investments (Continued)
| | | | | | | | | | | | | | | | |
| | | Shares
November 30, 2017 | | | Gross
Additions | | | Gross
Reductions | | | Shares
May 31, 2018 | |
| |
Spectris plca | | | 6,166,436 | | | | — | | | | 254,000 | | | | 5,912,436 | |
Technicolor SA | | | 33,477,250 | | | | — | | | | — | | | | 33,477,250 | |
Temenos AG | | | 4,273,616 | | | | — | | | | 176,038 | | | | 4,097,578 | |
TP ICAP plc | | | 30,570,947 | | | | 766,906 | | | | 1,259,270 | | | | 30,078,583 | |
Travis Perkins plca | | | 14,067,236 | | | | — | | | | 4,549,350 | | | | 9,517,886 | |
VAT Group AG | | | — | | | | 1,866,992 | | | | — | | | | 1,866,992 | |
| | | | |
| | | Value | | | Income | | | Realized Gain
(Loss) | | | Change in
Unrealized
Gain (Loss) | |
| |
Aalberts Industries NV | | $ | 321,833,439 | | | $ | 4,640,046 | | | $ | 7,519,250 | | | $ | (21,198,519) | |
ams AG | | | 394,574,658 | | | | — | | | | — | | | | (46,812,603) | |
Boskalis Westminster | | | 212,548,375 | | | | 7,818,885 | | | | — | | | | (77,392,895) | |
Dignity plc | | | — | | | | — | | | | (33,486,933 | ) | | | (23,767,393) | |
Domino’s Pizza Group plc | | | 248,720,968 | | | | 3,609,945 | | | | — | | | | 31,610,188 | |
Essentra plc | | | 138,350,585 | | | | 4,405,424 | | | | — | | | | (11,675,440) | |
NEX Group plc | | | 298,125,218 | | | | 1,074,619 | b | | | (2,200,637 | ) | | | 127,456,429 | |
Oppenheimer Institutional | | | | | | | | | | | | | | | | |
Government Money Market Fund, Cl. E | | | 537,604,540 | | | | 3,413,195 | | | | — | | | | — | |
Prosegur Cia de Seguridad SA | | | 270,691,602 | | | | 20,237,543 | | | | 1,590,041 | | | | (54,222,061) | |
Scout24 AG | | | 340,499,727 | | | | — | | | | — | | | | 60,684,245 | |
SPAR Group Ltd. (The) | | | 211,555,953 | | | | 3,981,956 | | | | (842,713 | ) | | | 19,409,183 | |
Spectris plca | | | — | c | | | 2,965,234 | | | | 915,983 | | | | 19,176,369 | |
Technicolor SA | | | 57,753,262 | | | | — | | | | — | | | | (64,987,555) | |
Temenos AG | | | 608,483,224 | | | | 2,755,468 | | | | 19,335,016 | | | | 86,752,623 | |
TP ICAP plc | | | 167,573,701 | | | | 4,813,548 | b | | | (530,795 | ) | | | (38,304,853) | |
Travis Perkins plca | | | — | c | | | 4,237,526 | | | | (37,326,499 | ) | | | (6,255,067) | |
VAT Group AG | | | 266,541,389 | | | | 7,141,545 | | | | — | | | | (14,428,352) | |
| | | | |
Total | | $ | 4,074,856,641 | | | $ | 71,094,934 | | | $ | (45,027,287) | | | $ | (13,955,701) | |
| | | | |
a. No longer an affiliate at period end.
b. All or a portion of the transactions were the result of non-cash dividends.
c. The security is no longer an affiliate. Therefore, the value has been excluded from this table.
3. Represents securities sold under Rule 144A, which are exempt from registration under the Securities Act of 1933, as amended. These securities have been determined to be liquid under guidelines established by the Board of Trustees. These securities amount to $1,129,613,910 or 4.16% of the Fund’s net assets at period end.
4. The value of this security was determined using significant unobservable inputs. See Note 3 of the accompanying Notes.
5. Rate shown is the 7-day yield at period end.
Distribution of investments representing geographic holdings, as a percentage of total investments at value, is as follows:
| | | | | | | | |
| Geographic Holdings | | Value | | | Percent | |
France | | $ | 4,300,794,074 | | | | 15.9% | |
United Kingdom | | | 3,479,130,768 | | | | 12.9 | |
Germany | | | 3,355,820,624 | | | | 12.4 | |
Japan | | | 3,255,816,123 | | | | 12.0 | |
Switzerland | | | 3,015,671,893 | | | | 11.2 | |
Netherlands | | | 1,405,960,867 | | | | 5.2 | |
14 OPPENHEIMER INTERNATIONAL GROWTH FUND
| | | | | | | | |
| Geographic Holdings (Continued) | | Value | | | Percent | |
Canada | | $ | 1,130,816,692 | | | | 4.2% | |
Spain | | | 1,121,121,470 | | | | 4.1 | |
Denmark | | | 1,056,728,033 | | | | 3.9 | |
United States | | | 943,128,241 | | | | 3.5 | |
India | | | 702,843,351 | | | | 2.6 | |
Sweden | | | 609,928,255 | | | | 2.3 | |
China | | | 441,176,541 | | | | 1.6 | |
Australia | | | 402,818,874 | | | | 1.5 | �� |
Austria | | | 394,574,657 | | | | 1.5 | |
Finland | | | 373,675,135 | | | | 1.4 | |
Thailand | | | 308,647,383 | | | | 1.1 | |
Hong Kong | | | 280,034,224 | | | | 1.0 | |
South Africa | | | 211,555,953 | | | | 0.8 | |
Ireland | | | 150,327,542 | | | | 0.6 | |
Brazil | | | 95,040,454 | | | | 0.3 | |
| | | | |
Total | | $ | 27,035,611,154 | | | | 100.0% | |
| | | | |
See accompanying Notes to Financial Statements.
15 OPPENHEIMER INTERNATIONAL GROWTH FUND
STATEMENT OF ASSETS AND LIABILITIES May 31, 2018 Unaudited
| | | | |
| |
| Assets | | | | |
Investments, at value—see accompanying statement of investments: | | | | |
Unaffiliated companies (cost $16,197,669,490) | | $ | 22,960,754,513 | |
Affiliated companies (cost $3,258,788,573) | | | 4,074,856,641 | |
| | | | |
| | | 27,035,611,154 | |
| |
Cash | | | 19,798,510 | |
| |
Cash—foreign currencies (cost $397,751) | | | 519,537 | |
| |
Receivables and other assets: | | | | |
Dividends | | | 126,839,403 | |
Shares of beneficial interest sold | | | 33,592,001 | |
Other | | | 741,667 | |
| | | | |
Total assets | | | 27,217,102,272 | |
|
| |
| Liabilities | | | | |
Payables and other liabilities: | | | | |
Shares of beneficial interest redeemed | | | 52,477,238 | |
Foreign capital gains tax | | | 23,951,423 | |
Distribution and service plan fees | | | 848,916 | |
Trustees’ compensation | | | 737,702 | |
Shareholder communications | | | 7,052 | |
Other | | | 1,854,665 | |
| | | | |
Total liabilities | | | 79,876,996 | |
|
| |
Net Assets | | $ | 27,137,225,276 | |
| | | | |
|
| |
| Composition of Net Assets | | | | |
Paid-in capital | | $ | 19,624,228,826 | |
| |
Accumulated net investment income | | | 221,597,141 | |
| |
Accumulated net realized loss on investments and foreign currency transactions | | | (263,348,458) | |
| |
Net unrealized appreciation on investments and translation of assets and liabilities denominated in foreign currencies | | | 7,554,747,767 | |
| | | | |
Net Assets | | $ | 27,137,225,276 | |
| | | | |
16 OPPENHEIMER INTERNATIONAL GROWTH FUND
| | | | |
| |
| Net Asset Value Per Share | |
| Class A Shares: | | | | |
| |
| Net asset value and redemption price per share (based on net assets of $2,960,149,988 and | | | | |
| 67,391,280 shares of beneficial interest outstanding) | | $ | 43.92 | |
| |
| Maximum offering price per share (net asset value plus sales charge of 5.75% of offering price) | | $ | 46.60 | |
| |
| |
| Class B Shares: | | | | |
| |
Net asset value, redemption price (excludes applicable contingent deferred sales charge) and offering price per share (based on net assets of $296,056 and 7,041 shares of beneficial interest outstanding) | | $ | 42.05 | |
| |
| |
| Class C Shares: | | | | |
| |
Net asset value, redemption price (excludes applicable contingent deferred sales charge) and offering price per share (based on net assets of $458,033,653 and 11,014,424 shares of beneficial interest outstanding) | | $ | 41.58 | |
| |
| |
| Class I Shares: | | | | |
| |
| Net asset value, redemption price and offering price per share (based on net assets of | | | | |
| $11,298,454,425 and 258,431,236 shares of beneficial interest outstanding) | | $ | 43.72 | |
| |
| |
| Class R Shares: | | | | |
| |
Net asset value, redemption price (excludes applicable contingent deferred sales charge) and offering price per share (based on net assets of $484,961,224 and 11,258,293 shares of beneficial interest outstanding) | | $ | 43.08 | |
| |
| |
| Class Y Shares: | | | | |
| |
| Net asset value, redemption price and offering price per share (based on net assets of $11,935,329,930 and 273,213,503 shares of beneficial interest outstanding) | | $ | 43.68 | |
See accompanying Notes to Financial Statements.
17 OPPENHEIMER INTERNATIONAL GROWTH FUND
STATEMENT OF OPERATIONS For the Six Months Ended May 31, 2018 Unaudited
| | | | |
| Investment Income | |
| Dividends: | | | | |
| Unaffiliated companies (net of foreign withholding taxes of $36,373,656) | | $ | 271,780,822 | |
| Affiliated companies (net of foreign withholding taxes of $7,648,411) | | | 71,094,934 | |
| |
| Interest | | | 4,213 | |
| | | | |
| Total investment income | | | 342,879,969 | |
|
| |
| Expenses | |
| Management fees | | | 89,638,044 | |
| |
| Distribution and service plan fees: | | | | |
| Class A | | | 3,905,839 | |
| Class B | | | 7,728 | |
| Class C | | | 2,352,435 | |
| Class R | | | 1,235,546 | |
| |
| Transfer and shareholder servicing agent fees: | | | | |
| Class A | | | 3,145,251 | |
| Class B | | | 1,574 | |
| Class C | | | 469,269 | |
| Class I | | | 1,663,185 | |
| Class R | | | 493,186 | |
| Class Y | | | 12,786,591 | |
| |
| Shareholder communications: | | | | |
| Class A | | | 10,735 | |
| Class B | | | 70 | |
| Class C | | | 1,409 | |
| Class I | | | 13,301 | |
| Class R | | | 389 | |
| Class Y | | | 30,941 | |
| |
| Custodian fees and expenses | | | 1,431,077 | |
| |
| Borrowing fees | | | 493,347 | |
| |
| Trustees’ compensation | | | 191,231 | |
| |
| Other | | | 269,476 | |
| | | | |
| Total expenses | | | 118,140,624 | |
| Less reduction to custodian expenses | | | (8,019) | |
| Less waivers and reimbursements of expenses | | | (466,752) | |
| | | | |
| Net expenses | | | 117,665,853 | |
|
| |
| Net Investment Income | | | 225,214,116 | |
18 OPPENHEIMER INTERNATIONAL GROWTH FUND
| | | | |
| |
| Realized and Unrealized Gain (Loss) | |
| Net realized gain (loss) on: | | | | |
| Investment transactions in: | | | | |
Unaffiliated companies(net of foreign capital gains tax of $242,532) | | $ | 494,440,717 | |
Affiliated companies | | | (45,027,287) | |
| Foreign currency transactions | | | 200,451 | |
| | | | |
| Net realized gain | | | 449,613,881 | |
| |
| Net change in unrealized appreciation/depreciation on: | |
| Investment transactions in: | | | | |
Unaffiliated companies (net of foreign capital gains tax of $3,157,037) | | | (326,425,520) | |
Affiliated companies | | | (13,955,701) | |
| Translation of assets and liabilities denominated in foreign currencies | | | (1,590,826) | |
| | | | |
| Net change in unrealized appreciation/depreciation | | | (341,972,047) | |
|
| |
| Net Increase in Net Assets Resulting from Operations | | $ | 332,855,950 | |
| | | | |
See accompanying Notes to Financial Statements.
19 OPPENHEIMER INTERNATIONAL GROWTH FUND
STATEMENTS OF CHANGES IN NET ASSETS
| | | | | | | | |
| | | Six Months Ended
May 31, 2018
(Unaudited) | | | Year Ended
November 30, 2017 | |
| |
| Operations | |
| Net investment income | | $ | 225,214,116 | | | $ | 255,686,768 | |
| |
| Net realized gain (loss) | | | 449,613,881 | | | | (59,445,386) | |
| |
| Net change in unrealized appreciation/depreciation | | | (341,972,047) | | | | 5,999,060,268 | |
| | | | |
| Net increase in net assets resulting from operations | | | 332,855,950 | | | | 6,195,301,650 | |
|
| |
| Dividends and/or Distributions to Shareholders | |
| Dividends from net investment income: | | | | | | | | |
| Class A | | | (19,117,217) | | | | (43,789,345) | |
| Class B | | | — | | | | — | |
| Class C | | | — | | | | (1,277,824) | |
| Class I | | | (111,069,812) | | | | (102,142,501) | |
| Class R | | | (2,152,886) | | | | (3,455,954) | |
| Class Y | | | (110,353,712) | | | | (133,413,496) | |
| | | | |
| | | (242,693,627) | | | | (284,079,120) | |
|
| |
| Beneficial Interest Transactions | |
| Net increase (decrease) in net assets resulting from beneficial interest transactions: | | | | | | | | |
| Class A | | | (308,927,121) | | | | (1,875,348,412) | |
| Class B | | | (2,798,020) | | | | (5,909,021) | |
| Class C | | | (14,229,540) | | | | (94,689,305) | |
| Class I | | | 743,323,122 | | | | 2,166,999,692 | |
| Class R | | | (3,675,102) | | | | (9,193,664) | |
| Class Y | | | (660,953,182) | | | | (269,714,228) | |
| | | | |
| | | (247,259,843) | | | | (87,854,938) | |
|
| |
| Net Assets | |
| Total increase (decrease) | | | (157,097,520) | | | | 5,823,367,592 | |
| |
| Beginning of period | | | 27,294,322,796 | | | | 21,470,955,204 | |
| | | | |
| End of period (including accumulated net investment income of $221,597,141 and $239,076,652, respectively) | | $ | 27,137,225,276 | | | $ | 27,294,322,796 | |
| | | | |
See accompanying Notes to Financial Statements.
20 OPPENHEIMER INTERNATIONAL GROWTH FUND
FINANCIAL HIGHLIGHTS
| | | | | | | | | | | | | | | | | | | | | | | | |
| Class A | | Six Months
Ended
May 31, 2018
(Unaudited) | | | Year Ended
November
30, 2017 | | | Year Ended
November
30, 2016 | | | Year Ended
November
30, 2015 | | | Year Ended
November
28, 20141 | | | Year Ended
November
29, 20131 | |
| |
| Per Share Operating Data | | | | | | | | | | | | | | | | | | | | | | | | |
| Net asset value, beginning of period | | | $43.71 | | | | $34.34 | | | | $37.14 | | | | $36.45 | | | | $37.45 | | | | $30.43 | |
| |
| Income (loss) from investment operations: | | | | | | | | | | | | | | | | | | | | | | | | |
| Net investment income2 | | | 0.30 | | | | 0.35 | | | | 0.38 | | | | 0.31 | | | | 0.38 | | | | 0.36 | |
| Net realized and unrealized gain (loss) | | | 0.17 | | | | 9.38 | | | | (2.87 | ) | | | 0.68 | | | | (1.11 | ) | | | 7.02 | |
| | | | |
| Total from investment operations | | | 0.47 | | | | 9.73 | | | | (2.49 | ) | | | 0.99 | | | | (0.73 | ) | | | 7.38 | |
| |
| Dividends and/or distributions to shareholders: | | | | | | | | | | | | | | | | | | | | | | | | |
| Dividends from net investment income | | | (0.26 | ) | | | (0.36 | ) | | | (0.31 | ) | | | (0.30 | ) | | | (0.27 | ) | | | (0.36) | |
| |
| Net asset value, end of period | | | $43.92 | | | | $43.71 | | | | $34.34 | | | | $37.14 | | | | $36.45 | | | | $37.45 | |
| | | | |
| |
| Total Return, at Net Asset Value3 | | | 1.10 | % | | | 28.61 | % | | | (6.73 | )% | | | 2.76 | % | | | (1.95 | )% | | | 24.52% | |
| |
| Ratios/Supplemental Data | | | | | | | | | | | | | | | | | | | | | | | | |
| Net assets, end of period (in thousands) | | | $2,960,150 | | | | $3,249,744 | | | | $4,253,937 | | | | $5,394,512 | | | | $4,726,302 | | | | $3,903,102 | |
| |
| Average net assets (in thousands) | | | $3,162,189 | | | | $3,550,263 | | | | $5,062,192 | | | | $4,848,329 | | | | $4,897,214 | | | | $3,048,384 | |
| |
| Ratios to average net assets:4 | | | | | | | | | | | | | | | | | | | | | | | | |
| Net investment income | | | 1.34 | % | | | 0.89 | % | | | 1.08 | % | | | 0.85 | % | | | 1.02 | % | | | 1.05% | |
| Expenses excluding specific expenses listed below | | | 1.10 | % | | | 1.13 | % | | | 1.14 | % | | | 1.14 | % | | | 1.14 | % | | | 1.21% | |
| Interest and fees from borrowings | | | 0.00 | %5 | | | 0.00 | %5 | | | 0.00 | %5 | | | 0.00 | %5 | | | 0.00 | % | | | 0.00% | |
| | | | |
| Total expenses6 | | | 1.10 | % | | | 1.13 | % | | | 1.14 | % | | | 1.14 | % | | | 1.14 | % | | | 1.21% | |
| Expenses after payments,waivers and/or reimbursements and reduction to custodian expenses | | | 1.10 | %7 | | | 1.11 | % | | | 1.14 | %7 | | | 1.14 | %7 | | | 1.14 | %7 | | | 1.20% | |
| |
| Portfolio turnover rate | | | 8 | % | | | 22 | % | | | 9 | % | | | 10 | % | | | 12 | % | | | 12% | |
21 OPPENHEIMER INTERNATIONAL GROWTH FUND
FINANCIAL HIGHLIGHTS Continued
1. Represents the last business day of the Fund’s reporting period.
2. Per share amounts calculated based on the average shares outstanding during the period.
3. Assumes an initial investment on the business day before the first day of the fiscal period, with all dividends and distributions reinvested in additional shares on the reinvestment date, and redemption at the net asset value calculated on the last business day of the fiscal period. Sales charges are not reflected in the total returns. Total returns are not annualized for periods less than one full year. Returns do not reflect the deduction of taxes that a shareholder would pay on fund distributions or the redemption of fund shares.
4. Annualized for periods less than one full year.
5. Less than 0.005%.
6. Total expenses including indirect expenses from affiliated fund fees and expenses were as follows:
| | | | | | |
| | Six Months Ended May 31, 2018 | | | 1.10 | % |
| | Year Ended November 30, 2017 | | | 1.13 | % |
| | Year Ended November 30, 2016 | | | 1.14 | % |
| | Year Ended November 30, 2015 | | | 1.14 | % |
| | Year Ended November 28, 2014 | | | 1.14 | % |
| | Year Ended November 29, 2013 | | | 1.21 | % |
7. Waiver was less than 0.005%.
See accompanying Notes to Financial Statements.
22 OPPENHEIMER INTERNATIONAL GROWTH FUND
| | | | | | | | | | | | |
| Class B | | Six Months Ended
May 31, 2018
(Unaudited) | | Year Ended
November
30, 2017 | | Year Ended
November
30, 2016 | | Year Ended
November
30, 2015 | | Year Ended
November
28, 20141 | | Year Ended
November
29, 20131 |
|
| Per Share Operating Data |
| Net asset value, beginning of period | | $41.77 | | $32.72 | | $35.35 | | $34.66 | | $35.62 | | $28.89 |
|
| Income (loss) from investment operations: | | | | | | | | | | | | |
| Net investment income2 | | 0.12 | | 0.13 | | 0.10 | | 0.05 | | 0.08 | | 0.10 |
| Net realized and unrealized gain (loss) | | 0.16 | | 8.92 | | (2.73) | | 0.64 | | (1.04) | | 6.69 |
| | |
| Total from investment operations | | 0.28 | | 9.05 | | (2.63) | | 0.69 | | (0.96) | | 6.79 |
|
| Dividends and/or distributions to shareholders: | | | | | | | | | | | | |
| Dividends from net investment income | | 0.00 | | 0.00 | | 0.00 | | 0.00 | | 0.00 | | (0.06) |
|
| Net asset value, end of period | | $42.05 | | $41.77 | | $32.72 | | $35.35 | | $34.66 | | $35.62 |
| | |
|
| Total Return, at Net Asset Value3 | | 0.67% | | 27.66% | | (7.44)% | | 1.99% | | (2.70)% | | 23.56% |
|
| Ratios/Supplemental Data | | | | | | | | | | | | |
| Net assets, end of period (in thousands) | | $296 | | $3,053 | | $7,642 | | $15,789 | | $23,058 | | $31,300 |
|
| Average net assets (in thousands) | | $1,537 | | $5,073 | | $11,285 | | $18,861 | | $27,680 | | $31,491 |
|
| Ratios to average net assets:4 | | | | | | | | | | | | |
| Net investment income | | 0.57% | | 0.35% | | 0.30% | | 0.14% | | 0.22% | | 0.30% |
| Expenses excluding specific expenses listed below | | 1.88% | | 1.89% | | 1.89% | | 1.89% | | 1.90% | | 2.04% |
| Interest and fees from borrowings | | 0.00%5 | | 0.00%5 | | 0.00%5 | | 0.00%5 | | 0.00% | | 0.00% |
| | |
| Total expenses6 | | 1.88% | | 1.89% | | 1.89% | | 1.89% | | 1.90% | | 2.04% |
| Expenses after payments, waivers and/or reimbursements and reduction to custodian expenses | | 1.88%7 | | 1.87% | | 1.89%7 | | 1.89%7 | | 1.90%7 | | 1.98% |
|
| Portfolio turnover rate | | 8% | | 22% | | 9% | | 10% | | 12% | | 12% |
23 OPPENHEIMER INTERNATIONAL GROWTH FUND
FINANCIAL HIGHLIGHTS Continued
1. Represents the last business day of the Fund’s reporting period.
2. Per share amounts calculated based on the average shares outstanding during the period.
3. Assumes an initial investment on the business day before the first day of the fiscal period, with all dividends and distributions reinvested in additional shares on the reinvestment date, and redemption at the net asset value calculated on the last business day of the fiscal period. Sales charges are not reflected in the total returns. Total returns are not annualized for periods less than one full year. Returns do not reflect the deduction of taxes that a shareholder would pay on fund distributions or the redemption of fund shares.
4. Annualized for periods less than one full year.
5. Less than 0.005%.
6. Total expenses including indirect expenses from affiliated fund fees and expenses were as follows:
| | | | | | |
| | Six Months Ended May 31, 2018 | | | 1.88 | % |
| | Year Ended November 30, 2017 | | | 1.89 | % |
| | Year Ended November 30, 2016 | | | 1.89 | % |
| | Year Ended November 30, 2015 | | | 1.89 | % |
| | Year Ended November 28, 2014 | | | 1.90 | % |
| | Year Ended November 29, 2013 | | | 2.04 | % |
7. Waiver was less than 0.005%.
See accompanying Notes to Financial Statements.
24 OPPENHEIMER INTERNATIONAL GROWTH FUND
| | | | | | | | | | | | | | | | | | | | | | | | |
| Class C | | Six Months Ended
May 31, 2018
(Unaudited) | | | Year Ended
November
30, 2017 | | | Year Ended
November
30, 2016 | | | Year Ended
November
30, 2015 | | | Year Ended
November
28, 20141 | | | Year Ended
November
29, 20131 | |
| |
| Per Share Operating Data | | | | | | | | | | | | | | | | | | | | | | | | |
| Net asset value, beginning of period | | | $41.29 | | | | $32.44 | | | | $35.10 | | | | $34.49 | | | | $35.54 | | | | $28.87 | |
| |
| Income (loss) from investment operations: | | | | | | | | | | | | | | | | | | | | | | | | |
| Net investment income2 | | | 0.12 | | | | 0.03 | | | | 0.10 | | | | 0.05 | | | | 0.09 | | | | 0.09 | |
| Net realized and unrealized gain (loss) | | | 0.17 | | | | 8.91 | | | | (2.70) | | | | 0.63 | | | | (1.04) | | | | 6.71 | |
| | | | |
| Total from investment operations | | | 0.29 | | | | 8.94 | | | | (2.60) | | | | 0.68 | | | | (0.95) | | | | 6.80 | |
| |
| Dividends and/or distributions to shareholders: | | | | | | | | | | | | | | | | | | | | | | | | |
| Dividends from net investment income | | | 0.00 | | | | (0.09) | | | | (0.06) | | | | (0.07) | | | | (0.10) | | | | (0.13) | |
| |
| Net asset value, end of period | | | $41.58 | | | | $41.29 | | | | $32.44 | | | | $35.10 | | | | $34.49 | | | | $35.54 | |
| | | | |
| |
| Total Return, at Net Asset Value3 | | | 0.73% | | | | 27.64% | | | | (7.42)% | | | | 1.99% | | | | (2.68)% | | | | 23.64% | |
| |
| Ratios/Supplemental Data | | | | | | | | | | | | | | | | | | | | | | | | |
| Net assets, end of period (in thousands) | | | $458,034 | | | | $468,753 | | | | $453,990 | | | | $543,536 | | | | $498,041 | | | | $368,340 | |
| |
| Average net assets (in thousands) | | | $472,400 | | | | $455,969 | | | | $519,037 | | | | $525,184 | | | | $471,895 | | | | $267,686 | |
| |
| Ratios to average net assets:4 | | | | | | | | | | | | | | | | | | | | | | | | |
| Net investment income | | | 0.59% | | | | 0.09% | | | | 0.30% | | | | 0.14% | | | | 0.25% | | | | 0.29% | |
| Expenses excluding specific expenses listed below | | | 1.85% | | | | 1.88% | | | | 1.89% | | | | 1.89% | | | | 1.89% | | | | 1.93% | |
| Interest and fees from borrowings | | | 0.00%5 | | | | 0.00%5 | | | | 0.00%5 | | | | 0.00%5 | | | | 0.00% | | | | 0.00% | |
| | | | |
| Total expenses6 | | | 1.85% | | | | 1.88% | | | | 1.89% | | | | 1.89% | | | | 1.89% | | | | 1.93% | |
| Expenses after payments, waivers and/or reimbursements and reduction to custodian expenses | | | 1.85%7 | | | | 1.86% | | | | 1.89%7 | | | | 1.89%7 | | | | 1.89%7 | | | | 1.93%7 | |
| |
| Portfolio turnover rate | | | 8% | | | | 22% | | | | 9% | | | | 10% | | | | 12% | | | | 12% | |
25 OPPENHEIMER INTERNATIONAL GROWTH FUND
FINANCIAL HIGHLIGHTS Continued
1. Represents the last business day of the Fund’s reporting period.
2. Per share amounts calculated based on the average shares outstanding during the period.
3. Assumes an initial investment on the business day before the first day of the fiscal period, with all dividends and distributions reinvested in additional shares on the reinvestment date, and redemption at the net asset value calculated on the last business day of the fiscal period. Sales charges are not reflected in the total returns. Total returns are not annualized for periods less than one full year. Returns do not reflect the deduction of taxes that a shareholder would pay on fund distributions or the redemption of fund shares.
4. Annualized for periods less than one full year.
5. Less than 0.005%.
6. Total expenses including indirect expenses from affiliated fund fees and expenses were as follows:
| | | | | | |
| | Six Months Ended May 31, 2018 | | | 1.85 | % |
| | Year Ended November 30, 2017 | | | 1.88 | % |
| | Year Ended November 30, 2016 | | | 1.89 | % |
| | Year Ended November 30, 2015 | | | 1.89 | % |
| | Year Ended November 28, 2014 | | | 1.89 | % |
| | Year Ended November 29, 2013 | | | 1.93 | % |
7. Waiver was less than 0.005%.
See accompanying Notes to Financial Statements.
26 OPPENHEIMER INTERNATIONAL GROWTH FUND
| | | | | | | | | | | | | | | | | | | | | | | | |
| Class I | | Six Months Ended
May 31, 2018
(Unaudited) | | | Year Ended
November
30, 2017 | | | Year Ended
November
30, 2016 | | | Year Ended
November
30, 2015 | | | Year Ended
November
28, 20141 | | | Year Ended
November
29, 20131 | |
| |
| Per Share Operating Data | | | | | | | | | | | | | | | | | | | | | | | | |
| Net asset value, beginning of period | | | $43.62 | | | | $34.31 | | | | $37.09 | | | | $36.43 | | | | $37.41 | | | | $30.37 | |
| |
| Income (loss) from investment operations: | | | | | | | | | | | | | | | | | | | | | | | | |
| Net investment income2 | | | 0.39 | | | | 0.45 | | | | 0.49 | | | | 0.48 | | | | 0.55 | | | | 0.44 | |
| Net realized and unrealized gain (loss) | | | 0.17 | | | | 9.40 | | | | (2.81) | | | | 0.65 | | | | (1.11) | | | | 7.08 | |
| | | | |
| Total from investment operations | | | 0.56 | | | | 9.85 | | | | (2.32) | | | | 1.13 | | | | (0.56) | | | | 7.52 | |
| |
| Dividends and/or distributions to shareholders: | | | | | | | | | | | | | | | | | | | | | | | | |
| Dividends from net investment income | | | (0.46) | | | | (0.54) | | | | (0.46) | | | | (0.47) | | | | (0.42) | | | | (0.48) | |
| |
| Net asset value, end of period | | | $43.72 | | | | $43.62 | | | | $34.31 | | | | $37.09 | | | | $36.43 | | | | $37.41 | |
| | | | |
| |
| Total Return, at Net Asset Value3 | | | 1.30% | | | | 29.14% | | | | (6.31)% | | | | 3.19% | | | | (1.51)% | | | | 25.14% | |
| |
| Ratios/Supplemental Data | | | | | | | | | | | | | | | | | | | | | | | | |
| Net assets, end of period (in thousands) | | | $11,298,454 | | | | $10,542,873 | | | | $6,435,502 | | | | $4,381,328 | | | | $3,763,546 | | | | $1,870,890 | |
| |
| Average net assets (in thousands) | | | $11,126,063 | | | | $8,241,107 | | | | $5,488,355 | | | | $4,091,145 | | | | $3,030,734 | | | | $961,530 | |
| |
| Ratios to average net assets:4 | | | | | | | | | | | | | | | | | | | | | | | | |
| Net investment income | | | 1.76% | | | | 1.15% | | | | 1.38% | | | | 1.31% | | | | 1.47% | | | | 1.28% | |
| Expenses excluding specific expenses listed below | | | 0.69% | | | | 0.69% | | | | 0.70% | | | | 0.70% | | | | 0.70% | | | | 0.72% | |
| Interest and fees from borrowings | | | 0.00%5 | | | | 0.00%5 | | | | 0.00%5 | | | | 0.00%5 | | | | 0.00% | | | | 0.00% | |
| | | | |
| Total expenses6 | | | 0.69% | | | | 0.69% | | | | 0.70% | | | | 0.70% | | | | 0.70% | | | | 0.72% | |
| Expenses after payments, waivers and/or reimbursements and reduction to custodian expenses | | | 0.69%7 | | | | 0.69%7 | | | | 0.70%7 | | | | 0.70%7 | | | | 0.70%7 | | | | 0.72%7 | |
| |
| Portfolio turnover rate | | | 8% | | | | 22% | | | | 9% | | | | 10% | | | | 12% | | | | 12% | |
27 OPPENHEIMER INTERNATIONAL GROWTH FUND
FINANCIAL HIGHLIGHTS Continued
1. Represents the last business day of the Fund’s reporting period.
2. Per share amounts calculated based on the average shares outstanding during the period.
3. Assumes an initial investment on the business day before the first day of the fiscal period, with all dividends and
distributions reinvested in additional shares on the reinvestment date, and redemption at the net asset value calculated on the last business day of the fiscal period. Sales charges are not reflected in the total returns. Total returns are not annualized for periods less than one full year. Returns do not reflect the deduction of taxes that a shareholder would pay on fund distributions or the redemption of fund shares.
4. Annualized for periods less than one full year.
5. Less than 0.005%.
6. Total expenses including indirect expenses from affiliated fund fees and expenses were as follows:
| | | | | | |
| | Six Months Ended May 31, 2018 | | | 0.69 | % |
| | Year Ended November 30, 2017 | | | 0.69 | % |
| | Year Ended November 30, 2016 | | | 0.70 | % |
| | Year Ended November 30, 2015 | | | 0.70 | % |
| | Year Ended November 28, 2014 | | | 0.70 | % |
| | Year Ended November 29, 2013 | | | 0.72 | % |
7. Waiver was less than 0.005%.
See accompanying Notes to Financial Statements.
28 OPPENHEIMER INTERNATIONAL GROWTH FUND
| | | | | | | | | | | | | | | | | | | | | | | | |
| Class R | | Six Months
Ended
May 31, 2018
(Unaudited) | | | Year Ended
November
30, 2017 | | | Year Ended
November
30, 2016 | | | Year Ended
November
30, 2015 | | | Year Ended
November
28, 20141 | | | Year Ended
November
29, 20131 | |
| |
| Per Share Operating Data | | | | | | | | | | | | | | | | | | | | | | | | |
| Net asset value, beginning of period | | | $42.86 | | | | $33.70 | | | | $36.44 | | | | $35.80 | | | | $36.81 | | | | $29.89 | |
| |
| Income (loss) from investment operations: | | | | | | | | | | | | | | | | | | | | | | | | |
| Net investment income2 | | | 0.24 | | | | 0.21 | | | | 0.27 | | | | 0.23 | | | | 0.28 | | | | 0.26 | |
| Net realized and unrealized gain (loss) | | | 0.17 | | | | 9.25 | | | | (2.79) | | | | 0.65 | | | | (1.09) | | | | 6.92 | |
| | | | |
| Total from investment operations | | | 0.41 | | | | 9.46 | | | | (2.52) | | | | 0.88 | | | | (0.81) | | | | 7.18 | |
| |
| Dividends and/or distributions to shareholders: | | | | | | | | | | | | | | | | | | | | | | | | |
| Dividends from net investment income | | | (0.19) | | | | (0.30) | | | | (0.22) | | | | (0.24) | | | | (0.20) | | | | (0.26) | |
| |
| Net asset value, end of period | | | $43.08 | | | | $42.86 | | | | $33.70 | | | | $36.44 | | | | $35.80 | | | | $36.81 | |
| | | | |
|
| |
| Total Return, at Net Asset Value3 | | | 0.96% | | | | 28.31% | | | | (6.96)% | | | | 2.50% | | | | (2.19)% | | | | 24.23% | |
|
| |
| Ratios/Supplemental Data | | | | | | | | | | | | | | | | | | | | | | | | |
| Net assets, end of period (in thousands) | | | $484,961 | | | | $486,089 | | | | $390,589 | | | | $400,622 | | | | $369,630 | | | | $272,619 | |
| |
| Average net assets (in thousands) | | | $496,583 | | | | $443,397 | | | | $399,345 | | | | $390,160 | | | | $341,419 | | | | $213,038 | |
| |
| Ratios to average net assets:4 | | | | | | | | | | | | | | | | | | | | | | | | |
| Net investment income | | | 1.09% | | | | 0.55% | | | | 0.78% | | | | 0.64% | | | | 0.74% | | | | 0.79% | |
| Expenses excluding specific expenses listed below | | | 1.35% | | | | 1.38% | | | | 1.38% | | | | 1.39% | | | | 1.39% | | | | 1.45% | |
| Interest and fees from borrowings | | | 0.00%5 | | | | 0.00%5 | | | | 0.00%5 | | | | 0.00%5 | | | | 0.00% | | | | 0.00% | |
| | | | |
| Total expenses6 | | | 1.35% | | | | 1.38% | | | | 1.38% | | | | 1.39% | | | | 1.39% | | | | 1.45% | |
| Expenses after payments,waivers and/or reimbursements and reduction to custodian expenses | | | 1.35%7 | | | | 1.36% | | | | 1.38%7 | | | | 1.39%7 | | | | 1.39%7 | | | | 1.44% | |
| |
| Portfolio turnover rate | | | 8% | | | | 22% | | | | 9% | | | | 10% | | | | 12% | | | | 12% | |
29 OPPENHEIMER INTERNATIONAL GROWTH FUND
FINANCIAL HIGHLIGHTS Continued
1. Represents the last business day of the Fund’s reporting period.
2. Per share amounts calculated based on the average shares outstanding during the period.
3. Assumes an initial investment on the business day before the first day of the fiscal period, with all dividends and
distributions reinvested in additional shares on the reinvestment date, and redemption at the net asset value calculated on the last business day of the fiscal period. Sales charges are not reflected in the total returns. Total returns are not annualized for periods less than one full year. Returns do not reflect the deduction of taxes that a shareholder would pay on fund distributions or the redemption of fund shares.
4. Annualized for periods less than one full year.
5. Less than 0.005%.
6. Total expenses including indirect expenses from affiliated fund fees and expenses were as follows:
| | | | | | |
| | Six Months Ended May 31, 2018 | | | 1.35 | % |
| | Year Ended November 30, 2017 | | | 1.38 | % |
| | Year Ended November 30, 2016 | | | 1.38 | % |
| | Year Ended November 30, 2015 | | | 1.39 | % |
| | Year Ended November 28, 2014 | | | 1.39 | % |
| | Year Ended November 29, 2013 | | | 1.45 | % |
7. Waiver was less than 0.005%.
See accompanying Notes to Financial Statements.
30 OPPENHEIMER INTERNATIONAL GROWTH FUND
| | | | | | | | | | | | | | | | | | | | | | | | |
| Class Y | | Six Months
Ended May 31, 2018
(Unaudited) | | | Year Ended
November
30, 2017 | | | Year Ended
November
30, 2016 | | | Year Ended
November
30, 2015 | | | Year Ended
November
28, 20141 | | | Year Ended
November
29, 20131 | |
| |
| Per Share Operating Data | | | | | | | | | | | | | | | | | | | | | | | | |
| Net asset value, beginning of period | | | $43.55 | | | | $34.23 | | | | $37.01 | | | | $36.36 | | | | $37.35 | | | | $30.34 | |
| |
| Income (loss) from investment operations: | | | | | | | | | | | | | | | | | | | | | | | | |
| Net investment income2 | | | 0.35 | | | | 0.41 | | | | 0.47 | | | | 0.42 | | | | 0.46 | | | | 0.46 | |
| Net realized and unrealized gain (loss) | | | 0.16 | | | | 9.37 | | | | (2.85) | | | | 0.64 | | | | (1.10) | | | | 6.99 | |
| | | | |
| Total from investment operations | | | 0.51 | | | | 9.78 | | | | (2.38) | | | | 1.06 | | | | (0.64) | | | | 7.45 | |
| |
| Dividends and/or distributions to shareholders: | | | | | | | | | | | | | | | | | | | | | | | | |
| Dividends from net investment income | | | (0.38) | | | | (0.46) | | | | (0.40) | | | | (0.41) | | | | (0.35) | | | | (0.44) | |
| |
| Net asset value, end of period | | | $43.68 | | | | $43.55 | | | | $34.23 | | | | $37.01 | | | | $36.36 | | | | $37.35 | |
| | | | |
|
| |
| |
| Total Return, at Net Asset Value3 | | | 1.21% | | | | 28.96% | | | | (6.49)% | | | | 2.99% | | | | (1.71)% | | | | 24.91% | |
|
| |
| Ratios/Supplemental Data | | | | | | | | | | | | | | | | | | | | | | | | |
| Net assets, end of period (in thousands) | | | $11,935,330 | | | | $12,543,811 | | | | $9,929,295 | | | | $10,782,234 | | | | $8,774,567 | | | | $6,691,921 | |
| |
| Average net assets (in thousands) | | | $12,873,782 | | | | $12,176,817 | | | | $10,731,785 | | | | $10,135,130 | | | | $8,185,239 | | | | $5,487,802 | |
| |
| Ratios to average net assets:4 | | | | | | | | | | | | | | | | | | | | | | | | |
| Net investment income | | | 1.59% | | | | 1.04% | | | | 1.33% | | | | 1.13% | | | | 1.23% | | | | 1.38% | |
| Expenses excluding specific expenses listed below | | | 0.86% | | | | 0.88% | | | | 0.89% | | | | 0.89% | | | | 0.89% | | | | 0.90% | |
| Interest and fees from borrowings | | | 0.00%5 | | | | 0.00%5 | | | | 0.00%5 | | | | 0.00%5 | | | | 0.00% | | | | 0.00% | |
| | | | |
| Total expenses6 | | | 0.86% | | | | 0.88% | | | | 0.89% | | | | 0.89% | | | | 0.89% | | | | 0.90% | |
| Expenses after payments, waivers and/or reimbursements and reduction to custodian expenses | | | 0.86%7 | | | | 0.86% | | | | 0.89%7 | | | | 0.89%7 | | | | 0.89%7 | | | | 0.90%7 | |
| |
| Portfolio turnover rate | | | 8% | | | | 22% | | | | 9% | | | | 10% | | | | 12% | | | | 12% | |
31 OPPENHEIMER INTERNATIONAL GROWTH FUND
FINANCIAL HIGHLIGHTS Continued
1. Represents the last business day of the Fund’s reporting period.
2. Per share amounts calculated based on the average shares outstanding during the period.
3. Assumes an initial investment on the business day before the first day of the fiscal period, with all dividends and
distributions reinvested in additional shares on the reinvestment date, and redemption at the net asset value calculated on the last business day of the fiscal period. Sales charges are not reflected in the total returns. Total returns are not annualized for periods less than one full year. Returns do not reflect the deduction of taxes that a shareholder would pay on fund distributions or the redemption of fund shares.
4. Annualized for periods less than one full year.
5. Less than 0.005%.
6. Total expenses including indirect expenses from affiliated fund fees and expenses were as follows:
| | | | | | |
| | Six Months Ended May 31, 2018 | | | 0.86 | % |
| | Year Ended November 30, 2017 | | | 0.88 | % |
| | Year Ended November 30, 2016 | | | 0.89 | % |
| | Year Ended November 30, 2015 | | | 0.89 | % |
| | Year Ended November 28, 2014 | | | 0.89 | % |
| | Year Ended November 29, 2013 | | | 0.90 | % |
7. Waiver was less than 0.005%.
See accompanying Notes to Financial Statements.
32 OPPENHEIMER INTERNATIONAL GROWTH FUND
NOTES TO FINANCIAL STATEMENTS May 31, 2018 Unaudited
1. Organization
Oppenheimer International Growth Fund (the “Fund”) is registered under the Investment Company Act of 1940 (“1940 Act”), as amended, as a diversified open-end management investment company. The Fund’s investment objective is to seek capital appreciation. The Fund’s investment adviser is OFI Global Asset Management, Inc. (“OFI Global” or the “Manager”), a wholly-owned subsidiary of OppenheimerFunds, Inc. (“OFI” or the “Sub-Adviser”). The Manager has entered into a sub-advisory agreement with OFI.
The Fund offers Class A, Class C, Class I, Class R and Class Y shares, and previously offered Class B shares for new purchase through June 29, 2012. Subsequent to that date, no new purchases of Class B shares are permitted, however reinvestment of dividend and/or capital gain distributions and exchanges of Class B shares into and from other Oppenheimer funds are allowed. Class B shares automatically converted to Class A shares 72 months after the date of purchase. Effective June 1, 2018, all Class B shares converted to Class A shares. Class A shares are sold at their offering price, which is normally net asset value plus a front-end sales charge. Class C and Class R shares are sold, and Class B shares were sold, without a front-end sales charge but may be subject to a contingent deferred sales charge (“CDSC”). Class R shares are sold only through retirement plans. Retirement plans that offer Class R shares may impose charges on those accounts. Class I and Class Y shares are sold to certain institutional investors or intermediaries without either a front-end sales charge or a CDSC, however, the intermediaries may impose charges on their accountholders who beneficially own Class I and Class Y shares. All classes of shares have identical rights and voting privileges with respect to the Fund in general and exclusive voting rights on matters that affect that class alone. Earnings, net assets and net asset value per share may differ due to each class having its own expenses, such as transfer and shareholder servicing agent fees and shareholder communications, directly attributable to that class. Class A, B, C and R shares have separate distribution and/or service plans under which they pay fees. Class I and Class Y shares do not pay such fees.
The following is a summary of significant accounting policies followed in the Fund’s preparation of financial statements in accordance with accounting principles generally accepted in the United States (“U.S. GAAP”).
2. Significant Accounting Policies
Security Valuation. All investments in securities are recorded at their estimated fair value, as described in Note 3.
Foreign Currency Translation. The books and records of the Fund are maintained in U.S. dollars. Any foreign currency amounts are translated into U.S. dollars on the following basis:
(1) Value of investment securities, other assets and liabilities — at the exchange rates prevailing at market close as described in Note 3.
(2) Purchases and sales of investment securities, income and expenses — at the rates of exchange prevailing on the respective dates of such transactions.
Although the net assets and the values are presented at the foreign exchange rates at
33 OPPENHEIMER INTERNATIONAL GROWTH FUND
NOTES TO FINANCIAL STATEMENTS Unaudited / Continued
2. Significant Accounting Policies (Continued)
market close, the Fund does not isolate the portion of the results of operations resulting from changes in foreign exchange rates on investments from the fluctuations arising from changes in prices of securities held. Such fluctuations are included with the net realized and unrealized gains or losses from investments shown in the Statement of Operations.
For securities, which are subject to foreign withholding tax upon disposition, realized and unrealized gains or losses on such securities are recorded net of foreign withholding tax.
Reported net realized foreign exchange gains or losses arise from sales of foreign currencies, currency gains or losses realized between the trade and settlement dates on securities transactions, the difference between the amounts of dividends, interest, and foreign withholding tax reclaims recorded on the Fund’s books, and the U.S. dollar equivalent of the amounts actually received or paid. Net unrealized foreign exchange gains and losses arise from changes in the value of assets and liabilities other than investments in securities, resulting from changes in the exchange rate.
Allocation of Income, Expenses, Gains and Losses. Income, expenses (other than those attributable to a specific class), gains and losses are allocated on a daily basis to each class of shares based upon the relative proportion of net assets represented by such class. Operating expenses directly attributable to a specific class are charged against the operations of that class.
Dividends and Distributions to Shareholders. Dividends and distributions to shareholders, which are determined in accordance with income tax regulations and may differ from U.S. GAAP, are recorded on the ex-dividend date. Income and capital gain distributions, if any, are declared and paid annually or at other times as determined necessary by the Manager.
The tax character of distributions is determined as of the Fund’s fiscal year end. Therefore, a portion of the Fund’s distributions made to shareholders prior to the Fund’s fiscal year end may ultimately be categorized as a tax return of capital.
Investment Income. Dividend income is recorded on the ex-dividend date or upon ex-dividend notification in the case of certain foreign dividends where the ex-dividend date may have passed. Non-cash dividends included in dividend income, if any, are recorded at the fair value of the securities received. Withholding taxes on foreign dividends, if any, and capital gains taxes on foreign investments, if any, have been provided for in accordance with the Fund’s understanding of the applicable tax rules and regulations. Interest income, if any, is recognized on an accrual basis. Discount and premium, which are included in interest income on the Statement of Operations, are amortized or accreted daily.
Custodian Fees. “Custodian fees and expenses” in the Statement of Operations may include interest expense incurred by the Fund on any cash overdrafts of its custodian account during the period. Such cash overdrafts may result from the effects of failed trades in portfolio securities and from cash outflows resulting from unanticipated shareholder redemption
34 OPPENHEIMER INTERNATIONAL GROWTH FUND
2. Significant Accounting Policies (Continued)
activity. The Fund pays interest to its custodian on such cash overdrafts, to the extent they are not offset by positive cash balances maintained by the Fund, at a rate equal to the Federal Funds Rate plus 2.00%. The “Reduction to custodian expenses” line item, if applicable, represents earnings on cash balances maintained by the Fund during the period. Such interest expense and other custodian fees may be paid with these earnings.
Security Transactions. Security transactions are recorded on the trade date. Realized gains and losses on securities sold are determined on the basis of identified cost.
Indemnifications. The Fund’s organizational documents provide current and former Trustees and officers with a limited indemnification against liabilities arising in connection with the performance of their duties to the Fund. In the normal course of business, the Fund may also enter into contracts that provide general indemnifications. The Fund’s maximum exposure under these arrangements is unknown as this would be dependent on future claims that may be made against the Fund. The risk of material loss from such claims is considered remote.
Federal Taxes. The Fund intends to comply with provisions of the Internal Revenue Code applicable to regulated investment companies and to distribute substantially all of its investment company taxable income to shareholders. Therefore, no federal income or excise tax provision is required. The Fund files income tax returns in U.S. federal and applicable state jurisdictions. The statute of limitations on the Fund’s tax return filings generally remains open for the three preceding fiscal reporting period ends. The Fund has analyzed its tax positions for the fiscal year ended November 30, 2017, including open tax years, and does not believe there are any uncertain tax positions requiring recognition in the Fund’s financial statements.
During the fiscal year ended November 30, 2017, the Fund did not utilize any capital loss carryforwards to offset capital gains realized in that fiscal year. Details of the fiscal year ended November 30, 2017 capital loss carryforwards are included in the table below. Capital losses with no expiration will be carried forward to future years if not offset by gains.
| | | | |
| Expiring | | | |
No expiration | | $ | 665,679,615 | |
At period end, it is estimated that the capital loss carryforwards would be $216,065,734 which will not expire. The estimated capital loss carryforward represents the carryforward as of the end of the last fiscal year, increased or decreased by capital losses or gains realized in the first six months of the current fiscal year. During the reporting period, it is estimated that the Fund will utilize $449,613,881 of capital loss carryforward to offset realized capital gains.
Net investment income (loss) and net realized gain (loss) may differ for financial statement and tax purposes. The character of dividends and distributions made during the fiscal year from net investment income or net realized gains are determined in accordance with federal income tax requirements, which may differ from the character of net investment income or net realized gains presented in those financial statements in accordance with U.S. GAAP. Also, due
35 OPPENHEIMER INTERNATIONAL GROWTH FUND
NOTES TO FINANCIAL STATEMENTS Unaudited / Continued
2. Significant Accounting Policies (Continued)
to timing of dividends and distributions, the fiscal year in which amounts are distributed may differ from the fiscal year in which the income or net realized gain was recorded by the Fund.
The aggregate cost of securities and other investments and the composition of unrealized appreciation and depreciation of securities and other investments for federal income tax purposes at period end are noted in the following table. The primary difference between book and tax appreciation or depreciation of securities and other investments, if applicable, is attributable to the tax deferral of losses or tax realization of financial statement unrealized gain or loss.
| | | | |
| Federal tax cost of securities | | $ | 19,494,037,162 | |
| Federal tax cost of other investments | | | 397,751 | |
| | | | |
| Total federal tax cost | | $ | 19,494,434,913 | |
| | | | |
| Gross unrealized appreciation | | $ | 9,334,537,142 | |
| Gross unrealized depreciation | | | (1,817,368,474) | |
| | | | |
| Net unrealized appreciation | | $ | 7,517,168,668 | |
| | | | |
Certain foreign countries impose a tax on capital gains which is accrued by the Fund based on unrealized appreciation, if any, on affected securities. The tax is paid when the gain is realized.
Use of Estimates. The preparation of financial statements in conformity with U.S. GAAP requires management to make estimates and assumptions that affect the reported amounts of assets and liabilities and disclosure of contingent assets and liabilities at the date of the financial statements and the reported amounts of increases and decreases in net assets from operations during the reporting period. Actual results could differ from those estimates.
3. Securities Valuation
The Fund calculates the net asset value of its shares as of 4:00 P.M. Eastern Time, on each day the New York Stock Exchange (the “Exchange”) is open for trading, except in the case of a scheduled early closing of the Exchange, in which case the Fund will calculate net asset value of the shares as of the scheduled early closing time of the Exchange.
The Fund’s Board has adopted procedures for the valuation of the Fund’s securities and has delegated the day-to-day responsibility for valuation determinations under those procedures to the Manager. The Manager has established a Valuation Committee which is responsible for determining a fair valuation for any security for which market quotations are not readily available. The Valuation Committee’s fair valuation determinations are subject to review, approval and ratification by the Fund’s Board at least quarterly or more frequently, if necessary.
Valuation Methods and Inputs
Securities are valued primarily using unadjusted quoted market prices, when available, as supplied by third party pricing services or broker-dealers.
The following methodologies are used to determine the market value or the fair value of the
36 OPPENHEIMER INTERNATIONAL GROWTH FUND
3. Securities Valuation (Continued)
types of securities described below:
Equity securities traded on a securities exchange (including exchange-traded derivatives other than futures and futures options) are valued based on the official closing price on the principal exchange on which the security is traded, as identified by the Manager, prior to the time when the Fund’s assets are valued. If the official closing price is unavailable, the security is valued at the last sale price on the principal exchange on which it is traded, or if no sales occurred, the security is valued at the mean between the quoted bid and asked prices. Over-the-counter equity securities are valued at the last published sale price, or if no sales occurred, at the mean between the quoted bid and asked prices. Events occurring after the close of trading on foreign exchanges may result in adjustments to the valuation of foreign securities to more accurately reflect their fair value as of the time when the Fund’s assets are valued.
Shares of a registered investment company that are not traded on an exchange are valued at that investment company’s net asset value per share.
Securities for which market quotations are not readily available, or when a significant event has occurred that would materially affect the value of the security, are fair valued either (i) by a standardized fair valuation methodology applicable to the security type or the significant event as previously approved by the Valuation Committee and the Fund’s Board or (ii) as determined in good faith by the Manager’s Valuation Committee. The Valuation Committee considers all relevant facts that are reasonably available, through either public information or information available to the Manager, when determining the fair value of a security. Those standardized fair valuation methodologies include, but are not limited to, valuing securities at the last sale price or initially at cost and subsequently adjusting the value based on: changes in company specific fundamentals, changes in an appropriate securities index, or changes in the value of similar securities which may be further adjusted for any discounts related to security-specific resale restrictions. When possible, such methodologies use observable market inputs such as unadjusted quoted prices of similar securities, observable interest rates, currency rates and yield curves. The methodologies used for valuing securities are not necessarily an indication of the risks associated with investing in those securities nor can it be assured that the Fund can obtain the fair value assigned to a security if it were to sell the security.
To assess the continuing appropriateness of security valuations, the Manager regularly compares prior day prices and sale prices to the current day prices and challenges those prices exceeding certain tolerance levels with the third party pricing service or broker source. For those securities valued by fair valuations, whether through a standardized fair valuation methodology or a fair valuation determination, the Valuation Committee reviews and affirms the reasonableness of the valuations based on such methodologies and fair valuation determinations on a regular basis after considering all relevant information that is reasonably available.
Classifications
Each investment asset or liability of the Fund is assigned a level at measurement date based on the significance and source of the inputs to its valuation. Various data inputs may be used
37 OPPENHEIMER INTERNATIONAL GROWTH FUND
NOTES TO FINANCIAL STATEMENTS Unaudited / Continued
3. Securities Valuation (Continued)
in determining the value of each of the Fund’s investments as of the reporting period end.
These data inputs are categorized in the following hierarchy under applicable financial accounting standards:
1) Level 1-unadjusted quoted prices in active markets for identical assets or liabilities (including securities actively traded on a securities exchange)
2) Level 2-inputs other than unadjusted quoted prices that are observable for the asset or liability (such as unadjusted quoted prices for similar assets and market corroborated inputs such as interest rates, prepayment speeds, credit risks, etc.)
3) Level 3-significant unobservable inputs (including the Manager’s own judgments about assumptions that market participants would use in pricing the asset or liability).
The inputs used for valuing securities are not necessarily an indication of the risks associated with investing in those securities.
The Fund classifies each of its investments in investment companies which are publicly offered as Level 1. Investment companies that are not publicly offered, if any, are classified as Level 2 in the fair value hierarchy.
The table below categorizes amounts that are included in the Fund’s Statement of Assets and Liabilities at period end based on valuation input level:
| | | | | | | | | | | | | | | | |
| | | Level 1—
Unadjusted
Quoted Prices | | | Level 2— Other Significant
Observable Inputs | | | Level 3—
Significant
Unobservable
Inputs | | | Value | |
| |
| Assets Table | | | | | | | | | | | | | | | | |
| Investments, at Value: | | | | | | | | | | | | | | | | |
| Common Stocks | | | | | | | | | | | | | | | | |
Consumer Discretionary | | $ | 1,101,765,771 | | | $ | 4,963,142,188 | | | $ | — | | | $ | 6,064,907,959 | |
Consumer Staples | | | 540,886,168 | | | | 2,484,794,344 | | | | — | | | | 3,025,680,512 | |
Energy | | | — | | | | 356,620,253 | | | | — | | | | 356,620,253 | |
Financials | | | 328,186,806 | | | | 1,456,200,859 | | | | — | | | | 1,784,387,665 | |
Health Care | | | — | | | | 2,794,845,331 | | | | 2,848 | | | | 2,794,848,179 | |
Industrials | | | — | | | | 4,268,780,193 | | | | — | | | | 4,268,780,193 | |
Information Technology | | | 315,553,581 | | | | 6,108,846,895 | | | | — | | | | 6,424,400,476 | |
Materials | | | 337,497,081 | | | | 748,299,530 | | | | — | | | | 1,085,796,611 | |
Telecommunication Services | | | — | | | | 690,618,043 | | | | — | | | | 690,618,043 | |
| Preferred Stock | | | 1,966,723 | | | | — | | | | — | | | | 1,966,723 | |
| Rights, Warrants and Certificates | | | — | | | | — | | | | — | | | | — | |
| Investment Company | | | 537,604,540 | | | | — | | | | — | | | | 537,604,540 | |
| | | | |
| Total Assets | | $ | 3,163,460,670 | | | $ | 23,872,147,636 | | | $ | 2,848 | | | $ | 27,035,611,154 | |
| | | | |
Forward currency exchange contracts and futures contracts, if any, are reported at their unrealized appreciation/depreciation at measurement date, which represents the change in the contract’s value from trade date. All additional assets and liabilities included in the above table are reported at their market value at measurement date.
For the reporting period, there were no transfers between levels.
38 OPPENHEIMER INTERNATIONAL GROWTH FUND
4. Investments and Risks
Risks of Foreign Investing. The Fund may invest in foreign securities which are subject to special risks. Securities traded in foreign markets may be less liquid and more volatile than those traded in U.S. markets. Foreign issuers are usually not subject to the same accounting and disclosure requirements that U.S. companies are subject to, which may make it difficult for the Fund to evaluate a foreign company’s operations or financial condition. A change in the value of a foreign currency against the U.S. dollar will result in a change in the U.S. dollar value of investments denominated in that foreign currency and in the value of any income or distributions the Fund may receive on those investments. The value of foreign investments may be affected by exchange control regulations, foreign taxes, higher transaction and other costs, delays in the settlement of transactions, changes in economic or monetary policy in the United States or abroad, expropriation or nationalization of a company’s assets, or other political and economic factors. In addition, due to the inter-relationship of global economies and financial markets, changes in political and economic factors in one country or region could adversely affect conditions in another country or region. Investments in foreign securities may also expose the Fund to time-zone arbitrage risk. Foreign securities may trade on weekends or other days when the Fund does not price its shares. At times, the Fund may emphasize investments in a particular country or region and may be subject to greater risks from adverse events that occur in that country or region. Foreign securities and foreign currencies held in foreign banks and securities depositories may be subject to limited or no regulatory oversight.
Investments in Affiliated Funds. The Fund is permitted to invest in other mutual funds advised by the Manager (“Affiliated Funds”). Affiliated Funds are open-end management investment companies registered under the 1940 Act, as amended. The Manager is the investment adviser of, and the Sub-Adviser provides investment and related advisory services to, the Affiliated Funds. When applicable, the Fund’s investments in Affiliated Funds are included in the Statement of Investments. Shares of Affiliated Funds are valued at their net asset value per share. As a shareholder, the Fund is subject to its proportional share of the Affiliated Funds’ expenses, including their management fee. The Manager will waive fees and/ or reimburse Fund expenses in an amount equal to the indirect management fees incurred through the Fund’s investment in the Affiliated Funds.
Each of the Affiliated Funds in which the Fund invests has its own investment risks, and those risks can affect the value of the Fund’s investments and therefore the value of the Fund’s shares. To the extent that the Fund invests more of its assets in one Affiliated Fund than in another, the Fund will have greater exposure to the risks of that Affiliated Fund.
Investments in Money Market Instruments. The Fund is permitted to invest its free cash balances in money market instruments to provide liquidity or for defensive purposes. The Fund may invest in money market instruments by investing in Class E shares of Oppenheimer Institutional Government Money Market Fund (“IGMMF”), which is an Affiliated Fund. IGMMF is regulated as a money market fund under the 1940 Act, as amended. The Fund may also invest in money market instruments directly or in other affiliated or unaffiliated money market funds.
39 OPPENHEIMER INTERNATIONAL GROWTH FUND
NOTES TO FINANCIAL STATEMENTS Unaudited / Continued
4. Investments and Risks (Continued)
Equity Security Risk. Stocks and other equity securities fluctuate in price. The value of the Fund’s portfolio may be affected by changes in the equity markets generally. Equity markets may experience significant short-term volatility and may fall sharply at times. Different markets may behave differently from each other and U.S. equity markets may move in the opposite direction from one or more foreign stock markets. Adverse events in any part of the equity or fixed-income markets may have unexpected negative effects on other market segments.
The prices of individual equity securities generally do not all move in the same direction at the same time and a variety of factors can affect the price of a particular company’s securities. These factors may include, but are not limited to, poor earnings reports, a loss of customers, litigation against the company, general unfavorable performance of the company’s sector or industry, or changes in government regulations affecting the company or its industry.
5. Market Risk Factors
The Fund’s investments in securities and/or financial derivatives may expose the Fund to various market risk factors:
Commodity Risk. Commodity risk relates to the change in value of commodities or commodity indexes as they relate to increases or decreases in the commodities market. Commodities are physical assets that have tangible properties. Examples of these types of assets are crude oil, heating oil, metals, livestock, and agricultural products.
Credit Risk. Credit risk relates to the ability of the issuer of debt to meet interest and principal payments, or both, as they come due. In general, lower-grade, higher-yield debt securities are subject to credit risk to a greater extent than lower-yield, higher-quality securities.
Equity Risk. Equity risk relates to the change in value of equity securities as they relate to increases or decreases in the general market.
Foreign Exchange Rate Risk. Foreign exchange rate risk relates to the change in the U.S. dollar value of a security held that is denominated in a foreign currency. The U.S. dollar value of a foreign currency denominated security will decrease as the dollar appreciates against the currency, while the U.S. dollar value will increase as the dollar depreciates against the currency.
Interest Rate Risk. Interest rate risk refers to the fluctuations in value of fixed-income securities resulting from the inverse relationship between price and yield. For example, an increase in general interest rates will tend to reduce the market value of already issued fixed-income investments, and a decline in general interest rates will tend to increase their value. In addition, debt securities with longer maturities, which tend to have higher yields, are subject to potentially greater fluctuations in value from changes in interest rates than obligations with shorter maturities.
Volatility Risk. Volatility risk refers to the magnitude of the movement, but not the direction of the movement, in a financial instrument’s price over a defined time period. Large increases or decreases in a financial instrument’s price over a relative time period typically indicate greater volatility risk, while small increases or decreases in its price
40 OPPENHEIMER INTERNATIONAL GROWTH FUND
5. Market Risk Factors (Continued)
typically indicate lower volatility risk.
6. Shares of Beneficial Interest
The Fund has authorized an unlimited number of no par value shares of beneficial interest of each class. Transactions in shares of beneficial interest were as follows:
| | | | | | | | | | | | | | | | |
| | | Six Months Ended May 31, 2018 | | | Year Ended November 30, 2017 | |
| | | Shares | | | Amount | | | Shares | | | Amount | |
| |
| Class A | | | | | | | | | | | | | | | | |
| Sold | | | 7,153,822 | | | $ | 318,271,240 | | | | 23,384,713 | | | $ | 891,969,392 | |
| Dividends and/or distributions reinvested | | | 368,769 | | | | 15,982,424 | | | | 1,102,537 | | | | 37,916,263 | |
| Redeemed | | | (14,473,029 | ) | | | (643,180,785 | ) | | | (74,019,607 | ) | | | (2,805,234,067 | ) |
| | | | |
| Net decrease | | | (6,950,438 | ) | | $ | (308,927,121 | ) | | | (49,532,357 | ) | | $ | (1,875,348,412) | |
| | | | |
|
| |
| Class B | | | | | | | | | | | | | | | | |
| Sold | | | 991 | | | $ | 42,173 | | | | 7,036 | | | $ | 258,875 | |
| Dividends and/or distributions reinvested | | | — | | | | — | | | | — | | | | — | |
| Redeemed | | | (67,045 | ) | | | (2,840,193 | ) | | | (167,466 | ) | | | (6,167,896 | ) |
| | | | |
| Net decrease | | | (66,054 | ) | | $ | (2,798,020 | ) | | | (160,430 | ) | | $ | (5,909,021) | |
| | | | |
|
| |
| Class C | | | | | | | | | | | | | | | | |
| Sold | | | 947,020 | | | $ | 39,927,980 | | | | 1,734,397 | | | $ | 65,069,982 | |
| Dividends and/or distributions reinvested | | | — | | | | — | | | | 33,508 | | | | 1,096,381 | |
| Redeemed | | | (1,284,158 | ) | | | (54,157,520 | ) | | | (4,410,945 | ) | | | (160,855,668 | ) |
| | | | |
| Net decrease | | | (337,138 | ) | | $ | (14,229,540 | ) | | | (2,643,040 | ) | | $ | (94,689,305) | |
| | | | |
|
| |
| Class I | | | | | | | | | | | | | | | | |
| Sold | | | 40,116,305 | | | $ | 1,777,471,002 | | | | 112,679,234 | | | $ | 4,474,908,956 | |
| Dividends and/or distributions reinvested | | | 2,213,094 | | | | 95,273,724 | | | | 2,802,712 | | | | 95,796,703 | |
| Redeemed | | | (25,577,584 | ) | | | (1,129,421,604 | ) | | | (61,395,521 | ) | | | (2,403,705,967 | ) |
| | | | |
| Net increase | | | 16,751,815 | | | $ | 743,323,122 | | | | 54,086,425 | | | $ | 2,166,999,692 | |
| | | | |
|
| |
| Class R | | | | | | | | | | | | | | | | |
| Sold | | | 1,697,923 | | | $ | 74,101,847 | | | | 2,931,234 | | | $ | 112,559,356 | |
| Dividends and/or distributions reinvested | | | 45,886 | | | | 1,952,456 | | | | 92,861 | | | | 3,138,702 | |
| Redeemed | | | (1,827,006 | ) | | | (79,729,405 | ) | | | (3,272,073 | ) | | | (124,891,722 | ) |
| | | | |
| Net decrease | | | (83,197 | ) | | $ | (3,675,102 | ) | | | (247,978 | ) | | $ | (9,193,664) | |
| | | | |
|
| |
| Class Y | | | | | | | | | | | | | | | | |
| Sold | | | 43,195,723 | | | $ | 1,911,810,388 | | | | 150,941,870 | | | $ | 5,785,785,346 | |
| Dividends and/or distributions reinvested | | | 2,017,447 | | | | 86,851,078 | | | | 2,702,975 | | | | 92,387,703 | |
| Redeemed | | | (60,047,277 | ) | | | (2,659,614,648 | ) | | | (155,637,371 | ) | | | (6,147,887,277 | ) |
| | | | |
| Net decrease | | | (14,834,107 | ) | | $ | (660,953,182 | ) | | | (1,992,526 | ) | | $ | (269,714,228) | |
| | | | |
41 OPPENHEIMER INTERNATIONAL GROWTH FUND
NOTES TO FINANCIAL STATEMENTS Unaudited / Continued
7. Purchases and Sales of Securities
The aggregate cost of purchases and proceeds from sales of securities, other than short-term obligations and investments in IGMMF, for the reporting period were as follows:
| | | | | | | | |
| | | Purchases | | | Sales | |
| |
Investment securities | | $ | 2,413,087,266 | | | $ | 2,214,511,507 | |
8. Fees and Other Transactions with Affiliates
Management Fees. Under the investment advisory agreement, the Fund pays the Manager a management fee based on the daily net assets of the Fund at an annual rate as shown in the following table:
| | | | |
| Fee Schedule | | | |
Up to $250 million | | | 0.80 | % |
Next $250 million | | | 0.77 | |
Next $500 million | | | 0.75 | |
Next $1 billion | | | 0.69 | |
Next $3 billion | | | 0.67 | |
Next $5 billion | | | 0.65 | |
Next $10 billion | | | 0.63 | |
Next $10 billion | | | 0.61 | |
Over $30 billion | | | 0.59 | |
The Fund’s effective management fee for the reporting period was 0.64% of average annual net assets before any applicable waivers.
Sub-Adviser Fees. The Manager has retained the Sub-Adviser to provide the day-to-day portfolio management of the Fund. Under the Sub-Advisory Agreement, the Manager pays the Sub-Adviser an annual fee in monthly installments, equal to a percentage of the investment management fee collected by the Manager from the Fund, which shall be calculated after any investment management fee waivers. The fee paid to the Sub-Adviser is paid by the Manager, not by the Fund.
Transfer Agent Fees. OFI Global (the “Transfer Agent”) serves as the transfer and shareholder servicing agent for the Fund. The Fund pays the Transfer Agent a fee based on annual net assets, which shall be calculated after any applicable fee waivers. Fees incurred and average net assets for each class with respect to these services are detailed in the Statement of Operations and Financial Highlights, respectively.
Sub-Transfer Agent Fees. The Transfer Agent has retained Shareholder Services, Inc., a wholly-owned subsidiary of OFI (the “Sub-Transfer Agent”), to provide the day-to-day transfer agent and shareholder servicing of the Fund. Under the Sub-Transfer Agency Agreement, the Transfer Agent pays the Sub-Transfer Agent an annual fee in monthly installments, equal to a percentage of the transfer agent fee collected by the Transfer Agent from the Fund, which shall be calculated after any applicable fee waivers. The fee paid to the Sub-Transfer Agent is paid by the Transfer Agent, not by the Fund.
42 OPPENHEIMER INTERNATIONAL GROWTH FUND
8. Fees and Other Transactions with Affiliates (Continued)
Trustees’ Compensation. The Fund has adopted an unfunded retirement plan (the “Plan”) for the Fund’s Independent Trustees. Benefits are based on years of service and fees paid to each Trustee during their period of service. The Plan was frozen with respect to adding new participants effective December 31, 2006 (the “Freeze Date”) and existing Plan Participants as of the Freeze Date will continue to receive accrued benefits under the Plan. Active Independent Trustees as of the Freeze Date have each elected a distribution method with respect to their benefits under the Plan.
During the reporting period, the Fund’s projected benefit obligations, payments to retired Trustees and accumulated liability were as follows:
| | | | |
| Projected Benefit Obligations Increased | | $ | — | |
| Payments Made to Retired Trustees | | | 12,595 | |
| Accumulated Liability as of May 31, 2018 | | | 108,604 | |
The Fund’s Board of Trustees (“Board”) has adopted a compensation deferral plan for Independent Trustees that enables Trustees to elect to defer receipt of all or a portion of the annual compensation they are entitled to receive from the Fund. For purposes of determining the amount owed to the Trustee under the plan, deferred amounts are treated as though equal dollar amounts had been invested in shares of the Fund or in other Oppenheimer funds selected by the Trustee. The Fund purchases shares of the funds selected for deferral by the Trustee in amounts equal to his or her deemed investment, resulting in a Fund asset equal to the deferred compensation liability. Such assets are included as a component of “Other” within the asset section of the Statement of Assets and Liabilities. Deferral of Trustees’ fees under the plan will not affect the net assets of the Fund and will not materially affect the Fund’s assets, liabilities or net investment income per share. Amounts will be deferred until distributed in accordance with the compensation deferral plan.
Distribution and Service Plan (12b-1) Fees. Under its General Distributor’s Agreement with the Fund, OppenheimerFunds Distributor, Inc. (the “Distributor”) acts as the Fund’s principal underwriter in the continuous public offering of the Fund’s classes of shares.
Service Plan for Class A Shares. The Fund has adopted a Service Plan (the “Plan”) for Class A shares pursuant to Rule 12b-1 under the 1940 Act. Under the Plan, the Fund reimburses the Distributor for a portion of its costs incurred for services provided to accounts that hold Class A shares. Reimbursement is made periodically at an annual rate of up to 0.25% of the daily net assets of Class A shares of the Fund. The Distributor currently uses all of those fees to pay dealers, brokers, banks and other financial institutions periodically for providing personal service and maintenance of accounts of their customers that hold Class A shares. Any unreimbursed expenses the Distributor incurs with respect to Class A shares in any fiscal year cannot be recovered in subsequent periods. Fees incurred by the Fund under the Plan are detailed in the Statement of Operations.
43 OPPENHEIMER INTERNATIONAL GROWTH FUND
NOTES TO FINANCIAL STATEMENTS Unaudited / Continued
8. Fees and Other Transactions with Affiliates (Continued)
Distribution and Service Plans for Class B, Class C and Class R Shares. The Fund has adopted Distribution and Service Plans (the “Plans”) for Class B, Class C and Class R shares pursuant to Rule 12b-1 under the 1940 Act to compensate the Distributor for distributing those share classes, maintaining accounts and providing shareholder services. Under the Plans, the Fund pays the Distributor an annual asset-based sales charge of 0.75% on Class B and Class C shares’ daily net assets and 0.25% on Class R shares’ daily net assets. The Fund also pays a service fee under the Plans at an annual rate of 0.25% of daily net assets. The Plans continue in effect from year to year only if the Fund’s Board of Trustees votes annually to approve their continuance at an in person meeting called for that purpose. Fees incurred by the Fund under the Plans are detailed in the Statement of Operations.
Sales Charges. Front-end sales charges and CDSC do not represent expenses of the Fund. They are deducted from the proceeds of sales of Fund shares prior to investment or from redemption proceeds prior to remittance, as applicable. The sales charges retained by the Distributor from the sale of shares and the CDSC retained by the Distributor on the redemption of shares is shown in the following table for the period indicated.
| | | | | | | | | | | | | | | | |
| Six Months Ended | | Class A Front-End
Sales Charges
Retained by
Distributor | | | Class A
Contingent
Deferred
Sales Charges
Retained by
Distributor | | | Class B
Contingent
Deferred
Sales Charges
Retained by
Distributor | | | Class C
Contingent
Deferred
Sales Charges
Retained by
Distributor | |
| |
May 31, 2018 | | | $177,875 | | | | $8,353 | | | | $530 | | | | $19,242 | |
Waivers and Reimbursements of Expenses. Effective for the period January 1, 2017 through December 31, 2017, the Transfer Agent voluntarily waived and/or reimbursed Fund expenses in an amount equal to 0.015% of average annual net assets for Classes A, B, C, R and Y.
During the reporting period, the Transfer Agent waived fees and/or reimbursed the Fund for transfer agent and shareholder servicing agent fees as follows:
| | | | |
| Class A | | $ | 41,155 | |
| Class B | | | 34 | |
| Class C | | | 5,956 | |
| Class R | | | 6,167 | |
| Class Y | | | 159,611 | |
The Manager will waive fees and/or reimburse Fund expenses in an amount equal to the indirect management fees incurred through the Fund’s investment in IGMMF. During the reporting period, the Manager waived fees and/or reimbursed the Fund $253,829 for IGMMF management fees. This fee waiver and/or expense reimbursement may not be amended or withdrawn for one year from the date of the Fund’s prospectus, unless approved by the Board.
44 OPPENHEIMER INTERNATIONAL GROWTH FUND
9. Borrowing and Other Financing
Joint Credit Facility. A number of mutual funds managed by the Manager participate in a $1.875 billion revolving credit facility (the “Facility”) intended to provide short-term financing, if necessary, subject to certain restrictions in connection with atypical redemption activity. Expenses and fees related to the Facility are paid by the participating funds and are disclosed separately or as other expenses on the Statement of Operations. The Fund did not utilize the Facility during the reporting period.
45 OPPENHEIMER INTERNATIONAL GROWTH FUND
PORTFOLIO PROXY VOTING POLICIES AND GUIDELINES; UPDATES TO STATEMENT OF INVESTMENTS Unaudited
The Fund has adopted Portfolio Proxy Voting Policies and Guidelines under which the Fund votes proxies relating to securities (“portfolio proxies”) held by the Fund. A description of the Fund’s Portfolio Proxy Voting Policies and Guidelines is available (i) without charge, upon request, by calling the Fund toll-free at 1.800.CALL OPP (225.5677), (ii) on the Fund’s website at www.oppenheimerfunds.com, and (iii) on the SEC’s website at www.sec.gov. In addition, the Fund is required to file Form N-PX, with its complete proxy voting record for the 12 months ended June 30th, no later than August 31st of each year. The Fund’s voting record is available (i) without charge, upon request, by calling the Fund toll-free at 1.800.CALL OPP (225.5677), and (ii) in the Form N-PX filing on the SEC’s website at www.sec.gov.
The Fund files its complete schedule of portfolio holdings with the SEC for the first quarter and the third quarter of each fiscal year on Form N-Q. The Fund’s Form N-Q filings are available on the SEC’s website at www.sec.gov. Those forms may be reviewed and copied at the SEC’s Public Reference Room in Washington, D.C. Information on the operation of the Public Reference Room may be obtained by calling 1-800-SEC-0330.
Householding—Delivery of Shareholder Documents
This is to inform you about OppenheimerFunds’ “householding” policy. If more than one member of your household maintains an account in a particular fund, OppenheimerFunds will mail only one copy of the fund’s prospectus (or, if available, the fund’s summary prospectus), annual and semiannual report and privacy policy. The consolidation of these mailings, called householding, benefits your fund through reduced mailing expense, and benefits you by reducing the volume of mail you receive from OppenheimerFunds. Householding does not affect the delivery of your account statements.
Please note that we will continue to household these mailings for as long as you remain an OppenheimerFunds shareholder, unless you request otherwise. If you prefer to receive multiple copies of these materials, please call us at 1.800.CALL-OPP (225-5677). You may also notify us in writing or via email. We will begin sending you individual copies of the prospectus (or, if available, the summary prospectus), reports and privacy policy within 30 days of receiving your request to stop householding.
46 OPPENHEIMER INTERNATIONAL GROWTH FUND
OPPENHEIMER INTERNATIONAL GROWTH FUND
| | |
| Trustees and Officers | | Brian F. Wruble, Chairman of the Board of Trustees and Trustee |
| | Beth Ann Brown, Trustee |
| | Edmund P. Giambastiani, Jr., Trustee |
| | Elizabeth Krentzman, Trustee |
| | Mary F. Miller, Trustee |
| | Joel W. Motley, Trustee |
| | Joanne Pace, Trustee |
| | Daniel Vandivort, Trustee |
| | Arthur P. Steinmetz, Trustee, President and Principal Executive Officer |
| | George R. Evans, Vice President |
| | Robert Dunphy, Vice President |
| | Cynthia Lo Bessette, Secretary and Chief Legal Officer |
| | Jennifer Foxson, Vice President and Chief Business Officer |
| | Mary Ann Picciotto, Chief Compliance Officer and Chief Anti-Money |
| | Laundering Officer |
| | Brian S. Petersen, Treasurer and Principal Financial & Accounting Officer |
| |
| Manager | | OFI Global Asset Management, Inc. |
| |
| Sub-Adviser | | OppenheimerFunds, Inc. |
| |
| Distributor | | OppenheimerFunds Distributor, Inc. |
| |
| Transfer and Shareholder | | OFI Global Asset Management, Inc. |
| Servicing Agent | | |
| |
| Sub-Transfer Agent | | Shareholder Services, Inc. |
| | DBA OppenheimerFunds Services |
| |
Independent Registered Public Accounting Firm | | KPMG LLP |
| |
| Legal Counsel | | Kramer Levin Naftalis & Frankel LLP |
| |
| | The financial statements included herein have been taken from the records of the Fund without examination of those records by the independent registered public accounting firm. |
© 2018 OppenheimerFunds, Inc. All rights reserved.
47 OPPENHEIMER INTERNATIONAL GROWTH FUND
PRIVACY NOTICE
As an Oppenheimer fund shareholder, you are entitled to know how we protect your personal information and how we limit its disclosure.
Information Sources
We obtain non-public personal information about our shareholders from the following sources:
| ● | Applications or other forms. |
| ● | When you create a user ID and password for online account access. |
| ● | When you enroll in eDocs Direct,SM our electronic document delivery service. |
| ● | Your transactions with us, our affiliates or others. |
| ● | Technologies on our website, including: “cookies” and web beacons, which are used to collect data on the pages you visit and the features you use. |
If you visit oppenheimerfunds.com and do not log on to the secure account information areas, we do not obtain any personal information about you. When you do log on to a secure area, we do obtain your user ID and password to identify you. We also use this information to provide you with products and services you have requested, to inform you about products and services that you may be interested in and assist you in other ways.
We do not collect personal information through our website unless you willingly provide it to us, either directly by email or in those areas of the website that request information. In order to update your personal information (including your mailing address, email address and phone number) you must first log on and visit your user profile.
If you have set your browser to warn you before accepting cookies, you will receive the warning message with each cookie. You can refuse cookies by turning them off in your browser. However, doing so may limit your access to certain sections of our website.
We use cookies to help us improve and manage our website. For example, cookies help us recognize new versus repeat visitors to the site, track the pages visited, and enable some special features on the website. This data helps us provide better service for our website visitors.
Protection of Information
We do not disclose any non-public personal information (such as names on a customer list) about current or former customers to anyone, except as permitted by law.
Disclosure of Information
Copies of confirmations, account statements and other documents reporting activity in your fund accounts are made available to your financial advisor (as designated by you). We may also use details about you and your investments to help us, our financial service affiliates, or firms that jointly market their financial products and services with ours, to better serve your investment needs or suggest educational material that may be of interest to you. If this requires us to provide you with an opportunity to “opt in” or “opt out” of such information sharing with a firm not affiliated with us, you will receive notification on how to do so, before any such sharing takes place.
Right of Refusal
We will not disclose your personal information to unaffiliated third parties (except as permitted by law), unless we first offer you a reasonable opportunity to refuse or “opt out” of such disclosure.
48 OPPENHEIMER INTERNATIONAL GROWTH FUND
Internet Security and Encryption
In general, the email services provided by our website are encrypted and provide a secure and private means of communication with us. To protect your own privacy, confidential and/ or personal information should only be communicated via email when you are advised that you are using a secure website.
As a security measure, we do not include personal or account information in non-secure emails, and we advise you not to send such information to us in non-secure emails. Instead, you may take advantage of the secure features of our website to encrypt your email correspondence. To do this, you will need to use a browser that supports Secure Sockets Layer (SSL) protocol.
| ● | All transactions conducted via our websites, including redemptions, exchanges and purchases, are secured by the highest encryption standards available. SSL is used to establish a secure connection between your PC and OppenheimerFunds’ server. It transmits information in an encrypted and scrambled format. |
| ● | Encryption is achieved through an electronic scrambling technology that uses a “key” to code and then decode the data. Encryption acts like the cable converter box you may have on your television set. It scrambles data with a secret code so that no one can make sense of it while it is being transmitted. When the data reaches its destination, the same software unscrambles the data. |
| ● | You can exit the secure area by closing your browser or, for added security, you can use the Log Out button before you close your browser. |
Other Security Measures
We maintain physical, electronic and procedural safeguards to protect your personal account information. Our employees and agents have access to that information only so that they may offer you products or provide services, for example, when responding to your account questions.
How You Can Help
You can also do your part to keep your account information private and to prevent unauthorized transactions. If you obtain a user ID and password for your account, safeguard that information. Strengthening your online credentials–your online security profile–typically your user name, password, and security questions and answers, can be one of your most important lines of defense on the Internet. For additional information on how you can help prevent identity theft, visit https://www. oppenheimerfunds.com/security.
Who We Are
This joint notice describes the privacy policies of the Oppenheimer funds, OppenheimerFunds, Inc., each of its investment adviser subsidiaries, OppenheimerFunds Distributor, Inc. and OFI Global Trust Co. It applies to all Oppenheimer fund accounts you presently have, or may open in the future, using your Social Security number—whether or not you remain a shareholder of our funds. This notice was last updated as of November 2017. In the event it is updated or changed, we will post an updated notice on our website at oppenheimerfunds.com. If you have any questions about this privacy policy, email us by clicking on the Contact Us section of our website at oppenheimerfunds.com, write to us at P.O. Box 5270, Denver, CO 80217-5270, or call us at 800 CALL OPP (225 5677).
49 OPPENHEIMER INTERNATIONAL GROWTH FUND
THIS PAGE INTENTIONALLY LEFT BLANK.
50 OPPENHEIMER INTERNATIONAL GROWTH FUND
THIS PAGE INTENTIONALLY LEFT BLANK.
51 OPPENHEIMER INTERNATIONAL GROWTH FUND
THIS PAGE INTENTIONALLY LEFT BLANK.
52 OPPENHEIMER INTERNATIONAL GROWTH FUND
THIS PAGE INTENTIONALLY LEFT BLANK.
53 OPPENHEIMER INTERNATIONAL GROWTH FUND
THIS PAGE INTENTIONALLY LEFT BLANK.
54 OPPENHEIMER INTERNATIONAL GROWTH FUND
THIS PAGE INTENTIONALLY LEFT BLANK.
55 OPPENHEIMER INTERNATIONAL GROWTH FUND
| | | | |
| | 
Visit us at oppenheimerfunds.com for 24-hr access to account information and transactions or call us at 800.CALL OPP (800.225.5677) for 24-hr automated information and automated transactions. Representatives also available Mon–Fri 8am-8pm ET. | | |
Visit Us oppenheimerfunds.com | | | | |
| | |
Call Us 800 225 5677 | | | | |
| | |
Follow us 
| | Oppenheimer funds are distributed by OppenheimerFunds Distributor, Inc. 225 Liberty Street, New York, NY 10281-1008 © 2018 OppenheimerFunds Distributor, Inc. All rights reserved. RS0825.001.0518 July 25, 2018 | | |
Item 2. Code of Ethics.
Not applicable to semiannual reports.
Item 3. Audit Committee Financial Expert.
Not applicable to semiannual reports.
Item 4. Principal Accountant Fees and Services.
Not applicable to semiannual reports.
Item 5. Audit Committee of Listed Registrants
Not applicable.
Item 6. Schedule of Investments.
a) Not applicable. The complete schedule of investments is included in Item 1 of this Form N-CSR.
b) Not applicable.
Item 7. Disclosure of Proxy Voting Policies and Procedures for Closed-End Management Investment Companies.
Not applicable.
Item 8. Portfolio Managers of Closed-End Management Investment Companies.
Not applicable.
Item 9. Purchases of Equity Securities by Closed-End Management Investment Company
and Affiliated Purchasers.
Not applicable.
Item 10. Submission of Matters to a Vote of Security Holders.
The Fund’s Governance Committee Provisions with Respect to Nominations of Directors/Trustees to the Respective Boards
None
Item 11. Controls and Procedures.
Based on their evaluation of the registrant’s disclosure controls and procedures (as defined in rule 30a-3(c) under the Investment Company Act of 1940 (17 CFR 270.30a-3(c)) as of 5/31/2018, the registrant’s principal executive officer and principal financial officer found the registrant’s disclosure controls and procedures to provide reasonable assurances that information required to be disclosed by the registrant in the reports that it files under the Securities Exchange Act of 1934 (a) is accumulated and communicated to registrant’s management, including its principal executive officer and principal financial officer, to allow timely decisions regarding required disclosure, and (b) is recorded, processed, summarized and reported, within the time
periods specified in the rules and forms adopted by the U.S. Securities and Exchange Commission.
There have been no changes in the registrant’s internal controls over financial reporting that occurred during the registrant’s second fiscal quarter of the period covered by this report that have materially affected, or are reasonably likely to materially affect, the registrant’s internal control over financial reporting.
Item 12. Disclosure of Securities Lending Activities for Closed-End Management Investment Companies.
Not applicable.
Item 13. Exhibits.
| (a) | (1) Exhibit attached hereto. |
(2) Exhibits attached hereto.
SIGNATURES
Pursuant to the requirements of the Securities Exchange Act of 1934 and the Investment Company Act of 1940, the registrant has duly caused this report to be signed on its behalf by the undersigned, thereunto duly authorized.
Oppenheimer International Growth Fund
| | |
| By: | | /s/ Arthur P. Steinmetz |
| | | Arthur P. Steinmetz |
| | | Principal Executive Officer |
| Date: | | 7/20/2018 |
Pursuant to the requirements of the Securities Exchange Act of 1934 and the Investment Company Act of 1940, this report has been signed below by the following persons on behalf of the registrant and in the capacities and on the dates indicated.
| | |
| By: | | /s/ Arthur P. Steinmetz |
| | | Arthur P. Steinmetz |
| | | Principal Executive Officer |
| Date: | | 7/20/2018 |
| |
| By: | | /s/ Brian S. Petersen |
| | | Brian S. Petersen |
| | | Principal Financial Officer |
| Date: | | 7/20/2018 |