UNITED STATES
SECURITIES AND EXCHANGE COMMISSION
Washington, D.C. 20549
FORM N-CSR
CERTIFIED SHAREHOLDER REPORT OF REGISTERED
MANAGEMENT INVESTMENT COMPANIES
Investment Company Act file number (811-07493)
Hennessy Funds, Inc.
(Exact name of registrant as specified in charter)
7250 Redwood Blvd., Suite 200
Novato, CA 94945
(Address of principal executive offices) (Zip code)
Neil J. Hennessy
7250 Redwood Blvd., Suite 200
Novato, CA 94945
(Name and address of agent for service)
800-966-4354
Registrant's telephone number, including area code
Date of fiscal year end: October 31, 2012
Date of reporting period: October 31, 2012
Item 1. Reports to Stockholders.
HENNESSY FUNDS
ANNUAL REPORT
OCTOBER 31, 2012

Hennessy Cornerstone Growth Fund
Hennessy Cornerstone Mid Cap 30 Fund
Hennessy Cornerstone Large Growth Fund
Hennessy Cornerstone Value Fund
Hennessy Large Value Fund
Hennessy Total Return Fund
Hennessy Balanced Fund
Hennessy Japan Fund
Hennessy Japan Small Cap Fund

(This Page Intentionally Left Blank.)
Contents
| Letter to shareholders | 2 |
| Performance overview (unaudited) | |
| Hennessy Cornerstone Growth Fund | 4 |
| Hennessy Cornerstone Mid Cap 30 Fund | 6 |
| Hennessy Cornerstone Large Growth Fund | 8 |
| Hennessy Cornerstone Value Fund | 10 |
| Hennessy Large Value Fund | 12 |
| Hennessy Total Return Fund | 14 |
| Hennessy Balanced Fund | 15 |
| Hennessy Japan Fund | 16 |
| Hennessy Japan Small Cap Fund | 18 |
| Financial statements | |
| Schedules of investments | |
| Hennessy Cornerstone Growth Fund | 21 |
| Hennessy Cornerstone Mid Cap 30 Fund | 26 |
| Hennessy Cornerstone Large Growth Fund | 29 |
| Hennessy Cornerstone Value Fund | 33 |
| Hennessy Large Value Fund | 36 |
| Hennessy Total Return Fund | 39 |
| Hennessy Balanced Fund | 43 |
| Hennessy Japan Fund | 46 |
| Hennessy Japan Small Cap Fund | 49 |
| Statements of assets and liabilities | 52 |
| Statements of operations | 54 |
| Statements of changes in net assets | 56 |
| Statement of cash flows – Hennessy Total Return Fund | 61 |
| Financial highlights | |
| Hennessy Cornerstone Growth Fund | 62 |
| Hennessy Cornerstone Mid Cap 30 Fund | 64 |
| Hennessy Cornerstone Large Growth Fund | 66 |
| Hennessy Cornerstone Value Fund | 68 |
| Hennessy Large Value Fund | 70 |
| Hennessy Total Return Fund | 72 |
| Hennessy Balanced Fund | 73 |
| Hennessy Japan Fund | 74 |
| Hennessy Japan Small Cap Fund | 76 |
| Notes to the financial statements | 77 |
| Report of Independent Registered Public Accounting Firm | 86 |
| Directors/Trustees and Officers of the Funds | 87 |
| Expense example | 89 |
| Proxy voting policy | 91 |
| Quarterly Filings on Form N-Q | 91 |
| Federal Tax Distribution Information | 91 |
| Privacy Policy | 92 |
HENNESSY FUNDS 1-800-966-4354
December, 2012
Dear Hennessy Funds Shareholder:
The past year has been jam-packed with politics, continued economic uncertainty in the United States and around the world, and most recently, non-stop talk of the possible effects of the looming “Fiscal Cliff.”
Since the economic crisis of 2008, most Americans seem to have taken a “glass half empty” view and now seem to expect doom and gloom. Talking about the decline of America has become a popular pastime around the world, and even Americans are jumping into the discussion. In fact, it feels like the United States has become an “underdog,” while China and other emerging nations are coined as the new world economic leaders. But the reality is that the U.S. remains the world’s largest economy, and the stock market has continued to perform well. Following the crisis in 2008, the Dow Jones Industrial Average was up 23% in 2009, up 14% in 2010, and up 8% in 2011. I believe, however, that many Americans, including individuals, business leaders, and political leaders, have remained resilient and continue to exhibit the stamina to work hard and the character to succeed.
I am not saying that our economy isn’t without issues. But, I believe investors may be missing some key facts about our economy, and those facts transcend the rhetoric. In last year’s shareholder letter, I told you that the major obstacle facing the U.S. economy and the stock market was clarity from our leaders in Washington on taxes, regulation and healthcare. With the elections behind us, we have the clarity that President Obama will be our leader for another four years. We know that the Democrats have the majority in the Senate and the Republicans have the majority in the House. But where does that leave our economy, the financial markets and investors?
Post-Election Economy
The moment the last ballot was cast in November, the media began its talk of the “Fiscal Cliff.” The dramatic use of the word “Cliff” is making everyone nervous. I keep picturing the old Road Runner cartoons with the Coyote plummeting off a cliff and landing in a cloud of dust. It is my somewhat controversial opinion that we should drive right off the Fiscal Cliff and force our policy makers to get things “right” and not compromise for the sake of a compromise. I strongly believe that if we fall off the “Cliff,” in six months’ time our leaders would have to work together to create better policies, rather than trying to force quick fixes on these issues critical to our economy and our nation.
The election, the Fiscal Cliff and slow earnings growth may be eroding the confidence of our business leaders, who have cut costs and driven profits. However, companies here in the U.S. are still sitting on record amounts of cash. Businesses require faith in their government to execute strategies that will put that capital to work, and to hire in earnest. Now that there is some clarity, it must, in my opinion, be coupled with actionable policy on taxes and regulation for corporate attitudes and behavior to shift. Corporate America, and frankly most of America, is losing its tolerance with polarized and stagnant politics.
For better or worse, business leaders need to know what regulations they’ll have to comply with, what tax rates will be and what healthcare will cost. The writing is on the wall for higher taxes, and the Healthcare Reform Law appears to be here to stay. The current administration seems to feel that they have a “green light” to push the 200 regulations related to Dodd-Frank and the numerous policies outlined in the Healthcare Reform Law into practice in the next four years. I know that innovative business leaders in this country will implement new strategies as they seek to remain profitable, because that’s what they do. Many of America’s business leaders have shown that they have the character to succeed in any political or economic climate.
Financial Markets
The stock market will be forced to wade through this murky economy as we continue to navigate the partisan political quagmire. Many companies comprising the Dow Jones Industrial Average Index or the S&P 500 have strong balance sheets, respectable fundamentals and reasonable returns. When our fiscal year ended on October 31, 2012, the Dow Jones was going strong at 9.51% calendar year to date. Of course, after the election, the market “rioted” in order to force some decisions on the Fiscal Cliff. In fact, in the ten days after the election, we saw the Dow lose 4%. But in the long term, I believe the strengths of the economy should filter through to the markets. We are in the midst of a slow but steady recovery that won’t easily be derailed. I am, therefore, expecting another year with slow to moderate growth. There are still plenty of great stocks to buy. We are seeing improvement in many sectors, including the housing industry, and we still see strength in lower-end retailers.
Investors
Investors are still uncertain about putting their cash to work in the stock market, and they continue to flock to fixed income products. Like business leaders, I believe that investors feel the same frustration with partisanship in Washington, and they need more answers in order to believe in the economic recovery. The strength I have seen in many of the lower-end retailers tells me that investors and consumers are still looking for value for their dollar. Many industry statistics report
WWW.HENNESSYFUNDS.COM
2
that Americans have been paying down their debt and saving more, even with interest rates at all-time lows. And, I believe, the average investor could be experiencing some long-awaited comfort in the slow return of the housing market in our country.
Japan Market
I remain very excited about the possibilities for growth in the Japanese market. Japanese companies have been employing the same tactics as U.S. based companies: they are saving money, paying dividends and making strategic acquisitions. With the passing of the torch to a new Prime-minister (Shinzo Abe) it looks as though the final piece to the economic puzzle in Japan may be in place. It appears that the Japanese Government is supporting the weakening of the Yen, and that companies in Japan are prepared to increase their exports. While I remain hopeful that the U.S. Administration’s actions and policies will support business and encourage personal success, Japan’s governing body seems to truly want Japanese companies and citizens to prosper and is taking action. In a surprise move, Shinzo Abe’s call for an inflation target of 2% and a Yen of around 90 (up from approximately 76) to the dollar could do two things. First, it could help to end the deflation that has hampered the country for years, and second, it can encourage Japanese business leaders to increased profits, which would in turn drive more revenues for the Japanese Government. All told, I truly believe that companies in Japan are poised to take off, and in turn so should the Japanese markets. I am confident that Japan is on the brink of the financial comeback that many investors have been waiting for.
While fiscal 2012 proved another difficult year for the global economy, at Hennessy Funds we remain focused on our proven investment strategies, and we will not compromise our long-standing commitment to manage our portfolios in the best interest of our shareholders. As investors regain their confidence and return to investing based on facts and fundamentals, I believe we should return to steady, long-term market gains.
In late October, Hennessy Funds added seven new funds to our family of funds. We are excited to now offer our shareholders an expanded line-up of products, including 16 traditional domestic equity, sector and specialty, as well as more conservative balanced and fixed income mutual funds.
I personally would like to take a moment to reach out to the victims of Hurricane Sandy and Sandy Hook Elementary School. No words can express the sorrow we feel for the families who lost loved ones.
Thank you for your continued confidence and investment in the Hennessy Funds. If you have any questions or want to speak with us directly, please don’t hesitate to call us at (800) 966-4354.
Best regards,

Neil J. Hennessy
President and Chief Investment Officer
Past performance does not guarantee future results.
Mutual fund investing involves risk. Principal loss is possible. Small and medium-capitalization companies tend to have more limited liquidity and greater price volatility than large-capitalization companies. Investments in foreign securities may involve greater volatility and political, economic and currency risk and differences in accounting methods. A non-diversified fund, one that may concentrate its assets in fewer individual holdings than a diversified fund, is more exposed to individual stock volatility than a diversified fund. A fund that concentrates its investments within one or a small group of industries may be more volatile than a fund that invests in a broader range of industries. Real estate values (and the values of real estate-related securities) fluctuate with changes in general and local economic conditions and are particularly sensitive to economic downturns. IPO shares are subject to market risk and liquidity risk. The yields and principal values of debt securities will also fluctuate. Generally, values of debt securities change inversely with interest rates. Some Funds may invest a portion of its assets in lower rated, high-yielding bonds (commonly known as “junk bonds”). Mortgage- and asset-backed securities are subject to prepayment risk, which is the risk that the borrower will prepay some or all of the principal owed to the issuer.
Opinions expressed are those of Neil Hennessy and are subject to change, are not guaranteed and should not be considered investment advice.
The Dow Jones Industrial Average and the S&P 500 Index are unmanaged indices of common stocks comprised of major companies and assume reinvestment of dividends. You cannot invest directly in an index.
HENNESSY FUNDS 1-800-966-4354
3
Performance Overview (Unaudited)
The opinions expressed in the following commentaries reflect those of the Portfolio Managers as of the date written. Any such opinions are subject to change based on market or other conditions. These opinions may not be relied upon as investment advice. Investment decisions for the Hennessy Funds are based on several factors, and may not be relied upon as an indication of trading intent on behalf of any Hennessy Fund. Security positions can and do change.
Hennessy Cornerstone Growth Fund
Investor Class Shares (HFCGX)
AVERAGE ANNUAL TOTAL RETURN PERIODS ENDED OCTOBER 31, 2012
| Since Inception | ||||
| One Year | Five Years | Ten Years | (11/1/96) | |
| Hennessy Cornerstone Growth Fund – Investor Class | 24.17% | -6.06% | 4.80% | 8.11% |
| Russell 2000 Index | 12.08% | 1.19% | 9.58% | 7.04% |
| S&P 500 Index | 15.21% | 0.36% | 6.91% | 6.35% |
Gross expense ratio: 1.33%.
Performance data quoted represents past performance; past performance does not guarantee future results. The investment return and principal value of an investment will fluctuate so that an investor’s shares, when redeemed, may be worth more or less than their original cost. Current performance of the Fund may be lower or higher than the performance quoted. Performance data current to the most recent month end may be obtained by visiting www.hennessyfunds.com.
The gross expense ratio presented is that from the most recent prospectus.
PERFORMANCE NARRATIVE*
The Hennessy Cornerstone Growth Fund returned 24.17% for the twelve-month period ended October 31, 2012, significantly outperforming both the Russell 2000 Index, which returned 12.08%, and the S&P 500, which returned 15.21%, for the same period. The Fund’s outperformance versus the Russell 2000 Index was primarily due to stock selection within the Industrial, Consumer Discretionary and Materials sectors. This offset negative stock selection and sector allocation within Health Care and Financial stocks. United Rentals (up nearly 75%) was the biggest positive contributor within the Industrials sector. The equipment rental company posted very good revenue and earnings numbers throughout the year as rental rates are anticipated to show approximately 7% year over year increase. Overall, the best preforming stock in the portfolio during the 12-month period was American Vanguard (up approximately 190%) as a historically tight crop supply, high prices and strong farm incomes drove revenues and earnings for the agrichemical manufacturer. The consumer electronics company, VOXX International, was the poorest performing stock in the portfolio during the period (down approximately 4%). While year over year revenues were up, earnings remained roughly the same in the latter part of the year, contributing to the stock’s decline during the second half of the year.
The Hennessy Cornerstone Funds employ time-tested, purely quantitative stock selection formulas resulting in a highly-disciplined and repeatable investment process.
CHANGE IN VALUE OF $10,000 INVESTMENT
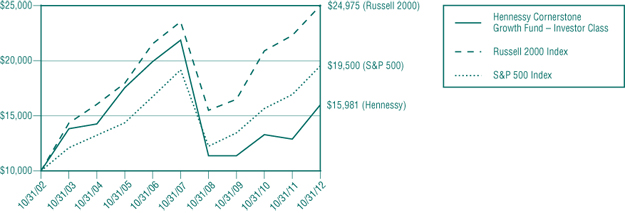
This chart assumes an initial gross investment of $10,000 made on October 31, 2002. Returns shown include the reinvestment of all dividends.
The table and the graph do not reflect the deduction of taxes that a shareholder would pay on Fund distributions or the redemption of Fund shares.
WWW.HENNESSYFUNDS.COM
4
Hennessy Cornerstone Growth Fund
Institutional Class Shares (HICGX)
AVERAGE ANNUAL TOTAL RETURN PERIODS ENDED OCTOBER 31, 2012
| Since Inception | |||
| One Year | Three Years | (3/3/08) | |
| Hennessy Cornerstone Growth Fund – Institutional Class | 24.58% | 12.37% | -1.35% |
| Russell 2000 Index | 12.08% | 14.82% | 5.41% |
| S&P 500 Index | 15.21% | 13.21% | 3.53% |
Gross expense ratio: 1.09%. Net expense ratio: 0.98%. The expense ratio is contractually capped at 0.98% indefinitely.
Performance data quoted represents past performance; past performance does not guarantee future results. The investment return and principal value of an investment will fluctuate so that an investor’s shares, when redeemed, may be worth more or less than their original cost. Current performance of the Fund may be lower or higher than the performance quoted. Performance data current to the most recent month end may be obtained by visiting www.hennessyfunds.com. Investment performance reflects fee waivers in effect. In the absence of such waivers, total return would be reduced.
The expense ratios presented are those from the most recent prospectus.
CHANGE IN VALUE OF $250,000 INVESTMENT

1 Inception date
This chart assumes an initial gross investment of $250,000 (minimum investment) made on March 3, 2008 (inception date of share class). Returns shown include the reinvestment of all dividends.
The table and the graph do not reflect the deduction of taxes that a shareholder would pay on Fund distributions or the redemption of Fund shares.
The S&P 500 Index and Russell 2000 Index are unmanaged indices commonly used to measure the performance of U.S. Stocks. You cannot invest directly in an index. Small and medium-capitalization companies tend to have limited liquidity and greater price volatility than large-capitalization companies. Investments in foreign securities involve greater volatility and political, economic and currency risk and differences in accounting methods. References to specific securities should not be considered a recommendation to buy or sell any security. Fund holdings and sector allocations are subject to change. Please refer to the included Schedule of Investments.
| * | On October 26, 2012 Hennessy purchased the assets of the FBR Funds. The FBR Small Cap Fund was reorganized into the Hennessy Cornerstone Growth Fund, which has a similar investment objective. These holdings had very little impact on the overall performance of the Fund as those securities were held for only a few days prior to the close of the fiscal year-end. |
HENNESSY FUNDS 1-800-966-4354
5
Hennessy Cornerstone Mid Cap 30 Fund (formerly Hennessy Focus 30 Fund)
Investor Class Shares (HFMDX)
AVERAGE ANNUAL TOTAL RETURN PERIODS ENDED OCTOBER 31, 2012
| Since Inception | |||
| One Year | Five Years | (9/17/03) | |
| Hennessy Cornerstone Mid Cap 30 Fund – Investor Class | 15.72% | 3.94% | 9.92% |
| S&P Midcap 400 Index | 12.11% | 3.12% | 8.56% |
| S&P 500 Index | 15.21% | 0.36% | 5.69% |
Gross expense ratio: 1.36%.
Performance data quoted represents past performance; past performance does not guarantee future results. The investment return and principal value of an investment will fluctuate so that an investor’s shares, when redeemed, may be worth more or less than their original cost. Current performance of the Fund may be lower or higher than the performance quoted. Performance data current to the most recent month end may be obtained by visiting www.hennessyfunds.com.
The gross expense ratio presented is that from the most recent prospectus.
PERFORMANCE NARRATIVE*
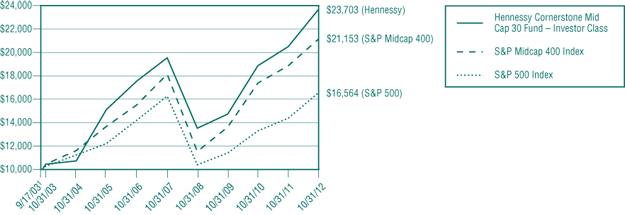
The Hennessy Cornerstone Mid Cap 30 Fund returned 15.72% for the twelve-month period ended October 31, 2012, outperforming both the S&P Midcap 400 Index and the S&P 500 Index, which returned 12.11% and 15.21% respectively for the same period. The Fund was aided by stock selection within the Consumer Discretionary, Consumer Staples and Energy sectors, but performance was hampered by the relative weighting within the Financial and Health Care sectors, which were both underweight versus the benchmarks. Sunoco Logistics and Tesoro Corporation, both in the Energy sector, were our largest contributors to Fund performance, with the stocks up 55% and 45% respectively during the period. Tesoro’s turnaround was significant as the company was our largest negative contributor for the first half of the year, but a nearly $300 million contract with the Department of Defense and an improving market environment drove the stock higher during the latter portion of the year. Our worst performing stock during the period was Towers Watson, the human resource and financial consulting company, which was down 17% for the year after reporting disappointing fiscal fourth quarter numbers in August.
The Hennessy Cornerstone Funds employ time-tested, purely quantitative stock selection formulas resulting in a highly-disciplined and repeatable investment process.
CHANGE IN VALUE OF $10,000 INVESTMENT
1 Inception date
This chart assumes an initial gross investment of $10,000 made on September 17, 2003 (inception). Returns shown include the reinvestment of all dividends.
The table and the graph do not reflect the deduction of taxes that a shareholder would pay on Fund distributions or the redemption of Fund shares.
WWW.HENNESSYFUNDS.COM
6
Hennessy Cornerstone Mid Cap 30 Fund (formerly Hennessy Focus 30 Fund)
Institutional Class Shares (HIMDX)
AVERAGE ANNUAL TOTAL RETURN PERIODS ENDED OCTOBER 31, 2012
| Since Inception | |||
| One Year | Three Years | (3/3/08) | |
| Hennessy Cornerstone Mid Cap 30 Fund – Institutional Class | 16.15% | 17.68% | 5.50% |
| S&P Midcap 400 Index | 12.11% | 15.81% | 6.37% |
| S&P 500 Index | 15.21% | 13. 21% | 3.53% |
Gross expense ratio: 1.14%. Net expense ratio: 0.98%. The expense ratio is contractually capped at 0.98% indefinitely.
Performance data quoted represents past performance; past performance does not guarantee future results. The investment return and principal value of an investment will fluctuate so that an investor’s shares, when redeemed, may be worth more or less than their original cost. Current performance of the Fund may be lower or higher than the performance quoted. Performance data current to the most recent month end may be obtained by visiting www.hennessyfunds.com. Investment performance reflects fee waivers in effect. In the absence of such waivers, total return would be reduced.
The expense ratios presented are those from the most recent prospectus.
CHANGE IN VALUE OF $250,000 INVESTMENT

1 Inception date
This chart assumes an initial gross investment of $250,000 (minimum investment) made on March 3, 2008 (inception date of share class). Returns shown include the reinvestment of all dividends.
The table and the graph do not reflect the deduction of taxes that a shareholder would pay on Fund distributions or the redemption of Fund shares.
The S&P 500 Index and S&P Midcap 400 Index are unmanaged indices commonly used to measure the performance of U.S. Stocks. You cannot invest directly in an index. Small and medium-capitalization companies tend to have limited liquidity and greater price volatility than large-capitalization companies. References to specific securities should not be considered a recommendation to buy or sell any security. Fund holdings and sector allocations are subject to change. Please refer to the included Schedule of Investments.
| * | On October 26, 2012 Hennessy purchased the assets of the FBR Funds. The FBR Mid Cap Fund was reorganized into the Hennessy Cornerstone Mid Cap 30 Fund, which has a similar investment objective. These holdings had very little impact on the overall performance of the Fund as those securities were held for only a few days prior to the close of the fiscal year-end. |
HENNESSY FUNDS 1-800-966-4354
7
Hennessy Cornerstone Large Growth Fund
Investor Class Shares (HFLGX)
AVERAGE ANNUAL TOTAL RETURN PERIODS ENDED OCTOBER 31, 2012
| Since Inception | |||
| One Year | Three Years | (3/20/09) | |
| Hennessy Cornerstone Large Growth Fund – Investor Class | 9.14% | 12.99% | 21.70% |
| Russell 1000 Index | 14.97% | 13.48% | 21.26% |
| S&P 500 Index | 15.21% | 13.21% | 20.83% |
Gross expense ratio: 1.26%.
Performance data quoted represents past performance; past performance does not guarantee future results. The investment return and principal value of an investment will fluctuate so that an investor’s shares, when redeemed, may be worth more or less than their original cost. Current performance of the Fund may be lower or higher than the performance quoted. Performance data current to the most recent month end may be obtained by visiting www.hennessyfunds.com.
The gross expense ratio presented is that from the most recent prospectus.
PERFORMANCE NARRATIVE*
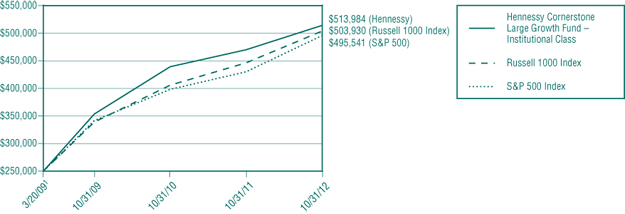
The Hennessy Cornerstone Large Growth Fund returned 9.14% for the twelve-month period ended October 31, 2012, underperforming both the Russell 1000 Index and the S&P 500 Index, which returned 14.97% and 15.21% respectively for the same period. The largest positive contribution to the Fund’s performance was stock selection in the Industrials sector and both allocation and stock selection in the Energy sector. Stock selection within the Materials and Information Technology sectors were negative contributors to overall performance, as was our relative underweighting in the Financial sector. The biggest drawdown on performance was from the investment in Apollo Group (down roughly 58%), the educational program provider perhaps best known for their University of Phoenix division. The stock had a difficult year as an improving labor market and heightened competition weighed on the company. The company’s most recent earnings announcement in October was saddled with further disappointment as net income dropped by roughly 60% as the company was hurt by higher costs and declining enrollment. The single largest contributor to Fund performance was Gap Inc. (up 92%), which started trending higher in February after announcing that earnings would be better than expected and that strategies the company was implementing to improve business performance were starting to pay off. Gap, Inc. continued to move higher throughout the year, posting impressive same store sales numbers and earnings through the summer and fall months.
The Hennessy Cornerstone Funds employ time-tested, purely quantitative stock selection formulas resulting in a highly-disciplined and repeatable investment process.
CHANGE IN VALUE OF $10,000 INVESTMENT

1 Inception date
This chart assumes an initial gross investment of $10,000 made on March 20, 2009 (inception). Returns shown include the reinvestment of all dividends.
The table and the graph do not reflect the deduction of taxes that a shareholder would pay on Fund distributions or the redemption of Fund shares.
WWW.HENNESSYFUNDS.COM
8
Hennessy Cornerstone Large Growth Fund
Institutional Class Shares (HILGX)
AVERAGE ANNUAL TOTAL RETURN PERIODS ENDED OCTOBER 31, 2012
| Since Inception | |||
| One Year | Three Years | (3/20/09) | |
| Hennessy Cornerstone Large Growth Fund – Institutional Class | 9.43% | 13.31% | 22.05% |
| Russell 1000 Index | 14.97% | 13.48% | 21.26% |
| S&P 500 Index | 15.21% | 13.21% | 20.83% |
Gross expense ratio: 1.14%. Net expense ratio: 0.98%. The expense ratio is contractually capped at 0.98% indefinitely.
Performance data quoted represents past performance; past performance does not guarantee future results. The investment return and principal value of an investment will fluctuate so that an investor’s shares, when redeemed, may be worth more or less than their original cost. Current performance of the Fund may be lower or higher than the performance quoted. Performance data current to the most recent month end may be obtained by visiting www.hennessyfunds.com. Investment performance reflects fee waivers in effect. In the absence of such waivers, total return would be reduced.
The expense ratios presented are that from the most recent prospectus.
CHANGE IN VALUE OF $250,000 INVESTMENT
1 Inception date
This chart assumes an initial gross investment of $250,000 (minimum investment) made on March 20, 2009 (inception). Returns shown include the reinvestment of all dividends.
The table and the graph do not reflect the deduction of taxes that a shareholder would pay on Fund distributions or the redemption of Fund shares.
The S&P 500 and Russell 1000 are unmanaged indices commonly used to measure the performance of U.S. stocks. One cannot invest directly in an index. The Fund may invest in medium-capitalization companies, which tend to have limited liquidity and greater price volatility than large-capitalization companies. References to specific securities should not be considered a recommendation to buy or sell any security. Fund holdings and sector allocations are subject to change. Please refer to the included Schedule of Investments.
| * | On October 26, 2012 Hennessy purchased the assets of the FBR Funds. The FBR Large Cap Fund was reorganized into the Hennessy Cornerstone Large Growth Fund, which has a similar investment objective. These holdings had very little impact on the overall performance of the Fund as those securities were held for only a few days prior to the close of the fiscal year-end. |
HENNESSY FUNDS 1-800-966-4354
9
Hennessy Cornerstone Value Fund
Investor Class Shares (HFCVX)
AVERAGE ANNUAL TOTAL RETURN PERIODS ENDED OCTOBER 31, 2012
| Since Inception | ||||
| One Year | Five Years | Ten Years | (11/1/96) | |
| Hennessy Cornerstone Value Fund – Investor Class | 12.79% | -0.46% | 6.77% | 5.73% |
| Russell 1000 Value Index | 16.89% | -1.00% | 7.34% | 7.18% |
| S&P 500 Index | 15.21% | 0.36% | 6.91% | 6.35% |
Gross expense ratio: 1.31%.
Performance data quoted represents past performance; past performance does not guarantee future results. The investment return and principal value of an investment will fluctuate so that an investor’s shares, when redeemed, may be worth more or less than their original cost. Current performance of the Fund may be lower or higher than the performance quoted. Performance data current to the most recent month end may be obtained by visiting www.hennessyfunds.com.
The gross expense ratio presented is that from the most recent prospectus.
PERFORMANCE NARRATIVE
The Hennessy Cornerstone Value Fund returned 12.79% for the twelve-month period ended October 31, 2012, underperforming its benchmark, the Russell 1000 Value Index, which returned 16.89%, and the S&P 500 Index, which returned 15.21% for the same period. The Fund’s performance was aided by both asset allocation and stock selection in the Information Technology sector, and the relative underweighting in the Utilities sector. The stronger performance within the Energy sector was offset by the underperformance within the Telecom Service sector. The Fund’s overall performance was hurt by positions in France Telecom and Spanish telecommunications provider, Telefonica (down 23% and 28% respectively), as concerns over European affairs continued to weaken the performance of those stocks. The Fund no longer holds positions in those stocks. The best performing holding in the Fund, and the largest single contributor to performance was Seagate Technologies (up 76%) which significantly raised 2012 revenue guidance, buoyed by disk drive shortages due to floods in Thailand. This disk shortage subsequently drove both disk drive prices and corporate earnings higher. The portfolio continues to hold the position in Seagate.
The Hennessy Cornerstone Funds employ time-tested, purely quantitative stock selection formulas resulting in a highly-disciplined and repeatable investment process.
CHANGE IN VALUE OF $10,000 INVESTMENT

This chart assumes an initial gross investment of $10,000 made on October 31, 2002. Returns shown include the reinvestment of all dividends.
The table and the graph do not reflect the deduction of taxes that a shareholder would pay on Fund distributions or the redemption of Fund shares.
WWW.HENNESSYFUNDS.COM
10
Hennessy Cornerstone Value Fund
Institutional Class Shares (HICVX)
AVERAGE ANNUAL TOTAL RETURN PERIODS ENDED OCTOBER 31, 2012
| Since Inception | |||
| One Year | Three Years | (3/3/08) | |
| Hennessy Cornerstone Value Fund – Institutional Class | 13.13% | 13.00% | 3.86% |
| Russell 1000 Value Index | 16.89% | 12.81% | 2.02% |
| S&P 500 Index | 15.21% | 13.21% | 3.53% |
Gross expense ratio: 1.14%. Net expense ratio: 0.98%. The expense ratio is contractually capped at 0.98% indefinitely.
Performance data quoted represents past performance; past performance does not guarantee future results. The investment return and principal value of an investment will fluctuate so that an investor’s shares, when redeemed, may be worth more or less than their original cost. Current performance of the Fund may be lower or higher than the performance quoted. Performance data current to the most recent month end may be obtained by visiting www.hennessyfunds.com. Investment performance reflects fee waivers in effect. In the absence of such waivers, total return would be reduced.
The expense ratios presented are those from the most recent prospectus.
CHANGE IN VALUE OF $250,000 INVESTMENT

* Inception date
This chart assumes an initial gross investment of $250,000 (minimum investment) made on March 3, 2008 (inception date of share class). Returns shown include the reinvestment of all dividends.
The table and the graph do not reflect the deduction of taxes that a shareholder would pay on Fund distributions or the redemption of Fund shares.
The Russell 1000 Value Index and S&P 500 Index are unmanaged indices commonly used to measure the performance of U.S. Stocks. You cannot invest directly in an index. The Fund may invest in medium-capitalization companies which tend to have limited liquidity and greater price volatility than large-capitalization companies. Investments in foreign securities involve greater volatility and political, economic and currency risk and differences in accounting methods. References to specific securities should not be considered a recommendation to buy or sell any security. Fund holdings and sector allocations are subject to change. Please refer to the included Schedule of Investments.
HENNESSY FUNDS 1-800-966-4354
11
Hennessy Large Value Fund (formerly Hennessy Select Large Value Fund)
Investor Class Shares (HLVFX)
AVERAGE ANNUAL TOTAL RETURN PERIODS ENDED OCTOBER 31, 2012
| Since Inception | ||||
| One Year | Five Years | Ten Years | (9/30/84) | |
| Hennessy Large Value Fund – Investor Class | 16.07% | -1.85% | 5.30% | 9.51% |
| Russell 1000 Value Index | 16.89% | -1.00% | 7.34% | 10.88% |
| S&P 500 Index | 15.21% | 0.36% | 6.91% | 10.55% |
Gross expense ratio: 1.38%.
Performance data quoted represents past performance; past performance does not guarantee future results. The performance for periods prior to March 20, 2009 reflects the performance of the Tamarack Value Fund, the predecessor to the Hennessy Select Large Value Fund. The investment return and principal value of an investment will fluctuate so that an investor’s shares, when redeemed, may be worth more or less than their original cost. Current performance of the Fund may be lower or higher than the performance quoted. Performance data current to the most recent month end may be obtained by visiting www.hennessyfunds.com.
The gross expense ratio presented is that from the most recent prospectus.
PERFORMANCE NARRATIVE
RBC GLOBAL ASSET MANAGEMENT (U.S.) INC., SUB-ADVISOR
The Hennessy Large Value Fund returned 16.07% for the twelve-month period ended October 31, 2012, slightly underperforming its benchmark, the Russell 1000 Value Index, which returned 16.89% for the same period, but outperforming the S&P 500 Index, which returned 15.21%. The Fund’s strong absolute performance was the result of stock selection across a number of sectors, led by Consumer Discretionary, Utilities and Materials. Conversely, stock selection in Health Care and Energy detracted from performance. Sector allocation detracted modestly from performance as the Fund’s sector neutral mandate, by design, limits the impact of sector weighting decisions, with the Fund’s managers instead making bets at the industry level.
The largest contributor to the Fund’s performance for the period, by a significant margin, was the Consumer Discretionary sector. Exposure to the improving U.S. housing market was the primary driver of returns as home improvement retailer Home Depot (+76%) and homebuilder PulteGroup (+109%) both outperformed. While we have taken some profits in each, we continue to believe in the continued progress of the housing market recovery and are actively looking for additional second derivative opportunities (i.e. Home Depot) as a means of investing in this theme. Also contributing to the sector’s outperformance was the decision to hold companies geared to the more cost conscious consumer, such as retailers TJX Companies (+40%), Target (+25%), and Macy’s (+28%). Media names Comcast Corporation (+63%) and CBS (+27%) were also significant contributors to the sector’s outperformance. Comcast, a provider of cable, telephone, and high speed internet, saw a marked increase in subscriptions for their higher margin, high-speed broadband internet offering as well as improving results at the company’s television network, NBC. CBS benefitted from its position as the #1 rated network, best in class content, and revenue generating retransmission contracts with local affiliates.
While Utilities and Materials sectors (both at +11%) generally underperformed versus the broader index, the Fund, due to strong stock selection in both sectors, outperformed significantly within these sectors, returning +20% and +25% respectively. Within Utilities, the Fund benefitted both from what it owned, NextEra (+20%), and from what it avoided, Exelon (-15%). The Fund’s outperformance in Materials was driven by one of the Fund’s top overall contributing stocks, Solutia Inc. (+70%), which was the beneficiary of a buyout from Eastman Chemical early in 2012.
The Health Care sector, which was significantly impacted by “Obamacare,” and the Energy sector, which sold off with declining oil prices, were the most impactful detractors from Fund performance. Within Health Care, Humana (-24%) and Watson Pharmaceuticals (-11%) both sold off as neither company was able to meet increased expectations. In Humana’s case, expectations for margin improvement went unrealized and the company subsequently missed estimates in both the first and second quarters of 2012, while expectations of a significant windfall for Watson from generic cholesterol drug Lipitor proved to be too lofty as the company failed to capture as much of the market as anticipated. Both Humana and Watson have been eliminated from the portfolio.
Within the Energy sector, Occidental Petroleum (-13%) was the largest detractor from performance as the company’s production growth lagged and the firm has been unable to monetize its substantial oil reserves in California. Oil States International (-12%), a services company with significant exposure to the Canadian Oil Sands and coal mining in Australia, was also a significant headwind for performance despite consistently beating estimates, as concerns about the strength of the companies two aforementioned primary markets weighed on the stock’s performance. We continue to believe in the longer term prospects of both companies and maintain their positions in the Fund.
WWW.HENNESSYFUNDS.COM
12
CHANGE IN VALUE OF $10,000 INVESTMENT
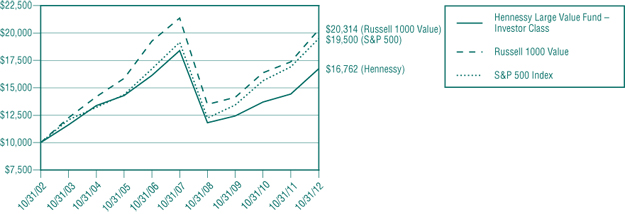
This chart assumes an initial gross investment of $10,000 made on October 31, 2002. Returns shown include the reinvestment of all dividends.
The table and the graph do not reflect the deduction of taxes that a shareholder would pay on Fund distributions or the redemption of Fund shares.
Hennessy Large Value Fund (formerly Hennessy Select Large Value Fund)
Institutional Class Shares (HLVIX)
AVERAGE ANNUAL TOTAL RETURN PERIODS ENDED OCTOBER 31, 2012
| Since Inception | |||
| One Year | Three Years | (3/20/09) | |
| Hennessy Large Value Fund – Institutional Class | 16.58% | 10.91% | 17.85% |
| Russell 1000 Value Index | 16.89% | 12.81% | 21.14% |
| S&P 500 Index | 15.21% | 13.21% | 20.83% |
Gross expense ratio: 1.21%. Net expense ratio: 0.98%. The expense ratio is contractually capped at 0.98% indefinitely.
Performance data quoted represents past performance; past performance does not guarantee future results. The investment return and principal value of an investment will fluctuate so that an investor’s shares, when redeemed, may be worth more or less than their original cost. Current performance of the Fund may be lower or higher than the performance quoted. Performance data current to the most recent month end may be obtained by visiting www.hennessyfunds.com. Investment performance reflects fee waivers in effect. In the absence of such waivers, total return would be reduced.
The gross and net expense ratios presented are those from the most recent prospectus.
CHANGE IN VALUE OF $250,000 INVESTMENT

* Inception date
This chart assumes an initial gross investment of $250,000 (minimum investment) made on March 20, 2009 (inception date of share class). Returns shown include the reinvestment of all dividends.
The table and the graph do not reflect the deduction of taxes that a shareholder would pay on Fund distributions or the redemption of Fund shares.
HENNESSY FUNDS 1-800-966-4354
13
The S&P 500 and Russell 1000 Value are unmanaged indices commonly used to measure the performance of U.S. stocks. The Russell 1000 Value measures large-cap, value-oriented stocks. One cannot invest directly in an index.
The Fund may invest in medium-capitalization companies, which tend to have limited liquidity and greater price volatility than large-capitalization companies.
The Fund’s composition and sector weightings are shown as a percentage of the Fund’s total net assets. Portfolio composition and sector weightings are subject to change at any time and should not be considered a recommendation to buy or sell a particular security. Please refer to the Schedule of Investments within this Annual Report for additional portfolio information, including percentages of holdings.
Hennessy Total Return Fund
Investor Class Shares (HDOGX)
AVERAGE ANNUAL TOTAL RETURN PERIODS ENDED OCTOBER 31, 2012
| Since Inception | ||||
| One Year | Five Years | Ten Years | (7/29/98) | |
| Hennessy Total Return Fund | 11.78% | 0.22% | 5.89% | 3.72% |
| Dow Jones Industrial Average | 12.56% | 1.60% | 7.23% | 5.11% |
| S&P 500 Index | 15.21% | 0.36% | 6.91% | 3.46% |
Gross expense ratio: 1.34%.
Performance data quoted represents past performance; past performance does not guarantee future results. The investment return and principal value of an investment will fluctuate so that an investor’s shares, when redeemed, may be worth more or less than their original cost. Current performance of the Fund may be lower or higher than the performance quoted. Performance data current to the most recent month end may be obtained by visiting www.hennessyfunds.com.
The gross expense ratio presented is that from the most recent prospectus.
PERFORMANCE NARRATIVE
The Hennessy Total Return Fund returned 11.78% for the twelve-month period ended October 31, 2012, underperforming the Dow Jones Industrial Average, which returned 12.56%, and the S&P 500 Index, which returned 15.21% for the same period. The Fund’s roughly 25% weighting in Treasury Bills hampered overall Fund performance as yields continue to flirt with historically low levels, at times essentially equaling zero. The Fund’s approximately 75% equity weighting was able to nearly capture the weighted return of the Dow Jones Industrial Average, with the Fund’s three largest holdings, AT&T, Verizon and Pfizer, all posting 20%+ returns during the period. Dividend yield is one of the primary criteria in the stock selection process for this Fund. With dividends taken into account, eight of the companies in our top ten holdings posted gains during the twelve-month period, with only Intel and DuPont posting negative returns.
The Hennessy Cornerstone Funds employ time-tested, purely quantitative stock selection formulas resulting in a highly-disciplined and repeatable investment process.
CHANGE IN VALUE OF $10,000 INVESTMENT
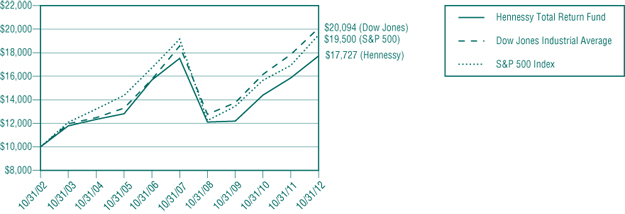
This chart assumes an initial gross investment of $10,000 made on October 31, 2002. Returns shown include the reinvestment of all dividend and other distributions.
The table and the graph do not reflect the deduction of taxes that a shareholder would pay on Fund distributions or the redemption of Fund shares.
The Dow Jones Industrial Average and S&P 500 Index are unmanaged indices commonly used to measure the performance of U.S. Stocks. You cannot invest directly in an index. The Fund is non-diversified, meaning it concentrates its assets in fewer individual holdings than a diversified fund, making it more exposed to individual stock volatility than a diversified fund. References to specific securities should not be considered a recommendation to buy or sell any security. Fund holdings are subject to change. Please refer to the included Schedule of Investments.
WWW.HENNESSYFUNDS.COM
14
Hennessy Balanced Fund
Investor Class Shares (HBFBX)
AVERAGE ANNUAL TOTAL RETURN PERIODS ENDED OCTOBER 31, 2012
| Since Inception | ||||
| One Year | Five Years | Ten Years | (3/8/96) | |
| Hennessy Balanced Fund | 7.13% | 0.98% | 4.00% | 4.17% |
| Dow Jones Industrial Average | 12.56% | 1.60% | 7.23% | 7.75% |
| S&P 500 Index | 15.21% | 0.36% | 6.91% | 6.85% |
Gross expense ratio: 1.62%.
Performance data quoted represents past performance; past performance does not guarantee future results. The investment return and principal value of an investment will fluctuate so that an investor’s shares, when redeemed, may be worth more or less than their original cost. Current performance of the Fund may be lower or higher than the performance quoted. Performance data current to the most recent month end may be obtained by visiting www.hennessyfunds.com.
The gross expense ratio presented is that from the most recent prospectus.
PERFORMANCE NARRATIVE
The Hennessy Balanced Fund returned 7.13% for the twelve-month period ended October 31, 2012, underperforming the Dow Jones Industrial Average, which returned 12.56%, and the S&P 500 Index, which returned 15.21% for the same period. The Fund’s relative underperformance to its benchmarks is due primarily to the continued low yields on Treasury Bills, which represent approximately 50% of the Fund’s holdings. While the portfolio may underperform the indices in periods where equities rise sharply, the strategy is geared to capture near market returns with a lower risk profile, since only half of the assets are invested in equities. Conversely, if equity markets were to fall sharply, we would expect the Fund to perform better than the indices. Ultimately, the overall goal of this portfolio is to capture upside performance while mitigating downside risk.
The Hennessy Cornerstone Funds employ time-tested, purely quantitative stock selection formulas resulting in a highly-disciplined and repeatable investment process.
CHANGE IN VALUE OF $10,000 INVESTMENT
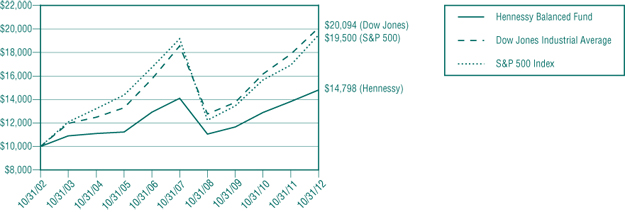
This chart assumes an initial gross investment of $10,000, made on October 31, 2002. Returns shown include the reinvestment of all dividend and other distributions.
The table and the graph do not reflect the deduction of taxes that a shareholder would pay on Fund distributions or the redemption of Fund shares.
The Dow Jones Industrial Average and S&P 500 Index are unmanaged indices commonly used to measure the performance of U.S. Stocks. You cannot invest directly in an index. The Fund is non-diversified, meaning it concentrates its assets in fewer individual holdings than a diversified fund, making it more exposed to individual stock volatility than a diversified fund. References to specific securities should not be considered a recommendation to buy or sell any security. Fund holdings are subject to change. Please refer to the included Schedule of Investments.
HENNESSY FUNDS 1-800-966-4354
15
Hennessy Japan Fund (formerly Hennessy Select SPARX Japan Fund)
Investor Class Shares (HJPNX)
AVERAGE ANNUAL TOTAL RETURN PERIODS ENDED OCTOBER 31, 2012
| Since Inception | |||
| One Year | Five Years | (10/31/03) | |
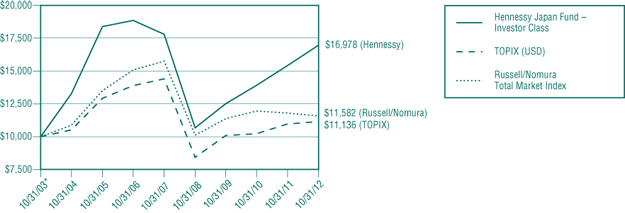
| Hennessy Japan Fund – Investor Class | 10.08% | -0.95% | 6.06% |
| Russell/Nomura Total Market Index | -1.86% | -5.97% | 1.65% |
| TOPIX | -3.10% | -6.13% | 1.30% |
Gross expense ratio: 1.87%.
Performance data quoted represents past performance; past performance does not guarantee future results. The investment return and principal value of an investment will fluctuate so that an investor’s shares, when redeemed, may be worth more or less than their original cost. Current performance of the Fund may be lower or higher than the performance quoted. Performance data current to the most recent month end may be obtained by visiting www.hennessyfunds.com.
The gross expense ratio presented is that from the most recent prospectus.
PERFORMANCE NARRATIVE
SPARX ASSET MANAGEMENT CO., LTD., SUB-ADVISOR
The Hennessy Japan Fund returned 10.08% for the twelve-month period ended October 31, 2012, significantly outperforming both the Russell/Nomura Total Market Index and TOPIX, which lost -1.86% and -3.10% respectively, for the same period. The largest positive contributors to the Fund’s performance among the TOPIX 33 sub-industries were wholesalers, retailers and automakers. Conversely, machinery manufacturers, iron & steel makers, and nonferrous metal producers were among the worst performers.
Among the strongest performing stocks during the twelve-month period were Ryohin Keikaku Co., Ltd., the operator of the “MUJI” brand chain of retail stores, Misumi Group Inc., a distributor of metal mold components and Shimano, Inc., the bicycle parts manufacturer with leading global market share.
Shares of Ryohin Keikaku jumped 42% on the back of a series of upbeat broker reports, citing the company’s improved domestic gross margin and overseas profitability. Shares of Misumi appreciated 17% as the company’s resilient business model garnered investor interest amid uncertain global economic conditions. Shares of Shimano climbed 28% following the release of its favorable full-term earnings results for the year ended December 2011.
Conversely, Terumo Corp., the medical equipment manufacturer, Komatsu Ltd., one of the largest global manufacturers of construction machinery, and Daikin Industries, Ltd., the leading global manufacturer of commercial-use air conditioners, were among the major detractors to the Fund’s performance during the period. Shares of Terumo fell -16% after the company announced disappointing earnings guidance for the fiscal year ending in May 2012. Shares of Komatsu fell -15% due to concerns about its earnings outlook amid the European debt crisis and the economic slowdown in China. Daikin fell -7% as its share price has been under pressure for much of the year due to mounting concerns over its businesses in China and Europe, the company’s two largest overseas markets.
CHANGE IN VALUE OF $10,000 INVESTMENT
* Inception date
This chart assumes an initial gross investment of $10,000 made on October 31, 2003 (inception). Returns shown include the reinvestment of all dividends.
The table and the graph do not reflect the deduction of taxes that a shareholder would pay on Fund distributions or the redemption of Fund shares.
WWW.HENNESSYFUNDS.COM
16
Hennessy Japan Fund (formerly Hennessy Select SPARX Japan Fund)
Institutional Class Shares (HJPIX)
AVERAGE ANNUAL TOTAL RETURN PERIODS ENDED OCTOBER 31, 2012
| Since Inception | |||
| One Year | Five Years | (10/31/03) | |
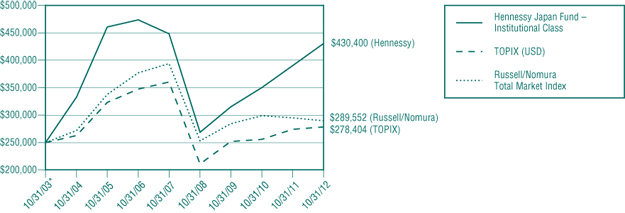
| Hennessy Japan Fund – Institutional Class | 10.33% | -0.80% | 6.22% |
| Russell/Nomura Total Market Index | -1.86% | -5.97% | 1.65% |
| TOPIX | -3.10% | -6.13% | 1.30% |
Gross expense ratio: 1.65%.
Performance data quoted represents past performance; past performance does not guarantee future results. The investment return and principal value of an investment will fluctuate so that an investor’s shares, when redeemed, may be worth more or less than their original cost. Current performance of the Fund may be lower or higher than the performance quoted. Performance data current to the most recent month end may be obtained by visiting www.hennessyfunds.com.
The gross expense ratio presented is that from the most recent prospectus.
CHANGE IN VALUE OF $250,000 INVESTMENT
* Inception date
This chart assumes an initial gross investment of $250,000 (minimum investment) made on October 31, 2003 (inception). Returns shown include the reinvestment of all dividends.
The table and the graph do not reflect the deduction of taxes that a shareholder would pay on Fund distributions or the redemption of Fund shares.
The Russell/Nomura Total Market Index contains the top 98% of all stocks listed on Japan’s stock exchange and registered on Japan’s OTC market, in terms of market capitalization. The Tokyo Stock Price Index (TOPIX) is a market capitalization-weighted index of all companies listed on the First Section of the Tokyo Stock Exchange. The Russell/Nomura Total Market and TOPIX indices are presented in U.S. Dollar terms and take into account reinvestment of dividends. One cannot invest directly in an index.
Small and medium-capitalization companies tend to have limited liquidity and greater price volatility than large-capitalization companies. Investments in foreign securities involve greater volatility and political, economic and currency risk and differences in accounting methods.
The Fund’s composition and sector weightings are shown as a percentage of the Fund’s total net assets. Portfolio composition and sector weightings are subject to change at any time and should not be considered a recommendation to buy or sell a particular security. Please refer to the Schedule of Investments within this Annual Report for additional portfolio information, including percentages of holdings.
HENNESSY FUNDS 1-800-966-4354
17
Hennessy Japan Small Cap Fund (formerly Hennessy Select SPARX Japan Smaller Companies Fund)
Investor Class Shares (HJPSX)
AVERAGE ANNUAL TOTAL RETURN PERIODS ENDED OCTOBER 31, 2012
| Since Inception | |||
| One Year | Five Years | (8/31/07) | |
| Hennessy Japan Small Cap Fund – Investor Class | 4.91% | 0.34% | 2.16% |
| Russell/Nomura Small Cap Index | 0.79% | -1.18% | -0.63% |
| TOPIX | -3.10% | -6.13% | -5.61% |
Gross expense ratio: 2.11%.
Performance data quoted represents past performance; past performance does not guarantee future results. The investment return and principal value of an investment will fluctuate so that an investor’s shares, when redeemed, may be worth more or less than their original cost. Current performance of the Fund may be lower or higher than the performance quoted. Performance data current to the most recent month end may be obtained by visiting www.hennessyfunds.com.
The gross expense ratio presented is that from the most recent prospectus.
PERFORMANCE NARRATIVE
SPARX ASSET MANAGEMENT CO., LTD., SUB-ADVISOR
The Hennessy Japan Small Cap Fund returned 4.91% for the twelve-month period ended October 31, 2012, outperforming both the Russell/Nomura Japan Small Cap Index, which returned 0.79% and the TOPIX which lost -3.10%, for the same period.
The largest positive contributors to the Fund’s performance among the TOPIX 33 sub-industries were wholesalers, service industry firms and construction firms. Conversely, electronic appliance makers, insurers and machinery manufacturers were among the worst performers.
Among the strongest performing stocks during the twelve-month period were shares of SMS Co., Ltd., which operates a recruiting website for workers in the nursing and medical industry, UKC Holdings Corp., a trading firm dealing in Sony-made semiconductors and electronic parts and Nippon Carbide Industries Co., Inc., a chemical company. Shares of SMS surged 119% due to a newspaper article which featured the company as a future high-growth company. Shares of UKC increased 96% after the firm revised upward its earnings forecast for the fiscal year ending in March 2013 on the back of favorable sales. Shares of Nippon Carbide increased 68% amid rising expectations that demand for its products will increase after being featured on television.
On the other hand, Nippon Chemi-Con Corporation, Japan’s largest manufacturer of aluminum electrolytic capacitors, Micronics Japan Co., Ltd., the leading manufacturer of semiconductor measuring devices, and Kyosan Electronics, one of largest signal manufacturers in Japan, were the biggest detractors to the Fund’s performance during the period. Shares of Nippon Chemi-Con declined -63% on concerns that a decrease in demand for electronics in its current fiscal year ending in March 2013 would negatively impact the company’s earnings. Shares of Micronics Japan fell -39% because of a rating downgrade by a number of securities companies due to worsening conditions in the dynamic random access memory (DRAM) market. Shares of Kyosan Electronics dropped -25% as we believe investors were concerned about the company’s earnings outlook for the fiscal year ending in March 2013 on the back of weak overseas demand.
CHANGE IN VALUE OF $10,000 INVESTMENT

* Inception date
This chart assumes an initial gross investment of $10,000 made on August 31, 2007 (inception). Returns shown include the reinvestment of all dividends.
The table and the graph do not reflect the deduction of taxes that a shareholder would pay on Fund distributions or the redemption of Fund shares.
WWW.HENNESSYFUNDS.COM
18
The Russell/Nomura Small Cap Index contains the bottom 15% of the Russell/Nomura Total Market Index, which contains the top 98% of all stocks listed on Japan’s stock exchange and registered on Japan’s OTC market, in terms of market capitalization. The Tokyo Stock Price Index (TOPIX) is a market capitalization-weighted index of all companies listed on the First Section of the Tokyo Stock Exchange. The Russell/Nomura Small Cap and TOPIX indices are presented in U.S. Dollar terms and take into account reinvestment of dividends. One cannot invest directly in an index.
Small and medium-capitalization companies tend to have limited liquidity and greater price volatility than large-capitalization companies. Investments in foreign securities involve greater volatility and political, economic and currency risk and differences in accounting methods.
The Fund’s composition and sector weightings are shown as a percentage of the Fund’s total net assets. Portfolio composition and sector weightings are subject to change at any time and should not be considered a recommendation to buy or sell a particular security. Please refer to the Schedule of Investments within this Annual Report for additional portfolio information, including percentages of holdings.
HENNESSY FUNDS �� 1-800-966-4354
19
(This Page Intentionally Left Blank.)
WWW.HENNESSYFUNDS.COM
20
Schedule of Investments
HENNESSY CORNERSTONE GROWTH FUND
As of October 31, 2012
(% of Net Assets)

| TOP TEN EQUITY HOLDINGS | % net assets | |
| American Vanguard Corp. | 3.60% | |
| Cambrex Corp. | 2.80% | |
| Susser Holdings Corp. | 2.33% | |
| Lithia Motors, Inc. | 2.25% | |
| NewMarket Corp. | 2.23% | |
| Papa Johns International, Inc. | 2.11% | |
| DXP Enterprises, Inc. | 2.09% | |
| Pier 1 Imports, Inc. | 2.08% | |
| Metropolitan Health Networks, Inc. | 2.08% | |
| Leapfrog Enterprises, Inc. | 2.04% |
The holdings reflected include stocks that were previously held in the former FBR Small Cap Fund, which was reorganized into the Hennessy Cornerstone Growth Fund as of close of business on 10/26/12. These positions will be held until the customary rebalance of the Hennessy Cornerstone Growth portfolio, generally in the winter.
Note: For presentation purposes, the Fund has grouped some of the industry categories. For purposes of categorizing securities for compliance with Section 8(b)(1) of the Investment Company Act of 1940, the Fund uses more specific industry classifications.
HENNESSY FUNDS 1-800-966-4354
21
| COMMON STOCKS – 93.83% | Number of | % of | |||||||||||
| Shares | Value | Net Assets | |||||||||||
| Consumer Discretionary – 41.25% | |||||||||||||
| American Axle & Manufacturing | |||||||||||||
| Holdings, Inc. (a) | 25,000 | $ | 271,750 | 0.09 | % | ||||||||
| Arctic Cat, Inc. (a) | 140,200 | 5,085,054 | 1.68 | % | |||||||||
| Asbury Automotive Group, Inc. (a) | 6,000 | 190,320 | 0.06 | % | |||||||||
| Ascena Retail Group, Inc. (a) | 16,000 | 316,800 | 0.11 | % | |||||||||
| Bally Technologies, Inc. (a) | 4,000 | 199,680 | 0.07 | % | |||||||||
| Caribou Coffee, Inc. (a) | 270,900 | 3,242,673 | 1.07 | % | |||||||||
| Chico’s FAS, Inc. | 13,000 | 241,800 | 0.08 | % | |||||||||
| Churchill Downs, Inc. | 84,096 | 5,493,992 | 1.82 | % | |||||||||
| Crocs, Inc. (a) | 6,000 | 75,600 | 0.03 | % | |||||||||
| Dollar General Corp. (a) | 112,585 | 5,473,883 | 1.81 | % | |||||||||
| Dominos Pizza, Inc. | 143,600 | 5,833,032 | 1.93 | % | |||||||||
| Express, Inc. (a) | 6,000 | 66,780 | 0.02 | % | |||||||||
| Foot Locker, Inc. | 178,400 | 5,976,400 | 1.97 | % | |||||||||
| Genesco, Inc. (a) | 78,800 | 4,515,240 | 1.49 | % | |||||||||
| Group 1 Automotive, Inc. | 85,300 | 5,289,453 | 1.75 | % | |||||||||
| KB Home | 4,000 | 63,920 | 0.02 | % | |||||||||
| La-Z-Boy, Inc. | 344,300 | 5,584,546 | 1.84 | % | |||||||||
| Leapfrog Enterprises, Inc. (a) | 699,100 | 6,180,044 | 2.04 | % | |||||||||
| Lithia Motors, Inc. | 199,300 | 6,816,060 | 2.25 | % | |||||||||
| Macy’s, Inc. | 133,100 | 5,067,117 | 1.67 | % | |||||||||
| Mens Wearhouse, Inc. | 128,150 | 4,202,038 | 1.39 | % | |||||||||
| Oxford Industries, Inc. | 96,850 | 5,373,238 | 1.78 | % | |||||||||
| Papa Johns International, Inc. (a) | 119,900 | 6,393,068 | 2.11 | % | |||||||||
| Penn National Gaming, Inc. (a) | 12,000 | 485,160 | 0.16 | % | |||||||||
| Pier 1 Imports, Inc. | 309,100 | 6,305,640 | 2.08 | % | |||||||||
| Pool Corp. | 137,009 | 5,770,819 | 1.91 | % | |||||||||
| Ross Stores, Inc. | 91,840 | 5,597,648 | 1.85 | % | |||||||||
| Sally Beauty Holdings, Inc. (a) | 229,400 | 5,523,952 | 1.82 | % | |||||||||
| Select Comfort Corp. (a) | 4,000 | 111,320 | 0.04 | % | |||||||||
| Standard Motor Products, Inc. | 209,600 | 3,936,288 | 1.30 | % | |||||||||
| Standard Pacific Corp. (a) | 15,000 | 103,500 | 0.03 | % | |||||||||
| Steven Madden Ltd. (a) | 7,500 | 321,900 | 0.11 | % | |||||||||
| Sturm Ruger & Co, Inc. | 4,000 | 188,920 | 0.06 | % | |||||||||
| The Buckle, Inc. | 5,600 | 252,952 | 0.08 | % | |||||||||
| The Children’s Place Retail Stores, Inc. (a) | 3,000 | 175,290 | 0.06 | % | |||||||||
| The Finish Line, Inc. | 10,000 | 208,050 | 0.07 | % | |||||||||
| TJX Companies, Inc. | 138,030 | 5,746,189 | 1.90 | % | |||||||||
| Tractor Supply Co. | 56,100 | 5,399,064 | 1.78 | % | |||||||||
| Vitamin Shoppe, Inc. (a) | 2,500 | 143,100 | 0.05 | % | |||||||||
| VOXX International Corp. (a) | 369,000 | 2,295,180 | 0.76 | % | |||||||||
| Wolverine World Wide, Inc. | 8,000 | 334,960 | 0.11 | % | |||||||||
| 124,852,420 | 41.25 | % | |||||||||||
| Consumer Staples – 7.93% | |||||||||||||
| CVS Caremark Corp. | 110,800 | 5,141,120 | 1.70 | % | |||||||||
| Elizabeth Arden, Inc. (a) | 120,500 | 5,685,190 | 1.88 | % | |||||||||
| Hain Celestial Group, Inc. (a) | 2,500 | 144,500 | 0.05 | % | |||||||||
| Susser Holdings Corp. (a) | 196,800 | 7,072,992 | 2.33 | % | |||||||||
| Whole Foods Market, Inc. | 62,950 | 5,963,253 | 1.97 | % | |||||||||
| 24,007,055 | 7.93 | % | |||||||||||
| Energy – 0.67% | |||||||||||||
| Atwood Oceanics, Inc. (a) | 10,012 | 478,574 | 0.16 | % | |||||||||
| Comstock Resources, Inc. (a) | 8,000 | 136,960 | 0.04 | % | |||||||||
| Energy XXI (Bermuda) Ltd. | 9,000 | 297,900 | 0.10 | % | |||||||||
| Kodiak Oil & Gas Corp. (a) | 38,000 | 351,120 | 0.11 | % | |||||||||
| Oasis Petroleum, Inc. (a) | 13,000 | 381,810 | 0.13 | % | |||||||||
| Rosetta Resources, Inc. (a) | 4,000 | 184,160 | 0.06 | % | |||||||||
| Superior Energy Services, Inc. (a) | 10,000 | 203,300 | 0.07 | % | |||||||||
| 2,033,824 | 0.67 | % | |||||||||||
| Financials – 2.19% | |||||||||||||
| Associated Banc-Corp. | 28,000 | 360,920 | 0.12 | % | |||||||||
| BankUnited, Inc. | 12,000 | 284,520 | 0.09 | % | |||||||||
| Berkshire Hills Bancorp, Inc. | 10,000 | 234,800 | 0.08 | % | |||||||||
| Brookline Bancorp, Inc. | 59,729 | 506,502 | 0.17 | % | |||||||||
| Capitol Federal Financial | 29,454 | 350,797 | 0.12 | % | |||||||||
| Chicopee Bancorp, Inc. (a) | 19,139 | 286,894 | 0.09 | % | |||||||||
| CNO Financial Group, Inc. | 23,000 | 220,340 | 0.07 | % | |||||||||
| First Horizon National Corp. | 32,253 | 300,275 | 0.10 | % | |||||||||
| Fulton Financial Corp. | 30,200 | 293,544 | 0.10 | % | |||||||||
| Horace Mann Educators Corp. | 24,000 | 461,040 | 0.15 | % | |||||||||
| Independent Bank Corp. | 11,000 | 324,610 | 0.11 | % | |||||||||
| Investors Title Co. | 3,407 | 223,499 | 0.07 | % | |||||||||
| Newport Bancorp, Inc. (a) | 6,000 | 100,230 | 0.03 | % | |||||||||
| Peoples Federal Bancshares, Inc. | 9,000 | 153,450 | 0.05 | % | |||||||||
| SI Financial Group, Inc. | 7,300 | 80,300 | 0.03 | % | |||||||||
| Susquehanna Bancshares, Inc. | 34,000 | 352,580 | 0.12 | % | |||||||||
| Tower Group, Inc. | 18,000 | 324,360 | 0.11 | % | |||||||||
| United Financial Bancorp, Inc. | 48,877 | 751,240 | 0.25 | % | |||||||||
| Waddell & Reed Financial, Inc. | 24,000 | 799,920 | 0.26 | % | |||||||||
| Washington Federal, Inc. | 13,400 | 224,852 | 0.07 | % | |||||||||
| 6,634,673 | 2.19 | % | |||||||||||
| Health Care – 10.01% | |||||||||||||
| Abiomed, Inc. (a) | 8,000 | 158,560 | 0.05 | % | |||||||||
| Allscripts Healthcare Solutions, Inc. (a) | 16,000 | 206,720 | 0.07 | % | |||||||||
| athenahealth, Inc. (a) | 2,000 | 128,580 | 0.04 | % | |||||||||
| Cambrex Corp. (a) | 702,200 | 8,482,576 | 2.80 | % | |||||||||
| Centene Corp. (a) | 107,800 | 4,094,244 | 1.35 | % | |||||||||
| Cepheid, Inc. (a) | 10,000 | 303,100 | 0.10 | % | |||||||||
| Genomic Health, Inc. (a) | 2,000 | 62,500 | 0.02 | % | |||||||||
| Greenway Medical Technologies, Inc. (a) | 8,000 | 132,720 | 0.04 | % | |||||||||
| Health Management Associates, Inc. (a) | 16,000 | 116,800 | 0.04 | % | |||||||||
The accompanying notes are an integral part of these financial statements.
WWW.HENNESSYFUNDS.COM
22
| COMMON STOCKS | Number of | % of | |||||||||||
| Shares | Value | Net Assets | |||||||||||
| Health Care (Continued) | |||||||||||||
HMS Holdings Corp. (a) | 1,000 | $ | 23,090 | 0.01 | % | ||||||||
| Impax Laboratories, Inc. (a) | 15,000 | 318,750 | 0.11 | % | |||||||||
| Jazz Pharmaceuticals, Inc. (a) | 4,000 | 214,920 | 0.07 | % | |||||||||
| MAKO Surgical Corp. (a) | 1,000 | 15,150 | 0.01 | % | |||||||||
| MedAssets, Inc. (a) | 18,000 | 319,140 | 0.11 | % | |||||||||
| Medidata Solutions, Inc. (a) | 10,000 | 420,200 | 0.14 | % | |||||||||
| Metropolitan Health Networks, Inc. (a) | 574,614 | 6,280,531 | 2.08 | % | |||||||||
| Molina Healthcare, Inc. (a) | 150,800 | 3,780,556 | 1.25 | % | |||||||||
| Myriad Genetics, Inc. (a) | 9,000 | 235,530 | 0.08 | % | |||||||||
| NPS Pharmaceuticals, Inc. (a) | 6,000 | 55,440 | 0.02 | % | |||||||||
| Obagi Medical Products, Inc. (a) | 11,000 | 135,630 | 0.04 | % | |||||||||
| Orexigen Therapeutics, Inc. (a) | 12,000 | 63,960 | 0.02 | % | |||||||||
| Sarepta Therapeutics, Inc. (a) | 2,000 | 42,620 | 0.01 | % | |||||||||
| Seattle Genetics, Inc. (a) | 4,500 | 113,220 | 0.04 | % | |||||||||
| Sirona Dental Systems, Inc. (a) | 8,000 | 458,080 | 0.15 | % | |||||||||
| The Cooper Companies, Inc. | 2,000 | 191,960 | 0.06 | % | |||||||||
| VIVUS, Inc. (a) | 3,000 | 44,700 | 0.01 | % | |||||||||
| Wellcare Health Plans, Inc. (a) | 82,000 | 3,903,200 | 1.29 | % | |||||||||
| 30,302,477 | 10.01 | % | |||||||||||
| Industrials – 17.62% | |||||||||||||
| A.O. Smith Corp. | 10,000 | 607,700 | 0.20 | % | |||||||||
| Alaska Air Group, Inc. (a) | 6,000 | 229,440 | 0.08 | % | |||||||||
| American Woodmark Corp. (a) | 16,000 | 368,000 | 0.12 | % | |||||||||
| Atlas Air Worldwide Holdings, Inc. (a) | 5,000 | 274,950 | 0.09 | % | |||||||||
| Avis Budget Group, Inc. (a) | 28,000 | 462,840 | 0.15 | % | |||||||||
| Cintas Corp. | 125,300 | 5,238,793 | 1.73 | % | |||||||||
| DXP Enterprises Inc. (a) | 128,300 | 6,316,209 | 2.09 | % | |||||||||
| Dycom Industries, Inc. (a) | 205,600 | 2,927,744 | 0.97 | % | |||||||||
| Encore Capital Group, Inc. (a) | 12,000 | 348,000 | 0.11 | % | |||||||||
| Genesee & Wyoming, Inc., Class A (a) | 2,000 | 144,940 | 0.05 | % | |||||||||
| Innerworkings, Inc. (a) | 411,965 | 5,940,535 | 1.96 | % | |||||||||
| JetBlue Airways Corp. (a) | 50,000 | 264,500 | 0.09 | % | |||||||||
| Lennox International, Inc. | 6,000 | 300,300 | 0.10 | % | |||||||||
| Mueller Industries, Inc. | 98,050 | 4,294,590 | 1.42 | % | |||||||||
| Navigant Consulting, Inc. (a) | 348,500 | 3,620,915 | 1.20 | % | |||||||||
| Old Dominion Freight Line, Inc. (a) | 162,400 | 5,446,896 | 1.80 | % | |||||||||
| Primoris Services Corp. | 294,900 | 4,119,753 | 1.36 | % | |||||||||
| Roadrunner Transportation | |||||||||||||
| Systems, Inc. (a) | 16,000 | 278,880 | 0.09 | % | |||||||||
| Sauer-Danfoss, Inc. | 7,000 | 280,420 | 0.09 | % | |||||||||
| Sun Hydraulics Corp. | 10,000 | 266,400 | 0.09 | % | |||||||||
| Terex Corp. (a) | 20,000 | 451,000 | 0.15 | % | |||||||||
| The Manitowoc Co, Inc. | 15,000 | 213,750 | 0.07 | % | |||||||||
| Trex Co, Inc. (a) | 8,000 | 279,520 | 0.09 | % | |||||||||
| Triumph Group, Inc. | 73,800 | 4,827,996 | 1.59 | % | |||||||||
| United Rentals, Inc. (a) | 126,339 | 5,136,944 | 1.70 | % | |||||||||
| US Airways Group, Inc. (a) | 18,000 | 219,240 | 0.07 | % | |||||||||
| USG Corp. (a) | 8,000 | 213,680 | 0.07 | % | |||||||||
| Werner Enterprises, Inc. | 11,250 | 260,550 | 0.09 | % | |||||||||
| 53,334,485 | 17.62 | % | |||||||||||
| Information Technology – 2.52% | |||||||||||||
| Aruba Networks, Inc. (a) | 6,500 | 118,105 | 0.04 | % | |||||||||
| Brocade Communications | |||||||||||||
| Systems, Inc. (a) | 25,100 | 133,030 | 0.04 | % | |||||||||
| Cirrus Logic, Inc. (a) | 6,000 | 244,560 | 0.08 | % | |||||||||
| Comm Vault Systems, Inc. (a) | 3,000 | 187,410 | 0.06 | % | |||||||||
| Compuware Corp. (a) | 18,000 | 155,880 | 0.05 | % | |||||||||
| Fusion-io, Inc. (a) | 1,000 | 23,600 | 0.01 | % | |||||||||
| Guidewire Software, Inc. (a) | 2,000 | 61,280 | 0.02 | % | |||||||||
| Jack Henry & Associates, Inc. | 18,000 | 684,000 | 0.23 | % | |||||||||
| MKS Instrument, Inc. | 9,000 | 212,670 | 0.07 | % | |||||||||
| Nanometrics, Inc. (a) | 4,000 | 55,040 | 0.02 | % | |||||||||
| Netgear, Inc. (a) | 115,000 | 4,083,650 | 1.35 | % | |||||||||
| OmniVision Technologies, Inc. (a) | 2,000 | 28,600 | 0.01 | % | |||||||||
| Open Text Corp. (a) | 5,175 | 278,881 | 0.09 | % | |||||||||
| Qlik Technologies, Inc. (a) | 4,600 | 84,686 | 0.03 | % | |||||||||
| Radware Ltd. (a) | 6,000 | 196,800 | 0.06 | % | |||||||||
| Sourcefire, Inc. (a) | 7,000 | 299,530 | 0.10 | % | |||||||||
| Splunk, Inc. (a) | 2,000 | 56,100 | 0.02 | % | |||||||||
| The Ultimate Software Group, Inc. (a) | 1,800 | 182,448 | 0.06 | % | |||||||||
| TriQuint Semiconductor, Inc. (a) | 18,000 | 84,600 | 0.03 | % | |||||||||
| Wex, Inc. (a) | 6,000 | 442,680 | 0.15 | % | |||||||||
| 7,613,550 | 2.52 | % | |||||||||||
| Materials – 11.36% | |||||||||||||
| American Vanguard Corp. | 305,300 | 10,908,369 | 3.60 | % | |||||||||
| Cytec Inds, Inc. | 3,000 | 206,460 | 0.07 | % | |||||||||
| H.B. Fuller Co. | 161,600 | 4,912,640 | 1.62 | % | |||||||||
| Huntsman Corp. | 7,000 | 105,280 | 0.04 | % | |||||||||
| Innospec, Inc. (a) | 10,000 | 323,800 | 0.11 | % | |||||||||
| Kaiser Aluminum Corp. | 3,000 | 181,740 | 0.06 | % | |||||||||
| Kraton Performance Polymers, Inc. (a) | 7,000 | 152,740 | 0.05 | % | |||||||||
| Neenah Paper, Inc. | 192,205 | 4,978,109 | 1.64 | % | |||||||||
| NewMarket Corp. | 24,900 | 6,755,619 | 2.23 | % | |||||||||
| PolyOne Corp. | 14,000 | 265,020 | 0.09 | % | |||||||||
| W.R. Grace & Co. (a) | 87,150 | 5,591,544 | 1.85 | % | |||||||||
| 34,381,321 | 11.36 | % | |||||||||||
| Utilities – 0.28% | |||||||||||||
| ALLETE, Inc. | 10,400 | 432,848 | 0.14 | % | |||||||||
| Portland General Electric Co. | 15,400 | 421,960 | 0.14 | % | |||||||||
| 854,808 | 0.28 | % | |||||||||||
| Total Common Stocks | |||||||||||||
| (Cost $255,299,237) | 284,014,613 | 93.83 | % | ||||||||||
The accompanying notes are an integral part of these financial statements.
HENNESSY FUNDS 1-800-966-4354
23
| RIGHTS – 0.00% | Number of | % of | |||||||||||
| Shares | Value | Net Assets | |||||||||||
| Forest Laboratories, Inc. (a) (b) | 5,500 | $ | 5,225 | 0.00 | % | ||||||||
| Total Rights | |||||||||||||
| (Cost $0) | 5,225 | 0.00 | % | ||||||||||
| PARTNERSHIPS – 1.69% | |||||||||||||
| Energy – 1.69% | |||||||||||||
| Oneok Partners L.P. | 83,900 | 5,113,705 | 1.69 | % | |||||||||
| Total Partnerships | |||||||||||||
| (Cost $4,781,651) | 5,113,705 | 1.69 | % | ||||||||||
| REITS – 0.14% | |||||||||||||
| Potlatch Corp. | 4,000 | 153,920 | 0.05 | % | |||||||||
| Sunstone Hotel Investors, Inc. (a) | 28,000 | 276,640 | 0.09 | % | |||||||||
| 430,560 | 0.14 | % | |||||||||||
Total Reits (Cost $421,475) | 430,560 | 0.14 | % | ||||||||||
| EXCHANGE TRADED FUNDS – 0.21% | |||||||||||||
| ishares Russell 2000 Index | 8,000 | 649,920 | 0.21 | % | |||||||||
| Total Exchange Traded Funds | |||||||||||||
| (Cost $677,334) | 649,920 | 0.21 | % | ||||||||||
| SHORT-TERM INVESTMENTS – 3.67% | |||||||||||||
| Money Market Fund – 3.67% | |||||||||||||
| Fidelity Government Portfolio – | |||||||||||||
| Institutional Class, 0.01% (c) | 11,098,776 | 11,098,776 | 3.67 | % | |||||||||
| Total Money Market Fund | |||||||||||||
| (Cost $11,098,776) | 11,098,776 | 3.67 | % | ||||||||||
| Total Short-Term Investments | |||||||||||||
| (Cost $11,098,776) | 11,098,776 | 3.67 | % | ||||||||||
| Total Investments | |||||||||||||
| (Cost $272,278,473) – 99.54% | 301,312,799 | 99.54 | % | ||||||||||
| Other Assets in Excess | |||||||||||||
| of Liabilities – 0.46% | 1,398,120 | 0.46 | % | ||||||||||
TOTAL NET ASSETS – 100.00% | $ | 302,710,919 | 100.00 | % | |||||||||
Percentages are stated as a percent of net assets.
(a)Non-income producing security.
(b)Security is fair valued.
(c)The rate listed is the fund’s 7-day yield as of October 31, 2012.
Summary of Fair Value Exposure at October 31, 2012
The following is a summary of the inputs used to value the Fund’s net assets as of October 31, 2012 (See Note 3 in the accompanying notes to the financial statements):
| Common Stock | Level 1 | Level 2 | Level 3 | Total | |||||||||||||
| Consumer Discretionary | $ | 124,852,420 | $ | — | $ | — | $ | 124,852,420 | |||||||||
| Consumer Staples | 24,007,055 | — | — | 24,007,055 | |||||||||||||
| Energy | 2,033,824 | — | — | 2,033,824 | |||||||||||||
| Financials | 6,534,443 | 100,230 | — | 6,634,673 | |||||||||||||
| Health Care | 30,302,477 | — | — | 30,302,477 | |||||||||||||
| Industrials | 53,334,485 | — | — | 53,334,485 | |||||||||||||
| Information Technology | 7,613,550 | — | — | 7,613,550 | |||||||||||||
| Materials | 34,381,321 | — | — | 34,381,321 | |||||||||||||
| Utilities | 854,808 | — | — | 854,808 | |||||||||||||
| Total Common Stock | $ | 283,914,383 | $ | 100,230 | $ | — | $ | 284,014,613 | |||||||||
| Rights | $ | — | $ | — | $ | 5,225 | $ | 5,225 | |||||||||
| Partnerships | |||||||||||||||||
| Energy | $ | 5,113,705 | $ | — | $ | — | $ | 5,113,705 | |||||||||
| Total Partnerships | $ | 5,113,705 | $ | — | $ | — | $ | 5,113,705 | |||||||||
| REITS | |||||||||||||||||
| Financials | $ | 430,560 | $ | — | $ | — | $ | 430,560 | |||||||||
| Total REITS | $ | 430,560 | $ | — | $ | — | $ | 430,560 | |||||||||
| Exchange Traded Funds | |||||||||||||||||
| ishares Russell 2000 Index | $ | 649,920 | $ | — | $ | — | $ | 649,920 | |||||||||
| Total Exchange Traded Funds | $ | 649,920 | $ | — | $ | — | $ | 649,920 | |||||||||
| Short-Term Investments | |||||||||||||||||
| Money Market Funds | $ | 11,098,776 | $ | — | $ | — | $ | 11,098,776 | |||||||||
| Total Short-Term Investments | $ | 11,098,776 | $ | — | $ | — | $ | 11,098,776 | |||||||||
| Total Investments in Securities | $ | 301,207,344 | $ | 100,230 | $ | 5,225 | $ | 301,312,799 | |||||||||
Transfers between levels are recognized at the end of the reporting period. During the period ended October 31, 2012, the Fund recognized no transfers between levels.
The accompanying notes are an integral part of these financial statements.
WWW.HENNESSYFUNDS.COM
24
Level 3 Reconciliation Disclosure
Following is a reconciliation of level 3 assets for which significant unobservable inputs were used to determine fair value.
| Common Stock | |||||
| Balance as of 10/31/11 | $ | — | |||
| Accrued discounts/premiums | — | ||||
| Realized gain (loss) | — | ||||
| Change in unrealized appreciation (depreciation) | — | ||||
| Purchases* | 5,225 | ||||
| (Sales) | — | ||||
| Transfer in and/or out of Level 3 | — | ||||
| Balance as of 10/31/12 | $ | 5,225 | |||
| Net in unrealized appreciation/depreciation during | |||||
| the year for level 3 investments held at October 31, 2012 | $ | 5,225 | |||
* Acquired in merger.
The accompanying notes are an integral part of these financial statements.
HENNESSY FUNDS 1-800-966-4354
25
HENNESSY CORNERSTONE MID CAP 30 FUND
(formerly Hennessy Focus 30 Fund)
As of October 31, 2012
(% of Net Assets)

| TOP TEN EQUITY HOLDINGS | % net assets | |
| Sunoco Logistics Partners L.P. | 3.93% | |
| LKQ Corp. | 3.85% | |
| Tesoro Corp. | 3.85% | |
| HSN, Inc. | 3.84% | |
| Ross Stores, Inc. | 3.68% | |
| Petsmart, Inc. | 3.66% | |
| Sally Beauty Holdings, Inc. | 3.48% | |
| Dominos Pizza, Inc. | 3.38% | |
| Oneok Partners L.P. | 3.31% | |
| Triumph Group, Inc. | 3.30% |
The holdings reflected include stocks that were previously held in the former FBR Mid Cap Fund, which was reorganized into the Hennessy Focus 30 Fund (now known as the Hennessy Cornerstone Mid Cap 30 Fund) as of close of business on 10/26/12. These positions were held until the customary rebalance of the Hennessy Cornerstone Mid Cap 30 portfolio, which took place subsequent to the fiscal year end in the fall of 2012.
Note: For presentation purposes, the Fund has grouped some of the industry categories. For purposes of categorizing securities for compliance with Section 8(b)(1) of the Investment Company Act of 1940, the Fund uses more specific industry classifications.
WWW.HENNESSYFUNDS.COM
26
| COMMON STOCKS – 92.96% | Number of | % of | |||||||||||
| Shares | Value | Net Assets | |||||||||||
| Consumer Discretionary – 31.81% | |||||||||||||
| Abercrombie & Fitch Co., Class A | 2,815 | $ | 86,083 | 0.05 | % | ||||||||
| Bed Bath & Beyond, Inc. (a) | 3,900 | 224,952 | 0.12 | % | |||||||||
| Big Lots, Inc. (a) | 2,980 | 86,807 | 0.05 | % | |||||||||
| Dominos Pizza, Inc. | 155,800 | 6,328,596 | 3.38 | % | |||||||||
| Family Dollar Stores, Inc. | 83,900 | 5,534,044 | 2.95 | % | |||||||||
| Genesco, Inc. (a) | 85,400 | 4,893,420 | 2.61 | % | |||||||||
| Genuine Parts Co. | 90,100 | 5,638,458 | 3.01 | % | |||||||||
| HSN, Inc. | 138,300 | 7,194,366 | 3.84 | % | |||||||||
| LKQ Corp. (a) | 345,700 | 7,221,673 | 3.85 | % | |||||||||
| Magna International, Inc. | 10,930 | 485,401 | 0.26 | % | |||||||||
| Mattel, Inc. | 12,824 | 471,667 | 0.25 | % | |||||||||
| Petsmart, Inc. | 103,500 | 6,871,365 | 3.66 | % | |||||||||
| Ross Stores, Inc. | 113,300 | 6,905,635 | 3.68 | % | |||||||||
| Sally Beauty Holdings, Inc. (a) | 270,900 | 6,523,272 | 3.48 | % | |||||||||
| Tiffany & Co. | 8,735 | 552,227 | 0.29 | % | |||||||||
| Tupperware Brands Corp. | 1,650 | 97,515 | 0.05 | % | |||||||||
| V.F. Corp. | 2,229 | 348,794 | 0.19 | % | |||||||||
| Williams-Sonoma, Inc. | 3,700 | 171,051 | 0.09 | % | |||||||||
| 59,635,326 | 31.81 | % | |||||||||||
| Consumer Staples – 9.13% | |||||||||||||
| Bunge Ltd. | 3,022 | 214,652 | 0.11 | % | |||||||||
| Casey’s General Stores, Inc. | 103,900 | 5,356,045 | 2.86 | % | |||||||||
| Dr. Pepper Snapple Group, Inc. | 123,200 | 5,279,120 | 2.82 | % | |||||||||
| Monster Beverage Corp. (a) | 8,000 | 357,360 | 0.19 | % | |||||||||
| PriceSmart, Inc. | 68,400 | 5,676,516 | 3.03 | % | |||||||||
| Tyson Foods, Inc., Class A | 13,275 | 223,153 | 0.12 | % | |||||||||
| 17,106,846 | 9.13 | % | |||||||||||
| Energy – 6.86% | |||||||||||||
| Energen Corp. | 3,277 | 152,872 | 0.08 | % | |||||||||
| Ensco PLC – ADR | 2,335 | 135,010 | 0.07 | % | |||||||||
| Helmerich & Payne, Inc. | 2,640 | 126,192 | 0.07 | % | |||||||||
| Nabors Industries Ltd. (a) | 7,800 | 105,222 | 0.06 | % | |||||||||
| Newfield Exploration Co. (a) | 2,925 | 79,326 | 0.04 | % | |||||||||
| Pioneer Natural Resources Co. | 2,425 | 256,201 | 0.14 | % | |||||||||
| Plains Exploration & Production Co. (a) | 2,900 | 103,414 | 0.05 | % | |||||||||
| Rowan Companies, Inc. (a) | 3,750 | 118,913 | 0.06 | % | |||||||||
| Tesoro Corp. | 191,400 | 7,217,694 | 3.85 | % | |||||||||
| Tidewater, Inc. | 2,750 | 130,652 | 0.07 | % | |||||||||
| World Fuel Services Corp. | 127,900 | 4,438,130 | 2.37 | % | |||||||||
| 12,863,626 | 6.86 | % | |||||||||||
| Financials – 1.79% | |||||||||||||
| Comerica, Inc. | 6,375 | 190,039 | 0.10 | % | |||||||||
| Fifth Third Bancorp | 17,900 | 260,087 | 0.14 | % | |||||||||
| First Niagara Financial Group, Inc. | 10,800 | 89,424 | 0.05 | % | |||||||||
| KeyCorp | 26,950 | 226,919 | 0.12 | % | |||||||||
| M&T Bank Corp. | 2,546 | 265,039 | 0.14 | % | |||||||||
| New York Community Bancorp, Inc. | 11,785 | 163,340 | 0.09 | % | |||||||||
| People’s United Financial, Inc. | 10,250 | 123,307 | 0.07 | % | |||||||||
| Raymond James Financial, Inc. | 8,700 | 331,818 | 0.18 | % | |||||||||
| Regions Financial Corp. | 32,200 | 209,944 | 0.11 | % | |||||||||
| Reinsurance Group of America, Inc. | 4,500 | 238,140 | 0.13 | % | |||||||||
| SEI Investments Co. | 15,450 | 338,046 | 0.18 | % | |||||||||
| T. Rowe Price Group, Inc. | 6,821 | 442,956 | 0.23 | % | |||||||||
| W.R. Berkley Corp. | 6,800 | 264,452 | 0.14 | % | |||||||||
| Zions Bancorporation | 9,600 | 206,112 | 0.11 | % | |||||||||
| 3,349,623 | 1.79 | % | |||||||||||
| Health Care – 0.78% | |||||||||||||
| C.R. Bard, Inc. | 2,446 | 235,281 | 0.12 | % | |||||||||
| Covance, Inc. (a) | 2,600 | 126,646 | 0.07 | % | |||||||||
| Endo Pharmaceuticals Holdings, Inc. (a) | 9,050 | 259,373 | 0.14 | % | |||||||||
| Forest Laboratories, Inc. (a) | 6,438 | 217,025 | 0.12 | % | |||||||||
| Humana, Inc. | 1,400 | 103,978 | 0.05 | % | |||||||||
| Techne Corp. | 3,385 | 228,014 | 0.12 | % | |||||||||
| Varian Medical Systems, Inc. (a) | 4,444 | 296,681 | 0.16 | % | |||||||||
| 1,466,998 | 0.78 | % | |||||||||||
| Industrials – 12.51% | |||||||||||||
| Copart, Inc. (a) | 14,970 | 430,986 | 0.23 | % | |||||||||
| Kansas City Southern | 5,950 | 478,737 | 0.26 | % | |||||||||
| Kirby Corp. (a) | 3,700 | 212,676 | 0.11 | % | |||||||||
| MSC Industrial Direct | |||||||||||||
| Company, Inc., Class A | 2,800 | 208,880 | 0.11 | % | |||||||||
| Mueller Industries, Inc. | 111,000 | 4,861,800 | 2.59 | % | |||||||||
| Pall Corp. | 7,195 | 452,997 | 0.24 | % | |||||||||
| Roper Industries, Inc. | 4,592 | 501,309 | 0.27 | % | |||||||||
| Spirit AeroSystems | |||||||||||||
| Holdings, Inc., Class A (a) | 10,300 | 160,989 | 0.09 | % | |||||||||
| Teledyne Technologies, Inc. (a) | 90,600 | 5,801,118 | 3.09 | % | |||||||||
| Towers Watson & Co. | 77,332 | 4,153,502 | 2.22 | % | |||||||||
| Triumph Group, Inc. | 94,600 | 6,188,732 | 3.30 | % | |||||||||
| 23,451,726 | 12.51 | % | |||||||||||
| Information Technology – 3.60% | |||||||||||||
| Activision Blizzard, Inc. | 23,968 | 261,012 | 0.14 | % | |||||||||
| Check Point Software | |||||||||||||
| Technologies Ltd. (a) | 8,403 | 374,186 | 0.20 | % | |||||||||
| Dolby Laboratories, Inc., Class A (a) | 2,825 | 89,242 | 0.05 | % | |||||||||
| FactSet Research Systems, Inc. | 3,797 | 343,818 | 0.18 | % | |||||||||
| FLIR Systems, Inc. | 4,575 | 88,892 | 0.05 | % | |||||||||
| Jabil Circuit, Inc. | 247,400 | 4,289,916 | 2.29 | % | |||||||||
| Microchip Technology, Inc. | 4,900 | 153,615 | 0.08 | % | |||||||||
| Paychex, Inc. | 9,575 | 310,517 | 0.16 | % | |||||||||
| SanDisk Corp. (a) | 3,400 | 141,984 | 0.07 | % | |||||||||
| Seagate Technology PLC | 6,700 | 183,044 | 0.10 | % | |||||||||
The accompanying notes are an integral part of these financial statements.
HENNESSY FUNDS 1-800-966-4354
27
| COMMON STOCKS | Number of | % of | |||||||||||
| Shares | Value | Net Assets | |||||||||||
| Information Technology (Continued) | |||||||||||||
| Siliconware Precision | |||||||||||||
| Industries Co. Ltd. ADR – ADR | 30,900 | $ | 148,320 | 0.08 | % | ||||||||
| Western Digital Corp. | 4,900 | 167,727 | 0.09 | % | |||||||||
| Xilinx, Inc. | 6,200 | 203,112 | 0.11 | % | |||||||||
| 6,755,385 | 3.60 | % | |||||||||||
| Materials – 0.15% | |||||||||||||
| Sigma-Aldrich Corp. | 3,984 | 279,438 | 0.15 | % | |||||||||
| Telecommunication Services – 0.11% | |||||||||||||
| Telephone & Data Systems, Inc. | 7,880 | 195,975 | 0.11 | % | |||||||||
| Utilities – 26.22% | |||||||||||||
| Alliant Energy Corp. | 119,100 | 5,323,770 | 2.84 | % | |||||||||
| Ameren Corp. | 7,300 | 240,024 | 0.13 | % | |||||||||
| Centerpoint Energy, Inc. | 233,800 | 5,066,446 | 2.70 | % | |||||||||
| CMS Energy Corp. | 235,900 | 5,737,088 | 3.06 | % | |||||||||
| New Jersey Resources Corp. | 107,700 | 4,788,342 | 2.55 | % | |||||||||
| NiSource, Inc. | 217,300 | 5,534,631 | 2.95 | % | |||||||||
| NRG Energy, Inc. | 12,500 | 269,500 | 0.14 | % | |||||||||
| Pinnacle West Capital Corp. | 106,700 | 5,651,899 | 3.02 | % | |||||||||
| Scana Corp. | 116,200 | 5,703,096 | 3.04 | % | |||||||||
| UIL Holdings Corp. | 146,400 | 5,295,288 | 2.83 | % | |||||||||
| Westar Energy, Inc. | 186,650 | 5,543,505 | 2.96 | % | |||||||||
| 49,153,589 | 26.22 | % | |||||||||||
| Total Common Stocks | |||||||||||||
| (Cost $150,891,239) | 174,258,532 | 92.96 | % | ||||||||||
| PARTNERSHIPS – 7.24% | |||||||||||||
| Energy – 7.24% | |||||||||||||
| Oneok Partners L.P. | 101,800 | 6,204,710 | 3.31 | % | |||||||||
| Sunoco Logistics Partners L.P. | 150,400 | 7,371,104 | 3.93 | % | |||||||||
| 13,575,814 | 7.24 | % | |||||||||||
Total Partnerships (Cost $9,490,863) | 13,575,814 | 7.24 | % | ||||||||||
| SHORT-TERM INVESTMENTS – 1.20% | |||||||||||||
| Money Market Fund – 1.20% | |||||||||||||
| Fidelity Government Portfolio – | |||||||||||||
| Institutional Class, 0.01% (b) | 2,256,267 | 2,256,267 | 1.20 | % | |||||||||
| Total Money Market Fund | |||||||||||||
| (Cost $2,256,267) | 2,256,267 | 1.20 | % | ||||||||||
| Total Short-Term Investments | |||||||||||||
| (Cost $2,256,267) | 2,256,267 | 1.20 | % | ||||||||||
| Total Investments | |||||||||||||
| (Cost $162,638,369) – 101.40% | 190,090,613 | 101.40 | % | ||||||||||
| Liabilities in Excess of | |||||||||||||
| Other Assets – (1.40)% | (2,618,963 | ) | (1.40 | )% | |||||||||
TOTAL NET ASSETS – 100.00% | $ | 187,471,650 | 100.00 | % | |||||||||
Percentages are stated as a percent of net assets.
(a)Non-income producing security.
(b)The rate listed is the fund’s 7-day yield as of October 31, 2012.
ADR – American Depositary Receipt
Summary of Fair Value Exposure at October 31, 2012
The following is a summary of the inputs used to value the Fund’s net assets as of October 31, 2012 (See Note 3 in the accompanying notes to the financial statements):
| Common Stock | Level 1 | Level 2 | Level 3 | Total | |||||||||||||
| Consumer Discretionary | $ | 59,635,326 | $ | — | $ | — | $ | 59,635,326 | |||||||||
| Consumer Staples | 17,106,846 | — | — | 17,106,846 | |||||||||||||
| Energy | 12,863,626 | — | — | 12,863,626 | |||||||||||||
| Financials | 3,349,623 | — | — | 3,349,623 | |||||||||||||
| Health Care | 1,466,998 | — | — | 1,466,998 | |||||||||||||
| Industrials | 23,451,726 | — | — | 23,451,726 | |||||||||||||
| Information Technology | 6,755,385 | — | — | 6,755,385 | |||||||||||||
| Materials | 279,438 | — | — | 279,438 | |||||||||||||
| Telecommunication Services | 195,975 | — | — | 195,975 | |||||||||||||
| Utilities | 49,153,589 | — | — | 49,153,589 | |||||||||||||
| Total Common Stock | $ | 174,258,532 | $ | — | $ | — | $ | 174,258,532 | |||||||||
| Partnerships | |||||||||||||||||
| Energy | $ | 13,575,814 | — | — | $ | 13,575,814 | |||||||||||
| Short-Term Investments | |||||||||||||||||
| Money Market Funds | $ | 2,256,267 | $ | — | $ | — | $ | 2,256,267 | |||||||||
| Total Short-Term Investments | $ | 2,256,267 | $ | — | $ | — | $ | 2,256,267 | |||||||||
| Total Investments in Securities | $ | 190,090,613 | $ | — | $ | — | $ | 190,090,613 | |||||||||
Transfers between levels are recognized at the end of the reporting period. During the period ended October 31, 2012, the Fund recognized no transfers between levels.
The accompanying notes are an integral part of these financial statements.
WWW.HENNESSYFUNDS.COM
28
HENNESSY CORNERSTONE LARGE GROWTH FUND
As of October 31, 2012
(% of Net Assets)
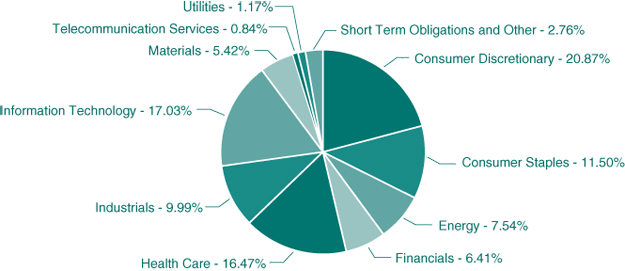
| TOP TEN EQUITY HOLDINGS | % net assets | |
| Gilead Sciences, Inc. | 2.66% | |
| Eli Lilly & Co. | 2.33% | |
| The Gap, Inc. | 2.13% | |
| TJX Companies, Inc. | 2.12% | |
| International Business Machines Corp. | 2.09% | |
| Microsoft Corp. | 2.01% | |
| Mattel, Inc. | 1.90% | |
| Wal-Mart Stores, Inc. | 1.85% | |
| Intel Corp. | 1.79% | |
| Kimberly Clark Corp. | 1.69% |
The holdings reflected include stocks that were previously held in he former FBR Large Cap Fund, which was reorganized into the Hennessy Cornerstone Large Growth Fund as of close of business on 10/26/12. These positions will be held until the customary rebalance of the Hennessy Cornerstone Large Growth portfolio, generally in the winter.
Note: For presentation purposes, the Fund has grouped some of the industry categories. For purposes of categorizing securities for compliance with Section 8(b)(1) of the Investment Company Act of 1940, the Fund uses more specific industry classifications.
HENNESSY FUNDS 1-800-966-4354
29
| COMMON STOCKS – 97.24% | Number of | % of | |||||||||||
| Shares | Value | Net Assets | |||||||||||
| Consumer Discretionary – 20.87% | |||||||||||||
| Advance Auto Parts, Inc. | 21,800 | $ | 1,546,492 | 1.41 | % | ||||||||
| Amazon.com, Inc. (a) | 1,000 | 232,820 | 0.21 | % | |||||||||
| AMC Networks, Inc. (a) | 10,625 | 496,400 | 0.45 | % | |||||||||
| Apollo Group, Inc. (a) | 35,800 | 718,864 | 0.65 | % | |||||||||
| Autoliv, Inc. | 19,400 | 1,117,440 | 1.02 | % | |||||||||
| Bed Bath & Beyond, Inc. (a) | 5,800 | 334,544 | 0.30 | % | |||||||||
| Best Buy Co., Inc. | 49,200 | 748,332 | 0.68 | % | |||||||||
| Cablevision Systems Corp. | 31,900 | 555,698 | 0.51 | % | |||||||||
| Coach, Inc. | 8,000 | 448,400 | 0.41 | % | |||||||||
| DIRECTV (a) | 30,200 | 1,543,522 | 1.41 | % | |||||||||
| Dish Network Corp. | 51,100 | 1,820,693 | 1.66 | % | |||||||||
| Genuine Parts Co. | 9,700 | 607,026 | 0.55 | % | |||||||||
| Guess?, Inc. | 9,400 | 232,932 | 0.21 | % | |||||||||
| Kohl’s Corp. | 11,700 | 623,376 | 0.57 | % | |||||||||
| Limited Brands, Inc. | 35,700 | 1,709,673 | 1.56 | % | |||||||||
| Mattel, Inc. | 56,600 | 2,081,748 | 1.90 | % | |||||||||
| Nordstrom, Inc. | 30,700 | 1,742,839 | 1.59 | % | |||||||||
| The Gap, Inc. | 65,500 | 2,339,660 | 2.13 | % | |||||||||
| Tiffany & Co. | 7,500 | 474,150 | 0.43 | % | |||||||||
| TJX Companies, Inc. | 56,000 | 2,331,280 | 2.12 | % | |||||||||
| TRW Automotive Holdings Corp. (a) | 25,900 | 1,204,609 | 1.10 | % | |||||||||
| 22,910,498 | 20.87 | % | |||||||||||
| Consumer Staples – 11.50% | |||||||||||||
| Campbell Soup Co. | 44,500 | 1,569,515 | 1.43 | % | |||||||||
| General Mills, Inc. | 38,600 | 1,547,088 | 1.41 | % | |||||||||
| Hormel Foods Corp. | 14,900 | 439,997 | 0.40 | % | |||||||||
| Kimberly Clark Corp. | 22,200 | 1,852,590 | 1.69 | % | |||||||||
| Pepsico, Inc. | 4,000 | 276,960 | 0.25 | % | |||||||||
| Procter & Gamble Co. | 7,800 | 540,072 | 0.49 | % | |||||||||
| Sysco Corp. | 48,100 | 1,494,467 | 1.36 | % | |||||||||
| The Coca-Cola Co. | 10,000 | 371,800 | 0.34 | % | |||||||||
| The Estee Lauder | |||||||||||||
| Companies, Inc., Class A | 9,600 | 591,552 | 0.54 | % | |||||||||
| Unilever PLC ADR – ADR | 15,000 | 559,350 | 0.51 | % | |||||||||
| Walgreen Co. | 38,200 | 1,345,786 | 1.23 | % | |||||||||
| Wal-Mart Stores, Inc. | 27,100 | 2,033,042 | 1.85 | % | |||||||||
| 12,622,219 | 11.50 | % | |||||||||||
| Energy – 7.54% | |||||||||||||
| Apache Corp. | 4,202 | 347,716 | 0.32 | % | |||||||||
| Chevron Corp. | 14,600 | 1,609,066 | 1.47 | % | |||||||||
| Cimarex Energy Co. | 16,200 | 926,316 | 0.84 | % | |||||||||
| Devon Energy Corp. | 8,800 | 512,248 | 0.47 | % | |||||||||
| Diamond Offshore Drilling, Inc. | 21,400 | 1,481,736 | 1.35 | % | |||||||||
| Exxon Mobil Corp. | 18,500 | 1,686,645 | 1.53 | % | |||||||||
| Halliburton Co. | 11,000 | 355,190 | 0.32 | % | |||||||||
| Hess Corp. | 9,000 | 470,340 | 0.43 | % | |||||||||
| Murphy Oil Corp. | 8,200 | 492,000 | 0.45 | % | |||||||||
| Range Resources Corp. | 6,000 | 392,160 | 0.36 | % | |||||||||
| 8,273,417 | 7.54 | % | |||||||||||
| Financials – 6.41% | |||||||||||||
| Bank of America Corp. | 60,000 | 559,200 | 0.51 | % | |||||||||
| Capital One Financial Corp. | 5,000 | 300,850 | 0.28 | % | |||||||||
| Discover Financial Services | 12,000 | 492,000 | 0.45 | % | |||||||||
| Franklin Resources, Inc. | 3,575 | 456,885 | 0.42 | % | |||||||||
| J.P. Morgan Chase & Co. | 13,725 | 572,058 | 0.52 | % | |||||||||
| Prudential Financial, Inc. | 6,200 | 353,710 | 0.32 | % | |||||||||
| T. Rowe Price Group, Inc. | 9,000 | 584,460 | 0.53 | % | |||||||||
| The Chubb Corp. | 5,800 | 446,484 | 0.41 | % | |||||||||
| The PNC Financial Services Group, Inc. | 6,000 | 349,140 | 0.32 | % | |||||||||
| The Progressive Corp. | 70,000 | 1,561,000 | 1.42 | % | |||||||||
| Torchmark Corp. | 4,400 | 222,596 | 0.20 | % | |||||||||
| U.S. Bancorp (b) | 17,000 | 564,570 | 0.51 | % | |||||||||
| Wells Fargo & Co. | 17,000 | 572,730 | 0.52 | % | |||||||||
| 7,035,683 | 6.41 | % | |||||||||||
| Health Care – 16.47% | |||||||||||||
| Abbott Laboratories | 8,640 | 566,093 | 0.52 | % | |||||||||
| Aetna, Inc. | 35,000 | 1,529,500 | 1.39 | % | |||||||||
| Baxter International, Inc. | 8,475 | 530,789 | 0.48 | % | |||||||||
| C.R. Bard, Inc. | 2,970 | 285,685 | 0.26 | % | |||||||||
| Cerner Corp. (a) | 8,200 | 624,758 | 0.57 | % | |||||||||
| CIGNA Corp. | 31,400 | 1,601,400 | 1.46 | % | |||||||||
| Eli Lilly & Co. | 52,600 | 2,557,938 | 2.33 | % | |||||||||
| Forest Laboratories, Inc. (a) | 44,500 | 1,500,095 | 1.37 | % | |||||||||
| Gilead Sciences, Inc. (a) | 43,400 | 2,914,744 | 2.66 | % | |||||||||
| HCA Holdings, Inc. | 43,300 | 1,230,153 | 1.12 | % | |||||||||
| Humana, Inc. | 19,100 | 1,418,557 | 1.29 | % | |||||||||
| Merck & Co., Inc. | 11,400 | 520,182 | 0.47 | % | |||||||||
| Novartis AG – ADR | 8,700 | 526,002 | 0.48 | % | |||||||||
| Stryker Corp. | 10,700 | 562,820 | 0.51 | % | |||||||||
| UnitedHealth Group, Inc. | 29,900 | 1,674,400 | 1.53 | % | |||||||||
| Wellpoint, Inc. | 600 | 36,768 | 0.03 | % | |||||||||
| 18,079,884 | 16.47 | % | |||||||||||
| Industrials – 9.99% | |||||||||||||
| 3M Co. | 9,600 | 840,960 | 0.77 | % | |||||||||
| Cummins, Inc. | 6,000 | 561,480 | 0.51 | % | |||||||||
| FedEx Corp. | 6,100 | 561,139 | 0.51 | % | |||||||||
| General Dynamics Corp. | 20,000 | 1,361,600 | 1.24 | % | |||||||||
| General Electric Co. | 37,600 | 791,856 | 0.72 | % | |||||||||
| Lockheed Martin Corp. | 18,900 | 1,770,363 | 1.61 | % | |||||||||
| Norfolk Southern Corp. | 8,600 | 527,610 | 0.48 | % | |||||||||
| Raytheon Co. | 30,300 | 1,713,768 | 1.56 | % | |||||||||
| The Boeing Co. | 18,900 | 1,331,316 | 1.21 | % | |||||||||
The accompanying notes are an integral part of these financial statements.
WWW.HENNESSYFUNDS.COM
30
| COMMON STOCKS | Number of | % of | |||||||||||
| Shares | Value | Net Assets | |||||||||||
| Industrials (Continued) | |||||||||||||
| The Timken Co. | 28,200 | $ | 1,113,618 | 1.02 | % | ||||||||
| Union Pacific Corp. | 3,200 | 393,696 | 0.36 | % | |||||||||
| 10,967,406 | 9.99 | % | |||||||||||
| Information Technology – 17.03% | |||||||||||||
| Apple, Inc. | 2,050 | 1,219,955 | 1.11 | % | |||||||||
| Applied Materials, Inc. | 116,700 | 1,237,020 | 1.13 | % | |||||||||
| Automatic Data Processing, Inc. | 7,000 | 404,530 | 0.37 | % | |||||||||
| Check Point Software | |||||||||||||
| Technologies Ltd. (a) | 7,000 | 311,710 | 0.28 | % | |||||||||
| Cisco Systems, Inc. | 30,000 | 514,200 | 0.47 | % | |||||||||
| Citrix Systems, Inc. (a) | 3,600 | 222,516 | 0.20 | % | |||||||||
| Dell, Inc. | 89,500 | 826,085 | 0.75 | % | |||||||||
| Google, Inc., Class A (a) | 1,100 | 747,747 | 0.68 | % | |||||||||
| Harris Corp. | 30,600 | 1,400,868 | 1.28 | % | |||||||||
| Hewlett-Packard Co. | 36,500 | 505,525 | 0.46 | % | |||||||||
| Intel Corp. | 91,000 | 1,967,875 | 1.79 | % | |||||||||
| International Business Machines Corp. | 11,800 | 2,295,454 | 2.09 | % | |||||||||
| LAM Research Corp. (a) | 31,700 | 1,122,180 | 1.02 | % | |||||||||
| LinkedIn Corp., Class A (a) | 900 | 96,237 | 0.09 | % | |||||||||
| MICROS Systems, Inc. (a) | 7,000 | 317,730 | 0.29 | % | |||||||||
| Microsoft Corp. | 77,350 | 2,207,182 | 2.01 | % | |||||||||
| NetApp, Inc. (a) | 9,900 | 266,310 | 0.24 | % | |||||||||
| Oracle Corp. | 19,000 | 589,950 | 0.54 | % | |||||||||
| Paychex, Inc. | 12,000 | 389,160 | 0.35 | % | |||||||||
| Rackspace Hosting, Inc. (a) | 6,000 | 382,140 | 0.35 | % | |||||||||
| Salesforce.com, Inc. (a) | 1,800 | 262,764 | 0.24 | % | |||||||||
| Texas Instruments, Inc. | 42,900 | 1,205,061 | 1.10 | % | |||||||||
| Yahoo, Inc. (a) | 12,300 | 206,763 | 0.19 | % | |||||||||
| 18,698,962 | 17.03 | % | |||||||||||
| Materials – 5.42% | |||||||||||||
| Cliffs Natural Resources Inc. | 17,500 | 634,725 | 0.58 | % | |||||||||
| Eastman Chemical Co. | 28,200 | 1,670,568 | 1.52 | % | |||||||||
| EI Du Pont de Nemours & Co. | 6,000 | 267,120 | 0.24 | % | |||||||||
| Freeport-McMoRan Copper & Gold, Inc. | 41,000 | 1,594,080 | 1.45 | % | |||||||||
| Monsanto Co. | 3,000 | 258,210 | 0.24 | % | |||||||||
| Newmont Mining Corp. | 28,000 | 1,527,400 | 1.39 | % | |||||||||
| 5,952,103 | 5.42 | % | |||||||||||
| Telecommunication Services – 0.84% | |||||||||||||
| AT&T, Inc. | 15,000 | 518,850 | 0.47 | % | |||||||||
| Verizon Communications, Inc. | 9,000 | 401,760 | 0.37 | % | |||||||||
| 920,610 | 0.84 | % | |||||||||||
| Utilities – 1.17% | |||||||||||||
| Edison International | 4,800 | 225,312 | 0.20 | % | |||||||||
| Exelon Corp. | 14,000 | 500,920 | 0.46 | % | |||||||||
| PG&E Corp. | 8,500 | 361,420 | 0.33 | % | |||||||||
| Public Service Enterprise Group, Inc. | 6,100 | 195,444 | 0.18 | % | |||||||||
| 1,283,096 | 1.17 | % | |||||||||||
| Total Common Stocks | |||||||||||||
| (Cost $98,172,303) | 106,743,878 | 97.24 | % | ||||||||||
| SHORT-TERM INVESTMENTS – 2.77% | |||||||||||||
| Money Market Fund – 2.77% | |||||||||||||
| Fidelity Government Portfolio – | |||||||||||||
| Institutional Class, 0.01% (c) | 3,045,421 | 3,045,421 | 2.77 | % | |||||||||
| Total Money Market Fund | |||||||||||||
| (Cost $3,045,421) | 3,045,421 | 2.77 | % | ||||||||||
| Total Short-Term Investments | |||||||||||||
| (Cost $3,045,421) | 3,045,421 | 2.77 | % | ||||||||||
| Total Investments | |||||||||||||
| (Cost $101,217,724) – 100.01% | 109,789,299 | 100.01 | % | ||||||||||
| Liabilities in Excess of | |||||||||||||
| Other Assets – (0.01)% | (14,113 | ) | (0.01 | )% | |||||||||
TOTAL NET ASSETS – 100.00% | $ | 109,775,186 | 100.00 | % | |||||||||
Percentages are stated as a percent of net assets.
| (a) | Non-income producing security. |
| (b) | Investment in affiliated security. Quasar Distributors, LLC, which serves as the Fund’s distributor, is a subsidiary of U.S. Bancorp. The position is a result of the merger with the former FBR Large Cap Fund which occurred on October 26, 2012. Details of transactions with this affiliated company for the year ended October 31, 2012, are as follows: |
| Issuer | U.S. Bancorp | |
| Beginning Cost* | $420,211 | |
| Purchase Cost | $— | |
| Sales Cost | $— | |
| Ending Cost | $420,211 | |
| Dividend Income | $— | |
| Shares | 17,000 | |
| Market Value | $564,570 |
| * | Represents cost at October 26, 2012 acquisition. |
| (c) | The rate listed is the fund’s 7-day yield as of October 31, 2012. |
ADR – American Depositary Receipt
The accompanying notes are an integral part of these financial statements.
HENNESSY FUNDS 1-800-966-4354
31
Summary of Fair Value Exposure at October 31, 2012
The following is a summary of the inputs used to value the Fund’s net assets as of October 31, 2012 (See Note 3 in the accompanying notes to the financial statements):
| Common Stock | Level 1 | Level 2 | Level 3 | Total | |||||||||||||
| Consumer Discretionary | $ | 22,910,498 | $ | — | $ | — | $ | 22,910,498 | |||||||||
| Consumer Staples | 12,622,219 | — | — | 12,622,219 | |||||||||||||
| Energy | 8,273,417 | — | — | 8,273,417 | |||||||||||||
| Financials | 7,035,683 | — | — | 7,035,683 | |||||||||||||
| Health Care | 18,079,884 | — | — | 18,079,884 | |||||||||||||
| Industrials | 10,967,406 | — | — | 10,967,406 | |||||||||||||
| Information Technology | 18,698,962 | — | — | 18,698,962 | |||||||||||||
| Materials | 5,952,103 | — | — | 5,952,103 | |||||||||||||
| Telecommunication Services | 920,610 | — | — | 920,610 | |||||||||||||
| Utilities | 1,283,096 | — | — | 1,283,096 | |||||||||||||
| Total Common Stock | $ | 106,743,878 | $ | — | $ | — | $ | 106,743,878 | |||||||||
| Short-Term Investments | |||||||||||||||||
| Money Market Funds | $ | 3,045,421 | $ | — | $ | — | $ | 3,045,421 | |||||||||
| Total Short-Term Investments | $ | 3,045,421 | $ | — | $ | — | $ | 3,045,421 | |||||||||
| Total Investments in Securities | $ | 109,789,299 | $ | — | $ | — | $ | 109,789,299 | |||||||||
Transfers between levels are recognized at the end of the reporting period. During the period ended October 31, 2012, the Fund recognized no transfers between levels.
The accompanying notes are an integral part of these financial statements.
WWW.HENNESSYFUNDS.COM
32
HENNESSY CORNERSTONE VALUE FUND
As of October 31, 2012
(% of Net Assets)

| TOP TEN EQUITY HOLDINGS | % net assets | |
| Seagate Technology PLC | 2.55% | |
| Encana Corp. | 2.37% | |
| Mattel, Inc. | 2.36% | |
| Carnival Corp. | 2.29% | |
| Sun Life Financial, Inc. | 2.29% | |
| HSBC Holdings PLC – ADR | 2.27% | |
| Eli Lilly & Co. | 2.24% | |
| Philip Morris International, Inc. | 2.23% | |
| Abbott Labs | 2.18% | |
| Merck & Co., Inc. | 2.17% |
Note: For presentation purposes, the Fund has grouped some of the industry categories. For purposes of categorizing securities for compliance with Section 8(b)(1) of the Investment Company Act of 1940, the Fund uses more specific industry classifications.
HENNESSY FUNDS 1-800-966-4354
33
| COMMON STOCKS – 99.10% | Number of | % of | |||||||||||
| Shares | Value | Net Assets | |||||||||||
| Consumer Discretionary – 6.48% | |||||||||||||
| Carnival Corp. | 77,100 | $ | 2,920,548 | 2.29 | % | ||||||||
| Mattel, Inc. | 81,700 | 3,004,926 | 2.36 | % | |||||||||
| Thomson Reuters Corp. | 82,700 | 2,337,102 | 1.83 | % | |||||||||
| 8,262,576 | 6.48 | % | |||||||||||
| Consumer Staples – 23.44% | |||||||||||||
| Altria Group, Inc. | 81,300 | 2,585,340 | 2.03 | % | |||||||||
| Avon Products, Inc. | 132,000 | 2,044,680 | 1.60 | % | |||||||||
| Campbell Soup Co. | 73,500 | 2,592,345 | 2.03 | % | |||||||||
| ConAgra Foods, Inc. | 86,800 | 2,416,512 | 1.90 | % | |||||||||
| H.J. Heinz Co. | 44,000 | 2,530,440 | 1.98 | % | |||||||||
| Kellogg Co. | 46,000 | 2,406,720 | 1.89 | % | |||||||||
| Kimberly Clark Corp. | 31,800 | 2,653,710 | 2.08 | % | |||||||||
| Pepsico, Inc. | 36,300 | 2,513,412 | 1.97 | % | |||||||||
| Philip Morris International, Inc. | 32,100 | 2,842,776 | 2.23 | % | |||||||||
| Procter & Gamble Co. | 35,700 | 2,471,868 | 1.94 | % | |||||||||
| Reynolds American, Inc. | 57,100 | 2,377,644 | 1.87 | % | |||||||||
| Sysco Corp. | 78,900 | 2,451,423 | 1.92 | % | |||||||||
| 29,886,870 | 23.44 | % | |||||||||||
| Energy – 13.64% | |||||||||||||
| BP PLC – ADR | 52,800 | 2,264,592 | 1.78 | % | |||||||||
| Chevron Corp. | 22,000 | 2,424,620 | 1.90 | % | |||||||||
| ConocoPhillips | 32,100 | 1,856,985 | 1.46 | % | |||||||||
| Encana Corp. | 134,300 | 3,028,465 | 2.37 | % | |||||||||
| Phillips 66 | 16,050 | 756,918 | 0.59 | % | |||||||||
| Royal Dutch Shell PLC – ADR | 33,500 | 2,294,080 | 1.80 | % | |||||||||
| Total SA – ADR | 45,600 | 2,298,240 | 1.80 | % | |||||||||
| Transocean Ltd. | 54,100 | 2,471,829 | 1.94 | % | |||||||||
| 17,395,729 | 13.64 | % | |||||||||||
| Financials – 6.45% | |||||||||||||
| Banco Santander SA – ADR | 323,400 | 2,412,564 | 1.89 | % | |||||||||
| HSBC Holdings PLC – ADR | 58,700 | 2,897,432 | 2.27 | % | |||||||||
| Sun Life Financial, Inc. | 117,600 | 2,916,480 | 2.29 | % | |||||||||
| 8,226,476 | 6.45 | % | |||||||||||
| Health Care – 14.32% | |||||||||||||
| Abbott Laboratories | 42,500 | 2,784,600 | 2.18 | % | |||||||||
| Bristol-Myers Squibb Co. | 69,800 | 2,320,850 | 1.82 | % | |||||||||
| Eli Lilly & Co. | 58,600 | 2,849,718 | 2.24 | % | |||||||||
| GlaxoSmithKline PLC – ADR | 51,700 | 2,321,330 | 1.82 | % | |||||||||
| Johnson & Johnson | 36,100 | 2,556,602 | 2.00 | % | |||||||||
| Merck & Co., Inc. | 60,600 | 2,765,178 | 2.17 | % | |||||||||
| Pfizer, Inc. | 107,200 | 2,666,064 | 2.09 | % | |||||||||
| 18,264,342 | 14.32 | % | |||||||||||
| Industrials – 13.84% | |||||||||||||
| Emerson Electric Co. | 47,300 | 2,290,739 | 1.80 | % | |||||||||
| General Electric Co. | 123,800 | 2,607,228 | 2.04 | % | |||||||||
| Lockheed Martin Corp. | 28,600 | 2,678,962 | 2.10 | % | |||||||||
| Northrop Grumman Corp. | 39,100 | 2,685,779 | 2.11 | % | |||||||||
| Raytheon Co. | 47,400 | 2,680,944 | 2.10 | % | |||||||||
| Republic Services, Inc. | 85,100 | 2,412,585 | 1.89 | % | |||||||||
| Waste Management, Inc. | 69,900 | 2,288,526 | 1.80 | % | |||||||||
| 17,644,763 | 13.84 | % | |||||||||||
| Information Technology – 4.12% | |||||||||||||
| Intel Corp. | 92,700 | 2,004,638 | 1.57 | % | |||||||||
| Seagate Technology PLC | 119,200 | 3,256,544 | 2.55 | % | |||||||||
| 5,261,182 | 4.12 | % | |||||||||||
| Materials – 8.78% | |||||||||||||
| Arcelormittal SA Luxembourg – ADR | 115,300 | 1,702,981 | 1.34 | % | |||||||||
| EI Du Pont de Nemours & Co. | 47,600 | 2,119,152 | 1.66 | % | |||||||||
| International Paper Co. | 73,400 | 2,629,922 | 2.06 | % | |||||||||
| Nucor Corp. | 55,200 | 2,215,176 | 1.74 | % | |||||||||
| Southern Copper Corp. | 66,300 | 2,526,030 | 1.98 | % | |||||||||
| 11,193,261 | 8.78 | % | |||||||||||
| Telecommunication Services – 8.03% | |||||||||||||
| AT&T, Inc. | 77,600 | 2,684,184 | 2.10 | % | |||||||||
| BCE, Inc. | 56,300 | 2,458,058 | 1.93 | % | |||||||||
| CenturyLink, Inc. | 62,800 | 2,410,264 | 1.89 | % | |||||||||
| Verizon Communications, Inc. | 60,300 | 2,691,792 | 2.11 | % | |||||||||
| 10,244,298 | 8.03 | % | |||||||||||
| Total Common Stocks | |||||||||||||
| (Cost $107,028,943) | 126,379,497 | 99.10 | % | ||||||||||
| SHORT-TERM INVESTMENTS – 1.00% | |||||||||||||
| Money Market Fund – 1.00% | |||||||||||||
| Fidelity Government Portfolio – | |||||||||||||
| Institutional Class, 0.01% (a) | 1,273,206 | 1,273,206 | 1.00 | % | |||||||||
| Total Money Market Fund | |||||||||||||
| (Cost $1,273,206) | 1,273,206 | 1.00 | % | ||||||||||
| Total Short-Term Investments | |||||||||||||
| (Cost $1,273,206) | 1,273,206 | 1.00 | % | ||||||||||
| Total Investments | |||||||||||||
| (Cost $108,302,149) – 100.10% | 127,652,703 | 100.10 | % | ||||||||||
| Liabilities in Excess | |||||||||||||
| of Other Assets – (0.10)% | (131,398 | ) | (0.10 | )% | |||||||||
TOTAL NET ASSETS – 100.00% | $ | 127,521,305 | 100.00 | % | |||||||||
Percentages are stated as a percent of net assets.
(a)The rate listed is the fund’s 7-day yield as of October 31, 2012.
ADR – American Depositary Receipt
The accompanying notes are an integral part of these financial statements.
WWW.HENNESSYFUNDS.COM
34
Summary of Fair Value Exposure at October 31, 2012
The following is a summary of the inputs used to value the Fund’s net assets as of October 31, 2012 (See Note 3 in the accompanying notes to the financial statements):
| Common Stock | Level 1 | Level 2 | Level 3 | Total | |||||||||||||
| Consumer Discretionary | $ | 8,262,576 | $ | — | $ | — | $ | 8,262,576 | |||||||||
| Consumer Staples | 29,886,870 | — | — | 29,886,870 | |||||||||||||
| Energy | 17,395,729 | — | — | 17,395,729 | |||||||||||||
| Financials | 8,226,476 | — | — | 8,226,476 | |||||||||||||
| Health Care | 18,264,342 | — | — | 18,264,342 | |||||||||||||
| Industrials | 17,644,763 | — | — | 17,644,763 | |||||||||||||
| Information Technology | 5,261,182 | — | — | 5,261,182 | |||||||||||||
| Materials | 11,193,261 | — | — | 11,193,261 | |||||||||||||
| Telecommunication Services | 10,244,298 | — | — | 10,244,298 | |||||||||||||
| Total Common Stock | $ | 126,379,497 | $ | — | $ | — | $ | 126,379,497 | |||||||||
| Short-Term Investments | |||||||||||||||||
| Money Market Funds | $ | 1,273,206 | $ | — | $ | — | $ | 1,273,206 | |||||||||
| Total Short-Term Investments | $ | 1,273,206 | $ | — | $ | — | $ | 1,273,206 | |||||||||
| Total Investments in Securities | $ | 127,652,703 | $ | — | $ | — | $ | 127,652,703 | |||||||||
Transfers between levels are recognized at the end of the reporting period. During the period ended October 31, 2012, the Fund recognized no transfers between levels.
Level 3 Reconciliation Disclosure
Following is a reconciliation of level 3 assets for which significant unobservable inputs were used to determine fair value.
| Common Stock | |||||
| Balance as of 10/31/11 | $ | — | |||
| Accrued discounts/premiums | — | ||||
| Realized gain (loss) | — | ||||
| Change in unrealized appreciation (depreciation) | — | ||||
| Purchases | — | ||||
| (Sales) | — | (1) | |||
| Transfer in and/or out of Level 3 | — | ||||
| Balance as of 10/31/12 | $ | — | |||
| Change in unrealized appreciation/depreciation during | |||||
| the year for level 3 investments held at October 31, 2012. | $ | — | |||
(1) Telefonica de Argentina was fair valued at $0 and written off during the period and was no longer held as of October 31, 2012.
The accompanying notes are an integral part of these financial statements.
HENNESSY FUNDS 1-800-966-4354
35
HENNESSY LARGE VALUE FUND
(formerly Hennessy Select Large Value Fund)
As of October 31, 2012
(% of Net Assets)

| TOP TEN EQUITY HOLDINGS | % net assets | |
| Chevron Corp. | 4.69% | |
| Exxon Mobil Corp. | 4.06% | |
| Johnson & Johnson | 3.64% | |
| General Electric Co. | 3.60% | |
| Wells Fargo & Co. | 2.77% | |
| J.P. Morgan Chase & Co. | 2.72% | |
| Cisco Systems, Inc. | 2.16% | |
| Citigroup, Inc. | 2.05% | |
| Nextera Energy, Inc. | 2.04% | |
| Comcast Corp. | 1.96% |
Note: For presentation purposes, the Fund has grouped some of the industry categories. For purposes of categorizing securities for compliance with Section 8(b)(1) of the Investment Company Act of 1940, the Fund uses more specific industry classifications.
WWW.HENNESSYFUNDS.COM
36
| COMMON STOCKS – 99.39% | Number of | % of | |||||||||||
| Shares | Value | Net Assets | |||||||||||
| Consumer Discretionary – 8.62% | |||||||||||||
| Abercrombie & Fitch Co., Class A | 19,645 | $ | 600,744 | 0.48 | % | ||||||||
| CBS Corp. | 40,330 | 1,306,692 | 1.05 | % | |||||||||
| Comcast Corp. | 65,290 | 2,449,028 | 1.96 | % | |||||||||
| Ford Motor Co. | 74,880 | 835,661 | 0.67 | % | |||||||||
| Macy’s, Inc. | 25,095 | 955,367 | 0.77 | % | |||||||||
| Pulte Homes, Inc. (a) | 38,575 | 668,890 | 0.52 | % | |||||||||
| Target Corp. | 30,470 | 1,942,462 | 1.55 | % | |||||||||
| The Home Depot, Inc. | 22,740 | 1,395,781 | 1.12 | % | |||||||||
| Time Warner, Inc. | 14,450 | 628,142 | 0.50 | % | |||||||||
| 10,782,767 | 8.62 | % | |||||||||||
| Consumer Staples – 4.93% | |||||||||||||
| Altria Group, Inc. | 19,550 | 621,690 | 0.50 | % | |||||||||
| Bunge Ltd. | 19,235 | 1,366,262 | 1.09 | % | |||||||||
| CVS Caremark Corp. | 33,535 | 1,556,024 | 1.24 | % | |||||||||
| Pepsico, Inc. | 9,160 | 634,238 | 0.51 | % | |||||||||
| Procter & Gamble Co. | 28,670 | 1,985,111 | 1.59 | % | |||||||||
| 6,163,325 | 4.93 | % | |||||||||||
| Energy – 16.31% | |||||||||||||
| Anadarko Petroleum Corp. | 14,085 | 969,189 | 0.77 | % | |||||||||
| Chevron Corp. | 53,215 | 5,864,825 | 4.69 | % | |||||||||
| ConocoPhillips | 20,115 | 1,163,653 | 0.93 | % | |||||||||
| Exxon Mobil Corp. | 55,690 | 5,077,257 | 4.06 | % | |||||||||
| Helmerich & Payne, Inc. | 31,660 | 1,513,348 | 1.21 | % | |||||||||
| Hess Corp. | 18,510 | 967,333 | 0.77 | % | |||||||||
| National Oilwell Varco, Inc. | 10,635 | 783,799 | 0.63 | % | |||||||||
| Occidental Petroleum Corp. | 24,685 | 1,949,128 | 1.56 | % | |||||||||
| Oil States International, Inc. (a) | 12,760 | 932,756 | 0.75 | % | |||||||||
| Valero Energy Corp. | 40,440 | 1,176,804 | 0.94 | % | |||||||||
| 20,398,092 | 16.31 | % | |||||||||||
| Financials – 24.64% | |||||||||||||
| Ace Ltd. | 23,980 | 1,886,027 | 1.51 | % | |||||||||
| Affiliated Managers Group, Inc. (a) | 6,215 | 786,198 | 0.63 | % | |||||||||
| Allstate Corp. | 40,740 | 1,628,785 | 1.30 | % | |||||||||
| American International Group, Inc. (a) | 31,800 | 1,110,774 | 0.89 | % | |||||||||
| Apartment Investment & | |||||||||||||
| Management Co. | 44,250 | 1,181,032 | 0.94 | % | |||||||||
| Capital One Financial Corp. | 16,560 | 996,415 | 0.80 | % | |||||||||
| Citigroup, Inc. | 68,525 | 2,562,150 | 2.05 | % | |||||||||
| Invesco Ltd. | 64,665 | 1,572,653 | 1.26 | % | |||||||||
| J.P. Morgan Chase & Co. | 81,710 | 3,405,673 | 2.72 | % | |||||||||
| Lincoln National Corp. | 28,175 | 698,458 | 0.56 | % | |||||||||
| Morgan Stanley | 36,975 | 642,625 | 0.51 | % | |||||||||
| Peabody Energy Corp. | 11,385 | 317,641 | 0.25 | % | |||||||||
| Prudential Financial, Inc. | 16,670 | 951,023 | 0.76 | % | |||||||||
| Simon Property Group, Inc. | 14,018 | 2,133,680 | 1.71 | % | |||||||||
| State Street Corp. | 25,950 | 1,156,592 | 0.92 | % | |||||||||
| The Chubb Corp. | 16,315 | 1,255,929 | 1.00 | % | |||||||||
| The Goldman Sachs Group, Inc. | 8,330 | 1,019,509 | �� | 0.82 | % | ||||||||
| The PNC Financial Services Group, Inc. | 37,295 | 2,170,196 | 1.73 | % | |||||||||
| Torchmark Corp. | 27,855 | 1,409,184 | 1.13 | % | |||||||||
| Wells Fargo & Co. | 102,990 | 3,469,733 | 2.77 | % | |||||||||
| Weyerhaeuser Co. | 17,105 | 473,637 | 0.38 | % | |||||||||
| 30,827,914 | 24.64 | % | |||||||||||
| Health Care – 11.40% | |||||||||||||
| HCA Holdings, Inc. | 36,045 | 1,024,038 | 0.82 | % | |||||||||
| Johnson & Johnson | 64,320 | 4,555,142 | 3.64 | % | |||||||||
| McKesson Corp. | 19,195 | 1,791,086 | 1.43 | % | |||||||||
| Medtronic, Inc. | 16,360 | 680,249 | 0.54 | % | |||||||||
| Merck & Co., Inc. | 40,287 | 1,838,296 | 1.47 | % | |||||||||
| Pfizer, Inc. | 82,900 | 2,061,723 | �� | 1.65 | % | ||||||||
| UnitedHealth Group, Inc. | 41,320 | 2,313,920 | 1.85 | % | |||||||||
| 14,264,454 | 11.40 | % | |||||||||||
| Industrials – 8.91% | |||||||||||||
| Eaton Corp. | 3,450 | 162,909 | 0.13 | % | |||||||||
| FedEx Corp. | 5,465 | 502,725 | 0.40 | % | |||||||||
| General Electric Co. | 213,620 | 4,498,837 | 3.60 | % | |||||||||
| Honeywell International, Inc. | 27,890 | 1,707,984 | 1.37 | % | |||||||||
| KBR, Inc. | 36,480 | 1,016,333 | 0.81 | % | |||||||||
| Raytheon Co. | 16,740 | 946,814 | 0.76 | % | |||||||||
| The Boeing Co. | 15,365 | 1,082,311 | 0.87 | % | |||||||||
| Union Pacific Corp. | 9,855 | 1,212,461 | 0.97 | % | |||||||||
| 11,130,374 | 8.91 | % | |||||||||||
| Information Technology – 5.60% | |||||||||||||
| Cisco Systems, Inc. | 157,160 | 2,693,722 | 2.16 | % | |||||||||
| Ebay, Inc. (a) | 16,365 | 790,266 | 0.63 | % | |||||||||
| Hewlett-Packard Co. | 36,335 | 503,240 | 0.40 | % | |||||||||
| Intel Corp. | 52,575 | 1,136,934 | 0.91 | % | |||||||||
| MasterCard, Inc., Class A | 1,230 | 566,944 | 0.45 | % | |||||||||
| Texas Instruments, Inc. | 46,900 | 1,317,421 | 1.05 | % | |||||||||
| 7,008,527 | 5.60 | % | |||||||||||
| Manufacturing – 4.50% | |||||||||||||
| Apple, Inc. | 905 | 538,565 | 0.43 | % | |||||||||
| EMC Corp. (a) | 37,700 | 920,634 | 0.74 | % | |||||||||
| Ingredion, Inc. | 29,085 | 1,787,564 | 1.43 | % | |||||||||
| Kraft Foods Group, Inc. | 19,316 | 878,492 | 0.70 | % | |||||||||
| Micron Technology, Inc. (a) | 90,425 | 490,556 | 0.39 | % | |||||||||
| Mondelez Intl, Inc. | 38,405 | 1,019,269 | 0.81 | % | |||||||||
| 5,635,080 | 4.50 | % | |||||||||||
| Materials – 4.10% | |||||||||||||
| Eastman Chemical Co. | 24,895 | 1,474,780 | 1.18 | % | |||||||||
| FMC Corp. | 19,510 | 1,044,175 | 0.83 | % | |||||||||
| Freeport-McMoRan Copper & Gold, Inc. | 32,925 | 1,280,124 | 1.02 | % | |||||||||
The accompanying notes are an integral part of these financial statements.
HENNESSY FUNDS 1-800-966-4354
37
| COMMON STOCKS | Number of | % of | |||||||||||
| Shares | Value | Net Assets | |||||||||||
| Materials (Continued) | |||||||||||||
| PPG Industries, Inc. | 11,390 | $ | 1,333,541 | 1.07 | % | ||||||||
| 5,132,620 | 4.10 | % | |||||||||||
| Telecommunication Services – 3.40% | |||||||||||||
| AT&T, Inc. | 51,030 | 1,765,128 | 1.41 | % | |||||||||
| CenturyLink, Inc. | 36,707 | 1,408,815 | 1.13 | % | |||||||||
| Verizon Communications, Inc. | 24,080 | 1,074,931 | 0.86 | % | |||||||||
| 4,248,874 | 3.40 | % | |||||||||||
| Utilities – 6.98% | |||||||||||||
| Edison International | 41,660 | 1,955,521 | 1.56 | % | |||||||||
| Nextera Energy, Inc. | 36,370 | 2,548,082 | 2.04 | % | |||||||||
| Northeast Utilities | 59,270 | 2,329,311 | 1.86 | % | |||||||||
| Oge Energy Corp. | 33,035 | 1,902,155 | 1.52 | % | |||||||||
| 8,735,069 | 6.98 | % | |||||||||||
| Total Common Stocks | |||||||||||||
| (Cost $105,483,754) | 124,327,096 | 99.39 | % | ||||||||||
| SHORT-TERM INVESTMENTS – 0.93% | |||||||||||||
| Money Market Fund – 0.93% | |||||||||||||
| Fidelity Government Portfolio – | |||||||||||||
| Institutional Class, 0.01% (b) | 1,164,771 | 1,164,771 | 0.93 | % | |||||||||
| Total Money Market Fund | |||||||||||||
| (Cost $1,164,771) | 1,164,771 | 0.93 | % | ||||||||||
| Total Short-Term Investments | |||||||||||||
| (Cost $1,164,771) | 1,164,771 | 0.93 | % | ||||||||||
| Total Investments | |||||||||||||
| (Cost $106,648,525) – 100.32% | 125,491,867 | 100.32 | % | ||||||||||
| Liabilities in Excess | |||||||||||||
| of Other Assets – (0.32)% | (401,422 | ) | (0.32 | )% | |||||||||
TOTAL NET ASSETS – 100.00% | $ | 125,090,445 | 100.00 | % | |||||||||
Percentages are stated as a percent of net assets.
(a)Non-income producing security.
(b)The rate listed is the fund’s 7-day yield as of October 31, 2012.
Summary of Fair Value Exposure at October 31, 2012
The following is a summary of the inputs used to value the Fund’s net assets as of October 31, 2012 (See Note 3 in the accompanying notes to the financial statements):
| Common Stock | Level 1 | Level 2 | Level 3 | Total | |||||||||||||
| Consumer Discretionary | $ | 10,782,767 | $ | — | $ | — | $ | 10,782,767 | |||||||||
| Consumer Staples | 6,163,325 | — | — | 6,163,325 | |||||||||||||
| Energy | 20,398,092 | — | — | 20,398,092 | |||||||||||||
| Financials | 30,827,914 | — | — | 30,827,914 | |||||||||||||
| Health Care | 14,264,454 | — | — | 14,264,454 | |||||||||||||
| Industrials | 11,130,374 | — | — | 11,130,374 | |||||||||||||
| Information Technology | 7,008,527 | — | — | 7,008,527 | |||||||||||||
| Manufacturing | 5,635,080 | — | — | 5,635,080 | |||||||||||||
| Materials | 5,132,620 | — | — | 5,132,620 | |||||||||||||
| Telecommunication Services | 4,248,874 | — | — | 4,248,874 | |||||||||||||
| Utilities | 8,735,069 | — | — | 8,735,069 | |||||||||||||
| Total Common Stock | $ | 124,327,096 | $ | — | $ | — | $ | 124,327,096 | |||||||||
| Short-Term Investments | |||||||||||||||||
| Money Market Funds | $ | 1,164,771 | $ | — | $ | — | $ | 1,164,771 | |||||||||
| Total Short-Term Investments | $ | 1,164,771 | $ | — | $ | — | $ | 1,164,771 | |||||||||
| Total Investments in Securities | $ | 125,491,867 | $ | — | $ | — | $ | 125,491,867 | |||||||||
Transfers between levels are recognized at the end of the reporting period. During the period ended October 31, 2012, the Fund recognized no transfers between levels.
The accompanying notes are an integral part of these financial statements.
WWW.HENNESSYFUNDS.COM
38
HENNESSY TOTAL RETURN FUND
As of October 31, 2012
(% of Net Assets)
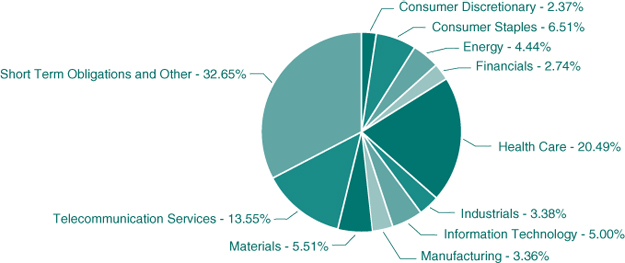
| TOP TEN EQUITY HOLDINGS | % net assets | |
| Pfizer, Inc. | 7.02% | |
| Merck & Co., Inc. | 6.92% | |
| Verizon Communications, Inc. | 6.87% | |
| AT&T, Inc. | 6.68% | |
| Johnson & Johnson | 6.55% | |
| Proctor & Gamble Co. | 6.51% | |
| EI Du Pont de Nemours & Co. | 5.51% | |
| Intel Corp. | 5.00% | |
| Chevron Corp. | 4.44% | |
| General Electric Co. | 3.38% |
Note: For presentation purposes, the Fund has grouped some of the industry categories. For purposes of categorizing securities for compliance with Section 8(b)(1) of the Investment Company Act of 1940, the Fund uses more specific industry classifications.
HENNESSY FUNDS 1-800-966-4354
39
| COMMON STOCKS – 67.35% | Number of | % of | |||||||||||
| Shares | Value | Net Assets | |||||||||||
| Consumer Discretionary – 2.37% | |||||||||||||
| McDonald’s Corp. | 21,200 | $ | 1,840,160 | 2.37 | % | ||||||||
| Consumer Staples – 6.51% | |||||||||||||
| Procter & Gamble Co. | 73,000 | 5,054,520 | 6.51 | % | |||||||||
| Energy – 4.44% | |||||||||||||
| Chevron Corp. | 31,300 | 3,449,573 | 4.44 | % | |||||||||
| Financials – 2.74% | |||||||||||||
| J.P. Morgan Chase & Co. | 51,100 | 2,129,848 | 2.74 | % | |||||||||
| Health Care – 20.49% | |||||||||||||
| Johnson & Johnson | 71,800 | 5,084,876 | 6.55 | % | |||||||||
| Merck & Co., Inc. | 117,800 | 5,375,214 | 6.92 | % | |||||||||
| Pfizer, Inc. | 219,300 | 5,453,991 | 7.02 | % | |||||||||
| 15,914,081 | 20.49 | % | |||||||||||
| Industrials – 3.38% | |||||||||||||
| General Electric Co. | 124,700 | 2,626,182 | 3.38 | % | |||||||||
| Information Technology – 5.00% | |||||||||||||
| Intel Corp. | 179,500 | 3,881,687 | 5.00 | % | |||||||||
| Manufacturing – 3.36% | |||||||||||||
| Kraft Foods Group, Inc. | 20,900 | 950,532 | 1.22 | % | |||||||||
| Mondelez International, Inc. | 62,700 | 1,664,058 | 2.14 | % | |||||||||
| 2,614,590 | 3.36 | % | |||||||||||
| Materials – 5.51% | |||||||||||||
| EI Du Pont de Nemours & Co. | 96,100 | 4,278,372 | 5.51 | % | |||||||||
| Telecommunication Services – 13.55% | |||||||||||||
| AT&T, Inc. | 149,900 | 5,185,041 | 6.68 | % | |||||||||
| Verizon Communications, Inc. | 119,500 | 5,334,480 | 6.87 | % | |||||||||
| 10,519,521 | 13.55 | % | |||||||||||
| Total Common Stocks | |||||||||||||
| (Cost $43,913,975) | 52,308,534 | 67.35 | % | ||||||||||
| SHORT-TERM INVESTMENTS – 69.74% | |||||||||||||
| Money Market Fund – 5.37% | |||||||||||||
| Federated Government Obligations | |||||||||||||
| Fund – Class I, 0.02% (b) | 471,379 | 471,379 | 0.61 | % | |||||||||
| Fidelity Government Portfolio – | |||||||||||||
| Institutional Class, 0.01% (b) | 3,700,000 | 3,700,000 | 4.76 | % | |||||||||
| Total Money Market Fund | |||||||||||||
| (Cost $4,171,379) | 4,171,379 | 5.37 | % | ||||||||||
U.S. Treasury Bill* – 64.37% | |||||||||||||
| 0.053%, 11/08/2012 (c) | 18,000,000 | 17,999,755 | 23.17 | % | |||||||||
| 0.089%, 12/13/2012 (c) | 20,000,000 | 19,997,900 | 25.75 | % | |||||||||
| 0.084%, 01/17/2013 (c) | 12,000,000 | 11,997,888 | 15.45 | % | |||||||||
| Total U.S. Treasury Bill | |||||||||||||
| (Cost $49,995,345) | 49,995,543 | 64.37 | % | ||||||||||
| Total Short-Term Investments | |||||||||||||
| (Cost $54,166,724) | 54,166,922 | 69.74 | % | ||||||||||
| Total Investments | |||||||||||||
| (Cost $98,080,699) – 137.09% | 106,475,456 | 137.09 | % | ||||||||||
| Liabilities in Excess of | |||||||||||||
| Other Assets – (37.09)% | (28,804,669 | ) | (37.09 | )% | |||||||||
TOTAL NET ASSETS – 100.00% | $ | 77,670,787 | 100.00 | % | |||||||||
Percentages are stated as a percent of net assets.
| (a) | Non-income producing security. |
| (b) | The rate listed is the fund’s 7-day yield as of October 31, 2012. |
| (c) | The rate listed is discount rate at issue. |
| * | Collateral or partial collateral for securities sold subject to repurchase. |
The accompanying notes are an integral part of these financial statements.
WWW.HENNESSYFUNDS.COM
40
Summary of Fair Value Exposure at October 31, 2012
The following is a summary of the inputs used to value the Fund’s net assets as of October 31, 2012 (See Note 3 in the accompanying notes to the financial statements):
| Common Stock | Level 1 | Level 2 | Level 3 | Total | |||||||||||||
| Consumer Discretionary | $ | 1,840,160 | $ | — | $ | — | $ | 1,840,160 | |||||||||
| Consumer Staples | 5,054,520 | — | — | 5,054,520 | |||||||||||||
| Energy | 3,449,573 | — | — | 3,449,573 | |||||||||||||
| Financials | 2,129,848 | — | — | 2,129,848 | |||||||||||||
| Health Care | 15,914,081 | — | — | 15,914,081 | |||||||||||||
| Industrials | 2,626,182 | — | — | 2,626,182 | |||||||||||||
| Information Technology | 3,881,687 | — | — | 3,881,687 | |||||||||||||
| Manufacturing | 2,614,590 | — | — | 2,614,590 | |||||||||||||
| Materials | 4,278,372 | — | — | 4,278,372 | |||||||||||||
| Telecommunication Services | 10,519,521 | — | — | 10,519,521 | |||||||||||||
| Total Common Stock | $ | 52,308,534 | $ | — | $ | — | $ | 52,308,534 | |||||||||
| Short-Term Investments | |||||||||||||||||
| Money Market Funds | $ | 4,171,379 | $ | — | $ | — | $ | 4,171,379 | |||||||||
| U.S. Treasury Bills | — | 49,995,543 | — | 49,995,543 | |||||||||||||
| Total Short-Term Investments | $ | 4,171,379 | $ | 49,995,543 | $ | — | $ | 54,166,922 | |||||||||
| Total Investments in Securities | $ | 56,479,913 | $ | 49,995,543 | $ | — | $ | 106,475,456 | |||||||||
Transfers between levels are recognized at the end of the reporting period. During the period ended October 31, 2012, the Fund recognized no transfers between levels.
Reverse repurchase agreements are carried at face value, hence, are not included in the fair valuation hierarchy. The face value of the reverse repurchase agreements at October 31, 2012, was $28,790,000. Due to the short term nature of the reverse repurchase agreements, face value approximates fair value. The face value plus interest due at maturity is equal to $28,808,500.
The accompanying notes are an integral part of these financial statements.
HENNESSY FUNDS 1-800-966-4354
41
Schedule of Reverse Repurchase Agreements
Hennessy Total Return Fund as of October 31, 2012 |
| Face | Principal | Maturity | Maturity | ||||||||||
| Value | Counterparty | Rate | Trade Date | Date | Amount | ||||||||
| $ | 10,800,000 | UBS Financial Services, Inc. | 0.28 | % | 8/24/12 | 11/8/12 | $ | 10,806,384 | |||||
| 10,794,000 | UBS Financial Services, Inc. | 0.27 | % | 9/21/12 | 12/13/12 | 10,800,719 | |||||||
| 7,196,000 | UBS Financial Services, Inc. | 0.30 | % | 10/19/12 | 1/17/13 | 7,201,397 | |||||||
| $ | 28,790,000 | $ | 28,808,500 | ||||||||||
As of October 31, 2012, the fair value of securities held as collateral for reverse repurchase agreements was $49,995,543 as noted on the Schedule of Investments.
The accompanying notes are an integral part of these financial statements.
WWW.HENNESSYFUNDS.COM
42
HENNESSY BALANCED FUND
As of October 31, 2012
(% of Net Assets)

| TOP TEN EQUITY HOLDINGS | % net assets | |
| Johnson & Johnson | 5.51% | |
| Verizon Communications, Inc. | 5.37% | |
| Merck & Co., Inc. | 5.33% | |
| Proctor & Gamble Co. | 5.28% | |
| Pfizer, Inc. | 5.25% | |
| AT&T, Inc. | 5.13% | |
| EI Du Pont de Nemours & Co. | 4.26% | |
| General Electric Co. | 4.22% | |
| Intel Corp. | 3.65% | |
| Chevron Corp. | 3.00% |
Note: For presentation purposes, the Fund has grouped some of the industry categories. For purposes of categorizing securities for compliance with Section 8(b)(1) of the Investment Company Act of 1940, the Fund uses more specific industry classifications.
HENNESSY FUNDS 1-800-966-4354
43
| COMMON STOCKS – 51.03% | Number of | % of | |||||||||||
| Shares | Value | Net Assets | |||||||||||
| Consumer Discretionary – 0.17% | |||||||||||||
| McDonald’s Corp. | 500 | $ | 43,400 | 0.17 | % | ||||||||
| Consumer Staples – 5.28% | |||||||||||||
| Procter & Gamble Co. | 19,200 | 1,329,408 | 5.28 | % | |||||||||
| Energy – 3.00% | |||||||||||||
| Chevron Corp. | 6,850 | 754,939 | 3.00 | % | |||||||||
| Financials – 0.77% | |||||||||||||
| J.P. Morgan Chase & Co. | 4,650 | 193,812 | 0.77 | % | |||||||||
| Health Care – 16.09% | |||||||||||||
| Johnson & Johnson | 19,600 | 1,388,072 | 5.51 | % | |||||||||
| Merck & Co., Inc. | 29,400 | 1,341,522 | 5.33 | % | |||||||||
| Pfizer, Inc. | 53,150 | 1,321,840 | 5.25 | % | |||||||||
| 4,051,434 | 16.09 | % | |||||||||||
| Industrials – 4.22% | |||||||||||||
| General Electric Co. | 50,450 | 1,062,477 | 4.22 | % | |||||||||
| Information Technology – 3.65% | |||||||||||||
| Intel Corp. | 42,450 | 917,981 | 3.65 | % | |||||||||
| Manufacturing – 3.09% | |||||||||||||
| Kraft Foods Group, Inc. | 6,216 | 282,704 | 1.12 | % | |||||||||
| Mondelez International, Inc. | 18,650 | 494,971 | 1.97 | % | |||||||||
| 777,675 | 3.09 | % | |||||||||||
| Materials – 4.26% | |||||||||||||
| EI Du Pont de Nemours & Co. | 24,100 | 1,072,932 | 4.26 | % | |||||||||
| Telecommunication Services – 10.50% | |||||||||||||
| AT&T, Inc. | 37,300 | 1,290,207 | 5.13 | % | |||||||||
| Verizon Communications, Inc. | 30,300 | 1,352,592 | 5.37 | % | |||||||||
| 2,642,799 | 10.50 | % | |||||||||||
| Total Common Stocks | |||||||||||||
| (Cost $11,199,593) | 12,846,857 | 51.03 | % | ||||||||||
| SHORT-TERM INVESTMENTS – 49.03% | |||||||||||||
| Money Market Funds – 2.56% | |||||||||||||
| Fidelity Government Portfolio – | |||||||||||||
| Institutional Class, 0.01 (b) | 644,312 | 644,312 | 2.56 | % | |||||||||
| Total Money Market Funds | |||||||||||||
| (Cost $644,312) | 644,312 | 2.56 | % | ||||||||||
| U.S. Treasury Bills – 46.47% | |||||||||||||
| 0.069%, 11/15/2012 (c) | 1,600,000 | 1,599,943 | 6.36 | % | |||||||||
| 0.089%, 12/13/2012 (c) | 2,100,000 | 2,099,753 | 8.34 | % | |||||||||
| 0.084%, 01/10/2013 (c) | 2,600,000 | 2,599,594 | 10.33 | % | |||||||||
| 0.114%, 02/07/2013 (c) | 800,000 | 799,761 | 3.18 | % | |||||||||
| 0.129%, 03/07/2013 (c) | 700,000 | 699,687 | 2.78 | % | |||||||||
| 0.155%, 05/02/2013 (c) | 200,000 | 199,846 | 0.79 | % | |||||||||
| 0.155%, 05/30/2013 (c) | 700,000 | 699,368 | 2.78 | % | |||||||||
| 0.160%, 06/27/2013 (c) | 800,000 | 799,181 | 3.18 | % | |||||||||
| 0.165%, 08/22/2013 (c) | 1,000,000 | 998,675 | 3.97 | % | |||||||||
| 0.170%, 09/19/2013 (c) | 1,200,000 | 1,198,231 | 4.76 | % | |||||||||
| Total U.S. Treasury Bills | |||||||||||||
| (Cost $11,698,583) | 11,694,039 | 46.47 | % | ||||||||||
| Total Short-Term Investments | |||||||||||||
| (Cost $12,342,895) | 12,338,351 | 49.03 | % | ||||||||||
| Total Investments | |||||||||||||
| (Cost $23,542,488) – 100.06% | 25,185,208 | 100.06 | % | ||||||||||
| Liabilities in Excess of | |||||||||||||
| Other Assets – (0.06)% | (15,432 | ) | (0.06 | )% | |||||||||
TOTAL NET ASSETS – 100.00% | $ | 25,169,776 | 100.00 | % | |||||||||
Percentages are stated as a percent of net assets.
| (a) | Non-income producing security. |
| (b) | The rate listed is the fund’s 7-day yield as of October 31, 2012. |
| (c) | The rate listed is discount rate at issue. |
The accompanying notes are an integral part of these financial statements.
WWW.HENNESSYFUNDS.COM
44
Summary of Fair Value Exposure at October 31, 2012
The following is a summary of the inputs used to value the Fund’s net assets as of October 31, 2012 (See Note 3 in the accompanying notes to the financial statements):
| Common Stock | Level 1 | Level 2 | Level 3 | Total | |||||||||||||
| Consumer Discretionary | $ | 43,400 | $ | — | $ | — | $ | 43,400 | |||||||||
| Consumer Staples | 1,329,408 | — | — | 1,329,408 | |||||||||||||
| Energy | 754,939 | — | — | 754,939 | |||||||||||||
| Financials | 193,812 | — | — | 193,812 | |||||||||||||
| Health Care | 4,051,434 | — | — | 4,051,434 | |||||||||||||
| Industrials | 1,062,477 | — | — | 1,062,477 | |||||||||||||
| Information Technology | 917,981 | — | — | 917,981 | |||||||||||||
| Manufacturing | 777,675 | — | — | 777,675 | |||||||||||||
| Materials | 1,072,932 | — | — | 1,072,932 | |||||||||||||
| Telecommunication Services | 2,642,799 | — | — | 2,642,799 | |||||||||||||
| Total Common Stock | $ | 12,846,857 | $ | — | $ | — | $ | 12,846,857 | |||||||||
| Short-Term Investments | |||||||||||||||||
| Money Market Funds | $ | 644,312 | $ | — | $ | — | $ | 644,312 | |||||||||
| U.S. Treasury Bills | — | 11,694,039 | — | 11,694,039 | |||||||||||||
| Total Short-Term Investments | $ | 644,312 | $ | 11,694,039 | $ | — | $ | 12,338,351 | |||||||||
| Total Investments in Securities | $ | 13,491,169 | $ | 11,694,039 | $ | — | $ | 25,185,208 | |||||||||
Transfers between levels are recognized at the end of the reporting period. During the period ended October 31, 2012, the Fund recognized no transfers between levels.
The accompanying notes are an integral part of these financial statements.
HENNESSY FUNDS 1-800-966-4354
45
HENNESSY JAPAN FUND
(formerly Hennessy Select SPARX Japan Fund)
As of October 31, 2012
(% of Net Assets)
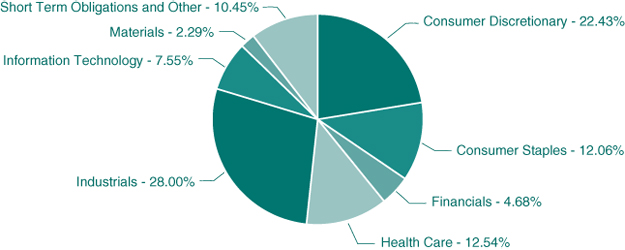
| TOP TEN EQUITY HOLDINGS | % net assets | |
| Ryohin Keikaku Co., Ltd. | 8.40% | |
| Keyence Corp. | 7.55% | |
| Misumi Group, Inc. | 7.29% | |
| Shimano, Inc. | 6.82% | |
| Rohto Pharmaceutical Co., Ltd. | 6.14% | |
| Sumitomo Corp. | 5.90% | |
| Asics Corp. | 5.51% | |
| Kao Corp. | 5.00% | |
| Mitsubishi Corp. | 4.54% | |
| Unicharm Corp. | 4.17% |
Note: For presentation purposes, the Fund has grouped some of the industry categories. For purposes of categorizing securities for compliance with Section 8(b)(1) of the Investment Company Act of 1940, the Fund uses more specific industry classifications.
WWW.HENNESSYFUNDS.COM
46
| COMMON STOCKS – 89.55% | Number of | % of | |||||||||||
| Shares | Value | Net Assets | |||||||||||
| Consumer Discretionary – 22.43% | |||||||||||||
| Asics Corp. | 73,300 | $ | 1,064,195 | 5.51 | % | ||||||||
| Isuzu Motors, Ltd. | 62,000 | 327,746 | 1.70 | % | |||||||||
| Ryohin Keikaku Co., Ltd. | 24,500 | 1,623,513 | 8.40 | % | |||||||||
| Shimano, Inc. | 20,900 | 1,316,886 | 6.82 | % | |||||||||
| 4,332,340 | 22.43 | % | |||||||||||
| Consumer Staples – 12.06% | |||||||||||||
| Kao Corp. | 34,400 | 966,113 | 5.00 | % | |||||||||
| Pigeon Corp. | 12,100 | 557,785 | 2.89 | % | |||||||||
| Unicharm Corp. | 14,900 | 806,313 | 4.17 | % | |||||||||
| 2,330,211 | 12.06 | % | |||||||||||
| Financials – 4.68% | |||||||||||||
| Mizuho Financial Group | 256,900 | 402,261 | 2.08 | % | |||||||||
| Sumitomo Mitsui Financial Group, Inc. | 16,400 | 502,087 | 2.60 | % | |||||||||
| 904,348 | 4.68 | % | |||||||||||
| Health Care – 12.54% | |||||||||||||
| Mani, Inc. | 13,700 | 507,979 | 2.63 | % | |||||||||
| Rohto Pharmaceutical Co., Ltd. | 86,000 | 1,187,173 | 6.14 | % | |||||||||
| Terumo Corp. | 16,900 | 728,248 | 3.77 | % | |||||||||
| 2,423,400 | 12.54 | % | |||||||||||
| Industrials – 28.00% | |||||||||||||
| Daikin Industries | 21,200 | 586,366 | 3.04 | % | |||||||||
| Itochu Corp. | 56,500 | 565,496 | 2.93 | % | |||||||||
| Komatsu, Ltd. | 12,200 | 255,523 | 1.32 | % | |||||||||
| Marubeni Corp. | 89,000 | 576,387 | 2.98 | % | |||||||||
| Misumi Group, Inc. | 57,400 | 1,408,576 | 7.29 | % | |||||||||
| Mitsubishi Corp. | 49,100 | 876,456 | 4.54 | % | |||||||||
| Sumitomo Corp. | 83,600 | 1,139,381 | 5.90 | % | |||||||||
| 5,408,185 | 28.00 | % | |||||||||||
| Information Technology – 7.55% | |||||||||||||
| Keyence Corp. | 5,500 | 1,459,226 | 7.55 | % | |||||||||
| Materials – 2.29% | |||||||||||||
| Fuji Seal International, Inc. | 20,800 | 442,941 | 2.29 | % | |||||||||
| Total Common Stocks | |||||||||||||
| (Cost $13,838,320) | 17,300,651 | 89.55 | % | ||||||||||
| SHORT-TERM INVESTMENTS – 10.10% | |||||||||||||
| Money Market Fund – 10.10% | |||||||||||||
| Federated Treasury Obligations | |||||||||||||
| Fund, 0.01% (a) | 80,730 | 80,730 | 0.42 | % | |||||||||
| Federated Government | |||||||||||||
| Obligations Fund – Class I, 0.02% (a) | 935,000 | 935,000 | 4.84 | % | |||||||||
| Fidelity Government Portfolio – | |||||||||||||
| Institutional Class, 0.01% (a) | 935,000 | 935,000 | 4.84 | % | |||||||||
| Total Money Market Funds | |||||||||||||
| (Cost $1,950,730) | 1,950,730 | 10.10 | % | ||||||||||
| Total Investments | |||||||||||||
| (Cost $15,789,050) – 99.65% | 19,251,381 | 99.65 | % | ||||||||||
| Other Assets in Excess | |||||||||||||
| of Liabilities – 0.35% | 66,840 | 0.35 | % | ||||||||||
TOTAL NET ASSETS – 100.00% | $ | 19,318,221 | 100.00 | % | |||||||||
Percentages are stated as a percent of net assets.
(a)The rate listed is the fund’s 7-day yield as of October 31, 2012.
The accompanying notes are an integral part of these financial statements.
HENNESSY FUNDS 1-800-966-4354
47
Summary of Fair Value Exposure at October 31, 2012
The following is a summary of the inputs used to value the Fund’s net assets as of October 31, 2012 (See Note 3 in the accompanying notes to the financial statements):
| Common Stock | Level 1 | Level 2 | Level 3 | Total | |||||||||||||
| Consumer Discretionary | $ | 4,332,340 | $ | — | $ | — | $ | 4,332,340 | |||||||||
| Consumer Staples | 2,330,211 | — | — | 2,330,211 | |||||||||||||
| Financials | 904,348 | — | — | 904,348 | |||||||||||||
| Health Care | 2,423,400 | — | — | 2,423,400 | |||||||||||||
| Industrials | 5,408,185 | — | — | 5,408,185 | |||||||||||||
| Information Technology | 1,459,226 | — | — | 1,459,226 | |||||||||||||
| Materials | 442,941 | — | — | 442,941 | |||||||||||||
| Total Common Stock | $ | 17,300,651 | $ | — | $ | — | $ | 17,300,651 | |||||||||
| Short-Term Investments | |||||||||||||||||
| Money Market Funds | $ | 1,950,730 | $ | — | $ | — | $ | 1,950,730 | |||||||||
| Total Short-Term Investments | $ | 1,950,730 | $ | — | $ | — | $ | 1,950,730 | |||||||||
| Total Investments in Securities | $ | 19,251,381 | $ | — | $ | — | $ | 19,251,381 | |||||||||
Transfers between levels are recognized at the end of the reporting period. During the period ended October 31, 2012, the Fund recognized all transfers between Levels 2 and 1.
Transfers between Level 2 and Level 1 relate to the use of a fair valuation pricing service. On days when the fair valuation pricing service is used, non-U.S. dollar denominated securities move from a Level 1 to a Level 2 classification. Due to the use of the fair value pricing service as described in Note 3, 100% of the common stocks held at October 31, 2011 were classified as Level 2. Such securities still held at October 31, 2012 were transferred to Level 1. Other than transfers due to the use of the fair value pricing service, no transfers were recognized.
The accompanying notes are an integral part of these financial statements.
WWW.HENNESSYFUNDS.COM
48
HENNESSY JAPAN SMALL CAP FUND
(formerly Hennessy Select SPARX Japan Smaller Companies Fund)
As of October 31, 2012
(% of Net Assets)

| TOP TEN EQUITY HOLDINGS | % net assets | |
| Gulliver International Co., Ltd. | 2.93% | |
| Mirait Holdings Corp. | 2.92% | |
| Morita Holdings Corp. | 2.80% | |
| Shin Nippon Air Technologies Co., Ltd. | 2.61% | |
| Yushiro Chemical | 2.55% | |
| UKC Holdings Corp. | 2.52% | |
| Towa Corp. | 2.42% | |
| Konishi Co., Ltd. | 2.35% | |
| Iriso Electronics | 2.34% | |
| Nisshinbo Holdings | 2.31% |
Note: For presentation purposes, the Fund has grouped some of the industry categories. For purposes of categorizing securities for compliance with Section 8(b)(1) of the Investment Company Act of 1940, the Fund uses more specific industry classifications.
HENNESSY FUNDS 1-800-966-4354
49
| COMMON STOCKS – 100.72% | Number of | % of | |||||||||||
| Shares | Value | Net Assets | |||||||||||
| Consumer Discretionary – 15.73% | |||||||||||||
| Accordia Golf Co., Ltd. | 151 | $ | 107,438 | 2.10 | % | ||||||||
| Ahresty Corp. | 18,300 | 72,898 | 1.43 | % | |||||||||
| Gulliver International Co., Ltd. | 3,910 | 149,631 | 2.93 | % | |||||||||
| Nippon Seiki Co., Ltd. | 11,000 | 105,687 | 2.07 | % | |||||||||
| Seiko Holdings | 37,000 | 97,332 | 1.91 | % | |||||||||
| Tohokushinsha Film Corp. | 12,100 | 84,880 | 1.66 | % | |||||||||
| Tomy Company Ltd | 13,700 | 75,511 | 1.48 | % | |||||||||
| Village Vanguard Co., Ltd. | 111 | 109,985 | 2.15 | % | |||||||||
| 803,362 | 15.73 | % | |||||||||||
| Consumer Staples – 1.02% | |||||||||||||
| Nippon Suisan | 23,700 | 51,954 | 1.02 | % | |||||||||
| Financials – 2.09% | |||||||||||||
| Kenedix, Inc. (a) | 823 | 106,702 | 2.09 | % | |||||||||
| Industrials – 40.43% | |||||||||||||
| Aichi Corp. | 24,800 | 98,790 | 1.94 | % | |||||||||
| Anest Iwata Corp. | 13,000 | 49,180 | 0.96 | % | |||||||||
| Asunaro Aoki Construction, Ltd. | 15,000 | 81,173 | 1.59 | % | |||||||||
| Fuji Machine Mfg | 6,000 | 84,855 | 1.66 | % | |||||||||
| Hanwa Co Ltd | 30,000 | 104,848 | 2.05 | % | |||||||||
| Japan Pulp & Paper | 17,000 | 50,683 | 0.99 | % | |||||||||
| Kito Corp. | 63 | 52,717 | 1.03 | % | |||||||||
| Kyosan Electric Manufacturing Co., Ltd. | 30,000 | 97,708 | 1.91 | % | |||||||||
| Mirait Holdings Corp. | 18,400 | 149,127 | 2.92 | % | |||||||||
| Morita Holdings Corp. | 17,000 | 142,891 | 2.80 | % | |||||||||
| NEC Capital Solutions Ltd. | 3,900 | 54,716 | 1.07 | % | |||||||||
| Nihon Trim Co., Ltd. | 2,550 | 69,061 | 1.35 | % | |||||||||
| Nippon Yusoki Co., Ltd. | 35,000 | 93,824 | 1.84 | % | |||||||||
| Nisshinbo Holdings | 18,000 | 117,700 | 2.31 | % | |||||||||
| Nittoku Eng Co. | 10,300 | 114,961 | 2.25 | % | |||||||||
| Prestige International, Inc. | 6,900 | 79,000 | 1.55 | % | |||||||||
| Sankyu, Inc. | 33,000 | 114,919 | 2.25 | % | |||||||||
| SBS Holdings, Inc. | 9,200 | 115,475 | 2.26 | % | |||||||||
| Shin Nippon Air Technologies Co., Ltd. | 24,300 | 133,021 | 2.61 | % | |||||||||
| Skymark Airlines (a) | 15,700 | 83,387 | 1.63 | % | |||||||||
| Tocalo Co Ltd | 5,200 | 75,495 | 1.48 | % | |||||||||
| Toshin Group Co., Ltd. | 3,800 | 101,248 | 1.98 | % | |||||||||
| 2,064,779 | 40.43 | % | |||||||||||
| Information Technology – 26.34% | |||||||||||||
| Asahi Net, Inc. | 11,000 | 53,326 | 1.04 | % | |||||||||
| D.A. Consortium, Inc. | 372 | 111,698 | 2.19 | % | |||||||||
| Elecom Co., Ltd. | 1,100 | 17,403 | 0.34 | % | |||||||||
| Iriso Electronics | 8,600 | 119,256 | 2.34 | % | |||||||||
| Macnica, Inc. | 3,100 | 61,006 | 1.19 | % | |||||||||
| Nihon Dempa Kogyo | 9,000 | 97,632 | 1.91 | % | |||||||||
| Nippon Chemi-con Corp. (a) | 67,000 | 97,357 | 1.91 | % | |||||||||
| Roland DG Corp. | 9,500 | 102,462 | 2.01 | % | |||||||||
| SIIX Corp. | 7,100 | 104,592 | 2.05 | % | |||||||||
| SMS Co., Ltd. | 30 | 66,366 | 1.30 | % | |||||||||
| SRA Holdings, Inc. | 7,100 | 77,377 | 1.52 | % | |||||||||
| Tamura Corp. | 47,000 | 103,031 | 2.02 | % | |||||||||
| Towa Corp. | 22,000 | 123,462 | 2.42 | % | |||||||||
| UKC Holdings Corp. | 6,900 | 128,700 | 2.52 | % | |||||||||
| UT Holdings Co., Ltd. | 150 | 80,797 | 1.58 | % | |||||||||
| 1,344,465 | 26.34 | % | |||||||||||
| Materials – 13.16% | |||||||||||||
| Fujikura Kasei Co., Ltd. | 25,200 | 106,381 | 2.08 | % | |||||||||
| Harima Chems Group | 12,500 | 57,466 | 1.13 | % | |||||||||
| Konishi Co., Ltd. | 8,000 | 119,754 | 2.35 | % | |||||||||
| Nippon Carbide Industries Co., Inc. | 29,000 | 71,928 | 1.41 | % | |||||||||
| Nippon Paper Group | 4,600 | 52,609 | 1.03 | % | |||||||||
| Okabe Co., Ltd. | 16,000 | 100,814 | 1.97 | % | |||||||||
| Ube Material Inds | 12,000 | 32,770 | 0.64 | % | |||||||||
| Yushiro Chemical | 13,600 | 130,327 | 2.55 | % | |||||||||
| 672,049 | 13.16 | % | |||||||||||
| Utilities – 1.95% | |||||||||||||
| Shizuokagas Co. | 14,000 | 99,612 | 1.95 | % | |||||||||
| Total Common Stocks | |||||||||||||
| (Cost $5,003,931) | 5,142,923 | 100.72 | % | ||||||||||
| SHORT-TERM INVESTMENTS – 1.66% | |||||||||||||
| Money Market Fund – 1.66% | |||||||||||||
| Fidelity Government Portfolio – | |||||||||||||
| Institutional Class, 0.01% (b) | 84,955 | 84,955 | 1.66 | % | |||||||||
| Total Money Market Fund | |||||||||||||
| (Cost $84,955) | 84,955 | 1.66 | % | ||||||||||
| Total Short-Term Investments | |||||||||||||
| (Cost $84,955) | 84,955 | 1.66 | % | ||||||||||
| Total Investments | |||||||||||||
| (Cost $5,088,886) – 102.38% | 5,227,878 | 102.38 | % | ||||||||||
| Liabilities in Excess | |||||||||||||
| of Other Assets – (2.38)% | (121,356 | ) | (2.38 | )% | |||||||||
TOTAL NET ASSETS – 100.00% | $ | 5,106,522 | 100.00 | % | |||||||||
Percentages are stated as a percent of net assets.
| (a) | Non-income producing security. |
| (b) | The rate listed is the fund’s 7-day yield as of October 31, 2012. |
The accompanying notes are an integral part of these financial statements.
WWW.HENNESSYFUNDS.COM
50
Summary of Fair Value Exposure at October 31, 2012
The following is a summary of the inputs used to value the Fund’s net assets as of October 31, 2012 (See Note 3 in the accompanying notes to the financial statements):
| Common Stock | Level 1 | Level 2 | Level 3 | Total | |||||||||||||
| Consumer Discretionary | $ | 803,362 | $ | — | $ | — | $ | 803,362 | |||||||||
| Consumer Staples | 51,954 | — | — | 51,954 | |||||||||||||
| Financials | 106,702 | — | — | 106,702 | |||||||||||||
| Industrials | 2,064,779 | — | — | 2,064,779 | |||||||||||||
| Information Technology | 1,344,465 | — | — | 1,344,465 | |||||||||||||
| Materials | 672,049 | — | — | 672,049 | |||||||||||||
| Utilities | 99,612 | — | — | 99,612 | |||||||||||||
| Total Common Stock | $ | 5,142,923 | $ | — | $ | — | $ | 5,142,923 | |||||||||
| Short-Term Investments | |||||||||||||||||
| Money Market Funds | $ | 84,955 | $ | — | $ | — | $ | 84,955 | |||||||||
| Total Short-Term Investments | $ | 84,955 | $ | — | $ | — | $ | 84,955 | |||||||||
| Total Investments in Securities | $ | 5,227,878 | $ | — | $ | — | $ | 5,227,878 | |||||||||
Transfers between levels are recognized at the end of the reporting period. During the period ended October 31, 2012, the Fund recognized all transfers between Levels 2 and 1.
Transfers between Level 2 and Level 1 relate to the use of a fair valuation pricing service. On days when the fair valuation pricing service is used, non-U.S. dollar denominated securities move from a Level 1 to a Level 2 classification. Due to the use of the fair value pricing service as described in Note 3, 100% of the common stocks held at October 31, 2011 were classified as Level 2. Such securities still held at October 31, 2012 were transferred to Level 1. Other than transfers due to the use of the fair value pricing service, no transfers were recognized.
The accompanying notes are an integral part of these financial statements.
HENNESSY FUNDS 1-800-966-4354
51
Financial Statements
Statements of Assets and Liabilities as of October 31, 2012 |
| HENNESSY | HENNESSY | ||||||||||||
| HENNESSY | CORNERSTONE | CORNERSTONE | |||||||||||
| CORNERSTONE | MID CAP 30 | LARGE GROWTH | |||||||||||
| GROWTH FUND | FUND | FUND | |||||||||||
| ASSETS: | |||||||||||||
| Investments in unaffiliated securities, at value (cost $272,278,473, $162,638,369, | |||||||||||||
| $100,797,513, $108,302,149, $106,648,525, $98,080,699, $23,542,488, | |||||||||||||
| $15,789,050 and $5,088,886, respectively) | $ | 301,312,799 | $ | 190,090,613 | $ | 109,224,729 | |||||||
| Investments in affiliated securities, at value (cost $0, $0, | |||||||||||||
| $420,211, $0, $0, $0, $0, $0 and $0, respectively | — | — | 564,570 | ||||||||||
| Cash | 960 | — | 6,391 | ||||||||||
| Dividends and interest receivable | 31,990 | 265,093 | 224,443 | ||||||||||
| Receivable for fund shares sold | 2,163,544 | 139,040 | 4,323 | ||||||||||
| Receivable for securities sold | — | 7,618 | — | ||||||||||
| Prepaid expenses and other assets | 39,686 | 26,755 | 25,322 | ||||||||||
| Total Assets | 303,548,979 | 190,529,119 | 110,049,778 | ||||||||||
| LIABILITIES: | |||||||||||||
| Payable for securities purchased | — | — | — | ||||||||||
| Payable for fund shares redeemed | 303,772 | 2,686,552 | 65,403 | ||||||||||
| Payable to Advisor | 180,177 | 122,844 | 64,209 | ||||||||||
| Payable to Administrator | 181,093 | 116,411 | 61,517 | ||||||||||
| Payable to Auditor | 37,828 | 40,189 | 38,909 | ||||||||||
| Accrued distribution fees | 5,355 | 1,250 | 1,623 | ||||||||||
| Accrued service fees | 21,786 | 13,866 | 6,537 | ||||||||||
| Reverse repurchase agreement | — | — | — | ||||||||||
| Accrued interest payable | 157 | 3,218 | 70 | ||||||||||
| Accrued directors fees | 3,094 | 3,144 | 3,105 | ||||||||||
| Accrued expenses and other payables | 104,798 | 69,995 | 33,219 | ||||||||||
| Total Liabilities | 838,060 | 3,057,469 | 274,592 | ||||||||||
| NET ASSETS | $ | 302,710,919 | $ | 187,471,650 | $ | 109,775,186 | |||||||
| NET ASSETS CONSIST OF: | |||||||||||||
| Capital stock | $ | 520,774,583 | $ | 204,115,102 | $ | 104,023,299 | |||||||
| Accumulated net investment income (loss) | (2,592,872 | ) | 1,029,849 | 1,080,454 | |||||||||
| Accumulated net realized gain (loss) on investments | (244,505,118 | ) | (45,125,545 | ) | (3,900,142 | ) | |||||||
| Unrealized net appreciation on investments | 29,034,326 | 27,452,244 | 8,571,575 | ||||||||||
| Total Net Assets | $ | 302,710,919 | $ | 187,471,650 | $ | 109,775,186 | |||||||
| NET ASSETS | |||||||||||||
| Investor Class: | |||||||||||||
| Shares authorized ($.0001 par value) | 25,000,000,000 | 25,000,000,000 | Unlimited | ||||||||||
| Net assets applicable to outstanding Investor Class shares | 265,600,452 | 145,846,928 | 75,832,638 | ||||||||||
| Shares issued and outstanding | 21,459,180 | 10,370,435 | 7,043,085 | ||||||||||
| Net asset value, offering price and redemption price per share | $ | 12.38 | $ | 14.06 | $ | 10.77 | |||||||
| Institutional Class: | |||||||||||||
| Shares authorized ($.0001 par value) | 25,000,000,000 | 25,000,000,000 | Unlimited | ||||||||||
| Net assets applicable to outstanding Institutional Class shares | 37,110,467 | 41,624,722 | 33,942,548 | ||||||||||
| Shares issued and outstanding | 2,951,325 | 2,908,254 | 3,127,989 | ||||||||||
| Net asset value, offering price and redemption price per share | $ | 12.57 | $ | 14.31 | $ | 10.85 | |||||||
The accompanying notes are an integral part of these financial statements.
WWW.HENNESSYFUNDS.COM
52
| HENNESSY | HENNESSY | HENNESSY | HENNESSY | HENNESSY | ||||||||||||||||||
| CORNERSTONE | LARGE | TOTAL RETURN | BALANCED | HENNESSY | JAPAN SMALL | |||||||||||||||||
| VALUE FUND | VALUE FUND | FUND | FUND | JAPAN FUND | CAP FUND | |||||||||||||||||
| $ | 127,652,703 | $ | 125,491,867 | $ | 106,475,456 | $ | 25,185,208 | $ | 19,251,381 | $ | 5,227,878 | |||||||||||
| — | — | — | — | — | — | |||||||||||||||||
| — | — | �� | — | — | — | — | ||||||||||||||||
| 304,293 | 127,655 | 168,549 | 42,812 | 155,495 | 36,552 | |||||||||||||||||
| 20,732 | 8,094 | 234,589 | 5,001 | 57,204 | 17,021 | |||||||||||||||||
| — | 1,599,483 | — | — | — | 86,396 | |||||||||||||||||
| 26,692 | 22,084 | 16,720 | 10,985 | 19,845 | 14,230 | |||||||||||||||||
| 128,004,420 | 127,249,183 | 106,895,314 | 25,244,006 | 19,483,925 | 5,382,077 | |||||||||||||||||
| — | 1,831,281 | — | — | — | 14,053 | |||||||||||||||||
| 259,226 | 91,681 | 248,117 | — | 100,457 | 221,091 | |||||||||||||||||
| 81,603 | 91,323 | 39,979 | 12,940 | 16,290 | 5,399 | |||||||||||||||||
| 80,562 | 80,969 | 49,637 | 16,812 | 11,481 | 3,866 | |||||||||||||||||
| 20,392 | 19,574 | 18,705 | 16,470 | 19,139 | 17,660 | |||||||||||||||||
| — | — | 25,042 | 13,023 | — | — | |||||||||||||||||
| 10,813 | 10,739 | 6,663 | 2,157 | 877 | 450 | |||||||||||||||||
| — | — | 28,790,000 | — | — | — | |||||||||||||||||
| — | — | 10,063 | — | 19 | — | |||||||||||||||||
| 3,235 | 3,351 | 2,486 | 2,509 | 3,328 | 3,328 | |||||||||||||||||
| 27,284 | 29,820 | 33,835 | 10,319 | 14,113 | 9,708 | |||||||||||||||||
| 483,115 | 2,158,738 | 29,224,527 | 74,230 | 165,704 | 275,555 | |||||||||||||||||
| $ | 127,521,305 | $ | 125,090,445 | $ | 77,670,787 | $ | 25,169,776 | $ | 19,318,221 | $ | 5,106,522 | |||||||||||
| $ | 149,994,707 | $ | 135,081,967 | $ | 76,377,331 | $ | 24,793,394 | $ | 49,296,211 | $ | 3,913,887 | |||||||||||
| 2,446,268 | 1,060,739 | 78,405 | 2,932 | — | (57,735 | ) | ||||||||||||||||
| (44,270,224 | ) | (29,895,603 | ) | (7,179,706 | ) | (1,269,270 | ) | (33,436,445 | ) | 1,112,310 | ||||||||||||
| 19,350,554 | 18,843,342 | 8,394,757 | 1,642,720 | 3,458,455 | 138,060 | |||||||||||||||||
| $ | 127,521,305 | $ | 125,090,445 | $ | 77,670,787 | $ | 25,169,776 | $ | 19,318,221 | $ | 5,106,522 | |||||||||||
| 25,000,000,000 | Unlimited | 100,000,000 | 100,000,000 | Unlimited | Unlimited | |||||||||||||||||
| 124,989,938 | 125,033,860 | 77,670,787 | 25,169,776 | 10,382,773 | 5,106,522 | |||||||||||||||||
| 8,913,769 | 5,059,089 | 6,144,368 | 2,118,394 | 674,038 | 484,408 | |||||||||||||||||
| $ | 14.02 | $ | 24.71 | $ | 12.64 | $ | 11.88 | $ | 15.40 | $ | 10.54 | |||||||||||
| 25,000,000,000 | Unlimited | N/A | N/A | Unlimited | N/A | |||||||||||||||||
| 2,531,367 | 56,585 | N/A | N/A | 8,935,448 | N/A | |||||||||||||||||
| 180,337 | 2,279 | N/A | N/A | 572,688 | N/A | |||||||||||||||||
| $ | 14.04 | $ | 24.83 | N/A | N/A | $ | 15.60 | N/A | ||||||||||||||
HENNESSY FUNDS 1-800-966-4354
53
Financial Statements
Statements of Operations For the Year Ended October 31, 2012 |
| HENNESSY | HENNESSY | |||||||||||
| HENNESSY | CORNERSTONE | CORNERSTONE | ||||||||||
| CORNERSTONE | MID CAP 30 | LARGE GROWTH | ||||||||||
| GROWTH FUND | FUND | FUND | ||||||||||
| INVESTMENT INCOME: | ||||||||||||
Dividend income from unaffiliated securities(1) | $ | 1,465,565 | $ | 3,202,959 | $ | 2,062,487 | ||||||
| Dividend income from affiliated securities | — | — | — | |||||||||
| Interest income | 3,469 | 908 | 226 | |||||||||
| Total investment income | 1,469,034 | 3,203,867 | 2,062,713 | |||||||||
| EXPENSES: | ||||||||||||
| Investment advisory fees | 1,612,148 | 1,205,874 | 574,284 | |||||||||
| Administration, fund accounting, custody and transfer agent fees | 555,538 | 415,538 | 197,895 | |||||||||
| Distribution fees – Investor Class (See Note 6) | — | — | — | |||||||||
| Service fees – Investor Class (See Note 6) | 214,761 | 139,469 | 76,989 | |||||||||
| Federal and state registration fees | 31,975 | 38,642 | 35,094 | |||||||||
| Audit fees | 27,011 | 25,353 | 23,206 | |||||||||
| Legal fees | 5,521 | 5,521 | 5,020 | |||||||||
| Compliance expense | 10,925 | 10,925 | 10,925 | |||||||||
| Reports to shareholders | 61,166 | 42,617 | 16,319 | |||||||||
| Directors’ fees and expenses | 15,553 | 15,453 | 15,029 | |||||||||
| Sub-transfer agent expenses – Investor Class (See Note 6) | 342,871 | 240,406 | 19,637 | |||||||||
| Sub-transfer agent expenses – Institutional Class (See Note 6) | 588 | 14,108 | 29 | |||||||||
| Interest expense (See Notes 4 and 7) | 777 | 6,607 | — | |||||||||
| Other | 22,830 | 16,396 | 10,473 | |||||||||
| Total expenses before reimbursement from advisor | 2,901,664 | 2,176,909 | 984,900 | |||||||||
| Administration expense waiver (See Note 6) | (4,007 | ) | (42,487 | ) | (2,641 | ) | ||||||
| Net expenses | 2,897,657 | 2,134,422 | 982,259 | |||||||||
| NET INVESTMENT INCOME (LOSS) | (1,428,623 | ) | 1,069,445 | 1,080,454 | ||||||||
| REALIZED AND UNREALIZED GAINS (LOSSES): | ||||||||||||
| Net realized gain (loss) on: | ||||||||||||
| Investments from unaffiliated securities | 3,675,303 | 465,078 | 171,724 | |||||||||
| Investments from affiliated securities | — | — | — | |||||||||
| Change in unrealized appreciation on investments | 43,342,497 | 21,872,356 | 5,528,323 | |||||||||
| Net gain (loss) on investments | 47,017,800 | 22,337,434 | 5,700,047 | |||||||||
| NET INCREASE IN NET ASSETS RESULTING FROM OPERATIONS | $ | 45,589,177 | $ | 23,406,879 | $ | 6,780,501 | ||||||
(1) Net of foreign taxes withheld of $0, $0, $0, $194,035, $2,092, $0, $0 $30,259 and $18,352 respectively.
The accompanying notes are an integral part of these financial statements.
WWW.HENNESSYFUNDS.COM
54
| HENNESSY | HENNESSY | HENNESSY | HENNESSY | HENNESSY | ||||||||||||||||||
| CORNERSTONE | LARGE | TOTAL RETURN | BALANCED | HENNESSY | JAPAN SMALL | |||||||||||||||||
| VALUE FUND | VALUE FUND | FUND | FUND | JAPAN FUND | CAP FUND | |||||||||||||||||
| $ | 4,848,327 | $ | 3,201,079 | $ | 1,968,445 | $ | 420,859 | $ | 401,971 | $ | 248,588 | |||||||||||
| — | — | — | — | — | — | |||||||||||||||||
| 2,032 | 138 | 18,574 | 8,469 | 148 | 179 | |||||||||||||||||
| 4,850,359 | 3,201,217 | 1,987,019 | 429,328 | 402,119 | 248,767 | |||||||||||||||||
| 912,705 | 1,065,815 | 425,005 | 136,881 | 205,473 | 179,755 | |||||||||||||||||
| 314,513 | 319,745 | 180,627 | 58,174 | 52,396 | 38,198 | |||||||||||||||||
| — | — | 106,251 | 34,220 | — | — | |||||||||||||||||
| 121,418 | 125,342 | 70,834 | 22,814 | 10,851 | 14,980 | |||||||||||||||||
| 35,915 | 33,242 | 27,337 | 24,655 | 36,957 | 20,530 | |||||||||||||||||
| 23,671 | 22,550 | 21,456 | 19,070 | 21,703 | 20,212 | |||||||||||||||||
| 5,521 | 7,020 | 5,516 | 5,516 | 5,020 | 5,520 | |||||||||||||||||
| 10,925 | 10,925 | 10,925 | 10,925 | 10,925 | 10,925 | |||||||||||||||||
| 25,082 | 43,944 | 15,038 | 4,455 | 8,547 | 6,518 | |||||||||||||||||
| 15,427 | 15,305 | 10,587 | 10,688 | 15,282 | 15,293 | |||||||||||||||||
| 72,797 | 89,951 | 30,149 | 20,402 | 15,567 | 23,539 | |||||||||||||||||
| 1,874 | — | N/A | N/A | 5,132 | N/A | |||||||||||||||||
| 708 | — | 57,585 | — | 2,204 | 3,166 | |||||||||||||||||
| 15,079 | 14,859 | 8,912 | 3,147 | 10,078 | 10,086 | |||||||||||||||||
| 1,555,635 | 1,748,698 | 970,222 | 350,947 | 400,135 | 348,722 | |||||||||||||||||
| (4,229 | ) | (118 | ) | — | — | — | N/A | |||||||||||||||
| 1,551,406 | 1,748,580 | 970,222 | 350,947 | 400,135 | 348,722 | |||||||||||||||||
| 3,298,953 | 1,452,637 | 1,016,797 | 78,381 | 1,984 | (99,955 | ) | ||||||||||||||||
| 3,221,518 | 9,806,738 | 3,337,953 | 493,334 | (816,325 | ) | 2,043,302 | ||||||||||||||||
| — | — | — | — | — | — | |||||||||||||||||
| 8,250,584 | 7,541,982 | 3,331,681 | 918,830 | 2,653,253 | (380,675 | ) | ||||||||||||||||
| 11,472,102 | 17,348,720 | 6,669,634 | 1,412,164 | 1,836,928 | 1,662,627 | |||||||||||||||||
| $ | 14,771,055 | $ | 18,801,357 | $ | 7,686,431 | $ | 1,490,545 | $ | 1,838,912 | $ | 1,562,672 | |||||||||||
HENNESSY FUNDS 1-800-966-4354
55
Financial Statements
| Statements of Changes in Net Assets |
| Hennessy Cornerstone Growth Fund | ||||||||
| Year Ended | Year Ended | |||||||
| October 31, 2012 | October 31, 2011 | |||||||
| OPERATIONS: | ||||||||
| Net investment income (loss) | $ | (1,428,623 | ) | $ | (1,513,994 | ) | ||
| Net realized gain on securities | 3,675,303 | 39,880,443 | ||||||
| Change in unrealized appreciation (depreciation) on securities | 43,342,497 | (41,240,390 | ) | |||||
| Net increase (decrease) in net assets resulting from operations | 45,589,177 | (2,873,941 | ) | |||||
| DISTRIBUTIONS TO SHAREHOLDERS FROM: | ||||||||
| Net investment income – Investor Class | — | — | ||||||
| Net investment income – Institutional Class | — | — | ||||||
| Net realized gains – Investor Class | — | — | ||||||
| Net realized gains – Institutional Class | — | — | ||||||
| Total distributions | — | — | ||||||
| CAPITAL SHARE TRANSACTIONS: | ||||||||
| Proceeds from shares issued in the Reorganization – Investor Class (See Note 9) | — | 25,825,466 | ||||||
| Proceeds from shares issued in the Reorganization – Institutional Class (See Note 9) | 34,071,809 | 339,345 | ||||||
| Proceeds from shares subscribed – Investor Class | 90,544,279 | 5,686,546 | ||||||
| Proceeds from shares subscribed – Institutional Class | 418,215 | 120,828 | ||||||
| Dividends reinvested – Investor Class | — | — | ||||||
| Dividends reinvested – Institutional Class | — | — | ||||||
| Cost of shares redeemed – Investor Class | (54,063,454 | ) | (51,326,442 | ) | ||||
| Cost of shares redeemed – Institutional Class | (778,530 | ) | (1,075,812 | ) | ||||
| Net increase (decrease) in net assets derived from capital share transactions | 70,192,319 | (20,430,069 | ) | |||||
| TOTAL INCREASE (DECREASE) IN NET ASSETS | 115,781,496 | (23,304,010 | ) | |||||
| NET ASSETS: | ||||||||
| Beginning of period | 186,929,423 | 210,233,433 | ||||||
| End of period | $ | 302,710,919 | $ | 186,929,423 | ||||
| Accumulated net investment income (loss), end of period | $ | (2,592,872 | ) | $ | 16,688 | |||
| CHANGES IN SHARES OUTSTANDING: | ||||||||
| Shares issued in connection with Acquisition – Investor Class (See Note 9) | — | 2,524,476 | ||||||
| Shares issued in connection with Acquisition – Institutional Class (See Note 9) | 2,732,499 | 32,783 | ||||||
| Shares sold – Investor Class | 7,702,040 | 536,989 | ||||||
| Shares sold – Institutional Class | 35,989 | 11,197 | ||||||
| Shares issued to holders as reinvestment of dividends – Investor Class | — | — | ||||||
| Shares issued to holders as reinvestment of dividends – Institutional Class | — | — | ||||||
| Shares redeemed – Investor Class | (4,743,651 | ) | (4,705,581 | ) | ||||
| Shares redeemed – Institutional Class | (67,781 | ) | (94,611 | ) | ||||
| Net increase (decrease) in shares outstanding | 5,659,096 | (1,694,747 | ) | |||||
The accompanying notes are an integral part of these financial statements.
WWW.HENNESSYFUNDS.COM
56
| Hennessy Cornerstone Mid Cap 30 Fund | Hennessy Cornerstone Large Growth Fund | Hennessy Cornerstone Value Fund | ||||||||||||||||||||
| Year Ended | Year Ended | Year Ended | Year Ended | Year Ended | Year Ended | |||||||||||||||||
| October 31, 2012 | October 31, 2011 | October 31, 2012 | October 31, 2011 | October 31, 2012 | October 31, 2011 | |||||||||||||||||
| $ | 1,069,445 | $ | (1,184,998 | ) | $ | 1,080,454 | $ | 559,148 | $ | 3,298,953 | $ | 4,048,072 | ||||||||||
| 465,078 | 21,853,896 | 171,724 | 15,375,964 | 3,221,518 | 10,696,825 | |||||||||||||||||
| 21,872,356 | (10,298,635 | ) | 5,528,323 | (10,653,411 | ) | $ | 8,250,584 | (7,231,439 | ) | |||||||||||||
| 23,406,879 | 10,370,263 | 6,780,501 | 5,281,701 | 14,771,055 | 7,513,458 | |||||||||||||||||
| — | — | (557,836 | ) | (626,839 | ) | (3,784,445 | ) | (4,238,610 | ) | |||||||||||||
| — | — | (1,312 | ) | (968 | ) | (49,840 | ) | (44,764 | ) | |||||||||||||
| — | — | (15,350,002 | ) | (109,149 | ) | — | — | |||||||||||||||
| — | — | (25,963 | ) | (99 | ) | — | — | |||||||||||||||
| — | — | (15,935,113 | ) | (737,055 | ) | (3,834,285 | ) | (4,283,374 | ) | |||||||||||||
| — | — | — | — | — | — | |||||||||||||||||
| 16,374,686 | — | 33,698,161 | — | — | — | |||||||||||||||||
| 61,505,408 | 59,931,720 | 2,170,407 | 1,432,151 | 16,434,099 | 10,694,626 | |||||||||||||||||
| 4,266,258 | 7,761,938 | 51,923 | 88,409 | 1,336,353 | 83,602 | |||||||||||||||||
| — | — | 14,646,437 | 671,356 | 3,373,717 | 3,846,379 | |||||||||||||||||
| — | — | 27,274 | 1,067 | 37,743 | 25,543 | |||||||||||||||||
| (81,736,037 | ) | (45,594,300 | ) | (9,670,991 | ) | (7,591,682 | ) | (21,987,512 | ) | (57,199,244 | ) | |||||||||||
| (6,640,858 | ) | (6,751,235 | ) | (16,525 | ) | (21,081 | ) | (188,855 | ) | (323,943 | ) | |||||||||||
| (6,230,543 | ) | 15,348,123 | 40,906,686 | (5,419,780 | ) | (994,455 | ) | (42,873,037 | ) | |||||||||||||
| 17,176,336 | 25,718,386 | 31,752,074 | (875,134 | ) | 9,942,315 | (39,642,953 | ) | |||||||||||||||
| 170,295,314 | 144,576,928 | 78,023,112 | 78,898,246 | 117,578,990 | 157,221,943 | |||||||||||||||||
| $ | 187,471,650 | $ | 170,295,314 | $ | 109,775,186 | $ | 78,023,112 | $ | 127,521,305 | $ | 117,578,990 | |||||||||||
| $ | 1,029,849 | $ | — | $ | 1,080,454 | $ | 559,148 | $ | 2,446,268 | $ | 3,329,807 | |||||||||||
| — | — | — | — | — | — | |||||||||||||||||
| 1,154,875 | — | 3,110,613 | — | — | — | |||||||||||||||||
| 4,595,496 | 4,688,679 | 204,448 | 113,003 | 1,221,855 | 847,873 | |||||||||||||||||
| 312,388 | 598,584 | 4,836 | 7,307 | 100,889 | 6,843 | |||||||||||||||||
| — | — | 1,455,027 | 55,671 | 264,813 | 312,206 | |||||||||||||||||
| — | — | 2,689 | 88 | 2,967 | 2,077 | |||||||||||||||||
| (6,262,135 | ) | (3,673,362 | ) | (911,650 | ) | (610,123 | ) | (1,636,482 | ) | (4,539,225 | ) | |||||||||||
| (512,726 | ) | (538,511 | ) | (1,399 | ) | (1,715 | ) | (14,382 | ) | (25,568 | ) | |||||||||||
| (712,102 | ) | 1,075,390 | 3,864,564 | (435,769 | ) | (60,340 | ) | (3,395,794 | ) | |||||||||||||
HENNESSY FUNDS 1-800-966-4354
57
Financial Statements
| Statements of Changes in Net Assets |
| Hennessy Large Value Fund | ||||||||
| Year Ended | Year Ended | |||||||
| October 31, 2012 | October 31, 2011 | |||||||
| OPERATIONS: | ||||||||
| Net investment income (loss) | $ | 1,452,637 | $ | 1,283,875 | ||||
| Net realized gain (loss) on securities | 9,806,738 | 11,600,606 | ||||||
| Change in unrealized appreciation (depreciation) on securities | 7,541,982 | (5,464,551 | ) | |||||
| Net increase (decrease) in net assets resulting from operations | 18,801,357 | 7,419,930 | ||||||
| DISTRIBUTIONS TO SHAREHOLDERS FROM: | ||||||||
| Net investment income – Investor Class | (1,007,288 | ) | (1,291,601 | ) | ||||
| Net investment income – Institutional Class | (471 | ) | (582 | ) | ||||
| Net realized gains – Investor Class | — | — | ||||||
| Net realized gains – Institutional Class | — | — | ||||||
| Total distributions | (1,007,759 | ) | (1,292,183 | ) | ||||
| CAPITAL SHARE TRANSACTIONS: | ||||||||
| Proceeds from shares subscribed – Investor Class | 1,325,949 | 1,847,792 | ||||||
| Proceeds from shares subscribed – Institutional Class | 13,303 | 10,610 | ||||||
| Dividends reinvested – Investor Class | 961,881 | 1,235,299 | ||||||
| Dividends reinvested – Institutional Class | 471 | 528 | ||||||
| Cost of shares redeemed – Investor Class | (19,010,445 | ) | (16,781,736 | ) | ||||
| Cost of shares redeemed – Institutional Class | (289 | ) | (12,669 | ) | ||||
| Net increase (decrease) in net assets derived from capital share transactions | (16,709,130 | ) | (13,700,176 | ) | ||||
| TOTAL INCREASE (DECREASE) IN NET ASSETS | 1,084,468 | (7,572,429 | ) | |||||
| NET ASSETS: | ||||||||
| Beginning of period | 124,005,977 | 131,578,406 | ||||||
| End of period | $ | 125,090,445 | $ | 124,005,977 | ||||
| Accumulated net investment income (loss), end of period | $ | 1,060,739 | $ | 634,102 | ||||
| CHANGES IN SHARES OUTSTANDING: | ||||||||
| Shares sold – Investor Class | 56,881 | 84,224 | ||||||
| Shares sold – Institutional Class | 579 | 497 | ||||||
| Shares issued to holders as reinvestment of dividends – Investor Class | 43,942 | 56,743 | ||||||
| Shares issued to holders as reinvestment of dividends – Institutional Class | 21 | 24 | ||||||
| Shares redeemed – Investor Class | (817,082 | ) | (759,938 | ) | ||||
| Shares redeemed – Institutional Class | (13 | ) | (615 | ) | ||||
| Net increase (decrease) in shares outstanding | (715,672 | ) | (619,065 | ) | ||||
(1) Certain prior year balances have been reclassified to match current year presentation.
The accompanying notes are an integral part of these financial statements.
WWW.HENNESSYFUNDS.COM
58
| Hennessy Total Return Fund | Hennessy Balanced Fund | Hennessy Japan Fund | ||||||||||||||||||||
| Year Ended | Year Ended | Year Ended | Year Ended | Year Ended | Year Ended | |||||||||||||||||
| October 31, 2012 | October 31, 2011 | October 31, 2012 | October 31, 2011 | October 31, 2012 | October 31, 2011 | |||||||||||||||||
| $ | 1,016,797 | $ | 1,021,401 | $ | 78,381 | $ | 57,635 | $ | 1,984 | $ | (82,227 | ) | ||||||||||
| 3,337,953 | 3,288,471 | 493,334 | 498,835 | (816,325 | ) | 1,052,378 | ||||||||||||||||
| 3,331,681 | 2,165,518 | 918,830 | 310,456 | 2,653,253 | (4,618,650 | ) | ||||||||||||||||
| 7,686,431 | 6,475,390 | 1,490,545 | 866,926 | 1,838,912 | (3,648,499 | ) | ||||||||||||||||
| (1,013,041 | ) | (1,003,505 | ) | (81,724 | ) | (55,526 | ) | — | — | |||||||||||||
| N/A | N/A | N/A | N/A | — | — | |||||||||||||||||
| — | — | — | — | — | — | |||||||||||||||||
| N/A | N/A | N/A | N/A | — | — | |||||||||||||||||
| (1,013,041 | ) | (1,003,505 | ) | (81,724 | ) | (55,526 | ) | — | — | |||||||||||||
| 29,998,535 | 11,718,225 | 13,386,838 | 8,374,392 | 6,766,669 | 68,660,478 | |||||||||||||||||
| N/A | N/A | N/A | N/A | 157,102 | 1,179,768 | |||||||||||||||||
| 923,418 | 905,737 | 77,883 | 53,435 | — | — | |||||||||||||||||
| N/A | N/A | N/A | N/A | — | — | |||||||||||||||||
| (24,056,017 | ) | (23,040,187 | ) | (7,726,009 | ) | (3,720,748 | ) | (12,101,974 | ) | (68,498,669 | )(1) | |||||||||||
| N/A | N/A | N/A | N/A | (1,853,965 | ) | (16,765,426 | ) | |||||||||||||||
| 6,865,936 | (10,416,225 | ) | 5,738,712 | 4,707,079 | (7,032,168 | ) | (15,423,849 | ) | ||||||||||||||
| 13,539,326 | (4,944,340 | ) | 7,147,533 | 5,518,479 | (5,193,256 | ) | (19,072,348 | ) | ||||||||||||||
| 64,131,461 | 69,075,801 | 18,022,243 | 12,503,764 | 24,511,477 | 43,583,825 | |||||||||||||||||
| $ | 77,670,787 | $ | 64,131,461 | $ | 25,169,776 | $ | 18,022,243 | $ | 19,318,221 | $ | 24,511,477 | |||||||||||
| $ | 78,405 | $ | 74,649 | $ | 2,932 | $ | 6,275 | $ | — | $ | — | |||||||||||
| 2,462,738 | 1,061,206 | 1,156,321 | 760,081 | 460,787 | 4,803,522 | |||||||||||||||||
| N/A | N/A | N/A | N/A | 10,560 | 80,655 | |||||||||||||||||
| 74,537 | 81,262 | 6,678 | 4,931 | — | — | |||||||||||||||||
| N/A | N/A | N/A | N/A | — | — | |||||||||||||||||
| (1,983,914 | ) | (2,087,396 | ) | (663,666 | ) | (344,283 | ) | (845,443 | ) | (5,335,288 | ) | |||||||||||
| N/A | N/A | N/A | N/A | (124,185 | ) | (1,256,328 | ) | |||||||||||||||
| 553,361 | (944,928 | ) | 499,333 | 420,729 | (498,281 | ) | (1,707,439 | ) | ||||||||||||||
HENNESSY FUNDS 1-800-966-4354
59
Financial Statements
| Statements of Changes in Net Assets |
| Hennessy Japan Small Cap Fund | ||||||||
| Year Ended | Year Ended | |||||||
| October 31, 2012 | October 31, 2011 | |||||||
| OPERATIONS: | ||||||||
| Net investment income (loss) | $ | (99,955 | ) | $ | 41,453 | |||
| Net realized gain (loss) on securities | 2,043,302 | 1,413,091 | ||||||
| Change in unrealized appreciation (depreciation) on securities | (380,675 | ) | (331,017 | ) | ||||
| Net increase (decrease) in net assets resulting from operations | 1,562,672 | 1,123,527 | ||||||
| DISTRIBUTIONS TO SHAREHOLDERS FROM: | ||||||||
| Net investment income – Investor Class | (99,101 | ) | — | |||||
| Net investment income – Institutional Class | N/A | N/A | ||||||
| Net realized gains – Investor Class | — | — | ||||||
| Net realized gains – Institutional Class | N/A | N/A | ||||||
| Total distributions | (99,101 | ) | — | |||||
| CAPITAL SHARE TRANSACTIONS: | ||||||||
| Proceeds from shares subscribed – Investor Class | 2,526,353 | 18,301,075 | ||||||
| Proceeds from shares subscribed – Institutional Class | N/A | N/A | ||||||
| Dividends reinvested – Investor Class | 95,320 | — | ||||||
| Dividends reinvested – Institutional Class | N/A | N/A | ||||||
| Cost of shares redeemed – Investor Class | (23,061,781 | ) | (10,506,600 | )(1) | ||||
| Cost of shares redeemed – Institutional Class | N/A | N/A | ||||||
| Net increase (decrease) in net assets derived from capital share transactions | (20,440,108 | ) | 7,794,475 | |||||
| TOTAL INCREASE (DECREASE) IN NET ASSETS | (18,976,537 | ) | 8,918,002 | |||||
| NET ASSETS: | ||||||||
| Beginning of period | 24,083,059 | 15,165,057 | ||||||
| End of period | $ | 5,106,522 | $ | 24,083,059 | ||||
| Accumulated net investment income (loss), end of period | $ | (57,735 | ) | $ | (190,480 | ) | ||
| CHANGES IN SHARES OUTSTANDING: | ||||||||
| Shares sold – Investor Class | 235,392 | 1,751,882 | ||||||
| Shares sold – Institutional Class | N/A | N/A | ||||||
| Shares issued to holders as reinvestment of dividends – Investor Class | 9,570 | — | ||||||
| Shares issued to holders as reinvestment of dividends – Institutional Class | N/A | N/A | ||||||
| Shares redeemed – Investor Class | (2,148,260 | ) | (1,007,763 | ) | ||||
| Shares redeemed – Institutional Class | N/A | N/A | ||||||
| Net increase (decrease) in shares outstanding | (1,903,298 | ) | 744,119 | |||||
(1) Certain prior year balances have been reclassified to match current year presentation.
The accompanying notes are an integral part of these financial statements.
WWW.HENNESSYFUNDS.COM
60
Statement of Cash Flows
Hennessy Total Return Fund For the Year Ended October 31, 2012 |
| Cash Flows From Operating Activities: | ||||
| Net increase in net assets from operations | $ | 7,686,431 | ||
| Adjustments to reconcile net increase in net assets from operations to net cash used in operating activities: | ||||
| Purchase of investment securities | (266,722,396 | ) | ||
| Proceeds on sale of securities | 248,951,662 | |||
| Decrease in other receivables, net | 750,048 | |||
| Increase in other assets | (60 | ) | ||
| Increase in accrued expenses and other payables | 276,380 | |||
| Net accretion of discount on securities | (18,326 | ) | ||
| Net realized gain on investments | (3,337,953 | ) | ||
| Unrealized appreciation on securities | (3,331,681 | ) | ||
| Net cash used in operating activities | (15,745,895 | ) | ||
| Cash Flows From Financing Activities: | ||||
| Increase in reverse repurchase agreements | 9,893,000 | |||
| Proceeds on shares sold | 29,998,535 | |||
| Payment on shares repurchased | (24,056,017 | ) | ||
| Cash dividends paid, net of dividends reinvested | (89,623 | ) | ||
| Net cash provided by financing activities | 15,745,895 | |||
| Cash at beginning of year | — | |||
| Cash at end of year | — | |||
| Net increase (decrease) in cash | $ | — | ||
| Cash paid for interest | $ | 52,901 | ||
The accompanying notes are an integral part of these financial statements.
HENNESSY FUNDS 1-800-966-4354
61
Financial Highlights
| Hennessy Cornerstone Growth Fund |
For an Investor Class share (formerly Original Class share) outstanding throughout each year
| Year Ended October 31 | ||||||||||||||||||||
| 2012 | 2011 | 2010 | 2009 | 2008 | ||||||||||||||||
| PER SHARE DATA: | ||||||||||||||||||||
| Net asset value, beginning of year | $ | 9.97 | $ | 10.28 | $ | 8.81 | $ | 8.80 | $ | 19.4 | ||||||||||
| Income from investment operations: | ||||||||||||||||||||
| Net investment loss | (0.07 | ) | (0.08 | ) | (0.10 | ) | (0.04 | ) | (0.05 | ) | ||||||||||
| Net realized and unrealized gains (losses) on securities | 2.48 | (0.23 | ) | 1.57 | 0.05 | (8.32 | ) | |||||||||||||
| Total from investment operations | 2.41 | (0.31 | ) | 1.47 | 0.01 | (8.37 | ) | |||||||||||||
| Less Distributions: | ||||||||||||||||||||
| Dividends from net investment income | — | — | — | — | — | |||||||||||||||
| Dividends from net realized gains | — | — | — | — | (2.24 | ) | ||||||||||||||
| Total distributions | — | — | — | — | (2.24 | ) | ||||||||||||||
| Net asset value, end of period | $ | 12.38 | $ | 9.97 | $ | 10.28 | $ | 8.81 | $ | 8.80 | ||||||||||
| TOTAL RETURN | 24.17 | % | (3.02 | )% | 16.69 | % | 0.11 | % | (48.00 | )% | ||||||||||
| SUPPLEMENTAL DATA AND RATIOS: | ||||||||||||||||||||
| Net assets, end of period (millions) | $ | 265.60 | $ | 184.40 | $ | 207.11 | $ | 228.96 | $ | 312.50 | ||||||||||
| Ratio of expenses to average net assets | 1.34 | % | 1.33 | % | 1.34 | % | 1.36 | % | 1.25 | % | ||||||||||
| Ratio of net investment loss to average net assets | (0.66 | )% | (0.78 | )% | (0.89 | )% | (0.42 | )% | (0.29 | )% | ||||||||||
Portfolio turnover rate(1) | 90 | % | 106 | % | 103 | % | 108 | % | 103 | % | ||||||||||
(1) Portfolio turnover is calculated on the basis of the Fund as a whole.
The accompanying notes are an integral part of these financial statements.
WWW.HENNESSYFUNDS.COM
62
Financial Highlights
| Hennessy Cornerstone Growth Fund |
For an Institutional Class share outstanding throughout each period
| Period Ended | ||||||||||||||||||||
| Year Ended October 31, | October 31, | |||||||||||||||||||
| 2012 | 2011 | 2010 | 2009 | 2008(1) | ||||||||||||||||
| PER SHARE DATA: | ||||||||||||||||||||
| Net asset value, beginning of period | $ | 10.09 | $ | 10.37 | $ | 8.86 | $ | 8.82 | $ | 13.29 | ||||||||||
| Income from investment operations: | ||||||||||||||||||||
| Net investment income (loss) | (0.04 | ) | (0.05 | ) | (0.07 | ) | — | 0.01 | ||||||||||||
| Net realized and unrealized gains (losses) on securities | 2.52 | (0.23 | ) | 1.58 | 0.04 | (4.48 | ) | |||||||||||||
| Total from investment operations | 2.48 | (0.28 | ) | 1.51 | 0.04 | (4.47 | ) | |||||||||||||
| Less Distributions: | ||||||||||||||||||||
| Dividends from net investment income | — | — | — | — | — | |||||||||||||||
| Dividends from net realized gains | — | — | — | — | — | |||||||||||||||
| Total distributions | — | — | — | — | — | |||||||||||||||
| Net asset value, end of period | $ | 12.57 | $ | 10.09 | $ | 10.37 | $ | 8.86 | $ | 8.82 | ||||||||||
| TOTAL RETURN | 24.58 | % | (2.70 | )% | 17.04 | % | 0.45 | % | (34.13 | )%(2) | ||||||||||
| SUPPLEMENTAL DATA AND RATIOS: | ||||||||||||||||||||
| Net assets, end of period (millions) | $ | 37.11 | $ | 2.53 | $ | 3.12 | $ | 4.68 | $ | 5.09 | ||||||||||
| Ratio of expenses to average net assets: | ||||||||||||||||||||
| Before expense reimbursement | 1.11 | % | 1.09 | % | 1.09 | % | 1.11 | % | 1.12 | %(3) | ||||||||||
| After expense reimbursement | 0.98 | % | 0.98 | % | 0.98 | % | 0.98 | % | 0.98 | %(3) | ||||||||||
| Ratio of net investment income (loss) to average net assets: | ||||||||||||||||||||
| Before expense reimbursement | (0.38 | )% | (0.55 | )% | (0.64 | )% | (0.17 | )% | 0.15 | %(3) | ||||||||||
| After expense reimbursement | (0.51 | )% | (0.44 | )% | (0.53 | )% | (0.04 | )% | 0.29 | %(3) | ||||||||||
Portfolio turnover rate(4) | 90 | % | 106 | % | 103 | % | 108 | % | 103 | %(2) | ||||||||||
| (1) | Institutional Class shares commenced operations on March 3, 2008. |
| (2) | Not Annualized. |
| (3) | Annualized. |
| (4) | Portfolio turnover is calculated on the basis of the Fund as a whole. |
The accompanying notes are an integral part of these financial statements.
HENNESSY FUNDS 1-800-966-4354
63
Financial Highlights
| Hennessy Cornerstone Mid Cap 30 Fund (formerly the Hennessy Focus 30 Fund) |
For an Investor Class share (formerly Original Class share) outstanding throughout each year
| Year Ended October 31, | ||||||||||||||||||||
| 2012 | 2011 | 2010 | 2009 | 2008 | ||||||||||||||||
| PER SHARE DATA: | ||||||||||||||||||||
| Net asset value, beginning of year | $ | 12.15 | $ | 11.18 | $ | 8.73 | $ | 8.02 | $ | 13.67 | ||||||||||
| Income from investment operations: | ||||||||||||||||||||
| Net investment income (loss) | 0.08 | (0.09 | ) | (0.03 | ) | (0.02 | ) | (0.06 | ) | |||||||||||
| Net realized and unrealized gains (losses) on investments | 1.83 | 1.06 | 2.48 | 0.73 | (3.57 | ) | ||||||||||||||
| Total from investment operations | 1.91 | 0.97 | 2.45 | 0.71 | (3.63 | ) | ||||||||||||||
| Less Distributions: | ||||||||||||||||||||
| Dividends from net investment income | — | — | — | — | — | |||||||||||||||
| Dividends from net realized gains | — | — | — | — | (2.02 | ) | ||||||||||||||
| Total distributions | — | — | — | — | (2.02 | ) | ||||||||||||||
| Net asset value, end of period | $ | 14.06 | $ | 12.15 | $ | 11.18 | $ | 8.73 | $ | 8.02 | ||||||||||
| TOTAL RETURN | 15.72 | % | 8.68 | % | 28.06 | % | 8.85 | % | (30.81 | )% | ||||||||||
| SUPPLEMENTAL DATA AND RATIOS: | ||||||||||||||||||||
| Net assets, end of period (millions) | $ | 145.85 | $ | 146.23 | $ | 123.20 | $ | 128.36 | $ | 167.32 | ||||||||||
| Ratio of expenses to average net assets | 1.37 | % | 1.36 | % | 1.39 | % | 1.39 | % | 1.27 | % | ||||||||||
| Ratio of net investment income (loss) to average net assets | 0.59 | % | (0.79 | )% | (0.26 | )% | (0.20 | )% | (0.62 | )% | ||||||||||
Portfolio turnover rate(1) | 25 | % | 107 | % | 87 | % | 90 | % | 123 | % | ||||||||||
(1) Portfolio turnover is calculated on the basis of the Fund as a whole.
The accompanying notes are an integral part of these financial statements.
WWW.HENNESSYFUNDS.COM
64
Financial Highlights
| Hennessy Cornerstone Mid Cap 30 Fund (formerly the Hennessy Focus 30 Fund) |
For an Institutional Class share outstanding throughout each period
| Period Ended | ||||||||||||||||||||
| Year Ended October 31, | October 31, | |||||||||||||||||||
| 2012 | 2011 | 2010 | 2009 | 2008(1) | ||||||||||||||||
| PER SHARE DATA: | ||||||||||||||||||||
| Net asset value, beginning of period | $ | 12.32 | $ | 11.29 | $ | 8.78 | $ | 8.04 | $ | 11.15 | ||||||||||
| Income from investment operations: | ||||||||||||||||||||
| Net investment income (loss) | 0.09 | (0.05 | ) | 0.02 | 0.02 | (0.02 | ) | |||||||||||||
| Net realized and unrealized gains (losses) on investments | 1.90 | 1.08 | 2.49 | 0.72 | (3.09 | ) | ||||||||||||||
| Total from investment operations | 1.99 | 1.03 | 2.51 | 0.74 | (3.11 | ) | ||||||||||||||
| Less Distributions: | ||||||||||||||||||||
| Dividends from net investment income | — | — | — | — | — | |||||||||||||||
| Dividends from net realized gains | — | — | — | — | — | |||||||||||||||
| Total distributions | — | — | — | — | — | |||||||||||||||
| Net asset value, end of period | $ | 14.31 | $ | 12.32 | $ | 11.29 | $ | 8.78 | $ | 8.04 | ||||||||||
| TOTAL RETURN | 16.15 | % | 9.12 | % | 28.59 | % | 9.20 | % | (27.89 | )%(2) | ||||||||||
| SUPPLEMENTAL DATA AND RATIOS: | ||||||||||||||||||||
| Net assets, end of period (millions) | $ | 41.62 | $ | 24.06 | $ | 21.38 | $ | 27.44 | $ | 26.78 | ||||||||||
| Ratio of expenses to average net assets: | ||||||||||||||||||||
| Before expense reimbursement | 1.16 | % | 1.14 | % | 1.16 | % | 1.15 | % | 1.13 | %(3) | ||||||||||
| After expense reimbursement | 0.98 | % | 0.98 | % | 0.98 | % | 0.98 | % | 0.98 | %(3) | ||||||||||
| Ratio of net investment income (loss) to average net assets: | ||||||||||||||||||||
| Before expense reimbursement | 0.90 | % | (0.41 | )% | (0.03 | )% | 0.04 | % | (0.28 | )%(3) | ||||||||||
| After expense reimbursement | 1.08 | % | (0.57 | )% | 0.15 | % | 0.21 | % | (0.13 | )%(3) | ||||||||||
Portfolio turnover rate(4) | 25 | % | 107 | % | 87 | % | 90 | % | 123 | %(2) | ||||||||||
(1) Institutional Class shares commenced operations on March 3, 2008.
(2) Not Annualized.
(3) Annualized.
(4) Portfolio turnover is calculated on the basis of the Fund as a whole.
The accompanying notes are an integral part of these financial statements.
HENNESSY FUNDS 1-800-966-4354
65
Financial Highlights
| Hennessy Cornerstone Large Growth Fund |
For an Investor Class share (formerly Original Class share) outstanding throughout each period
| One Month | ||||||||||||||||||||||||
| Ended | Year Ended | |||||||||||||||||||||||
| Year Ended October 31, | October 31, | September 30, | ||||||||||||||||||||||
| 2012 | 2011 | 2010 | 2009(1) | 2009(2) | 2008(2) | |||||||||||||||||||
| PER SHARE DATA: | ||||||||||||||||||||||||
| Net asset value, beginning of period | $ | 12.37 | $ | 11.70 | $ | 9.49 | $ | 9.60 | $ | 10.09 | $ | 12.61 | ||||||||||||
| Income from investment operations: | ||||||||||||||||||||||||
| Net investment income (loss) | 0.13 | 0.09 | 0.09 | — | (3) | 0.05 | — | (3)(4) | ||||||||||||||||
| Net realized and unrealized gains (losses) on securities | 0.80 | 0.69 | 2.17 | (0.11 | ) | (0.54 | ) | (2.52 | ) | |||||||||||||||
| Total from investment operations | 0.93 | 0.78 | 2.26 | (0.11 | ) | (0.49 | ) | (2.52 | ) | |||||||||||||||
| Less Distributions: | ||||||||||||||||||||||||
| Dividends from net investment income | (0.07 | ) | (0.09 | ) | (0.05 | ) | — | — | — | |||||||||||||||
| Dividends from net realized gains | (2.46 | ) | (0.02 | ) | — | — | — | — | ||||||||||||||||
| Total distributions | (2.53 | ) | (0.11 | ) | (0.05 | ) | — | — | — | |||||||||||||||
| Net asset value, end of period | $ | 10.77 | $ | 12.37 | $ | 11.70 | $ | 9.49 | $ | 9.60 | $ | 10.09 | ||||||||||||
| TOTAL RETURN | 9.14 | % | 6.70 | % | 23.88 | % | (1.15 | )%(5) | (4.86 | )% | (19.98 | )% | ||||||||||||
| SUPPLEMENTAL DATA AND RATIOS: | ||||||||||||||||||||||||
| Net assets, end of period (millions) | $ | 75.83 | $ | 77.88 | $ | 78.83 | $ | 69.41 | $ | 70.61 | $ | 80.91 | ||||||||||||
| Ratio of expenses to average net assets: | ||||||||||||||||||||||||
| Before expense reimbursement/recoupment | 1.27 | % | 1.26 | % | 1.30 | % | 1.26 | %(6) | 1.40 | % | 1.16 | % | ||||||||||||
| After expense reimbursement/recoupment | 1.27 | % | 1.30 | % | 1.30 | % | 1.30 | %(6) | 1.17 | % | 0.98 | % | ||||||||||||
| Ratio of net investment income to average net assets: | ||||||||||||||||||||||||
| Before expense reimbursement/recoupment | 1.35 | % | 0.72 | % | 0.84 | % | (0.01 | )%(6) | 0.36 | % | (0.19 | )% | ||||||||||||
| After expense reimbursement/recoupment | 1.35 | % | 0.68 | % | 0.84 | % | (0.05 | )%(6) | 0.59 | % | (0.01 | )% | ||||||||||||
Portfolio turnover rate(7) | 0 | % | 70 | % | 83 | % | 0 | %(5) | 116 | % | 38 | % | ||||||||||||
| (1) | For the one month period ended October 31, 2009. Effective October 31, 2009, the Fund changed its fiscal year end to October 31st from September 30th. |
| (2) | The financial highlights set forth for periods prior to March 20, 2009 represent the historical financial highlights of the Tamarack Large Cap Growth Fund, Class S shares. The assets of the Tamarack Large Cap Growth Fund were acquired by the Hennessy Cornerstone Large Growth Fund on March 20, 2009. At the time RBC Global Asset Management (U.S.), Inc. (formerly known as Voyageur Asset Management Inc.) ceased to be investment advisor and Hennessy Advisors, Inc. became investment advisor. The return of the Tamarack Large Cap Growth Fund, Class S shares during the period October 1, 2008 through March 20, 2009 was (33.30)%. The return of the Hennessy Cornerstone Large Growth Fund, Original Class shares during the period March 20, 2009 through September 30, 2009 was 42.64%. |
| (3) | Amount is less than $0.01 or ($0.01) per share. |
| (4) | Per share net investment income (loss) has been calculated using the average daily shares method. |
| (5) | Not annualized. |
| (6) | Annualized. |
| (7) | Portfolio turnover is calculated on the basis of the Fund as a whole. |
The accompanying notes are an integral part of these financial statements.
WWW.HENNESSYFUNDS.COM
66
Financial Highlights
| Hennessy Cornerstone Large Growth Fund |
For an Institutional Class share outstanding throughout each period
| One Month | Period | |||||||||||||||||||
| Ended | Ended | |||||||||||||||||||
| Year Ended October 31, | October 31, | September 30, | ||||||||||||||||||
| 2012 | 2011 | 2010 | 2009(1) | 2009(2) | ||||||||||||||||
| PER SHARE DATA: | ||||||||||||||||||||
| Net asset value, beginning of period | $ | 12.44 | $ | 11.76 | $ | 9.51 | $ | 9.61 | $ | 6.73 | ||||||||||
| Income from investment operations: | ||||||||||||||||||||
| Net investment income | 0.07 | 0.08 | 0.10 | — | (3) | 0.03 | ||||||||||||||
| Net realized and unrealized gains (losses) on securities | 0.89 | 0.74 | 2.20 | (0.10 | ) | 2.85 | ||||||||||||||
| Total from investment operations | 0.96 | 0.82 | 2.30 | (0.10 | ) | 2.88 | ||||||||||||||
| Less Distributions: | ||||||||||||||||||||
| Dividends from net investment income | (0.09 | ) | (0.12 | ) | (0.05 | ) | — | — | ||||||||||||
| Dividends from net realized gains | (2.46 | ) | (0.02 | ) | — | — | — | |||||||||||||
| Total distributions | (2.55 | ) | (0.14 | ) | (0.05 | ) | — | — | ||||||||||||
| Net asset value, end of period | $ | 10.85 | $ | 12.44 | $ | 11.76 | $ | 9.51 | $ | 9.61 | ||||||||||
| TOTAL RETURN | 9.43 | % | 6.99 | % | 24.26 | % | (1.04 | )%(4) | 42.79 | %(4) | ||||||||||
| SUPPLEMENTAL DATA AND RATIOS: | ||||||||||||||||||||
| Net assets, end of period (millions) | $ | 33.94 | $ | 0.14 | $ | 0.07 | $ | 0.04 | $ | 0.04 | ||||||||||
| Ratio of expenses to average net assets: | ||||||||||||||||||||
| Before expense reimbursement | 1.41 | % | 1.14 | % | 1.16 | % | 1.14 | %(5) | 16.51 | %(5) | ||||||||||
| After expense reimbursement | 0.98 | % | 0.98 | % | 0.98 | % | 0.98 | %(5) | 0.98 | %(5) | ||||||||||
| Ratio of net investment income to average net assets: | ||||||||||||||||||||
| Before expense reimbursement | 6.44 | % | 0.81 | % | 0.90 | % | 0.12 | %(5) | (14.54 | )%(5) | ||||||||||
| After expense reimbursement | 6.87 | % | 0.97 | % | 1.08 | % | 0.28 | %(5) | 0.99 | %(5) | ||||||||||
Portfolio turnover rate(6) | 0 | % | 70 | % | 83 | % | 0 | %(4) | 116 | %(4) | ||||||||||
| (1) | For the one month period ended October 31, 2009. Effective October 31, 2009, the Fund changed its fiscal year end to October 31st from September 30th. |
| (2) | Institutional Class shares commenced operations on March 20, 2009. |
| (3) | Amount is less than $0.01 or ($0.01) per share. |
| (4) | Not annualized. |
| (5) | Annualized. |
| (6) | Portfolio turnover is calculated on the basis of the Fund as a whole. |
The accompanying notes are an integral part of these financial statements.
HENNESSY FUNDS 1-800-966-4354
67
Financial Highlights
| Hennessy Cornerstone Value Fund |
For an Investor Class share (formerly Original Class share) outstanding throughout each year
| Year Ended October 31, | ||||||||||||||||||||
| 2012 | 2011 | 2010 | 2009 | 2008 | ||||||||||||||||
| PER SHARE DATA: | ||||||||||||||||||||
| Net asset value, beginning of year | $ | 12.84 | $ | 12.53 | $ | 10.63 | $ | 9.05 | $ | 17.06 | ||||||||||
| Income from investment operations: | ||||||||||||||||||||
| Net investment income | 0.37 | 0.45 | 0.29 | 0.24 | 0.55 | |||||||||||||||
| Net realized and unrealized gains (losses) on investments | 1.23 | 0.23 | 1.81 | 1.87 | (8.15 | ) | ||||||||||||||
| Total from investment operations | 1.60 | 0.68 | 2.10 | 2.11 | (7.60 | ) | ||||||||||||||
| Less Distributions: | ||||||||||||||||||||
| Dividends from net investment income | (0.42 | ) | (0.37 | ) | (0.20 | ) | (0.53 | ) | (0.41 | ) | ||||||||||
| Dividends from net realized gains | — | — | — | — | — | |||||||||||||||
| Total distributions | (0.42 | ) | (0.37 | ) | (0.20 | ) | (0.53 | ) | (0.41 | ) | ||||||||||
| Net asset value, end of period | $ | 14.02 | $ | 12.84 | $ | 12.53 | $ | 10.63 | $ | 9.05 | ||||||||||
| TOTAL RETURN | 12.79 | % | 5.58 | % | 19.98 | % | 25.51 | % | (45.50 | )% | ||||||||||
| SUPPLEMENTAL DATA AND RATIOS: | ||||||||||||||||||||
| Net assets, end of period (millions) | $ | 124.99 | $ | 116.41 | $ | 155.87 | $ | 145.91 | $ | 97.10 | ||||||||||
| Ratio of expenses to average net assets | 1.26 | % | 1.31 | % | 1.29 | % | 1.27 | % | 1.20 | % | ||||||||||
| Ratio of net investment income to average net assets | 2.67 | % | 2.94 | % | 2.33 | % | 3.19 | % | 3.92 | % | ||||||||||
Portfolio turnover rate(1) | 47 | % | 40 | % | 91 | % | 59 | % | 53 | % | ||||||||||
(1) Portfolio turnover is calculated on the basis of the Fund as a whole.
The accompanying notes are an integral part of these financial statements.
WWW.HENNESSYFUNDS.COM
68
Financial Highlights
| Hennessy Cornerstone Value Fund |
For an Institutional Class share outstanding throughout each period
| Period Ended | ||||||||||||||||||||
| Year Ended October 31, | October 31, | |||||||||||||||||||
| 2012 | 2011 | 2010 | 2009 | 2008(1) | ||||||||||||||||
| PER SHARE DATA: | ||||||||||||||||||||
| Net asset value, beginning of period | $ | 12.86 | $ | 12.54 | $ | 10.63 | $ | 9.06 | $ | 13.79 | ||||||||||
| Income from investment operations: | ||||||||||||||||||||
| Net investment income | 0.45 | 0.36 | 0.30 | 0.30 | 0.34 | |||||||||||||||
| Net realized and unrealized gains (losses) on investments | 1.19 | 0.37 | 1.83 | 1.83 | (5.07 | ) | ||||||||||||||
| Total from investment operations | 1.64 | 0.73 | 2.13 | 2.13 | (4.73 | ) | ||||||||||||||
| Less Distributions: | ||||||||||||||||||||
| Dividends from net investment income | (0.46 | ) | (0.41 | ) | (0.22 | ) | (0.56 | ) | — | |||||||||||
| Dividends from net realized gains | — | — | — | — | — | |||||||||||||||
| Total distributions | (0.46 | ) | (0.41 | ) | (0.22 | ) | (0.56 | ) | — | |||||||||||
| Net asset value, end of period | $ | 14.04 | $ | 12.86 | $ | 12.54 | $ | 10.63 | $ | 9.06 | ||||||||||
| TOTAL RETURN | 13.13 | % | 6.00 | % | 20.31 | % | 25.87 | % | (34.30 | )%(2) | ||||||||||
| SUPPLEMENTAL DATA AND RATIOS: | ||||||||||||||||||||
| Net assets, end of period (millions) | $ | 2.53 | $ | 1.17 | $ | 1.35 | $ | 1.11 | $ | 0.87 | ||||||||||
| Ratio of expenses to average net assets: | ||||||||||||||||||||
| Before expense reimbursement | 1.20 | % | 1.14 | % | 1.10 | % | 1.13 | % | 1.14 | %(3) | ||||||||||
| After expense reimbursement | 0.98 | % | 0.98 | % | 0.98 | % | 0.98 | % | 0.98 | %(3) | ||||||||||
| Ratio of net investment income to average net assets: | ||||||||||||||||||||
| Before expense reimbursement | 2.72 | % | 3.04 | % | 2.52 | % | 3.33 | % | 4.94 | %(3) | ||||||||||
| After expense reimbursement | 2.94 | % | 3.20 | % | 2.64 | % | 3.48 | % | 5.10 | %(3) | ||||||||||
Portfolio turnover rate(4) | 47 | % | 40 | % | 91 | % | 59 | % | 53 | %(2) | ||||||||||
| (1) | Institutional Class shares commenced operations on March 3, 2008. |
| (2) | Not Annualized. |
| (3) | Annualized. |
| (4) | Portfolio turnover is calculated on the basis of the Fund as a whole. |
The accompanying notes are an integral part of these financial statements.
HENNESSY FUNDS 1-800-966-4354
69
Financial Highlights
| Hennessy Large Value Fund (formerly the Hennessy Select Large Value Fund) |
For a Investor Class share (formerly Original Class share) outstanding throughout each period
| One Month | ||||||||||||||||||||||||
| Ended | Year Ended | |||||||||||||||||||||||
| Year Ended October 31, | October 31, | September 30, | ||||||||||||||||||||||
| 2012 | 2011 | 2010 | 2009(1) | 2009(2) | 2008(2) | |||||||||||||||||||
| PER SHARE DATA: | ||||||||||||||||||||||||
| Net asset value, beginning of period | $ | 21.47 | $ | 20.57 | $ | 18.88 | $ | 19.49 | $ | 21.80 | $ | 43.12 | ||||||||||||
| Income from investment operations: | ||||||||||||||||||||||||
| Net investment income | 0.28 | 0.22 | 0.14 | 0.01 | 0.31 | 0.42 | (3) | |||||||||||||||||
| Net realized and unrealized gains (losses) on securities | 3.14 | 0.89 | 1.78 | (0.62 | ) | (2.21 | ) | (7.43 | ) | |||||||||||||||
| Total from investment operations | 3.42 | 1.11 | 1.92 | (0.61 | ) | (1.90 | ) | (7.01 | ) | |||||||||||||||
| Less Distributions: | ||||||||||||||||||||||||
| Dividends from net investment income | (0.18 | ) | (0.21 | ) | (0.23 | ) | — | (0.41 | ) | (0.78 | ) | |||||||||||||
| Dividends from net realized gains | — | — | — | — | — | (13.53 | ) | |||||||||||||||||
| Total distributions | (0.18 | ) | (0.21 | ) | (0.23 | ) | — | (0.41 | ) | (14.31 | ) | |||||||||||||
| Net asset value, end of period | $ | 24.71 | $ | 21.47 | $ | 20.57 | $ | 18.88 | $ | 19.49 | $ | 21.80 | ||||||||||||
| TOTAL RETURN | 16.07 | % | 5.36 | % | 10.22 | % | (3.13 | )%(5) | (8.43 | )% | (22.42 | )% | ||||||||||||
| SUPPLEMENTAL DATA AND RATIOS: | ||||||||||||||||||||||||
| Net assets, end of period (millions) | $ | 125.00 | $ | 123.97 | $ | 131.54 | $ | 132.77 | $ | 138.34 | $ | 174.23 | ||||||||||||
| Ratio of expenses to average net assets: | ||||||||||||||||||||||||
| Before expense reimbursement | 1.40 | % | 1.38 | % | 1.41 | % | 1.37 | %(6) | 1.42 | % | 1.22 | % | ||||||||||||
| After expense reimbursement | 1.40 | % | 1.38 | % | 1.38 | % | 1.30 | %(6) | 1.17 | % | 1.02 | % | ||||||||||||
| Ratio of net investment income to average net assets: | ||||||||||||||||||||||||
| Before expense reimbursement | 1.16 | % | 0.97 | % | 0.64 | % | 0.28 | %(6) | 1.46 | % | 1.32 | % | ||||||||||||
| After expense reimbursement | 1.16 | % | 0.97 | % | 0.67 | % | 0.35 | %(6) | 1.71 | % | 1.52 | % | ||||||||||||
Portfolio turnover rate(4) | 111 | % | 149 | % | 146 | % | 10 | %(5) | 142 | % | 162 | % | ||||||||||||
| (1) | For the one month ended October 31, 2009. Effective October 31, 2009, the Fund changed its fiscal year end to October 31st from September 30th. |
| (2) | The financial highlights set forth for periods prior to March 20, 2009 represent the historical financial highlights of the Tamarack Value Fund, Class S shares. The assets of the Tamarack Value Fund were acquired by the Hennessy Select Large Value Fund on March 20, 2009. Prior to the reorganization, Tamarack Value Fund also offered Class A, Class C and R shares. At that time RBC Global Asset Management (U.S.), Inc., (formerly known as Voyageur Asset Management Inc.) ceased to be investment advisor and Hennessy Advisors, Inc. became investment advisor. The return of the Tamarack Value Fund, Class S shares during the period October 1, 2008 through March 20, 2009 was (33.09)%. The return of the Hennessy Select Large Value Fund, Original Class shares during the period March 20, 2009 through September 30, 2009 was 36.84%. |
| (3) | Per share net investment income (loss) has been calculated using the average daily shares method. |
| (4) | Portfolio turnover is calculated on the basis of the Fund as a whole. |
| (5) | Not annualized. |
| (6) | Annualized. |
The accompanying notes are an integral part of these financial statements.
WWW.HENNESSYFUNDS.COM
70
Financial Highlights
| Hennessy Large Value Fund (formerly the Hennessy Select Large Value Fund) |
For an Institutional Class share outstanding throughout each period
| One Month | Period | |||||||||||||||||||
| Ended | Ended | |||||||||||||||||||
| Year Ended October 31, | October 31, | September 30, | ||||||||||||||||||
| 2012 | 2011 | 2010 | 2009(1) | 2009(2) | ||||||||||||||||
| PER SHARE DATA: | ||||||||||||||||||||
| Net asset value, beginning of period | $ | 21.56 | $ | 20.65 | $ | 18.92 | $ | 19.53 | $ | 14.25 | ||||||||||
| Income from investment operations: | ||||||||||||||||||||
| Net investment income (loss) | 0.39 | 0.27 | 0.21 | — | (3) | 0.08 | ||||||||||||||
| Net realized and unrealized gains (losses) on securities | 3.15 | 0.92 | 1.80 | (0.61 | ) | 5.20 | ||||||||||||||
| Total from investment operations | 3.54 | 1.19 | 2.01 | (0.61 | ) | 5.28 | ||||||||||||||
| Less Distributions: | ||||||||||||||||||||
| Dividends from net investment income | (0.27 | ) | (0.28 | ) | (0.28 | ) | — | — | ||||||||||||
| Dividends from net realized gains | — | — | — | — | — | |||||||||||||||
| Total distributions | (0.27 | ) | (0.28 | ) | (0.28 | ) | — | — | ||||||||||||
| Net asset value, end of period | $ | 24.83 | $ | 21.56 | $ | 20.65 | $ | 18.92 | $ | 19.53 | ||||||||||
| TOTAL RETURN | 16.58 | % | 5.76 | % | 10.65 | % | (3.12 | )%(4) | 37.05 | %(4) | ||||||||||
| SUPPLEMENTAL DATA AND RATIOS: | ||||||||||||||||||||
| Net assets, end of period (millions) | $ | 0.06 | $ | 0.04 | $ | 0.04 | $ | 0.03 | $ | 0.03 | ||||||||||
| Ratio of expenses to average net assets: | ||||||||||||||||||||
| Before expense reimbursement | 1.22 | % | 1.21 | % | 1.22 | % | 1.20 | %(5) | 26.18 | %(5) | ||||||||||
| After expense reimbursement | 0.98 | % | 0.98 | % | 0.98 | % | 0.98 | %(5) | 0.98 | %(5) | ||||||||||
| Ratio of net investment income to average net assets: | ||||||||||||||||||||
| Before expense reimbursement | 1.29 | % | 1.13 | % | 0.80 | % | 0.44 | %(5) | (24.06 | )%(5) | ||||||||||
| After expense reimbursement | 1.53 | % | 1.36 | % | 1.04 | % | 0.66 | %(5) | 1.14 | %(5) | ||||||||||
Portfolio turnover rate(6) | 111 | % | 149 | % | 146 | % | 10 | %(4) | 142 | %(4) | ||||||||||
| (1) | For the one month ended October 31, 2009. Effective October 31, 2009, the Fund changed its fiscal year end to October 31st from September 30th. |
| (2) | Institutional Class shares commenced operations on March 20, 2009. |
| (3) | Amount is less than $0.01 or $(0.01). |
| (4) | Not annualized. |
| (5) | Annualized. |
| (6) | Portfolio turnover is calculated on the basis of the Fund as a whole. |
The accompanying notes are an integral part of these financial statements.
HENNESSY FUNDS 1-800-966-4354
71
Financial Highlights
| Hennessy Total Return Fund |
For an Investor Class share (formerly Original Class share) outstanding throughout each year
| Year Ended October 31, | ||||||||||||||||||||
| 2012 | 2011 | 2010 | 2009 | 2008 | ||||||||||||||||
| PER SHARE DATA: | ||||||||||||||||||||
| Net asset value, beginning of year | $ | 11.47 | $ | 10.57 | $ | 9.10 | $ | 9.22 | $ | 13.73 | ||||||||||
| Income from investment operations: | ||||||||||||||||||||
| Net investment income | 0.18 | 0.18 | 0.16 | 0.18 | 0.28 | |||||||||||||||
| Net realized and unrealized gains (losses) on securities | 1.17 | 0.89 | 1.48 | (0.14 | ) | (4.49 | ) | |||||||||||||
| Total from investment operations | 1.35 | 1.07 | 1.64 | 0.04 | (4.21 | ) | ||||||||||||||
| Less Distributions: | ||||||||||||||||||||
| Dividends from net investment income | (0.18 | ) | (0.17 | ) | (0.17 | ) | (0.16 | ) | (0.30 | ) | ||||||||||
| Dividends from realized capital gains | — | — | — | — | — | |||||||||||||||
| Total distributions | (0.18 | ) | (0.17 | ) | (0.17 | ) | (0.16 | ) | (0.30 | ) | ||||||||||
| Net asset value, end of period | $ | 12.64 | $ | 11.47 | $ | 10.57 | $ | 9.10 | $ | 9.22 | ||||||||||
| TOTAL RETURN | 11.78 | % | 10.22 | % | 18.09 | % | 0.69 | % | (30.97 | )% | ||||||||||
| SUPPLEMENTAL DATA AND RATIOS: | ||||||||||||||||||||
| Net assets, end of period (millions) | $ | 77.67 | $ | 64.13 | $ | 69.08 | $ | 52.38 | $ | 58.22 | ||||||||||
Gross ratio of expenses, including interest expense, to average net assets | 1.37 | % | 1.34 | % | 1.33 | % | 1.56 | % | 2.36 | % | ||||||||||
| Ratio of interest expense to average net assets | 0.08 | % | 0.10 | % | 0.08 | % | 0.29 | % | 1.16 | % | ||||||||||
Net ratio of expenses, excluding interest expense, to average net assets | 1.29 | % | 1.24 | % | 1.25 | % | 1.27 | % | 1.20 | % | ||||||||||
| Ratio of net investment income to average net assets | 1.44 | % | 1.56 | % | 1.62 | % | 2.12 | % | 2.43 | % | ||||||||||
| Portfolio turnover rate | 22 | % | 21 | % | 41 | % | 41 | % | 16 | % | ||||||||||
The accompanying notes are an integral part of these financial statements.
WWW.HENNESSYFUNDS.COM
72
Financial Highlights
| Hennessy Balanced Fund |
For an Investor Class share (formerly Original Class share) outstanding throughout each year
| Year Ended October 31, | ||||||||||||||||||||
| 2012 | 2011 | 2010 | 2009 | 2008 | ||||||||||||||||
| PER SHARE DATA: | ||||||||||||||||||||
| Net asset value, beginning of year | $ | 11.13 | $ | 10.43 | $ | 9.48 | $ | 9.11 | $ | 12.51 | ||||||||||
| Income from investment operations: | ||||||||||||||||||||
| Net investment income | 0.04 | 0.05 | 0.05 | 0.10 | 0.25 | |||||||||||||||
| Net realized and unrealized gains (losses) on securities | 0.75 | 0.70 | 0.95 | 0.38 | (2.80 | ) | ||||||||||||||
| Total from investment operations | 0.79 | 0.75 | 1.00 | 0.48 | (2.55 | ) | ||||||||||||||
| Less Distributions: | ||||||||||||||||||||
| Dividends from net investment income | (0.04 | ) | (0.05 | ) | (0.05 | ) | (0.11 | ) | (0.26 | ) | ||||||||||
| Dividends from realized capital gains | — | — | — | — | (0.59 | ) | ||||||||||||||
| Total distributions | (0.04 | ) | (0.05 | ) | (0.05 | ) | (0.11 | ) | (0.85 | ) | ||||||||||
| Net asset value, end of period | $ | 11.88 | $ | 11.13 | $ | 10.43 | $ | 9.48 | $ | 9.11 | ||||||||||
| TOTAL RETURN | 7.13 | % | 7.16 | % | 10.53 | % | 5.46 | % | (21.55 | )% | ||||||||||
| SUPPLEMENTAL DATA AND RATIOS: | ||||||||||||||||||||
| Net assets, end of period (millions) | $ | 25.17 | $ | 18.02 | $ | 12.50 | $ | 11.47 | $ | 11.46 | ||||||||||
| Ratio of net expenses to average net assets | 1.54 | % | 1.61 | % | 1.65 | % | 1.73 | % | 1.56 | % | ||||||||||
| Ratio of net investment income to average net assets | 0.34 | % | 0.42 | % | 0.45 | % | 1.17 | % | 2.31 | % | ||||||||||
| Portfolio turnover rate | 17 | % | 39 | % | 57 | % | 46 | % | 13 | % | ||||||||||
The accompanying notes are an integral part of these financial statements.
HENNESSY FUNDS 1-800-966-4354
73
Financial Highlights
| Hennessy Japan Fund (formerly the Hennessy Select SPARX Japan Fund) |
For an Investor Class share (formerly Original Class share) outstanding throughout each year
| Year Ended October 31, | ||||||||||||||||||||
| 2012 | 2011 | 2010 | 2009(1) | 2008(1) | ||||||||||||||||
| PER SHARE DATA: | ||||||||||||||||||||
| Net asset value, beginning of year | $ | 13.99 | $ | 12.58 | $ | 11.38 | $ | 9.73 | $ | 16.24 | ||||||||||
| Income from investment operations: | ||||||||||||||||||||
| Net investment income (loss) | (0.02 | ) | (0.10 | ) | (0.04 | ) | 0.02 | 0.05 | ||||||||||||
| Net realized and unrealized gains (losses) on securities | 1.43 | 1.51 | 1.25 | 1.66 | (6.56 | ) | ||||||||||||||
| Total from investment operations | 1.41 | 1.41 | 1.21 | 1.68 | (6.51 | ) | ||||||||||||||
| Less Distributions: | ||||||||||||||||||||
| Dividends from net investment income | — | — | (0.01 | ) | (0.03 | ) | — | |||||||||||||
| Dividends from net realized gains | — | — | — | — | — | |||||||||||||||
| Return of capital | — | — | (0.01 | ) | — | — | ||||||||||||||
| Total distributions | — | — | (0.02 | ) | (0.03 | ) | — | |||||||||||||
| Redemption fees retained | — | — | 0.01 | — | (2) | — | (2) | |||||||||||||
| Net asset value, end of period | $ | 15.40 | $ | 13.99 | $ | 12.58 | $ | 11.38 | $ | 9.73 | ||||||||||
| TOTAL RETURN | 10.08 | % | 11.21 | % | 11.04 | % | 17.36 | % | (40.09 | )% | ||||||||||
| SUPPLEMENTAL DATA AND RATIOS: | ||||||||||||||||||||
| Net assets, end of period (millions) | $ | 10.38 | $ | 14.81 | $ | 20.01 | $ | 28.29 | $ | 15.86 | ||||||||||
| Ratio of expenses to average net assets: | ||||||||||||||||||||
| Before expense reimbursement | 2.03 | % | 1.86 | % | 1.71 | % | 1.75 | % | 1.72 | % | ||||||||||
| After expense reimbursement | 2.03 | % | 1.86 | % | 1.59 | % | 1.24 | % | 1.25 | % | ||||||||||
| Ratio of net investment income (loss) to average net assets: | ||||||||||||||||||||
| Before expense reimbursement | (0.09 | )% | (0.54 | )% | (0.27 | )% | (0.34 | )% | (0.10 | )% | ||||||||||
| After expense reimbursement | (0.09 | )% | (0.54 | )% | (0.15 | )% | 0.17 | % | 0.37 | % | ||||||||||
Portfolio turnover rate(3) | 2 | % | 166 | % | 8 | % | 17 | % | 35 | % | ||||||||||
| (1) | The financial highlights set forth for periods prior to September 17, 2009 represent the historical financial highlights of the SPARX Japan Fund. On September 17, 2009 Hennessy Advisors, Inc., became the investment advisor to the Fund and the Fund changed its name to Hennessy Select SPARX Japan Fund. |
| (2) | Amount is less than $0.01. |
| (3) | Portfolio turnover is calculated on the basis of the Fund as a whole. |
The accompanying notes are an integral part of these financial statements.
WWW.HENNESSYFUNDS.COM
74
Financial Highlights
| Hennessy Japan Fund (formerly the Hennessy Select SPARX Japan Fund) |
For an Institutional Class share outstanding throughout each year
| Year Ended October 31, | ||||||||||||||||||||
| 2012 | 2011 | 2010 | 2009(1) | 2008(1) | ||||||||||||||||
| PER SHARE DATA: | ||||||||||||||||||||
| Net asset value, beginning of period | $ | 14.14 | $ | 12.66 | $ | 11.44 | $ | 9.78 | $ | 16.33 | ||||||||||
| Income from investment operations: | ||||||||||||||||||||
| Net investment income (loss) | 0.02 | 0.03 | 0.01 | 0.03 | 0.05 | |||||||||||||||
| Net realized and unrealized gains (losses) on securities | 1.44 | 1.45 | 1.23 | 1.66 | (6.60 | ) | ||||||||||||||
| Total from investment operations | 1.46 | 1.48 | 1.24 | 1.69 | (6.55 | ) | ||||||||||||||
| Less Distributions: | ||||||||||||||||||||
| Dividends from net investment income | — | — | (0.01 | ) | (0.03 | ) | — | |||||||||||||
| Dividends from net realized gains | — | — | — | — | — | |||||||||||||||
| Return of capital | — | — | (0.01 | ) | — | — | ||||||||||||||
| Total distributions | — | — | (0.02 | ) | (0.03 | ) | — | |||||||||||||
| Redemption fees retained | — | — | — | — | (2) | — | (2) | |||||||||||||
| Net asset value, end of period | $ | 15.60 | $ | 14.14 | $ | 12.66 | $ | 11.44 | $ | 9.78 | ||||||||||
| TOTAL RETURN | 10.33 | % | 11.69 | % | 11.07 | % | 17.37 | % | (40.11 | )% | ||||||||||
| SUPPLEMENTAL DATA AND RATIOS: | ||||||||||||||||||||
| Net assets, end of period (millions) | $ | 8.94 | $ | 9.70 | $ | 23.57 | $ | 25.55 | $ | 37.03 | ||||||||||
| Ratio of expenses to average net assets: | ||||||||||||||||||||
| Before expense reimbursement | 1.85 | % | 1.64 | % | 1.45 | % | 1.75 | % | 1.72 | % | ||||||||||
| After expense reimbursement | 1.85 | % | 1.64 | % | 1.40 | % | 1.24 | % | 1.25 | % | ||||||||||
| Ratio of net investment income (loss) to average net assets: | ||||||||||||||||||||
| Before expense reimbursement | 0.13 | % | 0.19 | % | 0.02 | % | (0.34 | )% | (0.10 | )% | ||||||||||
| After expense reimbursement | 0.13 | % | 0.19 | % | 0.07 | % | 0.17 | % | 0.37 | % | ||||||||||
Portfolio turnover rate(3) | 2 | % | 166 | % | 8 | % | 17 | % | 35 | % | ||||||||||
| (1) | The financial highlights set forth for periods prior to September 17, 2009 represent the historical financial highlights of the SPARX Japan Fund. On September 17, 2009 Hennessy Advisors, Inc., became the investment advisor to the Fund and the Fund changed its name to Hennessy Select SPARX Japan Fund. |
| (2) | Amount is less than $0.01 or $(0.01). |
| (3) | Portfolio turnover is calculated on the basis of the Fund as a whole. |
The accompanying notes are an integral part of these financial statements.
HENNESSY FUNDS 1-800-966-4354
75
Financial Highlights
| Hennessy Japan Small Cap Fund (formerly the Hennessy Select SPARX Japan Smaller Companies Fund) |
For an Investor Class share (formerly Original Class share) outstanding throughout each year
| Year Ended October 31, | ||||||||||||||||||||
| 2012 | 2011 | 2010 | 2009(1) | 2008(1) | ||||||||||||||||
| PER SHARE DATA: | ||||||||||||||||||||
| Net asset value, beginning of period | $ | 10.09 | $ | 9.23 | $ | 9.74 | $ | 6.87 | $ | 10.98 | ||||||||||
| Income from investment operations: | ||||||||||||||||||||
| Net investment income (loss) | (0.68 | ) | 0.06 | — | (2) | 0.07 | 0.02 | (3) | ||||||||||||
| Net realized and unrealized gains (losses) on securities | 1.17 | 0.80 | (0.10 | ) | 2.80 | (4.08 | ) | |||||||||||||
| Total from investment operations | 0.49 | 0.86 | (0.10 | ) | 2.87 | (4.06 | ) | |||||||||||||
| Less Distributions: | ||||||||||||||||||||
| Dividends from net investment income | (0.04 | ) | — | (0.42 | ) | — | (0.07 | ) | ||||||||||||
| Dividends from net realized gains | — | — | — | — | — | |||||||||||||||
| Total distributions | (0.04 | ) | — | (0.42 | ) | — | (0.07 | ) | ||||||||||||
| Redemption fees retained | — | — | 0.01 | — | (2) | 0.02 | ||||||||||||||
| Net asset value, end of period | $ | 10.54 | $ | 10.09 | $ | 9.23 | $ | 9.74 | $ | 6.87 | ||||||||||
| TOTAL RETURN | 4.91 | % | 9.32 | % | (0.72 | )% | 41.78 | % | (37.00 | )% | ||||||||||
| SUPPLEMENTAL DATA AND RATIOS: | ||||||||||||||||||||
| Net assets, end of period (millions) | $ | 5.11 | $ | 24.08 | $ | 15.17 | $ | 16.20 | $ | 11.74 | ||||||||||
| Ratio of expenses to average net assets: | ||||||||||||||||||||
| Before expense reimbursement | 2.33 | % | 2.10 | % | 2.14 | % | 3.10 | % | 4.47 | % | ||||||||||
| After expense reimbursement | 2.33 | % | 2.10 | % | 2.01 | % | 1.60 | % | 1.60 | % | ||||||||||
| Ratio of net investment income (loss) to average net assets: | ||||||||||||||||||||
| Before expense reimbursement | (0.66 | )% | 0.17 | % | (0.14 | )% | (0.86 | )% | (2.60 | )% | ||||||||||
| After expense reimbursement | (0.66 | )% | 0.17 | % | (0.01 | )% | 0.64 | % | 0.26 | % | ||||||||||
| Portfolio turnover rate | 49 | % | 61 | % | 100 | % | 138 | % | 55 | % | ||||||||||
| (1) | The financial highlights set forth for periods prior to September 17, 2009 represent the historical financial highlights of the SPARX Japan Smaller Companies Fund. On September 17, 2009 Hennessy Advisors, Inc., became the investment advisor to the Fund and the Fund changed its name to Hennessy Select SPARX Japan Smaller Companies Fund. |
| (2) | Amount is less than $0.01 or $(0.01). |
| (3) | Calculated based on average shares outstanding. |
The accompanying notes are an integral part of these financial statements.
WWW.HENNESSYFUNDS.COM
76
Notes to the Financial Statements
October 31, 2012
1). ORGANIZATION
The Hennessy Cornerstone Growth Fund (the “Growth Fund”), Hennessy Cornerstone Mid Cap 30 Fund (the “Mid Cap 30 Fund”, formerly known as the Hennessy Focus 30 Fund), and the Hennessy Cornerstone Value Fund (the “Value Fund”), are each series of Hennessy Mutual Funds, Inc., which was organized as a Maryland corporation on May 20, 1996. These Funds are open-end, diversified management investment companies registered under the Investment Company Act of 1940, as amended (the “1940 Act”). The investment objective of both the Growth Fund and Mid Cap 30 Fund is long-term growth of capital. The investment objective of the Value Fund is total return, consisting of capital appreciation and current income.
The Hennessy Cornerstone Large Growth Fund (the “Large Growth Fund”) and Hennessy Large Value Fund (the “Large Value Fund”, formerly known as the Hennessy Select Large Value Fund), are each series of Hennessy Funds Trust (the “Trust”), which was organized as a Delaware Statutory Trust on September 17, 1992. These Funds are open-end, diversified management investment companies registered under the 1940 Act. The investment objective of the Large Growth Fund is long-term growth of capital. The investment objective of the Large Value Fund is long-term growth of capital and current income.
The Hennessy Balanced Fund (the “Balanced Fund”), and Hennessy Total Return Fund (the “Total Return Fund”), are each series of Hennessy Funds, Inc., which was organized as a Maryland corporation on January 11, 1996. The Balanced and Total Return Funds are open-end, non-diversified management investment companies registered under the 1940 Act. The investment objective of the Balanced Fund is a combination of capital appreciation and current income. The investment objective of the Total Return Fund is total return, consisting of capital appreciation and current income.
The Hennessy Japan Fund (the “Japan Fund”, formerly known as the Hennessy Select SPARX Japan Fund and the Hennessy Japan Small Cap Fund (the “Japan Small Cap Fund”, formerly known as the Hennessy Select SPARX Japan Smaller Companies Fund), are each series of Hennessy SPARX Funds Trust, which was organized as a Massachusetts business trust on July 24, 1995. The Japan Fund and the Japan Small Cap Fund are open-end, diversified management investment companies registered under the 1940 Act. Although these Funds will each be considered a “diversified” mutual fund, the Funds may employ a relatively focused investment strategy and may hold securities of fewer issuers than other diversified funds. The investment objective of the Japan Fund and the Japan Small Cap Fund is long-term capital appreciation.
The Growth Fund, Mid Cap 30 Fund, Large Growth Fund, Value Fund, Large Value Fund, Total Return Fund, Balanced Fund, Japan Fund and Japan Small Cap Fund collectively represent the Hennessy Funds (the “Funds”).
The Growth Fund, Mid Cap 30 Fund, Large Growth Fund, Value Fund, Large Value Fund and Japan Fund offer Investor and Institutional Class shares. Prior to October 26, 2012, the Investor Class shares were known as Original Class shares. Each class of shares differs principally in its respective administration, shareholder servicing and transfer agent expenses and sales charges, if any. Each class has identical rights to earnings, assets and voting privileges, except for class-specific expenses and exclusive rights to vote on matters affecting only individual classes. The Total Return Fund, Balanced Fund and Japan Small Cap Fund offer only Investor Class shares.
2). SIGNIFICANT ACCOUNTING POLICIES
The following is a summary of significant accounting policies consistently followed by the Funds in the preparation of the financial statements. These policies are in conformity with U.S. generally accepted accounting principles (“GAAP”).
| a). | Investment Valuation – All investments in securities are recorded at their estimated fair value, as described in Note 3. |
| b). | Federal Income Taxes – Provision for Federal income taxes or excise taxes has not been made since the Funds have elected to be taxed as “regulated investment companies” and intend to distribute substantially all taxable income to shareholders and otherwise comply with the provisions of the Internal Revenue Code applicable to regulated investment companies. Net investment income or loss and realized gains and losses for federal income tax purposes may differ from that reported on the financial statements because of temporary book and tax basis differences. Temporary differences are primarily the result of the treatment of wash sales for tax reporting purposes. Distributions from net realized gains for book purposes may include short-term capital gains, which are included as ordinary income to shareholders for tax purposes. |
| Due to inherent differences in the recognition of income, expenses, and realized gains/losses under U.S. generally accepted accounting principles and federal income tax purposes, permanent differences between book and tax basis reporting for the 2012 fiscal year have been identified and appropriately reclassified on the Statement of Assets and Liabilities. |
| Accumulated Net | Accumulated Net | Paid In | ||||||||||||
| Investment Income/(Loss) | Realized Gain/(Loss) | Capital | ||||||||||||
| Growth Fund | $ | (1,180,937 | ) | $ | 2,766,634 | $ | (1,585,697 | ) | ||||||
| Mid Cap 30 Fund | $ | (39,596 | ) | $ | 1,567,459 | $ | (1,527,863 | ) | ||||||
| Large Growth Fund | $ | — | $ | 4,678,538 | $ | (4,678,538 | ) | |||||||
| Value Fund | $ | (348,207 | ) | $ | 306,487 | $ | 41,720 | |||||||
| Large Value Fund | $ | (18,241 | ) | $ | 18,323 | $ | (82 | ) | ||||||
| Total Return Fund | $ | — | $ | — | $ | — | ||||||||
| Balanced Fund | $ | — | $ | — | $ | — | ||||||||
| Japan Fund | $ | (1,984 | ) | $ | 4,767 | $ | (2,783 | ) | ||||||
| Japan Small Cap Fund | $ | 331,801 | $ | (233,429 | ) | $ | (98,372 | ) | ||||||
| The permanent differences primarily relate to Net Operating Losses, 988 currency transactions, partnership sales adjustments, and PFIC sale adjustments. |
WWW.HENNESSYFUNDS.COM
77
| c). | Income and Expenses – Dividend income is recognized on the ex-dividend date or as soon as information is available to the Funds and interest income, which includes the amortization of premium and accretion of discount, is recognized on an accrual basis. Income, expenses (other than expenses attributable to a specific class), and realized and unrealized gains or losses on investments are allocated to each class of shares based on its respective net assets. |
| d). | Distributions to Shareholders – Dividends from net investment income for the Growth Fund, Mid Cap 30 Fund, Large Growth Fund, Value Fund, Large Value Fund, Japan Fund and Japan Small Cap Fund, if any, are declared and paid out annually, usually in November or December of each year. Dividends from net investment income for the Total Return Fund and Balanced Fund are declared and paid on a calendar quarter basis. Distributions of net realized capital gains, if any, are declared and paid annually, usually in November or December of each year, for all of the Funds. |
| e). | Security Transactions – Investment and shareholder transactions are recorded on the trade date. The Funds determine the gain or loss realized from the investment transactions by comparing the original cost of the security lot sold with the net sale proceeds. Discounts and premiums on securities purchased are accreted/amortized over the life of the respective security. |
| f). | Use of Estimates – The preparation of financial statements in conformity with GAAP requires management to make estimates and assumptions that affect the reported amounts of assets and liabilities and disclosure of contingent assets and liabilities at the date of the financial statements and the reported change in net assets during the reporting period. Actual results could differ from those estimates. |
| g). | Share Valuation – The net asset value (“NAV”) per share of each Fund is calculated by dividing the sum of the value of the securities held by each Fund, plus cash or other assets, minus all liabilities (including estimated accrued expenses) by the total number of shares outstanding for each Fund, rounded to the nearest cent. The Funds’ shares will not be priced on the days on which the New York Stock Exchange is closed for trading. The offering and redemption price per share for each Fund is equal to each Fund’s net asset value per share. |
| h). | Foreign Currency – Values of investments denominated in foreign currencies are converted into U.S. dollars using the spot market rate of exchange at the time of valuation. Purchases and sales of investments and income are translated into U.S. dollars using the spot market rate of exchange prevailing on the respective dates of such transactions. The effect of changes in foreign exchange rates on realized and unrealized security gains and losses is reflected as a component of such gains or losses. Foreign investments present additional risks due to currency fluctuations, economic and political factors, lower liquidity, government regulations, differences in accounting standards and other factors. |
| i). | Forward Contracts – The Funds may enter into forward currency contracts to reduce their exposure to changes in foreign currency exchange rates on their foreign holdings and to lock in the U.S. dollar cost of firm purchase and sale commitments for securities denominated in foreign currencies. A forward currency contract is a commitment to purchase or sell a foreign currency at a future date at a negotiated forward rate. The gain or loss arising from the difference between the U.S. dollar cost of the original contract and the value of the foreign currency in U.S. dollars upon closing of such contract is included in net realized gain or loss from foreign currency transactions. During the year ended October 31, 2012, the Funds did not enter into any forward contracts. |
| j). | Repurchase Agreements – The Funds may enter into repurchase agreements with member banks or security dealers of the Federal Reserve whom the investment advisor deems creditworthy. The repurchase price generally equals the price paid by the Fund plus interest negotiated on the basis of current short-term rates. |
| Securities pledged as collateral for repurchase agreements are held by the custodian bank until the respective agreements mature. Provisions of the repurchase agreements ensure that the market value of the collateral, including accrued interest thereon, is sufficient, in the event of default of the counterparty. If the counterparty defaults and the value of the collateral declines or if the counterparty enters an insolvency proceeding, realization of the collateral by the Fund may be delayed or limited. |
| k). | Accounting for Uncertainty in Income Taxes – The Funds have adopted accounting policies regarding recognition and measurement of tax positions taken or expected to be taken on a tax return. The Funds have reviewed all open tax years and major jurisdictions and concluded that there is no impact on the Funds’ net assets and no tax liability resulting from unrecognized tax benefits relating to uncertain income tax positions taken or expected to be taken on a tax return. As of October 31, 2012, open Federal and state tax years for the Funds include the tax years ended October 31, 2009 through 2012. |
| l). | Derivatives – The Funds may invest in, or enter into, derivatives, such as options, futures contracts, options on futures contracts and swaps, for a variety of reasons, including to hedge certain risks, to provide a substitute for purchasing or selling particular securities or to increase potential income gain. Derivatives may provide a cheaper, quicker or more specifically focused way for a Fund to invest than “traditional” securities would. The main purpose of utilizing these derivative instruments is for hedging purposes. |
| The Funds have adopted the financial accounting reporting rules as required by the Derivatives and Hedging Topic of the FASB Accounting Standards Codification (“FASB ASC”). The Funds are required to include enhanced disclosure that enables investors to understand how and why an entity uses derivatives, how derivatives are accounted for, and how derivatives instruments affect an entity’s results of operations and financial position. During the year ended October 31, 2012, the Funds did not hold any derivative instruments. |
| m). | Events Subsequent to the Fiscal Period End – The Funds have adopted financial reporting rules regarding subsequent events which requires an entity to recognize in the financial statements the effects of all subsequent events that provide additional evidence about conditions that existed at the date of the balance sheet. Management has evaluated the Funds’ related events and transactions that occurred subsequent to October 31, 2012, through the date of issuance of the Funds’ financial statements. There were no events or transactions that occurred during this period that materially impacted the amounts or disclosures in the Funds’ financial statements. |
WWW.HENNESSYFUNDS.COM
78
| n). | New Accounting Pronouncements – In December 2011, FASB issued ASU No. 2011-11 related to disclosures about offsetting assets and liabilities. The amendments in this ASU require an entity to disclose information about offsetting and related arrangements to enable users of its financial statements to understand the effect of those arrangements on its financial position. The ASU is effective for annual reporting periods beginning on or after January 1, 2013, and interim periods within those annual periods. The guidance requires retrospective applications for all comparative periods presented. Management is currently evaluating the impact ASU 2011-11 will have on the financial statements disclosures. |
3). SECURITIES VALUATION
The Funds have adopted authoritative fair valuation accounting standards which establish an authoritative definition of fair value and set out a hierarchy for measuring fair value. These standards require additional disclosures about the various inputs and valuation techniques used to develop the measurements of fair value and a discussion in changes in valuation techniques and related inputs during the period. These inputs are summarized in the three broad levels listed below:
| Level 1 – | Quoted unadjusted prices for identical instruments in active markets to which the Fund has access at the date of measurement. |
| Level 2 – | Quoted prices for similar instruments in active markets; quoted prices for identical or similar instruments in markets that are not active; and model-derived valuations in which all significant inputs and significant value drivers are observable in active markets. Level 2 inputs are those in markets for which there are few transactions, the prices are not current, the prices are fair value adjusted due to post market close subsequent events (foreign markets), little public information exists or instances where prices vary substantially over time or among brokered market makers. These inputs may also include interest rates, prepayment speeds, credit risk curves, default rates and similar data. |
| Level 3 – | Model-derived valuations in which one or more significant inputs or significant value drivers are unobservable. Unobservable inputs are those inputs that reflect the Funds’ own assumptions that market participant’s would use to price the asset or liability based on the best available information. |
Following is a description of the valuation techniques applied to the Funds’ major categories of assets and liabilities measured at fair value on a recurring basis.
Equity Securities – Equity securities, including common stocks, preferred stocks, foreign issued common stocks, exchange traded funds, closed-end mutual funds and real estate investment trusts, which are traded on a securities exchange for which a last-quoted sales price is readily available will be valued at the last sales price as reported by the primary exchange on which the securities are listed. Securities listed on the Nasdaq National Market System (“Nasdaq”) will be valued at the Nasdaq Official Closing Price, which may differ from the last sales price reported. Securities traded on a securities exchange for which a last-quoted sales price is not readily available will be valued at the mean between the bid and ask prices. To the extent these securities are actively traded and valuation adjustments are not applied, they are categorized in Level 1 of the fair value hierarchy.
Mutual Funds – Investments in mutual funds are generally priced at the ending net asset value (“NAV”) provided by the service agent of the Funds and will be classified as Level 1 securities.
Investment Companies – Investments in investment companies (e.g. mutual funds and exchange traded funds) are generally priced at the ending net asset value (NAV) provided by the service agent of the Funds and will be classified as Level 1 securities.
U.S. Government Securities – U.S. government securities are normally valued using a model that incorporates market observable data such as reported sales of similar securities, broker quotes, yields, bids, offers, and reference data. Certain securities are valued principally using prices furnished by a pricing service. U.S. government securities are generally categorized in Level 2 of the fair value hierarchy based on the inputs used and market activity levels for specific securities.
Short-Term Securities – Short-term equity investments, including money market funds, are valued in the manner specified above. Short-term debt investments are valued at amortized cost, if their original maturity was 60 days or less, or by amortizing the values as of the 61st day prior to maturity, if their original term to maturity exceeded 60 days. Short-term securities are generally in Level 1 or Level 2 of the fair market hierarchy depending on the inputs used and market activity levels for specific securities.
The Board of Directors/Trustees of the Funds (the “Board”) has adopted fair value pricing procedures that are followed when a price for a security is not readily available or if a significant event has occurred that indicates the closing price of a security no longer represents the true value of that security. Fair value pricing determinations are made in good faith in accordance with these procedures. There are numerous criteria that will be given consideration in determining a fair value of a security. Some of these criteria are: trading volume of security and markets, value of other like securities and news events with direct bearing to security or market. Fair value pricing results in an estimated price that reasonably reflects the current market conditions in order to rate the portfolio holdings such that shareholder transactions receive a fair net asset value. Depending on the relative significance of the valuation inputs, these securities may be classified in either Level 2 or Level 3 of the fair value hierarchy.
Fair valuing of foreign securities may be determined with the assistance of a pricing service using correlations between the movement of prices of such securities and indices of domestic securities and other appropriate indicators, such as closing market prices of relevant American Depositary Receipts or futures contracts. The effect of using fair value pricing is that the Funds’ NAV will reflect the affected portfolio securities’ value as determined in the judgment of the Board or its designee instead of being determined by the market. Using a fair value pricing methodology to price securities may result in a value that is different from a security’s most recent closing price and from the prices used by other investment companies to calculate their net asset values and are considered Level 2 prices in the fair valuation hierarchy. Because the Funds invest in foreign securities, the value of the Funds’ portfolio securities may change on days when you will not be able to purchase or redeem your shares. Depending on the relative significance of the valuation inputs, these securities may be classified in either Level 2 or Level 3 of the fair value hierarchy.
HENNESSY FUNDS 1-800-966-4354
79
The Board has delegated day-to-day valuation issues to a Valuation Committee which is comprised of one or more representatives from Hennessy Advisors, Inc., the Fund’s advisor. The function of the Valuation Committee is to value securities where current and reliable market quotations are not readily available. All actions taken by the Valuation Committee are reviewed and ratified by the Board.
The Funds have performed an analysis of all existing investments to determine the significance and character of all inputs to their fair value determination. Various inputs are used in determining the value of each Fund’s investments. The inputs or methodology used for valuing securities are not necessarily an indication of the risk associated with investing in those securities. Details related to the fair valuation hierarchy of the Funds’ securities as of October 31, 2012, are included with each Fund’s Schedule of Investments.
4). REVERSE REPURCHASE AGREEMENTS
The Total Return Fund may enter into reverse repurchase agreements with the same parties with whom it may enter into repurchase agreements. Under a reverse repurchase agreement, the Fund sells securities and agrees to repurchase them at a mutually agreed upon date and price. Reverse repurchase agreements are regarded as a form of secured borrowing by the Fund. Securities sold under reverse repurchase agreements are reflected as a liability on the Statement of Assets and Liabilities. Interest payments made are recorded as a component of interest expense on the Statement of Operations.
For the year ended October 31, 2012, the average daily balance and average interest rate in effect for reverse repurchase agreements were $22,131,044 and 0.26%, respectively. At October 31, 2012, the interest rate in effect for the outstanding reverse repurchase agreements, scheduled to mature on November 8, 2012, ($10,800,000), December 13, 2012 ($10,794,000), and January 17, 2013 ($7,196,000), were 0.28%, 0.27% and 0.30%, respectively. Outstanding reverse repurchase agreements at October 31, 2012 were equal to 37.07% of the Total Return Fund’s net assets.
5). INVESTMENT TRANSACTIONS
Purchases and sales of investment securities (excluding government and short-term investments) during the year ended October 31, 2012 were as follows:
| Growth | Mid Cap 30 | Large Growth | Value | Large Value | |
| Fund | Fund | Fund | Fund | Fund | |
| Purchases | $226,967,274 | $39,499,217 | $ — | $58,195,967 | $136,908,387 |
| Sales | $192,094,061 | $53,398,542 | $8,666,147 | $56,321,280 | $152,295,014 |
| Total Return | Balanced | Japan | Japan Small Cap | ||
| Fund | Fund | Fund | Fund | ||
| Purchases | $11,487,835 | $4,746,748 | $ 462,576 | $ 7,218,187 | |
| Sales | $12,611,127 | $1,924,682 | $6,340,937 | $27,506,821 |
Purchases and sales/maturities of long-term U.S. Government Securities for the Balanced Fund were $1,699,110 and $700,000, respectively, for the year ended October 31, 2012. There were no purchases or sales/maturities of long-term U.S. Government Securities for the Growth Fund, Mid Cap 30 Fund, Large Growth Fund, Value Fund, Large Value Fund, Total Return Fund, Japan Fund or Japan Small Cap Fund for the year ended October 31, 2012.
6). INVESTMENT MANAGEMENT FEE AND OTHER TRANSACTIONS WITH AFFILIATES
Hennessy Advisors, Inc. (the “Advisor”) is the Advisor of the Funds. The Advisor provides the Funds with investment management services under a Management Agreement. The Advisor furnishes all investment advice, office space, facilities, and provides most of the personnel needed by the Funds. As compensation for its services, the Advisor is entitled to a monthly fee from each Fund. The fee is based upon the average daily net assets of the Funds at the annual rate of:
| Growth Fund | 0.74% | ||
| Mid Cap 30 Fund | 0.74% | ||
| Large Growth Fund | 0.74% | ||
| Value Fund | 0.74% | ||
| Large Value Fund | 0.85% | ||
| Total Return Fund | 0.60% | ||
| Balanced Fund | 0.60% | ||
| Japan Fund | 1.00% | ||
| Japan Small Cap Fund | 1.20% |
Advisor fees payable for the Funds as of October 31, 2012, were:
| Growth Fund | $180,177 | ||
| Mid Cap 30 Fund | $122,844 | ||
| Large Growth Fund | $64,209 | ||
| Value Fund | $81,603 | ||
| Large Value Fund | $91,323 | ||
| Total Return Fund | $39,979 | ||
| Balanced Fund | $12,940 | ||
| Japan Fund | $16,290 | ||
| Japan Small Cap Fund | $5,399 |
WWW.HENNESSYFUNDS.COM
80
The Advisor has delegated the day to day management of the Large Value Fund to a Sub-Advisor, RBC Global Asset Management (U.S.), Inc. (“RBC”). The Advisor has delegated the day to day management of the Japan and Japan Small Cap Funds to a Sub-Advisor, SPARX Asset Management Co. Ltd. (“SPARX”). The Advisor pays the Sub-Advisor fees for each of the Funds from its own assets and these fees are not an additional expense of the Funds.
The Advisor has agreed to waive its fees and absorb expenses to the extent that the total annual operating expenses (excluding all Federal, state and local taxes, interest, brokerage commissions, acquired fund fees and expenses and other costs incurred in connection with the purchase and sale of securities and extraordinary items) do not exceed 0.98% of the Funds’ net assets for the Institutional Class shares in the Growth, Mid Cap 30, Large Growth, Value and Large Value Funds. The expense limitation agreement for the Institutional Class shares can only be terminated by the Board. For a period of three years after the year in which the Advisor waives or reimburses expenses, the Advisor may seek reimbursement from the Funds to the extent that total annual Fund operating expenses are less than the expense limitation in effect at the time of the reimbursement. During the three years ended October 31, 2012, no Advisor fees were waived and therefore no expenses are subject to potential recovery.
The Large Value Fund, Japan Fund, and Japan Small Cap Fund each previously had operating expense limitation agreements which have since expired and/or have been terminated by the Board. As of October 31, 2012, cumulative expenses subject to potential recovery to the aforementioned conditions and year of expiration are as follows:
| Oct. 31, 2013 | Oct. 31, 2014 | Oct. 31, 2015 | Total | |
| Large Value Fund – Inv. Class | $38,444 | $ — | $ — | $38,444 |
| Japan Fund – Inv. Class | $37,425 | $ — | $ — | $37,425 |
| Japan Fund – Inst. Class | $12,915 | $ — | $ — | $12,915 |
| Japan Small Cap Fund – Inv. Class | $19,527 | $ — | $ — | $19,527 |
The Board has approved a Shareholder Servicing Plan for the Investor Class shares of each of the Funds which was instituted to compensate the Advisor for the non-investment management services it provides to the Funds. The Plan provides for a monthly fee paid to the Advisor at an annual rate of 0.10% of the average daily net assets of the Funds.
Service fees payable for the Funds as of October 31, 2012 were:
| Growth Fund | $21,786 | ||
| Mid Cap 30 Fund | $13,866 | ||
| Large Growth Fund | $6,537 | ||
| Value Fund | $10,813 | ||
| Large Value Fund | $10,739 | ||
| Total Return Fund | $6,663 | ||
| Balanced Fund | $2,157 | ||
| Japan Fund | $877 | ||
| Japan Small Cap Fund | $450 |
The Funds have entered into agreements with various brokers, dealers and financial intermediaries in connection with the sale of shares of the Funds. The agreements provide for periodic payments by the Funds to the brokers, dealers and financial intermediaries for providing certain shareholder maintenance services (sub-transfer agent expenses). These shareholder services include: the pre-processing and quality control of new accounts, shareholder correspondence, answering customer inquiries regarding account status and facilitating shareholder telephone transactions. Fees paid by the Funds to various brokers, dealers and financial intermediaries for the year ended October 31, 2012, were:
| Growth Fund | $343,459 | ||
| Mid Cap 30 Fund | $254,514 | ||
| Large Growth Fund | $19,666 | ||
| Value Fund | $74,671 | ||
| Large Value Fund | $89,951 | ||
| Total Return Fund | $30,149 | ||
| Balanced Fund | $20,402 | ||
| Japan Fund | $20,699 | ||
| Japan Small Cap Fund | $23,539 |
The Total Return Fund and Balanced Fund have adopted a plan pursuant to Rule 12b-1 which authorizes payments in connection with the distribution of the Total Return and Balanced Fund shares at an annual rate not to exceed 0.15% of each Fund’s average daily net assets. Amounts paid under the Plan may be spent on any activities or expenses primarily intended to result in the sale of shares, including but not limited to, advertising, compensation for sales and marketing activities or financial institutions and others such as dealers and distributors, shareholder account servicing, the printing and mailing of prospectuses to other than current shareowners and the printing and mailing of sales literature.
U.S. Bancorp Fund Services, LLC (the “Administrator”) acts as the Funds’ Administrator under an Administration Agreement. Administrative services under this agreement include custody, distribution, fund accounting, fund administration and transfer agent services. In addition, the Administrator prepares various federal and state regulatory filings, reports and returns for the Funds; prepares reports and materials to be supplied to the directors; monitors the activities of the Funds’ custodian, transfer agent and accountants; coordinates the preparation and payment of the Funds’ expenses and reviews the Funds’ expense accruals. Fees paid to U.S. Bancorp Fund Services, LLC for the year ended October 31, 2012, were:
HENNESSY FUNDS 1-800-966-4354
81
| Growth Fund | $555,538 | ||
| Mid Cap 30 Fund | $415,538 | ||
| Large Growth Fund | $197,895 | ||
| Value Fund | $314,513 | ||
| Large Value Fund | $319,745 | ||
| Total Return Fund | $180,627 | ||
| Balanced Fund | $58,174 | ||
| Japan Fund | $52,396 | ||
| Japan Small Cap Fund | $38,198 |
The Administrator has voluntarily waived all or a portion of its administration fees allocated to the Institutional Class shares of the Growth Fund, Mid Cap 30 Fund, Large Growth, Value and Large Value Fund. The administration fees voluntarily waived by the Administrator during the year ended October, 2012, were $4,007, $42,487, $2,641, $4,229 and $118, respectively.
Quasar Distributors, LLC (the “Distributor”) acts as the Funds’ principal underwriter in a continuous public offering of the Funds’ shares. The Distributor is an affiliated company of U.S. Bank, N.A.
7). LINE OF CREDIT
The Growth Fund, Mid Cap 30 Fund, Value Fund, Japan Fund and Japan Small Cap Fund have lines of credit of (i) $35,000,000, $25,000,000, $10,000,000, $3,000,000 and $3,000,000, respectively, or (ii) the lesser of 33.33% of each Fund’s net assets, intended to provide short-term financing, if necessary, subject to certain restrictions, in connection with shareholder redemptions. The credit facility is with its custodian bank, U.S. Bank, N.A. Borrowings under this arrangement bear interest at the bank’s prime rate. During the year ended October 31, 2012, the Growth Fund had an outstanding average daily balance and a weighted average interest rate of $8,374 and 3.25%, respectively. The maximum amount outstanding for the Growth Fund during the period was $1,583,000. During the year ended October 31, 2012, the Mid Cap 30 Fund had an outstanding average daily balance and a weighted average interest rate of $168,847 and 3.25%, respectively. The maximum amount outstanding for the Mid Cap 30 Fund during the period was $10,039,000. During the year ended October 31, 2012, the Value Fund had an outstanding average daily balance and a weighted average interest rate of $6,735 and 3.25%, respectively. The maximum amount outstanding for the Value Fund during the period was $939,000. During the year ended October 31, 2012, the Japan Fund had an outstanding average daily balance and a weighted average interest rate of $120 and 3.25%, respectively. The maximum amount outstanding for the Japan Fund during the period was $44,000. During the year ended October 31, 2012, the Japan Small Cap Fund had an outstanding average daily balance and a weighted average interest rate of $51,249 and 3.25%, respectively. The maximum amount outstanding for the Japan Small Cap Fund during the period was $3,000,000.
8). FEDERAL TAX INFORMATION
As of October 31, 2012, the components of accumulated earnings (losses) for income tax purposes were as follows:
| Growth | Mid Cap 30 | Large Growth | ||||||||||
| Fund | Fund | Fund | ||||||||||
| Cost of investments for tax purposes | $ | 272,787,207 | $ | 162,770,617 | $ | 101,226,194 | ||||||
| Gross tax unrealized appreciation | 44,200,587 | 30,575,395 | 18,829,340 | |||||||||
| Gross tax unrealized depreciation | (15,674,995 | ) | (3,255,399 | ) | (10,266,235 | ) | ||||||
| Net tax unrealized appreciation (depreciation) | $ | 28,525,592 | $ | 27,319,996 | $ | 8,563,105 | ||||||
| Undistributed ordinary income | $ | — | $ | 1,029,849 | $ | 1,080,454 | ||||||
| Undistributed long-term capital gains | — | — | 169,340 | |||||||||
| Total distributable earnings | $ | — | $ | 1,029,849 | $ | 1,249,794 | ||||||
| Other accumulated gains/(loss) | $ | (246,589,256 | ) | $ | (44,993,297 | ) | $ | (4,061,012 | ) | |||
| Total accumulated earnings/(loss) | $ | (218,063,664 | ) | $ | (16,643,452 | ) | $ | 5,751,887 | ||||
| Value | Large Value | Total Return | ||||||||||
| Fund | Fund | Fund | ||||||||||
| Cost of investments for tax purposes | $ | 108,730,517 | $ | 107,067,386 | $ | 98,251,218 | ||||||
| Gross tax unrealized appreciation | 21,078,375 | 20,433,398 | 8,394,757 | |||||||||
| Gross tax unrealized depreciation | (2,156,189 | ) | (2,008,917 | ) | (170,519 | ) | ||||||
| Net tax unrealized appreciation (depreciation) | $ | 18,922,186 | $ | 18,424,481 | $ | 8,224,238 | ||||||
| Undistributed ordinary income | $ | 2,446,268 | $ | 1,060,739 | $ | 78,405 | ||||||
| Undistributed long-term capital gains | — | — | — | |||||||||
| Total distributable earnings | $ | 2,446,268 | $ | 1,060,739 | $ | 78,405 | ||||||
| Other accumulated gains/(loss) | $ | (43,841,856 | ) | $ | (29,476,742 | ) | $ | (7,009,187 | ) | |||
| Total accumulated earnings/(loss) | $ | (22,473,402 | ) | $ | (9,991,522 | ) | $ | 1,293,456 | ||||
WWW.HENNESSYFUNDS.COM
82
| Balanced | Japan | Japan Small Cap | ||||||||||
| Fund | Fund | Fund | ||||||||||
| Cost of investments for tax purposes | $ | 23,578,357 | $ | 15,823,302 | $ | 5,091,643 | ||||||
| Gross tax unrealized appreciation | 1,793,810 | 4,105,359 | 590,961 | |||||||||
| Gross tax unrealized depreciation | (186,959 | ) | (677,280 | ) | (454,726 | ) | ||||||
| Net tax unrealized appreciation (depreciation) | $ | 1,606,851 | $ | 3,428,079 | $ | 136,235 | ||||||
| Undistributed ordinary income | $ | 2,932 | $ | — | $ | — | ||||||
| Undistributed long-term capital gains | — | — | 1,115,067 | |||||||||
| Total distributable earnings | $ | 2,932 | $ | — | $ | 1,115,067 | ||||||
| Other accumulated gains/(loss) | $ | (1,233,401 | ) | $ | (33,406,069 | ) | $ | (58,667 | ) | |||
| Total accumulated earnings/(loss) | $ | 376,382 | $ | (29,977,990 | ) | $ | 1,192,635 | |||||
The difference between book-basis and tax-basis unrealized appreciation is attributable primarily to capital loss carry overs, wash sales, and partnership adjustments.
At October 31, 2012, the Funds had capital loss carryforwards which expire as follows:
| Growth Fund | $60,841,121 | 10/31/16 | |
| 183,155,263 | 10/31/17 | ||
| Mid Cap 30 Fund | 3,858,159 | 10/31/16 | |
| 41,135,138 | 10/31/17 | ||
| Large Growth Fund | 4,061,012 | 10/31/16 | |
| Value Fund | 43,841,856 | 10/31/17 | |
| Large Value Fund | 29,468,928 | 10/31/17 | |
| Total Return Fund | 7,009,187 | 10/31/17 | |
| Balanced Fund | 1,233,401 | 10/31/17 | |
| Japan Fund | 4,786,618 | 10/31/15 | |
| 6,231,544 | 10/31/16 | ||
| 15,450,664 | 10/31/17 | ||
| 6,121,138 | 10/31/18 | ||
| 373,080 | Indefinite ST | ||
| 439,149 | Indefinite LT |
At October 31, 2012, the Japan Small Cap Fund had no tax basis capital losses to offset future capital gains.
During the year ended October 31, 2012, the capital loss carry forwards utilized for each fund was as follows:
| Growth Fund | 5,439,299 | |
| Mid Cap 30 Fund | 573,537 | |
| Large Growth Fund | 2,352 | |
| Value Fund | 2,872,985 | |
| Large Value Fund | 9,750,615 | |
| Total Return Fund | 3,320,669 | |
| Balanced Fund | 502,700 | |
| Japan Fund | — | |
| Japan Small Cap Fund | 694,391 |
Under recently enacted legislation, capital losses sustained in the year ended December 31, 2011 and in future taxable years will not expire and may be carried over by the Fund without limitation; however, they will retain the character of the original loss. Furthermore, any losses incurred during those taxable years will be required to be utilized prior to the losses incurred in the pre-enactment taxable years. As a result of this ordering rule, pre-enactment capital loss carryforwards may be more likely to expire unused. Under pre-enactment law, capital losses could be carried forward for eight years, and carried forward as short-term capital losses, irrespective of the character of the original loss.
At October 31, 2012 the following funds deferred, on a tax basis, post-October losses of:
| Post October Late Year | Post October | |||||||||
| Ordinary Loss Deferral | Loss Deferral | |||||||||
| Growth Fund | $ | 2,592,872 | — | |||||||
| Mid Cap 30 Fund | — | — | ||||||||
| Large Growth Fund | — | — | ||||||||
| Value Fund | — | — | ||||||||
| Large Value Fund | — | — | ||||||||
| Total Return Fund | — | — | ||||||||
| Balanced Fund | — | — | ||||||||
| Japan Fund | — | — | ||||||||
| Japan Small Cap Fund | 57,735 | — | ||||||||
HENNESSY FUNDS 1-800-966-4354
83
The tax character of distributions paid during 2012 and 2011 for the Funds were as follows:
| Year Ended | Year Ended | ||||||||
| Growth Fund | October 31, 2012 | October 31, 2011 | |||||||
| Ordinary Income | $ | — | $ | — | |||||
| Long-term capital gain | — | — | |||||||
| $ | — | $ | — | ||||||
| Year Ended | Year Ended | ||||||||
| Mid Cap 30 Fund | October 31, 2012 | October 31, 2011 | |||||||
| Ordinary Income | $ | — | $ | — | |||||
| Long-term capital gain | — | — | |||||||
| $ | — | $ | — | ||||||
| Year Ended | Year Ended | ||||||||
| Large Growth Fund | October 31, 2012 | October 31, 2011 | |||||||
| Ordinary Income | $ | 559,148 | $ | 627,807 | |||||
| Long-term capital gain | 15,375,965 | 109,248 | |||||||
| $ | 15,935,113 | $ | 737,055 | ||||||
| Year Ended | Year Ended | ||||||||
| Value Fund | October 31, 2012 | October 31, 2011 | |||||||
| Ordinary Income | $ | 3,834,285 | $ | 4,283,374 | |||||
| Long-term capital gain | — | — | |||||||
| $ | 3,834,285 | $ | 4,283,374 | ||||||
| Year Ended | Year Ended | ||||||||
| Large Value Fund | October 31, 2012 | October 31, 2011 | |||||||
| Ordinary Income | $ | 1,007,759 | $ | 1,292,183 | |||||
| Long-term capital gain | — | — | |||||||
| $ | 1,007,759 | $ | 1,292,183 | ||||||
| Year Ended | Year Ended | ||||||||
| Total Return Fund | October 31, 2012 | October 31, 2011 | |||||||
| Ordinary Income | $ | 1,013,041 | $ | 1,003,505 | |||||
| Long-term capital gain | — | — | |||||||
| $ | 1,013,041 | $ | 1,003,505 | ||||||
| Year Ended | Year Ended | ||||||||
| Balanced Fund | October 31, 2012 | October 31, 2011 | |||||||
| Ordinary Income | $ | 81,724 | $ | 55,526 | |||||
| Long-term capital gain | — | — | |||||||
| $ | 81,724 | $ | 55,526 | ||||||
| Year Ended | Year Ended | ||||||||
| Japan Fund | October 31, 2012 | October 31, 2011 | |||||||
| Ordinary Income | $ | — | $ | — | |||||
| Long-term capital gain | — | — | |||||||
| $ | — | $ | — | ||||||
| Year Ended | Year Ended | ||||||||
| Japan Small Cap Fund | October 31, 2012 | October 31, 2011 | |||||||
| Ordinary Income | $ | 99,101 | $ | — | |||||
| Long-term capital gain | — | — | |||||||
| $ | 99,101 | $ | — | ||||||
9). FUND REORGANIZATIONS
On October 25, 2012, the shareholders of the FBR Large Cap Fund, FBR Mid Cap Fund and FBR Small Cap Fund approved the agreement and plan of reorganization providing for the transfer of assets and the assumption of liabilities of the FBR Large Cap Fund, FBR Mid Cap Fund and FBR Small Cap Fund by each of the Hennessy Cornerstone Large Growth Fund, the Hennessy Cornerstone Mid Cap 30 Fund, and the Hennessy Cornerstone Growth Fund, respectively. The reorganization was effective as of the close of business on October 26, 2012. The following tables illustrate the specifics of each Fund’s reorganization:
| FBR Small Cap | Shares issued to Shareholders | Hennessy Cornerstone | |||
| Fund Net Assets | of FBR Small Cap Fund | Growth Fund Net Assets | Combined Net Assets | Tax Status of Transfer | |
$34,071,809(1) | 2,732,499 | $265,131,165 | $299,202,974 | Non-taxable |
| (1) | Includes accumulated realized losses and unrealized appreciation in the amounts of ($5,680,576) and $1,928,859 respectively. |
WWW.HENNESSYFUNDS.COM
84
| FBR Mid Cap | Shares issued to Shareholders | Hennessy Cornerstone | |||
| Fund Net Assets | of FBR Mid Cap Fund | Mid Cap 30 Fund Net Assets | Combined Net Assets | Tax Status of Transfer | |
$16,374,686(1) | 1,154,875 | $171,822,952 | $188,197,638 | Non-taxable |
| (1) | Includes accumulated realized losses and unrealized appreciation in the amounts of ($3,572,309) and $2,496,269 respectively. |
| FBR Large Cap | Shares issued to Shareholders | Hennessy Cornerstone | |||
| Fund Net Assets | of FBR Large Cap Fund | Large Growth Fund Net Assets | Combined Net Assets | Tax Status of Transfer | |
$33,698,161(1) | 3,110,613 | $75,963,129 | $109,661,290 | Non-taxable |
| (1) | Includes accumulated realized losses and unrealized appreciation in the amounts of ($8,751,401) and $4,423,584 respectively. |
Assuming the reorganization had been completed on November 1, 2011, the beginning of the annual reporting period of each of the respective Hennessy Funds, the pro forma results of operations (unaudited) for the year ended October 31, 2012, would have been as follows:
| Hennessy Cornerstone | Hennessy Cornerstone | Hennessy Cornerstone | ||||||||||||
| Growth Fund | Mid Cap 30 Fund | Large Growth Fund | ||||||||||||
| Net investment income/(loss) | $ | (1,277,452 | ) | $ | 1,183,817 | $ | 1,514,359 | |||||||
| Net realized gain/(loss) on investments | $ | 6,068,686 | $ | 415,390 | $ | 501,406 | ||||||||
| Change in unrealized appreciation/depreciation on investments | $ | 46,095,075 | $ | 22,755,030 | $ | 7,914,251 | ||||||||
| Net increase/(decrease) in net assets resulting from operations | $ | 50,886,309 | $ | 24,354,237 | $ | 9,930,016 | ||||||||
Because the combined investment portfolios have been managed as a single integrated portfolio since the reorganization was completed, it is not practicable to separate the amounts of revenue and earnings for the respective FBR Funds that have been included in each of the Hennessy Funds’ statement of operations since October 26, 2012.
HENNESSY FUNDS 1-800-966-4354
85
Report of Independent Registered Public Accounting Firm
The Shareholders and Board of Directors/Trustees of Hennessy Mutual Funds, Inc., Hennessy Funds, Inc.,
Hennessy Funds Trust, and Hennessy SPARX Funds Trust:
We have audited the accompanying statements of assets and liabilities of the Hennessy Cornerstone Growth Fund, Hennessy Cornerstone Mid Cap 30 Fund, Hennessy Cornerstone Large Growth Fund, Hennessy Cornerstone Value Fund, Hennessy Large Value Fund, Hennessy Total Return Fund, Hennessy Balanced Fund, Hennessy Japan Fund, and Hennessy Japan Small Cap Fund, including the schedules of investments, as of October 31, 2012, and the related statements of operations for the year then ended, statements of changes in net assets for the two-year period then ended, statement of cash flows for the year then ended for the Hennessy Total Return Fund, and the financial highlights for each of the periods presented in the five-year period then ended (each of the years in the three-year period ended October 31, 2012, month ended October 31, 2009, and year ended September 30, 2009 for Hennessy Cornerstone Large Growth Fund and Hennessy Large Value Fund, and each of the years in the four-year period ended October 31, 2012 for Hennessy Japan Fund and Hennessy Japan Small Cap Fund). These financial statements and financial highlights are the responsibility of management. Our responsibility is to express an opinion on these financial statements based on our audits. The financial highlights for the periods presented through September 30, 2008 of the Hennessy Cornerstone Large Growth Fund and Hennessy Large Value Fund were audited by other auditors whose report dated November 26, 2008 expressed an unqualified opinion on those financial highlights. The financial highlights for the periods presented through October 31, 2008 of the Hennessy Japan Fund and Hennessy Japan Small Cap Fund were audited by other auditors whose report dated December 10, 2008 expressed an unqualified opinion on those financial highlights.
We conducted our audits in accordance with generally accepted auditing standards as established by the Auditing Standards Board (United States) and in accordance with the auditing standards of the Public Company Accounting Oversight Board (United States). Those standards require that we plan and perform the audit to obtain reasonable assurance about whether the financial statements are free of material misstatement. An audit includes examining, on a test basis, evidence supporting the amounts and disclosures in the financial statements. Our procedures included confirmation of securities owned as of October 31, 2012, by correspondence with custodians or brokers, or by other appropriate auditing procedures. An audit also includes assessing the accounting principles used and significant estimates made by management, as well as evaluating the overall financial statement presentation. We believe that our audits provide a reasonable basis for our opinion.
In our opinion, the financial statements and financial highlights referred to above present fairly, in all material respects, the financial position of the Hennessy Cornerstone Growth Fund, Hennessy Cornerstone Mid Cap 30 Fund, Hennessy Cornerstone Large Growth Fund, Hennessy Cornerstone Value Fund, Hennessy Large Value Fund, Hennessy Total Return Fund, Hennessy Balanced Fund, Hennessy Japan Fund, and Hennessy Japan Small Cap as of October 31, 2012, and the results of their operations, changes in their net assets, cash flows of the Hennessy Total Return Fund, and the financial highlights for each of the periods described in the first paragraph above, in conformity with U.S. generally accepted accounting principles.

December 28, 2012
Milwaukee, WI
WWW.HENNESSYFUNDS.COM
86
Directors/Trustees and Officers of the Funds (Unaudited)
The business and affairs of the Funds are managed under the direction of the Funds’ Board of Directors/Trustees. Information pertaining to the Directors and Officers of the Funds is set forth below. The Funds’ Statement of Additional Information includes additional information about the Funds’ Directors/Trustees and Officers and is available, without charge, upon request by calling 1-800-966-4354.
| Number of | |||||
| Portfolios | Other | ||||
| in the Fund | Directorships | ||||
| Position(s) | Term of Office | Complex | (During Past | ||
| Held with | and Length of | Principal Occupation(s) | Overseen | 5 Years) Held | |
| Name, Address, and Age | the Fund | Time Served | During Past 5 Years | by Trustee | by Trustee |
| Disinterested Trustees (as defined below) | |||||
| J. Dennis DeSousa | Trustee | Indefinite, until | Mr. DeSousa is a real estate investor. | 16 | None. |
| Age: 76 | successor elected | ||||
| Address: | |||||
| c/o Hennessy Advisors, Inc. | Served since January | ||||
| 7250 Redwood Blvd. | 1996 HMFI and HFI; | ||||
| Suite 200 | since July 2005 HFT; | ||||
| Novato, CA 94945 | and since September | ||||
| 2009 HSFT | |||||
| Robert T. Doyle | Trustee | Indefinite, until | Mr. Doyle has been the Sheriff of | 16 | None. |
| Age: 65 | successor elected | Marin County, California since 1996. | |||
| Address: | |||||
| c/o Hennessy Advisors, Inc. | Served since January | ||||
| 7250 Redwood Blvd. | 1996 HMFI and HFI; | ||||
| Suite 200 | since July 2005 HFT; | ||||
| Novato, CA 94945 | and since September | ||||
| 2009 HSFT | |||||
| Gerald P. Richardson | Trustee | Indefinite, until | Mr. Richardson is an independent | 16 | None. |
| Age: 67 | successor elected | consultant in the securities industry. | |||
| Address: | |||||
| c/o Hennessy Advisors, Inc. | Served since May 2004 | ||||
| 7250 Redwood Blvd. | HMFI and HFI; since | ||||
| Suite 200 | July 2005 HFT; and | ||||
| Novato, CA 94945 | since September | ||||
| 2009 HSFT | |||||
| “Interested Persons” (as defined in the 1940 Act) | |||||
Neil J. Hennessy(1) | Trustee, | Trustee: | Mr. Hennessy has been employed by | 16 | Director of Hennessy |
| Age: 56 | President and | Indefinite, until | Hennessy Advisors, Inc., the Funds’ | Advisors, Inc. | |
| Address: | Chairman of | successor elected | investment advisor, since 1989. He | ||
| c/o Hennessy Advisors, Inc. | the Board | currently serves as President, Chairman, | |||
| 7250 Redwood Blvd. | Served since January | CEO, Portfolio Manager and CIO of | |||
| Suite 200 | 1996 HMFI and HFI; | Hennessy Advisors, Inc. | |||
| Novato, CA 94945 | since July 2005 HFT; | ||||
| and since September | |||||
| 2009 HSFT | |||||
| Officer: | |||||
| 1 year term | |||||
| Served since June 2008 | |||||
| HMFI, HFI and HFT; and | |||||
| since September 2009 HSFT | |||||
Joe Fahy(1) | Vice President | 1 year term | Mr. Fahy has been employed by | N/A | N/A |
| Age: 34 | and Chief | Hennessy Advisors, Inc., the Funds’ | |||
| Address: | Compliance | Since June 2010 HMFI, | investment advisor, since 2005. | ||
| c/o Hennessy Advisors, Inc. | Officer | HFI, HFT and HSFT | |||
| 7250 Redwood Blvd. | |||||
| Suite 200 | |||||
| Novato, CA 94945 | |||||
(1) All Officers of the Hennessy Funds and employees of the Manager are Interested Persons of the Fund.
HENNESSY FUNDS 1-800-966-4354
87
| Number of | |||||
| Portfolios | Other | ||||
| in the Fund | Directorships | ||||
| Position(s) | Term of Office | Complex | (During Past | ||
| Held with | and Length of | Principal Occupation(s) | Overseen | 5 Years) Held | |
| Name, Address, and Age | the Fund | Time Served | During Past 5 Years | by Trustee | by Trustee |
| Interested Persons | |||||
Teresa M. Nilsen(1) | Executive | 1 year term | Ms. Nilsen has been employed by | N/A | N/A |
| Age: 46 | Vice President | Hennessy Advisors, Inc., the Funds’ | |||
| Address: | and Treasurer | Since January 1996 | investment advisor, since 1989. She | ||
| c/o Hennessy Advisors, Inc. | HMFI and HFI; since | currently serves as Executive Vice | |||
| 7250 Redwood Blvd. | July 2005 HFT; and | President, Chief Operations Officer, | |||
| Suite 200 | since September | Chief Financial Officer and Secretary | |||
| Novato, CA 94945 | 2009 HSFT | of Hennessy Advisors, Inc. | |||
Daniel B. Steadman(1) | Executive | 1 year term | Mr. Steadman has been employed by | N/A | N/A |
| Age: 56 | Vice President | Hennessy Advisors, Inc., the Funds’ | |||
| Address: | and Secretary | Since March 2000 | investment advisor, since 2000. He | ||
| c/o Hennessy Advisors, Inc. | HMFI and HFI; since | currently serves as Executive Vice | |||
| 7250 Redwood Blvd. | July 2005 HFT; and | President and Chief Compliance Officer | |||
| Suite 200 | since September | of Hennessy Advisors, Inc. | |||
| Novato, CA 94945 | 2009 HSFT | ||||
David Ellison(1) | Senior | 1 year term | Mr. Ellison has served as Portfolio | N/A | N/A |
| Age: 54 | Vice President | Manager of the Hennessy Large Cap | |||
| Address: | & Chief | Since October 2012 | Financial Fund (formerly the FBR Large | ||
| 100 Federal Street | Investment | Cap Financial Fund), the Hennessy | |||
| 29th Floor | Officer | Small Cap Financial Fund (formerly the | |||
| Boston, MA 02110 | FBR Small Cap Financial Fund), and the | ||||
| Hennessy Technology Fund (formerly | |||||
| the FBR Technology Fund) since inception. | |||||
| Mr. Ellison previously served as Director, | |||||
| CIO & President of FBR Advisers, Inc. from | |||||
| December 1999 to October 2012. | |||||
Brian Peery(1) | Vice President | 1 year term | Mr. Peery has been employed by | N/A | N/A |
| Age: 43 | and | Hennessy Advisors, Inc., the Funds’ | |||
| Address: | Co-Portfolio | As Vice President, since | investment advisor, since 2002. | ||
| c/o Hennessy Advisors, Inc. | Manager | March 2003 HMFI and | |||
| 7250 Redwood Blvd. | HFI; since July 2005 | ||||
| Suite 200 | HFT; and since | ||||
| Novato, CA 94945 | September 2009 HSFT | ||||
| As Co-Portfolio Manager, | |||||
| since February 2011 | |||||
| HMFI, HFI, HFT and HSFT | |||||
Winsor (Skip) Aylesworth(1) | Vice President & | 1 year term | Mr. Aylesworth has been Portfolio | N/A | N/A |
| Age: 65 | Portfolio Manager | Manager of the Hennessy Gas Utility | |||
| Address: | Since October 2012 | Index Fund (formerly the FBR Gas Utility | |||
| 100 Federal Street | Index Fund) since 1998 and Portfolio | ||||
| 29th Floor | Manager of the Hennessy Technology | ||||
| Boston, MA 02110 | Fund (formerly the FBR Technology | ||||
| Fund) since inception. | |||||
| Mr. Aylesworth previously served as | |||||
| Executive Vice President of the FBR | |||||
| Funds from 1999 to October 2012. |
(1) All Officers of the Hennessy Funds and employees of the Manager are Interested Persons of the Fund.
Key:
HMFI = Hennessy Mutual Funds, Inc.
HFI = Hennessy Funds, Inc.
HFT = Hennessy Funds Trust
HSFT = Hennessy SPARX Funds Trust
WWW.HENNESSYFUNDS.COM
88
Expense Example (Unaudited)
October 31, 2012
As a shareholder of the Funds, you incur two types of costs: (1) transaction costs, including sales charges (loads) on purchase payments, reinvested dividends, or other distributions; redemption fees; and exchange fees; and (2) ongoing costs, including management fees; service fees; and other Fund expenses. This Example is intended to help you understand your ongoing costs (in dollars) of investing in each of the Funds and to compare these costs with the ongoing costs of investing in other mutual funds. The Example is based on an investment of $1,000 invested at the beginning of the period and held for the entire period from May 1, 2012 through October 31, 2012.
Actual Expenses
The first set of lines of the table below provide information about actual account values and actual expenses. Although the Funds charge no sales loads or transaction fees, you will be assessed fees for outgoing wire transfers, returned checks and stop payment orders at prevailing rates charged by U.S. Bancorp Fund Services, LLC, the Funds’ transfer agent. If you request that a redemption be made by wire transfer, currently a $15.00 fee is charged by the Funds’ transfer agent. IRA accounts will be charged a $15.00 annual maintenance fee. The example below includes, but is not limited to, management fees, shareholder servicing fees, fund accounting, custody and transfer agent fees. However, the example below does not include portfolio trading commissions and related expenses, and other extraordinary expenses as determined under generally accepted accounting principles. You may use the information within these lines, together with the amount you invested, to estimate the expenses that you paid over the six-month period. Simply divide your account value by $1,000 (for example, an $8,600 account value divided by $1,000 = 8.6), then multiply the result by the number in the first line under the heading entitled “Expenses Paid During Period” to estimate the expenses you paid on your account during this period.
Hypothetical Example for Comparison Purposes
The second set of lines within the table below provide information about hypothetical account values and hypothetical expenses based on the Funds’ actual expense ratios and an assumed rate of return of 5% per year before expenses, which is not the Funds’ actual return. The hypothetical account values and expenses may not be used to estimate the actual ending account balance or expenses you paid for the period. You may use this information to compare the ongoing costs of investing in the Funds and other funds. To do so, compare this 5% hypothetical example with the 5% hypothetical examples that appear in the shareholder reports of the other funds. Please note that the expenses shown in the table are meant to highlight your ongoing costs only and do not reflect any transactional costs, such as sales charges (loads), or exchange fees. Therefore, the second line of the table is useful in comparing ongoing costs only, and will not help you determine the relative total costs of owning different funds. In addition, if these transactional costs were included, your costs would have been higher.
HENNESSY FUNDS 1-800-966-4354
89
| Beginning | Ending | Expenses Paid | |
| Account Value | Account Value | During Period(1) | |
| Investor Class | 5/1/12 | 10/31/12 | 5/1/12 – 10/31/12 |
| Actual | |||
| Growth Fund – Investor Class | $1,000.00 | $1,047.40 | $ 6.84 |
| Mid Cap 30 Fund – Investor Class | $1,000.00 | $1,028.50 | $ 6.88 |
| Large Growth Fund – Investor Class | $1,000.00 | $986.30 | $ 6.34 |
| Value Fund – Investor Class | $1,000.00 | $1,036.20 | $ 6.40 |
| Large Value Fund – Investor Class | $1,000.00 | $1,026.60 | $ 7.13 |
| Total Return Fund – Investor Class | $1,000.00 | $1,028.60 | $ 6.78 |
| Balanced Fund – Investor Class | $1,000.00 | $1,016.90 | $ 8.16 |
| Japan Fund – Investor Class | $1,000.00 | $1,024.60 | $10.64 |
| Japan Small Cap Fund – Investor Class | $1,000.00 | $ 935.20 | $12.99 |
| Hypothetical (5% return before expenses) | |||
| Growth Fund – Investor Class | $1,000.00 | $1,018.45 | $6.75 |
| Mid Cap 30 Fund – Investor Class | $1,000.00 | $1,018.35 | $6.85 |
| Large Growth Fund – Investor Class | $1,000.00 | $1,018.75 | $6.44 |
| Value Fund – Investor Class | $1,000.00 | $1,018.85 | $6.34 |
| Large Value Fund – Investor Class | $1,000.00 | $1,018.10 | $7.10 |
| Total Return Fund – Investor Class | $1,000.00 | $1,018.45 | $6.75 |
| Balanced Fund – Investor Class | $1,000.00 | $1,017.04 | $8.16 |
| Japan Fund – Investor Class | $1,000.00 | $1,014.63 | $10.58 |
| Japan Small Cap Fund – Investor Class | $1,000.00 | $1,011.71 | $13.50 |
| (1) | Expenses are equal to the Growth Fund’s expense ratio of 1.33%, the Mid Cap 30 Fund’s expense ratio of 1.35%, the Large Growth Fund’s expense ratio of 1.27%, the Value Fund’s expense ratio of 1.25%, the Large Value Fund’s expense ratio of 1.40%, the Total Return Fund’s expense ratio of 1.33%, the Balanced Fund’s expense ratio of 1.61%, the Japan Fund’s expense ratio of 2.09%, and the Japan Small Cap Fund’s expense ratio of 2.67% multiplied by the average account value over the period, multiplied by 184/366 days (to reflect one-half year period). |
| Beginning | Ending | Expenses Paid | |
| Account Value | Account Value | During Period(2) | |
| Institutional Class | 5/1/12 | 10/31/12 | 5/1/12 – 10/31/12 |
| Actual | |||
| Growth Fund – Institutional Class | $1,000.00 | $1,048.40 | $5.05 |
| Mid Cap 30 Fund – Institutional Class | $1,000.00 | $1,030.20 | $5.00 |
| Large Growth Fund – Institutional Class | $1,000.00 | $ 987.30 | $4.90 |
| Value Fund – Institutional Class | $1,000.00 | $1,037.70 | $5.02 |
| Large Value Fund – Institutional Class | $1,000.00 | $1,028.60 | $5.00 |
| Japan Fund – Institutional Class | $1,000.00 | $1,025.60 | $9.52 |
| Hypothetical (5% return before expenses) | |||
| Growth Fund – Institutional Class | $1,000.00 | $1,020.21 | $4.98 |
| Mid Cap 30 Fund – Institutional Class | $1,000.00 | $1,020.21 | $4.98 |
| Large Growth Fund – Institutional Class | $1,000.00 | $1,020.21 | $4.98 |
| Value Fund – Institutional Class | $1,000.00 | $1,020.21 | $4.98 |
| Large Value Fund – Institutional Class | $1,000.00 | $1,020.21 | $4.98 |
| Japan Fund – Institutional Class | $1,000.00 | $1,015.74 | $9.48 |
| (2) | Expenses are equal to the Growth, Mid Cap 30, Large Growth, Value, and Large Value Fund’s expense ratio of 0.98%, and the Japan Fund’s expense ratio of 1.87%, multiplied by the average account value over the period, multiplied by 184/365 days (to reflect one-half year period). |
WWW.HENNESSYFUNDS.COM
90
How to Obtain a Copy of the Funds’ Proxy Voting Policy and Proxy Voting Records
A description of the policies and procedures that the Funds use to determine how to vote proxies relating to portfolio securities is available without charge: (1) by calling 1-800-966-4354; (2) on the Hennessy Funds website at www.hennessyfunds.com; or (3) on the U.S. Securities and Exchange Commission’s website at www.sec.gov. Hennessy Funds’ proxy voting record is available on the SEC’s website at www.sec.gov no later than August 31 for the prior 12 months ending June 30.
Quarterly Filings on Form N-Q
The Funds file their complete schedule of portfolio holdings with the SEC for the first and third quarters of each fiscal year on Form N-Q. The Funds’ Form N-Q will be available on the SEC’s website at www.sec.gov. The Funds’ Form N-Q may be reviewed and copied at the SEC’s Public Reference Room in Washington, DC and information on the operation of the Public Reference Room may be obtained by calling 1-800-SEC-0330. Information included in the Funds’ N-Q will also be available upon request by calling 1-800-966-4354.
Federal Tax Distribution Information (Unaudited)
For the fiscal year ended October 31, 2012, certain dividends paid by the Funds may be subject to a maximum tax rate of 15%, as provided for by the Jobs and Growth Tax Relief Reconciliation Act of 2003.
The percentage of dividends declared from ordinary income designated as qualified dividend income was as follows:
| Growth Fund | 0.00% | |
| Mid Cap 30 Fund | 0.00% | |
| Large Growth Fund | 100.00% | |
| Value Fund | 100.00% | |
| Large Value Fund | 100.00% | |
| Total Return Fund | 100.00% | |
| Balanced Fund | 100.00% | |
| Japan Fund | 0.00% | |
| Japan Small Cap Fund | 100.00% |
For corporate shareholders, the percent of ordinary income distributions qualifying for the corporate dividends received deduction for the fiscal year ended October 31, 2012 was as follows:
| Growth Fund | 0.00% | |
| Mid Cap 30 Fund | 0.00% | |
| Large Growth Fund | 100.00% | |
| Value Fund | 100.00% | |
| Large Value Fund | 100.00% | |
| Total Return Fund | 100.00% | |
| Balanced Fund | 100.00% | |
| Japan Fund | 0.00% | |
| Japan Small Cap Fund | 0.00% |
Householding
To help keep the Funds’ costs as low as possible, we generally deliver a single copy of most financial reports and prospectuses to shareholders who share an address, even if the accounts are registered under different names. This process, known as “householding,” does not apply to account statements. You may, of course, request an individual copy of a prospectus or financial report at any time. If you would like to receive separate mailings, please call the Transfer Agent at 1-800-261-6950 or 1-414-765-4124 and we will begin individual delivery within 30 days of your request. If your account is held through a financial institution or other intermediary, please contact them directly to request individual delivery.
HENNESSY FUNDS 1-800-966-4354
91
Privacy Policy
We collect the following non-public personal information about you:
| • | information we receive from you on or in applications or other forms, correspondence, or conversations, including, but not limited to, your name, address, phone number, social security number, assets, income and date of birth; |
| and |
| • | information about your transactions with us, our affiliates, or others, including, but not limited to, your account number and balance, payment history, parties to transactions, cost basis information and other financial information. |
We do not disclose any non-public personal information about our current or former shareholders to nonaffiliated third parties, except as permitted by law. For example, we are permitted by law to disclose all of the information we collect, as described above, to our Transfer Agent to process your transactions. Furthermore, we restrict access to your non-public personal information to those persons who require such information to provide products or services to you. We maintain physical, electronic and procedural safeguards that comply with federal standards to guard your non-public personal information.
In the event that you hold shares of the Fund through a financial intermediary, including, but not limited to, a broker-dealer, bank or trust company, the privacy policy of your financial intermediary would govern how your non-public personal information would be shared with nonaffiliated third parties.
WWW.HENNESSYFUNDS.COM
92
(This Page Intentionally Left Blank.)
HENNESSY FUNDS 1-800-966-4354
93
For information, questions
or assistance, please call
The Hennessy Funds
1-800-966-4354 or 1-415-899-1555
INVESTMENT ADVISOR
Hennessy Advisors, Inc.
7250 Redwood Blvd., Suite 200
Novato, California 94945
ADMINISTRATOR, TRANSFER
AGENT, DIVIDEND PAYING
AGENT & SHAREHOLDER
SERVICING AGENT
U.S. Bancorp Fund Services, LLC
P.O. Box 701
Milwaukee, Wisconsin 53201-0701
CUSTODIAN
U.S. Bank N.A.
Custody Operations
1555 North River Center Dr., Suite 302
Milwaukee, Wisconsin 53212
DIRECTORS/TRUSTEES
Neil J. Hennessy
Robert T. Doyle
J. Dennis DeSousa
Gerald P. Richardson
COUNSEL
Foley & Lardner LLP
777 East Wisconsin Avenue
Milwaukee, Wisconsin 53202-5306
INDEPENDENT REGISTERED
PUBLIC ACCOUNTING FIRM
KPMG LLP
777 East Wisconsin Avenue
Milwaukee, Wisconsin 53202-5306
DISTRIBUTOR
Quasar Distributors, LLC
615 East Michigan Street
Milwaukee, Wisconsin 53202
WWW.HENNESSYFUNDS.COM
This report has been prepared for shareholders and may be distributed to
others only if preceded or accompanied by a current prospectus.
Item 2. Code of Ethics.
The registrant has adopted a code of ethics that applies to the registrant’s principal executive officer and principal financial officer. The registrant has not made any amendments to its code of ethics during the period covered by this report. The registrant has not granted any waivers from any provisions of the code of ethics during the period covered by this report.
A copy of the registrant’s Code of Ethics is filed herewith.
Item 3. Audit Committee Financial Expert.
The registrant’s board of directors has determined that it does not have an audit committee financial expert serving on its audit committee. At this time, the registrant believes that the experience provided by each member of the audit committee together offers the registrant adequate oversight for the registrant’s level of financial complexity.
Item 4. Principal Accountant Fees and Services.
The registrant has engaged its principal accountant to perform audit services, audit-related services, tax services and other services during the past two fiscal years. “Audit services” refer to performing an audit of the registrant's annual financial statements or services that are normally provided by the accountant in connection with statutory and regulatory filings or engagements for those fiscal years. “Audit-related services” refer to the assurance and related services by the principal accountant that are reasonably related to the performance of the audit. “Tax services” refer to professional services rendered by the principal accountant for tax compliance, tax advice, and tax planning. The following table details the aggregate fees billed or expected to be billed for each of the last two fiscal years for audit fees, audit-related fees, tax fees and other fees by the principal accountant.
| FYE 10/31/2012 | FYE 10/31/2011 | |
| Audit Fees | $29,000 | $28,000 |
| Audit-Related Fees | - | - |
| Tax Fees | $7,200 | $7,000 |
| All Other Fees | - | - |
The audit committee has adopted pre-approval policies and procedures that require the audit committee to pre-approve all audit and non-audit services of the registrant, including services provided to any entity affiliated with the registrant.
The percentage of fees billed by KPMG, LLP applicable to non-audit services pursuant to waiver of pre-approval requirement were as follows:
| FYE 10/31/2012 | FYE 10/31/2011 | |
| Audit-Related Fees | 0% | 0% |
| Tax Fees | 0% | 0% |
| All Other Fees | 0% | 0% |
All of the principal accountant’s hours spent on auditing the registrant’s financial statements were attributed to work performed by full-time permanent employees of the principal accountant. (If more than 50 percent of the accountant’s hours were spent to audit the registrant's financial statements for the most recent fiscal year, state how many hours were attributed to work performed by persons other than the principal accountant's full-time, permanent employees.)
The following table indicates the non-audit fees billed or expected to be billed by the registrant’s accountant for services to the registrant and to the registrant’s investment adviser (and any other controlling entity, etc.—not sub-adviser) for the last two years. The audit committee of the board of trustees/directors has considered whether the provision of non-audit services that were rendered to the registrant's investment adviser is compatible with maintaining the principal accountant's independence and has concluded that the provision of such non-audit services by the accountant has not compromised the accountant’s independence.
| Non-Audit Related Fees | FYE 10/31/2012 | FYE 10/31/2011 |
| Registrant | - | - |
| Registrant’s Investment Adviser | - | - |
Item 5. Audit Committee of Listed Registrants.
Not applicable to registrants who are not listed issuers (as defined in Rule 10A-3 under the Securities Exchange Act of 1934).
Item 6. Investments.
Schedule of Investments is included as part of the report to shareholders filed under Item 1 of this Form.
Item 7. Disclosure of Proxy Voting Policies and Procedures for Closed-End Management Investment Companies.
Not applicable to open-end investment companies.
Item 8. Portfolio Managers of Closed-End Management Investment Companies.
Not applicable to open-end investment companies.
Item 9. Purchases of Equity Securities by Closed-End Management Investment Company and Affiliated Purchasers.
Not applicable to open-end investment companies.
Item 10. Submission of Matters to a Vote of Security Holders.
Not Applicable.
Item 11. Controls and Procedures.
| (a) | The Registrant’s President and Treasurer have reviewed the Registrant's disclosure controls and procedures (as defined in Rule 30a-3(c) under the Investment Company Act of 1940 (the “Act”)) as of a date within 90 days of the filing of this report, as required by Rule 30a-3(b) under the Act and Rules 13a-15(b) or 15d-15(b) under the Securities Exchange Act of 1934. Based on their review, such officers have concluded that the disclosure controls and procedures are effective in ensuring that information required to be disclosed in this report is appropriately recorded, processed, summarized and reported and made known to them by others within the Registrant and by the Registrant’s service provider. |
| (b) | There were no changes in the Registrant's internal control over financial reporting (as defined in Rule 30a-3(d) under the Act) that occurred during the second fiscal quarter of the period covered by this report that has materially affected, or is reasonably likely to materially affect, the Registrant's internal control over financial reporting. |
Item 12. Exhibits.
| (a) | (1) Any code of ethics or amendment thereto, that is the subject of the disclosure required by Item 2, to the extent that the registrant intends to satisfy Item 2 requirements through filing an exhibit. Filed herewith |
(2) A separate certification for each principal executive and principal financial officer pursuant to Section 302 of the Sarbanes-Oxley Act of 2002. Filed herewith.
(3) Any written solicitation to purchase securities under Rule 23c-1 under the Act sent or given during the period covered by the report by or on behalf of the registrant to 10 or more persons. Not applicable to open-end investment companies.
| (b) | Certifications pursuant to Section 906 of the Sarbanes-Oxley Act of 2002. Furnished herewith. |
SIGNATURES
Pursuant to the requirements of the Securities Exchange Act of 1934 and the Investment Company Act of 1940, the registrant has duly caused this report to be signed on its behalf by the undersigned, thereunto duly authorized.
(Registrant) Hennessy Funds, Inc.
By (Signature and Title)* /s/Neil J. Hennessy
Neil J. Hennessy, President
Date January 7, 2013
Pursuant to the requirements of the Securities Exchange Act of 1934 and the Investment Company Act of 1940, this report has been signed below by the following persons on behalf of the registrant and in the capacities and on the dates indicated.
By (Signature and Title)* /s/Neil J. Hennessy
Neil J. Hennessy, President
Date January 7, 2013
By (Signature and Title)* /s/Teresa M. Nilsen
Teresa M. Nilsen, Treasurer
Date January 7, 2013