UNITED STATES
SECURITIES AND EXCHANGE COMMISSION
Washington, D.C. 20549
FORM N-CSR
CERTIFIED SHAREHOLDER REPORT OF REGISTERED
MANAGEMENT INVESTMENT COMPANIES
Investment Company Act file number (811-7493)
The Hennessy Funds, Inc.
(Exact name of registrant as specified in charter)
The Courtyard Square
750 Grant Avenue, Suite 100
Novato, CA 94945
(Address of principal executive offices) (Zip code)
Neil J. Hennessy
Hennessy Advisors, Inc.
The Courtyard Square
750 Grant Avenue, Suite 100
Novato, CA 94945
(Name and address of agent for service)
800-966-4354
Registrant’s telephone number, including area code
Date of fiscal year end:October 31, 2004
Date of reporting period:October 31, 2004
Item 1. Report to Stockholders.

December 2004
Dear Hennessy Funds Shareholder:
As I’ve communicated to you in previous annual report letters this year, interest rates continue to be at historic lows, inflation remains in check, job creation appears to be stabilizing and corporations are seeing strong earnings and increasing their spending and hiring. Despite these positive economic indicators, the market has remained basically flat through the end of October. Up to this point, investors appear to have lacked confidence and enthusiasm in this otherwise strong economy and have been content to wait on the sidelines. However, with the presidential election now behind us, and as uncertainties, such as the war in Iraq and oil prices, become less volatile, the markets should improve significantly.
At Hennessy Funds we know one of the keys to investing success is maintaining a long-term view. We remain invested in the market and adhere to our formulas through good and bad markets, and we never let the headlines or emotions distract us from our proven strategies. With history as our guide, we believe that the market, over the long-run, will gain approximately 10 –11% per year.
We are pleased that the five Hennessy Funds all now have the same fiscal year end of October 31. As we consolidate the Funds into one annual report, this “abbreviated” annual report covers different periods for the various Funds since their most recent annual report. The reporting period is just one month for the Cornerstone Growth, Focus 30 and Cornerstone Value Funds and four months for the Total Return and Balanced Funds.
For the one-month period ending October 31, 2004 the Hennessy Cornerstone Growth Fund returned +1.57%, the Hennessy Focus 30 Fund returned –1.25%, and the Hennessy Cornerstone Value Fund returned +0.89%. For the same period the S&P 500 returned +1.53%. In general, small cap stocks outperformed both mid cap and large cap stocks in the month of October, which helped the Cornerstone Growth Fund beat the S&P 500. The relative underperformance of the Cornerstone Value Fund and the Focus 30 Fund versus this benchmark is attributed to the underperformance of energy stocks such as BP PLC and ChevronTexaco in Cornerstone Value and Lone Star Technologies and Maverick Tube Corp. in Focus 30. We feel this is due to the recent volatility in the oil market. Please keep in mind that the period being measured is very brief and does not necessarily represent long term performance trends.
For the four-month period ending October 31, 2004, the Hennessy Total Return Fund returned –1.61% and the Hennessy Balanced Fund returned –1.95%. During the same period, the S&P 500 Index and the Dow Jones Industrial Average returned –0.37% and –3.25%, respectively. In general, the performance of large cap stocks lagged that of small and mid cap stocks, which is in part why the Total Return and Balanced Funds lagged the S&P 500. Additionally, the Fund’s performance was hampered by significant investments in General Motors Corporation and Merck & Co., which both significantly under performed
1

during this period. Merck’s stock price was hit particularly hard following the recall of its drug, Vioxx. Despite these factors, both the Balanced and Total Return Funds outperformed the Dow Jones Industrial Average for the period.
I believe the recent market rally following the presidential election is not an isolated or temporary event, but instead signals the beginning of increased investor confidence and enthusiasm that should push the market higher. President Bush has indicated his desire to make the lower tax rate on dividends permanent during his second term, and we saw strong price increases among dividend-paying stocks immediately following the election. I believe we will continue to see strong stock price appreciation of dividend-paying companies, as well as increased dividend payouts. And, as interest rates continue to rise, as has been suggested by the Federal Reserve, the returns earned on the short-term government securities in the Hennessy Balanced and Total Return portfolios should increase as well.
At Hennessy Funds, we remain committed to our proven, disciplined investment style, and foremost we are committed to our shareholders. Thank you for your trust and confidence, and should you have any questions or need more information, please don’t hesitate to call us at (800) 966-4354 or visit our website at www.hennessyfunds.com.
Best regards,

President & Portfolio Manager
The Hennessy Total Return and Balanced Funds are non-diversified, meaning they may concentrate their assets in fewer individual holdings than a diversified fund, making them more exposed to individual stock volatility than a diversified fund.
References to specific securities should not be considered a recommendation to buy or sell any security. Fund holdings are subject to change. Please refer to the Schedule of Investments within this annual report for additional portfolio information, including percentages of holdings.
The S&P 500 Index is a broad-based unmanaged index of 500 stocks, which is widely recognized as representative of the equity market in general and commonly used to measure the performance of U.S. Stocks. The Dow Jones Industrial Average is an unmanaged index of common stocks comprised of major industrial companies and assumes reinvestment of dividends. One cannot invest directly in an index.
Opinions expressed are those of Neil Hennessy and are subject to change, are not guaranteed and should not be considered investment advice. 12/04
2
HENNESSY CORNERSTONE GROWTH FUND
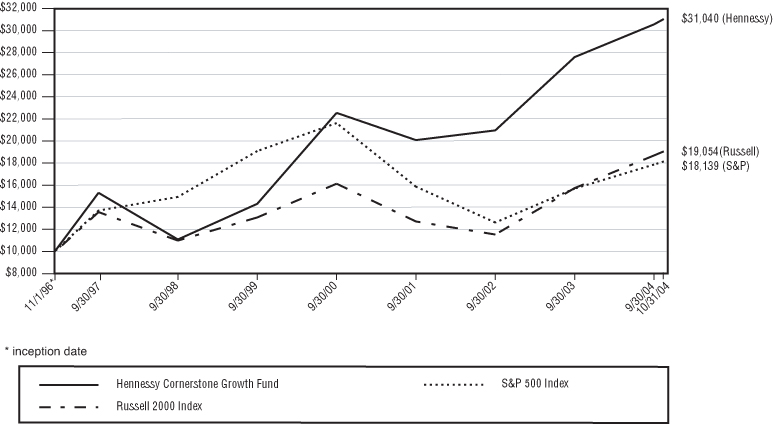
Performance data quoted represents past performance; past performance does not guarantee future results. The investment return and principal value of an investment will fluctuate so that an investor’s shares, when redeemed, may be worth more or less than their original cost. Current performance of the fund may be lower or higher than the performance quoted. Performance data current to the most recent month end may be obtained by visiting www.hennessyfunds.com.
AVERAGE ANNUAL TOTAL RETURN
PERIODS ENDED OCTOBER 31, 2004
| One Year | Five Years | Since Inception 11/1/96 | ||||||||
|---|---|---|---|---|---|---|---|---|---|---|
| Hennessy Cornerstone Growth Fund | 3.09 | % | 15.25 | % | 15.21% | |||||
| Russell 2000 Index | 11.73 | % | 7.74 | % | 8.40% | |||||
| S&P 500 Index | 9.42 | % | (2.22) | % | 7.73% | |||||
RUSSELL 2000 INDEX — An unmanaged index which measures the performance of the 2,000 smallest companies in the Russell 3000 Index. The Russell 3000 Index is an unmanaged index which measures the performance of the 3,000 largest U.S. Companies, based on total market capitalization, which represents approximately 98% of the investable U.S. equity market.
S&P 500 INDEX — An unmanaged capitalization-weighted index of 500 stocks designed to measure performance of the broad domestic economy through changes in the aggregate market value of the 500 stocks which represent all major industries.
3
HENNESSY FOCUS 30 FUND

Performance data quoted represents past performance; past performance does not guarantee future results. The investment return and principal value of an investment will fluctuate so that an investor’s shares, when redeemed, may be worth more or less than their original cost. Current performance of the fund may be lower or higher than the performance quoted. Performance data current to the most recent month end may be obtained by visiting www.hennessyfunds.com.
AVERAGE ANNUAL TOTAL RETURN
PERIODS ENDED OCTOBER 31, 2004
| One Year | Since Inception 9/17/03* | |||||
|---|---|---|---|---|---|---|
| Hennessy Focus 30 Fund | 2.73% | 6.49% | ||||
| S&P Midcap 400 Index | 11.04% | 13.09% | ||||
| S&P 500 Index | 9.42% | 9.62% |
| * | On September 17, 2003, the SYM Select Growth Fund merged into the Hennessy Focus 30 Fund. Due to the change in advisor and investment technique, performance is being quoted for the period after the merger. |
S&P MIDCAP 400 INDEX — An unmanaged capitalization-weighted index of 400 stocks designed to measure performance of mid-sized companies through changes in the aggregate market value of the 400 stocks which represent all major industries.
S&P 500 INDEX — An unmanaged capitalization-weighted index of 500 stocks designed to measure performance of the broad domestic economy through changes in the aggregate market value of the 500 stocks which represent all major industries.
4
HENNESSY CORNERSTONE VALUE FUND
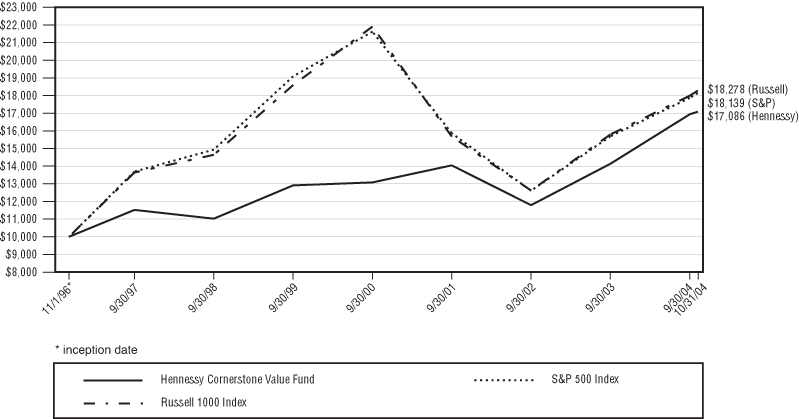
Performance data quoted represents past performance; past performance does not guarantee future results. The investment return and principal value of an investment will fluctuate so that an investor’s shares, when redeemed, may be worth more or less than their original cost. Current performance of the fund may be lower or higher than the performance quoted. Performance data current to the most recent month end may be obtained by visiting www.hennessyfunds.com.
AVERAGE ANNUAL TOTAL RETURN
PERIODS ENDED OCTOBER 31, 2004
| One Year | Five Years | Since Inception 11/1/96 | ||||||
|---|---|---|---|---|---|---|---|---|
| Hennessy Cornerstone Value Fund | 12.54% | 5.40% | 6.92% | |||||
| Russell 1000 Index | 9.33% | (1.63)% | 7.83% | |||||
| S&P 500 Index | 9.42% | (2.22)% | 7.73% |
Russell 1000 Index — An unmanaged index which measures the performance of the 1,000 largest companies in the Russell 3000 Index. The Russell 3000 Index is an unmanaged index which measures the performance of the 3,000 largest U.S. Companies, based on total market capitalization, which represents approximately 98% of the U.S. investable equity market.
S&P 500 INDEX — An unmanaged capitalization-weighted index of 500 stocks designed to measure performance of the broad domestic economy through changes in the aggregate market value of the 500 stocks which represent all major industries.
5
HENNESSY TOTAL RETURN FUND

Performance data quoted represents past performance; past performance does not guarantee future results. The investment return and principal value of an investment will fluctuate so that an investor’s shares, when redeemed, may be worth more or less than their original cost. Current performance of the fund may be lower or higher than the performance quoted. Performance data current to the most recent month end may be obtained by visiting www.hennessyfunds.com.
AVERAGE ANNUAL TOTAL RETURN
PERIODS ENDED OCTOBER 31, 2004
| One Year | Five Years | Since Inception 7/29/98 | ||||||
|---|---|---|---|---|---|---|---|---|
| Hennessy Total Return Fund | 4.74% | 2.33% | 2.55% | |||||
| Dow Jones Industrial Average | 4.46% | 0.56% | 3.82% | |||||
| S&P 500 Index | 9.42% | (2.22)% | 1.56% |
DOW JONES INDUSTRIAL AVERAGE — The Dow Jones Industrial Average is an unmanaged index of common stocks comprised of major industrial companies.
S&P 500 INDEX — An unmanaged capitalization-weighted index of 500 stocks designed to measure performance of the broad domestic economy through changes in the aggregate market value of the 500 stocks which represent all major industries.
6
HENNESSY BALANCED FUND

Performance data quoted represents past performance; past performance does not guarantee future results. The investment return and principal value of an investment will fluctuate so that an investor’s shares, when redeemed, may be worth more or less than their original cost. Current performance of the fund may be lower or higher than the performance quoted. Performance data current to the most recent month end may be obtained by visiting www.hennessyfunds.com.
AVERAGE ANNUAL TOTAL RETURN
PERIODS ENDED OCTOBER 31, 2004
| One Year | Five Years | Since Inception 3/8/96 | ||||||
|---|---|---|---|---|---|---|---|---|
| Hennessy Balanced Fund | 1.95% | 1.48% | 4.66% | |||||
| Dow Jones Industrial Average | 4.46% | 0.56% | 9.27% | |||||
| S&P 500 Index | 9.42% | (2.22)% | 8.62% |
DOW JONES INDUSTRIAL AVERAGE — The Dow Jones Industrial Average is an unmanaged index of common stocks comprised of major industrial companies.
S&P 500 INDEX — An unmanaged capitalization-weighted index of 500 stocks designed to measure performance of the broad domestic economy through changes in the aggregate market value of the 500 stocks which represent all major industries.
7
STATEMENTS OF ASSETS AND LIABILITIES
October 31, 2004
| Hennessy Cornerstone Growth Fund | Hennessy Focus 30 Fund | Hennessy Cornerstone Value Fund | Hennessy Total Return Fund | Hennessy Balanced Fund | ||||||||||||||||
|---|---|---|---|---|---|---|---|---|---|---|---|---|---|---|---|---|---|---|---|---|
ASSETS: | ||||||||||||||||||||
Investments, at value (cost $1,304,136,594, $49,580,368, $192,161,235, $130,737,154 and $21,682,346, respectively)(1) | $ | 1,313,654,594 | $ | 50,341,636 | $ | 195,628,447 | $ | 125,809,297 | $ | 21,365,157 | ||||||||||
| Cash | — | 1,551 | 87,765 | — | — | |||||||||||||||
| Dividends and interest receivable | 51,700 | 8,152 | 555,604 | 308,572 | 86,431 | |||||||||||||||
| Receivable for fund shares sold | 629,869 | 116,193 | 17,158 | 4,550 | — | |||||||||||||||
| Receivable for securities sold | — | — | — | — | 347,000 | |||||||||||||||
| Prepaid expenses and other assets | 79,343 | 11,710 | 37,509 | 14,367 | 11,705 | |||||||||||||||
| Total Assets | 1,314,415,506 | 50,479,242 | 196,326,483 | 126,136,786 | 21,810,293 | |||||||||||||||
LIABILITIES: | ||||||||||||||||||||
| Collateral for securities loaned | 442,351,971 | — | 133,986 | — | — | |||||||||||||||
| Payable for fund shares redeemed | 1,722,318 | 13,361 | 154,960 | 125,899 | 5,151 | |||||||||||||||
| Payable to Adviser | 545,361 | 42,781 | 122,448 | 47,001 | 11,209 | |||||||||||||||
| Payable to Administrator | 562,073 | 34,084 | 133,023 | 63,763 | 15,438 | |||||||||||||||
| Payable to Auditor | 26,627 | 16,781 | 22,344 | — | 4,162 | |||||||||||||||
| Payable to Distributor | — | — | — | 19,584 | 4,671 | |||||||||||||||
| Payable for reports to shareholders | 13,794 | 1,447 | 4,924 | — | 3,019 | |||||||||||||||
| Reverse repurchase agreement | — | — | — | 33,920,000 | — | |||||||||||||||
| Accrued expenses and other payables | 199,943 | 11,106 | 7,625 | 61,753 | 1,968 | |||||||||||||||
Other liabilities(2) | — | — | 101,463 | — | — | |||||||||||||||
| Total Liabilities | 445,422,087 | 119,560 | 680,773 | 34,238,000 | 45,618 | |||||||||||||||
NET ASSETS | $ | 868,993,419 | $ | 50,359,682 | $ | 195,645,710 | $ | 91,898,786 | $ | 21,764,675 | ||||||||||
NET ASSETS CONSIST OF: | ||||||||||||||||||||
| Capital stock | $ | 689,983,976 | $ | 57,639,310 | $ | 337,406,908 | $ | 193,154,102 | $ | 25,529,514 | ||||||||||
| Accumulated undistributed net investment income (loss) | — | — | 3,448,705 | 141,094 | 25,337 | |||||||||||||||
| Accumulated undistributed net realized gain (loss) on investments | 169,491,443 | (8,040,896 | ) | (148,677,115 | ) | (96,468,553 | ) | (3,472,987 | ) | |||||||||||
| Unrealized net appreciation (depreciation) on investments | 9,518,000 | 761,268 | 3,467,212 | (4,927,857 | ) | (317,189 | ) | |||||||||||||
| Total Net Assets | $ | 868,993,419 | $ | 50,359,682 | $ | 195,645,710 | $ | 91,898,786 | $ | 21,764,675 | ||||||||||
| Shares authorized ($.0001 par value) | 25,000,000,000 | 25,000,000,000 | 25,000,000,000 | 100,000,000 | 100,000,000 | |||||||||||||||
| Shares issued and outstanding | 44,830,825 | 5,810,275 | 15,677,820 | 8,835,350 | 2,050,228 | |||||||||||||||
| Net asset value, offering price and redemption price per share | $ | 19.38 | $ | 8.67 | $ | 12.48 | $ | 10.40 | $ | 10.62 | ||||||||||
| (1) | Market value of securities on loan $424,756,134, $0, $258, $0 and $0, respectively. |
| (2) | Prior to the merger, the Lindner Growth & Income Fund had an other liabilities balance of $101,463 on its books due to an underlying shareholder claim. As a result of the merger that transacted on February 27, 2004, the Value Fund assumed this balance. |
See notes to the financial statements.
8
STATEMENTS OF OPERATIONS — Hennessy Cornerstone Growth Fund
| Period Ended Oct. 31, 2004(1) | Year Ended Sept. 30, 2004 | |||||||
|---|---|---|---|---|---|---|---|---|
INVESTMENT INCOME: | ||||||||
| Dividend income | $ | 92,976 | $ | 4,116,630 | ||||
| Interest income | 1,882 | 186,839 | ||||||
| Securities lending income | 29,236 | 726,402 | ||||||
| Total investment income | 124,094 | 5,029,871 | ||||||
EXPENSES: | ||||||||
| Investment advisory fees | 545,361 | 6,575,291 | ||||||
| Administration, fund accounting, custody and transfer agent fees | 190,737 | 2,285,571 | ||||||
| Distribution fees | — | — | ||||||
| Service fees | 73,697 | 888,553 | ||||||
| Federal and state registration fees | 3,875 | 38,670 | ||||||
| Audit fees | 1,860 | 51,807 | ||||||
| Legal fees | 1,705 | 11,280 | ||||||
| Reports to shareholders | 5,735 | 102,907 | ||||||
| Directors’ fees and expenses | 930 | 8,723 | ||||||
| Sub-transfer agent expenses | 89,900 | 1,029,450 | ||||||
| Insurance expense | 5,425 | 45,837 | ||||||
| Interest expense (See Note 7) | 3,568 | 35,739 | ||||||
| Other | 124 | 1,299 | ||||||
| Total expenses | 922,917 | 11,075,127 | ||||||
NET INVESTMENT LOSS | $ | (798,823 | ) | $ | (6,045,256 | ) | ||
REALIZED AND UNREALIZED GAINS (LOSSES): | ||||||||
| Net realized gain (loss) on investments | $ | (519,598 | ) | $ | 260,819,119 | |||
| Change in unrealized appreciation (depreciation) on investments | 15,254,630 | (178,544,729 | ) | |||||
| Net gain on investments | 14,735,032 | 82,274,390 | ||||||
NET INCREASE IN NET ASSETS RESULTING FROM OPERATIONS | $ | 13,936,209 | $ | 76,229,134 | ||||
| (1) | For the one month ended October 31, 2004. Effective October 31, 2004, the Fund changed its fiscal year end to October 31st from September 30th. |
See notes to the financial statements.
9
STATEMENTS OF OPERATIONS — Hennessy Focus 30 Fund
| Period Ended Oct. 31, 2004(1) | Year Ended Sept. 30, 2004 | |||||||
|---|---|---|---|---|---|---|---|---|
INVESTMENT INCOME: | ||||||||
| Dividend income | $ | 3,439 | $ | 214,724 | ||||
| Interest income | 1,437 | 20,594 | ||||||
| Securities lending income | — | — | ||||||
| Total investment income | 4,876 | 235,318 | ||||||
EXPENSES: | ||||||||
| Investment advisory fees | 42,781 | 487,961 | ||||||
| Administration, fund accounting, custody and transfer agent fees | 11,568 | 131,749 | ||||||
| Distribution fees | — | — | ||||||
| Service fees | — | — | ||||||
| Federal and state registration fees | 2,139 | 14,085 | ||||||
| Audit fees | 186 | 16,736 | ||||||
| Legal fees | 1,426 | 9,898 | ||||||
| Reports to shareholders | 434 | 3,690 | ||||||
| Directors’ fees and expenses | 837 | 7,183 | ||||||
| Sub-transfer agent expenses | 2,232 | 12,087 | ||||||
| Insurance expense | 341 | 1,353 | ||||||
| Interest expense (See Note 7) | — | — | ||||||
| Other | 93 | 912 | ||||||
| Total expenses | 62,037 | 685,654 | ||||||
| Expense reimbursement by Advisor | — | (321 | ) | |||||
| Net expenses | 62,037 | 685,333 | ||||||
NET INVESTMENT LOSS | $ | (57,161 | ) | $ | (450,015 | ) | ||
REALIZED AND UNREALIZED GAINS (LOSSES): | ||||||||
| Net realized gain on investments | $ | — | $ | 1,712,086 | ||||
| Change in unrealized appreciation (depreciation) on investments | (625,572 | ) | 3,113,471 | |||||
| Net gain (loss) on investments | (625,572 | ) | 4,825,557 | |||||
NET INCREASE (DECREASE) IN NET ASSETS RESULTING FROM OPERATIONS | $ | (682,733 | ) | $ | 4,375,542 | |||
| (1) | For the one month ended October 31, 2004. Effective October 31, 2004, the Fund changed its fiscal year end to October 31st from September 30th. |
See notes to the financial statements.
10
STATEMENTS OF OPERATIONS — Hennessy Cornerstone Value Fund
| Period Ended Oct. 31, 2004(1) | Year Ended Sept. 30, 2004 | |||||
|---|---|---|---|---|---|---|
INVESTMENT INCOME: | ||||||
| Dividend income | $ | 474,429 | $ | 4,676,025 | ||
| Interest income | 2,109 | 17,560 | ||||
| Securities lending income | 182 | 9,954 | ||||
| Total investment income | 476,720 | 4,703,539 | ||||
EXPENSES: | ||||||
| Investment advisory fees | 122,448 | 931,767 | ||||
| Administration, fund accounting, custody and transfer agent fees | 44,677 | 339,969 | ||||
| Distribution fees | — | — | ||||
| Service fees | 16,547 | 125,915 | ||||
| Federal and state registration fees | 2,883 | 7,504 | ||||
| Audit fees | 1,488 | 7,688 | ||||
| Legal fees | 1,643 | 10,646 | ||||
| Reports to shareholders | 1,023 | 14,148 | ||||
| Directors’ fees and expenses | 837 | 6,369 | ||||
| Sub-transfer agent expenses | 2,821 | 34,855 | ||||
| Insurance expense | 1,240 | 5,898 | ||||
| Interest expense (See Note 7) | 46 | 1,031 | ||||
| Other | 124 | 917 | ||||
| Total expenses | 195,777 | 1,486,707 | ||||
NET INVESTMENT INCOME | $ | 280,943 | $ | 3,216,832 | ||
REALIZED AND UNREALIZED GAINS (LOSSES): | ||||||
| Net realized gain on investments | $ | — | $ | 976,738 | ||
| Change in unrealized appreciation on investments | 1,489,282 | 1,071,719 | ||||
| Net gain on investments | 1,489,282 | 2,048,457 | ||||
NET INCREASE IN NET ASSETS RESULTING FROM OPERATIONS | $ | 1,770,225 | $ | 5,265,289 | ||
| (1) | For the one month ended October 31, 2004. Effective October 31, 2004, the Fund changed its fiscal year end to October 31st from September 30th. |
See notes to the financial statements.
11
STATEMENTS OF OPERATIONS — Hennessy Total Return Fund
| Period Ended Oct. 31, 2004(1) | Year Ended June 30, 2004 | |||||||
|---|---|---|---|---|---|---|---|---|
INVESTMENT INCOME: | ||||||||
| Dividend income | $ | 921,340 | $ | 1,078,588 | ||||
| Interest income | 231,323 | 163,709 | ||||||
| Securities lending income | — | — | ||||||
| Total investment income | 1,152,663 | 1,242,297 | ||||||
EXPENSES: | ||||||||
| Investment advisory fees | 190,370 | 232,795 | ||||||
| Administration, fund accounting, custody and transfer agent fees | 85,747 | 104,677 | ||||||
| Distribution fees | 79,396 | 96,923 | ||||||
| Service fees | — | — | ||||||
| Federal and state registration fees | 10,053 | 30,810 | ||||||
| Audit fees | 4,901 | 7,746 | ||||||
| Legal fees | 4,047 | 11,031 | ||||||
| Reports to shareholders | 2,206 | 4,201 | ||||||
| Directors’ fees and expenses | 2,460 | 4,235 | ||||||
| Sub-transfer agent expenses | — | — | ||||||
| Insurance expense | 2,320 | 728 | ||||||
| Interest expense (See Note 3) | 183,599 | 148,489 | ||||||
| Other | 367 | 518 | ||||||
| Total expenses | 565,466 | 642,153 | ||||||
NET INVESTMENT INCOME | $ | 587,197 | $ | 600,144 | ||||
REALIZED AND UNREALIZED GAINS (LOSSES): | ||||||||
| Net realized gain on investments | $ | 13,282 | $ | 272,805 | ||||
| Change in unrealized depreciation on investments | (2,158,098 | ) | (3,087,326 | ) | ||||
| Net loss on investments | (2,144,816 | ) | (2,814,521 | ) | ||||
NET DECREASE IN NET ASSETS RESULTING FROM OPERATIONS | $ | (1,557,619 | ) | $ | (2,214,377 | ) | ||
| (1) | For the four months ended October 31, 2004. Effective October 31, 2004, the Fund changed its fiscal year end to October 31st from June 30th. |
See notes to the financial statements.
12
STATEMENTS OF OPERATIONS — Hennessy Balanced Fund
| Period Ended Oct. 31, 2004(1) | Year Ended June 30, 2004 | |||||||
|---|---|---|---|---|---|---|---|---|
INVESTMENT INCOME: | ||||||||
| Dividend income | $ | 144,036 | $ | 372,853 | ||||
| Interest income | 47,913 | 101,463 | ||||||
| Securities lending income | — | — | ||||||
| Total investment income | 191,949 | 474,316 | ||||||
EXPENSES: | ||||||||
| Investment advisory fees | 45,561 | 117,925 | ||||||
| Administration, fund accounting, custody and transfer agent fees | 20,503 | 53,066 | ||||||
| Distribution fees | 18,984 | 49,135 | ||||||
| Service fees | — | — | ||||||
| Federal and state registration fees | 6,878 | 15,378 | ||||||
| Audit fees | 6,654 | 20,540 | ||||||
| Legal fees | 3,411 | 8,164 | ||||||
| Reports to shareholders | 1,361 | 6,434 | ||||||
| Directors’ fees and expenses | 2,459 | 5,093 | ||||||
| Sub-transfer agent expenses | — | — | ||||||
| Insurance expense | 614 | 847 | ||||||
| Interest expense (See Note 7) | — | — | ||||||
| Other | 368 | 406 | ||||||
| Total expenses | 106,793 | 276,988 | ||||||
NET INVESTMENT INCOME | $ | 85,156 | $ | 197,328 | ||||
REALIZED AND UNREALIZED GAINS (LOSSES): | ||||||||
| Net realized gain (loss) on investments | $ | (86,296 | ) | $ | 32,241 | |||
| Change in unrealized appreciation (depreciation) on investments | (441,020 | ) | 673,215 | |||||
| Net gain (loss) on investments | (527,316 | ) | 705,456 | |||||
NET INCREASE (DECREASE) IN NET ASSETS RESULTING FROM OPERATIONS | $ | (442,160 | ) | $ | 902,784 | |||
| (1) | For the four months ended October 31, 2004. Effective October 31, 2004, the Fund changed its fiscal year end to October 31st from June 30th. |
See notes to the financial statements.
13
STATEMENTS OF CASH FLOWS — Hennessy Total Return Fund
| Period Ended Oct. 31, 2004(1) | Year Ended June 30, 2004 | |||||||
|---|---|---|---|---|---|---|---|---|
CASH FLOWS FROM OPERATING ACTIVITIES: | ||||||||
| Net decrease in net assets from operations | $ | (1,557,619 | ) | $ | (2,214,377 | ) | ||
| Adjustments to reconcile net increase in net assets from operations to net cash provided by operating activities: | ||||||||
| Purchase of investment securities | (177,927,250 | ) | (329,635,407 | ) | ||||
| Proceeds on sale of securities | 181,527,880 | 299,887,306 | ||||||
| Decrease in other receivables, net | (33,332 | ) | (118,697 | ) | ||||
| Decrease in other assets | 2,456 | 3,785 | ||||||
| Increase (decrease) in accrued expenses and other payables | 121,864 | (59,980 | ) | |||||
| Net accreation of discount on securities | (230,069 | ) | (160,100 | ) | ||||
| Net realized gain on investments | (13,282 | ) | (272,805 | ) | ||||
| Unrealized appreciation on securities | 2,158,098 | 3,087,326 | ||||||
| Net cash used by operating activities | $ | 4,048,746 | $ | (29,482,949 | ) | |||
CASH FLOWS FROM FINANCING ACTIVITIES: | ||||||||
| Increase (decrease) in reverse repurchase agreements | $ | (542,280 | ) | $ | 32,774,980 | |||
| Proceeds on shares sold | 459,224 | 2,789,770 | ||||||
| Payment on shares repurchased | (3,935,365 | ) | (6,029,885 | ) | ||||
| Cash dividends paid | (30,325 | ) | (51,916 | ) | ||||
| Net cash provided by financing activities | $ | (4,048,746 | ) | $ | 29,482,949 | |||
| Net increase (decrease) in cash | — | — | ||||||
| Cash at beginning of period | — | — | ||||||
| Cash at end of period | $ | — | $ | — | ||||
| Cash paid for interest | $ | 155,246 | $ | 128,181 | ||||
| (1) | For the four months ended October 31, 2004. Effective October 31, 2004, the Fund changed its fiscal year end to October 31st from June 30th. |
See notes to the financial statements.
14
STATEMENTS OF CHANGES IN NET ASSETS — Hennessy Cornerstone Growth Fund
| Period Ended Oct. 31, 2004(1) | Year Ended Sept. 30, 2004 | Year Ended Sept. 30, 2003 | ||||||||||
|---|---|---|---|---|---|---|---|---|---|---|---|---|
OPERATIONS: | ||||||||||||
| Net investment loss | $ | (798,823 | ) | $ | (6,045,256 | ) | $ | (3,179,428 | ) | |||
| Net realized gain (loss) on securities | (519,598 | ) | 260,819,119 | (44,057,725 | ) | |||||||
| Change in unrealized appreciation (depreciation) on securities | 15,254,630 | (178,544,729 | ) | 205,396,621 | ||||||||
| Net increase in net assets resulting from operations | 13,936,209 | 76,229,134 | 158,159,468 | |||||||||
DISTRIBUTIONS TO SHAREHOLDERS: | ||||||||||||
| From net investment income | — | — | — | |||||||||
| From net realized gains | — | — | (15,011,940 | ) | ||||||||
| — | — | (15,011,940 | ) | |||||||||
CAPITAL SHARE TRANSACTIONS: | ||||||||||||
| Proceeds from shares subscribed | 8,450,760 | 278,038,137 | 397,808,244 | |||||||||
| Proceeds from shares issued in connection with the Lindner Funds merger | — | 15,352,072 | — | |||||||||
| Dividends reinvested | — | — | 14,479,431 | |||||||||
| Redemption fees retained | 4,497 | 171,968 | — | |||||||||
| Cost of shares redeemed | (19,434,245 | ) | (255,741,417 | ) | (145,812,892 | ) | ||||||
| Net increase (decrease) in net assets derived from capital share transactions | (10,978,988 | ) | 37,820,760 | 266,474,783 | ||||||||
TOTAL INCREASE IN NET ASSETS | 2,957,221 | 114,049,894 | 409,622,311 | |||||||||
NET ASSETS: | ||||||||||||
| Beginning of period | 866,036,198 | 751,986,304 | 342,363,993 | |||||||||
| End of period | $ | 868,993,419 | $ | 866,036,198 | $ | 751,986,304 | ||||||
Undistributed net investment income, end of period | $ | — | $ | — | $ | — | ||||||
CHANGES IN SHARES OUTSTANDING: | ||||||||||||
| Shares sold | 437,895 | 14,598,984 | 27,858,357 | |||||||||
| Shares issued in connection to the acquisition of Lindner Funds | — | 795,750 | — | |||||||||
| Shares issued to holders as reinvestment of dividends | — | — | 1,039,442 | |||||||||
| Shares redeemed | (1,007,572 | ) | (13,629,312 | ) | (10,538,371 | ) | ||||||
| Net increase (decrease) in shares outstanding | (569,677 | ) | 1,765,422 | 18,359,428 | ||||||||
| (1) | For the one month ended October 31, 2004. Effective October 31, 2004, the Fund changed its fiscal year end to October 31st from September 30th. |
See notes to the financial statements.
15
STATEMENTS OF CHANGES IN NET ASSETS — Hennessy Focus 30 Fund
| Period Ended Oct. 31, 2004(1) | Year Ended Sept. 30, 2004 | Jan. 1, 2003 to Sept. 30, 2003(2) | Year Ended Dec. 31, 2002 | |||||||||||||
|---|---|---|---|---|---|---|---|---|---|---|---|---|---|---|---|---|
OPERATIONS: | ||||||||||||||||
| Net investment loss | $ | (57,161 | ) | $ | (450,015 | ) | $ | (132,022 | ) | $ | (73,185 | ) | ||||
| Net realized gain (loss) on securities | — | 1,712,086 | 4,642,882 | (10,144,772 | ) | |||||||||||
| Change in unrealized appreciation (depreciation) on securities | (625,572 | ) | 3,113,471 | (55,239 | ) | (2,684,534 | ) | |||||||||
| Net increase (decrease) in net assets resulting from operations | (682,733 | ) | 4,375,542 | 4,455,621 | (12,902,491 | ) | ||||||||||
DISTRIBUTIONS TO SHAREHOLDERS: | ||||||||||||||||
| From net investment income | — | — | — | — | ||||||||||||
| From net realized gains | — | — | — | — | ||||||||||||
| — | — | — | — | |||||||||||||
CAPITAL SHARE TRANSACTIONS: | ||||||||||||||||
| Proceeds from shares subscribed | 738,948 | 24,923,015 | 6,929,875 | 11,445,318 | ||||||||||||
| Proceeds from shares issued in connection with the Lindner Funds merger | — | — | — | — | ||||||||||||
| Dividends reinvested | — | — | — | — | ||||||||||||
| Redemption fees retained | 59 | 11,733 | — | — | ||||||||||||
| Cost of shares redeemed | (790,514 | ) | (11,503,642 | ) | (6,607,587 | ) | (13,262,933 | ) | ||||||||
| Net increase (decrease) in net assets derived from capital share transactions | (51,507 | ) | 13,431,106 | 322,288 | (1,817,615 | ) | ||||||||||
TOTAL INCREASE (DECREASE) IN NET ASSETS | (734,240 | ) | 17,806,648 | 4,777,909 | (14,720,106 | ) | ||||||||||
NET ASSETS: | ||||||||||||||||
| Beginning of period | 51,093,922 | 33,287,274 | 28,509,365 | 43,229,471 | ||||||||||||
| End of period | $ | 50,359,682 | $ | 51,093,922 | $ | 33,287,274 | $ | 28,509,365 | ||||||||
Undistributed net investment income, end of period | $ | — | $ | — | $ | — | $ | — | ||||||||
CHANGES IN SHARES OUTSTANDING: | ||||||||||||||||
| Shares sold | 84,638 | 2,846,070 | 919,363 | 1,465,603 | ||||||||||||
| Shares issued in connection to the acquisition of Lindner Funds | — | — | — | — | ||||||||||||
| Shares issued to holders as reinvestment of dividends | — | — | — | (1,831,311 | ) | |||||||||||
| Shares redeemed | (91,797 | ) | (1,340,339 | ) | (907,302 | ) | — | |||||||||
| Net increase (decrease) in shares outstanding | (7,159 | ) | 1,505,731 | 12,061 | (365,708 | ) | ||||||||||
| (1) | For the one month ended October 31, 2004. Effective October 31, 2004, the Fund changed its fiscal year end to October 31st from September 30th. |
| (2) | Fiscal year end was changed from December 31st to September 30th. |
See notes to the financial statements.
16
STATEMENTS OF CHANGES IN NET ASSETS — Hennessy Cornerstone Value Fund
| Period Ended Oct. 31, 2004(1) | Year Ended Sept. 30, 2004 | Year Ended Sept. 30, 2003 | ||||||||||
|---|---|---|---|---|---|---|---|---|---|---|---|---|
OPERATIONS: | ||||||||||||
| Net investment income | $ | 280,943 | $ | 3,216,832 | $ | 391,455 | ||||||
| Net realized gain (loss) on securities | — | 976,738 | (1,620,212 | ) | ||||||||
| Change in unrealized appreciation on securities | 1,489,282 | 1,071,719 | 4,612,282 | |||||||||
| Net increase in net assets resulting from operations | 1,770,225 | 5,265,289 | 3,383,525 | |||||||||
DISTRIBUTIONS TO SHAREHOLDERS: | ||||||||||||
| From net investment income | — | (421,282 | ) | (360,831 | ) | |||||||
| From net realized gains | — | — | — | |||||||||
| — | (421,282 | ) | (360,831 | ) | ||||||||
CAPITAL SHARE TRANSACTIONS: | ||||||||||||
| Proceeds from shares subscribed | 925,168 | 7,462,844 | 5,532,084 | |||||||||
| Proceeds from shares issued in connection with the Lindner Funds merger | — | 179,367,979 | — | |||||||||
| Dividends reinvested | — | 407,298 | 349,662 | |||||||||
| Redemption fees retained | — | 4,089 | — | |||||||||
| Cost of shares redeemed | (1,535,375 | ) | (17,914,176 | ) | (4,366,773 | ) | ||||||
| Net increase (decrease) in net assets derived from capital share transactions | (610,207 | ) | 169,328,034 | 1,514,973 | ||||||||
TOTAL INCREASE IN NET ASSETS | 1,160,018 | 174,172,041 | 4,537,667 | |||||||||
NET ASSETS: | ||||||||||||
| Beginning of period | 194,485,692 | 20,313,651 | 15,775,984 | |||||||||
| End of period | $ | 195,645,710 | $ | 194,485,692 | $ | 20,313,651 | ||||||
Undistributed net investment income, end of period | $ | 3,448,705 | $ | 3,167,762 | $ | 372,212 | ||||||
CHANGES IN SHARES OUTSTANDING: | ||||||||||||
| Shares sold | 74,555 | 624,832 | 578,931 | |||||||||
| Shares issued in connection to the acquisition of Lindner Funds | — | 14,615,807 | — | |||||||||
| Shares issued to holders as reinvestment of dividends | — | 34,871 | 36,806 | |||||||||
| Shares redeemed | (124,102 | ) | (1,480,254 | ) | (446,052 | ) | ||||||
| Net increase (decrease) in shares outstanding | (49,547 | ) | 13,795,256 | 169,685 | ||||||||
| (1) | For the one month ended October 31, 2004. Effective October 31, 2004, the Fund changed its fiscal year end to October 31st from September 30th. |
See notes to the financial statements.
17
STATEMENTS OF CHANGES IN NET ASSETS — Hennessy Total Return Fund
| Period Ended Oct. 31, 2004(1) | Year Ended June 30, 2004 | Year Ended June 30, 2003 | ||||||||||
|---|---|---|---|---|---|---|---|---|---|---|---|---|
OPERATIONS: | ||||||||||||
| Net investment income | $ | 587,197 | $ | 600,144 | $ | 64,501 | ||||||
| Net realized gain (loss) on securities | 13,282 | 272,805 | (73,764 | ) | ||||||||
| Change in unrealized appreciation (depreciation) on securities | (2,158,098 | ) | (3,087,326 | ) | 158,408 | |||||||
| Net increase (decrease) in net assets resulting from operations | (1,557,619 | ) | (2,214,377 | ) | 149,145 | |||||||
DISTRIBUTIONS TO SHAREHOLDERS: | ||||||||||||
| From net investment income | (446,103 | ) | (600,144 | ) | (64,810 | ) | ||||||
| From net realized gains | — | — | — | |||||||||
| Return of capital | — | (109,324 | ) | — | ||||||||
| (446,103 | ) | (709,468 | ) | (64,810 | ) | |||||||
CAPITAL SHARE TRANSACTIONS: | ||||||||||||
| Proceeds from shares subscribed | 459,224 | 2,789,770 | 4,185,908 | |||||||||
| Proceeds from shares issued in connection with the Lindner Funds merger | — | 96,447,508 | — | |||||||||
| Dividends reinvested | 415,778 | 657,552 | 62,205 | |||||||||
| Redemption fees retained | 482 | 514 | — | |||||||||
| Cost of shares redeemed | (3,935,847 | ) | (6,030,399 | ) | (1,769,912 | ) | ||||||
| Net increase (decrease) in net assets derived from capital share transactions | (3,060,363 | ) | 93,864,945 | 2,478,201 | ||||||||
TOTAL INCREASE (DECREASE) IN NET ASSETS | (5,064,085 | ) | 90,941,100 | 2,562,536 | ||||||||
NET ASSETS: | ||||||||||||
| Beginning of period | 96,962,871 | 6,021,771 | 3,459,235 | |||||||||
| End of period | $ | 91,898,786 | $ | 96,962,871 | $ | 6,021,771 | ||||||
Undistributed net investment income, end of period | $ | 141,094 | $ | — | $ | — | ||||||
CHANGES IN SHARES OUTSTANDING: | ||||||||||||
| Shares sold | 43,941 | 271,039 | 454,256 | |||||||||
| Shares issued in connection to the acquisition of Lindner Funds | — | 8,736,232 | — | |||||||||
| Shares issued to holders as reinvestment of dividends | 39,448 | 61,715 | 6,829 | |||||||||
| Shares redeemed | (376,366 | ) | (564,409 | ) | (191,076 | ) | ||||||
| Net increase (decrease) in shares outstanding | (292,977 | ) | 8,504,577 | 270,009 | ||||||||
| (1) | For the four months ended October 31, 2004. Effective October 31, 2004, the Fund changed its fiscal year end to October 31st from June 30th. |
See notes to the financial statements.
18
STATEMENTS OF CHANGES IN NET ASSETS — Hennessy Balanced Fund
| Period Ended Oct. 31, 2004(1) | Year Ended June 30, 2004 | Year Ended June 30, 2003 | ||||||||||
|---|---|---|---|---|---|---|---|---|---|---|---|---|
OPERATIONS: | ||||||||||||
| Net investment income | $ | 85,156 | $ | 197,328 | $ | 208,171 | ||||||
| Net realized gain (loss) on securities | (86,296 | ) | 32,241 | 26,558 | ||||||||
| Change in unrealized appreciation (depreciation) on securities | (441,020 | ) | 673,215 | (189,146 | ) | |||||||
| Net increase (decrease) in net assets resulting from operations | (442,160 | ) | 902,784 | 45,583 | ||||||||
DISTRIBUTIONS TO SHAREHOLDERS: | ||||||||||||
| From net investment income | (59,819 | ) | (197,328 | ) | (209,234 | ) | ||||||
| From net realized gains | — | (93,788 | ) | (82,379 | ) | |||||||
| Return of capital | — | (42,438 | ) | — | ||||||||
| (59,819 | ) | (333,554 | ) | (291,613 | ) | |||||||
CAPITAL SHARE TRANSACTIONS: | ||||||||||||
| Proceeds from shares subscribed | 857,432 | 3,350,098 | 2,122,026 | |||||||||
| Proceeds from shares issued in connection with the Lindner Funds merger | — | 10,051,535 | — | |||||||||
| Dividends reinvested | 57,564 | 323,188 | 285,635 | |||||||||
| Redemption fees retained | 239 | 5,244 | — | |||||||||
| Cost of shares redeemed | (2,041,113 | ) | (6,976,348 | ) | (1,425,284 | ) | ||||||
| Net increase (decrease) in net assets derived from capital share transactions | (1,125,878 | ) | 6,753,717 | 982,377 | ||||||||
TOTAL INCREASE (DECREASE) IN NET ASSETS | (1,627,857 | ) | 7,322,947 | 736,347 | ||||||||
NET ASSETS: | ||||||||||||
| Beginning of period | 23,392,532 | 16,069,585 | 15,333,238 | |||||||||
| End of period | $ | 21,764,675 | $ | 23,392,532 | $ | 16,069,585 | ||||||
Undistributed net investment income, end of period | $ | 25,337 | $ | — | $ | — | ||||||
CHANGES IN SHARES OUTSTANDING: | ||||||||||||
| Shares sold | 80,155 | 308,593 | 210,403 | |||||||||
| Shares issued in connection to the acquisition of Lindner Funds | — | 919,731 | — | |||||||||
| Shares issued to holders as reinvestment of dividends | 5,355 | 30,224 | 28,311 | |||||||||
| Shares redeemed | (190,755 | ) | (643,030 | ) | (142,278 | ) | ||||||
| Net increase (decrease) in shares outstanding | (105,245 | ) | 615,518 | 96,436 | ||||||||
| (1) | For the four months ended October 31, 2004. Effective October 31, 2004, the Fund changed its fiscal year end to October 31st from June 30th. |
See notes to the financial statements.
19
FINANCIAL HIGHLIGHTS — Hennessy Cornerstone Growth Fund
| Period Ended Oct. 31, 2004(1)(2) | Year Ended Sept. 30, | |||||||||||||||||||||||
|---|---|---|---|---|---|---|---|---|---|---|---|---|---|---|---|---|---|---|---|---|---|---|---|---|
| 2004 | 2003 | 2002 | 2001 | 2000 | ||||||||||||||||||||
PER SHARE DATA: | ||||||||||||||||||||||||
| Net asset value, beginning of period | $ | 19.08 | $ | 17.23 | $ | 13.55 | $ | 13.98 | $ | 19.48 | $ | 12.36 | ||||||||||||
| Income from investment operations: | ||||||||||||||||||||||||
Net investment loss(3) | (0.02 | ) | (0.13 | ) | (0.07 | ) | (0.07 | ) | (0.09 | ) | (0.16 | ) | ||||||||||||
| Net realized and unrealized gains (losses) on securities | 0.32 | 1.98 | 4.23 | 0.67 | (1.91 | ) | 7.28 | |||||||||||||||||
| Total from investment operations | 0.30 | 1.85 | 4.16 | 0.60 | (2.00 | ) | 7.12 | |||||||||||||||||
| Less Distributions: | ||||||||||||||||||||||||
| Dividends from net investment income | — | — | — | — | — | — | ||||||||||||||||||
| Dividends from net realized gains | — | — | (0.48 | ) | (1.03 | ) | (3.50 | ) | — | |||||||||||||||
| Total distributions | — | — | (0.48 | ) | (1.03 | ) | (3.50 | ) | — | |||||||||||||||
Redemption fees retained(4) | — | — | — | — | — | — | ||||||||||||||||||
| Net asset value, end of period | $ | 19.38 | $ | 19.08 | $ | 17.23 | $ | 13.55 | $ | 13.98 | $ | 19.48 | ||||||||||||
TOTAL RETURN | 1.57 | % | 10.74 | % | 31.67 | % | 4.47 | % | (10.95 | )% | 57.61 | % | ||||||||||||
SUPPLEMENTAL DATA AND RATIOS: | ||||||||||||||||||||||||
| Net assets, end of period (millions) | $ | 869.0 | $ | 866.0 | $ | 752.0 | $ | 342.4 | $ | 155.5 | $ | 182.5 | ||||||||||||
| Ratio of expenses to average net assets | 1.25 | % | 1.25 | % | 1.27 | % | 1.10 | % | 1.11 | % | 1.18 | % | ||||||||||||
| Ratio of net investment loss to average net assets | (1.08 | )% | (0.68 | )% | (0.60 | )% | (0.73 | )% | (0.60 | )% | (0.90 | )% | ||||||||||||
| Portfolio turnover rate | 0.00 | % | 106.97 | % | 74.80 | % | 70.33 | % | 103.33 | % | 95.28 | % | ||||||||||||
| (1) | For the one month ended October 31, 2004. Effective October 31, 2004, the Fund changed its fiscal year end to October 31st from September 30th. |
| (2) | All ratios for the period have been annualized, except portfolio turnover and total return. |
| (3) | Net investment loss per share is calculated using ending balances prior to consideration for adjustments for permanent book and tax differences. |
| (4) | Amount is less than $0.01. |
See notes to the financial statements.
20
FINANCIAL HIGHLIGHTS — Hennessy Focus 30 Fund(1)
| Period Ended Oct. 31, 2004(2)(3) | Year Ended Sept. 30, 2004 | Jan. 1, 2003 through Sept. 30, 2003(1) | Year Ended Dec. 31, 2002 | Jan. 2, 2001* through Dec. 31, 2001 | ||||||||||||||||
|---|---|---|---|---|---|---|---|---|---|---|---|---|---|---|---|---|---|---|---|---|
PER SHARE DATA: | ||||||||||||||||||||
| Net asset value, beginning of period | $ | 8.78 | $ | 7.72 | $ | 6.63 | $ | 9.27 | $ | 10.00 | ||||||||||
| Income from investment operations: | ||||||||||||||||||||
| Net investment loss | (0.01 | ) | (0.08 | ) | (0.03 | ) | (0.02 | ) | (0.02 | ) | ||||||||||
| Net realized and unrealized gains (losses) on investments | (0.10 | ) | 1.14 | 1.12 | (2.62 | ) | (0.71 | ) | ||||||||||||
| Total from investment operations | (0.11 | ) | 1.06 | 1.09 | (2.64 | ) | (0.73 | ) | ||||||||||||
| Less Distributions: | ||||||||||||||||||||
| Dividends from net investment income | — | — | — | — | — | |||||||||||||||
| Dividends from net realized gains | — | — | — | — | — | |||||||||||||||
| Total distributions | — | — | — | — | — | |||||||||||||||
Redemption fees retained(4) | — | — | — | — | — | |||||||||||||||
| Net asset value, end of period | $ | 8.67 | $ | 8.78 | $ | 7.72 | $ | 6.63 | $ | 9.27 | ||||||||||
TOTAL RETURN | (1.25 | )% | 13.73 | % | 16.44 | % | (28.48 | )% | (7.30 | )% | ||||||||||
SUPPLEMENTAL DATA AND RATIOS: | ||||||||||||||||||||
| Net assets, end of period (millions) | $ | 50.4 | $ | 51.1 | $ | 33.3 | $ | 28.5 | $ | 43.2 | ||||||||||
| Ratio of net expenses to average net assets: | ||||||||||||||||||||
| Before expense reimbursement | 1.45 | % | 1.41 | % | 1.59 | % | 1.54 | % | 1.80 | % | ||||||||||
| After expense reimbursement | 1.45 | %(5) | 1.41 | %(5) | 1.49 | %(5) | 1.50 | % | 1.50 | % | ||||||||||
| Ratio of net investment loss to average net assets: | ||||||||||||||||||||
| Before expense reimbursement | (1.33 | )% | (0.92 | )% | (0.67 | )% | (0.24 | )% | (0.62 | )% | ||||||||||
| After expense reimbursement | (1.33 | )% | (0.92 | )% | (0.57 | )% | (0.20 | )% | (0.32 | )% | ||||||||||
| Portfolio turnover rate | 0.00 | % | 113.13 | % | 356.77 | % | 291.00 | % | 210.00 | % | ||||||||||
| * | Commencement of operations |
| (1) | The financial highlights set forth herein include the historical financial highlights of the SYM Select Growth Fund. The assets of the SYM Select Growth Fund were acquired by the Hennessy Focus 30 Fund on September 17, 2003. At the time of the merger the Adviser also changed from SYM Financial Corporation to Hennessy Advisors, Inc. Effective September 30, 2003 the Fund changed its fiscal year end to September from December. |
| (2) | For the one month ended October 31, 2004. Effective October 31, 2004, the Fund changed its fiscal year end to October 31st from September 30th. |
| (3) | All ratios for the period have been annualized, except portfolio turnover and total return. |
| (4) | Amount is less than $0.01. |
| (5) | On September 17, 2003, the Hennessy Focus 30 Fund instituted an expense cap of 1.45% of the average daily net assets of the Focus 30 Fund until such contractual limitation is terminated by the Board of Directors of the Hennessy Mutual Funds, Inc. |
See notes to the financial statements.
21
FINANCIAL HIGHLIGHTS — Hennessy Cornerstone Value Fund
| Period Ended Oct. 31, 2004(1)(2) | Year Ended Sept. 30, | |||||||||||||||||||||||
|---|---|---|---|---|---|---|---|---|---|---|---|---|---|---|---|---|---|---|---|---|---|---|---|---|
| 2004 | 2003 | 2002 | 2001 | 2000 | ||||||||||||||||||||
PER SHARE DATA: | ||||||||||||||||||||||||
| Net asset value, beginning of period | $ | 12.37 | $ | 10.51 | $ | 8.95 | $ | 10.91 | $ | 10.29 | $ | 11.90 | ||||||||||||
| Income from investment operations: | ||||||||||||||||||||||||
| Net investment income | 0.02 | 0.31 | (3) | 0.21 | 0.25 | 0.24 | 0.32 | |||||||||||||||||
| Net realized and unrealized gains (losses) on investments | 0.09 | 1.76 | 1.55 | (1.95 | ) | 0.52 | (0.18 | ) | ||||||||||||||||
| Total from investment operations | 0.11 | 2.07 | 1.76 | (1.70 | ) | 0.76 | 0.14 | |||||||||||||||||
| Less Distributions: | ||||||||||||||||||||||||
| Dividends from net investment income | — | (0.21 | ) | (0.20 | ) | (0.26 | ) | (0.14 | ) | (0.47 | ) | |||||||||||||
| Dividends from net realized gains | — | — | — | — | — | (1.28 | ) | |||||||||||||||||
| Total distributions | — | (0.21 | ) | (0.20 | ) | (0.26 | ) | (0.14 | ) | (1.75 | ) | |||||||||||||
Redemption fees retained(4) | — | — | — | — | — | — | ||||||||||||||||||
| Net asset value, end of period | $ | 12.48 | $ | 12.37 | $ | 10.51 | $ | 8.95 | $ | 10.91 | $ | 10.29 | ||||||||||||
TOTAL RETURN | 0.89 | % | 19.83 | % | 19.88 | % | (16.05 | )% | 7.38 | % | 1.30 | % | ||||||||||||
SUPPLEMENTAL DATA AND RATIOS: | ||||||||||||||||||||||||
| Net assets, end of period (millions) | $ | 195.6 | $ | 194.5 | $ | 20.3 | $ | 15.8 | $ | 20.4 | $ | 17.5 | ||||||||||||
| Ratio of net expenses to average net assets | 1.18 | % | 1.18 | % | 1.51 | % | 1.43 | % | 1.74 | % | 1.85 | % | ||||||||||||
| Ratio of net investment income to average net assets | 1.70 | % | 2.56 | % | 2.10 | % | 2.12 | % | 2.12 | % | 2.36 | % | ||||||||||||
| Portfolio turnover rate | 0.00 | % | 8.20 | % | 57.29 | % | 76.93 | % | 78.01 | % | 86.13 | % | ||||||||||||
| (1) | For the one month ended October 31, 2004. Effective October 31, 2004, the Fund changed its fiscal year end to October 31st from September 30th. |
| (2) | All ratios for the period have been annualized, except portfolio turnover and total return. |
| (3) | Calculated using average shares outstanding during period. |
| (4) | Amount is less than $0.01. |
See notes to the financial statements.
22
FINANCIAL HIGHLIGHTS — Hennessy Total Return Fund
| Period Ended Oct. 31, 2004(1)(2) | Year Ended June 30, | |||||||||||||||||||||||
|---|---|---|---|---|---|---|---|---|---|---|---|---|---|---|---|---|---|---|---|---|---|---|---|---|
| 2004 | 2003 | 2002 | 2001 | 2000 | ||||||||||||||||||||
PER SHARE DATA: | ||||||||||||||||||||||||
| Net asset value, beginning of period | $ | 10.62 | $ | 9.65 | $ | 9.78 | $ | 10.49 | $ | 8.62 | $ | 10.70 | ||||||||||||
| Income from investment operations: | ||||||||||||||||||||||||
| Net investment income | 0.07 | 0.17 | (3) | 0.12 | 0.11 | 0.24 | 0.22 | |||||||||||||||||
| Net realized and unrealized gains (losses) on securities | (0.24 | ) | 0.92 | (0.13 | ) | (0.71 | ) | 1.87 | (2.08 | ) | ||||||||||||||
| Total from investment operations | (0.17 | ) | 1.09 | (0.01 | ) | (0.60 | ) | 2.11 | (1.86 | ) | ||||||||||||||
| Less Distributions: | ||||||||||||||||||||||||
| Dividends from net investment income | (0.05 | ) | (0.10 | ) | (0.12 | ) | (0.11 | ) | (0.24 | ) | (0.22 | ) | ||||||||||||
| Dividends from realized capital gains | — | — | — | — | — | — | ||||||||||||||||||
| Return of capital | — | (0.02 | ) | — | — | — | — | |||||||||||||||||
| Total distributions | (0.05 | ) | (0.12 | ) | (0.12 | ) | (0.11 | ) | (0.24 | ) | (0.22 | ) | ||||||||||||
Redemption fees retained(4) | — | — | — | — | — | — | ||||||||||||||||||
| Net asset value, end of period | $ | 10.40 | $ | 10.62 | $ | 9.65 | $ | 9.78 | $ | 10.49 | $ | 8.62 | ||||||||||||
TOTAL RETURN | (1.61 | )% | 11.36 | % | (0.04 | )% | (5.73 | )% | 24.66 | % | (17.50 | )% | ||||||||||||
SUPPLEMENTAL DATA AND RATIOS: | ||||||||||||||||||||||||
| Net assets, end of period (millions) | $ | 91.9 | $ | 97.0 | $ | 6.0 | $ | 3.5 | $ | 3.1 | $ | 3.4 | ||||||||||||
| Ratio of net expenses to average net assets, excluding interest expense: | ||||||||||||||||||||||||
| Before expense reimbursement | 1.20 | % | 1.27 | % | 2.12 | % | 4.35 | % | 4.54 | % | 2.76 | % | ||||||||||||
| After expense reimbursement | 1.20 | %(5) | 1.27 | %(5) | 1.95 | %(6) | 1.71 | %(6) | 1.20 | %(6) | 1.20 | %(6) | ||||||||||||
| Ratio of net expenses to average net assets, including interest expense: | ||||||||||||||||||||||||
| Before expense reimbursement | 1.78 | % | 1.66 | % | 2.50 | % | 4.97 | % | 6.06 | % | 4.44 | % | ||||||||||||
| After expense reimbursement | 1.78 | % | 1.66 | % | 2.33 | % | 2.33 | % | 2.72 | % | 2.88 | % | ||||||||||||
| Ratio of interest expense to average net assets | 0.58 | % | 0.39 | % | 0.38 | % | 0.62 | % | 1.52 | % | 1.68 | % | ||||||||||||
| Ratio of net investment income (loss) to average net assets: | ||||||||||||||||||||||||
| Before expense reimbursement | 1.85 | % | 1.55 | % | 1.25 | % | (1.58 | )% | (1.06 | )% | 0.56 | % | ||||||||||||
| After expense reimbursement | 1.85 | % | 1.55 | % | 1.42 | % | 1.06 | % | 2.28 | % | 2.12 | % | ||||||||||||
| Portfolio turnover rate | 0.30 | % | 8.37 | % | 17.60 | % | 34.76 | % | 48.80 | % | 33.58 | % | ||||||||||||
| (1) | For the four months ended October 31, 2004. Effective October 31, 2004, the Fund changed its fiscal year end to October 31st from June 30th. |
| (2) | All ratios for the period have been annualized, except portfolio turnover and total return. |
| (3) | Calculated using average shares outstanding during period. |
| (4) | Amount is less than $0.01. |
| (5) | On February 27, 2004, the Hennessy Total Return Fund instituted an expense cap, excluding interest expense, of 1.35% of the average daily net assets of the Total Return Fund. This expense cap will be in effect through June 30, 2005. |
| (6) | The Hennessy Total Return Fund instituted an expense cap, excluding interest expense of 1.95%. |
See notes to the financial statements.
23
FINANCIAL HIGHLIGHTS — Hennessy Balanced Fund
| Period Ended Oct. 31, 2004(1)(2) | Year Ended June 30, | |||||||||||||||||||||||
|---|---|---|---|---|---|---|---|---|---|---|---|---|---|---|---|---|---|---|---|---|---|---|---|---|
| 2004 | 2003 | 2002 | 2001 | 2000 | ||||||||||||||||||||
PER SHARE DATA: | ||||||||||||||||||||||||
| Net asset value, beginning of period | $ | 10.85 | $ | 10.44 | $ | 10.62 | $ | 11.50 | $ | 10.37 | $ | 12.56 | ||||||||||||
| Income from investment operations: | ||||||||||||||||||||||||
| Net investment income | 0.04 | 0.11 | 0.14 | 0.15 | 0.27 | 0.28 | ||||||||||||||||||
| Net realized and unrealized gains (losses) on securities | (0.24 | ) | 0.50 | (0.12 | ) | (0.50 | ) | 1.25 | (1.53 | ) | ||||||||||||||
| Total from investment operations | (0.20 | ) | 0.61 | 0.02 | (0.35 | ) | 1.52 | (1.25 | ) | |||||||||||||||
| Less Distributions: | ||||||||||||||||||||||||
| Dividends from net investment income | (0.03 | ) | (0.12 | ) | (0.14 | ) | (0.15 | ) | (0.27 | ) | (0.28 | ) | ||||||||||||
| Dividends from realized capital gains | — | (0.06 | ) | (0.06 | ) | (0.38 | ) | (0.12 | ) | (0.66 | ) | |||||||||||||
| Return of capital | — | (0.02 | ) | — | — | — | — | |||||||||||||||||
| Total distributions | (0.03 | ) | (0.20 | ) | (0.20 | ) | (0.53 | ) | (0.39 | ) | (0.94 | ) | ||||||||||||
Redemption fees retained(3) | — | — | — | — | — | — | ||||||||||||||||||
| Net asset value, end of period | $ | 10.62 | $ | 10.85 | $ | 10.44 | $ | 10.62 | $ | 11.50 | $ | 10.37 | ||||||||||||
TOTAL RETURN | (1.86 | )% | 5.81 | % | 0.24 | % | (3.12 | )% | 14.85 | % | (10.40 | )% | ||||||||||||
SUPPLEMENTAL DATA AND RATIOS: | ||||||||||||||||||||||||
| Net assets, end of period (millions) | $ | 21.8 | $ | 23.4 | $ | 16.1 | $ | 15.3 | $ | 15.2 | $ | 16.1 | ||||||||||||
| Ratio of net expenses to average net assets | 1.41 | % | 1.41 | % | 1.50 | % | 1.84 | % | 1.87 | % | 1.61 | % | ||||||||||||
| Ratio of net investment income to average net assets | 1.12 | % | 1.01 | % | 1.40 | % | 1.33 | % | 2.39 | % | 2.36 | % | ||||||||||||
| Portfolio turnover rate | 8.55 | % | 45.17 | % | 21.79 | % | 45.95 | % | 46.91 | % | 31.16 | % | ||||||||||||
| (1) | For the four months ended October 31, 2004. Effective October 31, 2004, the Fund changed its fiscal year end to October 31st from June 30th. |
| (2) | All ratios for the period have been annualized, except portfolio turnover and total return. |
| (3) | Amount is less than $0.01. |
See notes to the financial statements.
24
SCHEDULE OF INVESTMENTS — Hennessy Cornerstone Growth Fund
October 31, 2004
| Number of Shares | Value | ||
|---|---|---|---|
COMMON STOCKS — 100.18% | |||
Aerospace & Defense — 1.54% | |||
| 1,296,900 | Orbital Sciences Corp.*+ | $ 13,422,915 | |
Airlines — 1.10% | |||
| 1,228,400 | AMR Corp.*+ | 9,483,248 | |
Auto Components — 1.34% | |||
| 781,400 | Dana Corp.+ | 11,650,674 | |
Building Products — 2.49% | |||
| 964,300 | USG Corp.*+ | 21,590,677 | |
Commerical Services & Supplies — 2.08% | |||
| 1,260,800 | Labor Ready, Inc.*+ | 18,092,480 | |
Communications Equipment — 1.67% | |||
| 994,900 | Alcatel SA — ADR*+(a) | 14,535,489 | |
Construction & Engineering — 3.95% | |||
| 1,521,400 | McDermott International, Inc. — ADR*(a) | 20,767,110 | |
| 2,016,700 | Quanta Services, Inc.*+ | 13,552,224 | |
| 34,319,334 | |||
Consumer Finance — 2.32% | |||
| 795,500 | Cash America International, Inc. | 20,126,150 | |
Diversified Telecommunication Services — 0.30% | |||
| 1,385,600 | Primus Telcommunications GP*+ | 2,646,496 | |
Electronic Equipment & Instruments — 9.25% | |||
| 621,700 | Arrow Electronics, Inc.*+ | 14,895,932 | |
| 667,000 | Avnet, Inc.*+ | 11,312,320 | |
| 808,200 | Checkpoint Systems, Inc.*+ | 13,820,220 | |
| 1,148,900 | Sanmina — SCI Corp.* | 9,191,200 | |
| 314,700 | Scansource, Inc.*+ | 19,489,371 | |
| 2,233,800 | Solectron Corp.*+ | 11,660,436 | |
| 80,369,479 | |||
Food & Staples Retailing — 1.28% | |||
| 2,984,800 | Rite Aid Corp.*+ | 11,103,456 | |
Food Products — 4.70% | |||
| 730,400 | Chiquita Brands International, Inc*+ | 13,161,808 | |
| 1,025,100 | Pilgrim’s Pride Corp.+ | 27,718,704 | |
| 40,880,512 |
See notes to the financial statements.
25
SCHEDULE OF INVESTMENTS — Hennessy Cornerstone Growth Fund — (Continued)
October 31, 2004
| Number of Shares | Value | |||
|---|---|---|---|---|
COMMON STOCKS (Continued) | ||||
Health Care Providers & Services — 9.55% | ||||
| 2,057,600 | Beverly Enterprises, Inc.*+ | $ 17,880,544 | ||
| 388,200 | Coventry Health Care, Inc.* | 15,877,380 | ||
| 541,800 | Pacificare Health Systems*+ | 19,298,916 | ||
| 628,100 | Sierra Health Services*+ | 29,972,932 | ||
| 83,029,772 | ||||
Household Durables — 4.50% | ||||
| 646,200 | DR Horton, Inc.+ | 19,386,000 | ||
| 285,600 | William Lyon Homes, Inc.*+ | 19,692,120 | ||
| 39,078,120 | ||||
Insurance — 3.49% | ||||
| 495,600 | Allmerica Financial Corp.* | 14,917,560 | ||
| 496,300 | Infinity Property & Casualty Corp. | 15,425,004 | ||
| 30,342,564 | ||||
Internet Software & Services — 1.87% | ||||
| 1,568,500 | Earthlink, Inc.*+ | 16,202,605 | ||
IT Services — 0.58% | ||||
| 3,032,100 | Safeguard Scientifics, Inc.*+ | 5,063,607 | ||
Machinery — 12.48% | ||||
| 459,400 | Actuant Corp. — Class A*+ | 18,224,398 | ||
| 324,500 | Cummins, Inc.+ | 22,740,960 | ||
| 1,076,400 | JLG Industries, Inc.+ | 17,954,352 | ||
| 653,600 | Joy Global, Inc.+ | 22,085,144 | ||
| 340,300 | Navistar International Corp.*+ | 11,757,365 | ||
| 637,900 | Wabash National Corp.*+ | 15,679,582 | ||
| 108,441,801 | ||||
Metals & Mining — 5.16% | ||||
| 601,800 | Carpenter Technology | 28,561,428 | ||
| 701,500 | Century Aluminum Co.*+ | 16,232,710 | ||
| 44,794,138 | ||||
Multiline Retail — 2.23% | ||||
| 449,100 | Nordstrom, Inc. | 19,392,138 | ||
Multi-Utilities & Unregulated Power — 2.37% | ||||
| 2,150,100 | Sierra Pacific Resources* | 20,640,960 |
See notes to the financial statements.
26
SCHEDULE OF INVESTMENTS — Hennessy Cornerstone Growth Fund — (Continued)
October 31, 2004
| Number of Shares | Value | |||
|---|---|---|---|---|
COMMON STOCKS (Continued) | ||||
Oil & Gas — 3.93% | ||||
| 1,129,300 | Tesoro Petroleum Corp.* | $ 34,195,204 | ||
Paper & Forest Products — 2.35% | ||||
| 832,800 | Louisiana-Pacific Corp. | 20,411,928 | ||
Semiconductor & Semiconductor Equipment — 1.47% | ||||
| 1,172,400 | Infineon Technologies AG — ADR*+(a) | 12,814,332 | ||
Specialty Retail — 8.38% | ||||
| 670,300 | Dick’s Sporting Goods, Inc.*+ | 24,130,800 | ||
| 535,900 | Finish Line — Class A | 18,558,217 | ||
| 683,400 | Foot Locker, Inc. | 16,674,960 | ||
| 605,100 | TBC Corp.* | 13,451,373 | ||
| 72,815,350 | ||||
Textiles, Apparel & Luxury Goods — 1.92% | ||||
| 449,100 | Oxford Industries, Inc.+ | 16,657,119 | ||
Wireless Telecommunication Services — 7.88% | ||||
| 3,108,700 | Alamosa Holdings, Inc.*+ | 31,195,804 | ||
| 1,468,200 | Telesystem International Wireless, Inc.*(a) | 16,076,790 | ||
| 728,200 | Western Wireless Corp. — Class A*+ | 21,219,748 | ||
| 68,492,342 | ||||
Total Common Stocks (Cost $861,074,890) | 870,592,890 | |||
| Principal Amount | ||||
SHORT-TERM OBLIGATIONS — 50.99% | ||||
Commercial Paper — 19.95% | ||||
| $11,596,487 | Blue Grass, C.P., 1.959%, due 05/18/2005ˆ | 11,596,487 | ||
| 19,993,944 | Concord Min Cap C.P., 1.830%, due 11/09/2004ˆ | 19,993,944 | ||
| 14,918,231 | Ford Credit Floor Plan, C.P., 2.071%, due 01/20/2005ˆ | 14,918,231 | ||
| 16,994,852 | Goldman Sachs, C.P., 1.955%, due 04/22/2005ˆ | 16,994,852 | ||
| 3,998,789 | Independence, C.P., 1.940%, due 01/15/2005ˆ | 3,998,789 | ||
| 19,967,819 | Kitty Hawk Funding, C.P., 1.963%, due 11/22/2004ˆ | 19,967,819 | ||
| 11,996,366 | Lakeside Funding, C.P., 1.480%, due 11/08/2004ˆ | 11,996,366 | ||
| 5,998,487 | Landesbank Baden Wurtemberg, C.P., 1.480%, due 11/12/2004ˆ | 5,998,487 | ||
| 8,997,275 | Leafs LLC, C.P., 1.920%, due 04/20/2005ˆ | 8,997,275 | ||
| 4,998,486 | Lloyds Bank, C.P., 1.460%, due 11/17/2004ˆ | 4,998,486 |
See notes to the financial statements.
27
SCHEDULE OF INVESTMENTS — Hennessy Cornerstone Growth Fund — (Continued)
October 31, 2004
| Principal Amount | Value | |||||
|---|---|---|---|---|---|---|
SHORT-TERM OBLIGATIONS (Continued) | ||||||
Commercial Paper (Continued) | ||||||
| $19,972,394 | Main St. Wrehse, C.P., 1.942%, due 11/18/2004ˆ | $ 19,972,394 | ||||
| 3,998,789 | Morgan Stanley, C.P., 1.955%, due 12/08/2004ˆ | 3,998,789 | ||||
| 11,996,366 | Morgan Stanley, C.P., 1.955%, due 03/07/2005ˆ | 11,996,366 | ||||
| 7,935,930 | Sigma Finance, C.P., 1.512%, due 11/29/2004ˆ | 7,935,930 | ||||
| 9,994,973 | Sigma Finance, C.P., 1.945%, due 05/17/2005ˆ | 9,994,973 | ||||
Total Commercial Paper (Cost $173,359,188) | 173,359,188 | |||||
Corporate Bonds & Notes — 8.44% | ||||||
| 14,995,458 | Allstate Life Global, 1.860%, due 07/15/2009ˆ | 14,995,458 | ||||
| 9,996,972 | Bayer Lndbk NY, 1.923%, due 06/24/2005ˆ | 9,996,972 | ||||
| 20,343,838 | Halogen Funding Co. LLC, 1.890%, due 11/18/04ˆ | 20,343,838 | ||||
| 2,999,092 | Metlife Global Funding, 1.999%, due 10/28/2005ˆ | 2,999,092 | ||||
| 11,992,131 | Natexis Banq NY C.D., 1.920%, due 07/12/2005ˆ | 11,992,131 | ||||
| 2,999,092 | Premium Asset Trust, 1.910%, due 06/01/2005ˆ | 2,999,092 | ||||
| 9,996,972 | Rabobank Nederland C.D., 2.015%, due 03/02/2005ˆ | 9,996,972 | ||||
Total Corporate Bonds & Notes (Cost $73,323,555) | 73,323,555 | |||||
Corporate Paydown Security — 1.15% | ||||||
| 9,996,972 | REMAC, 1.840%, due 03/12/2025ˆ | 9,996,972 | ||||
Total Corporate Paydown Security (Cost $9,996,972) | 9,996,972 | |||||
Repurchase Agreements — 21.17% | ||||||
| 29,990,916 | CS First Boston Repo., 1.890%, dated 10/29/2004, | |||||
| matures 11/01/04, repurchase price $29,992,491 | ||||||
| (collateralized by Government Mortgage Securities $30,595,531)ˆ | 29,990,916 | |||||
| 64,980,318 | CS First Boston Repo., 1.935%, dated 10/29/2004, | |||||
| matures 11/01/04, repurchase price $64,983,811 | ||||||
| (collateralized by Private Mortgage Securities $68,229,527)ˆ | 64,980,318 | |||||
| 16,994,852 | CS First Boston Repo., 1.935%, dated 10/29/2004, | |||||
| matures 11/01/04, repurchase price $16,995,765 | ||||||
| (collateralized by Private Mortgage Securities $17,845,406)ˆ | 16,994,852 | |||||
| 51,984,254 | J.P. Morgan Repo., 1.890%, dated 10/29/2004, | |||||
| matures 11/01/04, repurchase price $51,986,983 | ||||||
| (collateralized by Federal Mortgage Securities $53,544,657)ˆ | 51,984,254 | |||||
See notes to the financial statements.
28
SCHEDULE OF INVESTMENTS — Hennessy Cornerstone Growth Fund — (Continued)
October 31, 2004
| Principal Amount | Value | ||||
|---|---|---|---|---|---|
SHORT-TERM OBLIGATIONS (Continued) | |||||
Repurchase Agreements (Continued) | |||||
| $19,993,944 | Merrill Lynch Repo., 1.965%, dated 10/29/2004, | ||||
| matures 11/01/04, repurchase price $19,995,035 | |||||
| (collateralized by Corporate Bonds $20,994,143)ˆ | $ 19,993,944 | ||||
Total Repurchase Agreements (Cost $183,944,284) | 183,944,284 | ||||
Discount Notes — 0.08% | |||||
| 705,000 | Federal Home Loan Bank Discount Note, 1.0000%, due 11/01/2004 | 705,000 | |||
Total Discount Notes (Cost $705,000) | 705,000 | ||||
Variable Rate Demand Notes# — 0.00% | |||||
| 2,367 | American Family Financial Services, Inc., 1.5628% | 2,367 | |||
| 2,366 | Wisconsin Corporate Central Credit Union, 1.6288% | 2,366 | |||
Total Variable Rate Demand Notes (Cost $4,733) | 4,733 | ||||
| Number of Shares | |||||
Money Market Fund — 0.20% | |||||
| 1,727,972 | Merrill Lynch Premier Institutional Fundˆ | 1,727,972 | |||
Total Money Market Fund (Cost $1,727,972) | 1,727,972 | ||||
Total Short-Term Obligations (Cost $443,061,704) | 443,061,704 | ||||
Total Investments — 151.17% (Cost $1,304,136,594) | 1,313,654,594 | ||||
| Other Liabilities and Assets, Net — (51.17%) | (444,661,175 | ) | |||
NET ASSETS — 100% | $ 868,993,419 | ||||
| * | Non-income producing security |
| # | Variable rate demand notes are considered short-term obligations and are payable on demand. Interest rates change periodically on specified dates. The rates listed are as of October 31, 2004. |
| ˆ | Securities lending collateral |
| + | All or a portion of this security is out on loan at October 31, 2004. |
| (a) | Foreign denominated security |
| ADR | American Depository Receipts |
See notes to the financial statements.
29
SCHEDULE OF INVESTMENTS — Hennessy Focus 30 Fund
October 31, 2004
| Number of Shares | Value | |||
|---|---|---|---|---|
COMMON STOCKS — 97.89% | ||||
Air Freight & Logistics — 3.50% | ||||
| 35,200 | Ryder System, Inc. | $ 1,763,520 | ||
Auto Components — 2.98% | ||||
| 149,000 | The Goodyear Tire & Rubber Co.* | 1,501,920 | ||
Chemicals — 3.60% | ||||
| 78,800 | Lyondell Chemical Co. | 1,810,824 | ||
Communications Equipment — 3.68% | ||||
| 30,100 | Harris Corp. | 1,852,053 | ||
Electric Utilities — 3.75% | ||||
| 103,200 | Allegheny Energy, Inc.* | 1,889,592 | ||
Energy Equipment & Services — 8.18% | ||||
| 49,200 | FMC Technologies, Inc.* | 1,487,316 | ||
| 45,500 | Lone Star Technologies* | 1,201,200 | ||
| 54,300 | Maverick Tube Corp.* | 1,431,891 | ||
| 4,120,407 | ||||
Hotels Restaurants & Leisure — 3.34% | ||||
| 40,500 | Penn National Gaming, Inc.* | 1,681,965 | ||
Household Durables — 6.22% | ||||
| 21,600 | The Black & Decker Corp. | 1,734,048 | ||
| 25,500 | Pulte Homes, Inc. | 1,399,440 | ||
| 3,133,488 | ||||
Leisure Equipment & Products — 3.50% | ||||
| 37,500 | Brunswick Corp. | 1,759,500 | ||
Machinery — 6.47% | ||||
| 49,500 | Joy Global, Inc. | 1,672,605 | ||
| 41,700 | Terex Corp* | 1,584,600 | ||
| 3,257,205 | ||||
Metals & Mining — 12.49% | ||||
| 56,500 | Massey Energy Co. | 1,521,545 | ||
| 36,200 | Nucor Corp. | 1,528,726 | ||
| 27,300 | Peabody Energy Corp. | 1,741,194 | ||
| 45,100 | Steel Dynamics, Inc. | 1,497,320 | ||
| 6,288,785 | ||||
Multiline Retail — 3.49% | ||||
| 19,100 | Kmart Holding Corp.* | 1,757,964 |
See notes to the financial statements.
30
SCHEDULE OF INVESTMENTS — Hennessy Focus 30 Fund — (Continued)
October 31, 2004
| Number of Shares | Value | |||
|---|---|---|---|---|
COMMON STOCKS (Continued) | ||||
Multi-Utilities & Unregulated Power — 3.47% | ||||
| 181,800 | Sierra Pacific Resources* | $ 1,745,280 | ||
Oil & Gas — 20.09% | ||||
| 18,700 | Amerada Hess Corp. | 1,509,277 | ||
| 29,400 | Ashland, Inc. | 1,694,028 | ||
| 43,100 | Premcor, Inc.* | 1,682,624 | ||
| 23,000 | Sunoco, Inc. | 1,710,280 | ||
| 55,800 | Tesoro Petroleum Corp.* | 1,689,624 | ||
| 42,600 | Valero Energy Corp. | 1,830,522 | ||
| 10,116,355 | ||||
Specialty Retail — 6.82% | ||||
| 109,800 | Circuit City Stores, Inc. | 1,784,250 | ||
| 45,900 | Dick’s Sporting Goods, Inc.* | 1,652,400 | ||
| 3,436,650 | ||||
Textiles, Apparel & Luxury Goods — 3.33% | ||||
| 61,600 | Quiksilver, Inc.* | 1,678,600 | ||
Trading Companies & Distributors — 2.98% | ||||
| 52,900 | Hughes Supply, Inc. | 1,502,889 | ||
Total Common Stocks (Cost $48,535,729) | 49,296,997 | |||
| Principal Amount | ||||
SHORT-TERM OBLIGATIONS — 2.07% | ||||
Discount Note — 2.05 % | ||||
| $1,033,000 | Federal Home Loan Bank Discount Note, 1.0000%, due 11/01/2004 | 1,033,000 | ||
Total Discount Note (Cost $1,033,000) | 1,033,000 | |||
Variable Rate Demand Notes# — 0.02% | ||||
| 5,745 | American Family Financial Services, Inc., 1.5628% | 5,745 | ||
| 5,894 | Wisconsin Corporate Central Credit Union, 1.6288% | 5,894 | ||
Total Variable Rate Demand Notes (Cost $11,639) | 11,639 | |||
Total Short-Term Obligations (Cost $1,044,639) | 1,044,639 | |||
Total Investments — 99.96% (Cost $49,580,368) | 50,341,636 | |||
| Other Assets and Liabilities, Net — 0.04% | 18,046 | |||
NET ASSETS — 100% | $ 50,359,682 |
| * | Non-income producing security |
| # | Variable rate demand notes are considered short-term obligations and are payable on demand. Interest rates change periodically on specified dates. The rates listed are as of October 31, 2004. |
See notes to the financial statements.
31
SCHEDULE OF INVESTMENTS — Hennessy Cornerstone Value Fund
October 31, 2004
| Number of Shares | Value | |||
|---|---|---|---|---|
COMMON STOCKS — 99.25% | ||||
Auto Components — 1.63% | ||||
| 378,800 | Delphi Corp. | $ 3,185,708 | ||
Automobiles — 3.21% | ||||
| 83,000 | DaimlerChrysler AG(a) | 3,440,350 | ||
| 73,500 | General Motors Corp. | 2,833,425 | ||
| 6,273,775 | ||||
Beverages — 1.94% | ||||
| 70,500 | Diageo PLC — ADR(a) | 3,791,490 | ||
Capital Markets — 0.03% | ||||
| 1,263 | Piper Jaffray Cos.* | 55,231 | ||
Chemicals — 3.86% | ||||
| 90,200 | The Dow Chemical Co. | 4,053,588 | ||
| 81,700 | E.I. du Pont de Nemours & Co. | 3,502,479 | ||
| 7,556,067 | ||||
Commercial Banks — 22.45% | ||||
| 150,900 | AmSouth Bancorp | 3,982,251 | ||
| 94,200 | Bank of America Corp. | 4,219,218 | ||
| 96,500 | BB&T Corp. | 3,967,115 | ||
| 68,200 | Comerica, Inc. | 4,194,982 | ||
| 83,500 | First Horizon National Corp. | 3,613,880 | ||
| 164,700 | Huntington Bancshares, Inc. | 3,944,565 | ||
| 110,100 | National City Corp. | 4,290,597 | ||
| 121,900 | Regions Financial Corp. | 4,276,252 | ||
| 129,800 | US Bancorp | 3,713,578 | ||
| 78,900 | Wachovia Corp. | 3,882,669 | ||
| 64,200 | Wells Fargo & Co. | 3,834,024 | ||
| 43,919,131 | ||||
Commercial Services & Supplies — 4.17% | ||||
| 92,700 | Pitney Bowes, Inc. | 4,055,625 | ||
| 130,700 | RR Donnelley & Sons Co. | 4,110,515 | ||
| 8,166,140 | ||||
Construction Materials — 2.18% | ||||
| 147,300 | Cemex S.A. de C.V. — ADR(a) | 4,268,754 |
See notes to the financial statements.
32
SCHEDULE OF INVESTMENTS — Hennessy Cornerstone Value Fund — (Continued)
October 31, 2004
| Number of Shares | Value | |||
|---|---|---|---|---|
COMMON STOCKS (Continued) | ||||
Distributors — 2.22% | ||||
| 108,800 | Genuine Parts Co. | $ 4,340,032 | ||
Diversified Financial Services — 3.72% | ||||
| 75,300 | Citigroup, Inc. | 3,341,061 | ||
| 102,100 | J.P. Morgan Chase & Co. | 3,941,060 | ||
| 7,282,121 | ||||
Diversified Telecommunication Services — 14.18% | ||||
| 78,900 | Alltel Corp. | 4,333,977 | ||
| 189,600 | AT&T Corp. | 3,244,056 | ||
| 130,800 | BellSouth Corp. | 3,488,436 | ||
| 144,700 | SBC Communications, Inc. | 3,655,122 | ||
| 239,900 | Sprint Corp. | 5,025,905 | ||
| 25,800 | Telefonica de Argentina SA — ADR*+ | 258 | ||
| 111,100 | Telefonos de Mexico SA de CV — ADR(a) | 3,804,064 | ||
| 107,300 | Verizon Communications, Inc. | 4,195,430 | ||
| 27,747,248 | ||||
Food & Staples Retailing — 2.10% | ||||
| 179,800 | Albertson’s, Inc. | 4,101,238 | ||
Food Products — 5.73% | ||||
| 138,500 | ConAgra Foods, Inc. | 3,656,400 | ||
| 99,300 | HJ Heinz Co. | 3,609,555 | ||
| 169,400 | Sara Lee Corp. | 3,943,632 | ||
| 11,209,587 | ||||
Household Durables — 1.86% | ||||
| 168,800 | Newell Rubbermaid, Inc. | 3,639,328 | ||
Insurance — 3.70% | ||||
| 91,700 | Lincoln National Corp. | 4,016,460 | ||
| 95,100 | The St. Paul Travelers Cos. Inc. | 3,229,596 | ||
| 7,246,056 | ||||
Multiline Retail — 1.78% | ||||
| 133,200 | The May Department Stores Co. | 3,471,192 | ||
Oil & Gas — 11.96% | ||||
| 91,200 | ChevronTexaco Corp. | 4,839,072 | ||
| 59,700 | ConocoPhillips | 5,033,307 |
See notes to the financial statements.
33
SCHEDULE OF INVESTMENTS — Hennessy Cornerstone Value Fund — (Continued)
October 31, 2004
| Number of Shares | Value | |||
|---|---|---|---|---|
COMMON STOCKS (Continued) | ||||
Oil & Gas (Continued) | ||||
| 82,700 | Kerr-McGee Corp. | $ 4,897,494 | ||
| 118,000 | Marathon Oil Corp. | 4,496,980 | ||
| 87,500 | Shell Transport & Trading Co. PLC — ADR(a) | 4,135,250 | ||
| 23,402,103 | ||||
Paper & Forest Products — 2.02% | ||||
| 125,300 | MeadWestvaco Corp. | 3,950,709 | ||
Petroleum Refining — 2.35% | ||||
| 78,900 | BP PLC — ADR(a) | 4,595,925 | ||
Pharmaceuticals — 4.69% | ||||
| 136,200 | Bristol-Myers Squibb Co. | 3,191,166 | ||
| 80,500 | GlaxoSmithKline PLC — ADR(a) | 3,413,200 | ||
| 82,300 | Merck & Co., Inc. | 2,576,813 | ||
| 9,181,179 | ||||
Thrifts & Mortgage Finance — 1.80% | ||||
| 91,000 | Washington Mutual, Inc. | 3,522,610 | ||
Tobacco — 1.67% | ||||
| 67,400 | Altria Group, Inc. | 3,266,204 | ||
Total Common Stocks (Cost $190,704,616) | 194,171,828 | |||
| Principal Amount | ||||
SHORT-TERM OBLIGATIONS — 0.74% | ||||
Commercial Paper — 0.02% | ||||
| $ 3,513 | Blue Grass, C.P., 1.959%, due 05/18/2005ˆ | 3,513 | ||
| 6,056 | Concord Min Cap C.P., 1.830%, due 11/09/2004ˆ | 6,056 | ||
| 4,519 | Ford Credit Floor Plan, C.P., 2.071%, due 01/20/2005ˆ | 4,519 | ||
| 5,148 | Goldman Sachs, C.P., 1.955%, due 04/22/2005ˆ | 5,148 | ||
| 1,211 | Independence, C.P., 1.940%, due 01/15/2005ˆ | 1,211 | ||
| 6,048 | Kitty Hawk Funding, C.P., 1.963%, due 11/22/2004ˆ | 6,048 | ||
| 3,634 | Lakeside Funding, C.P., 1.480%, due 11/08/2004ˆ | 3,634 | ||
| 1,817 | Landesbank Baden Wurtemberg, C.P., 1.480%, due 11/12/2004ˆ | 1,817 | ||
| 2,725 | Leafs LLC, C.P., 1.920%, due 04/20/2005ˆ | 2,725 |
See notes to the financial statements.
34
SCHEDULE OF INVESTMENTS — Hennessy Cornerstone Value Fund — (Continued)
October 31, 2004
| Principal Amount | Value | |||
|---|---|---|---|---|
SHORT-TERM OBLIGATIONS (Continued) | ||||
Commercial Paper (Continued) | ||||
| $ 1,514 | Lloyds Bank, C.P., 1.460%, due 11/17/2004ˆ | $ 1,514 | ||
| 6,050 | Main St. Wrehse, C.P., 1.942%, due 11/18/2004ˆ | 6,050 | ||
| 1,211 | Morgan Stanley, C.P., 1.955%, due 12/08/2004ˆ | 1,211 | ||
| 3,634 | Morgan Stanley, C.P., 1.955%, due 03/07/2005ˆ | 3,634 | ||
| 2,404 | Sigma Finance, C.P., 1.512%, due 11/29/2004ˆ | 2,404 | ||
| 3,027 | Sigma Finance, C.P., 1.945%, due 05/17/2005ˆ | 3,027 | ||
Total Commercial Paper (Cost $52,511) | 52,511 | |||
Corporate Bonds & Notes — 0.01% | ||||
| 4,542 | Allstate Life Global, 1.860%, due 07/15/2009ˆ | 4,542 | ||
| 3,028 | Bayer Lndbk NY, 1.923%, due 06/24/2005ˆ | 3,028 | ||
| 6,162 | Halogen Funding Co. LLC, 1.890%, due 11/18/04ˆ | 6,162 | ||
| 908 | Metlife Global Funding, 1.999%, due 10/28/2005ˆ | 908 | ||
| 3,632 | Natexis Banq NY C.D., 1.920%, due 07/12/2005ˆ | 3,632 | ||
| 908 | Premium Asset Trust, 1.910%, due 06/01/2005ˆ | 908 | ||
| 3,028 | Rabobank Nederland C.D., 2.015%, due 03/02/2005ˆ | 3,028 | ||
Total Corporate Bonds & Notes (Cost $22,208) | 22,208 | |||
Corporate Paydown Security — 0.00% | ||||
| 3,028 | REMAC, 1.840%, due 03/12/2025ˆ | 3,028 | ||
Total Corporate Paydown Security (Cost $3,028) | 3,028 | |||
Repurchase Agreements — 0.03% | ||||
| 9,084 | CS First Boston Repo., 1.890%, dated 10/29/2004, | |||
| matures 11/01/04, repurchase price $9,084 | ||||
| (collateralized by Government Mortgage Securities $9,267)ˆ | 9,084 | |||
| 19,682 | CS First Boston Repo., 1.935%, dated 10/29/2004, | |||
| matures 11/01/04, repurchase price $19,683 | ||||
| (collateralized by Private Mortgage Securities $20,666)ˆ | 19,682 | |||
| 5,148 | CS First Boston Repo., 1.935%, dated 10/29/2004, | |||
| matures 11/01/04, repurchase price $5,148 | ||||
| (collateralized by Private Mortgage Securities $5,405)ˆ | 5,148 | |||
| 15,746 | J.P. Morgan Repo., 1.890%, dated 10/29/2004, | |||
| matures 11/01/04, repurchase price $15,747 | ||||
| (collateralized by Federal Mortgage Securities $16,218)ˆ | 15,746 |
See notes to the financial statements.
35
SCHEDULE OF INVESTMENTS — Hennessy Cornerstone Value Fund — (Continued)
October 31, 2004
| Principal Amount | Value | |||
|---|---|---|---|---|
SHORT-TERM OBLIGATIONS (Continued) | ||||
Repurchase Agreements (Continued) | ||||
| $6,056 | Merrill Lynch Repo, 1.965%, dated 10/29/2004, | |||
| matures 11/01/04, repurchase price $6,056 | ||||
| (collateralized by Corporate Bonds $6,359)ˆ | $ 6,056 | |||
Total Repurchase Agreements (Cost $55,716) | 55,716 | |||
Discount Notes — 0.67% | ||||
| 1,308,000 | Federal Home Loan Bank Discount Note, 1.0000%, due 11/01/2004 | 1,308,000 | ||
Total Discount Notes (Cost $1,308,000) | 1,308,000 | |||
Variable Rate Demand Notes# — 0.01% | ||||
| 7,317 | American Family Financial Services, Inc., 1.5628% | 7,317 | ||
| 7,316 | Wisconsin Corporate Central Credit Union, 1.6288% | 7,316 | ||
Total Variable Rate Demand Notes (Cost $14,633) | 14,633 | |||
| Number of Shares | ||||
Money Market Fund — 0.00% | ||||
| 523 | Merrill Lynch Premier Institutional Fundˆ | 523 | ||
Total Money Market Fund (Cost $523) | 523 | |||
Total Short-Term Obligations (Cost $1,456,619) | 1,456,619 | |||
Total Investments — 99.99% (Cost $192,161,235) | 195,628,447 | |||
| Other Assets and Liabilities, Net — 0.01% | 17,263 | |||
NET ASSETS — 100% | $195,645,710 | |||
| * | Non-income producing security |
| # | Variable rate demand notes are considered short-term obligations and are payable on demand. Interest rates change periodically on specified dates. The rates listed are as of October 31, 2004. |
| ˆ | Securities lending collateral |
| + | All or a portion of this security is out on loan at October 31, 2004. |
| (a) | Foreign denominated security |
| ADR | American Depository Receipts |
See notes to the financial statements.
36
SCHEDULE OF INVESTMENTS — Hennessy Total Return Fund
October 31, 2004
| Number of Shares | Value | |||
|---|---|---|---|---|
COMMON STOCKS — 75.27% | ||||
Automobiles — 6.46% | ||||
| 153,900 | General Motors Corp. | $ 5,932,845 | ||
Beverages — 0.03% | ||||
| 725 | The Coca-Cola Co. | 29,478 | ||
Chemicals — 7.68% | ||||
| 164,625 | E. I. du Pont de Nemours and Co. | 7,057,474 | ||
Diversified Financial Services — 15.15% | ||||
| 152,525 | Citigroup, Inc. | 6,767,534 | ||
| 185,325 | J.P. Morgan Chase & Co. | 7,153,545 | ||
| 13,921,079 | ||||
Diversified Telecommunication Services — 15.59% | ||||
| 340,200 | AT&T Corp. | 5,820,822 | ||
| 310,350 | SBC Communications, Inc. | 7,839,441 | ||
| 17,125 | Verizon Communications, Inc. | 669,588 | ||
| 14,329,851 | ||||
Industrial Conglomerates — 8.46% | ||||
| 227,775 | General Electric Co. | 7,771,683 | ||
Oil & Gas — 9.45% | ||||
| 176,450 | Exxon Mobil Corp. | 8,684,869 | ||
Paper & Forest Products — 0.04% | ||||
| 1,075 | International Paper Co. | 41,398 | ||
Pharmaceuticals — 5.29% | ||||
| 155,200 | Merck & Co., Inc. | 4,859,312 | ||
Tobacco — 7.12% | ||||
| 135,050 | Altria Group, Inc. | 6,544,523 | ||
Total Common Stocks (Cost $74,074,627) | 69,172,512 | |||
| Principal Amount | ||||
SHORT-TERM OBLIGATIONS — 61.63% | ||||
U.S. Treasury Bills(a) — 60.75% | ||||
| $ 17,000,000 | 1.47%, 11/26/2004 | 16,983,467 | ||
| 15,000,000 | 1.50%, 12/30/2004 | 14,955,300 | ||
| 24,000,000 | 1.80%, 01/27/2005 | 23,891,544 | ||
Total U.S. Treasury Bills (Cost $55,856,053) | 55,830,311 |
See notes to the financial statements.
37
SCHEDULE OF INVESTMENTS — Hennessy Total Return Fund — (Continued)
October 31, 2004
| Principal Amount | Value | ||||
|---|---|---|---|---|---|
SHORT-TERM OBLIGATIONS (Continued) | |||||
Discount Notes — 0.87% | |||||
| $ 796,000 | Federal Home Loan Bank Discount Note, 1.0000%, due 11/01/2004 | $ 796,000 | |||
Total Discount Notes (Cost $796,000) | 796,000 | ||||
Variable Rate Demand Notes# — 0.01% | |||||
| 5,237 | American Family Financial Services, Inc., 1.5628% | 5,237 | |||
| 5,237 | Wisconsin Corporate Central Credit Union, 1.6288% | 5,237 | |||
Total Variable Rate Demand Notes (Cost $10,474) | 10,474 | ||||
Total Short-Term Obligations (Cost $56,662,527) | 56,636,785 | ||||
Total Investments — 136.90% (Cost $130,737,154) | 125,809,297 | ||||
| Other Liabilities and Assets, Net — (36.90%) | (33,910,511 | ) | |||
NET ASSETS — 100% | $ 91,898,786 | ||||
| (a) | Collateral or partial collateral for securities sold subject to repurchase. |
| # | Variable rate demand notes are considered short-term obligations and are payable on demand. Interest rates changed periodically on specified dates. The rates listed are as of October 31, 2004. |
See notes to the financial statements.
38
SCHEDULE OF INVESTMENTS — Hennessy Balanced Fund
October 31, 2004
| Number of Shares | Value | |||
|---|---|---|---|---|
COMMON STOCKS — 47.80% | ||||
Automobiles — 4.35% | ||||
| 24,575 | General Motors Corp. | $ 947,366 | ||
Beverages — 0.82% | ||||
| 4,400 | The Coca-Cola Co. | 178,904 | ||
Chemicals — 5.07% | ||||
| 25,750 | E.I. du Pont de Nemours & Co. | 1,103,903 | ||
Diversified Financial Services — 9.56% | ||||
| 22,725 | Citigroup, Inc. | 1,008,308 | ||
| 27,800 | J.P. Morgan Chase & Co. | 1,073,080 | ||
| 2,081,388 | ||||
Diversified Telecommunication Services — 9.87% | ||||
| 31,900 | AT&T Corp. | 545,809 | ||
| 44,200 | SBC Communications, Inc. | 1,116,492 | ||
| 12,400 | Verizon Communications, Inc. | 484,840 | ||
| 2,147,141 | ||||
Industrial Conglomerates — 5.30% | ||||
| 33,825 | General Electric Co. | 1,154,109 | ||
Oil & Gas — 2.17% | ||||
| 9,575 | Exxon Mobil Corp. | 471,281 | ||
Paper & Forest Products — 2.34% | ||||
| 13,225 | International Paper Co. | 509,295 | ||
Pharmaceuticals — 3.60% | ||||
| 25,025 | Merck & Co., Inc. | 783,533 | ||
Tobacco — 4.72% | ||||
| 21,200 | Altria Group, Inc. | 1,027,352 | ||
Total Common Stocks (Cost $10,695,184) | 10,404,272 |
See notes to the financial statements.
39
SCHEDULE OF INVESTMENTS — Hennessy Balanced Fund — (Continued)
October 31, 2004
| Principal Amount | Value | |||
|---|---|---|---|---|
SHORT-TERM OBLIGATIONS — 50.36% | ||||
U.S. Treasury Notes — 47.85% | ||||
| $ 620,000 | 2.000%, 11/30/2004 | $ 620,024 | ||
| 200,000 | 1.625%, 01/31/2005 | 199,844 | ||
| 4,970,000 | 1.500%, 02/28/2005 | 4,961,651 | ||
| 1,000,000 | 1.625%, 03/31/2005 | 998,203 | ||
| 250,000 | 1.625%, 04/30/2005 | 249,414 | ||
| 1,000,000 | 1.125%, 06/30/2005 | 993,516 | ||
| 650,000 | 1.500%, 07/31/2005 | 646,851 | ||
| 950,000 | 2.000%, 08/31/2005 | 948,516 | ||
| 800,000 | 1.625%, 09/30/2005 | 795,844 | ||
Total U.S. Treasury Notes (Cost $10,440,140) | 10,413,863 | |||
Discount Notes — 2.46% | ||||
| 536,000 | Federal Home Loan Bank Discount Note, 1.0000%, due 11/01/2004 | 536,000 | ||
Total Discount Notes (Cost $536,000) | 536,000 | |||
Variable Rate Demand Notes# — 0.05% | ||||
| 5,509 | American Family Financial Services, Inc., 1.5628% | 5,509 | ||
| 5,513 | Wisconsin Corporate Central Credit Union, 1.6288% | 5,513 | ||
Total Variable Rate Demand Notes (Cost $11,022) | 11,022 | |||
Total Short-Term Obligations (Cost $10,987,162) | 10,960,885 | |||
Total Investments — 98.16% (Cost $21,682,346) | 21,365,157 | |||
| Other Assets and Liabilities, Net — 1.84% | 399,518 | |||
NET ASSETS — 100% | $21,764,675 |
| # | Variable rate demand notes are considered short-term obligations and are payable on demand. Interest rates change periodically on specified dates. The rates listed are as of October 31, 2004. |
See notes to the financial statements.
40
NOTES TO THE FINANCIAL STATEMENTS
October 31, 2004
| 1). | ORGANIZATION |
| 2). | SIGNIFICANT ACCOUNTING POLICIES |
a). Investment Valuation – Securities which are traded on a national or recognized stock exchange are valued at the last sale price on the securities exchange on which such securities are primarily traded. Exchange-traded securities for which there were no transactions that day and debt securities are valued at the most recent bid prices. Instruments with a remaining maturity of 60 days or less are valued on an amortized cost basis. When a price for an underlying security is not readily available or if a significant event has occurred that indicates the closing price of a security no longer represents the true value of that security, procedures have been put in place to determine a fair value of a security. There are numerous criteria that will be given consideration in determining a fair value of a security. Some of these criteria are: size of holding, trading volume of security and markets, value of other like securities and news events with direct bearing to security or market.
b). Federal Income Taxes – Provision for federal income taxes or excise taxes has not been made since the Funds have elected to be taxed as “regulated investment companies” and intend to distribute substantially all taxable income to shareholders and otherwise comply with the provisions of the Internal Revenue Code applicable to regulated investment companies. Net investment income and realized gains and losses for federal income tax purposes may differ from that reported on the financial statements because of temporary book and tax basis differences. Temporary differences are primarily the result of the treatment of wash sales and deferred post-October losses for tax reporting purposes. Distributions from net realized gains for book purposes may include short-term capital gains, which are included as ordinary income to shareholders for tax purposes.
c). Income and Expenses – Dividend income is recognized on the ex-dividend date and interest income is recognized on an accrual basis. The Funds are charged for those expenses that are directly attributable to the portfolio, such as advisory, administration and certain shareowner service fees.
d). Distributions to Shareowners – Dividends from net investment income for the Growth, Focus 30 and Value Funds, if any, are declared and paid out annually, usually in November or December of each year. Dividends from net investment income for the Total Return and Balanced Funds are declared and paid on a calendar quarter basis. Distributions of net realized capital gains, if any, are declared and paid annually, usually in November or December of each year, for all of the Funds.
41
NOTES TO THE FINANCIAL STATEMENTS
(Continued)
October 31, 2004
e). Security Transactions – Investment and shareowner transactions are recorded on the trade date. The Funds determine the gain or loss realized from the investment transactions by comparing the original cost of the security lot sold with the net sale proceeds. Discounts and premiums on securities purchased are accreted/amortized over the life of the respective security.
f). Use of Estimates – The preparation of financial statements in conformity with GAAP requires management to make estimates and assumptions that affect the reported amounts of assets and liabilities and disclosure of contingent assets and liabilities at the date of the financial statements and the reported change in net assets during the reporting period. Actual results could differ from those estimates.
g). Share Valuation – The net asset value (“NAV”) per share of each Fund is calculated by dividing the sum of the value of the securities held by each Fund, plus cash or other assets, minus all liabilities (including estimated accrued expenses) by the total number of shares outstanding for each Fund, rounded to the nearest cent. The Funds’ shares will not be priced on the days on which the NYSE is closed for trading. The offering and redemption price per share for each Fund is equal to each Fund’s net asset value per share. The Funds charge a 1.50% redemption fee on shares held less than three months. These fees are deducted from the redemption proceeds otherwise payable to the shareholder. The Funds will retain the fee charged as paid-in capital and such fees become part of that Fund’s daily NAV calculation.
h). Repurchase Agreements – Each Fund may enter into repurchase agreements with member banks or security dealers of the Federal Reserve whom the investment advisor deems creditworthy. The repurchase price generally equals the price paid by the Fund plus interest negotiated on the basis of current short-term rates.
| 3). | REVERSE REPURCHASE AGREEMENTS |
| 4). | INVESTMENT TRANSACTIONS |
October 31, 2004
| Growth Fund | Focus 30 Fund | Value Fund | Total Return Fund | Balanced Fund | |||||||||||
|---|---|---|---|---|---|---|---|---|---|---|---|---|---|---|---|
| Purchases | $ | — | $ | — | $ | — | $ | 208,576 | $ | 946,094 | |||||
| Sales | $ | 5,651,507 | $ | — | $ | — | $ | 252,845 | $ | 1,749,656 | |||||
42
NOTES TO THE FINANCIAL STATEMENTS
(Continued)
October 31, 2004
September 30, 2004
| Growth Fund | Focus 30 Fund | Value Fund | |||||||
|---|---|---|---|---|---|---|---|---|---|
| Purchases | $ | 976,236,872 | $ | 65,582,565 | $ | 10,471,870 | |||
| Sales | $ | 929,295,989 | $ | 52,364,294 | $ | 12,718,243 | |||
June 30, 2004
| Total Return Fund | Balanced Fund | |||||||
|---|---|---|---|---|---|---|---|---|
| Purchases | $ | 2,671,969 | $ | 7,330,584 | ||||
| Sales | $ | 7,311,821 | $ | 4,507,674 | ||||
| 5). | INVESTMENT MANAGEMENT FEE AND OTHER TRANSACTIONS WITH AFFILIATES |
| Growth Fund | 0.74 | % | ||||
| Focus 30 Fund | 1.00 | % | ||||
| Value Fund | 0.74 | % | ||||
| Total Return Fund | 0.60 | % | ||||
| Balanced Fund | 0.60 | % |
43
NOTES TO THE FINANCIAL STATEMENTS
(Continued)
October 31, 2004
| 6). | SECURITIES LENDING |
| 7). | LINE OF CREDIT |
44
NOTES TO THE FINANCIAL STATEMENTS
(Continued)
October 31, 2004
| 8). | FEDERAL TAX INFORMATION |
| Hennessy Growth Fund | Hennessy Focus 30 Fund | Hennessy Value Fund | Hennessy Total Return Fund | Hennessy Balanced Fund | ||||||||||||||||
|---|---|---|---|---|---|---|---|---|---|---|---|---|---|---|---|---|---|---|---|---|
| Cost of investments (a) | $ | 1,304,136,594 | $ | 49,580,368 | $ | 192,225,560 | $ | 130,773,742 | $ | 21,730,776 | ||||||||||
| Gross unrealized appreciation | 117,031,606 | 2,245,808 | 12,723,267 | 2,482,813 | 735,178 | |||||||||||||||
| Gross unrealized depreciation | (107,513,606 | ) | (1,484,540 | ) | (9,320,380 | ) | (7,447,258 | ) | (1,100,797 | ) | ||||||||||
| Net unrealized appreciation (depreciation) | $ | 9,518,000 | $ | 761,268 | $ | 3,402,887 | $ | (4,964,445 | ) | $ | (365,619 | ) | ||||||||
| Undistributed ordinary income | $ | — | $ | — | $ | 3,448,705 | $ | 141,094 | $ | 25,337 | ||||||||||
| Undistributed long-term capital gain | 173,840,519 | — | — | — | — | |||||||||||||||
| Total distributable earnings | $ | 173,840,519 | $ | — | $ | 3,448,705 | $ | 141,094 | $ | 25,337 | ||||||||||
| Accumulated realized losses | $ | (4,349,076 | ) | $ | (8,040,896 | ) | $ | (148,612,790 | ) | $ | (96,431,965 | ) | $ | (3,424,557 | ) | |||||
| Total accumulated realized and unrealized gains (losses) | $ | 179,009,443 | $ | (7,279,628 | ) | $ | (141,761,198 | ) | $ | (101,255,316 | ) | $ | (3,764,839 | ) | ||||||
| (a) | Represents cost for federal income tax purposes and differs from the cost for financial reporting purposes primarily due to wash sale adjustments. |
45
NOTES TO THE FINANCIAL STATEMENTS
(Continued)
October 31, 2004
| Period Ended October 31, 2004 | Year Ended September 30, | ||||||||
|---|---|---|---|---|---|---|---|---|---|
| 2004 | 2003 | ||||||||
| Distributions paid from: | |||||||||
| Ordinary income | $ | — | $ | — | $ | 378,851 | |||
| Long-term capital gain | — | — | 14,633,089 | ||||||
| $ | — | $ | — | $ | 15,011,940 | ||||
| Year Ended September 30, | |||||||||
|---|---|---|---|---|---|---|---|---|---|
| Period Ended October 31, 2004 | 2004 | 2003 | |||||||
| Distributions paid from: | |||||||||
| Ordinary income | $ | — | $ | — | $ | — | |||
| Long-term capital gain | — | — | — | ||||||
| $ | — | $ | — | $ | — | ||||
| Period Ended October 31, 2004 | Year Ended September 30, | ||||||||
|---|---|---|---|---|---|---|---|---|---|
| 2004 | 2003 | ||||||||
| Distributions paid from: | |||||||||
| Ordinary income | $ | — | $ | 421,282 | $ | 360,831 | |||
| Long-term capital gain | — | — | — | ||||||
| $ | — | $ | 421,282 | $ | 360,831 | ||||
| Period Ended October 31, 2004 | Year Ended June 30, | ||||||||
|---|---|---|---|---|---|---|---|---|---|
| 2004 | 2003 | ||||||||
| Distributions paid from: | |||||||||
| Ordinary income | $ | 446,103 | $ | 600,144 | $ | 64,810 | |||
| Long-term capital gain | — | — | — | ||||||
| Return of capital | — | 109,324 | — | ||||||
| $ | 446,103 | $ | 709,468 | $ | 64,810 | ||||
| Period Ended October 31, 2004 | Year Ended June 30, | ||||||||
|---|---|---|---|---|---|---|---|---|---|
| 2004 | 2003 | ||||||||
| Distributions paid from: | |||||||||
| Ordinary income | $ | 59,819 | $ | 197,328 | $ | 208,171 | |||
| Long-term capital gain | — | 93,788 | 83,442 | ||||||
| Return of capital | — | 42,438 | — | ||||||
| $ | 59,819 | $ | 333,554 | $ | 291,613 | ||||
46
NOTES TO THE FINANCIAL STATEMENTS
(Continued)
October 31, 2004
| 9). | FUND MERGERS |
| Acquired Lindner Fund | Acquiring Hennessy Fund | Acquired Funds Net Assets | Shares issued to Shareholders of Acquired Fund | Acquiring Funds Net Assets | Combined Net Assets | |||||||||||
|---|---|---|---|---|---|---|---|---|---|---|---|---|---|---|---|---|
| Small Cap Growth | Growth | $ | 7,133,897 | (1) | 369,776 | $943,247,388 | $958,599,460 | |||||||||
| Communications | Growth | 8,218,175 | (2) | 425,974 | 943,247,388 | 958,599,460 | ||||||||||
| Growth & Income | Value | 179,367,979 | (3) | 14,615,807 | 25,954,467 | 205,322,446 | ||||||||||
| Large-Cap Growth | Total Return | 96,447,508 | (4) | 8,736,232 | 7,522,415 | 103,969,923 | ||||||||||
| Market Neutral | Balanced | 10,051,535 | (5) | 919,731 | 17,302,833 | 27,354,368 | ||||||||||
| (1) | Includes capital loss carryovers in the amount of $1,521,466. |
| (2) | Includes capital loss carryovers in the amount of $15,129,988. |
| (3) | Includes capital loss carryovers and unrealized appreciation in the amount of $145,153,143 and $942,674, respectively. |
| (4) | Includes accumulated net realized loss on investments of $96,508,193 and an unrealized gain on investments of $360,740. |
| (5) | Includes accumulated net realized loss on investments of $24,728,086 and no unrealized gain/loss on investments. |
| 10). | SUBSEQUENT EVENTS |
| 11). | FEDERAL TAX DISTRIBUTION INFORMATION (Unaudited) |
47
REPORT OF INDEPENDENT REGISTERED PUBLIC ACCOUNTING FIRM
The Shareholders and Board of Directors
The Hennessy Mutual Funds, Inc. and The Hennessy Funds, Inc.
We have audited the accompanying statements of assets and liabilities of The Hennessy Mutual Funds, Inc. (comprising, respectively, the Hennessy Cornerstone Growth Fund, the Hennessy Cornerstone Value Fund, and the Hennessy Focus 30 Fund) and The Hennessy Funds, Inc. (comprising, respectively, the Hennessy Balanced Fund and the Hennessy Total Return Fund), collectively referred to as the “Funds”, including the schedules of investments as of October 31, 2004, and the related statements of operations and cash flows for the periods presented, and the statements of changes in net assets for the periods presented (one month period ended October 31, 2004, year ended September 30, 2004, and nine-month period ended September 30, 2003 for the Hennessy Focus 30 Fund), and financial highlights for each of the periods presented (one month ended October 31, 2004, year ended September 30, 2004, and nine-month period ended September 30, 2003 for the Hennessy Focus 30 Fund). These financial statements and financial highlights are the responsibility of the Funds’ management. Our responsibility is to express an opinion on these financial statements and financial highlights based on our audits. The accompanying financial highlights for the Hennessy Cornerstone Growth Fund and the Hennessy Cornerstone Value Fund for the year ended September 30, 2000 were audited by other auditors whose report thereon dated November 13, 2000, expressed an unqualified opinion on these statements. The accompanying financial statements of the Hennessy Focus 30 Fund including the statement of changes in net assets for the year ended December 31, 2002 and the financial highlights for the year ended December 31, 2002 and period January 2, 2001 though December 31, 2001 were audited by other auditors whose report thereon dated January 25, 2003 expressed an unqualified opinion on these statements.
We conducted our audits in accordance with the auditing standards of the Public Company Accounting Oversight Board (United States). Those standards require that we plan and perform the audit to obtain reasonable assurance about whether the financial statements and financial highlights are free of material misstatement. An audit includes examining, on a test basis, evidence supporting the amounts and disclosures in the financial statements. Our procedures included confirmation of securities owned, by correspondence with the custodian and broker. An audit also includes assessing the accounting principles used and significant estimates made by management, as well as evaluating the overall financial statement presentation. We believe that our audits provide a reasonable basis for our opinion.
In our opinion, the financial statements and financial highlights referred to above present fairly, in all material respects, the financial position of the Hennessy Cornerstone Growth Fund, the Hennessy Cornerstone Value Fund, the Hennessy Focus 30 Fund, the Hennessy Balanced Fund, and the Hennessy Total Return Fund as of October 31, 2004, the results of their operations and cash flows for the periods presented, the changes in their net assets for the periods presented (one month period ended October 31, 2004, year ended September 30, 2004, and nine-month period ended September 30, 2003 for the Hennessy Focus 30 Fund), and the financial highlights for each of the periods presented (one month ended October 31, 2004, year ended September 30, 2004, nine-month period ended September 30, 2003 for the Hennessy Focus 30 Fund), in conformity with accounting principles generally accepted in the United States of America.

Chicago, Illinois
48
ADDITIONAL DISCLOSURE REGARDING FUND DIRECTORS (UNAUDITED)
| Name, Age and Address | Position(s) Held with the Companies | Term of Office and Length of Time Served | Principal Occupation During Past Five Years | # of Funds in Complex Overseen by Director | Other Directorships Held by Directors | |||||
|---|---|---|---|---|---|---|---|---|---|---|
“Disinterested Persons” | ||||||||||
| Robert T. Doyle, 57 The Courtyard Square 750 Grant Ave., Ste. 100 Novato, CA 94945 | Independent Director | Indefinite Term; Served since January 1996. | Currently the Sheriff of Marin County, California (since 1996) and has been employed in the Marin County Sheriff’s Office in various capacities since 1969. | 5 | None. | |||||
| J. Dennis DeSousa, 68 The Courtyard Square 750 Grant Ave., Ste. 100 Novato, CA 94945 | Independent Director | Indefinite Term; Served since January 1996. | Currently a real estate investor; Owner/director, North Bay Television, Inc. (1985-1999). | 5 | None. | |||||
| Gerald P. Richardson, 58 The Courtyard Square 750 Grant Ave., Ste. 100 Novato, CA 94945 | Independent Director | Indefinite Term; Served since May 2004. | Currently Chief Executive Officer/owner, ORBIS Payment Services (since January 2001); Consultant, Sonoma County Treasurer/Tax Collector (since July 2000); Principal, Morgan Stanley (Fixed Income) (1981-1999); Chief Investment Officer, City and County of San Francisco Treasurer’s Office (1971-1981). | 5 | None. | |||||
“Interested Persons” (as defined in the 1940 Act) | ||||||||||
| Neil J. Hennessy, 48 Hennessy Advisors, Inc. The Courtyard Square 750 Grant Ave., Ste. 100 Novato, CA 94945 | Director and President | Indefinite Term; Served since January 1996. | President of the Manager since 1989; President and Investment Manager of The Hennessy Mutual Funds, Inc. and The Hennessy Funds, Inc. since 1996. | 5 | Director of Hennessy Advisors, Inc. | |||||
| Officer: | ||||||||||
| Frank Ingarra, Jr., 33 The Courtyard Square 750 Grant Ave., Ste. 100 Novato, CA 94945 | Assistant Portfolio Manager and Vice President | 1 year term 2 years | Assistant Portfolio Manager for Hennessy Advisors, Inc., the Fund’s investment adviser, from March 2002 to the present; from August 2000 through March 2002, Mr. Ingarra was the Head Trader for Hennessy Advisors, Inc.; from August 2002 to the present, Mr. Ingarra has been a Vice President of The Hennessy Mutual Funds, Inc. and The Hennessy Funds, Inc.; from July 1999 through August 2000, Mr. Ingarra was the Vice President and lead trader for O’Shaughnessy Capital Management; and from May 1998 through July 1999, Mr. Ingarra was an Assistant Vice President and Equity Trader for O’Shaughnessy Capital Management. | N/A | None. | |||||
49
| Name, Age and Address | Position(s) Held with the Companies | Term of Office and Length of Time Served | Principal Occupation During Past Five Years | # of Funds in Complex Overseen by Director | Other Directorships Held by Directors | |||||
|---|---|---|---|---|---|---|---|---|---|---|
| Harry F. Thomas, 57 The Courtyard Square 750 Grant Ave., Ste. 100 Novato, CA 94945 | Chief Compliance Officer | 1 year term Newly appointed | Chief Compliance Officer for Hennessy Advisors, Inc., the Funds’ investment adviser, since 2004; retired business executive from 2001 through 2004; director of the Funds from 2000 to May 2004; Managing Director of Emplifi, Inc., a consulting firm, from 1999 through 2001; and Vice President and Manager of Employee Benefit Trust Operation of Wells Fargo Bank from 1997 through 1999. | N/A | None. | |||||
| Ana Miner, 46 The Courtyard Square 750 Grant Ave., Ste. 100 Novato, CA 94945 | Vice President of Operations | 1 year term 6 years | Has been employed by Hennessy Advisors, Inc., the Funds’ investment adviser, since 1998; from 1990 through 1998, Ms. Miner was employed as an institutional sales assistant by Merrill Lynch Capital Markets. | N/A | None. | |||||
| Teresa M. Nilsen, 38 The Courtyard Square 750 Grant Ave., Ste. 100 Novato, CA 94945 | Executive Vice President and Treasurer | 1 year term 8 years | Currently Executive Vice President, Chief Financial Officer and Secretary of Hennessy Advisors, Inc., the Funds’ investment adviser; Ms. Nilsen has been the corporate secretary and a financial officer of Hennessy Advisors, Inc. since 1989; Ms. Nilsen has been an officer of The Hennessy Mutual Funds, Inc. and The Hennessy Funds, Inc. since 1996, currently she is Executive Vice President and Treasurer. | N/A | Director of Hennessy Advisors, Inc. | |||||
| Daniel B. Steadman, 48 The Courtyard Square 750 Grant Ave., Ste. 100 Novato, CA 94945 | Executive Vice President and Secretary | 1 year term 5 years | Executive Vice President of Hennessy Advisors, Inc., the Funds’ investment adviser, from 2000 to the present; Vice President of Westamerica Bank from 1995 through 2000; Mr. Steadman has been Executive Vice President and Secretary of The Hennessy Mutual Funds, Inc. and The Hennessy Funds, Inc. since 2000. | N/A | Director of Hennessy Advisors, Inc. |
50
| Name, Age and Address | Position(s) Held with the Companies | Term of Office and Length of Time Served | Principal Occupation During Past Five Years | # of Funds in Complex Overseen by Director | Other Directorships Held by Directors | |||||
|---|---|---|---|---|---|---|---|---|---|---|
| Tania A. Kelley, 39 The Courtyard Square 750 Grant Ave., Ste. 100 Novato, CA 94945 | Vice President of Marketing | 1 year term 2 years | Has been employed by Hennessy Advisors, Inc., the Funds’ investment adviser, since October 2003; Director of Sales and Marketing for Comcast from 2002 through 2003; from 1999 to 2002, Ms. Kelley was Director of Sales and Marketing for AT&T. | N/A | None. | |||||
| Brian Peery, 35 The Courtyard Square 750 Grant Ave., Ste. 100 Novato, CA 94945 | Vice President of Sales | 1 year term 3 years | Has been employed by Hennessy Advisors, Inc., the Funds’ investment adviser, since June 2002; Vice President of Institutional Sales and Senior Analyst with Brad Peery Inc. from June 2000 to June 2002; from 1996 to 2002, Mr. Peery worked for Haywood Securities where he was a Vice President. | N/A | None. |
51
ALLOCATION OF PORTFOLIO ASSETS
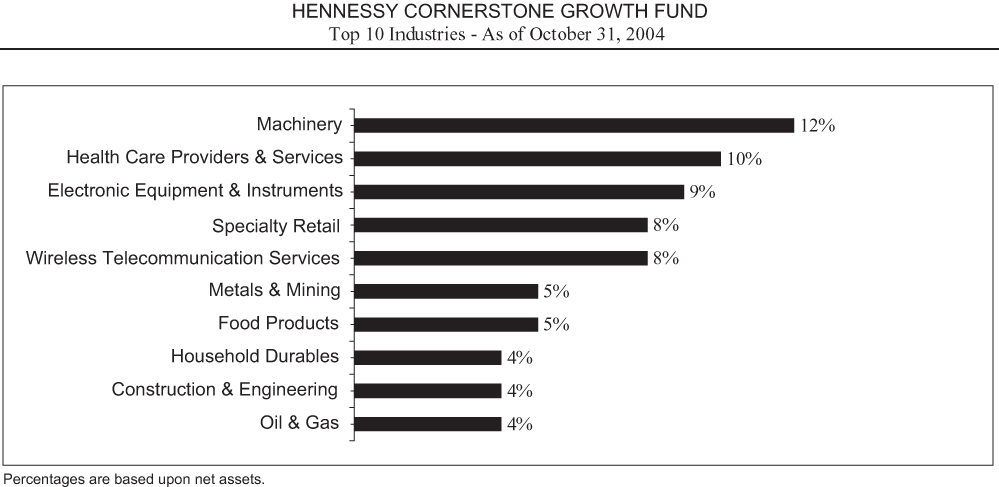
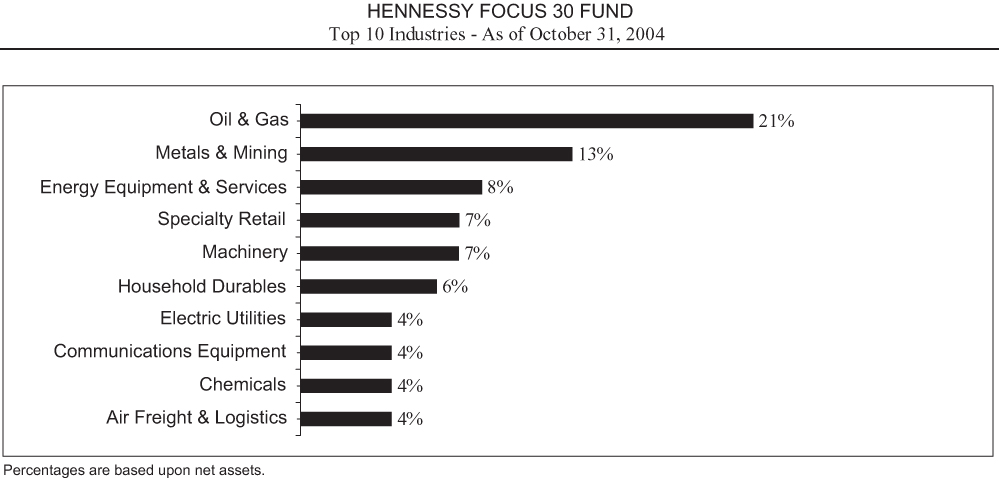
52
ALLOCATION OF PORTFOLIO ASSETS
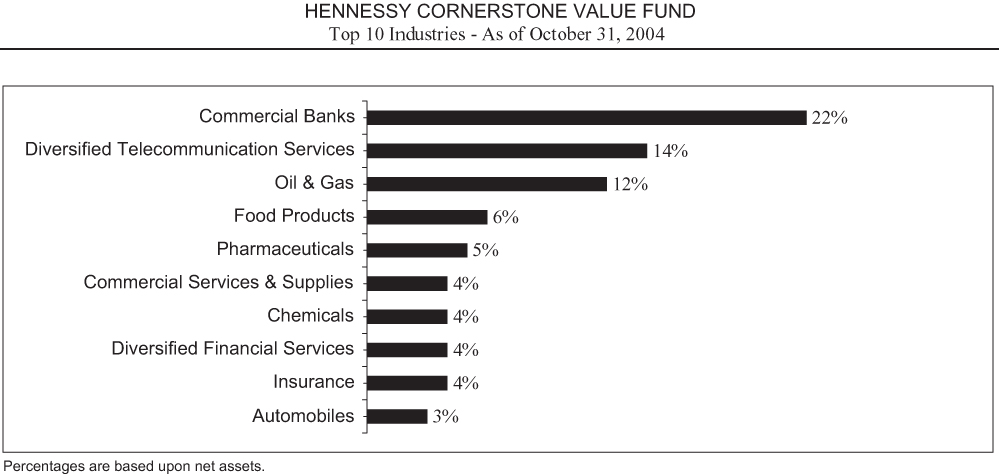
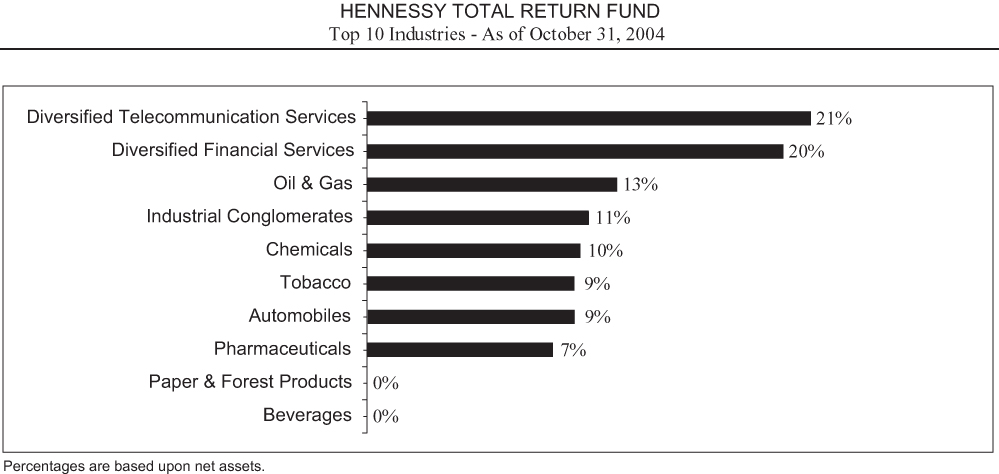
53
ALLOCATION OF PORTFOLIO ASSETS
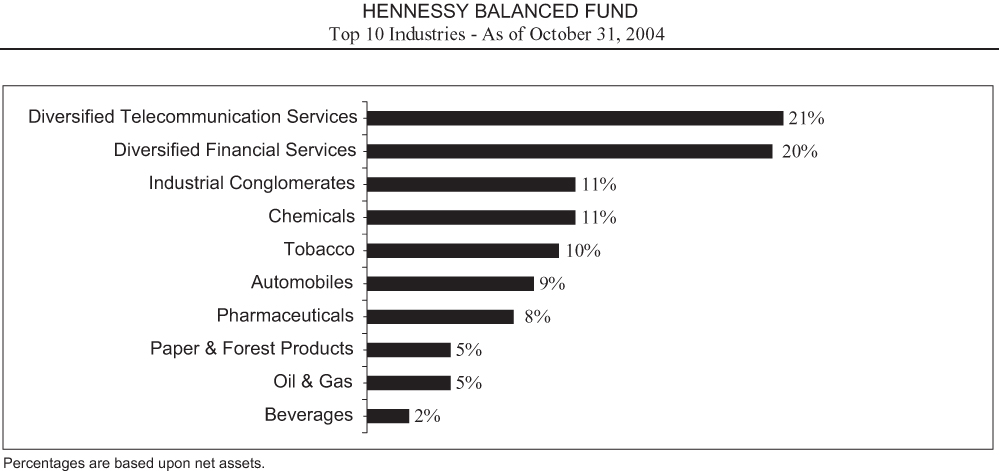
54
EXPENSE EXAMPLE
October 31, 2004
Actual Expenses
Hypothetical Example for Comparison Purposes
55
| Beginning Account Value 5/1/04 | Ending Account Value 10/31/04 | Expenses Paid During Period(1) 5/1/04–10/31/04 | |||||||
|---|---|---|---|---|---|---|---|---|---|
Actual | |||||||||
| Growth Fund | $1,000.00 | $1,069.00 | $6.55 | ||||||
| Focus 30 Fund | $1,000.00 | $1,000.90 | $7.25 | ||||||
| Value Fund | $1,000.00 | $1,031.20 | $5.87 | ||||||
| Total Return Fund | $1,000.00 | $ 961.70 | $8.55 | ||||||
| Balanced Fund | $1,000.00 | $ 965.60 | $6.67 | ||||||
Hypothetical (5% return before expenses) | |||||||||
| Growth Fund | $1,000.00 | $1,037.50 | $6.45 | ||||||
| Focus 30 Fund | $1,000.00 | $1,035.70 | $7.38 | ||||||
| Value Fund | $1,000.00 | $1,038.60 | $5.89 | ||||||
| Total Return Fund | $1,000.00 | $1,032.80 | $8.86 | ||||||
| Balanced Fund | $1,000.00 | $1,036.60 | $6.92 | ||||||
| (1) | Expenses are equal to the Growth Fund’s, Focus 30 Fund’s Value Fund’s, Total Return Fund’s and Balanced Fund’s expense ratios of 1.25%, 1.43%, 1.14%, 1.72% and 1.34%, respectively, multiplied by the average account value over the period, multiplied by the number of days in the most recent half-year/365 days (to reflect one-half year period). |
Quarterly Filings on Form N-Q
56
Investment Adviser Administrator, Transfer Agent, Custodian Directors Counsel Independent Registered Public Accounting Firm Distributor This report has been prepared for shareholders and may be distributed | HENNESSY ANNUAL REPORT OCTOBER 31, 2004 Hennessy Cornerstone Growth Fund  Hennessy Funds Hennessy Funds |
Item 2. Code of Ethics.
The registrant has adopted a code of ethics that applies to the registrant’s principal executive officer and principal financial officer. The registrant has not made any amendments to its code of ethics during the period covered by this report. The registrant has not granted any waivers from any provisions of the code of ethics during the period covered by this report.
The registrant undertakes to provide to any person without charge, upon request, a copy of its code of ethics by mail when they call the registrant at 1-800-966-4354.
Item 3. Audit Committee Financial Expert.
The registrant’s board of directors has determined that it does not have an audit committee financial expert serving on its audit committee. At this time, the registrant believes that the experience provided by each member of the audit committee together offers the registrant adequate oversight for the registrant’s level of financial complexity.
Item 4. Principal Accountant Fees and Services.
The registrant has engaged its principal accountant to perform audit services, audit-related services, tax services and other services during the past two fiscal years. “Audit services” refer to performing an audit of the registrant’s annual financial statements or services that are normally provided by the accountant in connection with statutory and regulatory filings or engagements for those fiscal years. “Audit-related services” refer to the assurance and related services by the principal accountant that are reasonably related to the performance of the audit. “Tax services” refer to professional services rendered by the principal accountant for tax compliance, tax advice, and tax planning. The following table details the aggregate fees billed for each of the last two fiscal years for audit fees, audit-related fees, tax fees and other fees by the principal accountant.
| FYE 10/31/2004 | FYE 6/30/2004 | ||||
| Audit Fees | $21,600 | $32,200 | |||
| Audit-Related Fees | -- | -- | |||
| Tax Fees | 3,000 | 7,200 | |||
| All Other Fees | -- | -- | |||
The audit committee has adopted pre-approval policies and procedures that require the audit committee to pre-approve all audit and non-audit services of the registrant, including services provided to any entity affiliated with the registrant. All of the principal accountant’s hours spent on auditing the registrant’s financial statements were attributed to work performed by full-time permanent employees of the principal accountant. (If more than 50 percent of the accountant’s hours were spent to audit the registrant’s financial statements for the most recent fiscal year, state how many hours were attributed to work performed by persons other than the principal accountant’s full-time, permanent employees.)
The following table indicates the non-audit fees billed by the registrant’s accountant for services to the registrant and to the registrant’s investment adviser (and any other controlling entity, etc.—not sub-adviser) for the last two years. The audit committee of the board of trustees/directors has considered whether the provision of non-audit services that were rendered to the registrant’s investment adviser is compatible with maintaining the principal accountant’s independence and has concluded that the provision of such non-audit services by the accountant has not compromised the accountant’s independence.
| Non-Audit Related Fees | FYE 10/31/2004 | FYE 6/30/2004 | |||
| Registrant | $-- | $-- | |||
| Registrant's Investment Adviser | -- | -- | |||
Item 5. Audit Committee of Listed Registrants.
Not applicable to open-end investment companies.
Item 6.Schedule of Investments.
Schedule of Investments is included as part of the report to shareholders filed under Item 1 of this Form.
Item 7. Disclosure of Proxy Voting Policies and Procedures for Closed-End Management Investment Companies.
Not applicable to open-end investment companies.
Item 8. Purchases of Equity Securities by Closed-End Management Investment Company and Affiliated Purchases.
Not applicable to open-end investment companies.
Item 9. Submission of Matters to a Vote of Security Holders.
Not applicable.
Item 10. Controls and Procedures.
| (a) | The Registrant’s President/Chief Executive Officer and Treasurer/Chief Financial Officer have concluded that the Registrant’s disclosure controls and procedures (as defined in Rule 30a-3(c) under the Investment Company Act of 1940 (the “1940 Act”)) are effective as of a date within 90 days of the filing date of the report that includes the disclosure required by this paragraph, based on the evaluation of these controls and procedures required by Rule 30a-3(b) under the 1940 Act and Rules 15d-15(b) under the Securities Exchange Act of 1934, as amended. |
| (b) | There were no significant changes in the Registrant’s internal controls over financial reporting that occurred during the Registrant’s last fiscal half-year that has materially |
affected, or is reasonably likely to materially affect, the Registrant’s internal control over financial reporting. |
Item 11. Exhibits.
| (a) | (1) Any code of ethics or amendment thereto, that is subject of the disclosure required by Item 2, to the extent that the registrant intends to satisfy Item 2 requirements through filing an exhibit. Filed herewith. |
(3) Not applicable to open-end investment companies. |
| (b) | Certification pursuant to Section 906 of the Sarbanes-Oxley Act of 2002. Furnished herewith. |
SIGNATURES
Pursuant to the requirements of the Securities Exchange Act of 1934 and the Investment Company Act of 1940, the registrant has duly caused this report to be signed on its behalf by the undersigned, thereunto duly authorized.
(Registrant) The Hennessy Funds, Inc |
By (Signature and Title) /s/ Neil J. Hennessy |
Date 1/7/05 |
Pursuant to the requirements of the Securities Exchange Act of 1934 and the Investment Company Act of 1940, this report has been signed below by the following persons on behalf of the registrant and in the capacities and on the dates indicated.
By (Signature and Title)* /s/ Neil J. Hennessy |
Date 1/7/05 |
By (Signature and Title)* /s/ Teresa M. Nilsen |
Date 1/7/05 |
* Print the name and title of each signing officer under his or her signature.