Tompkins Financial Corporation 8-K
Exhibit 99.1
Exhibit 99.1 Annual Meeting of Shareholders (Presentation Slides)
2022 Annual Shareholder Meeting May 10, 2022

Tom Rochon, Chair Tompkins Financial Corp.

Steve Romaine, President & CEO Tompkins Financial Corp.
"Safe Harbor" Statement under the Private Securities Litigation Reform Act of 1995 This presentation contains “forward - looking statements” within the meaning of the Private Securities Litigation Reform Act of 1995. Forward - looking statements are neither historical facts nor assurances of future performance. Forward - looking statements may be identified by use of such words as "may", "will", "estimate", "intend", "continue", "believe", "expect", "plan", or "anticipate", and other similar words. Forward - looking statements are made based on management’s expectations and beliefs concerning future events impacting the Company and are subject to certain uncertainties and factors relating to the Company’s operations and economic environment, all of which are difficult to predict and many of which are beyond the control of the Company, that could cause actual results of the Company to differ materially from those expressed and/or implied by forward - looking statements. The Company does not undertake any obligation to update its forward - looking statements.
2021 Operating Performance • Record earnings of $6.05 per share, up 16.4% over 2020 • Net income of $89.3 million, up $11.7 million over 2020 • Total revenue up 1.2% over 2020 largely due to growth in fee income businesses • Total loans down due to decline in loans under the of Paycheck Protection Program (PPP). Growth in total loans, exclusive of PPP • Remain well capitalized, with healthy liquidity & strong credit quality
First Quarter 2022 Operating Performance • Earnings per share of $1.60 down 7% from first quarter, 2021 driven by reduced income from PPP as the program came to a close • Favorable trends include • Improved net interest margin • Higher fee - based revenue • Lower past due & nonperforming loan balances • Increased loan balances (exclusive of PPP) • Continued growth in deposits
One Bank Charter, One Brand

Driving Business Growth
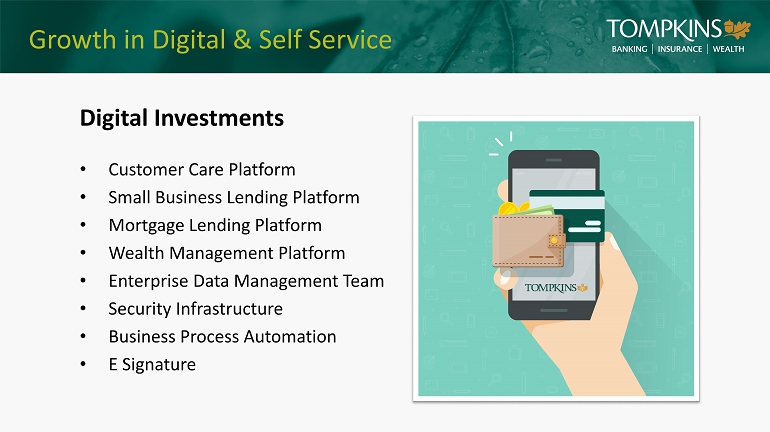
Growth in Digital & Self Service Digital Investments • Customer Care Platform • Small Business Lending Platform • Mortgage Lending Platform • Wealth Management Platform • Enterprise Data Management Team • Security Infrastructure • Business Process Automation • E Signature
Fee Based Business Contributions

Evolving World of Work

Leadership Transitions David DeMilia President Hudson Valley Market Ginger Kunkel President Pennsylvania Market Alyssa Fontaine EVP, General Counsel & Chief Risk Officer

Commitment to Our Communities

Thank You

Frank M. Fetsko, CFO, COO & Treasurer Tompkins Financial Corp.

Annual Earnings Trends $0.00 $1.00 $2.00 $3.00 $4.00 $5.00 $6.00 $7.00 2011Y 2012Y 2013Y 2014Y 2015Y 2016Y 2017Y 2018Y 2019Y 2020Y 2021Y Diluted EPS TMP Diluted EPS: 10 Year Compound Annual Growth Rate of 7%

Annual Cash Dividend Trends $0.00 $0.50 $1.00 $1.50 $2.00 $2.50 2011Y 2012Y 2013Y 2014Y 2015Y 2016Y 2017Y 2018Y 2019Y 2020Y 2021Y Cash Dividend Per Share TMP Cash Dividend: 10 Year Compound Annual Growth Rate of 5%

Quarterly Earnings Trend 18 $0.53 $1.44 $1.63 $1.61 $1.72 $1.54 $1.45 $1.33 $1.60 $0.00 $0.20 $0.40 $0.60 $0.80 $1.00 $1.20 $1.40 $1.60 $1.80 $2.00 1Q 2020 2Q 2020 3Q 2020 4Q 2020 1Q 2021 2Q 2021 3Q 2021 4Q 2021 1Q 2022
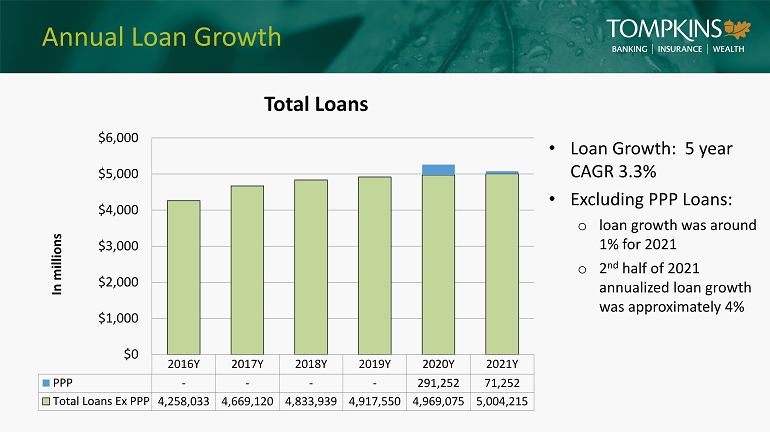
2016Y 2017Y 2018Y 2019Y 2020Y 2021Y PPP - - - - 291,252 71,252 Total Loans Ex PPP 4,258,033 4,669,120 4,833,939 4,917,550 4,969,075 5,004,215 $0 $1,000 $2,000 $3,000 $4,000 $5,000 $6,000 In millions Annual Loan Growth Total Loans • Loan Growth: 5 year CAGR 3.3% • Excluding PPP Loans: o loan growth was around 1% for 2021 o 2 nd half of 2021 annualized loan growth was approximately 4%
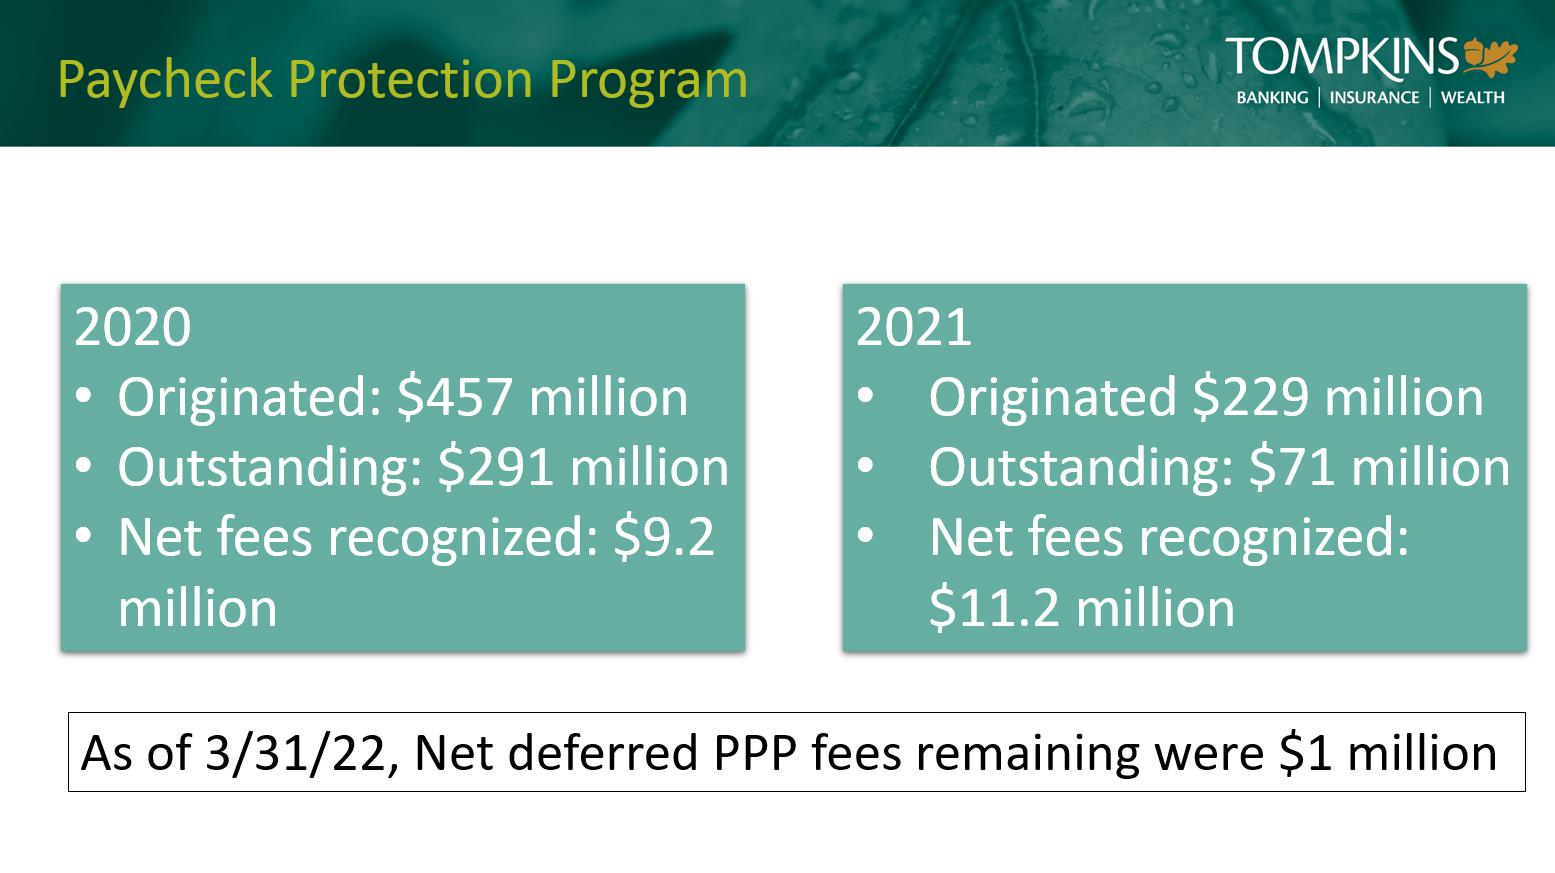
Paycheck Protection Program 2020 • Originated: $457 million • Outstanding: $291 million • Net fees recognized: $9.2 million 2021 • Originated $229 million • Outstanding: $71 million • Net fees recognized: $11.2 million As of 3/31/22, Net deferred PPP fees remaining were $1 million

Disciplined Credit Culture 0.00% 0.50% 1.00% 1.50% 2.00% 2.50% 2012Y 2013Y 2014Y 2015Y 2016Y 2017Y 2018Y 2019Y 2020Y 2021Y 2022Q1 TMP FRB Peer (1) Nonperforming Assets / Total Assets (1) Source: Federal Reserve Bank Holding Company Performance Report
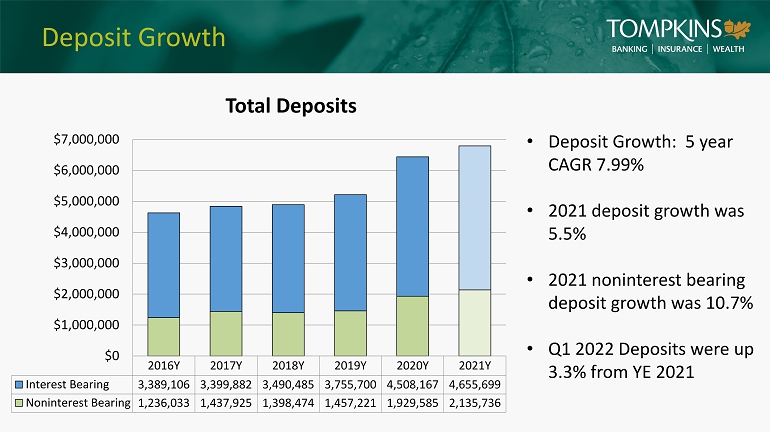
Deposit Growth Total Deposits 2016Y 2017Y 2018Y 2019Y 2020Y 2021Y Interest Bearing 3,389,106 3,399,882 3,490,485 3,755,700 4,508,167 4,655,699 Noninterest Bearing 1,236,033 1,437,925 1,398,474 1,457,221 1,929,585 2,135,736 $0 $1,000,000 $2,000,000 $3,000,000 $4,000,000 $5,000,000 $6,000,000 $7,000,000 • Deposit Growth: 5 year CAGR 7.99% • 2021 deposit growth was 5.5% • 2021 noninterest bearing deposit growth was 10.7% • Q1 2022 Deposits were up 3.3% from YE 2021

0% 2% 4% 6% 8% 10% 12% 14% 2017Y 2018Y 2019Y 2020Y 2021Y TMP FRB Peer (1) Profitability 0.00% 1.00% 2.00% 3.00% 4.00% 2017Y 2018Y 2019Y 2020Y 2021Y TMP FRB Peer (1) ROAA ROAE 0.00% 0.50% 1.00% 1.50% 2017Y 2018Y 2019Y 2020Y 2021Y TMP FRB Peer (1) NIM (1) Source Federal Reserve Bank Holding Company Performance Report
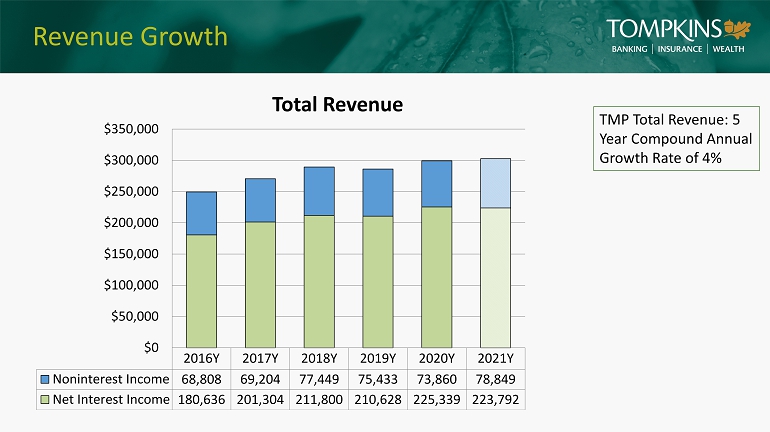
Revenue Growth 2016Y 2017Y 2018Y 2019Y 2020Y 2021Y Noninterest Income 68,808 69,204 77,449 75,433 73,860 78,849 Net Interest Income 180,636 201,304 211,800 210,628 225,339 223,792 $0 $50,000 $100,000 $150,000 $200,000 $250,000 $300,000 $350,000 Total Revenue TMP Total Revenue: 5 Year Compound Annual Growth Rate of 4%
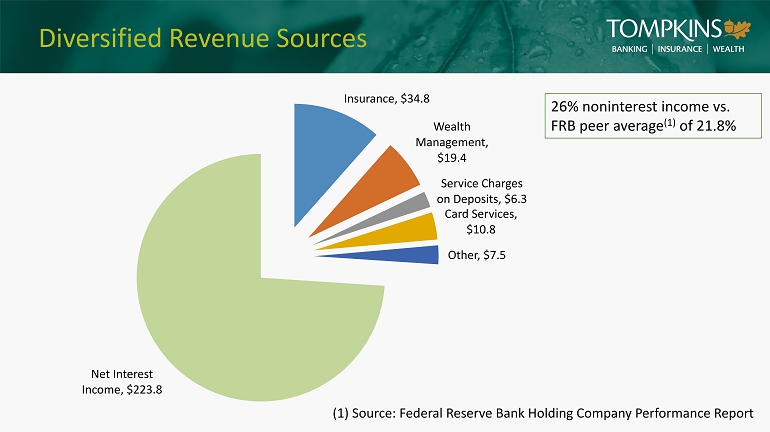
Diversified Revenue Sources Insurance , $34.8 Wealth Management , $19.4 Service Charges on Deposits , $6.3 Card Services , $10.8 Other , $7.5 Net Interest Income , $223.8 26% noninterest income vs. FRB peer average (1) of 21.8% (1) Source: Federal Reserve Bank Holding Company Performance Report
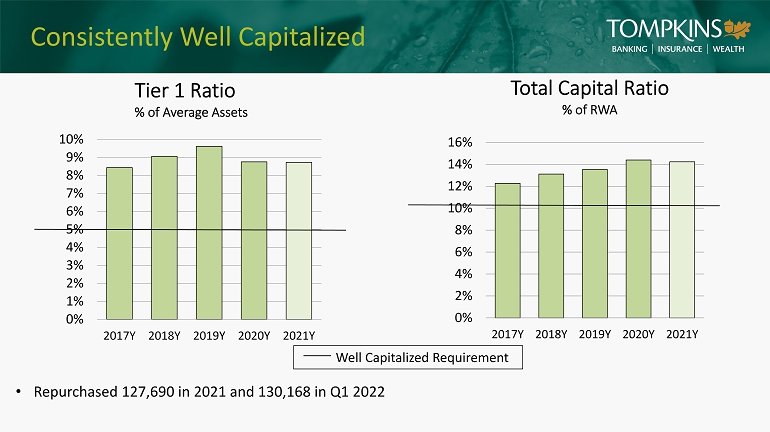
0% 1% 2% 3% 4% 5% 6% 7% 8% 9% 10% 2017Y 2018Y 2019Y 2020Y 2021Y Consistently Well Capitalized 0% 2% 4% 6% 8% 10% 12% 14% 16% 2017Y 2018Y 2019Y 2020Y 2021Y Total Capital Ratio % of RWA Tier 1 Ratio % of Average Assets • Repurchased 127,690 in 2021 and 130,168 in Q1 2022 Well Capitalized Requirement
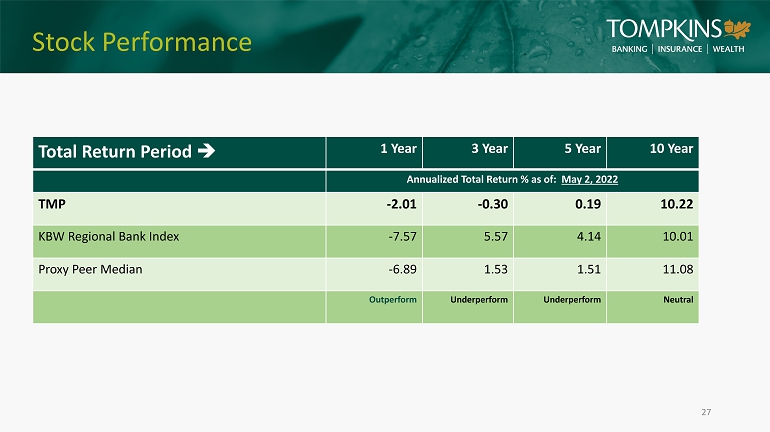
Stock Performance 27 Total Return Period 1 Year 3 Year 5 Year 10 Year Annualized Total Return % as of: May 2, 2022 TMP - 2.01 - 0.30 0.19 10.22 KBW Regional Bank Index - 7.57 5.57 4.14 10.01 Proxy Peer Median - 6.89 1.53 1.51 11.08 Outperform Underperform Underperform Neutral
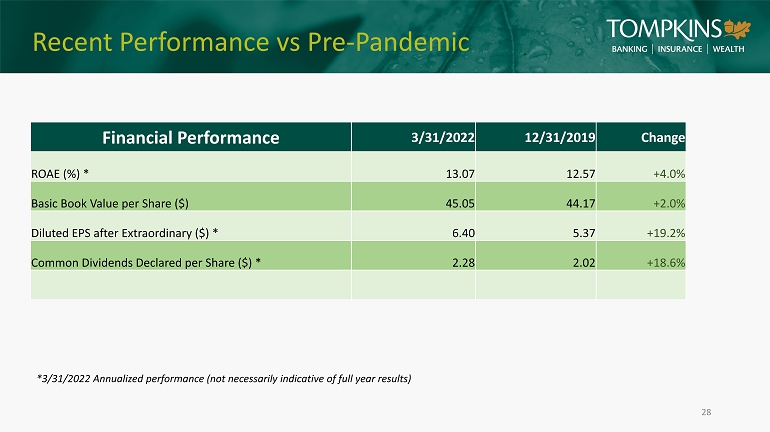
Recent Performance vs Pre - Pandemic 28 Financial Performance 3/31/2022 12/31/2019 Change ROAE (%) * 13.07 12.57 +4.0% Basic Book Value per Share ($) 45.05 44.17 +2.0% Diluted EPS after Extraordinary ($) * 6.40 5.37 +19.2% Common Dividends Declared per Share ($) * 2.28 2.02 +18.6% *3/31/2022 Annualized performance (not necessarily indicative of full year results)
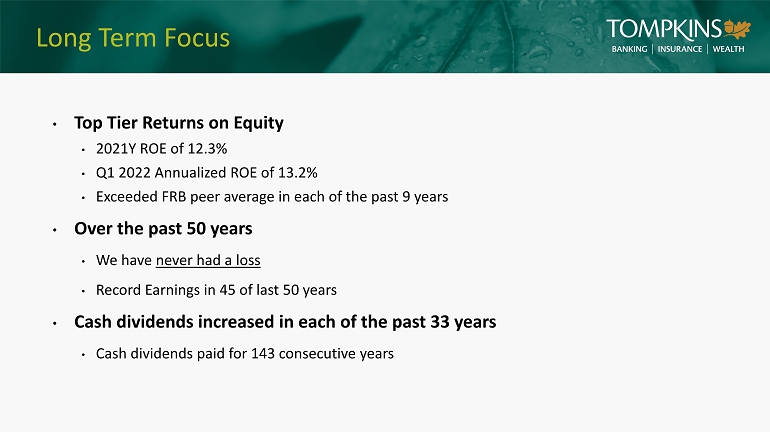
Long Term Focus • Top Tier Returns on Equity • 2021Y ROE of 12.3% • Q1 2022 Annualized ROE of 13.2% • Exceeded FRB peer average in each of the past 9 years • Over the past 50 years • We have never had a loss • Record Earnings in 45 of last 50 years • Cash dividends increased in each of the past 33 years • Cash dividends paid for 143 consecutive years

Preliminary Voting Results

Questions & Answers

Closing Remarks