| | |
| UNITED STATES
SECURITIES AND EXCHANGE COMMISSION |
| | |
| CERTIFIED SHAREHOLDER REPORT OF REGISTERED
MANAGEMENT INVESTMENT COMPANIES
|
| | |
| Investment Company Act file number: | (811-07513) |
| | |
| Exact name of registrant as specified in charter: | Putnam Funds Trust |
| | |
| Address of principal executive offices: | 100 Federal Street, Boston, Massachusetts 02110 |
| | |
| Name and address of agent for service: | Stephen Tate, Vice President
100 Federal Street
Boston, Massachusetts 02110 |
| | |
| Copy to: | Bryan Chegwidden, Esq.
Ropes & Gray LLP
1211 Avenue of the Americas
New York, New York 10036 |
| | |
| Registrant’s telephone number, including area code: | (617) 292-1000 |
| | |
| Date of fiscal year end: | July 31, 2022 |
| | |
| Date of reporting period: | August 1, 2021 – January 31, 2022 |
| | |
|
Item 1. Report to Stockholders: | |
| | |
| The following is a copy of the report transmitted to stockholders pursuant to Rule 30e-1 under the Investment Company Act of 1940: | |
Putnam
Ultra Short Duration
Income Fund
Semiannual report
1 | 31 | 22
Message from the Trustees
March 11, 2022
Dear Fellow Shareholder:
Financial markets have been bumpy in recent months. Investors are weighing the risks of rising inflation, changes in Federal Reserve policy, the latest Covid-19 variants, and the global impact of the Russia-Ukraine conflict.
Despite new uncertainties, the fundamental backdrop remains encouraging, in our view. Employment levels have been improving and may strengthen should Covid cases continue to decline. Businesses continue to adapt and show resilience.
In times like these, it’s worth remembering the benefits of staying focused on your long-term financial goals. At Putnam, professional, active investors are working for you. They are monitoring risks while looking for strong potential investments for your fund. Please read the interview with your fund manager(s) in the following pages.
As always, thank you for investing with Putnam.


Putnam Ultra Short Duration Income Fund is designed for investors who seek a conservative risk profile and low volatility, along with income potential. Managed by a team of industry veterans, the fund offers a level of flexibility not necessarily available in other conservative investment options. Because the fund is not a money market fund, the managers can invest in a broader range of sectors and securities that may offer higher yields without taking on significantly more risk.

|
| 2 Ultra Short Duration Income Fund |
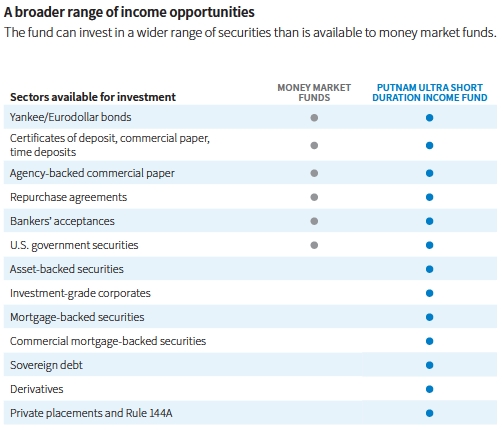
Investors should be aware of the differences between Putnam Ultra Short Duration Income Fund and money market funds before investing: Both seek to preserve capital and maintain liquidity. Money market funds generally focus on stability of principal, while Putnam Ultra Short Duration Income Fund seeks a balance of stability and income, which may result in increased volatility. Money market funds seek to maintain a net asset value (NAV) of $1.00 per share; the NAV of Putnam Ultra Short Duration Income Fund will fluctuate to reflect the market value of the portfolio. The fund’s fees and expenses differ from money market funds; see the prospectus for details. The fund can invest in more bond sectors than money market funds and, as a result, will be exposed to a larger number of risks. Neither money market funds nor this fund is insured or guaranteed by the FDIC or any other government agency, and investors can lose money in each.
|
| Ultra Short Duration Income Fund 3 |
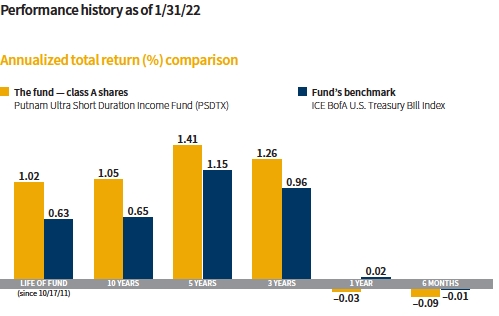
Current performance may be lower or higher than the quoted past performance, which cannot guarantee future results. Share price, principal value, and return will fluctuate, and you may have a gain or a loss when you sell your shares. Performance of class A shares assumes reinvestment of distributions and does not account for taxes a shareholder may owe on fund distributions or on the redemption of fund shares. See below and pages 9–11 for additional performance information. The fund had expense limitations during the period, without which returns would have been lower.
Returns for periods of less than one year are not annualized.
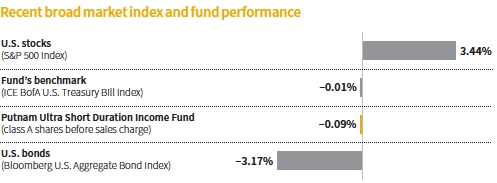
This comparison shows your fund’s performance in the context of broad market indexes for the six months ended 1/31/22. See above and pages 9–11 for additional fund performance information. Index descriptions can be found on page 15.
All Bloomberg indices are provided by Bloomberg Index Services Limited.
|
| 4 Ultra Short Duration Income Fund |
How were market conditions during the six-month reporting period?
Global financial markets had mixed results, buoyed by a recovering economy and ongoing fiscal and monetary stimulus. However, risks including higher inflation, rising interest rates, China’s weaker economy, and Covid-19 variants percolated through the markets. In U.S. bond markets, yields on long-term and short-term Treasuries have edged higher in recent weeks. Stock prices were volatile, but the S&P 500 Index — a broad measure of U.S. stock performance — gained 3.44%. The rate-sensitive Bloomberg U.S. Aggregate Bond Index, a broad measure of U.S. bond performance, declined 3.17% for the period.
In mid-December, the Federal Reserve pivoted toward tighter policy with plans to end its bond-buying stimulus program in March 2022. Most Fed officials penciled in raising interest rates, which are now set near zero, several times this year. In January, Fed Chair Jerome Powell said the central bank is likely to raise interest rates starting in March. The U.S. Treasury bond yield curve steepened slightly. The yield on the benchmark 10-year U.S. Treasury note reached 1.79% at the end of January 2022 from 1.20%
|
| Ultra Short Duration Income Fund 5 |
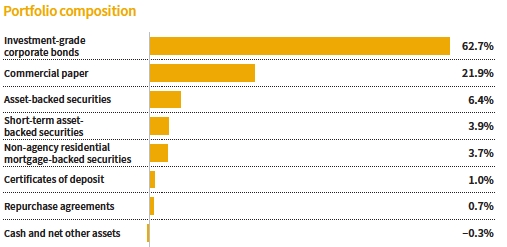
Allocations are shown as a percentage of the fund’s net assets as of 1/31/22. Cash and net other assets, if any, represent the market value weights of cash, derivatives, and other unclassified assets in the portfolio. Summary information may differ from the portfolio schedule included in the financial statements due to the inclusion of derivative securities, any interest accruals, the use of different classifications of securities for presentation purposes, and rounding. Holdings and allocations may vary over time.
The cash and net other assets category may show a negative market value percentage as a result of the timing of trade-date and settlement-date transactions.

at the start of the reporting period. The yield on 2-year Treasury notes rose to 1.18% from 0.17% at the start of the reporting period.
How did the fund perform for the period?
The fund slightly underperformed its benchmark, the ICE BofA U.S. Treasury Bill Index. The fund declined 0.09% on a net basis versus a decline of 0.01% for the benchmark index for the six months ended January 31, 2022.
What were the drivers of performance during the period?
A combination of widening credit spreads and rising short-term rates drove marginal underperformance during the period. Corporate credit was the largest detractor from the fund’s relative performance, as 1–3 year investment-grade corporate spreads widened from historically tight levels during the six-month period. In total, 1–3 year spreads widened 18 basis points, which negatively impacted our corporate bond positions. Though corporate credit detracted, the fund increased its exposure to corporate bonds with a floating-rate coupon during the period, which was additive to performance during the tail end of the period as rates rose.
On the other hand, our allocations to commercial paper contributed positively to returns. We keep a balance of short-maturity commercial paper for liquidity. Commercial paper yields remain low; however, if rates start to rise, we are able to reinvest the maturing paper at higher rates. Additionally, the fund’s allocation to securitized sectors, including non-agency residential mortgage-backed securities [RMBS], marginally aided the fund’s performance. The team continues to focus the portfolio’s allocation in this area on highly rated securities that are senior in the capital structure. We believe this emphasis provides diversification benefits to our corporate exposure.
What is your near-term outlook for fixed income markets?
Ultrashort fund managers faced a challenging yield environment in 2021. This was exacerbated
|
| 6 Ultra Short Duration Income Fund |
by the amount of liquidity entering the system driven by unprecedented monetary policy actions, including the Fed’s quantitative easing program. However, yield expectations have improved meaningfully over the last few months, with investors now pricing in multiple hikes from the Fed in 2022. At the Fed’s December meeting, there was discussion of hiking the federal funds rate earlier and faster than previously anticipated. The market has begun to take note, as the yields on 2-year and 3-year Treasury notes have risen sharply during the first month of the year. Additionally, short-term corporate credit spreads [as measured by the Bloomberg U.S. 1-3 Year Corporate Bond Index] have widened modestly over the last few months after reaching all-time tight spreads at the end of the third quarter.
With the Fed reaching an inflection point and with higher rates on the horizon, we are constructive on the outlook for ultrashort bond funds, and our fund in particular, as we can take advantage of higher interest rates. We believe this should benefit fixed income investors without taking the same level of interest-rate risk as longer-term bond funds.

What are the fund’s strategies going forward?
We have positioned the fund in an effort to take advantage of a higher interest-rate environment. Specifically, we increased the fund’s allocation to securities with a floating-rate coupon tied to either LIBOR or SOFR [Secured Overnight Financing Rate]. These securities’
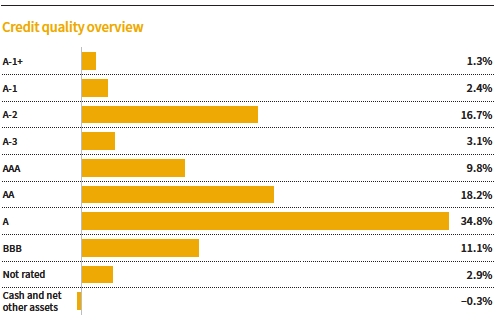
Credit qualities are shown as a percentage of the fund’s net assets as of 1/31/22. A bond rated BBB or higher (A-3/SP-3 or higher, for short-term debt) is considered investment grade. This chart reflects the highest security rating provided by one or more of Standard & Poor’s, Moody’s, and Fitch. Ratings may vary over time.
Cash and net other assets, if any, represent the market value weights of cash and derivatives and may show a negative market value as a result of the timing of trade versus settlement date transactions. The fund itself has not been rated by an independent rating agency.
|
| Ultra Short Duration Income Fund 7 |
coupons reset on a daily, 1-month, or 3-month basis to reflect current short-term rates and carry a very short duration [or interest-rate sensitivity]. In a rising-rate environment, this strategy can help the fund participate in increasing yields, without experiencing the negative price effects of longer-duration fixed-rate securities.
Throughout 2021, we shortened the duration of the fund. As of January 31, 2022, the fund’s duration is 0.26 years [down 0.12 years from where it began 2021 and down 0.02 years from July 31, 2021]. Additionally, we continue to structure the portfolio in a manner emphasizing a combination of lower-tier investment-grade securities [BBB or equivalent] generally maturing in one year or less, and upper-tier investment-grade securities [A or AA rated] generally maturing in a range of 1 to 3.5 years.
Given the current stretched valuations on the short end of the curve, we have also been judicious in adding incremental risk to the portfolio. Capital preservation remains the primary objective of our fund. We do not try to “stretch for yield” in the strategy, even in a challenging environment for yield generation.
Thank you, Joanne, for your time and for bringing us up to date.
The views expressed in this report are exclusively those of Putnam Management and are subject to change. They are not meant as investment advice.
Please note that the holdings discussed in this report may not have been held by the fund for the entire period. Portfolio composition is subject to review in accordance with the fund’s investment strategy and may vary in the future. Current and future portfolio holdings are subject to risk.
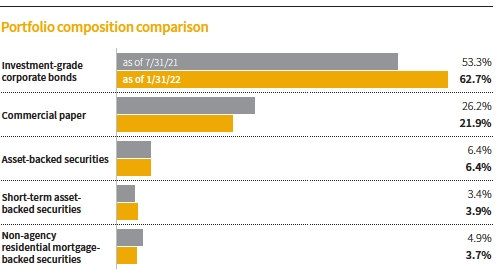
This chart shows how the fund’s top weightings have changed over the past six months. Allocations are shown as a percentage of the fund’s net assets. Current period summary information may differ from the portfolio schedule included in the financial statements due to the inclusion of derivative securities, any interest accruals, the use of different classifications of securities for presentation purposes, and rounding. Holdings and allocations may vary over time.
|
| 8 Ultra Short Duration Income Fund |
Your fund’s performance
This section shows your fund’s performance, price, and distribution information for periods ended January 31, 2022, the end of the first half of its current fiscal year. In accordance with regulatory requirements for mutual funds, we also include performance information as of the most recent calendar quarter-end and expense information taken from the fund’s current prospectus. Performance should always be considered in light of a fund’s investment strategy. Data represent past performance. Past performance does not guarantee future results. More recent returns may be less or more than those shown. Investment return and principal value will fluctuate, and you may have a gain or a loss when you sell your shares. Performance information does not reflect any deduction for taxes a shareholder may owe on fund distributions or on the redemption of fund shares. For the most recent month-end performance, please visit the Individual Investors section at putnam.com or call Putnam at 1-800-225-1581. Class N, R, R6, and Y shares are not available to all investors. See the Terms and definitions section in this report for definitions of the share classes offered by your fund.
Fund performance Total return for periods ended 1/31/22
| | | | | | | | | |
| | Annual | | | | | | | | |
| | average | | Annual | | Annual | | Annual | | |
| | (life of fund) | 10 years | average | 5 years | average | 3 years | average | 1 year | 6 months |
| Class A (10/17/11) | | | | | | | | | |
| Net asset value | 1.02% | 10.99% | 1.05% | 7.25% | 1.41% | 3.83% | 1.26% | –0.03% | –0.09% |
| Class B (10/17/11) | | | | | | | | | |
| Net asset value | 0.71 | 7.44 | 0.72 | 5.41 | 1.06 | 2.75 | 0.91 | –0.29 | –0.19 |
| Class C (10/17/11) | | | | | | | | | |
| Net asset value | 0.71 | 7.44 | 0.72 | 5.41 | 1.06 | 2.75 | 0.91 | –0.29 | –0.19 |
| Class N (11/1/18) | | | | | | | | | |
| Before sales charge | 0.89 | 9.47 | 0.91 | 6.57 | 1.28 | 3.26 | 1.07 | –0.18 | –0.17 |
| After sales charge | 0.74 | 7.83 | 0.76 | 4.97 | 0.97 | 1.71 | 0.57 | –1.68 | –1.66 |
| Class R (10/17/11) | | | | | | | | | |
| Net asset value | 0.63 | 6.65 | 0.65 | 5.20 | 1.02 | 2.65 | 0.87 | –0.39 | –0.29 |
| Class R6 (7/2/12) | | | | | | | | | |
| Net asset value | 1.14 | 12.27 | 1.16 | 7.83 | 1.52 | 4.06 | 1.34 | –0.02 | –0.13 |
| Class Y (10/17/11) | | | | | | | | | |
| Net asset value | 1.13 | 12.20 | 1.16 | 7.78 | 1.51 | 4.14 | 1.36 | 0.07 | –0.04 |
Current performance may be lower or higher than the quoted past performance, which cannot guarantee future results. Class A, B, C, R, R6, and Y share classes do not carry an initial sales charge or a contingent deferred sales charge. After-sales-charge returns for class N shares reflect the deduction of the maximum 1.50% sales charge, levied at the time of purchase. Performance for class N shares prior to their inception is derived from the historical performance of class A shares, adjusted for the applicable sales charge and the higher operating expenses of class N shares. Performance for class R6 shares prior to their inception is derived from the historical performance of class Y shares.
For a portion of the periods, the fund had expense limitations, without which returns would have been lower.
Class B and C share performance reflects conversion to class A shares after eight years.
|
| Ultra Short Duration Income Fund 9 |
Comparative index returns For periods ended 1/31/22
| | | | | | | | | |
| | Annual | | | | | | | | |
| | average | | Annual | | Annual | | Annual | | |
| | (life of fund) | 10 years | average | 5 years | average | 3 years | average | 1 year | 6 months |
| ICE BofA U.S. | | | | | | | | | |
| Treasury Bill Index | 0.63% | 6.69% | 0.65% | 5.86% | 1.15% | 2.91% | 0.96% | 0.02% | –0.01% |
Index results should be compared with fund performance at net asset value.
Fund price and distribution information For the six-month period ended 1/31/22
| | | | | | | | |
| Distributions | Class A | Class B | Class C | Class N | Class R | Class R6 | Class Y |
| Number | 6 | 6 | 6 | 6 | 6 | 6 | 6 |
| Income | $0.010835 | $0.000519 | $0.000510 | $0.003218 | $0.000509 | $0.016388 | $0.015900 |
| Capital gains | — | — | — | — | — | — | — |
| Total | $0.010835 | $0.000519 | $0.000510 | $0.003218 | $0.000509 | $0.016388 | $0.015900 |
| | Net | Net | Net | Before | After | Net | Net | Net |
| | asset | asset | asset | sales | sales | asset | asset | asset |
| Share value | value | value | value | charge | charge | value | value | value |
| 7/31/21 | $10.08 | $10.07 | $10.07 | $10.07 | $10.22 | $10.07 | $10.10 | $10.09 |
| 1/31/22 | 10.06 | 10.05 | 10.05 | 10.05 | 10.20 | 10.04 | 10.07 | 10.07 |
| | Net | Net | Net | Before | After | Net | Net | Net |
| Current rate | asset | asset | asset | sales | sales | asset | asset | asset |
| (end of period) | value | value | value | charge | charge | value | value | value |
| Current dividend rate1 | 0.26% | 0.01% | 0.01% | 0.10% | 0.10% | 0.01% | 0.36% | 0.36% |
| Current 30-day | | | | | | | | |
| SEC yield (with expense | | | | | | | | |
| limitation)2,3 | 0.23 | –0.02 | –0.02 | N/A | 0.08 | –0.02 | 0.33 | 0.32 |
| Current 30-day | | | | | | | | |
| SEC yield (without | | | | | | | | |
| expense limitation)3 | 0.17 | –0.23 | –0.23 | N/A | 0.02 | –0.23 | 0.27 | 0.26 |
The classification of distributions, if any, is an estimate. Before-sales-charge share value and current dividend rate for class N shares, if applicable, do not take into account any sales charge levied at the time of purchase. After-sales-charge share value, current dividend rate, and current 30-day SEC yield, if applicable, are calculated assuming that the maximum sales charge (1.50% for class N shares) was levied at the time of purchase. Final distribution information will appear on your year-end tax forms.
1 Most recent distribution, including any return of capital and excluding capital gains, annualized and divided by share price before or after sales charge at period-end.
2 For the period, the fund had an expense limitation, without which the yield would have been lower.
3 Based only on investment income and calculated using the maximum offering price for each share class, in accordance with SEC guidelines.
|
| 10 Ultra Short Duration Income Fund |
Fund performance as of most recent calendar quarter Total return for periods ended 12/31/21
| | | | | | | | | |
| | Annual | | | | | | | | |
| | average | | Annual | | Annual | | Annual | | |
| | (life of fund) | 10 years | average | 5 years | average | 3 years | average | 1 year | 6 months |
| Class A (10/17/11) | | | | | | | | | |
| Net asset value | 1.03% | 10.99% | 1.05% | 7.42% | 1.44% | 4.14% | 1.36% | –0.02% | –0.09% |
| Class B (10/17/11) | | | | | | | | | |
| Net asset value | 0.72 | 7.57 | 0.73 | 5.45 | 1.07 | 3.05 | 1.01 | –0.29 | –0.19 |
| Class C (10/17/11) | | | | | | | | | |
| Net asset value | 0.72 | 7.57 | 0.73 | 5.45 | 1.07 | 3.05 | 1.01 | –0.29 | –0.19 |
| Class N (11/1/18) | | | | | | | | | |
| Before sales charge | 0.89 | 9.47 | 0.91 | 6.73 | 1.31 | 3.68 | 1.21 | –0.17 | –0.17 |
| After sales charge | 0.74 | 7.83 | 0.76 | 5.13 | 1.01 | 2.12 | 0.70 | –1.67 | –1.66 |
| Class R (10/17/11) | | | | | | | | | |
| Net asset value | 0.64 | 6.86 | 0.67 | 5.45 | 1.07 | 3.05 | 1.01 | –0.29 | –0.19 |
| Class R6 (7/2/12) | | | | | | | | | |
| Net asset value | 1.16 | 12.38 | 1.17 | 8.00 | 1.55 | 4.59 | 1.51 | 0.09 | –0.03 |
| Class Y (10/17/11) | | | | | | | | | |
| Net asset value | 1.14 | 12.21 | 1.16 | 7.95 | 1.54 | 4.45 | 1.46 | 0.08 | –0.14 |
See the discussion following the fund performance table on page 9 for information about the calculation of fund performance.
Your fund’s expenses
As a mutual fund investor, you pay ongoing expenses, such as management fees, distribution fees (12b-1 fees), and other expenses. In the most recent six-month period, your fund’s expenses were limited; had expenses not been limited, they would have been higher. Using the following information, you can estimate how these expenses affect your investment and compare them with the expenses of other funds. You may also pay one-time transaction expenses, including sales charges (loads) and redemption fees, which are not shown in this section and would have resulted in higher total expenses. For more information, see your fund’s prospectus or talk to your financial representative.
Expense ratios
| | | | | | | |
| | Class A | Class B | Class C | Class N | Class R | Class R6 | Class Y |
| Net expenses for the fiscal year | | | | | | | |
| ended 7/31/21* | 0.40% | 0.80% | 0.80% | 0.55% | 0.80% | 0.29% | 0.30% |
| Total annual operating expenses for the | | | | | | | |
| fiscal year ended 7/31/21 | 0.46% | 0.86% | 0.86% | 0.61% | 0.86% | 0.35% | 0.36% |
| Annualized expense ratio for the | | | | | | | |
| six-month period ended 1/31/22 | 0.41% | 0.61%† | 0.61%† | 0.56% | 0.61%† | 0.30% | 0.31% |
Fiscal year expense information in this table is taken from the most recent prospectus, is subject to change, and may differ from that shown for the annualized expense ratio and in the financial highlights of this report.
Expenses are shown as a percentage of average net assets.
* Reflects Putnam Management’s contractual obligation to limit certain fund expenses through 11/30/22.
† Reflects a voluntary waiver of certain fund expenses.
|
| Ultra Short Duration Income Fund 11 |
Expenses per $1,000
The following table shows the expenses you would have paid on a $1,000 investment in each class of the fund from 8/1/21 to 1/31/22. It also shows how much a $1,000 investment would be worth at the close of the period, assuming actual returns and expenses.
| | | | | | | |
| | Class A | Class B | Class C | Class N | Class R | Class R6 | Class Y |
| Expenses paid per $1,000*† | $2.07 | $3.07 | $3.07 | $2.82 | $3.07 | $1.51 | $1.56 |
| Ending value (after expenses) | $999.10 | $998.10 | $998.10 | $998.30 | $997.10 | $998.70 | $999.60 |
* Expenses for each share class are calculated using the fund’s annualized expense ratio for each class, which represents the ongoing expenses as a percentage of average net assets for the six months ended 1/31/22. The expense ratio may differ for each share class.
† Expenses are calculated by multiplying the expense ratio by the average account value for the period; then multiplying the result by the number of days in the period (184); and then dividing that result by the number of days in the year (365).
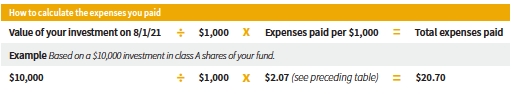
Estimate the expenses you paid
To estimate the ongoing expenses you paid for the six months ended 1/31/22, use the following calculation method. To find the value of your investment on 8/1/21, call Putnam at 1-800-225-1581.
Compare expenses using the SEC’s method
The Securities and Exchange Commission (SEC) has established guidelines to help investors assess fund expenses. Per these guidelines, the following table shows your fund’s expenses based on a $1,000 investment, assuming a hypothetical 5% annualized return. You can use this information to compare the ongoing expenses (but not transaction expenses or total costs) of investing in the fund with those of other funds. All mutual fund shareholder reports will provide this information to help you make this comparison. Please note that you cannot use this information to estimate your actual ending account balance and expenses paid during the period.
| | | | | | | |
| | Class A | Class B | Class C | Class N | Class R | Class R6 | Class Y |
| Expenses paid per $1,000*† | $2.09 | $3.11 | $3.11 | $2.85 | $3.11 | $1.53 | $1.58 |
| Ending value (after expenses) | $1,023.14 | $1,022.13 | $1,022.13 | $1,022.38 | $1,022.13 | $1,023.69 | $1,023.64 |
* Expenses for each share class are calculated using the fund’s annualized expense ratio for each class, which represents the ongoing expenses as a percentage of average net assets for the six months ended 1/31/22. The expense ratio may differ for each share class.
† Expenses are calculated by multiplying the expense ratio by the average account value for the six-month period; then multiplying the result by the number of days in the six-month period (184); and then dividing that result by the number of days in the year (365).
|
| 12 Ultra Short Duration Income Fund |
Consider these risks before investing
Putnam Ultra Short Duration Income Fund is not a money market fund. The effects of inflation may erode the value of your investment over time. Funds that invest in government securities are not guaranteed. Mortgage-backed investments, unlike traditional debt investments, are also subject to prepayment risk, which means that they may increase in value less than other bonds when interest rates decline and decline in value more than other bonds when interest rates rise. The fund may have to invest the proceeds from prepaid investments, including mortgage-backed investments, in other investments with less attractive terms and yields.
The value of investments in the fund’s portfolio may fall or fail to rise over extended periods of time for a variety of reasons, including general economic, political, or financial market conditions; investor sentiment and market perceptions; government actions; geopolitical events or changes; and factors related to a specific issuer, geography, industry, or sector. These and other factors may lead to increased volatility and reduced liquidity in the fund’s portfolio holdings.
Bond investments are subject to interest-rate risk (the risk of bond prices falling if interest rates rise) and credit risk (the risk of an issuer defaulting on interest or principal payments). Interest-rate risk is generally greater for longer-term bonds, and credit risk is generally greater for below-investment-grade bonds. Credit risk is generally greater for debt not backed by the full faith and credit of the U.S. government.
Risks associated with derivatives include increased investment exposure (which may be considered leverage) and, in the case of over-the-counter instruments, the potential inability to terminate or sell derivatives positions and the potential failure of the other party to the instrument to meet its obligations. Unlike bonds, funds that invest in bonds have fees and expenses.
Our investment techniques, analyses, and judgments may not produce the outcome we intend. The investments we select for the fund may not perform as well as other securities that we do not select for the fund. We, or the fund’s other service providers, may experience disruptions or operating errors that could have a negative effect on the fund. You can lose money by investing in the fund.
|
| Ultra Short Duration Income Fund 13 |
Terms and definitions
Important terms
Total return shows how the value of the fund’s shares changed over time, assuming you held the shares through the entire period and reinvested all distributions in the fund.
Before sales charge, or net asset value, is the price, or value, of one share of a mutual fund, without a sales charge. Before-sales-charge figures fluctuate with market conditions. They are calculated by dividing the net assets of the class of shares by the number of outstanding shares in the class.
After sales charge is the price of a mutual fund share plus the maximum sales charge levied at the time of purchase. After-sales-charge performance figures shown here assume the 1.50% maximum sales charge for class N shares.
Net asset value (NAV) is the price, or value, of one share of a mutual fund, without a sales charge. Net asset values fluctuate with market conditions. They are calculated by dividing the net assets of each class of shares by the number of outstanding shares in the class.
Contingent deferred sales charge (CDSC) is generally a charge applied at the time of the redemption of class B or C shares and assumes redemption at the end of the period. Your fund’s class B CDSC declines over time from a 5% maximum during the first year to 1% during the sixth year. After the sixth year, the CDSC no longer applies. The CDSC for class C shares is 1% for one year after purchase.
Share classes
Class A shares are not subject to an initial sales charge or a CDSC, except that a CDSC may apply to certain redemptions of class A shares obtained by exchanging shares from another Putnam fund that were originally purchased without an initial sales charge if the shares are redeemed within nine months of the original purchase. Exchange of your fund’s class A shares into another Putnam fund may involve an initial sales charge.
Class B shares are closed to new investments and are only available by exchange from another Putnam fund or through dividend and/or capital gains reinvestment. They are not subject to an initial sales charge and may be subject to a CDSC.
Class C shares are not subject to an initial sales charge or a CDSC, except that a CDSC of 1.00% may apply to class C shares obtained in an exchange for class C shares of another Putnam fund if exchanged within one year of the original purchase date.
Class N shares are generally subject to an initial sales charge and no CDSC (except on certain redemptions of shares bought without an initial sales charge). There is a 1.50% maximum sales charge.
Class R shares are not subject to an initial sales charge or CDSC and are only available to employer-sponsored retirement plans.
Class R6 shares are not subject to an initial sales charge or CDSC and carry no 12b-1 fee. They are generally only available to employer-sponsored retirement plans, corporate and institutional clients, and clients in other approved programs.
Class Y shares are not subject to an initial sales charge or CDSC and carry no 12b-1 fee. They are generally only available to corporate and institutional clients and clients in other approved programs.
Fixed-income terms
Current rate is the annual rate of return earned from dividends or interest of an investment. Current rate is expressed as a percentage of the price of a security, fund share, or principal investment.
Mortgage-backed security (MBS), also known as a mortgage “pass-through,” is a type
|
| 14 Ultra Short Duration Income Fund |
of asset-backed security that is secured by a mortgage or collection of mortgages. The following are types of MBSs:
• Agency “pass-through” has its principal and interest backed by a U.S. government agency, such as the Federal National Mortgage Association (Fannie Mae), Government National Mortgage Association (Ginnie Mae), and Federal Home Loan Mortgage Corporation (Freddie Mac).
• Collateralized mortgage obligation (CMO) represents claims to specific cash flows from pools of home mortgages. The streams of principal and interest payments on the mortgages are distributed to the different classes of CMO interests in “tranches.” Each tranche may have different principal balances, coupon rates, prepayment risks, and maturity dates. A CMO is highly sensitive to changes in interest rates and any resulting change in the rate at which homeowners sell their properties, refinance, or otherwise prepay loans. CMOs are subject to prepayment, market, and liquidity risks.
°Interest-only (IO) security is a type of CMO in which the underlying asset is the interest portion of mortgage, Treasury, or bond payments.
• Non-agency residential mortgage-backed security (RMBS) is an MBS not backed by Fannie Mae, Ginnie Mae, or Freddie Mac. One type of RMBS is an Alt-A mortgage-backed security.
• Commercial mortgage-backed security (CMBS) is secured by the loan on a commercial property.
Yield curve is a graph that plots the yields of bonds with equal credit quality against their differing maturity dates, ranging from shortest to longest. It is used as a benchmark for other debt, such as mortgage or bank lending rates.
Comparative indexes
Bloomberg U.S. 1-3 Year Corporate Bond Index is an unmanaged index that tracks the performance of U.S. dollar-denominated, investment-grade, fixed-rate, taxable corporate bonds with 1- to 3-year maturities.
Bloomberg U.S. Aggregate Bond Index is an unmanaged index of U.S. investment-grade fixed-income securities.
ICE BofA (Intercontinental Exchange Bank of America) U.S. Treasury Bill Index is an unmanaged index that tracks the performance of U.S. dollar-denominated U.S. Treasury bills publicly issued in the U.S. domestic market. Qualifying securities must have a remaining term of at least one month to final maturity and a minimum amount outstanding of $1 billion.
S&P 500® Index is an unmanaged index of common stock performance.
Indexes assume reinvestment of all distributions and do not account for fees. Securities and performance of a fund and an index will differ. You cannot invest directly in an index.
BLOOMBERG® is a trademark and service mark of Bloomberg Finance L.P. and its affiliates (collectively “Bloomberg”). Bloomberg or Bloomberg’s licensors own all proprietary rights in the Bloomberg Indices. Neither Bloomberg nor Bloomberg’s licensors approve or endorse this material, or guarantee the accuracy or completeness of any information herein, or make any warranty, express or implied, as to the results to be obtained therefrom, and to the maximum extent allowed by law, neither shall have any liability or responsibility for injury or damages arising in connection therewith.
ICE Data Indices, LLC (“ICE BofA”), used with permission. ICE BofA permits use of the ICE BofA indices and related data on an “as is” basis; makes no warranties regarding same; does not guarantee the suitability, quality, accuracy, timeliness, and/or completeness of the ICE BofA indices or any data included in, related to, or derived therefrom; assumes no liability in connection with the use of the foregoing; and does not sponsor, endorse, or recommend Putnam Investments, or any of its products or services.
|
| Ultra Short Duration Income Fund 15 |
Other information for shareholders
Important notice regarding delivery of shareholder documents
In accordance with Securities and Exchange Commission (SEC) regulations, Putnam sends a single notice of internet availability, or a single printed copy, of annual and semiannual shareholder reports, prospectuses, and proxy statements to Putnam shareholders who share the same address, unless a shareholder requests otherwise. If you prefer to receive your own copy of these documents, please call Putnam at 1-800-225-1581, and Putnam will begin sending individual copies within 30 days.
Proxy voting
Putnam is committed to managing our mutual funds in the best interests of our shareholders. The Putnam funds’ proxy voting guidelines and procedures, as well as information regarding how your fund voted proxies relating to portfolio securities during the 12-month period ended June 30, 2021, are available in the Individual Investors section of putnam.com and on the SEC’s website, www.sec.gov. If you have questions about finding forms on the SEC’s website, you may call the SEC at 1-800-SEC-0330. You may also obtain the Putnam funds’ proxy voting guidelines and procedures at no charge by calling Putnam’s Shareholder Services at 1-800-225-1581.
Fund portfolio holdings
The fund will file a complete schedule of its portfolio holdings with the SEC for the first and third quarters of each fiscal year on Form N-PORT within 60 days of the end of such fiscal quarter. Shareholders may obtain the fund’s Form N-PORT on the SEC’s website at www.sec.gov.
Prior to its use of Form N-PORT, the fund filed its complete schedule of its portfolio holdings with the SEC on Form N-Q, which is available online at www.sec.gov.
Trustee and employee fund ownership
Putnam employees and members of the Board of Trustees place their faith, confidence, and, most importantly, investment dollars in Putnam mutual funds. As of January 31, 2022, Putnam employees had approximately $537,000,000 and the Trustees had approximately $79,000,000 invested in Putnam mutual funds. These amounts include investments by the Trustees’ and employees’ immediate family members as well as investments through retirement and deferred compensation plans.
|
| 16 Ultra Short Duration Income Fund |
Financial statements
These sections of the report, as well as the accompanying Notes, constitute the fund’s financial statements.
The fund’s portfolio lists all the fund’s investments and their values as of the last day of the reporting period. Holdings are organized by asset type and industry sector, country, or state to show areas of concentration and diversification.
Statement of assets and liabilities shows how the fund’s net assets and share price are determined. All investment and non-investment assets are added together. Any unpaid expenses and other liabilities are subtracted from this total. The result is divided by the number of shares to determine the net asset value per share, which is calculated separately for each class of shares. (For funds with preferred shares, the amount subtracted from total assets includes the liquidation preference of preferred shares.)
Statement of operations shows the fund’s net investment gain or loss. This is done by first adding up all the fund’s earnings — from dividends and interest income — and subtracting its operating expenses to determine net investment income (or loss). Then, any net gain or loss the fund realized on the sales of its holdings — as well as any unrealized gains or losses over the period — is added to or subtracted from the net investment result to determine the fund’s net gain or loss for the fiscal period.
Statement of changes in net assets shows how the fund’s net assets were affected by the fund’s net investment gain or loss, by distributions to shareholders, and by changes in the number of the fund’s shares. It lists distributions and their sources (net investment income or realized capital gains) over the current reporting period and the most recent fiscal year-end. The distributions listed here may not match the sources listed in the Statement of operations because the distributions are determined on a tax basis and may be paid in a different period from the one in which they were earned. Dividend sources are estimated at the time of declaration. Actual results may vary. Any non-taxable return of capital cannot be determined until final tax calculations are completed after the end of the fund’s fiscal period.
Financial highlights provide an overview of the fund’s investment results, per-share distributions, expense ratios, net investment income ratios, and portfolio turnover in one summary table, reflecting the five most recent reporting periods. In a semiannual report, the highlights table also includes the current reporting period.
|
| Ultra Short Duration Income Fund 17 |
| | |
| The fund’s portfolio 1/31/22 (Unaudited) | | |
|
| | | | |
| CORPORATE BONDS AND NOTES (62.8%)* | | Principal
amount | Value |
| Banking (34.3%) |
| Australia & New Zealand Banking Group, Ltd. 144A sr. unsec. unsub. FRN (BBA LIBOR USD 3 Month + 0.49%), 0.65%, 11/21/22 (Australia) | | | $24,180,000 | $24,263,714 |
| Banco Bilbao Vizcaya Argentaria SA sr. unsec. unsub. notes 0.875%, 9/18/23 (Spain) | | | 28,200,000 | 27,896,603 |
| Banco Santander SA sr. unsec. unsub. FRN (BBA LIBOR USD 3 Month + 1.56%), 1.796%, 4/11/22 (Spain) | | | 33,870,000 | 33,953,523 |
| Banco Santander SA sr. unsec. unsub. FRN (BBA LIBOR USD 3 Month + 1.12%), 1.358%, 4/12/23 (Spain) | | | 58,074,000 | 58,609,111 |
| Banco Santander SA sr. unsec. unsub. FRN (BBA LIBOR USD 3 Month + 1.09%), 1.254%, 2/23/23 (Spain) | | | 26,200,000 | 26,412,910 |
| Banco Santander SA sr. unsec. unsub. notes 3.50%, 4/11/22 (Spain) | | | 25,349,000 | 25,494,821 |
| Bank of America Corp. sr. unsec. FRN Ser. GMTN, (BBA LIBOR USD 3 Month + 0.96%), 1.219%, 7/23/24 | | | 11,340,000 | 11,434,190 |
| Bank of America Corp. sr. unsec. FRN Ser. MTN, (Bloomberg 3 Month Short Term Bank Yield Index + 0.43%), 0.593%, 5/28/24 | | | 71,000,000 | 71,007,100 |
| Bank of America Corp. sr. unsec. unsub. FRN 3.004%, 12/20/23 | | | 36,246,000 | 36,796,384 |
| Bank of America Corp. sr. unsec. unsub. FRN Ser. MTN, (BBA LIBOR USD 3 Month + 0.79%), 0.97%, 3/5/24 | | | 62,949,000 | 63,265,009 |
| Bank of Montreal sr. unsec. FRN Ser. MTN, (Secured Overnight Funding Rate + 0.47%), 0.515%, 1/10/25 (Canada) | | | 46,935,000 | 46,983,343 |
| Bank of Montreal sr. unsec. unsub. FRN Ser. MTN, (BBA LIBOR USD 3 Month + 0.57%), 0.79%, 3/26/22 (Canada) | | | 57,966,000 | 58,006,195 |
| Bank of Montreal sr. unsec. unsub. FRN Ser. MTN, (Secured Overnight Funding Rate + 0.32%), 0.37%, 7/9/24 (Canada) | | | 37,695,000 | 37,574,671 |
| Bank of Montreal sr. unsec. unsub. FRN Ser. MTN, (Secured Overnight Funding Rate + 0.27%), 0.32%, 4/14/23 (Canada) | | | 28,038,000 | 28,020,056 |
| Bank of New York Mellon Corp. (The) sr. unsec. unsub. FRN (Secured Overnight Funding Rate + 0.20%), 0.25%, 10/25/24 | | | 32,723,000 | 32,631,023 |
| Bank of Nova Scotia (The) sr. unsec. FRN (Secured Overnight Funding Rate + 0.45%), 0.495%, 4/15/24 (Canada) | | | 74,000,000 | 74,065,860 |
| Bank of Nova Scotia (The) sr. unsec. notes 1.625%, 5/1/23 (Canada) | | | 5,040,000 | 5,059,004 |
| Bank of Nova Scotia (The) sr. unsec. unsub. FRN (Secured Overnight Funding Rate + 0.38%), 0.43%, 7/31/24 (Canada) | | | 46,700,000 | 46,652,821 |
| Bank of Nova Scotia (The) sr. unsec. unsub. FRN (Secured Overnight Funding Rate + 0.28%), 0.33%, 6/23/23 (Canada) | | | 25,700,000 | 25,684,837 |
| Bank of Nova Scotia (The) sr. unsec. unsub. FRN (Secured Overnight Funding Rate + 0.26%), 0.309%, 9/15/23 (Canada) | | | 22,930,000 | 22,906,382 |
| |
18 Ultra Short Duration Income Fund |
| | | | |
| CORPORATE BONDS AND NOTES (62.8%)* cont. | | Principal
amount | Value |
| Banking cont. |
| Bank of Nova Scotia (The) sr. unsec. unsub. FRN Ser. BKNT, (BBA LIBOR USD 3 Month + 0.62%), 0.834%, 9/19/22 (Canada) | | | $5,096,000 | $5,110,325 |
| Banque Federative du Credit Mutuel SA 144A sr. unsec. FRN (BBA LIBOR USD 3 Month + 0.96%), 1.214%, 7/20/23 (France) | | | 7,635,000 | 7,719,001 |
| Banque Federative du Credit Mutuel SA 144A sr. unsec. FRN (Secured Overnight Funding Rate + 0.41%), 0.459%, 2/4/25 (France) | | | 70,375,000 | 70,200,259 |
| Banque Federative du Credit Mutuel SA 144A sr. unsec. notes 2.125%, 11/21/22 (France) | | | 36,233,000 | 36,579,187 |
| Banque Federative du Credit Mutuel SA 144A sr. unsec. notes 0.65%, 2/27/24 (France) | | | 35,500,000 | 34,715,635 |
| Barclays PLC sr. unsec. FRN (BBA LIBOR USD 3 Month + 1.43%), 1.586%, 2/15/23 (United Kingdom) | | | 9,500,000 | 9,504,320 |
| Barclays PLC sr. unsec. unsub. FRN 4.61%, 2/15/23 (United Kingdom) | | | 63,388,000 | 63,461,396 |
| Barclays PLC sr. unsec. unsub. FRN (BBA LIBOR USD 3 Month + 1.38%), 1.535%, 5/16/24 (United Kingdom) | | | 45,440,000 | 46,046,694 |
| BBVA USA sr. unsec. notes Ser. BKNT, 2.875%, 6/29/22 | | | 8,545,000 | 8,605,605 |
| BNP Paribas SA 144A sr. unsec. notes 2.95%, 5/23/22 (France) | | | 21,815,000 | 21,976,983 |
| BPCE SA 144A company guaranty sr. unsec. unsub. FRN (BBA LIBOR USD 3 Month + 1.22%), 1.38%, 5/22/22 (France) | | | 26,663,000 | 26,743,789 |
| BPCE SA 144A sr. unsec. FRN (BBA LIBOR USD 3 Month + 1.24%), 1.441%, 9/12/23 (France) | | | 61,337,000 | 62,208,844 |
| BPCE SA 144A sr. unsec. FRN (Secured Overnight Funding Rate + 0.57%), 0.62%, 1/14/25 (France) | | | 24,089,000 | 24,109,596 |
| Canadian Imperial Bank of Commerce sr. unsec. unsub. FRN (BBA LIBOR USD 3 Month + 0.72%), 0.931%, 6/16/22 (Canada) | | | 6,300,000 | 6,314,532 |
| Canadian Imperial Bank of Commerce sr. unsec. unsub. FRN (Secured Overnight Funding Rate + 0.80%), 0.849%, 3/17/23 (Canada) | | | 62,781,000 | 63,148,098 |
| Canadian Imperial Bank of Commerce sr. unsec. unsub. FRN (Secured Overnight Funding Rate + 0.42%), 0.47%, 10/18/24 (Canada) | | | 37,396,000 | 37,365,335 |
| Canadian Imperial Bank of Commerce sr. unsec. unsub. FRN (Secured Overnight Funding Rate + 0.34%), 0.389%, 6/22/23 (Canada) | | | 47,455,000 | 47,474,658 |
| Canadian Imperial Bank of Commerce sr. unsec. unsub. FRN Ser. BKNT, (BBA LIBOR USD 3 Month + 0.66%), 0.861%, 9/13/23 (Canada) | | | 20,445,000 | 20,582,021 |
| Capital One NA sr. unsec. FRN Ser. BKNT, (BBA LIBOR USD 3 Month + 0.82%), 0.964%, 8/8/22 | | | 9,900,000 | 9,914,036 |
| Citigroup, Inc. sr. unsec. FRN (BBA LIBOR USD 3 Month + 1.43%), 1.601%, 9/1/23 | | | 30,501,000 | 30,709,681 |
| Citigroup, Inc. sr. unsec. FRN (BBA LIBOR USD 3 Month + 1.02%), 1.194%, 6/1/24 | | | 70,752,000 | 71,352,401 |
| Citigroup, Inc. sr. unsec. unsub. FRN (BBA LIBOR USD 3 Month + 0.96%), 1.218%, 4/25/22 | | | 28,085,000 | 28,101,304 |
| |
Ultra Short Duration Income Fund 19 |
| | | | |
| CORPORATE BONDS AND NOTES (62.8%)* cont. | | Principal
amount | Value |
| Banking cont. |
| Citigroup, Inc. sr. unsec. unsub. FRN (Secured Overnight Funding Rate + 0.67%), 0.719%, 5/1/25 | | | $39,605,000 | $39,771,618 |
| Citizens Bank NA sr. unsec. FRN Ser. BKNT, (BBA LIBOR USD 3 Month + 0.95%), 1.17%, 3/29/23 | | | 17,893,000 | 18,000,608 |
| Citizens Bank NA sr. unsec. FRN Ser. BKNT, (BBA LIBOR USD 3 Month + 0.81%), 0.99%, 5/26/22 | | | 12,580,000 | 12,610,322 |
| Cooperatieve Rabobank UA sr. unsec. FRN (Secured Overnight Funding Rate + 0.38%), 0.43%, 1/10/25 (Netherlands) | | | 63,599,000 | 63,713,478 |
| Cooperatieve Rabobank UA sr. unsec. FRN (Secured Overnight Funding Rate + 0.30%), 0.35%, 1/12/24 (Netherlands) | | | 46,000,000 | 46,072,246 |
| Cooperatieve Rabobank UA 144A sr. unsec. FRN (BBA LIBOR USD 3 Month + 0.86%), 1.08%, 9/26/23 (Netherlands) | | | 27,341,000 | 27,584,816 |
| Credit Agricole SA/London 144A sr. unsec. FRN (BBA LIBOR USD 3 Month + 1.02%), 1.279%, 4/24/23 (United Kingdom) | | | 65,372,000 | 66,002,517 |
| Credit Suisse Group AG sr. unsec. FRN (Secured Overnight Funding Rate + 0.39%), 0.44%, 2/2/24 | | | 33,500,000 | 33,470,755 |
| Credit Suisse Group AG sr. unsec. unsub. FRN (Secured Overnight Funding Rate + 0.38%), 0.429%, 8/9/23 | | | 18,345,000 | 18,347,753 |
| Credit Suisse Group AG 144A sr. unsec. FRN (BBA LIBOR USD 3 Month + 1.24%), 1.441%, 6/12/24 (Switzerland) | | | 71,642,000 | 72,256,691 |
| Credit Suisse Group Funding Guernsey, Ltd. company guaranty sr. unsec. unsub. notes 3.80%, 9/15/22 (United Kingdom) | | | 31,294,000 | 31,861,400 |
| DNB Bank ASA jr. unsec. sub. FRN 6.50%, 3/26/22 (Norway) | | | 35,141,000 | 35,369,417 |
| DNB Bank ASA 144A sr. unsec. FRN (BBA LIBOR USD 3 Month + 0.62%), 0.793%, 12/2/22 (Norway) | | | 46,725,000 | 46,938,162 |
| Federation des Caisses Desjardins du Quebec 144A sr. unsec. FRN (Secured Overnight Funding Rate + 0.43%), 0.479%, 5/21/24 (Canada) | | | 41,990,000 | 42,045,511 |
| First-Citizens Bank & Trust Co. sr. unsec. sub. FRN 3.929%, 6/19/24 | | | 3,963,000 | 4,061,422 |
| Huntington Bancshares, Inc. unsec. notes 4.35%, 2/4/23 | | | 7,864,000 | 8,080,894 |
| ING Groep NV sr. unsec. FRN (BBA LIBOR USD 3 Month + 1.00%), 1.214%, 10/2/23 (Netherlands) | | | 68,704,000 | 69,587,696 |
| ING Groep NV sr. unsec. unsub. FRN (BBA LIBOR USD 3 Month + 1.15%), 1.37%, 3/29/22 (Netherlands) | | | 34,003,000 | 34,061,112 |
| ING Groep NV sr. unsec. unsub. notes 3.15%, 3/29/22 (Netherlands) | | | 30,490,000 | 30,618,860 |
| Intesa Sanpaolo SpA 144A sr. unsec. notes 3.375%, 1/12/23 (Italy) | | | 30,113,000 | 30,622,639 |
| Intesa Sanpaolo SpA 144A sr. unsec. notes 3.125%, 7/14/22 (Italy) | | | 54,766,000 | 55,295,442 |
| JPMorgan Chase & Co. sr. unsec. unsub. FRN (BBA LIBOR USD 3 Month + 0.90%), 1.158%, 4/25/23 | | | 10,291,000 | 10,333,409 |
| JPMorgan Chase & Co. sr. unsec. unsub. FRN (BBA LIBOR USD 3 Month + 0.89%), 1.149%, 7/23/24 | | | 28,880,000 | 29,129,165 |
| |
20 Ultra Short Duration Income Fund |
| | | | |
| CORPORATE BONDS AND NOTES (62.8%)* cont. | | Principal
amount | Value |
| Banking cont. |
| JPMorgan Chase & Co. sr. unsec. unsub. FRN (BBA LIBOR USD 3 Month + 0.73%), 0.989%, 4/23/24 | | | $60,212,000 | $60,479,763 |
| JPMorgan Chase & Co. sr. unsec. unsub. FRN (Secured Overnight Funding Rate + 0.58%), 0.629%, 3/16/24 | | | 13,994,000 | 14,021,802 |
| JPMorgan Chase & Co. sr. unsec. unsub. FRN 2.776%, 4/25/23 | | | 11,870,000 | 11,911,694 |
| JPMorgan Chase & Co. sr. unsec. unsub. FRN (BBA LIBOR USD 3 Month + 1.23%), 1.489%, 10/24/23 | | | 52,951,000 | 53,333,624 |
| KeyBank NA sr. unsec. FRN Ser. BKNT, (BBA LIBOR USD 3 Month + 0.66%), 0.792%, 2/1/22 | | | 40,000,000 | 40,000,000 |
| KeyBank NA sr. unsec. FRN Ser. BKNT, 0.423%, 1/3/24 | | | 53,877,000 | 53,472,518 |
| KeyBank NA sr. unsec. FRN Ser. BKNT, (Secured Overnight Funding Rate + 0.34%), 0.39%, 1/3/24 | | | 54,980,000 | 54,969,581 |
| KeyBank NA sr. unsec. FRN Ser. BKNT, (Secured Overnight Funding Rate + 0.32%), 0.37%, 6/14/24 | | | 27,540,000 | 27,512,185 |
| Lloyds Banking Group PLC sr. unsec. FRN 1.326%, 6/15/23 (United Kingdom) | | | 44,200,000 | 44,203,700 |
| Lloyds Banking Group PLC sr. unsec. unsub. FRN 2.907%, 11/7/23 (United Kingdom) | | | 14,264,000 | 14,425,445 |
| Lloyds Banking Group PLC sr. unsec. unsub. FRN 2.858%, 3/17/23 (United Kingdom) | | | 33,189,000 | 33,256,090 |
| Lloyds Banking Group PLC sr. unsec. unsub. FRN 0.695%, 5/11/24 (United Kingdom) | | | 42,392,000 | 41,929,735 |
| Mitsubishi UFJ Financial Group, Inc. sr. unsec. FRN (BBA LIBOR USD 3 Month + 0.86%), 1.127%, 7/26/23 (Japan) | | | 80,595,000 | 81,303,435 |
| Mitsubishi UFJ Financial Group, Inc. sr. unsec. FRN (BBA LIBOR USD 3 Month + 0.74%), 0.913%, 3/2/23 (Japan) | | | 16,300,000 | 16,388,963 |
| Mitsubishi UFJ Financial Group, Inc. sr. unsec. unsub. FRN (BBA LIBOR USD 3 Month + 0.92%), 1.08%, 2/22/22 (Japan) | | | 23,818,000 | 23,828,717 |
| Mitsubishi UFJ Financial Group, Inc. sr. unsec. unsub. FRN (BBA LIBOR USD 3 Month + 0.79%), 1.048%, 7/25/22 (Japan) | | | 24,138,000 | 24,207,287 |
| Mizuho Financial Group, Inc. sr. unsec. FRN (BBA LIBOR USD 3 Month + 0.99%), 1.226%, 7/10/24 (Japan) | | | 17,800,000 | 17,954,432 |
| Mizuho Financial Group, Inc. sr. unsec. FRN (BBA LIBOR USD 3 Month + 0.94%), 1.116%, 2/28/22 (Japan) | | | 45,569,000 | 45,597,250 |
| Mizuho Financial Group, Inc. sr. unsec. FRN (BBA LIBOR USD 3 Month + 0.63%), 0.81%, 5/25/24 (Japan) | | | 36,473,000 | 36,588,891 |
| Mizuho Financial Group, Inc. sr. unsec. unsub. FRN (BBA LIBOR USD 3 Month + 1.00%), 1.201%, 9/11/24 (Japan) | | | 8,907,000 | 8,986,114 |
| Mizuho Financial Group, Inc. sr. unsec. unsub. FRN (BBA LIBOR USD 3 Month + 0.79%), 0.97%, 3/5/23 (Japan) | | | 13,977,000 | 14,054,181 |
| Mizuho Financial Group, Inc. sr. unsec. unsub. FRN (BBA LIBOR USD 3 Month + 0.88%), 1.081%, 9/11/22 (Japan) | | | 52,440,000 | 52,653,378 |
| National Australia Bank, Ltd. 144A sr. unsec. FRN (Secured Overnight Funding Rate + 0.38%), 0.422%, 1/12/25 (Australia) | | | 70,891,000 | 70,941,333 |
| National Australia Bank, Ltd. 144A sr. unsec. unsub. FRN (BBA LIBOR USD 3 Month + 0.41%), 0.611%, 12/13/22 (Australia) | | | 36,650,000 | 36,767,972 |
| |
Ultra Short Duration Income Fund 21 |
| | | | |
| CORPORATE BONDS AND NOTES (62.8%)* cont. | | Principal
amount | Value |
| Banking cont. |
| National Bank of Canada company guaranty sr. unsec. FRN 0.90%, 8/15/23 (Canada) | | | $48,000,000 | $47,926,963 |
| National Bank of Canada company guaranty sr. unsec. FRN (Secured Overnight Funding Rate + 0.49%), 0.539%, 8/6/24 (Canada) | | | 36,500,000 | 36,548,123 |
| Nationwide Building Society sr. unsec. FRN 3.622%, 4/26/23 (United Kingdom) | | | 68,804,000 | 69,161,808 |
| NatWest Group PLC sr. unsec. unsub. FRN 3.498%, 5/15/23 (United Kingdom) | | | 56,615,000 | 56,951,968 |
| NatWest Group PLC sr. unsec. unsub. FRN (BBA LIBOR USD 3 Month + 1.55%), 1.77%, 6/25/24 (United Kingdom) | | | 54,317,000 | 55,179,299 |
| NatWest Group PLC sr. unsec. unsub. FRN (BBA LIBOR USD 3 Month + 1.47%), 1.626%, 5/15/23 (United Kingdom) | | | 57,732,000 | 57,919,054 |
| Nordea Bank ABP 144A sr. unsec. FRN (BBA LIBOR USD 3 Month + 0.94%), 1.115%, 8/30/23 (Finland) | | | 8,522,000 | 8,602,006 |
| Nordea Bank ABP 144A unsec. sub. notes 4.25%, 9/21/22 (Finland) | | | 7,318,000 | 7,465,993 |
| PNC Bank NA sr. unsec. FRN (BBA LIBOR USD 3 Month + 0.33%), 0.495%, 2/24/23 | | | 46,065,000 | 46,122,436 |
| Royal Bank of Canada sr. unsec. FRN Ser. GMTN, (BBA LIBOR USD 3 Month + 0.36%), 0.601%, 1/17/23 (Canada) | | | 42,500,000 | 42,561,228 |
| Royal Bank of Canada sr. unsec. unsub. FRN (Secured Overnight Funding Rate + 0.36%), 0.41%, 7/29/24 (Canada) | | | 37,500,000 | 37,481,187 |
| Royal Bank of Canada sr. unsec. unsub. FRN Ser. GMTN, (Secured Overnight Funding Rate + 0.34%), 0.39%, 10/7/24 (Canada) | | | 45,925,000 | 45,850,697 |
| Royal Bank of Canada sr. unsec. unsub. FRN Ser. MTN, (Secured Overnight Funding Rate + 0.45%), 0.50%, 10/26/23 (Canada) | | | 27,919,000 | 28,041,006 |
| Royal Bank of Canada sr. unsec. unsub. notes (Secured Overnight Funding Rate + 0.40%), 0.449%, 8/5/22 (Canada) | | | 27,800,000 | 27,828,717 |
| Santander Holdings USA, Inc. sr. unsec. unsub. notes 3.40%, 1/18/23 | | | 21,353,000 | 21,733,919 |
| Skandinaviska Enskilda Banken AB 144A sr. unsec. FRN (BBA LIBOR USD 3 Month + 0.65%), 0.846%, 12/12/22 (Sweden) | | | 20,000,000 | 20,084,851 |
| Skandinaviska Enskilda Banken AB 144A sr. unsec. notes 0.55%, 9/1/23 (Sweden) | | | 23,478,000 | 23,172,669 |
| Skandinaviska Enskilda Banken AB 144A sr. unsec. notes (BBA LIBOR USD 3 Month + 0.32%), 0.491%, 9/1/23 (Sweden) | | | 57,957,000 | 58,047,804 |
| Sumitomo Mitsui Financial Group, Inc. sr. unsec. FRN (BBA LIBOR USD 3 Month + 0.80%), 1.041%, 10/16/23 (Japan) | | | 32,710,000 | 33,001,438 |
| Sumitomo Mitsui Financial Group, Inc. sr. unsec. unsub. FRN (BBA LIBOR USD 3 Month + 0.78%), 1.018%, 7/12/22 (Japan) | | | 10,614,000 | 10,642,325 |
| |
22 Ultra Short Duration Income Fund |
| | | | |
| CORPORATE BONDS AND NOTES (62.8%)* cont. | | Principal
amount | Value |
| Banking cont. |
| Sumitomo Mitsui Financial Group, Inc. sr. unsec. unsub. FRN (BBA LIBOR USD 3 Month + 0.74%), 0.981%, 1/17/23 (Japan) | | | $13,423,000 | $13,498,580 |
| Sumitomo Mitsui Financial Group, Inc. sr. unsec. unsub. FRN (BBA LIBOR USD 3 Month + 0.74%), 0.981%, 10/18/22 (Japan) | | | 4,932,000 | 4,954,641 |
| Sumitomo Mitsui Financial Group, Inc. sr. unsec. unsub. notes 2.778%, 10/18/22 (Japan) | | | 36,373,000 | 36,900,894 |
| Sumitomo Mitsui Trust Bank, Ltd. 144A sr. unsec. notes 0.80%, 9/12/23 (Japan) | | | 47,459,000 | 46,944,765 |
| Sumitomo Mitsui Trust Bank, Ltd. 144A sr. unsec. unsub. FRN (Secured Overnight Funding Rate + 0.44%), 0.485%, 9/16/24 (Japan) | | | 51,242,000 | 51,204,227 |
| SunTrust Bank sr. unsec. unsub. FRN Ser. BKNT, (BBA LIBOR USD 3 Month + 0.59%), 0.748%, 5/17/22 | | | 36,600,000 | 36,632,810 |
| Svenska Handelsbanken AB 144A sr. unsec. notes 0.625%, 6/30/23 (Sweden) | | | 17,000,000 | 16,852,528 |
| Swedbank AB 144A sr. unsec. FRN (BBA LIBOR USD 3 Month + 0.70%), 0.898%, 3/14/22 (Sweden) | | | 9,300,000 | 9,306,789 |
| Swedbank AB 144A sr. unsec. notes 1.30%, 6/2/23 (Sweden) | | | 19,500,000 | 19,494,872 |
| Swedbank AB 144A sr. unsec. notes 0.60%, 9/25/23 (Sweden) | | | 9,653,000 | 9,521,829 |
| Synovus Bank sr. unsec. FRN 2.289%, 2/10/23 | | | 13,485,000 | 13,487,729 |
| Toronto-Dominion Bank (The) sr. unsec. FRN Ser. MTN, (Secured Overnight Funding Rate + 0.35%), 0.399%, 9/10/24 (Canada) | | | 36,820,000 | 36,824,787 |
| Toronto-Dominion Bank (The) sr. unsec. unsub. FRN Ser. MTN, (BBA LIBOR USD 3 Month + 0.35%), 0.609%, 7/22/22 (Canada) | | | 42,000,000 | 41,971,692 |
| Toronto-Dominion Bank (The) sr. unsec. unsub. FRN Ser. MTN, (Secured Overnight Funding Rate + 0.48%), 0.53%, 1/27/23 (Canada) | | | 57,295,000 | 57,426,054 |
| Toronto-Dominion Bank (The) sr. unsec. unsub. notes Ser. MTN, 0.45%, 9/11/23 (Canada) | | | 11,127,000 | 10,974,789 |
| Truist Bank sr. unsec. FRN Ser. BKNT, (Secured Overnight Funding Rate + 0.73%), 0.779%, 3/9/23 | | | 38,890,000 | 39,061,434 |
| Truist Bank sr. unsec. unsub. FRN Ser. BKNT, (Secured Overnight Funding Rate + 0.20%), 0.25%, 1/17/24 | | | 55,450,000 | 55,359,062 |
| Truist Financial Corp. sr. unsec. unsub. FRB Ser. MTN, (BBA LIBOR USD 3 Month + 0.65%), 0.864%, 4/1/22 | | | 26,180,000 | 26,186,885 |
| U.S. Bank NA sr. unsec. FRN (BBA LIBOR USD 3 Month + 0.40%), 0.598%, 12/9/22 | | | 47,500,000 | 47,574,908 |
| U.S. Bank NA sr. unsec. FRN Ser. BKNT, (BBA LIBOR USD 3 Month + 0.44%), 0.604%, 5/23/22 | | | 47,990,000 | 48,018,840 |
| U.S. Bank NA sr. unsec. unsub. FRN Ser. BKNT, (Bloomberg 3 Month Short Term Bank Yield Index + 0.17%), 0.335%, 6/2/23 | | | 7,984,000 | 7,975,936 |
| UBS AG/London 144A sr. unsec. FRN (Secured Overnight Funding Rate + 0.47%), 0.52%, 1/13/25 (United Kingdom) | | | 2,480,000 | 2,477,644 |
| |
Ultra Short Duration Income Fund 23 |
| | | | |
| CORPORATE BONDS AND NOTES (62.8%)* cont. | | Principal
amount | Value |
| Banking cont. |
| UBS AG/London 144A sr. unsec. FRN (Secured Overnight Funding Rate + 0.36%), 0.409%, 2/9/24 (United Kingdom) | | | $47,500,000 | $47,391,035 |
| UBS AG/London 144A sr. unsec. notes 1.75%, 4/21/22 (United Kingdom) | | | 9,355,000 | 9,373,030 |
| UBS Group AG 144A sr. unsec. FRN 2.859%, 8/15/23 (Switzerland) | | | 46,684,000 | 47,086,696 |
| UBS Group AG 144A sr. unsec. FRN (BBA LIBOR USD 3 Month + 1.22%), 1.384%, 5/23/23 (Switzerland) | | | 15,030,000 | 15,079,256 |
| UBS Group AG 144A sr. unsec. FRN (BBA LIBOR USD 3 Month + 0.95%), 1.106%, 8/15/23 (Switzerland) | | | 50,313,000 | 50,496,935 |
| UBS Group Funding (Switzerland) AG 144A company guaranty sr. unsec. FRN (BBA LIBOR USD 3 Month + 1.53%), 1.662%, 2/1/22 (Switzerland) | | | 20,587,000 | 20,587,679 |
| UniCredit SpA 144A sr. unsec. unsub. notes 3.75%, 4/12/22 (Italy) | | | 75,701,000 | 76,108,249 |
| Wells Fargo & Co. sr. unsec. FRN (BBA LIBOR USD 3 Month + 1.23%), 1.529%, 10/31/23 | | | 53,206,000 | 53,599,458 |
| Wells Fargo & Co. sr. unsec. unsub. FRN (BBA LIBOR USD 3 Month + 0.90%), 1.058%, 5/17/23 | | | 9,100,000 | 9,120,411 |
| Westpac Banking Corp. sr. unsec. unsub. FRN (BBA LIBOR USD 3 Month + 0.39%), 0.634%, 1/13/23 (Australia) | | | 17,300,000 | 17,356,111 |
| Westpac Banking Corp. sr. unsec. unsub. FRN (Secured Overnight Funding Rate + 0.30%), 0.347%, 11/18/24 (Australia) | | | 43,562,000 | 43,470,258 |
| | | | 4,949,929,584 |
| Basic materials (0.6%) |
| Celanese US Holdings, LLC company guaranty sr. unsec. unsub. notes 4.625%, 11/15/22 (Germany) | | | 23,775,000 | 24,404,942 |
| Georgia-Pacific, LLC 144A sr. unsec. notes 0.625%, 5/15/24 | | | 23,275,000 | 22,694,400 |
| Glencore Finance Canada, Ltd. 144A company guaranty sr. unsec. unsub. notes 4.25%, 10/25/22 (Canada) | | | 4,540,000 | 4,645,419 |
| Glencore Funding, LLC 144A company guaranty sr. unsec. notes 3.00%, 10/27/22 | | | 2,490,000 | 2,520,873 |
| International Flavors & Fragrances, Inc. 144A sr. unsec. notes 0.697%, 9/15/22 | | | 14,000,000 | 13,960,539 |
| Nutrien, Ltd. sr. unsec. notes 1.90%, 5/13/23 (Canada) | | | 15,600,000 | 15,674,831 |
| Westlake Chemical Corp. sr. unsec. notes 0.875%, 8/15/24 | | | 7,332,000 | 7,137,411 |
| | | | 91,038,415 |
| Capital goods (0.8%) |
| Caterpillar Financial Services Corp. sr. unsec. unsub. FRN Ser. MTN, (Secured Overnight Funding Rate + 0.27%), 0.319%, 9/13/24 | | | 18,650,000 | 18,684,503 |
| Honeywell International, Inc. sr. unsec. unsub. FRN (BBA LIBOR USD 3 Month + 0.37%), 0.514%, 8/8/22 | | | 28,000,000 | 28,032,294 |
| L3Harris Technologies, Inc. sr. unsec. unsub. FRN (BBA LIBOR USD 3 Month + 0.75%), 0.951%, 3/10/23 | | | 64,900,000 | 65,089,450 |
| | | | 111,806,247 |
| |
24 Ultra Short Duration Income Fund |
| | | | |
| CORPORATE BONDS AND NOTES (62.8%)* cont. | | Principal
amount | Value |
| Communication services (1.2%) |
| American Tower Corp. sr. unsec. notes 0.60%, 1/15/24 R | | | $21,400,000 | $20,960,847 |
| American Tower Corp. sr. unsec. unsub. notes 3.50%, 1/31/23 R | | | 4,660,000 | 4,761,483 |
| AT&T, Inc. sr. unsec. FRN (BBA LIBOR USD 3 Month + 1.18%), 1.381%, 6/12/24 | | | 35,711,000 | 36,400,538 |
| AT&T, Inc. sr. unsec. unsub. FRN (Secured Overnight Funding Rate + 0.64%), 0.69%, 3/25/24 | | | 43,033,000 | 42,992,119 |
| Verizon Communications, Inc. sr. unsec. unsub. FRN (BBA LIBOR USD 3 Month + 1.10%), 1.256%, 5/15/25 | | | 43,166,000 | 44,055,047 |
| Verizon Communications, Inc. sr. unsec. unsub. FRN (BBA LIBOR USD 3 Month + 1.00%), 1.211%, 3/16/22 | | | 24,750,000 | 24,775,414 |
| | | | 173,945,448 |
| Conglomerates (0.6%) |
| Siemens Financieringsmaatschappij NV 144A company guaranty sr. unsec. FRN (BBA LIBOR USD 3 Month + 0.61%), 0.821%, 3/16/22 (Netherlands) | | | 37,850,000 | 37,874,020 |
| Siemens Financieringsmaatschappij NV 144A company guaranty sr. unsec. FRN (Secured Overnight Funding Rate + 0.43%), 0.479%, 3/11/24 (Netherlands) | | | 42,200,000 | 42,303,306 |
| | | | 80,177,326 |
| Consumer cyclicals (2.5%) |
| BMW US Capital, LLC 144A company guaranty sr. unsec. FRN (Secured Overnight Funding Rate + 0.53%), 0.58%, 4/1/24 | | | 24,200,000 | 24,305,571 |
| BMW US Capital, LLC 144A company guaranty sr. unsec. FRN (Secured Overnight Funding Rate + 0.38%), 0.429%, 8/12/24 | | | 37,400,000 | 37,477,792 |
| Daimler Finance North America, LLC 144A company guaranty sr. unsec. FRN (BBA LIBOR USD 3 Month + 0.90%), 1.056%, 2/15/22 | | | 14,000,000 | 14,004,199 |
| Daimler Trucks Finance North America, LLC 144A company guaranty sr. unsec. FRN (BBA LIBOR USD 3 Month + 0.84%), 0.985%, 5/4/23 | | | 10,615,000 | 10,683,629 |
| Daimler Trucks Finance North America, LLC 144A company guaranty sr. unsec. FRN (Secured Overnight Funding Rate + 0.75%), 0.799%, 12/13/24 | | | 23,389,000 | 23,422,488 |
| Daimler Trucks Finance North America, LLC 144A company guaranty sr. unsec. FRN (Secured Overnight Funding Rate + 0.60%), 0.649%, 12/14/23 | | | 28,067,000 | 28,130,422 |
| Daimler Trucks Finance North America, LLC 144A company guaranty sr. unsec. FRN (Secured Overnight Funding Rate + 0.50%), 0.549%, 6/14/23 | | | 37,423,000 | 37,470,527 |
| General Motors Financial Co., Inc. company guaranty sr. unsec. FRN (BBA LIBOR USD 3 Month + 1.31%), 1.528%, 6/30/22 | | | 4,580,000 | 4,599,648 |
| General Motors Financial Co., Inc. sr. unsec. sub. FRN (Secured Overnight Funding Rate + 0.76%), 0.809%, 3/8/24 | | | 4,420,000 | 4,428,634 |
| Hyundai Capital America 144A sr. unsec. notes 3.95%, 2/1/22 (South Korea) | | | 4,500,000 | 4,500,000 |
| |
Ultra Short Duration Income Fund 25 |
| | | | |
| CORPORATE BONDS AND NOTES (62.8%)* cont. | | Principal
amount | Value |
| Consumer cyclicals cont. |
| Toyota Motor Credit Corp. sr. unsec. unsub. FRN (Secured Overnight Funding Rate + 0.29%), 0.339%, 9/13/24 | | | $47,610,000 | $47,494,242 |
| Toyota Motor Credit Corp. sr. unsec. unsub. FRN Ser. MTN, (Secured Overnight Funding Rate + 0.34%), 0.39%, 10/14/22 | | | 18,500,000 | 18,505,180 |
| Toyota Motor Credit Corp. sr. unsec. unsub. FRN Ser. MTN, (Secured Overnight Funding Rate + 0.33%), 0.38%, 1/11/24 | | | 55,600,000 | 55,600,000 |
| Toyota Motor Credit Corp. sr. unsec. unsub. FRN Ser. MTN, (Secured Overnight Funding Rate + 0.32%), 0.37%, 4/6/23 | | | 32,700,000 | 32,700,785 |
| Volkswagen Group of America Finance, LLC 144A company guaranty sr. unsec. notes 2.90%, 5/13/22 | | | 2,900,000 | 2,917,765 |
| Whirlpool Corp. sr. unsec. unsub. notes 4.70%, 6/1/22 | | | 18,328,000 | 18,560,901 |
| | | | 364,801,783 |
| Consumer finance (4.0%) |
| AerCap Ireland Capital DAC/AerCap Global Aviation Trust company guaranty sr. unsec. FRN (Secured Overnight Funding Rate + 0.68%), 0.73%, 9/29/23 (Ireland) | | | 54,354,000 | 54,362,136 |
| AerCap Ireland Capital DAC/AerCap Global Aviation Trust company guaranty sr. unsec. unsub. notes 4.625%, 7/1/22 (Ireland) | | | 17,739,000 | 18,015,003 |
| Air Lease Corp. sr. unsec. FRN Ser. MTN, (BBA LIBOR USD 3 Month + 0.35%), 0.553%, 12/15/22 | | | 46,500,000 | 46,481,173 |
| American Express Co. sr. unsec. FRN (BBA LIBOR USD 3 Month + 0.61%), 0.927%, 8/1/22 | | | 2,600,000 | 2,604,714 |
| American Express Co. sr. unsec. FRN (BBA LIBOR USD 3 Month + 0.75%), 0.891%, 8/3/23 | | | 14,155,000 | 14,235,966 |
| American Express Co. sr. unsec. FRN (BBA LIBOR USD 3 Month + 0.65%), 0.826%, 2/27/23 | | | 5,901,000 | 5,926,761 |
| American Express Co. sr. unsec. notes 2.50%, 8/1/22 | | | 9,300,000 | 9,372,540 |
| American Express Co. sr. unsec. unsub. FRN (BBA LIBOR USD 3 Month + 0.62%), 0.78%, 5/20/22 | | | 61,545,000 | 61,612,325 |
| American Express Co. sr. unsec. unsub. FRN (Secured Overnight Funding Rate + 0.23%), 0.279%, 11/3/23 | | | 37,415,000 | 37,368,605 |
| American Honda Finance Corp. sr. unsec. FRN Ser. MTN, (BBA LIBOR USD 3 Month + 0.42%), 0.61%, 9/8/23 | | | 19,000,000 | 19,052,739 |
| American Honda Finance Corp. sr. unsec. FRN Ser. MTN, (BBA LIBOR USD 3 Month + 0.37%), 0.516%, 5/10/23 | | | 69,262,000 | 69,369,953 |
| American Honda Finance Corp. sr. unsec. unsub. notes Ser. MTN, 2.60%, 11/16/22 | | | 5,026,000 | 5,089,300 |
| Capital One Financial Corp. sr. unsec. unsub. FRN (BBA LIBOR USD 3 Month + 0.95%), 1.148%, 3/9/22 | | | 4,355,000 | 4,355,756 |
| Capital One Financial Corp. sr. unsec. unsub. FRN (BBA LIBOR USD 3 Month + 0.72%), 1.019%, 1/30/23 | | | 54,407,000 | 54,523,866 |
| Capital One Financial Corp. sr. unsec. unsub. FRN (Secured Overnight Funding Rate + 0.69%), 0.74%, 12/6/24 | | | 47,215,000 | 47,174,466 |
| Capital One Financial Corp. sr. unsec. unsub. notes 3.05%, 3/9/22 | | | 7,680,000 | 7,683,934 |
| |
26 Ultra Short Duration Income Fund |
| | | | |
| CORPORATE BONDS AND NOTES (62.8%)* cont. | | Principal
amount | Value |
| Consumer finance cont. |
| Discover Financial Services sr. unsec. notes 3.85%, 11/21/22 | | | $52,153,000 | $53,313,179 |
| Discover Financial Services sr. unsec. unsub. notes 5.20%, 4/27/22 | | | 19,857,000 | 20,075,754 |
| International Lease Finance Corp. sr. unsec. unsub. notes 5.875%, 8/15/22 | | | 2,189,000 | 2,245,778 |
| Synchrony Financial sr. unsec. notes 2.85%, 7/25/22 | | | 38,670,000 | 38,967,194 |
| | | | 571,831,142 |
| Consumer staples (0.7%) |
| Conagra Brands, Inc. sr. unsec. unsub. notes 0.50%, 8/11/23 | | | 14,000,000 | 13,786,638 |
| Constellation Brands, Inc. company guaranty sr. unsec. notes 3.20%, 2/15/23 | | | 2,480,000 | 2,522,074 |
| ERAC USA Finance, LLC 144A company guaranty sr. unsec. notes 3.30%, 10/15/22 | | | 1,065,000 | 1,081,827 |
| General Mills, Inc. sr. unsec. unsub. FRN (BBA LIBOR USD 3 Month + 1.01%), 1.249%, 10/17/23 | | | 11,535,000 | 11,682,081 |
| Keurig Dr Pepper, Inc. company guaranty sr. unsec. notes 0.75%, 3/15/24 | | | 29,313,000 | 28,677,729 |
| Mondelez International Holdings Netherlands BV 144A company guaranty sr. unsec. notes 2.125%, 9/19/22 (Netherlands) | | | 6,790,000 | 6,846,191 |
| Mondelez International, Inc. company guaranty sr. unsec. sub. notes 0.625%, 7/1/22 | | | 25,500,000 | 25,484,149 |
| Nestle Holdings, Inc. 144A company guaranty sr. unsec. notes 0.375%, 1/15/24 | | | 13,931,000 | 13,625,828 |
| | | | 103,706,517 |
| Energy (0.8%) |
| Chevron USA, Inc. company guaranty sr. unsec. unsub. FRN (BBA LIBOR USD 3 Month + 0.20%), 0.354%, 8/11/23 | | | 42,293,000 | 42,313,142 |
| Chevron USA, Inc. company guaranty sr. unsec. unsub. FRN (BBA LIBOR USD 3 Month + 0.11%), 0.264%, 8/12/22 | | | 28,196,000 | 28,208,197 |
| Phillips 66 company guaranty sr. unsec. unsub. notes 4.30%, 4/1/22 | | | 8,171,000 | 8,220,884 |
| Plains All American Pipeline LP/PAA Finance Corp. sr. unsec. unsub. notes 3.65%, 6/1/22 | | | 26,001,000 | 26,064,500 |
| Williams Partners LP sr. unsec. unsub. notes 3.35%, 8/15/22 | | | 3,924,000 | 3,952,538 |
| | | | 108,759,261 |
| Financial (1.7%) |
| Macquarie Group, Ltd. 144A sr. unsec. FRN (BBA LIBOR USD 3 Month + 1.35%), 1.57%, 3/27/24 (Australia) | | | 51,346,000 | 51,881,025 |
| Macquarie Group, Ltd. 144A sr. unsec. FRN (BBA LIBOR USD 3 Month + 1.02%), 1.196%, 11/28/23 (Australia) | | | 62,295,000 | 62,624,042 |
| Nasdaq, Inc. sr. unsec. notes 0.445%, 12/21/22 | | | 23,000,000 | 22,862,550 |
| Secured Forward-Backed Note 2021-05 144A sr. FRN (BBA LIBOR USD 3 Month + 0.35%), 0.57%, 6/28/22 | | | 82,500,000 | 82,483,500 |
| Secured Forward-Backed Note 2021-05 144A sr. unsub. FRN (BBA LIBOR USD 3 Month + 0.37%), 0.59%, 9/28/22 | | | 30,000,000 | 29,988,000 |
| | | | 249,839,117 |
| |
Ultra Short Duration Income Fund 27 |
| | | | |
| CORPORATE BONDS AND NOTES (62.8%)* cont. | | Principal
amount | Value |
| Health care (2.2%) |
| AbbVie, Inc. sr. unsec. FRN 0.81%, 11/21/22 | | | $22,961,000 | $23,045,816 |
| AstraZeneca PLC sr. unsec. unsub. FRN (BBA LIBOR USD 3 Month + 0.67%), 0.823%, 8/17/23 (United Kingdom) | | | 36,320,000 | 36,541,443 |
| Becton Dickinson and Co. sr. unsec. FRN (BBA LIBOR USD 3 Month + 1.03%), 1.21%, 6/6/22 | | | 45,451,000 | 45,586,958 |
| Bristol-Myers Squibb Co. sr. unsec. FRN (BBA LIBOR USD 3 Month + 0.38%), 0.535%, 5/16/22 | | | 9,300,000 | 9,306,632 |
| Cigna Corp. company guaranty sr. unsec. unsub. FRN (BBA LIBOR USD 3 Month + 0.89%), 1.131%, 7/15/23 | | | 64,462,000 | 65,083,475 |
| CVS Health Corp. sr. unsec. notes 4.75%, 12/1/22 | | | 10,500,000 | 10,724,690 |
| CVS Health Corp. sr. unsec. unsub. notes 3.50%, 7/20/22 | | | 4,000,000 | 4,034,374 |
| Gilead Sciences, Inc. sr. unsec. notes 0.75%, 9/29/23 | | | 21,000,000 | 20,764,317 |
| Stryker Corp. sr. unsec. notes 0.60%, 12/1/23 | | | 14,000,000 | 13,779,489 |
| Thermo Fisher Scientific, Inc. sr. unsec. FRN (Secured Overnight Funding Rate + 0.53%), 0.58%, 10/18/24 | | | 14,025,000 | 14,032,966 |
| Thermo Fisher Scientific, Inc. sr. unsec. FRN (Secured Overnight Funding Rate + 0.39%), 0.44%, 10/18/23 | | | 32,726,000 | 32,703,564 |
| Thermo Fisher Scientific, Inc. sr. unsec. FRN (Secured Overnight Funding Rate + 0.35%), 0.40%, 4/18/23 | | | 46,751,000 | 46,750,999 |
| | | | 322,354,723 |
| Insurance (5.3%) |
| AIG Global Funding 144A sr. unsub. FRN (Secured Overnight Funding Rate + 0.38%), 0.429%, 12/15/23 | | | 37,000,000 | 36,951,237 |
| Athene Global Funding 144A FRN (Secured Overnight Funding Rate + 0.72%), 0.765%, 1/7/25 | | | 46,845,000 | 46,893,250 |
| Athene Global Funding 144A FRN (Secured Overnight Funding Rate + 0.56%), 0.609%, 8/19/24 | | | 32,630,000 | 32,546,327 |
| Athene Global Funding 144A sr. FRN (Secured Overnight Funding Rate + 0.70%), 0.749%, 5/24/24 | | | 4,604,000 | 4,611,703 |
| Jackson National Life Global Funding 144A FRN (Secured Overnight Funding Rate + 0.60%), 0.65%, 1/6/23 | | | 46,750,000 | 46,893,990 |
| Jackson National Life Global Funding 144A sr. FRN (BBA LIBOR USD 3 Month + 0.73%), 0.95%, 6/27/22 | | | 33,784,000 | 33,857,197 |
| Liberty Mutual Group, Inc. 144A company guaranty sr. unsec. unsub. notes 4.95%, 5/1/22 | | | 4,660,000 | 4,709,175 |
| MassMutual Global Funding II 144A FRN (Secured Overnight Funding Rate + 0.36%), 0.41%, 4/12/24 | | | 74,780,000 | 74,928,812 |
| MassMutual Global Funding II 144A FRN (Secured Overnight Funding Rate + 0.27%), 0.32%, 10/21/24 | | | 28,116,000 | 28,115,999 |
| MassMutual Global Funding II 144A notes 2.25%, 7/1/22 | | | 7,440,000 | 7,496,321 |
| MET Tower Global Funding 144A FRN (Secured Overnight Funding Rate + 0.55%), 0.60%, 1/17/23 | | | 13,300,000 | 13,345,047 |
| MET Tower Global Funding 144A notes 0.55%, 7/13/22 | | | 23,000,000 | 22,998,893 |
| Metropolitan Life Global Funding I 144A company guaranty sr. FRN (Secured Overnight Funding Rate + 0.30%), 0.35%, 9/27/24 | | | 19,850,000 | 19,819,019 |
| Metropolitan Life Global Funding I 144A FRN (Secured Overnight Funding Rate + 0.32%), 0.37%, 1/7/24 | | | 27,300,000 | 27,276,549 |
| Metropolitan Life Global Funding I 144A notes 2.40%, 6/17/22 | | | 7,400,000 | 7,449,987 |
| |
28 Ultra Short Duration Income Fund |
| | | | |
| CORPORATE BONDS AND NOTES (62.8%)* cont. | | Principal
amount | Value |
| Insurance cont. |
| New York Life Global Funding 144A FRN (BBA LIBOR USD 3 Month + 0.52%), 0.721%, 6/10/22 | | | $47,550,000 | $47,622,600 |
| New York Life Global Funding 144A FRN (Secured Overnight Funding Rate + 0.36%), 0.41%, 10/21/23 | | | 9,500,000 | 9,525,337 |
| New York Life Global Funding 144A FRN (Secured Overnight Funding Rate + 0.22%), 0.27%, 2/2/23 | | | 27,255,000 | 27,258,734 |
| New York Life Global Funding 144A sr. notes (BBA LIBOR USD 3 Month + 0.28%), 0.511%, 1/10/23 | | | 56,750,000 | 56,809,074 |
| New York Life Global Funding 144A sr. unsub. FRN (Secured Overnight Funding Rate + 0.33%), 0.38%, 1/14/25 | | | 9,020,000 | 9,028,028 |
| Northwestern Mutual Global Funding 144A FRN (Secured Overnight Funding Rate + 0.33%), 0.38%, 3/25/24 | | | 27,995,000 | 28,015,569 |
| Pacific Life Global Funding II 144A company guaranty sr. notes 0.50%, 9/23/23 | | | 28,215,000 | 27,784,470 |
| Pacific Life Global Funding II 144A FRN (Secured Overnight Funding Rate + 0.40%), 0.45%, 1/27/25 | | | 46,685,000 | 46,685,349 |
| Pacific Life Global Funding II 144A unsec. FRN (Secured Overnight Funding Rate + 0.38%), 0.429%, 4/12/24 | | | 47,055,000 | 47,086,448 |
| Principal Life Global Funding II 144A FRN (Secured Overnight Funding Rate + 0.45%), 0.50%, 4/12/24 | | | 28,000,000 | 28,085,960 |
| Principal Life Global Funding II 144A FRN (Secured Overnight Funding Rate + 0.38%), 0.429%, 8/23/24 | | | 18,615,000 | 18,634,096 |
| Protective Life Global Funding 144A notes 0.631%, 10/13/23 | | | 11,851,000 | 11,694,553 |
| | | | 766,123,724 |
| Investment banking/Brokerage (3.8%) |
| Charles Schwab Corp. (The) sr. unsec. unsub. FRN (Secured Overnight Funding Rate + 0.50%), 0.549%, 3/18/24 | | | 60,160,000 | 60,241,367 |
| Deutsche Bank AG sr. unsec. unsub. FRN (BBA LIBOR USD 3 Month + 1.23%), 1.406%, 2/27/23 (Germany) | | | 24,430,000 | 24,623,755 |
| Deutsche Bank AG sr. unsec. unsub. FRN (Secured Overnight Funding Rate + 0.50%), 0.549%, 11/8/23 (Germany) | | | 32,732,000 | 32,702,962 |
| Deutsche Bank AG sr. unsec. unsub. notes 3.30%, 11/16/22 (Germany) | | | 18,734,000 | 19,034,439 |
| Deutsche Bank AG sr. unsec. unsub. notes Ser. D, 5.00%, 2/14/22 (Germany) | | | 3,000,000 | 3,004,162 |
| Discover Bank sr. unsec. notes Ser. BKNT, 3.35%, 2/6/23 | | | 41,041,000 | 41,846,184 |
| Goldman Sachs Group, Inc. (The) sr. unsec. FRN (BBA LIBOR USD 3 Month + 1.05%), 1.23%, 6/5/23 | | | 7,263,000 | 7,280,802 |
| Goldman Sachs Group, Inc. (The) sr. unsec. FRN (Secured Overnight Funding Rate + 0.58%), 0.629%, 3/8/24 | | | 65,854,000 | 65,757,063 |
| Goldman Sachs Group, Inc. (The) sr. unsec. unsub. FRN (BBA LIBOR USD 3 Month + 0.75%), 0.914%, 2/23/23 | | | 35,149,000 | 35,327,346 |
| Goldman Sachs Group, Inc. (The) sr. unsec. unsub. FRN 0.627%, 11/17/23 | | | 9,400,000 | 9,340,513 |
| |
Ultra Short Duration Income Fund 29 |
| | | | |
| CORPORATE BONDS AND NOTES (62.8%)* cont. | | Principal
amount | Value |
| Investment banking/Brokerage cont. |
| Goldman Sachs Group, Inc. (The) sr. unsec. unsub. FRN (Secured Overnight Funding Rate + 0.00%), 0.589%, 11/17/23 | | | $19,200,000 | $19,205,402 |
| Goldman Sachs Group, Inc. (The) sr. unsec. unsub. FRN (Secured Overnight Funding Rate + 0.50%), 0.549%, 9/10/24 | | | 37,185,000 | 37,103,937 |
| Goldman Sachs Group, Inc. (The) sr. unsec. unsub. FRN (Secured Overnight Funding Rate + 0.49%), 0.54%, 10/21/24 | | | 18,700,000 | 18,643,900 |
| Morgan Stanley sr. unsec. FRN Ser. MTN, 0.56%, 11/10/23 | | | 18,500,000 | 18,397,532 |
| Morgan Stanley sr. unsec. FRN Ser. MTN, 0.529%, 1/25/24 | | | 23,000,000 | 22,804,591 |
| Morgan Stanley sr. unsec. unsub. FRN Ser. GMTN, (BBA LIBOR USD 3 Month + 1.22%), 1.364%, 5/8/24 | | | 62,439,000 | 63,186,395 |
| Morgan Stanley unsec. sub. notes 4.875%, 11/1/22 | | | 72,216,000 | 74,232,903 |
| | | | 552,733,253 |
| Real estate (0.4%) |
| Kimco Realty Corp. sr. unsec. unsub. notes 3.40%, 11/1/22 R | | | 8,160,000 | 8,276,198 |
| Public Storage sr. unsec. FRN (Secured Overnight Funding Rate + 0.47%), 0.52%, 4/23/24 | | | 28,100,000 | 28,101,628 |
| Simon Property Group LP sr. unsec. unsub. FRN (Secured Overnight Funding Rate + 0.43%), 0.48%, 1/11/24 R | | | 28,054,000 | 28,088,506 |
| | | | 64,466,332 |
| Technology (0.2%) |
| Advanced Micro Devices, Inc. sr. unsec. unsub. notes 7.50%, 8/15/22 | | | 1,800,000 | 1,858,500 |
| Analog Devices, Inc. sr. unsec. FRN (Secured Overnight Funding Rate + 0.25%), 0.30%, 10/1/24 | | | 11,205,000 | 11,203,655 |
| VMware, Inc. sr. unsec. notes 1.00%, 8/15/24 | | | 18,765,000 | 18,309,724 |
| | | | 31,371,879 |
| Utilities and power (3.7%) |
| American Electric Power Co., Inc. jr. unsec. sub. notes 2.031%, 3/15/24 | | | 9,840,000 | 9,849,834 |
| American Electric Power Co., Inc. sr. unsec. unsub. FRN (BBA LIBOR USD 3 Month + 0.48%), 0.797%, 11/1/23 | | | 18,500,000 | 18,501,429 |
| American Electric Power Co., Inc. sr. unsec. unsub. notes 0.75%, 11/1/23 | | | 9,500,000 | 9,386,851 |
| Atmos Energy Corp. sr. unsec. unsub. FRN (BBA LIBOR USD 3 Month + 0.38%), 0.578%, 3/9/23 | | | 18,700,000 | 18,696,639 |
| Dominion Energy, Inc. sr. unsec. unsub. FRN Ser. D, (BBA LIBOR USD 3 Month + 0.53%), 0.733%, 9/15/23 | | | 20,688,000 | 20,691,103 |
| Duke Energy Carolinas, LLC sr. notes 3.05%, 3/15/23 | | | 28,893,000 | 29,502,164 |
| Duke Energy Corp. sr. unsec. FRN (Secured Overnight Funding Rate + 0.25%), 0.299%, 6/10/23 | | | 18,629,000 | 18,595,804 |
| Duke Energy Corp. sr. unsec. unsub. notes (BBA LIBOR USD 3 Month + 0.65%), 0.851%, 3/11/22 | | | 28,667,000 | 28,682,751 |
| |
30 Ultra Short Duration Income Fund |
| | | | |
| CORPORATE BONDS AND NOTES (62.8%)* cont. | | Principal
amount | Value |
| Utilities and power cont. |
| Enbridge, Inc. company guaranty sr. unsec. FRN (Secured Overnight Funding Rate + 0.40%), 0.449%, 2/17/23 (Canada) | | | $18,620,000 | $18,603,745 |
| Enbridge, Inc. company guaranty sr. unsec. notes 0.55%, 10/4/23 (Canada) | | | 9,341,000 | 9,183,605 |
| Enterprise Products Operating, LLC company guaranty sr. unsec. unsub. notes 4.05%, 2/15/22 | | | 4,650,000 | 4,655,662 |
| Eversource Energy sr. unsec. unsub. FRN (Secured Overnight Funding Rate + 0.25%), 0.299%, 8/15/23 | | | 18,600,000 | 18,594,234 |
| Kinder Morgan Energy Partners LP company guaranty sr. unsec. unsub. notes 3.95%, 9/1/22 | | | 8,656,000 | 8,746,522 |
| Kinder Morgan, Inc. company guaranty sr. unsec. unsub. FRN (BBA LIBOR USD 3 Month + 1.28%), 1.519%, 1/15/23 | | | 12,107,000 | 12,203,898 |
| Kinder Morgan, Inc. company guaranty sr. unsec. unsub. notes 3.15%, 1/15/23 | | | 4,845,000 | 4,926,424 |
| Mississippi Power Co. sr. unsec. unsub. FRN (Secured Overnight Funding Rate + 0.30%), 0.35%, 6/28/24 | | | 21,857,000 | 21,698,798 |
| NextEra Energy Capital Holdings, Inc. company guaranty sr. unsec. unsub. FRN (Secured Overnight Funding Rate + 0.54%), 0.589%, 3/1/23 | | | 18,700,000 | 18,730,401 |
| NextEra Energy Capital Holdings, Inc. company guaranty sr. unsec. unsub. FRN (Secured Overnight Funding Rate + 0.40%), 0.449%, 11/3/23 | | | 61,776,000 | 61,788,355 |
| NextEra Energy Capital Holdings, Inc. company guaranty sr. unsec. unsub. FRN (BBA LIBOR USD 3 Month + 0.27%), 0.43%, 2/22/23 | | | 70,700,000 | 70,693,993 |
| ONEOK Partners LP company guaranty sr. unsec. unsub. notes 3.375%, 10/1/22 | | | 49,821,000 | 50,332,012 |
| PPL Electric Utilities Corp. sr. FRN (Secured Overnight Funding Rate + 0.33%), 0.38%, 6/24/24 | | | 7,765,000 | 7,762,660 |
| PPL Electric Utilities Corp. sr. unsub. FRN (BBA LIBOR USD 3 Month + 0.25%), 0.47%, 9/28/23 | | | 9,000,000 | 8,979,947 |
| Southern Co. (The) sr. unsec. FRN (Secured Overnight Funding Rate + 0.37%), 0.419%, 5/10/23 | | | 28,047,000 | 28,006,558 |
| TransCanada PipeLines, Ltd. sr. unsec. unsub. notes 1.00%, 10/12/24 (Canada) | | | 23,370,000 | 22,829,218 |
| Xcel Energy, Inc. sr. unsec. notes 0.50%, 10/15/23 | | | 9,189,000 | 9,062,375 |
| | | | 530,704,982 |
| Total corporate bonds and notes (cost $9,086,393,004) | $9,073,589,733 |
|
| | | | |
| COMMERCIAL PAPER (21.9%)* | Yield (%) | Maturity
date | Principal
amount | Value |
| Albermarle Corp. | 0.450 | 2/4/22 | $11,500,000 | $11,499,540 |
| Albermarle Corp. | 0.450 | 2/2/22 | 23,250,000 | 23,249,535 |
| Albermarle Corp. | 0.400 | 3/2/22 | 15,000,000 | 14,995,000 |
| Albermarle Corp. | 0.350 | 2/22/22 | 19,000,000 | 18,995,483 |
| Albermarle Corp. | 0.350 | 2/17/22 | 14,850,000 | 14,847,412 |
| Albermarle Corp. | 0.350 | 2/16/22 | 18,600,000 | 18,596,983 |
| Albermarle Corp. | 0.350 | 2/3/22 | 17,500,000 | 17,499,475 |
| Alexandria Real Estate Equities, Inc. | 0.320 | 2/2/22 | 28,000,000 | 27,999,751 |
| |
Ultra Short Duration Income Fund 31 |
| | | | |
| COMMERCIAL PAPER (21.9%)* cont. | Yield (%) | Maturity
date | Principal
amount | Value |
| American Electric Power Co., Inc. | 0.470 | 2/11/22 | $46,750,000 | $46,747,357 |
| American Electric Power Co., Inc. | 0.400 | 3/1/22 | 23,500,000 | 23,495,324 |
| American Electric Power Co., Inc. | 0.250 | 2/14/22 | 19,000,000 | 18,998,493 |
| AT&T, Inc. | 0.401 | 4/12/22 | 70,500,000 | 70,451,474 |
| Autonation, Inc. | 0.260 | 2/2/22 | 18,500,000 | 18,499,680 |
| Autonation, Inc. | 0.220 | 2/1/22 | 125,000,000 | 124,998,934 |
| Avery Dennison Corp. | 0.300 | 3/8/22 | 28,250,000 | 28,242,825 |
| Avery Dennison Corp. | 0.300 | 3/1/22 | 21,600,000 | 21,595,876 |
| Avery Dennison Corp. | 0.270 | 2/22/22 | 21,500,000 | 21,497,123 |
| Aviation Capital Group, LLC | 0.480 | 2/22/22 | 15,500,000 | 15,497,405 |
| Aviation Capital Group, LLC | 0.440 | 2/24/22 | 12,250,000 | 12,247,730 |
| Aviation Capital Group, LLC | 0.440 | 2/18/22 | 9,250,000 | 9,248,909 |
| Aviation Capital Group, LLC | 0.440 | 2/17/22 | 14,000,000 | 13,998,519 |
| Aviation Capital Group, LLC | 0.420 | 2/7/22 | 28,250,000 | 28,248,901 |
| Aviation Capital Group, LLC | 0.230 | 2/1/22 | 64,750,000 | 64,749,640 |
| Conagra Brands, Inc. | 0.200 | 2/1/22 | 6,075,000 | 6,074,981 |
| Crown Castle International Corp. | 0.410 | 2/16/22 | 38,000,000 | 37,993,076 |
| Crown Castle International Corp. | 0.400 | 2/9/22 | 24,000,000 | 23,997,852 |
| Crown Castle International Corp. | 0.360 | 2/2/22 | 82,400,000 | 82,398,576 |
| Enbridge US, Inc. | 1.061 | 1/19/23 | 24,250,000 | 23,978,158 |
| Enbridge US, Inc. | 0.551 | 3/21/22 | 23,000,000 | 22,987,227 |
| Enbridge US, Inc. | 0.430 | 3/14/22 | 15,000,000 | 14,993,035 |
| Enbridge US, Inc. | 0.380 | 4/4/22 | 16,000,000 | 15,987,652 |
| Enbridge US, Inc. | 0.260 | 2/14/22 | 20,000,000 | 19,997,208 |
| Enbridge US, Inc. | 0.250 | 2/7/22 | 23,500,000 | 23,498,401 |
| Enel Finance America, LLC | 0.622 | 7/13/22 | 9,450,000 | 9,425,397 |
| Enel Finance America, LLC | 0.451 | 4/26/22 | 37,500,000 | 37,465,734 |
| Enel Finance America, LLC | 0.420 | 4/4/22 | 28,000,000 | 27,983,928 |
| Enel Finance America, LLC | 0.401 | 4/27/22 | 18,594,000 | 18,576,721 |
| Energy Transfer LP | 0.350 | 2/1/22 | 150,250,000 | 150,248,723 |
| ERP Operating LP | 0.350 | 2/28/22 | 19,000,000 | 18,990,808 |
| Eversource Energy | 0.310 | 2/1/22 | 13,500,000 | 13,499,951 |
| Fidelity National Information Services, Inc. | 0.521 | 3/22/22 | 27,000,000 | 26,989,125 |
| Fidelity National Information Services, Inc. | 0.480 | 3/3/22 | 30,000,000 | 29,993,490 |
| Fidelity National Information Services, Inc. | 0.250 | 2/23/22 | 28,000,000 | 27,995,868 |
| Fidelity National Information Services, Inc. | 0.250 | 2/16/22 | 23,000,000 | 22,997,823 |
| FMC Corp. | 0.500 | 2/23/22 | 36,250,000 | 36,237,702 |
| FMC Corp. | 0.450 | 2/22/22 | 18,750,000 | 18,743,939 |
| FMC Corp. | 0.450 | 2/14/22 | 23,500,000 | 23,495,394 |
| FMC Corp. | 0.350 | 2/1/22 | 15,000,000 | 14,999,812 |
| Fortune Brands Home & Security, Inc. | 0.320 | 2/24/22 | 36,250,000 | 36,241,348 |
| Fortune Brands Home & Security, Inc. | 0.320 | 2/17/22 | 23,250,000 | 23,246,223 |
| Fortune Brands Home & Security, Inc. | 0.320 | 2/14/22 | 9,250,000 | 9,248,777 |
| Fortune Brands Home & Security, Inc. | 0.300 | 2/7/22 | 20,000,000 | 19,998,678 |
| General Motors Financial Co., Inc. | 0.450 | 3/21/22 | 14,500,000 | 14,490,704 |
| General Motors Financial Co., Inc. | 0.401 | 2/28/22 | 14,000,000 | 13,995,568 |
| General Motors Financial Co., Inc. | 0.400 | 3/17/22 | 18,500,000 | 18,489,363 |
| General Motors Financial Co., Inc. | 0.400 | 2/7/22 | 13,500,000 | 13,499,239 |
| General Motors Financial Co., Inc. | 0.360 | 2/17/22 | 19,500,000 | 19,496,685 |
| General Motors Financial Co., Inc. | 0.360 | 2/14/22 | 32,500,000 | 32,495,564 |
| |
32 Ultra Short Duration Income Fund |
| | | | |
| COMMERCIAL PAPER (21.9%)* cont. | Yield (%) | Maturity
date | Principal
amount | Value |
| General Motors Financial Co., Inc. | 0.360 | 2/3/22 | $9,500,000 | $9,499,715 |
| General Motors Financial Co., Inc. | 0.360 | 2/2/22 | 22,750,000 | 22,749,670 |
| Glencore Funding, LLC | 0.270 | 2/9/22 | 23,500,000 | 23,499,131 |
| Glencore Funding, LLC | 0.246 | 2/10/22 | 65,250,000 | 65,247,263 |
| Healthpeak Properties, Inc. | 0.250 | 2/23/22 | 9,625,000 | 9,623,395 |
| Healthpeak Properties, Inc. | 0.250 | 2/22/22 | 31,000,000 | 30,995,093 |
| Healthpeak Properties, Inc. | 0.250 | 2/18/22 | 34,060,000 | 34,055,777 |
| Healthpeak Properties, Inc. | 0.240 | 2/8/22 | 32,500,000 | 32,498,584 |
| HSBC USA, Inc. | 0.725 | 1/3/23 | 28,250,000 | 27,983,962 |
| HSBC USA, Inc. | 0.725 | 12/28/22 | 23,250,000 | 23,036,871 |
| HSBC USA, Inc. | 0.370 | 3/24/22 | 48,000,000 | 48,009,696 |
| HSBC USA, Inc. | 0.330 | 7/8/22 | 46,750,000 | 46,762,669 |
| Humana, Inc. | 0.400 | 3/17/22 | 10,000,000 | 9,996,125 |
| Humana, Inc. | 0.400 | 3/15/22 | 24,000,000 | 23,991,199 |
| Humana, Inc. | 0.300 | 2/7/22 | 23,500,000 | 23,498,858 |
| Humana, Inc. | 0.350 | 2/11/22 | 23,250,000 | 23,248,224 |
| Humana, Inc. | 0.350 | 2/4/22 | 11,000,000 | 10,999,694 |
| Humana, Inc. | 0.350 | 2/2/22 | 24,500,000 | 24,499,660 |
| Humana, Inc. | 0.330 | 2/9/22 | 23,500,000 | 23,498,531 |
| Humana, Inc. | 0.300 | 2/1/22 | 10,000,000 | 9,999,931 |
| Ingredion, Inc. | 0.260 | 2/25/22 | 23,250,000 | 23,246,174 |
| Intercontinental Exchange, Inc. | 0.400 | 3/14/22 | 37,500,000 | 37,479,825 |
| Intercontinental Exchange, Inc. | 0.400 | 2/14/22 | 29,000,000 | 28,995,940 |
| Intercontinental Exchange, Inc. | 0.250 | 2/4/22 | 5,120,000 | 5,119,816 |
| International Flavors & Fragrances, Inc. | 0.852 | 5/18/22 | 14,000,000 | 13,981,691 |
| International Flavors & Fragrances, Inc. | 0.601 | 4/28/22 | 44,250,000 | 44,208,081 |
| International Flavors & Fragrances, Inc. | 0.601 | 3/29/22 | 24,500,000 | 24,479,102 |
| International Flavors & Fragrances, Inc. | 0.601 | 3/15/22 | 5,000,000 | 4,998,328 |
| International Flavors & Fragrances, Inc. | 0.581 | 4/12/22 | 14,800,000 | 14,789,813 |
| International Flavors & Fragrances, Inc. | 0.450 | 2/1/22 | 23,500,000 | 23,499,902 |
| Intesa Sanpaolo Funding, LLC (Spain) | 0.340 | 3/29/22 | 46,500,000 | 46,459,359 |
| Nasdaq, Inc. | 0.430 | 2/11/22 | 4,500,000 | 4,499,615 |
| National Grid PLC (United Kingdom) | 0.350 | 2/4/22 | 28,000,000 | 27,999,515 |
| Nutrien, Ltd. (Canada) | 0.400 | 3/24/22 | 23,500,000 | 23,488,595 |
| PPG Industries, Inc. | 0.260 | 2/18/22 | 23,250,000 | 23,247,466 |
| PPG Industries, Inc. | 0.250 | 2/15/22 | 42,000,000 | 41,996,325 |
| PPG Industries, Inc. | 0.250 | 2/10/22 | 21,500,000 | 21,498,931 |
| Realty Income Corp. | 0.400 | 2/15/22 | 18,000,000 | 17,998,425 |
| Sempra Energy | 0.250 | 2/16/22 | 34,000,000 | 33,996,630 |
| Sempra Energy | 0.250 | 2/9/22 | 43,000,000 | 42,998,119 |
| Sempra Energy | 0.250 | 2/8/22 | 21,000,000 | 20,999,221 |
| Sempra Energy | 0.250 | 2/4/22 | 24,575,000 | 24,574,574 |
| Sempra Energy | 0.250 | 2/3/22 | 23,250,000 | 23,249,702 |
| Thermo Fisher Scientific, Inc. | 0.501 | 6/1/22 | 58,500,000 | 58,407,390 |
| TransCanada PipeLines, Ltd. (Canada) | 0.340 | 2/1/22 | 19,000,000 | 18,999,920 |
| TransCanada PipeLines, Ltd. (Canada) | 0.310 | 2/8/22 | 32,000,000 | 31,998,820 |
| TransCanada PipeLines, Ltd. (Canada) | 0.300 | 2/9/22 | 9,145,000 | 9,144,604 |
| TransCanada PipeLines, Ltd. (Canada) | 0.270 | 2/18/22 | 19,000,000 | 18,997,929 |
| TransCanada PipeLines, Ltd. (Canada) | 0.260 | 2/17/22 | 20,000,000 | 19,997,969 |
| TransCanada PipeLines, Ltd. (Canada) | 0.250 | 2/23/22 | 23,250,000 | 23,246,569 |
| |
Ultra Short Duration Income Fund 33 |
| | | | |
| COMMERCIAL PAPER (21.9%)* cont. | Yield (%) | Maturity
date | Principal
amount | Value |
| Viatris, Inc. | 0.601 | 2/28/22 | $13,650,000 | $13,645,148 |
| Viatris, Inc. | 0.550 | 2/9/22 | 18,750,000 | 18,748,322 |
| Viatris, Inc. | 0.550 | 2/4/22 | 14,000,000 | 13,999,498 |
| Viatris, Inc. | 0.550 | 2/3/22 | 24,100,000 | 24,099,363 |
| Viatris, Inc. | 0.501 | 2/11/22 | 9,250,000 | 9,248,940 |
| Walgreens Boots Alliance, Inc. | 0.360 | 2/11/22 | 37,500,000 | 37,497,307 |
| Walgreens Boots Alliance, Inc. | 0.260 | 2/10/22 | 46,750,000 | 46,747,091 |
| WEC Energy Group, Inc. | 0.250 | 2/18/22 | 23,250,000 | 23,247,466 |
| Welltower, Inc. | 0.200 | 2/1/22 | 30,000,000 | 29,999,874 |
| Westpac Banking Corp. (Australia) | 0.241 | 3/11/22 | 46,750,000 | 46,755,708 |
| Total commercial paper (cost $3,159,286,218) | $3,159,235,214 |
|
| | | | |
| ASSET-BACKED SECURITIES (10.5%)* | | Principal
amount | Value |
| 1Sharpe Mortgage Trust 144A FRB Ser. 20-1, Class NOTE, (BBA LIBOR USD 3 Month + 2.90%), 3.025%, 7/25/24 | | | $36,188,000 | $36,188,000 |
| American Express Credit Account Master Trust Ser. 19-1, Class A, 2.87%, 10/15/24 | | | 32,889,000 | 32,994,705 |
| Bank of The West Auto Trust 144A Ser. 19-1, Class A3, 2.43%, 4/15/24 | | | 6,622,682 | 6,656,908 |
| BMW Vehicle Lease Trust | | | | |
| Ser. 22-1, Class A2, 0.67%, 5/28/24 | | | 5,750,000 | 5,738,912 |
| Ser. 21-2, Class A2, 0.19%, 11/27/23 | | | 11,000,000 | 10,975,300 |
| Canadian Pacer Auto Receivables Trust 144A Ser. 21-1A, Class A2A, 0.24%, 10/19/23 (Canada) | | | 6,361,726 | 6,348,449 |
| Capital One Multi-Asset Execution Trust | | | | |
| Ser. 19-A1, Class A1, 2.84%, 12/15/24 | | | 30,000,000 | 30,028,350 |
| FRB Ser. 17-A2, Class A2, (1 Month US LIBOR + 0.41%), 0.516%, 1/15/25 | | | 14,850,000 | 14,855,841 |
| Capital One Prime Auto Receivables Trust Ser. 20-1, Class A3, 1.60%, 11/15/24 | | | 10,037,607 | 10,084,372 |
| CarMax Auto Owner Trust | | | | |
| Ser. 18-4, Class A3, 3.36%, 9/15/23 | | | 5,654,760 | 5,687,574 |
| Ser. 19-1, Class A3, 3.05%, 3/15/24 | | | 2,679,195 | 2,699,206 |
| Ser. 19-3, Class A3, 2.18%, 8/15/24 | | | 9,077,675 | 9,145,195 |
| Ser. 20-1, Class A3, 1.89%, 12/16/24 | | | 13,829,424 | 13,917,250 |
| Ser. 20-3, Class A3, 0.62%, 3/17/25 | | | 18,691,727 | 18,670,886 |
| Ser. 21-1, Class A2A, 0.22%, 2/15/24 | | | 1,329,352 | 1,328,960 |
| Carvana Auto Receivables Trust Ser. 20-P1, Class A2, 0.28%, 11/8/23 | | | 1,452,336 | 1,452,061 |
| Cascade Funding Mortgage Trust 144A Ser. 21-HB6, Class A, 0.898%, 6/25/36 W | | | 7,684,757 | 7,684,757 |
| Cascade Funding Mortgage Trust, LLC 144A Ser. 21-HB5, Class A, 0.801%, 2/25/31 W | | | 14,574,284 | 14,310,300 |
| Citibank Credit Card Issuance Trust FRB Ser. 17-A7, Class A7, (1 Month US LIBOR + 0.37%), 0.474%, 8/8/24 | | | 5,000,000 | 5,008,179 |
| Discover Card Execution Note Trust Ser. 19-A3, Class A, 1.89%, 10/15/24 | | | 39,873,000 | 40,202,829 |
| Finance of America HECM Buyout 144A Ser. 21-HB1, Class A, 0.875%, 2/25/31 W | | | 7,186,700 | 7,180,232 |
| |
34 Ultra Short Duration Income Fund |
| | | | |
| ASSET-BACKED SECURITIES (10.5%)* cont. | | Principal
amount | Value |
| Ford Credit Auto Owner Trust | | | | |
| Ser. 18-A, Class A4, 3.16%, 10/15/23 | | | $1,615,214 | $1,616,892 |
| Ser. 19-B, Class A3, 2.23%, 10/15/23 | | | 4,586,516 | 4,608,830 |
| Ser. 20-A, Class A3, 1.04%, 8/15/24 | | | 25,896,525 | 25,938,037 |
| Ser. 21-A, Class A2, 0.17%, 10/15/23 | | | 11,521,492 | 11,514,035 |
| Ford Credit Auto Owner Trust 144A Ser. 18-2, Class A, 3.47%, 1/15/30 | | | 12,955,000 | 13,366,023 |
| Ford Credit Floorplan Master Owner Trust Ser. 20-1, Class A1, 0.70%, 9/15/25 | | | 31,000,000 | 30,717,435 |
| General Motors Financial Floorplan Owner Revolving Trust 144A Ser. 20-1, Class A, 0.68%, 8/15/25 | | | 26,500,000 | 26,257,340 |
| GM Financial Automobile Leasing Trust | | | | |
| Ser. 20-3, Class A3, 0.45%, 8/21/23 | | | 59,271,000 | 59,239,515 |
| Ser. 20-3, Class A2A, 0.35%, 11/21/22 | | | 201,273 | 201,172 |
| Ser. 21-3, Class A2, 0.24%, 12/20/23 | | | 4,050,000 | 4,035,616 |
| GM Financial Consumer Automobile Receivables Trust | | | | |
| Ser. 18-4, Class A3, 3.21%, 10/16/23 | | | 4,113,283 | 4,130,987 |
| Ser. 18-3, Class A3, 3.02%, 5/16/23 | | | 347,430 | 347,869 |
| Ser. 20-4, Class A3, 0.38%, 8/18/25 | | | 3,000,000 | 2,980,935 |
| Ser. 20-3, Class A2, 0.35%, 7/17/23 | | | 273,132 | 273,147 |
| Ser. 21-1, Class A2, 0.23%, 11/16/23 | | | 7,164,797 | 7,162,874 |
| Golden Credit Card Trust 144A | | | | |
| Ser. 18-4A, Class A, 3.44%, 8/15/25 | | | 1,250,000 | 1,290,185 |
| FRB Ser. 17-4A, Class A, (1 Month US LIBOR + 0.52%), 0.623%, 7/15/24 | | | 59,680,000 | 59,791,888 |
| Harley-Davidson Motorcycle Trust Ser. 21-B, Class A2, 0.24%, 12/16/24 | | | 9,929,013 | 9,907,209 |
| Honda Auto Receivables Owner Trust | | | | |
| Ser. 19-2, Class A4, 2.54%, 3/21/25 | | | 8,000,000 | 8,097,698 |
| Ser. 19-4, Class A3, 1.83%, 1/18/24 | | | 5,143,976 | 5,174,624 |
| Ser. 20-2, Class A3, 0.82%, 7/15/24 | | | 11,030,430 | 11,035,063 |
| Ser. 20-3, Class A3, 0.37%, 10/18/24 | | | 12,500,000 | 12,436,426 |
| Ser. 21-2, Class A2, 0.17%, 11/15/23 | | | 8,102,726 | 8,092,318 |
| Ser. 21-1, Class A2, 0.16%, 7/21/23 | | | 9,142,233 | 9,136,128 |
| Hyundai Auto Lease Securitization Trust 144A Ser. 20-B, Class A2, 0.36%, 1/17/23 | | | 2,951,991 | 2,952,248 |
| Mello Warehouse Securitization Trust 144A | | | | |
| FRB Ser. 20-1, Class A, (1 Month US LIBOR + 0.90%), 1.008%, 10/25/53 | | | 15,023,000 | 15,023,000 |
| FRB Ser. 20-2, Class A, (1 Month US LIBOR + 0.80%), 0.908%, 11/25/53 | | | 8,972,000 | 8,972,000 |
| FRB Ser. 21-2, Class A, (1 Month US LIBOR + 0.75%), 0.858%, 4/25/55 | | | 30,633,000 | 30,633,000 |
| FRB Ser. 21-1, Class A, (1 Month US LIBOR + 0.70%), 0.808%, 2/25/55 | | | 26,582,000 | 26,582,000 |
| Mercedes-Benz Auto Receivables Trust | | | | |
| Ser. 19-1, Class A3, 1.94%, 3/15/24 | | | 15,211,925 | 15,282,866 |
| Ser. 21-1, Class A2, 0.21%, 7/15/24 | | | 12,700,000 | 12,662,828 |
| |
Ultra Short Duration Income Fund 35 |
| | | | |
| ASSET-BACKED SECURITIES (10.5%)* cont. | | Principal
amount | Value |
| Mortgage Repurchase Agreement Financing Trust 144A | | | | |
| FRB Ser. 20-5, Class A1, (1 Month US LIBOR + 1.00%), 1.104%, 8/10/23 | | | $27,573,000 | $27,572,946 |
| FRB Ser. 21-S1, Class A1, (1 Month US LIBOR + 0.50%), 0.604%, 9/10/22 | | | 33,981,000 | 33,929,974 |
| MRA Issuance Trust 144A | | | | |
| FRB Ser. 21-EBO1, Class A2X, (1 Month US LIBOR + 1.75%), 1.852%, 4/15/22 | | | 47,396,000 | 47,336,204 |
| FRB Ser. 21-EBO4, Class A1X, (1 Month US LIBOR + 1.75%), 1.852%, 2/16/22 | | | 49,013,000 | 49,012,742 |
| FRB Ser. 20-11, Class A1X, (1 Month US LIBOR + 1.70%), 1.81%, 4/22/22 | | | 51,544,000 | 51,543,612 |
| FRB Ser. 21-NA1, Class A1X, (1 Month US LIBOR + 1.50%), 1.602%, 3/8/22 | | | 50,895,000 | 50,894,881 |
| FRB Ser. 20-2, Class A2, (1 Month US LIBOR + 1.45%), 1.302%, 8/15/22 | | | 45,609,000 | 45,608,806 |
| FRB Ser. 21-14, Class A1X, (1 Month US LIBOR + 1.25%), 1.243%, 2/15/22 | | | 48,984,000 | 48,983,771 |
| FRB Ser. 21-8, Class A2X, (1 Month US LIBOR + 1.15%), 1.238%, 5/15/22 | | | 46,725,000 | 46,724,456 |
| MSG III Securitization Trust 144A FRB Ser. 21-1, Class A, (1 Month US LIBOR + 0.75%), 0.858%, 6/25/54 | | | 5,018,533 | 5,014,518 |
| NewRez Warehouse Securitization Trust 144A FRB Ser. 21-1, Class A, (1 Month US LIBOR + 0.75%), 0.858%, 5/25/55 | | | 17,008,000 | 16,966,892 |
| Nissan Auto Lease Trust Ser. 20-B, Class A2, 0.34%, 12/15/22 | | | 4,266,345 | 4,267,040 |
| Nissan Auto Receivables Owner Trust | | | | |
| Ser. 19-A, Class A3, 2.90%, 10/16/23 | | | 3,680,664 | 3,706,706 |
| Ser. 19-B, Class A3, 2.50%, 11/15/23 | | | 8,853,362 | 8,917,846 |
| Ser. 19-C, Class A3, 1.93%, 7/15/24 | | | 12,155,315 | 12,230,812 |
| Ser. 20-B, Class A3, 0.55%, 7/15/24 | | | 28,325,396 | 28,292,624 |
| Santander Consumer Auto Receivables Trust 144A | | | | |
| Ser. 20-BA, Class A4, 0.54%, 4/15/25 | | | 8,925,000 | 8,899,724 |
| Ser. 21-AA, Class A2, 0.23%, 11/15/23 | | | 2,838,079 | 2,836,999 |
| Santander Retail Auto Lease Trust 144A Ser. 20-B, Class A2, 0.42%, 11/20/23 | | | 3,881,866 | 3,875,568 |
| Securitized Term Auto Receivables Trust 144A Ser. 19-1A, Class A3, 2.986%, 2/27/23 (Canada) | | | 562,334 | 563,438 |
| Station Place Securitization Trust 144A | | | | |
| FRB Ser. 21-6, Class A, (1 Month US LIBOR + 0.80%), 0.909%, 4/25/22 | | | 51,131,000 | 51,131,000 |
| FRB Ser. 21-10, Class A, (1 Month US LIBOR + 0.75%), 0.859%, 8/8/22 | | | 50,432,000 | 50,432,000 |
| FRB Ser. 21-14, Class A1, (1 Month US LIBOR + 0.70%), 0.809%, 12/8/22 | | | 16,990,000 | 16,990,000 |
| FRB Ser. 21-WL2, Class A, (1 Month US LIBOR + 0.70%), 0.808%, 3/25/54 | | | 36,890,000 | 36,890,000 |
| FRB Ser. 21-16, Class A1, (1 Month US LIBOR + 0.62%), 0.729%, 11/7/22 | | | 50,695,000 | 50,695,000 |
| Towd Point Asset Trust 144A FRB Ser. 18-SL1, Class A, (1 Month US LIBOR + 0.60%), 0.708%, 1/25/46 | | | 1,014,819 | 1,013,225 |
| |
36 Ultra Short Duration Income Fund |
| | | | |
| ASSET-BACKED SECURITIES (10.5%)* cont. | | Principal
amount | Value |
| Toyota Auto Receivables Owner Trust | | | | |
| Ser. 18-D, Class A4, 3.30%, 2/15/24 | | | $2,200,000 | $2,230,499 |
| Ser. 18-C, Class A4, 3.13%, 2/15/24 | | | 6,852,000 | 6,910,955 |
| Ser. 18-C, Class A3, 3.02%, 12/15/22 | | | 97,645 | 97,749 |
| Ser. 19-B, Class A3, 2.57%, 8/15/23 | | | 620,315 | 623,991 |
| Ser. 20-B, Class A3, 1.36%, 8/15/24 | | | 30,533,106 | 30,637,895 |
| Ser. 21-C, Class A2, 0.20%, 5/15/24 | | | 5,900,000 | 5,881,386 |
| Ser. 21-A, Class A2, 0.16%, 7/17/23 | | | 6,487,259 | 6,484,255 |
| UNIFY Auto Receivables Trust 144A Ser. 21-1A, Class A2, 0.39%, 2/15/24 | | | 8,753,428 | 8,752,544 |
| Volkswagen Auto Loan Enhanced Trust | | | | |
| Ser. 20-1, Class A3, 0.98%, 11/20/24 | | | 7,882,557 | 7,887,334 |
| Ser. 21-1, Class A2, 0.49%, 10/21/24 | | | 10,000,000 | 9,968,800 |
| World Omni Auto Receivables Trust | | | | |
| Ser. 18-D, Class A4, 3.44%, 12/16/24 | | | 2,000,000 | 2,056,240 |
| Ser. 18-C, Class A4, 3.27%, 9/16/24 | | | 1,369,000 | 1,386,879 |
| Ser. 18-C, Class A3, 3.13%, 11/15/23 | | | 4,579,958 | 4,599,102 |
| Ser. 21-A, Class A2, 0.17%, 2/15/24 | | | 12,526,844 | 12,519,309 |
| Total asset-backed securities (cost $1,519,208,945) | $1,514,986,176 |
|
| | | | |
| MORTGAGE-BACKED SECURITIES (3.5%)* | | Principal
amount | Value |
| Agency collateralized mortgage obligations (—%) |
| Federal Home Loan Mortgage Corporation | | | | |
| REMICs Ser. 1619, Class PZ, 6.50%, 11/15/23 | | | $9,284 | $9,575 |
| REMICs Ser. 3724, Class CM, 5.50%, 6/15/37 | | | 70,945 | 78,764 |
| REMICs Ser. 3316, Class CD, 5.50%, 5/15/37 | | | 25,733 | 28,427 |
| REMICs Ser. 3539, Class PM, 4.50%, 5/15/37 | | | 6,962 | 7,365 |
| REMICs Ser. 3611, PO, zero %, 7/15/34 | | | 23,573 | 21,670 |
| Federal National Mortgage Association | | | | |
| REMICs Ser. 11-60, Class PA, 4.00%, 10/25/39 | | | 5,353 | 5,605 |
| REMICs Ser. 10-81, Class AP, 2.50%, 7/25/40 | | | 15,595 | 15,781 |
| REMICs FRB Ser. 10-90, Class GF, (1 Month US LIBOR + 0.50%), 0.608%, 8/25/40 | | | 248,559 | 245,369 |
| REMICs FRB Ser. 06-74, Class FL, (1 Month US LIBOR + 0.35%), 0.458%, 8/25/36 | | | 166,295 | 166,947 |
| REMICs FRB Ser. 05-63, Class FC, (1 Month US LIBOR + 0.25%), 0.358%, 10/25/31 | | | 332,327 | 332,857 |
| Government National Mortgage Association Ser. 09-32, Class AB, 4.00%, 5/16/39 | | | 6,237 | 6,552 |
| | | | 918,912 |
| Residential mortgage-backed securities (non-agency) (3.5%) |
| Ameriquest Mortgage Securities, Inc. Asset-Backed Pass-Through Certificates | | | | |
| FRB Ser. 04-R5, Class M1, (1 Month US LIBOR + 0.87%), 0.978%, 7/25/34 | | | 496,577 | 496,577 |
| FRB Ser. 05-R7, Class M2, (1 Month US LIBOR + 0.75%), 0.858%, 9/25/35 | | | 56,630 | 56,630 |
| FRB Ser. 05-R11, Class M2, (1 Month US LIBOR + 0.71%), 0.813%, 1/25/36 | | | 4,677,774 | 4,676,543 |
| FRB Ser. 05-R9, Class M1, (1 Month US LIBOR + 0.71%), 0.813%, 11/25/35 | | | 9,080,914 | 9,069,507 |
| |
Ultra Short Duration Income Fund 37 |
| | | | |
| MORTGAGE-BACKED SECURITIES (3.5%)* cont. | | Principal
amount | Value |
| Residential mortgage-backed securities (non-agency) cont. |
| Angel Oak Mortgage Trust I, LLC 144A | | | | |
| Ser. 19-1, Class A1, 3.92%, 11/25/48 W | | | $2,662,839 | $2,665,768 |
| FRB Ser. 18-3, Class A1, 3.649%, 9/25/48 W | | | 1,851,553 | 1,855,177 |
| Ser. 19-4, Class A1, 2.993%, 7/26/49 W | | | 5,542,149 | 5,543,257 |
| Angel Oak Mortgage Trust LLC 144A Ser. 20-3, Class A1, 1.691%, 4/25/65 W | | | 17,441,165 | 17,385,353 |
| Arroyo Mortgage Trust 144A | | | | |
| Ser. 19-2, Class A1, 3.347%, 4/25/49 W | | | 6,164,465 | 6,163,990 |
| Ser. 19-3, Class A1, 2.962%, 10/25/48 W | | | 7,766,698 | 7,762,663 |
| Bear Stearns Asset Backed Securities I Trust FRB Ser. 07-HE7, Class 1A1, (1 Month US LIBOR + 1.00%), 1.108%, 10/25/37 | | | 1,612,672 | 1,612,976 |
| Bellemeade Re, Ltd. 144A FRB Ser. 18-1A, Class M1B, (1 Month US LIBOR + 1.60%), 1.708%, 4/25/28 (Bermuda) | | | 440,317 | 441,792 |
| BRAVO Residential Funding Trust 144A | | | | |
| Ser. 19-1, Class A1C, 3.50%, 3/25/58 | | | 2,904,407 | 2,928,655 |
| Ser. 19-NQM2, Class A1, 2.748%, 11/25/59 W | | | 7,968,053 | 7,979,208 |
| Ser. 19-NQM1, Class A1, 2.666%, 7/25/59 W | | | 5,301,163 | 5,273,805 |
| Ser. 20-NQM1, Class A1, 1.449%, 5/25/60 W | | | 7,253,118 | 7,191,481 |
| Ser. 21-NQM2, Class A1, 0.97%, 3/25/60 W | | | 12,330,982 | 12,238,156 |
| Ser. 21-NQM1, Class A1, 0.941%, 2/25/49 W | | | 5,703,814 | 5,638,106 |
| FRB Ser. 21-HE1, Class A1, (US 30 Day Average SOFR + 0.75%), 0.80%, 1/25/70 | | | 13,349,303 | 13,284,613 |
| Carrington Mortgage Loan Trust FRB Ser. 06-RFC1, Class A4, (1 Month US LIBOR + 0.48%), 0.588%, 3/25/36 | | | 1,660,597 | 1,657,289 |
| CIT Mortgage Loan Trust 144A FRB Ser. 07-1, Class 2A3, (1 Month US LIBOR + 1.45%), 1.558%, 10/25/37 | | | 479,076 | 479,972 |
| Citigroup Mortgage Loan Trust 144A Ser. 19-IMC1, Class A1, 2.72%, 7/25/49 W | | | 732,600 | 733,221 |
| Citigroup Mortgage Loan Trust, Inc. FRB Ser. 06-WFH1, Class M4, (1 Month US LIBOR + 0.75%), 0.858%, 1/25/36 | | | 1,387,254 | 1,387,417 |
| COLT Funding, LLC 144A Ser. 21-3R, Class A1, 1.051%, 12/25/64 W | | | 4,706,135 | 4,635,543 |
| COLT Mortgage Loan Trust 144A | | | | |
| FRB Ser. 20-1, Class A1, 2.488%, 2/25/50 W | | | 3,160,200 | 3,153,364 |
| Ser. 20-1R, Class A1, 1.255%, 9/25/65 W | | | 3,311,237 | 3,299,979 |
| Ser. 21-HX1, Class A1, 1.11%, 10/25/66 W | | | 23,655,108 | 23,225,228 |
| Countrywide Asset-Backed Certificates | | | | |
| FRB Ser. 05-BC3, Class M4, (1 Month US LIBOR + 1.50%), 1.608%, 6/25/35 | | | 1,113,305 | 1,115,123 |
| FRB Ser. 05-BC5, Class M3, (1 Month US LIBOR + 0.75%), 0.858%, 1/25/36 | | | 113,607 | 113,606 |
| Credit Suisse Mortgage Capital Certificates 144A | | | | |
| Ser. 20-SPT1, Class A2, 2.229%, 4/25/65 | | | 6,500,000 | 6,603,961 |
| FRB Ser. 20-SPT1, Class A1, 1.616%, 4/25/65 | | | 4,390,850 | 4,387,292 |
| Credit Suisse Mortgage Trust 144A Ser. 20-AFC1, Class A1, 2.24%, 2/25/50 W | | | 14,697,796 | 14,650,764 |
| Credit-Based Asset Servicing and Securitization, LLC FRB Ser. 05-CB7, Class M1, (1 Month US LIBOR + 0.62%), 0.723%, 11/25/35 | | | 762,266 | 760,413 |
| |
38 Ultra Short Duration Income Fund |
| | | | |
| MORTGAGE-BACKED SECURITIES (3.5%)* cont. | | Principal
amount | Value |
| Residential mortgage-backed securities (non-agency) cont. |
| CSMC Trust 144A | | | | |
| Ser. 19-NQM1, Class A1, 2.656%, 10/25/59 | | | $7,034,408 | $7,051,290 |
| Ser. 15-2R, Class 7A3, 2.61%, 8/27/36 W | | | 1,000,604 | 1,004,199 |
| CWABS Asset-Backed Certificates Trust | | | | |
| FRB Ser. 04-10, Class MV3, (1 Month US LIBOR + 1.13%), 1.233%, 12/25/34 | | | 2,088,576 | 2,090,068 |
| FRB Ser. 04-AB2, Class M2, (1 Month US LIBOR + 0.86%), 0.963%, 5/25/36 | | | 195,609 | 195,609 |
| Ellington Financial Mortgage Trust 144A | | | | |
| Ser. 19-2, Class A1, 2.739%, 11/25/59 W | | | 4,954,097 | 4,981,355 |
| Ser. 20-2, Class A1, 1.178%, 10/25/65 W | | | 2,538,100 | 2,512,465 |
| Encore Credit receivables Trust | | | | |
| FRB Ser. 05-3, Class M3, (1 Month US LIBOR + 0.77%), 0.873%, 10/25/35 | | | 362,799 | 362,653 |
| FRB Ser. 05-4, Class M3, (1 Month US LIBOR + 0.71%), 0.813%, 1/25/36 | | | 4,665,952 | 4,666,656 |
| EquiFirst Mortgage Loan Trust FRB Ser. 05-1, Class M3, (1 Month US LIBOR + 0.48%), 0.828%, 4/25/35 | | | 846,998 | 846,727 |
| Federal Home Loan Mortgage Corporation | | | | |
| Structured Agency Credit Risk Debt FRN Ser. 14-HQ1, Class M3, (1 Month US LIBOR + 4.10%), 4.208%, 8/25/24 | | | 347,972 | 349,277 |
| Structured Agency Credit Risk Debt FRN Ser. 16-DNA4, Class M3, (1 Month US LIBOR + 3.80%), 3.908%, 3/25/29 | | | 3,012,942 | 3,111,318 |
| Structured Agency Credit Risk Debt FRN Ser. 17-HQA2, Class M2AS, (1 Month US LIBOR + 1.05%), 1.158%, 12/25/29 | | | 22,743,823 | 22,740,480 |
| Structured Agency Credit Risk Debt FRN Ser. 17-DNA3, Class M2AR, (1 Month US LIBOR + 0.75%), 0.858%, 3/25/30 | | | 11,799,068 | 11,750,293 |
| Federal Home Loan Mortgage Corporation 144A | | | | |
| Structured Agency Credit Risk Trust FRB Ser. 18-HRP2, Class M2, (1 Month US LIBOR + 1.25%), 1.358%, 2/25/47 | | | 4,142,110 | 4,145,082 |
| Structured Agency Credit Risk Trust FRB Ser. 18-DNA2, Class M1, (1 Month US LIBOR + 0.80%), 0.908%, 12/25/30 | | | 187,187 | 187,187 |
| Structured Agency Credit Risk Trust FRB Ser. 18-HQA2, Class M1, (1 Month US LIBOR + 0.75%), 0.858%, 10/25/48 | | | 49,225 | 49,225 |
| Structured Agency Credit Risk Trust FRB Ser. 18-DNA3, Class M1, (1 Month US LIBOR + 0.75%), 0.858%, 9/25/48 | | | 4,263 | 4,263 |
| Federal National Mortgage Association | | | | |
| Connecticut Avenue Securities FRB Ser. 16-C04, Class 1M2, (1 Month US LIBOR + 4.25%), 4.358%, 1/25/29 | | | 2,479,730 | 2,564,305 |
| Connecticut Avenue Securities FRB Ser. 14-C03, Class 2M2, (1 Month US LIBOR + 2.90%), 3.008%, 7/25/24 | | | 2,393,537 | 2,428,877 |
| |
Ultra Short Duration Income Fund 39 |
| | | | |
| MORTGAGE-BACKED SECURITIES (3.5%)* cont. | | Principal
amount | Value |
| Residential mortgage-backed securities (non-agency) cont. |
| Federal National Mortgage Association | | | | |
| Connecticut Avenue Securities FRB Ser. 14-C02, Class 2M2, (1 Month US LIBOR + 2.60%), 2.708%, 5/25/24 | | | $743,247 | $754,377 |
| First Franklin Mortgage Loan Trust | | | | |
| FRB Ser. 04-FF7, Class M1, (1 Month US LIBOR + 0.87%), 0.978%, 9/25/34 | | | 454,651 | 453,036 |
| FRB Ser. 05-FF9, Class A4, (1 Month US LIBOR + 0.72%), 0.828%, 10/25/35 | | | 610,221 | 609,535 |
| FRB Ser. 05-FF12, Class M1, (1 Month US LIBOR + 0.68%), 0.783%, 11/25/36 | | | 151,501 | 151,304 |
| FRB Ser. 06-FF3, Class A2C, (1 Month US LIBOR + 0.58%), 0.688%, 2/25/36 | | | 4,498,141 | 4,497,861 |
| FRB Ser. 06-FF7, Class 1A, (1 Month US LIBOR + 0.28%), 0.388%, 5/25/36 | | | 5,920,754 | 5,874,565 |
| FWD Securitization Trust 144A | | | | |
| Ser. 19-INV1, Class A1, 2.81%, 6/25/49 W | | | 4,751,357 | 4,781,281 |
| FRB Ser. 20-INV1, Class A1, 2.24%, 1/25/50 W | | | 3,729,090 | 3,742,514 |
| Galton Funding Mortgage Trust 144A Ser. 19-2, Class A22, 3.50%, 6/25/59 W | | | 5,858,521 | 5,892,831 |
| GCAT Trust 144A Ser. 19-NQM3, Class A1, 2.686%, 11/25/59 W | | | 3,848,123 | 3,872,329 |
| GS Mortgage-Backed Securities Trust 144A Ser. 20-NQM1, Class A1, 1.382%, 9/27/60 W | | | 2,542,516 | 2,524,395 |
| GSAA Home Equity Trust | | | | |
| FRB Ser. 05-8, Class A3, (1 Month US LIBOR + 0.86%), 0.968%, 6/25/35 | | | 1,569,200 | 1,569,200 |
| FRB Ser. 06-2, Class 2A4, (1 Month US LIBOR + 0.62%), 0.728%, 12/25/35 | | | 4,852,673 | 4,870,727 |
| GSAMP Trust FRB Ser. 06-HE7, Class A2D, (1 Month US LIBOR + 0.23%), 0.338%, 10/25/46 | | | 402,315 | 385,860 |
| Home Equity Asset Trust | | | | |
| FRB Ser. 06-1, Class M2, (1 Month US LIBOR + 0.46%), 0.798%, 4/25/36 | | | 4,356,260 | 4,353,385 |
| FRB Ser. 06-4, Class 1A1, (1 Month US LIBOR + 0.16%), 0.428%, 8/25/36 | | | 3,079,326 | 3,069,877 |
| Home Re, Ltd. 144A FRB Ser. 18-1, Class M1, (1 Month US LIBOR + 1.60%), 1.708%, 10/25/28 (Bermuda) | | | 2,462,849 | 2,462,850 |
| HomeBanc Mortgage Trust FRB Ser. 05-4, Class A1, (1 Month US LIBOR + 0.54%), 0.648%, 10/25/35 | | | 1,950,880 | 1,948,995 |
| Homeward Opportunities Fund I Trust 144A Ser. 20-2, Class A1, 1.657%, 5/25/65 W | | | 3,088,182 | 3,064,323 |
| JPMorgan Mortgage Acquisition Trust FRB Ser. 07-CH2, Class MV1, (1 Month US LIBOR + 0.28%), 0.388%, 1/25/37 | | | 5,834,183 | 5,821,417 |
| JPMorgan Resecuritization Trust 144A Ser. 14-1, Class 7A1, 3.00%, 6/26/35 | | | 1,816,327 | 1,812,422 |
| Long Beach Mortgage Loan Trust FRB Ser. 04-1, Class M1, (1 Month US LIBOR + 0.75%), 0.858%, 2/25/34 | | | 385,096 | 384,938 |
| MASTR Asset-Backed Securities Trust FRB Ser. 06-FRE1, Class A4, (1 Month US LIBOR + 0.58%), 0.688%, 12/25/35 | | | 456,622 | 451,074 |
| |
40 Ultra Short Duration Income Fund |
| | | | |
| MORTGAGE-BACKED SECURITIES (3.5%)* cont. | | Principal
amount | Value |
| Residential mortgage-backed securities (non-agency) cont. |
| Merrill Lynch Mortgage Investors Trust FRB Ser. 05-AR1, Class M1, (1 Month US LIBOR + 0.75%), 0.858%, 6/25/36 | | | $27,841 | $27,840 |
| MFA Trust 144A Ser. 21-NQM1, Class A1, 1.153%, 4/25/65 W | | | 11,250,640 | 11,179,700 |
| MFRA Trust 144A Ser. 20-NQM1, Class A1, 1.479%, 3/25/65 W | | | 2,323,497 | 2,317,015 |
| Morgan Stanley ABS Capital I, Inc. Trust FRB Ser. 06-NC1, Class M1, (1 Month US LIBOR + 0.57%), 0.678%, 12/25/35 | | | 6,266,864 | 6,265,894 |
| Nationstar Home Equity Loan Trust FRB Ser. 07-B, Class 2AV4, (1 Month US LIBOR + 0.32%), 0.428%, 4/25/37 | | | 6,038,460 | 6,013,171 |
| New Century Home Equity Loan Trust FRB Ser. 05-C, Class A2D, (1 Month US LIBOR + 0.68%), 0.788%, 12/25/35 | | | 1,490,216 | 1,489,415 |
| New Residential Mortgage Loan Trust 144A | | | | |
| Ser. 19-NQM4, Class A1, 2.492%, 9/25/59 W | | | 3,076,907 | 3,080,600 |
| Ser. 20-NQM1, Class A1, 2.464%, 1/26/60 W | | | 1,809,480 | 1,811,470 |
| FRB Ser. 18-4A, Class 4A, (1 Month US LIBOR + 0.75%), 0.858%, 1/25/48 | | | 5,497,862 | 5,484,628 |
| Nomura Home Equity Loan, Inc./Home Equity Loan Trust FRB Ser. 05-FM1, Class M2, (1 Month US LIBOR + 0.74%), 0.843%, 5/25/35 | | | 397,352 | 396,598 |
| OBX Trust 144A Ser. 20-EXP2, Class A3, 2.50%, 5/25/60 W | | | 16,909,237 | 16,806,985 |
| Onslow Bay Financial, LLC Trust 144A FRB Ser. 20-EXP3, Class 2A1, (1 Month US LIBOR + 0.90%), 1.008%, 1/25/60 | | | 795,390 | 791,957 |
| Park Place Securities, Inc. Asset-Backed Pass-Through Certificates Asset Backed Pass-Through Certificates FRB Ser. 04-MHQ1, Class M3, (1 Month US LIBOR + 1.28%), 1.383%, 12/25/34 | | | 1,686,359 | 1,687,825 |
| Radnor Re, Ltd. 144A FRB Ser. 19-1, Class M1B, (1 Month US LIBOR + 1.95%), 2.058%, 2/25/29 (Bermuda) | | | 3,851,475 | 3,862,093 |
| RASC Series Trust FRB Ser. 06-KS6, Class A4, (1 Month US LIBOR + 0.25%), 0.358%, 8/25/36 | | | 2,345,232 | 2,333,460 |
| Residential Asset Mortgage Products Trust | | | | |
| FRB Ser. 05-RS2, Class M4, (1 Month US LIBOR + 1.08%), 1.188%, 2/25/35 | | | 1,293,853 | 1,297,462 |
| FRB Ser. 05-RS6, Class M4, (1 Month US LIBOR + 0.98%), 1.083%, 6/25/35 | | | 1,222,581 | 1,234,807 |
| FRB Ser. 06-EFC2, Class A4, (1 Month US LIBOR + 0.22%), 0.328%, 12/25/36 | | | 1,042,985 | 1,039,604 |
| Residential Asset Securities Corp., Trust | | | | |
| FRB Ser. 05-KS1, Class M2, (1 Month US LIBOR + 0.75%), 1.233%, 2/25/35 | | | 1,697,423 | 1,684,373 |
| FRB Ser. 04-KS10, Class M1, (1 Month US LIBOR + 0.90%), 1.008%, 11/25/34 | | | 1,549,503 | 1,549,777 |
| FRB Ser. 06-KS3, Class M1, (1 Month US LIBOR + 0.33%), 0.603%, 4/25/36 | | | 2,337,411 | 2,333,153 |
| FRB Ser. 06-KS7, Class A4, (1 Month US LIBOR + 0.24%), 0.348%, 9/25/36 | | | 325,563 | 324,576 |
| |
Ultra Short Duration Income Fund 41 |
| | | | |
| MORTGAGE-BACKED SECURITIES (3.5%)* cont. | | Principal
amount | Value |
| Residential mortgage-backed securities (non-agency) cont. |
| Residential Mortgage Loan Trust 144A | | | | |
| Ser. 19-2, Class A1, 2.913%, 5/25/59 W | | | $709,045 | $709,756 |
| Ser. 19-3, Class A1, 2.633%, 9/25/59 W | | | 3,909,511 | 3,897,093 |
| Securitized Asset Backed Receivables, LLC Trust FRB Ser. 06-CB1, Class AV1, (1 Month US LIBOR + 0.48%), 0.588%, 1/25/36 | | | 5,102,998 | 5,078,139 |
| SG Residential Mortgage Trust 144A Ser. 19-3, Class A1, 2.703%, 9/25/59 W | | | 275,569 | 274,295 |
| Soundview Home Loan Trust | | | | |
| FRB Ser. 05-OPT3, Class M1, (1 Month US LIBOR + 0.47%), 0.813%, 11/25/35 | | | 5,353,292 | 5,350,957 |
| FRB Ser. 06-OPT1, Class 2A4, (1 Month US LIBOR + 0.27%), 0.648%, 3/25/36 | | | 2,000,329 | 1,998,500 |
| Starwood Mortgage Residential Trust 144A | | | | |
| FRB Ser. 20-2, Class A1, 2.718%, 4/25/60 W | | | 5,824,316 | 5,851,609 |
| Ser. 19-INV1, Class A1, 2.61%, 9/27/49 W | | | 2,505,790 | 2,515,744 |
| Ser. 21-4, Class A1, 1.162%, 8/25/56 W | | | 12,458,346 | 12,338,149 |
| Starwood Residential Mortgage Trust 144A Ser. 21-1, Class A1, 1.219%, 5/25/65 W | | | 8,647,463 | 8,611,180 |
| Structured Asset Investment Loan Trust | | | | |
| FRB Ser. 04-7, Class A7, (1 Month US LIBOR + 0.84%), 0.948%, 8/25/34 | | | 323,624 | 323,425 |
| FRB Ser. 05-HE3, Class M1, (1 Month US LIBOR + 0.72%), 0.828%, 9/25/35 | | | 3,870,259 | 3,863,617 |
| Structured Asset Investment Loan Trust 144A FRB Ser. 05-1, Class M2, (1 Month US LIBOR + 0.72%), 0.828%, 2/25/35 | | | 21,803 | 21,795 |
| Structured Asset Securities Corp Mortgage Loan Trust FRB Ser. 06-OPT1, Class A5, (1 Month US LIBOR + 0.26%), 0.368%, 4/25/36 | | | 584,410 | 583,186 |
| Structured Asset Securities Corp. FRB Ser. 05-WF1, Class M1, (1 Month US LIBOR + 0.66%), 0.768%, 2/25/35 | | | 1,814,725 | 1,814,721 |
| Structured Asset Securities Corp. Mortgage Loan Trust | | | | |
| FRB Ser. 05-NC2, Class M5, (1 Month US LIBOR + 0.93%), 1.038%, 5/25/35 | | | 2,900,000 | 2,902,097 |
| FRB Ser. 05-NC2, Class M4, (1 Month US LIBOR + 0.71%), 0.813%, 5/25/35 | | | 333,523 | 333,583 |
| FRB Ser. 06-WF1, Class M4, (1 Month US LIBOR + 0.65%), 0.753%, 2/25/36 | | | 1,811,204 | 1,813,855 |
| Towd Point HE Trust 144A Ser. 21-HE1, Class A1, 0.918%, 2/25/63 W | | | 10,360,956 | 10,301,007 |
| Towd Point Mortgage Trust 144A | | | | |
| Ser. 15-2, Class 2M1, 3.75%, 11/25/57 W | | | 3,017,398 | 3,038,173 |
| Ser. 18-1, Class A1, 3.00%, 1/25/58 W | | | 5,988,279 | 6,042,641 |
| Ser. 17-3, Class A1, 2.75%, 7/25/57 W | | | 4,607,959 | 4,646,070 |
| FRB Ser. 19-HY2, Class A1, (1 Month US LIBOR + 1.00%), 1.108%, 5/25/58 | | | 853,030 | 856,972 |
| FRB Ser. 19-HY1, Class A1, (1 Month US LIBOR + 1.00%), 1.108%, 10/25/48 | | | 6,917,607 | 6,950,576 |
| |
42 Ultra Short Duration Income Fund |
| | | | |
| MORTGAGE-BACKED SECURITIES (3.5%)* cont. | | Principal
amount | Value |
| Residential mortgage-backed securities (non-agency) cont. |
| Verus Securitization Trust 144A | | | | |
| Ser. 19-INV2, Class A1, 2.913%, 7/25/59 W | | | $10,044,795 | $10,083,532 |
| Ser. 19-3, Class A1, 2.784%, 7/25/59 | | | 2,663,058 | 2,669,835 |
| Ser. 19-INV3, Class A1, 2.692%, 11/25/59 W | | | 3,734,491 | 3,768,501 |
| Ser. 19-4, Class A1, 2.642%, 11/25/59 | | | 7,592,484 | 7,636,751 |
| Ser. 20-1, Class A1, 2.417%, 1/25/60 | | | 1,448,083 | 1,448,699 |
| Ser. 20-5, Class A1, 1.218%, 5/25/65 | | | 8,644,383 | 8,576,571 |
| Wells Fargo Home Equity Asset-Backed Securities Trust FRB Ser. 05-3, Class M6, (1 Month US LIBOR + 1.01%), 1.113%, 11/25/35 | | | 1,126,781 | 1,126,565 |
| | | | 511,297,851 |
| Total mortgage-backed securities (cost $514,434,546) | $512,216,763 |
|
| | | | |
| CERTIFICATES OF DEPOSIT (1.0%)* | Yield (%) | Maturity
date | Principal
amount | Value |
| Credit Suisse AG/New York, NY FRN | 0.581 | 1/19/24 | $23,750,000 | $23,750,200 |
| Deutsche Bank AG/New York, NY FRN (Germany) | 0.760 | 2/16/22 | 46,500,000 | 46,513,739 |
| Standard Chartered Bank/New York FRN | 0.310 | 4/25/22 | 25,000,000 | 25,006,740 |
| Standard Chartered Bank/New York FRN | 0.274 | 3/18/22 | 49,000,000 | 49,002,436 |
| Total certificates of deposit (cost $144,250,702) | $144,273,115 |
|
| | |
| REPURCHASE AGREEMENTS (0.7%)* | Principal
amount | Value |
| Interest in $25,000,000 tri-party term repurchase agreement dated 1/31/2022 with RBC Capital Markets, LLC, 0.290% (collateralized by Corporate Debt Securities with coupon rates ranging from 2.150% to 5.930% and due dates ranging from 8/8/2022 to 11/1/2063, valued at $26,250,212) Ŧ EG (Canada) | $25,000,000 | $25,000,000 |
| Interest in $75,000,000 tri-party term repurchase agreement dated 1/31/2022 with BNP Paribas, 0.240% (collateralized by Corporate Debt Securities with coupon rates ranging from 0.000% to 10.750% and due dates ranging from 4/1/2024 to perpetual maturity, valued at $78,751,098) Ŧ EG (France) | 75,000,000 | 75,000,000 |
| Total repurchase agreements (cost $100,000,000) | $100,000,000 |
|
| | | | |
U.S. GOVERNMENT AND AGENCY
MORTGAGE OBLIGATIONS (—%)* | | Principal
amount | Value |
| U.S. Government Agency Mortgage Obligations (—%) |
| Federal National Mortgage Association Pass-Through Certificates | | | | |
| 6.00%, 5/1/23 | | | $74 | $74 |
| 5.50%, 11/1/23 | | | 5 | 5 |
| Total U.S. government and agency mortgage obligations (cost $84) | $79 |
|
| |
| TOTAL INVESTMENTS |
| Total investments (cost $14,523,573,499) | $14,504,301,080 |
|
| |
| Key to holding’s abbreviations |
| BKNT | Bank Note |
| |
Ultra Short Duration Income Fund 43 |
| | | |
| DAC | Designated Activity Company |
| FRB | Floating Rate Bonds: the rate shown is the current interest rate at the close of the reporting period. Rates may be subject to a cap or floor. For certain securities, the rate may represent a fixed rate currently in place at the close of the reporting period. |
| FRN | Floating Rate Notes: the rate shown is the current interest rate or yield at the close of the reporting period. Rates may be subject to a cap or floor. For certain securities, the rate may represent a fixed rate currently in place at the close of the reporting period. |
| GMTN | Global Medium Term Notes |
| MTN | Medium Term Notes |
| PO | Principal Only |
|
| | | |
| Notes to the fund’s portfolio |
| Unless noted otherwise, the notes to the fund’s portfolio are for the close of the fund’s reporting period, which ran from August 1, 2021 through January 31, 2022 (the reporting period). Within the following notes to the portfolio, references to “Putnam Management” represent Putnam Investment Management, LLC, the fund’s manager, an indirect wholly-owned subsidiary of Putnam Investments, LLC and references to “ASC 820” represent Accounting Standards Codification 820 Fair Value Measurements and Disclosures. |
| * | Percentages indicated are based on net assets of $14,457,984,387. |
| R | Real Estate Investment Trust. |
| W | The rate shown represents the weighted average coupon associated with the underlying mortgage pools. Rates may be subject to a cap or floor. |
| Ŧ | Repurchase agreements with a maturity of more than seven days are considered to be illiquid investments. |
| EG | Maturity date of the repurchase agreement is thirty-five days from the purchase date unless both parties agree to roll the transaction. Maturity value of the repurchase agreement will equal the principal amount of the repurchase agreement plus interest. |
| Debt obligations are considered secured unless otherwise indicated. |
| 144A after the name of an issuer represents securities exempt from registration under Rule 144A of the Securities Act of 1933, as amended. These securities may be resold in transactions exempt from registration, normally to qualified institutional buyers. |
| The dates shown on debt obligations are the original maturity dates. |
|
| | | | |
| DIVERSIFICATION BY COUNTRY | | | | |
| Distribution of investments by country of risk at the close of the reporting period, excluding collateral received, if any (as a percentage of Portfolio Value): |
| United States | 68.2% | | Switzerland | 1.4% |
| Canada | 8.5 | | Italy | 1.1 |
| United Kingdom | 4.9 | | Sweden | 1.1 |
| Japan | 3.6 | | Germany | 1.0 |
| France | 2.5 | | Norway | 0.6 |
| Netherlands | 2.5 | | Ireland | 0.5 |
| Australia | 2.4 | | Other | 0.2 |
| Spain | 1.5 | | Total | 100.0% |
|
| ASC 820 establishes a three-level hierarchy for disclosure of fair value measurements. The valuation hierarchy is based upon the transparency of inputs to the valuation of the fund’s investments. The three levels are defined as follows: |
| |
44 Ultra Short Duration Income Fund |
Level 1: Valuations based on quoted prices for identical securities in active markets.
Level 2: Valuations based on quoted prices in markets that are not active or for which all significant inputs are observable, either directly or indirectly.
Level 3: Valuations based on inputs that are unobservable and significant to the fair value measurement.
| The following is a summary of the inputs used to value the fund’s net assets as of the close of the reporting period: |
|
| | | |
| | Valuation inputs |
| Investments in securities: | Level 1 | Level 2 | Level 3 |
| Asset-backed securities | $— | $1,478,798,176 | $36,188,000 |
| Certificates of deposit | — | 144,273,115 | — |
| Commercial paper | — | 3,159,235,214 | — |
| Corporate bonds and notes | — | 9,073,589,733 | — |
| Mortgage-backed securities | — | 512,216,763 | — |
| Repurchase agreements | — | 100,000,000 | — |
| U.S. government and agency mortgage obligations | — | 79 | — |
| Totals by level | $— | $14,468,113,080 | $36,188,000 |
| The following is a reconciliation of Level 3 assets as of the close of the reporting period: |
|
| | | | | | | | | |
| Investments in securities: | Balance
as of
7/31/21 | Accrued discounts/premiums | Realized gain/(loss) | Change in net
unrealized
appreciation/
(deprecia-
tion) # | Cost of purchases | Proceeds from sales | Total
transfers
into
Level 3† | Total
transfers
out of
Level 3† | Balance
as of
1/31/22 |
| Asset-backed securities | $397,593,713 | $— | $(481) | $(22,400) | $8,195,467 | $(83,078,000) | $— | $(286,500,299) | $36,188,000 |
| Totals | $397,593,713 | $— | $(481) | $(22,400) | $8,195,467 | $(83,078,000) | $— | $(286,500,299) | $36,188,000 |
| † Transfers during the reporting period are accounted for using the end of period market value and include valuations where a secondary pricing service was obtained for certain securities. |
| # Includes $(21,713) related to Level 3 securities still held at period end. Total change in unrealized appreciation/(depreciation) for securities (including Level 1 and Level 2) can be found in the Statement of operations. |
The accompanying notes are an integral part of these financial statements.
| |
Ultra Short Duration Income Fund 45 |
Statement of assets and liabilities 1/31/22 (Unaudited)
| |
| ASSETS | |
| Investment in securities, at value (Note 1): | |
| Unaffiliated issuers (identified cost $14,523,573,499) | $14,504,301,080 |
| Interest and other receivables | 24,264,443 |
| Receivable for shares of the fund sold | 29,048,145 |
| Prepaid assets | 387,579 |
| Total assets | 14,558,001,247 |
| |
| LIABILITIES | |
| Payable to custodian | 29,968 |
| Payable for investments purchased | 46,194,500 |
| Payable for shares of the fund repurchased | 49,069,700 |
| Payable for compensation of Manager (Note 2) | 1,259,423 |
| Payable for custodian fees (Note 2) | 38,718 |
| Payable for investor servicing fees (Note 2) | 1,482,926 |
| Payable for Trustee compensation and expenses (Note 2) | 455,673 |
| Payable for administrative services (Note 2) | 21,174 |
| Payable for distribution fees (Note 2) | 502,898 |
| Distributions payable to shareholders | 520,082 |
| Other accrued expenses | 441,798 |
| Total liabilities | 100,016,860 |
| | |
| Net assets | $14,457,984,387 |
| |
| REPRESENTED BY | |
| Paid-in capital (Unlimited shares authorized) (Notes 1 and 4) | $14,498,665,983 |
| Total distributable earnings (Note 1) | (40,681,596) |
| Total — Representing net assets applicable to capital shares outstanding | $14,457,984,387 |
| |
| COMPUTATION OF NET ASSET VALUE AND OFFERING PRICE | |
| Net asset value, offering price and redemption price per class A share | |
| ($5,691,097,352 divided by 565,910,456 shares) | $10.06 |
| Net asset value and offering price per class B share ($309,084 divided by 30,763 shares)* | $10.05 |
| Net asset value and offering price per class C share ($17,980,722 divided by 1,789,873 shares)* | $10.05 |
| Net asset value and redemption price per class N share | |
| ($8,618,465 divided by 857,872 shares) | $10.05 |
| Offering price per class N share (100/98.50 of $10.05)** | $10.20 |
| Net asset value, offering price and redemption price per class R share | |
| ($4,684,304 divided by 466,433 shares) | $10.04 |
| Net asset value, offering price and redemption price per class R6 share | |
| ($114,957,197 divided by 11,416,084 shares) | $10.07 |
| Net asset value, offering price and redemption price per class Y share | |
| ($8,620,337,263 divided by 856,276,235 shares) | $10.07 |
* Redemption price per share is equal to net asset value less any applicable contingent deferred sales charge.
** On single retail sales of less than $50,000. On sales of more than $50,000 the offering price is reduced.
The accompanying notes are an integral part of these financial statements.
|
| 46 Ultra Short Duration Income Fund |
Statement of operations Six months ended 1/31/22 (Unaudited)
| |
| INVESTMENT INCOME | |
| Interest (including interest income of $31,023 from investments in affiliated issuers) (Note 5) | $47,479,792 |
| Total investment income | 47,479,792 |
| |
| EXPENSES | |
| Compensation of Manager (Note 2) | 20,851,811 |
| Investor servicing fees (Note 2) | 4,562,240 |
| Custodian fees (Note 2) | 75,404 |
| Trustee compensation and expenses (Note 2) | 296,117 |
| Distribution fees (Note 2) | 3,228,472 |
| Administrative services (Note 2) | 238,610 |
| Other | 1,363,934 |
| Fees waived and reimbursed by Manager (Note 2) | (4,248,036) |
| Total expenses | 26,368,552 |
| Expense reduction (Note 2) | (7,603) |
| Net expenses | 26,360,949 |
| | |
| Net investment income | 21,118,843 |
| |
| REALIZED AND UNREALIZED GAIN (LOSS) | |
| Net realized loss on: | |
| Securities from unaffiliated issuers (Notes 1 and 3) | (1,347,441) |
| Total net realized loss | (1,347,441) |
| Change in net unrealized depreciation on: | |
| Securities from unaffiliated issuers | (38,913,835) |
| Total change in net unrealized depreciation | (38,913,835) |
| | |
| Net loss on investments | (40,261,276) |
| |
| Net decrease in net assets resulting from operations | $(19,142,433) |
The accompanying notes are an integral part of these financial statements.
|
| Ultra Short Duration Income Fund 47 |
Statement of changes in net assets
| | |
| DECREASE IN NET ASSETS | Six months ended 1/31/22* | Year ended 7/31/21 |
| Operations | | |
| Net investment income | $21,118,843 | $70,815,672 |
| Net realized gain (loss) on investments | (1,347,441) | 11,328,393 |
| Change in net unrealized depreciation of investments | (38,913,835) | (3,076,142) |
| Net increase (decrease) in net assets resulting | | |
| from operations | (19,142,433) | 79,067,923 |
| Distributions to shareholders (Note 1): | | |
| From ordinary income | | |
| Net investment income | | |
| Class A | (6,776,637) | (26,949,735) |
| Class B | (13) | (60) |
| Class C | (843) | (5,433) |
| Class N | (3,961) | (42,991) |
| Class R | (239) | (1,003) |
| Class R6 | (196,217) | (509,506) |
| Class Y | (14,117,805) | (43,702,486) |
| Decrease from capital share transactions (Note 4) | (1,219,972,027) | (666,017,332) |
| Total decrease in net assets | (1,260,210,175) | (658,160,623) |
| |
| NET ASSETS | | |
| Beginning of period | 15,718,194,562 | 16,376,355,185 |
| End of period | $14,457,984,387 | $15,718,194,562 |
* Unaudited.
The accompanying notes are an integral part of these financial statements.
|
| 48 Ultra Short Duration Income Fund |
|
| This page left blank intentionally. |
|
| Ultra Short Duration Income Fund 49 |
Financial highlights (For a common share outstanding throughout the period)
| | | | | | | | | | | | | |
| | INVESTMENT OPERATIONS | | | LESS DISTRIBUTIONS | | | | RATIOS AND SUPPLEMENTAL DATA | |
| | | | | | | | | | | | Ratio | Ratio of net | |
| | Net asset | | Net realized | | | | | | | | of expenses | investment | |
| | value, | | and unrealized | Total from | From net | From | | Net asset | Total return | Net assets, | to average | income (loss) | Portfolio |
| | beginning | Net investment | gain (loss) | investment | investment | net realized gain | Total | value, end | at net asset | end of period | net assets | to average | turnover |
| Period ended | of period | income (loss)a | on investments | operations | income | on investments | distributions | of period | value (%)b | (in thousands) | (%)c,d | net assets (%)d | (%) |
| Class A | | | | | | | | | | | | | |
| January 31, 2022** | $10.08 | .01 | (.02) | (.01) | (.01) | — | (.01) | $10.06 | (.09)* | $5,691,097 | .20* | .11* | 29* |
| July 31, 2021 | 10.08 | .04 | —e | .04 | (.04) | — | (.04) | 10.08 | .36 | 6,611,459 | .40 | .37 | 63 |
| July 31, 2020 | 10.05 | .17 | .03 | .20 | (.17) | — | (.17) | 10.08 | 2.01 | 7,373,343 | .40 | 1.73 | 53 |
| July 31, 2019 | 10.05 | .25 | —e | .25 | (.25) | —e | (.25) | 10.05 | 2.53 | 8,257,742 | .40 | 2.50 | 27 |
| July 31, 2018 | 10.06 | .17 | (.01) | .16 | (.17) | —e | (.17) | 10.05 | 1.61 | 6,002,162 | .40 | 1.71 | 36 |
| July 31, 2017 | 10.04 | .10 | .02 | .12 | (.10) | — | (.10) | 10.06 | 1.17 | 3,843,494 | .40 | .99 | 45 |
| Class B | | | | | | | | | | | | | |
| January 31, 2022** | $10.07 | —e | (.02) | (.02) | —e | — | —e | $10.05 | (.19)* | $309 | .30*f | .01*f | 29* |
| July 31, 2021 | 10.07 | —e | —e | —e | —e | — | —e | 10.07 | .02 | 326 | .74f | .02f | 63 |
| July 31, 2020 | 10.04 | .13 | .03 | .16 | (.13) | — | (.13) | 10.07 | 1.61 | 258 | .80 | 1.21 | 53 |
| July 31, 2019 | 10.04 | .21 | —e | .21 | (.21) | —e | (.21) | 10.04 | 2.13 | 68 | .80 | 2.10 | 27 |
| July 31, 2018 | 10.04 | .13 | —e | .13 | (.13) | —e | (.13) | 10.04 | 1.31 | 1,529 | .80 | 1.27 | 36 |
| July 31, 2017 | 10.02 | .06 | .02 | .08 | (.06) | — | (.06) | 10.04 | .76 | 1,751 | .80 | .55 | 45 |
| Class C | | | | | | | | | | | | | |
| January 31, 2022** | $10.07 | —e | (.02) | (.02) | —e | — | —e | $10.05 | (.19)* | $17,981 | .31*f | .01*f | 29* |
| July 31, 2021 | 10.07 | —e | —e | —e | —e | — | —e | 10.07 | .02 | 22,031 | .75f | .02f | 63 |
| July 31, 2020 | 10.04 | .13 | .03 | .16 | (.13) | — | (.13) | 10.07 | 1.61 | 27,790 | .80 | 1.24 | 53 |
| July 31, 2019 | 10.04 | .21 | —e | .21 | (.21) | —e | (.21) | 10.04 | 2.13 | 19,754 | .80 | 2.10 | 27 |
| July 31, 2018 | 10.04 | .13 | —e | .13 | (.13) | —e | (.13) | 10.04 | 1.31 | 15,434 | .80 | 1.21 | 36 |
| July 31, 2017 | 10.02 | .06 | .02 | .08 | (.06) | — | (.06) | 10.04 | .76 | 24,162 | .80 | .57 | 45 |
| Class N | | | | | | | | | | | | | |
| January 31, 2022** | $10.07 | —e | (.02) | (.02) | —e | — | —e | $10.05 | (.17)* | $8,618 | .28* | .03* | 29* |
| July 31, 2021 | 10.07 | .02 | —e | .02 | (.02) | — | (.02) | 10.07 | .21 | 14,369 | .55 | .22 | 63 |
| July 31, 2020 | 10.04 | .15 | .03 | .18 | (.15) | — | (.15) | 10.07 | 1.86 | 19,303 | .55 | 1.48 | 53 |
| July 31, 2019 † | 10.03 | .18 | .01 | .19 | (.18) | —e | (.18) | 10.04 | 1.94* | 13,070 | .42* | 1.81* | 27 |
| Class R | | | | | | | | | | | | | |
| January 31, 2022** | $10.07 | —e | (.03) | (.03) | —e | — | —e | $10.04 | (.29)* | $4,684 | .31*f | —*f,g | 29* |
| July 31, 2021 | 10.07 | —e | —e | —e | —e | — | —e | 10.07 | .02 | 4,207 | .75f | .02f | 63 |
| July 31, 2020 | 10.04 | .13 | .03 | .16 | (.13) | — | (.13) | 10.07 | 1.61 | 5,118 | .80 | 1.30 | 53 |
| July 31, 2019 | 10.04 | .21 | —e | .21 | (.21) | —e | (.21) | 10.04 | 2.13 | 5,411 | .80 | 2.09 | 27 |
| July 31, 2018 | 10.05 | .13 | (.01) | .12 | (.13) | —e | (.13) | 10.04 | 1.21 | 5,019 | .80 | 1.26 | 36 |
| July 31, 2017 | 10.02 | .06 | .03 | .09 | (.06) | — | (.06) | 10.05 | .86 | 4,178 | .80 | .58 | 45 |
| Class R6 | | | | | | | | | | | | | |
| January 31, 2022** | $10.10 | .02 | (.03) | (.01) | (.02) | — | (.02) | $10.07 | (.13)* | $114,957 | .15* | .16* | 29* |
| July 31, 2021 | 10.09 | .05 | .01 | .06 | (.05) | — | (.05) | 10.10 | .57 | 121,669 | .29 | .46 | 63 |
| July 31, 2020 | 10.06 | .18 | .03 | .21 | (.18) | — | (.18) | 10.09 | 2.12 | 92,676 | .29 | 1.80 | 53 |
| July 31, 2019 | 10.06 | .26 | —e | .26 | (.26) | —e | (.26) | 10.06 | 2.64 | 97,971 | .29 | 2.68 | 27 |
| July 31, 2018 | 10.07 | .18 | (.01) | .17 | (.18) | —e | (.18) | 10.06 | 1.72 | 3,680 | .29 | 1.75 | 36 |
| July 31, 2017 | 10.05 | .11 | .02 | .13 | (.11) | — | (.11) | 10.07 | 1.27 | 3,151 | .29 | 1.08 | 45 |
See notes to financial highlights at the end of this section.
The accompanying notes are an integral part of these financial statements.
| |
| 50 Ultra Short Duration Income Fund | Ultra Short Duration Income Fund 51 |
Financial highlights cont.
| | | | | | | | | | | | | |
| | INVESTMENT OPERATIONS | | | LESS DISTRIBUTIONS | | | | RATIOS AND SUPPLEMENTAL DATA | |
| | | | | | | | | | | | Ratio | Ratio of net | |
| | Net asset | | Net realized | | | | | | | | of expenses | investment | |
| | value, | | and unrealized | Total from | From net | From | | Net asset | Total return | Net assets, | to average | income (loss) | Portfolio |
| | beginning | Net investment | gain (loss) | investment | investment | net realized gain | Total | value, end | at net asset | end of period | net assets | to average | turnover |
| Period ended | of period | income (loss)a | on investments | operations | income | on investments | distributions | of period | value (%)b | (in thousands) | (%)c,d | net assets (%)d | (%) |
| Class Y | | | | | | | | | | | | | |
| January 31, 2022** | $10.09 | .02 | (.02) | —e | (.02) | — | (.02) | $10.07 | (.04)* | $8,620,337 | .15* | .16* | 29 * |
| July 31, 2021 | 10.09 | .05 | —e | .05 | (.05) | — | (.05) | 10.09 | .46 | 8,944,133 | .30 | .46 | 63 |
| July 31, 2020 | 10.06 | .18 | .03 | .21 | (.18) | — | (.18) | 10.09 | 2.11 | 8,857,867 | .30 | 1.79 | 53 |
| July 31, 2019 | 10.06 | .26 | —e | .26 | (.26) | —e | (.26) | 10.06 | 2.63 | 8,052,123 | .30 | 2.61 | 27 |
| July 31, 2018 | 10.07 | .18 | (.01) | .17 | (.18) | —e | (.18) | 10.06 | 1.71 | 4,952,524 | .30 | 1.82 | 36 |
| July 31, 2017 | 10.05 | .11 | .02 | .13 | (.11) | — | (.11) | 10.07 | 1.27 | 2,925,780 | .30 | 1.09 | 45 |
* Not annualized.
** Unaudited.
† For the period November 1, 2018 (commencement of operations) to July 31, 2019.
a Per share net investment income (loss) has been determined on the basis of the weighted average number of shares outstanding during the period.
b Total return assumes dividend reinvestment and does not reflect the effect of sales charges.
c Includes amounts paid through expense offset arrangements, if any (Note 2). Also excludes acquired fund fees and expenses, if any.
d Reflects an involuntary contractual expense limitation in effect during the period. As a result of such limitation, the expenses of each class reflect a reduction of the following amounts as a percentage of net assets (Note 2):
| | | | | | | | | | | |
| | 1/31/22 | 7/31/21 | 7/31/20 | 7/31/19 | 7/31/18 | 7/31/17 | | | | | |
| Class A | 0.03% | 0.06% | 0.09% | 0.14% | 0.14% | 0.15% | | | | | |
| Class B | 0.03 | 0.06 | 0.09 | 0.14 | 0.14 | 0.15 | | | | | |
| Class C | 0.03 | 0.06 | 0.09 | 0.14 | 0.14 | 0.15 | | | | | |
| Class N | 0.03 | 0.06 | 0.09 | 0.10 | N/A | N/A | | | | | |
| Class R | 0.03 | 0.06 | 0.09 | 0.14 | 0.14 | 0.15 | | | | | |
| Class R6 | 0.03 | 0.06 | 0.09 | 0.14 | 0.14 | 0.15 | | | | | |
| Class Y | 0.03 | 0.06 | 0.09 | 0.14 | 0.14 | 0.15 | | | | | |
e Amount represents less than $0.01 per share.
f Reflects a voluntary waiver of certain fund expenses in effect during the period relating to the enhancement of certain annualized net yields for the fund. As a result of such waiver, the expenses reflect a reduction of the following amounts as a percentage of average net assets (Note 2):
| | | | |
| | 1/31/22 | 7/31/21 | | |
| Class B | 0.10% | 0.06% | | |
| Class C | 0.10 | 0.05 | | |
| Class R | 0.10 | 0.05 | | |
g Amount represents less than 0.01%.
The accompanying notes are an integral part of these financial statements.
| |
| 52 Ultra Short Duration Income Fund | Ultra Short Duration Income Fund 53 |
Notes to financial statements 1/31/22 (Unaudited)
Within the following Notes to financial statements, references to “State Street” represent State Street Bank and Trust Company, references to “the SEC” represent the Securities and Exchange Commission, references to “Putnam Management” represent Putnam Investment Management, LLC, the fund’s manager, an indirect wholly-owned subsidiary of Putnam Investments, LLC and references to “OTC”, if any, represent over-the-counter. Unless otherwise noted, the “reporting period” represents the period from August 1, 2021 through January 31, 2022.
Putnam Ultra Short Duration Income Fund (the fund) is a diversified series of Putnam Funds Trust (the Trust), a Massachusetts business trust registered under the Investment Company Act of 1940, as amended, as an open-end management investment company. The goal of the fund is to seek as high a rate of current income as Putnam Management believes is consistent with preservation of capital and maintenance of liquidity. The fund invests in a diversified portfolio of fixed income securities comprised of short duration, investment-grade money market and other fixed income securities. The fund’s investments may include obligations of the U.S. government, its agencies and instrumentalities, which are backed by the full faith and credit of the United States (e.g., U.S. Treasury bonds and Ginnie Mae mortgage-backed bonds) or by only the credit of a federal agency or government sponsored entity (e.g., Fannie Mae or Freddie Mac mortgage-backed bonds), domestic corporate debt obligations, taxable municipal debt securities, securitized debt instruments (such as mortgage- and asset backed securities), repurchase agreements, certificates of deposit, bankers acceptances, commercial paper (including asset-backed commercial paper), time deposits, Yankee Eurodollar securities and other money market instruments. The fund may also invest in U.S.-dollar denominated foreign securities of these types. Under normal circumstances, the effective duration of the fund’s portfolio will generally not be greater than one year. Effective duration provides a measure of a fund’s interest-rate sensitivity. The longer a fund’s duration, the more sensitive the fund is to shifts in interest rates. Under normal circumstances, the dollar-weighted average portfolio maturity of the fund is not expected to exceed three and one-half years. Putnam Management may consider, among other factors, credit, interest rate and prepayment risks, as well as general market conditions, when deciding whether to buy or sell investments. The fund may also use derivatives, such as futures, options and swap contracts, for both hedging and non-hedging purposes.
The fund offers class A, class B (only in exchange for class B shares of another Putnam fund), class C, class N, class R, class R6 and class Y shares. Class A, B, C, R, R6, and Y share classes are sold without a front-end sales charge. Class N shares are sold with an initial sales charge of up to 1.50%. Class A, class N, class R, class R6 and class Y shares also are generally not subject to a contingent deferred sales charge. Class B shares convert to class A shares after approximately eight years after the original purchase date and are subject to a contingent deferred sales charge on certain redemptions. Class C shares obtained in an exchange for class C shares of another Putnam fund, are subject to a one-year 1.00% contingent deferred sales charge on certain redemptions and generally convert to class A shares after approximately eight years. Class R shares are not available to all investors. The expenses for class A, class B, class C, class N and class R shares may differ based on each class’ distribution fee, which is identified in Note 2. Class R6 and class Y shares are generally subject to the same expenses as class A, class B, class C, class N and class R shares, but do not bear a distribution fee. Class R6 and class Y shares are not available to all investors.
In the normal course of business, the fund enters into contracts that may include agreements to indemnify another party under given circumstances. The fund’s maximum exposure under these arrangements is unknown as this would involve future claims that may be, but have not yet been, made against the fund. However, the fund’s management team expects the risk of material loss to be remote.
The fund has entered into contractual arrangements with an investment adviser, administrator, distributor, shareholder servicing agent and custodian, who each provide services to the fund. Unless expressly stated otherwise, shareholders are not parties to, or intended beneficiaries of these contractual arrangements, and these contractual arrangements are not intended to create any shareholder right to enforce them against the service providers or to seek any remedy under them against the service providers, either directly or on behalf of the fund.
Under the fund’s Amended and Restated Agreement and Declaration of Trust, any claims asserted against or on behalf of the Putnam Funds, including claims against Trustees and Officers, must be brought in state and federal courts located within the Commonwealth of Massachusetts.
Note 1: Significant accounting policies
The following is a summary of significant accounting policies consistently followed by the fund in the preparation of its financial statements. The preparation of financial statements is in conformity with accounting principles generally accepted in the United States of America and requires management to make estimates
|
| 54 Ultra Short Duration Income Fund |
and assumptions that affect the reported amounts of assets and liabilities in the financial statements and the reported amounts of increases and decreases in net assets from operations. Actual results could differ from those estimates. Subsequent events after the Statement of assets and liabilities date through the date that the financial statements were issued have been evaluated in the preparation of the financial statements.
Investment income, realized and unrealized gains and losses and expenses of the fund are borne pro-rata based on the relative net assets of each class to the total net assets of the fund, except that each class bears expenses unique to that class (including the distribution fees applicable to such classes). Each class votes as a class only with respect to its own distribution plan or other matters on which a class vote is required by law or determined by the Trustees. If the fund were liquidated, shares of each class would receive their pro-rata share of the net assets of the fund. In addition, the Trustees declare separate dividends on each class of shares.
Security valuation Portfolio securities and other investments are valued using policies and procedures adopted by the Board of Trustees. The Trustees have formed a Pricing Committee to oversee the implementation of these procedures and have delegated responsibility for valuing the fund’s assets in accordance with these procedures to Putnam Management. Putnam Management has established an internal Valuation Committee that is responsible for making fair value determinations, evaluating the effectiveness of the pricing policies of the fund and reporting to the Pricing Committee.
Market quotations are not considered to be readily available for certain debt obligations (including short-term investments with remaining maturities of 60 days or less) and other investments; such investments are valued on the basis of valuations furnished by an independent pricing service approved by the Trustees or dealers selected by Putnam Management. Such services or dealers determine valuations for normal institutional-size trading units of such securities using methods based on market transactions for comparable securities and various relationships, generally recognized by institutional traders, between securities (which consider such factors as security prices, yields, maturities and ratings). These securities will generally be categorized as Level 2. Securities quoted in foreign currencies, if any, are translated into U.S. dollars at the current exchange rate.
Investments in open-end investment companies (excluding exchange-traded funds), if any, which can be classified as Level 1 or Level 2 securities, are valued based on their net asset value. The net asset value of such investment companies equals the total value of their assets less their liabilities and divided by the number of their outstanding shares.
To the extent a pricing service or dealer is unable to value a security or provides a valuation that Putnam Management does not believe accurately reflects the security’s fair value, the security will be valued at fair value by Putnam Management in accordance with policies and procedures approved by the Trustees. Certain investments, including certain restricted and illiquid securities and derivatives, are also valued at fair value following procedures approved by the Trustees. These valuations consider such factors as significant market or specific security events such as interest rate or credit quality changes, various relationships with other securities, discount rates, U.S. Treasury, U.S. swap and credit yields, index levels, convexity exposures, recovery rates, sales and other multiples and resale restrictions. These securities are classified as Level 2 or as Level 3 depending on the priority of the significant inputs.
To assess the continuing appropriateness of fair valuations, the Valuation Committee reviews and affirms the reasonableness of such valuations on a regular basis after considering all relevant information that is reasonably available. Such valuations and procedures are reviewed periodically by the Trustees. Certain securities may be valued on the basis of a price provided by a single source. The fair value of securities is generally determined as the amount that the fund could reasonably expect to realize from an orderly disposition of such securities over a reasonable period of time. By its nature, a fair value price is a good faith estimate of the value of a security in a current sale and does not reflect an actual market price, which may be different by a material amount.
Joint trading account Pursuant to an exemptive order from the SEC, the fund may transfer uninvested cash balances into a joint trading account along with the cash of other registered investment companies and certain other accounts managed by Putnam Management. These balances may be invested in issues of short-term investments having maturities of up to 90 days.
Repurchase agreements The fund, or any joint trading account, through its custodian, receives delivery of the underlying securities, the fair value of which at the time of purchase is required to be in an amount at least equal to the resale price, including accrued interest. Collateral for certain tri-party repurchase agreements, which totaled $105,001,310 at the end of the reporting period, is held at the counterparty’s custodian in a segregated account for the benefit of the fund and the counterparty. Putnam Management is responsible for determining that the value of these underlying securities is at all times at least equal to the resale price, including accrued interest.
|
| Ultra Short Duration Income Fund 55 |
In the event of default or bankruptcy by the other party to the agreement, retention of the collateral may be subject to legal proceedings.
Security transactions and related investment income Security transactions are recorded on the trade date (the date the order to buy or sell is executed). Gains or losses on securities sold are determined on the identified cost basis.
Interest income, net of any applicable withholding taxes, if any, and including amortization and accretion of premiums and discounts on debt securities, is recorded on the accrual basis.
Stripped securities The fund may invest in stripped securities which represent a participation in securities that may be structured in classes with rights to receive different portions of the interest and principal. Interest-only securities receive all of the interest and principal-only securities receive all of the principal. If the interest-only securities experience greater than anticipated prepayments of principal, the fund may fail to recoup fully its initial investment in these securities. Conversely, principal-only securities increase in value if prepayments are greater than anticipated and decline if prepayments are slower than anticipated. The fair value of these securities is highly sensitive to changes in interest rates.
Interfund lending The fund, along with other Putnam funds, may participate in an interfund lending program pursuant to an exemptive order issued by the SEC. This program allows the fund to borrow from or lend to other Putnam funds that permit such transactions. Interfund lending transactions are subject to each fund’s investment policies and borrowing and lending limits. Interest earned or paid on the interfund lending transaction will be based on the average of certain current market rates. During the reporting period, the fund did not utilize the program.
Lines of credit The fund participates, along with other Putnam funds, in a $317.5 million unsecured committed line of credit and a $235.5 million unsecured uncommitted line of credit, both provided by State Street. Borrowings may be made for temporary or emergency purposes, including the funding of shareholder redemption requests and trade settlements. Interest is charged to the fund based on the fund’s borrowing at a rate equal to 1.25% plus the higher of (1) the Federal Funds rate and (2) the Overnight Bank Funding Rate for the committed line of credit and 1.30% plus the higher of (1) the Federal Funds rate and (2) the Overnight Bank Funding Rate for the uncommitted line of credit. A closing fee equal to 0.04% of the committed line of credit and 0.04% of the uncommitted line of credit has been paid by the participating funds. In addition, a commitment fee of 0.21% per annum on any unutilized portion of the committed line of credit is allocated to the participating funds based on their relative net assets and paid quarterly. During the reporting period, the fund had no borrowings against these arrangements.
Federal taxes It is the policy of the fund to distribute all of its taxable income within the prescribed time period and otherwise comply with the provisions of the Internal Revenue Code of 1986, as amended (the Code), applicable to regulated investment companies. It is also the intention of the fund to distribute an amount sufficient to avoid imposition of any excise tax under Section 4982 of the Code.
The fund is subject to the provisions of Accounting Standards Codification 740 Income Taxes (ASC 740). ASC 740 sets forth a minimum threshold for financial statement recognition of the benefit of a tax position taken or expected to be taken in a tax return. The fund did not have a liability to record for any unrecognized tax benefits in the accompanying financial statements. No provision has been made for federal taxes on income, capital gains or unrealized appreciation on securities held nor for excise tax on income and capital gains. Each of the fund’s federal tax returns for the prior three fiscal years remains subject to examination by the Internal Revenue Service.
Under the Regulated Investment Company Modernization Act of 2010, the fund will be permitted to carry forward capital losses incurred for an unlimited period and the carry forwards will retain their character as either short-term or long-term capital losses. At July 31, 2021, the fund had the following capital loss carryovers available, to the extent allowed by the Code, to offset future net capital gain, if any:
| | |
| | Loss carryover | |
| Short-term | Long-term | Total |
| $19,380,085 | $296,623 | $19,676,708 |
|
| 56 Ultra Short Duration Income Fund |
Tax cost of investments includes adjustments to net unrealized appreciation (depreciation) which may not necessarily be final tax cost basis adjustments, but closely approximate the tax basis unrealized gains and losses that may be realized and distributed to shareholders. The aggregate identified cost on a tax basis is $14,523,581,448, resulting in gross unrealized appreciation and depreciation of $7,778,460 and $27,058,828, respectively, or net unrealized depreciation of $19,280,368.
Distributions to shareholders Income dividends are recorded daily by the fund and are paid monthly. Distributions from capital gains, if any, are recorded on the ex-dividend date and paid at least annually. The amount and character of income and gains to be distributed are determined in accordance with income tax regulations which may differ from generally accepted accounting principles. Dividend sources are estimated at the time of declaration. Actual results may vary. Any non-taxable return of capital cannot be determined until final tax calculations are completed after the end of the fund’s fiscal year. Reclassifications are made to the fund’s capital accounts to reflect income and gains available for distribution (or available capital loss carryovers) under income tax regulations.
Expenses of the Trust Expenses directly charged or attributable to any fund will be paid from the assets of that fund. Generally, expenses of the Trust will be allocated among and charged to the assets of each fund on a basis that the Trustees deem fair and equitable, which may be based on the relative assets of each fund or the nature of the services performed and relative applicability to each fund.
Note 2: Management fee, administrative services and other transactions
The fund pays Putnam Management a management fee (based on the fund’s average net assets and computed and paid monthly) at annual rates that may vary based on the average of the aggregate net assets of all open-end mutual funds sponsored by Putnam Management (excluding net assets of funds that are invested in, or that are invested in by, other Putnam funds to the extent necessary to avoid “double counting” of those assets). Such annual rates may vary as follows:
| | | | |
| 0.440% | of the first $5 billion, | | 0.240% | of the next $50 billion, |
| 0.390% | of the next $5 billion, | | 0.220% | of the next $50 billion, |
| 0.340% | of the next $10 billion, | | 0.210% | of the next $100 billion and |
| 0.290% | of the next $10 billion, | | 0.205% | of any excess thereafter. |
For the reporting period, the management fee represented an effective rate (excluding the impact from any expense waivers in effect) of 0.136% of the fund’s average net assets.
Putnam Management has contractually agreed, through November 30, 2022, to waive fees and/or reimburse the fund’s expenses to the extent necessary to limit the cumulative expenses of the fund, exclusive of brokerage, interest, taxes, investment-related expenses, extraordinary expenses, acquired fund fees and expenses and payments under the fund’s investor servicing contract, investment management contract and distribution plans, on a fiscal year-to-date basis to an annual rate of 0.20% of the fund’s average net assets over such fiscal year-to-date period. During the reporting period, the fund’s expenses were not reduced as a result of this limit.
Putnam Management has also contractually agreed to waive fees (and, to the extent necessary, bear other expenses) of the fund through November 30, 2022, to the extent that total expenses of the fund (excluding brokerage, interest, taxes, investment-related expenses, payments under distribution plans, extraordinary expenses, payments under the fund’s investor servicing contract and acquired fund fees and expenses, but including payments under the fund’s investment management contract) would exceed an annual rate of 0.24% of the fund’s average net assets. During the reporting period, the fund’s expenses were reduced by $4,223,498 as a result of this limit.
|
| Ultra Short Duration Income Fund 57 |
Putnam Management may from time to time voluntarily undertake to waive fees and/or reimburse certain fund expenses in order to enhance the annualized net yield for the fund. Any such waiver or reimbursement would be voluntary and may be modified or discontinued by Putnam Management at any time without notice. During the reporting period, the fund’s expenses were reduced by $24,538 as a result of this limit. This includes the following amounts per class of class specific distribution fees from the fund:
| |
| | Distribution fee waived |
| Class B | $311 |
| Class C | 19,406 |
| Class R | 4,821 |
| Total | $24,538 |
Putnam Investments Limited (PIL), an affiliate of Putnam Management, is authorized by the Trustees to manage a separate portion of the assets of the fund as determined by Putnam Management from time to time. PIL did not manage any portion of the assets of the fund during the reporting period. If Putnam Management were to engage the services of PIL, Putnam Management would pay a quarterly sub-management fee to PIL for its services at an annual rate of 0.25% of the average net assets of the portion of the fund managed by PIL.
The fund reimburses Putnam Management an allocated amount for the compensation and related expenses of certain officers of the fund and their staff who provide administrative services to the fund. The aggregate amount of all such reimbursements is determined annually by the Trustees.
Custodial functions for the fund’s assets are provided by State Street. Custody fees are based on the fund’s asset level, the number of its security holdings and transaction volumes.
Putnam Investor Services, Inc., an affiliate of Putnam Management, provides investor servicing agent functions to the fund. Putnam Investor Services, Inc. received fees for investor servicing for class A, class B, class C, class N, class R and class Y shares that included (1) a per account fee for each direct and underlying non-defined contribution account (retail account) of the fund; (2) a specified rate of the fund’s assets attributable to defined contribution plan accounts; and (3) a specified rate based on the average net assets in retail accounts. Putnam Investor Services, Inc. has agreed that the aggregate investor servicing fees for each fund’s retail and defined contribution accounts for these share classes will not exceed an annual rate of 0.25% of the fund’s average assets attributable to such accounts.
Class R6 shares paid a monthly fee based on the average net assets of class R6 shares at an annual rate of 0.05%.
During the reporting period, the expenses for each class of shares related to investor servicing fees were as follows:
| | | | |
| Class A | $1,867,411 | | Class R | 1,466 |
| Class B | 94 | | Class R6 | 29,986 |
| Class C | 5,881 | | Class Y | 2,653,798 |
| Class N | 3,604 | | Total | $4,562,240 |
The fund has entered into expense offset arrangements with Putnam Investor Services, Inc. and State Street whereby Putnam Investor Services, Inc.’s and State Street’s fees are reduced by credits allowed on cash balances. For the reporting period, the fund’s expenses were reduced by $7,603 under the expense offset arrangements.
Each Independent Trustee of the fund receives an annual Trustee fee, of which $10,180, as a quarterly retainer, has been allocated to the fund, and an additional fee for each Trustees meeting attended. Trustees also are reimbursed for expenses they incur relating to their services as Trustees.
The fund has adopted a Trustee Fee Deferral Plan (the Deferral Plan) which allows the Trustees to defer the receipt of all or a portion of Trustees fees payable on or after July 1, 1995. The deferred fees remain invested in certain Putnam funds until distribution in accordance with the Deferral Plan.
|
| 58 Ultra Short Duration Income Fund |
The fund has adopted an unfunded noncontributory defined benefit pension plan (the Pension Plan) covering all Trustees of the fund who have served as a Trustee for at least five years and were first elected prior to 2004. Benefits under the Pension Plan are equal to 50% of the Trustee’s average annual attendance and retainer fees for the three years ended December 31, 2005. The retirement benefit is payable during a Trustee’s lifetime, beginning the year following retirement, for the number of years of service through December 31, 2006. Pension expense for the fund is included in Trustee compensation and expenses in the Statement of operations. Accrued pension liability is included in Payable for Trustee compensation and expenses in the Statement of assets and liabilities. The Trustees have terminated the Pension Plan with respect to any Trustee first elected after 2003.
The fund has adopted distribution plans (the Plans) with respect to the following share classes pursuant to Rule 12b–1 under the Investment Company Act of 1940. The purpose of the Plans is to compensate Putnam Retail Management Limited Partnership, an indirect wholly-owned subsidiary of Putnam Investments, LLC, for services provided and expenses incurred in distributing shares of the fund. The Plans provide payments by the fund to Putnam Retail Management Limited Partnership at an annual rate of up to the following amounts (Maximum %) of the average net assets attributable to each class. The Trustees have approved payment by the fund at the following annual rate (Approved %) of the average net assets attributable to each class. During the reporting period, the class-specific expenses related to distribution fees were as follows:
| | | |
| | Maximum % | Approved % | Amount |
| Class A | 0.35% | 0.10% | $3,150,474 |
| Class B | 0.75% | 0.50% | 791 |
| Class C | 1.00% | 0.50% | 49,631 |
| Class N | 1.00% | 0.25% | 15,202 |
| Class R | 1.00% | 0.50% | 12,374 |
| Total | | | $3,228,472 |
For the reporting period, Putnam Retail Management Limited Partnership, acting as underwriter, received net commissions of $363 from the sale of class N shares and received $8 and $34 in contingent deferred sales charges from redemptions of class B and class C shares purchased by exchange from another Putnam fund, respectively.
A deferred sales charge of up to 1.00% for class A shares may be assessed on certain redemptions. For the reporting period, Putnam Retail Management Limited Partnership, acting as underwriter, received $65 in contingent deferred sales charges from redemptions of class A shares purchased by exchange from another Putnam fund.
Note 3: Purchases and sales of securities
During the reporting period, the cost of purchases and the proceeds from sales, excluding short-term investments, were as follows:
| | |
| | Cost of purchases | Proceeds from sales |
| Investments in securities (Long-term) | $3,171,082,339 | $2,925,798,789 |
| U.S. government securities (Long-term) | — | — |
| Total | $3,171,082,339 | $2,925,798,789 |
The fund may purchase or sell investments from or to other Putnam funds in the ordinary course of business, which can reduce the fund’s transaction costs, at prices determined in accordance with SEC requirements and policies approved by the Trustees. During the reporting period, purchases or sales of long-term securities from or to other Putnam funds, if any, did not represent more than 5% of the fund’s total cost of purchases and/or total proceeds from sales.
|
| Ultra Short Duration Income Fund 59 |
Note 4: Capital shares
At the close of the reporting period, there were an unlimited number of shares of beneficial interest authorized. Transactions, including, if applicable, direct exchanges pursuant to share conversions, in capital shares were as follows:
| | | | |
| | SIX MONTHS ENDED 1/31/22 | YEAR ENDED 7/31/21 |
| Class A | Shares | Amount | Shares | Amount |
| Shares sold | 111,765,553 | $1,125,914,671 | 399,194,704 | $4,026,832,544 |
| Shares issued in connection with | | | | |
| reinvestment of distributions | 663,128 | 6,678,881 | 2,646,112 | 26,689,388 |
| | 112,428,681 | 1,132,593,552 | 401,840,816 | 4,053,521,932 |
| Shares repurchased | (202,210,979) | (2,036,565,097) | (477,737,205) | (4,818,972,338) |
| Net decrease | (89,782,298) | $(903,971,545) | (75,896,389) | $(765,450,406) |
| |
| | SIX MONTHS ENDED 1/31/22 | YEAR ENDED 7/31/21 |
| Class B | Shares | Amount | Shares | Amount |
| Shares sold | 920 | $9,258 | 26,094 | $263,012 |
| Shares issued in connection with | | | | |
| reinvestment of distributions | 2 | 13 | 5 | 55 |
| | 922 | 9,271 | 26,099 | 263,067 |
| Shares repurchased | (2,545) | (25,594) | (19,321) | (194,671) |
| Net increase (decrease) | (1,623) | $(16,323) | 6,778 | $68,396 |
| |
| | SIX MONTHS ENDED 1/31/22 | YEAR ENDED 7/31/21 |
| Class C | Shares | Amount | Shares | Amount |
| Shares sold | 110,951 | $1,115,737 | 1,019,066 | $10,269,451 |
| Shares issued in connection with | | | | |
| reinvestment of distributions | 97 | 843 | 512 | 5,161 |
| | 111,048 | 1,116,580 | 1,019,578 | 10,274,612 |
| Shares repurchased | (508,471) | (5,116,016) | (1,592,760) | (16,049,463) |
| Net decrease | (397,423) | $(3,999,436) | (573,182) | $(5,774,851) |
| |
| | SIX MONTHS ENDED 1/31/22 | YEAR ENDED 7/31/21 |
| Class N | Shares | Amount | Shares | Amount |
| Shares sold | 207,903 | $2,092,352 | 531,438 | $5,354,413 |
| Shares issued in connection with | | | | |
| reinvestment of distributions | 388 | 3,904 | 4,241 | 42,738 |
| | 208,291 | 2,096,256 | 535,679 | 5,397,151 |
| Shares repurchased | (776,974) | (7,818,380) | (1,026,317) | (10,342,502) |
| Net decrease | (568,683) | $(5,722,124) | (490,638) | $(4,945,351) |
|
| 60 Ultra Short Duration Income Fund |
| | | | |
| | SIX MONTHS ENDED 1/31/22 | YEAR ENDED 7/31/21 |
| Class R | Shares | Amount | Shares | Amount |
| Shares sold | 94,341 | $949,939 | 315,832 | $3,181,477 |
| Shares issued in connection with | | | | |
| reinvestment of distributions | 24 | 239 | 96 | 969 |
| | 94,365 | 950,178 | 315,928 | 3,182,446 |
| Shares repurchased | (45,705) | (459,387) | (406,603) | (4,096,872) |
| Net increase (decrease) | 48,660 | $490,791 | (90,675) | $(914,426) |
| |
| | SIX MONTHS ENDED 1/31/22 | YEAR ENDED 7/31/21 |
| Class R6 | Shares | Amount | Shares | Amount |
| Shares sold | 2,117,936 | $21,362,485 | 7,728,408 | $78,066,540 |
| Shares issued in connection with | | | | |
| reinvestment of distributions | 19,298 | 194,621 | 50,261 | 507,799 |
| | 2,137,234 | 21,557,106 | 7,778,669 | 78,574,339 |
| Shares repurchased | (2,771,597) | (27,950,228) | (4,910,390) | (49,605,627) |
| Net increase (decrease) | (634,363) | $(6,393,122) | 2,868,279 | $28,968,712 |
| |
| | SIX MONTHS ENDED 1/31/22 | YEAR ENDED 7/31/21 |
| Class Y | Shares | Amount | Shares | Amount |
| Shares sold | 305,171,660 | $3,076,792,931 | 819,260,036 | $8,272,859,782 |
| Shares issued in connection with | | | | |
| reinvestment of distributions | 1,136,940 | 11,462,075 | 3,496,348 | 35,307,960 |
| | 306,308,600 | 3,088,255,006 | 822,756,384 | 8,308,167,742 |
| Shares repurchased | (336,133,528) | (3,388,615,274) | (814,605,090) | (8,226,137,148) |
| Net increase (decrease) | (29,824,928) | $(300,360,268) | 8,151,294 | $82,030,594 |
Note 5: Affiliated transactions
Transactions during the reporting period with any company which is under common ownership or control were as follows:
| | | | | |
| | | | | | Shares |
| | | | | | outstanding |
| | | | | | and fair |
| | Fair value as | Purchase | Sale | Investment | value as |
| Name of affiliate | of 7/31/21 | cost | proceeds | income | of 1/31/22 |
| Short-term investments | | | | | |
| Putnam Short Term | | | | | |
| Investment Fund* | $— | $1,123,825,654 | $1,123,825,654 | $31,023 | $— |
| Total Short-term | | | | | |
| investments | $— | $1,123,825,654 | $1,123,825,654 | $31,023 | $— |
* Management fees charged to Putnam Short Term Investment Fund have been waived by Putnam Management. There were no realized or unrealized gains or losses during the period.
|
| Ultra Short Duration Income Fund 61 |
Note 6: Market, credit and other risks
In the normal course of business, the fund trades financial instruments and enters into financial transactions where risk of potential loss exists due to changes in the market (market risk) or failure of the contracting party to the transaction to perform (credit risk). The fund may be exposed to additional credit risk that an institution or other entity with which the fund has unsettled or open transactions will default. Investments in foreign securities involve certain risks, including those related to economic instability, unfavorable political developments, and currency fluctuations. The fund may invest a significant portion of its assets in securitized debt instruments, including mortgage-backed and asset-backed investments. The yields and values of these investments are sensitive to changes in interest rates, the rate of principal payments on the underlying assets and the market’s perception of the issuers. The market for these investments may be volatile and limited, which may make them difficult to buy or sell.
On July 27, 2017, the United Kingdom’s Financial Conduct Authority (“FCA”), which regulates LIBOR, announced its intention to cease compelling banks to provide the quotations needed to sustain LIBOR after 2021. ICE Benchmark Administration, the administrator of LIBOR, ceased publication of most LIBOR settings on a representative basis at the end of 2021 and is expected to cease publication of a majority of U.S. dollar LIBOR settings on a representative basis after June 30, 2023. In addition, global regulators have announced that, with limited exceptions, no new LIBOR-based contracts should be entered into after 2021. LIBOR has historically been a common benchmark interest rate index used to make adjustments to variable-rate loans. It is used throughout global banking and financial industries to determine interest rates for a variety of financial instruments and borrowing arrangements. The transition process might lead to increased volatility and illiquidity in markets that rely on LIBOR to determine interest rates. It could also lead to a reduction in the value of some LIBOR-based investments and reduce the effectiveness of related transactions, such as hedges. While some LIBOR-based instruments may contemplate a scenario where LIBOR is no longer available by providing for an alternative rate-setting methodology, not all may have such provisions and there may be significant uncertainty regarding the effectiveness of any such alternative methodologies. Since the usefulness of LIBOR as a benchmark could deteriorate during the transition period, these effects could occur at any time.
Beginning in January 2020, global financial markets have experienced, and may continue to experience, significant volatility resulting from the spread of a virus known as Covid–19. The outbreak of Covid–19 has resulted in travel and border restrictions, quarantines, supply chain disruptions, lower consumer demand, and general market uncertainty. The effects of Covid–19 have adversely affected, and may continue to adversely affect, the global economy, the economies of certain nations, and individual issuers, all of which may negatively impact the fund’s performance.
|
| 62 Ultra Short Duration Income Fund |
Note 7: Offsetting of financial and derivative assets and liabilities
The following table summarizes any derivatives, repurchase agreements and reverse repurchase agreements, at the end of the reporting period, that are subject to an enforceable master netting agreement or similar agreement. For securities lending transactions or borrowing transactions associated with securities sold short, if any, see Note 1. For financial reporting purposes, the fund does not offset financial assets and financial liabilities that are subject to the master netting agreements in the Statement of assets and liabilities.
| | | |
| | | | RBC Capital | |
| | | BNP Paribas | | Markets, LLC | | Total |
| Assets: | | | |
| Repurchase agreements ** | $75,000,000 | $25,000,000 | $100,000,000 |
| Total Assets | $75,000,000 | $25,000,000 | $100,000,000 |
| Liabilities: | | | |
| Total Liabilities | $— | $— | $— |
| Total Financial and Derivative Net Assets | $75,000,000 | $25,000,000 | $100,000,000 |
| Total collateral received (pledged)†## | $75,000,000 | $25,000,000 | |
| Net amount | $— | $— | |
| Controlled collateral received (including | | | |
| TBA commitments)** | $— | $— | $— |
| Uncontrolled collateral received | $78,751,098 | $26,250,212 | $105,001,310 |
| Collateral (pledged) (including TBA commitments)** | $— | $— | $— |
** Included with Investments in securities on the Statement of assets and liabilities.
† Additional collateral may be required from certain brokers based on individual agreements.
## Any over-collateralization of total financial and derivative net assets is not shown. Collateral may include amounts related to unsettled agreements.
Note 8: New accounting pronouncements
In March 2020, the Financial Accounting Standards Board (FASB) issued Accounting Standards Update (ASU) 2020–04, Reference Rate Reform (Topic 848) — Facilitation of the Effects of Reference Rate Reform on Financial Reporting. The amendments in ASU 2020–04 provide optional temporary financial reporting relief from the effect of certain types of contract modifications due to the planned discontinuation of LIBOR and other interbank-offered based reference rates as of the end of 2021. The discontinuation of LIBOR was subsequently extended to June 30, 2023. ASU 2020–04 is effective for certain reference rate-related contract modifications that occur during the period March 12, 2020 through December 31, 2022. Management expects that the adoption of the guidance will not have a material impact on the fund’s financial statements.
|
| Ultra Short Duration Income Fund 63 |
Services for shareholders
Investor services
Systematic investment plan Tell us how much you wish to invest regularly — weekly, semimonthly, or monthly — and the amount you choose will be transferred automatically from your checking or savings account. There’s no additional fee for this service, and you can suspend it at any time. This plan may be a great way to save for college expenses or to plan for your retirement.
Please note that regular investing does not guarantee a profit or protect against loss in a declining market. Before arranging a systematic investment plan, consider your financial ability to continue making purchases in periods when prices are low.
Systematic exchange You can make regular transfers from one Putnam fund to another Putnam fund. There are no additional fees for this service, and you can cancel or change your options at any time.
Dividends PLUS You can choose to have the dividend distributions from one of your Putnam funds automatically reinvested in another Putnam fund at no additional charge.
Free exchange privilege You can exchange money between Putnam funds free of charge, as long as they are the same class of shares. A signature guarantee is required if you are exchanging more than $500,000. The fund reserves the right to revise or terminate the exchange privilege.
Reinstatement privilege If you’ve sold Putnam shares or received a check for a dividend or capital gain, you may reinvest the proceeds with Putnam within 90 days of the transaction and they will be reinvested at the fund’s current net asset value — with no sales charge. However, reinstatement of class B shares may have special tax consequences. Ask your financial or tax representative for details.
Check-writing service You have ready access to many Putnam accounts. It’s as simple as writing a check, and there are no special fees or service charges. For more information about the check-writing service, call Putnam or visit our website.
Dollar cost averaging When you’re investing for long-term goals, it’s time, not timing, that counts. Investing on a systematic basis is a better strategy than trying to figure out when the markets will go up or down. This means investing the same amount of money regularly over a long period. This method of investing is called dollar cost averaging. When a fund’s share price declines, your investment dollars buy more shares at lower prices. When it increases, they buy fewer shares. Over time, you will pay a lower average price per share.
For more information
Visit the Individual Investors section at putnam.com A secure section of our website contains complete information on your account, including balances and transactions, updated daily. You may also conduct transactions, such as exchanges, additional investments, and address changes. Log on today to get your password.
Call us toll free at 1-800-225-1581 Ask a helpful Putnam representative or your financial advisor for details about any of these or other services, or see your prospectus.
|
| 64 Ultra Short Duration Income Fund |
Fund information
Founded over 80 years ago, Putnam Investments was built around the concept that a balance between risk and reward is the hallmark of a well-rounded financial program. We manage funds across income, value, blend, growth, sustainable, asset allocation, absolute return, and global sector categories.
| | |
| Investment Manager | Trustees | Richard T. Kircher |
| Putnam Investment | Kenneth R. Leibler, Chair | Vice President and BSA |
| Management, LLC | Liaquat Ahamed | Compliance Officer |
| 100 Federal Street | Ravi Akhoury | |
| Boston, MA 02110 | Barbara M. Baumann | Martin Lemaire |
| | Katinka Domotorffy | Vice President and |
| Investment Sub-Advisor | Catharine Bond Hill | Derivatives Risk Manager |
| Putnam Investments Limited | Paul L. Joskow | |
| 16 St James’s Street | George Putnam, III | Susan G. Malloy |
| London, England SW1A 1ER | Robert L. Reynolds | Vice President and |
| | Manoj P. Singh | Assistant Treasurer |
| Marketing Services | Mona K. Sutphen | |
| Putnam Retail Management | | Alan G. McCormack |
| Limited Partnership | Officers | Vice President and |
| 100 Federal Street | Robert L. Reynolds | Derivatives Risk Manager |
| Boston, MA 02110 | President | |
| | | Denere P. Poulack |
| Custodian | James F. Clark | Assistant Vice President, |
| State Street Bank | Vice President, Chief Compliance | Assistant Clerk, and |
| and Trust Company | Officer, and Chief Risk Officer | Assistant Treasurer |
| | | |
| Legal Counsel | Nancy E. Florek | Janet C. Smith |
| Ropes & Gray LLP | Vice President, Director of | Vice President, |
| | Proxy Voting and Corporate | Principal Financial Officer, |
| | Governance, Assistant Clerk, | Principal Accounting Officer, |
| | and Assistant Treasurer | and Assistant Treasurer |
| | | |
| | Michael J. Higgins | Stephen J. Tate |
| | Vice President, Treasurer, | Vice President and |
| | and Clerk | Chief Legal Officer |
| | | |
| | Jonathan S. Horwitz | Mark C. Trenchard |
| | Executive Vice President, | Vice President |
| Principal Executive Officer, | |
| | and Compliance Liaison | |
This report is for the information of shareholders of Putnam Ultra Short Duration Income Fund. It may also be used as sales literature when preceded or accompanied by the current prospectus, the most recent copy of Putnam’s Quarterly Performance Summary, and Putnam’s Quarterly Ranking Summary. For more recent performance, please visit putnam.com. Investors should carefully consider the investment objectives, risks, charges, and expenses of a fund, which are described in its prospectus. For this and other information or to request a prospectus or summary prospectus, call 1-800-225-1581 toll free. Please read the prospectus carefully before investing. The fund’s Statement of Additional Information contains additional information about the fund’s Trustees and is available without charge upon request by calling 1-800-225-1581.

| |
| Item 3. Audit Committee Financial Expert: |
| |
| Item 4. Principal Accountant Fees and Services: |
| |
| Item 5. Audit Committee of Listed Registrants |
| |
| Item 6. Schedule of Investments: |
| |
| The registrant’s schedule of investments in unaffiliated issuers is included in the report to shareholders in Item 1 above. |
| |
| Item 7. Disclosure of Proxy Voting Policies and Procedures For Closed-End Management Investment Companies: |
| |
| Item 8. Portfolio Managers of Closed-End Investment Companies |
| |
| Item 9. Purchases of Equity Securities by Closed-End Management Investment Companies and Affiliated Purchasers: |
| |
| Item 10. Submission of Matters to a Vote of Security Holders: |
| |
| Item 11. Controls and Procedures: |
| |
| (a) The registrant’s principal executive officer and principal financial officer have concluded, based on their evaluation of the effectiveness of the design and operation of the registrant’s disclosure controls and procedures as of a date within 90 days of the filing date of this report, that the design and operation of such procedures are generally effective to provide reasonable assurance that information required to be disclosed by the registrant in this report is recorded, processed, summarized and reported within the time periods specified in the Commission’s rules and forms. |
| |
| (b) Changes in internal control over financial reporting: Not applicable |
| |
| Item 12. Disclosures of Securities Lending Activities for Closed-End Investment Companies: |
| |
| Pursuant to the requirements of the Securities Exchange Act of 1934 and the Investment Company Act of 1940, the registrant has duly caused this report to be signed on its behalf by the undersigned, thereunto duly authorized. |
| |
| By (Signature and Title): |
| |
| /s/ Janet C. Smith
Janet C. Smith
Principal Accounting Officer
|
| |
| Pursuant to the requirements of the Securities Exchange Act of 1934 and the Investment Company Act of 1940, this report has been signed below by the following persons on behalf of the registrant and in the capacities and on the dates indicated. |
| |
| By (Signature and Title): |
| |
| /s/ Jonathan S. Horwitz
Jonathan S. Horwitz
Principal Executive Officer
|
| |
| By (Signature and Title): |
| |
| /s/ Janet C. Smith
Janet C. Smith
Principal Financial Officer
|