| UNITED STATES SECURITIES AND EXCHANGE COMMISSION | ||
| Washington, D.C. 20549 | ||
FORM N-CSR | ||
| CERTIFIED SHAREHOLDER REPORT OF REGISTERED MANAGEMENT INVESTMENT COMPANIES | ||
| Investment Company Act file number: | (811-07513) |
| Exact name of registrant as specified in charter: | Putnam Funds Trust |
| Address of principal executive offices: | 100 Federal Street, Boston, Massachusetts 02110 |
| Name and address of agent for service: | Stephen Tate, Vice President 100 Federal Street Boston, Massachusetts 02110 |
| Copy to: | Bryan Chegwidden, Esq. Ropes & Gray LLP 1211 Avenue of the Americas New York, New York 10036 |
| Registrant’s telephone number, including area code: | (617) 292-1000 |
| Date of fiscal year end: | May 31, 2022 |
| Date of reporting period: | June 1, 2021 – May 31, 2022 |
Item 1. Report to Stockholders: |
| The following is a copy of the report transmitted to stockholders pursuant to Rule 30e-1 under the Investment Company Act of 1940: | |||
Putnam
Dynamic Risk
Allocation Fund
Annual report
5 | 31 | 22
Message from the Trustees
July 14, 2022
Dear Fellow Shareholder:
Financial markets in the first half of 2022 have tested the patience of investors. High inflation and rising interest rates have clouded the outlook for the U.S. economy. The Russia-Ukraine War has disrupted global energy markets, while pandemic-driven lockdowns in China have slowed global growth.
These issues, which are important to monitor and may persist for some time, are likely shorter term in nature than your long-term financial goals. History has shown that markets eventually recover from downturns. At Putnam, dedicated and experienced investors are working for you. They are evaluating risks while trying to achieve strong performance for your fund. Learn more in the interview with your fund manager(s) in the following pages.
Thank you for investing with Putnam.


Traditional balanced funds can be unbalanced in terms of risk. Instead of balancing stocks and bonds, Putnam Dynamic Risk Allocation Fund makes allocations across four different risk sources — equity, credit, inflation, and interest rates. We believe this flexible approach can produce better risk-adjusted returns for investors over time.
The fund’s management team has experience in global allocation strategies over several market cycles.

Diversification does not assure a profit or protect against loss. It is possible to lose money in a diversified portfolio. The fund is not intended to outperform stocks and bonds during strong market rallies.
| 2 Dynamic Risk Allocation Fund |

Illustrations are hypothetical and are not intended to represent the current allocation of any Putnam fund. A traditional balanced fund is represented by a 60%/40% split between equities and fixed income, as defined by Lipper. Risk contribution is from Putnam research, which uses the historical standard deviation for the respective asset classes multiplied by the appropriate asset weight. Leverage may be achieved either through short-term borrowing or through the use of derivatives. Asset weights may exceed 100% in funds that employ leverage due to borrowed capital and/or derivatives exposure. Risk, as measured by standard deviation, gauges how widely a set of values varies from the mean. It is a historical measure of the variability of return earned by an investment portfolio over a three-year period. Asset weight for Putnam Dynamic Risk Allocation Fund represents a baseline allocation selected by the fund’s portfolio managers and is subject to change. It is inclusive of leverage and represents a starting point for future active allocation.
| Dynamic Risk Allocation Fund 3 |
Current performance may be lower or higher than the quoted past performance, which cannot guarantee future results. Share price, principal value, and return will fluctuate, and you may have a gain or a loss when you sell your shares. Performance of class A shares assumes reinvestment of distributions and does not account for taxes. Fund returns in the bar chart do not reflect a sales charge of 5.75%; had they, returns would have been lower. See page 5 and pages 11–13 for additional performance information. For a portion of the periods, the fund had expense limitations, without which returns would have been lower. To obtain the most recent month-end performance, visit putnam.com.
All Bloomberg indices are provided by Bloomberg Index Services Limited.
Lipper peer group average is provided by Lipper, a Refinitiv company.
* The Putnam Dynamic Risk Allocation Blended Index is an unmanaged index administered by Putnam Management. Effective September 1, 2020, the composition of the Putnam Dynamic Risk Allocation Blended Index is 60% MSCI World Index (ND) and 40% FTSE World Government Bond Index. Prior to September 1, 2020, the Putnam Dynamic Risk Allocation Blended Index was comprised as follows: 50% MSCI World Index (ND), 40% Bloomberg Global Aggregate Bond Index, and 10% S&P GSCI.
| 4 Dynamic Risk Allocation Fund |

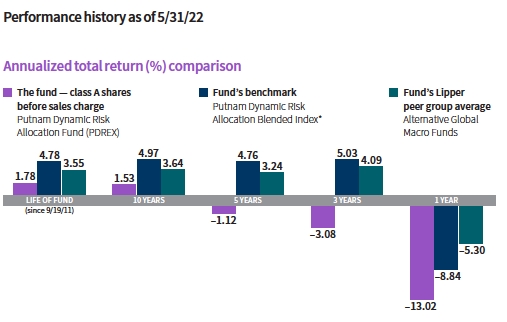
This comparison shows your fund’s performance in the context of broad market indexes for the 12 months ended 5/31/22. See page 4 and pages 11–13 for additional fund performance information. Index descriptions can be found on pages 17–18.
All Bloomberg indices are provided by Bloomberg Index Services Limited.
| Dynamic Risk Allocation Fund 5 |


Brett, please describe investing conditions over the 12-month reporting period.
At the start of the period, stocks were buoyed by a recovering global economy, the lifting of mobility restrictions, and fiscal and monetary stimulus. However, the spread of new Covid-19 variants, high inflation, and a hawkish policy pivot by the U.S. Federal Reserve dampened investor sentiment. In November 2021, the Fed began tapering its bond-buying program and indicated it would raise interest rates in calendar 2022. Despite increased market volatility, stocks posted double-digit gains in the first half of the period.
In the latter half of the period, investor sentiment turned risk averse. Overseas, Russia’s invasion of Ukraine on February 24, 2022, caused a flight to safety. Investors sold off stocks in favor of safer-haven assets, including U.S. Treasuries. The U.S. dollar strengthened, and global commodity prices soared. At the same time, China entered an extended lockdown period to control an outbreak of Covid. Disruptions to the world’s supply chains slowed global growth.
In March 2022, the Fed raised interest rates for the first time since 2018, adding 0.25% to borrowing costs. Markets factored in several
| 6 Dynamic Risk Allocation Fund |

Allocations are shown as a percentage of the fund’s net assets as of 5/31/22. Summary information may differ from the portfolio schedule included in the financial statements due to the inclusion of derivative securities, any interest accruals, the use of different classifications of securities for presentation purposes, and rounding. Allocations include the notional value of certain derivatives (the economic value for purposes of calculating periodic payment obligations), in addition to the market value of securities and may result in negative weights. Holdings and allocations may vary over time. Due to rounding, percentages may not equal to 100%.

more interest-rate hikes anticipated in 2022. In May, persistent inflation led the Fed to raise interest rates by an additional 0.50%. Policymakers lowered their U.S. annual growth estimates and increased inflation expectations for 2022. Stocks and bonds took a significant downturn.
For the 12-month reporting period, stocks, as measured by the S&P 500 Index, returned –0.30%. The Bloomberg U.S. Aggregate Bond Index, a measure of investment-grade corporate bonds, returned –8.22%. At period-end, the yield on the benchmark 10-year Treasury note had climbed to 2.85% from 1.58% at the start of the period. At times, yields on shorter-term U.S. Treasuries edged above those of longer-term Treasuries. This created a flat or inverted yield curve, which often signals a recession.
How did the fund perform for the reporting period?
The fund returned –13.02%, underperforming its custom benchmark, the Putnam Dynamic Risk Allocation Blended Index, which returned –8.84%.
What investment decisions influenced the fund’s performance during the period?
Overall, our asset allocation decisions helped performance. The portfolio benefited from equity positioning over the 12-month reporting period. During the first few months of the period, our equity positioning ranged from moderately overweight to overweight relative to the policy portfolio [the starting allocation around which we make active decisions]. This lifted performance as stocks soared to new highs due to more stimulus, progress in the fight against Covid-19, and continued signs of economic recovery. Equity positioning in the first quarter of calendar 2022 also aided results. We implemented short-term over- and underweights relative to the policy portfolio, which enabled us to take advantage of equity market volatility.
Tactical commodity positioning also added value. The portfolio held a long position to commodity risk from the start of the period until mid-August 2021. We anticipated that the vaccine rollout, fiscal support, and easy monetary conditions would stimulate significant global demand for commodities. At
| Dynamic Risk Allocation Fund 7 |
the beginning of March 2022, we implemented a modest long position to commodity risk, as we expected greater upside risks arising from the war in Ukraine and strong demand for global crude as global Covid restrictions were lifted. Exposure to interest rates and credit did not have a significant impact on fund results.
Security selection detracted from fund performance over the period. Strategic global macroeconomic trades in equities and currencies were the primary source of weakness. Our quantitative international equity strategy was slightly additive.
How were derivatives used during the reporting period?
Futures were used to help manage exposure to market risk and equitize cash. Interest-rate swaps and futures also were used to gain exposure to interest rates, and hedge interest-rate and prepayment risks. Forward currency contracts were used to hedge foreign exchange risk and gain exposure to currencies. In addition, total return swaps were used to help hedge sector exposure; manage exposure to specific sectors, industries, or securities; gain exposure to a basket of securities, specific markets, countries, sectors, or industries; and generate additional income for the portfolio.

What is your near-term outlook for the markets?
Volatility has been a major constant across markets year to date. Rising inflation, supply chain disruptions, monetary policy tightening, and Russia’s invasion of Ukraine have fueled sell-offs in stocks and bonds. Looking ahead, we expect market volatility to persist and investor sentiment to waver given many uncertainties and fears of a looming recession.
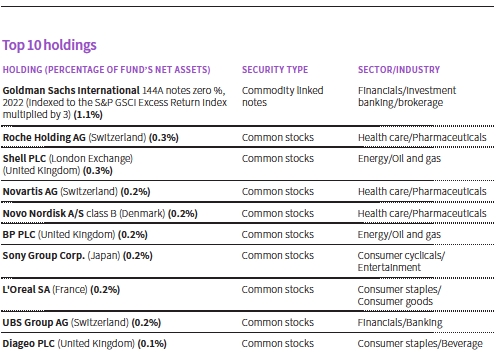
This table shows the fund’s top 10 individual holdings and the percentage of the fund’s net assets that each represented as of 5/31/22. Short-term investments and derivatives, if any, are excluded. Holdings may vary over time.
| 8 Dynamic Risk Allocation Fund |
Our near-term outlook on equities is slightly favorable. This view is supported by slightly bullish signals from our quantitative model and the Fed’s aggressive efforts to tackle inflation.
In fixed income, our view on credit is modestly bearish. As the pandemic transitions to an endemic, we believe the U.S. credit cycle will emerge close to where it was [in late 2019] before the pandemic began. We also believe the high-yield index has reached peak credit quality with little room for improvement, at least in the near term. Our outlook for rate-sensitive fixed income is neutral. Yields have moved higher due to a significant shift in Fed policy. By the end of May 2022, the Fed had raised interest rates by a total of 0.75%. Markets have priced in another increase in June followed by several more in 2022. We expect a balanced distribution of outcomes this year.
Our view on commodities is slightly bullish. This position is supported by increasing and historically high roll yield [a return in futures commodity investing], bullish signals from our quantitative model, and an increase in demand for global crude as economies fully reopen.
Against this backdrop, we continue to have conviction in our investment strategies given our ability to adapt the portfolio to changing market conditions.
Thank you, Brett, for your time and insights today.
The views expressed in this report are exclusively those of Putnam Management and are subject to change. They are not meant as investment advice.
Please note that the holdings discussed in this report may not have been held by the fund for the entire period. Portfolio composition is subject to review in accordance with the fund’s investment strategy and may vary in the future. Current and future portfolio holdings are subject to risk. Statements in the Q&A concerning the fund’s performance or portfolio composition relative to those of the fund’s Lipper peer group may reference information produced by Lipper Inc. or through a third party.
Allocations are shown as a percentage of the fund’s net assets as of 5/31/22. Risk contribution is from Putnam research, which uses the historical standard deviation for the respective asset classes multiplied by the appropriate asset weight. Holdings and allocations may vary over time.
| Dynamic Risk Allocation Fund 9 |
Of special interest
The fund had no direct exposure to Russian or Ukrainian securities or markets at the end of the period. We are closely monitoring governmental actions, including the issuance of sanctions, and related market developments.
ABOUT DERIVATIVES
Derivatives are an increasingly common type of investment instrument, the performance of which is derived from an underlying security, index, currency, or other area of the capital markets. Derivatives employed by the fund’s managers generally serve one of two main purposes: to implement a strategy that may be difficult or more expensive to invest in through traditional securities, or to hedge unwanted risk associated with a particular position.
For example, the fund’s managers might use currency forward contracts to capitalize on an anticipated change in exchange rates between two currencies. This approach would require a significantly smaller outlay of capital than purchasing traditional bonds denominated in the underlying currencies. In another example, the managers may identify a bond that they believe is undervalued relative to its risk of default, but may seek to reduce the interest-rate risk of that bond by using interest-rate swaps, a derivative through which two parties “swap” payments based on the movement of certain rates. In other examples, the managers may use options and futures contracts to hedge against a variety of risks by establishing a combination of long and short exposures to specific equity markets or sectors.
Like any other investment, derivatives may not appreciate in value and may lose money. Derivatives may amplify traditional investment risks through the creation of leverage and may be less liquid than traditional securities. And because derivatives typically represent contractual agreements between two financial institutions, derivatives entail “counterparty risk,” which is the risk that the other party is unable or unwilling to pay. Putnam monitors the counterparty risks we assume. For example, Putnam often enters into collateral agreements that require the counterparties to post collateral on a regular basis to cover their obligations to the fund. Counterparty risk for exchange-traded futures and centrally cleared swaps is mitigated by the daily exchange of margin and other safeguards against default through their respective clearinghouses.
| 10 Dynamic Risk Allocation Fund |
Your fund’s performance
This section shows your fund’s performance, price, and distribution information for periods ended May 31, 2022, the end of its most recent fiscal year. In accordance with regulatory requirements for mutual funds, we also include performance as of the most recent calendar quarter-end and expense information taken from the fund’s current prospectus. Performance should always be considered in light of a fund’s investment strategy. Data represent past performance. Past performance does not guarantee future results. More recent returns may be less or more than those shown. Investment return and principal value will fluctuate, and you may have a gain or a loss when you sell your shares. Performance information does not reflect any deduction for taxes a shareholder may owe on fund distributions or on the redemption of fund shares. For the most recent month-end performance, please visit the Individual Investors section at putnam.com or call Putnam at 1-800-225-1581. Class R, R6, and Y shares are not available to all investors. See the Terms and definitions section in this report for definitions of the share classes offered by your fund.
Annualized fund performance Total return for periods ended 5/31/22
| Life of fund | 10 years | 5 years | 3 years | 1 year | |
| Class A (9/19/11) | |||||
| Before sales charge | 1.78% | 1.53% | –1.12% | –3.08% | –13.02% |
| After sales charge | 1.22 | 0.93 | –2.29 | –4.97 | –18.02 |
| Class B (9/19/11) | |||||
| Before CDSC | 1.21 | 0.93 | –1.88 | –3.84 | –13.73 |
| After CDSC | 1.21 | 0.93 | –2.11 | –4.41 | –16.33 |
| Class C (9/19/11) | |||||
| Before CDSC | 1.21 | 0.93 | –1.87 | –3.83 | –13.71 |
| After CDSC | 1.21 | 0.93 | –1.87 | –3.83 | –14.24 |
| Class R (9/19/11) | |||||
| Net asset value | 1.53 | 1.28 | –1.37 | –3.34 | –13.24 |
| Class R6 (7/2/12) | |||||
| Net asset value | 2.16 | 1.91 | –0.74 | –2.70 | –12.68 |
| Class Y (9/19/11) | |||||
| Net asset value | 2.04 | 1.78 | –0.90 | –2.86 | –12.81 |
Current performance may be lower or higher than the quoted past performance, which cannot guarantee future results. After-sales-charge returns for class A shares reflect the deduction of the maximum 5.75% sales charge levied at the time of purchase. Class B share returns after contingent deferred sales charge (CDSC) reflect the applicable CDSC, which is 5% in the first year, declining over time to 1% in the sixth year, and is eliminated thereafter. Class C share returns after CDSC reflect a 1% CDSC for the first year that is eliminated thereafter. Class R, R6, and Y shares have no initial sales charge or CDSC. Performance for class R6 shares prior to their inception is derived from the historical performance of class Y shares and has not been adjusted for the lower investor servicing fees applicable to class R6 shares; had it, returns would have been higher.
For a portion of the periods, the fund had expense limitations, without which returns would have been lower.
Class B and C share performance reflects conversion to class A shares after eight years.
| Dynamic Risk Allocation Fund 11 |
Comparative annualized index returns For periods ended 5/31/22
| Life of fund | 10 years | 5 years | 3 years | 1 year | |
| Putnam Dynamic Risk | |||||
| Allocation Blended Index* | 4.78% | 4.97% | 4.76% | 5.03% | –8.84% |
| Lipper Alternative | |||||
| Global Macro Funds | 3.55 | 3.64 | 3.24 | 4.09 | –5.30 |
| category average† |
Index and Lipper results should be compared with fund performance before sales charge, before CDSC, or at net asset value.
All Bloomberg indices are provided by Bloomberg Index Services Limited.
Lipper peer group average is provided by Lipper, a Refinitiv company.
* The Putnam Dynamic Risk Allocation Blended Index is an unmanaged index administered by Putnam Management. Effective September 1, 2020, the composition of the Putnam Dynamic Risk Allocation Blended Index is 60% MSCI World Index (ND) and 40% FTSE World Government Bond Index. Prior to September 1, 2020, the Putnam Dynamic Risk Allocation Blended Index was comprised as follows: 50% MSCI World Index (ND), 40% Bloomberg Global Aggregate Bond Index, and 10% S&P GSCI.
† Over the 1-year, 3-year, 5-year, 10-year, and life-of-fund periods ended 5/31/22, there were 192, 184, 172, 124, and 113 funds, respectively, in this Lipper category.
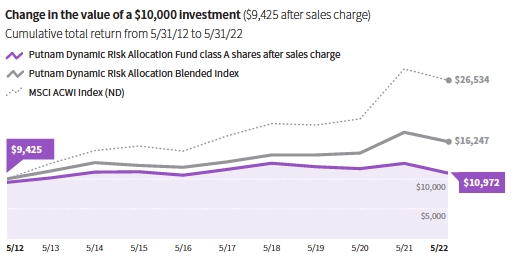
Past performance does not indicate future results. At the end of the same time period, a $10,000 investment in the fund’s class B and C shares would have been valued at $10,968 and $10,965, respectively, and no contingent deferred sales charge would apply. A $10,000 investment in the fund’s class R, R6, and Y shares would have been valued at $11,352, $12,078, and $11,930, respectively.
All Bloomberg indices are provided by Bloomberg Index Services Limited.
| 12 Dynamic Risk Allocation Fund |
Fund price and distribution information For the 12-month period ended 5/31/22
| Distributions | Class A | Class B | Class C | Class R | Class R6 | Class Y | |
| Number | 1 | 1 | 1 | 1 | 1 | 1 | |
| Income | $1.558835 | $1.441996 | $1.433233 | $1.534494 | $1.561756 | $1.352419 | |
| Capital gains | |||||||
| Long-term gains | 2.088547 | 2.088547 | 2.088547 | 2.088547 | 2.088547 | 2.088547 | |
| Short-term gains | 0.708726 | 0.708726 | 0.708726 | 0.708726 | 0.708726 | 0.708726 | |
| Return of capital* | 0.067892 | 0.064731 | 0.064494 | 0.067233 | 0.067971 | 0.062308 | |
| Total | $4.424000 | $4.304000 | $4.295000 | $4.399000 | $4.427000 | $4.212000 | |
| Before | After | Net | Net | Net | Net | Net | |
| sales | sales | asset | asset | asset | asset | asset | |
| Share value | charge | charge | value | value | value | value | value |
| 5/31/21 | $11.02 | $11.69 | $10.75 | $10.79 | $11.06 | $11.03 | $11.06 |
| 5/31/22 | 5.79 | 6.14 | 5.60 | 5.64 | 5.83 | 5.83 | 6.03 |
The classification of distributions, if any, is an estimate. Before-sales-charge share value and current dividend rate for class A shares do not take into account any sales charge levied at the time of purchase. After-sales-charge share value, current dividend rate, and current 30-day SEC yield, if applicable, are calculated assuming that the maximum sales charge (5.75% for class A shares) was levied at the time of purchase. Final distribution information will appear on your year-end tax forms.
* See page 57.
Annualized fund performance as of most recent calendar quarter
Total return for periods ended 6/30/22
| Life of fund | 10 years | 5 years | 3 years | 1 year | |
| Class A (9/19/11) | |||||
| Before sales charge | 1.35% | 0.84% | –1.83% | –5.69% | –17.53% |
| After sales charge | 0.80 | 0.25 | –2.99 | –7.53 | –22.27 |
| Class B (9/19/11) | |||||
| Before CDSC | 0.79 | 0.24 | –2.59 | –6.47 | –18.26 |
| After CDSC | 0.79 | 0.24 | –2.82 | –7.02 | –20.73 |
| Class C (9/19/11) | |||||
| Before CDSC | 0.79 | 0.24 | –2.58 | –6.42 | –18.22 |
| After CDSC | 0.79 | 0.24 | –2.58 | –6.42 | –18.72 |
| Class R (9/19/11) | |||||
| Net asset value | 1.10 | 0.60 | –2.07 | –5.93 | –17.70 |
| Class R6 (7/2/12) | |||||
| Net asset value | 1.73 | 1.22 | –1.44 | –5.32 | –17.25 |
| Class Y (9/19/11) | |||||
| Net asset value | 1.61 | 1.09 | –1.59 | –5.47 | –17.39 |
See the discussion following the fund performance table on page 11 for information about the calculation of fund performance.
| Dynamic Risk Allocation Fund 13 |
Your fund’s expenses
As a mutual fund investor, you pay ongoing expenses, such as management fees, distribution fees (12b-1 fees), and other expenses. In the most recent six-month period, your fund’s expenses were limited; had expenses not been limited, they would have been higher. Using the following information, you can estimate how these expenses affect your investment and compare them with the expenses of other funds. You may also pay one-time transaction expenses, including sales charges (loads) and redemption fees, which are not shown in this section and would have resulted in higher total expenses. For more information, see your fund’s prospectus or talk to your financial representative.
Expense ratios
| Class A | Class B | Class C | Class R | Class R6 | Class Y | |
| Net expenses for the fiscal year | ||||||
| ended 5/31/21* | 1.18% | 1.93% | 1.93% | 1.43% | 0.76% | 0.93% |
| Total annual operating expenses for the | ||||||
| fiscal year ended 5/31/21 | 1.53% | 2.28% | 2.28% | 1.78% | 1.11% | 1.28% |
| Annualized expense ratio for the | ||||||
| six-month period ended 5/31/22†‡ | 1.17% | 1.92% | 1.92% | 1.42% | 0.76% | 0.92% |
Fiscal year expense information in this table is taken from the most recent prospectus, is subject to change, and may differ from that shown for the annualized expense ratio and in the financial highlights of this report.
Expenses are shown as a percentage of average net assets.
* Reflects Putnam Management’s contractual obligation to limit certain fund expenses through 9/30/22.
† Expense ratios for each class are for the fund’s most recent fiscal half year. As a result of this, ratios may differ from expense ratios based on one-year data in the financial highlights.
‡ Includes one-time annualized proxy cost of 0.02%.
Expenses per $1,000
The following table shows the expenses you would have paid on a $1,000 investment in each class of the fund from 12/1/21 to 5/31/22. It also shows how much a $1,000 investment would be worth at the close of the period, assuming actual returns and expenses.
| Class A | Class B | Class C | Class R | Class R6 | Class Y | |
| Expenses paid per $1,000*† | $5.47 | $8.96 | $8.96 | $6.63 | $3.56 | $4.30 |
| Ending value (after expenses) | $874.50 | $870.80 | $870.90 | $873.20 | $876.40 | $875.00 |
* Expenses for each share class are calculated using the fund’s annualized expense ratio for each class, which represents the ongoing expenses as a percentage of average net assets for the six months ended 5/31/22. The expense ratio may differ for each share class.
† Expenses are calculated by multiplying the expense ratio by the average account value for the period; then multiplying the result by the number of days in the period (182); and then dividing that result by the number of days in the year (365).
| 14 Dynamic Risk Allocation Fund |
Estimate the expenses you paid
To estimate the ongoing expenses you paid for the six months ended 5/31/22, use the following calculation method. To find the value of your investment on 12/1/21, call Putnam at 1-800-225-1581.

Compare expenses using the SEC’s method
The Securities and Exchange Commission (SEC) has established guidelines to help investors assess fund expenses. Per these guidelines, the following table shows your fund’s expenses based on a $1,000 investment, assuming a hypothetical 5% annualized return. You can use this information to compare the ongoing expenses (but not transaction expenses or total costs) of investing in the fund with those of other funds. All mutual fund shareholder reports will provide this information to help you make this comparison. Please note that you cannot use this information to estimate your actual ending account balance and expenses paid during the period.
| Class A | Class B | Class C | Class R | Class R6 | Class Y | |
| Expenses paid per $1,000*† | $5.89 | $9.65 | $9.65 | $7.14 | $3.83 | $4.63 |
| Ending value (after expenses) | $1,019.10 | $1,015.36 | $1,015.36 | $1,017.85 | $1,021.14 | $1,020.34 |
* Expenses for each share class are calculated using the fund’s annualized expense ratio for each class, which represents the ongoing expenses as a percentage of average net assets for the six months ended 5/31/22. The expense ratio may differ for each share class.
† Expenses are calculated by multiplying the expense ratio by the average account value for the six-month period; then multiplying the result by the number of days in the six-month period (182); and then dividing that result by the number of days in the year (365).
| Dynamic Risk Allocation Fund 15 |
Consider these risks before investing
Emerging market securities carry illiquidity and volatility risks. The fund may invest a portion of its assets in small and/or midsize companies. Such investments increase the risk of greater price fluctuations. Funds that invest in government securities are not guaranteed. Mortgage-backed securities are subject to prepayment risk, which means that they may increase in value less than other bonds when interest rates decline and decline in value more than other bonds when interest rates rise.
Allocation of assets among asset classes may hurt performance, and efforts to diversify risk through the use of leverage and allocation decisions may not be successful. If the quantitative models or data that are used in managing the fund prove to be incorrect or incomplete, investment decisions made in reliance on the models or data may not produce the desired results and the fund may realize losses. Derivatives carry additional risks, such as the inability to terminate or sell derivatives positions and the failure of the other party to meet its obligations. Growth stocks may be more susceptible to earnings disappointments, and value stocks may fail to rebound. Bond investments are subject to interest-rate risk (the risk of bond prices falling if interest rates rise) and credit risk (the risk of an issuer defaulting on interest or principal payments). Interest-rate risk is generally greater for longer-term bonds, and credit risk is generally greater for below-investment-grade bonds. Unlike bonds, funds that invest in bonds have fees and expenses. Active trading strategies may lose money or not earn a return sufficient to cover trading and other costs. Use of leverage obtained through derivatives increases these risks by increasing investment exposure. Over-the-counter derivatives are also subject to the risk of the potential inability to terminate or sell derivatives positions and the potential failure of the other party to the instrument to meet its obligations. REITs are subject to the risk of economic downturns that have an adverse impact on real estate markets. The use of short selling may result in losses if the securities appreciate in value. Commodities involve market, political, regulatory, and natural conditions risks. The value of investments in the fund’s portfolio may fall or fail to rise over extended periods of time for a variety of reasons, including general economic, political, or financial market conditions; investor sentiment and market perceptions; government actions; geopolitical events or changes; and factors related to a specific issuer, asset class, geography, industry, or sector. International investing involves currency, economic, and political risks. These and other factors may lead to increased volatility and reduced liquidity in the fund’s portfolio holdings.
Our investment techniques, analyses, and judgments may not produce the outcome we intend. The investments we select for the fund may not perform as well as other securities that we do not select for the fund. We, or the fund’s other service providers, may experience disruptions or operating errors that could have a negative effect on the fund. You can lose money by investing in the fund.
| 16 Dynamic Risk Allocation Fund |
Terms and definitions
Important terms
Total return shows how the value of the fund’s shares changed over time, assuming you held the shares through the entire period and reinvested all distributions in the fund.
Before sales charge, or net asset value, is the price, or value, of one share of a mutual fund, without a sales charge. Before-sales-charge figures fluctuate with market conditions. They are calculated by dividing the net assets of each class of shares by the number of outstanding shares in the class.
After sales charge is the price of a mutual fund share plus the maximum sales charge levied at the time of purchase. After-sales-charge performance figures shown here assume the 5.75% maximum sales charge for class A shares.
Contingent deferred sales charge (CDSC) is generally a charge applied at the time of the redemption of class B or C shares and assumes redemption at the end of the period. Your fund’s class B CDSC declines over time from a 5% maximum during the first year to 1% during the sixth year. After the sixth year, the CDSC no longer applies. The CDSC for class C shares is 1% for one year after purchase.
Share classes
Class A shares are generally subject to an initial sales charge and no CDSC (except on certain redemptions of shares bought without an initial sales charge).
Class B shares are closed to new investments and are only available by exchange from class B shares of another Putnam fund or through dividend and/or capital gains reinvestment. They are not subject to an initial sales charge and may be subject to a CDSC.
Class C shares are not subject to an initial sales charge and are subject to a CDSC only if the shares are redeemed during the first year.
Class R shares are not subject to an initial sales charge or CDSC and are only available to employer-sponsored retirement plans.
Class R6 shares are not subject to an initial sales charge or CDSC and carry no 12b-1 fee. They are generally only available to employer-sponsored retirement plans, corporate and institutional clients, and clients in other approved programs.
Class Y shares are not subject to an initial sales charge or CDSC and carry no 12b-1 fee. They are generally only available to corporate and institutional clients and clients in other approved programs.
Comparative indexes
Bloomberg Global Aggregate Bond Index is an unmanaged index of global investment-grade fixed income securities.
Bloomberg U.S. Aggregate Bond Index is an unmanaged index of U.S. investment-grade fixed income securities.
FTSE® World Government Bond Index (WGBI) measures the performance of fixed-rate, local-currency, investment-grade sovereign bonds.
ICE BofA (Intercontinental Exchange Bank of America) U.S. 3-Month Treasury Bill Index is an unmanaged index that seeks to measure the performance of U.S. Treasury bills available in the marketplace.
MSCI ACWI (All Country World Index) (ND) is a free float-adjusted market capitalization index that is designed to measure equity market performance in the global developed and emerging markets. Calculated with net dividends (ND), this total return index reflects the reinvestment of dividends after the deduction of withholding taxes, using a tax rate applicable to non-resident institutional investors who do not benefit from double taxation treaties.
| Dynamic Risk Allocation Fund 17 |
MSCI EAFE Index (ND) is an unmanaged index of equity securities from developed countries in Western Europe, the Far East, and Australasia. Calculated with net dividends (ND), this total return index reflects the reinvestment of dividends after the deduction of withholding taxes, using a tax rate applicable to non-resident institutional investors who do not benefit from double taxation treaties.
MSCI World Index (ND) is an unmanaged index of equity securities from developed countries. Calculated with net dividends (ND), this total return index reflects the reinvestment of dividends after the deduction of withholding taxes, using a tax rate applicable to non-resident institutional investors who do not benefit from double taxation treaties.
Putnam Dynamic Risk Allocation Blended Index is an unmanaged index administered by Putnam Management. Effective September 1, 2020, the composition of the Putnam Dynamic Risk Allocation Blended Index is 60% MSCI World Index (ND) and 40% FTSE World Government Bond Index. Prior to September 1, 2020, the Putnam Dynamic Risk Allocation Blended Index was comprised as follows: 50% MSCI World Index (ND), 40% Bloomberg Global Aggregate Bond Index, and 10% S&P GSCI.
S&P 500® Index is an unmanaged index of common stock performance.
S&P GSCI® is a composite index of commodity sector returns that represents a broadly diversified, unleveraged, long-only position in commodity futures.
Indexes assume reinvestment of all distributions and do not account for fees. Securities and performance of a fund and an index will differ. You cannot invest directly in an index.
BLOOMBERG® is a trademark and service mark of Bloomberg Finance L.P. and its affiliates (collectively “Bloomberg”). Bloomberg or Bloomberg’s licensors own all proprietary rights in the Bloomberg Indices. Neither Bloomberg nor Bloomberg’s licensors approve or endorse this material, or guarantee the accuracy or completeness of any information herein, or make any warranty, express or implied, as to the results to be obtained therefrom, and to the maximum extent allowed by law, neither shall have any liability or responsibility for injury or damages arising in connection therewith.
ICE Data Indices, LLC (“ICE BofA”), used with permission. ICE BofA permits use of the ICE BofA indices and related data on an “as is” basis; makes no warranties regarding same; does not guarantee the suitability, quality, accuracy, timeliness, and/or completeness of the ICE BofA indices or any data included in, related to, or derived therefrom; assumes no liability in connection with the use of the foregoing; and does not sponsor, endorse, or recommend Putnam Investments, or any of its products or services.
FTSE® Russell is the source and owner of the trademarks, service marks, and copyrights related to the FTSE Indexes. FTSE® is a trademark of FTSE Russell.
Lipper, a Refinitiv company, is a third-party industry-ranking entity that ranks mutual funds. Its rankings do not reflect sales charges. Lipper rankings are based on total return at net asset value relative to other funds that have similar current investment styles or objectives as determined by Lipper. Lipper may change a fund’s category assignment at its discretion. Lipper category averages reflect performance trends for funds within a category.
| 18 Dynamic Risk Allocation Fund |
Other information for shareholders
Proxy voting
Putnam is committed to managing our mutual funds in the best interests of our shareholders. The Putnam funds’ proxy voting guidelines and procedures, as well as information regarding how your fund voted proxies relating to portfolio securities during the 12-month period ended June 30, 2021, are available in the Individual Investors section of putnam.com and on the Securities and Exchange Commission (SEC) website, www.sec.gov. If you have questions about finding forms on the SEC’s website, you may call the SEC at 1-800-SEC-0330. You may also obtain the Putnam funds’ proxy voting guidelines and procedures at no charge by calling Putnam’s Shareholder Services at 1-800-225-1581.
Fund portfolio holdings
The fund will file a complete schedule of its portfolio holdings with the SEC for the first and third quarters of each fiscal year on Form N-PORT within 60 days of the end of such fiscal quarter. Shareholders may obtain the fund’s Form N-PORT on the SEC’s website at www.sec.gov.
Prior to its use of Form N-PORT, the fund filed its complete schedule of its portfolio holdings with the SEC on Form N-Q, which is available online at www.sec.gov.
Trustee and employee fund ownership
Putnam employees and members of the Board of Trustees place their faith, confidence, and, most importantly, investment dollars in Putnam mutual funds. As of May 31, 2022, Putnam employees had approximately $488,000,000 and the Trustees had approximately $71,000,000 invested in Putnam mutual funds. These amounts include investments by the Trustees’ and employees’ immediate family members as well as investments through retirement and deferred compensation plans.
Liquidity risk management program
Putnam, as the administrator of the fund’s liquidity risk management program (appointed by the Board of Trustees), presented the most recent annual report on the program to the Trustees in April 2022. The report covered the structure of the program, including the program documents and related policies and procedures adopted to comply with Rule 22e-4 under the Investment Company Act of 1940, and reviewed the operation of the program from January 2021 through December 2021. The report included a description of the annual liquidity assessment of the fund that Putnam performed in November 2021. The report noted that there were no material compliance exceptions identified under Rule 22e-4 during the period. The report included a review of the governance of the program and the methodology for classification of the fund’s investments. The report also included a discussion of liquidity monitoring during the period, including during the market liquidity challenges caused by the Covid-19 pandemic, and the impact those challenges had on the liquidity of the fund’s investments. Putnam concluded that the program has been operating effectively and adequately to ensure compliance with Rule 22e-4.
| Dynamic Risk Allocation Fund 19 |
Important notice regarding Putnam’s privacy policy
In order to conduct business with our shareholders, we must obtain certain personal information such as account holders’ names, addresses, Social Security numbers, and dates of birth. Using this information, we are able to maintain accurate records of accounts and transactions.
It is our policy to protect the confidentiality of our shareholder information, whether or not a shareholder currently owns shares of our funds. In particular, it is our policy not to sell information about you or your accounts to outside marketing firms. We have safeguards in place designed to prevent unauthorized access to our computer systems and procedures to protect personal information from unauthorized use.
Under certain circumstances, we must share account information with outside vendors who provide services to us, such as mailings and proxy solicitations. In these cases, the service providers enter into confidentiality agreements with us, and we provide only the information necessary to process transactions and perform other services related to your account. Finally, it is our policy to share account information with your financial representative, if you’ve listed one on your Putnam account.
| 20 Dynamic Risk Allocation Fund |
Audited financial statements
These sections of the report, as well as the accompanying Notes, preceded by the Report of Independent Registered Public Accounting Firm, constitute the fund’s audited financial statements.
The fund’s portfolio lists all the fund’s investments and their values as of the last day of the reporting period. Holdings are organized by asset type and industry sector, country, or state to show areas of concentration and diversification.
Statement of assets and liabilities shows how the fund’s net assets and share price are determined. All investment and non-investment assets are added together. Any unpaid expenses and other liabilities are subtracted from this total. The result is divided by the number of shares to determine the net asset value per share, which is calculated separately for each class of shares. (For funds with preferred shares, the amount subtracted from total assets includes the liquidation preference of preferred shares.)
Statement of operations shows the fund’s net investment gain or loss. This is done by first adding up all the fund’s earnings — from dividends and interest income — and subtracting its operating expenses to determine net investment income (or loss). Then, any net gain or loss the fund realized on the sales of its holdings — as well as any unrealized gains or losses over the period — is added to or subtracted from the net investment result to determine the fund’s net gain or loss for the fiscal period.
Statement of changes in net assets shows how the fund’s net assets were affected by the fund’s net investment gain or loss, by distributions to shareholders, and by changes in the number of the fund’s shares. It lists distributions and their sources (net investment income or realized capital gains) over the current reporting period and the most recent fiscal year-end. The distributions listed here may not match the sources listed in the Statement of operations because the distributions are determined on a tax basis and may be paid in a different period from the one in which they were earned.
Financial highlights provide an overview of the fund’s investment results, per-share distributions, expense ratios, net investment income ratios, and portfolio turnover in one summary table, reflecting the five most recent reporting periods. In a semiannual report, the highlights table also includes the current reporting period.
| Dynamic Risk Allocation Fund 21 |
Report of Independent Registered Public Accounting Firm
To the Board of Trustees of Putnam Funds Trust and Shareholders of
Putnam Dynamic Risk Allocation Fund:
Opinion on the Financial Statements
We have audited the accompanying statement of assets and liabilities, including the fund’s portfolio, of Putnam Dynamic Risk Allocation Fund (one of the funds constituting Putnam Funds Trust, referred to hereafter as the “Fund”) as of May 31, 2022, the related statement of operations for the year ended May 31, 2022, the statement of changes in net assets for each of the two years in the period ended May 31, 2022, including the related notes, and the financial highlights for each of the two years in the period ended May 31, 2022 (collectively referred to as the “financial statements”). In our opinion, the financial statements present fairly, in all material respects, the financial position of the Fund as of May 31, 2022, the results of its operations for the year then ended, the changes in its net assets for each of the two years in the period ended May 31, 2022 and the financial highlights for each of the two years in the period ended May 31, 2022 in conformity with accounting principles generally accepted in the United States of America.
The financial statements of the Fund as of and for the year ended May 31, 2020 and the financial highlights for each of the periods ended on or prior to May 31, 2020 (not presented herein, other than the financial highlights) were audited by other auditors whose report dated July 14, 2020 expressed an unqualified opinion on those financial statements and financial highlights.
Basis for Opinion
These financial statements are the responsibility of the Fund’s management. Our responsibility is to express an opinion on the Fund’s financial statements based on our audits. We are a public accounting firm registered with the Public Company Accounting Oversight Board (United States) (“PCAOB”) and are required to be independent with respect to the Fund in accordance with the U.S. federal securities laws and the applicable rules and regulations of the Securities and Exchange Commission and the PCAOB.
We conducted our audits of these financial statements in accordance with the standards of the PCAOB. Those standards require that we plan and perform the audit to obtain reasonable assurance about whether the financial statements are free of material misstatement, whether due to error or fraud.
Our audits included performing procedures to assess the risks of material misstatement of the financial statements, whether due to error or fraud, and performing procedures that respond to those risks. Such procedures included examining, on a test basis, evidence regarding the amounts and disclosures in the financial statements. Our audits also included evaluating the accounting principles used and significant estimates made by management, as well as evaluating the overall presentation of the financial statements. Our procedures included confirmation of securities owned as of May 31, 2022 by correspondence with the custodian, transfer agent and brokers; when replies were not received from brokers, we performed other auditing procedures. We believe that our audits provide a reasonable basis for our opinion.
PricewaterhouseCoopers LLP
Boston, Massachusetts
July 14, 2022
We have served as the auditor of one or more investment companies in the Putnam Investments family of funds since at least 1957. We have not been able to determine the specific year we began serving as auditor.
| 22 Dynamic Risk Allocation Fund |
| The fund’s portfolio 5/31/22 | ||
| COMMON STOCKS (9.8%)* | Shares | Value |
| Basic materials (1.1%) | ||
| Anglo American PLC (London Exchange) (United Kingdom) | 338 | $16,548 |
| Arkema SA (France) | 34 | 4,120 |
| BHP Group, Ltd. (London Exchange) (Australia) | 56 | 1,780 |
| BlueScope Steel, Ltd. (Australia) | 333 | 4,311 |
| Brenntag SE (Germany) | 41 | 3,168 |
| Compagnie de Saint-Gobain (France) | 242 | 14,355 |
| Covestro AG (Germany) | 91 | 4,152 |
| CRH PLC (Ireland) | 137 | 5,669 |
| Eiffage SA (France) | 89 | 8,819 |
| Glencore PLC (United Kingdom) | 778 | 5,116 |
| James Hardie Industries PLC (CDI) (Australia) | 294 | 7,584 |
| Nitto Denko Corp. (Japan) | 100 | 7,234 |
| Rio Tinto PLC (United Kingdom) | 240 | 17,404 |
| Rio Tinto, Ltd. (Australia) | 134 | 10,954 |
| Shin-Etsu Chemical Co., Ltd. (Japan) | 100 | 14,170 |
| South32, Ltd. (Australia) | 1,036 | 3,691 |
| Toyo Suisan Kaisha, Ltd. (Japan) | 100 | 3,733 |
| Vat Group AG (Switzerland) | 5 | 1,490 |
| 134,298 | ||
| Capital goods (0.2%) | ||
| Dassault Aviation SA (France) | 22 | 3,725 |
| Fuji Electric Co., Ltd. (Japan) | 100 | 4,703 |
| GEA Group AG (Germany) | 149 | 5,941 |
| Komatsu, Ltd. (Japan) | 100 | 2,473 |
| Legrand SA (France) | 61 | 5,285 |
| Spirax_Sarco engineering PLC (United Kingdom) | 44 | 5,864 |
| Vinci SA (France) | 3 | 289 |
| 28,280 | ||
| Communication services (0.4%) | ||
| KDDI Corp. (Japan) | 500 | 17,406 |
| Koninklijke KPN NV (Netherlands) | 2,450 | 8,926 |
| Nippon Telegraph & Telephone Corp. (Japan) | 400 | 12,158 |
| Telstra Corp., Ltd. (Australia) | 4,473 | 12,434 |
| 50,924 | ||
| Conglomerates (0.1%) | ||
| Marubeni Corp. (Japan) | 1,200 | 12,579 |
| 12,579 | ||
| Consumer cyclicals (1.4%) | ||
| Aristocrat Leisure, Ltd. (Australia) | 306 | 7,396 |
| Berkeley Group Holdings PLC (The) (United Kingdom) | 67 | 3,549 |
| Bollore SA (France) | 256 | 1,366 |
| Brambles, Ltd. (Australia) | 639 | 4,972 |
| Chow Tai Fook Jewellery Group, Ltd. (Hong Kong) | 1,600 | 2,767 |
| Cie Financiere Richemont SA Class A (Switzerland) | 35 | 3,897 |
| CK Hutchison Holdings, Ltd. (Hong Kong) | 1,000 | 7,074 |
| Daiwa House Industry Co., Ltd. (Japan) | 400 | 9,620 |
| Hermes International (France) | 10 | 11,947 |
| Industria de Diseno Textil SA (Spain) | 317 | 7,626 |
Dynamic Risk Allocation Fund 23 | |
| COMMON STOCKS (9.8%)* cont. | Shares | Value |
| Consumer cyclicals cont. | ||
| JD Sports Fashion PLC (United Kingdom) | 5,147 | $7,964 |
| La Francaise des Jeux SAEM (France) | 92 | 3,358 |
| LVMH Moet Hennessy Louis Vuitton SA (France) | 6 | 3,859 |
| Moncler SpA (Italy) | 253 | 12,161 |
| Pandora A/S (Denmark) | 88 | 7,126 |
| Porsche Automobil Holding SE (Preference) (Germany) | 40 | 3,271 |
| Sofina SA (Belgium) | 5 | 1,178 |
| Sony Group Corp. (Japan) | 200 | 18,817 |
| Stellantis NV (Italy) | 1,034 | 15,520 |
| Toyota Motor Corp. (Japan) | 100 | 1,661 |
| Volkswagen AG (Preference) (Germany) | 94 | 15,619 |
| Volvo AB Class B (Sweden) | 252 | 4,426 |
| Wesfarmers, Ltd. (Australia) | 330 | 11,167 |
| 166,341 | ||
| Consumer staples (1.2%) | ||
| Coca-Cola HBC AG (Italy) | 195 | 4,300 |
| Coles Group, Ltd. (Australia) | 879 | 11,054 |
| Diageo PLC (United Kingdom) | 375 | 17,414 |
| Ferguson PLC (United Kingdom) | 99 | 11,902 |
| Imperial Brands PLC (United Kingdom) | 551 | 12,445 |
| ITOCHU Corp. (Japan) | 100 | 2,861 |
| Koninklijke Ahold Delhaize NV (Netherlands) | 474 | 13,087 |
| L’Oreal SA (France) | 53 | 18,736 |
| McDonald’s Holdings Co. (Japan), Ltd. (Japan) | 200 | 7,781 |
| Nestle SA (Switzerland) | 128 | 15,663 |
| Nissin Food Products Co., Ltd. (Japan) | 100 | 6,536 |
| Recruit Holdings Co., Ltd. (Japan) | 200 | 7,310 |
| Yakult Honsha Co., Ltd. (Japan) | 200 | 10,989 |
| 140,078 | ||
| Energy (0.6%) | ||
| BP PLC (United Kingdom) | 3,820 | 20,705 |
| DCC PLC (Ireland) | 103 | 7,289 |
| Equinor ASA (Norway) | 409 | 15,484 |
| Orsted AS (Denmark) | 23 | 2,602 |
| Shell PLC (London Exchange) (United Kingdom) | 1,031 | 30,535 |
| Woodside Energy Group, Ltd. (Australia) † | 10 | 213 |
| 76,828 | ||
| Financials (2.0%) | ||
| 3i Group PLC (United Kingdom) | 133 | 2,132 |
| Allianz SE (Germany) | 20 | 4,189 |
| Aviva PLC (United Kingdom) | 1,433 | 7,775 |
| Banco Bilbao Vizcaya Argentaria SA (Spain) | 2,873 | 15,732 |
| Banco Santander SA (Spain) | 5,387 | 17,411 |
| Bank Leumi Le-Israel BM (Israel) | 1,340 | 13,346 |
| BOC Hong Kong Holdings, Ltd. (Hong Kong) | 1,500 | 5,741 |
| CK Asset Holdings, Ltd. (Hong Kong) | 1,633 | 10,659 |
| Commonwealth Bank of Australia (Australia) | 8 | 598 |
| Dai-ichi Life Holdings, Inc. (Japan) | 400 | 8,191 |
| DBS Group Holdings, Ltd. (Singapore) | 600 | 13,519 |
24 Dynamic Risk Allocation Fund | |
| COMMON STOCKS (9.8%)* cont. | Shares | Value |
| Financials cont. | ||
| Dexus (Australia) R | 585 | $4,394 |
| Exor NV (Netherlands) | 71 | 5,245 |
| Gjensidige Forsikring ASA (Norway) | 133 | 2,902 |
| Goodman Group (Australia) R | 893 | 13,115 |
| Iida Group Holdings Co., Ltd. (Japan) | 200 | 3,157 |
| Investor AB Class B (Sweden) | 476 | 8,939 |
| Israel Discount Bank, Ltd. Class A (Israel) | 912 | 5,177 |
| Japan Post Holdings Co., Ltd. (Japan) | 1,900 | 14,182 |
| Lloyds Banking Group PLC (United Kingdom) | 3,795 | 2,160 |
| Mizrahi Tefahot Bank, Ltd. (Israel) | 34 | 1,119 |
| National Australia Bank, Ltd. (Australia) | 31 | 694 |
| NN Group NV (Netherlands) | 32 | 1,593 |
| Nomura Real Estate Holdings, Inc. (Japan) | 200 | 4,997 |
| Partners Group Holding AG (Switzerland) | 12 | 12,908 |
| Sumitomo Mitsui Financial Group, Inc. (Japan) | 200 | 6,119 |
| Sumitomo Realty & Development Co., Ltd. (Japan) | 100 | 2,691 |
| UBS Group AG (Switzerland) | 956 | 18,003 |
| United Overseas Bank, Ltd. (Singapore) | 600 | 12,888 |
| Zurich Insurance Group AG (Switzerland) | 13 | 5,954 |
| 225,530 | ||
| Government (—%) | ||
| Poste Italiane SpA (Italy) | 210 | 2,275 |
| 2,275 | ||
| Health care (1.3%) | ||
| AstraZeneca PLC (United Kingdom) | 33 | 4,366 |
| Eurofins Scientific (Luxembourg) | 50 | 4,665 |
| Fisher & Paykel Healthcare Corp., Ltd. (New Zealand) | 121 | 1,651 |
| Getinge AB Class B (Sweden) | 166 | 4,813 |
| GlaxoSmithKline PLC (United Kingdom) | 620 | 13,543 |
| Ipsen SA (France) | 55 | 5,509 |
| Merck KGaA (Germany) | 65 | 12,215 |
| Novartis AG (Switzerland) | 309 | 28,052 |
| Novo Nordisk A/S Class B (Denmark) | 239 | 26,462 |
| Ono Pharmaceutical Co., Ltd. (Japan) | 100 | 2,642 |
| Roche Holding AG (Switzerland) | 92 | 31,321 |
| Sartorius Stedim Biotech (France) | 15 | 5,182 |
| Sonic Healthcare, Ltd. (Australia) | 489 | 12,855 |
| 153,276 | ||
| Technology (0.9%) | ||
| ASML Holding NV (Netherlands) | 12 | 6,920 |
| Capgemini SE (France) | 50 | 9,711 |
| Hoya Corp. (Japan) | 100 | 10,674 |
| Nomura Research Institute, Ltd. (Japan) | 300 | 8,238 |
| NTT Data Corp. (Japan) | 300 | 4,695 |
| Sage Group PLC (The) (United Kingdom) | 969 | 8,022 |
| Sartorius AG (Preference) (Germany) | 15 | 6,047 |
| SCSK Corp. (Japan) | 100 | 1,672 |
| Shimadzu Corp. (Japan) | 200 | 7,325 |
| Square Enix Holdings Co., Ltd. (Japan) | 200 | 9,932 |
Dynamic Risk Allocation Fund 25 | |
| COMMON STOCKS (9.8%)* cont. | Shares | Value |
| Technology cont. | ||
| STMicroelectronics NV (France) | 271 | $10,844 |
| Telefonaktiebolaget LM Ericsson Class B (Sweden) | 1,697 | 13,778 |
| Thales SA (France) | 100 | 12,205 |
| 110,063 | ||
| Transportation (0.3%) | ||
| A.P. Moeller-Maersck A/S Class B (Denmark) | 2 | 5,817 |
| Deutsche Post AG (Germany) | 303 | 12,529 |
| Nippon Yusen KK (Japan) | 100 | 8,291 |
| SG Holdings Co., Ltd. (Japan) | 100 | 1,797 |
| Yamato Holdings Co., Ltd. (Japan) | 200 | 3,464 |
| 31,898 | ||
| Utilities and power (0.3%) | ||
| E.ON SE (Germany) | 1,321 | 13,450 |
| Enel SpA (Italy) | 900 | 5,846 |
| Eni SpA (Italy) | 83 | 1,257 |
| Fortum OYJ (Finland) | 185 | 3,425 |
| Glow Energy PCL (Thailand) † F | 400 | — |
| Osaka Gas Co., Ltd. (Japan) | 200 | 3,736 |
| RWE AG (Germany) | 101 | 4,450 |
| Tokyo Gas Co., Ltd. (Japan) | 400 | 7,799 |
| 39,963 | ||
| Total common stocks (cost $989,666) | $1,172,333 | |
| COMMODITY LINKED NOTES (1.1%)*††† | Principal amount | Value |
| Goldman Sachs International 144A notes zero %, 2023 (Indexed to the S&P GSCI Excess Return Index multiplied by 3) | $96,000 | $134,390 |
| Total commodity Linked Notes (cost $96,000) | $134,390 | |
| PURCHASED OPTIONS OUTSTANDING (—%)* Counterparty | Expiration date/strike price | Notional amount | Contract amount | Value | |
| JPMorgan Chase Bank N.A. | |||||
| S&P 500 Index (Put) | Jun-22/3500.00 | $1,264,438 | $306 | $688 | |
| Total purchased options outstanding (cost $8,446) | $688 | ||||
| SHORT-TERM INVESTMENTS (90.2%)* | Principal amount/ shares | Value | |
| Interest in $491,698,000 joint tri-party repurchase agreement dated 5/31/2022 with BofA Securities, Inc. due 6/1/2022 — maturity value of $552,012 for an effective yield of 0.800% (collateralized by Agency Mortgage-Backed Securities with coupon rates ranging from 1.500% to 5.970% and due dates ranging from 10/1/2028 to 5/1/2052, valued at $501,531,961) | $552,000 | $552,000 | |
| Putnam Short Term Investment Fund Class P 0.83% L | Shares | 9,427,729 | 9,427,729 |
| U.S. Treasury Bills 0.691%, 6/28/22 # | $100,000 | 99,946 | |
| U.S. Treasury Bills 0.573%, 6/23/22 ∆ | 400,000 | 399,860 | |
| U.S. Treasury Bills 0.569%, 6/21/22 # | 300,000 | 299,901 | |
| Total short-term investments (cost $10,779,446) | $10,779,436 | ||
| TOTAL INVESTMENTS | ||
| Total investments (cost $11,873,558) | $12,086,847 | |
26 Dynamic Risk Allocation Fund | |
| Key to holding’s abbreviations | |||
| OTC | Over-the-counter | ||
| Notes to the fund’s portfolio | |||
| Unless noted otherwise, the notes to the fund’s portfolio are for the close of the fund’s reporting period, which ran from June 1, 2021 through May 31, 2022 (the reporting period). Within the following notes to the portfolio, references to “Putnam Management” represent Putnam Investment Management, LLC, the fund’s manager, an indirect wholly-owned subsidiary of Putnam Investments, LLC and references to “ASC 820” represent Accounting Standards Codification 820 Fair Value Measurements and Disclosures. | |||
| * | Percentages indicated are based on net assets of $11,949,263. | ||
| ††† | The value of the commodity linked notes, which are marked to market daily, may be based on a multiple of the performance of the index. The multiple (or leverage) will increase the volatility of the note’s value relative to the change in the underlying index. | ||
| † | This security is non-income-producing. | ||
| # | This security, in part or in entirety, was pledged and segregated with the broker to cover margin requirements for futures contracts at the close of the reporting period. Collateral at period end totaled $247,896 and is included in Investments in securities on the Statement of assets and liabilities (Notes 1 and 8). | ||
| ∆ | This security, in part or in entirety, was pledged and segregated with the custodian for collateral on certain derivative contracts at the close of the reporting period. Collateral at period end totaled $151,939 and is included in Investments in securities on the Statement of assets and liabilities (Notes 1 and 8). | ||
| F | This security is valued by Putnam Management at fair value following procedures approved by the Trustees. Securities are classified as Level 3 for ASC 820 based on the securities’ valuation inputs. At the close of the reporting period, fair value pricing was also used for certain foreign securities in the portfolio (Note 1). | ||
| L | Affiliated company (Note 5). The rate quoted in the security description is the annualized 7-day yield of the fund at the close of the reporting period. | ||
| R | Real Estate Investment Trust. | ||
| At the close of the reporting period, the fund maintained liquid assets totaling $62,411 to cover certain derivative contracts. | |||
| Unless otherwise noted, the rates quoted in Short-term investments security descriptions represent the weighted average yield to maturity. | |||
| 144A after the name of an issuer represents securities exempt from registration under Rule 144A of the Securities Act of 1933, as amended. These securities may be resold in transactions exempt from registration, normally to qualified institutional buyers. | |||
| The dates shown on debt obligations are the original maturity dates. | |||
| FORWARD CURRENCY CONTRACTS at 5/31/22 (aggregate face value $5,354,217) | ||||||
| Counterparty | Currency | Contract type* | Delivery date | Value | Aggregate face value | Unrealized appreciation/ (depreciation) |
| Bank of America N.A. | ||||||
| British Pound | Buy | 6/15/22 | $27,343 | $26,733 | $610 | |
| Euro | Sell | 6/15/22 | 169,508 | 169,396 | (112) | |
| Citibank, N.A. | ||||||
| British Pound | Buy | 6/15/22 | 385,591 | 409,395 | (23,804) | |
| Canadian Dollar | Buy | 7/20/22 | 425,316 | 430,922 | (5,606) | |
| Danish Krone | Buy | 6/15/22 | 4,592 | 4,760 | (168) | |
| Norwegian Krone | Buy | 6/15/22 | 20,113 | 19,444 | 669 | |
| Goldman Sachs International | ||||||
| Chinese Yuan (Offshore) | Buy | 8/17/22 | 20,194 | 20,050 | 144 | |
| Polish Zloty | Buy | 6/15/22 | 32,737 | 32,209 | 528 | |
Dynamic Risk Allocation Fund 27 | |
| FORWARD CURRENCY CONTRACTS at 5/31/22 (aggregate face value $5,354,217) cont. | ||||||
| Counterparty | Currency | Contract type* | Delivery date | Value | Aggregate face value | Unrealized appreciation/ (depreciation) |
| HSBC Bank USA, National Association | ||||||
| Australian Dollar | Buy | 7/20/22 | $29,372 | $28,432 | $940 | |
| Danish Krone | Buy | 6/15/22 | 29,340 | 29,916 | (576) | |
| Euro | Sell | 6/15/22 | 49,735 | 50,459 | 724 | |
| Swedish Krona | Buy | 6/15/22 | 52,733 | 51,802 | 931 | |
| JPMorgan Chase Bank N.A. | ||||||
| Canadian Dollar | Sell | 7/20/22 | 35,253 | 34,235 | (1,018) | |
| Euro | Buy | 6/15/22 | 2,165,583 | 2,244,058 | (78,475) | |
| Japanese Yen | Buy | 8/17/22 | 1,041,768 | 1,033,420 | 8,348 | |
| Norwegian Krone | Sell | 6/15/22 | 8,237 | 8,659 | 422 | |
| Singapore Dollar | Buy | 8/17/22 | 584 | 578 | 6 | |
| Swiss Franc | Buy | 6/15/22 | 86,691 | 90,682 | (3,991) | |
| Morgan Stanley & Co. International PLC | ||||||
| Canadian Dollar | Sell | 7/20/22 | 37,149 | 37,285 | 136 | |
| Euro | Sell | 6/15/22 | 71,004 | 72,621 | 1,617 | |
| Swiss Franc | Buy | 6/15/22 | 39,538 | 38,135 | 1,403 | |
| NatWest Markets PLC | ||||||
| Euro | Sell | 6/15/22 | 71,112 | 72,728 | 1,616 | |
| Singapore Dollar | Buy | 8/17/22 | 23,503 | 23,233 | 270 | |
| State Street Bank and Trust Co. | ||||||
| Euro | Buy | 6/15/22 | 116,551 | 113,182 | 3,369 | |
| Hong Kong Dollar | Buy | 8/17/22 | 29,282 | 29,272 | 10 | |
| Israeli Shekel | Buy | 7/20/22 | 10,269 | 10,587 | (318) | |
| Toronto-Dominion Bank | ||||||
| Euro | Buy | 6/15/22 | 51,132 | 50,198 | 934 | |
| UBS AG | ||||||
| Australian Dollar | Buy | 7/20/22 | 114,832 | 122,294 | (7,462) | |
| Chinese Yuan (Offshore) | Buy | 8/17/22 | 60,925 | 60,361 | 564 | |
| WestPac Banking Corp. | ||||||
| Japanese Yen | Buy | 8/17/22 | 39,623 | 39,171 | 452 | |
| Unrealized appreciation | 23,693 | |||||
| Unrealized (depreciation) | (121,530) | |||||
| Total | $(97,837) | |||||
| * The exchange currency for all contracts listed is the United States Dollar. | ||||||
| FUTURES CONTRACTS OUTSTANDING at 5/31/22 | ||||||
| Number of contracts | Notional amount | Value | Expiration date | Unrealized depreciation | ||
| Canadian Government Bond 10 yr (Long) | 11 | $1,104,566 | $1,104,566 | Sep-22 | $(7,862) | |
| Euro-BTP Italian Government Bond (Long) | 6 | 817,208 | 817,208 | Jun-22 | (107,517) | |
| Euro-Bund 10 yr (Long) | 5 | 813,590 | 813,590 | Jun-22 | (76,285) | |
| Euro-OAT 10 yr (Long) | 6 | 928,127 | 928,127 | Jun-22 | (86,196) | |
28 Dynamic Risk Allocation Fund | |
| FUTURES CONTRACTS OUTSTANDING at 5/31/22 cont. | ||||||
| Number of contracts | Notional amount | Value | Expiration date | Unrealized depreciation | ||
| Japanese Government Bond 10 yr (Long) | 1 | $1,162,466 | $1,162,466 | Jun-22 | $(8,472) | |
| MSCI EAFE Index (Short) | 4 | 407,574 | 407,400 | Jun-22 | (15,953) | |
| S&P 500 Index E-Mini (Long) | 2 | 413,215 | 413,125 | Jun-22 | (2,543) | |
| S&P 500 Index E-Mini (Short) | 1 | 206,608 | 206,563 | Jun-22 | (588) | |
| U.K. Gilt 10 yr (Long) | 6 | 876,803 | 876,803 | Sep-22 | (18,840) | |
| U.S. Treasury Note Ultra 10 yr (Long) | 22 | 2,826,656 | 2,826,656 | Sep-22 | (22,549) | |
| Unrealized appreciation | — | |||||
| Unrealized (depreciation) | (346,805) | |||||
| Total | $(346,805) | |||||
| WRITTEN OPTIONS OUTSTANDING at 5/31/22 (premiums $30,080) | |||||
| Counterparty | Expiration date/strike price | Notional amount | Contract amount | Value | |
| JPMorgan Chase Bank N.A. | |||||
| S&P 500 Index (Put) | Jun-22/4000.00 | $1,264,438 | $306 | $13,236 | |
| Total | $13,236 | ||||
| OTC TOTAL RETURN SWAP CONTRACTS OUTSTANDING at 5/31/22 | |||||||
| Swap counterparty/ Notional amount | Value | Upfront premium received (paid) | Termination date | Payments received (paid) by fund | Total return received by or paid by fund | Unrealized appreciation/ (depreciation) | |
| Bank of America N.A. | |||||||
| $714,612 | $701,909 | $— | 4/27/23 | (Secured Overnight Financing Rate plus 0.22%) — Monthly | A basket (MLFCF15) of common stocks — Monthly* | $(12,658) | |
| 709,526 | 697,288 | — | 4/27/23 | Secured Overnight Financing Rate plus 0.05% — Monthly | Russell 2000 Total Return Index — Monthly | 12,319 | |
| Citibank, N.A. | |||||||
| 397,030 | 383,354 | — | 9/28/22 | (Secured Overnight Financing Rate plus 0.45%) — Monthly | S&P 500 Total Return 4 Jan 1988 Index — Monthly | (13,917) | |
| JPMorgan Chase Bank N.A. | |||||||
| 1,327,752 | 1,376,591 | — | 2/7/23 | (Secured Overnight Financing Rate plus 0.43%) — Monthly | S&P 500 Total Return 4 Jan 1988 Index — Monthly | 47,788 | |
| Upfront premium received | — | Unrealized appreciation | 60,107 | ||||
| Upfront premium (paid) | — | Unrealized (depreciation) | (26,575) | ||||
| Total | $— | Total | $33,532 | ||||
| * The 50 largest components, and any individual component greater than 1% of basket value, are shown below. | |||||||
Dynamic Risk Allocation Fund 29 | |
| A BASKET (MLFCF15) OF COMMON STOCKS | ||||
| Common stocks | Sector | Shares | Value | Percentage value |
| Apple, Inc. | Technology | 314 | $46,743 | 6.66% |
| Microsoft Corp. | Technology | 114 | 31,118 | 4.43% |
| Alphabet, Inc. Class A | Technology | 13 | 29,728 | 4.24% |
| Amazon.com, Inc. | Consumer cyclicals | 9 | 20,658 | 2.94% |
| JPMorgan Chase & Co. | Financials | 115 | 15,255 | 2.17% |
| NVIDIA Corp. | Technology | 80 | 14,913 | 2.12% |
| Merck & Co., Inc. | Health care | 152 | 13,952 | 1.99% |
| Accenture PLC Class A | Technology | 40 | 12,060 | 1.72% |
| Qualcomm, Inc. | Technology | 77 | 11,005 | 1.57% |
| Abbott Laboratories | Health care | 85 | 9,981 | 1.42% |
| Walmart, Inc. | Consumer cyclicals | 76 | 9,745 | 1.39% |
| Eli Lilly and Co. | Health care | 30 | 9,455 | 1.35% |
| Goldman Sachs Group, Inc. (The) | Financials | 29 | 9,394 | 1.34% |
| Intuit, Inc. | Technology | 23 | 9,387 | 1.34% |
| Booking Holdings, Inc. | Consumer cyclicals | 4 | 9,323 | 1.33% |
| Philip Morris International, Inc. | Consumer staples | 86 | 9,107 | 1.30% |
| Vertex Pharmaceuticals, Inc. | Health care | 32 | 8,690 | 1.24% |
| Citigroup, Inc. | Financials | 154 | 8,237 | 1.17% |
| Tesla, Inc. | Consumer cyclicals | 11 | 7,969 | 1.14% |
| Coca-Cola Co. (The) | Consumer staples | 124 | 7,842 | 1.12% |
| Procter & Gamble Co. (The) | Consumer staples | 52 | 7,744 | 1.10% |
| Adobe, Inc. | Technology | 18 | 7,499 | 1.07% |
| MetLife, Inc. | Financials | 102 | 6,891 | 0.98% |
| AbbVie, Inc. | Health care | 46 | 6,812 | 0.97% |
| Synopsys, Inc. | Technology | 21 | 6,766 | 0.96% |
| Cisco Systems, Inc./Delaware | Technology | 149 | 6,722 | 0.96% |
| Colgate-Palmolive Co. | Consumer staples | 85 | 6,682 | 0.95% |
| Exxon Mobil Corp. | Energy | 69 | 6,606 | 0.94% |
| Corteva, Inc. | Basic materials | 101 | 6,321 | 0.90% |
| AT&T, Inc. | Communication services | 292 | 6,224 | 0.89% |
| AutoZone, Inc. | Consumer cyclicals | 3 | 6,189 | 0.88% |
| CSX Corp. | Transportation | 188 | 5,976 | 0.85% |
| O’Reilly Automotive, Inc. | Consumer cyclicals | 9 | 5,948 | 0.85% |
| Chevron Corp. | Energy | 32 | 5,555 | 0.79% |
| Marathon Oil Corp. | Energy | 169 | 5,306 | 0.76% |
| General Dynamics Corp. | Capital goods | 24 | 5,302 | 0.76% |
| Cadence Design Systems, Inc. | Technology | 34 | 5,296 | 0.75% |
| Target Corp. | Consumer cyclicals | 33 | 5,294 | 0.75% |
| American Electric Power Co., Inc. | Utilities and power | 51 | 5,249 | 0.75% |
| Pfizer, Inc. | Health care | 99 | 5,235 | 0.75% |
| Verizon Communications, Inc. | Communication services | 101 | 5,189 | 0.74% |
| Ford Motor Co. | Consumer cyclicals | 378 | 5,175 | 0.74% |
| Lockheed Martin Corp. | Capital goods | 11 | 4,860 | 0.69% |
| Meta Platforms, Inc. Class A | Technology | 25 | 4,772 | 0.68% |
| Ameriprise Financial, Inc. | Financials | 16 | 4,493 | 0.64% |
| Crown Castle International Corp. | Communication services | 23 | 4,402 | 0.63% |
| Medtronic PLC | Health care | 43 | 4,356 | 0.62% |
| McKesson Corp. | Health care | 13 | 4,153 | 0.59% |
| Fortive Corp. | Capital goods | 66 | 4,078 | 0.58% |
| Gartner, Inc. | Consumer cyclicals | 15 | 4,004 | 0.57% |
30 Dynamic Risk Allocation Fund | |
Level 1: Valuations based on quoted prices for identical securities in active markets.
Level 2: Valuations based on quoted prices in markets that are not active or for which all significant inputs are observable, either directly or indirectly.
Level 3: Valuations based on inputs that are unobservable and significant to the fair value measurement.
| Valuation inputs | |||
| Investments in securities: | Level 1 | Level 2 | Level 3 |
| Common stocks*: | |||
| Basic materials | $— | $134,298 | $— |
| Capital goods | — | 28,280 | — |
| Communication services | — | 50,924 | — |
| Conglomerates | — | 12,579 | — |
| Consumer cyclicals | — | 166,341 | — |
| Consumer staples | — | 140,078 | — |
| Energy | 213 | 76,615 | — |
| Financials | — | 225,530 | — |
| Government | — | 2,275 | — |
| Health care | — | 153,276 | — |
| Technology | — | 110,063 | — |
| Transportation | — | 31,898 | — |
| Utilities and power | — | 39,963 | —** |
| Total common stocks | 213 | 1,172,120 | — |
| Commodity linked notes | — | 134,390 | — |
| Purchased options outstanding | — | 688 | — |
| Short-term investments | — | 10,779,436 | — |
| Totals by level | $213 | $12,086,634 | $— |
| Valuation inputs | |||
| Other financial instruments: | Level 1 | Level 2 | Level 3 |
| Forward currency contracts | $— | $(97,837) | $— |
| Futures contracts | (346,805) | — | — |
| Written options outstanding | — | (13,236) | — |
| Total return swap contracts | — | 33,532 | — |
| Totals by level | $(346,805) | $(77,541) | $— |
| * Common stock classifications are presented at the sector level, which may differ from the fund’s portfolio presentation. | |||
| ** Value of Level 3 security is $—. | |||
| At the start and close of the reporting period, Level 3 investments in securities represented less than 1% of the fund’s net assets and were not considered a significant portion of the fund’s portfolio. | |||
The accompanying notes are an integral part of these financial statements.
Dynamic Risk Allocation Fund 31 | |
Statement of assets and liabilities 5/31/22
| ASSETS | |
| Investment in securities, at value (Notes 1 and 8): | |
| Unaffiliated issuers (identified cost $2,445,829) | $2,659,118 |
| Affiliated issuers (identified cost $9,427,729) (Note 5) | 9,427,729 |
| Cash | 398 |
| Foreign currency (cost $694) (Note 1) | 628 |
| Dividends, interest and other receivables | 24,292 |
| Foreign tax reclaim | 30,381 |
| Receivable for shares of the fund sold | 3,256 |
| Receivable for investments sold | 321 |
| Receivable from Manager (Note 2) | 56,422 |
| Receivable for variation margin on futures contracts (Note 1) | 3,569 |
| Unrealized appreciation on forward currency contracts (Note 1) | 23,693 |
| Unrealized appreciation on OTC swap contracts (Note 1) | 60,107 |
| Prepaid assets | 25,471 |
| Total assets | 12,315,385 |
| LIABILITIES | |
| Payable for investments purchased | 866 |
| Payable for shares of the fund repurchased | 1,518 |
| Payable for custodian fees (Note 2) | 14,766 |
| Payable for investor servicing fees (Note 2) | 4,498 |
| Payable for Trustee compensation and expenses (Note 2) | 17,175 |
| Payable for administrative services (Note 2) | 48 |
| Payable for distribution fees (Note 2) | 4,816 |
| Payable for auditing and tax fees | 77,154 |
| Payable for variation margin on futures contracts (Note 1) | 68,180 |
| Unrealized depreciation on OTC swap contracts (Note 1) | 26,575 |
| Unrealized depreciation on forward currency contracts (Note 1) | 121,530 |
| Written options outstanding, at value (premiums $30,080) (Note 1) | 13,236 |
| Other accrued expenses | 15,760 |
| Total liabilities | 366,122 |
| Net assets | $11,949,263 |
| REPRESENTED BY | |
| Paid-in capital (Unlimited shares authorized) (Notes 1 and 4) | $13,351,367 |
| Total distributable earnings (Note 1) | (1,402,104) |
| Total — Representing net assets applicable to capital shares outstanding | $11,949,263 |
(Continued on next page)
| 32 Dynamic Risk Allocation Fund |
Statement of assets and liabilities cont.
| COMPUTATION OF NET ASSET VALUE AND OFFERING PRICE | |
| Net asset value and redemption price per class A share ($7,846,254 divided by 1,355,638 shares) | $5.79 |
| Offering price per class A share (100/94.25 of $5.79)* | $6.14 |
| Net asset value and offering price per class B share ($409,794 divided by 73,147 shares)** | $5.60 |
| Net asset value and offering price per class C share ($1,085,282 divided by 192,433 shares)** | $5.64 |
| Net asset value, offering price and redemption price per class R share | |
| ($8,871 divided by 1,521 shares) | $5.83 |
| Net asset value, offering price and redemption price per class R6 share | |
| ($1,180,932 divided by 202,506 shares) | $5.83 |
| Net asset value, offering price and redemption price per class Y share | |
| ($1,418,130 divided by 235,164 shares) | $6.03 |
* On single retail sales of less than $50,000. On sales of $50,000 or more the offering price is reduced.
** Redemption price per share is equal to net asset value less any applicable contingent deferred sales charge.
The accompanying notes are an integral part of these financial statements.
| Dynamic Risk Allocation Fund 33 |
Statement of operations Year ended 5/31/22
| INVESTMENT INCOME | |
| Dividends (net of foreign tax of $8,333) | $99,783 |
| Interest (net of foreign tax of $7,442) (including interest income of $19,898 from investments | |
| in affiliated issuers) (Note 5) | 58,469 |
| Securities lending (net of expenses) (Notes 1 and 5) | 4 |
| Total investment income | 158,256 |
| EXPENSES | |
| Compensation of Manager (Note 2) | 220,215 |
| Investor servicing fees (Note 2) | 62,780 |
| Custodian fees (Note 2) | 42,165 |
| Trustee compensation and expenses (Note 2) | 1,343 |
| Distribution fees (Note 2) | 46,245 |
| Administrative services (Note 2) | 656 |
| Auditing and tax fees | 94,822 |
| Blue sky expense | 87,954 |
| Other | 31,492 |
| Fees waived and reimbursed by Manager (Note 2) | (258,813) |
| Total expenses | 328,859 |
| Expense reduction (Note 2) | (747) |
| Net expenses | 328,112 |
| Net investment loss | (169,856) |
| REALIZED AND UNREALIZED GAIN (LOSS) | |
| Net realized gain (loss) on: | |
| Securities from unaffiliated issuers (Notes 1 and 3) | 3,176,833 |
| Foreign currency transactions (Note 1) | (10,442) |
| Forward currency contracts (Note 1) | (1,029,901) |
| Futures contracts (Note 1) | 380,143 |
| Swap contracts (Note 1) | 1,771,406 |
| Written options (Note 1) | (2,058) |
| Total net realized gain | 4,285,981 |
| Change in net unrealized appreciation (depreciation) on: | |
| Securities from unaffiliated issuers | (3,090,341) |
| Assets and liabilities in foreign currencies | (10,249) |
| Forward currency contracts | (455,186) |
| Futures contracts | (139,087) |
| Swap contracts | (607,410) |
| Written options | 16,844 |
| Total change in net unrealized depreciation | (4,285,429) |
| Net gain on investments | 552 |
| Net decrease in net assets resulting from operations | $(169,304) |
The accompanying notes are an integral part of these financial statements.
| 34 Dynamic Risk Allocation Fund |
Statement of changes in net assets
| INCREASE (DECREASE) IN NET ASSETS | Year ended 5/31/22 | Year ended 5/31/21 |
| Operations | ||
| Net investment income (loss) | $(169,856) | $576,538 |
| Net realized gain on investments | ||
| and foreign currency transactions | 4,285,981 | 1,969,697 |
| Change in net unrealized appreciation (depreciation) | ||
| of investments and assets and liabilities | ||
| in foreign currencies | (4,285,429) | 3,554,855 |
| Net increase (decrease) in net assets resulting | ||
| from operations | (169,304) | 6,101,090 |
| Distributions to shareholders (Note 1): | ||
| From ordinary income | ||
| Net investment income | ||
| Class A | (1,545,784) | — |
| Class B | (74,033) | — |
| Class C | (182,637) | — |
| Class R | (1,419) | — |
| Class R6 | (179,115) | — |
| Class Y | (402,915) | — |
| From return of capital | ||
| Class A | (67,325) | — |
| Class B | (3,323) | — |
| Class C | (8,218) | — |
| Class R | (62) | — |
| Class R6 | (7,796) | — |
| Class Y | (18,563) | — |
| Net realized short-term gain on investments | ||
| Class A | (702,792) | — |
| Class B | (36,386) | — |
| Class C | (90,313) | — |
| Class R | (655) | — |
| Class R6 | (81,283) | — |
| Class Y | (211,145) | — |
| From net realized long-term gain on investments | ||
| Class A | (2,071,062) | — |
| Class B | (107,226) | — |
| Class C | (266,143) | — |
| Class R | (1,930) | — |
| Class R6 | (239,532) | — |
| Class Y | (622,222) | — |
| Decrease from capital share transactions (Note 4) | (64,378,809) | (1,375,406) |
| Total increase (decrease) in net assets | (71,469,992) | 4,725,684 |
| NET ASSETS | ||
| Beginning of year | 83,419,255 | 78,693,571 |
| End of year | $11,949,263 | $83,419,255 |
The accompanying notes are an integral part of these financial statements.
| Dynamic Risk Allocation Fund 35 |
Financial highlights
(For a common share outstanding throughout the period)
| INVESTMENT OPERATIONS | LESS DISTRIBUTIONS | RATIOS AND SUPPLEMENTAL DATA | |||||||||||||
| Ratio of | Ratio of net | ||||||||||||||
| Net asset | Net | Net realized | From | expenses | investment | ||||||||||
| value, | investment | and unrealized | Total from | From net | net realized | Non-recurring | Net asset | Total return | Net assets, | to average | income (loss) | Portfolio | |||
| beginning | income | gain (loss) on | investment | investment | gain on | From return | Total | reimburse- | value, end | at net asset | end of period | net assets | to average | turnover | |
| Period ended | of period | (loss)a | investments | operations | income | investments | of capital | distributions | ments | of period | value (%)b | (in thousands) | (%)c,d | net assets (%)d | (%)e |
| Class A | |||||||||||||||
| May 31, 2022 | $11.02 | (.06) | (.74)h | (.80) | (1.56) | (2.80) | (.07) | (4.43) | — | $5.79 | (13.02) | $7,846 | 1.16 | (.69) | 366 |
| May 31, 2021 | 10.25 | .05 | .72 | .77 | — | — | — | — | — | 11.02 | 7.51 | 11,920 | 1.17 | .50 | 427 |
| May 31, 2020 | 10.90 | .20 | (.45) | (.25) | (.40) | — | — | (.40) | — | 10.25 | (2.64) | 11,609 | 1.17 | 1.86 | 283 |
| May 31, 2019 | 11.61 | .23 | (.78) | (.55) | (.16) | — | — | (.16) | — | 10.90 | (4.63) | 14,142 | 1.15 | 2.04 | 255 |
| May 31, 2018 | 10.96 | .22 | .74 | .96 | (.32) | — | — | (.32) | .01g | 11.61 | 8.86 | 18,906 | 1.14 | 1.93 | 312 |
| Class B | |||||||||||||||
| May 31, 2022 | $10.75 | (.12) | (.73)h | (.85) | (1.44) | (2.80) | (.06) | (4.30) | — | $5.60 | (13.73) | $410 | 1.91 | (1.44) | 366 |
| May 31, 2021 | 10.08 | (.01) | .68 | .67 | — | — | — | — | — | 10.75 | 6.65 | 735 | 1.92 | (.14) | 427 |
| May 31, 2020 | 10.72 | .12 | (.45) | (.33) | (.31) | — | — | (.31) | — | 10.08 | (3.36) | 1,340 | 1.92 | 1.10 | 283 |
| May 31, 2019 | 11.39 | .14 | (.74) | (.60) | (.07) | — | — | (.07) | — | 10.72 | (5.27) | 1,664 | 1.90 | 1.30 | 255 |
| May 31, 2018 | 10.76 | .13 | .72 | .85 | (.23) | — | — | (.23) | .01g | 11.39 | 7.97 | 2,315 | 1.89 | 1.18 | 312 |
| Class C | |||||||||||||||
| May 31, 2022 | $10.79 | (.12) | (.74)h | (.86) | (1.43) | (2.80) | (.06) | (4.29) | — | $5.64 | (13.71) | $1,085 | 1.91 | (1.44) | 366 |
| May 31, 2021 | 10.11 | (.02) | .70 | .68 | — | — | — | — | — | 10.79 | 6.73 | 1,717 | 1.92 | (.20) | 427 |
| May 31, 2020 | 10.75 | .12 | (.46) | (.34) | (.30) | — | — | (.30) | — | 10.11 | (3.43) | 3,163 | 1.92 | 1.11 | 283 |
| May 31, 2019 | 11.42 | .14 | (.74) | (.60) | (.07) | — | — | (.07) | — | 10.75 | (5.26) | 4,970 | 1.90 | 1.28 | 255 |
| May 31, 2018 | 10.78 | .13 | .72 | .85 | (.22) | — | — | (.22) | .01g | 11.42 | 7.99 | 5,812 | 1.89 | 1.18 | 312 |
| Class R | |||||||||||||||
| May 31, 2022 | $11.06 | (.08) | (.75)h | (.83) | (1.53) | (2.80) | (.07) | (4.40) | — | $5.83 | (13.24) | $9 | 1.41 | (.92) | 366 |
| May 31, 2021 | 10.32 | .03 | .71 | .74 | — | — | — | — | — | 11.06 | 7.17 | 10 | 1.42 | .24 | 427 |
| May 31, 2020 | 10.93 | .18 | (.47) | (.29) | (.32) | — | — | (.32) | — | 10.32 | (2.87) | 10 | 1.42 | 1.59 | 283 |
| May 31, 2019 | 11.56 | .21 | (.77) | (.56) | (.07) | — | — | (.07) | — | 10.93 | (4.77) | 10 | 1.40 | 1.87 | 255 |
| May 31, 2018 | 10.93 | .19 | .73 | .92 | (.30) | — | — | (.30) | .01g | 11.56 | 8.51 | 103 | 1.39 | 1.67 | 312 |
| Class R6 | |||||||||||||||
| May 31, 2022 | $11.03 | —f | (.77)h | (.77) | (1.56) | (2.80) | (.07) | (4.43) | — | $5.83 | (12.68) | $1,181 | .75 | (.06) | 366 |
| May 31, 2021 | 10.22 | .10 | .71 | .81 | — | — | — | — | — | 11.03 | 7.93 | 21,965 | .75 | .94 | 427 |
| May 31, 2020 | 10.87 | .25 | (.46) | (.21) | (.44) | — | — | (.44) | — | 10.22 | (2.26) | 22,348 | .75 | 2.27 | 283 |
| May 31, 2019 | 11.58 | .28 | (.78) | (.50) | (.21) | — | — | (.21) | — | 10.87 | (4.17) | 19,332 | .75 | 2.55 | 255 |
| May 31, 2018 | 10.94 | .26 | .73 | .99 | (.36) | — | — | (.36) | .01g | 11.58 | 9.19 | 81,403 | .75 | 2.31 | 312 |
| Class Y | |||||||||||||||
| May 31, 2022 | $11.06 | (.05) | (.77)h | (.82) | (1.35) | (2.80) | (.06) | (4.21) | — | $6.03 | (12.81) | $1,418 | .91 | (.41) | 366 |
| May 31, 2021 | 10.27 | .08 | .71 | .79 | — | — | — | — | — | 11.06 | 7.69 | 47,073 | .92 | .73 | 427 |
| May 31, 2020 | 10.92 | .23 | (.45) | (.22) | (.43) | — | — | (.43) | — | 10.27 | (2.37) | 40,223 | .92 | 2.11 | 283 |
| May 31, 2019 | 11.63 | .25 | (.77) | (.52) | (.19) | — | — | (.19) | — | 10.92 | (4.33) | 41,531 | .90 | 2.27 | 255 |
| May 31, 2018 | 10.99 | .25 | .73 | .98 | (.35) | — | — | (.35) | .01g | 11.63 | 9.02 | 48,411 | .89 | 2.17 | 312 |
See notes to financial highlights at the end of this section.
The accompanying notes are an integral part of these financial statements.
| 36 Dynamic Risk Allocation Fund | Dynamic Risk Allocation Fund 37 |
Financial highlights cont.
a Per share net investment income (loss) has been determined on the basis of the weighted average number of shares outstanding during the period.
b Total return assumes dividend reinvestment and does not reflect the effect of sales charges.
c Includes amounts paid through expense offset arrangements, if any (Note 2). Also excludes acquired fund fees and expenses, if any.
d Reflects an involuntary contractual expense limitation in effect during the period. As a result of such limitation, the expenses of each class reflect a reduction of the following amounts as a percentage of average net assets (Note 2):
| Percentage of average net assets | |||||
| 5/31/22 | 5/31/21 | 5/31/20 | 5/31/19 | 5/31/18 | |
| Class A | 0.83% | 0.35% | 0.52% | 0.30% | 0.24% |
| Class B | 0.83 | 0.35 | 0.52 | 0.30 | 0.24 |
| Class C | 0.83 | 0.35 | 0.52 | 0.30 | 0.24 |
| Class R | 0.83 | 0.35 | 0.52 | 0.30 | 0.24 |
| Class R6 | 0.83 | 0.35 | 0.52 | 0.30 | 0.24 |
| Class Y | 0.83 | 0.35 | 0.52 | 0.30 | 0.24 |
e Portfolio turnover includes TBA purchase and sale commitments.
f Amount represents less than $0.01 per share.
g Reflects a non-recurring reimbursement from Putnam Management which amounted to $0.01 per share outstanding on May 31, 2018.
h The net realized and unrealized gain (loss) on investments shown for the period noted may not correspond with the amounts shown on the Statement of operations in net assets as a result of timing of share activity.
The accompanying notes are an integral part of these financial statements.
| 38 Dynamic Risk Allocation Fund |
Notes to financial statements 5/31/22
Within the following Notes to financial statements, references to “State Street” represent State Street Bank and Trust Company, references to “the SEC” represent the Securities and Exchange Commission, references to “Putnam Management” represent Putnam Investment Management, LLC, the fund’s manager, an indirect wholly-owned subsidiary of Putnam Investments, LLC and references to “OTC”, if any, represent over-the-counter. Unless otherwise noted, the “reporting period” represents the period from June 1, 2021 through May 31, 2022.
Putnam Dynamic Risk Allocation Fund (the fund) is a diversified series of Putnam Funds Trust (the Trust), a Massachusetts business trust registered under the Investment Company Act of 1940, as amended, as an open-end management investment company. The goal of the fund is to seek total return. Total return is composed of capital appreciation and income. The fund invests in a diversified set of asset classes. By investing in a broader set of asset classes than a traditional balanced fund, and by using leverage to increase the fund’s exposures to asset classes, Putnam Management believes the fund may achieve a higher total return than a traditional balanced fund with approximately the same amount of risk as a traditional balanced fund. Risk is measured by the volatility of the fund’s investment portfolio. The fund may invest without limit in U.S., international, and emerging markets equity securities (growth or value stocks or both) of companies of any size and fixed-income securities (including in below-investment-grade securities, which are sometimes referred to as “junk bonds”); mortgage- and asset-backed securities; inflation-protected securities; commodities; and real estate investment trusts (REITs). These asset classes offer different return potential and exposure to different investment risks. Putnam Management allocates the fund’s assets among asset classes in a manner intended to diversify the fund’s exposure to these different types of risk. Putnam Management typically uses leverage to adjust or to increase the fund’s exposure to certain asset classes in order to diversify or balance risk exposure. Putnam Management expects that, on average, net notional investment exposure of approximately 150% of the net assets of the fund will result from the fund’s allocation strategy under normal market conditions, although the amounts of leverage may be significantly higher or lower at any given time. Putnam Management believes that better risk diversification creates the potential for the fund to perform well in a variety of market environments. Because the potential risks and returns of asset classes, the costs of leverage, and the benefits of diversification vary over time and with market conditions, Putnam Management makes dynamic adjustments to the fund’s asset allocations as the market environment changes. Putnam Management uses qualitative analysis, which includes evaluation of the business cycle environment and its impact on different asset classes, and quantitative techniques, which incorporate individual valuation and relative valuation measures, to establish asset class allocations that it believes will enable the fund to perform well in a variety of environments. Putnam Management also uses active trading strategies, such as active security selection, tactical asset allocation, currency transactions and options transactions. Certain of these strategies may introduce additional investment leverage. When making particular investments within an asset class, Putnam Management may consider, among other factors, a company’s valuation, financial strength, growth potential, competitive position in its industry, projected future earnings, cash flows and dividends when deciding whether to buy or sell equity investments, and among other factors, credit, interest rate and prepayment risks when deciding whether to buy or sell fixed-income investments. Putnam Management may also take into account general market conditions when making investment decisions. Putnam Management typically uses derivatives, such as futures, options, certain foreign currency transactions, warrants and swap contracts, to a significant extent for hedging purposes, to obtain leverage, and to adjust the return and volatility characteristics of the fund’s investments. The fund may also engage in short sales of securities.
The fund offers class A, class B, class C, class R, class R6 and class Y shares. Purchases of class B shares are closed to new and existing investors except by exchange from class B shares of another Putnam fund or through dividend and/or capital gains reinvestment. Class A shares are sold with a maximum front-end sales charge of 5.75%. Class A shares generally are not subject to a contingent deferred sales charge, and class R, class R6 and class Y shares are not subject to a contingent deferred sales charge. Class B shares, which convert to class A shares after approximately eight years, are not subject to a front-end sales charge and are subject to a contingent deferred sales charge if those shares are redeemed within six years of purchase. Class C shares are subject to a one-year 1.00% contingent deferred sales charge and generally convert to class A shares after approximately eight years. Class R shares, which are not available to all investors, are sold at net asset value. The expenses for class A, class B, class C and class R shares may differ based on the distribution fee of each class, which is identified in Note 2. Class R6 and class Y shares, which are sold at net asset value, are generally subject to the same expenses as class A, class B, class C and class R shares, but do not bear a distribution fee, and in the case of class R6 shares, bear a lower investor servicing fee, which is identified in Note 2. Class R6 and class Y shares are not available to all investors.
| Dynamic Risk Allocation Fund 39 |
In the normal course of business, the fund enters into contracts that may include agreements to indemnify another party under given circumstances. The fund’s maximum exposure under these arrangements is unknown as this would involve future claims that may be, but have not yet been, made against the fund. However, the fund’s management team expects the risk of material loss to be remote.
The fund has entered into contractual arrangements with an investment adviser, administrator, distributor, shareholder servicing agent and custodian, who each provide services to the fund. Unless expressly stated otherwise, shareholders are not parties to, or intended beneficiaries of these contractual arrangements, and these contractual arrangements are not intended to create any shareholder right to enforce them against the service providers or to seek any remedy under them against the service providers, either directly or on behalf of the fund.
Under the fund’s Amended and Restated Agreement and Declaration of Trust, any claims asserted against or on behalf of the Putnam Funds, including claims against Trustees and Officers, must be brought in state and federal courts located within the Commonwealth of Massachusetts.
Note 1: Significant accounting policies
The following is a summary of significant accounting policies consistently followed by the fund in the preparation of its financial statements. The preparation of financial statements is in conformity with accounting principles generally accepted in the United States of America and requires management to make estimates and assumptions that affect the reported amounts of assets and liabilities in the financial statements and the reported amounts of increases and decreases in net assets from operations. Actual results could differ from those estimates. Subsequent events after the Statement of assets and liabilities date through the date that the financial statements were issued have been evaluated in the preparation of the financial statements.
Investment income, realized and unrealized gains and losses and expenses of the fund are borne pro-rata based on the relative net assets of each class to the total net assets of the fund, except that each class bears expenses unique to that class (including the distribution fees applicable to such classes). Each class votes as a class only with respect to its own distribution plan or other matters on which a class vote is required by law or determined by the Trustees. If the fund were liquidated, shares of each class would receive their pro-rata share of the net assets of the fund. In addition, the Trustees declare separate dividends on each class of shares.
Security valuation Portfolio securities and other investments are valued using policies and procedures adopted by the Board of Trustees. The Trustees have formed a Pricing Committee to oversee the implementation of these procedures and have delegated responsibility for valuing the fund’s assets in accordance with these procedures to Putnam Management. Putnam Management has established an internal Valuation Committee that is responsible for making fair value determinations, evaluating the effectiveness of the pricing policies of the fund and reporting to the Pricing Committee.
Investments for which market quotations are readily available are valued at the last reported sales price on their principal exchange, or official closing price for certain markets, and are classified as Level 1 securities under Accounting Standards Codification 820 Fair Value Measurements and Disclosures (ASC 820). If no sales are reported, as in the case of some securities that are traded OTC, a security is valued at its last reported bid price and is generally categorized as a Level 2 security.
Investments in open-end investment companies (excluding exchange-traded funds), if any, which can be classified as Level 1 or Level 2 securities, are valued based on their net asset value. The net asset value of such investment companies equals the total value of their assets less their liabilities and divided by the number of their outstanding shares.
Market quotations are not considered to be readily available for certain debt obligations (including short-term investments with remaining maturities of 60 days or less) and other investments; such investments are valued on the basis of valuations furnished by an independent pricing service approved by the Trustees or dealers selected by Putnam Management. Such services or dealers determine valuations for normal institutional-size trading units of such securities using methods based on market transactions for comparable securities and various relationships, generally recognized by institutional traders, between securities (which consider such factors as security prices, yields, maturities and ratings). These securities will generally be categorized as Level 2.
Many securities markets and exchanges outside the U.S. close prior to the scheduled close of the New York Stock Exchange and therefore the closing prices for securities in such markets or on such exchanges may not fully reflect events that occur after such close but before the scheduled close of the New York Stock Exchange. Accordingly, on certain days, the fund will fair value certain foreign equity securities taking into account multiple factors including movements in the U.S. securities markets, currency valuations and comparisons to the valuation of
| 40 Dynamic Risk Allocation Fund |
American Depository Receipts, exchange-traded funds and futures contracts. The foreign equity securities, which would generally be classified as Level 1 securities, will be transferred to Level 2 of the fair value hierarchy when they are valued at fair value. The number of days on which fair value prices will be used will depend on market activity and it is possible that fair value prices will be used by the fund to a significant extent. At the close of the reporting period, fair value pricing was used for certain foreign securities in the portfolio. Securities quoted in foreign currencies, if any, are translated into U.S. dollars at the current exchange rate.
To the extent a pricing service or dealer is unable to value a security or provides a valuation that Putnam Management does not believe accurately reflects the security’s fair value, the security will be valued at fair value by Putnam Management in accordance with policies and procedures approved by the Trustees. Certain investments, including certain restricted and illiquid securities and derivatives, are also valued at fair value following procedures approved by the Trustees. These valuations consider such factors as significant market or specific security events such as interest rate or credit quality changes, various relationships with other securities, discount rates, U.S. Treasury, U.S. swap and credit yields, index levels, convexity exposures, recovery rates, sales and other multiples and resale restrictions. These securities are classified as Level 2 or as Level 3 depending on the priority of the significant inputs.
To assess the continuing appropriateness of fair valuations, the Valuation Committee reviews and affirms the reasonableness of such valuations on a regular basis after considering all relevant information that is reasonably available. Such valuations and procedures are reviewed periodically by the Trustees. The fair value of securities is generally determined as the amount that the fund could reasonably expect to realize from an orderly disposition of such securities over a reasonable period of time. By its nature, a fair value price is a good faith estimate of the value of a security in a current sale and does not reflect an actual market price, which may be different by a material amount.
Joint trading account Pursuant to an exemptive order from the SEC, the fund may transfer uninvested cash balances into a joint trading account along with the cash of other registered investment companies and certain other accounts managed by Putnam Management. These balances may be invested in issues of short-term investments having maturities of up to 90 days.
Repurchase agreements The fund, or any joint trading account, through its custodian, receives delivery of the underlying securities, the fair value of which at the time of purchase is required to be in an amount at least equal to the resale price, including accrued interest. Collateral for certain tri-party repurchase agreements, which totaled $563,040 at the end of the reporting period, is held at the counterparty’s custodian in a segregated account for the benefit of the fund and the counterparty. Putnam Management is responsible for determining that the value of these underlying securities is at all times at least equal to the resale price, including accrued interest. In the event of default or bankruptcy by the other party to the agreement, retention of the collateral may be subject to legal proceedings.
Security transactions and related investment income Security transactions are recorded on the trade date (the date the order to buy or sell is executed). Gains or losses on securities sold are determined on the identified cost basis.
Interest income, net of any applicable withholding taxes, if any, and including amortization and accretion of premiums and discounts on debt securities, is recorded on the accrual basis. Dividend income, net of any applicable withholding taxes, is recognized on the ex-dividend date except that certain dividends from foreign securities, if any, are recognized as soon as the fund is informed of the ex-dividend date. Non-cash dividends, if any, are recorded at the fair value of the securities received. Dividends representing a return of capital or capital gains, if any, are reflected as a reduction of cost and/or as a realized gain.
The fund may have earned certain fees in connection with its senior loan purchasing activities. These fees, if any, are treated as market discount and are amortized into income in the Statement of operations.
Foreign currency translation The accounting records of the fund are maintained in U.S. dollars. The fair value of foreign securities, currency holdings, and other assets and liabilities is recorded in the books and records of the fund after translation to U.S. dollars based on the exchange rates on that day. The cost of each security is determined using historical exchange rates. Income and withholding taxes are translated at prevailing exchange rates when earned or incurred. The fund does not isolate that portion of realized or unrealized gains or losses resulting from changes in the foreign exchange rate on investments from fluctuations arising from changes in the market prices of the securities. Such gains and losses are included with the net realized and unrealized gain or loss on investments. Net realized gains and losses on foreign currency transactions represent net realized exchange gains or losses on disposition of foreign currencies, currency gains and losses realized between the trade and
| Dynamic Risk Allocation Fund 41 |
settlement dates on securities transactions and the difference between the amount of investment income and foreign withholding taxes recorded on the fund’s books and the U.S. dollar equivalent amounts actually received or paid. Net unrealized appreciation and depreciation of assets and liabilities in foreign currencies arise from changes in the value of assets and liabilities other than investments at the period end, resulting from changes in the exchange rate.
Options contracts The fund uses options contracts to hedge duration and convexity, to isolate prepayment risk, to gain exposure to interest rates, to hedge against changes in values of securities it owns, owned or expects to own, to hedge prepayment risk, to generate additional income for the portfolio, to enhance returns on securities owned, to enhance the return on a security owned, to gain exposure to securities and to manage downside risks.
The potential risk to the fund is that the change in value of options contracts may not correspond to the change in value of the hedged instruments. In addition, losses may arise from changes in the value of the underlying instruments if there is an illiquid secondary market for the contracts, if interest or exchange rates move unexpectedly or if the counterparty to the contract is unable to perform. Realized gains and losses on purchased options are included in realized gains and losses on investment securities. If a written call option is exercised, the premium originally received is recorded as an addition to sales proceeds. If a written put option is exercised, the premium originally received is recorded as a reduction to the cost of investments.
Exchange-traded options are valued at the last sale price or, if no sales are reported, the last bid price for purchased options and the last ask price for written options. OTC traded options are valued using prices supplied by dealers.
Options on swaps are similar to options on securities except that the premium paid or received is to buy or grant the right to enter into a previously agreed upon interest rate or credit default contract. Forward premium swap option contracts include premiums that have extended settlement dates. The delayed settlement of the premiums is factored into the daily valuation of the option contracts. In the case of interest rate cap and floor contracts, in return for a premium, ongoing payments between two parties are based on interest rates exceeding a specified rate, in the case of a cap contract, or falling below a specified rate in the case of a floor contract.
Written option contracts outstanding at period end, if any, are listed after the fund’s portfolio.
Futures contracts The fund uses futures contracts to manage exposure to market risk, to hedge prepayment risk, to hedge interest rate risk, to gain exposure to interest rates and to equitize cash.
The potential risk to the fund is that the change in value of futures contracts may not correspond to the change in value of the hedged instruments. In addition, losses may arise from changes in the value of the underlying instruments, if there is an illiquid secondary market for the contracts, if interest or exchange rates move unexpectedly or if the counterparty to the contract is unable to perform. With futures, there is minimal counterparty credit risk to the fund since futures are exchange traded and the exchange’s clearinghouse, as counterparty to all exchange traded futures, guarantees the futures against default. Risks may exceed amounts recognized on the Statement of assets and liabilities. When the contract is closed, the fund records a realized gain or loss equal to the difference between the value of the contract at the time it was opened and the value at the time it was closed.
Futures contracts are valued at the quoted daily settlement prices established by the exchange on which they trade. The fund and the broker agree to exchange an amount of cash equal to the daily fluctuation in the value of the futures contract. Such receipts or payments are known as “variation margin.”
Futures contracts outstanding at period end, if any, are listed after the fund’s portfolio.
Forward currency contracts The fund buys and sells forward currency contracts, which are agreements between two parties to buy and sell currencies at a set price on a future date. These contracts are used to hedge foreign exchange risk and to gain exposure to currencies.
The U.S. dollar value of forward currency contracts is determined using current forward currency exchange rates supplied by a quotation service. The fair value of the contract will fluctuate with changes in currency exchange rates. The contract is marked to market daily and the change in fair value is recorded as an unrealized gain or loss. The fund records a realized gain or loss equal to the difference between the value of the contract at the time it was opened and the value at the time it was closed when the contract matures or by delivery of the currency. The fund could be exposed to risk if the value of the currency changes unfavorably, if the counterparties to the contracts are unable to meet the terms of their contracts or if the fund is unable to enter into a closing position. Risks may exceed amounts recognized on the Statement of assets and liabilities.
Forward currency contracts outstanding at period end, if any, are listed after the fund’s portfolio.
| 42 Dynamic Risk Allocation Fund |
Interest rate swap contracts The fund entered into OTC and/or centrally cleared interest rate swap contracts, which are arrangements between two parties to exchange cash flows based on a notional principal amount, to hedge interest rate risk, to gain exposure on interest rates and to hedge prepayment risk.
An OTC and centrally cleared interest rate swap can be purchased or sold with an upfront premium. For OTC interest rate swap contracts, an upfront payment received by the fund is recorded as a liability on the fund’s books. An upfront payment made by the fund is recorded as an asset on the fund’s books. OTC and centrally cleared interest rate swap contracts are marked to market daily based upon quotations from an independent pricing service or market makers. Any change is recorded as an unrealized gain or loss on OTC interest rate swaps. Daily fluctuations in the value of centrally cleared interest rate swaps are settled through a central clearing agent and are recorded in variation margin on the Statement of assets and liabilities and recorded as unrealized gain or loss. Payments, including upfront premiums, received or made are recorded as realized gains or losses at the reset date or the closing of the contract. Certain OTC and centrally cleared interest rate swap contracts may include extended effective dates. Payments related to these swap contracts are accrued based on the terms of the contract.
The fund could be exposed to credit or market risk due to unfavorable changes in the fluctuation of interest rates or if the counterparty defaults, in the case of OTC interest rate contracts, or the central clearing agency or a clearing member defaults, in the case of centrally cleared interest rate swap contracts, on its respective obligation to perform under the contract. The fund’s maximum risk of loss from counterparty risk or central clearing risk is the fair value of the contract. This risk may be mitigated for OTC interest rate swap contracts by having a master netting arrangement between the fund and the counterparty and for centrally cleared interest rate swap contracts through the daily exchange of variation margin. There is minimal counterparty risk with respect to centrally cleared interest rate swap contracts due to the clearinghouse guarantee fund and other resources that are available in the event of a clearing member default. Risk of loss may exceed amounts recognized on the Statement of assets and liabilities.
OTC and centrally cleared interest rate swap contracts outstanding, including their respective notional amounts at period end, if any, are listed after the fund’s portfolio.
Total return swap contracts The fund entered into OTC and/or centrally cleared total return swap contracts, which are arrangements to exchange a market-linked return for a periodic payment, both based on a notional principal amount, to hedge sector exposure, to manage exposure to specific sectors or industries, to manage exposure to specific securities, to gain exposure to a basket of securities, to gain exposure to specific markets or countries, to gain exposure to specific sectors or industries and to generate additional income for the portfolio.
To the extent that the total return of the security, index or other financial measure underlying the transaction exceeds or falls short of the offsetting interest rate obligation, the fund will receive a payment from or make a payment to the counterparty. OTC and/or centrally cleared total return swap contracts are marked to market daily based upon quotations from an independent pricing service or market maker. Any change is recorded as an unrealized gain or loss on OTC total return swaps. Daily fluctuations in the value of centrally cleared total return swaps are settled through a central clearing agent and are recorded in variation margin on the Statement of assets and liabilities and recorded as unrealized gain or loss. Payments received or made are recorded as realized gains or losses. Certain OTC and/or centrally cleared total return swap contracts may include extended effective dates. Payments related to these swap contracts are accrued based on the terms of the contract. The fund could be exposed to credit or market risk due to unfavorable changes in the fluctuation of interest rates or in the price of the underlying security or index, the possibility that there is no liquid market for these agreements or that the counterparty may default on its obligation to perform. The fund’s maximum risk of loss from counterparty risk or central clearing risk is the fair value of the contract. This risk may be mitigated for OTC total return swap contracts by having a master netting arrangement between the fund and the counterparty and for centrally cleared total return swap contracts through the daily exchange of variation margin. There is minimal counterparty risk with respect to centrally cleared total return swap contracts due to the clearinghouse guarantee fund and other resources that are available in the event of a clearing member default. Risk of loss may exceed amounts recognized on the Statement of assets and liabilities.
OTC and/or centrally cleared total return swap contracts outstanding, including their respective notional amounts at period end, if any, are listed after the fund’s portfolio.
Credit default contracts The fund entered into OTC and/or centrally cleared credit default contracts to hedge credit risk, to hedge market risk and to gain exposure on individual names and/or baskets of securities.
| Dynamic Risk Allocation Fund 43 |
In OTC and centrally cleared credit default contracts, the protection buyer typically makes a periodic stream of payments to a counterparty, the protection seller, in exchange for the right to receive a contingent payment upon the occurrence of a credit event on the reference obligation or all other equally ranked obligations of the reference entity. Credit events are contract specific but may include bankruptcy, failure to pay, restructuring and obligation acceleration. For OTC credit default contracts, an upfront payment received by the fund is recorded as a liability on the fund’s books. An upfront payment made by the fund is recorded as an asset on the fund’s books. Centrally cleared credit default contracts provide the same rights to the protection buyer and seller except the payments between parties, including upfront premiums, are settled through a central clearing agent through variation margin payments. Upfront and periodic payments received or paid by the fund for OTC and centrally cleared credit default contracts are recorded as realized gains or losses at the reset date or close of the contract. The OTC and centrally cleared credit default contracts are marked to market daily based upon quotations from an independent pricing service or market makers. Any change in value of OTC credit default contracts is recorded as an unrealized gain or loss. Daily fluctuations in the value of centrally cleared credit default contracts are recorded in variation margin on the Statement of assets and liabilities and recorded as unrealized gain or loss. Upon the occurrence of a credit event, the difference between the par value and fair value of the reference obligation, net of any proportional amount of the upfront payment, is recorded as a realized gain or loss.
In addition to bearing the risk that the credit event will occur, the fund could be exposed to market risk due to unfavorable changes in interest rates or in the price of the underlying security or index or the possibility that the fund may be unable to close out its position at the same time or at the same price as if it had purchased the underlying reference obligations. In certain circumstances, the fund may enter into offsetting OTC and centrally cleared credit default contracts which would mitigate its risk of loss. Risks of loss may exceed amounts recognized on the Statement of assets and liabilities. The fund’s maximum risk of loss from counterparty risk, either as the protection seller or as the protection buyer, is the fair value of the contract. This risk may be mitigated for OTC credit default contracts by having a master netting arrangement between the fund and the counterparty and for centrally cleared credit default contracts through the daily exchange of variation margin. Counterparty risk is further mitigated with respect to centrally cleared credit default swap contracts due to the clearinghouse guarantee fund and other resources that are available in the event of a clearing member default. Where the fund is a seller of protection, the maximum potential amount of future payments the fund may be required to make is equal to the notional amount.
OTC and centrally cleared credit default contracts outstanding, including their respective notional amounts at period end, if any, are listed after the fund’s portfolio.
TBA commitments The fund may enter into TBA (to be announced) commitments to purchase securities for a fixed unit price at a future date beyond customary settlement time. Although the unit price and par amount have been established, the actual securities have not been specified. However, it is anticipated that the amount of the commitments will not significantly differ from the principal amount. The fund holds, and maintains until settlement date, cash or high-grade debt obligations in an amount sufficient to meet the purchase price, or the fund may enter into offsetting contracts for the forward sale of other securities it owns. Income on the securities will not be earned until settlement date.
The fund may also enter into TBA sale commitments to hedge its portfolio positions, to sell mortgage-backed securities it owns under delayed delivery arrangements or to take a short position in mortgage-backed securities. Proceeds of TBA sale commitments are not received until the contractual settlement date. During the time a TBA sale commitment is outstanding, either equivalent deliverable securities or an offsetting TBA purchase commitment deliverable on or before the sale commitment date are held as “cover” for the transaction, or other liquid assets in an amount equal to the notional value of the TBA sale commitment are segregated. If the TBA sale commitment is closed through the acquisition of an offsetting TBA purchase commitment, the fund realizes a gain or loss. If the fund delivers securities under the commitment, the fund realizes a gain or a loss from the sale of the securities based upon the unit price established at the date the commitment was entered into.
TBA commitments, which are accounted for as purchase and sale transactions, may be considered securities themselves, and involve a risk of loss due to changes in the value of the security prior to the settlement date as well as the risk that the counterparty to the transaction will not perform its obligations. Counterparty risk is mitigated by having a master agreement between the fund and the counterparty.
Unsettled TBA commitments are valued at their fair value according to the procedures described under “Security valuation” above. The contract is marked to market daily and the change in fair value is recorded by the fund as an unrealized gain or loss. Based on market circumstances, Putnam Management will determine whether to take delivery of the underlying securities or to dispose of the TBA commitments prior to settlement.
| 44 Dynamic Risk Allocation Fund |
TBA purchase commitments outstanding at period end, if any, are listed within the fund’s portfolio and TBA sale commitments outstanding at period end, if any, are listed after the fund’s portfolio.
Master agreements The fund is a party to ISDA (International Swaps and Derivatives Association, Inc.) Master Agreements that govern OTC derivative and foreign exchange contracts and Master Securities Forward Transaction Agreements that govern transactions involving mortgage-backed and other asset-backed securities that may result in delayed delivery (Master Agreements) with certain counterparties entered into from time to time. The Master Agreements may contain provisions regarding, among other things, the parties’ general obligations, representations, agreements, collateral requirements, events of default and early termination. With respect to certain counterparties, in accordance with the terms of the Master Agreements, collateral pledged to the fund is held in a segregated account by the fund’s custodian and, with respect to those amounts which can be sold or repledged, are presented in the fund’s portfolio.
Collateral pledged by the fund is segregated by the fund’s custodian and identified in the fund’s portfolio. Collateral can be in the form of cash or debt securities issued by the U.S. Government or related agencies or other securities as agreed to by the fund and the applicable counterparty. Collateral requirements are determined based on the fund’s net position with each counterparty.
With respect to ISDA Master Agreements, termination events applicable to the fund may occur upon a decline in the fund’s net assets below a specified threshold over a certain period of time. Termination events applicable to counterparties may occur upon a decline in the counterparty’s long-term or short-term credit ratings below a specified level. In each case, upon occurrence, the other party may elect to terminate early and cause settlement of all derivative and foreign exchange contracts outstanding, including the payment of any losses and costs resulting from such early termination, as reasonably determined by the terminating party. Any decision by one or more of the fund’s counterparties to elect early termination could impact the fund’s future derivative activity.
As of May 31, 2022, due to a decrease in the fund’s net asset value during the year, such counterparties were entitled to elect, but had not yet elected, to terminate early, and cause settlement of all outstanding derivative and foreign exchange contracts outstanding under the applicable Master Agreements, including the payment by the fund of any losses and costs resulting from such early termination, as reasonably determined by such counterparty. At the close of the reporting period, the fund had a net asset position of $12,339 and net liability position of $89,192 on open derivative contracts subject to the Master Agreements. Collateral pledged by the fund at period end for these agreements totaled $151,939 and may include amounts related to unsettled agreements. The fund intends to seek a waiver of or other relief from this provision, from the counterparties.
Securities lending The fund may lend securities, through its agent, to qualified borrowers in order to earn additional income. The loans are collateralized by cash in an amount at least equal to the fair value of the securities loaned. The fair value of securities loaned is determined daily and any additional required collateral is allocated to the fund on the next business day. The remaining maturities of the securities lending transactions are considered overnight and continuous. The risk of borrower default will be borne by the fund’s agent; the fund will bear the risk of loss with respect to the investment of the cash collateral. Income from securities lending, net of expenses, is included in investment income on the Statement of operations. Cash collateral is invested in Putnam Cash Collateral Pool, LLC, a limited liability company managed by an affiliate of Putnam Management. Investments in Putnam Cash Collateral Pool, LLC are valued at its closing net asset value each business day. There are no management fees charged to Putnam Cash Collateral Pool, LLC. At the close of the reporting period, the fund had no securities out on loan.
Interfund lending The fund, along with other Putnam funds, may participate in an interfund lending program pursuant to an exemptive order issued by the SEC. This program allows the fund to borrow from or lend to other Putnam funds that permit such transactions. Interfund lending transactions are subject to each fund’s investment policies and borrowing and lending limits. Interest earned or paid on the interfund lending transaction will be based on the average of certain current market rates. During the reporting period, the fund did not utilize the program.
Lines of credit The fund participates, along with other Putnam funds, in a $317.5 million unsecured committed line of credit and a $235.5 million unsecured uncommitted line of credit, both provided by State Street. Borrowings may be made for temporary or emergency purposes, including the funding of shareholder redemption requests and trade settlements. Interest is charged to the fund based on the fund’s borrowing at a rate equal to 1.25% plus the higher of (1) the Federal Funds rate and (2) the Overnight Bank Funding Rate for the committed line of credit and 1.30% plus the higher of (1) the Federal Funds rate and (2) the Overnight Bank Funding Rate for the uncommitted line of credit. A closing fee equal to 0.04% of the committed line of credit and 0.04% of the uncommitted line of credit has been paid by the participating funds. In addition, a commitment fee of 0.21% per
| Dynamic Risk Allocation Fund 45 |
annum on any unutilized portion of the committed line of credit is allocated to the participating funds based on their relative net assets and paid quarterly. During the reporting period, the fund had no borrowings against these arrangements.
Federal taxes It is the policy of the fund to distribute all of its taxable income within the prescribed time period and otherwise comply with the provisions of the Internal Revenue Code of 1986, as amended (the Code), applicable to regulated investment companies. It is also the intention of the fund to distribute an amount sufficient to avoid imposition of any excise tax under Section 4982 of the Code.
The fund is subject to the provisions of Accounting Standards Codification 740 Income Taxes (ASC 740). ASC 740 sets forth a minimum threshold for financial statement recognition of the benefit of a tax position taken or expected to be taken in a tax return. The fund did not have a liability to record for any unrecognized tax benefits in the accompanying financial statements. No provision has been made for federal taxes on income, capital gains or unrealized appreciation on securities held nor for excise tax on income and capital gains. Each of the fund’s federal tax returns for the prior three fiscal years remains subject to examination by the Internal Revenue Service.
The fund may also be subject to taxes imposed by governments of countries in which it invests. Such taxes are generally based on either income or gains earned or repatriated. The fund accrues and applies such taxes to net investment income, net realized gains and net unrealized gains as income and/or capital gains are earned. In some cases, the fund may be entitled to reclaim all or a portion of such taxes, and such reclaim amounts, if any, are reflected as an asset on the fund’s books. In many cases, however, the fund may not receive such amounts for an extended period of time, depending on the country of investment.
Pursuant to federal income tax regulations applicable to regulated investment companies, the fund has elected to defer certain capital losses of $717,457 recognized during the period between November 1, 2021 and May 31, 2022 to its fiscal year ending May 31, 2023.
Pursuant to federal income tax regulations applicable to regulated investment companies, the fund has elected to defer $890,427 to its fiscal year ending May 31, 2023 of late year ordinary losses ((i) ordinary losses recognized between January 1, 2022 and May 31, 2022, and (ii) specified ordinary and currency losses recognized between November 1, 2021 and May 31, 2022).
Distributions to shareholders Distributions to shareholders from net investment income are recorded by the fund on the ex-dividend date. Distributions from capital gains, if any, are recorded on the ex-dividend date and paid at least annually. The amount and character of income and gains to be distributed are determined in accordance with income tax regulations, which may differ from generally accepted accounting principles. These differences include temporary and/or permanent differences from foreign currency gains and losses, from late year loss deferrals, from defaulted bond interest, from realized gains and losses on certain futures contracts, from unrealized gains and losses on certain futures contracts and from income on swap contracts. Reclassifications are made to the fund’s capital accounts to reflect income and gains available for distribution (or available capital loss carryovers) under income tax regulations. At the close of the reporting period, the fund reclassified $1,448,424 to decrease accumulated net investment loss and $1,448,424 to decrease accumulated net realized gain.
Tax cost of investments includes adjustments to net unrealized appreciation (depreciation) which may not necessarily be final tax cost basis adjustments, but closely approximate the tax basis unrealized gains and losses that may be realized and distributed to shareholders. The tax basis components of distributable earnings and the federal tax cost as of the close of the reporting period were as follows:
| Unrealized appreciation | $757,122 |
| Unrealized depreciation | (547,764) |
| Net unrealized appreciation | 209,358 |
| Post-October capital loss deferral | (717,457) |
| Late year ordinary loss deferral | (890,427) |
| Cost for federal income tax purposes | $11,453,143 |
Expenses of the Trust Expenses directly charged or attributable to any fund will be paid from the assets of that fund. Generally, expenses of the Trust will be allocated among and charged to the assets of each fund on a basis that the Trustees deem fair and equitable, which may be based on the relative assets of each fund or the nature of the services performed and relative applicability to each fund.
| 46 Dynamic Risk Allocation Fund |
Note 2: Management fee, administrative services and other transactions
The fund pays Putnam Management a management fee (based on the fund’s average net assets and computed and paid monthly) at annual rates that may vary based on the average of the aggregate net assets of all open-end mutual funds sponsored by Putnam Management (excluding net assets of funds that are invested in, or that are invested in by, other Putnam funds to the extent necessary to avoid “double counting” of those assets). Such annual rates may vary as follows:
| 0.880% | of the first $5 billion, | 0.680% | of the next $50 billion, | |
| 0.830% | of the next $5 billion, | 0.660% | of the next $50 billion, | |
| 0.780% | of the next $10 billion, | 0.650% | of the next $100 billion and | |
| 0.730% | of the next $10 billion, | 0.645% | of any excess thereafter. |
For the reporting period, the management fee represented an effective rate (excluding the impact from any expense waivers in effect) of 0.703% of the fund’s average net assets.
Putnam Management has contractually agreed, through September 30, 2023, to waive fees and/or reimburse the fund’s expenses to the extent necessary to limit the cumulative expenses of the fund, exclusive of brokerage, interest, taxes, investment-related expenses, extraordinary expenses, acquired fund fees and expenses and payments under the fund’s investor servicing contract, investment management contract and distribution plans, on a fiscal year-to-date basis to an annual rate of 0.20% of the fund’s average net assets over such fiscal year-to-date period. During the reporting period, the fund’s expenses were reduced by $195,219 as a result of this limit.
Putnam Management has also contractually agreed to waive fees (and, to the extent necessary, bear other expenses) of the fund through September 30, 2023, to the extent that total expenses of the fund (excluding brokerage, interest, taxes, investment-related expenses, payments under distribution plans, extraordinary expenses, payments under the fund’s investor servicing contract and acquired fund fees and expenses, but including payments under the fund’s investment management contract) would exceed an annual rate of 0.70% of the fund’s average net assets. During the reporting period, the fund’s expenses were reduced by $63,594 as a result of this limit.
Putnam Investments Limited (PIL), an affiliate of Putnam Management, is authorized by the Trustees to manage a separate portion of the assets of the fund as determined by Putnam Management from time to time. PIL did not manage any portion of the assets of the fund during the reporting period. If Putnam Management were to engage the services of PIL, Putnam Management would pay a quarterly sub-management fee to PIL for its services at an annual rate of 0.35% of the average net assets of the portion of the fund managed by PIL.
The fund reimburses Putnam Management an allocated amount for the compensation and related expenses of certain officers of the fund and their staff who provide administrative services to the fund. The aggregate amount of all such reimbursements is determined annually by the Trustees.
Custodial functions for the fund’s assets are provided by State Street. Custody fees are based on the fund’s asset level, the number of its security holdings and transaction volumes.
Putnam Investor Services, Inc., an affiliate of Putnam Management, provides investor servicing agent functions to the fund. Putnam Investor Services, Inc. received fees for investor servicing for class A, class B, class C, class R and class Y shares that included (1) a per account fee for each direct and underlying non-defined contribution account (retail account) of the fund; (2) a specified rate of the fund’s assets attributable to defined contribution plan accounts; and (3) a specified rate based on the average net assets in retail accounts. Putnam Investor Services, Inc. has agreed that the aggregate investor servicing fees for each fund’s retail and defined contribution accounts for these share classes will not exceed an annual rate of 0.25% of the fund’s average assets attributable to such accounts.
Class R6 shares paid a monthly fee based on the average net assets of class R6 shares at an annual rate of 0.05%.
| Dynamic Risk Allocation Fund 47 |
During the reporting period, the expenses for each class of shares related to investor servicing fees were as follows:
| Class A | $22,469 | Class R6 | 1,489 | |
| Class B | 1,230 | Class Y | 34,625 | |
| Class C | 2,946 | Total | $62,780 | |
| Class R | 21 |
The fund has entered into expense offset arrangements with Putnam Investor Services, Inc. and State Street whereby Putnam Investor Services, Inc.’s and State Street’s fees are reduced by credits allowed on cash balances. For the reporting period, the fund’s expenses were reduced by $747 under the expense offset arrangements.
Each Independent Trustee of the fund receives an annual Trustee fee, of which $10, as a quarterly retainer, has been allocated to the fund, and an additional fee for each Trustees meeting attended. Trustees also are reimbursed for expenses they incur relating to their services as Trustees.
The fund has adopted a Trustee Fee Deferral Plan (the Deferral Plan) which allows the Trustees to defer the receipt of all or a portion of Trustees fees payable on or after July 1, 1995. The deferred fees remain invested in certain Putnam funds until distribution in accordance with the Deferral Plan.
The fund has adopted an unfunded noncontributory defined benefit pension plan (the Pension Plan) covering all Trustees of the fund who have served as a Trustee for at least five years and were first elected prior to 2004. Benefits under the Pension Plan are equal to 50% of the Trustee’s average annual attendance and retainer fees for the three years ended December 31, 2005. The retirement benefit is payable during a Trustee’s lifetime, beginning the year following retirement, for the number of years of service through December 31, 2006. Pension expense for the fund is included in Trustee compensation and expenses in the Statement of operations. Accrued pension liability is included in Payable for Trustee compensation and expenses in the Statement of assets and liabilities. The Trustees have terminated the Pension Plan with respect to any Trustee first elected after 2003.
The fund has adopted distribution plans (the Plans) with respect to the following share classes pursuant to Rule 12b–1 under the Investment Company Act of 1940. The purpose of the Plans is to compensate Putnam Retail Management Limited Partnership, an indirect wholly-owned subsidiary of Putnam Investments, LLC, for services provided and expenses incurred in distributing shares of the fund. The Plans provide payments by the fund to Putnam Retail Management Limited Partnership at an annual rate of up to the following amounts (Maximum %) of the average net assets attributable to each class. The Trustees have approved payment by the fund at the following annual rate (Approved %) of the average net assets attributable to each class. During the reporting period, the class-specific expenses related to distribution fees were as follows:
| Maximum % | Approved % | Amount | |
| Class A | 0.35% | 0.25% | $26,521 |
| Class B | 1.00% | 1.00% | 5,788 |
| Class C | 1.00% | 1.00% | 13,886 |
| Class R | 1.00% | 0.50% | 50 |
| Total | $46,245 |
For the reporting period, Putnam Retail Management Limited Partnership, acting as underwriter, received net commissions of $639 from the sale of class A shares and received no monies in contingent deferred sales charges from redemptions of class B and class C shares.
A deferred sales charge of up to 1.00% is assessed on certain redemptions of class A shares. For the reporting period, Putnam Retail Management Limited Partnership, acting as underwriter, received no monies on class A redemptions.
| 48 Dynamic Risk Allocation Fund |
Note 3: Purchases and sales of securities
During the reporting period, the cost of purchases and the proceeds from sales, excluding short-term investments, were as follows:
| Cost of purchases | Proceeds from sales | |
| Investments in securities, including TBA commitments (Long-term) | $17,480,285 | $38,683,675 |
| U.S. government securities (Long-term) | — | — |
| Total | $17,480,285 | $38,683,675 |
The fund may purchase or sell investments from or to other Putnam funds in the ordinary course of business, which can reduce the fund’s transaction costs, at prices determined in accordance with SEC requirements and policies approved by the Trustees. During the reporting period, purchases or sales of long-term securities from or to other Putnam funds, if any, did not represent more than 5% of the fund’s total cost of purchases and/or total proceeds from sales.
Note 4: Capital shares
At the close of the reporting period, there were an unlimited number of shares of beneficial interest authorized. Transactions, including, if applicable, direct exchanges pursuant to share conversions, in capital shares were as follows:
| YEAR ENDED 5/31/22 | YEAR ENDED 5/31/21 | |||
| Class A | Shares | Amount | Shares | Amount |
| Shares sold | 114,979 | $985,820 | 170,604 | $1,839,396 |
| Shares issued in connection with | ||||
| reinvestment of distributions | 627,767 | 4,237,428 | — | — |
| 742,746 | 5,223,248 | 170,604 | 1,839,396 | |
| Shares repurchased | (468,916) | (3,598,118) | (220,971) | (2,413,988) |
| Net increase (decrease) | 273,830 | $1,625,130 | (50,367) | $(574,592) |
| YEAR ENDED 5/31/22 | YEAR ENDED 5/31/21 | |||
| Class B | Shares | Amount | Shares | Amount |
| Shares sold | 886 | $5,814 | 3 | $38 |
| Shares issued in connection with | ||||
| reinvestment of distributions | 32,798 | 215,154 | — | — |
| 33,684 | 220,968 | 3 | 38 | |
| Shares repurchased | (28,906) | (257,449) | (64,582) | (691,589) |
| Net increase (decrease) | 4,778 | $(36,481) | (64,579) | $(691,551) |
| YEAR ENDED 5/31/22 | YEAR ENDED 5/31/21 | |||
| Class C | Shares | Amount | Shares | Amount |
| Shares sold | 14,132 | $92,077 | 11,230 | $120,819 |
| Shares issued in connection with | ||||
| reinvestment of distributions | 82,926 | 547,311 | — | — |
| 97,058 | 639,388 | 11,230 | 120,819 | |
| Shares repurchased | (63,811) | (550,888) | (164,857) | (1,747,099) |
| Net increase (decrease) | 33,247 | $88,500 | (153,627) | $(1,626,280) |
| Dynamic Risk Allocation Fund 49 |
| YEAR ENDED 5/31/22 | YEAR ENDED 5/31/21 | |||
| Class R | Shares | Amount | Shares | Amount |
| Shares sold | — | $— | — | $— |
| Shares issued in connection with | ||||
| reinvestment of distributions | 597 | 4,066 | — | — |
| 597 | 4,066 | — | — | |
| Shares repurchased | — | — | — | — |
| Net increase | 597 | $4,066 | — | $— |
| YEAR ENDED 5/31/22 | YEAR ENDED 5/31/21 | |||
| Class R6 | Shares | Amount | Shares | Amount |
| Shares sold | 40,221 | $318,236 | 492,251 | $5,379,801 |
| Shares issued in connection with | ||||
| reinvestment of distributions | 71,223 | 483,606 | — | — |
| 111,444 | 801,842 | 492,251 | 5,379,801 | |
| Shares repurchased | (1,899,820) | (21,123,033) | (687,360) | (7,558,938) |
| Net decrease | (1,788,376) | $(20,321,191) | (195,109) | $(2,179,137) |
| YEAR ENDED 5/31/22 | YEAR ENDED 5/31/21 | |||
| Class Y | Shares | Amount | Shares | Amount |
| Shares sold | 99,860 | $1,026,607 | 1,084,343 | $11,856,819 |
| Shares issued in connection with | ||||
| reinvestment of distributions | 176,969 | 1,244,090 | — | — |
| 276,829 | 2,270,697 | 1,084,343 | 11,856,819 | |
| Shares repurchased | (4,296,891) | (48,009,530) | (746,170) | (8,160,665) |
| Net increase (decrease) | (4,020,062) | $(45,738,833) | 338,173 | $3,696,154 |
At the close of the reporting period, Putnam Investments, LLC owned 1,521 class R shares of the fund (100% of class R shares outstanding), valued at $8,871.
At the close of the reporting period, a shareholder of record owned 8.0% of the outstanding shares of the fund.
| 50 Dynamic Risk Allocation Fund |
Note 5: Affiliated transactions
Transactions during the reporting period with any company which is under common ownership or control were as follows:
| Shares | |||||
| outstanding | |||||
| and fair | |||||
| Fair value as | Purchase | Sale | Investment | value as | |
| Name of affiliate | of 5/31/21 | cost | proceeds | income | of 5/31/22 |
| Short-term investments | |||||
| Putnam Cash Collateral | |||||
| Pool, LLC* | $— | $134,400 | $134,400 | $5 | $— |
| Putnam Short Term | |||||
| Investment Fund** | 19,944,551 | 10,321,491 | 20,838,313 | 19,898 | 9,427,729 |
| Total Short-term | |||||
| investments | $19,944,551 | $10,455,891 | $20,972,713 | $19,903 | $9,427,729 |
* No management fees are charged to Putnam Cash Collateral Pool, LLC (Note 1). Investment income shown is included in securities lending income on the Statement of operations. There were no realized or unrealized gains or losses during the period.
** Management fees charged to Putnam Short Term Investment Fund have been waived by Putnam Management. There were no realized or unrealized gains or losses during the period.
Note 6: Market, credit and other risks
In the normal course of business, the fund trades financial instruments and enters into financial transactions where risk of potential loss exists due to changes in the market (market risk) or failure of the contracting party to the transaction to perform (credit risk). The fund may be exposed to additional credit risk that an institution or other entity with which the fund has unsettled or open transactions will default. Investments in foreign securities involve certain risks, including those related to economic instability, unfavorable political developments, and currency fluctuations. The fund may invest in higher-yielding, lower-rated bonds that may have a higher rate of default.
On July 27, 2017, the United Kingdom’s Financial Conduct Authority (“FCA”), which regulates LIBOR, announced its intention to cease compelling banks to provide the quotations needed to sustain LIBOR after 2021. ICE Benchmark Administration, the administrator of LIBOR, ceased publication of most LIBOR settings on a representative basis at the end of 2021 and is expected to cease publication of a majority of U.S. dollar LIBOR settings on a representative basis after June 30, 2023. In addition, global regulators have announced that, with limited exceptions, no new LIBOR-based contracts should be entered into after 2021.LIBOR has historically been a common benchmark interest rate index used to make adjustments to variable-rate loans. It is used throughout global banking and financial industries to determine interest rates for a variety of financial instruments and borrowing arrangements. Actions by regulators have resulted in the establishment of alternative reference rates to LIBOR in most major currencies. Various financial industry groups have been planning for the transition away from LIBOR, but there are obstacles to converting certain longer-term securities and transactions to new reference rates. Markets are developing slowly and questions around liquidity in these rates and how to appropriately adjust these rates to mitigate any economic value transfer at the time of transition remain a significant concern. Neither the effect of the transition process nor its ultimate success can yet be known. The transition process might lead to increased volatility and illiquidity in markets that rely on LIBOR to determine interest rates. It could also lead to a reduction in the value of some LIBOR-based investments and reduce the effectiveness of related transactions, such as hedges. While some LIBOR-based instruments may contemplate a scenario where LIBOR is no longer available by providing for an alternative rate-setting methodology, not all may have such provisions and there may be significant uncertainty regarding the effectiveness of any such alternative methodologies. Since the usefulness of LIBOR as a benchmark could deteriorate during the transition period, these effects could occur at any time.
Beginning in January 2020, global financial markets have experienced, and may continue to experience, significant volatility resulting from the spread of a virus known as Covid–19. The outbreak of Covid–19 has resulted in travel and border restrictions, quarantines, supply chain disruptions, lower consumer demand, and general market uncertainty. The effects of Covid–19 have adversely affected, and may continue to adversely affect, the global economy, the economies of certain nations, and individual issuers, all of which may negatively impact the fund’s performance.
| Dynamic Risk Allocation Fund 51 |
Note 7: Summary of derivative activity
The volume of activity for the reporting period for any derivative type that was held during the period is listed below and was based on an average of the holdings at the end of each fiscal quarter:
| Purchased equity option contracts (contract amount) | $70 |
| Purchased currency option contracts (contract amount) | $1,300,000 |
| Written equity option contracts (contract amount) | $70 |
| Written currency option contracts (contract amount) | $950,000 |
| Futures contracts (number of contracts) | 300 |
| Forward currency contracts (contract amount) | $89,700,000 |
| Centrally cleared interest rate swap contracts (notional) | $3,300,000 |
| OTC total return swap contracts (notional) | $22,300,000 |
| Centrally cleared total return swap contracts (notional) | $4,100,000 |
| OTC credit default contracts (notional) | $120,000 |
| Centrally cleared credit default contracts (notional) | $2,000,000 |
The following is a summary of the fair value of derivative instruments as of the close of the reporting period:
| Fair value of derivative instruments as of the close of the reporting period | ||||
| ASSET DERIVATIVES | LIABILITY DERIVATIVES | |||
| Derivatives not | ||||
| accounted for as | Statement of | Statement of | ||
| hedging instruments | assets and | assets and | ||
| under ASC 815 | liabilities location | Fair value | liabilities location | Fair value |
| Foreign exchange | ||||
| contracts | Receivables | $23,693 | Payables | $121,530 |
| Investments, | Payables, Net assets — | |||
| Equity contracts | Receivables | 60,795 | Unrealized depreciation | 58,895* |
| Receivables, Net | ||||
| assets — Unrealized | Payables, Net assets — | |||
| Interest rate contracts | appreciation | — | Unrealized depreciation | 327,721* |
| Total | $84,488 | $508,146 | ||
* Includes cumulative appreciation/depreciation of futures contracts as reported in the fund’s portfolio. Only current day’s variation margin is reported within the Statement of assets and liabilities.
| 52 Dynamic Risk Allocation Fund |
The following is a summary of realized and change in unrealized gains or losses of derivative instruments in the Statement of operations for the reporting period (Note 1):
| Amount of realized gain or (loss) on derivatives recognized in net gain or (loss) on investments | |||||
| Derivatives not accounted | Forward | ||||
| for as hedging instruments | currency | ||||
| under ASC 815 | Options | Futures | contracts | Swaps | Total |
| Credit contracts | $— | $— | $— | $143,103 | $143,103 |
| Foreign exchange contracts | (6,596) | — | (1,029,901) | — | $(1,036,497) |
| Equity contracts | — | (455,294) | — | (569,690) | $(1,024,984) |
| Interest rate contracts | — | 835,437 | — | 2,197,993 | $3,033,430 |
| Total | $(6,596) | $380,143 | $(1,029,901) | $1,771,406 | $1,115,052 |
| Change in unrealized appreciation or (depreciation) on derivatives recognized in net gain or (loss) | |||||
| on investments | |||||
| Derivatives not accounted | Forward | ||||
| for as hedging instruments | currency | ||||
| under ASC 815 | Options | Futures | contracts | Swaps | Total |
| Credit contracts | $— | $— | $— | $(103,327) | $(103,327) |
| Foreign exchange contracts | — | — | (455,186) | — | $(455,186) |
| Equity contracts | 9,086 | (11,851) | — | (541,465) | $(544,230) |
| Interest rate contracts | — | (127,236) | — | 37,382 | $(89,854) |
| Total | $9,086 | $(139,087) | $(455,186) | $(607,410) | $(1,192,597) |
| Dynamic Risk Allocation Fund 53 |
Note 8: Offsetting of financial and derivative assets and liabilities
The following table summarizes any derivatives, repurchase agreements and reverse repurchase agreements, at the end of the reporting period, that are subject to an enforceable master netting agreement or similar agreement. For securities lending transactions or borrowing transactions associated with securities sold short, if any, see Note 1. For financial reporting purposes, the fund does not offset financial assets and financial liabilities that are subject to the master netting agreements in the Statement of assets and liabilities.
| Bank of America N.A. | BofA Securities, Inc. | Citibank, N.A. | Goldman Sachs International | HSBC Bank USA, National Association | JPMorgan Chase Bank N.A. | JPMorgan Securities LLC | Morgan Stanley & Co. International PLC | NatWest Markets PLC | State Street Bank and Trust Co. | Toronto- Dominion Bank | UBS AG | WestPac Banking Corp. | Total | |
| Assets: | ||||||||||||||
| OTC Total return swap contracts*# | $12,319 | $— | $— | $— | $— | $47,788 | $— | $— | $— | $— | $— | $— | $— | $60,107 |
| Futures contracts§ | — | 3,569 | — | — | — | — | — | — | — | — | — | — | — | 3,569 |
| Forward currency contracts# | 610 | — | 669 | 672 | 2,595 | 8,776 | — | 3,156 | 1,886 | 3,379 | 934 | 564 | 452 | 23,693 |
| Purchased options**# | — | — | — | — | — | 688 | — | — | — | — | — | — | — | 688 |
| Repurchase agreements** | — | 552,000 | — | — | — | — | — | — | — | — | — | — | — | 552,000 |
| Total Assets | $12,929 | $555,569 | $669 | $672 | $2,595 | $57,252 | $— | $3,156 | $1,886 | $3,379 | $934 | $564 | $452 | $640,057 |
| Liabilities: | ||||||||||||||
| OTC Total return swap contracts*# | 12,658 | — | 13,917 | — | — | — | — | — | — | — | — | — | — | 26,575 |
| Futures contracts§ | — | 2,450 | — | — | — | — | 65,730 | — | — | — | — | — | — | 68,180 |
| Forward currency contracts# | 112 | — | 29,578 | — | 576 | 83,484 | — | — | — | 318 | — | 7,462 | — | 121,530 |
| Written options# | — | — | — | — | — | 13,236 | — | — | — | — | — | — | — | 13,236 |
| Total Liabilities | $12,770 | $2,450 | $43,495 | $— | $576 | $96,720 | $65,730 | $— | $— | $318 | $— | $7,462 | $— | $229,521 |
| Total Financial and Derivative | ||||||||||||||
| Net Assets | $159 | $553,119 | $(42,826) | $672 | $2,019 | $(39,468) | $(65,730) | $3,156 | $1,886 | $3,061 | $934 | $(6,898) | $452 | $410,536 |
| Total collateral received (pledged)†## | $— | $553,119 | $— | $— | $— | $(39,468) | $— | $(31,987) | $— | $— | $— | $— | $— | |
| Net amount | $159 | $— | $(42,826) | $672 | $2,019 | $— | $(65,730) | $35,143 | $1,886 | $3,061 | $934 | $(6,898) | $452 | |
| Controlled collateral received (including | ||||||||||||||
| TBA commitments)** | $— | $— | $— | $— | $— | $— | $— | $— | $— | $— | $— | $— | $— | $— |
| Uncontrolled collateral received | $— | $563,040 | $— | $— | $— | $— | $— | $— | $— | $— | $— | $— | $— | $563,040 |
| Collateral (pledged) (including | ||||||||||||||
| TBA commitments)** | $— | $— | $— | $— | $— | $(119,952) | $— | $(31,987) | $— | $— | $— | $— | $— | $(151,939) |
* Excludes premiums, if any. Included in unrealized appreciation and depreciation on OTC swap contracts on the Statement of assets and liabilities.
** Included with Investments in securities on the Statement of assets and liabilities.
† Additional collateral may be required from certain brokers based on individual agreements.
# Covered by master netting agreement (Note 1).
## Any over-collateralization of total financial and derivative net assets is not shown. Collateral may include amounts related to unsettled agreements.
§ Includes current day’s variation margin only as reported on the Statement of assets and liabilities, which is not collateralized. Cumulative appreciation/(depreciation) for futures contracts is represented in the tables listed after the fund’s portfolio. Collateral pledged for initial margin on futures contracts, which is not included in the table above, amounted to $247,896.
| 54 Dynamic Risk Allocation Fund | Dynamic Risk Allocation Fund 55 |
Note 9: New accounting pronouncements
In March 2020, the Financial Accounting Standards Board (FASB) issued Accounting Standards Update (ASU) 2020–04, Reference Rate Reform (Topic 848) — Facilitation of the Effects of Reference Rate Reform on Financial Reporting. The amendments in ASU 2020–04 provide optional temporary financial reporting relief from the effect of certain types of contract modifications due to the planned discontinuation of LIBOR and other interbank-offered based reference rates as of the end of 2021. The discontinuation of LIBOR was subsequently extended to June 30, 2023. ASU 2020–04 is effective for certain reference rate-related contract modifications that occur during the period March 12, 2020 through December 31, 2022. Management expects that the adoption of the guidance will not have a material impact on the fund’s financial statements.
| 56 Dynamic Risk Allocation Fund |
Federal tax information (Unaudited)
Pursuant to §852 of the Internal Revenue Code, as amended, the fund hereby designates $2,492,985 as a capital gain dividend with respect to the taxable year ended May 31, 2022, or, if subsequently determined to be different, the net capital gain of such year.
For the reporting period, a portion of the fund’s distribution represents a return of capital and is therefore not taxable to shareholders. The return of capital is partly due to foreign currency losses and/or losses on swaps.
For the reporting period, the fund hereby designates 4.53%, or the maximum amount allowable, of its taxable ordinary income distributions as qualified dividends taxed at the individual net capital gain rates.
The Form 1099 that will be mailed to you in January 2023 will show the tax status of all distributions paid to your account in calendar 2022.
| Dynamic Risk Allocation Fund 57 |

| 58 Dynamic Risk Allocation Fund |

* Mr. Reynolds is an “interested person” (as defined in the Investment Company Act of 1940) of the fund and Putnam Investments. He is President and Chief Executive Officer of Putnam Investments, as well as the President of your fund and each of the other Putnam funds.
The address of each Trustee is 100 Federal Street, Boston, MA 02110.
As of May 31, 2022, there were 100 funds in the Putnam fund complex, including 96 Putnam Funds and four funds in Putnam ETF Trust. Mses. Pillai and Murphy serve as Trustees of 76 Putnam Funds, and each other Trustee serves as Trustee of all Putnam Funds. In addition to serving as Trustees of the Putnam Funds, Dr. Hill, Mses. Domotorffy and Sutphen, and Mr. Ahamed serve as Trustees of Putnam ETF Trust.
Each Trustee serves for an indefinite term, until his or her resignation, retirement at age 75, removal, or death.
| Dynamic Risk Allocation Fund 59 |
Officers
In addition to Robert L. Reynolds, the other officers of the fund are shown below:
| James F. Clark (Born 1974) | Alan G. McCormack (Born 1964) |
| Vice President and Chief Compliance Officer | Vice President and Derivatives Risk Manager |
| Since 2016 | Since 2022 |
| Chief Compliance Officer and Chief Risk Officer, | Head of Quantitative Equities and Risk, |
| Putnam Investments, and Chief Compliance Officer, | Putnam Investments |
| Putnam Management | |
| Denere P. Poulack (Born 1968) | |
| Nancy E. Florek (Born 1957) | Assistant Vice President, Assistant Clerk, |
| Vice President, Director of Proxy Voting and Corporate | and Assistant Treasurer |
| Governance, Assistant Clerk, and Assistant Treasurer | Since 2004 |
| Since 2000 | |
| Janet C. Smith (Born 1965) | |
| Michael J. Higgins (Born 1976) | Vice President, Principal Financial Officer, Principal |
| Vice President, Treasurer, and Clerk | Accounting Officer, and Assistant Treasurer |
| Since 2010 | Since 2007 |
| Head of Fund Administration Services, | |
| Jonathan S. Horwitz (Born 1955) | Putnam Investments and Putnam Management |
| Executive Vice President, Principal Executive Officer, | |
| and Compliance Liaison | Stephen J. Tate (Born 1974) |
| Since 2004 | Vice President and Chief Legal Officer |
| Since 2021 | |
| Richard T. Kircher (Born 1962) | General Counsel, Putnam Investments, |
| Vice President and BSA Compliance Officer | Putnam Management, and Putnam Retail Management |
| Since 2019 | |
| Assistant Director, Operational Compliance, Putnam | Mark C. Trenchard (Born 1962) |
| Investments and Putnam Retail Management | Vice President |
| Since 2002 | |
| Martin Lemaire (Born 1984) | Director of Operational Compliance, Putnam |
| Vice President and Derivatives Risk Manager | Investments and Putnam Retail Management |
| Since 2022 | |
| Risk Manager and Risk Analyst, Putnam Investments | |
| Susan G. Malloy (Born 1957) | |
| Vice President and Assistant Treasurer | |
| Since 2007 | |
| Head of Accounting and Middle Office Services, | |
| Putnam Investments and Putnam Management | |
The principal occupations of the officers for the past five years have been with the employers as shown above, although in some cases they have held different positions with such employers. The address of each officer is 100 Federal Street, Boston, MA 02110.
| 60 Dynamic Risk Allocation Fund |
Fund information
Founded over 80 years ago, Putnam Investments was built around the concept that a balance between risk and reward is the hallmark of a well-rounded financial program. We manage funds across income, value, blend, growth, sustainable, asset allocation, absolute return, and global sector categories.
| Investment Manager | Trustees | Richard T. Kircher |
| Putnam Investment | Kenneth R. Leibler, Chair | Vice President and |
| Management, LLC | Barbara M. Baumann, Vice Chair | BSA Compliance Officer |
| 100 Federal Street | Liaquat Ahamed | |
| Boston, MA 02110 | Katinka Domotorffy | Martin Lemaire |
| Catharine Bond Hill | Vice President and | |
| Investment Sub-Advisor | Jennifer Williams Murphy | Derivatives Risk Manager |
| Putnam Investments Limited | Marie Pillai | |
| 16 St James’s Street | George Putnam, III | Susan G. Malloy |
| London, England SW1A 1ER | Robert L. Reynolds | Vice President and |
| Manoj P. Singh | Assistant Treasurer | |
| Marketing Services | Mona K. Sutphen | |
| Putnam Retail Management | Alan G. McCormack | |
| Limited Partnership | Officers | Vice President and |
| 100 Federal Street | Robert L. Reynolds | Derivatives Risk Manager |
| Boston, MA 02110 | President | |
| Denere P. Poulack | ||
| Custodian | James F. Clark | Assistant Vice President, |
| State Street Bank | Vice President, Chief Compliance | Assistant Clerk, and |
| and Trust Company | Officer, and Chief Risk Officer | Assistant Treasurer |
| Legal Counsel | Nancy E. Florek | Janet C. Smith |
| Ropes & Gray LLP | Vice President, Director of | Vice President, |
| Proxy Voting and Corporate | Principal Financial Officer, | |
| Independent Registered | Governance, Assistant Clerk, | Principal Accounting Officer, |
| Public Accounting Firm | and Assistant Treasurer | and Assistant Treasurer |
| PricewaterhouseCoopers LLP | ||
| Michael J. Higgins | Stephen J. Tate | |
| Vice President, Treasurer, | Vice President and | |
| and Clerk | Chief Legal Officer | |
| Jonathan S. Horwitz | Mark C. Trenchard | |
| Executive Vice President, | Vice President | |
| Principal Executive Officer, | ||
| and Compliance Liaison |
This report is for the information of shareholders of Putnam Dynamic Risk Allocation Fund. It may also be used as sales literature when preceded or accompanied by the current prospectus, the most recent copy of Putnam’s Quarterly Performance Summary, and Putnam’s Quarterly Ranking Summary. For more recent performance, please visit putnam.com. Investors should carefully consider the investment objectives, risks, charges, and expenses of a fund, which are described in its prospectus. For this and other information or to request a prospectus or summary prospectus, call 1-800-225-1581 toll free. Please read the prospectus carefully before investing. The fund’s Statement of Additional Information contains additional information about the fund’s Trustees and is available without charge upon request by calling 1-800-225-1581.

| Item 2. Code of Ethics: |
| (a) The fund’s principal executive, financial and accounting officers are employees of Putnam Investment Management, LLC, the Fund’s investment manager. As such they are subject to a comprehensive Code of Ethics adopted and administered by Putnam Investments which is designed to protect the interests of the firm and its clients. The Fund has adopted a Code of Ethics which incorporates the Code of Ethics of Putnam Investments with respect to all of its officers and Trustees who are employees of Putnam Investment Management, LLC. For this reason, the Fund has not adopted a separate code of ethics governing its principal executive, financial and accounting officers. |
| Item 3. Audit Committee Financial Expert: |
| The Funds’ Audit, Compliance and Risk Committee is comprised solely of Trustees who are “independent” (as such term has been defined by the Securities and Exchange Commission (“SEC”) in regulations implementing Section 407 of the Sarbanes-Oxley Act (the “Regulations”)). The Trustees believe that each member of the Audit, Compliance and Risk Committee also possesses a combination of knowledge and experience with respect to financial accounting matters, as well as other attributes, that qualifies him or her for service on the Committee. In addition, the Trustees have determined that each of Dr. Hill, Dr. Joskow, and Mr. Singh qualifies as an “audit committee financial expert” (as such term has been defined by the Regulations) based on their review of his or her pertinent experience and education; in the case of Dr. Joskow, including his experience serving on the audit committees of several public companies and institutions and his education and experience as an economist who studies companies and industries, routinely using public company financial statements in his research. The SEC has stated, and the funds’ amended and restated agreement and Declaration of Trust provides, that the designation or identification of a person as an audit committee financial expert pursuant to this Item 3 of Form N-CSR does not impose on such person any duties, obligations or liability that are greater than the duties, obligations and liability imposed on such person as a member of the Audit, Compliance and Risk Committee and the Board of Trustees in the absence of such designation or identification. |
| Item 4. Principal Accountant Fees and Services: |
| The following table presents fees billed in each of the last two fiscal years for services rendered to the fund by the fund’s independent auditor: |
| Fiscal year ended | Audit Fees | Audit-Related Fees | Tax Fees | All Other Fees | |
| May 31, 2022 | $85,658 | $ — | $11,556 | $ — | |
| May 31, 2021 | $70,054 | $ — | $16,273 | $ — | |
| For the fiscal years ended May 31, 2022 and May 31, 2021, the fund’s independent auditor billed aggregate non-audit fees in the amounts of $340,507 and $325,573 respectively, to the fund, Putnam Management and any entity controlling, controlled by or under common control with Putnam Management that provides ongoing services to the fund. |
| Audit Fees represent fees billed for the fund’s last two fiscal years relating to the audit and review of the financial statements included in annual reports and registration statements, and other services that are normally provided in connection with statutory and regulatory filings or engagements. |
| Audit-Related Fees represent fees billed in the fund’s last two fiscal years for services traditionally performed by the fund’s auditor, including accounting consultation for proposed transactions or concerning financial accounting and reporting standards and other audit or attest services not required by statute or regulation. |
| Tax Fees represent fees billed in the fund’s last two fiscal years for tax compliance, tax planning and tax advice services. Tax planning and tax advice services include assistance with tax audits, employee benefit plans and requests for rulings or technical advice from taxing authorities. |
| Pre-Approval Policies of the Audit, Compliance and Risk Committee. The Audit, Compliance and Risk Committee of the Putnam funds has determined that, as a matter of policy, all work performed for the funds by the funds’ independent auditors will be pre-approved by the Committee itself and thus will generally not be subject to pre-approval procedures. |
| The Audit, Compliance and Risk Committee also has adopted a policy to pre-approve the engagement by Putnam Management and certain of its affiliates of the funds’ independent auditors, even in circumstances where pre-approval is not required by applicable law. Any such requests by Putnam Management or certain of its affiliates are typically submitted in writing to the Committee and explain, among other things, the nature of the proposed engagement, the estimated fees, and why this work should be performed by that particular audit firm as opposed to another one. In reviewing such requests, the Committee considers, among other things, whether the provision of such services by the audit firm are compatible with the independence of the audit firm. |
| The following table presents fees billed by the fund’s independent auditor for services required to be approved pursuant to paragraph (c)(7)(ii) of Rule 2–01 of Regulation S-X. |
| Fiscal year ended | Audit-Related Fees | Tax Fees | All Other Fees | Total Non-Audit Fees | |
| May 31, 2022 | $ — | $328,951 | $ — | $ — | |
| May 31, 2021 | $ — | $309,300 | $ — | $ — | |
| Item 5. Audit Committee of Listed Registrants |
| Not applicable |
| Item 6. Schedule of Investments: |
| The registrant’s schedule of investments in unaffiliated issuers is included in the report to shareholders in Item 1 above. |
| Item 7. Disclosure of Proxy Voting Policies and Procedures For Closed-End Management Investment Companies: |
| Not applicable |
| Item 8. Portfolio Managers of Closed-End Investment Companies |
| Not Applicable |
| Item 9. Purchases of Equity Securities by Closed-End Management Investment Companies and Affiliated Purchasers: |
| Not applicable |
| Item 10. Submission of Matters to a Vote of Security Holders: |
| Not applicable |
| Item 11. Controls and Procedures: |
| (a) The registrant’s principal executive officer and principal financial officer have concluded, based on their evaluation of the effectiveness of the design and operation of the registrant’s disclosure controls and procedures as of a date within 90 days of the filing date of this report, that the design and operation of such procedures are generally effective to provide reasonable assurance that information required to be disclosed by the registrant in this report is recorded, processed, summarized and reported within the time periods specified in the Commission’s rules and forms. |
| (b) Changes in internal control over financial reporting: Not applicable |
| Item 12. Disclosures of Securities Lending Activities for Closed-End Management Investment Companies: |
| Not Applicable |
| Item 13. Exhibits: |
| (a)(1) The Code of Ethics of The Putnam Funds, which incorporates the Code of Ethics of Putnam Investments, is filed herewith. |
| (b) The certifications required by Rule 30a-2(b) under the Investment Company Act of 1940, as amended, are filed herewith. |
| SIGNATURES |
| Pursuant to the requirements of the Securities Exchange Act of 1934 and the Investment Company Act of 1940, the registrant has duly caused this report to be signed on its behalf by the undersigned, thereunto duly authorized. |
| Putnam Funds Trust |
| By (Signature and Title): |
| /s/ Janet C. Smith Janet C. Smith Principal Accounting Officer |
| Date: July 28, 2022 |
| Pursuant to the requirements of the Securities Exchange Act of 1934 and the Investment Company Act of 1940, this report has been signed below by the following persons on behalf of the registrant and in the capacities and on the dates indicated. |
| By (Signature and Title): |
| /s/ Jonathan S. Horwitz Jonathan S. Horwitz Principal Executive Officer |
| Date: July 28, 2022 |
| By (Signature and Title): |
| /s/ Janet C. Smith Janet C. Smith Principal Financial Officer |
| Date: July 28, 2022 |