| | |
| UNITED STATES
SECURITIES AND EXCHANGE COMMISSION |
| | |
| CERTIFIED SHAREHOLDER REPORT OF REGISTERED
MANAGEMENT INVESTMENT COMPANIES
|
| | |
| Investment Company Act file number: | (811-07513) |
| | |
| Exact name of registrant as specified in charter: | Putnam Funds Trust |
| | |
| Address of principal executive offices: | 100 Federal Street, Boston, Massachusetts 02110 |
| | |
| Name and address of agent for service: | Stephen Tate, Vice President
100 Federal Street
Boston, Massachusetts 02110 |
| | |
| Copy to: | Bryan Chegwidden, Esq.
Ropes & Gray LLP
1211 Avenue of the Americas
New York, New York 10036 |
| | |
| Registrant’s telephone number, including area code: | (617) 292-1000 |
| | |
| Date of fiscal year end: | May 31, 2023 |
| | |
| Date of reporting period: | June 1, 2022 – November 30, 2022 |
| | |
|
Item 1. Report to Stockholders: | |
| | |
| The following is a copy of the report transmitted to stockholders pursuant to Rule 30e-1 under the Investment Company Act of 1940: | |
Putnam
Mortgage Opportunities
Fund
Semiannual report
11 | 30 | 22
Message from the Trustees
January 12, 2023
Dear Fellow Shareholder:
As an investor, you might be happy to see 2022 in the rearview mirror. High inflation and aggressive interest-rate increases from the U.S. Federal Reserve contributed to market volatility and negative returns for stocks and bonds.
While inflation and interest rates are still high, the possibility remains that 2023 could be a better year for market returns than 2022. Historically, stocks and bonds have recovered from bear markets like the one we have been experiencing. Our investment teams are actively researching securities with attractive performance potential and working to keep portfolio risks in check.
We would like to note recent changes to the Board of Trustees that oversees your fund. In July 2022, we welcomed Jennifer Williams Murphy and Marie Pillai as new Trustees. Both have a wealth of investment advisory and executive management experience. We also want to thank our Trustees who retired from the Board on June 30, 2022. Paul Joskow served with us since 1997, and Ravi Akhoury joined the Board in 2009. We wish them well.
Thank you for investing with Putnam.

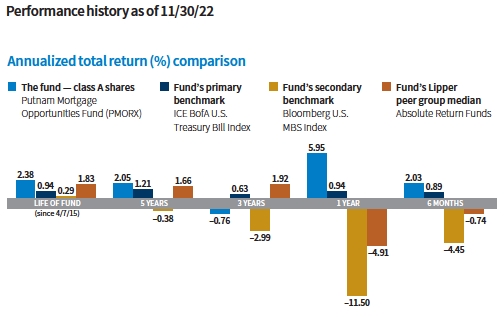
Current performance may be lower or higher than the quoted past performance, which cannot guarantee future results. Share price, principal value, and return will fluctuate, and you may have a gain or a loss when you sell your shares. Performance of class A shares assumes reinvestment of distributions and does not account for taxes. Fund returns in the bar chart do not reflect a sales charge of 4.00%; had they, returns would have been lower. Performance for class A shares before their inception (7/1/19) is derived from the historical performance of class I shares and has been adjusted for the higher operating expenses for class A shares. See below and pages 7–8 for additional performance information. For the periods, the fund had expense limitations, without which returns would have been lower. To obtain the most recent month-end performance, visit putnam.com.
Returns for periods of less than one year are not annualized.
All Bloomberg indices are provided by Bloomberg Index Services Limited.
Lipper peer group median is provided by Lipper, a Refinitiv company.
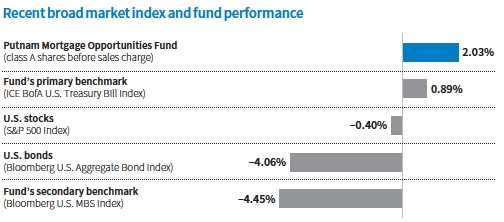
This comparison shows your fund’s performance in the context of broad market indexes for the six months ended 11/30/22. See above and pages 7–8 for additional fund performance information. Index descriptions can be found on pages 11–12.
All Bloomberg indices are provided by Bloomberg Index Services Limited.
|
| 2 Mortgage Opportunities Fund |


Brett, please describe investing conditions during the reporting period.
Financial markets were challenged by multiple, converging risks in the macroeconomy. High inflation, rising interest rates, and the Russia-Ukraine War weighed on investor sentiment. China’s zero-Covid-19 policy caused periodic lockdowns, worsening supply chain issues. New U.S. trade restrictions on China’s technology sector also stoked global growth concerns.
In the U.S., combating inflation remained a top priority of the Federal Reserve. In June 2022, inflation peaked to a 40-year high of 9.1%. In response, the Fed turned more hawkish, making four consecutive interest-rate hikes of 0.75% during the period. Borrowing rates moved from 0.00%–0.25% in early calendar 2022 to 3.75%–4.00% by period-end. Investors feared the Fed’s aggressive tactics would tip the U.S. economy into a recession.
By November 2022, inflation showed signs of improvement. While still near multidecade highs, the pace of inflation declined to 7.1%, as measured by the Consumer Price Index. Better-than-expected corporate earnings and steady employment helped lift investor sentiment near period-end.
Overall, credit spreads widened and bond yields rose. [Spreads are the yield advantage credit-sensitive bonds offer over comparable-maturity U.S. Treasuries. Bond prices rise as yield spreads tighten and decline as spreads widen.] The yield on the benchmark 10-year Treasury note climbed from 2.85% at the start of the period to a high of 4.25% in October 2022 before finishing the period at 3.68%. At times, yields on shorter-term U.S. Treasuries edged above those of longer-term Treasuries. This created a flat or inverted yield curve, which often signals a recession.
|
| Mortgage Opportunities Fund 3 |
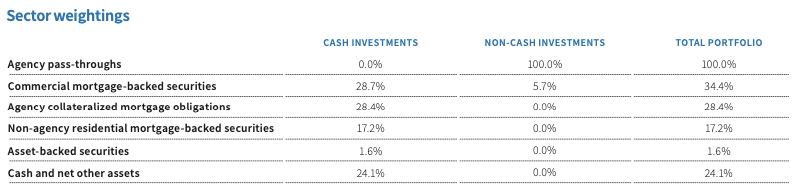
Allocations are shown as a percentage of the fund’s net assets as of 11/30/22. Cash and net other assets, if any, represent the market value weights of cash, derivatives, short-term securities, and other unclassified assets in the portfolio. Summary information may differ from the portfolio schedule included in the financial statements due to the inclusion of derivative securities, any interest accruals, the use of different classifications of securities for presentation purposes, and rounding. Allocations may not total 100% because the chart includes the notional value (non-cash investments) of certain derivatives (the economic value for purposes of calculating periodic payment obligations), including to-be-announced mortgage security trades, if any, in addition to the market value of securities. Holdings and allocations may vary over time.
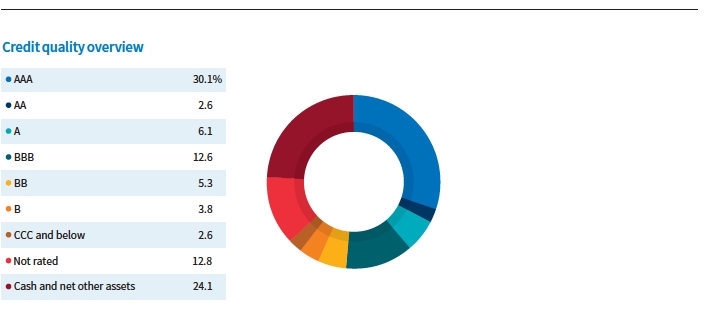
Credit qualities are shown as a percentage of the fund’s net assets as of 11/30/22. A bond rated BBB or higher (A-3 or higher, for short-term debt) is considered investment grade. This chart reflects the highest security rating provided by one or more of Standard & Poor’s, Moody’s, and Fitch. Ratings and portfolio credit quality will vary over time.
Cash and net other assets, if any, represent the market value weights of cash, derivatives, and short-term securities in the portfolio. The fund itself has not been rated by an independent rating agency. Data in the chart reflect a new calculation methodology put into effect on 6/30/22.
|
| 4 Mortgage Opportunities Fund |

Would you remind us of the fund’s investment process?
The fund focuses on multiple securitized sectors, including investing in agency collateralized mortgage obligations [CMOs], commercial mortgage-backed securities [CMBS], and residential mortgage-backed securities [RMBS]. Exposure to these sectors allows us to diversify the fund’s risk across mortgage prepayment, commercial mortgage, and residential credit dynamics. We expect to use derivatives and agency pass-throughs to hedge interest-rate and other portfolio risks. Derivatives also can help increase or adjust our exposure to commercial and agency mortgage-backed investments.
How did the fund perform for the reporting period?
The fund’s class A shares returned 2.03%, outperforming its primary benchmark, the ICE BofA U.S. Treasury Bill Index, which returned 0.89% for the period. The fund also outperformed its secondary benchmark, the Bloomberg U.S. MBS Index, which returned –4.45%.
Which holdings and strategies impacted fund performance for the reporting period?
Our allocation to CMBS, including mezzanine CMBS cash bonds and exposure to CMBX, added the most value. [CMBX is a group of tradable indexes that each reference a basket of 25 CMBS issued in a particular year.] Despite broad market volatility, CMBS fundamentals continued to strengthen, which benefited our CMBS positions. Cash flow forecasts improved, boosted by rent and occupancy growth. Forbearance agreements and other loan modifications issued on well-managed properties drove delinquency rates lower and reduced the number of distressed liquidations, in our view.
Exposure to residential mortgage credit, led by our seasoned credit risk transfer [CRT] holdings, marginally contributed to results. CRT bonds were tendered by issuers, and many were upgraded by rating agencies during the period, which benefited our holdings. Most borrowers who became delinquent on their loans post-pandemic resumed their payments or worked out loan modifications. We believe this trend will continue, which, in our view, should minimize losses for bond investors and buffer the portfolio against a likely challenged housing market due to higher mortgage rates and a slowing economy.
Prepayment strategies, driven by our mortgage basis [the difference between longer-term U.S. Treasury yields and the interest rates on 30-year home mortgages] positioning and reverse mortgage IO [interest-only] holdings, also contributed to fund performance. Given the extensive widening of the mortgage basis at the start of calendar 2022, we considered the risk of further widening to be low. During the period, we shifted to a long position to the mortgage basis, which aided results as the mortgage basis tightened. A slowdown in home price appreciation and higher interest rates made refinancing more difficult, which also boosted contributions from our reverse mortgage IO holdings.
Agency IO securities detracted from fund performance. Prepayment speeds lowered, driven by higher mortgage rates, burnout [a period when MBS prepayment rates drop despite lower interest rates], and the effects of a slowing housing market. These conditions are generally supportive for IO holdings. However, broader risk aversion, lower liquidity, and heightened interest-rate volatility were headwinds for our agency IO holdings.
ABOUT DERIVATIVES
Derivatives are an increasingly common type of investment instrument, the performance of which is derived from an underlying security, index, currency, or other area of the capital markets. Derivatives employed by the fund’s managers generally serve one of two main purposes: to implement a strategy that may be difficult or more expensive to invest in through traditional securities, or to hedge unwanted risk associated with a particular position.
For example, the fund’s managers might use currency forward contracts to capitalize on an anticipated change in exchange rates between two currencies. This approach would require a significantly smaller outlay of capital than purchasing traditional bonds denominated in the underlying currencies. In another example, the managers may identify a bond that they believe is undervalued relative to its risk of default, but may seek to reduce the interest-rate risk of that bond by using interest-rate swaps, a derivative through which two parties “swap” payments based on the movement of certain rates. In other examples, the managers may use options and futures contracts to hedge against a variety of risks by establishing a combination of long and short exposures to specific equity markets or sectors.
Like any other investment, derivatives may not appreciate in value and may lose money. Derivatives may amplify traditional investment risks through the creation of leverage and may be less liquid than traditional securities. And because derivatives typically represent contractual agreements between two financial institutions, derivatives entail “counterparty risk,” which is the risk that the other party is unable or unwilling to pay. Putnam monitors the counterparty risks we assume. For example, Putnam often enters into collateral agreements that require the counterparties to post collateral on a regular basis to cover their obligations to the fund. Counterparty risk for exchange-traded futures and centrally cleared swaps is mitigated by the daily exchange of margin and other safeguards against default through their respective clearinghouses.
|
| Mortgage Opportunities Fund 5 |
How did you use derivatives during the reporting period?
We used interest-rate swaps to hedge term structure risk and for yield curve positioning. We also used options to hedge duration and convexity, isolate prepayment risk, and manage downside risks. In addition, we used credit default swaps to gain exposure to specific sectors and hedge credit and market risks.
What is your outlook for the fund and the various sectors in which it invests?
Our outlook for commercial real estate is mixed. We expect fundamentals to improve as more people return to travel, offices, and retail stores. This view is tempered by the Fed’s hawkish interest-rate policy, which could cause a recession, in our view. We believe property types that can pass along inflation costs, such as hotels and apartments, will hold their value and perform well in this environment. On the other hand, property types that have longer leases, are exposed to rising capital costs, or require large capital improvements will come under pressure, in our view. In terms of positioning, we believe spread widening across the market, driven by broad macro sell-offs, has created attractive opportunities for security selection. We continue to favor seasoned mezzanine tranches with high-quality collateral that offer strong risk-adjusted relative value. These bonds can withstand additional spread widening and are more insulated from losses or a recession, in our view.
For the U.S. housing market, we expect home prices will decline modestly in calendar 2023 and grow more slowly thereafter. Home prices soared during the pandemic. Continued affordability pressures on demand and a gradual increase in supply will cause prices to moderate, in our view. Market spreads have widened across the capital stack [the various financing sources used for a real estate purchase] due to broad market volatility in calendar 2022. We see value in bonds higher in the capital stack with shorter spread duration, which may be less sensitive to inflation. Bonds with seasoned collateral can withstand home price declines, in our view. We would favor high-quality non-qualified mortgages, reperforming loans, and single-family rental bonds, where spreads are very wide from a historical standpoint. We also see value in legacy RMBS and CRT bonds backed by seasoned collateral.
We believe prepayment-sensitive assets offer attractive risk-adjusted returns at current price levels. This sector provides an important diversifier for the fund. We believe prepayment assets can benefit from an economic slowdown, tighter fiscal policies, or a sustained sell-off in mortgage rates. Investments in this sector also have upside potential, in our view, should prepayment speeds slow further. Given the sharp increase in mortgage rates year to date, we expect many borrowers will turn to alternate loan products, such as home equity loans, in calendar 2023. A slowing housing market, falling home prices, and more capacity or underwriting constraints could further dampen prepayment speeds, in our opinion. This could strengthen sector fundamentals. We seek investments in a variety of collateral types that we believe are attractively priced based on current prepayment speeds. As of period-end, our mortgage basis positioning is near neutral, and we expect to be tactical with our positioning in calendar 2023.
Thanks for your time and for bringing us up to date, Brett.
The views expressed in this report are exclusively those of Putnam Management and are subject to change. They are not meant as investment advice.
Please note that the holdings discussed in this report may not have been held by the fund for the entire period. Portfolio composition is subject to review in accordance with the fund’s investment strategy and may vary in the future. Current and future portfolio holdings are subject to risk.
|
| 6 Mortgage Opportunities Fund |
Your fund’s performance
This section shows your fund’s performance, price, and distribution information for periods ended November 30, 2022, the first half of its current fiscal year. In accordance with regulatory requirements for mutual funds, we also include performance information as of the most recent calendar quarter-end and expense information from the fund’s current prospectus. Performance should always be considered in light of a fund’s investment strategy. Data represent past performance. Past performance does not guarantee future results. More recent returns may be less or more than those shown. Investment return and principal value will fluctuate, and you may have a gain or a loss when you sell your shares. Performance information does not reflect any deduction for taxes a shareholder may owe on fund distributions or on the redemption of fund shares. For the most recent month-end performance, please visit the Institutional Investors section at putnam.com (class I), Individual Investors section at putnam.com (classes A, C, R6, and Y), or call Putnam at 1-800-487-0024. Class I, R6, and Y shares are not available to all investors. See the Terms and definitions section in this report for the definition of the share classes offered by your fund.
Annualized fund performance Total return for periods ended 11/30/22
| | | | | |
| | Life of fund | 5 years | 3 years | 1 year | 6 months |
| Class A (7/1/19) | | | | | |
| Before sales charge | 2.38% | 2.05% | –0.76% | 5.95% | 2.03% |
| After sales charge | 1.84 | 1.22 | –2.10 | 1.71 | –2.05 |
| Class C (7/1/19) | | | | | |
| Before CDSC | 1.65 | 1.32 | –1.46 | 5.26 | 1.76 |
| After CDSC | 1.65 | 1.32 | –1.46 | 4.27 | 0.76 |
| Class I (4/7/15) | | | | | |
| Net asset value | 2.76 | 2.40 | –0.44 | 6.26 | 2.30 |
| Class R6 (6/1/20) | | | | | |
| Net asset value | 2.73 | 2.37 | –0.46 | 6.24 | 2.29 |
| Class Y (7/1/19) | | | | | |
| Net asset value | 2.64 | 2.30 | –0.51 | 6.20 | 2.26 |
Current performance may be lower or higher than the quoted past performance, which cannot guarantee future results. Share price, principal value, and return will vary, and you may have a gain or a loss when you sell your shares. Performance assumes reinvestment of distributions and does not account for taxes. After-sales-charge returns for class A shares reflect the deduction of the maximum 4.00% sales charge levied at the time of purchase. Class C share returns after CDSC reflect a 1% CDSC the first year that is eliminated thereafter. Class I, R6, and Y shares have no initial sales charge or CDSC. Performance for class A, C, R6, and Y shares before their inception is derived from the historical performance of class I shares, adjusted for the applicable sales charge (or CDSC) and the higher operating expenses for such shares.
Returns for periods of less than one year are not annualized.
For the periods, the fund had expense limitations, without which returns would have been lower.
Comparative annualized index returns For periods ended 11/30/22
| | | | | |
| | Life of fund | 5 years | 3 years | 1 year | 6 months |
| ICE BofA U.S. Treasury | | | | | |
| Bill Index | 0.94% | 1.21% | 0.63% | 0.94% | 0.89% |
| Bloomberg U.S. MBS Index | 0.29 | –0.38 | –2.99 | –11.50 | –4.45 |
| Lipper Absolute Return Funds | | | | | |
| category median* | 1.83 | 1.66 | 1.92 | –4.91 | –0.74 |
Index and Lipper results should be compared with fund performance at net asset value.
Returns for periods of less than one year are not annualized.
All Bloomberg indices are provided by Bloomberg Index Services Limited.
* Over the 6-month, 1-year, 3-year, 5-year, and life-of-fund periods ended 11/30/22, there were 128, 125, 118, 107, and 86 funds, respectively, in this Lipper category.
|
| Mortgage Opportunities Fund 7 |
Fund price and distribution information For the six-month period ended 11/30/22
| | | | | | |
| Distributions | Class A | Class C | Class I | Class R6 | Class Y |
| Number | 6 | 6 | 6 | 6 | 6 |
| Income | $0.198 | $0.165 | $0.212 | $0.211 | $0.208 |
| Capital gains | — | — | — | — | — |
| Total | $0.198 | $0.165 | $0.212 | $0.211 | $0.208 |
| | Before | After | Net | Net | Net | Net |
| | sales | sales | asset | asset | asset | asset |
| Share value | charge | charge | value | value | value | value |
| 5/31/22 | $8.90 | $9.27 | $8.92 | $8.91 | $8.91 | $8.90 |
| 11/30/22 | 8.88 | 9.25 | 8.91 | 8.90 | 8.90 | 8.89 |
| | Before | After | Net | Net | Net | Net |
| Current rate | sales | sales | asset | asset | asset | asset |
| (end of period) | charge | charge | value | value | value | value |
| Current dividend rate1 | 4.46% | 4.28% | 3.64% | 4.85% | 4.72% | 4.72% |
| Current 30-day SEC yield | | | | | | |
| (with expense limitation)2,3 | N/A | 6.22 | 5.46 | 6.62 | 6.58 | 6.47 |
| Current 30-day SEC yield | | | | | | |
| (without expense | | | | | | |
| limitation)3 | N/A | 5.97 | 5.20 | 6.36 | 6.32 | 6.22 |
The classification of distributions, if any, is an estimate. Before-sales-charge share value and current dividend rate for class A shares, if applicable, do not take into account any sales charge levied at the time of purchase. After-sales-charge share value, current dividend rate, and current 30-day SEC yield, if applicable, are calculated assuming that the maximum sales charge (4.00% for class A shares) was levied at the time of purchase. Final distribution information will appear on your year-end tax forms.
1 Most recent distribution, including any return of capital and excluding capital gains, annualized and divided by share price before or after sales charge at period-end.
2 For a portion of the periods, the fund had expense limitations, without which returns would have been lower.
3 Based only on investment income and calculated using the maximum offering price for each share class, in accordance with SEC guidelines.
Annualized fund performance as of most recent calendar quarter Total return for periods ended 12/31/22
| | | | | |
| | Life of fund | 5 years | 3 years | 1 year | 6 months |
| Class A (7/1/19) | | | | | |
| Before sales charge | 2.44% | 1.99% | –0.78% | 6.43% | 3.27% |
| After sales charge | 1.90 | 1.16 | –2.12 | 2.18 | –0.86 |
| Class C (7/1/19) | | | | | |
| Before CDSC | 1.69 | 1.25 | –1.49 | 5.74 | 2.87 |
| After CDSC | 1.69 | 1.25 | –1.49 | 4.75 | 1.89 |
| Class I (4/7/15) | | | | | |
| Net asset value | 2.82 | 2.35 | –0.46 | 6.88 | 3.55 |
| Class R6 (6/1/20) | | | | | |
| Net asset value | 2.79 | 2.32 | –0.48 | 6.85 | 3.54 |
| Class Y (7/1/19) | | | | | |
| Net asset value | 2.71 | 2.25 | –0.53 | 6.69 | 3.50 |
See the discussion following the fund performance table on page 7 for information about the calculation of fund performance.
Returns for periods of less than one year are not annualized.
|
| 8 Mortgage Opportunities Fund |
Your fund’s expenses
As a mutual fund investor, you pay ongoing expenses, such as management fees, distribution fees (12b-1 fees), and other expenses. In the most recent six-month period, your fund’s expenses were limited; had expenses not been limited, they would have been higher. Using the following information, you can estimate how these expenses affect your investment and compare them with the expenses of other funds. You may also pay one-time transaction expenses, including sales charges (loads) and redemption fees, which are not shown in this section and would have resulted in higher total expenses. For more information, see your fund’s prospectus or talk to your financial representative.
Expense ratios
| | | | | |
| | Class A | Class C | Class I | Class R6 | Class Y |
| Net expenses for the fiscal year | | | | | |
| ended 5/31/22* | 0.79% | 1.54% | 0.47% | 0.52% | 0.54% |
| Total annual operating expenses for the fiscal | | | | | |
| year ended 5/31/22 | 1.07% | 1.82% | 0.75% | 0.80% | 0.82% |
| Annualized expense ratio for the six-month | | | | | |
| period ended 11/30/22 | 0.85% | 1.60% | 0.47% | 0.51% | 0.60% |
Fiscal year expense information in this table is taken from the most recent prospectus, is subject to change, and may differ from that shown for the annualized expense ratio and in the financial highlights of this report.
Expenses are shown as a percentage of average net assets.
* Reflects Putnam Management’s contractual obligation to limit certain fund expenses through 9/30/23.
Expenses per $1,000
The following table shows the expenses you would have paid on a $1,000 investment in each class of the fund from 6/1/22 to 11/30/22. It also shows how much a $1,000 investment would be worth at the close of the period, assuming actual returns and expenses.
| | | | | |
| | Class A | Class C | Class I | Class R6 | Class Y |
| Expenses paid per $1,000*† | $4.30 | $8.09 | $2.38 | $2.59 | $3.04 |
| Ending value (after expenses) | $1,020.30 | $1,017.60 | $1,023.00 | $1,022.90 | $1,022.60 |
* Expenses for each share class are calculated using the fund’s annualized expense ratio for each class, which represents the ongoing expenses as a percentage of average net assets for the six months ended 11/30/22. The expense ratio may differ for each share class.
† Expenses are calculated by multiplying the expense ratio by the average account value for the period; then multiplying the result by the number of days in the period (183); and then dividing that result by the number of days in the year (365).
Estimate the expenses you paid
To estimate the ongoing expenses you paid for the six months ended 11/30/22, use the following calculation method. To find the value of your investment on 6/1/22, call Putnam at 1-800-225-1581.

Compare expenses using the SEC’s method
The Securities and Exchange Commission (SEC) has established guidelines to help investors assess fund expenses. Per these guidelines, the following table shows your fund’s expenses based on a $1,000 investment, assuming a hypothetical 5% annualized return. You can use this information to compare the ongoing expenses (but not transaction expenses or total costs) of investing in the fund with those of other funds. All mutual fund shareholder reports will provide this information to help you make this comparison. Please note that you cannot use this information to estimate your actual ending account balance and expenses paid during the period.
| | | | | |
| | Class A | Class C | Class I | Class R6 | Class Y |
| Expenses paid per $1,000*† | $4.31 | $8.09 | $2.38 | $2.59 | $3.04 |
| Ending value (after expenses) | $1,020.81 | $1,017.05 | $1,022.71 | $1,022.51 | $1,022.06 |
* Expenses for each share class are calculated using the fund’s annualized expense ratio for each class, which represents the ongoing expenses as a percentage of average net assets for the six months ended 11/30/22. The expense ratio may differ for each share class.
† Expenses are calculated by multiplying the expense ratio by the average account value for the six-month period; then multiplying the result by the number of days in the six-month period (183); and then dividing that result by the number of days in the year (365).
|
| Mortgage Opportunities Fund 9 |
Consider these risks before investing
The value of investments in the fund’s portfolio may fall or fail to rise over extended periods of time for a variety of reasons, including general economic, political, or financial market conditions; investor sentiment and market perceptions; government actions; geopolitical events or changes; and factors related to a specific issuer, geography (such as a region of the United States), industry, or sector (such as the housing or real estate markets). These and other factors may lead to increased volatility and reduced liquidity in the fund’s portfolio holdings or in relevant markets.
Bond investments are subject to interest-rate risk (the risk of bond prices falling if interest rates rise) and credit risk (the risk of an issuer defaulting on interest or principal payments). Default risk is generally higher for non-qualified mortgages. Interest-rate risk is generally greater for longer-term bonds, and credit risk is generally greater for below-investment-grade bonds. Mortgage- and asset-backed securities are subject to prepayment risk and the risk that they may increase in value less than other bonds when interest rates decline and decline in value more than other bonds when interest rates rise. The fund’s investments in mortgage-backed securities and asset-backed securities, and in certain other securities and derivatives, may be or become illiquid. The fund’s concentration in an industry group comprising privately issued residential and commercial mortgage-backed securities and mortgage-backed securities issued or guaranteed by the U.S. government or its agencies or instrumentalities may make the fund’s net asset value more susceptible to economic, market, political, and other developments affecting the housing or real estate markets and the servicing of mortgage loans secured by real estate properties.
The fund currently has significant investment exposure to commercial mortgage-backed securities, which, during periods of difficult economic conditions, may experience an increase in delinquencies and losses as a result of the effects of those conditions on commercial real estate markets, the ability of commercial tenants to make loan payments, and the ability of a property to attract and retain commercial tenants. Risks associated with derivatives include increased investment exposure (which may be considered leverage) and, in the case of over-the-counter instruments, the potential inability to terminate or sell derivatives positions and the potential failure of the other party to the instrument to meet its obligations. Our use of short selling may result in losses if the securities appreciate in value.
Our investment techniques, analyses, and judgments may not produce the outcome we intend. The investments we select for the fund may not perform as well as other securities that we do not select for the fund. We, or the fund’s other service providers, may experience disruptions or operating errors that could have a negative effect on the fund. You can lose money by investing in the fund.
|
| 10 Mortgage Opportunities Fund |
Terms and definitions
Important terms
Total return shows how the value of the fund’s shares changed over time, assuming you held the shares through the entire period and reinvested all distributions in the fund.
Net asset value (NAV) is the price, or value, of one share of a mutual fund, without a sales charge. Net asset values fluctuate with market conditions and are calculated by dividing the net assets of the fund’s shares by the number of outstanding fund shares.
Before sales charge, or net asset value, is the price, or value, of one share of a mutual fund, without a sales charge. Before-sales-charge figures fluctuate with market conditions. They are calculated by dividing the net assets of each class of shares by the number of outstanding shares in the class.
After sales charge is the price of a mutual fund share plus the maximum sales charge levied at the time of purchase. After sales charge performance figures shown here assume the 4.00% maximum sales charge for class A shares.
Contingent deferred sales charge (CDSC) is generally a charge applied at the time of the redemption of class C shares and assumes redemption at the end of the period. The CDSC for class C shares is 1% for one year after purchase.
Share classes
Class A shares are generally subject to an initial sales charge and no CDSC (except on certain redemptions of shares bought without an initial sales charge).
Class C shares are not subject to an initial sales charge and are subject to a CDSC only if the shares are redeemed during the first year.
Class I shares are not subject to an initial sales charge or CDSC and carry no 12b-1 fee. They are only available to institutional clients and other investors who meet minimum investment requirements.
Class R6 shares are not subject to an initial sales charge or CDSC and carry no 12b-1 fee. They are generally only available to employer-sponsored retirement plans, corporate and institutional clients, and approved clients in other approved programs.
Class Y shares are not subject to an initial sales charge or CDSC and carry no 12b-1 fee. They are generally only available to corporate and institutional clients and clients in other approved programs.
Fixed income terms
Mortgage-backed security (MBS), also known as a mortgage “pass-through,” is a type of asset-backed security that is secured by a mortgage or collection of mortgages. The following are types of MBSs:
• Agency credit risk transfer (CRT) security is backed by a reference pool of agency mortgages. Unlike a regular agency pass-through, the principal invested in a CRT is not backed by a U.S. government agency. To compensate investors for this risk, a CRT typically offers a higher yield than conventional pass-through securities. Similar to a CMBS, a CRT is structured into various tranches for investors, offering different levels of risk and yield based on the underlying reference pool.
• Agency “pass-through” has its principal and interest backed by a U.S. government agency, such as the Federal National Mortgage Association (Fannie Mae), Government National Mortgage Association (Ginnie Mae), and Federal Home Loan Mortgage Corporation (Freddie Mac).
• Collateralized mortgage obligation (CMO) represents claims to specific cash flows from pools of home mortgages. The streams of principal and interest payments on the mortgages are distributed to the different classes of CMO interests in “tranches.” Each tranche may have different principal balances, coupon rates, prepayment risks, and maturity dates. A CMO is highly sensitive to changes in interest rates and any resulting change in the rate at which homeowners sell their properties, refinance, or otherwise prepay loans. CMOs are subject to prepayment, market, and liquidity risks.
◦ Interest-only (IO) security is a type of CMO in which the underlying asset is the interest portion of mortgage, Treasury, or bond payments.
• Non-agency residential mortgage-backed security (RMBS) is an MBS not backed by Fannie Mae, Ginnie Mae, or Freddie Mac. One type of RMBS is an Alt-A mortgage-backed security.
• Commercial mortgage-backed security (CMBS) is secured by the loan on a commercial property.
Yield curve is a graph that plots the yields of bonds with equal credit quality against their differing maturity dates, ranging from shortest to longest. It is used as a benchmark for other debt, such as mortgage or bank lending rates.
Comparative indexes
Bloomberg U.S. Aggregate Bond Index is an unmanaged index of U.S. investment-grade fixed income securities.
Bloomberg U.S. MBS Index is an unmanaged index of agency mortgage-backed pass-through securities (both fixed-rate and hybrid adjustable-rate mortgages) guaranteed by Ginnie Mae, Fannie Mae, and Freddie Mac.
CMBX Index is an unmanaged index that tracks the performance of a basket of CMBS issued in a particular year.
ICE BofA (Intercontinental Exchange Bank of America) U.S. Treasury Bill Index is an unmanaged index that tracks the performance of U.S. dollar-denominated U.S. Treasury bills publicly issued in the U.S. domestic market. Qualifying securities must have a remaining term of at least one month to final maturity and a minimum amount outstanding of $1 billion.
S&P 500® Index is an unmanaged index of common stock performance.
Indexes assume reinvestment of all distributions and do not account for fees. Securities and performance of a fund and an index will differ. You cannot invest directly in an index.
|
| Mortgage Opportunities Fund 11 |
BLOOMBERG® is a trademark and service mark of Bloomberg Finance L.P. and its affiliates (collectively “Bloomberg”). Bloomberg or Bloomberg’s licensors own all proprietary rights in the Bloomberg Indices. Neither Bloomberg nor Bloomberg’s licensors approve or endorse this material, or guarantee the accuracy or completeness of any information herein, or make any warranty, express or implied, as to the results to be obtained therefrom, and to the maximum extent allowed by law, neither shall have any liability or responsibility for injury or damages arising in connection therewith.
ICE Data Indices, LLC (“ICE BofA”), used with permission. ICE BofA permits use of the ICE BofA indices and related data on an “as is” basis; makes no warranties regarding same; does not guarantee the suitability, quality, accuracy, timeliness, and/or completeness of the ICE BofA indices or any data included in, related to, or derived therefrom, assumes no liability in connection with the use of the foregoing, and does not sponsor, endorse, or recommend Putnam Investments, or any of its products or services.
Lipper, a Refinitiv company, is a third-party industry-ranking entity that ranks mutual funds. Its rankings do not reflect sales charges. Lipper rankings are based on total return at net asset value relative to other funds that have similar current investment styles or objectives as determined by Lipper. Lipper may change a fund’s category assignment at its discretion. Lipper category medians reflect performance trends for funds within a category.
Other information for shareholders
Important notice regarding delivery of shareholder documents
In accordance with Securities and Exchange Commission (SEC) regulations, Putnam sends a single notice of internet availability, or a single printed copy, of annual and semiannual shareholder reports, prospectuses, and proxy statements to Putnam shareholders who share the same address, unless a shareholder requests otherwise. If you prefer to receive your own copy of these documents, please call Putnam at 1-800-225-1581, and Putnam will begin sending individual copies within 30 days.
Proxy voting
Putnam is committed to managing our mutual funds in the best interests of our shareholders. The Putnam funds’ proxy voting guidelines and procedures, as well as information regarding how your fund voted proxies relating to portfolio securities during the 12-month period ended June 30, 2022, are available in the Individual Investors section of putnam.com and on the SEC’s website, www.sec.gov. If you have questions about finding forms on the SEC’s website, you may call the SEC at 1-800-SEC-0330. You may also obtain the Putnam funds’ proxy voting guidelines and procedures at no charge by calling Putnam’s Shareholder Services at 1-800-225-1581.
Fund portfolio holdings
The fund will file a complete schedule of its portfolio holdings with the SEC for the first and third quarters of each fiscal year on Form N-PORT within 60 days of the end of such fiscal quarter. Shareholders may obtain the fund’s Form N-PORT on the SEC’s website at www.sec.gov.
Prior to its use of Form N-PORT, the fund filed its complete schedule of its portfolio holdings with the SEC on Form N-Q, which is available online at www.sec.gov.
Trustee and employee fund ownership
Putnam employees and members of the Board of Trustees place their faith, confidence, and, most importantly, investment dollars in Putnam mutual funds. As of November 30, 2022, Putnam employees had approximately $471,000,000 and the Trustees had approximately $64,000,000 invested in Putnam mutual funds. These amounts include investments by the Trustees’ and employees’ immediate family members as well as investments through retirement and deferred compensation plans.
|
| 12 Mortgage Opportunities Fund |
Important notice regarding Putnam’s privacy policy
In order to conduct business with our shareholders, we must obtain certain personal information such as account holders’ names, addresses, Social Security numbers, and dates of birth. Using this information, we are able to maintain accurate records of accounts and transactions.
It is our policy to protect the confidentiality of our shareholder information, whether or not a shareholder currently owns shares of our funds. In particular, it is our policy not to sell information about you or your accounts to outside marketing firms. We have safeguards in place designed to prevent unauthorized access to our computer systems and procedures to protect personal information from unauthorized use.
Under certain circumstances, we must share account information with outside vendors who provide services to us, such as mailings and proxy solicitations. In these cases, the service providers enter into confidentiality agreements with us, and we provide only the information necessary to process transactions and perform other services related to your account. Finally, it is our policy to share account information with your financial representative, if you’ve listed one on your Putnam account.
|
| Mortgage Opportunities Fund 13 |
Trustee approval of management contract
General conclusions
The Board of Trustees of The Putnam Funds oversees the management of each fund and, as required by law, determines annually whether to approve the continuance of your fund’s management contract with Putnam Investment Management, LLC (“Putnam Management”) and the sub-management contract with respect to your fund between Putnam Management and its affiliate, Putnam Investments Limited (“PIL”). The Board, with the assistance of its Contract Committee, requests and evaluates all information it deems reasonably necessary under the circumstances in connection with its annual contract review. The Contract Committee consists solely of Trustees who are not “interested persons” (as this term is defined in the Investment Company Act of 1940, as amended (the “1940 Act”)) of The Putnam Funds (“Independent Trustees”).
At the outset of the review process, members of the Board’s independent staff and independent legal counsel considered any possible changes to the annual contract review materials furnished to the Contract Committee during the course of the previous year’s review and, as applicable, identified those changes to Putnam Management. Following these discussions and in consultation with the Contract Committee, the Independent Trustees’ independent legal counsel requested that Putnam Management and its affiliates furnish specified information, together with any additional information that Putnam Management considered relevant, to the Contract Committee. Over the course of several months ending in June 2022, the Contract Committee met on a number of occasions with representatives of Putnam Management, and separately in executive session, to consider the information that Putnam Management provided. Throughout this process, the Contract Committee was assisted by the members of the Board’s independent staff and by independent legal counsel for The Putnam Funds and the Independent Trustees.
In May 2022, the Contract Committee met in executive session to discuss and consider its recommendations with respect to the continuance of the contracts. At the Trustees’ June 2022 meeting, the Contract Committee met in executive session with the other Independent Trustees to review a summary of the key financial, performance and other data that the Contract Committee considered in the course of its review. The Contract Committee then presented its written report, which summarized the key factors that the Committee had considered and set forth its recommendations. The Contract Committee recommended, and the Independent Trustees approved, the continuance of your fund’s management contract and the approval of your fund’s amended and restated sub-management contract, effective July 1, 2022. (Because PIL is an affiliate of Putnam Management and Putnam Management remains fully responsible for all services provided by PIL, the Trustees have not attempted to evaluate PIL as a separate entity, and all subsequent references to Putnam Management below should be deemed to include reference to PIL as necessary or appropriate in the context.)
The Independent Trustees’ approval was based on the following conclusions:
• That the fee schedule in effect for your fund represented reasonable compensation in light of the nature and quality of the services being provided to the fund, the fees paid by competitive funds, the costs incurred by Putnam Management in providing services to the fund and the application of certain reductions and waivers noted below; and
• That the fee schedule in effect for your fund represented an appropriate sharing between fund shareholders and Putnam Management of any economies of scale as may exist in the management of the fund at current asset levels.
These conclusions were based on a comprehensive consideration of all information provided to the Trustees and were not the result of any single factor. Some of the factors that figured particularly in the Trustees’ deliberations and how the Trustees considered these factors are described below, although individual Trustees may have evaluated the information presented differently, giving different weights to various factors. It is also important to recognize that the management arrangements for your fund and the other Putnam funds are the result of many years of review and discussion between the Independent Trustees and Putnam Management, that some aspects of the arrangements may receive greater scrutiny in some years than others and that the Trustees’ conclusions may be based, in part, on their consideration of fee arrangements in previous years. For example, with certain exceptions primarily involving newer or repositioned funds, the current fee arrangements under the vast majority of the funds’ management contracts were first implemented at the beginning of 2010 following extensive review by the Contract Committee and discussions with representatives of Putnam Management, as well as approval by shareholders.
Management fee schedules and total expenses
The Trustees reviewed the management fee schedules in effect for all Putnam funds, including fee levels and breakpoints. Under its management contract, your fund has the benefit of breakpoints in its management fee schedule that provide shareholders with economies of scale in the form of reduced fee levels as the fund’s assets under management increase. The Trustees also reviewed the total expenses of each Putnam fund, recognizing that in most cases management fees represented the major, but not the sole, determinant of total costs to fund shareholders. (Two funds have implemented so-called “all-in” management fees covering substantially all routine fund operating costs.) The Trustees considered that the proposed amended and restated sub-management contract would lower the sub-management fees paid by Putnam Management to PIL.
In reviewing fees and expenses, the Trustees generally focus their attention on material changes in circumstances — for example, changes in assets under management, changes in a fund’s investment strategy, changes in Putnam Management’s operating costs or profitability, or changes in competitive practices in the mutual fund industry —that suggest that consideration of fee changes might be warranted. The Trustees concluded that the circumstances did not indicate that changes to the management fee schedule for your fund would be appropriate at this time.
As in the past, the Trustees also focused on the competitiveness of each fund’s total expense ratio. The Trustees and Putnam Management and the funds’ investor servicing agent, Putnam Investor Services, Inc. (“PSERV”), have implemented expense limitations that were in effect during your fund’s fiscal year ending in 2021. These expense limitations were: (i) a contractual expense limitation applicable to specified open-end funds, including your fund, of 25 basis points on investor servicing fees and expenses and (ii) a contractual expense limitation applicable to specified open-end funds, including your fund, of 20 basis points on so-called “other expenses” (i.e., all expenses exclusive of management fees, distribution fees, investor servicing fees, investment-related expenses, interest, taxes, brokerage commissions, acquired fund fees and expenses and extraordinary expenses). These expense limitations attempt to maintain competitive expense levels for the funds. Most funds, including your fund, had sufficiently low expenses that these expense limitations were not operative during their fiscal years ending in 2021. Putnam Management and PSERV have agreed to maintain these expense limitations until at least September 30, 2023. In addition, Putnam Management contractually agreed to waive fees and/or reimburse expenses of your fund to the
|
| 14 Mortgage Opportunities Fund |
extent that expenses of the fund (excluding payments under the fund’s distribution plans, investor servicing fees, brokerage, interest, taxes, investment-related expenses, extraordinary expenses and acquired fund fees and expenses) would exceed an annual rate of 0.46% of its average net assets through at least September 30, 2023. During its fiscal year ending in 2021, your fund’s expenses were reduced as a result of this expense limitation. Putnam Management and PSERV’s commitment to these expense limitation arrangements, which were intended to support an effort to have fund expenses meet competitive standards, was an important factor in the Trustees’ decision to approve the continuance of your fund’s management contract and to approve your fund’s amended and restated sub-management contract.
The Trustees reviewed comparative fee and expense information for a custom group of competitive funds selected by Broadridge Financial Solutions, Inc. (“Broadridge”). This comparative information included your fund’s percentile ranking for effective management fees and total expenses (excluding any applicable 12b-1 fees), which provides a general indication of your fund’s relative standing. In the custom peer group, your fund ranked in the first quintile in effective management fees (determined for your fund and the other funds in the custom peer group based on fund asset size and the applicable contractual management fee schedule) and in the first quintile in total expenses (excluding any applicable 12b-1 fees) as of December 31, 2021. The first quintile represents the least expensive funds and the fifth quintile the most expensive funds. The fee and expense data reported by Broadridge as of December 31, 2021 reflected the most recent fiscal year-end data available in Broadridge’s database at that time.
In connection with their review of fund management fees and total expenses, the Trustees also reviewed the costs of the services provided and the profits realized by Putnam Management and its affiliates from their contractual relationships with the funds. This information included trends in revenues, expenses and profitability of Putnam Management and its affiliates relating to the investment management, investor servicing and distribution services provided to the funds. In this regard, the Trustees also reviewed an analysis of the revenues, expenses and profitability of Putnam Management and its affiliates, allocated on a fund-by-fund basis, with respect to the funds’ management, distribution and investor servicing contracts. For each fund, the analysis presented information about revenues, expenses and profitability for each of the agreements separately and for the agreements taken together on a combined basis. The Trustees concluded that, at current asset levels, the fee schedules in place for the Putnam funds, including the fee schedule for your fund, represented reasonable compensation for the services being provided and represented an appropriate sharing between fund shareholders and Putnam Management of any economies of scale as may exist in the management of the Putnam funds at that time.
The information examined by the Trustees in connection with their annual contract review for the Putnam funds included information regarding services provided and fees charged by Putnam Management and its affiliates to other clients, including collective investment trusts offered in the defined contribution and defined benefit retirement plan markets, sub-advised mutual funds, private funds sponsored by affiliates of Putnam Management, model-only separately managed accounts and Putnam Management’s exchange-traded funds. This information included, in cases where a product’s investment strategy corresponds with a fund’s strategy, comparisons of those fees with fees charged to the Putnam funds, as well as an assessment of the differences in the services provided to these clients as compared to the services provided to the Putnam funds. The Trustees observed that the differences in fee rates between these clients and the Putnam funds are by no means uniform when examined by individual asset sectors, suggesting that differences in the pricing of investment management services to these types of clients may reflect, among other things, historical competitive forces operating in separate marketplaces. The Trustees considered the fact that in many cases fee rates across different asset classes are higher on average for mutual funds than for other clients, and the Trustees also considered the differences between the services that Putnam Management provides to the Putnam funds and those that it provides to its other clients. The Trustees did not rely on these comparisons to any significant extent in concluding that the management fees paid by your fund are reasonable.
Investment performance
The quality of the investment process provided by Putnam Management represented a major factor in the Trustees’ evaluation of the quality of services provided by Putnam Management under your fund’s management contract. The Trustees were assisted in their review of Putnam Management’s investment process and performance by the work of the investment oversight committees of the Trustees and the full Board of Trustees, which meet on a regular basis with individual portfolio managers and with senior management of Putnam Management’s Investment Division throughout the year. The Trustees concluded that Putnam Management generally provides a high-quality investment process — based on the experience and skills of the individuals assigned to the management of fund portfolios, the resources made available to them and in general Putnam Management’s ability to attract and retain high-quality personnel — but also recognized that this does not guarantee favorable investment results for every fund in every time period.
The Trustees considered that, in the aggregate, the Putnam funds’ performance was generally solid in 2021 against a backdrop of strong U.S. economic and financial market growth. The Trustees considered Putnam Management’s observation that, despite an environment of generally strong growth, there had been various headwinds experienced in 2021. For the one-year period ended December 31, 2021, the Trustees noted that the Putnam funds, on an asset-weighted basis, ranked in the 52nd percentile of their peers as determined by Lipper Inc. (“Lipper”) and, on an asset-weighted-basis, delivered a gross return that trailed their benchmarks by 0.1%. Over the longer-term, the Committee noted that, on an asset-weighted basis, the Putnam funds delivered strong aggregate performance relative to their Lipper peers over the three-, five- and ten-year periods ended December 31, 2021, ranking in the 31st, 29th and 21st percentiles, respectively, and that the funds, in the aggregate, outperformed their benchmarks on a gross basis for each of those periods.
In addition to the performance of the individual Putnam funds, the Trustees considered, as they had in prior years, the performance of The Putnam Fund complex versus competitor fund complexes. In particular, the Trustees considered The Putnam Fund complex’s performance as reported in the Barron’s/Lipper Fund Families survey (the “Survey”), which ranks mutual fund companies based on their performance across a variety of asset types. The Trustees noted that The Putnam Fund complex continued to rank highly in the Survey, especially over the longer-term, with The Putnam Funds ranking as the 6th best performing mutual fund complex out of 45 complexes for the ten-year period and 13th out of 49 complexes for the five-year period. The Trustees noted that 2021 marked the fifth consecutive year that The Putnam Funds have ranked in the top ten fund complexes for the ten-year period. The Trustees also considered that The Putnam Fund complex’s Survey performance over the one-year period was solid, with The Putnam Funds ranking 27th out of 51 complexes. In addition to the Survey, the Trustees also considered the Putnam funds’ ratings assigned by Morningstar Inc., noting that 25 of the funds were four- or five-star rated at the end of 2021 (representing a decrease of one fund year-over-year) and that this included nine funds that had achieved a five-star rating (representing an increase of two funds year-over-year). They also noted, however, the disappointing investment performance of some Putnam funds for periods ended December 31, 2021 and considered information provided by Putnam Management regarding the factors contributing to the underperformance and actions being taken to improve the performance of these particular funds. The Trustees indicated their intention to continue to monitor closely the performance of those funds and evaluate whether additional actions to address areas of underperformance may be warranted.
For purposes of the Trustees’ evaluation of the Putnam funds’ investment performance, the Trustees generally focus on a competitive industry ranking of each fund’s total net return over a one-year, three-year and five-year period. For a number of Putnam funds with relatively unique
|
| Mortgage Opportunities Fund 15 |
investment mandates for which Putnam Management informed the Trustees that meaningful competitive performance rankings are not considered to be available, the Trustees evaluated performance based on their total gross and net returns and comparisons of those returns to the returns of selected investment benchmarks. In the case of your fund, the Trustees considered that its class I share cumulative total return performance at net asset value was in the following quartiles of its Lipper peer group (Lipper Absolute Return Funds) for the one-year, three-year and five-year periods ended December 31, 2021 (the first quartile representing the best-performing funds and the fourth quartile the worst-performing funds):
| |
| One-year period | 3rd |
| Three-year period | 4th |
| Five-year period | 3rd |
Over the one-year, three-year and five-year periods ended December 31, 2021, there were 147, 135 and 118 funds, respectively, in your fund’s Lipper peer group. (When considering performance information, shareholders should be mindful that past performance is not a guarantee of future results.)
The Trustees expressed concern about your fund’s fourth quartile performance over the three-year period ended December 31, 2021 and considered the circumstances that may have contributed to this disappointing performance. The Trustees considered Putnam Management’s observation that significant underperformance in the securitized products sector in 2021 had contributed to the fund’s disappointing results, noting that prepayment strategies had suffered as a result of significantly elevated refinancing (given strong home price appreciation and low interest rates) relative to expectations. The Trustees considered that the fund’s underperformance was also driven by significant underperformance in the securitized products sector in 2020, which resulted from the outsized impact of the COVID-19 pandemic on the commercial mortgage sector.
The Trustees considered Putnam Management’s observation that a number of the investment strategies that had detracted from the fund’s performance had begun to recover as of March 31, 2022 and that the fund had top decile performance year to date relative to its peers, as of March 31, 2022. The Trustees noted that Putnam Management remained confident in the fund’s portfolio managers. The Trustees also considered Putnam Management’s continued efforts to support fund performance through certain initiatives, including structuring compensation for portfolio managers to enhance accountability for fund performance, emphasizing accountability in the portfolio management process and affirming its commitment to a fundamental-driven approach to investing. The Trustees noted further that Putnam Management had made selective hires and internal promotions in 2021 to strengthen its investment team.
As a general matter, the Trustees believe that cooperative efforts between the Trustees and Putnam Management represent the most effective way to address investment performance concerns that may arise from time to time. The Trustees noted that investors in the Putnam funds have, in effect, placed their trust in the Putnam organization, under the oversight of the funds’ Trustees, to make appropriate decisions regarding the management of the funds. The Trustees also considered that Putnam Management has made changes in light of subpar investment performance when warranted. Based on Putnam Management’s willingness to take appropriate measures to address fund performance issues, the Trustees concluded that it continued to be advisable to seek change within Putnam Management to address performance shortcomings. In the Trustees’ view, the alternative of engaging a new investment adviser for an underperforming fund, with all the attendant risks and disruptions, would not likely provide any greater assurance of improved investment performance.
Brokerage and soft-dollar allocations; investor servicing
The Trustees considered various potential benefits that Putnam Management may receive in connection with the services it provides under the management contract with your fund. These include benefits related to brokerage allocation and the use of soft dollars, whereby a portion of the commissions paid by a fund for brokerage may be used to acquire research services that are expected to be useful to Putnam Management in managing the assets of the fund and of other clients. Subject to policies established by the Trustees, soft dollars generated by these means are used predominantly to acquire brokerage and research services (including third-party research and market data) that enhance Putnam Management’s investment capabilities and supplement Putnam Management’s internal research efforts. The Trustees indicated their continued intent to monitor regulatory and industry developments in this area with the assistance of their Brokerage Committee. In addition, with the assistance of their Brokerage Committee, the Trustees indicated their continued intent to monitor the allocation of the Putnam funds’ brokerage in order to ensure that the principle of seeking best price and execution remains paramount in the portfolio trading process.
Putnam Management may also receive benefits from payments that the funds make to Putnam Management’s affiliates for investor or distribution services. In conjunction with the annual review of your fund’s management and sub-management contracts, the Trustees reviewed your fund’s investor servicing agreement with PSERV and its distributor’s contract and distribution plans with Putnam Retail Management Limited Partnership (“PRM”), both of which are affiliates of Putnam Management. The Trustees concluded that the fees payable by the funds to PSERV and PRM, as applicable, for such services are fair and reasonable in relation to the nature and quality of such services, the fees paid by competitive funds and the costs incurred by PSERV and PRM, as applicable, in providing such services. Furthermore, the Trustees were of the view that the investor services provided by PSERV were required for the operation of the funds, and that they were of a quality at least equal to those provided by other providers.
|
| 16 Mortgage Opportunities Fund |
Financial statements
These sections of the report, as well as the accompanying Notes, constitute the fund’s financial statements.
The fund’s portfolio lists all the fund’s investments and their values as of the last day of the reporting period. Holdings are organized by asset type and industry sector, country, or state to show areas of concentration and diversification.
Statement of assets and liabilities shows how the fund’s net assets and share price are determined. All investment and non-investment assets are added together. Any unpaid expenses and other liabilities are subtracted from this total. The result is divided by the number of shares to determine the net asset value per share, which is calculated separately for each class of shares. (For funds with preferred shares, the amount subtracted from total assets includes the liquidation preference of preferred shares.)
Statement of operations shows the fund’s net investment gain or loss. This is done by first adding up all the fund’s earnings — from dividends and interest income — and subtracting its operating expenses to determine net investment income (or loss). Then, any net gain or loss the fund realized on the sales of its holdings — as well as any unrealized gains or losses over the period — is added to or subtracted from the net investment result to determine the fund’s net gain or loss for the fiscal period.
Statement of changes in net assets shows how the fund’s net assets were affected by the fund’s net investment gain or loss, by distributions to shareholders, and by changes in the number of the fund’s shares. It lists distributions and their sources (net investment income or realized capital gains) over the current reporting period and the most recent fiscal year-end. The distributions listed here may not match the sources listed in the Statement of operations because the distributions are determined on a tax basis and may be paid in a different period from the one in which they were earned. Dividend sources are estimated at the time of declaration. Actual results may vary. Any non-taxable return of capital cannot be determined until final tax calculations are completed after the end of the fund’s fiscal period.
Financial highlights provide an overview of the fund’s investment results, per-share distributions, expense ratios, net investment income ratios, and portfolio turnover in one summary table, reflecting the five most recent reporting periods. In a semiannual report, the highlights table also includes the current reporting period.
|
| Mortgage Opportunities Fund 17 |
| | |
| The fund’s portfolio 11/30/22 (Unaudited) | | |
|
| | |
U.S. GOVERNMENT AND AGENCY
MORTGAGE OBLIGATIONS (168.8%)* | Principal
amount | Value |
| U.S. Government Guaranteed Mortgage Obligations (4.3%) | | |
| Government National Mortgage Association Pass-Through Certificates | | |
| 4.50%, TBA, 12/1/52 | $8,000,000 | $7,836,562 |
| 4.00%, TBA, 12/1/52 | 6,000,000 | 5,726,609 |
| 4.00%, 1/20/50 | 22,197 | 21,373 |
| 3.00%, TBA, 12/1/52 | 6,000,000 | 5,411,614 |
| | 18,996,158 |
| U.S. Government Agency Mortgage Obligations (164.5%) | | |
| Uniform Mortgage-Backed Securities | | |
| 6.00%, TBA, 12/1/52 | 16,000,000 | 16,367,501 |
| 5.50%, TBA, 12/1/52 | 95,000,000 | 96,083,589 |
| 5.00%, TBA, 1/1/53 | 187,000,000 | 186,123,344 |
| 5.00%, TBA, 12/1/52 | 264,000,000 | 262,844,868 |
| 4.50%, TBA, 1/1/53 | 76,000,000 | 73,981,288 |
| 4.50%, TBA, 12/1/52 | 87,000,000 | 84,689,106 |
| 3.50%, TBA, 12/1/52 | 6,000,000 | 5,497,500 |
| | 725,587,196 |
| Total U.S. government and agency mortgage obligations (cost $731,961,613) | $744,583,354 |
|
| | | |
| MORTGAGE-BACKED SECURITIES (73.8%)* | Principal
amount | Value |
| Agency collateralized mortgage obligations (28.0%) |
| Federal Home Loan Mortgage Corporation | | | |
| REMICs Ser. 4560, IO, 5.859%, 5/15/39 | | $799,387 | $127,305 |
| REMICs Ser. 5043, IO, 5.00%, 11/25/50 | | 1,864,341 | 400,960 |
| REMICs Ser. 5168, Class BI, IO, 4.50%, 11/25/51 | | 2,193,092 | 457,418 |
| REMICs Ser. 4980, Class KI, IO, 4.50%, 6/25/50 | | 2,316,657 | 469,393 |
| REMICs Ser. 4976, Class MI, IO, 4.50%, 5/25/50 | | 3,086,620 | 654,675 |
| REMICs Ser. 5125, Class MI, IO, 4.50%, 11/25/48 | | 6,962,339 | 1,551,689 |
| REMICs Ser. 4024, Class PI, IO, 4.50%, 12/15/41 | | 117,414 | 12,873 |
| REMICs Ser. 4949, IO, 4.00%, 1/25/50 | | 13,833,935 | 2,891,646 |
| REMICs Ser. 4635, Class PI, IO, 4.00%, 12/15/46 | | 280,506 | 47,492 |
| REMICs Ser. 4425, IO, 4.00%, 1/15/45 | | 141,754 | 20,853 |
| REMICs Ser. 4452, Class QI, IO, 4.00%, 11/15/44 | | 29,599 | 6,102 |
| REMICs Ser. 4403, Class CI, IO, 4.00%, 10/15/44 | | 89,138 | 16,027 |
| REMICs Ser. 4355, Class DI, IO, 4.00%, 3/15/44 | | 1,833 | 35 |
| REMICs Ser. 4193, Class PI, IO, 4.00%, 3/15/43 | | 187,996 | 26,851 |
| REMICs Ser. 4425, Class WI, IO, 4.00%, 3/15/43 | | 116,698 | 7,956 |
| REMICs Ser. 4386, Class LI, IO, 4.00%, 2/15/43 | | 74,509 | 4,456 |
| REMICs Ser. 4694, Class GI, IO, 4.00%, 2/15/43 | | 61,475 | 2,798 |
| REMICs Ser. 4000, Class LI, IO, 4.00%, 2/15/42 | | 8,347 | 1,126 |
| REMICs Ser. 5065, Class MI, IO, 3.50%, 1/25/51 | | 3,779,181 | 643,784 |
| REMICs Ser. 5018, IO, 3.50%, 10/25/50 | | 12,204,539 | 2,091,377 |
| REMICs Ser. 5080, Class IQ, IO, 3.50%, 4/25/50 | | 8,760,879 | 1,711,113 |
| REMICs Ser. 4604, Class QI, IO, 3.50%, 7/15/46 | | 193,041 | 25,563 |
| REMICs Ser. 4580, Class ID, IO, 3.50%, 8/15/45 | | 22,825 | 2,916 |
| Ser. 5196, Class DI, IO, 3.00%, 2/25/52 | | 14,947,208 | 2,312,303 |
| REMICs Ser. 5172, Class KI, IO, 3.00%, 12/25/51 | | 6,992,103 | 1,180,477 |
| REMICs Ser. 5082, Class IQ, IO, 3.00%, 3/25/51 | | 3,297,848 | 492,731 |
| REMICs Ser. 5160, Class IW, IO, 3.00%, 10/25/50 | | 4,165,134 | 465,498 |
| REMICs Ser. 4801, Class IG, IO, 3.00%, 6/15/48 | | 207,555 | 29,472 |
| REMICs Ser. 5119, Class IB, IO, 3.00%, 6/25/41 | | 5,687,838 | 658,103 |
| REMICs IFB Ser. 3852, Class SC, IO, ((-1 x ICE LIBOR USD 1 Month) + 6.65%), 2.777%, 4/15/40 | | 79,401 | 1,577 |
| REMICs IFB Ser. 3346, Class SC, IO, ((-1 x ICE LIBOR USD 1 Month) + 6.55%), 2.677%, 10/15/33 | | 1,428,914 | 130,523 |
| REMICs Ser. 5034, Class IJ, IO, 2.50%, 11/25/50 | | 13,909,630 | 2,107,031 |
| REMICs IFB Ser. 4808, Class SD, IO, ((-1 x ICE LIBOR USD 1 Month) + 6.20%), 2.327%, 7/15/48 | | 1,608,896 | 184,513 |
| REMICs IFB Ser. 4789, Class AS, IO, ((-1 x ICE LIBOR USD 1 Month) + 6.20%), 2.327%, 5/15/48 | | 1,167,618 | 92,137 |
| REMICs IFB Ser. 4752, Class PS, IO, ((-1 x ICE LIBOR USD 1 Month) + 6.20%), 2.327%, 11/15/47 | | 2,659,669 | 311,667 |
| REMICs IFB Ser. 4839, Class WS, IO, ((-1 x ICE LIBOR USD 1 Month) + 6.10%), 2.227%, 8/15/56 | | 7,313,900 | 897,416 |
| |
18 Mortgage Opportunities Fund |
| | | |
| MORTGAGE-BACKED SECURITIES (73.8%)* cont. | Principal
amount | Value |
| Agency collateralized mortgage obligations cont. |
| Federal Home Loan Mortgage Corporation | | | |
| REMICs IFB Ser. 5057, Class SC, IO, ((-1 x ICE LIBOR USD 1 Month) + 6.10%), 2.227%, 12/15/48 | | $2,410,729 | $261,231 |
| REMICs IFB Ser. 4631, Class SA, IO, ((-1 x ICE LIBOR USD 1 Month) + 6.00%), 2.127%, 11/15/46 | | 29,934,658 | 3,494,335 |
| REMICs IFB Ser. 4990, Class SP, IO, ((-1 x ICE LIBOR USD 1 Month) + 6.10%), 2.084%, 7/25/50 | | 1,740,166 | 181,648 |
| REMICs IFB Ser. 4979, Class SN, IO, ((-1 x ICE LIBOR USD 1 Month) + 6.05%), 2.034%, 6/25/50 | | 2,368,776 | 291,170 |
| REMICs IFB Ser. 4937, Class 4937, IO, ((-1 x ICE LIBOR USD 1 Month) + 6.05%), 2.034%, 12/25/49 | | 5,419,186 | 587,657 |
| REMICs IFB Ser. 4915, Class SD, IO, ((-1 x ICE LIBOR USD 1 Month) + 6.05%), 2.034%, 9/25/49 | | 2,061,008 | 217,315 |
| REMICs IFB Ser. 4949, Class WS, IO, ((-1 x ICE LIBOR USD 1 Month) + 6.00%), 1.984%, 2/25/50 | | 1,516,064 | 158,883 |
| REMICs IFB Ser. 4933, Class SA, IO, ((-1 x ICE LIBOR USD 1 Month) + 6.00%), 1.984%, 12/25/49 | | 1,870,506 | 229,110 |
| Federal National Mortgage Association | | | |
| REMICs Ser. 17-8, IO, 6.00%, 2/25/47 | | 447,146 | 95,595 |
| REMICs Ser. 16-3, Class NI, IO, 6.00%, 2/25/46 | | 50,683 | 9,033 |
| REMICs Ser. 15-69, IO, 6.00%, 9/25/45 | | 224,738 | 49,194 |
| REMICs Ser. 10-99, Class NI, IO, 6.00%, 9/25/40 | | 1,019,884 | 191,749 |
| REMICs Ser. 10-109, Class IM, IO, 5.50%, 9/25/40 | | 729,524 | 96,681 |
| Interest Strip Ser. 397, Class 2, IO, 5.00%, 9/25/39 | | 207,071 | 41,713 |
| REMICs Ser. 12-132, Class PI, IO, 5.00%, 10/25/42 | | 620,013 | 103,431 |
| REMICs IFB Ser. 11-4, Class CS, ((-2 x ICE LIBOR USD 1 Month) + 12.90%), 4.868%, 5/25/40 | | 7,215 | 7,574 |
| Interest Strip Ser. 404, Class 2, IO, 4.50%, 5/25/40 | | 146,027 | 27,084 |
| REMICs Ser. 21-56, Class QI, IO, 4.50%, 9/25/51 | | 3,698,324 | 853,005 |
| REMICs Ser. 21-15, Class JI, IO, 4.50%, 4/25/51 | | 2,601,383 | 554,875 |
| REMICs Ser. 21-17, Class KI, IO, 4.50%, 4/25/51 | | 2,863,788 | 588,193 |
| REMICs Ser. 21-18, Class IY, IO, 4.50%, 8/25/49 | | 1,830,987 | 408,572 |
| REMICs Ser. 21-17, Class GI, IO, 4.00%, 2/25/51 | | 2,332,084 | 443,048 |
| REMICs Ser. 20-76, Class GI, IO, 4.00%, 11/25/50 | | 9,603,918 | 1,834,159 |
| REMICs Ser. 18-15, Class PI, IO, 4.00%, 10/25/47 | | 318,852 | 48,406 |
| REMICs Ser. 12-90, Class DI, IO, 4.00%, 3/25/42 | | 306,122 | 32,749 |
| REMICs Ser. 21-25, Class IJ, IO, 3.50%, 5/25/51 | | 6,042,225 | 995,336 |
| REMICs Ser. 21-8, Class ID, 3.50%, 3/25/51 | | 7,864,467 | 1,579,006 |
| REMICs Ser. 21-5, Class PI, IO, 3.50%, 2/25/51 | | 3,279,332 | 559,918 |
| REMICs Ser. 21-25, Class HI, 3.50%, 7/25/50 | | 2,470,935 | 386,901 |
| REMICs Ser. 20-99, Class IB, IO, 3.50%, 5/25/50 | | 9,944,736 | 1,827,345 |
| REMICs Ser. 16-70, Class QI, IO, 3.50%, 10/25/46 | | 37,013 | 5,271 |
| REMICs Ser. 21-94, Class AI, IO, 3.00%, 1/25/52 | | 2,512,066 | 394,874 |
| REMICs Ser. 21-67, Class IG, IO, 3.00%, 10/25/51 | | 3,904,726 | 608,563 |
| REMICs Ser. 20-24, Class IB, IO, 3.00%, 4/25/50 | | 2,957,371 | 458,525 |
| REMICs Ser. 13-6, Class JI, IO, 3.00%, 2/25/43 | | 26,056 | 3,257 |
| REMICs Ser. 13-35, Class PI, IO, 3.00%, 2/25/42 | | 35,687 | 1,012 |
| REMICs Ser. 13-57, Class IQ, IO, 3.00%, 6/25/41 | | 80,107 | 3,246 |
| REMICs IFB Ser. 13-90, Class SD, IO, ((-1 x ICE LIBOR USD 1 Month) + 6.60%), 2.584%, 9/25/43 | | 298,900 | 35,232 |
| REMICs Ser. 22-13, IO, 2.50%, 12/25/51 | | 8,138,422 | 1,018,810 |
| REMICs Ser. 21-57, Class I, IO, 2.50%, 7/25/51 | | 25,022,654 | 3,486,951 |
| REMICs Ser. 21-3, Class NI, IO, 2.50%, 2/25/51 | | 25,623,551 | 3,684,951 |
| REMICs IFB Ser. 10-35, Class SG, IO, ((-1 x ICE LIBOR USD 1 Month) + 6.40%), 2.384%, 4/25/40 | | 73,272 | 8,301 |
| REMICs IFB Ser. 19-18, Class SL, IO, ((-1 x ICE LIBOR USD 1 Month) + 6.10%), 2.084%, 5/25/49 | | 2,962,085 | 253,169 |
| REMICs IFB Ser. 19-17, Class JS, IO, ((-1 x ICE LIBOR USD 1 Month) + 6.10%), 2.084%, 4/25/49 | | 1,625,515 | 179,390 |
| REMICs IFB Ser. 16-83, Class BS, IO, ((-1 x ICE LIBOR USD 1 Month) + 6.10%), 2.084%, 11/25/46 | | 969,767 | 84,521 |
| REMICs IFB Ser. 16-85, Class SL, IO, ((-1 x ICE LIBOR USD 1 Month) + 6.10%), 2.084%, 11/25/46 | | 2,428,481 | 219,529 |
| REMICs IFB Ser. 16-65, Class CS, IO, ((-1 x ICE LIBOR USD 1 Month) + 6.10%), 2.084%, 9/25/46 | | 686,227 | 56,919 |
| REMICs IFB Ser. 16-78, Class CS, IO, ((-1 x ICE LIBOR USD 1 Month) + 6.10%), 2.084%, 5/25/39 | | 1,989,010 | 170,745 |
| REMICs IFB Ser. 19-58, Class SA, IO, ((-1 x ICE LIBOR USD 1 Month) + 6.05%), 2.034%, 10/25/49 | | 11,209,697 | 1,239,247 |
| REMICs IFB Ser. 19-60, Class BS, IO, ((-1 x ICE LIBOR USD 1 Month) + 6.05%), 2.034%, 10/25/49 | | 870,642 | 45,300 |
| REMICs IFB Ser. 19-26, Class SM, IO, ((-1 x ICE LIBOR USD 1 Month) + 6.05%), 2.034%, 6/25/49 | | 1,863,079 | 189,612 |
| REMICs Ser. 21-42, Class EI, IO, 2.00%, 3/25/51 | | 17,540,885 | 2,280,315 |
| REMICs IFB Ser. 19-66, Class SC, IO, ((-1 x ICE LIBOR USD 1 Month) + 6.00%), 1.984%, 11/25/49 | | 2,691,042 | 245,659 |
| REMICs IFB Ser. 19-75, Class KS, IO, ((-1 x ICE LIBOR USD 1 Month) + 6.00%), 1.984%, 11/25/49 | | 4,041,368 | 408,338 |
| REMICs IFB Ser. 16-54, Class SD, IO, ((-1 x ICE LIBOR USD 1 Month) + 6.00%), 1.984%, 8/25/46 | | 3,756,815 | 359,114 |
| REMICs IFB Ser. 11-126, Class SJ, IO, ((-1 x ICE LIBOR USD 1 Month) + 6.00%), 1.984%, 12/25/41 | | 3,576,841 | 368,367 |
| REMICs IFB Ser. 11-134, Class SP, IO, ((-1 x ICE LIBOR USD 1 Month) + 6.00%), 1.984%, 2/25/41 | | 518,413 | 13,824 |
| |
Mortgage Opportunities Fund 19 |
| | | |
| MORTGAGE-BACKED SECURITIES (73.8%)* cont. | Principal
amount | Value |
| Agency collateralized mortgage obligations cont. |
| Federal National Mortgage Association | | | |
| REMICs IFB Ser. 11-101, Class SA, IO, ((-1 x ICE LIBOR USD 1 Month) + 5.90%), 1.884%, 10/25/41 | | $166,861 | $15,005 |
| REMICs IFB Ser. 22-43, Class SB, IO, ((-1 x US 30 Day Average SOFR) + 5.40%), 1.879%, 7/25/52 | | 17,903,010 | 1,351,407 |
| Government National Mortgage Association | | | |
| Ser. 16-164, IO, 6.50%, 12/20/46 | | 590,278 | 98,699 |
| Ser. 16-75, Class LI, IO, 6.00%, 1/20/40 | | 33,694 | 5,853 |
| Ser. 21-176, Class IK, IO, 5.50%, 10/20/51 | | 2,404,996 | 443,986 |
| Ser. 16-149, Class MI, IO, 5.50%, 5/20/39 | | 41,220 | 2,856 |
| Ser. 22-23, Class UI, IO, 5.00%, 2/20/52 | | 2,612,212 | 474,691 |
| Ser. 20-4, IO, 5.00%, 1/20/50 | | 2,450,172 | 447,034 |
| Ser. 18-77, IO, 5.00%, 6/20/48 | | 380,217 | 66,272 |
| Ser. 17-179, Class WI, IO, 5.00%, 12/20/47 | | 319,415 | 67,378 |
| Ser. 17-38, Class DI, IO, 5.00%, 3/16/47 | | 79,970 | 15,619 |
| Ser. 16-150, Class I, IO, 5.00%, 11/20/46 | | 905,495 | 180,465 |
| Ser. 16-42, IO, 5.00%, 2/20/46 | | 175,767 | 33,452 |
| Ser. 18-127, Class ID, IO, 5.00%, 7/20/45 | | 181,752 | 26,111 |
| Ser. 17-136, Class IY, IO, 5.00%, 3/20/45 | | 299,805 | 55,533 |
| Ser. 15-89, Class LI, IO, 5.00%, 12/20/44 | | 429,984 | 82,673 |
| Ser. 14-132, IO, 5.00%, 9/20/44 | | 719,843 | 123,957 |
| Ser. 13-3, Class IT, IO, 5.00%, 1/20/43 | | 112,901 | 23,709 |
| Ser. 11-135, Class DI, IO, 5.00%, 4/16/40 | | 289,337 | 59,201 |
| Ser. 10-35, Class UI, IO, 5.00%, 3/20/40 | | 8,304 | 1,730 |
| Ser. 10-9, Class UI, IO, 5.00%, 1/20/40 | | 88,819 | 18,597 |
| Ser. 09-121, Class UI, IO, 5.00%, 12/20/39 | | 8,567 | 1,794 |
| Ser. 15-105, Class LI, IO, 5.00%, 10/20/39 | | 474,413 | 90,489 |
| Ser. 15-79, Class GI, IO, 5.00%, 10/20/39 | | 50,244 | 9,948 |
| Ser. 21-209, Class TG, IO, 4.50%, 11/20/51 | | 8,280,747 | 1,352,837 |
| Ser. 17-132, Class IA, IO, 4.50%, 9/20/47 | | 717,712 | 134,423 |
| Ser. 15-182, Class IC, IO, 4.50%, 12/20/45 | | 2,630,289 | 544,541 |
| Ser. 15-167, Class BI, IO, 4.50%, 4/16/45 | | 47,340 | 9,058 |
| Ser. 16-17, Class IA, IO, 4.50%, 3/20/45 | | 158,633 | 29,056 |
| Ser. 13-34, Class HI, IO, 4.50%, 3/20/43 | | 100,263 | 18,353 |
| Ser. 12-129, IO, 4.50%, 11/16/42 | | 56,192 | 10,253 |
| Ser. 12-98, Class AI, IO, 4.50%, 4/16/42 | | 356,117 | 49,245 |
| Ser. 10-35, Class DI, IO, 4.50%, 3/20/40 | | 22,634 | 4,124 |
| Ser. 10-35, Class QI, IO, 4.50%, 3/20/40 | | 16,297 | 3,098 |
| Ser. 14-95, Class JI, IO, 4.50%, 12/16/39 | | 674,847 | 127,074 |
| Ser. 17-H22, Class DI, IO, 4.159%, 11/20/67 W | | 2,013,659 | 125,385 |
| Ser. 21-162, Class IO, IO, 4.00%, 9/20/51 | | 4,299,012 | 687,842 |
| Ser. 19-137, Class GI, IO, 4.00%, 11/20/49 | | 3,361,713 | 552,384 |
| Ser. 17-104, Class GI, IO, 4.00%, 7/20/47 | | 1,975,800 | 336,457 |
| Ser. 16-29, IO, 4.00%, 2/16/46 | | 160,541 | 27,034 |
| Ser. 15-186, Class AI, IO, 4.00%, 12/20/45 | | 1,769,165 | 292,531 |
| Ser. 15-149, Class KI, IO, 4.00%, 10/20/45 | | 30,725 | 5,065 |
| Ser. 18-72, Class IC, IO, 4.00%, 5/20/45 | | 1,690,723 | 271,632 |
| Ser. 15-53, Class MI, IO, 4.00%, 4/16/45 | | 77,420 | 14,501 |
| Ser. 15-187, Class JI, IO, 4.00%, 3/20/45 | | 26,030 | 4,200 |
| Ser. 15-89, Class IP, IO, 4.00%, 2/20/45 | | 24,963 | 3,443 |
| Ser. 14-188, Class IB, IO, 4.00%, 12/20/44 | | 2,309,344 | 304,002 |
| Ser. 17-45, Class IM, IO, 4.00%, 10/20/44 | | 418,574 | 27,607 |
| Ser. 17-63, Class PI, IO, 4.00%, 12/20/43 | | 59,778 | 2,511 |
| Ser. 13-67, Class IP, IO, 4.00%, 4/16/43 | | 957,561 | 146,028 |
| Ser. 20-32, Class IA, IO, 3.948%, 3/16/47 W | | 2,902,365 | 500,349 |
| Ser. 21-214, Class DI, IO, 3.50%, 12/20/51 | | 10,913,790 | 1,512,293 |
| Ser. 22-34, Class IV, IO, 3.50%, 3/20/51 | | 14,542,769 | 2,195,376 |
| Ser. 20-167, Class PI, IO, 3.50%, 11/20/50 | | 2,604,000 | 463,162 |
| Ser. 20-74, Class BI, IO, 3.50%, 5/20/50 | | 8,765,440 | 1,384,148 |
| Ser. 19-158, Class PI, IO, 3.50%, 12/20/49 | | 1,716,382 | 269,592 |
| Ser. 16-75, Class EI, IO, 3.50%, 8/20/45 | | 315,534 | 37,362 |
| |
20 Mortgage Opportunities Fund |
| | | |
| MORTGAGE-BACKED SECURITIES (73.8%)* cont. | Principal
amount | Value |
| Agency collateralized mortgage obligations cont. |
| Government National Mortgage Association | | | |
| Ser. 15-52, Class IK, IO, 3.50%, 4/20/45 | | $83,059 | $10,570 |
| Ser. 15-20, Class PI, IO, 3.50%, 2/20/45 | | 22,817 | 3,637 |
| Ser. 13-82, Class TI, IO, 3.50%, 5/20/43 | | 2,074,185 | 306,147 |
| Ser. 15-168, Class IG, IO, 3.50%, 3/20/43 | | 18,551 | 2,366 |
| Ser. 13-100, Class MI, IO, 3.50%, 2/20/43 | | 8,392 | 611 |
| Ser. 12-145, IO, 3.50%, 12/20/42 | | 90,886 | 14,061 |
| Ser. 13-14, IO, 3.50%, 12/20/42 | | 23,201 | 2,488 |
| Ser. 18-127, Class IA, IO, 3.50%, 4/20/42 | | 14,366 | 987 |
| Ser. 15-165, Class IC, IO, 3.50%, 7/16/41 | | 860,852 | 44,174 |
| Ser. 13-6, Class AI, IO, 3.50%, 8/20/39 | | 708,257 | 42,465 |
| Ser. 17-H03, Class DI, IO, 3.375%, 12/20/66 W | | 1,731,624 | 64,995 |
| Ser. 17-H03, Class AI, IO, 3.246%, 12/20/66 W | | 818,703 | 27,347 |
| Ser. 22-12, Class JI, IO, 3.00%, 1/20/52 | | 18,983,534 | 2,185,768 |
| Ser. 21-188, Class IU, IO, 3.00%, 10/20/51 | | 11,834,286 | 2,411,025 |
| Ser. 21-191, Class HI, IO, 3.00%, 10/20/51 | | 3,356,782 | 546,165 |
| Ser. 21-155, IO, 3.00%, 9/20/51 | | 3,262,442 | 516,089 |
| Ser. 21-146, Class QI, IO, 3.00%, 8/20/51 | | 17,953,238 | 2,273,478 |
| Ser. 21-97, Class QI, IO, 3.00%, 6/20/51 | | 8,786,218 | 1,229,358 |
| Ser. 21-97, Class IY, IO, 3.00%, 5/20/51 | | 14,404,730 | 2,124,698 |
| Ser. 21-59, Class IM, IO, 3.00%, 4/20/51 | | 3,995,469 | 551,088 |
| Ser. 21-42, Class IG, IO, 3.00%, 3/20/51 | | 2,576,060 | 365,000 |
| Ser. 20-186, Class DI, IO, 3.00%, 12/20/50 | | 5,971,676 | 875,558 |
| Ser. 20-188, Class QI, IO, 3.00%, 10/20/50 | | 3,807,161 | 571,608 |
| Ser. 21-76, Class NI, IO, 3.00%, 8/20/50 | | 21,510,588 | 3,119,035 |
| Ser. 21-77, Class BI, IO, 3.00%, 7/20/50 | | 21,576,898 | 3,103,746 |
| IFB Ser. 13-9, Class S, IO, ((-1 x ICE LIBOR USD 1 Month) + 6.75%), 2.811%, 1/20/43 | | 1,498,062 | 194,600 |
| IFB Ser. 10-125, Class SD, ((-1 x ICE LIBOR USD 1 Month) + 6.68%), 2.793%, 1/16/40 | | 1,244,443 | 91,672 |
| IFB Ser. 13-182, Class SP, IO, ((-1 x ICE LIBOR USD 1 Month) + 6.70%), 2.761%, 12/20/43 | | 695,970 | 65,108 |
| Ser. 16-H27, Class BI, IO, 2.708%, 12/20/66 W | | 420,757 | 12,575 |
| IFB Ser. 11-156, Class SK, IO, ((-1 x ICE LIBOR USD 1 Month) + 6.60%), 2.661%, 4/20/38 | | 31,920 | 3,774 |
| Ser. 17-H02, Class BI, IO, 2.507%, 1/20/67 W | | 1,880,486 | 62,504 |
| Ser. 20-173, Class MI, IO, 2.50%, 11/20/50 | | 14,107,802 | 1,856,022 |
| Ser. 20-148, Class AI, IO, 2.50%, 10/20/50 | | 29,634,542 | 3,755,289 |
| Ser. 20-151, Class MI, IO, 2.50%, 10/20/50 | | 5,042,946 | 666,627 |
| Ser. 20-162, Class UI, IO, 2.50%, 10/20/50 | | 15,854,235 | 2,024,454 |
| Ser. 18-H01, Class AI, IO, 2.452%, 1/20/68 W | | 9,405,562 | 420,325 |
| Ser. 17-H03, Class EI, IO, 2.432%, 1/20/67 W | | 391,238 | 21,151 |
| Ser. 17-H06, Class BI, IO, 2.428%, 2/20/67 W | | 721,661 | 38,034 |
| IFB Ser. 21-96, Class SQ, IO, ((-1 x ICE LIBOR USD 1 Month) + 6.35%), 2.411%, 6/20/51 | | 2,237,110 | 322,995 |
| Ser. 17-H04, Class BI, IO, 2.394%, 2/20/67 W | | 3,009,188 | 126,234 |
| IFB Ser. 21-155, Class SE, IO, ((-1 x ICE LIBOR USD 1 Month) + 6.30%), 2.361%, 9/20/51 | | 9,051,752 | 734,731 |
| IFB Ser. 21-58, Class SA, IO, ((-1 x ICE LIBOR USD 1 Month) + 6.30%), 2.361%, 4/20/51 | | 5,573,636 | 706,381 |
| IFB Ser. 21-59, Class SU, IO, ((-1 x ICE LIBOR USD 1 Month) + 6.30%), 2.361%, 4/20/51 | | 2,777,820 | 314,449 |
| IFB Ser. 21-49, Class SB, IO, ((-1 x ICE LIBOR USD 1 Month) + 6.30%), 2.361%, 3/20/51 | | 3,086,676 | 370,397 |
| IFB Ser. 21-57, Class SD, IO, ((-1 x ICE LIBOR USD 1 Month) + 6.30%), 2.361%, 3/20/51 | | 4,211,951 | 503,387 |
| IFB Ser. 20-167, Class SC, IO, ((-1 x ICE LIBOR USD 1 Month) + 6.30%), 2.361%, 11/20/50 | | 16,392,945 | 2,283,288 |
| IFB Ser. 20-112, Class MS, IO, ((-1 x ICE LIBOR USD 1 Month) + 6.30%), 2.361%, 8/20/50 | | 1,510,938 | 193,113 |
| IFB Ser. 14-131, Class BS, IO, ((-1 x ICE LIBOR USD 1 Month) + 6.20%), 2.313%, 9/16/44 | | 2,527,507 | 383,991 |
| IFB Ser. 18-91, Class SJ, IO, ((-1 x ICE LIBOR USD 1 Month) + 6.25%), 2.311%, 7/20/48 | | 518,392 | 48,839 |
| IFB Ser. 10-26, Class QS, IO, ((-1 x ICE LIBOR USD 1 Month) + 6.25%), 2.311%, 2/20/40 | | 21,345,052 | 2,227,996 |
| IFB Ser. 22-45, Class DS, IO, ((-1 x US 30 Day Average SOFR) + 5.70%), 2.308%, 11/20/49 | | 7,153,086 | 506,109 |
| IFB Ser. 19-35, Class SE, IO, ((-1 x ICE LIBOR USD 1 Month) + 6.15%), 2.263%, 1/16/44 | | 1,762,563 | 118,678 |
| IFB Ser. 19-158, Class AS, IO, ((-1 x ICE LIBOR USD 1 Month) + 6.15%), 2.263%, 9/16/43 | | 4,319,022 | 457,458 |
| Ser. 10-H22, Class CI, IO, 2.261%, 10/20/60 W | | 72,303 | 2,821 |
| IFB Ser. 20-98, Class ES, IO, ((-1 x ICE LIBOR USD 1 Month) + 6.20%), 2.261%, 7/20/50 | | 2,368,909 | 290,121 |
| IFB Ser. 18-89, Class LS, IO, ((-1 x ICE LIBOR USD 1 Month) + 6.20%), 2.261%, 6/20/48 | | 560,734 | 52,593 |
| IFB Ser. 17-156, Class SL, IO, ((-1 x ICE LIBOR USD 1 Month) + 6.20%), 2.261%, 10/20/47 | | 1,683,854 | 161,722 |
| IFB Ser. 22-63, Class SB, IO, ((-1 x US 30 Day Average SOFR) + 5.60%), 2.208%, 11/20/46 | | 4,841,865 | 378,345 |
| |
Mortgage Opportunities Fund 21 |
| | | |
| MORTGAGE-BACKED SECURITIES (73.8%)* cont. | Principal
amount | Value |
| Agency collateralized mortgage obligations cont. |
| Government National Mortgage Association | | | |
| Ser. 18-H02, Class IM, IO, 2.20%, 2/20/68 W | | $1,655,016 | $101,976 |
| Ser. 18-H02, Class HI, IO, 2.182%, 1/20/68 W | | 2,843,941 | 134,198 |
| IFB Ser. 19-96, Class SY, IO, ((-1 x ICE LIBOR USD 1 Month) + 6.10%), 2.161%, 8/20/49 | | 2,855,764 | 253,792 |
| IFB Ser. 19-83, Class JS, IO, ((-1 x ICE LIBOR USD 1 Month) + 6.10%), 2.161%, 7/20/49 | | 3,654,033 | 302,883 |
| IFB Ser. 19-78, Class SM, IO, ((-1 x ICE LIBOR USD 1 Month) + 6.10%), 2.161%, 6/20/49 | | 2,899,402 | 231,874 |
| IFB Ser. 20-77, Class KS, IO, ((-1 x ICE LIBOR USD 1 Month) + 6.10%), 2.161%, 5/20/49 | | 17,971,797 | 1,757,728 |
| IFB Ser. 16-77, Class SC, IO, ((-1 x ICE LIBOR USD 1 Month) + 6.10%), 2.161%, 10/20/45 | | 30,515 | 3,281 |
| IFB Ser. 14-27, Class S, IO, ((-1 x ICE LIBOR USD 1 Month) + 6.10%), 2.161%, 2/20/44 | | 2,010,099 | 206,575 |
| IFB Ser. 14-3, Class SM, IO, ((-1 x ICE LIBOR USD 1 Month) + 6.10%), 2.161%, 1/20/44 | | 2,147,758 | 227,424 |
| IFB Ser. 13-182, Class SY, IO, ((-1 x ICE LIBOR USD 1 Month) + 6.10%), 2.161%, 12/20/43 | | 17,353 | 2,053 |
| Ser. 16-H24, IO, 2.143%, 9/20/66 W | | 226,810 | 16,942 |
| Ser. 17-H06, Class MI, IO, 2.132%, 2/20/67 W | | 1,029,990 | 40,381 |
| IFB Ser. 20-15, Class CS, IO, ((-1 x ICE LIBOR USD 1 Month) + 6.05%), 2.111%, 2/20/50 | | 905,745 | 66,874 |
| IFB Ser. 20-7, Class SK, IO, ((-1 x ICE LIBOR USD 1 Month) + 6.05%), 2.111%, 1/20/50 | | 4,936,524 | 504,488 |
| IFB Ser. 19-143, Class HS, IO, ((-1 x ICE LIBOR USD 1 Month) + 6.05%), 2.111%, 9/20/49 | | 1,644,832 | 151,241 |
| IFB Ser. 19-103, Class SC, IO, ((-1 x ICE LIBOR USD 1 Month) + 6.05%), 2.111%, 8/20/49 | | 15,803,238 | 1,562,607 |
| IFB Ser. 19-98, Class SC, IO, ((-1 x ICE LIBOR USD 1 Month) + 6.05%), 2.111%, 8/20/49 | | 1,791,917 | 183,347 |
| IFB Ser. 19-99, Class KS, IO, ((-1 x ICE LIBOR USD 1 Month) + 6.05%), 2.111%, 8/20/49 | | 118,113 | 10,628 |
| IFB Ser. 19-78, Class SJ, IO, ((-1 x ICE LIBOR USD 1 Month) + 6.05%), 2.111%, 6/20/49 | | 470,384 | 36,475 |
| IFB Ser. 19-23, Class SC, IO, ((-1 x ICE LIBOR USD 1 Month) + 6.05%), 2.111%, 2/20/49 | | 164,066 | 16,079 |
| Ser. 17-H08, Class EI, IO, 2.097%, 2/20/67 W | | 1,621,736 | 71,357 |
| Ser. 15-H24, Class HI, IO, 2.088%, 9/20/65 W | | 27,881 | 501 |
| Ser. 17-H19, Class MI, IO, 2.067%, 4/20/67 W | | 649,011 | 38,097 |
| Ser. 17-H08, Class NI, IO, 2.063%, 3/20/67 W | | 313,384 | 13,225 |
| IFB Ser. 19-121, Class SD, IO, ((-1 x ICE LIBOR USD 1 Month) + 6.00%), 2.061%, 10/20/49 | | 3,434,172 | 492,577 |
| IFB Ser. 19-4, Class S, IO, ((-1 x ICE LIBOR USD 1 Month) + 6.00%), 2.061%, 1/20/49 | | 15,492,031 | 1,179,284 |
| IFB Ser. 20-47, Class SA, IO, ((-1 x ICE LIBOR USD 1 Month) + 6.00%), 2.061%, 5/20/44 | | 4,020,269 | 365,603 |
| Ser. 18-H05, Class BI, IO, 1.914%, 2/20/68 W | | 1,196,452 | 83,004 |
| Ser. 17-H14, Class JI, IO, 1.885%, 6/20/67 W | | 1,427,581 | 108,911 |
| Ser. 15-H15, Class JI, IO, 1.88%, 6/20/65 W | | 119,231 | 5,962 |
| Ser. 17-H09, Class DI, IO, 1.812%, 3/20/67 W | | 992,750 | 49,100 |
| Ser. 15-H25, Class EI, IO, 1.77%, 10/20/65 W | | 90,179 | 4,166 |
| Ser. 15-H23, Class DI, IO, 1.77%, 9/20/65 W | | 105,401 | 5,776 |
| Ser. 17-H09, IO, 1.76%, 4/20/67 W | | 312,135 | 9,653 |
| Ser. 17-H10, Class MI, IO, 1.746%, 4/20/67 W | | 3,413,914 | 99,664 |
| Ser. 15-H20, Class AI, IO, 1.716%, 8/20/65 W | | 97,427 | 4,219 |
| Ser. 15-H10, Class CI, IO, 1.706%, 4/20/65 W | | 109,058 | 5,213 |
| FRB Ser. 16-H19, Class AI, IO, 1.664%, 9/20/66 W | | 5,034,689 | 197,742 |
| Ser. 17-H06, Class DI, IO, 1.66%, 2/20/67 W | | 507,273 | 19,631 |
| Ser. 15-H23, Class BI, IO, 1.649%, 9/20/65 W | | 64,640 | 2,527 |
| Ser. 15-H26, Class EI, IO, 1.636%, 10/20/65 W | | 126,952 | 6,411 |
| Ser. 17-H03, Class HI, IO, 1.587%, 1/20/67 W | | 262,885 | 8,987 |
| Ser. 16-H24, Class CI, IO, 1.584%, 10/20/66 W | | 3,173,480 | 136,142 |
| Ser. 17-H11, Class DI, IO, 1.577%, 5/20/67 W | | 205,528 | 10,057 |
| Ser. 16-H21, Class AI, IO, 1.573%, 9/20/66 W | | 1,906,506 | 77,001 |
| Ser. 14-H25, Class BI, IO, 1.565%, 12/20/64 W | | 1,164,941 | 40,243 |
| Ser. 16-H23, Class NI, IO, 1.562%, 10/20/66 W | | 153,720 | 5,060 |
| Ser. 15-H09, Class BI, IO, 1.562%, 3/20/65 W | | 40,342 | 1,436 |
| Ser. 15-H16, Class DI, IO, 1.504%, 7/20/65 W | | 3,136,998 | 160,701 |
| Ser. 15-H25, Class AI, IO, 1.502%, 9/20/65 W | | 158,562 | 5,772 |
| Ser. 15-H01, Class BI, IO, 1.451%, 1/20/65 W | | 3,266,759 | 111,945 |
| Ser. 16-H15, Class AI, IO, 1.428%, 7/20/66 W | | 12,576,794 | 451,771 |
| Ser. 13-H14, Class XI, IO, 1.428%, 3/20/63 W | | 75,929 | 2,005 |
| Ser. 14-H06, Class BI, IO, 1.375%, 2/20/64 W | | 3,429,963 | 67,104 |
| Ser. 10-H19, Class BI, IO, 1.362%, 8/20/60 W | | 150,926 | 4,622 |
| Ser. 15-H20, Class CI, IO, 1.299%, 8/20/65 W | | 1,341,353 | 70,689 |
| FRB Ser. 15-H16, Class XI, IO, 1.245%, 7/20/65 W | | 2,802,821 | 125,148 |
| Ser. 15-H26, Class DI, IO, 1.231%, 10/20/65 W | | 86,366 | 3,185 |
| |
22 Mortgage Opportunities Fund |
| | | |
| MORTGAGE-BACKED SECURITIES (73.8%)* cont. | Principal
amount | Value |
| Agency collateralized mortgage obligations cont. |
| Government National Mortgage Association | | | |
| Ser. 12-H29, Class AI, IO, 1.223%, 10/20/62 W | | $430,687 | $7,922 |
| Ser. 12-H29, Class FI, IO, 1.223%, 10/20/62 W | | 430,687 | 7,922 |
| Ser. 15-H25, Class BI, IO, 1.214%, 10/20/65 W | | 77,560 | 2,971 |
| Ser. 15-H25, Class CI, IO, 1.214%, 10/20/65 W | | 76,676 | 2,898 |
| Ser. 12-H06, Class AI, IO, 1.209%, 1/20/62 W | | 252,652 | 5,881 |
| FRB Ser. 11-H07, Class FI, IO, 1.136%, 2/20/61 W | | 76,441 | 1,949 |
| Ser. 14-H21, Class AI, IO, 0.94%, 10/20/64 W | | 897,375 | 28,172 |
| Ser. 17-H14, Class EI, IO, 0.91%, 6/20/67 W | | 1,706,948 | 53,230 |
| Ser. 15-H13, Class AI, IO, 0.852%, 6/20/65 W | | 189,779 | 6,646 |
| Ser. 18-H11, Class JI, IO, 0.812%, 7/20/68 W | | 2,137,783 | 88,343 |
| Ser. 19-H02, Class DI, IO, 0.776%, 11/20/68 W | | 4,856,190 | 195,619 |
| Ser. 18-H08, Class FI, IO, 0.771%, 6/20/68 W | | 1,629,886 | 89,059 |
| Ser. 20-H04, Class AI, IO, 0.647%, 2/20/70 W | | 9,671,957 | 398,659 |
| Ser. 18-H20, Class BI, IO, 0.628%, 6/20/68 W | | 6,331,678 | 223,391 |
| Ser. 19-H12, Class GI, IO, 0.625%, 7/20/69 W | | 10,539,614 | 458,642 |
| Ser. 16-H17, Class DI, IO, 0.533%, 7/20/66 W | | 1,410,873 | 45,305 |
| Ser. 19-H14, Class IB, IO, 0.523%, 8/20/69 W | | 245,563 | 9,358 |
| Ser. 19-H07, Class EI, IO, 0.499%, 3/20/69 W | | 21,306,844 | 770,924 |
| Ser. 17-H16, Class JI, IO, 0.436%, 8/20/67 W | | 359,643 | 18,387 |
| Ser. 22-H01, Class BI, IO, 0.433%, 12/20/71 W | | 11,522,986 | 484,553 |
| Ser. 16-H18, Class QI, IO, 0.386%, 6/20/66 W | | 1,251,601 | 57,945 |
| Ser. 22-H01, Class EI, IO, 0.366%, 1/20/72 W | | 6,705,784 | 287,580 |
| Ser. 16-H11, Class KI, IO, 0.365%, 5/20/66 W | | 7,318,811 | 198,989 |
| Ser. 22-H09, Class GI, IO, 0.298%, 4/20/72 W | | 27,294,998 | 1,206,029 |
| Ser. 17-H20, Class DI, IO, 0.294%, 10/20/67 W | | 863,796 | 47,584 |
| Ser. 17-H20, Class AI, IO, 0.232%, 10/20/67 W | | 2,030,858 | 91,389 |
| Ser. 17-H20, Class HI, IO, 0.216%, 10/20/67 W | | 688,045 | 38,509 |
| Ser. 22-H09, Class IG, IO, 0.154%, 4/20/72 W | | 21,876,581 | 826,982 |
| Ser. 16-H09, Class BI, IO, 0.081%, 4/20/66 W | | 4,697,604 | 222,666 |
| Ser. 17-H05, Class CI, IO, 0.056%, 2/20/67 W | | 4,297,060 | 200,570 |
| Ser. 15-H10, Class HI, IO, 0.046%, 4/20/65 W | | 105,577 | 3,247 |
| Ser. 19-H15, Class CI, IO, 0.021%, 7/20/69 W | | 6,070,747 | 233,784 |
| Ser. 16-H02, Class HI, IO, 0.017%, 1/20/66 W | | 145,158 | 3,363 |
| Ser. 16-H27, Class EI, IO, 0.015%, 12/20/66 W | | 2,101,036 | 60,812 |
| Ser. 15-H04, Class AI, IO, 0.012%, 12/20/64 W | | 2,191,371 | 57,326 |
| Ser. 16-H04, Class KI, IO, 0.011%, 2/20/66 W | | 65,244 | 1,343 |
| Ser. 21-H03, Class IM, IO, zero %, 2/20/71 W | | 8,298,545 | 325,715 |
| | | 123,564,487 |
| Commercial mortgage-backed securities (28.6%) |
| BANK 144A Ser. 18-BN11, Class D, 3.00%, 3/15/61 | | 2,170,000 | 1,511,715 |
| Barclays Commercial Mortgage Trust 144A | | | |
| Ser. 19-C4, Class D, 3.25%, 8/15/52 | | 510,000 | 360,651 |
| Ser. 19-C4, Class E, 3.25%, 8/15/52 | | 446,000 | 300,956 |
| Ser. 19-C3, Class D, 3.00%, 5/15/52 | | 1,145,000 | 783,171 |
| Ser. 19-C5, Class E, 2.50%, 11/15/52 | | 462,000 | 284,724 |
| Benchmark Mortgage Trust FRB Ser. 18-B1, Class C, 4.303%, 1/15/51 W | | 560,000 | 439,727 |
| Benchmark Mortgage Trust 144A | | | |
| FRB Ser. 18-B3, Class D, 3.187%, 4/10/51 W | | 2,459,000 | 1,779,055 |
| Ser. 19-B11, Class D, 3.00%, 5/15/52 | | 963,000 | 649,969 |
| Ser. 18-B1, Class D, 2.75%, 1/15/51 | | 2,021,000 | 1,613,027 |
| Ser. 19-B13, Class D, 2.50%, 8/15/57 | | 1,998,000 | 1,454,984 |
| BWAY Mortgage Trust 144A FRB Ser. 22-26BW, Class F, 5.029%, 2/10/44 W | | 580,000 | 383,891 |
| Cantor Commercial Real Estate Lending 144A Ser. 19-CF2, Class D, 2.50%, 11/15/52 | | 313,000 | 202,241 |
| CD Commercial Mortgage Trust 144A | | | |
| Ser. 17-CD3, Class D, 3.25%, 2/10/50 | | 686,000 | 481,764 |
| Ser. 19-CD8, Class D, 3.00%, 8/15/57 | | 507,000 | 334,870 |
| CFCRE Commercial Mortgage Trust 144A FRB Ser. 11-C2, Class F, 5.25%, 12/15/47 W | | 100,000 | 99,580 |
| |
Mortgage Opportunities Fund 23 |
| | | |
| MORTGAGE-BACKED SECURITIES (73.8%)* cont. | Principal
amount | Value |
| Commercial mortgage-backed securities cont. |
| Citigroup Commercial Mortgage Trust | | | |
| FRB Ser. 13-GC15, Class C, 5.335%, 9/10/46 W | | $598,000 | $583,313 |
| FRB Ser. 17-P7, Class C, 4.565%, 4/14/50 W | | 373,000 | 314,970 |
| FRB Ser. 15-GC27, Class C, 4.565%, 2/10/48 W | | 817,000 | 755,990 |
| Ser. 14-GC21, Class B, 4.328%, 5/10/47 W | | 1,749,000 | 1,635,701 |
| Ser. 16-P3, Class B, 4.271%, 4/15/49 W | | 1,630,000 | 1,456,045 |
| FRB Ser. 15-GC31, Class D, 4.172%, 6/10/48 W | | 1,541,000 | 1,347,188 |
| Ser. 13-GC11, Class C, 4.134%, 4/10/46 W | | 1,348,000 | 1,327,376 |
| Citigroup Commercial Mortgage Trust 144A | | | |
| FRB Ser. 14-GC19, Class D, 5.258%, 3/11/47 W | | 2,130,000 | 1,990,409 |
| FRB Ser. 13-GC17, Class D, 5.252%, 11/10/46 W | | 856,911 | 764,193 |
| FRB Ser. 12-GC8, Class C, 4.944%, 9/10/45 W | | 766,000 | 766,000 |
| FRB Ser. 13-GC11, Class D, 4.552%, 4/10/46 W | | 1,736,343 | 1,642,281 |
| Ser. 12-GC8, Class B, 4.285%, 9/10/45 | | 97,978 | 95,906 |
| Ser. 14-GC25, Class D, 3.548%, 10/10/47 | | 239,000 | 209,143 |
| Ser. 15-P1, Class D, 3.225%, 9/15/48 | | 2,325,000 | 1,926,999 |
| Ser. 15-GC27, Class E, 3.00%, 2/10/48 | | 680,000 | 519,598 |
| COMM Mortgage Trust | | | |
| FRB Ser. 14-CR16, Class C, 5.081%, 4/10/47 W | | 1,226,000 | 1,104,468 |
| FRB Ser. 13-CR13, Class C, 5.039%, 11/10/46 W | | 656,000 | 619,052 |
| FRB Ser. 14-UBS3, Class C, 4.895%, 6/10/47 W | | 301,000 | 283,220 |
| FRB Ser. 14-UBS4, Class C, 4.806%, 8/10/47 W | | 324,000 | 298,511 |
| FRB Ser. 14-CR14, Class C, 4.735%, 2/10/47 W | | 650,000 | 612,690 |
| FRB Ser. 14-UBS6, Class C, 4.583%, 12/10/47 W | | 193,000 | 177,095 |
| FRB Ser. 14-CR21, Class C, 4.566%, 12/10/47 W | | 628,000 | 566,223 |
| FRB Ser. 15-CR26, Class D, 3.616%, 10/10/48 W | | 875,000 | 721,356 |
| COMM Mortgage Trust 144A | | | |
| FRB Ser. 13-CR13, Class D, 5.039%, 11/10/46 W | | 1,744,000 | 1,533,632 |
| FRB Ser. 14-CR17, Class D, 5.007%, 5/10/47 W | | 1,247,000 | 1,081,008 |
| FRB Ser. 14-CR17, Class E, 5.007%, 5/10/47 W | | 1,366,000 | 947,348 |
| FRB Ser. 14-CR19, Class D, 4.854%, 8/10/47 W | | 721,000 | 648,311 |
| FRB Ser. 14-CR14, Class D, 4.735%, 2/10/47 W | | 1,073,000 | 974,932 |
| FRB Ser. 15-LC19, Class E, 4.356%, 2/10/48 W | | 845,000 | 702,840 |
| Ser. 12-CR4, Class B, 3.703%, 10/15/45 | | 1,399,000 | 1,147,180 |
| Ser. 13-LC6, Class E, 3.50%, 1/10/46 | | 706,000 | 687,273 |
| FRB Ser. 16-COR1, Class D, 3.474%, 10/10/49 W | | 1,501,500 | 1,142,049 |
| Ser. 17-COR2, Class D, 3.00%, 9/10/50 | | 2,120,000 | 1,616,309 |
| Ser. 15-LC19, Class D, 2.867%, 2/10/48 | | 1,072,000 | 930,901 |
| Credit Suisse Commercial Mortgage Trust 144A FRB Ser. 08-C1, Class AJ, 6.01%, 2/15/41 W | | 63,742 | 32,101 |
| Credit Suisse Mortgage Trust 144A FRB Ser. 22-NWPT, Class A, 6.937%, 9/9/24 | | 1,041,000 | 1,036,120 |
| CSAIL Commercial Mortgage Trust | | | |
| FRB Ser. 15-C2, Class C, 4.316%, 6/15/57 W | | 504,000 | 426,138 |
| FRB Ser. 15-C2, Class D, 4.316%, 6/15/57 W | | 1,355,000 | 1,013,112 |
| FRB Ser. 20-C19, Class C, 3.734%, 3/15/53 W | | 1,060,000 | 818,470 |
| CSAIL Commercial Mortgage Trust 144A | | | |
| FRB Ser. 18-C14, Class D, 5.08%, 11/15/51 W | | 1,765,000 | 1,340,207 |
| Ser. 19-C17, Class D, 2.50%, 9/15/52 | | 410,000 | 254,350 |
| Federal Home Loan Mortgage Corporation 144A Multifamily Structured Credit Risk FRB Ser. 21-MN3, Class M2, 7.521%, 11/25/51 | | 1,581,000 | 1,395,924 |
| GS Mortgage Securities Corp., II 144A FRB Ser. 13-GC10, Class D, 4.561%, 2/10/46 W | | 471,000 | 465,007 |
| GS Mortgage Securities Trust FRB Ser. 14-GC18, Class C, 5.224%, 1/10/47 W | | 1,131,000 | 769,080 |
| GS Mortgage Securities Trust 144A | | | |
| FRB Ser. 10-C1, Class D, 6.567%, 8/10/43 W | | 397,000 | 299,008 |
| FRB Ser. 14-GC24, Class D, 4.665%, 9/10/47 W | | 2,089,000 | 1,398,735 |
| FRB Ser. 13-GC13, Class D, 4.214%, 7/10/46 W | | 739,000 | 332,786 |
| Ser. 17-GS5, Class D, 3.509%, 3/10/50 W | | 2,215,000 | 1,624,859 |
| Ser. 19-GC38, Class D, 3.00%, 2/10/52 | | 532,000 | 375,742 |
| Ser. 16-GS2, Class D, 2.753%, 5/10/49 | | 311,000 | 240,709 |
| |
24 Mortgage Opportunities Fund |
| | | |
| MORTGAGE-BACKED SECURITIES (73.8%)* cont. | Principal
amount | Value |
| Commercial mortgage-backed securities cont. |
| JPMBB Commercial Mortgage Securities Trust | | | |
| FRB Ser. 14-C22, Class B, 4.699%, 9/15/47 W | | $399,000 | $374,623 |
| FRB Ser. 14-C22, Class C, 4.699%, 9/15/47 W | | 354,000 | 316,793 |
| FRB Ser. 13-C12, Class B, 4.218%, 7/15/45 W | | 438,000 | 431,183 |
| JPMBB Commercial Mortgage Securities Trust 144A | | | |
| FRB Ser. 13-C17, Class D, 5.046%, 1/15/47 W | | 1,500,000 | 1,394,053 |
| FRB Ser. 14-C18, Class D, 4.947%, 2/15/47 W | | 1,135,000 | 771,881 |
| FRB Ser. 14-C19, Class C19, 4.803%, 4/15/47 W | | 2,156,000 | 1,962,665 |
| FRB Ser. 13-C12, Class E, 4.218%, 7/15/45 W | | 625,000 | 555,336 |
| FRB Ser. 14-C23, Class D, 4.132%, 9/15/47 W | | 2,023,000 | 1,727,590 |
| FRB Ser. 14-C25, Class D, 4.084%, 11/15/47 W | | 1,500,000 | 998,724 |
| Ser. 13-C14, Class F, 3.598%, 8/15/46 W | | 402,000 | 44,554 |
| Ser. 14-C25, Class E, 3.332%, 11/15/47 W | | 100,000 | 58,874 |
| JPMCC Commercial Mortgage Securities Trust 144A FRB Ser. 17-JP7, Class D, 4.53%, 9/15/50 W | | 388,000 | 311,288 |
| JPMDB Commercial Mortgage Securities Trust Ser. 17-C5, Class C, 4.512%, 3/15/50 W | | 566,000 | 443,237 |
| JPMDB Commercial Mortgage Securities Trust 144A FRB Ser. 16-C2, Class D, 3.488%, 6/15/49 W | | 1,101,000 | 697,402 |
| JPMorgan Chase Commercial Mortgage Securities Trust | | | |
| Ser. 06-LDP9, Class AMS, 5.337%, 5/15/47 | | 638,274 | 594,544 |
| FRB Ser. 13-LC11, Class D, 4.372%, 4/15/46 W | | 740,000 | 585,933 |
| FRB Ser. 13-C10, Class C, 4.353%, 12/15/47 W | | 1,101,000 | 1,050,938 |
| JPMorgan Chase Commercial Mortgage Securities Trust 144A | | | |
| FRB Ser. 11-C3, Class D, 5.709%, 2/15/46 W | | 450,000 | 329,557 |
| FRB Ser. 11-C3, Class E, 5.709%, 2/15/46 W | | 242,000 | 104,629 |
| FRB Ser. 12-C6, Class E, 5.129%, 5/15/45 W | | 224,000 | 171,539 |
| FRB Ser. 13-LC11, Class E, 3.25%, 4/15/46 W | | 643,000 | 501,664 |
| Ser. 12-C6, Class G, 2.972%, 5/15/45 W | | 100,000 | 51,120 |
| Morgan Stanley Bank of America Merrill Lynch Trust | | | |
| FRB Ser. 14-C14, Class B, 5.038%, 2/15/47 W | | 2,109,000 | 2,040,729 |
| FRB Ser. 15-C25, Class C, 4.677%, 10/15/48 W | | 854,000 | 777,117 |
| Ser. 12-C6, Class C, 4.536%, 11/15/45 W | | 1,272,000 | 1,210,384 |
| FRB Ser. 14-C16, Class B, 4.474%, 6/15/47 W | | 967,000 | 930,525 |
| FRB Ser. 15-C22, Class C, 4.342%, 4/15/48 W | | 1,437,000 | 1,282,380 |
| FRB Ser. 13-C8, Class C, 4.206%, 12/15/48 W | | 579,000 | 574,145 |
| FRB Ser. 13-C9, Class C, 4.147%, 5/15/46 W | | 269,000 | 258,943 |
| Ser. 14-C19, Class C, 4.00%, 12/15/47 | | 787,000 | 708,076 |
| Ser. 13-C9, Class B, 3.708%, 5/15/46 W | | 1,700,000 | 1,671,451 |
| Ser. 15-C25, Class D, 3.068%, 10/15/48 | | 562,000 | 469,299 |
| Morgan Stanley Bank of America Merrill Lynch Trust 144A | | | |
| FRB Ser. 14-C14, Class D, 5.228%, 2/15/47 W | | 855,000 | 801,072 |
| FRB Ser. 13-C12, Class E, 4.915%, 10/15/46 W | | 405,000 | 300,750 |
| FRB Ser. 14-C17, Class D, 4.884%, 8/15/47 W | | 2,144,500 | 1,952,077 |
| FRB Ser. 13-C11, Class D, 4.545%, 8/15/46 W | | 932,000 | 65,436 |
| FRB Ser. 12-C6, Class G, 4.50%, 11/15/45 W | | 1,150,000 | 729,813 |
| FRB Ser. 15-C24, Class E, 4.476%, 5/15/48 W | | 677,000 | 543,083 |
| FRB Ser. 15-C23, Class D, 4.281%, 7/15/50 W | | 1,883,000 | 1,603,382 |
| FRB Ser. 13-C9, Class D, 4.235%, 5/15/46 W | | 2,027,000 | 1,788,799 |
| FRB Ser. 13-C10, Class E, 4.211%, 7/15/46 W | | 369,000 | 125,497 |
| FRB Ser. 13-C10, Class F, 4.211%, 7/15/46 W | | 1,286,000 | 276,926 |
| Ser. 14-C19, Class D, 3.25%, 12/15/47 | | 893,000 | 765,616 |
| Ser. 17-C34, Class D, 2.70%, 11/15/52 | | 168,000 | 110,572 |
| Morgan Stanley Capital I Trust | | | |
| Ser. 06-HQ10, Class B, 5.448%, 11/12/41 W | | 24,032 | 22,315 |
| FRB Ser. 18-H3, Class C, 5.025%, 7/15/51 W | | 1,174,000 | 1,025,431 |
| Ser. 15-UBS8, Class B, 4.315%, 12/15/48 W | | 2,528,000 | 2,154,050 |
| FRB Ser. 15-MS1, Class C, 4.158%, 5/15/48 W | | 709,000 | 616,516 |
| FRB Ser. 16-BNK2, Class C, 4.018%, 11/15/49 W | | 1,682,000 | 1,324,272 |
| Morgan Stanley Capital I Trust 144A | | | |
| FRB Ser. 12-C4, Class D, 5.336%, 3/15/45 W | | 869,416 | 804,210 |
| FRB Ser. 12-C4, Class E, 5.336%, 3/15/45 W | | 392,000 | 283,189 |
| |
Mortgage Opportunities Fund 25 |
| | | |
| MORTGAGE-BACKED SECURITIES (73.8%)* cont. | Principal
amount | Value |
| Commercial mortgage-backed securities cont. |
| Morgan Stanley Capital I Trust 144A | | | |
| FRB Ser. 11-C3, Class G, 5.253%, 7/15/49 W | | $753,000 | $387,721 |
| Ser. 18-L1, Class D, 3.00%, 10/15/51 | | 2,079,000 | 1,540,726 |
| Multifamily Connecticut Avenue Securities Trust 144A FRB Ser. 19-01, Class M10, 7.294%, 10/25/49 | | 1,376,155 | 1,269,598 |
| PFP, Ltd. 144A FRB Ser. 21-8, Class A, 4.904%, 8/9/37 (Cayman Islands) | | 1,044,374 | 1,001,569 |
| Ready Capital Mortgage Financing, LLC 144A | | | |
| FRB Ser. 20-FL4, Class C, 8.794%, 2/25/35 | | 1,468,000 | 1,432,605 |
| FRB Ser. 22-FL9, Class A, 6.486%, 6/25/37 | | 758,321 | 747,229 |
| UBS Commercial Mortgage Trust | | | |
| FRB Ser. 17-C3, Class C, 4.538%, 8/15/50 W | | 1,796,000 | 1,438,499 |
| Ser. 17-C3, Class B, 4.092%, 8/15/50 W | | 2,300,000 | 1,937,448 |
| UBS Commercial Mortgage Trust 144A | | | |
| FRB Ser. 12-C1, Class D, 6.661%, 5/10/45 W | | 75,697 | 66,975 |
| FRB Ser. 12-C1, Class E, 5.00%, 5/10/45 W | | 671,000 | 261,690 |
| UBS-Barclays Commercial Mortgage Trust 144A | | | |
| Ser. 12-C2, Class F, 5.00%, 5/10/63 W | | 37,000 | — |
| FRB Ser. 12-C2, Class E, 4.844%, 5/10/63 W | | 24,000 | 240 |
| FRB Ser. 12-C4, Class D, 4.416%, 12/10/45 W | | 395,096 | 392,940 |
| Wells Fargo Commercial Mortgage Trust | | | |
| FRB Ser. 16-NXS5, Class D, 5.148%, 1/15/59 W | | 781,000 | 666,356 |
| FRB Ser. 15-C31, Class C, 4.749%, 11/15/48 W | | 711,000 | 633,062 |
| FRB Ser. 15-SG1, Class B, 4.602%, 9/15/48 W | | 2,119,000 | 1,856,374 |
| FRB Ser. 15-C29, Class D, 4.361%, 6/15/48 W | | 2,017,000 | 1,720,201 |
| Ser. 19-C50, Class C, 4.345%, 5/15/52 | | 281,000 | 231,510 |
| Ser. 15-C31, Class D, 3.852%, 11/15/48 | | 491,000 | 399,901 |
| FRB Ser. 19-C52, Class XA, IO, 1.75%, 8/15/52 W | | 9,929,953 | 738,272 |
| FRB Ser. 21-C59, Class XA, IO, 1.67%, 4/15/54 W | | 23,954,317 | 2,016,733 |
| Wells Fargo Commercial Mortgage Trust 144A | | | |
| FRB Ser. 15-C31, Class E, 4.749%, 11/15/48 W | | 783,000 | 550,859 |
| FRB Ser. 15-C30, Class D, 4.648%, 9/15/58 W | | 2,090,000 | 1,766,879 |
| FRB Ser. 13-LC12, Class D, 4.431%, 7/15/46 W | | 381,000 | 154,864 |
| Ser. 14-LC16, Class D, 3.938%, 8/15/50 | | 777,000 | 121,198 |
| Ser. 17-RB1, Class D, 3.401%, 3/15/50 | | 2,367,000 | 1,713,365 |
| Ser. 16-C33, Class D, 3.123%, 3/15/59 | | 2,533,000 | 1,995,946 |
| Ser. 19-C50, Class D, 3.00%, 5/15/52 | | 418,000 | 280,883 |
| Ser. 19-C54, Class D, 2.50%, 12/15/52 | | 259,000 | 202,923 |
| WF-RBS Commercial Mortgage Trust Ser. 14-C21, Class C, 4.234%, 8/15/47 W | | 1,151,000 | 1,035,125 |
| WF-RBS Commercial Mortgage Trust 144A | | | |
| FRB Ser. 13-UBS1, Class D, 5.192%, 3/15/46 W | | 883,000 | 846,766 |
| FRB Ser. 13-UBS1, Class E, 5.192%, 3/15/46 W | | 1,894,000 | 1,796,608 |
| Ser. 11-C4, Class E, 4.988%, 6/15/44 W | | 806,022 | 614,821 |
| FRB Ser. 12-C9, Class D, 4.933%, 11/15/45 W | | 161,155 | 157,126 |
| FRB Ser. 12-C9, Class E, 4.933%, 11/15/45 W | | 456,000 | 454,120 |
| FRB Ser. 12-C7, Class D, 4.806%, 6/15/45 W | | 1,114,000 | 624,869 |
| FRB Ser. 12-C7, Class E, 4.806%, 6/15/45 (In default) † W | | 630,228 | 47,280 |
| FRB Ser. 13-C15, Class D, 4.68%, 8/15/46 W | | 1,324,000 | 811,082 |
| FRB Ser. 12-C10, Class D, 4.62%, 12/15/45 W | | 406,000 | 300,003 |
| FRB Ser. 14-LC14, Class D, 4.586%, 3/15/47 W | | 1,568,000 | 1,443,873 |
| | | 125,984,604 |
| Residential mortgage-backed securities (non-agency) (17.2%) |
| American Home Mortgage Investment Trust FRB Ser. 07-1, Class GA1C, (ICE LIBOR USD 1 Month + 0.19%), 4.234%, 5/25/47 | | 1,521,824 | 816,317 |
| Arroyo Mortgage Trust 144A Ser. 20-1, Class M1, 4.277%, 3/25/55 | | 442,000 | 360,532 |
| Bear Stearns Alt-A Trust | | | |
| FRB Ser. 05-10, Class 11A1, (ICE LIBOR USD 1 Month + 0.50%), 4.544%, 1/25/36 | | 113,171 | 141,916 |
| FRB Ser. 05-7, Class 21A1, 3.712%, 9/25/35 W | | 180,485 | 145,019 |
| FRB Ser. 05-8, Class 21A1, 3.34%, 10/25/35 W | | 334,291 | 276,579 |
| Bear Stearns Mortgage Funding Trust FRB Ser. 06-AR2, Class 2A1, (ICE LIBOR USD 1 Month + 0.23%), 4.504%, 9/25/46 | | 60,919 | 44,324 |
| |
26 Mortgage Opportunities Fund |
| | | |
| MORTGAGE-BACKED SECURITIES (73.8%)* cont. | Principal
amount | Value |
| Residential mortgage-backed securities (non-agency) cont. |
| Bellemeade Re, Ltd. 144A | | | |
| FRB Ser. 17-1, Class B1, (ICE LIBOR USD 1 Month + 4.75%), 8.794%, 10/25/27 (Bermuda) | | $633,000 | $635,513 |
| FRB Ser. 18-3A, Class M2, (ICE LIBOR USD 1 Month + 2.75%), 6.766%, 10/25/28 (Bermuda) | | 2,969,198 | 2,929,259 |
| Chevy Chase Funding, LLC Mortgage-Backed Certificates 144A FRB Ser. 06-4A, Class A2, (ICE LIBOR USD 1 Month + 0.18%), 4.224%, 11/25/47 | | 919,862 | 794,021 |
| Citigroup Mortgage Loan Trust, Inc. | | | |
| FRB Ser. 07-AMC3, Class A2D, (ICE LIBOR USD 1 Month + 0.35%), 4.394%, 3/25/37 | | 170,164 | 142,959 |
| FRB Ser. 07-AR5, Class 1A1A, 3.254%, 4/25/37 W | | 240,204 | 201,536 |
| Countrywide Alternative Loan Trust | | | |
| FRB Ser. 06-OA10, Class 2A1, (ICE LIBOR USD 1 Month + 0.38%), 4.424%, 8/25/46 | | 76,136 | 61,547 |
| FRB Ser. 06-OA10, Class 3A1, (ICE LIBOR USD 1 Month + 0.38%), 4.424%, 8/25/46 | | 203,451 | 174,084 |
| FRB Ser. 06-OA10, Class 4A1, (ICE LIBOR USD 1 Month + 0.38%), 4.424%, 8/25/46 | | 228,223 | 180,675 |
| FRB Ser. 06-OA19, Class A1, (ICE LIBOR USD 1 Month + 0.18%), 4.119%, 2/20/47 | | 247,574 | 185,285 |
| Countrywide Home Loans Mortgage Pass-Through Trust FRB Ser. 06-OA5, Class 2A1, (ICE LIBOR USD 1 Month + 0.40%), 4.444%, 4/25/46 | | 31,015 | 25,332 |
| Credit Suisse Mortgage Capital Certificates 144A FRB Ser. 20-SPT1, Class M1, 3.388%, 4/25/65 W | | 392,000 | 314,665 |
| CSMC Trust 144A FRB Ser. 20-RPL2, Class A12, 3.447%, 2/25/60 W | | 1,974,042 | 1,926,842 |
| Deephaven Residential Mortgage Trust Ser. 22-3, Class A3, 5.30%, 7/25/67 W | | 2,200,204 | 2,067,341 |
| Eagle Re, Ltd. 144A FRB Ser. 20-1, Class B1, (ICE LIBOR USD 1 Month + 2.85%), 6.894%, 1/25/30 | | 404,000 | 353,560 |
| Federal Home Loan Mortgage Corporation | | | |
| Structured Agency Credit Risk Debt FRN Ser. 15-HQA2, Class B, (ICE LIBOR USD 1 Month + 10.50%), 14.516%, 5/25/28 | | 248,371 | 257,929 |
| Structured Agency Credit Risk Debt FRN Ser. 16-DNA1, Class B, (ICE LIBOR USD 1 Month + 10.00%), 14.016%, 7/25/28 | | 246,536 | 258,176 |
| Structured Agency Credit Risk Debt FRN Ser. 15-DNA3, Class B, (ICE LIBOR USD 1 Month + 9.35%), 13.366%, 4/25/28 | | 295,388 | 303,508 |
| Structured Agency Credit Risk Debt FRN Ser. 15-HQA1, Class B, (ICE LIBOR USD 1 Month + 8.80%), 12.816%, 3/25/28 | | 369,109 | 369,289 |
| Structured Agency Credit Risk Debt FRN Ser. 15-DNA2, Class B, (ICE LIBOR USD 1 Month + 7.55%), 11.566%, 12/25/27 | | 1,336,478 | 1,334,660 |
| Structured Agency Credit Risk Debt FRN Ser. 17-DNA1, Class B1, (ICE LIBOR USD 1 Month + 4.95%), 8.966%, 7/25/29 | | 773,000 | 793,549 |
| Structured Agency Credit Risk Debt FRN Ser. 17-DNA3, Class B1, (ICE LIBOR USD 1 Month + 4.45%), 8.466%, 3/25/30 | | 250,000 | 252,505 |
| Seasoned Credit Risk Transfer Trust Ser. 18-1, Class M, 4.75%, 5/25/57 W | | 978,319 | 848,935 |
| Federal Home Loan Mortgage Corporation 144A | | | |
| Structured Agency Credit Risk Trust FRB Ser. 19-HQA1, Class B2, (ICE LIBOR USD 1 Month + 12.25%), 16.266%, 2/25/49 | | 1,100,000 | 1,194,306 |
| Structured Agency Credit Risk Trust FRB Ser. 18-HQA2, Class B2, (ICE LIBOR USD 1 Month + 11.00%), 15.016%, 10/25/48 | | 1,728,000 | 1,838,246 |
| Structured Agency Credit Risk Trust FRB Ser. 19-DNA1, Class B2, (ICE LIBOR USD 1 Month + 10.75%), 14.766%, 1/25/49 | | 439,000 | 464,252 |
| Structured Agency Credit Risk Trust REMICs FRB Ser. 22-HQA1, Class B2, (US 30 Day Average SOFR + 11.00%), 14.521%, 3/25/42 | | 2,600,000 | 2,307,500 |
| Structured Agency Credit Risk Trust FRB Ser. 19-DNA2, Class B2, (ICE LIBOR USD 1 Month + 10.50%), 14.516%, 3/25/49 | | 755,000 | 793,553 |
| Structured Agency Credit Risk Trust REMICs FRB Ser. 20-DNA3, Class B2, (ICE LIBOR USD 1 Month + 9.35%), 13.366%, 6/25/50 | | 750,000 | 793,125 |
| Structured Agency Credit Risk Trust FRB Ser. 19-FTR1, Class B2, (ICE LIBOR USD 1 Month + 8.35%), 12.366%, 1/25/48 | | 1,000,000 | 975,000 |
| Structured Agency Credit Risk Trust FRB Ser. 18-DNA3, Class B2, (ICE LIBOR USD 1 Month + 7.75%), 11.766%, 9/25/48 | | 818,000 | 757,828 |
| Structured Agency Credit Risk Trust FRB Ser. 19-HQA3, Class B2, (ICE LIBOR USD 1 Month + 7.50%), 11.516%, 9/25/49 | | 1,000,000 | 919,966 |
| Structured Agency Credit Risk Debt FRN Ser. 22-DNA5, Class M2, (US 30 Day Average SOFR + 6.75%), 10.271%, 6/25/42 | | 1,471,000 | 1,517,148 |
| Structured Agency Credit Risk Trust REMICs FRB Ser. 20-HQA1, Class B2, (ICE LIBOR USD 1 Month + 5.10%), 9.116%, 1/25/50 | | 800,000 | 632,115 |
| Structured Agency Credit Risk Trust REMICs FRB Ser. 22-DNA4, Class M2, (US 30 Day Average SOFR + 5.25%), 8.797%, 5/25/42 | | 2,000,000 | 1,855,000 |
| Structured Agency Credit Risk Trust REMICs FRB Ser. 22-HQA1, Class M2, (US 30 Day Average SOFR + 5.25%), 8.771%, 3/25/42 | | 2,759,000 | 2,600,358 |
| |
Mortgage Opportunities Fund 27 |
| | | |
| MORTGAGE-BACKED SECURITIES (73.8%)* cont. | Principal
amount | Value |
| Residential mortgage-backed securities (non-agency) cont. |
| Federal Home Loan Mortgage Corporation 144A | | | |
| Structured Agency Credit Risk Trust FRB Ser. 19-HQA1, Class HQA1, (ICE LIBOR USD 1 Month + 4.40%), 8.416%, 2/25/49 | | $2,950,000 | $3,002,603 |
| Structured Agency Credit Risk Trust FRB Ser. 18-HQA2, Class B1, (ICE LIBOR USD 1 Month + 4.25%), 8.266%, 10/25/48 | | 2,920,000 | 2,887,150 |
| Structured Agency Credit Risk Trust FRB Ser. 19-HQA2, Class HQA2, (ICE LIBOR USD 1 Month + 4.10%), 8.116%, 4/25/49 | | 2,518,000 | 2,492,645 |
| Structured Agency Credit Risk Trust REMICs FRB Ser. 20-HQA2, Class B1, (ICE LIBOR USD 1 Month + 4.10%), 8.116%, 3/25/50 | | 1,000,000 | 985,617 |
| Structured Agency Credit Risk Trust REMICs FRB Ser. 22-DNA3, Class M2, (US 30 Day Average SOFR + 4.35%), 7.871%, 4/25/42 | | 1,940,000 | 1,816,422 |
| Structured Agency Credit Risk Debt FRN Ser. 22-HQA2, Class M1B, (US 30 Day Average SOFR + 4.00%), 7.521%, 7/25/42 | | 800,000 | 775,809 |
| Structured Agency Credit Risk Trust REMICs FRB Ser. 20-HQA2, Class M2, (ICE LIBOR USD 1 Month + 3.10%), 7.116%, 3/25/50 | | 844,902 | 843,366 |
| Structured Agency Credit Risk Trust FRB Ser. 19-HQA3, Class B1, (ICE LIBOR USD 1 Month + 3.00%), 7.016%, 9/25/49 | | 500,000 | 470,000 |
| Structured Agency Credit Risk Trust REMICs FRB Ser. 22-DNA2, Class M1B, (US 30 Day Average SOFR + 2.40%), 5.921%, 2/25/42 | | 2,200,000 | 2,065,286 |
| Seasoned Credit Risk Transfer Trust Ser. 19-2, Class M, 4.75%, 8/25/58 W | | 244,000 | 201,238 |
| Seasoned Credit Risk Transfer Trust Ser. 17-3, Class M2, 4.75%, 7/25/56 W | | 400,000 | 340,643 |
| Seasoned Credit Risk Transfer Trust Ser. 19-4, Class M, 4.50%, 2/25/59 W | | 370,000 | 310,652 |
| Federal National Mortgage Association | | | |
| Connecticut Avenue Securities FRB Ser. 16-C03, Class 2B, (ICE LIBOR USD 1 Month + 12.75%), 16.766%, 10/25/28 | | 814,780 | 885,543 |
| Connecticut Avenue Securities FRB Ser. 16-C03, Class 1B, (ICE LIBOR USD 1 Month + 11.75%), 15.766%, 10/25/28 | | 111,163 | 120,428 |
| Connecticut Avenue Securities FRB Ser. 16-C01, Class 1B, (ICE LIBOR USD 1 Month + 11.75%), 15.766%, 8/25/28 | | 26,597 | 28,815 |
| Connecticut Avenue Securities FRB Ser. 16-C07, Class 2B, (ICE LIBOR USD 1 Month + 9.50%), 13.516%, 5/25/29 | | 597,426 | 598,726 |
| Connecticut Avenue Securities FRB Ser. 16-C06, Class 1B, (ICE LIBOR USD 1 Month + 9.25%), 13.266%, 4/25/29 | | 1,556,210 | 1,565,236 |
| Connecticut Avenue Securities FRB Ser. 15-C04, Class 1M2, (ICE LIBOR USD 1 Month + 5.70%), 9.716%, 4/25/28 | | 709,032 | 746,256 |
| Connecticut Avenue Securities FRB Ser. 17-C04, Class 2B1, (ICE LIBOR USD 1 Month + 5.05%), 9.066%, 11/25/29 | | 964,000 | 1,008,022 |
| Connecticut Avenue Securities FRB Ser. 17-C03, Class 1B1, (ICE LIBOR USD 1 Month + 4.85%), 8.866%, 10/25/29 | | 150,000 | 155,337 |
| Connecticut Avenue Securities FRB Ser. 18-C04, Class 2B1, (ICE LIBOR USD 1 Month + 4.50%), 8.516%, 12/25/30 | | 180,000 | 184,568 |
| Connecticut Avenue Securities FRB Ser. 17-C07, Class 2B1, (ICE LIBOR USD 1 Month + 4.45%), 8.494%, 5/25/30 | | 284,000 | 290,187 |
| Connecticut Avenue Securities FRB Ser. 17-C06, Class 2B1, (ICE LIBOR USD 1 Month + 4.45%), 8.466%, 2/25/30 | | 761,000 | 778,455 |
| Connecticut Avenue Securities FRB Ser. 17-C07, Class 2M2, (ICE LIBOR USD 1 Month + 2.50%), 6.544%, 5/25/30 | | 996,451 | 1,005,372 |
| Federal National Mortgage Association 144A | | | |
| Connecticut Avenue Securities Trust FRB Ser. 22-R06, Class 1B2, (US 30 Day Average SOFR + 10.60%), 14.121%, 5/25/42 | | 500,000 | 492,583 |
| Connecticut Avenue Securities Trust FRB Ser. 22-R03, Class 1B2, (US 30 Day Average SOFR + 9.85%), 13.371%, 3/25/42 | | 1,167,000 | 1,123,967 |
| Connecticut Avenue Securities Trust FRB Ser. 22-R09, Class 2B1, (US 30 Day Average SOFR + 6.75%), 10.297%, 9/25/42 | | 500,000 | 484,227 |
| Connecticut Avenue Securities Trust FRB Ser. 22-R04, Class 1B1, (US 30 Day Average SOFR + 5.25%), 8.771%, 3/25/42 | | 500,000 | 484,400 |
| Connecticut Avenue Securities Trust FRB Ser. 22-R09, Class 2M2, (US 30 Day Average SOFR + 4.75%), 8.297%, 9/25/42 | | 1,000,000 | 1,000,959 |
| Connecticut Avenue Securities Trust FRB Ser. 19-R03, Class 1B1, (ICE LIBOR USD 1 Month + 4.10%), 8.116%, 9/25/31 | | 1,291,000 | 1,282,931 |
| Connecticut Avenue Securities Trust FRB Ser. 22-R05, Class 2B1, (US 30 Day Average SOFR + 4.50%), 8.021%, 4/25/42 | | 2,540,000 | 2,391,562 |
| Connecticut Avenue Securities Trust FRB Ser. 22-R02, Class 2B1, (US 30 Day Average SOFR + 4.50%), 8.021%, 1/25/42 | | 2,146,000 | 1,960,908 |
| GSAA Home Equity Trust | | | |
| FRB Ser. 06-8, Class 2A2, (ICE LIBOR USD 1 Month + 0.36%), 4.404%, 5/25/36 | | 75,288 | 18,794 |
| FRB Ser. 06-1, Class A1, (ICE LIBOR USD 1 Month + 0.18%), 4.224%, 1/25/36 | | 1,094,222 | 361,093 |
| GSR Mortgage Loan Trust FRB Ser. 07-OA1, Class 2A3A, (ICE LIBOR USD 1 Month + 0.31%), 4.354%, 5/25/37 | | 328,682 | 234,997 |
| Home Re, Ltd. 144A FRB Ser. 22-1, Class B1, (US 30 Day Average SOFR + 9.00%), 12.521%, 10/25/34 (Bermuda) | | 900,000 | 875,350 |
| Imperial Fund Mortgage Trust 144A Ser. 22-NQM4, Class A3, 5.04%, 6/25/67 | | 1,372,582 | 1,293,528 |
| |
28 Mortgage Opportunities Fund |
| | | |
| MORTGAGE-BACKED SECURITIES (73.8%)* cont. | Principal
amount | Value |
| Residential mortgage-backed securities (non-agency) cont. |
| IndyMac INDX Mortgage Loan Trust FRB Ser. 06-AR11, Class 2A1, 3.215%, 6/25/36 W | | $25,008 | $22,342 |
| JPMorgan Alternative Loan Trust FRB Ser. 07-A2, Class 12A1, IO, (ICE LIBOR USD 1 Month + 0.20%), 4.444%, 6/25/37 | | 159,964 | 66,855 |
| LHOME Mortgage Trust 144A Ser. 21-RTL1, Class A1, 2.09%, 9/25/26 W | | 280,000 | 266,000 |
| Merrill Lynch Mortgage Investors Trust FRB Ser. 06-HE3, Class A4, (ICE LIBOR USD 1 Month + 0.50%), 4.544%, 6/25/37 | | 810,063 | 217,409 |
| Morgan Stanley Re-REMIC Trust 144A FRB Ser. 10-R4, Class 4B, (ICE LIBOR USD 1 Month + 0.23%), 2.702%, 2/26/37 | | 238,123 | 204,445 |
| MortgageIT Trust FRB Ser. 05-3, Class M4, (ICE LIBOR USD 1 Month + 0.95%), 4.989%, 8/25/35 | | 8,325 | 7,561 |
| Oaktown Re III, Ltd. 144A | | | |
| FRB Ser. 19-1A, Class B1B, (ICE LIBOR USD 1 Month + 4.35%), 8.394%, 7/25/29 (Bermuda) | | 191,000 | 188,821 |
| FRB Ser. 19-1A, Class B1A, (ICE LIBOR USD 1 Month + 3.50%), 7.544%, 7/25/29 (Bermuda) | | 159,000 | 153,922 |
| Radnor Re, Ltd. 144A FRB Ser. 18-1, Class M2, (ICE LIBOR USD 1 Month + 2.70%), 6.744%, 3/25/28 (Bermuda) | | 957,222 | 953,044 |
| Structured Asset Mortgage Investments II Trust | | | |
| FRB Ser. 06-AR7, Class A1A, (ICE LIBOR USD 1 Month + 0.21%), 4.464%, 8/25/36 | | 76,427 | 68,402 |
| FRB Ser. 07-AR1, Class 2A1, (ICE LIBOR USD 1 Month + 0.18%), 4.224%, 1/25/37 | | 28,289 | 23,949 |
| FRB Ser. 06-AR7, Class A1BG, (ICE LIBOR USD 1 Month + 0.12%), 4.164%, 8/25/36 | | 229,784 | 212,423 |
| Toorak Mortgage Corp., Ltd. 144A Ser. 20-1, Class A1, 2.734%, 3/25/23 W | | 2,755,916 | 2,701,894 |
| Visio Trust 144A Ser. 22-1, Class A2, 5.85%, 8/25/57 | | 2,195,553 | 2,103,954 |
| WaMu Mortgage Pass-Through Certificates Trust | | | |
| FRB Ser. 04-AR12, Class A2B, (ICE LIBOR USD 1 Month + 0.92%), 4.964%, 10/25/44 | | 78,990 | 71,924 |
| FRB Ser. 05-AR13, Class A1C4, (ICE LIBOR USD 1 Month + 0.86%), 4.904%, 10/25/45 | | 46,226 | 42,304 |
| | | 75,713,178 |
| Total mortgage-backed securities (cost $347,160,994) | $325,262,269 |
|
| | | |
| ASSET-BACKED SECURITIES (1.6%)* | Principal
amount | Value |
| 1Sharpe Mortgage Trust 144A FRB Ser. 20-1, Class NOTE, (ICE LIBOR USD 3 Month + 2.90%), 3.025%, 7/25/24 | | $625,131 | $615,754 |
| Mello Warehouse Securitization Trust 144A | | | |
| FRB Ser. 21-3, Class E, (ICE LIBOR USD 1 Month + 3.25%), 7.294%, 11/25/55 | | 1,206,000 | 1,099,285 |
| FRB Ser. 21-3, Class D, (ICE LIBOR USD 1 Month + 2.00%), 6.044%, 11/25/55 | | 663,000 | 604,678 |
| MRA Issuance Trust 144A FRB Ser. 22-2, Class A3, (US SOFR + 1.25%), 4.30%, 1/17/23 | | 783,000 | 783,000 |
| NewRez Warehouse Securitization Trust 144A FRB Ser. 21-1, Class F, (ICE LIBOR USD 1 Month + 5.25%), 9.294%, 5/25/55 | | 1,250,000 | 1,171,550 |
| Securitized Term Auto Loan Receivables Trust 144A Ser. 19-CRTA, Class D, 4.572%, 3/25/26 (Canada) | | 1,297,958 | 1,249,320 |
| Station Place Securitization Trust 144A | | | |
| FRB Ser. 22-3, Class A1, (CME Term SOFR 1 Month + 1.25%), 5.305%, 5/29/23 | | 1,200,000 | 1,200,000 |
| FRB Ser. 21-14, Class A1, (ICE LIBOR USD 1 Month + 0.70%), 4.744%, 12/8/22 | | 176,000 | 176,000 |
| Total asset-backed securities (cost $7,050,745) | $6,899,587 |
|
| | | |
| SHORT-TERM INVESTMENTS (25.6%)* | Principal amount/
shares | Value |
| Putnam Short Term Investment Fund Class P 3.95% L | Shares | 74,538,570 | $74,538,570 |
| State Street Institutional U.S. Government Money Market Fund, Premier Class 3.66% P | Shares | 6,596,000 | 6,596,000 |
| U.S. Treasury Bills 3.997%, 1/10/23 ∆ § | | $7,800,000 | 7,766,172 |
| U.S. Treasury Bills 3.981%, 1/3/23 | | 3,400,000 | 3,387,798 |
| U.S. Treasury Bills 3.673%, 12/22/22 ∆ § | | 6,600,000 | 6,586,232 |
| U.S. Treasury Bills 3.553%, 12/13/22 ∆ § | | 9,300,000 | 9,289,073 |
| U.S. Treasury Bills 3.476%, 12/6/22 ∆ § | | 900,000 | 899,552 |
| U.S. Treasury Bills 3.347%, 12/1/22 ∆ § | | 3,700,000 | 3,700,000 |
| Total short-term investments (cost $112,763,228) | $112,763,397 |
|
| |
| TOTAL INVESTMENTS |
| Total investments (cost $1,198,936,580) | $1,189,508,607 |
|
| |
Mortgage Opportunities Fund 29 |
| |
| Key to holding’s abbreviations |
| bp | Basis Points |
| FRB | Floating Rate Bonds: The rate shown is the current interest rate at the close of the reporting period. Rates may be subject to a cap or floor. For certain securities, the rate may represent a fixed rate currently in place at the close of the reporting period. |
| FRN | Floating Rate Notes: The rate shown is the current interest rate or yield at the close of the reporting period. Rates may be subject to a cap or floor. For certain securities, the rate may represent a fixed rate currently in place at the close of the reporting period. |
| IFB | Inverse Floating Rate Bonds, which are securities that pay interest rates that vary inversely to changes in the market interest rates. As interest rates rise, inverse floaters produce less current income. The rate shown is the current interest rate at the close of the reporting period. Rates may be subject to a cap or floor. |
| IO | Interest Only |
| LIBOR | London Interbank Offered Rate |
| OTC | Over-the-counter |
| SOFR | Secured Overnight Financing Rate |
| TBA | To Be Announced Commitments |
|
| | | |
| Notes to the fund’s portfolio |
| Unless noted otherwise, the notes to the fund’s portfolio are for the close of the fund’s reporting period, which ran from June 1, 2022 through November 30, 2022 (the reporting period). Within the following notes to the portfolio, references to “Putnam Management” represent Putnam Investment Management, LLC, the fund’s manager, an indirect wholly-owned subsidiary of Putnam Investments, LLC and references to “ASC 820” represent Accounting Standards Codification 820 Fair Value Measurements and Disclosures. |
| * | Percentages indicated are based on net assets of $441,000,328. |
| † | This security is non-income-producing. |
| ∆ | This security, in part or in entirety, was pledged and segregated with the custodian for collateral on certain derivative contracts at the close of the reporting period. Collateral at period end totaled $8,556,721 and is included in Investments in securities on the Statement of assets and liabilities (Notes 1 and 8). |
| § | This security, in part or in entirety, was pledged and segregated with the custodian for collateral on the initial margin on certain centrally cleared derivative contracts at the close of the reporting period. Collateral at period end totaled $19,222,239 and is included in Investments in securities on the Statement of assets and liabilities (Notes 1 and 8). |
| L | Affiliated company (Note 5). The rate quoted in the security description is the annualized 7-day yield of the fund at the close of the reporting period. |
| P | This security was pledged, or purchased with cash that was pledged, to the fund for collateral on certain derivative contracts and TBA commitments. The rate quoted in the security description is the annualized 7-day yield of the fund at the close of the reporting period. |
| W | The rate shown represents the weighted average coupon associated with the underlying mortgage pools. Rates may be subject to a cap or floor. |
| Unless otherwise noted, the rates quoted in Short-term investments security descriptions represent the weighted average yield to maturity. |
| 144A after the name of an issuer represents securities exempt from registration under Rule 144A of the Securities Act of 1933, as amended. These securities may be resold in transactions exempt from registration, normally to qualified institutional buyers. |
| See Note 1 to the financial statements regarding TBA commitments. |
| The dates shown on debt obligations are the original maturity dates. |
|
| | | | | |
| FORWARD PREMIUM SWAP OPTION CONTRACTS OUTSTANDING at 11/30/22 (Unaudited) |
Counterparty
Fixed right or obligation % to receive or (pay)/Floating rate index/
Maturity date | Expiration
date/strike | | Notional/
Contract
amount | Premium
receivable/
(payable) | Unrealized
appreciation/
(depreciation) |
| Citibank, N.A. |
| 4.108/US SOFR/Jan-28 (Purchased) | Jan-23/4.108 | | $2,902,400 | $(41,649) | $44,262 |
| (4.108)/US SOFR/Jan-28 (Purchased) | Jan-23/4.108 | | 2,902,400 | (41,649) | (36,570) |
| Goldman Sachs International |
| 3.92/US SOFR/Feb-33 (Purchased) | Feb-23/3.92 | | 7,798,700 | (170,402) | 270,848 |
| (3.92)/US SOFR/Feb-33 (Purchased) | Feb-23/3.92 | | 7,798,700 | (170,402) | (138,895) |
| Unrealized appreciation | 315,110 |
| Unrealized (depreciation) | (175,465) |
| Total | $139,645 |
|
| | | |
| TBA SALE COMMITMENTS OUTSTANDING at 11/30/22 (proceeds receivable $300,450,019) (Unaudited) |
| Agency | Principal
amount | Settlement
date | Value |
| Government National Mortgage Association, 3.50%, 12/1/52 | $1,000,000 | 12/20/22 | $927,715 |
| Uniform Mortgage-Backed Securities, 5.00%, 12/1/52 | 187,000,000 | 12/13/22 | 186,181,781 |
| Uniform Mortgage-Backed Securities, 4.50%, 12/1/52 | 87,000,000 | 12/13/22 | 84,689,106 |
| Uniform Mortgage-Backed Securities, 4.00%, 12/1/52 | 5,000,000 | 12/13/22 | 4,731,250 |
| Uniform Mortgage-Backed Securities, 3.00%, 12/1/52 | 8,000,000 | 12/13/22 | 7,081,875 |
| Uniform Mortgage-Backed Securities, 2.50%, 12/1/52 | 12,000,000 | 12/13/22 | 10,254,374 |
| Uniform Mortgage-Backed Securities, 2.00%, 12/1/52 | 12,000,000 | 12/13/22 | 9,869,250 |
| Total | $303,735,351 |
|
| |
30 Mortgage Opportunities Fund |
| | | | | | | |
| CENTRALLY CLEARED INTEREST RATE SWAP CONTRACTS OUTSTANDING at 11/30/22 (Unaudited) |
| Notional amount | Value | Upfront
premium
received
(paid) | Termination
date | Payments
made by fund | Payments
received by fund | Unrealized
appreciation/
(depreciation) |
| | $557,686,000 | $1,360,754 E | $(570,688) | 12/21/24 | 4.20% — Annually | US SOFR — Annually | $790,062 |
| | 51,551,000 | 660,368 E | 82,916 | 12/21/27 | 3.80% — Annually | US SOFR — Annually | (577,452) |
| | 88,197,000 | 677,353 E | (414,333) | 12/21/32 | 3.40% — Annually | US SOFR — Annually | (1,091,688) |
| | 1,786,000 | 13,216 E | (14,903) | 12/21/52 | US SOFR — Annually | 3.00% — Annually | (28,119) |
| | 3,190,000 | 6,093 | (108) | 9/29/52 | 3.0575% — Annually | US SOFR — Annually | (6,153) |
| | 3,190,000 | 7,911 | (108) | 9/29/52 | 3.0605% — Annually | US SOFR — Annually | (7,988) |
| | 4,869,250 | 127,039 | (64) | 9/29/32 | 3.6305% — Annually | US SOFR — Annually | (131,912) |
| | 6,831,500 | 99,398 | (55) | 9/29/27 | US SOFR — Annually | 3.884% — Annually | 109,121 |
| | 4,869,250 | 130,885 | (64) | 9/29/32 | 3.64% — Annually | US SOFR — Annually | (135,840) |
| | 6,831,500 | 103,156 | (55) | 9/29/27 | US SOFR — Annually | 3.8965% — Annually | 113,028 |
| | 395,000 | 940 | (1) | 9/29/24 | 4.321% — Annually | US SOFR — Annually | 71 |
| | 3,974,000 | 116,915 | (52) | 9/29/32 | 3.67061% — Annually | US SOFR — Annually | (121,171) |
| | 6,341,000 | 139,692 | (84) | 9/30/32 | 3.5815% — Annually | US SOFR — Annually | (145,391) |
| | 9,354,500 | 55,285 | (75) | 9/30/27 | US SOFR — Annually | 3.6865% — Annually | 65,186 |
| | 9,354,500 | 54,443 | (75) | 9/30/27 | US SOFR — Annually | 3.6845% — Annually | 64,312 |
| | 25,233,000 | 145,847 | (95) | 9/30/24 | 4.1255% — Annually | US SOFR — Annually | 110,266 |
| | 18,371,000 | 253,704 | (243) | 9/30/32 | 3.4825% — Annually | US SOFR — Annually | (259,438) |
| | 1,144,000 | 2,585 | (39) | 10/3/52 | US SOFR — Annually | 3.0355% — Annually | (2,882) |
| | 21,198,500 | 89,034 | (80) | 10/3/24 | 4.212% — Annually | US SOFR — Annually | 52,851 |
| | 4,449,500 | 14,327 | (151) | 10/3/52 | US SOFR — Annually | 3.0305% — Annually | (15,517) |
| | 21,198,500 | 90,306 | (80) | 10/3/24 | 4.2085% — Annually | US SOFR — Annually | 54,245 |
| | 4,449,500 | 21,580 | (151) | 10/3/52 | US SOFR — Annually | 3.022% — Annually | (22,831) |
| | 1,227,000 | 6,270 | (5) | 10/3/24 | US SOFR — Annually | 4.16% — Annually | (4,289) |
| | 9,290,000 | 145,110 | (123) | 10/3/32 | US SOFR — Annually | 3.504% — Annually | 150,029 |
| | 4,021,000 | 33,093 | (32) | 10/4/27 | 3.7375% — Annually | US SOFR — Annually | (36,764) |
| | 7,268,000 | 88,088 | (59) | 10/4/27 | 3.826% — Annually | US SOFR — Annually | (95,759) |
| | 5,843,000 | 73,856 | (77) | 10/5/32 | 3.468% — Annually | US SOFR — Annually | (76,120) |
| | 4,963,000 | 40,647 | (66) | 10/5/32 | US SOFR — Annually | 3.4145% — Annually | 42,019 |
| | 7,481,000 | 87,827 | (254) | 10/6/52 | US SOFR — Annually | 2.9857% — Annually | (88,441) |
| | 3,740,000 | 5,685 | (127) | 10/7/52 | 3.055% — Annually | US SOFR — Annually | (6,035) |
| | 3,630,000 | 60,367 | (48) | 10/11/32 | 3.5155% — Annually | US SOFR — Annually | (61,155) |
| | 6,197,000 | 129,889 | (82) | 10/11/32 | 3.5675% — Annually | US SOFR — Annually | (131,691) |
| | 31,901,000 | 418,541 | (257) | 10/12/27 | US SOFR — Annually | 3.8445% — Annually | 438,964 |
| | 24,057,000 | 533,344 | (318) | 10/12/32 | 3.582% — Annually | US SOFR — Annually | (540,485) |
| | 4,420,000 | 120,268 | (150) | 10/14/52 | 3.1885% — Annually | US SOFR — Annually | (121,099) |
| | 12,635,000 | 26,154 | (47) | 10/14/24 | US SOFR — Annually | 4.316% — Annually | (5,262) |
| | 10,213,000 | 258,491 | (135) | 10/14/32 | US SOFR — Annually | 3.6195% — Annually | 265,797 |
| | 11,335,000 | 160,504 | (91) | 10/18/27 | US SOFR — Annually | 3.865% — Annually | 169,435 |
| | 6,027,000 | 119,094 | (49) | 10/18/27 | 3.9915% — Annually | US SOFR — Annually | (124,872) |
| | 25,477,000 | 33,630 | (96) | 10/19/24 | US SOFR — Annually | 4.4955% — Annually | 70,266 |
| | 2,878,000 | 95,780 | (38) | 10/19/32 | 3.7145% — Annually | US SOFR — Annually | (97,282) |
| | 4,691,000 | 144,436 | (62) | 10/20/32 | 3.6845% — Annually | US SOFR — Annually | (147,827) |
| | 3,251,000 | 203,285 | (111) | 10/24/52 | 3.372% — Annually | US SOFR — Annually | (203,850) |
| | 1,362,400 | 64,918 | (18) | 10/31/32 | 3.885% — Annually | US SOFR — Annually | (65,639) |
| | 2,292,000 | 190,992 | (78) | 10/24/52 | 3.4805% — Annually | US SOFR — Annually | (191,653) |
| | 3,359,000 | 337,277 | (114) | 10/25/52 | 3.5695% — Annually | US SOFR — Annually | (337,657) |
| | 8,357,000 | 20,224 | (31) | 10/27/24 | 4.544% — Annually | US SOFR — Annually | (32,113) |
| | 5,934,000 | 128,056 | (48) | 10/27/27 | US SOFR — Annually | 4.027% — Annually | 133,445 |
| | 4,633,000 | 341,545 | (158) | 10/28/52 | US SOFR — Annually | 3.43% — Annually | 342,893 |
| | 18,426,000 | 26,718 | (69) | 10/28/24 | 4.4905% — Annually | US SOFR — Annually | (51,230) |
| | 12,717,000 | 487,697 | (168) | 10/28/32 | 3.774% — Annually | US SOFR — Annually | (496,129) |
| | 3,800,000 | 208,202 | (129) | 10/31/52 | US SOFR — Annually | 3.331% — Annually | 208,219 |
| | 12,443,000 | 7,590 | (47) | 11/1/24 | 4.4375% — Annually | US SOFR — Annually | (19,496) |
| | 5,585,000 | 245,405 | (74) | 11/2/32 | 3.84% — Annually | US SOFR — Annually | (247,425) |
| | 39,000 | 133 | — | 11/2/24 | US SOFR — Annually | 4.585% — Annually | 170 |
| |
Mortgage Opportunities Fund 31 |
| | | | | | | |
| CENTRALLY CLEARED INTEREST RATE SWAP CONTRACTS OUTSTANDING at 11/30/22 (Unaudited) cont. |
| Notional amount | Value | Upfront
premium
received
(paid) | Termination
date | Payments
made by fund | Payments
received by fund | Unrealized
appreciation/
(depreciation) |
| | $5,530,000 | $89,697 | $(45) | 11/3/27 | US SOFR — Annually | 3.9025% — Annually | $93,137 |
| | 3,011,000 | 129,563 | (40) | 11/3/32 | 3.829% — Annually | US SOFR — Annually | (131,328) |
| | 4,514,000 | 243,485 | (60) | 11/7/32 | 3.9585% — Annually | US SOFR — Annually | (245,461) |
| | 8,549,000 | 68,392 | (32) | 11/8/24 | US SOFR — Annually | 4.826% — Annually | 75,788 |
| | 4,946,000 | 469,425 | (168) | 11/10/52 | 3.539% — Annually | US SOFR — Annually | (471,973) |
| | 7,252,800 | 375,985 | (96) | 11/10/32 | 3.933% — Annually | US SOFR — Annually | (381,237) |
| | 7,360,000 | 177,818 | (59) | 11/10/27 | US SOFR — Annually | 4.076% — Annually | 183,605 |
| | 24,782,000 | 136,053 | (93) | 11/14/24 | 4.677% — Annually | US SOFR — Annually | (154,248) |
| | 16,676,000 | 326,183 | (220) | 11/15/32 | US SOFR — Annually | 3.5475% — Annually | 329,359 |
| | 4,791,000 | 271,841 | (163) | 11/16/52 | US SOFR — Annually | 3.3395% — Annually | 271,767 |
| | 4,791,000 | 271,362 | (163) | 11/16/52 | US SOFR — Annually | 3.339% — Annually | 271,287 |
| | 2,726,000 | 125,096 | (93) | 11/17/52 | US SOFR — Annually | 3.283% — Annually | 125,893 |
| | 5,650,000 | 205,604 | (192) | 11/18/52 | US SOFR — Annually | 3.2335% — Annually | 207,238 |
| | 11,997,000 | 39,710 | (97) | 11/18/27 | 3.6075% — Annually | US SOFR — Annually | (45,305) |
| | 5,546,000 | 75,093 | (189) | 11/18/52 | US SOFR — Annually | 3.1145% — Annually | 76,459 |
| | 5,928,000 | 102,377 | (78) | 11/23/32 | 3.5195% — Annually | US SOFR — Annually | (105,841) |
| | 10,557,300 | 169,550 | (139) | 11/25/32 | 3.505% — Annually | US SOFR — Annually | (174,745) |
| | 1,474,000 | 37,233 | (50) | 11/25/52 | 3.175% — Annually | US SOFR — Annually | (37,908) |
| | 3,767,000 | 17,630 | (128) | 11/28/52 | US SOFR — Annually | 3.0675% — Annually | 18,464 |
| | 6,850,000 | 40,689 | (90) | 11/28/32 | US SOFR — Annually | 3.845% — Annually | 42,531 |
| | 2,836,000 | 454 | (96) | 11/29/52 | US SOFR — Annually | 3.044% — Annually | 837 |
| | 9,521,866 | 47,609 | (77) | 11/30/27 | US SOFR — Annually | 3.64% — Annually | 48,495 |
| | 53,244,000 | 143,759 | (200) | 11/30/24 | 4.498% — Annually | US SOFR — Annually | (150,611) |
| | 26,905,000 | 174,613 | (355) | 11/30/32 | 3.391% — Annually | US SOFR — Annually | (177,503) |
| | 7,396,000 | 53,177 | (98) | 12/1/32 | 3.399% — Annually | US SOFR — Annually | (53,275) |
| | 8,047,000 | 78,458 | (106) | 12/1/32 | 3.4295% — Annually | US SOFR — Annually | (78,564) |
| Total | $(924,876) | $(3,011,415) |
| E Extended effective date. |
|
| | | | | | | | |
| OTC CREDIT DEFAULT CONTRACTS OUTSTANDING — PROTECTION SOLD at 11/30/22 (Unaudited) |
Swap counterparty/
Referenced debt* | Rating*** | Upfront
premium
received
(paid)** | | Notional
amount | Value | Termi-
nation
date | Payments
received by fund | Unrealized
appreciation/
(depreciation) |
| Barclays Bank PLC |
| CMBX NA BBB−.7 Index | BB−/P | $34 | | $6,000 | $1,245 | 1/17/47 | 300 bp — Monthly | $(1,208) |
| Citigroup Global Markets, Inc. |
| CMBX NA A.6 Index | A-/P | 8,834 | | 37,318 | 4,501 | 5/11/63 | 200 bp — Monthly | 4,346 |
| CMBX NA BB.11 Index | BB−/P | 365,555 | | 647,000 | 137,617 | 11/18/54 | 500 bp — Monthly | 228,477 |
| CMBX NA BB.13 Index | BB−/P | 25,194 | | 252,000 | 65,344 | 12/16/72 | 500 bp — Monthly | (39,940) |
| CMBX NA BB.13 Index | BB−/P | 30,616 | | 336,000 | 87,125 | 12/16/72 | 500 bp — Monthly | (56,229) |
| CMBX NA BB.13 Index | BB−/P | 52,944 | | 561,000 | 145,467 | 12/16/72 | 500 bp — Monthly | (92,056) |
| CMBX NA BB.13 Index | BB−/P | 408,566 | | 1,579,000 | 409,435 | 12/16/27 | 500 bp — Monthly | 447 |
| CMBX NA BB.13 Index | BB−/P | 182,893 | | 2,006,000 | 520,156 | 12/16/72 | 500 bp — Monthly | (335,591) |
| CMBX NA BB.14 Index | BB/P | 49,557 | | 452,000 | 104,186 | 12/16/72 | 500 bp — Monthly | (54,252) |
| CMBX NA BB.6 Index | B-/P | 114,988 | | 196,243 | 73,238 | 5/11/63 | 500 bp — Monthly | 41,914 |
| CMBX NA BB.6 Index | B-/P | 71,327 | | 300,177 | 112,026 | 5/11/63 | 500 bp — Monthly | (40,449) |
| CMBX NA BB.6 Index | B-/P | 154,784 | | 737,792 | 275,344 | 5/11/63 | 500 bp — Monthly | (119,945) |
| CMBX NA BB.6 Index | B-/P | 489,542 | | 838,307 | 312,856 | 5/11/63 | 500 bp — Monthly | 177,384 |
| CMBX NA BB.6 Index | B-/P | 754,500 | | 1,031,815 | 385,073 | 5/11/63 | 500 bp — Monthly | 370,287 |
| CMBX NA BB.7 Index | B-/P | 60,373 | | 1,183,000 | 393,111 | 1/17/47 | 500 bp — Monthly | (331,752) |
| CMBX NA BB.9 Index | B/P | 204 | | 1,000 | 311 | 9/17/58 | 500 bp — Monthly | (106) |
| CMBX NA BB.9 Index | B/P | 66,168 | | 324,000 | 100,699 | 9/17/58 | 500 bp — Monthly | (34,261) |
| CMBX NA BB.9 Index | B/P | 68,460 | | 326,000 | 101,321 | 9/17/58 | 500 bp — Monthly | (32,589) |
| CMBX NA BBB−.10 Index | BB+/P | 15,138 | | 122,000 | 20,984 | 11/17/59 | 300 bp — Monthly | (5,785) |
| |
32 Mortgage Opportunities Fund |
| | | | | | | | |
| OTC CREDIT DEFAULT CONTRACTS OUTSTANDING — PROTECTION SOLD at 11/30/22 (Unaudited) cont. |
Swap counterparty/
Referenced debt* | Rating*** | Upfront
premium
received
(paid)** | | Notional
amount | Value | Termi-
nation
date | Payments
received by fund | Unrealized
appreciation/
(depreciation) |
| Citigroup Global Markets, Inc. cont. |
| CMBX NA BBB−.10 Index | BB+/P | $24,219 | | $222,000 | $38,184 | 11/17/59 | 300 bp — Monthly | $(13,854) |
| CMBX NA BBB−.13 Index | BBB−/P | 10,635 | | 113,000 | 21,606 | 12/16/72 | 300 bp — Monthly | (10,914) |
| CMBX NA BBB−.13 Index | BBB−/P | 35,956 | | 410,000 | 78,392 | 12/16/72 | 300 bp — Monthly | (42,231) |
| CMBX NA BBB−.14 Index | BBB−/P | 16,632 | | 509,000 | 87,141 | 12/16/72 | 300 bp — Monthly | (70,255) |
| CMBX NA BBB−.15 Index | BBB−/P | 15,250 | | 146,000 | 25,462 | 11/18/64 | 300 bp — Monthly | (10,139) |
| CMBX NA BBB−.15Index | BBB−/P | 100,422 | | 591,000 | 103,070 | 11/18/64 | 300 bp — Monthly | (2,353) |
| Credit Suisse International |
| CMBX NA A.7 Index | BBB+/P | 110 | | 3,000 | 169 | 1/17/47 | 200 bp — Monthly | (57) |
| CMBX NA BB.7 Index | B-/P | 44,810 | | 335,000 | 111,321 | 1/17/47 | 500 bp — Monthly | (66,231) |
| CMBX NA BBB−.7 Index | BB−/P | 1,379 | | 21,000 | 4,358 | 1/17/47 | 300 bp — Monthly | (2,968) |
| Goldman Sachs International |
| CMBX NA BB.14 Index | BB/P | 39,633 | | 314,000 | 72,377 | 12/16/72 | 500 bp — Monthly | (32,483) |
| CMBX NA BB.14 Index | BB/P | 116,917 | | 751,000 | 173,106 | 12/16/72 | 500 bp — Monthly | (55,562) |
| CMBX NA BB.6 Index | B-/P | 122,657 | | 203,765 | 76,045 | 5/11/63 | 500 bp — Monthly | 46,782 |
| CMBX NA BB.6 Index | B-/P | 296,785 | | 616,080 | 229,921 | 5/11/63 | 500 bp — Monthly | 67,377 |
| CMBX NA BB.6 Index | B-/P | 1,571,131 | | 3,148,779 | 1,175,124 | 5/11/63 | 500 bp — Monthly | 398,630 |
| CMBX NA BB.9 Index | B/P | 264,866 | | 655,000 | 203,574 | 9/17/58 | 500 bp — Monthly | 61,837 |
| CMBX NA BBB−.14 Index | BBB−/P | 3,661 | | 75,000 | 12,840 | 12/16/72 | 300 bp — Monthly | (9,142) |
| CMBX NA BBB−.14 Index | BBB−/P | 71,047 | | 415,000 | 71,048 | 12/16/72 | 300 bp — Monthly | 207 |
| CMBX NA BBB−.14 Index | BBB−/P | 126,555 | | 833,000 | 142,610 | 12/16/72 | 300 bp — Monthly | (15,639) |
| CMBX NA BBB−.14 Index | BBB−/P | 784,092 | | 5,000,000 | 856,000 | 12/16/27 | 300 bp — Monthly | (69,408) |
| CMBX NA BBB−.14 Index | BBB−/P | 2,422,866 | | 14,792,000 | 2,532,390 | 12/16/27 | 300 bp — Monthly | (102,122) |
| CMBX NA BBB−.15 Index | BBB−/P | 4,970 | | 80,000 | 13,952 | 11/18/64 | 300 bp — Monthly | (8,942) |
| CMBX NA BBB−.7 Index | BB−/P | 370 | | 5,000 | 1,038 | 1/17/47 | 300 bp — Monthly | (665) |
| CMBX NA BBB−.7 Index | BB−/P | 3,816 | | 37,000 | 7,678 | 1/17/47 | 300 bp — Monthly | (3,843) |
| CMBX NA BBB−.7 Index | BB−/P | 4,227 | | 52,000 | 10,790 | 1/17/47 | 300 bp — Monthly | (6,537) |
| CMBX NA BBB−.7 Index | BB−/P | 4,856 | | 57,000 | 11,828 | 1/17/47 | 300 bp — Monthly | (6,943) |
| CMBX NA BBB−.7 Index | BB−/P | 23,196 | | 206,000 | 42,745 | 1/17/47 | 300 bp — Monthly | (19,446) |
| JPMorgan Securities LLC |
| CMBX NA BB.10 Index | B/P | 23,189 | | 289,000 | 91,526 | 5/11/63 | 500 bp — Monthly | (68,097) |
| CMBX NA BB.6 Index | B-/P | 974,000 | | 1,293,700 | 482,809 | 5/11/63 | 500 bp — Monthly | 492,266 |
| CMBX NA BBB−.14 Index | BBB−/P | 6,310 | | 102,000 | 17,462 | 12/16/72 | 300 bp — Monthly | (11,102) |
| CMBX NA BBB−.7 Index | BB−/P | 21,129 | | 90,000 | 18,675 | 1/17/47 | 300 bp — Monthly | 2,499 |
| CMBX NA BBB−.8 Index | BB/P | 19,336 | | 124,000 | 19,418 | 10/17/57 | 300 bp — Monthly | (20) |
| Merrill Lynch International |
| CMBX NA BB.6 Index | B-/P | 22,364 | | 136,755 | 51,037 | 5/11/63 | 500 bp — Monthly | (28,559) |
| CMBX NA BB.7 Index | B-/P | 16,216 | | 134,000 | 44,528 | 1/17/47 | 500 bp — Monthly | (28,200) |
| CMBX NA BB.7 Index | B-/P | 27,163 | | 287,000 | 95,370 | 1/17/47 | 500 bp — Monthly | (67,968) |
| Morgan Stanley & Co. International PLC |
| CMBX NA BB.11 Index | BB−/P | 2,116 | | 25,000 | 5,318 | 11/18/54 | 500 bp — Monthly | (3,181) |
| CMBX NA BB.13 Index | BB−/P | 4,036 | | 44,000 | 11,409 | 12/16/72 | 500 bp — Monthly | (7,337) |
| CMBX NA BB.13 Index | BB−/P | 7,720 | | 83,000 | 21,522 | 12/16/72 | 500 bp — Monthly | (13,733) |
| CMBX NA BB.13 Index | BB−/P | 61,641 | | 641,000 | 166,211 | 12/16/72 | 500 bp — Monthly | (104,036) |
| CMBX NA BB.13 Index | BB−/P | 83,550 | | 910,000 | 235,963 | 12/16/72 | 500 bp — Monthly | (151,654) |
| CMBX NA BB.13 Index | BB−/P | 280,942 | | 1,515,000 | 392,840 | 12/16/72 | 500 bp — Monthly | (110,635) |
| CMBX NA BB.14 Index | BB/P | 115,506 | | 944,000 | 217,592 | 12/16/72 | 500 bp — Monthly | (101,299) |
| CMBX NA BB.15 Index | BB/P | 284,725 | | 1,766,000 | 383,928 | 11/18/64 | 500 bp — Monthly | (97,732) |
| CMBX NA BB.6 Index | B-/P | 18,060 | | 29,402 | 10,973 | 5/11/63 | 500 bp — Monthly | 7,112 |
| CMBX NA BB.6 Index | B-/P | 7,415 | | 41,710 | 15,566 | 5/11/63 | 500 bp — Monthly | (8,116) |
| CMBX NA BB.6 Index | B-/P | 467,596 | | 944,292 | 352,410 | 5/11/63 | 500 bp — Monthly | 115,973 |
| CMBX NA BB.6 Index | B-/P | 963,350 | | 1,909,781 | 712,730 | 5/11/63 | 500 bp — Monthly | 252,211 |
| CMBX NA BB.9 Index | B/P | 40,857 | | 102,000 | 31,702 | 9/17/58 | 500 bp — Monthly | 9,240 |
| CMBX NA BBB−.14 Index | BBB−/P | 10,494 | | 215,000 | 36,808 | 12/16/72 | 300 bp — Monthly | (26,207) |
| |
Mortgage Opportunities Fund 33 |
| | | | | | | | |
| OTC CREDIT DEFAULT CONTRACTS OUTSTANDING — PROTECTION SOLD at 11/30/22 (Unaudited) cont. |
Swap counterparty/
Referenced debt* | Rating*** | Upfront
premium
received
(paid)** | | Notional
amount | Value | Termi-
nation
date | Payments
received by fund | Unrealized
appreciation/
(depreciation) |
| Morgan Stanley & Co. International PLC cont. |
| CMBX NA BBB−.14 Index | BBB−/P | $10,494 | | $215,000 | $36,808 | 12/16/72 | 300 bp — Monthly | $(26,207) |
| CMBX NA BBB−.14 Index | BBB−/P | 10,637 | | 215,000 | 36,808 | 12/16/72 | 300 bp — Monthly | (26,063) |
| CMBX NA BBB−.14 Index | BBB−/P | 14,984 | | 307,000 | 52,558 | 12/16/72 | 300 bp — Monthly | (37,421) |
| CMBX NA BBB−.14 Index | BBB−/P | 104,811 | | 637,000 | 109,054 | 12/16/72 | 300 bp — Monthly | (3,925) |
| CMBX NA BBB−.14 Index | BBB−/P | 211,511 | | 1,274,000 | 218,109 | 12/16/72 | 300 bp — Monthly | (5,961) |
| CMBX NA BBB−.14 Index | BBB−/P | 1,393,724 | | 8,887,500 | 1,521,540 | 12/16/27 | 300 bp — Monthly | (123,372) |
| CMBX NA BBB−.15 Index | BBB−/P | 4,400 | | 78,000 | 13,603 | 11/18/64 | 300 bp — Monthly | (9,165) |
| CMBX NA BBB−.15 Index | BBB−/P | 59,849 | | 652,000 | 113,709 | 11/18/64 | 300 bp — Monthly | (53,533) |
| CMBX NA BBB−.15 Index | BBB−/P | 111,626 | | 708,000 | 123,475 | 11/18/64 | 300 bp — Monthly | (11,495) |
| Upfront premium received | 14,410,486 | | | Unrealized appreciation | 2,276,989 |
| Upfront premium (paid) | — | | | Unrealized (depreciation) | (2,818,915) |
| Total | $14,410,486 | | | Total | $(541,926) |
| * Payments related to the referenced debt are made upon a credit default event. |
| ** Upfront premium is based on the difference between the original spread on issue and the market spread on day of execution. |
| *** Ratings for an underlying index represent the average of the ratings of all the securities included in that index. The Moody’s, Standard & Poor’s or Fitch ratings are believed to be the most recent ratings available at November 30, 2022. Securities rated by Fitch are indicated by “/F.” Securities rated by Putnam are indicated by “/P.” The Putnam rating categories are comparable to the Standard & Poor’s classifications. |
|
| | | | | | | | |
| OTC CREDIT DEFAULT CONTRACTS OUTSTANDING — PROTECTION PURCHASED at 11/30/22 (Unaudited) |
Swap counterparty/
Referenced debt* | | Upfront
premium
received
(paid)** | | Notional
amount | Value | Termi-
nation
date | Payments
(paid)
by fund | Unrealized
appreciation/
(depreciation) |
| Citigroup Global Markets, Inc. |
| CMBX NA A.6 Index | | $(11,103) | | $55,473 | $6,690 | 5/11/63 | (200 bp) — Monthly | $(4,432) |
| CMBX NA A.7 Index | | (22) | | 3,000 | 169 | 1/17/47 | (200 bp) — Monthly | 146 |
| CMBX NA BB.10 Index | | (78,285) | | 307,000 | 97,227 | 11/17/59 | (500 bp) — Monthly | 18,686 |
| CMBX NA BB.10 Index | | (61,722) | | 256,000 | 81,075 | 11/17/59 | (500 bp) — Monthly | 19,140 |
| CMBX NA BB.10 Index | | (13,985) | | 134,000 | 42,438 | 11/17/59 | (500 bp) — Monthly | 28,341 |
| CMBX NA BB.10 Index | | (12,061) | | 110,000 | 34,837 | 11/17/59 | (500 bp) — Monthly | 22,684 |
| CMBX NA BB.11 Index | | (25,963) | | 509,000 | 108,264 | 11/18/54 | (500 bp) — Monthly | 81,877 |
| CMBX NA BB.11 Index | | (8,456) | | 163,000 | 34,670 | 11/18/54 | (500 bp) — Monthly | 26,079 |
| CMBX NA BB.8 Index | | (263,238) | | 736,331 | 265,521 | 10/17/57 | (500 bp) — Monthly | 1,669 |
| CMBX NA BB.8 Index | | (38,367) | | 298,591 | 107,672 | 10/17/57 | (500 bp) — Monthly | 69,056 |
| CMBX NA BBB−.10 Index | | (360,552) | | 2,097,000 | 360,684 | 11/17/59 | (300 bp) — Monthly | (917) |
| CMBX NA BBB−.10 Index | | (78,056) | | 262,000 | 45,064 | 11/17/59 | (300 bp) — Monthly | (33,123) |
| CMBX NA BBB−.10 Index | | (25,080) | | 205,000 | 35,260 | 11/17/59 | (300 bp) — Monthly | 10,078 |
| CMBX NA BBB−.10 Index | | (3,824) | | 30,000 | 5,160 | 11/17/59 | (300 bp) — Monthly | 1,321 |
| CMBX NA BBB−.12 Index | | (347,747) | | 2,154,000 | 367,042 | 8/17/61 | (300 bp) — Monthly | 18,217 |
| CMBX NA BBB−.12 Index | | (31,258) | | 184,000 | 31,354 | 8/17/61 | (300 bp) — Monthly | 4 |
| CMBX NA BBB−.12 Index | | (8,468) | | 123,000 | 20,959 | 8/17/61 | (300 bp) — Monthly | 12,430 |
| CMBX NA BBB−.13 Index | | (10,154) | | 134,000 | 25,621 | 12/16/72 | (300 bp) — Monthly | 15,400 |
| CMBX NA BBB−.13 Index | | (3,463) | | 68,000 | 13,002 | 12/16/72 | (300 bp) — Monthly | 9,505 |
| CMBX NA BBB−.13 Index | | (3,429) | | 68,000 | 13,002 | 12/16/72 | (300 bp) — Monthly | 9,539 |
| CMBX NA BBB−.7 Index | | (60,813) | | 278,000 | 57,685 | 1/17/47 | (300 bp) — Monthly | (3,267) |
| CMBX NA BBB−.7 Index | | (989) | | 196,000 | 40,670 | 1/17/47 | (300 bp) — Monthly | 39,583 |
| CMBX NA BBB−.8 Index | | (239,250) | | 1,595,000 | 249,777 | 10/17/57 | (300 bp) — Monthly | 9,730 |
| CMBX NA BBB−.8 Index | | (52,451) | | 394,000 | 61,700 | 10/17/57 | (300 bp) — Monthly | 9,052 |
| CMBX NA BBB−.8 Index | | (33,994) | | 245,000 | 38,367 | 10/17/57 | (300 bp) — Monthly | 4,251 |
| CMBX NA BBB−.8 Index | | (33,634) | | 235,000 | 36,801 | 10/17/57 | (300 bp) — Monthly | 3,049 |
| CMBX NA BBB−.8 Index | | (16,928) | | 122,000 | 19,105 | 10/17/57 | (300 bp) — Monthly | 2,117 |
| CMBX NA BBB−.8 Index | | (13,594) | | 87,000 | 13,624 | 10/17/57 | (300 bp) — Monthly | (13) |
| CMBX NA BBB−.9 Index | | (946) | | 4,000 | 782 | 9/17/58 | (300 bp) — Monthly | (167) |
| |
34 Mortgage Opportunities Fund |
| | | | | | | | |
| OTC CREDIT DEFAULT CONTRACTS OUTSTANDING — PROTECTION PURCHASED at 11/30/22 (Unaudited) cont. |
Swap counterparty/
Referenced debt* | | Upfront
premium
received
(paid)** | | Notional
amount | Value | Termi-
nation
date | Payments
(paid)
by fund | Unrealized
appreciation/
(depreciation) |
| Credit Suisse International |
| CMBX NA BB.10 Index | | $(50,421) | | $424,000 | $134,281 | 11/17/59 | (500 bp) — Monthly | $83,507 |
| CMBX NA BB.10 Index | | (27,719) | | 223,000 | 70,624 | 11/17/59 | (500 bp) — Monthly | 42,720 |
| Goldman Sachs International |
| CMBX NA A.6 Index | | (1,060) | | 8,069 | 973 | 5/11/63 | (200 bp) — Monthly | (90) |
| CMBX NA A.6 Index | | (615) | | 3,026 | 365 | 5/11/63 | (200 bp) — Monthly | (251) |
| CMBX NA A.6 Index | | (589) | | 3,026 | 365 | 5/11/63 | (200 bp) — Monthly | (225) |
| CMBX NA A.6 Index | | (488) | | 2,521 | 304 | 5/11/63 | (200 bp) — Monthly | (184) |
| CMBX NA A.6 Index | | (393) | | 2,017 | 243 | 5/11/63 | (200 bp) — Monthly | (150) |
| CMBX NA A.6 Index | | (305) | | 1,513 | 182 | 5/11/63 | (200 bp) — Monthly | (123) |
| CMBX NA A.6 Index | | (291) | | 1,513 | 182 | 5/11/63 | (200 bp) — Monthly | (109) |
| CMBX NA A.6 Index | | (291) | | 1,513 | 182 | 5/11/63 | (200 bp) — Monthly | (109) |
| CMBX NA A.6 Index | | (198) | | 1,009 | 122 | 5/11/63 | (200 bp) — Monthly | (76) |
| CMBX NA A.6 Index | | (174) | | 1,009 | 122 | 5/11/63 | (200 bp) — Monthly | (53) |
| CMBX NA A.6 Index | | (198) | | 1,009 | 122 | 5/11/63 | (200 bp) — Monthly | (76) |
| CMBX NA A.6 Index | | (201) | | 1,009 | 122 | 5/11/63 | (200 bp) — Monthly | (80) |
| CMBX NA A.6 Index | | (86) | | 504 | 61 | 5/11/63 | (200 bp) — Monthly | (25) |
| CMBX NA BB.10 Index | | (286,885) | | 1,268,000 | 401,576 | 11/17/59 | (500 bp) — Monthly | 113,634 |
| CMBX NA BB.9 Index | | (9,105) | | 57,000 | 17,716 | 9/17/58 | (500 bp) — Monthly | 8,564 |
| CMBX NA BB.9 Index | | (6,258) | | 52,000 | 16,162 | 9/17/58 | (500 bp) — Monthly | 9,860 |
| CMBX NA BB.9 Index | | (1,903) | | 49,000 | 15,229 | 9/17/58 | (500 bp) — Monthly | 13,285 |
| CMBX NA BB.9 Index | | (4,641) | | 39,000 | 12,121 | 9/17/58 | (500 bp) — Monthly | 7,448 |
| CMBX NA BB.9 Index | | (3,026) | | 29,000 | 9,013 | 9/17/58 | (500 bp) — Monthly | 5,963 |
| CMBX NA BBB−.12 Index | | (971,289) | | 5,419,000 | 923,398 | 8/17/61 | (300 bp) — Monthly | (50,601) |
| CMBX NA BBB−.12 Index | | (357,181) | | 2,000,000 | 340,800 | 8/17/61 | (300 bp) — Monthly | (17,381) |
| CMBX NA BBB−.13 Index | | (18,566) | | 245,000 | 46,844 | 12/16/72 | (300 bp) — Monthly | 28,156 |
| CMBX NA BBB−.13 Index | | (366) | | 6,000 | 1,147 | 12/16/72 | (300 bp) — Monthly | 778 |
| JPMorgan Securities LLC |
| CMBX NA A.6 Index | | (234) | | 1,513 | 182 | 5/11/63 | (200 bp) — Monthly | (53) |
| CMBX NA BB.7 Index | | (1,047,366) | | 2,139,000 | 710,790 | 1/17/47 | (500 bp) — Monthly | (338,365) |
| CMBX NA BBB−.10 Index | | (74,773) | | 593,000 | 101,996 | 11/17/59 | (300 bp) — Monthly | 26,926 |
| CMBX NA BBB−.8 Index | | (10,823) | | 78,000 | 12,215 | 10/17/57 | (300 bp) — Monthly | 1,353 |
| Merrill Lynch International |
| CMBX NA BB.10 Index | | (19,061) | | 335,000 | 106,095 | 11/17/59 | (500 bp) — Monthly | 86,754 |
| Morgan Stanley & Co. International PLC |
| CMBX NA A.6 Index | | (488) | | 2,521 | 304 | 5/11/63 | (200 bp) — Monthly | (184) |
| CMBX NA A.6 Index | | (97) | | 504 | 61 | 5/11/63 | (200 bp) — Monthly | (36) |
| CMBX NA BB.10 Index | | (68,344) | | 225,000 | 71,258 | 11/17/59 | (500 bp) — Monthly | 2,726 |
| CMBX NA BB.10 Index | | (14,053) | | 134,000 | 42,438 | 11/17/59 | (500 bp) — Monthly | 28,273 |
| CMBX NA BB.7 Index | | (63,621) | | 340,000 | 112,982 | 1/17/47 | (500 bp) — Monthly | 49,078 |
| CMBX NA BB.7 Index | | (34,709) | | 180,000 | 59,814 | 1/17/47 | (500 bp) — Monthly | 24,955 |
| CMBX NA BB.8 Index | | (85,881) | | 229,016 | 82,583 | 10/17/57 | (500 bp) — Monthly | (3,489) |
| CMBX NA BB.8 Index | | (32,734) | | 86,002 | 31,012 | 10/17/57 | (500 bp) — Monthly | (1,794) |
| CMBX NA BB.9 Index | | (33,197) | | 941,000 | 292,463 | 9/17/58 | (500 bp) — Monthly | 258,481 |
| CMBX NA BB.9 Index | | (2,815) | | 72,000 | 22,378 | 9/17/58 | (500 bp) — Monthly | 19,503 |
| CMBX NA BB.9 Index | | (5,559) | | 65,000 | 20,202 | 9/17/58 | (500 bp) — Monthly | 14,589 |
| CMBX NA BB.9 Index | | (3,447) | | 56,000 | 17,405 | 9/17/58 | (500 bp) — Monthly | 13,911 |
| CMBX NA BB.9 Index | | (4,844) | | 32,000 | 9,946 | 9/17/58 | (500 bp) — Monthly | 5,075 |
| CMBX NA BB.9 Index | | (2,305) | | 16,000 | 4,973 | 9/17/58 | (500 bp) — Monthly | 2,654 |
| CMBX NA BBB−.10 Index | | (12,359) | | 57,000 | 9,804 | 11/17/59 | (300 bp) — Monthly | (2,583) |
| CMBX NA BBB−.10 Index | | (6,722) | | 53,000 | 9,116 | 11/17/59 | (300 bp) — Monthly | 2,368 |
| CMBX NA BBB−.10 Index | | (11,028) | | 51,000 | 8,772 | 11/17/59 | (300 bp) — Monthly | (2,282) |
| CMBX NA BBB−.12 Index | | (172,542) | | 1,325,000 | 225,780 | 8/17/61 | (300 bp) — Monthly | 52,576 |
| CMBX NA BBB−.13 Index | | (123) | | 2,000 | 382 | 12/16/72 | (300 bp) — Monthly | 258 |
| |
Mortgage Opportunities Fund 35 |
| | | | | | | | |
| OTC CREDIT DEFAULT CONTRACTS OUTSTANDING — PROTECTION PURCHASED at 11/30/22 (Unaudited) cont. |
Swap counterparty/
Referenced debt* | | Upfront
premium
received
(paid)** | | Notional
amount | Value | Termi-
nation
date | Payments
(paid)
by fund | Unrealized
appreciation/
(depreciation) |
| Morgan Stanley & Co. International PLC cont. |
| CMBX NA BBB−.8 Index | | $(208,302) | | $1,339,000 | $209,687 | 10/17/57 | (300 bp) — Monthly | $716 |
| CMBX NA BBB−.8 Index | | (107,262) | | 684,000 | 107,114 | 10/17/57 | (300 bp) — Monthly | (489) |
| CMBX NA BBB−.8 Index | | (88,846) | | 629,000 | 98,501 | 10/17/57 | (300 bp) — Monthly | 9,341 |
| CMBX NA BBB−.8 Index | | (49,050) | | 360,000 | 56,376 | 10/17/57 | (300 bp) — Monthly | 7,146 |
| CMBX NA BBB−.8 Index | | (38,653) | | 285,000 | 44,631 | 10/17/57 | (300 bp) — Monthly | 5,835 |
| CMBX NA BBB−.8 Index | | (27,649) | | 202,000 | 31,633 | 10/17/57 | (300 bp) — Monthly | 3,883 |
| CMBX NA BBB−.8 Index | | (24,863) | | 153,000 | 23,960 | 10/17/57 | (300 bp) — Monthly | (979) |
| CMBX NA BBB−.8 Index | | (21,183) | | 148,000 | 23,177 | 10/17/57 | (300 bp) — Monthly | 1,920 |
| CMBX NA BBB−.8 Index | | (14,210) | | 112,000 | 17,539 | 10/17/57 | (300 bp) — Monthly | 3,273 |
| CMBX NA BBB−.8 Index | | (5,625) | | 36,000 | 5,638 | 10/17/57 | (300 bp) — Monthly | (5) |
| Upfront premium received | — | | | Unrealized appreciation | 1,347,463 |
| Upfront premium (paid) | (5,872,849) | | | Unrealized (depreciation) | (461,711) |
| Total | $(5,872,849) | | | Total | $885,752 |
| * Payments related to the referenced debt are made upon a credit default event. |
| ** Upfront premium is based on the difference between the original spread on issue and the market spread on day of execution. |
|
| ASC 820 establishes a three-level hierarchy for disclosure of fair value measurements. The valuation hierarchy is based upon the transparency of inputs to the valuation of the fund’s investments. The three levels are defined as follows: |
Level 1: Valuations based on quoted prices for identical securities in active markets.
Level 2: Valuations based on quoted prices in markets that are not active or for which all significant inputs are observable, either directly or indirectly.
Level 3: Valuations based on inputs that are unobservable and significant to the fair value measurement.
| The following is a summary of the inputs used to value the fund’s net assets as of the close of the reporting period: |
|
| | | |
| | Valuation inputs |
| Investments in securities: | Level 1 | Level 2 | Level 3 |
| Asset-backed securities | $— | $6,899,587 | $— |
| Mortgage-backed securities | — | 325,262,269 | — |
| U.S. government and agency mortgage obligations | — | 744,583,354 | — |
| Short-term investments | 6,596,000 | 106,167,397 | — |
| Totals by level | $6,596,000 | $1,182,912,607 | $— |
|
| | | |
| | Valuation inputs |
| Other financial instruments: | Level 1 | Level 2 | Level 3 |
| Forward premium swap option contracts | $— | $139,645 | $— |
| TBA sale commitments | — | (303,735,351) | — |
| Interest rate swap contracts | — | (2,086,539) | — |
| Credit default contracts | — | (8,193,811) | — |
| Totals by level | $— | $(313,876,056) | $— |
The accompanying notes are an integral part of these financial statements.
| |
36 Mortgage Opportunities Fund |
Statement of assets and liabilities 11/30/22 (Unaudited)
| |
| ASSETS | |
| Investment in securities, at value (Notes 1 and 8): | |
| Unaffiliated issuers (identified cost $1,124,398,010) | $1,114,970,037 |
| Affiliated issuers (identified cost $74,538,570) (Note 5) | 74,538,570 |
| Interest and other receivables | 1,746,138 |
| Receivable for shares of the fund sold | 7,220,315 |
| Receivable for investments sold | 360 |
| Receivable for sales of TBA securities (Note 1) | 226,700,682 |
| Receivable from Manager (Note 2) | 21,105 |
| Receivable for variation margin on centrally cleared swap contracts (Note 1) | 811,148 |
| Unrealized appreciation on forward premium swap option contracts (Note 1) | 315,110 |
| Unrealized appreciation on OTC swap contracts (Note 1) | 3,624,452 |
| Premium paid on OTC swap contracts (Note 1) | 5,872,849 |
| Prepaid assets | 48,046 |
| Total assets | 1,435,868,812 |
| |
| LIABILITIES | |
| Payable to custodian | 132 |
| Payable for investments purchased | 4,352,908 |
| Payable for purchases of TBA securities (Note 1) | 658,926,783 |
| Payable for shares of the fund repurchased | 250,428 |
| Payable for custodian fees (Note 2) | 26,070 |
| Payable for investor servicing fees (Note 2) | 61,251 |
| Payable for Trustee compensation and expenses (Note 2) | 5,803 |
| Payable for administrative services (Note 2) | 1,214 |
| Payable for distribution fees (Note 2) | 7,676 |
| Payable for variation margin on centrally cleared swap contracts (Note 1) | 2,925,257 |
| Unrealized depreciation on OTC swap contracts (Note 1) | 3,280,626 |
| Premium received on OTC swap contracts (Note 1) | 14,410,486 |
| Unrealized depreciation on forward premium swap option contracts (Note 1) | 175,465 |
| TBA sale commitments, at value (proceeds receivable $300,450,019) (Note 1) | 303,735,351 |
| Collateral on certain derivative contracts and TBA commitments, at value (Notes 1 and 8) | 6,596,000 |
| Other accrued expenses | 113,034 |
| Total liabilities | 994,868,484 |
| | |
| Net assets | $441,000,328 |
| |
| REPRESENTED BY | |
| Paid-in capital (Unlimited shares authorized) (Notes 1 and 4) | $482,962,176 |
| Total distributable earnings (Note 1) | (41,961,848) |
| Total — Representing net assets applicable to capital shares outstanding | $441,000,328 |
| |
| COMPUTATION OF NET ASSET VALUE AND OFFERING PRICE | |
| Net asset value and redemption price per class A share ($17,523,628 divided by 1,972,770 shares) | $8.88 |
| Offering price per class A share (100/96.00 of $8.88)* | $9.25 |
| Net asset value and offering price per class C share ($1,530,878 divided by 171,896 shares)** | $8.91 |
| Net asset value and offering price per class I share ($148,075,948 divided by 16,633,778 shares) | $8.90 |
| Net asset value, offering price and redemption price per class R6 share ($3,510,934 divided by 394,381 shares) | $8.90 |
| Net asset value, offering price and redemption price per class Y share ($270,358,940 divided by 30,399,750 shares) | $8.89 |
*On single retail sales of less than $100,000. On sales of $100,000 or more the offering price is reduced.
**Redemption price per share is equal to net asset value less any applicable contingent deferred sales charge.
The accompanying notes are an integral part of these financial statements.
|
| Mortgage Opportunities Fund 37 |
Statement of operations Six months ended 11/30/22 (Unaudited)
| |
| INVESTMENT INCOME | |
| Interest (including interest income of $788,497 from investments in affiliated issuers) (Note 5) | $10,356,750 |
| Total investment income | 10,356,750 |
| |
| EXPENSES | |
| Compensation of Manager (Note 2) | 929,278 |
| Investor servicing fees (Note 2) | 142,125 |
| Custodian fees (Note 2) | 35,412 |
| Trustee compensation and expenses (Note 2) | 7,105 |
| Distribution fees (Note 2) | 18,823 |
| Administrative services (Note 2) | 4,002 |
| Other | 158,546 |
| Fees waived and reimbursed by Manager (Note 2) | (355,346) |
| Total expenses | 939,945 |
| Expense reduction (Note 2) | (1,168) |
| Net expenses | 938,777 |
| | |
| Net investment income | 9,417,973 |
| |
| REALIZED AND UNREALIZED GAIN (LOSS) | |
| Net realized gain (loss) on: | |
| Securities from unaffiliated issuers (Notes 1 and 3) | (13,228,549) |
| Swap contracts (Note 1) | 12,342,510 |
| Written options (Note 1) | (3,048,633) |
| Total net realized loss | (3,934,672) |
| Change in net unrealized appreciation (depreciation) on: | |
| Securities from unaffiliated issuers and TBA sale commitments | 1,158,903 |
| Swap contracts | 1,399,892 |
| Written options | (290,415) |
| Total change in net unrealized appreciation | 2,268,380 |
| | |
| Net loss on investments | (1,666,292) |
| |
| Net increase in net assets resulting from operations | $7,751,681 |
The accompanying notes are an integral part of these financial statements.
|
| 38 Mortgage Opportunities Fund |
Statement of changes in net assets
| | |
| INCREASE IN NET ASSETS | Six months ended 11/30/22* | Year ended 5/31/22 |
| Operations | | |
| Net investment income | $9,417,973 | $8,032,703 |
| Net realized loss on investments | (3,934,672) | (7,575,262) |
| Change in net unrealized appreciation of investments | 2,268,380 | 1,115,440 |
| Net increase in net assets resulting from operations | 7,751,681 | 1,572,881 |
| Distributions to shareholders (Note 1): | | |
| From ordinary income | | |
| Net investment income | | |
| Class A | (249,889) | (113,715) |
| Class C | (19,564) | (10,334) |
| Class I | (3,416,652) | (8,827,915) |
| Class R6 | (78,294) | (67,032) |
| Class Y | (4,252,137) | (2,355,394) |
| Increase from capital share transactions (Note 4) | 171,159,673 | 98,087,454 |
| Total increase in net assets | 170,894,818 | 88,285,945 |
| |
| NET ASSETS | | |
| Beginning of period | 270,105,510 | 181,819,565 |
| End of period | $441,000,328 | $270,105,510 |
*Unaudited.
The accompanying notes are an integral part of these financial statements.
|
| Mortgage Opportunities Fund 39 |
Financial highlights
(For a common share outstanding throughout the period)
| | | | | | | | | | | | | |
| | INVESTMENT OPERATIONS | LESS DISTRIBUTIONS | RATIOS AND SUPPLEMENTAL DATA |
| | | | Net realized and | Total from | | | | | | | Ratio of expenses to average | Ratio of net investment income | |
| | Net asset value, | Net investment | unrealized gain (loss) | investment | From net | From | Total | Net asset value, | Total return at net asset | Net assets, end of period | net assets excluding interest | (loss) to average net assets | |
| Period ended | beginning of period | income (loss)a | on investments | operations | investment income | return of capital | distributions | end of period | value (%)b | (in thousands) | expense (%)c,d | (%)d | Portfolio turnover (%)e |
| Class A | | | | | | | | | | | | | |
| November 30, 2022** | $8.90 | .24 | (.06) | .18 | (.20) | — | (0.20) | $8.88 | 2.03* | $17,524 | .43* | 2.71* | 692* |
| May 31, 2022 | 9.41 | .39 | (.33) | .06 | (.57) | — | (0.57) | 8.90 | .81 | 3,693 | .78 | 4.28 | 1,790 |
| May 31, 2021 | 9.01 | .34 | .39 | .73 | (.32) | (.01) | (0.33) | 9.41 | 8.19 | 1,660 | .75 | 3.64 | 1,058 |
| May 31, 2020 † | 10.51 | .31 | (1.11) | (.80) | (.69) | (.01) | (0.70) | 9.01 | (8.32)* | 2,805 | .71* | 3.11* | 1,311 |
| Class C | | | | | | | | | | | | | |
| November 30, 2022** | $8.92 | .21 | (.05) | .16 | (.17) | — | (0.17) | $8.91 | 1.76* | $1,531 | .80 * | 2.32* | 692* |
| May 31, 2022 | 9.42 | .32 | (.32) | —f | (.50) | — | (0.50) | 8.92 | .07 | $382 | 1.53 | 3.47 | 1,790 |
| May 31, 2021 | 9.01 | .28 | .39 | .67 | (.26) | —f | (0.26) | 9.42 | 7.48 | 260 | 1.50 | 2.93 | 1,058 |
| May 31, 2020 † | 10.51 | .24 | (1.11) | (.87) | (.62) | (.01) | (0.63) | 9.01 | (8.91)* | 337 | 1.40* | 2.46* | 1,311 |
| Class I | | | | | | | | | | | | | |
| November 30, 2022** | $8.91 | .25 | (.05) | .20 | (.21) | — | (0.21) | $8.90 | 2.30 * | $148,076 | .24* | 2.80 * | 692* |
| May 31, 2022 | 9.43 | .41 | (.33) | .08 | (.60) | — | (0.60) | 8.91 | .97 | 141,000 | .47 | 4.55 | 1,790 |
| May 31, 2021 | 9.02 | .37 | .40 | .77 | (.35) | (.01) | (0.36) | 9.43 | 8.58 | 135,399 | .47 | 3.94 | 1,058 |
| May 31, 2020 | 10.46 | .36 | (1.08) | (.72) | (.71) | (.01) | (0.72) | 9.02 | (7.40) | 196,765 | .47 | 3.50 | 1,311 |
| May 31, 2019 | 10.73 | .47 | (.14) | .33 | (.60) | — | (0.60) | 10.46 | 3.25 | 222,073 | .47 | 4.41 | 1,012 |
| May 31, 2018 | 10.08 | .42 | .31 | .73 | (.08) | — | (0.08) | 10.73 | 7.27 | 274,480 | .47 | 4.07 | 1,372 |
| Class R6 | | | | | | | | | | | | | |
| November 30, 2022** | $8.91 | .25 | (.05) | .20 | (.21) | — | (0.21) | $8.90 | 2.29 * | $3,511 | .26* | 2.82* | 692* |
| May 31, 2022 | 9.43 | .41 | (.33) | .08 | (.60) | — | (0.60) | 8.91 | .96 | 1,157 | .51 | 4.51 | 1,790 |
| May 31, 2021 # | 9.02 | .38 | .39 | .77 | (.35) | (.01) | (0.36) | 9.43 | 8.56 | 1,017 | .51 | 4.01 | 1,058 |
| Class Y | | | | | | | | | | | | | |
| November 30, 2022** | $8.90 | .25 | (.05) | .20 | (.21) | — | (0.21) | $8.89 | 2.26* | $270,359 | .30 * | 2.80 * | 692* |
| May 31, 2022 | 9.42 | .41 | (.33) | .08 | (.60) | — | (0.60) | 8.90 | .96 | 123,873 | .53 | 4.52 | 1,790 |
| May 31, 2021 | 9.02 | .37 | .39 | .76 | (.35) | (.01) | (0.36) | 9.42 | 8.46 | 43,483 | .50 | 3.93 | 1,058 |
| May 31, 2020 † | 10.51 | .33 | (1.11) | (.78) | (.70) | (.01) | (0.71) | 9.02 | (8.10)* | 54,750 | .48* | 3.40* | 1,311 |
* Not annualized.
** Unaudited.
# For the period June 1, 2020 (commencement of operations) to May 31, 2021.
† For the period July 1, 2019 (commencement of operations) to May 31, 2020.
a Per share net investment income (loss) has been determined on the basis of the weighted average number of shares outstanding during the period.
b Total return assumes dividend reinvestment and does not reflect the effect of sales charges.
c Includes amounts paid through expense offset and/or brokerage service arrangements, if any (Note 2). Also excludes acquired fund fees and expenses, if any.
d Reflects an involuntary contractual expense limitations in effect during the period. As a result of such limitations, the expenses of each class reflect a reduction of the following amount (Note 2):
| | | | | | | | |
| | | | | Percentage of average net assets | | |
| | 11/30/22 | 5/31/22 | 5/31/21 | 5/31/20 | 5/31/19 | 5/31/18 | | |
| Class A | 0.11% | 0.28% | 0.27% | 0.20% | N/A | N/A | | |
| Class C | 0.11 | 0.28 | 0.27 | 0.20 | N/A | N/A | | |
| Class I | 0.11 | 0.28 | 0.27 | 0.22 | 0.21% | 0.32% | | |
| Class R6 | 0.11 | 0.28 | 0.27 | N/A | N/A | N/A | | |
| Class Y | 0.11 | 0.28 | 0.27 | 0.20 | N/A | N/A | | |
e Portfolio turnover includes TBA roll transactions.
f Represents less than $0.01 per share.
The accompanying notes are an integral part of these financial statements.
| |
| 40 Mortgage Opportunities Fund | Mortgage Opportunities Fund 41 |
Notes to financial statements 11/30/22 (Unaudited)
Within the following Notes to financial statements, references to “State Street” represent State Street Bank and Trust Company, references to “the SEC” represent the Securities and Exchange Commission, references to “Putnam Management” represent Putnam Investment Management, LLC, the fund’s manager, an indirect wholly-owned subsidiary of Putnam Investments, LLC and references to “OTC”, if any, represent over-the-counter. Unless otherwise noted, the “reporting period” represents the period from June 1, 2022 through November 30, 2022.
Putnam Mortgage Opportunities Fund (the fund) is a diversified series of Putnam Funds Trust (the Trust), a Massachusetts business trust registered under the Investment Company Act of 1940, as amended, as an open-end management investment company. The goal of the fund is to maximize total return consistent with what Putnam Management believes to be prudent risk. Total return is composed of capital appreciation and income. The fund invests mainly in mortgage-related fixed income securities and related derivatives that are either investment-grade or below-investment-grade in quality (sometimes referred to as “junk bonds”). Under normal circumstances, the fund invests at least 80% of its net assets in mortgages, mortgage-related fixed income securities and related derivatives (i.e., derivatives used to acquire exposure to, or whose underlying securities are, mortgages or mortgage-related securities). The fund generally uses the net unrealized gain or loss, or market value, of mortgage-related derivatives for purposes of this policy, but may use the notional value of a derivative if that is determined to be a more appropriate measure of the fund’s investment exposure. This policy may be changed only after 60 days’ notice to shareholders. Putnam Management expects to invest in lower-rated, higher-yielding mortgage-backed securities, including nonagency residential mortgage-backed securities (which may be backed by non-qualified or “sub-prime” mortgages), commercial mortgage-backed securities, collateralized mortgage obligations (including interest only, principal only, and other prepayment derivatives), and agency mortgage-backed securities. The fund currently has significant investment exposure to commercial mortgage-backed securities. Non-agency (i.e., privately issued) securities typically are lower-rated and higher yielding than securities issued or backed by agencies such as Ginnie Mae, Fannie Mae or Freddie Mac. While Putnam Management’s emphasis will be on mortgage-backed securities, Putnam Management may also invest to a lesser extent in other types of asset-backed securities. Putnam Management may consider, among other factors, credit, interest rate, prepayment and liquidity risks, as well as general market conditions, when deciding whether to buy or sell investments. Putnam Management typically uses to a significant extent derivatives, including interest rate swaps, forward delivery contracts and total return swaps, options and swaptions on mortgage-backed securities and indices, for both hedging and non-hedging purposes, including to obtain or adjust exposure to mortgage-backed investments.
The fund offers the following share classes. The expenses for each class of shares may differ based on the distribution and investor servicing fees of each class, which are identified in Note 2.
| | | |
| Share class | Sales charge | Contingent deferred sales charge | Conversion feature |
| | | 1.00% on certain redemptions of shares bought | |
| Class A | Up to 4.00% | with no initial sales charge | None |
| Class C | None | 1.00% eliminated after one year | Converts to class A shares after 8 years |
| Class I§ | None | None | None |
| ClassR 6† | None | None | None |
| ClassY † | None | None | None |
† Not available to all investors.
§ Intended for institutional and other investors who meet the $5,000,000 minimum investment and who are not purchasing through an intermediary.
In the normal course of business, the fund enters into contracts that may include agreements to indemnify another party under given circumstances. The fund’s maximum exposure under these arrangements is unknown as this would involve future claims that may be, but have not yet been, made against the fund. However, the fund’s management team expects the risk of material loss to be remote.
The fund has entered into contractual arrangements with an investment adviser, administrator, distributor, shareholder servicing agent and custodian, who each provide services to the fund. Unless expressly stated otherwise, shareholders are not parties to, or intended beneficiaries of these contractual arrangements, and these contractual arrangements are not intended to create any shareholder right to enforce them against the service providers or to seek any remedy under them against the service providers, either directly or on behalf of the fund.
Under the fund’s Amended and Restated Agreement and Declaration of Trust, any claims asserted against or on behalf of the Putnam Funds, including claims against Trustees and Officers, must be brought in state and federal courts located within the Commonwealth of Massachusetts.
Note 1: Significant accounting policies
The following is a summary of significant accounting policies consistently followed by the fund in the preparation of its financial statements. The preparation of financial statements is in conformity with accounting principles generally accepted in the United States of America and requires management to make estimates and assumptions that affect the reported amounts of assets and liabilities in the financial statements and the reported amounts of increases and decreases in net assets from operations. Actual results could differ from those estimates. Subsequent events after the Statement of assets and liabilities date through the date that the financial statements were issued have been evaluated in the preparation of the financial statements.
Investment income, realized and unrealized gains and losses and expenses of the fund are borne pro-rata based on the relative net assets of each class to the total net assets of the fund, except that each class bears expenses unique to that class (including the distribution fees applicable to such classes). Each class votes as a class only with respect to its own distribution plan or other matters on which a class vote is required by law or determined by the Trustees. If the fund were liquidated, shares of each class would receive their pro-rata share of the net assets of the fund. In addition, the Trustees declare separate dividends on each class of shares.
Security valuation Portfolio securities and other investments are valued using policies and procedures adopted by the Board of Trustees. The Trustees have formed a Pricing Committee to oversee the implementation of these procedures and have delegated responsibility for valuing the fund’s assets in accordance with these procedures to Putnam Management. Putnam Management has established an internal Valuation Committee that is responsible for making fair value determinations, evaluating the effectiveness of the pricing policies of the fund and reporting to the Pricing Committee.
|
| 42 Mortgage Opportunities Fund |
Market quotations are not considered to be readily available for certain debt obligations (including short-term investments with remaining maturities of 60 days or less) and other investments; such investments are valued on the basis of valuations furnished by an independent pricing service approved by the Trustees or dealers selected by Putnam Management. Such services or dealers determine valuations for normal institutional-size trading units of such securities using methods based on market transactions for comparable securities and various relationships, generally recognized by institutional traders, between securities (which consider such factors as security prices, yields, maturities and ratings). These securities will generally be categorized as Level 2. Securities quoted in foreign currencies, if any, are translated into U.S. dollars at the current exchange rate.
Investments in open-end investment companies (excluding exchange-traded funds), if any, which can be classified as Level 1 or Level 2 securities, are valued based on their net asset value. The net asset value of such investment companies equals the total value of their assets less their liabilities and divided by the number of their outstanding shares.
To the extent a pricing service or dealer is unable to value a security or provides a valuation that Putnam Management does not believe accurately reflects the security’s fair value, the security will be valued at fair value by Putnam Management in accordance with policies and procedures approved by the Trustees. Certain investments, including certain restricted and illiquid securities and derivatives, are also valued at fair value following procedures approved by the Trustees. These valuations consider such factors as significant market or specific security events such as interest rate or credit quality changes, various relationships with other securities, discount rates, U.S. Treasury, U.S. swap and credit yields, index levels, convexity exposures, recovery rates, sales and other multiples and resale restrictions. These securities are classified as Level 2 or as Level 3 depending on the priority of the significant inputs.
To assess the continuing appropriateness of fair valuations, the Valuation Committee reviews and affirms the reasonableness of such valuations on a regular basis after considering all relevant information that is reasonably available. Such valuations and procedures are reviewed periodically by the Trustees. Certain securities may be valued on the basis of a price provided by a single source. The fair value of securities is generally determined as the amount that the fund could reasonably expect to realize from an orderly disposition of such securities over a reasonable period of time. By its nature, a fair value price is a good faith estimate of the value of a security in a current sale and does not reflect an actual market price, which may be different by a material amount.
Joint trading account Pursuant to an exemptive order from the SEC, the fund may transfer uninvested cash balances into a joint trading account along with the cash of other registered investment companies and certain other accounts managed by Putnam Management. These balances may be invested in issues of short-term investments having maturities of up to 90 days.
Repurchase agreements The fund, or any joint trading account, through its custodian, receives delivery of the underlying securities, the fair value of which at the time of purchase is required to be in an amount at least equal to the resale price, including accrued interest. Collateral for certain tri-party repurchase agreements is held at the counterparty’s custodian in a segregated account for the benefit of the fund and the counterparty. Putnam Management is responsible for determining that the value of these underlying securities is at all times at least equal to the resale price, including accrued interest. In the event of default or bankruptcy by the other party to the agreement, retention of the collateral may be subject to legal proceedings.
Security transactions and related investment income Security transactions are recorded on the trade date (the date the order to buy or sell is executed). Gains or losses on securities sold are determined on the identified cost basis.
Interest income, net of any applicable withholding taxes, if any, and including amortization and accretion of premiums and discounts on debt securities, is recorded on the accrual basis.
Stripped securities The fund may invest in stripped securities which represent a participation in securities that may be structured in classes with rights to receive different portions of the interest and principal. Interest-only securities receive all of the interest and principal-only securities receive all of the principal. If the interest-only securities experience greater than anticipated prepayments of principal, the fund may fail to recoup fully its initial investment in these securities. Conversely, principal-only securities increase in value if prepayments are greater than anticipated and decline if prepayments are slower than anticipated. The fair value of these securities is highly sensitive to changes in interest rates.
Options contracts The fund uses options contracts to hedge duration and convexity, to isolate prepayment risk and to manage downside risks.
The potential risk to the fund is that the change in value of options contracts may not correspond to the change in value of the hedged instruments. In addition, losses may arise from changes in the value of the underlying instruments if there is an illiquid secondary market for the contracts, if interest or exchange rates move unexpectedly or if the counterparty to the contract is unable to perform. Realized gains and losses on purchased options are included in realized gains and losses on investment securities. If a written call option is exercised, the premium originally received is recorded as an addition to sales proceeds. If a written put option is exercised, the premium originally received is recorded as a reduction to the cost of investments.
Exchange-traded options are valued at the last sale price or, if no sales are reported, the last bid price for purchased options and the last ask price for written options. OTC traded options are valued using prices supplied by dealers.
Options on swaps are similar to options on securities except that the premium paid or received is to buy or grant the right to enter into a previously agreed upon interest rate or credit default contract. Forward premium swap option contracts include premiums that have extended settlement dates. The delayed settlement of the premiums is factored into the daily valuation of the option contracts. In the case of interest rate cap and floor contracts, in return for a premium, ongoing payments between two parties are based on interest rates exceeding a specified rate, in the case of a cap contract, or falling below a specified rate in the case of a floor contract.
Written option contracts outstanding at period end, if any, are listed after the fund’s portfolio.
Interest rate swap contracts The fund entered into OTC and/or centrally cleared interest rate swap contracts, which are arrangements between two parties to exchange cash flows based on a notional principal amount, for hedging term structure risk and for yield curve positioning.
An OTC and centrally cleared interest rate swap can be purchased or sold with an upfront premium. For OTC interest rate swap contracts, an upfront payment received by the fund is recorded as a liability on the fund’s books. An upfront payment made by the fund is recorded as an asset on the fund’s books. OTC and centrally cleared interest rate swap contracts are marked to market daily based upon quotations from an independent pricing service or market makers. Any change is recorded as an unrealized gain or loss on OTC interest rate swaps. Daily fluctuations in the value of centrally cleared interest rate swaps are settled through a central clearing agent and are recorded in variation margin on the Statement of assets and liabilities and recorded as unrealized gain or loss. Payments, including upfront premiums, received or made are recorded as realized gains or losses at the reset date or the closing of the contract. Certain OTC and centrally cleared interest rate swap contracts may include extended effective dates. Payments related to these swap contracts are accrued based on the terms of the contract.
|
| Mortgage Opportunities Fund 43 |
The fund could be exposed to credit or market risk due to unfavorable changes in the fluctuation of interest rates or if the counterparty defaults, in the case of OTC interest rate contracts, or the central clearing agency or a clearing member defaults, in the case of centrally cleared interest rate swap contracts, on its respective obligation to perform under the contract. The fund’s maximum risk of loss from counterparty risk or central clearing risk is the fair value of the contract. This risk may be mitigated for OTC interest rate swap contracts by having a master netting arrangement between the fund and the counterparty and for centrally cleared interest rate swap contracts through the daily exchange of variation margin. There is minimal counterparty risk with respect to centrally cleared interest rate swap contracts due to the clearinghouse guarantee fund and other resources that are available in the event of a clearing member default. Risk of loss may exceed amounts recognized on the Statement of assets and liabilities.
OTC and centrally cleared interest rate swap contracts outstanding, including their respective notional amounts at period end, if any, are listed after the fund’s portfolio.
Credit default contracts The fund entered into OTC and/or centrally cleared credit default contracts to hedge credit risk, to hedge market risk and for gaining exposure to specific sectors.
In OTC and centrally cleared credit default contracts, the protection buyer typically makes a periodic stream of payments to a counterparty, the protection seller, in exchange for the right to receive a contingent payment upon the occurrence of a credit event on the reference obligation or all other equally ranked obligations of the reference entity. Credit events are contract specific but may include bankruptcy, failure to pay, restructuring and obligation acceleration. For OTC credit default contracts, an upfront payment received by the fund is recorded as a liability on the fund’s books. An upfront payment made by the fund is recorded as an asset on the fund’s books. Centrally cleared credit default contracts provide the same rights to the protection buyer and seller except the payments between parties, including upfront premiums, are settled through a central clearing agent through variation margin payments. Upfront and periodic payments received or paid by the fund for OTC and centrally cleared credit default contracts are recorded as realized gains or losses at the reset date or close of the contract. The OTC and centrally cleared credit default contracts are marked to market daily based upon quotations from an independent pricing service or market makers. Any change in value of OTC credit default contracts is recorded as an unrealized gain or loss. Daily fluctuations in the value of centrally cleared credit default contracts are recorded in variation margin on the Statement of assets and liabilities and recorded as unrealized gain or loss. Upon the occurrence of a credit event, the difference between the par value and fair value of the reference obligation, net of any proportional amount of the upfront payment, is recorded as a realized gain or loss.
In addition to bearing the risk that the credit event will occur, the fund could be exposed to market risk due to unfavorable changes in interest rates or in the price of the underlying security or index or the possibility that the fund may be unable to close out its position at the same time or at the same price as if it had purchased the underlying reference obligations. In certain circumstances, the fund may enter into offsetting OTC and centrally cleared credit default contracts which would mitigate its risk of loss. Risks of loss may exceed amounts recognized on the Statement of assets and liabilities. The fund’s maximum risk of loss from counterparty risk, either as the protection seller or as the protection buyer, is the fair value of the contract. This risk may be mitigated for OTC credit default contracts by having a master netting arrangement between the fund and the counterparty and for centrally cleared credit default contracts through the daily exchange of variation margin. Counterparty risk is further mitigated with respect to centrally cleared credit default swap contracts due to the clearinghouse guarantee fund and other resources that are available in the event of a clearing member default. Where the fund is a seller of protection, the maximum potential amount of future payments the fund may be required to make is equal to the notional amount.
OTC and centrally cleared credit default contracts outstanding, including their respective notional amounts at period end, if any, are listed after the fund’s portfolio.
TBA commitments The fund may enter into TBA (to be announced) commitments to purchase securities for a fixed unit price at a future date beyond customary settlement time. Although the unit price and par amount have been established, the actual securities have not been specified. However, it is anticipated that the amount of the commitments will not significantly differ from the principal amount. The fund holds, and maintains until settlement date, cash or high-grade debt obligations in an amount sufficient to meet the purchase price, or the fund may enter into offsetting contracts for the forward sale of other securities it owns. Income on the securities will not be earned until settlement date.
The fund may also enter into TBA sale commitments to hedge its portfolio positions, to sell mortgage-backed securities it owns under delayed delivery arrangements or to take a short position in mortgage-backed securities. Proceeds of TBA sale commitments are not received until the contractual settlement date. During the time a TBA sale commitment is outstanding, either equivalent deliverable securities or an offsetting TBA purchase commitment deliverable on or before the sale commitment date are held as “cover” for the transaction, or other liquid assets in an amount equal to the notional value of the TBA sale commitment are segregated. If the TBA sale commitment is closed through the acquisition of an offsetting TBA purchase commitment, the fund realizes a gain or loss. If the fund delivers securities under the commitment, the fund realizes a gain or a loss from the sale of the securities based upon the unit price established at the date the commitment was entered into.
TBA commitments, which are accounted for as purchase and sale transactions, may be considered securities themselves, and involve a risk of loss due to changes in the value of the security prior to the settlement date as well as the risk that the counterparty to the transaction will not perform its obligations. Counterparty risk is mitigated by having a master agreement between the fund and the counterparty.
Unsettled TBA commitments are valued at their fair value according to the procedures described under “Security valuation” above. The contract is marked to market daily and the change in fair value is recorded by the fund as an unrealized gain or loss. Based on market circumstances, Putnam Management will determine whether to take delivery of the underlying securities or to dispose of the TBA commitments prior to settlement.
TBA purchase commitments outstanding at period end, if any, are listed within the fund’s portfolio and TBA sale commitments outstanding at period end, if any, are listed after the fund’s portfolio.
Master agreements The fund is a party to ISDA (International Swaps and Derivatives Association, Inc.) Master Agreements that govern OTC derivative and foreign exchange contracts and Master Securities Forward Transaction Agreements that govern transactions involving mortgage-backed and other asset-backed securities that may result in delayed delivery (Master Agreements) with certain counterparties entered into from time to time. The Master Agreements may contain provisions regarding, among other things, the parties’ general obligations, representations, agreements, collateral requirements, events of default and early termination. With respect to certain counterparties, in accordance with the terms of the Master Agreements, collateral pledged to the fund is held in a segregated account by the fund’s custodian and, with respect to those amounts which can be sold or repledged, are presented in the fund’s portfolio.
Collateral pledged by the fund is segregated by the fund’s custodian and identified in the fund’s portfolio. Collateral can be in the form of cash or debt securities issued by the U.S. Government or related agencies or other securities as agreed to by the fund and the applicable counterparty. Collateral requirements are determined based on the fund’s net position with each counterparty.
|
| 44 Mortgage Opportunities Fund |
With respect to ISDA Master Agreements, termination events applicable to the fund may occur upon a decline in the fund’s net assets below a specified threshold over a certain period of time. Termination events applicable to counterparties may occur upon a decline in the counterparty’s long-term or short-term credit ratings below a specified level. In each case, upon occurrence, the other party may elect to terminate early and cause settlement of all derivative and foreign exchange contracts outstanding, including the payment of any losses and costs resulting from such early termination, as reasonably determined by the terminating party. Any decision by one or more of the fund’s counterparties to elect early termination could impact the fund’s future derivative activity.
At the close of the reporting period, the fund had a net liability position of $8,345,309 on open derivative contracts subject to the Master Agreements. Collateral pledged by the fund at period end for these agreements totaled $8,556,721 and may include amounts related to unsettled agreements.
Interfund lending The fund, along with other Putnam funds, may participate in an interfund lending program pursuant to an exemptive order issued by the SEC. This program allows the fund to borrow from or lend to other Putnam funds that permit such transactions. Interfund lending transactions are subject to each fund’s investment policies and borrowing and lending limits. Interest earned or paid on the interfund lending transaction will be based on the average of certain current market rates. During the reporting period, the fund did not utilize the program.
Lines of credit The fund participates, along with other Putnam funds, in a $100 million ($317.5 million prior to October 14, 2022) unsecured committed line of credit and a $235.5 million unsecured uncommitted line of credit, both provided by State Street. Borrowings may be made for temporary or emergency purposes, including the funding of shareholder redemption requests and trade settlements. Interest is charged to the fund based on the fund’s borrowing at a rate equal to 1.25% plus the higher of (1) the Federal Funds rate and (2) the Overnight Bank Funding Rate for the committed line of credit and 1.30% plus the higher of (1) the Federal Funds rate and (2) the Overnight Bank Funding Rate for the uncommitted line of credit. A closing fee equal to 0.04% of the committed line of credit and 0.04% of the uncommitted line of credit has been paid by the participating funds. In addition, a commitment fee of 0.21% per annum on any unutilized portion of the committed line of credit is allocated to the participating funds based on their relative net assets and paid quarterly. During the reporting period, the fund had no borrowings against these arrangements.
Federal taxes It is the policy of the fund to distribute all of its taxable income within the prescribed time period and otherwise comply with the provisions of the Internal Revenue Code of 1986, as amended (the Code), applicable to regulated investment companies. It is also the intention of the fund to distribute an amount sufficient to avoid imposition of any excise tax under Section 4982 of the Code.
The fund is subject to the provisions of Accounting Standards Codification 740 Income Taxes (ASC 740). ASC 740 sets forth a minimum threshold for financial statement recognition of the benefit of a tax position taken or expected to be taken in a tax return. The fund did not have a liability to record for any unrecognized tax benefits in the accompanying financial statements. No provision has been made for federal taxes on income, capital gains or unrealized appreciation on securities held nor for excise tax on income and capital gains. Each of the fund’s federal tax returns for the prior three fiscal years remains subject to examination by the Internal Revenue Service.
Under the Regulated Investment Company Modernization Act of 2010, the fund will be permitted to carry forward capital losses incurred for an unlimited period and the carry forwards will retain their character as either short-term or long-term capital losses. At May 31, 2022, the fund had the following capital loss carryovers available, to the extent allowed by the Code, to offset future net capital gain, if any:
| | |
| | Loss carryover | |
| Short-term | Long-term | Total |
| $12,166,821 | $6,395,343 | $18,562,164 |
Tax cost of investments includes adjustments to net unrealized appreciation (depreciation) which may not necessarily be final tax cost basis adjustments, but closely approximate the tax basis unrealized gains and losses that may be realized and distributed to shareholders. The aggregate identified cost on a tax basis is $896,905,702, resulting in gross unrealized appreciation and depreciation of $20,586,069 and $41,859,220, respectively, or net unrealized depreciation of $21,273,151.
Distributions to shareholders Distributions to shareholders from net investment income are recorded by the fund on the ex-dividend date. Distributions from capital gains, if any, are recorded on the ex-dividend date and paid at least annually. The amount and character of income and gains to be distributed are determined in accordance with income tax regulations, which may differ from generally accepted accounting principles. Dividend sources are estimated at the time of declaration. Actual results may vary. Any non-taxable return of capital cannot be determined until final tax calculations are completed after the end of the fund’s fiscal year. Reclassifications are made to the fund’s capital accounts to reflect income and gains available for distribution (or available capital loss carryovers) under income tax regulations.
Expenses of the Trust Expenses directly charged or attributable to any fund will be paid from the assets of that fund. Generally, expenses of the Trust will be allocated among and charged to the assets of each fund on a basis that the Trustees deem fair and equitable, which may be based on the relative assets of each fund or the nature of the services performed and relative applicability to each fund.
Note 2: Management fee, administrative services and other transactions
The fund pays Putnam Management for management and investment advisory services monthly based on the average net assets of the fund. Such fee is based on the following annual rates:
| | |
| 0.550% | of the first $500 million of average net assets, | |
| 0.500% | of the next $500 million of average net assets | |
| 0.450% | of any excess thereafter | |
For the reporting period, the management fee represented an effective rate (excluding the impact from any expense waivers in effect) of 0.276% of the fund’s average net assets.
Putnam Management has contractually agreed, through September 30, 2023, to waive fees and/or reimburse the fund’s expenses to the extent necessary to limit the cumulative expenses of the fund, exclusive of brokerage, interest, taxes, investment-related expenses, extraordinary expenses, acquired fund fees and expenses and payments under the fund’s investor servicing contract, investment management contract and distribution plans, on a fiscal year-to-date basis to an annual rate of 0.20% of the fund’s average net assets over such fiscal year-to-date period. During the reporting period, the fund’s expenses were not reduced as a result of this limit.
|
| Mortgage Opportunities Fund 45 |
Putnam Management has also contractually agreed to waive fees (and, to the extent necessary, bear other expenses) of the fund through September 30, 2023, to the extent that total expenses of the fund (excluding brokerage, interest, taxes, investment-related expenses, payments under distribution plans, extraordinary expenses, payments under the fund’s investor servicing contract and acquired fund fees and expenses, but including payments under the fund’s investment management contract) would exceed an annual rate of 0.46% of the fund’s average net assets. During the reporting period, the fund’s expenses were reduced by $355,346 as a result of this limit.
Putnam Investments Limited (PIL), an affiliate of Putnam Management, is authorized by the Trustees to manage a separate portion of the assets of the fund as determined by Putnam Management from time to time. PIL did not manage any portion of the assets of the fund during the reporting period. If Putnam Management were to engage the services of PIL, Putnam Management would pay a quarterly sub-management fee to PIL for its services at an annual rate of 0.20% (prior to July 1, 2022, the annual rate was 0.40%) of the average net assets of the portion of the fund managed by PIL.
The fund reimburses Putnam Management an allocated amount for the compensation and related expenses of certain officers of the fund and their staff who provide administrative services to the fund. The aggregate amount of all such reimbursements is determined annually by the Trustees.
Custodial functions for the fund’s assets are provided by State Street. Custody fees are based on the fund’s asset level, the number of its security holdings and transaction volumes.
Putnam Investor Services, Inc., an affiliate of Putnam Management, provides investor servicing agent functions to the fund. Putnam Investor Services, Inc. received fees for investor servicing for class A, class C and class Y shares that included (1) a per account fee for each direct and underlying non-defined contribution account (retail account) of the fund; (2) a specified rate of the fund’s assets attributable to defined contribution plan accounts; and (3) a specified rate based on the average net assets in retail accounts. Putnam Investor Services, Inc. has agreed that the aggregate investor servicing fees for each fund’s retail and defined contribution accounts for these share classes will not exceed an annual rate of 0.25% of the fund’s average assets attributable to such accounts.
Class I shares paid a monthly fee based on the average net assets of class I shares at an annual rate of 0.01%.
Class R6 shares paid a monthly fee based on the average net assets of class R6 shares at an annual rate of 0.05%.
During the reporting period, the expenses for each class of shares related to investor servicing fees were as follows:
| | | | |
| Class A | $7,510 | | Class R6 | 794 |
| Class C | 757 | | Class Y | 125,922 |
| Class I | 7,142 | | Total | $142,125 |
The fund has entered into expense offset arrangements with Putnam Investor Services, Inc. and State Street whereby Putnam Investor Services, Inc.’s and State Street’s fees are reduced by credits allowed on cash balances. For the reporting period, the fund’s expenses were reduced by $1,168 under the expense offset arrangements.
Each Independent Trustee of the fund receives an annual Trustee fee, of which $322, as a quarterly retainer, has been allocated to the fund, and an additional fee for each Trustees meeting attended. Trustees also are reimbursed for expenses they incur relating to their services as Trustees.
The fund has adopted a Trustee Fee Deferral Plan (the Deferral Plan) which allows the Trustees to defer the receipt of all or a portion of Trustees fees payable on or after July 1, 1995. The deferred fees remain invested in certain Putnam funds until distribution in accordance with the Deferral Plan.
The fund has adopted an unfunded noncontributory defined benefit pension plan (the Pension Plan) covering all Trustees of the fund who have served as a Trustee for at least five years and were first elected prior to 2004. Benefits under the Pension Plan are equal to 50% of the Trustee’s average annual attendance and retainer fees for the three years ended December 31, 2005. The retirement benefit is payable during a Trustee’s lifetime, beginning the year following retirement, for the number of years of service through December 31, 2006. Pension expense for the fund is included in Trustee compensation and expenses in the Statement of operations. Accrued pension liability is included in Payable for Trustee compensation and expenses in the Statement of assets and liabilities. The Trustees have terminated the Pension Plan with respect to any Trustee first elected after 2003.
The fund has adopted distribution plans (the Plans) with respect to the following share classes pursuant to Rule 12b–1 under the Investment Company Act of 1940. The purpose of the Plans is to compensate Putnam Retail Management Limited Partnership, an indirect wholly-owned subsidiary of Putnam Investments, LLC, for services provided and expenses incurred in distributing shares of the fund. The Plans provide payments by the fund to Putnam Retail Management Limited Partnership at an annual rate of up to the following amounts (Maximum %) of the average net assets attributable to each class. The Trustees have approved payment by the fund at the following annual rate (Approved %) of the average net assets attributable to each class. During the reporting period, the class-specific expenses related to distribution fees were as follows:
| | | |
| | Maximum % | Approved % | Amount |
| Class A | 0.35% | 0.25% | $13,405 |
| Class C | 1.00% | 1.00% | 5,418 |
| Total | | | $18,823 |
For the reporting period, Putnam Retail Management Limited Partnership, acting as underwriter, received net commissions of $4,368 from the sale of class A shares and received no monies in contingent deferred sales charges from redemptions of class C shares.
A deferred sales charge of up to 1.00% is assessed on certain redemptions of class A shares. For the reporting period, Putnam Retail Management Limited Partnership, acting as underwriter, received no monies on class A redemptions.
|
| 46 Mortgage Opportunities Fund |
Note 3: Purchases and sales of securities
During the reporting period, the cost of purchases and the proceeds from sales, excluding short-term investments, were as follows:
| | |
| | Cost of purchases | Proceeds from sales |
| Investments in securities, including TBA commitments (Long-term) | $3,480,301,779 | $3,040,083,598 |
| U.S. government securities (Long-term) | — | — |
| Total | $3,480,301,779 | $3,040,083,598 |
The fund may purchase or sell investments from or to other Putnam funds in the ordinary course of business, which can reduce the fund’s transaction costs, at prices determined in accordance with SEC requirements and policies approved by the Trustees. During the reporting period, purchases or sales of long-term securities from or to other Putnam funds, if any, did not represent more than 5% of the fund’s total cost of purchases and/or total proceeds from sales.
Note 4: Capital shares
At the close of the reporting period, there were an unlimited number of shares of beneficial interest authorized. Transactions, including, if applicable, direct exchanges pursuant to share conversions, in capital shares were as follows:
| | | | |
| | SIX MONTHS ENDED 11/30/22 | YEAR ENDED 5/31/22 |
| Class A | Shares | Amount | Shares | Amount |
| Shares sold | 1,884,082 | $16,693,279 | 382,119 | $3,420,459 |
| Shares issued in connection with reinvestment of distributions | 28,062 | 248,135 | 12,737 | 113,602 |
| | 1,912,144 | 16,941,414 | 394,856 | 3,534,061 |
| Shares repurchased | (354,483) | (3,132,316) | (156,120) | (1,403,924) |
| Net increase | 1,557,661 | $13,809,098 | 238,736 | $2,130,137 |
| |
| | SIX MONTHS ENDED 11/30/22 | YEAR ENDED 5/31/22 |
| Class C | Shares | Amount | Shares | Amount |
| Shares sold | 138,232 | $1,227,893 | 47,421 | $425,516 |
| Shares issued in connection with reinvestment of distributions | 2,189 | 19,406 | 1,154 | 10,334 |
| | 140,421 | 1,247,299 | 48,575 | 435,850 |
| Shares repurchased | (11,383) | (100,417) | (33,342) | (302,235) |
| Net increase | 129,038 | $1,146,882 | 15,233 | $133,615 |
| |
| | SIX MONTHS ENDED 11/30/22 | YEAR ENDED 5/31/22 |
| Class I | Shares | Amount | Shares | Amount |
| Shares sold | 566,251 | $5,000,001 | 1,670,379 | $15,000,001 |
| Shares issued in connection with reinvestment of distributions | 245,195 | 2,172,726 | 706,032 | 6,310,861 |
| | 811,446 | 7,172,727 | 2,376,411 | 21,310,862 |
| Shares repurchased | — | — | (918,447) | (8,222,353) |
| Net increase | 811,446 | $7,172,727 | 1,457,964 | $13,088,509 |
| |
| | SIX MONTHS ENDED 11/30/22 | YEAR ENDED 5/31/22 |
| Class R6 | Shares | Amount | Shares | Amount |
| Shares sold | 316,709 | $2,835,813 | 41,766 | $374,347 |
| Shares issued in connection with reinvestment of distributions | 8,696 | 77,056 | 7,498 | 67,032 |
| | 325,405 | 2,912,869 | 49,264 | 441,379 |
| Shares repurchased | (60,901) | (543,033) | (27,236) | (241,513) |
| Net increase | 264,504 | $2,369,836 | 22,028 | $199,866 |
| |
| | SIX MONTHS ENDED 11/30/22 | YEAR ENDED 5/31/22 |
| Class Y | Shares | Amount | Shares | Amount |
| Shares sold | 21,060,858 | $187,049,660 | 12,303,031 | $109,907,801 |
| Shares issued in connection with reinvestment of distributions | 389,850 | 3,449,946 | 244,867 | 2,191,499 |
| | 21,450,708 | 190,499,606 | 12,547,898 | 112,099,300 |
| Shares repurchased | (4,961,551) | (43,838,476) | (3,251,270) | (29,563,973) |
| Net increase | 16,489,157 | $146,661,130 | 9,296,628 | $82,535,327 |
At the close of the reporting period, four shareholders of record owned 7.6%, 8.2%, 9.9% and 11.1%, respectively, of the outstanding shares of the fund.
|
| Mortgage Opportunities Fund 47 |
Note 5: Affiliated transactions
Transactions during the reporting period with any company which is under common ownership or control were as follows:
| | | | | |
| | | | | | Shares outstanding |
| | Fair value as | | | | and fair value as |
| Name of affiliate | of 5/31/22 | Purchase cost | Sale proceeds | Investment income | of 11/30/22 |
| Short-term investments | | | | | |
| Putnam Short Term | | | | | |
| Investment Fund* | $55,625,091 | $164,052,009 | $145,138,530 | $788,497 | $74,538,570 |
| Total Short-term | | | | | |
| investments | $55,625,091 | $164,052,009 | $145,138,530 | $788,497 | $74,538,570 |
* Management fees charged to Putnam Short Term Investment Fund have been waived by Putnam Management. There were no realized or unrealized gains or losses during the period.
Note 6: Market, credit and other risks
In the normal course of business, the fund trades financial instruments and enters into financial transactions where risk of potential loss exists due to changes in the market (market risk) or failure of the contracting party to the transaction to perform (credit risk). The fund may be exposed to additional credit risk that an institution or other entity with which the fund has unsettled or open transactions will default. The fund may invest in higher-yielding, lower-rated bonds that may have a higher rate of default. The fund may invest a significant portion of its assets in securitized debt instruments, including mortgage-backed and asset-backed investments. The yields and values of these investments are sensitive to changes in interest rates, the rate of principal payments on the underlying assets and the market’s perception of the issuers. The market for these investments may be volatile and limited, which may make them difficult to buy or sell.
On July 27, 2017, the United Kingdom’s Financial Conduct Authority (“FCA”), which regulates LIBOR, announced its intention to cease compelling banks to provide the quotations needed to sustain LIBOR after 2021. ICE Benchmark Administration, the administrator of LIBOR, ceased publication of most LIBOR settings on a representative basis at the end of 2021 and is expected to cease publication of a majority of U.S. dollar LIBOR settings on a representative basis after June 30, 2023. In addition, global regulators have announced that, with limited exceptions, no new LIBOR-based contracts should be entered into after 2021. LIBOR has historically been a common benchmark interest rate index used to make adjustments to variable-rate loans. It is used throughout global banking and financial industries to determine interest rates for a variety of financial instruments and borrowing arrangements. Actions by regulators have resulted in the establishment of alternative reference rates to LIBOR in most major currencies. Various financial industry groups have been planning for the transition away from LIBOR, but there are obstacles to converting certain longer-term securities and transactions to new reference rates. Markets are developing slowly and questions around liquidity in these rates and how to appropriately adjust these rates to mitigate any economic value transfer at the time of transition remain a significant concern. Neither the effect of the transition process nor its ultimate success can yet be known. The transition process might lead to increased volatility and illiquidity in markets that rely on LIBOR to determine interest rates. It could also lead to a reduction in the value of some LIBOR-based investments and reduce the effectiveness of related transactions, such as hedges. While some LIBOR-based instruments may contemplate a scenario where LIBOR is no longer available by providing for an alternative rate-setting methodology, not all may have such provisions and there may be significant uncertainty regarding the effectiveness of any such alternative methodologies. Since the usefulness of LIBOR as a benchmark could deteriorate during the transition period, these effects could occur at any time.
Beginning in January 2020, global financial markets have experienced, and may continue to experience, significant volatility resulting from the spread of a virus known as Covid–19. The outbreak of Covid–19 has resulted in travel and border restrictions, quarantines, supply chain disruptions, lower consumer demand, and general market uncertainty. The effects of Covid–19 have adversely affected, and may continue to adversely affect, the global economy, the economies of certain nations, and individual issuers, all of which may negatively impact the fund’s performance.
Note 7: Summary of derivative activity
The volume of activity for the reporting period for any derivative type that was held during the period is listed below and was based on an average of the holdings at the end of each fiscal quarter:
| |
| Purchased TBA commitment option contracts (contract amount) | $43,600,000 |
| Purchased swap option contracts (contract amount) | $32,400,000 |
| Written TBA commitment option contracts (contract amount) | $43,600,000 |
| Centrally cleared interest rate swap contracts (notional) | $1,120,000,000 |
| OTC credit default contracts (notional) | $85,100,000 |
|
| 48 Mortgage Opportunities Fund |
The following is a summary of the fair value of derivative instruments as of the close of the reporting period:
| | | | |
| Fair value of derivative instruments as of the close of the reporting period | | |
| | ASSET DERIVATIVES | LIABILITY DERIVATIVES |
| Derivatives not accounted | | | | |
| for as hedging instruments | Statement of assets and | | Statement of assets and | |
| under ASC 815 | liabilities location | Fair value | liabilities location | Fair value |
| Credit contracts | Receivables | $6,758,601 | Payables | $14,952,412 |
| | Investments, Receivables, Net | | | |
| | assets — Unrealized | | Payables, Net assets — | |
| Interest rate contracts | appreciation | 5,814,203* | Unrealized depreciation | 7,761,097* |
| Total | | $12,572,804 | | $22,713,509 |
* Includes cumulative appreciation/depreciation of centrally cleared swaps as reported in the fund’s portfolio. Only current day’s variation margin is reported within the Statement of assets and liabilities.
The following is a summary of realized and change in unrealized gains or losses of derivative instruments in the Statement of operations for the reporting period (Note 1):
| | | | |
| Amount of realized gain or (loss) on derivatives recognized in net gain or (loss) on investments | | |
| Derivatives not accounted for as | | | | |
| hedging instruments under ASC 815 | Options | | Swaps | Total |
| Credit contracts | $— | | $(2,084,296) | $(2,084,296) |
| Interest rate contracts | (2,354,695) | | 14,426,806 | $12,072,111 |
| Total | $(2,354,695) | | $12,342,510 | $9,987,815 |
| |
| Change in unrealized appreciation or (depreciation) on derivatives recognized in net gain or (loss) on investments | |
| Derivatives not accounted for as | | | | |
| hedging instruments under ASC 815 | Options | | Swaps | Total |
| Credit contracts | $— | | $3,628,175 | $3,628,175 |
| Interest rate contracts | (113,565) | | (2,228,283) | $(2,341,848) |
| Total | $(113,565) | | $1,399,892 | $1,286,327 |
|
| Mortgage Opportunities Fund 49 |
Note 8: Offsetting of financial and derivative assets and liabilities
The following table summarizes any derivatives, repurchase agreements and reverse repurchase agreements, at the end of the reporting period, that are subject to an enforceable master netting agreement or similar agreement. For securities lending transactions or borrowing transactions associated with securities sold short, if any, see Note 1. For financial reporting purposes, the fund does not offset financial assets and financial liabilities that are subject to the master netting agreements in the Statement of assets and liabilities.
| | | | | | | | | | | |
| | Barclays Bank
PLC | Barclays
Capital, Inc.
(clearing
broker) | BofA
Securities,
Inc. | Citibank, N.A. | Citigroup
Global
Markets, Inc. | Credit Suisse
International | Goldman
Sachs
International | JPMorgan
Securities LLC | Merrill Lynch
International | Morgan
Stanley & Co.
International
PLC | Total |
| Assets: | | | | | | | | | | | |
| Centrally cleared interest rate swap contracts§ | $— | $811,148 | $— | $— | $— | $— | $— | $— | $— | $— | $811,148 |
| OTC Credit default contracts — protection sold*# | — | — | — | — | — | — | — | — | — | — | — |
| OTC Credit default contracts — protection purchased*# | — | — | — | — | 2,207,867 | 204,367 | 1,782,264 | 823,057 | 105,815 | 1,635,231 | 6,758,601 |
| Forward premium swap option contracts# | — | — | — | 44,262 | — | — | 270,848 | — | — | — | 315,110 |
| Total Assets | $— | $811,148 | $— | $44,262 | $2,207,867 | $204,367 | $2,053,112 | $823,057 | $105,815 | $1,635,231 | $7,884,859 |
| Liabilities: | | | | | | | | | | | |
| Centrally cleared interest rate swap contracts§ | — | 2,925,257 | — | — | — | — | — | — | — | — | 2,925,257 |
| OTC Credit default contracts — protection sold*# | 1,242 | — | — | — | 3,592,603 | 115,555 | 5,617,544 | 628,418 | 190,470 | 4,806,580 | 14,952,412 |
| OTC Credit default contracts — protection purchased*# | — | — | — | — | — | — | — | — | — | — | — |
| Forward premium swap option contracts# | — | — | — | 36,570 | — | — | 138,895 | — | — | — | 175,465 |
| Total Liabilities | $1,242 | $2,925,257 | $— | $36,570 | $3,592,603 | $115,555 | $5,756,439 | $628,418 | $190,470 | $4,806,580 | $18,053,134 |
| Total Financial and Derivative Net Assets | $(1,242) | $(2,114,109) | $— | $7,692 | $(1,384,736) | $88,812 | $(3,703,327) | $194,639 | $(84,655) | $(3,171,349) | $(10,168,275) |
| Total collateral received (pledged)†## | $— | $— | $— | $— | $(1,384,736) | $— | $(3,703,327) | $168,000 | $(84,655) | $(3,171,349) | |
| Net amount | $(1,242) | $(2,114,109) | $— | $7,692 | $— | $88,812 | $— | $26,639 | $— | $— | |
| Controlled collateral received (including TBA commitments)** | $— | $— | $3,324,000 | $— | $1,198,000 | $— | $— | $2,074,000 | $— | $— | $6,596,000 |
| Uncontrolled collateral received | $— | $— | $— | $— | $— | $— | $— | $— | $— | $— | $— |
| Collateral (pledged) (including TBA commitments)** | $— | $— | $— | $— | $(1,467,342) | $— | $(3,706,582) | $— | $(102,947) | $(3,279,850) | $(8,556,721) |
* Excludes premiums, if any. Included in unrealized appreciation and depreciation on OTC swap contracts on the Statement of assets and liabilities.
** Included with Investments in securities on the Statement of assets and liabilities.
† Additional collateral may be required from certain brokers based on individual agreements.
# Covered by master netting agreement (Note 1).
##Any over-collateralization of total financial and derivative net assets is not shown. Collateral may include amounts related to unsettled agreements.
§ Includes current day’s variation margin only as reported on the Statement of assets and liabilities, which is not collateralized. Cumulative appreciation/(depreciation) for centrally cleared swap contracts is represented in the tables listed after the fund’s portfolio. Collateral pledged for initial margin on centrally cleared swap contracts, which is not included in the table above, amounted to $19,222,239.
| |
| 50 Mortgage Opportunities Fund | Mortgage Opportunities Fund 51 |
Shareholder meeting results (Unaudited)
June 29, 2022 special meeting
At the meeting, each of the nominees for Trustees was elected, with all funds of the Trust voting together as a single class, as follows:
| | |
| | Votes for | Votes withheld |
| Liaquat Ahamed | 3,583,882,479 | 32,417,735 |
| Barbara M. Baumann | 3,584,377,892 | 31,922,322 |
| Katinka Domotorffy | 3,584,956,517 | 31,343,697 |
| Catharine Bond Hill | 3,586,682,827 | 29,617,387 |
| Kenneth R. Leibler | 3,569,431,371 | 46,868,843 |
| Jennifer Williams Murphy | 3,581,263,937 | 35,036,277 |
| Marie Pillai | 3,578,125,932 | 38,174,282 |
| George Putnam, III | 3,576,315,198 | 39,985,016 |
| Robert L. Reynolds | 3,579,411,077 | 36,889,137 |
| Manoj P. Singh | 3,582,573,738 | 33,726,476 |
| Mona K. Sutphen | 3,588,302,923 | 27,997,291 |
All tabulations are rounded to the nearest whole number.
|
| 52 Mortgage Opportunities Fund |
Fund information
Founded over 80 years ago, Putnam Investments was built around the concept that a balance between risk and reward is the hallmark of a well-rounded financial program. We manage funds across income, value, blend, growth, sustainable, asset allocation, absolute return, and global sector categories.
| | |
| Investment Manager | Trustees | Richard T. Kircher |
| Putnam Investment | Kenneth R. Leibler, Chair | Vice President and |
| Management, LLC | Barbara M. Baumann, Vice Chair | BSA Compliance Officer |
| 100 Federal Street | Liaquat Ahamed | |
| Boston, MA 02110 | Katinka Domotorffy | Martin Lemaire |
| | Catharine Bond Hill | Vice President and |
| Investment Sub-Advisor | Jennifer Williams Murphy | Derivatives Risk Manager |
| Putnam Investments Limited | Marie Pillai | |
| 16 St James’s Street | George Putnam, III | Susan G. Malloy |
| London, England SW1A 1ER | Robert L. Reynolds | Vice President and |
| Manoj P. Singh | Assistant Treasurer |
| Marketing Services | Mona K. Sutphen | |
| Putnam Retail Management | | Alan G. McCormack |
| Limited Partnership | Officers | Vice President and |
| 100 Federal Street | Robert L. Reynolds | Derivatives Risk Manager |
| Boston, MA 02110 | President | |
| | | Denere P. Poulack |
| Custodian | James F. Clark | Assistant Vice President, |
| State Street Bank | Vice President, Chief Compliance | Assistant Clerk, and |
| and Trust Company | Officer, and Chief Risk Officer | Assistant Treasurer |
| | | |
| Legal Counsel | Nancy E. Florek | Janet C. Smith |
| Ropes & Gray LLP | Vice President, Director of | Vice President, |
| | Proxy Voting and Corporate | Principal Financial Officer, |
| | Governance, Assistant Clerk, | Principal Accounting Officer, |
| | and Assistant Treasurer | and Assistant Treasurer |
| | | |
| | Michael J. Higgins | Stephen J. Tate |
| | Vice President, Treasurer, | Vice President and |
| | and Clerk | Chief Legal Officer |
| | | |
| | Jonathan S. Horwitz | Mark C. Trenchard |
| | Executive Vice President, | Vice President |
| Principal Executive Officer, | |
| | and Compliance Liaison | |
This report is for the information of shareholders of Putnam Mortgage Opportunities Fund. It may also be used as sales literature when preceded or accompanied by the current prospectus, the most recent copy of Putnam’s Quarterly Performance Summary, and Putnam’s Quarterly Ranking Summary. For more recent performance, please visit putnam.com. Investors should carefully consider the investment objectives, risks, charges, and expenses of a fund, which are described in its prospectus. For this and other information or to request a prospectus or summary prospectus, call 1-800-225-1581 toll free. Please read the prospectus carefully before investing. The fund’s Statement of Additional Information contains additional information about the fund’s Trustees and is available without charge upon request by calling 1-800-225-1581.

| |
| Item 3. Audit Committee Financial Expert: |
| |
| Item 4. Principal Accountant Fees and Services: |
| |
| Item 5. Audit Committee of Listed Registrants |
| |
| Item 6. Schedule of Investments: |
| |
| The registrant’s schedule of investments in unaffiliated issuers is included in the report to shareholders in Item 1 above. |
| |
| Item 7. Disclosure of Proxy Voting Policies and Procedures For Closed-End Management Investment Companies: |
| |
| Item 8. Portfolio Managers of Closed-End Investment Companies |
| |
| Item 9. Purchases of Equity Securities by Closed-End Management Investment Companies and Affiliated Purchasers: |
| |
| Item 10. Submission of Matters to a Vote of Security Holders: |
| |
| Item 11. Controls and Procedures: |
| |
| (a) The registrant’s principal executive officer and principal financial officer have concluded, based on their evaluation of the effectiveness of the design and operation of the registrant’s disclosure controls and procedures as of a date within 90 days of the filing date of this report, that the design and operation of such procedures are generally effective to provide reasonable assurance that information required to be disclosed by the registrant in this report is recorded, processed, summarized and reported within the time periods specified in the Commission’s rules and forms. |
| |
| (b) Changes in internal control over financial reporting: Not applicable |
| |
| Item 12. Disclosures of Securities Lending Activities for Closed-End Investment Companies: |
| |
| Pursuant to the requirements of the Securities Exchange Act of 1934 and the Investment Company Act of 1940, the registrant has duly caused this report to be signed on its behalf by the undersigned, thereunto duly authorized. |
| |
| By (Signature and Title): |
| |
| /s/ Janet C. Smith
Janet C. Smith
Principal Accounting Officer
|
| |
| Pursuant to the requirements of the Securities Exchange Act of 1934 and the Investment Company Act of 1940, this report has been signed below by the following persons on behalf of the registrant and in the capacities and on the dates indicated. |
| |
| By (Signature and Title): |
| |
| /s/ Jonathan S. Horwitz
Jonathan S. Horwitz
Principal Executive Officer
|
| |
| By (Signature and Title): |
| |
| /s/ Janet C. Smith
Janet C. Smith
Principal Financial Officer
|