| UNITED STATES SECURITIES AND EXCHANGE COMMISSION | ||
| Washington, D.C. 20549 | ||
FORM N-CSR | ||
| CERTIFIED SHAREHOLDER REPORT OF REGISTERED MANAGEMENT INVESTMENT COMPANIES | ||
| Investment Company Act file number: | (811-07513) |
| Exact name of registrant as specified in charter: | Putnam Funds Trust |
| Address of principal executive offices: | 100 Federal Street, Boston, Massachusetts 02110 |
| Name and address of agent for service: | Stephen Tate, Vice President 100 Federal Street Boston, Massachusetts 02110 |
| Copy to: | Bryan Chegwidden, Esq. Ropes & Gray LLP 1211 Avenue of the Americas New York, New York 10036 |
| James E. Thomas, Esq. Ropes & Gray LLP 800 Boylston Street Boston, Massachusetts 02199 |
| Registrant’s telephone number, including area code: | (617) 292-1000 |
| Date of fiscal year end: | May 31, 2023 |
| Date of reporting period: | June 1, 2022 – May 31, 2023 |
Item 1. Report to Stockholders: |
| The following is a copy of the report transmitted to stockholders pursuant to Rule 30e-1 under the Investment Company Act of 1940: | |||
Putnam
Mortgage Opportunities
Fund
Annual report
5 | 31 | 23
Message from the Trustees
July 13, 2023
Dear Fellow Shareholder:
Stocks have generally advanced in the first half of the year, and the performance of bond markets has also improved compared with 2022. Inflation is trending downward, while economic growth has remained positive. At the same time, investors are weighing the impact of high borrowing costs, a weak housing market, and stress in the banking system.
Fortunately, a strong pulse of innovation is gaining investors’ attention. The technology sector, for example, has started to rebound from a difficult 2022. More broadly, international markets are performing better this year, even though the reopening of China’s economy lacked the dynamism many had anticipated.
As active managers, your investment team continues to research attractive opportunities for your fund while monitoring risks. This report offers an update on their efforts.
Thank you for investing with Putnam.

Current performance may be lower or higher than the quoted past performance, which cannot guarantee future results. Share price, principal value, and return will fluctuate, and you may have a gain or a loss when you sell your shares. Performance of class A shares assumes reinvestment of distributions and does not account for taxes. Fund returns in the bar chart do not reflect a sales charge of 4.00%; had they, returns would have been lower. Performance for class A shares before their inception (7/1/19) is derived from the historical performance of class I shares and has been adjusted for the higher operating expenses for class A shares. See below and pages 6–8 for additional performance information. For the periods, the fund had expense limitations, without which returns would have been lower. To obtain the most recent month-end performance, visit putnam.com.
All Bloomberg indices are provided by Bloomberg Index Services Limited.
Lipper peer group median is provided by Lipper, a Refinitiv company.

This comparison shows your fund’s performance in the context of broad market indexes for the 12 months ended 5/31/23. See above and pages 6–8 for additional fund performance information. Index descriptions can be found on page 10.
All Bloomberg indices are provided by Bloomberg Index Services Limited.
| 2 Mortgage Opportunities Fund |


Brett, please describe investing conditions during the reporting period.
High inflation and rising interest rates were headwinds for bonds. In June 2022, U.S. inflation peaked at a 40-year high of 9.1%, as measured by the Consumer Price Index [CPI]. The Federal Reserve turned hawkish, making four consecutive interest-rate hikes of 0.75% through November 2022. Credit spreads widened and the yield curve inverted, stoking fears of a recession. [Spreads are the yield advantage credit-sensitive bonds offer over comparable-maturity U.S. Treasuries. Bond prices rise as yield spreads tighten and decline as spreads widen.]
In December 2022, the CPI showed that the pace of inflation declined to 6.5%, prompting the Fed to lower its rate hike to 0.50% for the month. After posting three quarters of losses, bond markets finished the fourth quarter of calendar 2022 in positive territory.
With inflation moderating but still high, the Fed raised interest rates by 0.25% in February and March 2023. Also in March, several U.S. bank failures rattled markets. Quick actions by global central banks to minimize systemic risk helped calm investors’ nerves. In May 2023, the Fed raised rates by 0.25%, but signaled its rate-hiking cycle may be nearing an end. The yield on the benchmark 10-year Treasury climbed from 2.85% at the start of the period to a high of 4.25% on October 24, 2022, before finishing the period at 3.65%.
How did the fund perform for the reporting period?
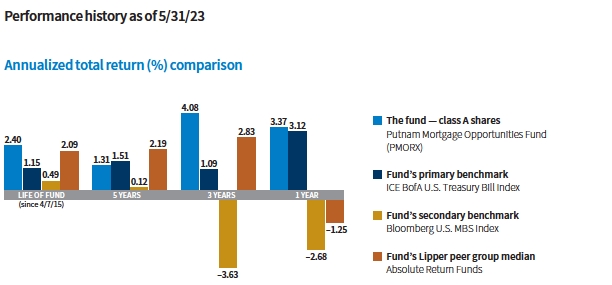
The fund returned 3.37%, outperforming its primary benchmark, the ICE BofA U.S. Treasury Bill Index, which returned 3.12% for the period. The fund also outperformed its secondary benchmark, the Bloomberg U.S. MBS Index, which returned –2.68%.
| Mortgage Opportunities Fund 3 |
Allocations are shown as a percentage of the fund’s net assets as of 5/31/23. Cash and net other assets, if any, represent the market value weights of cash, derivatives, short-term securities, and other unclassified assets in the portfolio. Summary information may differ from the portfolio schedule included in the financial statements due to the inclusion of derivative securities, any interest accruals, the use of different classifications of securities for presentation purposes, and rounding. Allocations may not total 100% because the table includes the notional value (non-cash investments) of certain derivatives (the economic value for purposes of calculating periodic payment obligations), including to-be-announced mortgage security trades, if any, in addition to the market value of securities. Holdings and allocations may vary over time.

Credit qualities are shown as a percentage of the fund’s net assets as of 5/31/23. A bond rated BBB or higher (A-3 or higher, for short-term debt) is considered investment grade. This chart reflects the highest security rating provided by one or more of Standard & Poor’s, Moody’s, and Fitch. Ratings and portfolio credit quality will vary over time. Due to rounding, percentages may not equal 100%.
Cash and net other assets, if any, represent the market value weights of cash, derivatives, and short-term securities in the portfolio. The fund itself has not been rated by an independent rating agency.

Which holdings and strategies impacted fund performance relative to its primary benchmark for the reporting period?
Our allocation to CMBS [collateralized mortgage-backed securities] was the primary detractor from the fund’s relative performance. Along with other risk assets, CMBS markets faced macro-driven headwinds over the period. Spreads widened as investors considered the impact of a potential recession. Poor technicals [supply/demand metrics] and negative headlines surrounding office properties also weighed on CMBS returns. CMBS market liquidity remained challenged. Bid-ask spreads widened, largely driven by an uncertain economic outlook, rising interest rates, and office vacancy rates, which reached a 30-year high in the U.S.
Exposure to residential mortgage credit, led by our seasoned credit risk transfer [CRT] holdings, marginally contributed to results. During the period, CRT bonds were tendered by issuers, and many were upgraded by rating agencies, which benefited our CRT holdings. Most borrowers who became delinquent on their loans post-pandemic resumed their payments or worked out loan modifications during the period. We believe this trend will continue, helping to minimize losses for bond investors. Overall, our CRT holdings are concentrated in older mortgage loans. These loans are now benefiting from several years of home price appreciation, which we believe lowers the downside risks of a more challenging housing market.
| 4 Mortgage Opportunities Fund |
Prepayment strategies, driven by our mortgage basis positioning and reverse mortgage IO [interest-only] holdings, also were additive to fund performance. [The mortgage basis is the difference between longer-term U.S. Treasury yields and the interest rates on 30-year home mortgages.] Given the extensive widening of the mortgage basis at the start of calendar 2022, we considered the risk of further widening to be low. During the period, we shifted to a long position to the mortgage basis, which helped fund performance as the mortgage basis tightened. A slowdown in home price appreciation and higher interest rates made refinancing more difficult, which also benefited our reverse mortgage IO holdings.
Agency IO securities detracted from fund performance. Prepayment speeds lowered, driven by high mortgage rates, burnout [a period when MBS prepayment rates drop despite lower interest rates], and the effects of a slowing housing market. These conditions are generally supportive for IO holdings. However, broader risk aversion, lower liquidity, and heightened interest-rate volatility challenged our agency IO holdings during the period.
How did you use derivatives during the reporting period?
We used interest-rate swaps to hedge term structure risk and for yield curve positioning. We also used options to hedge duration and convexity, isolate prepayment risk, and manage downside risks. In addition, we used credit default swaps to gain exposure to specific sectors and hedge credit and market risks. We also used futures for hedging Treasury term structure risk and for yield curve positioning.
What is your outlook for the fund and the various sectors in which it invests?
The broad commercial real estate market is facing meaningful headwinds and increased risks, in our view. While the U.S. economy continues to reopen to travel, office use, and retailers, the risk of recession is rising, in our view. The Fed continues to combat inflation by raising the cost of risk-free capital. We believe property types like hotels and apartments, which can adjust rents upward to keep pace with inflation, are better positioned to hold their value. Property types with longer leases and greater exposure to rising capital costs or needs for capital investment will be more challenged, in our view.
We believe office properties represent the largest risk going forward. Detailed analysis and security selection will be key to finding the most attractive relative-value opportunities in this environment, in our view. We expect greater return dispersion across the market in the near term. These conditions require rigorous loan-level analysis to uncover relative value, in our view. As of period-end, we favor shorter spread duration assets, including seasoned mezzanine tranches on deals with high-quality collateral. We believe these assets offer very attractive relative value and downside protection from losses, including the possibility of a recession.

U.S. homeowner balance sheets are well positioned, in our view. Homeowners who locked in ultra-low mortgage rates are benefiting from rapid home price appreciation in recent years. We believe the risk of a housing or economic correction that would cause widespread defaults and delinquencies is low. Based on this view, we believe that supply is unlikely to grow from distressed properties. While the supply of new homes is rising, we do not think it is enough to create an oversupply on a national level. We expect home prices will decline modestly through year-end. Thereafter, we expect tepid growth, as affordability pressures limit demand and supply increases gradually.
Residential mortgage credit spreads widened significantly in calendar 2022, creating very attractive risk-adjusted return opportunities, in our view. Given our cautious macro and housing outlooks, we favor investing in higher-quality bonds with shorter spread durations. We also prefer bonds with seasoned collateral that have built-up substantial home equity and could weather home price declines, in our view.
We think prepayment speeds will remain stable for lower-coupon mortgages. In our view, the prepayment sector offers protection against a potential recession, which could negatively impact home prices and/or employment levels. Macro volatility in interest rates would be a risk to performance, but we expect volatility of rates will decline through year-end. Many prepayment-sensitive assets offer an attractive risk-adjusted return at current price levels and significant upside potential, in our view, if interest rates stabilize and volatility declines.
Our security selection spans a variety of collateral types that we believe are attractively priced based on anticipated prepayment speeds. We have a neutral to slightly long position to the mortgage basis. Sales of mortgage holdings by the FDIC [Federal Deposit Insurance Corporation] have been robust, which is encouraging. Uncertainty related to bank demand remains a risk, and remaining tactical is important, in our view. We will actively trade the mortgage basis as new information emerges and market conditions change.
Thank you, Brett, for your time and insights today.
The views expressed in this report are exclusively those of Putnam Management and are subject to change. They are not meant as investment advice.
Please note that the holdings discussed in this report may not have been held by the fund for the entire period. Portfolio composition is subject to review in accordance with the fund’s investment strategy and may vary in the future. Current and future portfolio holdings are subject to risk.
| Mortgage Opportunities Fund 5 |
Your fund’s performance
This section shows your fund’s performance, price, and distribution information for periods ended May 31, 2023, the end of its most recent fiscal year. In accordance with regulatory requirements for mutual funds, we also include performance information as of the most recent calendar quarter-end and expense information from the fund’s current prospectus. Performance should always be considered in light of a fund’s investment strategy. Data represent past performance. Past performance does not guarantee future results. More recent returns may be less or more than those shown. Investment return and principal value will fluctuate, and you may have a gain or a loss when you sell your shares. Performance information does not reflect any deduction for taxes a shareholder may owe on fund distributions or on the redemption of fund shares. For the most recent month-end performance, please visit the Institutional Investors section at putnam.com (class I), Individual Investors section at putnam.com (classes A, C, R6, and Y), or call Putnam at 1-800-487-0024. Class I, R6, and Y shares are not available to all investors.
Annualized fund performance Total return for periods ended 5/31/23
| Life of fund | 5 years | 3 years | 1 year | |
| Class A (7/1/19) | ||||
| Before sales charge | 2.40% | 1.31% | 4.08% | 3.37% |
| After sales charge | 1.88 | 0.49 | 2.67 | –0.76 |
| Class C (7/1/19) | ||||
| Before CDSC | 1.66 | 0.60 | 3.34 | 2.60 |
| After CDSC | 1.66 | 0.60 | 3.34 | 1.64 |
| Class I (4/7/15) | ||||
| Net asset value | 2.76 | 1.65 | 4.39 | 3.74 |
| Class R6 (6/1/20) | ||||
| Net asset value | 2.73 | 1.62 | 4.36 | 3.70 |
| Class Y (7/1/19) | ||||
| Net asset value | 2.64 | 1.55 | 4.30 | 3.63 |
Current performance may be lower or higher than the quoted past performance, which cannot guarantee future results. Share price, principal value, and return will vary, and you may have a gain or a loss when you sell your shares. Performance assumes reinvestment of distributions and does not account for taxes. After-sales-charge returns for class A shares reflect the deduction of the maximum 4.00% sales charge levied at the time of purchase. Class C share returns after CDSC reflect a 1% CDSC the first year that is eliminated thereafter. Class I, R6, and Y shares have no initial sales charge or CDSC. Performance for class A, C, R6, and Y shares before their inception is derived from the historical performance of class I shares, adjusted for the applicable sales charge (or CDSC) and the higher operating expenses for such shares.
For the periods, the fund had expense limitations, without which returns would have been lower.
Comparative annualized index returns For periods ended 5/31/23
| Life of fund | 5 years | 3 years | 1 year | |
| ICE BofA U.S. Treasury Bill Index | 1.15% | 1.51% | 1.09% | 3.12% |
| Bloomberg U.S. MBS Index | 0.49 | 0.12 | –3.63 | –2.68 |
| Lipper Absolute Return Funds category median* | 2.09 | 2.19 | 2.83 | –1.25 |
Index and Lipper results should be compared with fund performance before sales charge, before CDSC, or at net asset value.
All Bloomberg indices are provided by Bloomberg Index Services Limited.
Lipper peer group median is provided by Lipper, a Refinitiv company.
* Over the 1-year, 3-year, 5-year, and life-of-fund periods ended 5/31/23, there were 116, 108, 97, and 75 funds, respectively, in this Lipper category.
| 6 Mortgage Opportunities Fund |

Past performance does not indicate future results. At the end of the same time period, a $10,000 investment in the fund’s class C shares would have been valued at $11,438, and no contingent deferred sales charges would apply. A $10,000 investment in the fund’s I, R6, and Y shares would have been valued at $12,487, $12,453, and $12,371, respectively.
Performance of class A shares before their inception date (7/1/19) is derived from the historical performance of class I shares, and has been adjusted for the applicable sales charge and higher operating expenses for class A shares.
All Bloomberg indices are provided by Bloomberg Index Services Limited.
Fund price and distribution information For the 12-month period ended 5/31/23
| Distributions | Class A | Class C | Class I | Class R6 | Class Y | |
| Number | 12 | 12 | 12 | 12 | 12 | |
| Income | $0.590473 | $0.525473 | $0.622473 | $0.619473 | $0.612473 | |
| Capital gains | ||||||
| Short-term gains | 0.051527 | 0.051527 | 0.051527 | 0.051527 | 0.051527 | |
| Total | $0.642000 | $0.577000 | $0.674000 | $0.671000 | $0.664000 | |
| Before | After | Net | Net | Net | Net | |
| sales | sales | asset | asset | asset | asset | |
| Share value | charge | charge | value | value | value | value |
| 5/31/22 | $8.90 | $9.27 | $8.92 | $8.91 | $8.91 | $8.90 |
| 5/31/23 | 8.55 | 8.91 | 8.57 | 8.56 | 8.56 | 8.55 |
| Before | After | Net | Net | Net | Net | |
| Current rate | sales | sales | asset | asset | asset | asset |
| (end of period) | charge | charge | value | value | value | value |
| Current dividend rate1 | 4.63% | 4.44% | 3.92% | 5.05% | 5.05% | 4.91% |
| Current 30-day | ||||||
| SEC yield (with | ||||||
| expense limitation)2,3 | N/A | 7.17 | 6.42 | 7.61 | 7.57 | 7.43 |
| Current 30-day | ||||||
| SEC yield (without | ||||||
| expense limitation)3 | N/A | 6.99 | 6.23 | 7.42 | 7.38 | 7.24 |
The classification of distributions, if any, is an estimate. Before-sales-charge share value and current dividend rate for class A shares, if applicable, do not take into account any sales charge levied at the time of purchase. After-sales-charge share value, current dividend rate, and current 30-day SEC yield, if applicable, are calculated assuming that the maximum sales charge (4.00% for class A shares) was levied at the time of purchase. Final distribution information will appear on your year-end tax forms.
1 Most recent distribution, including any return of capital and excluding capital gains, annualized and divided by share price before or after sales charge at period-end.
2 For a portion of the periods, the fund had expense limitations, without which returns would have been lower.
3 Based only on investment income and calculated using the maximum offering price for each share class, in accordance with SEC guidelines.
| Mortgage Opportunities Fund 7 |
Annualized fund performance as of most recent calendar quarter Total return for periods ended 6/30/23
| Life of fund | 5 years | 3 years | 1 year | |
| Class A (7/1/19) | ||||
| Before sales charge | 2.54% | 1.45% | 3.46% | 5.30% |
| After sales charge | 2.03 | 0.62 | 2.06 | 1.09 |
| Class C (7/1/19) | ||||
| Before CDSC | 1.81 | 0.70 | 2.72 | 4.51 |
| After CDSC | 1.81 | 0.70 | 2.72 | 3.53 |
| Class I (4/7/15) | ||||
| Net asset value | 2.92 | 1.80 | 3.81 | 5.81 |
| Class R6 (6/1/20) | ||||
| Net asset value | 2.88 | 1.76 | 3.78 | 5.76 |
| Class Y (7/1/19) | ||||
| Net asset value | 2.80 | 1.69 | 3.72 | 5.68 |
See the discussion following the fund performance table on page 6 for information about the calculation of fund performance.
As a mutual fund investor, you pay ongoing expenses, such as management fees, distribution fees (12b-1 fees), and other expenses. In the most recent six-month period, your fund’s expenses were limited; had expenses not been limited, they would have been higher. Using the following information, you can estimate how these expenses affect your investment and compare them with the expenses of other funds. You may also pay one-time transaction expenses, including sales charges (loads) and redemption fees, which are not shown in this section and would have resulted in higher total expenses. For more information, see your fund’s prospectus or talk to your financial representative.
Expense ratios
| Class A | Class C | Class I | Class R6 | Class Y | |
| Net expenses for the fiscal year | |||||
| ended 5/31/22* | 0.79% | 1.54% | 0.48% | 0.52% | 0.54% |
| Total annual operating expenses for the fiscal | |||||
| year ended 5/31/22 | 1.07% | 1.82% | 0.76% | 0.80% | 0.82% |
| Annualized expense ratio for the six-month | |||||
| period ended 5/31/23† | 0.86% | 1.61% | 0.47% | 0.51% | 0.61% |
Fiscal year expense information in this table is taken from the most recent prospectus, is subject to change, and may differ from that shown for the annualized expense ratio and in the financial highlights of this report.
Expenses are shown as a percentage of average net assets.
* Reflects Putnam Management’s contractual obligation to limit certain fund expenses through 9/30/23.
† Expense ratios for each class are for the fund’s most recent fiscal half year. As a result of this, ratios may differ from expense ratios based on one-year data in the financial highlights.
Expenses per $1,000
The following table shows the expenses you would have paid on a $1,000 investment in each class of the fund from 12/1/22 to 5/31/23. It also shows how much a $1,000 investment would be worth at the close of the period, assuming actual returns and expenses.
| Class A | Class C | Class I | Class R6 | Class Y | |
| Expenses paid per $1,000*† | $4.32 | $8.06 | $2.36 | $2.56 | $3.06 |
| Ending value (after expenses) | $1,013.20 | $1,008.20 | $1,014.10 | $1,013.80 | $1,013.40 |
* Expenses for each share class are calculated using the fund’s annualized expense ratio for each class, which represents the ongoing expenses as a percentage of average net assets for the six months ended 5/31/23. The expense ratio may differ for each share class.
† Expenses are calculated by multiplying the expense ratio by the average account value for the period; then multiplying the result by the number of days in the period (182); and then dividing that result by the number of days in the year (365).
| 8 Mortgage Opportunities Fund |
Estimate the expenses you paid
To estimate the ongoing expenses you paid for the six months ended 5/31/23, use the following calculation method. To find the value of your investment on 12/1/22, call Putnam at 1-800-225-1581.
Compare expenses using the SEC’s method
The Securities and Exchange Commission (SEC) has established guidelines to help investors assess fund expenses. Per these guidelines, the following table shows your fund’s expenses based on a $1,000 investment, assuming a hypothetical 5% annualized return. You can use this information to compare the ongoing expenses (but not transaction expenses or total costs) of investing in the fund with those of other funds. All mutual fund shareholder reports will provide this information to help you make this comparison. Please note that you cannot use this information to estimate your actual ending account balance and expenses paid during the period.
| Class A | Class C | Class I | Class R6 | Class Y | |
| Expenses paid per $1,000*† | $4.33 | $8.10 | $2.37 | $2.57 | $3.07 |
| Ending value (after expenses) | $1,020.64 | $1,016.90 | $1,022.59 | $1,022.39 | $1,021.89 |
* Expenses for each share class are calculated using the fund’s annualized expense ratio for each class, which represents the ongoing expenses as a percentage of average net assets for the six months ended 5/31/23. The expense ratio may differ for each share class.
† Expenses are calculated by multiplying the expense ratio by the average account value for the six-month period; then multiplying the result by the number of days in the six-month period (182); and then dividing that result by the number of days in the year (365).
| Mortgage Opportunities Fund 9 |
Comparative index definitions
Bloomberg U.S. Aggregate Bond Index is an unmanaged index of U.S. investment-grade fixed income securities.
Bloomberg U.S. MBS Index is an unmanaged index of agency mortgage-backed pass-through securities (both fixed-rate and hybrid adjustable-rate mortgages) guaranteed by the Federal National Mortgage Association, Government National Mortgage Association, and Federal Home Loan Mortgage Corporation.
ICE BofA (Intercontinental Exchange Bank of America) U.S. Treasury Bill Index is an unmanaged index that tracks the performance of U.S. dollar-denominated U.S. Treasury bills publicly issued in the U.S. domestic market. Qualifying securities must have a remaining term of at least one month to final maturity and a minimum amount outstanding of $1 billion.
S&P 500® Index is an unmanaged index of common stock performance.
Indexes assume reinvestment of all distributions and do not account for fees. Securities and performance of a fund and an index will differ. You cannot invest directly in an index.
BLOOMBERG® is a trademark and service mark of Bloomberg Finance L.P. and its affiliates (collectively “Bloomberg”). Bloomberg or Bloomberg’s licensors own all proprietary rights in the Bloomberg Indices. Neither Bloomberg nor Bloomberg’s licensors approve or endorse this material, or guarantee the accuracy or completeness of any information herein, or make any warranty, express or implied, as to the results to be obtained therefrom, and to the maximum extent allowed by law, neither shall have any liability or responsibility for injury or damages arising in connection therewith.
ICE Data Indices, LLC (“ICE BofA”), used with permission. ICE BofA permits use of the ICE BofA indices and related data on an “as is” basis; makes no warranties regarding same; does not guarantee the suitability, quality, accuracy, timeliness, and/or completeness of the ICE BofA indices or any data included in, related to, or derived therefrom; assumes no liability in connection with the use of the foregoing; and does not sponsor, endorse, or recommend Putnam Investments, or any of its products or services.
Lipper, a Refinitiv company, is a third-party industry-ranking entity that ranks funds. Its rankings do not reflect sales charges. Lipper rankings are based on total return at net asset value relative to other funds that have similar current investment styles or objectives as determined by Lipper. Lipper may change a fund’s category assignment at its discretion. Lipper category medians reflect performance trends for funds within a category.
| 10 Mortgage Opportunities Fund |
Other information for shareholders
Important notice regarding delivery of shareholder documents
In accordance with Securities and Exchange Commission (SEC) regulations, Putnam sends a single notice of internet availability, or a single printed copy, of annual and semiannual shareholder reports, prospectuses, and proxy statements to Putnam shareholders who share the same address, unless a shareholder requests otherwise. If you prefer to receive your own copy of these documents, please call Putnam at 1-800-225-1581 or, for exchange-traded funds only, 1-833-228-5577. We will begin sending individual copies within 30 days.
Proxy voting
Putnam is committed to managing our funds in the best interests of our shareholders. The Putnam funds’ proxy voting guidelines and procedures, as well as information regarding how your fund voted proxies relating to portfolio securities during the 12-month period ended June 30, 2022, are available in the Individual Investors section of putnam.com and on the SEC’s website, www.sec.gov. If you have questions about finding forms on the SEC’s website, you may call the SEC at 1-800-SEC-0330. You may also obtain the Putnam funds’ proxy voting guidelines and procedures at no charge by calling Putnam’s Shareholder Services at 1-800-225-1581 or, for exchange-traded funds only, 1-833-228-5577.
Fund portfolio holdings
The fund will file a complete schedule of its portfolio holdings with the SEC for the first and third quarters of each fiscal year on Form N-PORT within 60 days of the end of such fiscal quarter. Shareholders may obtain the fund’s Form N-PORT on the SEC’s website at www.sec.gov.
Trustee and employee fund ownership
Putnam employees and members of the Board of Trustees place their faith, confidence, and, most importantly, investment dollars in Putnam funds. As of May 31, 2023, Putnam employees had approximately $470,000,000 and the Trustees had approximately $66,000,000 invested in Putnam funds. These amounts include investments by the Trustees’ and employees’ immediate family members as well as investments through retirement and deferred compensation plans.
Liquidity risk management program
Putnam, as the administrator of the fund’s liquidity risk management program (appointed by the Board of Trustees), presented the most recent annual report on the program to the Trustees in May 2023. The report covered the structure of the program, including the program documents and related policies and procedures adopted to comply with Rule 22e-4 under the Investment Company Act of 1940, and reviewed the operation of the program from January 2022 through December 2022. The report included a description of the annual liquidity assessment of the fund that Putnam performed in November 2022. The report noted that there were no material compliance exceptions identified under Rule 22e-4 during the period. The report included a review of the governance of the program and the methodology for classification of the fund’s investments. The report also included a discussion of liquidity monitoring during the period, including during the market liquidity challenges caused by the Covid-19 pandemic, and the impact those challenges had on the liquidity of the fund’s investments. Putnam concluded that the program has been operating effectively and adequately to ensure compliance with Rule 22e-4.
| Mortgage Opportunities Fund 11 |
Important notice regarding Putnam’s privacy policy
In order to conduct business with our shareholders, we must obtain certain personal information such as account holders’ names, addresses, Social Security numbers, and dates of birth. Using this information, we are able to maintain accurate records of accounts and transactions.
It is our policy to protect the confidentiality of our shareholder information, whether or not a shareholder currently owns shares of our funds. In particular, it is our policy not to sell information about you or your accounts to outside marketing firms. We have safeguards in place designed to prevent unauthorized access to our computer systems and procedures to protect personal information from unauthorized use.
Under certain circumstances, we must share account information with outside vendors who provide services to us, such as mailings and proxy solicitations. In these cases, the service providers enter into confidentiality agreements with us, and we provide only the information necessary to process transactions and perform other services related to your account. Finally, it is our policy to share account information with your financial representative, if you’ve listed one on your Putnam account.
| 12 Mortgage Opportunities Fund |
Audited financial statements
These sections of the report, as well as the accompanying Notes, preceded by the Report of Independent Registered Public Accounting Firm, constitute the fund’s audited financial statements.
The fund’s portfolio lists all the fund’s investments and their values as of the last day of the reporting period. Holdings are organized by asset type and industry sector, country, or state to show areas of concentration and diversification.
Statement of assets and liabilities shows how the fund’s net assets and share price are determined. All investment and non-investment assets are added together. Any unpaid expenses and other liabilities are subtracted from this total. The result is divided by the number of shares to determine the net asset value per share, which is calculated separately for each class of shares. (For funds with preferred shares, the amount subtracted from total assets includes the liquidation preference of preferred shares.)
Statement of operations shows the fund’s net investment gain or loss. This is done by first adding up all the fund’s earnings — from dividends and interest income — and subtracting its operating expenses to determine net investment income (or loss). Then, any net gain or loss the fund realized on the sales of its holdings — as well as any unrealized gains or losses over the period — is added to or subtracted from the net investment result to determine the fund’s net gain or loss for the fiscal period.
Statement of changes in net assets shows how the fund’s net assets were affected by the fund’s net investment gain or loss, by distributions to shareholders, and by changes in the number of the fund’s shares. It lists distributions and their sources (net investment income or realized capital gains) over the current reporting period and the most recent fiscal year-end. The distributions listed here may not match the sources listed in the Statement of operations because the distributions are determined on a tax basis and may be paid in a different period from the one in which they were earned.
Financial highlights provide an overview of the fund’s investment results, per-share distributions, expense ratios, net investment income ratios, and portfolio turnover (not required for money market funds) in one summary table, reflecting the five most recent reporting periods. In a semiannual report, the highlights table also includes the current reporting period.
| Mortgage Opportunities Fund 13 |
Report of Independent Registered Public Accounting Firm
To the Board of Trustees of Putnam Funds Trust and Shareholders of
Putnam Mortgage Opportunities Fund:
Opinion on the Financial Statements
We have audited the accompanying statement of assets and liabilities, including the fund’s portfolio, of Putnam Mortgage Opportunities Fund (one of the funds constituting Putnam Funds Trust, referred to hereafter as the “Fund”) as of May 31, 2023, the related statement of operations for the year ended May 31, 2023, the statement of changes in net assets for each of the two years in the period ended May 31, 2023, including the related notes, and the financial highlights for each of the periods indicated therein (collectively referred to as the “financial statements”). In our opinion, the financial statements present fairly, in all material respects, the financial position of the Fund as of May 31, 2023, the results of its operations for the year then ended, the changes in its net assets for each of the two years in the period ended May 31, 2023 and the financial highlights for each of the periods indicated therein in conformity with accounting principles generally accepted in the United States of America.
Basis for Opinion
These financial statements are the responsibility of the Fund’s management. Our responsibility is to express an opinion on the Fund’s financial statements based on our audits. We are a public accounting firm registered with the Public Company Accounting Oversight Board (United States) (“PCAOB”) and are required to be independent with respect to the Fund in accordance with the U.S. federal securities laws and the applicable rules and regulations of the Securities and Exchange Commission and the PCAOB.
We conducted our audits of these financial statements in accordance with the standards of the PCAOB. Those standards require that we plan and perform the audit to obtain reasonable assurance about whether the financial statements are free of material misstatement, whether due to error or fraud.
Our audits included performing procedures to assess the risks of material misstatement of the financial statements, whether due to error or fraud, and performing procedures that respond to those risks. Such procedures included examining, on a test basis, evidence regarding the amounts and disclosures in the financial statements. Our audits also included evaluating the accounting principles used and significant estimates made by management, as well as evaluating the overall presentation of the financial statements. Our procedures included confirmation of securities owned as of May 31, 2023 by correspondence with the custodian, transfer agent and brokers; when replies were not received from brokers, we performed other auditing procedures. We believe that our audits provide a reasonable basis for our opinion.
PricewaterhouseCoopers LLP
Boston, Massachusetts
July 13, 2023
We have served as the auditor of one or more investment companies in the Putnam Investments family of funds since at least 1957. We have not been able to determine the specific year we began serving as auditor.
| 14 Mortgage Opportunities Fund |
| The fund’s portfolio 5/31/23 | ||
| U.S. GOVERNMENT AND AGENCY MORTGAGE OBLIGATIONS (294.0%)* | Principal amount | Value |
| U.S. Government Guaranteed Mortgage Obligations (5.2%) | ||
| Government National Mortgage Association Pass-Through Certificates | ||
| 4.50%, TBA, 6/1/53 | $8,000,000 | $7,768,966 |
| 4.00%, TBA, 6/1/53 | 6,000,000 | 5,701,534 |
| 4.00%, 1/20/50 | 21,987 | 21,094 |
| 3.00%, TBA, 6/1/53 | 6,000,000 | 5,395,684 |
| 18,887,278 | ||
| U.S. Government Agency Mortgage Obligations (288.8%) | ||
| Uniform Mortgage-Backed Securities | ||
| 6.00%, TBA, 6/1/53 | 16,000,000 | 16,183,125 |
| 5.50%, TBA, 7/1/53 | 74,000,000 | 73,942,184 |
| 5.50%, TBA, 6/1/53 | 74,000,000 | 73,950,857 |
| 5.00%, TBA, 7/1/53 | 302,000,000 | 297,481,808 |
| 5.00%, TBA, 6/1/53 | 403,000,000 | 396,907,768 |
| 4.50%, TBA, 7/1/53 | 50,000,000 | 48,402,340 |
| 4.50%, TBA, 6/1/53 | 128,000,000 | 123,849,997 |
| 3.50%, TBA, 6/1/53 | 6,000,000 | 5,504,531 |
| 2.00%, TBA, 6/1/53 | 8,000,000 | 6,577,813 |
| 1,042,800,423 | ||
| Total U.S. government and agency mortgage obligations (cost $1,067,447,383) | $1,061,687,701 | |
| MORTGAGE-BACKED SECURITIES (88.5%)* | Principal amount | Value | |
| Agency collateralized mortgage obligations (35.2%) | |||
| Federal Home Loan Mortgage Corporation | |||
| REMICs Ser. 5043, IO, 5.00%, 11/25/50 | $1,747,812 | $398,360 | |
| REMICs Ser. 4980, Class KI, IO, 4.50%, 6/25/50 | 26,897 | 5,747 | |
| REMICs Ser. 4976, Class MI, IO, 4.50%, 5/25/50 | 2,915,073 | 627,705 | |
| REMICs Ser. 5125, Class MI, IO, 4.50%, 11/25/48 | 6,610,339 | 1,531,855 | |
| REMICs Ser. 4024, Class PI, IO, 4.50%, 12/15/41 | 108,771 | 14,184 | |
| REMICs Ser. 4949, IO, 4.00%, 1/25/50 | 13,350,872 | 2,901,258 | |
| REMICs Ser. 4635, Class PI, IO, 4.00%, 12/15/46 | 257,298 | 41,683 | |
| REMICs Ser. 4425, IO, 4.00%, 1/15/45 | 133,297 | 19,583 | |
| REMICs Ser. 4452, Class QI, IO, 4.00%, 11/15/44 | 28,789 | 5,603 | |
| REMICs Ser. 4403, Class CI, IO, 4.00%, 10/15/44 | 85,756 | 16,477 | |
| REMICs Ser. 4193, Class PI, IO, 4.00%, 3/15/43 | 174,030 | 24,986 | |
| REMICs Ser. 4425, Class WI, IO, 4.00%, 3/15/43 | 99,101 | 6,713 | |
| REMICs Ser. 4386, Class LI, IO, 4.00%, 2/15/43 | 1,128 | 57 | |
| REMICs Ser. 4694, Class GI, IO, 4.00%, 2/15/43 | 1,552 | 39 | |
| REMICs Ser. 5065, Class MI, IO, 3.50%, 1/25/51 | 3,593,532 | 630,988 | |
| REMICs Ser. 5018, IO, 3.50%, 10/25/50 | 11,636,642 | 1,983,509 | |
| REMICs Ser. 5080, Class IQ, IO, 3.50%, 4/25/50 | 8,417,531 | 1,668,476 | |
| REMICs Ser. 5172, Class KI, IO, 3.00%, 12/25/51 | 6,737,235 | 1,185,888 | |
| REMICs Ser. 5160, Class IW, IO, 3.00%, 10/25/50 | 3,911,735 | 449,592 | |
| REMICs Ser. 5119, Class IB, IO, 3.00%, 6/25/41 | 5,375,489 | 610,118 | |
| REMICs Ser. 5274, IO, 2.50%, 1/25/51 | 14,939,855 | 2,318,034 | |
| REMICs Ser. 5034, Class IJ, IO, 2.50%, 11/25/50 | 13,584,068 | 2,117,756 | |
| REMICs IFB Ser. 4839, Class WS, IO, ((-1 x ICE LIBOR USD 1 Month) + 6.10%), 0.993%, 8/15/56 | 7,060,314 | 892,212 | |
| REMICs IFB Ser. 4979, Class SN, IO, ((-1 x ICE LIBOR USD 1 Month) + 6.05%), 0.912%, 6/25/50 | 2,258,225 | 256,611 | |
| REMICs IFB Ser. 4937, Class 4937, IO, ((-1 x ICE LIBOR USD 1 Month) + 6.05%), 0.912%, 12/25/49 | 5,093,989 | 568,285 | |
| REMICs IFB Ser. 4915, Class SD, IO, ((-1 x ICE LIBOR USD 1 Month) + 6.05%), 0.912%, 9/25/49 | 1,932,906 | 211,667 | |
| REMICs IFB Ser. 4631, Class SA, IO, ((-1 x ICE LIBOR USD 1 Month) + 6.00%), 0.893%, 11/15/46 | 28,962,623 | 3,446,659 | |
| REMICs IFB Ser. 4933, Class SA, IO, ((-1 x ICE LIBOR USD 1 Month) + 6.00%), 0.862%, 12/25/49 | 1,809,109 | 237,231 | |
| Federal National Mortgage Association | |||
| REMICs Ser. 17-8, IO, 6.00%, 2/25/47 | 412,677 | 93,541 | |
| REMICs Ser. 16-3, Class NI, IO, 6.00%, 2/25/46 | 46,663 | 7,974 | |
| REMICs Ser. 15-69, IO, 6.00%, 9/25/45 | 212,236 | 46,249 | |
| REMICs Ser. 12-132, Class PI, IO, 5.00%, 10/25/42 | 575,364 | 98,725 | |
| Interest Strip Ser. 404, Class 2, IO, 4.50%, 5/25/40 | 138,670 | 25,578 | |
Mortgage Opportunities Fund 15 | |
| MORTGAGE-BACKED SECURITIES (88.5%)* cont. | Principal amount | Value | |
| Agency collateralized mortgage obligations cont. | |||
| Federal National Mortgage Association | |||
| REMICs Ser. 21-56, Class QI, IO, 4.50%, 9/25/51 | $3,521,589 | $832,252 | |
| REMICs Ser. 21-15, Class JI, IO, 4.50%, 4/25/51 | 2,488,534 | 565,644 | |
| REMICs Ser. 21-17, Class KI, IO, 4.50%, 4/25/51 | 2,691,244 | 553,912 | |
| REMICs Ser. 20-98, Class OI, IO, 4.50%, 1/25/51 | 10,636,604 | 2,442,497 | |
| REMICs Ser. 20-50, IO, 4.50%, 3/25/50 | 6,648,611 | 1,542,741 | |
| REMICs Ser. 21-17, Class GI, IO, 4.00%, 2/25/51 | 2,223,029 | 413,122 | |
| REMICs Ser. 18-15, Class PI, IO, 4.00%, 10/25/47 | 311,386 | 46,352 | |
| REMICs Ser. 12-90, Class DI, IO, 4.00%, 3/25/42 | 288,447 | 33,411 | |
| REMICs Ser. 21-25, Class IJ, IO, 3.50%, 5/25/51 | 5,745,905 | 995,421 | |
| REMICs Ser. 21-8, Class ID, 3.50%, 3/25/51 | 7,613,913 | 1,537,568 | |
| REMICs Ser. 21-5, Class PI, IO, 3.50%, 2/25/51 | 3,123,208 | 554,871 | |
| REMICs Ser. 21-25, Class HI, 3.50%, 7/25/50 | 2,379,673 | 366,239 | |
| REMICs Ser. 20-99, Class IB, IO, 3.50%, 5/25/50 | 9,455,151 | 1,741,639 | |
| REMICs Ser. 16-70, Class QI, IO, 3.50%, 10/25/46 | 35,519 | 4,864 | |
| REMICs Ser. 21-94, Class AI, IO, 3.00%, 1/25/52 | 2,404,336 | 393,932 | |
| REMICs Ser. 22-13, Class CI, IO, 3.00%, 12/25/51 | 15,473,759 | 2,190,009 | |
| REMICs Ser. 21-67, Class IG, IO, 3.00%, 10/25/51 | 3,721,531 | 571,104 | |
| REMICs Ser. 13-6, Class JI, IO, 3.00%, 2/25/43 | 24,330 | 3,124 | |
| REMICs Ser. 22-13, IO, 2.50%, 12/25/51 | 7,933,396 | 1,034,169 | |
| REMICs Ser. 21-3, Class IB, IO, 2.50%, 2/25/51 | 11,308,857 | 1,861,777 | |
| REMICs Ser. 21-3, Class NI, IO, 2.50%, 2/25/51 | 24,667,512 | 3,415,052 | |
| REMICs Ser. 21-42, Class EI, IO, 2.00%, 3/25/51 | 17,172,169 | 2,280,464 | |
| REMICs IFB Ser. 16-83, Class BS, IO, ((-1 x ICE LIBOR USD 1 Month) + 6.10%), 0.962%, 11/25/46 | 893,845 | 75,315 | |
| REMICs IFB Ser. 16-85, Class SL, IO, ((-1 x ICE LIBOR USD 1 Month) + 6.10%), 0.962%, 11/25/46 | 2,210,110 | 176,174 | |
| REMICs IFB Ser. 16-78, Class CS, IO, ((-1 x ICE LIBOR USD 1 Month) + 6.10%), 0.962%, 5/25/39 | 1,828,067 | 136,041 | |
| REMICs IFB Ser. 19-58, Class SA, IO, ((-1 x ICE LIBOR USD 1 Month) + 6.05%), 0.912%, 10/25/49 | 10,679,051 | 1,210,762 | |
| REMICs IFB Ser. 16-54, Class SD, IO, ((-1 x ICE LIBOR USD 1 Month) + 6.00%), 0.862%, 8/25/46 | 3,573,890 | 363,250 | |
| REMICs IFB Ser. 11-126, Class SJ, IO, ((-1 x ICE LIBOR USD 1 Month) + 6.00%), 0.862%, 12/25/41 | 3,344,451 | 339,088 | |
| REMICs IFB Ser. 22-43, Class SB, IO, ((-1 x US 30 Day Average SOFR) + 5.40%), 0.427%, 7/25/52 | 17,358,779 | 1,287,211 | |
| REMICs IFB Ser. 22-49, Class SD, IO, ((-1 x US 30 Day Average SOFR) + 5.30%), 0.327%, 8/25/52 | 31,980,362 | 1,593,671 | |
| Government National Mortgage Association | |||
| Ser. 16-164, IO, 6.50%, 12/20/46 | 529,066 | 84,192 | |
| Ser. 16-75, Class LI, IO, 6.00%, 1/20/40 | 30,555 | 5,265 | |
| Ser. 21-176, Class IK, IO, 5.50%, 10/20/51 | 2,258,844 | 416,825 | |
| Ser. 17-179, Class WI, IO, 5.00%, 12/20/47 | 304,868 | 64,923 | |
| Ser. 15-89, Class LI, IO, 5.00%, 12/20/44 | 406,417 | 75,744 | |
| Ser. 14-132, IO, 5.00%, 9/20/44 | 679,695 | 143,035 | |
| Ser. 10-35, Class UI, IO, 5.00%, 3/20/40 | 4,799,137 | 982,101 | |
| Ser. 10-9, Class UI, IO, 5.00%, 1/20/40 | 83,603 | 17,034 | |
| Ser. 09-121, Class UI, IO, 5.00%, 12/20/39 | 8,062 | 1,593 | |
| Ser. 15-105, Class LI, IO, 5.00%, 10/20/39 | 446,922 | 83,293 | |
| Ser. 15-79, Class GI, IO, 5.00%, 10/20/39 | 47,378 | 9,230 | |
| Ser. 21-209, Class TG, IO, 4.50%, 11/20/51 | 7,801,352 | 1,397,986 | |
| Ser. 16-17, Class IA, IO, 4.50%, 3/20/45 | 150,127 | 26,904 | |
| Ser. 13-34, Class HI, IO, 4.50%, 3/20/43 | 94,596 | 17,082 | |
| Ser. 12-98, Class AI, IO, 4.50%, 4/16/42 | 324,533 | 43,876 | |
| Ser. 10-35, Class DI, IO, 4.50%, 3/20/40 | 21,464 | 3,793 | |
| Ser. 10-35, Class QI, IO, 4.50%, 3/20/40 | 15,381 | 2,670 | |
| Ser. 14-95, Class JI, IO, 4.50%, 12/16/39 | 628,938 | 116,228 | |
| Ser. 21-162, Class IO, IO, 4.00%, 9/20/51 | 3,926,207 | 700,043 | |
| Ser. 17-104, Class GI, IO, 4.00%, 7/20/47 | 1,874,848 | 331,795 | |
| Ser. 15-149, Class KI, IO, 4.00%, 10/20/45 | 29,081 | 4,596 | |
| Ser. 18-72, Class IC, IO, 4.00%, 5/20/45 | 1,597,894 | 250,614 | |
| Ser. 15-53, Class MI, IO, 4.00%, 4/16/45 | 73,385 | 13,591 | |
| Ser. 15-89, Class IP, IO, 4.00%, 2/20/45 | 23,336 | 3,085 | |
| Ser. 14-188, Class IB, IO, 4.00%, 12/20/44 | 2,133,956 | 266,574 | |
| Ser. 17-63, Class PI, IO, 4.00%, 12/20/43 | 46,085 | 1,636 | |
| Ser. 20-32, Class IA, IO, 3.958%, 3/16/47 W | 2,696,308 | 427,888 | |
16 Mortgage Opportunities Fund | |
| MORTGAGE-BACKED SECURITIES (88.5%)* cont. | Principal amount | Value | |
| Agency collateralized mortgage obligations cont. | |||
| Government National Mortgage Association | |||
| Ser. 21-214, Class DI, IO, 3.50%, 12/20/51 | $10,408,032 | $1,506,512 | |
| Ser. 21-177, Class IG, IO, 3.50%, 10/20/51 | 23,083,820 | 3,115,457 | |
| Ser. 22-34, Class IV, IO, 3.50%, 3/20/51 | 13,950,016 | 2,335,372 | |
| Ser. 20-167, Class PI, IO, 3.50%, 11/20/50 | 2,526,341 | 456,621 | |
| Ser. 20-74, Class BI, IO, 3.50%, 5/20/50 | 8,283,791 | 1,369,133 | |
| Ser. 20-32, Class IM, IO, 3.50%, 3/16/50 | 11,676,035 | 2,312,051 | |
| Ser. 19-158, Class PI, IO, 3.50%, 12/20/49 | 1,630,747 | 264,801 | |
| Ser. 16-75, Class EI, IO, 3.50%, 8/20/45 | 302,604 | 48,126 | |
| Ser. 15-168, Class IG, IO, 3.50%, 3/20/43 | 17,695 | 2,265 | |
| Ser. 13-14, IO, 3.50%, 12/20/42 | 22,223 | 2,208 | |
| Ser. 15-165, Class IC, IO, 3.50%, 7/16/41 | 693,607 | 31,885 | |
| Ser. 22-12, Class JI, IO, 3.00%, 1/20/52 | 18,055,948 | 2,013,870 | |
| Ser. 21-176, Class GI, IO, 3.00%, 10/20/51 | 11,224,594 | 1,515,769 | |
| Ser. 21-188, Class IU, IO, 3.00%, 10/20/51 | 11,607,809 | 2,340,119 | |
| Ser. 21-191, Class HI, IO, 3.00%, 10/20/51 | 3,266,505 | 528,596 | |
| Ser. 21-155, IO, 3.00%, 9/20/51 | 3,119,742 | 476,144 | |
| Ser. 21-146, Class QI, IO, 3.00%, 8/20/51 | 17,483,537 | 2,032,073 | |
| Ser. 21-97, Class QI, IO, 3.00%, 6/20/51 | 8,323,525 | 1,191,133 | |
| Ser. 21-97, Class IY, IO, 3.00%, 5/20/51 | 13,787,024 | 2,023,935 | |
| Ser. 21-59, Class IM, IO, 3.00%, 4/20/51 | 3,794,658 | 569,452 | |
| Ser. 21-42, Class IG, IO, 3.00%, 3/20/51 | 2,450,507 | 355,036 | |
| Ser. 20-186, Class DI, IO, 3.00%, 12/20/50 | 5,735,744 | 809,281 | |
| Ser. 20-188, Class QI, IO, 3.00%, 10/20/50 | 3,571,395 | 542,707 | |
| Ser. 21-77, Class BI, IO, 3.00%, 7/20/50 | 20,525,245 | 2,894,452 | |
| Ser. 21-7, Class MI, IO, 2.50%, 1/20/51 | 18,066,502 | 2,536,206 | |
| Ser. 20-173, Class MI, IO, 2.50%, 11/20/50 | 13,466,758 | 1,788,520 | |
| Ser. 20-151, Class MI, IO, 2.50%, 10/20/50 | 4,799,065 | 637,364 | |
| Ser. 20-162, Class UI, IO, 2.50%, 10/20/50 | 15,252,038 | 2,003,869 | |
| Ser. 16-H24, IO, 2.151%, 9/20/66 W | 228,525 | 17,670 | |
| IFB Ser. 23-20, Class SB, IO, ((-1 x US 30 Day Average SOFR) + 7.00%), 2.069%, 2/20/53 | 28,042,991 | 2,202,219 | |
| IFB Ser. 23-20, Class SP, IO, ((-1 x US 30 Day Average SOFR) + 7.00%), 2.069%, 2/20/53 | 34,748,995 | 2,258,970 | |
| Ser. 17-H19, Class MI, IO, 2.068%, 4/20/67 W | 619,787 | 35,080 | |
| Ser. 17-H11, Class DI, IO, 2.01%, 5/20/67 W | 193,009 | 9,967 | |
| Ser. 15-H23, Class DI, IO, 1.86%, 9/20/65 W | 103,711 | 5,206 | |
| Ser. 15-H25, Class EI, IO, 1.828%, 10/20/65 W | 84,350 | 3,711 | |
| Ser. 15-H20, Class AI, IO, 1.769%, 8/20/65 W | 93,115 | 3,706 | |
| Ser. 15-H10, Class CI, IO, 1.75%, 4/20/65 W | 102,095 | 4,380 | |
| Ser. 17-H06, Class DI, IO, 1.703%, 2/20/67 W | 474,834 | 17,331 | |
| Ser. 15-H26, Class EI, IO, 1.697%, 10/20/65 W | 117,889 | 5,152 | |
| Ser. 15-H23, Class BI, IO, 1.689%, 9/20/65 W | 60,715 | 2,155 | |
| Ser. 16-H24, Class CI, IO, 1.625%, 10/20/66 W | 3,019,650 | 114,445 | |
| Ser. 14-H25, Class BI, IO, 1.609%, 12/20/64 W | 1,084,168 | 32,159 | |
| IFB Ser. 13-9, Class S, IO, ((-1 x ICE LIBOR USD 1 Month) + 6.75%), 1.602%, 1/20/43 | 1,419,007 | 184,552 | |
| Ser. 17-H03, Class HI, IO, 1.593%, 1/20/67 W | 245,878 | 7,776 | |
| IFB Ser. 13-182, Class SP, IO, ((-1 x ICE LIBOR USD 1 Month) + 6.70%), 1.552%, 12/20/43 | 658,481 | 71,327 | |
| Ser. 15-H25, Class AI, IO, 1.543%, 9/20/65 W | 149,997 | 4,965 | |
| Ser. 15-H01, Class BI, IO, 1.496%, 1/20/65 W | 3,108,622 | 92,407 | |
| IFB Ser. 11-156, Class SK, IO, ((-1 x ICE LIBOR USD 1 Month) + 6.60%), 1.452%, 4/20/38 | 30,660 | 3,635 | |
| IFB Ser. 23-5, Class SE, IO, ((-1 x US 30 Day Average SOFR) + 6.25%), 1.319%, 1/20/53 | 37,504,749 | 1,579,595 | |
| Ser. 12-H29, Class AI, IO, 1.256%, 10/20/62 W | 307,547 | 5,642 | |
| Ser. 12-H29, Class FI, IO, 1.256%, 10/20/62 W | 307,547 | 5,642 | |
| IFB Ser. 21-96, Class SQ, IO, ((-1 x ICE LIBOR USD 1 Month) + 6.35%), 1.202%, 6/20/51 | 2,168,475 | 316,217 | |
| FRB Ser. 11-H07, Class FI, IO, 1.189%, 2/20/61 W | 60,115 | 1,575 | |
| IFB Ser. 21-155, Class SE, IO, ((-1 x ICE LIBOR USD 1 Month) + 6.30%), 1.152%, 9/20/51 | 8,546,742 | 817,581 | |
| IFB Ser. 21-49, Class SB, IO, ((-1 x ICE LIBOR USD 1 Month) + 6.30%), 1.152%, 3/20/51 | 2,935,231 | 376,807 | |
| IFB Ser. 21-57, Class SD, IO, ((-1 x ICE LIBOR USD 1 Month) + 6.30%), 1.152%, 3/20/51 | 10,507,717 | 1,337,594 | |
| IFB Ser. 20-167, Class SC, IO, ((-1 x ICE LIBOR USD 1 Month) + 6.30%), 1.152%, 11/20/50 | 15,972,867 | 2,169,358 | |
| IFB Ser. 20-112, Class MS, IO, ((-1 x ICE LIBOR USD 1 Month) + 6.30%), 1.152%, 8/20/50 | 1,438,322 | 186,437 | |
Mortgage Opportunities Fund 17 | |
| MORTGAGE-BACKED SECURITIES (88.5%)* cont. | Principal amount | Value | |
| Agency collateralized mortgage obligations cont. | |||
| Government National Mortgage Association | |||
| Ser. 17-H16, Class JI, IO, 1.134%, 8/20/67 W | $355,182 | $18,647 | |
| IFB Ser. 10-26, Class QS, IO, ((-1 x ICE LIBOR USD 1 Month) + 6.25%), 1.102%, 2/20/40 | 20,137,930 | 2,038,965 | |
| IFB Ser. 14-131, Class BS, IO, ((-1 x ICE LIBOR USD 1 Month) + 6.20%), 1.095%, 9/16/44 | 2,431,079 | 350,238 | |
| IFB Ser. 19-158, Class AS, IO, ((-1 x ICE LIBOR USD 1 Month) + 6.15%), 1.045%, 9/16/43 | 4,070,197 | 428,760 | |
| IFB Ser. 19-96, Class SY, IO, ((-1 x ICE LIBOR USD 1 Month) + 6.10%), 0.952%, 8/20/49 | 2,703,038 | 261,654 | |
| IFB Ser. 19-83, Class JS, IO, ((-1 x ICE LIBOR USD 1 Month) + 6.10%), 0.952%, 7/20/49 | 3,454,780 | 311,725 | |
| IFB Ser. 20-77, Class KS, IO, ((-1 x ICE LIBOR USD 1 Month) + 6.10%), 0.952%, 5/20/49 | 16,919,138 | 1,766,679 | |
| IFB Ser. 14-3, Class SM, IO, ((-1 x ICE LIBOR USD 1 Month) + 6.10%), 0.952%, 1/20/44 | 2,031,132 | 213,296 | |
| IFB Ser. 20-7, Class SK, IO, ((-1 x ICE LIBOR USD 1 Month) + 6.05%), 0.902%, 1/20/50 | 4,739,667 | 499,387 | |
| IFB Ser. 19-103, Class SC, IO, ((-1 x ICE LIBOR USD 1 Month) + 6.05%), 0.902%, 8/20/49 | 14,890,676 | 1,562,151 | |
| IFB Ser. 19-98, Class SC, IO, ((-1 x ICE LIBOR USD 1 Month) + 6.05%), 0.902%, 8/20/49 | 1,692,533 | 182,095 | |
| IFB Ser. 19-23, Class SC, IO, ((-1 x ICE LIBOR USD 1 Month) + 6.05%), 0.902%, 2/20/49 | 153,829 | 15,935 | |
| IFB Ser. 19-121, Class SD, IO, ((-1 x ICE LIBOR USD 1 Month) + 6.00%), 0.852%, 10/20/49 | 3,303,873 | 490,166 | |
| IFB Ser. 19-4, Class S, IO, ((-1 x ICE LIBOR USD 1 Month) + 6.00%), 0.852%, 1/20/49 | 14,839,809 | 978,997 | |
| IFB Ser. 20-47, Class SA, IO, ((-1 x ICE LIBOR USD 1 Month) + 6.00%), 0.852%, 5/20/44 | 3,792,443 | 342,496 | |
| IFB Ser. 23-20, Class PS, IO, ((-1 x US 30 Day Average SOFR) + 5.75%), 0.819%, 2/20/53 | 84,543,493 | 3,286,383 | |
| Ser. 19-H15, Class IH, IO, 0.75%, 9/20/69 W | 13,381,661 | 529,675 | |
| IFB Ser. 22-63, Class SB, IO, ((-1 x US 30 Day Average SOFR) + 5.60%), 0.669%, 11/20/46 | 4,579,721 | 353,427 | |
| Ser. 17-H20, Class AI, IO, 0.242%, 10/20/67 W | 1,975,138 | 104,929 | |
| Ser. 17-H20, Class HI, IO, 0.215%, 10/20/67 W | 663,747 | 40,376 | |
| Ser. 16-H24, Class HI, IO, 0.138%, 9/20/66 W | 12,525,042 | 734,223 | |
| Ser. 15-H16, Class DI, IO, 0.136%, 7/20/65 W | 2,866,101 | 172,032 | |
| Ser. 17-H22, Class DI, IO, 0.122%, 11/20/67 W | 2,014,995 | 136,348 | |
| Ser. 17-H03, Class EI, IO, 0.117%, 1/20/67 W | 377,452 | 21,754 | |
| Ser. 16-H09, Class BI, IO, 0.105%, 4/20/66 W | 4,545,851 | 215,019 | |
| FRB Ser. 15-H16, Class XI, IO, 0.104%, 7/20/65 W | 6,237,238 | 314,981 | |
| Ser. 15-H20, Class CI, IO, 0.087%, 8/20/65 W | 1,280,442 | 68,504 | |
| Ser. 16-H18, Class QI, IO, 0.078%, 6/20/66 W | 1,149,360 | 58,507 | |
| Ser. 15-H26, Class DI, IO, 0.077%, 10/20/65 W | 79,958 | 2,938 | |
| FRB Ser. 16-H19, Class AI, IO, 0.076%, 9/20/66 W | 4,558,678 | 186,550 | |
| Ser. 15-H10, Class HI, IO, 0.075%, 4/20/65 W | 104,585 | 4,173 | |
| Ser. 16-H15, Class AI, IO, 0.073%, 7/20/66 W | 12,083,368 | 446,082 | |
| Ser. 15-H13, Class AI, IO, 0.066%, 6/20/65 W | 169,889 | 7,008 | |
| Ser. 17-H06, Class MI, IO, 0.064%, 2/20/67 W | 958,751 | 36,804 | |
| Ser. 18-H02, Class IM, IO, 0.059%, 2/20/68 W | 1,611,786 | 97,912 | |
| Ser. 18-H02, Class HI, IO, 0.051%, 1/20/68 W | 2,705,714 | 131,481 | |
| Ser. 14-H21, Class AI, IO, 0.047%, 10/20/64 W | 839,920 | 26,488 | |
| Ser. 15-H25, Class CI, IO, 0.042%, 10/20/65 W | 69,634 | 2,709 | |
| Ser. 17-H04, Class BI, IO, 0.037%, 2/20/67 W | 2,843,472 | 127,541 | |
| Ser. 18-H05, Class BI, IO, 0.036%, 2/20/68 W | 1,121,937 | 52,415 | |
| Ser. 17-H02, Class BI, IO, 0.03%, 1/20/67 W | 1,781,761 | 62,593 | |
| Ser. 18-H01, Class AI, IO, 0.027%, 1/20/68 W | 9,118,663 | 475,082 | |
| Ser. 16-H23, Class NI, IO, 0.026%, 10/20/66 W | 142,266 | 5,904 | |
| Ser. 16-H27, Class EI, IO, 0.023%, 12/20/66 W | 1,982,621 | 60,472 | |
| Ser. 15-H04, Class AI, IO, 0.023%, 12/20/64 W | 2,103,347 | 64,517 | |
| Ser. 17-H10, Class MI, IO, 0.021%, 4/20/67 W | 3,272,080 | 100,453 | |
| Ser. 16-H11, Class KI, IO, 0.021%, 5/20/66 W | 6,925,391 | 224,176 | |
| Ser. 17-H08, Class NI, IO, 0.019%, 3/20/67 W | 293,729 | 10,692 | |
| Ser. 17-H06, Class BI, IO, 0.015%, 2/20/67 W | 686,643 | 22,797 | |
| Ser. 17-H09, IO, 0.014%, 4/20/67 W | 302,112 | 8,108 | |
| Ser. 22-H09, Class GI, IO, zero %, 4/20/72 W | 26,179,386 | 1,381,410 | |
| Ser. 22-H09, Class IG, IO, zero %, 4/20/72 W | 20,559,567 | 939,955 | |
| Ser. 22-H01, Class EI, IO, zero %, 1/20/72 W | 6,348,855 | 326,649 | |
| Ser. 22-H01, Class BI, IO, zero %, 12/20/71 W | 11,008,789 | 488,537 | |
| Ser. 20-H04, Class AI, IO, zero %, 2/20/70 W | 9,187,057 | 400,445 | |
| Ser. 19-H14, Class IB, IO, zero %, 8/20/69 W | 231,156 | 10,722 | |
| Ser. 19-H12, Class GI, IO, zero %, 7/20/69 W | 10,047,438 | 423,037 | |
| Ser. 19-H07, Class EI, IO, zero %, 3/20/69 W | 20,189,443 | 786,520 | |
18 Mortgage Opportunities Fund | |
| MORTGAGE-BACKED SECURITIES (88.5%)* cont. | Principal amount | Value | |
| Agency collateralized mortgage obligations cont. | |||
| Government National Mortgage Association | |||
| Ser. 19-H02, Class DI, IO, zero %, 11/20/68 W | $4,642,175 | $222,577 | |
| Ser. 18-H20, Class BI, IO, zero %, 6/20/68 W | 6,041,110 | 253,656 | |
| 126,960,585 | |||
| Commercial mortgage-backed securities (32.4%) | |||
| BANK 144A Ser. 18-BN11, Class D, 3.00%, 3/15/61 | 609,000 | 349,293 | |
| Barclays Commercial Mortgage Trust 144A | |||
| Ser. 19-C4, Class D, 3.25%, 8/15/52 | 771,000 | 483,866 | |
| Ser. 19-C4, Class E, 3.25%, 8/15/52 | 638,000 | 375,722 | |
| Ser. 19-C3, Class D, 3.00%, 5/15/52 | 1,145,000 | 727,762 | |
| Ser. 19-C5, Class E, 2.50%, 11/15/52 | 1,628,000 | 931,221 | |
| Benchmark Mortgage Trust FRB Ser. 18-B1, Class C, 4.189%, 1/15/51 W | 560,000 | 434,848 | |
| Benchmark Mortgage Trust 144A | |||
| FRB Ser. 18-B3, Class D, 3.026%, 4/10/51 W | 2,459,000 | 1,534,678 | |
| Ser. 19-B11, Class D, 3.00%, 5/15/52 | 963,000 | 613,189 | |
| Ser. 18-B1, Class D, 2.75%, 1/15/51 | 2,021,000 | 1,255,644 | |
| Ser. 19-B13, Class D, 2.50%, 8/15/57 | 1,998,000 | 1,176,562 | |
| BWAY Mortgage Trust 144A FRB Ser. 22-26BW, Class F, 4.866%, 2/10/44 W | 580,000 | 359,181 | |
| Cantor Commercial Real Estate Lending 144A Ser. 19-CF2, Class D, 2.50%, 11/15/52 | 313,000 | 181,227 | |
| CD Commercial Mortgage Trust | |||
| FRB Ser. 17-CD3, Class C, 4.546%, 2/10/50 W | 615,000 | 382,716 | |
| Ser. 17-CD3, Class B, 3.984%, 2/10/50 W | 888,000 | 688,862 | |
| CD Commercial Mortgage Trust 144A | |||
| Ser. 17-CD3, Class D, 3.25%, 2/10/50 | 686,000 | 311,778 | |
| Ser. 19-CD8, Class D, 3.00%, 8/15/57 | 507,000 | 317,027 | |
| CFCRE Commercial Mortgage Trust 144A FRB Ser. 11-C2, Class F, 5.25%, 12/15/47 W | 100,000 | 45,069 | |
| Citigroup Commercial Mortgage Trust | |||
| FRB Ser. 13-GC15, Class C, 5.154%, 9/10/46 W | 598,000 | 586,242 | |
| FRB Ser. 15-GC27, Class C, 4.419%, 2/10/48 W | 817,000 | 702,132 | |
| FRB Ser. 17-P7, Class C, 4.405%, 4/14/50 W | 373,000 | 282,213 | |
| Ser. 14-GC21, Class B, 4.328%, 5/10/47 W | 1,749,000 | 1,614,367 | |
| Ser. 16-P3, Class B, 4.271%, 4/15/49 W | 1,630,000 | 1,452,808 | |
| FRB Ser. 15-GC31, Class D, 4.036%, 6/10/48 W | 1,541,000 | 1,226,525 | |
| Citigroup Commercial Mortgage Trust 144A | |||
| FRB Ser. 13-GC17, Class D, 5.11%, 11/10/46 W | 1,780,298 | 1,567,245 | |
| FRB Ser. 14-GC19, Class D, 5.087%, 3/11/47 W | 2,130,000 | 1,962,929 | |
| FRB Ser. 15-GC27, Class D, 4.419%, 2/10/48 W | 631,000 | 499,579 | |
| Ser. 14-GC25, Class D, 3.548%, 10/10/47 | 239,000 | 183,089 | |
| Ser. 15-P1, Class D, 3.225%, 9/15/48 | 1,961,000 | 1,524,529 | |
| Ser. 15-GC27, Class E, 3.00%, 2/10/48 | 1,555,000 | 1,139,946 | |
| COMM Mortgage Trust | |||
| FRB Ser. 14-CR16, Class C, 4.916%, 4/10/47 W | 1,226,000 | 1,113,714 | |
| FRB Ser. 13-CR13, Class C, 4.874%, 11/10/46 W | 656,000 | 625,584 | |
| FRB Ser. 14-UBS3, Class C, 4.734%, 6/10/47 W | 301,000 | 278,693 | |
| FRB Ser. 14-UBS4, Class C, 4.649%, 8/10/47 W | 324,000 | 261,149 | |
| FRB Ser. 14-CR14, Class C, 4.586%, 2/10/47 W | 650,000 | 561,070 | |
| FRB Ser. 14-UBS6, Class C, 4.435%, 12/10/47 W | 334,000 | 288,426 | |
| Ser. 13-CR12, Class AM, 4.30%, 10/10/46 | 1,542,000 | 1,342,459 | |
| Ser. 15-DC1, Class B, 4.035%, 2/10/48 W | 1,263,000 | 1,129,619 | |
| FRB Ser. 15-CR26, Class D, 3.466%, 10/10/48 W | 875,000 | 560,000 | |
| COMM Mortgage Trust 144A | |||
| FRB Ser. 13-CR13, Class D, 4.874%, 11/10/46 W | 1,860,000 | 1,556,192 | |
| FRB Ser. 14-CR17, Class D, 4.844%, 5/10/47 W | 1,247,000 | 1,110,946 | |
| FRB Ser. 14-CR17, Class E, 4.844%, 5/10/47 W | 1,366,000 | 912,884 | |
| FRB Ser. 14-CR19, Class D, 4.697%, 8/10/47 W | 452,000 | 386,375 | |
| FRB Ser. 14-CR14, Class D, 4.586%, 2/10/47 W | 1,073,000 | 848,109 | |
| FRB Ser. 13-CR7, Class D, 4.26%, 3/10/46 W | 1,192,209 | 1,072,988 | |
| FRB Ser. 15-LC19, Class E, 4.214%, 2/10/48 W | 1,070,000 | 821,226 | |
| Ser. 12-CR4, Class B, 3.703%, 10/15/45 | 2,345,000 | 1,418,798 | |
Mortgage Opportunities Fund 19 | |
| MORTGAGE-BACKED SECURITIES (88.5%)* cont. | Principal amount | Value | |
| Commercial mortgage-backed securities cont. | |||
| COMM Mortgage Trust 144A | |||
| Ser. 13-LC6, Class E, 3.50%, 1/10/46 | $460,000 | $363,400 | |
| FRB Ser. 16-COR1, Class D, 3.328%, 10/10/49 W | 1,501,500 | 1,088,287 | |
| Ser. 17-COR2, Class D, 3.00%, 9/10/50 | 1,656,000 | 1,126,080 | |
| Ser. 15-LC19, Class D, 2.867%, 2/10/48 | 2,593,000 | 2,213,061 | |
| Credit Suisse Commercial Mortgage Trust 144A FRB Ser. 08-C1, Class AJ, 5.816%, 2/15/41 W | 63,742 | 17,848 | |
| Credit Suisse Mortgage Trust 144A FRB Ser. 22-NWPT, Class A, 8.202%, 9/9/24 | 1,041,000 | 1,038,770 | |
| CSAIL Commercial Mortgage Trust | |||
| FRB Ser. 15-C3, Class C, 4.355%, 8/15/48 W | 1,168,000 | 917,873 | |
| FRB Ser. 15-C2, Class C, 4.176%, 6/15/57 W | 1,299,000 | 1,061,131 | |
| FRB Ser. 15-C2, Class D, 4.176%, 6/15/57 W | 1,355,000 | 816,897 | |
| CSAIL Commercial Mortgage Trust 144A | |||
| FRB Ser. 18-C14, Class D, 4.901%, 11/15/51 W | 1,765,000 | 1,149,960 | |
| Ser. 19-C17, Class D, 2.50%, 9/15/52 | 594,000 | 321,518 | |
| Federal Home Loan Mortgage Corporation 144A | |||
| Multifamily Structured Credit Risk FRB Ser. 21-MN3, Class M2, 8.973%, 11/25/51 | 2,059,000 | 1,832,456 | |
| Multifamily Structured Agency Credit Risk FRB Ser. 21-MN1, Class M2, 8.723%, 1/25/51 | 1,364,000 | 1,226,147 | |
| GS Mortgage Securities Corp., II 144A FRB Ser. 13-GC10, Class D, 4.537%, 2/10/46 W | 471,000 | 389,669 | |
| GS Mortgage Securities Trust FRB Ser. 14-GC18, Class C, 5.055%, 1/10/47 W | 1,880,000 | 1,185,381 | |
| GS Mortgage Securities Trust 144A | |||
| FRB Ser. 10-C1, Class D, 6.357%, 8/10/43 W | 397,000 | 314,060 | |
| FRB Ser. 14-GC24, Class D, 4.525%, 9/10/47 W | 2,089,000 | 954,701 | |
| FRB Ser. 13-GC13, Class D, 4.007%, 7/10/46 W | 739,000 | 321,828 | |
| Ser. 17-GS5, Class D, 3.509%, 3/10/50 W | 3,043,000 | 1,867,577 | |
| Ser. 19-GC38, Class D, 3.00%, 2/10/52 | 439,000 | 281,076 | |
| JPMBB Commercial Mortgage Securities Trust | |||
| FRB Ser. 14-C22, Class B, 4.547%, 9/15/47 W | 399,000 | 369,098 | |
| FRB Ser. 14-C22, Class C, 4.547%, 9/15/47 W | 354,000 | 292,740 | |
| FRB Ser. 13-C12, Class B, 4.048%, 7/15/45 W | 438,000 | 423,762 | |
| JPMBB Commercial Mortgage Securities Trust 144A | |||
| FRB Ser. 13-C17, Class D, 4.883%, 1/15/47 W | 1,500,000 | 1,321,082 | |
| FRB Ser. 14-C18, Class D, 4.735%, 2/15/47 W | 1,135,000 | 709,077 | |
| FRB Ser. 14-C19, Class C19, 4.627%, 4/15/47 W | 2,283,000 | 2,118,450 | |
| FRB Ser. 13-C12, Class E, 4.048%, 7/15/45 W | 625,000 | 485,028 | |
| FRB Ser. 14-C25, Class D, 3.935%, 11/15/47 W | 1,500,000 | 1,001,172 | |
| Ser. 13-C14, Class F, 3.598%, 8/15/46 W | 402,000 | 42,535 | |
| Ser. 14-C25, Class E, 3.332%, 11/15/47 W | 100,000 | 58,600 | |
| JPMCC Commercial Mortgage Securities Trust 144A FRB Ser. 17-JP7, Class D, 4.382%, 9/15/50 W | 388,000 | 262,823 | |
| JPMDB Commercial Mortgage Securities Trust Ser. 17-C5, Class C, 4.512%, 3/15/50 W | 566,000 | 401,806 | |
| JPMDB Commercial Mortgage Securities Trust 144A FRB Ser. 16-C2, Class D, 3.329%, 6/15/49 W | 1,101,000 | 649,939 | |
| JPMorgan Chase Commercial Mortgage Securities Trust | |||
| Ser. 06-LDP9, Class AMS, 5.337%, 5/15/47 | 585,194 | 552,466 | |
| FRB Ser. 13-LC11, Class D, 4.139%, 4/15/46 W | 740,000 | 485,888 | |
| FRB Ser. 13-C10, Class C, 4.093%, 12/15/47 W | 1,101,000 | 1,029,138 | |
| JPMorgan Chase Commercial Mortgage Securities Trust 144A | |||
| FRB Ser. 11-C3, Class D, 5.526%, 2/15/46 W | 450,000 | 314,013 | |
| FRB Ser. 11-C3, Class E, 5.526%, 2/15/46 W | 242,000 | 98,746 | |
| FRB Ser. 13-LC11, Class E, 3.25%, 4/15/46 W | 643,000 | 325,229 | |
| Ser. 12-C6, Class G, 2.972%, 5/15/45 W | 100,000 | 53,710 | |
| Morgan Stanley Bank of America Merrill Lynch Trust | |||
| FRB Ser. 14-C14, Class B, 4.868%, 2/15/47 W | 2,109,000 | 2,060,098 | |
| Ser. 12-C6, Class C, 4.536%, 11/15/45 W | 1,385,434 | 1,279,833 | |
| FRB Ser. 15-C25, Class C, 4.523%, 10/15/48 W | 854,000 | 738,331 | |
| FRB Ser. 17-C34, Class C, 4.168%, 11/15/52 W | 691,000 | 565,666 | |
| FRB Ser. 15-C23, Class B, 4.139%, 7/15/50 W | 500,000 | 448,800 | |
| Ser. 14-C19, Class C, 4.00%, 12/15/47 | 787,000 | 709,387 | |
| FRB Ser. 13-C9, Class C, 3.815%, 5/15/46 W | 269,000 | 219,026 | |
| Ser. 13-C9, Class B, 3.708%, 5/15/46 W | 1,700,000 | 1,524,822 | |
20 Mortgage Opportunities Fund | |
| MORTGAGE-BACKED SECURITIES (88.5%)* cont. | Principal amount | Value | |
| Commercial mortgage-backed securities cont. | |||
| Morgan Stanley Bank of America Merrill Lynch Trust 144A | |||
| FRB Ser. 13-C12, Class E, 4.938%, 10/15/46 W | $405,000 | $307,199 | |
| FRB Ser. 14-C17, Class D, 4.727%, 8/15/47 W | 2,144,500 | 1,753,929 | |
| FRB Ser. 12-C6, Class E, 4.522%, 11/15/45 W | 1,303,000 | 919,389 | |
| FRB Ser. 12-C6, Class G, 4.50%, 11/15/45 W | 1,150,000 | 794,880 | |
| FRB Ser. 13-C11, Class D, 4.351%, 8/15/46 W | 932,000 | 49,245 | |
| FRB Ser. 15-C24, Class E, 4.325%, 5/15/48 W | 677,000 | 503,160 | |
| FRB Ser. 15-C23, Class D, 4.139%, 7/15/50 W | 1,242,000 | 1,023,425 | |
| FRB Ser. 13-C10, Class E, 4.047%, 7/15/46 W | 369,000 | 92,914 | |
| FRB Ser. 13-C10, Class F, 4.047%, 7/15/46 W | 1,286,000 | 176,117 | |
| FRB Ser. 13-C9, Class D, 3.903%, 5/15/46 W | 2,027,000 | 1,667,340 | |
| FRB Ser. 13-C9, Class G, 3.903%, 5/15/46 W | 1,500,000 | 729,750 | |
| Ser. 14-C19, Class D, 3.25%, 12/15/47 | 574,000 | 454,224 | |
| Ser. 17-C34, Class D, 2.70%, 11/15/52 | 663,000 | 386,071 | |
| Morgan Stanley Capital I Trust | |||
| Ser. 06-HQ10, Class B, 5.448%, 11/12/41 W | 24,032 | 20,249 | |
| FRB Ser. 18-H3, Class C, 4.862%, 7/15/51 W | 1,174,000 | 969,678 | |
| Ser. 15-UBS8, Class B, 4.315%, 12/15/48 W | 2,528,000 | 2,184,657 | |
| FRB Ser. 15-MS1, Class C, 4.024%, 5/15/48 W | 1,181,000 | 1,038,147 | |
| FRB Ser. 16-BNK2, Class C, 3.886%, 11/15/49 W | 983,000 | 746,437 | |
| Morgan Stanley Capital I Trust 144A | |||
| FRB Ser. 12-C4, Class D, 5.164%, 3/15/45 W | 770,491 | 708,852 | |
| FRB Ser. 12-C4, Class E, 5.164%, 3/15/45 W | 392,000 | 282,514 | |
| FRB Ser. 11-C3, Class G, 5.086%, 7/15/49 W | 753,000 | 387,488 | |
| Ser. 18-L1, Class D, 3.00%, 10/15/51 | 2,079,000 | 1,392,493 | |
| Multifamily Connecticut Avenue Securities Trust 144A FRB Ser. 19-01, Class M10, 8.388%, 10/25/49 | 1,362,937 | 1,296,135 | |
| PFP, Ltd. 144A FRB Ser. 21-8, Class A, 6.105%, 8/9/37 (Cayman Islands) | 871,132 | 847,199 | |
| Ready Capital Mortgage Financing, LLC 144A FRB Ser. 20-FL4, Class C, 9.888%, 2/25/35 | 1,468,000 | 1,416,772 | |
| UBS Commercial Mortgage Trust | |||
| FRB Ser. 18-C11, Class C, 4.873%, 6/15/51 W | 641,000 | 508,605 | |
| FRB Ser. 17-C3, Class C, 4.389%, 8/15/50 W | 1,796,000 | 1,453,952 | |
| UBS Commercial Mortgage Trust 144A | |||
| FRB Ser. 12-C1, Class E, 5.00%, 5/10/45 W | 518,909 | 347,669 | |
| FRB Ser. 18-C11, Class D, 3.00%, 6/15/51 W | 2,527,000 | 1,505,824 | |
| UBS-Barclays Commercial Mortgage Trust 144A | |||
| Ser. 12-C2, Class F, 5.00%, 5/10/63 W | 37,000 | — | |
| FRB Ser. 12-C2, Class E, 4.701%, 5/10/63 W | 24,000 | 240 | |
| Wells Fargo Commercial Mortgage Trust | |||
| FRB Ser. 16-NXS5, Class D, 4.98%, 1/15/59 W | 781,000 | 567,232 | |
| FRB Ser. 15-C31, Class C, 4.595%, 11/15/48 W | 711,000 | 620,155 | |
| FRB Ser. 15-SG1, Class B, 4.453%, 9/15/48 W | 2,119,000 | 1,844,522 | |
| FRB Ser. 15-C29, Class D, 4.218%, 6/15/48 W | 2,255,000 | 1,886,692 | |
| Ser. 15-C31, Class D, 3.852%, 11/15/48 | 491,000 | 367,299 | |
| FRB Ser. 19-C52, Class XA, IO, 1.603%, 8/15/52 W | 9,868,191 | 655,994 | |
| FRB Ser. 21-C59, Class XA, IO, 1.531%, 4/15/54 W | 23,864,253 | 1,974,151 | |
| Wells Fargo Commercial Mortgage Trust 144A | |||
| FRB Ser. 15-C31, Class E, 4.595%, 11/15/48 W | 783,000 | 476,997 | |
| FRB Ser. 15-C30, Class D, 4.498%, 9/15/58 W | 1,040,000 | 817,819 | |
| FRB Ser. 13-LC12, Class D, 4.254%, 7/15/46 W | 381,000 | 136,158 | |
| Ser. 14-LC16, Class D, 3.938%, 8/15/50 | 777,000 | 73,871 | |
| Ser. 17-RB1, Class D, 3.401%, 3/15/50 | 2,367,000 | 1,427,845 | |
| Ser. 16-C33, Class D, 3.123%, 3/15/59 | 2,533,000 | 1,979,380 | |
| Ser. 19-C50, Class D, 3.00%, 5/15/52 | 375,000 | 215,424 | |
| Ser. 19-C54, Class D, 2.50%, 12/15/52 | 311,000 | 174,134 | |
| WF-RBS Commercial Mortgage Trust | |||
| Ser. 14-LC14, Class C, 4.344%, 3/15/47 W | 997,250 | 926,890 | |
| Ser. 14-C21, Class C, 4.234%, 8/15/47 W | 1,151,000 | 949,882 | |
| Ser. 12-C10, Class AS, 3.241%, 12/15/45 | 454,270 | 430,525 | |
Mortgage Opportunities Fund 21 | |
| MORTGAGE-BACKED SECURITIES (88.5%)* cont. | Principal amount | Value | |
| Commercial mortgage-backed securities cont. | |||
| WF-RBS Commercial Mortgage Trust 144A | |||
| FRB Ser. 13-UBS1, Class D, 5.024%, 3/15/46 W | $883,000 | $842,865 | |
| Ser. 11-C4, Class E, 4.846%, 6/15/44 W | 806,022 | 594,167 | |
| FRB Ser. 12-C9, Class D, 4.719%, 11/15/45 W | 81,591 | 75,221 | |
| FRB Ser. 13-C15, Class D, 4.501%, 8/15/46 W | 1,324,000 | 333,366 | |
| FRB Ser. 12-C10, Class D, 4.392%, 12/15/45 W | 406,000 | 242,990 | |
| FRB Ser. 13-C11, Class D, 3.977%, 3/15/45 W | 2,068,000 | 1,426,799 | |
| 117,232,398 | |||
| Residential mortgage-backed securities (non-agency) (20.9%) | |||
| American Home Mortgage Investment Trust FRB Ser. 07-1, Class GA1C, (ICE LIBOR USD 1 Month + 0.19%), 5.328%, 5/25/47 | 1,469,221 | 783,317 | |
| Arroyo Mortgage Trust 144A Ser. 20-1, Class M1, 4.277%, 3/25/55 | 442,000 | 381,823 | |
| Bear Stearns Alt-A Trust | |||
| FRB Ser. 05-10, Class 11A1, (ICE LIBOR USD 1 Month + 0.50%), 5.638%, 1/25/36 | 107,096 | 129,903 | |
| FRB Ser. 05-7, Class 21A1, 4.175%, 9/25/35 W | 170,714 | 138,705 | |
| FRB Ser. 05-8, Class 21A1, 4.112%, 10/25/35 W | 306,891 | 251,554 | |
| Bear Stearns Mortgage Funding Trust FRB Ser. 06-AR2, Class 2A1, (ICE LIBOR USD 1 Month + 0.46%), 5.598%, 9/25/46 | 59,985 | 40,802 | |
| Chevy Chase Funding, LLC Mortgage-Backed Certificates 144A FRB Ser. 06-4A, Class A2, (ICE LIBOR USD 1 Month + 0.18%), 5.318%, 11/25/47 | 873,938 | 722,212 | |
| Citigroup Mortgage Loan Trust, Inc. FRB Ser. 07-AMC3, Class A2D, (ICE LIBOR USD 1 Month + 0.35%), 5.488%, 3/25/37 | 164,282 | 135,605 | |
| Countrywide Alternative Loan Trust | |||
| FRB Ser. 06-OA10, Class 2A1, (ICE LIBOR USD 1 Month + 0.38%), 5.518%, 8/25/46 | 72,920 | 61,170 | |
| FRB Ser. 06-OA10, Class 3A1, (ICE LIBOR USD 1 Month + 0.38%), 5.518%, 8/25/46 | 198,633 | 169,500 | |
| FRB Ser. 06-OA10, Class 4A1, (ICE LIBOR USD 1 Month + 0.38%), 5.518%, 8/25/46 | 221,886 | 180,850 | |
| FRB Ser. 06-OA19, Class A1, (ICE LIBOR USD 1 Month + 0.18%), 5.328%, 2/20/47 | 238,311 | 184,854 | |
| Countrywide Home Loans Mortgage Pass-Through Trust FRB Ser. 06-OA5, Class 2A1, (ICE LIBOR USD 1 Month + 0.40%), 5.538%, 4/25/46 | 29,884 | 24,325 | |
| Credit Suisse Mortgage Capital Certificates 144A FRB Ser. 20-SPT1, Class M1, 3.388%, 4/25/65 W | 392,000 | 341,453 | |
| CSMC Trust 144A FRB Ser. 20-RPL2, Class A12, 3.482%, 2/25/60 W | 1,902,022 | 1,906,827 | |
| Eagle Re, Ltd. 144A FRB Ser. 20-1, Class B1, (ICE LIBOR USD 1 Month + 2.85%), 7.988%, 1/25/30 | 404,000 | 393,055 | |
| Federal Home Loan Mortgage Corporation | |||
| Structured Agency Credit Risk Debt FRN Ser. 15-HQA2, Class B, (ICE LIBOR USD 1 Month + 10.50%), 15.638%, 5/25/28 | 248,412 | 269,792 | |
| Structured Agency Credit Risk Debt FRN Ser. 16-DNA1, Class B, (ICE LIBOR USD 1 Month + 10.00%), 15.138%, 7/25/28 | 246,252 | 272,933 | |
| Structured Agency Credit Risk Debt FRN Ser. 15-DNA3, Class B, (ICE LIBOR USD 1 Month + 9.35%), 14.488%, 4/25/28 | 294,992 | 317,540 | |
| Structured Agency Credit Risk Debt FRN Ser. 15-HQA1, Class B, (ICE LIBOR USD 1 Month + 8.80%), 13.938%, 3/25/28 | 368,999 | 381,024 | |
| Structured Agency Credit Risk Debt FRN Ser. 15-DNA2, Class B, (ICE LIBOR USD 1 Month + 7.55%), 12.688%, 12/25/27 | 1,271,155 | 1,316,466 | |
| Seasoned Credit Risk Transfer Trust Ser. 18-1, Class M, 4.75%, 5/25/57 W | 910,051 | 839,544 | |
| Federal Home Loan Mortgage Corporation 144A | |||
| Structured Agency Credit Risk Trust FRB Ser. 19-HQA1, Class B2, (ICE LIBOR USD 1 Month + 12.25%), 17.388%, 2/25/49 | 2,642,000 | 3,122,423 | |
| Structured Agency Credit Risk Trust FRB Ser. 18-HQA2, Class B2, (ICE LIBOR USD 1 Month + 11.00%), 16.138%, 10/25/48 | 1,728,000 | 2,037,385 | |
| Structured Agency Credit Risk Trust REMICs FRB Ser. 22-HQA1, Class B2, (US 30 Day Average SOFR + 11.00%), 15.973%, 3/25/42 | 2,600,000 | 2,520,375 | |
| Structured Agency Credit Risk Trust FRB Ser. 19-DNA1, Class B2, (ICE LIBOR USD 1 Month + 10.75%), 15.888%, 1/25/49 | 439,000 | 507,037 | |
| Structured Agency Credit Risk Trust FRB Ser. 19-DNA2, Class B2, (ICE LIBOR USD 1 Month + 10.50%), 15.638%, 3/25/49 | 755,000 | 870,630 | |
| Structured Agency Credit Risk Trust REMICs FRB Ser. 20-DNA3, Class B2, (ICE LIBOR USD 1 Month + 9.35%), 14.488%, 6/25/50 | 750,000 | 869,531 | |
| Structured Agency Credit Risk Trust FRB Ser. 19-FTR1, Class B2, (ICE LIBOR USD 1 Month + 8.35%), 13.488%, 1/25/48 | 3,300,000 | 3,547,500 | |
| Structured Agency Credit Risk Trust FRB Ser. 18-DNA3, Class B2, (ICE LIBOR USD 1 Month + 7.75%), 12.888%, 9/25/48 | 818,000 | 860,515 | |
22 Mortgage Opportunities Fund | |
| MORTGAGE-BACKED SECURITIES (88.5%)* cont. | Principal amount | Value | |
| Residential mortgage-backed securities (non-agency) cont. | |||
| Federal Home Loan Mortgage Corporation 144A | |||
| Structured Agency Credit Risk Trust REMICs FRB Ser. 20-HQA2, Class B2, (ICE LIBOR USD 1 Month + 7.60%), 12.738%, 3/25/50 | $3,000,000 | $3,069,722 | |
| Structured Agency Credit Risk Trust FRB Ser. 19-HQA3, Class B2, (ICE LIBOR USD 1 Month + 7.50%), 12.638%, 9/25/49 | 1,000,000 | 1,038,750 | |
| Structured Agency Credit Risk Debt FRN Ser. 22-DNA5, Class M2, (US 30 Day Average SOFR + 6.75%), 11.723%, 6/25/42 | 1,471,000 | 1,610,583 | |
| Structured Agency Credit Risk Trust REMICs FRB Ser. 20-HQA3, Class B1, (ICE LIBOR USD 1 Month + 5.75%), 10.888%, 7/25/50 | 2,462,812 | 2,643,520 | |
| Structured Agency Credit Risk Trust REMICs FRB Ser. 20-HQA1, Class B2, (ICE LIBOR USD 1 Month + 5.10%), 10.238%, 1/25/50 | 800,000 | 740,000 | |
| Structured Agency Credit Risk Trust REMICs FRB Ser. 22-DNA4, Class M2, (US 30 Day Average SOFR + 5.25%), 10.223%, 5/25/42 | 2,000,000 | 2,089,637 | |
| Structured Agency Credit Risk Trust REMICs FRB Ser. 22-HQA1, Class M2, (US 30 Day Average SOFR + 5.25%), 10.223%, 3/25/42 | 2,759,000 | 2,786,590 | |
| Structured Agency Credit Risk Trust REMICs FRB Ser. 20-DNA5, Class B1, (US 30 Day Average SOFR + 4.80%), 9.773%, 10/25/50 | 1,976,000 | 2,114,320 | |
| Structured Agency Credit Risk Trust REMICs FRB Ser. 21-DNA1, Class B2, (US 30 Day Average SOFR + 4.75%), 9.723%, 1/25/51 | 1,100,000 | 958,375 | |
| Structured Agency Credit Risk Trust FRB Ser. 19-HQA1, Class HQA1, (ICE LIBOR USD 1 Month + 4.40%), 9.538%, 2/25/49 | 2,950,000 | 3,112,081 | |
| Structured Agency Credit Risk Trust FRB Ser. 19-DNA2, Class B1, (ICE LIBOR USD 1 Month + 4.35%), 9.488%, 3/25/49 | 677,000 | 722,105 | |
| Structured Agency Credit Risk Trust REMICs FRB Ser. 22-DNA3, Class M2, (US 30 Day Average SOFR + 4.35%), 9.323%, 4/25/42 | 1,940,000 | 1,959,400 | |
| Structured Agency Credit Risk Trust FRB Ser. 19-HQA2, Class HQA2, (ICE LIBOR USD 1 Month + 4.10%), 9.238%, 4/25/49 | 2,518,000 | 2,621,575 | |
| Structured Agency Credit Risk Trust REMICs FRB Ser. 20-HQA2, Class B1, (ICE LIBOR USD 1 Month + 4.10%), 9.238%, 3/25/50 | 2,544,000 | 2,625,134 | |
| Structured Agency Credit Risk Debt FRN Ser. 22-HQA2, Class M1B, (US 30 Day Average SOFR + 4.00%), 8.973%, 7/25/42 | 800,000 | 820,077 | |
| Structured Agency Credit Risk Trust REMICs FRB Ser. 20-HQA2, Class M2, (ICE LIBOR USD 1 Month + 3.10%), 8.238%, 3/25/50 | 767,553 | 784,847 | |
| Structured Agency Credit Risk Trust FRB Ser. 19-HQA3, Class B1, (ICE LIBOR USD 1 Month + 3.00%), 8.138%, 9/25/49 | 500,000 | 502,272 | |
| Seasoned Credit Risk Transfer Trust Ser. 19-2, Class M, 4.75%, 8/25/58 W | 244,000 | 216,015 | |
| Seasoned Credit Risk Transfer Trust Ser. 17-3, Class M2, 4.75%, 7/25/56 W | 400,000 | 365,882 | |
| Seasoned Credit Risk Transfer Trust Ser. 19-4, Class M, 4.50%, 2/25/59 W | 370,000 | 312,063 | |
| Federal National Mortgage Association | |||
| Connecticut Avenue Securities FRB Ser. 16-C03, Class 2B, (ICE LIBOR USD 1 Month + 12.75%), 17.888%, 10/25/28 | 814,366 | 928,599 | |
| Connecticut Avenue Securities FRB Ser. 16-C03, Class 1B, (ICE LIBOR USD 1 Month + 11.75%), 16.888%, 10/25/28 | 111,100 | 125,589 | |
| Connecticut Avenue Securities FRB Ser. 16-C01, Class 1B, (ICE LIBOR USD 1 Month + 11.75%), 16.888%, 8/25/28 | 26,579 | 29,774 | |
| Connecticut Avenue Securities FRB Ser. 16-C07, Class 2B, (ICE LIBOR USD 1 Month + 9.50%), 14.638%, 5/25/29 | 597,535 | 627,374 | |
| Connecticut Avenue Securities FRB Ser. 16-C06, Class 1B, (ICE LIBOR USD 1 Month + 9.25%), 14.388%, 4/25/29 | 1,555,841 | 1,649,608 | |
| Connecticut Avenue Securities FRB Ser. 17-C04, Class 2B1, (ICE LIBOR USD 1 Month + 5.05%), 10.188%, 11/25/29 | 1,814,000 | 1,980,902 | |
| Connecticut Avenue Securities FRB Ser. 18-C04, Class 2B1, (ICE LIBOR USD 1 Month + 4.50%), 9.638%, 12/25/30 | 180,000 | 195,276 | |
| Connecticut Avenue Securities FRB Ser. 17-C07, Class 2B1, (ICE LIBOR USD 1 Month + 4.45%), 9.588%, 5/25/30 | 284,000 | 307,459 | |
| Federal National Mortgage Association 144A | |||
| Connecticut Avenue Securities Trust FRB Ser. 22-R06, Class 1B2, (US 30 Day Average SOFR + 10.60%), 15.573%, 5/25/42 | 500,000 | 518,750 | |
| Connecticut Avenue Securities Trust FRB Ser. 22-R09, Class 2B1, (US 30 Day Average SOFR + 6.75%), 11.731%, 9/25/42 | 500,000 | 523,610 | |
| Connecticut Avenue Securities Trust FRB Ser. 23-R03, Class 2B1, (US 30 Day Average SOFR + 6.35%), 11.323%, 4/25/43 | 850,000 | 865,980 | |
| Connecticut Avenue Securities Trust FRB Ser. 22-R04, Class 1B1, (US 30 Day Average SOFR + 5.25%), 10.223%, 3/25/42 | 500,000 | 511,650 | |
| Connecticut Avenue Securities Trust FRB Ser. 22-R09, Class 2M2, (US 30 Day Average SOFR + 4.75%), 9.731%, 9/25/42 | 1,000,000 | 1,041,250 | |
Mortgage Opportunities Fund 23 | |
| MORTGAGE-BACKED SECURITIES (88.5%)* cont. | Principal amount | Value | |
| Residential mortgage-backed securities (non-agency) cont. | |||
| Federal National Mortgage Association 144A | |||
| Connecticut Avenue Securities Trust FRB Ser. 19-R01, Class 2B1, (ICE LIBOR USD 1 Month + 4.35%), 9.488%, 7/25/31 | $862,000 | $907,255 | |
| Connecticut Avenue Securities Trust FRB Ser. 22-R05, Class 2B1, (US 30 Day Average SOFR + 4.50%), 9.473%, 4/25/42 | 2,540,000 | 2,524,310 | |
| Connecticut Avenue Securities Trust FRB Ser. 22-R02, Class 2B1, (US 30 Day Average SOFR + 4.50%), 9.473%, 1/25/42 | 2,146,000 | 2,080,279 | |
| Connecticut Avenue Securities Trust FRB Ser. 19-R03, Class 1B1, (ICE LIBOR USD 1 Month + 4.10%), 9.238%, 9/25/31 | 1,291,000 | 1,349,617 | |
| Connecticut Avenue Securities Trust FRB Ser. 22-R02, Class 2M2, (US 30 Day Average SOFR + 3.00%), 7.973%, 1/25/42 | 677,000 | 666,845 | |
| GSAA Home Equity Trust | |||
| FRB Ser. 06-8, Class 2A2, (ICE LIBOR USD 1 Month + 0.36%), 5.498%, 5/25/36 | 75,268 | 19,104 | |
| FRB Ser. 06-1, Class A1, (ICE LIBOR USD 1 Month + 0.18%), 5.318%, 1/25/36 | 1,066,780 | 341,370 | |
| GSR Mortgage Loan Trust FRB Ser. 07-OA1, Class 2A3A, (ICE LIBOR USD 1 Month + 0.31%), 5.448%, 5/25/37 | 316,721 | 229,209 | |
| Home Re, Ltd. 144A FRB Ser. 22-1, Class B1, (US 30 Day Average SOFR + 9.00%), 13.973%, 10/25/34 (Bermuda) | 900,000 | 899,969 | |
| Imperial Fund Mortgage Trust 144A Ser. 22-NQM4, Class A3, 5.04%, 6/25/67 | 1,329,858 | 1,243,183 | |
| IndyMac INDX Mortgage Loan Trust FRB Ser. 06-AR11, Class 2A1, 3.718%, 6/25/36 W | 23,957 | 21,707 | |
| JPMorgan Alternative Loan Trust FRB Ser. 07-A2, Class 12A1, IO, (ICE LIBOR USD 1 Month + 0.40%), 5.538%, 6/25/37 | 156,314 | 63,374 | |
| LHOME Mortgage Trust 144A Ser. 21-RTL1, Class A1, 2.09%, 2/25/26 W | 191,168 | 184,477 | |
| Merrill Lynch Mortgage Investors Trust FRB Ser. 06-HE3, Class A4, (ICE LIBOR USD 1 Month + 0.50%), 5.638%, 6/25/37 | 799,840 | 215,016 | |
| Morgan Stanley Re-REMIC Trust 144A FRB Ser. 10-R4, Class 4B, (ICE LIBOR USD 1 Month + 0.23%), 2.702%, 2/26/37 | 223,166 | 184,638 | |
| MortgageIT Trust FRB Ser. 05-3, Class M4, (ICE LIBOR USD 1 Month + 0.95%), 6.083%, 8/25/35 | 7,567 | 6,955 | |
| Oaktown Re III, Ltd. 144A | |||
| FRB Ser. 19-1A, Class B1B, (ICE LIBOR USD 1 Month + 4.35%), 9.488%, 7/25/29 (Bermuda) | 191,000 | 193,912 | |
| FRB Ser. 19-1A, Class B1A, (ICE LIBOR USD 1 Month + 3.50%), 8.638%, 7/25/29 (Bermuda) | 159,000 | 158,058 | |
| Structured Asset Mortgage Investments II Trust | |||
| FRB Ser. 06-AR7, Class A1A, (ICE LIBOR USD 1 Month + 0.42%), 5.558%, 8/25/36 | 52,212 | 40,204 | |
| FRB Ser. 07-AR1, Class 2A1, (ICE LIBOR USD 1 Month + 0.18%), 5.318%, 1/25/37 | 26,879 | 23,088 | |
| FRB Ser. 06-AR7, Class A1BG, (ICE LIBOR USD 1 Month + 0.12%), 5.258%, 8/25/36 | 157,003 | 130,018 | |
| WaMu Mortgage Pass-Through Certificates Trust FRB Ser. 05-AR13, Class A1C4, (ICE LIBOR USD 1 Month + 0.86%), 5.998%, 10/25/45 | 43,015 | 39,580 | |
| 75,499,587 | |||
| Total mortgage-backed securities (cost $337,369,034) | $319,692,570 | ||
| ASSET-BACKED SECURITIES (0.3%)* | Principal amount | Value | |
| NewRez Warehouse Securitization Trust 144A FRB Ser. 21-1, Class F, (ICE LIBOR USD 1 Month + 5.25%), 10.388%, 5/7/24 | $1,083,333 | $1,069,234 | |
| Total asset-backed securities (cost $1,080,117) | $1,069,234 | ||
| SHORT-TERM INVESTMENTS (12.8%)* | Principal amount/ shares | Value | |
| Putnam Short Term Investment Fund Class P 5.21% L | Shares | 20,223,800 | $20,223,800 |
| State Street Institutional U.S. Government Money Market Fund, Premier Class 5.02% P | Shares | 1,648,000 | 1,648,000 |
| U.S. Treasury Bills 5.453%, 10/26/23 # ∆ Φ | $8,800,000 | 8,610,856 | |
| U.S. Treasury Bills 5.326%, 11/16/23 # ∆ Φ | 11,300,000 | 11,024,982 | |
| U.S. Treasury Bills 4.998%, 11/2/23 # ∆ Φ | 4,785,000 | 4,678,586 | |
| Total short-term investments (cost $46,200,461) | $46,186,224 | ||
| TOTAL INVESTMENTS | ||
| Total investments (cost $1,452,096,995) | $1,428,635,729 | |
24 Mortgage Opportunities Fund | |
| Key to holding’s abbreviations | |||
| bp | Basis Points | ||
| FRB | Floating Rate Bonds: The rate shown is the current interest rate at the close of the reporting period. Rates may be subject to a cap or floor. For certain securities, the rate may represent a fixed rate currently in place at the close of the reporting period. | ||
| FRN | Floating Rate Notes: The rate shown is the current interest rate or yield at the close of the reporting period. Rates may be subject to a cap or floor. For certain securities, the rate may represent a fixed rate currently in place at the close of the reporting period. | ||
| ICE | Intercontinental Exchange | ||
| IFB | Inverse Floating Rate Bonds, which are securities that pay interest rates that vary inversely to changes in the market interest rates. As interest rates rise, inverse floaters produce less current income. The rate shown is the current interest rate at the close of the reporting period. Rates may be subject to a cap or floor. | ||
| IO | Interest Only | ||
| LIBOR | London Interbank Offered Rate | ||
| OTC | Over-the-counter | ||
| REMICs | Real Estate Mortgage Investment Conduits | ||
| SOFR | Secured Overnight Financing Rate | ||
| TBA | To Be Announced Commitments | ||
| Notes to the fund’s portfolio | |||
| Unless noted otherwise, the notes to the fund’s portfolio are for the close of the fund’s reporting period, which ran from June 1, 2022 through May 31, 2023 (the reporting period). Within the following notes to the portfolio, references to “Putnam Management” represent Putnam Investment Management, LLC, the fund’s manager, an indirect wholly-owned subsidiary of Putnam Investments, LLC and references to “ASC 820” represent Accounting Standards Codification 820 Fair Value Measurements and Disclosures. | |||
| * | Percentages indicated are based on net assets of $361,100,199. | ||
| # | This security, in part or in entirety, was pledged and segregated with the broker to cover margin requirements for futures contracts at the close of the reporting period. Collateral at period end totaled $10,121,462 and is included in Investments in securities on the Statement of assets and liabilities (Notes 1 and 8). | ||
| ∆ | This security, in part or in entirety, was pledged and segregated with the custodian for collateral on certain derivative contracts at the close of the reporting period. Collateral at period end totaled $6,899,353 and is included in Investments in securities on the Statement of assets and liabilities (Notes 1 and 8). | ||
| Φ | This security, in part or in entirety, was pledged and segregated with the custodian for collateral on certain TBA commitments at the close of the reporting period. Collateral at period end totaled $7,205,994 and is included in Investments in securities on the Statement of assets and liabilities (Notes 1 and 8). | ||
| L | Affiliated company (Note 5). The rate quoted in the security description is the annualized 7-day yield of the fund at the close of the reporting period. | ||
| P | This security was pledged, or purchased with cash that was pledged, to the fund for collateral on certain derivative contracts. The rate quoted in the security description is the annualized 7-day yield of the fund at the close of the reporting period. | ||
| W | The rate shown represents the weighted average coupon associated with the underlying mortgage pools. Rates may be subject to a cap or floor. | ||
| Unless otherwise noted, the rates quoted in Short-term investments security descriptions represent the weighted average yield to maturity. | |||
| 144A after the name of an issuer represents securities exempt from registration under Rule 144A of the Securities Act of 1933, as amended. These securities may be resold in transactions exempt from registration, normally to qualified institutional buyers. | |||
| See Note 1 to the financial statements regarding TBA commitments. | |||
| The dates shown on debt obligations are the original maturity dates. | |||
| FUTURES CONTRACTS OUTSTANDING at 5/31/23 | ||||||
| Number of contracts | Notional amount | Value | Expiration date | Unrealized appreciation/ (depreciation) | ||
| U.S. Treasury Note 2 yr (Short) | 1,750 | $360,199,221 | $360,199,221 | Sep-23 | $277,793 | |
| U.S. Treasury Note 5 yr (Short) | 1,644 | 179,324,438 | 179,324,438 | Sep-23 | (133,919) | |
| U.S. Treasury Note Ultra 10 yr (Short) | 1,348 | 162,370,813 | 162,370,813 | Sep-23 | (1,266,783) | |
| Unrealized appreciation | 277,793 | |||||
| Unrealized (depreciation) | (1,400,702) | |||||
| Total | $(1,122,909) | |||||
| FORWARD PREMIUM SWAP OPTION CONTRACTS OUTSTANDING at 5/31/23 | ||||||
| Counterparty Fixed right or obligation % to receive or (pay)/Floating rate index/ Maturity date | Expiration date/strike | Notional/ contract amount | Premium receivable/ (payable) | Unrealized appreciation/ (depreciation) | ||
| Bank of America N.A. | ||||||
| (3.17)/US SOFR/Dec-35 (Purchased) | Dec-25/3.17 | $19,228,900 | $(999,903) | $49,611 | ||
| 2.67/US SOFR/Dec-35 (Purchased) | Dec-25/2.67 | 19,228,900 | (980,674) | (282,088) | ||
| (3.18)/US SOFR/Dec-35 (Purchased) | Dec-25/3.18 | 18,652,000 | (941,926) | 66,774 | ||
| 2.68/US SOFR/Dec-35 (Purchased) | Dec-25/2.68 | 18,652,000 | (941,926) | (259,449) | ||
| 3.343/US SOFR/Dec-35 (Purchased) | Dec-25/3.343 | 16,579,900 | (1,075,207) | (21,388) | ||
| (3.343)/US SOFR/Dec-35 (Purchased) | Dec-25/3.343 | 16,579,900 | (1,075,207) | (241,569) | ||
Mortgage Opportunities Fund 25 | |
| FORWARD PREMIUM SWAP OPTION CONTRACTS OUTSTANDING at 5/31/23 cont. | ||||||
| Counterparty Fixed right or obligation % to receive or (pay)/Floating rate index/ Maturity date | Expiration date/strike | Notional/ contract amount | Premium receivable/ (payable) | Unrealized appreciation/ (depreciation) | ||
| Citibank, N.A. | ||||||
| (3.166)/US SOFR/Jul-28 (Purchased) | Jul-23/3.166 | $2,936,000 | $(36,590) | $18,174 | ||
| 3.166/US SOFR/Jul-28 (Purchased) | Jul-23/3.166 | 2,936,000 | (36,590) | (22,989) | ||
| Goldman Sachs International | ||||||
| (3.123)/US SOFR/Jul-33 (Purchased) | Jul-23/3.123 | 52,817,300 | (1,045,783) | 366,024 | ||
| 3.123/US SOFR/Jul-33 (Purchased) | Jul-23/3.123 | 52,817,300 | (1,045,783) | (565,146) | ||
| JPMorgan Chase Bank N.A. | ||||||
| 3.187/US SOFR/Jan-36 (Purchased) | Jan-26/3.187 | 8,413,600 | (543,098) | (65,458) | ||
| (3.187)/US SOFR/Jan-36 (Purchased) | Jan-26/3.187 | 8,413,600 | (543,098) | (74,797) | ||
| Unrealized appreciation | 500,583 | |||||
| Unrealized (depreciation) | (1,532,884) | |||||
| Total | $(1,032,301) | |||||
| TBA SALE COMMITMENTS OUTSTANDING at 5/31/23 (proceeds receivable $622,872,402) | |||
| Agency | Principal amount | Settlement date | Value |
| Government National Mortgage Association, 3.50%, 6/1/53 | $1,000,000 | 6/20/23 | $926,764 |
| Uniform Mortgage-Backed Securities, 5.50%, 6/1/53 | 74,000,000 | 6/13/23 | 73,950,857 |
| Uniform Mortgage-Backed Securities, 5.00%, 6/1/53 | 403,000,000 | 6/13/23 | 396,907,768 |
| Uniform Mortgage-Backed Securities, 4.50%, 6/1/53 | 128,000,000 | 6/13/23 | 123,849,996 |
| Uniform Mortgage-Backed Securities, 4.00%, 6/1/53 | 5,000,000 | 6/13/23 | 4,723,438 |
| Uniform Mortgage-Backed Securities, 3.00%, 6/1/53 | 8,000,000 | 6/13/23 | 7,088,125 |
| Uniform Mortgage-Backed Securities, 2.50%, 6/1/53 | 8,000,000 | 6/13/23 | 6,832,813 |
| Uniform Mortgage-Backed Securities, 2.00%, 6/1/53 | 8,000,000 | 6/13/23 | 6,577,813 |
| Total | $620,857,574 | ||
| CENTRALLY CLEARED INTEREST RATE SWAP CONTRACTS OUTSTANDING at 5/31/23 | |||||||
| Notional amount | Value | Upfront premium received (paid) | Termination date | Payments made by fund | Payments received by fund | Unrealized appreciation/ (depreciation) | |
| $5,571,000 | $4,513 | $(45) | 1/6/28 | 3.5615% — Annually | US SOFR — Annually | $29,374 | |
| 98,000 | 2,811 | (1) | 3/3/33 | US SOFR — Annually | 3.723% — Annually | 2,546 | |
| 3,959,000 | 45,806 | (52) | 3/15/33 | 3.234% — Annually | US SOFR — Annually | 59,414 | |
| 280,777,000 | 148,812 E | 1,611,701 | 6/21/25 | 4.20% — Annually | US SOFR — Annually | 1,760,505 | |
| 18,931,000 | 249,132 E | 402,405 | 6/21/28 | 3.80% — Annually | US SOFR — Annually | 153,274 | |
| 21,534,000 | 74,938 E | 321,114 | 6/21/33 | 3.40% — Annually | US SOFR — Annually | 246,176 | |
| 29,892,000 | 1,934,909 E | 1,194,079 | 6/21/53 | US SOFR — Annually | 2.80% — Annually | (740,830) | |
| 2,517,000 | 15,907 | (33) | 3/24/33 | US SOFR — Annually | 3.2975% — Annually | (23,459) | |
| 741,000 | 20,237 | (25) | 3/30/53 | 3.008% — Annually | US SOFR — Annually | 22,658 | |
| 5,036,000 | 53,029 | (66) | 3/30/33 | 3.2465% — Annually | US SOFR — Annually | 67,503 | |
| 10,302,000 | 31,009 | (83) | 3/31/28 | 3.4855% — Annually | US SOFR — Annually | 55,966 | |
| 13,156,000 | 73,016 | (49) | 3/31/25 | US SOFR — Annually | 4.0905% — Annually | (91,445) | |
| 5,140,000 | 44,564 | (68) | 3/31/33 | US SOFR — Annually | 3.269% — Annually | (59,085) | |
| 6,106,000 | 59,289 | (81) | 4/3/33 | US SOFR — Annually | 3.2565% — Annually | (75,848) | |
| 5,309,000 | 62,062 | (70) | 4/4/33 | US SOFR — Annually | 3.2325% — Annually | (76,410) | |
| 11,301,000 | 57,183 | (42) | 4/4/25 | US SOFR — Annually | 4.113% — Annually | (71,560) | |
| 4,357,000 | 59,604 | (58) | 4/4/33 | US SOFR — Annually | 3.2085% — Annually | (71,537) | |
| 5,681,000 | 47,948 | (46) | 4/4/28 | US SOFR — Annually | 3.361% — Annually | (62,082) | |
| 8,401,000 | 55,531 | (32) | 4/5/25 | US SOFR — Annually | 4.02% — Annually | (67,263) | |
| 4,474,000 | 89,435 | (59) | 4/5/33 | US SOFR — Annually | 3.1325% — Annually | (102,013) | |
| 4,336,000 | 184,714 | (147) | 4/5/53 | US SOFR — Annually | 2.927% — Annually | (198,404) | |
| 4,698,000 | 128,067 | (62) | 4/6/33 | 3.45% — Annually | US SOFR — Annually | 141,591 | |
| 6,311,000 | 107,792 | (51) | 4/6/28 | US SOFR — Annually | 3.1645% — Annually | (124,920) | |
| 7,856,000 | 138,108 | (63) | 4/7/28 | US SOFR — Annually | 3.153% — Annually | (159,179) | |
| 36,236,000 | 411,279 | (136) | 4/7/25 | 3.7505% — Annually | US SOFR — Annually | 474,960 | |
| 11,412,000 | 367,581 | (151) | 4/7/33 | 2.9855% — Annually | US SOFR — Annually | 400,866 | |
26 Mortgage Opportunities Fund | |
| CENTRALLY CLEARED INTEREST RATE SWAP CONTRACTS OUTSTANDING at 5/31/23 cont. | |||||||
| Notional amount | Value | Upfront premium received (paid) | Termination date | Payments made by fund | Payments received by fund | Unrealized appreciation/ (depreciation) | |
| $6,840,000 | $122,778 | $(55) | 4/7/28 | US SOFR — Annually | 3.1445% — Annually | $(141,212) | |
| 4,532,000 | 246,269 | (154) | 4/10/53 | US SOFR — Annually | 2.865% — Annually | (259,783) | |
| 8,884,000 | 86,974 | (33) | 4/10/25 | US SOFR — Annually | 3.8355% — Annually | (100,743) | |
| 4,127,000 | 129,216 | (54) | 4/10/33 | US SOFR — Annually | 2.9965% — Annually | (140,653) | |
| 4,350,000 | 230,550 | (148) | 4/11/53 | 2.872% — Annually | US SOFR — Annually | 242,924 | |
| 12,678,000 | 267,252 | (167) | 4/11/33 | 3.1195% — Annually | US SOFR — Annually | 299,135 | |
| 11,403,000 | 461,365 | (388) | 4/13/53 | 2.938% — Annually | US SOFR — Annually | 491,543 | |
| 5,330,000 | 215,599 | (181) | 4/14/53 | US SOFR — Annually | 2.938% — Annually | (229,771) | |
| 5,785,000 | 126,634 | (76) | 4/14/33 | US SOFR — Annually | 3.11% — Annually | (140,585) | |
| 209,700 | 2,512 | (2) | 4/19/28 | 3.278% — Annually | US SOFR — Annually | 2,920 | |
| 29,576,000 | 154,387 | (111) | 4/18/25 | 4.082% — Annually | US SOFR — Annually | 184,345 | |
| 15,633,000 | 73,162 | (59) | 4/18/25 | US SOFR — Annually | 4.1125% — Annually | (88,532) | |
| 8,689,000 | 107,744 | (115) | 4/18/33 | US SOFR — Annually | 3.224% — Annually | (125,804) | |
| 7,339,000 | 156,614 | (250) | 4/19/53 | 3.0383% — Annually | US SOFR — Annually | 172,823 | |
| 5,460,000 | 32,705 | (72) | 4/19/33 | 3.301% — Annually | US SOFR — Annually | 43,165 | |
| 5,291,000 | 43,386 | (70) | 4/20/33 | 3.2745% — Annually | US SOFR — Annually | 53,461 | |
| 4,530,000 | 33,930 | (60) | 4/20/33 | US SOFR — Annually | 3.283% — Annually | (42,630) | |
| 30,579,000 | 55,654 | (115) | 4/21/25 | US SOFR — Annually | 4.2675% — Annually | (78,497) | |
| 13,704,000 | 50,157 | (181) | 4/21/33 | US SOFR — Annually | 3.329% — Annually | (75,171) | |
| 10,475,000 | 26,397 | (39) | 4/24/25 | US SOFR — Annually | 4.223% — Annually | (34,227) | |
| 2,203,000 | 44,523 | (75) | 4/25/53 | US SOFR — Annually | 3.044% — Annually | (48,869) | |
| 4,036,000 | 39,795 | (53) | 4/26/33 | US SOFR — Annually | 3.2545% — Annually | (46,765) | |
| 3,559,000 | 44,416 | (47) | 4/26/33 | US SOFR — Annually | 3.223% — Annually | (50,675) | |
| 8,274,000 | 90,269 | (67) | 4/27/28 | 3.301% — Annually | US SOFR — Annually | 103,359 | |
| 7,244,000 | 147,271 | (96) | 4/28/33 | US SOFR — Annually | 3.129% — Annually | (160,008) | |
| 7,788,000 | 141,819 | (103) | 4/28/33 | 3.1545% — Annually | US SOFR — Annually | 155,121 | |
| 9,901,000 | 131,089 | (131) | 5/1/33 | 3.214% — Annually | US SOFR — Annually | 146,114 | |
| 21,031,200 | 350,590 | (278) | 5/11/33 | US SOFR — Annually | 3.173% — Annually | (359,196) | |
| 11,447,000 | 177,314 | (151) | 5/2/33 | 3.187% — Annually | US SOFR — Annually | 194,439 | |
| 4,016,000 | 67,589 | (53) | 5/2/33 | US SOFR — Annually | 3.171% — Annually | (73,757) | |
| 12,621,000 | 171,772 | (167) | 5/3/33 | US SOFR — Annually | 3.2095% — Annually | (190,181) | |
| 3,759,000 | 37,515 | (50) | 5/3/33 | 3.253% — Annually | US SOFR — Annually | 42,767 | |
| 7,038,000 | 37,301 | (93) | 5/3/33 | 3.309% — Annually | US SOFR — Annually | 46,582 | |
| 3,678,000 | 31,006 | (125) | 5/4/53 | 3.1055% — Annually | US SOFR — Annually | 36,329 | |
| 4,361,000 | 75,794 | (58) | 5/4/33 | US SOFR — Annually | 3.1645% — Annually | (81,966) | |
| 14,694,000 | 273,749 | (194) | 5/5/33 | US SOFR — Annually | 3.1495% — Annually | (294,522) | |
| 26,955,000 | 211,597 | (101) | 5/5/25 | US SOFR — Annually | 3.9135% — Annually | (234,003) | |
| 17,949,000 | 378,724 | (237) | 5/5/33 | US SOFR — Annually | 3.12% — Annually | (404,495) | |
| 9,961,000 | 197,327 | (131) | 5/8/33 | US SOFR — Annually | 3.1355% — Annually | (210,041) | |
| 6,843,000 | 113,457 | (55) | 5/9/28 | US SOFR — Annually | 3.172% — Annually | (121,770) | |
| 3,245,000 | 40,790 | (43) | 5/10/33 | 3.222% — Annually | US SOFR — Annually | 44,392 | |
| 9,433,000 | 127,251 | (125) | 5/11/33 | 3.211% — Annually | US SOFR — Annually | 137,298 | |
| 10,757,000 | 74,223 | (40) | 5/11/25 | US SOFR — Annually | 3.956% — Annually | (81,188) | |
| 8,089,000 | 90,839 | (107) | 5/11/33 | US SOFR — Annually | 3.238% — Annually | (99,541) | |
| 10,799,000 | 149,134 | (87) | 5/12/28 | US SOFR — Annually | 3.2335% — Annually | (160,172) | |
| 15,377,000 | 133,011 | (58) | 5/12/25 | US SOFR — Annually | 3.861% — Annually | (143,301) | |
| 6,770,000 | 114,887 | (89) | 5/12/33 | US SOFR — Annually | 3.1695% — Annually | (122,082) | |
| 15,377,000 | 142,852 | (58) | 5/12/25 | US SOFR — Annually | 3.8265% — Annually | (153,437) | |
| 6,770,000 | 117,663 | (89) | 5/12/33 | US SOFR — Annually | 3.1645% — Annually | (124,877) | |
| 17,098,000 | 273,739 | (138) | 5/12/28 | 3.1845% — Annually | US SOFR — Annually | 291,405 | |
| 10,078,000 | 214,561 | (133) | 5/15/33 | US SOFR — Annually | 3.118% — Annually | (223,925) | |
| 9,165,000 | 133,626 | (121) | 5/17/33 | 3.198% — Annually | US SOFR — Annually | 140,594 | |
| 4,118,000 | 51,640 | (33) | 5/17/28 | US SOFR — Annually | 3.261% — Annually | (54,750) | |
| 3,102,000 | 36,262 | (41) | 5/19/33 | 3.2325% — Annually | US SOFR — Annually | 38,266 | |
| 353,000 | 1,903 | (1) | 5/19/25 | US SOFR — Annually | 4.27% — Annually | (2,035) | |
Mortgage Opportunities Fund 27 | |
| CENTRALLY CLEARED INTEREST RATE SWAP CONTRACTS OUTSTANDING at 5/31/23 cont. | |||||||
| Notional amount | Value | Upfront premium received (paid) | Termination date | Payments made by fund | Payments received by fund | Unrealized appreciation/ (depreciation) | |
| $2,773,000 | $26,954 | $(37) | 5/19/33 | 3.256% — Annually | US SOFR — Annually | $28,717 | |
| 349,000 | 1,183 | (1) | 5/22/25 | US SOFR — Annually | 4.1295% — Annually | (1,274) | |
| 2,773,000 | 4,603 | (37) | 5/22/33 | 3.352% — Annually | US SOFR — Annually | 5,877 | |
| 7,169,000 | 24,733 | (27) | 5/22/25 | 4.126% — Annually | US SOFR — Annually | 26,552 | |
| 3,253,000 | 6,213 | (43) | 5/22/33 | 3.349% — Annually | US SOFR — Annually | 7,710 | |
| 5,977,000 | 3,646 | (68) | 5/23/30 | US SOFR — Annually | 3.4095% — Annually | (6,169) | |
| 3,852,000 | 68,219 | (131) | 5/24/53 | 3.2415% — Annually | US SOFR — Annually | (66,800) | |
| 8,739,855 | 223,828 E | (297) | 8/7/53 | 3.259% — Annually | US SOFR — Annually | (224,125) | |
| 6,141,000 | 983 | (49) | 5/26/28 | US SOFR — Annually | 3.5335% — Annually | (2,585) | |
| 49,509,000 | 65,847 | (8,238) | 5/26/25 | US SOFR — Annually | 4.231% — Annually | (80,852) | |
| 35,738,000 | 148,313 | 24,924 | 5/26/33 | 3.421% — Annually | US SOFR — Annually | (113,680) | |
| 10,797,000 | 198,557 | (12,885) | 5/26/53 | US SOFR — Annually | 3.2451% — Annually | 182,422 | |
| 12,097,000 | 8,468 | (45) | 5/26/25 | US SOFR — Annually | 4.264% — Annually | (10,100) | |
| 6,856,000 | 40,588 | (91) | 5/26/33 | US SOFR — Annually | 3.442% — Annually | 38,658 | |
| 6,338,000 | 12,296 | (51) | 5/26/28 | 3.58% — Annually | US SOFR — Annually | (10,793) | |
| 5,079,000 | 56,225 | (67) | 5/30/33 | 3.503% — Annually | US SOFR — Annually | (55,855) | |
| 2,495,000 | 55,214 | (85) | 5/31/53 | 3.2645% — Annually | US SOFR — Annually | (55,175) | |
| 10,890,000 | 23,522 | (41) | 6/1/25 | US SOFR — Annually | 4.403% — Annually | 23,482 | |
| 7,206,000 | 47,704 | (95) | 6/1/33 | US SOFR — Annually | 3.4495% — Annually | 47,609 | |
| 3,325,000 | 15,162 | (44) | 6/1/33 | US SOFR — Annually | 3.425% — Annually | 15,118 | |
| 2,836,000 | 9,784 | (23) | 6/1/28 | US SOFR — Annually | 3.6105% — Annually | 9,761 | |
| 8,549,000 | 59,416 | (291) | 6/2/53 | US SOFR — Annually | 3.184% — Annually | 59,125 | |
| Total | $3,524,399 | $(723,761) | |||||
| E Extended effective date. | |||||||
| OTC CREDIT DEFAULT CONTRACTS OUTSTANDING — PROTECTION SOLD at 5/31/23 | ||||||||
| Swap counterparty/ Referenced debt* | Rating*** | Upfront premium received (paid)** | Notional amount | Value | Termi- nation date | Payments received by fund | Unrealized appreciation/ (depreciation) | |
| Barclays Bank PLC | ||||||||
| CMBX NA BBB−.7 Index | BB−/P | $34 | $6,000 | $1,267 | 1/17/47 | 300 bp — Monthly | $(1,230) | |
| Citigroup Global Markets, Inc. | ||||||||
| CMBX NA A.6 Index | A/P | 8,834 | 28,288 | 4,206 | 5/11/63 | 200 bp — Monthly | 4,638 | |
| CMBX NA BB.11 Index | BB−/P | 365,555 | 647,000 | 279,569 | 11/18/54 | 500 bp — Monthly | 86,615 | |
| CMBX NA BB.13 Index | BB−/P | 25,194 | 252,000 | 114,912 | 12/16/72 | 500 bp — Monthly | (89,473) | |
| CMBX NA BB.13 Index | BB−/P | 30,616 | 336,000 | 153,216 | 12/16/72 | 500 bp — Monthly | (122,273) | |
| CMBX NA BB.13 Index | BB−/P | 52,944 | 561,000 | 255,816 | 12/16/72 | 500 bp — Monthly | (202,327) | |
| CMBX NA BB.13 Index | BB−/P | 408,566 | 1,579,000 | 720,024 | 12/16/27 | 500 bp — Monthly | (309,923) | |
| CMBX NA BB.13 Index | BB−/P | 182,893 | 2,006,000 | 914,736 | 12/16/72 | 500 bp — Monthly | (729,892) | |
| CMBX NA BB.14 Index | BB/P | 49,557 | 452,000 | 204,620 | 12/16/72 | 500 bp — Monthly | (154,624) | |
| CMBX NA BB.6 Index | B/P | 37,728 | 177,228 | 70,501 | 5/11/63 | 500 bp — Monthly | (32,601) | |
| CMBX NA BB.6 Index | B/P | 114,988 | 193,401 | 76,935 | 5/11/63 | 500 bp — Monthly | 38,241 | |
| CMBX NA BB.6 Index | B/P | 71,327 | 295,829 | 117,681 | 5/11/63 | 500 bp — Monthly | (46,066) | |
| CMBX NA BB.6 Index | B/P | 489,542 | 826,166 | 328,649 | 5/11/63 | 500 bp — Monthly | 161,696 | |
| CMBX NA BB.6 Index | B/P | 754,500 | 1,016,872 | 404,512 | 5/11/63 | 500 bp — Monthly | 350,977 | |
| CMBX NA BB.7 Index | B-/P | 60,373 | 1,183,000 | 497,215 | 1/17/47 | 500 bp — Monthly | (435,692) | |
| CMBX NA BB.9 Index | B/P | 204 | 1,000 | 437 | 9/17/58 | 500 bp — Monthly | (232) | |
| CMBX NA BB.9 Index | B/P | 66,168 | 324,000 | 141,523 | 9/17/58 | 500 bp — Monthly | (75,040) | |
| CMBX NA BB.9 Index | B/P | 68,460 | 326,000 | 142,397 | 9/17/58 | 500 bp — Monthly | (73,620) | |
| CMBX NA BBB−.10 Index | BB+/P | 15,138 | 122,000 | 39,491 | 11/17/59 | 300 bp — Monthly | (24,282) | |
| CMBX NA BBB−.10 Index | BB+/P | 24,219 | 222,000 | 71,861 | 11/17/59 | 300 bp — Monthly | (47,513) | |
| CMBX NA BBB−.13 Index | BBB−/P | 10,635 | 113,000 | 36,589 | 12/16/72 | 300 bp — Monthly | (25,889) | |
| CMBX NA BBB−.13 Index | BBB−/P | 35,956 | 410,000 | 132,758 | 12/16/72 | 300 bp — Monthly | (96,563) | |
28 Mortgage Opportunities Fund | |
| OTC CREDIT DEFAULT CONTRACTS OUTSTANDING — PROTECTION SOLD at 5/31/23 cont. | ||||||||
| Swap counterparty/ Referenced debt* | Rating*** | Upfront premium received (paid)** | Notional amount | Value | Termi- nation date | Payments received by fund | Unrealized appreciation/ (depreciation) | |
| Citigroup Global Markets, Inc. cont. | ||||||||
| CMBX NA BBB−.15 Index | BBB−/P | $1,280,986 | $4,796,000 | $1,486,760 | 11/18/64 | 300 bp — Monthly | $(202,969) | |
| CMBX NA BBB−.16 Index | BBB−/P | 276,187 | 1,215,000 | 375,800 | 4/17/65 | 300 bp — Monthly | (98,904) | |
| Credit Suisse International | ||||||||
| CMBX NA A.7 Index | BBB/P | 110 | 3,000 | 248 | 1/17/47 | 200 bp — Monthly | (136) | |
| CMBX NA BB.7 Index | B-/P | 44,810 | 335,000 | 140,801 | 1/17/47 | 500 bp — Monthly | (95,665) | |
| CMBX NA BBB−.7 Index | BB−/P | 1,379 | 21,000 | 4,435 | 1/17/47 | 300 bp — Monthly | (3,044) | |
| Goldman Sachs International | ||||||||
| CMBX NA BB.14 Index | BB/P | 30,981 | 199,000 | 90,087 | 12/16/72 | 500 bp — Monthly | (58,913) | |
| CMBX NA BB.14 Index | BB/P | 39,633 | 314,000 | 142,148 | 12/16/72 | 500 bp — Monthly | (102,210) | |
| CMBX NA BB.6 Index | B/P | 122,657 | 200,814 | 79,884 | 5/11/63 | 500 bp — Monthly | 42,968 | |
| CMBX NA BB.6 Index | B/P | 296,785 | 607,158 | 241,527 | 5/11/63 | 500 bp — Monthly | 55,847 | |
| CMBX NA BB.6 Index | B/P | 449,674 | 888,162 | 353,311 | 5/11/63 | 500 bp — Monthly | 97,227 | |
| CMBX NA BB.9 Index | B/P | 264,866 | 655,000 | 286,104 | 9/17/58 | 500 bp — Monthly | (20,602) | |
| CMBX NA BBB−.15 Index | BBB−/P | 4,970 | 80,000 | 24,800 | 11/18/64 | 300 bp — Monthly | (19,783) | |
| CMBX NA BBB−.16 Index | BBB−/P | 222,820 | 857,000 | 265,070 | 4/17/65 | 300 bp — Monthly | (41,750) | |
| CMBX NA BBB−.16 Index | BBB−/P | 216,598 | 900,000 | 278,370 | 4/17/65 | 300 bp — Monthly | (61,247) | |
| CMBX NA BBB−.7 Index | BB−/P | 370 | 5,000 | 1,056 | 1/17/47 | 300 bp — Monthly | (684) | |
| CMBX NA BBB−.7 Index | BB−/P | 3,816 | 37,000 | 7,814 | 1/17/47 | 300 bp — Monthly | (3,977) | |
| CMBX NA BBB−.7 Index | BB−/P | 4,227 | 52,000 | 10,982 | 1/17/47 | 300 bp — Monthly | (6,725) | |
| CMBX NA BBB−.7 Index | BB−/P | 4,856 | 57,000 | 12,038 | 1/17/47 | 300 bp — Monthly | (7,150) | |
| CMBX NA BBB−.7 Index | BB−/P | 23,196 | 206,000 | 43,507 | 1/17/47 | 300 bp — Monthly | (20,191) | |
| JPMorgan Securities LLC | ||||||||
| CMBX NA BB.10 Index | B/P | 23,189 | 289,000 | 133,778 | 5/11/63 | 500 bp — Monthly | (110,308) | |
| CMBX NA BB.6 Index | B/P | 974,000 | 1,274,964 | 507,181 | 5/11/63 | 500 bp — Monthly | 468,058 | |
| CMBX NA BBB−.14 Index | BBB−/P | 6,310 | 102,000 | 31,681 | 12/16/72 | 300 bp — Monthly | (25,312) | |
| CMBX NA BBB−.7 Index | BB−/P | 21,129 | 90,000 | 19,008 | 1/17/47 | 300 bp — Monthly | 2,173 | |
| CMBX NA BBB−.8 Index | BB−/P | 19,336 | 124,000 | 26,350 | 10/17/57 | 300 bp — Monthly | (6,941) | |
| Merrill Lynch International | ||||||||
| CMBX NA BB.6 Index | B/P | 22,364 | 134,774 | 53,613 | 5/11/63 | 500 bp — Monthly | (31,119) | |
| CMBX NA BB.7 Index | B-/P | 16,216 | 134,000 | 56,320 | 1/17/47 | 500 bp — Monthly | (39,973) | |
| CMBX NA BB.7 Index | B-/P | 27,163 | 287,000 | 120,626 | 1/17/47 | 500 bp — Monthly | (93,184) | |
| Morgan Stanley & Co. International PLC | ||||||||
| CMBX NA BB.11 Index | BB−/P | 2,116 | 25,000 | 10,803 | 11/18/54 | 500 bp — Monthly | (8,662) | |
| CMBX NA BB.13 Index | BB−/P | 4,036 | 44,000 | 20,064 | 12/16/72 | 500 bp — Monthly | (15,986) | |
| CMBX NA BB.13 Index | BB−/P | 7,720 | 83,000 | 37,848 | 12/16/72 | 500 bp — Monthly | (30,048) | |
| CMBX NA BB.13 Index | BB−/P | 61,641 | 641,000 | 292,296 | 12/16/72 | 500 bp — Monthly | (230,032) | |
| CMBX NA BB.13 Index | BB−/P | 83,550 | 910,000 | 414,960 | 12/16/72 | 500 bp — Monthly | (330,525) | |
| CMBX NA BB.13 Index | BB−/P | 280,942 | 1,515,000 | 690,840 | 12/16/72 | 500 bp — Monthly | (408,425) | |
| CMBX NA BB.14 Index | BB/P | 115,506 | 944,000 | 427,349 | 12/16/72 | 500 bp — Monthly | (310,925) | |
| CMBX NA BB.15 Index | BB/P | 284,725 | 1,766,000 | 762,559 | 11/18/64 | 500 bp — Monthly | (476,117) | |
| CMBX NA BB.6 Index | B/P | 18,060 | 28,976 | 11,527 | 5/11/63 | 500 bp — Monthly | 6,561 | |
| CMBX NA BB.6 Index | B/P | 7,415 | 41,106 | 16,352 | 5/11/63 | 500 bp — Monthly | (8,897) | |
| CMBX NA BB.6 Index | B/P | 467,596 | 930,616 | 370,199 | 5/11/63 | 500 bp — Monthly | 98,302 | |
| CMBX NA BB.6 Index | B/P | 963,350 | 1,882,122 | 748,708 | 5/11/63 | 500 bp — Monthly | 216,472 | |
| CMBX NA BB.9 Index | B/P | 40,857 | 102,000 | 44,554 | 9/17/58 | 500 bp — Monthly | (3,598) | |
| CMBX NA BBB−.14 Index | BBB−/P | 10,637 | 215,000 | 66,779 | 12/16/72 | 300 bp — Monthly | (56,016) | |
| CMBX NA BBB−.14 Index | BBB−/P | 10,494 | 215,000 | 66,779 | 12/16/72 | 300 bp — Monthly | (56,160) | |
| CMBX NA BBB−.14 Index | BBB−/P | 14,984 | 307,000 | 95,354 | 12/16/72 | 300 bp — Monthly | (80,191) | |
| CMBX NA BBB−.14 Index | BBB−/P | 138,000 | 880,000 | 273,328 | 12/16/27 | 300 bp — Monthly | (134,814) | |
| CMBX NA BBB−.15 Index | BBB−/P | 85,454 | 542,000 | 168,020 | 11/18/64 | 300 bp — Monthly | (82,250) | |
Mortgage Opportunities Fund 29 | |
| OTC CREDIT DEFAULT CONTRACTS OUTSTANDING — PROTECTION SOLD at 5/31/23 cont. | ||||||||
| Swap counterparty/ Referenced debt* | Rating*** | Upfront premium received (paid)** | Notional amount | Value | Termi- nation date | Payments received by fund | Unrealized appreciation/ (depreciation) | |
| Morgan Stanley & Co. International PLC cont. | ||||||||
| CMBX NA BBB−.15 Index | BBB−/P | $152,546 | $898,000 | $278,380 | 11/18/64 | 300 bp — Monthly | $(125,310) | |
| CMBX NA BBB−.16 Index | BBB−/P | 201,401 | 886,000 | 274,040 | 4/17/65 | 300 bp — Monthly | (72,122) | |
| Upfront premium received | 10,223,089 | Unrealized appreciation | 1,629,775 | |||||
| Upfront premium (paid) | — | Unrealized (depreciation) | (5,948,105) | |||||
| Total | $10,223,089 | Total | $(4,318,330) | |||||
| * Payments related to the referenced debt are made upon a credit default event. | ||||||||
| ** Upfront premium is based on the difference between the original spread on issue and the market spread on day of execution. | ||||||||
| *** Ratings for an underlying index represent the average of the ratings of all the securities included in that index. The Moody’s, Standard & Poor’s or Fitch ratings are believed to be the most recent ratings available at May 31, 2023. Securities rated by Putnam are indicated by “/P.” The Putnam rating categories are comparable to the Standard & Poor’s classifications. | ||||||||
| OTC CREDIT DEFAULT CONTRACTS OUTSTANDING — PROTECTION PURCHASED at 5/31/23 | ||||||||
| Swap counterparty/ Referenced debt* | Upfront premium received (paid)** | Notional amount | Value | Termi- nation date | Payments (paid) by fund | Unrealized appreciation/ (depreciation) | ||
| Citigroup Global Markets, Inc. | ||||||||
| CMBX NA A.6 Index | $(11,103) | $42,049 | $6,253 | 5/11/63 | (200 bp) — Monthly | $(4,867) | ||
| CMBX NA A.7 Index | (22) | 3,000 | 248 | 1/17/47 | (200 bp) — Monthly | 224 | ||
| CMBX NA BB.10 Index | (78,285) | 307,000 | 142,110 | 11/17/59 | (500 bp) — Monthly | 63,527 | ||
| CMBX NA BB.10 Index | (61,722) | 256,000 | 118,502 | 11/17/59 | (500 bp) — Monthly | 56,532 | ||
| CMBX NA BB.10 Index | (13,985) | 134,000 | 62,029 | 11/17/59 | (500 bp) — Monthly | 47,914 | ||
| CMBX NA BB.10 Index | (12,061) | 110,000 | 50,919 | 11/17/59 | (500 bp) — Monthly | 38,751 | ||
| CMBX NA BB.11 Index | (25,963) | 509,000 | 219,939 | 11/18/54 | (500 bp) — Monthly | 193,481 | ||
| CMBX NA BB.11 Index | (8,456) | 163,000 | 70,432 | 11/18/54 | (500 bp) — Monthly | 61,818 | ||
| CMBX NA BB.8 Index | (263,238) | 736,370 | 349,923 | 10/17/57 | (500 bp) — Monthly | 85,969 | ||
| CMBX NA BB.8 Index | (38,367) | 298,607 | 141,898 | 10/17/57 | (500 bp) — Monthly | 103,241 | ||
| CMBX NA BBB−.10 Index | (360,552) | 2,097,000 | 678,799 | 11/17/59 | (300 bp) — Monthly | 317,024 | ||
| CMBX NA BBB−.10 Index | (25,080) | 205,000 | 66,359 | 11/17/59 | (300 bp) — Monthly | 41,159 | ||
| CMBX NA BBB−.10 Index | (41,411) | 139,000 | 44,994 | 11/17/59 | (300 bp) — Monthly | 3,502 | ||
| CMBX NA BBB−.10 Index | (3,824) | 30,000 | 9,711 | 11/17/59 | (300 bp) — Monthly | 5,869 | ||
| CMBX NA BBB−.12 Index | (272,677) | 1,689,000 | 563,788 | 8/17/61 | (300 bp) — Monthly | 290,126 | ||
| CMBX NA BBB−.12 Index | (8,468) | 123,000 | 41,057 | 8/17/61 | (300 bp) — Monthly | 32,518 | ||
| CMBX NA BBB−.13 Index | (10,154) | 134,000 | 43,389 | 12/16/72 | (300 bp) — Monthly | 33,157 | ||
| CMBX NA BBB−.13 Index | (3,429) | 68,000 | 22,018 | 12/16/72 | (300 bp) — Monthly | 18,550 | ||
| CMBX NA BBB−.13 Index | (3,463) | 68,000 | 22,018 | 12/16/72 | (300 bp) — Monthly | 18,516 | ||
| CMBX NA BBB−.7 Index | (60,813) | 278,000 | 58,714 | 1/17/47 | (300 bp) — Monthly | (2,261) | ||
| CMBX NA BBB−.7 Index | (989) | 196,000 | 41,395 | 1/17/47 | (300 bp) — Monthly | 40,292 | ||
| CMBX NA BBB−.8 Index | (219,000) | 1,460,000 | 310,250 | 10/17/57 | (300 bp) — Monthly | 90,398 | ||
| CMBX NA BBB−.8 Index | (33,994) | 245,000 | 52,063 | 10/17/57 | (300 bp) — Monthly | 17,926 | ||
| CMBX NA BBB−.8 Index | (13,459) | 97,000 | 20,613 | 10/17/57 | (300 bp) — Monthly | 7,097 | ||
| CMBX NA BBB−.9 Index | (946) | 4,000 | 971 | 9/17/58 | (300 bp) — Monthly | 23 | ||
| Credit Suisse International | ||||||||
| CMBX NA BB.10 Index | (50,421) | 424,000 | 196,270 | 11/17/59 | (500 bp) — Monthly | 145,436 | ||
| CMBX NA BB.10 Index | (27,719) | 223,000 | 103,227 | 11/17/59 | (500 bp) — Monthly | 75,291 | ||
| Goldman Sachs International | ||||||||
| CMBX NA A.6 Index | (1,060) | 6,116 | 909 | 5/11/63 | (200 bp) — Monthly | (153) | ||
| CMBX NA A.6 Index | (589) | 2,294 | 341 | 5/11/63 | (200 bp) — Monthly | (249) | ||
| CMBX NA A.6 Index | (615) | 2,294 | 341 | 5/11/63 | (200 bp) — Monthly | (275) | ||
| CMBX NA A.6 Index | (488) | 1,911 | 284 | 5/11/63 | (200 bp) — Monthly | (204) | ||
| CMBX NA A.6 Index | (393) | 1,529 | 227 | 5/11/63 | (200 bp) — Monthly | (166) | ||
| CMBX NA A.6 Index | (305) | 1,147 | 171 | 5/11/63 | (200 bp) — Monthly | (135) | ||
| CMBX NA A.6 Index | (291) | 1,147 | 171 | 5/11/63 | (200 bp) — Monthly | (121) | ||
| CMBX NA A.6 Index | (291) | 1,147 | 171 | 5/11/63 | (200 bp) — Monthly | (121) | ||
30 Mortgage Opportunities Fund | |
| OTC CREDIT DEFAULT CONTRACTS OUTSTANDING — PROTECTION PURCHASED at 5/31/23 cont. | ||||||||
| Swap counterparty/ Referenced debt* | Upfront premium received (paid)** | Notional amount | Value | Termi- nation date | Payments (paid) by fund | Unrealized appreciation/ (depreciation) | ||
| Goldman Sachs International cont. | ||||||||
| CMBX NA A.6 Index | $(198) | $765 | $114 | 5/11/63 | (200 bp) — Monthly | $(84) | ||
| CMBX NA A.6 Index | (174) | 765 | 114 | 5/11/63 | (200 bp) — Monthly | (61) | ||
| CMBX NA A.6 Index | (198) | 765 | 114 | 5/11/63 | (200 bp) — Monthly | (84) | ||
| CMBX NA A.6 Index | (201) | 765 | 114 | 5/11/63 | (200 bp) — Monthly | (88) | ||
| CMBX NA A.6 Index | (86) | 382 | 57 | 5/11/63 | (200 bp) — Monthly | (29) | ||
| CMBX NA BB.10 Index | (286,885) | 1,268,000 | 586,957 | 11/17/59 | (500 bp) — Monthly | 298,839 | ||
| CMBX NA BB.9 Index | (9,105) | 57,000 | 24,898 | 9/17/58 | (500 bp) — Monthly | 15,738 | ||
| CMBX NA BB.9 Index | (6,258) | 52,000 | 22,714 | 9/17/58 | (500 bp) — Monthly | 16,405 | ||
| CMBX NA BB.9 Index | (1,903) | 49,000 | 21,403 | 9/17/58 | (500 bp) — Monthly | 19,453 | ||
| CMBX NA BB.9 Index | (4,641) | 39,000 | 17,035 | 9/17/58 | (500 bp) — Monthly | 12,356 | ||
| CMBX NA BB.9 Index | (3,026) | 29,000 | 12,667 | 9/17/58 | (500 bp) — Monthly | 9,613 | ||
| CMBX NA BBB−.12 Index | (971,289) | 5,419,000 | 1,808,862 | 8/17/61 | (300 bp) — Monthly | 834,412 | ||
| CMBX NA BBB−.12 Index | (210,201) | 1,177,000 | 392,883 | 8/17/61 | (300 bp) — Monthly | 181,995 | ||
| CMBX NA BBB−.13 Index | (18,566) | 245,000 | 79,331 | 12/16/72 | (300 bp) — Monthly | 60,622 | ||
| CMBX NA BBB−.13 Index | (366) | 6,000 | 1,943 | 12/16/72 | (300 bp) — Monthly | 1,574 | ||
| JPMorgan Securities LLC | ||||||||
| CMBX NA A.6 Index | (234) | 1,147 | 171 | 5/11/63 | (200 bp) — Monthly | (64) | ||
| CMBX NA BB.7 Index | (1,047,366) | 2,139,000 | 899,022 | 1/17/47 | (500 bp) — Monthly | (150,428) | ||
| CMBX NA BBB−.10 Index | (74,773) | 593,000 | 191,954 | 11/17/59 | (300 bp) — Monthly | 116,835 | ||
| CMBX NA BBB−.8 Index | (10,823) | 78,000 | 16,575 | 10/17/57 | (300 bp) — Monthly | 5,707 | ||
| Merrill Lynch International | ||||||||
| CMBX NA BB.10 Index | (19,061) | 335,000 | 155,072 | 11/17/59 | (500 bp) — Monthly | 135,684 | ||
| Morgan Stanley & Co. International PLC | ||||||||
| CMBX NA A.6 Index | (488) | 1,911 | 284 | 5/11/63 | (200 bp) — Monthly | (204) | ||
| CMBX NA A.6 Index | (97) | 382 | 57 | 5/11/63 | (200 bp) — Monthly | (40) | ||
| CMBX NA BB.10 Index | (68,344) | 225,000 | 104,153 | 11/17/59 | (500 bp) — Monthly | 35,590 | ||
| CMBX NA BB.10 Index | (14,053) | 134,000 | 62,029 | 11/17/59 | (500 bp) — Monthly | 47,845 | ||
| CMBX NA BB.7 Index | (63,621) | 340,000 | 142,902 | 1/17/47 | (500 bp) — Monthly | 78,950 | ||
| CMBX NA BB.7 Index | (34,709) | 180,000 | 75,654 | 1/17/47 | (500 bp) — Monthly | 40,770 | ||
| CMBX NA BB.8 Index | (85,881) | 229,029 | 108,834 | 10/17/57 | (500 bp) — Monthly | 22,731 | ||
| CMBX NA BB.8 Index | (32,734) | 86,006 | 40,870 | 10/17/57 | (500 bp) — Monthly | 8,052 | ||
| CMBX NA BB.9 Index | (33,197) | 941,000 | 411,029 | 9/17/58 | (500 bp) — Monthly | 376,917 | ||
| CMBX NA BB.9 Index | (2,815) | 72,000 | 31,450 | 9/17/58 | (500 bp) — Monthly | 28,565 | ||
| CMBX NA BB.9 Index | (5,559) | 65,000 | 28,392 | 9/17/58 | (500 bp) — Monthly | 22,770 | ||
| CMBX NA BB.9 Index | (3,447) | 56,000 | 24,461 | 9/17/58 | (500 bp) — Monthly | 20,959 | ||
| CMBX NA BB.9 Index | (4,844) | 32,000 | 13,978 | 9/17/58 | (500 bp) — Monthly | 9,103 | ||
| CMBX NA BB.9 Index | (2,305) | 16,000 | 6,989 | 9/17/58 | (500 bp) — Monthly | 4,668 | ||
| CMBX NA BBB−.10 Index | (11,028) | 51,000 | 16,509 | 11/17/59 | (300 bp) — Monthly | 5,451 | ||
| CMBX NA BBB−.10 Index | (434) | 2,000 | 647 | 11/17/59 | (300 bp) — Monthly | 213 | ||
| CMBX NA BBB−.12 Index | (165,119) | 1,268,000 | 423,258 | 8/17/61 | (300 bp) — Monthly | 257,400 | ||
| CMBX NA BBB−.13 Index | (123) | 2,000 | 648 | 12/16/72 | (300 bp) — Monthly | 523 | ||
| CMBX NA BBB−.8 Index | (208,302) | 1,339,000 | 284,538 | 10/17/57 | (300 bp) — Monthly | 75,454 | ||
| CMBX NA BBB−.8 Index | (107,262) | 684,000 | 145,350 | 10/17/57 | (300 bp) — Monthly | 37,689 | ||
| CMBX NA BBB−.8 Index | (88,846) | 629,000 | 133,663 | 10/17/57 | (300 bp) — Monthly | 44,449 | ||
| CMBX NA BBB−.8 Index | (49,050) | 360,000 | 76,500 | 10/17/57 | (300 bp) — Monthly | 27,240 | ||
| CMBX NA BBB−.8 Index | (38,653) | 285,000 | 60,563 | 10/17/57 | (300 bp) — Monthly | 21,743 | ||
| CMBX NA BBB−.8 Index | (27,649) | 202,000 | 42,925 | 10/17/57 | (300 bp) — Monthly | 15,158 | ||
| CMBX NA BBB−.8 Index | (21,183) | 148,000 | 31,450 | 10/17/57 | (300 bp) — Monthly | 10,181 | ||
| CMBX NA BBB−.8 Index | (14,210) | 112,000 | 23,800 | 10/17/57 | (300 bp) — Monthly | 9,525 | ||
Mortgage Opportunities Fund 31 | |
| OTC CREDIT DEFAULT CONTRACTS OUTSTANDING — PROTECTION PURCHASED at 5/31/23 cont. | ||||||||
| Swap counterparty/ Referenced debt* | Upfront premium received (paid)** | Notional amount | Value | Termi- nation date | Payments (paid) by fund | Unrealized appreciation/ (depreciation) | ||
| Morgan Stanley & Co. International PLC cont. | ||||||||
| CMBX NA BBB−.8 Index | $(5,625) | $36,000 | $7,650 | 10/17/57 | (300 bp) — Monthly | $2,004 | ||
| CMBX NA BBB−.8 Index | (488) | 3,000 | 638 | 10/17/57 | (300 bp) — Monthly | 148 | ||
| Upfront premium received | — | Unrealized appreciation | 4,701,672 | |||||
| Upfront premium (paid) | (5,409,053) | Unrealized (depreciation) | (159,634) | |||||
| Total | $(5,409,053) | Total | $4,542,038 | |||||
| * Payments related to the referenced debt are made upon a credit default event. | ||||||||
| ** Upfront premium is based on the difference between the original spread on issue and the market spread on day of execution. | ||||||||
ASC 820 establishes a three-level hierarchy for disclosure of fair value measurements. The valuation hierarchy is based upon the transparency of inputs to the valuation of the fund’s investments. The three levels are defined as follows:
Level 1: Valuations based on quoted prices for identical securities in active markets.
Level 2: Valuations based on quoted prices in markets that are not active or for which all significant inputs are observable, either directly or indirectly.
Level 3: Valuations based on inputs that are unobservable and significant to the fair value measurement.
The following is a summary of the inputs used to value the fund’s net assets as of the close of the reporting period:
| Valuation inputs | |||
| Investments in securities: | Level 1 | Level 2 | Level 3 |
| Asset-backed securities | $— | $1,069,234 | $— |
| Mortgage-backed securities | — | 319,692,570 | — |
| U.S. government and agency mortgage obligations | — | 1,061,687,701 | — |
| Short-term investments | 1,648,000 | 44,538,224 | — |
| Totals by level | $1,648,000 | $1,426,987,729 | $— |
| Valuation inputs | |||
| Other financial instruments: | Level 1 | Level 2 | Level 3 |
| Futures contracts | $(1,122,909) | $— | $— |
| Forward premium swap option contracts | — | (1,032,301) | — |
| TBA sale commitments | — | (620,857,574) | — |
| Interest rate swap contracts | — | (4,248,160) | — |
| Credit default contracts | — | (4,590,328) | — |
| Totals by level | $(1,122,909) | $(630,728,363) | $— |
The accompanying notes are an integral part of these financial statements.
32 Mortgage Opportunities Fund | |
Statement of assets and liabilities 5/31/23
| ASSETS | |
| Investment in securities, at value of securities on loan (Notes 1 and 8): | |
| Unaffiliated issuers (identified cost $1,431,873,195) | $1,408,411,929 |
| Affiliated issuers (identified cost $20,223,800) (Note 5) | 20,223,800 |
| Interest and other receivables | 3,245,458 |
| Receivable for shares of the fund sold | 1,026,023 |
| Receivable for investments sold | 2,636,186 |
| Receivable for sales of TBA securities (Note 1) | 350,021,101 |
| Receivable from Manager (Note 2) | 13,267 |
| Receivable for variation margin on centrally cleared swap contracts (Note 1) | 2,161,071 |
| Unrealized appreciation on forward premium swap option contracts (Note 1) | 500,583 |
| Unrealized appreciation on OTC swap contracts (Note 1) | 6,331,447 |
| Premium paid on OTC swap contracts (Note 1) | 5,409,053 |
| Deposits with broker (Note 1) | 2,960,872 |
| Prepaid assets | 54,393 |
| Total assets | 1,802,995,183 |
| LIABILITIES | |
| Payable to custodian | 5,660 |
| Payable for investments purchased | 264 |
| Payable for purchases of TBA securities (Note 1) | 795,343,455 |
| Payable for shares of the fund repurchased | 981,799 |
| Payable for custodian fees (Note 2) | 39,085 |
| Payable for investor servicing fees (Note 2) | 64,502 |
| Payable for Trustee compensation and expenses (Note 2) | 4,203 |
| Payable for administrative services (Note 2) | 2,611 |
| Payable for distribution fees (Note 2) | 6,128 |
| Payable for variation margin on futures contracts (Note 1) | 1,947,117 |
| Payable for variation margin on centrally cleared swap contracts (Note 1) | 2,098,482 |
| Payable to broker (Note 1) | 862,282 |
| Unrealized depreciation on forward premium swap option contracts (Note 1) | 1,532,884 |
| Unrealized depreciation on OTC swap contracts (Note 1) | 6,107,739 |
| Premium received on OTC swap contracts (Note 1) | 10,223,089 |
| TBA sale commitments, at value (proceeds receivable $622,872,402) (Note 1) | 620,857,574 |
| Collateral on certain derivative contracts and TBA commitments, at value (Notes 1 and 8) | 1,648,000 |
| Other accrued expenses | 170,110 |
| Total liabilities | 1,441,894,984 |
| Net assets | $361,100,199 |
| REPRESENTED BY | |
| Paid-in capital (Unlimited shares authorized) (Notes 1 and 4) | $417,514,985 |
| Total distributable earnings (Note 1) | (56,414,786) |
| Total — Representing net assets applicable to capital shares outstanding | $361,100,199 |
| COMPUTATION OF NET ASSET VALUE AND OFFERING PRICE | |
| Net asset value and redemption price per class A share ($10,290,861 divided by 1,204,237 shares) | $8.55 |
| Offering price per class A share (100/96.00 of $8.55)* | $8.91 |
| Net asset value and offering price per class C share ($1,835,500 divided by 214,269 shares)** | $8.57 |
| Net asset value and offering price per class I share ($147,651,457 divided by 17,244,862 shares) | $8.56 |
| Net asset value, offering price and redemption price per class R6 share ($3,548,192 divided by 414,399 shares) | $8.56 |
| Net asset value, offering price and redemption price per class Y share ($197,774,189 divided by 23,122,894 shares) | $8.55 |
* On single retail sales of less than $100,000. On sales of $100,000 or more the offering price is reduced.
** Redemption price per share is equal to net asset value less any applicable contingent deferred sales charge.
The accompanying notes are an integral part of these financial statements.
| Mortgage Opportunities Fund 33 |
Statement of operations Year ended 5/31/23
| INVESTMENT INCOME | |
| Interest (including interest income of $1,753,204 from investments in affiliated issuers) (Note 5) | $25,939,093 |
| Total investment income | 25,939,093 |
| EXPENSES | |
| Compensation of Manager (Note 2) | 2,090,573 |
| Investor servicing fees (Note 2) | 357,545 |
| Custodian fees (Note 2) | 69,546 |
| Trustee compensation and expenses (Note 2) | 17,104 |
| Distribution fees (Note 2) | 44,659 |
| Administrative services (Note 2) | 14,384 |
| Other | 319,970 |
| Fees waived and reimbursed by Manager (Note 2) | (761,510) |
| Total expenses | 2,152,271 |
| Expense reduction (Note 2) | (10,679) |
| Net expenses | 2,141,592 |
| Net investment income | 23,797,501 |
| REALIZED AND UNREALIZED GAIN (LOSS) | |
| Net realized gain (loss) on: | |
| Securities from unaffiliated issuers (Notes 1 and 3) | (13,604,156) |
| Futures contracts (Note 1) | 4,689,491 |
| Swap contracts (Note 1) | 8,005,578 |
| Written options (Note 1) | (3,048,633) |
| Total net realized loss | (3,957,720) |
| Change in net unrealized appreciation (depreciation) on: | |
| Securities from unaffiliated issuers and TBA sale commitments | (8,746,176) |
| Futures contracts | (1,122,909) |
| Swap contracts | 3,567,428 |
| Written options | (290,415) |
| Total change in net unrealized depreciation | (6,592,072) |
| Net loss on investments | (10,549,792) |
| Net increase in net assets resulting from operations | $13,247,709 |
The accompanying notes are an integral part of these financial statements.
| 34 Mortgage Opportunities Fund |
Statement of changes in net assets
| INCREASE IN NET ASSETS | Year ended 5/31/23 | Year ended 5/31/22 |
| Operations | ||
| Net investment income | $23,797,501 | $8,032,703 |
| Net realized loss on investments | (3,957,720) | (7,575,262) |
| Change in net unrealized appreciation (depreciation) of investments | (6,592,072) | 1,115,440 |
| Net increase in net assets resulting from operations | 13,247,709 | 1,572,881 |
| Distributions to shareholders (Note 1): | ||
| From ordinary income | ||
| Net investment income | ||
| Class A | (942,840) | (113,715) |
| Class C | (89,144) | (10,334) |
| Class I | (10,329,786) | (8,827,915) |
| Class R6 | (248,094) | (67,032) |
| Class Y | (16,123,649) | (2,355,394) |
| Net realized short-term gain on investments | ||
| Class A | (100,663) | — |
| Class C | (9,190) | — |
| Class I | (857,087) | — |
| Class R6 | (20,720) | — |
| Class Y | (1,532,912) | — |
| Increase from capital share transactions (Note 4) | 108,001,065 | 98,087,454 |
| Total increase in net assets | 90,994,689 | 88,285,945 |
| NET ASSETS | ||
| Beginning of year | 270,105,510 | 181,819,565 |
| End of year | $361,100,199 | $270,105,510 |
The accompanying notes are an integral part of these financial statements.
| Mortgage Opportunities Fund 35 |
Financial highlights
(For a common share outstanding throughout the period)
| INVESTMENT OPERATIONS | LESS DISTRIBUTIONS | RATIOS AND SUPPLEMENTAL DATA | ||||||||||||
| Net asset | Net realized | |||||||||||||
| value, | and unrealized | Total from | From net | From | Ratio of expenses to average | Ratio of net investment | ||||||||
| beginning | Net investment | gain (loss) on | investment | investment | From | return of | Total | Net asset value, | Total return at | Net assets, end of period | net assets excluding interest | income (loss) to average | ||
| Period ended | of period | income (loss)a | investments | operations | income | realized gain | capital | distributions | end of period | net asset value (%)b | (in thousands) | expense (%)c,d | net assets (%)d | Portfolio turnover (%)e |
| Class A | ||||||||||||||
| May 31, 2023 | $8.90 | .53 | (.24) | .29 | (.59) | (.05) | — | (0.64) | $8.55 | 3.37 | $10,291 | .86 | 6.03 | 1,412 |
| May 31, 2022 | 9.41 | .39 | (.33) | .06 | (.57) | — | — | (0.57) | 8.90 | .81 | 3,693 | .78 | 4.28 | 1,790 |
| May 31, 2021 | 9.01 | .34 | .39 | .73 | (.32) | — | (.01) | (0.33) | 9.41 | 8.19 | 1,660 | .75 | 3.64 | 1,058 |
| May 31, 2020 † | 10.51 | .31 | (1.11) | (.80) | (.69) | — | (.01) | (0.70) | 9.01 | (8.32)* | 2,805 | .71* | 3.11* | 1,311 |
| Class C | ||||||||||||||
| May 31, 2023 | $8.92 | .47 | (.24) | .23 | (.53) | (.05) | — | (0.58) | $8.57 | 2.60 | $1,836 | 1.61 | 5.37 | 1,412 |
| May 31, 2022 | 9.42 | .32 | (.32) | —f | (.50) | — | — | (0.50) | 8.92 | .07 | $382 | 1.53 | 3.47 | 1,790 |
| May 31, 2021 | 9.01 | .28 | .39 | .67 | (.26) | — | —f | (0.26) | 9.42 | 7.48 | 260 | 1.50 | 2.93 | 1,058 |
| May 31, 2020 † | 10.51 | .24 | (1.11) | (.87) | (.62) | — | (.01) | (0.63) | 9.01 | (8.91)* | 337 | 1.40* | 2.46* | 1,311 |
| Class I | ||||||||||||||
| May 31, 2023 | $8.91 | .55 | (.23) | .32 | (.62) | (.05) | — | (0.67) | $8.56 | 3.74 | $147,651 | .47 | 6.27 | 1,412 |
| May 31, 2022 | 9.43 | .41 | (.33) | .08 | (.60) | — | — | (0.60) | 8.91 | .97 | 141,000 | .47 | 4.55 | 1,790 |
| May 31, 2021 | 9.02 | .37 | .40 | .77 | (.35) | — | (.01) | (0.36) | 9.43 | 8.58 | 135,399 | .47 | 3.94 | 1,058 |
| May 31, 2020 | 10.46 | .36 | (1.08) | (.72) | (.71) | — | (.01) | (0.72) | 9.02 | (7.40) | 196,765 | .47 | 3.50 | 1,311 |
| May 31, 2019 | 10.73 | .47 | (.14) | .33 | (.60) | — | — | (0.60) | 10.46 | 3.25 | 222,073 | .47 | 4.41 | 1,012 |
| Class R6 | ||||||||||||||
| May 31, 2023 | $8.91 | .55 | (.23) | .32 | (.62) | (.05) | — | (0.67) | $8.56 | 3.70 | $3,548 | .51 | 6.30 | 1,412 |
| May 31, 2022 | 9.43 | .41 | (.33) | .08 | (.60) | — | — | (0.60) | 8.91 | .96 | 1,157 | .51 | 4.51 | 1,790 |
| May 31, 2021 # | 9.02 | .38 | .39 | .77 | (.35) | — | (.01) | (0.36) | 9.43 | 8.56 | 1,017 | .51 | 4.01 | 1,058 |
| Class Y | ||||||||||||||
| May 31, 2023 | $8.90 | .55 | (.24) | .31 | (.61) | (.05) | — | (0.66) | $8.55 | 3.63 | $197,774 | .61 | 6.29 | 1,412 |
| May 31, 2022 | 9.42 | .41 | (.33) | .08 | (.60) | — | — | (0.60) | 8.90 | .96 | 123,873 | .53 | 4.52 | 1,790 |
| May 31, 2021 | 9.02 | .37 | .39 | .76 | (.35) | — | (.01) | (0.36) | 9.42 | 8.46 | 43,483 | .50 | 3.93 | 1,058 |
| May 31, 2020 † | 10.51 | .33 | (1.11) | (.78) | (.70) | — | (.01) | (0.71) | 9.02 | (8.10)* | 54,750 | .48* | 3.40* | 1,311 |
* Not annualized.
# For the period June 1, 2020 (commencement of operations) to May 31, 2021.
† For the period July 1, 2019 (commencement of operations) to May 31, 2020.
a Per share net investment income (loss) has been determined on the basis of the weighted average number of shares outstanding during the period.
b Total return assumes dividend reinvestment and does not reflect the effect of sales charges.
c Includes amounts paid through expense offset and/or brokerage service arrangements, if any (Note 2). Also excludes acquired fund fees and expenses, if any.
d Reflects an involuntary contractual expense limitations in effect during the period. As a result of such limitations, the expenses of each class reflect a reduction of the following amount (Note 2):
| Percentage of average net assets | |||||||||||
| 5/31/23 | 5/31/22 | 5/31/21 | 5/31/20 | 5/31/19 | |||||||
| Class A | 0.20% | 0.28% | 0.27% | 0.20% | N/A | ||||||
| Class C | 0.20 | 0.28 | 0.27 | 0.20 | N/A | ||||||
| Class I | 0.20 | 0.28 | 0.27 | 0.22 | 0.21% | ||||||
| Class R6 | 0.20 | 0.28 | 0.27 | N/A | N/A | ||||||
| Class Y | 0.20 | 0.28 | 0.27 | 0.20 | N/A | ||||||
e Portfolio turnover includes TBA roll transactions.
f Represents less than $0.01 per share.
The accompanying notes are an integral part of these financial statements.
| 36 Mortgage Opportunities Fund | Mortgage Opportunities Fund 37 |
Notes to financial statements 5/31/23
Unless otherwise noted, the “reporting period” represents the period from June 1, 2022 through May 31, 2023. The following table defines commonly used references within the Notes to financial statements:
| References to | Represent |
| Putnam Management | Putnam Investment Management, LLC, the fund’s manager, an indirect wholly-owned subsidiary of Putnam Investments, LLC |
| State Street | State Street Bank and Trust Company |
| JPMorgan | JPMorgan Chase Bank, N.A. |
| the SEC | the Securities and Exchange Commission |
| OTC | over-the-counter |
| PIL | Putnam Investments Limited, an affiliate of Putnam Management |
Putnam Mortgage Opportunities Fund (the fund) is a diversified series of Putnam Funds Trust (the Trust), a Massachusetts business trust registered under the Investment Company Act of 1940, as amended, as an open-end management investment company. The goal of the fund is to maximize total return consistent with what Putnam Management believes to be prudent risk. Total return is composed of capital appreciation and income. The fund invests mainly in mortgage-related fixed income securities and related derivatives that are either investment-grade or below-investment-grade in quality (sometimes referred to as “junk bonds”). Under normal circumstances, the fund invests at least 80% of its net assets in mortgages, mortgage-related fixed income securities and related derivatives (i.e., derivatives used to acquire exposure to, or whose underlying securities are, mortgages or mortgage-related securities). The fund generally uses the net unrealized gain or loss, or market value, of mortgage-related derivatives for purposes of this policy, but may use the notional value of a derivative if that is determined to be a more appropriate measure of the fund’s investment exposure. This policy may be changed only after 60 days’ notice to shareholders. Putnam Management expects to invest in lower-rated, higher-yielding mortgage-backed securities, including nonagency residential mortgage-backed securities (which may be backed by non-qualified or “sub-prime” mortgages), commercial mortgage-backed securities, collateralized mortgage obligations (including interest only, principal only, and other prepayment derivatives), and agency mortgage-backed securities. The fund currently has significant investment exposure to commercial mortgage-backed securities. Non-agency (i.e., privately issued) securities typically are lower-rated and higher yielding than securities issued or backed by agencies such as Ginnie Mae, Fannie Mae or Freddie Mac. While Putnam Management’s emphasis will be on mortgage-backed securities, Putnam Management may also invest to a lesser extent in other types of asset-backed securities. Putnam Management may consider, among other factors, credit, interest rate, prepayment and liquidity risks, as well as general market conditions, when deciding whether to buy or sell investments. Putnam Management typically uses to a significant extent derivatives, including interest rate swaps, forward delivery contracts and total return swaps, options and swaptions on mortgage-backed securities and indices, for both hedging and non-hedging purposes, including to obtain or adjust exposure to mortgage-backed investments.
The fund offers the following share classes. The expenses for each class of shares may differ based on the distribution and investor servicing fees of each class, which are identified in Note 2.
| Share class | Sales charge | Contingent deferred sales charge | Conversion feature |
| 1.00% on certain redemptions of shares bought | |||
| Class A | Up to 4.00% | with no initial sales charge | None |
| Class C | None | 1.00% eliminated after one year | Converts to class A shares after 8 years |
| Class I§ | None | None | None |
| Class R6† | None | None | None |
| Class Y† | None | None | None |
† Not available to all investors.
§ Intended for institutional and other investors who meet the $5,000,000 minimum investment and who are not purchasing through an intermediary.
In the normal course of business, the fund enters into contracts that may include agreements to indemnify another party under given circumstances. The fund’s maximum exposure under these arrangements is unknown as this would involve future claims that may be, but have not yet been, made against the fund. However, the fund’s management team expects the risk of material loss to be remote.
The fund has entered into contractual arrangements with an investment adviser, administrator, distributor, shareholder servicing agent and custodian, who each provide services to the fund. Unless expressly stated otherwise, shareholders are not parties to, or intended beneficiaries of these contractual arrangements, and these contractual arrangements are not intended to create any shareholder right to enforce them against the service providers or to seek any remedy under them against the service providers, either directly or on behalf of the fund.
Under the fund’s Amended and Restated Agreement and Declaration of Trust, any claims asserted against or on behalf of the Putnam Funds, including claims against Trustees and Officers, must be brought in state and federal courts located within the Commonwealth of Massachusetts.
Note 1: Significant accounting policies
The following is a summary of significant accounting policies consistently followed by the fund in the preparation of its financial statements. The preparation of financial statements is in conformity with accounting principles generally accepted in the United States of America and requires management to make estimates and assumptions that affect the reported amounts of assets and liabilities in the financial statements and the reported amounts of increases and decreases in net assets from operations. Actual results could differ from those estimates. Subsequent events after the Statement of assets and liabilities date through the date that the financial statements were issued have been evaluated in the preparation of the financial statements.
Investment income, realized and unrealized gains and losses and expenses of the fund are borne pro-rata based on the relative net assets of each class to the total net assets of the fund, except that each class bears expenses unique to that class (including the distribution fees applicable to such classes). Each class votes as a class only with respect to its own distribution plan or other matters on which a class vote is required by law or determined by the Trustees.
| 38 Mortgage Opportunities Fund |
If the fund were liquidated, shares of each class would receive their pro-rata share of the net assets of the fund. In addition, the Trustees declare separate dividends on each class of shares.
Security valuation Portfolio securities and other investments are valued using policies and procedures adopted by the Board of Trustees. The Trustees have formed a Pricing Committee to oversee the implementation of these procedures and have delegated responsibility for valuing the fund’s assets in accordance with these procedures to Putnam Management. Putnam Management has established an internal Valuation Committee that is responsible for making fair value determinations, evaluating the effectiveness of the pricing policies of the fund and reporting to the Pricing Committee.
Market quotations are not considered to be readily available for certain debt obligations (including short-term investments with remaining maturities of 60 days or less) and other investments; such investments are valued on the basis of valuations furnished by an independent pricing service approved by the Trustees or dealers selected by Putnam Management. Such services or dealers determine valuations for normal institutional-size trading units of such securities using methods based on market transactions for comparable securities and various relationships, generally recognized by institutional traders, between securities (which consider such factors as security prices, yields, maturities and ratings). These securities will generally be categorized as Level 2. Securities quoted in foreign currencies, if any, are translated into U.S. dollars at the current exchange rate.
Investments in open-end investment companies (excluding exchange-traded funds), if any, which can be classified as Level 1 or Level 2 securities, are valued based on their net asset value. The net asset value of such investment companies equals the total value of their assets less their liabilities and divided by the number of their outstanding shares.
To the extent a pricing service or dealer is unable to value a security or provides a valuation that Putnam Management does not believe accurately reflects the security’s fair value, the security will be valued at fair value by Putnam Management, who has been designated as valuation designee pursuant to Rule 2a–5 under the Investment Company Act of 1940, in accordance with policies and procedures approved by the Trustees. Certain investments, including certain restricted and illiquid securities and derivatives, are also valued at fair value following procedures approved by the Trustees. These valuations consider such factors as significant market or specific security events such as interest rate or credit quality changes, various relationships with other securities, discount rates, U.S. Treasury, U.S. swap and credit yields, index levels, convexity exposures, recovery rates, sales and other multiples and resale restrictions. These securities are classified as Level 2 or as Level 3 depending on the priority of the significant inputs.
To assess the continuing appropriateness of fair valuations, the Valuation Committee reviews and affirms the reasonableness of such valuations on a regular basis after considering all relevant information that is reasonably available. Such valuations and procedures are reviewed periodically by the Trustees. Certain securities may be valued on the basis of a price provided by a single source. The fair value of securities is generally determined as the amount that the fund could reasonably expect to realize from an orderly disposition of such securities over a reasonable period of time. By its nature, a fair value price is a good faith estimate of the value of a security in a current sale and does not reflect an actual market price, which may be different by a material amount.
Joint trading account Pursuant to an exemptive order from the SEC, the fund may transfer uninvested cash balances into a joint trading account along with the cash of other registered investment companies and certain other accounts managed by Putnam Management. These balances may be invested in issues of short-term investments having maturities of up to 90 days.
Repurchase agreements The fund, or any joint trading account, through its custodian, receives delivery of the underlying securities, the fair value of which at the time of purchase is required to be in an amount at least equal to the resale price, including accrued interest. Collateral for certain tri-party repurchase agreements is held at the counterparty’s custodian in a segregated account for the benefit of the fund and the counterparty. Putnam Management is responsible for determining that the value of these underlying securities is at all times at least equal to the resale price, including accrued interest. In the event of default or bankruptcy by the other party to the agreement, retention of the collateral may be subject to legal proceedings.
Security transactions and related investment income Security transactions are recorded on the trade date (the date the order to buy or sell is executed). Gains or losses on securities sold are determined on the identified cost basis.
Interest income, net of any applicable withholding taxes, if any, is recorded on the accrual basis. Amortization and accretion of premiums and discounts on debt securities, if any, is recorded on the accrual basis.
Stripped securities The fund may invest in stripped securities which represent a participation in securities that may be structured in classes with rights to receive different portions of the interest and principal. Interest-only securities receive all of the interest and principal-only securities receive all of the principal. If the interest-only securities experience greater than anticipated prepayments of principal, the fund may fail to recoup fully its initial investment in these securities. Conversely, principal-only securities increase in value if prepayments are greater than anticipated and decline if prepayments are slower than anticipated. The fair value of these securities is highly sensitive to changes in interest rates.
Options contracts The fund uses options contracts for hedging duration and convexity, to isolate prepayment risk and to manage downside risks.
The potential risk to the fund is that the change in value of options contracts may not correspond to the change in value of the hedged instruments. In addition, losses may arise from changes in the value of the underlying instruments if there is an illiquid secondary market for the contracts, if interest or exchange rates move unexpectedly or if the counterparty to the contract is unable to perform. Realized gains and losses on purchased options are included in realized gains and losses on investment securities. If a written call option is exercised, the premium originally received is recorded as an addition to sales proceeds. If a written put option is exercised, the premium originally received is recorded as a reduction to the cost of investments.
Exchange-traded options are valued at the last sale price or, if no sales are reported, the last bid price for purchased options and the last ask price for written options. OTC traded options are valued using prices supplied by dealers.
Options on swaps are similar to options on securities except that the premium paid or received is to buy or grant the right to enter into a previously agreed upon interest rate or credit default contract. Forward premium swap option contracts include premiums that have extended settlement dates. The delayed settlement of the premiums is factored into the daily valuation of the option contracts. In the case of interest rate cap and floor contracts, in return for a premium, ongoing payments between two parties are based on interest rates exceeding a specified rate, in the case of a cap contract, or falling below a specified rate in the case of a floor contract.
Written option contracts outstanding at period end, if any, are listed after the fund’s portfolio.
Futures contracts The fund uses futures contracts for hedging treasury term structure risk and for yield curve positioning.
The potential risk to the fund is that the change in value of futures contracts may not correspond to the change in value of the hedged instruments. In addition, losses may arise from changes in the value of the underlying instruments, if there is an illiquid secondary market for the contracts, if interest or exchange rates move unexpectedly or if the counterparty to the contract is unable to perform. With futures, there is minimal counterparty credit risk to the
| Mortgage Opportunities Fund 39 |
fund since futures are exchange traded and the exchange’s clearinghouse, as counterparty to all exchange traded futures, guarantees the futures against default. Risks may exceed amounts recognized on the Statement of assets and liabilities. When the contract is closed, the fund records a realized gain or loss equal to the difference between the value of the contract at the time it was opened and the value at the time it was closed.
Futures contracts are valued at the quoted daily settlement prices established by the exchange on which they trade. The fund and the broker agree to exchange an amount of cash equal to the daily fluctuation in the value of the futures contract. Such receipts or payments are known as “variation margin.”
Futures contracts outstanding at period end, if any, are listed after the fund’s portfolio.
Interest rate swap contracts The fund entered into OTC and/or centrally cleared interest rate swap contracts, which are arrangements between two parties to exchange cash flows based on a notional principal amount, for hedging term structure risk and for yield curve positioning.
An OTC and centrally cleared interest rate swap can be purchased or sold with an upfront premium. For OTC interest rate swap contracts, an upfront payment received by the fund is recorded as a liability on the fund’s books. An upfront payment made by the fund is recorded as an asset on the fund’s books. OTC and centrally cleared interest rate swap contracts are marked to market daily based upon quotations from an independent pricing service or market makers. Any change is recorded as an unrealized gain or loss on OTC interest rate swaps. Daily fluctuations in the value of centrally cleared interest rate swaps are settled through a central clearing agent and are recorded in variation margin on the Statement of assets and liabilities and recorded as unrealized gain or loss. Payments, including upfront premiums, received or made are recorded as realized gains or losses at the reset date or the closing of the contract. Certain OTC and centrally cleared interest rate swap contracts may include extended effective dates. Payments related to these swap contracts are accrued based on the terms of the contract.
The fund could be exposed to credit or market risk due to unfavorable changes in the fluctuation of interest rates or if the counterparty defaults, in the case of OTC interest rate contracts, or the central clearing agency or a clearing member defaults, in the case of centrally cleared interest rate swap contracts, on its respective obligation to perform under the contract. The fund’s maximum risk of loss from counterparty risk or central clearing risk is the fair value of the contract. This risk may be mitigated for OTC interest rate swap contracts by having a master netting arrangement between the fund and the counterparty and for centrally cleared interest rate swap contracts through the daily exchange of variation margin. There is minimal counterparty risk with respect to centrally cleared interest rate swap contracts due to the clearinghouse guarantee fund and other resources that are available in the event of a clearing member default. Risk of loss may exceed amounts recognized on the Statement of assets and liabilities.
OTC and centrally cleared interest rate swap contracts outstanding, including their respective notional amounts at period end, if any, are listed after the fund’s portfolio.
At the close of the reporting period, the fund has deposited cash valued at $2,960,872 in a segregated account to cover margin requirements on open centrally cleared swap contracts.
Total return swap contracts The fund entered into OTC and/or centrally cleared total return swap contracts, which are arrangements to exchange a market-linked return for a periodic payment, both based on a notional principal amount, for hedging sector exposure and for gaining exposure to specific sectors.
To the extent that the total return of the security, index or other financial measure underlying the transaction exceeds or falls short of the offsetting interest rate obligation, the fund will receive a payment from or make a payment to the counterparty. OTC and/or centrally cleared total return swap contracts are marked to market daily based upon quotations from an independent pricing service or market maker. Any change is recorded as an unrealized gain or loss on OTC total return swaps. Daily fluctuations in the value of centrally cleared total return swaps are settled through a central clearing agent and are recorded in variation margin on the Statement of assets and liabilities and recorded as unrealized gain or loss. Payments received or made are recorded as realized gains or losses. Certain OTC and/or centrally cleared total return swap contracts may include extended effective dates. Payments related to these swap contracts are accrued based on the terms of the contract. The fund could be exposed to credit or market risk due to unfavorable changes in the fluctuation of interest rates or in the price of the underlying security or index, the possibility that there is no liquid market for these agreements or that the counterparty may default on its obligation to perform. The fund’s maximum risk of loss from counterparty risk or central clearing risk is the fair value of the contract. This risk may be mitigated for OTC total return swap contracts by having a master netting arrangement between the fund and the counterparty and for centrally cleared total return swap contracts through the daily exchange of variation margin. There is minimal counterparty risk with respect to centrally cleared total return swap contracts due to the clearinghouse guarantee fund and other resources that are available in the event of a clearing member default. Risk of loss may exceed amounts recognized on the Statement of assets and liabilities.
OTC and/or centrally cleared total return swap contracts outstanding, including their respective notional amounts at period end, if any, are listed after the fund’s portfolio.
Credit default contracts The fund entered into OTC and/or centrally cleared credit default contracts for hedging credit risk, for hedging market risk and for gaining exposure to specific sectors.
In OTC and centrally cleared credit default contracts, the protection buyer typically makes a periodic stream of payments to a counterparty, the protection seller, in exchange for the right to receive a contingent payment upon the occurrence of a credit event on the reference obligation or all other equally ranked obligations of the reference entity. Credit events are contract specific but may include bankruptcy, failure to pay, restructuring and obligation acceleration. For OTC credit default contracts, an upfront payment received by the fund is recorded as a liability on the fund’s books. An upfront payment made by the fund is recorded as an asset on the fund’s books. Centrally cleared credit default contracts provide the same rights to the protection buyer and seller except the payments between parties, including upfront premiums, are settled through a central clearing agent through variation margin payments. Upfront and periodic payments received or paid by the fund for OTC and centrally cleared credit default contracts are recorded as realized gains or losses at the reset date or close of the contract. The OTC and centrally cleared credit default contracts are marked to market daily based upon quotations from an independent pricing service or market makers. Any change in value of OTC credit default contracts is recorded as an unrealized gain or loss. Daily fluctuations in the value of centrally cleared credit default contracts are recorded in variation margin on the Statement of assets and liabilities and recorded as unrealized gain or loss. Upon the occurrence of a credit event, the difference between the par value and fair value of the reference obligation, net of any proportional amount of the upfront payment, is recorded as a realized gain or loss.
In addition to bearing the risk that the credit event will occur, the fund could be exposed to market risk due to unfavorable changes in interest rates or in the price of the underlying security or index or the possibility that the fund may be unable to close out its position at the same time or at the same price as if it had purchased the underlying reference obligations. In certain circumstances, the fund may enter into offsetting OTC and centrally cleared credit default contracts which would mitigate its risk of loss. Risks of loss may exceed amounts recognized on the Statement of assets and liabilities. The fund’s maximum risk of loss from counterparty risk, either as the protection seller or as the protection buyer, is the fair value of the contract. This risk may be
| 40 Mortgage Opportunities Fund |
mitigated for OTC credit default contracts by having a master netting arrangement between the fund and the counterparty and for centrally cleared credit default contracts through the daily exchange of variation margin. Counterparty risk is further mitigated with respect to centrally cleared credit default swap contracts due to the clearinghouse guarantee fund and other resources that are available in the event of a clearing member default. Where the fund is a seller of protection, the maximum potential amount of future payments the fund may be required to make is equal to the notional amount.
OTC and centrally cleared credit default contracts outstanding, including their respective notional amounts at period end, if any, are listed after the fund’s portfolio.
TBA commitments The fund may enter into TBA (to be announced) commitments to purchase securities for a fixed unit price at a future date beyond customary settlement time. Although the unit price and par amount have been established, the actual securities have not been specified. However, it is anticipated that the amount of the commitments will not significantly differ from the principal amount. The fund holds, and maintains until settlement date, cash or high-grade debt obligations in an amount sufficient to meet the purchase price, or the fund may enter into offsetting contracts for the forward sale of other securities it owns. Income on the securities will not be earned until settlement date.
The fund may also enter into TBA sale commitments to hedge its portfolio positions, to sell mortgage-backed securities it owns under delayed delivery arrangements or to take a short position in mortgage-backed securities. Proceeds of TBA sale commitments are not received until the contractual settlement date. During the time a TBA sale commitment is outstanding, either equivalent deliverable securities or an offsetting TBA purchase commitment deliverable on or before the sale commitment date are held as “cover” for the transaction, or other liquid assets in an amount equal to the notional value of the TBA sale commitment are segregated. If the TBA sale commitment is closed through the acquisition of an offsetting TBA purchase commitment, the fund realizes a gain or loss. If the fund delivers securities under the commitment, the fund realizes a gain or a loss from the sale of the securities based upon the unit price established at the date the commitment was entered into.
TBA commitments, which are accounted for as purchase and sale transactions, may be considered securities themselves, and involve a risk of loss due to changes in the value of the security prior to the settlement date as well as the risk that the counterparty to the transaction will not perform its obligations. Counterparty risk is mitigated by having a master agreement between the fund and the counterparty.
Unsettled TBA commitments are valued at their fair value according to the procedures described under “Security valuation” above. The contract is marked to market daily and the change in fair value is recorded by the fund as an unrealized gain or loss. Based on market circumstances, Putnam Management will determine whether to take delivery of the underlying securities or to dispose of the TBA commitments prior to settlement.
TBA purchase commitments outstanding at period end, if any, are listed within the fund’s portfolio and TBA sale commitments outstanding at period end, if any, are listed after the fund’s portfolio.
Master agreements The fund is a party to ISDA (International Swaps and Derivatives Association, Inc.) Master Agreements that govern OTC derivative and foreign exchange contracts and Master Securities Forward Transaction Agreements that govern transactions involving mortgage-backed and other asset-backed securities that may result in delayed delivery (Master Agreements) with certain counterparties entered into from time to time. The Master Agreements may contain provisions regarding, among other things, the parties’ general obligations, representations, agreements, collateral requirements, events of default and early termination. With respect to certain counterparties, in accordance with the terms of the Master Agreements, collateral pledged to the fund is held in a segregated account by the fund’s custodian and, with respect to those amounts which can be sold or repledged, are presented in the fund’s portfolio.
Collateral pledged by the fund is segregated by the fund’s custodian and identified in the fund’s portfolio. Collateral can be in the form of cash or debt securities issued by the U.S. Government or related agencies or other securities as agreed to by the fund and the applicable counterparty. Collateral requirements are determined based on the fund’s net position with each counterparty.
With respect to ISDA Master Agreements, termination events applicable to the fund may occur upon a decline in the fund’s net assets below a specified threshold over a certain period of time. Termination events applicable to counterparties may occur upon a decline in the counterparty’s long-term or short-term credit ratings below a specified level. In each case, upon occurrence, the other party may elect to terminate early and cause settlement of all derivative and foreign exchange contracts outstanding, including the payment of any losses and costs resulting from such early termination, as reasonably determined by the terminating party. Any decision by one or more of the fund’s counterparties to elect early termination could impact the fund’s future derivative activity.
At the close of the reporting period, the fund had a net liability position of $7,099,909 on open derivative contracts subject to the Master Agreements. Collateral pledged by the fund at period end for these agreements totaled $6,899,353 and may include amounts related to unsettled agreements.
Interfund lending The fund, along with other Putnam funds, may participate in an interfund lending program pursuant to an exemptive order issued by the SEC. This program allows the fund to borrow from or lend to other Putnam funds that permit such transactions. Interfund lending transactions are subject to each fund’s investment policies and borrowing and lending limits. Interest earned or paid on the interfund lending transaction will be based on the average of certain current market rates. During the reporting period, the fund did not utilize the program.
Lines of credit The fund participates, along with other Putnam funds, in a $320 million syndicated unsecured committed line of credit, provided by State Street ($160 million) and JPMorgan ($160 million), and a $235.5 million unsecured uncommitted line of credit, provided by State Street. Prior to May 2, 2023, the fund participated, along with other Putnam funds, in a $100 million unsecured committed line of credit and a $235.5 million unsecured uncommitted line of credit, both provided by State Street. Borrowings may be made for temporary or emergency purposes, including the funding of shareholder redemption requests and trade settlements. Interest is charged to the fund based on the fund’s borrowing at a rate equal to 1.25% plus the higher of (1) the Federal Funds rate and (2) the Overnight Bank Funding Rate for the committed line of credit and 1.30% plus the higher of (1) the Federal Funds rate and (2) the Overnight Bank Funding Rate for the uncommitted line of credit. A closing fee equal to 0.04% of the committed line of credit and 0.04% of the uncommitted line of credit has been paid by the participating funds and a $75,000 fee has been paid by the participating funds to State Street as agent of the syndicated committed line of credit. In addition, a commitment fee of 0.21% per annum on any unutilized portion of the committed line of credit is allocated to the participating funds based on their relative net assets and paid quarterly. During the reporting period, the fund had no borrowings against these arrangements.
Federal taxes It is the policy of the fund to distribute all of its taxable income within the prescribed time period and otherwise comply with the provisions of the Internal Revenue Code of 1986, as amended (the Code), applicable to regulated investment companies. It is also the intention of the fund to distribute an amount sufficient to avoid imposition of any excise tax under Section 4982 of the Code.
| Mortgage Opportunities Fund 41 |
The fund is subject to the provisions of Accounting Standards Codification 740 Income Taxes (ASC 740). ASC 740 sets forth a minimum threshold for financial statement recognition of the benefit of a tax position taken or expected to be taken in a tax return. The fund did not have a liability to record for any unrecognized tax benefits in the accompanying financial statements. No provision has been made for federal taxes on income, capital gains or unrealized appreciation on securities held nor for excise tax on income and capital gains. Each of the fund’s federal tax returns for the prior three fiscal years remains subject to examination by the Internal Revenue Service.
Under the Regulated Investment Company Modernization Act of 2010, the fund will be permitted to carry forward capital losses incurred for an unlimited period and the carry forwards will retain their character as either short-term or long-term capital losses. At May 31, 2023, the fund had the following capital loss carryovers available, to the extent allowed by the Code, to offset future net capital gain, if any:
| Loss carryover | ||
| Short-term | Long-term | Total |
| $7,362,906 | $4,871,475 | $12,234,381 |
Pursuant to federal income tax regulations applicable to regulated investment companies, the fund has elected to defer certain capital losses of $9,824,048 recognized during the period between November 1, 2022 and May 31, 2023 to its fiscal year ending May 31, 2024.
Distributions to shareholders Distributions to shareholders from net investment income are recorded by the fund on the ex-dividend date. Distributions from capital gains, if any, are recorded on the ex-dividend date and paid at least annually. The amount and character of income and gains to be distributed are determined in accordance with income tax regulations, which may differ from generally accepted accounting principles. These differences include temporary and/or permanent differences from late year loss deferrals, from unrealized gains and losses on certain futures contracts, from interest-only securities, from a redesignation of taxable distributions and from distributions in excess. Reclassifications are made to the fund’s capital accounts to reflect income and gains available for distribution (or available capital loss carryovers) under income tax regulations. At the close of the reporting period, the fund reclassified $60,266 to decrease undistributed net investment income, $2,288,583 to decrease paid-in capital and $2,348,849 to decrease accumulated net realized loss.
Tax cost of investments includes adjustments to net unrealized appreciation (depreciation) which may not necessarily be final tax cost basis adjustments, but closely approximate the tax basis unrealized gains and losses that may be realized and distributed to shareholders. The tax basis components of distributable earnings and the federal tax cost as of the close of the reporting period were as follows:
| Unrealized appreciation | $28,384,212 |
| Unrealized depreciation | (62,740,566) |
| Net unrealized depreciation | (34,356,354) |
| Capital loss carryforward | (12,234,381) |
| Post-October capital loss deferral | (9,824,048) |
| Cost for federal income tax purposes | $831,140,811 |
Expenses of the Trust Expenses directly charged or attributable to any fund will be paid from the assets of that fund. Generally, expenses of the Trust will be allocated among and charged to the assets of each fund on a basis that the Trustees deem fair and equitable, which may be based on the relative assets of each fund or the nature of the services performed and relative applicability to each fund.
Note 2: Management fee, administrative services and other transactions
The fund pays Putnam Management for management and investment advisory services monthly based on the average net assets of the fund. Such fee is based on the following annual rates:
| 0.550% | of the first $500 million of average net assets, | |||
| 0.500% | of the next $500 million of average net assets | |||
| 0.450% | of any excess thereafter |
For the reporting period, the management fee represented an effective rate (excluding the impact from any expense waivers in effect) of 0.551% of the fund’s average net assets.
Putnam Management has contractually agreed, through September 30, 2024, to waive fees and/or reimburse the fund’s expenses to the extent necessary to limit the cumulative expenses of the fund, exclusive of brokerage, interest, taxes, investment-related expenses, extraordinary expenses, acquired fund fees and expenses and payments under the fund’s investor servicing contract, investment management contract and distribution plans, on a fiscal year-to-date basis to an annual rate of 0.20% of the fund’s average net assets over such fiscal year-to-date period. During the reporting period, the fund’s expenses were not reduced as a result of this limit.
Putnam Management has also contractually agreed to waive fees (and, to the extent necessary, bear other expenses) of the fund through September 30, 2024, to the extent that total expenses of the fund (excluding brokerage, interest, taxes, investment-related expenses, payments under distribution plans, extraordinary expenses, payments under the fund’s investor servicing contract and acquired fund fees and expenses, but including payments under the fund’s investment management contract) would exceed an annual rate of 0.46% of the fund’s average net assets. During the reporting period, the fund’s expenses were reduced by $761,510 as a result of this limit.
PIL is authorized by the Trustees to manage a separate portion of the assets of the fund as determined by Putnam Management from time to time. PIL did not manage any portion of the assets of the fund during the reporting period. If Putnam Management were to engage the services of PIL, Putnam Management would pay a quarterly sub-management fee to PIL for its services at an annual rate of 0.20% (prior to July 1, 2022, the annual rate was 0.40%) of the average net assets of the portion of the fund managed by PIL.
| 42 Mortgage Opportunities Fund |
The fund reimburses Putnam Management an allocated amount for the compensation and related expenses of certain officers of the fund and their staff who provide administrative services to the fund. The aggregate amount of all such reimbursements is determined annually by the Trustees.
Custodial functions for the fund’s assets are provided by State Street. Custody fees are based on the fund’s asset level, the number of its security holdings and transaction volumes.
Putnam Investor Services, Inc., an affiliate of Putnam Management, provides investor servicing agent functions to the fund. Putnam Investor Services, Inc. received fees for investor servicing for class A, class C and class Y shares that included (1) a per account fee for each direct and underlying non-defined contribution account (retail account) of the fund; (2) a specified rate of the fund’s assets attributable to defined contribution plan accounts; and (3) a specified rate based on the average net assets in retail accounts. Putnam Investor Services, Inc. has agreed that the aggregate investor servicing fees for each fund’s retail and defined contribution accounts for these share classes will not exceed an annual rate of 0.25% of the fund’s average assets attributable to such accounts.
Class I shares paid a monthly fee based on the average net assets of class I shares at an annual rate of 0.01%.
Class R6 shares paid a monthly fee based on the average net assets of class R6 shares at an annual rate of 0.05%.
During the reporting period, the expenses for each class of shares related to investor servicing fees were as follows:
| Class A | $17,727 | Class R6 | 1,719 | |
| Class C | 2,164 | Class Y | 321,391 | |
| Class I | 14,544 | Total | $357,545 |
The fund has entered into expense offset arrangements with Putnam Investor Services, Inc. and State Street whereby Putnam Investor Services, Inc.’s and State Street’s fees are reduced by credits allowed on cash balances. For the reporting period, the fund’s expenses were reduced by $10,679 under the expense offset arrangements.
Each Independent Trustee of the fund receives an annual Trustee fee, of which $367, as a quarterly retainer, has been allocated to the fund, and an additional fee for each Trustees meeting attended. Trustees also are reimbursed for expenses they incur relating to their services as Trustees.
The fund has adopted a Trustee Fee Deferral Plan (the Deferral Plan) which allows the Trustees to defer the receipt of all or a portion of Trustees fees payable on or after July 1, 1995. The deferred fees remain invested in certain Putnam funds until distribution in accordance with the Deferral Plan.
The fund has adopted an unfunded noncontributory defined benefit pension plan (the Pension Plan) covering all Trustees of the fund who have served as a Trustee for at least five years and were first elected prior to 2004. Benefits under the Pension Plan are equal to 50% of the Trustee’s average annual attendance and retainer fees for the three years ended December 31, 2005. The retirement benefit is payable during a Trustee’s lifetime, beginning the year following retirement, for the number of years of service through December 31, 2006. Pension expense for the fund is included in Trustee compensation and expenses in the Statement of operations. Accrued pension liability is included in Payable for Trustee compensation and expenses in the Statement of assets and liabilities. The Trustees have terminated the Pension Plan with respect to any Trustee first elected after 2003.
The fund has adopted distribution plans (the Plans) with respect to the following share classes pursuant to Rule 12b–1 under the Investment Company Act of 1940. The purpose of the Plans is to compensate Putnam Retail Management Limited Partnership, an indirect wholly-owned subsidiary of Putnam Investments, LLC, for services provided and expenses incurred in distributing shares of the fund. The Plans provide payments by the fund to Putnam Retail Management Limited Partnership at an annual rate of up to the following amounts (Maximum %) of the average net assets attributable to each class. The Trustees have approved payment by the fund at the following annual rate (Approved %) of the average net assets attributable to each class. During the reporting period, the class-specific expenses related to distribution fees were as follows:
| Maximum % | Approved % | Amount | |
| Class A | 0.35% | 0.25% | $30,077 |
| Class C | 1.00% | 1.00% | 14,582 |
| Total | $44,659 |
For the reporting period, Putnam Retail Management Limited Partnership, acting as underwriter, received net commissions of $5,726 from the sale of class A shares and received no monies in contingent deferred sales charges from redemptions of class C shares.
A deferred sales charge of up to 1.00% is assessed on certain redemptions of class A shares. For the reporting period, Putnam Retail Management Limited Partnership, acting as underwriter, received $45 on class A redemptions.
Note 3: Purchases and sales of securities
During the reporting period, the cost of purchases and the proceeds from sales, excluding short-term investments, were as follows:
| Cost of purchases | Proceeds from sales | |
| Investments in securities, including TBA commitments (Long-term) | $10,614,932,272 | $9,173,740,331 |
| U.S. government securities (Long-term) | — | — |
| Total | $10,614,932,272 | $9,173,740,331 |
The fund may purchase or sell investments from or to other Putnam funds in the ordinary course of business, which can reduce the fund’s transaction costs, at prices determined in accordance with SEC requirements and policies approved by the Trustees. During the reporting period, purchases or sales of long-term securities from or to other Putnam funds, if any, did not represent more than 5% of the fund’s total cost of purchases and/or total proceeds from sales.
| Mortgage Opportunities Fund 43 |
Note 4: Capital shares
At the close of the reporting period, there were an unlimited number of shares of beneficial interest authorized. Transactions, including, if applicable, direct exchanges pursuant to share conversions, in capital shares were as follows:
| YEAR ENDED 5/31/23 | YEAR ENDED 5/31/22 | |||
| Class A | Shares | Amount | Shares | Amount |
| Shares sold | 2,137,657 | $18,897,268 | 382,119 | $3,420,459 |
| Shares issued in connection with reinvestment of distributions | 119,414 | 1,036,072 | 12,737 | 113,602 |
| 2,257,071 | 19,933,340 | 394,856 | 3,534,061 | |
| Shares repurchased | (1,467,943) | (12,769,740) | (156,120) | (1,403,924) |
| Net increase | 789,128 | $7,163,600 | 238,736 | $2,130,137 |
| YEAR ENDED 5/31/23 | YEAR ENDED 5/31/22 | |||
| Class C | Shares | Amount | Shares | Amount |
| Shares sold | 206,995 | $1,825,824 | 47,421 | $425,516 |
| Shares issued in connection with reinvestment of distributions | 11,297 | 98,177 | 1,154 | 10,334 |
| 218,292 | 1,924,001 | 48,575 | 435,850 | |
| Shares repurchased | (46,881) | (405,143) | (33,342) | (302,235) |
| Net increase | 171,411 | $1,518,858 | 15,233 | $133,615 |
| YEAR ENDED 5/31/23 | YEAR ENDED 5/31/22 | |||
| Class I | Shares | Amount | Shares | Amount |
| Shares sold | 566,251 | $5,000,001 | 1,670,379 | $15,000,001 |
| Shares issued in connection with reinvestment of distributions | 856,279 | 7,451,936 | 706,032 | 6,310,861 |
| 1,422,530 | 12,451,937 | 2,376,411 | 21,310,862 | |
| Shares repurchased | — | — | (918,447) | (8,222,353) |
| Net increase | 1,422,530 | $12,451,937 | 1,457,964 | $13,088,509 |
| YEAR ENDED 5/31/23 | YEAR ENDED 5/31/22 | |||
| Class R6 | Shares | Amount | Shares | Amount |
| Shares sold | 421,901 | $3,751,121 | 41,766 | $374,347 |
| Shares issued in connection with reinvestment of distributions | 30,073 | 261,755 | 7,498 | 67,032 |
| 451,974 | 4,012,876 | 49,264 | 441,379 | |
| Shares repurchased | (167,452) | (1,463,441) | (27,236) | (241,513) |
| Net increase | 284,522 | $2,549,435 | 22,028 | $199,866 |
| YEAR ENDED 5/31/23 | YEAR ENDED 5/31/22 | |||
| Class Y | Shares | Amount | Shares | Amount |
| Shares sold | 34,477,256 | $303,904,569 | 12,303,031 | $109,907,801 |
| Shares issued in connection with reinvestment of distributions | 1,807,519 | 15,690,275 | 244,867 | 2,191,499 |
| 36,284,775 | 319,594,844 | 12,547,898 | 112,099,300 | |
| Shares repurchased | (27,072,474) | (235,277,609) | (3,251,270) | (29,563,973) |
| Net increase | 9,212,301 | $84,317,235 | 9,296,628 | $82,535,327 |
At the close of the reporting period, five shareholders of record owned 5.2%, 9.7%, 11.2%, 12.2% and 13.8%, respectively, of the outstanding shares of the fund.
| 44 Mortgage Opportunities Fund |
Note 5: Affiliated transactions
Transactions during the reporting period with any company which is under common ownership or control were as follows:
| Shares outstanding | |||||
| Fair value as | and fair value as | ||||
| Name of affiliate | of 5/31/22 | Purchase cost | Sale proceeds | Investment income | of 5/31/23 |
| Short-term investments | |||||
| Putnam Short Term | |||||
| Investment Fund* | $55,625,091 | $351,775,752 | $387,177,043 | $1,753,204 | $20,223,800 |
| Total Short-term | |||||
| investments | $55,625,091 | $351,775,752 | $387,177,043 | $1,753,204 | $20,223,800 |
* Management fees charged to Putnam Short Term Investment Fund have been waived by Putnam Management. There were no realized or unrealized gains or losses during the period.
Note 6: Market, credit and other risks
In the normal course of business, the fund trades financial instruments and enters into financial transactions where risk of potential loss exists due to changes in the market (market risk) or failure of the contracting party to the transaction to perform (credit risk). The fund may be exposed to additional credit risk that an institution or other entity with which the fund has unsettled or open transactions will default. The fund may invest in higher-yielding, lower-rated bonds that may have a higher rate of default. The fund may invest a significant portion of its assets in securitized debt instruments, including mortgage-backed and asset-backed investments. The yields and values of these investments are sensitive to changes in interest rates, the rate of principal payments on the underlying assets and the market’s perception of the issuers. The market for these investments may be volatile and limited, which may make them difficult to buy or sell.
On July 27, 2017, the United Kingdom’s Financial Conduct Authority (“FCA”), which regulates LIBOR, announced its intention to cease compelling banks to provide the quotations needed to sustain LIBOR after 2021. ICE Benchmark Administration, the administrator of LIBOR, ceased publication of most LIBOR settings on a representative basis at the end of 2021 and is expected to cease publication of a majority of U.S. dollar LIBOR settings on a representative basis after June 30, 2023. In addition, global regulators have announced that, with limited exceptions, no new LIBOR-based contracts should be entered into after 2021. LIBOR has historically been a common benchmark interest rate index used to make adjustments to variable-rate loans. It is used throughout global banking and financial industries to determine interest rates for a variety of financial instruments and borrowing arrangements. Actions by regulators have resulted in the establishment of alternative reference rates to LIBOR in most major currencies. Various financial industry groups have been planning for the transition away from LIBOR, but there are obstacles to converting certain longer-term securities and transactions to new reference rates. Markets are developing slowly and questions around liquidity in these rates and how to appropriately adjust these rates to mitigate any economic value transfer at the time of transition remain a significant concern. Neither the effect of the transition process nor its ultimate success can yet be known. The transition process might lead to increased volatility and illiquidity in markets that rely on LIBOR to determine interest rates. It could also lead to a reduction in the value of some LIBOR-based investments and reduce the effectiveness of related transactions, such as hedges. While some LIBOR-based instruments may contemplate a scenario where LIBOR is no longer available by providing for an alternative rate-setting methodology, not all may have such provisions and there may be significant uncertainty regarding the effectiveness of any such alternative methodologies. Since the usefulness of LIBOR as a benchmark could deteriorate during the transition period, these effects could occur at any time.
Note 7: Summary of derivative activity
The volume of activity for the reporting period for any derivative type that was held during the period is listed below and was based on an average of the holdings at the end of each fiscal quarter:
| Purchased TBA commitment option contracts (contract amount) | $23,500,000 |
| Purchased swap option contracts (contract amount) | $125,600,000 |
| Written TBA commitment option contracts (contract amount) | $23,500,000 |
| Futures contracts (number of contracts) | 1,000 |
| Centrally cleared interest rate swap contracts (notional) | $1,139,900,000 |
| OTC credit default contracts (notional) | $83,600,000 |
| Mortgage Opportunities Fund 45 |
The following is a summary of the fair value of derivative instruments as of the close of the reporting period:
| Fair value of derivative instruments as of the close of the reporting period | ||||
| ASSET DERIVATIVES | LIABILITY DERIVATIVES | |||
| Derivatives not accounted | ||||
| for as hedging instruments | Statement of assets and | Statement of assets and | ||
| under ASC 815 | liabilities location | Fair value | liabilities location | Fair value |
| Credit contracts | Receivables | $9,951,091 | Payables | $14,541,419 |
| Investments, Receivables, Net | ||||
| assets — Unrealized | Payables, Net assets — | |||
| Interest rate contracts | appreciation | 5,510,702* | Unrealized depreciation | 11,914,072* |
| Total | $15,461,793 | $26,455,491 | ||
* Includes cumulative appreciation/depreciation of futures contracts and/or centrally cleared swaps as reported in the fund’s portfolio. Only current day’s variation margin is reported within the Statement of assets and liabilities.
The following is a summary of realized and change in unrealized gains or losses of derivative instruments in the Statement of operations for the reporting period (Note 1):
| Amount of realized gain or (loss) on derivatives recognized in net gain or (loss) on investments | ||||
| Derivatives not accounted | ||||
| for as hedging instruments | ||||
| under ASC 815 | Options | Futures | Swaps | Total |
| Credit contracts | $— | $— | $(4,602,602) | $(4,602,602) |
| Interest rate contracts | (3,221,754) | 4,689,491 | 12,608,180 | $14,075,917 |
| Total | $(3,221,754) | $4,689,491 | $8,005,578 | $9,473,315 |
| Change in unrealized appreciation or (depreciation) on derivatives recognized in net gain or (loss) on investments | ||||
| Derivatives not accounted | ||||
| for as hedging instruments | ||||
| under ASC 815 | Options | Futures | Swaps | Total |
| Credit contracts | $— | $— | $3,508,057 | $3,508,057 |
| Interest rate contracts | (1,285,511) | (1,122,909) | 59,371 | $(2,349,049) |
| Total | $(1,285,511) | $(1,122,909) | $3,567,428 | $1,159,008 |
| 46 Mortgage Opportunities Fund |
| This page left blank intentionally. |
| Mortgage Opportunities Fund 47 |
Note 8: Offsetting of financial and derivative assets and liabilities
The following table summarizes any derivatives, repurchase agreements and reverse repurchase agreements, at the end of the reporting period, that are subject to an enforceable master netting agreement or similar agreement. For securities lending transactions or borrowing transactions associated with securities sold short, if any, see Note 1. For financial reporting purposes, the fund does not offset financial assets and financial liabilities that are subject to the master netting agreements in the Statement of assets and liabilities.
| Bank of America N.A. | Barclays Bank PLC | Barclays Capital, Inc. (clearing broker) | BofA Securities, Inc. | Citibank, N.A. | Citigroup Global Markets, Inc. | Credit Suisse International | Goldman Sachs International | JPMorgan Chase Bank N.A. | JPMorgan Securities LLC | Merrill Lynch International | Morgan Stanley & Co. International PLC | Total | |
| Assets: | |||||||||||||
| Centrally cleared interest rate swap contracts§ | $— | $— | $2,161,071 | $— | $— | $— | $— | $— | $— | $— | $— | $— | $2,161,071 |
| OTC Credit default contracts - protection sold*# | — | — | — | — | — | — | — | — | — | — | — | — | — |
| OTC Credit default contracts - protection purchased*# | — | — | — | — | — | 3,131,947 | 298,867 | 2,966,366 | — | 1,105,246 | 154,745 | 2,293,920 | 9,951,091 |
| Futures contracts§ | — | — | — | — | — | — | — | — | — | — | — | — | — |
| Forward premium swap option contracts# | 116,385 | — | — | — | 18,174 | — | — | 366,024 | — | — | — | — | 500,583 |
| Total Assets | $116,385 | $— | $2,161,071 | $— | $18,174 | $3,131,947 | $298,867 | $3,332,390 | $— | $1,105,246 | $154,745 | $2,293,920 | $12,612,745 |
| Liabilities: | |||||||||||||
| Centrally cleared interest rate swap contracts§ | — | — | 2,098,482 | — | — | — | — | — | — | — | — | — | 2,098,482 |
| OTC Credit default contracts - protection sold*# | — | 1,264 | — | — | — | 6,556,286 | 145,144 | 1,832,639 | — | 716,294 | 230,019 | 5,059,773 | 14,541,419 |
| OTC Credit default contracts - protection purchased*# | — | — | — | — | — | — | — | — | — | — | — | — | — |
| Futures contracts§ | — | — | — | — | — | — | — | — | — | 1,947,117 | — | — | 1,947,117 |
| Forward premium swap option contracts# | 804,494 | — | — | — | 22,989 | — | — | 565,146 | 140,255 | — | — | — | 1,532,884 |
| Total Liabilities | $804,494 | $1,264 | $2,098,482 | $— | $22,989 | $6,556,286 | $145,144 | $2,397,785 | $140,255 | $2,663,411 | $230,019 | $5,059,773 | $20,119,902 |
| Total Financial and Derivative Net Assets | $(688,109) | $(1,264) | $62,589 | $— | $(4,815) | $(3,424,339) | $153,723 | $934,605 | $(140,255) | $(1,558,165) | $(75,274) | $(2,765,853) | $(7,507,157) |
| Total collateral received (pledged)†## | $(564,880) | $— | $— | $— | $— | $(3,371,510) | $110,000 | $934,605 | $(112,148) | $388,000 | $(72,320) | $(2,765,853) | |
| Net amount | $(123,229) | $(1,264) | $62,589 | $— | $(4,815) | $(52,829) | $43,723 | $— | $(28,107) | $(1,946,165) | $(2,954) | $— | |
| Controlled collateral received (including | |||||||||||||
| TBA commitments)** | $— | $— | $— | $— | $— | $— | $110,000 | $1,150,000 | $— | $388,000 | $— | $— | $1,648,000 |
| Uncontrolled collateral received | $— | $— | $— | $— | $— | $— | $— | $— | $— | $— | $— | $— | $— |
| Collateral (pledged) (including TBA commitments)** | $(564,880) | $— | $— | $(134,578) | $— | $(5,076,482) | $— | $— | $(112,148) | $(5,366,444) | $(72,320) | $(2,778,495) | $(14,105,347) |
* Excludes premiums, if any. Included in unrealized appreciation and depreciation on OTC swap contracts on the Statement of assets and liabilities.
** Included with Investments in securities on the Statement of assets and liabilities.
† Additional collateral may be required from certain brokers based on individual agreements.
# Covered by master netting agreement (Note 1).
## Any over-collateralization of total financial and derivative net assets is not shown. Collateral may include amounts related to unsettled agreements.
§ Includes current day’s variation margin only as reported on the Statement of assets and liabilities, which is not collateralized. Cumulative appreciation/ (depreciation) for futures contracts and centrally cleared swap contracts is represented in the tables listed after the fund’s portfolio. Collateral pledged for initial margin on futures contracts and centrally cleared swap contracts, which is not included in the table above, amounted to $10,121,462 and $2,960,872, respectively.
Note 9: Of special note
On May 31, 2023, Franklin Resources, Inc. (“Franklin Resources”) and Great-West Lifeco Inc., the parent company of Putnam U.S. Holdings I, LLC (“Putnam Holdings”), announced that they have entered into a definitive agreement for a subsidiary of Franklin Resources to acquire Putnam Holdings in a stock and cash transaction.
As part of this transaction, Putnam Management, a wholly-owned subsidiary of Putnam Holdings and investment manager to the Putnam family of funds (the “Putnam Funds”), would become an indirect wholly-owned subsidiary of Franklin Resources.
The transaction is subject to customary closing conditions, including receipt of applicable regulatory approvals. Subject to such approvals and the satisfaction of these conditions, the transaction is currently expected to be consummated in the fourth quarter of 2023.
Under the Investment Company Act of 1940, as amended, consummation of the transaction will result in the automatic termination of the investment management contract between each Putnam Fund and Putnam Management and any related sub-management and sub-advisory contracts, where applicable. In anticipation of this automatic termination, on June 23, 2023, the Board of Trustees of the Putnam Funds approved a new investment management contract between each Putnam Fund and Putnam Management (and new sub-management and sub-advisory contracts, if applicable), which will be presented to the shareholders of each Putnam Fund for their approval at shareholder meetings currently expected to occur in October 2023.
| 48 Mortgage Opportunities Fund | Mortgage Opportunities Fund 49 |
Federal tax information (Unaudited)
The Form 1099 that will be mailed to you in January 2024 will show the tax status of all distributions paid to your account in calendar 2023.
Shareholder meeting results (Unaudited)
June 29, 2022 special meeting
At the meeting, each of the nominees for Trustees was elected, with all funds of the Trust voting together as a single class, as follows:
| Votes for | Votes withheld | |
| Liaquat Ahamed | 3,583,882,479 | 32,417,735 |
| Barbara M. Baumann | 3,584,377,892 | 31,922,322 |
| Katinka Domotorffy | 3,584,956,517 | 31,343,697 |
| Catharine Bond Hill | 3,586,682,827 | 29,617,387 |
| Kenneth R. Leibler | 3,569,431,371 | 46,868,843 |
| Jennifer Williams Murphy | 3,581,263,937 | 35,036,277 |
| Marie Pillai | 3,578,125,932 | 38,174,282 |
| George Putnam III | 3,576,315,198 | 39,985,016 |
| Robert L. Reynolds | 3,579,411,077 | 36,889,137 |
| Manoj P. Singh | 3,582,573,738 | 33,726,476 |
| Mona K. Sutphen | 3,588,302,923 | 27,997,291 |
All tabulations are rounded to the nearest whole number.
| 50 Mortgage Opportunities Fund |
| Mortgage Opportunities Fund 51 |

* Mr. Reynolds is an “interested person” (as defined in the Investment Company Act of 1940) of the fund and Putnam Investments. He is President and Chief Executive Officer of Putnam Investments, as well as the President of your fund and each of the other Putnam funds.
The address of each Trustee is 100 Federal Street, Boston, MA 02110.
As of May 31, 2023, there were 89 mutual funds, 4 closed-end funds, and 12 exchange-traded funds in the Putnam funds complex. Each Trustee serves as Trustee of all funds in the Putnam funds complex.
Each Trustee serves for an indefinite term, until his or her resignation, retirement at age 75, removal, or death.
Officers
In addition to Robert L. Reynolds, the other officers of the fund are shown below:
| James F. Clark (Born 1974) | Alan G. McCormack (Born 1964) |
| Vice President and Chief Compliance Officer | Vice President and Derivatives Risk Manager |
| Since 2016 | Since 2022 |
| Chief Compliance Officer and Chief Risk Officer, | Head of Quantitative Equities and Risk, |
| Putnam Investments, and Chief Compliance Officer, Putnam Management | Putnam Investments |
| Michael J. Higgins (Born 1976) | Denere P. Poulack (Born 1968) |
| Vice President, Treasurer, and Clerk | Assistant Vice President, Assistant Clerk, |
| Since 2010 | and Assistant Treasurer |
| Since 2004 | |
| Jonathan S. Horwitz (Born 1955) | |
| Executive Vice President, Principal Executive Officer, | Janet C. Smith (Born 1965) |
| and Compliance Liaison | Vice President, Principal Financial Officer, Principal Accounting Officer, |
| Since 2004 | and Assistant Treasurer |
| Since 2007 | |
| Richard T. Kircher (Born 1962) | Head of Fund Administration Services, Putnam Investments and Putnam |
| Vice President and BSA Compliance Officer | Management |
| Since 2019 | |
| Assistant Director, Operational Compliance, Putnam Investments and Putnam | Stephen J. Tate (Born 1974) |
| Retail Management | Vice President and Chief Legal Officer |
| Since 2021 | |
| Martin Lemaire (Born 1984) | General Counsel, Putnam Investments, |
| Vice President and Derivatives Risk Manager | Putnam Management, and Putnam Retail Management |
| Since 2022 | |
| Risk Manager and Risk Analyst, Putnam Investments | Mark C. Trenchard (Born 1962) |
| Vice President | |
| Susan G. Malloy (Born 1957) | Since 2002 |
| Vice President and Assistant Treasurer | Director of Operational Compliance, Putnam |
| Since 2007 | Investments and Putnam Retail Management |
| Head of Accounting and Middle Office Services, | |
| Putnam Investments and Putnam Management |
The principal occupations of the officers for the past five years have been with the employers as shown above, although in some cases they have held different positions with such employers. The address of each officer is 100 Federal Street, Boston, MA 02110.
| 52 Mortgage Opportunities Fund |
Fund information
Founded over 85 years ago, Putnam Investments was built around the concept that a balance between risk and reward is the hallmark of a well-rounded financial program. We manage funds across income, value, blend, growth, sustainable, and asset allocation categories.
| Investment Manager | Trustees | Richard T. Kircher |
| Putnam Investment | Kenneth R. Leibler, Chair | Vice President and |
| Management, LLC | Barbara M. Baumann, Vice Chair | BSA Compliance Officer |
| 100 Federal Street | Liaquat Ahamed | |
| Boston, MA 02110 | Katinka Domotorffy | Martin Lemaire |
| Catharine Bond Hill | Vice President and | |
| Investment Sub-Advisor | Jennifer Williams Murphy | Derivatives Risk Manager |
| Putnam Investments Limited | Marie Pillai | |
| 16 St James’s Street | George Putnam III | Susan G. Malloy |
| London, England SW1A 1ER | Robert L. Reynolds | Vice President and |
| Manoj P. Singh | Assistant Treasurer | |
| Marketing Services | Mona K. Sutphen | |
| Putnam Retail Management | Alan G. McCormack | |
| Limited Partnership | Officers | Vice President and |
| 100 Federal Street | Robert L. Reynolds | Derivatives Risk Manager |
| Boston, MA 02110 | President | |
| Denere P. Poulack | ||
| Custodian | James F. Clark | Assistant Vice President, |
| State Street Bank | Vice President, Chief Compliance | Assistant Clerk, and |
| and Trust Company | Officer, and Chief Risk Officer | Assistant Treasurer |
| Legal Counsel | Michael J. Higgins | Janet C. Smith |
| Ropes & Gray LLP | Vice President, Treasurer, | Vice President, |
| and Clerk | Principal Financial Officer, | |
| Independent Registered | Principal Accounting Officer, | |
| Public Accounting Firm | Jonathan S. Horwitz | and Assistant Treasurer |
| PricewaterhouseCoopers LLP | Executive Vice President, | |
| Principal Executive Officer, | Stephen J. Tate | |
| and Compliance Liaison | Vice President and | |
| Chief Legal Officer | ||
| Mark C. Trenchard | ||
| Vice President |
This report is for the information of shareholders of Putnam Mortgage Opportunities Fund. It may also be used as sales literature when preceded or accompanied by the current prospectus, the most recent copy of Putnam’s Quarterly Performance Summary, and Putnam’s Quarterly Ranking Summary. For more recent performance, please visit putnam.com. Investors should carefully consider the investment objectives, risks, charges, and expenses of a fund, which are described in its prospectus. For this and other information or to request a prospectus or summary prospectus, call 1-800-225-1581 toll free. Please read the prospectus carefully before investing. The fund’s Statement of Additional Information contains additional information about the fund’s Trustees and is available without charge upon request by calling 1-800-225-1581.

| Item 2. Code of Ethics: |
| (a) The fund’s principal executive, financial and accounting officers are employees of Putnam Investment Management, LLC, the Fund’s investment manager. As such they are subject to a comprehensive Code of Ethics adopted and administered by Putnam Investments which is designed to protect the interests of the firm and its clients. The Fund has adopted a Code of Ethics which incorporates the Code of Ethics of Putnam Investments with respect to all of its officers and Trustees who are employees of Putnam Investment Management, LLC. For this reason, the Fund has not adopted a separate code of ethics governing its principal executive, financial and accounting officers. |
| (c) In January 2023, the Code of Ethics of Putnam Investments and Code of Ethics of Putnam Funds were amended. The key changes to the Putnam Investments Code of Ethics are as follows: (i) Prohibition on investments in a single stock ETFs and (ii) Revision to the 7-day blackout rule for Analysts. The key change to the Putnam Funds Code of Ethics was that the provisions of the Code of Ethics for employees of PanAgora Asset Management, inc. and any of its subsidiaries are excluded from the Putnam Funds’ Code of Ethics. |
| Item 3. Audit Committee Financial Expert: |
| The Funds’ Audit, Compliance and Risk Committee is comprised solely of Trustees who are “independent” (as such term has been defined by the Securities and Exchange Commission (“SEC”) in regulations implementing Section 407 of the Sarbanes-Oxley Act (the “Regulations”)). The Trustees believe that each member of the Audit, Compliance and Risk Committee also possesses a combination of knowledge and experience with respect to financial accounting matters, as well as other attributes, that qualifies him or her for service on the Committee. In addition, the Trustees have determined that each of Dr. Hill, Ms. Murphy and Mr. Singh qualifies as an “audit committee financial expert” (as such term has been defined by the Regulations) based on their review of his or her pertinent experience and education.The SEC has stated, and the funds’ amended and restated agreement and Declaration of Trust provides, that the designation or identification of a person as an audit committee financial expert pursuant to this Item 3 of Form N-CSR does not impose on such person any duties, obligations or liability that are greater than the duties, obligations and liability imposed on such person as a member of the Audit, Compliance and Risk Committee and the Board of Trustees in the absence of such designation or identification. |
| Item 4. Principal Accountant Fees and Services: |
| The following table presents fees billed in each of the last two fiscal years for services rendered to the fund by the fund’s independent auditor: |
| Fiscal year ended | Audit Fees | Audit-Related Fees | Tax Fees | All Other Fees | |
| May 31, 2023 | $106,354 | $ — | $12,016 | $ — | |
| May 31, 2022 | $110,724 | $ — | $21,456 | $ — | |
| For the fiscal years ended May 31, 2023 and May 31, 2022, the fund’s independent auditor billed aggregate non-audit fees in the amounts of $253,759 and $350,407 respectively, to the fund, Putnam Management and any entity controlling, controlled by or under common control with Putnam Management that provides ongoing services to the fund. |
| Audit Fees represent fees billed for the fund’s last two fiscal years relating to the audit and review of the financial statements included in annual reports and registration statements, and other services that are normally provided in connection with statutory and regulatory filings or engagements. |
| Audit-Related Fees represent fees billed in the fund’s last two fiscal years for services traditionally performed by the fund’s auditor, including accounting consultation for proposed transactions or concerning financial accounting and reporting standards and other audit or attest services not required by statute or regulation. |
| Tax Fees represent fees billed in the fund’s last two fiscal years for tax compliance, tax planning and tax advice services. Tax planning and tax advice services include assistance with tax audits, employee benefit plans and requests for rulings or technical advice from taxing authorities. |
| Pre-Approval Policies of the Audit, Compliance and Risk Committee. The Audit, Compliance and Risk Committee of the Putnam funds has determined that, as a matter of policy, all work performed for the funds by the funds’ independent auditors will be pre-approved by the Committee itself and thus will generally not be subject to pre-approval procedures. |
| The Audit, Compliance and Risk Committee also has adopted a policy to pre-approve the engagement by Putnam Management and certain of its affiliates of the funds’ independent auditors, even in circumstances where pre-approval is not required by applicable law. Any such requests by Putnam Management or certain of its affiliates are typically submitted in writing to the Committee and explain, among other things, the nature of the proposed engagement, the estimated fees, and why this work should be performed by that particular audit firm as opposed to another one. In reviewing such requests, the Committee considers, among other things, whether the provision of such services by the audit firm are compatible with the independence of the audit firm. |
| The following table presents fees billed by the fund’s independent auditor for services required to be approved pursuant to paragraph (c)(7)(ii) of Rule 2–01 of Regulation S-X. |
| Fiscal year ended | Audit-Related Fees | Tax Fees | All Other Fees | Total Non-Audit Fees | |
| May 31, 2023 | $ — | $241,743 | $ — | $ — | |
| May 31, 2022 | $ — | $328,951 | $ — | $ — | |
| Item 5. Audit Committee of Listed Registrants |
| Not applicable |
| Item 6. Schedule of Investments: |
| The registrant’s schedule of investments in unaffiliated issuers is included in the report to shareholders in Item 1 above. |
| Item 7. Disclosure of Proxy Voting Policies and Procedures For Closed-End Management Investment Companies: |
| Not applicable |
| Item 8. Portfolio Managers of Closed-End Investment Companies |
| Not Applicable |
| Item 9. Purchases of Equity Securities by Closed-End Management Investment Companies and Affiliated Purchasers: |
| Not applicable |
| Item 10. Submission of Matters to a Vote of Security Holders: |
| Not applicable |
| Item 11. Controls and Procedures: |
| (a) The registrant’s principal executive officer and principal financial officer have concluded, based on their evaluation of the effectiveness of the design and operation of the registrant’s disclosure controls and procedures as of a date within 90 days of the filing date of this report, that the design and operation of such procedures are generally effective to provide reasonable assurance that information required to be disclosed by the registrant in this report is recorded, processed, summarized and reported within the time periods specified in the Commission’s rules and forms. |
| (b) Changes in internal control over financial reporting: Not applicable |
| Item 12. Disclosures of Securities Lending Activities for Closed-End Management Investment Companies: |
| Not Applicable |
| Item 13. Exhibits: |
| (a)(1) The Code of Ethics of The Putnam Funds, which incorporates the Code of Ethics of Putnam Investments, is filed herewith |
| (b) The certifications required by Rule 30a-2(b) under the Investment Company Act of 1940, as amended, are filed herewith. |
| SIGNATURES |
| Pursuant to the requirements of the Securities Exchange Act of 1934 and the Investment Company Act of 1940, the registrant has duly caused this report to be signed on its behalf by the undersigned, thereunto duly authorized. |
| Putnam Funds Trust |
| By (Signature and Title): |
| /s/ Janet C. Smith Janet C. Smith Principal Accounting Officer |
| Date: July 26, 2023 |
| Pursuant to the requirements of the Securities Exchange Act of 1934 and the Investment Company Act of 1940, this report has been signed below by the following persons on behalf of the registrant and in the capacities and on the dates indicated. |
| By (Signature and Title): |
| /s/ Jonathan S. Horwitz Jonathan S. Horwitz Principal Executive Officer |
| Date: July 26, 2023 |
| By (Signature and Title): |
| /s/ Janet C. Smith Janet C. Smith Principal Financial Officer |
| Date: July 26, 2023 |