| UNITED STATES SECURITIES AND EXCHANGE COMMISSION | ||
| Washington, D.C. 20549 | ||
FORM N-CSR | ||
| CERTIFIED SHAREHOLDER REPORT OF REGISTERED MANAGEMENT INVESTMENT COMPANIES | ||
| Investment Company Act file number: | (811-07513) |
| Exact name of registrant as specified in charter: | Putnam Funds Trust |
| Address of principal executive offices: | 100 Federal Street, Boston, Massachusetts 02110 |
| Name and address of agent for service: | Stephen Tate, Vice President 100 Federal Street Boston, Massachusetts 02110 |
| Copy to: | Bryan Chegwidden, Esq. Ropes & Gray LLP 1211 Avenue of the Americas New York, New York 10036 |
| James E. Thomas, Esq. Ropes & Gray LLP 800 Boylston Street Boston, Massachusetts 02199 |
| Registrant’s telephone number, including area code: | (617) 292-1000 |
| Date of fiscal year end: | August 31, 2024 |
| Date of reporting period: | September 1, 2023 – February 29, 2024 |
Item 1. Report to Stockholders: |
| The following is a copy of the report transmitted to stockholders pursuant to Rule 30e-1 under the Investment Company Act of 1940: | |||
Putnam
Emerging Markets
Equity Fund
Semiannual report
2 | 29 | 24
Message from the Trustees
April 5, 2024
Dear Fellow Shareholder:
We are pleased to report that on January 1, 2024, Franklin Resources, Inc., a leading global asset management firm operating as Franklin Templeton, acquired Putnam Investments. With complementary capabilities and an established infrastructure serving over 150 countries, Franklin Templeton enhances Putnam’s investment, risk management, operations, and technology platforms. Together, our firms are committed to delivering strong fund performance and more choices for our investors.
We are also excited to welcome Jane E. Trust as an interested trustee to your Board of Trustees. Ms. Trust contributes over 30 years of investment management experience to The Putnam Funds, and has served as Senior Vice President, Fund Board Management, at Franklin Templeton since 2020.
As we enter this new chapter, you can rest assured that your fund continues to be actively managed by the same experienced professionals. Your investment team is exploring new and attractive opportunities for your fund while monitoring changing market conditions.
Thank you for investing with Putnam.

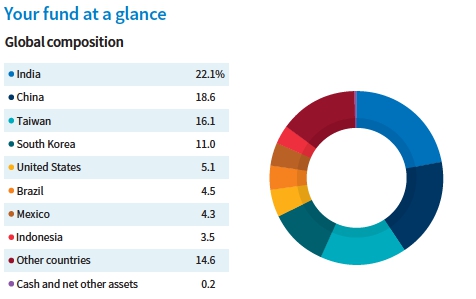
Allocations are shown as a percentage of the fund’s net assets as of 2/29/24. Cash and net other assets, if any, represent the market value weights of cash, derivatives, short-term securities, and other unclassified assets in the portfolio. Summary information may differ from the information in the portfolio schedule notes included in the financial statements due to the inclusion of derivative securities, any interest accruals, the exclusion of as-of trades, if any, and rounding. Holdings and allocations may vary over time. Due to rounding, percentages may not equal 100%.
| 2 Emerging Markets Equity Fund |
Your fund’s expenses
As a mutual fund investor, you pay ongoing expenses, such as management fees, distribution fees (12b-1 fees), and other expenses. In the most recent six-month period, your fund’s expenses were limited; had expenses not been limited, they would have been higher. Using the following information, you can estimate how these expenses affect your investment and compare them with the expenses of other funds. You may also pay one-time transaction expenses, including sales charges (loads) and redemption fees, which are not shown in this section and would have resulted in higher total expenses. For more information, see your fund’s prospectus or talk to your financial representative.
Expense ratios
| Class A | Class B | Class C | Class R | Class R6 | Class Y | |
| Net expenses for the fiscal year | ||||||
| ended 8/31/23*† | 1.27% | 2.02% | 2.02% | 1.52% | 0.83% | 1.02% |
| Total annual operating expenses for the | ||||||
| fiscal year ended 8/31/23* | 1.57% | 2.32% | 2.32% | 1.82% | 1.13% | 1.32% |
| Annualized expense ratio for the | ||||||
| six-month period ended 2/29/24‡ | 1.15% | 1.90% | 1.90% | 1.40% | 0.71% | 0.90% |
Fiscal year expense information in this table is taken from the most recent prospectus, is subject to change, and may differ from that shown for the annualized expense ratio and in the financial highlights of this report.
Prospectus expense information also includes the impact of acquired fund fees and expenses of 0.02%, which is not included in the financial highlights or annualized expense ratios. Expenses are shown as a percentage of average net assets.
* Restated to reflect current fees.
† Reflects Putnam Management’s contractual obligation to limit certain fund expenses through 12/30/24.
‡ Includes a decrease of 0.12% from annualizing the performance fee adjustment for the six months ended 2/29/24.
Expenses per $1,000
The following table shows the expenses you would have paid on a $1,000 investment in each class of the fund from 9/1/23 to 2/29/24. It also shows how much a $1,000 investment would be worth at the close of the period, assuming actual returns and expenses.
| Class A | Class B | Class C | Class R | Class R6 | Class Y | |
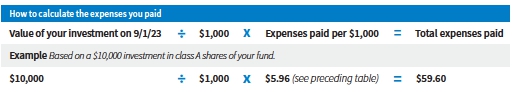
| Expenses paid per $1,000*† | $5.96 | $9.83 | $9.82 | $7.25 | $3.68 | $4.67 |
| Ending value (after expenses) | $1,084.40 | $1,079.80 | $1,079.70 | $1,082.30 | $1,086.00 | $1,085.00 |
* Expenses for each share class are calculated using the fund’s annualized expense ratio for each class, which represents the ongoing expenses as a percentage of average net assets for the six months ended 2/29/24. The expense ratio may differ for each share class.
† Expenses are calculated by multiplying the expense ratio by the average account value for the period; then multiplying the result by the number of days in the period (182); and then dividing that result by the number of days in the year (366).
| Emerging Markets Equity Fund 3 |
Estimate the expenses you paid
To estimate the ongoing expenses you paid for the six months ended 2/29/24, use the following calculation method. To find the value of your investment on 9/1/23, call Putnam at 1-800-225-1581.
Compare expenses using the SEC’s method
The Securities and Exchange Commission (SEC) has established guidelines to help investors assess fund expenses. Per these guidelines, the following table shows your fund’s expenses based on a $1,000 investment, assuming a hypothetical 5% annualized return. You can use this information to compare the ongoing expenses (but not transaction expenses or total costs) of investing in the fund with those of other funds. All mutual fund shareholder reports will provide this information to help you make this comparison. Please note that you cannot use this information to estimate your actual ending account balance and expenses paid during the period.
| Class A | Class B | Class C | Class R | Class R6 | Class Y | |
| Expenses paid per $1,000*† | $5.77 | $9.52 | $9.52 | $7.02 | $3.57 | $4.52 |
| Ending value (after expenses) | $1,019.14 | $1,015.42 | $1,015.42 | $1,017.90 | $1,021.33 | $1,020.39 |
* Expenses for each share class are calculated using the fund’s annualized expense ratio for each class, which represents the ongoing expenses as a percentage of average net assets for the six months ended 2/29/24. The expense ratio may differ for each share class.
† Expenses are calculated by multiplying the expense ratio by the average account value for the six-month period; then multiplying the result by the number of days in the six-month period (182); and then dividing that result by the number of days in the year (366).
| 4 Emerging Markets Equity Fund |
Other information for shareholders
Important notice regarding delivery of shareholder documents
In accordance with Securities and Exchange Commission (SEC) regulations, your fund’s manager sends a single notice of internet availability, or a single printed copy, of annual and semiannual shareholder reports, prospectuses, and proxy statements to shareholders who share the same address, unless a shareholder requests otherwise. If you prefer to receive your own copy of these documents, please call 1-800-225-1581 or, for exchange-traded funds only, 1-833-228-5577. We will begin sending individual copies within 30 days.
Proxy voting
The Putnam Funds’ proxy voting guidelines and procedures, as well as information regarding how your fund voted proxies relating to portfolio securities during the 12-month period ended June 30, 2023, are available in the Individual Investors section of putnam.com and on the SEC’s website, www.sec.gov. If you have questions about finding forms on the SEC’s website, you may call the SEC at 1-800-SEC-0330. You may also obtain The Putnam Funds’ proxy voting guidelines and procedures at no charge by calling Shareholder Services at 1-800-225-1581 or, for exchange-traded funds only, 1-833-228-5577.
Fund portfolio holdings
The fund will file a complete schedule of its portfolio holdings with the SEC for the first and third quarters of each fiscal year on Form N-PORT within 60 days of the end of such fiscal quarter. Shareholders may obtain the fund’s Form N-PORT on the SEC’s website at www.sec.gov.
| Emerging Markets Equity Fund 5 |
Important notice regarding Putnam’s privacy policy
In order to conduct business with our shareholders, we must obtain certain personal information such as account holders’ names, addresses, Social Security numbers, and dates of birth. Using this information, we are able to maintain accurate records of accounts and transactions.
It is our policy to protect the confidentiality of our shareholder information, whether or not a shareholder currently owns shares of our funds. In particular, it is our policy not to sell information about you or your accounts to outside marketing firms. We have safeguards in place designed to prevent unauthorized access to our computer systems and procedures to protect personal information from unauthorized use.
Under certain circumstances, we must share account information with outside vendors who provide services to us, such as mailings and proxy solicitations. In these cases, the service providers enter into confidentiality agreements with us, and we provide only the information necessary to process transactions and perform other services related to your account. Finally, it is our policy to share account information with your financial representative, if you’ve listed one on your Putnam account.
| 6 Emerging Markets Equity Fund |
Financial statements
These sections of the report, as well as the accompanying Notes, constitute the fund’s financial statements.
The fund’s portfolio lists all the fund’s investments and their values as of the last day of the reporting period. Holdings are organized by asset type and industry sector, country, or state to show areas of concentration and diversification.
Statement of assets and liabilities shows how the fund’s net assets and share price are determined. All investment and non-investment assets are added together. Any unpaid expenses and other liabilities are subtracted from this total. The result is divided by the number of shares to determine the net asset value per share, which is calculated separately for each class of shares. (For funds with preferred shares, the amount subtracted from total assets includes the liquidation preference of preferred shares.)
Statement of operations shows the fund’s net investment gain or loss. This is done by first adding up all the fund’s earnings — from dividends and interest income — and subtracting its operating expenses to determine net investment income (or loss). Then, any net gain or loss the fund realized on the sales of its holdings — as well as any unrealized gains or losses over the period — is added to or subtracted from the net investment result to determine the fund’s net gain or loss for the fiscal period.
Statement of changes in net assets shows how the fund’s net assets were affected by the fund’s net investment gain or loss, by distributions to shareholders, and by changes in the number of the fund’s shares. It lists distributions and their sources (net investment income or realized capital gains) over the current reporting period and the most recent fiscal year-end. The distributions listed here may not match the sources listed in the Statement of operations because the distributions are determined on a tax basis and may be paid in a different period from the one in which they were earned. Dividend sources are estimated at the time of declaration. Actual results may vary. Any non-taxable return of capital cannot be determined until final tax calculations are completed after the end of the fund’s fiscal period.
Financial highlights provide an overview of the fund’s investment results, per-share distributions, expense ratios, net investment income ratios, and portfolio turnover (not required for money market funds) in one summary table, reflecting the five most recent reporting periods. In a semiannual report, the highlights table also includes the current reporting period.
| Emerging Markets Equity Fund 7 |
| The fund’s portfolio 2/29/24 (Unaudited) | ||
| COMMON STOCKS (96.9%)* | Shares | Value |
| Automobiles (2.5%) | ||
| BYD Co., Ltd. Class H (China) | 135,500 | $3,345,316 |
| Kia Corp. (South Korea) | 61,877 | 5,785,286 |
| 9,130,602 | ||
| Banks (16.5%) | ||
| Abu Dhabi Islamic Bank PJSC (United Arab Emirates) | 1,834,302 | 5,613,350 |
| Alinma Bank (Saudi Arabia) | 467,086 | 5,473,810 |
| Banco do Brasil SA (Brazil) | 387,100 | 4,505,563 |
| Bank Central Asia Tbk PT (Indonesia) | 7,455,000 | 4,684,577 |
| Bank Mandiri Persero Tbk PT (Indonesia) | 13,359,900 | 5,950,958 |
| Bank of China, Ltd. Class H (China) | 20,867,000 | 8,208,744 |
| Grupo Financiero Banorte SAB de CV Class O (Mexico) | 1,046,700 | 10,826,713 |
| ICICI Bank, Ltd. (India) | 1,135,071 | 14,403,952 |
| 59,667,667 | ||
| Broadline retail (4.6%) | ||
| Alibaba Group Holding, Ltd. (China) | 748,368 | 6,968,009 |
| MercadoLibre, Inc. (Brazil) † | 2,715 | 4,331,240 |
| PDD Holdings, Inc. ADR (China) † | 42,700 | 5,317,858 |
| 16,617,107 | ||
| Capital markets (0.4%) | ||
| B3 SA — Brasil Bolsa Balcao (Brazil) | 574,200 | 1,481,963 |
| 1,481,963 | ||
| Chemicals (0.6%) | ||
| Hansol Chemical Co., Ltd. (South Korea) | 15,919 | 2,035,901 |
| 2,035,901 | ||
| Construction and engineering (1.2%) | ||
| Larsen & Toubro, Ltd. (India) | 100,896 | 4,231,630 |
| 4,231,630 | ||
| Construction materials (1.4%) | ||
| UltraTech Cement, Ltd. (India) | 44,006 | 5,250,177 |
| 5,250,177 | ||
| Consumer staples distribution and retail (3.6%) | ||
| Dino Polska SA (Poland) † | 36,597 | 4,259,003 |
| Shoprite Holdings, Ltd. (South Africa) | 270,214 | 3,637,886 |
| Sumber Alfaria Trijaya Tbk PT (Indonesia) | 13,126,600 | 2,297,051 |
| WalMart de Mexico (Walmex) SAB de CV (Mexico) | 695,000 | 2,776,045 |
| 12,969,985 | ||
| Electrical equipment (1.6%) | ||
| KEI Industries, Ltd. (India) † | 150,100 | 5,812,293 |
| 5,812,293 | ||
| Electronic equipment, instruments, and components (2.6%) | ||
| Dexerials Corp. (Japan) | 60,200 | 2,419,725 |
| Elite Material Co., Ltd. (Taiwan) | 210,000 | 3,288,568 |
| Sinbon Electronics Co., Ltd. (Taiwan) | 442,000 | 3,614,641 |
| 9,322,934 | ||
| Financial services (2.0%) | ||
| Meritz Financial Group, Inc. (South Korea) | 53,965 | 3,367,747 |
| REC, Ltd. (India) | 702,743 | 3,746,522 |
| 7,114,269 |
8 Emerging Markets Equity Fund | |
| COMMON STOCKS (96.9%)* cont. | Shares | Value |
| Gas utilities (1.6%) | ||
| China Resources Gas Group, Ltd. (China) | 1,907,900 | $5,775,239 |
| 5,775,239 | ||
| Ground transportation (0.4%) | ||
| Uber Technologies, Inc. † | 18,900 | 1,502,550 |
| 1,502,550 | ||
| Health care providers and services (2.2%) | ||
| Apollo Hospitals Enterprise, Ltd. (India) | 73,306 | 5,394,406 |
| Max Healthcare Institute, Ltd. (India) | 270,767 | 2,590,723 |
| 7,985,129 | ||
| Hotels, restaurants, and leisure (6.1%) | ||
| Alsea SAB de CV (Mexico) † | 582,600 | 2,239,579 |
| H World Group, Ltd. ADR (China) | 164,800 | 6,025,088 |
| Indian Hotels Co., Ltd. (India) | 1,234,098 | 8,732,248 |
| MakeMyTrip, Ltd. (India) † | 46,500 | 2,868,585 |
| Zomato, Ltd. (India) † | 1,230,638 | 2,455,599 |
| 22,321,099 | ||
| Independent power and renewable electricity producers (1.4%) | ||
| NTPC, Ltd. (India) | 1,229,767 | 4,977,430 |
| 4,977,430 | ||
| Insurance (1.8%) | ||
| AIA Group, Ltd. (Hong Kong) | 798,200 | 6,483,878 |
| 6,483,878 | ||
| Interactive media and services (5.5%) | ||
| Tencent Holdings, Ltd. (China) | 563,800 | 19,961,091 |
| 19,961,091 | ||
| IT Services (2.6%) | ||
| Tata Consultancy Services, Ltd. (India) | 194,609 | 9,611,425 |
| 9,611,425 | ||
| Metals and mining (1.2%) | ||
| Anglo American PLC (United Kingdom) | 112,256 | 2,459,273 |
| APL Apollo Tubes, Ltd. (India) | 99,156 | 1,850,649 |
| 4,309,922 | ||
| Oil, gas, and consumable fuels (3.3%) | ||
| PetroChina Co., Ltd. Class H (China) | 9,834,000 | 7,749,637 |
| Petroleo Brasileiro SA (Preference) (Brazil) | 280,500 | 2,264,945 |
| PRIO SA (Brazil) | 210,900 | 1,854,406 |
| 11,868,988 | ||
| Passenger airlines (0.9%) | ||
| Copa Holdings SA Class A (Panama) | 35,308 | 3,441,471 |
| 3,441,471 | ||
| Pharmaceuticals (1.9%) | ||
| AstraZeneca PLC (United Kingdom) | 14,355 | 1,808,951 |
| Eli Lilly and Co. | 1,800 | 1,356,624 |
| Sun Pharmaceutical Industries, Ltd. (India) | 187,717 | 3,572,376 |
| 6,737,951 | ||
| Professional services (0.4%) | ||
| Benefit Systems SA (Poland) | 2,396 | 1,404,082 |
| 1,404,082 |
Emerging Markets Equity Fund 9 | |
| COMMON STOCKS (96.9%)* cont. | Shares | Value |
| Real estate management and development (1.5%) | ||
| Phoenix Mills, Ltd. (The) (India) | 160,857 | $5,355,741 |
| 5,355,741 | ||
| Semiconductors and semiconductor equipment (16.8%) | ||
| Advanced Micro Devices, Inc. † | 5,600 | 1,078,168 |
| MediaTek, Inc. (Taiwan) | 168,000 | 6,058,938 |
| Novatek Microelectronics Corp. (Taiwan) | 152,000 | 2,890,017 |
| SK Hynix, Inc. (South Korea) | 83,167 | 9,755,696 |
| Taiwan Semiconductor Manufacturing Co., Ltd. (Taiwan) | 1,887,889 | 41,210,503 |
| 60,993,322 | ||
| Software (0.6%) | ||
| Totvs SA (Brazil) | 348,120 | 2,149,183 |
| 2,149,183 | ||
| Specialty retail (0.4%) | ||
| JUMBO SA (Greece) | 56,228 | 1,643,253 |
| 1,643,253 | ||
| Technology hardware, storage, and peripherals (5.9%) | ||
| Asia Vital Components Co., Ltd. (Taiwan) | 118,000 | 1,985,985 |
| Samsung Electronics Co., Ltd. (South Korea) | 351,001 | 19,347,757 |
| 21,333,742 | ||
| Textiles, apparel, and luxury goods (3.7%) | ||
| LVMH Moet Hennessy Louis Vuitton SA (France) | 3,541 | 3,225,489 |
| PRADA SpA (Italy) | 748,100 | 5,283,853 |
| Shenzhou International Group Holdings, Ltd. (China) | 587,500 | 4,843,620 |
| 13,352,962 | ||
| Transportation infrastructure (1.7%) | ||
| International Container Terminal Services, Inc. (Philippines) | 1,239,000 | 6,369,669 |
| 6,369,669 | ||
| Total common stocks (cost $292,588,154) | $351,212,655 | |
| INVESTMENT COMPANIES (4.1%)* | Shares | Value |
| iShares Core MSCI Emerging Markets ETF S | 295,600 | $14,880,504 |
| Total investment companies (cost $14,586,725) | $14,880,504 | |
| SHORT-TERM INVESTMENTS (3.1%)* | Shares | Value | |
| Putnam Cash Collateral Pool, LLC 5.53% d | 11,121,840 | $11,121,840 | |
| Putnam Short Term Investment Fund Class P 5.51% L | 49,856 | 49,856 | |
| Total short-term investments (cost $11,171,696) | $11,171,696 | ||
| TOTAL INVESTMENTS | ||
| Total investments (cost $318,346,575) | $377,264,855 | |
| Key to holding’s abbreviations | |||
| ADR | American Depository Receipts: Represents ownership of foreign securities on deposit with a custodian bank. | ||
| ETF | Exchange Traded Fund | ||
| PJSC | Public Joint Stock Company | ||
10 Emerging Markets Equity Fund | |
| Notes to the fund’s portfolio | |||
| Unless noted otherwise, the notes to the fund’s portfolio are for the close of the fund’s reporting period, which ran from September 1, 2023 through February 29, 2024 (the reporting period). Within the following notes to the portfolio, references to “Putnam Management” represent Putnam Investment Management, LLC, the fund’s manager, an indirect wholly-owned subsidiary of Franklin Resources, Inc., and references to “ASC 820” represent Accounting Standards Codification 820 Fair Value Measurements and Disclosures. | |||
| * | Percentages indicated are based on net assets of $362,476,943. | ||
| † | This security is non-income-producing. | ||
| d | Affiliated company. See Notes 1 and 5 to the financial statements regarding securities lending. The rate quoted in the security description is the annualized 7-day yield of the fund at the close of the reporting period. | ||
| L | Affiliated company (Note 5). The rate quoted in the security description is the annualized 7-day yield of the fund at the close of the reporting period. | ||
| S | Security on loan, in part or in entirety, at the close of the reporting period (Note 1). | ||
| DIVERSIFICATION BY COUNTRY | ||||
| Distribution of investments by country of risk at the close of the reporting period, excluding collateral received, if any (as a percentage of Portfolio Value): | ||||
| India | 22.1% | United Arab Emirates | 1.5% | |
| China | 18.6 | Saudi Arabia | 1.5 | |
| Taiwan | 16.1 | Italy | 1.4 | |
| South Korea | 11.0 | United Kingdom | 1.2 | |
| United States | 5.2 | South Africa | 1.0 | |
| Brazil | 4.5 | Panama | 0.9 | |
| Mexico | 4.3 | France | 0.9 | |
| Indonesia | 3.5 | Japan | 0.7 | |
| Hong Kong | 1.8 | Greece | 0.5 | |
| Philippines | 1.7 | Total | 100.0% | |
| Poland | 1.6 | |||
Emerging Markets Equity Fund 11 | |
ASC 820 establishes a three-level hierarchy for disclosure of fair value measurements. The valuation hierarchy is based upon the transparency of inputs to the valuation of the fund’s investments. The three levels are defined as follows:
Level 1: Valuations based on quoted prices for identical securities in active markets.
Level 2: Valuations based on quoted prices in markets that are not active or for which all significant inputs are observable, either directly or indirectly.
Level 3: Valuations based on inputs that are unobservable and significant to the fair value measurement.
The following is a summary of the inputs used to value the fund’s net assets as of the close of the reporting period:
| Valuation inputs | |||
| Investments in securities: | Level 1 | Level 2 | Level 3 |
| Common stocks*: | |||
| Communication services | $19,961,091 | $— | $— |
| Consumer discretionary | 63,065,023 | — | — |
| Consumer staples | 12,969,985 | — | — |
| Energy | 11,868,988 | — | — |
| Financials | 74,747,777 | — | — |
| Health care | 14,723,080 | — | — |
| Industrials | 22,761,695 | — | — |
| Information technology | 103,410,606 | — | — |
| Materials | 11,596,000 | — | — |
| Real estate | 5,355,741 | — | — |
| Utilities | 10,752,669 | — | — |
| Total common stocks | 351,212,655 | — | — |
| Investment companies | 14,880,504 | — | — |
| Short-term investments | — | 11,171,696 | — |
| Totals by level | $366,093,159 | $11,171,696 | $— |
* Common stock classifications are presented at the sector level, which may differ from the fund’s portfolio presentation.
The accompanying notes are an integral part of these financial statements.
12 Emerging Markets Equity Fund | |
Statement of assets and liabilities 2/29/24 (Unaudited)
| ASSETS | |
| Investment in securities, at value, including $10,913,712 of securities on loan (Note 1): | |
| Unaffiliated issuers (identified cost $307,174,879) | $366,093,159 |
| Affiliated issuers (identified cost $11,171,696) (Notes 1 and 5) | 11,171,696 |
| Foreign currency (cost $5,267,783) (Note 1) | 5,266,954 |
| Dividends, interest and other receivables | 510,394 |
| Foreign tax reclaim | 115,380 |
| Receivable for shares of the fund sold | 277,416 |
| Receivable for investments sold | 4,913,845 |
| Prepaid assets | 46,858 |
| Total assets | 388,395,702 |
| LIABILITIES | |
| Payable for investments purchased | 5,766,123 |
| Payable for shares of the fund repurchased | 4,991,661 |
| Payable for compensation of Manager (Note 2) | 76,473 |
| Payable for custodian fees (Note 2) | 113,325 |
| Payable for investor servicing fees (Note 2) | 128,690 |
| Payable for Trustee compensation and expenses (Note 2) | 163,791 |
| Payable for administrative services (Note 2) | 1,156 |
| Payable for distribution fees (Note 2) | 85,822 |
| Payable for foreign capital gains taxes | 3,403,676 |
| Collateral on securities loaned, at value (Note 1) | 11,121,840 |
| Other accrued expenses | 66,202 |
| Total liabilities | 25,918,759 |
| Net assets | $362,476,943 |
| REPRESENTED BY | |
| Paid-in capital (Unlimited shares authorized) (Notes 1 and 4) | $399,045,255 |
| Total distributable earnings (Note 1) | (36,568,312) |
| Total — Representing net assets applicable to capital shares outstanding | $362,476,943 |
| COMPUTATION OF NET ASSET VALUE AND OFFERING PRICE | |
| Net asset value and redemption price per class A share | |
| ($192,084,885 divided by 15,180,806 shares) | $12.65 |
| Offering price per class A share (100/94.25 of $12.65)* | $13.42 |
| Net asset value and offering price per class B share ($412,314 divided by 35,023 shares)** | $11.77 |
| Net asset value and offering price per class C share ($5,146,862 divided by 439,892 shares)** | $11.70 |
| Net asset value, offering price and redemption price per class R share | |
| ($5,291,449 divided by 423,180 shares) | $12.50 |
| Net asset value, offering price and redemption price per class R6 share | |
| ($23,829,364 divided by 1,839,575 shares) | $12.95 |
| Net asset value, offering price and redemption price per class Y share | |
| ($135,712,069 divided by 10,527,016 shares) | $12.89 |
*On single retail sales of less than $50,000. On sales of $50,000 or more the offering price is reduced.
**Redemption price per share is equal to net asset value less any applicable contingent deferred sales charge.
The accompanying notes are an integral part of these financial statements.
| Emerging Markets Equity Fund 13 |
Statement of operations Six months ended 2/29/24 (Unaudited)
| INVESTMENT INCOME | |
| Dividends (net of foreign tax of $403,830) | $2,577,569 |
| Interest (including interest income of $124,380 from investments in affiliated issuers) (Note 5) | 125,545 |
| Securities lending (net of expenses) (Notes 1 and 5) | 2,016 |
| Total investment income | 2,705,130 |
| EXPENSES | |
| Compensation of Manager (Note 2) | 1,426,133 |
| Investor servicing fees (Note 2) | 393,221 |
| Custodian fees (Note 2) | 141,209 |
| Trustee compensation and expenses (Note 2) | 8,185 |
| Distribution fees (Note 2) | 269,816 |
| Administrative services (Note 2) | 7,162 |
| Other | 145,468 |
| Fees waived and reimbursed by Manager (Note 2) | (545,634) |
| Total expenses | 1,845,560 |
| Expense reduction (Note 2) | (2,713) |
| Net expenses | 1,842,847 |
| Net investment income | 862,283 |
| REALIZED AND UNREALIZED GAIN (LOSS) | |
| Net realized gain (loss) on: | |
| Securities from unaffiliated issuers (net of foreign tax of $427,223) (Notes 1 and 3) | 16,655,937 |
| Foreign currency transactions (Note 1) | (86,106) |
| Total net realized gain | 16,569,831 |
| Change in net unrealized appreciation (depreciation) on: | |
| Securities from unaffiliated issuers (net of increase in deferred foreign taxes of $1,455,306) | 11,605,576 |
| Assets and liabilities in foreign currencies | (17,615) |
| Total change in net unrealized appreciation | 11,587,961 |
| Net gain on investments | 28,157,792 |
| Net increase in net assets resulting from operations | $29,020,075 |
The accompanying notes are an integral part of these financial statements.
| 14 Emerging Markets Equity Fund |
Statement of changes in net assets
| DECREASE IN NET ASSETS | Six months ended 2/29/24* | Year ended 8/31/23 |
| Operations | ||
| Net investment income | $862,283 | $3,764,055 |
| Net realized gain (loss) on investments | ||
| and foreign currency transactions | 16,569,831 | (28,374,455) |
| Change in net unrealized appreciation of investments | ||
| and assets and liabilities in foreign currencies | 11,587,961 | 40,501,865 |
| Net increase in net assets resulting from operations | 29,020,075 | 15,891,465 |
| Distributions to shareholders (Note 1): | ||
| From ordinary income | ||
| Net investment income | ||
| Class A | (1,513,002) | — |
| Class B | — | — |
| Class C | (1,834) | — |
| Class R | (29,663) | — |
| Class R6 | (350,852) | — |
| Class Y | (1,294,801) | — |
| Decrease from capital share transactions (Note 4) | (36,003,009) | (18,748,857) |
| Total decrease in net assets | (10,173,086) | (2,857,392) |
| NET ASSETS | ||
| Beginning of period | 372,650,029 | 375,507,421 |
| End of period | $362,476,943 | $372,650,029 |
* Unaudited.
The accompanying notes are an integral part of these financial statements.
| Emerging Markets Equity Fund 15 |
Financial highlights
(For a common share outstanding throughout the period)
| INVESTMENT OPERATIONS | LESS DISTRIBUTIONS | RATIOS AND SUPPLEMENTAL DATA | |||||||||||
| Ratio | Ratio of net | ||||||||||||
| Net asset | Net realized | of expenses | investment | ||||||||||
| value, | and unrealized | Total from | From net | From net | Net asset | Total return | Net assets, | to average | income (loss) | Portfolio | |||
| beginning | Net investment | gain (loss) | investment | investment | realized gain | Total | value, end | at net asset | end of period | net assets | to average | turnover | |
| Period ended | of period | income (loss)a | on investments | operations | income | on investments | distributions | of period | value (%)b | (in thousands) | (%)c,d | net assets (%)c | (%) |
| Class A | |||||||||||||
| February 29, 2024** | $11.76 | .02 | .97 | .99 | (.10) | — | (.10) | $12.65 | 8.44* | $192,085 | .57* | .18* | 30* |
| August 31, 2023 | 11.28 | .10 | .38 | .48 | — | — | — | 11.76 | 4.26 | 187,270 | 1.25 | .90 | 63 |
| August 31, 2022 | 17.25 | .05 | (5.20) | (5.15) | (.01) | (.81) | (.82) | 11.28 | (31.05) | 197,474 | 1.33 | .38 | 127 |
| August 31, 2021 | 14.68 | (.01) | 2.86 | 2.85 | (.02) | (.26) | (.28) | 17.25 | 19.50 | 315,105 | 1.29 | (.07) | 124 |
| August 31, 2020 | 11.05 | .08e | 3.69 | 3.77 | (.14) | — | (.14) | 14.68 | 34.30 | 269,748 | 1.31 | .60e | 127 |
| August 31, 2019 | 11.75 | .09 | (.57) | (.48) | (.01) | (.21) | (.22) | 11.05 | (3.96) | 36,325 | 1.26 | .80 | 175 |
| Class B | |||||||||||||
| February 29, 2024** | $10.90 | (.02) | .89 | .87 | — | — | — | $11.77 | 7.98* | $412 | .94* | (.15)* | 30* |
| August 31, 2023 | 10.53 | .01 | .36 | .37 | — | — | — | 10.90 | 3.51 | 658 | 2.00 | .10 | 63 |
| August 31, 2022 | 16.28 | (.07) e | (4.86) | (4.93) | (.01) | (.81) | (.82) | 10.53 | (31.57) | 1,227 | 2.08 | (.49)e | 127 |
| August 31, 2021 | 13.95 | (.13) | 2.72 | 2.59 | — | (.26) | (.26) | 16.28 | 18.65 | 2,993 | 2.04 | (.81) | 124 |
| August 31, 2020 | 10.52 | (.05) | 3.54 | 3.49 | (.06) | — | (.06) | 13.95 | 33.26 | 3,493 | 2.06 | (.43) | 127 |
| August 31, 2019 | 11.27 | .02 | (.56) | (.54) | — | (.21) | (.21) | 10.52 | (4.67) | 1,998 | 2.01 | .17 | 175 |
| Class C | |||||||||||||
| February 29, 2024** | $10.84 | (.02) | .88 | .86 | —f | — | —f | $11.70 | 7.97* | $5,147 | .94* | (.19)* | 30* |
| August 31, 2023 | 10.47 | .01 | .36 | .37 | — | — | — | 10.84 | 3.53 | 5,542 | 2.00 | .13 | 63 |
| August 31, 2022 | 16.19 | (.06) | (4.84) | (4.90) | (.01) | (.81) | (.82) | 10.47 | (31.55) | 7,088 | 2.08 | (.42) | 127 |
| August 31, 2021 | 13.88 | (.13) | 2.70 | 2.57 | — | (.26) | (.26) | 16.19 | 18.60 | 13,498 | 2.04 | (.82) | 124 |
| August 31, 2020 | 10.48 | (.05) | 3.52 | 3.47 | (.07) | — | (.07) | 13.88 | 33.27 | 11,606 | 2.06 | (.47) | 127 |
| August 31, 2019 | 11.23 | .02 | (.56) | (.54) | — | (.21) | (.21) | 10.48 | (4.69) | 6,546 | 2.01 | .19 | 175 |
| Class R | |||||||||||||
| February 29, 2024** | $11.62 | .01 | .94 | .95 | (.07) | — | (.07) | $12.50 | 8.23* | $5,291 | .70* | .05* | 30* |
| August 31, 2023 | 11.17 | .07 | .38 | .45 | — | — | — | 11.62 | 4.03 | 4,660 | 1.50 | .65 | 63 |
| August 31, 2022 | 17.13 | .02 | (5.16) | (5.14) | (.01) | (.81) | (.82) | 11.17 | (31.21) | 4,510 | 1.58 | .17 | 127 |
| August 31, 2021 | 14.62 | (.06) | 2.86 | 2.80 | (.03) | (.26) | (.29) | 17.13 | 19.25 | 6,419 | 1.54 | (.35) | 124 |
| August 31, 2020 | 10.97 | .01 | 3.70 | 3.71 | (.06) | — | (.06) | 14.62 | 33.86 | 1,119 | 1.56 | .11 | 127 |
| August 31, 2019 | 11.68 | .08 | (.58) | (.50) | — | (.21) | (.21) | 10.97 | (4.16) | 1,093 | 1.51 | .74 | 175 |
| Class R6 | |||||||||||||
| February 29, 2024** | $12.07 | .05 | .98 | 1.03 | (.15) | — | (.15) | $12.95 | 8.60* | $23,829 | .36* | .40* | 30* |
| August 31, 2023 | 11.52 | .16 | .39 | .55 | — | — | — | 12.07 | 4.77 | 27,784 | .81 | 1.33 | 63 |
| August 31, 2022 | 17.53 | .11 | (5.30) | (5.19) | (.01) | (.81) | (.82) | 11.52 | (30.77) | 27,655 | .91 | .81 | 127 |
| August 31, 2021 | 14.88 | .05 | 2.92 | 2.97 | (.06) | (.26) | (.32) | 17.53 | 20.06 | 41,708 | .89 | .31 | 124 |
| August 31, 2020 | 11.22 | .10 | 3.77 | 3.87 | (.21) | — | (.21) | 14.88 | 34.81 | 22,945 | .89 | .76 | 127 |
| August 31, 2019 | 11.89 | .17 | (.61) | (.44) | (.02) | (.21) | (.23) | 11.22 | (3.55) | 10,143 | .82 | 1.47 | 175 |
See notes to financial highlights at the end of this section.
The accompanying notes are an integral part of these financial statements.
| 16 Emerging Markets Equity Fund | Emerging Markets Equity Fund 17 |
Financial highlights cont.
| INVESTMENT OPERATIONS | LESS DISTRIBUTIONS | RATIOS AND SUPPLEMENTAL DATA | |||||||||||
| Ratio | Ratio of net | ||||||||||||
| Net asset | Net realized | of expenses | investment | ||||||||||
| value, | and unrealized | Total from | From net | From net | Net asset | Total return | Net assets, | to average | income (loss) | Portfolio | |||
| beginning | Net investment | gain (loss) | investment | investment | realized gain | Total | value, end | at net asset | end of period | net assets | to average | turnover | |
| Period ended | of period | income (loss)a | on investments | operations | income | on investments | distributions | of period | value (%)b | (in thousands) | (%)c,d | net assets (%)c | (%) |
| Class Y | |||||||||||||
| February 29, 2024** | $12.00 | .04 | .97 | 1.01 | (.12) | — | (.12) | $12.89 | 8.50* | $135,712 | .45* | .31* | 30* |
| August 31, 2023 | 11.48 | .13 | .39 | .52 | — | — | — | 12.00 | 4.53 | 146,736 | 1.00 | 1.13 | 63 |
| August 31, 2022 | 17.49 | .08 | (5.27) | (5.19) | (.01) | (.81) | (.82) | 11.48 | (30.84) | 137,553 | 1.08 | .60 | 127 |
| August 31, 2021 | 14.86 | .02 | 2.91 | 2.93 | (.04) | (.26) | (.30) | 17.49 | 19.84 | 253,336 | 1.04 | .13 | 124 |
| August 31, 2020 | 11.19 | .06 | 3.79 | 3.85 | (.18) | — | (.18) | 14.86 | 34.66 | 82,640 | 1.06 | .46 | 127 |
| August 31, 2019 | 11.88 | .13 | (.59) | (.46) | (.02) | (.21) | (.23) | 11.19 | (3.74) | 69,989 | 1.01 | 1.17 | 175 |
* Not annualized.
** Unaudited.
a Per share net investment income (loss) has been determined on the basis of the weighted average number of shares outstanding during the period.
b Total return assumes dividend reinvestment and does not reflect the effect of sales charges.
c Reflects an involuntary contractual expense limitation in effect during the period. As a result of such limitation, the expenses of each class reflect a reduction of the following amounts (Note 2):
| Percentage of average | |
| net assets | |
| February 29, 2024 | 0.15% |
| August 31, 2023 | 0.31 |
| August 31, 2022 | 0.29 |
| August 31, 2021 | 0.27 |
| August 31, 2020 | 0.48 |
| August 31, 2019 | 0.45 |
d Includes amounts paid through expense offset and/or brokerage/service arrangements, if any (Note 2). Also excludes acquired fund fees and expenses, if any.
e The net investment income ratio and per share amount shown for the period ending may not correspond with the expected class specific differences for the period due to the timing of subscriptions into or redemptions out of the class.
f Amount represents less than $0.01 per share.
The accompanying notes are an integral part of these financial statements.
| 18 Emerging Markets Equity Fund | Emerging Markets Equity Fund 19 |
Notes to financial statements 2/29/24 (Unaudited)
Unless otherwise noted, the “reporting period” represents the period from September 1, 2023 through February 29, 2024. The following table defines commonly used references within the Notes to financial statements:
| References to | Represent |
| Franklin Templeton | Franklin Resources, Inc. |
| JPMorgan | JPMorgan Chase Bank, N.A. |
| OTC | Over-the-counter |
| PAC | The Putnam Advisory Company, LLC, an affiliate of Putnam Management |
| PIL | Putnam Investments Limited, an affiliate of Putnam Management |
| Putnam Management | Putnam Investment Management, LLC, the fund’s manager, an indirect wholly-owned |
| subsidiary of Franklin Templeton | |
| SEC | Securities and Exchange Commission |
| State Street | State Street Bank and Trust Company |
Putnam Emerging Markets Equity Fund (the fund) is a non-diversified series of Putnam Funds Trust (the Trust), a Massachusetts business trust registered under the Investment Company Act of 1940, as amended, as an open-end management investment company. The goal of the fund is to seek long-term capital appreciation. The fund invests mainly in common stocks (growth or value stocks or both) of emerging market companies of any size that Putnam Management believes have favorable investment potential. For example, the fund may purchase stocks of companies with stock prices that reflect a value lower than that which Putnam Management places on the company. Putnam Management may also consider other factors that Putnam Management believes will cause the stock price to rise. Under normal circumstances, Putnam Management invests at least 80% of the fund’s net assets in equity securities of emerging market companies. This policy may be changed only after 60 days’ notice to shareholders. Emerging markets include countries in the MSCI Emerging Market Index or that Putnam Management considers to be emerging markets based on Putnam Management’s evaluation of their level of economic development or the size and nature of their securities markets. Putnam Management may consider, among other factors, a company’s valuation, financial strength, growth potential, competitive position in its industry, projected future earnings, cash flows and dividends when deciding whether to buy or sell investments. The fund may also use derivatives, such as futures, options, warrants and swap contracts, for both hedging and non-hedging purposes. The fund is “non-diversified,” which means it may invest a greater percentage of its assets in fewer issuers than a “diversified” fund.
The fund offers the following share classes. The expenses for each class of shares may differ based on the distribution and investor servicing fees of each class, which are identified in Note 2.
| Share class | Sales charge | Contingent deferred sales charge | Conversion feature |
| 1.00% on certain redemptions of shares | |||
| Class A | Up to 5.75% | bought with no initial sales charge | None |
| Converts to class A shares | |||
| Class B* | None | 5.00% phased out over six years | after 8 years |
| Converts to class A shares | |||
| Class C | None | 1.00% eliminated after one year | after 8 years |
| Class R† | None | None | None |
| Class R6† | None | None | None |
| Class Y† | None | None | None |
* Purchases of class B shares are closed to new and existing investors except by exchange from class B shares of another Putnam fund or through dividend and/or capital gains reinvestment.
† Not available to all investors.
In the normal course of business, the fund enters into contracts that may include agreements to indemnify another party under given circumstances. The fund’s maximum exposure under these arrangements is unknown as this would involve future claims that may be, but have not yet been, made against the fund. However, the fund’s management team expects the risk of material loss to be remote.
| 20 Emerging Markets Equity Fund |
The fund has entered into contractual arrangements with an investment adviser, administrator, distributor, shareholder servicing agent and custodian, who each provide services to the fund. Unless expressly stated otherwise, shareholders are not parties to, or intended beneficiaries of these contractual arrangements, and these contractual arrangements are not intended to create any shareholder right to enforce them against the service providers or to seek any remedy under them against the service providers, either directly or on behalf of the fund.
Under the Trust’s Agreement and Declaration of Trust, any claims asserted by a shareholder against or on behalf of the Trust (or its series), including claims against Trustees and Officers, must be brought in courts located within the Commonwealth of Massachusetts.
Note 1: Significant accounting policies
The fund follows the accounting and reporting guidance in Financial Accounting Standards Board (FASB) Accounting Standards Codification Topic 946, Financial Services – Investment Companies (ASC 946) and applies the specialized accounting and reporting guidance in U.S. Generally Accepted Accounting Principles (U.S. GAAP), including, but not limited to, ASC 946. The following is a summary of significant accounting policies consistently followed by the fund in the preparation of its financial statements. The preparation of financial statements is in conformity with accounting principles generally accepted in the United States of America and requires management to make estimates and assumptions that affect the reported amounts of assets and liabilities in the financial statements and the reported amounts of increases and decreases in net assets from operations. Actual results could differ from those estimates. Subsequent events after the Statement of assets and liabilities date through the date that the financial statements were issued have been evaluated in the preparation of the financial statements.
Investment income, realized and unrealized gains and losses and expenses of the fund are borne pro-rata based on the relative net assets of each class to the total net assets of the fund, except that each class bears expenses unique to that class (including the distribution fees applicable to such classes). Each class votes as a class only with respect to its own distribution plan or other matters on which a class vote is required by law or determined by the Trustees. If the fund were liquidated, shares of each class would receive their pro-rata share of the net assets of the fund. In addition, the Trustees declare separate dividends on each class of shares.
Security valuation Portfolio securities and other investments are valued using policies and procedures adopted by the Board of Trustees. The Trustees have formed a Pricing Committee to oversee the implementation of these procedures and have delegated responsibility for valuing the fund’s assets in accordance with these procedures to Putnam Management. Putnam Management has established an internal Valuation Committee that is responsible for making fair value determinations, evaluating the effectiveness of the pricing policies of the fund and reporting to the Pricing Committee.
Investments for which market quotations are readily available are valued at the last reported sales price on their principal exchange, or official closing price for certain markets, and are classified as Level 1 securities under Accounting Standards Codification 820 Fair Value Measurements and Disclosures (ASC 820). If no sales are reported, as in the case of some securities that are traded OTC, a security is valued at its last reported bid price and is generally categorized as a Level 2 security.
Investments in open-end investment companies (excluding exchange-traded funds), if any, which can be classified as Level 1 or Level 2 securities, are valued based on their net asset value. The net asset value of such investment companies equals the total value of their assets less their liabilities and divided by the number of their outstanding shares.
Many securities markets and exchanges outside the U.S. close prior to the scheduled close of the New York Stock Exchange and therefore the closing prices for securities in such markets or on such exchanges may not fully reflect events that occur after such close but before the scheduled close of the New York Stock Exchange. Accordingly, on certain days, the fund will fair value certain foreign equity securities taking into account multiple factors including movements in the U.S. securities markets, currency valuations and comparisons to the valuation of American Depository Receipts, exchange-traded funds and futures contracts. The foreign equity securities, which would generally be classified as Level 1 securities, will be transferred to Level 2 of the fair value hierarchy when they are valued at fair value. The number of days on which fair value prices will be used will depend on market activity and it is possible that fair value prices will be used by the fund to a significant extent. Securities quoted in foreign currencies, if any, are translated into U.S. dollars at the current exchange rate. Short-term securities with remaining maturities of 60 days or less are valued using an independent pricing service approved by the Trustees, and are classified as Level 2 securities.
| Emerging Markets Equity Fund 21 |
To the extent a pricing service or dealer is unable to value a security or provides a valuation that Putnam Management does not believe accurately reflects the security’s fair value, the security will be valued at fair value by Putnam Management, which has been designated as valuation designee pursuant to Rule 2a–5 under the Investment Company Act of 1940, in accordance with policies and procedures approved by the Trustees. Certain investments, including certain restricted and illiquid securities and derivatives, are also valued at fair value following procedures approved by the Trustees. These valuations consider such factors as significant market or specific security events such as interest rate or credit quality changes, various relationships with other securities, discount rates, U.S. Treasury, U.S. swap and credit yields, index levels, convexity exposures, recovery rates, sales and other multiples and resale restrictions. These securities are classified as Level 2 or as Level 3 depending on the priority of the significant inputs.
To assess the continuing appropriateness of fair valuations, the Valuation Committee reviews and affirms the reasonableness of such valuations on a regular basis after considering all relevant information that is reasonably available. Such valuations and procedures are reviewed periodically by the Trustees. The fair value of securities is generally determined as the amount that the fund could reasonably expect to realize from an orderly disposition of such securities over a reasonable period of time. By its nature, a fair value price is a good faith estimate of the value of a security in a current sale and does not reflect an actual market price, which may be different by a material amount.
Security transactions and related investment income Security transactions are recorded on the trade date (the date the order to buy or sell is executed). Gains or losses on securities sold are determined on the identified cost basis.
Interest income, net of any applicable withholding taxes, if any, is recorded on the accrual basis. Amortization and accretion of premiums and discounts on debt securities, if any, is recorded on the accrual basis.
Dividend income, net of any applicable withholding taxes, is recognized on the ex-dividend date except that certain dividends from foreign securities, if any, are recognized as soon as the fund is informed of the ex-dividend date. Non-cash dividends, if any, are recorded at the fair value of the securities received. Dividends representing a return of capital or capital gains, if any, are reflected as a reduction of cost and/or as a realized gain.
Foreign currency translation The accounting records of the fund are maintained in U.S. dollars. The fair value of foreign securities, currency holdings, and other assets and liabilities is recorded in the books and records of the fund after translation to U.S. dollars based on the exchange rates on that day. The cost of each security is determined using historical exchange rates. Income and withholding taxes are translated at prevailing exchange rates when earned or incurred. The fund does not isolate that portion of realized or unrealized gains or losses resulting from changes in the foreign exchange rate on investments from fluctuations arising from changes in the market prices of the securities. Such gains and losses are included with the net realized and unrealized gain or loss on investments. Net realized gains and losses on foreign currency transactions represent net realized exchange gains or losses on disposition of foreign currencies, currency gains and losses realized between the trade and settlement dates on securities transactions and the difference between the amount of investment income and foreign withholding taxes recorded on the fund’s books and the U.S. dollar equivalent amounts actually received or paid. Net unrealized appreciation and depreciation of assets and liabilities in foreign currencies arise from changes in the value of assets and liabilities other than investments at the period end, resulting from changes in the exchange rate.
Securities lending The fund may lend securities, through its agent, to qualified borrowers in order to earn additional income. The loans are collateralized by cash in an amount at least equal to the fair value of the securities loaned. The fair value of securities loaned is determined daily and any additional required collateral is allocated to the fund on the next business day. The remaining maturities of the securities lending transactions are considered overnight and continuous. The risk of borrower default will be borne by the fund’s agent; the fund will bear the risk of loss with respect to the investment of the cash collateral. Income from securities lending, if any, is net of expenses and is included in investment income on the Statement of operations. Cash collateral is invested in Putnam Cash Collateral Pool, LLC, a limited liability company managed by an affiliate of Putnam Management. Investments in Putnam Cash Collateral Pool, LLC are valued at its closing net asset value each business day. There are no management fees charged to Putnam Cash Collateral Pool, LLC. At the close of the reporting period, the fund received cash collateral of $11,121,840 and the value of securities loaned amounted to $10,913,712.
Interfund lending The fund, along with other Putnam funds, may participate in an interfund lending program pursuant to an exemptive order issued by the SEC. This program allows the fund to borrow from or lend to other Putnam funds that permit such transactions. Interfund lending transactions are subject to each fund’s investment policies and borrowing and lending limits. Interest earned or paid on the interfund lending
| 22 Emerging Markets Equity Fund |
transaction will be based on the average of certain current market rates. During the reporting period, the fund did not utilize the program.
Lines of credit The fund participates, along with other Putnam funds, in a $320 million syndicated unsecured committed line of credit, provided by State Street ($160 million) and JPMorgan ($160 million), and a $235.5 million unsecured uncommitted line of credit, provided by State Street. Borrowings may be made for temporary or emergency purposes, including the funding of shareholder redemption requests and trade settlements. Interest is charged to the fund based on the fund’s borrowing at a rate equal to 1.25% plus the higher of (1) the Federal Funds rate and (2) the Overnight Bank Funding Rate for the committed line of credit and 1.30% plus the higher of (1) the Federal Funds rate and (2) the Overnight Bank Funding Rate for the uncommitted line of credit. A closing fee equal to 0.04% of the committed line of credit and 0.04% of the uncommitted line of credit has been paid by the participating funds and a $75,000 fee has been paid by the participating funds to State Street as agent of the syndicated committed line of credit. In addition, a commitment fee of 0.21% per annum on any unutilized portion of the committed line of credit is allocated to the participating funds based on their relative net assets and paid quarterly. During the reporting period, the fund had no borrowings against these arrangements.
Federal taxes It is the policy of the fund to distribute all of its taxable income within the prescribed time period and otherwise comply with the provisions of the Internal Revenue Code of 1986, as amended (the Code), applicable to regulated investment companies. It is also the intention of the fund to distribute an amount sufficient to avoid imposition of any excise tax under Section 4982 of the Code.
The fund is subject to the provisions of Accounting Standards Codification 740 Income Taxes (ASC 740). ASC 740 sets forth a minimum threshold for financial statement recognition of the benefit of a tax position taken or expected to be taken in a tax return. The fund did not have a liability to record for any unrecognized tax benefits in the accompanying financial statements. No provision has been made for federal taxes on income, capital gains or unrealized appreciation on securities held nor for excise tax on income and capital gains. Each of the fund’s federal tax returns for the prior three fiscal years remains subject to examination by the Internal Revenue Service.
The fund may also be subject to taxes imposed by governments of countries in which it invests. Such taxes are generally based on either income or gains earned or repatriated. The fund accrues and applies such taxes to net investment income, net realized gains and net unrealized gains as income and/or capital gains are earned. In some cases, the fund may be entitled to reclaim all or a portion of such taxes, and such reclaim amounts, if any, are reflected as an asset on the fund’s books. In many cases, however, the fund may not receive such amounts for an extended period of time, depending on the country of investment.
Under the Regulated Investment Company Modernization Act of 2010, the fund will be permitted to carry forward capital losses incurred for an unlimited period and the carry forwards will retain their character as either short-term or long-term capital losses. At August 31, 2023, the fund had the following capital loss carryovers available, to the extent allowed by the Code, to offset future net capital gain, if any:
| Loss carryover | ||
| Short-term | Long-term | Total |
| $79,259,327 | $22,538,332 | $101,797,659 |
Tax cost of investments includes adjustments to net unrealized appreciation (depreciation) which may not necessarily be final tax cost basis adjustments, but closely approximate the tax basis unrealized gains and losses that may be realized and distributed to shareholders. The aggregate identified cost on a tax basis is $325,937,215, resulting in gross unrealized appreciation and depreciation of $68,713,152 and $17,385,512, respectively, or net unrealized appreciation of $51,327,640.
Distributions to shareholders Distributions to shareholders from net investment income, if any, are recorded by the fund on the ex-dividend date. Distributions from capital gains, if any, are recorded on the ex-dividend date and paid at least annually. The amount and character of income and gains to be distributed are determined in accordance with income tax regulations, which may differ from generally accepted accounting principles. Dividend sources are estimated at the time of declaration. Actual results may vary. Any non-taxable return of capital cannot be determined until final tax calculations are completed after the end of the fund’s fiscal year. Reclassifications are made to the fund’s capital accounts to reflect income and gains available for distribution (or available capital loss carryovers) under income tax regulations.
Expenses of the Trust Expenses directly charged or attributable to any fund will be paid from the assets of that fund. Generally, expenses of the Trust will be allocated among and charged to the assets of each fund on a basis
| Emerging Markets Equity Fund 23 |
that the Trustees deem fair and equitable, which may be based on the relative assets of each fund or the nature of the services performed and relative applicability to each fund.
Note 2: Management fee, administrative services and other transactions
The fund pays Putnam Management a management fee (base fee) (based on the fund’s average net assets and computed and paid monthly) at annual rates that may vary based on the average of the aggregate net assets of all open-end mutual funds sponsored by Putnam Management (excluding net assets of funds that are invested in, or that are invested in by, other Putnam funds to the extent necessary to avoid “double counting” of those assets). Such annual rates may vary as follows:
| 1.080% | of the first $5 billion, | 0.880% | of the next $50 billion, | |
| 1.030% | of the next $5 billion, | 0.860% | of the next $50 billion, | |
| 0.980% | of the next $10 billion, | 0.850% | of the next $100 billion and | |
| 0.930% | of the next $10 billion, | 0.845% | of any excess thereafter. |
In addition, the monthly management fee consists of the monthly base fee plus or minus a performance adjustment for the month. The performance adjustment is determined based on performance over the thirty-six month period then ended. Each month, the performance adjustment is calculated by multiplying the performance adjustment rate and the fund’s average net assets over the performance period and dividing the result by twelve. The resulting dollar amount is added to, or subtracted from the base fee for that month. The performance adjustment rate is equal to 0.03 multiplied by the difference between the fund’s annualized performance (measured by the fund’s class A shares) and the annualized performance of the MSCI Emerging Markets Index (Net Dividends) each measured over the performance period. The maximum annualized performance adjustment rate is +/- 0.21%. The monthly base fee is determined based on the fund’s average net assets for the month, while the performance adjustment is determined based on the fund’s average net assets over the thirty-six month performance period. This means it is possible that, if the fund underperforms significantly over the performance period, and the fund’s assets have declined significantly over that period, the negative performance adjustment may exceed the base fee. In this event, Putnam Management would make a payment to the fund.
In connection with the merger of Putnam International Growth Fund (“acquired fund”) into the fund on May 18, 2020, the management contract was amended such that, after completion of the merger, the combined fund’s performance adjustment will be calculated based on the combined assets of the fund and the acquired fund for any portion of a performance period that is prior to the merger, unless the use of the combined assets results in a fee payable by the fund under the amended management contract that is higher than the management fee that would have been paid under the fund’s current management contract. Under those circumstances, Putnam Management has agreed to reduce its management fee to reflect the lower amount that would have been payable under the fund’s current fee schedule, which would only take into account the assets of the fund for the period prior to the closing of the mergers. As a result of these management contract changes, the fund’s shareholders may pay a lower management fee, but would never pay a higher management fee, under the amended management contract than they would have paid under the fund’s current management contract.
Because the performance adjustment is based on the fund’s performance relative to its applicable benchmark index, and not its absolute performance, the performance adjustment could increase Putnam Management’s fee even if the fund’s shares lose value during the performance period provided that the fund outperformed its benchmark index, and could decrease Putnam Management’s fee even if the fund’s shares increase in value during the performance period provided that the fund underperformed its benchmark index.
For the reporting period, the management fee represented an effective rate (excluding the impact of any expense waiver in effect) of 0.398% of the fund’s average net assets, which included an effective base fee of 0.456% and a decrease of 0.058% ($207,474) based on performance.
Putnam Management has contractually agreed, through December 30, 2024, to waive fees and/or reimburse the fund’s expenses to the extent necessary to limit the cumulative expenses of the fund, exclusive of brokerage, interest, taxes, investment-related expenses, extraordinary expenses, acquired fund fees and expenses and payments under the fund’s investor servicing contract, investment management contract and distribution plans, on a fiscal year-to-date basis to an annual rate of 0.20% of the fund’s average net assets over such fiscal year-to-date period. During the reporting period, the fund’s expenses were not reduced as a result of this limit.
Putnam Management has also contractually agreed to waive fees (and, to the extent necessary, bear other expenses) of the fund through December 30, 2024, to the extent that total expenses of the fund (before any
| 24 Emerging Markets Equity Fund |
applicable performance-based adjustment to the fund’s base management fee and excluding brokerage, interest, taxes, investment-related expenses, payments under distribution plans, extraordinary expenses, payments under the fund’s investor servicing contract and acquired fund fees and expenses, but including payments under the fund’s investment management contract) would exceed an annual rate of 0.78% of the fund’s average net assets. During the reporting period, the fund’s expenses were reduced by $545,634 as a result of this limit.
PIL is authorized by the Trustees to manage a separate portion of the assets of the fund as determined by Putnam Management from time to time. PIL did not manage any portion of the assets of the fund during the reporting period. If Putnam Management were to engage the services of PIL, Putnam Management would pay a quarterly sub-management fee to PIL for its services at an annual rate of 0.25% of the average net assets of the portion of the fund managed by PIL.
PAC is authorized by the Trustees to manage a separate portion of the assets of the fund, as designated from time to time by Putnam Management or PIL. PAC did not manage any portion of the assets of the fund during the reporting period. If Putnam Management or PIL were to engage the services of PAC, Putnam Management or PIL, as applicable, would pay a quarterly sub-advisory fee to PAC for its services at the annual rate of 0.25% of the average net assets of the portion of the fund’s assets for which PAC is engaged as sub-adviser.
On January 1, 2024, a subsidiary of Franklin Templeton acquired Putnam U.S. Holdings I, LLC (“Putnam Holdings”), the parent company of Putnam Management, PIL and PAC, in a stock and cash transaction (the “Transaction”). As a result of the Transaction, Putnam Management, PIL and PAC became indirect, wholly-owned subsidiaries of Franklin Templeton. The Transaction also resulted in the automatic termination of the investment management contract between the fund and Putnam Management, the sub-management contract for the fund between Putnam Management and PIL, and the sub-advisory contract for the fund among Putnam Management, PIL and PAC that were in place for the fund before the Transaction. However, Putnam Management, PIL and PAC continued to provide uninterrupted services with respect to the fund pursuant to new investment management, sub-management, and sub-advisory contracts that were approved by fund shareholders at a shareholder meeting held in connection with the Transaction and that took effect on January 1, 2024. The terms of the new investment management, sub-management, and sub-advisory contracts are substantially similar to those of the previous investment management, sub-management, and sub-advisory contracts, and the fee rates payable under the new investment management, sub-management, and sub-advisory contracts are the same as the fee rates under the previous investment management, sub-management, and sub-advisory contracts.
The fund reimburses Putnam Management an allocated amount for the compensation and related expenses of certain officers of the fund and their staff who provide administrative services to the fund. The aggregate amount of all such reimbursements is determined annually by the Trustees.
Custodial functions for the fund’s assets are provided by State Street. Custody fees are based on the fund’s asset level, the number of its security holdings and transaction volumes.
Putnam Investor Services, Inc., an affiliate of Putnam Management, provides investor servicing agent functions to the fund. Putnam Investor Services, Inc. received fees for investor servicing for class A, class B, class C, class R and class Y shares that included (1) a per account fee for each direct and underlying non-defined contribution account (retail account) of the fund; (2) a specified rate of the fund’s assets attributable to defined contribution plan accounts; and (3) a specified rate based on the average net assets in retail accounts. Putnam Investor Services, Inc. has agreed that the aggregate investor servicing fees for each fund’s retail and defined contribution accounts for these share classes will not exceed an annual rate of 0.25% of the fund’s average assets attributable to such accounts.
Class R6 shares paid a monthly fee based on the average net assets of class R6 shares at an annual rate of 0.05%.
During the reporting period, the expenses for each class of shares related to investor servicing fees were as follows:
| Class A | $215,873 | Class R | 5,560 | |
| Class B | 590 | Class R6 | 6,986 | |
| Class C | 6,026 | Class Y | 158,186 | |
| Total | $393,221 |
| Emerging Markets Equity Fund 25 |
The fund has entered into expense offset arrangements with Putnam Investor Services, Inc. and State Street whereby Putnam Investor Services, Inc.’s and State Street’s fees are reduced by credits allowed on cash balances. For the reporting period, the fund’s expenses were reduced by $2,713 under the expense offset arrangements.
Each Independent Trustee of the fund receives an annual Trustee fee, of which $303, as a quarterly retainer, has been allocated to the fund, and an additional fee for each Trustees meeting attended. Trustees also are reimbursed for expenses they incur relating to their services as Trustees.
The fund has adopted a Trustee Fee Deferral Plan (the Deferral Plan) which allows the Trustees to defer the receipt of all or a portion of Trustees fees payable from July 1, 1995 through December 31, 2023. The deferred fees remain invested in certain Putnam funds until distribution in accordance with the Deferral Plan.
The fund has adopted an unfunded noncontributory defined benefit pension plan (the Pension Plan) covering all Trustees of the fund who have served as a Trustee for at least five years and were first elected prior to 2004. Benefits under the Pension Plan are equal to 50% of the Trustee’s average annual attendance and retainer fees for the three years ended December 31, 2005. The retirement benefit is payable during a Trustee’s lifetime, beginning the year following retirement, for the number of years of service through December 31, 2006. Pension expense for the fund is included in Trustee compensation and expenses in the Statement of operations. Accrued pension liability is included in Payable for Trustee compensation and expenses in the Statement of assets and liabilities. The Trustees have terminated the Pension Plan with respect to any Trustee first elected after 2003.
The fund has adopted distribution plans (the Plans) with respect to the following share classes pursuant to Rule 12b–1 under the Investment Company Act of 1940. The purpose of the Plans is to compensate Putnam Retail Management Limited Partnership, an indirect wholly-owned subsidiary of Franklin Templeton, for services provided and expenses incurred in distributing shares of the fund. The Plans provide payments by the fund to Putnam Retail Management Limited Partnership at an annual rate of up to the following amounts (Maximum %) of the average net assets attributable to each class. The Trustees have approved payment by the fund at the following annual rate (Approved %) of the average net assets attributable to each class. During the reporting period, the class-specific expenses related to distribution fees were as follows:
| Maximum % | Approved % | Amount | |
| Class A | 0.35% | 0.25% | $229,808 |
| Class B | 1.00% | 1.00% | 2,511 |
| Class C | 1.00% | 1.00% | 25,661 |
| Class R | 1.00% | 0.50% | 11,836 |
| Total | $269,816 |
For the reporting period, Putnam Retail Management Limited Partnership, acting as underwriter, received net commissions of $6,986 from the sale of class A shares and received no monies and $82 in contingent deferred sales charges from redemptions of class B and class C shares, respectively.
A deferred sales charge of up to 1.00% is assessed on certain redemptions of class A shares. For the reporting period, Putnam Retail Management Limited Partnership, acting as underwriter, received $16 on class A redemptions.
Note 3: Purchases and sales of securities
During the reporting period, the cost of purchases and the proceeds from sales, excluding short-term investments, were as follows:
| Cost of purchases | Proceeds from sales | |
| Investments in securities (Long-term) | $105,156,948 | $141,306,818 |
| U.S. government securities (Long-term) | — | — |
| Total | $105,156,948 | $141,306,818 |
The fund may purchase or sell investments from or to other Putnam funds in the ordinary course of business, which can reduce the fund’s transaction costs, at prices determined in accordance with SEC requirements and policies approved by the Trustees. During the reporting period, purchases or sales of long-term securities from or to other Putnam funds, if any, did not represent more than 5% of the fund’s total cost of purchases and/or total proceeds from sales.
| 26 Emerging Markets Equity Fund |
Note 4: Capital shares
At the close of the reporting period, there were an unlimited number of shares of beneficial interest authorized. Transactions, including, if applicable, direct exchanges pursuant to share conversions, in capital shares were as follows:
| SIX MONTHS ENDED 2/29/24 | YEAR ENDED 8/31/23 | |||
| Class A | Shares | Amount | Shares | Amount |
| Shares sold | 418,983 | $4,941,115 | 769,925 | $8,714,154 |
| Shares issued in connection with | ||||
| reinvestment of distributions | 119,644 | 1,442,956 | — | — |
| 538,627 | 6,384,071 | 769,925 | 8,714,154 | |
| Shares repurchased | (1,275,961) | (15,173,941) | (2,354,145) | (26,657,936) |
| Net decrease | (737,334) | $(8,789,870) | (1,584,220) | $(17,943,782) |
| SIX MONTHS ENDED 2/29/24 | YEAR ENDED 8/31/23 | |||
| Class B | Shares | Amount | Shares | Amount |
| Shares sold | — | $— | 2 | $19 |
| Shares issued in connection with | ||||
| reinvestment of distributions | — | — | — | — |
| — | — | 2 | 19 | |
| Shares repurchased | (25,303) | (275,942) | (56,159) | (595,279) |
| Net decrease | (25,303) | $(275,942) | (56,157) | $(595,260) |
| SIX MONTHS ENDED 2/29/24 | YEAR ENDED 8/31/23 | |||
| Class C | Shares | Amount | Shares | Amount |
| Shares sold | 14,966 | $164,622 | 42,073 | $447,193 |
| Shares issued in connection with | ||||
| reinvestment of distributions | 164 | 1,834 | — | — |
| 15,130 | 166,456 | 42,073 | 447,193 | |
| Shares repurchased | (86,748) | (948,401) | (207,607) | (2,173,342) |
| Net decrease | (71,618) | $(781,945) | (165,534) | $(1,726,149) |
| SIX MONTHS ENDED 2/29/24 | YEAR ENDED 8/31/23 | |||
| Class R | Shares | Amount | Shares | Amount |
| Shares sold | 55,982 | $658,837 | 119,868 | $1,362,262 |
| Shares issued in connection with | ||||
| reinvestment of distributions | 2,486 | 29,663 | — | — |
| 58,468 | 688,500 | 119,868 | 1,362,262 | |
| Shares repurchased | (36,451) | (421,141) | (122,508) | (1,389,619) |
| Net increase (decrease) | 22,017 | $267,359 | (2,640) | $(27,357) |
| Emerging Markets Equity Fund 27 |
| SIX MONTHS ENDED 2/29/24 | YEAR ENDED 8/31/23 | |||
| Class R6 | Shares | Amount | Shares | Amount |
| Shares sold | 278,488 | $3,371,599 | 548,424 | $6,437,314 |
| Shares issued in connection with | ||||
| reinvestment of distributions | 28,419 | 350,687 | — | — |
| 306,907 | 3,722,286 | 548,424 | 6,437,314 | |
| Shares repurchased | (769,978) | (9,697,357) | (646,104) | (7,544,131) |
| Net decrease | (463,071) | $(5,975,071) | (97,680) | $(1,106,817) |
| SIX MONTHS ENDED 2/29/24 | YEAR ENDED 8/31/23 | |||
| Class Y | Shares | Amount | Shares | Amount |
| Shares sold | 1,224,977 | $14,896,251 | 6,314,563 | $72,068,778 |
| Shares issued in connection with | ||||
| reinvestment of distributions | 105,034 | 1,289,823 | — | — |
| 1,330,011 | 16,186,074 | 6,314,563 | 72,068,778 | |
| Shares repurchased | (3,036,037) | (36,633,614) | (6,068,554) | (69,418,270) |
| Net increase (decrease) | (1,706,026) | $(20,447,540) | 246,009 | $2,650,508 |
Note 5: Affiliated transactions
Transactions during the reporting period with any company which is under common ownership or control were as follows:
| Shares | |||||
| outstanding | |||||
| and fair | |||||
| Fair value as | Purchase | Sale | Investment | value as | |
| Name of affiliate | of 8/31/23 | cost | proceeds | income | of 2/29/24 |
| Short-term investments | |||||
| Putnam Cash Collateral | |||||
| Pool, LLC* | $3,564,875 | $23,671,290 | $16,114,325 | $49,392 | $11,121,840 |
| Putnam Short Term | |||||
| Investment Fund | |||||
| Class P‡ | 6,198,433 | 69,119,533 | 75,268,110 | 124,380 | 49,856 |
| Total Short-term | |||||
| investments | $9,763,308 | $92,790,823 | $91,382,435 | $173,772 | $11,171,696 |
* No management fees are charged to Putnam Cash Collateral Pool, LLC (Note 1). Investment income shown is included in securities lending income on the Statement of operations. There were no realized or unrealized gains or losses during the period.
‡ Management fees charged to Putnam Short Term Investment Fund have been waived by Putnam Management. There were no realized or unrealized gains or losses during the period.
Note 6: Market, credit and other risks
In the normal course of business, the fund trades financial instruments and enters into financial transactions where risk of potential loss exists due to changes in the market (market risk) or failure of the contracting party to the transaction to perform (credit risk). The fund may be exposed to additional credit risk that an institution or other entity with which the fund has unsettled or open transactions will default. Investments in foreign securities involve certain risks, including those related to economic instability, unfavorable political developments, and currency fluctuations.
| 28 Emerging Markets Equity Fund |
Shareholder meeting results (Unaudited)
December 21, 2023 special meeting
At the meeting, a new Management Contract for your fund with Putnam Investment Management, LLC was approved, as follows:
| Votes for | Votes against | Abstentions/Votes withheld |
| 14,905,892 | 401,703 | 1,160,784 |
At the meeting, a new Sub-Management Contract for your fund between Putnam Investment Management, LLC and Putnam Investments Limited was approved, as follows:
| Votes for | Votes against | Abstentions/Votes withheld |
| 14,840,719 | 414,927 | 1,212,733 |
At the meeting, a new Sub-Advisory Contract for your fund between Putnam Investment Management, LLC, Putnam Investments Limited and The Putnam Advisory Company, LLC was approved, as follows:
| Votes for | Votes against | Abstentions/Votes withheld |
| 14,837,232 | 449,490 | 1,181,657 |
All tabulations are rounded to the nearest whole number.
| Emerging Markets Equity Fund 29 |
Fund information
| Investment Manager | Trustees | Jonathan S. Horwitz |
| Putnam Investment | Kenneth R. Leibler, Chair | Executive Vice President, |
| Management, LLC | Barbara M. Baumann, Vice Chair | Principal Executive Officer, |
| 100 Federal Street | Liaquat Ahamed | and Compliance Liaison |
| Boston, MA 02110 | Katinka Domotorffy | |
| Catharine Bond Hill | Kelley Hunt | |
| Investment Sub-Advisors | Jennifer Williams Murphy | AML Compliance Officer |
| Putnam Investments Limited | Marie Pillai | |
| 16 St James’s Street | George Putnam III | Martin Lemaire |
| London, England SW1A 1ER | Robert L. Reynolds | Vice President and |
| Manoj P. Singh | Derivatives Risk Manager | |
| The Putnam Advisory Company, LLC | Mona K. Sutphen | |
| 100 Federal Street | Jane E. Trust | Alan G. McCormack |
| Boston, MA 02110 | Vice President and | |
| Officers | Derivatives Risk Manager | |
| Marketing Services | Robert L. Reynolds | |
| Putnam Retail Management | President, The Putnam Funds | Denere P. Poulack |
| Limited Partnership | Assistant Vice President, | |
| 100 Federal Street | Kevin R. Blatchford | Assistant Clerk, and |
| Boston, MA 02110 | Vice President and | Assistant Treasurer |
| Assistant Treasurer | ||
| Custodian | Janet C. Smith | |
| State Street Bank | James F. Clark | Vice President, |
| and Trust Company | Vice President and | Principal Financial Officer, |
| Chief Compliance Officer | Principal Accounting Officer, | |
| Legal Counsel | and Assistant Treasurer | |
| Ropes & Gray LLP | Michael J. Higgins | |
| Vice President, Treasurer, | Stephen J. Tate | |
| and Clerk | Vice President and | |
| Chief Legal Officer |
This report is for the information of shareholders of Putnam Emerging Markets Equity Fund. It may also be used as sales literature when preceded or accompanied by the current prospectus, the most recent copy of the fund’s Quarterly Performance Summary, and the fund’s Quarterly Ranking Summary. For more recent performance, please visit putnam.com or franklintempleton.com. Investors should carefully consider the investment objectives, risks, charges, and expenses of a fund, which are described in its prospectus. For this and other information or to request a prospectus or summary prospectus, call 1-800-225-1581 toll free. Please read the prospectus carefully before investing. The fund’s Statement of Additional Information contains additional information about the fund’s Trustees and is available without charge upon request by calling 1-800-225-1581.
| This page left blank intentionally. |
| This page left blank intentionally. |
| This page left blank intentionally. |

| Item 2. Code of Ethics: |
| Not applicable |
| Item 3. Audit Committee Financial Expert: |
| Not applicable |
| Item 4. Principal Accountant Fees and Services: |
| Not applicable |
| Item 5. Audit Committee of Listed Registrants |
| Not applicable |
| Item 6. Schedule of Investments: |
| The registrant’s schedule of investments in unaffiliated issuers is included in the report to shareholders in Item 1 above. |
| Item 7. Disclosure of Proxy Voting Policies and Procedures For Closed-End Management Investment Companies: |
| Not applicable |
| Item 8. Portfolio Managers of Closed-End Investment Companies |
| Not Applicable |
| Item 9. Purchases of Equity Securities by Closed-End Management Investment Companies and Affiliated Purchasers: |
| Not applicable |
| Item 10. Submission of Matters to a Vote of Security Holders: |
| Not applicable |
| Item 11. Controls and Procedures: |
| (a) The registrant’s principal executive officer and principal financial officer have concluded, based on their evaluation of the effectiveness of the design and operation of the registrant’s disclosure controls and procedures as of a date within 90 days of the filing date of this report, that the design and operation of such procedures are generally effective to provide reasonable assurance that information required to be disclosed by the registrant in this report is recorded, processed, summarized and reported within the time periods specified in the Commission’s rules and forms. |
| (b) Changes in internal control over financial reporting: Not applicable |
| Item 12. Disclosures of Securities Lending Activities for Closed-End Investment Companies: |
| Not Applicable |
| Item 13. Recovery of Erroneously Awarded Compensation. |
| Not Applicable |
| Item 14. Exhibits: |
| (a)(1) Not applicable |
| (a)(2) Not applicable |
| (b) The certifications required by Rule 30a-2(b) under the Investment Company Act of 1940, as amended, are filed herewith. |
| SIGNATURES |
| Pursuant to the requirements of the Securities Exchange Act of 1934 and the Investment Company Act of 1940, the registrant has duly caused this report to be signed on its behalf by the undersigned, thereunto duly authorized. |
| Putnam Funds Trust |
| By (Signature and Title): |
| /s/ Janet C. Smith Janet C. Smith Principal Accounting Officer |
| Date: April 25, 2024 |
| Pursuant to the requirements of the Securities Exchange Act of 1934 and the Investment Company Act of 1940, this report has been signed below by the following persons on behalf of the registrant and in the capacities and on the dates indicated. |
| By (Signature and Title): |
| /s/ Jonathan S. Horwitz Jonathan S. Horwitz Principal Executive Officer |
| Date: April 25, 2024 |
| By (Signature and Title): |
| /s/ Janet C. Smith Janet C. Smith Principal Financial Officer |
| Date: April 25, 2024 |