| |
| SECURITIES AND EXCHANGE COMMISSION |
| |
| CERTIFIED SHAREHOLDER REPORT OF REGISTERED |
| |
| MANAGEMENT INVESTMENT COMPANIES |
| | |
| Investment Company Act file number: | (811-07513) |
| | |
| Exact name of registrant as specified in charter: | Putnam Funds Trust |
| | |
| Address of principal executive offices: | 100 Federal Street, Boston, Massachusetts 02110 |
| | |
| Name and address of agent for service: | Stephen Tate, Vice President |
| | |
| | Boston, Massachusetts 02110 |
| | |
| Copy to: | Bryan Chegwidden, Esq. |
| | |
| | 1211 Avenue of the Americas |
| | |
| | Boston, Massachusetts 02199 |
| | |
| Registrant’s telephone number, including area code: | (617) 292-1000 |
| | |
| Date of fiscal year end: | June 30, 2025 |
| | |
| Date of reporting period: | July 1, 2024 – December 31, 2024 |
| |
| Item 1. Report to Stockholders: |
| |
| The following is a copy of the report transmitted to stockholders pursuant to Rule 30e-1 under the Investment Company Act of 1940: |
| | |
Putnam Small Cap Growth Fund | |
| Class A [PNSAX] |
| Semi-Annual Shareholder Report | December 31, 2024 |
|
This semi-annual shareholder report contains important information about Putnam Small Cap Growth Fund for the period July 1, 2024, to December 31, 2024.
You can find additional information about the Fund at https://www.franklintempleton.com/regulatory-fund-documents. You can also request this information by contacting us at (800) 225-1581.
WHAT WERE THE FUND COSTS FOR THE LAST SIX MONTHS? (based on a hypothetical $10,000 investment)
| | |
Class Name | Costs of a $10,000 investment | Costs paid as a percentage of a $10,000 investment† |
| Class A | $61 | 1.17% |
KEY FUND STATISTICS (as of December 31, 2024)
| |
Total Net Assets | $2,993,406,348 |
Total Number of Portfolio Holdings* | 99 |
Portfolio Turnover Rate | 15% |
| * | Includes derivatives, if applicable. |
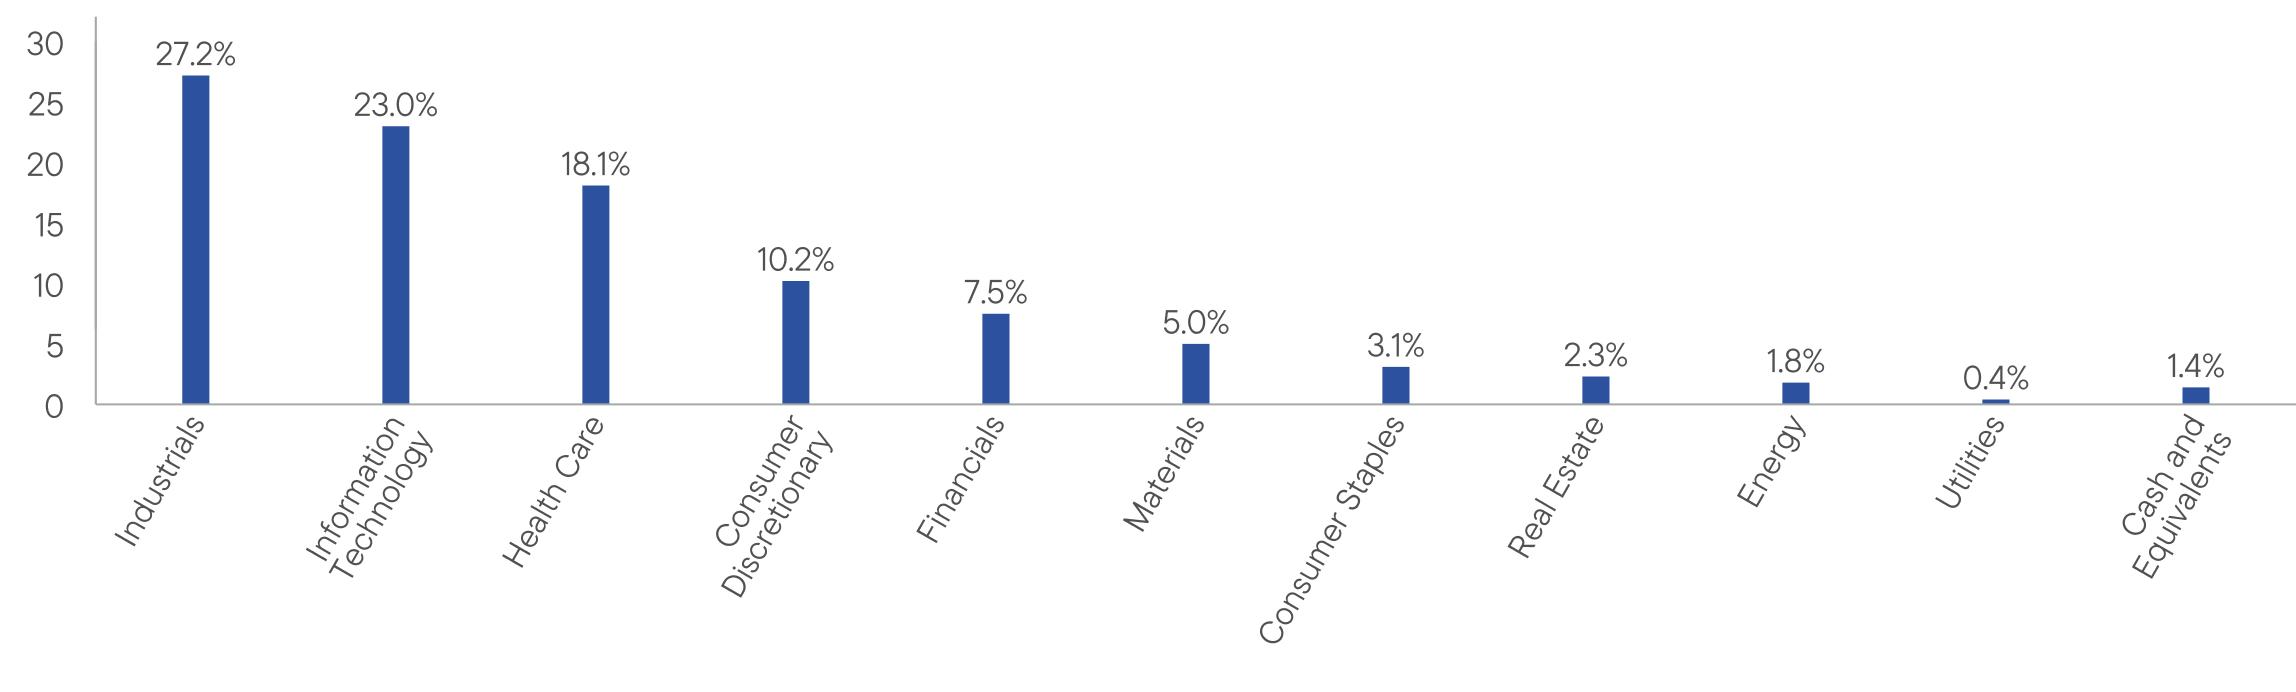
WHAT DID THE FUND INVEST IN? (as of December 31, 2024)
Portfolio Composition (% of Total Net Assets)
| Cash and Equivalents, if any, represent the market value weights of cash, derivatives, short-term securities, and other unclassified assets in the portfolio. Holdings and allocations may vary over time. |
| |
| WHERE CAN I FIND ADDITIONAL INFORMATION ABOUT THE FUND? |
Additional information is available on https://www.franklintempleton.com/regulatory-fund-documents, including its: |
| • prospectus • proxy voting information • financial information • holdings • tax information |
| Putnam Small Cap Growth Fund | PAGE 1 | 38972-STSA-0225 |
27.223.018.110.27.55.03.12.31.80.41.4
| | |
Putnam Small Cap Growth Fund | |
| Class C [PNSCX] |
| Semi-Annual Shareholder Report | December 31, 2024 |
|
This semi-annual shareholder report contains important information about Putnam Small Cap Growth Fund for the period July 1, 2024, to December 31, 2024.
You can find additional information about the Fund at https://www.franklintempleton.com/regulatory-fund-documents. You can also request this information by contacting us at (800) 225-1581.
WHAT WERE THE FUND COSTS FOR THE LAST SIX MONTHS? (based on a hypothetical $10,000 investment)
| | |
Class Name | Costs of a $10,000 investment | Costs paid as a percentage of a $10,000 investment† |
| Class C | $100 | 1.92% |
KEY FUND STATISTICS (as of December 31, 2024)
| |
Total Net Assets | $2,993,406,348 |
Total Number of Portfolio Holdings* | 99 |
Portfolio Turnover Rate | 15% |
| * | Includes derivatives, if applicable. |
WHAT DID THE FUND INVEST IN? (as of December 31, 2024)
Portfolio Composition (% of Total Net Assets)
| Cash and Equivalents, if any, represent the market value weights of cash, derivatives, short-term securities, and other unclassified assets in the portfolio. Holdings and allocations may vary over time. |
| |
| WHERE CAN I FIND ADDITIONAL INFORMATION ABOUT THE FUND? |
Additional information is available on https://www.franklintempleton.com/regulatory-fund-documents, including its: |
| • prospectus • proxy voting information • financial information • holdings • tax information |
| Putnam Small Cap Growth Fund | PAGE 1 | 38972-STSC-0225 |
27.223.018.110.27.55.03.12.31.80.41.4
| | |
Putnam Small Cap Growth Fund | |
| Class R [PSGRX] |
| Semi-Annual Shareholder Report | December 31, 2024 |
|
This semi-annual shareholder report contains important information about Putnam Small Cap Growth Fund for the period July 1, 2024, to December 31, 2024.
You can find additional information about the Fund at https://www.franklintempleton.com/regulatory-fund-documents. You can also request this information by contacting us at (800) 225-1581.
WHAT WERE THE FUND COSTS FOR THE LAST SIX MONTHS? (based on a hypothetical $10,000 investment)
| | |
Class Name | Costs of a $10,000 investment | Costs paid as a percentage of a $10,000 investment† |
| Class R | $74 | 1.42% |
KEY FUND STATISTICS (as of December 31, 2024)
| |
Total Net Assets | $2,993,406,348 |
Total Number of Portfolio Holdings* | 99 |
Portfolio Turnover Rate | 15% |
| * | Includes derivatives, if applicable. |
WHAT DID THE FUND INVEST IN? (as of December 31, 2024)
Portfolio Composition (% of Total Net Assets)
| Cash and Equivalents, if any, represent the market value weights of cash, derivatives, short-term securities, and other unclassified assets in the portfolio. Holdings and allocations may vary over time. |
| |
| WHERE CAN I FIND ADDITIONAL INFORMATION ABOUT THE FUND? |
Additional information is available on https://www.franklintempleton.com/regulatory-fund-documents, including its: |
| • prospectus • proxy voting information • financial information • holdings • tax information |
| Putnam Small Cap Growth Fund | PAGE 1 | 38972-STSR-0225 |
27.223.018.110.27.55.03.12.31.80.41.4
| | |
Putnam Small Cap Growth Fund | |
| Class R6 [PLKGX] |
| Semi-Annual Shareholder Report | December 31, 2024 |
|
This semi-annual shareholder report contains important information about Putnam Small Cap Growth Fund for the period July 1, 2024, to December 31, 2024.
You can find additional information about the Fund at https://www.franklintempleton.com/regulatory-fund-documents. You can also request this information by contacting us at (800) 225-1581.
WHAT WERE THE FUND COSTS FOR THE LAST SIX MONTHS? (based on a hypothetical $10,000 investment)
| | |
Class Name | Costs of a $10,000 investment | Costs paid as a percentage of a $10,000 investment† |
| Class R6 | $40 | 0.76% |
KEY FUND STATISTICS (as of December 31, 2024)
| |
Total Net Assets | $2,993,406,348 |
Total Number of Portfolio Holdings* | 99 |
Portfolio Turnover Rate | 15% |
| * | Includes derivatives, if applicable. |
WHAT DID THE FUND INVEST IN? (as of December 31, 2024)
Portfolio Composition (% of Total Net Assets)
| Cash and Equivalents, if any, represent the market value weights of cash, derivatives, short-term securities, and other unclassified assets in the portfolio. Holdings and allocations may vary over time. |
| |
| WHERE CAN I FIND ADDITIONAL INFORMATION ABOUT THE FUND? |
Additional information is available on https://www.franklintempleton.com/regulatory-fund-documents, including its: |
| • prospectus • proxy voting information • financial information • holdings • tax information |
| Putnam Small Cap Growth Fund | PAGE 1 | 38972-STSR6-0225 |
27.223.018.110.27.55.03.12.31.80.41.4
| | |
Putnam Small Cap Growth Fund | |
| Class Y [PSYGX] |
| Semi-Annual Shareholder Report | December 31, 2024 |
|
This semi-annual shareholder report contains important information about Putnam Small Cap Growth Fund for the period July 1, 2024, to December 31, 2024.
You can find additional information about the Fund at https://www.franklintempleton.com/regulatory-fund-documents. You can also request this information by contacting us at (800) 225-1581.
WHAT WERE THE FUND COSTS FOR THE LAST SIX MONTHS? (based on a hypothetical $10,000 investment)
| | |
Class Name | Costs of a $10,000 investment | Costs paid as a percentage of a $10,000 investment† |
| Class Y | $48 | 0.92% |
KEY FUND STATISTICS (as of December 31, 2024)
| |
Total Net Assets | $2,993,406,348 |
Total Number of Portfolio Holdings* | 99 |
Portfolio Turnover Rate | 15% |
| * | Includes derivatives, if applicable. |
WHAT DID THE FUND INVEST IN? (as of December 31, 2024)
Portfolio Composition (% of Total Net Assets)
| Cash and Equivalents, if any, represent the market value weights of cash, derivatives, short-term securities, and other unclassified assets in the portfolio. Holdings and allocations may vary over time. |
| |
| WHERE CAN I FIND ADDITIONAL INFORMATION ABOUT THE FUND? |
Additional information is available on https://www.franklintempleton.com/regulatory-fund-documents, including its: |
| • prospectus • proxy voting information • financial information • holdings • tax information |
| Putnam Small Cap Growth Fund | PAGE 1 | 38972-STSY-0225 |
27.223.018.110.27.55.03.12.31.80.41.4
| |
| Item 3. Audit Committee Financial Expert: |
| |
| Item 4. Principal Accountant Fees and Services: |
| |
| Item 5. Audit Committee of Listed Registrants |
| |
| The registrant’s schedule of investments in unaffiliated issuers is included in the Financial Statements and Other Important Information in Item 7 below. |
| |
| Item 7. Financial Statements and Financial Highlights for Open-End Management Investment Companies. |

Putnam
Small Cap Growth
Fund
Financial Statements and Other Important Information
Semiannual | December 31, 2024

Table of Contents
| | Financial Statements and Other Important Information—Semiannual | franklintempleton.com |
The fund’s portfolio 12/31/24 (Unaudited) |
| | COMMON STOCKS (98.2%)* | Shares | Value |
| | Aerospace and defense (1.8%) | | |
| | Kratos Defense & Security Solutions, Inc. † S | 839,000 | $22,132,820 |
| | Leonardo DRS, Inc. † | 753,460 | 24,344,293 |
| | Rocket Lab USA, Inc. † | 260,300 | 6,629,841 |
| | | | 53,106,954 |
| | Automobile components (1.2%) | | |
| | Modine Manufacturing Co. † | 253,357 | 29,371,677 |
| | Patrick Industries, Inc. | 87,749 | 7,290,187 |
| | | | 36,661,864 |
| | Banks (1.3%) | | |
| | Bancorp, Inc. (The) † | 763,763 | 40,196,847 |
| | | | 40,196,847 |
| | Biotechnology (5.8%) | | |
| | Ascendis Pharma A/S ADR (Denmark) † | 101,400 | 13,959,738 |
| | Crinetics Pharmaceuticals, Inc. † | 326,200 | 16,678,606 |
| | Cytokinetics, Inc. † S | 207,600 | 9,765,504 |
| | Halozyme Therapeutics, Inc. † | 651,600 | 31,152,996 |
| | Insmed, Inc. † | 372,900 | 25,745,016 |
| | Janux Therapeutics, Inc. † | 68,679 | 3,677,074 |
| | Krystal Biotech, Inc. † S | 54,700 | 8,569,302 |
| | Rhythm Pharmaceuticals, Inc. † | 243,600 | 13,636,728 |
| | Vaxcyte, Inc. † | 337,000 | 27,586,820 |
| | Viking Therapeutics, Inc. † S | 287,300 | 11,560,952 |
| | Xenon Pharmaceuticals, Inc. (Canada) † | 291,900 | 11,442,480 |
| | | | 173,775,216 |
| | Building products (1.1%) | | |
| | CSW Industrials, Inc. | 91,127 | 32,149,606 |
| | | | 32,149,606 |
| | Capital markets (3.0%) | | |
| | Hamilton Lane, Inc. Class A | 210,885 | 31,221,524 |
| | Perella Weinberg Partners | 525,112 | 12,518,670 |
| | StepStone Group, Inc. Class A | 788,507 | 45,638,785 |
| | | | 89,378,979 |
| | Commercial services and supplies (4.5%) | | |
| | ACV Auctions, Inc. Class A † | 884,200 | 19,098,720 |
| | Casella Waste Systems, Inc. Class A † | 340,600 | 36,038,886 |
| | Clean Harbors, Inc. † | 209,300 | 48,168,302 |
| | VSE Corp. S | 322,800 | 30,698,280 |
| | | | 134,004,188 |
| | Construction and engineering (5.2%) | | |
| | Comfort Systems USA, Inc. | 150,300 | 63,736,218 |
| | Construction Partners, Inc. Class A † | 217,100 | 19,204,666 |
| | Dycom Industries, Inc. † | 157,100 | 27,344,826 |
| | Everus Construction Group, Inc. † | 266,125 | 17,497,719 |
| | IES Holdings, Inc. † | 144,700 | 29,078,912 |
| | | | 156,862,341 |
| | Construction materials (3.1%) | | |
| | Eagle Materials, Inc. | 175,100 | 43,207,676 |
| | Knife River Corp. † | 477,400 | 48,522,936 |
| | | | 91,730,612 |
| | Consumer staples distribution and retail (1.2%) | | |
| | Sprouts Farmers Market, Inc. † | 292,000 | 37,104,440 |
| | | | 37,104,440 |
| | Diversified consumer services (0.9%) | | |
| | Duolingo, Inc. † | 85,700 | 27,786,511 |
| | | | 27,786,511 |
| | Electronic equipment, instruments, and components (2.6%) | | |
| | Fabrinet (Thailand) † | 117,000 | 25,725,960 |
| | Itron, Inc. † | 283,800 | 30,815,004 |
| | Novanta, Inc. † S | 145,605 | 22,244,076 |
| | | | 78,785,040 |
| | | | |
| | COMMON STOCKS (98.2%)* cont. | Shares | Value |
| | Energy equipment and services (1.8%) | | |
| | CES Energy Solutions Corp. (Canada) | 3,523,400 | $24,315,370 |
| | Oceaneering International, Inc. † | 593,600 | 15,481,088 |
| | Weatherford International PLC | 200,500 | 14,361,815 |
| | | | 54,158,273 |
| | Gas utilities (0.3%) | | |
| | MDU Resources Group, Inc. | 580,822 | 10,466,412 |
| | | | 10,466,412 |
| | Ground transportation (0.9%) | | |
| | Saia, Inc. † | 59,861 | 27,280,454 |
| | | | 27,280,454 |
| | Health care equipment and supplies (4.7%) | | |
| | Lantheus Holdings, Inc. † S | 282,400 | 25,263,504 |
| | Merit Medical Systems, Inc. † | 605,800 | 58,592,976 |
| | PROCEPT BioRobotics Corp. † S | 334,091 | 26,901,007 |
| | UFP Technologies, Inc. † | 121,900 | 29,805,769 |
| | | | 140,563,256 |
| | Health care providers and services (4.4%) | | |
| | Encompass Health Corp. | 612,000 | 56,518,200 |
| | Ensign Group, Inc. (The) | 364,100 | 48,374,326 |
| | RadNet, Inc. † | 370,500 | 25,875,720 |
| | | | 130,768,246 |
| | Hotels, restaurants, and leisure (2.1%) | | |
| | Churchill Downs, Inc. | 147,600 | 19,710,504 |
| | Texas Roadhouse, Inc. | 247,900 | 44,728,597 |
| | | | 64,439,101 |
| | Household durables (2.2%) | | |
| | Century Communities, Inc. | 155,375 | 11,398,310 |
| | Installed Building Products, Inc. S | 174,100 | 30,511,025 |
| | M/I Homes, Inc. † | 172,980 | 22,997,691 |
| | | | 64,907,026 |
| | Insurance (3.2%) | | |
| | Kinsale Capital Group, Inc. S | 93,154 | 43,328,720 |
| | Skyward Specialty Insurance Group, Inc. † | 1,013,700 | 51,232,398 |
| | | | 94,561,118 |
| | Life sciences tools and services (1.1%) | | |
| | Medpace Holdings, Inc. † | 101,200 | 33,621,676 |
| | | | 33,621,676 |
| | Machinery (3.1%) | | |
| | Federal Signal Corp. | 451,800 | 41,741,802 |
| | RBC Bearings, Inc. † | 98,037 | 29,326,788 |
| | SPX Technologies, Inc. † | 145,600 | 21,187,712 |
| | | | 92,256,302 |
| | Marine transportation (1.2%) | | |
| | Kirby Corp. † | 333,855 | 35,321,859 |
| | | | 35,321,859 |
| | Metals and mining (1.9%) | | |
| | Carpenter Technology Corp. | 342,717 | 58,162,502 |
| | | | 58,162,502 |
| | Personal care products (1.8%) | | |
| | BellRing Brands, Inc. † | 718,700 | 54,146,858 |
| | | | 54,146,858 |
| | Pharmaceuticals (2.1%) | | |
| | Axsome Therapeutics, Inc. † S | 164,500 | 13,918,345 |
| | Intra-Cellular Therapies, Inc. † | 229,300 | 19,151,136 |
| | Verona Pharma PLC ADR (United Kingdom) † S | 617,400 | 28,672,056 |
| | | | 61,741,537 |
| | Professional services (5.6%) | | |
| | Huron Consulting Group, Inc. † | 423,100 | 52,574,406 |
| | ICF International, Inc. | 259,809 | 30,971,831 |
| | Parsons Corp. † | 564,544 | 52,079,184 |
| | Verra Mobility Corp. † | 1,299,052 | 31,411,077 |
| | | | 167,036,498 |
| | | | |
| | COMMON STOCKS (98.2%)* cont. | Shares | Value |
| | Real estate management and development (2.3%) | | |
| | Colliers International Group, Inc. (Canada) | 286,180 | $38,917,852 |
| | FirstService Corp. (Canada) | 165,600 | 29,997,971 |
| | | | 68,915,823 |
| | Semiconductors and semiconductor equipment (4.9%) | | |
| | Camtek, Ltd. (Israel) S | 301,545 | 24,355,790 |
| | Credo Technology Group Holding, Ltd. † | 265,400 | 17,837,534 |
| | FormFactor, Inc. † | 359,900 | 15,835,600 |
| | Nova, Ltd. (Israel) † | 230,497 | 45,396,384 |
| | Onto Innovation, Inc. † | 166,200 | 27,700,554 |
| | Rambus, Inc. † | 279,100 | 14,753,226 |
| | | | 145,879,088 |
| | Software (15.5%) | | |
| | ACI Worldwide, Inc. † | 994,100 | 51,603,731 |
| | Agilysys, Inc. † | 250,709 | 33,020,882 |
| | Altair Engineering, Inc. Class A † | 295,388 | 32,229,785 |
| | Clearwater Analytics Holdings, Inc. Class A † | 750,300 | 20,648,256 |
| | Descartes Systems Group, Inc. (The) (Canada) † | 543,000 | 61,684,800 |
| | Intapp, Inc. † | 411,155 | 26,350,924 |
| | Manhattan Associates, Inc. † | 181,100 | 48,940,464 |
| | Marathon Digital Holdings, Inc. † S | 577,800 | 9,689,706 |
| | Pegasystems, Inc. | 130,900 | 12,199,880 |
| | Q2 Holdings, Inc. † | 295,600 | 29,752,140 |
| | SPS Commerce, Inc. † | 191,600 | 35,252,484 |
| | Tenable Holdings, Inc. † | 372,800 | 14,680,864 |
| | Vertex, Inc. Class A † | 1,392,865 | 74,309,348 |
| | Zeta Global Holdings Corp. Class A † | 680,300 | 12,238,597 |
| | | | 462,601,861 |
| | Specialty retail (3.7%) | | |
| | Aritzia, Inc. (Canada) † | 461,600 | 17,160,878 |
| | Boot Barn Holdings, Inc. † S | 275,873 | 41,883,039 |
| | Murphy USA, Inc. | 103,400 | 51,880,950 |
| | | | 110,924,867 |
| | Trading companies and distributors (3.7%) | | |
| | Applied Industrial Technologies, Inc. | 229,958 | 55,068,042 |
| | FTAI Aviation, Ltd. | 387,600 | 55,829,903 |
| | | | 110,897,945 |
| | Total common stocks (cost $2,229,065,104) | $2,940,193,300 |
| | SHORT-TERM INVESTMENTS (3.9%)* | Shares | Value |
| | Putnam Cash Collateral Pool, LLC 4.55% d | 76,192,655 | $76,192,655 |
| | Putnam Short Term Investment Fund Class P 4.56% L | 41,099,123 | 41,099,123 |
| | Total short-term investments (cost $117,291,778) | $117,291,778 |
| | TOTAL INVESTMENTS |
| | Total investments (cost $2,346,356,882) | $3,057,485,078 |
| | Key to holding’s abbreviations |
| | ADR | American Depository Receipts: Represents ownership of foreign securities on deposit with a custodian bank. |
| | Notes to the fund’s portfolio |
| | Unless noted otherwise, the notes to the fund’s portfolio are for the close of the fund’s reporting period, which ran from July 1, 2024 through December 31, 2024 (the reporting period). Within the following notes to the portfolio, references to “Putnam Management” represent Putnam Investment Management, LLC, the fund’s investment manager, an indirect wholly-owned subsidiary of Franklin Resources, Inc., and references to “ASC 820” represent Accounting Standards Codification 820 Fair Value Measurements and Disclosures. |
| * | Percentages indicated are based on net assets of $2,993,406,348. |
| † | This security is non-income-producing. |
| d | Affiliated company. See Notes 1 and 5 to the financial statements regarding securities lending. The rate quoted in the security description is the annualized 7-day yield of the fund at the close of the reporting period. |
| L | Affiliated company (Note 5). The rate quoted in the security description is the annualized 7-day yield of the fund at the close of the reporting period. |
| S | Security on loan, in part or in entirety, at the close of the reporting period (Note 1). |
| | ASC 820 establishes a three-level hierarchy for disclosure of fair value measurements. The valuation hierarchy is based upon the transparency of inputs to the valuation of the fund’s investments. The three levels are defined as follows: |
| | Level 1: Valuations based on quoted prices for identical securities in active markets. |
| | Level 2: Valuations based on quoted prices in markets that are not active or for which all significant inputs are observable, either directly or indirectly. |
| | Level 3: Valuations based on inputs that are unobservable and significant to the fair value measurement. |
| | The following is a summary of the inputs used to value the fund’s net assets as of the close of the reporting period: |
| | | Valuation inputs |
| | Investments in securities: | Level 1 | Level 2 | Level 3 |
| | Common stocks*: | | | |
| | Consumer discretionary | $304,719,369 | $— | $— |
| | Consumer staples | 91,251,298 | — | — |
| | Energy | 54,158,273 | — | — |
| | Financials | 224,136,944 | — | — |
| | Health care | 540,469,931 | — | — |
| | Industrials | 808,916,147 | — | — |
| | Information technology | 687,265,989 | — | — |
| | Materials | 149,893,114 | — | — |
| | Real estate | 68,915,823 | — | — |
| | Utilities | 10,466,412 | — | — |
| | Total common stocks | 2,940,193,300 | — | — |
| | Short-term investments | — | 117,291,778 | — |
| | Totals by level | $2,940,193,300 | $117,291,778 | $— |
| * | Common stock classifications are presented at the sector level, which may differ from the fund’s portfolio presentation. |
The accompanying notes are an integral part of these financial statements.
Financial statements
Statement of assets and liabilities
12/31/24 (Unaudited)
| ASSETS | |
| Investment in securities, at value, including $74,265,323 of securities on loan (Note 1): | |
| Unaffiliated issuers (identified cost $2,229,065,104) | $2,940,193,300 |
| Affiliated issuers (identified cost $117,291,778) (Notes 1 and 5) | 117,291,778 |
| Dividends, interest and other receivables | 766,023 |
| Receivable for shares of the fund sold | 20,246,951 |
| Receivable for investments sold | 1,009,454 |
| Prepaid assets | 129,400 |
| Total assets | 3,079,636,906 |
| | |
| LIABILITIES | |
| Payable for investments purchased | 3,861,429 |
| Payable for shares of the fund repurchased | 2,857,709 |
| Payable for compensation of Manager (Note 2) | 1,662,124 |
| Payable for custodian fees (Note 2) | 35,023 |
| Payable for investor servicing fees (Note 2) | 845,666 |
| Payable for Trustee compensation and expenses (Note 2) | 168,145 |
| Payable for administrative services (Note 2) | 25,491 |
| Payable for distribution fees (Note 2) | 163,341 |
| Collateral on securities loaned, at value (Note 1) | 76,192,655 |
| Other accrued expenses | 418,975 |
| Total liabilities | 86,230,558 |
| Net assets | $2,993,406,348 |
| | |
| Represented by | |
| Paid-in capital (Unlimited shares authorized) (Notes 1 and 4) | $2,363,791,689 |
| Total distributable earnings (Note 1) | 629,614,659 |
| Total — Representing net assets applicable to capital shares outstanding | $2,993,406,348 |
| | |
| COMPUTATION OF NET ASSET VALUE AND OFFERING PRICE | |
| Net asset value and redemption price per class A share ($560,150,129 divided by 7,616,939 shares) | $73.54 |
| Offering price per class A share (100/94.25 of $73.54)* | $78.03 |
| Net asset value and offering price per class C share ($34,272,878 divided by 581,810 shares)** | $58.91 |
| Net asset value, offering price and redemption price per class R share ($23,225,595 divided by 336,413 shares) | $69.04 |
| Net asset value, offering price and redemption price per class R6 share ($694,461,141 divided by 8,756,654 shares) | $79.31 |
| Net asset value, offering price and redemption price per class Y share ($1,681,296,605 divided by 21,508,066 shares) | $78.17 |
| * | On single retail sales of less than $50,000. On sales of $50,000 or more the offering price is reduced. |
| ** | Redemption price per share is equal to net asset value less any applicable contingent deferred sales charge. |
The accompanying notes are an integral part of these financial statements.
Statement of operations
Six months ended 12/31/24 (Unaudited)
| Investment income | |
| Dividends (net of foreign tax of $50,129) | $3,313,520 |
| Interest (including interest income of $1,444,823 from investments in affiliated issuers) (Note 5) | 1,457,071 |
| Securities lending (net of expenses) (Notes 1 and 5) | 124,668 |
| Total investment income | 4,895,259 |
| | |
| EXPENSES | |
| Compensation of Manager (Note 2) | 8,906,885 |
| Investor servicing fees (Note 2) | 2,270,130 |
| Custodian fees (Note 2) | 36,660 |
| Trustee compensation and expenses (Note 2) | 38,062 |
| Distribution fees (Note 2) | 901,189 |
| Administrative services (Note 2) | 33,539 |
| Other | 499,805 |
| Total expenses | 12,686,270 |
| Expense reduction (Note 2) | (16,165) |
| Net expenses | 12,670,105 |
| Net investment loss | (7,774,846) |
| | |
| REALIZED AND UNREALIZED GAIN (LOSS) | |
| Net realized gain (loss) on: | |
| Securities from unaffiliated issuers (Notes 1 and 3) | (3,149,604) |
| Foreign currency transactions (Note 1) | 1,897 |
| Total net realized loss | (3,147,707) |
| Change in net unrealized appreciation (depreciation) on: | |
| Securities from unaffiliated issuers | 138,889,409 |
| Assets and liabilities in foreign currencies | (136) |
| Total change in net unrealized appreciation | 138,889,273 |
| Net gain on investments | 135,741,566 |
| Net increase in net assets resulting from operations | $127,966,720 |
The accompanying notes are an integral part of these financial statements.
Statement of changes in net assets
| | Six months ended 12/31/24* | Year ended 6/30/24 |
| Increase in net assets | | |
| Operations | | |
| Net investment loss | $(7,774,846) | $(6,898,271) |
| Net realized gain (loss) on investments and foreign currency transactions | (3,147,707) | 45,973,083 |
| Change in net unrealized appreciation of investments and assets and liabilities in foreign currencies | 138,889,273 | 287,014,493 |
| Net increase in net assets resulting from operations | 127,966,720 | 326,089,305 |
| Increase from capital share transactions (Note 4) | 845,090,627 | 603,353,155 |
| Total increase in net assets | 973,057,347 | 929,442,460 |
| Net assets | | |
| Beginning of period | 2,020,349,001 | 1,090,906,541 |
| End of period | $2,993,406,348 | $2,020,349,001 |
| *Unaudited. |
The accompanying notes are an integral part of these financial statements.
Financial highlights
(For a common share outstanding throughout the period)
| INVESTMENT OPERATIONS | LESS DISTRIBUTIONS | RATIOS AND SUPPLEMENTAL DATA |
| Period ended | Net asset value, beginning of period | Net investment income (loss)a | Net realized and unrealized gain (loss) on investments | Total from investment operations | From net realized gain on investments | Total distributions | Net asset value, end of period | Total return at net asset value (%)b | Net assets, end of period (in thousands) | Ratio of expenses to average net assets (%)c | Ratio of net investment income (loss) to average net assets (%) | Portfolio turnover (%) |
| Class A |
| December 31, 2024** | $68.85 | (.30) | 4.99 | 4.69 | — | — | $73.54 | 6.81* | $560,150 | .59* | (.40)* | 15* |
| June 30, 2024 | 56.31 | (.40) | 12.94 | 12.54 | — | — | 68.85 | 22.27 | 501,770 | 1.21 | (.66) | 40 |
| June 30, 2023 | 46.89 | (.25) | 9.67 | 9.42 | — | — | 56.31 | 20.09 | 422,911 | 1.25 | (.48) | 48 |
| June 30, 2022 | 73.13 | (.62) | (15.28) | (15.90) | (10.34) | (10.34) | 46.89 | (25.78) | 383,000 | 1.24d | (.97) | 39 |
| June 30, 2021 | 53.07 | (.66) | 24.06 | 23.40 | (3.34) | (3.34) | 73.13 | 44.93 | 549,842 | 1.21 | (1.00) | 70 |
| June 30, 2020 | 47.49 | (.42) | 6.95 | 6.53 | (.95) | (.95) | 53.07 | 13.99 | 415,702 | 1.24 | (.88) | 56 |
| Class C |
| December 31, 2024** | $55.36 | (.47) | 4.02 | 3.55 | — | — | $58.91 | 6.41* | $34,273 | .97* | (.78)* | 15* |
| June 30, 2024 | 45.62 | (.69) | 10.43 | 9.74 | — | — | 55.36 | 21.35 | 22,177 | 1.96 | (1.41) | 40 |
| June 30, 2023 | 38.28 | (.51) | 7.85 | 7.34 | — | — | 45.62 | 19.17 | 13,906 | 2.00 | (1.23) | 48 |
| June 30, 2022 | 61.94 | (.92) | (12.40) | (13.32) | (10.34) | (10.34) | 38.28 | (26.32) | 11,761 | 1.99d | (1.72) | 39 |
| June 30, 2021 | 45.68 | (.99) | 20.59 | 19.60 | (3.34) | (3.34) | 61.94 | 43.84 | 17,120 | 1.96 | (1.74) | 70 |
| June 30, 2020 | 41.31 | (.67) | 5.99 | 5.32 | (.95) | (.95) | 45.68 | 13.15 | 13,869 | 1.99 | (1.63) | 56 |
| Class R |
| December 31, 2024** | $64.72 | (.37) | 4.69 | 4.32 | — | — | $69.04 | 6.67* | $23,226 | .71* | (.53)* | 15* |
| June 30, 2024 | 53.06 | (.51) | 12.17 | 11.66 | — | — | 64.72 | 21.98 | 20,938 | 1.46 | (.91) | 40 |
| June 30, 2023 | 44.30 | (.35) | 9.11 | 8.76 | — | — | 53.06 | 19.77 | 16,874 | 1.50 | (.73) | 48 |
| June 30, 2022 | 69.79 | (.74) | (14.41) | (15.15) | (10.34) | (10.34) | 44.30 | (25.96) | 15,995 | 1.49d | (1.22) | 39 |
| June 30, 2021 | 50.89 | (.81) | 23.05 | 22.24 | (3.34) | (3.34) | 69.79 | 44.56 | 23,571 | 1.46 | (1.26) | 70 |
| June 30, 2020 | 45.69 | (.52) | 6.67 | 6.15 | (.95) | (.95) | 50.89 | 13.71 | 12,669 | 1.49 | (1.13) | 56 |
| Class R6 |
| December 31, 2024** | $74.10 | (.16) | 5.37 | 5.21 | — | — | $79.31 | 7.03* | $694,461 | .39* | (.20)* | 15* |
| June 30, 2024 | 60.36 | (.17) | 13.91 | 13.74 | — | — | 74.10 | 22.76 | 422,360 | .81 | (.26) | 40 |
| June 30, 2023 | 50.07 | (.04) | 10.33 | 10.29 | — | — | 60.36 | 20.55 | 161,550 | .85 | (.08) | 48 |
| June 30, 2022 | 77.13 | (.39) | (16.33) | (16.72) | (10.34) | (10.34) | 50.07 | (25.49) | 58,592 | .85d | (.58) | 39 |
| June 30, 2021 | 55.62 | (.46) | 25.31 | 24.85 | (3.34) | (3.34) | 77.13 | 45.49 | 59,840 | .83 | (.64) | 70 |
| June 30, 2020 | 49.53 | (.24) | 7.28 | 7.04 | (.95) | (.95) | 55.62 | 14.45 | 24,596 | .84 | (.48) | 56 |
| Class Y |
| December 31, 2024** | $73.09 | (.22) | 5.30 | 5.08 | — | — | $78.17 | 6.95* | $1,681,297 | .46* | (.28)* | 15* |
| June 30, 2024 | 59.63 | (.26) | 13.72 | 13.46 | — | — | 73.09 | 22.57 | 1,052,476 | .96 | (.41) | 40 |
| June 30, 2023 | 49.54 | (.12) | 10.21 | 10.09 | — | — | 59.63 | 20.37 | 473,914 | 1.00 | (.23) | 48 |
| June 30, 2022 | 76.51 | (.47) | (16.16) | (16.63) | (10.34) | (10.34) | 49.54 | (25.58) | 221,055 | .99d | (.70) | 39 |
| June 30, 2021 | 55.27 | (.54) | 25.12 | 24.58 | (3.34) | (3.34) | 76.51 | 45.29 | 181,762 | .96 | (.77) | 70 |
| June 30, 2020 | 49.29 | (.31) | 7.24 | 6.93 | (.95) | (.95) | 55.27 | 14.30 | 83,884 | .99 | (.63) | 56 |
| a | Per share net investment income (loss) has been determined on the basis of the weighted average number of shares outstanding during the period. |
| b | Total return assumes dividend reinvestment and does not reflect the effect of sales charges. |
| c | Includes amounts paid through expense offset and/or brokerage/service arrangements, if any (Note 2). Also excludes acquired fund fees and expenses, if any. |
| d | Includes one-time proxy cost of 0.01%. |
The accompanying notes are an integral part of these financial statements.
Notes to financial statements 12/31/24 (Unaudited)
Unless otherwise noted, the “reporting period” represents the period from July 1, 2024 through December 31, 2024. The following table defines commonly used references within the Notes to financial statements:
| References to | Represent |
| 1940 Act | Investment Company Act of 1940, as amended |
| Franklin Advisers | Franklin Advisers, Inc., a direct wholly-owned subsidiary of Franklin Templeton |
| Franklin Distributors | Franklin Distributors, LLC, an indirect wholly-owned subsidiary of Franklin Templeton, and the fund’s distributor and principal underwriter for periods on or after August 2, 2024 |
| Franklin Templeton | Franklin Resources, Inc. |
| Franklin Templeton Services | Franklin Templeton Services, LLC, a wholly-owned subsidiary of Franklin Templeton |
| FTIML | Franklin Templeton Investment Management Limited |
| JPMorgan | JPMorgan Chase Bank, N.A. |
| OTC | Over-the-counter |
| PIL | Putnam Investments Limited, an indirect wholly-owned subsidiary of Franklin Templeton |
| PSERV | Putnam Investor Services, Inc., a wholly-owned subsidiary of Franklin Templeton |
| Putnam Management | Putnam Investment Management, LLC, the fund’s investment manager, an indirect wholly-owned subsidiary of Franklin Templeton |
| Putnam Retail Management | Putnam Retail Management Limited Partnership, an indirect wholly-owned subsidiary of Franklin Templeton, and the fund’s distributor and principal underwriter for periods prior to August 2, 2024 |
| SEC | Securities and Exchange Commission |
| State Street | State Street Bank and Trust Company |
Putnam Small Cap Growth Fund (the fund) is a diversified series of Putnam Funds Trust (the Trust), a Massachusetts business trust registered under the 1940 Act as an open-end management investment company. The goal of the fund is to seek capital appreciation. The fund invests mainly in common stocks of small U.S. companies, with a focus on growth stocks. Growth stocks are issued by companies whose earnings are expected to grow faster than those of similar firms, and whose business growth and other characteristics may lead to an increase in stock price. Under normal circumstances, the fund’s investment manager invests at least 80% of the fund’s net assets in companies of a size similar to those in the Russell 2000 Growth Index. This policy may be changed only after 60 days’ notice to shareholders. As of August 31, 2024, the index was composed of companies having market capitalizations of between approximately $11.8 million and $13.1 billion. The fund’s investment manager may consider, among other factors, a company’s valuation, financial strength, growth potential, competitive position in its industry, projected future earnings, cash flows and dividends when deciding whether to buy or sell investments.
The fund offers the following share classes. The expenses for each class of shares may differ based on the distribution and investor servicing fees of each class, which are identified in Note 2.
| Share class | Sales charge | Contingent deferred sales charge | Conversion feature |
| Class A | Up to 5.75% | 1.00% on certain redemptions of shares bought with no initial sales charge | None |
| Class C | None | 1.00% eliminated after one year | Converts to class A shares after 8 years |
| Class R † | None | None | None |
| Class R6 † | None | None | None |
| Class Y † | None | None | None |
| † Not available to all investors. |
Effective September 5, 2024, the fund converted all of its class B shares into class A shares, and subsequently terminated its class B shares as a fund offering.
In the normal course of business, the fund enters into contracts that may include agreements to indemnify another party under given circumstances. The fund’s maximum exposure under these arrangements is unknown as this would involve future claims that may be, but have not yet been, made against the fund. However, the fund’s management team expects the risk of material loss to be remote.
The fund has entered into contractual arrangements with an investment adviser, administrator, distributor, shareholder servicing agent and custodian, who each provide services to the fund. Unless expressly stated otherwise, shareholders are not parties to, or intended beneficiaries of these contractual arrangements, and these contractual arrangements are not intended to create any shareholder right to enforce them against the service providers or to seek any remedy under them against the service providers, either directly or on behalf of the fund.
Under the Trust’s Agreement and Declaration of Trust, any claims asserted by a shareholder against or on behalf of the Trust (or its series), including claims against Trustees and Officers, must be brought in courts located within the Commonwealth of Massachusetts.
Note 1: Significant accounting policies
The fund follows the accounting and reporting guidance in Financial Accounting Standards Board (FASB) Accounting Standards Codification Topic 946, Financial Services – Investment Companies (ASC 946) and applies the specialized accounting and reporting guidance in U.S. Generally Accepted Accounting Principles (U.S. GAAP), including, but not limited to, ASC 946. The following is a summary of significant accounting policies consistently followed by the fund in the preparation of its financial statements. The preparation of financial statements is in conformity with accounting principles generally accepted in the United States of America and requires management to make estimates and assumptions that affect the reported amounts of assets and liabilities in the financial statements and the reported amounts of increases and decreases in net assets from operations. Actual results could differ from those estimates. Subsequent events after the Statement of assets and liabilities date through the date that the financial statements were issued have been evaluated in the preparation of the financial statements.
Investment income, realized and unrealized gains and losses and expenses of the fund are borne pro-rata based on the relative net assets of each class to the total net assets of the fund, except that each class bears expenses unique to that class (including the distribution fees applicable to such classes). Each class votes as a class only with respect to its own distribution plan or other matters on which a class vote is required by law or determined by the Trustees. If the fund were liquidated, shares of each class would receive their pro-rata share of the net assets of the fund. In addition, the Trustees declare separate dividends on each class of shares.
Security valuation Portfolio securities and other investments are valued using policies and procedures adopted by the Board of Trustees (Trustees). The Trustees have formed a Pricing Committee to oversee the implementation of these procedures. Under compliance policies and procedures approved by the Trustees, the Trustees have designated the fund’s investment manager as the valuation designee and has responsibility for oversight of valuation. The investment manager is assisted by the fund’s administrator in performing this responsibility, including leading the cross-functional Valuation Committee (VC). The VC is responsible for making fair value determinations, evaluating the effectiveness of the pricing policies of the fund and reporting to the Trustees.
Investments for which market quotations are readily available are valued at the last reported sales price on their principal exchange, or official closing price for certain markets, and are classified as Level 1 securities under Accounting Standards Codification 820 Fair Value Measurements and Disclosures (ASC 820). If no sales are reported, as in the case of some securities that are traded OTC, a security is valued at the average of the last reported bid and ask prices, the “mid price” (prior to July 22, 2024, the most recent bid price was used), and is generally categorized as a Level 2 security.
Investments in open-end investment companies (excluding exchange-traded funds), if any, which can be classified as Level 1 or Level 2 securities, are valued based on their net asset value. The net asset value of such investment companies equals the total value of their assets less their liabilities and divided by the number of their outstanding shares.
Many securities markets and exchanges outside the U.S. close prior to the scheduled close of the New York Stock Exchange and therefore the closing prices for securities in such markets or on such exchanges may not fully reflect events that occur after such close but before the scheduled close of the New York Stock Exchange. Reliable prices are not readily available for equity securities in these circumstances, where the value of a security has been affected by events after the close of the exchange or market on which the security is principally traded, but before the fund calculates its net asset value. To address this, the fund will fair value these securities as determined in accordance with procedures approved by the Trustees. This includes using an independent third-party pricing service to adjust the value of such securities to the latest indications of fair value at 4:00 p.m. (Eastern Time). These securities, which would generally be classified as Level 1 securities, will be transferred to Level 2 of the fair value hierarchy when they are valued at fair value. Securities quoted in foreign currencies, if any, are translated into U.S. dollars at the current exchange rate. Short-term securities with remaining maturities of 60 days or less are valued using an independent pricing service approved by the Trustees, and are classified as Level 2 securities.
To the extent a pricing service or dealer is unable to value a security or provides a valuation that the fund’s investment manager does not believe accurately reflects the security’s fair value, the security will be valued at fair value by the fund’s investment manager, which has been designated as valuation designee pursuant to Rule 2a–5 under the 1940 Act, in accordance with policies and procedures approved by the Trustees. Certain investments, including certain restricted and illiquid securities and derivatives, are also valued at fair value following procedures approved by the Trustees. These valuations consider such factors as significant market or specific security events such as interest rate or credit quality changes, various relationships with other securities, discount rates, U.S. Treasury, U.S. swap and credit yields, index levels, convexity exposures, recovery rates, sales and other multiples and resale restrictions. These securities are classified as Level 2 or as Level 3 depending on the priority of the significant inputs.
To assess the continuing appropriateness of fair valuations, the Valuation Committee reviews and affirms the reasonableness of such valuations on a regular basis after considering all relevant information that is reasonably available. Such valuations and procedures are reviewed periodically by the Trustees. The fair value of securities is generally determined as the amount that the fund could reasonably expect to realize from an orderly disposition of such securities over a reasonable period of time. By its nature, a fair value price is a good faith estimate of the value of a security in a current sale and does not reflect an actual market price, which may be different by a material amount.
Security transactions and related investment income Security transactions are recorded on the trade date (the date the order to buy or sell is executed). Gains or losses on securities sold are determined on the identified cost basis.
Interest income, net of any applicable withholding taxes, if any, is recorded on the accrual basis. Amortization and accretion of premiums and discounts on debt securities, if any, is recorded on the accrual basis.
Dividend income, net of any applicable withholding taxes, is recognized on the ex-dividend date except that certain dividends from foreign securities, if any, are recognized as soon as the fund is informed of the ex-dividend date. Non-cash dividends, if any, are recorded at the fair value of the securities received. Dividends representing a return of capital or capital gains, if any, are reflected as a reduction of cost and/or as a realized gain.
Foreign currency translation The accounting records of the fund are maintained in U.S. dollars. The fair value of foreign securities, currency holdings, and other assets and liabilities is recorded in the books and records of the fund after translation to U.S. dollars based on the exchange rates on that day. The cost of each security is determined using historical exchange rates. Income and withholding taxes are translated at prevailing exchange rates when earned or incurred. The fund does not isolate that portion of realized or unrealized gains or losses resulting from changes in the foreign exchange rate on investments from fluctuations arising from changes in the market prices of the securities. Such gains and losses are included with the net realized and unrealized gain or loss on investments. Net realized gains and losses on foreign currency transactions represent net realized exchange gains or losses on disposition of foreign currencies, currency gains and losses realized between the trade and settlement dates on securities transactions and the difference between the amount of investment income and foreign withholding taxes recorded on the fund’s books and the U.S. dollar equivalent amounts actually received or paid. Net unrealized appreciation and depreciation of assets and liabilities in foreign currencies arise from changes in the value of assets and liabilities other than investments at the period end, resulting from changes in the exchange rate.
Securities lending The fund may lend securities, through its agent, to qualified borrowers in order to earn additional income. The loans are collateralized by cash in an amount at least equal to the fair value of the securities loaned. The fair value of securities loaned is determined daily and any additional required collateral is allocated to the fund on the next business day. The remaining maturities of the securities lending transactions are considered overnight and continuous. The risk of borrower default will be borne by the fund’s agent; the fund will bear the risk of loss with respect to the investment of the cash collateral. Income from securities lending, if any, is net of expenses and is included in investment income on the Statement of operations. Cash collateral is invested in Putnam Cash Collateral Pool, LLC, a limited liability company that is managed by an affiliate of Putnam Management. Investments in Putnam Cash Collateral Pool, LLC are valued at its closing net asset value each business day. There are no management fees charged to Putnam Cash Collateral Pool, LLC. At the close of the reporting period, the fund received cash collateral of $76,192,655 and the value of securities loaned amounted to $74,265,323.
Interfund lending The fund, along with other Putnam funds, may participate in an interfund lending program pursuant to an exemptive order issued by the SEC. This program allows the fund to borrow from or lend to other Putnam funds that permit such transactions. Interfund lending transactions are subject to each fund’s investment policies and borrowing and lending limits. Interest earned or paid on the interfund lending transaction will be based on the average of certain current market rates. During the reporting period, the fund did not utilize the program.
Lines of credit Prior to January 31, 2025, the fund participated, along with other Putnam funds, in a $320 million syndicated unsecured committed line of credit, provided by State Street ($160 million) and JPMorgan ($160 million), and a $235.5 million unsecured uncommitted line of credit, provided by State Street. Borrowings could be made for temporary or emergency purposes, including the funding of shareholder redemption requests and trade settlements. Interest is charged to the fund based on the fund’s borrowing at a rate equal to 1.25% plus the higher of (1) the Federal Funds rate and (2) the Overnight Bank Funding Rate for the committed line of credit and 1.30% plus the higher of (1) the Federal Funds rate and (2) the Overnight Bank Funding Rate for the uncommitted line of credit. A closing fee equal to 0.04% of the committed line of credit and 0.04% of the uncommitted line of credit was paid by the participating funds and a $75,000 fee was paid by the participating funds to State Street as agent of the syndicated committed line of credit. In addition, a commitment fee of 0.21% per annum on any unutilized portion of the committed line of credit is allocated to the participating funds based on their relative net assets and paid quarterly. During the reporting period, the fund had no borrowings against these arrangements.
Effective January 31, 2025, the fund, together with other U.S. registered and foreign investment funds managed by an affiliate of Franklin Templeton are borrowers in a joint syndicated senior unsecured credit facility totaling $2.995 billion, which matures on January 30, 2026.
Federal taxes It is the policy of the fund to distribute all of its taxable income within the prescribed time period and otherwise comply with the provisions of the Internal Revenue Code of 1986, as amended (the Code), applicable to regulated investment companies. It is also the intention of the fund to distribute an amount sufficient to avoid imposition of any excise tax under Section 4982 of the Code.
The fund is subject to the provisions of Accounting Standards Codification 740 Income Taxes (ASC 740). ASC 740 sets forth a minimum threshold for financial statement recognition of the benefit of a tax position taken or expected to be taken in a tax return. The fund did not have a liability to record for any unrecognized tax benefits in the accompanying financial statements. No provision has been made for federal taxes on income, capital gains or unrealized appreciation on securities held nor for excise tax on income and capital gains. Each of the fund’s federal tax returns for the prior three fiscal years remains subject to examination by the Internal Revenue Service.
The fund may also be subject to taxes imposed by governments of countries in which it invests. Such taxes are generally based on either income or gains earned or repatriated. The fund accrues and applies such taxes to net investment income, net realized gains and net unrealized gains as income and/or capital gains are earned. In some cases, the fund may be entitled to reclaim all or a portion of such taxes, and such reclaim amounts, if any, are reflected as an asset and other income on the fund’s books. In many cases, however, the fund may not receive such amounts for an extended period of time, depending on the country of investment.
Under the Regulated Investment Company Modernization Act of 2010, the fund will be permitted to carry forward capital losses incurred for an unlimited period and the carry forwards will retain their character as either short-term or long-term
capital losses. At June 30, 2024, the fund had the following capital loss carryovers available, to the extent allowed by the Code, to offset future net capital gain, if any:
| Loss carryover |
| Short-term | Long-term | Total |
| $60,660,687 | $— | $60,660,687 |
Pursuant to federal income tax regulations applicable to regulated investment companies, the fund has elected to defer $4,341,445 to its fiscal year ending June 30, 2025 of late year ordinary losses ((i) ordinary losses recognized between January 1, 2024 and June 30, 2024, and/or (ii) specified ordinary and currency losses recognized between November 1, 2023 and June 30, 2024).
Tax cost of investments includes adjustments to net unrealized appreciation (depreciation) which may not necessarily be final tax cost basis adjustments, but closely approximate the tax basis unrealized gains and losses that may be realized and distributed to shareholders. The aggregate identified cost on a tax basis is $2,351,945,638, resulting in gross unrealized appreciation and depreciation of $746,126,132 and $40,586,692, respectively, or net unrealized appreciation of $705,539,440.
Distributions to shareholders Distributions to shareholders from net investment income, if any, are recorded by the fund on the ex-dividend date. Distributions from capital gains, if any, are recorded on the ex-dividend date and paid at least annually. The amount and character of income and gains to be distributed are determined in accordance with income tax regulations, which may differ from generally accepted accounting principles. Dividend sources are estimated at the time of declaration. Actual results may vary. Any non-taxable return of capital cannot be determined until final tax calculations are completed after the end of the fund’s fiscal year. Reclassifications are made to the fund’s capital accounts to reflect income and gains available for distribution (or available capital loss carryovers) under income tax regulations.
Expenses of the Trust Expenses directly charged or attributable to any fund will be paid from the assets of that fund. Generally, expenses of the Trust will be allocated among and charged to the assets of each fund on a basis that the Trustees deem fair and equitable, which may be based on the relative assets of each fund or the nature of the services performed and relative applicability to each fund.
Note 2: Management fee, administrative services and other transactions
The fund pays Putnam Management a management fee (base fee) (based on the fund’s average net assets and computed and paid monthly) at annual rates that may vary based on the average of the aggregate net assets of all open-end mutual funds sponsored by Putnam Management (including open-end funds managed by affiliates of Putnam Management that have been deemed to be sponsored by Putnam Management for this purpose) (excluding net assets of funds that are invested in, or that are invested in by, other Putnam funds to the extent necessary to avoid “double counting” of those assets). Such annual rates may vary as follows:
| 0.780% | of the first $5 billion, |
| 0.730% | of the next $5 billion, |
| 0.680% | of the next $10 billion, |
| 0.630% | of the next $10 billion, |
| 0.580% | of the next $50 billion, |
| 0.560% | of the next $50 billion, |
| 0.550% | of the next $100 billion and |
| 0.545% | of any excess thereafter. |
In addition, the monthly management fee consists of the monthly base fee plus or minus a performance adjustment for the month. The performance adjustment is determined based on performance over the thirty-six month period then ended. Each month, the performance adjustment is calculated by multiplying the performance adjustment rate and the fund’s average net assets over the performance period and dividing the result by twelve. The resulting dollar amount is added to, or subtracted from the base fee for that month. The performance adjustment rate is equal to 0.03 multiplied by the difference between the fund’s annualized performance (measured by the fund’s class A shares) and the annualized performance of the Russell 2000 Growth Index each measured over the performance period. The maximum annualized performance adjustment rate is +/- 0.18%. The monthly base fee is determined based on the fund’s average net assets for the month, while the performance adjustment is determined based on the fund’s average net assets over the thirty-six month performance period. This means it is possible that, if the fund underperforms significantly over the performance period, and the fund’s assets have declined significantly over that period, the negative performance adjustment may exceed the base fee. In this event, Putnam Management would make a payment to the fund.
Because the performance adjustment is based on the fund’s performance relative to its applicable benchmark index, and not its absolute performance, the performance adjustment could increase Putnam Management’s fee even if the fund’s shares lose value during the performance period provided that the fund outperformed its benchmark index, and could decrease Putnam Management’s fee even if the fund’s shares increase in value during the performance period provided that the fund underperformed its benchmark index.
For the reporting period, the management fee represented an effective rate (excluding the impact of any expense waiver in effect) of 0.337% of the fund’s average net assets, which included an effective base fee of 0.306% and an increase of 0.031% ($816,724) based on performance.
Putnam Management has contractually agreed, through October 30, 2025, to waive fees and/or reimburse the fund’s expenses to the extent necessary to limit the cumulative expenses of the fund, exclusive of brokerage, interest, taxes, investment-related expenses, extraordinary expenses, acquired fund fees and expenses and payments under the fund’s investor servicing contract, investment management contract and distribution plans, on a fiscal year-to-date basis to an annual rate of 0.20% of the fund’s average net assets over such fiscal year-to-date period. During the reporting period, the fund’s expenses were not reduced as a result of this limit.
Effective July 15, 2024, Franklin Advisers was retained by Putnam Management as a sub-advisor for the fund pursuant to a new sub-advisory agreement between Putnam Management and Franklin Advisers. Pursuant to the agreement, Franklin Advisers provides certain advisory and related services. Putnam Management pays a monthly fee to Franklin Advisers based on the costs of Franklin Advisers in providing these services to the fund, which may include a mark-up not to exceed 15% over such costs.
Effective November 1, 2024, FTIML is authorized by the Trustees to manage a separate portion of the assets of the fund as determined by Putnam Management from time to time. FTIML did not manage any portion of the assets of the fund during the reporting period. If Putnam Management were to engage the services of FTIML, Putnam Management (and not the fund) would pay a monthly sub-management fee to FTIML for its services at an annual rate of 0.25% of the average net assets of the portion of the fund managed by FTIML.
Prior to November 1, 2024, PIL was authorized by the Trustees to manage a separate portion of the assets of the fund as determined by Putnam Management from time to time. PIL did not manage any portion of the assets of the fund during the reporting period. If Putnam Management had engaged the services of PIL, Putnam Management (and not the fund) would have paid a quarterly sub-management fee to PIL for its services at an annual rate of 0.25% of the average net assets of the portion of the fund managed by PIL. Effective November 1, 2024, PIL merged into FTIML, and PIL investment professionals became employees of FTIML.
Franklin Templeton Services provides certain administrative services to the fund. The fee for those services is paid by the fund’s investment manager based on the fund’s average daily net assets and is not an additional expense of the fund.
The fund reimburses Putnam Management an allocated amount for the compensation and related expenses of certain officers of the fund and their staff who provide administrative services to the fund. The aggregate amount of all such reimbursements is determined annually by the Trustees.
Custodial functions for the fund’s assets are provided by State Street. Custodian fees are based on the fund’s asset level, the number of its security holdings and transaction volumes.
PSERV, an affiliate of Putnam Management, provides investor servicing agent functions to the fund. PSERV received fees for investor servicing for class A, class B, class C, class R and class Y shares that included (1) a per account fee for each direct and underlying non-defined contribution account (retail account) of the fund; (2) a specified rate of the fund’s assets attributable to defined contribution plan accounts; and (3) a specified rate based on the average net assets in retail accounts. PSERV has agreed that the aggregate investor servicing fees for each fund’s retail and defined contribution accounts for these share classes will not exceed an annual rate of 0.25% of the fund’s average assets attributable to such accounts.
Class R6 shares paid a monthly fee based on the average net assets of class R6 shares at an annual rate of 0.05%.
During the reporting period, the expenses for each class of shares related to investor servicing fees were as follows:
| Class A | $571,011 |
| Class B | 197 |
| Class C | 29,258 |
| Class R | 23,773 |
| Class R6 | 146,014 |
| Class Y | 1,499,877 |
| Total | $2,270,130 |
The fund has entered into expense offset arrangements with PSERV and State Street whereby PSERV’s and State Street’s fees are reduced by credits allowed on cash balances. For the reporting period, the fund’s expenses were reduced by $16,165 under the expense offset arrangements.
Each Independent Trustee of the fund receives an annual Trustee fee, of which $1,719, as a quarterly retainer, has been allocated to the fund, and an additional fee for each Trustees meeting attended. Trustees also are reimbursed for expenses they incur relating to their services as Trustees.
The fund has adopted a Trustee Fee Deferral Plan (the Deferral Plan) which allows the Trustees to defer the receipt of all or a portion of Trustees fees payable from July 1, 1995 through December 31, 2023. The deferred fees remain invested in certain Putnam funds until distribution in accordance with the Deferral Plan.
The fund has adopted an unfunded noncontributory defined benefit pension plan (the Pension Plan) covering all Trustees of the fund who have served as a Trustee for at least five years and were first elected prior to 2004. Benefits under the Pension Plan are equal to 50% of the Trustee’s average annual attendance and retainer fees for the three years ended December 31, 2005. The retirement benefit is payable during a Trustee’s lifetime, beginning the year following retirement, for the number of years of service through December 31, 2006. Pension expense for the fund is included in Trustee compensation and expenses in the Statement of operations. Accrued pension liability is included in Payable for Trustee compensation and expenses in the Statement of assets and liabilities. The Trustees have terminated the Pension Plan with respect to any Trustee first elected after 2003.
The fund has adopted distribution plans (the Plans) with respect to the following share classes pursuant to Rule 12b–1 under the 1940 Act. The purpose of the Plans is to compensate Franklin Distributors, or for periods prior to August 2, 2024, Putnam Retail Management, for services provided and expenses incurred in distributing shares of the fund. The Plans provide payments by the fund to Franklin Distributors and to Putnam Retail Management at an annual rate of up to the following amounts (Maximum %) of the average net assets attributable to each class. The Trustees have approved payment by the fund at the following annual rate (Approved %) of the average net assets attributable to each class. During the reporting period, the class-specific expenses related to distribution fees were as follows:
| | Maximum % | Approved % | Franklin Distributors Amount | Putnam Retail Management Amount | Totals |
| Class A | 0.35% | 0.25% | $588,378 | $110,201 | $698,579 |
| Class B | 1.00% | 1.00% | 560 | 515 | $1,075 |
| Class C | 1.00% | 1.00% | 123,384 | 19,988 | $143,372 |
| Class R | 1.00% | 0.50% | 48,971 | 9,192 | $58,163 |
| Total | | | $761,293 | $139,896 | $901,189 |
For the period from August 2, 2024 through December 31, 2024, Franklin Distributors, acting as underwriter, received net commissions of $54,922 from the sale of class A shares and received no monies and $2,595 in contingent deferred sales charges from redemptions of class B and class C shares, respectively. For the period July 1, 2024 through August 1, 2024, Putnam Retail Management, acting as underwriter, received net commissions of $14,566 from the sale of class A shares and received no monies and $293 in contingent deferred sales charges from redemptions of class B and class C shares, respectively.
A deferred sales charge of up to 1.00% is accessed on certain redemptions of class A shares. For the period from August 2, 2024 through December 31, 2024, Franklin Distributors, acting as underwriter, received $135 on class A redemptions. For the period from July 1, 2024 through August 1, 2024, Putnam Retail Management, acting as underwriter, received $24 on class A redemptions.
Note 3: Purchases and sales of securities
During the reporting period, the cost of purchases and the proceeds from sales, excluding short-term investments, were as follows:
| | Cost of purchases | Proceeds from sales |
| Investments in securities (Long-term) | $1,218,590,741 | $380,153,163 |
| U.S. government securities (Long-term) | — | — |
| Total | $1,218,590,741 | $380,153,163 |
The fund may purchase or sell investments from or to other Putnam funds in the ordinary course of business, which can reduce the fund’s transaction costs, at prices determined in accordance with SEC requirements and policies approved by the Trustees. During the reporting period, purchases or sales of long-term securities from or to other Putnam funds, if any, did not represent more than 5% of the fund’s total cost of purchases and/or total proceeds from sales.
Note 4: Capital shares
At the close of the reporting period, there were an unlimited number of shares of beneficial interest authorized. Transactions, including, if applicable, direct exchanges pursuant to share conversions, in capital shares were as follows:
| | SIX MONTHS ENDED 12/31/24 | YEAR ENDED 6/30/24 |
| Class A | Shares | Amount | Shares | Amount |
| Shares sold | 802,622 | $60,172,635 | 749,283 | $45,685,803 |
| Shares issued in connection with reinvestment of distributions | — | — | — | — |
| | 802,622 | 60,172,635 | 749,283 | 45,685,803 |
| Shares repurchased | (473,294) | (35,236,855) | (971,825) | (58,654,472) |
| Net increase (decrease) | 329,328 | $24,935,780 | (222,542) | $(12,968,669) |
| | SIX MONTHS ENDED 12/31/24 * | YEAR ENDED 6/30/24 |
| Class B | Shares | Amount | Shares | Amount |
| Shares sold | 6 | $356 | 482 | $21,694 |
| Shares issued in connection with reinvestment of distributions | — | — | — | — |
| | 6 | 356 | 482 | 21,694 |
| Shares repurchased | (11,284) | (646,045) | (27,410) | (1,304,681) |
| Net decrease | (11,278) | $(645,689) | (26,928) | $(1,282,987) |
| | SIX MONTHS ENDED 12/31/24 | YEAR ENDED 6/30/24 |
| Class C | Shares | Amount | Shares | Amount |
| Shares sold | 221,997 | $13,500,838 | 180,066 | $8,895,988 |
| Shares issued in connection with reinvestment of distributions | — | — | — | — |
| | 221,997 | 13,500,838 | 180,066 | 8,895,988 |
| Shares repurchased | (40,781) | (2,435,100) | (84,310) | (4,095,270) |
| Net increase | 181,216 | $11,065,738 | 95,756 | $4,800,718 |
| | SIX MONTHS ENDED 12/31/24 | YEAR ENDED 6/30/24 |
| Class R | Shares | Amount | Shares | Amount |
| Shares sold | 67,019 | $4,723,070 | 120,076 | $6,996,641 |
| Shares issued in connection with reinvestment of distributions | — | — | — | — |
| | 67,019 | 4,723,070 | 120,076 | 6,996,641 |
| Shares repurchased | (54,126) | (3,798,050) | (114,573) | (6,487,019) |
| Net increase | 12,893 | $925,020 | 5,503 | $509,622 |
| | SIX MONTHS ENDED 12/31/24 | YEAR ENDED 6/30/24 |
| Class R6 | Shares | Amount | Shares | Amount |
| Shares sold | 3,833,248 | $308,992,183 | 4,084,141 | $268,607,746 |
| Shares issued in connection with reinvestment of distributions | — | — | — | — |
| | 3,833,248 | 308,992,183 | 4,084,141 | 268,607,746 |
| Shares repurchased | (776,488) | (62,384,573) | (1,060,632) | (71,451,751) |
| Net increase | 3,056,760 | $246,607,610 | 3,023,509 | $197,155,995 |
| | SIX MONTHS ENDED 12/31/24 | YEAR ENDED 6/30/24 |
| Class Y | Shares | Amount | Shares | Amount |
| Shares sold | 9,274,295 | $734,431,557 | 9,482,066 | $612,809,694 |
| Shares issued in connection with reinvestment of distributions | — | — | — | — |
| | 9,274,295 | 734,431,557 | 9,482,066 | 612,809,694 |
| Shares repurchased | (2,165,051) | (172,229,389) | (3,030,519) | (197,671,218) |
| Net increase | 7,109,244 | $562,202,168 | 6,451,547 | $415,138,476 |
* Effective September 5, 2024, the fund has terminated its class B shares.
Note 5: Affiliated transactions
Transactions during the reporting period with any company which is under common ownership or control were as follows:
| Name of affiliate | Fair value as of 6/30/24 | Purchase cost | Sale proceeds | Investment income | Shares outstanding and fair value as of 12/31/24 |
| Short-term investments | | | | | |
| Putnam Cash Collateral Pool, LLC* | $172,261,153 | $442,759,585 | $538,828,083 | $3,813,138 | $76,192,655 |
| Putnam Short Term Investment Fund Class P ‡ | 7,469,562 | 463,333,392 | 429,703,831 | 1,444,823 | 41,099,123 |
| Total Short-term investments | $179,730,715 | $906,092,977 | $968,531,914 | $5,257,961 | $117,291,778 |
| * No management fees are charged to Putnam Cash Collateral Pool, LLC (Note 1). Investment income shown is included in securities lending income on the Statement of operations. There were no realized or unrealized gains or losses during the period. |
| ‡ Management fees charged to Putnam Short Term Investment Fund have been waived by Putnam Management. There were no realized or unrealized gains or losses during the period. |
Note 6: Market, credit and other risks
In the normal course of business, the fund trades financial instruments and enters into financial transactions where risk of potential loss exists due to changes in the market (market risk) or failure of the contracting party to the transaction to perform (credit risk). The fund may be exposed to additional credit risk that an institution or other entity with which the fund has unsettled or open transactions will default. Investments in foreign securities involve certain risks, including those related to economic instability, unfavorable political developments, and currency fluctuations.
Note 7: Operating segments
The fund has adopted the Financial Accounting Standards Board (FASB) Accounting Standards Update (ASU) 2023-07, Segment Reporting (Topic 280) - Improvements to Reportable Segment Disclosures. The update is limited to disclosure requirements and does not impact the fund’s financial position or results of operations.
The fund operates as a single operating segment, which is an investment portfolio. The fund’s investment manager serves as the Chief Operating Decision Maker (CODM), evaluating fund-wide results and performance under a unified investment strategy. The CODM uses these measures to assess fund performance and allocate resources effectively. Internal reporting provided to the CODM aligns with the accounting policies and measurement principles used in the financial statements.
For information regarding segment assets, segment profit or loss, and significant expenses, refer to the Statement of assets and liabilities and the Statement of operations, along with the related notes to the financial statements. The fund’s portfolio provides details of the fund’s investments that generate returns such as interest, dividends, and realized and unrealized gains or losses. Performance metrics, including portfolio turnover and expense ratios, are disclosed in the Financial highlights.
Changes in and disagreements with accountants
Not applicable
Results of any shareholder votes
Not applicable
Remuneration paid to directors, officers, and others
Remuneration paid to directors, officers, and others is included in the Notes to financial statements above.
Board approval of management and subadvisory agreements (Unaudited)
At its meeting on September 27, 2024, the Board of Trustees of your fund, including all of the Trustees who are not “interested persons” (as this term is defined in the Investment Company Act of 1940, as amended (the “1940 Act”)) of the Putnam mutual funds, closed-end funds and exchange-traded funds (collectively, the “funds”) (the “Independent Trustees”), approved a new Sub-Advisory Agreement with respect to your fund (the “New FTIML Sub-Advisory Agreement”) between Putnam Investment Management, LLC (“Putnam Management”) and its affiliate, Franklin Templeton Investment Management Limited (“FTIML”). Putnam Management and FTIML are each direct or indirect, wholly-owned subsidiaries of Franklin Resources, Inc. (“Franklin Templeton”). (Because FTIML is an affiliate of Putnam Management and Putnam Management remains fully responsible for all services provided by FTIML, the Trustees did not attempt to evaluate FTIML as a separate entity.)
The Board of Trustees, with the assistance of its Contract Committee (which consists solely of Independent Trustees) and its independent legal counsel (as that term is defined in Rule 0-1(a)(6)(i) under the 1940 Act), requested and evaluated all information it deemed reasonably necessary under the circumstances in connection with its review of the New FTIML Sub-Advisory Agreement. At its September 2024 meeting, the Contract Committee met with representatives of Putnam Management and Franklin Templeton, and separately in executive session, to consider the information provided. At the September Trustees’ meetings, the Contract Committee also met in executive session with the other Independent Trustees to discuss its observations and recommendations. Throughout this process, the Contract Committee was assisted by the members of the Board of Trustees’ independent staff and by independent legal counsel for the Independent Trustees.
Considerations in connection with the Trustees’ approval of the New FTIML Sub-Advisory Agreement
The Trustees considered the proposed New FTIML Sub-Advisory Agreement in connection with the planned November 1, 2024 merger (the “Merger”) of Putnam Investments Limited (“PIL”), an affiliate of Putnam Management and a sub-adviser to your fund prior to the Merger, with and into FTIML. The Trustees considered that, in connection with the Merger, PIL investment professionals would become employees of FTIML, and, upon consummation of the Merger, PIL would cease to exist as a separate legal entity. The Trustees noted that Franklin Templeton viewed the Merger as a further step in the integration of the legacy Putnam and Franklin Templeton organizations, offering potential operational efficiencies and enhanced investment resources for the funds. The Trustees also considered, among other factors, that:
• The Merger and the New FTIML Sub-Advisory Agreement would not result in any reduction or material change in the nature or the level of the sub-advisory services provided to the funds;
• The PIL portfolio managers who are responsible for the day-to-day management of the applicable funds would be the same immediately prior to, and immediately after, the Merger, and these investment personnel would have access to the same research and other resources to support their respective investment advisory functions and operate under the same conditions both immediately before and after the Merger;
• Despite a change in the sub-advisory fee structure for certain funds, the New FTIML Sub-Advisory Agreement would not result in an increase in the advisory fee rates payable by each fund, as Putnam Management would be responsible for overseeing the investment advisory services provided to the applicable funds by FTIML under the New FTIML Sub-Advisory Agreement and would compensate FTIML for such services out of the fees it receives under each fund’s Management Contract with Putnam Management (each, a “Current Management Contract”); and
• The terms of the New FTIML Sub-Advisory Agreement were substantially similar to those under the sub-management contract between Putnam Management and PIL with respect to the fund (the “PIL Sub-Management Contract”). 1
The Trustees also considered that, prior to the Merger, counsel to Putnam Management and FTIML had provided a legal opinion that the Merger and the appointment of FTIML as sub-adviser to the funds would not result in an “assignment” under the 1940 Act of the PIL Sub-Management Contract and that the New FTIML Sub-Advisory Agreement did not require shareholder approval.
In addition, the Trustees considered that, in connection with their review of your fund’s Current Management Contract and the PIL Sub-Management Contract over the course of several months ending in June 2023, they had considered information regarding the nature, extent and quality of the services provided to the fund, the fund’s performance, the fund’s management fees and expense ratios, the profitability of Putnam Management and its affiliates in providing services to the fund, whether there had been economies of scale with respect to the management of the fund and other benefits received by Putnam Management and its affiliates as a result of their relationships with the fund. Because, other than the parties to the contract, the revised sub-advisory fee structure for certain funds, and certain other non-substantive changes to contractual terms, the New FTIML Sub-Advisory Agreement was substantially similar to the PIL Sub-Management Contract, the Trustees relied to a considerable extent on their previous approval of the PIL Sub-Management Contract in connection with their consideration of the New FTIML Sub-Advisory Agreement.
The Trustees also considered information received as part of the review process ending in June 2024 in connection with their consideration of a new Sub-Advisory Agreement for your fund (the “Franklin Advisers Sub-Advisory Agreement”) between Putnam Management and Franklin Advisers, Inc., an affiliate of Putnam Management and FTIML, including updated information regarding the profitability of Putnam Management and its affiliates, potential economies of scale, other benefits received by Putnam Management and its affiliates as a result of their relationships with the funds, and the performance and expenses of the funds. The Trustees also considered other information received in connection with their review of the Franklin Advisers Sub-Advisory Agreement, including certain performance information for Franklin Templeton’s fixed income and investment solutions investment strategies and information regarding the revenues, expenses and profitability of Franklin Templeton’s global investment management business and its U.S. registered investment company business, which included the financial results of FTIML.
1 The New PIL Sub-Management Contract was operative until the effective date of the Merger, November 1, 2024, and was replaced by the New FTIML Sub-Advisory Agreement effective as of that date.
Board of Trustees’ Conclusions
After considering the factors described above, as well as other factors, the Board of Trustees, including all of the Independent Trustees, concluded that the fees payable under the New FTIML Sub-Advisory Agreement represented reasonable compensation in light of the nature and quality of the services that would be provided to the funds, and determined to approve the New FTIML Sub-Advisory Agreement for your fund. These conclusions were based on a comprehensive consideration of all information provided to the Trustees and were not the result of any single factor.
| |
 | | |
| © 2024 Franklin Templeton. All rights reserved. | 38972-SFSOI 2/25 |
| |
| Item 8. Changes in and Disagreements with Accountants for Open-End Management Investment Companies. |
| |
| Included in Item 7 above. |
| |
| Item 9. Proxy Disclosure for Open-End Management Investment Companies. |
| |
| Included in Item 7 above. |
| |
| Item 10. Remuneration Paid to Directors, Officers, and Others of Open-End Management Investment Companies. |
| |
| Included in Item 7 above. |
| |
| Item 11. Statement Regarding Basis for Approval of Investment Advisory Contract. |
| |
| Included in Item 7 above. |
| |
| Item 12. Disclosure of Proxy Voting Policies and Procedures For Closed-End Management Investment Companies: |
| |
| Item 13. Portfolio Managers of Closed-End Investment Companies |
| |
| Item 14. Purchases of Equity Securities by Closed-End Management Investment Companies and Affiliated Purchasers: |
| |
| Item 15. Submission of Matters to a Vote of Security Holders: |
| |
| Item 16. Controls and Procedures: |
| |
| (a) The registrant’s principal executive officer and principal financial officer have concluded, based on their evaluation of the effectiveness of the design and operation of the registrant’s disclosure controls and procedures as of a date within 90 days of the filing date of this report, that the design and operation of such procedures are generally effective to provide reasonable assurance that information required to be disclosed by the registrant in this report is recorded, processed, summarized and reported within the time periods specified in the Commission’s rules and forms. |
| |
| (b) Changes in internal control over financial reporting: Not applicable |
| |
| Item 17. Disclosures of Securities Lending Activities for Closed-End Investment Companies: |
| |
| Item 18. Recovery of Erroneously Awarded Compensation. |
| |
| Pursuant to the requirements of the Securities Exchange Act of 1934 and the Investment Company Act of 1940, the registrant has duly caused this report to be signed on its behalf by the undersigned, thereunto duly authorized. |
| |
| By (Signature and Title): |
| |
| Jeffrey White
Principal Accounting Officer |
| |
| Pursuant to the requirements of the Securities Exchange Act of 1934 and the Investment Company Act of 1940, this report has been signed below by the following persons on behalf of the registrant and in the capacities and on the dates indicated. |
| |
| By (Signature and Title): |
| |
| Jonathan S. Horwitz
Principal Executive Officer |
| |
| By (Signature and Title): |
| |
| Jeffrey White
Principal Financial Officer |