UNITED STATES
SECURITIES AND EXCHANGE COMMISSION
WASHINGTON, D. C. 20549
FORM N-CSRS
Investment Company Act file number: 811-07507
Deutsche Investments VIT Funds
(Exact Name of Registrant as Specified in Charter)
345 Park Avenue
New York, NY 10154-0004
(Address of Principal Executive Offices) (Zip Code)
Registrant’s Telephone Number, including Area Code: (212) 250-3220
Paul Schubert
60 Wall Street
New York, NY 10005
(Name and Address of Agent for Service)
| Date of fiscal year end: | 12/31 |
| Date of reporting period: | 6/30/2014 |
| ITEM 1. | REPORT TO STOCKHOLDERS |

June 30, 2014
Semiannual Report
Deutsche Investments VIT Funds
(formerly DWS Investments VIT Funds)
Deutsche Small Cap Index VIP
(formerly DWS Small Cap Index VIP)
Contents
3 Letter to Shareholders 4 Performance Summary 4 Portfolio Summary 5 Portfolio Manager 6 Investment Portfolio 26 Statement of Assets and Liabilities 26 Statement of Operations 27 Statement of Changes in Net Assets 28 Financial Highlights 30 Notes to Financial Statements 35 Information About Your Fund's Expenses 35 Proxy Voting 37 Advisory Agreement Board Considerations and Fee Evaluation |
This report must be preceded or accompanied by a prospectus. To obtain an additional prospectus or summary prospectus, if available, call (800) 728-3337 or your financial representative. We advise you to consider the Fund's objectives, risks, charges and expenses carefully before investing. The summary prospectus and prospectus contain this and other important information about the Fund. Please read the prospectus carefully before you invest.
Investing in derivatives entails special risks relating to liquidity, leverage and credit that may reduce returns and/or increase volatility. Various factors, including costs, cash flows and security selection, may cause the Fund's performance to differ from that of the index. The Fund may lend securities to approved institutions. Smaller company stocks tend to be more volatile than medium-sized or large company stocks. Stocks may decline in value. See the prospectus for details.
Deutsche Asset & Wealth Management represents the asset management and wealth management activities conducted by Deutsche Bank AG or any of its subsidiaries, including the Advisor and DeAWM Distributors, Inc.
NOT FDIC/NCUA INSURED NO BANK GUARANTEE MAY LOSE VALUE NOT A DEPOSIT
NOT INSURED BY ANY FEDERAL GOVERNMENT AGENCY
Dear Shareholder:
I am very pleased to tell you that the DWS funds have been renamed Deutsche funds, aligning more closely with the Deutsche Asset & Wealth Management brand. We are proud to adopt the Deutsche name — a brand that fully represents the global access, discipline and intelligence that support all of our products and services.
Deutsche Asset & Wealth Management combines the asset management and wealth management divisions of Deutsche Bank to deliver a comprehensive suite of active, passive and alternative investment capabilities. Your investment in the Deutsche funds means you have access to the thought leadership and resources of one of the world’s largest and most influential financial institutions.
In conjunction with your fund’s name change, please note that the Deutsche funds’ Web address has changed as well. The former dws-investments.com is now deutschefunds.com.
In addition, key service providers have been renamed as follows:
| Former Name | New name, effective August 11, 2014 |
| DWS Investments Distributors, Inc. | DeAWM Distributors, Inc. |
| DWS Trust Company | DeAWM Trust Company |
| DWS Investments Service Company | DeAWM Service Company |
These changes have no effect on the day-to-day management of your investment, and there is no action required on your part. You will continue to experience the benefits that come from our decades of experience, in-depth research and worldwide network of investment professionals.
Thanks for your continued support. We appreciate your trust and the opportunity to put our capabilities to work for you.
Best regards,


Brian Binder
President, Deutsche Funds
Fund performance shown is historical, assumes reinvestment of all dividend and capital gain distributions, and does not guarantee future results. Investment return and principal value fluctuate with changing market conditions so that, when redeemed, shares may be worth more or less than their original cost. Current performance may be lower or higher than the performance data quoted. Please contact your participating insurance company for the Fund's most recent month-end performance. Performance figures for Classes A and B differ because each class maintains a distinct expense structure. Performance doesn't reflect charges and fees ("contract charges") associated with the separate account that invests in the Fund or any variable life insurance policy or variable annuity contract for which the Fund is an investment option. These charges and fees will reduce returns.
The gross expense ratios of the Fund, as stated in the fee table of the prospectus dated May 1, 2014 are 0.55% and 0.80% for Class A and Class B shares, respectively, and may differ from the expense ratios disclosed in the Financial Highlights tables in this report.
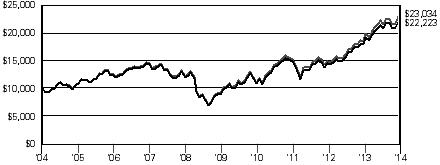
| Growth of an Assumed $10,000 Investment | ||
 | The Russell 2000® Index is an unmanaged, capitalization-weighted measure of approximately 2,000 of the smallest companies in the Russell 3000® Index. Index returns do not reflect any fees or expenses and it is not possible to invest directly into an index. | |
 | ||
| Yearly periods ended June 30 | ||
| Comparative Results (as of June 30, 2014) | |||||||||||||||||||||
| Deutsche Small Cap Index VIP | 6-Month‡ | 1-Year | 3-Year | 5-Year | 10-Year | ||||||||||||||||
| Class A | Growth of $10,000 | $ | 10,311 | $ | 12,341 | $ | 14,976 | $ | 24,844 | $ | 22,223 | ||||||||||
| Average annual total return | 3.11 | % | 23.41 | % | 14.41 | % | 19.96 | % | 8.31 | % | |||||||||||
| Russell 2000 Index | Growth of $10,000 | $ | 10,319 | $ | 12,364 | $ | 15,038 | $ | 25,103 | $ | 23,034 | ||||||||||
| Average annual total return | 3.19 | % | 23.64 | % | 14.57 | % | 20.21 | % | 8.70 | % | |||||||||||
| Deutsche Small Cap Index VIP | 6-Month‡ | 1-Year | 3-Year | 5-Year | 10-Year | ||||||||||||||||
| Class B | Growth of $10,000 | $ | 10,297 | $ | 12,309 | $ | 14,861 | $ | 24,519 | $ | 21,676 | ||||||||||
| Average annual total return | 2.97 | % | 23.09 | % | 14.12 | % | 19.65 | % | 8.04 | % | |||||||||||
| Russell 2000 Index | Growth of $10,000 | $ | 10,319 | $ | 12,364 | $ | 15,038 | $ | 25,103 | $ | 23,034 | ||||||||||
| Average annual total return | 3.19 | % | 23.64 | % | 14.57 | % | 20.21 | % | 8.70 | % | |||||||||||
The growth of $10,000 is cumulative.
‡ Total returns shown for periods less than one year are not annualized.
Asset Allocation (As a % of Investment Portfolio excluding Securities Lending Collateral) | 6/30/14 | 12/31/13 |
| Common Stocks | 98% | 98% |
| Cash Equivalents | 2% | 2% |
| Government & Agency Obligations | 0% | 0% |
| 100% | 100% |
Sector Diversification (As a % of Common Stocks and Warrants) | 6/30/14 | 12/31/13 |
| Financials | 24% | 23% |
| Information Technology | 18% | 18% |
| Industrials | 14% | 14% |
| Health Care | 13% | 13% |
| Consumer Discretionary | 13% | 14% |
| Energy | 6% | 5% |
| Materials | 5% | 5% |
| Utilities | 3% | 3% |
| Consumer Staples | 3% | 4% |
| Telecommunication Services | 1% | 1% |
| 100% | 100% |
Ten Largest Equity Holdings (2.3% of Net Assets) | |
1. InterMune, Inc. Developer of products for the treatment of pulmonary and infectious diseases | 0.3% |
2. Prosperity Bancshares, Inc. Holding company for Prosperity Bank | 0.3% |
3. Aspen Technology, Inc. Provider of prepackaged software | 0.3% |
4. WEX, Inc. Provides payment processing and information management services | 0.2% |
5. Isis Pharmaceuticals, Inc. Developer of novel human therapeutic compounds | 0.2% |
6. Tenneco, Inc. Manufacturer of automotive products and packaging design | 0.2% |
7. PolyOne Corp. Polymer services company | 0.2% |
8. Investors Bancorp., Inc. Attracts deposits from the general public, originates loans and invests in securities | 0.2% |
9. Ultimate Software Group, Inc. Designs, markets and supports Web-based and client/servers | 0.2% |
10. Brunswick Corp. Manufacturer of pleasure and recreational boats and marine engines | 0.2% |
Portfolio holdings and characteristics are subject to change. For more complete details about the Fund's investment portfolio, see page 6. | |
Following the Fund's fiscal first and third quarter-end, a complete portfolio holdings listing is filed with the SEC on Form N-Q. The form will be available on the SEC's Web site at sec.gov, and it also may be reviewed and copied at the SEC's Public Reference Room in Washington, D.C. Information on the operation of the SEC's Public Reference Room may be obtained by calling (800) SEC-0330. The Fund's portfolio holdings are also posted on deutschefunds.com from time to time. Please see the Fund's current prospectus for more information.
Brent Reeder
Senior Vice President, Northern Trust Investments, Inc., Subadvisor to the Fund
Portfolio Manager
| Shares | Value ($) | |||||||
| Common Stocks 97.4% | ||||||||
| Consumer Discretionary 12.8% | ||||||||
| Auto Components 1.2% | ||||||||
| American Axle & Manufacturing Holdings, Inc.* | 13,178 | 248,932 | ||||||
| Cooper Tire & Rubber Co. | 12,350 | 370,500 | ||||||
| Cooper-Standard Holding, Inc.* | 2,662 | 176,118 | ||||||
| Dana Holding Corp. | 30,498 | 744,761 | ||||||
| Dorman Products, Inc.* (a) | 5,259 | 259,374 | ||||||
| Drew Industries, Inc. | 4,598 | 229,946 | ||||||
| Federal-Mogul Holdings Corp.* | 5,608 | 113,450 | ||||||
| Fox Factory Holding Corp.* | 2,174 | 38,241 | ||||||
| Fuel Systems Solutions, Inc.* | 2,684 | 29,900 | ||||||
| Gentherm, Inc.* | 6,862 | 305,016 | ||||||
| Modine Manufacturing Co.* | 9,274 | 145,973 | ||||||
| Motorcar Parts of America, Inc.* | 2,937 | 71,516 | ||||||
| Remy International, Inc. | 2,784 | 65,006 | ||||||
| Shiloh Industries, Inc.* | 1,615 | 29,813 | ||||||
| Spartan Motors, Inc. | 6,654 | 30,209 | ||||||
| Standard Motor Products, Inc. | 3,853 | 172,114 | ||||||
| Stoneridge, Inc.* | 5,413 | 58,027 | ||||||
| Strattec Security Corp. | 675 | 43,531 | ||||||
| Superior Industries International, Inc. | 4,604 | 94,934 | ||||||
| Tenneco, Inc.* | 11,846 | 778,282 | ||||||
| Tower International, Inc.* | 4,009 | 147,692 | ||||||
| 4,153,335 | ||||||||
| Automobiles 0.0% | ||||||||
| Winnebago Industries, Inc.* | 5,300 | 133,454 | ||||||
| Distributors 0.2% | ||||||||
| Core-Mark Holding Co., Inc. | 4,532 | 206,795 | ||||||
| Pool Corp. | 8,776 | 496,370 | ||||||
| VOXX International Corp.* | 3,865 | 36,370 | ||||||
| Weyco Group, Inc. | 1,254 | 34,372 | ||||||
| 773,907 | ||||||||
| Diversified Consumer Services 1.0% | ||||||||
| 2U, Inc.* | 1,996 | 33,553 | ||||||
| American Public Education, Inc.* | 3,401 | 116,926 | ||||||
| Ascent Capital Group, Inc. "A"* | 2,701 | 178,293 | ||||||
| Bridgepoint Education, Inc.* | 3,215 | 42,695 | ||||||
| Bright Horizons Family Solutions, Inc.* | 5,969 | 256,309 | ||||||
| Capella Education Co. (a) | 2,127 | 115,688 | ||||||
| Career Education Corp.* | 13,083 | 61,228 | ||||||
| Carriage Services, Inc. | 3,165 | 54,216 | ||||||
| Chegg, Inc.* | 14,329 | 100,876 | ||||||
| Collectors Universe, Inc. | 1,342 | 26,290 | ||||||
| Education Management Corp.* | 4,785 | 8,087 | ||||||
| Grand Canyon Education, Inc.* | 9,088 | 417,775 | ||||||
| Houghton Mifflin Harcourt Co.* | 21,204 | 406,269 | ||||||
| ITT Educational Services, Inc.* (a) | 4,548 | 75,906 | ||||||
| JTH Holding, Inc. "A"* | 740 | 24,649 | ||||||
| K12, Inc.* | 6,689 | 161,004 | ||||||
| LifeLock, Inc.* | 15,658 | 218,586 | ||||||
| Matthews International Corp. "A" | 5,322 | 221,236 | ||||||
| Regis Corp. | 8,494 | 119,596 | ||||||
| Sotheby's (a) | 11,855 | 497,791 | ||||||
| Steiner Leisure Ltd.* | 2,841 | 122,987 | ||||||
| Strayer Education, Inc.* (a) | 2,092 | 109,851 | ||||||
| Universal Technical Institute, Inc. | 4,159 | 50,490 | ||||||
| Shares | Value ($) | |||||||
| Weight Watchers International, Inc. | 5,389 | 108,696 | ||||||
| 3,528,997 | ||||||||
| Hotels, Restaurants & Leisure 2.8% | ||||||||
| Belmond Ltd. "A"* | 18,783 | 273,105 | ||||||
| Biglari Holdings, Inc.* | 280 | 118,432 | ||||||
| BJ's Restaurants, Inc.* (a) | 4,607 | 160,830 | ||||||
| Bloomin' Brands, Inc.* | 15,014 | 336,764 | ||||||
| Bob Evans Farms, Inc. (a) | 4,802 | 240,340 | ||||||
| Boyd Gaming Corp.* (a) | 15,086 | 182,993 | ||||||
| Bravo Brio Restaurant Group, Inc.* | 3,724 | 58,132 | ||||||
| Buffalo Wild Wings, Inc.* | 3,676 | 609,150 | ||||||
| Caesars Acquisition Co. "A"* | 8,889 | 109,957 | ||||||
| Caesars Entertainment Corp.* (a) | 9,975 | 180,348 | ||||||
| Carrols Restaurant Group, Inc.* | 6,850 | 48,772 | ||||||
| Churchill Downs, Inc. | 2,607 | 234,917 | ||||||
| Chuy's Holdings, Inc.* | 3,230 | 117,249 | ||||||
| ClubCorp Holdings, Inc. | 4,259 | 78,962 | ||||||
| Cracker Barrel Old Country Store, Inc. (a) | 3,710 | 369,405 | ||||||
| Del Frisco's Restaurant Group, Inc.* | 4,595 | 126,638 | ||||||
| Denny's Corp.* | 17,175 | 111,981 | ||||||
| Diamond Resorts International, Inc.* | 6,879 | 160,074 | ||||||
| DineEquity, Inc. | 3,231 | 256,832 | ||||||
| Einstein Noah Restaurant Group, Inc. | 2,159 | 34,674 | ||||||
| Empire Resorts, Inc.* | 2,935 | 21,015 | ||||||
| Famous Dave's of America, Inc.* | 910 | 26,117 | ||||||
| Fiesta Restaurant Group, Inc.* | 5,210 | 241,796 | ||||||
| Ignite Restaurant Group, Inc.* | 1,441 | 20,981 | ||||||
| International Speedway Corp. "A" | 5,406 | 179,912 | ||||||
| Interval Leisure Group, Inc. | 7,734 | 169,684 | ||||||
| Intrawest Resorts Holdings, Inc.* | 2,613 | 29,945 | ||||||
| Isle of Capri Casinos, Inc.* | 4,217 | 36,098 | ||||||
| Jack in the Box, Inc. | 7,787 | 465,974 | ||||||
| Jamba, Inc.* | 3,239 | 39,192 | ||||||
| Krispy Kreme Doughnuts, Inc.* | 12,673 | 202,515 | ||||||
| La Quinta Holdings, Inc.* | 8,610 | 164,795 | ||||||
| Life Time Fitness, Inc.* (a) | 7,951 | 387,532 | ||||||
| Marcus Corp. | 3,482 | 63,547 | ||||||
| Marriott Vacations Worldwide Corp.* | 5,508 | 322,934 | ||||||
| Monarch Casino & Resort, Inc.* | 1,848 | 27,979 | ||||||
| Morgans Hotel Group Co.* | 5,693 | 45,145 | ||||||
| Multimedia Games Holding Co., Inc.* | 5,760 | 170,726 | ||||||
| Nathan's Famous, Inc.* | 635 | 34,411 | ||||||
| Noodles & Co.* (a) | 2,106 | 72,425 | ||||||
| Papa John's International, Inc. | 5,954 | 252,390 | ||||||
| Papa Murphy's Holdings, Inc.* | 1,137 | 10,892 | ||||||
| Penn National Gaming, Inc.* | 15,289 | 185,608 | ||||||
| Pinnacle Entertainment, Inc.* | 11,623 | 292,667 | ||||||
| Popeyes Louisiana Kitchen, Inc.* | 4,600 | 201,066 | ||||||
| Potbelly Corp.* | 2,907 | 46,396 | ||||||
| Red Robin Gourmet Burgers, Inc.* | 2,791 | 198,719 | ||||||
| Ruby Tuesday, Inc.* | 12,107 | 91,892 | ||||||
| Ruth's Hospitality Group, Inc. | 7,128 | 88,031 | ||||||
| Scientific Games Corp. "A"* | 9,861 | 109,654 | ||||||
| Sonic Corp.* | 10,571 | 233,408 | ||||||
| Speedway Motorsports, Inc. | 2,192 | 40,004 | ||||||
| Texas Roadhouse, Inc. | 13,556 | 352,456 | ||||||
| Shares | Value ($) | |||||||
| The Cheesecake Factory, Inc. | 9,712 | 450,831 | ||||||
| Vail Resorts, Inc. | 7,030 | 542,575 | ||||||
| Zoe's Kitchen, Inc.* | 1,135 | 39,021 | ||||||
| 9,667,888 | ||||||||
| Household Durables 1.0% | ||||||||
| Beazer Homes U.S.A., Inc.* | 5,266 | 110,481 | ||||||
| Cavco Industries, Inc.* | 1,718 | 146,545 | ||||||
| CSS Industries, Inc. | 1,805 | 47,598 | ||||||
| Dixie Group, Inc.* | 2,912 | 30,838 | ||||||
| Ethan Allen Interiors, Inc. | 4,890 | 120,979 | ||||||
| Flexsteel Industries, Inc. | 984 | 32,816 | ||||||
| Helen of Troy Ltd.* | 5,561 | 337,163 | ||||||
| Hovnanian Enterprises, Inc. "A"* (a) | 22,728 | 117,049 | ||||||
| Installed Building Products, Inc.* | 1,644 | 20,139 | ||||||
| iRobot Corp.* (a) | 5,735 | 234,848 | ||||||
| KB HOME (a) | 16,288 | 304,260 | ||||||
| La-Z-Boy, Inc. | 10,181 | 235,894 | ||||||
| LGI Homes, Inc.* | 2,778 | 50,698 | ||||||
| Libbey, Inc.* | 4,120 | 109,757 | ||||||
| Lifetime Brands, Inc. | 2,058 | 32,352 | ||||||
| M.D.C. Holdings, Inc. (a) | 7,588 | 229,841 | ||||||
| M/I Homes, Inc.* | 4,808 | 116,690 | ||||||
| Meritage Homes Corp.* | 7,606 | 321,049 | ||||||
| NACCO Industries, Inc. "A" | 964 | 48,778 | ||||||
| New Home Co., Inc.* | 1,620 | 22,891 | ||||||
| Ryland Group, Inc. (a) | 9,121 | 359,732 | ||||||
| Skullcandy, Inc.* | 3,924 | 28,449 | ||||||
| Standard Pacific Corp.* | 28,121 | 241,841 | ||||||
| TRI Pointe Homes, Inc.* (a) | 3,278 | 51,530 | ||||||
| Turtle Beach Corp.* | 1,365 | 12,613 | ||||||
| UCP, Inc. "A"* | 1,450 | 19,821 | ||||||
| Universal Electronics, Inc.* | 3,095 | 151,284 | ||||||
| WCI Communities, Inc.* | 2,274 | 43,911 | ||||||
| William Lyon Homes "A"* | 3,411 | 103,831 | ||||||
| 3,683,678 | ||||||||
| Internet & Catalog Retail 0.5% | ||||||||
| 1-800 FLOWERS.COM, Inc. "A"* | 4,730 | 27,434 | ||||||
| Blue Nile, Inc.* | 2,311 | 64,708 | ||||||
| Coupons.com, Inc.* | 2,348 | 61,776 | ||||||
| FTD Companies, Inc.* (a) | 3,699 | 117,591 | ||||||
| Gaiam, Inc. "A"* | 2,920 | 22,425 | ||||||
| HSN, Inc. | 6,459 | 382,631 | ||||||
| Lands' End, Inc.* | 3,207 | 107,691 | ||||||
| NutriSystem, Inc. (a) | 5,534 | 94,687 | ||||||
| Orbitz Worldwide, Inc.* | 10,044 | 89,391 | ||||||
| Overstock.com, Inc.* | 2,227 | 35,120 | ||||||
| PetMed Express, Inc. (a) | 4,039 | 54,446 | ||||||
| RetailMeNot, Inc.* (a) | 5,993 | 159,474 | ||||||
| Shutterfly, Inc.* (a) | 7,497 | 322,821 | ||||||
| Valuevision Media, Inc. "A"* | 8,424 | 42,036 | ||||||
| Vitacost.com, Inc.* | 4,246 | 26,580 | ||||||
| 1,608,811 | ||||||||
| Leisure Products 0.5% | ||||||||
| Arctic Cat, Inc. | 2,507 | 98,826 | ||||||
| Black Diamond, Inc.* | 4,355 | 48,863 | ||||||
| Brunswick Corp. | 18,029 | 759,562 | ||||||
| Callaway Golf Co. (a) | 15,234 | 126,747 | ||||||
| Escalade, Inc. | 1,919 | 30,972 | ||||||
| JAKKS Pacific, Inc. (a) | 3,799 | 29,404 | ||||||
| Johnson Outdoors, Inc. "A" | 976 | 25,181 | ||||||
| LeapFrog Enterprises, Inc.* | 12,677 | 93,176 | ||||||
| Shares | Value ($) | |||||||
| Malibu Boats, Inc. "A"* | 1,386 | 27,858 | ||||||
| Marine Products Corp. | 2,196 | 18,227 | ||||||
| Nautilus, Inc.* | 6,176 | 68,492 | ||||||
| Smith & Wesson Holding Corp.* (a) | 10,685 | 155,360 | ||||||
| Sturm, Ruger & Co., Inc. (a) | 3,772 | 222,586 | ||||||
| 1,705,254 | ||||||||
| Media 1.4% | ||||||||
| AH Belo Corp. "A" | 3,740 | 44,319 | ||||||
| AMC Entertainment Holdings, Inc. "A" | 4,053 | 100,798 | ||||||
| Carmike Cinemas, Inc.* | 4,476 | 157,242 | ||||||
| Central European Media Enterprises Ltd. "A"* (a) | 13,726 | 38,707 | ||||||
| Crown Media Holdings, Inc. "A"* | 6,391 | 23,199 | ||||||
| Cumulus Media, Inc. "A"* | 26,372 | 173,792 | ||||||
| Daily Journal Corp.* | 210 | 43,405 | ||||||
| Dex Media, Inc.* | 2,893 | 32,228 | ||||||
| Entercom Communications Corp. "A"* | 4,722 | 50,667 | ||||||
| Entravision Communications Corp. "A" | 11,433 | 71,113 | ||||||
| Eros International PLC* | 3,809 | 57,783 | ||||||
| Global Sources Ltd.* (a) | 3,457 | 28,624 | ||||||
| Gray Television, Inc.* | 9,640 | 126,573 | ||||||
| Harte-Hanks, Inc. | 9,575 | 68,844 | ||||||
| Hemisphere Media Group, Inc.* | 1,706 | 21,427 | ||||||
| Journal Communications, Inc. "A"* | 8,733 | 77,462 | ||||||
| Lee Enterprises, Inc.* | 10,429 | 46,409 | ||||||
| Loral Space & Communications, Inc.* | 2,548 | 185,214 | ||||||
| Martha Stewart Living Omnimedia, Inc. "A"* | 5,816 | 27,335 | ||||||
| McClatchy Co. "A"* | 11,944 | 66,289 | ||||||
| MDC Partners, Inc. "A" | 8,261 | 177,529 | ||||||
| Media General, Inc.* (a) | 10,580 | 217,207 | ||||||
| Meredith Corp. | 6,986 | 337,843 | ||||||
| National CineMedia, Inc. | 11,912 | 208,579 | ||||||
| New Media Investment Group, Inc.* | 5,838 | 82,374 | ||||||
| New York Times Co. "A" (a) | 26,912 | 409,332 | ||||||
| Nexstar Broadcasting Group, Inc. "A" (a) | 5,957 | 307,441 | ||||||
| Radio One, Inc. "D"* | 4,497 | 22,170 | ||||||
| ReachLocal, Inc.* | 2,573 | 18,088 | ||||||
| Reading International, Inc. "A"* | 3,264 | 27,842 | ||||||
| Rentrak Corp.* | 1,932 | 101,333 | ||||||
| Saga Communications, Inc. "A" | 704 | 30,075 | ||||||
| Salem Communications Corp. "A" | 2,207 | 20,878 | ||||||
| Scholastic Corp. (a) | 5,144 | 175,359 | ||||||
| SFX Entertainment, Inc.* (a) | 8,596 | 69,628 | ||||||
| Sinclair Broadcast Group, Inc. "A" (a) | 13,359 | 464,225 | ||||||
| Sizmek, Inc.* | 4,285 | 40,836 | ||||||
| The E.W. Scripps Co. "A"* | 6,147 | 130,071 | ||||||
| Time, Inc.* | 21,446 | 519,422 | ||||||
| World Wrestling Entertainment, Inc. "A" (a) | 5,737 | 68,443 | ||||||
| 4,870,105 | ||||||||
| Multiline Retail 0.1% | ||||||||
| Burlington Stores, Inc.* | 5,575 | 177,619 | ||||||
| Fred's, Inc. "A" | 7,168 | 109,599 | ||||||
| The Bon-Ton Stores, Inc. (a) | 2,928 | 30,188 | ||||||
| Tuesday Morning Corp.* (a) | 8,418 | 150,009 | ||||||
| 467,415 | ||||||||
| Shares | Value ($) | |||||||
| Specialty Retail 3.1% | ||||||||
| Aeropostale, Inc.* (a) | 15,624 | 54,528 | ||||||
| America's Car-Mart, Inc.* (a) | 1,488 | 58,850 | ||||||
| American Eagle Outfitters, Inc. | 37,825 | 424,397 | ||||||
| ANN, Inc.* | 9,110 | 374,785 | ||||||
| Asbury Automotive Group, Inc.* | 5,964 | 409,965 | ||||||
| Barnes & Noble, Inc.* (a) | 8,040 | 183,232 | ||||||
| bebe stores, inc. | 5,654 | 17,245 | ||||||
| Big 5 Sporting Goods Corp. | 3,590 | 44,049 | ||||||
| Brown Shoe Co., Inc. | 8,495 | 243,042 | ||||||
| Build-A-Bear Workshop, Inc.* | 2,399 | 32,051 | ||||||
| Cato Corp. "A" | 5,333 | 164,790 | ||||||
| Christopher & Banks Corp.* | 7,228 | 63,317 | ||||||
| Citi Trends, Inc.* | 3,032 | 65,067 | ||||||
| Conn's, Inc.* (a) | 5,388 | 266,113 | ||||||
| Destination Maternity Corp. | 2,727 | 62,094 | ||||||
| Destination XL Group, Inc.* | 6,816 | 37,556 | ||||||
| Express, Inc.* | 16,393 | 279,173 | ||||||
| Five Below, Inc.* (a) | 10,557 | 421,330 | ||||||
| Francesca's Holdings Corp.* | 8,214 | 121,074 | ||||||
| Genesco, Inc.* | 4,665 | 383,136 | ||||||
| Group 1 Automotive, Inc. (a) | 4,710 | 397,100 | ||||||
| Guess?, Inc. | 11,956 | 322,812 | ||||||
| Haverty Furniture Companies, Inc. | 3,899 | 97,982 | ||||||
| hhgregg, Inc.* | 2,255 | 22,933 | ||||||
| Hibbett Sports, Inc.* (a) | 5,038 | 272,908 | ||||||
| Kirkland's, Inc.* | 2,889 | 53,591 | ||||||
| Lithia Motors, Inc. "A" | 4,436 | 417,295 | ||||||
| Lumber Liquidators Holdings, Inc.* | 5,337 | 405,345 | ||||||
| MarineMax, Inc.* | 4,838 | 80,988 | ||||||
| Mattress Firm Holding Corp.* (a) | 2,916 | 139,239 | ||||||
| Monro Muffler Brake, Inc. (a) | 6,130 | 326,055 | ||||||
| New York & Co., Inc.* | 5,547 | 20,468 | ||||||
| Office Depot, Inc.* | 104,029 | 591,925 | ||||||
| Outerwall, Inc.* (a) | 3,966 | 235,382 | ||||||
| Pacific Sunwear of California, Inc.* | 9,186 | 21,863 | ||||||
| Pier 1 Imports, Inc. | 18,393 | 283,436 | ||||||
| Rent-A-Center, Inc. | 10,271 | 294,572 | ||||||
| Restoration Hardware Holdings, Inc.* | 6,065 | 564,348 | ||||||
| Sears Hometown & Outlet Stores, Inc.* | 2,258 | 48,479 | ||||||
| Select Comfort Corp.* | 10,558 | 218,128 | ||||||
| Shoe Carnival, Inc. | 2,907 | 60,030 | ||||||
| Sonic Automotive, Inc. "A" | 7,731 | 206,263 | ||||||
| Sportsman's Warehouse Holdings, Inc.* | 1,896 | 15,168 | ||||||
| Stage Stores, Inc. (a) | 6,167 | 115,261 | ||||||
| Stein Mart, Inc. | 5,458 | 75,812 | ||||||
| Systemax, Inc.* | 2,113 | 30,364 | ||||||
| The Buckle, Inc. (a) | 5,485 | 243,315 | ||||||
| The Children's Place, Inc. | 4,290 | 212,913 | ||||||
| The Container Store Group, Inc.* (a) | 3,348 | 93,007 | ||||||
| The Finish Line, Inc. "A" | 9,388 | 279,199 | ||||||
| The Men's Wearhouse, Inc. | 9,330 | 520,614 | ||||||
| The Pep Boys — Manny, Moe & Jack* | 10,452 | 119,780 | ||||||
| Tile Shop Holdings, Inc.* (a) | 5,457 | 83,438 | ||||||
| Tilly's, Inc. "A"* | 1,996 | 16,048 | ||||||
| Vitamin Shoppe, Inc.* | 5,958 | 256,313 | ||||||
| West Marine, Inc.* | 3,525 | 36,167 | ||||||
| Winmark Corp. | 458 | 31,891 | ||||||
| Shares | Value ($) | |||||||
| Zumiez, Inc.* | 4,036 | 111,353 | ||||||
| 11,027,579 | ||||||||
| Textiles, Apparel & Luxury Goods 1.0% | ||||||||
| Columbia Sportswear Co. | 2,671 | 220,758 | ||||||
| Crocs, Inc.* | 17,033 | 256,006 | ||||||
| Culp, Inc. | 1,776 | 30,920 | ||||||
| G-III Apparel Group Ltd.* | 3,477 | 283,932 | ||||||
| Iconix Brand Group, Inc.* (a) | 8,910 | 382,595 | ||||||
| Movado Group, Inc. | 3,580 | 149,179 | ||||||
| Oxford Industries, Inc. | 2,829 | 188,609 | ||||||
| Perry Ellis International, Inc.* | 2,380 | 41,507 | ||||||
| Quiksilver, Inc.* | 26,193 | 93,771 | ||||||
| R.G. Barry Corp. | 1,841 | 34,887 | ||||||
| Sequential Brands Group, Inc.* | 3,282 | 45,324 | ||||||
| Skechers U.S.A., Inc. "A"* | 7,606 | 347,594 | ||||||
| Steven Madden Ltd.* | 11,337 | 388,859 | ||||||
| Tumi Holdings, Inc.* | 9,851 | 198,301 | ||||||
| Unifi, Inc.* | 2,852 | 78,516 | ||||||
| Vera Bradley, Inc.* (a) | 4,219 | 92,270 | ||||||
| Vince Holding Corp.* | 2,174 | 79,612 | ||||||
| Wolverine World Wide, Inc. (a) | 19,732 | 514,216 | ||||||
| 3,426,856 | ||||||||
| Consumer Staples 3.1% | ||||||||
| Beverages 0.1% | ||||||||
| Boston Beer Co., Inc. "A"* (a) | 1,622 | 362,549 | ||||||
| Coca-Cola Bottling Co. Consolidated | 901 | 66,377 | ||||||
| Craft Brewers Alliance, Inc.* | 2,005 | 22,175 | ||||||
| National Beverage Corp.* | 2,179 | 41,227 | ||||||
| 492,328 | ||||||||
| Food & Staples Retailing 0.9% | ||||||||
| Casey's General Stores, Inc. | 7,488 | 526,331 | ||||||
| Fairway Group Holdings Corp.* (a) | 3,607 | 23,987 | ||||||
| Ingles Markets, Inc. "A" | 2,576 | 67,878 | ||||||
| Liberator Medical Holdings, Inc. | 6,126 | 22,972 | ||||||
| Natural Grocers by Vitamin Cottage, Inc.* | 1,765 | 37,789 | ||||||
| Pantry, Inc.* | 4,503 | 72,949 | ||||||
| PriceSmart, Inc. (a) | 3,642 | 317,000 | ||||||
| Roundy's, Inc. | 7,642 | 42,107 | ||||||
| SpartanNash Co. | 7,340 | 154,213 | ||||||
| SUPERVALU, Inc.* (a) | 39,448 | 324,263 | ||||||
| Susser Holdings Corp.* | 3,593 | 290,027 | ||||||
| The Andersons, Inc. | 5,486 | 282,968 | ||||||
| The Chefs' Warehouse, Inc.* | 3,498 | 69,155 | ||||||
| The Fresh Market, Inc.* | 8,330 | 278,805 | ||||||
| United Natural Foods, Inc.* | 9,656 | 628,606 | ||||||
| Village Super Market, Inc. "A" | 1,263 | 29,845 | ||||||
| Weis Markets, Inc. | 2,143 | 97,999 | ||||||
| 3,266,894 | ||||||||
| Food Products 1.5% | ||||||||
| Alico, Inc. | 546 | 20,469 | ||||||
| Annie's, Inc.* (a) | 3,308 | 111,876 | ||||||
| B&G Foods, Inc. | 10,427 | 340,859 | ||||||
| Boulder Brands, Inc.* | 11,812 | 167,494 | ||||||
| Cal-Maine Foods, Inc. | 3,018 | 224,298 | ||||||
| Calavo Growers, Inc. | 2,619 | 88,601 | ||||||
| Chiquita Brands International, Inc.* | 9,235 | 100,200 | ||||||
| Darling Ingredients, Inc.* | 32,019 | 669,197 | ||||||
| Dean Foods Co. | 18,188 | 319,927 | ||||||
| Diamond Foods, Inc.* (a) | 4,237 | 119,483 | ||||||
| Shares | Value ($) | |||||||
| Farmer Brothers Co.* | 1,454 | 31,421 | ||||||
| Fresh Del Monte Produce, Inc. | 7,026 | 215,347 | ||||||
| Inventure Foods, Inc.* | 3,095 | 34,881 | ||||||
| J & J Snack Foods Corp. | 2,898 | 272,760 | ||||||
| John B. Sanfilippo & Son, Inc. | 1,564 | 41,399 | ||||||
| Lancaster Colony Corp. | 3,599 | 342,481 | ||||||
| Lifeway Foods, Inc. | 911 | 12,736 | ||||||
| Limoneira Co. | 2,179 | 47,873 | ||||||
| Omega Protein Corp.* | 4,100 | 56,088 | ||||||
| Post Holdings, Inc.* | 8,551 | 435,331 | ||||||
| Sanderson Farms, Inc. (a) | 4,488 | 436,233 | ||||||
| Seaboard Corp.* | 55 | 166,115 | ||||||
| Seneca Foods Corp. "A"* | 1,603 | 49,052 | ||||||
| Snyder's-Lance, Inc. | 9,265 | 245,152 | ||||||
| Tootsie Roll Industries, Inc. (a) | 3,660 | 107,750 | ||||||
| TreeHouse Foods, Inc.* | 7,154 | 572,821 | ||||||
| 5,229,844 | ||||||||
| Household Products 0.2% | ||||||||
| Central Garden & Pet Co. "A"* | 8,550 | 78,660 | ||||||
| Harbinger Group, Inc.* | 16,174 | 205,409 | ||||||
| Oil-Dri Corp. of America | 986 | 30,142 | ||||||
| Orchids Paper Products Co. | 1,570 | 50,303 | ||||||
| WD-40 Co. | 2,913 | 219,116 | ||||||
| 583,630 | ||||||||
| Personal Products 0.2% | ||||||||
| Elizabeth Arden, Inc.* | 4,987 | 106,821 | ||||||
| Female Health Co. | 3,988 | 21,974 | ||||||
| IGI Laboratories, Inc.* | 5,594 | 29,704 | ||||||
| Inter Parfums, Inc. | 3,259 | 96,303 | ||||||
| Medifast, Inc.* | 2,558 | 77,789 | ||||||
| Nature's Sunshine Products, Inc. | 2,076 | 35,230 | ||||||
| Nutraceutical International Corp.* | 1,749 | 41,731 | ||||||
| Revlon, Inc. "A"* | 2,204 | 67,222 | ||||||
| Synutra International, Inc.* | 3,372 | 22,626 | ||||||
| USANA Health Sciences, Inc.* (a) | 1,254 | 97,988 | ||||||
| 597,388 | ||||||||
| Tobacco 0.2% | ||||||||
| 22nd Century Group, Inc.* | 8,002 | 24,566 | ||||||
| Alliance One International, Inc.* | 16,591 | 41,478 | ||||||
| Universal Corp. (a) | 4,520 | 250,182 | ||||||
| Vector Group Ltd. (a) | 12,802 | 264,745 | ||||||
| 580,971 | ||||||||
| Energy 6.2% | ||||||||
| Energy Equipment & Services 2.0% | ||||||||
| Basic Energy Services, Inc.* | 6,187 | 180,784 | ||||||
| Bristow Group, Inc. | 6,925 | 558,294 | ||||||
| C&J Energy Services, Inc.* (a) | 8,993 | 303,784 | ||||||
| CARBO Ceramics, Inc. (a) | 3,841 | 591,975 | ||||||
| CHC Group Ltd.* | 6,414 | 54,134 | ||||||
| Dawson Geophysical Co. | 1,561 | 44,723 | ||||||
| Era Group, Inc.* | 4,006 | 114,892 | ||||||
| Exterran Holdings, Inc. | 11,397 | 512,751 | ||||||
| Forum Energy Technologies, Inc.* | 11,597 | 422,479 | ||||||
| Geospace Technologies Corp.* (a) | 2,557 | 140,840 | ||||||
| Glori Energy, Inc.* | 2,376 | 25,803 | ||||||
| Gulf Island Fabrication, Inc. | 2,826 | 60,816 | ||||||
| GulfMark Offshore, Inc. "A" | 5,228 | 236,201 | ||||||
| Helix Energy Solutions Group, Inc.* | 20,540 | 540,407 | ||||||
| Hercules Offshore, Inc.* | 31,266 | 125,689 | ||||||
| Hornbeck Offshore Services, Inc.* | 7,035 | 330,082 | ||||||
| ION Geophysical Corp.* | 25,155 | 106,154 | ||||||
| Shares | Value ($) | |||||||
| Key Energy Services, Inc.* | 25,563 | 233,646 | ||||||
| Matrix Service Co.* | 5,125 | 168,049 | ||||||
| McDermott International, Inc.* | 46,220 | 373,920 | ||||||
| Mitcham Industries, Inc.* | 2,486 | 34,754 | ||||||
| Natural Gas Services Group* | 2,437 | 80,567 | ||||||
| Newpark Resources, Inc.* | 16,522 | 205,864 | ||||||
| North Atlantic Drilling Ltd. (a) | 13,885 | 147,459 | ||||||
| Nuverra Environmental Solutions, Inc.* (a) | 2,897 | 58,259 | ||||||
| Parker Drilling Co.* | 23,703 | 154,544 | ||||||
| PHI, Inc. (Non Voting)* | 2,430 | 108,305 | ||||||
| Pioneer Energy Services Corp.* | 12,121 | 212,602 | ||||||
| Profire Energy, Inc.* | 2,599 | 11,721 | ||||||
| RigNet, Inc.* | 2,349 | 126,423 | ||||||
| SEACOR Holdings, Inc.* | 4,008 | 329,658 | ||||||
| Tesco Corp. | 6,754 | 144,130 | ||||||
| TETRA Technologies, Inc.* | 15,366 | 181,011 | ||||||
| Vantage Drilling Co.* (a) | 39,316 | 75,487 | ||||||
| Willbros Group, Inc.* | 7,664 | 94,650 | ||||||
| 7,090,857 | ||||||||
| Oil, Gas & Consumable Fuels 4.2% | ||||||||
| Abraxas Petroleum Corp.* | 16,011 | 100,229 | ||||||
| Adams Resources & Energy, Inc. | 426 | 33,283 | ||||||
| Alon U.S.A. Energy, Inc. | 5,096 | 63,394 | ||||||
| Alpha Natural Resources, Inc.* (a) | 43,067 | 159,779 | ||||||
| American Eagle Energy Corp.* | 5,921 | 35,467 | ||||||
| Amyris, Inc.* (a) | 5,442 | 20,299 | ||||||
| Apco Oil & Gas International, Inc.* | 1,709 | 24,661 | ||||||
| Approach Resources, Inc.* (a) | 7,660 | 174,112 | ||||||
| Arch Coal, Inc. (a) | 41,302 | 150,752 | ||||||
| Ardmore Shipping Corp. | 3,514 | 48,599 | ||||||
| Bill Barrett Corp.* (a) | 9,669 | 258,936 | ||||||
| Bonanza Creek Energy, Inc.* | 6,381 | 364,929 | ||||||
| BPZ Resources, Inc.* | 23,079 | 71,083 | ||||||
| Callon Petroleum Co.* | 7,808 | 90,963 | ||||||
| Carrizo Oil & Gas, Inc.* | 8,849 | 612,882 | ||||||
| Clayton Williams Energy, Inc.* | 1,146 | 157,426 | ||||||
| Clean Energy Fuels Corp.* (a) | 13,682 | 160,353 | ||||||
| Cloud Peak Energy, Inc.* | 11,855 | 218,369 | ||||||
| Comstock Resources, Inc. | 9,307 | 268,414 | ||||||
| Contango Oil & Gas Co.* | 3,387 | 143,304 | ||||||
| Delek U.S. Holdings, Inc. | 11,547 | 325,972 | ||||||
| DHT Holdings, Inc. | 13,505 | 97,236 | ||||||
| Diamondback Energy, Inc.* | 7,407 | 657,742 | ||||||
| Dorian LPG Ltd.* | 1,423 | 32,715 | ||||||
| Emerald Oil, Inc.* (a) | 11,165 | 85,412 | ||||||
| Energy XXI (Bermuda) Ltd. (a) | 18,302 | 432,476 | ||||||
| Equal Energy Ltd. | 7,121 | 38,596 | ||||||
| Evolution Petroleum Corp. | 3,820 | 41,829 | ||||||
| EXCO Resources, Inc. (a) | 29,546 | 174,026 | ||||||
| Forest Oil Corp.* | 23,297 | 53,117 | ||||||
| Frontline Ltd.* (a) | 12,915 | 37,712 | ||||||
| FX Energy, Inc.* | 10,814 | 39,039 | ||||||
| GasLog Ltd. | 8,191 | 261,211 | ||||||
| Gastar Exploration, Inc.* | 10,835 | 94,373 | ||||||
| Goodrich Petroleum Corp.* (a) | 6,770 | 186,852 | ||||||
| Green Plains, Inc. | 7,277 | 239,195 | ||||||
| Halcon Resources Corp.* (a) | 50,729 | 369,814 | ||||||
| Hallador Energy Co. | 2,017 | 19,141 | ||||||
| Harvest Natural Resources, Inc.* | 8,189 | 40,863 | ||||||
| Isramco, Inc.* | 166 | 21,102 | ||||||
| Jones Energy, Inc. "A"* | 2,134 | 43,747 | ||||||
| Kodiak Oil & Gas Corp.* | 51,848 | 754,388 | ||||||
| Shares | Value ($) | |||||||
| Magnum Hunter Resources Corp.* (a) | 38,668 | 317,078 | ||||||
| Matador Resources Co.* | 14,261 | 417,562 | ||||||
| Midstates Petroleum Co., Inc.* (a) | 7,236 | 52,316 | ||||||
| Miller Energy Resources, Inc.* (a) | 5,715 | 36,576 | ||||||
| Navios Maritime Acquisition Corp. | 16,007 | 59,386 | ||||||
| Nordic American Tankers Ltd. (a) | 17,353 | 165,374 | ||||||
| Northern Oil & Gas, Inc.* (a) | 11,876 | 193,460 | ||||||
| Pacific Ethanol, Inc.* | 3,944 | 60,304 | ||||||
| Panhandle Oil & Gas, Inc. "A" | 1,360 | 76,201 | ||||||
| Parsley Energy, Inc. "A"* | 9,729 | 234,177 | ||||||
| PDC Energy, Inc.* | 6,964 | 439,777 | ||||||
| Penn Virginia Corp.* | 12,762 | 216,316 | ||||||
| PetroQuest Energy, Inc.* | 11,296 | 84,946 | ||||||
| Quicksilver Resources, Inc.* (a) | 24,365 | 65,055 | ||||||
| Renewable Energy Group, Inc.* | 6,720 | 77,078 | ||||||
| Resolute Energy Corp.* (a) | 15,163 | 131,008 | ||||||
| REX American Resources Corp.* | 1,221 | 89,512 | ||||||
| Rex Energy Corp.* | 9,356 | 165,695 | ||||||
| Ring Energy, Inc.* | 3,624 | 63,239 | ||||||
| Rosetta Resources, Inc.* | 11,952 | 655,567 | ||||||
| RSP Permian, Inc.* | 4,262 | 138,259 | ||||||
| Sanchez Energy Corp.* | 8,879 | 333,762 | ||||||
| Scorpio Tankers, Inc. | 38,855 | 395,155 | ||||||
| SemGroup Corp. "A" | 8,290 | 653,666 | ||||||
| Ship Finance International Ltd. (a) | 11,500 | 213,785 | ||||||
| Solazyme, Inc.* (a) | 14,783 | 174,144 | ||||||
| Stone Energy Corp.* | 10,926 | 511,228 | ||||||
| Swift Energy Co.* (a) | 8,470 | 109,941 | ||||||
| Synergy Resources Corp.* | 12,950 | 171,587 | ||||||
| Teekay Tankers Ltd. "A" (a) | 11,803 | 50,635 | ||||||
| TransAtlantic Petroleum Ltd.* | 4,402 | 50,139 | ||||||
| Triangle Petroleum Corp.* | 14,716 | 172,913 | ||||||
| VAALCO Energy, Inc.* | 9,697 | 70,109 | ||||||
| Vertex Energy, Inc.* | 2,295 | 22,284 | ||||||
| W&T Offshore, Inc. (a) | 6,839 | 111,954 | ||||||
| Warren Resources, Inc.* | 14,321 | 88,790 | ||||||
| Western Refining, Inc. | 10,350 | 388,642 | ||||||
| Westmoreland Coal Co.* | 2,594 | 94,110 | ||||||
| 14,555,522 | ||||||||
| Financials 22.3% | ||||||||
| Banks 7.2% | ||||||||
| 1st Source Corp. | 2,889 | 88,461 | ||||||
| 1st United Bancorp., Inc. | 5,887 | 50,746 | ||||||
| American National Bankshares, Inc. | 1,484 | 32,247 | ||||||
| Ameris Bancorp.* | 4,894 | 105,515 | ||||||
| Ames National Corp. | 1,604 | 37,117 | ||||||
| Arrow Financial Corp. | 2,026 | 52,554 | ||||||
| Banc of California, Inc. | 5,790 | 63,111 | ||||||
| BancFirst Corp. | 1,407 | 87,093 | ||||||
| Banco Latinoamericano de Comercio Exterior SA "E" | 5,805 | 172,234 | ||||||
| BancorpSouth, Inc. | 18,677 | 458,894 | ||||||
| Bank of Kentucky Financial Corp. | 1,241 | 43,174 | ||||||
| Bank of Marin Bancorp. | 1,118 | 50,970 | ||||||
| Bank of the Ozarks, Inc. | 15,496 | 518,341 | ||||||
| Banner Corp. | 3,773 | 149,524 | ||||||
| BBCN Bancorp., Inc. | 15,467 | 246,699 | ||||||
| BNC Bancorp. | 3,881 | 66,249 | ||||||
| Boston Private Financial Holdings, Inc. | 15,566 | 209,207 | ||||||
| Bridge Bancorp., Inc. | 2,266 | 54,361 | ||||||
| Bridge Capital Holdings* | 1,958 | 47,403 | ||||||
| Shares | Value ($) | |||||||
| Bryn Mawr Bank Corp. | 2,662 | 77,517 | ||||||
| Camden National Corp. | 1,444 | 55,969 | ||||||
| Capital Bank Financial Corp. "A"* | 4,762 | 112,431 | ||||||
| Capital City Bank Group, Inc. | 2,067 | 30,034 | ||||||
| Cardinal Financial Corp. | 6,222 | 114,858 | ||||||
| Cascade Bancorp.* | 6,326 | 32,958 | ||||||
| Cathay General Bancorp. | 15,490 | 395,924 | ||||||
| Centerstate Banks, Inc. | 6,914 | 77,437 | ||||||
| Central Pacific Financial Corp. | 3,329 | 66,081 | ||||||
| Century Bancorp., Inc. "A" | 692 | 24,455 | ||||||
| Chemical Financial Corp. | 5,811 | 163,173 | ||||||
| Citizens & Northern Corp. | 2,417 | 47,107 | ||||||
| City Holding Co. (a) | 3,054 | 137,797 | ||||||
| CNB Financial Corp. | 2,807 | 47,158 | ||||||
| CoBiz Financial, Inc. | 7,083 | 76,284 | ||||||
| Columbia Banking System, Inc. | 10,231 | 269,178 | ||||||
| Community Bank System, Inc. | 7,917 | 286,595 | ||||||
| Community Trust Bancorp., Inc. | 3,038 | 103,960 | ||||||
| CommunityOne Bancorp.* | 2,174 | 21,088 | ||||||
| ConnectOne Bancorp., Inc.* | 2,247 | 43,210 | ||||||
| ConnectOne Bancorp., Inc.* | 814 | 40,611 | ||||||
| CU Bancorp.* | 1,877 | 35,794 | ||||||
| Customers Bancorp., Inc.* | 4,971 | 99,470 | ||||||
| CVB Financial Corp. | 20,603 | 330,266 | ||||||
| Eagle Bancorp., Inc.* | 4,427 | 149,411 | ||||||
| Enterprise Bancorp., Inc. | 1,414 | 29,171 | ||||||
| Enterprise Financial Services Corp. | 3,837 | 69,296 | ||||||
| Fidelity Southern Corp. | 3,225 | 41,893 | ||||||
| Financial Institutions, Inc. | 2,751 | 64,428 | ||||||
| First BanCorp.* | 20,280 | 110,323 | ||||||
| First BanCorp. — North Carolina | 3,893 | 71,437 | ||||||
| First Bancorp., Inc. | 1,889 | 32,982 | ||||||
| First Busey Corp. | 14,096 | 81,898 | ||||||
| First Business Financial Services, Inc. | 766 | 36,025 | ||||||
| First Citizens BancShares, Inc. "A" | 1,472 | 360,640 | ||||||
| First Commonwealth Financial Corp. | 18,300 | 168,726 | ||||||
| First Community Bancshares, Inc. | 3,188 | 45,684 | ||||||
| First Connecticut Bancorp, Inc. | 3,142 | 50,429 | ||||||
| First Financial Bancorp. | 11,231 | 193,286 | ||||||
| First Financial Bankshares, Inc. (a) | 12,460 | 390,870 | ||||||
| First Financial Corp. — Indiana | 2,200 | 70,818 | ||||||
| First Interstate BancSystem, Inc. | 3,487 | 94,777 | ||||||
| First Merchants Corp. | 6,966 | 147,261 | ||||||
| First Midwest Bancorp., Inc. | 14,642 | 249,353 | ||||||
| First NBC Bank Holding Co.* | 2,904 | 97,313 | ||||||
| First of Long Island Corp. | 1,537 | 60,066 | ||||||
| FirstMerit Corp. | 32,168 | 635,318 | ||||||
| Flushing Financial Corp. | 5,888 | 120,998 | ||||||
| FNB Corp. | 32,373 | 415,022 | ||||||
| German American Bancorp., Inc. | 2,621 | 70,977 | ||||||
| Glacier Bancorp., Inc. | 14,530 | 412,361 | ||||||
| Great Southern Bancorp., Inc. | 2,027 | 64,965 | ||||||
| Guaranty Bancorp. | 2,848 | 39,587 | ||||||
| Hampton Roads Bankshares, Inc.* | 6,596 | 11,411 | ||||||
| Hancock Holding Co. | 16,004 | 565,261 | ||||||
| Hanmi Financial Corp. | 6,196 | 130,612 | ||||||
| Heartland Financial U.S.A., Inc. | 3,061 | 75,699 | ||||||
| Heritage Commerce Corp. | 4,110 | 33,579 | ||||||
| Heritage Financial Corp. | 5,789 | 93,145 | ||||||
| Heritage Oaks Bancorp.* | 4,274 | 32,611 | ||||||
| Home Bancshares, Inc. | 10,533 | 345,693 | ||||||
| HomeTrust Bancshares, Inc.* | 4,052 | 63,900 | ||||||
| Shares | Value ($) | |||||||
| Horizon Bancorp. | 1,792 | 39,137 | ||||||
| Hudson Valley Holding Corp. | 2,865 | 51,713 | ||||||
| IBERIABANK Corp. | 6,112 | 422,889 | ||||||
| Independent Bank Corp. | 4,455 | 57,336 | ||||||
| Independent Bank Corp. (a) | 4,646 | 178,314 | ||||||
| Independent Bank Group, Inc. | 1,778 | 98,981 | ||||||
| International Bancshares Corp. | 10,539 | 284,553 | ||||||
| Investors Bancorp., Inc. | 69,685 | 770,019 | ||||||
| Lakeland Bancorp., Inc. | 7,366 | 79,550 | ||||||
| Lakeland Financial Corp. | 3,253 | 124,135 | ||||||
| Macatawa Bank Corp. | 5,271 | 26,724 | ||||||
| MainSource Financial Group, Inc. | 3,972 | 68,517 | ||||||
| MB Financial, Inc. | 10,727 | 290,165 | ||||||
| Mercantile Bank Corp. | 3,275 | 74,932 | ||||||
| Merchants Bancshares, Inc. | 1,042 | 33,323 | ||||||
| Metro Bancorp., Inc.* | 2,807 | 64,898 | ||||||
| MidSouth Bancorp., Inc. | 1,695 | 33,714 | ||||||
| MidWestOne Financial Group, Inc. | 1,393 | 33,418 | ||||||
| National Bank Holdings Corp. "A" | 7,995 | 159,420 | ||||||
| National Bankshares, Inc. | 1,314 | 40,589 | ||||||
| National Penn Bancshares, Inc. | 22,829 | 241,531 | ||||||
| NBT Bancorp., Inc. | 8,496 | 204,074 | ||||||
| NewBridge Bancorp.* | 6,539 | 52,704 | ||||||
| Northrim BanCorp., Inc. | 1,327 | 33,931 | ||||||
| OFG Bancorp. (a) | 8,757 | 161,216 | ||||||
| Old Line Bancshares, Inc. | 1,627 | 25,642 | ||||||
| Old National Bancorp. | 20,568 | 293,711 | ||||||
| OmniAmerican Bancorp., Inc. | 2,226 | 55,650 | ||||||
| Opus Bank* | 996 | 28,944 | ||||||
| Pacific Continental Corp. | 3,501 | 48,069 | ||||||
| Pacific Premier Bancorp., Inc.* | 3,261 | 45,948 | ||||||
| Palmetto Bancshares, Inc.* | 879 | 12,649 | ||||||
| Park National Corp. (a) | 2,489 | 192,151 | ||||||
| Park Sterling Corp. | 8,760 | 57,728 | ||||||
| Peapack-Gladstone Financial Corp. | 2,417 | 51,265 | ||||||
| Penns Woods Bancorp., Inc. | 946 | 44,557 | ||||||
| Peoples Bancorp., Inc. | 2,155 | 57,000 | ||||||
| Peoples Financial Services Corp. | 1,468 | 75,441 | ||||||
| Pinnacle Financial Partners, Inc. | 6,902 | 272,491 | ||||||
| Preferred Bank* | 2,280 | 53,899 | ||||||
| PrivateBancorp., Inc. | 13,934 | 404,922 | ||||||
| Prosperity Bancshares, Inc. | 13,563 | 849,044 | ||||||
| Renasant Corp. | 6,120 | 177,908 | ||||||
| Republic Bancorp., Inc. "A" | 1,969 | 46,705 | ||||||
| Republic First Bancorp., Inc.* | 6,018 | 30,331 | ||||||
| S&T Bancorp., Inc. | 5,779 | 143,608 | ||||||
| Sandy Spring Bancorp., Inc. | 4,878 | 121,511 | ||||||
| Seacoast Banking Corp. of Florida* | 3,807 | 41,382 | ||||||
| ServisFirst Bancshares, Inc.* | 122 | 10,544 | ||||||
| Sierra Bancorp. | 2,278 | 35,992 | ||||||
| Simmons First National Corp. "A" | 3,173 | 124,985 | ||||||
| South State Corp. | 4,693 | 286,273 | ||||||
| Southside Bancshares, Inc. (a) | 3,629 | 105,096 | ||||||
| Southwest Bancorp., Inc. | 3,907 | 66,653 | ||||||
| Square 1 Financial, Inc. "A"* | 1,162 | 22,090 | ||||||
| State Bank Financial Corp. | 6,340 | 107,209 | ||||||
| Sterling Bancorp. | 16,250 | 195,000 | ||||||
| Stock Yards Bancorp., Inc. | 2,854 | 85,335 | ||||||
| Stonegate Bank | 1,936 | 48,787 | ||||||
| Suffolk Bancorp.* | 2,233 | 49,818 | ||||||
| Sun Bancorp., Inc.* | 8,548 | 34,278 | ||||||
| Susquehanna Bancshares, Inc. | 36,506 | 385,503 | ||||||
| Talmer Bancorp., Inc. "A"* | 3,481 | 48,003 | ||||||
| Shares | Value ($) | |||||||
| Taylor Capital Group, Inc.* | 3,411 | 72,927 | ||||||
| Texas Capital Bancshares, Inc.* | 8,377 | 451,939 | ||||||
| The Bancorp., Inc.* | 6,462 | 76,962 | ||||||
| Tompkins Financial Corp. | 2,869 | 138,228 | ||||||
| TowneBank | 5,738 | 90,144 | ||||||
| TriCo Bancshares | 3,113 | 72,035 | ||||||
| Tristate Capital Holdings, Inc.* | 4,293 | 60,660 | ||||||
| Trustmark Corp. | 13,118 | 323,883 | ||||||
| UMB Financial Corp. | 7,340 | 465,283 | ||||||
| Umpqua Holdings Corp. | 32,410 | 580,787 | ||||||
| Union Bankshares Corp. | 8,997 | 230,773 | ||||||
| United Bankshares, Inc. | 13,435 | 434,354 | ||||||
| United Community Banks, Inc. | 9,726 | 159,215 | ||||||
| Univest Corp. of Pennsylvania | 3,105 | 64,274 | ||||||
| Valley National Bancorp. | 39,008 | 386,569 | ||||||
| VantageSouth Bancshares, Inc.* | 4,113 | 24,472 | ||||||
| ViewPoint Financial Group | 7,771 | 209,118 | ||||||
| Washington Trust Bancorp., Inc. | 2,856 | 105,015 | ||||||
| Webster Financial Corp. | 17,570 | 554,158 | ||||||
| WesBanco, Inc. | 5,083 | 157,776 | ||||||
| West Bancorp. | 3,109 | 47,350 | ||||||
| Westamerica Bancorp. (a) | 5,117 | 267,517 | ||||||
| Western Alliance Bancorp.* | 14,618 | 347,908 | ||||||
| Wilshire Bancorp., Inc. | 13,675 | 140,442 | ||||||
| Wintrust Financial Corp. | 9,051 | 416,346 | ||||||
| Yadkin Financial Corp.* | 2,670 | 50,303 | ||||||
| 25,240,824 | ||||||||
| Capital Markets 1.5% | ||||||||
| Arlington Asset Investment Corp. "A" | 3,676 | 100,465 | ||||||
| BGC Partners, Inc. "A" | 33,920 | 252,365 | ||||||
| Calamos Asset Management, Inc. "A" | 3,223 | 43,156 | ||||||
| CIFC Corp. | 1,053 | 9,488 | ||||||
| Cohen & Steers, Inc. (a) | 3,787 | 164,280 | ||||||
| CorEnergy Infrastructure Trust, Inc. (REIT) | 6,166 | 45,690 | ||||||
| Cowen Group, Inc. "A"* | 22,464 | 94,798 | ||||||
| Diamond Hill Investment Group | 544 | 69,480 | ||||||
| Evercore Partners, Inc. "A" | 6,438 | 371,086 | ||||||
| FBR & Co.* | 1,825 | 49,512 | ||||||
| Financial Engines, Inc. (a) | 10,010 | 453,253 | ||||||
| FXCM, Inc. "A" (a) | 8,868 | 132,665 | ||||||
| GAMCO Investors, Inc. "A" | 1,249 | 103,729 | ||||||
| GFI Group, Inc. | 14,923 | 49,544 | ||||||
| Greenhill & Co., Inc. | 5,503 | 271,023 | ||||||
| HFF, Inc. "A" | 6,385 | 237,458 | ||||||
| ICG Group, Inc.* | 8,011 | 167,270 | ||||||
| INTL. FCStone, Inc.* | 3,011 | 59,979 | ||||||
| Investment Technology Group, Inc.* | 7,009 | 118,312 | ||||||
| Janus Capital Group, Inc. (a) | 29,099 | 363,155 | ||||||
| KCG Holdings, Inc. "A"* | 10,277 | 122,091 | ||||||
| Ladenburg Thalmann Financial Services, Inc.* | 19,442 | 61,242 | ||||||
| Manning & Napier, Inc. | 2,652 | 45,774 | ||||||
| Marcus & Millichap, Inc.* | 1,558 | 39,745 | ||||||
| Moelis & Co.* | 1,436 | 48,264 | ||||||
| Oppenheimer Holdings, Inc. "A" | 1,938 | 46,493 | ||||||
| Piper Jaffray Companies, Inc.* | 3,168 | 164,007 | ||||||
| Pzena Investment Management, Inc. "A" | 2,098 | 23,414 | ||||||
| RCS Capital Corp. "A" | 805 | 17,090 | ||||||
| Safeguard Scientifics, Inc.* | 3,991 | 82,973 | ||||||
| Shares | Value ($) | |||||||
| Silvercrest Asset Management Group, Inc. "A" | 1,029 | 17,709 | ||||||
| Stifel Financial Corp.* (a) | 12,762 | 604,281 | ||||||
| SWS Group, Inc.* | 5,696 | 41,467 | ||||||
| Virtus Investment Partners, Inc.* | 1,376 | 291,368 | ||||||
| Walter Investment Management Corp.* (a) | 7,325 | 218,138 | ||||||
| Westwood Holdings Group, Inc. | 1,427 | 85,677 | ||||||
| WisdomTree Investments, Inc.* (a) | 20,945 | 258,880 | ||||||
| 5,325,321 | ||||||||
| Consumer Finance 0.7% | ||||||||
| Cash America International, Inc. (a) | 5,473 | 243,165 | ||||||
| Consumer Portfolio Services, Inc.* | 4,093 | 31,189 | ||||||
| Credit Acceptance Corp.* | 1,371 | 168,770 | ||||||
| Encore Capital Group, Inc.* (a) | 4,981 | 226,237 | ||||||
| EZCORP, Inc. "A"* | 9,887 | 114,195 | ||||||
| First Cash Financial Services, Inc.* | 5,633 | 324,405 | ||||||
| Green Dot Corp. "A"* (a) | 6,058 | 114,981 | ||||||
| JGWPT Holdings, Inc. "A"* | 2,289 | 25,774 | ||||||
| Nelnet, Inc. "A" | 4,051 | 167,833 | ||||||
| Nicholas Financial, Inc. | 1,931 | 27,729 | ||||||
| Portfolio Recovery Associates, Inc.* (a) | 9,740 | 579,822 | ||||||
| Regional Management Corp.* | 2,079 | 32,162 | ||||||
| Springleaf Holdings, Inc.* | 4,816 | 124,975 | ||||||
| World Acceptance Corp.* (a) | 1,632 | 123,967 | ||||||
| 2,305,204 | ||||||||
| Diversified Financial Services 0.3% | ||||||||
| Gain Capital Holdings, Inc. | 4,506 | 35,462 | ||||||
| MarketAxess Holdings, Inc. | 7,341 | 396,854 | ||||||
| Marlin Business Services Corp. | 1,665 | 30,286 | ||||||
| NewStar Financial, Inc.* | 5,160 | 72,550 | ||||||
| PHH Corp.* (a) | 11,167 | 256,618 | ||||||
| PICO Holdings, Inc.* | 4,409 | 104,758 | ||||||
| Resource America, Inc. "A" | 2,632 | 24,609 | ||||||
| Tiptree Financial, Inc. "A", (REIT) | 1,524 | 13,259 | ||||||
| 934,396 | ||||||||
| Insurance 2.4% | ||||||||
| Ambac Financial Group, Inc.* | 8,757 | 239,154 | ||||||
| American Equity Investment Life Holding Co. (a) | 14,462 | 355,765 | ||||||
| AMERISAFE, Inc. | 3,635 | 147,835 | ||||||
| AmTrust Financial Services, Inc. (a) | 5,845 | 244,379 | ||||||
| Argo Group International Holdings Ltd. | 5,092 | 260,252 | ||||||
| Atlas Financial Holdings, Inc.* | 2,240 | 33,958 | ||||||
| Baldwin & Lyons, Inc. "B" | 1,830 | 47,470 | ||||||
| Citizens, Inc.* (a) | 8,561 | 63,351 | ||||||
| CNO Financial Group, Inc. | 42,390 | 754,542 | ||||||
| Crawford & Co. "B" | 5,510 | 55,541 | ||||||
| Donegal Group, Inc. "A" | 1,585 | 24,251 | ||||||
| eHealth, Inc.* | 3,664 | 139,122 | ||||||
| EMC Insurance Group, Inc. | 982 | 30,226 | ||||||
| Employers Holdings, Inc. | 6,076 | 128,690 | ||||||
| Enstar Group Ltd.* | 1,660 | 250,212 | ||||||
| FBL Financial Group, Inc. "A" | 1,882 | 86,572 | ||||||
| Federated National Holding Co. | 2,202 | 56,151 | ||||||
| Fidelity & Guaranty Life | 2,188 | 52,381 | ||||||
| First American Financial Corp. | 20,784 | 577,587 | ||||||
| Global Indemnity PLC* | 1,617 | 42,026 | ||||||
| Greenlight Capital Re Ltd. "A"* | 5,512 | 181,565 | ||||||
| Hallmark Financial Services, Inc.* | 2,633 | 28,305 | ||||||
| HCI Group, Inc. | 1,755 | 71,253 | ||||||
| Shares | Value ($) | |||||||
| Heritage Insurance Holdings, Inc.* | 1,342 | 20,412 | ||||||
| Hilltop Holdings, Inc.* | 13,185 | 280,313 | ||||||
| Horace Mann Educators Corp. | 7,926 | 247,846 | ||||||
| Independence Holding Co. | 1,493 | 21,096 | ||||||
| Infinity Property & Casualty Corp. | 2,241 | 150,662 | ||||||
| Kansas City Life Insurance Co. | 739 | 33,610 | ||||||
| Kemper Corp. | 9,042 | 333,288 | ||||||
| Maiden Holdings Ltd. | 9,661 | 116,801 | ||||||
| Meadowbrook Insurance Group, Inc. | 9,793 | 70,412 | ||||||
| Montpelier Re Holdings Ltd. | 7,623 | 243,555 | ||||||
| National General Holdings Corp. | 6,905 | 120,147 | ||||||
| National Interstate Corp. | 1,337 | 37,463 | ||||||
| National Western Life Insurance Co. "A" | 440 | 109,740 | ||||||
| Navigators Group, Inc.* | 2,018 | 135,307 | ||||||
| OneBeacon Insurance Group Ltd. "A" | 4,405 | 68,454 | ||||||
| Phoenix Companies, Inc.* | 1,140 | 55,165 | ||||||
| Platinum Underwriters Holdings Ltd. | 5,240 | 339,814 | ||||||
| Primerica, Inc. | 10,630 | 508,646 | ||||||
| RLI Corp. (a) | 8,372 | 383,270 | ||||||
| Safety Insurance Group, Inc. | 2,514 | 129,169 | ||||||
| Selective Insurance Group, Inc. | 10,943 | 270,511 | ||||||
| State Auto Financial Corp. | 2,920 | 68,416 | ||||||
| Stewart Information Services Corp. (a) | 4,182 | 129,684 | ||||||
| Symetra Financial Corp. | 14,664 | 333,459 | ||||||
| Third Point Reinsurance Ltd.* | 11,051 | 168,638 | ||||||
| United Fire Group, Inc. | 4,015 | 117,720 | ||||||
| United Insurance Holdings Corp. | 3,237 | 55,871 | ||||||
| Universal Insurance Holdings, Inc. | 6,064 | 78,650 | ||||||
| 8,498,707 | ||||||||
| Real Estate Investment Trusts 8.0% | ||||||||
| Acadia Realty Trust (REIT) | 11,162 | 313,541 | ||||||
| AG Mortgage Investment Trust, Inc. (REIT) | 5,534 | 104,759 | ||||||
| Agree Realty Corp. (REIT) | 2,932 | 88,634 | ||||||
| Alexander's, Inc. (REIT) | 409 | 151,113 | ||||||
| Altisource Residential Corp. (REIT) | 11,111 | 289,219 | ||||||
| American Assets Trust, Inc. (REIT) | 6,974 | 240,952 | ||||||
| American Capital Mortgage Investment Corp. (REIT) | 9,945 | 199,099 | ||||||
| American Realty Capital Healthcare Trust, Inc. (REIT) | 32,936 | 358,673 | ||||||
| American Residential Properties, Inc. (REIT)* | 6,259 | 117,356 | ||||||
| AmREIT, Inc. (REIT) | 3,855 | 70,547 | ||||||
| Anworth Mortgage Asset Corp. (REIT) | 25,152 | 129,784 | ||||||
| Apollo Commercial Real Estate Finance, Inc. (REIT) | 8,974 | 147,981 | ||||||
| Apollo Residential Mortgage, Inc. (REIT) | 6,203 | 103,714 | ||||||
| Ares Commercial Real Estate Corp. (REIT) | 5,563 | 69,037 | ||||||
| Armada Hoffler Properties, Inc. (REIT) | 3,782 | 36,610 | ||||||
| ARMOUR Residential REIT, Inc. (REIT) | 69,441 | 300,680 | ||||||
| Ashford Hospitality Prime, Inc. (REIT) | 4,941 | 84,788 | ||||||
| Ashford Hospitality Trust (REIT) | 13,630 | 157,290 | ||||||
| Associated Estates Realty Corp. (REIT) | 11,200 | 201,824 | ||||||
| Shares | Value ($) | |||||||
| Aviv REIT, Inc. (REIT) | 3,826 | 107,778 | ||||||
| Campus Crest Communities, Inc. (REIT) (a) | 12,460 | 107,904 | ||||||
| Capstead Mortgage Corp. (REIT) (a) | 18,608 | 244,695 | ||||||
| CareTrust REIT, Inc. (REIT)* | 3,857 | 76,369 | ||||||
| CatchMark Timber Trust, Inc. "A", (REIT) | 2,437 | 33,314 | ||||||
| Cedar Realty Trust, Inc. (REIT) | 15,419 | 96,369 | ||||||
| Chambers Street Properties (REIT) (a) | 46,114 | 370,757 | ||||||
| Chatham Lodging Trust (REIT) | 5,184 | 113,530 | ||||||
| Chesapeake Lodging Trust (REIT) | 9,726 | 294,017 | ||||||
| Colony Financial, Inc. (REIT) | 17,964 | 417,124 | ||||||
| Coresite Realty Corp. (REIT) | 4,086 | 135,124 | ||||||
| Cousins Properties, Inc. (REIT) | 38,598 | 480,545 | ||||||
| CubeSmart (REIT) | 28,124 | 515,232 | ||||||
| CyrusOne, Inc. (REIT) | 3,755 | 93,500 | ||||||
| CYS Investments, Inc. (REIT) | 31,519 | 284,301 | ||||||
| DCT Industrial Trust, Inc. (REIT) | 64,025 | 525,645 | ||||||
| DiamondRock Hospitality Co. (REIT) | 38,061 | 487,942 | ||||||
| DuPont Fabros Technology, Inc. (REIT) | 12,376 | 333,657 | ||||||
| Dynex Capital, Inc. (REIT) | 10,607 | 93,872 | ||||||
| EastGroup Properties, Inc. (REIT) | 6,090 | 391,161 | ||||||
| Education Realty Trust, Inc. (REIT) | 22,385 | 240,415 | ||||||
| Empire State Realty Trust, Inc. "A", (REIT) (a) | 17,833 | 294,244 | ||||||
| EPR Properties (REIT) | 10,393 | 580,657 | ||||||
| Equity One, Inc. (REIT) | 11,944 | 281,759 | ||||||
| Excel Trust, Inc. (REIT) | 9,429 | 125,689 | ||||||
| FelCor Lodging Trust, Inc. (REIT) | 24,164 | 253,964 | ||||||
| First Industrial Realty Trust, Inc. (REIT) | 21,481 | 404,702 | ||||||
| First Potomac Realty Trust (REIT) | 11,433 | 150,001 | ||||||
| Franklin Street Properties Corp. (REIT) | 17,488 | 219,999 | ||||||
| Getty Realty Corp. (REIT) | 4,912 | 93,721 | ||||||
| Gladstone Commercial Corp. (REIT) | 3,086 | 55,147 | ||||||
| Glimcher Realty Trust (REIT) | 28,235 | 305,785 | ||||||
| Government Properties Income Trust (REIT) | 10,640 | 270,150 | ||||||
| Gramercy Property Trust, Inc. (REIT) (a) | 22,892 | 138,497 | ||||||
| Hannon Armstrong Sustainable Infrastructure Capital, Inc. (REIT) | 4,134 | 59,282 | ||||||
| Hatteras Financial Corp. (REIT) | 18,775 | 371,933 | ||||||
| Healthcare Realty Trust, Inc. (REIT) | 18,683 | 474,922 | ||||||
| Hersha Hospitality Trust (REIT) | 39,035 | 261,925 | ||||||
| Highwoods Properties, Inc. (REIT) | 17,530 | 735,383 | ||||||
| Hudson Pacific Properties, Inc. (REIT) | 10,679 | 270,606 | ||||||
| Inland Real Estate Corp. (REIT) | 16,978 | 180,476 | ||||||
| Invesco Mortgage Capital (REIT) | 23,939 | 415,581 | ||||||
| Investors Real Estate Trust (REIT) (a) | 20,738 | 190,997 | ||||||
| iStar Financial, Inc. (REIT)* | 16,510 | 247,320 | ||||||
| Kite Realty Group Trust (REIT) | 25,593 | 157,141 | ||||||
| LaSalle Hotel Properties (REIT) | 20,243 | 714,375 | ||||||
| Lexington Realty Trust (REIT) (a) | 40,009 | 440,499 | ||||||
| LTC Properties, Inc. (REIT) | 6,774 | 264,457 | ||||||
| Mack-Cali Realty Corp. (REIT) | 17,249 | 370,509 | ||||||
| Medical Properties Trust, Inc. (REIT) | 33,552 | 444,228 | ||||||
| Shares | Value ($) | |||||||
| Monmouth Real Estate Investment Corp. "A", (REIT) | 10,779 | 108,221 | ||||||
| National Health Investors, Inc. (REIT) | 6,428 | 402,136 | ||||||
| New Residential Investment Corp. (REIT) | 54,854 | 345,580 | ||||||
| New York Mortgage Trust, Inc. (REIT) (a) | 17,641 | 137,776 | ||||||
| New York REIT, Inc. (REIT) (a) | 34,265 | 378,971 | ||||||
| One Liberty Properties, Inc. (REIT) | 2,456 | 52,411 | ||||||
| Owens Realty Mortgage, Inc. (REIT) | 2,092 | 40,689 | ||||||
| Parkway Properties, Inc. (REIT) | 13,841 | 285,817 | ||||||
| Pebblebrook Hotel Trust (REIT) | 12,428 | 459,339 | ||||||
| Pennsylvania Real Estate Investment Trust (REIT) (a) | 13,376 | 251,736 | ||||||
| PennyMac Mortgage Investment Trust (REIT) | 14,393 | 315,782 | ||||||
| Physicians Realty Trust (REIT) | 6,674 | 96,039 | ||||||
| Potlatch Corp. (REIT) | 7,898 | 326,977 | ||||||
| PS Business Parks, Inc. (REIT) | 3,784 | 315,926 | ||||||
| QTS Realty Trust, Inc. "A", (REIT) | 2,332 | 66,765 | ||||||
| RAIT Financial Trust (REIT) | 16,013 | 132,428 | ||||||
| Ramco-Gershenson Properties Trust (REIT) | 13,275 | 220,631 | ||||||
| Redwood Trust, Inc. (REIT) (a) | 16,141 | 314,265 | ||||||
| Resource Capital Corp. (REIT) | 25,191 | 141,825 | ||||||
| Retail Opportunity Investments Corp. (REIT) (a) | 14,574 | 229,249 | ||||||
| Rexford Industrial Realty, Inc. (REIT) | 5,563 | 79,217 | ||||||
| RLJ Lodging Trust (REIT) | 25,465 | 735,684 | ||||||
| Rouse Properties, Inc. (REIT) | 7,227 | 123,654 | ||||||
| Ryman Hospitality Properties, Inc. (REIT) (a) | 8,450 | 406,867 | ||||||
| Sabra Health Care REIT, Inc. (REIT) | 9,195 | 263,988 | ||||||
| Saul Centers, Inc. (REIT) | 1,894 | 92,048 | ||||||
| Select Income REIT (REIT) | 7,160 | 212,222 | ||||||
| Silver Bay Realty Trust Corp. (REIT) | 7,480 | 122,074 | ||||||
| Sovran Self Storage, Inc. (REIT) | 6,416 | 495,636 | ||||||
| STAG Industrial, Inc. (REIT) | 10,090 | 242,261 | ||||||
| Starwood Waypoint Residential Trust (REIT)* | 7,609 | 199,432 | ||||||
| Strategic Hotels & Resorts, Inc. (REIT)* | 48,109 | 563,356 | ||||||
| Summit Hotel Properties, Inc. (REIT) | 16,754 | 177,592 | ||||||
| Sun Communities, Inc. (REIT) (a) | 7,967 | 397,075 | ||||||
| Sunstone Hotel Investors, Inc. (REIT) | 35,672 | 532,583 | ||||||
| Terreno Realty Corp. (REIT) | 6,439 | 124,466 | ||||||
| The Geo Group, Inc. (REIT) | 14,122 | 504,579 | ||||||
| Trade Street Residential, Inc. (REIT) | 3,615 | 27,076 | ||||||
| UMH Properties, Inc. (REIT) | 3,746 | 37,572 | ||||||
| Universal Health Realty Income Trust (REIT) | 2,361 | 102,656 | ||||||
| Urstadt Biddle Properties "A", (REIT) | 4,855 | 101,372 | ||||||
| Washington Real Estate Investment Trust (REIT) | 12,965 | 336,831 | ||||||
| Western Asset Mortgage Capital Corp. (REIT) (a) | 8,065 | 114,281 | ||||||
| Whitestone REIT (REIT) | 4,364 | 65,067 | ||||||
| Winthrop Realty Trust (REIT) | 7,085 | 108,755 | ||||||
| 28,171,708 | ||||||||
| Shares | Value ($) | |||||||
| Real Estate Management & Development 0.5% | ||||||||
| Alexander & Baldwin, Inc. | 9,480 | 392,946 | ||||||
| Altisource Asset Management Corp.* | 274 | 198,118 | ||||||
| Altisource Portfolio Solutions SA* | 2,838 | 325,178 | ||||||
| AV Homes, Inc.* | 2,197 | 35,921 | ||||||
| Consolidated-Tomoka Land Co. | 834 | 38,281 | ||||||
| Forestar Group, Inc.* | 6,794 | 129,697 | ||||||
| Kennedy-Wilson Holdings, Inc. | 13,971 | 374,702 | ||||||
| RE/MAX Holdings, Inc. "A" | 2,072 | 61,311 | ||||||
| Tejon Ranch Co.* | 2,635 | 84,821 | ||||||
| The St. Joe Co.* | 12,293 | 312,611 | ||||||
| 1,953,586 | ||||||||
| Thrifts & Mortgage Finance 1.7% | ||||||||
| Astoria Financial Corp. | 16,856 | 226,713 | ||||||
| Bank Mutual Corp. | 9,229 | 53,528 | ||||||
| BankFinancial Corp. | 3,620 | 40,399 | ||||||
| BBX Capital Corp. "A"* | 1,672 | 30,096 | ||||||
| Beneficial Mutual Bancorp., Inc.* | 5,702 | 77,319 | ||||||
| Berkshire Hills Bancorp., Inc. | 4,892 | 113,592 | ||||||
| BofI Holding, Inc.* | 2,762 | 202,924 | ||||||
| Brookline Bancorp., Inc. | 13,897 | 130,215 | ||||||
| Capitol Federal Financial, Inc. | 27,854 | 338,705 | ||||||
| Charter Financial Corp. | 4,387 | 48,696 | ||||||
| Clifton Bancorp., Inc. | 5,150 | 65,251 | ||||||
| Dime Community Bancshares | 6,345 | 100,188 | ||||||
| ESB Financial Corp. | 2,580 | 33,385 | ||||||
| Essent Group Ltd.* | 8,105 | 162,829 | ||||||
| EverBank Financial Corp. (a) | 17,727 | 357,376 | ||||||
| Federal Agricultural Mortgage Corp. "C" | 2,041 | 63,434 | ||||||
| First Defiance Financial Corp. | 1,910 | 54,817 | ||||||
| First Financial Northwest, Inc. | 2,737 | 29,751 | ||||||
| Flagstar Bancorp., Inc.* | 3,943 | 71,368 | ||||||
| Fox Chase Bancorp. | 2,343 | 39,503 | ||||||
| Franklin Financial Corp.* | 1,881 | 40,818 | ||||||
| Home Loan Servicing Solutions Ltd. (a) | 13,818 | 314,083 | ||||||
| HomeStreet, Inc. | 2,891 | 53,108 | ||||||
| Kearny Financial Corp.* | 2,719 | 41,166 | ||||||
| Ladder Capital Corp. "A"* | 2,904 | 52,475 | ||||||
| Meridian Interstate Bancorp., Inc.* | 1,644 | 42,218 | ||||||
| Meta Financial Group, Inc. | 1,220 | 48,800 | ||||||
| MGIC Investment Corp.* (a) | 65,862 | 608,565 | ||||||
| NASB Financial, Inc. | 736 | 17,406 | ||||||
| NMI Holdings, Inc. "A"* | 9,831 | 103,226 | ||||||
| Northfield Bancorp., Inc. | 10,421 | 136,619 | ||||||
| Northwest Bancshares, Inc. | 18,309 | 248,453 | ||||||
| OceanFirst Financial Corp. | 2,591 | 42,907 | ||||||
| Oritani Financial Corp. | 8,840 | 136,048 | ||||||
| PennyMac Financial Services, Inc. "A"* | 2,540 | 38,583 | ||||||
| Provident Financial Services, Inc. | 11,731 | 203,181 | ||||||
| Radian Group, Inc. (a) | 37,161 | 550,354 | ||||||
| Stonegate Mortgage Corp.* | 2,784 | 38,837 | ||||||
| Territorial Bancorp., Inc. | 1,701 | 35,517 | ||||||
| Tree.com, Inc.* | 1,211 | 35,289 | ||||||
| TrustCo Bank Corp. | 18,324 | 122,404 | ||||||
| United Community Financial Corp.* | 9,557 | 39,470 | ||||||
| United Financial Bancorp., Inc. | 10,331 | 139,985 | ||||||
| Walker & Dunlop, Inc.* | 3,605 | 50,867 | ||||||
| Washington Federal, Inc. | 19,712 | 442,140 | ||||||
| Waterstone Financial, Inc. | 6,693 | 76,367 | ||||||
| Shares | Value ($) | |||||||
| WSFS Financial Corp. | 1,735 | 127,817 | ||||||
| 6,026,792 | ||||||||
| Health Care 12.9% | ||||||||
| Biotechnology 4.9% | ||||||||
| ACADIA Pharmaceuticals, Inc.* (a) | 15,333 | 346,372 | ||||||
| Acceleron Pharma, Inc.* | 3,201 | 108,738 | ||||||
| Achillion Pharmaceuticals, Inc.* (a) | 18,797 | 142,293 | ||||||
| Acorda Therapeutics, Inc.* | 8,090 | 272,714 | ||||||
| Actinium Pharmaceuticals, Inc.* | 3,857 | 27,848 | ||||||
| Adamas Pharmaceuticals, Inc.* | 570 | 10,420 | ||||||
| Aegerion Pharmaceuticals, Inc.* | 5,724 | 183,683 | ||||||
| Agenus, Inc.* | 12,111 | 38,997 | ||||||
| Agios Pharmaceuticals, Inc.* | 2,640 | 120,965 | ||||||
| Akebia Therapeutics, Inc.* | 1,525 | 42,380 | ||||||
| Alder Biopharmaceuticals, Inc.* | 1,557 | 31,249 | ||||||
| AMAG Pharmaceuticals, Inc.* (a) | 4,200 | 87,024 | ||||||
| Anacor Pharmaceuticals, Inc.* | 6,410 | 113,649 | ||||||
| Applied Genetic Technologies Corp/DE* | 944 | 21,806 | ||||||
| Arena Pharmaceuticals, Inc.* (a) | 42,740 | 250,456 | ||||||
| ARIAD Pharmaceuticals, Inc.* | 32,075 | 204,318 | ||||||
| Array BioPharma, Inc.* (a) | 24,700 | 112,632 | ||||||
| Arrowhead Research Corp.* | 10,093 | 144,431 | ||||||
| Auspex Pharmaceuticals, Inc.* | 1,510 | 33,628 | ||||||
| BioCryst Pharmaceuticals, Inc.* | 13,633 | 173,821 | ||||||
| BioSpecifics Technologies Corp.* | 710 | 19,142 | ||||||
| BioTime, Inc.* (a) | 10,140 | 30,927 | ||||||
| Bluebird Bio, Inc.* | 3,709 | 143,056 | ||||||
| Cara Therapeutics, Inc.* | 1,049 | 17,854 | ||||||
| Celldex Therapeutics, Inc.* (a) | 17,386 | 283,740 | ||||||
| Cellular Dynamics International, Inc.* | 1,890 | 27,537 | ||||||
| Cepheid, Inc.* (a) | 13,566 | 650,354 | ||||||
| ChemoCentryx, Inc.* | 5,407 | 31,631 | ||||||
| Chimerix, Inc.* | 5,245 | 115,075 | ||||||
| Clovis Oncology, Inc.* | 4,801 | 198,809 | ||||||
| CTI BioPharma Corp.* (a) | 26,505 | 74,479 | ||||||
| Cytokinetics, Inc.* | 6,697 | 32,012 | ||||||
| Cytori Therapeutics, Inc.* (a) | 12,909 | 30,853 | ||||||
| CytRx Corp.* | 10,858 | 45,386 | ||||||
| Dendreon Corp.* (a) | 30,641 | 70,474 | ||||||
| Dicerna Pharmaceuticals, Inc.* | 694 | 15,664 | ||||||
| Durata Therapeutics, Inc.* (a) | 3,024 | 51,499 | ||||||
| Dyax Corp.* | 26,423 | 253,661 | ||||||
| Dynavax Technologies Corp.* (a) | 52,066 | 83,306 | ||||||
| Eleven Biotherapeutics, Inc.* | 893 | 11,770 | ||||||
| Emergent Biosolutions, Inc.* | 5,686 | 127,708 | ||||||
| Enanta Pharmaceuticals, Inc.* | 2,012 | 86,657 | ||||||
| Epizyme, Inc.* | 2,492 | 77,551 | ||||||
| Esperion Therapeutics, Inc.* | 847 | 13,416 | ||||||
| Exact Sciences Corp.* (a) | 16,114 | 274,421 | ||||||
| Exelixis, Inc.* (a) | 37,891 | 128,450 | ||||||
| Five Prime Therapeutics, Inc.* | 3,355 | 52,170 | ||||||
| Flexion Therapeutics, Inc.* | 936 | 12,617 | ||||||
| Foundation Medicine, Inc.* | 2,717 | 73,250 | ||||||
| Galectin Therapeutics, Inc.* | 3,506 | 48,418 | ||||||
| Galena Biopharma, Inc.* (a) | 22,966 | 70,276 | ||||||
| Genocea Biosciences, Inc.* | 760 | 14,250 | ||||||
| Genomic Health, Inc.* (a) | 3,295 | 90,283 | ||||||
| Geron Corp.* (a) | 30,885 | 99,141 | ||||||
| Halozyme Therapeutics, Inc.* (a) | 20,121 | 198,795 | ||||||
| Heron Therapeutics, Inc.* | 3,783 | 46,607 | ||||||
| Hyperion Therapeutics, Inc.* | 2,650 | 69,165 | ||||||
| Shares | Value ($) | |||||||
| Idenix Pharmaceuticals, Inc.* | 22,864 | 551,022 | ||||||
| Idera Pharmaceuticals, Inc.* | 11,720 | 33,988 | ||||||
| ImmunoGen, Inc.* (a) | 16,701 | 197,907 | ||||||
| Immunomedics, Inc.* (a) | 16,110 | 58,801 | ||||||
| Infinity Pharmaceuticals, Inc.* | 9,523 | 121,323 | ||||||
| Inovio Pharmaceuticals, Inc.* | 11,705 | 126,531 | ||||||
| Insmed, Inc.* | 7,642 | 152,687 | ||||||
| Insys Therapeutics, Inc.* (a) | 1,944 | 60,711 | ||||||
| InterMune, Inc.* (a) | 19,237 | 849,314 | ||||||
| Intrexon Corp.* (a) | 6,934 | 174,251 | ||||||
| Ironwood Pharmaceuticals, Inc.* | 23,251 | 356,438 | ||||||
| Isis Pharmaceuticals, Inc.* (a) | 22,874 | 788,009 | ||||||
| Karyopharm Therapeutics, Inc.* | 2,410 | 112,185 | ||||||
| Keryx Biopharmaceuticals, Inc.* (a) | 17,793 | 273,656 | ||||||
| Kindred Biosciences, Inc.* | 2,101 | 39,163 | ||||||
| KYTHERA Biopharmaceuticals, Inc.* | 3,386 | 129,921 | ||||||
| Lexicon Pharmaceuticals, Inc.* | 43,845 | 70,590 | ||||||
| Ligand Pharmaceuticals, Inc.* | 4,033 | 251,216 | ||||||
| MacroGenics, Inc.* | 3,888 | 84,486 | ||||||
| MannKind Corp.* (a) | 44,364 | 487,560 | ||||||
| Merrimack Pharmaceuticals, Inc.* (a) | 18,918 | 137,912 | ||||||
| MiMedx Group, Inc.* (a) | 18,050 | 127,974 | ||||||
| Mirati Therapeutics, Inc.* | 1,396 | 27,920 | ||||||
| Momenta Pharmaceuticals, Inc.* | 9,362 | 113,093 | ||||||
| NanoViricides, Inc.* | 7,800 | 32,760 | ||||||
| Navidea Biopharmaceuticals, Inc.* (a) | 29,339 | 43,422 | ||||||
| NeoStem, Inc.* | 4,610 | 30,057 | ||||||
| Neuralstem, Inc.* | 13,383 | 56,476 | ||||||
| Neurocrine Biosciences, Inc.* | 14,764 | 219,098 | ||||||
| NewLink Genetics Corp.* (a) | 3,853 | 102,297 | ||||||
| Northwest Biotherapeutics, Inc.* | 6,915 | 46,400 | ||||||
| Novavax, Inc.* | 40,720 | 188,126 | ||||||
| NPS Pharmaceuticals, Inc.* | 20,686 | 683,672 | ||||||
| Ohr Pharmaceutical, Inc.* | 4,093 | 38,924 | ||||||
| OncoMed Pharmaceuticals, Inc.* | 2,460 | 57,318 | ||||||
| Oncothyreon, Inc.* | 13,769 | 44,612 | ||||||
| Ophthotech Corp.* (a) | 2,700 | 114,237 | ||||||
| Opko Health, Inc.* (a) | 38,344 | 338,961 | ||||||
| Orexigen Therapeutics, Inc.* (a) | 22,483 | 138,945 | ||||||
| Organovo Holdings, Inc.* | 12,162 | 101,553 | ||||||
| Osiris Therapeutics, Inc.* (a) | 3,693 | 57,685 | ||||||
| OvaScience, Inc.* | 2,845 | 26,089 | ||||||
| PDL BioPharma, Inc. (a) | 31,252 | 302,519 | ||||||
| Peregrine Pharmaceuticals, Inc.* (a) | 34,539 | 64,933 | ||||||
| Portola Pharmaceuticals, Inc.* | 7,177 | 209,425 | ||||||
| Progenics Pharmaceuticals, Inc.* | 13,460 | 58,013 | ||||||
| Prothena Corp. PLC* | 4,262 | 96,108 | ||||||
| PTC Therapeutics, Inc.* | 4,321 | 112,951 | ||||||
| Puma Biotechnology, Inc.* | 4,517 | 298,122 | ||||||
| Raptor Pharmaceutical Corp.* (a) | 12,196 | 140,864 | ||||||
| Receptos, Inc.* | 3,005 | 128,013 | ||||||
| Regado Biosciences, Inc.* | 3,008 | 20,424 | ||||||
| Regulus Therapeutics, Inc.* | 2,675 | 21,507 | ||||||
| Repligen Corp.* | 6,221 | 141,777 | ||||||
| Retrophin, Inc.* | 4,080 | 47,899 | ||||||
| Rigel Pharmaceuticals, Inc.* | 16,634 | 60,381 | ||||||
| Sangamo BioSciences, Inc.* | 13,135 | 200,571 | ||||||
| Sarepta Therapeutics, Inc.* (a) | 7,915 | 235,788 | ||||||
| Spectrum Pharmaceuticals, Inc.* | 12,877 | 104,690 | ||||||
| Stemline Therapeutics, Inc.* | 2,250 | 33,008 | ||||||
| Shares | Value ($) | |||||||
| Sunesis Pharmaceuticals, Inc.* (a) | 9,629 | 62,781 | ||||||
| Synageva BioPharma Corp.* | 4,172 | 437,226 | ||||||
| Synergy Pharmaceuticals, Inc.* (a) | 18,247 | 74,265 | ||||||
| Synta Pharmaceuticals Corp.* | 11,295 | 46,197 | ||||||
| TESARO, Inc.* | 3,751 | 116,694 | ||||||
| TG Therapeutics, Inc.* (a) | 4,570 | 42,912 | ||||||
| Threshold Pharmaceuticals, Inc.* (a) | 10,187 | 40,341 | ||||||
| Ultragenyx Pharmaceutical, Inc.* | 1,294 | 58,088 | ||||||
| Vanda Pharmaceuticals, Inc.* (a) | 6,497 | 105,121 | ||||||
| Verastem, Inc.* | 4,083 | 36,992 | ||||||
| Versartis, Inc.* | 1,349 | 37,826 | ||||||
| Vital Therapies, Inc.* | 1,007 | 27,431 | ||||||
| Xencor, Inc.* | 2,959 | 34,384 | ||||||
| XOMA Corp.* | 16,323 | 74,923 | ||||||
| ZIOPHARM Oncology, Inc.* (a) | 15,684 | 63,207 | ||||||
| 17,320,499 | ||||||||
| Health Care Equipment & Supplies 3.0% | ||||||||
| Abaxis, Inc. (a) | 4,394 | 194,698 | ||||||
| ABIOMED, Inc.* (a) | 7,740 | 194,584 | ||||||
| Accuray, Inc.* (a) | 14,932 | 131,402 | ||||||
| Analogic Corp. | 2,414 | 188,871 | ||||||
| AngioDynamics, Inc.* | 4,841 | 79,054 | ||||||
| Anika Therapeutics, Inc.* | 2,806 | 130,002 | ||||||
| Antares Pharma, Inc.* (a) | 22,505 | 60,088 | ||||||
| AtriCure, Inc.* | 5,331 | 97,984 | ||||||
| Atrion Corp. | 299 | 97,474 | ||||||
| Cantel Medical Corp. | 6,590 | 241,326 | ||||||
| Cardiovascular Systems, Inc.* | 5,380 | 167,641 | ||||||
| Cerus Corp.* (a) | 13,851 | 57,482 | ||||||
| CONMED Corp. | 5,294 | 233,730 | ||||||
| CryoLife, Inc. | 5,363 | 47,999 | ||||||
| Cyberonics, Inc.* | 5,220 | 326,041 | ||||||
| Cynosure, Inc. "A"* | 4,342 | 92,267 | ||||||
| Derma Sciences, Inc.* | 4,404 | 50,910 | ||||||
| Dexcom, Inc.* | 14,575 | 578,044 | ||||||
| Endologix, Inc.* | 12,452 | 189,395 | ||||||
| Exactech, Inc.* | 1,915 | 48,315 | ||||||
| Genmark Diagnostics, Inc.* | 8,094 | 109,512 | ||||||
| Globus Medical, Inc. "A"* | 12,794 | 306,032 | ||||||
| Greatbatch, Inc.* | 4,868 | 238,824 | ||||||
| Haemonetics Corp.* | 10,125 | 357,210 | ||||||
| HeartWare International, Inc.* | 3,305 | 292,492 | ||||||
| ICU Medical, Inc.* | 2,609 | 158,653 | ||||||
| Inogen, Inc.* | 1,014 | 22,876 | ||||||
| Insulet Corp.* (a) | 10,780 | 427,643 | ||||||
| Integra LifeSciences Holdings* | 4,854 | 228,429 | ||||||
| Invacare Corp. | 6,253 | 114,868 | ||||||
| K2M Group Holdings, Inc.* | 1,717 | 25,549 | ||||||
| LDR Holding Corp.* | 3,231 | 80,807 | ||||||
| Masimo Corp.* | 9,413 | 222,147 | ||||||
| Meridian Bioscience, Inc. | 8,018 | 165,491 | ||||||
| Merit Medical Systems, Inc.* | 8,358 | 126,206 | ||||||
| Natus Medical, Inc.* | 6,252 | 157,175 | ||||||
| Neogen Corp.* | 7,132 | 288,632 | ||||||
| NuVasive, Inc.* | 9,065 | 322,442 | ||||||
| NxStage Medical, Inc.* | 11,965 | 171,937 | ||||||
| OraSure Technologies, Inc.* | 10,878 | 93,660 | ||||||
| Orthofix International NV* | 3,549 | 128,651 | ||||||
| Oxford Immunotec Global PLC* | 2,529 | 42,563 | ||||||
| PhotoMedex, Inc.* (a) | 2,495 | 30,564 | ||||||
| Quidel Corp.* (a) | 5,588 | 123,551 | ||||||
| Rockwell Medical, Inc.* (a) | 8,048 | 96,496 | ||||||
| Shares | Value ($) | |||||||
| RTI Surgical, Inc.* | 11,253 | 48,951 | ||||||
| Spectranetics Corp.* | 8,061 | 184,436 | ||||||
| STAAR Surgical Co.* | 7,505 | 126,084 | ||||||
| STERIS Corp. | 11,494 | 614,699 | ||||||
| SurModics, Inc.* | 2,670 | 57,191 | ||||||
| Symmetry Medical, Inc.* | 7,449 | 65,998 | ||||||
| Tandem Diabetes Care, Inc.* | 1,616 | 26,276 | ||||||
| Thoratec Corp.* | 11,049 | 385,168 | ||||||
| Tornier NV* | 6,915 | 161,673 | ||||||
| TransEnterix, Inc.* | 5,576 | 28,103 | ||||||
| TriVascular Technologies, Inc.* | 1,445 | 22,499 | ||||||
| Unilife Corp.* (a) | 19,867 | 58,806 | ||||||
| Utah Medical Products, Inc. | 730 | 37,551 | ||||||
| Vascular Solutions, Inc.* | 3,329 | 73,870 | ||||||
| Veracyte, Inc.* | 1,264 | 21,640 | ||||||
| Volcano Corp.* (a) | 9,966 | 175,501 | ||||||
| West Pharmaceutical Services, Inc. | 13,744 | 579,722 | ||||||
| Wright Medical Group, Inc.* | 9,709 | 304,863 | ||||||
| Zeltiq Aesthetics, Inc.* | 5,657 | 85,930 | ||||||
| 10,598,678 | ||||||||
| Health Care Providers & Services 2.3% | ||||||||
| Acadia Healthcare Co., Inc.* | 7,092 | 322,686 | ||||||
| Addus HomeCare Corp.* | 1,228 | 27,605 | ||||||
| Air Methods Corp.* (a) | 7,615 | 393,315 | ||||||
| Alliance HealthCare Services, Inc.* | 990 | 26,730 | ||||||
| Almost Family, Inc.* | 1,622 | 35,814 | ||||||
| Amedisys, Inc.* (a) | 5,314 | 88,956 | ||||||
| AMN Healthcare Services, Inc.* | 9,140 | �� | 112,422 | |||||
| AmSurg Corp.* | 6,349 | 289,324 | ||||||
| Bio-Reference Laboratories, Inc.* (a) | 4,761 | 143,877 | ||||||
| BioScrip, Inc.* (a) | 13,310 | 111,005 | ||||||
| BioTelemetry, Inc.* | 5,136 | 36,825 | ||||||
| Capital Senior Living Corp.* | 5,705 | 136,007 | ||||||
| Chemed Corp. (a) | 3,411 | 319,679 | ||||||
| Chindex International, Inc.* | 2,704 | 64,058 | ||||||
| CorVel Corp.* | 2,154 | 97,318 | ||||||
| Cross Country Healthcare, Inc.* | 6,050 | 39,446 | ||||||
| Emeritus Corp.* | 7,299 | 231,013 | ||||||
| ExamWorks Group, Inc.* | 6,748 | 214,114 | ||||||
| Five Star Quality Care, Inc.* | 8,102 | 40,591 | ||||||
| Gentiva Health Services, Inc.* | 6,069 | 91,399 | ||||||
| Hanger, Inc.* | 6,849 | 215,401 | ||||||
| HealthSouth Corp. (a) | 17,134 | 614,597 | ||||||
| Healthways, Inc.* (a) | 6,111 | 107,187 | ||||||
| IPC The Hospitalist Co., Inc.* | 3,332 | 147,341 | ||||||
| Kindred Healthcare, Inc. | 10,616 | 245,230 | ||||||
| Landauer, Inc. | 1,884 | 79,128 | ||||||
| LHC Group, Inc.* | 2,392 | 51,117 | ||||||
| Magellan Health, Inc.* | 5,355 | 333,295 | ||||||
| Molina Healthcare, Inc.* | 5,873 | 262,112 | ||||||
| MWI Veterinary Supply, Inc.* | 2,501 | 355,117 | ||||||
| National Healthcare Corp. | 2,000 | 112,580 | ||||||
| National Research Corp. "A"* | 1,954 | 27,337 | ||||||
| Owens & Minor, Inc. (a) | 12,266 | 416,799 | ||||||
| PharMerica Corp.* | 5,833 | 166,766 | ||||||
| Providence Service Corp.* | 2,242 | 82,035 | ||||||
| RadNet, Inc.* | 6,359 | 42,160 | ||||||
| Select Medical Holdings Corp. | 15,311 | 238,852 | ||||||
| Skilled Healthcare Group, Inc. "A"* | 4,552 | 28,632 | ||||||
| Surgical Care Affiliates, Inc.* | 2,443 | 71,042 | ||||||
| Team Health Holdings, Inc.* | 13,660 | 682,180 | ||||||
| The Ensign Group, Inc. | 3,886 | 120,777 | ||||||
| Shares | Value ($) | |||||||
| Triple-S Management Corp. "B"* | 4,884 | 87,570 | ||||||
| U.S. Physical Therapy, Inc. | 2,392 | 81,783 | ||||||
| Universal American Corp. | 8,204 | 68,339 | ||||||
| WellCare Health Plans, Inc.* | 8,534 | 637,148 | ||||||
| 8,096,709 | ||||||||
| Health Care Technology 0.5% | ||||||||
| Castlight Health, Inc. "B"* | 2,519 | 38,289 | ||||||
| Computer Programs & Systems, Inc. | 2,181 | 138,712 | ||||||
| HealthStream, Inc.* | 4,118 | 100,067 | ||||||
| HMS Holdings Corp.* | 17,056 | 348,113 | ||||||
| MedAssets, Inc.* | 11,867 | 271,042 | ||||||
| Medidata Solutions, Inc.* | 10,525 | 450,575 | ||||||
| Merge Healthcare, Inc.* | 13,434 | 30,495 | ||||||
| Omnicell, Inc.* | 7,121 | 204,444 | ||||||
| Quality Systems, Inc. | 9,697 | 155,637 | ||||||
| Vocera Communications, Inc.* | 4,423 | 58,384 | ||||||
| 1,795,758 | ||||||||
| Life Sciences Tools & Services 0.5% | ||||||||
| Accelerate Diagnostics, Inc.* (a) | 4,416 | 114,816 | ||||||
| Affymetrix, Inc.* (a) | 14,202 | 126,540 | ||||||
| Albany Molecular Research, Inc.* | 4,630 | 93,156 | ||||||
| Cambrex Corp.* | 5,905 | 122,233 | ||||||
| Enzo Biochem, Inc.* | 6,647 | 34,897 | ||||||
| Fluidigm Corp.* | 5,460 | 160,524 | ||||||
| Furiex Pharmaceuticals, Inc.* | 1,386 | 147,165 | ||||||
| Luminex Corp.* | 7,294 | 125,092 | ||||||
| NanoString Technologies, Inc.* | 1,956 | 29,242 | ||||||
| Pacific Biosciences of California, Inc.* | 10,985 | 67,887 | ||||||
| PAREXEL International Corp.* | 11,064 | 584,622 | ||||||
| Sequenom, Inc.* (a) | 22,778 | 88,151 | ||||||
| 1,694,325 | ||||||||
| Pharmaceuticals 1.7% | ||||||||
| AcelRx Pharmaceuticals, Inc.* (a) | 4,914 | 50,369 | ||||||
| Achaogen, Inc.* | 1,343 | 18,748 | ||||||
| Aerie Pharmaceuticals, Inc.* | 2,045 | 50,655 | ||||||
| Akorn, Inc.* (a) | 12,128 | 403,256 | ||||||
| Alimera Sciences, Inc.* | 5,299 | 31,688 | ||||||
| Ampio Pharmaceuticals, Inc.* (a) | 7,774 | 64,913 | ||||||
| ANI Pharmaceuticals, Inc.* | 1,338 | 46,081 | ||||||
| Aratana Therapeutics, Inc.* | 4,754 | 74,210 | ||||||
| Auxilium Pharmaceuticals, Inc.* (a) | 9,781 | 196,207 | ||||||
| AVANIR Pharmaceuticals, Inc. "A"* (a) | 30,913 | 174,349 | ||||||
| Bio-Path Holdings, Inc.* | 14,277 | 43,545 | ||||||
| BioDelivery Sciences International, Inc.* (a) | 8,143 | 98,286 | ||||||
| Cempra, Inc.* | 4,452 | 47,770 | ||||||
| Corcept Therapeutics, Inc.* | 10,604 | 29,691 | ||||||
| DepoMed, Inc.* | 11,180 | 155,402 | ||||||
| Egalet Corp.* | 772 | 10,129 | ||||||
| Endocyte, Inc.* (a) | 7,333 | 48,324 | ||||||
| Horizon Pharma, Inc.* (a) | 12,663 | 200,329 | ||||||
| Impax Laboratories, Inc.* | 13,645 | 409,214 | ||||||
| Intra-Cellular Therapies, Inc.* | 3,326 | 56,076 | ||||||
| Lannett Co., Inc.* | 5,004 | 248,299 | ||||||
| Medicines Co.* | 12,678 | 368,423 | ||||||
| Nektar Therapeutics* | 24,705 | 316,718 | ||||||
| Omeros Corp.* (a) | 6,653 | 115,762 | ||||||
| Omthera Pharmaceutical, Inc.* | 1,167 | 0 | ||||||
| Pacira Pharmaceuticals, Inc.* | 6,936 | 637,141 | ||||||
| Pain Therapeutics, Inc.* | 7,403 | 42,567 | ||||||
| Shares | Value ($) | |||||||
| Pernix Therapeutics Holdings, Inc.* | 6,472 | 58,119 | ||||||
| Phibro Animal Health Corp. "A"* | 2,854 | 62,645 | ||||||
| POZEN, Inc. | 5,177 | 43,124 | ||||||
| Prestige Brands Holdings, Inc.* | 10,067 | 341,171 | ||||||
| Relypsa, Inc.* | 3,289 | 79,988 | ||||||
| Repros Therapeutics, Inc.* (a) | 4,558 | 78,853 | ||||||
| Revance Therapeutics, Inc.* | 1,309 | 44,506 | ||||||
| Sagent Pharmaceuticals, Inc.* | 4,257 | 110,086 | ||||||
| Sciclone Pharmaceuticals, Inc.* | 9,912 | 52,137 | ||||||
| Sucampo Pharmaceuticals, Inc. "A"* | 3,468 | 23,929 | ||||||
| Supernus Pharmaceuticals, Inc.* | 5,699 | 62,404 | ||||||
| Tetraphase Pharmaceuticals, Inc.* | 4,290 | 57,872 | ||||||
| TherapeuticsMD, Inc.* (a) | 19,571 | 86,504 | ||||||
| Theravance Biopharma, Inc.* | 4,578 | 145,947 | ||||||
| Theravance, Inc.* | 16,022 | 477,135 | ||||||
| VIVUS, Inc.* (a) | 17,499 | 93,095 | ||||||
| XenoPort, Inc.* | 11,393 | 55,028 | ||||||
| Zogenix, Inc.* | 23,907 | 48,053 | ||||||
| 5,858,748 | ||||||||
| Industrials 13.6% | ||||||||
| Aerospace & Defense 1.6% | ||||||||
| AAR Corp. | 7,695 | 212,074 | ||||||
| Aerovironment, Inc.* | 3,693 | 117,437 | ||||||
| American Science & Engineering, Inc. | 1,530 | 106,473 | ||||||
| Astronics Corp.* | 3,053 | 172,342 | ||||||
| Cubic Corp. | 4,029 | 179,331 | ||||||
| Curtiss-Wright Corp. | 9,368 | 614,166 | ||||||
| DigitalGlobe, Inc.* | 14,678 | 408,048 | ||||||
| Ducommun, Inc.* | 2,110 | 55,134 | ||||||
| Engility Holdings, Inc.* | 3,415 | 130,658 | ||||||
| Erickson, Inc.* (a) | 1,178 | 19,143 | ||||||
| Esterline Technologies Corp.* | 6,188 | 712,363 | ||||||
| GenCorp, Inc.* (a) | 11,636 | 222,248 | ||||||
| HEICO Corp. | 12,936 | 671,896 | ||||||
| Kratos Defense & Security Solutions, Inc.* | 8,744 | 68,203 | ||||||
| LMI Aerospace, Inc.* | 2,178 | 28,488 | ||||||
| Moog, Inc. "A"* | 8,654 | 630,790 | ||||||
| National Presto Industries, Inc. (a) | 939 | 68,397 | ||||||
| Orbital Sciences Corp.* | 11,782 | 348,158 | ||||||
| SIFCO Industries, Inc. | 492 | 15,350 | ||||||
| Sparton Corp.* | 1,924 | 53,372 | ||||||
| Taser International, Inc.* | 10,562 | 140,475 | ||||||
| Teledyne Technologies, Inc.* | 7,296 | 708,952 | ||||||
| The Keyw Holding Corp.* (a) | 6,335 | 79,631 | ||||||
| 5,763,129 | ||||||||
| Air Freight & Logistics 0.5% | ||||||||
| Air Transport Services Group, Inc.* | 10,114 | 84,654 | ||||||
| Atlas Air Worldwide Holdings, Inc.* | 4,908 | 180,860 | ||||||
| Echo Global Logistics, Inc.* | 4,568 | 87,569 | ||||||
| Forward Air Corp. | 6,098 | 291,789 | ||||||
| Hub Group, Inc. "A"* | 7,152 | 360,461 | ||||||
| Park-Ohio Holdings Corp. | 1,706 | 99,136 | ||||||
| UTi Worldwide, Inc. | 17,800 | 184,052 | ||||||
| XPO Logistics, Inc.* (a) | 10,217 | 292,410 | ||||||
| 1,580,931 | ||||||||
| Airlines 0.3% | ||||||||
| Allegiant Travel Co. | 2,685 | 316,212 | ||||||
| Hawaiian Holdings, Inc.* (a) | 8,767 | 120,196 | ||||||
| JetBlue Airways Corp.* (a) | 48,364 | 524,749 | ||||||
| Shares | Value ($) | |||||||
| Republic Airways Holdings, Inc.* | 9,661 | 104,725 | ||||||
| SkyWest, Inc. | 9,939 | 121,455 | ||||||
| 1,187,337 | ||||||||
| Building Products 0.7% | ||||||||
| AAON, Inc. | 5,478 | 183,622 | ||||||
| American Woodmark Corp.* | 2,394 | 76,297 | ||||||
| Apogee Enterprises, Inc. | 5,688 | 198,284 | ||||||
| Builders FirstSource, Inc.* | 8,839 | 66,116 | ||||||
| Continental Building Products, Inc.* | 2,280 | 35,112 | ||||||
| Gibraltar Industries, Inc.* | 5,998 | 93,029 | ||||||
| Griffon Corp. | 7,751 | 96,112 | ||||||
| Insteel Industries, Inc. | 3,512 | 69,011 | ||||||
| Masonite International Corp.* | 5,724 | 322,032 | ||||||
| NCI Building Systems, Inc.* | 5,459 | 106,068 | ||||||
| Norcraft Companies, Inc.* | 1,447 | 20,707 | ||||||
| Nortek, Inc.* | 1,767 | 158,606 | ||||||
| Patrick Industries, Inc.* | 1,585 | 73,845 | ||||||
| PGT, Inc.* | 9,190 | 77,839 | ||||||
| Ply Gem Holdings, Inc.* | 4,156 | 41,976 | ||||||
| Quanex Building Products Corp. | 7,368 | 131,666 | ||||||
| Simpson Manufacturing Co., Inc. | 8,038 | 292,262 | ||||||
| Trex Co., Inc.* (a) | 6,536 | 188,367 | ||||||
| Universal Forest Products, Inc. | 3,899 | 188,205 | ||||||
| 2,419,156 | ||||||||
| Commercial Services & Supplies 2.1% | ||||||||
| ABM Industries, Inc. | 10,869 | 293,246 | ||||||
| Acco Brands Corp.* | 22,128 | 141,840 | ||||||
| ARC Document Solutions, Inc.* | 8,003 | 46,898 | ||||||
| Brady Corp. "A" | 9,335 | 278,836 | ||||||
| Casella Waste Systems, Inc. "A"* | 7,335 | 36,748 | ||||||
| CECO Environmental Corp. (a) | 4,093 | 63,810 | ||||||
| Cenveo, Inc.* | 10,795 | 40,049 | ||||||
| Civeo Corp.* | 18,265 | 457,173 | ||||||
| Deluxe Corp. | 9,737 | 570,393 | ||||||
| Ennis, Inc. | 4,996 | 76,239 | ||||||
| G & K Services, Inc. "A" | 3,882 | 202,136 | ||||||
| Gerber Scientific, Inc.* | 6,939 | 0 | ||||||
| Healthcare Services Group, Inc. (a) | 13,668 | 402,386 | ||||||
| Heritage-Crystal Clean, Inc.* | 1,841 | 36,139 | ||||||
| Herman Miller, Inc. | 11,528 | 348,607 | ||||||
| HNI Corp. | 8,776 | 343,229 | ||||||
| Innerworkings, Inc.* | 6,828 | 58,038 | ||||||
| Interface, Inc. | 12,933 | 243,658 | ||||||
| Kimball International, Inc. "B" | 6,646 | 111,121 | ||||||
| Knoll, Inc. | 9,360 | 162,209 | ||||||
| McGrath RentCorp. | 5,004 | 183,897 | ||||||
| Mobile Mini, Inc. | 9,088 | 435,224 | ||||||
| MSA Safety, Inc. | 5,746 | 330,280 | ||||||
| Multi-Color Corp. | 2,432 | 97,304 | ||||||
| NL Industries, Inc. | 1,487 | 13,814 | ||||||
| Performant Financial Corp.* | 5,793 | 58,509 | ||||||
| Quad Graphics, Inc. | 5,376 | 120,261 | ||||||
| Quest Resource Holding Corp.* | 2,476 | 12,900 | ||||||
| Schawk, Inc. | 2,349 | 47,826 | ||||||
| SP Plus Corp.* | 3,025 | 64,705 | ||||||
| Steelcase, Inc. "A" | 16,081 | 243,306 | ||||||
| Team, Inc.* | 3,977 | 163,137 | ||||||
| Tetra Tech, Inc. (a) | 12,638 | 347,545 | ||||||
| The Brink's Co. | 9,425 | 265,973 | ||||||
| U.S. Ecology, Inc. | 4,184 | 204,807 | ||||||
| UniFirst Corp. | 2,870 | 304,220 | ||||||
| United Stationers, Inc. | 7,663 | 317,785 | ||||||
| Shares | Value ($) | |||||||
| Viad Corp. | 4,018 | 95,789 | ||||||
| West Corp. | 7,490 | 200,732 | ||||||
| 7,420,769 | ||||||||
| Construction & Engineering 0.8% | ||||||||
| Aegion Corp.* | 7,386 | 171,872 | ||||||
| Ameresco, Inc. "A"* | 4,004 | 28,148 | ||||||
| Argan, Inc. | 2,434 | 90,764 | ||||||
| Comfort Systems U.S.A., Inc. | 7,422 | 117,268 | ||||||
| Dycom Industries, Inc.* | 6,565 | 205,550 | ||||||
| EMCOR Group, Inc. | 13,083 | 582,586 | ||||||
| Furmanite Corp.* | 7,367 | 85,752 | ||||||
| Granite Construction, Inc. | 7,601 | 273,484 | ||||||
| Great Lakes Dredge & Dock Co.* | 11,734 | 93,755 | ||||||
| Layne Christensen Co.* | 3,824 | 50,859 | ||||||
| MasTec, Inc.* (a) | 12,067 | 371,905 | ||||||
| MYR Group, Inc.* | 4,118 | 104,309 | ||||||
| Northwest Pipe Co.* | 1,848 | 74,530 | ||||||
| Orion Marine Group, Inc.* | 5,326 | 57,681 | ||||||
| Pike Corp.* | 5,509 | 49,361 | ||||||
| Primoris Services Corp. | 7,384 | 212,954 | ||||||
| Sterling Construction Co., Inc.* | 3,588 | 33,655 | ||||||
| Tutor Perini Corp.* | 7,248 | 230,051 | ||||||
| 2,834,484 | ||||||||
| Electrical Equipment 1.1% | ||||||||
| AZZ, Inc. | 4,974 | 229,202 | ||||||
| Capstone Turbine Corp.* (a) | 63,983 | 96,614 | ||||||
| Encore Wire Corp. | 4,031 | 197,680 | ||||||
| EnerSys | 9,129 | 627,984 | ||||||
| Enphase Energy, Inc.* | 3,563 | 30,464 | ||||||
| Franklin Electric Co., Inc. | 9,283 | 374,384 | ||||||
| FuelCell Energy, Inc.* (a) | 42,970 | 103,128 | ||||||
| Generac Holdings, Inc.* (a) | 13,391 | 652,677 | ||||||
| General Cable Corp. (a) | 9,466 | 242,898 | ||||||
| Global Power Equipment Group, Inc. | 3,325 | 53,732 | ||||||
| GrafTech International Ltd.* (a) | 22,868 | 239,199 | ||||||
| LSI Industries, Inc. | 4,146 | 33,085 | ||||||
| Plug Power, Inc.* | 32,507 | 152,133 | ||||||
| Polypore International, Inc.* (a) | 8,770 | 418,592 | ||||||
| Powell Industries, Inc. | 1,803 | 117,880 | ||||||
| Power Solutions International, Inc.* | 873 | 62,830 | ||||||
| PowerSecure International, Inc.* (a) | 4,222 | 41,122 | ||||||
| Preformed Line Products Co. | 538 | 28,961 | ||||||
| Revolution Lighting Technologies, Inc.* (a) | 5,894 | 13,556 | ||||||
| Thermon Group Holdings, Inc.* (a) | 6,213 | 163,526 | ||||||
| Vicor Corp.* | 3,198 | 26,799 | ||||||
| 3,906,446 | ||||||||
| Industrial Conglomerates 0.1% | ||||||||
| Raven Industries, Inc. (a) | 7,088 | 234,896 | ||||||
| Machinery 3.2% | ||||||||
| Accuride Corp.* | 7,320 | 35,795 | ||||||
| Actuant Corp. "A" | 13,823 | 477,861 | ||||||
| Alamo Group, Inc. | 1,382 | 74,752 | ||||||
| Albany International Corp. "A" | 5,482 | 208,097 | ||||||
| Altra Industrial Motion Corp. | 5,237 | 190,575 | ||||||
| American Railcar Industries, Inc. (a) | 1,840 | 124,697 | ||||||
| ARC Group Worldwide, Inc.* | 597 | 9,074 | ||||||
| Astec Industries, Inc. | 3,674 | 161,215 | ||||||
| Barnes Group, Inc. | 10,550 | 406,597 | ||||||
| Blount International, Inc.* | 9,594 | 135,371 | ||||||
| Briggs & Stratton Corp. (a) | 9,101 | 186,207 | ||||||
| Shares | Value ($) | |||||||
| Chart Industries, Inc.* (a) | 5,928 | 490,483 | ||||||
| CIRCOR International, Inc. | 3,436 | 265,019 | ||||||
| CLARCOR, Inc. | 9,809 | 606,687 | ||||||
| Columbus McKinnon Corp. | 3,865 | 104,548 | ||||||
| Commercial Vehicle Group, Inc.* | 5,156 | 51,766 | ||||||
| Douglas Dynamics, Inc. | 4,336 | 76,400 | ||||||
| Dynamic Materials Corp. | 2,690 | 59,530 | ||||||
| Energy Recovery, Inc.* (a) | 7,497 | 36,885 | ||||||
| EnPro Industries, Inc.* | 4,420 | 323,367 | ||||||
| ESCO Technologies, Inc. | 5,169 | 179,054 | ||||||
| Federal Signal Corp. | 12,236 | 179,258 | ||||||
| FreightCar America, Inc. | 2,326 | 58,243 | ||||||
| Global Brass & Copper Holdings, Inc. | 4,160 | 70,304 | ||||||
| Gorman-Rupp Co. | 3,668 | 129,737 | ||||||
| Graham Corp. | 1,988 | 69,202 | ||||||
| Greenbrier Companies, Inc.* | 5,368 | 309,197 | ||||||
| Harsco Corp. | 15,710 | 418,357 | ||||||
| Hillenbrand, Inc. | 12,218 | 398,551 | ||||||
| Hurco Companies, Inc. | 1,216 | 34,291 | ||||||
| Hyster-Yale Materials Handling, Inc. | 2,000 | 177,080 | ||||||
| John Bean Technologies Corp. | 5,672 | 175,775 | ||||||
| Kadant, Inc. | 2,148 | 82,591 | ||||||
| L.B. Foster Co. "A" | 2,020 | 109,322 | ||||||
| Lindsay Corp. (a) | 2,502 | 211,344 | ||||||
| Lydall, Inc.* | 3,311 | 90,622 | ||||||
| Manitex International, Inc.* | 2,619 | 42,533 | ||||||
| Meritor, Inc.* | 19,039 | 248,269 | ||||||
| Miller Industries, Inc. | 2,128 | 43,794 | ||||||
| Mueller Industries, Inc. | 11,033 | 324,481 | ||||||
| Mueller Water Products, Inc. "A" | 31,012 | 267,944 | ||||||
| NN, Inc. | 3,454 | 88,353 | ||||||
| Omega Flex, Inc. | 496 | 9,732 | ||||||
| Proto Labs, Inc.* | 4,403 | 360,694 | ||||||
| RBC Bearings, Inc. | 4,525 | 289,826 | ||||||
| Rexnord Corp.* | 14,619 | 411,525 | ||||||
| Standex International Corp. | 2,486 | 185,157 | ||||||
| Sun Hydraulics Corp. | 4,333 | 175,920 | ||||||
| Tennant Co. | 3,585 | 273,607 | ||||||
| The ExOne Co.* (a) | 1,931 | 76,506 | ||||||
| Titan International, Inc. (a) | 8,576 | 144,248 | ||||||
| TriMas Corp.* | 8,800 | 335,544 | ||||||
| Twin Disc, Inc. | 1,624 | 53,673 | ||||||
| Wabash National Corp.* | 13,513 | 192,560 | ||||||
| Watts Water Technologies, Inc. "A" | 5,545 | 342,293 | ||||||
| Woodward, Inc. | 12,899 | 647,272 | ||||||
| Xerium Technologies, Inc.* | 2,169 | 30,279 | ||||||
| 11,262,064 | ||||||||
| Marine 0.2% | ||||||||
| Baltic Trading Ltd. | 9,583 | 57,306 | ||||||
| International Shipholding Corp. | 1,157 | 26,519 | ||||||
| Knightsbridge Tankers Ltd. | 6,532 | 92,689 | ||||||
| Matson, Inc. | 8,364 | 224,490 | ||||||
| Navios Maritime Holdings, Inc. | 15,444 | 156,293 | ||||||
| Safe Bulkers, Inc. | 7,578 | 73,961 | ||||||
| Scorpio Bulkers, Inc.* | 26,046 | 231,809 | ||||||
| Ultrapetrol Bahamas Ltd.* | 4,216 | 12,522 | ||||||
| 875,589 | ||||||||
| Professional Services 1.3% | ||||||||
| Acacia Research Corp. (a) | 9,663 | 171,518 | ||||||
| Barrett Business Services, Inc. | 1,370 | 64,390 | ||||||
| CBIZ, Inc.* (a) | 8,090 | 73,053 | ||||||
| Shares | Value ($) | |||||||
| CDI Corp. | 2,751 | 39,642 | ||||||
| Corporate Executive Board Co. | 6,580 | 448,888 | ||||||
| Corporate Resource Services, Inc.* | 3,418 | 10,186 | ||||||
| CRA International, Inc.* | 1,907 | 43,956 | ||||||
| Exponent, Inc. | 2,552 | 189,129 | ||||||
| Franklin Covey Co.* | 2,133 | 42,937 | ||||||
| FTI Consulting, Inc.* | 7,948 | 300,593 | ||||||
| GP Strategies Corp.* | 2,883 | 74,612 | ||||||
| Heidrick & Struggles International, Inc. | 3,547 | 65,619 | ||||||
| Hill International, Inc.* | 4,688 | 29,206 | ||||||
| Huron Consulting Group, Inc.* | 4,582 | 324,497 | ||||||
| ICF International, Inc.* | 3,867 | 136,737 | ||||||
| Insperity, Inc. | 4,409 | 145,497 | ||||||
| Kelly Services, Inc. "A" | 5,359 | 92,014 | ||||||
| Kforce, Inc. | 5,372 | 116,304 | ||||||
| Korn/Ferry International* | 9,634 | 282,951 | ||||||
| Mistras Group, Inc.* | 3,217 | 78,881 | ||||||
| Navigant Consulting, Inc.* | 9,566 | 166,927 | ||||||
| On Assignment, Inc.* | 10,573 | 376,082 | ||||||
| Paylocity Holding Corp.* | 1,631 | 35,279 | ||||||
| Pendrell Corp.* | 32,569 | 57,321 | ||||||
| Resources Connection, Inc. | 7,548 | 98,954 | ||||||
| RPX Corp.* | 10,319 | 183,162 | ||||||
| The Advisory Board Co.* (a) | 7,106 | 368,091 | ||||||
| TriNet Group, Inc.* | 3,060 | 73,654 | ||||||
| TrueBlue, Inc.* | 8,044 | 221,773 | ||||||
| VSE Corp. | 790 | 55,553 | ||||||
| WageWorks, Inc.* | 6,831 | 329,322 | ||||||
| 4,696,728 | ||||||||
| Road & Rail 0.7% | ||||||||
| ArcBest Corp. | 5,046 | 219,552 | ||||||
| Celadon Group, Inc. | 4,093 | 87,263 | ||||||
| Heartland Express, Inc. | 10,564 | 225,436 | ||||||
| Knight Transportation, Inc. | 11,653 | 276,992 | ||||||
| Marten Transport Ltd. | 4,675 | 104,486 | ||||||
| P.A.M. Transportation Services, Inc.* | 624 | 17,447 | ||||||
| Patriot Transportation Holding, Inc.* | 1,282 | 44,832 | ||||||
| Quality Distribution, Inc.* | 5,327 | 79,159 | ||||||
| Roadrunner Transportation Systems, Inc.* | 5,420 | 152,302 | ||||||
| Saia, Inc.* | 4,817 | 211,611 | ||||||
| Swift Transportation Co.* | 16,540 | 417,304 | ||||||
| Universal Truckload Services, Inc. | 1,276 | 32,359 | ||||||
| USA Truck, Inc.* | 1,217 | 22,624 | ||||||
| Werner Enterprises, Inc. (a) | 8,675 | 229,974 | ||||||
| YRC Worldwide, Inc.* | 6,082 | 170,965 | ||||||
| 2,292,306 | ||||||||
| Trading Companies & Distributors 0.9% | ||||||||
| Aceto Corp. | 5,589 | 101,384 | ||||||
| Aircastle Ltd. | 12,572 | 223,404 | ||||||
| Applied Industrial Technologies, Inc. | 8,126 | 412,232 | ||||||
| Beacon Roofing Supply, Inc.* | 9,594 | 317,753 | ||||||
| CAI International, Inc.* | 3,405 | 74,944 | ||||||
| DXP Enterprises, Inc.* | 2,519 | 190,285 | ||||||
| General Finance Corp.* | 2,151 | 20,435 | ||||||
| H&E Equipment Services, Inc.* | 6,085 | 221,129 | ||||||
| Houston Wire & Cable Co. | 3,424 | 42,492 | ||||||
| Kaman Corp. | 5,320 | 227,324 | ||||||
| Rush Enterprises, Inc. "A"* | 6,683 | 231,700 | ||||||
| Shares | Value ($) | |||||||
| Stock Building Supply Holdings, Inc.* | 2,835 | 55,935 | ||||||
| TAL International Group, Inc. | 6,614 | 293,397 | ||||||
| Textainer Group Holdings Ltd. (a) | 4,200 | 162,204 | ||||||
| Titan Machinery, Inc.* (a) | 3,337 | 54,927 | ||||||
| Watsco, Inc. | 5,025 | 516,369 | ||||||
| 3,145,914 | ||||||||
| Transportation Infrastructure 0.1% | ||||||||
| Wesco Aircraft Holdings, Inc.* | 10,202 | 203,632 | ||||||
| Information Technology 17.4% | ||||||||
| Communications Equipment 1.6% | ||||||||
| ADTRAN, Inc. | 10,976 | 247,619 | ||||||
| Alliance Fiber Optic Products, Inc. (a) | 2,451 | 44,363 | ||||||
| Applied Optoelectronics, Inc.* | 2,876 | 66,723 | ||||||
| Aruba Networks, Inc.* (a) | 20,772 | 363,925 | ||||||
| Bel Fuse, Inc. "B" | 1,950 | 50,056 | ||||||
| Black Box Corp. | 3,028 | 70,976 | ||||||
| CalAmp Corp.* | 6,991 | 151,425 | ||||||
| Calix, Inc.* | 8,184 | 66,945 | ||||||
| Ciena Corp.* (a) | 20,434 | 442,600 | ||||||
| Clearfield, Inc.* | 2,218 | 37,240 | ||||||
| Comtech Telecommunications Corp. | 2,981 | 111,281 | ||||||
| Digi International, Inc.* | 4,770 | 44,933 | ||||||
| Emulex Corp.* | 15,721 | 89,610 | ||||||
| Extreme Networks, Inc.* | 18,845 | 83,672 | ||||||
| Finisar Corp.* (a) | 18,843 | 372,149 | ||||||
| Harmonic, Inc.* | 18,436 | 137,533 | ||||||
| Infinera Corp.* (a) | 23,832 | 219,254 | ||||||
| InterDigital, Inc. | 7,870 | 376,186 | ||||||
| Ixia* | 11,202 | 128,039 | ||||||
| KVH Industries, Inc.* | 3,199 | 41,683 | ||||||
| NETGEAR, Inc.* | 7,100 | 246,867 | ||||||
| NumereX Corp. "A"* | 2,771 | 31,839 | ||||||
| Oclaro, Inc.* | 18,214 | 40,071 | ||||||
| Oplink Communications, Inc.* | 3,599 | 61,075 | ||||||
| ParkerVision, Inc.* (a) | 19,677 | 29,122 | ||||||
| Plantronics, Inc. | 8,275 | 397,614 | ||||||
| Polycom, Inc.* | 26,871 | 336,694 | ||||||
| Procera Networks, Inc.* (a) | 4,029 | 40,653 | ||||||
| Ruckus Wireless, Inc.* | 12,615 | 150,245 | ||||||
| ShoreTel, Inc.* | 12,169 | 79,342 | ||||||
| Sonus Networks, Inc.* | 47,824 | 171,688 | ||||||
| TESSCO Technologies, Inc. | 1,122 | 35,601 | ||||||
| Ubiquiti Networks, Inc.* (a) | 5,781 | 261,243 | ||||||
| ViaSat, Inc.* | 8,048 | 466,462 | ||||||
| 5,494,728 | ||||||||
| Electronic Equipment, Instruments & Components 2.7% | ||||||||
| Aeroflex Holding Corp.* | 3,847 | 40,394 | ||||||
| Agilysys, Inc.* | 2,773 | 39,044 | ||||||
| Anixter International, Inc. | 5,285 | 528,870 | ||||||
| Badger Meter, Inc. | 2,811 | 147,999 | ||||||
| Belden, Inc. | 8,484 | 663,109 | ||||||
| Benchmark Electronics, Inc.* | 10,489 | 267,260 | ||||||
| Checkpoint Systems, Inc.* | 8,143 | 113,921 | ||||||
| Cognex Corp.* | 16,895 | 648,768 | ||||||
| Coherent, Inc.* | 4,851 | 320,991 | ||||||
| Control4 Corp.* (a) | 2,225 | 43,521 | ||||||
| CTS Corp. | 6,500 | 121,550 | ||||||
| CUI Global, Inc.* | 4,014 | 33,718 | ||||||
| Daktronics, Inc. | 7,376 | 87,922 | ||||||
| Shares | Value ($) | |||||||
| DTS, Inc.* | 3,305 | 60,845 | ||||||
| Electro Rent Corp. | 3,196 | 53,469 | ||||||
| Electro Scientific Industries, Inc. | 4,754 | 32,375 | ||||||
| Fabrinet* | 6,832 | 140,739 | ||||||
| FARO Technologies, Inc.* | 3,354 | 164,748 | ||||||
| FEI Co. | 8,222 | 745,982 | ||||||
| GSI Group, Inc.* | 5,981 | 76,138 | ||||||
| II-VI, Inc.* | 10,228 | 147,897 | ||||||
| Insight Enterprises, Inc.* | 7,964 | 244,813 | ||||||
| InvenSense, Inc.* (a) | 13,829 | 313,780 | ||||||
| Itron, Inc.* | 7,651 | 310,248 | ||||||
| KEMET Corp.* | 8,719 | 50,134 | ||||||
| Littelfuse, Inc. | 4,379 | 407,028 | ||||||
| Maxwell Technologies, Inc.* | 5,735 | 86,771 | ||||||
| Measurement Specialties, Inc.* | 3,106 | 267,333 | ||||||
| Mercury Systems, Inc.* | 6,388 | 72,440 | ||||||
| Mesa Laboratories, Inc. | 543 | 45,590 | ||||||
| Methode Electronics, Inc. | 7,403 | 282,869 | ||||||
| MTS Systems Corp. (a) | 2,947 | 199,689 | ||||||
| Multi-Fineline Electronix, Inc.* | 1,850 | 20,424 | ||||||
| Newport Corp.* | 7,784 | 144,004 | ||||||
| OSI Systems, Inc.* | 3,880 | 258,990 | ||||||
| Park Electrochemical Corp. | 4,037 | 113,884 | ||||||
| PC Connection, Inc. | 1,942 | 40,161 | ||||||
| Plexus Corp.* | 6,600 | 285,714 | ||||||
| RealD, Inc.* | 7,754 | 98,941 | ||||||
| Rofin-Sinar Technologies, Inc.* | 5,455 | 131,138 | ||||||
| Rogers Corp.* | 3,526 | 233,950 | ||||||
| Sanmina Corp.* | 16,015 | 364,822 | ||||||
| ScanSource, Inc.* | 5,550 | 211,344 | ||||||
| Speed Commerce, Inc.* | 9,156 | 34,243 | ||||||
| SYNNEX Corp.* | 5,545 | 403,953 | ||||||
| TTM Technologies, Inc.* | 10,487 | 85,993 | ||||||
| Universal Display Corp.* (a) | 7,888 | 253,205 | ||||||
| Viasystems Group, Inc.* | 1,008 | 10,977 | ||||||
| Vishay Precision Group, Inc.* | 2,557 | 42,088 | ||||||
| 9,493,786 | ||||||||
| Internet Software & Services 2.7% | ||||||||
| Aerohive Networks, Inc.* | 1,864 | 15,322 | ||||||
| Amber Road, Inc.* | 1,738 | 28,034 | ||||||
| Angie's List, Inc.* (a) | 8,406 | 100,368 | ||||||
| Bankrate, Inc.* | 13,045 | 228,809 | ||||||
| Bazaarvoice, Inc.* (a) | 9,731 | 76,778 | ||||||
| Benefitfocus, Inc.* | 926 | 42,800 | ||||||
| Blucora, Inc.* | 8,229 | 155,281 | ||||||
| Borderfree, Inc.* | 1,165 | 19,304 | ||||||
| Brightcove, Inc.* | 6,255 | 65,928 | ||||||
| Carbonite, Inc.* | 3,452 | 41,320 | ||||||
| Care.com, Inc.* | 1,281 | 16,218 | ||||||
| ChannelAdvisor Corp.* | 4,029 | 106,204 | ||||||
| comScore, Inc.* | 6,747 | 239,384 | ||||||
| Constant Contact, Inc.* | 6,091 | 195,582 | ||||||
| Conversant, Inc.* (a) | 13,039 | 331,191 | ||||||
| Cornerstone OnDemand, Inc.* | 10,342 | 475,939 | ||||||
| Cvent, Inc.* | 3,492 | 101,582 | ||||||
| Dealertrack Technologies, Inc.* | 10,425 | 472,670 | ||||||
| Demand Media, Inc.* | 8,498 | 40,960 | ||||||
| Demandware, Inc.* | 5,846 | 405,537 | ||||||
| Dice Holdings, Inc.* | 7,494 | 57,029 | ||||||
| Digital River, Inc.* | 6,367 | 98,243 | ||||||
| E2open, Inc.* (a) | 4,517 | 93,366 | ||||||
| EarthLink Holdings Corp. (a) | 19,615 | 72,968 | ||||||
| Shares | Value ($) | |||||||
| Endurance International Group Holdings, Inc.* (a) | 5,870 | 89,752 | ||||||
| Envestnet, Inc.* | 6,627 | 324,193 | ||||||
| Everyday Health, Inc.* | 1,473 | 27,221 | ||||||
| Five9, Inc.* | 2,377 | 17,114 | ||||||
| Global Eagle Entertainment, Inc.* | 7,426 | 92,082 | ||||||
| Gogo, Inc.* (a) | 10,873 | 212,676 | ||||||
| GrubHub, Inc.* | 1,739 | 61,578 | ||||||
| GTT Communications, Inc.* | 2,743 | 28,006 | ||||||
| Internap Network Services Corp.* | 10,596 | 74,702 | ||||||
| Intralinks Holdings, Inc.* | 7,523 | 66,880 | ||||||
| j2 Global, Inc. (a) | 9,257 | 470,811 | ||||||
| Limelight Networks, Inc.* | 11,750 | 35,955 | ||||||
| Liquidity Services, Inc.* (a) | 5,170 | 81,479 | ||||||
| LivePerson, Inc.* | 10,564 | 107,225 | ||||||
| LogMeIn, Inc.* | 4,726 | 220,326 | ||||||
| Marchex, Inc. "B" | 6,394 | 76,856 | ||||||
| Marin Software, Inc.* | 5,130 | 60,380 | ||||||
| Marketo, Inc.* | 4,990 | 145,109 | ||||||
| Millennial Media, Inc.* (a) | 14,672 | 73,213 | ||||||
| Monster Worldwide, Inc.* | 17,716 | 115,863 | ||||||
| Move, Inc.* | 7,708 | 114,001 | ||||||
| NIC, Inc. | 12,697 | 201,248 | ||||||
| OpenTable, Inc.* | 4,564 | 472,830 | ||||||
| OPOWER, Inc.* | 1,514 | 28,539 | ||||||
| Perficient, Inc.* | 6,656 | 129,592 | ||||||
| Q2 Holdings, Inc.* | 1,927 | 27,479 | ||||||
| QuinStreet, Inc.* | 6,769 | 37,297 | ||||||
| RealNetworks, Inc.* | 4,458 | 34,015 | ||||||
| Reis, Inc. | 1,657 | 34,930 | ||||||
| Rocket Fuel, Inc.* | 3,571 | 111,022 | ||||||
| SciQuest, Inc.* | 5,297 | 93,704 | ||||||
| Shutterstock, Inc.* (a) | 2,961 | 245,704 | ||||||
| SPS Commerce, Inc.* | 3,155 | 199,365 | ||||||
| Stamps.com, Inc.* | 2,741 | 92,344 | ||||||
| TechTarget, Inc.* | 3,233 | 28,515 | ||||||
| Textura Corp.* (a) | 3,628 | 85,766 | ||||||
| Travelzoo, Inc.* | 1,394 | 26,974 | ||||||
| Tremor Video, Inc.* | 6,913 | 32,629 | ||||||
| TrueCar, Inc.* | 1,517 | 22,421 | ||||||
| Trulia, Inc.* (a) | 7,185 | 340,425 | ||||||
| Unwired Planet, Inc.* | 18,670 | 41,634 | ||||||
| VistaPrint NV* | 6,479 | 262,140 | ||||||
| Web.com Group, Inc.* | 10,078 | 290,952 | ||||||
| WebMD Health Corp.* | 7,539 | 364,134 | ||||||
| Wix.com Ltd.* | 2,699 | 53,548 | ||||||
| XO Group, Inc.* | 5,319 | 64,998 | ||||||
| Xoom Corp.* | 6,016 | 158,582 | ||||||
| YuMe, Inc.* | 3,539 | 20,880 | ||||||
| Zix Corp.* | 11,797 | 40,346 | ||||||
| 9,518,252 | ||||||||
| IT Services 2.3% | ||||||||
| Acxiom Corp.* | 14,975 | 324,808 | ||||||
| Blackhawk Network Holdings, Inc.* (a) | 10,234 | 288,803 | ||||||
| CACI International, Inc. "A"* | 4,555 | 319,807 | ||||||
| Cardtronics, Inc.* | 8,655 | 294,962 | ||||||
| Cass Information Systems, Inc. | 2,244 | 111,033 | ||||||
| CIBER, Inc.* | 15,290 | 75,533 | ||||||
| Computer Task Group, Inc. (a) | 2,934 | 48,294 | ||||||
| Convergys Corp. | 19,753 | 423,504 | ||||||
| CSG Systems International, Inc. | 6,637 | 173,292 | ||||||
| Datalink Corp.* | 3,701 | 37,010 | ||||||
| Shares | Value ($) | |||||||
| EPAM Systems, Inc.* | 6,927 | 303,056 | ||||||
| Euronet Worldwide, Inc.* | 9,914 | 478,251 | ||||||
| EVERTEC, Inc. | 12,785 | 309,908 | ||||||
| Exlservice Holdings, Inc.* | 6,361 | 187,331 | ||||||
| Forrester Research, Inc. | 2,128 | 80,609 | ||||||
| Global Cash Access Holdings, Inc.* | 12,749 | 113,466 | ||||||
| Heartland Payment Systems, Inc. (a) | 6,974 | 287,399 | ||||||
| Higher One Holdings Inc.* | 6,225 | 23,717 | ||||||
| iGATE Corp.* | 7,157 | 260,443 | ||||||
| Information Services Group, Inc.* | 6,354 | 30,563 | ||||||
| Lionbridge Technologies, Inc.* | 12,581 | 74,731 | ||||||
| Luxoft Holding, Inc.* | 1,526 | 55,028 | ||||||
| ManTech International Corp. "A" | 4,615 | 136,235 | ||||||
| MAXIMUS, Inc. | 13,171 | 566,616 | ||||||
| ModusLink Global Solutions, Inc.* (a) | 7,578 | 28,342 | ||||||
| MoneyGram International, Inc.* | 5,680 | 83,666 | ||||||
| NeuStar, Inc. "A"* | 11,720 | 304,954 | ||||||
| PRGX Global, Inc.* | 5,691 | 36,366 | ||||||
| Sapient Corp.* | 22,308 | 362,505 | ||||||
| Science Applications International Corp. | 8,177 | 361,096 | ||||||
| ServiceSource International, Inc.* | 13,324 | 77,279 | ||||||
| Sykes Enterprises, Inc.* | 7,641 | 166,039 | ||||||
| Syntel, Inc.* | 3,020 | 259,599 | ||||||
| TeleTech Holdings, Inc.* | 3,414 | 98,972 | ||||||
| The Hackett Group, Inc. | 4,839 | 28,889 | ||||||
| Unisys Corp.* | 9,948 | 246,114 | ||||||
| Virtusa Corp.* | 5,060 | 181,148 | ||||||
| WEX, Inc.* | 7,540 | 791,474 | ||||||
| 8,030,842 | ||||||||
| Semiconductors & Semiconductor Equipment 3.7% | ||||||||
| Advanced Energy Industries, Inc.* | 7,930 | 152,653 | ||||||
| Alpha & Omega Semiconductor Ltd.* | 4,209 | 39,017 | ||||||
| Ambarella, Inc.* (a) | 5,604 | 174,733 | ||||||
| Amkor Technology, Inc.* | 16,600 | 185,588 | ||||||
| Applied Micro Circuits Corp.* | 15,173 | 164,020 | ||||||
| Audience, Inc.* | 2,729 | 32,639 | ||||||
| Axcelis Technologies, Inc.* | 22,127 | 44,254 | ||||||
| Brooks Automation, Inc. | 12,919 | 139,138 | ||||||
| Cabot Microelectronics Corp.* | 4,694 | 209,587 | ||||||
| Cascade Microtech, Inc.* | 2,486 | 33,959 | ||||||
| Cavium, Inc.* | 10,276 | 510,306 | ||||||
| CEVA, Inc.* | 4,090 | 60,409 | ||||||
| Cirrus Logic, Inc.* (a) | 12,073 | 274,540 | ||||||
| Cohu, Inc. | 5,017 | 53,682 | ||||||
| Cypress Semiconductor Corp. (a) | 30,695 | 334,882 | ||||||
| Diodes, Inc.* | 7,086 | 205,211 | ||||||
| DSP Group, Inc.* | 4,315 | 36,634 | ||||||
| Entegris, Inc.* | 27,073 | 372,118 | ||||||
| Entropic Communications, Inc.* | 17,382 | 57,882 | ||||||
| Exar Corp.* | 7,632 | 86,242 | ||||||
| Fairchild Semiconductor International, Inc.* | 24,309 | 379,220 | ||||||
| FormFactor, Inc.* | 10,732 | 89,290 | ||||||
| GT Advanced Technologies, Inc.* (a) | 26,535 | 493,551 | ||||||
| Hittite Microwave Corp. | 6,104 | 475,807 | ||||||
| Inphi Corp.* | 6,096 | 89,489 | ||||||
| Integrated Device Technology, Inc.* | 25,987 | 401,759 | ||||||
| Integrated Silicon Solution, Inc.* | 5,853 | 86,449 | ||||||
| Shares | Value ($) | |||||||
| International Rectifier Corp.* | 13,907 | 388,005 | ||||||
| Intersil Corp. "A" | 25,019 | 374,034 | ||||||
| IXYS Corp. | 4,666 | 57,485 | ||||||
| Kopin Corp.* | 12,627 | 41,164 | ||||||
| Lattice Semiconductor Corp.* | 22,751 | 187,696 | ||||||
| MA-COM Technology Solutions Holdings, Inc.* | 2,340 | 52,603 | ||||||
| MaxLinear, Inc. "A"* | 5,421 | 54,589 | ||||||
| Micrel, Inc. | 8,694 | 98,068 | ||||||
| Microsemi Corp.* | 18,478 | 494,471 | ||||||
| MKS Instruments, Inc. | 10,420 | 325,521 | ||||||
| Monolithic Power Systems, Inc. | 7,513 | 318,176 | ||||||
| Nanometrics, Inc.* | 4,732 | 86,359 | ||||||
| NVE Corp.* | 927 | 51,532 | ||||||
| OmniVision Technologies, Inc.* | 10,928 | 240,197 | ||||||
| PDF Solutions, Inc.* | 5,940 | 126,047 | ||||||
| Peregrine Semiconductor Corp.* (a) | 5,252 | 36,029 | ||||||
| Pericom Semiconductor Corp.* | 4,408 | 39,848 | ||||||
| Photronics, Inc.* | 12,135 | 104,361 | ||||||
| PLX Technology, Inc.* | 7,915 | 51,210 | ||||||
| PMC-Sierra, Inc.* | 33,744 | 256,792 | ||||||
| Power Integrations, Inc. | 5,918 | 340,522 | ||||||
| QuickLogic Corp.* | 10,734 | 55,495 | ||||||
| Rambus, Inc.* | 22,072 | 315,630 | ||||||
| RF Micro Devices, Inc.* | 55,671 | 533,885 | ||||||
| Rubicon Technology, Inc.* (a) | 5,092 | 44,555 | ||||||
| Rudolph Technologies, Inc.* | 6,572 | 64,931 | ||||||
| Semtech Corp.* | 13,086 | 342,199 | ||||||
| Silicon Image, Inc.* | 15,312 | 77,172 | ||||||
| Silicon Laboratories, Inc.* | 8,454 | 416,360 | ||||||
| Spansion, Inc. "A"* | 11,748 | 247,530 | ||||||
| Synaptics, Inc.* (a) | 7,008 | 635,205 | ||||||
| Tessera Technologies, Inc. | 10,405 | 229,742 | ||||||
| TriQuint Semiconductor, Inc.* | 33,332 | 526,979 | ||||||
| Ultra Clean Holdings, Inc.* | 5,730 | 51,857 | ||||||
| Ultratech, Inc.* | 5,461 | 121,125 | ||||||
| Veeco Instruments, Inc.* | 7,746 | 288,616 | ||||||
| Vitesse Semiconductor Corp.* | 9,379 | 32,358 | ||||||
| Xcerra Corp.* | 9,380 | 85,358 | ||||||
| 12,976,765 | ||||||||
| Software 3.9% | ||||||||
| A10 Networks, Inc.* | 2,477 | 32,944 | ||||||
| ACI Worldwide, Inc.* | 7,381 | 412,081 | ||||||
| Actuate Corp.* | 9,194 | 43,855 | ||||||
| Advent Software, Inc. | 10,017 | 326,254 | ||||||
| American Software, Inc. "A" | 4,688 | 46,317 | ||||||
| Aspen Technology, Inc.* | 17,913 | 831,163 | ||||||
| AVG Technologies NV* | 6,782 | 136,522 | ||||||
| Barracuda Networks, Inc.* (a) | 1,544 | 47,895 | ||||||
| Blackbaud, Inc. | 8,985 | 321,124 | ||||||
| Bottomline Technologies de, Inc.* | 7,655 | 229,038 | ||||||
| BroadSoft, Inc.* | 5,580 | 147,256 | ||||||
| Callidus Software* | 8,946 | 106,815 | ||||||
| Cinedigm Corp. "A"* | 14,893 | 37,084 | ||||||
| CommVault Systems, Inc.* | 9,181 | 451,430 | ||||||
| Compuware Corp. | 42,758 | 427,152 | ||||||
| Comverse, Inc.* | 4,362 | 116,378 | ||||||
| Covisint Corp.* | 1,420 | 6,901 | ||||||
| Cyan, Inc.* | 5,352 | 21,569 | ||||||
| Digimarc Corp. | 1,234 | 40,228 | ||||||
| Ebix, Inc. (a) | 6,044 | 86,490 | ||||||
| Ellie Mae, Inc.* (a) | 5,472 | 170,343 | ||||||
| EnerNOC, Inc.* | 5,196 | 98,464 | ||||||
| Shares | Value ($) | |||||||
| EPIQ Systems, Inc. | 6,006 | 84,384 | ||||||
| ePlus, Inc.* | 1,015 | 59,073 | ||||||
| Fair Isaac Corp. | 6,669 | 425,216 | ||||||
| FleetMatics Group PLC* (a) | 7,266 | 234,982 | ||||||
| Gigamon, Inc.* (a) | 4,706 | 90,073 | ||||||
| Glu Mobile, Inc.* (a) | 17,501 | 87,505 | ||||||
| Guidance Software, Inc.* | 3,374 | 30,771 | ||||||
| Guidewire Software, Inc.* | 13,223 | 537,647 | ||||||
| Imperva, Inc.* | 4,304 | 112,679 | ||||||
| Infoblox, Inc.* | 10,486 | 137,891 | ||||||
| Interactive Intelligence Group* | 3,262 | 183,096 | ||||||
| Jive Software, Inc.* | 8,288 | 70,531 | ||||||
| Kofax Ltd.* | 14,436 | 124,150 | ||||||
| Manhattan Associates, Inc.* | 14,748 | 507,774 | ||||||
| Mavenir Systems, Inc.* | 1,881 | 28,497 | ||||||
| Mentor Graphics Corp. | 18,850 | 406,595 | ||||||
| MicroStrategy, Inc. "A"* | 1,766 | 248,335 | ||||||
| Model N, Inc.* | 3,754 | 41,482 | ||||||
| Monotype Imaging Holdings, Inc. | 7,696 | 216,796 | ||||||
| NetScout Systems, Inc.* | 7,090 | 314,371 | ||||||
| Park City Group, Inc.* | 1,860 | 20,255 | ||||||
| Paycom Software, Inc.* | 1,270 | 18,529 | ||||||
| Pegasystems, Inc. | 6,869 | 145,073 | ||||||
| Progress Software Corp.* | 10,000 | 240,400 | ||||||
| Proofpoint, Inc.* | 7,198 | 269,637 | ||||||
| PROS Holdings, Inc.* | 4,576 | 120,989 | ||||||
| QAD, Inc. "A" | 1,213 | 25,861 | ||||||
| Qlik Technologies, Inc.* | 17,406 | 393,724 | ||||||
| Qualys, Inc.* | 3,914 | 100,472 | ||||||
| Rally Software Development Corp.* | 4,840 | 52,708 | ||||||
| RealPage, Inc.* | 10,080 | 226,598 | ||||||
| Rosetta Stone, Inc.* | 4,138 | 40,221 | ||||||
| Rubicon Project, Inc.* | 1,540 | 19,774 | ||||||
| Sapiens International Corp.* | 4,779 | 38,232 | ||||||
| Seachange International, Inc.* | 6,507 | 52,121 | ||||||
| Silver Spring Networks, Inc.* (a) | 6,814 | 90,831 | ||||||
| SS&C Technologies Holdings, Inc.* | 13,253 | 586,048 | ||||||
| Synchronoss Technologies, Inc.* | 6,865 | 240,000 | ||||||
| Take-Two Interactive Software, Inc.* | 19,255 | 428,231 | ||||||
| Tangoe, Inc.* | 7,532 | 113,432 | ||||||
| TeleCommunication Systems, Inc. "A"* | 9,403 | 30,936 | ||||||
| TeleNav, Inc.* | 5,303 | 30,174 | ||||||
| TiVo, Inc.* | 22,360 | 288,668 | ||||||
| Tyler Technologies, Inc.* | 6,422 | 585,751 | ||||||
| Ultimate Software Group, Inc.* | 5,509 | 761,179 | ||||||
| Varonis Systems, Inc.* | 1,037 | 30,083 | ||||||
| VASCO Data Security International, Inc.* | 5,667 | 65,737 | ||||||
| Verint Systems, Inc.* | 10,487 | 514,387 | ||||||
| Virnetx Holding Corp.* (a) | 8,276 | 145,740 | ||||||
| Vringo, Inc.* (a) | 14,206 | 48,585 | ||||||
| Zendesk, Inc.* | 2,212 | 38,445 | ||||||
| 13,841,972 | ||||||||
| Technology Hardware, Storage & Peripherals 0.5% | ||||||||
| Cray, Inc.* (a) | 7,931 | 210,965 | ||||||
| Dot Hill Systems Corp.* | 11,673 | 54,863 | ||||||
| Eastman Kodak Co.* | 3,434 | 84,030 | ||||||
| Electronics for Imaging, Inc.* | 9,064 | 409,693 | ||||||
| Fusion-io, Inc.* | 21,013 | 237,447 | ||||||
| Immersion Corp.* | 5,488 | 69,807 | ||||||
| Intevac, Inc.* | 4,652 | 37,263 | ||||||
| Shares | Value ($) | |||||||
| Nimble Storage, Inc.* | 1,802 | 55,357 | ||||||
| QLogic Corp.* | 16,973 | 171,258 | ||||||
| Quantum Corp.* | 42,116 | 51,382 | ||||||
| Silicon Graphics International Corp.* (a) | 6,646 | 63,934 | ||||||
| Super Micro Computer, Inc.* | 6,715 | 169,688 | ||||||
| Violin Memory, Inc.* | 15,601 | 69,112 | ||||||
| 1,684,799 | ||||||||
| Materials 5.0% | ||||||||
| Chemicals 2.4% | ||||||||
| A. Schulman, Inc. | 5,678 | 219,739 | ||||||
| Advanced Emissions Solutions, Inc.* | 4,256 | 97,590 | ||||||
| American Vanguard Corp. | 5,594 | 73,953 | ||||||
| Axiall Corp. | 13,602 | 642,966 | ||||||
| Balchem Corp. | 5,937 | 317,986 | ||||||
| Calgon Carbon Corp.* | 10,362 | 231,383 | ||||||
| Chase Corp. | 1,320 | 45,065 | ||||||
| Chemtura Corp.* (a) | 18,688 | 488,317 | ||||||
| Ferro Corp.* | 13,951 | 175,225 | ||||||
| Flotek Industries, Inc.* (a) | 10,462 | 336,458 | ||||||
| FutureFuel Corp. | 4,315 | 71,586 | ||||||
| H.B. Fuller Co. | 9,742 | 468,590 | ||||||
| Hawkins, Inc. | 2,060 | 76,508 | ||||||
| Innophos Holdings, Inc. | 4,267 | 245,651 | ||||||
| Innospec, Inc. | 4,777 | 206,223 | ||||||
| Intrepid Potash, Inc.* (a) | 10,807 | 181,125 | ||||||
| KMG Chemicals, Inc. | 1,868 | 33,587 | ||||||
| Koppers Holdings, Inc. | 3,979 | 152,197 | ||||||
| Kraton Performance Polymers, Inc.* | 6,318 | 141,460 | ||||||
| Kronos Worldwide, Inc. | 4,070 | 63,777 | ||||||
| Landec Corp.* | 5,169 | 64,561 | ||||||
| LSB Industries, Inc.* | 3,759 | 156,637 | ||||||
| Marrone Bio Innovations, Inc.* | 2,201 | 25,576 | ||||||
| Minerals Technologies, Inc. | 6,707 | 439,845 | ||||||
| Olin Corp. (a) | 15,367 | 413,680 | ||||||
| OM Group, Inc. | 6,244 | 202,493 | ||||||
| Omnova Solutions, Inc.* | 9,210 | 83,719 | ||||||
| PolyOne Corp. | 18,308 | 771,499 | ||||||
| Quaker Chemical Corp. | 2,555 | 196,198 | ||||||
| Rentech, Inc.* | 44,243 | 114,589 | ||||||
| Senomyx, Inc.* | 8,273 | 71,561 | ||||||
| Sensient Technologies Corp. | 9,618 | 535,915 | ||||||
| Stepan Co. | 3,739 | 197,644 | ||||||
| Taminco Corp.* | 5,545 | 128,977 | ||||||
| Trecora Resources* | 3,844 | 45,513 | ||||||
| Tredegar Corp. | 4,895 | 114,592 | ||||||
| Tronox Ltd. "A" | 11,954 | 321,563 | ||||||
| Zep, Inc. | 4,537 | 80,123 | ||||||
| 8,234,071 | ||||||||
| Construction Materials 0.2% | ||||||||
| Headwaters, Inc.* | 14,285 | 198,419 | ||||||
| Texas Industries, Inc.* (a) | 4,318 | 398,810 | ||||||
| U.S. Concrete, Inc.* | 2,762 | 68,359 | ||||||
| United States Lime & Minerals, Inc. | 377 | 24,430 | ||||||
| 690,018 | ||||||||
| Containers & Packaging 0.4% | ||||||||
| AEP Industries, Inc.* | 840 | 29,291 | ||||||
| Berry Plastics Group, Inc.* | 17,500 | 451,500 | ||||||
| Graphic Packaging Holding Co.* | 63,605 | 744,178 | ||||||
| Myers Industries, Inc. | 5,373 | 107,944 | ||||||
| Shares | Value ($) | |||||||
| UFP Technologies, Inc.* | 1,182 | 28,474 | ||||||
| 1,361,387 | ||||||||
| Metals & Mining 1.3% | ||||||||
| A.M. Castle & Co.* | 3,669 | 40,506 | ||||||
| AK Steel Holding Corp.* (a) | 26,409 | 210,216 | ||||||
| Allied Nevada Gold Corp.* (a) | 20,655 | 77,663 | ||||||
| Ampco-Pittsburgh Corp. | 1,668 | 38,264 | ||||||
| Century Aluminum Co.* | 10,004 | 156,863 | ||||||
| Coeur Mining, Inc.* | 20,136 | 184,848 | ||||||
| Commercial Metals Co. | 22,911 | 396,589 | ||||||
| Globe Specialty Metals, Inc. | 12,419 | 258,067 | ||||||
| Gold Resource Corp. | 7,456 | 37,727 | ||||||
| Handy & Harman Ltd.* | 942 | 25,217 | ||||||
| Haynes International, Inc. | 2,413 | 136,552 | ||||||
| Hecla Mining Co. (a) | 66,469 | 229,318 | ||||||
| Horsehead Holding Corp.* | 9,866 | 180,153 | ||||||
| Kaiser Aluminum Corp. | 3,507 | 255,555 | ||||||
| Materion Corp. | 4,005 | 148,145 | ||||||
| Molycorp, Inc.* (a) | 35,422 | 91,035 | ||||||
| Noranda Aluminum Holding Corp. | 8,638 | 30,492 | ||||||
| Olympic Steel, Inc. | 1,750 | 43,313 | ||||||
| RTI International Metals, Inc.* | 5,973 | 158,822 | ||||||
| Schnitzer Steel Industries, Inc. "A" (a) | 5,086 | 132,592 | ||||||
| Stillwater Mining Co.* (a) | 23,307 | 409,038 | ||||||
| SunCoke Energy, Inc.* | 13,576 | 291,884 | ||||||
| U.S. Silica Holdings, Inc. | 10,458 | 579,792 | ||||||
| Universal Stainless & Alloy Products, Inc.* | 1,376 | 44,692 | ||||||
| Walter Energy, Inc. (a) | 12,811 | 69,820 | ||||||
| Worthington Industries, Inc. | 10,012 | 430,916 | ||||||
| 4,658,079 | ||||||||
| Paper & Forest Products 0.7% | ||||||||
| Boise Cascade Co.* | 7,664 | 219,497 | ||||||
| Clearwater Paper Corp.* | 3,971 | 245,090 | ||||||
| Deltic Timber Corp. | 2,160 | 130,507 | ||||||
| KapStone Paper & Packaging Corp.* | 16,451 | 545,022 | ||||||
| Louisiana-Pacific Corp.* | 27,454 | 412,359 | ||||||
| Neenah Paper, Inc. | 3,249 | 172,684 | ||||||
| P.H. Glatfelter Co. | 8,375 | 222,189 | ||||||
| Resolute Forest Products* (a) | 12,682 | 212,804 | ||||||
| Schweitzer-Mauduit International, Inc. | 5,925 | 258,686 | ||||||
| Wausau Paper Corp. | 8,210 | 88,832 | ||||||
| 2,507,670 | ||||||||
| Telecommunication Services 0.8% | ||||||||
| Diversified Telecommunication Services 0.7% | ||||||||
| 8x8, Inc.* | 17,237 | 139,275 | ||||||
| Atlantic Tele-Network, Inc. | 1,827 | 105,966 | ||||||
| Cbeyond, Inc.* | 5,254 | 52,277 | ||||||
| Cincinnati Bell, Inc.* | 40,695 | 159,931 | ||||||
| Cogent Communications Holdings, Inc. | 9,068 | 313,299 | ||||||
| Consolidated Communications Holdings, Inc. (a) | 7,854 | 174,673 | ||||||
| Enventis Corp. | 2,747 | 43,513 | ||||||
| FairPoint Communications, Inc.* | 4,037 | 56,397 | ||||||
| General Communication, Inc. "A"* | 7,001 | 77,571 | ||||||
| Globalstar, Inc.* | 53,416 | 227,018 | ||||||
| Hawaiian Telcom Holdco, Inc.* | 2,028 | 58,021 | ||||||
| IDT Corp. "B" | 3,285 | 57,225 | ||||||
| inContact, Inc.* | 11,653 | 107,091 | ||||||
| Shares | Value ($) | |||||||
| Inteliquent, Inc. | 6,291 | 87,256 | ||||||
| Intelsat SA* | 5,329 | 100,398 | ||||||
| Iridium Communications, Inc.* (a) | 15,678 | 132,636 | ||||||
| Lumos Networks Corp. | 3,664 | 53,018 | ||||||
| magicJack VocalTec Ltd.* (a) | 3,472 | 52,497 | ||||||
| Orbcomm, Inc.* | 8,589 | 56,602 | ||||||
| Premiere Global Services, Inc.* | 9,397 | 125,450 | ||||||
| Vonage Holdings Corp.* | 33,909 | 127,159 | ||||||
| 2,307,273 | ||||||||
| Wireless Telecommunication Services 0.1% | ||||||||
| Boingo Wireless, Inc.* | 4,508 | 30,790 | ||||||
| NTELOS Holdings Corp. | 3,297 | 41,081 | ||||||
| RingCentral, Inc. "A"* | 5,450 | 82,458 | ||||||
| Shenandoah Telecommunications Co. | 4,685 | 142,705 | ||||||
| U.S.A. Mobility, Inc. | 4,291 | 66,081 | ||||||
| 363,115 | ||||||||
| Utilities 3.3% | ||||||||
| Electric Utilities 1.4% | ||||||||
| ALLETE, Inc. | 8,248 | 423,535 | ||||||
| Cleco Corp. | 11,743 | 692,250 | ||||||
| El Paso Electric Co. | 7,845 | 315,448 | ||||||
| Empire District Electric Co. (a) | 8,422 | 216,277 | ||||||
| IDACORP, Inc. | 9,790 | 566,156 | ||||||
| MGE Energy, Inc. | 6,751 | 266,732 | ||||||
| NRG Yield, Inc. "A" (a) | 3,908 | 203,411 | ||||||
| Otter Tail Corp. | 7,100 | 215,059 | ||||||
| PNM Resources, Inc. | 15,497 | 454,527 | ||||||
| Portland General Electric Co. (a) | 15,219 | 527,643 | ||||||
| UIL Holdings Corp. | 11,002 | 425,887 | ||||||
| Unitil Corp. | 2,674 | 90,461 | ||||||
| UNS Energy Corp. | 8,115 | 490,227 | ||||||
| 4,887,613 | ||||||||
| Gas Utilities 1.0% | ||||||||
| Chesapeake Utilities Corp. | 1,869 | 133,316 | ||||||
| New Jersey Resources Corp. | 8,198 | 468,598 | ||||||
| Northwest Natural Gas Co. (a) | 5,284 | 249,141 | ||||||
| ONE Gas, Inc. | 10,112 | 381,728 | ||||||
| Piedmont Natural Gas Co., Inc. (a) | 15,166 | 567,360 | ||||||
| South Jersey Industries, Inc. | 6,411 | 387,288 | ||||||
| Southwest Gas Corp. | 9,051 | 477,802 | ||||||
| The Laclede Group, Inc. | 6,384 | 309,943 | ||||||
| WGL Holdings, Inc. | 10,101 | 435,353 | ||||||
| 3,410,529 | ||||||||
| Independent Power & Renewable Eletricity Producers 0.3% | ||||||||
| Atlantic Power Corp. (a) | 23,408 | 95,973 | ||||||
| Dynegy, Inc.* | 19,525 | 679,470 | ||||||
| Ormat Technologies, Inc. | 3,406 | 98,195 | ||||||
| Pattern Energy Group, Inc. | 7,682 | 254,351 | ||||||
| 1,127,989 | ||||||||
| Multi-Utilities 0.4% | ||||||||
| Avista Corp. | 11,716 | 392,720 | ||||||
| Black Hills Corp. | 8,688 | 533,357 | ||||||
| NorthWestern Corp. | 7,589 | 396,070 | ||||||
| 1,322,147 | ||||||||
| Water Utilities 0.2% | ||||||||
| American States Water Co. | 7,550 | 250,887 | ||||||
| Artesian Resources Corp. "A" | 1,483 | 33,338 | ||||||
| California Water Service Group | 9,310 | 225,302 | ||||||
| Connecticut Water Service, Inc. | 2,090 | 70,788 | ||||||
| Middlesex Water Co. | 3,152 | 66,759 | ||||||
| Shares | Value ($) | |||||||
| SJW Corp. | 3,061 | 83,259 | ||||||
| York Water Co. | 2,451 | 51,030 | ||||||
| 781,363 | ||||||||
Total Common Stocks (Cost $249,928,578) | 341,781,747 | |||||||
| Rights 0.0% | ||||||||
| Telecommunication Services 0.0% | ||||||||
| Leap Wireless International, Inc.* (Cost $26,873) | 10,664 | 26,873 | ||||||
| Warrants 0.0% | ||||||||
| Energy 0.0% | ||||||||
| Magnum Hunter Resources Corp., Expiration Date 4/15/2016* (a) | 3,420 | 6,376 | ||||||
| Financials 0.0% | ||||||||
| Tejon Ranch Co., Expiration Date 8/31/2016* | 403 | 1,181 | ||||||
Total Warrants (Cost $2,752) | 7,557 | |||||||
| Principal Amount ($) | Value ($) | |||||||
| Government & Agency Obligation 0.4% | ||||||||
| U.S. Treasury Obligation | ||||||||
| U.S. Treasury Bill, 0.04%**, 10/2/2014 (b) (Cost $1,334,862) | 1,335,000 | 1,334,862 | ||||||
| Shares | Value ($) | |||||||
| Securities Lending Collateral 17.5% | ||||||||
| Daily Assets Fund Institutional, 0.08% (c) (d) (Cost $61,425,863) | 61,425,863 | 61,425,863 | ||||||
| Cash Equivalents 1.9% | ||||||||
| Central Cash Management Fund, 0.06% (c) (Cost $6,641,361) | 6,641,361 | 6,641,361 | ||||||
| % of Net Assets | Value ($) | |||||||
Total Investment Portfolio (Cost $319,360,289)† | 117.2 | 411,218,263 | ||||||
| Other Assets and Liabilities, Net | (17.2 | ) | (60,289,580 | ) | ||||
| Net Assets | 100.0 | 350,928,683 | ||||||
* Non-income producing security.
** Annualized yield at time of purchase; not a coupon rate.
† The cost for federal income tax purposes was $323,326,639. At June 30, 2014, net unrealized appreciation for all securities based on tax cost was $87,891,624. This consisted of aggregate gross unrealized appreciation for all securities in which there was an excess of value over tax cost of $107,144,405 and aggregate gross unrealized depreciation for all securities in which there was an excess of tax cost over value of $19,252,781.
(a) All or a portion of these securities were on loan. In addition, "Other Assets and Liabilities, Net" may include pending sales that are also on loan. The value of all securities loaned at June 30, 2014 amounted to $59,863,493, which is 17.1% of net assets.
(b) At June 30, 2014, this security has been pledged, in whole or in part, to cover initial margin requirements for open futures contracts.
(c) Affiliated fund managed by Deutsche Investment Management Americas Inc. The rate shown is the annualized seven-day yield at period end.
(d) Represents collateral held in connection with securities lending. Income earned by the Fund is net of borrower rebates.
REIT: Real Estate Investment Trust
At June 30, 2014, open futures contracts purchased were as follows:
| Futures | Currency | Expiration Date | Contracts | Notional Value ($) | Unrealized Appreciation ($) | |||||||||
| Russell E Mini 2000 Index | USD | 9/19/2014 | 79 | 9,403,370 | 187,156 | |||||||||
| Currency Abbreviation |
| USD United States Dollar |
For information on the Fund's policy and additional disclosures regarding futures contracts, please refer to Note B in the accompanying Notes to Financial Statements.
Fair Value Measurements
Various inputs are used in determining the value of the Fund's investments. These inputs are summarized in three broad levels. Level 1 includes quoted prices in active markets for identical securities. Level 2 includes other significant observable inputs (including quoted prices for similar securities, interest rates, prepayment speeds and credit risk). Level 3 includes significant unobservable inputs (including the Fund's own assumptions in determining the fair value of investments). The level assigned to the securities valuations may not be an indication of the risk or liquidity associated with investing in those securities.
The following is a summary of the inputs used as of June 30, 2014 in valuing the Fund's investments. For information on the Fund's policy regarding the valuation of investments, please refer to the Security Valuation section of Note A in the accompanying Notes to Financial Statements.
| Assets | Level 1 | Level 2 | Level 3 | Total | ||||||||||||
| Common Stocks (e) | $ | 341,781,747 | $ | — | $ | 0 | $ | 341,781,747 | ||||||||
| Rights | — | — | 26,873 | 26,873 | ||||||||||||
| Warrants | 1,181 | — | 6,376 | 7,557 | ||||||||||||
| Government & Agency Obligations | — | 1,334,862 | — | 1,334,862 | ||||||||||||
| Short-Term Investments (e) | 68,067,224 | — | — | 68,067,224 | ||||||||||||
Derivatives (f) Futures Contracts | 187,156 | — | — | 187,156 | ||||||||||||
| Total | $ | 410,037,308 | $ | 1,334,862 | $ | 33,249 | $ | 411,405,419 | ||||||||
There have been no transfers between fair value measurement levels during the period ended June 30, 2014.
(e) See Investment Portfolio for additional detailed categorizations.
(f) Derivatives include unrealized appreciation (depreciation) on futures contracts.
The accompanying notes are an integral part of the financial statements.
| as of June 30, 2014 (Unaudited) | ||||
| Assets | ||||
Investments: Investments in non-affiliated securities, at value (cost $251,293,065) — including $59,863,493 of securities loaned | $ | 343,151,039 | ||
| Investment in Daily Assets Fund Institutional (cost $61,425,863)* | 61,425,863 | |||
| Investment in Central Cash Management Fund (cost $6,641,361) | 6,641,361 | |||
| Total investments in securities, at value (cost $319,360,289) | 411,218,263 | |||
| Cash | 374,489 | |||
| Receivable for investments sold | 35,124,470 | |||
| Receivable for Fund shares sold | 106,874 | |||
| Dividends receivable | 358,278 | |||
| Interest receivable | 57,159 | |||
| Receivable for variation margin on futures contracts | 63,801 | |||
| Other assets | 2,533 | |||
| Total assets | 447,305,867 | |||
| Liabilities | ||||
| Payable upon return of securities loaned | 61,425,863 | |||
| Payable for investments purchased | 34,461,069 | |||
| Payable for Fund shares redeemed | 253,349 | |||
| Accrued management fee | 84,107 | |||
| Accrued Trustees' fees | 1,425 | |||
| Other accrued expenses and payables | 151,371 | |||
| Total liabilities | 96,377,184 | |||
| Net assets, at value | $ | 350,928,683 | ||
| Net Assets Consist of | ||||
| Undistributed net investment income | 1,746,931 | |||
Net unrealized appreciation (depreciation) on: Investments | 91,857,974 | |||
| Futures | 187,156 | |||
| Foreign currency | 13 | |||
| Accumulated net realized gain (loss) | 12,191,973 | |||
| Paid-in capital | 244,944,636 | |||
| Net assets, at value | $ | 350,928,683 | ||
Class A Net Asset Value, offering and redemption price per share ($322,796,912 ÷ 18,929,351 outstanding shares of beneficial interest, $.001 par value, unlimited number of shares authorized) | $ | 17.05 | ||
Class B Net Asset Value, offering and redemption price per share ($28,131,771 ÷ 1,648,669 outstanding shares of beneficial interest, $.001 par value, unlimited number of shares authorized) | $ | 17.06 | ||
* Represents collateral on securities loaned.
The accompanying notes are an integral part of the financial statements.
Statement of Operations
| for the six months ended June 30, 2014 (Unaudited) | ||||
| Investment Income | ||||
Income: Dividends (net of foreign taxes withheld of $1,306) | $ | 2,315,149 | ||
| Interest | 305 | |||
| Income distributions — Central Cash Management Fund | 2,480 | |||
| Securities lending income, including income from Daily Assets Fund Institutional, net of borrower rebates | 310,210 | |||
| Total income | 2,628,144 | |||
Expenses: Management fee | 590,576 | |||
| Administration fee | 168,736 | |||
| Services to shareholders | 3,387 | |||
| Distribution service fee (Class B) | 33,228 | |||
| Record keeping fee (Class B) | 209 | |||
| Custodian fee | 19,425 | |||
| Professional fees | 37,221 | |||
| Reports to shareholders | 32,121 | |||
| Trustees' fees and expenses | 7,957 | |||
| Other | 29,718 | |||
| Total expenses before expense reductions | 922,578 | |||
| Expense reductions | (96,256 | ) | ||
| Total expenses after expense reductions | 826,322 | |||
| Net investment income (loss) | 1,801,822 | |||
| Realized and Unrealized Gain (Loss) | ||||
Net realized gain (loss) from: Investments | 15,730,446 | |||
| Futures | 573,951 | |||
| Foreign currency | (4 | ) | ||
| 16,304,393 | ||||
Change in net unrealized appreciation (depreciation) on: Investments | (7,302,664 | ) | ||
| Futures | (104,583 | ) | ||
| Foreign currency | 13 | |||
| (7,407,234 | ) | |||
| Net gain (loss) | 8,897,159 | |||
| Net increase (decrease) in net assets resulting from operations | $ | 10,698,981 | ||
The accompanying notes are an integral part of the financial statements.
| Increase (Decrease) in Net Assets | Six Months Ended June 30, 2014 (Unaudited) | Year Ended December 31, 2013 | ||||||
Operations: Net investment income (loss) | $ | 1,801,822 | $ | 3,537,646 | ||||
| Net realized gain (loss) | 16,304,393 | 33,732,429 | ||||||
| Change in net unrealized appreciation (depreciation) | (7,407,234 | ) | 69,002,996 | |||||
| Net increase (decrease) in net assets resulting from operations | 10,698,981 | 106,273,071 | ||||||
Distributions to shareholders from: Net investment income: Class A | (3,011,298 | ) | (5,181,767 | ) | ||||
| Class B | (190,757 | ) | (649,644 | ) | ||||
Net realized gains: Class A | (17,149,421 | ) | (12,456,476 | ) | ||||
| Class B | (1,452,843 | ) | (1,826,741 | ) | ||||
| Total distributions | (21,804,319 | ) | (20,114,628 | ) | ||||
Fund share transactions: Class A Proceeds from shares sold | 34,319,398 | 46,365,415 | ||||||
| Reinvestment of distributions | 20,160,719 | 17,638,243 | ||||||
| Cost of shares redeemed | (31,388,896 | ) | (64,690,808 | ) | ||||
| In-kind redemptions | — | (46,676,566 | ) | |||||
| Net increase (decrease) in net assets from Class A share transactions | 23,091,221 | (47,363,716 | ) | |||||
Class B Proceeds from shares sold | 3,006,177 | 2,558,345 | ||||||
| Reinvestment of distributions | 1,643,600 | 2,476,385 | ||||||
| Payments for shares redeemed | (1,677,456 | ) | (8,601,439 | ) | ||||
| In-kind redemptions | — | (20,534,236 | ) | |||||
| Net increase (decrease) in net assets from Class B share transactions | 2,972,321 | (24,100,945 | ) | |||||
| Increase (decrease) in net assets | 14,958,204 | 14,693,782 | ||||||
| Net assets at beginning of period | 335,970,479 | 321,276,697 | ||||||
| Net assets at end of period (including undistributed net investment income of $1,746,931 and $3,147,164, respectively) | $ | 350,928,683 | $ | 335,970,479 | ||||
| Other Information | ||||||||
Class A Shares outstanding at beginning of period | 17,517,574 | 20,638,404 | ||||||
| Shares sold | 1,994,847 | 2,970,719 | ||||||
| Shares issued to shareholders in reinvestment of distributions | 1,259,258 | 1,243,882 | ||||||
| Shares redeemed | (1,842,328 | ) | (4,231,936 | ) | ||||
| In-kind redemptions | — | (3,103,495 | ) | |||||
| Net increase (decrease) in Class A shares | 1,411,777 | (3,120,830 | ) | |||||
| Shares outstanding at end of period | 18,929,351 | 17,517,574 | ||||||
Class B Shares outstanding at beginning of period | 1,470,660 | 3,049,367 | ||||||
| Shares sold | 172,870 | 166,190 | ||||||
| Shares issued to shareholders in reinvestment of distributions | 102,533 | 174,516 | ||||||
| Shares redeemed | (97,394 | ) | (555,012 | ) | ||||
| In-kind redemptions | — | (1,364,401 | ) | |||||
| Net increase (decrease) in Class B shares | 178,009 | (1,578,707 | ) | |||||
| Shares outstanding at end of period | 1,648,669 | 1,470,660 | ||||||
The accompanying notes are an integral part of the financial statements.
| Years Ended December 31, | ||||||||||||||||||||||||
| Class A | Six Months Ended 6/30/14 (Unaudited) | 2013 | 2012 | 2011 | 2010 | 2009 | ||||||||||||||||||
| Selected Per Share Data | ||||||||||||||||||||||||
| Net asset value, beginning of period | $ | 17.69 | $ | 13.56 | $ | 11.77 | $ | 12.41 | $ | 9.90 | $ | 8.63 | ||||||||||||
Income (loss) from investment operations: Net investment income (loss)a | .09 | .18 | .23 | .12 | .10 | .10 | ||||||||||||||||||
| Net realized and unrealized gain (loss) | .39 | 4.84 | 1.67 | (.65 | ) | 2.51 | 1.93 | |||||||||||||||||
| Total from investment operations | .48 | 5.02 | 1.90 | (.53 | ) | 2.61 | 2.03 | |||||||||||||||||
Less distributions from: Net investment income | (.17 | ) | (.26 | ) | (.11 | ) | (.11 | ) | (.10 | ) | (.16 | ) | ||||||||||||
| Net realized gains | (.95 | ) | (.63 | ) | (.00 | )*** | — | — | (.60 | ) | ||||||||||||||
| Total distributions | (1.12 | ) | (.89 | ) | (.11 | ) | (.11 | ) | (.10 | ) | (.76 | ) | ||||||||||||
| Net asset value, end of period | $ | 17.05 | $ | 17.69 | $ | 13.56 | $ | 11.77 | $ | 12.41 | $ | 9.90 | ||||||||||||
Total Return (%)b | 3.11 | ** | 38.64 | 16.25 | (4.41 | ) | 26.39 | 26.57 | ||||||||||||||||
| Ratios to Average Net Assets and Supplemental Data | ||||||||||||||||||||||||
| Net assets, end of period ($ millions) | 323 | 310 | 280 | 256 | 285 | 258 | ||||||||||||||||||
| Ratio of expenses before expense reductions (%) | .53 | * | .54 | .55 | .52 | .52 | .56 | |||||||||||||||||
| Ratio of expenses after expense reductions (%) | .47 | * | .46 | .49 | .50 | .52 | .50 | |||||||||||||||||
| Ratio of net investment income (loss) (%) | 1.09 | * | 1.14 | 1.81 | .94 | .96 | 1.19 | |||||||||||||||||
| Portfolio turnover rate (%) | 15 | ** | 13 | c | 20 | 15 | 16 | 26 | ||||||||||||||||
a Based on average shares outstanding during the period. b Total return would have been lower had certain expenses not been reduced. c Excludes portfolio securities delivered as a result of processing redemption in-kind transactions. * Annualized ** Not annualized *** Amount is less than $.005. | ||||||||||||||||||||||||
| Years Ended December 31, | ||||||||||||||||||||||||
| Class B | Six Months Ended 6/30/14 (Unaudited) | 2013 | 2012 | 2011 | 2010 | 2009 | ||||||||||||||||||
| Selected Per Share Data | ||||||||||||||||||||||||
| Net asset value, beginning of period | $ | 17.68 | $ | 13.55 | $ | 11.77 | $ | 12.40 | $ | 9.89 | $ | 8.62 | ||||||||||||
Income (loss) from investment operations: Net investment income (loss)a | .07 | .12 | .20 | .08 | .08 | .08 | ||||||||||||||||||
| Net realized and unrealized gain (loss) | .38 | 4.86 | 1.66 | (.64 | ) | 2.50 | 1.93 | |||||||||||||||||
| Total from investment operations | .45 | 4.98 | 1.86 | (.56 | ) | 2.58 | 2.01 | |||||||||||||||||
Less distributions from: Net investment income | (.12 | ) | (.22 | ) | (.08 | ) | (.07 | ) | (.07 | ) | (.14 | ) | ||||||||||||
| Net realized gains | (.95 | ) | (.63 | ) | (.00 | )*** | — | — | (.60 | ) | ||||||||||||||
| Total distributions | (1.07 | ) | (.85 | ) | (.08 | ) | (.07 | ) | (.07 | ) | (.74 | ) | ||||||||||||
| Net asset value, end of period | $ | 17.06 | $ | 17.68 | $ | 13.55 | $ | 11.77 | $ | 12.40 | $ | 9.89 | ||||||||||||
Total Return (%)b | 2.97 | ** | 38.31 | 15.88 | (4.58 | ) | 26.11 | 26.27 | ||||||||||||||||
| Ratios to Average Net Assets and Supplemental Data | ||||||||||||||||||||||||
| Net assets, end of period ($ millions) | 28 | 26 | 41 | 41 | 50 | 45 | ||||||||||||||||||
| Ratio of expenses before expense reductions (%) | .78 | * | .79 | .80 | .77 | .77 | .81 | |||||||||||||||||
| Ratio of expenses after expense reductions (%) | .72 | * | .70 | .74 | .75 | .77 | .75 | |||||||||||||||||
| Ratio of net investment income (loss) (%) | .85 | * | .82 | 1.54 | .69 | .71 | .93 | |||||||||||||||||
| Portfolio turnover rate (%) | 15 | ** | 13 | c | 20 | 15 | 16 | 26 | ||||||||||||||||
a Based on average shares outstanding during the period. b Total return would have been lower had certain expenses not been reduced. c Excludes portfolio securities delivered as a result of processing redemption in-kind transactions. * Annualized ** Not annualized *** Amount is less than $.005. | ||||||||||||||||||||||||
A. Organization and Significant Accounting Policies
Deutsche Investments VIT Funds (formerly DWS Investments VIT Funds) (the "Trust") is registered under the Investment Company Act of 1940, as amended (the "1940 Act"), as an open-end management investment company. The Trust is organized as a Massachusetts business trust. The Trust is comprised of two series. Deutsche Small Cap Index VIP (formerly DWS Small Cap Index VIP) (the "Fund") is a diversified series of the Trust offered to investors. The Fund is an underlying investment vehicle for variable annuity contracts and variable life insurance policies to be offered by the separate accounts of certain life insurance companies ("Participating Insurance Companies").
Multiple Classes of Shares of Beneficial Interest. The Fund offers two classes of shares to investors: Class A shares and Class B shares. Class B shares are subject to Rule 12b-1 distribution fees under the 1940 Act and record keeping fees equal to an annual rate of 0.25% and up to 0.15%, respectively, of the Class B shares average daily net assets. Class A shares are not subject to such fees.
Investment income, realized and unrealized gains and losses, and certain fund-level expenses and expense reductions, if any, are borne pro rata on the basis of relative net assets by the holders of all classes of shares, except that each class bears certain expenses unique to that class (including the applicable Rule 12b-1 distribution fees). Differences in class-level expenses may result in payment of different per share dividends by class. All shares have equal rights with respect to voting subject to class-specific arrangements.
The Fund's financial statements are prepared in accordance with accounting principles generally accepted in the United States of America which require the use of management estimates. Actual results could differ from those estimates. The policies described below are followed consistently by the Fund in the preparation of its financial statements.
Security Valuation. Investments are stated at value determined as of the close of regular trading on the New York Stock Exchange on each day the exchange is open for trading.
Various inputs are used in determining the value of the Fund's investments. These inputs are summarized in three broad levels. Level 1 includes quoted prices in active markets for identical securities. Level 2 includes other significant observable inputs (including quoted prices for similar securities, interest rates, prepayment speeds and credit risk). Level 3 includes significant unobservable inputs (including the Fund's own assumptions in determining the fair value of investments). The level assigned to the securities valuations may not be an indication of the risk or liquidity associated with investing in those securities.
Equity securities are valued at the most recent sale price or official closing price reported on the exchange (U.S. or foreign) or over-the-counter market on which they trade. Securities for which no sales are reported are valued at the calculated mean between the most recent bid and asked quotations on the relevant market or, if a mean cannot be determined, at the most recent bid quotation. Equity securities are generally categorized as Level 1.
Debt securities are valued at prices supplied by independent pricing services approved by the Fund's Board. If the pricing services are unable to provide valuations, securities are valued at the most recent bid quotation or evaluated price, as applicable, obtained from one or more broker-dealers. Such services may use various pricing techniques which take into account appropriate factors such as yield, quality, coupon rate, maturity, type of issue, trading characteristics and other data, as well as broker quotes. These securities are generally categorized as Level 2.
Money market instruments purchased with an original or remaining maturity of sixty days or less, maturing at par, are valued at amortized cost, which approximates value, and are categorized as Level 2. Investments in open-end investment companies are valued at their net asset value each business day and are categorized as Level 1.
Futures contracts are generally valued at the settlement prices established each day on the exchange on which they are traded and are categorized as Level 1.
Securities and other assets for which market quotations are not readily available or for which the above valuation procedures are deemed not to reflect fair value are valued in a manner that is intended to reflect their fair value as determined in accordance with procedures approved by the Board and are generally categorized as Level 3. In accordance with the Fund's valuation procedures, factors considered in determining value may include, but are not limited to, the type of the security; the size of the holding; the initial cost of the security; the existence of any contractual restrictions on the security's disposition; the price and extent of public trading in similar securities of the issuer or of comparable companies; quotations or evaluated prices from broker-dealers and/or pricing services; information obtained from the issuer, analysts, and/or the appropriate stock exchange (for exchange-traded securities); an analysis of the company's or issuer's financial statements; an evaluation of the forces that influence the issuer and the market(s) in which the security is purchased and sold; and with respect to debt securities, the maturity, coupon, creditworthiness, currency denomination and the movement of the market in which the security is normally traded. The value determined under these procedures may differ from published values for the same securities.
Disclosure about the classification of fair value measurements is included in a table following the Fund's Investment Portfolio.
Securities Lending. Deutsche Bank AG, as lending agent, lends securities of the Fund to certain financial institutions under the terms of the Security Lending Agreement. The Fund retains benefits of owning the securities it has loaned and continues to receive interest and dividends generated by the securities and to participate in any changes in their market value. The Fund requires the borrowers of the securities to maintain collateral with the Fund consisting of either cash or liquid, unencumbered assets having a value at least equal to the value of the securities loaned. When the collateral falls below specified amounts, the lending agent will use its best effort to obtain additional collateral on the next business day to meet required amounts under the security lending agreement. The Fund may invest the cash collateral into a joint trading account in an affiliated money market fund pursuant to Exemptive Orders issued by the SEC. The Fund receives compensation for lending its securities either in the form of fees or by earning interest on invested cash collateral net of borrower rebates and fees paid to a lending agent. Either the Fund or the borrower may terminate the loan. There may be risks of delay and costs in recovery of securities or even loss of rights in the collateral should the borrower of the securities fail financially. If the Fund is not able to recover securities lent, the Fund may sell the collateral and purchase a replacement investment in the market, incurring the risk that the value of the replacement security is greater than the value of the collateral. The Fund is also subject to all investment risks associated with the reinvestment of any cash collateral received, including, but not limited to, interest rate, credit and liquidity risk associated with such investments.
As of June 30, 2014, the Fund had securities on loan. The value of the related collateral exceeded the value of the securities loaned at period end.
Federal Income Taxes. The Fund's policy is to comply with the requirements of the Internal Revenue Code, as amended, which are applicable to regulated investment companies, and to distribute all of its taxable income to its shareholders.
Under the Regulated Investment Company Modernization Act of 2010, net capital losses incurred post-enactment may be carried forward indefinitely, and their character is retained as short-term and/or long-term. Previously, net capital losses were carried forward for eight years and treated as short-term losses. As a transition rule, the Act requires that post-enactment net capital losses be used before pre-enactment net capital losses.
The Fund has reviewed the tax positions for the open tax years as of December 31, 2013 and has determined that no provision for income tax and/or uncertain tax provisions is required in the Fund's financial statements. The Fund's federal tax returns for the prior three fiscal years remain open subject to examination by the Internal Revenue Service.
Distribution of Income and Gains. Net investment income of the Fund, if any, is distributed to shareholders annually. Net realized gains from investment transactions, in excess of available capital loss carryforwards, would be taxable to the Fund if not distributed, and, therefore, will be distributed to shareholders at least annually. The Fund may also make additional distributions for tax purposes if necessary.
The timing and characterization of certain income and capital gain distributions are determined annually in accordance with federal tax regulations, which may differ from accounting principles generally accepted in the United States of America. These differences primarily relate to in-kind redemptions, investments in futures contracts and certain securities sold at a loss. As a result, net investment income (loss) and net realized gain (loss) on investment transactions for a reporting period may differ significantly from distributions during such period. Accordingly, the Fund may periodically make reclassifications among certain of its capital accounts without impacting the net asset value of the Fund.
The tax character of current year distributions will be determined at the end of the current fiscal year.
Contingencies. In the normal course of business, the Fund may enter into contracts with service providers that contain general indemnification clauses. The Fund's maximum exposure under these arrangements is unknown as this would involve future claims that may be made against the Fund that have not yet been made. However, based on experience, the Fund expects the risk of loss to be remote.
Expenses. Expenses of the Trust arising in connection with a specific fund are allocated to that fund. Other Trust expenses which cannot be directly attributed to a fund are apportioned among the funds in the Trust based upon the relative net assets or other appropriate measures.
Real Estate Investment Trusts. The Fund periodically recharacterizes distributions received from a Real Estate Investment Trust ("REIT") investment based on information provided by the REIT into the following categories: ordinary income, long-term and short-term capital gains, and return of capital. If information is not available timely from a REIT, the recharacterization will be estimated for financial statement purposes and a recharacterization will be made within the accounting records in the following year when such information becomes available. Distributions received from REITs in excess of income are recorded as either a reduction of cost of investments or realized gains. The Fund distinguishes between dividends received on a tax basis and a financial reporting basis and only distributions in excess of tax basis earnings and profits are reported in the financial statements as a tax return of capital.
Other. Investment transactions are accounted for on a trade date plus one basis for daily net asset valuation calculations. However, for financial reporting purposes, investment transactions are reported on trade date. Interest income is recorded on the accrual basis. Dividend income is recorded on the ex-dividend date net of foreign withholding taxes. Realized gains and losses from investment transactions are recorded on an identified cost basis. Proceeds from litigation payments, if any, are included in net realized gain (loss) from investments.
B. Derivative Instruments
Futures Contracts. A futures contract is an agreement between a buyer or seller and an established futures exchange or its clearinghouse in which the buyer or seller agrees to take or make a delivery of a specific amount of a financial instrument at a specified price on a specific date (settlement date). For the six months ended June 30, 2014, the Fund invested in futures to keep cash on hand to meet shareholder redemptions or other needs while maintaining exposure to the stock market.
Upon entering into a futures contract, the Fund is required to deposit with a financial intermediary cash or securities ("initial margin") in an amount equal to a certain percentage of the face value indicated in the futures contract. Subsequent payments ("variation margin") are made or received by the Fund dependent upon the daily fluctuations in the value and are recorded for financial reporting purposes as unrealized gains or losses by the Fund. Gains or losses are realized when the contract expires or is closed. Since all futures contracts are exchange traded, counterparty risk is minimized as the exchange's clearinghouse acts as the counterparty, and guarantees the futures against default.
Certain risks may arise upon entering into futures contracts, including the risk that an illiquid market will limit the Fund's ability to close out a futures contract prior to the settlement date and the risk that the futures contract is not well correlated with the security, index or currency to which it relates. Risk of loss may exceed amounts disclosed in the Statement of Assets and Liabilities.
A summary of the open futures contracts as of June 30, 2014 is included in a table following the Fund's Investment Portfolio. For the six months ended June 30, 2014, the investment in futures contracts purchased had a total notional value generally indicative of a range from approximately $7,201,000 to $9,403,000.
The following tables summarize the value of the Fund's derivative instruments held as of June 30, 2014 and the related location in the accompanying Statement of Assets and Liabilities, presented by primary underlying risk exposure:
| Asset Derivative | Futures Contracts | |||
Equity Contracts (a) | $ | 187,156 | ||
The above derivative is located in the following Statement of Assets and Liabilities account: (a) Includes cumulative appreciation of futures contracts as disclosed in the Investment Portfolio. Unsettled variation margin is disclosed separately within the Statement of Assets and Liabilities. | ||||
Additionally, the amount of unrealized and realized gains and losses on derivative instruments recognized in Fund earnings during the six months ended June 30, 2014 and the related location in the accompanying Statement of Operations is summarized in the following tables by primary underlying risk exposure:
| Realized Gain (Loss) | Futures Contracts | |||
Equity Contracts (a) | $ | 573,951 | ||
The above derivative is located in the following Statement of Operations account: (a) Net realized gain (loss) from futures | ||||
| Change in Net Unrealized Appreciation (Depreciation) | Futures Contracts | |||
Equity Contracts (a) | $ | (104,583 | ) | |
The above derivative is located in the following Statement of Operations account: (a) Change in net unrealized appreciation (depreciation) on futures | ||||
C. Purchases and Sales of Securities
During the six months ended June 30, 2014, purchases and sales of investment securities (excluding short-term investments) aggregated $57,938,336 and $48,553,245, respectively.
D. Related Parties
Investment Management Agreement. Under the Investment Management Agreement with Deutsche Investment Management Americas Inc. ("DIMA" or the "Advisor"), an indirect, wholly owned subsidiary of Deutsche Bank AG, the Advisor determines the securities, instruments and other contracts relating to investments to be purchased, sold, or entered into by the Fund or delegates such responsibility to the Fund's sub-advisor. Pursuant to the Investment Management Agreement with the Advisor, the Fund pays the Advisor an annual fee based on its average daily net assets, computed and accrued daily and payable monthly at the annual rate of 0.35%.
Northern Trust Investments, Inc. ("NTI") serves as subadvisor. As a sub-advisor to the Fund, NTI makes investment decisions and buys and sells securities for the Fund. NTI is paid by the Advisor for the services NTI provides to the Fund.
Accordingly, for the six months ended June 30, 2014, the fee pursuant to the Investment Management Agreement was equivalent to an annualized effective rate (exclusive of any applicable waivers/reimbursements) of 0.35% of the Fund's average daily net assets.
For the period from January 1, 2014 through September 30, 2014, the Advisor has contractually agreed to waive all or a portion of its fees and/or reimburse certain operating expenses of the Fund to the extent necessary to maintain the operating expenses (excluding certain expenses such as extraordinary expenses, taxes, brokerage and interest) of each class as follows:
| Class A | .47% |
| Class B | .72% |
For the six months ended June 30, 2014, fees waived and/or expenses reimbursed for each class are as follows:
| Class A | $ | 88,343 | ||
| Class B | 7,913 | |||
| $ | 96,256 |
Administration Fee. Pursuant to the Administrative Services Agreement, DIMA provides most administrative services to the Fund. For all services provided under the Administrative Services Agreement, the Fund pays DIMA an annual fee ("Administration Fee") of 0.10% of the Fund's average daily net assets, computed and accrued daily and payable monthly. For the six months ended June 30, 2014, the Administration Fee was $168,736, of which $28,377 is unpaid.
Distribution Service Agreement. DeAWM Distributors, Inc. ("DDI"), an affiliate of the Advisor, is the Fund's distributor. In accordance with the Distribution Plan, DDI receives 12b-1 fees of 0.25% of average daily net assets of Class B shares. For the six months ended June 30, 2014, the Distribution Service Fee was as follows:
| Distribution Service Fee | Total Aggregated | Unpaid at June 30, 2014 | ||||||
| Class B | $ | 33,228 | $ | 5,662 | ||||
Service Provider Fees. DeAWM Service Company ("DSC"), an affiliate of the Advisor, is the transfer agent, dividend-paying agent and shareholder service agent of the Fund. Pursuant to a sub-transfer agency agreement among DSC and DST Systems, Inc. ("DST"), DSC has delegated certain transfer agent, dividend-paying agent and shareholder service agent functions to DST. DSC compensates DST out of the shareholder servicing fee they receive from the Fund. For the six months ended June 30, 2014, the amounts charged to the Fund by DSC were as follows:
| Services to Shareholders | Total Aggregated | Unpaid at June 30, 2014 | ||||||
| Class A | $ | 509 | $ | 248 | ||||
| Class B | 161 | 80 | ||||||
| $ | 670 | $ | 328 | |||||
Typesetting and Filing Service Fees. Under an agreement with DIMA, DIMA is compensated for providing typesetting and certain regulatory filing services to the Fund. For the six months ended June 30, 2014, the amount charged to the Fund by DIMA included in the Statement of Operations under "reports to shareholders" aggregated $11,709, of which $5,838 is unpaid.
Trustees' Fees and Expenses. The Fund paid retainer fees to each Trustee not affiliated with the Advisor, plus specified amounts to the Board Chairperson and Vice Chairperson and to each committee Chairperson.
Affiliated Cash Management Vehicles. The Fund may invest uninvested cash balances in Central Cash Management Fund and Deutsche Variable NAV Money Fund, affiliated money market funds which are managed by the Advisor. Each affiliated money market fund seeks to provide a high level of current income consistent with liquidity and the preservation of capital. Each affiliated money market fund is managed in accordance with Rule 2a-7 under the Investment Company Act of 1940, which governs the quality, maturity, diversity and liquidity of instruments in which a money market fund may invest. Central Cash Management Fund seeks to maintain a stable net asset value, and Deutsche Variable NAV Money Fund maintains a floating net asset value. The Fund indirectly bears its proportionate share of the expenses of each affiliated money market fund in which it invests. Central Cash Management Fund does not pay the Advisor an investment management fee. To the extent that Deutsche Variable NAV Money Fund pays an investment management fee to the Advisor, the Advisor will waive an amount of the investment management fee payable to the Advisor by the Fund equal to the amount of the investment management fee payable on the Fund's assets invested in Deutsche Variable NAV Money Fund.
Security Lending Fees. Deutsche Bank AG serves as lending agent for the Fund. For the six months ended June 30, 2014, the Fund incurred lending agent fees to Deutsche Bank AG in the amount of $27,514.
E. Line of Credit
The Fund and other affiliated funds (the "Participants") share in a $400 million revolving credit facility provided by a syndication of banks. The Fund may borrow for temporary or emergency purposes, including the meeting of redemption requests that otherwise might require the untimely disposition of securities. The Participants are charged an annual commitment fee which is allocated based on net assets, among each of the Participants. Interest is calculated at a rate per annum equal to the sum of the Federal Funds Rate plus 1.25 percent plus if LIBOR exceeds the Federal Funds Rate the amount of such excess. The Fund may borrow up to a maximum of 33 percent of its net assets under the agreement. The Fund had no outstanding loans at June 30, 2014.
F. Ownership of the Fund
At June 30, 2014, two participating insurance companies were beneficial owners of record of 10% or more of the total outstanding Class A shares of the Fund, owning 44% and 14%. At June 30, 2014, two participating insurance companies were beneficial owners of record of 10% or more of the outstanding Class B shares of the Fund, each owning 52% and 12%, respectively.
G. In-Kind Redemptions
In certain circumstances, the Fund may distribute portfolio securities rather than cash as payments for a redemption of Fund shares (in-kind redemption). For financial reporting purposes, the Fund recognizes a gain on in-kind redemptions to the extent the value of the distributed securities exceeds their costs; the Fund recognizes a loss if cost exceeds value. Gains and losses realized on in-kind redemptions are not recognized for tax purposes and are reclassified from undistributed realized gain (loss) to paid-in capital. During the year ended December 31, 2013, the Fund realized $15,226,983 of net gain attributable to in-kind redemptions.
H. Fund Name Change
Effective August 11, 2014, the "DWS Funds" were rebranded "Deutsche Funds."
As an investor of the Fund, you incur two types of costs: ongoing expenses and transaction costs. Ongoing expenses include management fees, distribution and service (12b-1) fees and other Fund expenses. Examples of transaction costs include contract charges, redemption fees and account maintenance fees, which are not shown in this section. The following tables are intended to help you understand your ongoing expenses (in dollars) of investing in the Fund and to help you compare these expenses with the ongoing expenses of investing in other mutual funds. In the most recent six-month period, the Fund limited these expenses; had it not done so, expenses would have been higher. The example in the table is based on an investment of $1,000 invested at the beginning of the six-month period and held for the entire period (January 1, 2014 to June 30, 2014).
The tables illustrate your Fund's expenses in two ways:
—Actual Fund Return. This helps you estimate the actual dollar amount of ongoing expenses (but not transaction costs) paid on a $1,000 investment in the Fund using the Fund's actual return during the period. To estimate the expenses you paid over the period, simply divide your account value by $1,000 (for example, an $8,600 account value divided by $1,000 = 8.6), then multiply the result by the number in the "Expenses Paid per $1,000" line under the share class you hold.
—Hypothetical 5% Fund Return. This helps you to compare your Fund's ongoing expenses (but not transaction costs) with those of other mutual funds using the Fund's actual expense ratio and a hypothetical rate of return of 5% per year before expenses. Examples using a 5% hypothetical Fund return may be found in the shareholder reports of other mutual funds. The hypothetical account values and expenses may not be used to estimate the actual ending account balance or expenses you paid for the period.
Please note that the expenses shown in these tables are meant to highlight your ongoing expenses only and do not reflect any transaction costs. The "Expenses Paid per $1,000" line of the tables is useful in comparing ongoing expenses only and will not help you determine the relative total expense of owning different funds. If these transaction costs had been included, your costs would have been higher.
Expenses and Value of a $1,000 Investment for the six months ended June 30, 2014 (Unaudited) | ||||||||
| Actual Fund Return | Class A | Class B | ||||||
| Beginning Account Value 1/1/14 | $ | 1,000.00 | $ | 1,000.00 | ||||
| Ending Account Value 6/30/14 | $ | 1,031.10 | $ | 1,029.70 | ||||
| Expenses Paid per $1,000* | $ | 2.37 | $ | 3.62 | ||||
| Hypothetical 5% Fund Return | Class A | Class B | ||||||
| Beginning Account Value 1/1/14 | $ | 1,000.00 | $ | 1,000.00 | ||||
| Ending Account Value 6/30/14 | $ | 1,022.46 | $ | 1,021.22 | ||||
| Expenses Paid per $1,000* | $ | 2.36 | $ | 3.61 | ||||
* Expenses are equal to the Fund's annualized expense ratio for each share class, multiplied by the average account value over the period, multiplied by 181 (the number of days in the most recent six-month period), then divided by 365.
| Annualized Expense Ratios | Class A | Class B | |||
| Deutsche Small Cap Index VIP | .47% | .72% |
For more information, please refer to the Fund's prospectus.
These tables do not reflect charges and fees ("contract charges") associated with the separate account that invests in the Fund or any variable life insurance policy or variable annuity contract for which the Fund is an investment option.
For an analysis of the fees associated with an investment in the fund or similar funds, please refer to the current and hypothetical expense calculators for Variable Insurance Products which can be found at deutschefunds.com/EN/resources/calculators.jsp.
The Fund's policies and procedures for voting proxies for portfolio securities and information about how the Fund voted proxies related to its portfolio securities during the 12-month period ended June 30 are available on our Web site — deutschefunds.com (click on "proxy voting" at the bottom of the page) — or on the SEC's Web site — sec.gov. To obtain a written copy of the Fund's policies and procedures without charge, upon request, call us toll free at (800) 728-3337.
The Board of Trustees approved the renewal of DWS Small Cap Index VIP's investment management agreement (the "Agreement") with Deutsche Investment Management Americas Inc. ("DIMA") and sub-advisory agreement (the "Sub-Advisory Agreement" and together with the Agreement, the "Agreements") between DIMA and Northern Trust Investments, Inc. ("NTI") in September 2013.
In terms of the process that the Board followed prior to approving the Agreements, shareholders should know that:
— In September 2013, all of the Fund's Trustees were independent of DIMA and its affiliates.
— The Trustees met frequently during the past year to discuss fund matters and dedicated a substantial amount of time to contract review matters. Over the course of several months, the Board's Contract Committee, in coordination with the Board's Equity Oversight Committee, reviewed comprehensive materials received from DIMA, independent third parties and independent counsel. These materials included an analysis of the Fund's performance, fees and expenses, and profitability compiled by a fee consultant retained by the Fund's Independent Trustees (the "Fee Consultant"). The Board also received extensive information throughout the year regarding performance of the Fund.
— The Independent Trustees regularly meet privately with their independent counsel to discuss contract review and other matters. In addition, the Independent Trustees were also advised by the Fee Consultant in the course of their review of the Fund's contractual arrangements and considered a comprehensive report prepared by the Fee Consultant in connection with their deliberations.
— In connection with reviewing the Agreements, the Board also reviewed the terms of the Fund's Rule 12b-1 plan, distribution agreement, administrative services agreement, transfer agency agreement and other material service agreements.
— Based on its evaluation of the information provided, the Contract Committee presented its findings and recommendations to the Board. The Board then reviewed the Contract Committee's findings and recommendations.
In connection with the contract review process, the Contract Committee and the Board considered the factors discussed below, among others. The Board also considered that DIMA and its predecessors have managed the Fund since its inception, and the Board believes that a long-term relationship with a capable, conscientious advisor is in the best interests of the Fund. The Board considered, generally, that shareholders chose to invest or remain invested in the Fund knowing that DIMA managed the Fund, and that the Agreement was approved by the Fund's shareholders. DIMA is part of Deutsche Bank AG, a major global banking institution that is engaged in a wide range of financial services. The Board believes that there are advantages to being part of a global asset management business that offers a wide range of investing expertise and resources, including hundreds of portfolio managers and analysts with research capabilities in many countries throughout the world.
As part of the contract review process, the Board carefully considered the fees and expenses of each DWS fund overseen by the Board in light of the fund's performance. In many cases, this led to a negotiation with DIMA of lower expense caps as part of the 2012 and 2013 contract review processes than had previously been in place. As part of these negotiations, the Board indicated that it would consider relaxing these new lower caps in future years following sustained improvements in performance, among other considerations.
In June 2012, Deutsche Bank AG ("DB"), DIMA's parent company, announced that DB would combine its Asset Management (of which DIMA was a part) and Wealth Management divisions. DB has advised the Independent Trustees that the U.S. asset management business is a critical and integral part of DB, and that it has, and will continue to, reinvest a significant portion of the substantial savings it expects to realize by combining its Asset Management and Wealth Management divisions into the new Asset and Wealth Management ("AWM") division, including ongoing enhancements to its investment capabilities. DB also has confirmed its commitment to maintaining strong legal and compliance groups within the AWM division.
While shareholders may focus primarily on fund performance and fees, the Fund's Board considers these and many other factors, including the quality and integrity of DIMA's and NTI's personnel and such other issues as back-office operations, fund valuations, and compliance policies and procedures.
Nature, Quality and Extent of Services.The Board considered the terms of the Agreements, including the scope of advisory services provided under the Agreements. The Board noted that, under the Agreements, DIMA and NTI provide portfolio management services to the Fund and that, pursuant to a separate administrative services agreement, DIMA provides administrative services to the Fund. The Board considered the experience and skills of senior management and investment personnel, the resources made available to such personnel, the ability of DIMA to attract and retain high-quality personnel, and the organizational depth and stability of DIMA. The Board also requested and received information regarding DIMA's oversight of Fund sub-advisors, including NTI. The Board reviewed the Fund's performance over short-term and long-term periods and compared those returns to various agreed-upon performance measures, including market indices and a peer universe compiled by the Fee Consultant using information supplied by Morningstar Direct ("Morningstar"), an independent fund data service. The Board also noted that it has put into place a process of identifying "Focus Funds" (e.g., funds performing poorly relative to their benchmark or a peer universe compiled by an independent fund data service), and receives more frequent reporting and information from DIMA regarding such funds, along with DIMA's remedial plans to address underperformance. The Board believes this process is an effective manner of identifying and addressing underperforming funds. Based on the information provided, the Board noted that for the one-, three- and five-year periods ended December 31, 2012, the Fund's performance (Class A shares) was in the 2nd quartile, 2nd quartile and 3rd quartile, respectively, of the applicable Morningstar universe (the 1st quartile being the best performers and the 4th quartile being the worst performers).
Fees and Expenses. The Board considered the Fund's investment management fee schedule, sub-advisory fee schedule, operating expenses and total expense ratios, and comparative information provided by Lipper Inc. ("Lipper") and the Fee Consultant regarding investment management fee rates paid to other investment advisors by similar funds (1st quartile being the most favorable and 4th quartile being the least favorable). With respect to management fees paid to other investment advisors by similar funds, the Board noted that the contractual fee rates paid by the Fund, which include a 0.10% fee paid to DIMA under the Fund's administrative services agreement, were higher than the median (4th quartile) of the applicable Lipper peer group (based on Lipper data provided as of December 31, 2012). With respect to the sub-advisory fee paid to NTI, the Board noted that the fee is paid by DIMA out of its fee and not directly by the Fund. The Board noted that the Fund's Class A shares total (net) operating expenses were expected to be higher than the median (3rd quartile) of the applicable Lipper expense universe (based on Lipper data provided as of December 31, 2012) ("Lipper Universe Expenses"). The Board also reviewed data comparing each share class's total (net) operating expenses to the applicable Lipper Universe Expenses. The Board considered the Fund's management fee rate as compared to fees charged by DIMA to comparable funds and considered differences between the Fund and the comparable funds.. The Board also considered how the Fund's total (net) operating expenses compared to the total (net) operating expenses of a more customized peer group selected by Lipper (based on such factors as asset size).
The Board also noted that the expense limitations agreed to by DIMA helped to ensure that the Fund's total (net) operating expenses would remain competitive.
The information considered by the Board as part of its review of management fees included information regarding fees charged by DIMA and its affiliates to similar institutional accounts and to similar funds offered primarily to European investors ("DWS Europe funds"), in each case as applicable. The Board observed that advisory fee rates for institutional accounts generally were lower than the management fees charged by similarly managed DWS U.S. mutual funds ("DWS Funds"), but also took note of the differences in services provided to DWS Funds as compared to institutional accounts. In the case of DWS Europe funds, the Board observed that fee rates for DWS Europe funds generally were higher than for similarly managed DWS Funds, but noted that differences in the types of services provided to DWS Funds relative to DWS Europe funds made it difficult to compare such fees.
On the basis of the information provided, the Board concluded that management fees were reasonable and appropriate in light of the nature, quality and extent of services provided by DIMA and NTI.
Profitability. The Board reviewed detailed information regarding revenues received by DIMA under the Agreement. The Board considered the estimated costs and pre-tax profits realized by DIMA from advising the DWS Funds, as well as estimates of the pre-tax profits attributable to managing the Fund in particular. The Board also received information regarding the estimated enterprise-wide profitability of DWS and its affiliates with respect to all fund services in totality and by fund. The Board and the Fee Consultant reviewed DIMA's methodology in allocating its costs to the management of the Fund. Based on the information provided, the Board concluded that the pre-tax profits realized by DIMA in connection with the management of the Fund were not unreasonable. The Board also reviewed information regarding the profitability of certain similar investment management firms. The Board noted that while information regarding the profitability of such firms is limited (and in some cases is not necessarily prepared on a comparable basis), DIMA and its affiliates' overall profitability with respect to the DWS fund complex (after taking into account distribution and other services provided to the funds by DIMA and its affiliates) was lower than the overall profitability levels of many comparable firms for which such data was available. The Board did not consider the profitability of NTI with respect to the Fund. The Board noted that DIMA pays NTI's fee out of its management fee, and its understanding that the Fund's sub-advisory fee schedule was the product of an arm's length negotiation with DIMA.
Economies of Scale. The Board considered whether there are economies of scale with respect to the management of the Fund and whether the Fund benefits from any economies of scale. The Board concluded that the Fund's fee schedule represents an appropriate sharing between the Fund and DIMA of such economies of scale as may exist in the management of the Fund at current asset levels.
Other Benefits to DIMA and NTI and Their Affiliates. The Board also considered the character and amount of other incidental benefits received by DIMA and NTI and their affiliates, including any fees received by DIMA for administrative services provided to the Fund and any fees received by an affiliate of DIMA for distribution services. The Board also considered benefits to DIMA and NTI related to brokerage and soft-dollar allocations, including allocating brokerage to pay for research generated by parties other than the executing broker dealers, which pertain primarily to funds investing in equity securities, along with the incidental public relations benefits to DIMA and NTI related to DWS Funds advertising and cross-selling opportunities among DIMA products and services. The Board concluded that management fees were reasonable in light of these fallout benefits.
Compliance. The Board considered the significant attention and resources dedicated by DIMA to documenting and enhancing its compliance processes in recent years. The Board noted in particular (i) the experience and seniority of both DIMA's chief compliance officer and the Fund's chief compliance officer; (ii) the large number of DIMA compliance personnel; and (iii) the substantial commitment of resources by DIMA and its affiliates to compliance matters. The Board also considered the attention and resources dedicated by DIMA to the oversight of the investment sub-advisor's compliance program and compliance with the applicable fund policies and procedures.
Based on all of the information considered and the conclusions reached, the Board unanimously determined that the continuation of the Agreements is in the best interests of the Fund. In making this determination, the Board did not give particular weight to any single factor identified above. The Board considered these factors over the course of numerous meetings, certain of which were in executive session with only the Independent Trustees and their independent counsel present. It is possible that individual Trustees may have weighed these factors differently in reaching their individual decisions to approve the continuation of the Agreements.
Notes

DeAWM Distributors, Inc.
222 South Riverside Plaza
Chicago, IL 60606
(800) 621-1148
vit-scif-3 (R-028372-3 8/14)
| ITEM 2. | CODE OF ETHICS | |
| Not applicable. | ||
| ITEM 3. | AUDIT COMMITTEE FINANCIAL EXPERT | |
| Not applicable | ||
| ITEM 4. | PRINCIPAL ACCOUNTANT FEES AND SERVICES | |
| Not applicable | ||
| ITEM 5. | AUDIT COMMITTEE OF LISTED REGISTRANTS | |
| Not applicable | ||
| ITEM 6. | SCHEDULE OF INVESTMENTS | |
| Not applicable | ||
| ITEM 7. | DISCLOSURE OF PROXY VOTING POLICIES AND PROCEDURES FOR CLOSED-END MANAGEMENT INVESTMENT COMPANIES | |
| Not applicable | ||
| ITEM 8. | PORTFOLIO MANAGERS OF CLOSED-END MANAGEMENT INVESTMENT COMPANIES | |
| Not applicable | ||
| ITEM 9. | PURCHASES OF EQUITY SECURITIES BY CLOSED-END MANAGEMENT INVESTMENT COMPANY AND AFFILIATED PURCHASERS | |
| Not applicable | ||
| ITEM 10. | SUBMISSION OF MATTERS TO A VOTE OF SECURITY HOLDERS | |
| There were no material changes to the procedures by which shareholders may recommend nominees to the Fund’s Board. The primary function of the Nominating and Governance Committee is to identify and recommend individuals for membership on the Board and oversee the administration of the Board Governance Guidelines. Shareholders may recommend candidates for Board positions by forwarding their correspondence by U.S. mail or courier service to Kenneth C. Froewiss, Independent Chairman, Deutsche Mutual Funds, P.O. Box 390601, Cambridge, MA 02139. | ||
| ITEM 11. | CONTROLS AND PROCEDURES | |
| (a) | The Chief Executive and Financial Officers concluded that the Registrant’s Disclosure Controls and Procedures are effective based on the evaluation of the Disclosure Controls and Procedures as of a date within 90 days of the filing date of this report. | |
| (b) | There have been no changes in the registrant’s internal control over financial reporting that occurred during the second fiscal quarter of the period covered by this report that has materially affected, or is reasonably likely to materially affect, the registrant’s internal controls over financial reporting. | |
| ITEM 12. | EXHIBITS | |
| (a)(1) | Not applicable | |
| (a)(2) | Certification pursuant to Rule 30a-2(a) under the Investment Company Act of 1940 (17 CFR 270.30a-2(a)) is filed and attached hereto as Exhibit 99.CERT. | |
| (b) | Certification pursuant to Rule 30a-2(b) under the Investment Company Act of 1940 (17 CFR 270.30a-2(b)) is furnished and attached hereto as Exhibit 99.906CERT. | |
SIGNATURES
Pursuant to the requirements of the Securities Exchange Act of 1934 and the Investment Company Act of 1940, the registrant has duly caused this report to be signed on its behalf by the undersigned, thereunto duly authorized.
| Registrant: | Deutsche Small Cap Index VIP, a series of Deutsche Investments VIT Funds |
| By: | /s/Brian E. Binder Brian E. Binder President |
| Date: | August 20, 2014 |
Pursuant to the requirements of the Securities Exchange Act of 1934 and the Investment Company Act of 1940, this report has been signed below by the following persons on behalf of the registrant and in the capacities and on the dates indicated.
| By: | /s/Brian E. Binder Brian E. Binder President |
| Date: | August 20, 2014 |
| By: | /s/Paul Schubert Paul Schubert Chief Financial Officer and Treasurer |
| Date: | August 20, 2014 |