As filed with the U.S. Securities and Exchange Commission on August 10, 2018
Securities Act File No. 333-_________
UNITED STATES
SECURITIES AND EXCHANGE COMMISSION
WASHINGTON, D.C. 20549
Form N-14
REGISTRATION STATEMENT UNDER THE SECURITIES ACT OF 1933 x
Pre-Effective Amendment No. ¨
Post-Effective Amendment No. ¨
The Hartford Mutual Funds, Inc.
(Exact Name of Registrant as Specified in Charter)
690 Lee Road
Wayne, Pennsylvania 19087
(Address of Principal Executive Offices) (Zip Code)
1-610-386-4068
(Registrant’s Area Code and Telephone Number)
Thomas R. Phillips, Esq.
Hartford Funds Management Company, LLC
690 Lee Road
Wayne, Pennsylvania 19087
(Name and Address of Agent for Service)
With copies to:
John V. O’Hanlon, Esq.
Dechert LLP
One International Place, 40th Floor
100 Oliver Street
Boston, Massachusetts 02110-2605
Approximate Date of Proposed Public Offering:
As soon as practicable after this Registration Statement becomes effective.
It is proposed that this filing will become effective September 10, 2018, pursuant to Rule 488 under the Securities Act of 1933, as amended.
No filing fee is required because an indefinite number of shares have previously been registered pursuant to Rule 24f-2 under the Investment Company Act of 1940, as amended.
THE HARTFORD MUTUAL FUNDS, INC.,
ON BEHALF OF HARTFORD GLOBAL CAPITAL APPRECIATION FUND
September [___], 2018
Dear Shareholder:
At a meeting held on August 7-8, 2018, the Board of Directors (the “Board”) of The Hartford Mutual Funds, Inc., a Maryland corporation (the “Company”), approved an Agreement and Plan of Reorganization (the “Plan”) that provides for the reorganization of the Hartford Global Capital Appreciation Fund (the “Acquired Fund”), a series of the Company, with and into the Hartford International Equity Fund (the “Acquiring Fund” and, collectively, with the Acquired Fund, the “Funds”), another series of the Company (the “Reorganization”). The Reorganization does not require shareholder approval. The Reorganization is expected to occur on or about October 29, 2018 (the “Closing Date”), at which time you will receive shares of the Acquiring Fund of the same class and of equivalent dollar value to your shares in the Acquired Fund as of the Closing Date.
After carefully considering the merits of the Reorganization, the Board determined that combining the Funds is in the best interests of each Fund. In connection with the Reorganization, you should note the following:
| · | The Reorganization is expected to qualify as a tax-free transaction; |
| · | The value of your investment will not change as a result of the Reorganization; |
| · | The shareholders of the Acquired Fund are expected to benefit from lower management fees and expenses following the Reorganization; and |
| · | The Reorganization is also expected to provide shareholders of both Funds with the opportunity to potentially benefit from economies of scale. |
The Plan provides for:
| · | the transfer of all of the assets of the Acquired Fund to the Acquiring Fund in exchange for shares of the Acquiring Fund that have an aggregate net asset value equal to the aggregate net asset value of the shares of the Acquired Fund on the valuation date for the Reorganization; |
| · | the assumption by the Acquiring Fund of all of the liabilities of the Acquired Fund; and |
| · | the distribution of shares of the Acquiring Fund to the shareholders of the Acquired Fund in complete liquidation of the Acquired Fund. |
The Reorganization is expected to be completed on or about October 29, 2018 at 8:00 a.m. Eastern Time based on the net asset value of each Fund as of the close of regular trading on the New York Stock Exchange on October 26, 2018, or at such earlier or later date as determined by an officer of the Company. Existing shareholders will be able to purchase additional shares of the Acquired Fund through the close of business on or about October 26, 2018. The Acquired Fund was closed to new investors effective September 14, 2018.
The Reorganization does not require shareholder approval, and you are not being asked to vote or take any other action in connection with the Reorganization. We do, however, ask that you review the enclosed Combined Information Statement/Prospectus (the “Information Statement/Prospectus”), which contains information about the Acquiring Fund, including its investment objective, strategies, risks, performance, fees and expenses. As of the date of the Reorganization, your assets will automatically be invested in the Acquiring Fund, which has a similar investment objective, investment strategies and principal risks, as explained in the attached materials.
Enclosed is an Information Statement/Prospectus, which provides details of the Reorganization. If you have any questions, please call the Funds at 1-888-843-7824.
Sincerely,
James E. Davey
President and Chief Executive Officer
QUESTIONS AND ANSWERS ABOUT THE INFORMATION STATEMENT/PROSPECTUS
We encourage you to read the enclosed Combined Information Statement/Prospectus (“Information Statement/Prospectus”). However, we thought it would be helpful to provide brief answers to some questions.
General Information About the Reorganization
| Q. 1. | Why am I receiving the Information Statement/Prospectus? |
| A. 1. | The Hartford Global Capital Appreciation Fund (the “Acquired Fund”) is being reorganized with and into the Hartford International Equity Fund (the “Acquiring Fund”) (the “Reorganization”). You are receiving this Information Statement/Prospectus because you were a shareholder of the Acquired Fund as of the close of business on August 31, 2018 (the “Record Date”) and so that we can provide you with details about the Reorganization. The Acquired Fund and the Acquiring Fund are referred to herein as the “Funds.” Each of the Funds is a separate series of The Hartford Mutual Funds, Inc., a Maryland corporation (the “Company”). The Acquiring Fund, following completion of the Reorganization, may be referred to as the “Combined Fund.” The Information Statement/Prospectus provides the information about the Acquiring Fund that shareholders should know when evaluating the Reorganization. We suggest that you keep the Information Statement/Prospectus for your records and future reference. |
All documents may be obtained without charge by writing to Hartford Funds, P.O. Box 55022, Boston, MA 02205-5022 or by calling 1-888-843-7824.
| Q. 2. | How did the Board of Directors (the “Board”) of the Company reach its decision to approve the Reorganization? |
| A. 2. | In determining whether to approve the Reorganization, the Board considered, among other things, the potential impact of the Reorganization on each Fund’s shareholders and a variety of related factors, including, among others, (1) the fact that the Funds have similar investment strategies, investment styles and principal risks, but there are some differences; (2) the terms and conditions of the Agreement and Plan of Reorganization (the “Plan”), including provisions intended to avoid any dilution of shareholder interests; (3) the costs to the Funds of the Reorganization; (4) the fact that the Reorganization is intended to qualify as a tax-free reorganization under federal tax laws; (5) the fact that the pro forma gross and net operating expenses of the Acquiring Fund after the Reorganization are estimated to be lower than the current gross and net operating expenses of the Acquired Fund; (6) the fact that the Reorganization would increase the assets of the Acquiring Fund, which may result in the Acquiring Fund realizing economies of scale with possible beneficial effects on the Acquiring Fund’s expense ratio; and (7) possible alternatives to the Reorganization. The Board also considered that the Reorganization does not require, and would be effected without, a vote of the Acquired Fund’s shareholders. After careful consideration, the Board determined that the Reorganization is in the best interests of each Fund. |
| Q. 3. | Who will bear the costs of the Reorganization? |
| A. 3. | Hartford Funds Management Company, LLC (“HFMC”), the investment adviser to both Funds, or its affiliates, will bear all costs associated with the Reorganization, other than brokerage-related expenses, including stamp taxes, and other similar transaction costs, which will be borne by the respective Fund, as applicable. |
| Q. 4. | How will the Reorganization affect me as a Shareholder? |
| A. 4. | The Reorganization is expected to occur on or about October 29, 2018 (the “Closing Date”), at which time shareholders of the Acquired Fund will become shareholders of the Acquiring Fund. Specifically, shareholders of Class A, Class T, Class C, Class I, Class R3, Class R4, Class R5, Class Y, and Class F shares, respectively, of the Acquired Fund will receive shares of the corresponding class of the Acquiring Fund that are equal in value to their shares in the Acquired Fund as of the Closing Date. The number of shares you receive will depend on the relative net asset value of the Funds’ shares immediately prior to the Reorganization. Thus, although the aggregate net asset value of the shares in your account will be the same, you may receive a greater or lesser number of shares than you currently hold in the Acquired Fund. |
Based on assets as of July 13, 2018, it is expected that a portion of the Acquired Fund’s portfolio assets (approximately 75%) will be sold prior to the consummation of the Reorganization, which is expected to result in the Acquired Fund realizing capital gains. Taking into account unrealized short-term and long-term
losses and that there are no capital loss carryforwards available to offset realized gains, it is currently estimated that the Acquired Fund will be required to distribute to its shareholders approximately $5,472,541 in short-term capital gains and $48,531,436 in long-term capital gains (approximately $0.0994 and $0.8811 per share), respectively, as a result of the repositioning (based on assets as of July 13, 2018). The Acquired Fund already has approximately $38,867,674 in realized short-term capital gains (approximately $0.7057 per share) and approximately $40,283,478 in realized long-term capital gains (approximately $0.7314 per share) as of July 13, 2018, which would also be required to be distributed to the Acquired Fund’s shareholders prior to the Reorganization. However, the actual amount of such distribution could be higher or lower depending on market conditions and on transactions entered into by the Acquired Fund prior to the Closing Date. Shareholders of the Acquired Fund will generally be taxed on any resulting capital gain distributions. It is also estimated that such portfolio repositioning will result in brokerage and other transaction costs, including stamp taxes, of approximately $694,381 or approximately 0.07% (7 basis points) of the Acquired Fund’s net asset value as of July 13, 2018. The preceding are estimates that may change at the time of the Reorganization based on market conditions and other factors.
| Q. 5. | Can I exchange or redeem my Acquired Fund shares before the Reorganization takes place? |
| A. 5. | Yes. You may exchange your Acquired Fund shares, as described in the Acquired Fund’s prospectus, for shares of another Hartford Fund, before the Reorganization takes place. You may also redeem your shares at any time before the Reorganization takes place, as set forth in the Acquired Fund’s prospectus. Such transactions will be treated as normal exchanges or redemptions of shares and may be taxable. The Acquired Fund was closed to new investors effective September 14, 2018. Existing shareholders will be able to purchase shares of the Acquired Fund through the close of business on or about October 26, 2018. No purchases of the Acquired Fund’s shares will be allowed after that time. |
General Information About the Funds
| Q. 6. | How comparable are the Funds’ investment objectives and investment strategies? |
| A. 6. | The Funds have similar investment objectives. The Acquired Fund’s investment objective is to seek growth of capital. The Acquiring Fund’s investment objective is to seek long-term capital appreciation. |
Each Fund invests in equity securities. Under normal circumstances, the Acquiring Fund invests at least 80% of its net assets in equity securities or equity-related securities, including derivative investments that provide exposure to equity securities. The Acquired Fund seeks its investment objective by normally investing at least 65% of its net assets in common stocks of small, medium and large companies. Although both Funds have different percentage limitations for investing in equity securities, as of June 30, 2018, each Fund had over 95% of its net assets invested in equity securities.
Each Fund invests in international/global securities, including securities denominated in foreign currencies. Each Fund may invest without limitation in equity securities of foreign issuers located anywhere in the world and non-dollar securities, including companies that conduct their principal business activities in emerging markets or whose securities are traded principally on exchanges in emerging markets. Under normal circumstances, at least 40% (and normally not less than 30%) of the Acquired Fund’s net assets will be invested in or exposed to foreign securities or derivative instruments with exposure to foreign securities of at least three different countries outside the United States. The Acquiring Fund seeks to achieve its investment objective by investing at least 65% of its net assets in foreign equity securities. The Acquiring Fund seeks to outperform the MSCI All Country World ex USA Index. The Acquiring Fund diversifies its investments among a broad range of companies in a number of different countries throughout the world, with no limit on the amount of assets that may be invested in each country. As of June 30, 2018, the Acquired Fund had approximately 44% of its net assets in foreign securities and the Acquiring Fund had approximately 94% of its net assets in foreign securities.
Each Fund seeks its investment objective by employing a multiple sleeve structure, which means the Fund has several components that the sub-adviser, Wellington Management Company LLP (“Wellington Management”), manages using different investment styles. Together the strategies represent a wide range of investment philosophies, companies, industries and market capitalizations. With respect to each Fund, Wellington Management also may allocate a portion of the Fund’s assets in securities that Wellington Management believes may complement the risk factor biases of the other sleeves (“Risk Managed Sleeve”). However, the Risk Managed Sleeve accounts for a greater portion of the Acquiring Fund versus the Acquired
Fund. As of June 30, 2018, the Acquired Fund had approximately 10% of its net assets in the Risk Managed Sleeve and the Acquiring Fund had approximately 24% of its net assets in the Risk Managed Sleeve.
For more information regarding each Fund’s investment strategies, please see the section entitled “Comparison of the Investment Objectives, Principal Investment Strategies and Fundamental Investment Restrictions” in the Information Statement/Prospectus.
| Q. 7. | How comparable are the Funds’ principal risks? |
| A. 7. | The Funds have the same principal risks, except that the Acquiring Fund is also subject to Regional/Country Focus Risk and Quantitative Investing Risk. The principal risks of investing in each Fund are identified in the section entitled “COMPARISON OF THE PRINCIPAL RISKS” in the Information Statement/Prospectus. |
| Q. 8. | Who are the Adviser and Sub-Adviser of the Acquiring Fund? |
| A. 8. | The investment adviser of the Acquiring Fund, HFMC, is also the investment adviser of the Acquired Fund. The Acquiring Fund’s sub-adviser, Wellington Management, is also the sub-adviser of the Acquired Fund. HFMC and Wellington Management will continue to serve as the Acquiring Fund’s investment adviser and sub-adviser, respectively, after the closing of the Reorganization. |
| Q. 9. | Will the Plan result in different expenses for shareholders of the Acquired Fund? |
| A. 9. | Yes. The Acquiring Fund has different expenses than the Acquired Fund. It is anticipated that, immediately following the Reorganization, shareholders of the Combined Fund will incur lower actual management fees (i.e. the management fee rate payable calculated based on a fund’s asset level) than the shareholders of the Acquired Fund immediately prior to the Reorganization. The net expense ratios of the Combined Fund immediately after the Reorganization are expected to be lower than the corresponding expense ratios of the Acquired Fund immediately prior to the Reorganization. For more information on fees and expenses, see the section entitled “COMPARISON OF FEES AND EXPENSES OF THE ACQUIRED FUND AND THE ACQUIRING FUND” in the Information Statement/Prospectus. |
| Q. 10. | Will I have to pay any front-end sales charges, contingent deferred sales charges or redemption/exchange fees in connection with the Reorganization? |
| A. 10. | No. You will not have to pay any front-end sales charges, contingent deferred sales charges (“CDSCs”) or redemption/exchange fees in connection with the Reorganization. |
| Q. 11. | How do the share purchase, redemption and exchange procedures of the Acquiring Fund compare to those of the Acquired Fund? |
| A. 11. | Although certain classes of the Acquiring Fund are currently closed to certain new investors, after the closing of the Reorganization you will be able to continue to purchase, redeem and exchange shares of the Acquiring Fund in the same manner as you could with respect to the Acquired Fund. |
| Q. 12. | Will the Reorganization be considered a taxable event for federal income tax purposes? |
| A. 12. | It is anticipated that the Reorganization will qualify for federal income tax purposes as a tax-free reorganization. Accordingly, neither the Acquired Fund, the Acquiring Fund, nor the shareholders of the Funds are expected to recognize any gain or loss for federal income tax purposes from the transactions described in the Plan. The Acquired Fund is expected to sell certain assets in anticipation of the Reorganization. Sales of the Acquired Fund’s assets are expected to result in taxable gains to the Fund’s shareholders, as well as increased transaction costs regardless of the fact that the Reorganization itself is expected to be tax free. |
Important additional information about the Reorganization is set forth in the accompanying Information
Statement/Prospectus. Please read it carefully.
COMBINED INFORMATION STATEMENT/PROSPECTUS
September [___], 2018
The Hartford Mutual Funds, Inc.
690 Lee Road
Wayne, Pennsylvania 19087
(610) 386-4068
We Are Not Asking You for a Proxy and You Should Not Send Us a Proxy
This Combined Information Statement/Prospectus (“Information Statement/Prospectus”) is being furnished to shareholders of Hartford Global Capital Appreciation Fund (the “Acquired Fund”) in connection with an Agreement and Plan of Reorganization (the “Plan”) that has been approved by the Board of Directors (the “Board”) of The Hartford Mutual Funds, Inc. (the “Company”).
The Plan provides for the following: (1) the transfer of all of the assets of the Acquired Fund to the Hartford International Equity Fund (the “Acquiring Fund”), a separate series of the Company, in exchange for shares of the Acquiring Fund that have an aggregate net asset value equal to the aggregate net asset value of the shares of the Acquired Fund on the valuation date for the Reorganization; (2) the assumption by the Acquiring Fund of all of the liabilities of the Acquired Fund; and (3) the distribution of shares of the Acquiring Fund to the shareholders of the Acquired Fund in complete liquidation of the Acquired Fund (the “Reorganization”). The Acquired Fund and the Acquiring Fund are referred to herein as the “Funds.” The Acquiring Fund, following completion of the Reorganization, may be referred to as the “Combined Fund.”
The Board believes that the Reorganization is in the best interests of the Funds, and that the interests of the shareholders will not be diluted as a result of the Reorganization. For federal income tax purposes, the Reorganization is structured as a tax-free transaction for the Acquired Fund and its shareholders. However, this tax treatment does not extend to transactions that occur prior to or after the Reorganization.
The Funds are series of the Company, a Maryland corporation, registered with the U.S. Securities and Exchange Commission (the “SEC”) as an open-end management investment company.
This Information Statement/Prospectus, which you should read carefully and retain for future reference, concisely presents the information that you should know about the Acquiring Fund, the Acquired Fund and the Reorganization. It is both an information statement for the Acquired Fund and a prospectus for the Acquiring Fund. A Statement of Additional Information (“SAI”) dated September [___], 2018 relating to this Information Statement/Prospectus and the Reorganization has been filed with the U.S. Securities and Exchange Commission (the “SEC”) and is incorporated by reference into this Information Statement/Prospectus. Additional information is contained in the documents described below, all of which have been filed with the SEC.
| Documents: | How to Obtain a Copy: |
| · Hartford International Equity Fund Summary Prospectus dated March 1, 2018, as may be amended, supplemented or restated | This summary prospectus is being mailed with the Information Statement/Prospectus. This document is incorporated by reference into (and therefore legally part of) this Information Statement/Prospectus. |
· The Funds’ prospectus dated March 1, 2018, as may be amended, supplemented or restated (File Nos. 333-02381 and 811-07589 (Acquired Fund and Acquiring Fund)) (the “Prospectus”) · Combined Statement of Additional Information of The Hartford Mutual Funds, Inc. (the “Company”) and The Hartford Mutual Funds II, Inc. dated March 1, 2018, as may be amended, supplemented or restated (File Nos. 333-02381 and 811-07589 (Acquired Fund and Acquiring Fund)) (the “SAI”) | These documents are available, without charge, on the Funds’ website at www.hartfordfunds.com/prospectuses.html, by calling 1-888-843-7824, or by writing to the Hartford Funds, P.O. Box 55022, Boston, MA 02205-5022. Each of these documents is incorporated by reference into this Information Statement/Prospectus (meaning that they are legally considered to be part of this Information Statement/Prospectus) only insofar as they related to the Funds. No other parts of such documents are incorporated by reference herein. |
| Documents: | How to Obtain a Copy: |
· The Funds’ annual report dated October 31, 2017 (File No. 811-07589 (Acquired Fund and Acquiring Fund)) · The Funds’ semi-annual report dated April 30, 2018 (File No. 811-07589 (Acquired Fund and Acquiring Fund)) | These documents are available, without charge, on the Funds’ website at www.hartfordfunds.com/prospectuses.html, by calling 1-888-843-7824, or by writing to the Hartford Funds, P.O. Box 55022, Boston, MA 02205-5022. |
You can also obtain copies of any of these documents without charge on the EDGAR database on the SEC’s Internet site at http://www.sec.gov. Copies are available for a fee by electronic request at the following e-mail address: publicinfo@sec.gov, or from the Public Reference Section, Securities and Exchange Commission, Washington, D.C. 20549-1520.
The Company is subject to the informational requirements of the Securities Exchange Act of 1934, as amended, and certain other federal securities statutes, and files reports and other information with the SEC. Proxy materials, information statements, reports, and other information filed by the Funds can be inspected and copied at the Public Reference Room maintained by the SEC. Information on the operation of the SEC’s Public Reference Room may be obtained by calling 1-202-551-8090. The SEC maintains an Internet website (at http://www.sec.gov) which contains other information about the Funds.
NO PERSON HAS BEEN AUTHORIZED TO GIVE ANY INFORMATION OR TO MAKE ANY REPRESENTATIONS OTHER THAN THOSE CONTAINED IN THIS INFORMATION STATEMENT/PROSPECTUS AND IN THE MATERIALS EXPRESSLY INCORPORATED BY REFERENCE. IF ANY PERSON PROVIDES ANY OTHER REPRESENTATION OR INFORMATION, YOU SHOULD NOT RELY ON THOSE OTHER REPRESENTATIONS OR INFORMATION SINCE NEITHER FUND HAS AUTHORIZED THOSE REPRESENTATIONS.
THE SECURITIES AND EXCHANGE COMMISSION AND THE COMMODITY FUTURES TRADING COMMISSION HAVE NOT APPROVED OR DISAPPROVED OF THESE SECURITIES OR PASSED UPON THE ADEQUACY OR ACCURACY OF THIS INFORMATION STATEMENT/PROSPECTUS. ANY REPRESENTATION TO THE CONTRARY IS A CRIMINAL OFFENSE.
PLEASE NOTE THAT INVESTMENTS IN THE FUNDS ARE NOT BANK DEPOSITS, ARE NOT FEDERALLY INSURED, ARE NOT GUARANTEED BY ANY BANK OR GOVERNMENT AGENCY AND MAY LOSE VALUE. THERE IS NO ASSURANCE THAT ANY FUND WILL ACHIEVE ITS INVESTMENT OBJECTIVES.
Table of Contents
SYNOPSIS
You should read this entire Combined Information Statement/Prospectus (the “Information Statement/Prospectus”) carefully as well as the summary prospectus for the Hartford International Equity Fund (“Acquiring Fund”), which is enclosed. For additional information, you should consult the Funds’ Prospectus dated March 1, 2018, as may be amended, supplemented or restated (the “Prospectus”); the Combined Statement of Additional Information of The Hartford Mutual Funds, Inc. (the “Company”) and The Hartford Mutual Funds II, Inc. dated March 1, 2018, as may be amended, supplemented or restated (the “SAI”); and the Agreement and Plan of Reorganization (the “Plan”). A form of the Plan is attached hereto as APPENDIX A.
The Reorganization
At a meeting held on August 7-8, 2018, the Board of Directors (the “Board”) of the Company reviewed a proposal from Hartford Funds Management Company, LLC (“HFMC”) regarding the future of the Hartford Global Capital Appreciation Fund (the “Acquired Fund”), given, among other reasons, HFMC’s belief that the Acquired Fund would not be likely to experience meaningful future net inflows or growth in assets. For the reasons set forth herein, the Board approved the Plan that provides for the reorganization of the Acquired Fund with and into the Acquiring Fund (the “Reorganization”). The Reorganization does not require shareholder approval. The Reorganization is expected to occur on or about October 29, 2018 (the “Closing Date”), at which time you will receive shares of the Acquiring Fund of the same class and of equal value to your shares in the Acquired Fund as of the Closing Date.
The Plan provides for:
| · | the transfer of all of the assets of the Acquired Fund to the Acquiring Fund in exchange for shares of the Acquiring Fund that have an aggregate net asset value equal to the aggregate net asset value of the shares of the Acquired Fund on the valuation date for the Reorganization; |
| · | the assumption by the Acquiring Fund of all of the liabilities of the Acquired Fund; and |
| · | the distribution of shares of the Acquiring Fund to the shareholders of the Acquired Fund in complete liquidation of the Acquired Fund. |
The Reorganization is expected to be completed on the Closing Date at 8:00 a.m. Eastern Time based on the net asset value of each Fund’s shares as of the close of business on the New York Stock Exchange on October 26, 2018 (the “Valuation Date”) and after the declaration of any dividends on or prior to the Valuation Date. The Acquiring Fund, following completion of the Reorganization, may be referred to as the “Combined Fund.” The Acquired Fund was closed to new investors effective September 14, 2018. Existing shareholders will be able to purchase shares of the Acquired Fund through the close of business on or about October 26, 2018. No purchases of the Acquired Fund’s shares will be allowed after that time.
Each shareholder will hold, immediately after the Closing Date, shares of the same class of the Acquiring Fund having an aggregate value equal to the aggregate value of the same class of shares of the Acquired Fund held by that shareholder as of the close of business on the Closing Date. The Reorganization does not require shareholder approval, and you are not being asked to vote or take any other action in connection with the Reorganization. As of the date of the Reorganization, your assets will automatically be invested in the Acquiring Fund, which has a similar investment objective, principal investment strategies and principal risks, but there are some differences, which are explained below.
The Plan provides for the reorganization of the Acquired Fund with and into the Acquiring Fund in exchange for Class A, Class T, Class C, Class I, Class R3, Class R4, Class R5, Class Y, and Class F shares issued by the Acquiring Fund. The net asset value of the Class A, Class T, Class C, Class I, Class R3, Class R4, Class R5, Class Y, and Class F shares, respectively, issued by the Acquiring Fund in connection with the Reorganization will be equal at the time of the Reorganization to the net asset value of the Class A, Class T, Class C, Class I, Class R3, Class R4, Class R5, Class Y, and Class F shares, respectively, of the Acquired Fund. As a result of the Reorganization, each shareholder of the Acquired Fund will cease to be a shareholder of that Fund and will instead become a shareholder of the Acquiring Fund and will own that number of full and fractional Class A, Class T, Class C, Class I, Class R3, Class R4, Class R5, Class Y, and Class F shares of the Acquiring Fund that have an aggregate net asset value at the time of the Reorganization equal to the aggregate net asset value of the Class A, Class T, Class C, Class I, Class R3, Class R4, Class R5, Class Y, and Class F shares, respectively, of the Acquired Fund that were held by that shareholder at the Valuation Date.
The Acquired Fund and the Acquiring Fund anticipate receiving a tax opinion from Dechert LLP to the effect that, based on certain facts, assumptions and representations, the Reorganization will be a tax-free reorganization within the meaning of Section 368(a) of the Internal Revenue Code of 1986, as amended (the “Code”). Consequently, in general, no gain or loss is expected to be recognized for federal income tax purposes by the Acquired Fund or its shareholders as a result of the Reorganization. The Acquired Fund is expected to sell certain assets in anticipation of the Reorganization. Sales of the Acquired Fund’s assets are expected to result in taxable gains to the Fund’s shareholders, as well as increased transaction costs regardless of the fact that the Reorganization itself is expected to be tax free. Additional information about the federal income tax consequences of the Reorganization is included under “Information About the Reorganization – Tax Considerations.”
Comparison of the Investment Objectives, Principal Investment Strategies and Fundamental Investment Restrictions
The investment objective and principal investment strategies of each Fund are similar. Each Fund’s investment objective may be changed by the Board without approval of the shareholders of the Fund.
There are, however, differences in each Fund’s principal investment strategies that you should consider.
| · | The Acquired Fund invests at least 40% (and normally not less than 30%) of its net assets in foreign securities or derivative instruments with exposure to foreign securities of at least three different countries outside the United States. In comparison, the Acquiring Fund invests at least 65% of its net assets in foreign equity securities. |
| · | The Acquired Fund seeks its investment objective by normally investing at least 65% of its net assets in common stocks of small, medium and large companies. The Acquiring Fund invests at least 80% of its assets in equity securities or equity-related securities, including derivative investments that provide exposure to equity securities (“80% Policy”). The 80% Policy is a non-fundamental policy that may be changed by the Board without shareholder approval upon 60 days’ prior notice to shareholders. In contrast, the Acquired Fund is not required to adopt a similar policy because it does not have “equity” in its name. |
| · | As part of its principal investment strategy, the Acquiring Fund invests in securities that Wellington Management believes may complement the risk factor biases of the other sleeves (“Risk Managed Sleeve”) and selects such securities using systematic screening methodologies. In contrast, the Acquired Fund invests in the Risk Managed Sleeve as part of its additional investment strategy. |
Each Fund has adopted identical fundamental investment restrictions.
The following comparisons summarize the investment objectives and principal investment strategies of each Fund.
| | Acquired Fund | Acquiring Fund |
| Investment Objective | The Fund seeks growth of capital. | The Fund seeks long-term capital appreciation. |
| Principal Investment Strategies | The Fund seeks its investment objective by normally investing at least 65% of its net assets in common stocks of small, medium and large companies. The Fund may also invest without limitation in equity securities of foreign issuers located anywhere in the world and non-dollar securities, including companies that conduct their principal business activities in emerging markets or whose securities are traded principally on exchanges in emerging markets. The Fund may trade securities actively. Under normal circumstances, at least 40% (and normally not less than 30%) of the Fund’s net assets will be invested in or exposed to foreign securities or derivative instruments with exposure to foreign securities of at least three different countries outside the United States. Investments are deemed to be “foreign” if: (a) an issuer’s domicile or location of headquarters is in a foreign country; (b) an issuer derives a significant proportion (at least 50%) of its revenues or profits from goods produced or sold, investments made, or services performed in a foreign country or has at least 50% of its assets situated in a foreign country; (c) the principal trading market for a security is located in a foreign country; or (d) it is a foreign currency. The Fund seeks its investment objective by employing a multiple sleeve structure, which means the Fund has several components that are managed separately using different investment styles. Each component sleeve has a distinct investment philosophy and analytical process to identify specific | The Fund seeks to achieve its investment objective by investing at least 65% of its net assets in foreign equity securities. Under normal circumstances, the Fund invests at least 80% of its assets in equity securities or equity-related securities, including derivative investments that provide exposure to equity securities. The Fund seeks to outperform the MSCI All Country World ex USA Index. The Fund diversifies its investments among a broad range of companies in a number of different countries throughout the world, with no limit on the amount of assets that may be invested in each country. Securities in which the Fund invests are denominated in both U.S. dollars and foreign currencies and may trade in both U.S. and foreign markets. The Fund may invest in securities of companies that conduct their principal business activities in emerging markets or whose securities are traded principally on exchanges in emerging markets. The Fund may invest in companies of any market capitalization, and may trade securities actively. The Fund seeks its investment objective by employing a multiple sleeve structure, which means the Fund has several components that the sub-adviser, Wellington Management Company LLP (“Wellington Management”), manages using different investment styles. Each component sleeve has a distinct investment philosophy and analytical process to identify specific securities for purchase or sale. Each of these sleeves is managed independently of each other. Wellington Management also may allocate a portion of the Fund’s assets in securities that Wellington Management |
| | Acquired Fund | Acquiring Fund |
| | securities for purchase or sale. The sub-adviser, Wellington Management Company LLP (“Wellington Management”), does not allocate a set percentage to any specific sleeve but instead seeks a flexible and diversified Fund profile. Together the investment strategies represent a wide range of investment philosophies, companies, industries and market capitalizations. In addition, the Fund anticipates engaging in transition management techniques in anticipation of the Reorganization. During this time, it may not pursue its investment objective and principal investment strategies. | believes may complement the risk factor biases of the other sleeves (“Risk Managed Sleeve”) and selects such securities using systematic screening methodologies. Wellington Management does not allocate a set percentage to any specific sleeve but instead seeks a flexible and diversified Fund profile. Together the strategies represent a wide range of investment philosophies, companies, industries, and market capitalizations. Investments are deemed to be “foreign” if: (a) an issuer’s domicile or location of headquarters is in a foreign country; (b) an issuer derives a significant proportion (at least 50%) of its revenues or profits from goods produced or sold, investments made, or services performed in a foreign country or has at least 50% of its assets situated in a foreign country; (c) the principal trading market for a security is located in a foreign country; or (d) it is a foreign currency. |
| Additional Investment Strategies | Wellington Management chooses certain equity securities in which the Fund invests using what is sometimes referred to as a “bottom up” approach, which is the use of fundamental analysis to identify specific securities for purchase or sale. In analyzing a prospective investment, Wellington Management looks at a number of factors, such as business environment, management quality, balance sheet, income statement, anticipated earnings, revenues, dividends and other related measures of valuation and growth potential. As part of its fundamental analysis, Wellington Management may also consider certain environmental, social and/or governance (ESG) factors during its assessment. Wellington Management may also consider the research provided by its Global Industry Analysts (GIAs), who provide in-depth company analysis by sector coverage, in addition to other resources and tools. Wellington Management may also allocate a portion of the Fund’s assets in securities that it believes may complement the risk factor biases of the other sleeves (“Risk Managed Sleeve”). In selecting securities for the Risk Managed Sleeve, Wellington Management uses systematic screening methodologies to select equity securities based on their characteristics, which may include but are not limited to their volatility, quality, value, growth, and momentum risk factor characteristics. In pursuit of its principal investment strategy, the Fund may also: invest in private placements; invest in depositary receipts; and use derivatives for hedging purposes, to gain exposure to certain issuers or market sectors, and/or to equitize cash. The derivatives in which the Fund may invest include exchange and over-the-countertraded transactions including, but not limited to, forward currency contracts, futures, options and similar derivative instruments or combinations | Wellington Management chooses certain equity securities in which the Fund invests using what is sometimes referred to as a “bottom up” approach, which is the use of fundamental analysis to identify specific securities for purchase or sale. In analyzing a prospective investment, Wellington Management looks at a number of factors, such as business environment, management quality, balance sheet, income statement, anticipated earnings, revenues, dividends and other related measures of valuation and growth potential. As part of its fundamental analysis, Wellington Management may also consider certain environmental, social and/or governance (ESG) factors during its assessment. Wellington Management may also consider the research provided by its Global Industry Analysts (GIAs), who provide in-depth company analysis by sector coverage, in addition to other resources and tools. Wellington Management also employs systematic screening methodologies to select equity securities based on factors that include, but are not limited, to their volatility, quality, value, growth, and momentum risk factor characteristics. In pursuit of its principal investment strategy, the Fund may also invest in private placements and may use derivatives for hedging purposes, to gain exposure to certain issuers or market sectors, and/or to equitize cash. The derivatives in which the Fund may invest include exchange and over-the-counter traded transactions including, but not limited to, forward currency contracts, futures, options and similar derivatives instruments or combinations thereof. The Fund may also invest in other investment companies, exchange traded notes (ETNs) and restricted securities. |
| | Acquired Fund | Acquiring Fund |
| | thereof. The Fund may also invest in other investment companies, exchange traded notes (ETNs) and restricted securities. The Fund’s investments in derivative securities, exchange traded funds (ETFs), and ETNs will be considered to be “foreign” if the underlying assets represented by the investment are determined to be foreign using the criteria set forth in the Fund’s principal investment strategy. Emerging markets are those markets (1) included in emerging market or equivalent classifications by the United Nations (and its agencies); (2) having per capita income in the low to middle ranges, as determined by the World Bank; or (3) the Fund’s benchmark index provider designates as emerging. Unless stated otherwise in the Fund’s principal investment strategy, investments are deemed to be “emerging” (a) if an issuer’s domicile or location of headquarters is in an emerging market; or (b) it is an emerging market currency. The Fund may invest some or all of its assets in cash, high quality money market instruments (including, but not limited to U.S. government securities, bank obligations, commercial paper and repurchase agreements involving the foregoing securities) and shares of money market investment companies for temporary defensive purposes in response to adverse market, economic or political conditions. In addition, the Fund may invest some of its assets in these instruments to maintain liquidity or in response to atypical circumstances such as unusually large cash inflows or redemptions. Under such conditions, the Fund may not invest in accordance with its investment objective or principal investment strategy. As a result, there is no assurance that the Fund will achieve its investment objective and it may lose the benefit of market upswings. The Fund may lend portfolio securities to certain borrowers in U.S. and non-U.S. markets in an amount not to exceed one third (33 1/3%) of the value of its total assets. | The Fund’s investments in derivative securities, exchange traded funds (ETFs), and ETNs will be considered to be “foreign” if the underlying assets represented by the investment are determined to be foreign using the criteria set forth in the Fund’s principal investment strategy. Emerging markets are those markets (1) included in emerging market or equivalent classifications by the United Nations (and its agencies); (2) having per capita income in the low to middle ranges, as determined by the World Bank; or (3) the Fund’s benchmark index provider designates as emerging. Unless stated otherwise in the Fund’s principal investment strategy, investments are deemed to be “emerging” (a) if an issuer’s domicile or location of headquarters is in an emerging market; or (b) it is an emerging market currency. The Fund may invest some or all of its assets in cash, high quality money market instruments (including, but not limited to U.S. government securities, bank obligations, commercial paper and repurchase agreements involving the foregoing securities) and shares of money market investment companies for temporary defensive purposes in response to adverse market, economic or political conditions. In addition, the Fund may invest some of its assets in these instruments to maintain liquidity or in response to atypical circumstances such as unusually large cash inflows or redemptions. Under such conditions, the Fund may not invest in accordance with its investment objective or principal investment strategy. As a result, there is no assurance that the Fund will achieve its investment objective and it may lose the benefit of market upswings. The Fund may lend portfolio securities to certain borrowers in U.S. and non-U.S. markets in an amount not to exceed one third (33 1/3%) of the value of its total assets. |
The Funds have the same principal risks, except that the Acquiring Fund is also subject to Regional/Country Focus Risk and Quantitative Investing Risk. The principal risks of investing in each Fund are identified in the “COMPARISON OF PRINCIPAL RISKS” section below.
Comparison of Fund Classes and Distribution Arrangements
Each Fund offers the same classes of shares, except that the Acquiring Fund also offers Class R6 shares. Class R6 shares are not involved in the Reorganization. Shareholders of Class A, Class T, Class C, Class I, Class R3, Class R4, Class R5, Class Y, and Class F shares, respectively, of the Acquired Fund will receive shares of the corresponding class of the Acquiring Fund, which will have substantially identical legal characteristics as the corresponding shares of the Acquired Fund with respect to such matters as voting rights, accessibility, conversion rights, and transferability. Each Fund is organized as a series of a Maryland corporation. There are no material differences between the rights of shareholders of a class of shares of the Acquiring Fund and shareholders of a corresponding class of the Acquired Fund. The following chart summarizes the different features of each share class of each Fund.
| Front End
Sales Charge | Deferred Sales Charge
(Load) | Distribution and Service
(12b-1) Fees(1) | Administrative
Services Fee(1) |
| Class A | Class A shares are offered with a front-end sales charge ranging from 5.50% to 0.00% of the Fund’s offering price, depending on the amount invested. | Investments of $1 million or more in Class A shares may be made with no front-end sales charge. However, if you qualify to purchase your Class A shares without any sales charge and you redeem those shares within 18 months of the purchase, you may pay a CDSC of 1.00% on any Class A shares sold. | 0.25% | None |
| Class T(2) | Class T shares have front-end sales charges ranging from 2.50% to 0.00% of the Fund’s offering price, depending on the amount invested. | None | 0.25% | None |
| Class C(3) | None | 1.00% on shares sold within one year of purchase | 1.00% | None |
| Class I | None | None | None | None |
| Class R3 | None | None | 0.50% | 0.20% |
| Class R4 | None | None | 0.25% | 0.15% |
| Class R5 | None | None | None | 0.10% |
| Class R6(4) | None | None | None | None |
| Class Y | None | None | None | None |
| Class F(4) | None | None | None | None |
(1) As a percentage of the Fund’s average net assets.
(2) Class T shares are not currently available for purchase and not currently sold in any State or to residents of any State, including Oklahoma and residents of Oklahoma.
(3) Effective October 1, 2018, automatic conversion of Class C shares to Class A shares after ten years, thus reducing future annual expenses (certain exclusions may apply)
(4) You may be required to pay a commission to your financial intermediary when buying or selling Class R6 or Class F shares.
Comparison of Buying, Selling, and Exchanging Shares
Although certain classes of the Acquiring Fund are currently closed to certain new investors, after the closing of the Reorganization you will be able to continue to purchase, redeem and exchange shares of the Acquiring Fund in the same manner as you could with respect to the Acquired Fund. Not all share classes are available for all investors. Minimum investment amounts may be waived for certain accounts. Certain financial intermediaries may impose different restrictions than those described below.
| Share Classes | Minimum Initial Investment | Minimum Subsequent Investment |
| Class A, Class C and Class I | $2,000 for all accounts except: $250, if establishing an Automatic Investment Plan (“AIP”), with recurring monthly investments of at least $50 | $50 |
| Class T* | $2,000 | $50 |
| Class R3, Class R4 , Class R5 and Class R6 | No minimum initial investment | None |
| Class Y | $250,000 This requirement may be waived for certain investors as set forth in the section entitled “Classes of Shares – Investor Requirements” in the Funds’ statutory prospectus. | None |
| Share Classes | Minimum Initial Investment | Minimum Subsequent Investment |
| Class F | Generally, there is no minimum initial investment. There is a $1,000,000 minimum initial investment for certain eligible investors as set forth in the section entitled “Classes of Shares – Investor Requirements” in the Funds’ statutory prospectus. | None |
* Class T shares are not currently available for purchase and not currently sold in any State or to residents of any State, including Oklahoma and residents of Oklahoma.
For more information, please see the “How To Buy And Sell Shares” section of the Funds’ statutory prospectus. You may sell your shares of each Fund on those days when the New York Stock Exchange is open, typically Monday through Friday. You may sell your shares through your financial intermediary. With respect to certain accounts, you may sell your shares on the web at www.hartfordfunds.com, by phone by calling 1-888-843-7824, by electronic funds transfer, or by wire. In certain circumstances you will need to write to Hartford Funds, P.O. Box 55022, Boston, MA 02205-5022 to request to sell your shares. For overnight mail, please send the request to Hartford Funds, 30 Dan Road, Suite 55022, Canton, MA 02021-2809.
Comparison of Fund Distributions
Each Fund intends to distribute substantially all of its net investment income and capital gains to shareholders at least once a year. Capital gains of each Fund are normally declared and paid annually. Dividends from net investment income of each Fund are normally declared and paid annually. Notwithstanding the foregoing, the Company’s Board has delegated authority to the Fund’s Treasurer to reduce the frequency with which dividends are declared and paid and to declare and make payments of long-term capital gains as permitted or required by law or in order to avoid tax penalties. Further, each Fund reserves the right to change its dividend distribution policy at the discretion of its Board. Unless shareholders specify otherwise, all dividends and distributions received from a Fund are automatically reinvested in additional full or fractional shares of that Fund.
COMPARISON OF THE PRINCIPAL RISKS
The table below compares the principal risks of each Fund. When you sell your shares they may be worth more or less than what you paid for them, which means that you could lose money as a result of your investment. An investment in a Fund is not a bank deposit and is not insured or guaranteed by the Federal Deposit Insurance Corporation or any other government agency. As with any fund, there is no guarantee that a Fund will achieve its investment objective.
| Principal Risks | Acquired
Fund | Acquiring
Fund |
| Market Risk −Market risk is the risk that one or more markets in which the Fund invests will go down in value, including the possibility that the markets will go down sharply and unpredictably. Securities may decline in value due to the activities and financial prospects of individual companies or to general market and economic movements and trends, including adverse changes to credit markets. | Yes | Yes |
| Foreign Investments Risk −Investments in foreign securities may be riskier than investments in U.S. securities. Differences between the U.S. and foreign regulatory regimes and securities markets, including the less stringent investor protection and disclosure standards of some foreign markets, as well as political and economic developments in foreign countries and regions, may affect the value of the Fund’s investments in foreign securities. Changes in currency exchange rates may also adversely affect the Fund’s foreign investments. Certain European countries in which the Fund may invest have recently experienced significant volatility in financial markets and may continue to do so in the future. The impact of the United Kingdom’s intended departure from the European Union, commonly known as “Brexit,” and the potential departure of one or more other countries from the European Union may have significant political and financial consequences for global markets. This may adversely impact Fund performance. | Yes | Yes |
| Emerging Markets Risk −The risks related to investing in foreign securities are generally greater with respect to investments in companies that conduct their principal business activities in emerging markets or whose securities are traded principally on exchanges in emerging markets. The risks of investing in emerging markets include risks of illiquidity, increased price volatility, smaller market capitalizations, less government regulation, less extensive and less frequent accounting, financial and other reporting requirements, significant delays in settlement of trades, risk of loss resulting from problems in share registration and custody and substantial economic and political disruptions. Frontier markets are those emerging markets that are considered to be among the smallest, least mature and least liquid, and as a result, the risks of investing in emerging markets are magnified in frontier markets. | Yes | Yes |
| Principal Risks | Acquired
Fund | Acquiring
Fund |
| Currency Risk −The risk that the value of the Fund’s investments in foreign securities or currencies will be affected by the value of the applicable currency relative to the U.S. dollar. When the Fund sells a foreign currency or foreign currency denominated security, its value may be worth less in U.S. dollars even if the investment increases in value in its local market. U.S. dollar-denominated securities of foreign issuers may also be affected by currency risk, as the revenue earned by issuers of these securities may also be affected by changes in the issuer’s local currency. | Yes | Yes |
| Equity Risk −The risk that the price of equity or equity related securities may decline due to changes in a company’s financial condition and overall market and economic conditions. | Yes | Yes |
| Mid Cap and Small Cap Securities Risk − Investments in small capitalization and mid capitalization companies involve greater risks than investments in larger, more established companies. Many of these companies are young and have limited operating or business history. These securities may be subject to more abrupt or erratic price movements and may lack sufficient market liquidity, and these issuers often face greater business risks, including the risk of bankruptcy. | Yes | Yes |
| Investment Strategy Risk −The risk that, if the sub-adviser’s investment strategy does not perform as expected, the Fund could underperform its peers or lose money. There is no guarantee that the Fund’s investment objective will be achieved. | Yes | Yes |
| Asset Allocation Risk −The risk that if the Fund’s strategy for allocating assets among different asset classes and/or portfolio management teams does not work as intended, the Fund may not achieve its objective or may underperform other funds with similar investment strategies. The investment styles employed by the portfolio managers may not be complementary, which could adversely affect the performance of the Fund. | Yes | Yes |
| Securities Lending Risk −The Fund may seek to earn additional income by engaging in securities lending. The Fund may lose money because the borrower of the loaned securities fails to return the securities in a timely manner or at all. The Fund could also lose money in the event of a decline in the value of the collateral provided for loaned securities or a decline in the value of any investments made with cash collateral. These events could also trigger adverse tax consequences for the Fund. | Yes | Yes |
| Active Trading Risk −Active trading could increase the Fund’s transaction costs and may increase your tax liability as compared to a fund with less active trading policies. These effects may adversely affect Fund performance. | Yes | Yes |
| Regional/Country Focus Risk −To the extent that the Fund focuses its investments in a particular geographic region or country, the Fund may be subject to increased currency, political, regulatory and other risks. As a result, the Fund may be subject to greater price volatility and risk of loss than a fund holding more geographically diverse investments. | No | Yes |
| Quantitative Investing Risk −The value of securities or other investments selected using quantitative analysis can perform differently from the market as a whole or from their expected performance. This may be as a result of the factors used in building the quantitative analytical framework, the weights placed on each factor, the accuracy of historical data supplied by third parties, and changing sources of market returns. | No | Yes |
REASONS FOR THE REORGANIZATION
The Reorganization is being proposed to address the Acquired Fund’s lack of growth in assets in recent years. The Reorganization may provide the Acquired Fund shareholders the opportunity to benefit from the increased assets resulting from combining the Funds, which may contribute to lowering annual fund operating expenses of the Acquiring Fund over time. HFMC, the investment adviser for both the Acquired Fund and the Acquiring Fund, or its affiliates will bear all costs associated with the Reorganization, other than brokerage-related expenses, stamp taxes, and other similar transaction costs, which will be borne by the respective Fund, as applicable.
Board Considerations and Benefits of the Reorganization
The Reorganization was presented to the Board of the Company for consideration and approval at a meeting held on August 7-8, 2018. In advance of the meeting, the Board requested and received detailed information regarding the Reorganization. After reviewing and evaluating this information, including the factors summarized below and other information in this Information Statement/Prospectus, the Board, including all of the Directors who are not “interested persons” (as defined in the Investment Company Act of 1940 (the “1940 Act”)) (the “Independent Directors”) of the Company, unanimously approved the Reorganization. In approving the Reorganization, the Board, including all of the Independent Directors, determined that the interests of the shareholders of each Fund would not be diluted as a result of the Reorganization, and that the Reorganization was in the best interests of each Fund. The determinations were made on the basis of each Director’s judgment after consideration of all of the factors taken as a whole, though individual Directors may have
attributed different weights to various factors. In reviewing the Reorganization, the Board was assisted by counsel for the Funds, and the Independent Directors were also separately assisted by independent legal counsel.
The Company’s Board considered all factors deemed pertinent in its business judgment, including the following:
| · | The Reorganization would provide an opportunity for shareholders to benefit from potential economies of scale that may be realized by combining the Funds’ assets in the Reorganization. |
| · | The Acquired Fund and the Acquiring Fund have similar investment objectives. The Acquired Fund’s investment objective is to seek growth of capital, while the Acquiring Fund’s investment objective is to seek long-term capital appreciation. The Acquired Fund and the Acquiring Fund have the same fundamental investment policies. |
| · | The Acquired Fund and the Acquiring Fund have similar investment strategies, investment styles and principal risks, but there are some differences. HFMC believes that the main similarity between the Funds, which is that both Funds are equity funds that invest in international/global stocks, outweighs the differences. |
| · | The performance of both Funds relative to each other, their benchmarks and their peers, including that the Acquired Fund had better short-term performance than the Acquiring Fund as of June 30, 2018, but the Acquiring Fund had generated higher performance than the Acquired Fund for the calendar years ended 2015, 2016, and 2017. The Acquiring Fund had provided better benchmark relative returns for the 1-, 3- and 5-year periods and better peer-relative returns for the 3- and 5-year periods ending June 30, 2018. The Acquired Fund’s investment mandate was broadened in 2014 to be more globally-oriented. |
| · | The Acquiring Fund will be the accounting survivor of the Reorganization for performance purposes. |
| · | The Acquiring Fund’s management fee schedule provides for lower fee rates at all asset levels than the Acquired Fund. The Reorganization is expected to result in lower gross and net operating expenses for shareholders of each class of the Acquired Fund. The contractual operating expense caps for each share class of the Acquiring Fund will remain in effect until October 31, 2019, unless the Board approves their earlier termination. |
| · | The Acquired Fund and the Acquiring Fund have the same investment adviser, HFMC, and sub-adviser, Wellington Management, with the same portfolio management team, but some of the underlying sleeve managers are different. HFMC will continue to oversee the investment program of the Acquiring Fund and the performance of Wellington Management after consummation of the Reorganization. The Reorganization is not expected to result in diminution in the level or quality of services that the Acquired Fund shareholders currently receive. |
| · | The share purchase and redemption provisions for the Acquired Fund and the Acquiring Fund are the same. |
| · | The terms and conditions of the Plan. See “INFORMATION ABOUT THE REORGANIZATION - The Plan.” |
| · | The Reorganization will not dilute the interests of the shareholders of the Funds because the Acquired Fund shareholders will receive shares of the Acquiring Fund with the same aggregate net asset value as their Acquired Fund shares at the time of the Reorganization. |
| · | The Acquired Fund and the Acquiring Fund anticipate that the Reorganization will be considered a tax-free reorganization within the meaning of Section 368(a)(1) of the Code. As such, shareholders of the Acquired Fund and the Acquiring Fund are not expected to recognize gain or loss as a result of the Reorganization. See “Information About the Reorganization – Tax Considerations.” |
| · | HFMC or its affiliates will bear all costs associated with the Reorganization other than brokerage-related expenses, stamp taxes and other similar transaction costs, which will be borne by the respective Fund, as applicable. |
| · | The Board considered that the Acquired Fund would be repositioned in connection with the Reorganization and the costs associated with the repositioning, including brokerage commissions, stamp taxes, as well as the estimated amounts of capital gains to be distributed to shareholders. The Board recognized that there would be separate costs to invest any cash in the Acquiring Fund after the Reorganization. |
| · | The Acquired Fund is the larger fund (approximately $1.03 billion in assets versus approximately $227 million in assets for the Acquiring Fund, as of June 30, 2018). HFMC believes that the Acquiring Fund’s investment strategies with a focus on international securities have more potential for future growth. |
| · | The share class structure of the Acquired Fund is identical to that of the Acquiring Fund, except that the Acquiring Fund also offers Class R6 shares and certain share classes of the Acquiring Fund are closed to new investors, subject to certain exceptions. |
| · | The Reorganization does not require shareholder approval. |
| · | HFMC’s belief that the Reorganization provides a better resolution for the Acquired Fund than other options, such as liquidating the Acquired Fund. |
| · | The Reorganization may result in some potential benefits to HFMC and its affiliates, including cost savings, resulting from managing one Combined Fund rather than two separate Funds because the fixed costs involved with operating the Combined Fund will be spread across a larger asset base following the Reorganization. As a result, HFMC may benefit from reimbursing less expenses for the Acquiring Fund under the contractual expense reimbursement arrangement after the closing of the Reorganization. |
Comparison Of Fees And Expenses of the Acquired Fund and the Acquiring Fund
Fees and Expenses
The fees and expenses of each Fund and estimated pro forma fees and expenses after giving effect to the Reorganization are shown in the table below based on the fees and expenses of the Funds for the twelve months ended April 30, 2018; except as noted in the footnotes to the tables below. Pro forma fees and expenses show estimated fees and expenses of the Acquiring Fund after giving effect to the Reorganization as of April 30, 2018. Pro forma numbers are estimated in good faith and are hypothetical. The tables below describe the fees and expenses that you may pay if you buy and hold shares of the Funds. You may qualify for sales charge discounts with respect to Class A shares if you and your family invest, or agree to invest in the future, at least $50,000 in Hartford Funds. For purchases of Class T shares, you may qualify for a sales charge discount if you purchase $250,000 or more in a single transaction. More information about these and other discounts is available from your financial professional and in the “How Sales Charges Are Calculated” section of the Funds’ Prospectus and the “Purchase and Redemption of Shares” section of the Funds’ SAI. In addition, descriptions of any financial intermediary specific sales load waivers and/or discounts are reproduced in Appendix A to the Funds’ prospectus and in a supplement dated June 25, 2018 to the Funds’ prospectus based on information provided by the financial intermediaries. The tables and examples below do not reflect any transaction fees that may be charged by financial intermediaries. In addition, the tables and examples below do not reflect any commissions that a shareholder may be required to pay directly to its financial intermediary when buying or selling Class F shares.
| Shareholder Fees (fees paid directly from your investment) |
| | Global Capital Appreciation Fund
(Acquired Fund) | International Equity Fund
(Acquiring Fund) | International Equity Fund
(Acquiring Fund)
Pro Forma(1) |
| Share Classes | A | T | C | I, R3,
R4, R5,
Y and F | A | T | C | I, R3, R4,
R5, Y and
F | A | T | C | I, R3, R4,
R5, Y and
F |
| Maximum sales charge (load) imposed on purchases as a percentage of offering price | 5.50% | 2.50% | None | None | 5.50% | 2.50% | None | None | 5.50% | 2.50% | None | None |
| Maximum deferred sales charge (load) (as a percentage of purchase price or redemption proceeds, whichever is less) | None(2) | None | 1.00% | None | None(2) | None | 1.00% | None | None(2) | None | 1.00% | None |
| Annual Fund Operating Expenses (expenses that you pay each year as a percentage of the value of your investment) |
| | Global Capital Appreciation Fund
(Acquired Fund) | International Equity Fund
(Acquiring Fund) | International Equity Fund
(Acquiring Fund)
Pro Forma(1) |
| Share Classes | A | T | C | A | T | C | A | T | C |
| Management fees | 0.79% | 0.79% | 0.79% | 0.46%(3) | 0.46%(3) | 0.46%(3) | 0.46%(3) | 0.46%(3) | 0.46%(3) |
| Distribution and service (12b-1) fees | 0.25% | 0.25% | 1.00% | 0.25% | 0.25% | 1.00% | 0.25% | 0.25% | 1.00% |
| Total other expenses(4) | 0.25% | 0.25% | 0.20% | 0.69% | 0.69% | 0.69% | 0.24% | 0.24% | 0.21% |
| Administrative services fee | None | None | None | None | None | None | None | None | None |
| Other expenses | 0.25% | 0.25% | 0.20% | 0.69% | 0.69% | 0.69% | 0.24% | 0.24% | 0.21% |
| Acquired fund fees and expenses | 0.01% | 0.01% | 0.01% | 0.01% | 0.01% | 0.01% | 0.01% | 0.01% | 0.01% |
| Total annual fund operating expenses(5) | 1.30% | 1.30% | 2.00% | 1.41% | 1.41% | 2.16% | 0.96% | 0.96% | 1.68% |
| Fee waiver and/or expense reimbursement | 0.04% | 0.04% | 0.00% | 0.36% | 0.36% | 0.36% | 0.00% | 0.00% | 0.00% |
| Total annual fund operating expenses after fee waiver and/or expense reimbursement | 1.26%(6) | 1.26%(6) | 2.00%(6) | 1.05%(7) | 1.05%(7) | 1.80%(7) | 0.96%(7) | 0.96%(7) | 1.68%(7) |
| Annual Fund Operating Expenses (expenses that you pay each year as a percentage of the value of your investment) |
| | Global Capital Appreciation Fund
(Acquired Fund) | International Equity Fund
(Acquiring Fund) | International Equity Fund
(Acquiring Fund)
Pro-Forma(1) |
| Share Classes | I | R3 | R4 | I | R3 | R4 | I | R3 | R4 |
| Management fees | 0.79% | 0.79% | 0.79% | 0.46%(3) | 0.46%(3) | 0.46%(3) | 0.46%(3) | 0.46%(3) | 0.46%(3) |
| Distribution and service (12b-1) fees | None | 0.50% | 0.25% | None | 0.50% | 0.25% | None | 0.50% | 0.25% |
| Total other expenses(4) | 0.15% | 0.29% | 0.23% | 0.59% | 0.71% | 0.66% | 0.14% | 0.28% | 0.22% |
| Administrative services fee | None | 0.20% | 0.15% | None | 0.20% | 0.15% | None | 0.20% | 0.15% |
| Other expenses | 0.15% | 0.09% | 0.08% | 0.59% | 0.51% | 0.51% | 0.14% | 0.08% | 0.07% |
| Acquired fund fees and expenses | 0.01% | 0.01% | 0.01% | 0.01% | 0.01% | 0.01% | 0.01% | 0.01% | 0.01% |
| Total annual fund operating expenses(5) | 0.95% | 1.59% | 1.28% | 1.06% | 1.68% | 1.38% | 0.61% | 1.25% | 0.94% |
| Fee waiver and/or expense reimbursement | 0.00% | 0.23% | 0.22% | 0.31% | 0.41% | 0.41% | 0.00% | 0.00% | 0.00% |
Total annual fund operating expenses after fee waiver and/or expense reimbursement | 0.95%(6) | 1.36%(6) | 1.06%(6) | 0.75%(7) | 1.27%(7) | 0.97%(7) | 0.61%(7) | 1.25%(7) | 0.94%(7) |
| Annual Fund Operating Expenses (expenses that you pay each year as a percentage of the value of your investment) |
| | Global Capital Appreciation Fund
(Acquired Fund) | International Equity Fund
(Acquiring Fund) | International Equity Fund
(Acquiring Fund)
Pro Forma(1) |
| Share Classes | R5 | Y | F | R5 | Y | F | R5 | Y | F |
| Management fees | 0.79% | 0.79% | 0.79% | 0.46%(3) | 0.46%(3) | 0.46%(3) | 0.46%(3) | 0.46%(3) | 0.46%(3) |
| Distribution and service (12b-1) fees | None | None | None | None | None | None | None | None | None |
| Total other expenses(4) | 0.19% | 0.12% | 0.07% | 0.61% | 0.50% | 0.49% | 0.18% | 0.08% | 0.06% |
| Administrative services fee | 0.10% | None | None | 0.10% | None | None | 0.10% | None | None |
| Other expenses | 0.09% | 0.12% | 0.07% | 0.51% | 0.50% | 0.49% | 0.08% | 0.08% | 0.06% |
| Acquired fund fees and expenses | 0.01% | 0.01% | 0.01% | 0.01% | 0.01% | 0.01% | 0.01% | 0.01% | 0.01% |
| Total annual fund operating expenses(5) | 0.99% | 0.92% | 0.87% | 1.08% | 0.97% | 0.96% | 0.65% | 0.55% | 0.53% |
| Fee waiver and/or expense reimbursement | 0.03% | 0.01% | 0.00% | 0.41% | 0.31% | 0.41% | 0.00% | 0.00% | 0.00% |
Total annual fund operating expenses after fee waiver and/or expense reimbursement | 0.96%(6) | 0.91%(6) | 0.87%(6) | 0.67%(7) | 0.66%(7) | 0.55%(7) | 0.65%(7) | 0.55%(7) | 0.53%(7) |
| (1) | Reflects pro forma amounts following the Reorganization. |
| (2) | For investments over $1 million, a 1.00% maximum deferred sales charge may apply. |
| (3) | “Management fees” have been restated to reflect current fees. |
| (4) | “Total other expenses” for all classes, except Class T, have been restated to reflect current transfer agency fees. “Total other expenses” for Class T shares are based on estimated amounts. |
| (5) | “Total annual fund operating expenses” do not correlate to the ratio of expenses to average net assets that is disclosed in the Fund’s annual report and semi-annual report in the financial highlights table, which reflects the operating expenses of the Fund and does not include acquired fund fees and expenses. The ratio of expenses to average net assets that is disclosed in the Fund’s annual report and semi-annual report in the financial highlights table for the applicable period also does not reflect the restated “Management fees” with respect to the Acquiring Fund or the restated “Total other expenses.” |
| (6) | HFMC has contractually agreed to reimburse expenses (exclusive of taxes, interest expenses, brokerage commissions, acquired fund fees and expenses and extraordinary expenses) to the extent necessary to maintain total annual fund operating expenses as follows: 1.25% (Class A), 1.25% (Class T), 2.00% (Class C), 1.00% (Class I), 1.35% (Class R3), 1.05% (Class R4), 0.95% (Class R5), 0.90% (Class Y) and 0.90% (Class F). This contractual arrangement will remain in effect until February 28, 2019 unless the Company’s Board approves its earlier termination. |
| (7) | HFMC has contractually agreed to reimburse expenses (exclusive of taxes, interest expenses, brokerage commissions, acquired fund fees and expenses and extraordinary expenses) to the extent necessary to maintain total annual fund operating expenses as follows: 1.04% (Class A), 1.04% (Class T), 1.79% (Class C), 0.74% (Class I), 1.26% (Class R3), 0.96% (Class R4), 0.66% (Class R5), 0.65% (Class Y) and 0.54% (Class F). This contractual arrangement will remain in effect until October 31, 2019 unless the Company’s Board approves its earlier termination. |
Example
The examples below are intended to help you compare the cost of investing in the Funds and in the Acquiring Fund (after the Reorganization) on a pro forma basis. The examples assume that:
| · | Your investment has a 5% return each year |
| · | The Fund’s operating expenses remain the same (except that the examples reflect the expense limitation arrangements for only the first year) |
| · | You reinvest all dividends and distributions |
| · | You pay any deferred sales charge due for the applicable period. |
Your actual costs may be higher or lower. Based on these assumptions, for every $10,000 invested, you would pay the following expenses if you sell all of your shares at the end of each time period indicated:
| | Year 1 | Year 3 | Year 5 | Year 10 |
| Share Classes | A | T | C | A | T | C | A | T | C | A | T | C |
Global Capital Appreciation Fund (Acquired Fund) | $671 | $375 | $303 | $936 | $648 | $627 | $1,220 | $941 | $1,078 | $2,028 | $1,775 | $2,327 |
| International Equity Fund (Acquiring Fund) | $651 | $354 | $283 | $938 | $651 | $641 | $1,246 | $968 | $1,126 | $2,118 | $1,868 | $2,465 |
International Equity Fund (Acquiring Fund) Pro Forma(1) | $643 | $345 | $271 | $839 | $548 | $530 | $1,052 | $768 | $913 | $1,663 | $1,399 | $1,987 |
| | Year 1 | Year 3 | Year 5 | Year 10 |
| Share Classes | I | R3 | R4 | I | R3 | R4 | I | R3 | R4 | I | R3 | R4 |
Global Capital Appreciation Fund (Acquired Fund) | $97 | $138 | $108 | $303 | $479 | $384 | $525 | $844 | $681 | $1,166 | $1,870 | $1,526 |
| International Equity Fund (Acquiring Fund) | $77 | $129 | $99 | $306 | $490 | $397 | $555 | $874 | $716 | $1,266 | $1,953 | $1,622 |
International Equity Fund (Acquiring Fund) Pro Forma(1) | $62 | $127 | $96 | $195 | $397 | $300 | $340 | $686 | $520 | $762 | $1,511 | $1,155 |
| | Year 1 | Year 3 | Year 5 | Year 10 |
| Share Classes | R5 | Y | F | R5 | Y | F | R5 | Y | F | R5 | Y | F |
Global Capital Appreciation Fund (Acquired Fund) | $98 | $93 | $89 | $312 | $292 | $278 | $544 | $508 | $482 | $1,210 | $1,130 | $1,073 |
| International Equity Fund (Acquiring Fund) | $68 | $67 | $56 | $303 | $278 | $265 | $556 | $506 | $491 | $1,280 | $1,161 | $1,141 |
International Equity Fund (Acquiring Fund) Pro Forma(1) | $66 | $56 | $54 | $208 | $176 | $170 | $362 | $307 | $296 | $810 | $689 | $665 |
| (1) | Reflects pro forma amounts following the Reorganization. |
You would pay the following expenses if you did not redeem your shares:
| | Year 1 | Year 3 | Year 5 | Year 10 |
| Share Classes | A | T | C | A | T | C | A | T | C | A | T | C |
Global Capital Appreciation Fund (Acquired Fund) | $671 | $375 | $203 | $936 | $648 | $627 | $1,220 | $941 | $1,078 | $2,028 | $1,775 | $2,327 |
| International Equity Fund (Acquiring Fund) | $651 | $354 | $183 | $938 | $651 | $641 | $1,246 | $968 | $1,126 | $2,118 | $1,868 | $2,465 |
International Equity Fund (Acquiring Fund) Pro Forma(1) | $643 | $345 | $171 | $839 | $548 | $530 | $1,052 | $768 | $913 | $1,663 | $1,399 | $1,987 |
| | Year 1 | Year 3 | Year 5 | Year 10 |
| Share Classes | I | R3 | R4 | I | R3 | R4 | I | R3 | R4 | I | R3 | R4 |
Global Capital Appreciation Fund (Acquired Fund) | $97 | $138 | $108 | $303 | $479 | $384 | $525 | $844 | $681 | $1,166 | $1,870 | $1,526 |
| International Equity Fund (Acquiring Fund) | $77 | $129 | $99 | $306 | $490 | $397 | $555 | $874 | $716 | $1,266 | $1,953 | $1,622 |
International Equity Fund (Acquiring Fund) Pro Forma(1) | $62 | $127 | $96 | $195 | $397 | $300 | $340 | $686 | $520 | $762 | $1,511 | $1,155 |
| | Year 1 | Year 3 | Year 5 | Year 10 |
| Share Classes | R5 | Y | F | R5 | Y | F | R5 | Y | F | R5 | Y | F |
Global Capital Appreciation Fund (Acquired Fund) | $98 | $93 | $89 | $312 | $292 | $278 | $544 | $508 | $482 | $1,210 | $1,130 | $1,073 |
| International Equity Fund (Acquiring Fund) | $68 | $67 | $56 | $303 | $278 | $265 | $556 | $506 | $491 | $1,280 | $1,161 | $1,141 |
International Equity Fund (Acquiring Fund) Pro Forma(1) | $66 | $56 | $54 | $208 | $176 | $170 | $362 | $307 | $296 | $810 | $689 | $665 |
| (1) | Reflects pro forma amounts following the Reorganization. |
Portfolio Turnover
The Funds pay transaction costs, such as commissions, when they buy and sell securities (or “turn over” their portfolios). A higher portfolio turnover rate may indicate higher transaction costs and may result in higher taxes when Fund shares are held in a taxable account. These costs, which are not reflected in annual fund operating expenses or in the examples, affect the Funds’ performance. During the most recent fiscal year, the portfolio turnover rate for the Acquired Fund was 107% and the portfolio turnover rate for the Acquiring Fund was 133%, in each case of the average value of its respective portfolio.
MANAGEMENT AND PERFORMANCE OF THE FUNDS
The Investment Adviser and Sub-Adviser
The Investment Manager
HFMC is the investment manager to each Fund. HFMC is an indirect subsidiary of The Hartford Financial Services Group, Inc. (“The Hartford”), a Connecticut-based financial services company. Excluding affiliated funds of funds, as of June 30, 2018, HFMC and its wholly owned subsidiary, Lattice Strategies LLC, had approximately $117.0 billion in discretionary and non-discretionary assets under management. HFMC is responsible for the management of the Funds and supervises the activities of the investment sub-adviser. HFMC is principally located at 690 Lee Road, Wayne, PA 19087. Each Fund pays HFMC an investment management fee, which is accrued daily and paid monthly, equal on an annual basis to a stated percentage of the Fund’s average daily net assets. The Acquiring Fund’s contractual management fee rates are lower than those of the Acquired Fund.
Each Fund pays a monthly management fee to HFMC based on a stated percentage of the Fund’s average daily net asset value as follows:
| Acquired Fund | Acquiring Fund |
| AVERAGE DAILY NET ASSETS | ANNUAL RATE | AVERAGE DAILY NET ASSETS | ANNUAL RATE |
| First $500 million | 0.8500% | First $1 billion | 0.4600% |
| Next $500 million | 0.7500% | Next $1 billion | 0.4500% |
| Next $4 billion | 0.6500% | Next $3 billion | 0.4400% |
| Next $5 billion | 0.6300% | Amount Over $5 billion | 0.4300% |
| Amount Over $10 billion | 0.6250% | | |
For the fiscal year ended October 31, 2017, each Fund paid HFMC the following effective management fee as a percentage of average daily net assets:
| Fund | Effective Management Fee |
| Acquired Fund | 0.80% |
| Acquiring Fund | 0.66% |
Effective March 1, 2018, the management fee set forth in the investment management agreement with respect to the Acquiring Fund is 0.4600% of the first $1 billion, 0.4500% of the next $1 billion, 0.4400% of the next $3 billion and 0.4300% in excess of $5 billion annually of the Fund’s average daily net assets. From July 1, 2017 through February 28, 2018, the management fee set forth in the investment management agreement with respect to the Acquiring Fund was 0.6000% of the first $1 billion, 0.5900% of the next $4 billion and 0.5800% in excess of $5 billion annually of the Fund’s average daily net assets. Prior to July 1, 2017, the management fee set forth in the investment management agreement with respect to the Acquiring Fund was 0.7000% of the first $500 million, 0.6500% of the next $500 million, 0.6400% of the next $1.5 billion, 0.6300% of the next $2.5 billion and 0.6250% in excess of $5 billion annually of the Fund’s average daily net assets. Effective November 1, 2017, the management fee set forth in the investment management agreement with respect to the Acquired Fund is 0.8500% of the first $500 million, 0.7500% of the next $500 million, 0.6500% of the next $4 billion, 0.6300% of the next $5 billion, and 0.6250% in excess of $10 billion annually of the Fund’s average daily net assets. Prior to November 1, 2017, the management fee set forth in the investment management agreement with respect to the Acquired Fund was 0.8500% of the first $500 million, 0.7500% of the next $500 million, 0.7000% of the next $4 billion, 0.6800% of the next $5 billion, and 0.6750% in excess of $10 billion annually of the Fund’s average daily net assets.
HFMC has entered into a sub-advisory agreement with Wellington Management to perform the daily investment of the assets of the Funds. For such services, Wellington Management receives compensation from HFMC, not the Funds. A discussion regarding the basis for the Board’s approval of the investment management and investment sub-advisory agreements of each Fund is available in the annual report to shareholders of each Fund for the fiscal year ended October 31, 2017.
HFMC and the Funds rely on an exemptive order (the “Order”) from the U.S. Securities and Exchange Commission (“SEC”) under which the Funds operate pursuant to a “Manager of Managers” structure. HFMC has responsibility, subject to oversight by the Board of Directors, to oversee the sub-adviser and recommend its hiring, termination and replacement. The Order permits HFMC, on behalf of a Fund and subject to the approval of the Board of Directors, to hire, and to materially amend any existing or future sub-advisory agreement with, sub-advisers that are not affiliated with HFMC (the “Original Relief”), as well as sub-advisers that are indirect or direct, wholly-owned subsidiaries of HFMC or of another company that, indirectly or directly wholly owns HFMC (the “Expanded Relief”), in each case without obtaining approval from the respective Fund’s shareholders. Shareholders of the Acquiring Fund have approved the operation of the Fund under any “manager of managers” structure, including under (i) both the Original Relief and Expanded relief set forth in the Order and/or (ii) any future law, regulation, or exemptive relief provided by the SEC. However, shareholders of the Acquired Fund have approved the operation of the Fund under the “manager of managers” structure only under the Original Relief set forth in the Order. After the Reorganization, the Acquiring Fund intends to continue to rely on (i) both the Original Relief and Expanded relief set forth in the Order and/or (ii) any future law, regulation, or exemptive relief provided by the SEC. Within 90 days after hiring any new sub-adviser, the respective Fund’s shareholders will receive information about any new sub-advisory relationship.
The Investment Sub-Adviser
Wellington Management serves as each Fund’s sub-adviser, and Wellington Management performs the daily investment of the assets of each Fund. Wellington Management is a Delaware limited liability partnership with principal offices at 280 Congress Street, Boston, Massachusetts 02210. Wellington Management is a professional investment counseling firm that provides investment services to investment companies, employee benefit plans, endowments, foundations, and other institutions. Wellington Management and its predecessor organizations have provided investment advisory services for over 80 years. Wellington Management is owned by the partners of Wellington Management Group LLP, a Massachusetts limited liability partnership. As of June 30, 2018, Wellington Management and its investment advisory affiliates had investment management authority with respect to approximately $1,068 billion in assets.
The following individuals have responsibility for the day-to-day management of each Fund:
Kent M. Stahl, CFA, Senior Managing Director and Chief Investment Strategist of Wellington Management, has served as portfolio manager for each Fund since 2010 and is responsible for selecting and overseeing each Fund’s portfolio management and determining how Fund assets are allocated among the team’s members. Mr. Stahl joined Wellington Management as an investment professional in 1998.
Gregg R. Thomas, CFA, Senior Managing Director and Associate Director, Investment Strategy and Risk of Wellington Management, has served as portfolio manager for each Fund since 2013 and with respect to each Fund, is involved in overseeing the allocation of assets among the Fund’s portfolio management teams. Mr. Thomas joined Wellington Management in 2002 and has been an investment professional since 2004.
Mr. Stahl announced his plan to retire and withdraw from the partnership of Wellington Management Group LLP, the ultimate holding company of Wellington Management, as of December 31, 2018. Accordingly, he will no longer serve as a portfolio manager to the Acquiring Fund as of December 31, 2018. Mr. Thomas will remain a portfolio manager and Mr. Thomas will continue to select and oversee the Fund’s portfolio management team and determine how Fund assets are allocated among the team’s members after the closing of the Reorganization. The Funds’ SAI provides additional information about the portfolio managers’ compensation, other accounts managed by the portfolio managers, and the portfolio managers’ ownership of securities in the Funds.
Performance of the Acquired Fund and the Acquiring Fund
The performance information below indicates the risks of investing in each Fund. As of December 31, 2017, Class T shares had not commenced operations and performance is that of the respective Fund’s Class A shares (adjusted to reflect the Class T sales charge). Class F shares commenced operations on February 28, 2017 and performance prior to that date is that of the respective Fund’s Class I shares. To the extent a share class has adopted the prior performance of another share class that had different operating expenses, such performance has not been adjusted to reflect the different operating expenses. If the performance were adjusted, it may have been higher or lower. Keep in mind that past performance does not indicate future results. Updated performance information is available at www.hartfordfunds.com. With respect to the Acquiring Fund, the returns include the Acquiring Fund’s performance when it pursued a modified investment strategy prior to August 13, 2015. With respect to the Acquired Fund, the returns included the Acquired Fund’s performance when it pursued a modified strategy prior to February 28, 2014.
With respect to each Fund, the returns:
| · | Assume reinvestment of all dividends and distributions |
| · | Would be lower if the Fund’s operating expenses had not been limited. |
With respect to each Fund, the bar charts:
| · | Show how the Fund’s total return has varied from year to year |
| · | Do not include the effect of sales charges. If sales charges were reflected in the bar chart, returns would have been lower |
| · | Show the returns of the Fund’s Class A shares. Because the Fund’s shares are invested in the same portfolio of securities, returns for the Fund’s other classes differ only to the extent that the classes do not have the same expenses. |
The table following each Fund’s bar chart shows returns for the Fund over time compared to those of a broad-based market index. After-tax returns, which are calculated using the historical highest individual federal marginal income tax rates and do not reflect the impact of state and local taxes, are shown only for Class A shares and will vary for other classes. Actual after-tax returns, which depend on an investor’s particular tax situation, may differ from those shown and are not relevant to investors who hold their Fund shares through tax-deferred arrangements, such as 401(k) plans or individual retirement accounts. For more information regarding returns, see the “Performance Notes” section following the tables.
The Acquired Fund
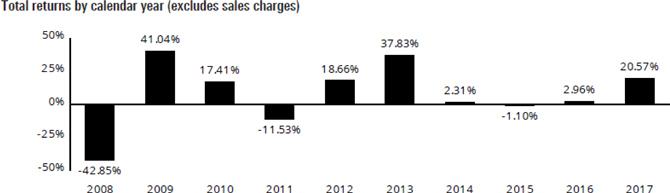
Highest/Lowest quarterly results during the periods shown in the bar chart were:
Highest 20.20% (2nd quarter, 2009) Lowest -22.59% (4th quarter, 2008)
The Acquired Fund’s Class A shares’ year-to-date return as of June 30, 2018 was -0.21%.
| Average annual total returns for periods ending December 31, 2017 (including sales charges) |
| Share Classes | 1 Year | 5 Years | 10 Years |
| Class A − Return Before Taxes | 13.94% | 10.35% | 4.98% |
| – After Taxes on Distributions | 13.50% | 8.58% | 4.13% |
| – After Taxes on Distributions and Sale of Fund Shares | 8.25% | 7.70% | 3.72% |
| Share Classes (Return Before Taxes) |
| Class T | 17.56% | 11.04% | 5.31% |
| Class C | 18.73% | 10.80% | 4.81% |
| Class I | 20.91% | 11.93% | 5.90% |
| Class R3 | 20.49% | 11.50% | 5.39% |
| Class R4 | 20.83% | 11.83% | 5.71% |
| Class R5 | 20.98% | 11.94% | 5.90% |
| Class Y | 21.01% | 12.00% | 6.00% |
| Class F | 21.05% | 11.96% | 5.91% |
| MSCI All Country World Index (Net) (reflects reinvested dividends net of withholding taxes but reflects no deduction for fees, expenses or other taxes) | 23.97% | 10.80% | 4.65% |
The Acquiring Fund
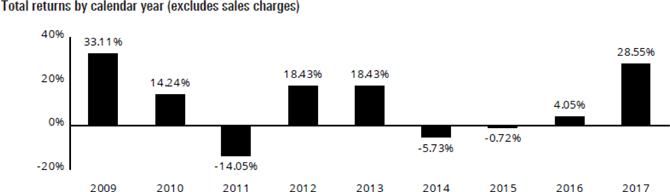
Highest/Lowest quarterly results during the periods shown in the bar chart were:
Highest 23.93% (2nd quarter, 2009) Lowest -20.37% (3rd quarter, 2011)
The Acquiring Fund’s Class A shares’ year-to-date return as of June 30, 2018 was -4.58%.
| Average annual total returns for periods ending December 31, 2017 (including sales charges) |
| Share Classes | 1 Year | 5 Years | Since Inception (6/30/08) |
| Class A – Return Before Taxes | 21.48% | 6.98% | 2.53% |
| – After Taxes on Distributions | 20.61% | 6.47% | 2.25% |
| – After Taxes on Distributions and Sale of Fund Shares | 12.91% | 5.48% | 2.04% |
| Share Classes (Return Before Taxes) |
| Class T | 25.33% | 7.65% | 2.87% |
| Class C | 26.49% | 7.40% | 2.39% |
| Class I | 28.80% | 8.55% | 3.51% |
| Class R3 | 28.17% | 7.93% | 2.89% |
| Class R4 | 28.47% | 8.24% | 3.18% |
| Class R5 | 28.90% | 8.44% | 3.43% |
| Class R6 | 29.03% | 8.67% | 3.57% |
| Class Y | 29.03% | 8.67% | 3.57% |
| Class F | 29.00% | 8.58% | 3.53% |
MSCI All Country World ex USA Index (Net) (reflects reinvested dividends net of withholding taxes but reflects no deduction for fees, expenses or other taxes) | 27.19% | 6.80% | 3.09% |
Indices
The MSCI All Country World Index is designed to capture large and mid cap representation across developed markets and emerging markets countries.
The MSCI All Country World ex USA Index is designed to capture large and mid cap representation across developed markets (excluding the United States) and emerging market countries.
Performance Notes
Prior to January 1, 2013, each Fund was managed by Hartford Investment Financial Services, LLC (“HIFSCO”), an affiliate of HFMC, the Funds’ current investment manager. There was no change, however, to the personnel providing services to the Funds.
ADDITIONAL INFORMATION ABOUT THE REORGANIZATION
The Agreement and Plan of Reorganization
The Agreement and Plan of Reorganization (the “Plan”) provides for the transfer of all of the assets and liabilities of the Acquired Fund to the Acquiring Fund solely in exchange for corresponding Class A, Class T, Class C, Class I, Class R3, Class R4, Class R5, Class Y, and Class F shares of the Acquiring Fund. The Acquired Fund will distribute the shares of the Acquiring Fund received in the exchange to its shareholders, and then the Acquired Fund will be liquidated.
After the Reorganization, each shareholder of the Acquired Fund will own shares in the Acquiring Fund having an aggregate value equal to the aggregate value of shares of the Acquired Fund held by that shareholder as of the close of business on the business day preceding the Closing Date.
Generally, the liquidation and distribution will be accomplished by opening accounts on the books of the Acquiring Fund in the names of the shareholders of the Acquired Fund and transferring to those shareholders’ accounts the same class of shares representing such shareholders’ interests previously credited to the accounts of the Acquired Fund. No sales charges or fees of any kind will be charged to the shareholders of the Acquired Fund in connection with their receipt of shares of the Acquiring Fund in the Reorganization.
Until the Valuation Date, shareholders of the Acquired Fund will continue to be able to redeem their shares. Redemption requests received after the Valuation Date will be treated as requests for the redemption of the Acquiring Fund shares received by the shareholder in the Reorganization.
The Plan requires that the Funds take, or cause to be taken, all actions, and do or cause to be done, all things reasonably necessary, proper or advisable to consummate and make effective the transactions contemplated by the Plan. The Plan may be amended or terminated by mutual agreement of the parties or on certain other grounds. For a complete description of the terms and conditions of the Reorganization, see the Plan at APPENDIX A, which qualifies in its entirety the foregoing summary of the Plan.
Tax Considerations
The Reorganization is expected to qualify for federal income tax purposes as a tax-free reorganization under Section 368 of the Code. It is intended that, as a result of the Reorganization:
(1) the Reorganization will constitute a “reorganization” within the meaning of Code Section 368(a);
(2) the Shareholders will recognize no gain or loss on their receipt of voting shares of the Acquiring Fund solely in exchange for their voting shares of the Acquired Fund pursuant to the Reorganization;
(3) the Acquired Fund will not recognize gain or loss on the transfer of all of its assets to the Acquiring Fund solely in exchange for voting shares of the Acquiring Fund and the assumption by the Acquiring Fund of the Acquired Fund’s Liabilities pursuant to the Reorganization, except that the Acquired Fund may be required to recognize gain or loss with respect to contracts described in Section 1256(b) of the Code or stock in a passive foreign investment company, as defined in Section 1297(a) of the Code;
(4) the Acquired Fund will not recognize gain or loss on its distribution of the voting shares of the Acquiring Fund to its Shareholders pursuant to the liquidation of the Acquired Fund;
(5) the Acquiring Fund will not recognize gain or loss on its acquisition of all of the assets of the Acquired Fund solely in exchange for voting shares of the Acquiring Fund and the assumption by the Acquiring Fund of the Acquired Fund’s liabilities;
(6) the aggregate tax basis of the voting shares of the Acquiring Fund received by each of the Acquired Fund’s Shareholders pursuant to the Reorganization will equal the aggregate tax basis of the voting shares of the Acquired Fund surrendered in exchange therefor;
(7) the holding period of the voting shares of the Acquiring Fund received by each of the Shareholders pursuant to the Reorganization will include the period that the Shareholder held the voting shares of the Acquired Fund exchanged therefor, provided that the Shareholder held such shares as a capital asset on the date of the Reorganization;
(8) the Acquiring Fund’s basis in the assets of the Acquired Fund received pursuant to the Reorganization will equal the Acquired Fund’s basis in the assets immediately before the Reorganization; and
(9) the Acquiring Fund’s holding period in the Acquired Fund’s assets received pursuant to the Reorganization will include the period during which the Acquired Fund held the assets (except where investment activities of the Acquiring Fund have the effect of reducing or eliminating a holding period with respect to an asset).
Shareholders of the Acquired Fund should consult their tax advisors regarding the effect, if any, of the Reorganization in light of their individual circumstances and, since the foregoing discussion only relates to the federal income tax consequences of the Reorganization, should consult their tax advisors as to state and local tax consequences, if any, of the Reorganization.
As a condition to the closing of the Reorganization, the Funds will request an opinion from the law firm of Dechert LLP to the effect that the Reorganization will qualify as a tax-free reorganization for federal income tax purposes. That opinion will be based in part upon certain assumptions and upon certain representations made by the Funds. Opinions of counsel are not binding upon the Internal Revenue Service (“IRS”) or the courts. If the Reorganization were consummated but the IRS or the courts were to determine that the Reorganization did not qualify as a tax-free reorganization under the Code, and thus was taxable, the Acquired Fund would recognize gain or loss on the transfer of its assets to the Acquiring Fund and each shareholder of the Acquired Fund that held shares in a taxable account would recognize a taxable gain or loss equal to the difference between its tax basis in its Acquired Fund shares and the fair market value of the shares of the Acquiring Fund it received.
As of October 31, 2017, the Funds did not have any capital loss carryovers. The amount of the Funds’ capital loss carryovers as of the date of the Reorganization may differ substantially from these amounts. The Acquiring Fund’s ability to use its own capital loss carryovers from prior to the Reorganization, or the capital loss carryovers of the Acquired Fund, if any, to offset gains of the Acquiring Fund in a given year after the Reorganization may be limited by loss limitation rules under Federal tax law. The impact of those loss limitation rules will depend on the relative sizes of, and the losses and gains in, the Acquired Fund and the Acquiring Fund at the time of the Reorganization and thus cannot be calculated precisely at this time.
Based on assets as of July 13, 2018, it is expected that a portion of the Acquired Fund’s portfolio assets (approximately 75%) will be sold prior to the consummation of the Reorganization, which is expected to result in the Acquired Fund realizing capital gains. Taking into account unrealized short-term and long-term losses and that there are no capital loss carryforwards available to offset realized gains, it is currently estimated that the Acquired Fund will be required to distribute to its shareholders approximately $5,472,541 in short-term capital gains and $48,531,436 in long-term capital gains (approximately $0.0994 and $0.8811 per share), respectively, as a result of the repositioning (based on assets as of July 13, 2018). The Acquired Fund already has approximately $38,867,674 in realized short-term capital gains (approximately $0.7057 per share) and approximately $40,283,478 in realized long-term capital gains (approximately $0.7314 per share) as of July 13, 2018, which would also be required to be distributed to the Acquired Fund’s shareholders prior to the Reorganization. However, the actual amount of such distribution could be higher or lower depending on market conditions and on transactions entered into by the Acquired Fund prior to the Closing Date. Shareholders of the Acquired Fund will generally be taxed on any resulting capital gain distributions. It is also estimated that such portfolio repositioning will result in brokerage and other transaction costs, including stamp taxes, of approximately $694,381 or approximately 0.07% (7 basis points) of the Acquired Fund’s net asset value as of July 13, 2018. The preceding are estimates that may change at the time of the Reorganization based on market conditions and other factors.
On or prior to the Valuation Date, the Acquired Fund may declare a distribution to its shareholders, which, together with all previous
distributions, will have the effect of distributing to shareholders of the Acquired Fund such Fund’s net investment income and realized capital gains (after reduction of any available capital loss carryforwards), if any through the Valuation Date. To the extent distributions are attributable to ordinary taxable income or capital gains, the distribution may be taxable to shareholders for federal income tax purposes. Currently, it is expected that there will be an ordinary income distribution on or prior to the Valuation Date as well as a capital gains distribution as discussed above. This may change at the time of the Reorganization based on market conditions, the Acquired Fund’s actual holdings at the time of the Closing Date and other factors.
Expenses of the Reorganization
HFMC or its affiliates will bear all costs associated with the Reorganization other than brokerage-related expenses and other similar transaction costs including stamp tax, which will be borne by the respective Fund, as applicable.
Accounting Survivor
The Acquiring Fund will be the accounting survivor of the Reorganization.
ADDITIONAL INFORMATION ABOUT THE FUNDS
Form of Organization
Each of the Acquired Fund and the Acquiring Fund is a series of the Company. The Company is a Maryland corporation registered as an open-end management investment company. The Company is governed by its Board, which currently consist of ten (10) directors, nine (9) of whom are not “interested persons” (as defined in the 1940 Act).
Capitalization of the Funds
The following table shows on an unaudited basis the capitalization of each Fund and the capitalization of the Acquiring Fund after the Reorganization on a pro forma basis after giving effect to the Reorganization, each as of July 27, 2018.
| | Hartford Global
Capital Appreciation
Fund (Acquired Fund) | Hartford
International Equity
Fund (Acquiring
Fund) | Pro Forma
Adjustments(1) | Hartford International Equity
Fund (Acquiring Fund) Pro
Forma(2) |
| Net Assets | | | | |
| Class A | $640,132,609 | $131,371,686 | | $771,504,295 |
| Class T(3) | N/A | N/A | | N/A |
| Class C | $176,126,980 | $16,861,628 | | $192,988,608 |
| Class I | $123,637,687 | $29,850,263 | | $153,487,950 |
| Class R3 | $22,464,610 | $224,124 | | $22,688,734 |
| Class R4 | $16,766,055 | $1,024,770 | | $17,790,825 |
| Class R5 | $313,758 | $661,683 | | $975,441 |
| Class R6 | N/A | $9,726 | | $9,726 |
| Class Y | $15,816,988 | $15,529,269 | | $31,346,257 |
| Class F | $51,212,349 | $32,964,947 | | $84,177,296 |
| Total Net Assets | $1,046,471,036 | $228,498,096 | | $1,274,969,132 |
| Shares Outstanding | | | | |
| Class A | 33,224,872 | 11,855,768 | 24,548,829 | 69,629,469 |
| Class T(3) | N/A | N/A | | N/A |
| Class C | 10,013,534 | 1,541,344 | 6,085,824 | 17,640,702 |
| Class I | 6,220,067 | 2,668,437 | 4,828,877 | 13,717,381 |
| Class R3 | 1,184,437 | 20,302 | 850,401 | 2,055,140 |
| Class R4 | 857,069 | 92,379 | 654,748 | 1,604,196 |
| Class R5 | 15,688 | 67,841 | 16,492 | 100,021 |
| Class R6 | N/A | 871 | N/A | 871 |
| Class Y | 783,814 | 1,390,935 | 633,479 | 2,808,228 |
| Class F | 2,575,376 | 2,938,328 | 1,989,004 | 7,502,708 |
| | Hartford Global
Capital Appreciation
Fund (Acquired Fund) | Hartford
International Equity
Fund (Acquiring
Fund) | Pro Forma
Adjustments(1) | Hartford International Equity
Fund (Acquiring Fund) Pro
Forma(2) |
| Net Asset Value Per Share | | | | |
| Class A | $19.27 | $11.08 | | $11.08 |
| Class T(3) | N/A | N/A | | N/A |
| Class C | $17.59 | $10.94 | | $10.94 |
| Class I | $19.88 | $11.19 | | $11.19 |
| Class R3 | $18.97 | $11.04 | | $11.04 |
| Class R4 | $19.56 | $11.09 | | $11.09 |
| Class R5 | $20.00 | $9.75 | | $9.75 |
| Class R6 | N/A | $11.17 | | $11.17 |
| Class Y | $20.18 | $11.16 | | $11.16 |
| Class F | $19.89 | $11.22 | | $11.22 |
| (1) | Pro forma shares outstanding have been adjusted for the accumulated change in the number of shares to be issued to the Acquired Fund based on its net asset value per share as of July 27, 2018 relative to the net asset value of the Acquiring Fund. The actual Closing Date of the Reorganization is expected to be on or about October 29, 2018, at which time the results would be reflective of the actual composition of shareholders’ equity as of that date. |
| (2) | Reflects pro forma amounts following the Reorganization. |
| (3) | As of the date of this Information Statement/Prospectus, Class T shares of the Funds have not commenced operations. |
GENERAL INFORMATION
Independent Registered Public Accounting Firm
Ernst & Young LLP (“EY”) serves as the Independent Registered Public Accounting Firm for each Fund. EY is responsible for performing annual audits of the financial statements and financial highlights of the Funds in accordance with the auditing standards of the Public Company Accounting Oversight Board. EY is located at 2005 Market Street, Philadelphia, Pennsylvania 19103.
Shareholder Reports
Shareholders can find important information about each Fund in its annual report dated October 31, 2017 and semi-annual report dated April 30, 2018, each of which has been previously mailed to shareholders. A free copy of each Annual/Semi-Annual Report and each Fund’s Prospectus is available on the Funds’ website at www.hartfordfunds.com/prospectuses.html, upon request by writing to: Hartford Funds, P.O. Box 55022, Boston, MA 02205-5022 or by calling 1-888-843-7824.
Beneficial Owners
As of [August 31], 2018, all directors and officers as a group owned less than 1% of the outstanding shares of each class of each Fund’s shares. As of [August 31], 2018, to the knowledge of the Company, no person owned beneficially more than 5% of the outstanding shares of any class of shares of the Funds, except as listed in Appendix B.
As of [August 31], 2018, none of the Independent Directors (or their immediate family members) had share ownership in securities of the Company’s investment manager or principal underwriter or in an entity controlling, controlled by or under common control with the investment manager or principal underwriter (not including registered investment companies).
FINANCIAL HIGHLIGHTS
The financial highlights table for each Fund is intended to help you understand the Fund’s financial performance for the past five years. Certain information reflects financial results for a single Acquiring Fund share. The total returns in the table represent the rate that an investor would have earned, or lost, on an investment in the Acquiring Fund (assuming reinvestment of all dividends and distributions). The information for the past five fiscal years has been derived from the financial statements audited by Ernst & Young LLP, each Fund’s independent registered public accounting firm, whose report, along with the Funds’ financial statements and financial highlights, is included in the Funds’ annual report, which is available upon request. The information for the six month period ending April 30, 2018 for each Fund is unaudited. Footnotes are located on the last page of these financial highlights.
Acquired Fund
| | — Selected Per-Share Data(1) — | — Ratios and Supplemental Data — |
| | | |
| Class | Net Asset
Value at
Beginning
of Period | Net
Investment
Income
(Loss) | Net
Realized
and
Unrealized
Gain (Loss)
on
Investments | Total from
Investment
Operations | Dividends
from Net
Investment
Income | Distributions
from
Capital
Gains | Returns
of
Capital | Total
Dividends
and
Distributions | Net
Asset
Value at
End of
Period | Total
Return(2) | Net
Assets at
End of
Period
(000s) | Ratio of
Expenses
to
Average
Net
Assets
Before
Adjust-
ments(3) | Ratio of
Expenses
to
Average
Net
Assets
After
Adjust-
ments(3) | Ratio of
Net
Investment
Income
(Loss) to
Average
Net Assets | Portfolio
Turnover |
| | | | | | | | | | | | | | | | |
| For the Six-Month Period Ended April 30, 2018 (Unaudited) | | | | | | | | | | |
| A | $ 18.69 | $ 0.05 | $ 0.31 | $ 0.36 | $ (0.22) | $ (0.09) | $ — | $ (0.31) | $ 18.74 | 1.92%(4) | $ 638,905 | 1.29%(5) | 1.25%(5) | 0.58%(5) | 53% |
| C | 17.06 | (0.01) | 0.27 | 0.26 | (0.09) | (0.09) | — | (0.18) | 17.14 | 1.52 (4) | 179,323 | 1.99 (5) | 1.99 (5) | (0.17)(5) | 53 |
| I | 19.28 | 0.09 | 0.31 | 0.40 | (0.27) | (0.09) | — | (0.36) | 19.32 | 2.08 (4) | 118,731 | 0.94 (5) | 0.94 (5) | 0.90 (5) | 53 |
| R3 | 18.40 | 0.04 | 0.31 | 0.35 | (0.20) | (0.09) | — | (0.29) | 18.46 | 1.89 (4) | 22,953 | 1.58 (5) | 1.35 (5) | 0.47 (5) | 53 |
| R4 | 18.98 | 0.07 | 0.32 | 0.39 | (0.26) | (0.09) | — | (0.35) | 19.02 | 2.04 (4) | 17,988 | 1.27 (5) | 1.05 (5) | 0.77 (5) | 53 |
| R5 | 19.40 | 0.09 | 0.31 | 0.40 | (0.27) | (0.09) | — | (0.36) | 19.44 | 2.07 (4) | 370 | 0.98 (5) | 0.95 (5) | 0.89 (5) | 53 |
| Y | 19.58 | 0.09 | 0.33 | 0.42 | (0.29) | (0.09) | — | (0.38) | 19.62 | 2.13 (4) | 15,615 | 0.90 (5) | 0.90 (5) | 0.93 (5) | 53 |
| F | 19.30 | 0.10 | 0.31 | 0.41 | (0.29) | (0.09) | — | (0.38) | 19.33 | 2.14 (4) | 47,427 | 0.86 (5) | 0.86 (5) | 1.00 (5) | 53 |
| | | | | | | | | | | | |
| For the Year Ended October 31, 2017 | | | | | | | | | | | |
| A | $ 15.61 | $ 0.12 | $ 3.08 | $ 3.20 | $ (0.12) | $ — | $ — | $ (0.12) | $ 18.69 | 20.71% | $ 663,020 | 1.28% | 1.25% | 0.71% | 107% |
| C | 14.24 | — | 2.83 | 2.83 | (0.01) | — | — | (0.01) | 17.06 | 19.85 | 194,420 | 1.98 | 1.98 | (0.02) | 107 |
| I | 16.10 | 0.18 | 3.17 | 3.35 | (0.17) | — | — | (0.17) | 19.28 | 20.98 | 117,153 | 0.98 | 0.98 | 1.02 | 107 |
| R3 | 15.36 | 0.10 | 3.04 | 3.14 | (0.10) | — | — | (0.10) | 18.40 | 20.60 | 24,084 | 1.58 | 1.35 | 0.61 | 107 |
| R4 | 15.85 | 0.16 | 3.13 | 3.29 | (0.16) | — | — | (0.16) | 18.98 | 20.91 | 19,484 | 1.27 | 1.05 | 0.93 | 107 |
| R5 | 16.19 | 0.18 | 3.19 | 3.37 | (0.16) | — | — | (0.16) | 19.40 | 21.03 | 400 | 1.00 | 0.95 | 1.02 | 107 |
| Y | 16.35 | 0.19 | 3.22 | 3.41 | (0.18) | — | — | (0.18) | 19.58 | 21.08 | 15,289 | 0.89 | 0.89 | 1.04 | 107 |
| F(7) | 17.18 | 0.10 | 2.02 | 2.12 | — | — | — | — | 19.30 | 12.34(4) | 39,119 | 0.86 (5) | 0.86 (5) | 0.79 (5) | 107 |
| | — Selected Per-Share Data(1) — | — Ratios and Supplemental Data — |
| | | |
| Class | Net Asset
Value at
Beginning
of Period | Net
Investment
Income
(Loss) | Net
Realized
and
Unrealized
Gain (Loss)
on
Investments | Total from
Investment
Operations | Dividends
from Net
Investment
Income | Distributions
from
Capital
Gains | Returns
of
Capital | Total
Dividends
and
Distributions | Net
Asset
Value at
End of
Period | Total
Return(2) | Net
Assets at
End of
Period
(000s) | Ratio of
Expenses
to
Average
Net
Assets
Before
Adjust-
ments(3) | Ratio of
Expenses
to
Average
Net
Assets
After
Adjust-
ments(3) | Ratio of
Net
Investment
Income
(Loss) to
Average
Net Assets | Portfolio
Turnover |
| | | | | | | | | | | | | | | | |
| For the Year Ended October 31, 2016 | | | | | | | | | | | |
| A | $ 16.88 | $ 0.12 | $ (0.34) | $ (0.22) | $ (0.16) | $ (0.89) | $ — | $ (1.05) | $15.61 | (1.23)% | $ 642,111 | 1.32% | 1.27%(8) | 0.77% | 100% |
| B | 15.37 | (0.01) | (0.30) | (0.31) | — | (0.89) | — | (0.89) | 14.17 | (1.91) | 5,279 | 2.24 | 2.02 (8) | (0.06) | 100 |
| C | 15.50 | — | (0.31) | (0.31) | (0.06) | (0.89) | — | (0.95) | 14.24 | (1.93) | 216,714 | 2.01 | 2.01 (8) | 0.03 | 100 |
| I | 17.38 | 0.16 | (0.34) | (0.18) | (0.21) | (0.89) | — | (1.10) | 16.10 | (0.88) | 107,469 | 0.98 | 0.98 (8) | 1.04 | 100 |
| R3 | 16.63 | 0.10 | (0.33) | (0.23) | (0.15) | (0.89) | — | (1.04) | 15.36 | (1.29) | 27,680 | 1.59 | 1.37 (8) | 0.67 | 100 |
| R4 | 17.13 | 0.15 | (0.34) | (0.19) | (0.20) | (0.89) | — | (1.09) | 15.85 | (0.97) | 17,291 | 1.28 | 1.07 (8) | 0.98 | 100 |
| R5 | 17.46 | 0.18 | (0.35) | (0.17) | (0.21) | (0.89) | — | (1.10) | 16.19 | (0.87) | 540 | 1.00 | 0.97 (8) | 1.13 | 100 |
| Y | 17.65 | 0.12 | (0.31) | (0.19) | (0.22) | (0.89) | — | (1.11) | 16.35 | (0.93) | 7,536 | 0.88 | 0.88 (8) | 0.69 | 100 |
| | | | | | | | | | | | |
| For the Year Ended October 31, 2015 | | | | | | | | | | | |
| A | $ 20.10 | $ 0.10 | $ (0.09) | $ 0.01 | $ (0.06) | $ (3.17) | $ — | $ (3.23) | $ 16.88 | 0.45% | $ 706,024 | 1.26% | 1.25% | 0.55% | 93% |
| B | 18.65 | (0.04) | (0.07) | (0.11) | — | (3.17) | — | (3.17) | 15.37 | (0.27) | 21,276 | 2.13 | 2.00 | (0.22) | 93 |
| C | 18.78 | (0.03) | (0.08) | (0.11) | — | (3.17) | — | (3.17) | 15.50 | (0.26) | 262,263 | 1.96 | 1.96 | (0.16) | 93 |
| I | 20.59 | 0.16 | (0.09) | 0.07 | (0.11) | (3.17) | — | (3.28) | 17.38 | 0.79 | 113,759 | 0.93 | 0.93 | 0.86 | 93 |
| R3 | 19.85 | 0.08 | (0.09) | (0.01) | (0.04) | (3.17) | — | (3.21) | 16.63 | 0.35 | 31,389 | 1.54 | 1.35 | 0.45 | 93 |
| R4 | 20.35 | 0.13 | (0.09) | 0.04 | (0.09) | (3.17) | — | (3.26) | 17.13 | 0.62 | 14,478 | 1.24 | 1.05 | 0.75 | 93 |
| R5 | 20.68 | 0.12 | (0.06) | 0.06 | (0.11) | (3.17) | — | (3.28) | 17.46 | 0.72 | 553 | 0.95 | 0.95 | 0.65 | 93 |
| Y | 20.86 | 0.18 | (0.09) | 0.09 | (0.13) | (3.17) | — | (3.30) | 17.65 | 0.87 | 194,050 | 0.83 | 0.83 | 0.97 | 93 |
| | | | | | | | | | | | |
| For the Year Ended October 31, 2014 | | | | | | | | | | | |
| A | $ 18.87 | $ 0.13 | $ 1.60 | $ 1.73 | $ — | $ (0.50) | $ — | $ (0.50) | $ 20.10 | 9.39% | $ 732,928 | 1.28% | 1.25% | 0.67% | 144%(9) |
| B | 17.67 | (0.02) | 1.50 | 1.48 | — | (0.50) | — | (0.50) | 18.65 | 8.59 | 46,336 | 2.11 | 2.00 | (0.08) | 144 (9) |
| C | 17.78 | (0.01) | 1.51 | 1.50 | — | (0.50) | — | (0.50) | 18.78 | 8.65 | 282,703 | 1.98 | 1.95 | (0.03) | 144 (9) |
| I | 19.26 | 0.20 | 1.63 | 1.83 | — | (0.50) | — | (0.50) | 20.59 | 9.72 | 117,640 | 0.95 | 0.92 | 0.98 | 144 (9) |
| R3 | 18.66 | 0.11 | 1.58 | 1.69 | — | (0.50) | — | (0.50) | 19.85 | 9.27 | 31,735 | 1.57 | 1.35 | 0.57 | 144 (9) |
| R4 | 19.06 | 0.18 | 1.61 | 1.79 | — | (0.50) | — | (0.50) | 20.35 | 9.61 | 10,055 | 1.26 | 1.05 | 0.88 | 144 (9) |
| R5 | 19.34 | 0.20 | 1.64 | 1.84 | — | (0.50) | — | (0.50) | 20.68 | 9.73 | 1,549 | 0.97 | 0.94 | 0.98 | 144 (9) |
| Y | 19.50 | 0.12 | 1.76 | 1.88 | (0.02) | (0.50) | — | (0.52) | 20.86 | 9.83 | 209,340 | 0.86 | 0.83 | 0.58 | 144 (9) |
| | — Selected Per-Share Data(1) — | — Ratios and Supplemental Data — |
| | | |
| Class | Net Asset
Value at
Beginning
of Period | Net
Investment
Income
(Loss) | Net
Realized
and
Unrealized
Gain (Loss)
on
Investments | Total from
Investment
Operations | Dividends
from Net
Investment
Income | Distributions
from
Capital
Gains | Returns of
Capital | Total
Dividends
and
Distributions | Net
Asset
Value at
End of
Period | Total
Return(2) | Net
Assets at
End of
Period
(000s) | Ratio of
Expenses
to
Average
Net
Assets
Before
Adjust-
ments(3) | Ratio of
Expenses
to
Average
Net
Assets
After
Adjust-
ments(3) | Ratio of
Net
Investment
Income
(Loss) to
Average
Net Assets | Portfolio
Turnover |
| | | | | | | | | | | | | | | | |
| For the Year Ended October 31, 2013 | | | | | | | | | | | |
| A | $ 13.93 | $ 0.07 | $ 4.93 | $ 5.00 | $ (0.06) | $ — | $ — | $ (0.06) | $ 18.87 | 35.97% | $ 503,765 | 1.36% | 1.25% | 0.42% | 128% |
| B | 13.10 | (0.05) | 4.62 | 4.57 | — | — | — | — | 17.67 | 34.89 | 56,743 | 2.20 | 2.00 | (0.32) | 128 |
| C | 13.18 | (0.05) | 4.65 | 4.60 | — | — | — | — | 17.78 | 34.90 | 258,520 | 2.07 | 2.00 | (0.33) | 128 |
| I | 14.22 | 0.11 | 5.02 | 5.13 | (0.09) | — | — | (0.09) | 19.26 | 36.29 | 117,325 | 1.04 | 1.00 | 0.66 | 128 |
| R3 | 13.79 | 0.05 | 4.87 | 4.92 | (0.05) | — | — | (0.05) | 18.66 | 35.75 | 30,704 | 1.64 | 1.35 | 0.31 | 128 |
| R4 | 14.07 | 0.11 | 4.96 | 5.07 | (0.08) | — | — | (0.08) | 19.06 | 36.18 | 10,603 | 1.33 | 1.05 | 0.63 | 128 |
| R5 | 14.28 | 0.12 | 5.04 | 5.16 | (0.10) | — | — | (0.10) | 19.34 | 36.36 | 1,242 | 1.05 | 0.95 | 0.74 | 128 |
| Y | 14.40 | 0.13 | 5.08 | 5.21 | (0.11) | — | — | (0.11) | 19.50 | 36.40 | 12,947 | 0.93 | 0.90 | 0.76 | 128 |
Acquiring Fund
| | — Selected Per-Share Data(1) — | — Ratios and Supplemental Data — |
| | | |
| Class | Net Asset
Value at
Beginning
of Period | Net
Investment
Income
(Loss) | Net
Realized
and
Unrealized
Gain (Loss)
on
Investments | Total from
Investment
Operations | Dividends
from Net
Investment
Income | Distributions
from
Capital
Gains | Returns of
Capital | Total
Dividends
and
Distributions | Net
Asset
Value at
End of
Period | Total
Return(2) | Net
Assets at
End of
Period
(000s) | Ratio of
Expenses
to
Average
Net
Assets
Before
Adjust-
ments(3) | Ratio of
Expenses
to
Average
Net
Assets
After
Adjust-
ments(3) | Ratio of
Net
Investment
Income
(Loss) to
Average
Net Assets | Portfolio
Turnover |
| | | | | | | | | | | | | | | | |
| For the Six-Month Period Ended April 30, 2018 (Unaudited) | | | | | | | | | |
| A | $ 11.42 | $ 0.06 | $ 0.29 | $ 0.35 | $ (0.18) | $ (0.18) | $ — | $ (0.36) | $ 11.41 | 3.09%(4) | $ 20,153 | 1.40%(5) | 1.05%(5) | 1.08%(5) | 77% |
| C | 11.28 | 0.02 | 0.28 | 0.30 | (0.12) | (0.18) | — | (0.30) | 11.28 | 2.67 (4) | 5,741 | 2.14 (5) | 1.78 (5) | 0.33 (5) | 77 |
| I | 11.52 | 0.09 | 0.28 | 0.37 | (0.20) | (0.18) | — | (0.38) | 11.51 | 3.24 (4) | 23,759 | 1.04 (5) | 0.70 (5) | 1.50 (5) | 77 |
| R3 | 11.37 | 0.03 | 0.30 | 0.33 | (0.15) | (0.18) | — | (0.33) | 11.37 | 2.92 (4) | 79 | 1.69 (5) | 1.34 (5) | 0.56 (5) | 77 |
| R4 | 11.43 | 0.06 | 0.29 | 0.35 | (0.18) | (0.18) | — | (0.36) | 11.42 | 3.05 (4) | 790 | 1.38 (5) | 1.04 (5) | 1.06 (5) | 77 |
| R5 | 10.09 | 0.07 | 0.25 | 0.32 | (0.20) | (0.18) | — | (0.38) | 10.03 | 3.20 (4) | 406 | 1.08 (5) | 0.74 (5) | 1.36 (5) | 77 |
| R6(6) | 11.48 | 0.06 | (0.06) | 0.00 | — | — | — | — | 11.48 | 0.00 (4) | 10 | 0.85 (5) | 0.54 (5) | 2.87 (5) | 77 |
| Y | 11.51 | 0.09 | 0.28 | 0.37 | (0.22) | (0.18) | — | (0.40) | 11.48 | 3.20 (4) | 18,648 | 0.96 (5) | 0.62 (5) | 1.58 (5) | 77 |
| F | 11.53 | 0.09 | 0.29 | 0.38 | (0.19) | (0.18) | — | (0.37) | 11.54 | 3.31 (4) | 2,792 | 0.96 (5) | 0.62 (5) | 1.52 (5) | 77 |
| | | | | | | | | | | | |
| For the Year Ended October 31, 2017 | | | | | | | | | | | |
| A | $ 9.37 | $ 0.15 | $ 2.07 | $ 2.22 | $ (0.17) | $ — | $ — | $ (0.17) | $ 11.42 | 24.17% | $ 15,943 | 1.74% | 1.16% | 1.43% | 133% |
| C | 9.25 | 0.07 | 2.06 | 2.13 | (0.10) | — | — | (0.10) | 11.28 | 23.29 | 4,527 | 2.47 | 1.91 | 0.71 | 133 |
| I | 9.44 | 0.20 | 2.06 | 2.26 | (0.18) | — | — | (0.18) | 11.52 | 24.49 | 14,971 | 1.43 | 0.88 | 1.88 | 133 |
| R3 | 9.37 | 0.11 | 2.07 | 2.18 | (0.18) | — | — | (0.18) | 11.37 | 23.76 | 93 | 2.28 | 1.46 | 1.10 | 133 |
| R4 | 9.40 | 0.15 | 2.07 | 2.22 | (0.19) | — | — | (0.19) | 11.43 | 24.13 | 740 | 1.75 | 1.17 | 1.39 | 133 |
| R5 | 9.38 | 0.21 | 1.75 | 1.96 | (1.25) | — | — | (1.25) | 10.09 | 24.50 | 397 | 1.38 | 0.85 | 2.28 | 133 |
| Y | 9.44 | 0.18 | 2.09 | 2.27 | (0.20) | — | — | (0.20) | 11.51 | 24.67 | 11,822 | 1.31 | 0.78 | 1.76 | 133 |
| F(7) | 9.65 | 0.08 | 1.80 | 1.88 | — | — | — | — | 11.53 | 19.48 (4) | 1,739 | 1.26 (5) | 0.66 (5) | 1.01 (5) | 133 |
| | | | | | | | | | | | |
| For the Year Ended October 31, 2016 | | | | | | | | | | | |
| A | $ 9.40 | $ 0.14 | $ 0.06 | $ 0.20 | $ (0.10) | $ (0.13) | $ — | $ (0.23) | $ 9.37 | 2.29% | $ 10,519 | 1.99% | 1.20%(10) | 1.52% | 95% |
| B | 9.35 | 0.01 | 0.11 | 0.12 | (0.03) | (0.13) | — | (0.16) | 9.31 | 1.37 | 120 | 2.71 | 1.95 (10) | 0.17 | 95 |
| C | 9.29 | 0.07 | 0.06 | 0.13 | (0.04) | (0.13) | — | (0.17) | 9.25 | 1.46 | 2,583 | 2.73 | 1.95 (10) | 0.80 | 95 |
| I | 9.47 | 0.16 | 0.07 | 0.23 | (0.13) | (0.13) | — | (0.26) | 9.44 | 2.55 | 5,109 | 1.63 | 0.90 (10) | 1.82 | 95 |
| R3 | 9.41 | 0.05 | 0.13 | 0.18 | (0.09) | (0.13) | — | (0.22) | 9.37 | 2.02 | 110 | 2.26 | 1.50 (10) | 0.57 | 95 |
| R4 | 9.44 | 0.07 | 0.13 | 0.20 | (0.11) | (0.13) | — | (0.24) | 9.40 | 2.24 | 251 | 1.94 | 1.20 (10) | 0.80 | 95 |
| R5 | 9.47 | 0.07 | 0.11 | 0.18 | (0.14) | (0.13) | — | (0.27) | 9.38 | 2.01 | 11 | 1.61 | 0.90 (10) | 0.79 | 95 |
| Y | 9.47 | 0.18 | 0.07 | 0.25 | (0.15) | (0.13) | — | (0.28) | 9.44 | 2.73 | 10,857 | 1.51 | 0.80 (10) | 1.96 | 95 |
| | — Selected Per-Share Data(1) — | — Ratios and Supplemental Data — |
| | | |
| Class | Net Asset
Value at
Beginning
of Period | Net
Investment
Income
(Loss) | Net
Realized
and
Unrealized
Gain (Loss)
on
Investments | Total from
Investment
Operations | Dividends
from Net
Investment
Income | Distributions
from
Capital
Gains | Returns of
Capital | Total
Dividends
and
Distributions | Net
Asset
Value at
End of
Period | Total
Return(2) | Net
Assets at
End of
Period
(000s) | Ratio of
Expenses
to
Average
Net
Assets
Before
Adjust-
ments(3) | Ratio of
Expenses
to
Average
Net
Assets
After
Adjust-
ments(3) | Ratio of
Net
Investment
Income
(Loss) to
Average
Net Assets | Portfolio
Turnover |
| | | | | | | | | | | | | | | | |
| For the Year Ended October 31, 2015 | | | | | | | | | | | |
| A | $ 9.92 | $ 0.07 | $ (0.26) | $ (0.19) | $ (0.08) | $ (0.25) | $ — | $ (0.33) | $ 9.40 | (1.76)% | $ 12,648 | 1.84% | 1.39% | 0.77% | 125% |
| B | 9.84 | — | (0.24) | (0.24) | — | (0.25) | — | (0.25) | 9.35 | (2.34) | 821 | 2.49 | 2.13 | 0.02 | 125 |
| C | 9.80 | 0.01 | (0.25) | (0.24) | (0.02) | (0.25) | — | (0.27) | 9.29 | (2.39) | 2,859 | 2.57 | 2.14 | 0.08 | 125 |
| I | 9.98 | 0.11 | (0.25) | (0.14) | (0.12) | (0.25) | — | (0.37) | 9.47 | (1.30) | 4,554 | 1.45 | 1.07 | 1.13 | 125 |
| R3 | 9.91 | 0.05 | (0.24) | (0.19) | (0.06) | (0.25) | — | (0.31) | 9.41 | (1.84) | 1,226 | 2.09 | 1.62 | 0.55 | 125 |
| R4 | 9.95 | 0.08 | (0.25) | (0.17) | (0.09) | (0.25) | — | (0.34) | 9.44 | (1.62) | 1,149 | 1.78 | 1.32 | 0.85 | 125 |
| R5 | 9.98 | 0.11 | (0.25) | (0.14) | (0.12) | (0.25) | — | (0.37) | 9.47 | (1.30) | 1,057 | 1.47 | 1.02 | 1.15 | 125 |
| Y | 9.98 | 0.12 | (0.26) | (0.14) | (0.12) | (0.25) | — | (0.37) | 9.47 | (1.25) | 10,625 | 1.37 | 0.96 | 1.21 | 125 |
| | | | | | | | | | | | |
| For the Year Ended October 31, 2014 | | | | | | | | | | | |
| A | $ 9.91 | $ 0.06 | $ 0.03 | $ 0.09 | $ (0.08) | $ — | $ — | $ (0.08) | $ 9.92 | 0.89% | $ 10,810 | 1.84% | 1.44% | 0.57% | 69% |
| B | 9.84 | (0.02) | 0.03 | 0.01 | (0.01) | — | — | (0.01) | 9.84 | 0.10 | 908 | 2.53 | 2.13 | (0.18) | 69 |
| C | 9.81 | (0.03) | 0.04 | 0.01 | (0.02) | — | — | (0.02) | 9.80 | 0.06 | 1,910 | 2.59 | 2.19 | (0.26) | 69 |
| I | 9.97 | 0.10 | 0.02 | 0.12 | (0.11) | — | — | (0.11) | 9.98 | 1.19 | 1,835 | 1.44 | 1.04 | 1.03 | 69 |
| R3 | 9.91 | 0.05 | 0.01 | 0.06 | (0.06) | — | — | (0.06) | 9.91 | 0.54 | 1,258 | 2.12 | 1.65 | 0.44 | 69 |
| R4 | 9.94 | 0.08 | 0.01 | 0.09 | (0.08) | — | — | (0.08) | 9.95 | 0.90 | 1,151 | 1.81 | 1.35 | 0.74 | 69 |
| R5 | 9.97 | 0.11 | 0.01 | 0.12 | (0.11) | — | — | (0.11) | 9.98 | 1.18 | 1,071 | 1.50 | 1.05 | 1.04 | 69 |
| Y | 9.97 | 0.11 | 0.01 | 0.12 | (0.11) | — | — | (0.11) | 9.98 | 1.22 | 10,756 | 1.40 | 1.00 | 1.09 | 69 |
| | | | | | | | | | | | |
| For the Year Ended October 31, 2013 | | | | | | | | | | | |
| A | $ 8.31 | $ 0.10 | $ 1.66 | $ 1.76 | $ (0.16) | $ — | $ — | $ (0.16) | $ 9.91 | 21.43% | $ 12,351 | 1.95% | 1.41% | 1.12% | 106% |
| B | 8.25 | 0.04 | 1.65 | 1.69 | (0.10) | — | — | (0.10) | 9.84 | 20.63 | 1,404 | 2.64 | 2.11 | 0.44 | 106 |
| C | 8.23 | 0.04 | 1.64 | 1.68 | (0.10) | — | — | (0.10) | 9.81 | 20.64 | 2,514 | 2.68 | 2.15 | 0.39 | 106 |
| I | 8.36 | 0.14 | 1.66 | 1.80 | (0.19) | — | — | (0.19) | 9.97 | 21.90 | 1,467 | 1.56 | 1.03 | 1.50 | 106 |
| R3 | 8.31 | 0.08 | 1.66 | 1.74 | (0.14) | — | — | (0.14) | 9.91 | 21.22 | 1,225 | 2.25 | 1.65 | 0.91 | 106 |
| R4 | 8.33 | 0.11 | 1.67 | 1.78 | (0.17) | — | — | (0.17) | 9.94 | 21.62 | 1,122 | 1.94 | 1.35 | 1.21 | 106 |
| R5 | 8.35 | 0.14 | 1.67 | 1.81 | (0.19) | — | — | (0.19) | 9.97 | 22.02 | 1,059 | 1.63 | 1.05 | 1.50 | 106 |
| Y | 8.36 | 0.14 | 1.66 | 1.80 | (0.19) | — | — | (0.19) | 9.97 | 21.93 | 10,623 | 1.53 | 1.00 | 1.55 | 106 |
| (1) | Information presented relates to a share outstanding throughout the indicated period. Net investment income (loss) per share amounts are calculated based on average shares outstanding unless otherwise noted. |
| (2) | Assumes initial investment at net asset value at the beginning of each period, reinvestment of all distributions, the complete redemption of the investment at net asset value at the end of each period and no sales charge. Total return would be reduced if sales charges were taken into account. |
| (3) | Adjustments include waivers and reimbursements, if applicable. Ratios do not include fees paid indirectly. |
| (6) | Commenced operations on February 28, 2018. |
| (7) | Commenced operations on February 28, 2017. |
| (8) | Excluding the expenses not subject to cap, the ratios would have been 1.25%, 2.00%, 1.99%, 0.96%, 1.35%, 1.05%, 0.95% and 0.86% for Class A, Class B, Class C, Class I, Class R3, Class R4, Class R5 and Class Y, respectively. |
| (9) | During the year ended October 31, 2014, the Fund incurred $165.7 million in sales of securities held associated with the transition of assets from The Hartford Global Growth Fund, which merged into the Fund on April 7, 2014. These sales are excluded from the portfolio turnover rate calculation. |
| (10) | Excluding the expenses not subject to cap, the ratios would have been 1.19%, 1.94%, 1.94%, 0.89%, 1.49%, 1.19%, 0.89% and 0.79% for Class A, Class B, Class C, Class I, Class R3, Class R4, Class R5 and Class Y, respectively. |
INDEX OF APPENDICES
| Appendix A: | Form of Agreement and Plan of Reorganization |
| Appendix B: | 5% Beneficial Owners of Fund Shares as of [August 31], 2018 |
APPENDIX A: FORM OF AGREEMENT AND PLAN OF REORGANIZATION
FORM OF AGREEMENT AND PLAN OF REORGANIZATION
THIS AGREEMENT AND PLAN OF REORGANIZATION (“Agreement”) is made as of this ___ day of _________, 2018, among The Hartford Mutual Funds, Inc. (the “Company”), a Maryland corporation, with its principal place of business at 690 Lee Road, Wayne, PA 19087, on behalf of its series, Hartford International Equity Fund (the “Acquiring Fund”); the Company, on behalf of its series, Hartford Global Capital Appreciation Fund (the “Acquired Fund”); and Hartford Funds Management Company, LLC (for purposes of Section 10.2 only of this Agreement).
This Agreement is intended to be and is adopted as a plan of reorganization and liquidation within the meaning of Section 368(a)(1) of the United States Internal Revenue Code of 1986, as amended (“Code”). The reorganization and liquidation will consist of (1) the sale, assignment, conveyance, transfer and delivery of all of the property and assets of the Acquired Fund to the Acquiring Fund in exchange solely for shares of common stock of the Acquiring Fund set forth on Exhibit A (“Acquiring Fund Shares”) corresponding to the class of outstanding shares of common stock of the Acquired Fund set forth on Exhibit A (“Acquired Fund Shares”), as described herein, (2) the assumption by the Acquiring Fund of all liabilities of the Acquired Fund, and (3) the distribution of the Acquiring Fund Shares to the shareholders of the Acquired Fund in complete liquidation of the Acquired Fund, as provided herein (“Reorganization”), all upon the terms and conditions hereinafter set forth in this Agreement.
WHEREAS, the Acquired Fund and the Acquiring Fund are each a series of the Company, a registered investment company classified as a management company of the open-end type, and the Acquired Fund owns securities that generally are assets of the character in which the Acquiring Fund is permitted to invest;
WHEREAS, the Directors of the Company have determined, with respect to the Acquiring Fund, that the sale, assignment, conveyance, transfer and delivery of all of the property and assets of the Acquired Fund for Acquiring Fund Shares and the assumption of all liabilities of the Acquired Fund by the Acquiring Fund is in the best interests of the Acquiring Fund and that the interests of the existing shareholders of the Acquiring Fund would not be diluted as a result of this transaction; and
WHEREAS, the Directors of the Company have determined, with respect to the Acquired Fund, that the sale, assignment, conveyance, transfer and delivery of all of the property and assets of the Acquired Fund for Acquiring Fund Shares and the assumption of all liabilities of the Acquired Fund by the Acquiring Fund is in the best interests of the Acquired Fund and that the interests of the existing shareholders of the Acquired Fund would not be diluted as a result of this transaction.
NOW, THEREFORE, in consideration of the promises and of the covenants and agreements hereinafter set forth, the parties hereto covenant and agree as follows:
| 1. | TRANSFER OF ASSETS OF THE ACQUIRED FUND TO THE ACQUIRING FUND IN EXCHANGE FOR ACQUIRING FUND SHARES, THE ASSUMPTION OF ALL ACQUIRED FUND LIABILITIES AND THE LIQUIDATION OF THE ACQUIRED FUND |
1.1. Subject to the terms and conditions herein set forth and on the basis of the representations and warranties contained herein, the Acquired Fund agrees to sell, assign, convey, transfer and deliver all of the property and assets of the Acquired Fund, as set forth in paragraph 1.2 herein, to the Acquiring Fund, and the Acquiring Fund agrees in exchange therefor: (i) to deliver to the Acquired Fund the number of full and fractional Acquiring Fund Shares determined by dividing the value of the Acquired Fund’s net assets with respect to the corresponding class of Acquired Fund Shares, computed in the manner and as of the time and date set forth in paragraph 2.1 herein, by the net asset value of one Acquiring Fund Share of the corresponding class, computed in the manner and as of the time and date set forth in paragraph 2.2 herein; and (ii) to assume all liabilities of the Acquired Fund, as set forth in paragraph 1.3 herein. Such transactions shall take place on the date of the closing provided for in paragraph 3.1 herein (“Closing Date”).
1.2. The property and assets of the Company attributable to the Acquired Fund to be acquired by the Acquiring Fund shall consist of all property and assets, including, without limitation, all rights, cash, securities, commodities and futures interests and dividends or interests receivable that are owned by the Acquired Fund and any deferred or prepaid expenses shown as an asset on the books of the Acquired Fund on the Valuation Date as defined in paragraph 2.1 (collectively, “Assets”). The Acquired Fund will sell,
assign, convey, transfer and deliver to the Acquiring Fund any rights, stock dividends, or other securities received by the Acquired Fund after the Closing Date as stock dividends or other distributions on or with respect to the property and assets transferred, which rights, stock dividends, and other securities shall be deemed included in the property and assets transferred to the Acquiring Fund at the Closing Date and shall not be separately valued, in which case any such distribution that remains unpaid as of the Closing Date shall be included in the determination of the value of the assets of the Acquired Fund acquired by the Acquiring Fund.
1.3. The Acquired Fund will make reasonable efforts to discharge all of its known liabilities and obligations prior to the Valuation Date. The Acquiring Fund shall assume all of the liabilities of the Acquired Fund, whether accrued or contingent, known or unknown, existing at the Valuation Date (collectively, “Liabilities”). On or as soon as practicable prior to the Closing Date, the Acquired Fund will declare and pay to its shareholders of record one or more dividends and/or other distributions so that it will have distributed substantially all (and in no event less than 98%) of its investment company taxable income (computed without regard to any deduction for dividends paid) and realized net capital gain, if any, for the current taxable year through the Closing Date.
1.4. Immediately following the actions contemplated by paragraph 1.1 herein, the Company shall take such actions necessary to complete the liquidation of the Acquired Fund. To complete the liquidation, the Company, on behalf of the Acquired Fund, shall (a) distribute to the Acquired Fund’s shareholders of record with respect to each class of its shares as of the Closing as defined in paragraph 3.1 herein (“Acquired Fund Shareholders”), on a pro rata basis within the class, the Acquiring Fund Shares of the corresponding class received by the Acquired Fund pursuant to paragraph 1.1 herein, and (b) completely liquidate. Such distribution and liquidation will be accomplished, with respect to each class of Acquired Fund shares, by the transfer of the Acquiring Fund Shares then credited to the account of the Acquired Fund on the books of the Acquiring Fund to open accounts on the share records of the Acquiring Fund in the names of the Acquired Fund Shareholders. The aggregate net asset value of the Acquiring Fund Shares to be so credited to the Acquired Fund Shareholders shall, with respect to the class, be equal to the aggregate net asset value of the Acquired Fund Shares of the corresponding class owned by Acquired Fund Shareholders on the Closing Date. All issued and outstanding Acquired Fund Shares will simultaneously be canceled on the books of the Acquired Fund, although share certificates representing interests in Acquired Fund Shares will thereafter represent interests in the corresponding class of Acquiring Fund Shares after the Closing Date, as determined in accordance with paragraph 2.3. The Acquiring Fund shall not issue certificates representing the Acquiring Fund Shares in connection with the Reorganization.
1.5. Ownership of Acquiring Fund Shares will be shown on the books of the Acquiring Fund’s Transfer Agent, as defined in paragraph 3.3 herein.
1.6. Any reporting responsibility of the Acquired Fund, including, but not limited to, the responsibility for filing regulatory reports, tax returns, or other documents with the Securities and Exchange Commission (“Commission”), any state securities commission, and any federal, state or local tax authorities or any other relevant regulatory authority, is and shall remain the responsibility of the Acquired Fund.
2.1. The value of the Assets shall be the value of such Assets as of the close of business of the New York Stock Exchange and after the declaration of any dividends on the last business day before the Closing Date (such time and date being hereinafter called the “Valuation Date”), computed using the valuation procedures set forth in the then-current prospectus and statement of additional information with respect to the Acquired Fund and valuation procedures established by the Company’s Board of Directors.
2.2. The net asset value of each Acquiring Fund Share shall be the net asset value per share computed with respect to the corresponding class as of the Valuation Date, using the valuation procedures set forth in the Acquiring Fund’s then-current prospectus and statement of additional information, and valuation procedures established by the Company’s Board of Directors.
2.3. The number of the Acquiring Fund Shares to be issued (including fractional shares, if any) in exchange for the Acquired Fund’s Assets shall be determined by dividing the value of the net assets with respect to the Acquired Fund Shares determined using the same valuation procedures referred to in
paragraph 2.1 herein, by the net asset value of the corresponding class of Acquiring Fund Shares, determined in accordance with paragraph 2.2 herein.
2.4. All computations of value shall be made by Hartford Funds Management Company, LLC (“HFMC”), in its capacity as Fund Accountant for the Company, and shall be subject to confirmation by the Company’s Treasurer.
| 3. | CLOSING AND CLOSING DATE |
3.1. The Closing Date shall be a date to be determined by an officer of the Company, or such other date as the parties may agree. All acts taking place at the closing of the transactions provided for in this Agreement (“Closing”) shall be deemed to take place simultaneously at a time immediately prior to the opening of business on the Closing Date unless otherwise agreed to by the parties. The Closing shall be held at the offices of the Company.
3.2. Prior to the Closing Date, the Company shall issue instructions directing State Street Bank and Trust Company (“Custodian”), to deliver to itself, as Acquiring Fund Custodian, all the Assets of the Acquired Fund held by it as Acquired Fund Custodian as of the Valuation Date in proper form. The Acquired Fund may inspect such Assets at the offices of the Custodian prior to the Valuation Date. As soon as practicable after the close of business on the Closing Date, the Custodian shall confirm that it has caused to be delivered to itself as Custodian for the Acquiring Fund and in proper form all of the Assets of the Acquired Fund held by the Custodian as of the Valuation Date identifying any Assets that could not be transferred. To the extent that any Assets, for any reason, are not transferable on the Closing Date, the Acquired Fund shall cause such Assets to be transferred to the Acquiring Fund’s account with the Custodian at the earliest practicable date thereafter.
3.3. The Company shall direct Hartford Administrative Services Company, in its capacity as transfer agent for the Company (“Transfer Agent”), to deliver to the Company at the Closing a certificate of an authorized officer of the Transfer Agent stating that its records contain the names and addresses of the Acquired Fund Shareholders and the number and percentage ownership of outstanding shares owned by each such shareholder immediately prior to the Closing. An officer of the Transfer Agent shall confirm that (a) the appropriate number of Acquiring Fund Shares have been credited to the Acquired Fund’s account on the books of the Acquiring Fund pursuant to paragraph 1.1 herein prior to the actions contemplated by paragraph 1.4 herein and (b) the appropriate number of Acquiring Fund Shares have been credited to the accounts of the Acquired Fund Shareholders on the books of the Acquiring Fund pursuant to paragraph 1.4 herein. At the Closing, the Company shall execute such bills of sale, checks, assignments, share certificates, if any, receipts or other documents as necessary to effect the Reorganization.
3.4. In the event that on the Valuation Date (a) the New York Stock Exchange or another primary trading market for portfolio securities of the Acquiring Fund or the Acquired Fund (each, an “Exchange”) shall be closed to trading or trading thereupon shall be restricted, or (b) trading or the reporting of trading on such Exchange or elsewhere shall be disrupted so that, in the judgment of HFMC or the Board of Directors of the Company, accurate appraisal of the value of the net assets of the Acquiring Fund or the Acquired Fund, respectively, is impracticable, the Closing Date shall be postponed until the first business day after the day when trading shall have been fully resumed and reporting shall have been restored.
| 4. | REPRESENTATIONS AND WARRANTIES |
4.1. Except as has been fully disclosed to the Acquiring Fund prior to the date of this Agreement in a written instrument executed by an officer of the Company, the Company, on behalf of the Acquired Fund, represents and warrants to the Acquiring Fund as follows:
(a) The Acquired Fund is duly organized as a series of the Company, which is a corporation duly organized, validly existing and in good standing under the laws of the State of Maryland, with power under the Company’s Articles of Incorporation, as amended from time to time (“Charter”), to own all of its Assets and to carry on its business as it is now being conducted;
(b) The Company is a registered investment company classified as a management company of the open-end type, and its registration with the Commission as an investment company under the 1940 Act, and the registration of the Acquired Fund Shares under the Securities Act of 1933, as amended (“1933 Act”), is in full force and effect;
(c) No consent, approval, authorization, or order of any court or governmental authority is required for the consummation by the Acquired Fund of the transactions contemplated herein, except such as may be required under the 1933 Act, the Securities Exchange Act of 1934, as amended (“1934 Act”), the 1940 Act and state securities laws;
(d) The current prospectus and statement of additional information of the Acquired Fund and each prospectus and statement of additional information of the Acquired Fund used at all times prior to the date of this Agreement conforms or conformed at the time of its use in all material respects to the applicable requirements of the 1933 Act and the 1940 Act and the rules and regulations of the Commission thereunder; and does not or did not at the time of its use include any untrue statement of a material fact or omit to state any material fact required to be stated therein or necessary to make the statements therein, in light of the circumstances under which they were made, not materially misleading;
(e) On the Valuation Date, the Company, on behalf of the Acquired Fund, will have good and marketable title to the Assets of the Acquired Fund and full right, power, and authority to sell, assign, transfer and deliver such Assets hereunder free of any liens or other encumbrances, and upon delivery and payment for such Assets, the Company, on behalf of the Acquiring Fund, will acquire good and marketable title thereto, subject to no restrictions on the full transfer thereof, including such restrictions as might arise under the 1933 Act;
(f) The Acquired Fund is not engaged currently, and the execution, delivery and performance of this Agreement will not result, in (i) a material violation of the Company’s Charter or Bylaws, as amended from time to time, or of any agreement, indenture, instrument, contract, lease or other undertaking to which the Company, on behalf of the Acquired Fund, is a party or by which it is bound, or (ii) the acceleration of any material obligation, or the imposition of any material penalty, under any agreement, indenture, instrument, contract, lease, judgment or decree to which the Company, on behalf of the Acquired Fund, is a party or by which it is bound;
(g) All material contracts or other commitments of the Acquired Fund (other than this Agreement and certain investment contracts including options, futures, and forward contracts) will terminate without liability to the Acquired Fund on or prior to the Closing Date;
(h) No litigation or administrative proceeding or investigation of or before any court or governmental body is presently pending or, to the Company’s knowledge, threatened against the Company, with respect to the Acquired Fund or any of its properties or assets, that, if adversely determined, would materially and adversely affect its financial condition or the conduct of its business. The Company, on behalf of the Acquired Fund, knows of no facts which might form the basis for the institution of such proceedings and is not a party to or subject to the provisions of any order, decree or judgment of any court or governmental body which materially and adversely affects its business or its ability to consummate the transactions herein contemplated;
(i) The Statement of Assets and Liabilities of the Acquired Fund as of October 31, 2017, and the related Statement of Operations, Statement of Changes in Net Assets, Schedule of Investments and Financial Highlights for the periods then ended, have been audited by Ernst & Young LLP (“EY”), independent registered public accounting firm, included in its report dated December 29, 2017, who issued an unqualified opinion thereon, and present fairly, in all material respects, the financial condition of the Acquired Fund as of such date in accordance with U.S. generally accepted accounting principles (“GAAP”), and there are no known contingent liabilities of the Acquired Fund required to be reflected on a balance sheet (including the notes thereto) in accordance with GAAP as of such date not disclosed therein;
(j) The Statement of Assets and Liabilities, Statements of Operations and Changes in Net Assets and Schedule of Investments of the Acquired Fund at April 30, 2018 present fairly, in all material respects, the financial condition of the Acquired Fund as of such date in accordance with GAAP, and there are no known contingent liabilities of the Acquired Fund required to be reflected on a balance sheet (including the notes thereto) in accordance with GAAP as of such date not disclosed therein;
(k) Since April 30, 2018, there has not been any material adverse change in the Acquired Fund’s financial condition, assets, liabilities or business, other than changes occurring in the ordinary course of business, or any incurrence by the Acquired Fund of indebtedness other than in the ordinary course in accordance with the Acquired Fund’s investment restrictions. For the purposes of this subparagraph (j), a decline in net asset value per share of Acquired Fund Shares due to declines in market values of securities held by the Acquired Fund, the discharge of Acquired Fund liabilities, or the redemption of Acquired Fund Shares by shareholders of the Acquired Fund shall not constitute a material adverse change;
(l) On the Closing Date, all federal and other tax returns, dividend reporting forms, and other tax-related reports of the Acquired Fund required by law to have been filed by such date (including any extensions) shall have been filed and are or will be correct in all material respects, and all federal and other taxes shown as due or required to be shown as due on said returns and reports shall have been paid or provision shall have been made for the payment thereof and, to the best knowledge of the Company, no such return is currently under audit and no assessment has been asserted with respect to such returns;
(m) For each taxable year of its operation (including the taxable year ending on the Closing Date), the Acquired Fund has met (or will meet) the requirements of Subchapter M of the Code for qualification as a regulated investment company, has been (or will be) eligible to and has computed (or will compute) its federal income tax under Section 852 of the Code, and will have distributed all of its investment company taxable income (computed without regard to any deduction for dividends paid) and net capital gain (as defined in the Code) that has accrued through the Closing Date, and before the Closing Date will have declared dividends sufficient to distribute all of its investment company taxable income (computed without regard to any deduction for dividends paid) and net capital gain (after reduction for any available capital loss carryover) for the period ending on the Closing Date;
(n) All issued and outstanding Acquired Fund Shares are, and on the Closing Date will be, duly and validly issued and outstanding, fully paid and non-assessable by the Company and have been offered and sold in every state, territory and the District of Columbia in compliance in all material respects with applicable registration requirements of the 1933 Act and other securities laws. All of the issued and outstanding Acquired Fund Shares will, at the time of Closing, be held by the persons and in the amounts set forth in the records of the Transfer Agent, on behalf of the Acquired Fund, as provided in paragraph 3.3 herein. The Acquired Fund does not have outstanding any options, warrants or other rights to subscribe for or purchase any of the Acquired Fund Shares, nor is there outstanding any security convertible into any of the Acquired Fund Shares;
(o) The execution, delivery and performance of this Agreement and the transactions contemplated herein have been duly authorized by all necessary action, if any, on the part of the Directors of the Company, on behalf of the Acquired Fund, and this Agreement constitutes a valid and binding obligation of the Company, on behalf of the Acquired Fund, enforceable in accordance with its terms, subject, as to enforcement, to bankruptcy, insolvency, reorganization, moratorium and other laws relating to or affecting creditors’ rights and to general equity principles;
(p) The information to be furnished by the Acquired Fund for use in registration statements, information statement materials and other documents filed or to be filed with any federal, state or local regulatory authority (including the Financial Industry Regulatory Authority, Inc.), which may be necessary in connection with the transactions contemplated hereby, shall be accurate and complete in all material respects and shall comply in all material respects with federal securities and other laws and regulations thereunder applicable thereto; and
(q) The combined information statement/prospectus (“Information Statement”) to be included in the Registration Statement referred to in paragraph 5.5 herein (and any amendment and supplement thereto), insofar as it relates to the Acquired Fund, will, on the effective date of the Registration Statement and on the Closing Date (i) not contain any untrue statement of a material fact or omit to state a material fact required to be stated therein or necessary to make the statements therein, in light of the circumstances under which such statements were made, not materially misleading, provided, however, that the representations and warranties of this subparagraph (p) shall not apply to statements in or omissions from the Information Statement and the Registration Statement made in reliance upon and in conformity with information that was furnished by the Acquiring Fund for use therein, and (ii) comply in all material respects with the provisions of the 1933 Act, the 1934 Act, and the 1940 Act and the rules and regulations thereunder.
4.2. Except as has been fully disclosed to the Acquired Fund prior to the date of this Agreement in a written instrument executed by an officer of the Company, the Company, on behalf of the Acquiring Fund, represents and warrants to the Acquired Fund as follows:
(a) The Acquiring Fund is duly organized as a series of the Company, which is a corporation duly organized, validly existing, and in good standing under the laws of the State of Maryland, with power under the Charter to own all of its properties and assets and to carry on its business as it is now being conducted;
(b) The Company is a registered investment company classified as a management company of the open-end type, and its registration with the Commission as an investment company under the 1940 Act and the registration of the Acquiring Fund Shares under the 1933 Act, is in full force and effect;
(c) No consent, approval, authorization, or order of any court or governmental authority is required for the consummation by the Acquiring Fund of the transactions contemplated herein, except such as may be required under the 1933 Act, the 1934 Act, the 1940 Act and state securities laws;
(d) The current prospectus and statement of additional information of the Acquiring Fund and each prospectus and statement of additional information of the Acquiring Fund used at all times prior to the date of this Agreement conforms or conformed at the time of its use in all material respects to the applicable requirements of the 1933 Act and the 1940 Act and the rules and regulations of the Commission thereunder and does not or did not at the time of its use include any untrue statement of a material fact or omit to state any material fact required to be stated therein or necessary to make the statements therein, in light of the circumstances under which they were made, not materially misleading;
(e) The Acquiring Fund is not engaged currently, and the execution, delivery and performance of this Agreement will not result, in (i) a material violation of the Company’s Charter or Bylaws, as amended from time to time, or of any agreement, indenture, instrument, contract, lease or other undertaking to which the Company, on behalf of the Acquiring Fund, is a party or by which it is bound, or (ii) the acceleration of any material obligation, or the imposition of any material penalty, under any agreement, indenture, instrument, contract, lease, judgment or decree to which the Company, on behalf of the Acquiring Fund, is a party or by which it is bound;
(f) No litigation or administrative proceeding or investigation of or before any court or governmental body is presently pending or, to its knowledge, threatened against the Company, with respect to the Acquiring Fund or any of the Acquiring Fund’s properties or assets, that, if adversely determined, would materially and adversely affect the Acquiring Fund’s financial condition or the conduct of its business. The Company, on behalf of the Acquiring Fund, knows of no facts which might form the basis for the institution of such proceedings and is not a party to or subject to the provisions of any order, decree or judgment of any court or governmental body which materially and adversely affects the Acquiring Fund’s business or its ability to consummate the transactions herein contemplated;
(g) The Statement of Assets and Liabilities of the Acquired Fund as of October 31, 2017, and the related Statement of Operations, Statement of Changes in Net Assets, Schedule of Investments and Financial Highlights for the periods then ended, have been audited by EY, independent registered public accounting firm, included in its report dated December 29, 2017, who issued an unqualified opinion thereon, and present fairly, in all material respects, the financial condition of the Acquired Fund as of such date in accordance with GAAP, and there are no known contingent liabilities of the Acquired Fund required to be reflected on a balance sheet (including the notes thereto) in accordance with GAAP as of such date not disclosed therein;
(h) The Statement of Assets and Liabilities, Statements of Operations and Changes in Net Assets and Schedule of Investments of the Acquiring Fund at April 30, 2018 present fairly, in all material respects, the financial condition of the Acquiring Fund as of such date in accordance with GAAP, and there are no known contingent liabilities of the Acquiring Fund required to be reflected on a balance sheet (including the notes thereto) in accordance with GAAP as of such date not disclosed therein;
(i) Since April 30, 2018, there has not been any material adverse change in the Acquiring Fund’s financial condition, assets, liabilities or business, other than changes occurring in the ordinary course of business, or any incurrence by the Acquiring Fund of indebtedness other than in the ordinary course in accordance with the Acquiring Fund’s investment restrictions. For purposes of this subparagraph (i), a decline in net asset value per share of the Acquiring Fund Shares due to declines in market values of securities held by the Acquiring Fund, the discharge of Acquiring Fund liabilities, or the redemption of Acquiring Fund Shares by shareholders of the Acquiring Fund, shall not constitute a material adverse change;
(j) On the Closing Date, all federal and other tax returns, dividend reporting forms, and other tax-related reports of the Acquiring Fund required by law to have been filed by such date (including any extensions) shall have been filed and are or will be correct in all material respects, and all federal and other taxes shown as due or required to be shown as due on said returns and reports shall have been paid or provision shall have been made for the payment thereof, and to the best knowledge of the Company no such return is currently under audit and no assessment has been asserted with respect to such returns;
(k) For each taxable year of its operation (including the taxable year that includes the Closing Date), the Acquiring Fund has met (or will meet) the requirements of Subchapter M of the Code for qualification as a
regulated investment company, has been eligible to (or will be eligible to) and has computed (or will compute) its federal income tax under Section 852 of the Code;
(l) All issued and outstanding Acquiring Fund Shares are, and on the Closing Date will be, duly and validly issued and outstanding, fully paid and non-assessable by the Company and have been offered and sold in every state, territory and the District of Columbia in compliance in all material respects with applicable registration requirements of the 1933 Act and other securities laws. The Acquiring Fund does not have outstanding any options, warrants or other rights to subscribe for or purchase any Acquiring Fund Shares, nor is there outstanding any security convertible into any Acquiring Fund Shares;
(m) The execution, delivery and performance of this Agreement and the transactions contemplated herein, have been duly authorized by all necessary action, if any, on the part of the Directors of the Company, on behalf of the Acquiring Fund, and this Agreement constitutes a valid and binding obligation of the Company, on behalf of the Acquiring Fund, enforceable in accordance with its terms, subject, as to enforcement, to bankruptcy, insolvency, reorganization, moratorium and other laws relating to or affecting creditors’ rights and to general equity principles;
(n) The Acquiring Fund Shares to be issued and delivered to the Acquired Fund, for the account of the Acquired Fund Shareholders, pursuant to the terms of this Agreement, will on the Closing Date have been duly authorized and, when so issued and delivered, will be duly and validly issued Acquiring Fund Shares, and will be fully paid and non-assessable by the Acquiring Fund;
(o) The information to be furnished by the Acquiring Fund for use in registration statements, information statement materials and other documents that may be necessary in connection with the transactions contemplated hereby shall be accurate and complete in all material respects and shall comply in all material respects with federal securities and other laws and regulations applicable thereto; and
(p) The Information Statement to be included in the Registration Statement referred to in paragraph 5.5 herein (and any amendment or supplement thereto), insofar as it relates to the Acquiring Fund and the Acquiring Fund Shares, will, from the effective date of the Registration Statement through the Closing Date (i) not contain any untrue statement of a material fact or omit to state a material fact required to be stated therein or necessary to make the statements therein, in light of the circumstances under which such statements were made, not materially misleading, provided, however, that the representations and warranties of this subparagraph (o) shall not apply to statements in or omissions from the Information Statement and the Registration Statement made in reliance upon and in conformity with information that was furnished by the Acquired Fund for use therein, and (ii) comply in all material respects with the provisions of the 1933 Act, the 1934 Act, and the 1940 Act and the rules and regulations thereunder.
| 5. | COVENANTS OF THE ACQUIRING FUND AND THE ACQUIRED FUND |
5.1. The Acquiring Fund and the Acquired Fund each will operate its business in the ordinary course between the date hereof and the Closing Date, it being understood that such ordinary course of business will include (a) the declaration and payment of customary dividends and distributions, and any other distribution that may be advisable; and (b) the repositioning of the Acquired Fund’s portfolio.
5.2. The Acquiring Fund Shares to be issued hereunder are not being acquired for the purpose of making any distribution thereof, other than in accordance with the terms of this Agreement.
5.3. Subject to the provisions of this Agreement, the Acquiring Fund and the Acquired Fund will each take, or cause to be taken, all action, and do or cause to be done, all things reasonably necessary, proper or advisable to consummate and make effective the transactions contemplated by this Agreement.
5.4. The Company, on behalf of the Acquired Fund, will prepare and file an Information Statement (referred to in paragraph 4.1(p) herein) to be included in a Registration Statement on Form N-14 (“Registration Statement”), in compliance with the 1933 Act, the 1934 Act and the 1940 Act. The Acquired Fund will provide to the Acquiring Fund such information regarding the Acquired Fund as may be reasonably necessary for the preparation of the Registration Statement.
5.5. The Acquiring Fund and the Acquired Fund shall each use its reasonable best efforts to fulfill or obtain the fulfillment of the conditions precedent to effect the transactions contemplated by this Agreement as promptly as practicable.
5.6. The Company, on behalf of the Acquired Fund, shall execute and deliver or cause to be executed and delivered all such assignments and other instruments, and will take or cause to be taken such further action as may be necessary or desirable in order to (1) vest in and confirm (a) the title and possession of the Company, on behalf of the Acquired Fund, of the Acquiring Fund Shares to be delivered hereunder and (b) the title and possession of the Company, on behalf of the Acquiring Fund, of all the Assets and (2) otherwise to carry out the intent and purpose of this Agreement.
5.7. The Acquiring Fund will use all reasonable efforts to obtain the approvals and authorizations required by the 1933 Act, the 1940 Act and such of the state blue sky or securities laws as may be necessary in order to continue its operations after the Closing Date.
| 6. | CONDITIONS PRECEDENT TO OBLIGATIONS OF THE ACQUIRED FUND |
The obligations of the Company, on behalf of the Acquired Fund, to consummate the transactions provided for herein shall be subject, at the Company’s election, to the performance by the Company, on behalf of the Acquiring Fund, of all the obligations to be performed by it hereunder on or before the Closing Date, and, in addition thereto, the following further conditions:
6.1. All representations and warranties of the Company, on behalf of the Acquiring Fund, contained in this Agreement shall be true and correct in all material respects as of the date hereof and, except as they may be affected by the transactions contemplated by this Agreement, as of the Closing Date, with the same force and effect as if made on and as of the Closing Date;
6.2. The Company, on behalf of the Acquiring Fund, shall have delivered to the Acquired Fund a certificate executed by the Company’s President or Vice President and its Treasurer or Assistant Treasurer, and dated as of the Closing Date, to the effect that the representations and warranties of the Company, on behalf of the Acquiring Fund, made in this Agreement are true and correct at and as of the Closing Date, except as they may be affected by the transactions contemplated by this Agreement;
6.3. The Company, on behalf of the Acquiring Fund, shall have performed all of the covenants and complied with all of the provisions required by this Agreement to be performed or complied with by the Company, on behalf of the Acquiring Fund, on or before the Closing Date; and
6.4. The number of full and fractional Acquiring Fund Shares to be issued in connection with the Reorganization shall have been calculated in accordance with paragraph 1.1 herein.
| 7. | CONDITIONS PRECEDENT TO OBLIGATIONS OF THE ACQUIRING FUND |
The obligations of the Company, on behalf of the Acquiring Fund, to consummate the transactions provided for herein shall be subject, at the Company’s election, to the performance by the Company, on behalf of the Acquired Fund, of all of the obligations to be performed by it hereunder on or before the Closing Date and, in addition thereto, the following conditions:
7.1. All representations and warranties of the Company, on behalf of the Acquired Fund, contained in this Agreement shall be true and correct in all material respects as of the date hereof and, except as they may be affected by the transactions contemplated by this Agreement, as of the Closing Date, with the same force and effect as if made on and as of the Closing Date;
7.2. The Company shall have delivered to the Acquiring Fund a statement of the Acquired Fund’s Assets and Liabilities, as of the Valuation Date, certified by the Treasurer of the Company;
7.3. The Company, on behalf of the Acquired Fund, shall have delivered to the Acquiring Fund a certificate executed in the name of the Acquired Fund by its President or Vice President and its Treasurer or Assistant Treasurer and dated as of the Closing Date to the effect that the representations and warranties of the Company, on behalf of the Acquired Fund, made in this Agreement are true and correct at and as of the Closing Date, except as they may be affected by the transactions contemplated by this Agreement;
7.4. The Company, on behalf of the Acquired Fund, shall have performed all of the covenants and complied with all of the provisions required by this Agreement to be performed or complied with by the Company, on behalf of the Acquired Fund, on or before the Closing Date;
7.5. The number of full and fractional Acquiring Fund Shares to be issued in connection with the Reorganization shall have been calculated in accordance with paragraph 1.1 herein; and
7.6. The Acquired Fund shall have declared and paid a distribution or distributions prior to the Closing that, together with all previous distributions, shall have the effect of distributing to its shareholders (i) all of its investment company taxable income and all of its net realized capital gains, if any, for the period from the close of its last fiscal year to 4:00 p.m. Eastern Time on the Valuation Date; and (ii) any undistributed investment company taxable income and net realized capital gains from any period to the extent not otherwise already distributed.
| 8. | FURTHER CONDITIONS PRECEDENT TO OBLIGATIONS OF THE ACQUIRING FUND AND THE ACQUIRED FUND |
If any of the conditions set forth below have not been satisfied on or before the Closing Date with respect to the Company, on behalf of the Acquired Fund, the Company may, at its option, refuse to consummate the transactions contemplated by this Agreement. If any of the conditions set forth below have not been satisfied on or before the Closing Date with respect to the Company, on behalf of the Acquiring Fund, the Company may, at its option, refuse to consummate the transactions contemplated by this Agreement:
8.1. The Agreement and the transactions contemplated herein shall have been approved by the Board of Directors of the Company, and each party shall have delivered to the other certified copies of the resolutions evidencing such approval;
8.2. On the Closing Date no action, suit or other proceeding shall be pending or, to the Company’s knowledge, threatened before any court or governmental agency in which it is sought to restrain or prohibit, or obtain damages or other relief in connection with, this Agreement or the transactions contemplated herein;
8.3. All consents of other parties and all other consents, orders and permits of federal, state and local regulatory authorities deemed necessary by the Company to permit consummation, in all material respects, of the transactions contemplated hereby shall have been obtained, except where failure to obtain any such consent, order or permit would not involve a risk of a material adverse effect on the assets or properties of the Acquiring Fund or the Acquired Fund;
8.4. The Registration Statement shall have become effective under the 1933 Act and no stop orders suspending the effectiveness thereof shall have been issued and, to the best knowledge of the parties hereto, no investigation or proceeding for that purpose shall have been instituted or be pending, threatened or contemplated under the 1933 Act;
8.5. The Company shall have received the opinion of counsel to the Company addressed to the Company substantially to the effect that, based upon certain facts, assumptions, and representations, the transaction contemplated by this Agreement shall constitute a tax-free reorganization for federal income tax purposes. The delivery of such opinion is conditioned upon receipt by counsel to the Company of representations it shall request of the Company. Notwithstanding anything herein to the contrary, the Company may not consummate such transactions contemplated by the Agreement if this condition is not satisfied.
9.1. The Company, out of the Acquiring Fund’s assets and property (including any amounts paid to the Acquiring Fund pursuant to any applicable liability insurance policies or indemnification agreements), agrees to indemnify and hold harmless the Acquired Fund from and against any and all losses, claims, damages, liabilities or expenses (including, without limitation, the payment of reasonable legal fees and reasonable costs of investigation) to which the Acquired Fund may become subject, insofar as such loss, claim, damage, liability or expense (or actions with respect thereto) arises out of or is based on any breach by the Acquiring Fund of any of its representations, warranties, covenants or agreements set forth in this Agreement, provided that such indemnification by the Acquiring Fund is not in violation of any applicable law.
9.2. The Company, out of the Acquired Fund’s assets and property (including any amounts paid to the Acquired Fund pursuant to any applicable liability insurance policies or indemnification agreements), agrees to indemnify and hold harmless the Acquiring Fund from and against any and all losses, claims, damages, liabilities or expenses (including, without limitation, the payment of reasonable legal fees and reasonable costs of investigation) to which the Acquiring Fund may become subject, insofar as such loss,
claim, damage, liability or expense (or actions with respect thereto) arises out of or is based on any breach by the Acquired Fund of any of its representations, warranties, covenants or agreements set forth in this Agreement, provided that such indemnification by the Acquired Fund is not in violation of any applicable law.
| 10. | BROKERAGE FEES AND EXPENSES |
10.1. The Company, on behalf of the Acquiring Fund and on behalf of the Acquired Fund, represents and warrants that there are no brokers or finders entitled to receive any payments in connection with the transactions provided for herein.
10.2. The expenses relating to the proposed Reorganization will be borne solely by HFMC or its affiliate. No such expenses incurred in connection with the Reorganization shall be borne by the Acquired Fund or the Acquiring Fund, except for brokerage fees, brokerage-related expenses and other similar transaction costs related to the purchase and sale of portfolio holdings, and stamp tax, if any. The costs of the Reorganization shall include, but not be limited to, costs associated with preparation of the Registration Statement, printing and distributing the Information Statement, legal fees, accounting fees and securities registration fees. Notwithstanding any of the foregoing, expenses will in any event be paid by the party directly incurring such expenses if and to the extent that the payment by another person of such expenses would result in the disqualification of such party as a “regulated investment company” within the meaning of Section 851 of the Code.
| 11. | ENTIRE AGREEMENT; SURVIVAL OF WARRANTIES |
11.1. The Company has not made any representation, warranty or covenant, on behalf of either the Acquired Fund or the Acquiring Fund, as applicable, not set forth herein, and this Agreement constitutes the entire agreement between the Acquiring Fund and Acquired Fund with respect to the Reorganization.
11.2. The representations, warranties and covenants contained in this Agreement or in any document delivered pursuant hereto or in connection herewith shall survive the consummation of the transactions contemplated hereunder. The covenants to be performed after the Closing and the obligations of each of the Acquired Fund and Acquiring Fund in paragraphs 9.1 and 9.2 shall survive the Closing.
This Agreement may be terminated and the transactions contemplated hereby may be abandoned by resolution of the Company’s Board of Directors, on behalf of either the Acquiring Fund or the Acquired Fund, at any time prior to the Closing Date, if circumstances should develop that, in its opinion, make proceeding with the Agreement inadvisable.
This Agreement may be amended, modified or supplemented in such manner as may be deemed necessary or advisable by the authorized officers of the Company.
| 14. | HEADINGS; GOVERNING LAW; ASSIGNMENT; LIMITATION OF LIABILITY |
14.1. The Article and paragraph headings contained in this Agreement are for reference purposes only and shall not affect in any way the meaning or interpretation of this Agreement.
14.2. This Agreement shall be governed by and construed in accordance with the laws of the State of Maryland without regard to its principles of conflicts of laws.
14.3. This Agreement shall bind and inure to the benefit of the parties hereto and their respective successors and assigns, but no assignment or transfer hereof or of any rights or obligations hereunder shall be made by any party without the written consent of the other party. Nothing herein expressed or implied is intended or shall be construed to confer upon or give any person, firm or corporation, other than the parties hereto and their respective successors and assigns, any rights or remedies under or by reason of this Agreement.
[Remainder of Page Intentionally Left Blank]
IN WITNESS WHEREOF, each of the parties hereto has caused this Agreement to be executed by its duly authorized officer.
| | THE HARTFORD MUTUAL FUNDS, INC., ON BEHALF OF Hartford Global Capital Appreciation Fund |
| | | |
| | By: | |
| | | |
| | Name: | |
| | | |
| | Title: | |
| | | |
| | THE HARTFORD MUTUAL FUNDS, INC., ON BEHALF OF Hartford INTERNATIONAL EQUITY Fund |
| | | |
| | By: | |
| | | |
| | Name: | |
| | | |
| | Title: | |
| | | |
| | With respect to Paragraph 10.2 of this Agreement, Accepted and Acknowledged by: |
| | |
| | HARTFORD FUNDS MANAGEMENT COMPANY, LLC |
| | | |
| | By: | |
| | | |
| | Name: | |
| | | |
| | Title: | |
EXHIBIT A
| Acquired Fund Share Class | Corresponding Acquiring Fund Share Class* |
| A | A |
| T | T |
| C | C |
| I | I |
| R3 | R3 |
| R4 | R4 |
| R5 | R5 |
| Y | Y |
| F | F |
* Class R6 shares of the Acquiring Fund are not involved in the Reorganization
APPENDIX B: 5% BENEFICIAL OWNERS OF FUND SHARES AS OF [AUGUST 31], 2018
To the knowledge of the Funds, as of [August 31], 2018, the following persons owned of record or beneficially 5% or more of the outstanding shares of the class identified of the Acquired Fund or Acquiring Fund. As of [August 31], 2018, no shareholder owned Class T shares of the Funds.
Acquired Fund
| Name and Address* | Class A | Class C | Class I | Class R3 | Class R4 | Class R5 | Class Y | Class F |
| | | | | | | | | |
* Each entity set forth in this column is the shareholder of record and may be deemed to be the beneficial owner of certain of the shares listed for certain purposes under the securities laws, although certain of the entities generally do not have an economic interest in these shares and would ordinarily disclaim any beneficial ownership therein.
** May be deemed to control the Fund because it owned more than 25% of the outstanding shares of the Fund.
Acquiring Fund
| Name and Address* | Class A | Class C | Class I | Class R3 | Class R4 | Class R5 | Class R6 | Class Y | Class F |
| | | | | | | | | | |
* Each entity set forth in this column is the shareholder of record and may be deemed to be the beneficial owner of certain of the shares listed for certain purposes under the securities laws, although certain of the entities generally do not have an economic interest in these shares and would ordinarily disclaim any beneficial ownership therein.
PART B
The Hartford Mutual Funds, Inc.
690 Lee Road
Wayne, PA 19087
Statement of Additional Information
September [___], 2018
This Statement of Additional Information is available to the shareholders of the Hartford Global Capital Appreciation Fund (the “Acquired Fund”) in connection with the proposed transaction (the “Reorganization”) whereby all of the assets and liabilities of the Acquired Fund will be transferred to the Hartford International Equity Fund (the “Acquiring Fund,” and together with the Acquired Fund, the “Funds”) in exchange for shares of the Acquired Fund. The Acquiring Fund, following completion of the Reorganization, may be referred to as the “Combined Fund.”
This Statement of Additional Information of the Acquiring Fund consists of this cover page, the accompanying pro forma financial information and related notes, and the following documents, each of which was filed electronically with the U.S. Securities and Exchange Commission (“SEC”) and is incorporated by reference herein:
| 1. | The Statement of Additional Information for The Hartford Mutual Funds, Inc. dated March 1, 2018, as may be amended, supplemented or restated (File Nos. 333-02381 and 811-07589) with respect to the information that pertains to the Acquired Fund and Acquiring Fund only; |
| 2. | The Financial Statements of the Acquired Fund and the Acquiring Fund as included in the Funds’ Annual Report filed for the year ended October 31, 2017 (File No. 811-07589); and |
| 3. | The Financial Statements of the Acquired Fund and the Acquiring Fund as included in the Funds’ Semi-Annual Report filed for the period ended April 30, 2018 (File No. 811-07589). |
This Statement of Additional Information is not a prospectus. A Combined Information Statement /Prospectus (the “Information Statement/Prospectus”) dated September [___], 2018 relating to the transaction may be obtained, without charge, by writing to The Hartford Mutual Funds, Inc., P.O. Box 55022, Boston, MA 02205-5022 or calling 1-888-843-7824. This Statement of Additional Information should be read in conjunction with the Information Statement/Prospectus.
For additional information, see the October 31, 2017 annual report for the Funds and the April 30, 2018 semi-annual report for the Funds.
PRO FORMA FINANCIAL Information
Unaudited pro forma financial information is presented below for the Reorganization. The Acquiring Fund will be the accounting survivor of the Reorganization. The pro forma financial information provided herein should be read in conjunction with the annual and semi-annual reports, which are on file with the SEC and are available at no charge.
The unaudited pro forma financial information set forth below for the twelve months ended April 30, 2018, is intended to present supplemental data as if the Reorganization, as noted in the table below, had occurred at the beginning of the period. The Reorganization does not require Shareholder approval.
The pro forma financial information is based on the estimates and assumptions set forth in the notes to such information and should be read in conjunction with this unaudited pro forma financial information. The pro forma financial information is being furnished solely for information purposes and, therefore, does not purport to be indicative of the combined financial position or results of operations that might have been achieved if the Reorganization had been consummated on the date or for the periods indicated. In addition, the unaudited pro forma financial information does not purport to be indicative of the financial position or results of operations that may occur in the future.
Pro Forma Schedule of Investments (Unaudited)
| | Shares | Value($) |
Description (All
percentages are based on
the Acquiring Fund Pro
Forma’s net assets) | Acquired
Fund | Acquiring
Fund | Pro Forma
Adjustments
Increase/
(Decrease) | Acquiring
Fund Pro
Forma | Acquired
Fund | Acquiring
Fund | Pro Forma
Adjustments
Increase/
(Decrease) | Acquiring
Fund Pro
Forma |
| | | | | | | | | |
| Common Stock — 96.1% | | | | | | | | |
| Argentina - 0.6% | | | | | | | | |
| Banco Macro S.A. | | 903 | 13,091 | 13,994 | | 87,519 | 1,268,780 | 1,356,299 |
| Grupo Financiero Galicia S.A. | | 1,569 | 22,746 | 24,315 | | 100,290 | 1,453,924 | 1,554,214 |
| Loma Negra Cia Industrial Argentina S.A. * | | 3,554 | 51,523 | 55,077 | | 73,710 | 1,068,587 | 1,142,297 |
| Pampa Energia S.A. * | | 1,251 | 18,136 | 19,387 | | 71,357 | 1,034,477 | 1,105,834 |
| YPF S.A. | | 3,949 | 57,250 | 61,199 | | 86,444 | 1,253,203 | 1,339,647 |
| Total Argentina | | | | | - | 419,320 | 6,078,971 | 6,498,291 |
| Australia - 2.1% | | | | | | | | |
| ASX Ltd.# | 34,751 | | (34,751) | - | 1,527,750 | | (1,527,750) | - |
| BHP Billiton plc | | 10,625 | 154,034 | 164,659 | | 226,551 | 3,284,375 | 3,510,926 |
| Goodman Group | | 52,286 | 758,006 | 810,292 | | 355,730 | 5,157,094 | 5,512,824 |
| New South Resources Ltd. *,# | 2,362,644 | | (2,362,644) | - | 2,836,611 | | (2,836,611) | - |
| QBE Insurance Group Ltd.# | 349,613 | | (349,613) | - | 2,611,112 | | (2,611,112) | - |
| Resolute Mining Ltd. | | 29,430 | 426,656 | 456,086 | | 25,134 | 364,364 | 389,498 |
| South32 Ltd. | | 94,608 | 1,371,562 | 1,466,170 | | 262,539 | 3,806,085 | 4,068,624 |
| Transurban Group | | 28,948 | 419,668 | 448,616 | | 252,244 | 3,656,861 | 3,909,105 |
| Treasury Wine Estates Ltd.# | 189,594 | | (189,594) | - | 2,708,158 | | (2,708,158) | - |
| Wesfarmers Ltd. | | 9,475 | 137,362 | 146,837 | | 311,723 | 4,519,155 | 4,830,878 |
| Western Areas Ltd. | | 27,973 | 405,533 | 433,506 | | 72,032 | 1,044,288 | 1,116,320 |
| Total Australia | | | | | 9,683,631 | 1,505,953 | 12,148,591 | 23,338,175 |
| Austria - 0.5% | | | | | | | | |
| ams AG | 53,617 | 3,745 | 675 | 58,037 | 4,422,165 | 308,876 | 55,672 | 4,786,713 |
| Zumtobel Group AG | | 4,102 | 59,468 | 63,570 | | 37,174 | 538,917 | 576,091 |
| Total Austria | | | | | 4,422,165 | 346,050 | 594,589 | 5,362,804 |
| | | | | | | | | |
| Belgium - 0.9% | | | | | | | | |
| Ageas | | 2,439 | 35,359 | 37,798 | | 130,468 | 1,891,441 | 2,021,909 |
| AGFA-Gevaert N.V. * | | 11,366 | 164,776 | 176,142 | | 40,522 | 587,459 | 627,981 |
| Groupe Bruxelles Lambert S.A. | | 3,559 | 51,596 | 55,155 | | 406,819 | 5,897,779 | 6,304,598 |
| Orange Belgium S.A. | | 2,327 | 33,735 | 36,062 | | 48,301 | 700,231 | 748,532 |
| | Shares | Value($) |
Description (All
percentages are based on
the Acquiring Fund Pro
Forma’s net assets) | Acquired
Fund | Acquiring
Fund | Pro Forma
Adjustments
Increase/
(Decrease) | Acquiring
Fund Pro
Forma | Acquired
Fund | Acquiring
Fund | Pro Forma
Adjustments
Increase/
(Decrease) | Acquiring
Fund Pro
Forma |
| Total Belgium | | | | | - | 626,110 | 9,076,910 | 9,703,020 |
| | | | | | | | | |
| Bermuda - 0.0% | | | | | | | | |
| Marvell Technology Group Ltd.# | 85,646 | | (85,646) | - | 1,718,059 | | (1,718,059) | - |
| RenaissanceRe Holdings Ltd.# | 17,864 | | (17,864) | - | 2,430,219 | | (2,430,219) | - |
| Total Bermuda | | | | | 4,148,278 | - | (4,148,278) | - |
| | | | | | | | | |
| Brazil - 3.0% | | | | | | | | |
| Banco do Brasil S.A. | | 11,800 | 171,068 | 182,868 | | 123,618 | 1,792,125 | 1,915,743 |
| BR Malls Participacoes S.A.# | 472,605 | 90,530 | 839,837 | 1,402,972 | 1,473,181 | 282,196 | 2,617,940 | 4,373,317 |
| Gerdau S.A.# | 562,698 | 28,860 | (144,306) | 447,252 | 2,627,800 | 134,776 | (673,909) | 2,088,667 |
| Gol Linhas Aereas Inteligentes S.A. * | | 9,631 | 139,624 | 149,255 | | 105,459 | 1,528,883 | 1,634,342 |
| Itau Unibanco Holding S.A.# | 417,900 | 28,575 | (3,639) | 442,836 | 6,085,030 | 416,080 | (52,987) | 6,448,123 |
| Itau Unibanco Holding S.A. ADR | 180,735 | 9,638 | (41,010) | 149,363 | 2,626,080 | 140,040 | (595,875) | 2,170,245 |
| Localiza Rent a Car S.A.# | 575,200 | 50,800 | 161,263 | 787,263 | 4,579,335 | 404,434 | 1,283,863 | 6,267,632 |
| Lojas Renner S.A. | | 10,530 | 152,657 | 163,187 | | 98,020 | 1,421,023 | 1,519,043 |
| Petroleo Brasileiro S.A. *,# | 474,389 | 25,221 | (108,752) | 390,858 | 6,684,141 | 355,364 | (1,532,316) | 5,507,189 |
| Suzano Papel e Celulose S.A. | | 11,000 | 159,470 | 170,470 | | 128,928 | 1,869,100 | 1,998,028 |
| Cia de Saneamento do Parana# | 174,900 | | (174,900) | - | 2,945,621 | | (2,945,621) | - |
| Magazine Luiza S.A.# | 72,100 | | (72,100) | - | 2,196,218 | | (2,196,218) | - |
| Total Brazil | | | | | 29,217,406 | 2,188,915 | 2,516,008 | 33,922,329 |
| | | | | | | | | |
| British Virgin Islands - 0.0% | | | | | | | | |
| J2 Acquisition Ltd. *(3)# | 157,250 | | (157,250) | - | 1,489,157 | | (1,489,157) | - |
| Ocean Outdoor Ltd. *(2)(3)(4)(5)# | 72,280 | | (72,280) | - | 692,081 | | (692,081) | - |
| Total British Virgin Islands | | | | | 2,181,238 | | (2,181,238) | - |
| | | | | | | | | |
| Canada 8.9% | | | | | | | | |
| Advantage Oil & Gas Ltd. * | | 10,472 | 151,816 | 162,288 | | 33,358 | 483,610 | 516,968 |
| ARC Resources Ltd. | | 8,514 | 123,430 | 131,944 | | 94,957 | 1,376,627 | 1,471,584 |
| Bank of Montreal | | 4,326 | 62,715 | 67,041 | | 328,540 | 4,762,909 | 5,091,449 |
See accompanying notes to pro forma financial statements.
| | Shares | Value($) |
Description (All
percentages are based on
the Acquiring Fund Pro
Forma’s net assets) | Acquired
Fund | Acquiring
Fund | Pro Forma
Adjustments
Increase/
(Decrease) | Acquiring
Fund Pro
Forma | Acquired
Fund | Acquiring
Fund | Pro Forma
Adjustments
Increase/
(Decrease) | Acquiring
Fund Pro
Forma |
| Bank of Nova Scotia# | 35,115 | 6,048 | 52,565 | 93,728 | 2,158,398 | 371,750 | 3,230,992 | 5,761,140 |
| Bank of Nova Scotia# | 48,146 | | (48,146) | - | 2,959,053 | | (2,959,053) | - |
| Barrick Gold Corp. | | 12,768 | 185,102 | 197,870 | | 171,838 | 2,491,195 | 2,663,033 |
| Brookfield Asset Management, Inc. | 37,836 | 8,200 | 81,042 | 127,078 | 1,499,649 | 325,011 | 3,212,140 | 5,036,800 |
| Cameco Corp. | | 19,108 | 277,015 | 296,123 | | 201,207 | 2,916,968 | 3,118,175 |
| Canadian Imperial Bank of Commerce | | 3,477 | 50,407 | 53,884 | | 302,841 | 4,390,369 | 4,693,210 |
| Canadian National Railway Co.# | 104,476 | 3,307 | (56,533) | 51,250 | 8,069,539 | 255,427 | (4,366,507) | 3,958,459 |
| Canadian Natural Resources Ltd.# | | 2,580 | 37,403 | 39,983 | | 93,077 | 1,349,358 | 1,442,435 |
| Canadian Natural Resources Ltd.# | 123,672 | | (123,672) | - | 4,462,086 | | (4,462,086) | - |
| Canadian Pacific Railway Ltd.# | 8,569 | | (8,569) | - | 1,563,570 | | (1,563,570) | - |
| Centerra Gold, Inc. * | | 11,316 | 164,052 | 175,368 | | 69,097 | 1,001,734 | 1,070,831 |
| CGI Group, Inc. * | | 5,682 | 82,374 | 88,056 | | 329,250 | 4,773,260 | 5,102,510 |
| Descartes Systems Group, Inc. * | 73,363 | 8,501 | 49,879 | 131,743 | 2,168,407 | 251,266 | 1,474,284 | 3,893,957 |
| Dollarama, Inc. | | 1,758 | 25,486 | 27,244 | | 202,370 | 2,933,783 | 3,136,153 |
| Eldorado Gold Corp. * | | 23,278 | 337,468 | 360,746 | | 22,114 | 320,595 | 342,709 |
| Encana Corp. | | 29,309 | 424,902 | 454,211 | | 365,007 | 5,291,645 | 5,656,652 |
| First Quantum Minerals Ltd.# | 193,438 | 12,622 | (10,453) | 195,607 | 2,787,182 | 181,866 | (150,614) | 2,818,434 |
| Fortis, Inc. | | 10,078 | 146,104 | 156,182 | | 338,301 | 4,904,463 | 5,242,764 |
| Imperial Oil Ltd.# | 89,563 | | (89,563) | - | 2,785,350 | | (2,785,350) | - |
| Intact Financial Corp. | | 3,558 | 51,581 | 55,139 | | 271,294 | 3,933,005 | 4,204,299 |
| Kinross Gold Corp. * | | 11,973 | 173,576 | 185,549 | | 46,455 | 673,475 | 719,930 |
| Magna International, Inc. | 40,249 | 5,153 | 34,456 | 79,858 | 2,377,103 | 304,336 | 2,034,968 | 4,716,407 |
| Northern Dynasty Minerals Ltd. * | | 1,489 | 21,586 | 23,075 | | 1,345 | 19,503 | 20,848 |
| Nutrien Ltd.# | 39,700 | | (39,700) | - | 1,807,286 | | (1,807,286) | - |
| Painted Pony Energy Ltd. * | | 12,549 | 181,927 | 194,476 | | 27,367 | 396,746 | 424,113 |
| PrairieSky Royalty Ltd. (1) | | 2,935 | 42,550 | 45,485 | | 65,080 | 943,495 | 1,008,575 |
| Raging River Exploration, Inc. * | | 38,165 | 553,290 | 591,455 | | 212,234 | 3,076,846 | 3,289,080 |
| Royal Bank of Canada | 31,586 | 5,719 | 51,324 | 88,629 | 2,402,007 | 434,910 | 3,903,016 | 6,739,933 |
| Shopify, Inc.# | 18,425 | | (18,425) | - | 2,462,133 | | (2,462,133) | - |
| StorageVault Canada, Inc. | | 45,573 | 660,686 | 706,259 | | 85,896 | 1,245,261 | 1,331,157 |
See accompanying notes to pro forma financial statements.
| | Shares | Value($) |
Description (All
percentages are based on
the Acquiring Fund Pro
Forma’s net assets) | Acquired
Fund | Acquiring
Fund | Pro Forma
Adjustments
Increase/
(Decrease) | Acquiring
Fund Pro
Forma | Acquired
Fund | Acquiring
Fund | Pro Forma
Adjustments
Increase/
(Decrease) | Acquiring
Fund Pro
Forma |
| Toronto-Dominion Bank | 34,505 | 6,982 | 66,715 | 108,202 | 1,937,891 | 392,128 | 3,746,888 | 6,076,907 |
| Tourmaline Oil Corp. | | 11,970 | 173,533 | 185,503 | | 225,146 | 3,264,000 | 3,489,146 |
| TransCanada Corp. | | 6,282 | 91,072 | 97,354 | | 266,359 | 3,861,489 | 4,127,848 |
| Tricon Capital Group, Inc. | | 17,240 | 249,934 | 267,174 | | 135,079 | 1,958,283 | 2,093,362 |
| Uranium Participation Corp. * | | 7,724 | 111,977 | 119,701 | | 23,341 | 338,383 | 361,724 |
| Total Canada | | | | | 39,439,654 | 6,428,247 | 53,752,691 | 99,620,592 |
| | | | | | | | | |
| Chile - 0.0% | | | | | | | | |
| Vina Concha y Toro S.A.# | 606,874 | | (606,874) | - | 1,337,941 | | (1,337,941) | - |
| | | | | | | | | |
| China - 7.2% | | | | | | | | |
| 361 Degrees International Ltd. | | 121,260 | 1,757,944 | 1,879,204 | | 38,342 | 555,862 | 594,204 |
| Alibaba Group Holding Ltd. * | 44,936 | 3,749 | 9,414 | 58,099 | 8,022,873 | 669,346 | 1,680,776 | 10,372,995 |
| Anhui Conch Cement Co., Ltd.# | 145,200 | 27,600 | 254,926 | 427,726 | 776,073 | 147,518 | 1,362,554 | 2,286,145 |
| Anhui Conch Cement Co., Ltd.# | 1,045,500 | 10,900 | (887,479) | 168,921 | 6,525,464 | 68,032 | (5,539,200) | 1,054,296 |
| BeiGene Ltd. * | | 614 | 8,901 | 9,515 | | 104,122 | 1,509,432 | 1,613,554 |
| China BlueChemical Ltd. | | 179,790 | 2,606,472 | 2,786,262 | | 47,253 | 684,981 | 732,234 |
| China Construction Bank Corp. | 2,657,000 | 353,000 | 2,460,551 | 5,470,551 | 2,783,629 | 369,823 | 2,577,919 | 5,731,371 |
| China Longyuan Power Group Corp. Ltd. | 1,781,000 | 250,570 | 1,851,591 | 3,883,161 | 1,749,334 | 246,115 | 1,818,633 | 3,814,082 |
| China Machinery Engineering Corp. | | 30,000 | 434,919 | 464,919 | | 17,429 | 252,688 | 270,117 |
| China Merchants Bank Co., Ltd.# | 301,000 | | (301,000) | - | 1,312,480 | | (1,312,480) | - |
| China Telecom Corp. Ltd. | 1,960,000 | 519,670 | 5,573,818 | 8,053,488 | 950,075 | 251,901 | 2,701,630 | 3,903,606 |
| Chongqing Changan Automobile Co., Ltd.# | 1,847,443 | | (1,847,443) | - | 1,725,661 | | (1,725,661) | - |
| CIFI Holdings Group Co., Ltd. | | 101,502 | 1,471,506 | 1,573,008 | | 79,928 | 1,158,664 | 1,238,592 |
| CNOOC Ltd. | | 70,800 | 1,026,410 | 1,097,210 | | 119,773 | 1,736,378 | 1,856,151 |
| CSPC Pharmaceutical Group Ltd. | | 41,100 | 595,839 | 636,939 | | 104,684 | 1,517,662 | 1,622,346 |
| Daphne International Holdings Ltd. * | | 110,710 | 1,604,997 | 1,715,707 | | 5,680 | 82,336 | 88,016 |
| Dongfeng Motor Group Co., Ltd. | | 91,480 | 1,326,214 | 1,417,694 | | 101,162 | 1,466,527 | 1,567,689 |
| ENN Energy Holdings Ltd. | | 18,120 | 262,691 | 280,811 | | 169,450 | 2,456,555 | 2,626,005 |
| Gree Electric Appliances, Inc. of Zhuhai | | 14,188 | 205,688 | 219,876 | | 98,219 | 1,423,916 | 1,522,135 |
| Hangzhou Hikvision Digital Technology Co., Ltd. | | 17,750 | 257,327 | 275,077 | | 107,312 | 1,555,748 | 1,663,060 |
See accompanying notes to pro forma financial statements.
| | Shares | Value($) |
Description (All
percentages are based on
the Acquiring Fund Pro
Forma’s net assets) | Acquired
Fund | Acquiring
Fund | Pro Forma
Adjustments
Increase/
(Decrease) | Acquiring
Fund Pro
Forma | Acquired
Fund | Acquiring
Fund | Pro Forma
Adjustments
Increase/
(Decrease) | Acquiring
Fund Pro
Forma |
| Hilong Holding Ltd.# | 5,396,085 | | (5,396,085) | - | 818,106 | | (818,106) | - |
| JD.com, Inc. * | | 2,473 | 35,852 | 38,325 | | 90,289 | 1,308,957 | 1,399,246 |
| Kweichow Moutai Co., Ltd. | | 841 | 12,192 | 13,033 | | 87,603 | 1,269,983 | 1,357,586 |
| Midea Group Co., Ltd. | | 13,900 | 201,513 | 215,413 | | 112,807 | 1,635,399 | 1,748,206 |
| NetEase, Inc. | | 687 | 9,960 | 10,647 | | 176,607 | 2,560,417 | 2,737,024 |
| New Oriental Education & Technology Group, Inc. | 31,772 | 4,195 | 29,044 | 65,011 | 2,854,396 | 376,879 | 2,609,313 | 5,840,588 |
| PICC Property & Casualty Co., Ltd. | | 73,960 | 1,072,221 | 1,146,181 | | 132,401 | 1,919,490 | 2,051,891 |
| Ping An Healthcare and Technology Co., Ltd. * (2)(3) | 8,400 | 700 | 1,748 | 10,848 | 58,650 | 4,887 | 12,205 | 75,742 |
| Ping An Insurance Group Co. of China Ltd. | 230,000 | 22,660 | 98,509 | 351,169 | 2,247,422 | 221,420 | 962,571 | 3,431,413 |
| Shandong Weigao Group Medical Polymer Co., Ltd.# | 2,468,780 | | (2,468,780) | - | 1,517,160 | | (1,517,160) | - |
| Sunny Optical Technology Group Co., Ltd. | | 8,832 | 128,040 | 136,872 | | 144,117 | 2,089,306 | 2,233,423 |
| Tencent Holdings Ltd. | 86,600 | 13,425 | 108,026 | 208,051 | 4,257,506 | 660,012 | 5,310,871 | 10,228,389 |
| Weibo Corp. * | 21,656 | 2,244 | 10,876 | 34,776 | 2,480,045 | 256,983 | 1,245,520 | 3,982,548 |
| Wuxi Biologics Cayman, Inc. *(4) | | 9,952 | 144,277 | 154,229 | | 90,274 | 1,308,722 | 1,398,996 |
| Xtep International Holdings Ltd. | | 87,840 | 1,273,444 | 1,361,284 | | 51,033 | 739,871 | 790,904 |
| Yantai Changyu Pioneer Wine Co., Ltd.# | 664,017 | | (664,017) | - | 1,687,824 | | (1,687,824) | - |
| Total China | | | | | 39,766,698 | 5,151,401 | 34,914,455 | 79,832,554 |
| | | | | | | | | |
| Colombia 0.1% | | | | | | | | |
| Ecopetrol S.A. | | 4,039 | 58,555 | 62,594 | | 89,181 | 1,292,894 | 1,382,075 |
| | | | | | | | | |
| Denmark - 0.4% | | | | | | | | |
| AP Moller - Maersk A/S | | 31 | 449 | 480 | | 49,662 | 719,296 | 768,958 |
| D/S Norden A/S * | | 3,749 | 54,350 | 58,099 | | 68,397 | 991,556 | 1,059,953 |
| DSV A/S | 31,243 | 2,213 | 840 | 34,296 | 2,474,312 | 175,260 | 66,524 | 2,716,096 |
| Total Denmark | | | | | 2,474,312 | 293,319 | 1,777,376 | 4,545,007 |
| | | | | | | | | |
| Finland -0.1% | | | | | | | | |
| Nokia Oyj | | 9,906 | 143,610 | 153,516 | | 59,438 | 861,689 | 921,127 |
| | | | | | �� | | | |
| France - 8.4% | | | | | | | | |
See accompanying notes to pro forma financial statements.
| | Shares | Value($) |
Description (All
percentages are based on
the Acquiring Fund Pro
Forma’s net assets) | Acquired
Fund | Acquiring
Fund | Pro Forma
Adjustments
Increase/
(Decrease) | Acquiring
Fund Pro
Forma | Acquired
Fund | Acquiring
Fund | Pro Forma
Adjustments
Increase/
(Decrease) | Acquiring
Fund Pro
Forma |
| Airbus SE | 20,074 | 1,859 | 6,877 | 28,810 | 2,356,348 | 218,215 | 807,244 | 3,381,807 |
| Alstom S.A. | 39,075 | 6,213 | 50,997 | 96,285 | 1,779,023 | 282,868 | 2,321,812 | 4,383,703 |
| BNP Paribas S.A. | 61,429 | 8,897 | 67,554 | 137,880 | 4,742,273 | 686,842 | 5,215,122 | 10,644,237 |
| Capgemini SE# | 31,220 | 1,831 | (4,675) | 28,376 | 4,294,802 | 251,883 | (643,120) | 3,903,565 |
| Cie de Saint-Gobain | 65,697 | 14,116 | 138,947 | 218,760 | 3,437,334 | 738,563 | 7,269,846 | 11,445,743 |
| Coface S.A. * | | 1,770 | 25,660 | 27,430 | | 22,425 | 325,102 | 347,527 |
| Danone S.A.(1) | | 4,671 | 67,717 | 72,388 | | 378,378 | 5,485,470 | 5,863,848 |
| Engie S.A. | | 6,626 | 96,059 | 102,685 | | 116,230 | 1,685,019 | 1,801,249 |
| Essilor International Cie Generale d'Optique S.A. | | 1,454 | 21,079 | 22,533 | | 198,600 | 2,879,151 | 3,077,751 |
| Kaufman & Broad S.A.# | 52,643 | | (52,643) | - | 2,773,332 | | (2,773,332) | - |
| Legrand S.A. | 23,978 | 2,418 | 11,076 | 37,472 | 1,865,798 | 188,152 | 861,856 | 2,915,806 |
| L'Oreal S.A. | | 833 | 12,076 | 12,909 | | 200,578 | 2,907,775 | 3,108,353 |
| Maisons du Monde S.A. (4) | | 2,933 | 42,521 | 45,454 | | 119,180 | 1,727,811 | 1,846,991 |
| Metropole Television S.A. | | 835 | 12,105 | 12,940 | | 20,558 | 298,035 | 318,593 |
| Neopost S.A. | | 2,401 | 34,808 | 37,209 | | 64,787 | 939,235 | 1,004,022 |
| Nexity S.A.# | 39,927 | | (39,927) | - | 2,496,644 | | (2,496,644) | - |
| Pernod Ricard S.A. | 12,567 | 2,367 | 21,748 | 36,682 | 2,087,201 | 393,125 | 3,612,036 | 6,092,362 |
| Peugeot S.A. (1) | | 6,419 | 93,058 | 99,477 | | 158,059 | 2,291,423 | 2,449,482 |
| Renault S.A. | | 448 | 6,495 | 6,943 | | 48,555 | 703,938 | 752,493 |
| Rexel S.A. | | 6,372 | 92,377 | 98,749 | | 98,777 | 1,432,001 | 1,530,778 |
| Safran S.A. | 18,924 | 1,685 | 5,504 | 26,113 | 2,219,597 | 197,634 | 645,564 | 3,062,795 |
| Schneider Electric SE | 32,221 | 6,229 | 58,083 | 96,533 | 2,920,652 | 564,624 | 5,264,899 | 8,750,175 |
| Societe Generale S.A. | | 2,784 | 40,361 | 43,145 | | 152,365 | 2,208,905 | 2,361,270 |
| Sopra Steria Group | | 322 | 4,668 | 4,990 | | 68,733 | 996,421 | 1,065,154 |
| Television Francaise (1) | | 4,939 | 71,602 | 76,541 | | 61,744 | 895,118 | 956,862 |
| TOTAL S.A.# | 38,415 | 5,766 | 45,176 | 89,357 | 2,414,448 | 362,403 | 2,839,388 | 5,616,239 |
| TOTAL S.A.# | 41,500 | | (41,500) | - | 2,598,315 | | (2,598,315) | - |
| Unibail-Rodamco SE | | 740 | 10,728 | 11,468 | | 177,652 | 2,575,469 | 2,753,121 |
| Valeo S.A. | 39,315 | 3,258 | 7,917 | 50,490 | 2,628,570 | 217,827 | 529,324 | 3,375,721 |
| Vicat S.A. | | 838 | 12,149 | 12,987 | | 61,759 | 895,357 | 957,116 |
See accompanying notes to pro forma financial statements.
| | Shares | Value($) |
Description (All
percentages are based on
the Acquiring Fund Pro
Forma’s net assets) | Acquired
Fund | Acquiring
Fund | Pro Forma
Adjustments
Increase/
(Decrease) | Acquiring
Fund Pro
Forma | Acquired
Fund | Acquiring
Fund | Pro Forma
Adjustments
Increase/
(Decrease) | Acquiring
Fund Pro
Forma |
| Vinci S.A. (1)# | 42,131 | | (42,131) | - | 4,212,411 | | (4,212,411) | - |
| Total France | | | | | 42,826,748 | 6,050,516 | 44,889,499 | 93,766,763 |
| | | | | | | | | |
| Germany - 3.3% | | | | | | | | |
| adidas AG# | 9,655 | | (9,655) | - | 2,372,903 | | (2,372,903) | - |
| Allianz SE# | 10,984 | | (10,984) | - | 2,597,977 | | (2,597,977) | - |
| Beiersdorf AG | | 2,393 | 34,692 | 37,085 | | 270,740 | 3,924,990 | 4,195,730 |
| Brenntag AG# | 71,860 | | (71,860) | - | 4,115,564 | | (4,115,564) | - |
| CECONOMY AG | | 5,697 | 82,591 | 88,288 | | 63,840 | 925,498 | 989,338 |
| Daimler AG# | 21,438 | | (21,438) | - | 1,685,414 | | (1,685,414) | - |
| E.ON SE | 164,005 | 43,285 | 463,511 | 670,801 | 1,795,815 | 473,960 | 5,075,353 | 7,345,128 |
| Hamburger Hafen und Logistik AG | | 1,396 | 20,238 | 21,634 | | 33,521 | 485,963 | 519,484 |
| Henkel AG & Co. KGaA | | 2,972 | 43,086 | 46,058 | | 377,696 | 5,475,571 | 5,853,267 |
| Infineon Technologies AG | | 8,163 | 118,342 | 126,505 | | 209,019 | 3,030,230 | 3,239,249 |
| Metro AG * | | 4,827 | 69,979 | 74,806 | | 69,833 | 1,012,393 | 1,082,226 |
| Rheinmetall AG | | 139 | 2,015 | 2,154 | | 18,165 | 263,323 | 281,488 |
| RWE AG | | 3,330 | 48,276 | 51,606 | | 79,593 | 1,153,878 | 1,233,471 |
| Salzgitter AG | | 1,061 | 15,382 | 16,443 | | 58,265 | 844,712 | 902,977 |
| SAP SE# | 21,143 | | (21,143) | - | 2,349,105 | | (2,349,105) | - |
| Volkswagen AG | 34,290 | 2,412 | 678 | 37,380 | 7,071,792 | 497,438 | 139,827 | 7,709,057 |
| Zalando SE *(4) | | 4,828 | 69,993 | 74,821 | | 248,433 | 3,601,602 | 3,850,035 |
| Total Germany | | | | | 21,988,570 | 2,400,503 | 12,812,377 | 37,201,450 |
| | | | | | | | | |
| Greece - 0.4% | | | | | | | | |
| Grivalia Properties REIC A.E.# | 85,669 | | (85,669) | - | 940,822 | | (940,822) | - |
| Hellenic Telecommunications Organization S.A. | 77,175 | 14,561 | 133,920 | 225,656 | 1,123,543 | 211,985 | 1,949,661 | 3,285,189 |
| OPAP S.A.# | 77,207 | 4,969 | (5,170) | 77,006 | 923,809 | 59,456 | (61,861) | 921,404 |
| Total Greece | | | | | 2,988,174 | 271,441 | 946,978 | 4,206,593 |
| | | | | | | | | |
| Hong Kong - 2.7% | | | | | | | | |
| AIA Group Ltd. | 238,020 | 22,715 | 91,286 | 352,021 | 2,127,232 | 203,009 | 815,841 | 3,146,082 |
See accompanying notes to pro forma financial statements.
| | Shares | Value($) |
Description (All
percentages are based on
the Acquiring Fund Pro
Forma’s net assets) | Acquired
Fund | Acquiring
Fund | Pro Forma
Adjustments
Increase/
(Decrease) | Acquiring
Fund Pro
Forma | Acquired
Fund | Acquiring
Fund | Pro Forma
Adjustments
Increase/
(Decrease) | Acquiring
Fund Pro
Forma |
| AMVIG Holdings Ltd. | | 45,195 | 655,206 | 700,401 | | 11,632 | 168,650 | 180,282 |
| China Mobile Ltd. | | 13,830 | 200,498 | 214,328 | | 131,751 | 1,910,044 | 2,041,795 |
| China Resources Cement Holdings Ltd. | | 154,500 | 2,239,835 | 2,394,335 | | 162,083 | 2,349,811 | 2,511,894 |
| China Resources Gas Group Ltd. | | 42,700 | 619,035 | 661,735 | | 157,034 | 2,276,563 | 2,433,597 |
| China Unicom Hong Kong Ltd. * | | 91,140 | 1,321,285 | 1,412,425 | | 128,876 | 1,868,297 | 1,997,173 |
| CLP Holdings Ltd. | | 30,500 | 442,168 | 472,668 | | 316,714 | 4,591,517 | 4,908,231 |
| CST Group Ltd. * | | 216,000 | 3,131,419 | 3,347,419 | | 958 | 13,778 | 14,736 |
| Dah Sing Financial Holdings Ltd. | | 4,650 | 67,412 | 72,062 | | 31,051 | 450,157 | 481,208 |
| Global Brands Group Holding Ltd. *,# | 6,277,165 | | (6,277,165) | - | 309,333 | | (309,333) | - |
| G-Resources Group Ltd.* | | 1,177,890 | 17,076,238 | 18,254,128 | | 9,721 | 141,733 | 151,454 |
| Henderson Land Development Co., Ltd. | | 42,000 | 608,887 | 650,887 | | 266,303 | 3,860,709 | 4,127,012 |
| Hong Kong & China Gas Co., Ltd.# | 821,000 | | (821,000) | - | 1,715,435 | | (1,715,435) | - |
| Melco Resorts & Entertainment Ltd.# | 96,559 | | (96,559) | - | 3,013,606 | | (3,013,606) | - |
| Pacific Basin Shipping Ltd. * | | 253,210 | 3,670,864 | 3,924,074 | | 67,327 | 976,083 | 1,043,410 |
| Power Assets Holdings Ltd.# | 398,480 | | (398,480) | - | 2,967,537 | | (2,967,537) | - |
| Sands China Ltd. | | 76,587 | 1,110,306 | 1,186,893 | | 442,625 | 6,416,902 | 6,859,527 |
| Total Hong Kong | | | | | 10,133,143 | 1,929,084 | 17,834,174 | 29,896,401 |
| | | | | | | | | |
| Hungary - 0.3% | | | | | | | | |
| Magyar Telekom Telecommunications plc | | 37,450 | 542,924 | 580,374 | | 64,776 | 939,096 | 1,003,872 |
| OTP Bank Nyrt | | 2,858 | 41,433 | 44,291 | | 124,618 | 1,806,620 | 1,931,238 |
| Total Hungary | | | | | | 189,394 | 2,745,716 | 2,935,110 |
| | | | | | | | | |
| India - 1.4% | | | | | | | | |
| Allahabad Bank * | | 18,273 | 264,909 | 283,182 | | 13,372 | 193,860 | 207,232 |
| Bharat Financial Inclusion Ltd. * | | 4,718 | 68,398 | 73,116 | | 81,855 | 1,186,678 | 1,268,533 |
| Canara Bank | | 14,009 | 203,093 | 217,102 | | 55,377 | 802,827 | 858,204 |
| Corp. Bank * | | 12,689 | 183,956 | 196,645 | | 5,702 | 82,670 | 88,372 |
| Eicher Motors Ltd. | | 253 | 3,668 | 3,921 | | 117,659 | 1,705,825 | 1,823,484 |
| HDFC Bank Ltd. | | 1,810 | 26,240 | 28,050 | | 173,416 | 2,514,054 | 2,687,470 |
| ICICI Bank Ltd. | 377,893 | 26,547 | 6,967 | 411,407 | 1,607,496 | 112,927 | 29,636 | 1,750,059 |
See accompanying notes to pro forma financial statements.
| | Shares | Value($) |
Description (All
percentages are based on
the Acquiring Fund Pro
Forma’s net assets) | Acquired
Fund | Acquiring
Fund | Pro Forma
Adjustments
Increase/
(Decrease) | Acquiring
Fund Pro
Forma | Acquired
Fund | Acquiring
Fund | Pro Forma
Adjustments
Increase/
(Decrease) | Acquiring
Fund Pro
Forma |
| ICICI Bank Ltd. ADR | 110,462 | 23,755 | 233,922 | 368,139 | 940,032 | 202,155 | 1,990,676 | 3,132,863 |
| Indiabulls Housing Finance Ltd. | | 5,061 | 73,371 | 78,432 | | 98,628 | 1,429,839 | 1,528,467 |
| IndusInd Bank Ltd.# | 87,035 | | (87,035) | - | 2,464,288 | | (2,464,288) | - |
| LIC Housing Finance Ltd.# | 295,464 | | (295,464) | - | 2,407,804 | | (2,407,804) | - |
| NTPC Ltd.# | 782,184 | 25,439 | (413,387) | 394,236 | 2,013,024 | 65,470 | (1,063,893) | 1,014,601 |
| Oberoi Realty Ltd.# | 353,048 | | (353,048) | - | 2,895,194 | | (2,895,194) | - |
| State Bank of India# | 163,094 | 15,942 | 68,022 | 247,058 | 599,814 | 58,630 | 250,165 | 908,609 |
| Total India | | | | | 12,927,652 | 985,191 | 1,355,051 | 15,267,894 |
| | | | | | | | | |
| Ireland - 1.3% | | | | | | | | |
| Bank of Ireland Group plc# | | 27,324 | 173,644 | 200,968 | | 245,135 | 1,557,830 | 1,802,965 |
| Bank of Ireland Group plc# | 673,559 | | (451,078) | 222,481 | 6,042,767 | | (4,037,148) | 2,005,619 |
| Cairn Homes plc * | | 80,271 | 1,163,714 | 1,243,985 | | 174,096 | 2,523,863 | 2,697,959 |
| CRH plc# | | 6,379 | 92,478 | 98,857 | | 226,527 | 3,284,023 | 3,510,550 |
| CRH plc# | 183,896 | | (183,896) | - | 6,526,660 | | (6,526,660) | - |
| Experian plc# | 81,550 | | (81,550) | - | 1,868,487 | | (1,868,487) | - |
| Glenveagh Properties plc *(4) | | 94,734 | 1,373,388 | 1,468,122 | | 126,527 | 1,834,297 | 1,960,824 |
| Hibernia plc | 706,071 | 79,664 | 448,843 | 1,234,578 | 1,237,423 | 139,615 | 786,597 | 2,163,635 |
| Total Ireland | | | | | 15,675,337 | 911,900 | (2,445,685) | 14,141,552 |
| | | | | | | | | |
| Isle of Man - 0.0% | | | | | | | | |
| GVC Holdings plc# | 126,751 | | (126,751) | - | 1,551,508 | | (1,551,508) | - |
| | | | | | | | | |
| Israel - 0.0% | | | | | | | | |
| Wix.com Ltd. *,# | 33,882 | | (33,882) | - | 2,786,795 | | (2,786,795) | - |
| | | | | | | | | |
| Italy - 3.7% | | | | | | | | |
| Anima Holding S.p.A. (3)# | 821,739 | | (821,739) | - | 5,895,932 | | (5,895,932) | - |
| Assicurazioni Generali S.p.A. | | 7,931 | 114,978 | 122,909 | | 160,039 | 2,320,141 | 2,480,180 |
| Banca Popolare dell'Emilia Romagna SC | | 14,066 | 203,919 | 217,985 | | 81,196 | 1,177,122 | 1,258,318 |
| Cerved Information Solutions S.p.A.# | 122,534 | | (122,534) | - | 1,482,774 | | (1,482,774) | - |
See accompanying notes to pro forma financial statements.
| | Shares | Value($) |
Description (All
percentages are based on
the Acquiring Fund Pro
Forma’s net assets) | Acquired
Fund | Acquiring
Fund | Pro Forma
Adjustments
Increase/
(Decrease) | Acquiring
Fund Pro
Forma | Acquired
Fund | Acquiring
Fund | Pro Forma
Adjustments
Increase/
(Decrease) | Acquiring
Fund Pro
Forma |
| Davide Campari-Milano S.p.A. | | 21,357 | 309,619 | 330,976 | | 159,984 | 2,319,325 | 2,479,309 |
| Eni S.p.A. | | 40,063 | 580,806 | 620,869 | | 783,167 | 11,353,828 | 12,136,995 |
| Ferrari N.V.# | 21,600 | | (21,600) | - | 2,649,819 | | (2,649,819) | - |
| FinecoBank Banca Fineco S.p.A. | | 29,877 | 433,136 | 463,013 | | 355,768 | 5,157,697 | 5,513,465 |
| Geox S.p.A. | | 11,349 | 164,530 | 175,879 | | 38,172 | 553,397 | 591,569 |
| Leonardo S.p.A. | 187,136 | 17,861 | 71,800 | 276,797 | 2,162,281 | 206,377 | 829,620 | 3,198,278 |
| Moncler S.p.A. | | 4,226 | 61,266 | 65,492 | | 190,474 | 2,761,375 | 2,951,849 |
| Pirelli & C. S.p.A. *(4) | | 22,456 | 325,552 | 348,008 | | 194,558 | 2,820,550 | 3,015,108 |
| Saipem S.p.A. * | | 16,273 | 235,915 | 252,188 | | 62,150 | 901,007 | 963,157 |
| UniCredit S.p.A. | 107,218 | 18,979 | 167,926 | 294,123 | 2,324,477 | 411,463 | 3,640,619 | 6,376,559 |
| Total Italy | | | | | 14,515,283 | 2,643,348 | 23,806,156 | 40,964,787 |
| | | | | | | | | |
| Japan – 14.0% | | | | | | | | |
| Aisan Industry Co., Ltd. | | 3,200 | 46,391 | 49,591 | | 33,016 | 478,635 | 511,651 |
| Alpha Systems, Inc. | | 385 | 5,581 | 5,966 | | 7,988 | 115,794 | 123,782 |
| Avex, Inc. | | 4,380 | 63,498 | 67,878 | | 60,461 | 876,520 | 936,981 |
| Benesse Holdings, Inc. | | 1,170 | 16,962 | 18,132 | | 42,615 | 617,810 | 660,425 |
| Canon, Inc. | | 3,020 | 43,782 | 46,802 | | 103,886 | 1,506,066 | 1,609,952 |
| Cawachi Ltd. | | 1,130 | 16,382 | 17,512 | | 26,273 | 380,895 | 407,168 |
| Chiyoda Corp. | | 5,340 | 77,416 | 82,756 | | 54,830 | 794,892 | 849,722 |
| Chubu Steel Plate Co., Ltd. | | 1,310 | 18,991 | 20,301 | | 9,084 | 131,689 | 140,773 |
| Citizen Watch Co., Ltd. | | 9,510 | 137,869 | 147,379 | | 70,857 | 1,027,234 | 1,098,091 |
| CMIC Holdings Co., Ltd. | | 1,050 | 15,222 | 16,272 | | 24,079 | 349,072 | 373,151 |
| Dai-ichi Life Holdings, Inc. | | 5,900 | 85,534 | 91,434 | | 117,130 | 1,698,064 | 1,815,194 |
| Daiwa House Industry Co., Ltd.# | 72,020 | | (72,020) | - | 2,633,141 | | (2,633,141) | - |
| DeNA Co., Ltd.# | 81,900 | 2,970 | (38,843) | 46,027 | 1,560,985 | 56,607 | (740,336) | 877,256 |
| Eisai Co., Ltd. | | 4,240 | 61,469 | 65,709 | | 284,373 | 4,122,664 | 4,407,037 |
| Exedy Corp. | | 2,620 | 37,983 | 40,603 | | 88,734 | 1,286,404 | 1,375,138 |
| Ezaki Glico Co., Ltd.# | 37,200 | | (37,200) | - | 2,003,887 | | (2,003,887) | - |
| FANUC Corp. | | 815 | 11,815 | 12,630 | | 174,582 | 2,530,896 | 2,705,478 |
See accompanying notes to pro forma financial statements.
| | Shares | Value($) |
Description (All
percentages are based on
the Acquiring Fund Pro
Forma’s net assets) | Acquired
Fund | Acquiring
Fund | Pro Forma
Adjustments
Increase/
(Decrease) | Acquiring
Fund Pro
Forma | Acquired
Fund | Acquiring
Fund | Pro Forma
Adjustments
Increase/
(Decrease) | Acquiring
Fund Pro
Forma |
| Fuji Media Holdings, Inc. | | 3,385 | 49,073 | 52,458 | | 55,497 | 804,557 | 860,054 |
| Fujitsu Ltd. | | 19,910 | 288,641 | 308,551 | | 120,703 | 1,749,857 | 1,870,560 |
| Funai Electric Co., Ltd. | | 5,510 | 79,880 | 85,390 | | 38,114 | 552,546 | 590,660 |
| Fuso Chemical Co., Ltd.# | 46,200 | | (46,200) | - | 1,170,885 | | (1,170,885) | - |
| Gendai Agency, Inc. | | 1,235 | 17,904 | 19,139 | | 6,093 | 88,326 | 94,419 |
| Gree, Inc. | | 11,760 | 170,488 | 182,248 | | 64,978 | 941,997 | 1,006,975 |
| Hazama Ando Corp.# | 298,900 | | (298,900) | - | 2,401,633 | | (2,401,633) | - |
| Hisaka Works Ltd. | | 1,730 | 25,080 | 26,810 | | 18,405 | 266,816 | 285,221 |
| Hitachi Transport System Ltd.# | 55,125 | | (55,125) | - | 1,476,337 | | (1,476,337) | - |
| Honda Motor Co., Ltd. | | 7,340 | 106,410 | 113,750 | | 252,393 | 3,659,004 | 3,911,397 |
| Honeys Holdings Co., Ltd. | | 2,270 | 32,909 | 35,179 | | 21,705 | 314,669 | 336,374 |
| Hosiden Corp. | | 2,620 | 37,983 | 40,603 | | 31,236 | 452,841 | 484,077 |
| Ichiyoshi Securities Co., Ltd. | | 3,500 | 50,741 | 54,241 | | 42,831 | 620,933 | 663,764 |
| Inpex Corp. | | 6,540 | 94,812 | 101,352 | | 83,606 | 1,212,058 | 1,295,664 |
| Japan Airlines Co., Ltd.# | 66,100 | | (66,100) | - | 2,608,600 | | (2,608,600) | - |
| Japan Petroleum Exploration Co., Ltd. | | 3,010 | 43,637 | 46,647 | | 78,327 | 1,135,539 | 1,213,866 |
| Japan Steel Works Ltd. | | 1,590 | 23,051 | 24,641 | | 52,081 | 755,038 | 807,119 |
| JGC Corp. | | 4,130 | 59,874 | 64,004 | | 101,222 | 1,467,452 | 1,568,674 |
| JSR Corp. | | 5,080 | 73,646 | 78,726 | | 95,697 | 1,387,351 | 1,483,048 |
| KDDI Corp.# | 162,005 | 7,620 | (51,535) | 118,090 | 4,348,796 | 204,548 | (1,383,385) | 3,169,959 |
| Keihin Corp. | | 4,070 | 59,004 | 63,074 | | 80,399 | 1,165,571 | 1,245,970 |
| Komatsu Ltd. | 67,300 | 6,010 | 19,829 | 93,139 | 2,294,170 | 204,873 | 675,945 | 3,174,988 |
| Kyoei Steel Ltd. | | 3,520 | 51,031 | 54,551 | | 73,298 | 1,062,639 | 1,135,937 |
| LIXIL Group Corp.# | 56,600 | | (56,600) | - | 1,267,608 | | (1,267,608) | - |
| Mazda Motor Corp.# | 76,870 | | (76,870) | - | 1,068,793 | | (1,068,793) | - |
| Melco Holdings, Inc. | | 850 | 12,323 | 13,173 | | 31,244 | 452,970 | 484,214 |
| Minebea Mitsumi, Inc.# | 116,200 | | (116,200) | - | 2,324,094 | | (2,324,094) | - |
| Miraial Co., Ltd. | | 560 | 8,118 | 8,678 | | 7,816 | 113,300 | 121,116 |
| Mitsubishi Heavy Industries Ltd. | | 3,601 | 52,205 | 55,806 | | 142,354 | 2,063,752 | 2,206,106 |
| Mitsubishi Motors Corp. | | 4,570 | 66,253 | 70,823 | | 34,009 | 493,042 | 527,051 |
See accompanying notes to pro forma financial statements.
| | Shares | Value($) |
Description (All
percentages are based on
the Acquiring Fund Pro
Forma’s net assets) | Acquired
Fund | Acquiring
Fund | Pro Forma
Adjustments
Increase/
(Decrease) | Acquiring
Fund Pro
Forma | Acquired
Fund | Acquiring
Fund | Pro Forma
Adjustments
Increase/
(Decrease) | Acquiring
Fund Pro
Forma |
| Mitsubishi UFJ Financial Group, Inc. | 332,100 | 113,449 | 1,312,605 | 1,758,154 | 2,225,516 | 760,261 | 8,796,160 | 11,781,937 |
| Mitsui Fudosan Co., Ltd. | | 10,580 | 153,382 | 163,962 | | 271,011 | 3,928,941 | 4,199,952 |
| Mizuho Financial Group, Inc. | | 97,690 | 1,416,242 | 1,513,932 | | 176,744 | 2,562,265 | 2,739,009 |
| Nakayama Steel Works Ltd. | | 5,380 | 77,996 | 83,376 | | 37,798 | 547,969 | 585,767 |
| Neturen Co., Ltd. | | 1,820 | 26,385 | 28,205 | | 18,354 | 266,080 | 284,434 |
| Nexon Co., Ltd. *,# | 197,320 | | (197,320) | - | 2,871,282 | | (2,871,282) | - |
| Nichicon Corp. | | 5,650 | 81,910 | 87,560 | | 63,750 | 924,207 | 987,957 |
| Nidec Corp. | | 1,535 | 22,253 | 23,788 | | 240,139 | 3,481,308 | 3,721,447 |
| Nikon Corp. | | 3,020 | 43,782 | 46,802 | | 52,549 | 761,829 | 814,378 |
| Nintendo Co., Ltd. | | 615 | 8,916 | 9,531 | | 258,408 | 3,746,290 | 4,004,698 |
| Nippon Television Holdings, Inc.# | 102,330 | 4,775 | (33,105) | 74,000 | 1,793,625 | 83,695 | (580,261) | 1,297,059 |
| Nipro Corp. | | 8,200 | 118,878 | 127,078 | | 118,022 | 1,710,999 | 1,829,021 |
| Nishimatsuya Chain Co., Ltd. | | 2,830 | 41,027 | 43,857 | | 34,788 | 504,324 | 539,112 |
| Nissin Kogyo Co., Ltd. | | 4,380 | 63,498 | 67,878 | | 76,854 | 1,114,180 | 1,191,034 |
| NOK Corp. | | 4,130 | 59,874 | 64,004 | | 84,464 | 1,224,501 | 1,308,965 |
| Ono Pharmaceutical Co., Ltd. | 41,600 | 8,866 | 86,933 | 137,399 | 961,595 | 204,940 | 2,009,482 | 3,176,017 |
| Pacific Metals Co., Ltd. * | | 1,990 | 28,850 | 30,840 | | 69,820 | 1,012,220 | 1,082,040 |
| PAL GROUP Holdings Co., Ltd. | | 1,778 | 25,776 | 27,554 | | 48,706 | 706,105 | 754,811 |
| Pioneer Corp. * | | 38,640 | 560,176 | 598,816 | | 60,275 | 873,819 | 934,094 |
| Proto Corp. | | 650 | 9,423 | 10,073 | | 9,330 | 135,262 | 144,592 |
| Relia, Inc. | | 3,260 | 47,261 | 50,521 | | 41,447 | 600,862 | 642,309 |
| Sankyo Co., Ltd. | | 2,560 | 37,113 | 39,673 | | 89,746 | 1,301,074 | 1,390,820 |
| Sanwa Holdings Corp.# | 336,890 | | (336,890) | - | 4,326,035 | | (4,326,035) | - |
| Sanyo Shokai Ltd. | | 2,370 | 34,359 | 36,729 | | 54,902 | 795,943 | 850,845 |
| SCREEN Holdings Co., Ltd. | 14,300 | 1,625 | 9,258 | 25,183 | 1,169,665 | 132,916 | 757,256 | 2,059,837 |
| Seven & i Holdings Co., Ltd. | | 7,910 | 114,674 | 122,584 | | 348,521 | 5,052,628 | 5,401,149 |
| Shin-Etsu Chemical Co., Ltd. | 18,500 | 3,884 | 37,808 | 60,192 | 1,856,469 | 389,758 | 3,794,021 | 6,040,248 |
| Shinko Electric Industries Co., Ltd. | | 8,520 | 123,517 | 132,037 | | 66,284 | 960,938 | 1,027,222 |
| Showa Corp. | | 1,340 | 19,426 | 20,766 | | 20,141 | 291,990 | 312,131 |
| SoftBank Group Corp. | 29,957 | 3,200 | 16,434 | 49,591 | 2,288,975 | 244,508 | 1,255,701 | 3,789,184 |
See accompanying notes to pro forma financial statements.
| | Shares | Value($) |
Description (All
percentages are based on
the Acquiring Fund Pro
Forma’s net assets) | Acquired
Fund | Acquiring
Fund | Pro Forma
Adjustments
Increase/
(Decrease) | Acquiring
Fund Pro
Forma | Acquired
Fund | Acquiring
Fund | Pro Forma
Adjustments
Increase/
(Decrease) | Acquiring
Fund Pro
Forma |
| Sony Corp. | 116,011 | 8,660 | 9,536 | 134,207 | 5,418,421 | 404,475 | 445,389 | 6,268,285 |
| Sumitomo Mitsui Financial Group, Inc. | 56,197 | 13,225 | 135,530 | 204,952 | 2,342,192 | 551,195 | 5,648,646 | 8,542,033 |
| Sumitomo Mitsui Trust Holdings, Inc. | | 2,880 | 41,752 | 44,632 | | 122,132 | 1,770,581 | 1,892,713 |
| Sumitomo Osaka Cement Co., Ltd. | 543,130 | | (543,130) | - | 2,486,466 | | (2,486,466) | - |
| Sumitomo Riko Co., Ltd. | | 4,650 | 67,412 | 72,062 | | 48,608 | 704,685 | 753,293 |
| Suzuken Co., Ltd. | | 1,890 | 27,400 | 29,290 | | 81,267 | 1,178,156 | 1,259,423 |
| T&D Holdings, Inc. | 101,500 | 20,575 | 196,782 | 318,857 | 1,723,875 | 349,446 | 3,342,145 | 5,415,466 |
| Taiheiyo Cement Corp.# | 63,534 | | (63,534) | - | 2,399,041 | | (2,399,041) | - |
| Takeda Pharmaceutical Co., Ltd. | | 3,550 | 51,465 | 55,015 | | 149,491 | 2,167,191 | 2,316,682 |
| Tochigi Bank Ltd. | | 7,770 | 112,644 | 120,414 | | 29,442 | 426,831 | 456,273 |
| Tokai Rika Co., Ltd. | | 4,890 | 70,892 | 75,782 | | 97,688 | 1,416,217 | 1,513,905 |
| Tokio Marine Holdings, Inc. | 64,900 | 7,162 | 38,930 | 110,992 | 3,063,101 | 338,027 | 1,837,387 | 5,238,515 |
| Tokyo Seimitsu Co., Ltd. | | 1,860 | 26,965 | 28,825 | | 70,645 | 1,024,168 | 1,094,813 |
| Tokyo Steel Manufacturing Co., Ltd. | | 8,030 | 116,413 | 124,443 | | 67,010 | 971,455 | 1,038,465 |
| Toppan Forms Co., Ltd. | | 5,120 | 74,226 | 79,346 | | 57,191 | 829,119 | 886,310 |
| Toshiba Machine Co., Ltd. | | 8,120 | 117,718 | 125,838 | | 53,787 | 779,764 | 833,551 |
| Toyo Engineering Corp. * | | 4,250 | 61,614 | 65,864 | | 44,216 | 641,020 | 685,236 |
| Toyo Tire & Rubber Co., Ltd. | | 10,175 | 147,510 | 157,685 | | 173,201 | 2,510,945 | 2,684,146 |
| Toyoda Gosei Co., Ltd. | | 3,520 | 51,031 | 54,551 | | 88,876 | 1,288,482 | 1,377,358 |
| TV Asahi Holdings Corp. | | 1,820 | 26,385 | 28,205 | | 42,682 | 618,770 | 661,452 |
| Ushio, Inc. | | 5,120 | 74,226 | 79,346 | | 72,174 | 1,046,319 | 1,118,493 |
| Xebio Holdings Co., Ltd. | | 3,520 | 51,031 | 54,551 | | 66,316 | 961,414 | 1,027,730 |
| Yamato Kogyo Co., Ltd. | | 2,990 | 43,347 | 46,337 | | 88,141 | 1,277,813 | 1,365,954 |
| Total Japan | | | | | 60,085,187 | 10,050,085 | 85,613,905 | 155,749,177 |
| | | | | | | | | |
| Jersey - 0.0% | | | | | | | | |
| Randgold Resources Ltd.# | 17,647 | | (17,647) | - | 1,431,172 | - | (1,431,172) | - |
| | | | | | | | | |
| Luxembourg - 0.5% | | | | | | | | |
| ArcelorMittal *,# | 125,697 | | (125,697) | - | 4,253,586 | | (4,253,586) | - |
Spotify Technology S.A.
* | 23,044 | 2,056 | 6,762 | 31,862 | 3,725,524 | 332,394 | 1,093,213 | 5,151,131 |
See accompanying notes to pro forma financial statements.
| | Shares | Value($) |
Description (All
percentages are based on
the Acquiring Fund Pro
Forma’s net assets) | Acquired
Fund | Acquiring
Fund | Pro Forma
Adjustments
Increase/
(Decrease) | Acquiring
Fund Pro
Forma | Acquired
Fund | Acquiring
Fund | Pro Forma
Adjustments
Increase/
(Decrease) | Acquiring
Fund Pro
Forma |
| Tenaris S.A.# | 52,920 | | (52,920) | - | 1,978,150 | | (1,978,150) | - |
| Total Luxembourg | | | | | 9,957,260 | 332,394 | (5,138,523) | 5,151,131 |
| | | | | | | | | |
| Malaysia - 1.4% | | | | | | | | |
| IHH Healthcare Bhd | | 154,700 | 2,242,734 | 2,397,434 | | 239,005 | 3,465,024 | 3,704,029 |
| Kuala Lumpur Kepong Bhd# | 336,900 | 55,900 | 473,500 | 866,300 | 2,183,405 | 362,280 | 3,068,706 | 5,614,391 |
| Public Bank Bhd | | 72,000 | 1,043,806 | 1,115,806 | | 435,670 | 6,316,070 | 6,751,740 |
| Total Malaysia | | | | | 2,183,405 | 1,036,955 | 12,849,800 | 16,070,160 |
| | | | | | | | | |
| Mexico - 0.0% | | | | | | | | |
| Corp. Inmobiliaria Vesta S.A.B. de C.V.# | 1,361,020 | | (1,361,020) | - | 1,953,978 | | (1,953,978) | - |
| | | | | | | | | |
| Netherlands - 2.2% | | | | | | | | |
| AerCap Holdings N.V. | 64,651 | 4,476 | 239 | 69,366 | 3,370,257 | 233,334 | 12,459 | 3,616,050 |
| Fugro N.V. * | | 3,454 | 50,074 | 53,528 | | 54,622 | 791,880 | 846,502 |
| Heineken N.V. | 32,709 | 3,612 | 19,655 | 55,976 | 3,443,451 | 380,254 | 2,069,186 | 5,892,891 |
| ING Groep N.V. | 94,678 | 20,447 | 201,749 | 316,874 | 1,595,373 | 344,542 | 3,399,572 | 5,339,487 |
| Koninklijke Philips N.V.# | 146,633 | 3,255 | (99,444) | 50,444 | 6,206,418 | 137,772 | (4,209,087) | 2,135,103 |
| PostNL N.V. (1) | | 24,239 | 351,400 | 375,639 | | 94,095 | 1,364,135 | 1,458,230 |
| Royal Dutch Shell plc# | | 8,438 | 122,328 | 130,766 | | 301,227 | 4,366,963 | 4,668,190 |
| Royal Dutch Shell plc# | 55,858 | | (55,858) | - | 1,943,366 | | (1,943,366) | - |
| Total Netherlands | | | | | 16,558,865 | 1,545,846 | 5,851,742 | 23,956,453 |
| | | | | | | | | |
| Norway - 0.6% | | | | | | | | |
| Statoil ASA | | 1,245 | - | 1,245 | | 31,838 | - | 31,838 |
| Storebrand ASA | | 5,312 | 77,010 | 82,322 | | 45,398 | 658,151 | 703,549 |
| Telenor ASA | | 9,263 | 134,289 | 143,552 | | 205,026 | 2,972,339 | 3,177,365 |
| Yara International ASA | 28,204 | 3,394 | 21,000 | 52,598 | 1,189,604 | 143,154 | 885,751 | 2,218,509 |
| Total Norway | | | | | 1,189,604 | 425,416 | 4,516,241 | 6,131,261 |
| | | | | | | | | |
| Poland - 0.3% | | | | | | | | |
| Alior Bank S.A. * | | 4,946 | 71,704 | 76,650 | | 99,505 | 1,442,563 | 1,542,068 |
| CCC S.A. | | 1,600 | 23,196 | 24,796 | | 117,535 | 1,703,964 | 1,821,499 |
See accompanying notes to pro forma financial statements.
| | Shares | Value($) |
Description (All
percentages are based on
the Acquiring Fund Pro
Forma’s net assets) | Acquired
Fund | Acquiring
Fund | Pro Forma
Adjustments
Increase/
(Decrease) | Acquiring
Fund Pro
Forma | Acquired
Fund | Acquiring
Fund | Pro Forma
Adjustments
Increase/
(Decrease) | Acquiring
Fund Pro
Forma |
| Total Poland | | | | | | 217,040 | 3,146,527 | 3,363,567 |
| | | | | | | | | |
| Portugal - 0.3% | | | | | | | | |
| CTT-Correios de Portugal S.A. | | 10,330 | 149,757 | 160,087 | | 38,093 | 552,244 | 590,337 |
| Galp Energia SGPS S.A. | | 9,712 | 140,798 | 150,510 | | 186,403 | 2,702,336 | 2,888,739 |
| Total Portugal | | | | | | 224,496 | 3,254,580 | 3,479,076 |
| | | | | | | | | |
| Russia – 1.4% | | | | | | | | |
| Gazprom PJSC | | 26,494 | 384,092 | 410,586 | | 122,256 | 1,772,393 | 1,894,649 |
| LUKOIL PJSC | | 2,290 | 33,199 | 35,489 | | 152,642 | 2,212,903 | 2,365,545 |
| Sberbank of Russia PJSC * | | 10,478 | 151,903 | 162,381 | | 37,769 | 547,550 | 585,319 |
| Sberbank of Russia PJSC | 28,900 | 3,340 | 19,521 | 51,761 | 427,323 | 49,386 | 288,643 | 765,352 |
| Surgutneftegas OJSC | | 18,770 | 272,115 | 290,885 | | 87,963 | 1,275,240 | 1,363,203 |
| Yandex N.V. * | 168,229 | 17,311 | 82,734 | 268,274 | 5,612,119 | 577,495 | 2,760,006 | 8,949,620 |
| Total Russia | | | | | 6,039,442 | 1,027,511 | 8,856,735 | 15,923,688 |
| | | | | | | | | |
| Singapore - 1.5% | | | | | | | | |
| DBS Group Holdings Ltd. | | 15,560 | 225,578 | 241,138 | | 359,002 | 5,204,558 | 5,563,560 |
| Oversea-Chinese Banking Corp. Ltd. | | 36,279 | 525,948 | 562,227 | | 374,710 | 5,432,307 | 5,807,017 |
| Singapore Telecommunications Ltd. | 632,700 | 130,700 | 1,262,099 | 2,025,499 | 1,682,513 | 347,565 | 3,356,300 | 5,386,378 |
| Total Singapore | | | | | 1,682,513 | 1,081,277 | 13,993,165 | 16,756,955 |
| | | | | | | | | |
| South Africa - 0.4% | | | | | | | | |
| Anglo American Platinum Ltd. | | 2,135 | 30,952 | 33,087 | | 57,293 | 830,600 | 887,893 |
| Gold Fields Ltd. | | 21,286 | 308,590 | 329,876 | | 80,813 | 1,171,562 | 1,252,375 |
| Impala Platinum Holdings Ltd. * | | 12,888 | 186,841 | 199,729 | | 22,955 | 332,783 | 355,738 |
| Nampak Ltd. * | | 56,610 | 820,693 | 877,303 | | 63,127 | 915,155 | 978,282 |
| Raubex Group Ltd. | | 18,152 | 263,155 | 281,307 | | 30,144 | 437,022 | 467,166 |
| Total South Africa | | | | | | 254,332 | 3,687,122 | 3,941,454 |
| | | | | | | | | |
| South Korea - 3.6% | | | | | | | | |
| CJ CheilJedang Corp.# | 16,645 | 1,061 | (1,263) | 16,443 | 5,321,784 | 339,226 | (403,810) | 5,257,200 |
See accompanying notes to pro forma financial statements.
| | Shares | Value($) |
Description (All
percentages are based on
the Acquiring Fund Pro
Forma’s net assets) | Acquired
Fund | Acquiring
Fund | Pro Forma
Adjustments
Increase/
(Decrease) | Acquiring
Fund Pro
Forma | Acquired
Fund | Acquiring
Fund | Pro Forma
Adjustments
Increase/
(Decrease) | Acquiring
Fund Pro
Forma |
| CJ E&M Corp.# | 21,162 | 2,126 | 9,659 | 32,947 | 1,785,460 | 179,373 | 814,939 | 2,779,772 |
| CJ Logistics Corp. * | | 292 | 4,233 | 4,525 | | 42,573 | 617,158 | 659,731 |
| Hugel, Inc. *,# | 5,108 | 207 | (2,107) | 3,208 | 2,397,664 | 97,164 | (989,013) | 1,505,815 |
| Hyundai Engineering & Construction Co., Ltd. | | 2,463 | 35,707 | 38,170 | | 145,867 | 2,114,683 | 2,260,550 |
| ING Life Insurance Korea Ltd. (4) | | 3,315 | 48,059 | 51,374 | | 127,354 | 1,846,316 | 1,973,670 |
| KB Financial Group, Inc. | | 1,839 | 26,661 | 28,500 | | 104,483 | 1,514,747 | 1,619,230 |
| Kia Motors Corp. | | 3,446 | 49,958 | 53,404 | | 106,394 | 1,542,438 | 1,648,832 |
| KT Corp. | | 4,004 | 58,047 | 62,051 | | 101,805 | 1,475,891 | 1,577,696 |
| NCSoft Corp. | | 304 | 4,407 | 4,711 | | 101,893 | 1,477,107 | 1,579,000 |
| NHN Entertainment Corp. * | | 934 | 13,540 | 14,474 | | 53,538 | 776,137 | 829,675 |
| Samsung Electronics Co., Ltd. *(2)(3)# | 3,736 | 387 | 1,874 | 5,997 | 9,260,075 | 959,221 | 4,646,049 | 14,865,345 |
| Shinhan Financial Group Co., Ltd. | | 2,008 | 29,111 | 31,119 | | 89,409 | 1,296,217 | 1,385,626 |
| SK Hynix, Inc.# | 33,123 | | (33,123) | - | 2,604,925 | | (2,604,925) | - |
| Ssangyong Cement Industrial Co., Ltd. | | 4,382 | 63,527 | 67,909 | | 122,469 | 1,775,459 | 1,897,928 |
| Tongyang Life Insurance Co., Ltd. | | 6,651 | 96,422 | 103,073 | | 51,161 | 741,697 | 792,858 |
| Total South Korea | | | | | 21,369,908 | 2,621,930 | 16,641,090 | 40,632,928 |
| | | | | | | | | |
| Spain - 2.1% | | | | | | | | |
| Aedas Homes SAU *(4) | 30,649 | 2,277 | 2,361 | 35,287 | 1,091,846 | 81,116 | 84,109 | 1,257,071 |
| Almirall S.A. | | 3,278 | 47,522 | 50,800 | | 40,746 | 590,708 | 631,454 |
| Atento S.A.# | 213,088 | | (213,088) | - | 1,598,160 | | (1,598,160) | - |
| CaixaBank S.A. | | 65,054 | 943,108 | 1,008,162 | | 316,349 | 4,586,240 | 4,902,589 |
| Cellnex Telecom S.A. (4) | | 6,683 | 96,886 | 103,569 | | 179,233 | 2,598,405 | 2,777,638 |
| Iberdrola S.A. | 541,942 | 43,523 | 89,024 | 674,489 | 4,187,011 | 336,256 | 687,791 | 5,211,058 |
| Industria de Diseno Textil S.A. (1) | 73,536 | 5,108 | 516 | 79,160 | 2,279,482 | 158,339 | 15,995 | 2,453,816 |
| Metrovacesa S.A. *(4) | 70,353 | 6,277 | 20,647 | 97,277 | 1,264,179 | 112,792 | 371,008 | 1,747,979 |
| Neinor Homes S.A.*(4) | 103,999 | 11,581 | 63,894 | 179,474 | 2,013,329 | 224,198 | 1,236,930 | 3,474,457 |
| Parques Reunidos Servicios Centrales SAU (4)# | 125,474 | | (125,474) | - | 2,063,735 | | (2,063,735) | - |
| Prosegur Cia de Seguridad S.A.# | 345,321 | | (345,321) | - | 2,610,348 | | (2,610,348) | - |
| Unicaja Banco S.A. *(4) | | 36,073 | 522,962 | 559,035 | | 65,426 | 948,496 | 1,013,922 |
See accompanying notes to pro forma financial statements.
| | Shares | Value($) |
Description (All
percentages are based on
the Acquiring Fund Pro
Forma’s net assets) | Acquired
Fund | Acquiring
Fund | Pro Forma
Adjustments
Increase/
(Decrease) | Acquiring
Fund Pro
Forma | Acquired
Fund | Acquiring
Fund | Pro Forma
Adjustments
Increase/
(Decrease) | Acquiring
Fund Pro
Forma |
| Total Spain | | | | | 17,108,090 | 1,514,455 | 4,847,439 | 23,469,984 |
| | | | | | | | | |
| Sweden - 1.1% | | | | | | | | |
| Assa Abloy AB (1)# | 126,344 | 8,308 | (5,900) | 128,752 | 2,647,781 | 174,110 | (123,646) | 2,698,245 |
| Atlas Copco AB * | | 4,251 | 61,628 | 65,879 | | 166,241 | 2,410,043 | 2,576,284 |
| BillerudKorsnas AB# | 108,524 | | (108,524) | - | 1,594,608 | | (1,594,608) | - |
| Essity AB | | 9,418 | 136,536 | 145,954 | | 238,889 | 3,463,263 | 3,702,152 |
| Klarna Holding AB * (2)(3)(4)(5) | 2,210 | | | 2,210 | 303,360 | | | 303,360 |
| Qliro Group AB * | | 14,953 | 216,778 | 231,731 | | 18,096 | 262,345 | 280,441 |
| SAS AB * | | 21,903 | 317,535 | 339,438 | | 54,661 | 792,440 | 847,101 |
| Telefonaktiebolaget LM Ericsson | | 18,295 | 265,228 | 283,523 | | 139,471 | 2,021,966 | 2,161,437 |
| Total Sweden | | | | | 4,545,749 | 791,468 | 7,231,803 | 12,569,020 |
| | | | | | | | | |
| Switzerland - 6.8% | | | | | | | | |
| Adecco Group AG | | 1,115 | 16,165 | 17,280 | | 73,841 | 1,070,530 | 1,144,371 |
| Chocoladefabriken Lindt & Spruengli AG * | | 3 | 43 | 46 | | 227,541 | 3,261,418 | 3,488,959 |
| Chubb Ltd.# | 30,960 | | (30,960) | - | 4,200,343 | | (4,200,343) | - |
| Cie Financiere Richemont S.A.# | 25,845 | | (25,845) | - | 2,456,791 | | (2,456,791) | - |
| GAM Holding AG * | | 5,426 | 78,662 | 84,088 | | 86,611 | 1,255,619 | 1,342,230 |
| Geberit AG | | 673 | 9,757 | 10,430 | | 287,191 | 4,163,624 | 4,450,815 |
| Givaudan S.A. | | 111 | 1,609 | 1,720 | | 247,091 | 3,581,713 | 3,828,804 |
| Julius Baer Group Ltd. * | | 5,170 | 74,951 | 80,121 | | 306,831 | 4,448,214 | 4,755,045 |
| Kuehne + Nagel International AG | 15,416 | 1,625 | 8,142 | 25,183 | 2,400,207 | 253,006 | 1,267,676 | 3,920,889 |
| LafargeHolcim Ltd. * | | 4,552 | 65,992 | 70,544 | | 252,870 | 3,665,955 | 3,918,825 |
| Nestle S.A. | 61,371 | 6,228 | 28,918 | 96,517 | 4,754,416 | 482,484 | 2,240,280 | 7,477,180 |
| Novartis AG | 56,287 | 9,754 | 85,120 | 151,161 | 4,332,652 | 750,807 | 6,552,052 | 11,635,511 |
| Roche Holding AG# | 13,395 | | (13,395) | - | 2,976,200 | | (2,976,200) | - |
| Schindler Holding AG# | | 1,718 | 24,906 | 26,624 | | 354,744 | 5,142,753 | 5,497,497 |
| Schindler Holding AG# | 9,653 | | (9,653) | - | 1,931,559 | | (1,931,559) | - |
| Swiss Prime Site AG * | | 4,582 | 66,427 | 71,009 | | 429,306 | 6,223,805 | 6,653,111 |
| Swisscom AG (1) | | 658 | 9,539 | 10,197 | | 315,598 | 4,575,213 | 4,890,811 |
See accompanying notes to pro forma financial statements.
| | Shares | Value($) |
Description (All
percentages are based on
the Acquiring Fund Pro
Forma’s net assets) | Acquired
Fund | Acquiring
Fund | Pro Forma
Adjustments
Increase/
(Decrease) | Acquiring
Fund Pro
Forma | Acquired
Fund | Acquiring
Fund | Pro Forma
Adjustments
Increase/
(Decrease) | Acquiring
Fund Pro
Forma |
| UBS Group AG * | 344,383 | 41,592 | 258,589 | 644,564 | 5,780,431 | 698,117 | 4,340,391 | 10,818,939 |
| Zurich Insurance Group AG# | 7,844 | 354 | (2,712) | 5,486 | 2,505,651 | 113,080 | (866,309) | 1,752,422 |
| Total Switzerland | | | | | 31,338,250 | 4,879,118 | 39,358,041 | 75,575,409 |
| | | | | | | | | |
| Taiwan - 3.2% | | | | | | | | |
| Acer, Inc. * | | 91,840 | 1,331,433 | 1,423,273 | | 70,041 | 1,015,351 | 1,085,392 |
| Catcher Technology Co., Ltd.# | 148,000 | 23,765 | 196,529 | 368,294 | 1,641,345 | 263,558 | 2,179,546 | 4,084,449 |
| Chunghwa Telecom Co., Ltd. | | 89,000 | 1,290,261 | 1,379,261 | | 338,651 | 4,909,572 | 5,248,223 |
| Compal Electronics, Inc. | | 139,800 | 2,026,724 | 2,166,524 | | 91,059 | 1,320,208 | 1,411,267 |
| Elite Material Co., Ltd.# | 501,000 | | (501,000) | - | 1,227,768 | | (1,227,768) | - |
| Formosa Chemicals & Fibre Corp. | | 74,000 | 1,072,801 | 1,146,801 | | 271,887 | 3,941,685 | 4,213,572 |
| Formosa Plastics Corp. | | 89,000 | 1,290,261 | 1,379,261 | | 312,322 | 4,527,784 | 4,840,106 |
| MediaTek, Inc. | | 2,890 | 41,897 | 44,787 | | 32,870 | 476,520 | 509,390 |
| Nan Ya Plastics Corp. | | 107,000 | 1,551,212 | 1,658,212 | | 293,071 | 4,248,770 | 4,541,841 |
| PChome Online, Inc. | | 24,000 | 347,935 | 371,935 | | 111,173 | 1,611,705 | 1,722,878 |
| Shin Kong Financial Holding Co., Ltd. | | 179,410 | 2,600,963 | 2,780,373 | | 72,916 | 1,057,031 | 1,129,947 |
| Silicon Motion Technology Corp.# | 49,920 | | (49,920) | - | 2,256,883 | | (2,256,883) | - |
| Simplo Technology Co., Ltd. * | | 9,810 | 142,219 | 152,029 | | 54,847 | 795,132 | 849,979 |
| Taiwan Mobile Co., Ltd.# | 531,000 | | (531,000) | - | 1,960,932 | | (1,960,932) | - |
| Taiwan Semiconductor Manufacturing Co., Ltd. *,# | 388,630 | 50,050 | 336,960 | 775,640 | 2,960,326 | 381,248 | 2,566,725 | 5,908,299 |
| WPG Holdings Ltd.# | 972,020 | | (972,020) | - | 1,307,988 | | (1,307,988) | - |
| Total Taiwan | | | | | 11,355,242 | 2,293,643 | 21,896,458 | 35,545,343 |
| | | | | | | | | |
| United Kingdom - 11.4% | | | | | | | | |
| Acacia Mining plc | | 20,683 | 299,848 | 320,531 | | 41,003 | 594,419 | 635,422 |
| Anglo American plc | 126,471 | 12,852 | 59,848 | 199,171 | 2,975,768 | 302,398 | 1,408,182 | 4,686,348 |
| Aptiv plc# | 18,451 | | (18,451) | - | 1,560,585 | | (1,560,585) | - |
| AstraZeneca plc# | 52,518 | 13,393 | 141,644 | 207,555 | 3,676,381 | 937,541 | 9,915,406 | 14,529,328 |
| AstraZeneca plc ADR | 138,135 | | (138,135) | - | 4,907,937 | | (4,907,937) | - |
| B&M European Value Retail S.A.# | 530,581 | | (530,581) | - | 2,956,735 | | (2,956,735) | - |
| BP plc | | 50,240 | 728,345 | 778,585 | | 373,181 | 5,410,147 | 5,783,328 |
See accompanying notes to pro forma financial statements.
| | Shares | Value($) |
Description (All
percentages are based on
the Acquiring Fund Pro
Forma’s net assets) | Acquired
Fund | Acquiring
Fund | Pro Forma
Adjustments
Increase/
(Decrease) | Acquiring
Fund Pro
Forma | Acquired
Fund | Acquiring
Fund | Pro Forma
Adjustments
Increase/
(Decrease) | Acquiring
Fund Pro
Forma |
| British American Tobacco plc# | 82,391 | 1,789 | (56,455) | 27,725 | 4,518,939 | 98,122 | (3,096,416) | 1,520,645 |
| BT Group plc | | 105,570 | 1,530,481 | 1,636,051 | | 362,352 | 5,253,070 | 5,615,422 |
| Centrica plc | | 53,680 | 778,216 | 831,896 | | 113,660 | 1,647,795 | 1,761,455 |
| Cobham plc * | 1,077,579 | 91,197 | 244,532 | 1,413,308 | 1,701,901 | 144,034 | 386,214 | 2,232,149 |
| Compass Group plc | 129,023 | 14,985 | 88,219 | 232,227 | 2,767,899 | 321,469 | 1,892,545 | 4,981,913 |
| Diageo plc# | 153,030 | 5,933 | (67,017) | 91,946 | 5,459,291 | 211,658 | (2,390,805) | 3,280,144 |
| Fiat Chrysler Automobiles N.V. * | | 9,772 | 141,668 | 151,440 | | 217,122 | 3,147,693 | 3,364,815 |
| GlaxoSmithKline plc | | 25,072 | 363,477 | 388,549 | | 502,873 | 7,290,331 | 7,793,204 |
| Glencore plc * | 472,924 | 33,722 | 15,954 | 522,600 | 2,278,072 | 162,439 | 76,850 | 2,517,361 |
| Go-Ahead Group plc | | 3,284 | 47,609 | 50,893 | | 87,322 | 1,265,928 | 1,353,250 |
| Grainger plc | | 50,095 | 726,243 | 776,338 | | 215,742 | 3,127,711 | 3,343,453 |
| Halfords Group plc | | 13,969 | 202,513 | 216,482 | | 72,798 | 1,055,376 | 1,128,174 |
| Hays plc | | 31,482 | 456,404 | 487,886 | | 77,582 | 1,124,716 | 1,202,298 |
| Hikma Pharmaceuticals plc# | 113,637 | | (113,637) | - | 2,003,698 | | (2,003,698) | - |
| HSBC Holdings plc | 272,689 | 34,851 | 232,557 | 540,097 | 2,714,885 | 346,976 | 2,315,337 | 5,377,198 |
| IHS Markit Ltd. *,# | 63,294 | | (63,294) | - | 3,109,634 | | (3,109,634) | - |
| Imperial Brands plc | | 6,388 | 92,609 | 98,997 | | 228,560 | 3,313,513 | 3,542,073 |
| J Sainsbury plc | | 29,471 | 427,250 | 456,721 | | 125,050 | 1,812,907 | 1,937,957 |
| Just Eat plc * | | 18,825 | 272,912 | 291,737 | | 200,409 | 2,905,394 | 3,105,803 |
| Lancashire Holdings Ltd.# | 425,610 | | (425,610) | - | 3,492,185 | | (3,492,185) | - |
| Marks & Spencer Group plc | | 20,312 | 294,469 | 314,781 | | 80,314 | 1,164,330 | 1,244,644 |
| National Grid plc | 339,947 | 31,402 | 115,298 | 486,647 | 3,933,166 | 363,319 | 1,333,986 | 5,630,471 |
| Petra Diamonds Ltd. * | | 33,473 | 485,268 | 518,741 | | 31,453 | 455,958 | 487,411 |
| Prudential plc# | 64,314 | | (64,314) | - | 1,653,772 | | (1,653,772) | - |
| QinetiQ Group plc | 349,962 | 37,941 | 200,080 | 587,983 | 1,106,314 | 119,941 | 632,493 | 1,858,748 |
| Reckitt Benckiser Group plc | 31,021 | 3,522 | 20,039 | 54,582 | 2,433,535 | 276,294 | 1,572,019 | 4,281,848 |
| RELX N.V. (1) | | 16,405 | 237,828 | 254,233 | | 349,051 | 5,060,290 | 5,409,341 |
| RELX plc | 108,893 | 16,008 | 123,180 | 248,081 | 2,327,369 | 342,139 | 2,632,726 | 5,302,234 |
| SIG plc | | 23,424 | 339,585 | 363,009 | | 45,792 | 663,855 | 709,647 |
| Smith & Nephew plc | 74,248 | 17,608 | 181,021 | 272,877 | 1,421,926 | 337,211 | 3,466,733 | 5,225,870 |
See accompanying notes to pro forma financial statements.
| | Shares | Value($) |
Description (All
percentages are based on
the Acquiring Fund Pro
Forma’s net assets) | Acquired
Fund | Acquiring
Fund | Pro Forma
Adjustments
Increase/
(Decrease) | Acquiring
Fund Pro
Forma | Acquired
Fund | Acquiring
Fund | Pro Forma
Adjustments
Increase/
(Decrease) | Acquiring
Fund Pro
Forma |
| Standard Chartered plc | | 12,886 | 186,812 | 199,698 | | 135,355 | 1,962,273 | 2,097,628 |
| SThree plc | | 3,069 | 44,492 | 47,561 | | 13,668 | 198,150 | 211,818 |
| Ultra Electronics Holdings plc | 96,776 | 9,855 | 46,095 | 152,726 | 1,875,899 | 191,029 | 893,501 | 2,960,429 |
| Unilever N.V.# | 60,055 | | (60,055) | - | 3,430,341 | | (3,430,341) | - |
| Unilever N.V.# | | 7,323 | 106,164 | 113,487 | | 419,817 | 6,086,233 | 6,506,050 |
| Vodafone Group plc | 531,112 | 111,797 | 1,089,644 | 1,732,553 | 1,549,896 | 326,247 | 3,179,799 | 5,055,942 |
| Willis Towers Watson plc# | 16,440 | | (16,440) | - | 2,441,504 | | (2,441,504) | - |
| Total United Kingdom | | | | | 66,297,632 | 8,173,921 | 52,202,268 | 126,673,821 |
| | | | | | | | | |
| United States - 0.1% | | | | | | | | |
| 3M Co.# | 8,565 | | (8,565) | - | 1,664,950 | | (1,664,950) | - |
| Abbott Laboratories# | 31,033 | | (31,033) | - | 1,803,948 | | (1,803,948) | - |
| Acacia Communications, Inc. *(1)# | 39,820 | | (39,820) | - | 1,120,933 | | (1,120,933) | - |
| Accenture plc# | 29,152 | | (29,152) | - | 4,407,782 | | (4,407,782) | - |
| Adobe Systems, Inc. *,# | 12,447 | | (12,447) | - | 2,758,255 | | (2,758,255) | - |
| ADT, Inc. (1)# | 39,606 | | (39,606) | - | 352,890 | | (352,890) | - |
| Aetna, Inc.# | 11,234 | | (11,234) | - | 2,011,448 | | (2,011,448) | - |
| Allergan plc# | 10,180 | | (10,180) | - | 1,564,157 | | (1,564,157) | - |
| Alliance Data Systems Corp.# | 11,264 | | (11,264) | - | 2,287,155 | | (2,287,155) | - |
| Allstar Co. *(2)(3)(4)(5) | 727,000 | | - | 727,000 | 87,240 | | | 87,240 |
| Allstate Corp.# | 18,423 | | (18,423) | - | 1,802,138 | | (1,802,138) | - |
| Alphabet, Inc. *,# | 2,621 | | (2,621) | - | 2,669,698 | | (2,669,698) | - |
| Alphabet, Inc. *,# | 10,190 | | (10,190) | - | 10,366,593 | | (10,366,593) | - |
| Altria Group, Inc.# | 28,796 | | (28,796) | - | 1,615,744 | | (1,615,744) | - |
| Amazon.com, Inc. *,# | 1,203 | | (1,203) | - | 1,884,054 | | (1,884,054) | - |
| Amdocs Ltd.# | 26,693 | | (26,693) | - | 1,795,104 | | (1,795,104) | - |
| American Express Co.# | 36,492 | | (36,492) | - | 3,603,585 | | (3,603,585) | - |
| American International Group, Inc.# | 82,504 | | (82,504) | - | 4,620,224 | | (4,620,224) | - |
| American Tower Corp.# | 37,236 | | (37,236) | - | 5,077,501 | | (5,077,501) | - |
| Anadarko Petroleum Corp.# | 60,131 | | (60,131) | - | 4,048,019 | | (4,048,019) | - |
See accompanying notes to pro forma financial statements.
| | Shares | Value($) |
Description (All
percentages are based on
the Acquiring Fund Pro
Forma’s net assets) | Acquired
Fund | Acquiring
Fund | Pro Forma
Adjustments
Increase/
(Decrease) | Acquiring
Fund Pro
Forma | Acquired
Fund | Acquiring
Fund | Pro Forma
Adjustments
Increase/
(Decrease) | Acquiring
Fund Pro
Forma |
| Apple, Inc.# | 20,742 | | (20,742) | - | 3,427,823 | | (3,427,823) | - |
| Automatic Data Processing, Inc.# | 23,877 | | (23,877) | - | 2,819,396 | | (2,819,396) | - |
| AvalonBay Communities, Inc.# | 10,585 | | (10,585) | - | 1,725,355 | | (1,725,355) | - |
| Ball Corp.# | 66,965 | | (66,965) | - | 2,684,627 | | (2,684,627) | - |
| Bank of America Corp.# | 279,137 | | (279,137) | - | 8,351,779 | | (8,351,779) | - |
| Baxter International, Inc.# | 44,733 | | (44,733) | - | 3,108,944 | | (3,108,944) | - |
| Becton Dickinson and Co.# | 7,499 | | (7,499) | - | 1,738,793 | | (1,738,793) | - |
| Berkshire Hathaway, Inc. *,# | 12,115 | | (12,115) | - | 2,347,039 | | (2,347,039) | - |
| Biogen, Inc. *,# | 6,885 | | (6,885) | - | 1,883,736 | | (1,883,736) | - |
| Booking Holdings, Inc. *,# | 1,344 | | (1,344) | - | 2,927,232 | | (2,927,232) | - |
| Bristol-Myers Squibb Co.# | 113,278 | | (113,278) | - | 5,905,182 | | (5,905,182) | - |
| Broadcom, Inc.# | 14,251 | | (14,251) | - | 3,269,464 | | (3,269,464) | - |
| Cardinal Health, Inc.# | 41,372 | | (41,372) | - | 2,654,841 | | (2,654,841) | - |
| Celanese Corp.# | 24,324 | | (24,324) | - | 2,643,289 | | (2,643,289) | - |
| Chevron Corp.# | 13,993 | | (13,993) | - | 1,750,664 | | (1,750,664) | - |
| Chipotle Mexican Grill, Inc. *,# | 15,741 | | (15,741) | - | 6,663,638 | | (6,663,638) | - |
| Cimarex Energy Co.# | 23,049 | | (23,049) | - | 2,318,499 | | (2,318,499) | - |
| Citigroup, Inc.# | 34,892 | | (34,892) | - | 2,382,077 | | (2,382,077) | - |
| Citizens Financial Group, Inc.# | 31,346 | | (31,346) | - | 1,300,546 | | (1,300,546) | - |
| Clorox Co.# | 12,418 | | (12,418) | - | 1,455,390 | | (1,455,390) | - |
| Coca-Cola Co.# | 97,956 | | (97,956) | - | 4,232,679 | | (4,232,679) | - |
| Colgate-Palmolive Co.# | 49,681 | | (49,681) | - | 3,240,692 | | (3,240,692) | - |
| Comcast Corp.# | 44,100 | | (44,100) | - | 1,384,299 | | (1,384,299) | - |
| Concho Resources, Inc. *,# | 12,790 | | (12,790) | - | 2,010,716 | | (2,010,716) | - |
| Consolidated Edison, Inc.# | 28,547 | | (28,547) | - | 2,287,471 | | (2,287,471) | - |
| CoStar Group, Inc. *,# | 11,298 | | (11,298) | - | 4,142,525 | | (4,142,525) | - |
| Costco Wholesale Corp.# | 13,356 | | (13,356) | - | 2,633,269 | | (2,633,269) | - |
| Coty, Inc.# | 242,432 | | (242,432) | - | 4,206,195 | | (4,206,195) | - |
| CSX Corp.# | 101,009 | | (101,009) | - | 5,998,925 | | (5,998,925) | - |
| Danaher Corp.# | 45,933 | | (45,933) | - | 4,607,999 | | (4,607,999) | - |
See accompanying notes to pro forma financial statements.
| | Shares | Value($) |
Description (All
percentages are based on
the Acquiring Fund Pro
Forma’s net assets) | Acquired
Fund | Acquiring
Fund | Pro Forma
Adjustments
Increase/
(Decrease) | Acquiring
Fund Pro
Forma | Acquired
Fund | Acquiring
Fund | Pro Forma
Adjustments
Increase/
(Decrease) | Acquiring
Fund Pro
Forma |
| Deere & Co.# | 16,746 | | (16,746) | - | 2,266,236 | | (2,266,236) | - |
| Delta Air Lines, Inc.# | 42,046 | | (42,046) | - | 2,195,642 | | (2,195,642) | - |
| Diamondback Energy, Inc. *,# | 21,934 | | (21,934) | - | 2,817,422 | | (2,817,422) | - |
| Dollar Tree, Inc. *,# | 27,664 | | (27,664) | - | 2,652,701 | | (2,652,701) | - |
| Dominion Energy, Inc.# | 29,115 | | (29,115) | - | 1,937,894 | | (1,937,894) | - |
| DraftKings, Inc.*(2)(3)(4)(5) | 202,061 | | | 202,061 | 268,741 | | | 268,741 |
| Duke Energy Corp.# | 34,307 | | (34,307) | - | 2,750,049 | | (2,750,049) | - |
| Ecolab, Inc.# | 17,564 | | (17,564) | - | 2,542,740 | | (2,542,740) | - |
| Edwards Lifesciences Corp.*,# | 29,497 | | (29,497) | - | 3,756,738 | | (3,756,738) | - |
| Envision Healthcare Corp.*,# | 40,743 | | (40,743) | - | 1,514,417 | | (1,514,417) | - |
| EOG Resources, Inc.# | 14,426 | | (14,426) | - | 1,704,721 | | (1,704,721) | - |
| Equity Residential# | 30,227 | | (30,227) | - | 1,865,308 | | (1,865,308) | - |
| Exact Sciences Corp. *,# | 67,134 | | (67,134) | - | 3,357,371 | | (3,357,371) | - |
| Expedia Group, Inc.# | 16,111 | | (16,111) | - | 1,855,021 | | (1,855,021) | - |
| Exxon Mobil Corp.# | 27,484 | | (27,484) | - | 2,136,881 | | (2,136,881) | - |
| Facebook, Inc. *,# | 65,535 | | (65,535) | - | 11,272,020 | | (11,272,020) | - |
| Fidelity National Information Services, Inc.# | 20,474 | | (20,474) | - | 1,944,416 | | (1,944,416) | - |
| First Republic Bank# | 20,551 | | (20,551) | - | 1,908,571 | | (1,908,571) | - |
| Fiserv, Inc. *,# | 33,973 | | (33,973) | - | 2,407,327 | | (2,407,327) | - |
| Five Prime Therapeutics, Inc. *,# | 26,008 | | (26,008) | - | 435,634 | | (435,634) | - |
| FleetCor Technologies, Inc. *,# | 11,192 | | (11,192) | - | 2,319,878 | | (2,319,878) | - |
| Flex Ltd. *,# | 181,933 | | (181,933) | - | 2,365,129 | | (2,365,129) | - |
| ForeScout Technologies, Inc. *,# | 15,321 | | (15,321) | - | 490,119 | | (490,119) | - |
| General Dynamics Corp.# | 13,829 | | (13,829) | - | 2,783,916 | | (2,783,916) | - |
| General Motors Co.# | 94,104 | | (94,104) | - | 3,457,381 | | (3,457,381) | - |
| Genesee & Wyoming, Inc.*,# | 37,003 | | (37,003) | - | 2,634,614 | | (2,634,614) | - |
| Genpact Ltd.# | 41,638 | | (41,638) | - | 1,327,836 | | (1,327,836) | - |
| Global Payments, Inc.# | 27,621 | | (27,621) | - | 3,122,554 | | (3,122,554) | - |
| Guidewire Software, Inc. *,# | 43,791 | | (43,791) | - | 3,705,594 | | (3,705,594) | - |
| Halliburton Co.# | 139,659 | | (139,659) | - | 7,400,530 | | (7,400,530) | - |
See accompanying notes to pro forma financial statements.
| | Shares | Value($) |
Description (All
percentages are based on
the Acquiring Fund Pro
Forma’s net assets) | Acquired
Fund | Acquiring
Fund | Pro Forma
Adjustments
Increase/
(Decrease) | Acquiring
Fund Pro
Forma | Acquired
Fund | Acquiring
Fund | Pro Forma
Adjustments
Increase/
(Decrease) | Acquiring
Fund Pro
Forma |
| Heron Therapeutics, Inc. *,# | 20,000 | | (20,000) | - | 606,000 | | (606,000) | - |
| Hess Corp.# | 28,359 | | (28,359) | - | 1,616,179 | | (1,616,179) | - |
| Hilton Worldwide Holdings, Inc.# | 16,200 | | (16,200) | - | 1,277,208 | | (1,277,208) | - |
| Home Depot, Inc.# | 12,168 | | (12,168) | - | 2,248,646 | | (2,248,646) | - |
| Honest Co. *(2)(3)(4)(5)# | 5,968 | | | 5,968 | 105,514 | | | 105,514 |
| Honeywell International, Inc.# | 17,386 | | (17,386) | - | 2,515,406 | | (2,515,406) | - |
| Host Hotels & Resorts, Inc.# | 111,882 | | (111,882) | - | 2,188,412 | | (2,188,412) | - |
| Illinois Tool Works, Inc.# | 12,700 | | (12,700) | - | 1,803,654 | | (1,803,654) | - |
| Incyte Corp. *,# | 27,700 | | (27,700) | - | 1,715,738 | | (1,715,738) | - |
| Intercontinental Exchange, Inc.# | 44,500 | | (44,500) | - | 3,224,470 | | (3,224,470) | - |
| International Paper Co.# | 34,475 | | (34,475) | - | 1,777,531 | | (1,777,531) | - |
| JAND, Inc. *(2)(3)(4)(5) | 5,907 | | | 5,907 | 79,213 | | | 79,213 |
| Johnson & Johnson# | 33,545 | | (33,545) | - | 4,243,107 | | (4,243,107) | - |
| Johnson Controls International plc# | 36,900 | | (36,900) | - | 1,249,803 | | (1,249,803) | - |
| JP Morgan Chase & Co.# | 21,427 | | (21,427) | - | 2,330,829 | | (2,330,829) | - |
| KeyCorp# | 158,601 | | (158,601) | - | 3,159,332 | | (3,159,332) | - |
| Keysight Technologies, Inc. 8# | 46,159 | | (46,159) | - | 2,385,497 | | (2,385,497) | - |
| Kimberly-Clark Corp.# | 16,365 | | (16,365) | - | 1,694,432 | | (1,694,432) | - |
| KLA-Tencor Corp.# | 67,248 | | (67,248) | - | 6,841,811 | | (6,841,811) | - |
| Knight-Swift Transportation Holdings, Inc. *,# | 78,694 | | (78,694) | - | 3,069,853 | | (3,069,853) | - |
| Kroger Co.# | 159,778 | | (159,778) | - | 4,024,808 | | (4,024,808) | - |
| Laredo Petroleum, Inc. *,# | 147,059 | | (147,059) | - | 1,617,649 | | (1,617,649) | - |
| Las Vegas Sands Corp.# | 62,378 | | (62,378) | - | 4,574,179 | | (4,574,179) | - |
| Lockheed Martin Corp.# | 8,951 | | (8,951) | - | 2,871,839 | | (2,871,839) | - |
| Marsh & McLennan Cos., Inc.# | 23,740 | | (23,740) | - | 1,934,810 | | (1,934,810) | - |
| Mastercard, Inc.# | 14,311 | | (14,311) | - | 2,551,222 | | (2,551,222) | - |
| McDonald's Corp.# | 27,056 | | (27,056) | - | 4,530,257 | | (4,530,257) | - |
| McKesson Corp.# | 22,069 | | (22,069) | - | 3,447,399 | | (3,447,399) | - |
| Medtronic plc# | 58,502 | | (58,502) | - | 4,687,765 | | (4,687,765) | - |
| Merck & Co., Inc.# | 69,553 | | (69,553) | - | 4,094,585 | | (4,094,585) | - |
See accompanying notes to pro forma financial statements.
| | Shares | Value($) |
Description (All
percentages are based on
the Acquiring Fund Pro
Forma’s net assets) | Acquired
Fund | Acquiring
Fund | Pro Forma
Adjustments
Increase/
(Decrease) | Acquiring
Fund Pro
Forma | Acquired
Fund | Acquiring
Fund | Pro Forma
Adjustments
Increase/
(Decrease) | Acquiring
Fund Pro
Forma |
| MetLife, Inc.# | 84,509 | | (84,509) | - | 4,028,544 | | (4,028,544) | - |
| MGM Resorts International# | 82,329 | | (82,329) | - | 2,586,777 | | (2,586,777) | - |
| Microchip Technology, Inc.# | 25,897 | | (25,897) | - | 2,166,543 | | (2,166,543) | - |
| Micron Technology, Inc. *,# | 112,973 | | (112,973) | - | 5,194,499 | | (5,194,499) | - |
| Microsoft Corp.# | 54,353 | | (54,353) | - | 5,083,093 | | (5,083,093) | - |
| Mondelez International, Inc.# | 39,880 | | (39,880) | - | 1,575,260 | | (1,575,260) | - |
| Mylan N.V. *,# | 86,417 | | (86,417) | - | 3,349,523 | | (3,349,523) | - |
| Newell Brands, Inc.# | 95,784 | | (95,784) | - | 2,646,512 | | (2,646,512) | - |
| NextEra Energy, Inc.# | 14,842 | | (14,842) | - | 2,432,752 | | (2,432,752) | - |
| NIKE, Inc.# | 163,388 | | (163,388) | - | 11,174,105 | | (11,174,105) | - |
| NVIDIA Corp.# | 9,934 | | (9,934) | - | 2,234,157 | | (2,234,157) | - |
| Packaging Corp. of America# | 25,417 | | (25,417) | - | 2,940,493 | | (2,940,493) | - |
| PayPal Holdings, Inc. *,# | 53,663 | | (53,663) | - | 4,003,796 | | (4,003,796) | - |
| PepsiCo, Inc.# | 37,442 | | (37,442) | - | 3,779,395 | | (3,779,395) | - |
| Pfizer, Inc.# | 73,602 | | (73,602) | - | 2,694,569 | | (2,694,569) | - |
| Philip Morris International, Inc.# | 45,879 | | (45,879) | - | 3,762,078 | | (3,762,078) | - |
| PNC Financial Services Group, Inc.# | 26,786 | | (26,786) | - | 3,900,309 | | (3,900,309) | - |
| PPG Industries, Inc.# | 11,615 | | (11,615) | - | 1,229,796 | | (1,229,796) | - |
| Praxair, Inc.# | 38,191 | | (38,191) | - | 5,824,891 | | (5,824,891) | - |
| Procter & Gamble Co.# | 44,271 | | (44,271) | - | 3,202,564 | | (3,202,564) | - |
| Prologis, Inc# | 24,918 | | (24,918) | - | 1,617,427 | | (1,617,427) | - |
| Public Storage# | 26,752 | | (26,752) | - | 5,398,018 | | (5,398,018) | - |
| QUALCOMM, Inc.# | 70,466 | | (70,466) | - | 3,594,471 | | (3,594,471) | - |
| Raytheon Co.# | 9,358 | | (9,358) | - | 1,917,828 | | (1,917,828) | - |
| Reliance Steel & Aluminum Co.# | 44,641 | | (44,641) | - | 3,924,837 | | (3,924,837) | - |
| salesforce.com, Inc. *,# | 37,728 | | (37,728) | - | 4,564,711 | | (4,564,711) | - |
| Samsonite International S.A.# | 482,400 | | (482,400) | - | 2,175,958 | | (2,175,958) | - |
| Seattle Genetics, Inc. *,# | 24,747 | | (24,747) | - | 1,266,799 | | (1,266,799) | - |
| ServiceNow, Inc. *,# | 25,360 | | (25,360) | - | 4,213,310 | | (4,213,310) | - |
| Simon Property Group, Inc.# | 10,058 | | (10,058) | - | 1,572,468 | | (1,572,468) | - |
See accompanying notes to pro forma financial statements.
| | Shares | Value($) |
Description (All
percentages are based on
the Acquiring Fund Pro
Forma’s net assets) | Acquired
Fund | Acquiring
Fund | Pro Forma
Adjustments
Increase/
(Decrease) | Acquiring
Fund Pro
Forma | Acquired
Fund | Acquiring
Fund | Pro Forma
Adjustments
Increase/
(Decrease) | Acquiring
Fund Pro
Forma |
| Southwestern Energy Co. *,# | 93,908 | | (93,908) | - | 385,023 | | (385,023) | - |
| SS&C Technologies Holdings, Inc.# | 49,365 | | (49,365) | - | 2,450,972 | | (2,450,972) | - |
| Steelcase, Inc.# | 168,140 | | (168,140) | - | 2,227,855 | | (2,227,855) | - |
| STORE Capital Corp.# | 70,145 | | (70,145) | - | 1,769,758 | | (1,769,758) | - |
| SunTrust Banks, Inc.# | 53,906 | | (53,906) | - | 3,600,921 | | (3,600,921) | - |
| Synchrony Financial# | 44,172 | | (44,172) | - | 1,465,185 | | (1,465,185) | - |
| Tapestry, Inc.# | 39,314 | | (39,314) | - | 2,113,914 | | (2,113,914) | - |
| TD Ameritrade Holding Corp.# | 44,218 | | (44,218) | - | 2,568,624 | | (2,568,624) | - |
| Teradyne, Inc.# | 44,891 | | (44,891) | - | 1,461,202 | | (1,461,202) | - |
| TESARO, Inc. *,# | 24,177 | | (24,177) | - | 1,230,851 | | (1,230,851) | - |
| Thermo Fisher Scientific, Inc.# | 16,161 | | (16,161) | - | 3,399,467 | | (3,399,467) | - |
| TJX Cos., Inc.# | 37,934 | | (37,934) | - | 3,218,700 | | (3,218,700) | - |
| Tory Burch LLC *(2)(3)(4)(5) | 16,188 | | | 16,188 | 889,524 | | | 889,524 |
| Trade Desk, Inc. *(1)# | 59,540 | | (59,540) | - | 3,046,662 | | (3,046,662) | - |
| Under Armour, Inc. *(1)# | 266,460 | | (266,460) | - | 4,732,330 | | (4,732,330) | - |
| Under Armour, Inc. *(1)# | 323,674 | | (323,674) | - | 4,968,396 | | (4,968,396) | - |
| United Parcel Service, Inc.# | 41,230 | | (41,230) | - | 4,679,605 | | (4,679,605) | - |
| United Technologies Corp.# | 21,713 | | (21,713) | - | 2,608,817 | | (2,608,817) | - |
| UnitedHealth Group, Inc.# | 33,986 | | (33,986) | - | 8,034,290 | | (8,034,290) | - |
| US Bancorp# | 38,829 | | (38,829) | - | 1,958,923 | | (1,958,923) | - |
| Verint Systems, Inc. *,# | 30,888 | | (30,888) | - | 1,300,385 | | (1,300,385) | - |
| Verizon Communications, Inc.# | 59,999 | | (59,999) | - | 2,960,951 | | (2,960,951) | - |
| Visa, Inc.# | 31,966 | | (31,966) | - | 4,055,846 | | (4,055,846) | - |
| Vulcan Materials Co.# | 15,762 | | (15,762) | - | 1,760,458 | | (1,760,458) | - |
| Walgreens Boots Alliance, Inc.# | 54,017 | | (54,017) | - | 3,589,430 | | (3,589,430) | - |
| Walt Disney Co.# | 17,702 | | (17,702) | - | 1,776,041 | | (1,776,041) | - |
| Wayfair, Inc. *,# | 23,017 | | (23,017) | - | 1,433,959 | | (1,433,959) | - |
| Western Digital Corp.# | 38,394 | | (38,394) | - | 3,025,063 | | (3,025,063) | - |
| WeWork Companies, Inc. *(2)(3)(4)(5) | 1,485 | | - | 1,485 | 76,938 | | - | 76,938 |
| Workday, Inc. *,# | 22,982 | | (22,982) | - | 2,869,073 | | (2,869,073) | - |
See accompanying notes to pro forma financial statements.
| | Shares | Value($) |
Description (All
percentages are based on
the Acquiring Fund Pro
Forma’s net assets) | Acquired
Fund | Acquiring
Fund | Pro Forma
Adjustments
Increase/
(Decrease) | Acquiring
Fund Pro
Forma | Acquired
Fund | Acquiring
Fund | Pro Forma
Adjustments
Increase/
(Decrease) | Acquiring
Fund Pro
Forma |
| WPX Energy, Inc. *,# | 122,340 | | (122,340) | - | 2,090,791 | | (2,090,791) | - |
| Xcel Energy, Inc.# | 51,417 | | (51,417) | - | 2,408,372 | | (2,408,372) | - |
| Zuora, Inc. *,# | 2,900 | | (2,900) | - | 55,854 | | (55,854) | - |
| Total United States | | | | | 499,578,714 | | (498,071,544) | 1,507,170 |
| | | | | | | | | |
| Vietnam - 0.0% | | | | | | | | |
| Vincom Retail JSC | | 16,660 | 241,525 | 258,185 | | 33,685 | 488,339 | 522,024 |
| | | | | | | | | |
| | | | | | | | | |
| TOTAL COMMON STOCK | | | | | | | | |
| (Cost $1,034,614,375) | | | | | 1,010,739,544 | 68,992,883 | (9,207,282) | 1,070,525,145 |
| | | | | | | | | |
| Exchange-Traded Funds | | | | | | | | |
| Other Investment Pools & Funds 2.0% | | | | | | | | |
| iShares MSCI ACWI ETF (1)# | 146,513 | | (146,513) | - | 10,547,471 | | (10,547,471) | - |
| iShares Core MSCI EAFE ETF | | 464 | 6,727 | 7,191 | | 30,921 | 448,287 | 479,208 |
| iShares MSCI ACWI ex U.S. ETF | | 28,151 | 408,114 | 436,265 | | 1,406,705 | 20,393,457 | 21,800,162 |
| | | | | | | | | |
| Total Exchange-Traded Funds | | | | | | | | |
| (Cost $12,137,809) | | | | | 10,547,471 | 1,437,626 | 10,294,273 | 22,279,370 |
| | | | | | | | | |
| Preferred Stocks - 1.4% | | | | | | | | |
| Brazil | | | | | | | | |
| Cia Paranaense de Energia | | 10,100 | 146,423 | 156,523 | | 77,238 | 1,119,741 | 1,196,979 |
| Telefonica Brasil S.A. | | 3,100 | 44,942 | 48,042 | | 43,484 | 630,410 | 673,894 |
| United States | | | | | | | | |
| Airbnb, Inc. *(2)(3)(4)(5) | 5,648 | | | 5,648 | 593,040 | | | 593,040 |
| Coupang LLC *(2)(3)(4)(5) | 225,050 | | | 225,050 | 1,120,096 | | | 1,120,096 |
| Dropbox, Inc. *(2)(3)(4)(5)(6) | 7,113 | | | 7,113 | 197,267 | | | 197,267 |
| Essence Group Holdings Corp. *(2)(3)(4)(5) | 243,469 | | | 243,469 | 506,415 | | | 506,415 |
| General Assembly Space, Inc. *(2)(3)(4)(5) | 5,988 | | | 5,988 | 403,613 | | | 403,613 |
| JAND, Inc. *(2)(3)(4)(5) | 13,190 | | | 13,190 | 182,286 | | | 182,286 |
See accompanying notes to pro forma financial statements.
| | Shares | Value($) |
Description (All
percentages are based on
the Acquiring Fund Pro
Forma’s net assets) | Acquired
Fund | Acquiring
Fund | Pro Forma
Adjustments
Increase/
(Decrease) | Acquiring
Fund Pro
Forma | Acquired
Fund | Acquiring
Fund | Pro Forma
Adjustments
Increase/
(Decrease) | Acquiring
Fund Pro
Forma |
| Lookout, Inc.*(2)(3)(4)(5) | 38,688 | | | 38,688 | 319,950 | | | 319,950 |
| MarkLogic Corp.*(2)(3)(4)(5) | 51,890 | | | 51,890 | 514,749 | | | 514,749 |
| Pinterest, Inc.*(2)(3)(4)(5) | 249,735 | | | 249,735 | 1,588,315 | | | 1,588,315 |
| Rubicon Global Holdings LLC*(2)(3)(4)(5) | 15,711 | | | 15,711 | 460,332 | | | 460,332 |
| Uber Technologies, Inc.*(2)(3)(4)(5) | 133,270 | | | 133,270 | 4,677,777 | | | 4,677,777 |
| WeWork Companies, Inc.*(2)(3)(4)(5) | 20,282 | | | 20,282 | 1,050,811 | | | 1,050,811 |
| WeWork Companies, Inc.*(2)(3)(4)(5) | 15,935 | | | 15,935 | 825,592 | | | 825,592 |
| Zuora, Inc. *(2)(3)(4)(5)(6) | 80,354 | | | 80,354 | 1,407,473 | | | 1,407,473 |
| | | | | | | | | |
| Total Preferred Stocks | | | | | 13,847,716 | 120,722 | 1,750,151 | 15,718,589 |
| (cost $8,807,790) | | | | | | | | |
| | | | | | | | | |
| Convertible Preferred Stocks - 0.0% | | | | | | | | |
| United States | | | | | | | | |
| Honest Co.*(2)(3)(4)(5) | 13,926 | | | 13,926 | 425,021 | | | 425,021 |
| Total Convertible Preferred Stocks | | | | | 425,021 | | | 425,021 |
| (cost $376,800) | | | | | | | | |
| | | | | | | | | |
| Rights - 0.0% | | | | | | | | |
| United Kingdom | | | | | | | | |
| GVC CVR *(4)(5) | 825,418 | | | 825,418 | - | | | - |
| | | | | | | | | |
| Total Rights | | | | | - | | | - |
| (cost $—) | | | | | | | | |
| | | | | | | | | |
| Warrants - 0.0% | | | | | | | | |
| British Virgin Islands | | | | | | | | |
| J2 Acquisition Ltd. *,# | 159,200 | | (159,200) | - | 78,008 | | (78,008) | - |
| | | | | | | | | |
| Total Warrants | | | | | 78,008 | | (78,008) | - |
| (cost $—) | | | | | | | | |
| | | | | | | | | |
| Escrows - 0.0% | | | | | | | | |
See accompanying notes to pro forma financial statements.
| | Shares | Value($) |
Description (All
percentages are based on
the Acquiring Fund Pro
Forma’s net assets) | Acquired
Fund | Acquiring
Fund | Pro Forma
Adjustments
Increase/
(Decrease) | Acquiring
Fund Pro
Forma | Acquired
Fund | Acquiring
Fund | Pro Forma
Adjustments
Increase/
(Decrease) | Acquiring
Fund Pro
Forma |
| United States | | | | | | | | |
| Birst, Inc. Escrow*(2)(3)(4)(5) | 151,796 | | | 151,796 | 14,421 | | | 14,421 |
| Lithium Technology Corp., Escrow*(2)(3)(4)(5) | 198,151 | | | 198,151 | 59,445 | | | 59,445 |
| One Kings Lane, Inc., Escrow*(2)(3)(4)(5) | 46,766 | | | 46,766 | 8,418 | | | 8,418 |
| Veracode, Inc. Escrow*(2)(3)(4)(5) | 28,813 | | | 28,813 | 115,828 | | | 115,828 |
| | | | | | | | | |
| Total Escrows | | | | | 198,112 | | | 198,112 |
| (cost $—) | | | | | | | | |
| | | | | | | | | |
| Total Long-Term Investments | | | | | 1,035,835,872 | 70,551,231 | 2,759,134 | 1,109,146,237 |
| (cost $1,055,938,366) | | | | | | | | |
| | | | | | | | | |
| SHORT-TERM INVESTMENTS — 2.5% | | | | | | | | |
| Other Investment Pools & Funds - 0.7% | | | | | | | | |
| BlackRock Liquidity Funds TempFund Portfolio, | 6,543,901 | 1,367,267 | | 7,911,168 | 6,543,901 | 1,367,267 | (2,759,134) | 5,152,034 |
| Institutional Class, 1.60% (7) | | | | | | | | |
| Securities Lending Collateral - 1.5% | | | | | | | | |
| Citibank NA DDCA, 1.50%, 5/1/2018((7) | 884,955 | 92,703 | | 977,658 | 884,955 | 92,703 | | 977,658 |
| Goldman Sachs Financial Sq, Government | | | | | | | | |
| Institutional Fund, 1.60%(7) | 9,417,669 | 986,537 | (2,759,134) | 7,645,072 | 9,417,669 | 986,537 | | 10,404,206 |
| Invesco Government & Agency Portfolio, 1.60%(7) | 7,396,485 | 774,810 | | 8,171,295 | 7,396,485 | 774,810 | | 8,171,295 |
| | | | | | | | | |
| TOTAL SHORT-TERM INVESTMENTS | | | | | 24,243,010 | 3,221,317 | (2,759,134) | 24,705,193 |
| (Cost $24,705,193) | | | | | | | | |
| | | | | | | | | |
| TOTAL INVESTMENTS — 101.8% | | | | | 1,060,078,882 | 73,772,548 | - | 1,133,851,430 |
| (Cost $1,083,402,693) (f) | | | | | | | | |
| Other Assets/(Liabilities) — (1.8)% | | | | | (18,767,246) | (1,393,593) | | (20,160,839) |
| | | | | | | | | |
| NET ASSETS — 100.0% | | | | | 1,041,311,636 | 72,378,955 | | 1,113,690,591 |
Note: Percentage of investments as shown is the ratio of the total market value to total net assets.
See accompanying notes to pro forma financial statements.
Prices of foreign equities that are principally traded on certain foreign markets will generally be adjusted daily pursuant to a fair value pricing service approved by the Board of Directors in order to reflect an adjustment for factors occurring after the close of certain foreign markets but before the close of the New York Stock Exchange.
Other than the industry classifications “Other Investment Pools & Funds,” equity industry classifications used in this report are the Global Industry Classification Standard, which was developed by and is the exclusive property and service mark of MSCI, Inc. and Standard & Poor’s.
For Fund compliance purposes, the Fund may not use the same classification system shown in this report as these classifications are used for financial reporting purposes.
* Non-income producing.
(1) Represents entire or partial securities on loan.
(2) Investment valued using significant unobservable inputs.
(3) This security is valued in good faith at fair value as determined under policies and procedures established by and under the supervision of the Board of Directors. At April 30, 2018, the aggregate fair value of this security was $27,256,293, which represented 2.4% of total net assets. This amount excludes securities that are principally traded in certain foreign markets and whose prices are adjusted pursuant to a third party pricing service methodology approved by the Board of Directors.
(4) This security has been identified as illiquid. Illiquid securities are often purchased in private placement transactions, are often not registered under the Securities Act of 1933, as amended, and may have contractual restrictions on resale. A security may also be considered illiquid if the security lacks a readily available market or if its valuation has not changed for a certain period of time. The identification of illiquid securities is unaudited. At April 30, 2018, the aggregate value of these securities was $27,256,293, which represents 2.4% of total net assets.
(5) Securities issued within terms of a private placement memorandum and exempt from registration under Rule 144A under the Securities Act of 1933, as amended, and may be sold to qualified institutional buyers. Unless otherwise indicated, these holdings are determined to be liquid. At April 30, 2018, the aggregate value of these securities was $32,360,729, which represented 2.9% of total net assets.
(6) The following illiquid securities are considered restricted due to a contractual lock-up period associated with the securities.
Period
Acquired | Security Name | Shares/
Par Value | Base
Total Cost | Base
Market Value |
| 1.2014 | Dropbox, Inc. Series C Preferred | 7,113 | $ 203,791 | $ 197,267 |
| 1.2015 | Zuora, Inc. Series F Preferred | 80,354 | 610,582 | 1,407,473 |
| | | | $ 814,373 | $ 1,604,740 |
(7) Current yield as of period end.
# All or a portion of this security to be sold in connection with the Reorganization.
| Foreign Currency Contracts Outstanding at April 30, 2018 | | | | | |
Amount and Description
of Currency to be
Purchased | Amount and Description
of Currency to be
Sold | Counterparty | Settlement Date | Appreciation | Depreciation |
| 6,104,697 USD | 645,590,000 JPY | ANZ | 6/20/2018 | $178,345 | $ — |
| GLOSSARY: (abbreviations used in preceding Schedule of Investments) |
| Counterparty Abbreviations: |
| ANZ Australia and New Zealand Banking Group |
| |
| Currency Abbreviations: |
| JPY Japanese Yen |
| USD United States Dollar |
| |
| Other Abbreviations: |
| ACWI All Country World Index |
See accompanying notes to pro forma financial statements.
| ADR American Depositary Receipt |
| DDCA Dollars on Deposit in Custody Account |
| ETF Exchange-Traded Fund |
| MSCI Morgan Stanley Capital International |
| PJSC Private Joint Stock Company |
| REIC Real Estate Investment Company |
| REIT Real Estate Investment Trust |
| JSC Joint Stock Company |
| OJSC Open Joint Stock Company |
Fair Valuation Summary
Acquired Fund
The following is the aggregate value by input level, as of April 30, 2018:
| Assets | Level 1(1) | Level 2(1) | Level 3(1) | Total |
| Common Stock | | | | |
| Australia | $2,611,112 | $7,072,519 | — | $9,683,631 |
| Austria | — | 4,422,165 | — | 4,422,165 |
| Bermuda | 4,148,278 | — | — | 4,148,278 |
| Brazil | 29,217,406 | — | — | 29,217,406 |
| British Virgin Islands | 1,489,157 | — | 692,081 | 2,181,238 |
| Canada | 39,439,654 | — | — | 39,439,654 |
| Chile | — | 1,337,941 | — | 1,337,941 |
| China | 32,951,050 | 6,756,998 | 58,650 | 39,766,698 |
| Denmark | 2,474,312 | — | — | 2,474,312 |
| France | 7,232,360 | 35,594,388 | — | 42,826,748 |
| Germany | 7,319,985 | 14,668,585 | — | 21,988,570 |
| Greece | — | 2,988,174 | — | 2,988,174 |
| Hong Kong | 8,005,911 | 2,127,232 | — | 10,133,143 |
| India | 940,032 | 11,987,620 | — | 12,927,652 |
| Ireland | 1,868,487 | 13,806,850 | — | 15,675,337 |
| Isle of Man | — | 1,551,508 | — | 1,551,508 |
| Israel | 2,786,795 | — | — | 2,786,795 |
| Italy | — | 14,515,283 | — | 14,515,283 |
| Japan | 15,986,444 | 44,098,743 | — | 60,085,187 |
| Jersey | 1,431,172 | — | — | 1,431,172 |
| Luxembourg | 9,957,260 | — | — | 9,957,260 |
| Malaysia | 2,183,405 | — | — | 2,183,405 |
| Mexico | 1,953,978 | — | — | 1,953,978 |
| Netherlands | 13,115,414 | 3,443,451 | — | 16,558,865 |
| Norway | — | 1,189,604 | — | 1,189,604 |
See accompanying notes to pro forma financial statements.
| Assets | Level 1(1) | Level 2(1) | Level 3(1) | Total |
| Russia | 6,039,442 | — | — | 6,039,442 |
| Singapore | 1,682,513 | — | — | 1,682,513 |
| South Korea | 11,865,000 | 9,504,908 | — | 21,369,908 |
| Spain | 8,297,402 | 8,810,688 | — | 17,108,090 |
| Sweden | — | 4,242,389 | 303,360 | 4,545,749 |
| Switzerland | 26,949,900 | 4,388,350 | — | 31,338,250 |
| Taiwan | 11,355,242 | — | — | 11,355,242 |
| United Kingdom | 48,129,187 | 18,168,445 | — | 66,297,632 |
| United States | 352,040,799 | 136,770,670 | 10,767,245 | 499,578,714 |
| Exchange-Traded Funds | 10,547,471 | — | — | 10,547,471 |
| Preferred Stocks | — | — | 13,847,716 | 13,847,716 |
| Convertible Preferred Stocks | — | — | 425,021 | 425,021 |
| Rights | — | — | — | — |
| Warrants | 78,008 | — | — | 78,008 |
| Escrows | — | — | 198,112 | 198,112 |
| Short-Term Investments | 24,243,010 | — | — | 24,243,010 |
| Foreign Currency Contracts(2) | — | 178,345 | — | 178,345 |
| Total Investments | $686,340,186 | $347,624,856 | $26,292,185 | 1,060,257,227 |
(1) For the year ended April 30, 2018 investments valued at $17,791,783 were transferred from Level 1 to Level 2 due to the application of a fair valuation factor; investments valued at $8,263,031 were transferred from Level 2 to Level 3 due to the unavailability of active market pricing; investments valued at $5,056,817 were transferred from Level 2 to Level 1 due to the discontinuation of a fair valuation factor; investments valued at $531,258 were transferred from Level 1 to Level 3 due to the unavailability of active market pricing.
(2) Derivative instruments (excluding purchased and written options, if applicable) are valued at the unrealized appreciation/(depreciation) on the investments.
The following is a rollforward of the Fund’s investments that were valued using unobservable inputs (Level 3) for the year ended April 30, 2018:
| Investments in Securities | Common Stocks | Preferred Stocks | Convertible Preferred Stocks | Escrows | Total |
| Beginning balance | 2,212,798 | 16,546,289 | 425,021 | — | 19,184,108 |
| Conversions* | (207,331) | — | — | 207,331 | — |
| Accrued Discounts (Premiums) | — | — | — | — | — |
| Realized Gain (Loss) | 351,318 | 612,969 | — | — | 964,287 |
| Change in Unrealized Appreciation (Depreciation) | 52,421 | (1,747,001) | — | (9,219) | (1,703,799) |
| Net Purchases | 3,130,770 | — | — | — | 3,130,770 |
| Net Sales | (2,512,929) | (1,564,541) | — | — | (4,077,470) |
| Net Transfers in to Level 3 | 8,794,289 | — | — | — | 8,794,289 |
| Net Transfers out of Level 3 | — | — | — | — | — |
| Ending balance | 11,821,336 | 13,847,716 | 425,021 | 198,112 | 26,292,185 |
The change in net unrealized appreciation/(depreciation) relating to the Level 3 investments held at April 30, 2018 was $(1,141,655).
* Private Equity securities that were a common stock are now trading as escrow.
See accompanying notes to pro forma financial statements.
Acquiring Fund
The following is the aggregate value by input level, as of as of April 30, 2018:
| Investments | Level 1(1) | Level 2(1) | Level 3(1) | Total |
| Common Stock | | | | |
| Argentina | $419,320 | $— | $— | $419,320 |
| Australia | — | 1,505,953 | — | 1,505,953 |
| Austria | — | 346,050 | — | 346,050 |
| Belgium | — | 626,110 | — | 626,110 |
| Brazil | 2,188,915 | — | — | 2,188,915 |
| Canada | 6,428,247 | — | — | 6,428,247 |
| China | 1,674,226 | 3,472,288 | 4,887 | 5,146,514 |
| Colombia | 89,181 | — | — | 89,181 |
| Denmark | — | 293,319 | — | 293,319 |
| Finland | — | 59,438 | — | 59,438 |
| France | — | 6,050,516 | — | 6,050,516 |
| Germany | — | 2,400,503 | — | 2,400,503 |
| Greece | — | 271,441 | — | 271,441 |
| Hong Kong | 11,632 | 1,917,452 | — | 1,929,084 |
| Hungary | — | 189,394 | — | 189,394 |
| India | 375,571 | 609,620 | — | 985,191 |
| Ireland | 300,623 | 611,277 | — | 911,900 |
| Italy | — | 2,643,348 | — | 2,643,348 |
| Japan | — | 10,050,085 | — | 10,050,085 |
| Luxembourg | 332,394 | — | — | 332,394 |
| Malaysia | — | 1,036,955 | — | 1,036,955 |
| Netherlands | 233,334 | 1,312,512 | — | 1,545,846 |
| Norway | — | 425,416 | — | 425,416 |
| Poland | — | 217,040 | — | 217,040 |
| Portugal | — | 224,496 | — | 224,496 |
| Russia | 577,495 | 450,016 | — | 1,027,511 |
| Singapore | — | 1,081,277 | — | 1,081,277 |
| South Africa | 93,271 | 161,061 | — | 254,332 |
| South Korea | 122,469 | 1,540,240 | 959,221 | 2,621,930 |
| Spain | 193,908 | 1,320,547 | — | 1,514,455 |
| Sweden | — | 791,468 | — | 791,468 |
| Switzerland | — | 4,879,118 | — | 4,879,118 |
| Taiwan | — | 2,293,643 | — | 2,293,643 |
| United Kingdom | 359,360 | 7,814,561 | — | 8,173,921 |
| Vietnam | — | 33,685 | — | 33,685 |
| Exchange-Traded Funds | 1,437,626 | — | — | 1,437,626 |
| Preferred Stocks | 120,722 | — | — | 120,722 |
See accompanying notes to pro forma financial statements.
| Investments | Level 1(1) | Level 2(1) | Level 3(1) | Total |
| Short-Term Investments | 3,221,317 | — | — | 3,221,317 |
| Total Investments | $18,179,611 | $54,628,829 | $964,108 | $73,772,548 |
(1) For the year ended April 30, 2018, investments valued at $1,710,264 were transferred from Level 1 to Level 2 due to the application of a fair valuation factor; investments valued at $210,778 were transferred from Level 2 to Level 1 due to the discontinuation of a fair valuation factor and investments valued at $631,067 were transferred from Level 2 to Level 3 due to the unavailability of active market pricing.
| | Common Stocks | Total |
| Beginning balance | $43 | $43 |
| Purchases | 494,535 | 494,535 |
| Sales | (183,622) | (183,622) |
| Total realized gain/(loss) | 70,904 | 70,904 |
| Net change in unrealized appreciation/depreciation | (48,819) | (48,819) |
| Transfers into Level 3 | 631,067 | 631,067 |
| Ending balance | $964,108 | $964,108 |
The change in net unrealized appreciation/depreciation relating to the Level 3 investments held at April 30, 2018 was $(48,819).
Acquiring Fund Pro Forma
The following is the aggregate value by input level, as of April 30, 2018:
| | Level 1 | Level 2 | Level 3 | Pro Forma
Adjustments
Increase/(Decrease) | Total |
| Investments | | | | | |
| Common Stock | | | | | |
| Argentina | $419,320 | $— | $— | $6,078,971 | $6,498,291 |
| Australia | 2,611,112 | 8,578,472 | — | 12,148,591 | 23,338,175 |
| Austria | — | 4,768,215 | — | 594,589 | 5,362,804 |
| Belgium | — | 626,110 | — | 9,076,910 | 9,703,020 |
| Bermuda | 4,148,278 | — | — | (4,148,278) | 0 |
| Brazil | 31,406,321 | — | — | 2,516,008 | 33,922,329 |
| British Virgin Islands | 1,489,157 | — | 692,081 | (2,181,238) | 0 |
| Canada | 45,867,901 | — | — | 53,752,691 | 99,620,592 |
| Chile | — | 1,337,941 | — | (1,337,941) | 0 |
| China | 34,625,276 | 10,229,286 | 63,537 | 34,914,455 | 79,832,554 |
| Colombia | 89,181 | — | — | 1,292,894 | 1,382,075 |
| Denmark | 2,474,312 | 293,319 | — | 1,777,376 | 4,545,007 |
| Finland | — | 59,438 | — | 861,689 | 921,127 |
| France | 7,232,360 | 41,644,904 | — | 44,889,500 | 93,766,764 |
| Germany | 7,319,985 | 17,069,088 | — | 12,812,377 | 37,201,450 |
| Greece | — | 3,259,615 | — | 946,978 | 4,206,593 |
| Hong Kong | 8,017,543 | 4,044,684 | — | 17,834,174 | 29,896,401 |
| Hungary | — | 189,394 | — | 2,745,716 | 2,935,110 |
| India | 1,315,603 | 12,597,240 | — | 1,355,051 | 15,267,894 |
See accompanying notes to pro forma financial statements.
| | Level 1 | Level 2 | Level 3 | Pro Forma
Adjustments
Increase/(Decrease) | Total |
| Ireland | 2,169,110 | 14,418,127 | — | (2,445,685) | 14,141,552 |
| Isle of Man | — | 1,551,508 | — | (1,551,508) | 0 |
| Israel | 2,786,795 | — | — | (2,786,795) | 0 |
| Italy | — | 17,158,631 | — | 23,806,156 | 40,964,787 |
| Japan | 15,986,444 | 54,148,828 | — | 85,613,905 | 155,749,177 |
| Jersey | 1,431,172 | — | — | (1,431,172) | 0 |
| Luxembourg | 10,289,654 | — | — | (5,138,523) | 5,151,131 |
| Malaysia | 2,183,405 | 1,036,955 | — | 12,849,800 | 16,070,160 |
| Mexico | 1,953,978 | — | — | (1,953,978) | 0 |
| Netherlands | 13,348,748 | 4,755,963 | — | 5,851,742 | 23,956,453 |
| Norway | — | 1,615,020 | — | 4,516,241 | 6,131,261 |
| Poland | — | 217,040 | — | 3,146,527 | 3,363,567 |
| Portugal | — | 224,496 | — | 3,254,580 | 3,479,076 |
| Russia | 6,616,937 | 450,016 | — | 8,856,735 | 15,923,688 |
| Singapore | 1,682,513 | 1,081,277 | — | 13,993,165 | 16,756,955 |
| South Africa | 93,271 | 161,061 | — | 3,687,122 | 3,941,454 |
| South Korea | 11,987,469 | 11,045,148 | 959,221 | 16,641,090 | 40,632,928 |
| Spain | 8,491,310 | 10,131,235 | — | 4,847,439 | 23,469,984 |
| Sweden | — | 5,033,857 | 303,360 | 7,231,803 | 12,569,020 |
| Switzerland | 26,949,900 | 9,267,468 | — | 39,358,041 | 75,575,409 |
| Taiwan | 11,355,242 | 2,293,643 | — | 21,896,458 | 35,545,343 |
| United Kingdom | 48,488,547 | 25,983,006 | — | 52,202,268 | 126,673,821 |
| United States | 352,040,799 | 136,770,670 | 10,767,245 | (498,071,544) | 1,507,170 |
| Vietnam | — | 33,685 | — | 488,339 | 522,024 |
| Exchange-Traded Funds | 11,985,097 | — | — | 10,294,273 | 22,279,370 |
| Preferred Stocks | 120,722 | — | 13,847,716 | 1,750,151 | 15,718,589 |
| Convertible Preferred Stocks | — | — | 425,021 | | 425,021 |
| Rights | — | — | — | | 0 |
| Warrants | 78,008 | — | — | (78,008) | 0 |
| Escrows | — | — | 198,112 | | 198,112 |
| Short-Term Investments | 27,464,327 | — | — | (2,759,135) | 24,705,192 |
| Foreign Currency Contracts(2) | — | 178,345 | — | | 178,345 |
| Total | $704,519,797 | $402,253,685 | $27,256,293 | $0 | $1,134,029,775 |
See accompanying notes to pro forma financial statements.
Pro Forma Statement of Assets and Liabilities as of April 30, 2018 (Unaudited)
| | Hartford Global Capital
Appreciation Fund (Acquired
Fund) | Hartford International Equity
Fund (Acquiring Fund) | Pro Forma
Adjustments | Pro Forma Acquiring
Fund |
| Assets: | | | | |
| Investments in securities, at market value(1) | $ 1,060,078,882 | $ 73,772,548 | $ - | $ 1,133,851,430 |
| Cash | 115,321 | - | - | 115,321 |
| Foreign currency | 267,475 | 95,149 | - | 362,624 |
| Unrealized appreciation on foreign currency contracts | 178,345 | - | - | 178,345 |
| Receivables: | - | - | - | - |
| Investment securities sold | 3,439,320 | 737,510 | - | 4,176,830 |
| Fund shares sold | 530,286 | 222,195 | - | 752,481 |
| Dividends and interest | 1,992,217 | 197,540 | - | 2,189,757 |
| Securities lending income | 17,621 | 860 | - | 18,481 |
| Tax reclaims | 818,091 | 58,789 | - | 876,880 |
| Other assets | 99,285 | 81,052 | - | 180,337 |
| Total assets | 1,067,536,843 | 75,165,643 | - | 1,142,702,486 |
| Liabilities: | | | | |
| Obligation to return securities lending collateral | 17,699,109 | 1,854,050 | - | 19,553,159 |
| Payables: | - | - | - | - |
| Investment securities purchased | 6,518,014 | 817,756 | - | 7,335,770 |
| Fund shares redeemed | 820,295 | 33,411 | - | 853,706 |
| Investment management fees | 682,754 | 27,002 | - | 709,756 |
| Transfer agent fees | 268,365 | 6,253 | - | 274,618 |
| Accounting services fees | 18,936 | 1,057 | - | 19,993 |
| Board of Directors' fees | 4,007 | 61 | - | 4,068 |
| Distribution fees | 49,057 | 1,560 | - | 50,617 |
| Distributions payable | 55 | - | - | 55 |
| Accrued expenses | 164,615 | 45,538 | - | 210,153 |
| Total liabilities | 26,225,207 | 2,786,688 | - | 29,011,895 |
| Total Net assets | $ 1,041,311,636 | $ 72,378,955 | $ - | $ 1,113,690,591 |
| | | | | |
| Summary of Net Assets: | | | | |
| Capital stock and paid-in-capital | $ 933,863,385 | $ 65,570,603 | $ - | $ 999,433,988 |
| Undistributed (distributions in excess of) net investment income | $ 1,630,850 | $ 252,134 | $ - | $ 1,882,984 |
| Accumulated net realized gain (loss) | $ 58,513,672 | $ 3,417,558 | $ - | $ 61,931,230 |
| Unrealized appreciation (depreciation) of investments and the translation of assets and liabilities denominated in foreign currency | $ 47,303,729 | $ 3,138,660 | $ - | $ 50,442,389 |
| Net assets | $ 1,041,311,636 | $ 72,378,955 | $ - | $ 1,113,690,591 |
| | | | | |
See accompanying notes to pro forma financial statements.
| | Hartford Global Capital
Appreciation Fund (Acquired
Fund) | Hartford International Equity
Fund (Acquiring Fund) | Pro Forma
Adjustments | Pro Forma Acquiring
Fund |
| Net Assets | | | | |
| Class A | $ 638,905,293 | $ 20,153,227 | $ - | $ 659,058,520 |
| Class T(2) | N/A | N/A | N/A | N/A |
| Class C | $ 179,322,906 | $ 5,741,116 | $ - | $ 185,064,022 |
| Class I | $ 118,731,024 | $ 23,759,228 | $ - | $ 142,490,252 |
| Class R3 | $ 22,952,905 | $ 79,385 | $ - | $ 23,032,290 |
| Class R4 | $ 17,988,229 | $ 790,168 | $ - | $ 18,778,397 |
| Class R5 | $ 369,544 | $ 406,477 | $ - | $ 776,021 |
| Class R6 | N/A | $ 10,001 | $ - | $ 10,001 |
| Class Y | $ 15,614,947 | $ 18,647,658 | $ - | $ 34,262,605 |
| Class F | $ 47,426,788 | $ 2,791,695 | $ - | $ 50,218,483 |
| Total Net assets | $ 1,041,311,636 | $ 72,378,955 | $ - | $ 1,113,690,591 |
| | | | | |
| Share Outstanding | | | | |
| Class A | 34,085,680 | 1,766,962 | 21,909,525 | 57,762,167 |
| Class T(2) | N/A | N/A | N/A | N/A |
| Class C | 10,460,619 | 508,930 | 5,436,802 | 16,406,351 |
| Class I | 6,144,530 | 2,064,952 | 4,170,937 | 12,380,419 |
| Class R3 | 1,243,614 | 6,982 | 775,111 | 2,025,707 |
| Class R4 | 945,645 | 69,208 | 629,506 | 1,644,359 |
| Class R5 | 19,007 | 40,520 | 17,837 | 77,364 |
| Class R6 | N/A | 871 | - | 871 |
| Class Y | 796,060 | 1,623,737 | 564,127 | 2,983,924 |
| Class F | 2,453,878 | 242,009 | 1,655,896 | 4,351,783 |
| Net Asset Value per Share | | | | |
| Class A | $ 18.74 | $ 11.41 | $ - | $ 11.41 |
| Class T(2) | N/A | N/A | N/A | N/A |
| Class C | $ 17.14 | $ 11.28 | $ - | $ 11.28 |
| Class I | $ 19.32 | $ 11.51 | $ - | $ 11.51 |
| Class R3 | $ 18.46 | $ 11.37 | $ - | $ 11.37 |
| Class R4 | $ 19.02 | $ 11.42 | $ - | $ 11.42 |
| Class R5 | $ 19.44 | $ 10.03 | $ - | $ 10.03 |
| Class R6 | N/A | $ 11.48 | | $ 11.48 |
| Class Y | $ 19.62 | $ 11.48 | $ - | $ 11.48 |
| Class F | $ 19.33 | $ 11.54 | $ - | $ 11.54 |
| Cost of investments | $ 1,012,774,550 | $ 70,628,143 | | $ 1,083,402,693 |
| Cost of foreign currency | $ 267,588 | $ 95,389 | | $ 362,977 |
| (1) | Includes Investment in securities on loan, at value: Acquired Fund ($17,008,528); Acquiring Fund ($1,766,388); and Acquiring Fund Pro Forma ($18,744,916). |
| (2) | Class T shares have not commenced operations as of the date of this Statement of Additional Information. |
See accompanying notes to pro forma financial statements.
Pro Forma Statement of Operations Year Ended April 30, 2018 (Unaudited)
| | Acquired Fund | Acquiring Fund | Pro Forma
Adjustments | Pro Forma Acquiring
Fund |
| Investment Income: | | | | |
| Dividends | $ 21,231,858 | $ 1,359,261 | $ - | $ 22,591,119 |
| Interest | 169,004 | 16,217 | - | 185,221 |
| Other income | 1 | 1 | - | 2 |
| Non-cash dividends | 514,790 | 49,086 | - | 563,876 |
| Securities lending | 25,378 | 1,238 | - | 26,616 |
| Less: Foreign tax withheld | (1,036,677) | (130,040) | - | (1,166,717) |
| Total Investment Income | 20,904,354 | 1,295,763 | | 22,200,117 |
| Expenses: | | | | |
| Investment management fees | 8,468,489 | 302,294 | (3,659,175)(1) | 5,111,608 |
| Custodian fees | 107,034 | 44,107 | - | 151,141 |
| Audit fees | 49,164 | 62,825 | (49,164)(2) | 62,825 |
| Accounting services fees | 235,323 | 9,371 | (44,230)(3) | 200,464 |
| Shareholder reporting fees | | | | - |
| Board of Directors’ fees | 30,003 | 1,158 | - | 31,161 |
| Registration and filing fees | 149,445 | 118,674 | (149,445)(2) | 118,674 |
| Transfer agent fees | | | | |
| Class A | 1,090,091 | 28,407 | | 1,118,498 |
| Class B* | 4,433 | 24 | | 4,457 |
| Class C | 240,831 | 7,465 | | 248,296 |
| Class I | 121,601 | 18,048 | | 139,649 |
| Class R3 | 4,378 | 130 | | 4,508 |
| Class R4 | 1,507 | 215 | | 1,722 |
| Class R5 | 144 | 63 | (52)(4) | 155 |
| Class Y | 6,640 | 582 | | 7,222 |
| Class F | 8 | 5 | | 13 |
| Administrative services fees | | | | |
| Class R3 | 48,819 | 181 | - | 49,000 |
| Class R4 | 28,771 | 991 | - | 29,762 |
| Class R5 | 455 | 401 | - | 856 |
| Distribution fees | | | | |
| Class A | 1,651,602 | 39,821 | - | 1,691,423 |
| Class B* | 4,681 | 205 | - | 4,886 |
| Class C | 1,955,290 | 44,752 | - | 2,000,042 |
| Class R3 | 122,050 | 453 | - | 122,503 |
| Class R4 | 47,951 | 1,652 | - | 49,603 |
| Other expenses | 157,786 | 19,315 | (28,117)(2) | 148,984 |
| Total expenses (before waivers and fees paid indirectly) | 14,526,496 | 701,139 | (3,930,184) | 11,297,451 |
| Expenses waived: | | | | |
| Expense waivers | (242,391) | (212,507) | - | (454,898) |
| Transfer agent fee waivers | (3,013) | 1 | - | (3,012) |
| Distribution fee reimbursements | (29,607) | (749) | - | (30,356) |
| Commission recapture | (16,390) | (81) | - | (16,471) |
| Total expenses, net | 14,235,095 | 487,803 | (3,930,184) | 10,792,714 |
| Net Investment Income (Loss) | 6,669,259 | 807,960 | 3,930,184 | 11,407,403 |
| Net Realized Gain (Loss) on Investments, Other Financial Instruments and Foreign Currency Transactions: | | | | |
| Net realized gain (loss) on: | | | | |
| Net realized gain (loss) on investments | 128,106,732 | 5,774,021 | - | 133,880,753 |
| Less: Foreign taxes paid on realized capital gains | - | (6,661) | - | (6,661) |
| Net realized gain (loss) on foreign currency contracts | (851,778) | (4,183) | - | (855,961) |
| Net realized gain (loss) on other foreign currency transactions | (323,646) | (43,490) | - | (367,136) |
| Net Realized Gain (Loss) on Investments, Other Financial Instruments and Foreign Currency Transactions | 126,931,308 | 5,719,687 | - | 132,650,995 |
See accompanying notes to pro forma financial statements.
| | Acquired Fund | Acquiring Fund | Pro Forma
Adjustments | Pro Forma Acquiring
Fund |
| Net Changes in Unrealized Appreciation (Depreciation) of Investments, Other Financial Instruments and Foreign Currency Transactions: | | | | |
| Net unrealized appreciation (depreciation) of investments | (32,648,754) | (84,417) | - | (32,733,171) |
| Net unrealized appreciation (depreciation) of foreign currency contracts | 722,372 | 4,174 | - | 726,546 |
| Net unrealized appreciation (depreciation) of translation of other assets and liabilities in foreign currencies | (149,217) | (5,772) | - | (154,989) |
| Net Changes in Unrealized Appreciation (Depreciation) of Investments, Other Financial Instruments and Foreign Currency Transactions | (32,075,599) | (86,015) | - | (32,161,614) |
| Net Increase (Decrease) in Net Assets Resulting from Operations | $ 101,524,968 | $ 6,441,632 | $ 3,930,184 | $ 111,896,784 |
| * | Any remaining Class B shares converted to Class A shares on September 19, 2017. |
| (1) | Pro Forma investment management fees reflect the application of the Acquiring Fund’s management fee schedule, which is lower than that of the Acquired Fund. |
| (2) | Reflects the anticipated reduction of certain duplicative expenses eliminated as a result of the Reorganization. |
| (3) | These fees are asset based. As a result of the Reorganization, it is anticipated that the addition of the Acquired Fund assets to the Acquiring Fund will not result in the Combined Fund Pro Forma expense exceeding the next breakpoint, if any. |
| (4) | Transfer agency fees have been restated to reflect current fees. |
See accompanying notes to pro forma financial statements.
Notes to Pro Forma Financial Statements (Unaudited)
| (1) | General. The accompanying unaudited pro forma financial statements give effect to the reorganization of the Hartford Global Capital Appreciation Fund (the “Acquired Fund”), a series of The Hartford Mutual Funds, Inc. (the “Company”) into the Hartford International Equity Fund (the “Acquiring Fund”), a separate series of the Company, (the “Reorganization”), pursuant to the terms of an Agreement and Plan of Reorganization (“Plan”). The Company is an open-end registered management investment company. Each Fund has registered for sale Class A, Class, T, Class C, Class I, Class R3, Class R4, Class R5, Class Y and Class F shares. As of April 30, 2018, Class T shares have not commenced operations. The Acquiring Fund has also registered for sale Class R6 shares. The pro forma financial information set forth in the preceding statements and the corresponding notes is as of and for the unaudited twelve-month period ended April 30, 2018 and is intended to present the data as if the Reorganization had occurred as of April 30, 2018 and at the beginning, or May 1, 2017, of the unaudited twelve-month period, as applicable. The pro forma financial information provided herein should be read in conjunction with the Funds’ annual and semi-annual reports, which are incorporated by reference to this Statement of Additional Information. All pro forma estimates are approximate, based on factors that could change, and subject to potential revision. |
| (2) | Basis of the Combination. The Reorganization will be accounted for as a tax-free reorganization for federal income tax purposes. Accordingly, pursuant to this treatment, neither the Acquired Fund nor its shareholders, nor the Acquiring Fund nor its shareholders, are expected to recognize any gain or loss as a result of the Reorganization, excluding any net capital gains that are expected to arise from the sale of investment securities related to portfolio realignment. For financial reporting purposes, the historical cost basis of the investments received from the Acquired Fund will be carried forward to align ongoing reporting of the realized and unrealized gains and losses of the surviving fund (which will be the Acquiring Fund) with amounts distributable to shareholders for tax purposes. |
The Plan provides for: (a) the transfer of all of the assets of the Acquired Fund to the Acquiring Fund in exchange for shares of the Acquiring Fund that have an aggregate net asset value equal to the aggregate net asset value of the shares of the Acquired Fund on the valuation date for the Reorganization; (b) the assumption by the Acquiring Fund of all of the liabilities of the Acquired Fund; and (c) the distribution of shares of the Acquiring Fund to the shareholders of the Acquired Fund in complete liquidation of the Acquired Fund.
The Acquiring Fund will be the accounting survivor. The Combined Fund will have the portfolio management team, portfolio composition, strategies, investment objectives, expense structure and policies/restrictions of the Acquiring Fund. No significant accounting policies will change as a result of the Reorganization, specifically policies regarding security valuation or compliance with Subchapter M of the Internal Revenue Code of 1986, as amended (the “Code”). No significant changes to any existing contracts of the Acquiring Fund are expected as a result of the Reorganization. As of October 31, 2017, neither Fund has any capital loss carryforwards.
Hartford Funds Management Company, LLC (“HFMC”), the investment adviser to both Funds, or its affiliates, will bear all costs associated with the Reorganization, other than brokerage-related expenses, including stamp taxes and other similar transaction costs, which will be borne by the respective Fund, as applicable. The Reorganization does not require shareholder approval and is anticipated to occur on or about October 29, 2018.
| (3) | Investment Valuation. For purposes of calculating the net asset value (“NAV”) of each Fund, portfolio securities and other assets held in the Fund’s portfolio for which market prices are readily available are valued at market value. Market value is generally determined on the basis of last reported trade prices or official close price. If no trades were reported, market value is based on prices obtained from a quotation reporting system, established market makers, or independent pricing services. If market prices are not readily available or are deemed unreliable, a Fund will use the fair value of the security or other instrument as determined in good faith under policies and procedures established by and under the supervision of the Board of Directors of the Company. Market prices are considered not readily available where there is an absence of current or reliable market-based data (e.g., trade information or broker quotes), including where events occur after the close of the relevant market, but prior to the NYSE Close that materially affect the values of a Fund’s portfolio holdings or assets. In addition, market prices are considered not readily available when, due to extraordinary circumstances, the exchanges or markets on which the securities or other instruments trade do not open for trading for the entire day and no other market prices are available. In addition, prices of foreign equities that are principally traded on certain foreign markets will generally be adjusted daily pursuant to a fair value pricing service approved by the Company’s Board of Directors in order to reflect an adjustment for the factors occurring after the close of certain foreign markets but before the NYSE Close. Securities and other instruments that are primarily traded on foreign markets may trade on days that are not business days of the Funds. The value of the foreign securities or other instruments in which a Fund invests may change on days when a shareholder will not be able to purchase or redeem shares of the Fund. Fair value pricing is subjective in nature and the use of fair value pricing by a Fund may cause the NAV of its shares to differ significantly from the NAV that would have been calculated using market prices at the close of the exchange on which a portfolio holding is primarily traded. There can be no assurance that a Fund could obtain the fair value assigned to an |
investment if the Fund were to sell the investment at approximately the time at which the Fund determines its NAV.
Fixed income investments (other than short-term obligations and senior floating rate interests), non-exchange-traded derivatives and centrally cleared swaps held by a Fund are normally valued on the basis of quotes obtained from brokers and dealers or independent pricing services in accordance with procedures established by the Company’s Board of Directors. Prices obtained from independent pricing services use information provided by market makers or estimates of market values obtained from yield data relating to investments or securities with similar characteristics. Senior floating rate interests generally trade in over-the-counter (“OTC”) markets and are priced through an independent pricing service utilizing independent market quotations from loan dealers or financial institutions. Generally, a Fund may use fair valuation in regard to fixed income positions when the Fund holds defaulted or distressed investments or investments in a company in which a reorganization is pending. Short-term investments maturing in 60 days or less are generally valued at amortized cost if their original term to maturity was 60 days or less, or by amortizing their value on the 61st day prior to maturity, if the original term exceeded 60 days.
Exchange-traded options, futures and options on futures are valued at the settlement price or last trade price determined by the relevant exchange as of the NYSE Close. If a last trade price is not available, the value will be the mean of the bid and ask prices as of the NYSE Close. If a mean of the bid and ask prices cannot be calculated for the day, the value will be the bid price as of the NYSE Close. In the case of options privately negotiated in the over-the-counter market (“OTC options”) and such instruments that do not trade on an exchange, values may be supplied by a pricing service using a formula or other objective method that may take into consideration the style, direction, expiration, strike price, notional value and volatility or other special adjustments.
Investments valued in currencies other than U.S. dollars are converted to U.S. dollars using exchange rates obtained from independent pricing services for calculation of the NAV. As a result, the NAV of a Fund’s shares may be affected by changes in the value of currencies in relation to the U.S. dollar. The value of securities or other instruments traded in markets outside the United States or denominated in currencies other than the U.S. dollar may be affected significantly on a day that the NYSE is closed and the market value may change on days when an investor is not able to purchase, redeem or exchange shares of a Fund.
Foreign currency contracts represent agreements to exchange currencies on specific future dates at predetermined rates. Foreign currency contracts are valued using foreign currency exchange rates and forward rates as provided by an independent pricing service on the Valuation Date. Investments in open-end mutual funds are valued at the respective NAV of each open-end mutual fund on the Valuation Date. Such open-end mutual funds may use fair value pricing as disclosed in their prospectuses.
Financial instruments for which prices are not available from an independent pricing service may be valued using market quotations obtained from one or more dealers that make markets in the respective financial instrument in accordance with procedures established by the Company’s Board of Directors.
GAAP defines fair value as the price that a Fund would receive to sell an asset or pay to transfer a liability in an orderly transaction between market participants. The GAAP fair value measurement standards require disclosure of a fair value hierarchy for each major category of assets and liabilities. Various inputs are used in determining the fair value of each Fund’s investments. These inputs are summarized into three broad hierarchy levels. This hierarchy is based on whether the valuation inputs are observable or unobservable. These levels are:
• Level 1 – Quoted prices in active markets for identical investments. Level 1 may include exchange-traded instruments, such as domestic equities, some foreign equities, options, futures, mutual funds, exchange-traded funds, rights and warrants.
• Level 2 – Observable inputs other than Level 1 prices, such as quoted prices for similar investments; quoted prices in markets that are not active; or other inputs that are observable or can be corroborated by observable market data. Level 2 may include debt investments that are traded less frequently than exchange-traded instruments and which are valued using independent pricing services; foreign equities, which are principally traded on certain foreign markets and are adjusted daily pursuant to a fair value pricing service in order to reflect an adjustment for the factors occurring after the close of certain foreign markets but before the NYSE Close; senior floating rate interests, which are valued using an aggregate of dealer bids; short-term investments, which are valued at amortized cost; and swaps, which are valued based upon the terms of each swap contract.
• Level 3 – Significant unobservable inputs that are supported by limited or no market activity. Level 3 may include financial instruments whose values are determined using indicative market quotes or require significant management judgment or estimation. These unobservable valuation inputs may include estimates for current yields, maturity/duration, prepayment speed, and indicative market quotes for comparable investments along with other assumptions relating to credit quality, collateral value, complexity of the investment structure, general market conditions and liquidity. This category may include investments where trading has been halted or there are certain restrictions on trading. While these investments are priced
using unobservable inputs, the valuation of these investments reflects the best available data and management believes the prices are a reasonable representation of exit price.
The Board of Directors of the Company generally reviews and approves the “Procedures for Valuation of Portfolio Investments” at least once a year. These procedures define how investments are to be valued, including the formation and activities of a Valuation Committee. The Valuation Committee is responsible for determining in good faith the fair value of investments when the value cannot be obtained from primary pricing services or alternative sources or if the valuation of an investment as provided by the primary pricing service or alternative source is believed not to reflect the investment’s fair value as of the Valuation Date. The Valuation Committee will consider all relevant factors in determining an investment’s fair value, and may seek the advice of such Fund’s sub-adviser, as applicable, knowledgeable brokers, and legal counsel in making such determination. The Valuation Committee reports to the Audit Committee of the Board of Directors of the Company. The Audit Committee receives quarterly written reports which include details of all fair-valued investments, including the reason for the fair valuation, and an indication, when possible, of the accuracy of the valuation by disclosing the next available reliable public price quotation or the disposition price of such investments (the “lookback” test). The Board of Directors of the Company then must consider for ratification all of the fair value determinations made during the previous quarter.
Valuation levels are not necessarily indicative of the risk associated with investing in such investments. Individual investments within any of the above mentioned asset classes may be assigned a different hierarchical level than those presented above, as individual circumstances dictate.
| (4) | Capital Shares. Shareholders of the Acquired Fund will become shareholders of the Acquiring Fund receiving shares of the corresponding class of the Acquiring Fund equal to the value of their holdings in the Acquired Fund. The amount of additional shares assumed to be issued was calculated based on the April 30, 2018 net assets of the Acquired Fund and the net asset value per share of the Acquiring Fund as disclosed within the Pro Forma Statement of Assets and Liabilities as of April 30, 2018 (unaudited). |
| (5) | Use of Estimates. The pro forma information has been derived from the books and records used in calculating daily net asset values of the Acquired Fund and the Acquiring Fund and has been prepared in accordance with GAAP for investment companies. The presentation of financial statement information requires management to make estimates and assumptions that affect this information. Actual results could differ from those estimates. |
| (6) | Portfolio Realignment. Based on assets as of April 30, 2018, it is expected that a portion of the Acquired Fund’s portfolio assets (approximately 77%) will be sold prior to the consummation of the Reorganization. Taking into account unrealized short-term and long-term losses and that there are no capital loss carryforwards available to offset realized gains, it is currently estimated that the Acquired Fund will be required to distribute to its shareholders approximately $40,099,663 in long-term capital gains (approximately $0.7142 per share) as a result of the repositioning (based on assets as of April 30, 2018). It is also estimated that such portfolio repositioning will result in brokerage and other transaction costs, including stamp taxes, of approximately $897,066 or approximately 0.08% (8 basis points) of the Acquired Fund’s net asset value as of April 30, 2018. The preceding are estimates that may change at the time of the Reorganization based on market conditions and other factors. |
| (7) | Subsequent Events. Effective October 1, 2018, Class C shares automatically convert to Class A shares of the same Fund after ten years provided that the Fund or the financial intermediary has records verifying that the Class C shares have been held for at least ten years. Effective October 1, 2018, Class C shares held in an account directly through the Funds’ transfer agent for which no financial intermediary is specified or Hartford Funds Distributors, LLC is listed as the dealer of record will periodically be converted to Class A shares. Effective October 1, 2018, each Fund no longer accepts direct purchases of Class C shares by accounts for which no broker-dealer or other financial intermediary is specified. Any such direct purchase received by the Funds’ transfer agent for Class C shares for such accounts will automatically be invested in Class A shares. |
Effective immediately before the opening of business on June 25, 2018, the Hartford Global Equity Income Fund (“Global Equity Income Fund”) was reorganized into the Acquiring Fund, pursuant to the terms of an agreement and plan of reorganization. Immediately before the opening of business on June 25, 2018, the consummation of the reorganization was accomplished by a tax-free exchange of shares of the Acquiring Fund in the following amounts:
| Share Class | Net Assets of Global
Equity Income Fund as of
business on June 22, 2018 | Shares of the
Global Equity
Income Fund as of
the Valuation Date | Value of Shares
Issued by
Acquiring Fund | Shares Issued By the
Acquiring Fund | Net Assets of the
Acquiring Fund
immediately after the
Reorganization |
| Class A | $112,183,481 | 8,949,924 | $112,183,481 | 10,200,909 | $130,931,462 |
| Class C | 11,791,309 | 964,674 | 11,791,309 | 1,085,206 | 17,222,638 |
| Class I | 9,013,411 | 717,389 | 9,013,411 | 811,990 | 31,707,683 |
| Class R3 | 142,307 | 11,359 | 142,307 | 12,983 | 220,019 |
| Class R4 | 137,200 | 10,908 | 137,200 | 12,461 | 856,077 |
| Class R5 | 252,935 | 20,142 | 252,935 | 26,134 | 650,707 |
| Class R6 | N/A | N/A | N/A | N/A | 9,650 |
| Class Y | 5,270,818 | 424,857 | 5,270,818 | 475,671 | 25,054,016 |
| Class F | 20,819,824 | 1,659,416 | 20,819,824 | 1,870,352 | 23,629,466 |
| Total | $159,611,285 | 12,758,669 | $159,611,285 | 1,158,756 | $230,281,718 |
Each shareholder of a share class of Global Equity Income Fund received shares of the same share class of the Acquiring Fund with the same class designation and at the respective Class NAV, as determined on the close of business on June 22, 2018. Some of the investments held by Global Equity Income Fund may have been purchased or sold prior to the acquisition for the purpose of complying with the anticipated investment policies or limitations of the International Equity Fund after the acquisition. The expenses associated with the reorganization other than brokerage-related expenses, including stamp taxes and other similar transaction costs were borne by Hartford Funds Management Company, LLC or its affiliates. As of the close of business on June 22, 2018, the Global Equity Income Fund had investments valued at $159,267,510 with a cost basis of $158,607,354. For financial reporting purposes, assets received, liabilities assumed and shares issued by the Acquiring Fund were recorded at fair value; however, the cost basis of the investments received by the Acquiring Fund from Global Equity Income Fund were carried forward to align ongoing reporting of the Acquiring Fund’s realized and unrealized gains and losses with amounts distributable to shareholders for tax purposes. The aggregate net assets of the Acquiring Fund immediately after the acquisition were $230,281,718, which included $660,156 of acquired unrealized appreciation.
PART C
OTHER INFORMATION
Article V, paragraph (f) of the Registrant’s Articles of Restatement provides that the Registrant shall indemnify (i) its directors and officers to the full extent required or permitted by law and (ii) other employees and agents to such extent authorized by the Registrant’s board of directors or bylaws and as permitted by law; provided, however, that no such indemnification shall protect any director or officer of the Registrant against any liability to the Registrant or its shareholders to which he would otherwise be subject by reason of willful misfeasance, bad faith, gross negligence or reckless disregard of the duties involved in the conduct of his office. The rights of indemnification contained in Article V are not exclusive to any other rights to which any officer, director or employee seeking indemnification may be entitled.
Subsection (b) of Section 2-418 of the General Corporation Law of Maryland permits a corporation to indemnify any person who was or is party or is threatened to be made a party to any threatened, pending or completed action, suit or proceeding, whether civil, criminal, administrative or investigative (other than an action by or in the right of the corporation) by reason of the fact that he is or was a director, officer, employee or agent of the corporation or is or was serving at the request of the corporation as a director, officer, employee or agent of another corporation or enterprise, against reasonable expenses (including attorneys’ fees), judgments, penalties, fines and amounts paid in settlement actually incurred by him in connection with such action, suit or proceeding unless it is proved that: (i) the act or omission of the person was material to the cause of action adjudicated in the proceeding and was committed in bad faith or was the result of active and deliberate dishonesty; (ii) the person actually received an improper personal benefit of money, property or services; or (iii) with respect to any criminal action or proceeding, the person had reasonable cause to believe his act or omission was unlawful.
Indemnification under subsection (b) of Section 2-418 may not be made by a corporation unless authorized for a specific proceeding after a determination has been made that indemnification is permissible in the circumstances because the party to be indemnified has met the standard of conduct set forth in subsection (b). This determination shall be made (i) by the Board of Directors by a majority vote of a quorum consisting of directors not, at the time, parties to the proceeding, or, if such quorum cannot be obtained, then by a majority vote of a committee of the Board consisting solely of two or more directors not, at the time, parties to such proceeding and who were duly designated to act in the matter by a majority vote of the full Board in which the designated directors who are parties may participate; (ii) by special legal counsel selected by the Board of Directors or a committee of the Board by vote as set forth in subparagraph (i),or, if the requisite quorum of the full Board cannot be obtained therefor and the committee cannot be established, by a majority vote of the full Board in which any director who is a party may participate; or (iii) by the stockholders (except that shares held by directors who are parties to the specific proceeding may not be voted). A court of appropriate jurisdiction may also order indemnification if the court determines that a person seeking indemnification is entitled to reimbursement under subsection (b).
Section 2-418 further provides that indemnification provided for by Section 2-418 shall not be deemed exclusive of any rights to which the indemnified party may be entitled; and permits a corporation to purchase and maintain insurance on behalf of a director, officer, employee or agent of the corporation against any liability asserted against or incurred by such person in any such capacity or arising out of such person’s status as such whether or not the corporation would have the power to indemnify such person against such liabilities under Section 2-418.
Insofar as indemnification for liability arising under the Securities Act of 1933, as amended (the “Act”) may be permitted to directors, officers and controlling persons of the Registrant pursuant to the foregoing provisions, or otherwise, the Registrant has been advised that in the opinion of the Securities and Exchange Commission such indemnification is against public policy as expressed in the Act and is, therefore, unenforceable. In the event that a claim for indemnification against such liabilities (other than the payment by the Registrant of expenses incurred or paid by a director, officer or controlling person in connection with the securities being registered), the Registrant undertakes that it will, unless in the opinion of its counsel the matter has been settled by controlling precedent, submit to a court of appropriate jurisdiction the questions whether such indemnification by it is against public policy as expressed in the Act and will be governed by the final adjudication of such issue.
The Registrant’s various agreements with its service providers provide for indemnification.
| 1.(i) | Articles of Restatement dated July 12, 2010 (incorporated by reference to Post-Effective Amendment No. 86 to Registration Statement on Form N-1A (File No. 333-02381) filed on December 15, 2010) |
| 1.(ii) | Articles Supplementary dated August 13, 2010 (incorporated by reference to Post-Effective Amendment No. 86 to Registration Statement on Form N-1A (File No. 333-02381) filed on December 15, 2010) |
| | |
| 1.(iii) | Articles of Amendment dated November 30, 2010 (incorporated by reference to Post-Effective Amendment No. 86 to Registration Statement on Form N-1A (File No. 333-02381) filed on December 15, 2010) |
| | |
| 1.(iv) | Articles of Amendment dated November 30, 2010 (incorporated by reference to Post-Effective Amendment No. 86 to Registration Statement on Form N-1A (File No. 333-02381) filed on December 15, 2010) |
| | |
| 1.(v) | Articles Supplementary dated February 25, 2011 (incorporated by reference to Post-Effective Amendment No. 88 to Registration Statement on Form N-1A (File No. 333-02381) filed on March 15, 2011) |
| | |
| 1.(vi) | Articles Supplementary dated July 14, 2011 (incorporated by reference to Post-Effective Amendment No. 94 to Registration Statement on Form N-1A (File No. 333-02381) filed on September 30, 2011) |
| | |
| 1.(vii) | Articles of Amendment dated July 14, 2011 (incorporated by reference to Post-Effective Amendment No. 94 to Registration Statement on Form N-1A (File No. 333-02381) filed on September 30, 2011) |
| | |
| 1.(viii) | Articles of Amendment dated August 8, 2011 (incorporated by reference to Post-Effective Amendment No. 94 to Registration Statement on Form N-1A (File No. 333-02381) filed on September 30, 2011) |
| | |
| 1.(ix) | Articles Supplementary dated August 10, 2011 (incorporated by reference to Post-Effective Amendment No. 94 to Registration Statement on Form N-1A (File No. 333-02381) filed on September 30, 2011) |
| | |
| 1.(x) | Articles of Amendment dated April 11, 2012 (incorporated by reference to Post-Effective Amendment No. 107 to Registration Statement on Form N-1A (File No. 333-02381) filed on September 17, 2012) |
| | |
| 1.(xi) | Articles of Amendment dated April 27, 2012 (incorporated by reference to Post-Effective Amendment No. 107 to Registration Statement on Form N-1A (File No. 333-02381) filed on September 17, 2012) |
| | |
| 1.(xii) | Articles Supplementary dated April 27, 2012 (incorporated by reference to Post-Effective Amendment No. 107 to Registration Statement on Form N-1A (File No. 333-02381) filed on September 17, 2012) |
| | |
| 1.(xiii) | Articles Supplementary dated June 1, 2012 (incorporated by reference to Post-Effective Amendment No. 107 to Registration Statement on Form N-1A (File No. 333-02381) filed on September 17, 2012) |
| | |
| 1.(xiv) | Articles Supplementary dated October 31, 2012 (incorporated by reference to Post-Effective Amendment No. 109 to Registration Statement on Form N-1A (File No. 333-02381) filed on November 30, 2012) |
| | |
| 1.(xv) | Certificate of Correction dated January 24, 2013 (incorporated by reference to Post-Effective Amendment No. 116 to Registration Statement on Form N-1A (File No. 333-02381) filed on February 28, 2013) |
| | |
| 1.(xvi) | Articles Supplementary dated February 27, 2013 (incorporated by reference to Post-Effective Amendment No. 116 to Registration Statement on Form N-1A (File No. 333-02381) filed on February 28, 2013) |
| | |
| 1.(xvii) | Articles Supplementary dated June 28, 2013 (incorporated by reference to Post-Effective Amendment No. 121 to Registration Statement on Form N-1A (File No. 333-02381) filed on December 19, 2013) |
| | |
| 1.(xviii) | Articles Supplementary dated August 7, 2013 (incorporated by reference to Post-Effective Amendment No. 121 to Registration Statement on Form N-1A (File No. 333-02381) filed on December 19, 2013) |
| | |
| 1.(xix) | Articles Supplementary dated November 19, 2013 (incorporated by reference to Post-Effective Amendment No. 119 to Registration Statement on Form N-1A (File No. 333-02381) filed on November 29, 2013) |
| | |
| 1.(xx) | Articles of Amendment dated February 25, 2014 (incorporated by reference to Post-Effective Amendment No. 123 to Registration Statement on Form N-1A (File No. 333-02381) filed on February 28, 2014) |
| | |
| 1.(xxi) | Articles Supplementary dated March 6, 2014 (incorporated by reference to Post-Effective Amendment No. 126 to Registration Statement on Form N-1A (File No. 333-02381) filed on April 30, 2014) |
| | |
| 1.(xxii) | Certificate of Correction dated April 29, 2014 (incorporated by reference to Post-Effective Amendment No. 126 to Registration Statement on Form N-1A (File No. 333-02381) filed on April 30, 2014) |
| | |
| 1.(xxiii) | Articles of Amendment dated May 30, 2014 (incorporated by reference to Post-Effective Amendment No. 128 to Registration Statement on Form N-1A (File No. 333-02381) filed on May 30, 2014) |
| | |
| 1.(xxiv) | Articles Supplementary dated July 23, 2014 (incorporated by reference to Post-Effective Amendment No. 132 to Registration Statement on Form N-1A (File No. 333-02381) filed on August 29, 2014) |
| | |
| 1.(xxv) | Articles Supplementary dated October 27, 2014 (incorporated by reference to Post-Effective Amendment No. 134 to Registration Statement on Form N-1A (File No. 333-02381) filed on November 7, 2014) |
| 1.(xxvi) | Articles Supplementary dated November 27, 2014 (incorporated by reference to Post-Effective Amendment No. 136 to Registration Statement on Form N-1A (File No. 333-02381) filed on December 19, 2014) |
| | |
| 1.(xxvii) | Articles Supplementary dated February 18, 2015 (incorporated by reference to Post-Effective Amendment No. 137 to Registration Statement on Form N-1A (File No. 333-02381) filed on February 27, 2015) |
| | |
| 1.(xxviii) | Articles of Amendment dated March 24, 2015 (incorporated by reference to Post-Effective Amendment No. 143 to Registration Statement on Form N-1A (File No. 333-02381) filed on December 22, 2015) |
| | |
| 1.(xxix) | Articles Supplementary dated May 26, 2015 (incorporated by reference to Post-Effective Amendment No. 140 to Registration Statement on Form N-1A (File No. 333-02381) filed on May 28, 2015) |
| | |
| 1.(xxx) | Articles of Amendment dated May 28, 2015 (incorporated by reference to Post-Effective Amendment No. 143 to Registration Statement on Form N-1A (File No. 333-02381) filed on December 22, 2015) |
| | |
| 1.(xxxi) | Articles of Amendment dated July 7, 2015 (incorporated by reference to Post-Effective Amendment No. 143 to Registration Statement on Form N-1A (File No. 333-02381) filed on December 22, 2015) |
| | |
| 1.(xxxii) | Articles of Amendment dated August 31, 2015 (incorporated by reference to Post-Effective Amendment No. 143 to Registration Statement on Form N-1A (File No. 333-02381) filed on December 22, 2015) |
| | |
| 1.(xxxiii) | Articles Supplementary dated February 10, 2016 (incorporated by reference to Post-Effective Amendment No. 144 to Registration Statement on Form N-1A (File No. 333-02381) filed on February 29, 2016) |
| | |
| 1.(xxxiv) | Articles Supplementary dated June 1, 2016 (incorporated by reference to Post-Effective Amendment No. 150 to Registration Statement on Form N-1A (File No. 333-02381) filed on December 27, 2016) |
| | |
| 1.(xxxv) | Articles Supplementary dated November 11, 2016 (incorporated by reference to Post-Effective Amendment No. 150 to Registration Statement on Form N-1A (File No. 333-02381) filed on December 27, 2016) |
| | |
| 1.(xxxvi) | Articles Supplementary dated February 23, 2017 (incorporated by reference to Post-Effective Amendment No. 153 to Registration Statement on Form N-1A (File No. 333-02381) filed on February 28, 2017) |
| | |
| 1.(xxxvii) | Articles Supplementary dated February 15, 2018 (incorporated by reference to Post-Effective Amendment No. 157 to Registration Statement on Form N-1A (File No. 333-02381) filed on February 28, 2018) |
| | |
| 2. | Amended and Restated Bylaws (incorporated by reference to Post-Effective Amendment No. 157 to Registration Statement on Form N-1A (File No. 333-02381) filed on February 28, 2018) |
| | |
| 3. | Not Applicable |
| | |
| 4. | Form of Agreement and Plan of Reorganization is incorporated herein as Appendix A to the Information Statement/Prospectus |
| | |
| 5. | Not Applicable |
| | |
| 6.(i).a | Form of Investment Management Agreement with Hartford Funds Management Company, LLC with respect to Floating Rate High Income Fund, Healthcare Fund, Municipal Opportunities Fund and Small Company Fund (incorporated by reference to Post-Effective Amendment No. 132 to Registration Statement on form N-1A (File No. 333-02381) filed on August 29, 2014) |
| | |
| 6.(i).b | Schedules A and B to the Investment Management Agreement with Hartford Funds Management Company, LLC with respect to Floating Rate High Income Fund, Healthcare Fund, Municipal Opportunities Fund and Small Company Fund (incorporated by reference to Post-Effective Amendment No. 150 to Registration Statement on Form N-1A (File No. 333-02381) filed on December 27, 2016) |
| | |
| 6.(ii).a | Investment Management Agreement with Hartford Funds Management Company, LLC with respect to all Funds, except Floating Rate High Income Fund, Healthcare Fund, Municipal Opportunities Fund, Small Company Fund and Global Impact Fund (incorporated by reference to Post-Effective Amendment No. 149 to Registration Statement on Form N-1A (File No. 333-02381) filed on December 8, 2016) |
| | |
| 6.(ii).b | Schedules A and B to Investment Management Agreement with Hartford Funds Management Company, LLC with respect to all Funds, except Floating Rate High Income Fund, Healthcare Fund, Municipal Opportunities Fund, Small Company Fund and Global Impact Fund (incorporated by reference to Post-Effective Amendment No. 157 to Registration Statement on Form N-1A (File No. 333-02381) filed on February 28, 2018) |
| | |
| 6.(iii) | Sub-Advisory Agreement with Wellington Management Company LLP (incorporated by reference to Post-Effective Amendment No. 157 to Registration Statement on Form N-1A (File No. 333-02381) filed on February 28, 2018) |
| 7.(i).a | Amended and Restated Principal Underwriting Agreement (incorporated by reference to Post-Effective Amendment No. 131 to Registration Statement on Form N-1A (File No. 333-02381) filed on August 27, 2014) |
| | |
| 7.(i).b | Amendment Number 1 Principal Underwriting Agreement (incorporated by reference to Post-Effective Amendment No. 119 to Registration Statement on Form N-1A (File No. 333-02381) filed on November 29, 2013) |
| | |
| 7.(i).c | Form of Amendment Number 2 to Principal Underwriting Agreement (incorporated by reference to Post-Effective Amendment No. 126 to Registration Statement on Form N-1A (File No. 333-02381) filed on April 30, 2014) |
| | |
| 7.(i).d | Amendment Number 3 to Principal Underwriting Agreement (incorporated by reference to Post-Effective Amendment No. 131 to Registration Statement on Form N-1A (File No. 333-02381) filed on August 27, 2014) |
| | |
| 7.(i).e | Amendment Number 4 to Principal Underwriting Agreement (incorporated by reference to Post-Effective Amendment No. 132 to Registration Statement on form N-1A (File No. 333-02381) filed on August 29, 2014) |
| | |
| 7.(i).f | Form of Amendment Number 5 to Principal Underwriting Agreement (incorporated by reference to Post-Effective Amendment No. 140 to Registration Statement on Form N-1A (File No. 333-02381) filed on May 28, 2015) |
| | |
| 7.(i).g | Amendment Number 6 to Principal Underwriting Agreement (incorporated by reference to Post-Effective Amendment No. 144 to Registration Statement on Form N-1A (File No. 333-02381) filed on February 29, 2016) |
| | |
| 7.(i).h | Amendment Number 7 to Principal Underwriting Agreement (incorporated by reference to Post-Effective Amendment No. 149 to Registration Statement on Form N-1A (File No. 333-02381) filed on December 8, 2016) |
| | |
| 7.(i).i | Amendment Number 8 to Principal Underwriting Agreement (incorporated by reference to Post-Effective Amendment No. 153 to Registration Statement on Form N-1A (File No. 333-02381) filed on February 28, 2017) |
| | |
| 7.(ii) | Form of Selling Agreement (incorporated by reference to Post-Effective Amendment No. 153 to Registration Statement on Form N-1A (File No. 333-02381) filed on February 28, 2017) |
| | |
| 8. | Not Applicable |
| | |
| 9.(i) | Custodian Agreement with State Street Bank and Trust Company (incorporated by reference to Post-Effective Amendment No. 137 to Registration Statement on Form N-1A (File No. 333-02381) filed on February 27, 2015) |
| | |
| 9.(ii) | Form of Prime Broker Margin Account Agreement (incorporated by reference to Post-Effective Amendment No. 132 to Registration Statement on Form N-1A (File No. 333-02381) filed on August 29, 2014) |
| | |
| 10.(i) | Amended and Restated Rule 12b-1 Distribution Plan for Class A, Class B, Class C, Class R3, Class R4 and Class T Shares dated February 28, 2017 (incorporated by reference to Post-Effective Amendment No. 157 to Registration Statement on Form N-1A (File No. 333-02381) filed on February 28, 2018) |
| | |
| 10.(ii) | Rule 18f-3 Plan (incorporated by reference to Post-Effective Amendment No. 157 to Registration Statement on Form N-1A (File No. 333-02381) filed on February 28, 2018) |
| | |
| 11. | Opinion and Consent of Counsel as to legality of the securities being registered (filed herewith) |
| | |
| 12. | Form of Opinion and Consent of Dechert LLP as to tax matters (to be filed by subsequent amendment) |
| | |
| 13.(i).a | Amended and Restated Transfer Agency and Service Agreement with Hartford Administrative Services Company (incorporated by reference to Post-Effective Amendment No. 157 to Registration Statement on Form N-1A (File No. 333-02381) filed on February 28, 2018) |
| | |
| 13.(i).b | Amendment Number One to the Amended and Restated Transfer Agency and Service Agreement with Hartford Administrative Services Company (incorporated by reference to Post-Effective Amendment No. 157 to Registration Statement on Form N-1A (File No. 333-02381) filed on February 28, 2018) |
| | |
| 13.(ii) | Share Purchase Agreement (incorporated by reference to Post-Effective Amendment No. 35 to Registration Statement on Form N-1A (File No. 333-02381) filed on May 19, 2004) |
| | |
| 13.(iii).a | Fund Accounting Agreement with Hartford Funds Management Company, LLC dated December 31, 2014 (incorporated by reference to Post-Effective Amendment No. 137 to Registration Statement on Form N-1A (File No. 333-02381) filed on February 27, 2015) |
| | |
| 13.(iii).b | Form of Amendment One to Fund Accounting Agreement (incorporated by reference to Post-Effective Amendment No. 140 to Registration Statement on Form N-1A (File No. 333-02381) filed on May 28, 2015) |
| | |
| 13.(iii).c | Amendment Two to Fund Accounting Agreement (incorporated by reference to Post-Effective Amendment No. 143 to Registration Statement on Form N-1A (File No. 333-02381) filed on December 22, 2015) |
| 13.(iii).d | Amendment Three to Fund Accounting Agreement (incorporated by reference to Post-Effective Amendment No. 144 to Registration Statement on Form N-1A (File No. 333-02381) filed on February 29, 2016) |
| | |
| 13.(iii).e | Form of Amendment Four to Fund Accounting Agreement (incorporated by reference to Post-Effective Amendment No. 149 to Registration Statement on Form N-1A (File No. 333-02381) filed on December 8, 2016) |
| | |
| 13.(iii).f | Amendment Five to Fund Accounting Agreement (incorporated by reference to Post-Effective Amendment No. 150 to Registration Statement on Form N-1A (File No. 333-02381) filed on December 27, 2016) |
| | |
| 13.(iii).g | Form of Amendment Six to Fund Accounting Agreement (incorporated by reference to Post-Effective Amendment No. 153 to Registration Statement on Form N-1A (File No. 333-02381) filed on February 28, 2017) |
| | |
| 13.(iv)(a) | Form of Amended and Restated Expense Limitation Agreement (incorporated by reference to Post-Effective Amendment No. 1 to the Registration Statement on Form N-14 (File No. 333-224270) filed on May 14, 2018) |
| | |
| 13.(iv)(b) | Form of Expense Limitation Agreement for the Hartford International Equity Fund (filed herewith) |
| | |
| 13.(v) | Form of Global Securities Lending Agency Agreement (incorporated by reference to Post-Effective Amendment No. 157 to Registration Statement on Form N-1A (File No. 333-02381) filed on February 28, 2018) |
| | |
| 14. | Consent of Independent Public Accounting Firm (filed herewith) |
| | |
| 15. | Not Applicable |
| | |
| 16. | Power of Attorney (filed herewith) |
| | |
| 17.(i) | Code of Ethics of Hartford Funds Management Company, LLC, Hartford Funds Distributors, LLC and The Hartford-Sponsored Mutual Funds (incorporated by reference to Post-Effective Amendment No. 157 to Registration Statement on Form N-1A (File No. 333-02381) filed on February 28, 2018) |
| | |
| 17.(ii) | Code of Ethics of Wellington Management Company LLP dated July 1, 2016 (incorporated by reference to Post-Effective Amendment No. 150 to Registration Statement on Form N-1A (File No. 333-02381) filed on December 27, 2016) |
| 1. | The undersigned registrant agrees that prior to any public reoffering of the securities registered through the use of a prospectus which is a part of this registration statement by any person or party who is deemed to be an underwriter within the meaning of Rule 145(c) of the Act (17 CFR 230.145c), the reoffering prospectus will contain the information called for by the applicable registration form for the reofferings by persons who may be deemed underwriters, in addition to the information called for by the other items of the applicable form. |
| 2. | The undersigned registrant agrees that every prospectus that is filed under paragraph (1) above will be filed as a part of an amendment to the registration statement and will not be used until the amendment is effective, and that, in determining any liability under the Act, each post-effective amendment shall be deemed to be a new registration statement for the securities offered therein, and the offering of the securities at that time shall be deemed to be the initial bona fide offering of them. |
| 3. | The undersigned registrant undertakes to file a post-effective amendment to this registration statement upon the closing of the reorganization described in this registration statement that contains an opinion of counsel supporting the tax matters. |
SIGNATURES
As required by the Securities Act of 1933, this Registration Statement on Form N-14 has been signed on behalf of the Registrant, in the city of Wayne and Commonwealth of Pennsylvania, on the 10th day of August 2018.
| | THE HARTFORD MUTUAL FUNDS, INC. |
| | |
| | By: | /s/ James E. Davey |
| | | James E. Davey |
| | | President |
As required by the Securities Act of 1933, this Registration Statement on Form N-14 has been signed by the following persons in the capacities and on the date indicated.
| Signature | | Title | | Date |
| | | | | |
| /s/ James E. Davey | | Director, President and Chief Executive Officer | | August 10, 2018 |
| James E. Davey | | | | |
| | | | | |
| /s/ Amy N. Furlong | | Treasurer | | August 10, 2018 |
| Amy N. Furlong | | (Principal Financial Officer and Principal Accounting Officer) | | |
| | | | | |
| | | Director | | |
| Hilary E. Ackermann | | | | |
| | | | | |
| * | | Director | | August 10, 2018 |
| Robin C. Beery | | | | |
| | | | | |
| * | | Director | | August 10, 2018 |
| Lynn S. Birdsong | | | | |
| | | | | |
| * | | Director | | August 10, 2018 |
| Christine R. Detrick | | | | |
| | | | | |
| * | | Director | | August 10, 2018 |
| Duane E. Hill | | | | |
| | | | | |
| * | | Chairman of the Board and Director | | August 10, 2018 |
| William P. Johnston | | | | |
| | | | | |
| * | | Director | | August 10, 2018 |
| Phillip O. Peterson | | | | |
| | | | | |
| * | | Director | | August 10, 2018 |
| Lemma W. Senbet | | | | |
| | | | | |
| * | | Director | | August 10, 2018 |
| David Sung | | | | |
| | | | | |
| /s/ Thomas R. Phillips | | | August 10, 2018 |
| * By Thomas R. Phillips | | | |
| Attorney-in-fact | | | |
* Pursuant to Power of Attorney (filed herewith)
EXHIBIT INDEX
| Exhibit No. | Description |
| 11 | Opinion and Consent of Counsel as to legality of the securities being registered |
| 13.(iv)(b) | Form of Expense Limitation Agreement |
| 14 | Consent of Independent Public Accounting Firm |
| 16 | Power of Attorney |