
HC2 HOLDINGS, INC. Third Quarter 2018 Conference Call © HC2 Holdings, Inc. 2018
Safe Harbor Disclaimers Special Note Regarding Forward-Looking Statements Safe Harbor Statement under the Private Securities Litigation Reform Act of 1995: This presentation contains, and certain oral statements made by our representatives from time to time may contain, forward-looking statements. Generally, forward-looking statements include information describing actions, events, results, strategies and expectations and are generally identifiable by use of the words “believes,” “expects,” “intends,” “anticipates,” “plans,” “seeks,” “estimates,” “projects,” “may,” “will,” “could,” “might,” or “continues” or similar expressions. The forward-looking statements in this presentation include, without limitation, our 2018 guidance for the Construction and Marine Services segments and statements regarding our expectations regarding building shareholder value and future cash [flow] and invested assets. Such statements are based on the beliefs and assumptions of HC2's management and the management of HC2's subsidiaries and portfolio companies. The Company believes these judgments are reasonable, but you should understand that these statements are not guarantees of performance or results, and the Company’s actual results could differ materially from those expressed or implied in the forward-looking statements due to a variety of important factors, both positive and negative, that may be revised or supplemented in subsequent statements and reports filed with the Securities and Exchange Commission (“SEC”), including in our reports on Forms 10-K, 10-Q and 8-K. Such important factors include, without limitation, issues related to the restatement of our financial statements; the fact that we have historically identified material weaknesses in our internal control over financial reporting, and any inability to remediate future material weaknesses; capital market conditions; the ability of HC2's subsidiaries and portfolio companies to generate sufficient net income and cash flows to make upstream cash distributions; volatility in the trading price of HC2 common stock; the ability of HC2 and its subsidiaries and portfolio companies to identify any suitable future acquisition or disposition opportunities; our ability to realize efficiencies, cost savings, income and margin improvements, growth, economies of scale and other anticipated benefits of strategic transactions; difficulties related to the integration of financial reporting of acquired or target businesses; difficulties completing pending and future acquisitions and dispositions; effects of litigation, indemnification claims, and other contingent liabilities; changes in regulations and tax laws; and risks that may affect the performance of the operating subsidiaries and portfolio companies of HC2. Although HC2 believes its expectations and assumptions regarding its future operating performance are reasonable, there can be no assurance that the expectations reflected herein will be achieved. These risks and other important factors discussed under the caption “Risk Factors” in our most recent Annual Report on Form 10-K filed with the SEC, and our other reports filed with the SEC could cause actual results to differ materially from those indicated by the forward-looking statements made in this presentation. You should not place undue reliance on forward-looking statements. All forward-looking statements attributable to HC2 or persons acting on its behalf are expressly qualified in their entirety by the foregoing cautionary statements. All such statements speak only as of the date made, and unless legally required, HC2 undertakes no obligation to update or revise publicly any forward-looking statements, whether as a result of new information, future events or otherwise. © 2 0 1 8 H C 2 H O L D I N G S , I NC. 1
Safe Harbor Disclaimers Non-GAAP Financial Measures In this presentation, HC2 refers to certain financial measures that are not presented in accordance with U.S. generally accepted accounting principles (“GAAP”), including Core Operating Subsidiary Adjusted EBITDA, Total Adjusted EBITDA (excluding the Insurance segment), Adjusted EBITDA for its operating segments, Adjusted Operating Income for the Insurance segment and Pre-Tax Adjusted Operating Income for the Insurance segment. Adjusted EBITDA Management believes that Adjusted EBITDA measures provide investors with meaningful information for gaining an understanding of the Company’s results as it is frequently used by the financial community to provide insight into an organization’s operating trends and facilitates comparisons between peer companies, because interest, taxes, depreciation, amortization and the other items for which adjustments are made as noted in the definition of Adjusted EBITDA below can differ greatly between organizations as a result of differing capital structures and tax strategies. In addition, management uses Adjusted EBITDA measures in evaluating certain of the Company’s segments performance because they eliminate the effects of considerable amounts of non-cash depreciation and amortization and items not within the control of the Company’s operations managers. While management believes that these non-GAAP measurements are useful as supplemental information, such adjusted results are not intended to replace our GAAP financial results and should be read together with HC2’s results reported under GAAP. Management defines Adjusted EBITDA as Net income (loss) as adjusted for depreciation and amortization; amortization of equity method fair value adjustments at acquisition; (gain) loss on sale or disposal of assets; lease termination costs; asset impairment expense; interest expense; net gain (loss) on contingent consideration; loss on early extinguishment or restructuring of debt; gain (loss) on sale of subsidiaries; other (income) expense, net; foreign currency transaction (gain) loss included in cost of revenue; income tax (benefit) expense; (gain) loss from discontinued operations; noncontrolling interest; bonus to be settled in equity; share-based compensation expense; non-recurring items; and acquisition and disposition costs. A reconciliation of Adjusted EBITDA to Net Income (Loss) is included in the financial tables at the end of this presentation. Management recognizes that using Adjusted EBITDA as a performance measure has inherent limitations as an analytical tool as compared to net income (loss) or other GAAP financial measures, as these non-GAAP measures exclude certain items, including items that are recurring in nature, which may be meaningful to investors. As a result of the exclusions, Adjusted EBITDA should not be considered in isolation and do not purport to be alternatives to net income (loss) or other GAAP financial measures or a measure of our operating performance. Total Adjusted EBITDA excludes the results of operations and any consolidating eliminations of our Insurance segment. Adjusted Operating Income Adjusted Operating Income ("Insurance AOI") and Pre-tax Adjusted Operating Income (“Pre-tax Insurance AOI”) for the Insurance segment are non- GAAP financial measures frequently used throughout the insurance industry and are economic measures the Insurance segment uses to evaluate its financial performance. Management believes that Insurance AOI and Pretax Insurance AOI measures provide investors with meaningful information for gaining an understanding of certain results and provide insight into an organization’s operating trends and facilitates comparisons between peer companies. However, Insurance AOI and Pre-tax Insurance AOI have certain limitations, and we may not calculate it the same as other companies in our industry. It should, therefore, be read together with the Company's results calculated in accordance with GAAP. Similarly to Adjusted EBITDA, using Insurance AOI and Pre-tax Insurance AOI as performance measures have inherent limitations as an analytical tool as compared to income (loss) from operations or other GAAP financial measures, as these non-GAAP measures exclude certain items, including items that are recurring in nature, which may be meaningful to investors. As a result of the exclusions, Insurance AOI and Pre-tax Insurance AOI should not be considered in isolation and do not purport to be an alternative to income (loss) from operations or other GAAP financial measures as measures of our operating performance. Management defines Insurance AOI as Net income (loss) for the Insurance segment adjusted to exclude the impact of net investment gains (losses), including OTTI losses recognized in operations; asset impairment; intercompany elimination; gain on bargain purchase; reinsurance gain; and acquisition costs. Management defines Pre-tax Insurance AOI as Insurance AOI adjusted to exclude the impact of income tax (benefit) expense recognized during the current period. Management believes that Insurance AOI and Pre-tax Insurance AOI provide meaningful financial metrics that help investors understand certain results and profitability. While these adjustments are an integral part of the overall performance of the Insurance segment, market conditions impacting these items can overshadow the underlying performance of the business. Accordingly, we believe using a measure which excludes their impact is effective in analyzing the trends of our operations. By accepting this document, each recipient agrees to and acknowledges the foregoing terms and conditions. © 2 0 1 8 H C 2 H O L D I N G S , I NC. 2
Agenda OVERVIEW AND Philip A. Falcone Chairman, President and CEO FINANCIAL HIGHLIGHTS Philip A. Falcone Chairman, President and CEO Michael J. Sena Chief Financial Officer Q AND A Andrew G. Backman Managing Director © 2 0 1 8 H C 2 H O L D I N G S , I NC. 3

Quarterly Overview
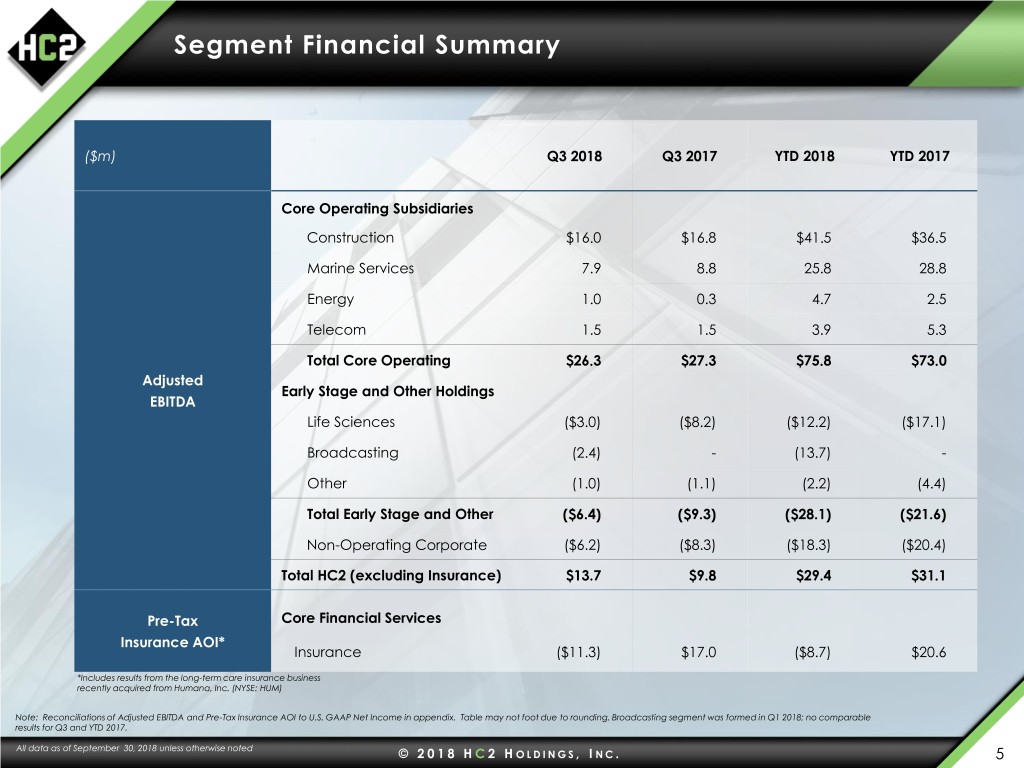
Segment Financial Summary ($m) Q3 2018 Q3 2017 YTD 2018 YTD 2017 Core Operating Subsidiaries Construction $16.0 $16.8 $41.5 $36.5 Marine Services 7.9 8.8 25.8 28.8 Energy 1.0 0.3 4.7 2.5 Telecom 1.5 1.5 3.9 5.3 Total Core Operating $26.3 $27.3 $75.8 $73.0 Adjusted Early Stage and Other Holdings EBITDA Life Sciences ($3.0) ($8.2) ($12.2) ($17.1) Broadcasting (2.4) - (13.7) - Other (1.0) (1.1) (2.2) (4.4) Total Early Stage and Other ($6.4) ($9.3) ($28.1) ($21.6) Non-Operating Corporate ($6.2) ($8.3) ($18.3) ($20.4) Total HC2 (excluding Insurance) $13.7 $9.8 $29.4 $31.1 Pre-Tax Core Financial Services Insurance AOI* Insurance ($11.3) $17.0 ($8.7) $20.6 *Includes results from the long-term care insurance business recently acquired from Humana, Inc. (NYSE: HUM) Note: Reconciliations of Adjusted EBITDA and Pre-Tax Insurance AOI to U.S. GAAP Net Income in appendix. Table may not foot due to rounding. Broadcasting segment was formed in Q1 2018; no comparable results for Q3 and YTD 2017. All data as of September 30, 2018 unless otherwise noted © 2 0 1 8 H C 2 H O L D I N G S , I NC. 5
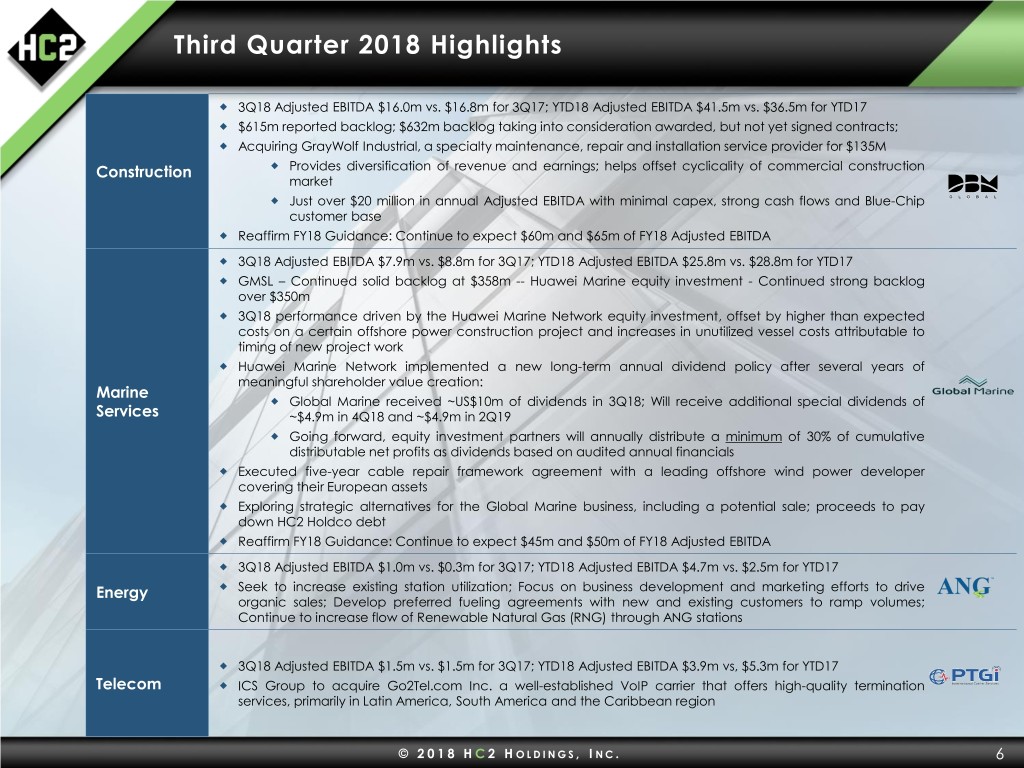
Third Quarter 2018 Highlights 3Q18 Adjusted EBITDA $16.0m vs. $16.8m for 3Q17; YTD18 Adjusted EBITDA $41.5m vs. $36.5m for YTD17 $615m reported backlog; $632m backlog taking into consideration awarded, but not yet signed contracts; Acquiring GrayWolf Industrial, a specialty maintenance, repair and installation service provider for $135M Construction Provides diversification of revenue and earnings; helps offset cyclicality of commercial construction market Just over $20 million in annual Adjusted EBITDA with minimal capex, strong cash flows and Blue-Chip customer base Reaffirm FY18 Guidance: Continue to expect $60m and $65m of FY18 Adjusted EBITDA 3Q18 Adjusted EBITDA $7.9m vs. $8.8m for 3Q17; YTD18 Adjusted EBITDA $25.8m vs. $28.8m for YTD17 GMSL – Continued solid backlog at $358m -- Huawei Marine equity investment - Continued strong backlog over $350m 3Q18 performance driven by the Huawei Marine Network equity investment, offset by higher than expected costs on a certain offshore power construction project and increases in unutilized vessel costs attributable to timing of new project work Huawei Marine Network implemented a new long-term annual dividend policy after several years of meaningful shareholder value creation: Marine Global Marine received ~US$10m of dividends in 3Q18; Will receive additional special dividends of Services ~$4.9m in 4Q18 and ~$4.9m in 2Q19 Going forward, equity investment partners will annually distribute a minimum of 30% of cumulative distributable net profits as dividends based on audited annual financials Executed five-year cable repair framework agreement with a leading offshore wind power developer covering their European assets Exploring strategic alternatives for the Global Marine business, including a potential sale; proceeds to pay down HC2 Holdco debt Reaffirm FY18 Guidance: Continue to expect $45m and $50m of FY18 Adjusted EBITDA 3Q18 Adjusted EBITDA $1.0m vs. $0.3m for 3Q17; YTD18 Adjusted EBITDA $4.7m vs. $2.5m for YTD17 Energy Seek to increase existing station utilization; Focus on business development and marketing efforts to drive organic sales; Develop preferred fueling agreements with new and existing customers to ramp volumes; Continue to increase flow of Renewable Natural Gas (RNG) through ANG stations 3Q18 Adjusted EBITDA $1.5m vs. $1.5m for 3Q17; YTD18 Adjusted EBITDA $3.9m vs, $5.3m for YTD17 Telecom ICS Group to acquire Go2Tel.com Inc. a well-established VoIP carrier that offers high-quality termination services, primarily in Latin America, South America and the Caribbean region © 2 0 1 8 H C 2 H O L D I N G S , I NC. 6
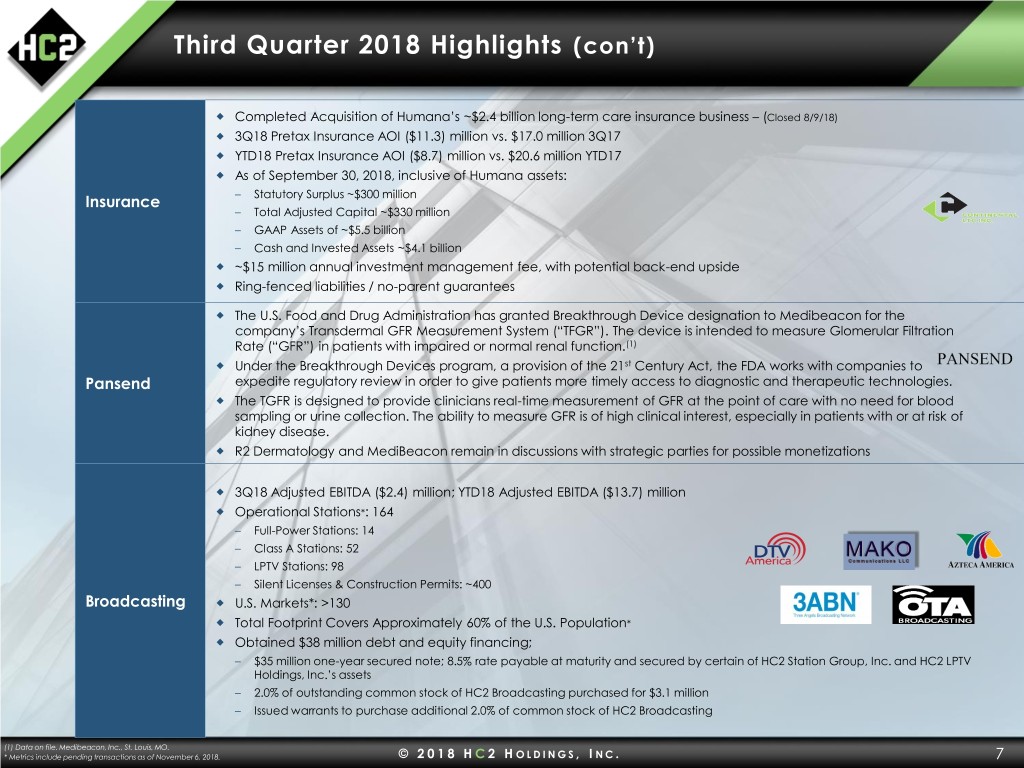
Third Quarter 2018 Highlights (con’t) Completed Acquisition of Humana’s ~$2.4 billion long-term care insurance business – (Closed 8/9/18) 3Q18 Pretax Insurance AOI ($11.3) million vs. $17.0 million 3Q17 YTD18 Pretax Insurance AOI ($8.7) million vs. $20.6 million YTD17 As of September 30, 2018, inclusive of Humana assets: Insurance – Statutory Surplus ~$300 million – Total Adjusted Capital ~$330 million – GAAP Assets of ~$5.5 billion – Cash and Invested Assets ~$4.1 billion ~$15 million annual investment management fee, with potential back-end upside Ring-fenced liabilities / no-parent guarantees The U.S. Food and Drug Administration has granted Breakthrough Device designation to Medibeacon for the company’s Transdermal GFR Measurement System (“TFGR”). The device is intended to measure Glomerular Filtration Rate (“GFR”) in patients with impaired or normal renal function.(1) Under the Breakthrough Devices program, a provision of the 21st Century Act, the FDA works with companies to Pansend expedite regulatory review in order to give patients more timely access to diagnostic and therapeutic technologies. The TGFR is designed to provide clinicians real-time measurement of GFR at the point of care with no need for blood sampling or urine collection. The ability to measure GFR is of high clinical interest, especially in patients with or at risk of kidney disease. R2 Dermatology and MediBeacon remain in discussions with strategic parties for possible monetizations 3Q18 Adjusted EBITDA ($2.4) million; YTD18 Adjusted EBITDA ($13.7) million Operational Stations*: 164 – Full-Power Stations: 14 – Class A Stations: 52 – LPTV Stations: 98 – Silent Licenses & Construction Permits: ~400 Broadcasting U.S. Markets*: >130 Total Footprint Covers Approximately 60% of the U.S. Population* Obtained $38 million debt and equity financing; – $35 million one-year secured note; 8.5% rate payable at maturity and secured by certain of HC2 Station Group, Inc. and HC2 LPTV Holdings, Inc.’s assets – 2.0% of outstanding common stock of HC2 Broadcasting purchased for $3.1 million – Issued warrants to purchase additional 2.0% of common stock of HC2 Broadcasting (1) Data on file. Medibeacon, Inc., St. Louis, MO. * Metrics include pending transactions as of November 6, 2018. © 2 0 1 8 H C 2 H O L D I N G S , I NC. 7
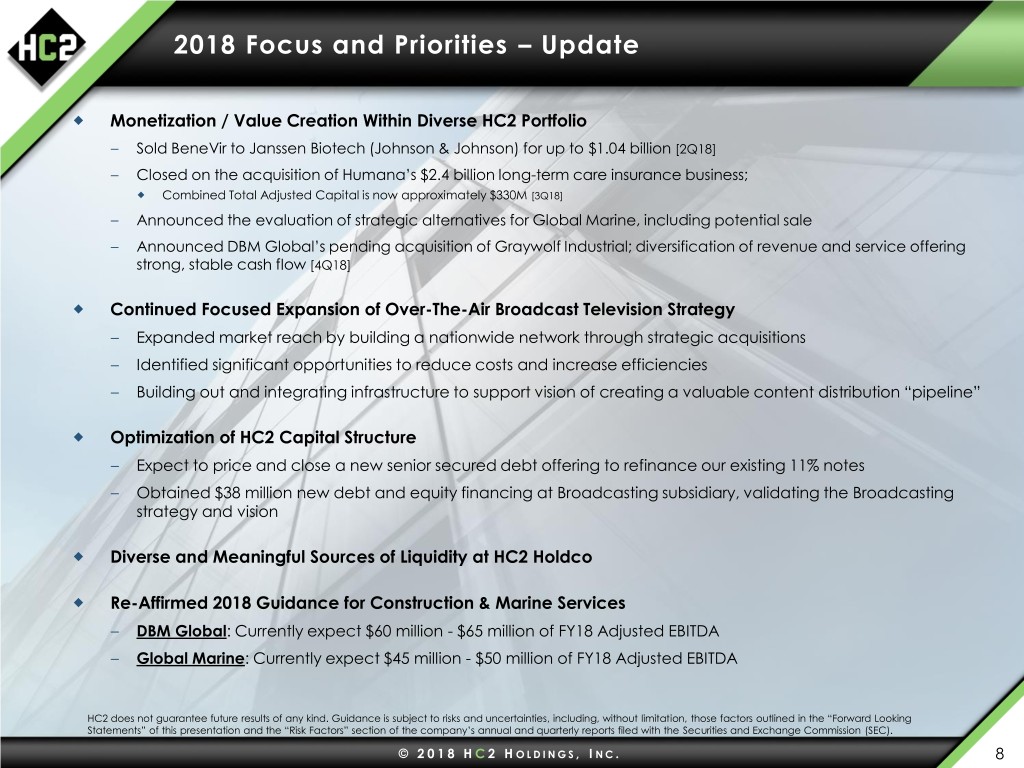
2018 Focus and Priorities – Update Monetization / Value Creation Within Diverse HC2 Portfolio – Sold BeneVir to Janssen Biotech (Johnson & Johnson) for up to $1.04 billion [2Q18] – Closed on the acquisition of Humana’s $2.4 billion long-term care insurance business; Combined Total Adjusted Capital is now approximately $330M [3Q18] – Announced the evaluation of strategic alternatives for Global Marine, including potential sale – Announced DBM Global’s pending acquisition of Graywolf Industrial; diversification of revenue and service offering strong, stable cash flow [4Q18] Continued Focused Expansion of Over-The-Air Broadcast Television Strategy – Expanded market reach by building a nationwide network through strategic acquisitions – Identified significant opportunities to reduce costs and increase efficiencies – Building out and integrating infrastructure to support vision of creating a valuable content distribution “pipeline” Optimization of HC2 Capital Structure – Expect to price and close a new senior secured debt offering to refinance our existing 11% notes – Obtained $38 million new debt and equity financing at Broadcasting subsidiary, validating the Broadcasting strategy and vision Diverse and Meaningful Sources of Liquidity at HC2 Holdco Re-Affirmed 2018 Guidance for Construction & Marine Services – DBM Global: Currently expect $60 million - $65 million of FY18 Adjusted EBITDA – Global Marine: Currently expect $45 million - $50 million of FY18 Adjusted EBITDA HC2 does not guarantee future results of any kind. Guidance is subject to risks and uncertainties, including, without limitation, those factors outlined in the “Forward Looking Statements” of this presentation and the “Risk Factors” section of the company’s annual and quarterly reports filed with the Securities and Exchange Commission (SEC). © 2 0 1 8 H C 2 H O L D I N G S , I NC. 8

Questions and Answers

Appendix:
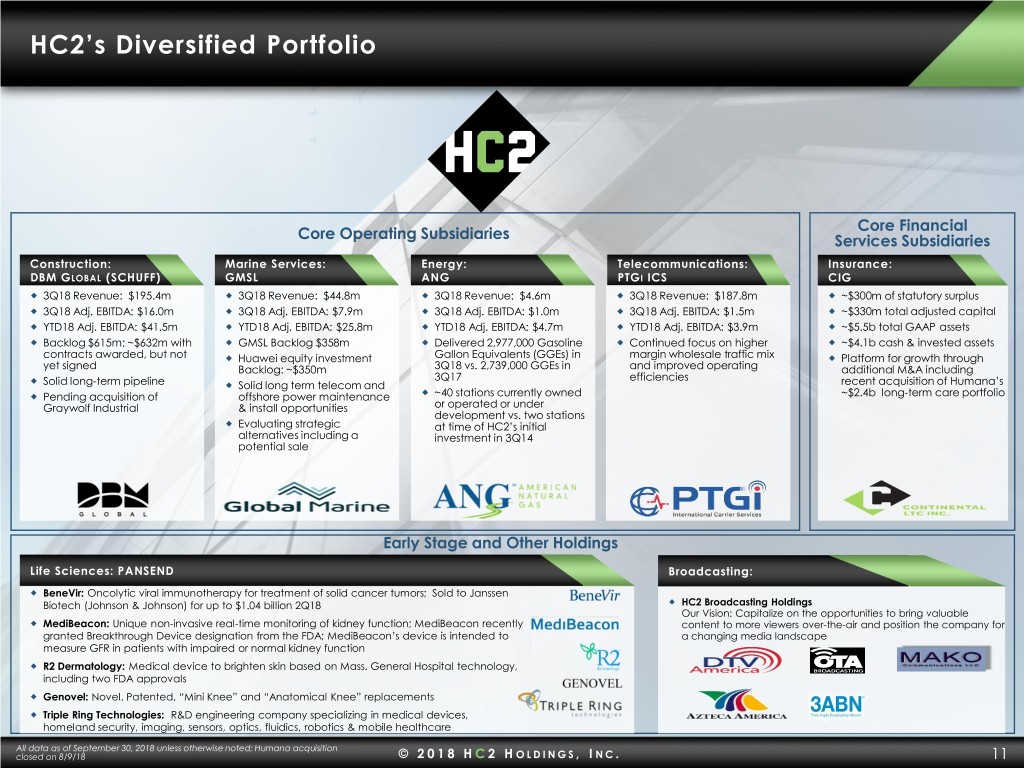
HC2’s Diversified Portfolio Core Financial Core Operating Subsidiaries Services Subsidiaries Construction: Marine Services: Energy: Telecommunications: Insurance: DBM GLOBAL (SCHUFF) GMSL ANG PTGI ICS CIG 3Q18 Revenue: $195.4m 3Q18 Revenue: $44.8m 3Q18 Revenue: $4.6m 3Q18 Revenue: $187.8m ~$300m of statutory surplus 3Q18 Adj. EBITDA: $16.0m 3Q18 Adj. EBITDA: $7.9m 3Q18 Adj. EBITDA: $1.0m 3Q18 Adj. EBITDA: $1.5m ~$330m total adjusted capital YTD18 Adj. EBITDA: $41.5m YTD18 Adj. EBITDA: $25.8m YTD18 Adj. EBITDA: $4.7m YTD18 Adj. EBITDA: $3.9m ~$5.5b total GAAP assets Backlog $615m; ~$632m with GMSL Backlog $358m Delivered 2,977,000 Gasoline Continued focus on higher ~$4.1b cash & invested assets contracts awarded, but not Huawei equity investment Gallon Equivalents (GGEs) in margin wholesale traffic mix Platform for growth through yet signed Backlog: ~$350m 3Q18 vs. 2,739,000 GGEs in and improved operating additional M&A including Solid long-term pipeline 3Q17 efficiencies recent acquisition of Humana’s Solid long term telecom and Pending acquisition of offshore power maintenance ~40 stations currently owned ~$2.4b long-term care portfolio Graywolf Industrial & install opportunities or operated or under development vs. two stations Evaluating strategic at time of HC2’s initial alternatives including a investment in 3Q14 potential sale Early Stage and Other Holdings Life Sciences: PANSEND Broadcasting: BeneVir: Oncolytic viral immunotherapy for treatment of solid cancer tumors; Sold to Janssen Biotech (Johnson & Johnson) for up to $1.04 billion 2Q18 HC2 Broadcasting Holdings Our Vision: Capitalize on the opportunities to bring valuable MediBeacon: Unique non-invasive real-time monitoring of kidney function; MediBeacon recently content to more viewers over-the-air and position the company for granted Breakthrough Device designation from the FDA; MediBeacon’s device is intended to a changing media landscape measure GFR in patients with impaired or normal kidney function R2 Dermatology: Medical device to brighten skin based on Mass. General Hospital technology, including two FDA approvals Genovel: Novel, Patented, “Mini Knee” and “Anatomical Knee” replacements Triple Ring Technologies: R&D engineering company specializing in medical devices, homeland security, imaging, sensors, optics, fluidics, robotics & mobile healthcare All data as of September 30, 2018 unless otherwise noted; Humana acquisition closed on 8/9/18 © 2 0 1 8 H C 2 H O L D I N G S , I NC. 11
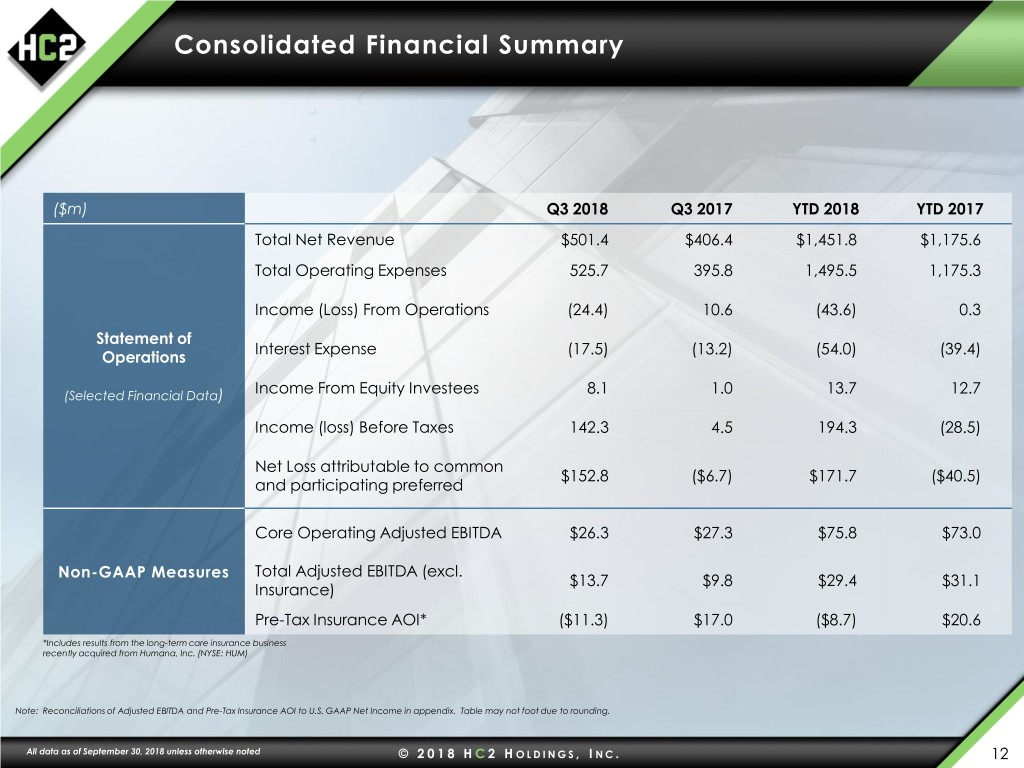
Consolidated Financial Summary ($m) Q3 2018 Q3 2017 YTD 2018 YTD 2017 Total Net Revenue $501.4 $406.4 $1,451.8 $1,175.6 Total Operating Expenses 525.7 395.8 1,495.5 1,175.3 Income (Loss) From Operations (24.4) 10.6 (43.6) 0.3 Statement of Interest Expense (17.5) (13.2) (54.0) (39.4) Operations Income From Equity Investees (Selected Financial Data) 8.1 1.0 13.7 12.7 Income (loss) Before Taxes 142.3 4.5 194.3 (28.5) Net Loss attributable to common $152.8 ($6.7) $171.7 ($40.5) and participating preferred Core Operating Adjusted EBITDA $26.3 $27.3 $75.8 $73.0 Non-GAAP Measures Total Adjusted EBITDA (excl. $13.7 $9.8 $29.4 $31.1 Insurance) Pre-Tax Insurance AOI* ($11.3) $17.0 ($8.7) $20.6 *Includes results from the long-term care insurance business recently acquired from Humana, Inc. (NYSE: HUM) Note: Reconciliations of Adjusted EBITDA and Pre-Tax Insurance AOI to U.S. GAAP Net Income in appendix. Table may not foot due to rounding. All data as of September 30, 2018 unless otherwise noted © 2 0 1 8 H C 2 H O L D I N G S , I NC. 12

Segment Financial Summary ($m) Q3 2018 Q2 2018 Q1 2018 FY 2017 Q4 2017 Q3 2017 Q2 2017 Q1 2017 FY 2016 Core Operating Subsidiaries Construction $16.0 $15.5 $10.0 $51.6 $15.1 $16.8 $11.1 $8.6 $59.9 Marine Services 7.9 20.4 (2.4) 44.0 15.3 8.8 3.6 16.3 41.2 Energy 1.0 3.0 0.7 2.9 0.4 0.3 1.0 1.2 2.5 Telecom 1.5 1.3 1.1 6.9 1.6 1.5 2.2 1.7 5.6 Total Core Operating $26.3 $40.2 $9.3 $105.5 $32.4 $27.3 $17.9 $27.8 $109.1 Adjusted Early Stage and Other Holdings EBITDA Life Sciences ($3.0) ($4.9) ($4.4) ($22.4) ($5.2) ($8.2) ($4.9) ($4.1) ($12.0) Broadcasting (2.4) (6.2) (5.1) (0.8) (0.8) 0.0 0.0 0.0 0.0 Other (1.0) (1.0) (0.2) (2.3) 2.1 (1.1) (2.2) (1.2) (11.2) Total Early Stage and Other ($6.4) ($12.1) ($9.6) ($25.5) ($3.9) ($9.3) ($7.1) ($5.2) ($23.2) Non-Operating Corporate ($6.2) ($5.4) ($6.7) ($29.2) ($8.7) ($8.3) ($6.3) ($5.9) ($25.7) Total HC2 (excluding Insurance) $13.7 $22.7 ($6.9) $50.8 $19.7 $9.8 $4.6 $16.7 $60.2 Pre-Tax Core Financial Services Insurance AOI* Insurance $(11.3) $0.5 $2.2 $24.2 $3.6 $17.0 $4.1 ($0.5) ($2.7) *Includes results from the long-term care insurance business recently acquired from Humana, Inc. (NYSE: HUM) Note: Reconciliations of Adjusted EBITDA and Pre-Tax Insurance AOI to U.S. GAAP Net Income in appendix. Table may not foot due to rounding. Pre-Tax Insurance Adjusted Operating Income for Q1 2016 was adjusted to exclude certain intercompany eliminations to better reflect the results of the Insurance segment, and remain consistent with internally reported metrics. Additional details in appendix. All data as of September 30, 2018 unless otherwise noted © 2 0 1 8 H C 2 H O L D I N G S , I NC. 13

Construction: DBM Global Inc. Third Quarter Update 3Q18 Net Income: $9.2m vs. $7.1m in 3Q17; YTD18 Net Income $20.1m vs. $14.5m for YTD17 3Q18 Adjusted EBITDA: $16.0m vs. $16.8m in 3Q17 YTD18 Adjusted EBITDA: $41.5m vs. $36.5m for the comparable 2017 YTD period Backlog of $615m at end of 3Q18, vs. $656m in year-ago quarter – ~$632m taking into consideration awarded, but not yet signed contracts Continued ramp of Inglewood Stadium (LA Rams / Chargers); Loma Linda Hospital; Google Bayview Acquiring GrayWolf Industrial, a specialty maintenance, repair and installation service provider for $135M Provides diversification of revenue and earnings; helps offset cyclicality of commercial construction market Just over $20 million annual Adjusted EBITDA with minimal capex, strong cash flows and Blue-Chip customer base Reaffirm FY18 Guidance: Continue to expect $60 million and $65 million of FY18 Adjusted EBITDA Strategic Initiatives Continue to select profitable, strategic and “core competency” jobs, not all jobs Solid long-term pipeline of prospective projects; No shortage of transactions to evaluate Commercial / Healthcare sectors remain strong, primarily in West region Continue to diversify core business to counter cyclicality of commercial construction Opportunities to add higher margin, value added services to overall product offering (e.g. BDS VirCon/PDC/Candraft) Expanding U.S. bridge & infrastructure construction opportunities Historical Performance $579.0 $526.1 $513.8 $502.7 $59.9 $52.0 $51.6 $45.8 11.9% 8.9% 10.1% 8.7% 2014PF 2015A 2016A 2017A Loma Linda Hospital Adjusted EBITDA Revenue Los Angeles Rams Stadium All data as of September 30, 2018 unless otherwise noted © 2 0 1 8 H C 2 H O L D I N G S , I NC. 14

Marine Services: Global Marine Group Third Quarter Update 3Q18 Net Income (Loss): Net (Loss) ($0.5)m vs. Net Income $0.8m in 3Q17; YTD18 Net Income $4.1m vs. $8.9m for YTD17 3Q18 Adjusted EBITDA: $7.9m vs. $8.8m in 3Q17; Strong 3Q18 performance from Huawei Marine equity investment, offset by some higher than expected costs on a certain offshore power construction project and an increase in unutilized vessel costs attributable to recently acquired marine assets and the timing of new project work YTD18 Adjusted EBITDA: $25.8m vs. $28.8m for the comparable 2017 YTD period Global Marine backlog of $358m at 3Q18 quarter-end -- Huawei Marine equity investment - Continued strong backlog of ~$350m Huawei Marine Network implemented a new long-term annual dividend policy after several years of meaningful shareholder value creation: Global Marine received ~US$10m of dividends in 3Q18; Will receive additional special dividends of ~$4.9m in 4Q18 and ~$4.9m in 2Q19 HMN will annually distribute a minimum of 30% of cumulative distributable net profits as dividends based on audited annual financials. Exploring strategic alternatives for the Global Marine business, including a potential sale; proceeds to pay down HC2 debt Reaffirm FY18 Guidance: Continue to expect $45 million and $50 million of FY18 Adjusted EBITDA Strategic Initiatives 49% ownership 49% ownership Total HMN* 2017 2016 2015 2014 Equity investment established in 1995 with China Telecom Revenue ~$246m ~$207m ~$203m ~$88m China’s leading provider of submarine cable installation Profit ~$37m ~$25m ~$14m ~$2m Cash, Equivalents, & Located in Shanghai and possesses a fleet of advanced purpose-built cable ~$73m ~$48m ~$27m ~$16m AFS Securities ships Historical Performance $163.6 $161.9 $169.5 $134.9 $50.0 $44.0 $42.1 $41.2 29.8% 31.2% 25.4% 26.0 % 2014PF 2015A 2016A 2017A Adjusted EBITDA Revenue Note: 2014 PF Adj. EBITDA inclusive of approx. $10m offshore power installation vs. minimal contribution in 2015 & 1H16 as a result of Prysmian agreement which expired in 4Q15 *Currency Exchange: CNY:USD 1:0.129 used for illustrative purposes All data as of September 30, 2018 unless otherwise noted © 2 0 1 8 H C 2 H O L D I N G S , I NC. 15
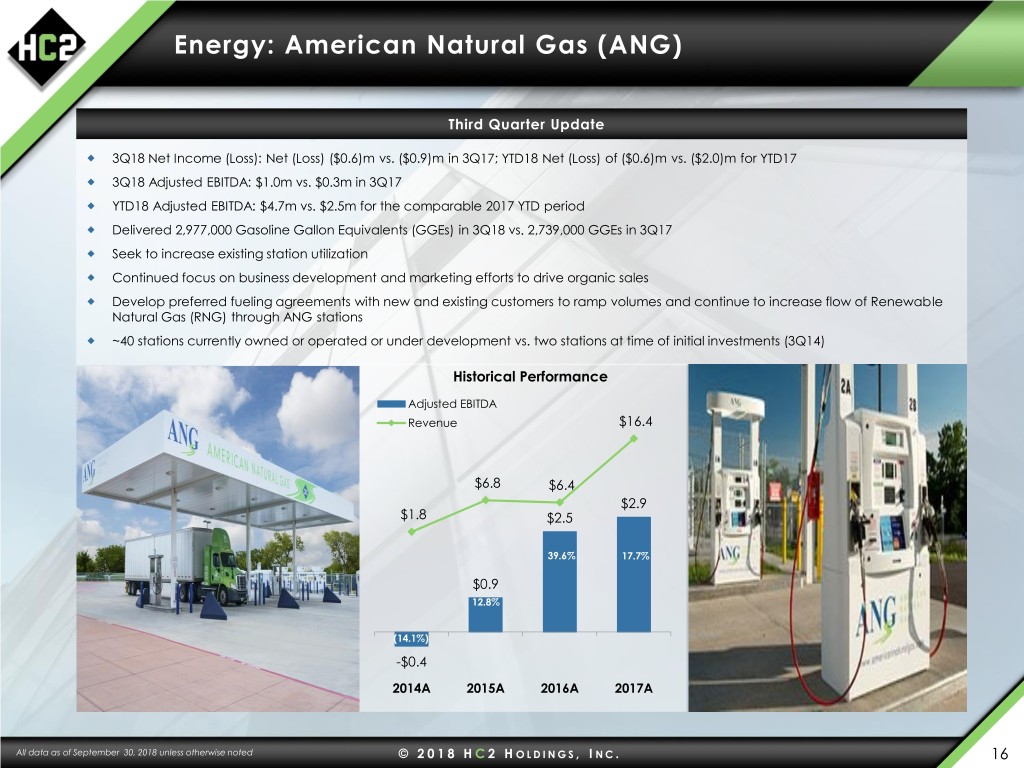
Energy: American Natural Gas (ANG) Third Quarter Update 3Q18 Net Income (Loss): Net (Loss) ($0.6)m vs. ($0.9)m in 3Q17; YTD18 Net (Loss) of ($0.6)m vs. ($2.0)m for YTD17 3Q18 Adjusted EBITDA: $1.0m vs. $0.3m in 3Q17 YTD18 Adjusted EBITDA: $4.7m vs. $2.5m for the comparable 2017 YTD period Delivered 2,977,000 Gasoline Gallon Equivalents (GGEs) in 3Q18 vs. 2,739,000 GGEs in 3Q17 Seek to increase existing station utilization Continued focus on business development and marketing efforts to drive organic sales Develop preferred fueling agreements with new and existing customers to ramp volumes and continue to increase flow of Renewable Natural Gas (RNG) through ANG stations ~40 stations currently owned or operated or under development vs. two stations at time of initial investments (3Q14) Historical Performance Adjusted EBITDA Revenue $16.4 $6.8 $6.4 $2.9 $1.8 $2.5 39.6% 17.7% $0.9 12.8% (14.1%) -$0.4 2014A 2015A 2016A 2017A All data as of September 30, 2018 unless otherwise noted © 2 0 1 8 H C 2 H O L D I N G S , I NC. 16

Telecommunications: PTGi-ICS Third Quarter Update 3Q18 Net Income: $1.3m vs. $1.3m in 3Q17; YTD18 Net Income of $3.4m vs. $4.9m for YTD17 3Q18 Adjusted EBITDA: $1.5m vs. $1.5m in 3Q17 YTD18 Adjusted EBITDA: $3.9m vs. $5.3m for the comparable 2017 YTD period ICS Group to acquire Go2Tel.com Inc. a well-established VoIP carrier that offers high-quality termination services, primarily in Latin America, South America and the Caribbean region One of the key objectives: leverage the infrastructure and management expertise within PTGi-ICS – Over 800+ wholesale interconnections globally provides HC2 the opportunity to leverage the existing cost effective infrastructure by bolting on higher margin products and M&A opportunities – A focused strategic initiative has been launched within PTGi-ICS to identify potential M&A opportunities Historical Performance Adjusted EBITDA $735.0 Revenue $701.9 $6.9 $460.4 $5.6 $162.0 $2.0 1.0% 0.8% 0.4% (0.1%) $(1.2) 2014A 2015A 2016A 2017A All data as of September 30, 2018 unless otherwise noted © 2 0 1 8 H C 2 H O L D I N G S , I NC. 17
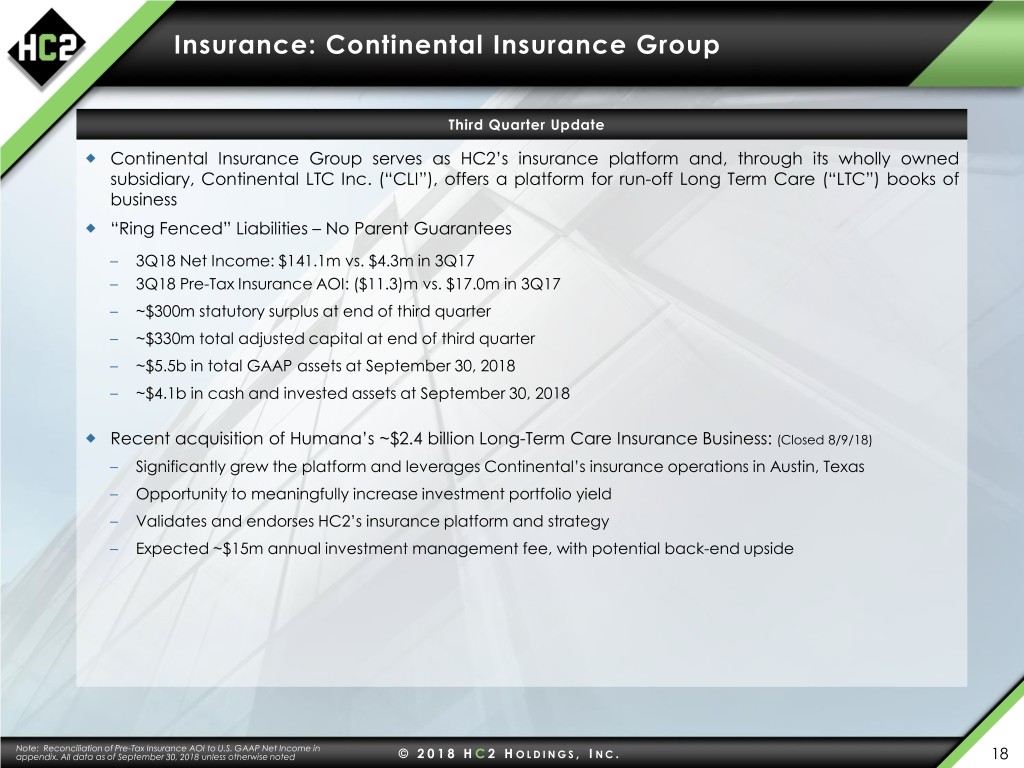
Insurance: Continental Insurance Group Third Quarter Update Continental Insurance Group serves as HC2’s insurance platform and, through its wholly owned subsidiary, Continental LTC Inc. (“CLI”), offers a platform for run-off Long Term Care (“LTC”) books of business “Ring Fenced” Liabilities – No Parent Guarantees – 3Q18 Net Income: $141.1m vs. $4.3m in 3Q17 – 3Q18 Pre-Tax Insurance AOI: ($11.3)m vs. $17.0m in 3Q17 – ~$300m statutory surplus at end of third quarter – ~$330m total adjusted capital at end of third quarter – ~$5.5b in total GAAP assets at September 30, 2018 – ~$4.1b in cash and invested assets at September 30, 2018 Recent acquisition of Humana’s ~$2.4 billion Long-Term Care Insurance Business: (Closed 8/9/18) – Significantly grew the platform and leverages Continental’s insurance operations in Austin, Texas – Opportunity to meaningfully increase investment portfolio yield – Validates and endorses HC2’s insurance platform and strategy – Expected ~$15m annual investment management fee, with potential back-end upside Note: Reconciliation of Pre-Tax Insurance AOI to U.S. GAAP Net Income in appendix. All data as of September 30, 2018 unless otherwise noted © 2 0 1 8 H C 2 H O L D I N G S , I NC. 18
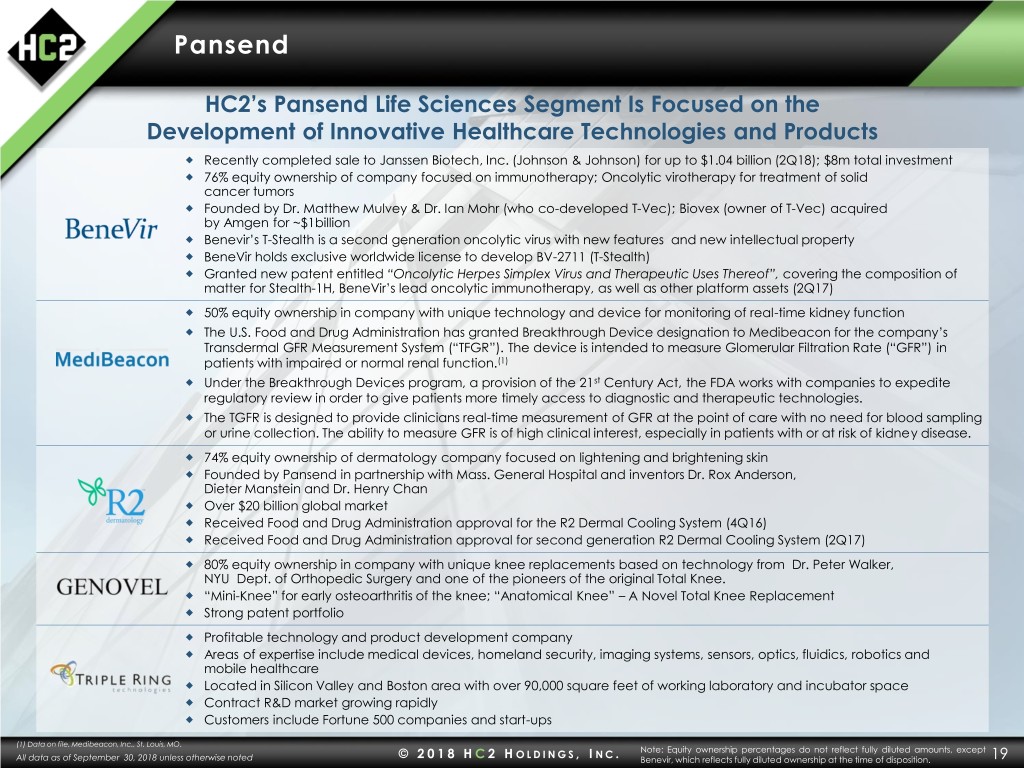
Pansend HC2’s Pansend Life Sciences Segment Is Focused on the Development of Innovative Healthcare Technologies and Products Recently completed sale to Janssen Biotech, Inc. (Johnson & Johnson) for up to $1.04 billion (2Q18); $8m total investment 76% equity ownership of company focused on immunotherapy; Oncolytic virotherapy for treatment of solid cancer tumors Founded by Dr. Matthew Mulvey & Dr. Ian Mohr (who co-developed T-Vec); Biovex (owner of T-Vec) acquired by Amgen for ~$1billion Benevir’s T-Stealth is a second generation oncolytic virus with new features and new intellectual property BeneVir holds exclusive worldwide license to develop BV-2711 (T-Stealth) Granted new patent entitled “Oncolytic Herpes Simplex Virus and Therapeutic Uses Thereof”, covering the composition of matter for Stealth-1H, BeneVir’s lead oncolytic immunotherapy, as well as other platform assets (2Q17) 50% equity ownership in company with unique technology and device for monitoring of real-time kidney function The U.S. Food and Drug Administration has granted Breakthrough Device designation to Medibeacon for the company’s Transdermal GFR Measurement System (“TFGR”). The device is intended to measure Glomerular Filtration Rate (“GFR”) in patients with impaired or normal renal function.(1) Under the Breakthrough Devices program, a provision of the 21st Century Act, the FDA works with companies to expedite regulatory review in order to give patients more timely access to diagnostic and therapeutic technologies. The TGFR is designed to provide clinicians real-time measurement of GFR at the point of care with no need for blood sampling or urine collection. The ability to measure GFR is of high clinical interest, especially in patients with or at risk of kidney disease. 74% equity ownership of dermatology company focused on lightening and brightening skin Founded by Pansend in partnership with Mass. General Hospital and inventors Dr. Rox Anderson, Dieter Manstein and Dr. Henry Chan Over $20 billion global market Received Food and Drug Administration approval for the R2 Dermal Cooling System (4Q16) Received Food and Drug Administration approval for second generation R2 Dermal Cooling System (2Q17) 80% equity ownership in company with unique knee replacements based on technology from Dr. Peter Walker, NYU Dept. of Orthopedic Surgery and one of the pioneers of the original Total Knee. “Mini-Knee” for early osteoarthritis of the knee; “Anatomical Knee” – A Novel Total Knee Replacement Strong patent portfolio Profitable technology and product development company Areas of expertise include medical devices, homeland security, imaging systems, sensors, optics, fluidics, robotics and mobile healthcare Located in Silicon Valley and Boston area with over 90,000 square feet of working laboratory and incubator space Contract R&D market growing rapidly Customers include Fortune 500 companies and start-ups (1) Data on file. Medibeacon, Inc., St. Louis, MO. O L D I N G S NC Note: Equity ownership percentages do not reflect fully diluted amounts, except All data as of September 30, 2018 unless otherwise noted © 2 0 1 8 H C 2 H , I . Benevir, which reflects fully diluted ownership at the time of disposition. 19
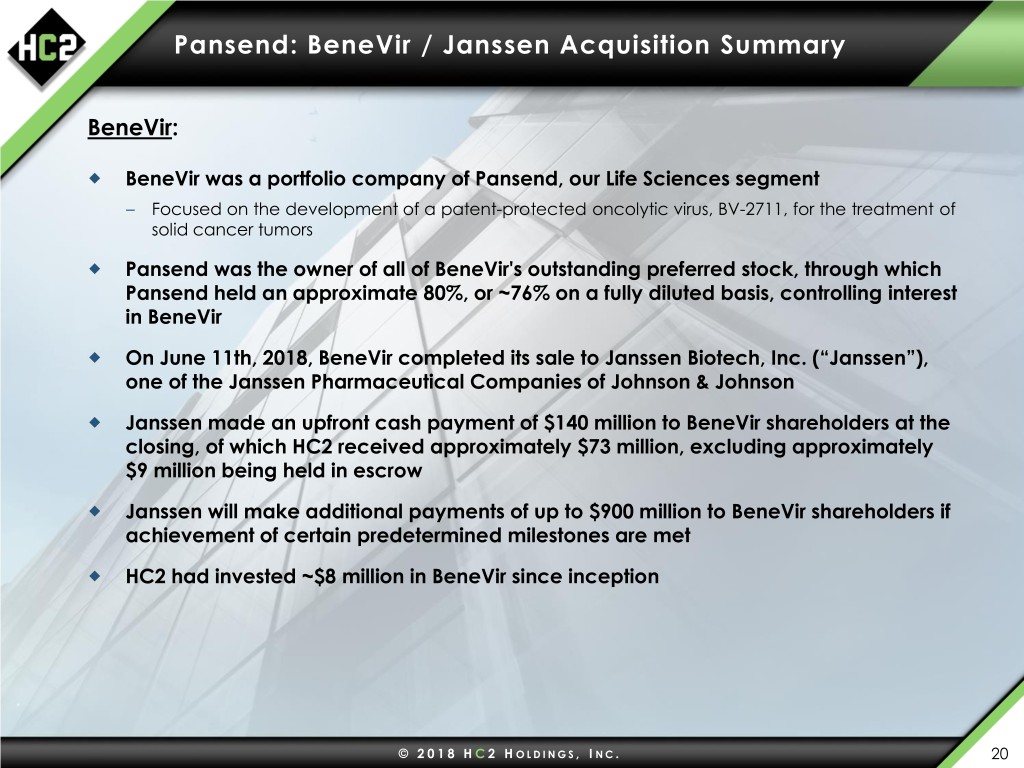
Pansend: BeneVir / Janssen Acquisition Summary BeneVir: BeneVir was a portfolio company of Pansend, our Life Sciences segment – Focused on the development of a patent-protected oncolytic virus, BV-2711, for the treatment of solid cancer tumors Pansend was the owner of all of BeneVir's outstanding preferred stock, through which Pansend held an approximate 80%, or ~76% on a fully diluted basis, controlling interest in BeneVir On June 11th, 2018, BeneVir completed its sale to Janssen Biotech, Inc. (“Janssen”), one of the Janssen Pharmaceutical Companies of Johnson & Johnson Janssen made an upfront cash payment of $140 million to BeneVir shareholders at the closing, of which HC2 received approximately $73 million, excluding approximately $9 million being held in escrow Janssen will make additional payments of up to $900 million to BeneVir shareholders if achievement of certain predetermined milestones are met HC2 had invested ~$8 million in BeneVir since inception * © 2 0 1 8 H C 2 H O L D I N G S , I NC. 20
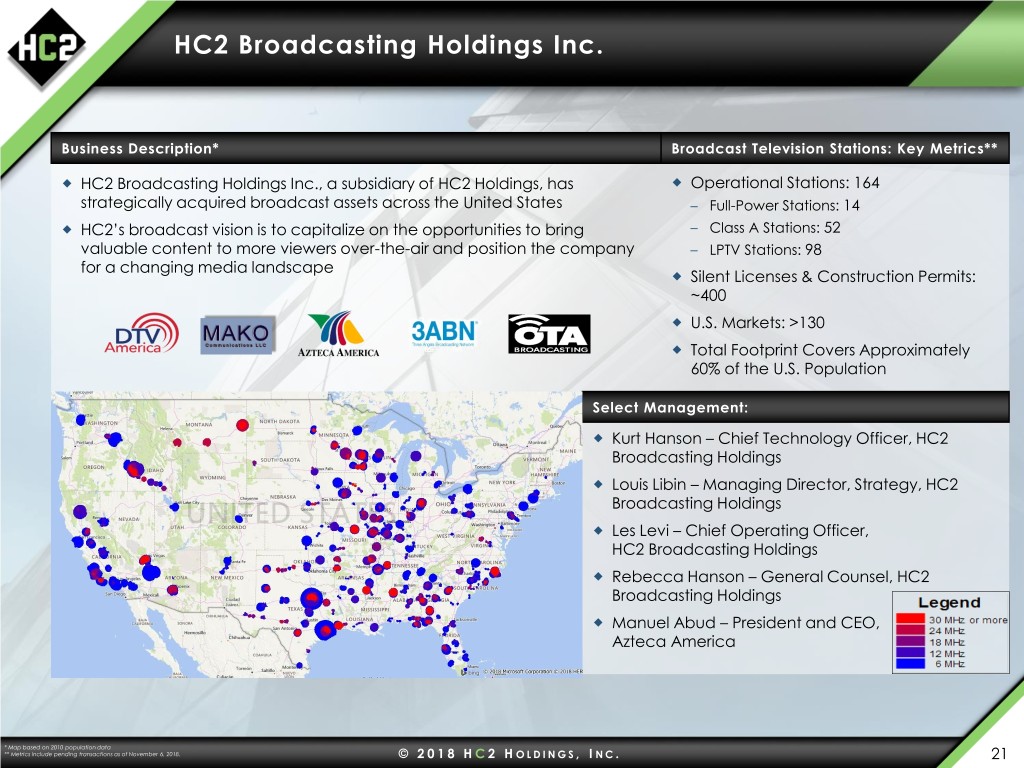
HC2 Broadcasting Holdings Inc. Business Description* Broadcast Television Stations: Key Metrics** HC2 Broadcasting Holdings Inc., a subsidiary of HC2 Holdings, has Operational Stations: 164 strategically acquired broadcast assets across the United States – Full-Power Stations: 14 HC2’s broadcast vision is to capitalize on the opportunities to bring – Class A Stations: 52 valuable content to more viewers over-the-air and position the company – LPTV Stations: 98 for a changing media landscape Silent Licenses & Construction Permits: ~400 U.S. Markets: >130 Total Footprint Covers Approximately 60% of the U.S. Population Select Management: Kurt Hanson – Chief Technology Officer, HC2 Broadcasting Holdings Louis Libin – Managing Director, Strategy, HC2 Broadcasting Holdings Les Levi – Chief Operating Officer, HC2 Broadcasting Holdings Rebecca Hanson – General Counsel, HC2 Broadcasting Holdings Manuel Abud – President and CEO, Azteca America * Map based on 2010 population data ** Metrics include pending transactions as of November 6, 2018. © 2 0 1 8 H C 2 H O L D I N G S , I NC. 21

Notable Financial and Other Updates Collateral Coverage Ratio Exceeded 2.00x at Quarter End (3Q18) $82.5 million in Consolidated Cash (excluding Insurance segment) at Quarter End (3Q18) – $44.4 million Corporate Cash at Quarter End 2018 Key Priorities: – Monetization / value creation within diverse HC2 portfolio – Continued focused expansion of Over-the-Air broadcast television strategy – Optimization of HC2 capital structure Re-Affirmed 2018 Guidance for Construction & Marine Services – DBM Global: Continue to expect $60 million - $65 million of FY18 Adjusted EBITDA – Global Marine: Continue to expect $45 million - $50 million of FY18 Adjusted EBITDA ($m) Balance Sheet (at September 30, 2018) Market Cap(1) $238.5 Preferred Equity $26.7 Total Corporate Debt $510.0 Corporate Cash(2) $44.4 Enterprise Value(3) $730.8 (1) Market capitalization on a fully diluted basis, excluding preferred equity, using a common stock price per share of $5.33 on November 6, 2018 (2) Cash and cash equivalents (3) Enterprise Value is calculated by adding market capitalization, total preferred equity and total debt amounts, less corporate cash HC2 does not guarantee future results of any kind. Guidance is subject to risks and uncertainties, including, without limitation, those factors outlined in the “Forward Looking Statements” of this presentation and the “Risk Factors” section of the company’s annual and quarterly reports filed with the Securities and Exchange Commission (SEC). All data as of September 30, 2018 unless otherwise noted © 2 0 1 8 H C 2 H O L D I N G S , I NC. 22

Reconciliations
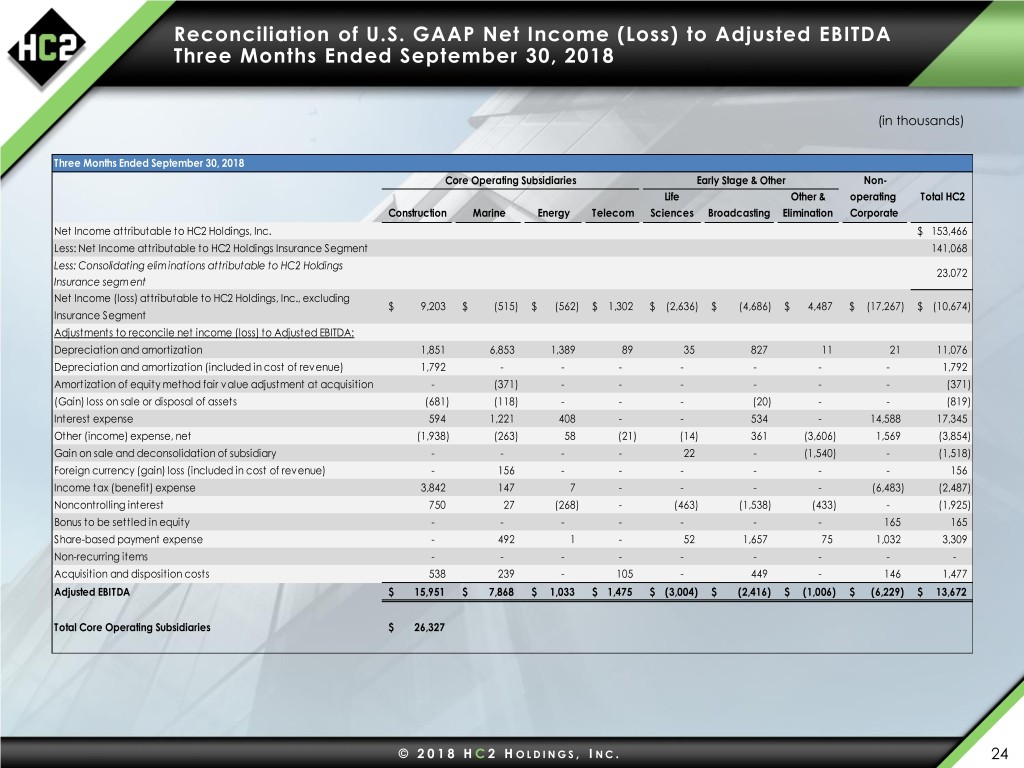
Reconciliation of U.S. GAAP Net Income (Loss) to Adjusted EBITDA Three Months Ended September 30, 2018 (in thousands) Three Months Ended September 30, 2018 Core Operating Subsidiaries Early Stage & Other Non- Life Other & operating Total HC2 Construction Marine Energy Telecom Sciences Broadcasting Elimination Corporate Net Income attributable to HC2 Holdings, Inc. $ 153,466 Less: Net Income attributable to HC2 Holdings Insurance Segment 141,068 Less: Consolidating elim inations attributable to HC2 Holdings 23,072 Insurance segm ent Net Income (loss) attributable to HC2 Holdings, Inc., excluding $ 9,203 $ (515) $ (562) $ 1,302 $ (2,636) $ (4,686) $ 4,487 $ (17,267) $ (10,674) Insurance Segment Adjustments to reconcile net income (loss) to Adjusted EBITDA: Depreciation and amortization 1,851 6,853 1,389 89 35 827 11 21 11,076 Depreciation and amortization (included in cost of revenue) 1,792 - - - - - - - 1,792 Amortization of equity method fair value adjustment at acquisition - (371) - - - - - - (371) (Gain) loss on sale or disposal of assets (681) (118) - - - (20) - - (819) Interest expense 594 1,221 408 - - 534 - 14,588 17,345 Other (income) expense, net (1,938) (263) 58 (21) (14) 361 (3,606) 1,569 (3,854) Gain on sale and deconsolidation of subsidiary - - - - 22 - (1,540) - (1,518) Foreign currency (gain) loss (included in cost of revenue) - 156 - - - - - - 156 Income tax (benefit) expense 3,842 147 7 - - - - (6,483) (2,487) Noncontrolling interest 750 27 (268) - (463) (1,538) (433) - (1,925) Bonus to be settled in equity - - - - - - - 165 165 Share-based payment expense - 492 1 - 52 1,657 75 1,032 3,309 Non-recurring items - - - - - - - - - Acquisition and disposition costs 538 239 - 105 - 449 - 146 1,477 Adjusted EBITDA $ 15,951 $ 7,868 $ 1,033 $ 1,475 $ (3,004) $ (2,416) $ (1,006) $ (6,229) $ 13,672 Total Core Operating Subsidiaries $ 26,327 © 2 0 1 8 H C 2 H O L D I N G S , I NC. 24

Reconciliation of U.S. GAAP Net Income (Loss) to Adjusted EBITDA Three Months Ended September 30, 2017 (in thousands) Three Months Ended September 30, 2017 Core Operating Subsidiaries Early Stage & Other Non- Life Other & operating Total HC2 Construction Marine Energy Telecom Sciences Broadcasting Elimination Corporate Net loss attributable to HC2 Holdings, Inc. $ (5,967) Less: Net Income attributable to HC2 Holdings Insurance segment 4,280 Net Income (loss) attributable to HC2 Holdings, Inc., excluding $ 7,082 $ 844 $ (939) $ 1,348 $ (6,760) $ - $ (600) $ (11,222) $ (10,247) Insurance Segment Adjustments to reconcile net income (loss) to Adjusted EBITDA: Depreciation and amortization 1,314 6,221 1,247 94 50 - 272 17 9,215 Depreciation and amortization (included in cost of revenue) 1,293 - - - - - - - 1,293 Amortization of equity method fair value adjustment at acquisition - (573) - - - - - - (573) (Gain) loss on sale or disposal of assets 486 - 25 - - - - - 511 Lease termination costs - - - 15 - - - - 15 Interest expense 238 1,021 262 14 - - 1 11,686 13,222 Net loss (gain) on contingent consideration - - - - - - - (6,320) (6,320) Other (income) expense, net (165) 888 277 12 (10) - (118) (718) 166 Foreign currency (gain) loss (included in cost of revenue) - (238) - - - - - - (238) Income tax (benefit) expense 4,481 (137) - - - - - (4,746) (402) Noncontrolling interest 558 43 (763) - (1,506) - (689) - (2,357) Bonus to be settled in equity - - - - - - - 765 765 Share-based payment expense - 394 179 - 71 - 19 718 1,381 Non-recurring items - - - - - - - - - Acquisition and disposition costs 1,501 300 - - - - - 1,564 3,365 Adjusted EBITDA $ 16,788 $ 8,763 $ 288 $ 1,483 $ (8,155) $ - $ (1,115) $ (8,256) $ 9,796 Total Core Operating Subsidiaries $ 27,322 © 2 0 1 8 H C 2 H O L D I N G S , I NC. 25
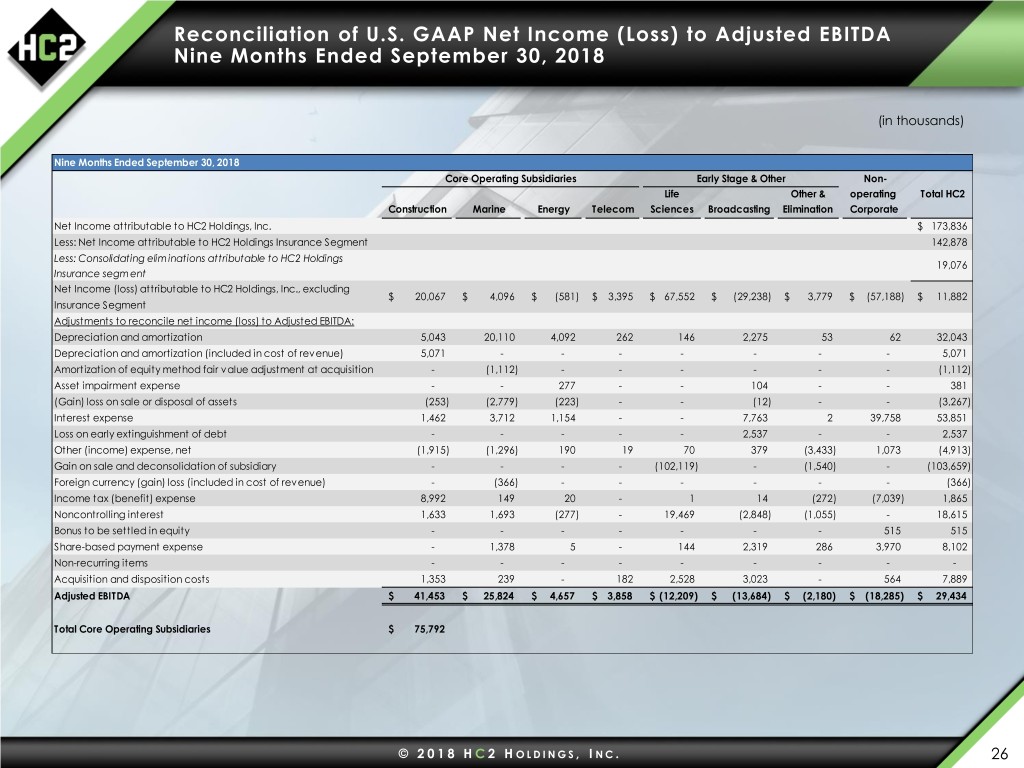
Reconciliation of U.S. GAAP Net Income (Loss) to Adjusted EBITDA Nine Months Ended September 30, 2018 (in thousands) Nine Months Ended September 30, 2018 Core Operating Subsidiaries Early Stage & Other Non- Life Other & operating Total HC2 Construction Marine Energy Telecom Sciences Broadcasting Elimination Corporate Net Income attributable to HC2 Holdings, Inc. $ 173,836 Less: Net Income attributable to HC2 Holdings Insurance Segment 142,878 Less: Consolidating elim inations attributable to HC2 Holdings 19,076 Insurance segm ent Net Income (loss) attributable to HC2 Holdings, Inc., excluding $ 20,067 $ 4,096 $ (581) $ 3,395 $ 67,552 $ (29,238) $ 3,779 $ (57,188) $ 11,882 Insurance Segment Adjustments to reconcile net income (loss) to Adjusted EBITDA: Depreciation and amortization 5,043 20,110 4,092 262 146 2,275 53 62 32,043 Depreciation and amortization (included in cost of revenue) 5,071 - - - - - - - 5,071 Amortization of equity method fair value adjustment at acquisition - (1,112) - - - - - - (1,112) Asset impairment expense - - 277 - - 104 - - 381 (Gain) loss on sale or disposal of assets (253) (2,779) (223) - - (12) - - (3,267) Interest expense 1,462 3,712 1,154 - - 7,763 2 39,758 53,851 Loss on early extinguishment of debt - - - - - 2,537 - - 2,537 Other (income) expense, net (1,915) (1,296) 190 19 70 379 (3,433) 1,073 (4,913) Gain on sale and deconsolidation of subsidiary - - - - (102,119) - (1,540) - (103,659) Foreign currency (gain) loss (included in cost of revenue) - (366) - - - - - - (366) Income tax (benefit) expense 8,992 149 20 - 1 14 (272) (7,039) 1,865 Noncontrolling interest 1,633 1,693 (277) - 19,469 (2,848) (1,055) - 18,615 Bonus to be settled in equity - - - - - - - 515 515 Share-based payment expense - 1,378 5 - 144 2,319 286 3,970 8,102 Non-recurring items - - - - - - - - - Acquisition and disposition costs 1,353 239 - 182 2,528 3,023 - 564 7,889 Adjusted EBITDA $ 41,453 $ 25,824 $ 4,657 $ 3,858 $ (12,209) $ (13,684) $ (2,180) $ (18,285) $ 29,434 Total Core Operating Subsidiaries $ 75,792 © 2 0 1 8 H C 2 H O L D I N G S , I NC. 26
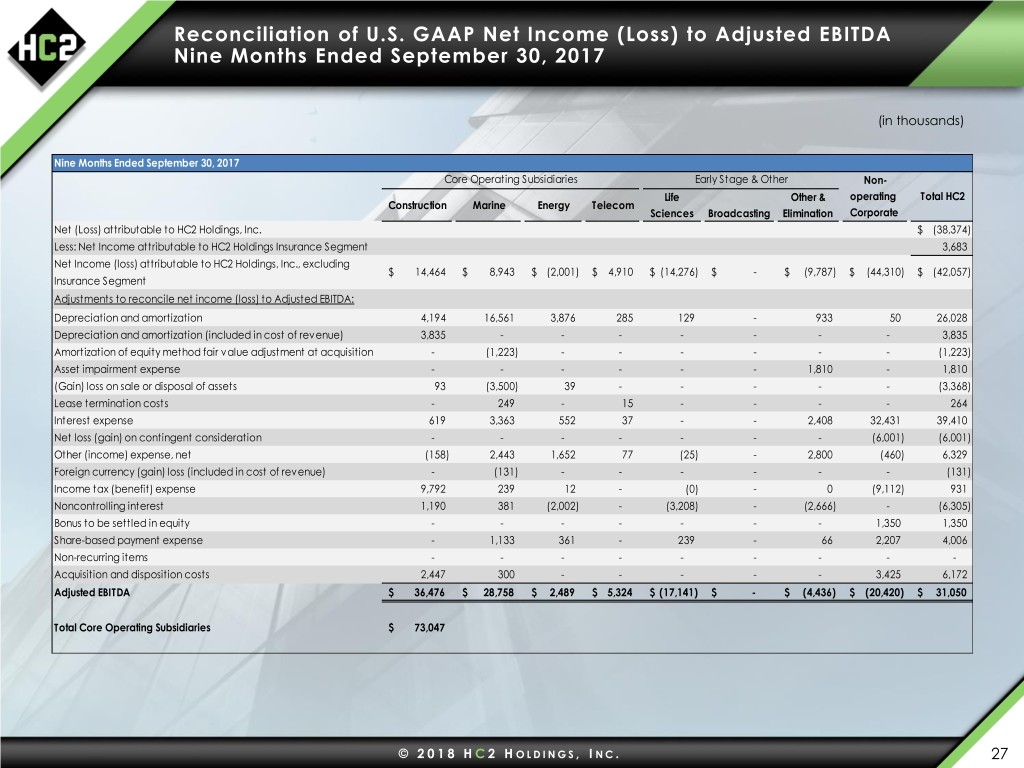
Reconciliation of U.S. GAAP Net Income (Loss) to Adjusted EBITDA Nine Months Ended September 30, 2017 (in thousands) Nine Months Ended September 30, 2017 Core Operating Subsidiaries Early Stage & Other Non- Life Other & operating Total HC2 Construction Marine Energy Telecom Sciences Broadcasting Elimination Corporate Net (Loss) attributable to HC2 Holdings, Inc. $ (38,374) Less: Net Income attributable to HC2 Holdings Insurance Segment 3,683 Net Income (loss) attributable to HC2 Holdings, Inc., excluding $ 14,464 $ 8,943 $ (2,001) $ 4,910 $ (14,276) $ - $ (9,787) $ (44,310) $ (42,057) Insurance Segment Adjustments to reconcile net income (loss) to Adjusted EBITDA: Depreciation and amortization 4,194 16,561 3,876 285 129 - 933 50 26,028 Depreciation and amortization (included in cost of revenue) 3,835 - - - - - - - 3,835 Amortization of equity method fair value adjustment at acquisition - (1,223) - - - - - - (1,223) Asset impairment expense - - - - - - 1,810 - 1,810 (Gain) loss on sale or disposal of assets 93 (3,500) 39 - - - - - (3,368) Lease termination costs - 249 - 15 - - - - 264 Interest expense 619 3,363 552 37 - - 2,408 32,431 39,410 Net loss (gain) on contingent consideration - - - - - - - (6,001) (6,001) Other (income) expense, net (158) 2,443 1,652 77 (25) - 2,800 (460) 6,329 Foreign currency (gain) loss (included in cost of revenue) - (131) - - - - - - (131) Income tax (benefit) expense 9,792 239 12 - (0) - 0 (9,112) 931 Noncontrolling interest 1,190 381 (2,002) - (3,208) - (2,666) - (6,305) Bonus to be settled in equity - - - - - - - 1,350 1,350 Share-based payment expense - 1,133 361 - 239 - 66 2,207 4,006 Non-recurring items - - - - - - - - - Acquisition and disposition costs 2,447 300 - - - - - 3,425 6,172 Adjusted EBITDA $ 36,476 $ 28,758 $ 2,489 $ 5,324 $ (17,141) $ - $ (4,436) $ (20,420) $ 31,050 Total Core Operating Subsidiaries $ 73,047 © 2 0 1 8 H C 2 H O L D I N G S , I NC. 27

Reconciliation of U.S. GAAP Net Income (Loss) to Adjusted EBITDA Three Months Ended June 30, 2018 (in thousands) Three Months Ended June 30, 2018 Core Operating Subsidiaries Early Stage & Other Non- Life Other & operating Total HC2 Construction Marine Energy Telecom Sciences Broadcasting Elimination Corporate Net Income attributable to HC2 Holdings, Inc. $ 55,366 Less: Net Income attributable to HC2 Holdings Insurance Segment 565 Less: Consolidating elim inations attributable to HC2 Holdings (2,009) Insurance segm ent Net Income (loss) attributable to HC2 Holdings, Inc., excluding $ 7,397 $ 10,864 $ 679 $ 1,040 $ 74,124 $ (11,816) $ (552) $ (24,926) $ 56,810 Insurance Segment Adjustments to reconcile net income (loss) to Adjusted EBITDA: Depreciation and amortization 1,665 6,429 1,359 87 53 743 21 20 10,377 Depreciation and amortization (included in cost of revenue) 1,686 - - - - - - - 1,686 Amortization of equity method fair value adjustment at acquisition - (370) - - - - - - (370) Asset impairment expense - - 277 - - 104 - - 381 (Gain) loss on sale or disposal of assets 13 (25) (192) - - 8 - - (196) Interest expense 458 1,328 426 - - 1,523 - 13,446 17,181 Loss on early extinguishment of debt - - - - - 2,537 - - 2,537 Gain on sale and deconsolidation of subsidiary - - - - (102,141) - - - (102,141) Other (income) expense, net (66) (1,981) 66 99 56 93 121 226 (1,386) Foreign currency (gain) loss (included in cost of revenue) - (420) - - - - - - (420) Income tax (benefit) expense 3,318 68 13 - 1 14 (272) 2,759 5,901 Noncontrolling interest 601 4,030 324 - 20,679 (700) (536) - 24,398 Bonus to be settled in equity - - - - - - - 175 175 Share-based payment expense - 476 2 - 18 349 200 2,660 3,705 Non-recurring items - - - - - - - - - Acquisition and disposition costs 456 - - 49 2,355 928 - 240 4,028 Adjusted EBITDA $ 15,528 $ 20,399 $ 2,954 $ 1,275 $ (4,855) $ (6,217) $ (1,018) $ (5,400) $ 22,666 Total Core Operating Subsidiaries $ 40,156 © 2 0 1 8 H C 2 H O L D I N G S , I NC. 28
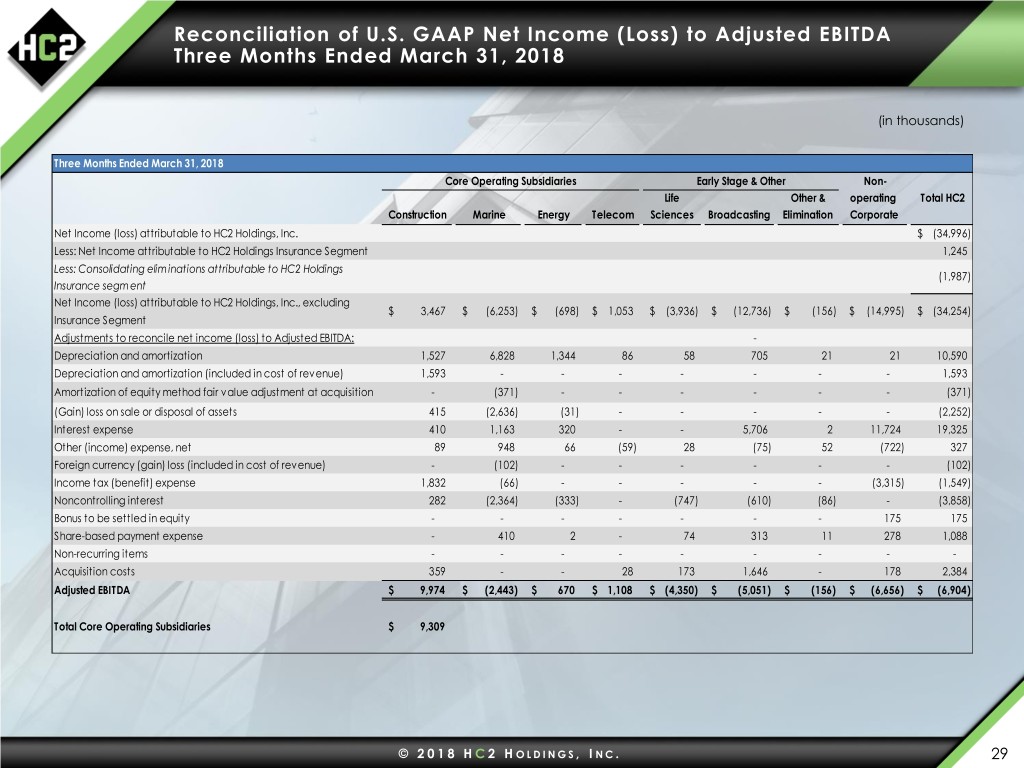
Reconciliation of U.S. GAAP Net Income (Loss) to Adjusted EBITDA Three Months Ended March 31, 2018 (in thousands) Three Months Ended March 31, 2018 Core Operating Subsidiaries Early Stage & Other Non- Life Other & operating Total HC2 Construction Marine Energy Telecom Sciences Broadcasting Elimination Corporate Net Income (loss) attributable to HC2 Holdings, Inc. $ (34,996) Less: Net Income attributable to HC2 Holdings Insurance Segment 1,245 Less: Consolidating elim inations attributable to HC2 Holdings (1,987) Insurance segm ent Net Income (loss) attributable to HC2 Holdings, Inc., excluding $ 3,467 $ (6,253) $ (698) $ 1,053 $ (3,936) $ (12,736) $ (156) $ (14,995) $ (34,254) Insurance Segment Adjustments to reconcile net income (loss) to Adjusted EBITDA: - Depreciation and amortization 1,527 6,828 1,344 86 58 705 21 21 10,590 Depreciation and amortization (included in cost of revenue) 1,593 - - - - - - - 1,593 Amortization of equity method fair value adjustment at acquisition - (371) - - - - - - (371) (Gain) loss on sale or disposal of assets 415 (2,636) (31) - - - - - (2,252) Interest expense 410 1,163 320 - - 5,706 2 11,724 19,325 Other (income) expense, net 89 948 66 (59) 28 (75) 52 (722) 327 Foreign currency (gain) loss (included in cost of revenue) - (102) - - - - - - (102) Income tax (benefit) expense 1,832 (66) - - - - - (3,315) (1,549) Noncontrolling interest 282 (2,364) (333) - (747) (610) (86) - (3,858) Bonus to be settled in equity - - - - - - - 175 175 Share-based payment expense - 410 2 - 74 313 11 278 1,088 Non-recurring items - - - - - - - - - Acquisition costs 359 - - 28 173 1,646 - 178 2,384 Adjusted EBITDA $ 9,974 $ (2,443) $ 670 $ 1,108 $ (4,350) $ (5,051) $ (156) $ (6,656) $ (6,904) Total Core Operating Subsidiaries $ 9,309 © 2 0 1 8 H C 2 H O L D I N G S , I NC. 29
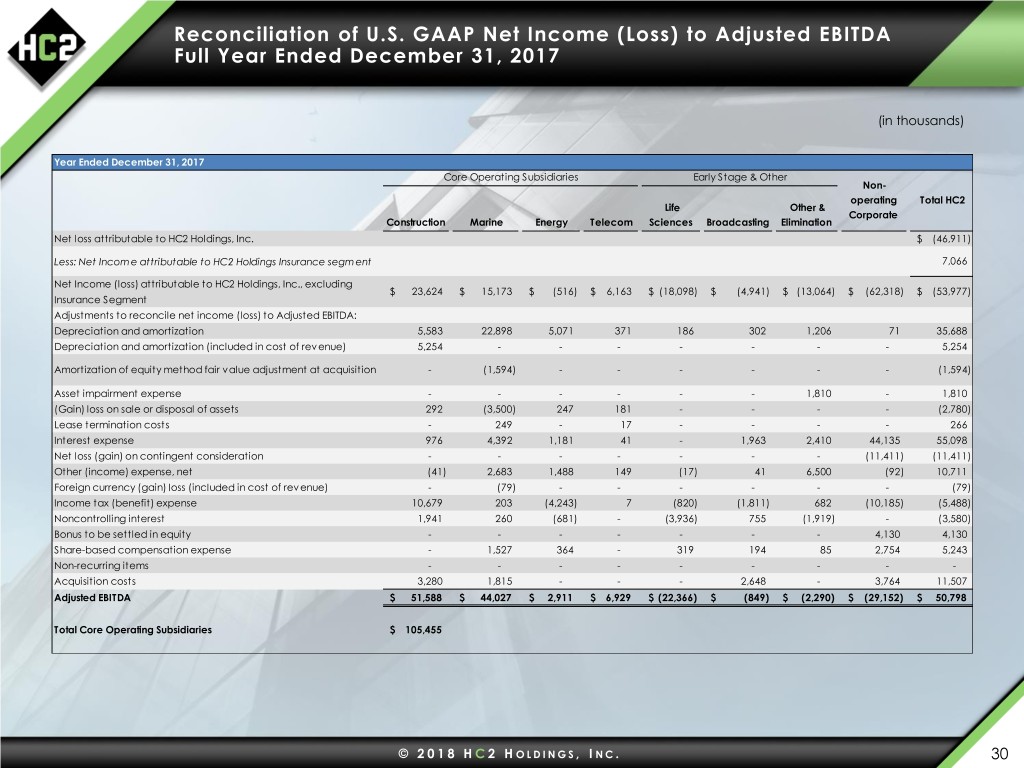
Reconciliation of U.S. GAAP Net Income (Loss) to Adjusted EBITDA Full Year Ended December 31, 2017 (in thousands) Year Ended December 31, 2017 Core Operating Subsidiaries Early Stage & Other Non- operating Total HC2 Life Other & Corporate Construction Marine Energy Telecom Sciences Broadcasting Elimination Net loss attributable to HC2 Holdings, Inc. $ (46,911) Less: Net Incom e attributable to HC2 Holdings Insurance segm ent 7,066 Net Income (loss) attributable to HC2 Holdings, Inc., excluding $ 23,624 $ 15,173 $ (516) $ 6,163 $ (18,098) $ (4,941) $ (13,064) $ (62,318) $ (53,977) Insurance Segment Adjustments to reconcile net income (loss) to Adjusted EBITDA: Depreciation and amortization 5,583 22,898 5,071 371 186 302 1,206 71 35,688 Depreciation and amortization (included in cost of revenue) 5,254 - - - - - - - 5,254 Amortization of equity method fair value adjustment at acquisition - (1,594) - - - - - - (1,594) Asset impairment expense - - - - - - 1,810 - 1,810 (Gain) loss on sale or disposal of assets 292 (3,500) 247 181 - - - - (2,780) Lease termination costs - 249 - 17 - - - - 266 Interest expense 976 4,392 1,181 41 - 1,963 2,410 44,135 55,098 Net loss (gain) on contingent consideration - - - - - - - (11,411) (11,411) Other (income) expense, net (41) 2,683 1,488 149 (17) 41 6,500 (92) 10,711 Foreign currency (gain) loss (included in cost of revenue) - (79) - - - - - - (79) Income tax (benefit) expense 10,679 203 (4,243) 7 (820) (1,811) 682 (10,185) (5,488) Noncontrolling interest 1,941 260 (681) - (3,936) 755 (1,919) - (3,580) Bonus to be settled in equity - - - - - - - 4,130 4,130 Share-based compensation expense - 1,527 364 - 319 194 85 2,754 5,243 Non-recurring items - - - - - - - - - Acquisition costs 3,280 1,815 - - - 2,648 - 3,764 11,507 Adjusted EBITDA $ 51,588 $ 44,027 $ 2,911 $ 6,929 $ (22,366) $ (849) $ (2,290) $ (29,152) $ 50,798 Total Core Operating Subsidiaries $ 105,455 © 2 0 1 8 H C 2 H O L D I N G S , I NC. 30
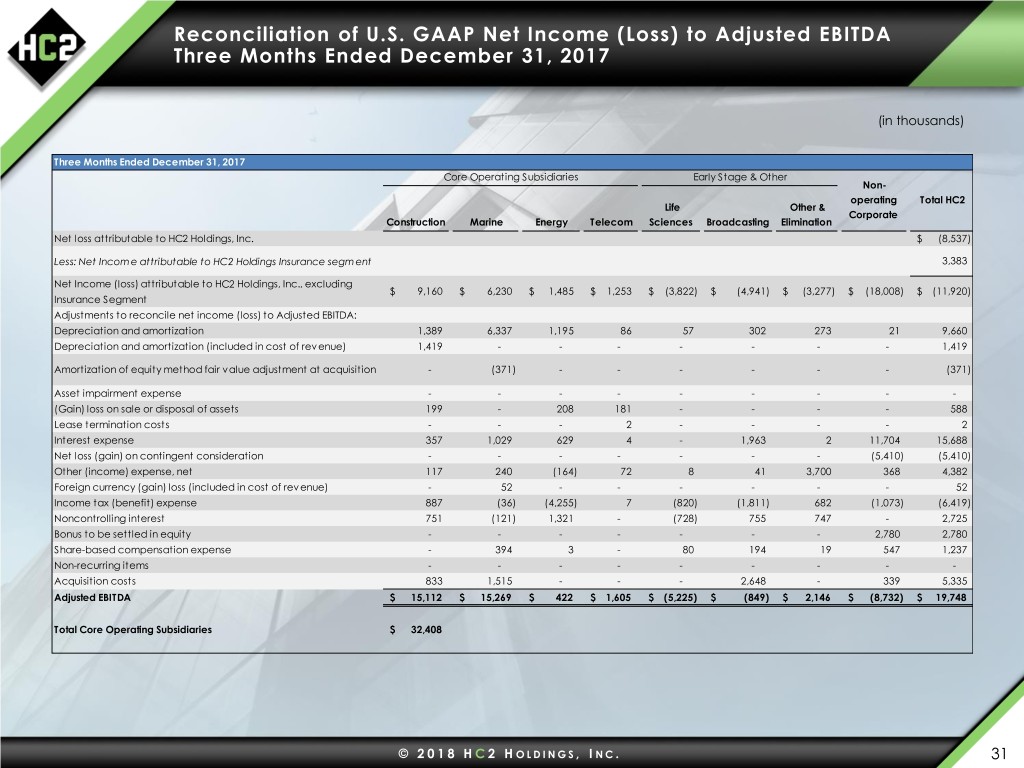
Reconciliation of U.S. GAAP Net Income (Loss) to Adjusted EBITDA Three Months Ended December 31, 2017 (in thousands) Three Months Ended December 31, 2017 Core Operating Subsidiaries Early Stage & Other Non- operating Total HC2 Life Other & Corporate Construction Marine Energy Telecom Sciences Broadcasting Elimination Net loss attributable to HC2 Holdings, Inc. $ (8,537) Less: Net Incom e attributable to HC2 Holdings Insurance segm ent 3,383 Net Income (loss) attributable to HC2 Holdings, Inc., excluding $ 9,160 $ 6,230 $ 1,485 $ 1,253 $ (3,822) $ (4,941) $ (3,277) $ (18,008) $ (11,920) Insurance Segment Adjustments to reconcile net income (loss) to Adjusted EBITDA: Depreciation and amortization 1,389 6,337 1,195 86 57 302 273 21 9,660 Depreciation and amortization (included in cost of revenue) 1,419 - - - - - - - 1,419 Amortization of equity method fair value adjustment at acquisition - (371) - - - - - - (371) Asset impairment expense - - - - - - - - - (Gain) loss on sale or disposal of assets 199 - 208 181 - - - - 588 Lease termination costs - - - 2 - - - - 2 Interest expense 357 1,029 629 4 - 1,963 2 11,704 15,688 Net loss (gain) on contingent consideration - - - - - - - (5,410) (5,410) Other (income) expense, net 117 240 (164) 72 8 41 3,700 368 4,382 Foreign currency (gain) loss (included in cost of revenue) - 52 - - - - - - 52 Income tax (benefit) expense 887 (36) (4,255) 7 (820) (1,811) 682 (1,073) (6,419) Noncontrolling interest 751 (121) 1,321 - (728) 755 747 - 2,725 Bonus to be settled in equity - - - - - - - 2,780 2,780 Share-based compensation expense - 394 3 - 80 194 19 547 1,237 Non-recurring items - - - - - - - - - Acquisition costs 833 1,515 - - - 2,648 - 339 5,335 Adjusted EBITDA $ 15,112 $ 15,269 $ 422 $ 1,605 $ (5,225) $ (849) $ 2,146 $ (8,732) $ 19,748 Total Core Operating Subsidiaries $ 32,408 © 2 0 1 8 H C 2 H O L D I N G S , I NC. 31
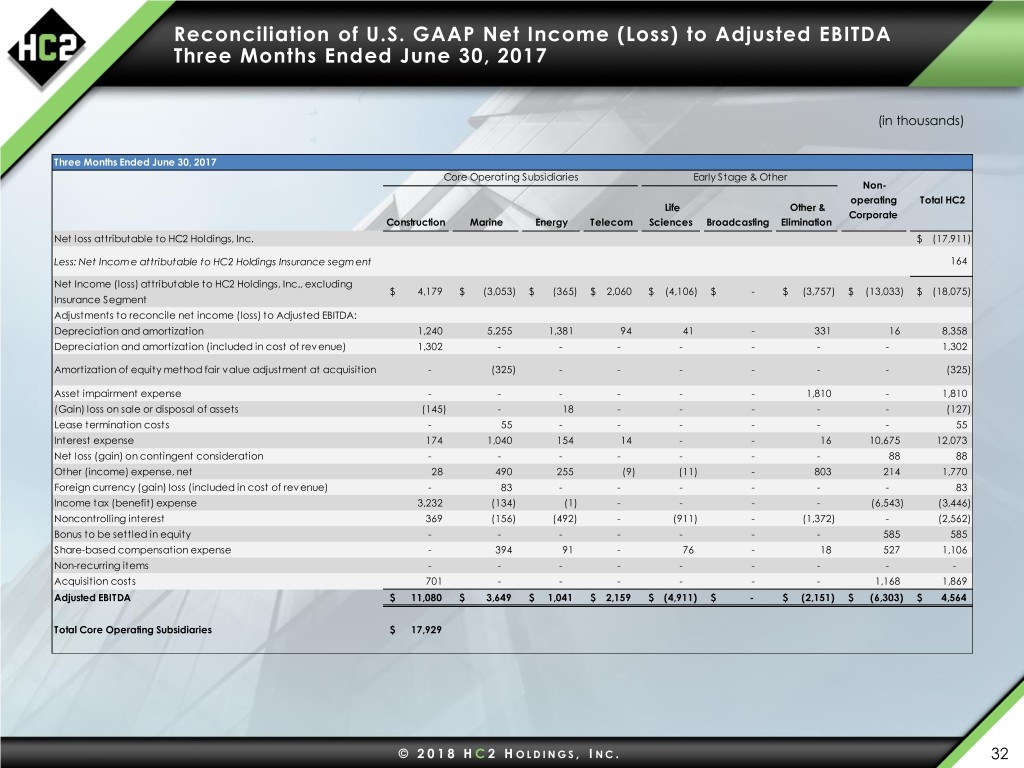
Reconciliation of U.S. GAAP Net Income (Loss) to Adjusted EBITDA Three Months Ended June 30, 2017 (in thousands) Three Months Ended June 30, 2017 Core Operating Subsidiaries Early Stage & Other Non- operating Total HC2 Life Other & Corporate Construction Marine Energy Telecom Sciences Broadcasting Elimination Net loss attributable to HC2 Holdings, Inc. $ (17,911) Less: Net Incom e attributable to HC2 Holdings Insurance segm ent 164 Net Income (loss) attributable to HC2 Holdings, Inc., excluding $ 4,179 $ (3,053) $ (365) $ 2,060 $ (4,106) $ - $ (3,757) $ (13,033) $ (18,075) Insurance Segment Adjustments to reconcile net income (loss) to Adjusted EBITDA: Depreciation and amortization 1,240 5,255 1,381 94 41 - 331 16 8,358 Depreciation and amortization (included in cost of revenue) 1,302 - - - - - - - 1,302 Amortization of equity method fair value adjustment at acquisition - (325) - - - - - - (325) Asset impairment expense - - - - - - 1,810 - 1,810 (Gain) loss on sale or disposal of assets (145) - 18 - - - - - (127) Lease termination costs - 55 - - - - - - 55 Interest expense 174 1,040 154 14 - - 16 10,675 12,073 Net loss (gain) on contingent consideration - - - - - - - 88 88 Other (income) expense, net 28 490 255 (9) (11) - 803 214 1,770 Foreign currency (gain) loss (included in cost of revenue) - 83 - - - - - - 83 Income tax (benefit) expense 3,232 (134) (1) - - - - (6,543) (3,446) Noncontrolling interest 369 (156) (492) - (911) - (1,372) - (2,562) Bonus to be settled in equity - - - - - - - 585 585 Share-based compensation expense - 394 91 - 76 - 18 527 1,106 Non-recurring items - - - - - - - - - Acquisition costs 701 - - - - - - 1,168 1,869 Adjusted EBITDA $ 11,080 $ 3,649 $ 1,041 $ 2,159 $ (4,911) $ - $ (2,151) $ (6,303) $ 4,564 Total Core Operating Subsidiaries $ 17,929 © 2 0 1 8 H C 2 H O L D I N G S , I NC. 32

Reconciliation of U.S. GAAP Net Income (Loss) to Adjusted EBITDA Three Months Ended March 31, 2017 (in thousands) Three Months Ended March 31, 2017 Core Operating Subsidiaries Early Stage & Other Non- operating Total HC2 Life Other & Corporate Construction Marine Energy Telecom Sciences Broadcasting Elimination Net loss attributable to HC2 Holdings, Inc. $ (14,496) Less: Net loss attributable to HC2 Holdings Insurance segm ent (761) Net Income (loss) attributable to HC2 Holdings, Inc., excluding $ 3,203 $ 11,152 $ (697) $ 1,502 $ (3,410) $ - $ (5,430) $ (20,055) $ (13,735) Insurance Segment Adjustments to reconcile net income (loss) to Adjusted EBITDA: Depreciation and amortization 1,640 5,085 1,248 97 38 - 330 16 8,454 Depreciation and amortization (included in cost of revenue) 1,240 - - - - - - - 1,240 Amortization of equity method fair value adjustment at acquisition - (325) - - - - - - (325) Asset impairment expense - - - - - - - - - (Gain) loss on sale or disposal of assets (248) (3,500) (4) - - - - - (3,752) Lease termination costs - 194 - - - - - - 194 Interest expense 207 1,302 136 9 - - 2,391 10,070 14,115 Net loss (gain) on contingent consideration - - - - - - - 231 231 Other (income) expense, net (21) 1,065 1,120 74 (4) - 2,115 44 4,393 Foreign currency (gain) loss (included in cost of revenue) - 24 - - - - - - 24 Income tax (benefit) expense 2,079 510 13 - - - - 2,177 4,779 Noncontrolling interest 263 494 (747) - (791) - (605) - (1,386) Bonus to be settled in equity - - - - - - - - - Share-based compensation expense - 345 91 - 92 - 29 962 1,519 Non-recurring items - - - - - - - - - Acquisition costs 245 - - - - - - 693 938 Adjusted EBITDA $ 8,608 $ 16,346 $ 1,160 $ 1,682 $ (4,075) $ - $ (1,170) $ (5,862) $ 16,689 Total Core Operating Subsidiaries $ 27,796 © 2 0 1 8 H C 2 H O L D I N G S , I NC. 33
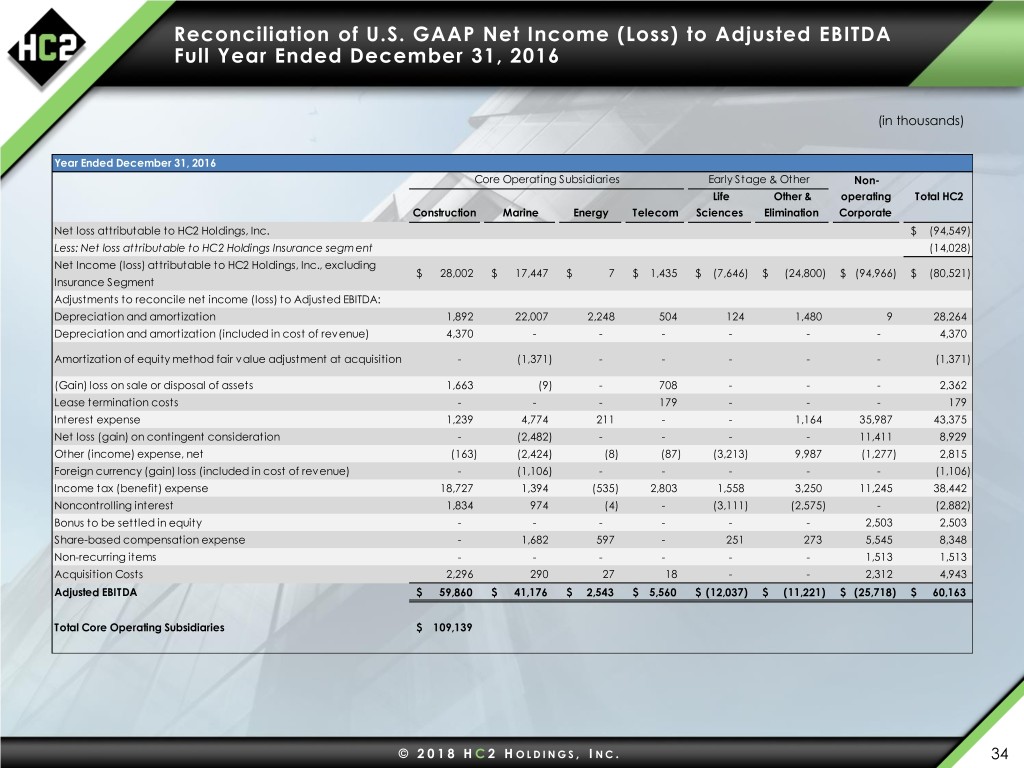
Reconciliation of U.S. GAAP Net Income (Loss) to Adjusted EBITDA Full Year Ended December 31, 2016 (in thousands) Year Ended December 31, 2016 Core Operating Subsidiaries Early Stage & Other Non- Life Other & operating Total HC2 Construction Marine Energy Telecom Sciences Elimination Corporate Net loss attributable to HC2 Holdings, Inc. $ (94,549) Less: Net loss attributable to HC2 Holdings Insurance segm ent (14,028) Net Income (loss) attributable to HC2 Holdings, Inc., excluding $ 28,002 $ 17,447 $ 7 $ 1,435 $ (7,646) $ (24,800) $ (94,966) $ (80,521) Insurance Segment Adjustments to reconcile net income (loss) to Adjusted EBITDA: Depreciation and amortization 1,892 22,007 2,248 504 124 1,480 9 28,264 Depreciation and amortization (included in cost of revenue) 4,370 - - - - - - 4,370 Amortization of equity method fair value adjustment at acquisition - (1,371) - - - - - (1,371) (Gain) loss on sale or disposal of assets 1,663 (9) - 708 - - - 2,362 Lease termination costs - - - 179 - - - 179 Interest expense 1,239 4,774 211 - - 1,164 35,987 43,375 Net loss (gain) on contingent consideration - (2,482) - - - - 11,411 8,929 Other (income) expense, net (163) (2,424) (8) (87) (3,213) 9,987 (1,277) 2,815 Foreign currency (gain) loss (included in cost of revenue) - (1,106) - - - - - (1,106) Income tax (benefit) expense 18,727 1,394 (535) 2,803 1,558 3,250 11,245 38,442 Noncontrolling interest 1,834 974 (4) - (3,111) (2,575) - (2,882) Bonus to be settled in equity - - - - - - 2,503 2,503 Share-based compensation expense - 1,682 597 - 251 273 5,545 8,348 Non-recurring items - - - - - - 1,513 1,513 Acquisition Costs 2,296 290 27 18 - - 2,312 4,943 Adjusted EBITDA $ 59,860 $ 41,176 $ 2,543 $ 5,560 $ (12,037) $ (11,221) $ (25,718) $ 60,163 Total Core Operating Subsidiaries $ 109,139 © 2 0 1 8 H C 2 H O L D I N G S , I NC. 34
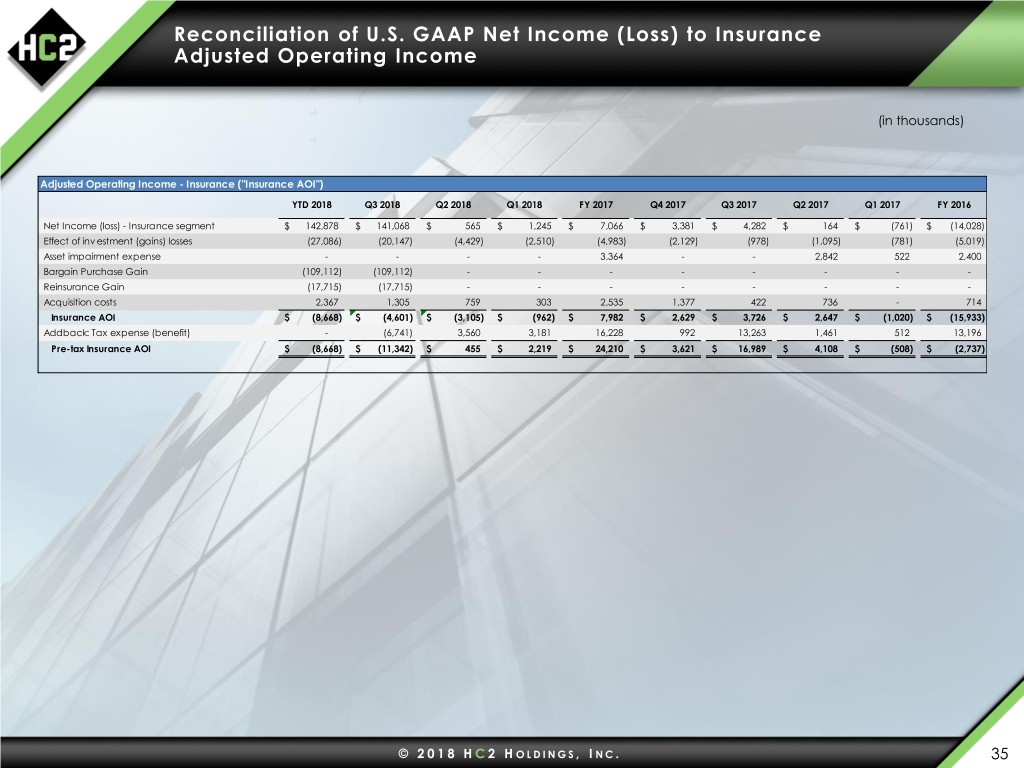
Reconciliation of U.S. GAAP Net Income (Loss) to Insurance Adjusted Operating Income (in thousands) Adjusted Operating Income - Insurance ("Insurance AOI") YTD 2018 Q3 2018 Q2 2018 Q1 2018 FY 2017 Q4 2017 Q3 2017 Q2 2017 Q1 2017 FY 2016 Net Income (loss) - Insurance segment $ 142,878 $ 141,068 $ 565 $ 1,245 $ 7,066 $ 3,381 $ 4,282 $ 164 $ (761) $ (14,028) Effect of inv estment (gains) losses (27,086) (20,147) (4,429) (2,510) (4,983) (2,129) (978) (1,095) (781) (5,019) Asset impairment expense - - - - 3,364 - - 2,842 522 2,400 Bargain Purchase Gain (109,112) (109,112) - - - - - - - - Reinsurance Gain (17,715) (17,715) - - - - - - - - Acquisition costs 2,367 1,305 759 303 2,535 1,377 422 736 - 714 Insurance AOI $ (8,668) $ (4,601) $ (3,105) $ (962) $ 7,982 $ 2,629 $ 3,726 $ 2,647 $ (1,020) $ (15,933) Addback: Tax expense (benefit) - (6,741) 3,560 3,181 16,228 992 13,263 1,461 512 13,196 Pre-tax Insurance AOI $ (8,668) $ (11,342) $ 455 $ 2,219 $ 24,210 $ 3,621 $ 16,989 $ 4,108 $ (508) $ (2,737) © 2 0 1 8 H C 2 H O L D I N G S , I NC. 35
HC2 HOLDINGS, INC. A n d r e w G . B a c k m a n • i r @ h c 2 . c o m • 2 1 2 . 2 3 5 . 2 6 9 1 • 4 5 0 P a r k A v e n u e , 3 0 th F l o o r , N e w Y o r k , N Y 1 0 0 2 2 © HC2 Holdings, Inc. 2018 November 2018


