
HC2 Holdings, Inc. Q2 2020 Earnings Release Supplement August 10, 2020 © HC2 HOLDINGS, INC. 2020

Safe Harbor Disclaimers Cautionary Statement Regarding Forward-Looking Statements Safe Harbor Statement under the Private Securities Litigation Reform Act of 1995: This earnings supplement contains, and certain oral statements made by our representatives from time to time may contain, forward-looking statements, including, among others, statements related to the expected or potential impact of the novel coronavirus (COVID-19) pandemic, and the related responses of the government and HC2 on our business, financial condition and results of operations, and any such forward-looking statements, whether concerning the COVID-19 pandemic or otherwise, involve risks, assumptions and uncertainties. Generally, forward-looking statements include information describing actions, events, results, strategies and expectations and are generally identifiable by use of the words “believes,” “expects,” “intends,” “anticipates,” “plans,” “seeks,” “estimates,” “projects,” “may,” “will,” “could,” “might,” or “continues” or similar expressions. The forward-looking statements in this earnings supplement include, without limitation, any statements regarding our expectations regarding entering definitive agreements in respect of the potential divestitures of DBM Global, Continental Insurance Group, Ltd. and/or PTGi-International Carrier Services Inc., reducing debt and related interest expense at the holding company level with the net proceeds of a DBM Global divestiture, our ability to successfully enter into and close on divestiture transactions being contemplated, including DBM Global, Continental Insurance Group, Ltd. and PTGi-International Carrier Services Inc., building shareholder value, future cash flow, longer-term growth and invested assets, the timing and effects of redeeming the 11.5% Notes, reducing HC2's leverage and interest expense, and the timing or prospects of any refinancing of HC2's remaining corporate debt, the severity, magnitude and duration of the COVID-19 pandemic, including impacts of the pandemic and of businesses’ and governments’ responses to the pandemic on HC2’s operations and personnel, and on commercial activity and demand across our businesses, HC2’s inability to predict the extent to which the COVID-19 pandemic and related impacts will continue to adversely impact HC2’s business operations, financial performance, results of operations, financial position, the prices of HC2’s securities and the achievement of HC2’s strategic objectives, and changes in macroeconomic and market conditions and market volatility (including developments and volatility arising from the COVID-19 pandemic), including interest rates, the value of securities and other financial assets, and the impact of such changes and volatility on HC2’s financial position. Such statements are based on the beliefs and assumptions of HC2’s management and the management of HC2’s subsidiaries and portfolio companies. The Company believes these judgments are reasonable, but you should understand that these statements are not guarantees of performance or results, and the Company’s actual results could differ materially from those expressed or implied in the forward-looking statements due to a variety of important factors, both positive and negative, that may be revised or supplemented in subsequent statements and reports filed with the Securities and Exchange Commission (“SEC”), including in our reports on Forms 10-K, 10-Q, and 8-K. Such important factors include, without limitation: issues related to the restatement of our financial statements; the fact that we have historically identified material weaknesses in our internal control over financial reporting, and any inability to remediate future material weaknesses; capital market conditions, including the ability of HC2 and HC2’s subsidiaries to raise capital; the ability of HC2’s subsidiaries and portfolio companies to generate sufficient net income and cash flows to make upstream cash distributions; volatility in the trading price of HC2 common stock; the ability of HC2 and its subsidiaries and portfolio companies to identify any suitable future acquisition or disposition opportunities; our ability to realize efficiencies, cost savings, income and margin improvements, growth, economies of scale and other anticipated benefits of strategic transactions; difficulties related to the integration of financial reporting of acquired or target businesses; difficulties completing pending and future acquisitions and dispositions; effects of litigation, indemnification claims, and other contingent liabilities; changes in regulations and tax laws; and risks that may affect the performance of the operating subsidiaries and portfolio companies of HC2. Although HC2 believes its expectations and assumptions regarding its future operating performance are reasonable, there can be no assurance that the expectations reflected herein will be achieved. There can be no assurance that definitive agreements for potential divestitures or other strategic transactions will be entered into with respect to either DBM Global, Continental Insurance Group, Ltd. or PTGi-International Carrier Services Inc., that any transactions consummated, or the timing, terms, conditions or net proceeds thereof. These risks and other important factors discussed under the caption “Risk Factors” in our most recent Annual Report on Form 10-K filed with the SEC, and our other reports filed with the SEC could cause actual results to differ materially from those indicated by the forward-looking statements made in this earnings supplement. You should not place undue reliance on forward-looking statements. All forward-looking statements attributable to HC2 or persons acting on its behalf are expressly qualified in their entirety by the foregoing cautionary statements. All such statements speak only as of the date made, and unless legally required, HC2 undertakes no obligation to update or revise publicly any forward-looking statements, whether as a result of new information, future events or otherwise. © HC2 HOLDINGS, INC. 2020 2
Safe Harbor Disclaimers Non-GAAP Financial Measures In this earnings release supplement, HC2 refers to certain financial measures that are not presented in accordance with U.S. generally accepted accounting principles (“GAAP”), including Adjusted EBITDA (excluding the Insurance segment) and Adjusted Operating Income and Pre-tax Adjusted Operating Income for our Insurance segment. Adjusted EBITDA Management believes that Adjusted EBITDA provides investors with meaningful information for gaining an understanding of our results as it is frequently used by the financial community to provide insight into an organization’s operating trends and facilitates comparisons between peer companies, since interest, taxes, depreciation, amortization and the other items listed in the definition of Adjusted EBITDA below can differ greatly between organizations as a result of differing capital structures and tax strategies. Adjusted EBITDA can also be a useful measure of a company’s ability to service debt. While management believes that non-U.S. GAAP measurements are useful supplemental information, such adjusted results are not intended to replace our U.S. GAAP financial results. Using Adjusted EBITDA as a performance measure has inherent limitations as an analytical tool as compared to net income (loss) or other U.S. GAAP financial measures, as this non-GAAP measure excludes certain items, including items that are recurring in nature, which may be meaningful to investors. As a result of the exclusions, Adjusted EBITDA should not be considered in isolation and does not purport to be an alternative to net income (loss) or other U.S. GAAP financial measures as a measure of our operating performance. Adjusted EBITDA excludes the results of operations and any consolidating eliminations of our Insurance segment. The calculation of Adjusted EBITDA, as defined by us, consists of Net income (loss) as adjusted for depreciation and amortization; Other operating (income) expense, which is inclusive of (gain) loss on sale or disposal of assets, lease termination costs, and FCC reimbursements; asset impairment expense; interest expense; net gain (loss) on contingent consideration; loss on early extinguishment or restructuring of debt; gain (loss) on sale of subsidiaries; other (income) expense, net; foreign currency transaction (gain) loss included in cost of revenue; income tax (benefit) expense; noncontrolling interest; bonus to be settled in equity; share-based compensation expense; discontinued operations; non-recurring items; costs associated with the COVID-19 pandemic, and acquisition and disposition costs. To help our board, management and investors assess the impact of COVID-19 pandemic on our results of operations, we are excluding the impacts of COVID-19 response initiatives for the cost of personal protective equipment distributed to employees, cleaning and sanitization equipment and procedures, and additional overhead costs to maintain proper social distancing from Adjusted EBITDA. Our board and management find the exclusion of the impact of these COVID-19 response initiatives from Adjusted EBITDA to be useful because it allows us and our investors to assess the impact of these response initiatives on our results of operations. Adjusted Operating Income Adjusted Operating Income (“Insurance AOI”) and Pre-tax Adjusted Operating Income (“Pre-tax Insurance AOI”) for the Insurance segment are non-U.S. GAAP financial measures frequently used throughout the insurance industry and are economic measures the Insurance segment uses to evaluate its financial performance. Management believes that Insurance AOI and Pre-tax Insurance AOI measures provide investors with meaningful information for gaining an understanding of certain results and provide insight into an organization’s operating trends and facilitates comparisons between peer companies. However, Insurance AOI and Pre-tax Insurance AOI have certain limitations, and we may not calculate it the same as other companies in our industry. It should, therefore, be read together with the Company's results calculated in accordance with U.S. GAAP. Management recognizes that using Insurance AOI and Pre-tax Insurance AOI as performance measures have inherent limitations as an analytical tool as compared to income (loss) from operations or other U.S. GAAP financial measures, as these non-U.S. GAAP measures excludes certain items, including items that are recurring in nature, which may be meaningful to investors. As a result of the exclusions, Insurance AOI and Pre-tax Insurance AOI should not be considered in isolation and do not purport to be an alternative to income (loss) from operations or other U.S. GAAP financial measures as a measure of our operating performance. Management defines Insurance AOI as Net income (loss) for the Insurance segment adjusted to exclude the impact of net investment gains (losses), including other-than-temporary impairment ("OTTI") losses recognized in operations; asset impairment; intercompany elimination; gain on bargain purchase; gain on reinsurance recaptures; and acquisition costs. Management defines Pre-tax Insurance AOI as Insurance AOI adjusted to exclude the impact of income tax (benefit) expense recognized during the current period. Management believes that Insurance AOI and Pre-tax Insurance AOI provide meaningful financial metrics that help investors understand certain results and profitability. While these adjustments are an integral part of the overall performance of the Insurance segment, market conditions impacting these items can overshadow the underlying performance of the business. Accordingly, we believe using a measure which excludes their impact is effective in analyzing the trends of our operations. Third Party Sources Third party information presented in this earnings release supplement is based on sources we believe to be reliable, however there can be no assurance information so presented will prove accurate in whole or in part. © HC2 HOLDINGS, INC. 2020 3
COVID-19: Segment Update How is COVID-19 Impacting Our Segments? Construction Commercial Fabrication and Erection • Certain new project awards still pending release by customers, which could result in a decrease in backlog depending on how long COVID-19 persists. Industrial Maintenance and Repair (GrayWolf) • Non-essential projects under existing frameworks for certain large customers continue to be postponed, due in part to differing customer responses to COVID-19 and the impact of volatile oil & gas markets. • Across all business lines, focused on reducing costs in response to the current economic environment and temporary disruptions to the commercial construction and industrial services markets to preserve margins. • Adjusted Backlog of $714M remains near all-time high. Energy Broadcasting American Natural Energy HC2 Broadcasting • Despite stable GGEs for consumer staples such as grocers • Advertising revenues have continued to decrease across and food companies, sequential decrease in GGEs driven the industry, impacting the Azteca America revenues as by decrease in fueling by non-consumer staple customers well as top-line contribution from recently-signed broadcast as they transported fewer goods. networks that are on revenue-share agreements. – Contracts under take-or-pay arrangements reduce the • Construction has mostly resumed with fewer shipping impact of any slowdown in volumes. delays and more contractors available to assist with – Receipt of AFTC1 for 2020 volumes will benefit stations. installing broadcast equipment. Currently expanding the number of CentralCast connected stations at an average of • Longer term, adoption of natural gas vehicles could two per week. potentially slow as companies evaluate CAPEX needs. 1 Alternative Fuel Tax Credit © HC2 HOLDINGS, INC. 2020 4
COVID-19: Segment Update How is COVID-19 Impacting Our Segments? Insurance Telecommunications Continental Insurance PTGi ICS • Reducing portfolio exposure to companies heavily impacted • As an international wholesale telecom service company that by COVID-19 and rotating into high quality corporate bonds provides voice and data call termination services, the in more defensive sectors. Maintaining a net realized gain company has not been significantly impacted. position on YTD basis. • Call volumes have remained relatively steady, except for • Claim notifications are down 18% relative to full year 2019 larger industry pressures on the international wholesale monthly average. termination market, which existed prior to COVID-19. • Continue to work with regulators to ensure sufficient cash to cover any potential claims and delays in premium collections due to extended grace periods. Life Sciences R2 Technologies MediBeacon • Commercialization efforts are still underway, with the • Remote research and development is still being performed. commercial launch of the F1 device in the US expected • Clinical trials in the U.S. have resumed. As a result of during 4Q20 and the F0 device in China expected in 1Q21. COVID-19, the pivotal study has been delayed by one • Onboarding new hires in commercial sales and finance quarter, which could potentially slow progress toward teams remotely as the company begins scaling for regulatory approval for its Transdermal GFR measurement commercialization. system, which measures kidney function in real-time. • Recent $10M additional equity investment in April by • Interest in point of care measurement of kidney function Huadong provides sufficient capital resources to continue continues to be high, as a significant number of I.C.U. planned commercialization efforts. patients with COVID-19 also suffered kidney failure and needed emergency dialysis.1 1 Source: "An Overlooked, Possibly Fatal Coronavirus Crisis: a Dire Need for Kidney Dialysis", New York Times, April 18, 2020. © HC2 HOLDINGS, INC. 2020 5
Q2 2020 Key Highlights HC2 Holdco • Completed sale of 30% interest in HMN with net proceeds used to redeem $50.6M of 11.5% Notes. • YTD reduction in HC2 Holdco debt of $127.6M, reducing annual interest expense by ~$15M. • Evaluating portfolio for potential monetization opportunities. Construction • Paid $13.5M in dividends to HC2; subsequent to quarter end, paid an additional dividend of $4.5M to HC2. • 2Q20 Net Income of $1.6M; Adjusted EBITDA of $19.1M. • Contract backlog of $410.3M as of 2Q20; approximately $714M on an adjusted basis. Energy • 5.3M gasoline gallon equivalents fueled in 2Q20, up from 3.8M in 2Q19. • 2Q20 Net Income of $0.4M; Adjusted EBITDA of $4.2M. • Subsequent to quarter end, completed the refinancing of its debt instruments into a single facility at a competitive rate. Life Sciences • R2 Technologies received an additional $10M equity investment from Huadong at a post-money valuation of approximately $90M to fund commercialization efforts of its CryoAesthetic technology. Broadcasting • 233 operational stations as of early August; ~190 connected to our CentralCast system in 95 DMAs. • Silent station builds expected to be completed in 3Q20; expect to cover 98 DMAs when complete. Insurance • 2Q20 Net Income of $11.4M; Pre-Tax Insurance AOI of $14.6M. • Total Adjusted Capital of approximately $360M at June 30, 2020. © HC2 HOLDINGS, INC. 2020 6
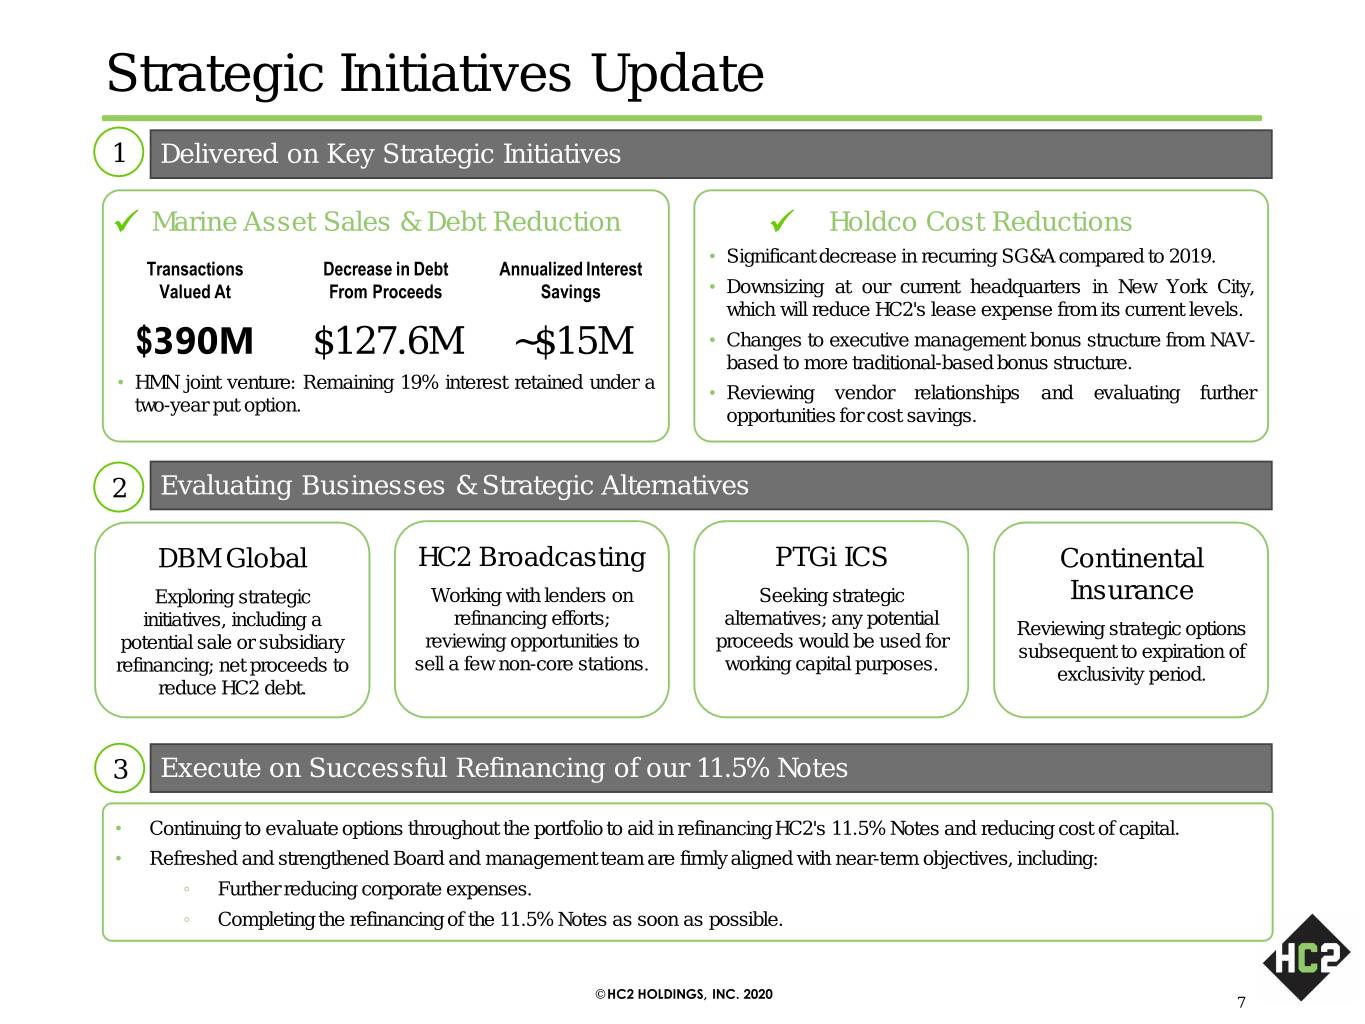
Strategic Initiatives Update 1 Delivered on Key Strategic Initiatives ✓ Marine Asset Sales & Debt Reduction ✓ Holdco Cost Reductions • Significant decrease in recurring SG&A compared to 2019. Transactions Decrease in Debt Annualized Interest Valued At From Proceeds Savings • Downsizing at our current headquarters in New York City, which will reduce HC2's lease expense from its current levels. $390M $127.6M ~$15M • Changes to executive management bonus structure from NAV- based to more traditional-based bonus structure. • HMN joint venture: Remaining 19% interest retained under a • Reviewing vendor relationships and evaluating further two-year put option. opportunities for cost savings. 2 Evaluating Businesses & Strategic Alternatives DBM Global HC2 Broadcasting PTGi ICS Continental Exploring strategic Working with lenders on Seeking strategic Insurance refinancing efforts; alternatives; any potential initiatives, including a Reviewing strategic options reviewing opportunities to proceeds would be used for potential sale or subsidiary subsequent to expiration of sell a few non-core stations. working capital purposes. refinancing; net proceeds to exclusivity period. reduce HC2 debt. 3 Execute on Successful Refinancing of our 11.5% Notes • Continuing to evaluate options throughout the portfolio to aid in refinancing HC2's 11.5% Notes and reducing cost of capital. • Refreshed and strengthened Board and management team are firmly aligned with near-term objectives, including: ◦ Further reducing corporate expenses. ◦ Completing the refinancing of the 11.5% Notes as soon as possible. © HC2 HOLDINGS, INC. 2020 7
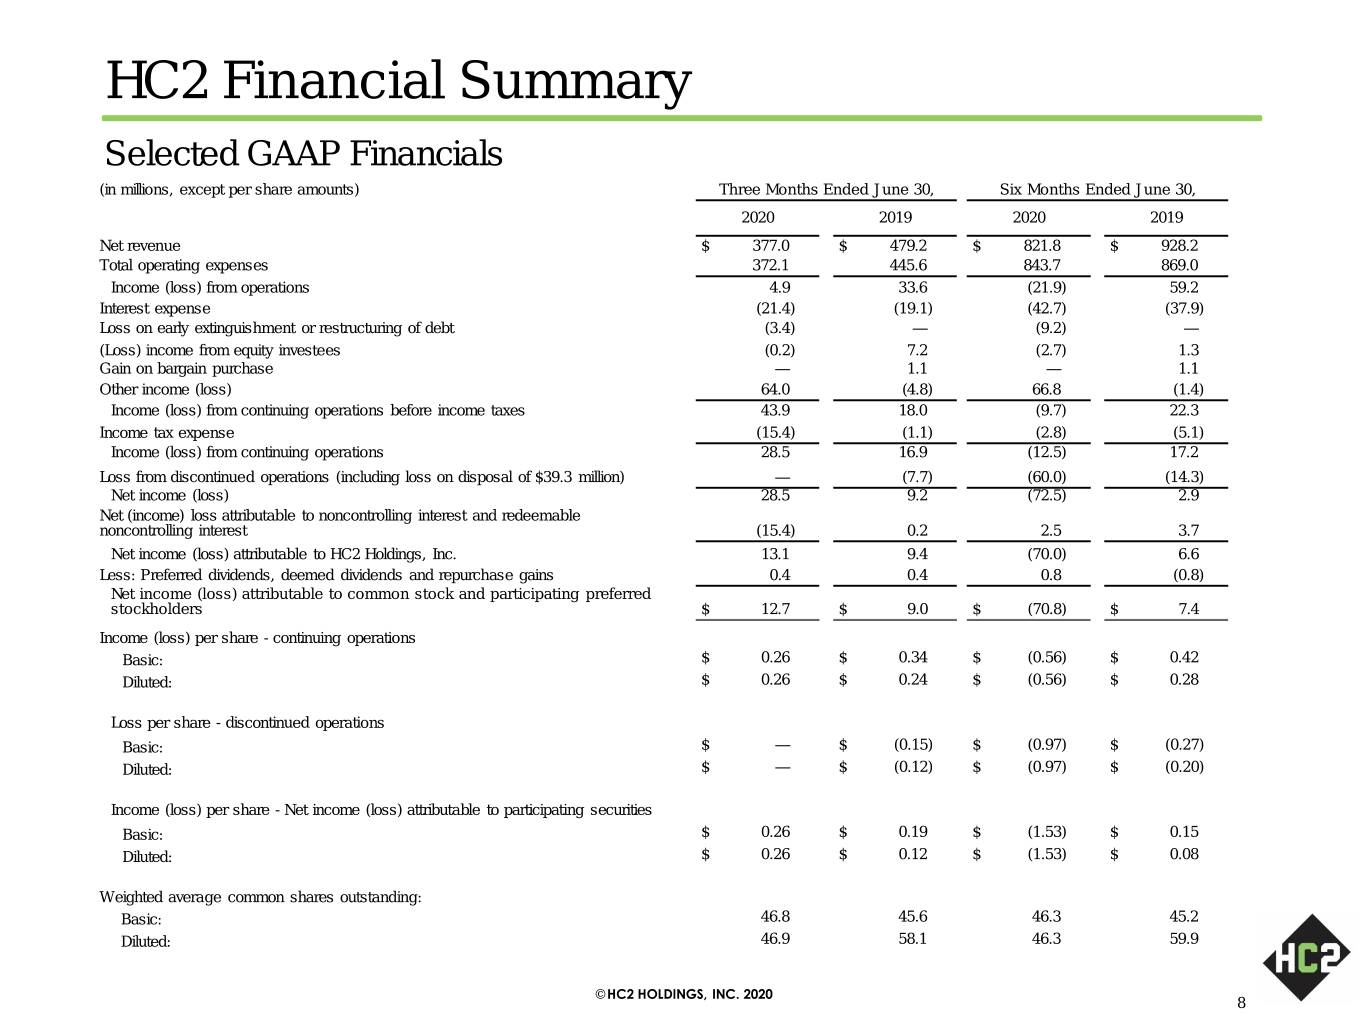
HC2 Financial Summary Selected GAAP Financials (in millions, except per share amounts) Three Months Ended June 30, Six Months Ended June 30, 2020 2019 2020 2019 Net revenue $ 377.0 $ 479.2 $ 821.8 $ 928.2 Total operating expenses 372.1 445.6 843.7 869.0 Income (loss) from operations 4.9 33.6 (21.9) 59.2 Interest expense (21.4) (19.1) (42.7) (37.9) Loss on early extinguishment or restructuring of debt (3.4) — (9.2) — (Loss) income from equity investees (0.2) 7.2 (2.7) 1.3 Gain on bargain purchase — 1.1 — 1.1 Other income (loss) 64.0 (4.8) 66.8 (1.4) Income (loss) from continuing operations before income taxes 43.9 18.0 (9.7) 22.3 Income tax expense (15.4) (1.1) (2.8) (5.1) Income (loss) from continuing operations 28.5 16.9 (12.5) 17.2 Loss from discontinued operations (including loss on disposal of $39.3 million) — (7.7) (60.0) (14.3) Net income (loss) 28.5 9.2 (72.5) 2.9 Net (income) loss attributable to noncontrolling interest and redeemable noncontrolling interest (15.4) 0.2 2.5 3.7 Net income (loss) attributable to HC2 Holdings, Inc. 13.1 9.4 (70.0) 6.6 Less: Preferred dividends, deemed dividends and repurchase gains 0.4 0.4 0.8 (0.8) Net income (loss) attributable to common stock and participating preferred stockholders $ 12.7 $ 9.0 $ (70.8) $ 7.4 Income (loss) per share - continuing operations Basic: $ 0.26 $ 0.34 $ (0.56) $ 0.42 Diluted: $ 0.26 $ 0.24 $ (0.56) $ 0.28 Loss per share - discontinued operations Basic: $ — $ (0.15) $ (0.97) $ (0.27) Diluted: $ — $ (0.12) $ (0.97) $ (0.20) Income (loss) per share - Net income (loss) attributable to participating securities Basic: $ 0.26 $ 0.19 $ (1.53) $ 0.15 Diluted: $ 0.26 $ 0.12 $ (1.53) $ 0.08 Weighted average common shares outstanding: Basic: 46.8 45.6 46.3 45.2 Diluted: 46.9 58.1 46.3 59.9 © HC2 HOLDINGS, INC. 2020 8
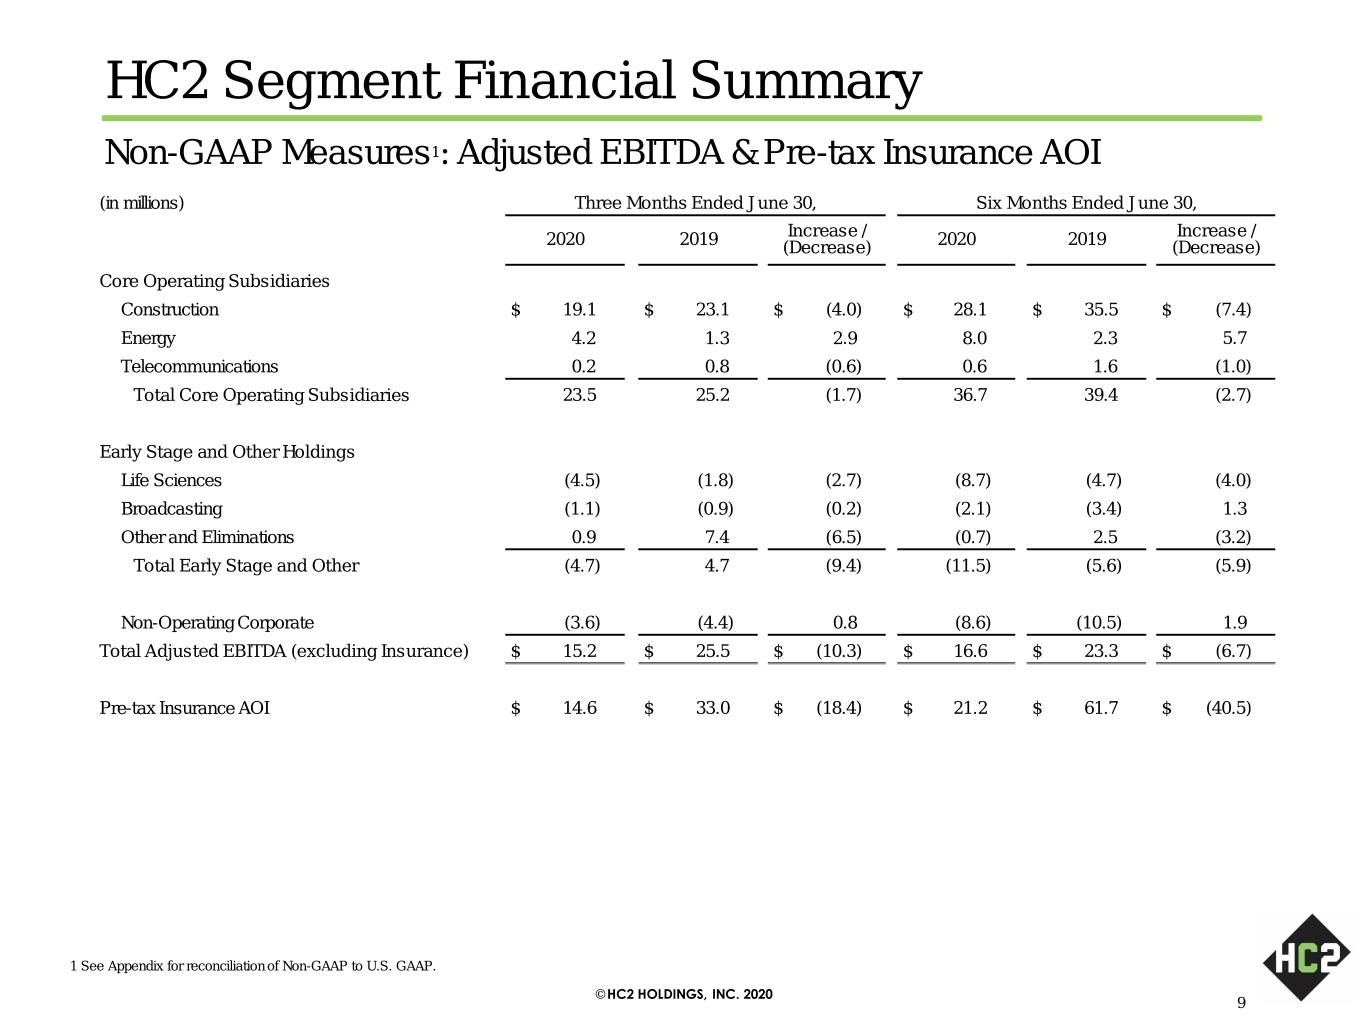
HC2 Segment Financial Summary Non-GAAP Measures1: Adjusted EBITDA & Pre-tax Insurance AOI (in millions) Three Months Ended June 30, Six Months Ended June 30, Increase / Increase / 2020 2019 (Decrease) 2020 2019 (Decrease) Core Operating Subsidiaries Construction $ 19.1 $ 23.1 $ (4.0) $ 28.1 $ 35.5 $ (7.4) Energy 4.2 1.3 2.9 8.0 2.3 5.7 Telecommunications 0.2 0.8 (0.6) 0.6 1.6 (1.0) Total Core Operating Subsidiaries 23.5 25.2 (1.7) 36.7 39.4 (2.7) Early Stage and Other Holdings Life Sciences (4.5) (1.8) (2.7) (8.7) (4.7) (4.0) Broadcasting (1.1) (0.9) (0.2) (2.1) (3.4) 1.3 Other and Eliminations 0.9 7.4 (6.5) (0.7) 2.5 (3.2) Total Early Stage and Other (4.7) 4.7 (9.4) (11.5) (5.6) (5.9) Non-Operating Corporate (3.6) (4.4) 0.8 (8.6) (10.5) 1.9 Total Adjusted EBITDA (excluding Insurance) $ 15.2 $ 25.5 $ (10.3) $ 16.6 $ 23.3 $ (6.7) Pre-tax Insurance AOI $ 14.6 $ 33.0 $ (18.4) $ 21.2 $ 61.7 $ (40.5) 1 See Appendix for reconciliation of Non-GAAP to U.S. GAAP. © HC2 HOLDINGS, INC. 2020 9
Non-GAAP Reconciliations © HC2 HOLDINGS, INC. 2020 10
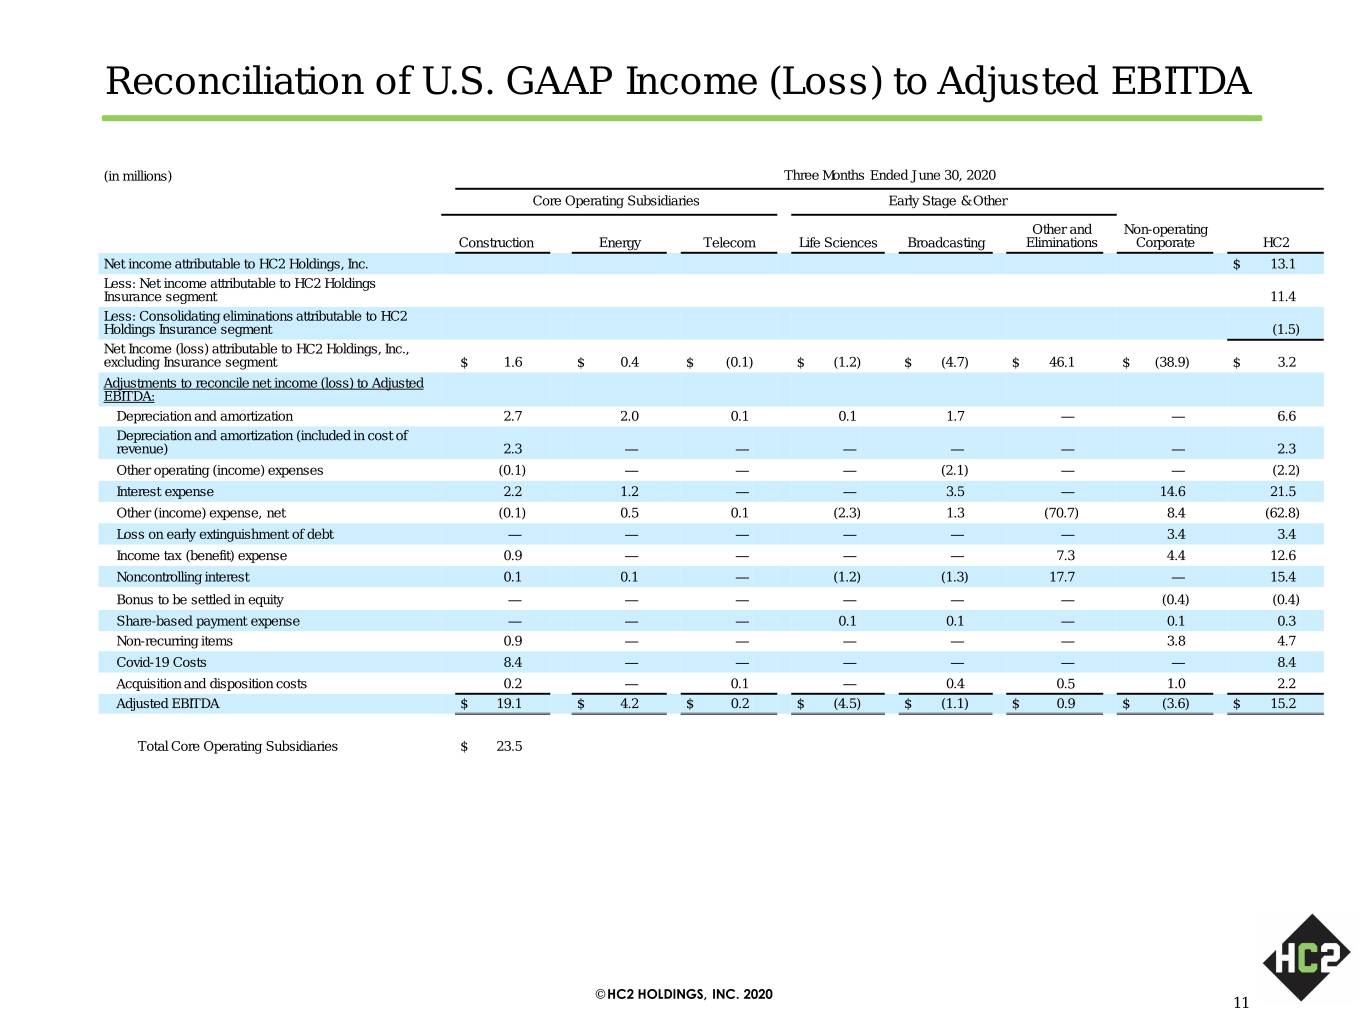
Reconciliation of U.S. GAAP Income (Loss) to Adjusted EBITDA (in millions) Three Months Ended June 30, 2020 Core Operating Subsidiaries Early Stage & Other Other and Non-operating Construction Energy Telecom Life Sciences Broadcasting Eliminations Corporate HC2 Net income attributable to HC2 Holdings, Inc. $ 13.1 Less: Net income attributable to HC2 Holdings Insurance segment 11.4 Less: Consolidating eliminations attributable to HC2 Holdings Insurance segment (1.5) Net Income (loss) attributable to HC2 Holdings, Inc., excluding Insurance segment $ 1.6 $ 0.4 $ (0.1) $ (1.2) $ (4.7) $ 46.1 $ (38.9) $ 3.2 Adjustments to reconcile net income (loss) to Adjusted EBITDA: Depreciation and amortization 2.7 2.0 0.1 0.1 1.7 — — 6.6 Depreciation and amortization (included in cost of revenue) 2.3 — — — — — — 2.3 Other operating (income) expenses (0.1) — — — (2.1) — — (2.2) Interest expense 2.2 1.2 — — 3.5 — 14.6 21.5 Other (income) expense, net (0.1) 0.5 0.1 (2.3) 1.3 (70.7) 8.4 (62.8) Loss on early extinguishment of debt — — — — — — 3.4 3.4 Income tax (benefit) expense 0.9 — — — — 7.3 4.4 12.6 Noncontrolling interest 0.1 0.1 — (1.2) (1.3) 17.7 — 15.4 Bonus to be settled in equity — — — — — — (0.4) (0.4) Share-based payment expense — — — 0.1 0.1 — 0.1 0.3 Non-recurring items 0.9 — — — — — 3.8 4.7 Covid-19 Costs 8.4 — — — — — — 8.4 Acquisition and disposition costs 0.2 — 0.1 — 0.4 0.5 1.0 2.2 Adjusted EBITDA $ 19.1 $ 4.2 $ 0.2 $ (4.5) $ (1.1) $ 0.9 $ (3.6) $ 15.2 Total Core Operating Subsidiaries $ 23.5 © HC2 HOLDINGS, INC. 2020 11

Reconciliation of U.S. GAAP Income (Loss) to Adjusted EBITDA (in millions) Six Months Ended June 30, 2020 Core Operating Subsidiaries Early Stage & Other Other and Non-operating Construction Energy Telecom Life Sciences Broadcasting Eliminations Corporate HC2 Net loss attributable to HC2 Holdings, Inc. $ (70.0) Less: Net income attributable to HC2 Holdings Insurance segment 11.4 Less: Consolidating eliminations attributable to HC2 Holdings Insurance segment (3.1) Net Income (loss) attributable to HC2 Holdings, Inc., excluding Insurance segment $ 1.5 $ 1.0 $ 0.5 $ (4.4) $ (10.9) $ 4.0 $ (70.0) $ (78.3) Adjustments to reconcile net income (loss) to Adjusted EBITDA: Depreciation and amortization 5.3 4.1 0.2 0.1 3.4 — — 13.1 Depreciation and amortization (included in cost of revenue) 4.6 — — — — — — 4.6 Other operating (income) expenses 0.1 — — — (2.1) — — (2.0) Interest expense 4.4 2.4 — — 6.7 — 29.3 42.8 Other (income) expense, net 0.1 0.1 (0.3) (2.3) 2.6 (71.3) 6.6 (64.5) Loss on early extinguishment of debt — — — — — — 9.2 9.2 Income tax (benefit) expense 1.1 — — — — 7.3 4.0 12.4 Noncontrolling interest 0.1 0.4 — (2.2) (2.4) 1.6 — (2.5) Bonus to be settled in equity — — — — — — (0.4) (0.4) Share-based payment expense — — — 0.1 0.2 — 1.5 1.8 Discontinued Operations — — — — — 56.3 3.8 60.1 Non-recurring items 1.8 — — — — — 5.2 7.0 Covid-19 costs 8.8 — — — — — — 8.8 Acquisition and disposition costs 0.3 — 0.2 — 0.4 1.4 2.2 4.5 Adjusted EBITDA $ 28.1 $ 8.0 $ 0.6 $ (8.7) $ (2.1) $ (0.7) $ (8.6) $ 16.6 Total Core Operating Subsidiaries $ 36.7 © HC2 HOLDINGS, INC. 2020 12
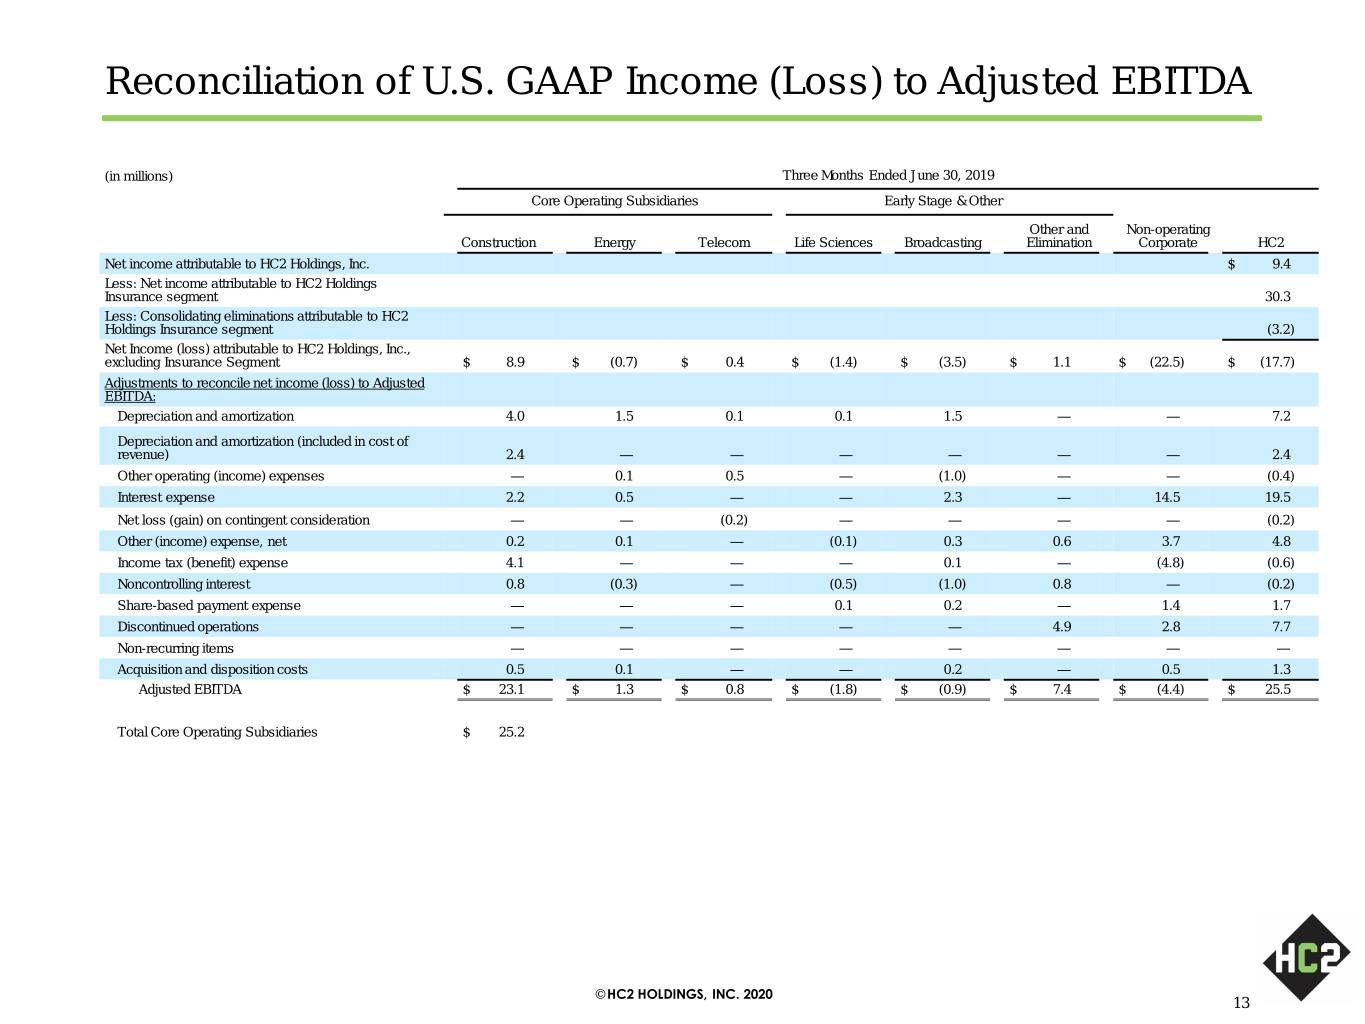
Reconciliation of U.S. GAAP Income (Loss) to Adjusted EBITDA (in millions) Three Months Ended June 30, 2019 Core Operating Subsidiaries Early Stage & Other Other and Non-operating Construction Energy Telecom Life Sciences Broadcasting Elimination Corporate HC2 Net income attributable to HC2 Holdings, Inc. $ 9.4 Less: Net income attributable to HC2 Holdings Insurance segment 30.3 Less: Consolidating eliminations attributable to HC2 Holdings Insurance segment (3.2) Net Income (loss) attributable to HC2 Holdings, Inc., excluding Insurance Segment $ 8.9 $ (0.7) $ 0.4 $ (1.4) $ (3.5) $ 1.1 $ (22.5) $ (17.7) Adjustments to reconcile net income (loss) to Adjusted EBITDA: Depreciation and amortization 4.0 1.5 0.1 0.1 1.5 — — 7.2 Depreciation and amortization (included in cost of revenue) 2.4 — — — — — — 2.4 Other operating (income) expenses — 0.1 0.5 — (1.0) — — (0.4) Interest expense 2.2 0.5 — — 2.3 — 14.5 19.5 Net loss (gain) on contingent consideration — — (0.2) — — — — (0.2) Other (income) expense, net 0.2 0.1 — (0.1) 0.3 0.6 3.7 4.8 Income tax (benefit) expense 4.1 — — — 0.1 — (4.8) (0.6) Noncontrolling interest 0.8 (0.3) — (0.5) (1.0) 0.8 — (0.2) Share-based payment expense — — — 0.1 0.2 — 1.4 1.7 Discontinued operations — — — — — 4.9 2.8 7.7 Non-recurring items — — — — — — — — Acquisition and disposition costs 0.5 0.1 — — 0.2 — 0.5 1.3 Adjusted EBITDA $ 23.1 $ 1.3 $ 0.8 $ (1.8) $ (0.9) $ 7.4 $ (4.4) $ 25.5 Total Core Operating Subsidiaries $ 25.2 © HC2 HOLDINGS, INC. 2020 13
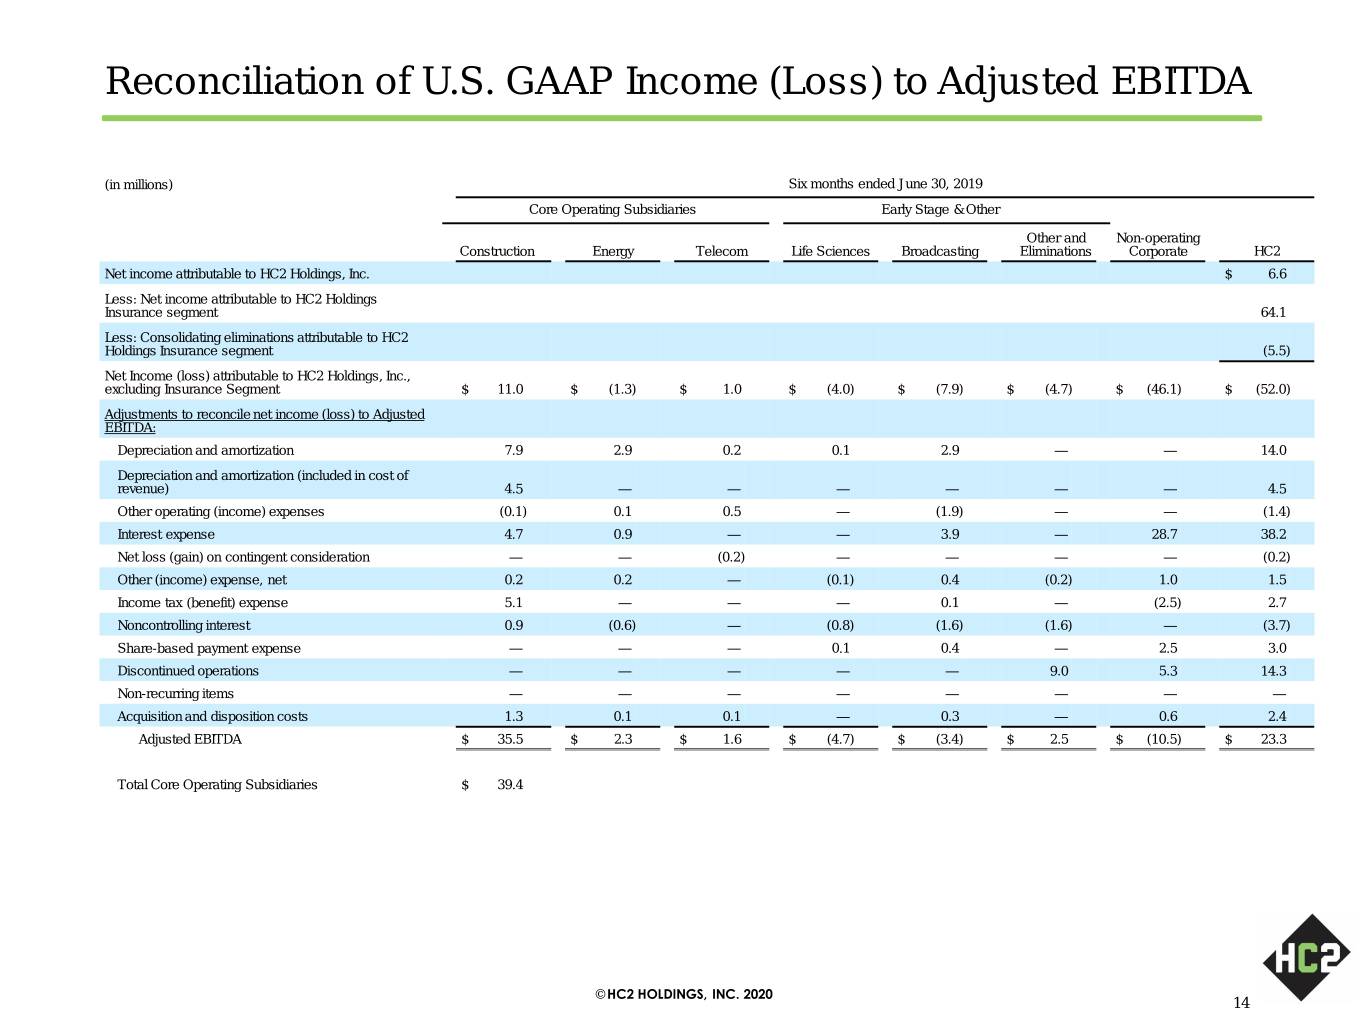
Reconciliation of U.S. GAAP Income (Loss) to Adjusted EBITDA (in millions) Six months ended June 30, 2019 Core Operating Subsidiaries Early Stage & Other Other and Non-operating Construction Energy Telecom Life Sciences Broadcasting Eliminations Corporate HC2 Net income attributable to HC2 Holdings, Inc. $ 6.6 Less: Net income attributable to HC2 Holdings Insurance segment 64.1 Less: Consolidating eliminations attributable to HC2 Holdings Insurance segment (5.5) Net Income (loss) attributable to HC2 Holdings, Inc., excluding Insurance Segment $ 11.0 $ (1.3) $ 1.0 $ (4.0) $ (7.9) $ (4.7) $ (46.1) $ (52.0) Adjustments to reconcile net income (loss) to Adjusted EBITDA: Depreciation and amortization 7.9 2.9 0.2 0.1 2.9 — — 14.0 Depreciation and amortization (included in cost of revenue) 4.5 — — — — — — 4.5 Other operating (income) expenses (0.1) 0.1 0.5 — (1.9) — — (1.4) Interest expense 4.7 0.9 — — 3.9 — 28.7 38.2 Net loss (gain) on contingent consideration — — (0.2) — — — — (0.2) Other (income) expense, net 0.2 0.2 — (0.1) 0.4 (0.2) 1.0 1.5 Income tax (benefit) expense 5.1 — — — 0.1 — (2.5) 2.7 Noncontrolling interest 0.9 (0.6) — (0.8) (1.6) (1.6) — (3.7) Share-based payment expense — — — 0.1 0.4 — 2.5 3.0 Discontinued operations — — — — — 9.0 5.3 14.3 Non-recurring items — — — — — — — — Acquisition and disposition costs 1.3 0.1 0.1 — 0.3 — 0.6 2.4 Adjusted EBITDA $ 35.5 $ 2.3 $ 1.6 $ (4.7) $ (3.4) $ 2.5 $ (10.5) $ 23.3 Total Core Operating Subsidiaries $ 39.4 © HC2 HOLDINGS, INC. 2020 14
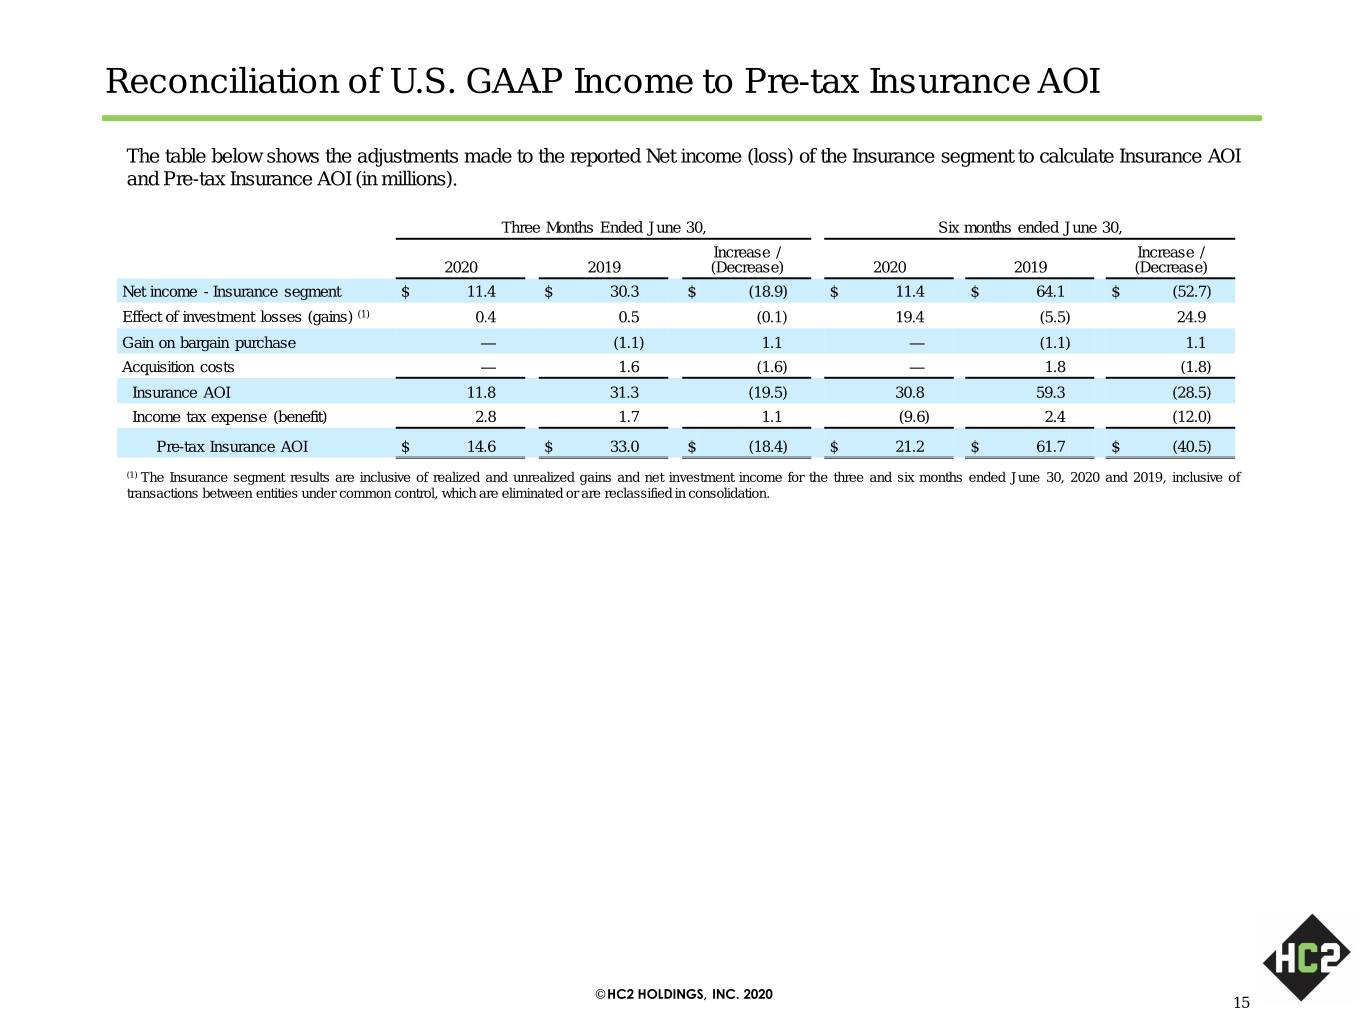
Reconciliation of U.S. GAAP Income to Pre-tax Insurance AOI The table below shows the adjustments made to the reported Net income (loss) of the Insurance segment to calculate Insurance AOI and Pre-tax Insurance AOI (in millions). Three Months Ended June 30, Six months ended June 30, Increase / Increase / 2020 2019 (Decrease) 2020 2019 (Decrease) Net income - Insurance segment $ 11.4 $ 30.3 $ (18.9) $ 11.4 $ 64.1 $ (52.7) Effect of investment losses (gains) (1) 0.4 0.5 (0.1) 19.4 (5.5) 24.9 Gain on bargain purchase — (1.1) 1.1 — (1.1) 1.1 Acquisition costs — 1.6 (1.6) — 1.8 (1.8) Insurance AOI 11.8 31.3 (19.5) 30.8 59.3 (28.5) Income tax expense (benefit) 2.8 1.7 1.1 (9.6) 2.4 (12.0) Pre-tax Insurance AOI $ 14.6 $ 33.0 $ (18.4) $ 21.2 $ 61.7 $ (40.5) (1) The Insurance segment results are inclusive of realized and unrealized gains and net investment income for the three and six months ended June 30, 2020 and 2019, inclusive of transactions between entities under common control, which are eliminated or are reclassified in consolidation. © HC2 HOLDINGS, INC. 2020 15


