© HC2 HOLDINGS, INC. 2021 HC2 Holdings, Inc. Q4 2020 Earnings Release Supplement March 10, 2021
© HC2 HOLDINGS, INC. 2021 Safe Harbor Disclaimers 2 Cautionary Statement Regarding Forward-Looking Statements Safe Harbor Statement under the Private Securities Litigation Reform Act of 1995: This presentation contains, and certain oral statements made by our representatives from time to time may contain, forward-looking statements, including, among others, statements related to the expected or potential impact of the novel coronavirus (COVID-19) pandemic, and the related responses of the government and HC2 on our business, financial condition and results of operations, and any such forward-looking statements, whether concerning the COVID-19 pandemic or otherwise, involve risks, assumptions and uncertainties. Generally, forward- looking statements include information describing actions, events, results, strategies and expectations and are generally identifiable by use of the words “believes,” “expects,” “intends,” “anticipates,” “plans,” “seeks,” “estimates,” “projects,” “may,” “will,” “could,” “might,” or “continues” or similar expressions. The forward-looking statements in this presentation include, without limitation, any statements regarding our expectations regarding entering definitive agreements in respect of and consummating potential divestitures of any of our subsidiaries, the severity, magnitude and duration of the COVID-19 pandemic, including impacts of the pandemic and of businesses’ and governments’ responses to the pandemic on HC2’s operations and personnel, and on commercial activity and demand across our businesses, HC2’s inability to predict the extent to which the COVID-19 pandemic and related impacts will continue to adversely impact HC2’s business operations, financial performance, results of operations, financial position, the prices of HC2’s securities and the achievement of HC2’s strategic objectives, and changes in macroeconomic and market conditions and market volatility (including developments and volatility arising from the COVID-19 pandemic), including interest rates, the value of securities and other financial assets, and the impact of such changes and volatility on HC2’s financial position. Such statements are based on the beliefs and assumptions of HC2’s management and the management of HC2’s subsidiaries and portfolio companies. The Company believes these judgments are reasonable, but you should understand that these statements are not guarantees of performance or results, and the Company’s actual results could differ materially from those expressed or implied in the forward-looking statements due to a variety of important factors, both positive and negative, that may be revised or supplemented in subsequent statements and reports filed with the Securities and Exchange Commission (“SEC”), including in our reports on Forms 10-K, 10-Q, and 8-K. Such important factors include, without limitation: capital market conditions, including the ability of HC2 and HC2’s subsidiaries to raise capital; the ability of HC2’s subsidiaries and portfolio companies to generate sufficient net income and cash flows to make upstream cash distributions; volatility in the trading price of HC2 common stock; the ability of HC2 and its subsidiaries and portfolio companies to identify any suitable future acquisition or disposition opportunities; our ability to realize efficiencies, cost savings, income and margin improvements, growth, economies of scale and other anticipated benefits of strategic transactions; difficulties related to the integration of financial reporting of acquired or target businesses; difficulties completing pending and future acquisitions and dispositions; effects of litigation, indemnification claims, and other contingent liabilities; changes in regulations and tax laws; and risks that may affect the performance of the operating subsidiaries and portfolio companies of HC2. Although HC2 believes its expectations and assumptions regarding its future operating performance are reasonable, there can be no assurance that the expectations reflected herein will be achieved. There can be no assurance that definitive agreements for potential divestitures or other strategic transactions will be entered into with respect to any of our subsidiaries, that any such transactions will be consummated, or the timing, terms, conditions or net proceeds thereof. These risks and other important factors discussed under the caption “Risk Factors” in our most recent Annual Report on Form 10-K filed with the SEC, and our other reports filed with the SEC could cause actual results to differ materially from those indicated by the forward-looking statements made in this presentation. You should not place undue reliance on forward-looking statements. All forward-looking statements attributable to HC2 or persons acting on its behalf are expressly qualified in their entirety by the foregoing cautionary statements. All such statements speak only as of the date made, and unless legally required, HC2 undertakes no obligation to update or revise publicly any forward-looking statements, whether as a result of new information, future events or otherwise.
© HC2 HOLDINGS, INC. 2021 Safe Harbor Disclaimers Non-GAAP Financial Measures In this earnings release supplement, HC2 refers to certain financial measures that are not presented in accordance with U.S. generally accepted accounting principles (“GAAP”), including Adjusted EBITDA (excluding the Insurance segment) and Adjusted Operating Income and Pre-tax Adjusted Operating Income for our Insurance segment. Adjusted EBITDA Adjusted EBITDA is not a measurement recognized under U.S. GAAP. In addition, other companies may define Adjusted EBITDA differently than we do, which could limit its usefulness. Management believes that Adjusted EBITDA provides investors with meaningful information for gaining an understanding of our results as it is frequently used by the financial community to provide insight into an organization’s operating trends and facilitates comparisons between peer companies, since interest, taxes, depreciation, amortization and the other items listed in the definition of Adjusted EBITDA below can differ greatly between organizations as a result of differing capital structures and tax strategies. Adjusted EBITDA can also be a useful measure of a company’s ability to service debt. While management believes that non-U.S. GAAP measurements are useful supplemental information, such adjusted results are not intended to replace our U.S. GAAP financial results. Using Adjusted EBITDA as a performance measure has inherent limitations as an analytical tool as compared to net income (loss) or other U.S. GAAP financial measures, as this non-GAAP measure excludes certain items, including items that are recurring in nature, which may be meaningful to investors. As a result of the exclusions, Adjusted EBITDA should not be considered in isolation and does not purport to be an alternative to net income (loss) or other U.S. GAAP financial measures as a measure of our operating performance. Adjusted EBITDA excludes the results of operations and any consolidating eliminations of our Insurance segment. The calculation of Adjusted EBITDA, as defined by us, consists of Net income (loss) as adjusted for depreciation and amortization; amortization of equity method fair value adjustments at acquisition; Other operating (income) expense, which is inclusive of (gain) loss on sale or disposal of assets, lease termination costs, and FCC reimbursements; asset impairment expense, interest expense; net gain (loss) on contingent consideration; loss on early extinguishment or restructuring of debt; gain (loss) on sale of subsidiaries; other (income) expense, net; foreign currency transaction (gain) loss included in cost of revenue; income tax (benefit) expense; noncontrolling interest; bonus to be settled in equity; share-based compensation expense; non-recurring items; and acquisition and disposition costs. To help our board, management and investors assess the impact of COVID-19 pandemic on our results of operations, we are excluding the impacts of COVID-19 response initiatives for the cost of personal protective equipment distributed to employees, cleaning and sanitization equipment and procedures, and additional overhead costs to maintain proper social distancing from Adjusted EBITDA. Our board and management find the exclusion of the impact of these COVID-19 response initiatives from Adjusted EBITDA to be useful because it allows us and our investors to assess the impact of these response initiatives on our results of operations. Adjusted Operating Income Adjusted Operating Income ("Insurance AOI") and Pre-tax Adjusted Operating Income (“Pre-tax Insurance AOI”) for the Insurance segment are non-U.S. GAAP financial measures frequently used throughout the insurance industry and are economic measures the Insurance segment uses to evaluate its financial performance. Management believes that Insurance AOI and Pretax Insurance AOI measures provide investors with meaningful information for gaining an understanding of certain results and provide insight into an organization’s operating trends and facilitates comparisons between peer companies. However, Insurance AOI and Pre-tax Insurance AOI have certain limitations, and we may not calculate it the same as other companies in our industry. It should, therefore, be read together with the Company's results calculated in accordance with U.S. GAAP. Similarly to Adjusted EBITDA, using Insurance AOI and Pre-tax Insurance AOI as performance measures have inherent limitations as an analytical tool as compared to income (loss) from operations or other U.S. GAAP financial measures, as these non-U.S. GAAP measures exclude certain items, including items that are recurring in nature, which may be meaningful to investors. As a result of the exclusions, Insurance AOI and Pre-tax Insurance AOI should not be considered in isolation and do not purport to be an alternative to income (loss) from operations or other U.S. GAAP financial measures as measures of our operating performance. Management defines Insurance AOI as Net income for the Insurance segment adjusted to exclude the impact of net investment gains (losses), including OTTI losses recognized in operations; asset impairment; intercompany elimination; gain on bargain purchase, gain on reinsurance recaptures; and acquisition costs. Management defines Pre-tax Insurance AOI as Insurance AOI adjusted to exclude the impact of income tax (benefit) expense recognized during the current period. Management believes that Insurance AOI and Pre-tax Insurance AOI provide meaningful financial metrics that help investors understand certain results and profitability. While these adjustments are an integral part of the overall performance of the Insurance segment, market conditions impacting these items can overshadow the underlying performance of the business. Accordingly, we believe using a measure which excludes their impact is effective in analyzing the trends of our operations. Third Party Sources Third party information presented in this earnings release supplement is based on sources we believe to be reliable, however there can be no assurance information so presented will prove accurate in whole or in part. 3
© HC2 HOLDINGS, INC. 2021 Full Year 2020 Summary Reshaping a New HC2 ■ Sharpened strategic focus through multiple business divestitures ■ Reduced aggregate debt levels on improved terms with extended maturities ■ Improved flexibility and overall liquidity position ■ Resilient, improving performance at Infrastructure, Life Sciences, Spectrum ■ Well-positioned to accelerate growth and create sustainable value ■ Aligned with stakeholders for future success 4 “The new HC2 has a sharpened strategic focus on the three key business areas which we believe will drive growth and increased stakeholder value: Infrastructure, Life Sciences and Spectrum.” -Avie Glazer, Chairman
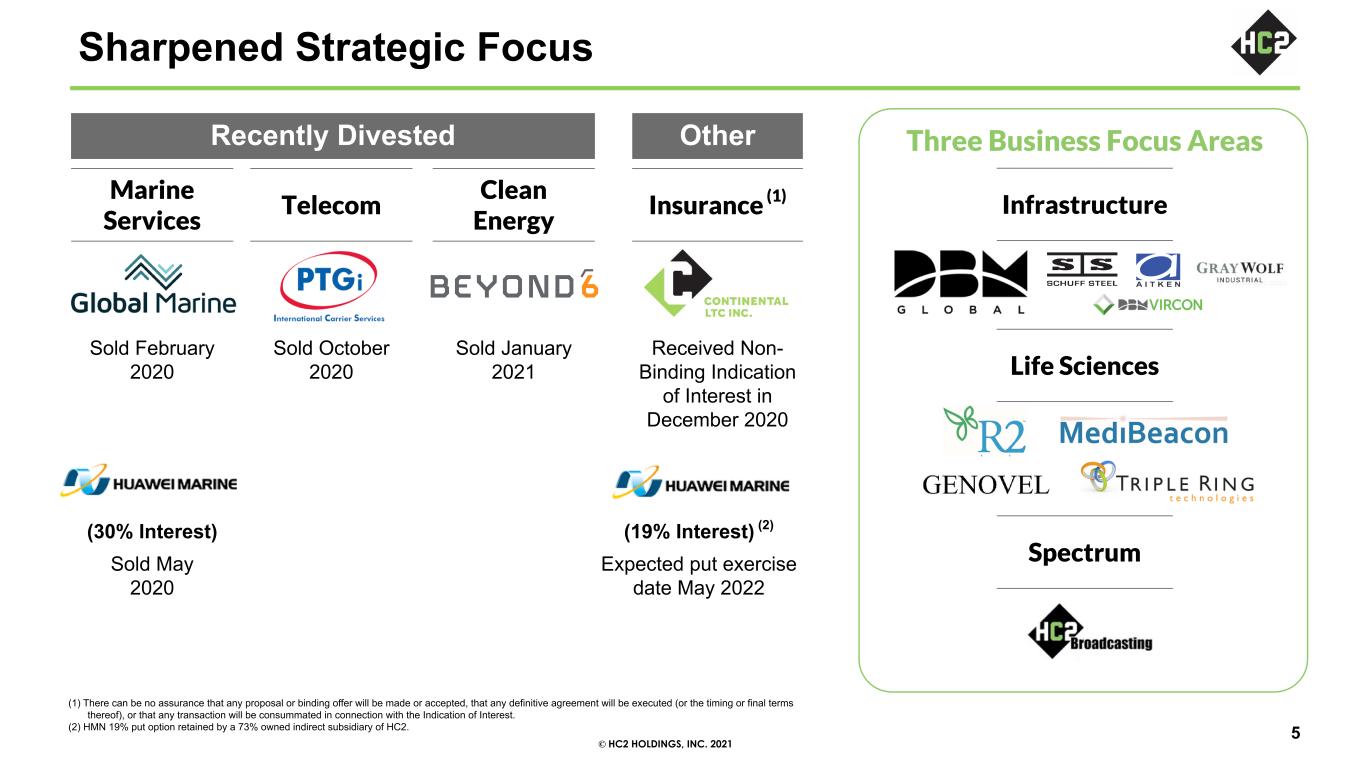
© HC2 HOLDINGS, INC. 2021 Three Business Focus Areas Infrastructure Life Sciences Spectrum Recently Divested Other Marine Services Telecom Clean Energy Insurance (1) Sold February 2020 Sold October 2020 Sold January 2021 Received Non- Binding Indication of Interest in December 2020 (30% Interest) Sold May 2020 (19% Interest) (2) Expected put exercise date May 2022 Sharpened Strategic Focus (1) There can be no assurance that any proposal or binding offer will be made or accepted, that any definitive agreement will be executed (or the timing or final terms thereof), or that any transaction will be consummated in connection with the Indication of Interest. (2) HMN 19% put option retained by a 73% owned indirect subsidiary of HC2. 5
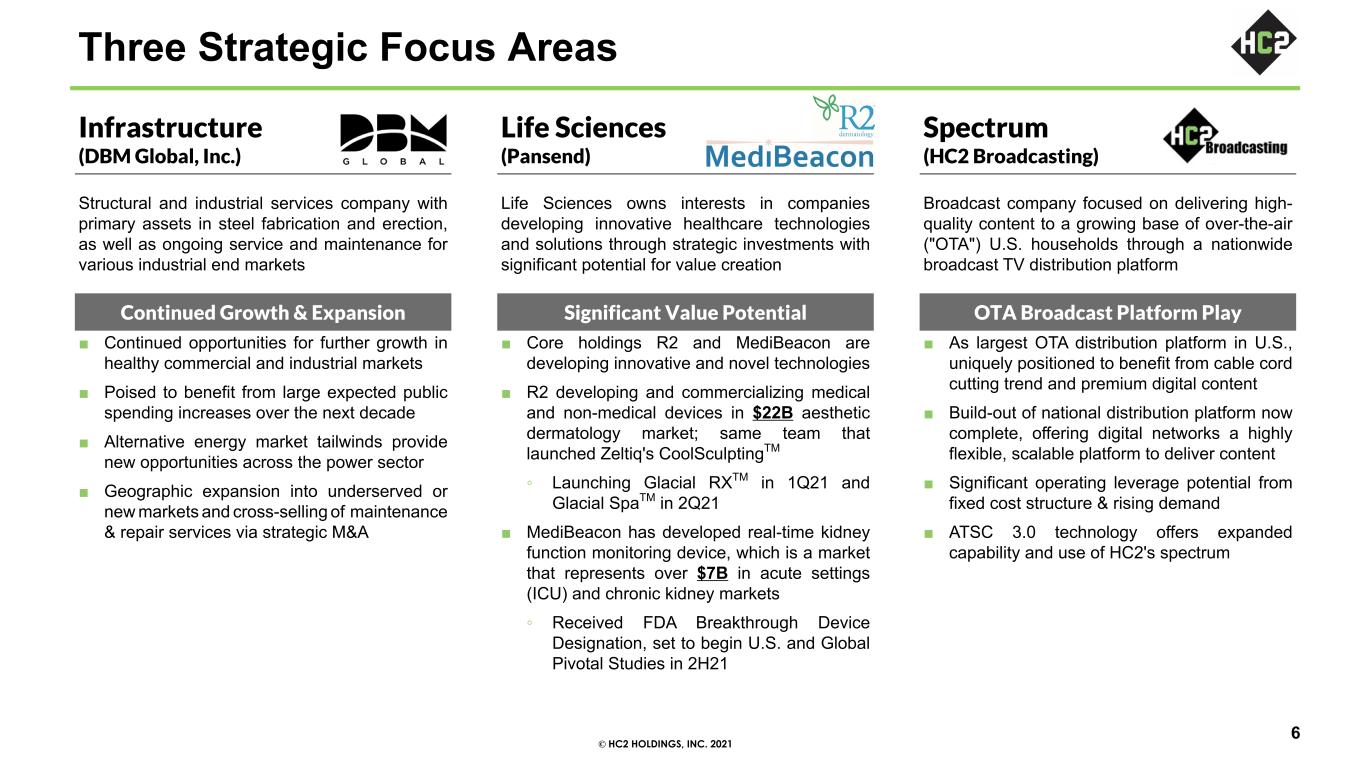
© HC2 HOLDINGS, INC. 2021 Three Strategic Focus Areas 6 Infrastructure (DBM Global, Inc.) Life Sciences (Pansend) Spectrum (HC2 Broadcasting) Structural and industrial services company with primary assets in steel fabrication and erection, as well as ongoing service and maintenance for various industrial end markets Life Sciences owns interests in companies developing innovative healthcare technologies and solutions through strategic investments with significant potential for value creation Broadcast company focused on delivering high- quality content to a growing base of over-the-air ("OTA") U.S. households through a nationwide broadcast TV distribution platform Continued Growth & Expansion Significant Value Potential OTA Broadcast Platform Play ■ Continued opportunities for further growth in healthy commercial and industrial markets ■ Poised to benefit from large expected public spending increases over the next decade ■ Alternative energy market tailwinds provide new opportunities across the power sector ■ Geographic expansion into underserved or new markets and cross-selling of maintenance & repair services via strategic M&A ■ Core holdings R2 and MediBeacon are developing innovative and novel technologies ■ R2 developing and commercializing medical and non-medical devices in $22B aesthetic dermatology market; same team that launched Zeltiq's CoolSculptingTM ◦ Launching Glacial RXTM in 1Q21 and Glacial SpaTM in 2Q21 ■ MediBeacon has developed real-time kidney function monitoring device, which is a market that represents over $7B in acute settings (ICU) and chronic kidney markets ◦ Received FDA Breakthrough Device Designation, set to begin U.S. and Global Pivotal Studies in 2H21 ■ As largest OTA distribution platform in U.S., uniquely positioned to benefit from cable cord cutting trend and premium digital content ■ Build-out of national distribution platform now complete, offering digital networks a highly flexible, scalable platform to deliver content ■ Significant operating leverage potential from fixed cost structure & rising demand ■ ATSC 3.0 technology offers expanded capability and use of HC2's spectrum
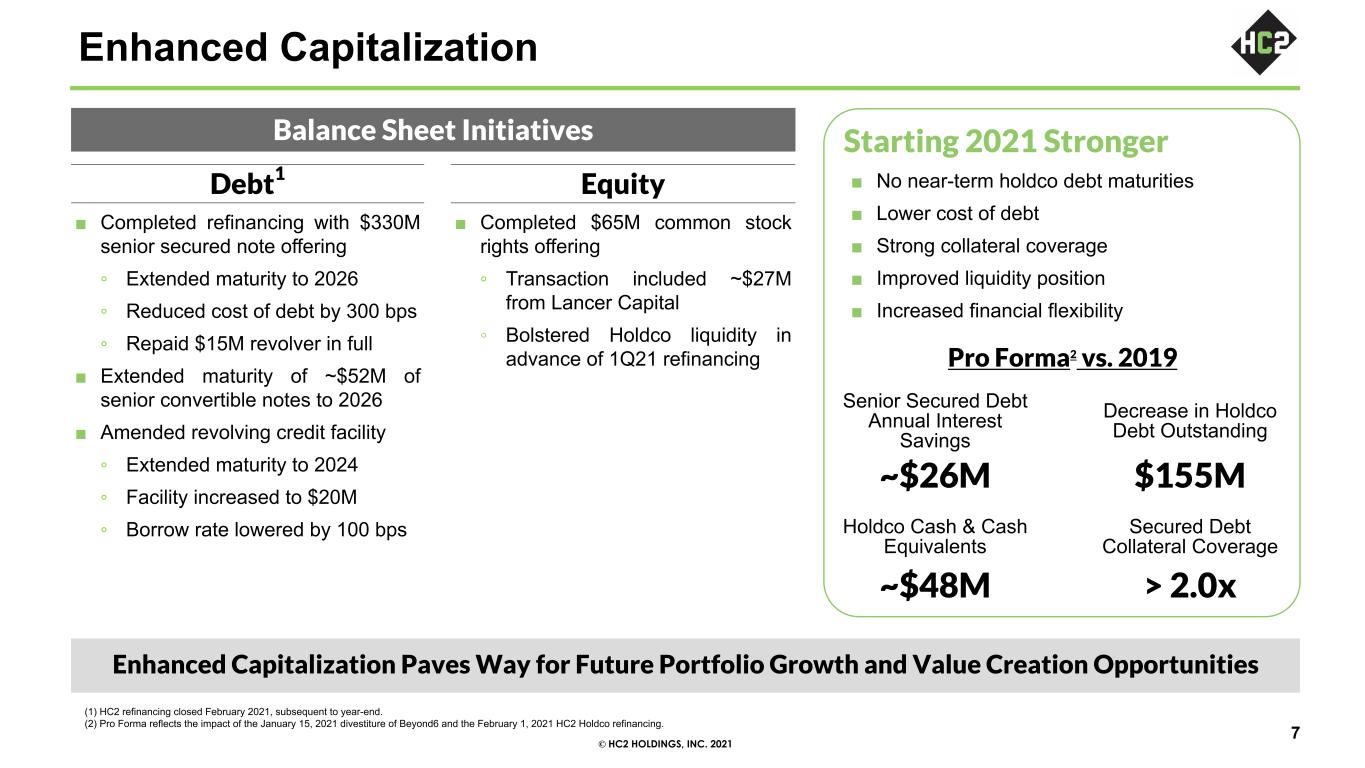
© HC2 HOLDINGS, INC. 2021 7 Enhanced Capitalization Balance Sheet Initiatives Debt1 Equity ■ Completed refinancing with $330M senior secured note offering ◦ Extended maturity to 2026 ◦ Reduced cost of debt by 300 bps ◦ Repaid $15M revolver in full ■ Extended maturity of ~$52M of senior convertible notes to 2026 ■ Amended revolving credit facility ◦ Extended maturity to 2024 ◦ Facility increased to $20M ◦ Borrow rate lowered by 100 bps ■ Completed $65M common stock rights offering ◦ Transaction included ~$27M from Lancer Capital ◦ Bolstered Holdco liquidity in advance of 1Q21 refinancing Enhanced Capitalization Paves Way for Future Portfolio Growth and Value Creation Opportunities Starting 2021 Stronger ■ No near-term holdco debt maturities ■ Lower cost of debt ■ Strong collateral coverage ■ Improved liquidity position ■ Increased financial flexibility Pro Forma2 vs. 2019 Senior Secured Debt Annual Interest Savings Decrease in Holdco Debt Outstanding ~$26M $155M Holdco Cash & Cash Equivalents Secured Debt Collateral Coverage ~$48M > 2.0x (1) HC2 refinancing closed February 2021, subsequent to year-end. (2) Pro Forma reflects the impact of the January 15, 2021 divestiture of Beyond6 and the February 1, 2021 HC2 Holdco refinancing.
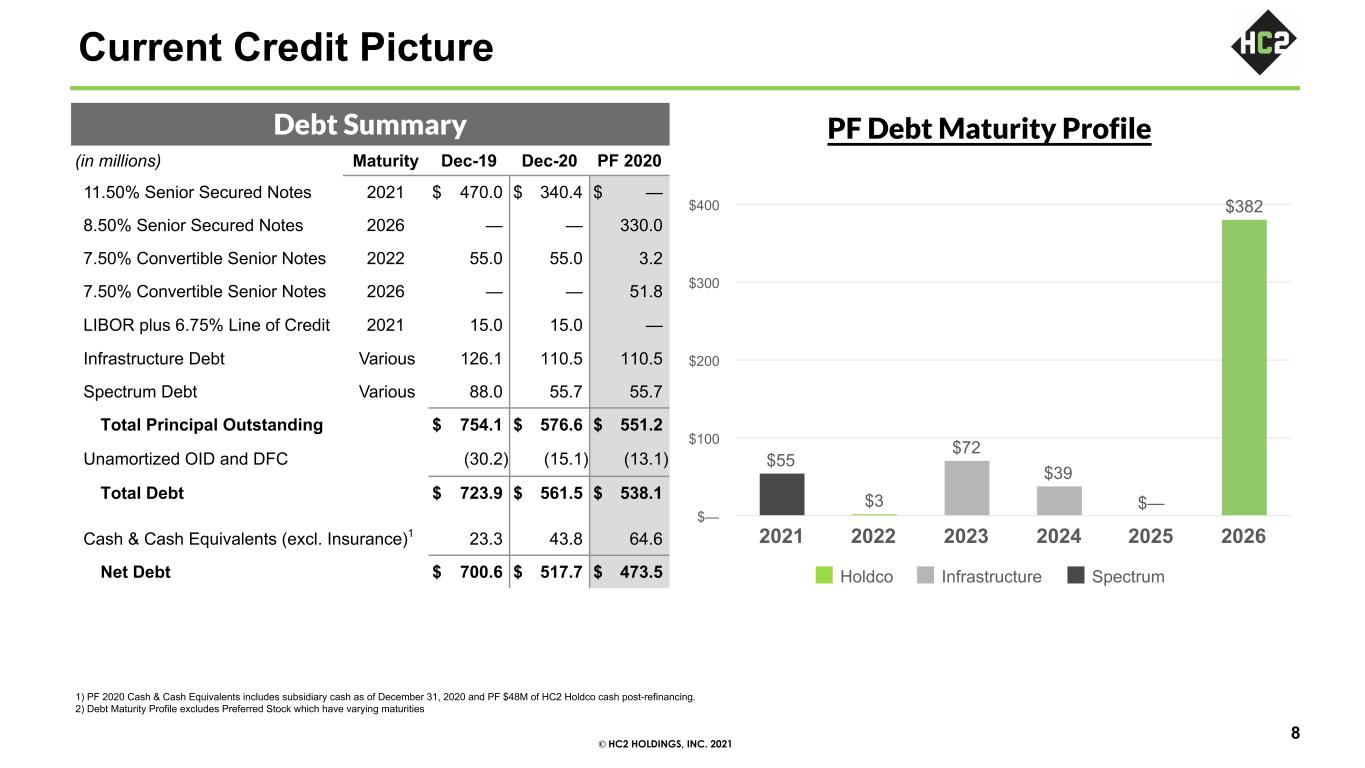
© HC2 HOLDINGS, INC. 2021 1) PF 2020 Cash & Cash Equivalents includes subsidiary cash as of December 31, 2020 and PF $48M of HC2 Holdco cash post-refinancing. 2) Debt Maturity Profile excludes Preferred Stock which have varying maturities Debt Summary (in millions) Maturity Dec-19 Dec-20 PF 2020 11.50% Senior Secured Notes 2021 $ 470.0 $ 340.4 $ — 8.50% Senior Secured Notes 2026 — — 330.0 7.50% Convertible Senior Notes 2022 55.0 55.0 3.2 7.50% Convertible Senior Notes 2026 — — 51.8 LIBOR plus 6.75% Line of Credit 2021 15.0 15.0 — Infrastructure Debt Various 126.1 110.5 110.5 Spectrum Debt Various 88.0 55.7 55.7 Total Principal Outstanding $ 754.1 $ 576.6 $ 551.2 Unamortized OID and DFC (30.2) (15.1) (13.1) Total Debt $ 723.9 $ 561.5 $ 538.1 Cash & Cash Equivalents (excl. Insurance)1 23.3 43.8 64.6 Net Debt $ 700.6 $ 517.7 $ 473.5 Current Credit Picture 8 PF Debt Maturity Profile $55 $3 $72 $39 $— $382 Holdco Infrastructure Spectrum 2021 2022 2023 2024 2025 2026 $— $100 $200 $300 $400
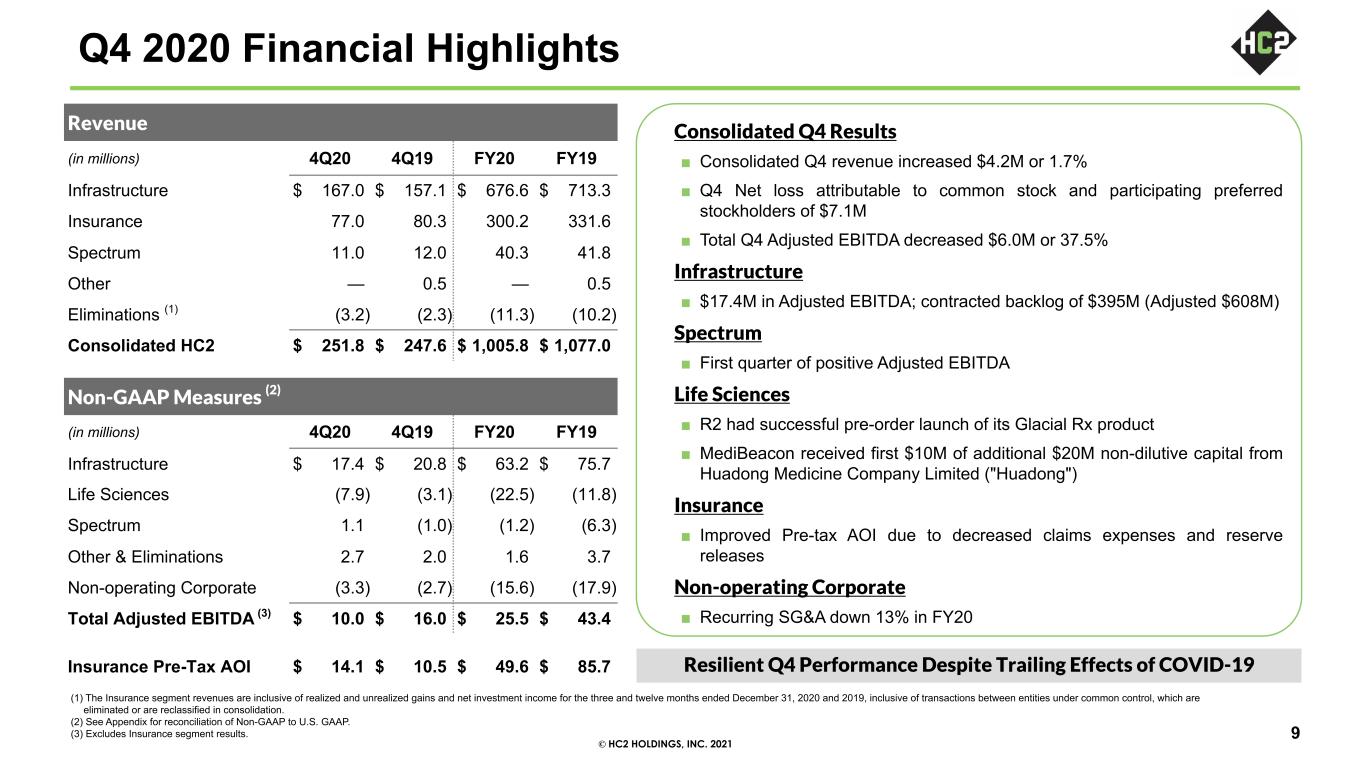
© HC2 HOLDINGS, INC. 2021 Q4 2020 Financial Highlights Revenue (in millions) 4Q20 4Q19 FY20 FY19 Infrastructure $ 167.0 $ 157.1 $ 676.6 $ 713.3 Insurance 77.0 80.3 300.2 331.6 Spectrum 11.0 12.0 40.3 41.8 Other — 0.5 — 0.5 Eliminations (1) (3.2) (2.3) (11.3) (10.2) Consolidated HC2 $ 251.8 $ 247.6 $ 1,005.8 $ 1,077.0 Non-GAAP Measures (2) (in millions) 4Q20 4Q19 FY20 FY19 Infrastructure $ 17.4 $ 20.8 $ 63.2 $ 75.7 Life Sciences (7.9) (3.1) (22.5) (11.8) Spectrum 1.1 (1.0) (1.2) (6.3) Other & Eliminations 2.7 2.0 1.6 3.7 Non-operating Corporate (3.3) (2.7) (15.6) (17.9) Total Adjusted EBITDA (3) $ 10.0 $ 16.0 $ 25.5 $ 43.4 Insurance Pre-Tax AOI $ 14.1 $ 10.5 $ 49.6 $ 85.7 (1) The Insurance segment revenues are inclusive of realized and unrealized gains and net investment income for the three and twelve months ended December 31, 2020 and 2019, inclusive of transactions between entities under common control, which are eliminated or are reclassified in consolidation. (2) See Appendix for reconciliation of Non-GAAP to U.S. GAAP. (3) Excludes Insurance segment results. Consolidated Q4 Results ■ Consolidated Q4 revenue increased $4.2M or 1.7% ■ Q4 Net loss attributable to common stock and participating preferred stockholders of $7.1M ■ Total Q4 Adjusted EBITDA decreased $6.0M or 37.5% Infrastructure ■ $17.4M in Adjusted EBITDA; contracted backlog of $395M (Adjusted $608M) Spectrum ■ First quarter of positive Adjusted EBITDA Life Sciences ■ R2 had successful pre-order launch of its Glacial Rx product ■ MediBeacon received first $10M of additional $20M non-dilutive capital from Huadong Medicine Company Limited ("Huadong") Insurance ■ Improved Pre-tax AOI due to decreased claims expenses and reserve releases Non-operating Corporate ■ Recurring SG&A down 13% in FY20 9 Resilient Q4 Performance Despite Trailing Effects of COVID-19
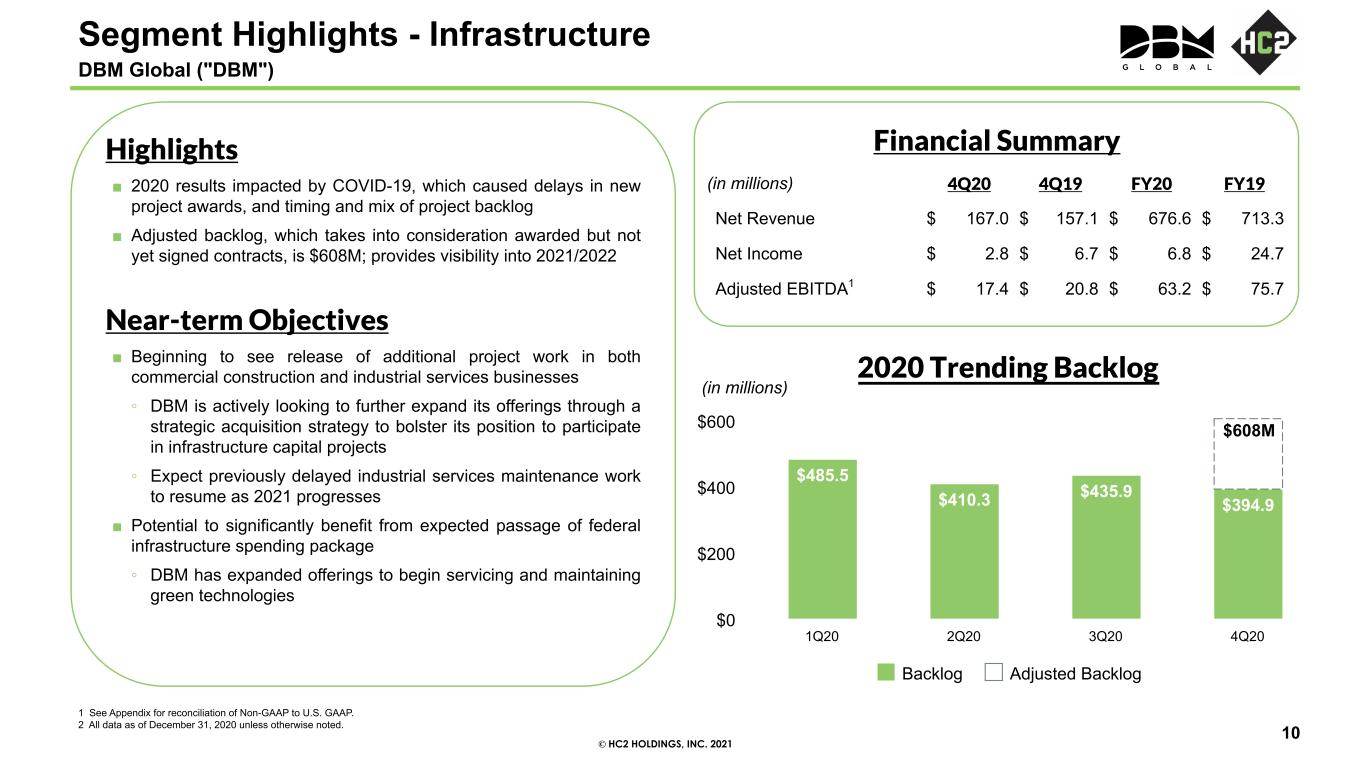
© HC2 HOLDINGS, INC. 2021 Highlights ■ 2020 results impacted by COVID-19, which caused delays in new project awards, and timing and mix of project backlog ■ Adjusted backlog, which takes into consideration awarded but not yet signed contracts, is $608M; provides visibility into 2021/2022 Near-term Objectives ■ Beginning to see release of additional project work in both commercial construction and industrial services businesses ◦ DBM is actively looking to further expand its offerings through a strategic acquisition strategy to bolster its position to participate in infrastructure capital projects ◦ Expect previously delayed industrial services maintenance work to resume as 2021 progresses ■ Potential to significantly benefit from expected passage of federal infrastructure spending package ◦ DBM has expanded offerings to begin servicing and maintaining green technologies Financial Summary (in millions) 4Q20 4Q19 FY20 FY19 Net Revenue $ 167.0 $ 157.1 $ 676.6 $ 713.3 Net Income $ 2.8 $ 6.7 $ 6.8 $ 24.7 Adjusted EBITDA1 $ 17.4 $ 20.8 $ 63.2 $ 75.7 1 See Appendix for reconciliation of Non-GAAP to U.S. GAAP. 2 All data as of December 31, 2020 unless otherwise noted. Segment Highlights - Infrastructure DBM Global ("DBM") 10 2020 Trending Backlog $485.5 $410.3 $435.9 $394.9 Backlog Adjusted Backlog 1Q20 2Q20 3Q20 4Q20 $0 $200 $400 $600 $608M (in millions)
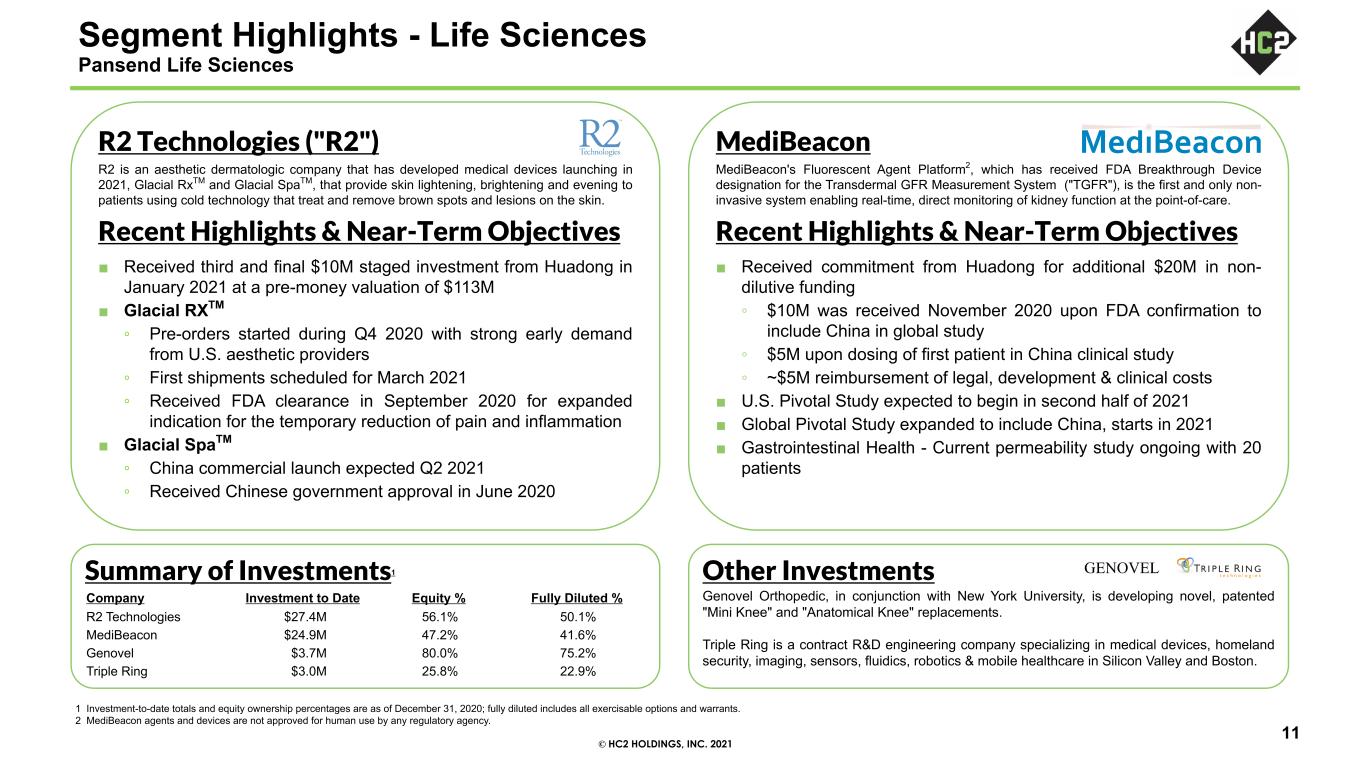
© HC2 HOLDINGS, INC. 2021 1 Investment-to-date totals and equity ownership percentages are as of December 31, 2020; fully diluted includes all exercisable options and warrants. 2 MediBeacon agents and devices are not approved for human use by any regulatory agency. Other Investments Genovel Orthopedic, in conjunction with New York University, is developing novel, patented "Mini Knee" and "Anatomical Knee" replacements. Triple Ring is a contract R&D engineering company specializing in medical devices, homeland security, imaging, sensors, fluidics, robotics & mobile healthcare in Silicon Valley and Boston. Summary of Investments1 R2 Technologies ("R2") R2 is an aesthetic dermatologic company that has developed medical devices launching in 2021, Glacial RxTM and Glacial SpaTM, that provide skin lightening, brightening and evening to patients using cold technology that treat and remove brown spots and lesions on the skin. Recent Highlights & Near-Term Objectives ■ Received third and final $10M staged investment from Huadong in January 2021 at a pre-money valuation of $113M ■ Glacial RXTM ◦ Pre-orders started during Q4 2020 with strong early demand from U.S. aesthetic providers ◦ First shipments scheduled for March 2021 ◦ Received FDA clearance in September 2020 for expanded indication for the temporary reduction of pain and inflammation ■ Glacial SpaTM ◦ China commercial launch expected Q2 2021 ◦ Received Chinese government approval in June 2020 MediBeacon MediBeacon's Fluorescent Agent Platform2, which has received FDA Breakthrough Device designation for the Transdermal GFR Measurement System ("TGFR"), is the first and only non- invasive system enabling real-time, direct monitoring of kidney function at the point-of-care. Recent Highlights & Near-Term Objectives ■ Received commitment from Huadong for additional $20M in non- dilutive funding ◦ $10M was received November 2020 upon FDA confirmation to include China in global study ◦ $5M upon dosing of first patient in China clinical study ◦ ~$5M reimbursement of legal, development & clinical costs ■ U.S. Pivotal Study expected to begin in second half of 2021 ■ Global Pivotal Study expanded to include China, starts in 2021 ■ Gastrointestinal Health - Current permeability study ongoing with 20 patients Company Investment to Date Equity % Fully Diluted % R2 Technologies $27.4M 56.1% 50.1% MediBeacon $24.9M 47.2% 41.6% Genovel $3.7M 80.0% 75.2% Triple Ring $3.0M 25.8% 22.9% 11 Segment Highlights - Life Sciences Pansend Life Sciences
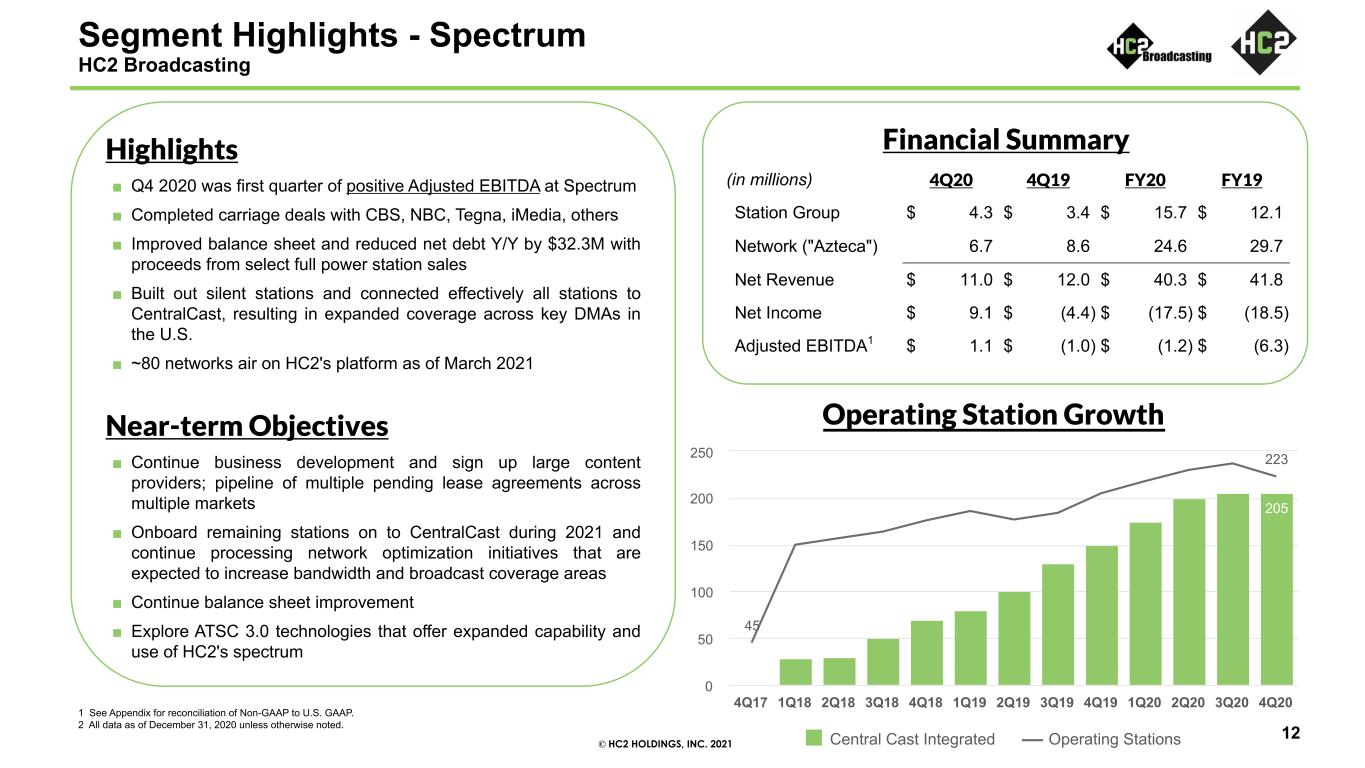
© HC2 HOLDINGS, INC. 2021 Highlights ■ Q4 2020 was first quarter of positive Adjusted EBITDA at Spectrum ■ Completed carriage deals with CBS, NBC, Tegna, iMedia, others ■ Improved balance sheet and reduced net debt Y/Y by $32.3M with proceeds from select full power station sales ■ Built out silent stations and connected effectively all stations to CentralCast, resulting in expanded coverage across key DMAs in the U.S. ■ ~80 networks air on HC2's platform as of March 2021 Near-term Objectives ■ Continue business development and sign up large content providers; pipeline of multiple pending lease agreements across multiple markets ■ Onboard remaining stations on to CentralCast during 2021 and continue processing network optimization initiatives that are expected to increase bandwidth and broadcast coverage areas ■ Continue balance sheet improvement ■ Explore ATSC 3.0 technologies that offer expanded capability and use of HC2's spectrum Financial Summary (in millions) 4Q20 4Q19 FY20 FY19 Station Group $ 4.3 $ 3.4 $ 15.7 $ 12.1 Network ("Azteca") 6.7 8.6 24.6 29.7 Net Revenue $ 11.0 $ 12.0 $ 40.3 $ 41.8 Net Income $ 9.1 $ (4.4) $ (17.5) $ (18.5) Adjusted EBITDA1 $ 1.1 $ (1.0) $ (1.2) $ (6.3) 1 See Appendix for reconciliation of Non-GAAP to U.S. GAAP. 2 All data as of December 31, 2020 unless otherwise noted. 12 Segment Highlights - Spectrum HC2 Broadcasting Operating Station Growth 205 45 223 Central Cast Integrated Operating Stations 4Q17 1Q18 2Q18 3Q18 4Q18 1Q19 2Q19 3Q19 4Q19 1Q20 2Q20 3Q20 4Q20 0 50 100 150 200 250
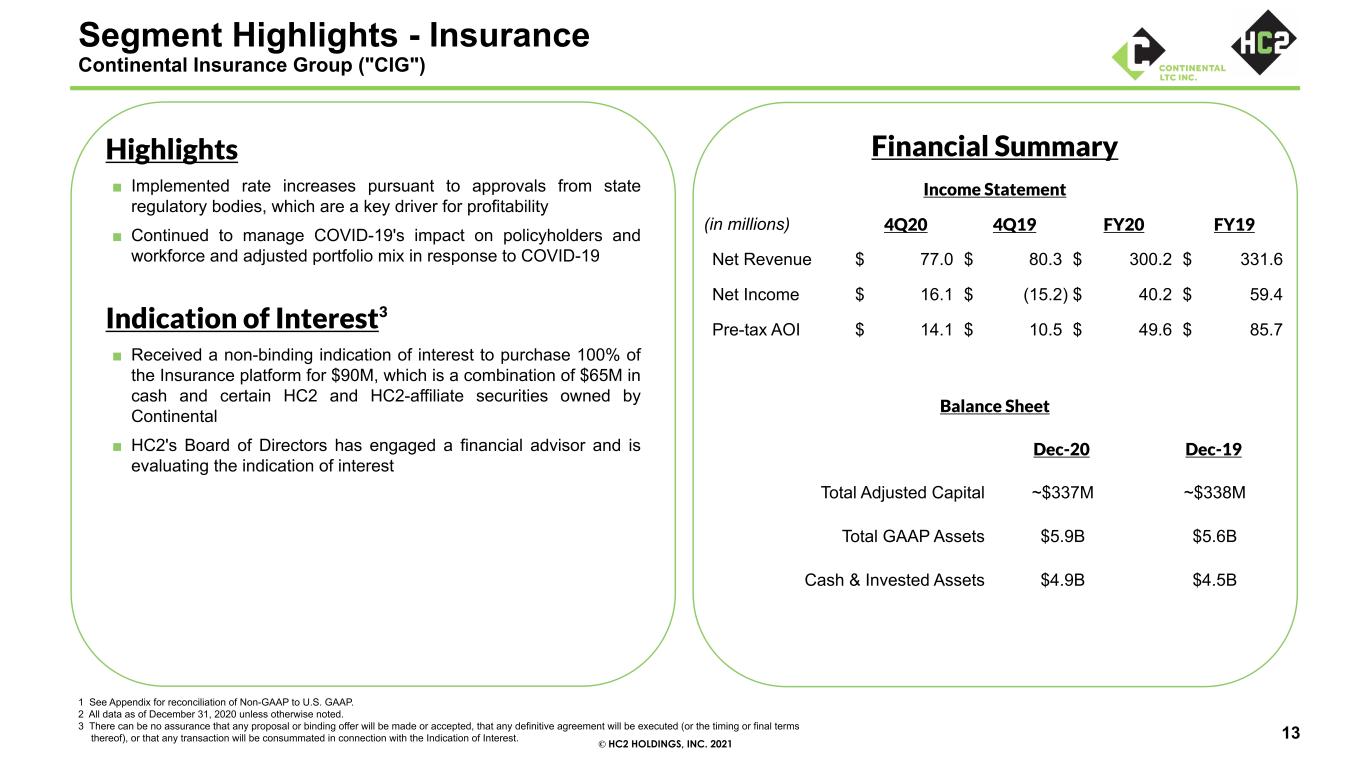
© HC2 HOLDINGS, INC. 2021 Highlights ■ Implemented rate increases pursuant to approvals from state regulatory bodies, which are a key driver for profitability ■ Continued to manage COVID-19's impact on policyholders and workforce and adjusted portfolio mix in response to COVID-19 Indication of Interest3 ■ Received a non-binding indication of interest to purchase 100% of the Insurance platform for $90M, which is a combination of $65M in cash and certain HC2 and HC2-affiliate securities owned by Continental ■ HC2's Board of Directors has engaged a financial advisor and is evaluating the indication of interest Financial Summary Income Statement (in millions) 4Q20 4Q19 FY20 FY19 Net Revenue $ 77.0 $ 80.3 $ 300.2 $ 331.6 Net Income $ 16.1 $ (15.2) $ 40.2 $ 59.4 Pre-tax AOI $ 14.1 $ 10.5 $ 49.6 $ 85.7 1 See Appendix for reconciliation of Non-GAAP to U.S. GAAP. 2 All data as of December 31, 2020 unless otherwise noted. 3 There can be no assurance that any proposal or binding offer will be made or accepted, that any definitive agreement will be executed (or the timing or final terms thereof), or that any transaction will be consummated in connection with the Indication of Interest. 13 Segment Highlights - Insurance Continental Insurance Group ("CIG") Balance Sheet Dec-20 Dec-19 Total Adjusted Capital ~$337M ~$338M Total GAAP Assets $5.9B $5.6B Cash & Invested Assets $4.9B $4.5B
© HC2 HOLDINGS, INC. 2021 Appendix Select GAAP Financials & Non-GAAP Reconciliations 14
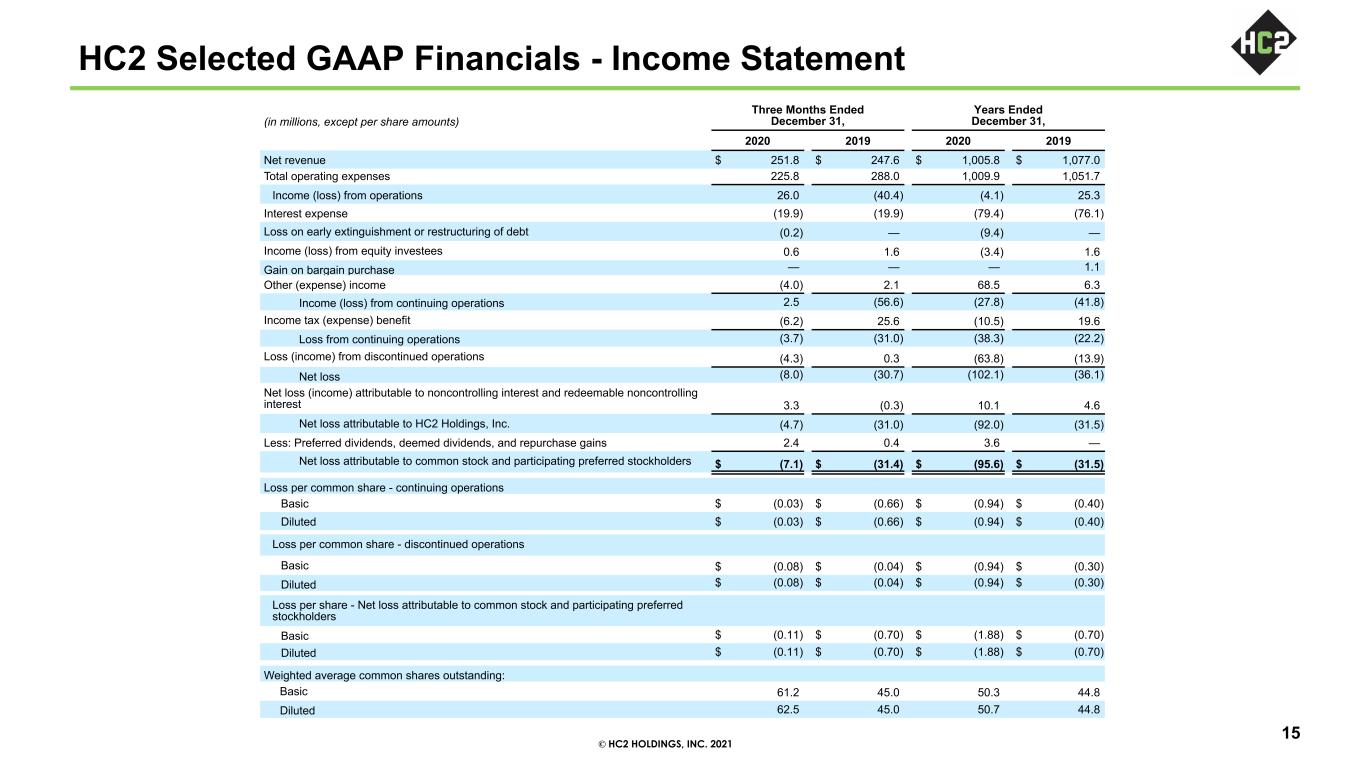
© HC2 HOLDINGS, INC. 2021 HC2 Selected GAAP Financials - Income Statement (in millions, except per share amounts) Three Months Ended December 31, Years Ended December 31, 2020 2019 2020 2019 Net revenue $ 251.8 $ 247.6 $ 1,005.8 $ 1,077.0 Total operating expenses 225.8 288.0 1,009.9 1,051.7 Income (loss) from operations 26.0 (40.4) (4.1) 25.3 Interest expense (19.9) (19.9) (79.4) (76.1) Loss on early extinguishment or restructuring of debt (0.2) — (9.4) — Income (loss) from equity investees 0.6 1.6 (3.4) 1.6 Gain on bargain purchase — — — 1.1 Other (expense) income (4.0) 2.1 68.5 6.3 Income (loss) from continuing operations 2.5 (56.6) (27.8) (41.8) Income tax (expense) benefit (6.2) 25.6 (10.5) 19.6 Loss from continuing operations (3.7) (31.0) (38.3) (22.2) Loss (income) from discontinued operations (4.3) 0.3 (63.8) (13.9) Net loss (8.0) (30.7) (102.1) (36.1) Net loss (income) attributable to noncontrolling interest and redeemable noncontrolling interest 3.3 (0.3) 10.1 4.6 Net loss attributable to HC2 Holdings, Inc. (4.7) (31.0) (92.0) (31.5) Less: Preferred dividends, deemed dividends, and repurchase gains 2.4 0.4 3.6 — Net loss attributable to common stock and participating preferred stockholders $ (7.1) $ (31.4) $ (95.6) $ (31.5) Loss per common share - continuing operations Basic $ (0.03) $ (0.66) $ (0.94) $ (0.40) Diluted $ (0.03) $ (0.66) $ (0.94) $ (0.40) Loss per common share - discontinued operations Basic $ (0.08) $ (0.04) $ (0.94) $ (0.30) Diluted $ (0.08) $ (0.04) $ (0.94) $ (0.30) Loss per share - Net loss attributable to common stock and participating preferred stockholders Basic $ (0.11) $ (0.70) $ (1.88) $ (0.70) Diluted $ (0.11) $ (0.70) $ (1.88) $ (0.70) Weighted average common shares outstanding: Basic 61.2 45.0 50.3 44.8 Diluted 62.5 45.0 50.7 44.8 15
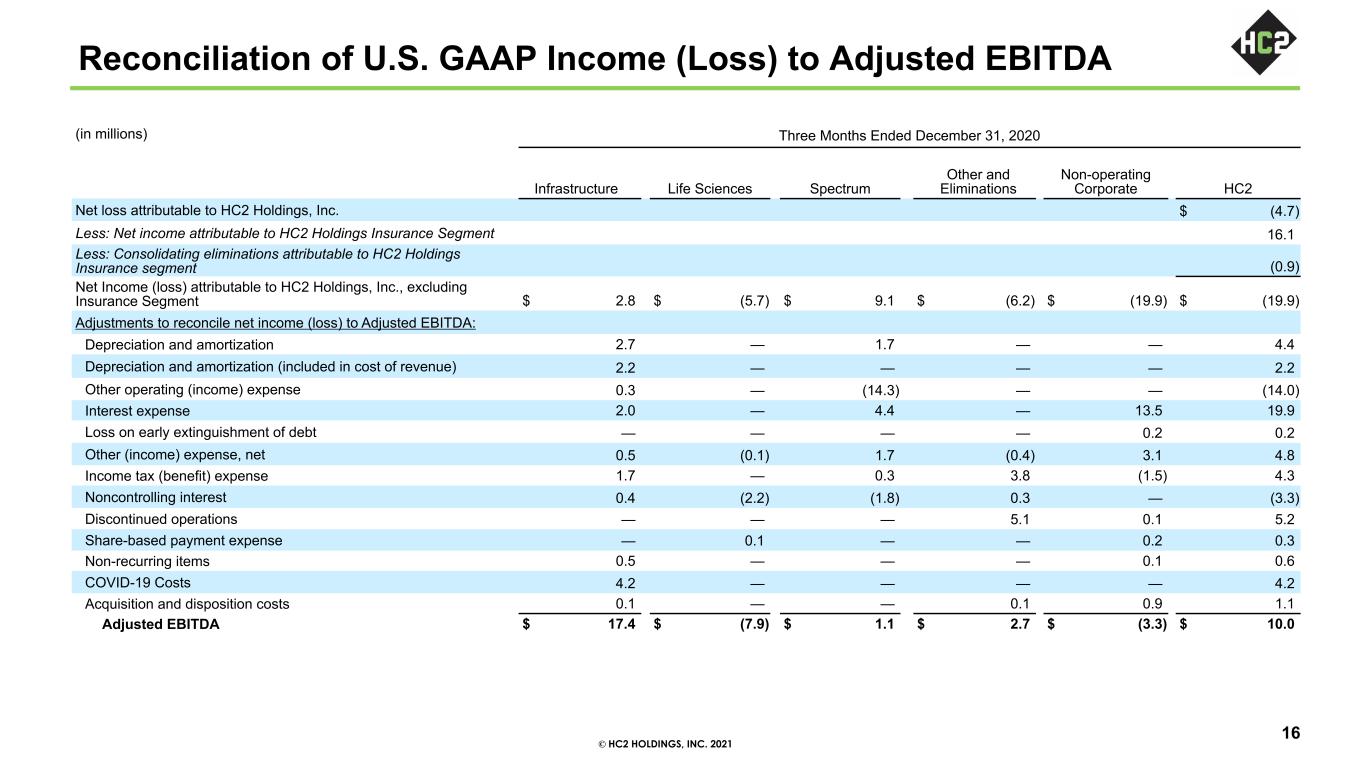
© HC2 HOLDINGS, INC. 2021 Reconciliation of U.S. GAAP Income (Loss) to Adjusted EBITDA (in millions) Three Months Ended December 31, 2020 Infrastructure Life Sciences Spectrum Other and Eliminations Non-operating Corporate HC2 Net loss attributable to HC2 Holdings, Inc. $ (4.7) Less: Net income attributable to HC2 Holdings Insurance Segment 16.1 Less: Consolidating eliminations attributable to HC2 Holdings Insurance segment (0.9) Net Income (loss) attributable to HC2 Holdings, Inc., excluding Insurance Segment $ 2.8 $ (5.7) $ 9.1 $ (6.2) $ (19.9) $ (19.9) Adjustments to reconcile net income (loss) to Adjusted EBITDA: Depreciation and amortization 2.7 — 1.7 — — 4.4 Depreciation and amortization (included in cost of revenue) 2.2 — — — — 2.2 Other operating (income) expense 0.3 — (14.3) — — (14.0) Interest expense 2.0 — 4.4 — 13.5 19.9 Loss on early extinguishment of debt — — — — 0.2 0.2 Other (income) expense, net 0.5 (0.1) 1.7 (0.4) 3.1 4.8 Income tax (benefit) expense 1.7 — 0.3 3.8 (1.5) 4.3 Noncontrolling interest 0.4 (2.2) (1.8) 0.3 — (3.3) Discontinued operations — — — 5.1 0.1 5.2 Share-based payment expense — 0.1 — — 0.2 0.3 Non-recurring items 0.5 — — — 0.1 0.6 COVID-19 Costs 4.2 — — — — 4.2 Acquisition and disposition costs 0.1 — — 0.1 0.9 1.1 Adjusted EBITDA $ 17.4 $ (7.9) $ 1.1 $ 2.7 $ (3.3) $ 10.0 16
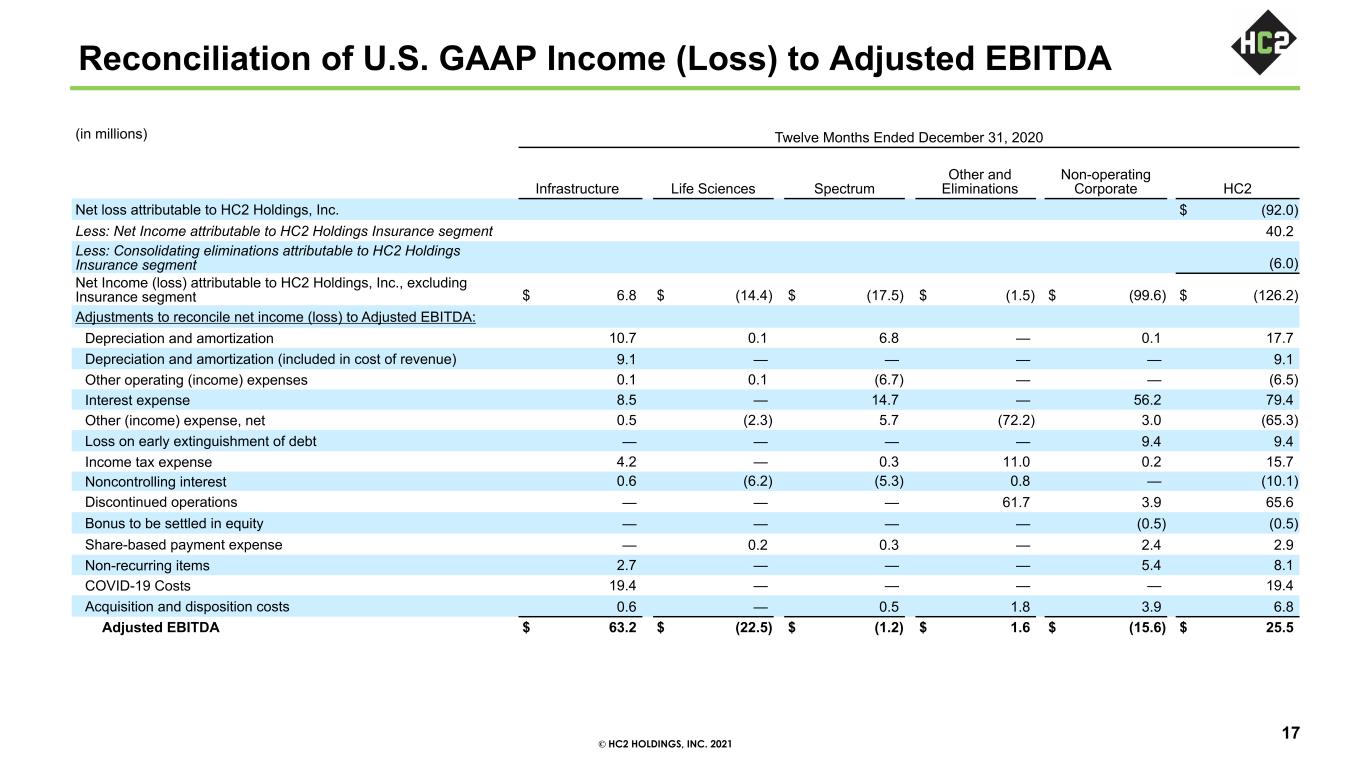
© HC2 HOLDINGS, INC. 2021 Reconciliation of U.S. GAAP Income (Loss) to Adjusted EBITDA (in millions) Twelve Months Ended December 31, 2020 Infrastructure Life Sciences Spectrum Other and Eliminations Non-operating Corporate HC2 Net loss attributable to HC2 Holdings, Inc. $ (92.0) Less: Net Income attributable to HC2 Holdings Insurance segment 40.2 Less: Consolidating eliminations attributable to HC2 Holdings Insurance segment (6.0) Net Income (loss) attributable to HC2 Holdings, Inc., excluding Insurance segment $ 6.8 $ (14.4) $ (17.5) $ (1.5) $ (99.6) $ (126.2) Adjustments to reconcile net income (loss) to Adjusted EBITDA: Depreciation and amortization 10.7 0.1 6.8 — 0.1 17.7 Depreciation and amortization (included in cost of revenue) 9.1 — — — — 9.1 Other operating (income) expenses 0.1 0.1 (6.7) — — (6.5) Interest expense 8.5 — 14.7 — 56.2 79.4 Other (income) expense, net 0.5 (2.3) 5.7 (72.2) 3.0 (65.3) Loss on early extinguishment of debt — — — — 9.4 9.4 Income tax expense 4.2 — 0.3 11.0 0.2 15.7 Noncontrolling interest 0.6 (6.2) (5.3) 0.8 — (10.1) Discontinued operations — — — 61.7 3.9 65.6 Bonus to be settled in equity — — — — (0.5) (0.5) Share-based payment expense — 0.2 0.3 — 2.4 2.9 Non-recurring items 2.7 — — — 5.4 8.1 COVID-19 Costs 19.4 — — — — 19.4 Acquisition and disposition costs 0.6 — 0.5 1.8 3.9 6.8 Adjusted EBITDA $ 63.2 $ (22.5) $ (1.2) $ 1.6 $ (15.6) $ 25.5 17
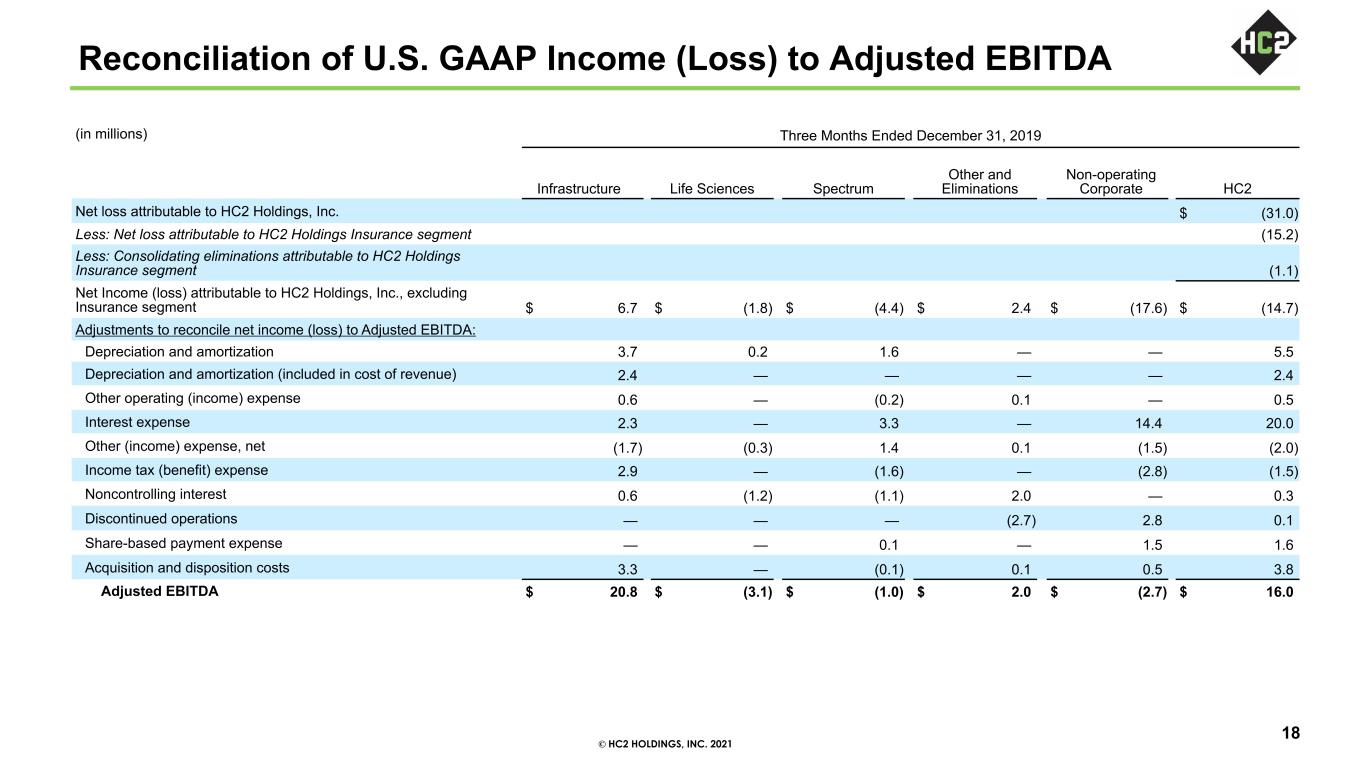
© HC2 HOLDINGS, INC. 2021 Reconciliation of U.S. GAAP Income (Loss) to Adjusted EBITDA (in millions) Three Months Ended December 31, 2019 Infrastructure Life Sciences Spectrum Other and Eliminations Non-operating Corporate HC2 Net loss attributable to HC2 Holdings, Inc. $ (31.0) Less: Net loss attributable to HC2 Holdings Insurance segment (15.2) Less: Consolidating eliminations attributable to HC2 Holdings Insurance segment (1.1) Net Income (loss) attributable to HC2 Holdings, Inc., excluding Insurance segment $ 6.7 $ (1.8) $ (4.4) $ 2.4 $ (17.6) $ (14.7) Adjustments to reconcile net income (loss) to Adjusted EBITDA: Depreciation and amortization 3.7 0.2 1.6 — — 5.5 Depreciation and amortization (included in cost of revenue) 2.4 — — — — 2.4 Other operating (income) expense 0.6 — (0.2) 0.1 — 0.5 Interest expense 2.3 — 3.3 — 14.4 20.0 Other (income) expense, net (1.7) (0.3) 1.4 0.1 (1.5) (2.0) Income tax (benefit) expense 2.9 — (1.6) — (2.8) (1.5) Noncontrolling interest 0.6 (1.2) (1.1) 2.0 — 0.3 Discontinued operations — — — (2.7) 2.8 0.1 Share-based payment expense — — 0.1 — 1.5 1.6 Acquisition and disposition costs 3.3 — (0.1) 0.1 0.5 3.8 Adjusted EBITDA $ 20.8 $ (3.1) $ (1.0) $ 2.0 $ (2.7) $ 16.0 18
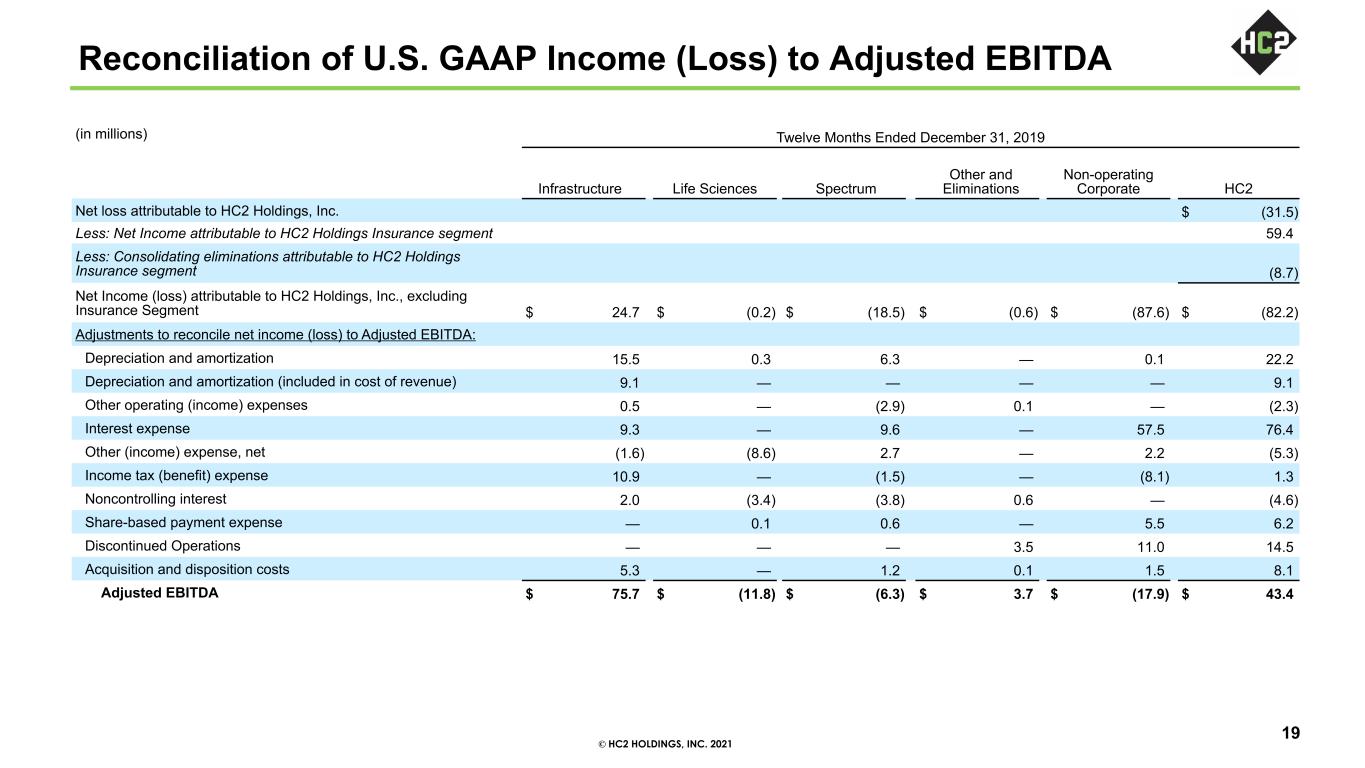
© HC2 HOLDINGS, INC. 2021 Reconciliation of U.S. GAAP Income (Loss) to Adjusted EBITDA (in millions) Twelve Months Ended December 31, 2019 Infrastructure Life Sciences Spectrum Other and Eliminations Non-operating Corporate HC2 Net loss attributable to HC2 Holdings, Inc. $ (31.5) Less: Net Income attributable to HC2 Holdings Insurance segment 59.4 Less: Consolidating eliminations attributable to HC2 Holdings Insurance segment (8.7) Net Income (loss) attributable to HC2 Holdings, Inc., excluding Insurance Segment $ 24.7 $ (0.2) $ (18.5) $ (0.6) $ (87.6) $ (82.2) Adjustments to reconcile net income (loss) to Adjusted EBITDA: Depreciation and amortization 15.5 0.3 6.3 — 0.1 22.2 Depreciation and amortization (included in cost of revenue) 9.1 — — — — 9.1 Other operating (income) expenses 0.5 — (2.9) 0.1 — (2.3) Interest expense 9.3 — 9.6 — 57.5 76.4 Other (income) expense, net (1.6) (8.6) 2.7 — 2.2 (5.3) Income tax (benefit) expense 10.9 — (1.5) — (8.1) 1.3 Noncontrolling interest 2.0 (3.4) (3.8) 0.6 — (4.6) Share-based payment expense — 0.1 0.6 — 5.5 6.2 Discontinued Operations — — — 3.5 11.0 14.5 Acquisition and disposition costs 5.3 — 1.2 0.1 1.5 8.1 Adjusted EBITDA $ 75.7 $ (11.8) $ (6.3) $ 3.7 $ (17.9) $ 43.4 19
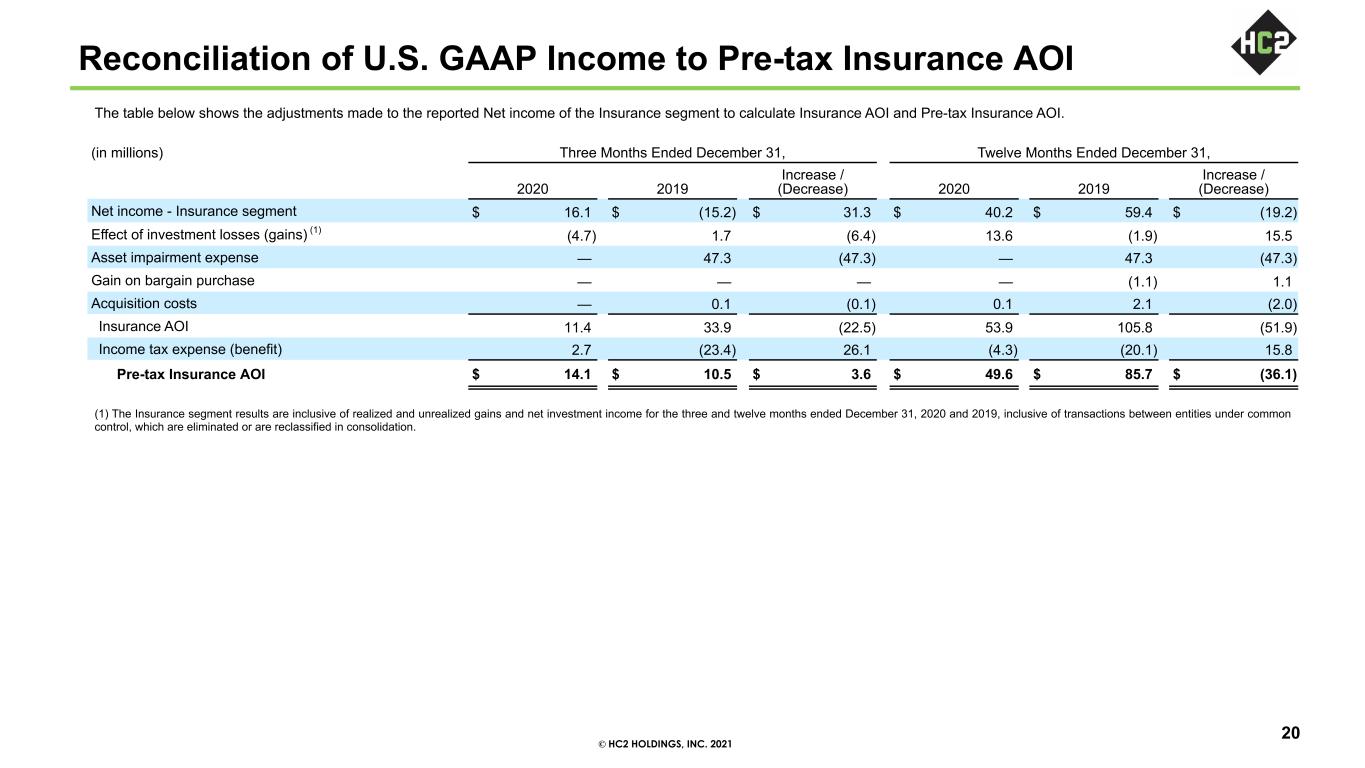
© HC2 HOLDINGS, INC. 2021 Reconciliation of U.S. GAAP Income to Pre-tax Insurance AOI (1) The Insurance segment results are inclusive of realized and unrealized gains and net investment income for the three and twelve months ended December 31, 2020 and 2019, inclusive of transactions between entities under common control, which are eliminated or are reclassified in consolidation. (in millions) Three Months Ended December 31, Twelve Months Ended December 31, 2020 2019 Increase / (Decrease) 2020 2019 Increase / (Decrease) Net income - Insurance segment $ 16.1 $ (15.2) $ 31.3 $ 40.2 $ 59.4 $ (19.2) Effect of investment losses (gains) (1) (4.7) 1.7 (6.4) 13.6 (1.9) 15.5 Asset impairment expense — 47.3 (47.3) — 47.3 (47.3) Gain on bargain purchase — — — — (1.1) 1.1 Acquisition costs — 0.1 (0.1) 0.1 2.1 (2.0) Insurance AOI 11.4 33.9 (22.5) 53.9 105.8 (51.9) Income tax expense (benefit) 2.7 (23.4) 26.1 (4.3) (20.1) 15.8 Pre-tax Insurance AOI $ 14.1 $ 10.5 $ 3.6 $ 49.6 $ 85.7 $ (36.1) The table below shows the adjustments made to the reported Net income of the Insurance segment to calculate Insurance AOI and Pre-tax Insurance AOI. 20


