United States
Securities and Exchange Commission
Washington, D.C. 20549
FORM N-CSR
CERTIFIED SHAREHOLDER REPORT OF REGISTERED
MANAGEMENT INVESTMENT COMPANIES
811-07925
(Investment Company Act file number)
WesMark Funds
(Exact name of registrant as specified in charter)
One Bank Plaza, 5th floor
Wheeling, WV 26003
(Address of principal executive offices)
(304) 234-9000
(Registrant’s telephone number)
Sareena Khwaja-Dixon, Esq.
ALPS Fund Services, Inc.
1290 Broadway, Suite 1000
Denver, CO 80203
(Name and address of agent for service)
Date of fiscal year end: December 31
Date of reporting period: January 1 – December 31, 2021
Item 1. Reports to Stockholders.
| (a) | Report of the Shareholders. |
President’s Message
December 31, 2021
Dear Fellow Shareholders:
After nearly two years, the U.S. appears to be adapting to this new normal. While economic growth slowed in the third quarter of 2021, largely due to supply chain issues, full-year economic growth saw the highest year-over-year increase since 1984. The sharp economic recovery has resulted in the shortest recession on record. The National Bureau of Economic Research announced in mid-2021 that the recession officially ended in April 2020. At a length of two months, it was the quickest recession on record, easily beating the six-month recession that occurred in 1980.
During the year, the focus was on combating the spread of COVID-19 and its variants. According to Centers for Disease Control, the U.S. ended 2021 with nearly 60% of the total population fully vaccinated against the virus. This appears to have helped mitigate the seriousness of symptoms for many with total deaths and hospitalization rates lower than levels seen one year ago. Nevertheless, economic growth slowed at times due to these variants. The inconsistent application of policies used to fight infection and “start and stop” reopening has negatively impacted supply chains. In addition, the solid demand due to fiscal stimulus has led to high levels of inflation. The December Consumer Price Index (CPI) reported a year-over-year increase of 7.0%. The results were the highest year-over-year increase since June 1982, led by gasoline and used car prices.
Higher inflation has the Federal Reserve accelerating its plans for interest rate hikes. The Federal Reserve has been central to the economic recovery. Over the past several years, low interest rates and quantitative easing programs have allowed liquidity to return to the markets and the economy. Following the 2008 recession, the Federal Funds rate stayed at the lower bound for six years. The anticipation of higher rates led to slightly higher volatility in equity markets and higher fixed-income yields that were posted at the end of 2021. Part of the rationale in keeping rates low was that labor markets need to regain “full employment” levels. Following the 2008 recession, the U.S. needed six and half years for the labor market to fully recover. During the 2001 recession, that figure was closer to four years. The December nonfarm payroll report highlighted that the total number of U.S. workers was 97% of the prior employment record. This is less than two years from the prior peak in employment.
Strong economic readings, improved labor markets, and compelling company fundamentals led to positive equity market returns for 2021.
For 2021, the S&P 500 Index posted a total return of 28.7% for its 21st best finish since 1926. Equity markets were less volatile than historical averages. The largest decline for the year was a 5.2% drawdown, the fourth smallest since 1987. Since 1980, the S&P 500 Index has averaged an intra-year drop of 14.0%. However, equity market volatility, as measured by the VIX Index, remained in line with long-term averages for most of the year. Equity returns for smaller market capitalization indexes and international markets were not as strong. While still above its long-term average return, the Russell 2000 Index rose 14.78% for the year compared to its 25-year average return of 8.97%. Developed international equities, as measured by the MSCI EAFA Index, rose 11.86%, and the MSCI Emerging Markets Index fell 2.40% over the same period.
The improving U.S. economic outlook pushed the 10-year Treasury higher for 2021. The year began with the 10-year Treasury yield at 0.91%; however, by the end of the quarter, yields stood at 1.74%. That marked the highest reading since the start of the pandemic, and it marked the sharpest rally since 2018. But yields fell as new COVID-19 variants impacted economic growth. As inflation readings moved higher, and the Federal Reserve altered expectations for rate hikes, the 10-year Treasury yield closed the year at 1.51%. The move higher in yields placed downward pressure on bond prices. As a result, the Bloomberg Barclay’s Government/Credit Index fell by 1.75% for 2021.
The Funds ended the year with net assets of $1.05 billion, an increase of 5.7% from the prior year end. Fund flows were negative for the full year, but they were more than fully offset by positive investment performance.
Your investment in and support of WesMark Funds is important to us. As always, we thank you. We strive to provide a competitive result to you, our investors. Our investment in the resources necessary to execute a successful investment plan for all our funds is always top of mind. Your support is instrumental to this success.
Should you have any questions or need additional information about the Funds, please visit our website www.wesmarkfunds.com or call 1-800-864-1013.
Sincerely,

Scott Love, CAIA, CIMA®
President, WesMark Funds
| www.wesmarkfunds.com |  |
| Save Paper | Lower Fund expenses | Enroll in eDelivery |  |
Call 1-800-864-1013 for more information
Table of Contents
December 31, 2021
| Management’s Discussion of Fund Performance | |
| Small Company Fund | 2 |
| Large Company Fund | 5 |
| Balanced Fund | 8 |
| Government Bond Fund | 11 |
| West Virginia Municipal Bond Fund | 14 |
| Tactical Opportunity Fund | 17 |
| Small Company Fund | |
| Portfolio of Investments Summary Table | 20 |
| Portfolio of Investments | 21 |
| Large Company Fund | |
| Portfolio of Investments Summary Table | 24 |
| Portfolio of Investments | 25 |
| Balanced Fund | |
| Portfolio of Investments Summary Table | 28 |
| Portfolio of Investments | 29 |
| Government Bond Fund | |
| Portfolio of Investments Summary Table | 34 |
| Portfolio of Investments | 35 |
| West Virginia Municipal Bond Fund | |
| Portfolio of Investments Summary Table | 40 |
| Portfolio of Investments | 41 |
| Tactical Opportunity Fund | |
| Portfolio of Investments Summary Table | 45 |
| Portfolio of Investments | 46 |
| Statements of Assets and Liabilities | 47 |
| Statements of Operations | 48 |
| Statements of Changes in Net Assets | 49 |
| Financial Highlights | 52 |
| Notes to Financial Statements | 58 |
| Report of Independent Registered Public Accounting Firm | 71 |
| Shareholder Expense Example | 72 |
| Board of Trustees and Trust Officers | 73 |
| Statement Regarding the Liquidity Risk Management Program | 76 |
| Additional Information | 77 |
| Glossary of Terms | 78 |
| Annual Report » December 31, 2021 | |
| Management’s Discussion of Fund Performance | |
| WesMark Small Company Fund | December 31, 2021 (Unaudited) |
For 2021, the Russell 2000 Index posted a total return of 14.8%, but it trailed its large-cap peers. The sharp rise in the first quarter was followed by sideways trading over the second and third quarters. During these periods, smaller companies were more negatively impacted by increased competition for labor, rising material costs, and supply chain issues. The Russell 2000 Index broke out of its tight trading range in the fourth quarter, and it set a new all-time high on November 8th. However, this asset class faded to year end as COVID-19 variants reemerged and threatened economic growth expectations.
Over the past year, the WesMark Small Company Fund (the "Fund") posted a gain of 23.23% compared to the Russell 2000 Index ( +14.8%) and the Lipper Small-Cap Core Fund (+25.1%). Over the past five years, the Fund earned an average annual total return of 14.6% versus 10.6% for the Lipper Small-Cap Core Fund.
Relative performance can be measured by both sector allocation decisions and stock selection. Sector allocation deviated from the previous year, specifically in the Industrial and Information Technology sectors. From a sector perspective, returns were positive across all sectors except Consumer Staples and Communication Services. In terms of highest absolute performance, the S&P 600 Energy Index and S&P 600 Consumer Discretionary Index led with gains of 37.3% and 36.6%, respectively. Both sectors benefited from easing pandemic restrictions and increased vaccinations. Also, stimulus remained in place most of the year which benefited the consumer.
The Fund’s top four sectors accounted for nearly 83% of the Fund’s overall allocation for much of 2021. We made several changes in the underlying holdings that resulted in shifts to the Industrial and Information Technology sector weightings. The changes reflect our view of the current economic and market conditions and how different sectors perform. We will continue to monitor our sector decisions over the next year, especially given the outlook for tighter monetary policy and economic growth projections.
The Fund’s largest sector allocation, Financials, posted strong gains for the period. The S&P 600 Financial Index rose 24.1% for 2021 while the Fund’s holdings gained 30.3%. For the year, the Fund’s allocation to the Financial sector was 26.1%, compared to the benchmark weighting of 22.1%. Interest rates trended higher throughout the year. Historically the Financial sector is the biggest beneficiary of a steeper yield curve. Approximately half of the portfolio holdings outperformed the benchmark return. The sector returns were led by Signature Bank, Jackson Financial, Victory Capital Holdings, and Moelis & Co.
The Industrial sector underwent significant changes and ended the year as the second largest allocation. The Industrial sector accounted for 17.5% of the final portfolio weight, up from 15.9% at the start of the year. This allocation was a significant overweight to the benchmark allocation of 13.7%. Economic trends in the U.S. improved as vaccines increased and restrictions began to fade. The transition to overweight proved beneficial as the Fund’s holdings posted gains of 41.6% compared to the benchmark return of 24.9%. Stock selection was also positive for the Fund. Top performers in the sector were Korn Ferry, The Shyft Group Inc., Atlas Air Worldwide Holdings, and Quanta Services Inc.
The Information Technology sector represented 16.8% of the Fund, down from 27.5% at the beginning of 2021. Despite the decrease, the allocation was still overweight, compared to the benchmark weighting of 15.9%. We lowered the Fund’s allocation throughout the year as M&A activity increased, allowing us to exit some long-term holdings. Given the sector allocation, we chose to deploy the proceeds in other areas. In addition, stock selection was difficult. As a result, the benchmark posted a sector return of 26.5% while the Fund posted a modest return of 5.8%. The best performing holdings in the Fund were Box Inc., Pure Storage Inc., and Ultra Clean Holdings.
The Health Care sector held a slight overweight allocation relative to the benchmark throughout the year. COVID-19 variants dominated headlines in 2021. As a result, investors gravitated towards vaccine and testing-related companies within the Health Care sector. Virus variants did have a negative impact as elective procedures and office visits were delayed. Security selection was more impactful as the Fund’s holdings returned 41%, well above the benchmark return of 5.8%. For the year, Icon PLC, Vocera Communications, and Hill-Rom Holdings led returns for the sector.
During 2021, approximately half of the Fund’s holdings posted gains that were greater than the Russell 2000 Index. The average performance for these top holdings were compelling for the year with eight of the top 10 posting returns that exceeded the benchmark. In addition to the strong performers mentioned above, the Fund saw sizable gains in Antero Resources (+77.7%), Evoqua Water Technologies (+51.4%), and Charles River Laboratories (+50.9%). In general, the holdings that produced losses were smaller positions and were used to offset recognized gains from other holdings. The Fund’s top 10 holdings accounted for 32.4% of the overall market value of the Fund.
| 2 |  | www.wesmarkfunds.com |
| | Management’s Discussion of Fund Performance |
| December 31, 2021 (Unaudited) | WesMark Small Company Fund |
TOP 10 EQUITY HOLDINGS
| Security Name | % of Total
Net Assets |
| Quanta Services, Inc. | 5.4% |
| Stifel Financial Corp. | 4.0% |
| Syneos Health, Inc. | 3.7% |
| Vocera Communications, Inc. | 3.5% |
| Shyft Group, Inc. | 3.0% |
| Pure Storage, Inc. | 2.7% |
| Lithia Motors, Inc. | 2.7% |
| Korn Ferry | 2.6% |
| First Foundation, Inc. | 2.5% |
| Rapid7, Inc. | 2.3% |
| Total Net Assets | 32.4% |
Also see Glossary of Terms on page 78.
Performance data quoted represents past performance which is no guarantee of future results.
An investment in the Fund involves risk, including loss of principal. Investment in the Fund is subject to investment risks, including, without limitation, market risk, credit risk, interest rate risk, risks related to ETF net asset value and market price, foreign securities risk, commodity risk, manager risks, risks of investing in real estate investment trust (REITs), and risks related to company size.
The views in this report were those of the Fund Managers as of the letter’s publication date and may not reflect his views on the date this letter is first distributed or anytime thereafter. These views are intended to assist readers in understanding the Fund’s investment methodology and do not constitute investment advice.
| Annual Report | December 31, 2021 | | 3 |
| Management’s Discussion of Fund Performance | |
| WesMark Small Company Fund | December 31, 2021 (Unaudited) |
GROWTH of $10,000 invested in WesMark Small Company Fund
The graph below illustrates the hypothetical investment of $10,000* in the WesMark Small Company Fund (the “Fund”) from December 31, 2011 to December 31, 2021, compared to the Russell 2000® Index (“Russell 2000®”)** and the Lipper Small-Cap Core Funds Average (“LSCCFA”).***
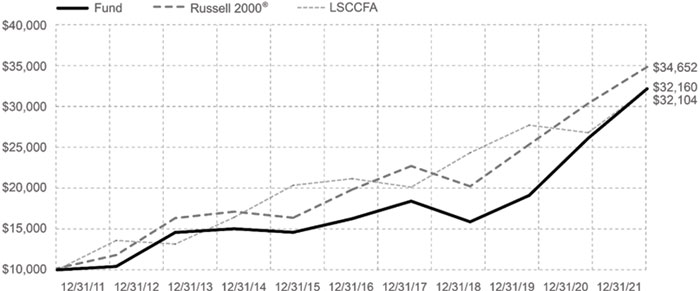
AVERAGE ANNUAL TOTAL RETURN for the periods ended December 31, 2021
| 1 Year | 5 Years | 10 Years |
| 23.23% | 14.62% | 12.39% |
Total Annual Fund Operating Expense (as of most current Prospectus): 1.28%
Performance data quoted represents past performance which is no guarantee of future results. Investment return and principal value will fluctuate so that an investor’s shares, when redeemed, may be worth more or less than their original cost. Mutual fund performance changes over time and current performance may be lower or higher than what is stated. For current to the most recent month end performance and after-tax returns call 1-800-864-1013. Returns shown do not reflect the deduction of taxes that a shareholder would pay on Fund distributions or the redemption of Fund shares. Mutual funds are not obligations of or guaranteed by any bank and are not federally insured.
Small-company stocks may be less liquid and subject to greater price volatility than large capitalization stocks.
| * | Represents a hypothetical investment of $10,000 in the Fund. The Fund’s performance assumes the reinvestment of all dividends and distributions. The Russell 2000® and LSCCFA have been adjusted to reflect reinvestment of dividends on securities in the index and average. |
| ** | The Russell 2000® measures the performance of the 2,000 smallest companies in the Russell 3000® Index, which represents approximately 10% of the total market capitalization of the Russell 3000® Index. The index is unmanaged and unlike the Fund, is not affected by cash flows. The Russell 2000® is not adjusted to reflect sales charges, expenses, or other fees that the Securities and Exchange Commission (SEC) requires to be reflected in the Fund’s performance. It is not possible to invest directly in an index. |
| *** | The information presented for the LSCCFA is the average of the total returns of the 30 largest qualifying mutual funds (based on net assets) in the Lipper Small-Cap classification. Lipper averages do not reflect sales charges. It is not possible to invest directly in an average. |
| 4 | | www.wesmarkfunds.com |
| | Management’s Discussion of Fund Performance |
| December 31, 2021 (Unaudited) | WesMark Large Company Fund |
The WesMark Large Company Fund (the "Fund") posted a total return of 26.1% for 2021 compared to the Lipper Large-Cap Core Funds Average of 26.5%. Equity market returns were some of the bests since the Great Depression. For example, the S&P 500 Index rose 28.7%; this was the 21st highest return since 1926.
Equity market returns were consistent throughout the year. Positive monthly returns occurred in 10 of the year’s 12 months. From a style perspective, value stocks started 2020 off strong, reversing the trend of the past several years. However, as economic growth showed signs of slowing, largely due to COVID-19 variants, growth stocks dominated the market. For the year, the S&P 500 Growth Index rose 32.0% while the S&P 500 Value Index increased by 24.9%.
The Fund increased its allocation to companies in the Information Technology sector largely due to improved valuation and growth rates. Through increased allocation and stock-specific performance, the Fund ended the year with 23.2% invested in the Information Technology sector. The year-end allocation was below the S&P 500 Information Technology’s 29.1% weight in the overall index. For the year, the S&P 500 Information Technology sector rose 34.5%. The decision to overweight the sector and security selection were accretive to the overall performance for the Fund. For the year, nearly half of the holdings posted returns above the S&P 500 Index, led by ON Semiconductor (+107.5%), NVIDIA (+65.8%), and Accenture (+60.4%).
The second largest sector allocation within the Fund, Health Care, posted results that were in line with the overall benchmark for the year. At 21.1%, Health Care-related holdings were well above the S&P 500 Index’s 13.3% allocation to the sector. For the year, the S&P 500 Health Care Index reported a total return of 26.1%, slightly trailing the broader index. However, the holdings within the Fund posted returns that were above the sector and overall benchmark. Health care holdings in the Fund increased by 26.1%, led by Iqvia Holdings (+57.2%), Zoetis (+48.2%), and Unitedhealth (+45.1%). Though impacted by ongoing restrictions related to COVID-19 variants, the sector was able report compelling growth rates while trading at attractive valuations.
The Financial sector also posted returns that were accretive to the Fund. For the year, the Fund maintained exposure to the Financial sector that was slightly overweight relative to the S&P 500 Index. Returns in this sector were above the overall S&P 500 Index while the holdings within the Fund posted returns above the benchmark. In addition, the 43.3% return was the highest sector return for the Fund in 2021. The strong performers were led by SVB Financial (+75.1%), Goldman Sachs (+47.5%), and Morgan Stanley (+46.4%).
For most of the year, the Fund maintained a nominal allocation to the Energy sector. However, the Fund’s underweight allocation relative to the S&P 500 Energy sector detracted from performance. The price of West Texas crude oil began 2021 at $48 per barrel. Over the course of the year, prices steadily rose to close at $76 per barrel. As a result, earnings in the sector increased significantly. For the year, the S&P 500 Energy sector posted a total return of 53.3%. The Fund’s holdings posted a return of 30.7%, well below the benchmark. It was led by Diamondback Energy (+56.1%) and Devon Energy (+27.8%).
The top 10 holdings accounted for 42.6% of the overall market value of the Fund. More than two-thirds of these holdings reported total returns for the year that exceeded the S&P 500 Index. In addition to the strong performers mentioned above, the Fund saw sizable gains in Alphabet (+65.3%), Home Depot (+59.4%), and Microsoft (+52.5%).
The WesMark Large Company Fund finished the year with strong momentum. Our strategy benefited from a market more focused on value and valuation levels than growth at any price.
| Annual Report | December 31, 2021 | | 5 |
| Management’s Discussion of Fund Performance | |
| WesMark Large Company Fund | December 31, 2021 (Unaudited) |
TOP 10 EQUITY HOLDINGS
| | % of Total |
| Security Name | Net Assets |
| Apple, Inc. | 5.9% |
| UnitedHealth Group, Inc. | 5.0% |
| Broadcom, Inc. | 4.9% |
| BlackRock, Inc. | 4.8% |
| Amazon.com, Inc. | 4.7% |
| Alphabet, Inc. | 4.3% |
| salesforce.com, Inc. | 3.5% |
| Home Depot, Inc. | 3.5% |
| Microsoft Corp. | 3.1% |
| Abbott Laboratories | 2.9% |
| Total Net Assets | 42.6% |
Also see Glossary of Terms on page 78.
Performance data quoted represents past performance which is no guarantee of future results.
Diversification does not eliminate the risk of experiencing investment losses.
An investment in the Fund involves risk, including loss of principal. Investment in the Fund is subject to investment risks, including, without limitation, market risk, credit risk, interest rate risk, risks related to ETF net asset value and market price, foreign securities risk, commodity risk, manager risks, risks of investing in real estate investment trust (REITs), and risks related to company size.
The views in this report were those of the Fund Managers as of the letter’s publication date and may not reflect his views on the date this letter is first distributed or anytime thereafter. These views are intended to assist readers in understanding the Fund’s investment methodology and do not constitute investment advice.
Lipper, Inc., a Reuters company, is a nationally recognized organization that ranks the performance of mutual funds within a universe of funds that have similar investment objectives. Rankings are historical and are based on total returns with capital gains and dividends reinvested. For the 10-, 5-, 3- and 1- year periods, the Large Company Fund was ranked 338 out of 406, 298 out of 516, 158 out of 578, and 23 out of 638 as of 12/31/20 in the Large Cap Core Funds category. Lipper does not guarantee the accuracy of the information. Lipper rankings are not intended to predict future results.
| 6 | | www.wesmarkfunds.com |
| | Management’s Discussion of Fund Performance |
| December 31, 2021 (Unaudited) | WesMark Large Company Fund |
GROWTH of $10,000 invested in WesMark Large Company Fund
The graph below illustrates the hypothetical investment of $10,000* in the WesMark Large Company Fund (the “Fund”) from December 31, 2011 to December 31, 2021, compared to the Standard and Poor’s 500® Index (“S&P 500®”)** and Lipper Large-Cap Core Funds Average ("LLCCFA").***
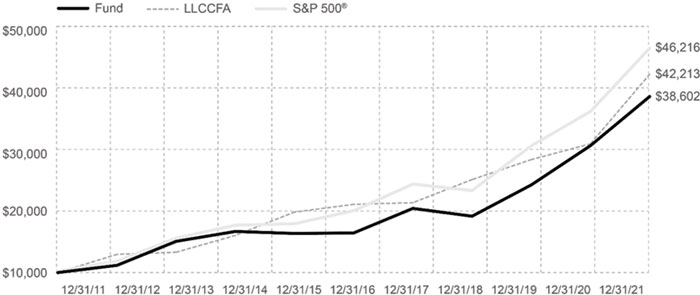
AVERAGE ANNUAL TOTAL RETURN for the periods ended December 31, 2021
| 1 Year | 5 Years | 10 Years |
| 26.06% | 18.61% | 14.46% |
Total Annual Fund Operating Expense (as of most current Prospectus): 1.15%
Performance data quoted represents past performance which is no guarantee of future results. Investment return and principal value will fluctuate so that an investor’s shares, when redeemed, may be worth more or less than their original cost. Mutual fund performance changes over time and current performance may be lower or higher than what is stated. For current to the most recent month end performance and after-tax returns call 1-800-864-1013. Returns shown do not reflect the deduction of taxes that a shareholder would pay on Fund distributions or the redemption of Fund shares. Mutual funds are not obligations of or guaranteed by any bank and are not federally insured.
| * | Represents a hypothetical investment of $10,000 in the Fund. The Fund’s performance assumes the reinvestment of all dividends and distributions. The S&P 500® and LLCCFA have been adjusted to reflect reinvestment of dividends on securities in the index and average. |
| ** | The S&P 500® measures the performance of 500 large-cap U.S. companies. The S&P 500 is not adjusted to reflect sales charges, expenses or other fees that the SEC requires to be reflected in the Fund’s performance. The index is unmanaged and unlike the Fund, it is not affected by cash flows. It is not possible to invest directly in an index. |
| *** | The information presented for the LLCCFA is the average of the total returns of the 30 largest qualifying mutual funds (based on net assets) in the Lipper Large-Cap classification. Lipper averages do not reflect sales charges. It is not possible to invest directly in an average. |
| Annual Report | December 31, 2021 | | 7 |
| Management’s Discussion of Fund Performance | |
| WesMark Balanced Fund | December 31, 2021 (Unaudited) |
The WesMark Balanced Fund (the "Fund") provided a total return of 15.85% for the year ended December 31, 2021, compared to the Lipper Balanced Funds’ return of 12.53%. The Fund seeks to achieve capital appreciation and income by allocating its assets primarily among fixed-income and equity securities. The Fund began the year with 30.61% in fixed-income and cash equivalents. Given the move in yields during the year, we maintained an allocation to the space that was toward the lower end of our range. The asset allocation at year end was 28.4% in fixed-income, 68.8% in common equity, and 2.8% in cash equivalents.
The Fund’s focus on value stocks was positive in the first quarter. Rising rates and attractive valuations led investors to reexamine asset class style. In addition, value stocks tend to be more levered toward economic expansion. For the first quarter, the S&P 500 Value Index rose 10.76% while the S&P 500 Growth Index gained 2.11% over the same period. However, as U.S. economic growth slowed, growth stocks recaptured their momentum. For the year, the S&P 500 Value Index was up 24.86%, and the S&P 500 Growth Index rose 32.00%.
The improving U.S. economic outlook pushed the 10-year Treasury higher for 2021. The year began with the 10-year Treasury yield at 0.91%; however, by the end of the quarter, yields stood at 1.74%. That marked the highest reading since the start of the pandemic, and it marked the sharpest rally since 2018. Yields fell, though, as new COVID-19 variants impacted economic growth. As inflation readings moved higher and the Federal Reserve altered expectations for rate hikes, the 10-year Treasury yield closed the year at 1.51%. The move higher in yields placed downward pressure on bond prices.
The Fund continued to maintain a relatively short fixed-income structure with a modified duration of 3.67 years compared to the fixed-income benchmark duration of 6.12 years. All fixed-income securities held in the Fund at year end remained investment grade as determined by a nationally recognized statistical rating organization. The largest exposure in the fixed-income allocation was corporate debt. This provided a return for the Fund’s fixed-income sector of -0.50% compared to the Lipper Core Bond Fund Index’s return of -1.20%. Taxable municipal bonds provided a return of 2.30% compared to the benchmark’s 1.40% return. The Fund’s fixed-income structure remained in a position to benefit from a rising interest rate environment and a steeper yield curve.
The Health Care sector was the largest overweight relative to the S&P 500 Index. For the period, the S&P 500 Health Care sector reported a total return that trailed the overall index. However, the holdings within the Fund were up 29.80% compared to the S&P 500 Index’s return of 28.68%. The focus on high-quality earnings growth and reasonable relative valuations resulted in positive selection relative to the sector and overall benchmark. The compelling results were led by Pfizer Inc. (+66.30%), Eli Lilly (+65.90%), and CVS Health Corp (+54.90%).
The second largest holding relative to the S&P 500 Index was the Fund’s Financial sector allocation. Of the equity allocation, the S&P 500 Financial sector accounted for 11.8% of the Fund’s holdings compared to 11.32% for the S&P 500 Index. The sector decision was accretive to the Fund with the S&P 500 Financials Index gaining 34.87% for the year. However, security selection, while positive, did not exceed the sector benchmark. The holdings in the sector posted a return of 31.70% led by Goldman Sachs (+47.60%), People’s United Financial (+40.90%), and PNC Financial Services (+38.10%).
The largest detractor of returns was the S&P Communication Services sector. For the period, the Fund’s holdings fell by 5.20% led by a 2% decline from Comcast Corp and a 7.40% decline from Verizon Communications.
The Fund’s top 10 holdings accounted for 27.6% of its overall market value. Over two-thirds of these holdings reported total returns for the year that exceeded the S&P 500 Index. In addition to the strong performers mentioned above, the Fund saw sizable gains in Abbvie Inc (+32.20%) and Texas Instruments (+17.30%).
| 8 | | www.wesmarkfunds.com |
| | Management’s Discussion of Fund Performance |
| December 31, 2021 (Unaudited) | WesMark Balanced Fund |
TOP 10 EQUITY HOLDINGS
| Security Name | % of Total
Net Assets |
| Apple, Inc. | 6.0% |
| Cisco Systems, Inc./Delaware | 3.0% |
| AbbVie, Inc. | 2.9% |
| CVS Health Corp. | 2.5% |
| Discover Financial Services | 2.3% |
| Pfizer, Inc. | 2.3% |
| Texas Instruments, Inc. | 2.3% |
| Target Corp. | 2.1% |
| Eli Lilly & Co. | 2.1% |
| PepsiCo, Inc. | 2.1% |
| Total Net Assets | 27.6% |
Also see Glossary of Terms on page 78.
Performance data quoted represents past performance which is no guarantee of future results.
An investment in the Fund involves risk, including loss of principal. Investment in the Fund is subject to investment risks, including, without limitation, market risk, credit risk, interest rate risk, risks related to ETF net asset value and market price, foreign securities risk, commodity risk, manager risks, risks of investing in real estate investment trust (REITs), and risks related to company size.
The views in this report were those of the Fund Managers as of the letter’s publication date and may not reflect his views on the date this letter is first distributed or anytime thereafter. These views are intended to assist readers in understanding the Fund’s investment methodology and do not constitute investment advice.
Lipper, Inc., a Reuters company, is a nationally recognized organization that ranks the performance of mutual funds within a universe of funds that have similar investment objectives. Rankings are historical and are based on total return with capital gains and dividends reinvested. For the 10-, 5-, 3-, and 1 -year periods, the Balanced Fund was ranked 241 out of 396, 320 out of 478, 388 out of 511, and 484 out of 529 as of 12/31/20 in the Balanced Funds category. Lipper does not guarantee the accuracy of this information. Lipper rankings are not intended to predict future results.
| Annual Report | December 31, 2021 | | 9 |
| Management’s Discussion of Fund Performance | |
| WesMark Balanced Fund | December 31, 2021 (Unaudited) |
GROWTH of $10,000 invested in WesMark Balanced Fund
The graph below illustrates the hypothetical investment of $10,000* in the WesMark Balanced Fund (the “Fund”) from December 31, 2011 to December 31, 2021, compared to the Standard and Poor’s 500® Index (“S&P 500®”)**, the Barclays Capital Intermediate U.S. Government/Credit Index (“BCIGCI”)***, the Lipper Balanced Funds Average (“LBFA”)****, and a combined index consisting of 60% S&P 500® and 40% BCIGCI (“Balanced Composite Index”)*****.
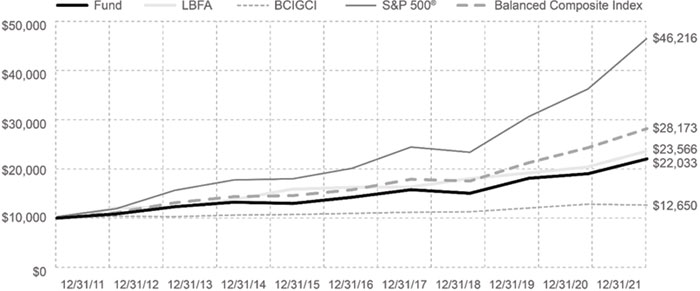
AVERAGE ANNUAL TOTAL RETURN for the periods ended December 31, 2021
| 1 Year | 5 Years | 10 Years |
| 15.85% | 9.12% | 8.22% |
Total Annual Fund Operating Expense (as of most current Prospectus): 1.28%
Performance data quoted represents past performance which is no guarantee of future results. Investment return and principal value will fluctuate so that an investor’s shares, when redeemed, may be worth more or less than their original cost. Mutual fund performance changes over time and current performance may be lower or higher than what is stated. For current to the most recent month end performance and after-tax returns call 1-800-864-1013. Returns shown do not reflect the deduction of taxes that a shareholder would pay on Fund distributions or the redemption of Fund shares. Mutual funds are not obligations of or guaranteed by any bank and are not federally insured.
Bond prices are sensitive to changes in interest rates and a rise in interest rates can cause a decline in their prices.
| * | Represents a hypothetical investment of $10,000 in the Fund. The Fund’s performance assumes the reinvestment of all dividends and distributions. The S&P 500®, BCIGCI, LBFA, and Balanced Composite Index have been adjusted to reflect reinvestment of dividends on securities in the index and average. |
| ** | The S&P 500® measures the performance of 500 large-cap U.S. companies. The S&P 500 is not adjusted to reflect sales charges, expenses or other fees that the SEC requires to be reflected in the Fund’s performance. The index is unmanaged and unlike the Fund, it is not affected by cash flows. It is not possible to invest directly in an index. |
| *** | The BCIGCI is an unmanaged market value weighted performance index for government and corporate fixed rate debt issues with maturities between one and ten years. The BCIGCI is not adjusted to reflect sales charges, expenses or other fees that the SEC requires to be reflected in the Fund’s performance. The index is unmanaged and unlike the Fund, is not affected by cash flows. It is not possible to invest directly in an index. |
| **** | The information presented for the LBFA is the average of the total returns of the 30 largest U.S. Balanced Funds. Lipper averages do not reflect sales charges. It is not possible to invest directly in an average. |
| ***** | The Balanced Composite Index is an unmanaged index, comprised 60% S&P 500® and 40% BCIGCI, and unlike the Fund, is not affected by cash flows. The Balanced Composite Index is not adjusted to reflect sales charges, expenses or other fees that the SEC requires to be reflected in the Fund’s performance. It is not possible to invest directly in an index or average. |
| 10 | | www.wesmarkfunds.com |
Management’s Discussion of Fund Performance
| December 31, 2021 (Unaudited) | WesMark Government Bond Fund |
President Biden signed the American Rescue Plan Act on March 11, 2021, marking the third round of pandemic-related stimulus. While the rollout of vaccines offered hope for a return to normalcy, the Delta and Omicron variants of the COVID-19 virus surfaced and disrupted those plans. The economic impact was most notable in the labor market and supply chains. The monetary and fiscal stimulus provided to combat the economic effects of the pandemic easily exceeded that of the global financial crisis in 2008. However, the challenges inherent to restoring a disrupted supply chain were not foreseen by policymakers.
Disruptions in supply of both labor and goods put additional upward pressure on wages and consumer prices. According to Bureau of Labor Statistics, average hourly earnings increased 4.7% in 2021 while payrolls ended the year $3.6 million below where they were in February 2020. Consumer prices moved sharply higher as supply chain bottlenecks created shortages of goods resulting in the December CPI increasing 7.0% year-over-year. These factors led to a policy pivot by the Federal Reserve. The Federal Reserve’s policy position moved closer to consensus market views which at year-end 2021 were pricing in three 25-basis point rate increases for 2022. This was a notable shift given that 2021 began with the Federal Reserve forecasting no rate hikes until 2024.
The U.S. Treasury curve shifted higher in 2021 on what may be the strongest pace of economic growth and inflation since the 1980s. The benchmark U.S. 10-year Treasury rose from 0.92% in January 2021 to the year high of 1.74% on March 31, 2021. In the first quarter of 2021, the U.S. Treasury curve steepened as the market became concerned with the Federal Reserve’s willingness to accept strong economic growth and its view that rising inflation pressures were “transitory.” The spread between the 2-year U.S. Treasury and the 10-year U.S. Treasury went from 80 basis points to 158 basis points. The Federal Reserve responded in the third quarter of 2021 by signaling it was “talking about tapering” its asset purchase program.
This forward guidance was followed by the Federal Reserve’s announcement that it would begin tapering $15 billion of purchases per month in November 2021, which was accelerated to a $30 billion monthly pace in December 2021. The tapering response and conveyance of possible post-tapering rate increases lifted short to intermediate yields in the fourth quarter of 2021 with longer yields moving lower, flattening the yield curve. The largest rate move for the year was the 5-year U.S. Treasury which rose 91 basis points while the 1-year U.S. Treasury rose 28 basis points, and the 30-year U.S. Treasury yield rose 26 basis points.
Fixed-income markets succumbed to upward pressure on interest rates. The Bloomberg Barclay’s U.S. Treasury Index declined 2.32% in 2021, the Bloomberg Barclay’s U.S. Government/Credit Index declined 1.75%. Bloomberg Barclay’s Investment Grade Corporate Index delivered a decline of 1.04%. Within 2021, credit risk was rewarded as the Bloomberg Barclay’s U.S. High Yield Corporate Index provided a return of 5.28%. The leading performer in 2021 was the Bloomberg Barclay’s U.S. Treasury Inflation Protected Securities Index which provided a total return of 5.96%. While this index has a longer duration, which would have been a headwind in 2021, it was more than offset by increased investor demand for inflation protection.
Total mortgage securities guaranteed by Fannie Mae and Freddie Mac represented 71% of the WesMark Government Bond Fund (“the Fund”) holdings as of December 31, 2021, as compared to 67% of the Fund on December 31, 2020. Within the mortgage allocation, Fannie Mae and Freddie Mac Guaranteed Mortgage Pools (MBS) accounted for 14%, Collateralized Mortgage Obligations (CMO’s) accounted for 27%, and Commercial Mortgage Securities (CMBS) accounted for 30%. Small Business Administration Securities accounted for 3% of the portfolio, U.S. Government Agency Securities accounted for 1%, and taxable municipalities accounted for 20%. The portfolio ended 2021 with a 6% cash position. The U.S. Government related securities within the Fund posted a return of negative 1.0% compared to the Lipper Intermediate U.S. Government Index which posted a negative return of 2.0%. The taxable municipal allocation posted a return of 1% while the Lipper Intermediate Municipal Index posted a 1.4% return for the period.
The WesMark Government Bond Fund had a total return of -1.35% for calendar year 2021. The Lipper General U.S. Government Bond Fund average return was -2.15%, and the Barclay’s U.S. Government Credit Bond Index was -1.75% for the same period. The duration of the securities within the Fund was 5.1 years as of December 31, 2021 compared to 6.3 years as of December 31, 2020. The duration of the Barclay’s U.S. Government Credit Index was 7.5 years at the end of the period. Within the period, option-adjusted spreads tightened. The U.S. Aggregate Bond Index spreads tightened 6 basis points while U.S. Residential Mortgage-Backed Securities and U.S. Agency Commercial Mortgage-Backed Securities tightened 10 basis points and 14 basis points, respectively. In 2021, short-term U.S. interest rates increased while longer-term interest rates declined. The portfolios increased its exposure to U.S. Agency Commercial Mortgage-Backed Securities (CMBS) and taxable municipal securities, both of which have longer duration. These enhanced the performance of the Fund relative to its benchmark.
| Annual Report | December 31, 2021 | | 11 |
Management’s Discussion of Fund Performance
| WesMark Government Bond Fund | December 31, 2021 (Unaudited) |
TOP 10 BOND HOLDINGS
| Name | Rate | Maturity | % of Total Net Assets |
| Government National Mortgage Association GNR 2021-147 DQ | 1.350% | DUE 5/16/2056 | 4.0% |
| Government National Mortgage Association GNR 2021-180 AM | 1.750% | DUE 11/16/2063 | 3.7% |
| Fannie Mae REMICS FNR 2021-18 MC | 1.500% | DUE 3/25/2051 | 3.7% |
| Government National Mortgage Association GNR 2020-134 ED | 2.000% | DUE 9/20/2050 | 2.9% |
| Government National Mortgage Association GNR 2021-45 AD | 1.500% | DUE 4/16/2063 | 2.3% |
| Government National Mortgage Association GNR 2021-150 AP | 1.750% | DUE 11/16/2063 | 2.2% |
| Government National Mortgage Association GNR 2021-203 B | 2.000% | DUE 12/31/2049 | 2.0% |
| Government National Mortgage Association GNR 2021-181 B | 1.900% | DUE 12/31/2049 | 2.0% |
| Government National Mortgage Association GNR 2020-118 AL | 1.750% | DUE 6/16/2062 | 2.0% |
| Government National Mortgage Association GNR 2021-195 AL | 1.500% | DUE 8/16/2063 | 2.0% |
| Total Net Assets | | | 26.8% |
Also see Glossary of Terms on page 78.
Performance data quoted represents past performance which is no guarantee of future results.
An investment in the Fund involves risk, including loss of principal. Investment in the Fund is subject to investment risks, including, without limitation, market risk, credit risk, interest rate risk, risks related to ETF net asset value and market price, foreign securities risk, commodity risk, manager risks, risks of investing in real estate investment trust (REITs), and risks related to company size.
The views in this report were those of the Fund Managers as of the letter’s publication date and may not reflect his views on the date this letter is first distributed or anytime thereafter. These views are intended to assist readers in understanding the Fund’s investment methodology and do not constitute investment advice.
| 12 | | www.wesmarkfunds.com |
Management’s Discussion of Fund Performance
| December 31, 2021 (Unaudited) | WesMark Government Bond Fund |
GROWTH of $10, 000 invested in WesMark Government Bond Fund
The graph below illustrates the hypothetical investment of $10,000* in the WesMark Government Bond Fund (the “Fund”) from December 31, 2011 to December 31, 2021, compared to the Barclays Capital Intermediate U.S. Government/Credit Index (“BCIGCI”)**, the Lipper Intermediate U.S. Government Funds Average (“LIGFA”)***, and the Lipper General U.S. Government Funds Average (“LGUSFA”).****
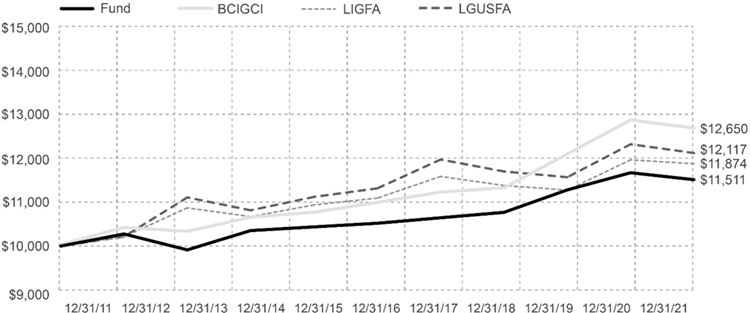
AVERAGE ANNUAL TOTAL RETURN for the periods ended December 31, 2021
| 1 Year | 5 Years | 10 Years |
| -1.35% | 1.82% | 1.42% |
Total Annual Fund Operating Expense (as of most current Prospectus): 1.04%
Performance data quoted represents past performance which is no guarantee of future results. Investment return and principal value will fluctuate so that an investor’s shares, when redeemed, may be worth more or less than their original cost. Mutual fund performance changes over time and current performance may be lower or higher than what is stated. For current to the most recent month end performance and after-tax returns call 1-800-864-1013. Returns shown do not reflect the deduction of taxes that a shareholder would pay on Fund distributions or the redemption of Fund shares. Mutual funds are not obligations of or guaranteed by any bank and are not federally insured.
Bond prices are sensitive to changes in interest rates and a rise in interest rates can cause a decline in their prices. The value of some mortgage-backed securities may be particularly sensitive to changes in prevailing interest rates, and although the securities are generally supported by some form of government or private insurance, there is no assurance that private guarantors or insurers will meet their obligations.
| * | Represents a hypothetical investment of $10,000 in the Fund. The Fund’s performance assumes the reinvestment of all dividends and distributions. The BCIGCI, LIGFA and the LGUSFA have been adjusted to reflect reinvestment of dividends on securities in the index and averages. |
| ** | The BCIGCI is an unmanaged market value weighted performance index for government and corporate fixed rate debt issues with maturities between one and ten years. The BCIGCI is not adjusted to reflect sales charges, expenses or other fees that the SEC requires to be reflected in the Fund’s performance. The index is unmanaged and unlike the Fund, is not affected by cash flows. It is not possible to invest directly in an index. |
| *** | The information presented for the LIGFA is the average of the total returns of funds designated by Lipper as falling into the category of funds that invest primarily in securities issued or guaranteed by the U.S. government, its agencies, or its instrumentalities, with dollar-weighted average maturities of five to ten years. Lipper averages do not reflect sales charges. It is not possible to invest directly in an average. |
| **** | The information presented for the LGUSFA is the average total returns of funds designated by Lipper as falling into the category of funds that invest primarily in U.S. government and agency issues. Lipper averages do not reflect sales charges. It is not possible to invest directly in an average. |
| Annual Report | December 31, 2021 | | 13 |
Management’s Discussion of Fund Performance
| WesMark West Virginia Municipal Bond Fund | December 31, 2021 (Unaudited) |
President Biden signed the American Rescue Plan Act on March 11, 2021, marking the third round of pandemic-related stimulus. While the rollout of vaccines to begin 2021 offered hope for a return to normalcy, the Delta and Omicron variants of the COVID-19 virus surfaced and disrupted those plans. The economic impact was most notable in the labor market and supply chains. The monetary and fiscal stimulus provided to combat the economic effects of the pandemic easily exceeded that of the global financial crisis in 2008. However, the challenges inherent to restoring a disrupted supply chain were not foreseen by policymakers.
Disruptions in supply of both labor and goods put additional upward pressure on wages and consumer prices. According to the Bureau of Labor Statistics, average hourly earnings increased 4.7% in 2021, while payrolls ended the year $3.6 million below where they were in February 2020. Consumer prices moved sharply higher as supply chain bottlenecks created shortages of goods resulting in the December CPI increasing 7.0% year-over-year. These factors led to a policy pivot by the Federal Reserve. The Federal Reserve’s policy position moved closer to consensus market views which at year-end 2021 were pricing in three 25-basis point rate increases for 2022. This was a notable shift given that 2021 began with the Federal Reserve forecasting no rate hikes until 2024.
The U.S. Treasury curve shifted higher in 2021 on what may be the strongest pace of economic growth and inflation since the 1980s. The benchmark U.S. 10-year Treasury rose from 0.92% in January 2021 to the year high of 1.74% on March 31, 2021. In the first quarter of 2021, the U.S. Treasury curve steepened as the market became concerned with the Federal Reserve’s willingness to accept strong economic growth and its view that rising inflation pressures were “transitory.” The spread between the 2-year U.S. Treasury and the 10-year U.S. Treasury went from 80 basis points to 158 basis points. The Federal Reserve responded in the third quarter of 2021 by signaling it was “talking about tapering” its asset purchase program.
This forward guidance was followed by the Federal Reserve’s announcement that it would begin tapering $15 billion of purchases per month in November 2021, which was accelerated to a $30 billion monthly pace in December 2021. The tapering response and conveyance of possible post-tapering rate increases lifted short to intermediate yields in the fourth quarter of 2021 with longer yields moving lower, flattening the yield curve. The largest rate move for the year was the 5-year U.S. Treasury which rose 91 basis points while the 1-year U.S. Treasury rose 28 basis points, and the 30-year U.S. Treasury yield rose 26 basis points.
2021 saw record cash flows into tax-exempt municipal bond funds as there were expectations of higher income tax rates, and investors sought safety and income. With the flattening of the yield curve, short-term, tax-free rates increased because of expectations that the Federal Reserve would increase interest rates three times in 2022. Long-term, tax-free yields declined on expectations that the Federal Reserve would succeed in slowing growth and inflation. The flattening trend resulted in longer-dated maturities outperforming shorter maturities. Within the period, lower-quality issues outperformed higher-credit quality. High-yield, tax-exempt municipal bonds returned 7.77% in the period, and BBB-rated securities returned 4.85%. AA-rated credits returned 0.92%, and AAA-rated securities returned 0.47%.
The duration of the fund was 3.8 years as of December 31, 2021, compared to 3.7 years on December 31, 2020. The net investment income dividend (excluding capital gain distributions) was ($0.17) per share for the period compared to ($0.19) for the prior period. Approximately 97.56% of the dividend was derived from West Virginia Municipal securities, and it is exempt from federal and state income tax for West Virginia residents. At the end of the period, 87% of portfolio securities were BBB-rated or higher with 5% being AAA-rated.
The WesMark West Virginia Municipal Bond Fund had a total return of 0.43% in 2021. The Fund’s benchmark, the Bloomberg Barclays Municipal 5-year Index, saw a total return of 0.34% for the period. The Lipper Other States Municipal Debt Fund return was 1.40%. The WesMark West Virginia Municipal Bond Fund’s higher-credit quality, shorter duration, and maturity structure limited its performance relative to the Lipper Other States Municipal benchmark.
| 14 | | www.wesmarkfunds.com |
Management’s Discussion of Fund Performance
| December 31, 2021 (Unaudited) | WesMark West Virginia Municipal Bond Fund |
TOP 10 BOND HOLDINGS
| Name | | % of Total Net Assets |
| Ohio County Board of Education | | 2.9% |
| West Virginia Water Development Authority Infrastructure Revenue Bonds (West Virginia Infrastructure Jobs Program) | 2.7% |
| Jefferson County Board of Education | | 2.7% |
| Hancock, WV | | 2.1% |
| Monongalia County Building Commission | | 2.0% |
| Mason County Public Service District Water Revenue | | 1.8% |
| West Virginia Higher Education Policy Commission Revenue Bonds (Higher Education Facilities) | 1.8% |
| Cabell County Board of Education | | 1.8% |
| West Virginia Economic Development Authority Lease Revenue Bonds (Correctional Juvenile & Public) | 1.5% |
| Hampshire County, West Virginia, Building Commission Revenue Bonds | 1.5% |
| Total Net Assets | | 20.8% |
Also see Glossary of Terms on page 78.
Performance data quoted represents past performance which is no guarantee of future results.
An investment in the Fund involves risk, including loss of principal. Investment in the Fund is subject to investment risks, including, without limitation, market risk, credit risk, interest rate risk, risks related to ETF net asset value and market price, foreign securities risk, commodity risk, manager risks, risks of investing in real estate investment trust (REITs), and risks related to company size.
The views in this report were those of the Fund Managers as of the letter’s publication date and may not reflect his views on the date this letter is first distributed or anytime thereafter. These views are intended to assist readers in understanding the Fund’s investment methodology and do not constitute investment advice.
| Annual Report | December 31, 2021 | | 15 |
Management’s Discussion of Fund Performance
| WesMark West Virginia Municipal Bond Fund | December 31, 2021 (Unaudited) |
GROWTH of $10,000 invested in WesMark West Virginia Municipal Bond Fund
The graph below illustrates the hypothetical investment of $10,000* in the WesMark West Virginia Municipal Bond Fund (the “Fund”) from December 31, 2011 to December 31, 2021, compared to the Bloomberg Barclays Capital Municipal Bond 5 Year Total Return Index (“BCM5I”)**, the Lipper Intermediate Municipal Debt Funds Average (“LIMDFA”)*** and the Lipper Other States Muni Debt Fund Average ("LOSMFA").****
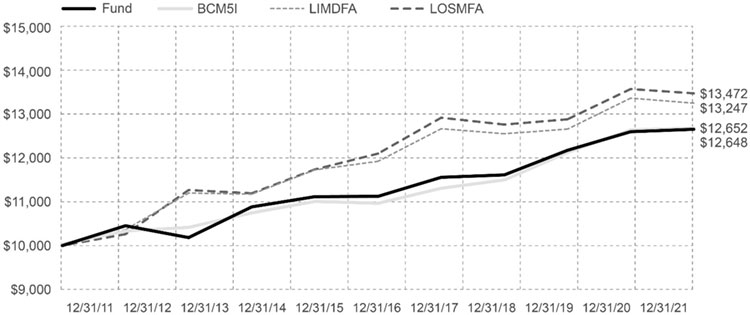
AVERAGE ANNUAL TOTAL RETURN for the periods ended December 31, 2021
| 1 Year | 5 Years | 10 Years |
| 0.43% | 2.61% | 2.38% |
Total Annual Fund Operating Expense (as of most current Prospectus): 1.10%
Performance data quoted represents past performance which is no guarantee of future results. Investment return and principal value will fluctuate so that an investor’s shares, when redeemed, may be worth more or less than their original cost. Mutual fund performance changes over time and current performance may be lower or higher than what is stated. For current to the most recent month end performance and after-tax returns call 1-800-864-1013. Returns shown do not reflect the deduction of taxes that a shareholder would pay on Fund distributions or the redemption of Fund shares. Mutual funds are not obligations of or guaranteed by any bank and are not federally insured.
Bond prices are sensitive to changes in interest rates and a rise in interest rates can cause a decline in their prices.
| * | Represents a hypothetical investment of $10,000 in the Fund. The Fund’s performance assumes the reinvestment of all dividends and distributions. The BCM5I, LOSMFA and the LIMDFA have been adjusted to reflect reinvestment of dividends on securities in the index and average. |
| ** | The BCM5I is an unmanaged market value weighted performance index for major municipal bonds of all quality ratings with an average maturity of approximately five years. BCM5I is not adjusted to reflect sales charges, expenses, or other fees that the SEC requires to be reflected in the Fund’s performance. The index is unmanaged and unlike the Fund, is not affected by cash flows. It is not possible to invest directly in an index. |
| *** | The LIMDFA is an unmanaged index of funds that invest in municipal debt issues with dollar-weighted average maturities of five to ten years. These figures do not reflect sales charges. It is not possible to invest directly in an average. |
| **** | The LOSMFA is an unmanaged index of funds that limit assets to those securities exempt from taxation in a specified state or city. These figures do not reflect sales charges. It is not possible to invest directly in an average. |
| 16 | | www.wesmarkfunds.com |
Management’s Discussion of Fund Performance
| December 31, 2021 (Unaudited) | WesMark Tactical Opportunity Fund |
The WesMark Tactical Opportunity Fund (the "Fund") began 2021 with an allocation to equity markets that was toward the upper end of our target, largely due to our belief that the U.S. economy would continue to post solid growth rates. In addition, the yield on the 10-year Treasury was slightly below 1.0%. However, as the quarter progressed, the yield on the 10-year Treasury rose quickly to 1.50%. At the same time, the S&P 500 Index increased and met new highs. During this period, we periodically reduced our equity exposure and increased fixed-income holdings. The goal was a more neutral allocation, not out of recession concerns, but for caution given the swift move in both asset classes.
The allocation went unchanged in the second quarter. However, we added to our commodity exposure. In addition, higher rates and the shape of the yield curve allowed us to build a position in U.S. regional banks. During the second quarter, though, the rise of the Delta variant caused economic growth to slow. As a result, yields fell slightly, but equity markets continued to report new highs. Throughout 2021, equity market drawdowns were modest. The largest decline for the year was a 5.2% drawdown, the fourth smallest since 1987. Since 1980, the S&P 500 Index has averaged an intra-year drop of 14.0%.
As economic growth rates slowed, we shifted some of our exposure to high-quality domestic equities. In our view, earnings growth largely recovered to pre-pandemic highs, and going forward the focus would be on companies that could deliver quality earnings for the rest of the economic cycle. The economic volatility and widening of corporate bond spreads allowed us to shift some proceeds to corporate bonds at the expense of our Treasury bond holdings.
As we closed out 2021, we remained near the upper end of our equity exposure at 71%. This focused primarily on domestic assets with a preference for value and cyclical holdings. The Fund’s fixed-income allocation remained near the lower end of our target, given our view on interest rates over the next several quarters. The current allocation is focused on corporate debt with a smaller holding in emerging markets debt.
For the year, the Fund posted a total return of 13.94% compared to the Lipper Flexible Funds category return of 12.21%. On a trailing three-year, the Fund reported a 12.96% annualized return compared to the Lipper category’s 12.51% annualized return. Since the Fund’s inception, March 1, 2017, the Fund posted an annualized total return of 8.45%. That compares to the MSCI All World Index’s return of 14.01% and the U.S. BarCap Aggregate Bond Index’s return of 3.62% for the same period.
For the year, several of the Fund’s industry-specific holdings posted solid returns. Our decision to focus on sectors that benefited from accelerating U.S. economic growth drove results. The SPDR Oil and Gas Exploration and Production ETF and SPDR Materials ETF rose 40.90% and 27.10%, respectively. In addition, more diverse holdings, such as regional banks and technology, were also accretive to performance. The iShares Regional Bank ETF gained 40.30% while the SPDR Information Technology ETF rose 34.90%. From a size and style perspective, the focus on value stocks helped returns for the year. The Vanguard Mega Cap Value ETF rose 25.40% for the year while the iShares Russell 2000 Index ETF’s 10.60% return trailed the broad benchmark. During the recovery, the demand for raw materials, coupled with higher inflation readings, drove commodity prices higher for the period. The Invesco Diversified Commodity ETF rose 40.30% for the holding period.
Within the Fund’s fixed-income allocation, non-traditional holdings provided the most accretive returns. The iShares High Yield Corporate Bond ETF gained 0.60% for the holding period. Tactical allocations to traditional fixed income provided positive returns. The Vanguard Intermediate-Term Corporate Bond and Vanguard Total Bond ETF rose 0.40% and 0.10%, respectively. For 2021, the U.S. BarCap Aggregate Bond Index fell 1.54%.
The top 10 holdings accounted for 72.9% of the overall market value of the Fund.
| Annual Report | December 31, 2021 | | 17 |
Management’s Discussion of Fund Performance
| WesMark Tactical Opportunity Fund | December 31, 2021 (Unaudited) |
TOP 10 EQUITY HOLDINGS
| Security Name | % of Total
Net Assets |
| Vanguard Mega Cap Value ETF | 10.9 | % |
| iShares Russell 2000 ETF | 10.5 | % |
| iShares MSCI USA Quality Factor ETF | 9.1 | % |
| Vanguard Total Bond Market ETF | 8.6 | % |
| Vanguard Intermediate-Term Corporate Bond ETF | 7.3 | % |
| Industrial Select Sector SPDR® Fund | 6.4 | % |
| iShares JP Morgan USD Emerging Markets Bond ETF | 5.4 | % |
| Technology Select Sector SPDR Fund | 5.3 | % |
| Health Care Select Sector SPDR Fund | 5.1 | % |
| iShares MSCI EAFE ETF | 4.3 | % |
| Total Net Assets | 72.9 | % |
Also see Glossary of Terms on page 78.
Performance data quoted represents past performance which is no guarantee of future results.
An investment in the Fund involves risk, including loss of principal. Investment in the Fund is subject to investment risks, including, without limitation, market risk, credit risk, interest rate risk, risks related to ETF net asset value and market price, foreign securities risk, commodity risk, manager risks, risks of investing in real estate investment trust (REITs), and risks related to company size.
The views in this report were those of the Fund Managers as of the letter’s publication date and may not reflect his views on the date this letter is first distributed or anytime thereafter. These views are intended to assist readers in understanding the Fund’s investment methodology and do not constitute investment advice.
| 18 | | www.wesmarkfunds.com |
Management’s Discussion of Fund Performance
| December 31, 2021 (Unaudited) | WesMark Tactical Opportunity Fund |
| | |
GROWTH of $10,000 invested in WesMark Tactical Opportunity Fund
The graph below illustrates the hypothetical investment of $10,000* in the WesMark Tactical Opportunity Fund (the “Fund”) from March 1, 2017 to December 31, 2021, compared to the Tactical Composite Index (“Composite”)**, The Hedge Fund Research, Inc. (HFRI) Fund of Funds Composite Index ***, and the Lipper Flexible Portfolio Funds****

AVERAGE ANNUAL TOTAL RETURN for the periods ended December 31, 2021
| 1 Year | Since Inception (3/1/17) |
| 13.94% | 8.45% |
Total Annual Fund Operating Expense (as of most current Prospectus): 1.69%
Performance data quoted represents past performance which is no guarantee of future results. Investment return and principal value will fluctuate so that an investor’s shares, when redeemed, may be worth more or less than their original cost. Mutual fund performance changes over time and current performance may be lower or higher than what is stated. For current to the most recent month end performance and after-tax returns call 1-800-864-1013. Returns shown do not reflect the deduction of taxes that a shareholder would pay on Fund distributions or the redemption of Fund shares. Mutual funds are not obligations of or guaranteed by any bank and are not federally insured.
Bond prices are sensitive to changes in interest rates and a rise in interest rates can cause a decline in their prices.
| * | Represents a hypothetical investment of $10,000 in the Fund. The Fund’s performance assumes the reinvestment of all dividends and distributions. The Composite, the MSCI ACWI and the US BarCap Agg have been adjusted to reflect reinvestment of dividends on securities in the index and average. |
| ** | The Tactical Composite Index is comprised of a combination of 60% of MSCI All World Index (“ACWI”) 30% Bloomberg Barclays US Aggregate Index and 10% of HFRI Fund of Funds Index. The Tactical Composite Index is not adjusted to reflect sales charges, expenses, or other fees that the SEC requires to be reflected in the Fund’s performance. The index is unmanaged and unlike the Fund, is not affected by cash flows. It is not possible to invest directly in an index. |
| *** | The Hedge Fund Research, Inc. (HFRI) Fund of Funds Composite Index is an equal weighted index that consists of over 800 constituent hedge funds, including both domestic and offshore funds. The HFRI is not adjusted to reflect sales charges, expenses, or other fees that the SEC requires to be reflected in the Fund’s performance. The index is unmanaged and unlike the Fund, is not affected by cash flows. It is not possible to invest directly in an index. |
| **** | The Lipper Flexible Portfolio Funds is an unmanaged index of funds that allocate their investments to both domestic and foreign securities across traditional asset classes with a focus on total return. The traditional asset classes utilized are common stocks, bonds, and money market instruments. Lipper Flexible Portfolio Funds is not adjusted to reflect sales charges, expenses, or other fees that the SEC requires to be reflected in the Fund’s performance. The index is unmanaged and unlike the Fund, is not affected by cash flows. It is not possible to invest directly in an index. |
| Annual Report | December 31, 2021 | | 19 |
Portfolio of Investments Summary Table
WesMark Small Company Fund | December 31, 2021 (Unaudited) |
As of December 31, 2021, the Fund's Portfolio Composition(1) was as follows:
| Portfolio Composition | Percentage of
Total Net Assets |
| COMMON STOCKS | 94.9% |
| SHORT TERM INVESTMENTS(2) | 2.8% |
| EXCHANGE TRADED FUNDS (ETF) | 2.3% |
| OTHER ASSETS AND LIABILITIES - NET(3) | -0.0%(4) |
| TOTAL NET ASSETS | 100.0% |
As of December 31, 2021, the Fund's Sector composition(5) was as follows:
| Sector Composition | Percentage of
Total Net Assets |
| Financials | 26.1% |
| Industrials | 17.5% |
| Information Technology | 16.8% |
| Health Care | 12.8% |
| Consumer Discretionary | 7.7% |
| Consumer, Cyclical | 3.3% |
| Consumer, Non-cyclical | 2.9% |
| Energy | 2.6% |
| Technology | 2.6% |
| Exchange Traded Funds | 2.3% |
| Communication Services | 2.1% |
| Materials | 0.5% |
| Equity Portfolio Sub-Total | 97.2% |
| Short Term Investments(2) | 2.8% |
| Other Assets and Liabilities - Net(3) | -0.0%(4) |
| Total Net Assets | 100.0% |
| (1) | See the Fund's Prospectus and Statement of Additional Information for a description of the types of securities in which the Fund invests. |
| (2) | Short Term Investments include investment in a money market mutual fund. |
| (3) | Assets, other than investments in securities, less liabilities. |
| (4) | Amount represents less than 0.05% of net assets. |
| (5) | Securities are assigned to a sector classification by the Fund's advisor. |
| 20 | | www.wesmarkfunds.com |
| December 31, 2021 | WesMark Small Company Fund |
| Shares | | | | | Value | |
| COMMON STOCKS-94.9% | | | | |
| COMMUNICATION SERVICES-2.1% | | | | |
| | | | | Interactive Media & Services-2.1% | | | | |
| | 73,742 | | | Cargurus, Inc.(1) | | $ | 2,480,681 | |
| | | | | | | | | |
| TOTAL COMMUNICATION SERVICES | | | 2,480,681 | |
| | | | | | | | | |
| CONSUMER, CYCLICAL-3.3% | | | | |
| | | | | Home Builders-1.0% | | | | |
| | 5,550 | | | Installed Building Products, Inc. | | | 775,446 | |
| | 5,932 | | | Skyline Champion Corp.(1) | | | 468,509 | |
| | | | | | | | 1,243,955 | |
| | | | | Lodging-0.8% | | | | |
| | 17,210 | | | Travel + Leisure Co. | | | 951,197 | |
| | | | | | | | | |
| | | | | Retail-1.5% | | | | |
| | 33,762 | | | First Watch Restaurant Group, Inc.(1) | | | 565,851 | |
| | 6,887 | | | Wingstop, Inc. | | | 1,190,074 | |
| | | | | | | | 1,755,925 | |
| TOTAL CONSUMER, CYCLICAL | | | 3,951,077 | |
| | | | | | | | | |
| CONSUMER DISCRETIONARY-7.7% | | | | |
| | | | | Automotive Retail-3.6% | | | | |
| | 6,107 | | | Asbury Automotive Group, Inc.(1) | | | 1,054,862 | |
| | 10,713 | | | Lithia Motors, Inc., Class A | | | 3,181,225 | |
| | | | | | | | 4,236,087 | |
| | | | | Consumer Electronics-1.5% | | | | |
| | 61,058 | | | Sonos, Inc.(1) | | | 1,819,528 | |
| | | | | | | | | |
| | | | | Industrials-2.6% | | | | |
| | 40,816 | | | Korn Ferry | | | 3,090,996 | |
| | | | | | | | | |
| TOTAL CONSUMER DISCRETIONARY | | | 9,146,611 | |
| | | | | | |
| CONSUMER, NON-CYCLICAL-2.9% | | | | |
| | | | | Agriculture-0.4% | | | | |
| | 13,213 | | | Andersons, Inc. | | | 511,475 | |
| | | | | | | | | |
| | | | | Commercial Services-1.2% | | | | |
| | 55,575 | | | Custom Truck One Source, Inc.(1) | | | 444,600 | |
| | 29,630 | | | Driven Brands Holdings, Inc.(1) | | | 996,161 | |
| | | | | | | | 1,440,761 | |
| Shares | | | | | Value | |
| | | | | Healthcare-Services-1.3% | | | | |
| | 29,607 | | | Surgery Partners, Inc.(1) | | $ | 1,581,310 | |
| | | | | | | | | |
| TOTAL CONSUMER, NON-CYCLICAL | | | 3,533,546 | |
| | | | | | | | | |
| ENERGY-2.6% | | | | |
| | | | | Oil & Gas Equipment & Services-0.7% | | | | |
| | 42,571 | | | ChampionX Corp.(1) | | | 860,360 | |
| | | | | | | | | |
| | | | | Oil & Gas Exploration & Production-0.5% | | | | |
| | 35,678 | | | Antero Resources Corp.(1) | | | 624,365 | |
| | | | | | | | | |
| | | | | Oil&Gas-1.4% | | | | |
| | 6,578 | | | Civitas Resources, Inc. | | | 322,125 | |
| | 100,523 | | | Comstock Resources, Inc.(1) | | | 813,231 | |
| | 27,411 | | | Coterra Energy, Inc. | | | 520,809 | |
| | | | | | | | 1,656,165 | |
| TOTAL ENERGY | | | 3,140,890 | |
| | | | | | | | | |
| FINANCIALS-26.1% | | | | |
| | | | | Asset Management & Custody Banks-1.7% | | | | |
| | 16,534 | | | Focus Financial Partners, Inc., Class A(1) | | | 987,411 | |
| | | | | | | | | |
| | 28,962 | | | Victory Capital Holdings, Inc., Class A | | | 1,057,982 | |
| | | | | | | | 2,045,393 | |
| | | | | Insurance-0.9% | | | | |
| | 24,808 | | | Jackson Financial, Inc., Class A | | | 1,037,719 | |
| | | | | | | | | |
| | | | | Investment Banking & Brokerage-5.1% | | | | |
| | 21,786 | | | Moelis & Co., Class A | | | 1,361,843 | |
| | 68,311 | | | Stifel Financial Corp. | | | 4,810,461 | |
| | | | | | | | 6,172,304 | |
| | | | | Investment Companies-0.8% | | | | |
| | 33,037 | | | Compass Diversified Holdings | | | 1,010,271 | |
| | | | | | | | | |
| | | | | Private Equity-0.7% | | | | |
| | 31,708 | | | Bridge Investment Group Holdings, Inc. | | | 791,749 | |
| | | | | | | | | |
| | | | | Regional Banks-16.9% | | | | |
| | 27,827 | | | Ameris Bancorp | | | 1,382,445 | |
| | 34,808 | | | Atlantic Union Bankshares Corp. | | | 1,297,990 | |
| | 62,942 | | | BankUnited, Inc. | | | 2,663,076 | |
| | 16,169 | | | Banner Corp. | | | 980,973 | |
| | 37,281 | | | Cadence Bank | | | 1,110,601 | |
| | 23,121 | | | Community Bank System, Inc. | | | 1,722,052 | |
| | 46,246 | | | First Bancorp/Southern Pines, NC | | | 2,114,367 | |
| Annual Report | December 31, 2021 | | 21 |
| WesMark Small Company Fund | December 31, 2021 |
| Shares | | | | | Value | |
| | 120,427 | | | First Foundation, Inc. | | $ | 2,993,815 | |
| | 39,740 | | | First Interstate BancSystem, Inc., Class A | | | 1,616,226 | |
| | 52,504 | | | Old National Bancorp | | | 951,373 | |
| | 19,244 | | | Pinnacle Financial Partners, Inc. | | | 1,837,802 | |
| | 8,527 | | | South State Corp. | | | 683,098 | |
| | 28,160 | | | Trustmark Corp. | | | 914,074 | |
| | | | | | | | 20,267,892 | |
| TOTAL FINANCIALS | | | 31,325,328 | |
| | | | | | | | | |
| HEALTH CARE-12.8% | | | | |
| | | | | Health Care Distributors-0.9% | | | | |
| | 38,036 | | | Patterson Cos., Inc. | | | 1,116,357 | |
| | | | | | | | | |
| | | | | Health Care Equipment-1.2% | | | | |
| | 6,525 | | | AtriCure, Inc.(1) | | | 453,683 | |
| | 14,656 | | | Integra LifeSciences Holdings Corp.(1) | | | 981,805 | |
| | | | | | | | 1,435,488 | |
| | | | | Health Care Supplies-1.9% | | | | |
| | 50,028 | | | Neogen Corp.(1) | | | 2,271,772 | |
| | | | | | | | | |
| | | | | Health Care Technology-3.5% | | | | |
| | 64,587 | | | Vocera Communications, Inc.(1) | | | 4,187,821 | |
| | | | | | | | | |
| | | | | Life Sciences Tools & Services-5.3% | | | | |
| | 1,441 | | | Charles River Laboratories International, Inc.(1) | | | 542,940 | |
| | 4,332 | | | ICON PLC(1) | | | 1,341,620 | |
| | 43,208 | | | Syneos Health, Inc.(1) | | | 4,436,597 | |
| | | | | | | | 6,321,157 | |
| TOTAL HEALTH CARE | | | 15,332,595 | |
| | | | | | | | | |
| INDUSTRIALS-17.5% | | | | |
| | | | | Aerospace & Defense-2.0% | | | | |
| | 29,619 | | | Moog, Inc., Class A | | | 2,398,250 | |
| | | | | | | | | |
| | | | | Air Freight & Logistics-0.8% | | | | |
| | 10,473 | | | Atlas Air Worldwide Holdings, Inc.(1) | | | 985,719 | |
| | | | | | | | | |
| | | | | Building Products-1.9% | | | | |
| | 28,646 | | | AAON, Inc. | | | 2,275,352 | |
| | | | | | | | | |
| | | | | Construction & Engineering-6.3% | | | | |
| | 28,922 | | | Granite Construction, Inc. | | | 1,119,281 | |
| | 56,729 | | | Quanta Services, Inc. | | | 6,504,547 | |
| | | | | | | | 7,623,828 | |
| Shares | | | | | Value | |
| | | | | Construction Machinery & Heavy Trucks-3.0% | |
| | 72,715 | | | Shyft Group, Inc. | | $ | 3,572,488 | |
| | | | | | | | | |
| | | | | Electric-1.6% | | | | |
| | 40,721 | | | Evoqua Water Technologies Corp.(1) | | | 1,903,707 | |
| | | | | | | | | |
| | | | | Machinery-Diversified-1.3% | | | | |
| | 14,705 | | | Applied Industrial Technologies, Inc. | | | 1,510,204 | |
| | | | | | | | | |
| | | | | Transportation-0.6% | | | | |
| | 25,529 | | | Schneider National, Inc., Class B | | | 686,985 | |
| | | | | | | | | |
| TOTAL INDUSTRIALS | | | 20,956,533 | |
| | | | | | | | | |
| INFORMATION TECHNOLOGY-16.8% | | | | |
| | | | | Application Software-4.6% | | | | |
| | 81,254 | | | Box, Inc., Class A(1) | | | 2,128,042 | |
| | 46,263 | | | LivePerson, Inc.(1) | | | 1,652,514 | |
| | 48,000 | | | PagerDuty, Inc.(1) | | | 1,668,000 | |
| | | | | | | | 5,448,556 | |
| | | | | Data Processing & Outsourced Services-0.9% | |
| | 49,338 | | | I3 Verticals, Inc., Class A(1) | | | 1,124,413 | |
| | | | | | | | | |
| | | | | Electronic Components-1.8% | | | | |
| | 91,551 | | | Knowles Corp.(1) | | | 2,137,716 | |
| | | | | | | | | |
| | | | | Electronic Equipment & Instruments-1.4% | | | | |
| | 17,549 | | | OSI Systems, Inc.(1) | | | 1,635,567 | |
| | | | | | | | | |
| | | | | IT Consulting & Other Services-0.9% | | | | |
| | 12,363 | | | Science Applications International Corp. | | | 1,033,423 | |
| | | | | | | | | |
| | | | | Systems Software-4.5% | | | | |
| | 6,656 | | | Qualys, Inc.(1) | | | 913,336 | |
| | 23,833 | | | Rapid7, Inc.(1) | | | 2,804,906 | |
| | 34,343 | | | Varonis Systems, Inc.(1) | | | 1,675,252 | |
| | | | | | | | 5,393,494 | |
| | | | | Technology Hardware, Storage & Peripherals-2.7% | | | | |
| | 101,024 | | | Pure Storage, Inc., Class A(1) | | | 3,288,331 | |
| | | | | | | | | |
| TOTAL INFORMATION TECHNOLOGY | | | 20,061,500 | |
| | | | | | | | | |
| MATERIALS-0.5% | | | | |
| | | | | Chemicals-0.5% | | | | |
| | 4,400 | | | HB Fuller Co. | | | 356,400 | |
| 22 | | www.wesmarkfunds.com |
| December 31, 2021 | WesMark Small Company Fund |
| Shares | | | | | | Value | |
| | 2,300 | | | Stepan Co. | | $ | 285,867 | |
| | | | | | | | 642,267 | |
| TOTAL MATERIALS | | | 642,267 | |
| | | | | | | | | |
| TECHNOLOGY-2.6% | | | | |
| | | | | Semiconductors-2.6% | | | | |
| | 14,776 | | | SMART Global Holdings, Inc.(1) | | | 1,048,948 | |
| | 36,129 | | | Ultra Clean Holdings, Inc.(1) | | | 2,072,359 | |
| | | | | | | | 3,121,307 | |
| TOTAL TECHNOLOGY | | | 3,121,307 | |
| | | | | | | | | |
| TOTAL COMMON STOCKS | | | | |
| (Cost $59,829,476) | | | 113,692,335 | |
| | | | | | | | | |
| EXCHANGE TRADED FUNDS - 2.3% | | | | |
| | 23,956 | | | iShares® Core S&P Small-Cap® ETF | | | 2,743,202 | |
| | | | | | | | | |
| TOTAL EXCHANGE TRADED FUNDS | | | | |
| (Cost $2,753,419) | | | 2,743,202 | |
| | | | | | | | | |
| SHORT TERM INVESTMENTS - 2.8% | | | | |
| | | | | Mutual Funds-2.8% | | | | |
| | 3,333,231 | | | Federated Hermes Government Obligations Fund, Premier Class, 7-Day Yield 0.030% (at net asset value) | | | 3,333,231 | |
| | | | | | | | | |
| TOTAL SHORT TERM INVESTMENTS | | | | |
| (Cost $3,333,231) | | | 3,333,231 | |
| | | | | | | | | |
| TOTAL INVESTMENTS-100.0% | | | | |
| (Cost $65,916,126) | | | 119,768,768 | |
| OTHER ASSETS AND LIABILITIES-NET(2)-(0.0)%(3) | | | (31,684) | |
| NET ASSETS-100.0% | | $ | 119,737,084 | |
| (1) | Non-income producing security. |
| (2) | Assets, other than investments in securities, less liabilities. |
| (3) | Amount represents less than 0.05% of net assets. |
Note - The categories of investments are shown as a percentage of net assets as of December 31, 2021.
See Notes to Financial Statements which are an integral part of the Financial Statements.
| Annual Report | December 31, 2021 | | 23 |
| Portfolio of Investments Summary Table | |
| WesMark Large Company Fund | December 31, 2021 (Unaudited) |
As of December 31, 2021, the Fund's Portfolio Composition(1) was as follows:
| Portfolio Composition | Percentage of
Total Net Assets |
| COMMON STOCKS | 99.2% |
| EXCHANGE TRADED FUNDS (ETF) | 0.4% |
| SHORT TERM INVESTMENTS(2) | 0.4% |
| OTHER ASSETS AND LIABILITIES - NET(3) | 0.0%(4) |
| TOTAL NET ASSETS | 100.0% |
As of December 31, 2021, the Fund's Sector composition(5) was as follows:
| Sector Composition | Percentage of
Total Net Assets |
| Information Technology | 23.2% |
| Health Care | 21.1% |
| Financials | 10.3% |
| Consumer Discretionary | 10.4% |
| Industrials | 8.1% |
| Interactive Media & Services | 7.1% |
| Technology Hardware & Storage | 5.9% |
| Consumer Staples | 3.7% |
| Movies & Entertainment | 2.1% |
| Regional Banks | 2.1% |
| Communication Services | 1.9% |
| Materials | 1.4% |
| Energy | 1.3% |
| Broad Domestic Equity | 0.4% |
| Consumer, Cyclical | 0.3% |
| Basic Materials | 0.3% |
| Equity Portfolio Sub-Total | 99.6% |
| Short Term Investments(2) | 0.4% |
| Other Assets and Liabilities - Net(3) | 0.0%(4) |
| Total Net Assets | 100.0% |
| (1) | See the Fund's Prospectus and Statement of Additional Information for a description of the types of securities in which the Fund invests. |
| (2) | Short Term Investments include investment in a money market mutual fund. |
| (3) | Assets, other than investments in securities, less liabilities. |
| (4) | Amount represents less than 0.05% of net assets. |
| (5) | Securities are assigned to a sector classification by the Fund's advisor. |
| 24 | | www.wesmarkfunds.com |
| December 31, 2021 | WesMark Large Company Fund |
| Shares | | | | | Value | |
| COMMON STOCKS-99.2% | | | | |
| BASIC MATERIALS-0.3% | | | | |
| | | | | Mining-0.3% | | | | |
| | 27,353 | | | Freeport-McMoRan, Inc. | | $ | 1,141,441 | |
| | | | | | | | | |
| TOTAL BASIC MATERIALS | | | 1,141,441 | |
| | | | | | | | | |
| COMMUNICATION SERVICES-1.9% | | | | |
| | | | | Cable & Satellite-1.9% | | | | |
| | 151,453 | | | Comcast Corp., Class A | | | 7,622,630 | |
| | | | | | | | | |
| TOTAL COMMUNICATION SERVICES | | | 7,622,630 | |
| | | | | | | | | |
| CONSUMER, CYCLICAL-0.3% | | | | |
| | | | | Retail-0.3% | | | | |
| | 3,077 | | | Lululemon Athletica, Inc.(1) | | | 1,204,492 | |
| | | | | | | | | |
| TOTAL CONSUMER, CYCLICAL | | | 1,204,492 | |
| | | | | | | | | |
| CONSUMER DISCRETIONARY-10.4% | | | | |
| | | | | Auto Parts & Equipment-1.1% | | | | |
| | 26,248 | | | Aptiv PLC(1) | | | 4,329,608 | |
| | | | | | | | | |
| | | | | Footwear-0.5% | | | | |
| | 12,910 | | | NIKE, Inc., Class B | | | 2,151,710 | |
| | | | | | | | | |
| | | | | Home Improvement Retail-3.5% | | | | |
| | 34,000 | | | Home Depot, Inc. | | | 14,110,340 | |
| | | | | | | | | |
| | | | | Internet & Direct Marketing Retail-5.3% | | | | |
| | 5,694 | | | Amazon.com, Inc.(1) | | | 18,985,732 | |
| | 12,748 | | | Expedia Group, Inc.(1) | | | 2,303,819 | |
| | | | | | | | 21,289,551 | |
| TOTAL CONSUMER DISCRETIONARY | | | 41,881,209 | |
| | | | | | | | | |
| CONSUMER STAPLES-3.7% | | | | |
| | | | | Distillers & Vintners-1.9% | | | | |
| | 29,956 | | | Constellation Brands, Inc., Class A | | | 7,518,057 | |
| | | | | | | | | |
| | | | | Packaged Foods & Meats-1.8% | | | | |
| | 110,000 | | | Mondelez International, Inc., Class A | | | 7,294,100 | |
| | | | | | | | | |
| TOTAL CONSUMER STAPLES | | | 14,812,157 | |
| Shares | | | | | Value | |
| ENERGY-1.3% | | | | |
| | | | | Energy-Alternate Sources-0.3% | | | | |
| | 6,723 | | | Enphase Energy, Inc.(1) | | $ | 1,229,906 | |
| | | | | | | | | |
| | | | | Oil & Gas Exploration & Production-1.0% | | | | |
| | 19,950 | | | ConocoPhillips | | | 1,439,991 | |
| | 28,837 | | | Devon Energy Corp. | | | 1,270,270 | |
| | 9,479 | | | Diamondback Energy, Inc. | | | 1,022,310 | |
| | | | | | | | 3,732,571 | |
| TOTAL ENERGY | | | 4,962,477 | |
| | | | | | | | | |
| FINANCIALS-10.3% | | | | |
| | | | | Asset Management & Custody Banks-4.8% | | | | |
| | 21,000 | | | BlackRock, Inc. | | | 19,226,760 | |
| | | | | | | | | |
| | | | | Banks-0.4% | | | | |
| | 37,416 | | | Bank of America Corp. | | | 1,664,638 | |
| | | | | | | | | |
| | | | | Investment Banking & Brokerage-3.7% | | | | |
| | 9,747 | | | The Goldman Sachs Group, Inc. | | | 3,728,715 | |
| | 116,509 | | | Morgan Stanley | | | 11,436,523 | |
| | | | | | | | 15,165,238 | |
| | | | | Regional Banks-1.1% | | | | |
| | 96,977 | | | Citizens Financial Group, Inc. | | | 4,582,163 | |
| | | | | | | | | |
| | | | | Specialized Finance-0.3% | | | | |
| | 6,281 | | | Nasdaq, Inc. | | | 1,319,073 | |
| | | | | | | | | |
| TOTAL FINANCIALS | | | 41,957,872 | |
| | | | | | | | | |
| HEALTH CARE-21.1% | | | | |
| | | | | Biotechnology-2.6% | | | | |
| | 39,408 | | | AbbVie, Inc. | | | 5,335,844 | |
| | 23,491 | | | Amgen, Inc. | | | 5,284,770 | |
| | | | | | | | 10,620,614 | |
| | | | | Health Care Equipment-3.5% | | | | |
| | 83,587 | | | Abbott Laboratories | | | 11,764,034 | |
| | 17,630 | | | Zimmer Biomet Holdings, Inc. | | | 2,239,715 | |
| | | | | | | | 14,003,749 | |
| | | | | Healthcare-Products-0.3% | | | | |
| | 10,146 | | | Edwards Lifesciences Corp.(1) | | | 1,314,414 | |
| | | | | | | | | |
| | | | | Healthcare-Services-0.2% | | | | |
| | 6,200 | | | Catalent, Inc.(1) | | | 793,786 | |
| Annual Report | December 31, 2021 | | 25 |
| WesMark Large Company Fund | December 31, 2021 |
| Shares | | | | | Value | |
| | | | | Life Sciences Tools & Services-4.9% | | | | |
| | 33,894 | | | IQVIA Holdings, Inc.(1) | | $ | 9,562,853 | |
| | 15,000 | | | Thermo Fisher Scientific, Inc. | | | 10,008,600 | |
| | | | | | | | 19,571,453 | |
| | | | | Managed Health Care-5.0% | | | | |
| | 40,000 | | | UnitedHealth Group, Inc. | | | 20,085,600 | |
| | | | | | | | | |
| | | | | Pharmaceuticals-4.6% | | | | |
| | 4,844 | | | Cigna Corp. | | | 1,112,328 | |
| | 159,612 | | | Elanco Animal Health, Inc.(1) | | | 4,529,789 | |
| | 57,000 | | | Merck & Co., Inc. | | | 4,368,480 | |
| | 34,468 | | | Zoetis, Inc. | | | 8,411,226 | |
| | | | | | | | 18,421,823 | |
| TOTAL HEALTH CARE | | | 84,811,439 | |
| | | | | | | | | |
| INDUSTRIALS -8.1% | | | | |
| | | | | Aerospace & Defense-1.7% | | | | |
| | 80,955 | | | Raytheon Technologies Corp. | | | 6,966,987 | |
| | | | | | | | | |
| | | | | Engineering & Construction-1.6% | | | | |
| | 46,838 | | | Jacobs Engineering Group, Inc. | | | 6,521,255 | |
| | | | | | | | | |
| | | | | Industrial Conglomerates-2.4% | | | | |
| | 19,500 | | | Roper Technologies, Inc. | | | 9,591,270 | |
| | | | | | | | | |
| | | | | Industrial Machinery-1.9% | | | | |
| | 20,201 | | | Parker-Hannifin Corp. | | | 6,426,342 | |
| | 5,421 | | | Stanley Black & Decker, Inc. | | | 1,022,509 | |
| | | | | | | | 7,448,851 | |
| | | | | Trading Companies & Distributors-0.5% | | | | |
| | 6,391 | | | United Rentals, Inc.(1) | | | 2,123,665 | |
| | | | | | | | | |
| TOTAL INDUSTRIALS | | | 32,652,028 | |
| | | | | | | | | |
| INFORMATION TECHNOLOGY-23.2% | | | | |
| | | | | Application Software-5.3% | | | | |
| | 11,922 | | | Adobe, Inc.(1) | | | 6,760,489 | |
| | 56,178 | | | salesforce.com, Inc.(1) | | | 14,276,515 | |
| | | | | | | | 21,037,004 | |
| | | | | Data Processing & Outsourced Services-3.8% | | | | |
| | 26,162 | | | Mastercard, Inc., Class A | | | 9,400,530 | |
| | 31,251 | | | PayPal Holdings, Inc.(1) | | | 5,893,314 | |
| | | | | | | | 15,293,844 | |
| | | | | IT Consulting & Other Services-2.1% | | | | |
| | 20,626 | | | Accenture PLC, Class A | | | 8,550,508 | |
| Shares | | | | | Value | |
| | | | | Semiconductors-6.5% | | | | |
| | 29,454 | | | Broadcom, Inc. | | $ | 19,598,986 | |
| | 93,023 | | | ON Semiconductor Corp.(1) | | | 6,318,122 | |
| | | | | | | | 25,917,108 | |
| | | | | Systems Software-5.5% | | | | |
| | 37,388 | | | Microsoft Corp. | | | 12,574,332 | |
| | 50,505 | | | Oracle Corp. | | | 4,404,541 | |
| | 8,082 | | | ServiceNow, Inc.(1) | | | 5,246,107 | |
| | | | | | | | 22,224,980 | |
| TOTAL INFORMATION TECHNOLOGY | | | 93,023,444 | |
| | | | | | | | | |
| INTERACTIVE MEDIA & SERVICES-7.1% | | | | |
| | | | | Internet Software & Services-7.1% | | | | |
| | 6,000 | | | Alphabet, Inc., Class A(1) | | | 17,382,240 | |
| | 33,500 | | | Meta Platforms, Inc., Class A(1) | | | 11,267,725 | |
| | | | | | | | 28,649,965 | |
| TOTAL INTERACTIVE MEDIA & SERVICES | | | 28,649,965 | |
| | | | | | | | | |
| MATERIALS-1.4% | | | | |
| | | | | Specialty Chemicals-1.4% | | | | |
| | 33,130 | | | PPG Industries, Inc. | | | 5,712,937 | |
| | | | | | | | | |
| TOTAL MATERIALS | | | 5,712,937 | |
| | | | | | | | | |
| MOVIES & ENTERTAINMENT-2.1% | | | | |
| | | | | Communication Services-2.1% | | | | |
| | 55,000 | | | Walt Disney Co.(1) | | | 8,518,950 | |
| | | | | | | | | |
| TOTAL MOVIES & ENTERTAINMENT | | | 8,518,950 | |
| | | | | | | | | |
| REGIONAL BANKS-2.1% | | | | |
| | | | | Banks-2.1% | | | | |
| | 12,558 | | | SVB Financial Group(1) | | | 8,517,338 | |
| | | | | | | | | |
| TOTAL REGIONAL BANKS | | | 8,517,338 | |
| | | | | | | | | |
| TECHNOLOGY HARDWARE & STORAGE-5.9% | | | | |
| | | | | Communications Equipment-5.9% | | | | |
| | 133,953 | | | Apple, Inc. | | | 23,786,034 | |
| | | | | | | | | |
| TOTAL TECHNOLOGY HARDWARE & STORAGE | | | 23,786,034 | |
| | | | | | | | | |
| TOTAL COMMON STOCKS | | | | |
| (Cost $133,967,939) | | | 399,254,413 | |
| 26 | | www.wesmarkfunds.com |
| December 31, 2021 | WesMark Large Company Fund |
| Shares | | | | | Value | |
| EXCHANGE TRADED FUNDS-0.4% | | | | |
| | 3,991 | | | Vanguard® S&P 500® ETF | | $ | 1,742,351 | |
| | | | | | | | | |
| TOTAL EXCHANGE TRADED FUNDS | | | | |
| (Cost $1,754,497) | | | 1,742,351 | |
| | | | | | | | | |
| SHORT TERM INVESTMENTS-0.4% | | | | |
| | | | | Mutual Funds-0.4% | | | | |
| | 1,699,398 | | | Federated Hermes Government Obligations Fund, Premier Class, 7-Day Yield 0.030% (at net asset value) | | | 1,699,398 | |
| | | | | | | | | |
| TOTAL SHORT TERM INVESTMENTS | | | | |
| (Cost $1,699,398) | | | 1,699,398 | |
| | | | | | | | | |
| TOTAL INVESTMENTS-100.0% | | | | |
| (Cost $137,421,834) | | | 402,696,162 | |
| OTHER ASSETS AND LIABILITIES-NET(2)-0.0%(3) | | | 77,111 | |
| NET ASSETS-100.0% | | $ | 402,773,273 | |
| (1) | Non-income producing security. |
| (2) | Assets, other than investments in securities, less liabilities. |
| (3) | Amount represents less than 0.05% of net assets. |
| Note - | The categories of investments are shown as a percentage of net assets as of December 31, 2021. |
See Notes to Financial Statements which are an integral part of the Financial Statements.
| Annual Report | December 31, 2021 | | 27 |
Portfolio of Investments Summary Table
| WesMark Balanced Fund | December 31, 2021 (Unaudited) |
As of December 31, 2021, the Fund's Portfolio Composition(1) was as follows:
| Portfolio Composition | Percentage of
Total Net Assets |
| COMMON STOCKS | 66.4% |
| EXCHANGE TRADED FUNDS (ETF) | 2.4% |
| CORPORATE BONDS | 19.4% |
| U.S. GOVERNMENT AGENCY - MORTGAGE-BACKED SECURITIES | 3.8% |
| TAXABLE MUNICIPAL BONDS | 1.9% |
| COMMERCIAL MORTGAGE-BACKED SECURITIES | 1.6% |
| U.S. GOVERNMENT AGENCY - COLLATERALIZED MORTGAGE OBLIGATIONS | 1.3% |
| NON-TAXABLE MUNICIPAL BONDS | 0.4% |
| FIXED INCOME PORTFOLIO SUB-TOTAL | 28.4% |
| SHORT TERM INVESTMENTS(2) | 2.6% |
| OTHER ASSETS AND LIABILITIES - NET(3) | 0.2% |
| TOTAL NET ASSETS | 100.0% |
As of December 31, 2021, the Fund's Sector composition(4) was as follows:
| Sector Composition | Percentage of
Total Net Assets |
| Health Care | 15.9% |
| Financials | 11.8% |
| Information Technology | 9.0% |
| Technology Hardware & Storage | 6.0% |
| Industrials | 5.9% |
| Consumer Staples | 5.3% |
| Consumer Discretionary | 4.1% |
| Energy | 2.4% |
| Exchange Traded Funds | 2.4% |
| Materials | 1.8% |
| Utilities | 1.6% |
| Communication Services | 1.1% |
| Telecommunication Services | 0.8% |
| Real Estate | 0.4% |
| Consumer, Non-cyclical | 0.3% |
| Equity Portfolio Sub-Total | 68.8% |
| Corporate Bonds | 19.4% |
| U.S. Government Agencies (Combined) | 5.1% |
| Taxable Municipal Bonds | 1.9% |
| Commercial Mortgage-Backed Securities | 1.6% |
| Non-Taxable Municipal Bonds | 0.4% |
| Fixed Income Portfolio Sub-Total | 28.4% |
| Short Term Investments(2) | 2.6% |
| Other Assets and Liabilities - Net(3) | 0.2% |
| Total Net Assets | 100.0% |
| (1) | See the Fund's Prospectus and Statement of Additional Information for a description of the types of securities in which the Fund invests. |
| (2) | Short Term Investments include investment in a money market mutual fund. |
| (3) | Assets, other than investments in securities, less liabilities. |
| (4) | Securities are assigned to a sector classification by the Fund's advisor. |
| 28 | | www.wesmarkfunds.com |
Portfolio of Investments
| December 31, 2021 | WesMark Balanced Fund |
| Shares/Principal Amount | | Value | |
| COMMON STOCKS-66.4% | | | |
| COMMUNICATION SERVICES-1.1% | | | |
| | | | Cable & Satellite-1.1% | | | |
| | 25,879 | | | Comcast Corp., Class A | | $ | 1,302,490 | |
| TOTAL COMMUNICATION SERVICES | | | 1,302,490 | |
| | | | | | | | | |
| CONSUMER DISCRETIONARY-4.1% | | | | |
| | | | | General Merchandise Stores-2.1% | | | | |
| | 11,240 | | | Target Corp. | | | 2,601,386 | |
| | | | | | | | | |
| | | | | Home Improvement Retail-1.6% | | | | |
| | 7,773 | | | Lowe's Cos, Inc. | | | 2,009,165 | |
| | | | | | | | | |
| | | | | Restaurants-0.4% | | | | |
| | 1,687 | | | McDonald's Corp. | | | 452,234 | |
| TOTAL CONSUMER DISCRETIONARY | | | 5,062,785 | |
| | | | | | | | | |
| CONSUMER STAPLES-5.3% | | | | |
| | | | | Food Distributors-1.0% | | | | |
| | 14,902 | | | Sysco Corp. | | | 1,170,552 | |
| | | | | | | | | |
| | | | | Hypermarkets & Super Centers-0.8% | | | | |
| | 6,329 | | | Walmart, Inc. | | | 915,743 | |
| | | | | | | | | |
| | | | | Packaged Foods & Meats-1.4% | | | | |
| | 25,000 | | | General Mills, Inc. | | | 1,684,500 | |
| | | | | | | | | |
| | | | | Soft Drinks-2.1% | | | | |
| | 14,886 | | | PepsiCo, Inc. | | | 2,585,847 | |
| TOTAL CONSUMER STAPLES | | | 6,356,642 | |
| | | | | | | | | |
| CONSUMER, NON-CYCLICAL-0.3% | | | | |
| | | | | Commercial Services-0.3% | | | | |
| | 5,348 | | | Service Corp. International | | | 379,655 | |
| TOTAL CONSUMER, NON-CYCLICAL | | | 379,655 | |
| | | | | | | | | |
| ENERGY-2.4% | | | | |
| | | | | Integrated Oil & Gas-2.1% | | | | |
| | 21,913 | | | Chevron Corp. | | | 2,571,491 | |
| Shares/Principal Amount | | Value | |
| | | | | Oil & Gas Equipment & Services-0.0% | | | | |
| | 2,500 | | | Halliburton Co. | | $ | 57,175 | |
| | | | | | | | | |
| | | | | Oil & Gas Refining & Marketing-0.3% | | | | |
| | 5,117 | | | Valero Energy Corp. | | | 384,338 | |
| TOTAL ENERGY | | | 3,013,004 | |
| | | | | | | | | |
| FINANCIALS-11.8% | | | | |
| | | | | Asset Management & Custody Banks-1.2% | | | | |
| | 15,471 | | | State Street Corp. | | | 1,438,803 | |
| | | | | | | | | |
| | | | | Consumer Finance-2.3% | | | | |
| | 24,497 | | | Discover Financial Services | | | 2,830,873 | |
| | | | | | | | | |
| | | | | Diversified Banks-3.3% | | | | |
| | 13,409 | | | JPMorgan Chase & Co. | | | 2,123,315 | |
| | 34,000 | | | US Bancorp | | | 1,909,780 | |
| | | | | | | | 4,033,095 | |
| | | | | Investment Banking & Brokerage-1.2% | | | | |
| | 3,805 | | | The Goldman Sachs Group, Inc. | | | 1,455,603 | |
| | | | | | | | | |
| | | | | Private Equity-0.2% | | | | |
| | 1,807 | | | Blackstone, Inc. | | | 233,808 | |
| | | | | | | | | |
| | | | | Regional Banks-3.4% | | | | |
| | 8,000 | | | PNC Financial Services Group, Inc. | | | 1,604,160 | |
| | 42,928 | | | Truist Financial Corp. | | | 2,513,434 | |
| | | | | | | | 4,117,594 | |
| | | | | REITS-0.2% | | | | |
| | 3,500 | | | Realty Income Corp. | | | 250,565 | |
| TOTAL FINANCIALS | | | 14,360,341 | |
| | | | | | | | | |
| HEALTH CARE-15.9% | | | | |
| | | | | Biotechnology-5.4% | | | | |
| | 26,411 | | | AbbVie, Inc. | | | 3,576,049 | |
| | 9,500 | | | Amgen, Inc. | | | 2,137,215 | |
| | 11,000 | | | Gilead Sciences, Inc. | | | 798,710 | |
| | | | | | | | 6,511,974 | |
| | | | | Health Care Equipment-1.4% | | | | |
| | 17,000 | | | Medtronic PLC | | | 1,758,650 | |
| | | | | | | | | |
| | | | | Health Care Services-2.5% | | | | |
| | 30,000 | | | CVS Health Corp. | | | 3,094,800 | |
| Annual Report | December 31, 2021 | | 29 |
Portfolio of Investments
| WesMark Balanced Fund | December 31, 2021 |
| Shares/Principal Amount | Value | |
| | | | | Pharmaceuticals-6.6% | | | | |
| | 1,444 | | | Cigna Corp. | | $ | 331,586 | |
| | 9,382 | | | Eli Lilly & Co. | | | 2,591,496 | |
| | 29,717 | | | Merck & Co., Inc. | | | 2,277,511 | |
| | 47,725 | | | Pfizer, Inc. | | | 2,818,161 | |
| | | | | | | | 8,018,754 | |
| TOTAL HEALTH CARE | | | 19,384,178 | |
| | | | | | | | | |
| INDUSTRIALS-5.9% | | | | |
| | | | | Air Freight & Logistics-1.7% | | | | |
| | 9,508 | | | United Parcel Service, Inc., Class B | | | 2,037,945 | |
| | | | | | | | | |
| | | | | Construction & Farm Machinery & Heavy Trucks-0.1% | | | | |
| | 519 | | | Deere & Co. | | | 177,960 | |
| | | | | | | | | |
| | | | | Construction Machinery & Heavy Equipment-1.5% | | | | |
| | 8,825 | | | Caterpillar, Inc. | | | 1,824,480 | |
| | | | | | | | | |
| | | | | Electrical Components & Equipment-1.7% | | | | |
| | 22,000 | | | Emerson Electric Co. | | | 2,045,340 | |
| | | | | | | | | |
| | | | | Industrial Conglomerates-0.9% | | | | |
| | 5,971 | | | 3M Co. | | | 1,060,629 | |
| TOTAL INDUSTRIALS | | | 7,146,354 | |
| | | | | | | | | |
| INFORMATION TECHNOLOGY-9.0% | | | | |
| | | | | Communications Equipment-3.0% | | | | |
| | 58,222 | | | Cisco Systems, Inc./Delaware | | | 3,689,528 | |
| | | | | | | | | |
| | | | | Semiconductor Equipment-1.8% | | | | |
| | 14,272 | | | Applied Materials, Inc. | | | 2,245,842 | |
| | | | | | | | | |
| | | | | Semiconductors-4.2% | | | | |
| | 34,799 | | | Intel Corp. | | | 1,792,149 | |
| | 3,122 | | | Skyworks Solutions, Inc. | | | 484,347 | |
| | 14,713 | | | Texas Instruments, Inc. | | | 2,772,959 | |
| | | | | | | | 5,049,455 | |
| TOTAL INFORMATION TECHNOLOGY | | | 10,984,825 | |
| | | | | | | | | |
| MATERIALS-1.8% | | | | |
| | | | | Commodity Chemicals-1.3% | | | | |
| | 28,469 | | | Dow Chemical Co. | | | 1,614,762 | |
| Shares/Principal Amount | | Value | |
| | | | | Paper Packaging-0.5% | | | |
| | 9,137 | | | Sealed Air Corp. | | $ | 616,473 | |
| TOTAL MATERIALS | | | 2,231,235 | |
| | | | | | | | | |
| REAL ESTATE-0.4% | | | | |
| | | | | Industrial REITS-0.4% | | | | |
| | 2,834 | | | Prologis, Inc. | | | 477,132 | |
| TOTAL REAL ESTATE | | | 477,132 | |
| | | | | | | | | |
| TECHNOLOGY HARDWARE & STORAGE-6.0% |
| | | | | Communications Equipment-6.0% | | | | |
| | 41,353 | | | Apple, Inc. | | | 7,343,052 | |
| TOTAL TECHNOLOGY HARDWARE & STORAGE | | | 7,343,052 | |
| | | | | | | | | |
| TELECOMMUNICATION SERVICES-0.8% |
| | | | | Integrated Telecommunication Services-0.8% | | | | |
| | 17,779 | | | Verizon Communications, Inc. | | | 923,797 | |
| TOTAL TELECOMMUNICATION SERVICES | | | 923,797 | |
| | | | | | | | | |
| UTILITIES-1.6% | | | | |
| | | | | Electric Utilities-0.8% | | | | |
| | 9,886 | | | Duke Energy Corp. | | | 1,037,041 | |
| | | | | | | | | |
| | | | | Multi-Utilities-0.8% | | | | |
| | 12,000 | | | Dominion Energy, Inc. | | | 942,720 | |
| TOTAL UTILITIES | | 1,979,761 | |
| | | | | | | | | |
| TOTAL COMMON STOCKS | | | |
| (Cost $43,542,564) | | 80,945,251 | |
| | | | | | | | | |
| EXCHANGE TRADED FUNDS-2.4% | | | |
| | 31,148 | | | Vanguard® Intermediate-Term Corporate Bond ETF | | | 2,889,288 | |
| | | | | | | | | |
| TOTAL EXCHANGE TRADED FUNDS | | | |
| (Cost $2,920,934) | | 2,889,288 | |
| | | | | | | | | |
| CORPORATE BONDS-19.4% | | | |
| | | | | Banks-1.9% | | | | |
| $ | 500,000 | | | Citigroup, Inc., 4.450%, 9/29/2027 | | | 557,930 | |
| 30 | | www.wesmarkfunds.com |
Portfolio of Investments
| December 31, 2021 | WesMark Balanced Fund |
| Shares/Principal Amount | | Value | |
| $ | 500,000 | | | Fifth Third Bank NA, 3.850%, 3/15/2026 | | $ | 539,869 | |
| | | | | | | | | |
| | 150,000 | | | PNC Bank NA, 2.700%, 10/22/2029 | | | 155,121 | |
| | 1,000,000 | | | Wells Fargo & Co., Subordinated Notes, 3.450%, 2/13/2023 | | | 1,029,148 | |
| | | | | | | | 2,282,068 | |
| | | | | Chemicals-0.6% | | | | |
| | 250,000 | | | Ecolab, Inc., 1.300%, 1/30/2031 | | | 234,594 | |
| | 500,000 | | | PPG Industries, Inc., 1.200%, 3/15/2026 | | | 489,516 | |
| | | | | | | | 724,110 | |
| | | | | Commercial Services-0.4% | | | | |
| | 500,000 | | | PayPal Holdings, Inc., 2.650%, 10/1/2026 | | | 525,172 | |
| | | | | | | | | |
| | | | | Consumer Finance-0.4% | | | | |
| | 500,000 | | | Capital One Financial Corp., 3M US L + 0.95%, 3/9/2022(1) | | | 500,372 | |
| | | | | | | | | |
| | | | | Diversified Financial Services-1.5% | | | | |
| | 500,000 | | | American Express Co., 3.400%, 2/22/2024 | | | 524,609 | |
| | 500,000 | | | American Express Co., 3.000%, 10/30/2024 | | | 524,340 | |
| | 250,000 | | | BlackRock, Inc., 1.900%, 1/28/2031 | | | 246,653 | |
| | 250,000 | | | Legg Mason, Inc., 4.750%, 3/15/2026 | | | 280,383 | |
| | 250,000 | | | Charles Schwab Corp., 1.650%, 3/11/2031 | | | 240,384 | |
| | | | | | | | 1,816,369 | |
| | | | | Diversified Manufacturing-0.9% | | | | |
| | 1,000,000 | | | 3M Co., 3.375%, 3/1/2029 | | | 1,085,529 | |
| | | | | | | | | |
| | | | | Diversified Telecommunication-0.8% | | | | |
| | 1,000,000 | | | Verizon Communications, Inc., Sr. Unsecured Notes, 3M US L + 1.00%, 3/16/2022(1) | | | 1,001,749 | |
| | | | | | | | | |
| | | | | Environmental Control-0.9% | | | | |
| | 500,000 | | | Republic Services, Inc., 3.200%, 3/15/2025 | | | 524,873 | |
| | 500,000 | | | Waste Management, Inc., 3.500%, 5/15/2024 | | | 522,663 | |
| | | | | | | | 1,047,536 | |
| Shares/Principal Amount | | Value | |
| | | | | Gas-0.4% | | | | |
| $ | 500,000 | | | East Ohio Gas Co., 1.300%, 6/15/2025(2) | | $ | 493,526 | |
| | | | | | | | | |
| | | | | Industrial Gases-0.7% | | | | |
| | 835,000 | | | Air Products & Chemicals, Inc., Sr. Unsecured Notes, 3.350%, 7/31/2024 | | | 878,082 | |
| | | | | | | | | |
| | | | | Insurance-0.4% | | | | |
| | 500,000 | | | Prudential Financial, Inc., 1.500%, 3/10/2026 | | | 500,724 | |
| | | | | | | | | |
| | | | | Internet-0.2% | | | | |
| | 250,000 | | | Expedia Group, Inc., 3.800%, 2/15/2028 | | | 267,508 | |
| | | | | | | | | |
| | | | | Internet Software & Services-1.6% | | | | |
| | 2,000,000 | | | Ebay, Inc., Sr. Unsecured Notes, 3M US L + 0.87%, 1/30/2023(1) | | | 2,014,242 | |
| | | | | | | | | |
| | | | | Investment Banking & Brokerage-1.3% | | | | |
| | 1,000,000 | | | Goldman Sachs Group, Inc., Sr. Unsecured Notes, 3M US L + 1.60%, 11/29/2023(1) | | | 1,020,521 | |
| | 500,000 | | | Goldman Sachs Group, Inc., 2.600%, 2/7/2030 | | | 508,889 | |
| | | | | | | | 1,529,410 | |
| | | | | Machinery-Constr&Mining-0.2% | | | | |
| | 250,000 | | | Caterpillar, Inc., 1.900%, 3/12/2031 | | | 249,465 | |
| | | | | | | | | |
| | | | | Miscellaneous Manufacture-0.4% | | | | |
| | 500,000 | | | Parker-Hannifin Corp., 3.250%, 6/14/2029 | | | 530,422 | |
| | | | | | | | | |
| | | | | Pharmaceuticals-2.0% | | | | |
| | 500,000 | | | AbbVie, Inc., 2.600%, 11/21/2024 | | | 519,121 | |
| | 500,000 | | | AbbVie, Inc., 3.200%, 11/21/2029(2) | | | 535,150 | |
| | 250,000 | | | Bristol-Myers Squibb Co., 3.900%, 2/20/2028 | | | 278,857 | |
| | 1,000,000 | | | CVS Health Corp., 4.300%, 3/25/2028 | | | 1,123,101 | |
| | | | | | | | 2,456,229 | |
| | | | | Regional Banks-1.7% | | | | |
| | 1,000,000 | | | PNC Bank NA, Sr. Unsecured Notes, 3M US L + 0.50%, 7/27/2022(1) | | | 1,001,837 | |
| Annual Report | December 31, 2021 | | 31 |
Portfolio of Investments
| WesMark Balanced Fund | December 31, 2021 |
| Shares/Principal Amount | | Value | |
| $ | 1,000,000 | | | PNC Bank NA, Sr. Unsecured Notes, 3.250%, 6/1/2025 | | $ | 1,063,529 | |
| | | | | | | | 2,065,366 | |
| | | | | Restaurants-0.5% | | | | |
| | 500,000 | | | McDonald's Corp., 3.600%, 7/1/2030 | | | 553,014 | |
| | | | | | | | | |
| | | | | Retail-1.1% | | | | |
| | 250,000 | | | Dollar Tree, Inc., 4.200%, 5/15/2028 | | | 278,843 | |
| | 500,000 | | | Lowe's Cos., Inc., 3.100%, 5/3/2027 | | | 533,862 | |
| | 500,000 | | | O'Reilly Automotive, Inc., 4.350%, 6/1/2028 | | | 564,470 | |
| | | | | | | | 1,377,175 | |
| | | | | Software & Services-1.0% | | | | |
| | 400,000 | | | Autodesk, Inc., Sr. Unsecured Notes, 3.600%, 12/15/2022 | | | 408,146 | |
| | 750,000 | | | Oracle Corp., Sr. Unsecured Notes, 3.400%, 7/8/2024 | | | 784,517 | |
| | | | | | | | 1,192,663 | |
| | | | | Transportation Services-0.5% | | | | |
| | 500,000 | | | FedEx Corp., 4.250%, 5/15/2030 | | | 569,164 | |
| | | | | |
| TOTAL CORPORATE BONDS | | | | |
| (Cost $23,787,218) | | 23,659,895 | |
| | | | | |
| U.S. GOVERNMENT AGENCY - COLLATERALIZED MORTGAGE OBLIGATIONS-1.3% | | | | |
| | | | | | | | | |
| | | | | Federal Home Loan Mortgage Corp.-0.2% | | | | |
| | 231,769 | | | Series 2015-4517, Class PC, 2.500%, 5/15/2044 | | | 236,999 | |
| | | | | | | | | |
| | | | | Federal National Mortgage Association-0.5% | | | | |
| | 634,417 | | | Series 2019-51, Class JD, 2.500%, 9/25/2049 | | | 650,651 | |
| | | | | | | | | |
| | | | | Government National Mortgage Association-0.6% | | | | |
| | 704,792 | | | Series 2018-126, Class DA, 3.500%, 1/20/2048 | | | 734,520 | |
| | | | | |
| TOTAL U.S. GOVERNMENT AGENCY - COLLATERALIZED MORTGAGE OBLIGATIONS | | | | |
| (Cost $1,568,924) | | 1,622,170 | |
| Shares/Principal Amount | | Value | |
| COMMERCIAL MORTGAGE-BACKED SECURITIES-1.6% | |
| | | | | Commercial Mortgage-Backed Securities-1.6% | |
| $ | 1,500,000 | | | Series 2015-UBS8, Class A4, 3.809%, 11/15/2025 | | $ | 1,606,847 | |
| | 397,939 | | | Series 2012-C3, Class A4, 3.091%, 9/10/2022 | | | 400,932 | |
| | | | | | | | 2,007,779 | |
| TOTAL COMMERCIAL MORTGAGE-BACKED SECURITIES | | | | |
| (Cost $1,937,162) | | 2,007,779 | |
| | | | | |
| U.S. GOVERNMENT AGENCY - MORTGAGE-BACKED SECURITIES-3.8% | | | | |
| | | | | Federal Home Loan Bank-0.4% | | | | |
| | 450,000 | | | 5.250%, 6/10/2022 | | | 459,785 | |
| | | | | | | | | |
| | | | | Federal Home Loan Mortgage Corp.-0.4% | | | | |
| | 101,292 | | | Pool G18527, 3.000%, 10/1/2029 | | | 106,341 | |
| | 402,350 | | | Pool 18707, 3.500%, 9/1/2033 | | | 424,941 | |
| | | | | | | | 531,282 | |
| | | | | Federal National Mortgage Association-2.6% | | | | |
| | 407,358 | | | Pool AM3301, 2.350%, 5/1/2023 | | | 413,194 | |
| | 730,129 | | | Pool BL5389, 2.710%, 5/1/2027 | | | 768,167 | |
| | 610,201 | | | Pool AM6756, 3.570%, 10/1/2029 | | | 678,711 | |
| | 221,638 | | | Pool MA3621, 3.500%, 3/1/2039 | | | 233,924 | |
| | 173,668 | | | Pool BN4896, 4.000%, 1/1/2049 | | | 184,822 | |
| | 192,077 | | | Pool MA3592, 4.000%, 2/1/2049 | | | 204,296 | |
| | 596,477 | | | Pool BP4338, 1Y US TI + 1.94%, 3/1/2049(1) | | | 618,182 | |
| | | | | | | | 3,101,296 | |
| | | | | Small Business Administration Pools-0.4% | | | | |
| | 162,936 | | | PRIME - 2.50%, 1/25/2042(1) | | | 165,784 | |
| | 349,678 | | | PRIME - 2.60%, 7/25/2042(1) | | | 355,287 | |
| | | | 521,071 | |
| | | | | |
| TOTAL U.S. GOVERNMENT AGENCY - MORTGAGE-BACKED SECURITIES | | | | |
| (Cost $4,475,293) | | 4,613,434 | |
| | | | | |
| TAXABLE MUNICIPAL BONDS-1.9% | | | | |
| | | | | Michigan-0.2% | | | | |
| | 270,000 | | | Belding Area Schools, General Obligation Unlimited Bonds, 6.700%, 5/1/2027 | | | 271,084 | |
| 32 | | www.wesmarkfunds.com |
Portfolio of Investments
| December 31, 2021 | WesMark Balanced Fund |
| Shares/Principal Amount | | Value | |
| | | | | Ohio-0.8% | | | | |
| $ | 815,000 | | | Columbus-Franklin County Finance Authority, 4.490%, 11/15/2032 | | $ | 906,080 | |
| | | | | | | | | |
| | | | | Pennsylvania-0.4% | | | | |
| | 450,000 | | | Commonwealth Financing Authority, 4.014%, 6/1/2033 | | | 513,067 | |
| | | | | | | | | |
| | | | | West Virginia-0.5% | | | | |
| | 575,000 | | | Marshall University, 3.177%, 5/1/2029 | | | 618,803 | |
| | | | | |
| TOTAL TAXABLE MUNICIPAL BONDS | | | | |
| (Cost $2,170,424) | | 2,309,034 | |
| | | | | |
| NON-TAXABLE MUNICIPAL BONDS-0.4% | | | | |
| | | | | Utah-0.4% | | | | |
| | 450,000 | | | Utah Transit Authority, 3.393%, 12/15/2036 | | | 470,700 | |
| | | | | | | | | |
| TOTAL NON-TAXABLE MUNICIPAL BONDS | | | 470,700 | |
| (Cost $456,530) | | | |
| | | | | |
| SHORT TERM INVESTMENTS-2.6% | | | | |
| | | | | Mutual Funds-2.6% | | | | |
| | 3,136,055 | | | Federated Hermes Government Obligations Fund, Premier Class, 7-Day Yield 0.030% (at net asset value) | | | 3,136,055 | |
| | | | | |
| TOTAL SHORT TERM INVESTMENTS | | | | |
| (Cost $3,136,055) | | 3,136,055 | |
| | | | | | | | |
| TOTAL INVESTMENTS-99.8% | | | |
| (Cost $83,995,104) | | 121,653,606 | |
| OTHER ASSETS AND LIABILITIES-NET(3)-0.2% | | | 198,825 | |
| NET ASSETS-100.0% | | $ | 121,852,431 | |
Investment Abbreviations:
LIBOR - London Interbank Offered Rate
Reference Rates:
3M US L - 3 Month LIBOR as of December 31, 2021 was 0.21%
1Y US TI - 1 Year US Treasury Bill as of December 31, 2021 was 0.39%
PRIME - US Prime Rate as of December 31, 2021 was 3.25%
| (1) | Floating or variable rate security. The reference rate is described above. The Rate in effect as of December 31, 2021 is based on the reference rate plus the displayed spread as of the security's last reset date. |
| (2) | Security exempt from registration under rule 144A of the Securities Act of 1933. These securities may be resold in transactions exempt from registration, normally to qualified institutional buyers. As of December 31, 2021, these securities amounted to a value of $1,028,676 or 0.84% of net assets. These Securities have been determined to be liquid pursuant to procedures adopted by the board. |
| (3) | Assets, other than investments in securities, less liabilities. |
| Note - | The categories of investments are shown as a percentage of net assets as of December 31, 2021. |
See Notes to Financial Statements which are an integral part of the Financial Statements.
| Annual Report | December 31, 2021 | | 33 |
Portfolio of Investments Summary Table
| WesMark Government Bond Fund | December 31, 2021 (Unaudited) |
As of December 31, 2021, the Fund's Portfolio Composition(1) was as follows:
| Portfolio Composition | Percentage of
Total Net Assets |
| U.S. GOVERNMENT AGENCY - COLLATERALIZED MORTGAGE OBLIGATIONS | 60.6% |
| TAXABLE MUNICIPAL BONDS | 19.9% |
| U.S. GOVERNMENT AGENCY - MORTGAGE-BACKED SECURITIES | 14.4% |
| NON-TAXABLE MUNICIPAL BONDS | 0.2% |
| FIXED INCOME PORTFOLIO SUB-TOTAL | 95.1% |
| SHORT TERM INVESTMENTS(2) | 5.1% |
| OTHER ASSETS AND LIABILITIES - NET(3) | -0.2% |
| TOTAL NET ASSETS | 100.0% |
(1) | See the Fund's Prospectus and Statement of Additional Information for a description of the types of securities in which the Fund invests. |
| (2) | Short Term Investments include investment in a money market mutual fund. |
| (3) | Assets, other than investments in securities, less liabilities. |
| 34 | | www.wesmarkfunds.com |
Portfolio of Investments
| December 31, 2021 | WesMark Government Bond Fund |
| Shares/Principal Amount | | Value | |
| U.S. GOVERNMENT AGENCY - COLLATERALIZED MORTGAGE OBLIGATIONS-60.6% |
| | | | | Agency Collat CMO-2.8% |
| $ | 297,960 | | | Series 2003-55, Class 1A3A, 1M US L + 0.40%, 3/25/2043(1) | | $ | 298,359 | |
| | 796,906 | | | Series 2004-W14, Class 1AF, 1M US L + 0.40%, 7/25/2044(1) | | | 797,745 | |
| | 816,883 | | | Series 2010-59, Class FL, 1M US L + 0.50%, 5/20/2040(1) | | | 823,630 | |
| | 1,037,844 | | | Series 2012-273, Class 40, 4.000%, 8/15/2042 | | | 1,099,637 | |
| | 3,682,058 | | | Series 2014-330, Class F4, 1M US L + 0.35%, 10/15/2037(1) | | | 3,714,567 | |
| | | | | | | | 6,733,938 | |
| | | | | Agency Collat PAC CMO-13.3% |
| | 2,145,600 | | | Series 2014-25, Class PA, 2.250%, 1/20/2044 | | | 2,190,954 | |
| | 469,666 | | | Series 2019-99, Class GA, 3.500%, 7/20/2049 | | | 482,493 | |
| | 4,534,142 | | | Series 2020-5020, Class TP, 2.000%, 10/25/2050 | | | 4,505,531 | |
| | 6,973,538 | | | Series 2020-134, Class ED, 2.000%, 9/20/2050 | | | 7,012,552 | |
| | 4,587,052 | | | Series 2020-134, Class GD, 2.000%, 9/20/2050 | | | 4,616,108 | |
| | 4,584,633 | | | Series 2021-23, Class TE, 1.000%, 2/20/2051 | | | 4,343,896 | |
| | 9,225,347 | | | Series 2021-18, Class MC, 1.500%, 3/25/2051 | | | 9,042,977 | |
| | | | | | | | 32,194,511 | |
| | | | | Commercial MBS-32.9% |
| | 504,428 | | | Series 2019-SB58, Class A10H, 3.730%, 10/25/2038(1) | | | 528,271 | |
| | 323,636 | | | Series 2019-SB60, Class A10H, 3.500%, 1/25/2029(1) | | | 337,360 | |
| | 4,711,748 | | | Series 2019-KF60, Class A, 1M US L + 0.49%, 2/25/2026(1) | | | 4,732,496 | |
| | 2,289,653 | | | Series 2019-KF67, Class A, 1M US L + 0.52%, 8/25/2029(1) | | | 2,307,122 | |
| | 2,713,184 | | | Series 2019-KF73, Class AL, 1M US L + 0.60%, 11/25/2029(1) | | | 2,729,958 | |
| | 3,547,031 | | | Series 2020-8, Class B, 2.600%, 1/16/2061 | | | 3,641,781 | |
| | 4,949,557 | | | Series 2020-118, Class AL, 1.750%, 6/16/2062 | | | 4,763,227 | |
| Shares/Principal Amount | | Value | |
| $ | 4,605,333 | | | Series 2020-Q013, Class APT2, 1.254%, 5/25/2050(1) | | $ | 4,518,874 | |
| | 963,004 | | | Series 2020-128, Class AN, 1.500%, 10/16/2062 | | | 909,732 | |
| | 4,883,188 | | | Series 2020-150, Class AM, 1.400%, 12/16/2062 | | | 4,620,006 | |
| | 2,746,161 | | | Series 2020-177, Class DA, 1.250%, 6/16/2062 | | | 2,541,883 | |
| | 5,742,254 | | | Series 2021-45, Class AD, 1.500%, 4/16/2063 | | | 5,596,720 | |
| | 5,470,916 | | | Series 2021-150, Class AP, 1.750%, 11/16/2063 | | | 5,297,031 | |
| | 9,938,433 | | | Series 2021-147, Class DQ, 1.350%, 5/16/2056 | | | 9,658,694 | |
| | 4,483,078 | | | Series 2021-164, Class AF, 1.650%, 10/16/2063 | | | 4,336,860 | |
| | 9,380,892 | | | Series 2021-180, Class AM, 1.750%, 11/16/2063 | | | 9,053,705 | |
| | 5,000,000 | | | Series 2021-181, Class B, 1.900%, 1/16/2063 | | | 4,823,719 | |
| | 4,994,664 | | | Series 2021-195, Class AL, 1.500%, 8/16/2063 | | | 4,737,853 | |
| | 5,000,000 | | | Series 2021-203, Class B, 2.000%, 4/16/2062 | | | 4,860,741 | |
| | | | | | | | 79,996,033 | |
| | | | Federal Home Loan Mortgage Corp.-1.3% |
| | 530,554 | | | Series 2012-276, Class 25, 2.500%, 9/15/2042 | | | 548,457 | |
| | 261,817 | | | Series 2015-4531, Class PD, 2.500%, 5/15/2043, REMIC | | | 263,959 | |
| | 1,047,552 | | | Series 2016-4629, Class QG, 2.500%, 11/15/2046, REMIC | | | 1,066,608 | |
| | 1,149,705 | | | Series 2016-4631, Class AE, 3.500%, 5/15/2044, REMIC | | | 1,189,705 | |
| | 0 | | | Series 2017-4661, Class AC, 4.000%, 4/15/2043, REMIC | | | 0 | |
| | | | | | | | 3,068,729 | |
| | | | Federal National Mortgage Association-4.8% |
| | 360,016 | | | Series 2003-39, Class JC, 4.000%, 5/25/2033, REMIC | | | 389,501 | |
| | 598,288 | | | Series 2003-44, Class Q, 3.500%, 6/25/2033, REMIC | | | 631,176 | |
| | 995,039 | | | Series 2003-W18, Class 2A, 3.285%, 6/25/2043, REMIC (1) | | | 1,034,631 | |
| | 594,790 | | | Series 2010-99, Class CP, 2.750%, 8/25/2040, REMIC | | | 611,906 | |
| Annual Report | December 31, 2021 | | 35 |
| WesMark Government Bond Fund | December 31, 2021 |
| Shares/Principal Amount | | Value | |
| $ | 1,158,982 | | | Series 2013-20, Class YA, 2.000%, 3/25/2042, REMIC | | $ | 1,176,614 | |
| | 693,871 | | | Series 2013-102, Class DG, 3.000%, 5/25/2032, REMIC | | | 713,567 | |
| | 143,157 | | | Series 2014-4, Class KA, 3.000%, 1/25/2044, REMIC | | | 149,499 | |
| | 540,686 | | | Series 2016-16, Class PD, 3.000%, 12/25/2044, REMIC | | | 550,488 | |
| | 1,123,514 | | | Series 2016-90, Class DA, 3.000%, 8/25/2046, REMIC | | | 1,146,757 | |
| | 1,420,669 | | | Series 2016-95, Class L, 2.500%, 6/25/2046, REMIC | | | 1,465,543 | |
| | 364,841 | | | Series 2017-1, Class JP, 3.500%, 4/25/2045, REMIC | | | 366,605 | |
| | 1,510,935 | | | Series 2017-89, Class PL, 3.000%, 6/25/2043, REMIC | | | 1,535,450 | |
| | 1,036,368 | | | Series 2018-3, Class LD, 3.000%, 8/25/2046, REMIC | | | 1,058,054 | |
| | 840,338 | | | Series 2019-74, Class LB, 3.000%, 10/25/2049 | | | 855,520 | |
| | | | | | | | 11,685,311 | |
| | | | Government National Mortgage Association- 2.4% |
| | 2,054,185 | | | Series 2005-26, Class ZA, 5.500%, 1/20/2035 | | | 2,228,519 | |
| | 236,242 | | | Series 2012-50, Class ED, 2.250%, 8/20/2040 | | | 239,090 | |
| | 814,980 | | | Series 2013-38, Class KA, 1.250%, 2/20/2042 | | | 808,467 | |
| | 437,204 | | | Series 2016-55, Class JA, 3.500%, 4/20/2046 | | | 463,944 | |
| | 2,054,239 | | | Series 2016-77, Class MB, 2.000%, 9/20/2045 | | | 2,068,863 | |
| | | | | | | | 5,808,883 | |
| | | | Other ABS-3.1% |
| | 2,267,128 | | | Series 2007-20F, Class 1, 5.710%, 6/1/2027 | | | 2,441,212 | |
| | 3,810,751 | | | Series 2010-20C, Class 1, 4.190%, 3/1/2030 | | | 4,041,864 | |
| | 1,106,906 | | | Series 2015-20D, Class 1, 2.510%, 4/1/2035 | | | 1,139,850 | |
| | | | | | | | 7,622,926 | |
| Shares/Principal Amount | | Value | |
| TOTAL U.S. GOVERNMENT AGENCY - COLLATERALIZED MORTGAGE OBLIGATIONS | | | | |
| (Cost $148,314,680) | | $ | 147,110,331 | |
| | | | | | | | | |
| U.S. GOVERNMENT AGENCY - MORTGAGE-BACKED SECURITIES-14.4% |
| | | | | | | | | |
| | | | | Federal Home Loan Banks-1.2% |
| | 3,000,000 | | | Federal Home Loan Banks, 1.290%, 12/30/2030 | | | 2,891,106 | |
| | | | | Federal Home Loan Mortgage Corp.-1.2% |
| | 336,848 | | | Freddie Mac Gold Pool, Pool C91361, 4.000%, 3/1/2031 | | | 360,988 | |
| | 156,255 | | | Freddie Mac Gold Pool, Pool T65458, 3.500%, 2/1/2048 | | | 162,445 | |
| | 284,504 | | | Freddie Mac Non Gold Pool, Pool 2B7395, 12M US L + 1.63%, 3/1/2049(1) | | | 294,170 | |
| | 1,973,159 | | | Freddie Mac Pool, Pool QA6315, 3.500%, 1/1/2050 | | | 2,129,567 | |
| | | | | | | | 2,947,170 | |
| | | | | Federal National Mortgage Association-2.7% |
| | 1,247,232 | | | Fannie Mae Pool, Pool MA0641, 4.000%, 2/1/2031 | | | 1,336,169 | |
| | 558,582 | | | Fannie Mae Pool, Pool MA0695, 4.000%, 4/1/2031 | | | 598,379 | |
| | 351,358 | | | Fannie Mae Pool, Pool MA0756, 4.000%, 6/1/2031 | | | 379,001 | |
| | 931,634 | | | Fannie Mae Pool, Pool MA0818, 4.000%, 8/1/2031 | | | 1,004,845 | |
| | 1,358,804 | | | Fannie Mae Pool, Pool AL5169, 4.000%, 4/1/2034 | | | 1,463,360 | |
| | 1,187,867 | | | Fannie Mae Pool, Pool 995026, 6.000%, 9/1/2036 | | | 1,364,643 | |
| | 325,809 | | | Fannie Mae Pool, Pool AL6620, 4.500%, 8/1/2042 | | | 357,905 | |
| | | | | | | | 6,504,302 | |
| | | | | FGLMC Collateral-0.3% |
| | 750,153 | | | Freddie Mac Gold Pool, Pool T62075, 3.000%, 9/1/2046 | | | 769,928 | |
| | | | | FNMA Collateral-5.4% |
| | 427,456 | | | Fannie Mae Pool, Pool MA0988, 4.000%, 2/1/2042 | | | 448,080 | |
| | 1,251,075 | | | Fannie Mae Pool, Pool AL2984, 12M US L + 1.666%, 10/1/2042(1) | | | 1,316,731 | |
| 36 | | www.wesmarkfunds.com |
Portfolio of Investments
| December 31, 2021 | WesMark Government Bond Fund |
| Shares/Principal Amount | | Value | |
| $ | 736,399 | | | Fannie Mae Pool, Pool MA1371, 3.000%, 3/1/2043 | | $ | 755,553 | |
| | 534,145 | | | Fannie Mae Pool, Pool MA1966, 4.500%, 6/1/2044 | | | 584,724 | |
| | 768,524 | | | Fannie Mae Pool, Pool MA2270, 3.000%, 5/1/2045 | | | 787,638 | |
| | 2,514,621 | | | Fannie Mae Pool, Pool MA2711, 3.000%, 8/1/2046 | | | 2,577,023 | |
| | 1,556,399 | | | Fannie Mae Pool, Pool BM3178, 12M US L + 1.603%, 12/1/2047(1) | | | 1,618,705 | |
| | 423,859 | | | Fannie Mae Pool, Pool BK0870, 12M US L + 1.620%, 6/1/2048(1) | | | 442,208 | |
| | 107,827 | | | Fannie Mae Pool, Pool BH0724, 12M US L + 1.61%, 1/1/2049(1) | | | 109,229 | |
| | 3,384,776 | | | Fannie Mae Pool, Pool BO9776, 1Y US TI + 2.029%, 3/1/2049(1) | | | 3,509,564 | |
| | 983,276 | | | Fannie Mae Pool, Pool CA3453, 12M US L + 1.615%, 4/1/2049(1) | | | 1,021,626 | |
| | | | | | | | 13,171,081 | |
| | | | | GNMA2 Collateral-0.7% |
| | 674,412 | | | Ginnie Mae II Pool, Pool G24922, 4.000%, 1/20/2041 | | | 730,895 | |
| | 913,209 | | | Ginnie Mae II Pool, Pool MA5766, 5.500%, 2/20/2049 | | | 991,727 | |
| | | | | | | | 1,722,622 | |
| | | | | Government National Mortgage Association-1.9% |
| | 1,631,419 | | | Ginnie Mae II Pool, Pool A09704, 3.000%, 10/20/2036 | | | 1,710,038 | |
| | 2,197,973 | | | Ginnie Mae II Pool, Pool AY5131, 3.000%, 6/20/2037 | | | 2,303,773 | |
| | 177,376 | | | Ginnie Mae II Pool, Pool G24828, 4.500%, 10/20/2040 | | | 188,769 | |
| | 215,679 | | | Ginnie Mae I Pool, Pool 589693, 4.500%, 7/15/2029 | | | 235,264 | |
| | | | | | | | 4,437,844 | |
| | | | | UMBS Collateral-1.0% |
| | 761,028 | | | Fannie Mae Pool, Pool AE5463, 4.000%, 10/1/2040 | | | 833,345 | |
| | 1,408,100 | | | Fannie Mae Pool, Pool AX5302, 4.000%, 1/1/2042 | | | 1,546,779 | |
| | | | | | | | 2,380,124 | |
| TOTAL U.S. GOVERNMENT AGENCY - MORTGAGE-BACKED SECURITIES | | | | |
| (Cost $34,439,482) | | | 34,824,177 | |
| Shares/Principal Amount | | Value | |
| TAXABLE MUNICIPAL BONDS-19.9% | | | | |
| | | | | Alabama-0.8% |
| $ | 750,000 | | | City of Brewton AL, 3.180%, 12/1/2034 | | $ | 785,531 | |
| | 1,000,000 | | | Water Works Board of the City of Birmingham, 3.463%, 1/1/2039 | | | 1,072,178 | |
| | | | | | | | 1,857,709 | |
| | | | | Arkansas-0.6% |
| | | | | University of Arkansas: | | | | |
| | 500,000 | | | 3.382%, 9/1/2037 | | | 528,014 | |
| | 1,000,000 | | | 3.301%, 11/1/2039 | | | 1,042,333 | |
| | | | | | | | 1,570,347 | |
| | | | | California-5.8% |
| | 1,900,000 | | | California Educational Facilities Authority, 3.686%, 4/1/2037 | | | 2,010,053 | |
| | 1,630,000 | | | City of Fairfield CA, 4.358%, 6/1/2034 | | | 1,778,612 | |
| | 1,000,000 | | | Contra Costa Community College District, 2.926%, 8/1/2038 | | | 1,035,005 | |
| | 1,000,000 | | | El Dorado Irrigation District, 2.635%, 3/1/2035 | | | 994,297 | |
| | 500,000 | | | Kings Canyon Unified School District, 3.212%, 8/1/2040 | | | 520,682 | |
| | 500,000 | | | Pasadena Public Financing Authority, Build America Revenue Bonds, Series B, 6.998%, 3/1/2034 | | | 753,953 | |
| | 1,500,000 | | | San Jose Unified School District, 2.306%, 8/1/2039 | | | 1,406,166 | |
| | 900,000 | | | San Mateo Foster City School District, 2.731%, 8/1/2037 | | | 915,483 | |
| | 910,000 | | | Santa Paula Utility Authority, 2.870%, 2/1/2034 | | | 953,460 | |
| | 3,000,000 | | | Ventura County Public Financing Authority, 2.712%, 11/1/2034 | | | 3,105,017 | |
| | 500,000 | | | West Sacramento Area Flood Control Agency, 3.082%, 9/1/2034 | | | 532,570 | |
| | | | | | | | 14,005,298 | |
| | | | | Colorado-0.4% |
| | 1,000,000 | | | Denver City & County Housing Authority, 2.936%, 12/1/2034 | | | 1,046,098 | |
| | | | | Florida-1.7% | | | | |
| | 3,000,000 | | | Broward County FL Water & Sewer Utility Revenue, 3.338%, 10/1/2037 | | | 3,283,072 | |
| | 860,000 | | | County of Palm Beach FL, 3.000%, 11/1/2035 | | | 914,398 | |
| | | | | | | | 4,197,470 | |
| Annual Report | December 31, 2021 | | 37 |
| WesMark Government Bond Fund | December 31, 2021 |
| Shares/Principal Amount | | Value | |
| | | | | Hawaii-0.4% |
| $ | 1,000,000 | | | University of Hawaii, 3.850%, 10/1/2038 | | $ | 1,091,020 | |
| | | | | | | | | |
| | | | | Illinois-0.9% |
| | 2,000,000 | | | McHenry & Kane Counties Community Consolidated School District No 158 Huntley, 2.940%, 2/15/2036 | | | 2,068,531 | |
| | | | | | | | | |
| | | | | Massachusetts-1.1% |
| | 1,000,000 | | | City of Quincy MA, 2.788%, 12/15/2035 | | | 1,023,946 | |
| | 1,500,000 | | | Massachusetts School Building Authority, 2.950%, 5/15/2043 | | | 1,525,839 | |
| | | | | | | | 2,549,785 | |
| | | | | Michigan-1.4% |
| | 1,400,000 | | | Michigan State Building Authority, 2.705%, 10/15/2040 | | | 1,361,368 | |
| | 2,000,000 | | | University of Michigan, 2.437%, 4/1/2040 | | | 2,003,374 | |
| | | | | | | | 3,364,742 | |
| | | | | New York-0.4% |
| | 700,000 | | | City of New York NY, 5.985%, 12/1/2036 | | | 925,514 | |
| | | | | | | | | |
| | | | | Ohio-0.5% |
| | 565,000 | | | Summit County Development Finance Authority, 3.201%, 11/15/2036 | | | 566,187 | |
| | 500,000 | | | Warrensville Heights City School District, 3.406%, 12/1/2040 | | | 535,886 | |
| | | | | | | | 1,102,073 | |
| | | | | Oklahoma-1.3% |
| | 3,000,000 | | | Glenpool Utility Services Authority, 3.565%, 12/1/2037 | | | 3,214,708 | |
| | | | | | | | | |
| | | | | Pennsylvania-0.2% |
| | 550,000 | | | Borough of Columbia PA, 2.540%, 6/15/2038 | | | 546,438 | |
| | | | | | | | | |
| | | | | South Carolina-0.4% |
| | 1,000,000 | | | Joint Municipal Water & Sewer Commission, 3.194%, 6/1/2039 | | | 1,071,296 | |
| | | | | | | | | |
| | | | | Texas-1.3% |
| | 500,000 | | | Corpus Christi, Texas, Taxable Certificates Obligation Bonds, Series B, 4.950%, 3/1/2038 | | | 573,304 | |
| Shares/Principal Amount | | Value | |
| | | | | Round Rock Transportation & Economic Development Corp.: | | | | |
| $ | 500,000 | | | 2.900%, 8/15/2038 | | $ | 515,821 | |
| | 500,000 | | | 3.000%, 8/15/2039 | | | 517,790 | |
| | 1,015,000 | | | Stephen F Austin State University, 4.192%, 10/15/2035 | | | 1,119,061 | |
| | 500,000 | | | Texas Public Finance Authority, 2.367%, 2/1/2038 | | | 480,782 | |
| | | | | | | | 3,206,758 | |
| | | | | Utah-0.8% |
| | 1,870,000 | | | Utah Municipal Power Agency, 3.806%, 7/1/2036 | | | 1,995,188 | |
| | | | | | | | | |
| | | | | Virginia-0.6% |
| | 1,395,000 | | | Virginia Housing Development Authority, 3.050%, 8/1/2038 | | | 1,445,756 | |
| | | | | | | | | |
| | | | | West Virginia-1.3% |
| | 2,000,000 | | | Marshall University, 3.677%, 5/1/2035 | | | 2,178,350 | |
| | 875,000 | | | Putnam Public Service District, 2.889%, 4/1/2036 | | | 881,470 | |
| | | | | | | | 3,059,820 | |
| TOTAL TAXABLE MUNICIPAL BONDS | | | | |
| (Cost $47,320,146) | | | 48,318,551 | |
| | | | | | | | | |
| NON-TAXABLE MUNICIPAL BONDS-0.2% | | | | |
| | | | | California-0.2% | | | | |
| | 500,000 | | | Desert Community College District, 2.978%, 8/1/2037 | | | 511,795 | |
| | | | | | | | | |
| TOTAL NON-TAXABLE MUNICIPAL BONDS | | | | |
| (Cost $500,000) | | | 511,795 | |
| | | | | | | | | |
| SHORT TERM INVESTMENTS-5.1% | | | | |
| | | | | Mutual Funds-5.1% | | | | |
| | 12,342,620 | | | Federated Hermes Government Obligations Fund, Premier Class, 7- Day Yield 0.030% (at net asset value) | | | 12,342,620 | |
| | | | | | | | | |
| TOTAL SHORT TERM INVESTMENTS | | | | |
| (Cost $12,342,620) | | | 12,342,620 | |
| | | | | | | | | |
| TOTAL INVESTMENTS-100.2% | | | | |
| (Cost $242,916,928) | | | 243,107,474 | |
| 38 | | www.wesmarkfunds.com |
Portfolio of Investments
| December 31, 2021 | WesMark Government Bond Fund |
| Shares/Principal Amount | | Value | |
| OTHER ASSETS AND LIABILITIES-NET(2)-(0.2)% | | | (374,692 | ) |
| NET ASSETS-100.0% | | $ | 242,732,782 | |
Investment Abbreviations:
LIBOR - London Interbank Offered Rate
Reference Rates:
1M US L - 1 Month LIBOR as of December 31, 2021 was 0.10%
12M US L - 12 Month LIBOR as of December 31, 2021 was 0.58%
1Y US TI - 1 Year US Treasury Bill as of December 31, 2021 was 0.39%
| (1) | Floating or variable rate security. The reference rate is described above. The Rate in effect as of December 31, 2021 is based on the reference rate plus the displayed spread as of the security's last reset date. Certain variable rate securities are not based on a published reference rate and spread but are determined by the issuer or agent and are based on current market conditions. These securities do not indicate a reference rate and spread in their description above. |
| (2) | Assets, other than investments in securities, less liabilities. |
| Note - | The categories of investments are shown as a percentage of net assets as of December 31, 2021. |
See Notes to Financial Statements which are an integral part of the Financial Statements.
| Annual Report | December 31, 2021 | | 39 |
| Portfolio of Investments Summary Table | |
| WesMark West Virginia Municipal Bond Fund | December 31, 2021 (Unaudited) |
As of December 31, 2021, the Fund's Portfolio Composition(1) was as follows:
| Portfolio Composition | Percentage of Total Net Assets |
| NON-TAXABLE MUNICIPAL BONDS | 97.5% |
| SHORT TERM INVESTMENTS(2) | 2.0% |
| OTHER ASSETS AND LIABILITIES - NET(3) | 0.5% |
| TOTAL NET ASSETS | 100.0% |
| Years to Maturity of Municipal Bonds | Percentage of Total Net Assets |
| Less than 1 Year | 0.4% |
| 1-3 Years | 4.5% |
| 3-5 Years | 15.6% |
| 5-10 Years | 29.3% |
| 10 Years or Greater | 47.7% |
| Short Term Investments(2) | 2.0% |
| Other Assets and Liabilities - Net(3) | 0.5% |
| TOTAL | 100.0% |
S&P Ratings of Municipal Bonds as
Percentage of Total Net Assets(4) | |
| AAA | 10.6% |
| AA | 28.2% |
| AA- | 15.8% |
| A+ | 14.7% |
| A | 2.5% |
| A- | 0.2% |
| Not rated by S&P | 25.6% |
| Short Term Investments(2) | 2.0% |
| Other Assets and Liabilities - Net(3) | 0.5% |
| TOTAL PORTFOLIO VALUE | 100.0% |
Moody's Ratings of Municipal Bonds as Percentage of Total Net Assets(4) | |
| Aaa | 4.9% |
| Aa2 | 0.8% |
| Aa3 | 20.8% |
| A1 | 23.3% |
| A2 | 4.6% |
| Not rated by Moody's | 43.2% |
| Short Term Investments(2) | 2.0% |
| Other Assets and Liabilities - Net(3) | 0.5% |
| TOTAL PORTFOLIO VALUE | 100.0% |
| (1) | See the Fund's Prospectus and Statement of Additional Information for a description of the types of securities in which the Fund invests. |
| (2) | Cash Equivalents include investments in U.S. government agency securities and a money market mutual fund. |
| (3) | Assets, other than investment in securities, less liabilities. See Statement of Assets and Liabilities. |
| (4) | These tables depict the long-term credit-quality ratings assigned to the Fund’s portfolio holdings by Standard & Poor’s (S&P) and Moody’s Investors Service (Moody’s), each of which is a Nationally Recognized Statistical Rating Organization (NRSRO). These credit-quality ratings are shown without regard to gradations within a given rating category. For example, securities rated “A-” have been included in the “A” rated category. Rated securities that have been prerefunded, but not rated again by the NRSRO, have been included in the “Not rated by…” category. |
Rated securities include a security with an obligor and/or credit enhancer that has received a rating from an NRSRO with respect to a class of debt obligations that is comparable in priority and security with the security held by the Fund. Credit-quality ratings are an assessment of the risk that a security will default in payment and do not address other risks presented by the security. Please see the descriptions of credit-quality ratings in the Fund’s Statement of Additional Information. Holdings that are rated only by a different NRSRO than the one identified have been included in the “Not rated by…” category. Of the portfolio’s total investments, 11.6% do not have long-term ratings by either of these NRSROs.
| 40 | | www.wesmarkfunds.com |
Portfolio of Investments
| December 31, 2021 | WesMark West Virginia Municipal Bond Fund |
| Shares/Principal Amount | | Value | |
| NON-TAXABLE MUNICIPAL BONDS-97.5% | | | | |
| | | | | Ohio-1.1% | | | | |
| $ | 1,100,000 | | | Westerville, Ohio, General Obligation Limited Bonds, 5.000%, 12/1/2028 | | $ | 1,219,482 | |
| | | | | Pennsylvania-1.5% | | | | |
| | 1,425,000 | | | Borough of Plum PA, 4.000%, 12/1/2034 | | | 1,715,918 | |
| | | | | West Virginia-94.9% | | | | |
| | | | | Berkeley County Building Commission: | | | | |
| | 580,000 | | | 2.000%, 6/1/2035 | | | 576,826 | |
| | 750,000 | | | 2.000%, 6/1/2040 | | | 728,857 | |
| | 1,500,000 | | | Berkeley County Public Service Sewer District, 4.500%, 10/1/2032 | | | 1,601,922 | |
| | | | | Berkeley County, West Virginia, Building Commission Lease Revenue Bonds (Judicial Center Project): | | | | |
| | 100,000 | | | Series B, 2.600%, 12/1/2023 | | | 102,182 | |
| | 100,000 | | | Series B, 2.800%, 12/1/2024 | | | 102,363 | |
| | | | | Berkeley County, West Virginia, Public Service District Revenue Bonds: | | | | |
| | 370,000 | | | Series C, 3.000%, 12/1/2029 | | | 399,190 | |
| | 450,000 | | | Series C, 3.400%, 12/1/2034 | | | 490,612 | |
| | 345,000 | | | Series D, 3.000%, 12/1/2024 | | | 368,713 | |
| | 585,000 | | | Series D, 3.000%, 12/1/2025 | | | 636,382 | |
| | 380,000 | | | Berkeley County, West Virginia, Public Service District Water Revenue Bonds, Series A, 4.500%, 12/1/2033 | | | 407,443 | |
| | | | | Berkeley County, West Virginia, Public Service Sewer District Revenue Bonds: | | | | |
| | 275,000 | | | 5.000%, 6/1/2027 | | | 325,038 | |
| | 950,000 | | | 5.000%, 6/1/2028 | | | 1,121,049 | |
| | 655,000 | | | 5.000%, 6/1/2029 | | | 771,066 | |
| | 620,000 | | | Series A, 5.300%, 3/1/2029 | | | 622,319 | |
| | 285,000 | | | Series C, 3.500%, 10/1/2025 | | | 285,739 | |
| | | | | Brooke County, West Virginia, Board of Education General Obligation Unlimited Bonds: | | | | |
| | 1,065,000 | | | 4.000%, 6/1/2025 | | | 1,184,551 | |
| | 1,100,000 | | | 3.000%, 6/1/2026 | | | 1,181,523 | |
| | 965,000 | | | 3.000%, 6/1/2027 | | | 1,032,540 | |
| | 2,000,000 | | | Cabell County Board of Education, 2.000%, 6/1/2033 | | | 2,061,289 | |
| Shares/Principal Amount | | Value | |
| | | | Calhoun County, West Virginia, Board of Education General Obligation Unlimited Bonds (Public Schools): | | | |
| $ | 195,000 | | | 3.600%, 6/1/2024 | | $ | 195,458 | |
| | 205,000 | | | 3.750%, 6/1/2025 | | | 205,489 | |
| | 215,000 | | | 3.850%, 6/1/2026 | | | 215,512 | |
| | 265,000 | | | City of Buckhannon, West Virginia, Commercial Development Revenue Bonds, Series A, 3.700%, 12/1/2028 | | | 265,309 | |
| | 595,000 | | | City of Buckhannon, West Virginia, Waterworks Revenue Bonds, Series A, 4.000%, 3/1/2029 | | | 596,933 | |
| | | | | City of Charles Town WV Waterworks & Sewerage System Revenue: | | | | |
| | 400,000 | | | 2.250%, 6/1/2035 | | | 406,762 | |
| | 315,000 | | | 3.000%, 6/1/2041 | | | 332,779 | |
| | | | | City of Charles Town, West Virginia, Waterworks & Sewage System Revenue Bonds: | | | | |
| | 185,000 | | | Series A, 3.000%, 3/1/2025 | | | 197,806 | |
| | 190,000 | | | Series A, 3.000%, 3/1/2026 | | | 205,971 | |
| | 620,000 | | | Series A, 4.000%, 3/1/2029 | | | 700,274 | |
| | 405,000 | | | Series A, 3.500%, 12/1/2030 | | | 405,710 | |
| | 260,000 | | | Series B, 3.000%, 10/1/2028 | | | 260,424 | |
| | 310,000 | | | Series B, 4.000%, 6/1/2031 | | | 341,712 | |
| | | | | City of Charleston, West Virginia, Sewage System Revenue Bonds: | | | | |
| | 310,000 | | | 4.000%, 7/1/2031 | | | 351,897 | |
| | 275,000 | | | 4.000%, 7/1/2032 | | | 312,101 | |
| | 300,000 | | | City of Clarksburg WV Water Revenue, 2.000%, 6/1/2034 | | | 302,107 | |
| | | | | City of Huntington, West Virginia, Sewerage System Revenue Bonds: | | | | |
| | 300,000 | | | 3.000%, 11/1/2026 | | | 318,246 | |
| | 300,000 | | | 3.000%, 11/1/2028 | | | 318,134 | |
| | | | | City of Martinsburg, West Virginia, Combined Waterworks & Sewerage System Revenue Bonds: | | | | |
| | 250,000 | | | Series A, 3.000%, 9/1/2023 | | | 250,508 | |
| | 490,000 | | | Series A, 3.500%, 9/1/2027 | | | 491,084 | |
| | | | | City of Saint Albans, West Virginia, Combined Waterworks & Sewerage System Revenue Bonds: | | | | |
| | 220,000 | | | Series A, 4.250%, 6/1/2026 | | | 222,757 | |
| | 600,000 | | | Series B, 4.000%, 12/1/2027 | | | 601,143 | |
| Annual Report | December 31, 2021 | | 41 |
| WesMark West Virginia Municipal Bond Fund | December 31, 2021 |
| Shares/Principal Amount | | Value | |
| | | | City of Wheeling WV Waterworks & Sewerage System Revenue: | | | |
| $ | 500,000 | | | 4.000%, 6/1/2035 | | $ | 608,963 | |
| | 500,000 | | | 4.000%, 6/1/2036 | | | 606,081 | |
| | | | | City of Wheeling, West Virginia, Waterworks & Sewerage System Revenue Bonds: | | | | |
| | 500,000 | | | 4.000%, 6/1/2026 | | | 525,814 | |
| | 535,000 | | | Series A, 3.000%, 6/1/2029 | | | 554,878 | |
| | 555,000 | | | Series A, 3.000%, 6/1/2030 | | | 575,622 | |
| | | | | Claywood Park Public Service District WV Water Revenue: | | | | |
| | 950,000 | | | 3.000%, 11/1/2036 | | | 1,008,514 | |
| | 680,000 | | | 3.000%, 11/1/2041 | | | 712,828 | |
| | | | | Claywood Park Public Service District, West Virginia, Water Revenue Bonds: | | | | |
| | 110,000 | | | Series C, 3.200%, 11/1/2029 | | | 111,974 | |
| | 225,000 | | | Series C, 3.400%, 11/1/2031 | | | 229,257 | |
| | 380,000 | | | Corporation of Shepherdstown, West Virginia, Water Revenue Bonds, 3.300%, 3/1/2032 | | | 380,907 | |
| | | | | Fayette County Board of Education: | | | | |
| | 545,000 | | | 2.250%, 10/1/2030 | | | 545,455 | |
| | 500,000 | | | 2.000%, 10/1/2031 | | | 500,021 | |
| | 640,000 | | | 2.250%, 10/1/2032 | | | 640,347 | |
| | 565,000 | | | 2.500%, 10/1/2033 | | | 565,681 | |
| | | | | Hampshire County, West Virginia, Building Commission Revenue Bonds: | | | | |
| | 355,000 | | | Series A, 3.000%, 1/1/2029 | | | 359,701 | |
| | 380,000 | | | Series A, 3.000%, 1/1/2031 | | | 383,258 | |
| | 1,660,000 | | | Series A, 4.250%, 1/1/2035 | | | 1,738,837 | |
| | 2,265,000 | | | Hancock, WV, 3.250%, 5/1/2036(1)(2) | | | 2,448,281 | |
| | 1,000,000 | | | Harrison County Building Commission, 3.500%, 10/1/2035 | | | 1,072,925 | |
| | 3,000,000 | | | Jefferson County Board of Education, 2.000%, 6/1/2036 | | | 3,063,247 | |
| | 1,910,000 | | | Mason County Public Service District Water Revenue, 3.000%, 12/1/2036 | | | 2,086,062 | |
| | 2,320,000 | | | Monongalia County Building Commission, 2.000%, 2/1/2034 | | | 2,340,724 | |
| | | | | Morgantown Utility Board, Inc.: | | | | |
| | 500,000 | | | 3.250%, 12/1/2032 | | | 549,491 | |
| | 500,000 | | | 4.000%, 12/1/2034 | | | 603,054 | |
| | 1,500,000 | | | 3.000%, 12/1/2040 | | | 1,622,233 | |
| Shares/Principal Amount | | Value | |
| $ | 1,430,000 | | | Morgantown, West Virginia, Combined Utility System Revenue Bonds, Series A, 3.500%, 12/1/2035 | | $ | 1,587,010 | |
| | 200,000 | | | Morgantown, West Virginia, Combined Utility System Revenue Bonds, Series A, 3.750%, 10/1/2032 | | | 207,482 | |
| | | | | Morgantown, West Virginia, Utility Board Revenue Bonds: | | | | |
| | 1,000,000 | | | Series A, 3.000%, 12/1/2028 | | | 1,092,597 | |
| | 1,000,000 | | | Series A, 4.000%, 12/1/2029 | | | 1,149,588 | |
| | 1,210,000 | | | Series A, 4.000%, 12/1/2030 | | | 1,388,830 | |
| | 1,000,000 | | | Series A, 4.000%, 12/1/2031 | | | 1,145,947 | |
| | | | | Ohio County Board of Education: | | | | |
| | 3,000,000 | | | 3.000%, 6/1/2033 | | | 3,343,619 | |
| | 635,000 | | | 3.000%, 6/1/2034 | | | 706,572 | |
| | 265,000 | | | Putnam County, West Virginia, Public Service District Revenue Bonds, Series A, 3.500%, 4/1/2027 | | | 267,085 | |
| | | | | Putnam Public Service District: | | | | |
| | 1,000,000 | | | 4.000%, 12/1/2039 | | | 1,085,628 | |
| | 1,150,000 | | | 3.000%, 11/1/2040 | | | 1,241,936 | |
| | 1,000,000 | | | 3.000%, 4/1/2041 | | | 1,059,803 | |
| | 1,000,000 | | | 3.000%, 6/1/2041 | | | 1,065,658 | |
| | 1,000,000 | | | 3.625%, 12/1/2045 | | | 1,053,394 | |
| | 1,035,000 | | | Salem, West Virginia Sewer Revenue Bonds, Series A, 4.000%, 12/1/2032 | | | 1,078,951 | |
| | 500,000 | | | State of West Virginia, 5.000%, 6/1/2033 | | | 624,588 | |
| | 795,000 | | | Wayne County, West Virginia, Board of Education General Obligation Unlimited Bonds, 3.000%, 6/1/2026 | | | 836,600 | |
| | 500,000 | | | West Virginia Commissioner Of Highways Special Obligation Surface Transportation Improvements Bonds, Series A, 5.000%, 9/1/2029 | | | 612,791 | |
| | 670,000 | | | West Virginia Economic Development Authority Lease Revenue Bonds (Clarksburg Office Building), 3.500%, 6/1/2030 | | | 715,319 | |
| | 1,750,000 | | | West Virginia Economic Development Authority Lease Revenue Bonds (Correctional Juvenile & Public), 4.000%, 6/1/2024 | | | 1,754,488 | |
| 42 | | www.wesmarkfunds.com |
Portfolio of Investments
| December 31, 2021 | WesMark West Virginia Municipal Bond Fund |
| Shares/Principal Amount | | Value | |
| $ | 500,000 | | | West Virginia Economic Development Authority Lease Revenue Bonds (Correctional Juvenile), 5.000%, 6/1/2022 | | $ | 501,766 | |
| | | | | West Virginia Economic Development Authority Lease Revenue Bonds (Department of Environmental Protection): | | | | |
| | 1,280,000 | | | Series B, 3.375%, 11/1/2025 | | | 1,307,274 | |
| | 755,000 | | | Series B, 3.500%, 11/1/2026 | | | 771,171 | |
| | 1,650,000 | | | West Virginia Economic Development Authority Lease Revenue Bonds (State Office Building & Parking Lot), Series A, 4.750%, 8/1/2029 | | | 1,655,800 | |
| | | | | West Virginia Economic Development Authority Lease Revenue Bonds (State Office Building): | | | | |
| | 1,525,000 | | | Series A, 5.000%, 6/1/2025 | | | 1,554,525 | |
| | 315,000 | | | Series A, 3.375%, 6/1/2029 | | | 336,026 | |
| | 365,000 | | | Series B, 3.375%, 10/1/2023 | | | 365,786 | |
| | 390,000 | | | Series B, 3.500%, 10/1/2024 | | | 390,846 | |
| | 415,000 | | | Series B, 3.625%, 10/1/2025 | | | 415,907 | |
| | 435,000 | | | Series B, 3.750%, 10/1/2026 | | | 436,025 | |
| | 310,000 | | | Series C, 3.500%, 6/1/2030 | | | 330,969 | |
| | 515,000 | | | Series D, 5.000%, 6/1/2025 | | | 589,199 | |
| | 600,000 | | | Series D, 3.250%, 6/1/2028 | | | 641,208 | |
| | 330,000 | | | Series D, 3.375%, 6/1/2029 | | | 352,028 | |
| | 355,000 | | | Series D, 3.500%, 6/1/2030 | | | 379,013 | |
| | 1,000,000 | | | West Virginia Economic Development Authority Lottery Revenue Bonds, Series A, 5.000%, 7/1/2032 | | | 1,214,629 | |
| | | | | West Virginia Higher Education Policy Commission Revenue Bonds (Higher Education Facilities): | | | | |
| | 1,730,000 | | | 5.000%, 7/1/2034 | | | 2,076,775 | |
| | 360,000 | | | Series B, 3.200%, 4/1/2024 | | | 362,118 | |
| | 375,000 | | | Series B, 3.375%, 4/1/2025 | | | 377,281 | |
| | 385,000 | | | Series B, 3.500%, 4/1/2026 | | | 387,384 | |
| | 400,000 | | | Series B, 3.600%, 4/1/2027 | | | 402,578 | |
| | 1,000,000 | | | West Virginia Hospital Finance Authority Revenue Bonds (ARCs Improvement), Series D, 4.000%, 6/1/2029 | | | 1,129,805 | |
| | 585,000 | | | West Virginia Hospital Finance Authority Revenue Bonds (West Virginia University Health System), Series A, 3.375%, 6/1/2029 | | | 646,138 | |
| Shares/Principal Amount | | Value | |
| | | | | West Virginia Housing Development Fund: | | | | |
| $ | 500,000 | | | 2.000%, 11/1/2032 | | $ | 507,098 | |
| | 1,500,000 | | | 3.700%, 11/1/2032 | | | 1,620,300 | |
| | 500,000 | | | 3.375%, 11/1/2034 | | | 538,610 | |
| | 800,000 | | | 2.050%, 11/1/2035 | | | 807,113 | |
| | 350,000 | | | 3.950%, 11/1/2049 | | | 365,103 | |
| | | | | West Virginia School Building Authority Excess Lottery Revenue Bonds: | | | | |
| | 500,000 | | | Series A, 3.000%, 7/1/2025 | | | 506,149 | |
| | 700,000 | | | Series A, 3.125%, 7/1/2026 | | | 708,557 | |
| | 370,000 | | | Series B, 4.000%, 7/1/2023 | | | 371,056 | |
| | | | | West Virginia School Building Authority Lottery Revenue Capital Improvement Bonds: | | | | |
| | 515,000 | | | Series A, 5.000%, 7/1/2026 | | | 550,654 | |
| | 535,000 | | | Series A, 5.000%, 7/1/2027 | | | 571,623 | |
| | 300,000 | | | West Virginia State Bonds, Series A, 3.250%, 6/1/2033 | | | 332,371 | |
| | 500,000 | | | West Virginia State Economic Development Authority Lottery Revenue Bonds, 3.000%, 6/15/2031 | | | 541,551 | |
| | 500,000 | | | West Virginia State Hospital Finance Authority Refunding West Virginia United Health System, Series A, 4.000%, 6/1/2034 | | | 558,716 | |
| | 500,000 | | | West Virginia State Housing Development Fund Revenue Bonds, Series A, Series A, 3.450%, 11/1/2033 | | | 542,557 | |
| | 1,030,000 | | | West Virginia State University Revenues Revenue Bonds, Series A, 5.250%, 4/1/2028 | | | 1,185,129 | |
| | 1,000,000 | | | West Virginia University, 4.000%, 10/1/2037 | | | 1,183,236 | |
| | 500,000 | | | West Virginia University Revenue Bonds (West Virginia University Project), Series A, 5.000%, 10/1/2027 | | | 517,954 | |
| | 500,000 | | | West Virginia Water Development Authority, 4.000%, 10/1/2041 | | | 559,028 | |
| | 500,000 | | | West Virginia Water Development Authority Infrastructure Revenue Bonds, Series A, 5.000%, 10/1/2032 | | | 598,072 | |
| Annual Report | December 31, 2021 | | 43 |
| WesMark West Virginia Municipal Bond Fund | December 31, 2021 |
| Shares/Principal Amount | | Value | |
| $ | 2,605,000 | | | West Virginia Water Development Authority Infrastructure Revenue Bonds (West Virginia Infrastructure Jobs Program), Series A, 5.000%, 10/1/2029 | | $ | 3,126,723 | |
| | 250,000 | | | West Virginia Water Development Authority Revenue Bonds (Loan Program I), Series B-I, 4.000%, 11/1/2024 | | | 257,500 | |
| | 1,395,000 | | | West Virginia Water Development Authority Revenue Bonds (Loan Program), Series B-I, 4.000%, 11/1/2025 | | | 1,436,456 | |
| | | | | West Virginia Water Development Authority Revenue Bonds (Loan Program II): | | | | |
| | 605,000 | | | Series A-II, 3.000%, 11/1/2024 | | | 630,133 | |
| | 600,000 | | | Series A-II, 3.250%, 11/1/2025 | | | 626,040 | |
| | 550,000 | | | Series A-II, 5.000%, 11/1/2025 | | | 640,280 | |
| | 650,000 | | | Series A-II, 5.000%, 11/1/2026 | | | 780,405 | |
| | 800,000 | | | Series A-II, 3.000%, 11/1/2027 | | | 877,017 | |
| | 300,000 | | | Series A-II, 3.125%, 11/1/2028 | | | 327,576 | |
| | 725,000 | | | Series B-II, 4.000%, 11/1/2025 | | | 746,545 | |
| | 250,000 | | | West Virginia Water Development Authority Revenue Bonds (Loan Program IV), Series A-IV, 5.000%, 11/1/2033 | | | 306,957 | |
| | 500,000 | | | West Virginia, State Parkways Authority Senior Turnpike Toll Revenue Bonds, 5.000%, 6/1/2033 | | | 621,777 | |
| | 1,000,000 | | | Wood County, West Virginia, Board of Education Public School General Obligation Unlimited Bonds, 3.000%, 6/1/2029 | | | 1,098,178 | |
| | 860,000 | | | Wood County, West Virginia, Building Commission Lease Revenue Bonds, 4.000%, 1/1/2032 | | | 863,923 | |
| | | | | | | | 108,878,399 | |
| TOTAL NON-TAXABLE MUNICIPAL BONDS | | | | |
| (Cost $107,015,513) | | | 111,813,799 | |
| Shares/Principal Amount | | Value | |
| SHORT TERM INVESTMENTS-2.0% | | | | |
| | | | | Mutual Funds-2.0% | | | | |
| | 2,272,894 | | | Federated Hermes Government Obligations Fund, Premier Class, 7-Day Yield 0.030% (at net asset value) | | $ | 2,272,894 | |
| TOTAL SHORT TERM INVESTMENTS | | | | |
| (Cost $2,272,894) | | | 2,272,894 | |
| | | | | | | | | |
| TOTAL INVESTMENTS-99.5% |
| (Cost $109,288,407) | | | 114,086,693 | |
| OTHER ASSETS AND LIABILITIES-NET(3)-0.5% | | | 611,305 | |
| NET ASSETS-100.0% | | $ | 114,697,998 | |
| (1) | Floating or variable rate security. The reference rate is described above. The Rate in effect as of December 31, 2021 is based on the reference rate plus the displayed spread as of the security's last reset date. |
| (2) | Security exempt from registration under rule 144A of the Securities Act of 1933. These securities may be resold in transactions exempt from registration, normally to qualified institutional buyers. As of December 31, 2021, these securities amounted to a value of $2,448,281 or 2.13% of net assets. These Securities have been determined to be liquid pursuant to procedures adopted by the board. |
| (3) | Assets, other than investments in securities, less liabilities. |
Note - The categories of investments are shown as a percentage of net assets as of December 31, 2021.
See Notes to Financial Statements which are an integral part of the Financial Statements.
| 44 | | www.wesmarkfunds.com |
Portfolio of Investments Summary Table
| December 31, 2021 (Unaudited) | WesMark Tactical Opportunity Fund |
As of December 31, 2021, the Fund's Portfolio Composition(1) was as follows:
| Portfolio Composition | Percentage of Total Net Assets |
| EXCHANGE TRADED FUNDS (ETF) | 94.1% |
| SHORT TERM INVESTMENTS(2) | 5.6% |
| OTHER ASSETS AND LIABILITIES - NET(3) | 0.3% |
| TOTAL NET ASSETS | 100.0% |
As of December 31, 2021, the Fund's Category composition(4) was as follows:
| Category Composition | Percentage of Total Net Assets |
| U.S. Sector Focused Equity | 28.0% |
| U.S. Value Company Focused Equity | 20.0% |
| Exchange Traded Funds | 15.9% |
| U.S. Small and Mid Cap Equity | 10.5% |
| International (ex. U.S.) Equity | 5.8% |
| International (ex. U.S.) Fixed Income | 5.4% |
| Broad Domestic Equity | 4.3% |
| Commodities | 4.2% |
| ETF Portfolio Sub-Total | 94.1% |
| Short Term Investments(2) | 5.6% |
| Other Assets and Liabilities - Net(3) | 0.3% |
| Total Net Assets | 100.0% |
| (1) | See the Fund's Prospectus and Statement of Additional Information for a description of the types of securities in which the Fund invests. |
| (2) | Short Term Investments include investment in a money market mutual fund. |
| (3) | Assets, other than investments in securities, less liabilities. |
| (4) | Securities are assigned to a category classification by the Fund's advisor. |
| Annual Report | December 31, 2021 | | 45 |
| WesMark Tactical Opportunity Fund | December 31, 2021 |
| Shares/Principal Amount | | Value | |
| EXCHANGE TRADED FUNDS-94.1% | | | | |
| BROAD DOMESTIC EQUITY-4.3% | | | | |
| | 4,335 | | | SPDR S&P 500® ETF Trust | | $ | 2,058,952 | |
| | | | | | | | | |
| TOTAL BROAD DOMESTIC EQUITY | | | 2,058,952 | |
| | | | | | | | | |
| BROAD DOMESTIC FIXED INCOME-15.9% | | | | |
| | 37,890 | | | Vanguard® Intermediate-Term Corporate Bond ETF | | | 3,514,676 | |
| | 48,409 | | | Vanguard® Total Bond Market ETF | | | 4,102,663 | |
| | | | | | | | | |
| TOTAL BROAD DOMESTIC FIXED INCOME | | | 7,617,339 | |
| | | | | | | | | |
| COMMODITIES-4.2% | | | | |
| | 87,511 | | | Invesco Optimum Yield Diversified Commodity Strategy No K-1 ETF | | | 1,230,405 | |
| | 4,510 | | | SPDR® Gold Shares(1) | | | 771,029 | |
| | | | | | | | | |
| TOTAL COMMODITIES | | | 2,001,434 | |
| | | | | | | | | |
| INTERNATIONAL (EX. U.S.) EQUITY-5.8% | | | | |
| | 26,311 | | | iShares® MSCI EAFE ETF | | | 2,070,150 | |
| | 12,065 | | | iShares® MSCI Emerging Markets ex China ETF | | | 731,501 | |
| | | | | | | | | |
| TOTAL INTERNATIONAL (EX. U.S.) EQUITY | | | 2,801,651 | |
| | | | | | | | | |
| INTERNATIONAL (EX. U.S.) FIXED INCOME-5.4% | | | | |
| | 23,545 | | | iShares® JP Morgan USD Emerging Markets Bond ETF | | | 2,567,818 | |
| | | | | | | | | |
| TOTAL INTERNATIONAL (EX. U.S.) FIXED INCOME | | | 2,567,818 | |
| | | | | | | | | |
| U.S. SECTOR FOCUSED EQUITY-28.0% | | | | |
| | 8,393 | | | First Trust Consumer Discretionary AlphaDEX Fund | | | 520,702 | |
| | 17,219 | | | Health Care Select Sector SPDR® Fund | | | 2,425,985 | |
| | 28,966 | | | Industrial Select Sector SPDR® Fund | | | 3,064,892 | |
| | 9,197 | | | iShares® U.S. Broker-Dealers & Securities Exchanges ETF | | | 1,013,509 | |
| | 18,798 | | | iShares® US Regional Banks ETF | | | 1,160,964 | |
| | 8,696 | | | Materials Select Sector SPDR® Fund | | | 787,945 | |
| | 14,570 | | | Technology Select Sector SPDR® Fund | | | 2,533,286 | |
| | 16,780 | | | Vanguard® REIT ETF | | | 1,946,648 | |
| Shares/Principal Amount | | Value | |
| TOTAL U.S. SECTOR FOCUSED EQUITY | | $ | 13,453,931 | |
| | | | | | | | | |
| U.S. SMALL AND MID CAP EQUITY-10.5% | | | | |
| | 22,549 | | | iShares® Russell 2000® ETF | | | 5,016,025 | |
| | | | | | | | | |
| TOTAL U.S. SMALL AND MID CAP EQUITY | | | 5,016,025 | |
| | | | | | | | | |
| U.S. VALUE COMPANY FOCUSED EQUITY-20.0% | | | | |
| | 30,065 | | | iShares® MSCI USA Quality Factor ETF | | | 4,376,261 | |
| | 49,078 | | | Vanguard® Mega Cap Value ETF | | | 5,242,512 | |
| | | | | | | | | |
| TOTAL U.S. VALUE COMPANY FOCUSED EQUITY | | | 9,618,773 | |
| | | | | | | | | |
| TOTAL EXCHANGE TRADED FUNDS | | | | |
| (Cost $38,708,944) | | | 45,135,923 | |
| | | | | | | | | |
| SHORT TERM INVESTMENTS-5.6% | | | | |
| | | | | Mutual Funds-5.6% | | | | |
| | 2,717,033 | | | Federated Hermes Government Obligations Fund, Premier Class, 7-Day Yield 0.030% (at net asset value) | | | 2,717,033 | |
| | | | | | | | | |
| TOTAL SHORT TERM INVESTMENTS | | | | |
| (Cost $2,717,033) | | | 2,717,033 | |
| | | | | | | | | |
| TOTAL INVESTMENTS-99.7% | | | | |
| (Cost $41,425,977) | | | 47,852,956 | |
| OTHER ASSETS AND LIABILITIES-NET(2)-0.3% | | | 126,133 | |
| NET ASSETS-100.0% | | $ | 47,979,089 | |
| (1) | Non-income producing security. |
| (2) | Assets, other than investments in securities, less liabilities. |
Note - The categories of investments are shown as a percentage of net assets as of December 31, 2021.
See Notes to Financial Statements which are an integral part of the Financial Statements.
| 46 | | www.wesmarkfunds.com |
Statements of Assets and Liabilities
December 31, 2021
| | | | WesMark Small Company Fund | | | WesMark Large Company Fund | | | WesMark Balanced
Fund | | | WesMark Government Bond
Fund | | | WesMark
West Virginia Municipal
Bond
Fund | | | WesMark Tactical Opportunity Fund | |
| ASSETS: | | | | | | | | | | | | | | | | | | |
| | | | | | | | | | | | | | | | | | | |
| Investments in securities, at value (cost - see below) | | $ | 119,768,768 | | | $ | 402,696,162 | | | $ | 121,653,606 | | | $ | 243,107,474 | | | $ | 114,086,693 | | | $ | 47,852,956 | |
| Cash | | | 1,665 | | | | 125,448 | | | | 3,016 | | | | – | | | | – | | | | 156,132 | |
| | | | | | | | | | | | | | | | | | | | | | | | | |
| RECEIVABLE FOR: | | | | | | | | | | | | | | | | | | | | | | | | |
| Dividends and interest | | | 43,710 | | | | 115,680 | | | | 264,702 | | | | 744,223 | | | | 722,550 | | | | 19,281 | |
| Investments sold | | | – | | | | – | | | | 24,590 | | | | 261,226 | | | | – | | | | – | |
| Fund shares sold | | | 21,232 | | | | 34,043 | | | | 4,393 | | | | 76,775 | | | | 133,681 | | | | 6,177 | |
| Prepaid expenses | | | 9,553 | | | | 30,325 | | | | 9,750 | | | | 18,233 | | | | 9,224 | | | | 4,281 | |
| Total Assets | | | 119,844,928 | | | | 403,001,658 | | | | 121,960,057 | | | | 244,207,931 | | | | 114,952,148 | | | | 48,038,827 | |
| | | | | | | | | | | | | | | | | | | | | | | | | |
| LIABILITIES: | | | | | | | | | | | | | | | | | | | | | | | | |
| | | | | | | | | | | | | | | | | | | | | | | | | |
| PAYABLE FOR: | | | | | | | | | | | | | | | | | | | | | | | | |
| Investments purchased | | | – | | | | – | | | | – | | | | 1,013,472 | | | | – | | | | – | |
| Fund shares redeemed | | | 26,762 | | | | 74,583 | | | | 16,630 | | | | 49,531 | | | | – | | | | 3,520 | |
| Income distribution payable | | | – | | | | – | | | | – | | | | 265,828 | | | | 156,500 | | | | – | |
| Investment advisory fees | | | – | | | | – | | | | – | | | | 10 | | | | – | | | | 1 | |
| Fund Accounting and Administration fees | | | 16,543 | | | | 26,617 | | | | 26,668 | | | | 56,920 | | | | 44,491 | | | | 12,637 | |
| Audit, Tax, and Legal expenses | | | 26,422 | | | | 26,422 | | | | 26,422 | | | | 26,422 | | | | 19,822 | | | | 26,422 | |
| Shareholder services fee (Note 5) | | | 25,087 | | | | 85,867 | | | | 26,538 | | | | 52,987 | | | | 25,569 | | | | 10,329 | |
| Transfer agency expenses | | | 6,520 | | | | 11,942 | | | | 8,368 | | | | 6,837 | | | | 4,827 | | | | 3,589 | |
| Registration expenses | | | 3,474 | | | | – | | | | – | | | | – | | | | – | | | | – | |
| Printing and Postage expenses | | | 3,034 | | | | 2,952 | | | | 2,998 | | | | 3,140 | | | | 2,939 | | | | 3,238 | |
| Trustees' fees and expenses | | | 2 | | | | 2 | | | | 2 | | | | 2 | | | | 2 | | | | 2 | |
| Total Liabilities | | | 107,844 | | | | 228,385 | | | | 107,626 | | | | 1,475,149 | | | | 254,150 | | | | 59,738 | |
| Net Assets | | $ | 119,737,084 | | | $ | 402,773,273 | | | $ | 121,852,431 | | | $ | 242,732,782 | | | $ | 114,697,998 | | | $ | 47,979,089 | |
| | | | | | | | | | | | | | | | | | | | | | | | | |
| NET ASSETS CONSIST OF: | | | | | | | | | | | | | | | | | | | | | | | | |
| | | | | | | | | | | | | | | | | | | | | | | | | |
| Paid-in capital | | $ | 61,719,402 | | | $ | 129,540,459 | | | $ | 82,172,700 | | | $ | 245,489,879 | | | $ | 109,900,588 | | | $ | 40,902,545 | |
| Total distributable earnings | | | 58,017,682 | | | | 273,232,814 | | | | 39,679,731 | | | | (2,757,097 | ) | | | 4,797,410 | | | | 7,076,544 | |
| Net Assets | | $ | 119,737,084 | | | $ | 402,773,273 | | | $ | 121,852,431 | | | $ | 242,732,782 | | | $ | 114,697,998 | | | $ | 47,979,089 | |
| | | | | | | | | | | | | | | | | | | | | | | | | |
| Shares Outstanding, No Par Value, Unlimited Shares Authorized | | | 7,648,415 | | | | 14,695,170 | | | | 8,300,602 | | | | 24,753,171 | | | | 10,727,700 | | | | 3,944,960 | |
| Net asset value, offering price & redemption price per share | | $ | 15.66 | | | $ | 27.41 | | | $ | 14.68 | | | $ | 9.81 | | | $ | 10.69 | | | $ | 12.16 | |
| Investments, at identified cost | | $ | 65,916,126 | | | $ | 137,421,834 | | | $ | 83,995,104 | | | $ | 242,916,928 | | | $ | 109,288,407 | | | $ | 41,425,977 | |
See Notes to Financial Statements which are an integral part of the Financial Statements.
| Annual Report | December 31, 2021 | | 47 |
For the Year Ended December 31, 2021
| | | WesMark Small Company Fund | | | WesMark Large Company Fund | | | WesMark
Balanced Fund | | | WesMark Government Bond Fund | | | WesMark
West Virginia
Municipal Bond
Fund | | | WesMark
Tactical Opportunity
Fund | |
| INVESTMENT INCOME: | | | | | | | | | | | | | | | | | | | | | | | | |
| Dividends, net of foreign taxes* | | $ | 964,310 | | | $ | 4,061,240 | | | $ | 2,003,082 | | | $ | – | | | $ | – | | | $ | 1,412,748 | |
| Interest | | | 1,243 | | | | 1,613 | | | | 714,452 | | | | 4,153,083 | | | | 3,183,924 | | | | 545 | |
| Total Investment Income | | | 965,553 | | | | 4,062,853 | | | | 2,717,534 | | | | 4,153,083 | | | | 3,183,924 | | | | 1,413,293 | |
| EXPENSES: | | | | | | | | | | | | | | | | | | | | | | | | |
| Investment adviser fee (Note 5) | | | 961,030 | | | | 2,943,918 | | | | 891,407 | | | | 1,427,534 | | | | 703,779 | | | | 366,756 | |
| Fund Accounting and Administration fees (Note 5) | | | 124,528 | | | | 243,203 | | | | 135,479 | | | | 214,253 | | | | 155,081 | | | | 90,164 | |
| Custodian fees (Note 5) | | | 21,799 | | | | 46,431 | | | | 19,422 | | | | 30,731 | | | | 18,058 | | | | 12,392 | |
| Transfer agency expenses (Note 5) | | | 32,791 | | | | 57,543 | | | | 41,379 | | | | 34,290 | | | | 25,346 | | | | 19,439 | |
| Trustees' fees and expenses (Note 8) | | | 30,076 | | | | 55,759 | | | | 29,186 | | | | 40,912 | | | | 29,189 | | | | 22,209 | |
| Audit and tax expenses | | | 21,561 | | | | 21,561 | | | | 21,561 | | | | 21,561 | | | | 21,561 | | | | 21,644 | |
| Chief compliance officer fees | | | 106 | | | | 106 | | | | 106 | | | | 106 | | | | 106 | | | | 106 | |
| Legal expenses | | | 22,903 | | | | 22,903 | | | | 22,903 | | | | 22,903 | | | | 22,881 | | | | 22,903 | |
| Shareholder services fee (Note 5) | | | 318,326 | | | | 971,038 | | | | 295,057 | | | | 594,097 | | | | 293,849 | | | | 123,000 | |
| Registration expenses | | | 21,878 | | | | 20,238 | | | | 14,631 | | | | 14,881 | | | | 8,816 | | | | 15,992 | |
| Printing and Postage expenses | | | 7,776 | | | | 7,838 | | | | 7,751 | | | | 7,679 | | | | 7,747 | | | | 7,575 | |
| Insurance premiums | | | 5,402 | | | | 17,639 | | | | 5,610 | | | | 11,608 | | | | 6,111 | | | | 2,180 | |
| Miscellaneous fees | | | 3,540 | | | | 12,276 | | | | 4,222 | | | | 9,137 | | | | 4,668 | | | | 1,544 | |
| Net Expenses | | | 1,571,716 | | | | 4,420,453 | | | | 1,488,714 | | | | 2,429,692 | | | | 1,297,192 | | | | 705,904 | |
| Net Investment Income (Loss) | | | (606,163 | ) | | | (357,600 | ) | | | 1,228,820 | | | | 1,723,391 | | | | 1,886,732 | | | | 707,389 | |
| REALIZED & UNREALIZED GAIN (LOSS) ON INVESTMENTS: | | | | | | | | | | | | | | | | | | | | | | | | |
| Net realized gain on investments | | | 24,128,527 | | | | 25,778,073 | | | | 7,572,866 | | | | 931,138 | | | | 244,197 | | | | 4,893,008 | |
| Net realized gain on written options | | | – | | | | 23,523 | | | | 50,262 | | | | – | | | | – | | | | 77,042 | |
| Long-term capital gain distributions from other investment companies | | | – | | | | – | | | | – | | | | – | | | | – | | | | 29,022 | |
| Net change in unrealized appreciation (depreciation) of investments | | | 1,723,734 | | | | 64,883,254 | | | | 8,425,299 | | | | (5,980,545 | ) | | | (1,582,104 | ) | | | 523,492 | |
| Net change in unrealized appreciation (depreciation) of written options | | | – | | | | – | | | | 16,382 | | | | – | | | | – | | | | 14,085 | |
| Net realized and unrealized gain (loss) on investments | | | 25,852,261 | | | | 90,684,850 | | | | 16,064,809 | | | | (5,049,407 | ) | | | (1,337,907 | ) | | | 5,536,649 | |
| Net Increase (Decrease) in Net Assets Resulting from Operations | | $ | 25,246,098 | | | $ | 90,327,250 | | | $ | 17,293,629 | | | $ | (3,326,016 | ) | | $ | 548,825 | | | $ | 6,244,038 | |
| *Foreign tax withholding | | $ | – | | | $ | 25,201 | | | $ | 10,823 | | | $ | – | | | $ | – | | | $ | – | |
See Notes to Financial Statements which are an integral part of the Financial Statements.
| 48 | | www.wesmarkfunds.com |
Statements of Changes in Net Assets
| | | WesMark Small Company Fund | | | WesMark Large Company Fund | |
| | | For the Year Ended December 31, 2021 | | | For the Year Ended December 31, 2020 | | | For the Year Ended December 31, 2021 | | | For the Year Ended December 31, 2020 | |
| INCREASE (DECREASE) IN NET ASSETS FROM: | | | | | | | | | | | | | | | | |
| OPERATIONS | | | | | | | | | | | | | | | | |
| | | | | | | | | | | | | | | | | |
| Net investment income (loss) | | $ | (606,163 | ) | | $ | (354,553 | ) | | $ | (357,600 | ) | | $ | 220,884 | |
| Net realized gain | | | 24,128,527 | | | | 18,081,826 | | | | 25,801,596 | | | | 31,263,642 | |
| Net change in unrealized appreciation | | | 1,723,734 | | | | 16,581,381 | | | | 64,883,254 | | | | 48,769,116 | |
| Net increase in net assets resulting from operations | | | 25,246,098 | | | | 34,308,654 | | | | 90,327,250 | | | | 80,253,642 | |
| | | | | | | | | | | | | | | | | |
| DISTRIBUTIONS TO SHAREHOLDERS (NOTE 4) | | | | | | | | | | |
| | | | | | | | | | | | | | | | | |
| From distributable earnings | | | (27,541,484 | ) | | | (9,440,746 | ) | | | (29,514,204 | ) | | | (26,435,378 | ) |
| Decrease in net assets from distributions to shareholders | | | (27,541,484 | ) | | | (9,440,746 | ) | | | (29,514,204 | ) | | | (26,435,378 | ) |
| | | | | | | | | | | | | | | | | |
| BENEFICIAL INTEREST TRANSACTIONS (NOTE 3) | | | | | | | | | | | | |
| | | | | | | | | | | | | | | | | |
| Proceeds from sale of shares | | | 15,299,257 | | | | 8,738,188 | | | | 18,372,976 | | | | 19,375,754 | |
| Shares issued in reinvestment of distributions | | | 6,408,336 | | | | 2,599,130 | | | | 8,481,757 | | | | 8,375,367 | |
| Cost of shares redeemed | | | (15,779,816 | ) | | | (16,285,252 | ) | | | (48,980,226 | ) | | | (48,721,725 | ) |
| Net increase (decrease) resulting from beneficial interest transactions | | | 5,927,777 | | | | (4,947,934 | ) | | | (22,125,493 | ) | | | (20,970,604 | ) |
| Net Increase in Net Assets | | | 3,632,391 | | | | 19,919,974 | | | | 38,687,553 | | | | 32,847,660 | |
| | | | | | | | | | | | | | | | | |
| NET ASSETS: | | | | | | | | | | | | | | | | |
| Beginning of Year | | | 116,104,693 | | | | 96,184,719 | | | | 364,085,720 | | | | 331,238,060 | |
| End of Year | | $ | 119,737,084 | | | $ | 116,104,693 | | | $ | 402,773,273 | | | $ | 364,085,720 | |
See Notes to Financial Statements which are an integral part of the Financial Statements.
| Annual Report | December 31, 2021 | | 49 |
| Statements of Changes in Net Assets | |
| | | WesMark Balanced Fund | | WesMark Government Bond Fund | |
| | | For the Year Ended December 31, 2021 | | | For the Year Ended December 31, 2020 | | | For the Year Ended December 31, 2021 | | | | For the Year Ended December 31, 2020 | |
| INCREASE (DECREASE) IN NET ASSETS FROM: | | | | | | | | | | | | | | | | |
| OPERATIONS | | | | | | | | | | | | | | | | |
| | | | | | | | | | | | | | | | | |
| Net investment income | | $ | 1,228,820 | | | $ | 1,789,738 | | | $ | 1,723,391 | | | $ | 2,489,663 | |
| Net realized gain | | | 7,623,128 | | | | 703,719 | | | | 931,138 | | | | 1,674,514 | |
| Net change in unrealized appreciation (depreciation) | | | 8,441,681 | | | | 3,339,053 | | | | (5,980,545 | ) | | | 3,771,435 | |
| Net increase (decrease) in net assets resulting from operations | | | 17,293,629 | | | | 5,832,510 | | | | (3,326,016 | ) | | | 7,935,612 | |
| | | | | | | | | | | | | | | | | |
| DISTRIBUTIONS TO SHAREHOLDERS (NOTE 4) | | | | | | | | | | | | |
| | | | | | | | | | | | | | | | | |
| From distributable earnings | | | (7,186,523 | ) | | | (4,335,827 | ) | | | (3,221,768 | ) | | | (4,353,098 | ) |
| Decrease in net assets from distributions to shareholders | | | (7,186,523 | ) | | | (4,335,827 | ) | | | (3,221,768 | ) | | | (4,353,098 | ) |
| | | | | | | | | | | | | | | | | |
| BENEFICIAL INTEREST TRANSACTIONS (NOTE 3) | | | | | | | | | | | | |
| | | | | | | | | | | | | |
| Proceeds from sale of shares | | | 14,566,594 | | | | 11,578,341 | | | | 40,640,060 | | | | 28,599,594 | |
| Shares issued in reinvestment of distributions | | | 1,167,831 | | | | 670,599 | | | | 323,238 | | | | 516,263 | |
| Cost of shares redeemed | | | (18,755,578 | ) | | | (11,149,851 | ) | | | (24,247,563 | ) | | | (32,092,284 | ) |
| Net increase (decrease) resulting from beneficial interest transactions | | | (3,021,153 | ) | | | 1,099,089 | | | | 16,715,735 | | | | (2,976,427 | ) |
| Net Increase in Net Assets | | | 7,085,953 | | | | 2,595,772 | | | | 10,167,951 | | | | 606,087 | |
| | | | | | | | | | | | | | | �� | | |
| NET ASSETS: | | | | | | | | | | | | | | | | |
| Beginning of Year | | | 114,766,478 | | | | 112,170,706 | | | | 232,564,831 | | | | 231,958,744 | |
| End of Year | | $ | 121,852,431 | | | $ | 114,766,478 | | | $ | 242,732,782 | | | $ | 232,564,831 | |
See Notes to Financial Statements which are an integral part of the Financial Statements.
| 50 | | www.wesmarkfunds.com |
Statements of Changes in Net Assets
| | | WesMark West Virginia Municipal Bond Fund | | | WesMark Tactical Opportunity Fund | |
| | | For the Year Ended December 31, 2021 | | | For the Year Ended December 31, 2020 | | | For the Year Ended December 31, 2021 | | | For the Year Ended December 31, 2020 | |
| INCREASE (DECREASE) IN NET ASSETS FROM: | | | | | | | | | | | | | | | | |
| OPERATIONS | | | | | | | | | | | | | | | | |
| | | | | | | | | | | | | | | | | |
| Net investment income | | $ | 1,886,732 | | | $ | 2,124,958 | | | $ | 707,389 | | | $ | 145,794 | |
| Net realized gain | | | 244,197 | | | | 55,975 | | | | 4,970,050 | | | | 831,218 | |
| Long-term capital gain distributions from other investment companies | | | – | | | | – | | | | 29,022 | | | | – | |
| Net change in unrealized appreciation (depreciation) | | | (1,582,104 | ) | | | 1,803,816 | | | | 537,577 | | | | 2,908,130 | |
| Net increase in net assets resulting from operations | | | 548,825 | | | | 3,984,749 | | | | 6,244,038 | | | | 3,885,142 | |
| | | | | | | | | | | | | | | | | |
| DISTRIBUTIONS TO SHAREHOLDERS (NOTE 4) | | | | | | | | | | | | |
| | | | | | | | | | | | | | | | | |
| From distributable earnings | | | (2,137,480 | ) | | | (2,174,183 | ) | | | (5,429,673 | ) | | | (960,583 | ) |
| Decrease in net assets from distributions to shareholders | | | (2,137,480 | ) | | | (2,174,183 | ) | | | (5,429,673 | ) | | | (960,583 | ) |
| | | | | | | | | | | | | | | | | |
| BENEFICIAL INTEREST TRANSACTIONS (NOTE 3) | | | | | | | | | | |
| | | | | | | | | | | | | | | | | |
| Proceeds from sale of shares | | | 10,140,985 | | | | 6,366,348 | | | | 6,127,251 | | | | 4,092,334 | |
| Shares issued in reinvestment of distributions | | | 285,768 | | | | 311,173 | | | | 86,696 | | | | 24,479 | |
| Cost of shares redeemed | | | (13,594,596 | ) | | | (6,901,445 | ) | | | (4,811,104 | ) | | | (2,731,965 | ) |
| Net increase (decrease) resulting from beneficial interest transactions | | | (3,167,843 | ) | | | (223,924 | ) | | | 1,402,843 | | | | 1,384,848 | |
| Net Increase (Decrease) in Net Assets | | | (4,756,498 | ) | | | 1,586,642 | | | | 2,217,208 | | | | 4,309,407 | |
| | | | | | | | | | | | | | | | | |
| NET ASSETS: | | | | | | | | | | | | | | | | |
| Beginning of Year | | | 119,454,496 | | | | 117,867,854 | | | | 45,761,881 | | | | 41,452,474 | |
| End of Year | | $ | 114,697,998 | | | $ | 119,454,496 | | | $ | 47,979,089 | | | $ | 45,761,881 | |
See Notes to Financial Statements which are an integral part of the Financial Statements.
| Annual Report | December 31, 2021 | | 51 |
Financial Highlights
WesMark Small Company Fund
| | | For the Year Ended December 31, 2021 | | | For the Year Ended December 31, 2020 | | | For the Year Ended December 31, 2019 | | | For the Year Ended December 31, 2018 | | | For the Year Ended December 31, 2017 | |
| PER COMMON SHARE OPERATING PERFORMANCE | | | | | | |
| | | | | | | | | | | |
| Net Asset Value, Beginning of Year | | $ | 16.12 | | | $ | 12.79 | | | $ | 10.63 | | | $ | 13.90 | | | $ | 13.32 | |
| Income (Loss) from Investment Operations: | | | | | | | | | | | | | | | | | | | | |
| Net Investment Loss | | | (0.07 | ) | | | (1.36 | ) | | | (0.05 | ) | | | (0.05 | ) | | | (0.04 | ) |
| Net Realized and Unrealized Gain (Loss) on Investments | | | 3.64 | | | | 6.01 | | | | 2.21 | | | | (1.89 | ) | | | 1.81 | |
| Total from Investment Operations | | | 3.57 | | | | 4.65 | | | | 2.16 | | | | (1.94 | ) | | | 1.77 | |
| | | | | | | | | | | | | | | | | | | | | |
| LESS DISTRIBUTIONS TO COMMON SHAREHOLDERS | | | | | | | | | | | | | | | | |
| | | | | | | | | | | | | | | | | | | | | |
| From Net Realized Gain on Investments | | | (4.03 | ) | | | (1.32 | ) | | | – | | | | (1.33 | ) | | | (1.19 | ) |
| Total Distributions | | | (4.03 | ) | | | (1.32 | ) | | | – | | | | (1.33 | ) | | | (1.19 | ) |
| Net Asset Value, End of Year | | $ | 15.66 | | | $ | 16.12 | | | $ | 12.79 | | | $ | 10.63 | | | $ | 13.90 | |
| | | | | | | | | | | | | | | | | | | | | |
| Total Return | | | 23.23 | % | | | 36.61 | % | | | 20.32 | % | | | (13.72 | )% | | | 13.19 | % |
| | | | | | | | | | | | | | | | | | | | | |
| RATIOS TO AVERAGE NET ASSETS | | | | | | | | | | | | | | | | | | | | |
| | | | | | | | | | | | | | | | | | | | | |
| Net Expenses | | | 1.23 | % | | | 1.27 | % | | | 1.26 | % | | | 1.25 | % | | | 1.24 | % |
| Net Investment Loss | | | (0.47 | )% | | | (0.37 | )% | | | (0.46 | )% | | | (0.43 | )% | | | (0.33 | )% |
| Net Assets Value End of Year (000 omitted) | | $ | 119,737 | | | $ | 116,105 | | | $ | 96,185 | | | $ | 81,439 | | | $ | 101,061 | |
| Portfolio Turnover Rate | | | 42 | % | | | 52 | % | | | 50 | % | | | 88 | % | | | 49 | % |
See Notes to Financial Statements which are an integral part of the Financial Statements.
| 52 | | www.wesmarkfunds.com |
Financial Highlights
WesMark Large Company Fund
| | | For the Year Ended December 31, 2021 | | | For the Year Ended December 31, 2020 | | | For the Year Ended December 31, 2019 | | | For the Year Ended December 31, 2018 | | | For the Year Ended December 31, 2017 | |
| PER COMMON SHARE OPERATING PERFORMANCE | | | | | | | | | |
| | | | | | | | | | | | | | | | |
| Net Asset Value, Beginning of Year | | $ | 23.41 | | | $ | 19.95 | | | $ | 16.80 | | | $ | 20.00 | | | $ | 17.37 | |
| Income (Loss) from Investment Operations: | | | | | | | | | | | | | | | | | | | | |
| Net Investment Income (Loss) | | | (0.02 | ) | | | (1.66 | ) | | | 0.04 | | | | 0.04 | | | | 0.03 | |
| Net Realized and Unrealized Gain (Loss) on Investments | | | 6.08 | | | | 6.89 | | | | 4.40 | | | | (1.32 | ) | | | 4.19 | |
| Total from Investment Operations | | | 6.06 | | | | 5.23 | | | | 4.44 | | | | (1.28 | ) | | | 4.22 | |
| | | | | | | | | | | | | | | | | | | | | |
| LESS DISTRIBUTIONS TO COMMON SHAREHOLDERS | | | | | | | | | | | | | | |
| | | | | | | | | | | | | | | | | | | | | |
| From Net Investment Income | | | (0.00 | )(1) | | | (0.02 | ) | | | (0.04 | ) | | | (0.04 | ) | | | (0.03 | ) |
| From Net Realized Gain on Investments | | | (2.06 | ) | | | (1.75 | ) | | | (1.25 | ) | | | (1.88 | ) | | | (1.56 | ) |
| Total Distributions | | | (2.06 | ) | | | (1.77 | ) | | | (1.29 | ) | | | (1.92 | ) | | | (1.59 | ) |
| Net Asset Value, End of Year | | $ | 27.41 | | | $ | 23.41 | | | $ | 19.95 | | | $ | 16.80 | | | $ | 20.00 | |
| | | | | | | | | | | | | | | | | | | | | |
| Total Return | | | 26.06 | % | | | 26.31 | % | | | 26.53 | % | | | (6.19 | )% | | | 24.22 | % |
| | | | | | | | | | | | | | | | | | | | | |
| RATIOS TO AVERAGE NET ASSETS | | | | | | | | | | | | | | | | | | | | |
| | | | | | | | | | | | | | | | | | | | | |
| Net Expenses | | | 1.12 | % | | | 1.14 | % | | | 1.14 | % | | | 1.13 | % | | | 1.13 | % |
| Net Investment Income/(Loss) | | | (0.09 | )% | | | 0.07 | % | | | 0.23 | % | | | 0.19 | % | | | 0.13 | % |
| Net Assets Value End of Year (000 omitted) | | $ | 402,773 | | | $ | 364,086 | | | $ | 331,238 | | | $ | 287,441 | | | $ | 347,982 | |
| Portfolio Turnover Rate | | | 14 | % | | | 27 | % | | | 55 | % | | | 37 | % | | | 37 | % |
| (1) | Less than $0.005 per share. |
See Notes to Financial Statements which are an integral part of the Financial Statements.
| Annual Report | December 31, 2021 | | 53 |
Financial Highlights
WesMark Balanced Fund
| | | For the Year Ended December 31, 2021 | | | For the Year Ended December 31, 2020 | | | For the Year Ended December 31, 2019 | | | For the Year Ended December 31, 2018 | | | For the Year Ended December 31, 2017 | |
| PER COMMON SHARE OPERATING PERFORMANCE | | | | | | | | | |
| | | | | | | | | | | | | | | | |
| Net Asset Value, Beginning of Year | | $ | 13.45 | | | $ | 13.31 | | | $ | 11.77 | | | $ | 13.05 | | | $ | 12.30 | |
| Income (Loss) from Investment Operations: | | | | | | | | | | | | | | | | | | | | |
| Net Investment Income (Loss) | | | 0.16 | | | | (0.08 | ) | | | 0.23 | | | | 0.23 | | | | 0.22 | |
| Net Realized and Unrealized Gain (Loss) on Investments | | | 1.96 | | | | 0.72 | | | | 2.14 | | | | (0.82 | ) | | | 1.09 | |
| Total from Investment Operations | | | 2.12 | | | | 0.64 | | | | 2.37 | | | | (0.59 | ) | | | 1.31 | |
| | | | | | | | | | | | | | | | | | | | | |
| LESS DISTRIBUTIONS TO COMMON SHAREHOLDERS | | | | | | | | | | | | | | | | |
| | | | | | | | | | | | | | | | | | | | | |
| From Net Investment Income | | | (0.17 | ) | | | (0.22 | ) | | | (0.23 | ) | | | (0.23 | ) | | | (0.21 | ) |
| From Net Realized Gain on Investments | | | (0.72 | ) | | | (0.28 | ) | | | (0.60 | ) | | | (0.46 | ) | | | (0.35 | ) |
| Total Distributions | | | (0.89 | ) | | | (0.50 | ) | | | (0.83 | ) | | | (0.69 | ) | | | (0.56 | ) |
| Net Asset Value, End of Year | | $ | 14.68 | | | $ | 13.45 | | | $ | 13.31 | | | $ | 11.77 | | | $ | 13.05 | |
| | | | | | | | | | | | | | | | | | | | | |
| Total Return | | | 15.85 | % | | | 5.05 | % | | | 20.30 | % | | | (4.58 | )% | | | 10.77 | % |
| | | | | | | | | | | | | | | | | | | | | |
| RATIOS TO AVERAGE NET ASSETS | | | | | | | | | | | | | | | | | | | | |
| | | | | | | | | | | | | | | | | | | | | |
| Net Expenses | | | 1.25 | % | | | 1.27 | % | | | 1.25 | % | | | 1.24 | % | | | 1.23 | % |
| Net Investment Income | | | 1.03 | % | | | 1.66 | % | | | 1.74 | % | | | 1.69 | % | | | 1.71 | % |
| Net Assets Value End of Year (000 omitted) | | $ | 121,852 | | | $ | 114,766 | | | $ | 112,171 | | | $ | 101,893 | | | $ | 116,398 | |
| Portfolio Turnover Rate | | | 23 | % | | | 29 | % | | | 31 | % | | | 35 | % | | | 23 | % |
See Notes to Financial Statements which are an integral part of the Financial Statements.
| 54 | | www.wesmarkfunds.com |
Financial Highlights
WesMark Government Bond Fund
| | | For the Year Ended December 31, 2021 | | | For the Year Ended December 31, 2020 | | | For the Year Ended December 31, 2019 | | | For the Year Ended December 31, 2018 | | | For the Year Ended December 31, 2017 | |
| PER COMMON SHARE OPERATING PERFORMANCE | | | | | | | | | |
| | | | | | | | | | | | | | | | |
| Net Asset Value, Beginning of Year | | $ | 10.08 | | | $ | 9.93 | | | $ | 9.68 | | | $ | 9.77 | | | $ | 9.84 | |
| Income (Loss) from Investment Operations: | | | | | | | | | | | | | | | | | | | | |
| Net Investment Income | | | 0.07 | | | | 0.11 | | | | 0.19 | | | | 0.17 | | | | 0.21 | |
| Net Realized and Unrealized Gain (Loss) on Investments | | | (0.21 | ) | | | 0.23 | | | | 0.27 | | | | (0.06 | ) | | | (0.09 | ) |
| Total from Investment Operations | | | (0.14 | ) | | | 0.34 | | | | 0.46 | | | | 0.11 | | | | 0.12 | |
| | | | | | | | | | | | | | | | | | | | | |
| LESS DISTRIBUTIONS TO COMMON SHAREHOLDERS | | | | | | | | | | | | | | |
| | | | | | | | | | | | | | | | | | | | | |
| From Net Investment Income | | | (0.13 | ) | | | (0.19 | ) | | | (0.21 | ) | | | (0.20 | ) | | | (0.19 | ) |
| Total Distributions | | | (0.13 | ) | | | (0.19 | ) | | | (0.21 | ) | | | (0.20 | ) | | | (0.19 | ) |
| Net Asset Value, End of Year | | $ | 9.81 | | | $ | 10.08 | | | $ | 9.93 | | | $ | 9.68 | | | $ | 9.77 | |
| | | | | | | | | | | | | | | | | | | | | |
| Total Return | | | (1.35 | )% | | | 3.46 | % | | | 4.75 | % | | | 1.15 | % | | | 1.20 | % |
| | | | | | | | | | | | | | | | | | | | | |
| RATIOS TO AVERAGE NET ASSETS | | | | | | | | | | | | | | | | | | | | |
| | | | | | | | | | | | | | | | | | | | | |
| Net Expenses | | | 1.02 | % | | | 1.03 | % | | | 1.01 | % | | | 1.01 | % | | | 1.00 | % |
| Net Investment Income | | | 0.72 | % | | | 1.09 | % | | | 1.72 | % | | | 1.81 | % | | | 2.19 | % |
| Net Assets Value End of Year (000 omitted) | | $ | 242,733 | | | $ | 232,565 | | | $ | 231,959 | | | $ | 230,250 | | | $ | 249,951 | |
| Portfolio Turnover Rate | | | 40 | % | | | 51 | % | | | 37 | % | | | 17 | % | | | 26 | % |
See Notes to Financial Statements which are an integral part of the Financial Statements.
| Annual Report | December 31, 2021 | | 55 |
Financial Highlights
WesMark West Virginia Municipal Bond Fund
| | | For the Year Ended December 31, 2021 | | | For the Year Ended December 31, 2020 | | | For the Year Ended December 31, 2019 | | | For the Year Ended December 31, 2018 | | | For the Year Ended December 31, 2017 | |
| PER COMMON SHARE OPERATING PERFORMANCE | | | | | | | | | |
| | | | | | | | | | | | | | | | |
| Net Asset Value, Beginning of Year | | $ | 10.84 | | | $ | 10.67 | | | $ | 10.38 | | | $ | 10.54 | | | $ | 10.36 | |
| Income (Loss) from Investment Operations: | | | | | | | | | | | | | | | | | | | | |
| Net Investment Income | | | 0.17 | | | | 0.18 | | | | 0.20 | | | | 0.21 | | | | 0.21 | |
| Net Realized and Unrealized Gain (Loss) on Investments | | | (0.13 | ) | | | 0.18 | | | | 0.30 | | | | (0.16 | ) | | | 0.19 | |
| Total from Investment Operations | | | 0.04 | | | | 0.36 | | | | 0.50 | | | | 0.05 | | | | 0.40 | |
| | | | | | | | | | | | | | | | | | | | | |
| LESS DISTRIBUTIONS TO COMMON SHAREHOLDERS | | | | | | | | | | | | | | | | |
| | | | | | | | | | | | | | | | | | | | | |
| From Net Investment Income | | | (0.17 | ) | | | (0.19 | ) | | | (0.21 | ) | | | (0.21 | ) | | | (0.21 | ) |
| From Net Realized Gain on Investments | | | (0.02 | ) | | | (0.00 | )(1) | | | (0.00 | )(1) | | | – | | | | (0.01 | ) |
| Total Distributions | | | (0.19 | ) | | | (0.19 | ) | | | (0.21 | ) | | | (0.21 | ) | | | (0.22 | ) |
| Net Asset Value, End of Year | | $ | 10.69 | | | $ | 10.84 | | | $ | 10.67 | | | $ | 10.38 | | | $ | 10.54 | |
| | | | | | | | | | | | | | | | | | | | | |
| Total Return | | | 0.43 | % | | | 3.48 | % | | | 4.83 | % | | | 0.47 | % | | | 3.90 | % |
| | | | | | | | | | | | | | | | | | | | | |
| RATIOS TO AVERAGE NET ASSETS | | | | | | | | | | | | | | | | | | | | |
| | | | | | | | | | | | | | | | | | | | | |
| Net Expenses | | | 1.11 | % | | | 1.10 | % | | | 1.08 | % | | | 1.09 | % | | | 1.08 | % |
| Net Investment Income | | | 1.61 | % | | | 1.81 | % | | | 1.94 | % | | | 2.00 | % | | | 2.01 | % |
| Net Assets Value End of Year (000 omitted) | | $ | 114,698 | | | $ | 119,454 | | | $ | 117,868 | | | $ | 114,345 | | | $ | 116,039 | |
| Portfolio Turnover Rate | | | 15 | % | | | 10 | % | | | 9 | % | | | 10 | % | | | 7 | % |
| (1) | Less than $0.005 per share. |
See Notes to Financial Statements which are an integral part of the Financial Statements.
| 56 | | www.wesmarkfunds.com |
Financial Highlights
WesMark Tactical Opportunity Fund
| | | For the Year Ended December 31, 2021 | | | For the Year Ended December 31, 2020 | | | For the Year Ended December 31, 2019 | | | For the Year Ended December 31, 2018 | | | For the Period Ended December 31, 2017(1) | |
| PER COMMON SHARE OPERATING PERFORMANCE | | | | | | | | | | | | |
| | | | | | | | | | | | | |
| Net Asset Value, Beginning of Period | | $ | 11.95 | | | $ | 11.25 | | | $ | 10.01 | | | $ | 10.62 | | | $ | 10.00 | |
| Income (Loss) from Investment Operations: | | | | | | | | | | | | | | | | | | | | |
| Net Investment Income | | | 0.19 | | | | 0.04 | | | | 0.10 | | | | 0.05 | | | | 0.04 | |
| Net Realized and Unrealized Gain (Loss) on Investments | | | 1.45 | | | | 0.91 | | | | 1.56 | | | | (0.60 | ) | | | 0.80 | |
| Total from Investment Operations | | | 1.64 | | | | 0.95 | | | | 1.66 | | | | (0.55 | ) | | | 0.84 | |
| | | | | | | | | | | | | | | | | | | | | |
| LESS DISTRIBUTIONS TO COMMON SHAREHOLDERS | | | | | | | | | | | | | | | | |
| | | | | | | | | | | | | | | | | | | | | |
| From Net Investment Income | | | (0.13 | ) | | | (0.04 | ) | | | (0.11 | ) | | | (0.04 | ) | | | (0.05 | ) |
| From Net Realized Gain on Investments | | | (1.30 | ) | | | (0.21 | ) | | | (0.31 | ) | | | (0.02 | ) | | | (0.17 | ) |
| Total Distributions | | | (1.43 | ) | | | (0.25 | ) | | | (0.42 | ) | | | (0.06 | ) | | | (0.22 | ) |
| Net Asset Value, End of Year | | $ | 12.16 | | | $ | 11.95 | | | $ | 11.25 | | | $ | 10.01 | | | $ | 10.62 | |
| | | | | | | | | | | | | | | | | | | | | |
| Total Return | | | 13.94 | % | | | 8.48 | % | | | 16.61 | % | | | (5.20 | )% | | | 8.33 | %(2) |
| | | | | | | | | | | | | | | | | | | | | |
| RATIOS TO AVERAGE NET ASSETS | | | | | | | | | | | | | | | | | | | | |
| | | | | | | | | | | | | | | | | | | | | |
| Net Expenses(3) | | | 1.44 | % | | | 1.50 | % | | | 1.46 | % | | | 1.56 | % | | | 1.75 | %(4) |
| Net Investment Income(3)(5) | | | 1.45 | % | | | 0.36 | % | | | 0.91 | % | | | 0.55 | % | | | 0.50 | %(4) |
| Expense Waiver/Reimbursement(6) | | | – | | | | – | | | | – | | | | – | | | | 0.23 | %(4) |
| Net Assets Value End of Year (000 omitted) | | $ | 47,979 | | | $ | 45,762 | | | $ | 41,452 | | | $ | 35,734 | | | $ | 28,023 | |
| Portfolio Turnover Rate | | | 78 | % | | | 169 | % | | | 152 | % | | | 145 | % | | | 88 | % |
| (1) | The WesMark Tactical Opportunity Fund commenced operations on March 1, 2017. |
| (2) | Total return not annualized for periods less than one full year. |
| (3) | The ratios shown do not include the Fund's proportionate shares of the expenses of the underlying investment companies in which the Fund invests. |
| (4) | Ratios for periods of less than a year are annualized. |
| (5) | Recognition of net investment income is affected by the timing and declaration of dividends by the underlying investment companies in which the Fund invests. |
| (6) | This expense decrease from the contractual waiver is reflected in both the net expense and the net investment income ratios shown. |
See Notes to Financial Statements which are an integral part of the Financial Statements.
| Annual Report | December 31, 2021 | | 57 |
Notes to Financial Statements
December 31, 2021
1. ORGANIZATION
WesMark Funds (the “Trust”) is registered under the Investment Company Act of 1940, as amended (the “Act”), as an open-end management investment company. The Trust consists of six portfolios (individually referred to as the “Fund”, or collectively as the “Funds”), which are presented herein:
| Portfolio Name | Diversification | Investment Objective |
| WesMark Small Company Fund (“Small Company Fund”) | Diversified | To achieve capital appreciation |
| WesMark Large Company Fund (“Large Company Fund”) | Diversified | To achieve capital appreciation |
| WesMark Balanced Fund (“Balanced Fund”) | Diversified | To achieve capital appreciation and income |
| WesMark Government Bond Fund (“Government Bond Fund”) | Diversified | To achieve high current income consistent with preservation of capital |
| WesMark West Virginia Municipal Bond Fund (“West Virginia Municipal Bond Fund”) | Non-diversified | To achieve current income which is exempt from federal income tax and income taxes imposed by the State of West Virginia |
| WesMark Tactical Opportunity Fund (“Tactical Opportunity Fund”) | Diversified | To achieve capital appreciation |
The assets of each Fund are segregated and a shareholder’s interest is limited to the Fund in which shares are held.
2. SIGNIFICANT ACCOUNTING POLICIES
The following is a summary of significant accounting policies consistently followed by the Funds in the preparation of their financial statements. These policies are in conformity with generally accepted accounting principles (“GAAP”) in the United States of America.
The accompanying financial statements were prepared in accordance with GAAP in the United States, which require the use of estimates made by management of the Funds. Actual results could differ from those estimates that affect the reported amounts of assets and liabilities and disclosure of contingent assets and liabilities at the date of the financial statements and the reported amounts of increases and decreases in net assets from operations during the reporting period. Each Fund is an investment company and accordingly follows the investment company accounting and reporting guidance of the Financial Accounting Standards Board ("FASB") Accounting Standards Codification Topic 946 Financial Services - Investment Companies.
Investment Valuation – All investments in securities are recorded at their estimated fair value, as described below. In calculating their net asset value ("NAV"), the Funds generally value investments as follows:
| ›› | Equity securities listed on an exchange or traded through a regulated market system are valued at their last reported sale price or official closing price on their principal exchange or market. |
| ›› | Fixed-income securities acquired with remaining maturities greater than 60 days are valued using price evaluations provided by a pricing service approved by the Board of Trustees (the “Trustees”). |
| ›› | Fixed-income securities acquired with remaining maturities of 60 days or less may be valued using price evaluations provided by a pricing service approved by the Trustees. They may also be valued at their cost (adjusted for the accretion of any discount or amortization of any premium), which approximates value. |
| ›› | Options are generally valued at market values established by the exchanges on which they are traded at the close of trading on such exchanges. |
| ›› | Shares of other mutual funds are valued based upon their reported NAVs. |
If the Funds cannot obtain a price or price evaluation from a pricing service for an investment, the Funds may attempt to value the investment based upon the mean of bid and asked quotations or fair value the investment based on price evaluations, from one or more dealers. If any price, quotation, price evaluation or other pricing source is not readily available when the NAV is calculated, the Funds use the fair value of the investment determined in accordance with the procedures described below. There can be no assurance that the Funds could purchase or sell an investment at the price used to calculate the Funds’ NAVs.
| 58 | | www.wesmarkfunds.com |
Notes to Financial Statements
December 31, 2021
Fair Valuation and Significant Events Procedures – The Trustees have authorized the use of pricing services to provide evaluations of the current fair value of certain investments for purposes of calculating the NAV. Factors considered by pricing services in evaluating an investment include the yields or prices of investments of comparable quality, coupon, maturity, call rights and other potential prepayments, terms and type, reported transactions, indications as to values from dealers, and general market conditions. The Funds normally use mean evaluations (a price evaluation indicative of a price between the bid and asked prices for an investment) for fixed-income securities. In the event that market quotations and price evaluations are not available for an investment, the fair value of the investment is determined in accordance with procedures adopted by the Trustees.
The Trustees also have adopted procedures requiring an investment to be priced at its fair value whenever the Adviser (WesBanco) determines that a significant event affecting the value of the investment has occurred between the time as of which the price of the investment would otherwise be determined and the time as of which the NAV is computed. An event is considered significant if there is both an affirmative expectation that the investment’s value will change in response to the event and a reasonable basis for quantifying the resulting change in value. Examples of significant events that may occur after the close of the principal market on which a security is traded, or after the time of a price evaluation provided by a pricing service or a dealer, include:
| ›› | With respect to securities traded in foreign markets, significant trends in U.S. equity markets or in the trading of foreign securities index futures or options contracts; |
| ›› | With respect to price evaluations of fixed-income securities determined before the close of regular trading on the NYSE, actions by the Federal Reserve Open Market Committee and other significant trends in U.S. fixed-income markets; and |
| ›› | Corporate announcements concerning matters such as acquisitions, recapitalizations, litigation developments, a natural disaster affecting the issuer’s operations or regulatory changes or market developments affecting the issuer’s industry. |
The Funds may seek to obtain more current quotations or price evaluations from alternative pricing sources. If a reliable alternative pricing source is not available, the Funds will determine the fair value of the investment using another method approved by the Trustees.
A three-tier hierarchy has been established to maximize the use of observable market data and minimize the use of unobservable inputs and to establish classification of fair value measurements for disclosure purposes. Inputs refer broadly to the assumptions that market participants would use in pricing the asset or liability, including assumptions about risk, for example, the risk inherent in a particular valuation approach used to measure fair value including such a pricing model and/or the risk inherent in the inputs to the valuation approach. Observable inputs are inputs that reflect the assumptions market participants would use in pricing the asset or liability developed based on market data obtained from sources independent of the reporting entity. Unobservable inputs are inputs that reflect the reporting entity’s own assumptions about the assumptions market participants would use in pricing the asset or liability developed based on the best information available in the circumstances.
The three-tier hierarchy of inputs is summarized in the three broad Levels listed below.
| Level 1 — | Unadjusted quoted prices in active markets for identical assets or liabilities that the Funds have the ability to access at the measurement date. |
| Level 2 — | Observable inputs other than quoted prices included in Level 1 that are observable for the asset or liability either directly or indirectly. These inputs may include quoted prices for the identical instrument on an inactive market, prices for similar instruments, interest rates, prepayment speeds, credit risk, yield curves, default rates and similar data. |
| Level 3 — | Unobservable inputs for the asset or liability, to the extent relevant observable inputs are not available, representing the Funds’ own assumptions about the assumptions a market participant would use in valuing the asset or liability, and would be based on the best information available. |
| Annual Report | December 31, 2021 | | 59 |
Notes to Financial Statements
December 31, 2021
The following is a summary of the inputs used as of December 31, 2021 in valuing the Funds’ investments carried at fair value:
Small Company Fund
| Investments in Securities at Value* | | Level 1 -
Quoted Prices | | | Level 2 -
Other Significant
Observable
Inputs | | | Level 3 -
Significant
Unobservable
Inputs | | | Total | |
| Common Stocks | | $ | 113,692,335 | | | $ | – | | | $ | – | | | $ | 113,692,335 | |
| Exchange Traded Funds | | | 2,743,202 | | | | – | | | | – | | | | 2,743,202 | |
| Short Term Investments | | | 3,333,231 | | | | – | | | | – | | | | 3,333,231 | |
| Total | | $ | 119,768,768 | | | $ | – | | | $ | – | | | $ | 119,768,768 | |
Large Company Fund
| Investments in Securities at Value* | | Level 1 -
Quoted Prices | | | Level 2 -
Other Significant
Observable
Inputs | | | Level 3 -
Significant
Unobservable
Inputs | | | Total | |
| Common Stocks | | $ | 399,254,413 | | | $ | – | | | $ | – | | | $ | 399,254,413 | |
| Exchange Traded Funds | | | 1,742,351 | | | | – | | | | – | | | | 1,742,351 | |
| Short Term Investments | | | 1,699,398 | | | | – | | | | – | | | | 1,699,398 | |
| Total | | $ | 402,696,162 | | | $ | – | | | $ | – | | | $ | 402,696,162 | |
Balanced Fund
| Investments in Securities at Value* | | Level 1 -
Quoted Prices | | | Level 2 -
Other Significant
Observable
Inputs | | | Level 3 -
Significant
Unobservable
Inputs | | | Total | |
| Common Stocks | | $ | 80,945,251 | | | $ | – | | | $ | – | | | $ | 80,945,251 | |
| Exchange Traded Funds | | | 2,889,288 | | | | – | | | | – | | | | 2,889,288 | |
| Corporate Bonds | | | – | | | | 23,659,895 | | | | – | | | | 23,659,895 | |
| U.S. Government Agency - Collateralized Mortgage Obligations | | | – | | | | 1,622,170 | | | | – | | | | 1,622,170 | |
| Commercial Mortgage-Backed Securities | | | – | | | | 2,007,779 | | | | – | | | | 2,007,779 | |
| U.S. Government Agency - Mortgage-Backed Securities | | | – | | | | 4,613,434 | | | | – | | | | 4,613,434 | |
| Taxable Municipal Bonds | | | – | | | | 2,309,034 | | | | – | | | | 2,309,034 | |
| Non-Taxable Municipal Bonds | | | – | | | | 470,700 | | | | – | | | | 470,700 | |
| Short Term Investments | | | 3,136,055 | | | | – | | | | – | | | | 3,136,055 | |
| Total | | $ | 86,970,594 | | | $ | 34,683,012 | | | $ | – | | | $ | 121,653,606 | |
| 60 | | www.wesmarkfunds.com |
Notes to Financial Statements
December 31, 2021
Government Bond Fund
| Investments in Securities at Value* | | Level 1 -
Quoted Prices | | | Level 2 -
Other Significant
Observable
Inputs | | | Level 3 -
Significant
Unobservable
Inputs | | | Total | |
| U.S. Government Agency - Collateralized Mortgage Obligations | | $ | – | | | $ | 147,110,331 | | | $ | – | | | $ | 147,110,331 | |
| U.S. Government Agency - Mortgage-Backed Securities | | | – | | | | 34,824,177 | | | | – | | | | 34,824,177 | |
| Taxable Municipal Bonds | | | – | | | | 48,318,551 | | | | – | | | | 48,318,551 | |
| Non-Taxable Municipal Bonds | | | – | | | | 511,795 | | | | – | | | | 511,795 | |
| Short Term Investments | | | 12,342,620 | | | | – | | | | – | | | | 12,342,620 | |
| Total | | $ | 12,342,620 | | | $ | 230,764,854 | | | $ | – | | | $ | 243,107,474 | |
West Virginia Municipal Bond Fund
| Investments in Securities at Value* | | Level 1 -
Quoted Prices | | | Level 2 -
Other Significant
Observable
Inputs | | | Level 3 -
Significant
Unobservable
Inputs | | | Total | |
| Non-Taxable Municipal Bonds | | $ | – | | | $ | 111,813,799 | | | $ | – | | | $ | 111,813,799 | |
| Short Term Investments | | | 2,272,894 | | | | – | | | | – | | | | 2,272,894 | |
| Total | | $ | 2,272,894 | | | $ | 111,813,799 | | | $ | – | | | $ | 114,086,693 | |
Tactical Opportunity Fund
| Investments in Securities at Value* | | Level 1 -
Quoted Prices | | | Level 2 -
Other Significant
Observable
Inputs | | | Level 3 -
Significant
Unobservable
Inputs | | | Total | |
| Exchange Traded Funds | | $ | 45,135,923 | | | $ | – | | | $ | – | | | $ | 45,135,923 | |
| Short Term Investments | | | 2,717,033 | | | | – | | | | – | | | | 2,717,033 | |
| Total | | $ | 47,852,956 | | | $ | – | | | $ | – | | | $ | 47,852,956 | |
All securities of the Funds were valued using either Level 1 or Level 2 inputs during the year ended December 31, 2021. Thus, a reconciliation of assets in which unobservable inputs (Level 3) were used is not applicable for the Funds.
| * | For detailed descriptions of sector and/or geography classifications, see the accompanying Portfolios of Investments. |
Investment Income, Expenses and Distributions – Investment transactions are accounted for on a trade-date basis. Realized gains and losses from investment transactions are recorded on an identified cost basis. Interest income and expenses are accrued daily. Dividend income and distributions to shareholders are recorded on the ex-dividend date. Non-cash dividends included in dividend income, if any, are recorded at fair value. Foreign dividends are recorded on the ex-dividend date or when the Funds are informed of the ex-dividend date. Trust level expenses are allocated to each Fund based on net assets, equally across all Funds, or to a specific Fund, whichever is deemed most appropriate for a particular expense. Each Fund pays its own expenses.
Distributions of net investment income, if any, for the Small Company Fund, Large Company Fund, and Tactical Opportunity Fund are declared and paid quarterly. Distributions of net investment income for the Balanced Fund are declared and paid monthly, and distributions of net investment income for the Government Bond Fund and West Virginia Municipal Bond Fund are declared daily and paid monthly. Distributions of capital gains, if any, for Small Company Fund, Large Company Fund, Balanced Fund, Government Bond Fund, West Virginia Municipal Bond Fund, and Tactical Opportunity Fund are declared and paid annually.
Premium and Discount Amortization/Paydown Gains and Losses – All premiums and discounts on fixed-income securities are amortized/accreted over the estimated lives of such securities for financial statement purposes using the effective interest method. Gains and losses realized on principal payments of mortgage-backed securities (paydown gains and losses) are classified as part of investment income.
| Annual Report | December 31, 2021 | | 61 |
Notes to Financial Statements
December 31, 2021
Federal Taxes – It is each Fund’s policy to comply with the Subchapter M provision of the Internal Revenue Code of 1986, as amended, (the “Code”) and to distribute to shareholders each year substantially all of its income. As of and during the year ended December 31, 2021, the Funds did not have a liability for any unrecognized tax benefits. The Funds recognize interest and penalties, if any, related to tax liabilities as income tax expense in the Statements of Operations. The Funds file U.S. federal, state, and local tax returns as required. The Funds’ tax returns are subject to examination by the relevant tax authorities until expiration of the applicable statute of limitations which is generally three years after the filing of the tax return for federal purposes and four years for most state returns. Tax returns for open years have not incorporated uncertain tax positions that require a provision for income taxes and federal and state taxing authorities.
The Funds may be subject to taxes imposed by governments of countries in which they invest. Such taxes are generally based on either income or gains earned or repatriated. The Funds accrue and apply such taxes to net investment income, net realized gains and net unrealized gains as income is earned.
Withholding taxes on foreign dividends have been provided for in accordance with the Funds’ understanding of the applicable country’s tax rules and rates.
When-Issued and Delayed Delivery Transactions – The Funds may engage in when-issued or delayed delivery transactions. The Funds record when-issued securities on the trade date and maintain security positions such that sufficient liquid assets will be available to make payment for the securities purchased. Securities purchased on a when-issued or delayed delivery basis are marked to market daily and begin earning interest on the settlement date. Losses may occur on these transactions due to changes in market conditions or the failure of counterparties to perform under the contract.
Restricted Securities – Restricted securities are securities that either: (a) cannot be offered for public sale without first being registered, or being able to take advantage of an exemption from registration, under the Securities Act of 1933; or (b) are subject to contractual restrictions on public sales. In some cases, when a security cannot be offered for public sale without first being registered, the issuer of the restricted security has agreed to register such securities for resale, at the issuer’s expense, either upon demand by the Funds or in connection with another registered offering of the securities. Many such restricted securities may be resold in the secondary market in transactions exempt from registration. Restricted securities may be determined to be liquid under criteria established by the Trustees. The Funds will not incur any registration costs upon such resales. The Funds’ restricted securities are valued at the price provided by dealers in the secondary market or, if no market prices are available, at the fair value as determined in accordance with procedures established by and under the general supervision of the Trustees.
Derivative Instruments and Hedging Activities – The following discloses the Funds’ use of derivative instruments and hedging activities.
The Funds’ exposure to derivative contracts and hybrid instruments, either directly or indirectly through another investment company, may involve risks different from or possibly greater than the risk associated with investing directly in a security instead of the derivative. Risks include: 1) the value of the derivative may not correlate with the value of the underlying security or may correlate inversely; 2) any potential risk reduction may be offset with gain limitations; 3) derivatives may be difficult to price; 4) possible adverse tax consequences; and 5) other risks, such as but not limited to, stock market, interest rate, credit, currency, liquidity, and leverage risks.
Market Risk Factors: In pursuit of their investment objectives, certain Funds may use derivatives that increase or decrease a Fund’s exposure to the following market risk factors:
Equity Risk: Equity risk relates to the change in value of equity securities as they relate to increases or decreases in the general market.
Interest Rate Risk: Changes in interest rates will affect the value of a Fund’s investments. In general, as interest rates rise, bond prices fall, and as interest rates fall, bond prices rise. Interest rate risk is generally greater for funds that invest a significant portion of their assets in high yield securities.
| 62 | | www.wesmarkfunds.com |
Notes to Financial Statements
December 31, 2021
Writing Covered Call Options and Purchasing Put Options
The Funds will not write call options on securities unless the securities are held in the Fund’s portfolio or unless the Fund is entitled to them in deliverable forms without further payment or after segregating cash in the amount of any further payment.
The Funds will not purchase put options on securities unless the securities are held in the Fund’s portfolio.
Option contracts (options) - are rights to buy or sell a security for a specified price within a specified period. The seller of the option receives a payment, or premium, from the buyer, which the seller keeps regardless of whether the buyer uses (or exercises) the option. Options can trade on exchanges or in the over the counter (OTC) market and may be bought or sold on a wide variety of securities. There were no options held as of December 31, 2021.
A Fund may buy and/or sell the following types of options:
Call Options – A call option gives the holder (buyer) the right to buy the underlying security from the seller (writer) of the option. A Fund may use call options in the following ways:
| ›› | Buy call options on a security in anticipation of an increase in the value of the security; or |
| ›› | Sell call options on a security to generate income from premiums, and in anticipation of a decrease or only limited increase in the value of the underlying security. If a Fund writes a call option on a security that it owns and that call option is exercised, a Fund must deliver the security to the buyer and foregoes any possible profit from an increase in the market price of the security over the exercise price plus the premium received. |
Put Options – A put option gives the holder the right to sell the security to the writer of the option. A Fund may use put options in the following ways:
| ›› | Buy put options on a security in anticipation of a decrease in the value of the security; or |
| ›› | Write put options on a security to generate income from premiums, and in anticipation of an increase or only limited decrease in the value of the security. In writing puts, there is a risk that a Fund may be required to take delivery of the security when its current market price is lower than the exercise price. |
A Fund may also buy or write options, as needed, to close out existing option positions. Finally, a Fund may enter into combinations of options contracts in an attempt to benefit from changes in the prices of those options contracts (without regard to changes in the value of the security).
| Annual Report | December 31, 2021 | | 63 |
Notes to Financial Statements
December 31, 2021
The effect of derivative instruments on the Statements of Operations for the year ended December 31, 2021:
| Risk Exposure | | Statements of Operations Location | | Realized Gain/(Loss)
on Derivatives
Recognized in Income | | | Change in Unrealized
Appreciation/(Depreciation)
on Derivatives
Recognized in Income | |
| Large Company Fund | | | | | | | | |
Equity Contracts
(Written Options) | | Net realized gain (loss) on written options/Net change in unrealized appreciation (depreciation) of written options | | $ | 23,523 | | | $ | – | |
| Total | | | | $ | 23,523 | | | $ | – | |
| Balanced Fund | | | | | | | | | | |
Equity Contracts
(Written Options) | | Net realized gain (loss) on written options/Net change in unrealized appreciation (depreciation) of written options | | $ | 50,262 | | | $ | 16,382 | |
| Total | | | | $ | 50,262 | | | $ | 16,382 | |
| Tactical Opportunity Fund | | | | | | | | | | |
Equity Contracts
(Purchased Options) | | Net realized gain (loss) on investments/Net change in unrealized appreciation (depreciation) on investments | | $ | (7,576 | ) | | $ | – | |
Equity Contracts
(Written Options) | | Net realized gain (loss) on written options/Net change in unrealized appreciation (depreciation) of written options | | $ | 77,042 | | | $ | 14,085 | |
| Total | | | | $ | 69,466 | | | $ | 14,085 | |
The Balanced Fund, Large Company Fund and Tactical Opportunity Fund had average monthly written call option notional value of $222,511, $0 and $2,373,608, respectively, during the year ended December 31, 2021. The Tactical Opportunity Fund had average monthly purchased option notional value of $95,563 during the year ended December 31, 2021.
Market Risk – The Funds may incur losses due to political, regulatory, market, economic or social developments affecting the market(s) generally. Local, regional or global events such as terrorism, war, natural disasters, disease/virus outbreaks and epidemics or other public health crises, recessions, depressions or other events – or the potential for such events – could have a significant negative impact on economic and market conditions.
The public health crisis caused by the novel coronavirus disease known as COVID-19 has become a pandemic that has resulted in, and may continue to result in, significant global economic and market volatility. COVID-19 has caused, and may continue to cause, societal disruptions such as quarantines, travel restrictions, workforce displacement and loss of resources. There is significant uncertainty surrounding the magnitude, duration, reach, costs and other effects of the COVID-19 pandemic, including actions that have been or could be taken by governmental authorities or other third parties. The impacts, as well as the uncertainty over impacts yet to unfold, of COVID-19 – and any other infectious illness outbreaks, epidemics, pandemics or other public health crises that may arise in the future – could negatively affect economies and markets in ways that cannot be foreseen.
| 64 | | www.wesmarkfunds.com |
Notes to Financial Statements
December 31, 2021
3. SHARES OF BENEFICIAL INTEREST
The following tables summarize share activity:
| | | For the Year Ended
December 31:
2021 | | | For the Year Ended
December 31:
2020 | |
| Small Company Fund | | | | | | |
| Shares sold | | | 891,447 | | | | 755,653 | |
| Shares issued to shareholders in payment of distributions declared | | | 426,654 | | | | 164,710 | |
| Shares redeemed | | | (871,546 | ) | | | (1,238,536 | ) |
| Net increase/(decrease) resulting from share transactions | | | 446,555 | | | | (318,173 | ) |
| Common shares outstanding, end of period | | | 7,648,415 | | | | 7,201,860 | |
| | | For the Year Ended
December 31:
2021 | | | For the Year Ended
December 31:
2020 | |
| Large Company Fund | | | | | | |
| Shares sold | | | 709,056 | | | | 956,297 | |
| Shares issued to shareholders in payment of distributions declared | | | 315,451 | | | | 362,574 | |
| Shares redeemed | | | (1,884,187 | ) | | | (2,369,749 | ) |
| Net decrease resulting from share transactions | | | (859,680 | ) | | | (1,050,878 | ) |
| Common shares outstanding, end of period | | | 14,695,170 | | | | 15,554,850 | |
| | | For the Year Ended
December 31:
2021 | | | For the Year Ended
December 31:
2020 | |
| Balanced Fund | | | | | | |
| Shares sold | | | 1,008,176 | | | | 935,567 | |
| Shares issued to shareholders in payment of distributions declared | | | 80,283 | | | | 51,586 | |
| Shares redeemed | | | (1,319,080 | ) | | | (884,291 | ) |
| Net increase/(decrease) resulting from share transactions | | | (230,621 | ) | | | 102,862 | |
| Common shares outstanding, end of period | | | 8,300,602 | | | | 8,531,223 | |
| | | For the Year Ended
December 31:
2021 | | | For the Year Ended
December 31:
2020 | |
| Government Bond Fund | | | | | | |
| Shares sold | | | 4,084,453 | | | | 2,829,844 | |
| Shares issued to shareholders in payment of distributions declared | | | 32,519 | | | | 50,998 | |
| Shares redeemed | | | (2,433,837 | ) | | | (3,180,339 | ) |
| Net increase/(decrease) resulting from share transactions | | | 1,683,135 | | | | (299,497 | ) |
| Common shares outstanding, end of period | | | 24,753,171 | | | | 23,070,036 | |
| Annual Report | December 31, 2021 | | 65 |
Notes to Financial Statements
December 31, 2021
| | | For the Year Ended
December 31:
2021 | | | For the Year Ended
December 31:
2020 | |
| West Virginia Municipal Bond Fund | | | | | | |
| Shares sold | | | 942,015 | | | | 589,584 | |
| Shares issued to shareholders in payment of distributions declared | | | 26,618 | | | | 28,859 | |
| Shares redeemed | | | (1,263,228 | ) | | | (645,953 | ) |
| Net decrease resulting from share transactions | | | (294,595 | ) | | | (27,510 | ) |
| Common shares outstanding, end of period | | | 10,727,700 | | | | 11,022,295 | |
| | | For the Year Ended
December 31:
2021 | | | For the Year Ended
December 31:
2020 | |
| Tactical Opportunity Fund | | | | | | |
| Shares sold | | | 486,751 | | | | 404,246 | |
| Shares issued to shareholders in payment of distributions declared | | | 7,245 | | | | 2,062 | |
| Shares redeemed | | | (378,269 | ) | | | (261,018 | ) |
| Net increase resulting from share transactions | | | 115,727 | | | | 145,290 | |
| Common shares outstanding, end of period | | | 3,944,960 | | | | 3,829,233 | |
4. FEDERAL TAX INFORMATION AND TAX BASIS
The timing and character of income and capital gain distributions are determined in accordance with income tax regulations, which may differ from GAAP. These differences were primarily attributable to non-deductible excise taxes paid. For the Funds’ most recent year ended December 31, 2021, permanent differences identified and reclassified among the components of net assets were as follows:
| Fund Name | | Paid-in Capital | | | Total Distributable earnings | |
| Small Company Fund | | $ | – | | | $ | – | |
| Large Company Fund | | $ | – | | | $ | – | |
| Balanced Fund | | $ | – | | | $ | – | |
| Government Bond Fund | | $ | – | | | $ | – | |
| West Virginia Municipal Bond Fund | | $ | (255 | ) | | $ | 255 | |
| Tactical Opportunity Fund | | $ | – | | | $ | – | |
For federal income tax purposes, the following amounts apply as of December 31, 2021:
| Fund Name | | Gross Appreciation
(excess of value
over tax cost) | | | Gross Depreciation
(excess of tax cost
over value) | | | Net Unrealized
Appreciation
(Depreciation) | | | Cost of Investments for
Income Tax Purposes
(includes cost of derivatives) | |
| Small Company Fund | | $ | 54,522,360 | | | $ | (661,401 | ) | | $ | 53,860,959 | | | $ | 65,907,809 | |
| Large Company Fund | | $ | 265,114,284 | | | $ | (45,342 | ) | | $ | 265,068,942 | | | $ | 137,627,220 | |
| Balanced Fund | | $ | 38,090,671 | | | $ | (442,770 | ) | | $ | 37,647,901 | | | $ | 84,005,705 | |
| Government Bond Fund | | $ | 2,926,194 | | | $ | (2,735,648 | ) | | $ | 190,546 | | | $ | 242,916,928 | |
| West Virginia Municipal Bond Fund | | $ | 4,884,788 | | | $ | (86,502 | ) | | $ | 4,798,286 | | | $ | 109,288,407 | |
| Tactical Opportunity Fund | | $ | 6,808,217 | | | $ | (378,051 | ) | | $ | 6,430,166 | | | $ | 41,422,790 | |
The difference between book and tax basis for unrealized appreciation/(depreciation) for the Funds is attributable to wash sales, deferred dividends, callable bond premium amortization and certain other investments.
| 66 | | www.wesmarkfunds.com |
Notes to Financial Statements
December 31, 2021
The tax character of distributions as reported on the Statements of Changes in Net Assets for the years ended December 31, 2021 and December 31, 2020 was as follows:
| | | For Year Ended December 31, 2021 | |
| Fund Name | | Tax-Exempt Income | | | Ordinary Income | | | Long-Term Capital Gain | | | Total | |
| Small Company Fund | | $ | – | | | $ | 2,835,651 | | | $ | 24,705,833 | | | $ | 27,541,484 | |
| Large Company Fund | | $ | – | | | $ | 2,672,193 | | | $ | 26,842,011 | | | $ | 29,514,204 | |
| Balanced Fund | | $ | – | | | $ | 2,414,119 | | | $ | 4,772,404 | | | $ | 7,186,523 | |
| Government Bond Fund | | $ | – | | | $ | 3,221,768 | | | $ | – | | | $ | 3,221,768 | |
| West Virginia Municipal Bond Fund | | $ | 1,853,582 | | | $ | 33,405 | | | $ | 250,493 | | | $ | 2,137,480 | |
| Tactical Opportunity Fund | | $ | – | | | $ | 3,174,726 | | | $ | 2,254,947 | | | $ | 5,429,673 | |
| | | For Year Ended December 31, 2020 | |
| Fund Name | | Tax-Exempt Income | | | Ordinary Income | | | Long-Term Capital Gain | | | Total | |
| Small Company Fund | | $ | – | | | $ | – | | | $ | 9,440,746 | | | $ | 9,440,746 | |
| Large Company Fund | | $ | – | | | $ | 248,515 | | | $ | 26,186,863 | | | $ | 26,435,378 | |
| Balanced Fund | | $ | – | | | $ | 1,912,881 | | | $ | 2,422,946 | | | $ | 4,335,827 | |
| Government Bond Fund | | $ | – | | | $ | 4,353,098 | | | $ | – | | | $ | 4,353,098 | |
| West Virginia Municipal Bond Fund | | $ | 2,122,947 | | | $ | 2,068 | | | $ | 49,168 | | | $ | 2,174,183 | |
| Tactical Opportunity Fund | | $ | – | | | $ | 328,108 | | | $ | 632,475 | | | $ | 960,583 | |
As of December 31, 2021, the Funds' most recent year end, the components of distributable earnings on a tax basis was as follows:
| Fund Name | | Undistributed net
investment
income | | | Accumulated net
realized gain
(loss) on
investments | | | Other cumulative
effect of timing
differences | | | Net unrealized
appreciation
(depreciation) on
investments | | | Total | |
| Small Company Fund | | $ | – | | | $ | 4,665,296 | | | $ | (508,573 | ) | | $ | 53,860,959 | | | $ | 58,017,682 | |
| Large Company Fund | | $ | – | | | $ | 8,163,872 | | | $ | – | | | $ | 265,068,942 | | | $ | 273,232,814 | |
| Balanced Fund | | $ | 197,947 | | | $ | 1,826,431 | | | $ | 7,452 | | | $ | 37,647,901 | | | $ | 39,679,731 | |
| Government Bond Fund | | $ | 139,018 | | | $ | (3,086,661 | ) | | $ | – | | | $ | 190,546 | | | $ | (2,757,097 | ) |
| West Virginia Municipal Bond Fund | | $ | – | | | $ | (876 | ) | | $ | – | | | $ | 4,798,286 | | | $ | 4,797,410 | |
| Tactical Opportunity Fund | | $ | 363,674 | | | $ | 282,704 | | | $ | – | | | $ | 6,430,166 | | | $ | 7,076,544 | |
Under current law, capital losses maintain their character as short-term or long-term and are carried forward to the next tax year without expiration. As of December 31, 2021, the following amounts are available as carry forwards to the next tax year:
| | | Non expiring | |
| Fund Name | | ST | | | LT | |
| Government Bond Fund | | $ | 1,638,604 | | | $ | 1,448,057 | |
| Annual Report | December 31, 2021 | | 67 |
Notes to Financial Statements
December 31, 2021
The Funds elect to defer to the period ending December 31, 2022, capital losses recognized during the period November 1, 2021 to December 31, 2021 in the amount of:
| Fund Name | | Capital Losses | |
| Small Company Fund | | $ | 508,573 | |
| West Virginia Municipal Bond Fund | | $ | 876 | |
Capital losses arising in the post-October period of the current fiscal year may be deferred to the next fiscal year if the fund elects to defer the recognition of these losses. When this election is made any losses recognized during the period are treated as having occurred on the first day of the next fiscal year separate from and in addition to the application of normal capital loss carryovers as described above.
5. INVESTMENT ADVISER FEE AND OTHER TRANSACTIONS WITH AFFILIATES
Investment Adviser Fee – WesBanco Investment Department is the Funds’ investment adviser (the “Adviser”). The Advisory Agreement between the Funds and the Adviser provides for an annual fee, accrued daily and paid monthly, equal to the percentage of each Fund’s average daily net assets as follows:
| Fund Name | Investment Adviser
Fee Percentage |
| Small Company Fund | 0.75% |
| Large Company Fund | 0.75% |
| Balanced Fund | 0.75% |
| Government Bond Fund | 0.60% |
| West Virginia Municipal Bond Fund | 0.60% |
| Tactical Opportunity Fund | 0.75% |
The Adviser is contractually obligated to waive a portion of its fees and reimburse other expenses until March 1, 2022 in amounts necessary to limit the Tactical Opportunity Fund’s operating expenses (including the organizational expenses of the Fund, but excluding interest expense, fees on borrowings and expenses associated with the Fund’s investment in other investment companies, if any, extraordinary expenses, tax reclaim recovery expenses and proxy-related expenses) to an annual rate (as a percentage of the Fund’s average daily net assets) of 1.75%. This expense limitation arrangement may not be terminated by the Adviser prior to such date unless such termination is approved by the Trustees. The Adviser is not entitled to recoup any of the fees or expenses waived or reimbursed within this expense limitation arrangement.
For the year ended December 31, 2021, the Adviser did not waive any fees due to expenses being under the limit.
Administrative Fee – ALPS Fund Services, Inc. (“ALPS”) provides the Funds with certain administrative personnel and services. The fees paid to ALPS are based on the daily average aggregate net assets of the Trust for the period, subject to an annual minimum (on the Trust level). The annual minimum fee will be allocated among the Funds using an equal per-Fund allocation. Any remaining amounts of the minimum fee after the per-Fund allocation will be allocated among the Funds based upon the relative net assets of each Fund.
Transfer Agent Fee – ALPS is the Transfer Agent and Dividend Disbursing Agent for the Funds. ALPS receives an annual base fee per Fund in addition to certain out-of-pocket expenses.
Distribution (12b-1) Fee – ALPS Distributors, Inc. (“ADI”), an affiliate of ALPS, serves as the Funds’ distributor. The Funds currently have no active distribution plan pursuant to Rule 12b-1 under the Act.
Shareholder Services Fee – Under the terms of Shareholder Services Agreements with WesBanco Bank ("WesBanco", an affiliate of the Adviser) and other financial institutions, the Funds may pay WesBanco as well as other financial institutions, up to 0.25% of average daily net assets. The fee is used to finance certain services for shareholders and to maintain shareholder accounts. WesBanco and other financial institutions may voluntarily choose to waive any portion of their fee, which arrangement they can modify or terminate at any time at their sole discretion.
Recordkeeping Fee – The Funds may pay recordkeeping fees on an average net assets basis or on a per account per year basis to financial intermediaries for providing recordkeeping services to the Funds and shareholders.
| 68 | | www.wesmarkfunds.com |
Notes to Financial Statements
December 31, 2021
Custodian Fees – WesBanco is the Funds’ custodian. The custodian fee paid to WesBanco is based on the level of each Fund’s average daily net assets for the period, plus out-of-pocket expenses. WesBanco may voluntarily choose to waive any portion of its fee. WesBanco can modify or terminate this voluntary waiver at any time at its sole discretion.
General – Certain Officers and Trustees of the Funds are Officers and Directors or Trustees of the above companies.
6. INVESTMENT TRANSACTIONS
Purchases and sales of investments, excluding long-term U.S. government securities and short-term obligations, for the year ended December 31, 2021 were as follows:
| Fund | | Purchases | | | Sales | |
| Small Company Fund | | $ | 51,432,640 | | | $ | 70,834,998 | |
| Large Company Fund | | | 54,111,455 | | | | 90,293,026 | |
| Balanced Fund | | | 27,031,854 | | | | 37,331,410 | |
| Government Bond Fund | | | 77,186,423 | | | | 57,722,447 | |
| West Virginia Municipal Bond Fund | | | 17,093,073 | | | | 21,462,844 | |
| Tactical Opportunity Fund | | | 35,865,471 | | | | 41,405,625 | |
Purchases and sales of U.S. Government Securities, other than short-term securities, for the period ended December 31, 2021 were as follows:
| Fund | | | Purchases | | | Sales | |
| Balanced Fund | | | $ | – | | | $ | 1,095,000 | |
| Government Bond Fund | | | | 33,973,935 | | | | 32,796,649 | |
7. CONCENTRATION OF RISK
Since the West Virginia Municipal Bond Fund invests a substantial portion of its assets in issuers located in one state, it is more susceptible to factors adversely affecting issuers of that state than would be a comparable tax-exempt mutual fund that invests nationally. In order to reduce the credit risk associated with such factors, as of December 31, 2021, 29% of the securities in the portfolio were backed by letters of credit, bond insurance of various financial institutions, or financial guaranty assurance agencies.
Additionally, the Funds may invest a portion of their assets in securities of companies that are deemed by the Funds’ management to be classified in similar business sectors. The economic developments within a particular sector may have an adverse effect on the ability of issuers to meet their obligations. Additionally, economic developments may have an effect on the liquidity and volatility of portfolio securities.
8. COMPENSATION OF TRUSTEES
None of the Trustees are entitled to receive any retirement, pension plan or deferred compensation benefits from the Trust. Interested Trustees receive the same compensation as Independent Trustees. No officers of the Funds are compensated by the Funds, but officers may be reimbursed by the Funds for travel and related expenses incurred in performing their duties.
9. RECENT ACCOUNTING PRONOUNCEMENT
In March 2020, the FASB issued guidance providing optional temporary financial reporting relief from the effect of certain types of contract modifications due to the planned discontinuation of the LIBOR (London Interbank Offered Rate) or other interbank-offered based reference rates as of the end of December 2021. Management continues to evaluate the impact of the guidance and may apply other elections, as applicable, as the expected market transition to alternative reference rates evolves.
| Annual Report | December 31, 2021 | | 69 |
Notes to Financial Statements
December 31, 2021
10. SUBSEQUENT EVENTS
In preparing these financial statements, the Funds’ management has evaluated events and transactions for potential recognition or disclosure through the date the financial statements were issued.
Shareholder Distributions for the Balanced Fund: On January 28, 2022, the Balanced Fund paid a monthly distribution of $0.018 per share to common shareholders of record as of January 24, 2022.
Shareholder Distributions for Government Bond Fund and West Virginia Municipal Bond Fund: On February 1, 2022, the Government Bond Fund and the West Virginia Municipal Bond Fund paid daily distributions declared from January 1, 2022 to January 31, 2022 totaling $0.008 and $0.014 per share, respectively, to common shareholders.
| 70 | | www.wesmarkfunds.com |
Report of Independent Registered Public Accounting Firm
To the Shareholders and Board of Trustees of
WesMark Funds
Opinion on the Financial Statements
We have audited the accompanying statements of assets and liabilities, including the portfolios of investments, of WesMark Funds comprising WesMark Small Company Fund (formerly, WesMark Small Company Growth Fund), WesMark Large Company Fund (formerly, WesMark Growth Fund), WesMark Balanced Fund, WesMark Government Bond Fund, WesMark West Virginia Municipal Bond Fund, and WesMark Tactical Opportunity Fund (the “Funds”) as of December 31, 2021, the related statements of operations for the year then ended, the statements of changes in net assets for each of the two years in the period then ended, the related notes, and the financial highlights for each of the five years in the period then ended of WesMark Small Company Fund, WesMark Large Company Fund, WesMark Balanced Fund, WesMark Government Bond Fund, and WesMark West Virginia Municipal Bond Fund, and the related statement of operations for the year then ended, the statements of changes in net assets for each of the two years in the period then ended, the related notes, and the financial highlights for each of the five periods in the period then ended of WesMark Tactical Opportunity Fund (collectively referred to as the “financial statements”). In our opinion, the financial statements present fairly, in all material respects, the financial position of each of the Funds as of December 31, 2021, the results of their operations, the changes in net assets, and the financial highlights for the periods indicated above, in conformity with accounting principles generally accepted in the United States of America.
Basis for Opinion
These financial statements are the responsibility of the Funds’ management. Our responsibility is to express an opinion on the Funds’ financial statements based on our audits. We are a public accounting firm registered with the Public Company Accounting Oversight Board (United States) (“PCAOB”) and are required to be independent with respect to the Funds in accordance with the U.S. federal securities laws and the applicable rules and regulations of the Securities and Exchange Commission and the PCAOB.
We conducted our audits in accordance with the standards of the PCAOB. Those standards require that we plan and perform the audit to obtain reasonable assurance about whether the financial statements are free of material misstatement whether due to error or fraud.
Our audits included performing procedures to assess the risks of material misstatement of the financial statements, whether due to error or fraud, and performing procedures that respond to those risks. Such procedures included examining, on a test basis, evidence regarding the amounts and disclosures in the financial statements. Our procedures included confirmation of securities owned as of December 31, 2021, by correspondence with the custodian and brokers. Our audits also included evaluating the accounting principles used and significant estimates made by management, as well as evaluating the overall presentation of the financial statements. We believe that our audits provide a reasonable basis for our opinion.
We have served as the Funds’ auditor since 2011.

COHEN & COMPANY, LTD.
Cleveland, Ohio
February 28, 2022
| Annual Report | December 31, 2021 | | 71 |
Shareholder Expense Example
December 31, 2021 (Unaudited)
As a shareholder of a Fund, you incur ongoing costs, including management fees and to the extent applicable, shareholder services fees and other Fund expenses. This example is intended to help you to understand your ongoing costs (in dollars) of investing in the Funds and to compare these costs with the ongoing costs of investing in other mutual funds. It is based on an investment of $1,000 invested at the beginning of the period and held for the entire period from July 1, 2021 to December 31, 2021.
ACTUAL EXPENSES
The first line of the table below (“Actual Fund Return”) provides information about actual account values and actual expenses. You may use the information in this section, together with the amount you invested, to estimate the expenses that you incurred over the period. Simply divide your account value by $1,000 (for example, an $8,600 account value divided by $1,000 = 8.6), then multiply the result by the number in the first section under the heading “Expense Paid During Period” to estimate the expenses attributable to your investment during this period.
HYPOTHETICAL EXAMPLE FOR COMPARISON PURPOSES
The second line under each fund of the table below (“Hypothetical Fund Return”) provides information about hypothetical account values and hypothetical expenses based on a Fund’s actual expense ratio and an assumed rate of return of 5% per year before expenses, which is not the Fund’s actual return. Thus, you should not use the hypothetical account values and expenses to estimate the actual ending account balance or your expenses for the period. Rather, these figures are required to be provided to enable you to compare the ongoing costs of investing in the Funds with other funds. To do so, compare this 5% hypothetical example with the 5% hypothetical examples that appear in the shareholder reports of the other funds.
Please note that the expenses shown in the table are meant to highlight your ongoing costs only. Therefore, the second line of the table below (“Hypothetical Fund Return”) is useful in comparing ongoing costs only and will not help you determine the relative total costs of owning different funds.
| | Beginning
Account Value
July 1, 2021 | Ending
Account Value
December 31, 2021 | Expense Paid
During Period(1) | Net
Expense
Ratios(2) |
| WesMark Small Company Fund | | | | |
| Actual Fund Return | $1,000.00 | $1,063.40 | $6.40 | 1.23% |
| Hypothetical Fund Return (assuming a 5% return before expenses) | $1,000.00 | $1,019.00 | $6.26 | 1.23% |
| WesMark Balanced Fund | | | | |
| Actual Fund Return | $1,000.00 | $1,052.60 | $6.47 | 1.25% |
| Hypothetical Fund Return (assuming a 5% return before expenses) | $1,000.00 | $1,018.90 | $6.36 | 1.25% |
| WesMark Government Bond Fund | | | | |
| Actual Fund Return | $1,000.00 | $991.20 | $5.17 | 1.03% |
| Hypothetical Fund Return (assuming a 5% return before expenses) | $1,000.00 | $1,020.01 | $5.24 | 1.03% |
| WesMark West Virginia Municipal Bond Fund | | | | |
| Actual Fund Return | $1,000.00 | $1,002.50 | $5.60 | 1.11% |
| Hypothetical Fund Return (assuming a 5% return before expenses) | $1,000.00 | $1,019.61 | $5.65 | 1.11% |
| WesMark Tactical Opportunity Fund | | | | |
| Actual Fund Return | $1,000.00 | $1,039.00 | $7.40 | 1.44% |
| Hypothetical Fund Return (assuming a 5% return before expenses) | $1,000.00 | $1,017.95 | $7.32 | 1.44% |
| WesMark Large Company Fund | | | | |
| Actual Fund Return | $1,000.00 | $1,099.90 | $5.98 | 1.13% |
| Hypothetical Fund Return (assuming a 5% return before expenses) | $1,000.00 | $1,019.51 | $5.75 | 1.13% |
| (1) | Expenses are equal to the Funds' annualized net expense ratios, multiplied by the average account value over the period, multiplied by 184/365 (to reflect the six month period). |
| (2) | Annualized, based on the Fund's most recent fiscal half-year expenses. |
| 72 | | www.wesmarkfunds.com |
Board of Trustees and Trust Officers
December 31, 2021 (Unaudited)
The Board is responsible for managing the Trust’s business affairs and for exercising all the Trust’s powers except those reserved for the shareholders. The following tables give information about each Board member and the senior officers of the Funds. Where required, the tables separately list Board members who are “interested persons” of the Funds (i.e., “Interested” Board members) and those who are not (i.e., “Independent” Board members). The WesMark Fund Complex consists of one Investment Company (comprising six portfolios). Unless otherwise noted, each Officer is elected annually; each Board member oversees all portfolios in the WesMark Fund Complex; and serves for an indefinite term.
As of January 31, 2022, the Funds’ Board and Officers as a group owned approximately less than 1% of the Funds’ outstanding Shares.
Name, Year of Birth,
Address* and
Date Service Began | Principal Occupations in Past Five Years,
other Directorships Held and Previous Positions |
| Independent Trustees | |
Lawrence E. Bandi
(1954) TRUSTEE
Began serving September 2004 | Principal Occupations: Retired Other Directorships: Welty Corporation, St. Vincent’s de Paul Parish School. Previous Positions: President, Central Catholic High School (Education); President and Chief Executive Officer, Valley National Gases, Inc. (Gas Supplier); Chief Financial Officer & Vice President, West Virginia Northern Community College (Education); VP & CFO MPD Corporation (Hospitality). |
Mark M. Gleason
(1950) TRUSTEE
Began serving January
2011 – Retirement Effective
as of February 28, 2021 | Principal Occupation: Managing Director, Gleason & Associates (Certified Public Accounting and Consulting Firm). Other Directorships: Trustee, Various Asbestos Trusts (Investment of Assets and Claim Payment). |
Jordan A. Miller, Jr.
(1951) TRUSTEE
Began serving March 2021 | Principal Occupation: Retired Previous Positions and Directorships: Regional Chairman Fifth Third Bank Central Ohio (National Bank); Regional CEO and President Fifth Third Bank Central Ohio (Commercial, Consumer, and Private banking); Managing Director of Fifth Third Advisor Services (Investment Management); CEO Fifth Third Bank Investments a FINRA registered broker dealer (Investment Management). |
Gary J. Madich
(1955) TRUSTEE
Began serving November 2020 | Principal Occupation: Retired Other Directorships: Managing Director/CEO Global Fixed Income and previously Managing Director/Global CIO Fixed Income, JPMorgan Investment Management (Investment Management); Senior Managing Director/ CIO Fixed Income, Banc One Investment Advisors (Investment Management); Senior Vice President and Senior Portfolio Manager Fixed Income, Federated Investors (Investment Management). |
| Annual Report | December 31, 2021 | | 73 |
Board of Trustees and Trust Officers
December 31, 2021 (Unaudited)
Name, Year of Birth,
Address* and
Date Service Began | Principal Occupations in Past Five Years,
other Directorships Held and Previous Positions |
| Interested Trustees | |
Robert E. Kirkbride**
(1939) CHAIRMAN AND TRUSTEE
Began serving September 2004 | Principal Occupations and Other Directorships: Paid Consultant to the Executive Loan Committee of WesBanco Bank, Inc.(Financial Services); Vice President and Director, Ohio Valley Land Company (Real Estate Development); Director, The Mountain Company (Holding Company); Director, The Laurel Management Group (Holding Company); President and Director, Thunder Corporation (Oil and Gas Production); Member and Manager, Marietta Ventures LLC (real estate development and related consulting); Vice President and Director, Spartan Foundation (private foundation). |
J. Christopher Gardill***
(1976) TRUSTEE
Began serving August 2015 | Principal Occupations: Member, Phillips, Gardill, Kaiser & Altmeyer, PLLC (private law firm). Other Directorships: Board Member, Wheeling Vintage Raceboat Regatta (Private Organization). |
| * | All Trustees may be reached via the Funds at 1290 Broadway, Suite 1000, Denver, CO, 80203. |
| ** | Mr. Kirkbride is an interested person due to his security holdings in WesBanco, Inc. The Funds’ investment adviser, WesBanco Investment Department, is a division of WesBanco Bank, Inc., a wholly owned subsidiary of WesBanco, Inc. Mr. Kirkbride previously served as a Director for WesBanco, Inc. and WesBanco Bank, Inc., and currently serves as a paid consultant to the Executive Loan Committee of WesBanco Bank, Inc. Mr. Kirkbride retired from the WesMark Board effective January 31, 2022. |
| *** | Mr. Gardill is an interested person due to his affiliation with Phillips, Gardill, Kaiser & Altmeyer, PLLC who serves as legal counsel to Wesbanco Inc. and Wesbanco Bank. The Funds’ investment adviser, WesBanco Investment Department, is a division of WesBanco Bank, Inc., a wholly owned subsidiary of WesBanco, Inc. Mr. Gardill was also an independent consultant to the Trust Committee of WesBanco Bank, Inc. |
| 74 | | www.wesmarkfunds.com |
Board of Trustees and Trust Officers
December 31, 2021 (Unaudited)
The name, address, age and principal occupations for the past five years of the officers of the Trust are listed below. Each officer serves as an officer of the six fund portfolios that comprise the Trust.
Name, Year of Birth and Address* | Positions Held with Fund Date Service Began | Principal Occupation(s) and Previous Position(s) |
| Officers | | |
Scott Love
(1976) | CHIEF EXECUTIVE OFFICER, PRESIDENT
Began Serving: March 2020 | Principal Occupations: Co-Portfolio Manager of the WesMark Funds; Executive Vice President, WesBanco Trust and Investment Services. Previous Positions: Vice President of the WesMark Funds. |
Jennifer S. Roth
(1975) | CHIEF COMPLIANCE OFFICER
Began Serving: August 2019 | Principal Occupations: Chief Compliance Officer of the WesMark Funds; Chief Compliance Officer and Senior Vice President of WesBanco Investment Department and Wesbanco Trust and Investment Services; Registered Principal WesBanco Securities, Inc. Previous Positions: Chief Compliance Officer/Compliance Manager, Global Alternative Investment Services, Inc., 2015 to August 2019. |
Steven Kellas
(1966) | CHIEF FINANCIAL OFFICER, TREASURER
Began Serving: January 2013 | Principal Occupation: Co-Portfolio Manager, Treasurer and Chief Financial Officer of the WesMark Funds, Executive Vice President WesBanco Trust and Investment Services. |
Todd P. Zerega
(1974) | SECRETARY
Began Serving: September 2004 | Principal Occupations: Partner, Perkins Coie LLP. |
Sareena Khwaja-Dixon
(1980) | ASSISTANT SECRETARY
Began Serving: June 2021 | Principal Occupation: Principal Legal Counsel and Vice President of SS&C ALPS since 2020. Previous Positions: Vice President, Senior Legal Counsel, SS&C ALPS from 2015-2020. |
Joel Breitenbach
(1984) | ASSISTANT TREASURER
Began Serving: August 2021 | Principal Occupation: Fund Controller, SS&C ALPS since 2021. Previous Positions: Vice President Fund Business Group, PIMCO from 2020-2021; Assistant Director Fund Treasury, Invesco/Oppenheimer Funds from 2017-2020. |
| Annual Report | December 31, 2021 | | 75 |
Statement Regarding the Liquidity Risk Management Program
December 31, 2021 (Unaudited)
The WesMark Funds have adopted a liquidity risk management program pursuant to Rule 22e-4 (the “Liquidity Rule”) under the Investment Company Act of 1940, as amended (the “Program”). The Funds’ Board of Trustees (the “Board”) has designated WesBanco Investment Department as the administrator of the Program. The Program’s principal objectives are to support the Funds’ compliance with limits on investments in illiquid assets and to mitigate the risk that a Fund is unable to meet its redemption obligations on a timely basis. In this regard, the Program includes a number of elements that support the management or assessment of liquidity risk, including an assessment of factors that influence a Fund’s liquidity and the periodic classification and, as determined necessary, re-classification of a Fund’s investments into buckets that reflect the relative liquidity under current market conditions.
On November 16, 2021, the Funds’ Board reviewed a written report from the Program administrator that addressed the operation of the Program, assessed its adequacy and effectiveness since February 16, 2021, the date of the last report, and recommended certain modifications to the Program. The Administrator’s report described the key features of the Funds’ liquidity risk management program, including the liquidity classification methodology and classifications of the holdings for each of the WesMark Funds, the status of regulatory filings required by the Liquidity Rule, a summary of exam and inspection results during the period, an update of monitoring of illiquid securities, and a review of redemptions in-kind policies and procedures. The Administrator recommended changes to the Funds’ highly liquid investment minimum (“HLIM”) based upon the determination that the Funds were primarily highly liquid funds. Based upon such recommendation, the Board approved the changes to the HLIM for the Funds, as well as certain other recommended changes to the Program. Lastly, the Board approved changes to the policies and procedures governing redemptions in-kind.
Upon completion of the review, the Board concluded that based on the operation of the functions, as described in the Report, the Program is operating as intended and is effective in implementing the requirements of the Liquidity Rule.
| 76 | | www.wesmarkfunds.com |
Additional Information
December 31, 2021 (Unaudited)
Mutual funds are not bank deposits or obligations, are not guaranteed by any bank, and are not insured or guaranteed by the U.S. government, the Federal Deposit Insurance Corporation, the Federal Reserve Board, or any other government agency. Investment in mutual funds involves investment risk, including the possible loss of principal.
This report is authorized for distribution to prospective investors only when preceded or accompanied by the funds’ prospectus which contains facts concerning its objective and policies, management fees, expenses and other information.
VOTING PROXIES ON FUND PORTFOLIO SECURITIES
A description of the policies and procedures that the Funds use to determine how to vote proxies relating to securities held in a Fund’s portfolio is available, without charge and upon request, by calling 1-800-864-1013. A report on Form N-PX of how the Funds voted any such proxies during the most recent 12-month period ended June 30 is available without charge and upon request by calling the Funds toll-free at 1-800-864-1013. This information is also available from the EDGAR database on the SEC’s website at https://www.sec.gov.
QUARTERLY PORTFOLIO SCHEDULE
The Funds file with the SEC a complete schedule of their portfolio holdings, as of the close of the first and third quarters of its fiscal year, on Form N-PORT. These filings are also available on the SEC’s website at http://www.sec.gov and may be reviewed and copied at the SEC’s Public Reference Room in Washington, DC (call 1-800-SEC-0330 for information on the operation of the Public Reference Room). You may also access this information on the WesMark Funds website at www.wesmarkfunds.com by clicking on “Quarterly Reports”, then selecting the name of the Fund.
NOTICE TO STOCKHOLDERS
For the year ended December 31, 2021, 98.29% of the distributions from net investment income for West Virginia Municipal Bond Fund are exempt from federal income tax.
Of the ordinary income (including short-term capital gain) distributions made by the Funds during the year ended December 31, 2021, the percentages qualifying for the dividend received deduction available to corporate shareholders are as follows:
| Fund Name | Percentage |
| Small Company Fund | 42.71% |
| Large Company Fund | 58.81% |
| Balanced Fund | 82.15% |
| Tactical Opportunity Fund | 7.62% |
For the year ended December 31, 2021, the following percentages of total ordinary dividends paid by the Funds are qualifying dividends which may be subject to a maximum tax rate of 15%, as provided for by the Jobs and Growth Tax Relief Act of 2003. Complete information will be reported in conjunction with the reporting of your distributions on Form 1099-DIV. The percentages were as follows:
| Fund Name | Percentage |
| Small Company Fund | 42.63% |
| Large Company Fund | 59.95% |
| Balanced Fund | 83.46% |
| Tactical Opportunity Fund | 14.10% |
Pursuant to Section 852(b)(3) of the Internal Revenue Code, Small Company Fund, West Virginia Municipal Bond Fund, Large Company Fund, Balanced Fund, and Tactical Opportunity Fund designated $24,705,833, $250,493, $26,842,011, $4,772,404, and $2,254,947, respectively as long-term capital gain dividends.
| Annual Report | December 31, 2021 | | 77 |
Glossary of Terms
December 31, 2021 (Unaudited)
Basis points – a unit that is equal to 1/100th of 1% and is used to denote the change in a financial instrument.
Collateralized Mortgage Obligation – complex mortgage backed securities that allocate payments and prepayments from an underlying mortgage pools among holders of different classes or tranches of the CMO.
Commercial Mortgage Securities (CMBS) – fixed-income investment products that are backed by mortgages on commercial properties rather than residential real estate.
Consumer Price Index (CPI) – a measure of the average change over time in the prices paid by urban consumers for a market basket of consumer goods and services.
Covered call – an options strategy where an investor holds a long position in an asset and writes (sells) call options on that same asset to generate an income stream.
Duration – a measure of a security’s price sensitivity to changes in interest rates. Securities with longer durations are more sensitive to changes in interest rates than securities of shorter durations.
Fannie Mae and Freddie Mac – government sponsored entities that receive support through federal subsidies, loan or other benefits.
Floating rate debt – a debt instrument with a variable interest rate.
HFRI Fund of Funds Composite Index – The Hedge Fund Research, Inc. (HFRI) Fund of Funds Composite Index is an equal weighted index that consists of over 800 constituent hedge funds, including both domestic and offshore funds.
LIBOR – London Interbank Offered Rate – a benchmark interest rate at which major global banks lend to one another in the international interbank market for short-term loans.
Maturity – maturity date refers to the final payment date of a loan or other financial instrument, at which point the principal (and all remaining interest) is due to be paid.
Mortgage Backed Securities – a type of asset-backed security that is secured by a mortgage or collection of mortgages.
Mortgage Pool – a group of mortgages with similar interest rates and maturity dates “pooled together” for the issuance of a mortgage-backed security. Some mortgage-backed securities issued by Fannie Mae, Freddie Mac and Ginnie Mae are known as "pools" themselves. These are the simplest form of mortgage-backed security.
MSCI All World index – The MSCI All World Index captures large and mid-c stocks across 23 developed and 27 emerging markets.
MSCI EAFA Index – The MSCI EAFE Index is an equity index which captures large and mid cap representation across 21 Developed Markets countries around the world, excluding the US and Canada.
MSCI Emerging Markets Index – The MSCI Emerging Markets Index captures large and mid cap representation across 27 Emerging Markets (EM) countries.
Options – a contract which offers the buyer the right, but not the obligation, to buy (call option) or sell (put option) the underlying asset at an agreed-upon price during a certain period of time or on a specific date.
Russell 2000 Index – an index measuring the performance of approximately 2,000 small-cap companies in the Russell 3000 Index, which is made up of 3,000 of the biggest U.S. stocks. The Russell 2000 serves as a benchmark for small-cap stocks in the United States.
S&P 500 – a market-capitalization-weighted index of the 500 largest publicly-traded companies in the U.S.
| 78 | | www.wesmarkfunds.com |
Glossary of Terms
December 31, 2021 (Unaudited)
S&P 600 – An index of small-cap stocks managed by Standard and Poor's. The S&P 600 SmallCap Index covers a broad range of small cap stocks in the United States. The index is weighted according to market capitalization and covers about 3-4% of the total market for equities in the United States.
VIX Index – The Volatility Index, or VIX, is a real-time market index created by the Chicago Board Options Exchange (CBOE), that represents the market's expectation of 30-day forward-looking volatility. Derived from the price inputs of the S&P 500 index options, it provides a measure of market risk and investors' sentiments.
Yield – the income return on an investment, such as the interest or dividends received from holding a particular security.
Yield curve – a line that plots the interest rates, at a set point in time, of bonds having equal credit quality but differing maturity dates.
Yield spread – the difference between yields on differing debt instruments of varying maturities, credit ratings and risk, calculated by deducting the yield of one instrument from another.
Investment Ratings:
| Description | Standard and Poor’s
Long-Term Debt Rating | Moody’s Investors Service
Long-Term Bond Rating |
| Highest rating available. Capacity to pay interest and repay principal is extremely strong. Carry smallest degree of investment risk. | AAA | Aaa |
| Very strong capacity to pay interest and repay principal. Differ from AAA rated securities by very small degree. Still considered high grade obligation. | AA | Aa |
| Strong capacity to pay interest and repay principal although is somewhat more susceptible to adverse effects of changes in circumstances and economic conditions than those rated higher. Considered upper medium grade obligation. | A | A |
| Regarded as having an adequate capacity to pay interest and repay principal. Any adverse economic conditions or changing circumstances are more likely to lead to a weakened capacity to pay vs. those rated higher. Considered medium grade obligation. | BBB | Baa |
| Judged to have speculative elements, but has less near-term vulnerability to default than other speculative=e issues. Faces major ongoing uncertainties or exposure to adverse business, financial, or economic conditions which could lead to inadequate capacity to meet timely interest and principal payments. | BB | Ba |
| Has greater vulnerability to default but currently has capacity to meet interest payments and principal repayments. Adverse business, financial, or economic conditions will likely impair capacity or willingness to pay interest or principal. Generally lack characteristics of the desirable investment. | B | B |
| Currently identifiable vulnerability to default and is dependent upon favorable business, financial, and economic conditions to meet timely payment of interest and repayment of principal. Such issues may be in default or there may be present elements of danger with respect to principal or interest. | CCC | Caa |
| Typically applied to debt subordinated to senior debt that is assigned an actual or implied CCC debt rating (by S&P). Represent obligations which are speculative in a high degree. | CC | Ca |
| Typically applied to debt subordinated to senior debt which has been assigned an actual or implied CCC-debt rating (by S&P). Represents the lowest rated class of bonds. | C | C |
Credit rating firms, such as Standard & Poor's and Moody's, use different designations consisting of upper- and lower-case letters 'A' and 'B' to identify a bond's credit quality rating. 'AAA' and 'AA' (high credit quality) and 'A' and 'BBB' (medium credit quality) are considered investment grade. Credit ratings for bonds below these designations ('BB', 'B', 'CCC', etc.) are considered low credit quality, and are commonly referred to as "junk bonds."
| Annual Report | December 31, 2021 | | 79 |

Item 2. Code of Ethics.
(a) As of the end of the period covered by this report, the registrant has adopted a code of ethics (the “Section 406 Standards for Investment Companies - Ethical Standards for Principal Executive and Financial Officers”) that applies to the registrant’s Principal Executive Officer and Principal Financial Officer.
(b) Not applicable.
(c) During the period covered by this report, no amendments were made to the provisions of the code of ethics adopted in 2(a) above.
(d) During the period covered by this report, no implicit or explicit waivers to the provisions of the code of ethics adopted in 2(a) above were granted.
(e) Not applicable to the registrant.
(f)(3) The registrant hereby undertakes to provide to any person, without charge, upon request, a copy of the code of ethics referenced in Item 2(a) above. To request a copy of the code of ethics, contact the registrant at 1-800-864-1013.
Item 3. Audit Committee Financial Expert.
The registrant’s Board of Trustees has determined that the following members of the Board’s Audit Committee are each an “audit committee financial expert” and are “independent” for purposes of this Item: Lawrence E. Bandi and Jordan A. Miller, Jr.
Item 4. Principal Accountant Fees and Services.
(a) Audit Fees. The aggregate fees billed in each of the fiscal years ended December 31, 2020 and December 31, 2021 for professional services rendered by the principal accountant for the audit of the registrant’s annual financial statements or services that are normally provided by the accountant in connection with statutory and regulatory filings or engagements were $83,500 and $83,500 respectively.
(b) Audit-Related Fees. The aggregate fees billed in each of the fiscal years ended December 31, 2020 and December 31, 2021 for assurance and related services by the principal accountant that are reasonably related to the performance of the audit of the registrant’s financial statements and are not reported under paragraph (a) of this Item were $0 and $0, respectively.
(c) Tax Fees. The aggregate fees billed in each of the fiscal years ended December 31, 2020 and December 31, 2021 for professional services rendered by the principal accountant for tax compliance, tax advice and tax planning were $18,500 and $18,500, respectively.
(d) All Other Fees. The aggregate fees billed in each of the fiscal years ended December 31, 2020 and December 31, 2021 for products and services provided by the principal accountant, other than the services reported in paragraphs (a) through (c) of this Item were $12,800 and $12,800 respectively. These services were provided in connection with conducting Rule 17f-2 examinations and preparing related SEC filings.
(e)(1) Audit Committee Policies Regarding Pre-approval of Services.
The Audit Committee is required to pre-approve audit and non-audit services performed by the independent auditor in order to assure that the provision of such services does not impair the auditor’s independence. Unless a type of service to be provided by the independent auditor has received general pre-approval, it will require specific pre-approval by the Audit Committee. Any proposed services exceeding pre-approved cost levels will require specific pre-approval by the Audit Committee.
Certain services have the general pre-approval of the Audit Committee. The term of the general pre-approval is 12 months from the date of pre-approval, unless the Audit Committee specifically provides for a different period. The Audit Committee will annually review the services that may be provided by the independent auditor without obtaining specific pre-approval from the Audit Committee and may grant general pre-approval for such services. The Audit Committee will revise the list of general pre-approved services from time to time, based on subsequent determinations. The Audit Committee will not delegate its responsibilities to pre-approve services performed by the independent auditor to management.
The Audit Committee has delegated pre-approval authority to its Chairman. The Chairman will report any pre-approval decisions to the Audit Committee at its next scheduled meeting. The Committee will designate another member with such pre-approval authority when the Chairman is unavailable.
AUDIT SERVICES
The annual Audit Services engagement terms and fees will be subject to the specific pre-approval of the Audit Committee. The Audit Committee must approve any changes in terms, conditions and fees resulting from changes in audit scope, registered investment company structure or other matters.
In addition to the annual Audit services engagement specifically approved by the Audit Committee, the Audit Committee may grant general pre-approval for other Audit Services, which are those services that only the independent auditor reasonably can provide. The Audit Committee has pre-approved certain Audit Services; all other Audit Services must be specifically pre-approved by the Audit Committee.
AUDIT-RELATED SERVICES
Audit-Related Services are assurance and related services that are reasonably related to the performance of the audit or review of the registrant’s financial statements or that are traditionally performed by the independent auditor. The Audit Committee believes that the provision of Audit-Related Services does not impair the independence of the auditor, and has pre-approved certain Audit-Related Services; all other Audit-Related Services must be specifically pre-approved by the Audit Committee.
TAX SERVICES
The Audit Committee believes that the independent auditor can provide Tax Services to the registrant such as tax compliance, tax planning and tax advice without impairing the auditor’s independence. However, the Audit Committee will not permit the retention of the independent auditor in connection with a transaction initially recommended by the independent auditor, the purpose of which may be tax avoidance and the tax treatment of which may not be supported in the Internal Revenue Code and related regulations. The Audit Committee has pre-approved certain Tax Services; all Tax Services involving large and complex transactions must be specifically pre-approved by the Audit Committee.
ALL OTHER SERVICES
With respect to the provision of services other than audit, review or attest services the pre-approval requirement is waived if:
| (1) | The aggregate amount of all such services provided constitutes no more than five percent of the total amount of revenues paid by the registrant, the registrant’s adviser (not including any sub-adviser whose role is primarily portfolio management and is subcontracted with or overseen by another investment adviser), and any entity controlling, controlled by, or under common control with the investment adviser that provides ongoing services to the registrant to its accountant during the fiscal year in which the services are provided; |
| (2) | Such services were not recognized by the registrant, the registrant’s adviser (not including any sub-adviser whose role is primarily portfolio management and is subcontracted with or overseen by another investment adviser), and any entity controlling, controlled by, or under common control with the investment adviser that provides ongoing services to the registrant at the time of the engagement to be non-audit services; and |
| (3) | Such services are promptly brought to the attention of the Audit Committee of the issuer and approved prior to the completion of the audit by the Audit Committee or by one or more members of the Audit Committee who are members of the board of directors to whom authority to grant such approvals has been delegated by the Audit Committee. |
The Audit Committee may grant general pre-approval to those permissible non-audit services classified as All Other services that it believes are routine and recurring services, and would not impair the independence of the auditor.
The SEC’s rules and relevant guidance should be consulted to determine the precise definitions of prohibited non-audit services and the applicability of exceptions to certain of the prohibitions.
PRE-APPROVAL FEE LEVELS
Pre-approval fee levels for all services to be provided by the independent auditor will be established annually by the Audit Committee. Any proposed services exceeding these levels will require specific pre-approval by the Audit Committee.
PROCEDURES
Requests or applications to provide services that require specific approval by the Audit Committee will be submitted to the Audit Committee by both the independent auditor and the Principal Accounting Officer and/or Internal Auditor, and must include a joint statement as to whether, in their view, the request or application is consistent with the SEC’s rules on auditor independence.
(e)(2) The services described in paragraphs (c) and (d) of this Item were approved by the registrant’s Audit Committee pursuant to paragraph (c)(7)(i)(C) of Rule 2-01 of Regulation S-X. There were no services of the kind described in paragraph (b) of this Item provided.
(f) Not applicable to registrant.
(g) Non-Audit Fees. The aggregate non-audit fees billed by the registrant’s accountant for services rendered to the registrant, and rendered to the registrant’s investment adviser, and any entity controlling, controlled by, or under common control with the adviser that provides ongoing services to the registrant for each of the fiscal years of the registrant ended December 31, 2020 and December 31, 2021 were $31,300 and $31,300, respectively.
(h) The registrant’s Audit Committee has considered that the provision of non-audit services that were rendered to the registrant’s adviser, and any entity controlling, controlled by, or under common control with the investment adviser that provides ongoing services to the registrant that were not pre-approved pursuant to paragraph (c)(7)(ii) of Rule 2-01 of Regulation S-X is compatible with maintaining the principal accountant’s independence.
Item 5. Audit Committee of Listed Registrants.
Not applicable to the registrant.
Item 6. Investments.
| (a) | The registrant’s “Schedule I – Investments in securities of unaffiliated issuers” (as set forth in 17 CFR 210.12-12) is included in Item 1 of this Form N-CSR. |
| (b) | Not applicable to the registrant. |
Item 7. Disclosure of Proxy Voting Policies and Procedures for Closed-End Management Investment Companies.
Not applicable to the registrant.
Item 8. Portfolio Managers of Closed-End Management Investment Companies.
Not applicable to the registrant.
Item 9. Purchases of Equity Securities by Closed-End Management Investment Company and Affiliated Purchasers.
Not applicable to the registrant.
Item 10. Submission of Matters to a Vote of Security Holders.
No changes to report.
Item 11. Controls and Procedures.
| (a) | The registrant’s principal executive and principal financial officers have concluded that the registrant’s disclosure controls and procedures (as defined in Rule 30a-3(c) under the Investment Company Act of 1940, as amended (17 CFR 270.30a-3(c))), are effective in design and operation and are sufficient to form the basis of the certifications required by Rule 30a-(2) under the Investment Company Act of 1940, as amended, based on their evaluation of these disclosure controls and procedures within 90 days of the filing date of this report on Form N-CSR. |
| (b) | There were no changes in the registrant’s internal control over financial reporting (as defined in Rule 30a-3(d) under the Investment Company Act of 1940, as amended) that occurred during the period covered by this report that have materially affected, or are reasonably likely to materially affect, the registrant’s internal control over financial reporting. |
Item 12. Disclosure of Securities Lending Activities for Closed-End Management Investment Companies.
Not applicable.
Item 13. Exhibits.
SIGNATURES
Pursuant to the requirements of the Securities Exchange Act of 1934 and the Investment Company Act of 1940, the registrant has duly caused this report to be signed on its behalf by the undersigned, thereunto duly authorized.
| Registrant | WesMark Funds | |
| | | |
| By | /s/Scott Love | |
| | Scott Love President and Chief Executive Officer (Principal Executive Officer) | |
| Date | March 4, 2022 | |
Pursuant to the requirements of the Securities Exchange Act of 1934 and the Investment Company Act of 1940, this report has been signed below by the following persons on behalf of the registrant and in the capacities and on the dates indicated.
| By | /s/Scott Love | |
| | Scott Love President and Chief Executive Officer (Principal Executive Officer) | |
| Date | March 4, 2022 | |
| | | |
| | | |
| By | /s/Steven Kellas | |
| | Steven Kellas Treasurer and Chief Financial Officer (Principal Financial Officer) | |
| Date | March 4, 2022 | |