
Unifi, Inc.
For the Third Quarter Ended
March 24, 2013
Conference Call
Slide Presentation
Exhibit 99.2
Cautionary Statement
Certain statements included herein contain forward-looking statements within the meaning of federal securities laws about the financial condition and results of operations of Unifi, Inc. (the “Company”) that are based on management’s current expectations, estimates and projections about the markets in which the Company operates, as well as management's beliefs and assumptions. Words such as "expects," "anticipates," "believes," "estimates," variations of such words and other similar expressions are intended to identify such forward-looking statements. These statements are not guarantees of future performance and involve certain risks, uncertainties and assumptions, which are difficult to predict. Therefore, actual outcomes and results may differ materially from what is expressed or forecasted in, or implied by, such forward-looking statements. Readers are cautioned not to place undue reliance on these forward-looking statements, which reflect management's judgment only as of the date hereof. The Company undertakes no obligation to update publicly any of these forward-looking statements to reflect new information, future events or otherwise.
Factors that may cause actual outcome and results to differ materially from those expressed in, or implied by, these forward-looking statements include, but are not necessarily limited to, availability, sourcing and pricing of raw materials, the success of our subsidiaries, pressures on sales prices and volumes due to competition and economic conditions, reliance on and financial viability of significant customers, operating performance of joint ventures and other equity investments, technological advancements, employee relations, changes in construction spending, capital expenditures and long-term investments (including those related to unforeseen acquisition opportunities), continued availability of financial resources through financing arrangements and operations, market price of the Company’s stock, restrictions imposed by the Company’s credit facility, outcomes of pending or threatened legal proceedings, negotiation of new or modifications of existing contracts for asset management and for property and equipment construction and acquisition, regulations governing tax laws, other governmental and authoritative bodies’ policies and legislation, and proceeds received from the sale of assets held for disposal. In addition to these representative factors, forward-looking statements could be impacted by general domestic and international economic and industry conditions in the markets where the Company competes, such as changes in currency exchange rates, interest and inflation rates, recession and other economic and political factors over which the Company has no control. Other risks and uncertainties may be described from time to time in the Company’s other reports and filings with the Securities and Exchange Commission.
Unifi, Inc.
Third Qtr. Conf. Call
April 25, 2013
(Unaudited)
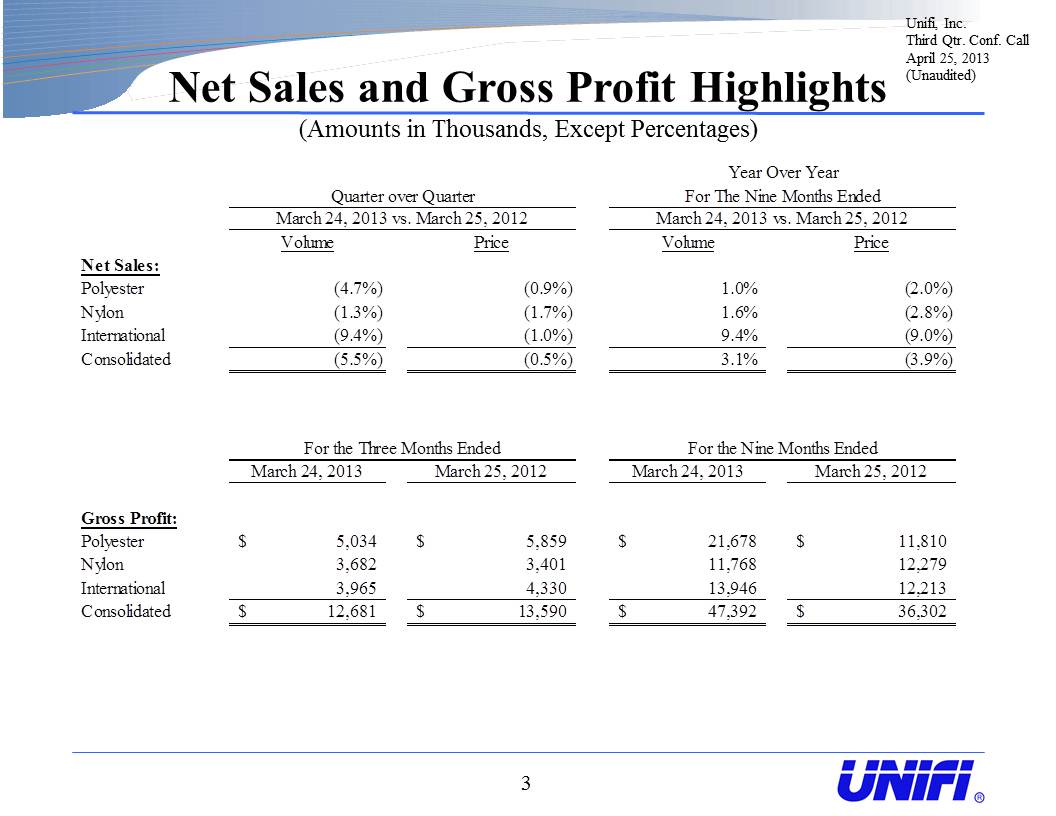
Net Sales and Gross Profit Highlights
(Amounts in Thousands, Except Percentages)
Unifi, Inc.
Third Qtr. Conf. Call
April 25, 2013
(Unaudited)
Year Over Year
Quarter over Quarter For The Nine Months Ended
March 24, 2013 vs. March 25, 2012 March 24, 2013 vs. March 25, 2012
Volume Price Volume Price
Net Sales:
Polyester (4.7%) (0.9%) 1.0% (2.0%)
Nylon (1.3%) (1.7%) 1.6% (2.8%)
International (9.4%) (1.0%) 9.4% (9.0%)
Consolidated (5.5%) (0.5%) 3.1% (3.9%)
For the Three Months Ended For the Nine Months Ended
March 24, 2013 March 25, 2012 March 24, 2013 March 25, 2012
Gross Profit:
Polyester $5,034 $5,859 $21,678 $11,810
Nylon 3,682 3,401 11,768 12,279
International 3,965 4,330 13,946 12,213
Consolidated $12,681 $13,590 $47,392 $36,302
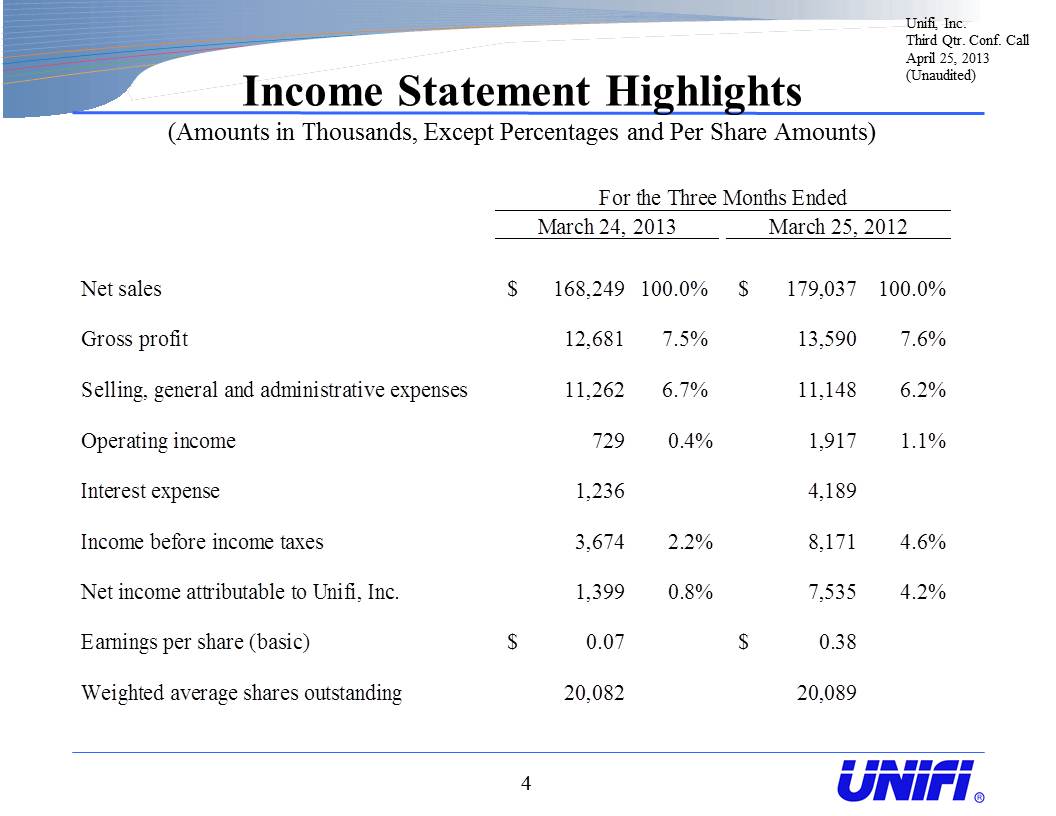
Income Statement Highlights(Amounts in Thousands, Except Percentages and Per Share Amounts)
Unifi, Inc.
Third Qtr. Conf. Call
April 25, 2013
(Unaudited)
For the Three Months Ended
March 24, 2013 March 25, 2012
Net sales $168,249 100.0% $179,037 100.0%
Gross profit 12,681 7.5% 13,590 7.6%
Selling, general and administrative expenses 11,262 6.7% 11,148 6.2%
Operating income 729 0.4% 1,917 1.1%
Interest expense 1,236 4,189
Income before income taxes 3,674 2.2% 8,171 4.6%
Net income attributable to Unifi, Inc. 1,399 0.8% 7,535 4.2%
Earnings per share (basic) $0.07 $0.38
Weighted average shares outstanding 20,082 20,089

Income Statement Highlights(Amounts in Thousands, Except Percentages and Per Share Amounts)
Unifi, Inc.
Third Qtr. Conf. Call
April 25, 2013
(Unaudited)
For the Nine Months Ended
March 24, 2013 March 25, 2012
Net sales $513,220 100.0% $517,160 100.0%
Gross profit 47,392 9.2% 36,302 7.0%
Selling, general and administrative expenses 33,941 6.6% 32,505 6.3%
Operating income 11,417 2.2% 2,261 0.4%
Interest expense 4,041 12,791
Income before income taxes 13,398 2.6% 2,719 0.5%
Net income attributable to Unifi, Inc. 6,119 1.2% 213 0.0%
Earnings per share (basic) $0.30 $0.01
Weighted average shares outstanding 20,091 20,088
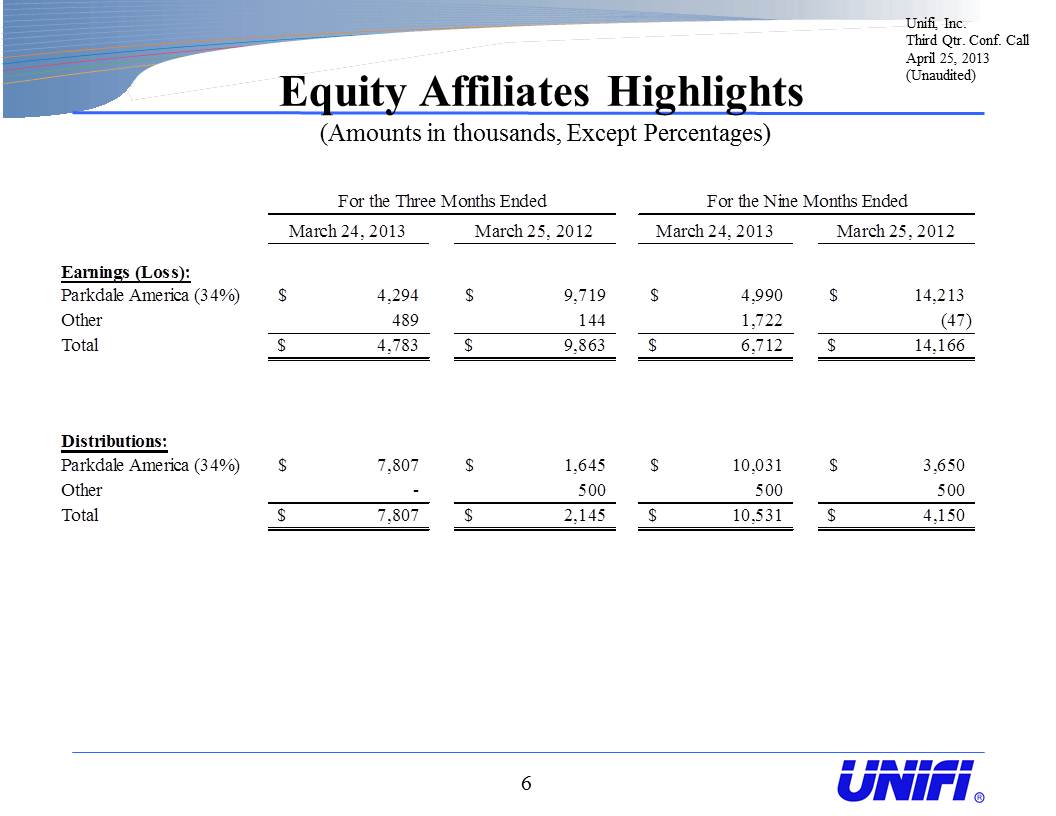
Equity Affiliates Highlights
(Amounts in thousands, Except Percentages)
Unifi, Inc.
Third Qtr. Conf. Call
April 25, 2013
(Unaudited)
For the Three Months Ended For the Nine Months Ended
March 24, 2013 March 25, 2012 March 24, 2013 March 25, 2012
Earnings (Loss):
Parkdale America (34%) $4,294 $9,719 $4,990 $14,213
Other 489 144 1,722 (47)
Total $4,783 $9,863 $6,712 $14,166
Distributions:
Parkdale America (34%) $7,807 $1,645 $10,031 $3,650
Other - 500 500 500
Total $7,807 $2,145 $10,531 $4,150
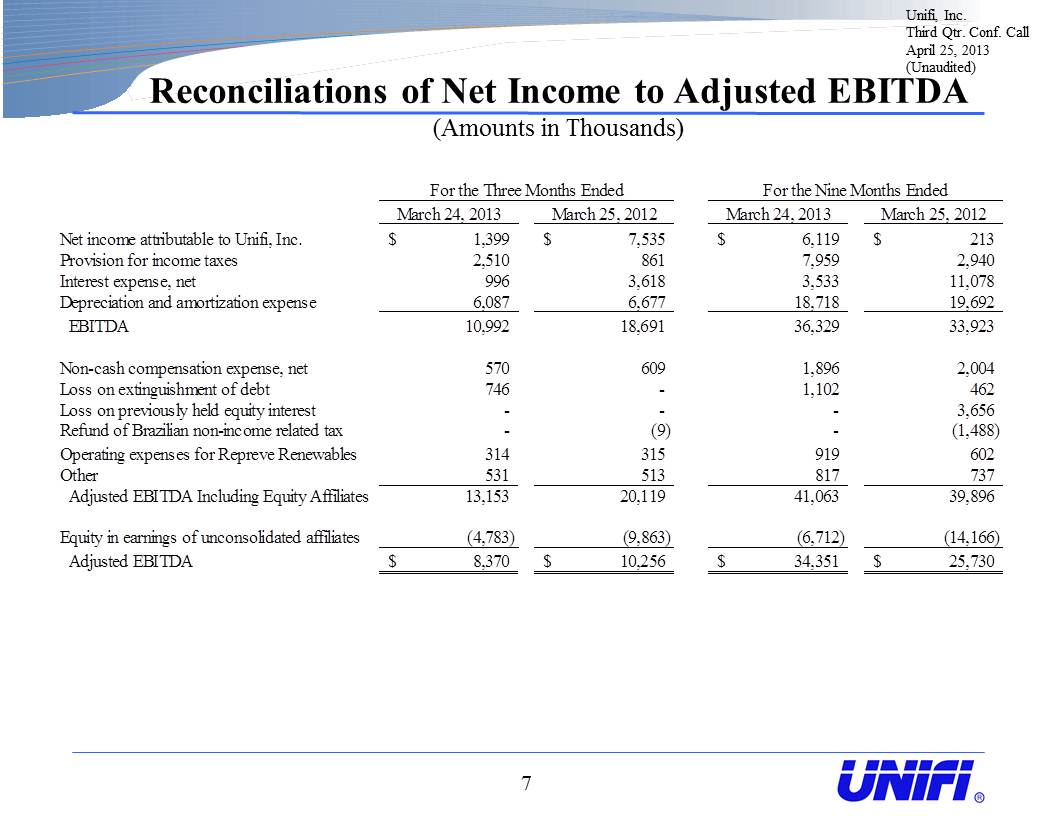
Reconciliations of Net Income to Adjusted EBITDA (Amounts in Thousands)
Unifi, Inc.
Third Qtr. Conf. Call
April 25, 2013
(Unaudited)
For the Three Months Ended For the Nine Months Ended
March 24, 2013 March 25, 2012 March 24, 2013 March 25, 2012
Net income attributable to Unifi, Inc. $1,399 $7,535 $6,119 $213
Provision for income taxes 2,510 861 7,959 2,940
Interest expense, net 996 3,618 3,533 11,078
Depreciation and amortization expense 6,087 6,677 18,718 19,692
EBITDA 10,992 18,691 36,329 33,923
Non-cash compensation expense, net 570 609 1,896 2,004
Loss on extinguishment of debt 746 - 1,102 462
Loss on previously held equity interest - - - 3,656
Refund of Brazilian non-income related tax - (9) - (1,488)
Operating expenses for Repreve Renewables 314 315 919 602
Other 531 513 817 737
Adjusted EBITDA Including Equity Affiliates 13,153 20,119 41,063 39,896
Equity in earnings of unconsolidated affiliates (4,783) (9,863) (6,712) (14,166)
Adjusted EBITDA $8,370 $10,256 $34,351 $25,730

Working Capital Highlights(Amounts in Thousands)
Unifi, Inc.
Third Qtr. Conf. Call
April 25, 2013
(Unaudited)
March 24, December 23, June 24,
2013 2012 2012
Receivables, net $97,219 $88,618 $99,236
Inventory 108,749 107,101 112,750
Accounts payable (53,561) (38,623) (48,541)
Accrued expenses (11,761) (12,162) (14,004)
Adjusted Working Capital $140,646 $144,934 $149,441
Adjusted Working Capital $140,646 $144,934 $149,441
Cash 15,901 15,246 10,886
Other current assets 10,425 13,515 15,125
Accrued interest (205) (260) (398)
Other current liabilities (8,130) (7,421) (8,569)
Working Capital $158,637 $166,014 $166,485

Capital Structure(Amounts in Thousands)
Unifi, Inc.
Third Qtr. Conf. Call
April 25, 2013
(Unaudited)
March 24, December 23, June 24,
2013 2012 2012
Cash $15,901 $15,246 $10,886
Revolver Availability, Net 34,199 35,447 37,122
Total Liquidity $50,100 $50,693 $48,008
ABL Revolver $51,300 $44,000 $51,000
ABL Term Loan 44,600 46,400 50,000
Term B Loan - 13,800 20,515
Other 2,468 2,482 37
Total Debt $98,368 $106,682 $121,552
Cash 15,901 15,246 10,886
Net Debt $82,467 $91,436 $110,666
Shares Outstanding 19,542 20,104 20,090

Key Dates
Unifi, Inc.
Third Qtr. Conf. Call
April 25, 2013
(Unaudited)
Form 10-Q for quarter ended March 24, 2013
Filing due on Friday, May 3, 2013
Quiet period for quarter ended June 30, 2013
Begins on Friday, June 28, 2013
Extends through our Earnings Release date
Expected to be Thursday, July 25, 2013
Non-GAAP Financial Measures
Included in this presentation are certain non-GAAP financial measures designed to complement the financial information presented in accordance with generally accepted accounting principles in the United States of America ("GAAP") because management believes such measures are useful to investors.
EBITDA, Adjusted EBITDA Including Equity Affiliates and Adjusted EBITDA
EBITDA represents net income or loss attributable to Unifi, Inc. before income tax expense, net interest expense, and depreciation and amortization expense (excluding interest portion of amortization). Adjusted EBITDA Including Equity Affiliates represents EBITDA adjusted to exclude non-cash compensation expense net of distributions, gains or losses on extinguishment of debt, loss on previously held equity interest, refund of Brazilian non-income related tax, operating expenses for Repreve Renewables, and certain other adjustments. Such other adjustments include gains or losses on sales or disposals of property, plant and equipment, currency and derivative gains or losses, restructuring and certain employee severance and healthcare expenses, and other operating or non-operating income or expense items necessary to understand the underlying results of the Company. Adjusted EBITDA represents Adjusted EBITDA Including Equity Affiliates adjusted to exclude equity in earnings and losses of unconsolidated affiliates. We present Adjusted EBITDA as a supplemental measure of our operating performance. We also present Adjusted EBITDA because we believe such measure is frequently used by securities analysts, investors and other interested parties in the evaluation of companies in our industry.
EBITDA, Adjusted EBITDA Including Equity Affiliates and Adjusted EBITDA are alternative views of performance used by management and we believe that investors’ understanding of our performance is enhanced by disclosing these performance measures. Our management uses Adjusted EBITDA: (i) as a measurement of operating performance because it assists us in comparing our operating performance on a consistent basis as it removes the impact of (a) items directly related to our asset base (primarily depreciation and amortization) and (b) items that we would not expect to occur as a part of our normal operating business; (ii) for planning purposes, including the preparation of our annual operating budget; (iii) as a valuation measure for evaluating our operating performance and our capacity to incur and service debt, fund capital expenditures and expand our business; and (iv) as one measure in determining the value of other acquisitions and dispositions. Adjusted EBITDA is also a key performance metric utilized in the determination of variable compensation. We believe that the use of EBITDA, Adjusted EBITDA Including Equity Affiliates, and Adjusted EBITDA as operating performance measures provides investors and analysts with a measure of operating results unaffected by differences in capital structures, capital investment cycles, and ages of related assets, among otherwise comparable companies. We also believe Adjusted EBITDA is an appropriate supplemental measure of debt service capacity, because cash expenditures on interest are, by definition, available to pay interest, and tax expense is inversely correlated to interest expense because tax expense decreases as deductible interest expense increases; depreciation and amortization are non-cash charges. Equity in earnings and losses of unconsolidated affiliates is excluded because such earnings or losses do not reflect our operating performance. The other items excluded from Adjusted EBITDA are excluded in order to better reflect the performance of our continuing operations. In evaluating EBITDA, Adjusted EBITDA Including Equity Affiliates and Adjusted EBITDA, you should be aware that in the future we may incur expenses similar to the adjustments in this presentation. Our presentation of EBITDA, Adjusted EBITDA Including Equity Affiliates and Adjusted EBITDA should not be construed as an inference that our future results will be unaffected by unusual or non-recurring items. EBITDA, Adjusted EBITDA Including Equity Affiliates, and Adjusted EBITDA are not measurements of our financial performance under GAAP and should not be considered as alternatives to net income, operating income or any other performance measures derived in accordance with GAAP or as an alternative to cash flow from operating activities as a measure of our liquidity.
Unifi, Inc. Third Qtr. Conf. Call April 25, 2013 (Unaudited)
Non-GAAP Financial Measures - continued
Each of our Adjusted EBITDA and Adjusted EBITDA Including Equity Affiliates measures has limitations as an analytical tool, and you should not consider it in isolation or as a substitute for analysis of our results as reported under GAAP. Some of these limitations are:
• it does not reflect our cash expenditures, future requirements for capital expenditures or contractual commitments;
• it does not reflect changes in, or cash requirements for, our working capital needs;
• it does not reflect the significant interest expense or the cash requirements necessary to service interest or principal payments on our debt;
• although depreciation and amortization are non-cash charges, the assets being depreciated and amortized will often have to be replaced in the future,
and our Adjusted EBITDA (or our Adjusted EBITDA Including Equity Affiliates) measure does not reflect any cash requirements for such replacements;
• it is not adjusted for all non-cash income or expense items that are reflected in our statements of cash flows;
• it does not reflect the impact of earnings or charges resulting from matters we consider not indicative of our ongoing operations;
• it does not reflect limitations on or costs related to transferring earnings from our subsidiaries to us; and
• other companies in our industry may calculate this measure differently than we do, limiting its usefulness as a comparative measure.
Because of these limitations, neither of Adjusted EBITDA or Adjusted EBITDA Including Equity Affiliates should be considered as a measure of discretionary cash available to us to invest in the growth of our business or as a measure of cash that will be available to us to meet our obligations, including those under our outstanding debt obligations. You should compensate for these limitations by relying primarily on our GAAP results and using Adjusted EBITDA only as supplemental information.
Unifi, Inc.
Third Qtr. Conf. Call
April 25, 2013
(Unaudited)