
Unifi, Inc.
For the Second Quarter Ended
December 29, 2013
Conference Call
Slide Presentation
Exhibit 99.2
2
Cautionary Statement
Certain statements included herein contain forward-looking statements within the meaning of federal securities laws about the financial condition and results of operations of Unifi, Inc. (the “Company”) that are based on management’s beliefs, assumptions and expectations about our future economic performance, considering the information currently available to management. The words “believe,” “may,” “could,” “will,” “should,” “would,” “anticipate,” “estimate,” “project,” “expect,” “intend,” “seek,” “strive,” and words of similar import, or the negative of such words, identify or signal the presence of forward-looking statements. These statements are not statements of historical fact; they involve risk and uncertainties that may cause our actual results, performance or financial condition to differ materially from the expectations of future results, performance or financial condition that we express or imply in any forward-looking statement.
Factors that could contribute to such differences include, but are not limited to: the competitive nature of the textile industry and the impact of worldwide competition; changes in the trade regulatory environment and governmental policies and legislation; the availability, sourcing and pricing of raw materials; general domestic and international economic and industry conditions in markets where the Company competes, such as recession and other economic and political factors over which the Company has no control; changes in consumer spending, customer preferences, fashion trends and end-uses; the financial condition of the Company’s customers; the loss of a significant customer; the success of the Company’s strategic business initiatives; the continuity of the Company’s leadership; volatility of financial and credit markets; the ability to service indebtedness and fund capital expenditures and strategic initiatives; availability of and access to credit on reasonable terms; changes in currency exchange, interest and inflation rates; the ability to reduce production costs; the ability to protect intellectual property; employee relations; the impact of environmental, health and safety regulations; the operating performance of joint ventures and other equity investments; and the accurate financial reporting of information from equity method investees.
All such factors are difficult to predict, contain uncertainties that may materially affect actual results and may be beyond our control. New factors emerge from time to time, and it is not possible for management to predict all such factors or to assess the impact of each such factor on the Company. Any forward-looking statement speaks only as of the date on which such statement is made, and we do not undertake any obligation to update any forward-looking statement to reflect events or circumstances after the date on which such statement is made, except as may be required by federal securities law. The above and other risks and uncertainties are described in the Company’s most recent annual report on Form 10-K, and additional risks or uncertainties may be described from time to time in other reports filed by the Company with the Securities and Exchange Commission pursuant to the Securities Exchange Act of 1934, as amended.
Unifi, Inc.
Second Qtr. Conf. Call
January 22, 2014
(Unaudited)
3
Net Sales and Gross Profit Highlights
(Amounts in Thousands, Except Percentages)
Unifi, Inc.
Second Qtr. Conf. Call
January 22, 2014
(Unaudited)
3
Quarter over Quarter Year over Year
For the Three Months Ended For the Six Months Ended
December 29, 2013 vs. December 23, 2012 December 29, 2013 vs. December 23, 2012
Volume Price Volume Price
Net Sales:
Polyester (11.5%) 3.4% (5.2%) 1.3%
Nylon (2.4%) 3.0% 0.4% (0.5%)
International (8.6%) (2.3%) (7.1%) (3.9%)
Consolidated (9.8%) 3.2% (5.2%) 0.6%
For the Three Months Ended For the Six Months Ended
December 29, 2013 December 23, 2012 December 29, 2013 December 23, 2012
Gross Profit:
Polyester $9,797 $8,437 $20,157 $16,644
Nylon 4,758 4,016 9,452 8,086
International 3,942 4,238 8,873 9,981
4
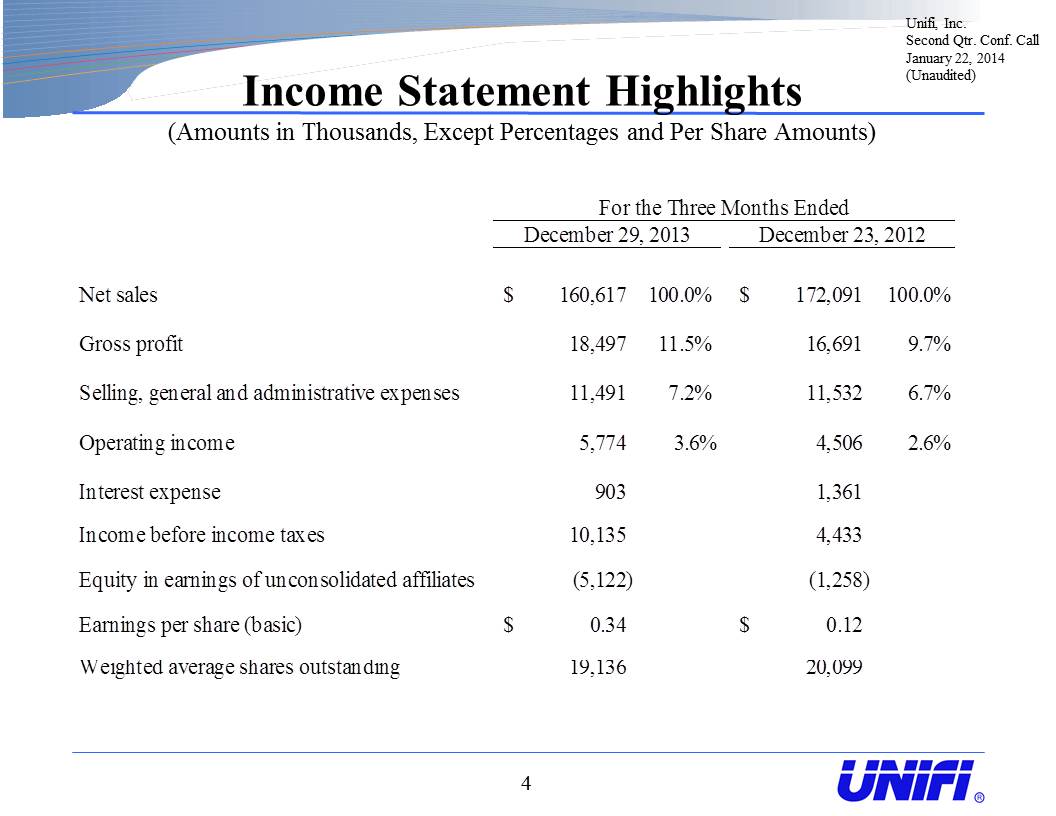
Income Statement Highlights (Amounts in Thousands, Except Percentages and Per Share Amounts)
Unifi, Inc.
Second Qtr. Conf. Call
January 22, 2014
(Unaudited)
For the Three Months Ended
December 29, 2013 December 23, 2012
Net sales$ 160,617100.0%$ 172,091100.0%
Gross profit 18,49711.5% 16,6919.7%
Selling, general and administrative expenses 11,4917.2% 11,5326.7%
Operating income 5,7743.6% 4,5062.6%
Interest expense 903 1,361
Income before income taxes 10,135 4,433
Equity in earnings of unconsolidated affiliates (5,122) (1,258)
Earnings per share (basic)$ 0.34 $ 0.12
Weighted average shares outstanding 19,136 20,099

5
Income Statement Highlights (Amounts in Thousands, Except Percentages and Per Share Amounts)
Unifi, Inc.
Second Qtr. Conf. Call
January 22, 2014
(Unaudited)
For the Six Months Ended
December 29, 2013 December 23, 2012
Net sales$ 329,286100.0%$ 344,971100.0%
Gross profit 38,48211.7% 34,71110.1%
Selling, general and administrative expenses 21,6056.6% 22,6796.6%
Operating income 14,0594.3% 10,6883.1%
Interest expense 2,155 2,805
Income before income taxes 24,505 9,724
Equity in earnings of unconsolidated affiliates (11,245) (1,929)
Earnings per share (basic)$ 0.80 $ 0.23
Weighted average shares outstanding 19,200 20,095

6
Equity Affiliates Highlights
(Amounts in thousands, Except Percentages)
Unifi, Inc.
Second Qtr. Conf. Call
January 22, 2014
(Unaudited)
For the Three Months Ended For the Six Months Ended
December 29, 2013December 23, 2012December 29, 2013December 23, 2012
Earnings:
Parkdale America (34%)$ 4,803$ 655$ 10,718$ 697
Other 319 603 527 1,232
Total$ 5,122$ 1,258$ 11,245$ 1,929
Distributions:
Parkdale America (34%)$ -$ -$ 2,559$ 2,224
Other 500 500 500 500
Total$ 500$ 500$ 3,059$ 2,724
7
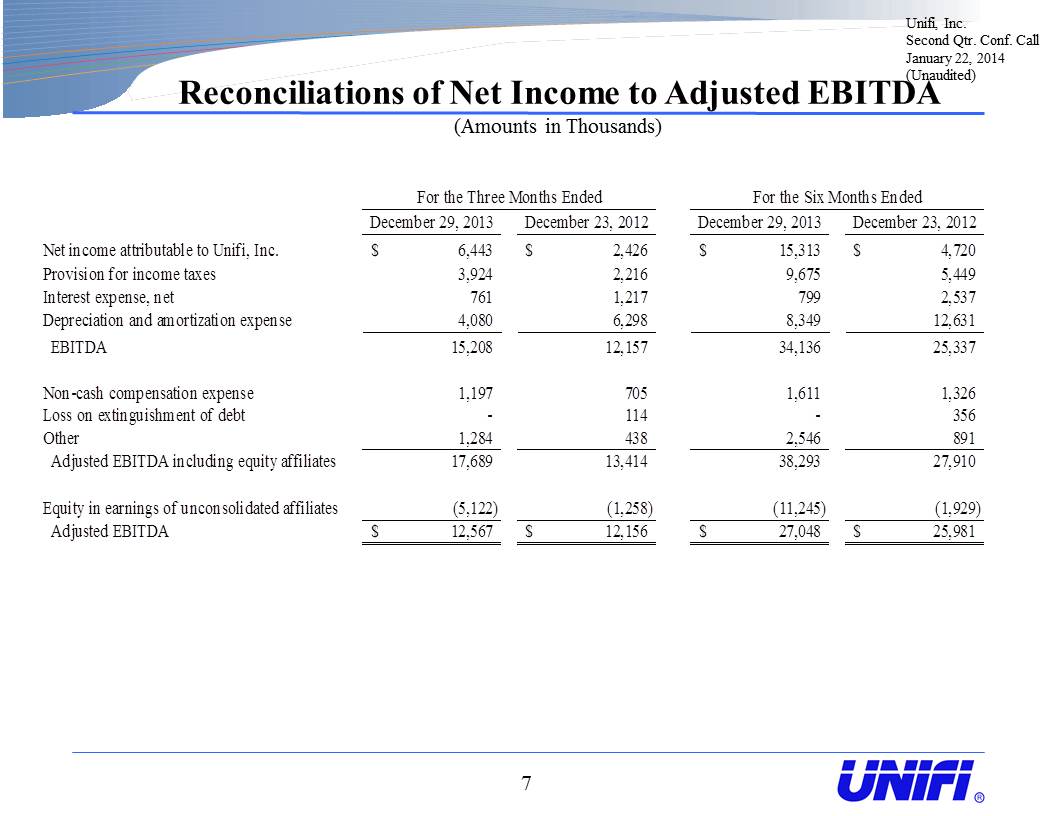
Reconciliations of Net Income to Adjusted EBITDA (Amounts in Thousands)
Unifi, Inc.
Second Qtr. Conf. Call
January 22, 2014
(Unaudited)
For the Three Months Ended For the Six Months Ended
December 29, 2013December 23, 2012December 29, 2013December 23, 2012
Net income attributable to Unifi, Inc.$ 6,443$ 2,426$ 15,313$ 4,720
Provision for income taxes 3,924 2,216 9,675 5,449
Interest expense, net 761 1,217 799 2,537
Depreciation and amortization expense 4,080 6,298 8,349 12,631
EBITDA 15,208 12,157 34,136 25,337
Non-cash compensation expense 1,197 705 1,611 1,326
Loss on extinguishment of debt - 114 - 356
Other 1,284 438 2,546 891
Adjusted EBITDA including equity affiliates 17,689 13,414 38,293 27,910
Equity in earnings of unconsolidated affiliates (5,122) (1,258) (11,245) (1,929)
Adjusted EBITDA$ 12,567$ 12,156$ 27,048$ 25,981
Adjusted EBITDA12567121562704825981
8
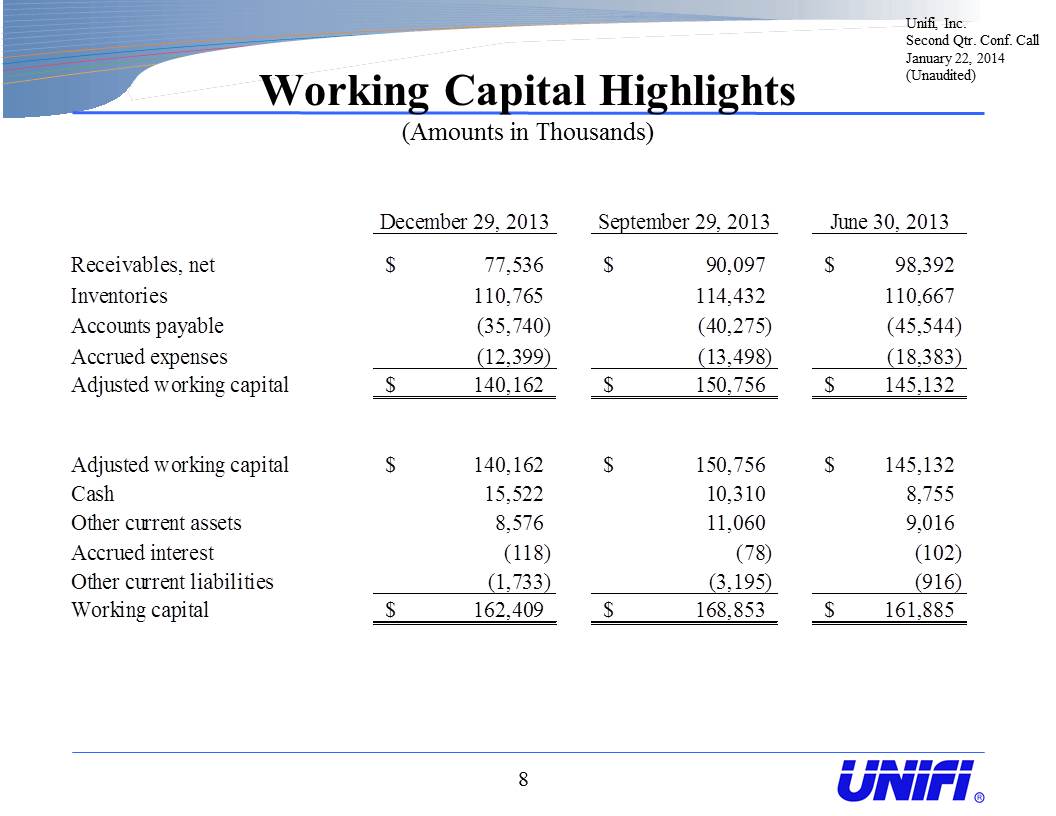
Working Capital Highlights (Amounts in Thousands)
Unifi, Inc.
Second Qtr. Conf. Call
January 22, 2014
(Unaudited)
December 29, 2013September 29, 2013June 30, 2013
Receivables, net$ 77,536$ 90,097$ 98,392
Inventories 110,765 114,432 110,667
Accounts payable (35,740) (40,275) (45,544)
Accrued expenses (12,399) (13,498) (18,383)
Adjusted working capital$ 140,162$ 150,756$ 145,132
Adjusted working capital$ 140,162$ 150,756$ 145,132
Cash 15,522 10,310 8,755
Other current assets 8,576 11,060 9,016
Accrued interest (118) (78) (102)
Other current liabilities (1,733) (3,195) (916)
Working capital$ 162,409$ 168,853$ 161,885
9
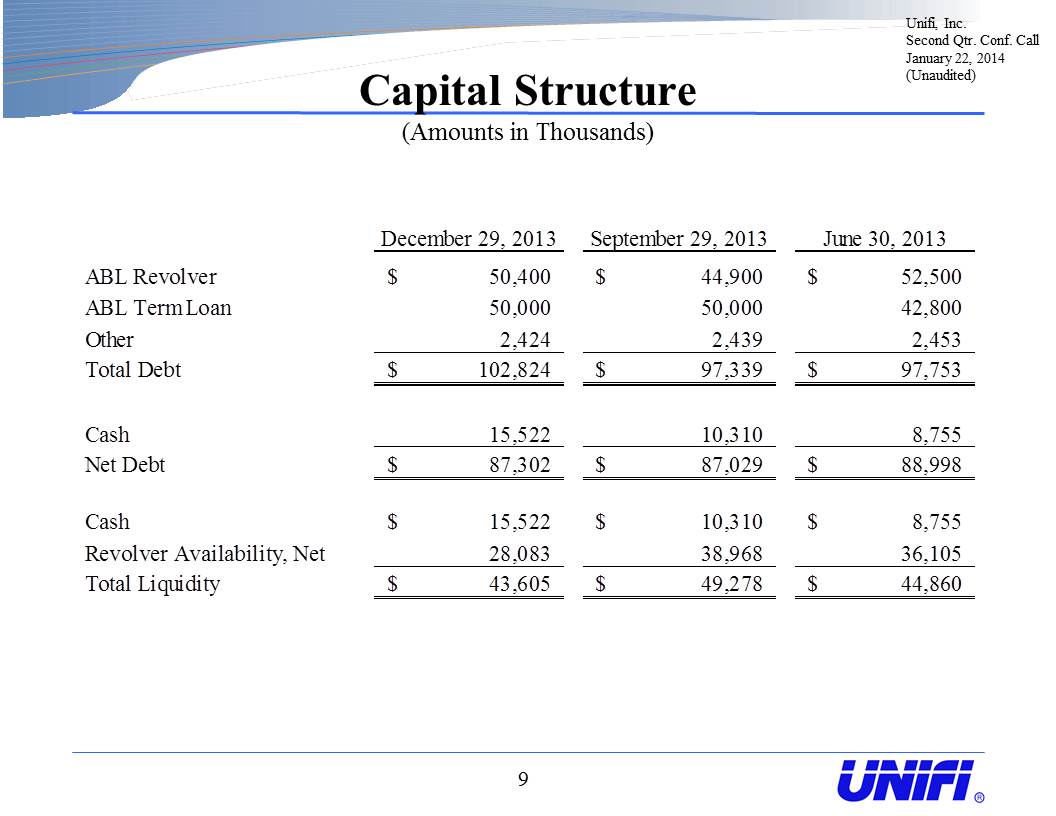
Capital Structure (Amounts in Thousands)
Unifi, Inc.
Second Qtr. Conf. Call
January 22, 2014
(Unaudited)
June 24,
December 29, 2013September 29, 2013June 30, 20132012
ABL Revolver$ 50,400$ 44,900$ 52,500$ 51,000
ABL Term Loan 50,000 50,000 42,800 50,000
Other 2,424 2,439 2,453 37
Total Debt$ 102,824$ 97,339$ 97,753$ 101,037
Cash 15,522 10,310 8,755 10,886
Net Debt$ 87,302$ 87,029$ 88,998$ 90,151
Cash$ 15,522$ 10,310$ 8,755$ 10,886
Revolver Availability, Net 28,083 38,968 36,105 37,122
Total Liquidity$ 43,605$ 49,278$ 44,860$ 48,008

10
Non-GAAP Financial Measures
Certain non-GAAP financial measures included herein are designed to complement the financial information presented in accordance with generally accepted accounting principles in the United States of America ("GAAP") because management believes such measures are useful to investors. These non-GAAP financial measures are Earnings Before Interest, Taxes, Depreciation and Amortization (“EBITDA”), Adjusted EBITDA including equity affiliates, and Adjusted EBITDA.
EBITDA represents net income or loss attributable to Unifi, Inc. before net interest expense, income tax expense, and depreciation and amortization expense. Adjusted EBITDA including equity affiliates represents EBITDA adjusted to exclude non-cash compensation expense, gains or losses on extinguishment of debt, loss on previously held equity interest, and certain other adjustments. Such other adjustments include operating expenses for Repreve Renewables, restructuring charges and start-up costs, gains or losses on sales or disposals of property, plant and equipment, currency and derivative gains or losses, certain employee healthcare expenses, and other operating or non-operating income or expense items necessary to understand and compare the underlying results of the Company. Adjusted EBITDA represents Adjusted EBITDA including equity affiliates adjusted to exclude equity in earnings and losses of unconsolidated affiliates. The Company may, from time to time, change the items included within Adjusted EBITDA.
EBITDA, Adjusted EBITDA including equity affiliates and Adjusted EBITDA are alternative views of performance used by management, and we believe that investors’ understanding of our performance is enhanced by disclosing these performance measures. Management uses Adjusted EBITDA: (i) as a measurement of operating performance because it assists us in comparing our operating performance on a consistent basis, as it removes the impact of (a) items directly related to our asset base (primarily depreciation and amortization) and (b) items that we would not expect to occur as a part of our normal business on a regular basis; (ii) for planning purposes, including the preparation of our annual operating budget; (iii) as a valuation measure for evaluating our operating performance and our capacity to incur and service debt, fund capital expenditures and expand our business; and (iv) as one measure in determining the value of other acquisitions and dispositions. Adjusted EBITDA is also a key performance metric utilized in the determination of variable compensation.
We believe that the use of EBITDA, Adjusted EBITDA including equity affiliates and Adjusted EBITDA as operating performance measures provides investors and analysts with a measure of operating results unaffected by differences in capital structures, capital investment cycles, and ages of related assets, among otherwise comparable companies. We also believe Adjusted EBITDA is an appropriate supplemental measure of debt service capacity, because cash expenditures on interest are, by definition, available to pay interest, and tax expense is inversely correlated to interest expense because tax expense decreases as deductible interest expense increases; and depreciation and amortization are non-cash charges. Equity in earnings and losses of unconsolidated affiliates is excluded because such earnings or losses do not reflect our operating performance. The other items excluded from Adjusted EBITDA are excluded in order to better reflect the performance of our continuing operations.
Unifi, Inc.
Second Qtr. Conf. Call
January 22, 2014
(Unaudited)

11
Non-GAAP Financial Measures - continued
In evaluating EBITDA, Adjusted EBITDA including equity affiliates, and Adjusted EBITDA, you should be aware that in the future, we may incur expenses similar to the adjustments included herein. Our presentation of EBITDA, Adjusted EBITDA including equity affiliates and Adjusted EBITDA should not be construed as indicating that our future results will be unaffected by unusual or non-recurring items. EBITDA, Adjusted EBITDA including equity affiliates, and Adjusted EBITDA are not determined in accordance with GAAP and should not be considered as substitutes for net income, operating income or any other performance measures determined in accordance with GAAP or as an alternative to cash flow from operating activities as a measure of our liquidity.
Each of our EBITDA, Adjusted EBITDA including equity affiliates, and Adjusted EBITDA measures has limitations as an analytical tool, and you should not consider it in isolation or as a substitute for analysis of our results as reported under GAAP. Some of these limitations are:
it is not adjusted for all non-cash income or expense items that are reflected in our statements of cash flows;
it does not reflect the impact of earnings or charges resulting from matters we consider not indicative of our ongoing operations;
it does not reflect changes in, or cash requirements for, our working capital needs;
it does not reflect the cash requirements necessary to make payments on our debt;
it does not reflect our future requirements for capital expenditures or contractual commitments;
it does not reflect limitations on or costs related to transferring earnings from our subsidiaries to us; and
other companies in our industry may calculate this measure differently than we do, limiting its usefulness as a comparative measure.
Because of these limitations, EBITDA, Adjusted EBITDA including equity affiliates, and Adjusted EBITDA should not be considered as a measure of discretionary cash available to us to invest in the growth of our business or as a measure of cash that will be available to us to meet our obligations, including those under our outstanding debt obligations. You should compensate for these limitations by relying primarily on our GAAP results and using these measures only as supplemental information.
Unifi, Inc.
Second Qtr. Conf. Call
January 22, 2014
(Unaudited)