Exhibit 99.1


 | For more information, contact: James M. Otterberg Chief Financial Officer (336) 316-5424 |
Unifi Announces Second Quarter 2014 Results
GREENSBORO, N.C., – January 21, 2014 – Unifi, Inc. (NYSE: UFI) today released preliminary operating results for the second quarter ended December 29, 2013 of its 2014 fiscal year. Net income for the current year quarter was $6.4 million, or $0.34 per basic share, compared to net income of $2.4 million, or $0.12 per basic share, for the prior year quarter, reflecting gains from improved margins, lower net interest expense and higher earnings from the Company’s equity affiliates. These gains were partially offset by higher expenses for income taxes.
Highlights for the December 2013 quarter included:
| | ● | Adjusted EBITDA improved to $12.6 million for the current year quarter from $12.2 million for the prior year quarter; |
| | ● | Domestic gross profit was higher due to improved margins and lower expenses for depreciation; |
| | ● | Higher earnings from the Company’s equity affiliates, primarily Parkdale America LLC, increased income before income taxes by $3.9 million versus the prior year quarter; and |
| | ● | The Company used $12.9 million of excess cash flows from operations to repurchase 522,220 shares of its common stock under its previously announced stock repurchase program. |
A net sales decrease of $11.5 million, or 6.7%, to $160.6 million for the second quarter of the current year compared to net sales of $172.1 million for the prior year quarter, was offset by improved operating margins and earnings from equity affiliates. The comparative decrease was primarily attributable to the timing of the holiday shutdown, which adversely affected domestic sales activity in the second quarter of the current year versus the third quarter of the prior year; in addition, declines in sales volumes for the Company’s foreign subsidiaries, reductions in lower margin business and the currency translation effects of the weakened Brazilian Real also contributed to lower net sales.
Unifi Announces Second Quarter 2014 Results - page 2
“We are encouraged with the continued performance of our domestic business, focusing on products that are profitable, defensible and compliant within the Central American Free Trade Agreement, and we have experienced growth in our domestic operations from our premier value-added products,” said Roger Berrier, President and Chief Operating Officer of Unifi. “Although operating conditions remain challenging in Brazil and China, we remain encouraged by the long-term sales opportunities that we anticipate from the development work that we are currently engaged in.”
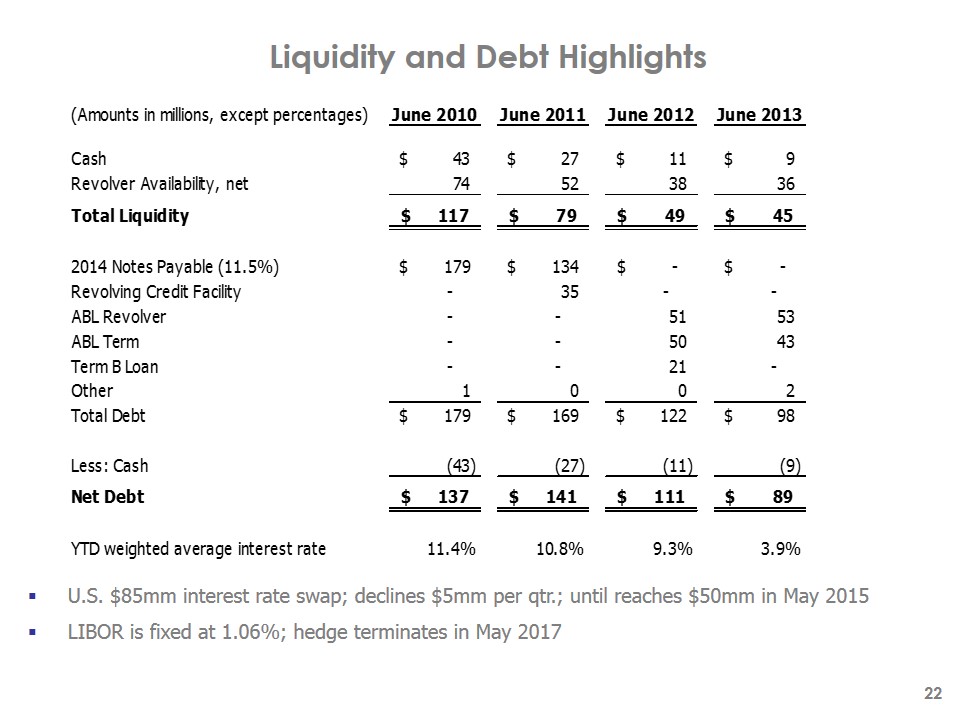
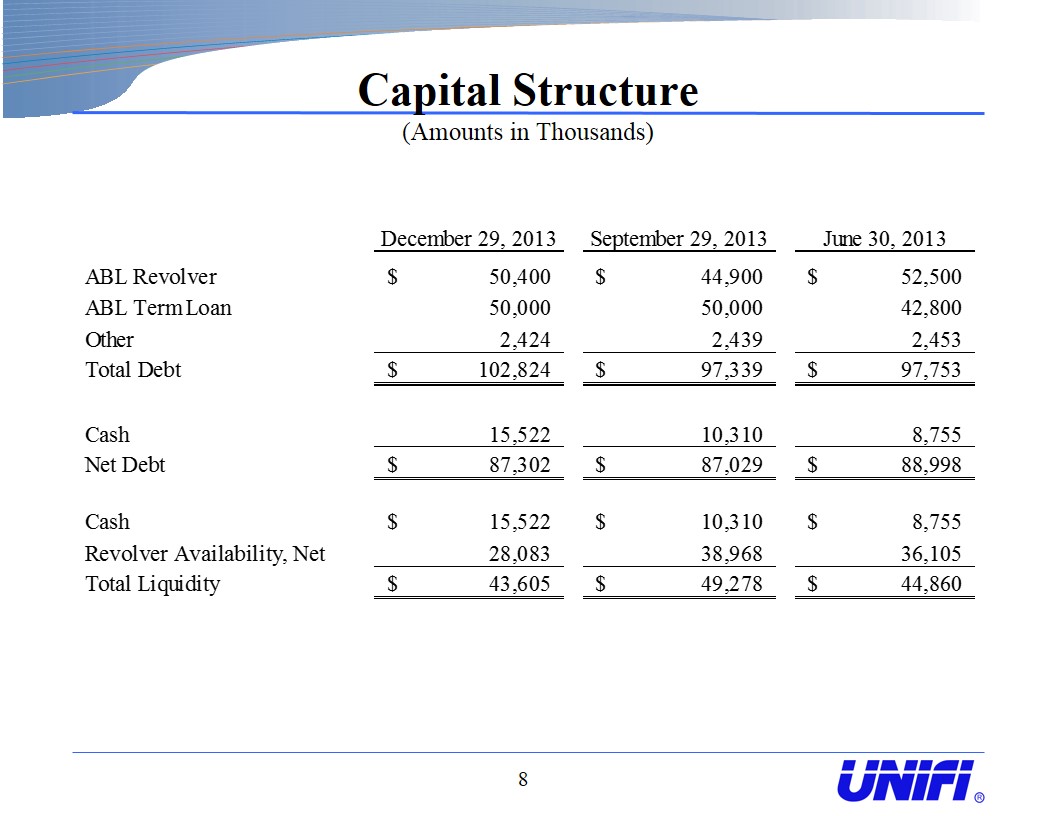
Cash-on-hand as of December 29, 2013 was $15.5 million, an increase of $6.8 million from June 30, 2013. Net debt at the end of the December 2013 quarter was $87.3 million, compared to $89.0 million at June 30, 2013. As of December 29, 2013, the weighted average interest rate for the Company’s outstanding debt obligations was 3.1%.
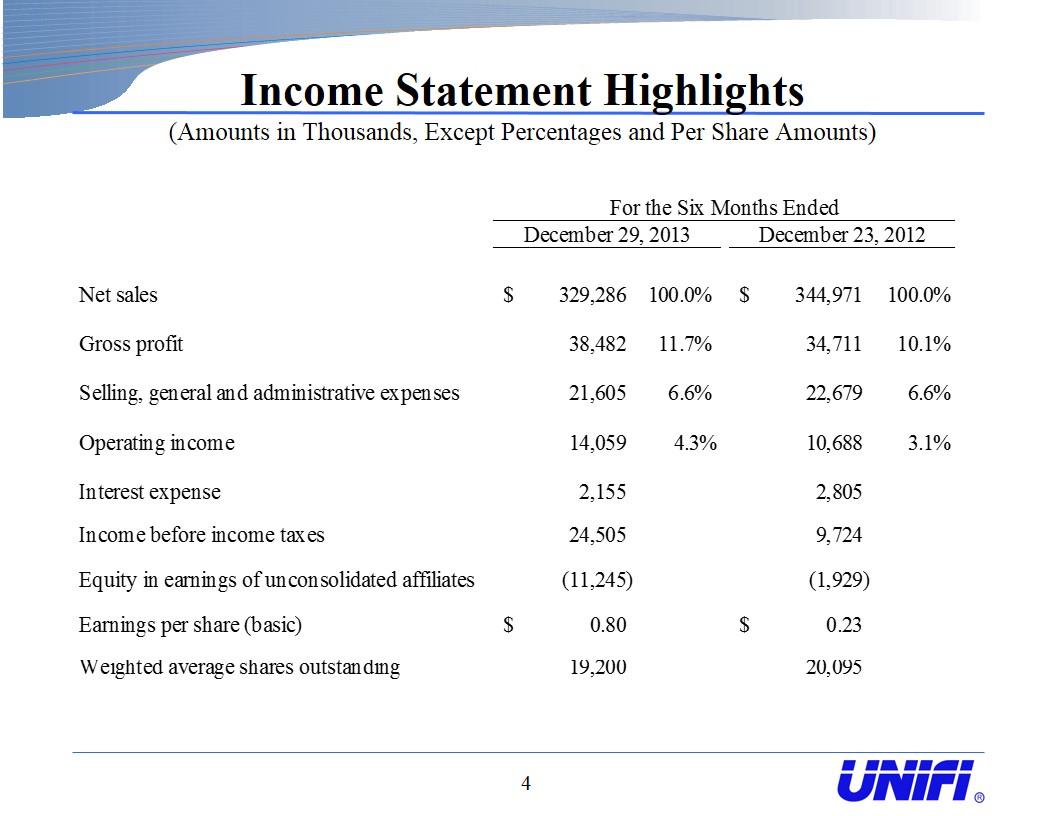
Net income was $15.3 million, or $0.80 per basic share, for the six months ended December 29, 2013 compared to net income of $4.7 million, or $0.23 per share, for the prior year six-month period. A net sales decrease of $15.7 million, or 4.5%, to $329.3 million for the current year six-month period compared to net sales of $345.0 million for the prior year six-month period, was offset by improved operating margins and earnings from equity affiliates.
“We continue to have strong, improving earnings and cash flow. Our operating results over the past twelve months have enabled us to fund our operating and capital needs, while repurchasing $38 million of the Company’s common stock and reducing net debt by slightly over $4 million, significantly enhancing shareholder value,” said Bill Jasper, Chairman and CEO of Unifi. “We expect to continue our financial improvement by continuing to focus on lean manufacturing initiatives, enriching our product mix and deriving value from sustainability based initiatives.”
CONDENSED CONSOLIDATED BALANCE SHEETS (Unaudited)
(amounts in thousands, except share and per share amounts)
| | | December 29, 2013 | | | June 30, 2013 | |
ASSETS | | | | | | | | |
Cash and cash equivalents | | $ | 15,522 | | | $ | 8,755 | |
Receivables, net | | | 77,536 | | | | 98,392 | |
Inventories | | | 110,765 | | | | 110,667 | |
Income taxes receivable | | | 1,374 | | | | 1,388 | |
Deferred income taxes | | | 1,831 | | | | 1,715 | |
Other current assets | | | 5,371 | | | | 5,913 | |
Total current assets | | | 212,399 | | | | 226,830 | |
| | | | | | | | | |
Property, plant and equipment, net | | | 116,562 | | | | 115,164 | |
Deferred income taxes | | | 2,590 | | | | 2,196 | |
Intangible assets, net | | | 8,549 | | | | 7,772 | |
Investments in unconsolidated affiliates | | | 101,562 | | | | 93,261 | |
Other non-current assets | | | 4,510 | | | | 10,243 | |
Total assets | | $ | 446,172 | | | $ | 455,466 | |
| | | | | | | | | |
LIABILITIES AND SHAREHOLDERS’ EQUITY | | | | | | | | |
Accounts payable | | $ | 35,740 | | | $ | 45,544 | |
Accrued expenses | | | 12,517 | | | | 18,485 | |
Income taxes payable | | | 417 | | | | 851 | |
Current portion of long-term debt | | | 1,316 | | | | 65 | |
Total current liabilities | | | 49,990 | | | | 64,945 | |
Long-term debt | | | 101,508 | | | | 97,688 | |
Other long-term liabilities | | | 6,950 | | | | 5,053 | |
Deferred income taxes | | | 1,991 | | | | 1,300 | |
Total liabilities | | | 160,439 | | | | 168,986 | |
Commitments and contingencies | | | | | | | | |
| | | | | | | | | |
Common stock, $0.10 par (500,000,000 shares authorized,19,035,918 and 19,205,209 shares outstanding) | | | 1,904 | | | | 1,921 | |
Capital in excess of par value | | | 42,814 | | | | 36,375 | |
Retained earnings | | | 248,242 | | | | 252,112 | |
Accumulated other comprehensive loss | | | (8,662 | ) | | | (5,500 | ) |
Total Unifi, Inc. shareholders’ equity | | | 284,298 | | | | 284,908 | |
Non-controlling interest | | | 1,435 | | | | 1,572 | |
Total shareholders’ equity | | | 285,733 | | | | 286,480 | |
Total liabilities and shareholders’ equity | | $ | 446,172 | | | $ | 455,466 | |
| |
CONDENSED CONSOLIDATED STATEMENTS OF INCOME (Unaudited)
(amounts in thousands, except per share amounts)
| | | For the Three Months Ended | | | For the Six Months Ended | |
| | | December 29, 2013 | | | December 23, 2012 | | | December 29, 2013 | | | December 23, 2012 | |
Net sales | | $ | 160,617 | | | $ | 172,071 | | | $ | 329,286 | | | $ | 344,971 | |
Cost of sales | | | 142,120 | | | | 155,380 | | | | 290,804 | | | | 310,260 | |
Gross profit | | | 18,497 | | | | 16,691 | | | | 38,482 | | | | 34,711 | |
Selling, general and administrative expenses | | | 11,491 | | | | 11,532 | | | | 21,605 | | | | 22,679 | |
Provision for bad debts | | | 87 | | | | 73 | | | | 49 | | | | 183 | |
Other operating expense, net | | | 1,145 | | | | 580 | | | | 2,769 | | | | 1,161 | |
Operating income | | | 5,774 | | | | 4,506 | | | | 14,059 | | | | 10,688 | |
Interest income | | | (142 | ) | | | (144 | ) | | | (1,356 | ) | | | (268 | ) |
Interest expense | | | 903 | | | | 1,361 | | | | 2,155 | | | | 2,805 | |
Loss on extinguishment of debt | | | — | | | | 114 | | | | — | | | | 356 | |
Equity in earnings of unconsolidated affiliates | | | (5,122 | ) | | | (1,258 | ) | | | (11,245 | ) | | | (1,929 | ) |
Income before income taxes | | | 10,135 | | | | 4,433 | | | | 24,505 | | | | 9,724 | |
Provision for income taxes | | | 3,924 | | | | 2,216 | | | | 9,675 | | | | 5,449 | |
Net income including non-controlling interest | | | 6,211 | | | | 2,217 | | | | 14,830 | | | | 4,275 | |
Less: net (loss) attributable to non-controlling interest | | | (232 | ) | | | (209 | ) | | | (483 | ) | | | (445 | ) |
Net income attributable to Unifi, Inc. | | $ | 6,443 | | | $ | 2,426 | | | $ | 15,313 | | | $ | 4,720 | |
| | | | | | | | | | | | | | | | | |
Net income attributable to Unifi, Inc. per common share: | | | | | | | | | | | | | | | | |
Basic | | $ | 0.34 | | | $ | 0.12 | | | $ | 0.80 | | | $ | 0.23 | |
Diluted | | $ | 0.32 | | | $ | 0.12 | | | $ | 0.76 | | | $ | 0.23 | |
| |
CONDENSED CONSOLIDATED STATEMENTS OF CASH FLOWS (Unaudited)
(amounts in thousands)
| | | For The Six Months Ended | |
| | | December 29, 2013 | | | December 23, 2012 | |
Cash and cash equivalents at beginning of year | | $ | 8,755 | | | $ | 10,886 | |
Operating activities: | | | | | | | | |
Net income including non-controlling interest | | | 14,830 | | | | 4,275 | |
Adjustments to reconcile net income including non-controlling interest to net cash provided by operating activities: | | | | | | | | |
Equity in earnings of unconsolidated affiliates | | | (11,245 | ) | | | (1,929 | ) |
Dividends received from unconsolidated affiliates | | | 3,059 | | | | 2,724 | |
Depreciation and amortization expense | | | 8,625 | | | | 12,997 | |
Loss on extinguishment of debt | | | — | | | | 356 | |
Non-cash compensation expense | | | 1,611 | | | | 1,326 | |
Excess tax benefit on stock-based compensation plans | | | (3,536 | ) | | | — | |
Deferred income taxes | | | 25 | | | | 3,159 | |
Other | | | 3,465 | | | | 97 | |
Changes in assets and liabilities, excluding effects of foreign currency adjustments: | | | | | | | | |
Receivables, net | | | 19,829 | | | | 10,447 | |
Inventories | | | (1,609 | ) | | | 5,467 | |
Other current assets and income taxes receivable | | | 3,684 | | | | (784 | ) |
Accounts payable and accrued expenses | | | (19,299 | ) | | | (12,235 | ) |
Income taxes payable | | | 3,137 | | | | (1,161 | ) |
Net cash provided by operating activities | | | 22,576 | | | | 24,739 | |
Investing activities: | | | | | | | | |
Capital expenditures | | | (9,431 | ) | | | (2,872 | ) |
Other investments | | | — | | | | (1,620 | ) |
Proceeds from sale of assets | | | 268 | | | | 56 | |
Proceeds from other investments | | | 392 | | | | — | |
Other | | | (60 | ) | | | (55 | ) |
Net cash used in investing activities | | | (8,831 | ) | | | (4,491 | ) |
Financing activities: | | | | | | | | |
Proceeds from revolving credit facility | | | 72,700 | | | | 28,700 | |
Payments on revolving credit facility | | | (74,800 | ) | | | (35,700 | ) |
Proceeds from term loan | | | 7,200 | | | | — | |
Payments on term loans | | | — | | | | (10,516 | ) |
Payments of debt financing fees | | | (3 | ) | | | (63 | ) |
Proceeds from related party term loan | | | — | | | | 1,250 | |
Repurchase and retirement of common stock | | | (18,686 | ) | | | — | |
Proceeds from stock option exercises | | | 2,833 | | | | 29 | |
Contributions from non-controlling interest | | | 346 | | | | 480 | |
Excess tax benefit on stock-based compensation plans | | | 3,536 | | | | — | |
Other | | | (29 | ) | | | (39 | ) |
Net cash used in financing activities | | | (6,903 | ) | | | (15,859 | ) |
| | | | | | | | | |
Effect of exchange rate changes on cash and cash equivalents | | | (75 | ) | | | (29 | ) |
Net increase in cash and cash equivalents | | | 6,767 | | | | 4,360 | |
Cash and cash equivalents at end of period | | $ | 15,522 | | | $ | 15,246 | |
| |
RECONCILIATIONS OF NET INCOME ATTRIBUTABLE TO UNIFI, INC. TO ADJUSTED EBITDA (Unaudited)
(amounts in thousands)
The reconciliations of Net income attributable to Unifi, Inc. to EBITDA, Adjusted EBITDA including equity affiliates and Adjusted EBITDA are as follows:
| | | For the Three Months Ended | | | For the Six Months Ended | |
| | | December 29, 2013 | | | December 23, 2012 | | | December 29, 2013 | | | December 23, 2012 | |
Net income attributable to Unifi, Inc. | | $ | 6,443 | | | $ | 2,426 | | | $ | 15,313 | | | $ | 4,720 | |
Provision for income taxes | | | 3,924 | | | | 2,216 | | | | 9,675 | | | | 5,449 | |
Interest expense, net | | | 761 | | | | 1,217 | | | | 799 | | | | 2,537 | |
Depreciation and amortization expense | | | 4,080 | | | | 6,298 | | | | 8,349 | | | | 12,631 | |
EBITDA | | | 15,208 | | | | 12,157 | | | | 34,136 | | | | 25,337 | |
| | | | | | | | | | | | | | | | | |
Non-cash compensation expense | | | 1,197 | | | | 705 | | | | 1,611 | | | | 1,326 | |
Loss on extinguishment of debt | | | — | | | | 114 | | | | — | | | | 356 | |
Other | | | 1,284 | | | | 438 | | | | 2,546 | | | | 891 | |
Adjusted EBITDA including equity affiliates | | | 17,689 | | | | 13,414 | | | | 38,293 | | | | 27,910 | |
| | | | | | | | | | | | | | | | | |
Equity in earnings of unconsolidated affiliates | | | (5,122 | ) | | | (1,258 | ) | | | (11,245 | ) | | | (1,929 | ) |
Adjusted EBITDA | | $ | 12,567 | | | $ | 12,156 | | | $ | 27,048 | | | $ | 25,981 | |